UNITED STATES
SECURITIES AND EXCHANGE COMMISSION
Washington, D.C. 20549
FORM N-CSR
CERTIFIED SHAREHOLDER REPORT OF REGISTERED
MANAGEMENT INVESTMENT COMPANIES
Investment Company Act file number | 811-07062 | |||||||
| ||||||||
PACIFIC GLOBAL FUND INC. D/B/A PACIFIC ADVISORS FUND INC. | ||||||||
(Exact name of registrant as specified in charter) | ||||||||
| ||||||||
101 NORTH BRAND BLVD., SUITE 1950 GLENDALE, CALIFORNIA |
| 91203 | ||||||
(Address of principal executive offices) |
| (Zip code) | ||||||
| ||||||||
GEORGE A. HENNING 101 NORTH BRAND BLVD., SUITE 1950 GLENDALE, CA 91203 | ||||||||
(Name and address of agent for service) | ||||||||
| ||||||||
Registrant’s telephone number, including area code: | 818-242-6693 |
| ||||||
| ||||||||
Date of fiscal year end: | December 31 |
| ||||||
| ||||||||
Date of reporting period: | December 31, 2017 |
| ||||||
Item 1. Report to Shareholders
Filed herewith.

annual report
december 31, 2017
income and equity fund
balanced fund
large cap value fund
mid cap value fund
small cap value fund


Pacific Advisors
table of contents
Message from the Chairman | 1 | ||||||
Income and Equity Fund | 4 | ||||||
Balanced Fund | 9 | ||||||
Large Cap Value Fund | 14 | ||||||
Mid Cap Value Fund | 19 | ||||||
Small Cap Value Fund | 24 | ||||||
Schedule of Investments | 30 | ||||||
Statements of Assets and Liabilities | 48 | ||||||
Statements of Operations | 50 | ||||||
Statements of Changes in Net Assets | 52 | ||||||
Financial Highlights | 54 | ||||||
Notes to Financial Statements | 60 | ||||||
| Report of Independent Registered Public Accounting Firm | 72 | ||||||
| Disclosure Regarding the Board's Approval of the Funds' Advisory Contracts | 73 | ||||||
Directors and Officers | 76 | ||||||
Additional Tax Information | 78 | ||||||
This Report is submitted for the general information of the shareholders of Pacific Advisors Funds. It is not authorized for distribution to prospective investors unless accompanied or preceded by the Funds' current prospectus, which contains information concerning the investment policies of the Funds as well as other pertinent information.
This Report is for informational purposes only and is not a solicitation or recommendation that any particular investor should purchase or sell any particular security. The statements in the Chairman's Letter and the discussions of the Funds' performance are the opinions and beliefs expressed at the time of this commentary and are not intended to represent opinions and beliefs at any other time. These opinions are subject to change at any time based on market or other conditions and are not meant as a market forecast. All economic and performance information referenced is historical. Past performance does not guarantee future results.
For more information on the Pacific Advisors Funds, including information on charges, expenses and other classes offered, please obtain a copy of the prospectus by calling (800) 989-6693. Please read the prospectus and consider carefully the investment risks, objectives, charges and expenses before you invest or send money. Shares of the Pacific Advisors Funds are not deposits or obligations of any bank, are not guaranteed by any bank, are not insured by the FDIC or any other agency, and involve investment risks, including the possible loss of the principal amount invested. The investment return and principal value of an investment will fluctuate so that an investor's shares, when redeemed, may be worth more or less than their original cost.


Message
from the chairman
Dear Shareholders,
Stocks extended their advance in the second half of 2017 as tax reform underpinned expectations for continued economic growth. All of the major indices hit record highs. For the year, the 31.5% gain on the Nasdaq-100 Index1, which includes many of the largest technology companies, led all other indices. The Nasdaq-100's results contrast sharply to the far more modest 5.8% gain for the Russell 2000® Value Index1; the more than 25% gap in performance was the greatest differential since 2009. Large caps outperformed small caps for the third time in four years. For the year, the three largest companies in the Index (Apple, Microsoft and Amazon) generated over 16% of the S&P® 500 Index's return while the more conservative areas of the market underperformed. Here, strategies which had prioritized high dividends during the extended period of ultra-low interest rates fell out of favor.
A synchronized upswing in global economic growth provided a favorable backdrop for the market's performance. The Organisation of Economic Co-operation and Development (OECD) anticipated a 3.5% growth rate worldwide for 2017, with expansion in all of the 45 countries it tracks. The synchronized growth should continue as the demand for goods and services remains high.
At home, low unemployment and low interest rates combined with strong business and consumer confidence to drive back-to-back quarters of 3% or greater GDP growth. In addition, the late-September release of the framework for tax reform provided an unmistakable catalyst; stocks rose across the board in anticipation of lower corporate tax rates as well as the potential repatriation of cash held overseas. The final tax bill reduced corporate taxes to 21% from 35%; also, the reduced tax rate for repatriation of overseas earnings provides flexibility for large international corporations to fund investments and growth initiatives.
Six consecutive quarters of increased corporate earnings fueled rising stock prices. In the third quarter, the average earnings per share for companies in the S&P 500® Index rose 6.4%; estimates for the fourth quarter, at 14.9%, are notably higher. Rising stock prices are also funding large acquisitions: CVS Health announced its acquisition of Aetna; Walt Disney announced the purchase of Twenty-First Century Fox's entertainment businesses; and, Broadcom continues its active pursuit of Qualcomm. These huge transactions reflect changing business conditions as well as confidence in the economy.
During the second half of 2017, the demands of economic expansion fueled the recovery of oil prices from the long and severe bear market. The stabilization of oil prices at approximately $60 per barrel is an important step in revitalizing the energy sector, especially in the U.S. which has become a major exporter of oil and natural gas. The sector's resurgence will also provide an indirect growth catalyst for many other sectors of the economy.
Bond yields remained stubbornly low despite another increase in the Federal Funds rate, the third rate increase in 2017 and the fifth since the financial crisis. Also, in October, the Federal Reserve began to gradually reduce the size of its massive bond portfolio.
Equity Investment Review
For the year, the Nasdaq index, heavily weighted towards technology growth companies, led the way while the Russell 2000® Index for small cap companies lagged all other indices. Large cap growth-oriented stocks significantly outperformed small cap value-oriented stocks.
Large cap technology stocks benefitted from increased earnings as well as investors' continued preference
Market Review • December 31, 2017
Index1 | Close | YTD Price Return | |||||||||
Dow Jones Industrial Average | 24,719.22 | 25.08 | % | ||||||||
S&P 500® Index | 2,673.61 | 19.42 | % | ||||||||
Nasdaq | 6,903.39 | 28.24 | % | ||||||||
Russell Midcap® Index | 2,078.33 | 16.51 | % | ||||||||
Russell 2000® Index (small cap) | 1,535.51 | 13.14 | % | ||||||||
12/31/17 | 12/31/16 | ||||||||||
| 10-Year T-Note Yield | 2.40 | % | 2.45 | % | |||||||
Data: Bloomberg; Federal Reserve
1


Message
from the chairman (unaudited) continued
for well-recognized growth companies. For examples, during just the fourth quarter, Alphabet (Google Class C) rose 9%, Cisco rose 14%, Intel gained 21%, and Microsoft gained 15%. Continued expansion of the global economy and increased corporate spending, a likely benefit of tax reform, should enable technology companies to deliver another year of sales and profit growth. For some of these companies, though, the revenue growth may be insufficient to support their already lofty stock valuations. As a result, large cap technology stocks are unlikely to repeat their 2017 performance. Results will vary, though, as some performance leaders with high valuations show that investors have been willing to pay far more for their future growth than for other market leaders.
The resurgence of U.S. industries was an important theme in 2017. The recovery in industrial production due to new home construction, automobile production, and shale drilling activity have, in turn, enabled many companies to invest in growth initiatives.
Retailers faced increased scrutiny as industry analysts assessed the growing competition of online giants. The success of e-commerce, especially the dominance of Amazon, has created pressures for retailers to differentiate services through their brick and mortar stores and improve their own e-commerce efforts.
Continued economic growth, increasing interest rates, improving credit trends, and, more recently, the prospect for a more relaxed regulatory environment, helped Financials companies. At the Federal Reserve, Jerome Powell, Janet Yellen's replacement, is likely to continue the current monetary policy framework. These developments should provide a favorable environment for financial institutions.
A more in-depth discussion of the investment performance and strategies for the equity Funds is provided in the interviews with portfolio managers of the Balanced, Large Cap Value, Mid Cap Value, and Small Cap Value Funds.
Fixed Income Investment Review
The yield on short-term U.S. Treasuries closely reflects changes in the Fed Funds rate; during the second half of the year, the yield on the 2-year Note rose from 1.38% to 1.92%. The yield on the 10-year Note ranged between 2.05% and 2.49% while the 30-year Bond stayed within a narrow range to close the year at 2.74%, 10 basis points below its yield on June 30th.
After years of ultra-low rates, interest rates have begun to rise; the combination of Fed actions, market forces, and economic data will determine the pace and extent of rate increases for short-, medium- and long-term maturities. An in-depth discussion of the Funds' fixed income strategies follows in the interviews with portfolio managers of the Income and Equity and Balanced Funds.
Looking Ahead
The lower corporate tax rate should benefit most companies and attract foreign investments as well; in particular, though, smaller companies which generate most of their revenues in the U.S. stand to benefit as these companies have typically paid relatively high tax rates. Companies have announced plans to improve wages and benefits, add jobs and/or invest in growth opportunities such as new plants, equipment and/or acquisitions.
Improving economic data continue to support the markets' advance. All of the major measures of U.S. economic activity are rising. The Fed recently raised its 2018 forecast for U.S. economic growth from 2.1% to 2.5%. And, the OECD increased its 2018 estimate of worldwide growth to 3.7%; the countries with the highest projected growth rates are India (+7.2%), China (+6.6%) and the U.S. (+2.4%).
Tax reform, along with continued global and domestic economic growth, may prompt investors to transition away from recent market leaders, such as large Technology companies. Under-valued areas, including small cap stocks and sectors associated with economic growth such as Energy and Industrials, offer opportunities; many stocks in these areas have, along with value-oriented strategies in general, underperformed in four of the past five years. The resurgence in the industrial economy should continue; earnings growth in the sector may enable Industrials to overtake Technology as the main engine for market appreciation.
2


The Fed's actions to gradually raise rates and slowly unwind its bond purchase program should push interest rates higher. Most economists also expect inflation to rise as tight labor market conditions eventually lead to higher wages. Higher interest rates and inflation may dampen economic growth. And yet, business executives indicate that higher interest rates and inflation provide beneficial pricing power as well as the opportunity to gain market share relative to competitors which have difficulty servicing debt, refinancing or expanding credit lines.
The bull market is one of the longest on record; even so, its length masks the corrections and bear markets in several sectors that have started, and ended, during this extended cycle. Unforeseen market risks such as geopolitical events, changes in Fed policies, or other events, remain. The specter of a correction is always a risk to the equity market; but, the strength of the economy continues to provide a solid foundation for growth.
Sincerely,

George A. Henning
1 The Nasdaq-100 Index is an unmanaged, market capitalization weighted measure of 100 of the largest domestic and international non-financial securities listed on The Nasdaq Stock Market based on market capitalization. The Dow Jones Industrial Average is an unmanaged, price weighted measure of 30 U.S. stocks selected by the Averages Committee to represent the performance of all U.S. stocks outside the Transportation and Utilities sectors. The S&P 500® Index is an unmanaged, market capitalization weighted index which measures the performance of the large cap segment of the U.S. equities market, covering approximately 75% of the U.S. equities market. The Index includes 500 leading companies in leading industries of the U.S. economy. The NASDAQ Composite Index is an unmanaged, market capitalization weighted measure of all domestic and international common stocks (currently over 3,000 stocks) listed on The Nasdaq Stock Market. The Russell Indices are unmanaged, market-weighted indices. The Russell Midcap® Index measures the 800 smallest companies within the Russell 1000® Index based on a combination of their market cap and current index membership. The Russell 2000® Index measures the stocks of the 2,000 smallest publicly traded companies of the Russell 3000® Index. The Russell 2000® Value Index includes those Russell 2000® Index companies with lower price-to-book ratios and lower forecasted growth values. These indices are not available for direct investment.
Economic and performance information referenced is historical and past performance does not guarantee future results. The principal value and return of an investment will fluctuate so that an investor's shares may be worth less than the original cost when redeemed. For more information on the Pacific Advisors Funds, including information on charges, expenses and other classes offered, please obtain a copy of the prospectus by calling (800) 989-6693. Please read the prospectus and consider carefully the investment risks, objectives, charges and expenses before you invest or send money.
Shares of the Funds are not deposits or obligations of any bank, are not guaranteed by any bank, are not insured by the FDIC or any other agency, and involve investment risks, including the possible loss of the principal amount invested. The views expressed represent the opinions and beliefs at the time of this commentary and are not meant as a market forecast. These views are subject to change at any time based on market or other conditions. This information may not be relied on as investment advice or as an indication of trading.
3
Pacific Advisors
Income and Equity Fund (unaudited)
Fund Objective: Current income and, secondarily, long-term capital appreciation.
Investment Invests primarily in investment grade U.S. corporate bonds and in dividend-paying
Strategy: stocks.
Investor Profile: Conservative. Some current income required; capital preservation aim.
Please see the Chairman's Letter for a detailed market and economic review
as well as the Manager's general market outlook.
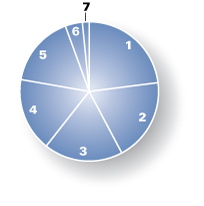
Portfolio Holdings (As of 12/31/17 based on total investments)
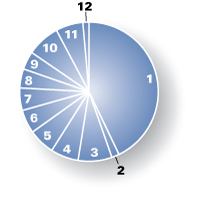
| 1. | Corporate Bonds | 42.87 | % | ||||||||
| 2. | Convertible Bonds | 1.76 | % | ||||||||
Equities | 47.59 | % | |||||||||
| 3. | Consumer Staples | 7.89 | % | ||||||||
| 4. | Information Technology | 6.49 | % | ||||||||
| 5. | Industrials | 6.14 | % | ||||||||
| 6. | Consumer Discretionary | 5.49 | % | ||||||||
| 7. | Financials | 5.22 | % | ||||||||
| 8. | Health Care | 4.44 | % | ||||||||
| 9. | Utilities | 4.21 | % | ||||||||
| 10. | Others | 7.71 | % | ||||||||
| 11. | Preferred Stock | 6.36 | % | ||||||||
| 12. | Cash and Cash Equivalents | 1.42 | % | ||||||||
| Total Returns (For the year ended 12/31/17) | |||||||
Class A | 5.26 | % | |||||
Class C | 4.38 | % | |||||
| |||||||
| Barclays Capital U.S. Intermediate Corporate Bond Index1 | 3.92 | % | |||||
S&P 500® Index1 | 21.83 | % | |||||
Current expense ratio: net 2.96% (A), 3.72% (C); gross 3.71% (A), 4.47% (C). Prospectus expense ratio: net 2.88% (A), 3.64% (C); gross 3.63% (A); 4.39% (C).2
Performance quoted is past performance which does not guarantee future results. Current performance may be higher or lower than the performance quoted. Call (800) 989-6693 for performance current to the most recent month-end. The investment return and principal value of an investment will fluctuate so that an investor's shares, when redeemed, may be worth more or less than their original cost. Returns represent the change in value over the stated period assuming reinvestment of dividends and capital gains at net asset value. Returns do not take into account the maximum 4.75% sales charge on Class A shares or the 1% Contingent Deferred Sales Charge (CDSC) for Class C shares sold within one year of purchase. Returns would be lower if the applicable sales charge and CDSC were included. Returns do not take into account individual taxes which may reduce actual returns when shares are sold.
The Fund's investment adviser is waiving a portion of its management fees pursuant to an Expense Limitation Agreement. The waiver may be discontinued at any time with ninety days written notice in consultation with the Fund's board, but is expected to continue at current levels. Please see the Notes to Financial Statements in this report for details. Performance shown reflects the waiver, without which the results would have been lower.
1 The S&P 500® Index is an unmanaged, market capitalization weighted index which measures the performance of the large cap segment of the U.S. equities market, covering approximately 75% of the U.S. equities market. The Index includes 500 leading companies in leading industries of the U.S. economy. Index returns assume the reinvestment of dividends, but, unlike the Fund's returns, do not reflect the effects of management fees or expenses. The Barclays Capital U.S. Intermediate Corporate Bond Index is an unmanaged index of publicly issued investment grade U.S. corporate bonds with one to ten years to maturity. It is not possible to invest directly in either Index.
2 "Current" expense ratio is as of 12/31/17. "Prospectus" expense ratio is for the fiscal year ended 12/31/16.
4
Pacific Advisors
Income and Equity Fund (unaudited)
Discussion with Portfolio Managers February 26, 2018
Charles Suh, CFA and Jingjing Yan, CFA
Fund Strategy
The Fund employs a conservative strategy that seeks to achieve total return through current income and capital appreciation. The Fund's fixed income holdings, typically investment-grade bonds and preferred stocks, are actively managed to seek the greatest income and return potential while minimizing risk. The Fund's equity holdings are a focused selection of 30-40 dividend-paying, blue chip stocks; the equity allocation depends upon economic and market conditions. When interest rates are low and the economic outlook is optimistic, the Fund's equity allocation, which typically ranges between 20% and 40%, often increases above 40% to capture dividend income as well as opportunities for price appreciation. During the period, the allocation to common stocks remained between 45% and 50%. Equity investments are selected based upon a history of price stability, long-term growth potential, and attractive dividend income.
Fund Performance
In 2017, Class A shares rose 5.26% to outperform is fixed income benchmark, the Barclays Capital U.S. Intermediate Corporate Bond Index (+3.92%), and underperform its equity benchmark, the S&P 500® Index (+21.83%). Overall Fund performance is best compared to a blended return1 based on the benchmarks (12.38% for the 1-year period) even though the composition of the Fund's fixed income and equity holdings differ from their respective benchmarks. The equity benchmark performed well during the period due to the significant contribution of leading technology and online retailers: Apple, Microsoft, Amazon, Facebook, and Alphabet drove 23% of the Index's performance. Importantly, the Fund maintained substantially lower volatility than the benchmark as demonstrated by the Fund's one-year beta2 of 0.38 as of December 31st.
What Helped/Hurt Performance3
The Fund's top equity contributors to returns during the second half of the year were AbbVie, Intel, and T. Rowe Price. Pharmaceutical company AbbVie rose over 35% on higher sales of its best-selling drug Humira; the company raised both its dividend and 2018 outlook. Semiconductor giant Intel gained over 38% during the period; the company announced a collaboration with AMD to manufacture a thinner, lighter, and more powerful laptop chip that will compete with rival Nvidia. Asset manager T. Rowe Price rose over 43% as revenues increased 12% year-over-year; in particular, investment advisory fees rose 13% compared to the year-ago period.
The Fund's most significant detractors from returns were GE, Omnicom, and CVS. Industrial company GE fell more than 30% due to ongoing challenges in Power, its largest business segment; in November, the company announced a dividend cut for the first time since 2009. Advertising firm Omnicom declined over 10%; the company faces increased competition as the industry is increasingly dominated by digital ad giants. Retail pharmacy chain CVS fell over 8% after the media announced, and the company later confirmed, a deal to acquire health insurer Aetna.
1 Blended return calculated from the benchmark index returns based on ratio of stocks to fixed-income securities in the Fund's portfolio as of the end of the period.
2 "Beta" measures volatility relative to the stock market or an alternative benchmark. A beta less than 1.0 indicates lower risk than the market or the benchmark; a beta greater than 1.0 indicates higher risk than the market or the benchmark.
3 For detailed information on Fund holdings, please see the Fund's Schedule of Investments in this Report.
5
Pacific Advisors
Income and Equity Fund (unaudited) continued
Several of the Fund's corporate bonds were called in as issuers retired debt. The Fund reinvested the proceeds in similar investment-grade bonds of high-quality companies, such as Government Properties Inc. which yields 3.92% and matures in 2022. The Fund also purchased securities with interest rates that adjust if not called; these investments provide both principal protection and attractive yields. For example, the Fund bought a fixed-to-floating rate preferred stock issued by Charles Schwab. The security will provide a 3.97% yield for the next four and a half years; if not called, the yield will adjust to 3-month LIBOR plus 3.315%.
The Fund's fixed income allocation continued to invest primarily in short-to-intermediate-term bonds (maturing in five years or less) which help protect principal and reduce price volatility. The Fund's 2.92% dividend yield is essentially equal to the Barclays Capital benchmark's 2.94% yield while the Fund's weighted average duration (2.42 years as of December 31st) was substantially shorter than the 4.44-year weighted average duration of the benchmark, an unmanaged bond portfolio. Duration measures a portfolio's sensitivity to interest rate movements; when rates increase by 1%, the value of a portfolio with a 4-year duration would decrease by approximately 4%.
Looking Ahead
For 2018, we anticipate that investors will focus on U.S. economic growth and the timing of future interest rate increases by the Federal Reserve. Jerome Powell, the new Chair, is not expected to diverge drastically from Janet Yellen's prudent pace of rate hikes. The Fund's fixed income portfolio of shorter-term bonds provides the flexibility to adapt as rates change; the Fund expects to gradually lengthen the average duration of its bond portfolio as rates rise. The Fund will continue to identify stocks that offer attractive opportunities for price appreciation and dividend increases although, as rates increase, the Fund may decrease its equity allocation to add fixed income holdings with higher interest rates.
6
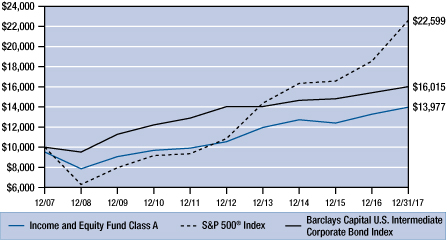
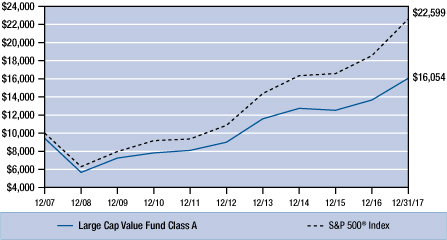
Change in Value of $10,000 Investment1
This chart compares the growth of a $10,000 investment in Class A shares of the Income and Equity Fund for the period January 1, 2008 through December 31, 2017 with the same investment in the S&P 500® Index2 and the Barclays Capital U.S. Intermediate Corporate Bond Index3.
Average Annual Compounded Returns as of December 31, 2017
Class A | Class C | Barclays Capital U.S. Intermediate Corporate Bond Index | S&P 500® Index | ||||||||||||||||
One Year | 0.24 | % | 3.38 | % | 3.92 | % | 21.83 | % | |||||||||||
Five Year | 4.77 | % | 4.98 | % | 2.68 | % | 15.79 | % | |||||||||||
Ten Year | 3.40 | % | 3.13 | % | 4.82 | % | 8.50 | % | |||||||||||
Past performance does not guarantee future results. Performance quoted represents past performance. Current performance may be higher or lower than the performance data quoted. Returns include reinvested dividends and capital gains. Returns for Class A shares reflect a maximum front-end sales charge of 4.75%; and returns for Class C shares reflect the deduction of a contingent deferred sales charge of 1% on shares sold within the first year of purchase. Returns do not take into account individual taxes which may reduce actual returns when shares are sold. The investment return and principal value of an investment will fluctuate so that an investor's shares, when redeemed, may be worth more or less than their original cost. Call (800) 989-6693 for the most recent month-end performance.
1 Fund results are shown for Class A shares and reflect deduction of the maximum front-end sales charge of 4.75% on the $10,000 investment for a net amount invested of $9,525. At the end of the same period, a $10,000 investment in Class C shares would have been valued at $13,608, and no contingent deferred sales charges would apply. Performance of the share classes will vary based on the difference in charges and expenses. The inception date is 02/08/93 for Class A shares and 04/01/98 for Class C shares. It is not possible to invest directly in either Index. Index results assume reinvestment of dividends, but, unlike the Fund's results, do not reflect sales charges, fees or expenses.
2 The Standard & Poor's 500® Index is an unmanaged, market capitalization weighted index which measures the performance of the large cap segment of the U.S. equities market, covering approximately 75% of the U.S. equities market. The Index includes 500 leading companies in leading industries of the U.S. economy.
3 The Barclays Capital U.S. Intermediate Corporate Bond Index is an unmanaged index of publicly issued investment grade U.S. corporate bonds with one to ten years to maturity.
7
Pacific Advisors
Income and Equity Fund (unaudited) continued
Expense Examples
As a shareholder of the Fund you incur two types of costs: (1) transaction costs, including sales charges (loads) on purchase payments, reinvested dividends, or other distributions; redemption fees; and exchange fees; and (2) ongoing costs, including management fees; distribution (12b-1) fees; and other Fund expenses. This Example is intended to help you understand your ongoing costs (in dollars) of investing in the Fund and to compare these costs with the ongoing costs of investing in other mutual funds.
The Example is based on an investment of $1,000 invested at the beginning of the period and held for the entire period from July 1, 2017 through December 31, 2017.
Actual Expenses
The first line of the table below provides information about actual account values and actual expenses. You may use the information in this line, together with the amount you invested, to estimate the expenses that you paid over the period. Simply divide your account value by $1,000 (for example, an $8,600 account value divided by $1,000 = 8.6), then multiply the result by the number in the first line under the heading entitled "Expenses Paid During the Period" to estimate the expenses you paid on your account during the period.
The following transaction costs are not included in the expenses shown in the table and, if applicable, would increase the expenses that you paid over the period: (1) a front-end sales charge (load) of 4.75% on Class A shares; (2) a 2% redemption fee if you sell or exchange shares within 30 days of purchase, with certain exceptions. The redemption fee does not apply to: (a) redemptions under an automatic withdrawal program or periodic asset reallocation plan, required minimum distributions (RMD), employer mandated distributions from a qualified plan, or redemptions under a qualified domestic relations order (QDRO); (b) redemptions to pay for expenses related to terminal illness, extended hospital or nursing home care, or other serious medical conditions, including death; (c) redemptions of shares acquired through dividend or capital gains reinvestments; (d) loans from a qualified plan account; and (e) redemptions initiated by the Fund; and (3) a $10 service fee on each exchange after the first five exchanges in each calendar year.
The following ongoing costs are not included in the expenses shown in the table and, if applicable, would increase the expenses that you paid over the period: (1) a $12 low balance fee on accounts with balances of less than $250 as of September 30th of each calendar year and no investment activity (excluding reinvestment of dividends and/or capital gains) during the prior calendar year or the first nine months of the current calendar year. This fee does not apply to IRAs, qualified plan accounts, or Coverdell Education Savings Accounts; (2) a $15 annual custodial fee on IRAs, SEPs, SIMPLE IRAs, and Coverdell Education Savings Accounts; and (3) a $20 annual custodial fee on 403(b) accounts.
Hypothetical Example for Comparison Purposes
The second line of the table below provides information about hypothetical account values and hypothetical expenses based on the Fund's actual expense ratio and an assumed rate of return of 5% per year before expenses, which in not the Fund's actual return. The hypothetical account values and expenses may not be used to estimate the actual ending account balance or expenses you paid for the period. You may use this information to compare the ongoing costs of investing in the Fund and other funds. To do so, compare this 5% hypothetical example with the 5% hypothetical examples that appear in the shareholder reports of the other funds.
The following transaction costs are not included in the expenses shown in the table and, if applicable, would increase the expenses that you paid over the period: (1) a front-end sales charge (load) of 4.75% on Class A shares; (2) a 2% redemption fee if you sell or exchange shares within 30 days of purchase, with certain exceptions. The redemption fee does not apply to: (a) redemptions under an automatic withdrawal program or periodic asset reallocation plan, required minimum distributions (RMD), employer mandated distributions from a qualified plan, or redemptions under a qualified domestic relations order (QDRO); (b) redemptions to pay for expenses related to terminal illness, extended hospital or nursing home care, or other serious medical conditions, including death; (c) redemptions of shares acquired through dividend or capital gains reinvestments; (d) loans from a qualified plan account; and (e) redemptions initiated by the Fund; and (3) a $10 service fee on each exchange after the first five exchanges in each calendar year.
The following ongoing costs are not included in the expenses shown in the table and, if applicable, would increase the expenses that you paid over the period: (1) a $12 low balance fee on accounts with balances of less than $250 as of September 30th of each calendar year and no investment activity (excluding reinvestment of dividends and/or capital gains) during the prior calendar year or the first nine months of the current calendar year. This fee does not apply to IRAs, qualified plan accounts, or Coverdell Education Savings Accounts; (2) a $15 annual custodial fee on IRAs, SEPs, SIMPLE IRAs, and Coverdell Education Savings Accounts; and (3) a $20 annual custodial fee on 403(b) accounts.
Please note that the expenses shown in the table are meant to highlight your ongoing costs only and do not reflect any transactional costs, such as sales charges (loads), redemption fees, or exchange fees. Therefore, the second line of the table is useful in comparing ongoing costs only, and will not help you determine the relative total costs of owning different funds. In addition, if these transactional costs were included, your costs would have been higher.
| Beginning Account Value 07/01/17 | Ending Account Value 12/31/17 | Expense Paid During Period 07/01/17 – 12/31/17 | |||||||||||||
Income and Equity Fund Class A | |||||||||||||||
Actual | $ | 1,000.00 | $ | 1,051.40 | $ | 15.31 | |||||||||
Hypothetical (5% return before expense) | $ | 1,000.00 | $ | 1,010.28 | $ | 15.00 | |||||||||
Income and Equity Fund Class C | |||||||||||||||
Actual | $ | 1,000.00 | $ | 1,046.49 | $ | 19.19 | |||||||||
Hypothetical (5% return before expense) | $ | 1,000.00 | $ | 1,006.45 | $ | 18.81 | |||||||||
4 Expenses are equal to the Fund's annualized expense ratio, net of expense waivers, of 2.96% for Class A shares and 3.72% for Class C shares, multiplied by the average account value over the period, multiplied by 184/365 days to reflect the one-half year period.
8
Pacific Advisors
Balanced Fund (unaudited)
Fund Objective: Long-term capital appreciation and income consistent with reduced risk.
Investment Invests primarily in large cap common stocks and investment grade U.S. corporate
Strategy: bonds. Invests at least 25% of its assets in fixed income securities and preferred stocks and at least 25% in equities.
Investor Profile: Moderately conservative. Seeks combination of long-term growth, income, liquidity and reduced risk of price fluctuations.
Please see the Chairman's Letter for a detailed market and economic review
as well as the Manager's general market outlook.
Portfolio Holdings (As of 12/31/17 based on total investments)
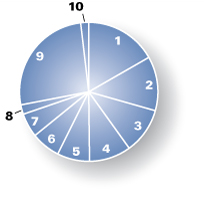
| Equities | 71.98 | % | |||||||||
| 1. | Consumer Discretionary | 16.75 | % | ||||||||
| 2. | Industrials | 12.63 | % | ||||||||
| 3. | Information Technology | 10.68 | % | ||||||||
| 4. | Financials | 9.75 | % | ||||||||
| 5. | Health Care | 7.58 | % | ||||||||
| 6. | Consumer Staples | 6.78 | % | ||||||||
| 7. | Energy | 5.60 | % | ||||||||
| 8. | Telecommunication Services | 2.21 | % | ||||||||
| 9. | Corporate Bonds | 26.15 | % | ||||||||
| 10. | Preferred Stock | 1.87 | % | ||||||||
| Total Returns (For the year ended 12/31/17) | |||||||
Class A | 10.55 | % | |||||
Class C | 9.65 | % | |||||
| |||||||
S&P 500® Index1 | 21.83 | % | |||||
| Barclays Capital U.S. Intermediate 3.92% Corporate Bond Index1 |
| ||||||
Current expense ratio: 4.76% (A); 5.52% (C). Prospectus expense ratio: 4.50% (A); 5.25% (C).2
Performance quoted is past performance which does not guarantee future results. Current performance may be higher or lower than the performance quoted. Call (800) 989-6693 for performance current to the most recent month-end. The investment return and principal value of an investment will fluctuate so that an investor's shares, when redeemed, may be worth more or less than their original cost. Returns represent the change in value over the stated period assuming reinvestment of dividends and capital gains at net asset value. Returns do not take into account the maximum 5.75% sales charge on Class A shares or the 1% Contingent Deferred Sales Charge (CDSC) for Class C shares sold within one year of purchase. Returns would be lower if the applicable sales charge and CDSC were included. Returns do not take into account individual taxes which may reduce actual returns when shares are sold.
1 The S&P 500® Index is an unmanaged, market capitalization weighted index which measures the performance of the large cap segment of the U.S. equities market, covering approximately 75% of the U.S. equities market. The Index includes 500 leading companies in leading industries of the U.S. economy. Index returns assume the reinvestment of dividends, but, unlike the Fund's returns, do not reflect the effects of management fees or expenses. The Barclays Capital U.S. Intermediate Corporate Bond Index is an unmanaged index of publicly issued investment grade U.S. corporate bonds with one to ten years to maturity. It is not possible to invest directly in either Index.
2 "Current" expense ratio is as of 12/31/17. "Prospectus" expense ratio is for the fiscal year ended 12/31/16.
9
Pacific Advisors
Balanced Fund (unaudited)
Discussion with Portfolio Managers February 26, 2018
Charles Suh, CFA, and Jingjing Yan, CFA
Fund Strategy
The Fund is designed for investors seeking to participate in the equity markets with reduced volatility. The Fund's strategy combines high-quality stocks across all market capitalizations with investment-grade corporate bonds. We identify leading, well-managed companies that generate high returns on capital and consistent earnings over a full economic cycle. We look to purchase stocks at a discount to our internal price targets with the expectation that, as the companies' growth strategies unfold, the stocks will appreciate over the medium-to-long-term. The Fund may experience periods of underperformance when short-term market trends overshadow long-term outlooks; yet, over time, performance should reflect the strength of these companies as they demonstrate the ability to grow through various economic and business cycles.
We manage the Fund's asset allocation based on our assessment of risk-appropriate investments in the context of the overall economic, market, and interest rate outlook. This balanced approach enables the Fund to take advantage of specific growth opportunities while reducing overall risk.
Fund Performance
Class A shares of the Fund gained 10.55% in 2017 to underperform its equity benchmark, the S&P 500® Index (+21.83%), and outpace its fixed income benchmark, the Barclays Capital U.S. Intermediate Corporate Bond Index (+3.92%). The Fund's one-year beta1, as compared against the S&P 500® Index, was 0.87. The results are in-line with the Fund's investment objective of participating in the equity markets with reduced volatility. For the second half of 2017, Class A shares gained 7.88%; the Fund's equity allocation returned 14.24% to outpace the S&P 500® Index's 11.42% return during the period. The Fund's fixed income holdings remained concentrated in investment-grade issuers and shorter-term maturities (less than five years); its conservative positioning helped minimize the impact of rising interest rates.
What Helped/Hurt Performance2
The Fund's top contributors to returns during the second half of the year were Conn's, Chefs' Warehouse, and Tractor Supply. Conn's, a specialty retailer that provides in-store financing, surged 86% on improved credit performance as well as higher margins; credit delinquency rates declined for the first time in four years while retail gross margins hit record highs. The company is resuming its store expansion plans with five to nine new store openings in 2018. Chefs' Warehouse, a specialty food distributor focused on fine dining restaurants, caterers and gourmet stores jumped 58% on improving earnings results. During the third quarter, the company acquired Fells Point Wholesale Meats, a Baltimore-based distributor of high-end specialty meats. Tractor Supply rose 39% as the largest retailer catering to the rural lifestyle delivered better-than-expected sales growth. The company reported higher same store sales and higher average tickets with sales growth in all major product categories and geographic regions. The company's recent initiatives, including "Buy Online and Pickup in Store" and "Drop Ship" programs, which deliver goods directly to customers from distribution centers, continue to gain momentum.
1 "Beta" measures volatility relative to the stock market or an alternative benchmark. A beta less than 1.0 indicates lower risk than the market or the benchmark; a beta greater than 1.0 indicates higher risk than the market or the benchmark.
2 For detailed information on Fund holdings, please see the Fund's Schedule of Investments in this Report.
10
The Fund's most significant detractors to returns were Team, Henry Schein, and Ulta Beauty. Team, a provider of industrial maintenance services, fell 36% as the company changed management to address disappointing performance results. The company remains well-positioned for a rebound in service activity; the recovery in oil prices should enable customers to move forward with long-delayed, and federally mandated, maintenance projects. Henry Schein, the world's largest provider of health care products and services to office-based dental, animal care and medical practitioners, declined 24% as investors reacted to potential competition from Amazon; the company's field representatives, though, provide critical consultative services for clinicians which online-only distributors cannot replicate. Also, Henry Schein's Canadian subsidiary recently expanded its relationship with Dentsply-Sirona to include the rapidly growing market for dental CAD/CAM technologies; these advances can mold a crown within an hour. Ulta Beauty fell 13% as sales of beauty products slowed. Yet, the company continues to gain market share from department stores and retail pharmacy chains. The retailer's vision of providing All Things Beauty, All in One PlaceTM has resonated with its customers which include attractive demographics, such as millennials and social media "influencers."
During the period, the Fund sold its positions in several companies, including Equifax, MarketAxess and Shutterstock as the stock prices approached our internal targets; the sale of Equifax occurred in July, before reports of the company's security breach which triggered a sharp selloff. The Fund used proceeds from these sales to initiate positions in Costco, Oracle, and Ulta Beauty. The Fund liquidated its holding in Hornbeck Offshore Services, a provider of support vessels for offshore oil wells, in favor of Noble Energy, an offshore drilling contractor; we believe Noble provides greater upside potential and lower downside risk while maintaining exposure to the emerging recovery in offshore activity.
Looking Ahead
The Fund is positioned to benefit from continued economic growth, both at home and abroad. Large cap holdings, such as Disney and Nike provide favorable exposure to overseas markets, especially China. Also, domestically-focused small and mid-cap companies, such as Ulta Beauty, Spirit Airlines, and Healthcare Services Group, should benefit from economic growth in the U.S. and a reduced tax rate due to corporate tax reform. Oil price stability, at approximately $60 per barrel, should enable producers to move forward with long-delayed projects; the Fund's Energy holdings include Schlumberger, Core Laboratories, and Noble Energy. And, banks and financial services companies should be able to profit from higher interest rates on loans and investments; here, East West Bancorp, Signature Bank, and SEI Investments are well positioned. The Fund utilizes its diversified selection of investment grade corporate bonds with shorter-term maturities to mitigate volatility within the equity allocation and provide a balanced overall return.
11
Pacific Advisors
Balanced Fund (unaudited) continued
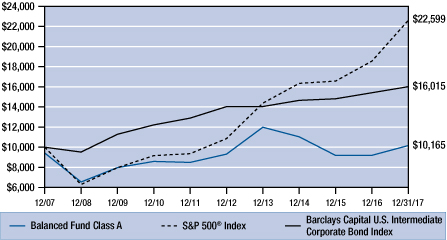
Change in Value of $10,000 Investment1
This chart compares the growth of a $10,000 investment in Class A shares of the Balanced Fund for the period January 1, 2008 through December 31, 2017 with the same investment in the S&P 500® Index2 and the Barclays Capital U.S. Intermediate Corporate Bond Index3.
Average Annual Compounded Returns as of December 31, 2017
Class A | Class C | S&P 500® Index | Barclays Capital U.S. Intermediate Corporate Bond Index | ||||||||||||||||
One Year | 4.21 | % | 8.65 | % | 21.83 | % | 3.92 | % | |||||||||||
Five Year | 0.57 | % | 0.99 | % | 15.79 | % | 2.68 | % | |||||||||||
Ten Year | 0.17 | % | – 0.01 | % | 8.50 | % | 4.82 | % | |||||||||||
Past performance does not guarantee future results. Performance quoted represents past performance. Current performance may be higher or lower than the performance data quoted. Returns include reinvested dividends and capital gains. Returns for Class A shares reflect a maximum front-end sales charge of 5.75%; and returns for Class C shares reflect the deduction of a contingent deferred sales charge of 1% on shares sold within the first year of purchase. Returns do not take into account individual taxes which may reduce actual returns when shares are sold. The investment return and principal value of an investment will fluctuate so that an investor's shares, when redeemed, may be worth more or less than their original cost. Call (800) 989-6693 for the most recent month-end performance.
1 Fund results are shown for Class A shares and reflect deduction of the maximum front-end sales charge of 5.75% on the $10,000 investment for a net amount invested of $9,425. At the end of the same period, a $10,000 investment in Class C shares would have been valued at $9,994, and no contingent deferred sales charges would apply. Performance of the share classes will vary based on the difference in charges and expenses. The inception date is 02/08/93 for Class A shares and 04/01/98 for Class C shares. It is not possible to invest directly in either Index. Index results assume reinvestment of dividends, but, unlike the Fund's results, do not reflect sales charges, fees or expenses.
2 The Standard & Poor's 500® Index is an unmanaged, market capitalization weighted index which measures the performance of the large cap segment of the U.S. equities market, covering approximately 75% of the U.S. equities market. The Index includes 500 leading companies in leading industries of the U.S. economy.
3 The Barclays Capital U.S. Intermediate Corporate Bond Index is an unmanaged index of publicly issued investment grade U.S. corporate bonds with one to ten years to maturity.
12
Expense Examples
As a shareholder of the Fund you incur two types of costs: (1) transaction costs, including sales charges (loads) on purchase payments, reinvested dividends, or other distributions; redemption fees; and exchange fees; and (2) ongoing costs, including management fees; distribution (12b-1) fees; and other Fund expenses. This Example is intended to help you understand your ongoing costs (in dollars) of investing in the Fund and to compare these costs with the ongoing costs of investing in other mutual funds.
The Example is based on an investment of $1,000 invested at the beginning of the period and held for the entire period from July 1, 2017 through December 31, 2017.
Actual Expenses
The first line of the table below provides information about actual account values and actual expenses. You may use the information in this line, together with the amount you invested, to estimate the expenses that you paid over the period. Simply divide your account value by $1,000 (for example, an $8,600 account value divided by $1,000 = 8.6), then multiply the result by the number in the first line under the heading entitled "Expenses Paid During the Period" to estimate the expenses you paid on your account during the period.
The following transaction costs are not included in the expenses shown in the table and, if applicable, would increase the expenses that you paid over the period: (1) a front-end sales charge (load) of 5.75% on Class A shares; (2) a 2% redemption fee if you sell or exchange shares within 180 days of purchase, with certain exceptions. The redemption fee does not apply to: (a) redemptions under an automatic withdrawal program or periodic asset reallocation plan, required minimum distributions (RMD), employer mandated distributions from a qualified plan, or redemptions under a qualified domestic relations order (QDRO); (b) redemptions to pay for expenses related to terminal illness, extended hospital or nursing home care, or other serious medical conditions, including death; (c) redemptions of shares acquired through dividend or capital gains reinvestments; (d) loans from a qualified plan account, and (e) redemptions initiated by the Fund; and (3) a $10 service fee on each exchange after the first five exchanges in each calendar year.
The following ongoing costs are not included in the expenses shown in the table and, if applicable, would increase the expenses that you paid over the period: (1) a $12 low balance fee on accounts with balances of less than $250 as of September 30th of each calendar year and no investment activity (excluding reinvestment of dividends and/or capital gains) during the prior calendar year or the first nine months of the current calendar year. This fee does not apply to IRAs, qualified plan accounts, or Coverdell Education Savings Accounts; (2) a $15 annual custodial fee on IRAs, SEPs, SIMPLE IRAs, and Coverdell Education Savings Accounts; and (3) a $20 annual custodial fee on 403(b) accounts.
Hypothetical Example for Comparison Purposes
The second line of the table below provides information about hypothetical account values and hypothetical expenses based on the Fund's actual expense ratio and an assumed rate of return of 5% per year before expenses, which in not the Fund's actual return. The hypothetical account values and expenses may not be used to estimate the actual ending account balance or expenses you paid for the period. You may use this information to compare the ongoing costs of investing in the Fund and other funds. To do so, compare this 5% hypothetical example with the 5% hypothetical examples that appear in the shareholder reports of the other funds.
The following transaction costs are not included in the expenses shown in the table and, if applicable, would increase the expenses that you paid over the period: (1) a front-end sales charge (load) of 5.75% on Class A shares; (2) a 2% redemption fee if you sell or exchange shares within 180 days of purchase, with certain exceptions. The redemption fee does not apply to: (a) redemptions under an automatic withdrawal program or periodic asset reallocation plan, required minimum distributions (RMD), employer mandated distributions from a qualified plan, or redemptions under a qualified domestic relations order (QDRO); (b) redemptions to pay for expenses related to terminal illness, extended hospital or nursing home care, or other serious medical conditions, including death; (c) redemptions of shares acquired through dividend or capital gains reinvestments; (d) loans from a qualified plan account, and (e) redemptions initiated by the Fund; and (3) a $10 service fee on each exchange after the first five exchanges in each calendar year.
The following ongoing costs are not included in the expenses shown in the table and, if applicable, would increase the expenses that you paid over the period: (1) a $12 low balance fee on accounts with balances of less than $250 as of September 30th of each calendar year and no investment activity (excluding reinvestment of dividends and/or capital gains) during the prior calendar year or the first nine months of the current calendar year. This fee does not apply to IRAs, qualified plan accounts, or Coverdell Education Savings Accounts; (2) a $15 annual custodial fee on IRAs, SEPs, SIMPLE IRAs, and Coverdell Education Savings Accounts; and (3) a $20 annual custodial fee on 403(b) accounts.
Please note that the expenses shown in the table are meant to highlight your ongoing costs only and do not reflect any transactional costs, such as sales charges (loads), redemption fees, or exchange fees. Therefore, the second line of the table is useful in comparing ongoing costs only, and will not help you determine the relative total costs of owning different funds. In addition, if these transactional costs were included, your costs would have been higher.
| Beginning Account Value 07/01/17 | Ending Account Value 12/31/17 | Expense Paid During Period 07/01/17 – 12/31/17 | |||||||||||||
Balanced Fund Class A | |||||||||||||||
Actual | $ | 1,000.00 | $ | 1,078.82 | $ | 24.94 | |||||||||
Hypothetical (5% return before expense) | $ | 1,000.00 | $ | 1,001.21 | $ | 24.01 | |||||||||
Balanced Fund Class C | |||||||||||||||
Actual | $ | 1,000.00 | $ | 1,075.04 | $ | 28.87 | |||||||||
Hypothetical (5% return before expense) | $ | 1,000.00 | $ | 997.38 | $ | 27.79 | |||||||||
4 Expenses are equal to the Fund's annualized expense ratio of 4.76% for Class A shares and 5.52% for Class C shares, multiplied by the average account value over the period, multiplied by 184/365 days to reflect the one-half year period.
13
Pacific Advisors
Large Cap Value Fund (unaudited)
Fund Objective: Long-term capital appreciation.
Investment Invests at least 80% of its assets in large cap companies that are, at the time of
Strategy: purchase, within the market cap range of companies in the S&P 500® Index1.
Investor Profile: Conservative equity. Growth-oriented with a long-term investment horizon.
Please see the Chairman's Letter for a detailed market and economic review
as well as the Manager's general market outlook.
Portfolio Holdings (As of 12/31/17 based on total investments)
Equities | 100.00 | % | |||||||||
| 1. | Information Technology | 22.98 | % | ||||||||
| 2. | Consumer Discretionary | 19.24 | % | ||||||||
| 3. | Financials | 18.43 | % | ||||||||
| 4. | Consumer Staples | 17.09 | % | ||||||||
| 5. | Industrials | 16.67 | % | ||||||||
| 6. | Health Care | 4.00 | % | ||||||||
| 7. | Energy | 1.59 | % | ||||||||
| Total Returns (For the year ended 12/31/17) | |||||||
Class A | 17.56 | % | |||||
Class C | 16.67 | % | |||||
| |||||||
S&P 500® Index | 21.83 | % | |||||
Current expense ratio: net 3.78% (A), 4.53% (C); gross 4.53% (A), 5.27% (C). Prospectus expense ratio: net 3.85% (A), 4.59% (C); gross 4.60% (A); 5.34% (C).2
Performance quoted is past performance which does not guarantee future results. Current performance may be higher or lower than the performance quoted. Call (800) 989-6693 for performance current to the most recent month-end. The investment return and principal value of an investment will fluctuate so that an investor's shares, when redeemed, may be worth more or less than their original cost. Returns represent the change in value over the stated period assuming reinvestment of dividends and capital gains at net asset value. Returns do not take into account the maximum 5.75% sales charge on Class A shares or the 1% Contingent Deferred Sales Charge (CDSC) for Class C shares sold within one year of purchase. Returns would be lower if the applicable sales charge and CDSC were included. Returns do not take into account individual taxes which may reduce actual returns when shares are sold.
The Fund's investment adviser is waiving a portion of its management fees pursuant to an Expense Limitation Agreement. The waiver may be discontinued at any time with ninety days written notice in consultation with the Fund's board, but is expected to continue at current levels. Please see the Notes to Financial Statements in this report for details. Performance shown reflects the waiver, without which the results would have been lower.
1 The Standard & Poor's 500® Index is an unmanaged, market capitalization weighted index which measures the performance of the large cap segment of the U.S. equities market, covering approximately 75% of the U.S. equities market. The Index includes 500 leading companies in leading industries of the U.S. economy. Index returns assume the reinvestment of dividends, but, unlike the Fund's returns, do not reflect the effects of management fees or expenses. It is not possible to invest directly in the Index.
2 "Current" expense ratio is as of 12/31/17. "Prospectus" expense ratio is for the fiscal year ended 12/31/16.
14
Pacific Advisors
Large Cap Value Fund (unaudited)
Discussion with Portfolio Manager February 26, 2018
Samuel C. Coquillard
Fund Strategy
The Fund uses a value-oriented, focused portfolio strategy (30 holdings as of 12/31/17) to invest in more conservative, less volatile U.S. stocks that pay attractive dividends. The Fund seeks to achieve long-term capital appreciation with reduced volatility. Holdings concentrate on mega-cap stocks of well-managed companies with dominant market positions, strong financials, and track records of steady growth. The weighted average market capitalization of Fund holdings ($249 billion as of 12/31/17) is almost five times larger than the average of the benchmark S&P 500® Index. The mega-cap emphasis helps achieve stable total returns with less volatility than the broader market; as of December 31st, the Fund's one-year beta1 of 0.93 remains consistently below the Index. The weighted average dividend yield was 1.80%; several holdings, including ExxonMobil, Coca-Cola, Metlife, Kraft Heinz, and Proctor & Gamble, paid dividends in excess of 3.00%.
Fund Performance
For the year, Class A shares rose 17.56% compared to the S&P 500® Index's gain of 21.83%. The Fund performed relatively well relative to the benchmark despite maintaining a conservative, value-oriented strategy. The popular FAANG group of leading technology companies continued to drive performance in the benchmark; these high growth stocks, though, are not consistent with the Fund's more conservative strategy. Another factor contributing to the performance difference is the contrast in sector allocations between the Fund and the benchmark. The Fund's allocation to Consumer Staples, Industrials, and Home Improvement companies helped performance while the Fund's relative underweighting of the Energy and Healthcare sectors hurt performance.
The Fund's positioning in mega-cap holdings is suitable for investors who want to participate in the equity markets while incurring lower volatility. The Fund, though, will typically trail its benchmark during a strong bull market and outperform during a correction or bear market.
What Helped/Hurt Performance2
The Fund's top three contributors to returns during the second half of the year were Microsoft, Intel, and Walmart. Technology giant Microsoft gained over 25% during the period as the company's commercial cloud business surpassed its revenue goal ($20 billion, annualized) three quarters ahead of schedule; the cloud business includes Office 365 and cloud computing service Azure. Intel, the world's second largest semiconductor chip maker, gained over 38%; revenues for its memory and data center businesses jumped 37% and 23%, respectively, year-over-year. Walmart, the world's largest company by revenue, rose over 31% during the period. The stock hit an all-time high in mid-November following third quarter earnings release; the big-box retail noted online sales growth of 50% and announced a partnership with department store chain Lord & Taylor to create an online flagship store on Walmart.com.
1 "Beta" measures volatility relative to the stock market or an alternative benchmark. A beta less than 1.0 indicates lower risk than the market or the benchmark; a beta greater than 1.0 indicates higher risk than the market or the benchmark.
2 For detailed information on Fund holdings, please see the Fund's Schedule of Investments in this Report.
15
Pacific Advisors
Large Cap Value Fund (unaudited) continued
The Fund's most significant detractors for the second half of the year were GE, Time Warner, and Kraft Heinz. Industrial company GE fell over 20% during the period after announcing a 50% dividend reduction, the first cut since 2009, and a disappointing forecast for 2018. Time Warner, which owns Turner, HBO, and Warner Bros., dropped over 8%; the Justice Department sued to block AT&T's bid to acquire the media and entertainment company. Food producer Kraft Heinz declined over 7% during the period after lowering earnings estimates; the company, and the consumer packaged food industry as a whole, faces increased competition from newer, health-focused brands.
During the period, the Fund exited its positions in GE, IBM, and food and beverage company Mondelez; no new positions were established.
Looking Ahead
We expect that moderately strong economic activity, including the manufacturing and services indices, new home construction, retail sales, job growth, and industrial production, will support continued growth in the domestic economy. The new lower corporate tax rate should provide material tax savings to most companies; the program should be especially beneficial to the Fund's mega-cap companies which hold significant amounts of cash overseas. Many large multi-national companies have announced plans to repatriate offshore funds, improve wages and benefits, create jobs, and/or invest in capital intensive growth projects.
Continued economic growth coupled with tax reform may prompt a rotation out of recent market leaders, such as large Technology companies, into sectors which are associated with economic growth, such as Industrials. The Fund's value-oriented strategy stands to gain from such a transition as many of its holdings have operations, at home and abroad, that are positioned to benefit from an expanding economy.
16
Change in Value of $10,000 Investment1
This chart compares the growth of a $10,000 investment in Class A shares of the Large Cap Value Fund for the period January 1, 2008 through December 31, 2017 with the same investment in the S&P 500® Index2.
Average Annual Compounded Returns as of December 31, 2017
Class A | Class C | S&P 500® Index | |||||||||||||
One Year | 10.82 | % | 15.67 | % | 21.83 | % | |||||||||
Five Year | 10.95 | % | 11.44 | % | 15.79 | % | |||||||||
Ten Year | 4.85 | % | 4.66 | % | 8.50 | % | |||||||||
Past performance does not guarantee future results. Performance quoted represents past performance. Current performance may be higher or lower than the performance data quoted. Returns include reinvested dividends and capital gains. Returns for Class A shares reflect a maximum front-end sales charge of 5.75%; and returns for Class C shares reflect the deduction of a contingent deferred sales charge of 1% on shares sold within the first year of purchase. Returns do not take into account individual taxes which may reduce actual returns when shares are sold. The investment return and principal value of an investment will fluctuate so that an investor's shares, when redeemed, may be worth more or less than their original cost. Call (800) 989-6693 for the most recent month-end performance.
1 Fund results are shown for Class A shares and reflect deduction of the maximum front-end sales charge of 5.75% on the $10,000 investment for a net amount invested of $9,425. At the end of the same period, a $10,000 investment in Class C shares would have been valued at $15,764, and no contingent deferred sales charges would apply. Performance of the share classes will vary based on the difference in charges and expenses. The inception date for Class A shares and Class C shares is 05/01/99. It is not possible to invest directly in either Index. Index results assume reinvestment of dividends, but, unlike the Fund's results, do not reflect sales charges, fees or expenses.
2 The Standard & Poor's 500® Index is an unmanaged, market capitalization weighted index which measures the performance of the large cap segment of the U.S. equities market, covering approximately 75% of the U.S. equities market. The Index includes 500 leading companies in leading industries of the U.S. economy.
17
Pacific Advisors
Large Cap Value Fund (unaudited) continued
Expense Examples
As a shareholder of the Fund you incur two types of costs: (1) transaction costs, including sales charges (loads) on purchase payments, reinvested dividends, or other distributions; redemption fees; and exchange fees; and (2) ongoing costs, including management fees; distribution (12b-1) fees; and other Fund expenses. This Example is intended to help you understand your ongoing costs (in dollars) of investing in the Fund and to compare these costs with the ongoing costs of investing in other mutual funds.
The Example is based on an investment of $1,000 invested at the beginning of the period and held for the entire period from July 1, 2017 through December 31, 2017.
Actual Expenses
The first line of the table below provides information about actual account values and actual expenses. You may use the information in this line, together with the amount you invested, to estimate the expenses that you paid over the period. Simply divide your account value by $1,000 (for example, an $8,600 account value divided by $1,000 = 8.6), then multiply the result by the number in the first line under the heading entitled "Expenses Paid During the Period" to estimate the expenses you paid on your account during the period.
The following transaction costs are not included in the expenses shown in the table and, if applicable, would increase the expenses that you paid over the period: (1) a front-end sales charge (load) of 5.75% on Class A shares; (2) a 2% redemption fee if you sell or exchange shares within 180 days of purchase, with certain exceptions. The redemption fee does not apply to: (a) redemptions under an automatic withdrawal program or periodic asset reallocation plan, required minimum distributions (RMD), employer mandated distributions from a qualified plan, or redemptions under a qualified domestic relations order (QDRO); (b) redemptions to pay for expenses related to terminal illness, extended hospital or nursing home care, or other serious medical conditions, including death; (c) redemptions of shares acquired through dividend or capital gains reinvestments; (d) loans from a qualified plan account, and (e) redemptions initiated by the Fund; and (3) a $10 service fee on each exchange after the first five exchanges in each calendar year.
The following ongoing costs are not included in the expenses shown in the table and, if applicable, would increase the expenses that you paid over the period: (1) a $12 low balance fee on accounts with balances of less than $250 as of September 30th of each calendar year and no investment activity (excluding reinvestment of dividends and/or capital gains) during the prior calendar year or the first nine months of the current calendar year. This fee does not apply to IRAs, qualified plan accounts, or Coverdell Education Savings Accounts; (2) a $15 annual custodial fee on IRAs, SEPs, SIMPLE IRAs, and Coverdell Education Savings Accounts; and (3) a $20 annual custodial fee on 403(b) accounts.
Hypothetical Example for Comparison Purposes
The second line of the table below provides information about hypothetical account values and hypothetical expenses based on the Fund's actual expense ratio and an assumed rate of return of 5% per year before expenses, which in not the Fund's actual return. The hypothetical account values and expenses may not be used to estimate the actual ending account balance or expenses you paid for the period. You may use this information to compare the ongoing costs of investing in the Fund and other funds. To do so, compare this 5% hypothetical example with the 5% hypothetical examples that appear in the shareholder reports of the other funds.
The following transaction costs are not included in the expenses shown in the table and, if applicable, would increase the expenses that you paid over the period: (1) a front-end sales charge (load) of 5.75% on Class A shares; (2) a 2% redemption fee if you sell or exchange shares within 180 days of purchase, with certain exceptions. The redemption fee does not apply to: (a) redemptions under an automatic withdrawal program or periodic asset reallocation plan, required minimum distributions (RMD), employer mandated distributions from a qualified plan, or redemptions under a qualified domestic relations order (QDRO); (b) redemptions to pay for expenses related to terminal illness, extended hospital or nursing home care, or other serious medical conditions, including death; (c) redemptions of shares acquired through dividend or capital gains reinvestments; (d) loans from a qualified plan account, and (e) redemptions initiated by the Fund; and (3) a $10 service fee on each exchange after the first five exchanges in each calendar year.
The following ongoing costs are not included in the expenses shown in the table and, if applicable, would increase the expenses that you paid over the period: (1) a $12 low balance fee on accounts with balances of less than $250 as of September 30th of each calendar year and no investment activity (excluding reinvestment of dividends and/or capital gains) during the prior calendar year or the first nine months of the current calendar year. This fee does not apply to IRAs, qualified plan accounts, or Coverdell Education Savings Accounts; (2) a $15 annual custodial fee on IRAs, SEPs, SIMPLE IRAs, and Coverdell Education Savings Accounts; and (3) a $20 annual custodial fee on 403(b) accounts.
Please note that the expenses shown in the table are meant to highlight your ongoing costs only and do not reflect any transactional costs, such as sales charges (loads), redemption fees, or exchange fees. Therefore, the second line of the table is useful in comparing ongoing costs only, and will not help you determine the relative total costs of owning different funds. In addition, if these transactional costs were included, your costs would have been higher.
| Beginning Account Value 07/01/17 | Ending Account Value 12/31/17 | Expense Paid During Period 07/01/17 – 12/31/17 | |||||||||||||
Large Cap Value Fund Class A | |||||||||||||||
Actual | $ | 1,000.00 | $ | 1,102.04 | $ | 20.03 | |||||||||
Hypothetical (5% return before expense) | $ | 1,000.00 | $ | 1,006.15 | $ | 19.11 | |||||||||
Large Cap Value Fund Class C | |||||||||||||||
Actual | $ | 1,000.00 | $ | 1,097.50 | $ | 23.97 | |||||||||
Hypothetical (5% return before expense) | $ | 1,000.00 | $ | 1,002.35 | $ | 22.88 | |||||||||
5 Expenses are equal to the Fund's annualized expense ratio, net of expense waivers, of 3.78% for Class A shares and 4.53% for Class C shares, multiplied by the average account value over the period, multiplied by 184/365 days to reflect the one-half year period.
18
Pacific Advisors
Mid Cap Value Fund (unaudited)
Fund Objective: Long-term capital appreciation.
Investment Invests at least 80% of its assets in mid-cap companies that are, at the time of
Strategy: purchase, within the market cap range of companies in the Russell Midcap® Index.1
Investor Profile: Moderately aggressive. Growth-oriented with a long-term investment horizon.
Please see the Chairman's Letter for a detailed market and economic review
as well as the Manager's general market outlook.
Portfolio Holdings (As of 12/31/17 based on total investments)
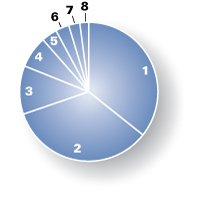
| Equities | 100.00 | % | |||||||||
| 1. | Industrials | 35.67 | % | ||||||||
| 2. | Consumer Discretionary | 34.09 | % | ||||||||
| 3. | Energy | 11.29 | % | ||||||||
| 4. | Financials | 7.42 | % | ||||||||
| 5. | Information Technology | 3.67 | % | ||||||||
| 6. | Health Care | 3.17 | % | ||||||||
| 7. | Consumer Staples | 2.61 | % | ||||||||
| 8. | Materials | 2.08 | % | ||||||||
| Total Returns (For the year ended 12/31/17) | |||||||
Class A | 11.97 | % | |||||
Class C | 11.13 | % | |||||
| |||||||
Russell Midcap® Index | 18.52 | % | |||||
Current expense ratio: 4.94% (A); 5.71% (C). Prospectus expense ratio: 4.74% (A); 5.54% (C).2
Performance quoted is past performance which does not guarantee future results. Current performance may be higher or lower than the performance quoted. Call (800) 989-6693 for performance current to the most recent month-end. The investment return and principal value of an investment will fluctuate so that an investor's shares, when redeemed, may be worth more or less than their original cost. Returns represent the change in value over the stated period assuming reinvestment of dividends and capital gains at net asset value. Returns do not take into account the maximum 5.75% sales charge on Class A shares or the 1% Contingent Deferred Sales Charge (CDSC) for Class C shares sold within one year of purchase. Returns would be lower if the applicable sales charge and CDSC were included. Returns do not take into account individual taxes which may reduce actual returns when shares are sold.
1 The Russell Midcap® Index is an unmanaged, weighted measure of the 800 smallest companies within the Russell 1000® Index based on a combination of their market cap and current index membership. Index returns assume the reinvestment of dividends, but, unlike the Fund's returns, do not reflect management fees or expenses. It is not possible to invest directly in the Index.
2 "Current" expense ratio is as of 12/31/17. "Prospectus" expense ratio is for the fiscal year ended 12/31/16.
19
Pacific Advisors
Mid Cap Value Fund (unaudited)
Discussion with Portfolio Manager February 26, 2018
George A. Henning
Fund Strategy
Mid-cap companies provide distinctive advantages for long-term investors by combining the strategic flexibility of smaller businesses with the economies of scale typically enjoyed by large corporations. The Fund uses a fundamental, bottom-up strategy to identify leading mid-cap companies with attractive opportunities for long-term appreciation. Our focused, value-oriented approach selects approximately 30 to 40 stocks; we expect to hold each investment for 3 to 5 years, or longer. Our long-term investment horizon typically reduces turnover and contributes to tax efficiency by minimizing the realization of short-term gains. As of the period end, the Fund's annualized turnover rate of 9% was consistent with its five-year average annual turnover rate of 19.8%1.
Fund Performance
In the second half of the year, Class A shares rose 15.80% to significantly outpace the benchmark Russell Midcap® Index's 9.75% gain. For the year, the Fund gained 11.97%, compared to an 18.52% return for the benchmark. Fund holdings rallied as investors assessed the positive impact of tax reform on domestically-oriented businesses. The Fund's Consumer Discretionary holdings (34% of total assets), which includes retailers, apparel companies, and automotive parts suppliers, surged 33.80% to drive the majority of the second half outperformance. Energy holdings (10% of total assets) also gained 23.63% as oil prices rose above $60 per barrel for the first time since 2014. The Fund also benefitted from its absence of holdings in several of the worst performing sectors including Telecommunication Services, Utilities, and Real Estate.
What Helped/Hurt Performance2
The Fund's top contributors to returns during the second half of the year were Conn's, Navistar International, and Tractor Supply. Conn's, a specialty retailer, surged 86% on improved profitability as a result of better credit performance and higher margins; credit delinquency rates declined for the first time in four years while retail gross margins hit record highs. The company is resuming its store expansion plans with five to nine new store openings in 2018. Navistar gained 63% as the commercial truck manufacturer completed a breakthrough year from its alliance with Volkswagen Truck & Bus; the company launched a line of vocational trucks, and gained 1.5% in market share with improving sales in all truck segments. Tractor Supply, a retailer catering to the rural lifestyle, rose 39% to rebound from its 28% decline in the first half of the year. Improved merchandising and sales strategies, including a "Buy Online and Pick Up in Store" service offering, contributed to a 6.6% improvement in same-store-sales, well ahead of analysts' expectations of a 2.8% increase.
The Fund's most significant detractors to returns were Spirit Airlines, Wabtec, and Chicago Bridge & Iron. Spirit Airlines, an ultra-low cost airline, declined 13% due to concerns related to increased competition and pilot contract negotiations. Still, the company's discount prices create a substantial competitive advantage; the low price policies should become more apparent as fuel prices rise. Wabtec, a parts
1 Annual turnover: 13% (2016); 25% (2015); 22% (2014); 15% (2013); and 24% (2012).
2 For detailed information on Fund holdings, please see the Fund's Schedule of Investments in this Report.
20
supplier and manufacturer for passenger and freight trains, fell 11% following disappointing earnings results that forced management to lower guidance for the year. A significant contributor to the company's underperformance was the integration of Faiveley Transport, a large European transit company Wabtec acquired in December 2016. The company's business trends remain positive; the backlog of work for both the passenger transit segment and freight segments increased to record levels. Chicago Bridge & Iron dropped 18%; during the period, the company reported disappointing earnings, suspended the dividend, and announced its intention to sell the company's Technology business. In December, management announced an agreement to merge with McDermott International; the transaction would include the Technology unit.
In September, Swift Transportation completed a merger with Knight Transportation to form Knight-Swift Transportation, the largest long-haul trucking company in the country. During the period, the Fund trimmed holdings in Conn's and Navistar International. The risk management process actively manages each holding as it approaches the Fund's estimation of fair value and targeted allocation. These companies maintain favorable fundamental outlooks; therefore, the Fund holds the positions for long-term appreciation potential. The allocation to Conn's, in particular, is higher than normal; we anticipate that the Fund will continue to trim the position while participating in the stock's price appreciation.
Looking Ahead
Market momentum remains generally favorable due, in large part, to tax reform. The lower corporate tax rate should benefit domestically-oriented companies; many may use the tax savings for capital expenditures, mergers and acquisitions, share buybacks, and other initiatives. The outlook for moderately strong economic growth should also improve revenues and earnings for companies in such growth sectors as Industrials, Energy, and Consumer Discretionary; these areas account for roughly 80% of Fund assets. Meanwhile, oil prices have increased to $60 or more per barrel; at these levels, energy companies may have the confidence to move forward with long-delayed projects. The Fund's Energy holdings (10% of assets) are primarily concentrated in offshore service companies: Helix Energy Solutions, which provides offshore well maintenance; Noble, a drilling contractor; and TechnipFMC, the leading manufacturer of subsea production equipment. So far, higher oil prices have primarily benefitted companies involved in shale oil; looking ahead, though, activities in offshore drilling area are finally beginning to participate in the industry's recovery.
21
Pacific Advisors
Mid Cap Value Fund (unaudited) continued
Change in Value of $10,000 Investment1
This chart compares the growth of a $10,000 investment in Class A shares of the Mid Cap Value Fund for the period January 1, 2008 through December 31, 2017 with the same investment in the Russell Midcap® Index2.
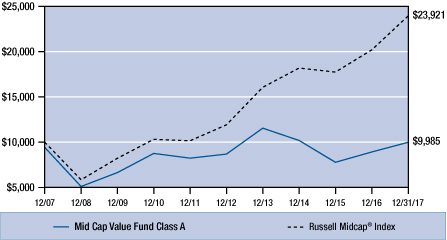
Average Annual Compounded Returns as of December 31, 2017
Class A | Class C | Russell Midcap® Index | |||||||||||||
One Year | 5.52 | % | 10.13 | % | 18.52 | % | |||||||||
Five Year | 1.62 | % | 2.06 | % | 14.96 | % | |||||||||
Ten Year | – 0.01 | % | – 0.23 | % | 9.11 | % | |||||||||
Past performance does not guarantee future results. Performance quoted represents past performance. Current performance may be higher or lower than the performance data quoted. Returns include reinvested dividends and capital gains. Returns for Class A shares reflect a maximum front-end sales charge of 5.75%; and returns for Class C shares reflect the deduction of a contingent deferred sales charge of 1% on shares sold within the first year of purchase. Returns do not take into account individual taxes which may reduce actual returns when shares are sold. The investment return and principal value of an investment will fluctuate so that an investor's shares, when redeemed, may be worth more or less than their original cost. Call (800) 989-6693 for the most recent month-end performance.
1 Fund results are shown for Class A shares and reflect deduction of the maximum front-end sales charge of 5.75% on the $10,000 investment for a net amount invested of $9,425. At the end of the same period, a $10,000 investment in Class C shares would have been valued at $9,772, and no contingent deferred sales charges would apply. Performance of the share classes will vary based on the difference in charges and expenses. The inception date for Class A shares and Class C shares is 04/01/02. It is not possible to invest directly in either Index. Index results assume reinvestment of dividends, but, unlike the Fund's results, do not reflect sales charges, fees or expenses.
2 The Russell Midcap® Index is an unmanaged, weighted measure of the 800 smallest companies within the Russell 1000® Index based on a combination of their market cap and current index membership.
22
Expense Examples
As a shareholder of the Fund you incur two types of costs: (1) transaction costs, including sales charges (loads) on purchase payments, reinvested dividends, or other distributions; redemption fees; and exchange fees; and (2) ongoing costs, including management fees; distribution (12b-1) fees; and other Fund expenses. This Example is intended to help you understand your ongoing costs (in dollars) of investing in the Fund and to compare these costs with the ongoing costs of investing in other mutual funds.
The Example is based on an investment of $1,000 invested at the beginning of the period and held for the entire period from July 1, 2017 through December 31, 2017.
Actual Expenses
The first line of the table below provides information about actual account values and actual expenses. You may use the information in this line, together with the amount you invested, to estimate the expenses that you paid over the period. Simply divide your account value by $1,000 (for example, an $8,600 account value divided by $1,000 = 8.6), then multiply the result by the number in the first line under the heading entitled "Expenses Paid During the Period" to estimate the expenses you paid on your account during the period.
The following transaction costs are not included in the expenses shown in the table and, if applicable, would increase the expenses that you paid over the period: (1) a front-end sales charge (load) of 5.75% on Class A shares; (2) a 2% redemption fee if you sell or exchange shares within 180 days of purchase, with certain exceptions. The redemption fee does not apply to: (a) redemptions under an automatic withdrawal program or periodic asset reallocation plan, required minimum distributions (RMD), employer mandated distributions from a qualified plan, or redemptions under a qualified domestic relations order (QDRO); (b) redemptions to pay for expenses related to terminal illness, extended hospital or nursing home care, or other serious medical conditions, including death; (c) redemptions of shares acquired through dividend or capital gains reinvestments; (d) loans from a qualified plan account, and (e) redemptions initiated by the Fund; and (3) a $10 service fee on each exchange after the first five exchanges in each calendar year.
The following ongoing costs are not included in the expenses shown in the table and, if applicable, would increase the expenses that you paid over the period: (1) a $12 low balance fee on accounts with balances of less than $250 as of September 30th of each calendar year and no investment activity (excluding reinvestment of dividends and/or capital gains) during the prior calendar year or the first nine months of the current calendar year. This fee does not apply to IRAs, qualified plan accounts, or Coverdell Education Savings Accounts; (2) a $15 annual custodial fee on IRAs, SEPs, SIMPLE IRAs, and Coverdell Education Savings Accounts; and (3) a $20 annual custodial fee on 403(b) accounts.
Hypothetical Example for Comparison Purposes
The second line of the table below provides information about hypothetical account values and hypothetical expenses based on the Fund's actual expense ratio and an assumed rate of return of 5% per year before expenses, which in not the Fund's actual return. The hypothetical account values and expenses may not be used to estimate the actual ending account balance or expenses you paid for the period. You may use this information to compare the ongoing costs of investing in the Fund and other funds. To do so, compare this 5% hypothetical example with the 5% hypothetical examples that appear in the shareholder reports of the other funds.
The following transaction costs are not included in the expenses shown in the table and, if applicable, would increase the expenses that you paid over the period: (1) a front-end sales charge (load) of 5.75% on Class A shares; (2) a 2% redemption fee if you sell or exchange shares within 180 days of purchase, with certain exceptions. The redemption fee does not apply to: (a) redemptions under an automatic withdrawal program or periodic asset reallocation plan, required minimum distributions (RMD), employer mandated distributions from a qualified plan, or redemptions under a qualified domestic relations order (QDRO); (b) redemptions to pay for expenses related to terminal illness, extended hospital or nursing home care, or other serious medical conditions, including death; (c) redemptions of shares acquired through dividend or capital gains reinvestments; (d) loans from a qualified plan account, and (e) redemptions initiated by the Fund; and (3) a $10 service fee on each exchange after the first five exchanges in each calendar year.
The following ongoing costs are not included in the expenses shown in the table and, if applicable, would increase the expenses that you paid over the period: (1) a $12 low balance fee on accounts with balances of less than $250 as of September 30th of each calendar year and no investment activity (excluding reinvestment of dividends and/or capital gains) during the prior calendar year or the first nine months of the current calendar year. This fee does not apply to IRAs, qualified plan accounts, or Coverdell Education Savings Accounts; (2) a $15 annual custodial fee on IRAs, SEPs, SIMPLE IRAs, and Coverdell Education Savings Accounts; and (3) a $20 annual custodial fee on 403(b) accounts.
Please note that the expenses shown in the table are meant to highlight your ongoing costs only and do not reflect any transactional costs, such as sales charges (loads), redemption fees, or exchange fees. Therefore, the second line of the table is useful in comparing ongoing costs only, and will not help you determine the relative total costs of owning different funds. In addition, if these transactional costs were included, your costs would have been higher.
| Beginning Account Value 07/01/17 | Ending Account Value 12/31/17 | Expense Paid During Period 07/01/17 – 12/31/17 | |||||||||||||
Mid Cap Value Fund Class A | |||||||||||||||
Actual | $ | 1,000.00 | $ | 1,158.03 | $ | 26.87 | |||||||||
Hypothetical (5% return before expense) | $ | 1,000.00 | $ | 1,000.30 | $ | 24.91 | |||||||||
Mid Cap Value Fund Class C | |||||||||||||||
Actual | $ | 1,000.00 | $ | 1,153.39 | $ | 30.99 | |||||||||
Hypothetical (5% return before expense) | $ | 1,000.00 | $ | 996.42 | $ | 28.73 | |||||||||
3 Expenses are equal to the Fund's annualized expense ratio of 4.94% for Class A shares and 5.71% for Class C shares, multiplied by the average account value over the period, multiplied by 184/365 days to reflect the one-half year period.
23
Pacific Advisors
Small Cap Value Fund (unaudited)
Fund Objective: Capital appreciation through investment in small cap companies.
Investment Invests at least 80% of its assets in small cap companies which are, at the time of
Strategy: purchase, not greater than the highest market capitalization of companies within the Russell 2000® Index1. Generally invests a significant proportion of its assets in companies with market capitalizations that are, at the time of purchase, not greater than the highest market capitalization of companies in the Russell Microcap® Index1 (which are often referred to as "micro-cap" stocks).
Investor Profile: Aggressive. Opportunity-oriented with a long-term investment horizon.
Please see the Chairman's Letter for a detailed market and economic review
as well as the Manager's general market outlook.
Portfolio Holdings (As of 12/31/17 based on total investments)

| Equities | 100.00 | % | |||||||||
| 1. | Industrials | 44.05 | % | ||||||||
| 2. | Consumer Discretionary | 22.62 | % | ||||||||
| 3. | Energy | 18.69 | % | ||||||||
| 4. | Financials | 7.59 | % | ||||||||
| 5. | Consumer Staples | 7.05 | % | ||||||||
| Total Returns (For the year ended 12/31/17) | |||||||
Class A | 12.47 | % | |||||
Class C | 11.60 | % | |||||
Class I | 12.71 | % | |||||
| |||||||
Russell 2000® Index | 14.65 | % | |||||
Current expense ratio: 4.08% (A); 4.84% (C); 3.85% (I). Prospectus expense ratio: 4.19% (A); 4.95% (C); 3.93% (I).2
Performance quoted is past performance which does not guarantee future results. Current performance may be higher or lower than the performance quoted. Call (800) 989-6693 for performance current to the most recent month-end. The investment return and principal value of an investment will fluctuate so that an investor's shares, when redeemed, may be worth more or less than their original cost. Returns represent the change in value over the stated period assuming reinvestment of dividends and capital gains at net asset value. Rankings shown are for Class A shares; rankings for other share classes may be different. Returns and rankings do not take into account the maximum 5.75% sales charge on Class A shares or the 1% Contingent Deferred Sales Charge (CDSC) for Class C shares sold within one year of purchase. Returns would be lower if the applicable sales charge and CDSC were included. Returns do not take into account individual taxes which may reduce actual returns when shares are sold. Small cap companies typically have fewer financial resources and may carry higher investment risks and experience greater stock price volatility than larger stocks.
1 The Russell 2000® Index is an unmanaged, market-weighted measure of the 2,000 smallest companies of the Russell 3000® Index which represents approximately 98% of the investable U.S. equity market. Index returns assume the reinvestment of dividends, but, unlike the Fund's returns, do not reflect management fees or expenses. The Russell Microcap® Index is an unmanaged, market capitalization weighted measure of the 1,000 smallest publicly traded companies within the Russell 2000® Index, plus the next smallest 1,000 U.S. based listed stocksIt is not possible to invest directly in either Index.
2 "Current" expense ratio is as of 12/31/17. "Prospectus" expense ratio is for the fiscal year ended 12/31/16.
24
Pacific Advisors
Small Cap Value Fund (unaudited)
Discussion with Portfolio Manager February 26, 2018
George A. Henning
Fund Strategy
The Fund employs a value-oriented approach to identify when high-quality, well-managed companies with attractive growth outlooks become undervalued. Periods of heightened market volatility often create opportunities to strategically invest in these companies for long-term appreciation. The Fund takes a business ownership view in seeking to identify stocks that are undervalued or temporarily out-of-favor and have a catalyst for multi-year growth. The Fund focuses on a limited number of small cap stocks (typically 25 to 50 holdings), including a significant number of micro-cap stocks which tend to attract limited analyst attention. Investing in small and micro-cap stocks may contribute to above-average volatility; yet, smaller, well-positioned companies can provide superior long-term results. Partly due to the strategic allocation to undervalued micro-cap stocks, the Fund's one-year beta1 was 1.35, as of December 31st, in comparison to the Russell 2000® Index.
Fund Performance
In the second half of the year, the Class A shares rose 18.71% to significantly outpace the benchmark Russell 2000® Index's 9.18% gain. For the year, the Fund gained 12.47% in 2017, compared to a 14.65% return for the benchmark. An upswing in global economic growth, combined with the anticipated benefits of tax reform outlook, dominated market sentiment in the latter stages of the year. Market sectors that typically respond well during periods of economic growth, such as Industrials, Energy, and Consumer Discretionary, outperformed; these sectors accounted for more than 80% of Fund assets. In contrast, other, more conservative segments of the market, including Telecommunication Services, Real Estate, and Utilities, lagged; the Fund's lack of representation in these areas (0% weighting compared to 12% for the benchmark) benefitted the Fund. Also, the rise in oil prices, to above $60 per barrel, drove a 24% gain in the Fund's Energy holdings (18% of assets) over the final six months of the year.
For the year, Class A shares of the Fund ranked in the top 21% out of 269 Lipper Small Cap Value Funds based on total return, a repeat of the Fund's 2016 results out of 874 Lipper Small Cap Core Funds (for the 5-year and 10-year periods ended 12/31/17 and 12/31/16, the Fund ranked in the 97% percentile (210 funds), the 99% percentile (141 funds), the 100% percentile (640 funds) and the 99% percentile (448 funds), respectively2.
What Helped/Hurt Performance3
The Fund's top contributors to returns during the second half of the year were Conn's, Navistar International, and Matrix Service. Conn's, a specialty retailer, continued its impressive transformation; following a 51% gain in the first half of the year, shares rose 86% for a total annual return of 181%. The company reported improved profitability as a result of better credit performance and higher margins; credit delinquencies declined for the first time in four years while retail gross margins hit record highs. The company is resuming its store expansion plans with five to nine new store openings in 2018. Navistar, a commercial truck manufacturer, rose 63% as commercial truck sales in the U.S. and Canada rebounded from a lackluster start to the year. The company benefitted from its alliance with Volkswagen Truck & Bus with the launch of a line of vocational trucks; market share rose 1.5% with improving sales in all truck segments. Matrix, a construction contractor serving the energy, power and industrial markets, reversed its first half losses with a stellar 90% gain over the final six months of 2017. The company
1 "Beta" measures volatility relative to the stock market or an alternative benchmark. A beta less than 1.0 indicates lower risk than the market or the benchmark and a beta greater than 1.0 indicates higher risk than the market or the benchmark.
2 Rankings do not take into account the maximum front-end sales charge of 5.75%. Rankings for other share classes may vary.
3 For detailed information on Fund holdings, please see the Fund's Schedule of Investments in this Report.
25
Pacific Advisors
Small Cap Value Fund (unaudited) continued
reported quarter-to-quarter increases in backlog orders (+7%) and new contact awards (+20%); management anticipates major planned maintenance programs in the energy industry which could further boost revenues and earnings next year.
The Fund's most significant detractors to returns were Team, Hibbett Sports, and Gentherm. Team, an industrial services provider, fell 36% on disappointing results. Due to the extended period of low oil prices, many energy company clients had deferred routine maintenance projects. And, the company's slow response in adjusting operations highlighted concerns about management as well as the company's financial condition. The company completed a convertible bond offering to shore up finances; also, the company named a new CEO, Amerino Gatti, who was previously President of the Production Group at Schlumberger Limited. Team holds a leading market position in industrial maintenance programs; activity in this area is poised to significantly expand in 2018. Hibbett, a sporting goods retailer focused on small town markets, declined 38% as concerns over online competition continued to weigh on the sector. And Gentherm, the leading supplier of temperature controlled automotive seats and other thermal applications, fell 18% as a decline in automotive production more than offset growth in industrial applications for its patented thermal technologies. In October, the company appointed Phillip Eyler President and CEO; his tenure as President of the Connected Car division at Harman included the successful introduction of technology-based businesses in the automotive industry.
During the period, the Fund liquidated its holdings in Hibbett Sports and Hornbeck Offshore Services. The Fund used proceeds to initiate a position in Noble Corporation, a leading offshore drilling contractor which, we believe, offers a greater upside potential and lower downside risk while maintaining exposure to the emerging recovery in offshore activity. The Fund also trimmed holdings in Chefs' Warehouse, Conn's, Navistar International, Rush Enterprises, and Triton International. The risk management process actively manages each holding relative to the Fund's estimation of fair value and targeted allocation. These companies maintain favorable fundamental outlooks; therefore, the Fund continues to hold the positions for long-term appreciation potential. The Fund's allocation to Conn's, in particular, has appreciated to a significantly higher than normal allocation; in closely monitoring the company and its representation in the Fund, we anticipate that the Fund will continue to trim the position while participating in the stock's price appreciation.
Looking Ahead
The Fund is well-positioned to benefit as investors gain confidence in the economy. Tax reform should disproportionately aid small cap companies, many of which have typically qualified for few tax breaks. And, the influx of capital, including the repatriation of funds held offshore by large cap companies, should lead to increased business activity including mergers and acquisitions. Leading small cap stocks may be attractive targets for mid and large cap companies.
The Fund is well positioned to participate in the continuing growth cycle for the U.S. and global economies. Value-oriented investment strategies, in general, and the Fund, in particular, have underperformed for the past four years relative to growth-oriented strategies and the overall market. Over the past two years, the markets have begun rewarding the better performing companies, including Fund holdings. Now, a rotation away from the recently popular growth areas, such as Technology and Health Care, into underappreciated value sectors, including Industrials and Energy, could drive substantial returns for the Fund. Energy stocks, in particular are recovering from an unusually severe 3-year bear market. The recent recovery in land-based oil and gas drilling, especially fracking, is accelerating growth in many sectors of the economy; initial signs of recovery in offshore drilling should also provide an important catalyst. Many Fund holdings, in energy servicing, transportation, and related industries, will benefit directly or indirectly from the resurgence in energy activity. Following several years of challenging market conditions, especially for small cap value-oriented strategies, the Fund anticipates a much improved environment in 2018.
26
Change in Value of $10,000 Investment1
This chart compares the growth of a $10,000 investment in Class A shares of the Small Cap Value Fund for the period January 1, 2008 through December 31, 2017 with the same investment in the Russell 2000® Index2.
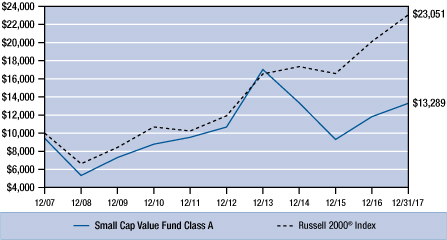
Average Annual Compounded Returns as of December 31, 2017
Class A | Class C | Class I | Russell 2000® Index | ||||||||||||||||
One Year | 6.01 | % | 10.60 | % | 12.71 | % | 14.65 | % | |||||||||||
Five Year | 3.26 | % | 3.71 | % | 4.75 | % | 14.12 | % | |||||||||||
Ten Year | 2.88 | % | 2.70 | % | 4.45 | % | 8.71 | % | |||||||||||
Past performance does not guarantee future results. Performance quoted represents past performance. Current performance may be higher or lower than the performance data quoted. Returns include reinvested dividends and capital gains. Returns for Class A shares reflect a maximum front-end sales charge of 5.75%; and returns for Class C shares reflect the deduction of a contingent deferred sales charge of 1% on shares sold within the first year of purchase. Returns do not take into account individual taxes which may reduce actual returns when shares are sold. Small cap stocks typically have fewer financial resources and may carry higher risks and experience greater volatility than large cap stocks. The investment return and principal value of an investment will fluctuate so that an investor's shares, when redeemed, may be worth more or less than their original cost. Call (800) 989-6693 for the most recent month-end performance.
1 Fund results are shown for Class A shares and reflect deduction of the maximum front-end sales charge of 5.75% on the $10,000 investment for a net amount invested of $9,425. At the end of the same period, a $10,000 investment in Class C shares and Class I shares would have been valued at $13,052, and $15,458, respectively, and no contingent deferred sales charges would apply. The inception date is 02/08/93 for Class A shares; 04/01/98 for Class C shares; and 10/09/06 for Class I shares. Performance of the share classes will vary based on the difference in charges and expenses. It is not possible to invest directly in the Index. Index results assume reinvestment of dividends, but, unlike the Fund's results, do not reflect sales charges, commissions or expenses.
2 The Russell 2000® Index is an unmanaged, weighted measure of the 2,000 smallest companies within the Russell 3000® Index.
27
Pacific Advisors
Small Cap Value Fund (unaudited) continued
Expense Examples
As a shareholder of the Fund you incur two types of costs: (1) transaction costs, including sales charges (loads) on purchase payments, reinvested dividends, or other distributions; redemption fees; and exchange fees; and (2) ongoing costs, including management fees; distribution (12b-1) fees; and other Fund expenses. This Example is intended to help you understand your ongoing costs (in dollars) of investing in the Fund and to compare these costs with the ongoing costs of investing in other mutual funds.
The Example is based on an investment of $1,000 invested at the beginning of the period and held for the entire period from July 1, 2017 through December 31, 2017.
Actual Expenses
The first line of the table below provides information about actual account values and actual expenses. You may use the information in this line, together with the amount you invested, to estimate the expenses that you paid over the period. Simply divide your account value by $1,000 (for example, an $8,600 account value divided by $1,000 = 8.6), then multiply the result by the number in the first line under the heading entitled "Expenses Paid During the Period" to estimate the expenses you paid on your account during the period.
The following transaction costs are not included in the expenses shown in the table and, if applicable, would increase the expenses that you paid over the period: (1) a front-end sales charge (load) of 5.75% on Class A shares; (2) a 2% redemption fee if you sell or exchange shares within 180 days of purchase, with certain exceptions. The redemption fee does not apply to: (a) redemptions under an automatic withdrawal program or periodic asset reallocation plan, required minimum distributions (RMD), employer mandated distributions from a qualified plan, or redemptions under a qualified domestic relations order (QDRO); (b) redemptions to pay for expenses related to terminal illness, extended hospital or nursing home care, or other serious medical conditions, including death; (c) redemptions of shares acquired through dividend or capital gains reinvestments; (d) loans from a qualified plan account, and (e) redemptions initiated by the Fund; and (3) a $10 service fee on each exchange after the first five exchanges in each calendar year.
The following ongoing costs are not included in the expenses shown in the table and, if applicable, would increase the expenses that you paid over the period: (1) a $12 low balance fee on accounts with balances of less than $250 as of September 30th of each calendar year and no investment activity (excluding reinvestment of dividends and/or capital gains) during the prior calendar year or the first nine months of the current calendar year. This fee does not apply to IRAs, qualified plan accounts, or Coverdell Education Savings Accounts; (2) a $15 annual custodial fee on IRAs, SEPs, SIMPLE IRAs, and Coverdell Education Savings Accounts; and (3) a $20 annual custodial fee on 403(b) accounts.
Hypothetical Example for Comparison Purposes
The second line of the table below provides information about hypothetical account values and hypothetical expenses based on the Fund's actual expense ratio and an assumed rate of return of 5% per year before expenses, which in not the Fund's actual return. The hypothetical account values and expenses may not be used to estimate the actual ending account balance or expenses you paid for the period. You may use this information to compare the ongoing costs of investing in the Fund and other funds. To do so, compare this 5% hypothetical example with the 5% hypothetical examples that appear in the shareholder reports of the other funds.
The following transaction costs are not included in the expenses shown in the table and, if applicable, would increase the expenses that you paid over the period: (1) a front-end sales charge (load) of 5.75% on Class A shares; (2) a 2% redemption fee if you sell or exchange shares within 180 days of purchase, with certain exceptions. The redemption fee does not apply to: (a) redemptions under an automatic withdrawal program or periodic asset reallocation plan, required minimum distributions (RMD), employer mandated distributions from a qualified plan, or redemptions under a qualified domestic relations order (QDRO); (b) redemptions to pay for expenses related to terminal illness, death, extended hospital or nursing home care, or other serious medical conditions; (c) redemptions of shares acquired through dividend or capital gains reinvestments; (d) loans from a qualified plan account; and (e) redemptions initiated by the Fund; and (3) a $10 service fee on each exchange after the first five exchanges in each calendar year.
The following ongoing costs are not included in the expenses shown in the table and, if applicable, would increase the expenses that you paid over the period: (1) a $12 low balance fee on accounts with balances of less than $250 as of September 30th of each calendar year and no investment activity (excluding reinvestment of dividends and/or capital gains) during the prior calendar year or the first nine months of the current calendar year. This fee does not apply to IRAs, qualified plan accounts, or Coverdell Education Savings Accounts; (2) a $15 annual custodial fee on IRAs, SEPs, SIMPLE IRAs, and Coverdell Education Savings Accounts; and (3) a $20 annual custodial fee on 403(b) accounts.
Please note that the expenses shown in the table are meant to highlight your ongoing costs only and do not reflect any transactional costs, such as sales charges (loads), redemption fees, or exchange fees. Therefore, the second line of the table is useful in comparing ongoing costs only, and will not help you determine the relative total costs of owning different funds. In addition, if these transactional costs were included, your costs would have been higher.
| Beginning Account Value 07/01/17 | Ending Account Value 12/31/17 | Expense Paid During Period 07/01/17 – 12/31/17 | |||||||||||||
Small Cap Value Class A | |||||||||||||||
Actual | $ | 1,000.00 | $ | 1,187.06 | $ | 22.49 | |||||||||
Hypothetical (5% return before expense) | $ | 1,000.00 | $ | 1,004.64 | $ | 20.62 | |||||||||
Small Cap Value Class C | |||||||||||||||
Actual | $ | 1,000.00 | $ | 1,182.27 | $ | 26.62 | |||||||||
Hypothetical (5% return before expense) | $ | 1,000.00 | $ | 1,000.81 | $ | 24.41 | |||||||||
Small Cap Value Class I | |||||||||||||||
Actual | $ | 1,000.00 | $ | 1,188.48 | $ | 21.24 | |||||||||
Hypothetical (5% return before expense) | $ | 1,000.00 | $ | 1,005.80 | $ | 19.46 | |||||||||
3 Expenses are equal to the Fund's annualized expense ratio of 4.08% for Class A shares, 4.84% for Class C shares and 3.85% for Class I shares, multiplied by the average account value over the period, multiplied by 184/365 days to reflect the one-half year period.
28

Pacific Advisors Fund Inc.
Financial Statements
29
Pacific Advisors Income and Equity Fund
Schedule of Investments
as of December 31, 2017
| Quantity or Principal** | Description | Current $ Value** | % of Total Net Assets | ||||||||||||
COMMON STOCK | |||||||||||||||
CONSUMER DISCRETIONARY | 5.44 | ||||||||||||||
DISTRIBUTORS | |||||||||||||||
1,750 | GENUINE PARTS CO. | 166,268 | |||||||||||||
166,268 | 1.13 | ||||||||||||||
MEDIA | |||||||||||||||
2,500 | OMNICOM GROUP INC. | 182,075 | |||||||||||||
182,075 | 1.24 | ||||||||||||||
MULTILINE RETAIL | |||||||||||||||
3,500 | TARGET CORPORATION | 228,375 | |||||||||||||
228,375 | 1.56 | ||||||||||||||
TEXTILES, APPAREL & LUXURY GOODS | |||||||||||||||
5,000 | TAPESTRY INC. | 221,150 | |||||||||||||
221,150 | 1.51 | ||||||||||||||
CONSUMER STAPLES | 7.83 | ||||||||||||||
BEVERAGES | |||||||||||||||
4,000 | COCA-COLA CO. | 183,520 | |||||||||||||
183,520 | 1.25 | ||||||||||||||
FOOD & STAPLES RETAILING | |||||||||||||||
3,000 | CVS HEALTH CORP. | 217,500 | |||||||||||||
3,000 | SYSCO CORP. | 182,190 | |||||||||||||
7,000 | THE KROGER CO. | 192,150 | |||||||||||||
2,000 | WAL-MART STORES INC. | 197,500 | |||||||||||||
789,340 | 5.39 | ||||||||||||||
HOUSEHOLD PRODUCTS | |||||||||||||||
1,900 | PROCTER & GAMBLE CO. | 174,572 | |||||||||||||
174,572 | 1.19 | ||||||||||||||
ENERGY | 2.75 | ||||||||||||||
ENERGY EQUIPMENT & SERVICES | |||||||||||||||
3,500 | SCHLUMBERGER LTD | 235,865 | |||||||||||||
235,865 | 1.61 | ||||||||||||||
OIL, GAS & CONSUMABLE FUELS | |||||||||||||||
2,000 | EXXON MOBIL CORP. | 167,280 | |||||||||||||
167,280 | 1.14 | ||||||||||||||
See Accompanying Notes to Financial Statements which are an integral part of these financial statements.
30
Pacific Advisors Income and Equity Fund
Schedule of Investments
as of December 31, 2017
| Quantity or Principal** | Description | Current $ Value** | % of Total Net Assets | ||||||||||||
COMMON STOCK continued | |||||||||||||||
FINANCIALS | 5.18 | ||||||||||||||
BANKS | |||||||||||||||
3,500 | U.S. BANCORP | 187,530 | |||||||||||||
3,000 | WELLS FARGO & CO. | 182,010 | |||||||||||||
369,540 | 2.53 | ||||||||||||||
CAPITAL MARKETS | |||||||||||||||
2,500 | T. ROWE PRICE GROUP INC. | 262,325 | |||||||||||||
262,325 | 1.79 | ||||||||||||||
INSURANCE | |||||||||||||||
2,500 | METLIFE INC. | 126,400 | |||||||||||||
126,400 | 0.86 | ||||||||||||||
HEALTH CARE | 4.41 | ||||||||||||||
BIOTECHNOLOGY | |||||||||||||||
3,000 | ABBVIE INC. | 290,130 | |||||||||||||
290,130 | 1.98 | ||||||||||||||
PHARMACEUTICALS | |||||||||||||||
1,250 | JOHNSON & JOHNSON | 174,650 | |||||||||||||
5,000 | PFIZER INC. | 181,100 | |||||||||||||
355,750 | 2.43 | ||||||||||||||
INDUSTRIALS | 6.10 | ||||||||||||||
AIR FREIGHT & LOGISTICS | |||||||||||||||
1,750 | UNITED PARCEL SERVICE, INC. B | 208,512 | |||||||||||||
208,512 | 1.43 | ||||||||||||||
COMMERCIAL SERVICES & SUPPLIES | |||||||||||||||
2,000 | WASTE MANAGEMENT INC. | 172,600 | |||||||||||||
172,600 | 1.18 | ||||||||||||||
INDUSTRIAL CONGLOMERATES | |||||||||||||||
8,000 | GENERAL ELECTRIC CO. | 139,600 | |||||||||||||
1,000 | HONEYWELL INTERNATIONAL INC. | 153,360 | |||||||||||||
292,960 | 2.00 | ||||||||||||||
TRADING COMPANIES & DISTRIBUTORS | |||||||||||||||
4,000 | FASTENAL COMPANY | 218,760 | |||||||||||||
218,760 | 1.49 | ||||||||||||||
INFORMATION TECHNOLOGY | 6.44 | ||||||||||||||
COMMUNICATIONS EQUIPMENT | |||||||||||||||
6,000 | CISCO SYSTEMS INC. | 229,800 | |||||||||||||
229,800 | 1.57 | ||||||||||||||
See Accompanying Notes to Financial Statements which are an integral part of these financial statements.
31
Pacific Advisors Income and Equity Fund
Schedule of Investments
as of December 31, 2017
| Quantity or Principal** | Description | Current $ Value** | % of Total Net Assets | ||||||||||||
COMMON STOCK continued | |||||||||||||||
IT SERVICES | |||||||||||||||
1,500 | INT'L BUSINESS MACHINES CORP. | 230,130 | |||||||||||||
230,130 | 1.57 | ||||||||||||||
SEMICONDUCTORS & EQUIPMENT | |||||||||||||||
4,000 | INTEL CORP. | 184,640 | |||||||||||||
184,640 | 1.26 | ||||||||||||||
SOFTWARE | |||||||||||||||
3,500 | MICROSOFT CORP. | 299,390 | |||||||||||||
299,390 | 2.04 | ||||||||||||||
MATERIALS | 1.86 | ||||||||||||||
CHEMICALS | |||||||||||||||
2,205 | DOWDUPONT INC. | 157,040 | |||||||||||||
157,040 | 1.07 | ||||||||||||||
CONTAINERS & PACKAGING | |||||||||||||||
2,000 | INTERNATIONAL PAPER COMPANY | 115,880 | |||||||||||||
115,880 | 0.79 | ||||||||||||||
TELECOMMUNICATION SERVICES | 3.04 | ||||||||||||||
DIVERSIFIED TELECOM. SERVICES | |||||||||||||||
6,000 | AT&T INC. | 233,280 | |||||||||||||
4,000 | VERIZON COMMUNICATIONS INC. | 211,720 | |||||||||||||
445,000 | 3.04 | ||||||||||||||
UTILITIES | 4.17 | ||||||||||||||
ELECTRIC UTILITIES | |||||||||||||||
1,500 | DUKE ENERGY CORP. | 126,165 | |||||||||||||
3,500 | XCEL ENERGY INC. | 168,385 | |||||||||||||
294,550 | 2.01 | ||||||||||||||
MULTI-UTILITIES | |||||||||||||||
2,000 | DOMINION ENERGY INC. | 162,120 | |||||||||||||
3,000 | PUBLIC SERVICE ENTERPRISE GROUP INC | 154,500 | |||||||||||||
316,620 | 2.16 | ||||||||||||||
TOTAL COMMON STOCK (Cost: $4,642,299) | 6,918,472 | 47.22 | |||||||||||||
CORPORATE BOND | |||||||||||||||
CONSUMER DISCRETIONARY | 6.35 | ||||||||||||||
AUTOMOBILES | |||||||||||||||
200,000 | HYUNDAI CAPITAL AMER 3.10% 04/05/22 | 198,934 | |||||||||||||
198,934 | 1.36 | ||||||||||||||
See Accompanying Notes to Financial Statements which are an integral part of these financial statements.
32
Pacific Advisors Income and Equity Fund
Schedule of Investments
as of December 31, 2017
| Quantity or Principal** | Description | Current $ Value** | % of Total Net Assets | ||||||||||||
CORPORATE BOND continued | |||||||||||||||
DIVERSIFIED CONSUMER SERVICES | |||||||||||||||
150,000 | BLOCK FINANCIAL LLC 4.125% 10/01/20 | 154,612 | |||||||||||||
154,612 | 1.06 | ||||||||||||||
HOTELS, RESTAURANTS & LEISURE | |||||||||||||||
100,000 | INTL GAME TECHNOLOGY 7.50% 06/15/19 | 106,000 | |||||||||||||
106,000 | 0.72 | ||||||||||||||
HOUSEHOLD DURABLES | |||||||||||||||
150,000 | TUPPERWARE BRANDS CORP. 4.75% 06/01/21 | 158,132 | |||||||||||||
158,132 | 1.08 | ||||||||||||||
INTERNET & CATALOG RETAIL | |||||||||||||||
150,000 | EXPEDIA INC. 5.95% 08/15/20 | 161,383 | |||||||||||||
161,383 | 1.10 | ||||||||||||||
MULTILINE RETAIL | |||||||||||||||
150,000 | MACYS RETAIL 3.45% 01/15/21 | 150,871 | |||||||||||||
150,871 | 1.03 | ||||||||||||||
CONSUMER STAPLES | 1.03 | ||||||||||||||
FOOD & STAPLES RETAILING | |||||||||||||||
150,000 | DELHAIZE GROUP SA 4.125% 04/10/19 | 150,955 | |||||||||||||
150,955 | 1.03 | ||||||||||||||
ENERGY | 3.23 | ||||||||||||||
ENERGY EQUIPMENT & SERVICES | |||||||||||||||
100,000 | PRIDE INTERNATIONAL INC. 6.875% 08/15/20 | 104,375 | |||||||||||||
150,000 | ROWAN COMPANY INC. 7.875% 08/01/19 | 160,500 | |||||||||||||
100,000 | WEATHERFORD BERMUDA 6.00% 03/15/18 | 100,120 | |||||||||||||
364,995 | 2.49 | ||||||||||||||
OIL, GAS & CONSUMABLE FUELS | |||||||||||||||
100,000 | ENERGY TRANSFER PARTNERS 9.00% 04/15/19 | 107,901 | |||||||||||||
107,901 | 0.74 | ||||||||||||||
FINANCIALS | 15.82 | ||||||||||||||
BANKS | |||||||||||||||
100,000 | BANK OF AMERICA CORP 4.733% 03/19/20 FLOAT | 103,499 | |||||||||||||
100,000 | BANK OF AMERICA CORP 3.446% 09/28/20 FLOAT | 100,998 | |||||||||||||
122,000 | BANK OF AMERICA CORP 3.983% 07/07/21 FLOAT | 123,061 | |||||||||||||
150,000 | BARCLAY BANK PLC 2.845% 04/18/21 FLOAT | 146,850 | |||||||||||||
94,000 | FULTON FINANCIAL CORP. 3.60% 03/16/22 | 94,374 | |||||||||||||
125,000 | JPMORGAN CHASE & CO. 4.203% 02/25/21 FLOAT | 128,025 | |||||||||||||
696,807 | 4.75 | ||||||||||||||
See Accompanying Notes to Financial Statements which are an integral part of these financial statements.
33
Pacific Advisors Income and Equity Fund
Schedule of Investments
as of December 31, 2017
| Quantity or Principal** | Description | Current $ Value** | % of Total Net Assets | ||||||||||||
CORPORATE BOND continued | |||||||||||||||
CAPITAL MARKETS | |||||||||||||||
150,000 | ARES CAPITAL CORP. 4.875% 11/30/18 | 153,425 | |||||||||||||
150,000 | BGC PARTNERS INC. 5.375% 12/09/19 | 156,831 | |||||||||||||
100,000 | GOLDMAN SACHS GROUP INC. 2.862% 08/26/20 FLOAT | 100,491 | |||||||||||||
200,000 | HERCULES CAPITAL INC. 4.625% 10/23/22 | 202,788 | |||||||||||||
100,000 | MORGAN STANLEY 4.874% 10/27/18 FLOAT | 100,375 | |||||||||||||
100,000 | MORGAN STANLEY 4.233% 04/25/23 FLOAT | 102,125 | |||||||||||||
100,000 | MORGAN STANLEY 3.433% 10/28/24 FLOAT | 99,000 | |||||||||||||
100,000 | OAKTREE SPECIALTY CORP.4.875% 03/01/19 | 100,208 | |||||||||||||
100,000 | PROSPECT CAPITAL CORP. 5.00% 07/15/19 | 102,152 | |||||||||||||
150,000 | STIFEL FINANCIAL CORP. 3.50% 12/01/20 | 151,178 | |||||||||||||
1,268,573 | 8.66 | ||||||||||||||
DIVERSIFIED FINANCIAL SERVICES | |||||||||||||||
100,000 | ICAHN ENTERPRISES 6.00% 08/01/20 | 102,843 | |||||||||||||
150,000 | JEFFERIES GROUP LLC 3.00% STEP 07/27/22 | 145,747 | |||||||||||||
248,590 | 1.70 | ||||||||||||||
INSURANCE | |||||||||||||||
100,000 | PRUDENTIAL FINANCIAL INC. 4.203% 11/02/20 FLOAT | 103,875 | |||||||||||||
103,875 | 0.71 | ||||||||||||||
HEALTH CARE | 2.74 | ||||||||||||||
BIOTECHNOLOGY | |||||||||||||||
114,000 | BAXALTA INC. 3.60% 06/23/22 | 116,593 | |||||||||||||
116,593 | 0.79 | ||||||||||||||
PHARMACEUTICALS | |||||||||||||||
100,000 | TEVA PHARMACEUTICAL 3.65% 11/10/21 | 95,130 | |||||||||||||
200,000 | TEVA PHARMACEUTICAL 3.65% 11/10/21 | 190,259 | |||||||||||||
285,389 | 1.95 | ||||||||||||||
INDUSTRIALS | 4.30 | ||||||||||||||
AEROSPACE & DEFENSE | |||||||||||||||
150,000 | SPIRIT AEROSYSTEMS INC. 5.25% 03/15/22 | 154,574 | |||||||||||||
154,574 | 1.05 | ||||||||||||||
MACHINERY | |||||||||||||||
150,000 | AGCO CORP. 5.875% 12/01/21 | 161,930 | |||||||||||||
150,000 | HILLENBRAND INC 5.50% 07/15/20 | 159,679 | |||||||||||||
321,609 | 2.20 | ||||||||||||||
PROFESSIONAL SERVICES | |||||||||||||||
150,000 | DUN & BRADSTREET CORP. 4.00% 06/15/20 | 153,840 | |||||||||||||
153,840 | 1.05 | ||||||||||||||
See Accompanying Notes to Financial Statements which are an integral part of these financial statements.
34
Pacific Advisors Income and Equity Fund
Schedule of Investments
as of December 31, 2017
| Quantity or Principal** | Description | Current $ Value** | % of Total Net Assets | ||||||||||||
CORPORATE BOND continued | |||||||||||||||
INFORMATION TECHNOLOGY | 3.08 | ||||||||||||||
ELECTRONIC EQUIPMENT & INSTRUMENTS | |||||||||||||||
150,000 | KEYSIGHT TECHNOLOGIES 3.30% 10/30/19 | 151,419 | |||||||||||||
150,000 | TECH DATA CORP. 3.70% 02/15/22 | 150,465 | |||||||||||||
301,884 | 2.06 | ||||||||||||||
SEMICONDUCTORS & EQUIPMENT | |||||||||||||||
150,000 | QUALCOMM INC. 3.00% 05/20/22 | 150,137 | |||||||||||||
150,137 | 1.02 | ||||||||||||||
REAL ESTATE | 5.29 | ||||||||||||||
HEALTH CARE REITS | |||||||||||||||
150,000 | OMEGA HLTHCARE INVESTORS 4.375% 08/01/23 | 152,134 | |||||||||||||
152,134 | 1.04 | ||||||||||||||
OFFICE REITS | |||||||||||||||
150,000 | CORPORATE OFFICE PROP 3.60% 05/15/23 | 150,094 | |||||||||||||
150,000 | GOV'T PROPERTIES INC TR 4.00% 07/15/22 | 150,907 | |||||||||||||
160,000 | SL GREEN REALTY CORP 4.50% 12/01/22 | 167,560 | |||||||||||||
468,561 | 3.20 | ||||||||||||||
REAL ESTATE SERVICES | |||||||||||||||
150,000 | CBRE SERVICES INC. 5.00% 03/15/23 | 154,248 | |||||||||||||
154,248 | 1.05 | ||||||||||||||
UTILITIES | 0.69 | ||||||||||||||
ELECTRIC UTILITIES | |||||||||||||||
100,000 | PPL ENERGY SUPPLY LLC 6.50% 05/01/18 | 101,500 | |||||||||||||
101,500 | 0.69 | ||||||||||||||
TOTAL CORPORATE BOND (Cost: $6,210,798) | 6,232,097 | 42.53 | |||||||||||||
CONVERTIBLE CORPORATE BOND | |||||||||||||||
FINANCIALS | 1.74 | ||||||||||||||
CAPITAL MARKETS | |||||||||||||||
150,000 | BLACKROCK CAP INV CONV 5.00% 06/15/22 | 155,438 | |||||||||||||
100,000 | PROSPECT CAPITAL CORP. 4.95% 07/15/22 | 99,875 | |||||||||||||
255,313 | 1.74 | ||||||||||||||
TOTAL CONVERTIBLE CORPORATE BOND (Cost: $256,553) | 255,313 | 1.74 | |||||||||||||
See Accompanying Notes to Financial Statements which are an integral part of these financial statements.
35
Pacific Advisors Income and Equity Fund
Schedule of Investments
as of December 31, 2017
| Quantity or Principal** | Description | Current $ Value** | % of Total Net Assets | ||||||||||||
PREFERRED STOCK | |||||||||||||||
FINANCIALS | 6.31 | ||||||||||||||
BANKS | |||||||||||||||
100,000 | JPMORGAN CHASE & CO. 5.30% PFD FIX-FLOAT*** | 103,710 | |||||||||||||
100,000 | JPMORGAN CHASE & CO. 5.00% PFD FIX-FLOAT*** | 101,738 | |||||||||||||
150,000 | WELLS FARGO & CO. 7.98% PFD FIX-FLOAT*** | 152,430 | |||||||||||||
357,878 | 2.44 | ||||||||||||||
CAPITAL MARKETS | |||||||||||||||
150,000 | BANK OF NY MELLON 4.95% PFD FIX-FLOAT*** | 155,257 | |||||||||||||
200,000 | CHARLES SCHWAB CORP. 4.625% FIX-FLOAT PFD*** | 204,000 | |||||||||||||
359,257 | 2.45 | ||||||||||||||
INSURANCE | |||||||||||||||
200,000 | METLIFE INC. 5.25% PFD FIX-FLOAT*** | 207,948 | |||||||||||||
207,948 | 1.42 | ||||||||||||||
TOTAL PREFERRED STOCK (Cost: $903,053) | 925,083 | 6.31 | |||||||||||||
TOTAL INVESTMENT IN SECURITIES (Cost: $12,012,703) | 14,330,965 | 97.81 | |||||||||||||
CASH OR CASH EQUIVALENT | 206,991 | 1.41 | |||||||||||||
OTHER ASSETS LESS LIABILITIES | 114,461 | 0.78 | |||||||||||||
TOTAL NET ASSETS | 14,652,417 | 100.00 | |||||||||||||
* Non-income producing
** The principal amount is stated in U.S. dollars unless otherwise indicated.
*** These securities' coupon rates and/or dividends are fixed for a certain period and then convert to floating rates.
See Accompanying Notes to Financial Statements which are an integral part of these financial statements.
36
Pacific Advisors Balanced Fund
Schedule of Investments
as of December 31, 2017
| Quantity or Principal** | Description | Current $ Value** | % of Total Net Assets | ||||||||||||
COMMON STOCK | |||||||||||||||
CONSUMER DISCRETIONARY | 16.71 | ||||||||||||||
MEDIA | |||||||||||||||
1,000 | WALT DISNEY CO. | 107,510 | |||||||||||||
107,510 | 1.95 | ||||||||||||||
SPECIALTY RETAIL | |||||||||||||||
8,000 | CONN'S INC.* | 284,400 | |||||||||||||
600 | O'REILLY AUTOMOTIVE INC.* | 144,324 | |||||||||||||
1,500 | TRACTOR SUPPLY COMPANY | 112,125 | |||||||||||||
800 | ULTA BEAUTY, INC.* | 178,928 | |||||||||||||
719,777 | 13.06 | ||||||||||||||
TEXTILES, APPAREL & LUXURY GOODS | |||||||||||||||
1,500 | NIKE INC. | 93,825 | |||||||||||||
93,825 | 1.70 | ||||||||||||||
CONSUMER STAPLES | 6.76 | ||||||||||||||
FOOD & STAPLES RETAILING | |||||||||||||||
5,500 | CHEFS' WAREHOUSE INC* | 112,750 | |||||||||||||
750 | COSTCO WHOLESALE | 139,590 | |||||||||||||
1,400 | PRICESMART, INC. | 120,540 | |||||||||||||
372,880 | 6.76 | ||||||||||||||
ENERGY | 5.59 | ||||||||||||||
ENERGY EQUIPMENT & SERVICES | |||||||||||||||
900 | CORE LABORATORIES N.V. | 98,595 | |||||||||||||
27,000 | NOBLE CORPORATION* | 122,040 | |||||||||||||
1,300 | SCHLUMBERGER LTD | 87,607 | |||||||||||||
308,242 | 5.59 | ||||||||||||||
FINANCIALS | 9.73 | ||||||||||||||
BANKS | |||||||||||||||
1,500 | EAST WEST BANCORP INC. | 91,245 | |||||||||||||
1,100 | SIGNATURE BANK* | 150,986 | |||||||||||||
242,231 | 4.39 | ||||||||||||||
CAPITAL MARKETS | |||||||||||||||
650 | FACTSET RESEARCH SYSTEMS INC. | 125,294 | |||||||||||||
1,000 | MORNINGSTAR, INC. | 96,970 | |||||||||||||
1,000 | SEI INVESTMENTS COMPANY | 71,860 | |||||||||||||
294,124 | 5.34 | ||||||||||||||
See Accompanying Notes to Financial Statements which are an integral part of these financial statements.
37
Pacific Advisors Balanced Fund
Schedule of Investments
as of December 31, 2017
| Quantity or Principal** | Description | Current $ Value** | % of Total Net Assets | ||||||||||||
COMMON STOCK continued | |||||||||||||||
HEALTH CARE | 7.56 | ||||||||||||||
HEALTH CARE TECHNOLOGY | |||||||||||||||
1,800 | CERNER CORPORATION* | 121,302 | |||||||||||||
1,900 | HENRY SCHEIN INC.* | 132,772 | |||||||||||||
350 | IDEXX LABORATORIES, INC.* | 54,733 | |||||||||||||
308,807 | 5.60 | ||||||||||||||
PHARMACEUTICALS | |||||||||||||||
1,500 | ZOETIS, INC. | 108,060 | |||||||||||||
108,060 | 1.96 | ||||||||||||||
INDUSTRIALS | 12.60 | ||||||||||||||
AIRLINES | |||||||||||||||
4,000 | SPIRIT AIRLINES INC.* | 179,400 | |||||||||||||
179,400 | 3.25 | ||||||||||||||
COMMERCIAL SERVICES & SUPPLIES | |||||||||||||||
2,500 | HEALTHCARE SERVICES GROUP, INC. | 131,800 | |||||||||||||
10,000 | TEAM INC.* | 149,000 | |||||||||||||
280,800 | 5.09 | ||||||||||||||
MACHINERY | |||||||||||||||
1,500 | WABTEC CORP. | 122,145 | |||||||||||||
122,145 | 2.22 | ||||||||||||||
TRADING COMPANIES & DISTRIBUTORS | |||||||||||||||
3,000 | TRITON INTERNATIONAL LIMITED | 112,350 | |||||||||||||
112,350 | 2.04 | ||||||||||||||
INFORMATION TECHNOLOGY | 10.66 | ||||||||||||||
INTERNET SOFTWARE & SERVICES | |||||||||||||||
150 | ALPHABET INC.* | 158,010 | |||||||||||||
1,000 | FACEBOOK, INC.* | 176,460 | |||||||||||||
334,470 | 6.07 | ||||||||||||||
IT SERVICES | |||||||||||||||
600 | ACCENTURE PLC | 91,854 | |||||||||||||
1,000 | VISA INC. | 114,020 | |||||||||||||
205,874 | 3.73 | ||||||||||||||
SOFTWARE | |||||||||||||||
1,000 | ORACLE CORPORATION | 47,280 | |||||||||||||
47,280 | 0.86 | ||||||||||||||
See Accompanying Notes to Financial Statements which are an integral part of these financial statements.
38
Pacific Advisors Balanced Fund
Schedule of Investments
as of December 31, 2017
| Quantity or Principal** | Description | Current $ Value** | % of Total Net Assets | ||||||||||||
COMMON STOCK continued | |||||||||||||||
TELECOMMUNICATION SERVICES | 2.21 | ||||||||||||||
DIVERSIFIED TELECOM. SERVICES | |||||||||||||||
2,300 | VERIZON COMMUNICATIONS INC. | 121,739 | |||||||||||||
121,739 | 2.21 | ||||||||||||||
TOTAL COMMON STOCK (Cost: $3,140,396) | 3,959,514 | 71.82 | |||||||||||||
CORPORATE BOND | |||||||||||||||
CONSUMER DISCRETIONARY | 3.71 | ||||||||||||||
DIVERSIFIED CONSUMER SERVICES | |||||||||||||||
100,000 | WASHINGTON POST CO. 7.25% 02/01/19 | 103,750 | |||||||||||||
103,750 | 1.88 | ||||||||||||||
MULTILINE RETAIL | |||||||||||||||
100,000 | MACYS RETAIL HLDGS INC. 3.875% 01/15/21 | 100,632 | |||||||||||||
100,632 | 1.83 | ||||||||||||||
ENERGY | 9.60 | ||||||||||||||
ENERGY EQUIPMENT & SERVICES | |||||||||||||||
105,000 | NOBLE HOLDING INTL LTD 5.75% 03/16/18 FLOAT | 105,262 | |||||||||||||
100,000 | PRIDE INTERNATIONAL INC. 8.50% 06/15/19 | 105,750 | |||||||||||||
100,000 | ROWAN COMPANY INC. 7.875% 08/01/19 | 107,000 | |||||||||||||
100,000 | SEACOR HOLDING 7.375% 10/01/19 | 103,250 | |||||||||||||
421,262 | 7.64 | ||||||||||||||
OIL, GAS & CONSUMABLE FUELS | |||||||||||||||
100,000 | ENERGY TRANSFER PARTNERS 9.00% 04/15/19 | 107,901 | |||||||||||||
107,901 | 1.96 | ||||||||||||||
FINANCIALS | 5.45 | ||||||||||||||
CAPITAL MARKETS | |||||||||||||||
100,000 | ARES CAPITAL CORP. 3.625% 01/19/22 | 100,414 | |||||||||||||
100,414 | 1.82 | ||||||||||||||
DIVERSIFIED FINANCIAL SERVICES | |||||||||||||||
100,000 | ICAHN ENTERPRISES 6.00% 08/01/20 | 102,843 | |||||||||||||
100,000 | JEFFERIES GRP LLC 3.00% STEP 07/27/22 | 97,165 | |||||||||||||
200,008 | 3.63 | ||||||||||||||
HEALTH CARE | 1.72 | ||||||||||||||
PHARMACEUTICALS | |||||||||||||||
100,000 | TEVA PHARMACEUTICAL 3.65% 11/10/21 | 95,130 | |||||||||||||
95,130 | 1.72 | ||||||||||||||
See Accompanying Notes to Financial Statements which are an integral part of these financial statements.
39
Pacific Advisors Balanced Fund
Schedule of Investments
as of December 31, 2017
| Quantity or Principal** | Description | Current $ Value** | % of Total Net Assets | ||||||||||||
CORPORATE BOND continued | |||||||||||||||
INFORMATION TECHNOLOGY | 1.77 | ||||||||||||||
SEMICONDUCTORS & EQUIPMENT | |||||||||||||||
100,000 | QUALCOMM INC. 2.60% 01/30/23 | 97,542 | |||||||||||||
97,542 | 1.77 | ||||||||||||||
REAL ESTATE | 3.84 | ||||||||||||||
OFFICE REITS | |||||||||||||||
100,000 | GOV'T PROPERTIES INC TR 4.00% 07/15/22 | 100,604 | |||||||||||||
100,604 | 1.83 | ||||||||||||||
SPECIALIZED REITS | |||||||||||||||
100,000 | EPR PROPERTIES 7.75% 07/15/20 | 110,918 | |||||||||||||
110,918 | 2.01 | ||||||||||||||
TOTAL CORPORATE BOND (Cost: $1,440,412) | 1,438,161 | 26.09 | |||||||||||||
PREFERRED STOCK | |||||||||||||||
FINANCIALS | 1.86 | ||||||||||||||
CAPITAL MARKETS | |||||||||||||||
100,000 | MORGAN STANLEY 5.45% PFD FIX-FLOAT*** | 102,650 | |||||||||||||
102,650 | 1.86 | ||||||||||||||
TOTAL PREFERRED STOCK (Cost: $99,875) | 102,650 | 1.86 | |||||||||||||
TOTAL INVESTMENT IN SECURITIES (Cost: $4,680,683) | 5,500,325 | 99.77 | |||||||||||||
OTHER ASSETS LESS LIABILITIES | 12,421 | 0.23 | |||||||||||||
TOTAL NET ASSETS | 5,512,746 | 100.00 | |||||||||||||
* Non-income producing
** The principal amount is stated in U.S. dollars unless otherwise indicated.
*** These securities' coupon rates and/or dividends are fixed for a certain period and then convert to floating rates.
See Accompanying Notes to Financial Statements which are an integral part of these financial statements.
40
Pacific Advisors Large Cap Value Fund
Schedule of Investments
as of December 31, 2017
| Quantity or Principal** | Description | Current $ Value** | % of Total Net Assets | ||||||||||||
COMMON STOCK | |||||||||||||||
CONSUMER DISCRETIONARY | 19.52 | ||||||||||||||
HOTELS, RESTAURANTS & LEISURE | |||||||||||||||
1,800 | MCDONALD'S CORP. | 309,816 | |||||||||||||
309,816 | 3.99 | ||||||||||||||
MEDIA | |||||||||||||||
2,975 | TIME WARNER INC. | 272,123 | |||||||||||||
3,008 | WALT DISNEY CO. | 323,390 | |||||||||||||
595,513 | 7.67 | ||||||||||||||
SPECIALTY RETAIL | |||||||||||||||
3,175 | LOWE'S COMPANIES INC. | 295,085 | |||||||||||||
1,665 | THE HOME DEPOT, INC. | 315,567 | |||||||||||||
610,652 | 7.86 | ||||||||||||||
CONSUMER STAPLES | 17.34 | ||||||||||||||
BEVERAGES | |||||||||||||||
5,120 | COCA-COLA CO. | 234,906 | |||||||||||||
975 | PEPSICO, INC. | 116,922 | |||||||||||||
351,828 | 4.53 | ||||||||||||||
FOOD & STAPLES RETAILING | |||||||||||||||
4,900 | SYSCO CORP. | 297,577 | |||||||||||||
2,950 | WAL-MART STORES INC. | 291,312 | |||||||||||||
588,889 | 7.58 | ||||||||||||||
FOOD PRODUCTS | |||||||||||||||
2,390 | THE KRAFT HEINZ COMPANY | 185,846 | |||||||||||||
185,846 | 2.39 | ||||||||||||||
HOUSEHOLD PRODUCTS | |||||||||||||||
2,400 | PROCTER & GAMBLE CO. | 220,512 | |||||||||||||
220,512 | 2.84 | ||||||||||||||
ENERGY | 1.62 | ||||||||||||||
OIL, GAS & CONSUMABLE FUELS | |||||||||||||||
1,500 | EXXON MOBIL CORP. | 125,460 | |||||||||||||
125,460 | 1.62 | ||||||||||||||
FINANCIALS | 18.70 | ||||||||||||||
BANKS | |||||||||||||||
7,000 | BANK OF AMERICA CORP. | 206,640 | |||||||||||||
2,850 | CITIGROUP INC. | 212,069 | |||||||||||||
2,863 | WELLS FARGO & CO. | 173,698 | |||||||||||||
592,407 | 7.63 | ||||||||||||||
See Accompanying Notes to Financial Statements which are an integral part of these financial statements.
41
Pacific Advisors Large Cap Value Fund
Schedule of Investments
as of December 31, 2017
| Quantity or Principal** | Description | Current $ Value** | % of Total Net Assets | ||||||||||||
COMMON STOCK continued | |||||||||||||||
DIVERSIFIED FINANCIAL SERVICES | |||||||||||||||
1,862 | BERKSHIRE HATHAWAY INC. B* | 369,086 | |||||||||||||
369,086 | 4.75 | ||||||||||||||
INSURANCE | |||||||||||||||
4,000 | AMERICAN INT'L GROUP INC. | 238,320 | |||||||||||||
5,000 | METLIFE INC. | 252,800 | |||||||||||||
491,120 | 6.32 | ||||||||||||||
HEALTH CARE | 4.06 | ||||||||||||||
PHARMACEUTICALS | |||||||||||||||
2,257 | JOHNSON & JOHNSON | 315,348 | |||||||||||||
315,348 | 4.06 | ||||||||||||||
INDUSTRIALS | 16.91 | ||||||||||||||
AIR FREIGHT & LOGISTICS | |||||||||||||||
1,000 | FEDEX CORP. | 249,540 | |||||||||||||
1,200 | UNITED PARCEL SERVICE, INC. B | 142,980 | |||||||||||||
392,520 | 5.05 | ||||||||||||||
INDUSTRIAL CONGLOMERATES | |||||||||||||||
2,000 | HONEYWELL INTERNATIONAL INC. | 306,720 | |||||||||||||
306,720 | 3.95 | ||||||||||||||
MACHINERY | |||||||||||||||
1,900 | DEERE & CO. | 297,369 | |||||||||||||
1,899 | ILLINOIS TOOL WORKS INC. | 316,848 | |||||||||||||
614,217 | 7.91 | ||||||||||||||
INFORMATION TECHNOLOGY | 23.31 | ||||||||||||||
INTERNET SOFTWARE & SERVICES | |||||||||||||||
300 | ALPHABET INC. CLASS C* | 313,920 | |||||||||||||
313,920 | 4.04 | ||||||||||||||
IT SERVICES | |||||||||||||||
2,049 | MASTERCARD INCORPORATED | 310,137 | |||||||||||||
310,137 | 3.99 | ||||||||||||||
SEMICONDUCTORS & EQUIPMENT | |||||||||||||||
5,600 | INTEL CORP. | 258,496 | |||||||||||||
258,496 | 3.33 | ||||||||||||||
See Accompanying Notes to Financial Statements which are an integral part of these financial statements.
42
Pacific Advisors Large Cap Value Fund
Schedule of Investments
as of December 31, 2017
| Quantity or Principal** | Description | Current $ Value** | % of Total Net Assets | ||||||||||||
COMMON STOCK continued | |||||||||||||||
SOFTWARE | |||||||||||||||
3,730 | MICROSOFT CORP. | 319,064 | |||||||||||||
5,710 | ORACLE CORPORATION | 269,969 | |||||||||||||
| �� | 589,033 | 7.58 | |||||||||||||
TECHNOLOGY HARDWARE STORAGE & PERIPHERALS | |||||||||||||||
2,007 | APPLE INC. | 339,645 | |||||||||||||
339,645 | 4.37 | ||||||||||||||
TOTAL COMMON STOCK (Cost: $3,687,918) | 7,881,165 | 101.46 | |||||||||||||
TOTAL INVESTMENT IN SECURITIES (Cost: $3,687,918) | 7,881,165 | 101.46 | |||||||||||||
LIABILITIES IN EXCESS OF OTHER ASSETS | (113,231 | ) | (1.46 | ) | |||||||||||
TOTAL NET ASSETS | 7,767,934 | 100.00 | |||||||||||||
* Non-income producing
** The principal amount is stated in U.S. dollars unless otherwise indicated.
See Accompanying Notes to Financial Statements which are an integral part of these financial statements.
43
Pacific Advisors Mid Cap Value Fund
Schedule of Investments
as of December 31, 2017
| Quantity or Principal** | Description | Current $ Value** | % of Total Net Assets | ||||||||||||
COMMON STOCK | |||||||||||||||
CONSUMER DISCRETIONARY | 34.36 | ||||||||||||||
AUTO COMPONENTS | |||||||||||||||
1,300 | LEAR CORP. | 229,658 | |||||||||||||
229,658 | 3.89 | ||||||||||||||
DISTRIBUTORS | |||||||||||||||
1,600 | POOL CORPORATION | 207,440 | |||||||||||||
207,440 | 3.51 | ||||||||||||||
SPECIALTY RETAIL | |||||||||||||||
12,400 | CONN'S INC.* | 440,820 | |||||||||||||
3,600 | MONRO, INC. | 205,020 | |||||||||||||
850 | O'REILLY AUTOMOTIVE INC.* | 204,459 | |||||||||||||
5,300 | PENSKE AUTOMOTIVE GROUP INC. | 253,605 | |||||||||||||
3,400 | TRACTOR SUPPLY COMPANY | 254,150 | |||||||||||||
1,358,054 | 23.01 | ||||||||||||||
TEXTILES, APPAREL & LUXURY GOODS | |||||||||||||||
1,700 | PVH CORP. | 233,257 | |||||||||||||
233,257 | 3.95 | ||||||||||||||
CONSUMER STAPLES | 2.63 | ||||||||||||||
BEVERAGES | |||||||||||||||
1,600 | DR PEPPER SNAPPLE GROUP INC. | 155,296 | |||||||||||||
155,296 | 2.63 | ||||||||||||||
ENERGY | 11.38 | ||||||||||||||
ENERGY EQUIPMENT & SERVICES | |||||||||||||||
1,200 | CORE LABORATORIES N.V. | 131,460 | |||||||||||||
30,000 | HELIX ENERGY SOLUTIONS GROUP INC.* | 226,200 | |||||||||||||
41,000 | NOBLE CORPORATION* | 185,320 | |||||||||||||
4,100 | TECHNIPFMC PLC | 128,371 | |||||||||||||
671,351 | 11.38 | ||||||||||||||
FINANCIALS | 7.48 | ||||||||||||||
BANKS | |||||||||||||||
4,400 | CIT GROUP INC. | 216,612 | |||||||||||||
3,700 | EAST WEST BANCORP INC. | 225,071 | |||||||||||||
441,683 | 7.48 | ||||||||||||||
HEALTH CARE | 3.20 | ||||||||||||||
HEALTH CARE TECHNOLOGY | |||||||||||||||
2,800 | CERNER CORPORATION* | 188,692 | |||||||||||||
188,692 | 3.20 | ||||||||||||||
See Accompanying Notes to Financial Statements which are an integral part of these financial statements.
44
Pacific Advisors Mid Cap Value Fund
Schedule of Investments
as of December 31, 2017
| Quantity or Principal** | Description | Current $ Value** | % of Total Net Assets | ||||||||||||
COMMON STOCK continued | |||||||||||||||
INDUSTRIALS | 35.95 | ||||||||||||||
AIRLINES | |||||||||||||||
4,700 | SPIRIT AIRLINES INC.* | 210,795 | |||||||||||||
210,795 | 3.57 | ||||||||||||||
CONSTRUCTION & ENGINEERING | |||||||||||||||
7,500 | CHICAGO BRIDGE & IRON CO. N.V. | 121,050 | |||||||||||||
121,050 | 2.05 | ||||||||||||||
MACHINERY | |||||||||||||||
4,800 | GRACO INC. | 217,056 | |||||||||||||
5,600 | NAVISTAR INT'L CORP.* | 240,128 | |||||||||||||
2,700 | WABTEC CORP. | 219,861 | |||||||||||||
677,045 | 11.47 | ||||||||||||||
MARINE | |||||||||||||||
3,800 | KIRBY CORP.* | 253,840 | |||||||||||||
253,840 | 4.30 | ||||||||||||||
ROAD & RAIL | |||||||||||||||
3,300 | GENESEE & WYOMING INC.* | 259,809 | |||||||||||||
2,000 | KANSAS CITY SOUTHERN | 210,440 | |||||||||||||
5,324 | KNIGHT-SWIFT TRANSPORTATION HLDG | 232,765 | |||||||||||||
1,500 | LANDSTAR SYSTEM INC. | 156,150 | |||||||||||||
859,164 | 14.56 | ||||||||||||||
INFORMATION TECHNOLOGY | 3.70 | ||||||||||||||
SOFTWARE | |||||||||||||||
3,300 | ASPEN TECHNOLOGY, INC.* | 218,460 | |||||||||||||
218,460 | 3.70 | ||||||||||||||
MATERIALS | 2.10 | ||||||||||||||
CHEMICALS | |||||||||||||||
2,300 | H.B. FULLER CO. | 123,901 | |||||||||||||
123,901 | 2.10 | ||||||||||||||
TOTAL COMMON STOCK (Cost: $4,060,663) | 5,949,686 | 100.80 | |||||||||||||
TOTAL INVESTMENT IN SECURITIES (Cost: $4,060,663) | 5,949,686 | 100.80 | |||||||||||||
LIABILITIES IN EXCESS OF OTHER ASSETS | (46,964 | ) | (0.80 | ) | |||||||||||
TOTAL NET ASSETS | 5,902,722 | 100.00 | |||||||||||||
* Non-income producing
** The principal amount is stated in U.S. dollars unless otherwise indicated.
See Accompanying Notes to Financial Statements which are an integral part of these financial statements.
45
Pacific Advisors Small Cap Value Fund
Schedule of Investments
as of December 31, 2017
| Quantity or Principal** | Description | Current $ Value** | % of Total Net Assets | ||||||||||||
COMMON STOCK | |||||||||||||||
CONSUMER DISCRETIONARY | 22.78 | ||||||||||||||
AUTO COMPONENTS | |||||||||||||||
25,500 | GENTHERM INC.* | 809,625 | |||||||||||||
809,625 | 3.48 | ||||||||||||||
SPECIALTY RETAIL | |||||||||||||||
107,000 | CONN'S INC.* | 3,803,850 | |||||||||||||
37,000 | SONIC AUTOMOTIVE INC. | 682,650 | |||||||||||||
4,486,500 | 19.30 | ||||||||||||||
CONSUMER STAPLES | 7.10 | ||||||||||||||
FOOD & STAPLES RETAILING | |||||||||||||||
39,812 | CHEFS' WAREHOUSE INC* | 816,146 | |||||||||||||
816,146 | 3.51 | ||||||||||||||
FOOD PRODUCTS | |||||||||||||||
46,000 | DARLING INGREDIENTS INC.* | 833,980 | |||||||||||||
833,980 | 3.59 | ||||||||||||||
ENERGY | 18.84 | ||||||||||||||
ENERGY EQUIPMENT & SERVICES | |||||||||||||||
135,000 | HELIX ENERGY SOLUTIONS GROUP INC.* | 1,017,900 | |||||||||||||
53,000 | MATRIX SERVICE CO.* | 943,400 | |||||||||||||
37,000 | NATURAL GAS SERVICES GROUP, INC.* | 969,400 | |||||||||||||
84,000 | NOBLE CORPORATION* | 379,680 | |||||||||||||
192,193 | NORTH AMERICAN ENERGY PARTNERS INC. | 951,355 | |||||||||||||
110,000 | PARKER DRILLING CO.* | 110,000 | |||||||||||||
4,371,735 | 18.81 | ||||||||||||||
OIL, GAS & CONSUMABLE FUELS | |||||||||||||||
100,000 | INFINITY ENERGY RESOURCES INC.* | 6,000 | |||||||||||||
6,000 | 0.03 | ||||||||||||||
FINANCIALS | 7.64 | ||||||||||||||
BANKS | |||||||||||||||
14,500 | EAST WEST BANCORP INC. | 882,035 | |||||||||||||
882,035 | 3.79 | ||||||||||||||
CONSUMER FINANCE | |||||||||||||||
34,000 | REGIONAL MANAGEMENT CORP.* | 894,540 | |||||||||||||
894,540 | 3.85 | ||||||||||||||
See Accompanying Notes to Financial Statements which are an integral part of these financial statements.
46
Pacific Advisors Small Cap Value Fund
Schedule of Investments
as of December 31, 2017
| Quantity or Principal** | Description | Current $ Value** | % of Total Net Assets | ||||||||||||
COMMON STOCK continued | |||||||||||||||
INDUSTRIALS | 44.39 | ||||||||||||||
BUILDING PRODUCTS | |||||||||||||||
22,195 | INSTEEL INDUSTRIES, INC. | 628,563 | |||||||||||||
628,563 | 2.71 | ||||||||||||||
COMMERCIAL SERVICES & SUPPLIES | |||||||||||||||
24,000 | MOBILE MINI INC. | 828,000 | |||||||||||||
60,000 | TEAM INC.* | 894,000 | |||||||||||||
1,722,000 | 7.41 | ||||||||||||||
CONSTRUCTION & ENGINEERING | |||||||||||||||
120,000 | ORION GROUP HOLDINGS, INC.* | 939,600 | |||||||||||||
939,600 | 4.04 | ||||||||||||||
MACHINERY | |||||||||||||||
24,000 | NAVISTAR INT'L CORP.* | 1,029,120 | |||||||||||||
1,029,120 | 4.43 | ||||||||||||||
MARINE | |||||||||||||||
15,500 | KIRBY CORP.* | 1,035,400 | |||||||||||||
1,035,400 | 4.45 | ||||||||||||||
ROAD & RAIL | |||||||||||||||
13,000 | GENESEE & WYOMING INC.* | 1,023,490 | |||||||||||||
14,000 | SAIA INC.* | 990,500 | |||||||||||||
2,013,990 | 8.67 | ||||||||||||||
TRADING COMPANIES & DISTRIBUTORS | |||||||||||||||
32,000 | DXP ENTERPRISES INC.* | 946,240 | |||||||||||||
19,500 | RUSH ENTERPRISES INC.* | 990,795 | |||||||||||||
27,000 | TRITON INTERNATIONAL LIMITED | 1,011,150 | |||||||||||||
2,948,185 | 12.68 | ||||||||||||||
TOTAL COMMON STOCK (Cost: $14,688,287) | 23,417,419 | 100.75 | |||||||||||||
TOTAL INVESTMENT IN SECURITIES (Cost: $14,688,287) | 23,417,419 | 100.75 | |||||||||||||
LIABILITIES IN EXCESS OF OTHER ASSETS | (173,378 | ) | (0.75 | ) | |||||||||||
TOTAL NET ASSETS | 23,244,041 | 100.00 | |||||||||||||
* Non-income producing
** The principal amount is stated in U.S. dollars unless otherwise indicated.
See Accompanying Notes to Financial Statements which are an integral part of these financial statements.
47
Pacific Advisors Fund Inc.
Statements of Assets and Liabilities
December 31, 2017
| Income and Equity Fund | Balanced Fund | Large Cap Value Fund | |||||||||||||
Assets | |||||||||||||||
Investment securities | |||||||||||||||
At cost | $ | 12,012,703 | $ | 4,680,683 | $ | 3,687,918 | |||||||||
At fair value | $ | 14,330,965 | $ | 5,500,325 | $ | 7,881,165 | |||||||||
Cash or cash equivalent, at fair value | 206,991 | - | - | ||||||||||||
Accrued income receivable | 84,463 | 31,109 | 7,937 | ||||||||||||
Receivable for Fund shares sold | 83,299 | 3,733 | 23,983 | ||||||||||||
Receivable for investments sold | - | 74,978 | - | ||||||||||||
Total assets | 14,705,718 | 5,610,145 | 7,913,085 | ||||||||||||
Liabilities | |||||||||||||||
Bank borrowings (Note 7) | - | 34,182 | 113,077 | ||||||||||||
Payable for investments purchased | - | 35,264 | - | ||||||||||||
Payable for Fund shares redeemed | 6,600 | - | - | ||||||||||||
Accounts payable | 43,101 | 24,353 | 28,474 | ||||||||||||
Accounts payable to related parties (Note 3) | 3,600 | 3,600 | 3,600 | ||||||||||||
Total liabilities | 53,301 | 97,399 | 145,151 | ||||||||||||
Net Assets | $ | 14,652,417 | $ | 5,512,746 | $ | 7,767,934 | |||||||||
Summary of Shareholders' Equity | |||||||||||||||
Paid in capital | 11,891,387 | 4,613,720 | 3,378,481 | ||||||||||||
Accumulated net investment income | 6,533 | - | - | ||||||||||||
Accumulated net realized gain (loss) on security transactions | 436,235 | 79,384 | 196,206 | ||||||||||||
Net unrealized appreciation of investments | 2,318,262 | 819,642 | 4,193,247 | ||||||||||||
Net assets at December 31, 2017 | $ | 14,652,417 | $ | 5,512,746 | $ | 7,767,934 | |||||||||
Class A: | |||||||||||||||
Net assets | $ | 12,393,796 | $ | 4,109,464 | $ | 7,224,409 | |||||||||
Shares authorized ($0.01 par value) | 50,000,000 | 50,000,000 | 50,000,000 | ||||||||||||
Shares outstanding | 952,873 | 330,102 | 417,167 | ||||||||||||
Net asset value (and redemption price) per share | $ | 13.01 | $ | 12.45 | $ | 17.32 | |||||||||
Maximum offering price per share | $ | 13.66 | $ | 13.21 | $ | 18.38 | |||||||||
Sales load | 4.75 | % | 5.75 | % | 5.75 | % | |||||||||
Class C: | |||||||||||||||
Net assets | $ | 2,258,621 | $ | 1,403,282 | $ | 543,525 | |||||||||
Shares authorized ($0.01 par value) | 50,000,000 | 50,000,000 | 50,000,000 | ||||||||||||
Shares outstanding | 182,386 | 128,877 | 36,967 | ||||||||||||
Net asset value (and offering and redemption price) per share | $ | 12.38 | $ | 10.89 | $ | 14.70 | |||||||||
Class I: | |||||||||||||||
Net assets | N/A | N/A | N/A | ||||||||||||
Shares authorized ($0.01 par value) | |||||||||||||||
Shares outstanding | |||||||||||||||
Net asset value (and offering and redemption price) per share | N/A | N/A | N/A | ||||||||||||
* Net assets divided by shares outstanding does not equal net asset value per share due to rounding.
See Accompanying Notes to Financial Statements which are an integral part of these financial statements.
48
| Mid Cap Value Fund | Small Cap Value Fund | ||||||||||
Assets | |||||||||||
Investment securities | |||||||||||
At cost | $ | 4,060,663 | $ | 14,688,287 | |||||||
At fair value | $ | 5,949,686 | $ | 23,417,419 | |||||||
Cash or cash equivalent, at fair value | - | - | |||||||||
Accrued income receivable | 1,648 | 27,750 | |||||||||
Receivable for Fund shares sold | 6,780 | 19,539 | |||||||||
Receivable for investments sold | - | 112,010 | |||||||||
Total assets | 5,958,114 | 23,576,718 | |||||||||
Liabilities | |||||||||||
Bank borrowings (Note 7) | 29,000 | 156,435 | |||||||||
Payable for investments purchased | - | - | |||||||||
Payable for Fund shares redeemed | - | 106,782 | |||||||||
Accounts payable | 22,792 | 58,534 | |||||||||
Accounts payable to related parties (Note 3) | 3,600 | 10,926 | |||||||||
Total liabilities | 55,392 | 332,677 | |||||||||
Net Assets | $ | 5,902,722 | $ | 23,244,041 | |||||||
Summary of Shareholders' Equity | |||||||||||
Paid in capital | 4,013,699 | 14,635,758 | |||||||||
Accumulated net investment income | - | - | |||||||||
Accumulated net realized gain (loss) on security transactions | - | (120,849 | ) | ||||||||
Net unrealized appreciation of investments | 1,889,023 | 8,729,132 | |||||||||
Net assets at December 31, 2017 | $ | 5,902,722 | $ | 23,244,041 | |||||||
Class A: | |||||||||||
Net assets | $ | 5,495,402 | $ | 20,439,213 | |||||||
Shares authorized ($0.01 par value) | 50,000,000 | 50,000,000 | |||||||||
Shares outstanding | 416,732 | 697,923 | |||||||||
Net asset value (and redemption price) per share | $ | 13.19 | $ | 29.29 | |||||||
Maximum offering price per share | $ | 13.99 | $ | 31.08 | |||||||
Sales load | 5.75 | % | 5.75 | % | |||||||
Class C: | |||||||||||
Net assets | $ | 407,320 | $ | 2,796,067 | |||||||
Shares authorized ($0.01 par value) | 50,000,000 | 50,000,000 | |||||||||
Shares outstanding | 35,173 | 134,735 | |||||||||
Net asset value (and offering and redemption price) per share | $ | 11.58 | $ | 20.75 | |||||||
Class I: | |||||||||||
Net assets | N/A | $ | 8,761 | ||||||||
Shares authorized ($0.01 par value) | 50,000,000 | ||||||||||
Shares outstanding | 230 | ||||||||||
Net asset value (and offering and redemption price) per share | N/A | $ | 38.17 | * | |||||||
49
Pacific Advisors Fund Inc.
Statements of Operations
December 31, 2017
| Income and Equity Fund | Balanced Fund | Large Cap Value Fund | |||||||||||||
Investment Income | |||||||||||||||
Dividends | $ | 300,537 | $ | 35,686 | $ | 156,773 | |||||||||
Interest | 276,566 | 63,411 | 1 | ||||||||||||
Total investment income | 577,103 | 99,097 | 156,774 | ||||||||||||
Expenses | |||||||||||||||
Investment management fees (Note 3) | 128,365 | 42,514 | 59,190 | ||||||||||||
Transfer agent fees (Note 3) | 128,705 | 71,884 | 103,896 | ||||||||||||
Fund accounting fees (Note 3) | 124,990 | 41,488 | 57,616 | ||||||||||||
Legal fees | 45,659 | 14,968 | 20,958 | ||||||||||||
Audit fees | 26,447 | 16,319 | 18,475 | ||||||||||||
Registration fees | 36,819 | 30,016 | 26,152 | ||||||||||||
Printing | 20,316 | 6,698 | 9,323 | ||||||||||||
Custody fees | 8,452 | 7,504 | 7,209 | ||||||||||||
Interest on bank borrowings (Note 7) | 1,031 | 669 | 2,170 | ||||||||||||
Director fees/meetings | 25,454 | 8,438 | 11,641 | ||||||||||||
Distribution and service (12b-1) fees (Note 3) | 60,265 | 25,302 | 24,840 | ||||||||||||
Administration fees (Note 3) | 8,558 | 2,834 | 3,946 | ||||||||||||
Compliance fees (Note 3) | 39,434 | 13,039 | 17,972 | ||||||||||||
Total expenses, before fees waived | 654,495 | 281,673 | 363,388 | ||||||||||||
Less fees waived (Note 3) | 128,365 | - | 59,190 | ||||||||||||
Net expenses | 526,130 | 281,673 | 304,198 | ||||||||||||
Net Investment Income (Loss) | 50,973 | (182,576 | ) | (147,424 | ) | ||||||||||
Net Realized and Unrealized Gain on Investments | |||||||||||||||
Net realized gain on investments | 721,575 | 172,925 | 398,209 | ||||||||||||
Change in net unrealized appreciation on investments | 72,562 | 552,780 | 1,010,394 | ||||||||||||
Net realized and unrealized gain on investments | 794,137 | 725,705 | 1,408,603 | ||||||||||||
Net Increase in Net Assets Resulting from Operations | $ | 845,110 | $ | 543,129 | $ | 1,261,179 | |||||||||
See Accompanying Notes to Financial Statements which are an integral part of these financial statements.
50
| Mid Cap Value Fund | Small Cap Value Fund | ||||||||||
Investment Income | |||||||||||
Dividends | $ | 43,288 | $ | 91,446 | |||||||
Interest | - | 1 | |||||||||
Total investment income | 43,288 | 91,447 | |||||||||
Expenses | |||||||||||
Investment management fees (Note 3) | 58,005 | 191,293 | |||||||||
Transfer agent fees (Note 3) | 72,327 | 275,392 | |||||||||
Fund accounting fees (Note 3) | 42,436 | 187,019 | |||||||||
Legal fees | 15,211 | 66,019 | |||||||||
Audit fees | 16,643 | 33,115 | |||||||||
Registration fees | 27,864 | 63,284 | |||||||||
Printing | 6,866 | 30,516 | |||||||||
Custody fees | 7,308 | 11,571 | |||||||||
Interest on bank borrowings (Note 7) | 1,087 | 8,928 | |||||||||
Director fees/meetings | 8,667 | 38,797 | |||||||||
Distribution and service (12b-1) fees (Note 3) | 17,208 | 85,727 | |||||||||
Administration fees (Note 3) | 2,900 | 12,753 | |||||||||
Compliance fees (Note 3) | 13,397 | 59,984 | |||||||||
Total expenses, before fees waived | 289,919 | 1,064,398 | |||||||||
Less fees waived (Note 3) | - | - | |||||||||
Net expenses | 289,919 | 1,064,398 | |||||||||
Net Investment Income (Loss) | (246,631 | ) | (972,951 | ) | |||||||
Net Realized and Unrealized Gain on Investments | |||||||||||
Net realized gain on investments | 190,701 | 728,078 | |||||||||
Change in net unrealized appreciation on investments | 680,621 | 2,472,244 | |||||||||
Net realized and unrealized gain on investments | 871,322 | 3,200,322 | |||||||||
Net Increase in Net Assets Resulting from Operations | $ | 624,691 | $ | 2,227,371 | |||||||
51
Pacific Advisors Fund Inc.
Statements of Changes in Net Assets
Income and Equity Fund | Balanced Fund | Large Cap Value Fund | |||||||||||||||||||||||||
| Year ended December 31, 2017 | Year ended December 31, 2016 | Year ended December 31, 2017 | Year ended December 31, 2016 | Year ended December 31, 2017 | Year ended December 31, 2016 | ||||||||||||||||||||||
| Increase (Decrease) in Net Assets From Operations | |||||||||||||||||||||||||||
Net investment income (loss) | $ | 50,973 | $ | 21,268 | $ | (182,576 | ) | $ | (173,862 | ) | $ | (147,424 | ) | $ | (126,115 | ) | |||||||||||
Net realized gain on investments | 721,575 | 126,786 | 172,925 | 207,753 | 398,209 | 99,141 | |||||||||||||||||||||
| Change in net unrealized appreciation (depreciation) on investments | 72,562 | 883,905 | 552,780 | (67,001 | ) | 1,010,394 | 650,331 | ||||||||||||||||||||
| Increase (decrease) in net assets resulting from operations | 845,110 | 1,031,959 | 543,129 | (33,110 | ) | 1,261,179 | 623,357 | ||||||||||||||||||||
| From Distributions to Shareholders | |||||||||||||||||||||||||||
Class A: | |||||||||||||||||||||||||||
Net investment income | (44,440 | ) | (23,421 | ) | - | - | - | - | |||||||||||||||||||
Net capital gains | - | - | (28,394 | ) | (155,274 | ) | (195,913 | ) | (20,212 | ) | |||||||||||||||||
Return of Capital | - | (11,626 | ) | - | - | - | - | ||||||||||||||||||||
Class C: | |||||||||||||||||||||||||||
Net investment income | - | - | - | - | - | - | |||||||||||||||||||||
Net capital gains | - | - | (11,011 | ) | (69,979 | ) | (17,462 | ) | (2,847 | ) | |||||||||||||||||
Class I: | |||||||||||||||||||||||||||
Net capital gains | N/A | N/A | N/A | N/A | N/A | N/A | |||||||||||||||||||||
| Decrease in net assets resulting from distributions | (44,440 | ) | (35,047 | ) | (39,405 | ) | (225,253 | ) | (213,375 | ) | (23,059 | ) | |||||||||||||||
| From Capital Share Transactions (Note 6) | |||||||||||||||||||||||||||
Proceeds from shares sold | 2,592,423 | 4,599,494 | 187,244 | 849,404 | 412,204 | 737,466 | |||||||||||||||||||||
| Proceeds from shares purchased by reinvestment of distributions | 39,442 | 31,280 | 36,406 | 208,156 | 194,273 | 20,835 | |||||||||||||||||||||
Cost of shares repurchased | (6,030,834 | ) | (2,684,739 | ) | (1,215,004 | ) | (1,523,942 | ) | (1,676,071 | ) | (1,316,655 | ) | |||||||||||||||
| Increase (decrease) in net assets resulting from capital share transactions | (3,398,969 | ) | 1,946,035 | (991,354 | ) | (466,382 | ) | (1,069,594 | ) | (558,354 | ) | ||||||||||||||||
Increase (decrease) in net assets | (2,598,299 | ) | 2,942,947 | (487,630 | ) | (724,745 | ) | (21,790 | ) | 41,944 | |||||||||||||||||
Net Assets | |||||||||||||||||||||||||||
Beginning of year | 17,250,716 | 14,307,769 | 6,000,376 | 6,725,121 | 7,789,724 | 7,747,780 | |||||||||||||||||||||
End of year | $ | 14,652,417 | $ | 17,250,716 | $ | 5,512,746 | $ | 6,000,376 | $ | 7,767,934 | $ | 7,789,724 | |||||||||||||||
| Including accumulated net investment income | $ | 6,533 | $ | - | $ | - | $ | - | $ | - | $ | - | |||||||||||||||
See Accompanying Notes to Financial Statements which are an integral part of these financial statements.
52
Mid Cap Value Fund | Small Cap Value Fund | ||||||||||||||||||
| Year ended December 31, 2017 | Year ended December 31, 2016 | Year ended December 31, 2017 | Year ended December 31, 2016 | ||||||||||||||||
| Increase (Decrease) in Net Assets From Operations | |||||||||||||||||||
Net investment income (loss) | $ | (246,631 | ) | $ | (219,294 | ) | $ | (972,951 | ) | $ | (1,191,012 | ) | |||||||
Net realized gain on investments | 190,701 | 125,190 | 728,078 | 1,188,133 | |||||||||||||||
| Change in net unrealized appreciation (depreciation) on investments | 680,621 | 885,408 | 2,472,244 | 6,332,333 | |||||||||||||||
| Increase (decrease) in net assets resulting from operations | 624,691 | 791,304 | 2,227,371 | 6,329,454 | |||||||||||||||
| From Distributions to Shareholders | |||||||||||||||||||
Class A: | |||||||||||||||||||
Net investment income | - | - | - | - | |||||||||||||||
Net capital gains | - | - | (905,450 | ) | (3,617,413 | ) | |||||||||||||
Return of Capital | - | - | - | - | |||||||||||||||
Class C: | |||||||||||||||||||
Net investment income | - | - | - | - | |||||||||||||||
Net capital gains | - | - | (171,390 | ) | (648,113 | ) | |||||||||||||
Class I: | |||||||||||||||||||
Net capital gains | N/A | N/A | (297 | ) | (840 | ) | |||||||||||||
| Decrease in net assets resulting from distributions | - | - | (1,077,137 | ) | (4,266,366 | ) | |||||||||||||
| From Capital Share Transactions (Note 6) | |||||||||||||||||||
Proceeds from shares sold | 299,238 | 574,094 | 1,730,271 | 1,705,215 | |||||||||||||||
| Proceeds from shares purchased by reinvestment of distributions | - | - | 1,022,031 | 3,949,069 | |||||||||||||||
Cost of shares repurchased | (1,115,015 | ) | (808,187 | ) | (10,682,161 | ) | (16,971,079 | ) | |||||||||||
| Increase (decrease) in net assets resulting from capital share transactions | (815,777 | ) | (234,093 | ) | (7,929,859 | ) | (11,316,795 | ) | |||||||||||
Increase (decrease) in net assets | (191,086 | ) | 557,211 | (6,779,625 | ) | (9,253,707 | ) | ||||||||||||
Net Assets | |||||||||||||||||||
Beginning of year | 6,093,808 | 5,536,597 | 30,023,666 | 39,277,373 | |||||||||||||||
End of year | $ | 5,902,722 | $ | 6,093,808 | $ | 23,244,041 | $ | 30,023,666 | |||||||||||
| Including accumulated net investment income | $ | - | $ | - | $ | - | $ | - | |||||||||||
53
Pacific Advisors Fund Inc.
Financial Highlights
(For a share outstanding throughout each year presented)
Income and Equity Fund | |||||||||||||||||||||||
Class A | |||||||||||||||||||||||
For the year ended December 31, | |||||||||||||||||||||||
2017 | 2016 | 2015 | 2014 | 2013 | |||||||||||||||||||
Per Share Operating Performance | |||||||||||||||||||||||
Net asset value, beginning of year | $ | 12.40 | $ | 11.61 | $ | 12.06 | $ | 11.55 | $ | 10.30 | |||||||||||||
Income from investing operations | |||||||||||||||||||||||
Net investment income (c) | 0.05 | 0.03 | 0.14 | 0.22 | (d) | 0.14 | (d) | ||||||||||||||||
Net realized and unrealized gain (loss) on securities | 0.60 | 0.78 | (0.45 | ) | 0.51 | (d) | 1.24 | (d) | |||||||||||||||
Total from investment operations | 0.65 | 0.81 | (0.31 | ) | 0.73 | 1.38 | |||||||||||||||||
Less distributions | |||||||||||||||||||||||
From net investment income | (0.04 | ) | (0.02 | ) | (0.14 | ) | (0.22 | ) | (0.13 | ) | |||||||||||||
From return of capital | - | (0.01 | ) | - | - | - | |||||||||||||||||
Total distributions | (0.04 | ) | (0.03 | ) | (0.14 | ) | (0.22 | ) | (0.13 | ) | |||||||||||||
Redemption fees (c) | - | (b) | 0.01 | - | (b) | - | (b,d) | - | (b,d) | ||||||||||||||
Net asset value, end of year | $ | 13.01 | $ | 12.40 | $ | 11.61 | $ | 12.06 | $ | 11.55 | |||||||||||||
Total Investment Return (a) | 5.26 | % | 7.08 | % | (2.57 | )% | 6.41 | % | 13.40 | % | |||||||||||||
Ratios/Supplemental Data | |||||||||||||||||||||||
Net assets, end of year (000's) | $ | 12,394 | $ | 14,794 | $ | 11,541 | $ | 11,324 | $ | 9,247 | |||||||||||||
Ratio of net investment income (loss) to average net assets | |||||||||||||||||||||||
With expense reductions | 0.39 | % | 0.26 | % | 1.23 | % | 1.88 | % | 1.27 | % | |||||||||||||
Without expense reductions | (0.36 | )% | (0.49 | )% | 0.48 | % | 1.13 | % | 0.52 | % | |||||||||||||
Ratio of expenses to average net assets | |||||||||||||||||||||||
With expense reductions | 2.96 | % | 2.88 | % | 2.06 | % | 1.91 | % | 2.23 | % | |||||||||||||
Without expense reductions | 3.71 | % | 3.63 | % | 2.81 | % | 2.66 | % | 2.98 | % | |||||||||||||
Fund portfolio turnover rate | 19 | % | 14 | % | 22 | % | 13 | % | 20 | % | |||||||||||||
Class C | |||||||||||||||||||||||
For the year ended December 31, | |||||||||||||||||||||||
2017 | 2016 | 2015 | 2014 | 2013 | |||||||||||||||||||
Per Share Operating Performance | |||||||||||||||||||||||
Net asset value, beginning of year | $ | 11.86 | $ | 11.16 | $ | 11.59 | $ | 11.11 | $ | 9.91 | |||||||||||||
Income from investing operations | |||||||||||||||||||||||
Net investment income (loss) (c) | (0.04 | ) | (0.06 | ) | 0.05 | 0.13 | (d) | 0.05 | (d) | ||||||||||||||
Net realized and unrealized gain (loss) on securities | 0.56 | 0.75 | (0.42 | ) | 0.48 | (d) | 1.19 | (d) | |||||||||||||||
Total from investment operations | 0.52 | 0.69 | (0.37 | ) | 0.61 | 1.24 | |||||||||||||||||
Less distributions | |||||||||||||||||||||||
From net investment income | - | - | (0.06 | ) | (0.13 | ) | (0.04 | ) | |||||||||||||||
Total distributions | - | - | (0.06 | ) | (0.13 | ) | (0.04 | ) | |||||||||||||||
Redemption fees (c) | - | (b) | 0.01 | - | (b) | - | (b,d) | - | (b,d) | ||||||||||||||
Net asset value, end of year | $ | 12.38 | $ | 11.86 | $ | 11.16 | $ | 11.59 | $ | 11.11 | |||||||||||||
Total Investment Return | 4.38 | % | 6.27 | % | (3.21 | )% | 5.51 | % | 12.55 | % | |||||||||||||
Ratios/Supplemental Data | |||||||||||||||||||||||
Net assets, end of year (000's) | $ | 2,259 | $ | 2,456 | $ | 2,766 | $ | 2,471 | $ | 2,234 | |||||||||||||
Ratio of net investment income (loss) to average net assets | |||||||||||||||||||||||
With expense reductions | (0.36 | )% | (0.48 | )% | 0.48 | % | 1.14 | % | 0.49 | % | |||||||||||||
Without expense reductions | (1.11 | )% | (1.23 | )% | (0.27 | )% | 0.39 | % | (0.26 | )% | |||||||||||||
Ratio of expenses to average net assets | |||||||||||||||||||||||
With expense reductions | 3.72 | % | 3.64 | % | 2.81 | % | 2.66 | % | 3.03 | % | |||||||||||||
Without expense reductions | 4.47 | % | 4.39 | % | 3.56 | % | 3.41 | % | 3.78 | % | |||||||||||||
Fund portfolio turnover rate | 19 | % | 14 | % | 22 | % | 13 | % | 20 | % | |||||||||||||
(a) The Fund's maximum sales charge is not included in the total return computation.
(b) The amount is less than $0.005 and rounded to zero.
(c) Based on average shares outstanding.
(d) Net investment income, net realized and unrealized gain (loss) on securities and redemptions fees for Class A and Class C for the years ended December 31, 2013 and December 31, 2014 were restated during the year ended December 31, 2015. See Note 2(H).
See Accompanying Notes to Financial Statements which are an integral part of these financial statements.
54
Pacific Advisors Fund Inc.
Financial Highlights
(For a share outstanding throughout each year presented)
Balanced Fund | |||||||||||||||||||||||
Class A | |||||||||||||||||||||||
For the year ended December 31, | |||||||||||||||||||||||
2017 | 2016 | 2015 | 2014 | 2013 | |||||||||||||||||||
Per Share Operating Performance | |||||||||||||||||||||||
Net asset value, beginning of year | $ | 11.34 | $ | 11.75 | $ | 14.40 | $ | 16.59 | $ | 14.13 | |||||||||||||
Income from investing operations | |||||||||||||||||||||||
Net investment loss (c) | (0.35 | ) | (0.29 | ) | (0.15 | ) | (0.14 | )(d) | (0.15 | )(d) | |||||||||||||
Net realized and unrealized gain (loss) on securities | 1.55 | 0.30 | (2.25 | ) | (1.17 | )(d) | 4.17 | (d) | |||||||||||||||
Total from investment operations | 1.20 | 0.01 | (2.40 | ) | (1.31 | ) | 4.02 | ||||||||||||||||
Less distributions | |||||||||||||||||||||||
From net capital gain | (0.09 | ) | (0.42 | ) | (0.25 | ) | (0.88 | ) | (1.57 | ) | |||||||||||||
Total distributions | (0.09 | ) | (0.42 | ) | (0.25 | ) | (0.88 | ) | (1.57 | ) | |||||||||||||
Redemption fees (c) | - | (b) | - | (b) | - | (b) | - | (b)(d) | 0.01 | (d) | |||||||||||||
Net asset value, end of year | $ | 12.45 | $ | 11.34 | $ | 11.75 | $ | 14.40 | $ | 16.59 | |||||||||||||
Total Investment Return (a) | 10.55 | % | 0.08 | % | (16.73 | )% | (7.94 | )% | 28.68 | % | |||||||||||||
Ratios/Supplemental Data | |||||||||||||||||||||||
Net assets, end of year (000's) | $ | 4,109 | $ | 4,276 | $ | 4,046 | $ | 5,017 | $ | 5,144 | |||||||||||||
Ratio of net investment loss to average net assets | (3.02 | )% | (2.56 | )% | (1.08 | )% | (0.90 | )% | (0.93 | )% | |||||||||||||
Ratio of expenses to average net assets | 4.76 | % | 4.50 | % | 3.27 | % | 2.84 | % | 3.07 | % | |||||||||||||
Fund portfolio turnover rate | 26 | % | 55 | % | 28 | % | 22 | % | 23 | % | |||||||||||||
Class C | |||||||||||||||||||||||
For the year ended December 31, | |||||||||||||||||||||||
2017 | 2016 | 2015 | 2014 | 2013 | |||||||||||||||||||
Per Share Operating Performance | |||||||||||||||||||||||
Net asset value, beginning of year | $ | 10.01 | $ | 10.50 | $ | 12.99 | $ | 15.18 | $ | 13.13 | |||||||||||||
Income from investing operations | |||||||||||||||||||||||
Net investment loss (c) | (0.39 | ) | (0.33 | ) | (0.23 | ) | (0.24 | )(d) | (0.25 | )(d) | |||||||||||||
Net realized and unrealized gain (loss) on securities | 1.36 | 0.26 | (2.01 | ) | (1.07 | )(d) | 3.87 | (d) | |||||||||||||||
Total from investment operations | 0.97 | (0.07 | ) | (2.24 | ) | (1.31 | ) | 3.62 | |||||||||||||||
Less distributions | |||||||||||||||||||||||
From net capital gain | (0.09 | ) | (0.42 | ) | (0.25 | ) | (0.88 | ) | (1.57 | ) | |||||||||||||
Total distributions | (0.09 | ) | (0.42 | ) | (0.25 | ) | (0.88 | ) | (1.57 | ) | |||||||||||||
Redemption fees (b)(c) | - | - | - | - | (d) | - | (d) | ||||||||||||||||
Net asset value, end of year | $ | 10.89 | $ | 10.01 | $ | 10.50 | $ | 12.99 | $ | 15.18 | |||||||||||||
Total Investment Return | 9.65 | % | (0.67 | )% | (17.31 | )% | (8.68 | )% | 27.75 | % | |||||||||||||
Ratios/Supplemental Data | |||||||||||||||||||||||
Net assets, end of year (000's) | $ | 1,403 | $ | 1,724 | $ | 2,679 | $ | 4,203 | $ | 5,471 | |||||||||||||
Ratio of net investment loss to average net assets | (3.77 | )% | (3.27 | )% | (1.85 | )% | (1.64 | )% | (1.70 | )% | |||||||||||||
Ratio of expenses to average net assets | 5.52 | % | 5.25 | % | 4.05 | % | 3.58 | % | 3.86 | % | |||||||||||||
Fund portfolio turnover rate | 26 | % | 55 | % | 28 | % | 22 | % | 23 | % | |||||||||||||
(a) The Fund's maximum sales charge is not included in the total return computation.
(b) The amount is less than $0.005 and rounded to zero.
(c) Based on average shares outstanding.
(d) Net investment income, net realized and unrealized gain (loss) on securities and redemptions fees for Class A and Class C for the years ended December 31, 2013 and December 31, 2014 were restated during the year ended December 31, 2015. See Note 2(H).
See Accompanying Notes to Financial Statements which are an integral part of these financial statements.
55
Pacific Advisors Fund Inc.
Financial Highlights
(For a share outstanding throughout each year presented)
Large Cap Value Fund | |||||||||||||||||||||||
Class A | |||||||||||||||||||||||
For the year ended December 31, | |||||||||||||||||||||||
2017 | 2016 | 2015 | 2014 | 2013 | |||||||||||||||||||
Per Share Operating Performance | |||||||||||||||||||||||
Net asset value, beginning of year | $ | 15.14 | $ | 13.92 | $ | 14.18 | $ | 13.05 | $ | 10.34 | |||||||||||||
Income from investing operations | |||||||||||||||||||||||
Net investment loss (c) | (0.29 | ) | (0.23 | ) | (0.09 | ) | (0.07 | )(d) | (0.02 | )(d) | |||||||||||||
Net realized and unrealized gain (loss) on securities | 2.95 | 1.49 | (0.15 | ) | 1.37 | (d) | 2.99 | (d) | |||||||||||||||
Total from investment operations | 2.66 | 1.26 | (0.24 | ) | 1.30 | 2.97 | |||||||||||||||||
Less distributions | |||||||||||||||||||||||
From net capital gain | (0.48 | ) | (0.04 | ) | (0.02 | ) | (0.17 | ) | (0.26 | ) | |||||||||||||
Total distributions | (0.48 | ) | (0.04 | ) | (0.02 | ) | (0.17 | ) | (0.26 | ) | |||||||||||||
Redemption fees (b)(c) | - | - | - | - | (d) | - | (d) | ||||||||||||||||
Net asset value, end of year | $ | 17.32 | $ | 15.14 | $ | 13.92 | $ | 14.18 | $ | 13.05 | |||||||||||||
Total Investment Return (a) | 17.56 | % | 9.08 | % | (1.68 | )% | 9.94 | % | 28.72 | % | |||||||||||||
Ratios/Supplemental Data | |||||||||||||||||||||||
Net assets, end of year (000's) | $ | 7,224 | $ | 6,953 | $ | 6,587 | $ | 6,892 | $ | 5,453 | |||||||||||||
Ratio of net investment loss to average net assets | |||||||||||||||||||||||
With expense reductions | (1.80 | )% | (1.60 | )% | (0.64 | )% | (0.55 | )% | (0.17 | )% | |||||||||||||
Without expense reductions | (2.54 | )% | (2.35 | )% | (1.39 | )% | (1.30 | )% | (1.72 | )% | |||||||||||||
Ratio of expenses to average net assets | |||||||||||||||||||||||
With expense reductions | 3.78 | % | 3.85 | % | 2.72 | % | 2.64 | % | 2.47 | % | |||||||||||||
Without expense reductions | 4.53 | % | 4.60 | % | 3.47 | % | 3.39 | % | 4.02 | % | |||||||||||||
Fund portfolio turnover rate | 0 | % | 0 | % | 7 | % | 3 | % | 24 | % | |||||||||||||
Class C | |||||||||||||||||||||||
For the year ended December 31, | |||||||||||||||||||||||
2017 | 2016 | 2015 | 2014 | 2013 | |||||||||||||||||||
Per Share Operating Performance | |||||||||||||||||||||||
Net asset value, beginning of year | $ | 13.01 | $ | 12.06 | $ | 12.39 | $ | 11.50 | $ | 9.20 | |||||||||||||
Income from investing operations | |||||||||||||||||||||||
Net investment loss (c) | (0.36 | ) | (0.28 | ) | (0.17 | ) | (0.15 | )(d) | (0.10 | )(d) | |||||||||||||
Net realized and unrealized gain (loss) on securities | 2.53 | 1.27 | (0.14 | ) | 1.21 | (d) | 2.66 | (d) | |||||||||||||||
Total from investment operations | 2.17 | 0.99 | (0.31 | ) | 1.06 | 2.56 | |||||||||||||||||
Less distributions | |||||||||||||||||||||||
From net capital gain | (0.48 | ) | (0.04 | ) | (0.02 | ) | (0.17 | ) | (0.26 | ) | |||||||||||||
Total distributions | (0.48 | ) | (0.04 | ) | (0.02 | ) | (0.17 | ) | (0.26 | ) | |||||||||||||
Redemption fees (b)(c) | - | - | - | - | (d) | - | (d) | ||||||||||||||||
Net asset value, end of year | $ | 14.70 | $ | 13.01 | $ | 12.06 | $ | 12.39 | $ | 11.50 | |||||||||||||
Total Investment Return | 16.67 | % | 8.24 | % | (2.48 | )% | 9.18 | % | 27.83 | % | |||||||||||||
Ratios/Supplemental Data | |||||||||||||||||||||||
Net assets, end of year (000's) | $ | 544 | $ | 837 | $ | 1,160 | $ | 1,167 | $ | 816 | |||||||||||||
Ratio of net investment loss to average net assets | |||||||||||||||||||||||
With expense reductions | (2.57 | )% | (2.34 | )% | (1.41 | )% | (1.29 | )% | (0.92 | )% | |||||||||||||
Without expense reductions | (3.31 | )% | (3.09 | )% | (2.16 | )% | (2.03 | )% | (2.47 | )% | |||||||||||||
Ratio of expenses to average net assets | |||||||||||||||||||||||
With expense reductions | 4.53 | % | 4.59 | % | 3.50 | % | 3.38 | % | 3.22 | % | |||||||||||||
Without expense reductions | 5.27 | % | 5.34 | % | 4.25 | % | 4.13 | % | 4.77 | % | |||||||||||||
Fund portfolio turnover rate | 0 | % | 0 | % | 7 | % | 3 | % | 24 | % | |||||||||||||
(a) The Fund's maximum sales charge is not included in the total return computation.
(b) The amount is less than $0.005 and rounded to zero.
(c) Based on average shares outstanding.
(d) Net investment income, net realized and unrealized gain (loss) on securities and redemptions fees for Class A and Class C for the years ended December 31, 2013 and December 31, 2014 were restated during the year ended December 31, 2015. See Note 2(H).
See Accompanying Notes to Financial Statements which are an integral part of these financial statements.
56
Pacific Advisors Fund Inc.
Financial Highlights
(For a share outstanding throughout each year presented)
Mid Cap Value Fund | |||||||||||||||||||||||
Class A | |||||||||||||||||||||||
For the year ended December 31, | |||||||||||||||||||||||
2017 | 2016 | 2015 | 2014 | 2013 | |||||||||||||||||||
Per Share Operating Performance | |||||||||||||||||||||||
Net asset value, beginning of year | $ | 11.78 | $ | 10.28 | $ | 13.46 | $ | 15.25 | $ | 11.47 | |||||||||||||
Income from investing operations | |||||||||||||||||||||||
Net investment loss (c) | (0.49 | ) | (0.40 | ) | (0.31 | ) | (0.35 | )(d) | (0.39 | )(d) | |||||||||||||
Net realized and unrealized gain (loss) on securities | 1.90 | 1.90 | (2.87 | ) | (1.44 | )(d) | 4.17 | (d) | |||||||||||||||
Total from investment operations | 1.41 | 1.50 | (3.18 | ) | (1.79 | ) | 3.78 | ||||||||||||||||
Redemption fees (c) | - | (b) | - | (b) | - | (b) | - | (b,d) | - | (d) | |||||||||||||
Net asset value, end of year | $ | 13.19 | $ | 11.78 | $ | 10.28 | $ | 13.46 | $ | 15.25 | |||||||||||||
Total Investment Return (a) | 11.97 | % | 14.59 | % | (23.63 | )% | (11.74 | )% | 32.96 | % | |||||||||||||
Ratios/Supplemental Data | |||||||||||||||||||||||
Net assets, end of year (000's) | $ | 5,495 | $ | 5,728 | $ | 4,875 | $ | 5,981 | $ | 6,058 | |||||||||||||
Ratio of net investment loss to average net assets | (4.19 | )% | (3.80 | )% | (2.48 | )% | (2.46 | )% | (2.88 | )% | |||||||||||||
Ratio of expenses to average net assets | 4.94 | % | 4.74 | % | 3.68 | % | 3.42 | % | 3.69 | % | |||||||||||||
Fund portfolio turnover rate | 9 | % | 13 | % | 25 | % | 22 | % | 15 | % | |||||||||||||
Class C | |||||||||||||||||||||||
For the year ended December 31, | |||||||||||||||||||||||
2017 | 2016 | 2015 | 2014 | 2013 | |||||||||||||||||||
Per Share Operating Performance | |||||||||||||||||||||||
Net asset value, beginning of year | $ | 10.42 | $ | 9.16 | $ | 12.09 | $ | 13.80 | $ | 10.46 | |||||||||||||
Income from investing operations | |||||||||||||||||||||||
Net investment loss (c) | (0.51 | ) | (0.42 | ) | (0.37 | ) | (0.42 | )(d) | (0.45 | )(d) | |||||||||||||
Net realized and unrealized gain (loss) on securities | 1.67 | 1.68 | (2.56 | ) | (1.29 | )(d) | 3.79 | (d) | |||||||||||||||
Total from investment operations | 1.16 | 1.26 | (2.93 | ) | (1.71 | ) | 3.34 | ||||||||||||||||
Redemption fees (c) | - | (b) | - | (b) | - | (b) | - | (b,d) | - | (d) | |||||||||||||
Net asset value, end of year | $ | 11.58 | $ | 10.42 | $ | 9.16 | $ | 12.09 | $ | 13.80 | |||||||||||||
Total Investment Return | 11.13 | % | 13.76 | % | (24.23 | )% | (12.39 | )% | 31.93 | % | |||||||||||||
Ratios/Supplemental Data | |||||||||||||||||||||||
Net assets, end of year (000's) | $ | 407 | $ | 366 | $ | 661 | $ | 891 | $ | 1,204 | |||||||||||||
Ratio of net investment loss to average net assets | (4.96 | )% | (4.56 | )% | (3.26 | )% | (3.22 | )% | (3.61 | )% | |||||||||||||
Ratio of expenses to average net assets | 5.71 | % | 5.54 | % | 4.46 | % | 4.17 | % | 4.42 | % | |||||||||||||
Fund portfolio turnover rate | 9 | % | 13 | % | 25 | % | 22 | % | 15 | % | |||||||||||||
(a) The Fund's maximum sales charge is not included in the total return computation.
(b) The amount is less than $0.005 and rounded to zero.
(c) Based on average shares outstanding.
(d) Net investment loss, net realized and unrealized gain (loss) on securities and redemptions fees for Class A and Class C for the years ended December 31, 2013 and December 31, 2014 were restated during the year ended December 31, 2015. See Note 2(H).
See Accompanying Notes to Financial Statements which are an integral part of these financial statements.
57
Pacific Advisors Fund Inc.
Financial Highlights
(For a share outstanding throughout each year presented)
Small Cap Value Fund | |||||||||||||||||||||||
Class A | |||||||||||||||||||||||
For the year ended December 31, | |||||||||||||||||||||||
2017 | 2016 | 2015 | 2014 | 2013 | |||||||||||||||||||
Per Share Operating Performance | |||||||||||||||||||||||
Net asset value, beginning of year | $ | 27.23 | $ | 24.72 | $ | 44.51 | $ | 61.41 | $ | 38.50 | |||||||||||||
Income from investing operations | |||||||||||||||||||||||
Net investment loss (c) | (0.99 | ) | (0.92 | ) | (1.06 | ) | (1.11 | )(d) | (0.99 | )(d) | |||||||||||||
Net realized and unrealized gain (loss) on securities | 4.38 | 7.66 | (12.25 | ) | (12.20 | )(d) | 23.87 | (d) | |||||||||||||||
Total from investment operations | 3.39 | 6.74 | (13.31 | ) | (13.31 | ) | 22.88 | ||||||||||||||||
Less distributions | |||||||||||||||||||||||
From net capital gain | (1.34 | ) | (4.24 | ) | (6.50 | ) | (3.62 | ) | - | ||||||||||||||
Total distributions | (1.34 | ) | (4.24 | ) | (6.50 | ) | (3.62 | ) | - | ||||||||||||||
Redemption fees (c) | 0.01 | 0.01 | 0.02 | 0.03 | (d) | 0.03 | (d) | ||||||||||||||||
Net asset value, end of year | $ | 29.29 | $ | 27.23 | $ | 24.72 | $ | 44.51 | $ | 61.41 | |||||||||||||
Total Investment Return (a) | 12.47 | % | 27.08 | % | (30.31 | )% | (21.60 | )% | 59.51 | % | |||||||||||||
Ratios/Supplemental Data | |||||||||||||||||||||||
Net assets, end of year (000's) | $ | 20,439 | $ | 26,420 | $ | 33,942 | $ | 122,642 | $ | 199,163 | |||||||||||||
Ratio of net investment loss to average net assets | (3.72 | )% | (3.74 | )% | (2.64 | )% | (1.72 | )% | (1.93 | )% | |||||||||||||
Ratio of expenses to average net assets | 4.08 | % | 4.19 | % | 3.03 | % | 2.19 | % | 2.31 | % | |||||||||||||
Fund portfolio turnover rate | 5 | % | 11 | % | 7 | % | 16 | % | 9 | % | |||||||||||||
Class C | |||||||||||||||||||||||
For the year ended December 31, | |||||||||||||||||||||||
2017 | 2016 | 2015 | 2014 | 2013 | |||||||||||||||||||
Per Share Operating Performance | |||||||||||||||||||||||
Net asset value, beginning of year | $ | 19.79 | $ | 19.01 | $ | 36.59 | $ | 51.70 | $ | 32.65 | |||||||||||||
Income from investing operations | |||||||||||||||||||||||
Net investment loss (c) | (0.86 | ) | (0.85 | ) | (1.11 | ) | (1.29 | )(d) | (1.16 | )(d) | |||||||||||||
Net realized and unrealized gain (loss) on securities | 3.15 | 5.87 | (9.99 | ) | (10.23 | )(d) | 20.19 | (d) | |||||||||||||||
Total from investment operations | 2.29 | 5.02 | (11.10 | ) | (11.52 | ) | 19.03 | ||||||||||||||||
Less distributions | |||||||||||||||||||||||
From net capital gain | (1.34 | ) | (4.24 | ) | (6.50 | ) | (3.62 | ) | - | ||||||||||||||
Total distributions | (1.34 | ) | (4.24 | ) | (6.50 | ) | (3.62 | ) | - | ||||||||||||||
Redemption fees (c) | 0.01 | - | (b) | 0.02 | 0.03 | (d) | 0.02 | (d) | |||||||||||||||
Net asset value, end of year | $ | 20.75 | $ | 19.79 | $ | 19.01 | $ | 36.59 | $ | 51.70 | |||||||||||||
Total Investment Return | 11.60 | % | 26.12 | % | (30.83 | )% | (22.19 | )% | 58.35 | % | |||||||||||||
Ratios/Supplemental Data | |||||||||||||||||||||||
Net assets, end of year (000's) | $ | 2,796 | $ | 3,596 | $ | 5,180 | $ | 10,498 | $ | 14,646 | |||||||||||||
Ratio of net investment loss to average net assets | (4.48 | )% | (4.51 | )% | (3.45 | )% | (2.47 | )% | (2.69 | )% | |||||||||||||
Ratio of expenses to average net assets | 4.84 | % | 4.95 | % | 3.88 | % | 2.95 | % | 3.08 | % | |||||||||||||
Fund portfolio turnover rate | 5 | % | 11 | % | 7 | % | 16 | % | 9 | % | |||||||||||||
(a) The Fund's maximum sales charge is not included in the total return computation.
(b) The amount is less than $0.005 and rounded to zero.
(c) Based on average shares outstanding.
(d) Net investment loss, net realized and unrealized gain (loss) on securities and redemptions fees for Class A and Class C for the years ended December 31, 2013 and December 31, 2014 were restated during the year ended December 31, 2015. See Note 2(H).
See Accompanying Notes to Financial Statements which are an integral part of these financial statements.
58
Pacific Advisors Fund Inc.
Financial Highlights
(For a share outstanding throughout each year presented)
Small Cap Value Fund | |||||||||||||||||||||||
Class I | |||||||||||||||||||||||
For the year ended December 31, | |||||||||||||||||||||||
2017 | 2016 | 2015 | 2014 | 2013 | |||||||||||||||||||
Per Share Operating Performance | |||||||||||||||||||||||
Net asset value, beginning of year | $ | 35.05 | $ | 30.87 | $ | 53.06 | $ | 72.10 | $ | 45.13 | |||||||||||||
Income from investing operations | |||||||||||||||||||||||
Net investment loss (c) | (1.19 | ) | (1.08 | ) | (1.20 | ) | (1.15 | )(d) | (1.32 | )(d) | |||||||||||||
Net realized and unrealized gain (loss) on securities | 5.63 | 9.49 | (14.52 | ) | (14.30 | )(d) | 28.27 | (d) | |||||||||||||||
Total from investment operations | 4.44 | 8.41 | (15.72 | ) | (15.45 | ) | 26.95 | ||||||||||||||||
Less distributions | |||||||||||||||||||||||
From net capital gain | (1.34 | ) | (4.24 | ) | (6.50 | ) | (3.62 | ) | - | ||||||||||||||
Total distributions | (1.34 | ) | (4.24 | ) | (6.50 | ) | (3.62 | ) | - | ||||||||||||||
Redemption fees (c) | 0.02 | 0.01 | 0.03 | 0.03 | (d) | 0.02 | (d) | ||||||||||||||||
Net asset value, end of year | $ | 38.17 | $ | 35.05 | $ | 30.87 | $ | 53.06 | $ | 72.10 | |||||||||||||
Total Investment Return | 12.71 | % | 27.10 | % | (29.94 | )% | (21.36 | )% | 59.76 | % | |||||||||||||
Ratios/Supplemental Data | |||||||||||||||||||||||
Net assets, end of year (000's) | $ | 9 | $ | 8 | $ | 155 | $ | 1,402 | $ | 380 | |||||||||||||
Ratio of net investment loss to average net assets | (3.47 | )% | (3.57 | )% | (2.55 | )% | (1.54 | )% | (1.93 | )% | |||||||||||||
Ratio of expenses to average net assets | 3.85 | % | 3.93 | % | 2.86 | % | 2.03 | % | 2.06 | % | |||||||||||||
Fund portfolio turnover rate | �� | 5 | % | 11 | % | 7 | % | 16 | % | 9 | % | ||||||||||||
(c) Based on average shares outstanding.
(d) Net investment loss, net realized and unrealized gain (loss) on securities and redemptions fees for Class I for the years ended December 31, 2013 and December 31, 2014 were restated during the year ended December 31, 2015. See Note 2(H).
See Accompanying Notes to Financial Statements which are an integral part of these financial statements.
59
Pacific Advisors Fund Inc.
Notes to Financial Statements
December 31, 2017
Note 1. Organization
Pacific Advisors Fund Inc. (the "Company") is an open-end diversified investment management company registered under the Investment Company Act of 1940 ("the 40 Act"), as amended. The Company currently offers five Funds: Income and Equity Fund, Balanced Fund, Large Cap Value Fund, Mid Cap Value Fund and Small Cap Value Fund (individually, a "Fund," or collectively, the "Funds"). Each Fund is a separate investment portfolio of the Company with a distinct investment objective, investment program, policies and restrictions.
The Income and Equity Fund seeks to provide current income and, secondarily, long-term capital appreciation. The Balanced Fund seeks to achieve long-term capital appreciation and income consistent with reduced risk. The Large Cap Value Fund seeks to achieve long-term capital appreciation. The Mid Cap Value Fund seeks to achieve long-term capital appreciation. The Small Cap Value Fund seeks to provide capital appreciation through investment in small capitalization companies.
The Funds offer Class A and Class C shares. In addition to Class A and Class C shares, the Small Cap Value Fund also offers Class I shares. Each Class has equal rights as to assets and voting privileges except that Class A and Class C each has exclusive voting rights with respect to its distribution plan. Investment income, realized and unrealized capital gains and losses, and the common expenses of each Fund are allocated on a pro rata basis to each Class based on the relative net assets of each Class to the total net assets of the Fund. Each Class of shares differs in its respective service and distribution expenses and may differ in its transfer agent, registration, and certain other Class-specific fees and expenses.
The Company enters into contracts that contain a variety of indemnifications. The Company's maximum exposure under these arrangements is unknown. However, the Company has not had prior claims or losses pursuant to these contracts and expects the risk of loss to be remote.
The Funds follow the investment company accounting and reporting guidance of the Financial Accounting Standards Board (FASB) Accounting Standard Codification Topic 946 "Financial Services – Investment Companies."
Note 2. Significant Accounting Policies
A. Security Valuation and Fair Value Measurement. Securities, including American Depository Receipts (ADRs), listed on a national securities exchange and certain over-the-counter ("OTC") issues traded on the NASDAQ national market system are valued at the last quoted sale price at the close of the New York Stock Exchange. OTC issues not quoted on the NASDAQ system, and other equity securities for which no sale price is available, are valued at the last bid price as obtained from published sources or real time quote services, where available, and otherwise from brokers who are market makers for such securities. Fixed Income securities, which are typically purchased and held as odd lots (less than $1 million) are valued based on bid prices for institutional round lot positions (typically $1 million or greater); round lot prices often reflect more favorable pricing than odd lot holdings. For securities that mature in 60 days or less, the Funds may utilize the amortized cost method of valuation if it is reasonable to conclude it approximates fair value. In determining the fair value of other debt securities, Pacific Global Investment Management Company, Inc. (the "Investment Manager") utilizes independent pricing services approved by the Board of Directors (the "Board") using one or more of the following valuation techniques:
(1) a matrix pricing approach that considers market inputs including, in approximate order of priority, the following: benchmark yields, reported trades, broker/dealer quotes, issuer spreads, two-sided markets, benchmark securities, bids, offers and reference data including market research publications; market indicators, industry and economic events. Evaluators may prioritize inputs differently on any given day for any security based on market conditions, and not all inputs listed are available for use in the evaluation process for each security evaluation on any given day; (2) a comparison of the value of the borrower's outstanding equity and debt to that of comparable public companies; and/or (3) a discounted cash flow analysis. Fair value determinations are made by the Investment Manager based on the Company's Fair Value Procedure, as adopted by the Board. In conducting its assessment and analysis for the purpose of determining fair value, the Investment Manager uses its discretion and judgment in considering and appraising the relevant factors, including examining the source and nature of the quotations, to validate that the quotations and prices are representative of fair value.
Various inputs are used to determine the fair value of each Fund's investments. For financial statements, these inputs are summarized in the three broad levels listed below. Level 1 inputs are based on quoted prices in active markets for identical securities. Level 2 inputs are based on significant observable market inputs, such as quoted prices for similar securities and quoted prices in inactive markets. Level 3 inputs are significant unobservable inputs that reflect the Fund's own assumptions in determining the fair value of investments. The valuation levels are not necessarily an indication of the risk associated with investing in those securities.
60
Pacific Advisors Fund Inc.
Notes to Financial Statements
December 31, 2017
The following is a summary of the inputs used to value each Fund's investment securities as of December 31, 2017.
| Income and Equity Fund | Balanced Fund | Large Cap Value Fund | Mid Cap Value Fund | Small Cap Value Fund | |||||||||||||||||||
Level 1 - Quoted Prices | |||||||||||||||||||||||
Common Stock | |||||||||||||||||||||||
Consumer Discretionary | $ | 797,868 | $ | 921,112 | $ | 1,515,981 | $ | 2,028,409 | $ | 5,296,125 | |||||||||||||
Consumer Staples | 1,147,432 | 372,880 | 1,347,075 | 155,296 | 1,650,126 | ||||||||||||||||||
Energy | 403,145 | 308,242 | 125,460 | 671,351 | 4,377,735 | ||||||||||||||||||
Financials | 758,265 | 536,355 | 1,452,613 | 441,683 | 1,776,575 | ||||||||||||||||||
Health Care | 645,880 | 416,867 | 315,348 | 188,692 | - | ||||||||||||||||||
Industrials | 892,832 | 694,695 | 1,313,457 | 2,121,894 | 10,316,858 | ||||||||||||||||||
Information Technology | 943,960 | 587,624 | 1,811,231 | 218,460 | - | ||||||||||||||||||
Materials | 272,920 | - | - | 123,901 | - | ||||||||||||||||||
Telecommunication Services | 445,000 | 121,739 | - | - | - | ||||||||||||||||||
Utilities | 611,170 | - | - | - | - | ||||||||||||||||||
Preferred Stock | |||||||||||||||||||||||
Financials | 925,083 | 102,650 | - | - | - | ||||||||||||||||||
Level 1 Total | 7,843,555 | 4,062,164 | 7,881,165 | 5,949,686 | 23,417,419 | ||||||||||||||||||
Level 2 - Other significant observable inputs | |||||||||||||||||||||||
Corporate Bond | |||||||||||||||||||||||
Consumer Discretionary | 929,932 | 204,382 | - | - | - | ||||||||||||||||||
Consumer Staples | 150,955 | - | - | - | - | ||||||||||||||||||
Energy | 472,896 | 529,163 | - | - | - | ||||||||||||||||||
Financials | 2,317,845 | 300,422 | - | - | - | ||||||||||||||||||
Health Care | 401,982 | 95,130 | - | - | - | ||||||||||||||||||
Industrials | 630,023 | - | - | - | - | ||||||||||||||||||
Information Technology | 452,021 | 97,542 | - | - | - | ||||||||||||||||||
Real Estate | 774,943 | 211,522 | - | - | - | ||||||||||||||||||
Utilities | 101,500 | - | - | - | - | ||||||||||||||||||
Convertible Corporate Bond | |||||||||||||||||||||||
Financials | 255,313 | - | - | - | - | ||||||||||||||||||
Level 2 Total | 6,487,410 | 1,438,161 | - | - | - | ||||||||||||||||||
Level 3 - Significant unobservable inputs | - | - | - | - | - | ||||||||||||||||||
Total Investments | $ | 14,330,965 | $ | 5,500,325 | $ | 7,881,165 | $ | 5,949,686 | $ | 23,417,419 | |||||||||||||
Equity securities (common and preferred stock) that are actively traded and market priced are typically classified as Level 1 securities. Fixed income securities are typically classified as Level 2 securities. The Funds had no Level 3 holdings during the period ended December 31, 2017. In addition, the Funds are required to disclose the amounts of significant transfers between Level 1 and Level 2 of the fair value hierarchy and the reasons for these transfers. The Investment Manager has evaluated the Funds' positions for the year ended December 31, 2017, and determined that, for purposes of fair value pricing measurement, there were no transfers between Level 1 and Level 2.
B. Cash and Cash Equivalents. The Company considers all highly liquid financial instruments with maturities of less than three months when acquired to be cash equivalents. For cash management purposes, each Fund may concentrate cash with the Fund's custodian, United Missouri Bank, ("UMB"). This typically results in cash balances exceeding the Federal Deposit Insurance Corporation ("FDIC") insurance limits. As of December 31, 2017, Income and Equity Fund held $206,991 as reserves at UMB Bank, n.a. that did not exceed the FDIC insurance limits.
C. Security Transactions and Investment Income. Security transactions are accounted for on the trade date. The cost of investments sold is determined by use of the specific identification method for both financial reporting and federal income tax purposes. Dividends are recorded on the ex-dividend date. Interest income is recorded on an accrual basis. Premium or discount on debt securities are amortized or accreted using the effective interest method.
D. Dividends and Distributions to Shareholders. The Income and Equity Fund declares and distributes dividends of its net investment income, if any, quarterly. The Balanced Fund, Large Cap Value Fund, Mid Cap Value Fund and Small Cap Value Fund declare and distribute dividends of their net investment income, if any, annually. In addition, each Fund declares and distributes a capital gain dividend, if any, annually. The Board determines the amount and timing of such payments.
61
Pacific Advisors Fund Inc.
Notes to Financial Statements
December 31, 2017
E. Federal Income Tax. The Funds intends to comply with the requirements of Subchapter M of the Internal Revenue Code applicable to regulated investment companies and to distribute substantially all of their taxable income to their shareholders. Therefore, no federal income tax provision is required.
Management has analyzed the Funds' tax positions taken on federal income tax returns for all open tax years and for the year ended December 31, 2017 and has concluded that no provision for income tax is required in the Funds' financial statements. Tax years 2014, 2015, 2016 and 2017 are still subject to examination by major federal jurisdictions. Tax years 2013, 2014, 2015, 2016, and 2017 are still subject to examination by major state jurisdictions.
The Funds recognize interest and penalties, if any, related to unrecognized tax benefits as income tax expense in the Statements of Operations. During the year, the Funds did not incur any interest or penalties.
At December 31, 2017, components of distributable earnings on a tax basis were as follows:
| Income and Equity Fund | Balanced Fund | Large Cap Value Fund | Mid Cap Value Fund | Small Cap Value Fund | |||||||||||||||||||
Undistributed ordinary income | $ | 6,533 | $ | - | $ | - | $ | - | $ | - | |||||||||||||
Undistributed long-term gains | 436,235 | 79,384 | 197,090 | - | - | ||||||||||||||||||
Capital loss carry forward | - | - | - | - | - | ||||||||||||||||||
Net unrealized appreciation on investments | 2,318,262 | 819,642 | 4,192,363 | 1,889,023 | 8,608,283 | ||||||||||||||||||
Accumulated earnings | $ | 2,761,030 | $ | 899,026 | $ | 4,389,453 | $ | 1,889,023 | $ | 8,608,283 | |||||||||||||
The difference between book basis and tax basis unrealized appreciation is attributable primarily to the tax deferral of losses on wash sales and characterization of certain income items. The Funds intend to treat post October losses (net capital losses incurred for the period subsequent to October 31, 2017 through the year end December 31, 2017) as having been incurred in the next fiscal year.
The Funds intend to utilize provisions of the federal income tax laws which allow them to carry a capital loss realized prior to 2011 forward for eight years following the year of the loss and offset such losses against any future realized capital gains. During the most recent fiscal year, the following capital losses carried forward have been utilized:
| Income and Equity Fund | Balanced Fund | Large Cap Value Fund | Mid Cap Value Fund | Small Cap Value Fund | |||||||||||||||||||
Capital loss carryforward utilized | $ | - | $ | - | $ | - | $ | 190,701 | $ | - | |||||||||||||
As of December 31, 2017, the Funds had no accumulated net realized losses on investment transactions that represent capital loss carryforwards for federal income tax purposes.
During the year ended December 31, 2017, the Mid Cap Value Fund had a capital loss carryforward in the amount of $449,466 that expired.
The Regulated Investment Company Modernization Act of 2010 (the "Act") changed various technical rules governing the tax treatment of regulated investment companies ("RICs") including the Funds. Under the Act, each Fund is permitted to carry forward capital losses incurred in taxable years beginning in 2011 for an unlimited period. However, any losses incurred during those future taxable years will be required to be utilized prior to the losses incurred in pre-enactment taxable years, which carry an expiration date. As a result of this ordering rule, pre-enactment capital loss carryforwards may be more likely to expire unused. Additionally, post-enactment capital loss carryforwards will retain their character as either short-term or long-term capital losses rather than being considered all short-term as permitted under previous regulation.
Finally, the Act contains several provisions aimed at preserving the character of distributions made by a fiscal year RIC during the portion of its taxable year ending after October 31 or December 31, reducing the circumstances under which a RIC might be required to file amended Forms 1099 to restate previously reported distributions.
During the most recent fiscal year, the Fund had no capital losses carried forward under the provisions of the Act that were utilized.
F. Reclassification of Capital Accounts. Distributions of net investment income and realized gains are determined in accordance with income tax regulations which may differ from GAAP. These differences are due to differing treatments for items such as net operating losses, reclassification of dividends and return of capital. To the extent that these differences are permanent in nature, reclassifications are made among the net asset accounts on the Statements of Assets and Liabilities. Net assets and net asset value per share are not affected by these reclassifications.
62
Pacific Advisors Fund Inc.
Notes to Financial Statements
December 31, 2017
For the year ended December 31, 2017, reclassifications among the components of net assets are as follows:
| Accumulated Net Investment Income | Paid in Capital | Accumulated Net Realized Gain (Loss) on Security Transactions | |||||||||||||
Balanced Fund | $ | 182,576 | $ | (97,216 | ) | $ | (85,360 | ) | |||||||
Large Cap Value Fund | 147,424 | (147,323 | ) | (101 | ) | ||||||||||
Mid Cap Value Fund | 246,631 | (696,097 | ) | 449,466 | |||||||||||
Small Cap Value Fund | 972,951 | (347,742 | ) | (625,209 | ) | ||||||||||
The reclassifications were due to net investment losses incurred by the Funds, which are not permitted to be carried forward for tax purposes and the expiration of capital loss carryforwards, as well as differing book and tax treatment of certain securities.
G. Use of Estimates. The preparation of financial statements in conformity with U.S. GAAP requires management to make estimates and assumptions that affect the reported amounts in the financial statements and footnotes. Actual results could differ from those estimates.
H. Accounting Method Change. On December 31, 2015, the Funds elected to change their method of determining net investment income (loss) per share to the average shares method, which determines the net investment income (loss) per share by dividing the net investment income (loss) by the average number of shares outstanding during the year. In prior years the net investment income (loss) per share was determined using the SEC method, which compares ending undistributed income (loss) per share to the beginning undistributed income (loss) per share, adjusted for distributions paid per share. The new method of accounting was adopted as a result of management's determination that the average shares method produced a result that was more reflective of the actual net investment income (loss) on a per share basis during each of the years. The financial highlights for each of the years presented have been adjusted to apply this new method retrospectively. The following financial statement line items for the years 2013-2014 were affected by this change in accounting principle.
Financial Highlights | |||||||||||
| Income and Equity Fund (Class A) | 2014 | 2013 | |||||||||
As Computed Under SEC Method | |||||||||||
Net investment income | 0.21 | 0.10 | |||||||||
Net realized and unrealized gain | 0.52 | 1.28 | |||||||||
Redemption Fees | 0.00 | 0.00 | |||||||||
As Computed Under Average Shares Method | |||||||||||
Net investment income | 0.22 | 0.14 | |||||||||
Net realized and unrealized gain | 0.51 | 1.24 | |||||||||
Redemption Fees | 0.00 | 0.00 | |||||||||
Effect of Change | |||||||||||
Net investment income | 0.01 | 0.04 | |||||||||
Net realized and unrealized gain (loss) | (0.01 | ) | (0.04 | ) | |||||||
Redemption Fees | 0.00 | 0.00 | |||||||||
| Income and Equity Fund (Class C) | |||||||||||
As Computed Under SEC Method | |||||||||||
Net investment income (loss) | 0.14 | 0.06 | |||||||||
Net realized and unrealized gain | 0.47 | 1.18 | |||||||||
Redemption Fees | 0.00 | 0.00 | |||||||||
As Computed Under Average Shares Method | |||||||||||
Net investment income | 0.13 | 0.05 | |||||||||
Net realized and unrealized gain (loss) | 0.48 | 1.19 | |||||||||
Redemption Fees | 0.00 | 0.00 | |||||||||
Effect of Change | |||||||||||
Net investment income (loss) | (0.01 | ) | (0.01 | ) | |||||||
Net realized and unrealized gain (loss) | 0.01 | 0.01 | |||||||||
Redemption Fees | 0.00 | 0.00 | |||||||||
63
Pacific Advisors Fund Inc.
Notes to Financial Statements
December 31, 2017
| Balanced Fund (Class A) | 2014 | 2013 | |||||||||
As Computed Under SEC Method | |||||||||||
Net investment income (loss) | (0.16 | ) | (0.18 | ) | |||||||
Net realized and unrealized gain (loss) | (1.15 | ) | 4.21 | ||||||||
Redemption Fees | 0.00 | 0.00 | |||||||||
As Computed Under Average Shares Method | |||||||||||
Net investment income (loss) | (0.14 | ) | (0.15 | ) | |||||||
Net realized and unrealized gain (loss) | (1.17 | ) | 4.17 | ||||||||
Redemption Fees | 0.00 | 0.01 | |||||||||
Effect of Change | |||||||||||
Net investment income (loss) | 0.02 | 0.03 | |||||||||
Net realized and unrealized gain (loss) | (0.02 | ) | (0.04 | ) | |||||||
Redemption Fees | 0.00 | 0.01 | |||||||||
| Balanced Fund (Class C) | |||||||||||
As Computed Under SEC Method | |||||||||||
Net investment loss | (0.40 | ) | (0.54 | ) | |||||||
Net realized and unrealized gain (loss) | (0.91 | ) | 4.16 | ||||||||
Redemption Fees | 0.00 | 0.00 | |||||||||
As Computed Under Average Shares Method | |||||||||||
Net investment loss | (0.24 | ) | (0.25 | ) | |||||||
Net realized and unrealized gain (loss) | (1.07 | ) | 3.87 | ||||||||
Redemption Fees | 0.00 | 0.00 | |||||||||
Effect of Change | |||||||||||
Net investment income | 0.16 | 0.29 | |||||||||
Net realized and unrealized loss | (0.16 | ) | (0.29 | ) | |||||||
Redemption Fees | 0.00 | 0.00 | |||||||||
| Large Cap Value Fund (Class A) | |||||||||||
As Computed Under SEC Method | |||||||||||
Net investment income | 0.02 | 0.03 | |||||||||
Net realized and unrealized gain | 1.28 | 2.94 | |||||||||
Redemption Fees | 0.00 | 0.00 | |||||||||
As Computed Under Average Shares Method | |||||||||||
Net investment loss | (0.07 | ) | (0.02 | ) | |||||||
Net realized and unrealized gain | 1.37 | 2.99 | |||||||||
Redemption Fees | 0.00 | 0.00 | |||||||||
Effect of Change | |||||||||||
Net investment loss | (0.09 | ) | (0.05 | ) | |||||||
Net realized and unrealized gain | 0.09 | 0.05 | |||||||||
Redemption Fees | 0.00 | 0.00 | |||||||||
| Large Cap Value Fund (Class C) | |||||||||||
As Computed Under SEC Method | |||||||||||
Net investment income (loss) | 0.68 | 0.32 | |||||||||
Net realized and unrealized gain | 0.38 | 2.24 | |||||||||
Redemption Fees | 0.00 | 0.00 | |||||||||
As Computed Under Average Shares Method | |||||||||||
Net investment loss | (0.15 | ) | (0.10 | ) | |||||||
Net realized and unrealized gain | 1.21 | 2.66 | |||||||||
Redemption Fees | 0.00 | 0.00 | |||||||||
Effect of Change | |||||||||||
Net investment income (loss) | (0.83 | ) | (0.42 | ) | |||||||
Net realized and unrealized gain (loss) | 0.83 | 0.42 | |||||||||
Redemption Fees | 0.00 | 0.00 | |||||||||
64
Pacific Advisors Fund Inc.
Notes to Financial Statements
December 31, 2017
| Mid Cap Value Fund (Class A) | 2014 | 2013 | |||||||||
As Computed Under SEC Method | |||||||||||
Net investment loss | (0.11 | ) | (0.36 | ) | |||||||
Net realized and unrealized gain (loss) | (1.68 | ) | 4.14 | ||||||||
Redemption Fees | 0.00 | 0.00 | |||||||||
As Computed Under Average Shares Method | |||||||||||
Net investment loss | (0.35 | ) | (0.39 | ) | |||||||
Net realized and unrealized gain (loss) | (1.44 | ) | 4.17 | ||||||||
Redemption Fees | 0.00 | 0.00 | |||||||||
Effect of Change | |||||||||||
Net investment loss | (0.24 | ) | (0.03 | ) | |||||||
Net realized and unrealized gain | 0.24 | 0.03 | |||||||||
Redemption Fees | 0.00 | 0.00 | |||||||||
| Mid Cap Value Fund (Class C) | |||||||||||
As Computed Under SEC Method | |||||||||||
Net investment income (loss) | (2.95 | ) | 0.48 | ||||||||
Net realized and unrealized gain | 1.24 | 2.86 | |||||||||
Redemption Fees | 0.00 | 0.00 | |||||||||
As Computed Under Average Shares Method | |||||||||||
Net investment loss | (0.42 | ) | (0.45 | ) | |||||||
Net realized and unrealized gain (loss) | (1.29 | ) | 3.79 | ||||||||
Redemption Fees | 0.00 | 0.00 | |||||||||
Effect of Change | |||||||||||
Net investment income (loss) | 2.53 | (0.93 | ) | ||||||||
Net realized and unrealized gain (loss) | (2.53 | ) | 0.93 | ||||||||
Redemption Fees | 0.00 | 0.00 | |||||||||
| Small Cap Value Fund (Class A) | |||||||||||
As Computed Under SEC Method | |||||||||||
Net investment income (loss) | (2.29 | ) | 1.44 | ||||||||
Net realized and unrealized gain (loss) | (10.99 | ) | 21.47 | ||||||||
Redemption Fees | 0.00 | 0.00 | |||||||||
As Computed Under Average Shares Method | |||||||||||
Net investment loss | (1.11 | ) | (0.99 | ) | |||||||
Net realized and unrealized gain (loss) | (12.20 | ) | 23.87 | ||||||||
Redemption Fees | 0.03 | 0.03 | |||||||||
Effect of Change | |||||||||||
Net investment income (loss) | 1.18 | (2.43 | ) | ||||||||
Net realized and unrealized gain (loss) | (1.21 | ) | 2.40 | ||||||||
Redemption Fees | 0.03 | 0.03 | |||||||||
| Small Cap Value Fund (Class C) | |||||||||||
As Computed Under SEC Method | |||||||||||
Net investment income (loss) | (1.15 | ) | 3.10 | ||||||||
Net realized and unrealized gain (loss) | (10.34 | ) | 15.95 | ||||||||
Redemption Fees | 0.00 | 0.00 | |||||||||
As Computed Under Average Shares Method | |||||||||||
Net investment loss | (1.29 | ) | (1.16 | ) | |||||||
Net realized and unrealized gain (loss) | (10.23 | ) | 20.19 | ||||||||
Redemption Fees | 0.03 | 0.02 | |||||||||
Effect of Change | |||||||||||
Net investment income (loss) | (0.14 | ) | (4.26 | ) | |||||||
Net realized and unrealized gain (loss) | 0.11 | 4.24 | |||||||||
Redemption Fees | 0.03 | 0.02 | |||||||||
65
Pacific Advisors Fund Inc.
Notes to Financial Statements
December 31, 2017
| Small Cap Value Fund (Class I) | 2014 | 2013 | |||||||||
As Computed Under SEC Method | |||||||||||
Net investment income (loss) | 9.85 | 431.95 | |||||||||
Net realized and unrealized gain (loss) | (25.27 | ) | (404.98 | ) | |||||||
Redemption Fees | 0.00 | 0.00 | |||||||||
As Computed Under Average Shares Method | |||||||||||
Net investment loss | (1.15 | ) | (1.32 | ) | |||||||
Net realized and unrealized gain (loss) | (14.30 | ) | 28.27 | ||||||||
Redemption Fees | 0.03 | 0.02 | |||||||||
Effect of Change | |||||||||||
Net investment income (loss) | (11.00 | ) | (433.27 | ) | |||||||
Net realized and unrealized gain (loss) | 10.97 | 433.25 | |||||||||
Redemption Fees | 0.03 | 0.02 | |||||||||
Note 3. Investment Management, Distributor and Other Related Party Transactions
The Company and the Funds have entered into investment management agreements ("Management Agreements") with the Investment Manager.
The Management Agreements provide for investment management fees, payable monthly, and calculated at the maximum annual rate of 0.75% of average net assets for the Income and Equity, Balanced, Large Cap Value and Small Cap Value Funds and 1.00% of average net assets for the Mid Cap Value Fund.
In accordance with Expense Limitation Agreements with the Company, the Investment Manager waives its respective management fees to the extent that the actual operating expenses of the following Funds exceed the following thresholds:
Class A | Class C | ||||||||||
Income and Equity Fund | 1.95 | % | 2.70 | % | |||||||
Large Cap Value Fund | 2.65 | % | 3.40 | % | |||||||
Pursuant to the Expense Limitation Agreements, providing for the waiver of fees and the assumption of expenses by the Investment Manager, the following amounts were waived for the year ended December 31, 2017.
| Management Fees Waived | |||||||
Income and Equity Fund | $ | 128,365 | |||||
Large Cap Value Fund | 59,190 | ||||||
The Investment Manager does not have any rights to recover fees it waives or expenses it may reimburse, with respect to any of the Funds.
For the year ended December 31, 2017, Pacific Global Fund Distributors, Inc. ("PGFD"), the principal underwriter for the Company and a wholly-owned subsidiary of the Investment Manager, received commissions on sales of capital stock, after deducting amounts allowed to authorized distributors as commissions. In addition, PGFD, as a registered broker-dealer, may act as broker for the Funds, in conformity with Rule 17e-1 under the Investment Company Act of 1940. The Company's Board has approved procedures for evaluating the reasonableness of commissions paid to PGFD and periodically reviews these procedures. PGFD will not act as principal in effecting any portfolio transactions for the Funds. The amounts of commissions are as follows:
| Underwriting Fees Retained | Commissions Retained | Brokerage Commissions Received | |||||||||||||
Income and Equity Fund | $ | 183 | $ | 5 | $ | 951 | |||||||||
Balanced Fund | 189 | 253 | (433 | ) | |||||||||||
Large Cap Value Fund | 860 | 1,764 | (451 | ) | |||||||||||
Mid Cap Value Fund | 1,340 | 278 | (1,295 | ) | |||||||||||
Small Cap Value Fund | 921 | 801 | 1,999 | ||||||||||||
66
Pacific Advisors Fund Inc.
Notes to Financial Statements
December 31, 2017
The Company has also entered into separate agreements with Pacific Global Investor Services, Inc. ("PGIS"), Transfer Agent for the Company and a wholly-owned subsidiary of the Investment Manager, that provide for transfer agent fees at a rate of $21 per year per open account and $3.50 per year per closed account, with a minimum charge of $1,800 per month per class for each Fund; fund accounting fees equal to the greater of $1,500 or three basis points for the first hundred million in net assets and one basis point on the balance of net assets for each Fund per month; and annual administrative agent fees of five basis points of average daily net assets of each Fund subject to a maximum annual fee of $50,000 per Fund. The fee is computed and payable monthly. The Company reimburses the Investment Manager for monthly expenses related to the Company's Compliance Program. The Company also reimburses PGIS for applicable out-of-pocket expenses incurred in connection with transfer agent or fund accounting services performed.
On the Statement of Assets and Liabilities, "Accounts payable to related parties" consists of transfer agent fees payable to PGIS.
The Company has adopted a plan of distribution whereby the Funds may pay a service fee to qualified recipients in an amount up to 0.25% per annum of each Fund's average daily net assets for Class A shares. The Company has also adopted a plan of distribution whereby the Funds may pay a service fee to qualified recipients in an amount up to 0.25% per annum of each Fund's average daily net assets for Class C shares and a distribution fee in an amount up to 0.75% per annum of each Fund's average daily net assets for Class C shares. The Company has not adopted a plan of distribution for Class I Shares.
For the year end December 31, 2017, total distribution and/or service (12b-1) fees were:
Class A | Class C | Total | |||||||||||||
Income and Equity Fund | $ | 36,910 | $ | 23,355 | $ | 60,265 | |||||||||
Balanced Fund | 10,333 | 14,969 | 25,302 | ||||||||||||
Large Cap Value Fund | 17,988 | 6,852 | 24,840 | ||||||||||||
Mid Cap Value Fund | 13,564 | 3,644 | 17,208 | ||||||||||||
Small Cap Value Fund | 55,826 | 29,901 | 85,727 | ||||||||||||
Note 4. Purchase and Sales of Securities
The following summarizes purchases and sales of investment securities, other than short-term investments, and aggregate gross unrealized appreciation and depreciation on a tax basis by each Fund for the year ended and as of December 31, 2017. The difference between book basis and tax basis unrealized appreciation is attributable primarily to the tax deferral of losses on wash sales.
| Year ended December 31, 2017 | As of December 31, 2017 | ||||||||||||||||||||||||||
| Cost of Purchases | Proceeds From Sales | Tax Cost of Securities | Gross Unrealized Appreciation | Gross Unrealized (Depreciation) | Net Unrealized Appreciation | ||||||||||||||||||||||
Income and Equity Fund | $ | 3,159,845 | $ | 6,359,046 | $ | 12,012,703 | $ | 2,478,728 | $ | (160,466 | ) | $ | 2,318,262 | ||||||||||||||
Balanced Fund | 1,467,536 | 2,633,719 | 4,680,683 | 1,018,066 | (198,424 | ) | 819,642 | ||||||||||||||||||||
Large Cap Value Fund | - | 1,228,749 | 3,688,802 | 4,192,363 | - | 4,192,363 | |||||||||||||||||||||
Mid Cap Value Fund | 556,441 | 1,619,868 | 4,060,663 | 2,553,658 | (664,635 | ) | 1,889,023 | ||||||||||||||||||||
Small Cap Value Fund | 1,349,711 | 11,184,038 | 14,809,136 | 13,236,174 | (4,627,891 | ) | 8,608,283 | ||||||||||||||||||||
Note 5. Distributions to Shareholders
The tax character of distributions paid during 2017 and 2016 was as follows:
| Income and Equity Fund | Balanced Fund | Large Cap Value Fund | Mid Cap Value Fund | Small Cap Value Fund | |||||||||||||||||||
Year ended December 31, 2017 | |||||||||||||||||||||||
Distributions paid from: | |||||||||||||||||||||||
Ordinary Income | $ | 44,440 | $ | - | $ | - | $ | - | $ | - | |||||||||||||
Long-Term Capital Gain | - | 39,405 | 213,375 | - | 1,077,137 | ||||||||||||||||||
Total Distributions | $ | 44,440 | $ | 39,405 | $ | 213,375 | $ | - | $ | 1,077,137 | |||||||||||||
67
Pacific Advisors Fund Inc.
Notes to Financial Statements
December 31, 2017
| Income and Equity Fund | Balanced Fund | Large Cap Value Fund | Mid Cap Value Fund | Small Cap Value Fund | |||||||||||||||||||
Year ended December 31, 2016 | |||||||||||||||||||||||
Distributions paid from: | |||||||||||||||||||||||
Ordinary Income | $ | 23,421 | $ | - | $ | - | $ | - | $ | - | |||||||||||||
Long-Term Capital Gain | - | 225,253 | 23,059 | - | 4,266,366 | ||||||||||||||||||
Return of Capital | 11,626 | - | - | - | - | ||||||||||||||||||
Total Distributions | $ | 35,047 | $ | 225,253 | $ | 23,059 | $ | - | $ | 4,266,366 | |||||||||||||
Note 6. Capital Share Transactions
A 2% redemption fee is assessed on shares of the Income and Equity Fund sold or exchanged within 30 days of purchase or shares of the Balanced Fund, Large Cap Value Fund, Mid Cap Value Fund or Small Cap Value Fund sold or exchanged within 180 days of purchase and is retained in each Fund. The redemption fees collected during 2017 and 2016 are included in the dollar amount of shares sold in the table below. The amount of the increase is as follows:
2017 | 2016 | ||||||||||||||||||||||||||
Class A | Class C | Class I | Class A | Class C | Class I | ||||||||||||||||||||||
Income and Equity Fund | $ | 129 | $ | 19 | N/A | $ | 6,856 | $ | 1,503 | N/A | |||||||||||||||||
Balanced Fund | 124 | 55 | N/A | 330 | 173 | N/A | |||||||||||||||||||||
Large Cap Value Fund | 532 | 51 | N/A | 348 | 58 | N/A | |||||||||||||||||||||
Mid Cap Value Fund | 214 | 15 | N/A | 258 | 29 | N/A | |||||||||||||||||||||
Small Cap Value Fund | 12,223 | 1,619 | $ | 3 | 5,429 | 866 | $ | 26 | |||||||||||||||||||
| Year ended December 31, 2017 | Year ended December 31, 2016 | ||||||||||||||||||
Shares | Amount | Shares | Amount | ||||||||||||||||
Income and Equity Fund | |||||||||||||||||||
Class A | |||||||||||||||||||
Shares sold | 206,052 | $ | 2,587,653 | 370,091 | $ | 4,478,478 | |||||||||||||
Reinvestment of distributions | 3,114 | 39,442 | 2,551 | 31,280 | |||||||||||||||
209,166 | 2,627,095 | 372,642 | 4,509,758 | ||||||||||||||||
Shares repurchased | (448,993 | ) | (5,732,058 | ) | (174,172 | ) | (2,090,689 | ) | |||||||||||
Net increase (decrease) | (239,827 | ) | $ | (3,104,963 | ) | 198,470 | $ | 2,419,069 | |||||||||||
Class C | |||||||||||||||||||
Shares sold | 398 | $ | 4,770 | 10,277 | $ | 121,016 | |||||||||||||
Reinvestment of distributions | - | - | - | - | |||||||||||||||
398 | 4,770 | 10,277 | 121,016 | ||||||||||||||||
Shares repurchased | (25,095 | ) | (298,776 | ) | (51,170 | ) | (594,050 | ) | |||||||||||
Net decrease | (24,697 | ) | $ | (294,006 | ) | (40,893 | ) | $ | (473,034 | ) | |||||||||
68
Pacific Advisors Fund Inc.
Notes to Financial Statements
December 31, 2017
| Year ended December 31, 2017 | Year ended December 31, 2016 | ||||||||||||||||||
Shares | Amount | Shares | Amount | ||||||||||||||||
Balanced Fund | |||||||||||||||||||
Class A | |||||||||||||||||||
Shares sold | 9,698 | $ | 113,495 | 64,938 | $ | 747,487 | |||||||||||||
Reinvestment of distributions | 2,036 | 25,395 | 12,295 | 140,652 | |||||||||||||||
11,734 | 138,890 | 77,233 | 888,139 | ||||||||||||||||
Shares repurchased | (58,544 | ) | (685,019 | ) | (44,591 | ) | (508,739 | ) | |||||||||||
Net increase (decrease) | (46,810 | ) | $ | (546,129 | ) | 32,642 | $ | 379,400 | |||||||||||
Class C | |||||||||||||||||||
Shares sold | 7,176 | $ | 73,749 | 10,017 | $ | 101,917 | |||||||||||||
Reinvestment of distributions | 1,009 | 11,011 | 6,690 | 67,504 | |||||||||||||||
8,185 | 84,760 | 16,707 | 169,421 | ||||||||||||||||
Shares repurchased | (51,631 | ) | (529,985 | ) | (99,644 | ) | (1,015,203 | ) | |||||||||||
Net decrease | (43,446 | ) | $ | (445,225 | ) | (82,937 | ) | $ | (845,782 | ) | |||||||||
| Year ended December 31, 2017 | Year ended December 31, 2016 | ||||||||||||||||||
Shares | Amount | Shares | Amount | ||||||||||||||||
Large Cap Value Fund | |||||||||||||||||||
Class A | |||||||||||||||||||
Shares sold | 25,084 | $ | 407,454 | 47,998 | $ | 697,236 | |||||||||||||
Reinvestment of distributions | 10,614 | 184,686 | 1,244 | 19,074 | |||||||||||||||
35,698 | 592,140 | 49,242 | 716,310 | ||||||||||||||||
Shares repurchased | (77,693 | ) | (1,281,775 | ) | (63,389 | ) | (879,751 | ) | |||||||||||
Net decrease | (41,995 | ) | $ | (689,635 | ) | (14,147 | ) | $ | (163,441 | ) | |||||||||
Class C | |||||||||||||||||||
Shares sold | 347 | $ | 4,750 | 3,237 | $ | 40,230 | |||||||||||||
Reinvestment of distributions | 649 | 9,587 | 134 | 1,761 | |||||||||||||||
996 | 14,337 | 3,371 | 41,991 | ||||||||||||||||
Shares repurchased | (28,341 | ) | (394,296 | ) | (35,298 | ) | (436,904 | ) | |||||||||||
Net decrease | (27,345 | ) | $ | (379,959 | ) | (31,927 | ) | $ | (394,913 | ) | |||||||||
69
Pacific Advisors Fund Inc.
Notes to Financial Statements
December 31, 2017
| Year ended December 31, 2017 | Year ended December 31, 2016 | ||||||||||||||||||
Shares | Amount | Shares | Amount | ||||||||||||||||
Mid Cap Value Fund | |||||||||||||||||||
Class A | |||||||||||||||||||
Shares sold | 24,830 | $ | 297,523 | 53,336 | $ | 562,552 | |||||||||||||
Reinvestment of distributions | - | - | - | - | |||||||||||||||
24,830 | 297,523 | 53,336 | 562,552 | ||||||||||||||||
Shares repurchased | (94,358 | ) | (1,114,055 | ) | (41,408 | ) | (452,469 | ) | |||||||||||
Net increase (decrease) | (69,528 | ) | $ | (816,532 | ) | 11,928 | $ | 110,083 | |||||||||||
Class C | |||||||||||||||||||
Shares sold | 165 | $ | 1,715 | 1,236 | $ | 11,542 | |||||||||||||
Reinvestment of distributions | - | - | - | - | |||||||||||||||
165 | 1,715 | 1,236 | 11,542 | ||||||||||||||||
Shares repurchased | (84 | ) | (960 | ) | (38,319 | ) | (355,718 | ) | |||||||||||
Net increase (decrease) | 81 | $ | 755 | (37,083 | ) | $ | (344,176 | ) | |||||||||||
| Year ended December 31, 2017 | Year ended December 31, 2016 | ||||||||||||||||||
Shares | Amount | Shares | Amount | ||||||||||||||||
Small Cap Value Fund | |||||||||||||||||||
Class A | |||||||||||||||||||
Shares sold | 62,393 | $ | 1,719,079 | 68,311 | $ | 1,671,143 | |||||||||||||
Reinvestment of distributions | 29,460 | 864,655 | 121,832 | 3,362,552 | |||||||||||||||
91,853 | 2,583,734 | 190,143 | 5,033,695 | ||||||||||||||||
Shares repurchased | (364,114 | ) | (9,649,625 | ) | (592,790 | ) | (14,443,161 | ) | |||||||||||
Net decrease | (272,261 | ) | $ | (7,065,891 | ) | (402,647 | ) | $ | (9,409,466 | ) | |||||||||
Class C | |||||||||||||||||||
Shares sold | 477 | $ | 11,189 | 1,745 | $ | 34,046 | |||||||||||||
Reinvestment of distributions | 7,552 | 157,079 | 29,196 | 585,677 | |||||||||||||||
8,029 | 168,268 | 30,941 | 619,723 | ||||||||||||||||
Shares repurchased | (54,984 | ) | (1,032,536 | ) | (121,755 | ) | (2,351,201 | ) | |||||||||||
Net decrease | (46,955 | ) | $ | (864,268 | ) | (90,814 | ) | $ | (1,731,478 | ) | |||||||||
Class I | |||||||||||||||||||
Shares sold | - | $ | 3 | - | $ | 26 | |||||||||||||
Reinvestment of distributions | 8 | 297 | 24 | 840 | |||||||||||||||
8 | 300 | 24 | 866 | ||||||||||||||||
Shares repurchased | - | - | (4,824 | ) | (176,717 | ) | |||||||||||||
Net increase (decrease) | 8 | $ | 300 | (4,800 | ) | $ | (175,851 | ) | |||||||||||
70
Pacific Advisors Fund Inc.
Notes to Financial Statements
December 31, 2017
Note 7. Bank Borrowings
Each Fund may borrow money to the extent permitted by the 1940 Act, as amended, or any rules, exemptions or interpretations thereunder that may be adopted, granted or issued by the Securities and Exchange Commission. Under the 1940 Act, a mutual fund may borrow up to one-third of its total assets (including the amount borrowed) from banks for any purpose, and may borrow up to 5% of its total assets from banks or other lenders for temporary purposes. Each Fund may borrow to facilitate portfolio transactions or meet redemptions. The Large Cap Value Fund, Mid Cap Value Fund, and Small Cap Value Fund also may borrow money to invest in portfolio securities. Each Fund has the ability to borrow, from UMB, on an unsecured basis, at 2.75% over the Federal Funds rate. As of December 31, 2017, Balanced Fund, Large Cap Value Fund, Mid Cap Value Fund and Small Cap Value Fund had borrowings from UMB with amounts of $34,182, $113,077, $29,000 and $156,435, respectively, and were paying interest at 4.02% per annum on their outstanding borrowings. In 2017, the Balanced Fund, Large Cap Value Fund, Mid Cap Value Fund and Small Cap Value Fund had a daily average borrowing of $18,823, $58,582, $29,341 and $245,554, respectively, with a weighted average interest rate of 3.55%, 3.70%, 3.70% and 3.64% per annum, respectively. No compensating balances were required.
Note 8. Subsequent Events
Subsequent events occurring after the date of this report through the date these financial statements were issued have been evaluated for potential impact and the Fund has had no such events.
71
Pacific Advisors Fund Inc.
Report of Independent Registered Public Accounting Firm
To the Board of Directors of Pacific Advisors Fund Inc.
and the Shareholders of Income and Equity Fund, Balanced Fund, Large Cap Value Fund, Mid Cap Value Fund and Small Cap Value Fund
Opinion on the Financial Statements
We have audited the accompanying statements of assets and liabilities of Income and Equity Fund, Balanced Fund, Large Cap Value Fund, Mid Cap Value Fund and Small Cap Value Fund, each a series of shares of beneficial interest in Pacific Advisors Fund Inc. (the "Funds"), including the schedules of investments, as of December 31, 2017, and the related statements of operations for the year then ended, the statements of changes in net assets for each of the years in the two-year period then ended and the financial highlights for each of the years in the three-year period then ended, and the related notes and schedules (collectively referred to as the "financial statements"). The financial highlights for each of the years in the two-year period ended December 31, 2014 (except for the restated amounts as described in Note 2H) for each of the Funds were audited by other auditors, whose report dated February 27, 2015 expressed an unqualified opinion on such financial highlights. In our opinion, the financial statements present fairly, in all material respects, the financial position of the Funds as of December 31, 2017, and the results of their operations for the year then ended, the changes in their net assets for each of the years in the two-year period then ended and their financial highlights for each of the years in the three-year period then ended, in conformity with accounting principles generally accepted in the United States of America ("GAAP").
Basis for Opinion
These financial statements are the responsibility of the Funds' management. Our responsibility is to express an opinion on the Funds' financial statements based on our audits. We are a public accounting firm registered with the Public Company Accounting Oversight Board (United States) ("PCAOB") and are required to be independent with respect to the Funds in accordance with the U.S. federal securities law and the applicable rules and regulations of the Securities and Exchange Commission and the PCAOB.
We conducted our audits in accordance with the standards of the PCAOB. Those standards require that we plan and perform the audits to obtain reasonable assurance about whether the financial statements are free of material misstatement, whether due to error or fraud. The Funds are not required to have, nor were we engaged to perform, an audit of their internal control over financial reporting. As part of our audits we are required to obtain an understanding of internal control over financial reporting but not for the purpose of expressing an opinion on the effectiveness of the Funds' internal control over financial reporting. Accordingly, we express no such opinion.
Our audits included performing procedures to assess the risk of material misstatement of those financial statements, whether due to error or fraud, and performing procedures that respond to those risks. Such procedures included examining, on a test basis, evidence regarding the amounts and disclosures in the financial statements. Our procedures included confirmation of securities owned as of December 31, 2017 by correspondence with the custodian and brokers, or by other appropriate auditing procedures where replies from brokers were not received. Our audits also included evaluating the accounting principles used and significant estimates made by management, as well as evaluating the overall presentation of the financial statements. We believe that our audits provide a reasonable basis for our opinion.

BBD, LLP
We have served as the auditor of one or more of the Funds in the Pacific Advisors Fund Inc. since 2015.
Philadelphia, Pennsylvania
February 28, 2018
72
Pacific Advisors Fund Inc.
Disclosure Regarding the Board's Approval
of the Funds' Advisory Contracts
The Board of Directors, including a majority of the Independent Directors, most recently approved the Investment Management Agreements (the "Agreements") for the Funds at its meeting held on August 11, 2017. At that meeting, the Board approved the continuation of the Agreements by and between Pacific Advisors Fund Inc. (the "Corporation"), on behalf of each of its Funds, and Pacific Global Investment Management Company, Inc. ("PGIMC").
In approving the Agreements, the Board considered materials relating to, among other matters: (1) the financial condition and profitability of PGIMC, including information regarding PGIMC's cost of providing services, as well as comparative fee and expense information for a peer group of funds; (2) investment performance of each Fund over various periods, including information comparing the performance of each Fund with a peer group of funds and an appropriate index or combination of indices; (3) the services provided by PGIMC to the Funds; (4) sales and redemption data for each Fund; (5) the extent to which economies of scale could be realized as the Funds grow and whether fee levels reflect any economies of scale for the Funds' investors; (6) the economic outlook and the general investment outlook in the markets in which each Fund invests; and (7) "fall-out" benefits realized by PGIMC (i.e., ancillary benefits derived by PGIMC and its affiliates from PGIMC's relationship with the Funds). The Board also periodically considers other material facts such as the allocation of each Fund's brokerage commissions, each Fund's record of compliance with its investment policies and restrictions on personal securities transactions, and the nature, cost, and character of non-investment management services provided by PGIMC and its affiliates. In approving the Agreements, the Board relied on all information presented to it over the course of the year.
Prior to the Board's approval of the Agreements, the Independent Directors met separately with independent counsel to review the materials provided. Based on its evaluation of all material factors, the Board, including a majority of the Independent Directors, determined that the Agreements were in the best interests of the Funds and their shareholders and that the fees to be paid to PGIMC under the Agreements were fair and reasonable in relationship to the services to be rendered thereunder and in light of the factors considered. During its deliberations, the Board did not identify any single factor as all important or controlling, and individual Directors may have weighed the same factors differently. The following summaries do not detail every matter considered. Matters considered by the Board included the following:
Nature, Quality and Extent of Services. The Board examined the nature, quality and extent of the services provided by PGIMC to the Funds. The Board reviewed PGIMC's key personnel in providing investment management services to the Funds, as well as the changes in such personnel, and the duties that such personnel perform for the Funds. The Board considered the qualifications and experience of PGIMC's portfolio management team and PGIMC's commitment of its resources to portfolio management services. The Board considered PGIMC's responsibilities under the Agreements in serving as the Funds' investment manager, including responsibilities for investment research and stock selection; administration of the Funds' daily business operations; supervision of the Funds' transfer agent and administrative services agent; monitoring adherence to the Funds' investment restrictions; monitoring compliance with various policies and procedures of the Funds; and responsiveness to the Independent Directors. The Board was provided with, and considered information regarding, PGIMC's trading; operations; compliance; and investment research functions. The Board considered PGIMC's marketing strategy with respect to the Funds and the current asset levels of the Funds. The Board also considered the Funds' compliance program, the compliance and risk management reports periodically furnished to the Board, and the results of any regulatory exams. The Board concluded that the Funds have the potential to benefit from the nature, extent and quality of the services provided by PGIMC under the Agreements.
73
Pacific Advisors Fund Inc.
Disclosure Regarding the Board's Approval
of the Funds' Advisory Contracts
Investment Performance of PGIMC and the Funds. The Board considered the performance of PGIMC and the Funds, including each Fund's year-to-date, one-, three-, five-, and ten-year performance for the periods ended June 30, 2017 and December 31, 2016; as well as certain comparative performance information sourced by an independent data service for each Fund's benchmark(s) and funds PGIMC considered peers of the Funds. The Board was provided information regarding PGIMC's investment decision making process and trade execution policies and strategies. After reviewing the Funds' performance records, including performance relative to the Funds' benchmarks, peers and, with respect to the Balanced Fund, the blended returns of the Fund's benchmark, and its investment objective, strategy and role in the overall Corporation's complex, the Board remained very attentive to the continued substantial underperformance over most periods and very high relative expenses. The Board recognized the importance and potential value of PGIMC's consistency and discipline with respect to its investment strategy and determined that these factors overall weighed in favor of renewing the relevant Agreement for each Fund given the Board's continued monitoring of each Fund's investment performance and the potential for improvement based in part on some recent improvements in relative performance for certain Funds for very recent short periods.
Among other factors, the Board considered:
(i) with respect to the Small Cap Value Fund: the Fund's outperformance versus its benchmark for the one-year periods ended June 30, 2017 and December 31, 2016; and the Fund's disappointing longer-term performance in light of challenging market conditions; and management's explanation of the Fund's investment strategy, portfolio composition and long-term growth potential;
(ii) with respect to the Mid Cap Value Fund: the Fund's (Class A shares) outperformance versus its benchmark for the one-year period ended December 31, 2016; the Fund's performance in light of the mid-cap strategy adopted at the end of 2010 and its long-term investment approach; and management's explanation of the Fund's focused portfolio strategy and long-term growth potential;
(iii) with respect to the Large Cap Value Fund: the Fund's performance in light of market conditions and the Fund's emphasis on minimizing volatility; management's explanation of the Fund's conservative approach and its expectation for the Fund to grow at a slower rate, and with less volatility, in rising markets while potentially providing better downside protection in falling markets; and management's recognition of the difference between the Fund's concentrated portfolio focused on leading mega-cap companies within the benchmark S&P 500® Index, and the benchmark's larger number of holdings;
(iv) with respect to the Balanced Fund: the Fund's (Class A shares) improved performance for the one-year periods ended June 30, 2017 and December 31, 2016; the Fund's disappointing longer-term performance in light of market conditions and the Fund's investment objective and policies; management's explanation of the Fund's equity approach to seek total return while minimizing risk and its fixed income strategy, in response to the persistently low yields and heightened interest rate volatility of the past few years, to remain concentrated in shorter-term bonds which provided greater principal protection during periods of rising interest rates and market turbulence; and
(v) with respect to the Income and Equity Fund: the Fund's improved performance in light of market conditions and the Fund's investment objective, strategy, and policies; management's explanation of the Fund's more defensive fixed income strategy during the past few years focused on short-to-intermediate-term investment grade, lower-duration bonds seeking to provide greater principal protection and manage interest rate risk; the Fund's use of high-quality, well-established equities with attractive dividend yields to achieve total return; and the Fund's active strategy which was positioned to preserve valuations as interest rates rise.
74
Pacific Advisors Fund Inc.
Disclosure Regarding the Board's Approval
of the Funds' Advisory Contracts
Costs of Services and Profits Realized by PGIMC. The Board reviewed PGIMC's 2016 audited financial statements. The Board reviewed the 2016 consolidated statement of operations of PGIMC and its subsidiaries and also considered the costs and profitability of PGIMC and its affiliates from their operations. The Board also reviewed the 2016 consolidated statement of financial condition of PGIMC and its subsidiaries and considered the financial condition of PGIMC and its ability to provide the services specified under the Agreements and expected by the Board. The Board examined the fee information for the Funds as compared to that of comparable funds managed by other advisers, and in light of the investment strategy applied to each Fund. The comparative fee information provided to the Board indicated that each Fund's advisory fees were near the range, given the level of each Fund's assets, of those charged by funds PGIMC considered peers of the Funds based on factors such as portfolio characteristics, investment style and asset level. The Board noted, however, that gross expenses and/or net expenses for each Fund, even with the application of the expense limitation, continued to place it as the most expensive fund in its respective peer group, in some cases by a considerable margin. The Board reviewed a description of the methodology used for selecting the funds in each peer group. The Board considered that during 2016, PGIMC had waived fees for the Income and Equity Fund and Large Cap Value Fund in order to reduce their expenses; and that PGIMC expected to continue to waive fees for the Income and Equity Fund and Large Cap Value Fund in 2017 to the extent expenses exceed the agreed expense limits for those Funds. Another factor was that, over the history of the Funds, PGIMC and its affiliates had waived and/or reimbursed expenses for all the Funds in excess of $5.1 million. The Board recognized the limited financial resources of PGIMC with respect to subsidizing the Funds' expenses, and the small asset size of each Fund. The Board also considered that affiliates of PGIMC provide distribution, administrative, and transfer agency services for the Funds, and, based on information furnished by PGIMC, the benefits to the Funds of having such services provided by such affiliates. The Board also considered the Funds' sales and redemption data in the first six months of 2017, in light of current market conditions. The Board concluded that the Funds' management fees were reasonable in light of the services provided, despite the high level of other expenses.
Economies of Scale. The Board considered the extent to which the Funds' management fees reflect economies of scale for the benefit of the Funds' shareholders. The Board reviewed the Funds' fee arrangements, which include breakpoints that decrease the fee rate as the Funds' assets increase. The Board considered the fact that current assets were well below the threshold for the initial advisory fee breakpoint for each Fund. The Board noted that the expense ratios for the Funds were impacted by lower asset levels for most of the Funds in 2016 as compared to 2015. Based on its review, the Board concluded that the Funds' management fee structures have the potential to allow shareholders to benefit from economies of scale if the Funds' assets were to increase. The Board also considered that PGIMC had been waiving fees for the Income and Equity Fund and the Large Cap Value Fund.
Other Benefits to PGIMC. In evaluating the benefits that accrue to PGIMC through its relationship with the Funds, the Board recognized that, in addition to providing advisory services, PGIMC and its affiliates serve the Funds in various capacities, including as transfer agent, administrative services agent and distributor, and receive compensation from the Funds in connection with providing these services. The Board considered that each service provided to the Funds by PGIMC or one of its affiliates is pursuant to a written agreement, which the Board evaluates periodically. The Board also considered the benefits that accrue to PGIMC through its relationship with the Funds in its management of separately managed accounts. The Board concluded that the benefits were consistent with PGIMC's rights and obligations under the Agreements.
After full consideration of these and other factors, the Board, including a majority of the Independent Directors, concluded that approval of the Agreements was in the best interest of the Funds and their shareholders.
75
Pacific Advisors Fund Inc.
Directors and Officers
"Independent" Directors
Name (Age) | Position with the Company1 | Year elected Director of the Company | Principal occupation(s) during past 5 years | Other Directorships held by Director | |||||||||||||||
| L. Michael Haller, III (74) | Director | 1992 | Consultant, d/b/a Asahi Broadcasting Enterprises (software development); Chairman and President, Gammaker Inc. (mobile game developer); Chairman and CEO, AdLib Mediation, Inc. (mobile advertising); and formerly Executive Vice President, MGT Capital Investments (mobile game developer) (2013); and CEO, Digital Angel, Inc. (communications equipment distributor) (2012-2013) | Digital Angel, Inc. | |||||||||||||||
| Peter C. Hoffman (67) | Director | 2010 | President, Sierra Autocars, Inc. (auto dealership), Sierra Vehicles, Inc. (auto dealership) and Sierra Pursuits, Inc. (management company) | None | |||||||||||||||
| Gerald E. Miller (88) | Director | 1992 | Retired in 1992; and formerly worked for Merrill Lynch for over 30 years and was a Senior Resident Vice President at retirement in 1992 | None | |||||||||||||||
| Louise K. Taylor, PhD (71) | Director | 1992 | Assistant Executive Director, School Employers Association of California; and formerly Superintendent, Monrovia Unified School District (1991-2009) | None | |||||||||||||||
"Interested" Directors2
Name (Age) | Position with the Company1 | Year elected a Director and officer of the Company | Principal occupations during past 5 years | Other Directorships held by Director | |||||||||||||||
| George A. Henning (70)* | President and Chairman | 1992 | Chairman, President and Director, Pacific Global Investment Management Company; and Chairman and Director, Pacific Global Fund Distributors, Inc. and Pacific Global Investor Services, Inc. | None | |||||||||||||||
Each Director oversees all 5 Pacific Advisors Fund portfolios.
The Fund's Statement of Additional Information contains additional information about the Fund's Directors and Officers and is available without charge upon request by calling (800) 989-6693. The business address for all Directors and officers of the Company is 101 N. Brand Blvd., Suite 1950, Glendale, CA 91203, Attn: Secretary.
76
Pacific Advisors Fund Inc.
Directors and Officers
Other Officers
Name (Age) | Position(s) with the Company | Year elected an officer of the Company | Principal occupations during past 5 years | ||||||||||||
| Catherine L. Henning (40) | Vice President Secretary | 2010 2006 | Senior Vice President, Secretary, Director of Client Services and Director, Pacific Global Investment Management Company; President, Secretary, Chief Compliance Officer and Director, Pacific Global Fund Distributors, Inc.; and Vice President, Secretary and Director, Pacific Global Investor Services, Inc. | ||||||||||||
| Barbara A. Kelley (64) | Vice President and Chief Compliance Officer | 2001 | Executive Vice President, Chief Compliance Officer and Director, Pacific Global Investment Management Company; Director, Pacific Global Fund Distributors, Inc.; President and Director, Pacific Global Investor Services, Inc.; and formerly Treasurer (2001-2014). | ||||||||||||
| Araceli Olea (45) | Assistant Secretary | 2008 | Shareholder Services Manager, Pacific Global Investor Services, Inc.; and Assistant Secretary, Pacific Global Investment Management Company and Pacific Global Investor Services, Inc. | ||||||||||||
| Jingjing Yan (44) | Treasurer | 2014 | Vice President and Treasurer, Pacific Global Investment Management Company; Treasurer, Pacific Global Fund Distributors, Inc. and Pacific Global Investor Services, Inc.; and formerly Assistant Treasurer (2005-2014). | ||||||||||||
1 Each director is elected to serve until the next annual shareholders meeting and until his or her successor is elected or appointed. The Company does not hold regular annual shareholders meetings to elect Directors. Vacancies on the Board can be filled by the action of a majority of the Directors, provided that at least two-thirds of the Directors have been elected by the shareholders.
2 "Interested persons" as defined in the 1940 Act, as amended, based on the director's affiliation with the Funds' investment manager and its affiliates (including the Funds' principal underwriter).
* Mr. Henning is considered an interested director because (a) he holds the positions described above with the Company, the Manager and its affiliates; (b) by virtue of his ownership of the Manager's shares he may be deemed a "control person" of the Manager; and (c) he is Ms. Henning's father.
77
Pacific Advisors Fund Inc.
Additional Tax Information (Unaudited)
For federal income tax purposes, the following information is furnished with respect to the distributions paid by the Funds during the taxable year ended December 31, 2017. The Funds designated and paid as short-term capital gain and long-term capital gain distributions as follows:
| Income and Equity Fund | Balanced Fund | Large Cap Value Fund | Mid Cap Value Fund | Small Cap Value Fund | |||||||||||||||||||
Short-term capital gain distributions | $ | - | $ | - | $ | - | $ | - | $ | - | |||||||||||||
Long-term capital gain distributions | - | 39,405 | 213,375 | - | 1,077,137 | ||||||||||||||||||
A percentage of the dividends distributed during the fiscal year for the Funds qualifies for the dividends-received deduction for corporate shareholders:
| Income and Equity Fund | Balanced Fund | Large Cap Value Fund | Mid Cap Value Fund | Small Cap Value Fund | |||||||||||||||||||
Corporate dividends-received deduction | 100.00 | % | N/A | N/A | N/A | N/A | |||||||||||||||||
Under the Jobs and Growth Tax Relief Reconciliation Act of 2003 (the "Act"), the following percentage of ordinary dividends paid during the taxable year ended December 31, 2017 are designated as "qualified dividend income," as defined in Act and subject to reduced tax rates in 2017.
| Income and Equity Fund | Balanced Fund | Large Cap Value Fund | Mid Cap Value Fund | Small Cap Value Fund | |||||||||||||||||||
Percentage of qualified dividends | 100.00 | % | N/A | N/A | N/A | N/A | |||||||||||||||||
In January 2018, the Funds provided tax information to shareholders for the preceding calendar year.
78
Pacific Advisors Fund Inc.
notes
79
Pacific Advisors Fund Inc.
notes
80

Pacific Advisors Fund Inc.
Directors
George A. Henning, Chairman
L. Michael Haller, III
Peter C. Hoffman
Gerald E. Miller
Louise K. Taylor, Ph.D.
Officers
George A. Henning, President
Barbara A. Kelley, Vice President
Catherine L. Henning, Vice President and Secretary
Araceli Olea, Assistant Secretary
Jingjing Yan, Treasurer
Investment Manager
Pacific Global Investment Management Company
101 North Brand Blvd., Suite 1950
Glendale, California 91203
Transfer Agent and Administrator
Pacific Global Investor Services, Inc.
101 North Brand Blvd., Suite 1950
Glendale, California 91203
Distributor
Pacific Global Fund Distributors, Inc.
101 North Brand Blvd., Suite 1950
Glendale, California 91203
(800) 989-6693
Availability of Quarterly Portfolio Schedule
The Fund files its complete schedule of portfolio holdings with the SEC for the first and third quarters of each fiscal year on Form N-Q. The Fund's Forms N-Q are available on the SEC's Web site at http://www.sec.gov. The Fund's Forms N-Q may be reviewed and copied at the SEC's Public Reference Room in Washington, DC. Information about the operation of the Public Reference Room may be obtained by calling the SEC at (800) SEC-0330.
The Fund's complete schedule of portfolio holdings for each fiscal quarter is posted on the Fund's Web site at www.PacificAdvisorsFund.com and is available without charge, upon request by calling (800) 989-6693. Documents will be sent within 3 business days of receipt of your request.
Availability of Proxy Voting Policies and Procedures and Proxy Voting Record
A description of the policies and procedures that the Fund uses to determine how to vote proxies relating to portfolio securities and information regarding how the Fund voted proxies relating to portfolio securities during the most recent 12-month period ended June 30 is available without charge, upon request by calling (800) 989-6693. Documents will be sent within 3 business days of receipt of your request. This information is also available on the SEC's Web site at http://www.sec.gov.

Pacific Global Fund Distributors, Inc.
101 North Brand Blvd., Suite 1950
Glendale, California 91203

Item 2. Code of Ethics
Registrant has adopted a Code of Ethics pursuant to Section 406 of the Sarbanes-Oxley Act of 2002 that applies to Registrant’s principal executive officer, principal financial officer, principal accounting officer or controller. Registrant will provide to any person without charge, upon request, a copy of the Code of Ethics if such person submits a request in writing addressed to the Registrant’s secretary at the principal executive offices listed above.
Item 3. Audit Committee Financial Expert
Registrant’s Audit Committee has three members. While these members are “financially literate,” the Board has determined that none of the members of the Audit Committee meet the technical definition of “audit committee financial expert.” Registrant has determined that an audit committee financial expert is not necessary at this time because (i) the Audit Committee members are financially literate; (ii) they have served on Registrant’s Audit Committee for several years; (iii) the accounting methodologies applicable to registered investment companies and the types of investment activities in which the Funds engage are well established; and (iv) Registrant’s financial statements do not involve the types of complex accounting issues that other types of public companies may have.
Item 4. Principal Accountant Fees and Services
(a)-(d) BBD LLP (“BBD”) billed the Registrant aggregate fees for professional services rendered for the fiscal years ending December 31, 2016 and December 31, 2017 as follows:
BBD |
| Audit Fees |
| Audit Related Fees |
| Tax Fees |
| All Other Fees |
| ||||
2017 |
| $ | 96,000 |
| $ | 0 |
| $ | 15,000 |
| $ | 0 |
|
2016 |
| $ | 96,000 |
| $ | 0 |
| $ | 15,000 |
| $ | 0 |
|
(b) Audit Related Fees are for services rendered to provide consent of the annual update to the Corporation’s Form N1-A and non-routine N1-A filings.
(c) Tax Fees include the services for the review of income tax returns and excise taxes.
(e)(1) The Audit Committee is authorized to pre-approve non-audit services provided by the Corporation’s auditors, if they find it appropriate in light of their fiduciary duties and in the exercise of their good faith business judgment and compatible with the auditors’ independence. The Chairman of the Audit Committee is authorized to approve audit and non-audit services for newly established funds of the Corporation on the same terms as the full Audit Committee previously had approved for the then existing funds, and to approve non-audit services which are permissible under applicable law, provided the estimated fee is not more than $5,000 based on a good faith estimate provided by the auditor. The Chairman shall report any such pre-approval to the Audit Committee at its next following meeting.
(e)(2) None.
(f) None.
(g) None.
(h) Not applicable.
Item 5. Audit Committee of Listed Registrants
Not applicable as Registrant is not a listed issuer as defined in Rule 10A-3 under the Securities Exchange Act of 1934.
Item 6. Statements of Investments
Statements of Investments is included as part of the report to shareholders filed under Item 1 of this form.
Item 7. Disclosure of Proxy Voting Policies and Procedures for Closed-End Management Investment Companies
Not applicable to open-end investment companies.
Item 8. Portfolio Managers of Closed-End Management Investment Companies
Not applicable to open-end investment companies.
Item 9. Purchases of Equity Securities by Managers of Closed-End Management Investment Company and Affiliated Purchasers.
Not applicable to open-end investment companies.
Item 10. Submission of Matters to a Vote of Security Holders
No material changes have been made.
Item 11. Controls and Procedures.
(a) Based upon their evaluation of Registrant’s disclosure controls and procedures (as defined in Rule 30a-3(c) under the Investment Company Act of 1940) as conducted within 90 days of the filing date of this Form N-CSR, Registrant’s principal executive officer and principal financial officer have concluded that those disclosure controls and procedures provide reasonable assurance that the material information required to be disclosed by Registrant on this report is recorded, processed, summarized and reported within the time periods specified in the Securities and Exchange Commission’s rules and forms.
(b) There were no changes in Registrant’s internal control over financial reporting (as defined in Rule 30a-3(d) under the Investment Company Act of 1940) that occurred during the second fiscal quarter of the period covered by this report that have materially affected, or are reasonably likely to materially affect, Registrant’s internal control over financial reporting.
Item 12. Exhibits
(a)(1) Not applicable.
(a)(2) Certifications required by Item 12(a) of Form N-CSR and Section 302 of the Sarbanes-Oxley Act of 2002 (filed herewith).
(b) Certification required by Section 906 of the Sarbanes-Oxley Act of 2002 (filed herewith).
SIGNATURES
Pursuant to the requirements of the Securities Exchange Act of 1934 and the Investment Company Act of 1940, Registrant has duly caused this report to be signed on its behalf by the undersigned, thereunto duly authorized.
Pacific Global Fund Inc. d/b/a Pacific Advisors Fund Inc.
By: | /s/ George A. Henning |
|
| George A. Henning |
|
| Chairman, Pacific Advisors Fund Inc. |
|
|
|
|
Date: | March 5, 2018 |
|
Pursuant to the requirements of the Securities Exchange Act of 1934 and the Investment Company Act of 1940, this report has been signed below by the following persons on behalf of Registrant and in the capacities and on the dates indicated.
By: | /s/ George A. Henning |
|
| George A. Henning |
|
| Chief Executive Officer |
|
|
|
|
Date: | March 5, 2018 |
|
|
|
|
By: | /s/ Jingjing Yan |
|
| Jingjing Yan |
|
| Chief Financial Officer |
|
|
|
|
Date: | March 5, 2018 |
|