UNITED STATES
SECURITIES AND EXCHANGE COMMISSION
Washington, D.C. 20549
FORM N-CSR
CERTIFIED SHAREHOLDER REPORT OF REGISTERED
MANAGEMENT INVESTMENT COMPANIES
Investment Company Act file number | 811-07062 | |||||||
| ||||||||
PACIFIC GLOBAL FUND INC. D/B/A PACIFIC ADVISORS FUND INC. | ||||||||
(Exact name of registrant as specified in charter) | ||||||||
| ||||||||
101 NORTH BRAND BLVD., SUITE 1950 GLENDALE, CALIFORNIA |
| 91203 | ||||||
(Address of principal executive offices) |
| (Zip code) | ||||||
| ||||||||
GEORGE A. HENNING 101 NORTH BRAND BLVD., SUITE 1950 GLENDALE, CA 91203 | ||||||||
(Name and address of agent for service) | ||||||||
| ||||||||
Registrant’s telephone number, including area code: | 818-242-6693 |
| ||||||
| ||||||||
Date of fiscal year end: | December 31 |
| ||||||
| ||||||||
Date of reporting period: | December 31, 2016 |
| ||||||
Item 1. Report to Shareholders
Filed herewith.

annual report
december 31, 2016
income and equity fund
balanced fund
large cap value fund
mid cap value fund
small cap value fund


Pacific Advisors
table of contents
Message from the Chairman | 1 | ||||||
Income and Equity Fund | 4 | ||||||
Balanced Fund | 9 | ||||||
Large Cap Value Fund | 14 | ||||||
Mid Cap Value Fund | 19 | ||||||
Small Cap Value Fund | 24 | ||||||
Schedule of Investments | 30 | ||||||
Statement of Assets and Liabilities | 50 | ||||||
Statement of Operations | 52 | ||||||
Statement of Changes in Net Assets | 54 | ||||||
Financial Highlights | 58 | ||||||
Notes to Financial Statements | 64 | ||||||
| Report of Independent Registered Public Accounting Firm | 76 | ||||||
| Disclosure Regarding the Board's Approval of the Funds' Advisory Contracts | 77 | ||||||
Directors and Officers | 80 | ||||||
Additional Tax Information | 82 | ||||||
This Report is submitted for the general information of the shareholders of Pacific Advisors Funds. It is not authorized for distribution to prospective investors unless accompanied or preceded by the Funds' current prospectus, which contains information concerning the investment policies of the Funds as well as other pertinent information.
This Report is for informational purposes only and is not a solicitation or recommendation that any particular investor should purchase or sell any particular security. The statements in the Chairman's Letter and the discussions of the Funds' performance are the opinions and beliefs expressed at the time of this commentary and are not intended to represent opinions and beliefs at any other time. These opinions are subject to change at any time based on market or other conditions and are not meant as a market forecast. All economic and performance information referenced is historical. Past performance does not guarantee future results.
For more information on the Pacific Advisors Funds, including information on charges, expenses and other classes offered, please obtain a copy of the prospectus by calling (800) 989-6693. Please read the prospectus and consider carefully the investment risks, objectives, charges and expenses before you invest or send money. Shares of the Pacific Advisors Funds are not deposits or obligations of any bank, are not guaranteed by any bank, are not insured by the FDIC or any other agency, and involve investment risks, including the possible loss of the principal amount invested. The investment return and principal value of an investment will fluctuate so that an investor's shares, when redeemed, may be worth more or less than their original cost.


Message
from the chairman
Dear Shareholders,
Investor sentiment soared in the fourth quarter with the unexpected results of the U.S. elections. Markets had not only assumed that Hillary Clinton would be the next President of the U.S. but that she might also deliver a Democratic majority in the U.S. Senate. In hindsight, Donald Trump's election and Republican control of the Congress turned out to be the U.S. version of Brexit when voters chose a different course of action from polling projections. After the initial shock subsided, the markets reacted favorably with a strong showing in November that carried the markets through the end of the year.
Reports prior to the elections showed signs of improving economic growth in the U.S. and around the globe: October set a record for merger and acquisition activity, and companies announced growth initiatives such as new services, new products and geographical expansions. And, companies provided more positive commentaries along with improved third quarter results. Sales for companies in the S&P 500® Index rose for the first time since the fourth quarter of 2014 whilst earnings increased for the first time since the first quarter of 2015. These results set a more optimistic tone for many companies.
Additionally, indications began to emerge that the energy bear market was nearing an end as oil prices recovered from less than $30 per barrel in January to the mid-$50 range. During the summer, OPEC announced a preliminary agreement to reduce oil production in order to eliminate the excess supply of oil so that prices would stabilize at $55 to $65 per barrel. OPEC's position represented a significant change from the policy it announced two years ago of producing more oil at lower prices to drive out competition. That strategy failed; it ended up reducing the income needed to support OPEC economies and reinvest for future production. The competition, while severely weakened, was not eliminated; hydraulic fracturing ("fracking") in the U.S. slowed, but technological advances enabled companies to reduce drilling costs while dramatically improving output.
Federal Reserve commentary, that the economy was growing and a second rate hike would likely occur before the end of the year, provided another important signal for the market. Improving trends in employment and wages signaled a need to raise rates to keep inflation under control. While a modest pace of rate increases is expected over the next several quarters, the increases nevertheless would provide a positive benefit (that is, increased income and/or profits) for fixed income investors and financial institutions.
Against this backdrop, investors began to rotate some investments from stable dividend-paying companies into industrials, consumer spending and energy investments that would provide the opportunity for earnings growth needed to outpace future inflation. The shift, while moderate leading into the elections, nevertheless signaled a change in sentiment and a more optimistic market outlook. Then, the unexpected election results provided the catalyst to ignite a rally.
Equity Investment Review
Major indices recorded broad-based gains with the Dow Jones Industrial Average, S&P 500® Index, NASDAQ, and Russell 2000® Index all reaching record highs in December. Companies and sectors that respond well to economic growth rallied on the expectation that a Trump administration would increase infrastructure spending, cut taxes, and loosen regulations. Meanwhile, the more conservative areas of the market, including high-dividend stocks and less volatile consumer product and food & beverage companies, lagged. These sectors declined as improving economic data and the outlook for continued expansion encouraged investors to accept increased risk.
Market Review • December 31, 2016
Index1 | Close | YTD Price Return | |||||||||
Dow Jones Industrial Average | 19,762.60 | 13.42 | % | ||||||||
S&P 500® Index | 2,238.83 | 9.54 | % | ||||||||
NASDAQ | 5,383.12 | 7.50 | % | ||||||||
Russell Midcap® Index | 1,783.89 | 11.76 | % | ||||||||
Russell 2000® Index (small cap) | 1,357.13 | 19.48 | % | ||||||||
12/31/16 | 12/31/15 | ||||||||||
| 10-Year T-Note Yield | 2.45 | % | 2.27 | % | |||||||
Data: Bloomberg; Federal Reserve
1


Message
from the chairman (unaudited) continued
Notably, Financials was the best performing sector during the fourth quarter. Energy stocks also rose following OPEC's agreement to curtail oil production. The sector, which had been mired in its worst bear market of the last 30 years, began to rebound as crude oil prices stabilized and as confidence in the industry's recovery grew. Industrials also outperformed on the outlook for accelerated growth, rising inflation, and increased fiscal spending. Small cap industrial holdings, in particular, which had rallied during the third quarter, continued to post strong gains through year-end.
The Mid Cap Value and Small Cap Value Funds reflected the dramatic change in the markets as they transitioned from underperformance as of June 30th, to outperform their benchmark indices through December 31, 2016. The following Fund discussions highlight in more detail the outperformance of individual companies and sectors that contributed to each of the Funds' results.
Fixed Income Investment Review
The Fed's December rate hike reflected efforts to manage inflation as pricing pressures increased in response to economic growth and higher oil prices. The Fed's meeting statement and Chair Janet Yellen's press conference emphasized the outlook for continued economic expansion and a gradual, data-dependent pace of future increases. In short, monetary policy remains accommodative with the Fed Funds rate likely to remain below historical levels. Following the rate increase, yields across the maturity spectrum rose to multi-year highs. For example, the yield on the benchmark 10-year U.S. Treasury Note, which hit a low of 1.37% in July, reached a two-year high of 2.60% before ending the year at 2.45%. The Income and Equity and Balanced Funds have maintained a fixed income strategy of investing in high-quality bonds with shorter maturities in anticipation of rising interest rates. A more in-depth discussion of the Funds' fixed income strategies is provided in the performance discussion for each Fund.
Looking Ahead
Since the second quarter of 2014, investors have endured significant challenges including political uncertainty in China, Europe and Japan; the energy bear market; and uncertainty as to the Fed's actions. These concerns, combined with a modest economic outlook, caused many to favor "safe havens" in cash and more defensive dividend-paying equities. The popularity of these conservative stocks led to significant outperformance relative to other sectors in the equity markets. During such periods of uncertainty, we adjust holdings in our portfolios by actively investing in companies that we expect to recover strongly as economic conditions improve. This process may, from time-to-time, result in a period of underperformance yet we believe our shareholders will benefit as markets recover and reward the strategic decisions implemented by individual companies.
The new administration has identified corporate tax reform as a top priority item. The likelihood of corporate tax reform is perhaps the most powerful economic catalyst the markets have experienced in many years. Currently, a fully taxed corporation remits approximately 35% to 40% of pre-tax earnings for state and federal taxes; a reduction in this expense to a combined 25%, a level which may receive bipartisan support, would immediately enhance net income by 20% or more. The increased profits would encourage investments in growth initiatives as these projects would also generate higher returns at the lower tax rate. Smaller companies, which typically derive a majority of revenues from the U.S. and therefore tend to carry relatively higher tax burdens, stand to gain the most from corporate tax reform; in addition, domestic growth-oriented policies would disproportionately benefit these companies.
Following the market's strong year-end performance, investors may worry about a significant correction. We believe that any possible pullback would be shallow and brief. Why? A look at market sector performance confirms that the recent rally was led by previously underperforming Financials, Industrials and Energy sectors; the latter two, which only recently began recovering from a two-year bear market, have considerable appreciation potential.
As we look to 2017, we believe stocks are likely to move higher as the recovery in the Industrial and Energy sectors continues. Obviously, the markets will closely monitor the economic impacts of political
2


developments in the U.S. and abroad. Here, investors need only recall the negative effects over the last two years of headline events in Europe, China, Middle East and the U.S.; these issues created a cautious and uncertain investment climate and triggered higher market volatility. Now, the combination of improving economic trends and the lessening of many of the headline events create more optimism for significant economic growth. While the markets will always reflect challenges and unanticipated events, the opportunities to identify attractive investments appear promising.
Sincerely,

George A. Henning
1 The Dow Jones Industrial Average is an unmanaged, price weighted measure of 30 U.S. stocks selected by the Averages Committee to represent the performance of all U.S. stocks outside the Transportation and Utilities sectors. The S&P 500® Index is an unmanaged, market capitalization weighted index which measures the performance of the large cap segment of the U.S. equities market, covering approximately 75% of the U.S. equities market. The Index includes 500 leading companies in leading industries of the U.S. economy. The NASDAQ Composite Index is an unmanaged, market capitalization weighted measure of all domestic and international common stocks (currently over 3,000 stocks) listed on The Nasdaq Stock Market. The Russell Indices are unmanaged, market-weighted indices. The Russell Midcap® Index measures the 800 smallest companies within the Russell 1000® Index based on a combination of their market cap and current index membership. The Russell 2000® Index measures the stocks of the 2,000 smallest publicly traded companies of the Russell 3000® Index. These indices are not available for direct investment.
Economic and performance information referenced is historical and past performance does not guarantee future results. The principal value and return of an investment will fluctuate so that an investor's shares may be worth less than the original cost when redeemed. For more information on the Pacific Advisors Funds, including information on charges, expenses and other classes offered, please obtain a copy of the prospectus by calling (800) 989-6693. Please read the prospectus and consider carefully the investment risks, objectives, charges and expenses before you invest or send money.
Shares of the Funds are not deposits or obligations of any bank, are not guaranteed by any bank, are not insured by the FDIC or any other agency, and involve investment risks, including the possible loss of the principal amount invested. The views expressed represent the opinions and beliefs at the time of this commentary and are not meant as a market forecast. These views are subject to change at any time based on market or other conditions. This information may not be relied on as investment advice or as an indication of trading.
3
Pacific Advisors
Income and Equity Fund (unaudited)
Fund Objective: Current income and, secondarily, long-term capital appreciation.
Investment Invests primarily in investment grade U.S. corporate bonds and in dividend-paying
Strategy: stocks.
Investor Profile: Conservative. Some current income required; capital preservation aim.
Please see the Chairman's Letter for a detailed market and economic review
as well as the Manager's general market outlook.
Portfolio Holdings (As of 12/31/16 based on total investments)
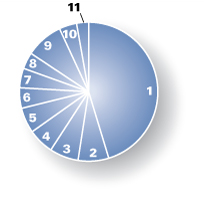
| 1. | Corporate Bonds | 45.30 | % | ||||||||
Equities | 47.78 | % | |||||||||
| 2. | Consumer Staples | 7.16 | % | ||||||||
| 3. | Industrials | 6.74 | % | ||||||||
| 4. | Consumer Discretionary | 6.02 | % | ||||||||
| 5. | Information Technology | 5.92 | % | ||||||||
| 6. | Financials | 4.77 | % | ||||||||
| 7. | Health Care | 4.55 | % | ||||||||
| 8. | Utilities | 3.84 | % | ||||||||
| 9. | Others | 8.78 | % | ||||||||
| 10. | Preferred Stock | 4.11 | % | ||||||||
| 11. | Cash and Cash Equivalents | 2.81 | % | ||||||||
| Total Returns (For the year ended 12/31/16) | |||||||
Class A | 7.08 | % | |||||
Class C | 6.27 | % | |||||
| |||||||
| Barclays Capital U.S. Intermediate Corporate Bond Index1 | 4.04 | % | |||||
S&P 500® Index1 | 11.96 | % | |||||
Current expense ratio: net 2.88% (A), 3.64% (C); gross 3.63% (A), 4.39% (C). Prospectus expense ratio: net 2.06% (A), 2.81% (C); gross 2.81% (A); 3.56% (C).2
Performance quoted is past performance which does not guarantee future results. Current performance may be higher or lower than the performance quoted. Call (800) 989-6693 for performance current to the most recent month-end. The investment return and principal value of an investment will fluctuate so that an investor's shares, when redeemed, may be worth more or less than their original cost. Returns represent the change in value over the stated period assuming reinvestment of dividends and capital gains at net asset value. Returns do not take into account the maximum 4.75% sales charge on Class A shares or the 1% Contingent Deferred Sales Charge (CDSC) for Class C shares sold within one year of purchase. Returns would be lower if the applicable sales charge and CDSC were included. Returns do not take into account individual taxes which may reduce actual returns when shares are sold.
The Fund's investment adviser is waiving a portion of its management fees pursuant to an Expense Limitation Agreement. The waiver may be discontinued at any time with ninety days written notice in consultation with the Fund's board, but is expected to continue at current levels. Please see the Notes to Financial Statements in this report for details. Performance shown reflects the waiver, without which the results would have been lower.
1 The S&P 500® Index is an unmanaged, market capitalization weighted index which measures the performance of the large cap segment of the U.S. equities market, covering approximately 75% of the U.S. equities market. The Index includes 500 leading companies in leading industries of the U.S. economy. Index returns assume the reinvestment of dividends, but, unlike the Fund's returns, do not reflect the effects of management fees or expenses. The Barclays Capital U.S. Intermediate Corporate Bond Index is an unmanaged index of publicly issued investment grade U.S. corporate bonds with one to ten years to maturity. It is not possible to invest directly in either Index.
2 "Current" expense ratio is as of 12/31/16. "Prospectus" expense ratio is for the fiscal year ended 12/31/15.
4
Discussion with Portfolio Managers February 24, 2017
Charles Suh, CFA and Jingjing Yan, CFA
Fund Strategy
The Fund actively manages the allocation between fixed income and equity holdings to create risk-appropriate opportunities for both income and capital appreciation. The Fund seeks investment-quality bonds that provide current income and principal protection. The Fund also invests in a focused selection of 30-40 dividend-paying, blue-chip stocks with stable growth patterns and low volatility. This equity approach has significantly contributed to Fund performance during the long period of low interest rates; that is, the dividend yields for portfolio stocks were often greater than the yields on corporate bonds issued by those same companies. We anticipate that the Fund's allocation to equities may decline as interest rates rise and we reinvest capital in intermediate and longer-term bonds at prevailing higher yields.
Fund Performance
In 2016, Class A shares rose 7.08%; in comparison, the Fund's fixed income benchmark, the Barclays Capital U.S. Intermediate Corporate Bond Index, gained 4.04% while the Fund's equity benchmark, the S&P 500® Index, rose 11.96%. For the 1-year period, the Fund ranked1 in the 24% percentile (out of 364 funds) of its Lipper category, Mixed-Asset Target Allocation Conservative, and outperformed the category's average return of 5.79%. Similarly, for the five-year period, the Fund ranked in the 22% percentile (out of 292 funds) and the 6.03% return for Class A shares outperformed the category's average return of 4.89%. For the ten-year period, including three years under a previous portfolio manager, the Fund ranked in the 61% percentile (out of 212 funds) and slightly underperformed (3.62% for Class A shares) the category's average return of 3.77%.
The composition of the Fund's fixed income holdings and equity holdings differ from their respective benchmarks; as a result, overall Fund performance is best compared to a blended return based on the two benchmarks. For the year, the blended benchmark return2 was 8.16%. Importantly, the Fund maintained significantly lower volatility than the overall market as demonstrated by the Fund's one-year beta3 of 0.39, as of December 31st, versus the S&P 500® Index.
What Helped/Hurt Performance4
The Fund's top equity contributors to returns during the second half of the year were US Bancorp, Metlife, and International Paper. US Bancorp and Metlife gained 30% and 38%, respectively, as financial stocks outperformed in anticipation of improving business conditions and interest rate hikes by the Federal Reserve. In December, the Fed responded to improving trends in employment and wages by raising rates to keep inflation under control. Following the November elections, the equity markets rallied as investors favored sectors that were expected to perform well as the economy grew. International Paper, which rose 28%, completed its acquisition of Weyerhaeuser's pulp business. The transaction positioned International Paper as the premier global supplier of specialty pulp used in tissues, textiles and a variety of other consumer products.
1 Rankings and returns do not take into account the maximum front-end sales charge of 4.75%. Rankings for other share classes may vary.
2 Blended return calculated from the benchmark index returns based on ratio of stocks to fixed-income securities in the Fund's portfolio as of the end of the period.
3 "Beta" measures volatility relative to the stock market or an alternative benchmark. A beta less than 1.0 indicates lower risk than the market or the benchmark; a beta greater than 1.0 indicates higher risk than the market or the benchmark.
4 For detailed information on Fund holdings, please see the Fund's Schedule of Investments in this Report.
5
Pacific Advisors
Income and Equity Fund (unaudited) continued
The Fund's most significant detractors from returns were CVS Health, Mattel, and Pfizer. CVS Health declined 17% after warning investors that the company would begin losing retail prescriptions as pending industry mergers, and new network alliances impact its pharmacy business. An aging demographic and demand for more cost-efficient delivery of prescription medication support the company's longer-term outlook. Mattel fell 10% to underperform other toy companies; nevertheless, the stock offered an attractive dividend yield (5.52% as of December 31st). Pfizer declined 6% as the company lowered profitability estimates and abandoned the development of a cholesterol drug as pricing pressure increased and sales expectations fell.
Prior to the Fed's interest rate increase, the Fund continued to purchase securities which offer greater principal protection as rates rise. The Fund purchased investment-grade bonds of high-quality companies including meat processor Smithfield Foods. The company's callable, variable rate bond yields 2.06% through its August 2017 call date; if the security is not called, the yield will increase to 5.34% through its maturity in August 2022. Also, the Fund purchased several fixed-to-floating rate preferred stocks from financial services firms such as JPMorgan Chase & Co. The security yields an attractive 5.73% through its July 2019 call date; if the security is not called, the coupon rate increases to the 3-month LIBOR + 3.32%.
The Fund remained invested primarily in short-to-intermediate-term bonds which will help preserve principal and lower price volatility. As of year-end, the Fund maintained an average duration of 2.2 years; in contrast, the average duration of the benchmark (the Barclays Capital U.S. Intermediate Corporate Bond Index, an unmanaged bond portfolio) was 4.4 years. Duration measures a portfolio's sensitivity to interest rate movements; when rates increase by 1%, the value of a portfolio with a 4-year duration would decrease by approximately 4%.
Looking Ahead
For 2017, we anticipate that investors will pay close attention to the Fed. The central bank's December rate hike reflected efforts to manage inflation as pricing pressures increase in response to economic growth and higher oil prices. In December, the Fed's meeting statement and Chair Janet Yellen's press conference emphasized the outlook for continued economic expansion and a gradual, data-dependent pace of future increases. The Fund should benefit from the flexibility of holding shorter-term bonds as the interest rate environment shifts. The Fund anticipates that proceeds from maturing and called bonds will be reinvested at higher yields. The Fund also expects to steadily lengthen its bond portfolio's average duration as rates trend higher. The Fund will continue investing in stocks which offer the potential for price appreciation and dividend increases; nevertheless, as rates rise, the Fund may decrease equity positions to increase the fixed income portfolio and take advantage of higher prevailing yields.
6
Change in Value of $10,000 Investment1
This chart compares the growth of a $10,000 investment in Class A shares of the Income and Equity Fund for the period January 1, 2007 through December 31, 2016 with the same investment in the S&P 500® Index2 and the Barclays Capital U.S. Intermediate Corporate Bond Index3.
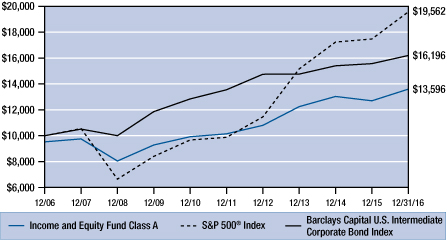
Average Annual Compounded Returns as of December 31, 2016
Class A | Class C | Barclays Capital U.S. Int Corp Bond Index | S&P 500® Index | ||||||||||||||||
One Year | 1.98 | % | 5.27 | % | 4.04 | % | 11.96 | % | |||||||||||
Five Year | 5.01 | % | 5.25 | % | 3.63 | % | 14.66 | % | |||||||||||
Ten Year | 3.12 | % | 2.85 | % | 4.94 | % | 6.95 | % | |||||||||||
Past performance does not guarantee future results. Performance quoted represents past performance. Current performance may be higher or lower than the performance data quoted. Returns include reinvested dividends and capital gains. Returns for Class A shares reflect a maximum front-end sales charge of 4.75%; and returns for Class C shares reflect the deduction of a contingent deferred sales charge of 1% on shares sold within the first year of purchase. Returns do not take into account individual taxes which may reduce actual returns when shares are sold. The investment return and principal value of an investment will fluctuate so that an investor's shares, when redeemed, may be worth more or less than their original cost. Call (800) 989-6693 for the most recent month-end performance.
1 Fund results are shown for Class A shares and reflect deduction of the maximum front-end sales charge of 4.75% on the $10,000 investment for a net amount invested of $9,525. At the end of the same period, a $10,000 investment in Class C shares would have been valued at $13,249, and no contingent deferred sales charges would apply. Performance of the share classes will vary based on the difference in charges and expenses. The inception date is 02/08/93 for Class A shares and 04/01/98 for Class C shares. It is not possible to invest directly in either Index. Index results assume reinvestment of dividends, but, unlike the Fund's results, do not reflect sales charges, fees or expenses.
2 The Standard & Poor's 500® Index is an unmanaged, market capitalization weighted index which measures the performance of the large cap segment of the U.S. equities market, covering approximately 75% of the U.S. equities market. The Index includes 500 leading companies in leading industries of the U.S. economy.
3 The Barclays Capital U.S. Intermediate Corporate Bond Index is an unmanaged index of publicly issued investment grade U.S. corporate bonds with one to ten years to maturity.
7
Pacific Advisors
Income and Equity Fund (unaudited) continued
Expense Examples
As a shareholder of the Fund you incur two types of costs: (1) transaction costs, including sales charges (loads) on purchase payments, reinvested dividends, or other distributions; redemption fees; and exchange fees; and (2) ongoing costs, including management fees; distribution (12b-1) fees; and other Fund expenses. This Example is intended to help you understand your ongoing costs (in dollars) of investing in the Fund and to compare these costs with the ongoing costs of investing in other mutual funds.
The Example is based on an investment of $1,000 invested at the beginning of the period and held for the entire period from July 1, 2016 through December 31, 2016.
Actual Expenses
The first line of the table below provides information about actual account values and actual expenses. You may use the information in this line, together with the amount you invested, to estimate the expenses that you paid over the period. Simply divide your account value by $1,000 (for example, an $8,600 account value divided by $1,000 = 8.6), then multiply the result by the number in the first line under the heading entitled "Expenses Paid During the Period" to estimate the expenses you paid on your account during the period.
The following transaction costs are not included in the expenses shown in the table and, if applicable, would increase the expenses that you paid over the period: (1) a front-end sales charge (load) of 4.75% on Class A shares; (2) a 2% redemption fee if you sell or exchange shares within 30 days of purchase, with certain exceptions. The redemption fee does not apply to: (a) redemptions under an automatic withdrawal program or periodic asset reallocation plan, required minimum distributions (RMD), employer mandated distributions from a qualified plan, or redemptions under a qualified domestic relations order (QDRO); (b) redemptions to pay for expenses related to terminal illness, extended hospital or nursing home care, or other serious medical conditions, including death; (c) redemptions of shares acquired through dividend or capital gains reinvestments; (d) loans from a qualified plan account; and (e) redemptions initiated by the Fund; and (3) a $10 service fee on each exchange after the first five exchanges in each calendar year.
The following ongoing costs are not included in the expenses shown in the table and, if applicable, would increase the expenses that you paid over the period: (1) a $12 low balance fee on accounts with balances of less than $250 as of September 30th of each calendar year and no investment activity (excluding reinvestment of dividends and/or capital gains) during the prior calendar year or the first nine months of the current calendar year. This fee does not apply to IRAs, qualified plan accounts, or Coverdell Education Savings Accounts; (2) a $15 annual custodial fee on IRAs, SEPs, SIMPLE IRAs, and Coverdell Education Savings Accounts; and (3) a $20 annual custodial fee on 403(b) accounts.
Hypothetical Example for Comparison Purposes
The second line of the table below provides information about hypothetical account values and hypothetical expenses based on the Fund's actual expense ratio and an assumed rate of return of 5% per year before expenses, which in not the Fund's actual return. The hypothetical account values and expenses may not be used to estimate the actual ending account balance or expenses you paid for the period. You may use this information to compare the ongoing costs of investing in the Fund and other funds. To do so, compare this 5% hypothetical example with the 5% hypothetical examples that appear in the shareholder reports of the other funds.
The following transaction costs are not included in the expenses shown in the table and, if applicable, would increase the expenses that you paid over the period: (1) a front-end sales charge (load) of 4.75% on Class A shares; (2) a 2% redemption fee if you sell or exchange shares within 30 days of purchase, with certain exceptions. The redemption fee does not apply to: (a) redemptions under an automatic withdrawal program or periodic asset reallocation plan, required minimum distributions (RMD), employer mandated distributions from a qualified plan, or redemptions under a qualified domestic relations order (QDRO); (b) redemptions to pay for expenses related to terminal illness, extended hospital or nursing home care, or other serious medical conditions, including death; (c) redemptions of shares acquired through dividend or capital gains reinvestments; (d) loans from a qualified plan account; and (e) redemptions initiated by the Fund; and (3) a $10 service fee on each exchange after the first five exchanges in each calendar year.
The following ongoing costs are not included in the expenses shown in the table and, if applicable, would increase the expenses that you paid over the period: (1) a $12 low balance fee on accounts with balances of less than $250 as of September 30th of each calendar year and no investment activity (excluding reinvestment of dividends and/or capital gains) during the prior calendar year or the first nine months of the current calendar year. This fee does not apply to IRAs, qualified plan accounts, or Coverdell Education Savings Accounts; (2) a $15 annual custodial fee on IRAs, SEPs, SIMPLE IRAs, and Coverdell Education Savings Accounts; and (3) a $20 annual custodial fee on 403(b) accounts.
Please note that the expenses shown in the table are meant to highlight your ongoing costs only and do not reflect any transactional costs, such as sales charges (loads), redemption fees, or exchange fees. Therefore, the second line of the table is useful in comparing ongoing costs only, and will not help you determine the relative total costs of owning different funds. In addition, if these transactional costs were included, your costs would have been higher.
| Beginning Account Value 07/01/16 | Ending Account Value 12/31/16 | Expense Paid During Period 07/01/16 – 12/31/16 | |||||||||||||
Income & Equity Fund Class A | |||||||||||||||
Actual | $ | 1,000.00 | $ | 1,019.62 | $ | 14.62 | |||||||||
Hypothetical (5% return before expense) | $ | 1,000.00 | $ | 1,010.66 | $ | 14.56 | |||||||||
Income & Equity Fund Class C | |||||||||||||||
Actual | $ | 1,000.00 | $ | 1,015.41 | $ | 18.44 | |||||||||
Hypothetical (5% return before expense) | $ | 1,000.00 | $ | 1,006.84 | $ | 18.36 | |||||||||
4 Expenses are equal to the Fund's annualized expense ratio, net of expense waivers, of 2.88% for Class A shares and 3.64% for Class C shares, multiplied by the average account value over the period, multiplied by 184/366 days to reflect the one-half year period.
8
Pacific Advisors
Balanced Fund (unaudited)
Fund Objective: Long-term capital appreciation and income consistent with reduced risk.
Investment Invests primarily in large cap common stocks and investment grade U.S. corporate
Strategy: bonds. Invests at least 25% of its assets in fixed income securities and preferred stocks and at least 25% in equities.
Investor Profile: Moderately conservative. Seeks combination of long-term growth, income, liquidity and reduced risk of price fluctuations.
Please see the Chairman's Letter for a detailed market and economic review
as well as the Manager's general market outlook.
Portfolio Holdings (As of 12/31/16 based on total investments)
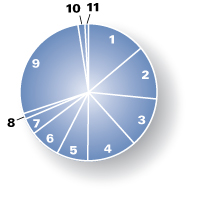
Equities | 69.94 | % | |||||||||
| 1. | Industrials | 13.87 | % | ||||||||
| 2. | Financials | 12.70 | % | ||||||||
| 3. | Information Technology | 11.82 | % | ||||||||
| 4. | Consumer Discretionary | 11.80 | % | ||||||||
| 5. | Energy | 7.34 | % | ||||||||
| 6. | Health Care | 7.18 | % | ||||||||
| 7. | Consumer Staples | 3.90 | % | ||||||||
| 8. | Telecommunication Services | 1.33 | % | ||||||||
| 9. | Corporate Bonds | 27.57 | % | ||||||||
| 10. | Preferred Stock | 1.64 | % | ||||||||
| 11. | Cash and Cash Equivalents | 0.85 | % | ||||||||
| Total Returns (For the year ended 12/31/16) | |||||||
Class A | 0.08 | % | |||||
Class C | –0.67 | % | |||||
| |||||||
S&P 500® Index1 | 11.96 | % | |||||
| Barclays Capital U.S. Intermediate Corporate Bond Index1 | 4.04 | % | |||||
Current expense ratio: 4.50% (A); 5.25% (C). Prospectus expense ratio: 3.27% (A); 4.05% (C).2
Performance quoted is past performance which does not guarantee future results. Current performance may be higher or lower than the performance quoted. Call (800) 989-6693 for performance current to the most recent month-end. The investment return and principal value of an investment will fluctuate so that an investor's shares, when redeemed, may be worth more or less than their original cost. Returns represent the change in value over the stated period assuming reinvestment of dividends and capital gains at net asset value. Returns do not take into account the maximum 5.75% sales charge on Class A shares or the 1% Contingent Deferred Sales Charge (CDSC) for Class C shares sold within one year of purchase. Returns would be lower if the applicable sales charge and CDSC were included. Returns do not take into account individual taxes which may reduce actual returns when shares are sold.
1 The S&P 500® Index is an unmanaged, market capitalization weighted index which measures the performance of the large cap segment of the U.S. equities market, covering approximately 75% of the U.S. equities market. The Index includes 500 leading companies in leading industries of the U.S. economy. Index returns assume the reinvestment of dividends, but, unlike the Fund's returns, do not reflect the effects of management fees or expenses. The Barclays Capital U.S. Intermediate Corporate Bond Index is an unmanaged index of publicly issued investment grade U.S. corporate bonds with one to ten years to maturity. It is not possible to invest directly in either Index.
2 "Current" expense ratio is as of 12/31/16. "Prospectus" expense ratio is for the fiscal year ended 12/31/15.
9
Pacific Advisors
Balanced Fund (unaudited) continued
Discussion with Portfolio Managers February 24, 2017
Charles Suh, CFA and Jingjing Yan, CFA
Fund Strategy
The Fund is designed for investors seeking to participate in the equity markets with reduced volatility. The Fund's strategy combines high-quality stocks across all market capitalizations with investment-grade corporate bonds. We identify leading, well-managed companies that generate high returns on capital and consistent earnings over a full economic cycle. We look to purchase stocks at a discount to our internal price targets with the expectation that, as the companies' growth strategies unfold, the stocks will appreciate over the medium-to-long-term. The Fund may experience periods of underperformance when short-term market trends overshadow long-term outlooks; yet, over time, performance should reflect the strength of these companies as they demonstrate the ability to grow through various economic and business cycles.
We manage the Fund's asset allocation based on our assessment of risk-appropriate investments in the context of the overall economic, market, and interest rate outlook. This balanced approach enables the Fund to take advantage of specific growth opportunities while reducing overall risk.
Fund Performance
During the second half of 2016, the Class A Shares of the Fund gained 3.79% to rebound from a loss during the first six months. For the year, Class A shares rose 0.08% to underperform the Fund's equity benchmark, the S&P 500® Index (11.96%), and the Fund's fixed income benchmark, the Barclays Capital U.S. Intermediate Corporate Bond Index (4.04%). During the second half of the year, the Fund benefitted as improving economic conditions, the post-election stock market rally, and OPEC's November agreement to curtail oil production raised investor confidence. The Fund's "all cap" equity strategy includes a relative overweighting in areas expected to respond more quickly than others to economic growth. Meanwhile, bond prices declined as many investors adjusted allocation strategies away from conservative investments; also, anticipation ahead of the Federal Reserve's decision to raise interest rates in December further pressured fixed income securities. The Fund's fixed income holdings remained concentrated in investment-grade issuers and shorter-term maturities (typically, three to five years) which helped minimize the effects of interest rate volatility.
What Helped/Hurt Performance1
The Fund's top contributors to returns during the second half of the year were Team, East West Bancorp, and Spirit Airlines. Team, which provides industrial maintenance services for refineries and petrochemical plants, gained 58% as oil prices rose ahead of OPEC's November meeting. The company has begun to benefit as clients are scheduling required maintenance projects which had been temporarily deferred due to budget constraints; these activities are expected to increase significantly in 2017. Regional bank East West Bancorp gained 50% as the expected rise in interest rates buoyed the outlook for higher profit margins from lending activities. The company, which focuses exclusively on the U.S. and greater China markets, serves ethnic Chinese and Chinese-American businesses and borrowers; specialized areas include health care, technology, and entertainment. Spirit Airlines, a low-cost airline, rose 29% as competitive pricing pressures eased and low fuel prices supported the industry's profits. The company strategically selects the flight routes to maximize returns on investment; and, its relatively young fleet of similar airplanes minimizes costly repairs and maintenance expenses.
1 For detailed information on Fund holdings, please see the Fund's Schedule of Investments in this Report.
10
The Fund's most significant detractors to returns were Stericycle, Chefs' Warehouse, and Cerner. Stericycle, which provides regulated waste processing treatments and disposal services for hospitals, physicians and other businesses, declined 23% as contract renewal pricing pressures weighed on company profits. While we believe the company will weather the storm in the long run, we sold the holding in favor of other areas with clearer growth opportunities. Chefs' Warehouse, a specialty foods distributor, fell 22% as the continued challenges in integrating a major acquisition weighed on operating and financial results. Changes to the company's inventory management system and sales organization should return the company to profitable growth in 2017. Cerner provides healthcare IT services to over 25,000 facilities in more than thirty countries. The company's shares lost 19% as uncertainty in the healthcare industry impacted customer spending plans. Nevertheless, the substantial demand for electronic health records and advanced data analytics should enable the company to expand its market leading position over a long-term horizon.
During the period, the Fund continued to adjust the equity portfolio to increase diversification and lessen price volatility. New holdings included Signature Bank, Healthcare Services Group, and Morningstar. Signature Bank offers premier business and personal banking services in the New York metropolitan area. The bank has an exceptional track record of profitable growth by serving privately-owned business clients, their owners and senior managers. Healthcare Services Group provides management and administration for housekeeping/laundry and dining/nutrition services to nursing homes, hospitals and hospice care facilities in the U.S. The business generates attractive returns on capital and reports an average annual growth rate exceeding 10% over the past ten years. Morningstar provides investment research, analysis and related services to retail and institutional investors. A subsidiary company, which is registered with the SEC as a nationally recognized statistical rating organization (NRSRO), received approval to rate corporate and financial institution bond issuances; this business provides significant growth opportunities in addition to the company's subscription-based services for advisors, asset managers and investors.
Looking Ahead
The long-awaited rotation from conservative investments to growth-oriented strategies appears to be underway. As a candidate, now-President Trump proposed several business-friendly initiatives, including tax reform and reduced regulations, which, along with plans for fiscal stimulus, could spur a wave of investment and growth. The Fund's focus on high-quality stocks with attractive long-term prospects should benefit from the improved economic outlook. The ongoing recovery in energy-related activity may also provide a boost to holdings such as Schlumberger, the world's largest energy services provider, and Core Laboratories, which provides reservoir analysis and production enhancement tools. And, rising interest rates should support improved profits for financial institutions, including East West Bancorp and Signature Bank. At the same time, market forces and Fed interest rate increases may further pressure bond prices in 2017; accordingly, the Fund anticipates maintaining its fixed income allocation at the lower end of its historical range, while remaining concentrated in investment-grade bonds with shorter-term maturities.
11
Pacific Advisors
Balanced Fund (unaudited) continued
Change in Value of $10,000 Investment1
This chart compares the growth of a $10,000 investment in Class A shares of the Balanced Fund for the period January 1, 2007 through December 31, 2016 with the same investment in the S&P 500® Index2 and the Barclays Capital U.S. Intermediate Corporate Bond Index3.

Average Annual Compounded Returns as of December 31, 2016
Class A | Class C | S&P 500® Index | Barclays Capital U.S. Int Corp Bond Index | ||||||||||||||||
One Year | – 5.70 | % | – 1.66 | % | 11.96 | % | 4.04 | % | |||||||||||
Five Year | 0.41 | % | 0.84 | % | 14.66 | % | 3.63 | % | |||||||||||
Ten Year | – 0.20 | % | – 0.38 | % | 6.95 | % | 4.94 | % | |||||||||||
Past performance does not guarantee future results. Performance quoted represents past performance. Current performance may be higher or lower than the performance data quoted. Returns include reinvested dividends and capital gains. Returns for Class A shares reflect a maximum front-end sales charge of 5.75%; and returns for Class C shares reflect the deduction of a contingent deferred sales charge of 1% on shares sold within the first year of purchase. Returns do not take into account individual taxes which may reduce actual returns when shares are sold. The investment return and principal value of an investment will fluctuate so that an investor's shares, when redeemed, may be worth more or less than their original cost. Call (800) 989-6693 for the most recent month-end performance.
1 Fund results are shown for Class A shares and reflect deduction of the maximum front-end sales charge of 5.75% on the $10,000 investment for a net amount invested of $9,425. At the end of the same period, a $10,000 investment in Class C shares would have been valued at $9,632, and no contingent deferred sales charges would apply. Performance of the share classes will vary based on the difference in charges and expenses. The inception date is 02/08/93 for Class A shares and 04/01/98 for Class C shares. It is not possible to invest directly in either Index. Index results assume reinvestment of dividends, but, unlike the Fund's results, do not reflect sales charges, fees or expenses.
2 The Standard & Poor's 500® Index is an unmanaged, market capitalization weighted index which measures the performance of the large cap segment of the U.S. equities market, covering approximately 75% of the U.S. equities market. The Index includes 500 leading companies in leading industries of the U.S. economy.
3 The Barclays Capital U.S. Intermediate Corporate Bond Index is an unmanaged index of publicly issued investment grade U.S. corporate bonds with one to ten years to maturity.
12
Expense Examples
As a shareholder of the Fund you incur two types of costs: (1) transaction costs, including sales charges (loads) on purchase payments, reinvested dividends, or other distributions; redemption fees; and exchange fees; and (2) ongoing costs, including management fees; distribution (12b-1) fees; and other Fund expenses. This Example is intended to help you understand your ongoing costs (in dollars) of investing in the Fund and to compare these costs with the ongoing costs of investing in other mutual funds.
The Example is based on an investment of $1,000 invested at the beginning of the period and held for the entire period from July 1, 2016 through December 31, 2016.
Actual Expenses
The first line of the table below provides information about actual account values and actual expenses. You may use the information in this line, together with the amount you invested, to estimate the expenses that you paid over the period. Simply divide your account value by $1,000 (for example, an $8,600 account value divided by $1,000 = 8.6), then multiply the result by the number in the first line under the heading entitled "Expenses Paid During the Period" to estimate the expenses you paid on your account during the period.
The following transaction costs are not included in the expenses shown in the table and, if applicable, would increase the expenses that you paid over the period: (1) a front-end sales charge (load) of 5.75% on Class A shares; (2) a 2% redemption fee if you sell or exchange shares within 180 days of purchase, with certain exceptions. The redemption fee does not apply to: (a) redemptions under an automatic withdrawal program or periodic asset reallocation plan, required minimum distributions (RMD), employer mandated distributions from a qualified plan, or redemptions under a qualified domestic relations order (QDRO); (b) redemptions to pay for expenses related to terminal illness, extended hospital or nursing home care, or other serious medical conditions, including death; (c) redemptions of shares acquired through dividend or capital gains reinvestments; (d) loans from a qualified plan account, and (e) redemptions initiated by the Fund; and (3) a $10 service fee on each exchange after the first five exchanges in each calendar year.
The following ongoing costs are not included in the expenses shown in the table and, if applicable, would increase the expenses that you paid over the period: (1) a $12 low balance fee on accounts with balances of less than $250 as of September 30th of each calendar year and no investment activity (excluding reinvestment of dividends and/or capital gains) during the prior calendar year or the first nine months of the current calendar year. This fee does not apply to IRAs, qualified plan accounts, or Coverdell Education Savings Accounts; (2) a $15 annual custodial fee on IRAs, SEPs, SIMPLE IRAs, and Coverdell Education Savings Accounts; and (3) a $20 annual custodial fee on 403(b) accounts.
Hypothetical Example for Comparison Purposes
The second line of the table below provides information about hypothetical account values and hypothetical expenses based on the Fund's actual expense ratio and an assumed rate of return of 5% per year before expenses, which in not the Fund's actual return. The hypothetical account values and expenses may not be used to estimate the actual ending account balance or expenses you paid for the period. You may use this information to compare the ongoing costs of investing in the Fund and other funds. To do so, compare this 5% hypothetical example with the 5% hypothetical examples that appear in the shareholder reports of the other funds.
The following transaction costs are not included in the expenses shown in the table and, if applicable, would increase the expenses that you paid over the period: (1) a front-end sales charge (load) of 5.75% on Class A shares; (2) a 2% redemption fee if you sell or exchange shares within 180 days of purchase, with certain exceptions. The redemption fee does not apply to: (a) redemptions under an automatic withdrawal program or periodic asset reallocation plan, required minimum distributions (RMD), employer mandated distributions from a qualified plan, or redemptions under a qualified domestic relations order (QDRO); (b) redemptions to pay for expenses related to terminal illness, extended hospital or nursing home care, or other serious medical conditions, including death; (c) redemptions of shares acquired through dividend or capital gains reinvestments; (d) loans from a qualified plan account, and (e) redemptions initiated by the Fund; and (3) a $10 service fee on each exchange after the first five exchanges in each calendar year.
The following ongoing costs are not included in the expenses shown in the table and, if applicable, would increase the expenses that you paid over the period: (1) a $12 low balance fee on accounts with balances of less than $250 as of September 30th of each calendar year and no investment activity (excluding reinvestment of dividends and/or capital gains) during the prior calendar year or the first nine months of the current calendar year. This fee does not apply to IRAs, qualified plan accounts, or Coverdell Education Savings Accounts; (2) a $15 annual custodial fee on IRAs, SEPs, SIMPLE IRAs, and Coverdell Education Savings Accounts; and (3) a $20 annual custodial fee on 403(b) accounts.
Please note that the expenses shown in the table are meant to highlight your ongoing costs only and do not reflect any transactional costs, such as sales charges (loads), redemption fees, or exchange fees. Therefore, the second line of the table is useful in comparing ongoing costs only, and will not help you determine the relative total costs of owning different funds. In addition, if these transactional costs were included, your costs would have been higher.
| Beginning Account Value 07/01/16 | Ending Account Value 12/31/16 | Expense Paid During Period 07/01/16 – 12/31/16 | |||||||||||||
Balanced Fund Class A | |||||||||||||||
Actual | $ | 1,000.00 | $ | 1,037.91 | $ | 23.05 | |||||||||
Hypothetical (5% return before expense) | $ | 1,000.00 | $ | 1,002.51 | $ | 22.65 | |||||||||
Balanced Fund Class C | |||||||||||||||
Actual | $ | 1,000.00 | $ | 1,034.68 | $ | 26.85 | |||||||||
Hypothetical (5% return before expense) | $ | 1,000.00 | $ | 998.74 | $ | 26.38 | |||||||||
4 Expenses are equal to the Fund's annualized expense ratio of 4.50% for Class A shares and 5.25% for Class C shares, multiplied by the average account value over the period, multiplied by 184/366 days to reflect the one-half year period.
13
Pacific Advisors
Large Cap Value Fund (unaudited)
Fund Objective: Long-term capital appreciation.
Investment Invests at least 80% of its assets in large cap companies that are, at the time of
Strategy: purchase, within the market cap range of companies in the S&P 500® Index1.
Investor Profile: Conservative equity. Growth-oriented with a long-term investment horizon.
Please see the Chairman's Letter for a detailed market and economic review
as well as the Manager's general market outlook.
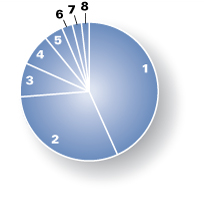
Portfolio Holdings (As of 12/31/16 based on total investments)
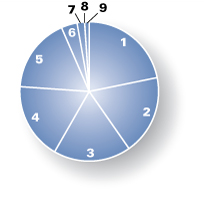
Equities | 98.94 | % | |||||||||
| 1. | Information Technology | 21.81 | % | ||||||||
| 2. | Consumer Discretionary | 18.47 | % | ||||||||
| 3. | Financials | 18.03 | % | ||||||||
| 4. | Consumer Staples | 17.79 | % | ||||||||
| 5. | Industrials | 17.36 | % | ||||||||
| 6. | Health Care | 3.72 | % | ||||||||
| 7. | Energy | 1.74 | % | ||||||||
| 8. | Materials | 0.02 | % | ||||||||
| 9. | Cash and Cash Equivalents | 1.06 | % | ||||||||
| Total Returns (For the year ended 12/31/16) | |||||||
Class A | 9.08 | % | |||||
Class C | 8.24 | % | |||||
| |||||||
S&P 500® Index | 11.96 | % | |||||
Current expense ratio: net 3.85% (A), 4.59% (C); gross 4.60% (A), 5.34% (C). Prospectus expense ratio: net 2.72% (A), 3.50% (C); gross 3.47% (A); 4.25% (C).2
Performance quoted is past performance which does not guarantee future results. Current performance may be higher or lower than the performance quoted. Call (800) 989-6693 for performance current to the most recent month-end. The investment return and principal value of an investment will fluctuate so that an investor's shares, when redeemed, may be worth more or less than their original cost. Returns represent the change in value over the stated period assuming reinvestment of dividends and capital gains at net asset value. Returns do not take into account the maximum 5.75% sales charge on Class A shares or the 1% Contingent Deferred Sales Charge (CDSC) for Class C shares sold within one year of purchase. Returns would be lower if the applicable sales charge and CDSC were included. Returns do not take into account individual taxes which may reduce actual returns when shares are sold.
The Fund's investment adviser is waiving a portion of its management fees pursuant to an Expense Limitation Agreement. The waiver may be discontinued at any time with ninety days written notice in consultation with the Fund's board, but is expected to continue at current levels. Please see the Notes to Financial Statements in this report for details. Performance shown reflects the waiver, without which the results would have been lower.
1 The Standard & Poor's 500® Index is an unmanaged, market capitalization weighted index which measures the performance of the large cap segment of the U.S. equities market, covering approximately 75% of the U.S. equities market. The Index includes 500 leading companies in leading industries of the U.S. economy. Index returns assume the reinvestment of dividends, but, unlike the Fund's returns, do not reflect the effects of management fees or expenses. It is not possible to invest directly in the Index.
2 "Current" expense ratio is as of 12/31/16. "Prospectus" expense ratio is for the fiscal year ended 12/31/15.
14
Discussion with Portfolio Manager February 24, 2017
Samuel C. Coquillard
Fund Strategy
The Fund uses a value-oriented, focused portfolio strategy (34 holdings as of 12/31/16) to invest in more conservative, less volatile U.S. stocks that pay attractive dividends. The Fund seeks to achieve long-term capital appreciation with reduced volatility. Holdings concentrate on mega-cap stocks of well-managed companies with dominant market positions, strong financials, and track records of steady growth. The weighted average market capitalization of Fund holdings ($196 billion as of 12/31/16) is almost five times larger than the average of the benchmark S&P 500® Index. The mega-cap emphasis helps achieve stable total returns with less volatility than the broader market; as of December 31st, the Fund's one-year beta1 of 0.97 remains consistently below the Index. The weighted average dividend yield was 2.08%; several holdings, including Coca-Cola, Proctor & Gamble, ExxonMobil, and International Business Machines, paid dividends in excess of 3.00%.
Fund Performance
During the second half of the year, Class A shares gained 8.85% compared to the S&P 500® Index's gain of 6.67%. Improving economic conditions, the post-election prospects for a business-friendly administration, and OPEC's November agreement to curtail oil production raised investor sentiment. Equity markets, despite a worst-ever start to the year, reached all-time highs in December. For 2016, Class A shares gained 9.08% while the benchmark gained 11.96%. In recent years, market performance was primarily driven by demand for conservative stocks; in contrast, the second half of the year marked a rotation away from these lower risk investments into sectors that typically respond well to economic growth. Specifically, the Fund's allocation to Industrials companies (including Machinery and Air Freight companies) and Media companies during the period helped performance while the Fund's underallocation to the Energy sector hurt performance.
What Helped/Hurt Performance2
The Fund's top three contributors to returns during the second half were Time Warner, MetLife, and Microsoft. Diversified media and entertainment company, Time Warner Inc., which owns Turner, HBO, and Warner Bros., gained over 32% during the period after the company agreed to an $84.5 billion acquisition by AT&T. The proposed merger, which awaits regulatory approval, would create a media and telecommunication giant capable of producing and distributing content to millions with wireless phones, broadband subscriptions, and satellite TV connections. MetLife, the nation's largest insurance provider, increased over 37%; the company, along with others in the financial sector, gained in anticipation of a roll back of financial regulations as well as a higher interest rate environment. Microsoft shares rose above its historical high, set in 1999, as growth in the company's cloud-based businesses is helping offset weakness in PCs.
The Fund's bottom three detractors to returns were Lowe's Companies, Coca-Cola, and Oracle. Home improvement retailer Lowe's fell over 9% during the period after reporting lower profitability and weaker comparable sales trends compared to analyst estimates. Still, the company's longer-term outlook remains positive; the home improvement industry, a beneficiary of the strong housing market, is expected to
1 "Beta" measures volatility relative to the stock market or an alternative benchmark. A beta less than 1.0 indicates lower risk than the market or the benchmark; a beta greater than 1.0 indicates higher risk than the market or the benchmark.
2 For detailed information on Fund holdings, please see the Fund's Schedule of Investments in this Report.
15
Pacific Advisors
Large Cap Value Fund (unaudited) continued
outpace the broader retail market. Coca-Cola reported modest volume growth amid challenging global economic conditions, particularly in Latin America, and shifting consumer preferences. The company's focus on new product innovation, acquisitions of non-carbonated beverage products, and a unified "One Brand" marketing strategy should drive stronger growth in 2017. Enterprise software and database company Oracle fell 5% as weak hardware sales and the company's transition to the recurring revenues of its cloud subscription services are pressuring licensing sales in the short-term.
Looking Ahead
We expect the U.S. economy to expand at a moderate, or better, pace. Pledges by the new administration to initiate business-friendly initiatives, including tax reform and reduced regulations, and infrastructure spending, could spur a wave of investment and growth. Economic data, such as job creation, wage growth, consumer spending, and housing, remain encouraging. Meanwhile, the Fed, which cited on-going improvements in the economy when raising interest rates in December, expects to gradually raise interest rates in 2017. These factors support the appeal of stocks as investors rotate from "safe havens." The Fund, with considerable holdings in well-known market leaders, would likely benefit as these investors favor companies with strong international operations that are positioned to participate in the global economic expansion.
16
Change in Value of $10,000 Investment1
This chart compares the growth of a $10,000 investment in Class A shares of the Large Cap Value Fund for the period January 1, 2007 through December 31, 2016 with the same investment in the S&P 500® Index2.
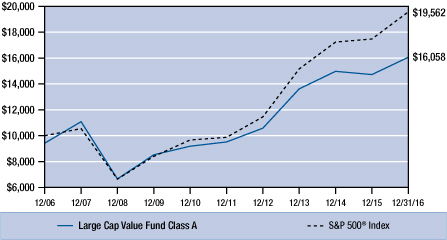
Average Annual Compounded Returns as of December 31, 2016
Class A | Class C | S&P 500® Index | |||||||||||||
One Year | 2.80 | % | 7.24 | % | 11.96 | % | |||||||||
Five Year | 9.72 | % | 10.20 | % | 14.66 | % | |||||||||
Ten Year | 4.85 | % | 4.67 | % | 6.95 | % | |||||||||
Past performance does not guarantee future results. Performance quoted represents past performance. Current performance may be higher or lower than the performance data quoted. Returns include reinvested dividends and capital gains. Returns for Class A shares reflect a maximum front-end sales charge of 5.75%; and returns for Class C shares reflect the deduction of a contingent deferred sales charge of 1% on shares sold within the first year of purchase. Returns do not take into account individual taxes which may reduce actual returns when shares are sold. The investment return and principal value of an investment will fluctuate so that an investor's shares, when redeemed, may be worth more or less than their original cost. Call (800) 989-6693 for the most recent month-end performance.
1 Fund results are shown for Class A shares and reflect deduction of the maximum front-end sales charge of 5.75% on the $10,000 investment for a net amount invested of $9,425. At the end of the same period, a $10,000 investment in Class C shares would have been valued at $15,777, and no contingent deferred sales charges would apply. Performance of the share classes will vary based on the difference in charges and expenses. The inception date for Class A shares and Class C shares is 05/01/99. It is not possible to invest directly in either Index. Index results assume reinvestment of dividends, but, unlike the Fund's results, do not reflect sales charges, fees or expenses.
2 The Standard & Poor's 500® Index is an unmanaged, market capitalization weighted index which measures the performance of the large cap segment of the U.S. equities market, covering approximately 75% of the U.S. equities market. The Index includes 500 leading companies in leading industries of the U.S. economy.
17
Pacific Advisors
Large Cap Value Fund (unaudited) continued
Expense Examples
As a shareholder of the Fund you incur two types of costs: (1) transaction costs, including sales charges (loads) on purchase payments, reinvested dividends, or other distributions; redemption fees; and exchange fees; and (2) ongoing costs, including management fees; distribution (12b-1) fees; and other Fund expenses. This Example is intended to help you understand your ongoing costs (in dollars) of investing in the Fund and to compare these costs with the ongoing costs of investing in other mutual funds.
The Example is based on an investment of $1,000 invested at the beginning of the period and held for the entire period from July 1, 2016 through December 31, 2016.
Actual Expenses
The first line of the table below provides information about actual account values and actual expenses. You may use the information in this line, together with the amount you invested, to estimate the expenses that you paid over the period. Simply divide your account value by $1,000 (for example, an $8,600 account value divided by $1,000 = 8.6), then multiply the result by the number in the first line under the heading entitled "Expenses Paid During the Period" to estimate the expenses you paid on your account during the period.
The following transaction costs are not included in the expenses shown in the table and, if applicable, would increase the expenses that you paid over the period: (1) a front-end sales charge (load) of 5.75% on Class A shares; (2) a 2% redemption fee if you sell or exchange shares within 180 days of purchase, with certain exceptions. The redemption fee does not apply to: (a) redemptions under an automatic withdrawal program or periodic asset reallocation plan, required minimum distributions (RMD), employer mandated distributions from a qualified plan, or redemptions under a qualified domestic relations order (QDRO); (b) redemptions to pay for expenses related to terminal illness, extended hospital or nursing home care, or other serious medical conditions, including death; (c) redemptions of shares acquired through dividend or capital gains reinvestments; (d) loans from a qualified plan account, and (e) redemptions initiated by the Fund; and (3) a $10 service fee on each exchange after the first five exchanges in each calendar year.
The following ongoing costs are not included in the expenses shown in the table and, if applicable, would increase the expenses that you paid over the period: (1) a $12 low balance fee on accounts with balances of less than $250 as of September 30th of each calendar year and no investment activity (excluding reinvestment of dividends and/or capital gains) during the prior calendar year or the first nine months of the current calendar year. This fee does not apply to IRAs, qualified plan accounts, or Coverdell Education Savings Accounts; (2) a $15 annual custodial fee on IRAs, SEPs, SIMPLE IRAs, and Coverdell Education Savings Accounts; and (3) a $20 annual custodial fee on 403(b) accounts.
Hypothetical Example for Comparison Purposes
The second line of the table below provides information about hypothetical account values and hypothetical expenses based on the Fund's actual expense ratio and an assumed rate of return of 5% per year before expenses, which in not the Fund's actual return. The hypothetical account values and expenses may not be used to estimate the actual ending account balance or expenses you paid for the period. You may use this information to compare the ongoing costs of investing in the Fund and other funds. To do so, compare this 5% hypothetical example with the 5% hypothetical examples that appear in the shareholder reports of the other funds.
The following transaction costs are not included in the expenses shown in the table and, if applicable, would increase the expenses that you paid over the period: (1) a front-end sales charge (load) of 5.75% on Class A shares; (2) a 2% redemption fee if you sell or exchange shares within 180 days of purchase, with certain exceptions. The redemption fee does not apply to: (a) redemptions under an automatic withdrawal program or periodic asset reallocation plan, required minimum distributions (RMD), employer mandated distributions from a qualified plan, or redemptions under a qualified domestic relations order (QDRO); (b) redemptions to pay for expenses related to terminal illness, extended hospital or nursing home care, or other serious medical conditions, including death; (c) redemptions of shares acquired through dividend or capital gains reinvestments; (d) loans from a qualified plan account, and (e) redemptions initiated by the Fund; and (3) a $10 service fee on each exchange after the first five exchanges in each calendar year.
The following ongoing costs are not included in the expenses shown in the table and, if applicable, would increase the expenses that you paid over the period: (1) a $12 low balance fee on accounts with balances of less than $250 as of September 30th of each calendar year and no investment activity (excluding reinvestment of dividends and/or capital gains) during the prior calendar year or the first nine months of the current calendar year. This fee does not apply to IRAs, qualified plan accounts, or Coverdell Education Savings Accounts; (2) a $15 annual custodial fee on IRAs, SEPs, SIMPLE IRAs, and Coverdell Education Savings Accounts; and (3) a $20 annual custodial fee on 403(b) accounts.
Please note that the expenses shown in the table are meant to highlight your ongoing costs only and do not reflect any transactional costs, such as sales charges (loads), redemption fees, or exchange fees. Therefore, the second line of the table is useful in comparing ongoing costs only, and will not help you determine the relative total costs of owning different funds. In addition, if these transactional costs were included, your costs would have been higher.
| Beginning Account Value 07/01/16 | Ending Account Value 12/31/16 | Expense Paid During Period 07/01/16 – 12/31/16 | |||||||||||||
Large Cap Value Fund Class A | |||||||||||||||
Actual | $ | 1,000.00 | $ | 1,088.46 | $ | 20.21 | |||||||||
Hypothetical (5% return before expense) | $ | 1,000.00 | $ | 1,005.78 | $ | 19.41 | |||||||||
Large Cap Value Fund Class C | |||||||||||||||
Actual | $ | 1,000.00 | $ | 1,084.21 | $ | 24.05 | |||||||||
Hypothetical (5% return before expense) | $ | 1,000.00 | $ | 1,002.06 | $ | 23.10 | |||||||||
5 Expenses are equal to the Fund's annualized expense ratio, net of expense waivers, of 3.85% for Class A shares and 4.59% for Class C shares, multiplied by the average account value over the period, multiplied by 184/366 days to reflect the one-half year period.
18
Pacific Advisors
Mid Cap Value Fund (unaudited)
Fund Objective: Long-term capital appreciation.
Investment Invests at least 80% of its assets in mid-cap companies that are, at the time of
Strategy: purchase, within the market cap range of companies in the Russell Midcap® Index.1
Investor Profile: Moderately aggressive. Growth-oriented with a long-term investment horizon.
Please see the Chairman's Letter for a detailed market and economic review
as well as the Manager's general market outlook.
Portfolio Holdings (As of 12/31/16 based on total investments)
Equities | 100.00 | % | |||||||||
| 1. | Industrials | 43.26 | % | ||||||||
| 2. | Consumer Discretionary | 30.50 | % | ||||||||
| 3. | Financials | 7.92 | % | ||||||||
| 4. | Energy | 7.39 | % | ||||||||
| 5. | Information Technology | 4.45 | % | ||||||||
| 6. | Consumer Staples | 2.51 | % | ||||||||
| 7. | Health Care | 2.16 | % | ||||||||
| 8. | Materials | 1.81 | % | ||||||||
| Total Returns (For the year ended 12/31/16) | |||||||
Class A | 14.59 | % | |||||
Class C | 13.76 | % | |||||
| |||||||
Russell Midcap® Index | 13.80 | % | |||||
Current expense ratio: 4.74% (A); 5.54% (C). Prospectus expense ratio: 3.68% (A); 4.46% (C).2
Performance quoted is past performance which does not guarantee future results. Current performance may be higher or lower than the performance quoted. Call (800) 989-6693 for performance current to the most recent month-end. The investment return and principal value of an investment will fluctuate so that an investor's shares, when redeemed, may be worth more or less than their original cost. Returns represent the change in value over the stated period assuming reinvestment of dividends and capital gains at net asset value. Returns do not take into account the maximum 5.75% sales charge on Class A shares or the 1% Contingent Deferred Sales Charge (CDSC) for Class C shares sold within one year of purchase. Returns would be lower if the applicable sales charge and CDSC were included. Returns do not take into account individual taxes which may reduce actual returns when shares are sold.
1 The Russell Midcap® Index is an unmanaged, weighted measure of the 800 smallest companies within the Russell 1000® Index based on a combination of their market cap and current index membership. Index returns assume the reinvestment of dividends, but, unlike the Fund's returns, do not reflect management fees or expenses. It is not possible to invest directly in the Index.
2 "Current" expense ratio is as of 12/31/16. "Prospectus" expense ratio is for the fiscal year ended 12/31/15.
19
Pacific Advisors
Mid Cap Value Fund (unaudited) continued
Discussion with Portfolio Manager February 24, 2017
George A. Henning
Fund Strategy
Mid-cap companies provide distinctive advantages for long-term investors by combining the strategic flexibility of smaller businesses with the economies of scale typically enjoyed by large corporations. The Fund uses a fundamental, bottom-up strategy to identify leading mid-cap companies with attractive opportunities for long-term appreciation. Our focused, value-oriented approach selects approximately 30 to 40 stocks; we expect to hold each investment for 3 to 5 years, or longer. Our long-term investment horizon typically reduces turnover and contributes to tax efficiency by minimizing the realization of short-term gains. As of year-end, the Fund's low annual turnover rate of 13% was consistent with its five-year average annual turnover rate of 20%1.
Fund Performance
The Fund meaningfully outperformed its benchmark over the final six months of 2016; Class A shares surged 16.52%, compared to a 6.93% gain for the Russell Midcap® Index. For the full year, the Fund (Class A) gained 14.59% to modestly outpace the Index's 13.80% return. Stock selection was the main driver of the impressive performance during the second half of the year. The Fund's low turnover ratio reflects its long-term investment strategy in well-managed, industry-leading companies with opportunities for long-term appreciation. The Fund also benefitted from a relative overweighting in areas that respond well to economic growth, such as retailers and transportation companies. President Trump's election in November and Republican control of both houses of Congress signaled policy changes in favor of corporate tax reform, reduced regulations, and infrastructure spending. The prospect of these growth-oriented policies reignited investor enthusiasm in stocks, particularly those with attractive growth opportunities, including many Fund holdings.
What Helped/Hurt Performance2
The Fund's top three contributors to returns were Navistar International, Penske Automotive Group, and Conn's. Navistar, a commercial truck manufacturer, rose 168% following the announcement in September of an alliance with Volkswagen Truck & Bus, a subsidiary of Volkswagen AG. The alliance, which includes an equity investment, strategic technology collaboration, and a procurement joint venture, could lead to a potential acquisition of the company by the German automotive company. Penske Automotive, a global retailer of cars and trucks, rose 67%; the stock had suffered in the wake of the unexpected Brexit vote, but rallied on strong earnings results; the company also reported better-than-expected performance in the U.K. which accounts for roughly a third of overall revenues. Conn's, a furniture and appliances retailer, rose 68% as signs of a turnaround in its credit operations emerged. The company's revised underwriting standards are lowering delinquencies on new loans; and, the company's recently implemented rate increase on loans in Texas (where the majority of its stores are located) should contribute to increased earnings growth.
1 Annual turnover: 13% (2016); 25% (2015); 22% (2014); 15% (2013); and 24% (2012)
2 For detailed information on Fund holdings, please see the Fund's Schedule of Investments in this Report.
20
The Fund's bottom three detractors to returns were Noble, Stericycle, and Tractor Supply. Noble, an offshore drilling rig contractor, declined 28%; the disappointing performance seems to have reflected the market's pessimistic outlook for the deep-water industry, in general. Yet, many offshore projects, particularly in the Gulf of Mexico, are profitable at oil prices as low as $40 per barrel. Noble, which owns an industry leading fleet, operates roughly half of its high-specification rigs in the Gulf where activity should recover sooner than other offshore areas. Stericycle, a hazardous waste disposal and document shredding services provider, declined 26% as volatile commodity prices (specifically paper and other materials) weighed on profits; we expect the impact of short-term commodity prices to ease over time. Tractor Supply, a retailer that caters to recreational ranchers and farmers in rural communities, declined 16% as the economic slow-down in energy-producing states and lower pre-season demand for cold weather items, such as power generators, reduced sales. The company remains one of the most attractive long-term growth stories in retail, with an opportunity to eventually expand from 1,600 stores to over 2,500.
During the period, the Fund added to positions in CIT Group and Conn's. CIT Group is undergoing a transformation to focus on commercial banking in North America; the company's transition includes divesting its commercial aircraft leasing portfolio. Over time, these changes should drive further appreciation in the bank's already attractive valuation. The Fund trimmed positions in Navistar International, Penske Automotive Group, and Swift Transportation as these stocks approached our internal price and allocation targets.
Looking Ahead
The second half of 2016 marked a turnaround from the two-year period during which headline news events had created uncertain market conditions. Improving global economies and stabilization in the energy sector began to encourage investors to move away from "safe havens" in favor of growth opportunities in sectors such as Industrials, Energy, Specialty Retail and Financials. Pledges by President Trump and Republican-led Congress to initiate more pro-growth measures through tax reform, deregulation and infrastructure spending could be significant catalysts for additional growth. As demonstrated by the Fund's strong performance over in the latter portion of 2016, the Fund's investment strategy has been well-positioned to take advantage of the improving business outlook.
21
Pacific Advisors
Mid Cap Value Fund (unaudited) continued
Change in Value of $10,000 Investment1
This chart compares the growth of a $10,000 investment in Class A shares of the Mid Cap Value Fund for the period January 1, 2007 through December 31, 2016 with the same investment in the Russell Midcap® Index2.
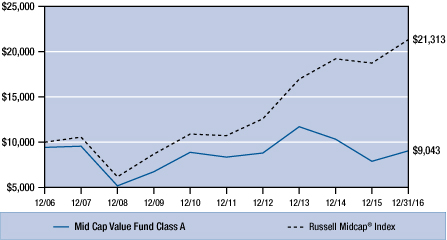
Average Annual Compounded Returns as of December 31, 2016
Class A | Class C | Russell Midcap® Index | |||||||||||||
One Year | 7.97 | % | 12.76 | % | 13.80 | % | |||||||||
Five Year | 0.41 | % | 0.83 | % | 14.72 | % | |||||||||
Ten Year | – 1.00 | % | – 1.22 | % | 7.86 | % | |||||||||
Past performance does not guarantee future results. Performance quoted represents past performance. Current performance may be higher or lower than the performance data quoted. Returns include reinvested dividends and capital gains. Returns for Class A shares reflect a maximum front-end sales charge of 5.75%; and returns for Class C shares reflect the deduction of a contingent deferred sales charge of 1% on shares sold within the first year of purchase. Returns do not take into account individual taxes which may reduce actual returns when shares are sold. The investment return and principal value of an investment will fluctuate so that an investor's shares, when redeemed, may be worth more or less than their original cost. Call (800) 989-6693 for the most recent month-end performance.
1 Fund results are shown for Class A shares and reflect deduction of the maximum front-end sales charge of 5.75% on the $10,000 investment for a net amount invested of $9,425. At the end of the same period, a $10,000 investment in Class C shares would have been valued at $8,844, and no contingent deferred sales charges would apply. Performance of the share classes will vary based on the difference in charges and expenses. The inception date for Class A shares and Class C shares is 04/01/02. It is not possible to invest directly in either Index. Index results assume reinvestment of dividends, but, unlike the Fund's results, do not reflect sales charges, fees or expenses.
2 The Russell Midcap® Index is an unmanaged, weighted measure of the 800 smallest companies within the Russell 1000® Index based on a combination of their market cap and current index membership.
22
Expense Examples
As a shareholder of the Fund you incur two types of costs: (1) transaction costs, including sales charges (loads) on purchase payments, reinvested dividends, or other distributions; redemption fees; and exchange fees; and (2) ongoing costs, including management fees; distribution (12b-1) fees; and other Fund expenses. This Example is intended to help you understand your ongoing costs (in dollars) of investing in the Fund and to compare these costs with the ongoing costs of investing in other mutual funds.
The Example is based on an investment of $1,000 invested at the beginning of the period and held for the entire period from July 1, 2016 through December 31, 2016.
Actual Expenses
The first line of the table below provides information about actual account values and actual expenses. You may use the information in this line, together with the amount you invested, to estimate the expenses that you paid over the period. Simply divide your account value by $1,000 (for example, an $8,600 account value divided by $1,000 = 8.6), then multiply the result by the number in the first line under the heading entitled "Expenses Paid During the Period" to estimate the expenses you paid on your account during the period.
The following transaction costs are not included in the expenses shown in the table and, if applicable, would increase the expenses that you paid over the period: (1) a front-end sales charge (load) of 5.75% on Class A shares; (2) a 2% redemption fee if you sell or exchange shares within 180 days of purchase, with certain exceptions. The redemption fee does not apply to: (a) redemptions under an automatic withdrawal program or periodic asset reallocation plan, required minimum distributions (RMD), employer mandated distributions from a qualified plan, or redemptions under a qualified domestic relations order (QDRO); (b) redemptions to pay for expenses related to terminal illness, extended hospital or nursing home care, or other serious medical conditions, including death; (c) redemptions of shares acquired through dividend or capital gains reinvestments; (d) loans from a qualified plan account, and (e) redemptions initiated by the Fund; and (3) a $10 service fee on each exchange after the first five exchanges in each calendar year.
The following ongoing costs are not included in the expenses shown in the table and, if applicable, would increase the expenses that you paid over the period: (1) a $12 low balance fee on accounts with balances of less than $250 as of September 30th of each calendar year and no investment activity (excluding reinvestment of dividends and/or capital gains) during the prior calendar year or the first nine months of the current calendar year. This fee does not apply to IRAs, qualified plan accounts, or Coverdell Education Savings Accounts; (2) a $15 annual custodial fee on IRAs, SEPs, SIMPLE IRAs, and Coverdell Education Savings Accounts; and (3) a $20 annual custodial fee on 403(b) accounts.
Hypothetical Example for Comparison Purposes
The second line of the table below provides information about hypothetical account values and hypothetical expenses based on the Fund's actual expense ratio and an assumed rate of return of 5% per year before expenses, which in not the Fund's actual return. The hypothetical account values and expenses may not be used to estimate the actual ending account balance or expenses you paid for the period. You may use this information to compare the ongoing costs of investing in the Fund and other funds. To do so, compare this 5% hypothetical example with the 5% hypothetical examples that appear in the shareholder reports of the other funds.
The following transaction costs are not included in the expenses shown in the table and, if applicable, would increase the expenses that you paid over the period: (1) a front-end sales charge (load) of 5.75% on Class A shares; (2) a 2% redemption fee if you sell or exchange shares within 180 days of purchase, with certain exceptions. The redemption fee does not apply to: (a) redemptions under an automatic withdrawal program or periodic asset reallocation plan, required minimum distributions (RMD), employer mandated distributions from a qualified plan, or redemptions under a qualified domestic relations order (QDRO); (b) redemptions to pay for expenses related to terminal illness, extended hospital or nursing home care, or other serious medical conditions, including death; (c) redemptions of shares acquired through dividend or capital gains reinvestments; (d) loans from a qualified plan account, and (e) redemptions initiated by the Fund; and (3) a $10 service fee on each exchange after the first five exchanges in each calendar year.
The following ongoing costs are not included in the expenses shown in the table and, if applicable, would increase the expenses that you paid over the period: (1) a $12 low balance fee on accounts with balances of less than $250 as of September 30th of each calendar year and no investment activity (excluding reinvestment of dividends and/or capital gains) during the prior calendar year or the first nine months of the current calendar year. This fee does not apply to IRAs, qualified plan accounts, or Coverdell Education Savings Accounts; (2) a $15 annual custodial fee on IRAs, SEPs, SIMPLE IRAs, and Coverdell Education Savings Accounts; and (3) a $20 annual custodial fee on 403(b) accounts.
Please note that the expenses shown in the table are meant to highlight your ongoing costs only and do not reflect any transactional costs, such as sales charges (loads), redemption fees, or exchange fees. Therefore, the second line of the table is useful in comparing ongoing costs only, and will not help you determine the relative total costs of owning different funds. In addition, if these transactional costs were included, your costs would have been higher.
| Beginning Account Value 07/01/16 | Ending Account Value 12/31/16 | Expense Paid During Period 07/01/16 – 12/31/16 | |||||||||||||
Mid Cap Value Fund Class A | |||||||||||||||
Actual | $ | 1,000.00 | $ | 1,165.18 | $ | 25.80 | |||||||||
Hypothetical (5% return before expense) | $ | 1,000.00 | $ | 1,001.31 | $ | 23.85 | |||||||||
Mid Cap Value Fund Class C | |||||||||||||||
Actual | $ | 1,000.00 | $ | 1,160.36 | $ | 30.08 | |||||||||
Hypothetical (5% return before expense) | $ | 1,000.00 | $ | 997.29 | $ | 27.81 | |||||||||
3 Expenses are equal to the Fund's annualized expense ratio of 4.74% for Class A shares and 5.54% for Class C shares, multiplied by the average account value over the period, multiplied by 184/366 days to reflect the one-half year period.
23
Pacific Advisors
Small Cap Value Fund (unaudited)
Fund Objective: Capital appreciation through investment in small cap companies.
Investment Invests at least 80% of its assets in small cap companies which are, at the time of
Strategy: purchase, not greater than the highest market capitalization of companies within the Russell 2000® Index1. Generally invests a significant proportion of its assets in companies with market capitalizations that are, at the time of purchase, not greater than the highest market capitalization of companies in the Russell Microcap® Index1 (which are often referred to as "micro-cap" stocks).
Investor Profile: Aggressive. Opportunity-oriented with a long-term investment horizon.
Please see the Chairman's Letter for a detailed market and economic review
as well as the Manager's general market outlook.
Portfolio Holdings (As of 12/31/16 based on total investments)
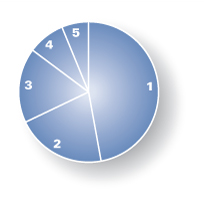
Equities | 100.00 | % | |||||||||
| 1. | Industrials | 47.13 | % | ||||||||
| 2. | Energy | 20.80 | % | ||||||||
| 3. | Consumer Discretionary | 17.24 | % | ||||||||
| 4. | Financials | 8.60 | % | ||||||||
| 5. | Consumer Staples | 6.23 | % | ||||||||
| Total Returns (For the year ended 12/31/16) | |||||||
Class A | 27.08 | % | |||||
Class C | 26.12 | % | |||||
Class I | 27.10 | % | |||||
| |||||||
Russell 2000® Index | 21.31 | % | |||||
Current expense ratio: 4.19% (A); 4.95% (C); 3.93% (I). Prospectus expense ratio: 3.03% (A); 3.88% (C); 2.86% (I).2
Performance quoted is past performance which does not guarantee future results. Current performance may be higher or lower than the performance quoted. Call (800) 989-6693 for performance current to the most recent month-end. The investment return and principal value of an investment will fluctuate so that an investor's shares, when redeemed, may be worth more or less than their original cost. Returns represent the change in value over the stated period assuming reinvestment of dividends and capital gains at net asset value. Rankings shown are for Class A shares; rankings for other share classes may be different. Returns and rankings do not take into account the maximum 5.75% sales charge on Class A shares or the 1% Contingent Deferred Sales Charge (CDSC) for Class C shares sold within one year of purchase. Returns would be lower if the applicable sales charge and CDSC were included. Returns do not take into account individual taxes which may reduce actual returns when shares are sold. Small cap companies typically have fewer financial resources and may carry higher investment risks and experience greater stock price volatility than larger stocks.
1 The Russell 2000® Index is an unmanaged, market-weighted measure of the 2,000 smallest companies of the Russell 3000® Index which represents approximately 98% of the investable U.S. equity market. Index returns assume the reinvestment of dividends, but, unlike the Fund's returns, do not reflect management fees or expenses. The Russell Microcap® Index is an unmanaged, market capitalization weighted measure of the 1,000 smallest publicly traded companies within the Russell 2000® Index, plus the next smallest 1,000 U.S. based listed stocksIt is not possible to invest directly in either Index.
2 "Current" expense ratio is as of 12/31/16. "Prospectus" expense ratio is for the fiscal year ended 12/31/15.
24
Discussion with Portfolio Manager February 24, 2017
George A. Henning
Fund Strategy
The Fund employs a value-oriented approach to identify when high-quality, well-managed companies with attractive growth outlooks become undervalued. Periods of heightened market volatility often create opportunities to strategically invest in these companies for long-term appreciation. The Fund takes a business ownership view in seeking to identify stocks that are undervalued or temporarily out-of-favor and have a catalyst for multi-year growth. The Fund focuses on a limited number of small cap stocks (typically 30 to 50 holdings), including a significant number of micro-cap stocks which tend to attract limited analyst attention. Investing in small and micro-cap stocks may contribute to above-average volatility; yet, smaller, well-positioned companies can provide superior long-term results. Partly due to the strategic allocation to undervalued micro-cap stocks, the Fund's one-year beta1 was 1.40, as of December 31st, in comparison to the Russell 2000® Index.
Fund Performance
Class A shares gained 27.08% in 2016, compared to a 21.31% increase for the Russell 2000® Index. The outperformance was concentrated during the second half of the year when the Fund (Class A) rose 34.08% to significantly outpace the benchmark's 17.81% gain; in the fourth quarter alone, the Fund (Class A) rose 20.55% compared to the Index's more modest 8.43% gain. The Fund's sharp rally during the final six months of the year resulted from the combination of positive earnings results and other company-specific developments, and improving economic data. Incoming President Trump's campaign promises to introduce pro-growth policies, including reduced regulations, tax reform, and an infrastructure spending program, further buoyed the outlook for economic growth. Also, OPEC's decision in November to freeze oil production helped support oil prices and end the two-year bear market in energy stocks. The Fund, which holds over 65% of its assets in industrial and energy companies, was well positioned to benefit from these developments.
What Helped/Hurt Performance2
The Fund's top contributors to returns during the second half of the year were Navistar International, DXP Enterprises, and Saia. Shares of Navistar, a leading commercial truck manufacturer, surged 168% following the announcement in September of an alliance with Volkswagen Truck & Bus, a subsidiary of Volkswagen AG. The alliance, which includes an equity investment, strategic technology collaboration, and a procurement joint venture, is due to close in the first quarter of 2017. DXP Enterprises jumped 133% on improved prospects for a recovery in shale-related drilling activity. The company recently launched a proprietary, lower-cost industrial pump that expands its customer base across the company's national network of distribution facilities. Saia, a regional trucking operator, rose 76% on strong earnings due to the combination of rate increases, service enhancements, and cost savings. The company also announced a 2017 expansion into the Northeast, starting with Pennsylvania and New Jersey.
The Fund's most significant detractors to returns were Hornbeck Offshore Services, Bravo Brio Restaurant Group, and Darling Ingredients. Hornbeck, which operates supply vessels servicing offshore oil wells, declined 13%; the disappointing performance seems to have reflected the market's pessimistic outlook for the deep-water industry, in general. Yet, many offshore projects, particularly in the Gulf of Mexico, are profitable at oil prices as low as $40 per barrel. Hornbeck, which owns the industry's highest-quality fleet, has focused its assets in the Gulf where utilization rates should provide sustainable cash
1 "Beta" measures volatility relative to the stock market or an alternative benchmark. A beta less than 1.0 indicates lower risk than the market or the benchmark and a beta greater than 1.0 indicates higher risk than the market or the benchmark.
2 For detailed information on Fund holdings, please see the Fund's Schedule of Investments in this Report.
25
Pacific Advisors
Small Cap Value Fund (unaudited) continued
flow. Bravo Brio, an Italian-themed restaurant chain, fell 44% as shifting consumer tastes and the rise of social media and mobile apps have increased competitive pressure across the industry. Darling, a manufacturer of raw materials for the pharmaceutical, animal feed, and biofuel industries, fell 13%; the company's products are tied to corn and soybean prices which came under pressure in the second half of the year.
During the period, the Fund added new positions in Helix Energy Solutions and Morningstar. Helix is a low-cost leader in providing intervention services for offshore oil wells. These activities are typically performed on producing wells that have encountered problems. Historically, intervention work had been performed by more expensive drilling rigs; Helix offers a cost-effective service using its purpose-built fleet of well intervention vessels. These projects offer relatively modest capital investments and high returns; should oil prices remain above $50 per barrel, they will likely be among the earliest activities to rebound. Morningstar provides investment research, analysis and related services to retail and institutional investors. A subsidiary company, which is registered with the SEC as a nationally recognized statistical rating organization NRSRO received approval to rate corporate and financial institution bond issuances; this business provides significant growth opportunities in addition to the company's subscription-based services for advisors, asset managers and investors. The Fund sold its position in NCI Building Systems as the stock approached our internal price target, and Bravo Brio Restaurant Group in order to focus on more attractive growth opportunities.
Looking Ahead
As we look to 2017, we believe the markets are likely to move higher as the recovery in the Industrials and Energy sectors continues. Historically, the Fund has performed well during periods of economic expansion. Fund holdings are market leaders in their respective sectors or they offer exceptional growth opportunities as a result of business turnaround or other special situation. The high-quality management of these companies has demonstrated both the discipline to manage through the challenges of the past two years and ability to identify growth opportunities for a stronger recovery. Moreover, small cap stocks generally offer higher return potential relative to other stocks as interest rates and inflation begin to rise; in addition, any reduction in corporate tax rates would provide an additional boost to the bottom line and stock market valuations.
26
Change in Value of $10,000 Investment1
This chart compares the growth of a $10,000 investment in Class A shares of the Small Cap Value Fund for the period January 1, 2007 through December 31, 2016 with the same investment in the Russell 2000® Index2.
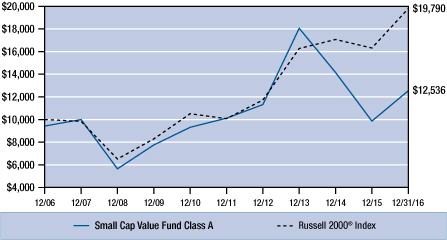
Average Annual Compounded Returns as of December 31, 2016
Class A | Class C | Class I | Russell 2000® Index | ||||||||||||||||
One Year | 19.77 | % | 25.12 | % | 27.10 | % | 21.31 | % | |||||||||||
Five Year | 3.15 | % | 3.60 | % | 5.22 | % | 14.46 | % | |||||||||||
Ten Year | 2.29 | % | 2.10 | % | 3.83 | % | 7.07 | % | |||||||||||
Past performance does not guarantee future results. Performance quoted represents past performance. Current performance may be higher or lower than the performance data quoted. Returns include reinvested dividends and capital gains. Returns for Class A shares reflect a maximum front-end sales charge of 5.75%; and returns for Class C shares reflect the deduction of a contingent deferred sales charge of 1% on shares sold within the first year of purchase. Returns do not take into account individual taxes which may reduce actual returns when shares are sold. Small cap stocks typically have fewer financial resources and may carry higher risks and experience greater volatility than large cap stocks. The investment return and principal value of an investment will fluctuate so that an investor's shares, when redeemed, may be worth more or less than their original cost. Call (800) 989-6693 for the most recent month-end performance.
1 Fund results are shown for Class A shares and reflect deduction of the maximum front-end sales charge of 5.75% on the $10,000 investment for a net amount invested of $9,425. At the end of the same period, a $10,000 investment in Class C shares and Class I shares would have been valued at $12,306, and $14,564, respectively, and no contingent deferred sales charges would apply. The inception date is 02/08/93 for Class A shares; 04/01/98 for Class C shares; and 10/09/06 for Class I shares. Performance of the share classes will vary based on the difference in charges and expenses. It is not possible to invest directly in the Index. Index results assume reinvestment of dividends, but, unlike the Fund's results, do not reflect sales charges, commissions or expenses.
2 The Russell 2000® Index is an unmanaged, weighted measure of the 2,000 smallest companies within the Russell 3000® Index.
27
Pacific Advisors
Small Cap Value Fund (unaudited) continued
Expense Examples
As a shareholder of the Fund you incur two types of costs: (1) transaction costs, including sales charges (loads) on purchase payments, reinvested dividends, or other distributions; redemption fees; and exchange fees; and (2) ongoing costs, including management fees; distribution (12b-1) fees; and other Fund expenses. This Example is intended to help you understand your ongoing costs (in dollars) of investing in the Fund and to compare these costs with the ongoing costs of investing in other mutual funds.
The Example is based on an investment of $1,000 invested at the beginning of the period and held for the entire period from July 1, 2016 through December 31, 2016.
Actual Expenses
The first line of the table below provides information about actual account values and actual expenses. You may use the information in this line, together with the amount you invested, to estimate the expenses that you paid over the period. Simply divide your account value by $1,000 (for example, an $8,600 account value divided by $1,000 = 8.6), then multiply the result by the number in the first line under the heading entitled "Expenses Paid During the Period" to estimate the expenses you paid on your account during the period.
The following transaction costs are not included in the expenses shown in the table and, if applicable, would increase the expenses that you paid over the period: (1) a front-end sales charge (load) of 5.75% on Class A shares; (2) a 2% redemption fee if you sell or exchange shares within 180 days of purchase, with certain exceptions. The redemption fee does not apply to: (a) redemptions under an automatic withdrawal program or periodic asset reallocation plan, required minimum distributions (RMD), employer mandated distributions from a qualified plan, or redemptions under a qualified domestic relations order (QDRO); (b) redemptions to pay for expenses related to terminal illness, extended hospital or nursing home care, or other serious medical conditions, including death; (c) redemptions of shares acquired through dividend or capital gains reinvestments; (d) loans from a qualified plan account, and (e) redemptions initiated by the Fund; and (3) a $10 service fee on each exchange after the first five exchanges in each calendar year.
The following ongoing costs are not included in the expenses shown in the table and, if applicable, would increase the expenses that you paid over the period: (1) a $12 low balance fee on accounts with balances of less than $250 as of September 30th of each calendar year and no investment activity (excluding reinvestment of dividends and/or capital gains) during the prior calendar year or the first nine months of the current calendar year. This fee does not apply to IRAs, qualified plan accounts, or Coverdell Education Savings Accounts; (2) a $15 annual custodial fee on IRAs, SEPs, SIMPLE IRAs, and Coverdell Education Savings Accounts; and (3) a $20 annual custodial fee on 403(b) accounts.
Hypothetical Example for Comparison Purposes
The second line of the table below provides information about hypothetical account values and hypothetical expenses based on the Fund's actual expense ratio and an assumed rate of return of 5% per year before expenses, which in not the Fund's actual return. The hypothetical account values and expenses may not be used to estimate the actual ending account balance or expenses you paid for the period. You may use this information to compare the ongoing costs of investing in the Fund and other funds. To do so, compare this 5% hypothetical example with the 5% hypothetical examples that appear in the shareholder reports of the other funds.
The following transaction costs are not included in the expenses shown in the table and, if applicable, would increase the expenses that you paid over the period: (1) a front-end sales charge (load) of 5.75% on Class A shares; (2) a 2% redemption fee if you sell or exchange shares within 180 days of purchase, with certain exceptions. The redemption fee does not apply to: (a) redemptions under an automatic withdrawal program or periodic asset reallocation plan, required minimum distributions (RMD), employer mandated distributions from a qualified plan, or redemptions under a qualified domestic relations order (QDRO); (b) redemptions to pay for expenses related to terminal illness, death, extended hospital or nursing home care, or other serious medical conditions; (c) redemptions of shares acquired through dividend or capital gains reinvestments; (d) loans from a qualified plan account; and (e) redemptions initiated by the Fund; and (3) a $10 service fee on each exchange after the first five exchanges in each calendar year.
The following ongoing costs are not included in the expenses shown in the table and, if applicable, would increase the expenses that you paid over the period: (1) a $12 low balance fee on accounts with balances of less than $250 as of September 30th of each calendar year and no investment activity (excluding reinvestment of dividends and/or capital gains) during the prior calendar year or the first nine months of the current calendar year. This fee does not apply to IRAs, qualified plan accounts, or Coverdell Education Savings Accounts; (2) a $15 annual custodial fee on IRAs, SEPs, SIMPLE IRAs, and Coverdell Education Savings Accounts; and (3) a $20 annual custodial fee on 403(b) accounts.
Please note that the expenses shown in the table are meant to highlight your ongoing costs only and do not reflect any transactional costs, such as sales charges (loads), redemption fees, or exchange fees. Therefore, the second line of the table is useful in comparing ongoing costs only, and will not help you determine the relative total costs of owning different funds. In addition, if these transactional costs were included, your costs would have been higher.
| Beginning Account Value 07/01/16 | Ending Account Value 12/31/16 | Expense Paid During Period 07/01/16 – 12/31/16 | |||||||||||||
Small Cap Value Class A | |||||||||||||||
Actual | $ | 1,000.00 | $ | 1,340.79 | $ | 24.65 | |||||||||
Hypothetical (5% return before expense) | $ | 1,000.00 | $ | 1,004.07 | $ | 21.11 | |||||||||
Small Cap Value Class C | |||||||||||||||
Actual | $ | 1,000.00 | $ | 1,335.64 | $ | 29.06 | |||||||||
Hypothetical (5% return before expense) | $ | 1,000.00 | $ | 1,000.25 | $ | 24.89 | |||||||||
Small Cap Value Class I | |||||||||||||||
Actual | $ | 1,000.00 | $ | 1,340.02 | $ | 23.12 | |||||||||
Hypothetical (5% return before expense) | $ | 1,000.00 | $ | 1,005.38 | $ | 19.81 | |||||||||
3 Expenses are equal to the Fund's annualized expense ratio of 4.19% for Class A shares, 4.95% for Class C shares and 3.93% for Class I shares, multiplied by the average account value over the period, multiplied by 184/366 days to reflect the one-half year period.
28

Pacific Advisors Fund Inc.
Financial Statements
29
Pacific Advisors Income and Equity Fund
Schedule of Investments
as of December 31, 2016
| Quantity or Principal** | Description | Current $ Value** | % of Total Net Assets | ||||||||||||
COMMON STOCK | |||||||||||||||
CONSUMER DISCRETIONARY | 6.04 | ||||||||||||||
DISTRIBUTORS | |||||||||||||||
1,750 | GENUINE PARTS CO. | 167,195 | |||||||||||||
167,195 | 0.97 | ||||||||||||||
LEISURE PRODUCTS | |||||||||||||||
7,000 | MATTEL INC. | 192,850 | |||||||||||||
192,850 | 1.12 | ||||||||||||||
MEDIA | |||||||||||||||
3,000 | OMNICOM GROUP INC. | 255,330 | |||||||||||||
255,330 | 1.48 | ||||||||||||||
MULTILINE RETAIL | |||||||||||||||
3,000 | TARGET CORP. | 216,690 | |||||||||||||
216,690 | 1.25 | ||||||||||||||
TEXTILES, APPAREL & LUXURY GOODS | |||||||||||||||
6,000 | COACH, INC. | 210,120 | |||||||||||||
210,120 | 1.22 | ||||||||||||||
CONSUMER STAPLES | 7.19 | ||||||||||||||
BEVERAGES | |||||||||||||||
4,500 | COCA-COLA CO. | 186,570 | |||||||||||||
186,570 | 1.08 | ||||||||||||||
FOOD & STAPLES RETAILING | |||||||||||||||
3,000 | CVS HEALTH CORP. | 236,730 | |||||||||||||
4,000 | SYSCO CORP. | 221,480 | |||||||||||||
5,600 | THE KROGER CO. | 193,256 | |||||||||||||
3,500 | WAL-MART STORES INC. | 241,920 | |||||||||||||
893,386 | 5.18 | ||||||||||||||
HOUSEHOLD PRODUCTS | |||||||||||||||
1,900 | PROCTER & GAMBLE CO. | 159,752 | |||||||||||||
159,752 | 0.93 | ||||||||||||||
ENERGY | 2.86 | ||||||||||||||
ENERGY EQUIPMENT & SERVICES | |||||||||||||||
3,500 | SCHLUMBERGER LTD | 293,825 | |||||||||||||
293,825 | 1.70 | ||||||||||||||
OIL, GAS & CONSUMABLE FUELS | |||||||||||||||
4,000 | CONOCOPHILLIPS | 200,560 | |||||||||||||
200,560 | 1.16 | ||||||||||||||
See Accompanying Notes to Financial Statements which are an integral part of these financial statements.
30
Pacific Advisors Income and Equity Fund
Schedule of Investments
as of December 31, 2016
| Quantity or Principal** | Description | Current $ Value** | % of Total Net Assets | ||||||||||||
COMMON STOCK continued | |||||||||||||||
FINANCIALS | 4.79 | ||||||||||||||
BANKS | |||||||||||||||
6,000 | U.S. BANCORP | 308,220 | |||||||||||||
5,000 | WELLS FARGO & CO. | 275,550 | |||||||||||||
583,770 | 3.38 | ||||||||||||||
INSURANCE | |||||||||||||||
4,500 | METLIFE INC. | 242,505 | |||||||||||||
242,505 | 1.41 | ||||||||||||||
HEALTH CARE | 4.57 | ||||||||||||||
BIOTECHNOLOGY | |||||||||||||||
4,500 | ABBVIE INC. | 281,790 | |||||||||||||
281,790 | 1.63 | ||||||||||||||
PHARMACEUTICALS | |||||||||||||||
2,000 | JOHNSON & JOHNSON | 230,420 | |||||||||||||
8,500 | PFIZER INC. | 276,080 | |||||||||||||
506,500 | 2.94 | ||||||||||||||
INDUSTRIALS | 6.76 | ||||||||||||||
AIR FREIGHT & LOGISTICS | |||||||||||||||
2,250 | UNITED PARCEL SERVICE, INC. B | 257,940 | |||||||||||||
257,940 | 1.50 | ||||||||||||||
COMMERCIAL SERVICES & SUPPLIES | |||||||||||||||
2,000 | WASTE MANAGEMENT INC. | 141,820 | |||||||||||||
141,820 | 0.82 | ||||||||||||||
INDUSTRIAL CONGLOMERATES | |||||||||||||||
8,000 | GENERAL ELECTRIC CO. | 252,800 | |||||||||||||
2,000 | HONEYWELL INT'L INC. | 231,700 | |||||||||||||
484,500 | 2.81 | ||||||||||||||
TRADING COMPANIES & DISTRIBUTORS | |||||||||||||||
6,000 | FASTENAL COMPANY | 281,880 | |||||||||||||
281,880 | 1.63 | ||||||||||||||
INFORMATION TECHNOLOGY | 5.93 | ||||||||||||||
COMMUNICATIONS EQUIPMENT | |||||||||||||||
8,000 | CISCO SYSTEMS INC. | 241,760 | |||||||||||||
241,760 | 1.40 | ||||||||||||||
IT SERVICES | |||||||||||||||
1,500 | INT'L BUSINESS MACHINES CORP. | 248,985 | |||||||||||||
248,985 | 1.44 | ||||||||||||||
See Accompanying Notes to Financial Statements which are an integral part of these financial statements.
31
Pacific Advisors Income and Equity Fund
Schedule of Investments
as of December 31, 2016
| Quantity or Principal** | Description | Current $ Value** | % of Total Net Assets | ||||||||||||
COMMON STOCK continued | |||||||||||||||
SEMICONDUCTORS & SEMICONDUCTOR EQUIPMENT | |||||||||||||||
7,000 | INTEL CORP. | 253,890 | |||||||||||||
253,890 | 1.47 | ||||||||||||||
SOFTWARE | |||||||||||||||
4,500 | MICROSOFT CORP. | 279,630 | |||||||||||||
279,630 | 1.62 | ||||||||||||||
MATERIALS | 2.97 | ||||||||||||||
CHEMICALS | |||||||||||||||
3,000 | DUPONT DE NEMOURS & CO. | 220,200 | |||||||||||||
220,200 | 1.28 | ||||||||||||||
CONTAINERS & PACKAGING | |||||||||||||||
5,500 | INTERNATIONAL PAPER COMPANY | 291,830 | |||||||||||||
291,830 | 1.69 | ||||||||||||||
TELECOMMUNICATION SERVICES | 2.97 | ||||||||||||||
DIVERSIFIED TELECOMMUNICATION SERVICES | |||||||||||||||
6,000 | AT&T INC. | 255,180 | |||||||||||||
4,815 | VERIZON COMMUNICATIONS INC. | 257,025 | |||||||||||||
512,205 | 2.97 | ||||||||||||||
UTILITIES | 3.86 | ||||||||||||||
ELECTRIC UTILITIES | |||||||||||||||
2,500 | DUKE ENERGY CORP. | 194,050 | |||||||||||||
3,500 | XCEL ENERGY INC. | 142,450 | |||||||||||||
336,500 | 1.95 | ||||||||||||||
MULTI-UTILITIES | |||||||||||||||
2,000 | DOMINION RESOURCES INC. | 153,180 | |||||||||||||
4,000 | PUBLIC SERVICE ENTERPRISE GROUP INC. | 175,520 | |||||||||||||
328,700 | 1.91 | ||||||||||||||
TOTAL COMMON STOCK (Cost: $6,054,670) | 8,270,683 | 47.94 | |||||||||||||
CORPORATE BOND | |||||||||||||||
CONSUMER DISCRETIONARY | 6.57 | ||||||||||||||
AUTO COMPONENTS | |||||||||||||||
150,000 | LEAR CORP. 4.75% 01/15/23 | 153,000 | |||||||||||||
153,000 | 0.89 | ||||||||||||||
AUTOMOBILES | |||||||||||||||
130,000 | GENERAL MOTORS FINL CO. 4.75% 08/15/17 | 132,466 | |||||||||||||
132,466 | 0.77 | ||||||||||||||
See Accompanying Notes to Financial Statements which are an integral part of these financial statements.
32
Pacific Advisors Income and Equity Fund
Schedule of Investments
as of December 31, 2016
| Quantity or Principal** | Description | Current $ Value** | % of Total Net Assets | ||||||||||||
CORPORATE BOND continued | |||||||||||||||
DIVERSIFIED CONSUMER SERVICES | |||||||||||||||
150,000 | BLOCK FINANCIAL LLC 4.125% 10/01/20 | 153,141 | |||||||||||||
153,141 | 0.89 | ||||||||||||||
HOTELS, RESTAURANTS & LEISURE | |||||||||||||||
100,000 | INTL GAME TECHNOLOGY 7.50% 06/15/19 | 110,000 | |||||||||||||
100,000 | WYNDHAM WORLDWIDE 2.95% 03/01/17 | 100,101 | |||||||||||||
150,000 | YUM! BRANDS INC. 5.30% 09/15/19 | 158,625 | |||||||||||||
368,726 | 2.14 | ||||||||||||||
HOUSEHOLD DURABLES | |||||||||||||||
150,000 | TUPPERWARE BRANDS CORP. 4.75% 06/01/21 | 160,409 | |||||||||||||
160,409 | 0.93 | ||||||||||||||
INTERNET & DIRECT MARKETING RETAIL | |||||||||||||||
150,000 | EXPEDIA INC. 5.95% 08/15/20 | 163,961 | |||||||||||||
163,961 | 0.95 | ||||||||||||||
CONSUMER STAPLES | 1.81 | ||||||||||||||
FOOD & STAPLES RETAILING | |||||||||||||||
150,000 | DELHAIZE GROUP SA 4.125% 04/10/19 | 154,061 | |||||||||||||
154,061 | 0.89 | ||||||||||||||
FOOD PRODUCTS | |||||||||||||||
150,000 | SMITHFIELD FOODS INC. 6.625% 08/15/22 | 158,062 | |||||||||||||
158,062 | 0.92 | ||||||||||||||
ENERGY | 3.68 | ||||||||||||||
ENERGY EQUIPMENT & SERVICES | |||||||||||||||
100,000 | PRIDE INTERNATIONAL INC. 6.875% 08/15/20 | 106,750 | |||||||||||||
150,000 | ROWAN COMPANY INC. 7.875% 08/01/19 | 164,625 | |||||||||||||
150,000 | SESI LLC 6.375% 05/01/19 | 150,000 | |||||||||||||
100,000 | WEATHERFORD BERMUDA 6.00% 03/15/18 | 99,000 | |||||||||||||
520,375 | 3.02 | ||||||||||||||
OIL, GAS & CONSUMABLE FUELS | |||||||||||||||
100,000 | ENERGY TRANSFER PARTNERS 9.00% 04/15/19 | 113,785 | |||||||||||||
113,785 | 0.66 | ||||||||||||||
FINANCIALS | 13.51 | ||||||||||||||
BANKS | |||||||||||||||
100,000 | BANK OF AMERICA CORP. 3.964% 03/19/20 FLOAT | 101,890 | |||||||||||||
100,000 | BANK OF AMERICA CORP. 2.757% 09/28/20 FLOAT | 100,264 | |||||||||||||
122,000 | BANK OF AMERICA CORP. 3.214% 07/07/21 FLOAT | 124,562 | |||||||||||||
150,000 | BARCLAY BANK PLC 2.382% 04/18/21 FLOAT | 146,175 | |||||||||||||
125,000 | JPMORGAN CHASE & CO. 3.636% 02/25/21 FLOAT | 124,825 | |||||||||||||
597,716 | 3.46 | ||||||||||||||
See Accompanying Notes to Financial Statements which are an integral part of these financial statements.
33
Pacific Advisors Income and Equity Fund
Schedule of Investments
as of December 31, 2016
| Quantity or Principal** | Description | Current $ Value** | % of Total Net Assets | ||||||||||||
CORPORATE BOND continued | |||||||||||||||
CAPITAL MARKETS | |||||||||||||||
150,000 | ARES CAPITAL CORP. 4.875% 11/30/18 | 155,474 | |||||||||||||
150,000 | E*TRADE FINANCIAL CORP. 5.375% 11/15/22 | 158,732 | |||||||||||||
100,000 | FIFTH STREET FINANCE CORP. 4.875% 03/01/19 | 100,933 | |||||||||||||
100,000 | GOLDMAN SACHS GROUP INC. 2.337% 08/26/20 FLOAT | 99,934 | |||||||||||||
100,000 | JEFFERIES GROUP INC. 5.125% 04/13/18 | 103,365 | |||||||||||||
100,000 | MORGAN STANLEY 3.50% 09/30/17 FLOAT | 100,611 | |||||||||||||
100,000 | MORGAN STANLEY 4.50% 10/27/18 FLOAT | 102,000 | |||||||||||||
100,000 | MORGAN STANLEY 3.464% 04/25/23 FLOAT | 101,250 | |||||||||||||
100,000 | MORGAN STANLEY 2.664% 10/28/24 FLOAT | 91,250 | |||||||||||||
100,000 | NASDAQ OMX GROUP 5.55% 01/15/20 | 108,068 | |||||||||||||
100,000 | PROSPECT CAPITAL CORP. 5.00% 07/15/19 | 101,253 | |||||||||||||
150,000 | STIFEL FINANCIAL CORP. 3.50% 12/01/20 | 150,416 | |||||||||||||
1,373,286 | 7.96 | ||||||||||||||
DIVERSIFIED FINANCIAL SERVICES | |||||||||||||||
100,000 | ICAHN ENTERPRISES 6.00% 08/01/20 | 102,125 | |||||||||||||
102,125 | 0.59 | ||||||||||||||
INSURANCE | |||||||||||||||
150,000 | BLACK KNIGHT INFOSERVE 5.75% 04/15/23 | 157,125 | |||||||||||||
100,000 | PRUDENTIAL FINANCIAL INC. 3.464% 11/02/20 FLOAT | 101,590 | |||||||||||||
258,715 | 1.50 | ||||||||||||||
HEALTH CARE | 2.09 | ||||||||||||||
BIOTECHNOLOGY | |||||||||||||||
114,000 | BAXALTA INC. 3.60% 06/23/22 | 114,872 | |||||||||||||
114,872 | 0.67 | ||||||||||||||
PHARMACEUTICALS | |||||||||||||||
110,000 | PFIZER INC. 6.05% 03/30/17 | 111,332 | |||||||||||||
130,000 | ZOETIS INC. 3.45% 11/13/20 | 133,427 | |||||||||||||
244,759 | 1.42 | ||||||||||||||
INDUSTRIALS | 6.80 | ||||||||||||||
AEROSPACE & DEFENSE | |||||||||||||||
150,000 | L-3 COMMUNICATIONS CORP. 5.20% 10/15/19 | 161,335 | |||||||||||||
150,000 | SPIRIT AEROSYSTEMS INC. 5.25% 03/15/22 | 156,716 | |||||||||||||
318,051 | 1.84 | ||||||||||||||
BUILDING PRODUCTS | |||||||||||||||
115,000 | OWENS CORNING INC. 9.00% 06/15/19 | 131,124 | |||||||||||||
131,124 | 0.76 | ||||||||||||||
See Accompanying Notes to Financial Statements which are an integral part of these financial statements.
34
Pacific Advisors Income and Equity Fund
Schedule of Investments
as of December 31, 2016
| Quantity or Principal** | Description | Current $ Value** | % of Total Net Assets | ||||||||||||
CORPORATE BOND continued | |||||||||||||||
MACHINERY | |||||||||||||||
150,000 | AGCO CORP. 5.875% 12/01/21 | 160,808 | |||||||||||||
150,000 | HILLENBRAND INC. 5.50% 07/15/20 | 162,103 | |||||||||||||
322,911 | 1.87 | ||||||||||||||
PROFESSIONAL SERVICES | |||||||||||||||
150,000 | DUN & BRADSTREET CORP. 4.00% 06/15/20 | 153,957 | |||||||||||||
153,957 | 0.89 | ||||||||||||||
TRADING COMPANIES & DISTRIBUTORS | |||||||||||||||
100,000 | AIR LEASE CORP. 5.625% 04/01/17 | 100,875 | |||||||||||||
150,000 | GATX CORP. 2.60% 03/30/20 | 148,150 | |||||||||||||
249,025 | 1.44 | ||||||||||||||
INFORMATION TECHNOLOGY | 3.88 | ||||||||||||||
ELECTRONIC EQUIPMENT & INSTRUMENTS | |||||||||||||||
102,000 | ARROW ELECTRONICS INC. 6.875% 06/01/18 | 108,401 | |||||||||||||
100,000 | INGRAM MICRO INC. 5.25% 09/01/17 | 101,470 | |||||||||||||
150,000 | KEYSIGHT TECHNOLOGIES 3.30% 10/30/19 | 152,318 | |||||||||||||
362,189 | 2.10 | ||||||||||||||
IT SERVICES | |||||||||||||||
150,000 | FIDELITY NATIONAL INFORMATION 3.625% 10/15/20 | 155,290 | |||||||||||||
155,290 | 0.90 | ||||||||||||||
SEMICONDUCTORS & SEMICONDUCTOR EQUIPMENT | |||||||||||||||
150,000 | QUALCOMM INC. 3.00% 05/20/22 | 151,993 | |||||||||||||
151,993 | 0.88 | ||||||||||||||
MATERIALS | 1.29 | ||||||||||||||
CHEMICALS | |||||||||||||||
112,000 | CF INDUSTRIES INC. 6.875% 05/01/18 | 117,896 | |||||||||||||
117,896 | 0.68 | ||||||||||||||
METALS & MINING | |||||||||||||||
100,000 | COMMERCIAL METALS CO. 7.35% 08/15/18 | 106,000 | |||||||||||||
106,000 | 0.61 | ||||||||||||||
REAL ESTATE | 4.19 | ||||||||||||||
HEALTH CARE REITS | |||||||||||||||
150,000 | OMEGA HEALTHCARE INVESTORS 5.875% 03/15/24 | 154,741 | |||||||||||||
154,741 | 0.90 | ||||||||||||||
HOTEL & RESORT REITS | |||||||||||||||
105,000 | HOSPITALITY PROP TRUST 6.70% 01/15/18 | 107,655 | |||||||||||||
107,655 | 0.62 | ||||||||||||||
See Accompanying Notes to Financial Statements which are an integral part of these financial statements.
35
Pacific Advisors Income and Equity Fund
Schedule of Investments
as of December 31, 2016
| Quantity or Principal** | Description | Current $ Value** | % of Total Net Assets | ||||||||||||
CORPORATE BOND continued | |||||||||||||||
OFFICE REITS | |||||||||||||||
150,000 | CORPORATE OFFICE PROP 3.60% 05/15/23 | 144,336 | |||||||||||||
160,000 | SL GREEN REALTY CORP. 4.50% 12/01/22 | 161,594 | |||||||||||||
305,930 | 1.77 | ||||||||||||||
REAL ESTATE SERVICES | |||||||||||||||
150,000 | CBRE SERVICES INC. 5.00% 03/15/23 | 154,739 | |||||||||||||
154,739 | 0.90 | ||||||||||||||
TELECOMMUNICATION SERVICES | 0.74 | ||||||||||||||
DIVERSIFIED TELECOMMUNICATION SERVICES | |||||||||||||||
125,000 | QWEST CORP. 6.50% 06/01/17 | 127,275 | |||||||||||||
127,275 | 0.74 | ||||||||||||||
UTILITIES | 0.89 | ||||||||||||||
ELECTRIC UTILITIES | |||||||||||||||
49,000 | CLEVELAND ELECTRIC ILLUMINATING 5.70% 04/01/17 | 49,445 | |||||||||||||
100,000 | PPL ENERGY SUPPLY LLC 6.50% 05/01/18 | 103,250 | |||||||||||||
152,695 | 0.89 | ||||||||||||||
TOTAL CORPORATE BOND (Cost: $7,820,307) | 7,840,930 | 45.45 | |||||||||||||
PREFERRED STOCK | |||||||||||||||
FINANCIALS | 4.13 | ||||||||||||||
BANKS | |||||||||||||||
100,000 | JPMORGAN CHASE & CO. 5.30% PFD FIX-FLOAT*** | 102,056 | |||||||||||||
100,000 | JPMORGAN CHASE & CO. 5.00% PFD FIX-FLOAT*** | 99,750 | |||||||||||||
150,000 | WELLS FARGO & CO. 7.98% PFD FIX-FLOAT*** | 156,750 | |||||||||||||
358,556 | 2.08 | ||||||||||||||
CAPITAL MARKETS | |||||||||||||||
150,000 | BANK OF NY MELLON 4.95% PFD FIX-FLOAT*** | 150,750 | |||||||||||||
150,750 | 0.87 | ||||||||||||||
INSURANCE | |||||||||||||||
200,000 | METLIFE INC. 5.25% PFD FIX-FLOAT*** | 202,500 | |||||||||||||
202,500 | 1.17 | ||||||||||||||
TOTAL PREFERRED STOCK (Cost: $702,742) | 711,806 | 4.13 | |||||||||||||
TOTAL INVESTMENT IN SECURITIES (Cost: $14,577,719) | 16,823,419 | 97.52 | |||||||||||||
CASH OR CASH EQUIVALENT | 486,514 | 2.82 | |||||||||||||
OTHER ASSETS LESS LIABILITIES | (59,217 | ) | (0.34 | ) | |||||||||||
TOTAL NET ASSETS | 17,250,716 | 100.00 | |||||||||||||
* Non-income producing
** The principal amount and value are stated in U.S. dollars unless otherwise indicated.
*** These securities' coupon rates and/or dividends are fixed for a certain period and then convert to floating rates.
See Accompanying Notes to Financial Statements which are an integral part of these financial statements.
36
Pacific Advisors Balanced Fund
Schedule of Investments
as of December 31, 2016
| Quantity or Principal** | Description | Current $ Value** | % of Total Net Assets | ||||||||||||
COMMON STOCK | |||||||||||||||
CONSUMER DISCRETIONARY | 11.88 | ||||||||||||||
MEDIA | |||||||||||||||
1,235 | WALT DISNEY CO. | 128,712 | |||||||||||||
128,712 | 2.15 | ||||||||||||||
SPECIALTY RETAIL | |||||||||||||||
10,000 | CONN'S INC.* | 126,500 | |||||||||||||
500 | O'REILLY AUTOMOTIVE INC.* | 139,205 | |||||||||||||
2,350 | TRACTOR SUPPLY COMPANY | 178,153 | |||||||||||||
443,858 | 7.40 | ||||||||||||||
TEXTILES, APPAREL & LUXURY GOODS | |||||||||||||||
2,750 | NIKE INC. | 139,782 | |||||||||||||
139,782 | 2.33 | ||||||||||||||
CONSUMER STAPLES | 3.92 | ||||||||||||||
FOOD & STAPLES RETAILING | |||||||||||||||
7,500 | CHEFS' WAREHOUSE INC.* | 118,500 | |||||||||||||
1,400 | PRICESMART, INC. | 116,900 | |||||||||||||
235,400 | 3.92 | ||||||||||||||
ENERGY | 7.38 | ||||||||||||||
ENERGY EQUIPMENT & SERVICES | |||||||||||||||
1,000 | CORE LABORATORIES N.V. | 120,040 | |||||||||||||
15,000 | HORNBECK OFFSHORE SERVICES INC.* | 108,300 | |||||||||||||
15,000 | NOBLE CORPORATION | 88,800 | |||||||||||||
1,500 | SCHLUMBERGER LTD | 125,925 | |||||||||||||
443,065 | 7.38 | ||||||||||||||
FINANCIALS | 12.78 | ||||||||||||||
BANKS | |||||||||||||||
2,500 | EAST WEST BANCORP INC. | 127,075 | |||||||||||||
1,000 | SIGNATURE BANK* | 150,200 | |||||||||||||
277,275 | 4.62 | ||||||||||||||
CAPITAL MARKETS | |||||||||||||||
850 | FACTSET RESEARCH SYSTEMS INC. | 138,915 | |||||||||||||
650 | MARKETAXESS HOLDINGS INC. | 95,498 | |||||||||||||
2,000 | MORNINGSTAR, INC. | 147,120 | |||||||||||||
2,190 | SEI INVESTMENTS COMPANY | 108,098 | |||||||||||||
489,631 | 8.16 | ||||||||||||||
See Accompanying Notes to Financial Statements which are an integral part of these financial statements.
37
Pacific Advisors Balanced Fund
Schedule of Investments
as of December 31, 2016
| Quantity or Principal** | Description | Current $ Value** | % of Total Net Assets | ||||||||||||
COMMON STOCK continued | |||||||||||||||
HEALTH CARE | 7.22 | ||||||||||||||
HEALTH CARE TECHNOLOGY | |||||||||||||||
2,445 | CERNER CORPORATION* | 115,820 | |||||||||||||
115,820 | 1.93 | ||||||||||||||
HEALTH CARE PROVIDERS & SERVICES | |||||||||||||||
700 | HENRY SCHEIN INC.* | 106,197 | |||||||||||||
106,197 | 1.77 | ||||||||||||||
HEALTH CARE EQUIPMENT & SUPPLIES | |||||||||||||||
900 | IDEXX LABORATORIES, INC.* | 105,543 | |||||||||||||
105,543 | 1.76 | ||||||||||||||
PHARMACEUTICALS | |||||||||||||||
1,975 | ZOETIS, INC. | 105,722 | |||||||||||||
105,722 | 1.76 | ||||||||||||||
INDUSTRIALS | 13.96 | ||||||||||||||
AIRLINES | |||||||||||||||
2,500 | SPIRIT AIRLINES INC.* | 144,650 | |||||||||||||
144,650 | 2.41 | ||||||||||||||
COMMERCIAL SERVICES & SUPPLIES | |||||||||||||||
3,750 | HEALTHCARE SERVICES GROUP, INC. | 146,888 | |||||||||||||
5,000 | TEAM INC.* | 196,250 | |||||||||||||
343,138 | 5.72 | ||||||||||||||
MACHINERY | |||||||||||||||
1,500 | WABTEC CORP. | 124,530 | |||||||||||||
124,530 | 2.08 | ||||||||||||||
PROFESSIONAL SERVICES | |||||||||||||||
700 | EQUIFAX INC. | 82,761 | |||||||||||||
82,761 | 1.38 | ||||||||||||||
TRADING COMPANIES & DISTRIBUTORS | |||||||||||||||
9,000 | TRITON INTERNATIONAL LIMITED | 142,200 | |||||||||||||
142,200 | 2.37 | ||||||||||||||
INFORMATION TECHNOLOGY | 11.89 | ||||||||||||||
INTERNET SOFTWARE & SERVICES | |||||||||||||||
200 | ALPHABET INC.* | 158,490 | |||||||||||||
1,150 | FACEBOOK, INC.* | 132,308 | |||||||||||||
2,700 | SHUTTERSTOCK, INC.* | 128,304 | |||||||||||||
419,102 | 6.98 | ||||||||||||||
See Accompanying Notes to Financial Statements which are an integral part of these financial statements.
38
Pacific Advisors Balanced Fund
Schedule of Investments
as of December 31, 2016
| Quantity or Principal** | Description | Current $ Value** | % of Total Net Assets | ||||||||||||
COMMON STOCK continued | |||||||||||||||
IT SERVICES | |||||||||||||||
1,315 | ACCENTURE PLC | 154,026 | |||||||||||||
1,800 | VISA INC. | 140,436 | |||||||||||||
294,462 | 4.91 | ||||||||||||||
TELECOMMUNICATION SERVICES | 1.33 | ||||||||||||||
DIVERSIFIED TELECOM. SERVICES | |||||||||||||||
1,500 | VERIZON COMMUNICATIONS INC. | 80,070 | |||||||||||||
80,070 | 1.33 | ||||||||||||||
TOTAL COMMON STOCK (Cost: $3,961,859) | 4,221,918 | 70.36 | |||||||||||||
CORPORATE BOND | |||||||||||||||
CONSUMER DISCRETIONARY | 1.80 | ||||||||||||||
DIVERSIFIED CONSUMER SERVICES | |||||||||||||||
100,000 | WASHINGTON POST CO. 7.25% 02/01/19 | 108,291 | |||||||||||||
108,291 | 1.80 | ||||||||||||||
ENERGY | 10.67 | ||||||||||||||
ENERGY EQUIPMENT & SERVICES | |||||||||||||||
105,000 | NOBLE HOLDING INTL LTD 5.25% 03/16/18 FLOAT | 104,737 | |||||||||||||
100,000 | PRIDE INTERNATIONAL INC. 8.50% 06/15/19 | 111,500 | |||||||||||||
100,000 | ROWAN COMPANY INC. 7.875% 08/01/19 | 109,750 | |||||||||||||
100,000 | SEACOR HOLDING 7.375% 10/01/19 | 100,500 | |||||||||||||
100,000 | SESI LLC 6.375% 05/01/19 | 100,000 | |||||||||||||
526,487 | 8.77 | ||||||||||||||
OIL, GAS & CONSUMABLE FUELS | |||||||||||||||
100,000 | ENERGY TRANSFER PARTNERS 9.00% 04/15/19 | 113,785 | |||||||||||||
113,785 | 1.90 | ||||||||||||||
FINANCIALS | 3.37 | ||||||||||||||
BANKS | |||||||||||||||
100,000 | BANK OF AMERICA 2.64% 07/28/17 FLOAT | 100,068 | |||||||||||||
100,068 | 1.67 | ||||||||||||||
DIVERSIFIED FINANCIAL SERVICES | |||||||||||||||
100,000 | ICAHN ENTERPRISES 6.00% 08/01/20 | 102,125 | |||||||||||||
102,125 | 1.70 | ||||||||||||||
HEALTH CARE | 1.71 | ||||||||||||||
HEALTH CARE PROVIDERS & SERVICES | |||||||||||||||
100,000 | FRESENIUS MED CARE US 6.875% 07/15/17 | 102,625 | |||||||||||||
102,625 | 1.71 | ||||||||||||||
See Accompanying Notes to Financial Statements which are an integral part of these financial statements.
39
Pacific Advisors Balanced Fund
Schedule of Investments
as of December 31, 2016
| Quantity or Principal** | Description | Current $ Value** | % of Total Net Assets | ||||||||||||
CORPORATE BOND continued | |||||||||||||||
INDUSTRIALS | 5.04 | ||||||||||||||
MACHINERY | |||||||||||||||
100,000 | CASE NEW HOLLAND INC. 7.875% 12/01/17 | 105,125 | |||||||||||||
105,125 | 1.75 | ||||||||||||||
TRADING COMPANIES & DISTRIBUTORS | |||||||||||||||
100,000 | AIRCASTLE 6.75% 04/15/17 | 101,000 | |||||||||||||
95,000 | INTL LEASE FINANCE CORP. 8.75% 03/15/17 | 96,306 | |||||||||||||
197,306 | 3.29 | ||||||||||||||
INFORMATION TECHNOLOGY | 1.49 | ||||||||||||||
INTERNET SOFTWARE & SERVICES | |||||||||||||||
88,000 | IAC/INTERACTIVECORP 4.875% 11/30/18 | 89,430 | |||||||||||||
89,430 | 1.49 | ||||||||||||||
MATERIALS | 1.77 | ||||||||||||||
METALS & MINING | |||||||||||||||
100,000 | COMMERCIAL METALS CO. 7.35% 08/15/18 | 106,000 | |||||||||||||
106,000 | 1.77 | ||||||||||||||
REAL ESTATE | 1.89 | ||||||||||||||
SPECIALIZED REITS | |||||||||||||||
100,000 | EPR PROPERTIES 7.75% 07/15/20 | 113,420 | |||||||||||||
113,420 | 1.89 | ||||||||||||||
TOTAL CORPORATE BOND (Cost: $1,656,984) | 1,664,662 | 27.74 | |||||||||||||
PREFERRED STOCK | |||||||||||||||
FINANCIALS | 1.65 | ||||||||||||||
CAPITAL MARKETS | |||||||||||||||
100,000 | MORGAN STANLEY 5.45% PFD FIX-FLOAT*** | 99,000 | |||||||||||||
99,000 | 1.65 | ||||||||||||||
TOTAL PREFERRED STOCK (Cost: $99,875) | 99,000 | 1.65 | |||||||||||||
TOTAL INVESTMENT IN SECURITIES (Cost: $5,718,718) | 5,985,580 | 99.75 | |||||||||||||
CASH OR CASH EQUIVALENT | 51,176 | 0.85 | |||||||||||||
OTHER ASSETS LESS LIABILITIES | (36,380 | ) | (0.60 | ) | |||||||||||
TOTAL NET ASSETS | 6,000,376 | 100.00 | |||||||||||||
* Non-income producing
** The principal amount and value are stated in U.S. dollars unless otherwise indicated.
*** These securities' coupon rates and/or dividends are fixed for a certain period and then convert to floating rates.
See Accompanying Notes to Financial Statements which are an integral part of these financial statements.
40
Pacific Advisors Large Cap Value Fund
Schedule of Investments
as of December 31, 2016
| Quantity or Principal** | Description | Current $ Value** | % of Total Net Assets | ||||||||||||
COMMON STOCK | |||||||||||||||
CONSUMER DISCRETIONARY | 18.49 | ||||||||||||||
HOTELS, RESTAURANTS & LEISURE | |||||||||||||||
2,000 | MCDONALD'S CORP. | 243,440 | |||||||||||||
243,440 | 3.13 | ||||||||||||||
MEDIA | |||||||||||||||
3,175 | TIME WARNER INC. | 306,483 | |||||||||||||
3,100 | WALT DISNEY CO. | 323,082 | |||||||||||||
629,565 | 8.08 | ||||||||||||||
SPECIALTY RETAIL | |||||||||||||||
3,750 | LOWE'S COMPANIES INC. | 266,700 | |||||||||||||
2,240 | THE HOME DEPOT, INC. | 300,339 | |||||||||||||
567,039 | 7.28 | ||||||||||||||
CONSUMER STAPLES | 17.80 | ||||||||||||||
BEVERAGES | |||||||||||||||
5,120 | COCA-COLA CO. | 212,275 | |||||||||||||
975 | PEPSICO, INC. | 102,014 | |||||||||||||
314,289 | 4.03 | ||||||||||||||
FOOD & STAPLES RETAILING | |||||||||||||||
5,000 | SYSCO CORP. | 276,850 | |||||||||||||
2,950 | WAL-MART STORES INC. | 203,904 | |||||||||||||
480,754 | 6.17 | ||||||||||||||
FOOD PRODUCTS | |||||||||||||||
2,700 | MONDELEZ INT'L INC. | 119,691 | |||||||||||||
3,000 | THE KRAFT HEINZ COMPANY | 261,960 | |||||||||||||
381,651 | 4.90 | ||||||||||||||
HOUSEHOLD PRODUCTS | |||||||||||||||
2,500 | PROCTER & GAMBLE CO. | 210,200 | |||||||||||||
210,200 | 2.70 | ||||||||||||||
ENERGY | 1.74 | ||||||||||||||
OIL, GAS & CONSUMABLE FUELS | |||||||||||||||
1,500 | EXXON MOBIL CORP. | 135,390 | |||||||||||||
135,390 | 1.74 | ||||||||||||||
FINANCIALS | 18.04 | ||||||||||||||
BANKS | |||||||||||||||
7,000 | BANK OF AMERICA CORP. | 154,700 | |||||||||||||
2,850 | CITIGROUP INC. | 169,375 | |||||||||||||
4,225 | WELLS FARGO & CO. | 232,840 | |||||||||||||
556,915 | 7.15 | ||||||||||||||
See Accompanying Notes to Financial Statements which are an integral part of these financial statements.
41
Pacific Advisors Large Cap Value Fund
Schedule of Investments
as of December 31, 2016
| Quantity or Principal** | Description | Current $ Value** | % of Total Net Assets | ||||||||||||
COMMON STOCK continued | |||||||||||||||
DIVERSIFIED FINANCIAL SERVICES | |||||||||||||||
1,952 | BERKSHIRE HATHAWAY INC. B* | 318,137 | |||||||||||||
318,137 | 4.08 | ||||||||||||||
INSURANCE | |||||||||||||||
4,000 | AMERICAN INT'L GROUP INC. | 261,240 | |||||||||||||
5,000 | METLIFE INC. | 269,450 | |||||||||||||
530,690 | 6.81 | ||||||||||||||
HEALTH CARE | 3.72 | ||||||||||||||
PHARMACEUTICALS | |||||||||||||||
2,515 | JOHNSON & JOHNSON | 289,753 | |||||||||||||
289,753 | 3.72 | ||||||||||||||
| INDUSTRIALS17.37 | |||||||||||||||
AIR FREIGHT & LOGISTICS | |||||||||||||||
1,000 | FEDEX CORP. | 186,200 | |||||||||||||
1,200 | UNITED PARCEL SERVICE, INC. B | 137,568 | |||||||||||||
323,768 | 4.16 | ||||||||||||||
INDUSTRIAL CONGLOMERATES | |||||||||||||||
9,605 | GENERAL ELECTRIC CO. | 303,518 | |||||||||||||
2,000 | HONEYWELL INT'L INC. | 231,700 | |||||||||||||
535,218 | 6.87 | ||||||||||||||
MACHINERY | |||||||||||||||
2,000 | DEERE & CO. | 206,080 | |||||||||||||
2,350 | ILLINOIS TOOL WORKS INC. | 287,781 | |||||||||||||
493,861 | 6.34 | ||||||||||||||
INFORMATION TECHNOLOGY | 21.83 | ||||||||||||||
INTERNET SOFTWARE & SERVICES | |||||||||||||||
300 | ALPHABET INC. CLASS C* | 231,546 | |||||||||||||
231,546 | 2.97 | ||||||||||||||
IT SERVICES | |||||||||||||||
1,350 | INT'L BUSINESS MACHINES CORP. | 224,087 | |||||||||||||
2,200 | MASTERCARD INC. | 227,150 | |||||||||||||
451,237 | 5.79 | ||||||||||||||
SEMICONDUCTORS & SEMICONDUCTOR EQUIPMENT | |||||||||||||||
5,600 | INTEL CORP. | 203,112 | |||||||||||||
203,112 | 2.61 | ||||||||||||||
See Accompanying Notes to Financial Statements which are an integral part of these financial statements.
42
Pacific Advisors Large Cap Value Fund
Schedule of Investments
as of December 31, 2016
| Quantity or Principal** | Description | Current $ Value** | % of Total Net Assets | ||||||||||||
COMMON STOCK continued | |||||||||||||||
SOFTWARE | |||||||||||||||
4,887 | MICROSOFT CORP. | 303,678 | |||||||||||||
5,710 | ORACLE CORPORATION | 219,550 | |||||||||||||
523,228 | 6.72 | ||||||||||||||
TECHNOLOGY HARDWARE, STORAGE & PERIPHERALS | |||||||||||||||
2,513 | APPLE INC. | 291,056 | |||||||||||||
291,056 | 3.74 | ||||||||||||||
MATERIALS | 0.02 | ||||||||||||||
CHEMICALS | |||||||||||||||
80 | ADVANSIX INC.* | 1,771 | |||||||||||||
1,771 | 0.02 | ||||||||||||||
TOTAL COMMON STOCK (Cost: $4,529,768) | 7,712,620 | 99.01 | |||||||||||||
TOTAL INVESTMENT IN SECURITIES (Cost: $4,529,768) | 7,712,620 | 99.01 | |||||||||||||
CASH OR CASH EQUIVALENT | 82,964 | 1.07 | |||||||||||||
OTHER ASSETS LESS LIABILITIES | (5,860 | ) | (0.08 | ) | |||||||||||
TOTAL NET ASSETS | 7,789,724 | 100.00 | |||||||||||||
* Non-income producing
** The principal amount and value are stated in U.S. dollars unless otherwise indicated.
See Accompanying Notes to Financial Statements which are an integral part of these financial statements.
43
Pacific Advisors Mid Cap Value Fund
Schedule of Investments
as of December 31, 2016
| Quantity or Principal** | Description | Current $ Value** | % of Total Net Assets | ||||||||||||
COMMON STOCK | |||||||||||||||
CONSUMER DISCRETIONARY | 30.76 | ||||||||||||||
AUTO COMPONENTS | |||||||||||||||
1,900 | LEAR CORP. | 251,503 | |||||||||||||
251,503 | 4.13 | ||||||||||||||
DISTRIBUTORS | |||||||||||||||
2,300 | POOL CORPORATION | 239,982 | |||||||||||||
239,982 | 3.94 | ||||||||||||||
SPECIALTY RETAIL | |||||||||||||||
25,000 | CONN'S INC.* | 316,250 | |||||||||||||
4,000 | GAMESTOP CORP. A | 101,040 | |||||||||||||
850 | O'REILLY AUTOMOTIVE INC.* | 236,648 | |||||||||||||
5,000 | PENSKE AUTOMOTIVE GROUP INC. | 259,200 | |||||||||||||
3,400 | TRACTOR SUPPLY COMPANY | 257,754 | |||||||||||||
1,170,892 | 19.21 | ||||||||||||||
TEXTILES, APPAREL & LUXURY GOODS | |||||||||||||||
2,350 | PVH CORP. | 212,064 | |||||||||||||
212,064 | 3.48 | ||||||||||||||
CONSUMER STAPLES | 2.53 | ||||||||||||||
BEVERAGES | |||||||||||||||
1,700 | DR PEPPER SNAPPLE GROUP INC. | 154,139 | |||||||||||||
154,139 | 2.53 | ||||||||||||||
ENERGY | 7.45 | ||||||||||||||
ENERGY EQUIPMENT & SERVICES | |||||||||||||||
28,000 | HELIX ENERGY SOLUTIONS GROUP INC.* | 246,960 | |||||||||||||
35,000 | NOBLE CORPORATION | 207,200 | |||||||||||||
454,160 | 7.45 | ||||||||||||||
FINANCIALS | 7.99 | ||||||||||||||
BANKS | |||||||||||||||
4,500 | CIT GROUP INC. | 192,060 | |||||||||||||
5,800 | EAST WEST BANCORP INC. | 294,814 | |||||||||||||
486,874 | 7.99 | ||||||||||||||
HEALTH CARE | 2.18 | ||||||||||||||
HEALTH CARE TECHNOLOGY | |||||||||||||||
2,800 | CERNER CORPORATION* | 132,636 | |||||||||||||
132,636 | 2.18 | ||||||||||||||
See Accompanying Notes to Financial Statements which are an integral part of these financial statements.
44
Pacific Advisors Mid Cap Value Fund
Schedule of Investments
as of December 31, 2016
| Quantity or Principal** | Description | Current $ Value** | % of Total Net Assets | ||||||||||||
COMMON STOCK continued | |||||||||||||||
INDUSTRIALS | 43.63 | ||||||||||||||
AIRLINES | |||||||||||||||
5,500 | SPIRIT AIRLINES INC.* | 318,230 | |||||||||||||
318,230 | 5.22 | ||||||||||||||
COMMERCIAL SERVICES & SUPPLIES | |||||||||||||||
1,500 | STERICYCLE, INC.* | 115,560 | |||||||||||||
115,560 | 1.90 | ||||||||||||||
CONSTRUCTION & ENGINEERING | |||||||||||||||
7,500 | CHICAGO BRIDGE & IRON CO. N.V. | 238,125 | |||||||||||||
238,125 | 3.91 | ||||||||||||||
MACHINERY | |||||||||||||||
2,400 | GRACO INC. | 199,416 | |||||||||||||
10,000 | NAVISTAR INT'L CORP.* | 313,700 | |||||||||||||
3,100 | WABTEC CORP. | 257,362 | |||||||||||||
770,478 | 12.64 | ||||||||||||||
MARINE | |||||||||||||||
3,800 | KIRBY CORP.* | 252,700 | |||||||||||||
252,700 | 4.15 | ||||||||||||||
ROAD & RAIL | |||||||||||||||
3,800 | GENESEE & WYOMING INC.* | 263,758 | |||||||||||||
2,300 | KANSAS CITY SOUTHERN | 195,155 | |||||||||||||
1,800 | LANDSTAR SYSTEM INC. | 153,540 | |||||||||||||
10,600 | SWIFT TRANSPORTATION CO.* | 258,216 | |||||||||||||
870,669 | 14.29 | ||||||||||||||
TRADING COMPANIES & DISTRIBUTORS | |||||||||||||||
400 | W.W. GRAINGER, INC. | 92,900 | |||||||||||||
92,900 | 1.52 | ||||||||||||||
INFORMATION TECHNOLOGY | 4.49 | ||||||||||||||
SOFTWARE | |||||||||||||||
5,000 | ASPEN TECHNOLOGY, INC.* | 273,400 | |||||||||||||
273,400 | 4.49 | ||||||||||||||
See Accompanying Notes to Financial Statements which are an integral part of these financial statements.
45
Pacific Advisors Mid Cap Value Fund
Schedule of Investments
as of December 31, 2016
| Quantity or Principal** | Description | Current $ Value** | % of Total Net Assets | ||||||||||||
COMMON STOCK continued | |||||||||||||||
MATERIALS | 1.82 | ||||||||||||||
CHEMICALS | |||||||||||||||
2,300 | H.B. FULLER CO. | 111,113 | |||||||||||||
111,113 | 1.82 | ||||||||||||||
TOTAL COMMON STOCK (Cost: $4,937,023) | 6,145,425 | 100.85 | |||||||||||||
TOTAL INVESTMENT IN SECURITIES (Cost: $4,937,023) | 6,145,425 | 100.85 | |||||||||||||
OTHER ASSETS LESS LIABILITIES | (51,617 | ) | (0.85 | ) | |||||||||||
TOTAL NET ASSETS | 6,093,808 | 100.00 | |||||||||||||
* Non-income producing
** The principal amount and value are stated in U.S. dollars unless otherwise indicated.
See Accompanying Notes to Financial Statements which are an integral part of these financial statements.
46
Pacific Advisors Small Cap Value Fund
Schedule of Investments
as of December 31, 2016
| Quantity or Principal** | Description | Current $ Value** | % of Total Net Assets | ||||||||||||
COMMON STOCK | |||||||||||||||
CONSUMER DISCRETIONARY | 17.31 | ||||||||||||||
AUTO COMPONENTS | |||||||||||||||
35,000 | GENTHERM INC.* | 1,184,750 | |||||||||||||
1,184,750 | 3.95 | ||||||||||||||
SPECIALTY RETAIL | |||||||||||||||
140,000 | CONN'S INC.* | 1,771,000 | |||||||||||||
30,000 | HIBBETT SPORTS INC.* | 1,119,000 | |||||||||||||
49,000 | SONIC AUTOMOTIVE INC. | 1,122,100 | |||||||||||||
4,012,100 | 13.36 | ||||||||||||||
CONSUMER STAPLES | 6.27 | ||||||||||||||
FOOD & STAPLES RETAILING | |||||||||||||||
65,812 | CHEFS' WAREHOUSE INC.* | 1,039,830 | |||||||||||||
1,039,830 | 3.47 | ||||||||||||||
FOOD PRODUCTS | |||||||||||||||
65,000 | DARLING INGREDIENTS INC.* | 839,150 | |||||||||||||
839,150 | 2.80 | ||||||||||||||
ENERGY | 20.87 | ||||||||||||||
ENERGY EQUIPMENT & SERVICES | |||||||||||||||
84,000 | HELIX ENERGY SOLUTIONS GROUP INC.* | 740,880 | |||||||||||||
90,000 | HORNBECK OFFSHORE SERVICES INC.* | 649,800 | |||||||||||||
62,000 | MATRIX SERVICE CO.* | 1,407,400 | |||||||||||||
37,000 | NATURAL GAS SERVICES GROUP, INC.* | 1,189,550 | |||||||||||||
369,944 | NORTH AMERICAN ENERGY PARTNERS INC. | 1,424,284 | |||||||||||||
325,000 | PARKER DRILLING CO.* | 845,000 | |||||||||||||
6,256,914 | 20.84 | ||||||||||||||
OIL, GAS & CONSUMABLE FUELS | |||||||||||||||
100,000 | INFINITY ENERGY RESOURCES INC.* | 10,000 | |||||||||||||
10,000 | 0.03 | ||||||||||||||
FINANCIALS | 8.63 | ||||||||||||||
BANKS | |||||||||||||||
24,000 | EAST WEST BANCORP INC. | 1,219,920 | |||||||||||||
1,219,920 | 4.06 | ||||||||||||||
CAPITAL MARKETS | |||||||||||||||
1,500 | MORNINGSTAR, INC. | 110,340 | |||||||||||||
110,340 | 0.37 | ||||||||||||||
CONSUMER FINANCE | |||||||||||||||
48,000 | REGIONAL MANAGEMENT CORP.* | 1,261,440 | |||||||||||||
1,261,440 | 4.20 | ||||||||||||||
See Accompanying Notes to Financial Statements which are an integral part of these financial statements.
47
Pacific Advisors Small Cap Value Fund
Schedule of Investments
as of December 31, 2016
| Quantity or Principal** | Description | Current $ Value** | % of Total Net Assets | ||||||||||||
COMMON STOCK continued | |||||||||||||||
INDUSTRIALS | 47.30 | ||||||||||||||
BUILDING PRODUCTS | |||||||||||||||
26,195 | INSTEEL INDUSTRIES, INC. | 933,590 | |||||||||||||
933,590 | 3.11 | ||||||||||||||
COMMERCIAL SERVICES & SUPPLIES | |||||||||||||||
33,000 | MOBILE MINI INC. | 998,250 | |||||||||||||
39,000 | TEAM INC.* | 1,530,750 | |||||||||||||
2,529,000 | 8.42 | ||||||||||||||
CONSTRUCTION & ENGINEERING | |||||||||||||||
131,000 | ORION GROUP HOLDINGS, INC.* | 1,303,450 | |||||||||||||
1,303,450 | 4.34 | ||||||||||||||
MACHINERY | |||||||||||||||
42,000 | NAVISTAR INT'L CORP.* | 1,317,540 | |||||||||||||
1,317,540 | 4.39 | ||||||||||||||
MARINE | |||||||||||||||
21,000 | KIRBY CORP.* | 1,396,500 | |||||||||||||
1,396,500 | 4.65 | ||||||||||||||
ROAD & RAIL | |||||||||||||||
18,000 | GENESEE & WYOMING INC.* | 1,249,380 | |||||||||||||
29,000 | SAIA INC.* | 1,280,350 | |||||||||||||
2,529,730 | 8.43 | ||||||||||||||
TRADING COMPANIES & DISTRIBUTORS | |||||||||||||||
38,000 | DXP ENTERPRISES INC.* | 1,320,120 | |||||||||||||
41,000 | RUSH ENTERPRISES INC.* | 1,307,900 | |||||||||||||
99,000 | TRITON INTERNATIONAL LIMITED | 1,564,200 | |||||||||||||
4,192,220 | 13.96 | ||||||||||||||
TOTAL COMMON STOCK (Cost: $23,879,586) | 30,136,474 | 100.38 | |||||||||||||
TOTAL INVESTMENT IN SECURITIES (Cost: $23,879,586) | 30,136,474 | 100.38 | |||||||||||||
OTHER ASSETS LESS LIABILITIES | (112,808 | ) | (0.38 | ) | |||||||||||
TOTAL NET ASSETS | 30,023,666 | 100.00 | |||||||||||||
* Non-income producing
** The principal amount and value are stated in U.S. dollars unless otherwise indicated.
See Accompanying Notes to Financial Statements which are an integral part of these financial statements.
48
(This page has been left blank intentionally.)
49
Pacific Advisors Fund Inc.
Statements of Assets and Liabilities
December 31, 2016
| Income and Equity Fund | Balanced Fund | Large Cap Value Fund | |||||||||||||
Assets | |||||||||||||||
Investment securities | |||||||||||||||
At cost | $ | 14,577,719 | $ | 5,718,718 | $ | 4,529,768 | |||||||||
At fair value | $ | 16,823,419 | $ | 5,985,580 | $ | 7,712,620 | |||||||||
Cash or cash equivalent, at fair value | 486,514 | 51,176 | 82,964 | ||||||||||||
Accrued income receivable | 102,758 | 35,809 | 10,572 | ||||||||||||
Receivable for capital shares sold | 45,845 | 7,550 | 78,206 | ||||||||||||
Receivable for investments sold | 51,381 | - | - | ||||||||||||
Prepaid expense | 500 | 500 | 500 | ||||||||||||
Total assets | 17,510,417 | 6,080,615 | 7,884,862 | ||||||||||||
Liabilities | |||||||||||||||
Bank borrowings (Note 7) | - | - | - | ||||||||||||
Payable for investments purchased | 206,220 | - | - | ||||||||||||
Payable for fund shares redeemed | 4,478 | 56,742 | 68,031 | ||||||||||||
Accounts payable | 45,403 | 19,897 | 23,507 | ||||||||||||
Accounts payable to related parties (Note 3) | 3,600 | 3,600 | 3,600 | ||||||||||||
Total liabilities | 259,701 | 80,239 | 95,138 | ||||||||||||
Net Assets | $ | 17,250,716 | $ | 6,000,376 | $ | 7,789,724 | |||||||||
Summary of Shareholders' Equity | |||||||||||||||
Paid in capital | 15,290,356 | 5,702,290 | 4,595,398 | ||||||||||||
Accumulated undistributed net realized gain (loss) on security transactions | (285,340 | ) | 31,224 | 11,474 | |||||||||||
Net unrealized appreciation of investments | 2,245,700 | 266,862 | 3,182,852 | ||||||||||||
Net assets at December 31, 2016 | $ | 17,250,716 | $ | 6,000,376 | $ | 7,789,724 | |||||||||
Class A: | |||||||||||||||
Net assets | $ | 14,794,400 | $ | 4,275,913 | $ | 6,952,750 | |||||||||
Shares authorized ($0.01 par value) | 50,000,000 | 50,000,000 | 50,000,000 | ||||||||||||
Shares outstanding | 1,192,700 | 376,911 | 459,162 | ||||||||||||
Net asset value (and redemption price) per share | $ | 12.40 | $ | 11.34 | $ | 15.14 | |||||||||
Maximum offering price per share | $ | 13.02 | $ | 12.03 | $ | 16.06 | |||||||||
Sales load | 4.75 | % | 5.75 | % | 5.75 | % | |||||||||
Class C: | |||||||||||||||
Net assets | $ | 2,456,316 | $ | 1,724,463 | $ | 836,974 | |||||||||
Shares authorized ($0.01 par value) | 50,000,000 | 50,000,000 | 50,000,000 | ||||||||||||
Shares outstanding | 207,083 | 172,323 | 64,312 | ||||||||||||
Net asset value (and offering and redemption price) per share | $ | 11.86 | $ | 10.01 | $ | 13.01 | |||||||||
Class I: | |||||||||||||||
Net assets | N/A | N/A | N/A | ||||||||||||
Shares authorized ($0.01 par value) | |||||||||||||||
Shares outstanding | |||||||||||||||
Net asset value (and offering and redemption price) per share | N/A | N/A | N/A | ||||||||||||
* Net assets divided by shares outstanding does not equal net asset value per share due to rounding.
See Accompanying Notes to Financial Statements which are an integral part of these financial statements.
50
| Mid Cap Value Fund | Small Cap Value Fund | ||||||||||
Assets | |||||||||||
Investment securities | |||||||||||
At cost | $ | 4,937,023 | $ | 23,879,586 | |||||||
At fair value | $ | 6,145,425 | $ | 30,136,474 | |||||||
Cash or cash equivalent, at fair value | - | - | |||||||||
Accrued income receivable | 1,660 | 41,089 | |||||||||
Receivable for capital shares sold | 23,521 | 178,681 | |||||||||
Receivable for investments sold | - | 343,602 | |||||||||
Prepaid expense | 500 | 500 | |||||||||
Total assets | 6,171,106 | 30,700,346 | |||||||||
Liabilities | |||||||||||
Bank borrowings (Note 7) | 18,984 | 206,255 | |||||||||
Payable for investments purchased | - | 206,100 | |||||||||
Payable for fund shares redeemed | 38,400 | 165,373 | |||||||||
Accounts payable | 16,314 | 87,234 | |||||||||
Accounts payable to related parties (Note 3) | 3,600 | 11,718 | |||||||||
Total liabilities | 77,298 | 676,680 | |||||||||
Net Assets | $ | 6,093,808 | $ | 30,023,666 | |||||||
Summary of Shareholders' Equity | |||||||||||
Paid in capital | 5,525,573 | 22,913,357 | |||||||||
Accumulated undistributed net realized gain (loss) on security transactions | (640,167 | ) | 853,421 | ||||||||
Net unrealized appreciation of investments | 1,208,402 | 6,256,888 | |||||||||
Net assets at December 31, 2016 | $ | 6,093,808 | $ | 30,023,666 | |||||||
Class A: | |||||||||||
Net assets | $ | 5,728,054 | $ | 26,420,294 | |||||||
Shares authorized ($0.01 par value) | 50,000,000 | 50,000,000 | |||||||||
Shares outstanding | 486,260 | 970,184 | |||||||||
Net asset value (and redemption price) per share | $ | 11.78 | $ | 27.23 | |||||||
Maximum offering price per share | $ | 12.50 | $ | 28.89 | |||||||
Sales load | 5.75 | % | 5.75 | % | |||||||
Class C: | |||||||||||
Net assets | $ | 365,754 | $ | 3,595,600 | |||||||
Shares authorized ($0.01 par value) | 50,000,000 | 50,000,000 | |||||||||
Shares outstanding | 35,093 | 181,690 | |||||||||
Net asset value (and offering and redemption price) per share | $ | 10.42 | $ | 19.79 | |||||||
Class I: | |||||||||||
Net assets | N/A | $ | 7,772 | ||||||||
Shares authorized ($0.01 par value) | 50,000,000 | ||||||||||
Shares outstanding | 222 | ||||||||||
Net asset value (and offering and redemption price) per share | N/A | $ | 35.05 | * | |||||||
51
Pacific Advisors Fund Inc.
Statements of Operations
December 31, 2016
| Income and Equity Fund | Balanced Fund | Large Cap Value Fund | |||||||||||||
Investment Income | |||||||||||||||
Dividends | $ | 238,792 | $ | 41,616 | $ | 167,129 | |||||||||
Interest | 248,227 | 79,772 | 3 | ||||||||||||
Total investment income | 487,019 | 121,388 | 167,132 | ||||||||||||
Expenses | |||||||||||||||
Investment management fees (Note 3) | 116,065 | 46,614 | 55,635 | ||||||||||||
Transfer agent fees (Note 3) | 112,140 | 74,015 | 102,687 | ||||||||||||
Fund accounting fees (Note 3) | 110,086 | 47,042 | 58,257 | ||||||||||||
Legal fees | 38,418 | 15,355 | 18,301 | ||||||||||||
Audit fees | 26,144 | 10,491 | 12,526 | ||||||||||||
Registration fees | 33,844 | 28,623 | 24,840 | ||||||||||||
Printing | 10,365 | 5,372 | 8,906 | ||||||||||||
Custody fees | 8,670 | 7,727 | 7,351 | ||||||||||||
Interest on bank borrowings (Note 7) | 41 | 736 | 1,344 | ||||||||||||
Director fees/meetings | 20,925 | 8,449 | 10,052 | ||||||||||||
Distribution and service (12b-1) fees (Note 3) | 58,379 | 31,185 | 25,973 | ||||||||||||
Administration fees (Note 3) | 7,737 | 3,108 | 3,709 | ||||||||||||
Compliance fees (Note 3) | 39,002 | 16,533 | 19,301 | ||||||||||||
Total expenses, before fees waived | 581,816 | 295,250 | 348,882 | ||||||||||||
Less fees waived (Note 3) | 116,065 | - | 55,635 | ||||||||||||
Net expenses | 465,751 | 295,250 | 293,247 | ||||||||||||
Net Investment Income (Loss) | 21,268 | (173,862 | ) | (126,115 | ) | ||||||||||
Net Realized and Unrealized Gain on Investments | |||||||||||||||
Net realized gain on investments | 126,786 | 207,753 | 99,141 | ||||||||||||
Change in net unrealized appreciation (depreciation) on investments | 883,905 | (67,001 | ) | 650,331 | |||||||||||
Net realized and unrealized gain on investments | 1,010,691 | 140,752 | 749,472 | ||||||||||||
Net Increase (Decrease) in Net Assets Resulting from Operations | $ | 1,031,959 | $ | (33,110 | ) | $ | 623,357 | ||||||||
See Accompanying Notes to Financial Statements which are an integral part of these financial statements.
52
| Mid Cap Value Fund | Small Cap Value Fund | ||||||||||
Investment Income | |||||||||||
Dividends | $ | 53,203 | $ | 137,219 | |||||||
Interest | - | - | |||||||||
Total investment income | 53,203 | 137,219 | |||||||||
Expenses | |||||||||||
Investment management fees (Note 3) | 56,637 | 232,350 | |||||||||
Transfer agent fees (Note 3) | 69,325 | 335,002 | |||||||||
Fund accounting fees (Note 3) | 41,378 | 252,631 | |||||||||
Legal fees | 13,476 | 78,704 | |||||||||
Audit fees | 9,566 | 52,272 | |||||||||
Registration fees | 26,806 | 65,829 | |||||||||
Printing | 4,745 | 27,974 | |||||||||
Custody fees | 7,352 | 11,962 | |||||||||
Interest on bank borrowings (Note 7) | 961 | 14,457 | |||||||||
Director fees/meetings | 7,549 | 42,510 | |||||||||
Distribution and service (12b-1) fees (Note 3) | 17,941 | 107,991 | |||||||||
Administration fees (Note 3) | 2,832 | 15,490 | |||||||||
Compliance fees (Note 3) | 13,929 | 91,059 | |||||||||
Total expenses, before fees waived | 272,497 | 1,328,231 | |||||||||
Less fees waived (Note 3) | - | - | |||||||||
Net expenses | 272,497 | 1,328,231 | |||||||||
Net Investment Income (Loss) | (219,294 | ) | (1,191,012 | ) | |||||||
Net Realized and Unrealized Gain on Investments | |||||||||||
Net realized gain on investments | 125,190 | 1,188,133 | |||||||||
Change in net unrealized appreciation (depreciation) on investments | 885,408 | 6,332,333 | |||||||||
Net realized and unrealized gain on investments | 1,010,598 | 7,520,466 | |||||||||
Net Increase (Decrease) in Net Assets Resulting from Operations | $ | 791,304 | $ | 6,329,454 | |||||||
53
Pacific Advisors Fund Inc.
Statements of Changes in Net Assets
Income and Equity Fund | Balanced Fund | ||||||||||||||||||
| Year ended December 31, 2016 | Year ended December 31, 2015 | Year ended December 31, 2016 | Year ended December 31, 2015 | ||||||||||||||||
| Increase (Decrease) in Net Assets From Operations | |||||||||||||||||||
Net investment income (loss) | $ | 21,268 | $ | 151,422 | $ | (173,862 | ) | $ | (116,856 | ) | |||||||||
Net realized gain (loss) on investments | 126,786 | 85,639 | 207,753 | 123,988 | |||||||||||||||
Change in net unrealized appreciation (depreciation) on investments | 883,905 | (614,621 | ) | (67,001 | ) | (1,417,116 | ) | ||||||||||||
Increase (decrease) in net assets resulting from operations | 1,031,959 | (377,560 | ) | (33,110 | ) | (1,409,984 | ) | ||||||||||||
From Distributions to Shareholders | |||||||||||||||||||
Class A: | |||||||||||||||||||
Net investment income | (23,421 | ) | (135,748 | ) | - | - | |||||||||||||
Net capital gains | - | - | (155,274 | ) | (82,968 | ) | |||||||||||||
Return of Capital | (11,626 | ) | - | - | - | ||||||||||||||
Class C: | |||||||||||||||||||
Net investment income | - | (14,183 | ) | - | - | ||||||||||||||
Net capital gains | - | - | (69,979 | ) | (63,042 | ) | |||||||||||||
Class I: | |||||||||||||||||||
Net capital gains | N/A | N/A | N/A | N/A | |||||||||||||||
Decrease in net assets resulting from distributions | (35,047 | ) | (149,931 | ) | (225,253 | ) | (146,010 | ) | |||||||||||
From Capital Share Transactions (Note 6) | |||||||||||||||||||
Proceeds from shares sold | 4,599,494 | 2,752,000 | 849,404 | 696,319 | |||||||||||||||
Proceeds from shares purchased by reinvestment of distributions | 31,280 | 133,740 | 208,156 | 132,222 | |||||||||||||||
Cost of shares repurchased | (2,684,739 | ) | (1,845,187 | ) | (1,523,942 | ) | (1,767,846 | ) | |||||||||||
Increase (decrease) in net assets resulting from capital share transactions | 1,946,035 | 1,040,553 | (466,382 | ) | (939,305 | ) | |||||||||||||
Increase (decrease) in net assets | 2,942,947 | 513,062 | (724,745 | ) | (2,495,299 | ) | |||||||||||||
Net Assets | |||||||||||||||||||
Beginning of year | 14,307,769 | 13,794,707 | 6,725,121 | 9,220,420 | |||||||||||||||
End of year | $ | 17,250,716 | $ | 14,307,769 | $ | 6,000,376 | $ | 6,725,121 | |||||||||||
Including undistributed net investment income | $ | - | $ | 2,153 | $ | - | $ | - | |||||||||||
See Accompanying Notes to Financial Statements which are an integral part of these financial statements.
54
Large Cap Value Fund | |||||||||||
| Year ended December 31, 2016 | Year ended December 31, 2015 | ||||||||||
| Increase (Decrease) in Net Assets From Operations | |||||||||||
Net investment income (loss) | $ | (126,115 | ) | $ | (59,487 | ) | |||||
Net realized gain (loss) on investments | 99,141 | (63,724 | ) | ||||||||
Change in net unrealized appreciation (depreciation) on investments | 650,331 | (19,216 | ) | ||||||||
Increase (decrease) in net assets resulting from operations | 623,357 | (142,427 | ) | ||||||||
From Distributions to Shareholders | |||||||||||
Class A: | |||||||||||
Net investment income | - | - | |||||||||
Net capital gains | (20,212 | ) | (10,259 | ) | |||||||
Return of Capital | - | - | |||||||||
Class C: | |||||||||||
Net investment income | - | - | |||||||||
Net capital gains | (2,847 | ) | (2,098 | ) | |||||||
Class I: | |||||||||||
Net capital gains | N/A | N/A | |||||||||
Decrease in net assets resulting from distributions | (23,059 | ) | (12,357 | ) | |||||||
From Capital Share Transactions (Note 6) | |||||||||||
Proceeds from shares sold | 737,466 | 686,897 | |||||||||
Proceeds from shares purchased by reinvestment of distributions | 20,835 | 11,071 | |||||||||
Cost of shares repurchased | (1,316,655 | ) | (854,981 | ) | |||||||
Increase (decrease) in net assets resulting from capital share transactions | (558,354 | ) | (157,013 | ) | |||||||
Increase (decrease) in net assets | 41,944 | (311,797 | ) | ||||||||
Net Assets | |||||||||||
Beginning of year | 7,747,780 | 8,059,577 | |||||||||
End of year | $ | 7,789,724 | $ | 7,747,780 | |||||||
Including undistributed net investment income | $ | - | $ | - | |||||||
55
Pacific Advisors Fund Inc.
Statements of Changes in Net Assets
Mid Cap Value Fund | |||||||||||
| Year ended December 31, 2016 | Year ended December 31, 2015 | ||||||||||
| Increase (Decrease) in Net Assets From Operations | |||||||||||
Net investment income (loss) | $ | (219,294 | ) | $ | (168,992 | ) | |||||
Net realized gain (loss) on investments | 125,190 | (88,212 | ) | ||||||||
Change in net unrealized appreciation (depreciation) on investments | 885,408 | (1,427,491 | ) | ||||||||
Increase (decrease) in net assets resulting from operations | 791,304 | (1,684,695 | ) | ||||||||
From Distributions to Shareholders | |||||||||||
Class A: | |||||||||||
Net investment income | - | - | |||||||||
Net capital gains | - | - | |||||||||
Return of Capital | - | - | |||||||||
Class C: | |||||||||||
Net investment income | - | - | |||||||||
Net capital gains | - | - | |||||||||
Class I: | |||||||||||
Net capital gains | N/A | N/A | |||||||||
Decrease in net assets resulting from distributions | - | - | |||||||||
From Capital Share Transactions (Note 6) | |||||||||||
Proceeds from shares sold | 574,094 | 697,270 | |||||||||
Proceeds from shares purchased by reinvestment of distributions | - | - | |||||||||
Cost of shares repurchased | (808,187 | ) | (347,630 | ) | |||||||
Increase (decrease) in net assets resulting from capital share transactions | (234,093 | ) | 349,640 | ||||||||
Increase (decrease) in net assets | 557,211 | (1,335,055 | ) | ||||||||
Net Assets | |||||||||||
Beginning of year | 5,536,597 | 6,871,652 | |||||||||
End of year | $ | 6,093,808 | $ | 5,536,597 | |||||||
Including undistributed net investment income | $ | - | $ | - | |||||||
See Accompanying Notes to Financial Statements which are an integral part of these financial statements.
56
Small Cap Value Fund | |||||||||||
| Year ended December 31, 2016 | Year ended December 31, 2015 | ||||||||||
| Increase (Decrease) in Net Assets From Operations | |||||||||||
Net investment income (loss) | $ | (1,191,012 | ) | $ | (2,228,870 | ) | |||||
Net realized gain (loss) on investments | 1,188,133 | 7,754,982 | |||||||||
Change in net unrealized appreciation (depreciation) on investments | 6,332,333 | (32,263,584 | ) | ||||||||
Increase (decrease) in net assets resulting from operations | 6,329,454 | (26,737,472 | ) | ||||||||
From Distributions to Shareholders | |||||||||||
Class A: | |||||||||||
Net investment income | - | - | |||||||||
Net capital gains | (3,617,413 | ) | (7,431,577 | ) | |||||||
Return of Capital | - | - | |||||||||
Class C: | |||||||||||
Net investment income | - | - | |||||||||
Net capital gains | (648,113 | ) | (1,365,654 | ) | |||||||
Class I: | |||||||||||
Net capital gains | (840 | ) | (32,425 | ) | |||||||
Decrease in net assets resulting from distributions | (4,266,366 | ) | (8,829,656 | ) | |||||||
From Capital Share Transactions (Note 6) | |||||||||||
Proceeds from shares sold | 1,705,215 | 14,004,821 | |||||||||
Proceeds from shares purchased by reinvestment of distributions | 3,949,069 | 7,967,113 | |||||||||
Cost of shares repurchased | (16,971,079 | ) | (81,669,459 | ) | |||||||
Increase (decrease) in net assets resulting from capital share transactions | (11,316,795 | ) | (59,697,525 | ) | |||||||
Increase (decrease) in net assets | (9,253,707 | ) | (95,264,653 | ) | |||||||
Net Assets | |||||||||||
Beginning of year | 39,277,373 | 134,542,026 | |||||||||
End of year | $ | 30,023,666 | $ | 39,277,373 | |||||||
Including undistributed net investment income | $ | - | $ | - | |||||||
57
Pacific Advisors Fund Inc.
Financial Highlights
(For a share outstanding throughout each year presented)
Income and Equity Fund | |||||||||||||||||||||||
Class A | |||||||||||||||||||||||
For the year ended December 31, | |||||||||||||||||||||||
2016 | 2015 | 2014 | 2013 | 2012 | |||||||||||||||||||
Per Share Operating Performance | |||||||||||||||||||||||
Net asset value, beginning of year | $ | 11.61 | $ | 12.06 | $ | 11.55 | $ | 10.30 | $ | 9.84 | |||||||||||||
Income from investing operations | |||||||||||||||||||||||
Net investment income (c) | 0.03 | 0.14 | 0.22 | (d) | 0.14 | (d) | 0.15 | (d) | |||||||||||||||
Net realized and unrealized gain (loss) on securities | 0.78 | (0.45 | ) | 0.51 | (d) | 1.24 | (d) | 0.48 | (d) | ||||||||||||||
Total from investment operations | 0.81 | (0.31 | ) | 0.73 | 1.38 | 0.63 | |||||||||||||||||
Less distributions | |||||||||||||||||||||||
From net investment income | (0.02 | ) | (0.14 | ) | (0.22 | ) | (0.13 | ) | (0.17 | ) | |||||||||||||
From return of capital | (0.01 | ) | - | - | - | - | |||||||||||||||||
Total distributions | (0.03 | ) | (0.14 | ) | (0.22 | ) | (0.13 | ) | (0.17 | ) | |||||||||||||
Redemption fees (c) | 0.01 | - | (b) | - | (b,d) | - | (b,d) | - | (b,d) | ||||||||||||||
Net asset value, end of year | $ | 12.40 | $ | 11.61 | $ | 12.06 | $ | 11.55 | $ | 10.30 | |||||||||||||
Total Investment Return (a) | 7.08 | % | (2.57 | )% | 6.41 | % | 13.40 | % | 6.46 | % | |||||||||||||
Ratios/Supplemental Data | |||||||||||||||||||||||
Net assets, end of year (000's) | $ | 14,794 | $ | 11,541 | $ | 11,324 | $ | 9,247 | $ | 4,659 | |||||||||||||
Ratio of net investment income (loss) to average net assets | |||||||||||||||||||||||
With expense reductions | 0.26 | % | 1.23 | % | 1.88 | % | 1.27 | % | 1.56 | % | |||||||||||||
Without expense reductions | (0.49 | )% | 0.48 | % | 1.13 | % | 0.52 | % | 0.81 | % | |||||||||||||
Ratio of expenses to average net assets | |||||||||||||||||||||||
With expense reductions | 2.88 | % | 2.06 | % | 1.91 | % | 2.23 | % | 2.68 | % | |||||||||||||
Without expense reductions | 3.63 | % | 2.81 | % | 2.66 | % | 2.98 | % | 3.42 | % | |||||||||||||
Fund portfolio turnover rate | 14 | % | 22 | % | 13 | % | 20 | % | 29 | % | |||||||||||||
Class C | |||||||||||||||||||||||
For the year ended December 31, | |||||||||||||||||||||||
2016 | 2015 | 2014 | 2013 | 2012 | |||||||||||||||||||
Per Share Operating Performance | |||||||||||||||||||||||
Net asset value, beginning of year | $ | 11.16 | $ | 11.59 | $ | 11.11 | $ | 9.91 | $ | 9.42 | |||||||||||||
Income from investing operations | |||||||||||||||||||||||
Net investment income (loss) (c) | (0.06 | ) | 0.05 | 0.13 | (d) | 0.05 | (d) | 0.08 | (d) | ||||||||||||||
Net realized and unrealized gain (loss) on securities | 0.75 | (0.42 | ) | 0.48 | (d) | 1.19 | (d) | 0.46 | (d) | ||||||||||||||
Total from investment operations | 0.69 | (0.37 | ) | 0.61 | 1.24 | 0.54 | |||||||||||||||||
Less distributions | |||||||||||||||||||||||
From net investment income | - | (0.06 | ) | (0.13 | ) | (0.04 | ) | (0.05 | ) | ||||||||||||||
Total distributions | - | (0.06 | ) | (0.13 | ) | (0.04 | ) | (0.05 | ) | ||||||||||||||
Redemption fees (c) | 0.01 | - | (b) | - | (b,d) | - | (b,d) | - | (b,d) | ||||||||||||||
Net asset value, end of year | $ | 11.86 | $ | 11.16 | $ | 11.59 | $ | 11.11 | $ | 9.91 | |||||||||||||
Total Investment Return | 6.27 | % | (3.21 | )% | 5.51 | % | 12.55 | % | 5.74 | % | |||||||||||||
Ratios/Supplemental Data | |||||||||||||||||||||||
Net assets, end of year (000's) | $ | 2,456 | $ | 2,766 | $ | 2,471 | $ | 2,234 | $ | 1,906 | |||||||||||||
Ratio of net investment income (loss) to average net assets | |||||||||||||||||||||||
With expense reductions | (0.48 | )% | 0.48 | % | 1.14 | % | 0.49 | % | 0.80 | % | |||||||||||||
Without expense reductions | (1.23 | )% | (0.27 | )% | 0.39 | % | (0.26 | )% | 0.05 | % | |||||||||||||
Ratio of expenses to average net assets | |||||||||||||||||||||||
With expense reductions | 3.64 | % | 2.81 | % | 2.66 | % | 3.03 | % | 3.45 | % | |||||||||||||
Without expense reductions | 4.39 | % | 3.56 | % | 3.41 | % | 3.78 | % | 4.20 | % | |||||||||||||
Fund portfolio turnover rate | 14 | % | 22 | % | 13 | % | 20 | % | 29 | % | |||||||||||||
(a) The Fund's maximum sales charge is not included in the total return computation.
(b) The amount is less than $0.005 and rounded to zero.
(c) Based on average shares outstanding.
(d) Net investment income, net realized and unrealized gain (loss) on securities and redemptions fees for Class A and Class C for the years ended December 31, 2012 to December 31, 2014 were restated during the year ended December 31, 2015. See Note 2(H).
See Accompanying Notes to Financial Statements which are an integral part of these financial statements.
58
Pacific Advisors Fund Inc.
Financial Highlights
(For a share outstanding throughout each year presented)
Balanced Fund | |||||||||||||||||||||||
Class A | |||||||||||||||||||||||
For the year ended December 31, | |||||||||||||||||||||||
2016 | 2015 | 2014 | 2013 | 2012 | |||||||||||||||||||
Per Share Operating Performance | |||||||||||||||||||||||
Net asset value, beginning of year | $ | 11.75 | $ | 14.40 | $ | 16.59 | $ | 14.13 | $ | 13.47 | |||||||||||||
Income from investing operations | |||||||||||||||||||||||
Net investment loss (c) | (0.29 | ) | (0.15 | ) | (0.14 | )(d) | (0.15 | )(d) | (0.04 | )(d) | |||||||||||||
Net realized and unrealized gain (loss) on securities | 0.30 | (2.25 | ) | (1.17 | )(d) | 4.17 | (d) | 1.35 | (d) | ||||||||||||||
Total from investment operations | 0.01 | (2.40 | ) | (1.31 | ) | 4.02 | 1.31 | ||||||||||||||||
Less distributions | |||||||||||||||||||||||
From net capital gain | (0.42 | ) | (0.25 | ) | (0.88 | ) | (1.57 | ) | (0.65 | ) | |||||||||||||
Total distributions | (0.42 | ) | (0.25 | ) | (0.88 | ) | (1.57 | ) | (0.65 | ) | |||||||||||||
Redemption fees (c) | - | (b) | - | (b) | - | (b,d) | 0.01 | (d) | - | (b,d) | |||||||||||||
Net asset value, end of year | $ | 11.34 | $ | 11.75 | $ | 14.40 | $ | 16.59 | $ | 14.13 | |||||||||||||
Total Investment Return (a) | 0.08 | % | (16.73 | )% | (7.94 | )% | 28.68 | % | 9.69 | % | |||||||||||||
Ratios/Supplemental Data | |||||||||||||||||||||||
Net assets, end of year (000's) | $ | 4,276 | $ | 4,046 | $ | 5,017 | $ | 5,144 | $ | 3,919 | |||||||||||||
Ratio of net investment loss to average net assets | (2.56 | )% | (1.08 | )% | (0.90 | )% | (0.93 | )% | (0.27 | )% | |||||||||||||
Ratio of expenses to average net assets | 4.50 | % | 3.27 | % | 2.84 | % | 3.07 | % | 3.30 | % | |||||||||||||
Fund portfolio turnover rate | 55 | % | 28 | % | 22 | % | 23 | % | 34 | % | |||||||||||||
Class C | |||||||||||||||||||||||
For the year ended December 31, | |||||||||||||||||||||||
2016 | 2015 | 2014 | 2013 | 2012 | |||||||||||||||||||
Per Share Operating Performance | |||||||||||||||||||||||
Net asset value, beginning of year | $ | 10.50 | $ | 12.99 | $ | 15.18 | $ | 13.13 | $ | 12.66 | |||||||||||||
Income from investing operations | |||||||||||||||||||||||
Net investment loss (c) | (0.33 | ) | (0.23 | ) | (0.24 | )(d) | (0.25 | )(d) | (0.13 | )(d) | |||||||||||||
Net realized and unrealized gain (loss) on securities | 0.26 | (2.01 | ) | (1.07 | )(d) | 3.87 | (d) | 1.25 | (d) | ||||||||||||||
Total from investment operations | (0.07 | ) | (2.24 | ) | (1.31 | ) | 3.62 | 1.12 | |||||||||||||||
Less distributions | |||||||||||||||||||||||
From net capital gain | (0.42 | ) | (0.25 | ) | (0.88 | ) | (1.57 | ) | (0.65 | ) | |||||||||||||
Total distributions | (0.42 | ) | (0.25 | ) | (0.88 | ) | (1.57 | ) | (0.65 | ) | |||||||||||||
Redemption fees (c) | - | (b) | - | (b) | - | (b,d) | - | (b,d) | - | (b,d) | |||||||||||||
Net asset value, end of year | $ | 10.01 | $ | 10.50 | $ | 12.99 | $ | 15.18 | $ | 13.13 | |||||||||||||
Total Investment Return | (0.67 | )% | (17.31 | )% | (8.68 | )% | 27.75 | % | 8.81 | % | |||||||||||||
Ratios/Supplemental Data | |||||||||||||||||||||||
Net assets, end of year (000's) | $ | 1,724 | $ | 2,679 | $ | 4,203 | $ | 5,471 | $ | 6,647 | |||||||||||||
Ratio of net investment loss to average net assets | (3.27 | )% | (1.85 | )% | (1.64 | )% | (1.70 | )% | (0.97 | )% | |||||||||||||
Ratio of expenses to average net assets | 5.25 | % | 4.05 | % | 3.58 | % | 3.86 | % | 4.02 | % | |||||||||||||
Fund portfolio turnover rate | 55 | % | 28 | % | 22 | % | 23 | % | 34 | % | |||||||||||||
(a) The Fund's maximum sales charge is not included in the total return computation.
(b) The amount is less than $0.005 and rounded to zero.
(c) Based on average shares outstanding.
(d) Net investment loss, net realized and unrealized gain (loss) on securities and redemptions fees for Class A and Class C for the years ended December 31, 2012 to December 31, 2014 were restated during the year ended December 31, 2015. See Note 2(H).
See Accompanying Notes to Financial Statements which are an integral part of these financial statements.
59
Pacific Advisors Fund Inc.
Financial Highlights
(For a share outstanding throughout each year presented)
Large Cap Value Fund | |||||||||||||||||||||||
Class A | |||||||||||||||||||||||
For the year ended December 31, | |||||||||||||||||||||||
2016 | 2015 | 2014 | 2013 | 2012 | |||||||||||||||||||
Per Share Operating Performance | |||||||||||||||||||||||
Net asset value, beginning of year | $ | 13.92 | $ | 14.18 | $ | 13.05 | $ | 10.34 | $ | 9.30 | |||||||||||||
Income from investing operations | |||||||||||||||||||||||
Net investment loss (c) | (0.23 | ) | (0.09 | ) | (0.07 | )(d) | (0.02 | )(d) | (0.02 | )(d) | |||||||||||||
Net realized and unrealized gain (loss) on securities | 1.49 | (0.15 | ) | 1.37 | (d) | 2.99 | (d) | 1.06 | (d) | ||||||||||||||
Total from investment operations | 1.26 | (0.24 | ) | 1.30 | 2.97 | 1.04 | |||||||||||||||||
Less distributions | |||||||||||||||||||||||
From net investment income | - | - | - | - | - | ||||||||||||||||||
From net capital gain | (0.04 | ) | (0.02 | ) | (0.17 | ) | (0.26 | ) | - | ||||||||||||||
Total distributions | (0.04 | ) | (0.02 | ) | (0.17 | ) | (0.26 | ) | - | ||||||||||||||
Redemption fees (b)(c) | - | - | - | (d) | - | (d) | - | (d) | |||||||||||||||
Net asset value, end of year | $ | 15.14 | $ | 13.92 | $ | 14.18 | $ | 13.05 | $ | 10.34 | |||||||||||||
Total Investment Return (a) | 9.08 | % | (1.68 | )% | 9.94 | % | 28.72 | % | 11.18 | % | |||||||||||||
Ratios/Supplemental Data | |||||||||||||||||||||||
Net assets, end of year (000's) | $ | 6,953 | $ | 6,587 | $ | 6,892 | $ | 5,453 | $ | 3,973 | |||||||||||||
Ratio of net investment loss to average net assets | |||||||||||||||||||||||
With expense reductions | (1.60 | )% | (0.64 | )% | (0.55 | )% | (0.17 | )% | (0.18 | )% | |||||||||||||
Without expense reductions | (2.35 | )% | (1.39 | )% | (1.30 | )% | (1.72 | )% | (1.91 | )% | |||||||||||||
Ratio of expenses to average net assets | |||||||||||||||||||||||
With expense reductions | 3.85 | % | 2.72 | % | 2.64 | % | 2.47 | % | 2.61 | % | |||||||||||||
Without expense reductions | 4.60 | % | 3.47 | % | 3.39 | % | 4.02 | % | 4.34 | % | |||||||||||||
Fund portfolio turnover rate | 0 | % | 7 | % | 3 | % | 24 | % | 9 | % | |||||||||||||
Class C | |||||||||||||||||||||||
For the year ended December 31, | |||||||||||||||||||||||
2016 | 2015 | 2014 | 2013 | 2012 | |||||||||||||||||||
Per Share Operating Performance | |||||||||||||||||||||||
Net asset value, beginning of year | $ | 12.06 | $ | 12.39 | $ | 11.50 | $ | 9.20 | $ | 8.34 | |||||||||||||
Income from investing operations | |||||||||||||||||||||||
Net investment loss (c) | (0.28 | ) | (0.17 | ) | (0.15 | )(d) | (0.10 | )(d) | (0.09 | )(d) | |||||||||||||
Net realized and unrealized gain (loss) on securities | 1.27 | (0.14 | ) | 1.21 | (d) | 2.66 | (d) | 0.95 | (d) | ||||||||||||||
Total from investment operations | 0.99 | (0.31 | ) | 1.06 | 2.56 | 0.86 | |||||||||||||||||
Less distributions | |||||||||||||||||||||||
From net investment income | - | - | - | - | - | ||||||||||||||||||
From net capital gain | (0.04 | ) | (0.02 | ) | (0.17 | ) | (0.26 | ) | - | ||||||||||||||
Total distributions | (0.04 | ) | (0.02 | ) | (0.17 | ) | (0.26 | ) | - | ||||||||||||||
Redemption fees (c) | - | (b) | - | (b) | - | (b,d) | - | (d) | - | (b,d) | |||||||||||||
Net asset value, end of year | $ | 13.01 | $ | 12.06 | $ | 12.39 | $ | 11.50 | $ | 9.20 | |||||||||||||
Total Investment Return | 8.24 | % | (2.48 | )% | 9.18 | % | 27.83 | % | 10.31 | % | |||||||||||||
Ratios/Supplemental Data | |||||||||||||||||||||||
Net assets, end of year (000's) | $ | 837 | $ | 1,160 | $ | 1,167 | $ | 816 | $ | 578 | |||||||||||||
Ratio of net investment loss to average net assets | |||||||||||||||||||||||
With expense reductions | (2.34 | )% | (1.41 | )% | (1.29 | )% | (0.92 | )% | (1.01 | )% | |||||||||||||
Without expense reductions | (3.09 | )% | (2.16 | )% | (2.03 | )% | (2.47 | )% | (2.74 | )% | |||||||||||||
Ratio of expenses to average net assets | |||||||||||||||||||||||
With expense reductions | 4.59 | % | 3.50 | % | 3.38 | % | 3.22 | % | 3.43 | % | |||||||||||||
Without expense reductions | 5.34 | % | 4.25 | % | 4.13 | % | 4.77 | % | 5.15 | % | |||||||||||||
Fund portfolio turnover rate | 0 | % | 7 | % | 3 | % | 24 | % | 9 | % | |||||||||||||
(a) The Fund's maximum sales charge is not included in the total return computation.
(b) The amount is less than $0.005 and rounded to zero.
(c) Based on average shares outstanding.
(d) Net investment loss, net realized and unrealized gain (loss) on securities and redemptions fees for Class A and Class C for the years ended December 31, 2012 to December 31, 2014 were restated during the year ended December 31, 2015. See Note 2(H).
See Accompanying Notes to Financial Statements which are an integral part of these financial statements.
60
Pacific Advisors Fund Inc.
Financial Highlights
(For a share outstanding throughout each year presented)
Mid Cap Value Fund | |||||||||||||||||||||||
Class A | |||||||||||||||||||||||
For the year ended December 31, | |||||||||||||||||||||||
2016 | 2015 | 2014 | 2013 | 2012 | |||||||||||||||||||
Per Share Operating Performance | |||||||||||||||||||||||
Net asset value, beginning of year | $ | 10.28 | $ | 13.46 | $ | 15.25 | $ | 11.47 | $ | 10.88 | |||||||||||||
Income from investing operations | |||||||||||||||||||||||
Net investment loss (c) | (0.40 | ) | (0.31 | ) | (0.35 | )(d) | (0.39 | )(d) | (0.33 | )(d) | |||||||||||||
Net realized and unrealized gain (loss) on securities | 1.90 | (2.87 | ) | (1.44 | )(d) | 4.17 | (d) | 0.92 | (d) | ||||||||||||||
Total from investment operations | 1.50 | (3.18 | ) | (1.79 | ) | 3.78 | 0.59 | ||||||||||||||||
Redemption fees (c) | - | (b) | - | (b) | - | (b,d) | - | (d) | - | (b,d) | |||||||||||||
Net asset value, end of year | $ | 11.78 | $ | 10.28 | $ | 13.46 | $ | 15.25 | $ | 11.47 | |||||||||||||
Total Investment Return (a) | 14.59 | % | (23.63 | )% | (11.74 | )% | 32.96 | % | 5.42 | % | |||||||||||||
Ratios/Supplemental Data | |||||||||||||||||||||||
Net assets, end of year (000's) | $ | 5,728 | $ | 4,875 | $ | 5,981 | $ | 6,058 | $ | 4,500 | |||||||||||||
Ratio of net investment loss to average net assets | (3.80 | )% | (2.48 | )% | (2.46 | )% | (2.88 | )% | (3.01 | )% | |||||||||||||
Ratio of expenses to average net assets | 4.74 | % | 3.68 | % | 3.42 | % | 3.69 | % | 4.19 | % | |||||||||||||
Fund portfolio turnover rate | 13 | % | 25 | % | 22 | % | 15 | % | 24 | % | |||||||||||||
Class C | |||||||||||||||||||||||
For the year ended December 31, | |||||||||||||||||||||||
2016 | 2015 | 2014 | 2013 | 2012 | |||||||||||||||||||
Per Share Operating Performance | |||||||||||||||||||||||
Net asset value, beginning of year | $ | 9.16 | $ | 12.09 | $ | 13.80 | $ | 10.46 | $ | 10.00 | |||||||||||||
Income from investing operations | |||||||||||||||||||||||
Net investment loss (c) | (0.42 | ) | (0.37 | ) | (0.42 | )(d) | (0.45 | )(d) | (0.38 | )(d) | |||||||||||||
Net realized and unrealized gain (loss) on securities | 1.68 | (2.56 | ) | (1.29 | )(d) | 3.79 | (d) | 0.84 | (d) | ||||||||||||||
Total from investment operations | 1.26 | (2.93 | ) | (1.71 | ) | 3.34 | 0.46 | ||||||||||||||||
Redemption fees (c) | - | (b) | - | (b) | - | (b,d) | - | (d) | - | (b,d) | |||||||||||||
Net asset value, end of year | $ | 10.42 | $ | 9.16 | $ | 12.09 | $ | 13.80 | $ | 10.46 | |||||||||||||
Total Investment Return | 13.76 | % | (24.23 | )% | (12.39 | )% | 31.93 | % | 4.60 | % | |||||||||||||
Ratios/Supplemental Data | |||||||||||||||||||||||
Net assets, end of year (000's) | $ | 366 | $ | 661 | $ | 891 | $ | 1,204 | $ | 854 | |||||||||||||
Ratio of net investment loss to average net assets | (4.56 | )% | (3.26 | )% | (3.22 | )% | (3.61 | )% | (3.77 | )% | |||||||||||||
Ratio of expenses to average net assets | 5.54 | % | 4.46 | % | 4.17 | % | 4.42 | % | 4.95 | % | |||||||||||||
Fund portfolio turnover rate | 13 | % | 25 | % | 22 | % | 15 | % | 24 | % | |||||||||||||
(a) The Fund's maximum sales charge is not included in the total return computation.
(b) The amount is less than $0.005 and rounded to zero.
(c) Based on average shares outstanding.
(d) Net investment loss, net realized and unrealized gain (loss) on securities and redemptions fees for Class A and Class C for the years ended December 31, 2012 to December 31, 2014 were restated during the year ended December 31, 2015. See Note 2(H).
See Accompanying Notes to Financial Statements which are an integral part of these financial statements.
61
Pacific Advisors Fund Inc.
Financial Highlights
(For a share outstanding throughout each year presented)
Small Cap Value Fund | |||||||||||||||||||||||
Class A | |||||||||||||||||||||||
For the year ended December 31, | |||||||||||||||||||||||
2016 | 2015 | 2014 | 2013 | 2012 | |||||||||||||||||||
Per Share Operating Performance | |||||||||||||||||||||||
Net asset value, beginning of year | $ | 24.72 | $ | 44.51 | $ | 61.41 | $ | 38.50 | $ | 34.42 | |||||||||||||
Income from investing operations | |||||||||||||||||||||||
Net investment loss (c) | (0.92 | ) | (1.06 | ) | (1.11 | )(d) | (0.99 | )(d) | (0.76 | )(d) | |||||||||||||
Net realized and unrealized gain (loss) on securities | 7.66 | (12.25 | ) | (12.20 | )(d) | 23.87 | (d) | 4.79 | (d) | ||||||||||||||
Total from investment operations | 6.74 | (13.31 | ) | (13.31 | ) | 22.88 | 4.03 | ||||||||||||||||
Less distributions | |||||||||||||||||||||||
From net capital gain | (4.24 | ) | (6.50 | ) | (3.62 | ) | - | - | |||||||||||||||
Total distributions | (4.24 | ) | (6.50 | ) | (3.62 | ) | - | - | |||||||||||||||
Redemption fees (c) | 0.01 | 0.02 | 0.03 | (d) | 0.03 | (d) | 0.05 | (d) | |||||||||||||||
Net asset value, end of year | $ | 27.23 | $ | 24.72 | $ | 44.51 | $ | 61.41 | $ | 38.50 | |||||||||||||
Total Investment Return (a) | 27.08 | % | (30.31 | )% | (21.60 | )% | 59.51 | % | 11.85 | % | |||||||||||||
Ratios/Supplemental Data | |||||||||||||||||||||||
Net assets, end of year (000's) | $ | 26,420 | $ | 33,942 | $ | 122,642 | $ | 199,163 | $ | 85,607 | |||||||||||||
Ratio of net investment loss to average net assets | (3.74 | )% | (2.64 | )% | (1.72 | )% | (1.93 | )% | (2.06 | )% | |||||||||||||
Ratio of expenses to average net assets | 4.19 | % | 3.03 | % | 2.19 | % | 2.31 | % | 2.71 | % | |||||||||||||
Fund portfolio turnover rate | 11 | % | 7 | % | 16 | % | 9 | % | 12 | % | |||||||||||||
Class C | |||||||||||||||||||||||
For the year ended December 31, | |||||||||||||||||||||||
2016 | 2015 | 2014 | 2013 | 2012 | |||||||||||||||||||
Per Share Operating Performance | |||||||||||||||||||||||
Net asset value, beginning of year | $ | 19.01 | $ | 36.59 | $ | 51.70 | $ | 32.65 | $ | 29.41 | |||||||||||||
Income from investing operations | |||||||||||||||||||||||
Net investment loss (c) | (0.85 | ) | (1.11 | ) | (1.29 | )(d) | (1.16 | )(d) | (0.88 | )(d) | |||||||||||||
Net realized and unrealized gain (loss) on securities | 5.87 | (9.99 | ) | (10.23 | )(d) | 20.19 | (d) | 4.08 | (d) | ||||||||||||||
Total from investment operations | 5.02 | (11.10 | ) | (11.52 | ) | 19.03 | 3.20 | ||||||||||||||||
Less distributions | |||||||||||||||||||||||
From net capital gain | (4.24 | ) | (6.50 | ) | (3.62 | ) | - | - | |||||||||||||||
Total distributions | (4.24 | ) | (6.50 | ) | (3.62 | ) | - | - | |||||||||||||||
Redemption fees (c) | - | (b) | 0.02 | 0.03 | (d) | 0.02 | (d) | 0.04 | (d) | ||||||||||||||
Net asset value, end of year | $ | 19.79 | $ | 19.01 | $ | 36.59 | $ | 51.70 | $ | 32.65 | |||||||||||||
Total Investment Return | 26.12 | % | (30.83 | )% | (22.19 | )% | 58.35 | % | 11.02 | % | |||||||||||||
Ratios/Supplemental Data | |||||||||||||||||||||||
Net assets, end of year (000's) | $ | 3,596 | $ | 5,180 | $ | 10,498 | $ | 14,646 | $ | 6,912 | |||||||||||||
Ratio of net investment loss to average net assets | (4.51 | )% | (3.45 | )% | (2.47 | )% | (2.69 | )% | (2.80 | )% | |||||||||||||
Ratio of expenses to average net assets | 4.95 | % | 3.88 | % | 2.95 | % | 3.08 | % | 3.45 | % | |||||||||||||
Fund portfolio turnover rate | 11 | % | 7 | % | 16 | % | 9 | % | 12 | % | |||||||||||||
(a) The Fund's maximum sales charge is not included in the total return computation.
(b) The amount is less than $0.005 and rounded to zero.
(c) Based on average shares outstanding.
(d) Net investment loss, net realized and unrealized gain (loss) on securities and redemptions fees for Class A, Class C and Class I for the years ended December 31, 2012 to December 31, 2014 were restated during the year ended December 31, 2015. See Note 2(H).
See Accompanying Notes to Financial Statements which are an integral part of these financial statements.
62
Pacific Advisors Fund Inc.
Financial Highlights
(For a share outstanding throughout each year presented)
Small Cap Value Fund | |||||||||||||||||||||||
Class I | |||||||||||||||||||||||
For the year ended December 31, | |||||||||||||||||||||||
2016 | 2015 | 2014 | 2013 | 2012 | |||||||||||||||||||
Per Share Operating Performance | |||||||||||||||||||||||
Net asset value, beginning of year | $ | 30.87 | $ | 53.06 | $ | 72.10 | $ | 45.13 | $ | 39.15 | |||||||||||||
Income from investing operations | |||||||||||||||||||||||
Net investment loss (c) | (1.08 | ) | (1.20 | ) | (1.15 | )(d) | (1.32 | )(d) | (0.85 | )(d) | |||||||||||||
Net realized and unrealized gain (loss) on securities | 9.49 | (14.52 | ) | (14.30 | )(d) | 28.27 | (d) | 6.76 | (d) | ||||||||||||||
Total from investment operations | 8.41 | (15.72 | ) | (15.45 | ) | 26.95 | 5.91 | ||||||||||||||||
Less distributions | |||||||||||||||||||||||
From net capital gain | (4.24 | ) | (6.50 | ) | (3.62 | ) | - | - | |||||||||||||||
Total distributions | (4.24 | ) | (6.50 | ) | (3.62 | ) | - | - | |||||||||||||||
Redemption fees (c) | 0.01 | 0.03 | 0.03 | (d) | 0.02 | (d) | 0.07 | (d) | |||||||||||||||
Net asset value, end of year | $ | 35.05 | $ | 30.87 | $ | 53.06 | $ | 72.10 | $ | 45.13 | |||||||||||||
Total Investment Return | 27.10 | % | (29.94 | )% | (21.36 | )% | 59.76 | % | 15.27 | % | |||||||||||||
Ratios/Supplemental Data | |||||||||||||||||||||||
Net assets, end of year (000's) | $ | 8 | $ | 155 | $ | 1,402 | $ | 380 | $ | 7 | |||||||||||||
Ratio of net investment loss to average net assets | (3.57 | )% | (2.55 | )% | (1.54 | )% | (1.93 | )% | (2.02 | )% | |||||||||||||
Ratio of expenses to average net assets | 3.93 | % | 2.86 | % | 2.03 | % | 2.06 | % | 2.63 | % | |||||||||||||
Fund portfolio turnover rate | 11 | % | 7 | % | 16 | % | 9 | % | 12 | % | |||||||||||||
(c) Based on average shares outstanding.
(d) Net investment loss, net realized and unrealized gain (loss) on securities and redemptions fees for Class A, Class C and Class I for the years ended December 31, 2012 to December 31, 2014 were restated during the year ended December 31, 2015. See Note 2(H).
See Accompanying Notes to Financial Statements which are an integral part of these financial statements.
63
Pacific Advisors Fund Inc.
Notes to Financial Statements
December 31, 2016
Note 1. Organization
Pacific Advisors Fund Inc. (the "Company") is an open-end diversified investment management company registered under the Investment Company Act of 1940 ("the 40 Act"), as amended. The Company currently offers five Funds: Income and Equity Fund, Balanced Fund, Large Cap Value Fund, Mid Cap Value Fund and Small Cap Value Fund (individually, a "Fund," or collectively, the "Funds"). Each Fund is a separate investment portfolio of the Company with a distinct investment objective, investment program, policies and restrictions.
The Income and Equity Fund seeks to provide current income and, secondarily, long-term capital appreciation. The Balanced Fund seeks to achieve long-term capital appreciation and income consistent with reduced risk. The Large Cap Value Fund seeks to achieve long-term capital appreciation. The Mid Cap Value Fund seeks to achieve long-term capital appreciation. The Small Cap Value Fund seeks to provide capital appreciation through investment in small capitalization companies.
The Funds offer Class A and Class C shares. In addition to Class A and Class C shares, the Small Cap Value Fund also offers Class I shares. Each Class has equal rights as to assets and voting privileges except that Class A and Class C each has exclusive voting rights with respect to its distribution plan. Investment income, realized and unrealized capital gains and losses, and the common expenses of each Fund are allocated on a pro rata basis to each Class based on the relative net assets of each Class to the total net assets of the Fund. Each Class of shares differs in its respective service and distribution expenses and may differ in its transfer agent, registration, and certain other Class-specific fees and expenses.
The Company enters into contracts that contain a variety of indemnifications. The Company's maximum exposure under these arrangements is unknown. However, the Company has not had prior claims or losses pursuant to these contracts and expects the risk of loss to be remote.
The Funds follow the investment company accounting and reporting guidance of the Financial Accounting Standards Board (FASB) Accounting Standard Codification Topic 946 "Financial Services – Investment Companies."
Note 2. Significant Accounting Policies
A. Security Valuation and Fair Value Measurement. Securities, including American Depository Receipts (ADRs), listed on a national securities exchange and certain over-the-counter ("OTC") issues traded on the NASDAQ national market system are valued at the last quoted sale price at the close of the New York Stock Exchange. OTC issues not quoted on the NASDAQ system, and other equity securities for which no sale price is available, are valued at the last bid price as obtained from published sources or real time quote services, where available, and otherwise from brokers who are market makers for such securities. For securities that mature in 60 days or less, the Funds may utilize the amortized cost method of valuation if it is reasonable to conclude it approximates fair value. In determining the fair value of other debt securities, Pacific Global Investment Management Company, Inc. (the "Investment Manager") utilizes independent pricing services approved by the Board of Directors (the "Board") using one or more of the following valuation techniques:
(1) a matrix pricing approach that considers market inputs including, in approximate order of priority, the following: benchmark yields, reported trades, broker/dealer quotes, issuer spreads, two-sided markets, benchmark securities, bids, offers and reference data including market research publications; market indicators, industry and economic events. Evaluators may prioritize inputs differently on any given day for any security based on market conditions, and not all inputs listed are available for use in the evaluation process for each security evaluation on any given day; (2) a comparison of the value of the borrower's outstanding equity and debt to that of comparable public companies; and/or (3) a discounted cash flow analysis. Fair value determinations are made by the Investment Manager based on the Company's Fair Value Procedure, as adopted by the Board. In conducting its assessment and analysis for purpose of determining fair value, the Investment Manager uses its discretion and judgment in considering and appraising the relevant factors, including examining the source and nature of the quotations, to validate that the quotations and prices are representative of fair value.
Various inputs are used to determine the fair value of each Fund's investments. For financial statements, these inputs are summarized in the three broad levels listed below. Level 1 inputs are based on quoted prices in active markets for identical securities. Level 2 inputs are based on significant observable market inputs, such as quoted prices for similar securities and quoted prices in inactive markets. Level 3 inputs are significant unobservable inputs that reflect the Fund's own assumptions in determining the fair value of investments. The valuation levels are not necessarily an indication of the risk associated with investing in those securities.
64
Pacific Advisors Fund Inc.
Notes to Financial Statements
December 31, 2016
The following is a summary of the inputs used to value each Fund's investment securities as of December 31, 2016.
| Income and Equity Fund | Balanced Fund | Large Cap Value Fund | Mid Cap Value Fund | Small Cap Value Fund | |||||||||||||||||||
Level 1 - Quoted Prices | |||||||||||||||||||||||
Common Stock | |||||||||||||||||||||||
Consumer Discretionary | $ | 1,042,185 | $ | 712,352 | $ | 1,440,044 | $ | 1,874,441 | $ | 5,196,850 | |||||||||||||
Consumer Staples | 1,239,708 | 235,400 | 1,386,894 | 154,139 | 1,878,980 | ||||||||||||||||||
Energy | 494,385 | 443,065 | 135,390 | 454,160 | 6,266,914 | ||||||||||||||||||
Financials | 826,275 | 766,906 | 1,405,742 | 486,874 | 2,591,700 | ||||||||||||||||||
Health Care | 788,290 | 433,282 | 289,753 | 132,636 | - | ||||||||||||||||||
Industrials | 1,166,140 | 837,279 | 1,352,847 | 2,658,662 | 14,202,030 | ||||||||||||||||||
Information Technology | 1,024,265 | 713,564 | 1,700,179 | 273,400 | - | ||||||||||||||||||
Materials | 512,030 | - | 1,771 | 111,113 | - | ||||||||||||||||||
Telecommunication Services | 512,205 | 80,070 | - | - | - | ||||||||||||||||||
Utilities | 665,200 | - | - | - | - | ||||||||||||||||||
Preferred Stock | |||||||||||||||||||||||
Financials | 711,806 | 99,000 | - | - | - | ||||||||||||||||||
Level 1 Total | 8,982,489 | 4,320,918 | 7,712,620 | 6,145,425 | 30,136,474 | ||||||||||||||||||
Level 2 - Other significant observable inputs | |||||||||||||||||||||||
Corporate Bond | |||||||||||||||||||||||
Consumer Discretionary | 1,131,703 | 108,291 | - | - | - | ||||||||||||||||||
Consumer Staples | 312,123 | - | - | - | - | ||||||||||||||||||
Energy | 634,160 | 640,272 | - | - | - | ||||||||||||||||||
Financials | 2,331,842 | 202,193 | - | - | - | ||||||||||||||||||
Health Care | 359,631 | 102,625 | - | - | - | ||||||||||||||||||
Industrials | 1,175,068 | 302,431 | - | - | - | ||||||||||||||||||
Information Technology | 669,472 | 89,430 | - | - | - | ||||||||||||||||||
Materials | 223,896 | 106,000 | - | - | - | ||||||||||||||||||
Real Estate | 723,065 | 113,420 | - | - | - | ||||||||||||||||||
Telecommunication Services | 127,275 | - | - | - | - | ||||||||||||||||||
Utilities | 152,695 | - | - | - | - | ||||||||||||||||||
Level 2 Total | 7,840,930 | 1,664,662 | - | - | - | ||||||||||||||||||
Level 3 - Significant unobservable inputs | - | - | - | - | - | ||||||||||||||||||
Total Investments | $ | 16,823,419 | $ | 5,985,580 | $ | 7,712,620 | $ | 6,145,425 | $ | 30,136,474 | |||||||||||||
Equity securities (common and preferred stock) that are actively traded and market priced are typically classified as Level 1 securities. Fixed income securities are typically classified as Level 2 securities. The Funds had no Level 3 holdings during the period ended December 31, 2016. In addition, the Funds are required to disclose the amounts of significant transfers between Level 1 and Level 2 of the fair value hierarchy and the reasons for these transfers. The Investment Manager has evaluated the Funds' positions for the year ended December 31, 2016, and determined that, for purposes of fair value pricing measurement, there were no transfers between Level 1 and Level 2.
B. Cash and Cash Equivalents. The Company considers all highly liquid financial instruments with maturities of less than three months when acquired to be cash equivalents. For cash management purposes, each Fund may concentrate cash with the Fund's custodian, United Missouri Bank, n.a. ("UMB"). This typically results in cash balances exceeding the Federal Deposit Insurance Corporation ("FDIC") insurance limits. As of December 31, 2016, Income and Equity Fund held $486,514 as reserves at UMB Bank, n.a. that exceeded the FDIC insurance limits.
C. Security Transactions and Investment Income. Security transactions are accounted for on the trade date. The cost of investments sold is determined by use of the specific identification method for both financial reporting and federal income tax purposes. Dividends are recorded on the ex-dividend date. Interest income is recorded on an accrual basis. Premium or discount on debt securities are amortized or accreted using the effective interest method.
D. Dividends and Distributions to Shareholders. The Income and Equity Fund declares and distributes dividends of its net investment income, if any, quarterly. The Balanced Fund, Large Cap Value Fund, Mid Cap Value Fund and Small Cap Value Fund declare and distribute dividends of their net investment income, if any, annually. In addition, each Fund declares and distributes a capital gain dividend, if any, annually. The Board determines the amount and timing of such payments.
65
Pacific Advisors Fund Inc.
Notes to Financial Statements
December 31, 2016
E. Federal Income Tax. The Funds intends to comply with the requirements of Subchapter M of the Internal Revenue Code applicable to regulated investment companies and to distribute substantially all of their taxable income to their shareholders. Therefore, no federal income tax provision is required.
Management has analyzed the Funds' tax positions taken on federal income tax returns for all open tax years and for the year ended December 31, 2016 and has concluded that no provision for income tax is required in the Funds' financial statements. Tax years 2013, 2014, 2015 and 2016 are still subject to examination by major federal jurisdictions. Tax years 2012, 2013, 2014, 2015, and 2016 are still subject to examination by major state jurisdictions.
The Funds recognize interest and penalties, if any, related to unrecognized tax benefits as income tax expense in the Statement of Operations. During the year, the Funds did not incur any interest or penalties.
At December 31, 2016, components of distributable earnings on a tax basis were as follows:
| Income and Equity Fund | Balanced Fund | Large Cap Value Fund | Mid Cap Value Fund | Small Cap Value Fund | |||||||||||||||||||
Undistributed long-term gains | $ | - | $ | 31,224 | $ | 12,358 | $ | - | $ | 1,077,138 | |||||||||||||
Capital loss carry forward* | (285,340 | ) | - | - | (640,167 | ) | - | ||||||||||||||||
Net unrealized appreciation on investments | 2,245,700 | 266,862 | 3,181,968 | 1,208,402 | 6,033,171 | ||||||||||||||||||
Accumulated earnings | $ | 1,960,360 | $ | 298,086 | $ | 3,194,326 | $ | 568,235 | $ | 7,110,309 | |||||||||||||
The difference between book basis and tax basis unrealized appreciation is attributable primarily to the tax deferral of losses on wash sales and characterization of certain income items. The Funds intend to treat post October losses (net capital losses incurred for the period subsequent to October 31, 2016 through the year end December 31, 2016) as having been incurred in the next fiscal year.
The Funds intend to utilize provisions of the federal income tax laws which allow them to carry a capital loss realized prior to 2011 forward for eight years following the year of the loss and offset such losses against any future realized capital gains. During the most recent fiscal year, the following capital losses carried forward have been utilized:
| Income and Equity Fund | Balanced Fund | Large Cap Value Fund | Mid Cap Value Fund | Small Cap Value Fund | |||||||||||||||||||
Capital loss carryforward utilized | $ | 126,786 | $ | - | $ | - | $ | 15,195 | $ | - | |||||||||||||
* As of December 31, 2016, the following Funds had accumulated net realized losses on investment transactions that represent capital loss carryforwards for federal income tax purposes, which expire as follows:
Capital losses expiring in: | |||||||||||||||
2017 | 2018 | Total | |||||||||||||
Income and Equity Fund | $ | 285,340 | $ | - | $ | 285,340 | |||||||||
Mid Cap Value Fund | 640,167 | - | 640,167 | ||||||||||||
During the year ended December 31, 2016, the Mid Cap Value Fund had a capital loss carryforward in the amount of $527,469 that expired.
The Regulated Investment Company Modernization Act of 2010 (the "Act") changed various technical rules governing the tax treatment of regulated investment companies ("RICs") including the Funds. Under the Act, each Fund is permitted to carry forward capital losses incurred in taxable years beginning in 2011 for an unlimited period. However, any losses incurred during those future taxable years will be required to be utilized prior to the losses incurred in pre-enactment taxable years, which carry an expiration date. As a result of this ordering rule, pre-enactment capital loss carryforwards may be more likely to expire unused. Additionally, post-enactment capital loss carryforwards will retain their character as either short-term or long-term capital losses rather than being considered all short-term as permitted under previous regulation.
Finally, the Act contains several provisions aimed at preserving the character of distributions made by a fiscal year RIC during the portion of its taxable year ending after October 31 or December 31, reducing the circumstances under which a RIC might be required to file amended Forms 1099 to restate previously reported distributions.
66
Pacific Advisors Fund Inc.
Notes to Financial Statements
December 31, 2016
During the most recent fiscal year, the following capital losses carried forward under the provisions of the Act were utilized:
| Loss Carryforward Utilized | |||||||||||
Short Term | Long Term | ||||||||||
Mid Cap Value Fund | $ | 63,496 | $ | 46,499 | |||||||
No losses will be carried forward under the provisions of the Act.
F. Reclassification of Capital Accounts. Distributions of net investment income and realized gains are determined in accordance with income tax regulations which may differ from GAAP. These differences are due to differing treatments for items such as net operating losses, reclassification of dividends and return of capital. To the extent that these differences are permanent in nature, reclassifications are made among the net asset accounts on the Statement of Assets and Liabilities. Net assets and net asset value per share are not affected by these reclassifications.
For the year ended December 31, 2016, reclassifications among the components of net assets are as follows:
| Accumulated Undistributed Net Investment Income | Paid in Capital | Accumulated Undistributed Net Realized Gain (Loss) on Security Transactions | |||||||||||||
Balanced Fund | $ | 173,862 | $ | (173,862 | ) | $ | - | ||||||||
Large Cap Value Fund | 126,115 | (126,115 | ) | - | |||||||||||
Mid Cap Value Fund | 219,294 | (746,763 | ) | 527,469 | |||||||||||
Small Cap Value Fund | 1,191,012 | (1,080,017 | ) | (110,995 | ) | ||||||||||
The reclassifications were due to net investment losses incurred by the Funds, which are not permitted to be carried forward for tax purposes and the expiration of capital loss carryforwards, as well as differing book and tax treatment of certain securities.
G. Use of Estimates. The preparation of financial statements in conformity with U.S. GAAP requires management to make estimates and assumptions that affect the reported amounts in the financial statements and footnotes. Actual results could differ from those estimates.
H. Accounting Method Change. On December 31, 2015, the Funds elected to change their method of determining net investment income (loss) per share to the average shares method, which determines the net investment income (loss) per share by dividing the net investment income (loss) by the average number of shares outstanding during the year. In prior years the net investment income (loss) per share was determined using the SEC method, which compares ending undistributed income (loss) per share to the beginning undistributed income (loss) per share, adjusted for distributions paid per share. The new method of accounting was adopted as a result of management's determination that the average shares method produced a result that was more reflective of the actual net investment income (loss) on a per share basis during each of the years. The financial highlights for each of the years presented have been adjusted to apply this new method retrospectively. The following financial statement line items for the years 2012-2014 were affected by this change in accounting principle.
Financial Highlights | |||||||||||||||
| Income and Equity Fund (Class A) | 2014 | 2013 | 2012 | ||||||||||||
As Computed Under SEC Method | |||||||||||||||
Net investment income | 0.21 | 0.10 | 0.15 | ||||||||||||
Net realized and unrealized gain | 0.52 | 1.28 | 0.48 | ||||||||||||
Redemption Fees | 0.00 | 0.00 | 0.00 | ||||||||||||
As Computed Under Average Shares Method | |||||||||||||||
Net investment income | 0.22 | 0.14 | 0.15 | ||||||||||||
Net realized and unrealized gain | 0.51 | 1.24 | 0.48 | ||||||||||||
Redemption Fees | 0.00 | 0.00 | 0.00 | ||||||||||||
Effect of Change | |||||||||||||||
Net investment income | 0.01 | 0.04 | 0.00 | ||||||||||||
Net realized and unrealized gain (loss) | (0.01 | ) | (0.04 | ) | 0.00 | ||||||||||
Redemption Fees | 0.00 | 0.00 | 0.00 | ||||||||||||
67
Pacific Advisors Fund Inc.
Notes to Financial Statements
December 31, 2016
| Income and Equity Fund (Class C) | 2014 | 2013 | 2012 | ||||||||||||
As Computed Under SEC Method | |||||||||||||||
Net investment income (loss) | 0.14 | 0.06 | (0.01 | ) | |||||||||||
Net realized and unrealized gain | 0.47 | 1.18 | 0.55 | ||||||||||||
Redemption Fees | 0.00 | 0.00 | 0.00 | ||||||||||||
As Computed Under Average Shares Method | |||||||||||||||
Net investment income | 0.13 | 0.05 | 0.08 | ||||||||||||
Net realized and unrealized gain (loss) | 0.48 | 1.19 | 0.46 | ||||||||||||
Redemption Fees | 0.00 | 0.00 | 0.00 | ||||||||||||
Effect of Change | |||||||||||||||
Net investment income (loss) | (0.01 | ) | (0.01 | ) | 0.09 | ||||||||||
Net realized and unrealized gain (loss) | 0.01 | 0.01 | (0.09 | ) | |||||||||||
Redemption Fees | 0.00 | 0.00 | 0.00 | ||||||||||||
| Balanced Fund (Class A) | |||||||||||||||
As Computed Under SEC Method | |||||||||||||||
Net investment income (loss) | (0.16 | ) | (0.18 | ) | (0.03 | ) | |||||||||
Net realized and unrealized gain (loss) | (1.15 | ) | 4.21 | 1.34 | |||||||||||
Redemption Fees | 0.00 | 0.00 | 0.00 | ||||||||||||
As Computed Under Average Shares Method | |||||||||||||||
Net investment income (loss) | (0.14 | ) | (0.15 | ) | (0.04 | ) | |||||||||
Net realized and unrealized gain (loss) | (1.17 | ) | 4.17 | 1.35 | |||||||||||
Redemption Fees | 0.00 | 0.01 | 0.00 | ||||||||||||
Effect of Change | |||||||||||||||
Net investment income (loss) | 0.02 | 0.03 | (0.01 | ) | |||||||||||
Net realized and unrealized gain (loss) | (0.02 | ) | (0.04 | ) | 0.01 | ||||||||||
Redemption Fees | 0.00 | 0.01 | 0.00 | ||||||||||||
| Balanced Fund (Class C) | |||||||||||||||
As Computed Under SEC Method | |||||||||||||||
Net investment loss | (0.40 | ) | (0.54 | ) | (0.39 | ) | |||||||||
Net realized and unrealized gain (loss) | (0.91 | ) | 4.16 | 1.51 | |||||||||||
Redemption Fees | 0.00 | 0.00 | 0.00 | ||||||||||||
As Computed Under Average Shares Method | |||||||||||||||
Net investment loss | (0.24 | ) | (0.25 | ) | (0.13 | ) | |||||||||
Net realized and unrealized gain (loss) | (1.07 | ) | 3.87 | 1.25 | |||||||||||
Redemption Fees | 0.00 | 0.00 | 0.00 | ||||||||||||
Effect of Change | |||||||||||||||
Net investment income | 0.16 | 0.29 | 0.26 | ||||||||||||
Net realized and unrealized loss | (0.16 | ) | (0.29 | ) | (0.26 | ) | |||||||||
Redemption Fees | 0.00 | 0.00 | 0.00 | ||||||||||||
| Large Cap Value Fund (Class A) | |||||||||||||||
As Computed Under SEC Method | |||||||||||||||
Net investment income | 0.02 | 0.03 | 0.04 | ||||||||||||
Net realized and unrealized gain | 1.28 | 2.94 | 1.00 | ||||||||||||
Redemption Fees | 0.00 | 0.00 | 0.00 | ||||||||||||
As Computed Under Average Shares Method | |||||||||||||||
Net investment loss | (0.07 | ) | (0.02 | ) | (0.02 | ) | |||||||||
Net realized and unrealized gain | 1.37 | 2.99 | 1.06 | ||||||||||||
Redemption Fees | 0.00 | 0.00 | 0.00 | ||||||||||||
Effect of Change | |||||||||||||||
Net investment loss | (0.09 | ) | (0.05 | ) | (0.06 | ) | |||||||||
Net realized and unrealized gain | 0.09 | 0.05 | 0.06 | ||||||||||||
Redemption Fees | 0.00 | 0.00 | 0.00 | ||||||||||||
| Large Cap Value Fund (Class C) | |||||||||||||||
As Computed Under SEC Method | |||||||||||||||
Net investment income (loss) | 0.68 | 0.32 | (0.69 | ) | |||||||||||
Net realized and unrealized gain | 0.38 | 2.24 | 1.55 | ||||||||||||
Redemption Fees | 0.00 | 0.00 | 0.00 | ||||||||||||
68
Pacific Advisors Fund Inc.
Notes to Financial Statements
December 31, 2016
2014 | 2013 | 2012 | |||||||||||||
As Computed Under Average Shares Method | |||||||||||||||
Net investment loss | (0.15 | ) | (0.10 | ) | (0.09 | ) | |||||||||
Net realized and unrealized gain | 1.21 | 2.66 | 0.95 | ||||||||||||
Redemption Fees | 0.00 | 0.00 | 0.00 | ||||||||||||
Effect of Change | |||||||||||||||
Net investment income (loss) | (0.83 | ) | (0.42 | ) | 0.60 | ||||||||||
Net realized and unrealized gain (loss) | 0.83 | 0.42 | (0.60 | ) | |||||||||||
Redemption Fees | 0.00 | 0.00 | 0.00 | ||||||||||||
| Mid Cap Value Fund (Class A) | |||||||||||||||
As Computed Under SEC Method | |||||||||||||||
Net investment loss | (0.11 | ) | (0.36 | ) | (0.25 | ) | |||||||||
Net realized and unrealized gain (loss) | (1.68 | ) | 4.14 | 0.84 | |||||||||||
Redemption Fees | 0.00 | 0.00 | 0.00 | ||||||||||||
As Computed Under Average Shares Method | |||||||||||||||
Net investment loss | (0.35 | ) | (0.39 | ) | (0.33 | ) | |||||||||
Net realized and unrealized gain (loss) | (1.44 | ) | 4.17 | 0.92 | |||||||||||
Redemption Fees | 0.00 | 0.00 | 0.00 | ||||||||||||
Effect of Change | |||||||||||||||
Net investment loss | (0.24 | ) | (0.03 | ) | (0.08 | ) | |||||||||
Net realized and unrealized gain | 0.24 | 0.03 | 0.08 | ||||||||||||
Redemption Fees | 0.00 | 0.00 | 0.00 | ||||||||||||
| Mid Cap Value Fund (Class C) | |||||||||||||||
As Computed Under SEC Method | |||||||||||||||
Net investment income (loss) | (2.95 | ) | 0.48 | (3.40 | ) | ||||||||||
Net realized and unrealized gain | 1.24 | 2.86 | 3.86 | ||||||||||||
Redemption Fees | 0.00 | 0.00 | 0.00 | ||||||||||||
As Computed Under Average Shares Method | |||||||||||||||
Net investment loss | (0.42 | ) | (0.45 | ) | (0.38 | ) | |||||||||
Net realized and unrealized gain (loss) | (1.29 | ) | 3.79 | 0.84 | |||||||||||
Redemption Fees | 0.00 | 0.00 | 0.00 | ||||||||||||
Effect of Change | |||||||||||||||
Net investment income (loss) | 2.53 | (0.93 | ) | 3.02 | |||||||||||
Net realized and unrealized gain (loss) | (2.53 | ) | 0.93 | (3.02 | ) | ||||||||||
Redemption Fees | 0.00 | 0.00 | 0.00 | ||||||||||||
| Small Cap Value Fund (Class A) | |||||||||||||||
As Computed Under SEC Method | |||||||||||||||
Net investment income (loss) | (2.29 | ) | 1.44 | (1.70 | ) | ||||||||||
Net realized and unrealized gain (loss) | (10.99 | ) | 21.47 | 5.78 | |||||||||||
Redemption Fees | 0.00 | 0.00 | 0.00 | ||||||||||||
As Computed Under Average Shares Method | |||||||||||||||
Net investment loss | (1.11 | ) | (0.99 | ) | (0.76 | ) | |||||||||
Net realized and unrealized gain (loss) | (12.20 | ) | 23.87 | 4.79 | |||||||||||
Redemption Fees | 0.03 | 0.03 | 0.05 | ||||||||||||
Effect of Change | |||||||||||||||
Net investment income (loss) | 1.18 | (2.43 | ) | 0.94 | |||||||||||
Net realized and unrealized gain (loss) | (1.21 | ) | 2.40 | (0.99 | ) | ||||||||||
Redemption Fees | 0.03 | 0.03 | 0.05 | ||||||||||||
| Small Cap Value Fund (Class C) | |||||||||||||||
As Computed Under SEC Method | |||||||||||||||
Net investment income (loss) | (1.15 | ) | 3.10 | (2.53 | ) | ||||||||||
Net realized and unrealized gain (loss) | (10.34 | ) | 15.95 | 5.77 | |||||||||||
Redemption Fees | 0.00 | 0.00 | 0.00 | ||||||||||||
69
Pacific Advisors Fund Inc.
Notes to Financial Statements
December 31, 2016
2014 | 2013 | 2012 | |||||||||||||
As Computed Under Average Shares Method | |||||||||||||||
Net investment loss | (1.29 | ) | (1.16 | ) | (0.88 | ) | |||||||||
Net realized and unrealized gain (loss) | (10.23 | ) | 20.19 | 4.08 | |||||||||||
Redemption Fees | 0.03 | 0.02 | 0.04 | ||||||||||||
Effect of Change | |||||||||||||||
Net investment income (loss) | (0.14 | ) | (4.26 | ) | 1.65 | ||||||||||
Net realized and unrealized gain (loss) | 0.11 | 4.24 | (1.69 | ) | |||||||||||
Redemption Fees | 0.03 | 0.02 | 0.04 | ||||||||||||
| Small Cap Value Fund (Class I) | |||||||||||||||
As Computed Under SEC Method | |||||||||||||||
Net investment income (loss) | 9.85 | 431.95 | (120.29 | ) | |||||||||||
Net realized and unrealized gain (loss) | (25.27 | ) | (404.98 | ) | 126.27 | ||||||||||
Redemption Fees | 0.00 | 0.00 | 0.00 | ||||||||||||
As Computed Under Average Shares Method | |||||||||||||||
Net investment loss | (1.15 | ) | (1.32 | ) | (0.85 | ) | |||||||||
Net realized and unrealized gain (loss) | (14.30 | ) | 28.27 | 6.76 | |||||||||||
Redemption Fees | 0.03 | 0.02 | 0.07 | ||||||||||||
Effect of Change | |||||||||||||||
Net investment income (loss) | (11.00 | ) | (433.27 | ) | 119.44 | ||||||||||
Net realized and unrealized gain (loss) | 10.97 | 433.25 | (119.51 | ) | |||||||||||
Redemption Fees | 0.03 | 0.02 | 0.07 | ||||||||||||
Note 3. Investment Management, Distributor and Other Related Party Transactions
The Company and the Funds have entered into investment management agreements ("Management Agreements") with the Investment Manager.
The Management Agreements provide for investment management fees, payable monthly, and calculated at the maximum annual rate of 0.75% of average net assets for the Income and Equity, Balanced, Large Cap Value and Small Cap Value Funds and 1.00% of average net assets for the Mid Cap Value Fund.
In accordance with Expense Limitation Agreements with the Company, the Investment Manager waives its respective management fees to the extent that the actual operating expenses of the following Funds exceed the following thresholds:
Class A | Class C | ||||||||||
Income and Equity Fund | 1.95 | % | 2.70 | % | |||||||
Large Cap Value Fund | 2.65 | % | 3.40 | % | |||||||
Pursuant to the Expense Limitation Agreements, providing for the waiver of fees and the assumption of expenses by the Investment Manager, the following amounts were waived for the year ended December 31, 2016.
| Management Fees Waived | |||||||
Income and Equity Fund | $ | 116,065 | |||||
Large Cap Value Fund | 55,635 | ||||||
The Investment Manager does not have any rights to recover fees it waives or expenses it may reimburse, with respect to any of the Funds.
For the year ended December 31, 2016, Pacific Global Fund Distributors, Inc. ("PGFD"), the principal underwriter for the Company and a wholly-owned subsidiary of the Investment Manager, received commissions on sales of capital stock, after deducting amounts allowed to authorized distributors as commissions. In addition, PGFD, as a registered broker-dealer, may act as broker for the Funds, in conformity with Rule 17e-1 under the Investment Company Act of 1940. The Company's Board has approved procedures for
70
Pacific Advisors Fund Inc.
Notes to Financial Statements
December 31, 2016
evaluating the reasonableness of commissions paid to PGFD and periodically reviews these procedures. PGFD will not act as principal in effecting any portfolio transactions for the Funds. The amounts of commissions are as follows:
| Underwriting Fees Retained | Commissions Retained | Brokerage Commissions Received | |||||||||||||
Income and Equity Fund | $ | 1,297 | $ | 14 | $ | 299 | |||||||||
Balanced Fund | 326 | 461 | 2,209 | ||||||||||||
Large Cap Value Fund | 1,449 | 1,892 | (104 | ) | |||||||||||
Mid Cap Value Fund | 1,091 | 374 | (80 | ) | |||||||||||
Small Cap Value Fund | 2,646 | 766 | 4,010 | ||||||||||||
The Company has also entered into separate agreements with Pacific Global Investor Services, Inc. ("PGIS"), Transfer Agent for the Company and a wholly-owned subsidiary of the Investment Manager, that provide for transfer agent fees at a rate of $21 per year per open account and $3.50 per year per closed account, with a minimum charge of $1,800 per month per class for each Fund; fund accounting fees equal to the greater of $1,500 or three basis points for the first hundred million in net assets and one basis point on the balance of net assets for each Fund per month; and annual administrative agent fees of five basis points of average daily net assets of each Fund subject to a maximum annual fee of $50,000 per Fund. The fee is computed and payable monthly. The Company reimburses the Investment Manager for monthly expenses related to the Company's Compliance Program.
On the Statement of Assets and Liabilities, "Accounts payable to related parties" consists of transfer agent fees payable to PGIS.
The Company has adopted a plan of distribution whereby the Funds may pay a service fee to qualified recipients in an amount up to 0.25% per annum of each Fund's average daily net assets for Class A shares. The Company has also adopted a plan of distribution whereby the Funds may pay a service fee to qualified recipients in an amount up to 0.25% per annum of each Fund's average daily net assets for Class C shares and a distribution fee in an amount up to 0.75% per annum of each Fund's average daily net assets for Class C shares. The Company has not adopted a plan of distribution for Class I Shares.
For the year end December 31, 2016, total distribution and/or service (12b-1) fees were:
Class A | Class C | Total | |||||||||||||
Income and Equity Fund | $ | 32,110 | $ | 26,269 | $ | 58,379 | |||||||||
Balanced Fund | 10,157 | 21,028 | 31,185 | ||||||||||||
Large Cap Value Fund | 16,053 | 9,920 | 25,973 | ||||||||||||
Mid Cap Value Fund | 12,869 | 5,072 | 17,941 | ||||||||||||
Small Cap Value Fund | 66,009 | 41,982 | 107,991 | ||||||||||||
Note 4. Purchase and Sales of Securities
The following summarizes purchases and sales of investment securities, other than short-term investments, and aggregate gross unrealized appreciation and depreciation on a tax basis by each Fund for the year ended and as of December 31, 2016. The difference between book basis and tax basis unrealized appreciation is attributable primarily to the tax deferral of losses on wash sales.
| Year ended December 31, 2016 | As of December 31, 2016 | ||||||||||||||||||||||||||
| Cost of Purchases | Proceeds From Sales | Tax Cost of Securities | Gross Unrealized Appreciation | Gross Unrealized (Depreciation) | Net Unrealized Appreciation | ||||||||||||||||||||||
Income and Equity Fund | $ | 4,147,767 | $ | 2,175,441 | $ | 14,577,719 | $ | 2,314,620 | $ | (68,920 | ) | $ | 2,245,700 | ||||||||||||||
Balanced Fund | 3,395,521 | 4,174,996 | 5,718,718 | 677,483 | (410,621 | ) | 266,862 | ||||||||||||||||||||
Large Cap Value Fund | - | 755,672 | 4,530,652 | 3,181,968 | - | 3,181,968 | |||||||||||||||||||||
Mid Cap Value Fund | 734,728 | 1,162,600 | 4,937,023 | 2,013,069 | (804,667 | ) | 1,208,402 | ||||||||||||||||||||
Small Cap Value Fund | 3,424,418 | 21,871,264 | 24,103,303 | 13,519,115 | (7,485,944 | ) | 6,033,171 | ||||||||||||||||||||
71
Pacific Advisors Fund Inc.
Notes to Financial Statements
December 31, 2016
Note 5. Distributions to Shareholders
The tax character of distributions paid during 2016 and 2015 was as follows:
| Income and Equity Fund | Balanced Fund | Large Cap Value Fund | Mid Cap Value Fund | Small Cap Value Fund | |||||||||||||||||||
Year ended December 31, 2016 | |||||||||||||||||||||||
Distributions paid from: | |||||||||||||||||||||||
Ordinary Income | $ | 23,421 | $ | - | $ | - | $ | - | $ | - | |||||||||||||
Long-Term Capital Gain | - | 225,253 | 23,059 | - | 4,266,366 | ||||||||||||||||||
Return of Capital | 11,626 | - | - | - | - | ||||||||||||||||||
Total Distributions | $ | 35,047 | $ | 225,253 | $ | 23,059 | $ | - | $ | 4,266,366 | |||||||||||||
Year ended December 31, 2015 | |||||||||||||||||||||||
Distributions paid from: | |||||||||||||||||||||||
Ordinary Income | $ | 149,931 | $ | - | $ | - | $ | - | $ | - | |||||||||||||
Long-Term Capital Gain | - | 146,010 | 12,357 | - | 8,829,656 | ||||||||||||||||||
Total Distributions | $ | 149,931 | $ | 146,010 | $ | 12,357 | $ | - | $ | 8,829,656 | |||||||||||||
Note 6. Capital Share Transactions
A 2% redemption fee is assessed on shares of the Income and Equity Fund sold or exchanged within 30 days of purchase or shares of the Balanced Fund, Large Cap Value Fund, Mid Cap Value Fund or Small Cap Value Fund sold or exchanged within 180 days of purchase and is retained in each Fund. The redemption fees collected during 2016 and 2015 are included in the dollar amount of shares sold in the table below. The amount of the increase is as follows:
2016 | 2015 | ||||||||||||||||||||||||||
Class A | Class C | Class I | Class A | Class C | Class I | ||||||||||||||||||||||
Income and Equity Fund | $ | 6,856 | $ | 1,503 | N/A | $ | 57 | $ | 13 | N/A | |||||||||||||||||
Balanced Fund | 330 | 173 | N/A | 723 | 577 | N/A | |||||||||||||||||||||
Large Cap Value Fund | 348 | 58 | N/A | 154 | 27 | N/A | |||||||||||||||||||||
Mid Cap Value Fund | 258 | 29 | N/A | 62 | 8 | N/A | |||||||||||||||||||||
Small Cap Value Fund | 5,429 | 866 | $ | 26 | 44,507 | 4,959 | $ | 185 | |||||||||||||||||||
| Year ended December 31, 2016 | Year ended December 31, 2015 | ||||||||||||||||||
Shares | Amount | Shares | Amount | ||||||||||||||||
Income and Equity Fund | |||||||||||||||||||
Class A | |||||||||||||||||||
Shares sold | 370,091 | $ | 4,478,478 | 181,771 | $ | 2,142,787 | |||||||||||||
Reinvestment of distributions | 2,551 | 31,280 | 10,262 | 119,557 | |||||||||||||||
372,642 | 4,509,758 | 192,033 | 2,262,344 | ||||||||||||||||
Shares repurchased | (174,172 | ) | (2,090,689 | ) | (137,000 | ) | (1,620,088 | ) | |||||||||||
Net increase | 198,470 | $ | 2,419,069 | 55,033 | $ | 642,256 | |||||||||||||
Class C | |||||||||||||||||||
Shares sold | 10,277 | $ | 121,016 | 53,339 | $ | 609,213 | |||||||||||||
Reinvestment of distributions | - | - | 1,267 | 14,183 | |||||||||||||||
10,277 | 121,016 | 54,606 | 623,396 | ||||||||||||||||
Shares repurchased | (51,170 | ) | (594,050 | ) | (19,772 | ) | (225,099 | ) | |||||||||||
Net increase (decrease) | (40,893 | ) | $ | (473,034 | ) | 34,834 | $ | 398,297 | |||||||||||
72
Pacific Advisors Fund Inc.
Notes to Financial Statements
December 31, 2016
| Year ended December 31, 2016 | Year ended December 31, 2015 | ||||||||||||||||||
Shares | Amount | Shares | Amount | ||||||||||||||||
Balanced Fund | |||||||||||||||||||
Class A | |||||||||||||||||||
Shares sold | 64,938 | $ | 747,487 | 27,630 | $ | 378,261 | |||||||||||||
Reinvestment of distributions | 12,295 | 140,652 | 6,103 | 72,868 | |||||||||||||||
77,233 | 888,139 | 33,733 | 451,129 | ||||||||||||||||
Shares repurchased | (44,591 | ) | (508,739 | ) | (37,983 | ) | (520,573 | ) | |||||||||||
Net increase (decrease) | 32,642 | $ | 379,400 | (4,250 | ) | $ | (69,444 | ) | |||||||||||
Class C | |||||||||||||||||||
Shares sold | 10,017 | $ | 101,917 | 25,176 | $ | 318,058 | |||||||||||||
Reinvestment of distributions | 6,690 | 67,504 | 5,563 | 59,354 | |||||||||||||||
16,707 | 169,421 | 30,739 | 377,412 | ||||||||||||||||
Shares repurchased | (99,644 | ) | (1,015,203 | ) | (99,092 | ) | (1,247,273 | ) | |||||||||||
Net decrease | (82,937 | ) | $ | (845,782 | ) | (68,353 | ) | $ | (869,861 | ) | |||||||||
| Year ended December 31, 2016 | Year ended December 31, 2015 | ||||||||||||||||||
Shares | Amount | Shares | Amount | ||||||||||||||||
Large Cap Value Fund | |||||||||||||||||||
Class A | |||||||||||||||||||
Shares sold | 47,998 | $ | 697,236 | 45,174 | $ | 633,380 | |||||||||||||
Reinvestment of distributions | 1,244 | 19,074 | 677 | 9,509 | |||||||||||||||
49,242 | 716,310 | 45,851 | 642,889 | ||||||||||||||||
Shares repurchased | (63,389 | ) | (879,751 | ) | (58,456 | ) | (824,362 | ) | |||||||||||
Net decrease | (14,147 | ) | $ | (163,441 | ) | (12,605 | ) | $ | (181,473 | ) | |||||||||
Class C | |||||||||||||||||||
Shares sold | 3,237 | $ | 40,230 | 4,317 | $ | 53,517 | |||||||||||||
Reinvestment of distributions | 134 | 1,761 | 128 | 1,562 | |||||||||||||||
3,371 | 41,991 | 4,445 | 55,079 | ||||||||||||||||
Shares repurchased | (35,298 | ) | (436,904 | ) | (2,458 | ) | (30,619 | ) | |||||||||||
Net increase (decrease) | (31,927 | ) | $ | (394,913 | ) | 1,987 | $ | 24,460 | |||||||||||
73
Pacific Advisors Fund Inc.
Notes to Financial Statements
December 31, 2016
| Year ended December 31, 2016 | Year ended December 31, 2015 | ||||||||||||||||||
Shares | Amount | Shares | Amount | ||||||||||||||||
Mid Cap Value Fund | |||||||||||||||||||
Class A | |||||||||||||||||||
Shares sold | 53,336 | $ | 562,552 | 54,544 | $ | 679,122 | |||||||||||||
Reinvestment of distributions | - | - | - | - | |||||||||||||||
53,336 | 562,552 | 54,544 | 679,122 | ||||||||||||||||
Shares repurchased | (41,408 | ) | (452,469 | ) | (24,651 | ) | (310,595 | ) | |||||||||||
Net increase | 11,928 | $ | 110,083 | 29,893 | $ | 368,527 | |||||||||||||
Class C | |||||||||||||||||||
Shares sold | 1,236 | $ | 11,542 | 1,601 | $ | 18,148 | |||||||||||||
Reinvestment of distributions | - | - | - | - | |||||||||||||||
1,236 | 11,542 | 1,601 | 18,148 | ||||||||||||||||
Shares repurchased | (38,319 | ) | (355,718 | ) | (3,099 | ) | (37,035 | ) | |||||||||||
Net decrease | (37,083 | ) | $ | (344,176 | ) | (1,498 | ) | $ | (18,887 | ) | |||||||||
| Year ended December 31, 2016 | Year ended December 31, 2015 | ||||||||||||||||||
Shares | Amount | Shares | Amount | ||||||||||||||||
Small Cap Value Fund | |||||||||||||||||||
Class A | |||||||||||||||||||
Shares sold | 68,311 | $ | 1,671,143 | 320,308 | $ | 13,021,788 | |||||||||||||
Reinvestment of distributions | 121,832 | 3,362,552 | 263,570 | 6,721,040 | |||||||||||||||
190,143 | 5,033,695 | 583,878 | 19,742,828 | ||||||||||||||||
Shares repurchased | (592,790 | ) | (14,443,161 | ) | (1,966,404 | ) | (77,129,551 | ) | |||||||||||
Net decrease | (402,647 | ) | $ | (9,409,466 | ) | (1,382,526 | ) | $ | (57,386,723 | ) | |||||||||
Class C | |||||||||||||||||||
Shares sold | 1,745 | $ | 34,046 | 22,817 | $ | 732,848 | |||||||||||||
Reinvestment of distributions | 29,196 | 585,677 | 63,488 | 1,245,004 | |||||||||||||||
30,941 | 619,723 | 86,305 | 1,977,852 | ||||||||||||||||
Shares repurchased | (121,755 | ) | (2,351,201 | ) | (100,726 | ) | (3,263,601 | ) | |||||||||||
Net decrease | (90,814 | ) | $ | (1,731,478 | ) | (14,421 | ) | $ | (1,285,749 | ) | |||||||||
Class I | |||||||||||||||||||
Shares sold | - | $ | 26 | 4,824 | $ | 250,185 | |||||||||||||
Reinvestment of distributions | 24 | 840 | 34 | 1,069 | |||||||||||||||
24 | 866 | 4,858 | 251,254 | ||||||||||||||||
Shares repurchased | (4,824 | ) | (176,717 | ) | (26,256 | ) | (1,276,307 | ) | |||||||||||
Net decrease | (4,800 | ) | $ | (175,851 | ) | (21,398 | ) | $ | (1,025,053 | ) | |||||||||
74
Pacific Advisors Fund Inc.
Notes to Financial Statements
December 31, 2016
Note 7. Bank Borrowings
Each Fund may borrow money to the extent permitted by the 1940 Act, as amended, or any rules, exemptions or interpretations thereunder that may be adopted, granted or issued by the Securities and Exchange Commission. Under the 1940 Act, a mutual fund may borrow up to one-third of its total assets (including the amount borrowed) from banks for any purpose, and may borrow up to 5% of its total assets from banks or other lenders for temporary purposes. Each Fund may borrow to facilitate portfolio transactions or meet redemptions. The Large Cap Value Fund, Mid Cap Value Fund, and Small Cap Value Fund also may borrow money to invest in portfolio securities. Each Fund has the ability to borrow, from UMB, on an unsecured basis, at 2.75% over the Federal Funds rate. As of December 31, 2016, the Mid Cap Value Fund and Small Cap Value Fund had borrowings from UMB with amounts of $18,984 and $206,255, respectively, and were paying interest at 3.25% per annum on their outstanding borrowings. In 2016, the Mid Cap Value Fund and Small Cap Value Fund had a daily average borrowing of $33,706 and $595,718, respectively, with a weighted average interest rate of 2.85% and 2.43% per annum, respectively. No compensating balances were required.
Note 8. Subsequent Events
Subsequent events occurring after the date of this report through the date these financial statements were issued have been evaluated for potential impact and the Fund has had no such events.
75
Pacific Advisors Fund Inc.
Report of Independent Registered Public Accounting Firm
To the Board of Directors of Pacific Advisors Fund Inc.
and the Shareholders of Income and Equity Fund, Balanced Fund, Large Cap Value Fund,
Mid Cap Value Fund and Small Cap Value Fund
We have audited the accompanying statements of assets and liabilities of Income and Equity Fund, Balanced Fund, Large Cap Value Fund, Mid Cap Value Fund and Small Cap Value Fund (the "Funds"), each a series of shares of beneficial interest in Pacific Advisors Fund Inc. (the "Company"), including the schedules of investments, as of December 31, 2016, and the related statements of operations for the year then ended, and the statements of changes in net assets and the financial highlights for each of the years in the two-year period then ended. We have also audited certain restated financial highlight figures as described in Note 2H for each of the years in the three-year period ended December 31, 2014. These financial statements and financial highlights are the responsibility of the Funds' management. Our responsibility is to express an opinion on these financial statements and financial highlights based on our audits. The financial highlights for each of the years in the three-year period ended December 31, 2014 (except for the restated amounts as described in Note 2H) for each of the Funds were audited by other auditors, whose report dated February 27, 2015 expressed an unqualified opinion on such financial highlights.
We conducted our audits in accordance with the standards of the Public Company Accounting Oversight Board (United States). Those standards require that we plan and perform the audits to obtain reasonable assurance about whether the financial statements and financial highlights are free of material misstatement. An audit includes examining, on a test basis, evidence supporting the amounts and disclosures in the financial statements. Our procedures included confirmation of securities owned as of December 31, 2016 by correspondence with the custodian and brokers. An audit also includes assessing the accounting principles used and significant estimates made by management, as well as evaluating the overall financial statement presentation. We believe that our audits provide a reasonable basis for our opinion.
In our opinion, the financial statements and financial highlights referred to above present fairly, in all material respects, the financial position of Income and Equity Fund, Balanced Fund, Large Cap Value Fund, Mid Cap Value Fund and Small Cap Value Fund, as of December 31, 2016, and the results of their operations for the year then ended, the changes in their net assets and their financial highlights for each of the years in the two-year period then ended, and the restated financial highlight information described in Note 2H for each of the years in the three-year period ended December 31, 2014 in conformity with accounting principles generally accepted in the United States of America.

BBD, LLP
Philadelphia, Pennsylvania
February 24, 2017
76
Pacific Advisors Fund Inc.
Disclosure Regarding the Board's Approval
of the Funds' Advisory Contracts
The Board of Directors, including a majority of the Independent Directors, most recently approved the Investment Management Agreements (the "Agreements") for the Funds at its meeting held on August 12, 2016. At that meeting, the Board approved the continuation of the Agreements by and between Pacific Advisors Fund Inc. (the "Corporation"), on behalf of each of its Funds, and Pacific Global Investment Management Company, Inc. ("PGIMC").
In approving the Agreements, the Board considered materials relating to, among other matters: (1) the financial condition and profitability of PGIMC, including information regarding PGIMC's cost of providing services, as well as comparative fee and expense information for a peer group of funds; (2) investment performance of each Fund, including information comparing the performance of each Fund with a peer group of funds and an appropriate index or combination of indices; (3) the services provided by PGIMC to the Funds; (4) sales and redemption data for each Fund; (5) the extent to which economies of scale are realized as the Funds grow and whether fee levels reflect any economies of scale for the Funds' investors; (6) the economic outlook and the general investment outlook in the markets in which each Fund invests; and (7) "fall-out" benefits realized by PGIMC (i.e., ancillary benefits derived by PGIMC and its affiliates from PGIMC's relationship with the Funds). The Board also periodically considers other material facts such as the allocation of each Fund's brokerage commissions, each Fund's record of compliance with its investment policies and restrictions on personal securities transactions, and the nature, cost, and character of non-investment management services provided by PGIMC and its affiliates. In approving the Agreements, the Board relied on all information presented to it over the course of the year.
Prior to the Board's approval of the Agreements, the Independent Directors met separately with independent counsel to review the materials provided. Based on its evaluation of all material factors, the Board, including a majority of the Independent Directors, determined that the Agreements were in the best interests of the Funds and their shareholders and that the fees to be paid to PGIMC under the Agreements were fair and reasonable in relationship to the services to be rendered thereunder and in light of the factors considered. During its deliberations, the Board did not identify any single factor as all important or controlling, and individual Directors may have weighed the same factors differently. The following summaries do not detail every matter considered. Matters considered by the Board included the following:
Nature, Quality and Extent of Services. The Board examined the nature, quality and extent of the services provided by PGIMC to the Funds. The Board reviewed PGIMC's key personnel in providing investment management services to the Funds, as well as the changes in such personnel, and the duties that such personnel perform for the Funds. The Board considered the qualifications and experience of PGIMC's portfolio management team and PGIMC's commitment of its resources to portfolio management services. The Board considered PGIMC's responsibilities under the Agreements in serving as the Funds' investment manager, including responsibilities for investment research and stock selection; administration of the Funds' daily business operations; supervision of the Funds' transfer agent and administrative services agent; monitoring adherence to the Funds' investment restrictions; monitoring compliance with various policies and procedures of the Funds; and responsiveness to the Independent Directors. The Board was provided with, and considered information regarding, PGIMC's trading; operations; compliance; and investment research functions. The Board considered PGIMC's marketing strategy with respect to the Funds and the current asset levels of the Funds. The Board also considered the Funds' compliance program, the compliance and risk management reports periodically furnished to the Board, and the results of any regulatory exams. The Board concluded that the Funds have the potential to benefit from the nature, extent and quality of the services provided by PGIMC under the Agreements.
77
Pacific Advisors Fund Inc.
Disclosure Regarding the Board's Approval
of the Funds' Advisory Contracts
Investment Performance of PGIMC and the Funds. The Board considered the performance of PGIMC and the Funds, including, to the extent applicable, each Fund's year-to-date, one-, three-, five-, and ten-year performance for the periods ended June 30, 2016 and December 31, 2015; as well as certain comparative performance information sourced by an independent data service for each Fund's benchmark(s) and funds PGIMC considered peers of the Funds. The Board was provided information regarding PGIMC's investment decision making process and trade execution policies and strategies. After reviewing the Funds' performance records, including performance relative to the Funds' benchmarks, peers and, with respect to the Income and Equity Fund and the Balanced Fund, the blended returns of these Funds' benchmarks, and each Fund's respective investment objective, strategy and role in the overall Fund complex, the Board concluded that, while past performance is no guarantee of future performance, PGIMC's consistency and discipline with respect to its investment style for each Fund, despite continued noted underperformance over various periods and high expenses, overall weighed in favor of renewing the relevant Agreement given the Board's continued monitoring of each Fund's investment performance.
Among other factors, the Board considered:
(i) with respect to the Small Cap Value Fund: the Fund's disappointing performance in light of challenging market conditions; and management's explanation of the Fund's investment strategy, portfolio composition and long-term growth potential;
(ii) with respect to the Mid Cap Value Fund: the Fund's performance in light of the mid-cap strategy adopted at the end of 2010 and its long-term investment approach; management's explanation of the Fund's focused portfolio strategy and long-term growth potential;
(iii) with respect to the Large Cap Value Fund: the Fund's performance in light of market conditions and the Fund's emphasis on minimizing volatility; management's explanation of the Fund's conservative approach and its expectation for the Fund to grow at a slower rate, and with less volatility, in rising markets while potentially providing better downside protection in falling markets; and management's recognition of the difference between the Fund's concentrated portfolio focused on leading mega-cap companies within the benchmark S&P 500® Index, and the benchmark's larger number of holdings.
(iv) with respect to the Balanced Fund: the Fund's disappointing performance in light of market conditions and the Fund's investment objective and policies; management's explanation of the Fund's equity approach to seek total return while minimizing risk and its fixed income strategy, in response to the persistently low yields and heightened interest rate volatility of the past few years, to remain concentrated in shorter-term bonds which provided greater principal protection during periods of rising interest rates and market turbulence; and
(v) with respect to the Income and Equity Fund: the Fund's improved performance in light of market conditions and the Fund's investment objective, strategy, and policies; management's explanation of the Fund's more defensive fixed income strategy during the past few years focused on short-to-intermediate-term investment grade, lower-duration bonds seeking to provide greater principal protection and manage interest rate risk; the Fund's use of high-quality, well-established equities with attractive dividend yields to achieve total return; and the Fund's active strategy which was positioned to preserve valuations as interest rates rise.
Costs of Services and Profits Realized by PGIMC. The Board reviewed PGIMC's 2015 audited financial statements. The Board reviewed the 2015 consolidated statement of operations of PGIMC and its subsidiaries and also considered the costs and profitability of PGIMC and its affiliates from their operations. The Board also reviewed the 2015 consolidated statement of financial condition of PGIMC and its
78
Pacific Advisors Fund Inc.
Disclosure Regarding the Board's Approval
of the Funds' Advisory Contracts
subsidiaries and considered the financial condition of PGIMC and its ability to provide the services specified under the Agreements and expected by the Board. The Board examined the fee information for the Funds as compared to that of comparable funds managed by other advisers, and in light of the investment strategy applied to each Fund. The comparative fee information provided to the Board indicated that each Fund's advisory fees were near the range, given the level of each Fund's assets, of those charged by funds PGIMC considered peers of the Funds based on factors such as portfolio characteristics, investment style and asset level. The Board noted, however, that gross expenses and/or net expenses for each Fund, even with the application of the expense limitation, continued to place it as the most expensive fund in its respective peer group. The Board reviewed a description of the methodology used for selecting the funds in each peer group. The Board considered that during 2015, PGIMC had waived fees for the Income and Equity Fund and Large Cap Value Fund in order to reduce their expenses; and that PGIMC expected to continue to waive fees for the Income and Equity Fund and Large Cap Value Fund in 2016 to the extent expenses exceed the agreed expense limits for those Funds. Another factor was that, over the history of the Funds, PGIMC and its affiliates had waived and/or reimbursed expenses for all the Funds in excess of $4.8 million. The Board recognized the limited financial resources of PGIMC with respect to subsidizing the Funds' expenses, and the small asset size of each Fund. The Board also considered that affiliates of PGIMC provide distribution, administrative, and transfer agency services for the Funds, and, based on information furnished by PGIMC, the benefits to the Funds of having such services provided by such affiliates. The Board also considered the Funds' sales and redemption data in the first six months of 2016, in light of current market conditions. The Board concluded that the Funds' management fees were reasonable in light of the services provided, despite the high level of other expenses.
Economies of Scale. The Board considered the extent to which the Funds' management fees reflect economies of scale for the benefit of the Funds' shareholders. The Board reviewed the Funds' fee arrangements, which include breakpoints that decrease the fee rate as the Funds' assets increase. The Board considered the fact that current assets were well below the threshold for the initial advisory fee breakpoint for each Fund. The Board noted that the expense ratios for the Funds were impacted by lower asset levels for most of the Funds in 2015 as compared to 2014. Based on its review, the Board concluded that the Funds' management fee structures have the potential to allow shareholders to benefit from economies of scale if the Funds' assets were to increase. The Board also considered that PGIMC had been waiving fees for the Income and Equity Fund and the Large Cap Value Fund.
Other Benefits to PGIMC. In evaluating the benefits that accrue to PGIMC through its relationship with the Funds, the Board recognized that, in addition to providing advisory services, PGIMC and its affiliates serve the Funds in various capacities, including as transfer agent, administrative services agent and distributor, and receive compensation from the Funds in connection with providing these services. The Board considered that each service provided to the Funds by PGIMC or one of its affiliates is pursuant to a written agreement, which the Board evaluates periodically. The Board also considered the benefits that accrue to PGIMC through its relationship with the Funds in its management of separately managed accounts, and another fund for which it serves as sub-adviser. The Board concluded that the benefits were consistent with PGIMC's rights and obligations under the Agreements.
After full consideration of these and other factors, the Board, including a majority of the Independent Directors, concluded that approval of the Agreements was in the best interest of the Funds and their shareholders.
79
Pacific Advisors Fund Inc.
Directors and Officers
"Independent" Directors
Name (Age) | Position with the Company1 | Year elected Director of the Company | Principal occupation(s) during past 5 years | Other Directorships held by Director | |||||||||||||||
| L. Michael Haller, III (73) | Director | 1992 | Consultant, d/b/a Asahi Broadcasting Enterprises (software development); Chairman and President, Gammaker Pte. Ltd. (mobile game developer); Chairman and CEO, AdLib Mediation, Inc. (mobile advertising); and formerly Executive Vice President, MGT Capital Investments (mobile game developer) (2013); CEO, Digital Angel, Inc. (communications equipment distributor) (2012-2013); and Chairman, Kapitall, Inc. (online introducing brokerage) (2011-2012) | Digital Angel, Inc. | |||||||||||||||
| Peter C. Hoffman (66) | Director | 2010 | President, Sierra Autocars, Inc. (auto dealership), Sierra Vehicles, Inc. (auto dealership), Sierra Automotive Enterprises, Inc. (auto dealership) and Sierra Pursuits, Inc. (management company) | None | |||||||||||||||
| Gerald E. Miller (87) | Director | 1992 | Retired in 1992; and formerly worked for Merrill Lynch for over 30 years and was a Senior Resident Vice President at retirement in 1992 | None | |||||||||||||||
| Louise K. Taylor, PhD (70) | Director | 1992 | Assistant Executive Director, Employers Association of California; and formerly Superintendent, Monrovia Unified School District (1991-2009) | None | |||||||||||||||
"Interested" Director2
Name (Age) | Positions with the Company1 | Year elected a Director and officer of the Company | Principal occupations during past 5 years | Other Directorships held by Director | |||||||||||||||
| George A. Henning (69)* | President and Chairman | 1992 | Chairman, President and Director, Pacific Global Investment Management Company; and Chairman and Director, Pacific Global Fund Distributors, Inc. and Pacific Global Investor Services, Inc. | None | |||||||||||||||
Each Director oversees all 5 Pacific Advisors Fund portfolios.
The Fund's Statement of Additional Information contains additional information about the Fund's Directors and Officers and is available without charge upon request by calling (800) 989-6693. The business address for all Directors and officers of the Company is 101 N. Brand Blvd., Suite 1950, Glendale, CA 91203, Attn: Secretary.
80
Pacific Advisors Fund Inc.
Directors and Officers
Other Officers
Name (Age) | Position(s) with the Company | Year elected an officer of the Company | Principal occupations during past 5 years | ||||||||||||
| Catherine L. Henning (39) | Vice President Secretary | 2010 2006 | Senior Vice President, Secretary, Director of Client Services and Director, Pacific Global Investment Management Company; President, Secretary, Chief Compliance Officer and Director, Pacific Global Fund Distributors, Inc.; and Vice President, Secretary and Director, Pacific Global Investor Services, Inc. | ||||||||||||
| Barbara A. Kelley (63) | Vice President and Chief Compliance Officer | 2001 | Executive Vice President, Chief Compliance Officer and Director, Pacific Global Investment Management Company; Director, Pacific Global Fund Distributors, Inc.; President and Director, Pacific Global Investor Services, Inc.; and formerly Treasurer (2001-2014). | ||||||||||||
| Araceli Olea (44) | Assistant Secretary | 2008 | Shareholder Services Manager, Pacific Global Investor Services, Inc.; and Assistant Secretary, Pacific Global Investment Management Company and Pacific Global Investor Services, Inc. | ||||||||||||
| Jingjing Yan (43) | Treasurer | 2014 | Vice President and Treasurer, Pacific Global Investment Management Company; Treasurer, Pacific Global Fund Distributors, Inc. and Pacific Global Investor Services, Inc.; and formerly Assistant Treasurer (2005-2014). | ||||||||||||
1 Each director is elected to serve until the next annual shareholders meeting and until his or her successor is elected or appointed. The Company does not hold regular annual shareholders meetings to elect Directors. Vacancies on the Board can be filled by the action of a majority of the Directors, provided that at least two-thirds of the Directors have been elected by the shareholders.
2 "Interested persons" as defined in the 1940 Act, as amended, based on the director's affiliation with the Funds' investment manager and its affiliates (including the Funds' principal underwriter).
* Mr. Henning is considered an interested director because (a) he holds the positions described above with the Company, the Manager and its affiliates; (b) by virtue of his ownership of the Manager's shares he may be deemed a "control person" of the Manager; and (c) he is Ms. Henning's father.
81
Pacific Advisors Fund Inc.
Additional Tax Information (Unaudited)
For federal income tax purposes, the following information is furnished with respect to the distributions paid by the Funds during the taxable year ended December 31, 2016. The Funds designated and paid as short-term capital gain and long-term capital gain distributions as follows:
| Income and Equity Fund | Balanced Fund | Large Cap Value Fund | Mid Cap Value Fund | Small Cap Value Fund | |||||||||||||||||||
Short-term capital gain distributions | - | - | - | - | - | ||||||||||||||||||
Long-term capital gain distributions | - | $ | 225,253 | $ | 23,059 | - | $ | 4,266,366 | |||||||||||||||
A percentage of the dividends distributed during the fiscal year for the Funds qualifies for the dividends-received deduction for corporate shareholders:
| Income and Equity Fund | Balanced Fund | Large Cap Value Fund | Mid Cap Value Fund | Small Cap Value Fund | |||||||||||||||||||
Corporate dividends-received deduction | 100.00 | % | N/A | N/A | N/A | N/A | |||||||||||||||||
Under the Jobs and Growth Tax Relief Reconciliation Act of 2003 (the "Act"), the following percentage of ordinary dividends paid during the taxable year ended December 31, 2016 are designated as "qualified dividend income," as defined in Act and subject to reduced tax rates in 2016.
| Income and Equity Fund | Balanced Fund | Large Cap Value Fund | Mid Cap Value Fund | Small Cap Value Fund | |||||||||||||||||||
Percentage of qualified dividends | 100.00 | % | N/A | N/A | N/A | N/A | |||||||||||||||||
In January 2017, the Funds provided tax information to shareholders for the preceding calendar year.
82
Pacific Advisors Fund Inc.
notes
83
Pacific Advisors Fund Inc.
notes
84

Pacific Advisors Fund Inc.
Directors
George A. Henning, Chairman
L. Michael Haller, III
Peter C. Hoffman
Gerald E. Miller
Louise K. Taylor, Ph.D.
Officers
George A. Henning, President
Barbara A. Kelley, Vice President
Catherine L. Henning, Vice President and Secretary
Araceli Olea, Assistant Secretary
Jingjing Yan, Treasurer
Investment Manager
Pacific Global Investment Management Company
101 North Brand Blvd., Suite 1950
Glendale, California 91203
Transfer Agent and Administrator
Pacific Global Investor Services, Inc.
101 North Brand Blvd., Suite 1950
Glendale, California 91203
Distributor
Pacific Global Fund Distributors, Inc.
101 North Brand Blvd., Suite 1950
Glendale, California 91203
(800) 989-6693
Availability of Quarterly Portfolio Schedule
The Fund files its complete schedule of portfolio holdings with the SEC for the first and third quarters of each fiscal year on Form N-Q. The Fund's Forms N-Q are available on the SEC's Web site at http://www.sec.gov. The Fund's Forms N-Q may be reviewed and copied at the SEC's Public Reference Room in Washington, DC. Information about the operation of the Public Reference Room may be obtained by calling the SEC at (800) SEC-0330.
The Fund's complete schedule of portfolio holdings for each fiscal quarter is posted on the Fund's Web site at www.PacificAdvisorsFund.com and is available without charge, upon request by calling (800) 989-6693. Documents will be sent within 3 business days of receipt of your request.
Availability of Proxy Voting Policies and Procedures and Proxy Voting Record
A description of the policies and procedures that the Fund uses to determine how to vote proxies relating to portfolio securities and information regarding how the Fund voted proxies relating to portfolio securities during the most recent 12-month period ended June 30 is available without charge, upon request by calling (800) 989-6693. Documents will be sent within 3 business days of receipt of your request. This information is also available on the SEC's Web site at http://www.sec.gov.

Pacific Global Fund Distributors, Inc.
101 North Brand Blvd., Suite 1950
Glendale, California 91203

Item 2. Code of Ethics
Registrant has adopted a Code of Ethics pursuant to Section 406 of the Sarbanes-Oxley Act of 2002 that applies to Registrant’s principal executive officer, principal financial officer, principal accounting officer or controller. Registrant will provide to any person without charge, upon request, a copy of the Code of Ethics if such person submits a request in writing addressed to the Registrant’s secretary at the principal executive offices listed above.
Item 3. Audit Committee Financial Expert
Registrant’s Audit Committee has three members. While these members are “financially literate,” the Board has determined that none of the members of the Audit Committee meet the technical definition of “audit committee financial expert.” Registrant has determined that an audit committee financial expert is not necessary at this time because (i) the Audit Committee members are financially literate; (ii) they have served on Registrant’s Audit Committee for several years; (iii) the accounting methodologies applicable to registered investment companies and the types of investment activities in which the Funds engage are well established; and (iv) Registrant’s financial statements do not involve the types of complex accounting issues that other types of public companies may have.
Item 4. Principal Accountant Fees and Services
(a)-(d) BBD LLP (“BBD”) billed the Registrant aggregate fees for professional services rendered for the fiscal years ending December 31, 2015 and December 31, 2016; and Ernst & Young LLP (“E&Y”) billed the Registrant aggregate fees for professional services rendered for the fiscal year ending December 31, 2015, as follows:
BBD |
| Audit Fees |
| Audit Related Fees |
| Tax Fees |
| All Other Fees |
| ||||
2016 |
| $ | 96,000 |
| $ | 0 |
| $ | 15,000 |
| $ | 0 |
|
2015 |
| $ | 103,000 |
| $ | 0 |
| $ | 18,000 |
| $ | 0 |
|
E&Y |
| Audit Fees |
| Audit Related Fees |
| Tax Fees |
| All Other Fees |
| ||||
2015 |
| $ | 0 |
| $ | 2,500 |
| $ | 0 |
| $ | 0 |
|
(b) Audit Related Fees are for services rendered to provide consent of the annual update to the Corporation’s Form N1-A and non-routine N1-A filings.
(c) Tax Fees include the services for the review of income tax returns and excise taxes.
(e)(1) The Audit Committee is authorized to pre-approve non-audit services provided by the Corporation’s auditors, if they find it appropriate in light of their fiduciary duties and in the exercise of their good faith business judgment and compatible with the auditors’ independence. The Chairman of the Audit Committee is authorized to approve audit and non-audit services for newly established funds of the Corporation on the same terms as the full Audit Committee previously had approved for the then existing funds, and to approve non-audit services which are permissible under applicable law, provided the estimated fee is not more than $5,000 based on a good faith estimate provided by the auditor. The Chairman shall report any such pre-approval to the Audit Committee at its next following meeting.
(e)(2) None.
(f) None.
(g) None.
(h) Not applicable.
Item 5. Audit Committee of Listed Registrants
Not applicable as Registrant is not a listed issuer as defined in Rule 10A-3 under the Securities Exchange Act of 1934.
Item 6. Statements of Investments
Statements of Investments is included as part of the report to shareholders filed under Item 1 of this form.
Item 7. Disclosure of Proxy Voting Policies and Procedures for Closed-End Management Investment Companies
Not applicable to open-end investment companies.
Item 8. Portfolio Managers of Closed-End Management Investment Companies
Not applicable to open-end investment companies.
Item 9. Purchases of Equity Securities by Managers of Closed-End Management Investment Company and Affiliated Purchasers.
Not applicable to open-end investment companies.
Item 10. Submission of Matters to a Vote of Security Holders
No material changes have been made.
Item 11. Controls and Procedures.
(a) Based upon their evaluation of Registrant’s disclosure controls and procedures (as defined in Rule 30a-3(c) under the Investment Company Act of 1940) as conducted within 90 days of the filing date of this Form N-CSR, Registrant’s principal executive officer and principal financial officer have concluded that those disclosure controls and procedures provide reasonable assurance that the material information required to be disclosed by Registrant on this report is recorded, processed, summarized and reported within the time periods specified in the Securities and Exchange Commission’s rules and forms.
(b) There were no changes in Registrant’s internal control over financial reporting (as defined in Rule 30a-3(d) under the Investment Company Act of 1940) that occurred during the second fiscal quarter of the period covered by this report that have materially affected, or are reasonably likely to materially affect, Registrant’s internal control over financial reporting.
Item 12. Exhibits
(a)(1) Not applicable.
(a)(2) Certifications required by Item 12(a) of Form N-CSR and Section 302 of the Sarbanes-Oxley Act of 2002 (filed herewith).
(b) Certification required by Section 906 of the Sarbanes-Oxley Act of 2002 (filed herewith).
SIGNATURES
Pursuant to the requirements of the Securities Exchange Act of 1934 and the Investment Company Act of 1940, Registrant has duly caused this report to be signed on its behalf by the undersigned, thereunto duly authorized.
Pacific Global Fund Inc. d/b/a Pacific Advisors Fund Inc.
By: | /s/ George A. Henning |
|
| George A. Henning |
|
| Chairman, Pacific Advisors Fund Inc. |
|
|
|
|
Date: | March 6, 2017 |
|
Pursuant to the requirements of the Securities Exchange Act of 1934 and the Investment Company Act of 1940, this report has been signed below by the following persons on behalf of Registrant and in the capacities and on the dates indicated.
By: | /s/ George A. Henning |
|
| George A. Henning |
|
| Chief Executive Officer |
|
|
|
|
Date: | March 6, 2017 |
|
|
|
|
By: | /s/ Jingjing Yan |
|
| Jingjing Yan |
|
| Chief Financial Officer |
|
|
|
|
Date: | March 6, 2017 |
|