UNITED STATES
SECURITIES AND EXCHANGE COMMISSION
Washington, D.C. 20549
FORM N-CSR
CERTIFIED SHAREHOLDER REPORT OF REGISTERED
MANAGEMENT INVESTMENT COMPANIES
Investment Company Act file number | 811-07062 | |||||||
| ||||||||
PACIFIC GLOBAL FUND INC. D/B/A PACIFIC ADVISORS FUND INC. | ||||||||
(Exact name of registrant as specified in charter) | ||||||||
| ||||||||
101 NORTH BRAND BLVD., SUITE 1950 GLENDALE, CALIFORNIA |
| 91203 | ||||||
(Address of principal executive offices) |
| (Zip code) | ||||||
| ||||||||
GEORGE A. HENNING 101 NORTH BRAND BLVD., SUITE 1950 GLENDALE, CA 91203 | ||||||||
(Name and address of agent for service) | ||||||||
| ||||||||
Registrant’s telephone number, including area code: | 818-242-6693 |
| ||||||
| ||||||||
Date of fiscal year end: | December 31 |
| ||||||
| ||||||||
Date of reporting period: | December 31, 2014 |
| ||||||
Item 1. Report to Shareholders
Filed herewith.

annual report
december 31, 2014
government securities fund
income and equity fund
balanced fund
large cap value fund
mid cap value fund
small cap value fund


Pacific Advisors
table of contents
Message from the Chairman | 1 | ||||||
Government Securities Fund | 5 | ||||||
Income and Equity Fund | 10 | ||||||
Balanced Fund | 16 | ||||||
Large Cap Value Fund | 22 | ||||||
Mid Cap Value Fund | 27 | ||||||
Small Cap Value Fund | 32 | ||||||
Schedule of Investments | 38 | ||||||
Statement of Assets and Liabilities | 58 | ||||||
Statement of Operations | 60 | ||||||
Statement of Changes in Net Assets | 62 | ||||||
Financial Highlights | 66 | ||||||
Notes to Financial Statements | 73 | ||||||
| Report of Independent Registered Public Accounting Firm | 83 | ||||||
| Disclosure Regarding the Board's Approval of the Funds' Advisory Contracts | 84 | ||||||
Directors and Officers | 89 | ||||||
Additional Tax Information | 91 | ||||||
This Report is submitted for the general information of the shareholders of Pacific Advisors Funds. It is not authorized for distribution to prospective investors unless accompanied or preceded by the Funds' current prospectus, which contains information concerning the investment policies of the Funds as well as other pertinent information.
This Report is for informational purposes only and is not a solicitation or recommendation that any particular investor should purchase or sell any particular security. The statements in the Chairman's Letter and the discussions of the Funds' performance are the opinions and beliefs expressed at the time of this commentary and are not intended to represent opinions and beliefs at any other time. These opinions are subject to change at any time based on market or other conditions and are not meant as a market forecast. All economic and performance information referenced is historical. Past performance does not guarantee future results.
For more information on the Pacific Advisors Funds, including information on charges, expenses and other classes offered, please obtain a copy of the prospectus by calling (800) 989-6693. Please read the prospectus and consider carefully the investment risks, objectives, charges and expenses before you invest or send money. Shares of the Pacific Advisors Funds are not deposits or obligations of any bank, are not guaranteed by any bank, are not insured by the FDIC or any other agency, and involve investment risks, including the possible loss of the principal amount invested. The investment return and principal value of an investment will fluctuate so that an investor's shares, when redeemed, may be worth more or less than their original cost.


Message
from the chairman
Dear Shareholders,
2014: more than meets the eye. The major indices posted strong returns for the year: the S&P 500® Index, the Dow Jones Industrial Average, and the NASDAQ each gained over 10%. At first glance, these results suggest broad-based strength across the equity markets. And yet, the details reveal a more complex story. Large cap stocks (with market capitalizations over $20 billion), attracted significant investor attention. These stocks presented an appealing alternative to low-yielding fixed income securities. Substantial cash inflows translated into impressive gains for many large caps, especially those that offered both relatively high dividend yields and relative price stability. The price gains for many large caps, in turn, drove returns for the indices. A closer look at the indices, and the formulas used to calculate performance, reveals that performance was disproportionally concentrated in specific sectors of the equity markets. The indices are market-weighted. Therefore, even though large cap companies constituted approximately 46% of the companies in the S&P 500® Index as of year-end, they accounted for 91% of the Index's 13.69% return for 2014.1 More notably, mega-cap stocks (with market capitalizations over $100 billion), which represented just 9% of the companies in the S&P 500® Index as of year-end, were responsible for 41% of the Index's return for 2014.1 Meanwhile, stocks of smaller cap companies felt the persistent pressure of negative market sentiment as investors grew cautious in response to declining oil prices, economic slowdowns in Europe and China, and geopolitical tension.
Energy stocks tumbled as growing supplies from North American shale oil, combined with weakening demand in Europe and Asia, sent oil prices from $112 per barrel in June to below $60 by year-end. The widespread and seemingly indiscriminate selling of energy-related stocks in response to falling oil prices battered the sector as a singular group; well-positioned energy service companies suffered even though some of these companies' operations continue with little or no disruption. The selloff is sparking comparisons to the Energy bear markets of 2001 and 2008. However, the factors contributing to the prior cycles are markedly different from those that exist today. Most crucially, both the 2001 and 2008 bear markets were triggered by global economic recessions; that is, they were demand-driven selloffs. In contrast, the current downturn is primarily a supply-driven selloff resulting from increased production. Notably, the International Energy Agency still expects global oil demand to rise in 2015 even as it lowered its forecast due to slower growth abroad. We anticipate, therefore, that any policies or corporate decisions to reduce production would directly address the current supply-demand imbalance and potentially hasten the sector's recovery.
Investors were also troubled by the European economy's weak growth, high unemployment, and deflation threats. Many had expected that the European Central Bank (ECB) would have expanded stimulus measures in an effort to boost economic activity and inflation. In December, however, the ECB stated that it would not revisit accommodative monetary policies before January; the underlying political and policy negotiation created further euro zone anxiety. In addition, Greece's financial and political fragility resurfaced in the run-up to the country's January elections. The newly elected government intends to negotiate for more favorable terms and conditions on its debt obligations and financial support. Protracted negotiations await as the ECB is disinclined to further reduce the country's already reset debt.
Interest rates trended lower as fixed income investors favored the relative safety of U.S. bonds. The decline in oil prices, which prompted some to flee equities, also helped push rates lower. And, while the decrease in the unemployment rate reflects notable improvement in the labor market, wage growth was nevertheless unimpressive; furthermore, inflation remained weak. In response, the Federal Reserve reiterated that rates may remain low for a "considerable time."
1 Source: Bloomberg 2014 attribution analysis. Large cap companies contributed 12.40% to the S&P 500® Index's return. Mega-cap companies contributed 8.53% to the Index's return.
1


Message
from the chairman continued
Market Review
The major indices posted moderate gains in the second half of the year. The Dow Jones Industrial Average rose 7.17%, the S&P 500® Index rose 6.11%, the technology-heavy NASDAQ gained 8.13% and the Russell Midcap® Index rose 4.18%. The Russell 2000® Index of small cap stocks continued to underperform with a 1.65% gain.
Interest rates unexpectedly fell every quarter in 2014; the largest decline occurred in the last quarter when the yield on the 10-year U.S. Treasury Note plunged from 2.52% at the end of September to 2.15% in mid-October. Volatility eased somewhat before falling, in mid-December, to the year's lowest yield of 2.07% before ending the year at 2.17%.
Equity Investment Review
During the second half of the year, investors became increasingly concerned about the prospects for world economic growth. The focal points were Europe's inability to implement structural reforms as well as a sense that the ECB's on-going discussions about economic stimulus measures were mostly rhetoric to soothe the markets. Investors, fearing that Europe might fall into a double-dip recession, turned their focus on conservative large cap equities. This scenario is reminiscent of the worries in 2011 about the double-dip recession in the U.S. Yet, since then, quantitative easing and data showing slow but continuing economic growth have eased some of these worries.
In Asia, China's economic growth slowed somewhat and Japan, despite aggressive commitments to monetary stimulus, appeared vulnerable to another recession. Here too, recent economic data show modest growth in Japan. Leadership priorities in China emphasize shifting from an export-driven to a more consumer-oriented economy. In contrast, the Japanese economy remains largely reliant on exports. Both nations will likely succeed in reigniting economic growth although market volatility in each country may reflect the uneasy journey.
Geopolitical events in the Middle East and Ukraine continued to dominate the headlines. The market impact of these conflicts, though, has been muted; previously, such events would have unsettled oil prices due to fears of trade sanctions or supply shortages. The emerging energy production in the U.S. and Canada has offset those concerns and largely removed foreign oil supply as political leverage. The oversupply of oil that developed in the second half of the year highlighted this paradigm shift. The steep decline in oil prices led to a swift selloff of the Energy sector and created bear market conditions for energy-related businesses that are even more severe than during the "Great Recession."
We believe that Energy remains an attractive, long-term growth sector even in the midst of a cyclical downturn. Supply-demand imbalances are not unusual phenomena. Most industry executives believe that the imbalance is temporary rather than a fundamental change in the economics of oil exploration and production. Many of the oil producing nations require oil prices of $85 or more to support their economic agendas. Moreover, the investments to support the sophisticated technology used in most oil production have increased over time. We expect, therefore, that oil prices will rise although the timetable for recovery remains uncertain.
Low oil prices have significantly impacted oil and gas exploration companies while refineries and storage facilities are actually benefitting; these businesses, and the companies that support their operations, have experienced little or no activity disruption. Even so, the stocks of many of these companies remain considerably undervalued. We anticipate that the markets will, in time, recognize that these energy-related companies have limited exposure to oil production. During periods of economic downturn, we assess opportunities for companies that we anticipate will recover sooner or emerge stronger than their peers. Well-positioned companies in the Energy sector may identify strategic growth opportunities through attractively priced
Market Review • December 31, 2014
Index1 | Close | YTD Return | |||||||||
Dow Jones Industrial Avg | 17,823.07 | 10.04 | % | ||||||||
S&P 500® | 2,058.90 | 13.69 | % | ||||||||
NASDAQ | 4,736.05 | 14.81 | % | ||||||||
Russell 2000® (small cap) | 1,204.70 | 4.89 | % | ||||||||
12/31/14 | 12/31/13 | ||||||||||
| 10-Year T-Note Yield | 2.17 | % | 3.04 | % | |||||||
Data: Bloomberg; Russell Investments; Federal Reserve. Returns include reinvested dividends.
2


acquisitions. In the past, financially strong companies have expanded operations and improved their market positioning in preparation for the eventual growth cycle.
Many companies continue to benefit from the economic expansion in the U.S. and abroad. Small cap companies usually lead the markets during periods of economic growth. We believe that the recovery of small caps will continue as global economic growth concerns ease. A more detailed discussion of our equity investment strategies is provided in the discussions with our portfolio managers following this letter.
Fixed Income Investment Review
Most analysts expected interest rates to rise as the U.S. economy gained strength; instead, rates fell when heightened global geopolitical and economic concerns caused investors to seek the "safe haven" of U.S. government and corporate debt. Interest rates declined as conservative investors continued to favor U.S. Treasuries. Corporate bond yields also fell in response to strong demand and limited supply. As a result, the yield spread between U.S. Treasuries and investment grade U.S. corporate bonds tightened.
We actively evaluate the economy and fixed income markets to identify opportunities to respond as markets conditions evolve. The Fed has indicated that, as the economy improves in 2015, it will begin raising interest rates; however, global economic and political considerations will likely affect the timing and impact. In the near-term, we anticipate that interest rates will be somewhat volatile due to uncertainties regarding oil prices, global monetary policies and the timing of the Fed's rate "liftoff." In light of the expectation for higher interest rates, we continue to select shorter-term fixed income securities to manage risk. A more detailed discussion of our government and corporate bond strategies is provided in the discussions for our Funds following this letter.
Looking Ahead
Heading into 2015, we anticipate that the U.S. will continue its leading role in the global recovery. The strength of the U.S., and increasing expectations of additional supportive measures in Japan, China and Europe, should buoy investor sentiment. And, lower energy costs are clearly helping the economy; even so, energy prices should self-correct as global demand improves, as expected, in 2015. Stronger economic growth should benefit all sectors over the long-term even though certain market segments may face periodic setbacks. Importantly, though, such short-term setbacks often set the stage for significant returns as markets, and companies, adapt to changing conditions. For example, a look back at the 2008 financial crisis serves as a poignant reminder that industry stresses often create opportunities for well-positioned companies.
The Fed's guidance and eventual actions to increase short-term interest rates will also continue to strongly influence the markets in 2015. Several factors, including wage growth at home, and the impact of higher interest rates on the global economy, will affect the schedule and pace of the Fed's "liftoff" policy. And, market forces will likely influence longer-term rates separate and apart from any Fed actions. Regardless, the Fed's eventual move to raise short-term interest rates should be viewed positively; the return to a more normal interest rate environment will reflect the Fed's confidence in the U.S. and world economies.
We anticipate that equities will rise broadly on the expectation of domestic growth and monetary stimulus in Europe. Still, risks remain; the timing of the Fed's decision to raise interest rates, geopolitical volatilities and the strength of the U.S. dollar (and its effect on foreign profits) could challenge investor sentiment. Yet, some of the notable trends that helped certain investment sectors in 2014 may not repeat this year: for example, dividend-paying stocks benefitted disproportionately from the persistently low interest rate environment. Even so, we believe that the domestic economy is in the middle stages of an expansion cycle which should lead to further gains in corporate revenues and profits; U.S. equities, especially in light of global economic considerations, remain well-positioned for 2015.
Our strategy since the "Great Recession," has consistently anticipated modest economic growth. We continue to believe that companies are well-positioned to manage through temporary setbacks and strengthen their market positions as economic growth continues. We anticipate that, over time, the Energy sector will
3


Message
from the chairman continued
recover and that other underperforming areas, such as small caps, are poised to recover and provide market leadership in 2015. Last year, the outsized-effect of mega-cap companies in the performance of market indices overshadowed some of the unusual weaknesses in the equity markets. Maintaining patience and investment discipline during such times is vital as these distortions temporarily impact investment performance.
Sincerely,

George A. Henning
1 The Dow Jones Industrial Average is an unmanaged, price weighted measure of 30 U.S. stocks selected by the Averages Committee to represent the performance of all U.S. stocks outside the Transportation and Utilities sectors. The S&P 500® Index is an unmanaged, market capitalization weighted index which measures the performance of the large cap segment of the U.S. equities market, covering approximately 75% of the U.S. equities market. The Index includes 500 leading companies in leading industries of the U.S. economy. The NASDAQ Composite Index is an unmanaged, market capitalization weighted measure of all domestic and international common stocks (currently over 3,000 stocks) listed on The Nasdaq Stock Market. The Russell 2000® Index is an unmanaged, market-weighted measure of the 2,000 smallest publicly traded companies of the Russell 3000® Index. The Russell Midcap® Index is an unmanaged, weighted measure of the 800 smallest companies within the Russell 1000® Index based on a combination of their market cap and current index membership. These indices are not available for direct investment. Index returns assume the reinvestment of dividends.
Economic and performance information referenced is historical and past performance does not guarantee future results. The principal value and return of an investment will fluctuate so that an investor's shares may be worth less than the original cost when redeemed. For more information on the Pacific Advisors Funds, including information on charges, expenses and other classes offered, please obtain a copy of the prospectus by calling (800) 989-6693. Please read the prospectus and consider carefully the investment risks, objectives, charges and expenses before you invest or send money.
Shares of the Funds are not deposits or obligations of any bank, are not guaranteed by any bank, are not insured by the FDIC or any other agency, and involve investment risks, including the possible loss of the principal amount invested. The views expressed represent the opinions and beliefs at the time of this commentary and are not meant as a market forecast. These views are subject to change at any time based on market or other conditions. This information may not be relied on as investment advice or as an indication of trading
4
Pacific Advisors
Government Securities Fund
Fund Objective: High current income, preservation of capital, and rising future income consistent with prudent investment risk.
Investment Invests at least 80% of its assets in U.S. Government fixed income
Strategy: securities. These include securities issued or guaranteed by the U.S. Treasury; issued by a U.S. Government agency; or issued by a Government-Sponsored Enterprise (GSE). May also invest in high quality dividend-paying common stocks.
Investor Profile: Conservative. Income-focused; capital preservation aim.
TOTAL RETURNS | EXPENSE RATIOS1 | ||||||||||||||||||||||||||
For the year ended December 31, 2014 | Current | Prospectus | |||||||||||||||||||||||||
Net | Gross | Net | Gross | ||||||||||||||||||||||||
Class A | –0.44 | % | Class A | 3.50 | % | 6.37 | % | 3.39 | % | 6.09 | % | ||||||||||||||||
Class C | –1.24 | % | Class C | 4.23 | % | 7.09 | % | 4.16 | % | 6.82 | % | ||||||||||||||||
Barclays Capital U.S. Int T-Bond Index2 | 2.52 | % | |||||||||||||||||||||||||
Performance quoted is past performance which does not guarantee future results. Current performance may be higher or lower than the performance quoted. Call (800) 989-6693 for performance current to the most recent month-end. The investment return and principal value of an investment will fluctuate so that an investor's shares, when redeemed, may be worth more or less than their original cost. Returns represent the change in value over the stated period assuming reinvestment of dividends and capital gains at net asset value. Rankings shown are for Class A shares; rankings for other share classes may be different. Returns and rankings do not take into account the maximum 4.75% sales charge on Class A shares or the 1% Contingent Deferred Sales Charge (CDSC) for Class C shares sold within one year of purchase. Returns would be lower if the applicable sales charge and CDSC were included. Returns do not take into account individual taxes which may reduce actual returns when shares are sold.
The Fund's investment adviser is waiving a portion of its management fees pursuant to an Expense Limitation Agreement. The waiver may be discontinued at any time with ninety days written notice in consultation with the Fund's board, but is expected to continue at current levels. Please see the Notes to Financial Statements in this report for details. Performance shown reflects the waiver, without which the results would have been lower.
Discussion with Portfolio Manager February 24, 2015
Jingjing Yan, CFA
Please see the Chairman's Letter at the beginning of this Report for a detailed market and economic review
as well as the Manager's general market outlook.
Fund Performance
The Fund's investment strategy is to manage interest rate risk for long-term and short-term investors who seek principal protection. The Fund's fixed income investments were focused in short to intermediate-term bonds in response to the persistent low interest rate environment, weak global economic growth, and uncertainty surrounding the Federal Reserve's timeline for interest rate increases.
For the year, Class A shares of the Fund returned –0.44% compared to 2.52% for its benchmark, the Barclays Capital U.S. Intermediate T-Bond Index. However, unlike the Fund, the benchmark is an unmanaged portfolio. Furthermore, the Index's longer average duration reveals a substantially greater exposure to principal loss as interest rates rise.
During the period, the Fund maintained an average duration of approximately 1.0 year which contrasts with the benchmark's average duration of 3.7 years. Duration measures a portfolio's sensitivity to interest rate movements; when rates increase by 1%, a portfolio with a 5-year duration would decrease by
1 "Current" expense ratio as of 12/31/14. "Prospectus" expense ratio is for the fiscal year ended 12/31/13.
2 The Barclays Capital U.S. Intermediate Treasury Bond Index is an unmanaged index of U.S. government securities with one to ten years to maturity. It is not possible to invest directly in the Index.
5
Pacific Advisors
Government Securities Fund continued
approximately 5%. As demonstrated by the Fund's short average duration, we remained committed to minimizing the negative effects of rising interest rates on bond portfolios. The Fund's strategy provides price stability as well as flexibility to respond to investment opportunities that may arise.
The Fund's portfolio includes a small allocation to common stocks; these equities contribute to total return by providing dividend income and the potential for price appreciation. The Fund invests in high-quality, dividend-paying securities which help curtail volatility by counteracting price changes in U.S. government securities holdings.
Market Overview
Interest rates defied expectations and continued to fall in the second half of the year as demand for U.S. Treasuries rose. Geopolitical tensions and weak domestic inflation supported conservative investors' preferences for these "safe-haven" securities. The decline in oil prices, which prompted some to flee equities, also helped push rates lower. Additionally, investors favored the relatively high yield from U.S. Treasuries in comparison to the sovereign debt issued by other creditworthy nations. The yield on the 10-year Treasury Note, which ended the second quarter at 2.53%, hovered around 2.50% in the third quarter. In mid-October, after the International Monetary Fund cut its global economic growth forecast for 2014 and 2015, the yield plunged to 2.15%. Volatility eased somewhat until rates fell, in mid-December, to the year's lowest yield of 2.07% before inching higher to end the year at 2.17%.
Speculation about the timing and scope of changes in the Fed's monetary policies led to greater demand for bonds as well as unusual interest rate volatility. Then, the September FOMC meeting provided clarification on the central bank's perspective on interest rates. The emphasis on the 'data dependency' of any policy changes reassured investors that the Fed would balance domestic as well as global considerations in determining the timing of rate increases.
As expected, the Fed concluded its monthly bond-buying program in October; prevailing interest rates are likely to trend higher, though the timing and the degree to which the central bank will raise rates remains uncertain. During the period we continued to invest in shorter-term government securities; these bonds provide principal protection as rates increase. Higher yields may be obtained by investing in bonds with longer durations; however, we believe that the long-term risk tradeoff of higher yields versus falling prices is not favorable. The rising rate environment in 2013 serves as a poignant reminder that investing in longer-term securities can result in significant losses.
Fund Strategy
Fixed Income Strategy
The Fund invested over 80% of its assets in U.S. government agency bonds. These securities, which have higher coupon rates than U.S. Treasuries, enabled the Fund to generate additional income without significantly increasing risk. The Fund invested in callable government agency bonds with short-to-intermediate maturities; these bonds offer higher coupon rates than non-callable bonds because their issuing agencies are allowed to buy back, or "call," the bonds before maturity. To capture higher yields, the Fund invested in callable bonds that also included a "step-up" feature. Yields for step-up bonds increase at fixed intervals if they are not called back on the predefined call dates; furthermore, as interest rates rise, they will preserve their value better than fixed-rate government securities with comparable maturities. We believed that, given the low interest rate environment, these bonds would be called back within a year. Indeed, many of these bonds were called, and we reinvested the proceeds in other government agency securities with similar call and step-up features.
The Fund does not utilize higher-risk strategies to enhance return. For example, the Fund does not purchase bonds with extended durations, use leverage strategies, or invest in mortgage-backed securities.
6
Equity Positioning
The Fund invests a small portion of its portfolio in high-quality, dividend-paying common stocks; as of year-end, less than 18% of the Fund's assets were invested in these securities. Yet, these holdings provided important price appreciation to offset the low interest rates on short-to-intermediate-term U.S. government securities. Equity investments focus on stocks that are less sensitive than the overall market to economic developments; in addition, they provide attractive dividends and appreciation potential. These blue-chip stocks offer stability by counterbalancing price movements in the fixed income markets without materially increasing the Fund's exposure to risk. We anticipate that, as interest rates rise, the Fund may reduce its allocation to equities and reposition the portfolio toward longer-term U.S. government securities.
Several Fund holdings3, including Consolidated Edison and Eli Lilly, had strong performance as investors preferred the more conservative areas of the equity market. During the period, the Fund took profits and trimmed positions in companies such as Unilever, Microsoft, and PPL.
Looking Ahead
The Fed's guidance and eventual actions to increase short-term interest rates will continue to strongly influence the markets in 2015. Several factors, including wage growth at home and the impact of higher interest rates on the global economy, will affect the schedule and pace of the Fed's "liftoff" policy. Additionally, market forces will likely influence longer-term rates separate and apart from any Fed actions. Regardless, the Fed's eventual move to raise short-term interest rates should be viewed positively; the return to a more normal interest rate environment will reflect the Fed's confidence in the U.S. and world economies. A shift in the interest rate environment should pressure conservative investors to reconsider their willingness to hold longer-term bonds as interest rates increase.
The Fund will continue utilizing the conservative strategy of investing in shorter-term U.S. government securities. We believe this approach is appropriate given the uncertainty of interest rate movements, depressed oil prices, and slow global economic growth. Signals that the markets are transitioning as interest rates resume their upward trend will prompt us to adjust the portfolio toward longer-term U.S. government securities to provide higher yields. The Fund's flexibility to adjust holdings according to economic and market conditions positions the Fund to successfully manage an upward trend in rates.
3 For detailed information on Fund holdings, please see the Fund's Schedule of Investments in this Report.
7
Pacific Advisors
Government Securities Fund continued
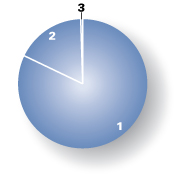
Portfolio Holdings as of 12/31/14 (Based on Total Investments)
| 1. | U.S. Government Securities | 82.22 | % | ||||||||
| 2. | Equities | 17.70 | % | ||||||||
| 3. | Cash and Cash Equivalents | 0.08 | % | ||||||||
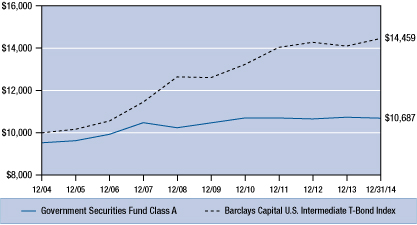
Change in Value of $10,000 Investment1
This chart compares the growth of a $10,000 investment in Class A shares of the Government Securities Fund for the period January 1, 2005 through December 31, 2014 with the same investment in the Barclays Capital U.S. Intermediate Treasury Bond Index2.
Average Annual Compounded Return as of December 31, 2014
Class A | Class C | Barclays Capital U.S. Int T-Bond Index | |||||||||||||
One Year | – 5.20 | % | – 2.23 | % | 2.52 | % | |||||||||
Five Year | – 0.57 | % | – 0.31 | % | 2.78 | % | |||||||||
Ten Year | 0.67 | % | 0.42 | % | 3.76 | % | |||||||||
Past performance does not guarantee future results. Performance quoted represents past performance. Current performance may be higher or lower than the performance data quoted. Returns include reinvested dividends and capital gains. Returns for Class A shares reflect a maximum front-end sales charge of 4.75%; and returns for Class C shares reflect the deduction of a contingent deferred sales charge of 1% on shares sold within the first year of purchase. Returns do not take into account individual taxes which may reduce actual returns when shares are sold. The investment return and principal value of an investment will fluctuate so that an investor's shares, when redeemed, may be worth more or less than their original cost. Call (800) 989-6693 for the most recent month-end performance.
1 Fund results are shown for Class A shares and reflect deduction of the maximum front-end sales charge of 4.75% on the $10,000 investment for a net amount invested of $9,525. At the end of the same period, a $10,000 investment in Class C shares would have been valued at $10,422, and no contingent deferred sales charges would apply. Performance of the share classes will vary based on the difference in charges and expenses. The inception date is 02/08/93 for Class A shares and 04/01/98 for Class C shares. It is not possible to invest directly in the Index. Unlike the Fund's results, the results for the Index do not reflect sales charges, fees or expenses.
2 The Barclays Capital U.S. Intermediate Treasury Bond Index is an unmanaged index of U.S. government securities with one to ten years to maturity.
8
Expense Examples
As a shareholder of the Fund you incur two types of costs: (1) transaction costs, including sales charges (loads) on purchase payments, reinvested dividends, or other distributions; redemption fees; and exchange fees; and (2) ongoing costs, including management fees; distribution (12b-1) fees; and other Fund expenses. This Example is intended to help you understand your ongoing costs (in dollars) of investing in the Fund and to compare these costs with the ongoing costs of investing in other mutual funds.
The Example is based on an investment of $1,000 invested at the beginning of the period and held for the entire period from July 1, 2014 through December 31, 2014.
Actual Expenses
The first line of the table below provides information about actual account values and actual expenses. You may use the information in this line, together with the amount you invested, to estimate the expenses that you paid over the period. Simply divide your account value by $1,000 (for example, an $8,600 account value divided by $1,000 = 8.6), then multiply the result by the number in the first line under the heading entitled "Expenses Paid During the Period" to estimate the expenses you paid on your account during the period.
The following transaction costs are not included in the expenses shown in the table and, if applicable, would increase the expenses that you paid over the period: (1) a front-end sales charge (load) of 4.75% on Class A shares; (2) a 2% redemption fee if you sell or exchange shares within 30 days of purchase, with certain exceptions. The redemption fee does not apply to: (a) redemptions under an automatic withdrawal program or periodic asset reallocation plan, required minimum distributions (RMD), employer mandated distributions from a qualified plan, or redemptions under a qualified domestic relations order (QDRO); (b) redemptions to pay for expenses related to terminal illness, extended hospital or nursing home care, or other serious medical conditions, including death; (c) redemptions of shares acquired through dividend or capital gains reinvestments; (d) loans from a qualified plan account; and (e) redemptions initiated by the Fund; and (3) a $10 service fee on each exchange after the first five exchanges in each calendar year.
The following ongoing costs are not included in the expenses shown in the table and, if applicable, would increase the expenses that you paid over the period: (1) a $12 low balance fee on accounts with balances of less than $250 as of September 30th of each calendar year and no investment activity (excluding reinvestment of dividends and/or capital gains) during the prior calendar year or the first nine months of the current calendar year. This fee does not apply to IRAs, qualified plan accounts, or Coverdell Education Savings Accounts; (2) a $15 annual custodial fee on IRAs, SEPs, SIMPLE IRAs, and Coverdell Education Savings Accounts; and (3) a $20 annual custodial fee on 403(b) accounts.
Hypothetical Example for Comparison Purposes
The second line of the table below provides information about hypothetical account values and hypothetical expenses based on the Fund's actual expense ratio and an assumed rate of return of 5% per year before expenses, which in not the Fund's actual return. The hypothetical account values and expenses may not be used to estimate the actual ending account balance or expenses you paid for the period. You may use this information to compare the ongoing costs of investing in the Fund and other funds. To do so, compare this 5% hypothetical example with the 5% hypothetical examples that appear in the shareholder reports of the other funds.
The following transaction costs are not included in the expenses shown in the table and, if applicable, would increase the expenses that you paid over the period: (1) a front-end sales charge (load) of 4.75% on Class A shares; (2) a 2% redemption fee if you sell or exchange shares within 30 days of purchase, with certain exceptions. The redemption fee does not apply to: (a) redemptions under an automatic withdrawal program or periodic asset reallocation plan, required minimum distributions (RMD), employer mandated distributions from a qualified plan, or redemptions under a qualified domestic relations order (QDRO); (b) redemptions to pay for expenses related to terminal illness, extended hospital or nursing home care, or other serious medical conditions, including death; (c) redemptions of shares acquired through dividend or capital gains reinvestments; (d) loans from a qualified plan account; and (e) redemptions initiated by the Fund; and (3) a $10 service fee on each exchange after the first five exchanges in each calendar year.
The following ongoing costs are not included in the expenses shown in the table and, if applicable, would increase the expenses that you paid over the period: (1) a $12 low balance fee on accounts with balances of less than $250 as of September 30th of each calendar year and no investment activity (excluding reinvestment of dividends and/or capital gains) during the prior calendar year or the first nine months of the current calendar year. This fee does not apply to IRAs, qualified plan accounts, or Coverdell Education Savings Accounts; (2) a $15 annual custodial fee on IRAs, SEPs, SIMPLE IRAs, and Coverdell Education Savings Accounts; and (3) a $20 annual custodial fee on 403(b) accounts.
Please note that the expenses shown in the table are meant to highlight your ongoing costs only and do not reflect any transactional costs, such as sales charges (loads), redemption fees, or exchange fees. Therefore, the second line of the table is useful in comparing ongoing costs only, and will not help you determine the relative total costs of owning different funds. In addition, if these transactional costs were included, your costs would have been higher.
| Beginning Account Value 07/01/14 | Ending Account Value 12/31/14 | Expense Paid During Period 07/01/14 – 12/31/14 | |||||||||||||
Government Secs Fund Class A | |||||||||||||||
Actual | $ | 1,000.00 | $ | 991.30 | $ | 17.57 | |||||||||
Hypothetical (5% return before expense) | $ | 1,000.00 | $ | 1,007.44 | $ | 17.71 | |||||||||
Government Secs Fund Class C | |||||||||||||||
Actual | $ | 1,000.00 | $ | 987.60 | $ | 21.19 | |||||||||
Hypothetical (5% return before expense) | $ | 1,000.00 | $ | 1,003.82 | $ | 21.36 | |||||||||
3 Expenses are equal to the Fund's annualized expense ratio, net of expense waivers, of 3.50% for Class A shares and 4.23% for Class C shares, multiplied by the average account value over the period, multiplied by 184/365 days to reflect the one-half year period.
9
Pacific Advisors
Income and Equity Fund
Fund Objective: Current income and, secondarily, long-term capital appreciation.
Investment Invests primarily in investment grade U.S. corporate bonds and in dividend-paying
Strategy: stocks.
Investor Profile: Conservative. Some current income required; capital preservation aim.
TOTAL RETURNS | EXPENSE RATIOS1 | ||||||||||||||||||||||||||
For the year ended December 31, 2014 | Current | Prospectus | |||||||||||||||||||||||||
Net | Gross | Net | Gross | ||||||||||||||||||||||||
Class A | 6.41 | % | Class A | 1.91 | % | 2.66 | % | 2.23 | % | 2.98 | % | ||||||||||||||||
Class C | 5.51 | % | Class C | 2.66 | % | 3.41 | % | 3.03 | % | 3.78 | % | ||||||||||||||||
Barclays Capital U.S. Int Corp Bond Index2 | 4.35 | % | |||||||||||||||||||||||||
S&P 500® Index3 | 13.69 | % | |||||||||||||||||||||||||
Performance quoted is past performance which does not guarantee future results. Current performance may be higher or lower than the performance quoted. Call (800) 989-6693 for performance current to the most recent month-end. The investment return and principal value of an investment will fluctuate so that an investor's shares, when redeemed, may be worth more or less than their original cost. Returns represent the change in value over the stated period assuming reinvestment of dividends and capital gains at net asset value. Rankings are shown for Class A shares; rankings for other share classes may be different. Returns and rankings do not take into account the maximum 4.75% sales charge on Class A shares or the 1% Contingent Deferred Sales Charge (CDSC) for Class C shares sold within one year of purchase. Returns would be lower if the applicable sales charge and CDSC were included. Returns do not take into account individual taxes which may reduce actual returns when shares are sold.
The Fund's investment adviser is waiving a portion of its management fees pursuant to an Expense Limitation Agreement. The waiver may be discontinued at any time with ninety days written notice in consultation with the Fund's board, but is expected to continue at current levels. Please see the Notes to Financial Statements in this report for details. Performance shown reflects the waiver, without which the results would have been lower.
Discussion with Portfolio Managers February 24, 2015
Charles Suh, CFA
Jingjing Yan, CFA
Please see the Chairman's Letter at the beginning of this Report for a detailed market and economic review
as well as the Manager's general market outlook.
Fund Performance
For the year, Class A shares had a moderate gain of 6.41%. Notably, the Fund achieved these returns with significantly less risk than the overall market as demonstrated by the Fund's one-year beta of 0.364, as of December 31st, versus the S&P 500® Index. Interest rates unexpectedly continued to decline during the second half of the year as concerns about slow global economic growth, geopolitical tensions, and falling oil prices increased the demand for bonds. To manage interest rate risk, the Fund's fixed income strategy focused on short-to-intermediate-term investment grade bonds. These conservative bonds offer price protection during periods of pronounced volatility; in addition, they preserve their valuations better
1 "Current" expense ratio as of 12/31/14. "Prospectus" expense ratio is for the fiscal year ended 12/31/13.
2 The Barclays Capital U.S. Intermediate Corporate Bond Index is an unmanaged index of publicly issued investment grade U.S. corporate bonds with one to ten years to maturity. It is not possible to invest directly in the Index.
3 The S&P 500® Index is an unmanaged, market capitalization weighted index which measures the performance of the large cap segment of the U.S. equities market, covering approximately 75% of the U.S. equities market. The Index includes 500 leading companies in leading industries of the U.S. economy. Index returns assume the reinvestment of dividends, but, unlike the Fund's returns, do not reflect the effects of management fees or expenses. It is not possible to invest directly in the Index.
4 "Beta" measures volatility relative to the stock market or an alternative benchmark. A beta less than 1.0 indicates lower risk than the market or the benchmark; a beta greater than 1.0 indicates higher risk than the market or the benchmark.
10
than longer-term bonds when interest rates increase. The Fund is well positioned for rising interest rates in response to market forces or the eventual change in Federal Reserve policy.
The average maturity of the Fund's fixed income holdings, at 3.3 years, reflects our priority of protecting principal against volatility and rising rates. In contrast, the Fund's fixed income benchmark, the Barclays Capital U.S. Intermediate Corporate Bond Index, an unmanaged bond portfolio, maintained an average maturity of 5.0 years which represents a greater risk of principal loss as rates head higher.
The Fund's equity portfolio performed well as notably strong individual stocks combined with modest overall gains. Equities were concentrated in 30 to 40 well-recognized, high-quality, dividend-paying stocks with stable growth patterns and low volatility. In contrast, the Fund's equity benchmark, the S&P 500® Index, consists of companies across a broad range of quality, risk factors and volatility. The market capitalization of the Fund's equity holdings are, on average, more than three times larger than the average for companies in the Index; this substantial size variance highlights a fundamental difference between the Fund and the Index.
The Fund's fixed income and equity portfolios differ from their respective benchmarks; nevertheless, Fund performance is best compared to a blended return based on the two benchmarks. During the period, the blended return was 8.80%.5
Fund Strategy
The Fund actively manages the allocation between fixed income and equity holdings to create a risk-appropriate portfolio with the most attractive opportunities for both income and capital appreciation. The Fund seeks investment-quality bonds that offer current income and principal protection. In addition, the Fund invests in a diverse selection of dividend-paying, blue-chip stocks. This equity approach has been an important contributor to Fund performance during the long period of low interest rates since the dividend yields for portfolio stocks were often higher than the yields on corporate bonds issued by those same companies. We anticipate that the Fund's allocation to equities may decrease as interest rates rise and we reinvest capital in bonds with prevailing higher yields.
Interest rates fell during the period as investors preferred the relative safety of U.S. bonds. Demand for quality corporate bonds and U.S. Treasuries rose despite the termination, in October, of the Fed's monthly bond-buying program and its indication of interest rate hikes as the economy improves. Weak global economic growth, geopolitical conflicts, and falling energy prices helped push rates lower. Indeed, the 10-year Treasury Note's yield fell, in mid-December, to the year's low of 2.07%.
Yield "spreads," or differences in yields between U.S. Treasuries and high-grade corporate bonds, remained tight as investors sought safety in these bonds. The narrow spread demonstrates the willingness of some investors to purchase bonds with relatively low yields that do not compensate for interest rate risk. An exception to this tight spread situation during the period, though, were bonds issued by Energy-related companies; low demand drove yields higher as these bonds suffered widespread and seemingly indiscriminate selling in response to tumbling oil prices. The selloff impacted energy service companies' bonds even though some of these firms face little-to-no business disruption.
The recent downturn in Energy sector bonds may present opportunities to acquire quality bonds at attractive prices. We continue to monitor the fixed income markets to identify corporate bonds that may be temporarily out-of-favor due to industry- or company-specific issues.
Fixed Income Strategy
The Fund's fixed income strategy concentrated on corporate bonds with short-to-intermediate maturities. These securities provide better principal protection than longer-term bonds while also providing the flexibility to identify timely investment opportunities as fixed income markets evolve. The supply of attractive, shorter-term bonds remained limited as investors, including other bond fund managers, also favored these securities. As of June 30th, the average yield on 5-year investment grade U.S. corporate
5 Blended return calculated from the benchmark index returns based on ratio of stocks to fixed-income securities in the Fund's portfolio as of the end of the period.
11
Pacific Advisors
Income and Equity Fund continued
bonds was 2.59%; to enhance returns in the low-yield, limited supply environment, the Fund identified risk-appropriate opportunities in good-quality corporate bonds with distinctive characteristics.
The Fund utilized callable corporate bonds during the period. These securities can be bought back, or "called," by their issuers prior to maturity at preset dates and prices; typically, the issuer pays a premium to the bondholder when the bond is called. Callable bonds generally have higher yields due to their special features. The Fund's callable bonds provide higher returns and, when called, they provide flexibility to potentially reinvest in higher-yielding bonds. Nevertheless, if the bond is not called, the Fund may earn higher returns as the bond's yield increases. In September, we bought a callable bond issued by Delphi that matures in six years.6 The yield until the first call date, in mid-2016, is approximately 1.48%; but, if the bond is not called prior to that date, the yield to maturity increases to 4.27%. The company, which supplies electrical and safety systems for light vehicles, was under pressure due to investor concerns about its exposure to weak economic growth in Europe and China; yet, our analysis determined not only that the auto industry trends are positive but also that the company is sufficiently diversified geographically; furthermore, the company's low debt levels and operating revenues made its bond offering an attractive investment.
We continuously evaluate the fundamental characteristics and financial strength of current holdings to ensure that they are risk-appropriate investments. During the period, we sold bonds issued by Cliffs Natural Resources, an iron ore and coal miner, and Petrobras, a major oil producer, when we determined that the outlooks for these Energy companies were unfavorable. Shortly after our sales, the prices for these bonds declined.
Equity Strategy
The Fund's equity portfolio is an important complement to corporate bond holdings especially during the current period of historically low interest rates. The strategy seeks stocks that offer dividend income and price appreciation; we select high-quality, well-established companies across a broad range of industries. During the period, we added to our holdings in companies that typically provide stronger growth prospects during global economic expansions; for example, we increased our allocations to industrial firms and businesses that sell consumer goods and services.
The Fund continued to favor blue-chip stocks with attractive dividends. Low interest rates have enabled businesses to issue inexpensive debt or refinance existing debt at extremely low rates; consequently, the difference between a firm's dividend yield and bond yield may have narrowed. For some Fund holdings, the dividend yield surpassed the yields of the companies' corporate bonds. For example, as of December 31st, AT&T's dividend yield of 5.51% was significantly greater than the approximate 2.33% yield of the company's corporate bond maturing in March 2019.
The Fund's equity holdings had a weighted average yield of 2.90% which was notably higher the 2.59% average yield for 5-year investment grade corporate bonds. Fund holdings with a dividend yield over 4.50% included AT&T, Vodafone, Mattel, and Verizon; stocks paying a dividend yield between 3.50% and 4.50% included Copart, Duke Energy, General Electric, McDonald's, and Pfizer.
We anticipate adjusting the Fund's allocations between equity and fixed income holdings as the global economy strengthens and interest rates rise. To manage portfolio risk while producing meaningful returns, we may reduce the Fund's equity allocation in favor of bonds with higher coupon yields as interest rates increase.
Looking Ahead
We actively monitor the economy and the markets to identify opportunities to respond as markets conditions evolve. The Fed has indicated that it will begin raising interest rates as the economy improves in 2015. However, global economic and political considerations will likely affect the timing and pace of rate increases; additionally, improvements in wage growth and global deflationary pressures may impact
6 For detailed information on Fund holdings, please see the Fund's Schedule of Investments in this Report.
12
the central bank's actions. In the near-term, we anticipate that interest rates will be somewhat volatile due to uncertainties regarding oil prices, global monetary policies, and the speculation on the timing of the Fed's rate "liftoff."
The Fund's strategy adapts as market environments change. Interest rates have an upward bias even though they have remained low for a considerable time. The Fund's shorter-term fixed income holdings will enable the Fund to capture higher yields as proceeds from maturing or called bonds are reinvested at prevailing higher interest rates. We believe that the Fund is well positioned for unfolding economic and market conditions regardless of the timing and magnitude of eventual rate increases.
13
Pacific Advisors
Income and Equity Fund continued
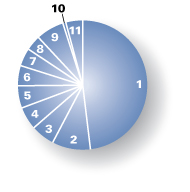
Portfolio Holdings as of 12/31/14 (Based on Total Investments)
| 1. | Corporate Bonds | 48.07 | % | ||||||||
Equities | 47.09 | % | |||||||||
| 2. | Consumer Staples | 9.60 | % | ||||||||
| 3. | Industrials | 5.94 | % | ||||||||
| 4. | Utilities | 5.70 | % | ||||||||
| 5. | Information Technology | 5.55 | % | ||||||||
| 6. | Consumer Discretionary | 4.97 | % | ||||||||
| 7. | Health Care | 4.44 | % | ||||||||
| 8. | Telecommunication Services | 3.79 | % | ||||||||
| 9. | Others | 7.10 | % | ||||||||
| 10. | Preferred Stock | 0.57 | % | ||||||||
| 11. | Cash and Cash Equivalents | 4.27 | % | ||||||||
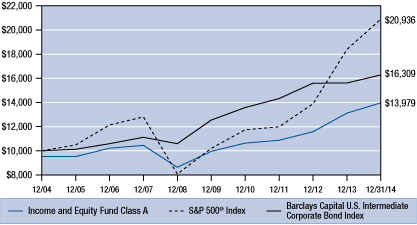
Change in Value of $10,000 Investment1
This chart compares the growth of a $10,000 investment in Class A shares of the Income and Equity Fund for the period January 1, 2005 through December 31, 2014 with the same investment in the S&P 500® Index2 and the Barclays Capital U.S. Intermediate Corporate Bond Index3.
Average Annual Compounded Returns as of December 31, 2014
Class A | Class C | Barclays Capital U.S. Int Corp Bond Index | S&P 500® Index | ||||||||||||||||
One Year | 1.32 | % | 4.51 | % | 4.35 | % | 13.69 | % | |||||||||||
Five Year | 5.99 | % | 6.20 | % | 5.36 | % | 15.45 | % | |||||||||||
Ten Year | 3.41 | % | 3.13 | % | 5.01 | % | 7.67 | % | |||||||||||
Past performance does not guarantee future results. Performance quoted represents past performance. Current performance may be higher or lower than the performance data quoted. Returns include reinvested dividends and capital gains. Returns for Class A shares reflect a maximum front-end sales charge of 4.75%; and returns for Class C shares reflect the deduction of a contingent deferred sales charge of 1% on shares sold within the first year of purchase. Returns do not take into account individual taxes which may reduce actual returns when shares are sold. The investment return and principal value of an investment will fluctuate so that an investor's shares, when redeemed, may be worth more or less than their original cost. Call (800) 989-6693 for the most recent month-end performance.
1 Fund results are shown for Class A shares and reflect deduction of the maximum front-end sales charge of 4.75% on the $10,000 investment for a net amount invested of $9,525. At the end of the same period, a $10,000 investment in Class C shares would have been valued at $13,614, and no contingent deferred sales charges would apply. Performance of the share classes will vary based on the difference in charges and expenses. The inception date is 02/08/93 for Class A shares and 04/01/98 for Class C shares. It is not possible to invest directly in either Index. Index results assume reinvestment of dividends, but, unlike the Fund's results, do not reflect sales charges, fees or expenses.
2 The Standard & Poor's 500® Index is an unmanaged, market capitalization weighted index which measures the performance of the large cap segment of the U.S. equities market, covering approximately 75% of the U.S. equities market. The Index includes 500 leading companies in leading industries of the U.S. economy.
3 The Barclays Capital U.S. Intermediate Corporate Bond Index is an unmanaged index of publicly issued investment grade U.S. corporate bonds with one to ten years to maturity.
14
Expense Examples
As a shareholder of the Fund you incur two types of costs: (1) transaction costs, including sales charges (loads) on purchase payments, reinvested dividends, or other distributions; redemption fees; and exchange fees; and (2) ongoing costs, including management fees; distribution (12b-1) fees; and other Fund expenses. This Example is intended to help you understand your ongoing costs (in dollars) of investing in the Fund and to compare these costs with the ongoing costs of investing in other mutual funds.
The Example is based on an investment of $1,000 invested at the beginning of the period and held for the entire period from July 1, 2014 through December 31, 2014.
Actual Expenses
The first line of the table below provides information about actual account values and actual expenses. You may use the information in this line, together with the amount you invested, to estimate the expenses that you paid over the period. Simply divide your account value by $1,000 (for example, an $8,600 account value divided by $1,000 = 8.6), then multiply the result by the number in the first line under the heading entitled "Expenses Paid During the Period" to estimate the expenses you paid on your account during the period.
The following transaction costs are not included in the expenses shown in the table and, if applicable, would increase the expenses that you paid over the period: (1) a front-end sales charge (load) of 4.75% on Class A shares; (2) a 2% redemption fee if you sell or exchange shares within 30 days of purchase, with certain exceptions. The redemption fee does not apply to: (a) redemptions under an automatic withdrawal program or periodic asset reallocation plan, required minimum distributions (RMD), employer mandated distributions from a qualified plan, or redemptions under a qualified domestic relations order (QDRO); (b) redemptions to pay for expenses related to terminal illness, extended hospital or nursing home care, or other serious medical conditions, including death; (c) redemptions of shares acquired through dividend or capital gains reinvestments; (d) loans from a qualified plan account; and (e) redemptions initiated by the Fund; and (3) a $10 service fee on each exchange after the first five exchanges in each calendar year.
The following ongoing costs are not included in the expenses shown in the table and, if applicable, would increase the expenses that you paid over the period: (1) a $12 low balance fee on accounts with balances of less than $250 as of September 30th of each calendar year and no investment activity (excluding reinvestment of dividends and/or capital gains) during the prior calendar year or the first nine months of the current calendar year. This fee does not apply to IRAs, qualified plan accounts, or Coverdell Education Savings Accounts; (2) a $15 annual custodial fee on IRAs, SEPs, SIMPLE IRAs, and Coverdell Education Savings Accounts; and (3) a $20 annual custodial fee on 403(b) accounts.
Hypothetical Example for Comparison Purposes
The second line of the table below provides information about hypothetical account values and hypothetical expenses based on the Fund's actual expense ratio and an assumed rate of return of 5% per year before expenses, which in not the Fund's actual return. The hypothetical account values and expenses may not be used to estimate the actual ending account balance or expenses you paid for the period. You may use this information to compare the ongoing costs of investing in the Fund and other funds. To do so, compare this 5% hypothetical example with the 5% hypothetical examples that appear in the shareholder reports of the other funds.
The following transaction costs are not included in the expenses shown in the table and, if applicable, would increase the expenses that you paid over the period: (1) a front-end sales charge (load) of 4.75% on Class A shares; (2) a 2% redemption fee if you sell or exchange shares within 30 days of purchase, with certain exceptions. The redemption fee does not apply to: (a) redemptions under an automatic withdrawal program or periodic asset reallocation plan, required minimum distributions (RMD), employer mandated distributions from a qualified plan, or redemptions under a qualified domestic relations order (QDRO); (b) redemptions to pay for expenses related to terminal illness, extended hospital or nursing home care, or other serious medical conditions, including death; (c) redemptions of shares acquired through dividend or capital gains reinvestments; (d) loans from a qualified plan account; and (e) redemptions initiated by the Fund; and (3) a $10 service fee on each exchange after the first five exchanges in each calendar year.
The following ongoing costs are not included in the expenses shown in the table and, if applicable, would increase the expenses that you paid over the period: (1) a $12 low balance fee on accounts with balances of less than $250 as of September 30th of each calendar year and no investment activity (excluding reinvestment of dividends and/or capital gains) during the prior calendar year or the first nine months of the current calendar year. This fee does not apply to IRAs, qualified plan accounts, or Coverdell Education Savings Accounts; (2) a $15 annual custodial fee on IRAs, SEPs, SIMPLE IRAs, and Coverdell Education Savings Accounts; and (3) a $20 annual custodial fee on 403(b) accounts.
Please note that the expenses shown in the table are meant to highlight your ongoing costs only and do not reflect any transactional costs, such as sales charges (loads), redemption fees, or exchange fees. Therefore, the second line of the table is useful in comparing ongoing costs only, and will not help you determine the relative total costs of owning different funds. In addition, if these transactional costs were included, your costs would have been higher.
| Beginning Account Value 07/01/14 | Ending Account Value 12/31/14 | Expense Paid During Period 07/01/14 – 12/31/14 | |||||||||||||
Income & Equity Fund Class A | |||||||||||||||
Actual | $ | 1,000.00 | $ | 1,022.30 | $ | 9.74 | |||||||||
Hypothetical (5% return before expense) | $ | 1,000.00 | $ | 1,015.32 | $ | 9.70 | |||||||||
Income & Equity Fund Class C | |||||||||||||||
Actual | $ | 1,000.00 | $ | 1,018.60 | $ | 13.53 | |||||||||
Hypothetical (5% return before expense) | $ | 1,000.00 | $ | 1,011.60 | $ | 13.49 | |||||||||
4 Expenses are equal to the Fund's annualized expense ratio, net of expense waivers, of 1.91% for Class A shares and 2.66% for Class C shares, multiplied by the average account value over the period, multiplied by 184/365 days to reflect the one-half year period.
15
Pacific Advisors
Balanced Fund
Fund Objective: Long-term capital appreciation and income consistent with reduced risk.
Investment Invests primarily in large cap common stocks and investment grade
Strategy: U.S. corporate bonds. Invests at least 25% of its assets in fixed income securities and preferred stocks and at least 25% in equities.
Investor Profile: Moderately conservative. Seeks combination of long-term growth, income, liquidity and reduced risk of price fluctuations.
TOTAL RETURNS | EXPENSE RATIOS1 | ||||||||||||||||||
For the year ended December 31, 2014 | Current | Prospectus | |||||||||||||||||
Class A | –7.94 | % | Class A | 2.84 | % | 3.07 | % | ||||||||||||
Class C | –8.68 | % | Class C | 3.58 | % | 3.86 | % | ||||||||||||
S&P 500® Index2 | 13.69 | % | |||||||||||||||||
Barclays Capital U.S. Int Corp Bond Index3 | 4.35 | % | |||||||||||||||||
Performance quoted is past performance which does not guarantee future results. Current performance may be higher or lower than the performance quoted. Call (800) 989-6693 for performance current to the most recent month-end. The investment return and principal value of an investment will fluctuate so that an investor's shares, when redeemed, may be worth more or less than their original cost. Returns represent the change in value over the stated period assuming reinvestment of dividends and capital gains at net asset value. Rankings are shown for Class A shares; rankings for other share classes may be different. Returns and rankings do not take into account the maximum 5.75% sales charge on Class A shares or the 1% Contingent Deferred Sales Charge (CDSC) for Class C shares sold within one year of purchase. Returns would be lower if the applicable sales charge and CDSC were included. Returns do not take into account individual taxes which may reduce actual returns when shares are sold.
Discussion with Portfolio Managers February 24, 2015
Charles Suh, CFA
Jingjing Yan, CFA
Samuel C. Coquillard
Please see the Chairman's Letter at the beginning of this Report for a detailed market and economic review
as well as the Manager's general market outlook.
Fund Performance
Performance results reflect the Fund's diversified "all cap" equity strategy and "total return" approach to fixed income investing. 2014 was a challenging year for the Fund as investors' preference for large cap stocks, the selloff in energy markets, and persistently low interest rates weighed on performance. Class A shares fell 7.94%; in comparison, the Fund's equity benchmark, the S&P 500® Index, rose 13.69% while the Fund's fixed income benchmark, the Barclays Capital U.S. Intermediate Corporate Bond Index, rose 4.35%. The strong performance of the Fund's benchmarks largely reflected investor behavior; in response to low interest rates many, in searching for yield, gravitated towards large cap, dividend-paying equities and longer-term bonds. Notably, large and mega-cap stocks drove the S&P 500® Index's gains; these companies make up just under half of the Index's holdings yet accounted for over 90% of its gains. Volatility, as measured by the Fund's beta, increased due to the relative underperformance of small and
1 "Current" expense ratio as of 12/31/14. "Prospectus" expense ratio is for the fiscal year ended 12/31/13.
2 The S&P 500® Index is an unmanaged, market capitalization weighted index which measures the performance of the large cap segment of the U.S. equities market, covering approximately 75% of the U.S. equities market. The Index includes 500 leading companies in leading industries of the U.S. economy. Index returns assume the reinvestment of dividends, but, unlike the Fund's returns, do not reflect the effects of management fees or expenses. It is not possible to invest directly in the Index.
3 The Barclays Capital U.S. Intermediate Corporate Bond Index is an unmanaged index of publicly issued investment grade U.S. corporate bonds with one to ten years to maturity. It is not possible to invest directly in the Index.
16
mid-cap holdings; even so, the beta, which rose from 0.814 last year to 0.88, as of December 31st, versus the S&P 500® Index, remained below average.
Fund Strategy
The Fund is designed for conservative investors seeking to participate in the equity markets with reduced risk. The Fund's strategy combines high-quality stocks across all market capitalizations with investment grade corporate bonds that provide additional income and appreciation potential. We identify leading, well-managed companies whose stocks trade at a discount to our internal price targets; in most cases, we anticipate that the stocks will appreciate over a medium-to-long-term time horizon as the companies' growth strategies unfold. The Fund may experience periods of underperformance when short-term market trends overshadow long-term outlooks; yet, over time, the Fund's performance should reflect the strength of these companies as they demonstrate the ability to grow during various economic and business cycles.
We manage the Fund's asset allocation based on our assessment of risk-appropriate investments in the context of the overall economic, market, and interest rate outlook. This approach enables the Fund to take advantage of specific growth opportunities while reducing overall price volatility.
During the second half of 2014, the U.S. economy continued to grow while other leading economies slowed or stalled. The combination of strengthening conditions at home and lackluster growth abroad highlighted the appeal of U.S. stocks and bonds. Strong demand for large cap, dividend-paying stocks and high-quality bonds led to significant price gains for these investments. As a result, and despite widespread expectations for higher interest rates, bond yields declined throughout the year. Reflecting the improving economy and attractive prospects for individual companies, the Fund maintained its emphasis on stocks with a 70% allocation to equity holdings. Bond holdings continued to concentrate in shorter-term investment grade corporates; these bonds, which were selected to protect principal and minimize price volatility, trailed the benchmark which includes bonds with longer maturities.
Equity Strategy
The Fund's "all cap" equity strategy diversifies investments among high-quality, well-managed companies with proven growth track records. Large cap investments, which accounted for approximately 47% of the equity allocation, favor prominent global companies that offer stability with moderate growth potential. Mid-cap holdings, which represented approximately 44% of the equity allocation, feature industry leaders that are well positioned to participate in sector or economic trends. Small cap holdings focus on established companies with attractive long-term growth prospects.
During the second half of 2014, the broad selloff in energy markets heavily impacted the Fund's mid-cap and small cap holdings; their underperformance more than offset the strong performance of the Fund's large cap holdings. A close look at the likely impact of lower oil prices suggests that some companies and industries may struggle to survive the downturn while others stand to profit. Demand should improve for Fund holdings5 such as Chicago Bridge & Iron, an engineering and construction firm, and Team, an industrial maintenance and repair company; lower oil prices will help their customers in the refinery and petrochemical industries. Similarly, for Kirby, the market leader for marine transportation services, increased shipments of refined petroleum products and petrochemicals along the inland and coastal waterways will offset declines for other products.
Some Energy sector stocks sold off even though falling oil prices would seemingly have little impact on the companies' business prospects. For example, Helix Energy Solutions provides well intervention services and robotics for unproductive deepwater wells; regulatory mandates, rather than the price of oil, drive the demand for these services. Likewise, Tidewater and Hornbeck Offshore Services, which provide offshore service vessels to the energy industry, continue to deliver essential services to drilling operations
4 "Beta" measures volatility relative to the stock market or an alternative benchmark. A beta less than 1.0 indicates lower risk than the market or the benchmark; a beta greater than 1.0 indicates higher risk than the market or the benchmark.
5 For detailed information on Fund holdings, please see the Fund's Schedule of Investments in this Report.
17
Pacific Advisors
Balanced Fund continued
worldwide. Finally, the turmoil in the Energy markets may lead to attractive acquisition opportunities. Halliburton's pending merger with Baker Hughes will combine the second and third largest oilfield services companies in the world. In previous downturns, National Oilwell Varco and DXP Enterprises strategically expanded their operations through acquisitions.
Despite the challenging overall performance during the period, several Fund holdings generated impressive results. CVS Health added pharmaceutical benefits management and specialty pharmaceutical services to integrated health services offerings. Nike shares rose as the company credited its advanced manufacturing plants for improving operating margins; also, demand for the company's iconic products remains strong. The strengthening domestic economy continued to increase shipping volumes for eastern U.S. railroad operator CSX; management expects further improvements as the upcoming delivery of new locomotives will ease network congestion. And, Wal-Mart reported strong results in its Health and Wellness, Apparel, and Home categories; the company credits lower fuel prices in aiding the company's core middle-income customers.
During the period, we sold several holdings including Microsoft, United Parcel Service, MRC Global, an energy parts distributor, and TAL International Group, a shipping container leasing company; we used the proceeds to establish new positions in Google and Perrigo. Google's leading position in search engine and mobile technologies provides a solid base for emerging opportunities such as Android Auto, a mobile interface for cars, and home automation products. Perrigo manufactures and distributes store-branded over-the-counter drugs and generic prescription medication. The low-cost drug provider is ideally positioned to meet the growing health care needs of an aging population; and, the company's recent acquisition of Omega Pharma, based in Ireland, provides a base for international expansion.
Fixed Income Strategy
The Fund's "total return" approach actively manages fixed income holdings in response to current interest rate trends. In selecting bonds, we examine each company's fundamentals including cash flow trends, liquidity ratios and debt maturity schedules, and then assess the income and capital appreciation potential. The Fund's investments have continued to focus on shorter-term bonds that are less sensitive to interest rate changes while avoiding higher risk investments. The extended period of low interest rates and our expectation for higher interest rates contributed to our decision to maintain the Fund's fixed income allocation near the lower end of its historical range.
Interest rates continued to decline; the yield on the U.S. 10-year Treasury Note fell from 3.04% at the end of 2013 to 2.53% at the end of June to close the year at 2.17%. Investors flocked to Treasuries in response to the impressive performance of the U.S. economy and concerns about slowing global growth. Interestingly, yields fell despite indications that the Federal Reserve plans to raise short-term rates in 2015. The timing of the Fed's move is uncertain, however, as the central bank intends to consider factors including wage growth, global economic growth, and the deflationary impact of low oil prices in determining the timing and pace of rate increases.
The Fund's shorter-term investment grade corporate bonds underperformed as interest rates fell. Unlike the Fund, the Barclays Capital benchmark includes longer-term and lower-quality bonds which increase in price when demand rises and interest rates fall. Despite the underperformance, we believe that the Fund's current positioning offers important price protection when interest rates increase.
Looking Ahead
Despite the challenging 2014, the Fund remains well positioned to take advantage of the strengthening U.S. economy and encouraging signs of a recovery abroad. Rising business confidence will likely translate into new orders from industrial equipment manufacturers including Cummins, General Electric, and Navistar. Increased consumer spending will benefit American Express while retailers including apparel company PVH, owner of the Calvin Klein, Tommy Hilfiger, and Phillips van Heusen clothing brands, and auto retailer Lithia Motors should benefit as job prospects, and wages, improve. Rapid growth in mobile technology in emerging markets, such as China and India, provide significant growth opportunities for
18
leading technology firms, including Qualcomm and Google. Meanwhile, the turnaround at Conn's is underway; the company recently released sales and credit trends for January and February which pointed to substantial operational improvements.
Lower oil prices will likely suppress industry activity and investment in the first half of 2015. Energy-related stock volatility may continue until signs of a recovery in oil prices begin to emerge. Still, valuations in this sector have fallen to extreme lows; prices could rebound sooner than many anticipate. We believe the Fund's focus on high-quality, well-managed businesses will prove an important distinction as the bear market cycle in oil runs its course. Moreover, lower energy prices are increasing consumer demand and contributing to global economic growth. Improved prospects of a sustainable recovery in Europe will, in turn, encourage investors toward higher risk opportunities. Therefore, last year's widespread preference for dividend-paying, large cap stocks may give way to stronger demand for growth-oriented investments; mid-cap and small cap stocks, in particular, are likely to benefit as investors prioritize growth over safety.
Opportunities for conservative fixed income investors, meanwhile, may be limited as the markets react to the policies of global central banks and economic growth prospects. Most expect the Fed to raise short-term interest rates in 2015 yet global developments and the lingering effects of low oil prices will strongly influence the timing and pace of the central bank's interest rate "liftoff." For their part, the European Central Bank and the Bank of Japan have embarked on bond-buying programs designed to support economic growth. Taken together, long-term interest rates may remain near historical lows until Europe shows signs of an enduring recovery.
19
Pacific Advisors
Balanced Fund continued
Portfolio Holdings as of 12/31/14 (Based on Total Investments)
| Equities | 70.35 | % | |||||||||
| 1. | Industrials | 24.33 | % | ||||||||
| 2. | Consumer Discretionary | 15.95 | % | ||||||||
| 3. | Energy | 10.16 | % | ||||||||
| 4. | Financials | 8.21 | % | ||||||||
| 5. | Consumer Staples | 5.69 | % | ||||||||
| 6. | Information Technology | 5.10 | % | ||||||||
| 7. | Health Care | 0.91 | % | ||||||||
| 8. | Corporate Bonds | 28.81 | % | ||||||||
| 9. | Cash and Cash Equivalents | 0.84 | % | ||||||||
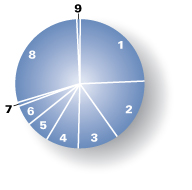
Change in Value of $10,000 Investment1
This chart compares the growth of a $10,000 investment in Class A shares of the Balanced Fund for the period January 1, 2005 through December 31, 2014 with the same investment in the S&P 500® Index2 and the Barclays Capital U.S. Intermediate Corporate Bond Index3.
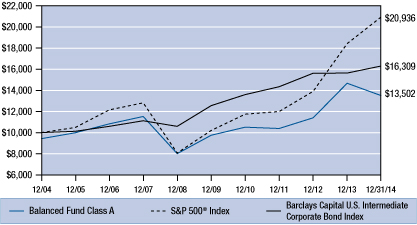
Average Annual Compounded Returns as of December 31, 2014
Class A | Class C | S&P 500® Index | Barclays Capital U.S. Int Corp Bond Index | ||||||||||||||||
One Year | – 13.22 | % | – 9.59 | % | 13.69 | % | 4.35 | % | |||||||||||
Five Year | 5.45 | % | 5.89 | % | 15.45 | % | 5.36 | % | |||||||||||
Ten Year | 3.05 | % | 2.87 | % | 7.67 | % | 5.01 | % | |||||||||||
Past performance does not guarantee future results. Performance quoted represents past performance. Current performance may be higher or lower than the performance data quoted. Returns include reinvested dividends and capital gains. Returns for Class A shares reflect a maximum front-end sales charge of 5.75%; and returns for Class C shares reflect the deduction of a contingent deferred sales charge of 1% on shares sold within the first year of purchase. Returns do not take into account individual taxes which may reduce actual returns when shares are sold. The investment return and principal value of an investment will fluctuate so that an investor's shares, when redeemed, may be worth more or less than their original cost. Call (800) 989-6693 for the most recent month-end performance.
1 Fund results are shown for Class A shares and reflect deduction of the maximum front-end sales charge of 5.75% on the $10,000 investment for a net amount invested of $9,425. At the end of the same period, a $10,000 investment in Class C shares would have been valued at $13,275, and no contingent deferred sales charges would apply. Performance of the share classes will vary based on the difference in charges and expenses. The inception date is 02/08/93 for Class A shares and 04/01/98 for Class C shares. It is not possible to invest directly in either Index. Index results assume reinvestment of dividends, but, unlike the Fund's results, do not reflect sales charges, fees or expenses.
2 The Standard & Poor's 500® Index is an unmanaged, market capitalization weighted index which measures the performance of the large cap segment of the U.S. equities market, covering approximately 75% of the U.S. equities market. The Index includes 500 leading companies in leading industries of the U.S. economy.
3 The Barclays Capital U.S. Intermediate Corporate Bond Index is an unmanaged index of publicly issued investment grade U.S. corporate bonds with one to ten years to maturity.
20
Expense Examples
As a shareholder of the Fund you incur two types of costs: (1) transaction costs, including sales charges (loads) on purchase payments, reinvested dividends, or other distributions; redemption fees; and exchange fees; and (2) ongoing costs, including management fees; distribution (12b-1) fees; and other Fund expenses. This Example is intended to help you understand your ongoing costs (in dollars) of investing in the Fund and to compare these costs with the ongoing costs of investing in other mutual funds.
The Example is based on an investment of $1,000 invested at the beginning of the period and held for the entire period from July 1, 2014 through December 31, 2014.
Actual Expenses
The first line of the table below provides information about actual account values and actual expenses. You may use the information in this line, together with the amount you invested, to estimate the expenses that you paid over the period. Simply divide your account value by $1,000 (for example, an $8,600 account value divided by $1,000 = 8.6), then multiply the result by the number in the first line under the heading entitled "Expenses Paid During the Period" to estimate the expenses you paid on your account during the period.
The following transaction costs are not included in the expenses shown in the table and, if applicable, would increase the expenses that you paid over the period: (1) a front-end sales charge (load) of 5.75% on Class A shares; (2) a 2% redemption fee if you sell or exchange shares within 180 days of purchase, with certain exceptions. The redemption fee does not apply to: (a) redemptions under an automatic withdrawal program or periodic asset reallocation plan, required minimum distributions (RMD), employer mandated distributions from a qualified plan, or redemptions under a qualified domestic relations order (QDRO); (b) redemptions to pay for expenses related to terminal illness, extended hospital or nursing home care, or other serious medical conditions, including death; (c) redemptions of shares acquired through dividend or capital gains reinvestments; (d) loans from a qualified plan account, and (e) redemptions initiated by the Fund; and (3) a $10 service fee on each exchange after the first five exchanges in each calendar year.
The following ongoing costs are not included in the expenses shown in the table and, if applicable, would increase the expenses that you paid over the period: (1) a $12 low balance fee on accounts with balances of less than $250 as of September 30th of each calendar year and no investment activity (excluding reinvestment of dividends and/or capital gains) during the prior calendar year or the first nine months of the current calendar year. This fee does not apply to IRAs, qualified plan accounts, or Coverdell Education Savings Accounts; (2) a $15 annual custodial fee on IRAs, SEPs, SIMPLE IRAs, and Coverdell Education Savings Accounts; and (3) a $20 annual custodial fee on 403(b) accounts.
Hypothetical Example for Comparison Purposes
The second line of the table below provides information about hypothetical account values and hypothetical expenses based on the Fund's actual expense ratio and an assumed rate of return of 5% per year before expenses, which in not the Fund's actual return. The hypothetical account values and expenses may not be used to estimate the actual ending account balance or expenses you paid for the period. You may use this information to compare the ongoing costs of investing in the Fund and other funds. To do so, compare this 5% hypothetical example with the 5% hypothetical examples that appear in the shareholder reports of the other funds.
The following transaction costs are not included in the expenses shown in the table and, if applicable, would increase the expenses that you paid over the period: (1) a front-end sales charge (load) of 5.75% on Class A shares; (2) a 2% redemption fee if you sell or exchange shares within 180 days of purchase, with certain exceptions. The redemption fee does not apply to: (a) redemptions under an automatic withdrawal program or periodic asset reallocation plan, required minimum distributions (RMD), employer mandated distributions from a qualified plan, or redemptions under a qualified domestic relations order (QDRO); (b) redemptions to pay for expenses related to terminal illness, extended hospital or nursing home care, or other serious medical conditions, including death; (c) redemptions of shares acquired through dividend or capital gains reinvestments; (d) loans from a qualified plan account, and (e) redemptions initiated by the Fund; and (3) a $10 service fee on each exchange after the first five exchanges in each calendar year.
The following ongoing costs are not included in the expenses shown in the table and, if applicable, would increase the expenses that you paid over the period: (1) a $12 low balance fee on accounts with balances of less than $250 as of September 30th of each calendar year and no investment activity (excluding reinvestment of dividends and/or capital gains) during the prior calendar year or the first nine months of the current calendar year. This fee does not apply to IRAs, qualified plan accounts, or Coverdell Education Savings Accounts; (2) a $15 annual custodial fee on IRAs, SEPs, SIMPLE IRAs, and Coverdell Education Savings Accounts; and (3) a $20 annual custodial fee on 403(b) accounts.
Please note that the expenses shown in the table are meant to highlight your ongoing costs only and do not reflect any transactional costs, such as sales charges (loads), redemption fees, or exchange fees. Therefore, the second line of the table is useful in comparing ongoing costs only, and will not help you determine the relative total costs of owning different funds. In addition, if these transactional costs were included, your costs would have been higher.
| Beginning Account Value 07/01/14 | Ending Account Value 12/31/14 | Expense Paid During Period 07/01/14 – 12/31/14 | |||||||||||||
Balanced Fund Class A | |||||||||||||||
Actual | $ | 1,000.00 | $ | 922.30 | $ | 13.76 | |||||||||
Hypothetical (5% return before expense) | $ | 1,000.00 | $ | 1,010.71 | $ | 14.39 | |||||||||
Balanced Fund Class C | |||||||||||||||
Actual | $ | 1,000.00 | $ | 918.60 | $ | 17.31 | |||||||||
Hypothetical (5% return before expense) | $ | 1,000.00 | $ | 1,007.04 | $ | 18.11 | |||||||||
4 Expenses are equal to the Fund's annualized expense ratio of 2.84% for Class A shares and 3.58% for Class C shares, multiplied by the average account value over the period, multiplied by 184/365 days to reflect the one-half year period.
21
Pacific Advisors
Large Cap Value Fund
Fund Objective: Long-term capital appreciation.
Investment Invests at least 80% of its assets in large cap companies that are, at the
Strategy: time of purchase, within the market cap range of companies in the S&P 500® Index1.
Investor Profile: Conservative equity. Growth-oriented with a long-term investment horizon.
TOTAL RETURNS | EXPENSE RATIOS2 | ||||||||||||||||||||||||||
For the year ended December 31, 2014 | Current | Prospectus | |||||||||||||||||||||||||
Net | Gross | Net | Gross | ||||||||||||||||||||||||
Class A | 9.94 | % | Class A | 2.64 | % | 3.39 | % | 2.47 | % | 4.02 | % | ||||||||||||||||
Class C | 9.18 | % | Class C | 3.38 | % | 4.13 | % | 3.22 | % | 4.77 | % | ||||||||||||||||
S&P 500® Index | 13.69 | % | |||||||||||||||||||||||||
Performance quoted is past performance which does not guarantee future results. Current performance may be higher or lower than the performance quoted. Call (800) 989-6693 for performance current to the most recent month-end. The investment return and principal value of an investment will fluctuate so that an investor's shares, when redeemed, may be worth more or less than their original cost. Returns represent the change in value over the stated period assuming reinvestment of dividends and capital gains at net asset value. Returns do not take into account the maximum 5.75% sales charge on Class A shares or the 1% Contingent Deferred Sales Charge (CDSC) for Class C shares sold within one year of purchase. Returns would be lower if the applicable sales charge and CDSC were included. Returns do not take into account individual taxes which may reduce actual returns when shares are sold.
The Fund's investment adviser is waiving a portion of its management fees pursuant to an Expense Limitation Agreement. The waiver may be discontinued at any time with ninety days written notice in consultation with the Fund's board, but is expected to continue at current levels. Please see the Notes to Financial Statements in this report for details. Performance shown reflects the waiver, without which the results would have been lower.
Discussion with Portfolio Manager February 24, 2015
Samuel C. Coquillard
Please see the Chairman's Letter at the beginning of this Report for a detailed market and economic review
as well as the Manager's general market outlook.
Fund Performance
Equity markets continued to trend higher during the second half of the year despite several sharp but short-lived declines along the way. The S&P 500® Index and the Dow Jones Industrial Average3 reached record highs in late December. The strong performance of these indices reflected investor preference for large cap stocks, especially those that offered relatively high dividend yields and relative price stability; these stocks were an appealing alternative to low-yielding fixed income securities. The Fund, which concentrates in mega-cap companies, performed well (5.65%), with slightly less volatility, in comparison to the benchmark's gain of 6.12%.
Fund holdings that contributed to performance in latter half of the year included4:
• Home improvement retailers Lowe's and Home Depot were top performers during the period. Both companies continue to benefit from the ongoing recovery in the U.S. housing market and increased
1 The S&P 500® Index is an unmanaged, market capitalization weighted index which measures the performance of the large cap segment of the U.S. equities market, covering approximately 75% of the U.S. equities market. The Index includes 500 leading companies in leading industries of the U.S. economy. Index returns assume the reinvestment of dividends, but, unlike the Fund's returns, do not reflect the effects of management fees or expenses. It is not possible to invest directly in the Index.
2 "Current" expense ratio as of 12/31/14. "Prospectus" expense ratio is for the fiscal year ended 12/31/13.
3 The Dow Jones Industrial Average is an unmanaged, price weighted measure of 30 U.S. stocks selected by the Averages Committee to represent the performance of all U.S. stocks outside the Transportation and Utilities sectors.
4 For detailed information on Fund holdings, please see the Fund's Schedule of Investments in this Report.
22
demand for home improvement products. Lowe's focuses on improving the in-store experience for both professional and DIY customers; the company is also pursuing initiatives such as smaller store formats in more urban markets as well as international expansion. Home Depot, meanwhile, is targeting productivity improvements to increase store profitability. Both companies are aggressively repurchasing shares to improve earnings per share growth and return cash to shareholders.
• Apple stock rose as customers and investors cheered recent new product releases. To date, the much anticipated iPhone 6 and iPhone 6 Plus, with larger displays and a new operating system, have been the company's most successful phone launches by far. Customers looking to upgrade to the latest devices and hardware should provide excellent sales and earnings growth well into 2015.
• Media and entertainment company Time Warner jumped in mid-July on reports of a takeover bid by 21st Century Fox. When management rebuffed the offer, the stock fell back only to appreciate through year-end. The company's strong operating results seemed to confirm management's confidence in rejecting the takeover bid. Over the last several years, the company has spun-off non-core divisions such as AOL, Time Warner Cable, and Time, Inc. to focus on TV production, film production, basic cable and premium cable.
• Wal-Mart Stores reported strong growth in global e-commerce sales. The low-cost retailer also noted that customers increased their per visit spending; management acknowledged the impact of lower gas prices on customers' spending habits.
• Oracle reported better-than-expected growth in hardware sales and total revenue; in addition, the computer technology company's revenues related to cloud-based services grew an impressive 47% year-over-year. The firm plans to continue investing in research and development to enhance its software licensing and delivery services.
Some Fund holdings underperformed as oil prices tumbled during the period. Energy holdings National Oilwell Varco, ExxonMobil, and NOW Inc. fell sharply in response to the dramatic decline in oil prices; even so, we believe that the prospects for these companies remain strong. National Oilwell Varco, which makes equipment for the oil-and-gas industry, maintains a dominant industry position; years of order backlogs will help weather the industry downturn. In addition, the company's strong financials have enabled management to aggressively repurchase shares at depressed prices. In May, National Oilwell Varco spun-off NOW, Inc., which distributed pipes, valves and fittings for the energy industry, as a debt-free company. Major integrated oil and gas producer ExxonMobil, while not immune to the impact of falling oil prices, appears relatively well positioned due to its product, business, and geographic diversification; for example, the company's refineries and chemicals businesses benefit from low oil prices.
Fund Strategy
The Fund uses a focused portfolio strategy to invest in 35 to 50 holdings with an emphasis on more conservative, less volatile stocks. Fund holdings concentrate on mega-cap stocks of well-managed companies with dominant market positions, strong financials, attractive dividends, and track records of steady growth. The Fund's weighted average market cap is more than four times larger than the average of the S&P 500® Index. The mega cap emphasis helped the Fund achieve stable returns with slightly less volatility than the overall market; the Fund's one-year beta, which was 0.965 as of December 31st, versus the S&P 500® Index, was consistently below the Index. At year-end, the Fund's weighted average dividend yield was 1.96%; several holdings, including Cola-Cola, Kraft Foods, McDonald's, National Oilwell Varco, Proctor & Gamble, Sysco, and ExxonMobil, pay dividends in excess of 2.75%.
5 "Beta" measures volatility relative to the stock market or an alternative benchmark. A beta less than 1.0 indicates lower risk than the market or the benchmark; a beta greater than 1.0 indicates higher risk than the market or the benchmark.
23
Pacific Advisors
Large Cap Value Fund continued
During the period, the Fund added two globally diversified financial services firms Citigroup and Bank of America. These companies reflect the changes to the financial sector since the Great Recession: higher capital and liquidity requirements and less risk-taking. Over time, these steps will reduce earnings volatility and position the banks to focus on core businesses. And, higher interest rates will translate into increased revenues and earnings for these institutions.
Also, during the period, to take advantage of buying opportunities at discounted prices, we selectively added to the Fund's positions in Deere & Company, Johnson Controls, and Time Warner.
Looking Ahead
Heading into 2015, we anticipate that the U.S. will continue its leading role in the global recovery. The strength of the U.S., and increasing expectations of additional monetary stimulus measures in Japan, China and Europe, should buoy investor sentiment. And, lower oil prices are helping the global economy; stronger global economic growth would, in turn, help all sectors over the long-term. The Fund will remain focused on companies with strong international operations that are positioned to profit from strengthening economies. These multinational mega-cap companies, such as MasterCard, Disney, Honeywell International, Berkshire Hathaway and General Electric, have the broad geographic footprint, product, and distribution diversity to effectively manage changing economic conditions. Positive economic trends, including lower fuel prices, higher household income, and an improving labor market, should improve results for consumer-oriented companies such as Wal-Mart, Home Depot, Lowe's, and Proctor & Gamble. Industrial and manufacturing expansion will support sales and earnings growth for Illinois Tool Works, Timken Company, and Deere & Company.
We believe that the Fed will raise interest rates in 2015. Higher rates will improve earnings for Wells Fargo, Bank of America, and Citigroup as these companies earn higher rates on loan portfolios. Some fixed income investors, especially those holding long-term bonds, may seek to protect against principal losses by migrating to conservative equities. Leading large cap stocks ought to appeal to these risk-averse investors; the Fund, with considerable holdings in well-known market leaders, would likely benefit as these investors move into equities.
24
Portfolio Holdings as of 12/31/14 (Based on Total Investments)
| Equities | 99.36 | % | |||||||||
| 1. | Information Technology | 20.36 | % | ||||||||
| 2. | Industrials | 19.95 | % | ||||||||
| 3. | Financials | 18.92 | % | ||||||||
| 4. | Consumer Discretionary | 18.21 | % | ||||||||
| 5. | Consumer Staples | 14.72 | % | ||||||||
| 6. | Energy | 3.79 | % | ||||||||
| 7. | Health Care | 3.41 | % | ||||||||
| 8. | Cash and Cash Equivalents | 0.64 | % | ||||||||
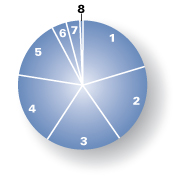
Change in Value of $10,000 Investment1
This chart compares the growth of a $10,000 investment in Class A shares of the Large Cap Value Fund for the period January 1, 2005 through December 31, 2014 with the same investment in the S&P 500® Index2.
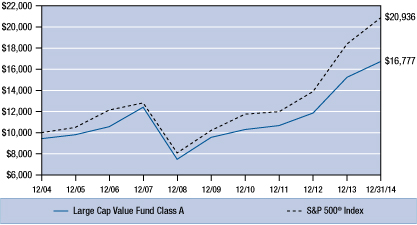
Average Annual Compounded Returns as of December 31, 2014
Class A | Class C | S&P 500® Index | |||||||||||||
One Year | 3.59 | % | 8.18 | % | 13.69 | % | |||||||||
Five Year | 10.60 | % | 11.12 | % | 15.45 | % | |||||||||
Ten Year | 5.31 | % | 5.12 | % | 7.67 | % | |||||||||
Past performance does not guarantee future results. Performance quoted represents past performance. Current performance may be higher or lower than the performance data quoted. Returns include reinvested dividends and capital gains. Returns for Class A shares reflect a maximum front-end sales charge of 5.75%; and returns for Class C shares reflect the deduction of a contingent deferred sales charge of 1% on shares sold within the first year of purchase. Returns do not take into account individual taxes which may reduce actual returns when shares are sold. The investment return and principal value of an investment will fluctuate so that an investor's shares, when redeemed, may be worth more or less than their original cost. Call (800) 989-6693 for the most recent month-end performance.
1 Fund results are shown for Class A shares and reflect deduction of the maximum front-end sales charge of 5.75% on the $10,000 investment for a net amount invested of $9,425. At the end of the same period, a $10,000 investment in Class C shares would have been valued at $16,481, and no contingent deferred sales charges would apply. Performance of the share classes will vary based on the difference in charges and expenses. The inception date for Class A shares and Class C shares is 05/01/99. It is not possible to invest directly in either Index. Index results assume reinvestment of dividends, but, unlike the Fund's results, do not reflect sales charges, fees or expenses.
2 The Standard & Poor's 500® Index is an unmanaged, market capitalization weighted index which measures the performance of the large cap segment of the U.S. equities market, covering approximately 75% of the U.S. equities market. The Index includes 500 leading companies in leading industries of the U.S. economy.
25
Pacific Advisors
Large Cap Value Fund continued
Expense Examples
As a shareholder of the Fund you incur two types of costs: (1) transaction costs, including sales charges (loads) on purchase payments, reinvested dividends, or other distributions; redemption fees; and exchange fees; and (2) ongoing costs, including management fees; distribution (12b-1) fees; and other Fund expenses. This Example is intended to help you understand your ongoing costs (in dollars) of investing in the Fund and to compare these costs with the ongoing costs of investing in other mutual funds.
The Example is based on an investment of $1,000 invested at the beginning of the period and held for the entire period from July 1, 2014 through December 31, 2014.
Actual Expenses
The first line of the table below provides information about actual account values and actual expenses. You may use the information in this line, together with the amount you invested, to estimate the expenses that you paid over the period. Simply divide your account value by $1,000 (for example, an $8,600 account value divided by $1,000 = 8.6), then multiply the result by the number in the first line under the heading entitled "Expenses Paid During the Period" to estimate the expenses you paid on your account during the period.
The following transaction costs are not included in the expenses shown in the table and, if applicable, would increase the expenses that you paid over the period: (1) a front-end sales charge (load) of 5.75% on Class A shares; (2) a 2% redemption fee if you sell or exchange shares within 180 days of purchase, with certain exceptions. The redemption fee does not apply to: (a) redemptions under an automatic withdrawal program or periodic asset reallocation plan, required minimum distributions (RMD), employer mandated distributions from a qualified plan, or redemptions under a qualified domestic relations order (QDRO); (b) redemptions to pay for expenses related to terminal illness, extended hospital or nursing home care, or other serious medical conditions, including death; (c) redemptions of shares acquired through dividend or capital gains reinvestments; (d) loans from a qualified plan account, and (e) redemptions initiated by the Fund; and (3) a $10 service fee on each exchange after the first five exchanges in each calendar year.
The following ongoing costs are not included in the expenses shown in the table and, if applicable, would increase the expenses that you paid over the period: (1) a $12 low balance fee on accounts with balances of less than $250 as of September 30th of each calendar year and no investment activity (excluding reinvestment of dividends and/or capital gains) during the prior calendar year or the first nine months of the current calendar year. This fee does not apply to IRAs, qualified plan accounts, or Coverdell Education Savings Accounts; (2) a $15 annual custodial fee on IRAs, SEPs, SIMPLE IRAs, and Coverdell Education Savings Accounts; and (3) a $20 annual custodial fee on 403(b) accounts.
Hypothetical Example for Comparison Purposes
The second line of the table below provides information about hypothetical account values and hypothetical expenses based on the Fund's actual expense ratio and an assumed rate of return of 5% per year before expenses, which in not the Fund's actual return. The hypothetical account values and expenses may not be used to estimate the actual ending account balance or expenses you paid for the period. You may use this information to compare the ongoing costs of investing in the Fund and other funds. To do so, compare this 5% hypothetical example with the 5% hypothetical examples that appear in the shareholder reports of the other funds.
The following transaction costs are not included in the expenses shown in the table and, if applicable, would increase the expenses that you paid over the period: (1) a front-end sales charge (load) of 5.75% on Class A shares; (2) a 2% redemption fee if you sell or exchange shares within 180 days of purchase, with certain exceptions. The redemption fee does not apply to: (a) redemptions under an automatic withdrawal program or periodic asset reallocation plan, required minimum distributions (RMD), employer mandated distributions from a qualified plan, or redemptions under a qualified domestic relations order (QDRO); (b) redemptions to pay for expenses related to terminal illness, extended hospital or nursing home care, or other serious medical conditions, including death; (c) redemptions of shares acquired through dividend or capital gains reinvestments; (d) loans from a qualified plan account, and (e) redemptions initiated by the Fund; and (3) a $10 service fee on each exchange after the first five exchanges in each calendar year.
The following ongoing costs are not included in the expenses shown in the table and, if applicable, would increase the expenses that you paid over the period: (1) a $12 low balance fee on accounts with balances of less than $250 as of September 30th of each calendar year and no investment activity (excluding reinvestment of dividends and/or capital gains) during the prior calendar year or the first nine months of the current calendar year. This fee does not apply to IRAs, qualified plan accounts, or Coverdell Education Savings Accounts; (2) a $15 annual custodial fee on IRAs, SEPs, SIMPLE IRAs, and Coverdell Education Savings Accounts; and (3) a $20 annual custodial fee on 403(b) accounts.
Please note that the expenses shown in the table are meant to highlight your ongoing costs only and do not reflect any transactional costs, such as sales charges (loads), redemption fees, or exchange fees. Therefore, the second line of the table is useful in comparing ongoing costs only, and will not help you determine the relative total costs of owning different funds. In addition, if these transactional costs were included, your costs would have been higher.
| Beginning Account Value 07/01/14 | Ending Account Value 12/31/14 | Expense Paid During Period 07/01/14 – 12/31/14 | |||||||||||||
Large Cap Value Fund Class A | |||||||||||||||
Actual | $ | 1,000.00 | $ | 1,056.50 | $ | 13.68 | |||||||||
Hypothetical (5% return before expense) | $ | 1,000.00 | $ | 1,011.70 | $ | 13.39 | |||||||||
Large Cap Value Fund Class C | |||||||||||||||
Actual | $ | 1,000.00 | $ | 1,052.50 | $ | 17.49 | |||||||||
Hypothetical (5% return before expense) | $ | 1,000.00 | $ | 1,008.03 | $ | 17.11 | |||||||||
5 Expenses are equal to the Fund's annualized expense ratio, net of expense waivers, of 2.64% for Class A shares and 3.38% for Class C shares, multiplied by the average account value over the period, multiplied by 184/365 days to reflect the one-half year period.
26
Pacific Advisors
Mid Cap Value Fund
Fund Objective: Long-term capital appreciation.
Investment Invests at least 80% of its assets in mid-cap companies that are, at the time of
Strategy: purchase, within the market cap range of companies in the Russell Midcap Index®.1
Investor Profile: Moderately aggressive. Growth-oriented with a long-term investment horizon.
TOTAL RETURNS | EXPENSE RATIOS2 | ||||||||||||||||||
| For the year ended December 31, 2014 | Current | Prospectus | |||||||||||||||||
Class A | –11.74 | % | Class A | 3.42 | % | 3.69 | % | ||||||||||||
Class C | –12.39 | % | Class C | 4.17 | % | 4.42 | % | ||||||||||||
Russell Midcap Index® | 13.22 | % | |||||||||||||||||
Performance quoted is past performance which does not guarantee future results. Current performance may be higher or lower than the performance quoted. Call (800) 989-6693 for performance current to the most recent month-end. The investment return and principal value of an investment will fluctuate so that an investor's shares, when redeemed, may be worth more or less than their original cost. Returns represent the change in value over the stated period assuming reinvestment of dividends and capital gains at net asset value. Returns do not take into account the maximum 5.75% sales charge on Class A shares or the 1% Contingent Deferred Sales Charge (CDSC) for Class C shares sold within one year of purchase. Returns would be lower if the applicable sales charge and CDSC were included. Returns do not take into account individual taxes which may reduce actual returns when shares are sold.
Discussion with Portfolio Manager February 24, 2015
George A. Henning
Please see the Chairman's Letter at the beginning of this Report for a detailed market and economic review
as well as the Manager's general market outlook.
Fund Performance
The Fund is actively positioned toward companies and sectors that will respond well to economic growth; the Fund's holdings in the transportation, automotive, and retail areas outperformed amidst the steady global economic recovery. Unexpectedly, however, as oil prices plummeted from $112 at the end of June to below $60 by year-end, energy stocks fell sharply; the Fund's significant allocation to the Energy sector and related Industrial businesses hurt fund performance. The Fund's losses occurred primarily during the second half of the year when Class A shares fell 11.33% in comparison to the benchmark's 4.18% gain. For the full year, Class A shares dropped 11.74% to significantly lag the benchmark's 13.22% increase.
The transportation sector performed well as industrial and manufacturing growth increased shipping activity. Trucking companies Swift Transportation, the largest truckload carrier in North America, and Landstar Systems benefitted from strong demand for freight services; and, capacity constraints enabled trucking firms to charge higher rates.3 Rail transportation experienced similar manufacturing-related growth as increased shipping volumes have created capacity challenges. Kansas City Southern, which operates railroads in the U.S., Mexico and Panama, reported record revenues and shipment volumes. Spirit Airlines, the ultra-low base fare airline, also reported record revenues and earnings despite fears of Ebola-related travel disruptions.
1 The Russell Midcap® Index is an unmanaged, weighted measure of the 800 smallest companies within the Russell 1000® Index based on a combination of their market cap and current index membership. Index returns assume the reinvestment of dividends, but, unlike the Fund's returns, do not reflect management fees or expenses. It is not possible to invest directly in the Index.
2 "Current" expense ratio as of 12/31/14. "Prospectus" expense ratio is for the fiscal year ended 12/31/13.
3 For detailed information on Fund holdings, please see the Fund's Schedule of Investments in this Report.
27
Pacific Advisors
Mid Cap Value Fund continued
Several Fund holdings profited from the continued strength in the automotive market. Lear, a leading global manufacturer of automotive seats and electrical systems, recently acquired Eagle Ottawa, the world's largest supplier of leather to the automotive industry; the addition will complement Lear's existing capabilities in the design and manufacturing of luxury seat covers. O'Reilly Automotive, an auto parts retailer offering top-quality products and services to do-it-yourselfers and professionals, is well positioned as the average age of cars and light trucks in the U.S. remains unusually high; increasingly complex parts and higher maintenance costs are translating into impressive growth in same-store sales and earnings.
Fund holdings in the retail and consumer-oriented sectors were strong contributors to performance. A new addition to the Fund, Tractor Supply Company, rose over 31% during the second half of the year. The firm operates over 1,300 stores that supply the "lifestyle needs of recreational farmers and ranchers." Recently, the retailer has invested heavily to improve efficiency and productivity for future growth; the stock jumped following impressive third quarter results which confirm the effectiveness of the company's inventory management system.
In contrast, the Fund's Energy holdings fell sharply as the dramatic decline in oil prices, which began in June, accelerated during the last half of the year. Not surprisingly, most of the Fund's Energy holdings dropped. Our response to the wide-spread, seemingly indiscriminate sell-off included a comprehensive assessment of companies that we anticipate would recover sooner or emerge stronger than their peers. Helix Energy Solutions provides well intervention services and robotics to maximize productivity and efficiency of deepwater wells. Many of the company's services, including deepwater engineering services, involve multi-year contracts. Tidewater, the leading supplier of offshore service vessels to the energy industry, continues to provide essential maintenance services to drilling operations worldwide. Also, the firm initiated a $200 million stock buyback program which will enhance opportunities for future growth. Noble, an offshore oil and gas drilling contractor, is well positioned to participate in the eventual recovery in offshore drilling activity. The company has completed a major fleet modernization program including the spinoff of its older, less productive rigs in a new company. Meanwhile, we elected to sell the Fund's small position in Denbury Resources, an exploration and production company, as we determined that this company's recovery may be protracted.
Fund performance was also impacted by a selloff in shares of specialty retailer Conn's. The company underwrites credit for its furniture, home appliances and electronics customers; rapid store expansion pressured its credit operations. Despite strong sales growth and profit margins in excess of forty percent, investors lost confidence as credit trends deteriorated. Management's response included slowing the store expansion schedule, adding a Chief Risk Officer, and creating a credit and compliance oversight committee to stabilize and then improve performance. We remained positive on the company's long-term outlook; in fact, we added to the Fund's position following the selloff in anticipation of improved operating results and stock price recovery.
Long-term prospects for other Fund holdings remain favorable despite temporary setbacks. Chicago Bridge & Iron, an engineering and construction company, suffered due to concerns that the decline in oil prices would negatively impact the company's energy-related infrastructure projects. The company, though, is poised to profit from the significant investments in the construction of chemical and petrochemical facilities. Weak commodity prices hurt Joy Global, which manufactures and services mining equipment. The company's outlook should resume as global economic growth improves demand, and prices, for commodities.
Fund Strategy
Mid-cap companies provide distinctive advantages for long-term investors by combining the strategic flexibility of smaller businesses with the economies of scale typically enjoyed by large corporations. The Fund uses a focused strategy to invest in 30 to 40 stocks with an emphasis on high-quality companies with exceptional long-term growth opportunities. We expect to hold each investment for 2 to 5 years, or longer. This long-term horizon typically reduces turnover and contributes to tax efficiency by minimizing the realization of short-term gains. As of year-end, the Fund's low annual turnover rate of 22% was consistent with its five-year average annual turnover rate of 18%4.
4 Annual turnover: 22% (2014); 15% (2013); 24% (2012); 12% (2011); and 18% (2010)
28
The Fund added several new positions during the period. In addition to Tractor Supply Company (which is discussed in the Fund Performance section above), other new investments included:
• CIT Group is a finance company that focuses on transportation leasing and commercial loans to small and mid-sized businesses. In July, the company announced plans to acquire OneWest Bank; still subject to approval, the merger would add wholesale lending and branch banking to the company's operations. The combined businesses would expand cross-selling opportunities for retail and commercial customers.
• Aspen Technology provides software to more than 1,750 companies in engineering and manufacturing industries ranging from energy and chemicals to pharmaceuticals, food, and beverages. The company is the dominant industry leader in providing solutions for process design and planning to optimize operating performance. The Fund acquired shares following a significant decline in stock price due to concerns about the negative impact of lower oil prices to Aspen's business.
During the period, the Fund reallocated funds from the sale of several positions to purchase additional shares of Pool Corporation, Conn's, and several Energy holdings as we determined that the discounted prices offered attractive opportunities for long-term appreciation.
Looking Ahead
We anticipate that economic growth in the U.S. and a recovery in global growth will continue to benefit the Fund holdings. Leading transportation companies including short-line railroad operator Genesee & Wyoming as well as Navistar International, a leading manufacturer of commercial trucks, buses, defense vehicles, and engines. Also, Wabtec, a global provider of products for locomotives, freight cars, and passenger cars, will likely experience steady demand as rail operators invest in infrastructure. Lower fuel prices and an improving labor market should bolster consumer spending and improve results for retailers including apparel company PVH which owns Calvin Klein, Tommy Hilfiger, and other brands. Additionally, we expect many of the Fund's positions which have posted strong results over the past year to continue the growth strategies that have proven successful.
A recovery in the housing sector would increase business for Graco; the firm's fluid-handling products are used for spray finishing, lubrication, and the application of sealants and adhesives in the housing, wood finishing, and other industries. New home construction would further aid Pool Corporation's results as new pool construction declined 70% during to the housing downturn.
We believe that oil prices are beginning to stabilize and over time will provide significant upside potential as the Energy sector begins its recovery. Consistent with our investment strategy, we seek to invest long-term in high-quality companies that enjoy strong competitive positioning and market leadership. Although several Fund holdings underperformed during the period, these stocks should, over time, recover to reward patient investors.
29
Pacific Advisors
Mid Cap Value Fund
Pacific Advisors
Mid Cap Value Fund continued
Portfolio Holdings as of 12/31/14 (Based on Total Investments)
Equities | 100.00 | % | |||||||||
| 1. | Industrials | 43.76 | % | ||||||||
| 2. | Consumer Discretionary | 34.86 | % | ||||||||
| 3. | Energy | 10.80 | % | ||||||||
| 4. | Financials | 4.56 | % | ||||||||
| 5. | Consumer Staples | 2.07 | % | ||||||||
| 6. | Information Technology | 2.02 | % | ||||||||
| 7. | Materials | 1.93 | % | ||||||||
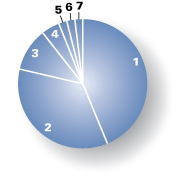
Change in Value of $10,000 Investment1
This chart compares the growth of a $10,000 investment in Class A shares of the Mid Cap Value Fund for the period January 1, 2005 through December 31, 2014 with the same investment in the Russell Midcap® Index2.
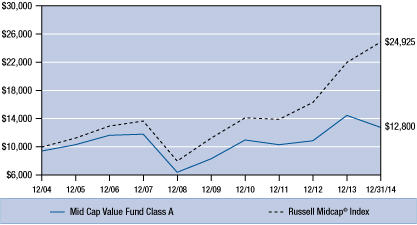
Average Annual Compounded Returns as of December 31, 2014
Class A | Class C | Russell Midcap® Index | |||||||||||||
One Year | – 16.81 | % | – 13.27 | % | 13.22 | % | |||||||||
Five Year | 7.63 | % | 8.05 | % | 17.19 | % | |||||||||
Ten Year | 2.50 | % | 2.27 | % | 9.56 | % | |||||||||
Past performance does not guarantee future results. Performance quoted represents past performance. Current performance may be higher or lower than the performance data quoted. Returns include reinvested dividends and capital gains. Returns for Class A shares reflect a maximum front-end sales charge of 5.75%; and returns for Class C shares reflect the deduction of a contingent deferred sales charge of 1% on shares sold within the first year of purchase. Returns do not take into account individual taxes which may reduce actual returns when shares are sold. The investment return and principal value of an investment will fluctuate so that an investor's shares, when redeemed, may be worth more or less than their original cost. Call (800) 989-6693 for the most recent month-end performance.
1 Fund results are shown for Class A shares and reflect deduction of the maximum front-end sales charge of 5.75% on the $10,000 investment for a net amount invested of $9,425. At the end of the same period, a $10,000 investment in Class C shares would have been valued at $12,521, and no contingent deferred sales charges would apply. Performance of the share classes will vary based on the difference in charges and expenses. The inception date for Class A shares and Class C shares is 04/01/02. It is not possible to invest directly in either Index. Index results assume reinvestment of dividends, but, unlike the Fund's results, do not reflect sales charges, fees or expenses.
2 The Russell Midcap® Index is an unmanaged, weighted measure of the 800 smallest companies within the Russell 1000® Index based on a combination of their market cap and current index membership.
30
Expense Examples
As a shareholder of the Fund you incur two types of costs: (1) transaction costs, including sales charges (loads) on purchase payments, reinvested dividends, or other distributions; redemption fees; and exchange fees; and (2) ongoing costs, including management fees; distribution (12b-1) fees; and other Fund expenses. This Example is intended to help you understand your ongoing costs (in dollars) of investing in the Fund and to compare these costs with the ongoing costs of investing in other mutual funds.
The Example is based on an investment of $1,000 invested at the beginning of the period and held for the entire period from July 1, 2014 through December 31, 2014.
Actual Expenses
The first line of the table below provides information about actual account values and actual expenses. You may use the information in this line, together with the amount you invested, to estimate the expenses that you paid over the period. Simply divide your account value by $1,000 (for example, an $8,600 account value divided by $1,000 = 8.6), then multiply the result by the number in the first line under the heading entitled "Expenses Paid During the Period" to estimate the expenses you paid on your account during the period.
The following transaction costs are not included in the expenses shown in the table and, if applicable, would increase the expenses that you paid over the period: (1) a front-end sales charge (load) of 5.75% on Class A shares; (2) a 2% redemption fee if you sell or exchange shares within 180 days of purchase, with certain exceptions. The redemption fee does not apply to: (a) redemptions under an automatic withdrawal program or periodic asset reallocation plan, required minimum distributions (RMD), employer mandated distributions from a qualified plan, or redemptions under a qualified domestic relations order (QDRO); (b) redemptions to pay for expenses related to terminal illness, extended hospital or nursing home care, or other serious medical conditions, including death; (c) redemptions of shares acquired through dividend or capital gains reinvestments; (d) loans from a qualified plan account, and (e) redemptions initiated by the Fund; and (3) a $10 service fee on each exchange after the first five exchanges in each calendar year.
The following ongoing costs are not included in the expenses shown in the table and, if applicable, would increase the expenses that you paid over the period: (1) a $12 low balance fee on accounts with balances of less than $250 as of September 30th of each calendar year and no investment activity (excluding reinvestment of dividends and/or capital gains) during the prior calendar year or the first nine months of the current calendar year. This fee does not apply to IRAs, qualified plan accounts, or Coverdell Education Savings Accounts; (2) a $15 annual custodial fee on IRAs, SEPs, SIMPLE IRAs, and Coverdell Education Savings Accounts; and (3) a $20 annual custodial fee on 403(b) accounts.
Hypothetical Example for Comparison Purposes
The second line of the table below provides information about hypothetical account values and hypothetical expenses based on the Fund's actual expense ratio and an assumed rate of return of 5% per year before expenses, which in not the Fund's actual return. The hypothetical account values and expenses may not be used to estimate the actual ending account balance or expenses you paid for the period. You may use this information to compare the ongoing costs of investing in the Fund and other funds. To do so, compare this 5% hypothetical example with the 5% hypothetical examples that appear in the shareholder reports of the other funds.
The following transaction costs are not included in the expenses shown in the table and, if applicable, would increase the expenses that you paid over the period: (1) a front-end sales charge (load) of 5.75% on Class A shares; (2) a 2% redemption fee if you sell or exchange shares within 180 days of purchase, with certain exceptions. The redemption fee does not apply to: (a) redemptions under an automatic withdrawal program or periodic asset reallocation plan, required minimum distributions (RMD), employer mandated distributions from a qualified plan, or redemptions under a qualified domestic relations order (QDRO); (b) redemptions to pay for expenses related to terminal illness, extended hospital or nursing home care, or other serious medical conditions, including death; (c) redemptions of shares acquired through dividend or capital gains reinvestments; (d) loans from a qualified plan account, and (e) redemptions initiated by the Fund; and (3) a $10 service fee on each exchange after the first five exchanges in each calendar year.
The following ongoing costs are not included in the expenses shown in the table and, if applicable, would increase the expenses that you paid over the period: (1) a $12 low balance fee on accounts with balances of less than $250 as of September 30th of each calendar year and no investment activity (excluding reinvestment of dividends and/or capital gains) during the prior calendar year or the first nine months of the current calendar year. This fee does not apply to IRAs, qualified plan accounts, or Coverdell Education Savings Accounts; (2) a $15 annual custodial fee on IRAs, SEPs, SIMPLE IRAs, and Coverdell Education Savings Accounts; and (3) a $20 annual custodial fee on 403(b) accounts.
Please note that the expenses shown in the table are meant to highlight your ongoing costs only and do not reflect any transactional costs, such as sales charges (loads), redemption fees, or exchange fees. Therefore, the second line of the table is useful in comparing ongoing costs only, and will not help you determine the relative total costs of owning different funds. In addition, if these transactional costs were included, your costs would have been higher.
| Beginning Account Value 07/01/14 | Ending Account Value 12/31/14 | Expense Paid During Period 07/01/14 – 12/31/14 | |||||||||||||
Mid Cap Value Fund Class A | |||||||||||||||
Actual | $ | 1,000.00 | $ | 886.70 | $ | 16.26 | |||||||||
Hypothetical (5% return before expense) | $ | 1,000.00 | $ | 1,007.84 | $ | 17.31 | |||||||||
Mid Cap Value Fund Class C | |||||||||||||||
Actual | $ | 1,000.00 | $ | 883.10 | $ | 19.79 | |||||||||
Hypothetical (5% return before expense) | $ | 1,000.00 | $ | 1,004.12 | $ | 21.06 | |||||||||
3 Expenses are equal to the Fund's annualized expense ratio of 3.42% for Class A shares and 4.17% for Class C shares, multiplied by the average account value over the period, multiplied by 184/365 days to reflect the one-half year period.
31
Pacific Advisors
Small Cap Value Fund
Fund Objective: Capital appreciation through investment in small cap companies.
Investment Invests at least 80% of its assets in small cap companies which are, at the time of
Strategy: purchase, not greater than the highest market capitalization of companies within the Russell 2000® Index1. Generally invests a significant proportion of its assets in companies with market capitalizations that are, at the time of purchase, not greater than the highest market capitalization of companies in the Russell Microcap® Index2 (which are often referred to as "micro-cap" stocks).
Investor Profile: Aggressive. Opportunity-oriented with a long-term investment horizon.
TOTAL RETURNS | EXPENSE RATIOS3 | ||||||||||||||||||
| For the year ended December 31, 2014 | Current | Prospectus | |||||||||||||||||
Class A | –21.60 | % | Class A | 2.19 | % | 2.31 | % | ||||||||||||
Class C | –22.19 | % | Class C | 2.95 | % | 3.08 | % | ||||||||||||
Class I | –21.36 | % | Class I | 2.03 | % | 2.06 | % | ||||||||||||
Russell 2000® Index | 4.89 | % | |||||||||||||||||
Performance quoted is past performance which does not guarantee future results. Current performance may be higher or lower than the performance quoted. Call (800) 989-6693 for performance current to the most recent month-end. The investment return and principal value of an investment will fluctuate so that an investor's shares, when redeemed, may be worth more or less than their original cost. Returns represent the change in value over the stated period assuming reinvestment of dividends and capital gains at net asset value. Rankings shown are for Class A shares; rankings for other share classes may be different. Returns and rankings do not take into account the maximum 5.75% sales charge on Class A shares or the 1% Contingent Deferred Sales Charge (CDSC) for Class C shares sold within one year of purchase. Returns would be lower if the applicable sales charge and CDSC were included. Returns do not take into account individual taxes which may reduce actual returns when shares are sold. Small cap companies typically have fewer financial resources and may carry higher investment risks and experience greater stock price volatility than larger stocks.
Discussion with Portfolio Manager February 24, 2015
George A. Henning
Please see the Chairman's Letter at the beginning of this Report for a detailed market and economic review
as well as the Manager's general market outlook.
Fund Performance
The Fund lagged its benchmark in the second half of 2014 primarily due to the rapid deterioration in oil prices which negatively impacted holdings of Energy and related companies. For the full year, Class A shares fell 21.60% compared to the 4.89% gain in the Russell 2000® Index of small companies. Notably, the challenging 2014 followed the Fund's stellar 2013 performance; as of December 31, 2013, Lipper ranked the Fund's Class A shares the number one Small Cap Core fund (out of 718 Funds) for one-year performance, the number two fund (out of 622) for three-year performance, the number 21 fund (out of 573 funds) for five-year performance, and number one fund (out of 350 funds) for ten-year performance, each based on total return.4 The Fund selects investments based on long-term growth opportunities; we expect to hold each investment for 2 to 5 years, or longer. This long-term horizon typically reduces
1 The Russell 2000® Index is an unmanaged, market-weighted measure of the 2,000 smallest companies of the Russell 3000® Index which represents approximately 98% of the investable U.S. equity market. Index returns assume the reinvestment of dividends, but, unlike the Fund's returns, do not reflect management fees or expenses. It is not possible to invest directly in the Index.
2 The Russell Microcap® Index is an unmanaged, market capitalization weighted measure of the 1,000 smallest publicly traded companies within the Russell 2000® Index, plus the next smallest 1,000 U.S. based listed stocks.
3 "Current" expense ratio as of 12/31/14. "Prospectus" expense ratio is for the fiscal year ended 12/31/13.
4 As of 12/31/14, Lipper ranked the Fund 764 (out of 765 funds) for one-year performance; 469 (out of 600 funds) for five-year performance; and 129 (out of 378 funds) for ten-year performance.
32
turnover: as of year-end, the Fund's low annual turnover rate of 16% was consistent with its five-year average annual turnover rate of 11%5. Based on the Fund's investment approach, therefore, performance is best viewed over a multi-year time frame. Notwithstanding the disappointing results in 2014, we anticipate that the Fund's strategy of focusing on high-quality, well-managed businesses with identifiable growth prospects will deliver attractive returns over the long-term.
Several high-performing Fund holdings6 continued to deliver stellar results in 2014. Regional trucking company Saia once again outperformed; following an impressive 107.9% gain in 2013, shares rose an additional 72.7% in 2014 to outpace industry peers. The company benefitted not only from the improving economy but also from improved service levels. Management's continued emphasis on operational efficiency enabled the company to increase shipping rates while controlling costs. Shares of East West Bancorp rose in reaction to year-over-year results for the third quarter which reported impressive growth in loans and deposits. The bank focuses exclusively on the U.S. and greater China markets; its advantaged position facilitates opportunities in the technology, entertainment, and private equity industries. And, Insteel Industries, the largest manufacturer of steel wire reinforcing products in the U.S., rose after reporting significant year-over-year increases in revenues and earnings. Management noted favorable pricing trends and higher factory utilization as construction activity improves.
Energy stocks, however, tumbled as growing supplies from North American shale oil, combined with weakening demand in Europe and Asia, sent Brent crude oil prices from $112 per barrel at the end of June to below $60 by year-end. As a result of the broad-based selloff, shares of Energy companies traded at prices not seen since the 2008 financial crisis; in some cases, valuations fell well below their previous nadir. Indeed, the rapid and seemingly indiscriminate selling bore striking similarities to the 2008 bear market when investors liquidated holdings with little regard to individual company considerations. We believe the current selloff overlooks the varying impacts of lower oil prices across the diverse range of Energy companies. Importantly, though, the short-term setbacks often set the stage for significant returns as markets, and companies, adapt to changing conditions. For example, a look back at the 2008 financial crisis serves as a poignant reminder that industry stresses often create opportunities for well-positioned companies. In particular, the dramatic reduction in asset values may lead to industry consolidation and strategic acquisitions that bolster company growth prospects.
We believe that Energy remains an attractive, long-term growth sector even in the midst of a cyclical downturn. During these periods, we assess opportunities for companies that we anticipate will recover sooner or emerge stronger than their peers. Moreover, the Fund continues to focus on energy service companies rather than the more exposed exploration businesses. For example, the operations of service companies that principally support downstream activities such as refining and industrial production should experience minimal impact. One such company is Team, which provides specialty maintenance and inspection services. Most of the company's revenues come from recurring services to refining and petrochemical plants yet the stock remains significantly undervalued. Other financially-strong companies may identify strategic growth opportunities through attractively priced acquisitions. Case in point: Kirby used the previous downturn to expand operations into the coastal transportation market. And, companies that used the post-2008 economic downturn to rebuild their operations now have the financial flexibility to weather the storm and recover more quickly. Hornbeck Offshore Services, for example, operates the industry's most modern fleets to service offshore oilfields; the stock trades at a fraction of book value even though the company generates significant free cash flow. Many of these companies are reducing debt and buying back stock at a substantial discount.
Fund performance was also impacted by a selloff in shares of specialty retailer Conn's. The company underwrites credit for its furniture, home appliances and electronics customers; rapid store expansion pressured its collections operations. Despite strong sales growth and profit margins in excess of forty percent, investors lost confidence as credit trends deteriorated. Management's response included slowing the store expansion schedule, adding a Chief Risk Officer, and creating a credit and compliance oversight committee to stabilize and then improve performance. We remained positive on the company's long-term outlook; in fact, we added to the Fund's position following the selloff in anticipation of improved operating results and stock price recovery.
5 Annual turnover: 16% (2014); 9% (2013); 12 (2012); 9% (2011); and 9% (2010)
6 For detailed information on Fund holdings, please see the Fund's Schedule of Investments in this Report.
33
Pacific Advisors
Small Cap Value Fund continued
Fund Strategy
The Fund employs a value-oriented approach to identify when high-quality, well-managed companies with attractive growth outlooks become undervalued. Periods of heightened market volatility often create opportunities to strategically invest in these companies for long-term appreciation. The Fund takes an ownership view in seeking to identify stocks that are undervalued or temporarily out-of-favor and have a catalyst for multi-year growth. The Fund focuses on a limited number of holdings (typically 30 to 50 holdings), including a significant number of micro-cap stocks. Investing in small and micro-cap stocks may contribute to above-average volatility; yet, smaller, well-positioned companies can provide superior long-term results. Despite its strategic allocation to micro-cap stocks, we note the Fund's relatively modest one-year beta7 of 1.06, as of December 31st, in comparison to the Russell 2000® Index.
During the second half of 2014, the Fund sold its position in Suncoke Energy after the stock rose to our internal price target. Also, as part of our active management approach, we trimmed the Fund's allocations in Darling Ingredients, East West Bancorp, Saia, and Gentherm as the stock prices appreciated. In trimming or selling positions as they achieve our targeted holding percentages or price targets, we adjusted allocations toward companies that offered the most appealing prospects for long-term gains; these included Sonic Automotive, Team, and Navistar. We also added to Conn's, Hornbeck Offshore Services, and Regional Management as these stocks remained under pressure due to industry- and company-specific factors. As long-term investors, we identified opportunities to purchase additional shares of these companies at discounted prices when they encountered setbacks as they expanded into new products and geographies.
Looking Ahead
We anticipate that U.S. economic growth will broaden in 2015 to include lower and middle income households. And, lower energy costs will provide a net benefit for the global economy; even so, energy prices should self-correct as global demand improves, as expected. Stronger economic growth will help all sectors over the long-term even though certain areas of the market may experience periodic setbacks. The Federal Reserve's guidance and eventual actions to increase short-term interest rates will also continue to strongly influence the markets in 2015. Several factors, including wage growth at home, and the impact of higher interest rates on the global economy, will affect the schedule and pace of the Fed's "liftoff" policy. Additionally, market forces will likely influence longer-term rates separate and apart from any Fed actions. Regardless, the Fed's eventual move to raise short-term interest rates ought to be viewed positively; the return to a more normal interest rate environment will reflect the Fed's confidence in the U.S and world economies.
Accelerating momentum in the U.S. economy bodes well for leading small cap companies. Commercial truck retailer Rush Enterprises and truck manufacturer Navistar are well positioned to participate as the domestic economy strengthens. We anticipate that higher employment levels, wage increases and lower energy costs will bolster consumer confidence; Bravo Brio Restaurant Group and retailer Hibbett Sports will benefit from increased consumer spending. Meanwhile, construction and housing industry expansions are positive signs for marine construction firm Orion Marine Group, steel wire manufacturer Insteel Industries, and building products provider NCI Building Systems. The decline in oil prices and the selloff in the Energy sector, though, will strongly impact investor sentiment and business outlooks; here, we are identifying emerging opportunities in this sector for long-term price appreciation. Finally, the turnarounds underway at Conn's and Regional Management are establishing a basis for better operating results going forward which may, in turn, improve stock price performance.
The momentum of the U.S. economy may sustain markets for an extended period of time. Indeed, we believe that the U.S. economy is in the middle stages of an expansion cycle which should lead to increased corporate revenues and profits; U.S. equities, especially in light of global economic considerations, remain well positioned for 2015.
7 "Beta" measures volatility relative to the stock market or an alternative benchmark. A beta less than 1.0 indicates lower risk than the market or the benchmark and a beta greater than 1.0 indicates higher risk than the market or the benchmark.
34
Portfolio Holdings as of 12/31/14 (Based on Total Investments)
Equities | 100.00 | % | |||||||||
| 1. | Industrials | 49.98 | % | ||||||||
| 2. | Consumer Discretionary | 17.96 | % | ||||||||
| 3. | Energy | 16.81 | % | ||||||||
| 4. | Financials | 7.67 | % | ||||||||
| 5. | Telecommunication Services | 3.95 | % | ||||||||
| 6. | Consumer Staples | 3.63 | % | ||||||||
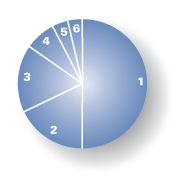
Change in Value of $10,000 Investment1
This chart compares the growth of a $10,000 investment in Class A shares of the Small Cap Value Fund for the period January 1, 2005 through December 31, 2014 with the same investment in the Russell 2000® Index2.
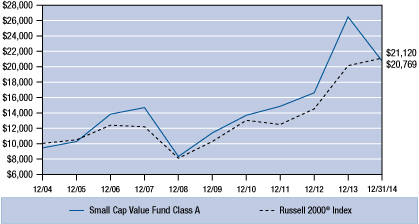
Average Annual Compounded Returns as of December 31, 2014
Class A | Class C | Class I | Russell 2000® Index | ||||||||||||||||
One Year | – 26.11 | % | – 22.97 | % | – 21.36 | % | 4.89 | % | |||||||||||
Five Year | 11.47 | % | 11.96 | % | 13.68 | % | 15.55 | % | |||||||||||
Ten Year | 7.58 | % | 7.37 | % | N/A | 7.77 | % | ||||||||||||
Since Inception | 9.57 | % | 6.11 | % | 7.05 | % | - | ||||||||||||
Past performance does not guarantee future results. Performance quoted represents past performance. Current performance may be higher or lower than the performance data quoted. Returns include reinvested dividends and capital gains. Returns for Class A shares reflect a maximum front-end sales charge of 5.75%; and returns for Class C shares reflect the deduction of a contingent deferred sales charge of 1% on shares sold within the first year of purchase. Returns do not take into account individual taxes which may reduce actual returns when shares are sold. Rankings do not take sales loads into account. Small cap stocks typically have fewer financial resources and may carry higher risks and experience greater volatility than large cap stocks. The investment return and principal value of an investment will fluctuate so that an investor's shares, when redeemed, may be worth more or less than their original cost. Call (800) 989-6693 for the most recent month-end performance.
1 Fund results are shown for Class A shares and reflect deduction of the maximum front-end sales charge of 5.75% on the $10,000 investment for a net amount invested of $9,425. At the end of the same period, a $10,000 investment in Class C shares would have been valued at $20,356, and no contingent deferred sales charges would apply. The inception date is 02/08/93 for Class A shares; 04/01/98 for Class C shares; and 10/09/06 for Class I shares. From inception through December 31, 2014, a $10,000 investment in Class I shares would have been valued at $17,458, and no contingent deferred sales charges would apply. Performance of the share classes will vary based on the difference in charges and expenses. It is not possible to invest directly in the Index. Index results assume reinvestment of dividends, but, unlike the Fund's results, do not reflect sales charges, commissions or expenses.
2 The Russell 2000® Index is an unmanaged, weighted measure of the 2,000 smallest companies within the Russell 3000® Index.
35
Pacific Advisors
Small Cap Value Fund continued
Expense Examples
As a shareholder of the Fund you incur two types of costs: (1) transaction costs, including sales charges (loads) on purchase payments, reinvested dividends, or other distributions; redemption fees; and exchange fees; and (2) ongoing costs, including management fees; distribution (12b-1) fees; and other Fund expenses. This Example is intended to help you understand your ongoing costs (in dollars) of investing in the Fund and to compare these costs with the ongoing costs of investing in other mutual funds.
The Example is based on an investment of $1,000 invested at the beginning of the period and held for the entire period from July 1, 2014 through December 31, 2014.
Actual Expenses
The first line of the table below provides information about actual account values and actual expenses. You may use the information in this line, together with the amount you invested, to estimate the expenses that you paid over the period. Simply divide your account value by $1,000 (for example, an $8,600 account value divided by $1,000 = 8.6), then multiply the result by the number in the first line under the heading entitled "Expenses Paid During the Period" to estimate the expenses you paid on your account during the period.
The following transaction costs are not included in the expenses shown in the table and, if applicable, would increase the expenses that you paid over the period: (1) a front-end sales charge (load) of 5.75% on Class A shares; (2) a 2% redemption fee if you sell or exchange shares within 180 days of purchase, with certain exceptions. The redemption fee does not apply to: (a) redemptions under an automatic withdrawal program or periodic asset reallocation plan, required minimum distributions (RMD), employer mandated distributions from a qualified plan, or redemptions under a qualified domestic relations order (QDRO); (b) redemptions to pay for expenses related to terminal illness, extended hospital or nursing home care, or other serious medical conditions, including death; (c) redemptions of shares acquired through dividend or capital gains reinvestments; (d) loans from a qualified plan account, and (e) redemptions initiated by the Fund; and (3) a $10 service fee on each exchange after the first five exchanges in each calendar year.
The following ongoing costs are not included in the expenses shown in the table and, if applicable, would increase the expenses that you paid over the period: (1) a $12 low balance fee on accounts with balances of less than $250 as of September 30th of each calendar year and no investment activity (excluding reinvestment of dividends and/or capital gains) during the prior calendar year or the first nine months of the current calendar year. This fee does not apply to IRAs, qualified plan accounts, or Coverdell Education Savings Accounts; (2) a $15 annual custodial fee on IRAs, SEPs, SIMPLE IRAs, and Coverdell Education Savings Accounts; and (3) a $20 annual custodial fee on 403(b) accounts.
Hypothetical Example for Comparison Purposes
The second line of the table below provides information about hypothetical account values and hypothetical expenses based on the Fund's actual expense ratio and an assumed rate of return of 5% per year before expenses, which in not the Fund's actual return. The hypothetical account values and expenses may not be used to estimate the actual ending account balance or expenses you paid for the period. You may use this information to compare the ongoing costs of investing in the Fund and other funds. To do so, compare this 5% hypothetical example with the 5% hypothetical examples that appear in the shareholder reports of the other funds.
The following transaction costs are not included in the expenses shown in the table and, if applicable, would increase the expenses that you paid over the period: (1) a front-end sales charge (load) of 5.75% on Class A shares; (2) a 2% redemption fee if you sell or exchange shares within 180 days of purchase, with certain exceptions. The redemption fee does not apply to: (a) redemptions under an automatic withdrawal program or periodic asset reallocation plan, required minimum distributions (RMD), employer mandated distributions from a qualified plan, or redemptions under a qualified domestic relations order (QDRO); (b) redemptions to pay for expenses related to terminal illness, death, extended hospital or nursing home care, or other serious medical conditions; (c) redemptions of shares acquired through dividend or capital gains reinvestments; (d) loans from a qualified plan account; and (e) redemptions initiated by the Fund; and (3) a $10 service fee on each exchange after the first five exchanges in each calendar year.
The following ongoing costs are not included in the expenses shown in the table and, if applicable, would increase the expenses that you paid over the period: (1) a $12 low balance fee on accounts with balances of less than $250 as of September 30th of each calendar year and no investment activity (excluding reinvestment of dividends and/or capital gains) during the prior calendar year or the first nine months of the current calendar year. This fee does not apply to IRAs, qualified plan accounts, or Coverdell Education Savings Accounts; (2) a $15 annual custodial fee on IRAs, SEPs, SIMPLE IRAs, and Coverdell Education Savings Accounts; and (3) a $20 annual custodial fee on 403(b) accounts.
Please note that the expenses shown in the table are meant to highlight your ongoing costs only and do not reflect any transactional costs, such as sales charges (loads), redemption fees, or exchange fees. Therefore, the second line of the table is useful in comparing ongoing costs only, and will not help you determine the relative total costs of owning different funds. In addition, if these transactional costs were included, your costs would have been higher.
| Beginning Account Value 07/01/14 | Ending Account Value 12/31/14 | Expense Paid During Period 07/01/14 – 12/31/14 | |||||||||||||
Small Cap Value Class A | |||||||||||||||
Actual | $ | 1,000.00 | $ | 780.70 | $ | 9.83 | |||||||||
Hypothetical (5% return before expense) | $ | 1,000.00 | $ | 1,013.93 | $ | 11.12 | |||||||||
Small Cap Value Class C | |||||||||||||||
Actual | $ | 1,000.00 | $ | 777.80 | $ | 13.22 | |||||||||
Hypothetical (5% return before expense) | $ | 1,000.00 | $ | 1,010.17 | $ | 14.95 | |||||||||
Small Cap Value Class I | |||||||||||||||
Actual | $ | 1,000.00 | $ | 781.80 | $ | 9.12 | |||||||||
Hypothetical (5% return before expense) | $ | 1,000.00 | $ | 1,014.73 | $ | 10.31 | |||||||||
3 Expenses are equal to the Fund's annualized expense ratio of 2.19% for Class A shares, 2.95% for Class C shares and 2.03% for Class I shares, multiplied by the average account value over the period, multiplied by 184/365 days to reflect the one-half year period.
36

Pacific Advisors Fund Inc.
Financial Statements
37
Pacific Advisors Government Securities Fund
Schedule of Investments
as of December 31, 2014
| Quantity or Principal | Description | Current $ Value** | % of Total Net Assets | ||||||||||||
COMMON STOCK | |||||||||||||||
CONSUMER DISCRETIONARY | 1.29 | ||||||||||||||
HOTELS, RESTAURANTS & LEISURE | |||||||||||||||
250 | MCDONALD'S CORP. | 23,425 | |||||||||||||
23,425 | 1.29 | ||||||||||||||
CONSUMER STAPLES | 5.36 | ||||||||||||||
BEVERAGES | |||||||||||||||
250 | PEPSICO, INC. | 23,640 | |||||||||||||
23,640 | 1.30 | ||||||||||||||
FOOD PRODUCTS | |||||||||||||||
500 | GENERAL MILLS INC. | 26,665 | |||||||||||||
600 | UNILEVER PLC | 24,288 | |||||||||||||
50,953 | 2.80 | ||||||||||||||
HOUSEHOLD PRODUCTS | |||||||||||||||
200 | KIMBERLY-CLARK CORP. | 23,108 | |||||||||||||
23,108 | 1.27 | ||||||||||||||
ENERGY | 1.23 | ||||||||||||||
OIL, GAS & CONSUMABLE FUELS | |||||||||||||||
200 | CHEVRON CORP. | 22,436 | |||||||||||||
22,436 | 1.23 | ||||||||||||||
HEALTH CARE | 2.66 | ||||||||||||||
PHARMACEUTICALS | |||||||||||||||
400 | ELI LILLY & CO. | 27,596 | |||||||||||||
200 | JOHNSON & JOHNSON | 20,914 | |||||||||||||
48,510 | 2.66 | ||||||||||||||
INFORMATION TECHNOLOGY | 1.27 | ||||||||||||||
SOFTWARE | |||||||||||||||
500 | MICROSOFT CORP. | 23,225 | |||||||||||||
23,225 | 1.27 | ||||||||||||||
TELECOMMUNICATION SERVICES | 1.47 | ||||||||||||||
DIVERSIFIED TELECOM. SERVICES | |||||||||||||||
800 | AT&T INC. | 26,872 | |||||||||||||
26,872 | 1.47 | ||||||||||||||
See Accompanying Notes to Financial Statements which are an integral part of these financial statements.
38
Pacific Advisors Government Securities Fund
Schedule of Investments
as of December 31, 2014
| Quantity or Principal | Description | Current $ Value** | % of Total Net Assets | ||||||||||||
COMMON STOCK continued | |||||||||||||||
UTILITIES | 4.43 | ||||||||||||||
ELECTRIC UTILITIES | |||||||||||||||
750 | PPL CORP. | 27,248 | |||||||||||||
550 | SOUTHERN CO. | 27,011 | |||||||||||||
54,258 | 2.98 | ||||||||||||||
MULTI-UTILITIES | |||||||||||||||
400 | CONSOLIDATED EDISON INC. | 26,404 | |||||||||||||
26,404 | 1.45 | ||||||||||||||
| TOTAL COMMON STOCK (Cost: $225,705) | 322,831 | 17.72 | |||||||||||||
US GOVT SECURITIES | |||||||||||||||
US GOVERNMENT AGENCY | 82.29 | ||||||||||||||
US GOVERNMENT AGENCY | |||||||||||||||
250,000 | FEDERAL HOME LOAN MTG CORP. 0.50% 05/27/16 | 250,053 | |||||||||||||
175,000 | FEDERAL HOME LOAN BANK 0.50% 12/12/17 STEP | 174,796 | |||||||||||||
300,000 | FEDERAL HOME LOAN BANK 0.625% 12/18/17 STEP | 299,873 | |||||||||||||
375,000 | FEDERAL HOME LOAN BANK 0.50% 09/30/19 STEP | 374,962 | |||||||||||||
100,000 | FEDERAL HOME LOAN BANK 0.50% 10/23/19 STEP | 100,021 | |||||||||||||
100,000 | FEDERAL HOME LOAN BANK 0.50% 11/26/19 STEP | 99,929 | |||||||||||||
200,000 | FEDERAL HOME LOAN BANK 0.75% 11/25/20 STEP | 200,000 | |||||||||||||
1,499,633 | 82.29 | ||||||||||||||
| TOTAL US GOVT SECURITIES (Cost: $1,499,969) | 1,499,633 | 82.29 | |||||||||||||
SHORT TERM INVESTMENTS | |||||||||||||||
MONEY MARKET | 0.08 | ||||||||||||||
1,528 | UMB MONEY MARKET FIDUCIARY | 1,528 | |||||||||||||
1,528 | 0.08 | ||||||||||||||
TOTAL SHORT TERM INVESTMENTS (Cost: $1,528) | 1,528 | 0.08 | |||||||||||||
TOTAL INVESTMENT IN SECURITIES (Cost: $1,727,202) | 1,823,992 | 100.09 | |||||||||||||
OTHER ASSETS LESS LIABILITIES | (1,716 | ) | (0.09 | ) | |||||||||||
TOTAL NET ASSETS | 1,822,276 | 100.00 | |||||||||||||
* Non-income producing
** The principal amount is stated in U.S. dollars unless otherwise indicated.
See Accompanying Notes to Financial Statements which are an integral part of these financial statements.
39
Pacific Advisors Income & Equity Fund
Schedule of Investments
as of December 31, 2014
| Quantity or Principal | Description | Current $ Value** | % of Total Net Assets | ||||||||||||
COMMON STOCK | |||||||||||||||
CONSUMER DISCRETIONARY | 4.94 | ||||||||||||||
DISTRIBUTORS | |||||||||||||||
1,750 | GENUINE PARTS CO. | 186,497 | |||||||||||||
186,497 | 1.35 | ||||||||||||||
HOTELS, RESTAURANTS & LEISURE | |||||||||||||||
1,650 | MCDONALD'S CORP. | 154,605 | |||||||||||||
154,605 | 1.12 | ||||||||||||||
LEISURE PRODUCTS | |||||||||||||||
3,500 | MATTEL INC. | 108,308 | |||||||||||||
108,308 | 0.79 | ||||||||||||||
MEDIA | |||||||||||||||
3,000 | OMNICOM GROUP INC. | 232,410 | |||||||||||||
232,410 | 1.68 | ||||||||||||||
CONSUMER STAPLES | 9.54 | ||||||||||||||
BEVERAGES | |||||||||||||||
4,500 | COCA-COLA CO. | 189,990 | |||||||||||||
189,990 | 1.38 | ||||||||||||||
FOOD & STAPLES RETAILING | |||||||||||||||
2,600 | CVS HEALTH CORP. | 250,406 | |||||||||||||
5,000 | SYSCO CORP. | 198,450 | |||||||||||||
4,250 | THE KROGER CO. | 272,893 | |||||||||||||
2,700 | WAL-MART STORES INC. | 231,876 | |||||||||||||
953,624 | 6.91 | ||||||||||||||
HOUSEHOLD PRODUCTS | |||||||||||||||
1,900 | PROCTER & GAMBLE CO. | 173,071 | |||||||||||||
173,071 | 1.25 | ||||||||||||||
ENERGY | 2.49 | ||||||||||||||
ENERGY EQUIPMENT & SERVICES | |||||||||||||||
2,000 | SCHLUMBERGER LTD | 170,820 | |||||||||||||
170,820 | 1.24 | ||||||||||||||
OIL, GAS & CONSUMABLE FUELS | |||||||||||||||
2,500 | CONOCOPHILLIPS | 172,650 | |||||||||||||
172,650 | 1.25 | ||||||||||||||
FINANCIALS | 2.96 | ||||||||||||||
BANKS | |||||||||||||||
4,000 | WELLS FARGO & CO. | 219,280 | |||||||||||||
219,280 | 1.59 | ||||||||||||||
See Accompanying Notes to Financial Statements which are an integral part of these financial statements.
40
Pacific Advisors Income & Equity Fund
Schedule of Investments
as of December 31, 2014
| Quantity or Principal | Description | Current $ Value** | % of Total Net Assets | ||||||||||||
COMMON STOCK continued | |||||||||||||||
INSURANCE | |||||||||||||||
3,500 | METLIFE INC. | 189,315 | |||||||||||||
189,315 | 1.37 | ||||||||||||||
HEALTH CARE | 4.42 | ||||||||||||||
PHARMACEUTICALS | |||||||||||||||
3,500 | ABBVIE INC. | 229,040 | |||||||||||||
2,000 | JOHNSON & JOHNSON | 209,140 | |||||||||||||
5,500 | PFIZER INC. | 171,325 | |||||||||||||
609,505 | 4.42 | ||||||||||||||
INDUSTRIALS | 5.91 | ||||||||||||||
AEROSPACE & DEFENSE | |||||||||||||||
2,000 | HONEYWELL INT'L INC. | 199,840 | |||||||||||||
199,840 | 1.45 | ||||||||||||||
AIR FREIGHT & LOGISTICS | |||||||||||||||
1,750 | UNITED PARCEL SERVICE INC. B | 194,548 | |||||||||||||
194,548 | 1.41 | ||||||||||||||
COMMERCIAL SERVICES & SUPPLIES | |||||||||||||||
4,500 | WASTE MANAGEMENT INC. | 230,940 | |||||||||||||
230,940 | 1.67 | ||||||||||||||
INDUSTRIAL CONGLOMERATES | |||||||||||||||
7,500 | GENERAL ELECTRIC CO. | 189,525 | |||||||||||||
189,525 | 1.37 | ||||||||||||||
INFORMATION TECHNOLOGY | 5.52 | ||||||||||||||
COMMUNICATIONS EQUIPMENT | |||||||||||||||
9,000 | CISCO SYSTEMS INC. | 250,335 | |||||||||||||
250,335 | 1.81 | ||||||||||||||
SEMICONDUCTORS & EQUIPMENT | |||||||||||||||
8,000 | INTEL CORP. | 290,320 | |||||||||||||
290,320 | 2.10 | ||||||||||||||
SOFTWARE | |||||||||||||||
4,750 | MICROSOFT CORP. | 220,638 | |||||||||||||
220,638 | 1.60 | ||||||||||||||
MATERIALS | 1.61 | ||||||||||||||
CHEMICALS | |||||||||||||||
3,000 | DUPONT DE NEMOURS & CO. | 221,820 | |||||||||||||
221,820 | 1.61 | ||||||||||||||
See Accompanying Notes to Financial Statements which are an integral part of these financial statements.
41
Pacific Advisors Income & Equity Fund
Schedule of Investments
as of December 31, 2014
| Quantity or Principal | Description | Current $ Value** | % of Total Net Assets | ||||||||||||
COMMON STOCK continued | |||||||||||||||
TELECOMMUNICATION SERVICES | 3.77 | ||||||||||||||
DIVERSIFIED TELECOM. SERVICES | |||||||||||||||
6,000 | AT&T INC. | 201,540 | |||||||||||||
4,815 | VERIZON COMMUNICATIONS INC. | 225,246 | |||||||||||||
426,786 | 3.09 | ||||||||||||||
WIRELESS TELECOM. SERVICES | |||||||||||||||
2,727 | VODAFONE GROUP PLC | 93,181 | |||||||||||||
93,181 | 0.68 | ||||||||||||||
UTILITIES | 5.67 | ||||||||||||||
ELECTRIC UTILITIES | |||||||||||||||
2,500 | DUKE ENERGY CORP. | 208,850 | |||||||||||||
6,000 | XCEL ENERGY INC. | 215,520 | |||||||||||||
424,370 | 3.08 | ||||||||||||||
MULTI-UTILITIES | |||||||||||||||
2,500 | DOMINION RESOURCES INC. | 192,250 | |||||||||||||
4,000 | PUBLIC SERVICE ENTERPRISE GROUP INC. | 165,640 | |||||||||||||
357,890 | 2.59 | ||||||||||||||
TOTAL COMMON STOCK (Cost: $4,525,006) | 6,460,268 | 46.83 | |||||||||||||
CORPORATE BOND | |||||||||||||||
CONSUMER DISCRETIONARY | 5.18 | ||||||||||||||
AUTO COMPONENTS | |||||||||||||||
150,000 | DELPHI CORP. 6.125% 05/15/21 | 163,500 | |||||||||||||
163,500 | 1.19 | ||||||||||||||
HOTELS, RESTAURANTS & LEISURE | |||||||||||||||
100,000 | DARDEN RESTAURANTS INC. 6.45% 10/15/17 | 109,968 | |||||||||||||
100,000 | INTL GAME TECHNOLOGY 7.50% 06/15/19 | 108,289 | |||||||||||||
100,000 | WYNDHAM WORLDWIDE 2.95% 03/01/17 | 102,123 | |||||||||||||
100,000 | WYNN LAS VEGAS LLC 7.75% 08/15/20 | 106,523 | |||||||||||||
426,903 | 3.09 | ||||||||||||||
MEDIA | |||||||||||||||
100,000 | TIME WARNER CABLE INC. 8.75% 02/14/19 | 123,785 | |||||||||||||
123,785 | 0.90 | ||||||||||||||
ENERGY | 4.21 | ||||||||||||||
ENERGY EQUIPMENT & SERVICES | |||||||||||||||
150,000 | ROWAN COMPANY INC. 7.875% 08/01/19 | 170,929 | |||||||||||||
150,000 | SESI LLC 6.375% 05/01/19 | 145,500 | |||||||||||||
100,000 | WEATHERFORD BERMUDA 6.00% 03/15/18 | 106,751 | |||||||||||||
423,180 | 3.07 | ||||||||||||||
See Accompanying Notes to Financial Statements which are an integral part of these financial statements.
42
Pacific Advisors Income & Equity Fund
Schedule of Investments
as of December 31, 2014
| Quantity or Principal | Description | Current $ Value** | % of Total Net Assets | ||||||||||||
CORPORATE BOND continued | |||||||||||||||
OIL, GAS & CONSUMABLE FUELS | |||||||||||||||
150,000 | CONTINENTAL RESOURCES 7.375% 10/01/20 | 157,313 | |||||||||||||
157,313 | 1.14 | ||||||||||||||
FINANCIALS | 19.23 | ||||||||||||||
CAPITAL MARKETS | |||||||||||||||
150,000 | ARES CAPITAL CORP. 4.875% 11/30/18 | 157,708 | |||||||||||||
100,000 | FIFTH STREET FINANCE CORP. 4.875% 03/01/19 | 102,100 | |||||||||||||
100,000 | GOLDMAN SACHS GROUP INC. 1.634% 08/26/20 FLOAT | 99,947 | |||||||||||||
100,000 | JANUS CAPITAL GROUP INC. 6.70% 06/15/17 | 110,643 | |||||||||||||
100,000 | JEFFERIES GROUP INC. 5.125% 04/13/18 | 105,461 | |||||||||||||
100,000 | MORGAN STANLEY 3.50% 09/30/17 FLOAT | 105,890 | |||||||||||||
100,000 | MORGAN STANLEY 4.50% 10/27/18 FLOAT | 107,875 | |||||||||||||
100,000 | PROSPECT CAPITAL CORP. 5.00% 07/15/19 | 101,755 | |||||||||||||
891,378 | 6.46 | ||||||||||||||
BANKS | |||||||||||||||
100,000 | BANK OF AMERICA CORP. 2.015% 09/28/20 FIX-FLOAT | 100,161 | |||||||||||||
100,000 | BANK OF AMERICA CORP. 4.158% 03/19/20 FLOAT | 103,500 | |||||||||||||
125,000 | JPMORGAN CHASE & CO. 3.664% 02/25/21 FLOAT | 125,850 | |||||||||||||
150,000 | SUNTRUST BANKS INC. 1.233% 11/22/16 FLOAT | 151,434 | |||||||||||||
480,944 | 3.49 | ||||||||||||||
DIVERSIFIED FINANCIAL SERVICES | |||||||||||||||
100,000 | ICAHN ENTERPRISES 6.00% 08/01/20 | 103,020 | |||||||||||||
100,000 | LEUCADIA NATIONAL CORP. 8.125% 09/15/15 | 104,457 | |||||||||||||
100,000 | NASDAQ OMX GROUP 5.25% 01/16/18 | 108,844 | |||||||||||||
100,000 | NASDAQ OMX GROUP 5.55% 01/15/20 | 111,122 | |||||||||||||
427,443 | 3.10 | ||||||||||||||
INSURANCE | |||||||||||||||
115,000 | GENWORTH FINANCIAL INC. 8.625% 12/15/16 | 121,674 | |||||||||||||
100,000 | PRUDENTIAL FINANCIAL INC. 3.66% 11/02/20 FLOAT | 104,580 | |||||||||||||
226,254 | 1.64 | ||||||||||||||
REAL ESTATE INVESTMENT TRUSTS | |||||||||||||||
105,000 | HOSPITALITY PROPERTIES TRUST 6.70% 01/15/18 | 116,019 | |||||||||||||
100,000 | HRPT PROPERTIES 6.25% 08/15/16 | 104,663 | |||||||||||||
125,000 | MACK-CALI REALTY LP 7.75% 08/15/19 | 147,807 | |||||||||||||
150,000 | OMEGA HEALTHCARE INVESTORS 7.50% 02/15/20 | 156,750 | |||||||||||||
100,000 | SENIOR HOUSING PROP TRUST 4.30% 01/15/16 | 102,087 | |||||||||||||
627,326 | 4.55 | ||||||||||||||
See Accompanying Notes to Financial Statements which are an integral part of these financial statements.
43
Pacific Advisors Income & Equity Fund
Schedule of Investments
as of December 31, 2014
| Quantity or Principal | Description | Current $ Value** | % of Total Net Assets | ||||||||||||
CORPORATE BOND continued | |||||||||||||||
HEALTH CARE | 0.86 | ||||||||||||||
PHARMACEUTICALS | |||||||||||||||
110,000 | HOSPIRA INC. 6.05% 03/30/17 | 118,598 | |||||||||||||
118,598 | 0.86 | ||||||||||||||
INDUSTRIALS | 4.93 | ||||||||||||||
BUILDING PRODUCTS | |||||||||||||||
115,000 | OWENS CORNING INC. 9.00% 06/15/19 | 139,170 | |||||||||||||
139,170 | 1.01 | ||||||||||||||
MACHINERY | |||||||||||||||
100,000 | CNH AMERICA LLC 7.25% 01/15/16 | 103,750 | |||||||||||||
100,000 | HARSCO CORP. 5.75% 05/15/18 | 105,250 | |||||||||||||
115,000 | JOY GLOBAL INC. 6.00% 11/15/16 | 124,209 | |||||||||||||
333,209 | 2.42 | ||||||||||||||
TRADING COMPANIES & DISTRIBUTORS | |||||||||||||||
100,000 | AIR LEASE CORP. 5.625% 04/01/17 | 107,750 | |||||||||||||
100,000 | INTL LEASE FINANCE CORP. 2.191% 06/15/16 FLOAT | 99,875 | |||||||||||||
207,625 | 1.51 | ||||||||||||||
INFORMATION TECHNOLOGY | 4.71 | ||||||||||||||
TECHNOLOGY HARDWARE, STORAGE & PERIPHERALS | |||||||||||||||
145,000 | LEXMARK INT'L INC. 6.65% 06/01/18 | 161,083 | |||||||||||||
150,000 | SEAGATE HDD CAYMAN 6.875% 05/01/20 | 157,500 | |||||||||||||
318,583 | 2.31 | ||||||||||||||
ELECTRONIC EQUIPMENT & INSTRUMENTS | |||||||||||||||
102,000 | ARROW ELECTRONICS INC. 6.875% 06/01/18 | 115,538 | |||||||||||||
100,000 | INGRAM MICRO INC. 5.25% 09/01/17 | 108,193 | |||||||||||||
100,000 | JABIL CIRCUIT INC. 7.75% 07/15/16 | 107,125 | |||||||||||||
330,856 | 2.40 | ||||||||||||||
MATERIALS | 6.13 | ||||||||||||||
CHEMICALS | |||||||||||||||
100,000 | ROCKWOOD SPECIALTIES 4.625% 10/15/20 | 103,250 | |||||||||||||
103,250 | 0.75 | ||||||||||||||
CONTAINERS & PACKAGING | |||||||||||||||
100,000 | BALL CORP. 6.75% 09/15/20 | 104,000 | |||||||||||||
104,000 | 0.75 | ||||||||||||||
See Accompanying Notes to Financial Statements which are an integral part of these financial statements.
44
Pacific Advisors Income & Equity Fund
Schedule of Investments
as of December 31, 2014
| Quantity or Principal | Description | Current $ Value** | % of Total Net Assets | ||||||||||||
CORPORATE BOND continued | |||||||||||||||
METALS & MINING | |||||||||||||||
100,000 | ALCOA INC. 5.55% 02/01/17 | 106,706 | |||||||||||||
100,000 | COMMERCIAL METALS CO. 7.35% 08/15/18 | 108,000 | |||||||||||||
150,000 | RELIANCE STEEL & ALUMINUM 6.20% 11/15/16 | 160,100 | |||||||||||||
150,000 | VALE OVERSEAS LIMITED 6.25% 01/23/17 | 159,992 | |||||||||||||
534,797 | 3.88 | ||||||||||||||
PAPER & FOREST PRODUCTS | |||||||||||||||
100,000 | DOMTAR CORP. 7.125% 08/15/15 | 103,273 | |||||||||||||
103,273 | 0.75 | ||||||||||||||
TELECOMMUNICATION SERVICES | 1.41 | ||||||||||||||
DIVERSIFIED TELECOM. SERVICES | |||||||||||||||
55,934 | BELLSOUTH TELECOM. 6.30% 12/15/15 | 57,610 | |||||||||||||
125,000 | QWEST CORP. 6.50% 06/01/17 | 136,660 | |||||||||||||
194,270 | 1.41 | ||||||||||||||
UTILITIES | 1.14 | ||||||||||||||
ELECTRIC UTILITIES | |||||||||||||||
49,000 | CLEVELAND ELECTRIC ILLUMINATING 5.70% 04/01/17 | 52,845 | |||||||||||||
100,000 | PPL ENERGY SUPPLY LLC 6.50% 05/01/18 | 105,026 | |||||||||||||
157,870 | 1.14 | ||||||||||||||
TOTAL CORPORATE BOND (Cost: $6,554,773) | 6,593,527 | 47.80 | |||||||||||||
PREFERRED STOCK | |||||||||||||||
FINANCIALS | 0.56 | ||||||||||||||
INSURANCE | |||||||||||||||
3,000 | METLIFE INC. 6.50% PFD | 77,400 | |||||||||||||
77,400 | 0.56 | ||||||||||||||
TOTAL PREFERRED STOCK (Cost: $75,000) | 77,400 | 0.56 | |||||||||||||
SHORT TERM INVESTMENTS | |||||||||||||||
MONEY MARKET | 4.25 | ||||||||||||||
585,950 | UMB MONEY MARKET FIDUCIARY | 585,950 | |||||||||||||
585,950 | 4.25 | ||||||||||||||
TOTAL SHORT TERM INVESTMENTS (Cost: $585,950) | 585,950 | 4.25 | |||||||||||||
TOTAL INVESTMENT IN SECURITIES (Cost: $11,740,729) | 13,717,145 | 99.44 | |||||||||||||
OTHER ASSETS LESS LIABILITIES | 77,562 | 0.56 | |||||||||||||
TOTAL NET ASSETS | 13,794,707 | 100.00 | |||||||||||||
* Non-income producing
** The principal amount is stated in U.S. dollars unless otherwise indicated.
See Accompanying Notes to Financial Statements which are an integral part of these financial statements.
45
Pacific Advisors Balanced Fund
Schedule of Investments
as of December 31, 2014
| Quantity or Principal | Description | Current $ Value** | % of Total Net Assets | ||||||||||||
COMMON STOCK | |||||||||||||||
CONSUMER DISCRETIONARY | 15.90 | ||||||||||||||
MEDIA | |||||||||||||||
2,500 | OMNICOM GROUP INC. | 193,675 | |||||||||||||
2,750 | WALT DISNEY CO. | 259,022 | |||||||||||||
452,697 | 4.91 | ||||||||||||||
SPECIALTY RETAIL | |||||||||||||||
5,800 | CONN'S INC.* | 108,402 | |||||||||||||
3,000 | LITHIA MOTORS INC. A | 260,070 | |||||||||||||
1,250 | O'REILLY AUTOMOTIVE INC.* | 240,775 | |||||||||||||
609,247 | 6.61 | ||||||||||||||
TEXTILES, APPAREL & LUXURY GOODS | |||||||||||||||
2,000 | NIKE INC. | 192,300 | |||||||||||||
1,650 | PVH CORP. | 211,481 | |||||||||||||
403,781 | 4.38 | ||||||||||||||
CONSUMER STAPLES | 5.67 | ||||||||||||||
FOOD & STAPLES RETAILING | |||||||||||||||
2,750 | CVS HEALTH CORP. | 264,853 | |||||||||||||
3,000 | WAL-MART STORES INC. | 257,640 | |||||||||||||
522,493 | 5.67 | ||||||||||||||
ENERGY | 10.12 | ||||||||||||||
ENERGY EQUIPMENT & SERVICES | |||||||||||||||
4,000 | HALLIBURTON CO. | 157,320 | |||||||||||||
11,000 | HELIX ENERGY SOLUTIONS GROUP INC.* | 238,700 | |||||||||||||
6,500 | HORNBECK OFFSHORE SERVICES INC.* | 162,305 | |||||||||||||
3,000 | NATIONAL OILWELL VARCO INC. | 196,590 | |||||||||||||
5,500 | TIDEWATER INC. | 178,255 | |||||||||||||
933,170 | 10.12 | ||||||||||||||
FINANCIALS | 8.18 | ||||||||||||||
BANKS | |||||||||||||||
7,250 | EAST WEST BANCORP INC. | 280,647 | |||||||||||||
3,850 | JPMORGAN CHASE & CO. | 240,933 | |||||||||||||
521,580 | 5.66 | ||||||||||||||
CONSUMER FINANCE | |||||||||||||||
2,500 | AMERICAN EXPRESS CO. | 232,600 | |||||||||||||
232,600 | 2.52 | ||||||||||||||
See Accompanying Notes to Financial Statements which are an integral part of these financial statements.
46
Pacific Advisors Balanced Fund
Schedule of Investments
as of December 31, 2014
| Quantity or Principal | Description | Current $ Value** | % of Total Net Assets | ||||||||||||
COMMON STOCK continued | |||||||||||||||
HEALTH CARE | 0.91 | ||||||||||||||
PHARMACEUTICALS | |||||||||||||||
500 | PERRIGO CO PLC | 83,580 | |||||||||||||
83,580 | 0.91 | ||||||||||||||
INDUSTRIALS | 24.25 | ||||||||||||||
COMMERCIAL SERVICES & SUPPLIES | |||||||||||||||
4,000 | TEAM INC.* | 161,840 | |||||||||||||
161,840 | 1.76 | ||||||||||||||
CONSTRUCTION & ENGINEERING | |||||||||||||||
5,000 | CHICAGO BRIDGE & IRON CO. N.V. | 209,900 | |||||||||||||
209,900 | 2.28 | ||||||||||||||
INDUSTRIAL CONGLOMERATES | |||||||||||||||
9,250 | GENERAL ELECTRIC CO. | 233,747 | |||||||||||||
233,747 | 2.54 | ||||||||||||||
MACHINERY | |||||||||||||||
1,700 | CUMMINS INC. | 245,089 | |||||||||||||
3,000 | NAVISTAR INT'L CORP.* | 100,440 | |||||||||||||
2,900 | WABTEC CORP. | 251,981 | |||||||||||||
597,510 | 6.48 | ||||||||||||||
MARINE | |||||||||||||||
2,550 | KIRBY CORP.* | 205,887 | |||||||||||||
205,887 | 2.23 | ||||||||||||||
ROAD & RAIL | |||||||||||||||
6,250 | CSX CORP. | 226,437 | |||||||||||||
2,500 | GENESEE & WYOMING INC.* | 224,800 | |||||||||||||
1,900 | KANSAS CITY SOUTHERN | 231,857 | |||||||||||||
683,094 | 7.41 | ||||||||||||||
TRADING COMPANIES & DISTRIBUTORS | |||||||||||||||
2,850 | DXP ENTERPRISES INC.* | 144,011 | |||||||||||||
144,011 | 1.56 | ||||||||||||||
INFORMATION TECHNOLOGY | 5.08 | ||||||||||||||
COMMUNICATIONS EQUIPMENT | |||||||||||||||
2,750 | QUALCOMM INC. | 204,408 | |||||||||||||
204,408 | 2.22 | ||||||||||||||
INTERNET SOFTWARE & SERVICES | |||||||||||||||
150 | GOOGLE INC.* | 79,599 | |||||||||||||
79,599 | 0.86 | ||||||||||||||
See Accompanying Notes to Financial Statements which are an integral part of these financial statements.
47
Pacific Advisors Balanced Fund
Schedule of Investments
as of December 31, 2014
| Quantity or Principal | Description | Current $ Value** | % of Total Net Assets | ||||||||||||
COMMON STOCK continued | |||||||||||||||
IT SERVICES | |||||||||||||||
1,150 | INT'L BUSINESS MACHINES CORP. | 184,506 | |||||||||||||
184,506 | 2.00 | ||||||||||||||
TOTAL COMMON STOCK (Cost: $4,718,444) | 6,463,650 | 70.10 | |||||||||||||
CORPORATE BOND | |||||||||||||||
CONSUMER DISCRETIONARY | 3.55 | ||||||||||||||
AUTO COMPONENTS | |||||||||||||||
100,000 | DELPHI CORP. 6.125% 05/15/21 | 109,000 | |||||||||||||
100,000 | LEAR CORP. 8.125% 03/15/20 | 105,250 | |||||||||||||
214,250 | 2.32 | ||||||||||||||
DIVERSIFIED CONSUMER SERVICES | |||||||||||||||
100,000 | WASHINGTON POST CO. 7.25% 02/01/19 | 112,673 | |||||||||||||
112,673 | 1.22 | ||||||||||||||
ENERGY | 5.10 | ||||||||||||||
ENERGY EQUIPMENT & SERVICES | |||||||||||||||
100,000 | ROWAN COMPANY INC. 7.875% 08/01/19 | 113,952 | |||||||||||||
100,000 | SESI LLC 6.375% 05/01/19 | 97,000 | |||||||||||||
210,952 | 2.29 | ||||||||||||||
OIL, GAS & CONSUMABLE FUELS | |||||||||||||||
100,000 | CONTINENTAL RESOURCES 7.375% 10/01/20 | 104,875 | |||||||||||||
150,000 | PEABODY ENERGY CORP. 7.375% 11/01/16 | 154,125 | |||||||||||||
259,000 | 2.81 | ||||||||||||||
FINANCIALS | 10.78 | ||||||||||||||
CAPITAL MARKETS | |||||||||||||||
100,000 | JEFFERIES GROUP INC. 5.50% 03/15/16 | 103,356 | |||||||||||||
103,356 | 1.12 | ||||||||||||||
BANKS | |||||||||||||||
100,000 | BANK OF AMERICA CORP. 1.983% 07/28/17 FLOAT | 102,036 | |||||||||||||
102,036 | 1.11 | ||||||||||||||
CONSUMER FINANCE | |||||||||||||||
150,000 | FORD MOTOR CREDIT CO. 7.00% 04/15/15 | 152,581 | |||||||||||||
152,581 | 1.65 | ||||||||||||||
DIVERSIFIED FINANCIAL SERVICES | |||||||||||||||
100,000 | ICAHN ENTERPRISES 6.00% 08/01/20 | 103,020 | |||||||||||||
100,000 | LEUCADIA NATIONAL CORP. 8.125% 09/15/15 | 104,457 | |||||||||||||
150,000 | NASDAQ OMX GROUP 5.25% 01/16/18 | 163,266 | |||||||||||||
370,743 | 4.02 | ||||||||||||||
See Accompanying Notes to Financial Statements which are an integral part of these financial statements.
48
Pacific Advisors Balanced Fund
Schedule of Investments
as of December 31, 2014
| Quantity or Principal | Description | Current $ Value** | % of Total Net Assets | ||||||||||||
CORPORATE BOND continued | |||||||||||||||
REAL ESTATE INVESTMENT TRUSTS | |||||||||||||||
125,000 | CORRECTIONS CORP. OF AMERICA 4.125% 04/01/20 | 121,562 | |||||||||||||
140,000 | HEALTH CARE REIT INC. 3.625% 03/15/16 | 144,090 | |||||||||||||
265,652 | 2.88 | ||||||||||||||
HEALTH CARE | 1.18 | ||||||||||||||
HEALTH CARE PROVIDERS & SERVICES | |||||||||||||||
100,000 | FRESENIUS MED CARE US 6.875% 07/15/17 | 109,250 | |||||||||||||
109,250 | 1.18 | ||||||||||||||
INDUSTRIALS | 3.49 | ||||||||||||||
MACHINERY | |||||||||||||||
100,000 | CASE NEW HOLLAND INC. 7.875% 12/01/17 | 110,000 | |||||||||||||
110,000 | 1.19 | ||||||||||||||
TRADING COMPANIES & DISTRIBUTORS | |||||||||||||||
100,000 | AIRCASTLE 6.75% 04/15/17 | 106,750 | |||||||||||||
95,000 | INTL LEASE FINANCE CORP. 8.75% 03/15/17 | 105,213 | |||||||||||||
211,963 | 2.30 | ||||||||||||||
INFORMATION TECHNOLOGY | 2.30 | ||||||||||||||
TECHNOLOGY HARDWARE, STORAGE & PERIPHERALS | |||||||||||||||
100,000 | SEAGATE HDD CAYMAN 6.875% 05/01/20 | 105,000 | |||||||||||||
105,000 | 1.14 | ||||||||||||||
ELECTRONIC EQUIPMENT & INSTRUMENTS | |||||||||||||||
100,000 | JABIL CIRCUIT INC. 7.75% 07/15/16 | 107,125 | |||||||||||||
107,125 | 1.16 | ||||||||||||||
MATERIALS | 2.31 | ||||||||||||||
CHEMICALS | |||||||||||||||
105,000 | ALBEMARLE CORP. 5.10% 02/01/15 | 105,328 | |||||||||||||
105,328 | 1.14 | ||||||||||||||
METALS & MINING | |||||||||||||||
100,000 | COMMERCIAL METALS CO. 7.35% 08/15/18 | 108,000 | |||||||||||||
108,000 | 1.17 | ||||||||||||||
TOTAL CORPORATE BOND (Cost: $2,642,136) | 2,647,909 | 28.72 | |||||||||||||
See Accompanying Notes to Financial Statements which are an integral part of these financial statements.
49
Pacific Advisors Balanced Fund
Schedule of Investments
as of December 31, 2014
| Quantity or Principal | Description | Current $ Value** | % of Total Net Assets | ||||||||||||
SHORT TERM INVESTMENTS | |||||||||||||||
MONEY MARKET | 0.84 | ||||||||||||||
77,433 | UMB MONEY MARKET FIDUCIARY | 77,433 | |||||||||||||
77,433 | 0.84 | ||||||||||||||
TOTAL SHORT TERM INVESTMENTS (Cost: $77,433) | 77,433 | 0.84 | |||||||||||||
TOTAL INVESTMENT IN SECURITIES (Cost: $7,438,013) | 9,188,992 | 99.66 | |||||||||||||
OTHER ASSETS LESS LIABILITIES | 31,428 | 0.34 | |||||||||||||
TOTAL NET ASSETS | 9,220,420 | 100.00 | |||||||||||||
* Non-income producing
** The principal amount is stated in U.S. dollars unless otherwise indicated.
See Accompanying Notes to Financial Statements which are an integral part of these financial statements.
50
Pacific Advisors Large Cap Value Fund
Schedule of Investments
as of December 31, 2014
| Quantity or Principal | Description | Current $ Value** | % of Total Net Assets | ||||||||||||
COMMON STOCK | |||||||||||||||
CONSUMER DISCRETIONARY | 18.14 | ||||||||||||||
AUTO COMPONENTS | |||||||||||||||
2,500 | JOHNSON CONTROLS INC. | 120,850 | |||||||||||||
120,850 | 1.50 | ||||||||||||||
HOTELS, RESTAURANTS & LEISURE | |||||||||||||||
2,000 | MCDONALD'S CORP. | 187,400 | |||||||||||||
187,400 | 2.33 | ||||||||||||||
MEDIA | |||||||||||||||
3,650 | TIME WARNER INC. | 311,783 | |||||||||||||
3,000 | WALT DISNEY CO. | 282,570 | |||||||||||||
594,353 | 7.37 | ||||||||||||||
SPECIALTY RETAIL | |||||||||||||||
3,750 | LOWE'S COMPANIES INC. | 258,000 | |||||||||||||
2,870 | THE HOME DEPOT, INC. | 301,264 | |||||||||||||
559,264 | 6.94 | ||||||||||||||
CONSUMER STAPLES | 14.66 | ||||||||||||||
BEVERAGES | |||||||||||||||
5,120 | COCA-COLA CO. | 216,166 | |||||||||||||
216,166 | 2.68 | ||||||||||||||
FOOD & STAPLES RETAILING | |||||||||||||||
5,000 | SYSCO CORP. | 198,450 | |||||||||||||
2,950 | WAL-MART STORES INC. | 253,346 | |||||||||||||
451,796 | 5.61 | ||||||||||||||
FOOD PRODUCTS | |||||||||||||||
3,000 | KRAFT FOODS GROUP INC. | 187,980 | |||||||||||||
2,700 | MONDELEZ INT'L INC. | 98,078 | |||||||||||||
286,057 | 3.55 | ||||||||||||||
HOUSEHOLD PRODUCTS | |||||||||||||||
2,500 | PROCTER & GAMBLE CO. | 227,725 | |||||||||||||
227,725 | 2.83 | ||||||||||||||
ENERGY | 3.77 | ||||||||||||||
ENERGY EQUIPMENT & SERVICES | |||||||||||||||
1,675 | NATIONAL OILWELL VARCO INC. | 109,763 | |||||||||||||
109,763 | 1.36 | ||||||||||||||
OIL, GAS & CONSUMABLE FUELS | |||||||||||||||
2,100 | EXXON MOBIL CORP. | 194,145 | |||||||||||||
194,145 | 2.41 | ||||||||||||||
See Accompanying Notes to Financial Statements which are an integral part of these financial statements.
51
Pacific Advisors Large Cap Value Fund
Schedule of Investments
as of December 31, 2014
| Quantity or Principal | Description | Current $ Value** | % of Total Net Assets | ||||||||||||
COMMON STOCK continued | |||||||||||||||
FINANCIALS | 18.85 | ||||||||||||||
CAPITAL MARKETS | |||||||||||||||
4,000 | LEGG MASON INC. | 213,480 | |||||||||||||
213,480 | 2.65 | ||||||||||||||
BANKS | |||||||||||||||
7,000 | BANK OF AMERICA CORP. | 125,230 | |||||||||||||
2,850 | CITIGROUP INC. | 154,214 | |||||||||||||
4,225 | WELLS FARGO & CO. | 231,615 | |||||||||||||
511,058 | 6.34 | ||||||||||||||
DIVERSIFIED FINANCIAL SERVICES | |||||||||||||||
2,000 | BERKSHIRE HATHAWAY INC. B* | 300,300 | |||||||||||||
300,300 | 3.73 | ||||||||||||||
INSURANCE | |||||||||||||||
4,000 | AMERICAN INT'L GROUP INC. | 224,040 | |||||||||||||
5,000 | METLIFE INC. | 270,450 | |||||||||||||
494,490 | 6.14 | ||||||||||||||
HEALTH CARE | 3.39 | ||||||||||||||
PHARMACEUTICALS | |||||||||||||||
2,615 | JOHNSON & JOHNSON | 273,451 | |||||||||||||
273,451 | 3.39 | ||||||||||||||
INDUSTRIALS | 19.87 | ||||||||||||||
AEROSPACE & DEFENSE | |||||||||||||||
2,000 | HONEYWELL INT'L INC. | 199,840 | |||||||||||||
199,840 | 2.48 | ||||||||||||||
AIR FREIGHT & LOGISTICS | |||||||||||||||
1,000 | FEDEX CORP. | 173,660 | |||||||||||||
1,200 | UNITED PARCEL SERVICE INC. B | 133,404 | |||||||||||||
307,064 | 3.81 | ||||||||||||||
INDUSTRIAL CONGLOMERATES | |||||||||||||||
9,750 | GENERAL ELECTRIC CO. | 246,383 | |||||||||||||
246,383 | 3.06 | ||||||||||||||
MACHINERY | |||||||||||||||
3,200 | DEERE & CO. | 283,104 | |||||||||||||
2,350 | ILLINOIS TOOL WORKS INC. | 222,545 | |||||||||||||
1,250 | SPX CORP. | 107,400 | |||||||||||||
2,500 | TIMKEN CO. | 106,700 | |||||||||||||
719,749 | 8.93 | ||||||||||||||
See Accompanying Notes to Financial Statements which are an integral part of these financial statements.
52
Pacific Advisors Large Cap Value Fund
Schedule of Investments
as of December 31, 2014
| Quantity or Principal | Description | Current $ Value** | % of Total Net Assets | ||||||||||||
COMMON STOCK continued | |||||||||||||||
TRADING COMPANIES & DISTRIBUTORS | |||||||||||||||
5,000 | NOW INC.* | 128,650 | |||||||||||||
128,650 | 1.60 | ||||||||||||||
INFORMATION TECHNOLOGY | 20.29 | ||||||||||||||
TECHNOLOGY HARDWARE, STORAGE & PERIPHERALS | |||||||||||||||
3,290 | APPLE INC. | 363,150 | |||||||||||||
363,150 | 4.51 | ||||||||||||||
IT SERVICES | |||||||||||||||
1,350 | INT'L BUSINESS MACHINES CORP. | 216,594 | |||||||||||||
2,200 | MASTERCARD INC. | 189,552 | |||||||||||||
406,146 | 5.04 | ||||||||||||||
SEMICONDUCTORS & EQUIPMENT | |||||||||||||||
5,600 | INTEL CORP. | 203,224 | |||||||||||||
203,224 | 2.52 | ||||||||||||||
SOFTWARE | |||||||||||||||
7,000 | MICROSOFT CORP. | 325,150 | |||||||||||||
7,500 | ORACLE CORPORATION | 337,275 | |||||||||||||
662,425 | 8.22 | ||||||||||||||
TOTAL COMMON STOCK (Cost: $5,425,192) | 7,976,929 | 98.97 | |||||||||||||
SHORT TERM INVESTMENTS | |||||||||||||||
MONEY MARKET | 0.64 | ||||||||||||||
51,524 | UMB MONEY MARKET FIDUCIARY | 51,524 | |||||||||||||
51,524 | 0.64 | ||||||||||||||
TOTAL SHORT TERM INVESTMENTS (Cost: $51,524) | 51,524 | 0.64 | |||||||||||||
TOTAL INVESTMENT IN SECURITIES (Cost: $5,476,715) | 8,028,453 | 99.61 | |||||||||||||
OTHER ASSETS LESS LIABILITIES | 31,124 | 0.39 | |||||||||||||
TOTAL NET ASSETS | 8,059,577 | 100.00 | |||||||||||||
* Non-income producing
** The principal amount is stated in U.S. dollars unless otherwise indicated.
See Accompanying Notes to Financial Statements which are an integral part of these financial statements.
53
Pacific Advisors Mid Cap Value Fund
Schedule of Investments
as of December 31, 2014
| Quantity or Principal | Description | Current $ Value** | % of Total Net Assets | ||||||||||||
COMMON STOCK | |||||||||||||||
CONSUMER DISCRETIONARY | 35.18 | ||||||||||||||
AUTO COMPONENTS | |||||||||||||||
12,000 | DANA HOLDING CORP. | 260,880 | |||||||||||||
3,100 | LEAR CORP. | 304,048 | |||||||||||||
564,928 | 8.22 | ||||||||||||||
DISTRIBUTORS | |||||||||||||||
3,500 | POOL CORPORATION | 222,040 | |||||||||||||
222,040 | 3.23 | ||||||||||||||
SPECIALTY RETAIL | |||||||||||||||
8,000 | CONN'S INC.* | 149,520 | |||||||||||||
5,000 | GAMESTOP CORP. A | 169,000 | |||||||||||||
1,800 | O'REILLY AUTOMOTIVE INC.* | 346,716 | |||||||||||||
6,500 | PENSKE AUTOMOTIVE GROUP INC. | 318,955 | |||||||||||||
4,300 | TRACTOR SUPPLY COMPANY | 338,926 | |||||||||||||
1,323,117 | 19.25 | ||||||||||||||
TEXTILES, APPAREL & LUXURY GOODS | |||||||||||||||
2,400 | PVH CORP. | 307,608 | |||||||||||||
307,608 | 4.48 | ||||||||||||||
CONSUMER STAPLES | 2.09 | ||||||||||||||
BEVERAGES | |||||||||||||||
2,000 | DR PEPPER SNAPPLE GROUP INC. | 143,360 | |||||||||||||
143,360 | 2.09 | ||||||||||||||
ENERGY | 10.90 | ||||||||||||||
ENERGY EQUIPMENT & SERVICES | |||||||||||||||
11,500 | HELIX ENERGY SOLUTIONS GROUP INC.* | 249,550 | |||||||||||||
11,000 | NOBLE CORP. | 182,270 | |||||||||||||
7,000 | TIDEWATER INC. | 226,870 | |||||||||||||
658,690 | 9.59 | ||||||||||||||
OIL, GAS & CONSUMABLE FUELS | |||||||||||||||
4,600 | CHESAPEAKE ENERGY CORP. | 90,022 | |||||||||||||
90,022 | 1.31 | ||||||||||||||
FINANCIALS | 4.61 | ||||||||||||||
BANKS | |||||||||||||||
7,700 | CATHAY GENERAL BANCORP | 197,043 | |||||||||||||
2,500 | CIT GROUP INC. | 119,575 | |||||||||||||
316,618 | 4.61 | ||||||||||||||
See Accompanying Notes to Financial Statements which are an integral part of these financial statements.
54
Pacific Advisors Mid Cap Value Fund
Schedule of Investments
as of December 31, 2014
| Quantity or Principal | Description | Current $ Value** | % of Total Net Assets | ||||||||||||
COMMON STOCK continued | |||||||||||||||
INDUSTRIALS | 44.16 | ||||||||||||||
AIRLINES | |||||||||||||||
4,300 | SPIRIT AIRLINES INC.* | 324,994 | |||||||||||||
324,994 | 4.73 | ||||||||||||||
CONSTRUCTION & ENGINEERING | |||||||||||||||
4,800 | CHICAGO BRIDGE & IRON CO. N.V. | 201,504 | |||||||||||||
201,504 | 2.93 | ||||||||||||||
MACHINERY | |||||||||||||||
1,800 | GRACO INC. | 144,324 | |||||||||||||
3,800 | JOY GLOBAL INC. | 176,776 | |||||||||||||
8,700 | NAVISTAR INT'L CORP.* | 291,276 | |||||||||||||
3,800 | WABTEC CORP. | 330,182 | |||||||||||||
942,558 | 13.72 | ||||||||||||||
ROAD & RAIL | |||||||||||||||
3,700 | GENESEE & WYOMING INC.* | 332,704 | |||||||||||||
2,100 | KANSAS CITY SOUTHERN | 256,263 | |||||||||||||
3,100 | LANDSTAR SYSTEM INC. | 224,843 | |||||||||||||
11,800 | SWIFT TRANSPORTATION CO.* | 337,834 | |||||||||||||
1,151,644 | 16.76 | ||||||||||||||
TRADING COMPANIES & DISTRIBUTORS | |||||||||||||||
10,500 | MRC GLOBAL INC.* | 159,075 | |||||||||||||
1,000 | W.W. GRAINGER, INC. | 254,890 | |||||||||||||
413,965 | 6.02 | ||||||||||||||
INFORMATION TECHNOLOGY | 2.04 | ||||||||||||||
SOFTWARE | |||||||||||||||
4,000 | ASPEN TECHNOLOGY INC.* | 140,080 | |||||||||||||
140,080 | 2.04 | ||||||||||||||
MATERIALS | 1.94 | ||||||||||||||
CHEMICALS | |||||||||||||||
3,000 | H.B. FULLER CO. | 133,590 | |||||||||||||
133,590 | 1.94 | ||||||||||||||
TOTAL COMMON STOCK (Cost: $5,184,233) | 6,934,718 | 100.92 | |||||||||||||
TOTAL INVESTMENT IN SECURITIES (Cost: $5,184,233) | 6,934,718 | 100.92 | |||||||||||||
OTHER ASSETS LESS LIABILITIES | (63,066 | ) | (0.92 | ) | |||||||||||
TOTAL NET ASSETS | 6,871,652 | 100.00 | |||||||||||||
* Non-income producing
** The principal amount is stated in U.S. dollars unless otherwise indicated.
See Accompanying Notes to Financial Statements which are an integral part of these financial statements.
55
Pacific Advisors Small Cap Value Fund
Schedule of Investments
as of December 31, 2014
| Quantity or Principal | Description | Current $ Value** | % of Total Net Assets | ||||||||||||
COMMON STOCK | |||||||||||||||
CONSUMER DISCRETIONARY | 18.68 | ||||||||||||||
AUTO COMPONENTS | |||||||||||||||
175,000 | GENTHERM INC.* | 6,408,500 | |||||||||||||
6,408,500 | 4.76 | ||||||||||||||
HOTELS, RESTAURANTS & LEISURE | |||||||||||||||
375,000 | BRAVO BRIO RESTAURANT GROUP INC.* | 5,216,250 | |||||||||||||
5,216,250 | 3.88 | ||||||||||||||
SPECIALTY RETAIL | |||||||||||||||
230,000 | CONN'S INC.* | 4,298,700 | |||||||||||||
70,000 | HIBBETT SPORTS INC.* | 3,390,100 | |||||||||||||
215,000 | SONIC AUTOMOTIVE INC. | 5,813,600 | |||||||||||||
13,502,400 | 10.04 | ||||||||||||||
CONSUMER STAPLES | 3.78 | ||||||||||||||
FOOD PRODUCTS | |||||||||||||||
280,000 | DARLING INGREDIENTS INC.* | 5,084,800 | |||||||||||||
5,084,800 | 3.78 | ||||||||||||||
ENERGY | 17.48 | ||||||||||||||
ENERGY EQUIPMENT & SERVICES | |||||||||||||||
220,000 | HORNBECK OFFSHORE SERVICES INC.* | 5,493,400 | |||||||||||||
300,000 | MATRIX SERVICE CO.* | 6,696,000 | |||||||||||||
70,000 | MITCHAM INDUSTRIES INC.* | 415,100 | |||||||||||||
225,000 | NATURAL GAS SERVICES GROUP* | 5,184,000 | |||||||||||||
910,000 | NORTH AMERICAN ENERGY PARTNERS INC. | 2,857,400 | |||||||||||||
755,000 | PARKER DRILLING CO.* | 2,317,850 | |||||||||||||
22,963,750 | 17.07 | ||||||||||||||
OIL, GAS & CONSUMABLE FUELS | |||||||||||||||
1,000,000 | INFINITY ENERGY RESOURCES INC.* | 550,000 | |||||||||||||
550,000 | 0.41 | ||||||||||||||
FINANCIALS | 7.97 | ||||||||||||||
BANKS | |||||||||||||||
240,000 | BBCN BANCORP INC. | 3,451,200 | |||||||||||||
130,000 | EAST WEST BANCORP INC. | 5,032,300 | |||||||||||||
8,483,500 | 6.31 | ||||||||||||||
CONSUMER FINANCE | |||||||||||||||
142,000 | REGIONAL MANAGEMENT CORP.* | 2,245,020 | |||||||||||||
2,245,020 | 1.67 | ||||||||||||||
See Accompanying Notes to Financial Statements which are an integral part of these financial statements.
56
Pacific Advisors Small Cap Value Fund
Schedule of Investments
as of December 31, 2014
| Quantity or Principal | Description | Current $ Value** | % of Total Net Assets | ||||||||||||
COMMON STOCK continued | |||||||||||||||
INDUSTRIALS | 51.98 | ||||||||||||||
BUILDING PRODUCTS | |||||||||||||||
160,595 | INSTEEL INDUSTRIES INC. | 3,786,830 | |||||||||||||
335,000 | NCI BUILDING SYSTEMS INC.* | 6,204,200 | |||||||||||||
9,991,030 | 7.43 | ||||||||||||||
COMMERCIAL SERVICES & SUPPLIES | |||||||||||||||
159,436 | MOBILE MINI INC. | 6,458,753 | |||||||||||||
162,000 | TEAM INC.* | 6,554,520 | |||||||||||||
13,013,273 | 9.67 | ||||||||||||||
CONSTRUCTION & ENGINEERING | |||||||||||||||
750,000 | FURMANITE CORP.* | 5,865,000 | |||||||||||||
210,000 | ORION MARINE GROUP INC.* | 2,320,500 | |||||||||||||
8,185,500 | 6.08 | ||||||||||||||
MACHINERY | |||||||||||||||
160,000 | NAVISTAR INT'L CORP.* | 5,356,800 | |||||||||||||
5,356,800 | 3.98 | ||||||||||||||
MARINE | |||||||||||||||
77,000 | KIRBY CORP.* | 6,216,980 | |||||||||||||
6,216,980 | 4.62 | ||||||||||||||
ROAD & RAIL | |||||||||||||||
100,000 | SAIA INC.* | 5,536,000 | |||||||||||||
5,536,000 | 4.11 | ||||||||||||||
TRADING COMPANIES & DISTRIBUTORS | |||||||||||||||
130,000 | DXP ENTERPRISES INC.* | 6,568,900 | |||||||||||||
265,000 | MRC GLOBAL INC.* | 4,014,750 | |||||||||||||
168,000 | RUSH ENTERPRISES INC.* | 5,384,400 | |||||||||||||
130,000 | TAL INT'L GROUP INC. | 5,664,100 | |||||||||||||
21,632,150 | 16.08 | ||||||||||||||
TELECOMMUNICATION SERVICES | 4.10 | ||||||||||||||
DIVERSIFIED TELECOM. SERVICES | |||||||||||||||
520,000 | PREMIERE GLOBAL SERVICES INC.* | 5,522,400 | |||||||||||||
5,522,400 | 4.10 | ||||||||||||||
TOTAL COMMON STOCK (Cost: $107,720,214) | 139,908,353 | 103.99 | |||||||||||||
TOTAL INVESTMENT IN SECURITIES (Cost: $107,720,214) | 139,908,353 | 103.99 | |||||||||||||
OTHER ASSETS LESS LIABILITIES | (5,366,327 | ) | (3.99 | ) | |||||||||||
TOTAL NET ASSETS | 134,542,026 | 100.00 | |||||||||||||
* Non-income producing
** The principal amount is stated in U.S. dollars unless otherwise indicated.
See Accompanying Notes to Financial Statements which are an integral part of these financial statements.
57
Pacific Advisors Fund Inc.
Statement of Assets and Liabilities
December 31, 2014
| Government Securities Fund | Income and Equity Fund | Balanced Fund | |||||||||||||
Assets | |||||||||||||||
Investment securities | |||||||||||||||
At cost | $ | 1,725,674 | $ | 11,154,779 | $ | 7,360,580 | |||||||||
At fair value | $ | 1,822,464 | $ | 13,131,195 | $ | 9,111,559 | |||||||||
Cash or cash equivalent, at fair value | 1,528 | 585,950 | 77,433 | ||||||||||||
Accrued income receivable | 1,165 | 101,486 | 56,315 | ||||||||||||
Receivable for capital shares sold | 810 | 1,003 | 2,913 | ||||||||||||
Receivable for investments sold | - | - | - | ||||||||||||
Other assets | - | - | - | ||||||||||||
Total assets | 1,825,967 | 13,819,634 | 9,248,220 | ||||||||||||
Liabilities | |||||||||||||||
Bank borrowings (Note 7) | - | - | - | ||||||||||||
Payable for fund shares redeemed | - | - | - | ||||||||||||
Accounts payable | 3,691 | 21,327 | 24,200 | ||||||||||||
Accounts payable to related parties (Note 3) | - | 3,600 | 3,600 | ||||||||||||
Total liabilities | 3,691 | 24,927 | 27,800 | ||||||||||||
Net Assets | $ | 1,822,276 | $ | 13,794,707 | $ | 9,220,420 | |||||||||
Summary of Shareholders' Equity | |||||||||||||||
Paid in capital | 1,814,902 | 12,315,394 | 7,398,695 | ||||||||||||
Accumulated undistributed net investment income | - | 662 | - | ||||||||||||
Accumulated undistributed net realized gain (loss) on security transactions | (89,416 | ) | (497,765 | ) | 70,746 | ||||||||||
Net unrealized appreciation of investments | 96,790 | 1,976,416 | 1,750,979 | ||||||||||||
Net assets at December 31, 2014 | $ | 1,822,276 | $ | 13,794,707 | $ | 9,220,420 | |||||||||
Class A: | |||||||||||||||
Net assets | $ | 1,620,342 | $ | 11,323,570 | $ | 5,017,310 | |||||||||
Shares authorized | 50,000,000 | 50,000,000 | 50,000,000 | ||||||||||||
Shares outstanding | 177,689 | 939,196 | 348,519 | ||||||||||||
Net asset value and redemption price per share | $ | 9.12 | $ | 12.06 | $ | 14.40 | |||||||||
Maximum offering price per share | $ | 9.57 | $ | 12.66 | $ | 15.28 | |||||||||
Sales load | 4.75 | % | 4.75 | % | 5.75 | % | |||||||||
Class C: | |||||||||||||||
Net assets | $ | 201,934 | $ | 2,471,137 | $ | 4,203,110 | |||||||||
Shares authorized | 50,000,000 | 50,000,000 | 50,000,000 | ||||||||||||
Shares outstanding | 23,077 | 213,142 | 323,612 | ||||||||||||
Net asset value and redemption price per share | $ | 8.75 | $ | 11.59 | $ | 12.99 | |||||||||
Class I: | |||||||||||||||
Net assets | N/A | N/A | N/A | ||||||||||||
Shares authorized | |||||||||||||||
Shares outstanding | |||||||||||||||
Net asset value and redemption price per share | N/A | N/A | N/A | ||||||||||||
See Accompanying Notes to Financial Statements which are an integral part of these financial statements.
58
| Large Cap Value Fund | Mid Cap Value Fund | Small Cap Value Fund | |||||||||||||
Assets | |||||||||||||||
Investment securities | |||||||||||||||
At cost | $ | 5,425,192 | $ | 5,184,233 | $ | 107,720,214 | |||||||||
At fair value | $ | 7,976,929 | $ | 6,934,718 | $ | 139,908,353 | |||||||||
Cash or cash equivalent, at fair value | 51,524 | - | - | ||||||||||||
Accrued income receivable | 15,687 | 1,408 | 21,581 | ||||||||||||
Receivable for capital shares sold | 35,676 | 16,528 | 882,614 | ||||||||||||
Receivable for investments sold | - | - | 4,933,838 | ||||||||||||
Other assets | - | - | 262 | ||||||||||||
Total assets | 8,079,816 | 6,952,654 | 145,746,648 | ||||||||||||
Liabilities | |||||||||||||||
Bank borrowings (Note 7) | - | 48,452 | 9,316,935 | ||||||||||||
Payable for fund shares redeemed | - | 15,116 | 1,631,600 | ||||||||||||
Accounts payable | 14,153 | 13,834 | 236,816 | ||||||||||||
Accounts payable to related parties (Note 3) | 6,086 | 3,600 | 19,271 | ||||||||||||
Total liabilities | 20,239 | 81,002 | 11,204,622 | ||||||||||||
Net Assets | $ | 8,059,577 | $ | 6,871,652 | $ | 134,542,026 | |||||||||
Summary of Shareholders' Equity | |||||||||||||||
Paid in capital | 5,496,365 | 6,325,781 | 97,236,563 | ||||||||||||
Accumulated undistributed net investment income | - | - | - | ||||||||||||
Accumulated undistributed net realized gain (loss) on security transactions | 11,475 | (1,204,614 | ) | 5,117,324 | |||||||||||
Net unrealized appreciation of investments | 2,551,737 | 1,750,485 | 32,188,139 | ||||||||||||
Net assets at December 31, 2014 | $ | 8,059,577 | $ | 6,871,652 | $ | 134,542,026 | |||||||||
Class A: | |||||||||||||||
Net assets | $ | 6,892,116 | $ | 5,980,784 | $ | 122,642,324 | |||||||||
Shares authorized | 50,000,000 | 50,000,000 | 50,000,000 | ||||||||||||
Shares outstanding | 485,914 | 444,438 | 2,755,357 | ||||||||||||
Net asset value and redemption price per share | $ | 14.18 | $ | 13.46 | $ | 44.51 | |||||||||
Maximum offering price per share | $ | 15.05 | $ | 14.28 | $ | 47.23 | |||||||||
Sales load | 5.75 | % | 5.75 | % | 5.75 | % | |||||||||
Class C: | |||||||||||||||
Net assets | $ | 1,167,461 | $ | 890,868 | $ | 10,497,926 | |||||||||
Shares authorized | 50,000,000 | 50,000,000 | 50,000,000 | ||||||||||||
Shares outstanding | 94,252 | 73,674 | 286,926 | ||||||||||||
Net asset value and redemption price per share | $ | 12.39 | $ | 12.09 | $ | 36.59 | |||||||||
Class I: | |||||||||||||||
Net assets | N/A | N/A | $ | 1,401,776 | |||||||||||
Shares authorized | 50,000,000 | ||||||||||||||
Shares outstanding | 26,421 | ||||||||||||||
Net asset value and redemption price per share | N/A | N/A | $ | 53.06 | |||||||||||
59
Pacific Advisors Fund Inc.
Statement of Operations
For the period ended December 31, 2014
| Government Securities Fund | Income and Equity Fund | Balanced Fund | |||||||||||||
Investment Income | |||||||||||||||
Dividends | $ | 12,968 | $ | 266,677 | $ | 92,617 | |||||||||
Interest | 4,852 | 218,953 | 105,005 | ||||||||||||
Total investment income | 17,820 | 485,630 | 197,622 | ||||||||||||
Expenses | |||||||||||||||
Investment management fees (Note 3) | 12,644 | 95,942 | 76,538 | ||||||||||||
Transfer agent fees (Note 3) | 48,446 | 70,070 | 64,850 | ||||||||||||
Fund accounting fees (Note 3) | 21,366 | 63,407 | 50,558 | ||||||||||||
Legal fees | 2,425 | 12,960 | 10,319 | ||||||||||||
Audit fees | 1,651 | 11,125 | 8,902 | ||||||||||||
Registration fees | 21,183 | 24,449 | 25,913 | ||||||||||||
Printing | 611 | 3,055 | 2,444 | ||||||||||||
Custody fees | 6,898 | 7,671 | 7,411 | ||||||||||||
Interest on borrowings | 212 | 38 | 541 | ||||||||||||
Director fees/meetings | 678 | 4,149 | 3,368 | ||||||||||||
Distribution and service (12b-1) fees (Note 3) | 6,577 | 49,979 | 63,077 | ||||||||||||
Other expenses | 2,838 | 15,724 | 12,565 | ||||||||||||
Total expenses, before fees waived | 125,529 | 358,569 | 326,486 | ||||||||||||
Less fees waived (Note 3) | 55,844 | 95,942 | - | ||||||||||||
Net expenses | 69,685 | 262,627 | 326,486 | ||||||||||||
Net Investment Income (Loss) | (51,865 | ) | 223,003 | (128,864 | ) | ||||||||||
Net Realized and Unrealized Gain (Loss) on Investments | |||||||||||||||
Net realized gain (loss) on investments | 42,268 | (7,526 | ) | 492,224 | |||||||||||
Change in net unrealized appreciation (depreciation) on investments | (783 | ) | 555,686 | (1,219,005 | ) | ||||||||||
Net realized and unrealized gain (loss) on investments | 41,485 | 548,160 | (726,781 | ) | |||||||||||
Net Increase (Decrease) in Net Assets Resulting from Operations | $ | (10,380 | ) | $ | 771,163 | $ | (855,645 | ) | |||||||
See Accompanying Notes to Financial Statements which are an integral part of these financial statements.
60
| Large Cap Value Fund | Mid Cap Value Fund | Small Cap Value Fund | |||||||||||||
Investment Income | |||||||||||||||
Dividends | $ | 148,262 | $ | 68,788 | $ | 487,444 | |||||||||
Interest | 15 | 1 | 17 | ||||||||||||
Total investment income | 148,277 | 68,789 | 487,461 | ||||||||||||
Expenses | |||||||||||||||
Investment management fees (Note 3) | 53,105 | 71,804 | 1,477,554 | ||||||||||||
Transfer agent fees (Note 3) | 77,366 | 59,229 | 704,221 | ||||||||||||
Fund accounting fees (Note 3) | 35,928 | 36,348 | 770,397 | ||||||||||||
Legal fees | 7,745 | 7,721 | 218,268 | ||||||||||||
Audit fees | 6,108 | 6,230 | 173,283 | ||||||||||||
Registration fees | 21,697 | 25,199 | 100,268 | ||||||||||||
Printing | 1,833 | 1,833 | 51,332 | ||||||||||||
Custody fees | 6,738 | 7,244 | 41,226 | ||||||||||||
Interest on borrowings | 252 | 618 | 22,021 | ||||||||||||
Director fees/meetings | 2,336 | 2,390 | 66,907 | ||||||||||||
Distribution and service (12b-1) fees (Note 3) | 24,991 | 25,765 | 595,110 | ||||||||||||
Other expenses | 9,137 | 9,187 | 206,709 | ||||||||||||
Total expenses, before fees waived | 247,236 | 253,568 | 4,427,296 | ||||||||||||
Less fees waived (Note 3) | 53,105 | - | - | ||||||||||||
Net expenses | 194,131 | 253,568 | 4,427,296 | ||||||||||||
Net Investment Income (Loss) | (45,854 | ) | (184,779 | ) | (3,939,835 | ) | |||||||||
Net Realized and Unrealized Gain (Loss) on Investments | |||||||||||||||
Net realized gain (loss) on investments | 36,532 | 269,443 | 17,799,597 | ||||||||||||
Change in net unrealized appreciation (depreciation) on investments | 704,309 | (976,275 | ) | (58,208,503 | ) | ||||||||||
Net realized and unrealized gain (loss) on investments | 740,841 | (706,832 | ) | (40,408,906 | ) | ||||||||||
Net Increase (Decrease) in Net Assets Resulting from Operations | $ | 694,987 | $ | (891,611 | ) | $ | (44,348,741 | ) | |||||||
61
Pacific Advisors Fund Inc.
Statements of Changes in Net Assets
Government Securities Fund | Income and Equity Fund | ||||||||||||||||||
| Year ended December 31, 2014 | Year ended December 31, 2013 | Year ended December 31, 2014 | Year ended December 31, 2013 | ||||||||||||||||
| Increase (Decrease) in Net Assets From Operations | |||||||||||||||||||
Net investment income (loss) | $ | (51,865 | ) | $ | (53,912 | ) | $ | 223,003 | $ | 105,221 | |||||||||
Net realized gain (loss) on investments | 42,268 | 22,305 | (7,526 | ) | 157,675 | ||||||||||||||
Change in net unrealized appreciation (depreciation) on investments | (783 | ) | 44,376 | 555,686 | 852,476 | ||||||||||||||
Increase (decrease) in net assets resulting from operations | (10,380 | ) | 12,769 | 771,163 | 1,115,372 | ||||||||||||||
From Distributions to Shareholders | |||||||||||||||||||
Class A: | |||||||||||||||||||
Net investment income | - | - | (196,112 | ) | (92,081 | ) | |||||||||||||
Net capital gains | - | - | - | - | |||||||||||||||
Return of capital | - | - | - | - | |||||||||||||||
Class C: | |||||||||||||||||||
Net investment income | - | - | (26,605 | ) | (8,152 | ) | |||||||||||||
Net capital gains | - | - | - | - | |||||||||||||||
Return of capital | - | - | - | - | |||||||||||||||
Class I: | |||||||||||||||||||
Net investment income | |||||||||||||||||||
Net capital gains | |||||||||||||||||||
Return of capital | |||||||||||||||||||
Decrease in net assets resulting from distributions | - | - | (222,717 | ) | (100,233 | ) | |||||||||||||
From Capital Share Transactions (Note 6) | |||||||||||||||||||
Proceeds from shares sold | 41,597 | 357,237 | 4,371,535 | 6,884,497 | |||||||||||||||
Proceeds from shares purchased by reinvestment of dividends | - | - | 193,524 | 88,260 | |||||||||||||||
Cost of shares repurchased | (314,796 | ) | (462,725 | ) | (2,799,741 | ) | (3,072,137 | ) | |||||||||||
Increase (decrease) in net assets resulting from capital share transactions | (273,199 | ) | (105,488 | ) | 1,765,318 | 3,900,620 | |||||||||||||
Increase (decrease) in net assets | (283,579 | ) | (92,719 | ) | 2,313,764 | 4,915,759 | |||||||||||||
Net Assets | |||||||||||||||||||
Beginning of period | 2,105,855 | 2,198,574 | 11,480,943 | 6,565,184 | |||||||||||||||
End of period | $ | 1,822,276 | $ | 2,105,855 | $ | 13,794,707 | $ | 11,480,943 | |||||||||||
Including undistributed net investment income | $ | - | $ | - | $ | 662 | $ | 5,416 | |||||||||||
See Accompanying Notes to Financial Statements which are an integral part of these financial statements.
62
Balanced Fund | |||||||||||
| Year ended December 31, 2014 | Year ended December 31, 2013 | ||||||||||
| Increase (Decrease) in Net Assets From Operations | |||||||||||
Net investment income (loss) | $ | (128,864 | ) | $ | (136,702 | ) | |||||
Net realized gain (loss) on investments | 492,224 | 942,114 | |||||||||
Change in net unrealized appreciation (depreciation) on investments | (1,219,005 | ) | 1,732,863 | ||||||||
Increase (decrease) in net assets resulting from operations | (855,645 | ) | 2,538,275 | ||||||||
From Distributions to Shareholders | |||||||||||
Class A: | |||||||||||
Net investment income | - | - | |||||||||
Net capital gains | (289,923 | ) | (450,051 | ) | |||||||
Return of capital | - | - | |||||||||
Class C: | |||||||||||
Net investment income | - | - | |||||||||
Net capital gains | (266,984 | ) | (516,508 | ) | |||||||
Return of capital | - | - | |||||||||
Class I: | |||||||||||
Net investment income | |||||||||||
Net capital gains | |||||||||||
Return of capital | |||||||||||
Decrease in net assets resulting from distributions | (556,907 | ) | (966,559 | ) | |||||||
From Capital Share Transactions (Note 6) | |||||||||||
Proceeds from shares sold | 1,503,714 | 873,959 | |||||||||
Proceeds from shares purchased by reinvestment of dividends | 507,337 | 879,476 | |||||||||
Cost of shares repurchased | (1,993,905 | ) | (3,274,852 | ) | |||||||
Increase (decrease) in net assets resulting from capital share transactions | 17,146 | (1,521,417 | ) | ||||||||
Increase (decrease) in net assets | (1,395,406 | ) | 50,299 | ||||||||
Net Assets | |||||||||||
Beginning of period | 10,615,826 | 10,565,527 | |||||||||
End of period | $ | 9,220,420 | $ | 10,615,826 | |||||||
Including undistributed net investment income | $ | - | $ | 15,375 | |||||||
63
Pacific Advisors Fund Inc.
Statements of Changes in Net Assets
Large Cap Value Fund | Mid Cap Value Fund | ||||||||||||||||||
| Year ended December 31, 2014 | Year ended December 31, 2013 | Year ended December 31, 2014 | Year ended December 31, 2013 | ||||||||||||||||
| Increase (Decrease) in Net Assets From Operations | |||||||||||||||||||
Net investment income (loss) | $ | (45,854 | ) | $ | (14,366 | ) | $ | (184,779 | ) | $ | (189,782 | ) | |||||||
Net realized gain (loss) on investments | 36,532 | 387,459 | 269,443 | 183,442 | |||||||||||||||
Change in net unrealized appreciation (depreciation) on investments | 704,309 | 978,296 | (976,275 | ) | 1,754,608 | ||||||||||||||
Increase (decrease) in net assets resulting from operations | 694,987 | 1,351,389 | (891,611 | ) | 1,748,268 | ||||||||||||||
From Distributions to Shareholders | |||||||||||||||||||
Class A: | |||||||||||||||||||
Net investment income | - | - | - | - | |||||||||||||||
Net capital gains | (78,849 | ) | (104,170 | ) | - | - | |||||||||||||
Return of capital | - | - | - | - | |||||||||||||||
Class C: | |||||||||||||||||||
Net investment income | - | - | - | - | |||||||||||||||
Net capital gains | (15,442 | ) | (17,794 | ) | - | - | |||||||||||||
Return of capital | - | - | - | - | |||||||||||||||
Class I: | |||||||||||||||||||
Net investment income | |||||||||||||||||||
Net capital gains | |||||||||||||||||||
Return of capital | |||||||||||||||||||
Decrease in net assets resulting from distributions | (94,291 | ) | (121,964 | ) | - | - | |||||||||||||
From Capital Share Transactions (Note 6) | |||||||||||||||||||
Proceeds from shares sold | 1,756,401 | 678,348 | 1,085,293 | 662,676 | |||||||||||||||
Proceeds from shares purchased by reinvestment of dividends | 84,055 | 115,965 | - | - | |||||||||||||||
Cost of shares repurchased | (651,075 | ) | (305,719 | ) | (584,005 | ) | (503,149 | ) | |||||||||||
Increase (decrease) in net assets resulting from capital share transactions | 1,189,381 | 488,594 | 501,288 | 159,527 | |||||||||||||||
Increase (decrease) in net assets | 1,790,077 | 1,718,019 | (390,323 | ) | 1,907,795 | ||||||||||||||
Net Assets | |||||||||||||||||||
Beginning of period | 6,269,500 | 4,551,481 | 7,261,975 | 5,354,180 | |||||||||||||||
End of period | $ | 8,059,577 | $ | 6,269,500 | $ | 6,871,652 | $ | 7,261,975 | |||||||||||
Including undistributed net investment income | $ | - | $ | - | $ | - | $ | - | |||||||||||
See Accompanying Notes to Financial Statements which are an integral part of these financial statements.
64
Small Cap Value Fund | |||||||||||
| Year ended December 31, 2014 | Year ended December 31, 2013 | ||||||||||
| Increase (Decrease) in Net Assets From Operations | |||||||||||
Net investment income (loss) | $ | (3,939,835 | ) | $ | (2,827,751 | ) | |||||
Net realized gain (loss) on investments | 17,799,597 | 5,025,568 | |||||||||
Change in net unrealized appreciation (depreciation) on investments | (58,208,503 | ) | 61,375,400 | ||||||||
Increase (decrease) in net assets resulting from operations | (44,348,741 | ) | 63,573,217 | ||||||||
From Distributions to Shareholders | |||||||||||
Class A: | |||||||||||
Net investment income | - | - | |||||||||
Net capital gains | (9,943,412 | ) | - | ||||||||
Return of capital | - | - | |||||||||
Class C: | |||||||||||
Net investment income | - | - | |||||||||
Net capital gains | (972,804 | ) | - | ||||||||
Return of capital | - | - | |||||||||
Class I: | |||||||||||
Net investment income | - | - | |||||||||
Net capital gains | (89,404 | ) | - | ||||||||
Return of capital | - | - | |||||||||
Decrease in net assets resulting from distributions | (11,005,620 | ) | - | ||||||||
From Capital Share Transactions (Note 6) | |||||||||||
Proceeds from shares sold | 59,591,254 | 87,929,777 | |||||||||
Proceeds from shares purchased by reinvestment of dividends | 10,270,298 | - | |||||||||
Cost of shares repurchased | (94,154,161 | ) | (29,840,356 | ) | |||||||
Increase (decrease) in net assets resulting from capital share transactions | (24,292,609 | ) | 58,089,421 | ||||||||
Increase (decrease) in net assets | (79,646,970 | ) | 121,662,638 | ||||||||
Net Assets | |||||||||||
Beginning of period | 214,188,996 | 92,526,358 | |||||||||
End of period | $ | 134,542,026 | $ | 214,188,996 | |||||||
Including undistributed net investment income | $ | - | $ | 727,146 | |||||||
65
Pacific Advisors Fund Inc.
Financial Highlights
(For a share outstanding throughout the period)
Government Securities Fund | |||||||||||||||||||||||
Class A | |||||||||||||||||||||||
For the year ended December 31, | |||||||||||||||||||||||
2014 | 2013 | 2012 | 2011 | 2010 | |||||||||||||||||||
Per Share Operating Performance | |||||||||||||||||||||||
Net asset value, beginning of period | $ | 9.16 | $ | 9.09 | $ | 9.13 | $ | 9.13 | $ | 8.99 | |||||||||||||
Income from investing operations | |||||||||||||||||||||||
Net investment income (loss) | (0.28 | ) | (0.20 | ) | (0.17 | ) | (0.02 | ) | 0.05 | ||||||||||||||
Net realized and unrealized gain on securities | 0.24 | 0.27 | 0.13 | 0.02 | 0.14 | ||||||||||||||||||
Total from investment operations | (0.04 | ) | 0.07 | (0.04 | ) | - | 0.19 | ||||||||||||||||
Less distributions | |||||||||||||||||||||||
From net investment income | - | - | - | - | (0.02 | ) | |||||||||||||||||
From net capital gain | - | - | - | - | - | ||||||||||||||||||
From return of capital | - | - | - | - | (0.03 | ) | |||||||||||||||||
Total distributions | - | - | - | - | (0.05 | ) | |||||||||||||||||
Net asset value, end of period | $ | 9.12 | $ | 9.16 | $ | 9.09 | $ | 9.13 | $ | 9.13 | |||||||||||||
Total Investment Return (a) | (0.44 | )% | 0.77 | % | (0.44 | )% | 0.00 | % | 2.16 | % | |||||||||||||
Ratios/Supplemental Data | |||||||||||||||||||||||
Net assets, end of period (000's) | $ | 1,620 | $ | 1,801 | $ | 1,723 | $ | 1,873 | $ | 2,375 | |||||||||||||
Ratio of net investment income (loss) to average net assets | |||||||||||||||||||||||
With expense reductions | (2.58 | )% | (2.39 | )% | (1.82 | )% | (0.54 | )% | 0.49 | % | |||||||||||||
Without expense reductions | (5.45 | )% | (5.09 | )% | (4.14 | )% | (2.39 | )% | (1.10 | )% | |||||||||||||
Ratio of expenses to average net assets | |||||||||||||||||||||||
With expense reductions | 3.50 | % | 3.39 | % | 3.12 | % | 2.42 | % | 2.09 | % | |||||||||||||
Without expense reductions | 6.37 | % | 6.09 | % | 5.44 | % | 4.26 | % | 3.69 | % | |||||||||||||
Fund portfolio turnover rate | 183 | % | 135 | % | 181 | % | 115 | % | 156 | % | |||||||||||||
Class C | |||||||||||||||||||||||
For the year ended December 31, | |||||||||||||||||||||||
2014 | 2013 | 2012 | 2011 | 2010 | |||||||||||||||||||
Per Share Operating Performance | |||||||||||||||||||||||
Net asset value, beginning of period | $ | 8.86 | $ | 8.86 | $ | 8.96 | $ | 9.02 | $ | 8.90 | |||||||||||||
Income from investing operations | |||||||||||||||||||||||
Net investment loss | (1.68 | ) | (1.24 | ) | (0.94 | ) | (0.33 | ) | (0.09 | ) | |||||||||||||
Net realized and unrealized gain on securities | 1.57 | 1.24 | 0.84 | 0.27 | 0.23 | ||||||||||||||||||
Total from investment operations | (0.11 | ) | - | (0.10 | ) | (0.06 | ) | 0.14 | |||||||||||||||
Less distributions | |||||||||||||||||||||||
From net investment income | - | - | - | - | (0.01 | ) | |||||||||||||||||
From net capital gain | - | - | - | - | - | ||||||||||||||||||
From return of capital | - | - | - | - | (0.01 | ) | |||||||||||||||||
Total distributions | - | - | - | - | (0.02 | ) | |||||||||||||||||
Net asset value, end of period | $ | 8.75 | $ | 8.86 | $ | 8.86 | $ | 8.96 | $ | 9.02 | |||||||||||||
Total Investment Return | (1.24 | )% | 0.00 | % | (1.12 | )% | (0.67 | )% | 1.49 | % | |||||||||||||
Ratios/Supplemental Data | |||||||||||||||||||||||
Net assets, end of period (000's) | $ | 202 | $ | 305 | $ | 476 | $ | 1,011 | $ | 1,740 | |||||||||||||
Ratio of net investment loss to average net assets | |||||||||||||||||||||||
With expense reductions | (3.33 | )% | (3.17 | )% | (2.48 | )% | (1.27 | )% | (0.18 | )% | |||||||||||||
Without expense reductions | (6.20 | )% | (5.84 | )% | (4.92 | )% | (3.14 | )% | (1.80 | )% | |||||||||||||
Ratio of expenses to average net assets | |||||||||||||||||||||||
With expense reductions | 4.23 | % | 4.16 | % | 3.85 | % | 3.16 | % | 2.80 | % | |||||||||||||
Without expense reductions | 7.09 | % | 6.82 | % | 6.29 | % | 5.03 | % | 4.42 | % | |||||||||||||
Fund portfolio turnover rate | 183 | % | 135 | % | 181 | % | 115 | % | 156 | % | |||||||||||||
(a) The Fund's maximum sales charge is not included in the total return computation.
See Accompanying Notes to Financial Statements which are an integral part of these financial statements.
66
Pacific Advisors Fund Inc.
Financial Highlights
(For a share outstanding throughout the period)
Income and Equity Fund | |||||||||||||||||||||||
Class A | |||||||||||||||||||||||
For the year ended December 31, | |||||||||||||||||||||||
2014 | 2013 | 2012 | 2011 | 2010 | |||||||||||||||||||
Per Share Operating Performance | |||||||||||||||||||||||
Net asset value, beginning of period | $ | 11.55 | $ | 10.30 | $ | 9.84 | $ | 9.87 | $ | 9.49 | |||||||||||||
Income from investing operations | |||||||||||||||||||||||
Net investment income | 0.21 | 0.10 | 0.15 | 0.21 | 0.19 | ||||||||||||||||||
Net realized and unrealized gain on securities | 0.52 | 1.28 | 0.48 | 0.01 | 0.45 | ||||||||||||||||||
Total from investment operations | 0.73 | 1.38 | 0.63 | 0.22 | 0.64 | ||||||||||||||||||
Less distributions | |||||||||||||||||||||||
From net investment income | (0.22 | ) | (0.13 | ) | (0.17 | ) | (0.25 | ) | (0.26 | ) | |||||||||||||
From net capital gain | - | - | - | - | - | ||||||||||||||||||
From return of capital | - | - | - | - | - | (b) | |||||||||||||||||
Total distributions | (0.22 | ) | (0.13 | ) | (0.17 | ) | (0.25 | ) | (0.26 | ) | |||||||||||||
Net asset value, end of period | $ | 12.06 | $ | 11.55 | $ | 10.30 | $ | 9.84 | $ | 9.87 | |||||||||||||
Total Investment Return (a) | 6.41 | % | 13.40 | % | 6.46 | % | 2.24 | % | 6.88 | % | |||||||||||||
Ratios/Supplemental Data | |||||||||||||||||||||||
Net assets, end of period (000's) | $ | 11,324 | $ | 9,247 | $ | 4,659 | $ | 4,235 | $ | 3,922 | |||||||||||||
Ratio of net investment income to average net assets | |||||||||||||||||||||||
With expense reductions | 1.88 | % | 1.27 | % | 1.56 | % | 2.27 | % | 2.57 | % | |||||||||||||
Without expense reductions | 1.13 | % | 0.52 | % | 0.81 | % | 1.52 | % | 1.81 | % | |||||||||||||
Ratio of expenses to average net assets | |||||||||||||||||||||||
With expense reductions | 1.91 | % | 2.23 | % | 2.68 | % | 2.59 | % | 2.34 | % | |||||||||||||
Without expense reductions | 2.66 | % | 2.98 | % | 3.42 | % | 3.34 | % | 3.09 | % | |||||||||||||
Fund portfolio turnover rate | 13 | % | 20 | % | 29 | % | 16 | % | 21 | % | |||||||||||||
Class C | |||||||||||||||||||||||
For the year ended December 31, | |||||||||||||||||||||||
2014 | 2013 | 2012 | 2011 | 2010 | |||||||||||||||||||
Per Share Operating Performance | |||||||||||||||||||||||
Net asset value, beginning of period | $ | 11.11 | $ | 9.91 | $ | 9.42 | $ | 9.40 | $ | 9.03 | |||||||||||||
Income from investing operations | |||||||||||||||||||||||
Net investment income (loss) | 0.14 | 0.06 | (0.01 | ) | 0.09 | 0.15 | |||||||||||||||||
Net realized and unrealized gain on securities | 0.47 | 1.18 | 0.55 | 0.05 | 0.38 | ||||||||||||||||||
Total from investment operations | 0.61 | 1.24 | 0.54 | 0.14 | 0.53 | ||||||||||||||||||
Less distributions | |||||||||||||||||||||||
From net investment income | (0.13 | ) | (0.04 | ) | (0.05 | ) | (0.12 | ) | (0.16 | ) | |||||||||||||
From net capital gain | - | - | - | - | - | ||||||||||||||||||
From return of capital | - | - | - | - | - | (b) | |||||||||||||||||
Total distributions | (0.13 | ) | (0.04 | ) | (0.05 | ) | (0.12 | ) | (0.16 | ) | |||||||||||||
Net asset value, end of period | $ | 11.59 | $ | 11.11 | $ | 9.91 | $ | 9.42 | $ | 9.40 | |||||||||||||
Total Investment Return | 5.51 | % | 12.55 | % | 5.74 | % | 1.54 | % | 5.95 | % | |||||||||||||
Ratios/Supplemental Data | |||||||||||||||||||||||
Net assets, end of period (000's) | $ | 2,471 | $ | 2,234 | $ | 1,906 | $ | 3,049 | $ | 4,774 | |||||||||||||
Ratio of net investment income to average net assets | |||||||||||||||||||||||
With expense reductions | 1.14 | % | 0.49 | % | 0.80 | % | 1.52 | % | 1.82 | % | |||||||||||||
Without expense reductions | 0.39 | % | (0.26 | )% | 0.05 | % | 0.77 | % | 1.07 | % | |||||||||||||
Ratio of expenses to average net assets | |||||||||||||||||||||||
With expense reductions | 2.66 | % | 3.03 | % | 3.45 | % | 3.33 | % | 3.07 | % | |||||||||||||
Without expense reductions | 3.41 | % | 3.78 | % | 4.20 | % | 4.08 | % | 3.82 | % | |||||||||||||
Fund portfolio turnover rate | 13 | % | 20 | % | 29 | % | 16 | % | 21 | % | |||||||||||||
(a) The Fund's maximum sales charge is not included in the total return computation.
(b) The amount is less than $0.005 and rounded to zero.
See Accompanying Notes to Financial Statements which are an integral part of these financial statements.
67
Pacific Advisors Fund Inc.
Financial Highlights
(For a share outstanding throughout the period)
Balanced Fund | |||||||||||||||||||||||
Class A | |||||||||||||||||||||||
For the year ended December 31, | |||||||||||||||||||||||
2014 | 2013 | 2012 | 2011 | 2010 | |||||||||||||||||||
Per Share Operating Performance | |||||||||||||||||||||||
Net asset value, beginning of period | $ | 16.59 | $ | 14.13 | $ | 13.47 | $ | 14.56 | $ | 14.91 | |||||||||||||
Income from investing operations | |||||||||||||||||||||||
Net investment income (loss) | (0.16 | ) | (0.18 | ) | (0.03 | ) | - | 0.13 | |||||||||||||||
Net realized and unrealized gain (loss) on securities | (1.15 | ) | 4.21 | 1.34 | (0.16 | ) | 1.02 | ||||||||||||||||
Total from investment operations | (1.31 | ) | 4.03 | 1.31 | (0.16 | ) | 1.15 | ||||||||||||||||
Less distributions | - | - | - | - | |||||||||||||||||||
From net investment income | - | - | - | - | (0.01 | ) | |||||||||||||||||
From net capital gain | (0.88 | ) | (1.57 | ) | (0.65 | ) | (0.93 | ) | (1.49 | ) | |||||||||||||
Total distributions | (0.88 | ) | (1.57 | ) | (0.65 | ) | (0.93 | ) | (1.50 | ) | |||||||||||||
Net asset value, end of period | $ | 14.40 | $ | 16.59 | $ | 14.13 | $ | 13.47 | $ | 14.56 | |||||||||||||
Total Investment Return (a) | (7.94 | )% | 28.68 | % | 9.69 | % | (1.14 | )% | 7.71 | % | |||||||||||||
Ratios/Supplemental Data | |||||||||||||||||||||||
Net assets, end of period (000's) | $ | 5,017 | $ | 5,144 | $ | 3,919 | $ | 3,801 | $ | 3,789 | |||||||||||||
Ratio of net investment income (loss) to average net assets | (0.90 | )% | (0.93 | )% | (0.27 | )% | 0.29 | % | 0.55 | % | |||||||||||||
Ratio of expenses to average net assets | 2.84 | % | 3.07 | % | 3.30 | % | 3.13 | % | 2.77 | % | |||||||||||||
Fund portfolio turnover rate | 22 | % | 23 | % | 34 | % | 14 | % | 36 | % | |||||||||||||
Class C | |||||||||||||||||||||||
For the year ended December 31, | |||||||||||||||||||||||
2014 | 2013 | 2012 | 2011 | 2010 | |||||||||||||||||||
Per Share Operating Performance | |||||||||||||||||||||||
Net asset value, beginning of period | $ | 15.18 | $ | 13.13 | $ | 12.66 | $ | 13.84 | $ | 14.35 | |||||||||||||
Income from investing operations | |||||||||||||||||||||||
Net investment loss | (0.40 | ) | (0.54 | ) | (0.39 | ) | (0.15 | ) | (0.06 | ) | |||||||||||||
Net realized and unrealized gain (loss) on securities | (0.91 | ) | 4.16 | 1.51 | (0.10 | ) | 1.04 | ||||||||||||||||
Total from investment operations | (1.31 | ) | 3.62 | 1.12 | (0.25 | ) | 0.98 | ||||||||||||||||
Less distributions | |||||||||||||||||||||||
From net investment income | - | - | - | - | - | (b) | |||||||||||||||||
From net capital gain | (0.88 | ) | (1.57 | ) | (0.65 | ) | (0.93 | ) | (1.49 | ) | |||||||||||||
Total distributions | (0.88 | ) | (1.57 | ) | (0.65 | ) | (0.93 | ) | (1.49 | ) | |||||||||||||
Net asset value, end of period | $ | 12.99 | $ | 15.18 | $ | 13.13 | $ | 12.66 | $ | 13.84 | |||||||||||||
Total Investment Return | (8.68 | )% | 27.75 | % | 8.81 | % | (1.86 | )% | 6.88 | % | |||||||||||||
Ratios/Supplemental Data | |||||||||||||||||||||||
Net assets, end of period (000's) | $ | 4,203 | $ | 5,471 | $ | 6,647 | $ | 10,768 | $ | 18,035 | |||||||||||||
Ratio of net investment loss to average net assets | (1.64 | )% | (1.70 | )% | (0.97 | )% | (0.42 | )% | (0.18 | )% | |||||||||||||
Ratio of expenses to average net assets | 3.58 | % | 3.86 | % | 4.02 | % | 3.83 | % | 3.50 | % | |||||||||||||
Fund portfolio turnover rate | 22 | % | 23 | % | 34 | % | 14 | % | 36 | % | |||||||||||||
(a) The Fund's maximum sales charge is not included in the total return computation.
(b) The amount is less than $0.005 and rounded to zero.
See Accompanying Notes to Financial Statements which are an integral part of these financial statements.
68
Pacific Advisors Fund Inc.
Financial Highlights
(For a share outstanding throughout the period)
Large Cap Value Fund | |||||||||||||||||||||||
Class A | |||||||||||||||||||||||
For the year ended December 31, | |||||||||||||||||||||||
2014 | 2013 | 2012 | 2011 | 2010 | |||||||||||||||||||
Per Share Operating Performance | |||||||||||||||||||||||
Net asset value, beginning of period | $ | 13.05 | $ | 10.34 | $ | 9.30 | $ | 8.98 | $ | 8.33 | |||||||||||||
Income from investing operations | |||||||||||||||||||||||
Net investment income (loss) | 0.02 | 0.03 | 0.04 | 0.11 | (0.06 | ) | |||||||||||||||||
Net realized and unrealized gain on securities | 1.28 | 2.94 | 1.00 | 0.21 | 0.71 | ||||||||||||||||||
Total from investment operations | 1.30 | 2.97 | 1.04 | 0.32 | 0.65 | ||||||||||||||||||
Less distributions | |||||||||||||||||||||||
From net investment income | - | - | - | - | - | ||||||||||||||||||
From net capital gain | (0.17 | ) | (0.26 | ) | - | - | - | ||||||||||||||||
Total distributions | (0.17 | ) | (0.26 | ) | - | - | - | ||||||||||||||||
Net asset value, end of period | $ | 14.18 | $ | 13.05 | $ | 10.34 | $ | 9.30 | $ | 8.98 | |||||||||||||
Total Investment Return (a) | 9.94 | % | 28.72 | % | 11.18 | % | 3.56 | % | 7.80 | % | |||||||||||||
Ratios/Supplemental Data | |||||||||||||||||||||||
Net assets, end of period (000's) | $ | 6,892 | $ | 5,453 | $ | 3,973 | $ | 3,278 | $ | 2,511 | |||||||||||||
Ratio of net investment loss to average net assets | |||||||||||||||||||||||
With expense reductions | (0.55 | )% | (0.17 | )% | (0.18 | )% | (0.66 | )% | (1.32 | )% | |||||||||||||
Without expense reductions | (1.30 | )% | (1.72 | )% | (1.91 | )% | (2.61 | )% | (3.50 | )% | |||||||||||||
Ratio of expenses to average net assets | |||||||||||||||||||||||
With expense reductions | 2.64 | % | 2.47 | % | 2.61 | % | 3.05 | % | 3.64 | % | |||||||||||||
Without expense reductions | 3.39 | % | 4.02 | % | 4.34 | % | 4.99 | % | 5.82 | % | |||||||||||||
Fund portfolio turnover rate | 3 | % | 24 | % | 9 | % | 7 | % | 106 | % | |||||||||||||
Class C | |||||||||||||||||||||||
For the year ended December 31, | |||||||||||||||||||||||
2014 | 2013 | 2012 | 2011 | 2010 | |||||||||||||||||||
Per Share Operating Performance | |||||||||||||||||||||||
Net asset value, beginning of period | $ | 11.50 | $ | 9.20 | $ | 8.34 | $ | 8.12 | $ | 7.58 | |||||||||||||
Income from investing operations | |||||||||||||||||||||||
Net investment income (loss) | 0.68 | 0.32 | (0.69 | ) | (0.42 | ) | (0.17 | ) | |||||||||||||||
Net realized and unrealized gain on securities | 0.38 | 2.24 | 1.55 | 0.64 | 0.71 | ||||||||||||||||||
Total from investment operations | 1.06 | 2.56 | 0.86 | 0.22 | 0.54 | ||||||||||||||||||
Less distributions | |||||||||||||||||||||||
From net investment income | - | - | - | - | - | ||||||||||||||||||
From net capital gain | (0.17 | ) | (0.26 | ) | - | - | - | ||||||||||||||||
Total distributions | (0.17 | ) | (0.26 | ) | - | - | - | ||||||||||||||||
Net asset value, end of period | $ | 12.39 | $ | 11.50 | $ | 9.20 | $ | 8.34 | $ | 8.12 | |||||||||||||
Total Investment Return | 9.18 | % | 27.83 | % | 10.31 | % | 2.71 | % | 7.12 | % | |||||||||||||
Ratios/Supplemental Data | |||||||||||||||||||||||
Net assets, end of period (000's) | $ | 1,167 | $ | 816 | $ | 578 | $ | 630 | $ | 681 | |||||||||||||
Ratio of net investment loss to average net assets | |||||||||||||||||||||||
With expense reductions | (1.29 | )% | (0.92 | )% | (1.01 | )% | (1.53 | )% | (2.03 | )% | |||||||||||||
Without expense reductions | (2.03 | )% | (2.47 | )% | (2.74 | )% | (3.46 | )% | (4.23 | )% | |||||||||||||
Ratio of expenses to average net assets | |||||||||||||||||||||||
With expense reductions | 3.38 | % | 3.22 | % | 3.43 | % | 3.89 | % | 4.37 | % | |||||||||||||
Without expense reductions | 4.13 | % | 4.77 | % | 5.15 | % | 5.82 | % | 6.57 | % | |||||||||||||
Fund portfolio turnover rate | 3 | % | 24 | % | 9 | % | 7 | % | 106 | % | |||||||||||||
(a) The Fund's maximum sales charge is not included in the total return computation.
See Accompanying Notes to Financial Statements which are an integral part of these financial statements.
69
Pacific Advisors Fund Inc.
Financial Highlights
(For a share outstanding throughout the period)
Mid Cap Value Fund | |||||||||||||||||||||||
Class A | |||||||||||||||||||||||
For the year ended December 31, | |||||||||||||||||||||||
2014 | 2013 | 2012 | 2011 | 2010 | |||||||||||||||||||
Per Share Operating Performance | |||||||||||||||||||||||
Net asset value, beginning of period | $ | 15.25 | $ | 11.47 | $ | 10.88 | $ | 11.57 | $ | 8.78 | |||||||||||||
Income from investing operations | |||||||||||||||||||||||
Net investment loss | (0.11 | ) | (0.36 | ) | (0.25 | ) | (0.13 | ) | (0.48 | ) | |||||||||||||
Net realized and unrealized gain (loss) on securities | (1.68 | ) | 4.14 | 0.84 | (0.56 | ) | 3.27 | ||||||||||||||||
Total from investment operations | (1.79 | ) | 3.78 | 0.59 | (0.69 | ) | 2.79 | ||||||||||||||||
Less distributions | |||||||||||||||||||||||
From net investment income | - | - | - | - | - | ||||||||||||||||||
From net capital gain | - | - | - | - | - | ||||||||||||||||||
Total distributions | - | - | - | - | - | ||||||||||||||||||
Net asset value, end of period | $ | 13.46 | $ | 15.25 | $ | 11.47 | $ | 10.88 | $ | 11.57 | |||||||||||||
Total Investment Return (a) | (11.74 | )% | 32.96 | % | 5.42 | % | (5.96 | )% | 31.78 | % | |||||||||||||
Ratios/Supplemental Data | |||||||||||||||||||||||
Net assets, end of period (000's) | $ | 5,981 | $ | 6,058 | $ | 4,500 | $ | 4,052 | $ | 3,672 | |||||||||||||
Ratio of net investment loss to average net assets | (2.46 | )% | (2.88 | )% | (3.01 | )% | (3.11 | )% | (3.39 | )% | |||||||||||||
Ratio of expenses to average net assets | 3.42 | % | 3.69 | % | 4.19 | % | 4.16 | % | 4.35 | % | |||||||||||||
Fund portfolio turnover rate | 22 | % | 15 | % | 24 | % | 12 | % | 18 | % | |||||||||||||
Class C | |||||||||||||||||||||||
For the year ended December 31, | |||||||||||||||||||||||
2014 | 2013 | 2012 | 2011 | 2010 | |||||||||||||||||||
Per Share Operating Performance | |||||||||||||||||||||||
Net asset value, beginning of period | $ | 13.80 | $ | 10.46 | $ | 10.00 | $ | 10.72 | $ | 8.21 | |||||||||||||
Income from investing operations | |||||||||||||||||||||||
Net investment income (loss) | (2.95 | ) | 0.48 | (3.40 | ) | (4.28 | ) | (3.84 | ) | ||||||||||||||
Net realized and unrealized gain on securities | 1.24 | 2.86 | 3.86 | 3.56 | 6.35 | ||||||||||||||||||
Total from investment operations | (1.71 | ) | 3.34 | 0.46 | (0.72 | ) | 2.51 | ||||||||||||||||
Less distributions | |||||||||||||||||||||||
From net investment income | - | - | - | - | - | ||||||||||||||||||
From net capital gain | - | - | - | - | - | ||||||||||||||||||
Total distributions | - | - | - | - | - | ||||||||||||||||||
Net asset value, end of period | $ | 12.09 | $ | 13.80 | $ | 10.46 | $ | 10.00 | $ | 10.72 | |||||||||||||
Total Investment Return | (12.39 | )% | 31.93 | % | 4.60 | % | (6.72 | )% | 30.57 | % | |||||||||||||
Ratios/Supplemental Data | |||||||||||||||||||||||
Net assets, end of period (000's) | $ | 891 | $ | 1,204 | $ | 854 | $ | 1,044 | $ | 1,784 | |||||||||||||
Ratio of net investment loss to average net assets | (3.22 | )% | (3.61 | )% | (3.77 | )% | (3.92 | )% | (3.91 | )% | |||||||||||||
Ratio of expenses to average net assets | 4.17 | % | 4.42 | % | 4.95 | % | 4.91 | % | 4.88 | % | |||||||||||||
Fund portfolio turnover rate | 22 | % | 15 | % | 24 | % | 12 | % | 18 | % | |||||||||||||
(a) The Fund's maximum sales charge is not included in the total return computation.
See Accompanying Notes to Financial Statements which are an integral part of these financial statements.
70
Pacific Advisors Fund Inc.
Financial Highlights
(For a share outstanding throughout the period)
Small Cap Value Fund | |||||||||||||||||||||||
Class A | |||||||||||||||||||||||
For the year ended December 31, | |||||||||||||||||||||||
2014 | 2013 | 2012 | 2011 | 2010 | |||||||||||||||||||
Per Share Operating Performance | |||||||||||||||||||||||
Net asset value, beginning of period | $ | 61.41 | $ | 38.50 | $ | 34.42 | $ | 31.68 | $ | 26.37 | |||||||||||||
Income from investing operations | |||||||||||||||||||||||
Net investment income (loss) | (2.29 | ) | 1.44 | (1.70 | ) | (1.35 | ) | (1.87 | ) | ||||||||||||||
Net realized and unrealized gain (loss) on securities | (10.99 | ) | 21.47 | 5.78 | 4.09 | 7.18 | |||||||||||||||||
Total from investment operations | (13.28 | ) | 22.91 | 4.08 | 2.74 | 5.31 | |||||||||||||||||
Less distributions | |||||||||||||||||||||||
From net investment income | - | - | - | - | - | ||||||||||||||||||
From net capital gain | (3.62 | ) | - | - | - | - | |||||||||||||||||
From return of capital | - | - | - | - | - | ||||||||||||||||||
Total distributions | (3.62 | ) | - | - | - | - | |||||||||||||||||
Net asset value, end of period | $ | 44.51 | $ | 61.41 | $ | 38.50 | $ | 34.42 | $ | 31.68 | |||||||||||||
Total Investment Return (a) | (21.60 | )% | 59.51 | % | 11.85 | % | 8.65 | % | 20.14 | % | |||||||||||||
Ratios/Supplemental Data | |||||||||||||||||||||||
Net assets, end of period (000's) | $ | 122,642 | $ | 199,163 | $ | 85,607 | $ | 88,323 | $ | 92,830 | |||||||||||||
Ratio of net investment loss to average net assets | (1.95 | )% | (1.93 | )% | (2.06 | )% | (2.31 | )% | (2.14 | )% | |||||||||||||
Ratio of expenses to average net assets | 2.19 | % | 2.31 | % | 2.71 | % | 2.88 | % | 2.66 | % | |||||||||||||
Fund portfolio turnover rate | 16 | % | 9 | % | 12 | % | 9 | % | 9 | % | |||||||||||||
Class C | |||||||||||||||||||||||
For the year ended December 31, | |||||||||||||||||||||||
2014 | 2013 | 2012 | 2011 | 2010 | |||||||||||||||||||
Per Share Operating Performance | |||||||||||||||||||||||
Net asset value, beginning of period | $ | 51.70 | $ | 32.65 | $ | 29.41 | $ | 27.26 | $ | 22.87 | |||||||||||||
Income from investing operations | |||||||||||||||||||||||
Net investment income (loss) | (1.15 | ) | 3.10 | (2.53 | ) | (6.46 | ) | (3.31 | ) | ||||||||||||||
Net realized and unrealized gain (loss) on securities | (10.34 | ) | 15.95 | 5.77 | 8.61 | 7.70 | |||||||||||||||||
Total from investment operations | (11.49 | ) | 19.05 | 3.24 | 2.15 | 4.39 | |||||||||||||||||
Less distributions | |||||||||||||||||||||||
From net investment income | - | - | - | - | - | ||||||||||||||||||
From net capital gain | (3.62 | ) | - | - | - | - | |||||||||||||||||
From return of capital | - | - | - | - | - | ||||||||||||||||||
Total distributions | (3.62 | ) | - | - | - | - | |||||||||||||||||
Net asset value, end of period | $ | 36.59 | $ | 51.70 | $ | 32.65 | $ | 29.41 | $ | 27.26 | |||||||||||||
Total Investment Return | (22.19 | )% | 58.35 | % | 11.02 | % | 7.89 | % | 19.20 | % | |||||||||||||
Ratios/Supplemental Data | |||||||||||||||||||||||
Net assets, end of period (000's) | $ | 10,498 | $ | 14,646 | $ | 6,912 | $ | 6,949 | $ | 11,355 | |||||||||||||
Ratio of net investment loss to average net assets | (2.70 | )% | (2.69 | )% | (2.80 | )% | (3.05 | )% | (2.89 | )% | |||||||||||||
Ratio of expenses to average net assets | 2.95 | % | 3.08 | % | 3.45 | % | 3.62 | % | 3.40 | % | |||||||||||||
Fund portfolio turnover rate | 16 | % | 9 | % | 12 | % | 9 | % | 9 | % | |||||||||||||
(a) The Fund's maximum sales charge is not included in the total return computation.
See Accompanying Notes to Financial Statements which are an integral part of these financial statements.
71
Pacific Advisors Fund Inc.
Financial Highlights
(For a share outstanding throughout the period)
Small Cap Value Fund | |||||||||||||||||||||||
Class I | |||||||||||||||||||||||
For the year ended December 31, | |||||||||||||||||||||||
2014 | 2013 | 2012 | 2011 | 2010 | |||||||||||||||||||
Per Share Operating Performance | |||||||||||||||||||||||
Net asset value, beginning of period | $ | 72.10 | $ | 45.13 | $ | 39.15 | $ | 35.95 | $ | 29.86 | |||||||||||||
Income from investing operations | |||||||||||||||||||||||
Net investment income (loss) | 9.85 | 431.95 | (120.29 | ) | (0.77 | ) | (0.60 | ) | |||||||||||||||
Net realized and unrealized gain (loss) on securities | (25.27 | )* | (404.98 | )* | 126.27 | * | 3.97 | 6.69 | |||||||||||||||
Total from investment operations | (15.42 | ) | 26.97 | 5.98 | 3.20 | 6.09 | |||||||||||||||||
Less distributions | |||||||||||||||||||||||
From net investment income | - | - | - | - | - | ||||||||||||||||||
From net capital gain | (3.62 | ) | - | - | - | - | |||||||||||||||||
From return of capital | - | - | - | - | - | ||||||||||||||||||
Total distributions | (3.62 | ) | - | - | - | - | |||||||||||||||||
Net asset value, end of period | $ | 53.06 | $ | 72.10 | $ | 45.13 | $ | 39.15 | $ | 35.95 | |||||||||||||
Total Investment Return | (21.36 | )% | 59.76 | % | 15.27 | % | 8.90 | % | 20.40 | % | |||||||||||||
Ratios/Supplemental Data | |||||||||||||||||||||||
Net assets, end of period (000's) | $ | 1,402 | $ | 380 | $ | 7 | $ | 6 | $ | 6 | |||||||||||||
Ratio of net investment loss to average net assets | (1.77 | )% | (1.93 | )% | (2.02 | )% | (2.08 | )% | (1.97 | )% | |||||||||||||
Ratio of expenses to average net assets | 2.03 | % | 2.06 | % | 2.63 | % | 2.65 | % | 2.50 | % | |||||||||||||
Fund portfolio turnover rate | 16 | % | 9 | % | 12 | % | 9 | % | 9 | % | |||||||||||||
* Numbers reflected significant subscription and redemption activity in Class I during the period.
See Accompanying Notes to Financial Statements which are an integral part of these financial statements.
72
Pacific Advisors Fund Inc.
Notes to Financial Statements
December 31, 2014
Note 1. Organization
Pacific Advisors Fund Inc. (the "Company") is an open-end diversified investment management company registered under the Investment Company Act of 1940 ("the 40 Act"), as amended. The Company currently offers six Funds: Government Securities Fund, Income and Equity Fund, Balanced Fund, Large Cap Value Fund, Mid Cap Value Fund and Small Cap Value Fund (individually, a "Fund," or collectively, the "Funds"). Each Fund is a separate investment portfolio of the Company with a distinct investment objective, investment program, policies and restrictions.
The Government Securities Fund seeks to provide high current income, preservation of capital, and rising future income, consistent with prudent investment risk. The Income and Equity Fund seeks to provide current income and, secondarily, long-term capital appreciation. The Balanced Fund seeks to achieve long-term capital appreciation and income consistent with reduced risk. The Large Cap Value Fund seeks to achieve long-term capital appreciation. The Mid Cap Value Fund seeks to achieve long-term capital appreciation. The Small Cap Value Fund seeks to provide capital appreciation through investment in small capitalization companies.
The Funds offer Class A and Class C shares. In addition to Class A and Class C shares, the Small Cap Value Fund also offers Class I shares. Each Class has equal rights as to assets and voting privileges except that Class A and Class C each has exclusive voting rights with respect to its distribution plan. Investment income, realized and unrealized capital gains and losses, and the common expenses of each Fund are allocated on a pro rata basis to each Class based on the relative net assets of each Class to the total net assets of the Fund. Each Class of shares differs in its respective service and distribution expenses and may differ in its transfer agent, registration, and certain other Class-specific fees and expenses.
The Company enters into contracts that contain a variety of indemnifications. The Company's maximum exposure under these arrangements is unknown. However, the Company has not had prior claims or losses pursuant to these contracts and expects the risk of loss to be remote.
Note 2. Significant Accounting Policies
A. Security Valuation and Fair Value Measurement. Securities, including American Depository Receipts (ADRs), listed on a national securities exchange and certain over-the-counter ("OTC") issues traded on the NASDAQ national market system are valued at the last quoted sale price at the close of the New York Stock Exchange. OTC issues not quoted on the NASDAQ system, and other equity securities for which no sale price is available, are valued at the last bid price as obtained from published sources or real time quote services, where available, and otherwise from brokers who are market makers for such securities. For securities that mature in 60 days or less, the Funds may utilize the amortized cost method of valuation if it is reasonable to conclude it approximates fair value. In determining the fair value of other debt securities, Pacific Global Investment Management Company, Inc. (the "Investment Manager") utilizes independent pricing services approved by the Board of Directors using one or more of the following valuation techniques:
(1) a matrix pricing approach that considers market inputs including, in approximate order of priority, the following: benchmark yields, reported trades, broker/dealer quotes, issuer spreads, two-sided markets, benchmark securities, bids, offers and reference data including market research publications; market indicators, industry and economic events. Evaluators may prioritize inputs differently on any given day for any security based on market conditions, and not all inputs listed are available for use in the evaluation process for each security evaluation on any given day; (2) a comparison of the value of the borrower's outstanding equity and debt to that of comparable public companies; (3) a discounted cash flow analysis. Fair value determinations are made by the Investment Manager based on the Company's Fair Value Procedure, as adopted by the Board of Directors. In conducting its assessment and analysis for purpose of determining fair value, the Investment Manager uses its discretion and judgment in considering and appraising the relevant factors, including examining the source and nature of the quotations, to validate that the quotations and prices are representative of fair value.
Various inputs are used to determine the fair value of each Fund's investments. For financial statements, these inputs are summarized in the three broad levels listed below. Level 1 inputs are based on quoted prices in active markets for identical securities. Level 2 inputs are based on significant observable market inputs, such as quoted prices for similar securities and quoted prices in inactive markets. Level 3 inputs are significant unobservable inputs that reflect the Fund's own assumptions in determining the fair value of investments. The valuation levels are not necessarily an indication of the risk associated with investing in those securities.
73
Pacific Advisors Fund Inc.
Notes to Financial Statements
December 31, 2014
The following is a summary of the inputs used to value each Fund's investment securities and cash and cash equivalents as of December 31, 2014.
| Government Securities Fund | Income and Equity Fund | Balanced Fund | Large Cap Value Fund | Mid Cap Value Fund | Small Cap Value Fund | ||||||||||||||||||||||
Level 1 - Quoted Prices | |||||||||||||||||||||||||||
Common Stock | |||||||||||||||||||||||||||
Energy | $ | 22,436 | $ | 343,470 | $ | 933,170 | $ | 303,908 | $ | 748,712 | $ | 23,513,750 | |||||||||||||||
Materials | - | 221,820 | - | - | 133,590 | - | |||||||||||||||||||||
Industrials | - | 814,853 | 2,235,989 | 1,601,686 | 3,034,665 | 69,931,733 | |||||||||||||||||||||
Consumer Discretionary | 23,425 | 681,820 | 1,465,725 | 1,461,867 | 2,417,693 | 25,127,150 | |||||||||||||||||||||
Consumer Staples | 97,701 | 1,316,685 | 522,493 | 1,181,744 | 143,360 | 5,084,800 | |||||||||||||||||||||
Health Care | 48,510 | 609,505 | 83,580 | 273,451 | - | - | |||||||||||||||||||||
Financials | - | 408,595 | 754,180 | 1,519,328 | 316,618 | 10,728,520 | |||||||||||||||||||||
Information Technology | 23,225 | 761,293 | 468,513 | 1,634,945 | 140,080 | - | |||||||||||||||||||||
Telecommunication Services | 26,872 | 519,967 | - | - | - | 5,522,400 | |||||||||||||||||||||
Utilities | 80,662 | 782,260 | - | - | - | - | |||||||||||||||||||||
Preferred Stock | |||||||||||||||||||||||||||
Financials | - | 77,400 | - | - | - | - | |||||||||||||||||||||
Level 1 Total | 322,831 | 6,537,668 | 6,463,650 | 7,976,929 | 6,934,718 | 139,908,353 | |||||||||||||||||||||
Level 2 - Other significant observable inputs | |||||||||||||||||||||||||||
Bonds and notes | |||||||||||||||||||||||||||
Corporate Bonds | - | 6,593,527 | 2,647,909 | - | - | - | |||||||||||||||||||||
U.S. Government Fixed Income Securities | 1,499,633 | - | - | - | - | - | |||||||||||||||||||||
Short Term Investments | |||||||||||||||||||||||||||
Money Market | 1,528 | 585,950 | 77,433 | 51,524 | - | - | |||||||||||||||||||||
Level 2 Total | 1,501,161 | 7,179,477 | 2,725,342 | 51,524 | - | - | |||||||||||||||||||||
Level 3 - Significant unobservable inputs | - | - | - | - | - | - | |||||||||||||||||||||
Total Investments | $ | 1,823,992 | $ | 13,717,145 | $ | 9,188,992 | $ | 8,028,453 | $ | 6,934,718 | $ | 139,908,353 | |||||||||||||||
Equity securities (common and preferred stock) that are actively traded and market priced are classified as Level 1 securities. All fixed income securities are classified as Level 2 securities. The Funds had no Level 3 holdings during the year ended December 31, 2014. In addition, the Funds are required to disclose the amounts of significant transfers between Level 1 and Level 2 of the fair value hierarchy and the reasons for these transfers. The Investment Manager has evaluated the Funds' positions for the year ended December 31, 2014, and determined that, for purposes of fair value pricing measurement, there were no transfers between Level 1 and Level 2.
B. Cash and Cash Equivalents. The Company considers all highly liquid financial instruments with maturities of less than three months when acquired to be cash equivalents.
C. Security Transactions and Investment Income. Security transactions are accounted for on the trade date. The cost of investments sold is determined by use of the specific identification method for both financial reporting and federal income tax purposes. Dividends are recorded on the ex-dividend date. Interest income is recorded on an accrual basis. Premium or discount on debt securities are amortized using the effective interest amortization method.
D. Dividends and Distributions to Shareholders. The Government Securities Fund and Income and Equity Fund declare and distribute dividends of their net investment income, if any, quarterly. The Balanced Fund, Large Cap Value Fund, Mid Cap Value Fund and Small Cap Value Fund declare and distribute dividends of their net investment income, if any, annually. In addition, each Fund declares and distributes a capital gain dividend, if any, annually. The Board of Directors determines the amount and timing of such payments.
E. Federal Income Tax. The Company intends to comply with the requirements of Subchapter M of the Internal Revenue Code applicable to regulated investment companies and to distribute substantially all of their taxable income to their shareholders. Therefore, no federal income tax provision is required.
Management has analyzed the Funds' tax positions taken on federal income tax returns for all open tax years and for the year ended December 31, 2014 and has concluded that no provision for income tax is required in the Funds' financial statements. Tax years 2011, 2012, 2013 and 2014 are still subject to examination by major federal jurisdictions. Tax years 2010, 2011, 2012, 2013 and 2014 are still subject to examination by major state jurisdictions.
74
Pacific Advisors Fund Inc.
Notes to Financial Statements
December 31, 2014
The Funds recognize interest and penalties, if any, related to unrecognized tax benefits as income tax expense in the Statement of Operations. During the period, the Funds did not incur any interest or penalties.
At December 31, 2014, components of distributable earnings (accumulated deficits) on a tax basis were as follows:
| Government Securities Fund | Income and Equity Fund | Balanced Fund | Large Cap Value Fund | Mid Cap Value Fund | Small Cap Value Fund | ||||||||||||||||||||||
Undistributed ordinary income | $ | - | $ | 662 | $ | - | $ | - | $ | - | $ | - | |||||||||||||||
Undistributed long-term gains | - | - | 70,746 | 12,359 | - | 5,397,013 | |||||||||||||||||||||
Capital loss carry forward* | (89,416 | ) | (497,765 | ) | - | - | (1,182,831 | ) | - | ||||||||||||||||||
Post October Loss | - | - | - | - | (21,783 | ) | - | ||||||||||||||||||||
| Net unrealized appreciation on investments | 96,790 | 1,976,416 | 1,750,979 | 2,550,853 | 1,750,485 | 31,908,450 | |||||||||||||||||||||
Accumulated earnings | $ | 7,374 | $ | 1,479,313 | $ | 1,821,725 | $ | 2,563,212 | $ | 545,871 | $ | 37,305,463 | |||||||||||||||
The difference between book basis and tax basis unrealized appreciation (depreciation) is attributable primarily to the tax deferral of losses on wash sales and characterization of certain income items. The Funds intend to treat post October losses (net capital losses incurred for the period subsequent to October 31, 2014 through the fiscal year end December 31, 2014) as having been incurred in the next fiscal year.
The Funds intend to utilize provisions of the federal income tax laws which allow them to carry a realized capital loss forward for eight years following the year of the loss and offset such losses against any future realized capital gains. During the current fiscal year, the following capital losses carried forward have been utilized:
| Government Securities Fund | Income and Equity Fund | Balanced Fund | Large Cap Value Fund | Mid Cap Value Fund | Small Cap Value Fund | ||||||||||||||||||||||
Capital loss carryforward utilized | $ | 42,268 | - | - | - | $ | 243,320 | $ | 1,798,458 | ||||||||||||||||||
* As of December 31, 2014, the following Funds had accumulated net realized losses on investment transactions that represent capital loss carryforwards for federal income tax purposes, which expire as follows:
Capital losses expiring in: | |||||||||||||||||||||||
2015 | 2016 | 2017 | 2018 | Total | |||||||||||||||||||
Government Securities Fund | $ | 1,178 | $ | 9,585 | $ | 73,971 | $ | 4,682 | $ | 89,416 | |||||||||||||
Income and Equity Fund | - | 102,173 | 388,066 | - | 490,239 | ||||||||||||||||||
Balanced Fund | - | - | - | - | - | ||||||||||||||||||
Large Cap Value Fund | - | - | - | - | - | ||||||||||||||||||
Mid Cap Value Fund | - | 542,664 | 640,167 | - | 1,182,831 | ||||||||||||||||||
Small Cap Value Fund | - | - | - | - | - | ||||||||||||||||||
During the year ended December 31, 2014, the Government Securities Fund had a capital loss carryforward in the amount of $46,376 that expired.
The Regulated Investment Company Modernization Act of 2010 (the "Act") changed various technical rules governing the tax treatment of regulated investment companies ("RICs") including the Funds. Under the Act, each Fund is permitted to carry forward capital losses incurred in taxable years beginning in 2011 for an unlimited period. However, any losses incurred during those future taxable years will be required to be utilized prior to the losses incurred in pre-enactment taxable years, which carry an expiration date. As a result of this ordering rule, pre-enactment capital loss carryforwards may be more likely to expire unused. Additionally, post-enactment capital loss carryforwards will retain their character as either short-term or long-term capital losses rather than being considered all short-term as permitted under previous regulation.
Finally, the Act contains several provisions aimed at preserving the character of distributions made by a fiscal year RIC during the portion of its taxable year ending after October 31 or December 31, reducing the circumstances under which a RIC might be required to file amended Forms 1099 to restate previously reported distributions.
75
Pacific Advisors Fund Inc.
Notes to Financial Statements
December 31, 2014
During the current fiscal year, the following capital losses carried forward under the provisions of the Act were utilized:
| Loss Carryforward Utilized | |||||||||||
Short Term | Long Term | ||||||||||
Mid Cap Value Fund | $ | 27,116 | $ | 20,790 | |||||||
Losses that will be carried forward under the provisions of the Act are as follows:
| Loss Carryforward Character | |||||||||||
Short Term | Long Term | ||||||||||
Income and Equity Fund | $ | 7,526 | - | ||||||||
F. Reclassification of Capital Accounts. Distributions of net investment income and realized gains are determined in accordance with income tax regulations which may differ from GAAP. These differences are due to differing treatments for items such as net operating losses, reclassification of dividends and return of capital. To the extent that these differences are permanent in nature, reclassifications are made among the net asset accounts on the Statement of Assets and Liabilities. Net assets and net asset value per share are not affected by this classification.
For the year ended December 31, 2014, reclassifications among the components of net assets are as follows:
| Accumulated Undistributed Net Investment Income | Paid in Capital | Accumulated Capital Gain/(Loss) | |||||||||||||
Government Securities Fund | $ | 51,865 | $ | (98,241 | ) | $ | 46,376 | ||||||||
Income and Equity Fund | (5,040 | ) | - | - | |||||||||||
Balanced Fund | 113,489 | (137,144 | ) | 23,655 | |||||||||||
Large Cap Value Fund | 45,853 | (45,853 | ) | - | |||||||||||
Mid Cap Value Fund | 184,779 | (184,779 | ) | - | |||||||||||
Small Cap Value Fund | 3,212,690 | (3,939,836 | ) | 259,890 | |||||||||||
The reclassifications were due to net investment losses incurred by the Funds, which are not permitted to be carried forward for tax purposes and differing book and tax treatment of certain securities.
G. Use of Estimates. The preparation of financial statements in conformity with U.S. GAAP requires management to make estimates and assumptions that affect the reported amounts in the financial statements and footnotes. Actual results could differ from those estimates.
Note 3. Investment Management, Distributor and Other Related Party Transactions
The Company and the Funds have entered into investment management agreements ("Management Agreements") with the Investment Manager.
The Management Agreements provide for investment management fees, payable monthly, and calculated at the maximum annual rate of 0.65% of average net assets for the Government Securities Fund, 0.75% of average net assets for the Income and Equity, Balanced, Large Cap Value and Small Cap Value Funds and 1.00% of average net assets for the Mid Cap Value Fund.
In accordance with Expense Limitation Agreements with the Company, the Investment Manager waives its respective management fees to the extent that the actual operating expenses of the following Funds exceed the following thresholds:
Class A | Class C | ||||||||||
Government Securities Fund | 1.65 | % | 2.40 | % | |||||||
Income and Equity Fund | 1.95 | % | 2.70 | % | |||||||
Large Cap Value Fund | 2.65 | % | 3.40 | % | |||||||
For the Government Securities Fund only, if net expenses exceed the above thresholds after waiver of the entire management fee, Pacific Global Investor Services, Inc. ("PGIS"), Transfer Agent for the Company and a wholly-owned subsidiary of the Investment Manager, will waive its transfer agency fee to the extent necessary to reduce Class expenses to the above thresholds. This agreement may be terminated by either party upon 90 days prior written notice. For the Large Cap Value Fund only, if net expenses exceed the above thresholds after waiver of the entire management fee, PGIS will waive its transfer agency fee through December 31, 2014 to
76
Pacific Advisors Fund Inc.
Notes to Financial Statements
December 31, 2014
the extent necessary to reduce Class expenses to the above thresholds. The Transfer Agent does not, however, waive out of pocket expenses.
On August 8, 2014, the Company's Board of Directors approved an amendment to, and continuation of, the Expense Limitation Agreement for the Large Cap Value Fund. Effective January 1, 2015, PGIS will no longer be a party to the Expense Limitation Agreement or be required to waive any portion of its transfer agent fees.
Pursuant to the Expense Limitation Agreements, providing for the voluntary waiver of fees and the assumption of expenses by the Investment Manager and Transfer Agent, the following amounts were waived for the year ended December 31, 2014.
| Management Fees Waived | Transfer Agent Fees Waived | Total | |||||||||||||
Government Securities Fund | $ | 12,644 | $ | 43,200 | $ | 55,844 | |||||||||
Income and Equity Fund | 95,942 | N/A | 95,942 | ||||||||||||
Large Cap Value Fund | 53,105 | N/A | 53,105 | ||||||||||||
The Investment Manager does not have any rights to recover fees it waives or expenses it may reimburse, with respect to any of the Funds.
For the year ended December 31, 2014, Pacific Global Fund Distributors, Inc. ("PGFD"), the principal underwriter for the Company and a wholly-owned subsidiary of the Investment Manager, received commissions on sales of capital stock, after deducting amounts allowed to authorized distributors as commissions. In addition, PGFD, as a registered broker-dealer, may act as broker for the Funds, in conformity with Rule 17e-1 under the Investment Company Act of 1940. The Company's Board of Directors has approved procedures for evaluating the reasonableness of commissions paid to PGFD and periodically reviews these procedures. PGFD will not act as principal in effecting any portfolio transactions for the Funds. The amounts of commissions are as follows:
| Underwriting Fees Retained | Commissions Retained | Brokerage Commissions Received (Paid) | |||||||||||||
Government Securities Fund | $ | 8 | $ | 8 | $ | (498 | ) | ||||||||
Income and Equity Fund | 589 | 18 | 90 | ||||||||||||
Balanced Fund | 1,253 | 2,064 | (427 | ) | |||||||||||
Large Cap Value Fund | 3,616 | 2,470 | 435 | ||||||||||||
Mid Cap Value Fund | 2,858 | 663 | 1,008 | ||||||||||||
Small Cap Value Fund | 60,203 | 4,256 | 15,756 | ||||||||||||
The Company has also entered into separate agreements with PGIS that provide for transfer agent fees at a rate of $21 per year per open account and $3.50 per year per closed account, with a minimum charge of $1,800 per month per class for each fund; fund accounting fees equal to the greater of $1,500 or three basis points for the first hundred million in net assets and one basis point on the balance of net assets for each fund per month; and annual administrative agent fees of five basis points of average daily net assets of each fund subject to a maximum annual fee of $50,000 per fund. The fee is computed and payable monthly.
On the Statement of Assets and Liabilities, "Accounts payable to related parties" consist of transfer agent fees payable to PGIS.
The Company has adopted a plan of distribution whereby the Funds may pay a service fee to qualified recipients in an amount up to 0.25% per annum of each Fund's average daily net assets for Class A shares. The Company has also adopted a plan of distribution whereby the Funds may pay a service fee to qualified recipients in an amount up to 0.25% per annum of each Fund's average daily net assets for Class C shares and a distribution fee in an amount up to 0.75% per annum of each Fund's average daily net assets for Class C shares. The Company has not adopted a plan of distribution for Class I Shares.
For the year ended December 31, 2014, total distribution and/or service (12b-1) fees were:
Class A | Class C | Total | |||||||||||||
Government Securities Fund | $ | 4,292 | $ | 2,285 | $ | 6,577 | |||||||||
Income and Equity Fund | 25,982 | 23,997 | 49,979 | ||||||||||||
Balanced Fund | 12,991 | 50,086 | 63,077 | ||||||||||||
Large Cap Value Fund | 15,272 | 9,719 | 24,991 | ||||||||||||
Mid Cap Value Fund | 15,346 | 10,419 | 25,765 | ||||||||||||
Small Cap Value Fund | 455,959 | 139,151 | 595,110 | ||||||||||||
77
Pacific Advisors Fund Inc.
Notes to Financial Statements
December 31, 2014
Note 4. Purchase and Sales of Securities
The following summarizes purchases and sales of investment securities, other than short-term investments, and aggregate gross unrealized appreciation and depreciation on a tax basis by each Fund for the period ended and as of December 31, 2014. The difference between book basis and tax basis unrealized appreciation is attributable primarily to the tax deferral of losses on wash sales.
| Year ended December 31, 2014 | As of December 31, 2014 | ||||||||||||||||||||||||||
| Cost of Purchases | Proceeds From Sales | Tax Cost of Securities | Gross Unrealized Appreciation | Gross Unrealized Depreciation | Net Unrealized Appreciation | ||||||||||||||||||||||
Government Securities Fund | $ | 3,557,161 | $ | 3,727,545 | $ | 1,725,674 | $ | 97,202 | $ | 412 | $ | 96,790 | |||||||||||||||
Income and Equity Fund | 3,540,081 | 1,608,888 | 11,154,779 | 2,091,796 | 115,380 | 1,976,416 | |||||||||||||||||||||
Balanced Fund | 2,282,722 | 2,962,979 | 7,360,580 | 2,004,540 | 253,561 | 1,750,979 | |||||||||||||||||||||
Large Cap Value Fund | 1,212,019 | 210,295 | 5,426,076 | 2,634,082 | 83,229 | 2,550,853 | |||||||||||||||||||||
Mid Cap Value Fund | 2,037,432 | 1,609,540 | 5,184,233 | 2,511,124 | 760,639 | 1,750,485 | |||||||||||||||||||||
Small Cap Value Fund | 32,272,982 | 64,106,463 | 107,999,903 | 50,047,408 | 18,138,958 | 31,908,450 | |||||||||||||||||||||
Note 5. Distributions to Shareholders
The tax character of distributions paid during 2014 and 2013 was as follows:
| Government Securities Fund | Income and Equity Fund | Balanced Fund | Large Cap Value Fund | Mid Cap Value Fund | Small Cap Value Fund | ||||||||||||||||||||||
Year ended December 31, 2014 | |||||||||||||||||||||||||||
Distributions paid from: | |||||||||||||||||||||||||||
Ordinary Income | $ | - | $ | 222,717 | $ | - | $ | - | $ | - | $ | - | |||||||||||||||
Long-Term Capital Gain | - | - | 556,907 | 94,291 | - | 11,005,620 | |||||||||||||||||||||
Return of Capital | - | - | - | - | - | - | |||||||||||||||||||||
Total Distributions | $ | - | $ | 222,717 | $ | 556,907 | $ | 94,291 | $ | - | $ | 11,005,620 | |||||||||||||||
Year ended December 31, 2013 | |||||||||||||||||||||||||||
Distributions paid from: | |||||||||||||||||||||||||||
Ordinary Income | $ | - | $ | 100,233 | $ | 122,053 | $ | - | $ | - | $ | - | |||||||||||||||
Long-Term Capital Gain | - | - | 844,506 | 121,964 | - | - | |||||||||||||||||||||
Return of Capital | - | - | - | - | - | - | |||||||||||||||||||||
Total Distributions | $ | - | $ | 100,233 | $ | 966,559 | $ | 121,964 | $ | - | $ | - | |||||||||||||||
Note 6. Capital Share Transactions
A 2% redemption fee is assessed on shares of the Government Securities Fund or Income and Equity Fund sold or exchanged within 30 days of purchase or shares of the Balanced Fund, Large Cap Value Fund, Mid Cap Value Fund or Small Cap Value Fund sold or exchanged within 180 days of purchase and is retained in each Fund. The redemption fees collected through December 31, 2014 are included in the dollar amount of shares sold in the table below. The amount of the increase is as follows:
Class A | Class C | Class I | |||||||||||||
Government Securities Fund | $ | - | $ | - | N/A | ||||||||||
Income and Equity Fund | 156 | 36 | N/A | ||||||||||||
Balanced Fund | 538 | 524 | N/A | ||||||||||||
Large Cap Value Fund | 420 | 70 | N/A | ||||||||||||
Mid Cap Value Fund | 8 | 1 | N/A | ||||||||||||
Small Cap Value Fund | 103,264 | 7,852 | $ | 509 | |||||||||||
78
Pacific Advisors Fund Inc.
Notes to Financial Statements
December 31, 2014
| Year ended December 31, 2014 | Year ended December 31, 2013 | ||||||||||||||||||
Shares | Amount | Shares | Amount | ||||||||||||||||
Government Securities Fund | |||||||||||||||||||
Class A | |||||||||||||||||||
Shares sold | 4,544 | $ | 41,597 | 26,886 | $ | 246,630 | |||||||||||||
Reinvestment of distributions | - | - | - | - | |||||||||||||||
4,544 | 41,597 | 26,886 | 246,630 | ||||||||||||||||
Shares repurchased | (23,494 | ) | (214,588 | ) | (19,765 | ) | (181,572 | ) | |||||||||||
Net increase (decrease) | (18,950 | ) | $ | (172,991 | ) | 7,121 | $ | 65,058 | |||||||||||
Class C | |||||||||||||||||||
Shares sold | - | $ | - | 12,308 | $ | 110,607 | |||||||||||||
Reinvestment of distributions | - | - | - | - | |||||||||||||||
- | - | 12,308 | 110,607 | ||||||||||||||||
Shares repurchased | (11,362 | ) | (100,208 | ) | (31,588 | ) | (281,153 | ) | |||||||||||
Net decrease | (11,362 | ) | $ | (100,208 | ) | (19,280 | ) | $ | (170,546 | ) | |||||||||
| Year ended December 31, 2014 | Year ended December 31, 2013 | ||||||||||||||||||
Shares | Amount | Shares | Amount | ||||||||||||||||
Income and Equity Fund | |||||||||||||||||||
Class A | |||||||||||||||||||
Shares sold | 310,822 | $ | 3,641,453 | 543,079 | $ | 5,971,466 | |||||||||||||
Reinvestment of distributions | 14,324 | 167,480 | 7,163 | 80,318 | |||||||||||||||
325,146 | 3,808,933 | 550,242 | 6,051,784 | ||||||||||||||||
Shares repurchased | (186,327 | ) | (2,172,749 | ) | (202,114 | ) | (2,253,619 | ) | |||||||||||
Net increase | 138,819 | $ | 1,636,184 | 348,128 | $ | 3,798,165 | |||||||||||||
Class C | |||||||||||||||||||
Shares sold | 65,292 | $ | 730,082 | 86,434 | $ | 913,031 | |||||||||||||
Reinvestment of distributions | 2,342 | 26,044 | 733 | 7,942 | |||||||||||||||
67,634 | 756,126 | 87,167 | 920,973 | ||||||||||||||||
Shares repurchased | (55,612 | ) | (626,992 | ) | (78,464 | ) | (818,518 | ) | |||||||||||
Net increase | 12,022 | $ | 129,134 | 8,703 | $ | 102,455 | |||||||||||||
79
Pacific Advisors Fund Inc.
Notes to Financial Statements
December 31, 2014
| Year ended December 31, 2014 | Year ended December 31, 2013 | ||||||||||||||||||
Shares | Amount | Shares | Amount | ||||||||||||||||
Balanced Fund | |||||||||||||||||||
Class A | |||||||||||||||||||
Shares sold | 44,611 | $ | 712,675 | 26,192 | $ | 440,990 | |||||||||||||
Reinvestment of distributions | 17,557 | 253,878 | 23,621 | 386,678 | |||||||||||||||
62,168 | 966,553 | 49,813 | 827,668 | ||||||||||||||||
Shares repurchased | (23,763 | ) | (378,167 | ) | (17,005 | ) | (277,869 | ) | |||||||||||
Net increase | 38,405 | $ | 588,386 | 32,808 | $ | 549,799 | |||||||||||||
Class C | |||||||||||||||||||
Shares sold | 54,268 | $ | 791,039 | 28,778 | $ | 432,969 | |||||||||||||
Reinvestment of distributions | 19,422 | 253,459 | 32,897 | 492,798 | |||||||||||||||
73,690 | 1,044,498 | 61,675 | 925,767 | ||||||||||||||||
Shares repurchased | (110,595 | ) | (1,615,738 | ) | (207,273 | ) | (2,996,983 | ) | |||||||||||
Net decrease | (36,905 | ) | $ | (571,240 | ) | (145,598 | ) | $ | (2,071,216 | ) | |||||||||
| Year ended December 31, 2014 | Year ended December 31, 2013 | ||||||||||||||||||
Shares | Amount | Shares | Amount | ||||||||||||||||
Large Cap Value Fund | |||||||||||||||||||
Class A | |||||||||||||||||||
Shares sold | 103,317 | $ | 1,392,376 | 50,422 | $ | 598,660 | |||||||||||||
Reinvestment of distributions | 5,050 | 72,769 | 7,743 | 99,578 | |||||||||||||||
108,367 | 1,465,145 | 58,165 | 698,238 | ||||||||||||||||
Shares repurchased | (40,278 | ) | (554,467 | ) | (24,768 | ) | (296,250 | ) | |||||||||||
Net increase | 68,089 | $ | 910,678 | 33,397 | $ | 401,988 | |||||||||||||
Class C | |||||||||||||||||||
Shares sold | 30,432 | $ | 364,025 | 7,591 | $ | 79,688 | |||||||||||||
Reinvestment of distributions | 897 | 11,286 | 1,445 | 16,387 | |||||||||||||||
31,329 | 375,311 | 9,036 | 96,075 | ||||||||||||||||
Shares repurchased | (8,022 | ) | (96,608 | ) | (941 | ) | (9,469 | ) | |||||||||||
Net increase | 23,307 | $ | 278,703 | 8,095 | $ | 86,606 | |||||||||||||
80
Pacific Advisors Fund Inc.
Notes to Financial Statements
December 31, 2014
| Year ended December 31, 2014 | Year ended December 31, 2013 | ||||||||||||||||||
Shares | Amount | Shares | Amount | ||||||||||||||||
Mid Cap Value Fund | |||||||||||||||||||
Class A | |||||||||||||||||||
Shares sold | 74,713 | $ | 1,068,126 | 37,733 | $ | 524,759 | |||||||||||||
Reinvestment of distributions | - | - | - | - | |||||||||||||||
74,713 | 1,068,126 | 37,733 | 524,759 | ||||||||||||||||
Shares repurchased | (27,647 | ) | (392,096 | ) | (32,613 | ) | (439,410 | ) | |||||||||||
Net increase | 47,066 | $ | 676,030 | 5,120 | $ | 85,349 | |||||||||||||
Class C | |||||||||||||||||||
Shares sold | 1,324 | $ | 17,167 | 11,069 | $ | 137,917 | |||||||||||||
Reinvestment of distributions | - | - | - | - | |||||||||||||||
1,324 | 17,167 | 11,069 | 137,917 | ||||||||||||||||
Shares repurchased | (14,861 | ) | (191,909 | ) | (5,473 | ) | (63,739 | ) | |||||||||||
Net increase (decrease) | (13,537 | ) | $ | (174,742 | ) | 5,596 | $ | 74,178 | |||||||||||
| Year ended December 31, 2014 | Year ended December 31, 2013 | ||||||||||||||||||
Shares | Amount | Shares | Amount | ||||||||||||||||
Small Cap Value Fund | |||||||||||||||||||
Class A | |||||||||||||||||||
Shares sold | 969,631 | $ | 55,073,377 | 1,580,059 | $ | 82,261,860 | |||||||||||||
Reinvestment of distributions | 210,424 | 9,311,267 | - | - | |||||||||||||||
1,180,055 | 64,384,644 | 1,580,059 | 82,261,860 | ||||||||||||||||
Shares repurchased | (1,667,878 | ) | (90,313,780 | ) | (560,706 | ) | (27,816,000 | ) | |||||||||||
Net increase (decrease) | (487,823 | ) | $ | (25,929,136 | ) | 1,019,353 | $ | 54,445,860 | |||||||||||
Class C | |||||||||||||||||||
Shares sold | 56,369 | $ | 2,767,368 | 120,471 | $ | 5,317,905 | |||||||||||||
Reinvestment of distributions | 23,904 | 869,627 | - | - | |||||||||||||||
80,273 | 3,636,995 | 120,471 | 5,317,905 | ||||||||||||||||
Shares repurchased | (76,645 | ) | (3,479,336 | ) | (48,891 | ) | (2,024,356 | ) | |||||||||||
Net increase | 3,628 | $ | 157,659 | 71,580 | $ | 3,293,549 | |||||||||||||
Class I | |||||||||||||||||||
Shares sold | 24,572 | $ | 1,750,509 | 5,113 | $ | 350,012 | |||||||||||||
Reinvestment of distributions | 1,695 | 89,404 | - | - | |||||||||||||||
26,267 | 1,839,913 | 5,113 | 350,012 | ||||||||||||||||
Shares repurchased | (5,113 | ) | (361,045 | ) | - | - | |||||||||||||
Net increase | 21,154 | $ | 1,478,868 | 5,113 | $ | 350,012 | |||||||||||||
81
Pacific Advisors Fund Inc.
Notes to Financial Statements
December 31, 2014
Note 7. Bank Borrowings
Each Fund may borrow money to the extent permitted by the 1940 Act, as amended, or any rules, exemptions or interpretations thereunder that may be adopted, granted or issued by the Securities and Exchange Commission. Under the 1940 Act, a mutual fund may borrow up to one-third of its total assets (including the amount borrowed) from banks for any purpose, and may borrow up to 5% of its total assets from banks or other lenders for temporary purposes. Each Fund may borrow to facilitate portfolio transactions or meet redemptions. The Large Cap Value Fund, Mid Cap Value Fund, and Small Cap Value Fund also may borrow money to invest in portfolio securities. Each Fund has the ability to borrow, from UMB Bank, n.a. (UMB), on an unsecured basis, at 1.50% over the Federal Funds rate. As of December 31, 2014, the Mid Cap Value Fund and Small Cap Value Fund had borrowings from UMB with amounts of $48,452 and $9,316,935, respectively, and were paying interest at 1.56% per annum on their outstanding borrowings. No compensating balances were required.
82
Pacific Advisors Fund Inc.
Report of Independent Registered Public Accounting Firm
The Board of Directors and Shareholders
Pacific Advisors Fund Inc.
We have audited the accompanying statements of assets and liabilities of Pacific Advisors Fund Inc. (comprising, respectively, the Government Securities Fund, Income and Equity Fund, Balanced Fund, Large Cap Value Fund, Mid Cap Value Fund and Small Cap Value Fund) (the "Company"), including the schedules of investments, as of December 31, 2014, and the related statements of operations for the year then ended, the statements of changes in net assets for each of the two years in the period then ended and the financial highlights for each of the five years in the period then ended. These financial statements and financial highlights are the responsibility of the Company's management. Our responsibility is to express an opinion on these financial statements and financial highlights based on our audits.
We conducted our audits in accordance with the standards of the Public Company Accounting Oversight Board (United States). Those standards require that we plan and perform the audit to obtain reasonable assurance about whether the financial statements and financial highlights are free of material misstatement. We were not engaged to perform an audit of the Company's internal control over financial reporting. Our audits included consideration of internal control over financial reporting as a basis for designing audit procedures that are appropriate in the circumstances, but not for the purpose of expressing an opinion on the effectiveness of the Company's internal control over financial reporting. Accordingly, we express no such opinion. An audit also includes examining, on a test basis, evidence supporting the amounts and disclosures in the financial statements and financial highlights, assessing the accounting principles used and significant estimates made by management, and evaluating the overall financial statement presentation. Our procedures included confirmation of securities owned as of December 31, 2014, by correspondence with the custodian and brokers or by other appropriate auditing procedures where replies from brokers were not received. We believe that our audits provide a reasonable basis for our opinion.
In our opinion, the financial statements and financial highlights referred to above present fairly, in all material respects, the financial position of each of the respective funds constituting the Pacific Advisors Fund Inc. at December 31, 2014, the results of their operations for the year then ended, the changes in their net assets for each of the two years in the period then ended, and the financial highlights for each of the five years in the period then ended, in conformity with U.S. generally accepted accounting principles.

Los Angeles, California
February 27, 2015
83
Pacific Advisors Fund Inc.
Disclosure Regarding the Board's Approval
of the Funds' Advisory Contracts
The Board of Directors, including a majority of the Independent Directors, most recently approved the Investment Management Agreements (the "Agreements") for the Funds at its meeting held on August 8, 2014. At that meeting, the Board approved the continuation of the Agreements by and between Pacific Advisors Fund Inc. (the "Corporation"), on behalf of each of its Funds, and Pacific Global Investment Management Company, Inc. ("PGIMC").
In approving the Agreements, the Board considered materials relating to, among other matters: (1) the financial condition and profitability of PGIMC, including information regarding PGIMC's cost of providing services, as well as comparative expense information for a peer group of funds; (2) investment performance of each Fund, including information comparing the performance of each Fund with a peer group of funds and an appropriate index or combination of indices; (3) the services provided by PGIMC to the Funds; (4) sales and redemption data for each Fund; (5) the extent to which economies of scale are realized as the Funds grow and whether fee levels reflect these economies of scale for the Funds' investors; (6) the economic outlook and the general investment outlook in the markets in which each Fund invests; and (7) "fall-out" benefits realized by PGIMC (i.e., ancillary benefits derived by PGIMC and its affiliates from PGIMC's relationship with the Funds). The Board also periodically considers other material facts such as the allocation of each Fund's brokerage commissions, each Fund's record of compliance with its investment policies and restrictions on personal securities transactions, and the nature, cost, and character of non-investment management services provided by PGIMC and its affiliates. In approving the Agreements, the Board relied on all information presented to it over the course of the year.
Prior to the Board's approval of the Agreements, the Independent Directors met separately with independent counsel to review the materials provided. Based on its evaluation of all material factors, the Board, including a majority of the Independent Directors, determined that the Agreements were in the best interests of the Funds and their shareholders and that the fees to be paid to PGIMC under the Agreements were fair and reasonable in relationship to the services to be rendered thereunder and in light of the factors considered. During its deliberations, the Board did not identify any single factor as all important or controlling, and individual Directors may have weighed the same factors differently. The following summaries do not detail every matter considered. Matters considered by the Board included the following:
Nature, Quality and Extent of Services. The Board examined the nature, quality and extent of the services provided by PGIMC to the Funds. The Board reviewed PGIMC's key personnel in providing investment management services to the Funds, as well as the changes in such personnel, and the duties that such personnel perform for the Funds. The Board considered the qualifications and experience of PGIMC's portfolio management team and PGIMC's commitment of its resources to portfolio management services. The Board considered PGIMC's responsibilities under the Agreements in serving as the Funds' investment manager, including responsibilities for investment research and stock selection; administration of the Funds' daily business operations; supervision of the Funds' transfer agent and administrative services agent; monitoring adherence to the Funds' investment restrictions; monitoring compliance with various policies and procedures of the Funds; and responsiveness to the Independent Directors. The Board was provided with, and considered information regarding, PGIMC's trading; operations; compliance; and investment research functions. The Board considered PGIMC's marketing strategy with respect to the Funds and the current asset levels of the Funds. The Board also considered the Funds' compliance program, the compliance and risk management reports periodically furnished to the Board, and the results of any regulatory exams. The Board concluded that the Funds were likely to benefit from the nature, extent and quality of the services provided by PGIMC under the Agreements.
84
Pacific Advisors Fund Inc.
Disclosure Regarding the Board's Approval
of the Funds' Advisory Contracts
Investment Performance of PGIMC and the Funds. The Board considered the performance of PGIMC and the Funds, including, to the extent applicable, each Fund's year-to-date, one-, three-, five-, and ten-year performance for the periods ended June 30, 2014 and December 31, 2013; as well as certain comparative performance information sourced by an independent data service for each Fund's benchmark(s) and funds PGIMC considered peers of the Funds. The Board was provided information regarding PGIMC's investment decision making process and trade execution policies and strategies. After reviewing the Funds' performance records, including performance relative to the Funds' benchmarks, peers and, with respect to the Income and Equity Fund and the Balanced Fund, the blended returns of these Funds' benchmarks, and each Fund's respective investment objective, strategy and role in the overall Fund complex, the Board concluded that, while past performance is no guarantee of future performance, each Fund's investment performance overall weighed in favor of renewing the relevant Agreement.
Among other factors, the Board considered:
(i) with respect to the Small Cap Value Fund: management's explanation of the Fund's investment strategy and portfolio composition; the Fund's rank as the number one Lipper Small Cap Core fund for the one-year (Class A shares), three-year (Class I shares) and ten-year (Class A shares) periods as of December 31, 2013; and the Fund's outperformance versus its benchmark for the one-year, three-year, five-year and ten-year periods ended June 30, 2014;
(ii) with respect to the Mid Cap Value Fund: the Fund's performance in light of the mid-cap strategy adopted at the end of 2010 and its long-term investment approach; management's explanation of the Fund's portfolio composition and long-term growth prospects;
(iii) with respect to the Large Cap Value Fund: the Fund's performance in light of market conditions and the Fund's emphasis on minimizing volatility; management's explanation of the Fund's conservative approach and its expectation for the Fund to grow at a slower rate, and with less volatility, in rising markets while potentially providing better downside protection in falling markets; and management's recognition of the difference between the Fund's concentrated portfolio focused on leading mega-cap companies within the benchmark S&P 500® Index, and the benchmark's larger number of holdings.
(iv) with respect to the Balanced Fund: the Fund's performance in light of market conditions and the Fund's investment objective and policies; management's explanation of the Fund's equity approach to seek the greatest return potential while minimizing risk and its fixed income strategy, in response to the persistently low yields and heightened interest rate volatility of the past few years, to remain concentrated in shorter-term bonds which provided greater principal protection during periods of rising interest rates and market turbulence; the Fund's transition from investing predominately in large cap equities to an all cap equity approach; the Fund's (Class A shares) rank as the number six Lipper Mixed Asset Target Allocation Growth fund based on its one-year return as of December 31, 2013; and the Fund's (Class A shares) ou-performance versus the Barclays Capital U.S. Intermediate Corporate Bond Index for the one-year, three-year, and five-year periods ended June 30, 2014;
(v) with respect to the Income and Equity Fund: the Fund's performance in light of market conditions and the Fund's investment objective, strategy, and policies; management's explanation of the Fund's more defensive fixed income strategy during the past few years focused on intermediate-term investment grade, lower-duration bonds seeking to provide greater principal protection and manage interest rate risk, the Fund's use of superior, well-established equities with meaningful dividend yields to achieve total return, and the Fund's active strategy which was positioned for rising interest rates; the Fund's (Class A shares) rank as the number six Lipper Conservative Mixed Asset Target Allocation fund based on its one-year
85
Pacific Advisors Fund Inc.
Disclosure Regarding the Board's Approval
of the Funds' Advisory Contracts
return as of December 31, 2013; and the Fund's (Class A shares) outperformance versus the Barclays Capital U.S. Intermediate Corporate Bond Index for the year-to-date, one-year, three-year and five-year periods ended June 30, 2014; and
(vi) with respect to the Government Securities Fund: the Fund's performance in light of market conditions, the Fund's active-yet-conservative investment strategy, objective and policies; management's explanation of the overall favorable performance, including the Fund's equity holdings, despite some underperformance of the bond portion of the holdings, which reflected the Fund's emphasis on shorter-term bonds to preserve capital and protect against risk, and its benchmark, which reflected the index's relatively wider range of maturities; the Fund's conservative positioning in anticipation of a rising interest rate environment; and the Fund's year-to-date and one-year performance as of June 30, 2014 and the Fund's (Class A shares) rank as the number three Lipper General US Govt fund based on its one-year return as of December 31, 2013.
Costs of Services and Profits Realized by PGIMC. The Board reviewed PGIMC's 2013 audited financial statements. The Board reviewed the 2013 consolidated statement of operations of PGIMC and its subsidiaries and also considered the costs and profitability of PGIMC and its affiliates from their operations. The Board also reviewed the 2013 consolidated statement of financial condition of PGIMC and its subsidiaries and considered the financial condition of PGIMC and its ability to provide the quality of services specified under the Agreements and expected by the Board. The Board examined the fee information for the Funds as compared to that of comparable funds managed by other advisers, and in light of the investment strategy applied to each Fund. The comparative fee information provided to the Board indicated that each Fund's advisory fees were within the range of those charged by funds PGIMC considered peers of the Funds based on factors such as portfolio characteristics, investment style and asset level. The Board noted, however, that the total expenses for each Fund placed it as the most expensive fund in its respective peer group. The Board reviewed a description of the methodology used for selecting the funds in each peer group. The Board considered that during 2013, PGIMC had waived fees and reimbursed expenses for the Government Securities Fund, Income and Equity Fund, and Large Cap Value Fund in order to reduce their expenses; and that PGIMC expected to continue to waive fees for the Government Securities Fund, Income and Equity Fund, and Large Cap Value Fund in 2014 to the extent expenses exceed the agreed expense limits for those Funds. Another factor was that, over the history of the Funds, PGIMC and its affiliates had waived and/or reimbursed expenses for all the Funds in excess of $4.4 million. The Board also considered that affiliates of PGIMC provide distribution, administrative, and transfer agency services for the Funds, and, based on information furnished by PGIMC, the benefits to the Funds of having such services provided by such affiliates. The Board also considered the Funds' sales and redemption data in the first six months of 2014, in light of current market conditions. The Board concluded that the Funds' management fees were reasonable in light of the services provided.
Economies of Scale. The Board considered the extent to which the Funds' management fees reflect economies of scale for the benefit of the Funds' shareholders. The Board reviewed the Funds' fee arrangements, which include breakpoints that decrease the fee rate as the Funds' assets increase. The Board considered the fact that current assets were well below the threshold for the initial advisory fee breakpoint for each Fund. The Board noted that the expense ratios for the Funds were impacted by higher asset levels for most of the Funds in 2013 as compared to 2012. Based on its review, the Board concluded that the Funds' management fee structures allow shareholders to benefit from economies of scale as the Funds' assets increase. The Board also considered that PGIMC had been waiving fees and reimbursing expenses for the Government Securities Fund, Income and Equity Fund, and the Large Cap Value Fund.
86
Pacific Advisors Fund Inc.
Disclosure Regarding the Board's Approval
of the Funds' Advisory Contracts
Other Benefits to PGIMC. In evaluating the benefits that accrue to PGIMC through its relationship with the Funds, the Board recognized that, in addition to providing advisory services, PGIMC and its affiliates serve the Funds in various capacities, including as transfer agent, administrative services agent and distributor, and receive compensation from the Funds in connection with providing these services. The Board considered that each service provided to the Funds by PGIMC or one of its affiliates is pursuant to a written agreement, which the Board evaluates periodically. The Board also considered the benefits that accrue to PGIMC through its relationship with the Funds in its management of separately managed accounts, and another fund for which it serves as sub-adviser. The Board concluded that the benefits were consistent with PGIMC's rights and obligations under the Agreements.
After full consideration of these and other factors, the Board, including a majority of the Independent Directors, concluded that approval of the Agreements was in the best interest of the Funds and their shareholders.
87
Pacific Advisors Fund Inc.
notes
88
Pacific Advisors Fund Inc.
Directors and Officers
"Independent" Directors
Name (Age) | Position with the Company1 | Year elected Director of the Company | Principal occupation(s) during past 5 years | Other Directorships held by Director | |||||||||||||||
| L. Michael Haller, III (71) | Director | 1992 | Consultant, d/b/a Asahi Broadcasting Enterprises (software development); Chairman and President, Gammaker Pte. Ltd. (mobile game developer); President, AdLib Mediation LLC (mobile advertising); and formerly Executive Vice President, MGT Capital Investments (mobile game developer) (2013); CEO, Digital Angel, Inc. (communications equipment distributor) (2012-2013); Chairman, Kapitall, Inc. (online introducing brokerage) (2011-2012); President, Bionic Games, Inc. (game software development company) (2008-2011); and Vice President and General Manager, Kapitall Studio (division of Kapitall, Inc.) (2010-2011) | Digital Angel, Inc. | |||||||||||||||
| Peter C. Hoffman (64) | Director | 2010 | President, Sierra Autocars, Inc. (auto dealership), Sierra Vehicles, Inc. (auto dealership), Sierra Automotive Enterprises, Inc. (auto dealership) and Sierra Pursuits, Inc. (management company) | None | |||||||||||||||
| Gerald E. Miller (64) | Director | 1992 | Retired in 1992; and formerly worked for Merrill Lynch for over 30 years and was a Senior Resident Vice President at retirement in 1992 | None | |||||||||||||||
| Louise K. Taylor, PhD (68) | Director | 1992 | Assistant Executive Director, Employers Association of California; and formerly Superintendent, Monrovia Unified School District (1991-2009) | None | |||||||||||||||
"Interested" Directors2
Name (Age) | Positions with the Company1 | Year elected a Director and officer of the Company | Principal occupations during past 5 years | Other Directorships held by Director | |||||||||||||||
| Victoria L. Breen (63)* | Director Assistant Secretary | 1992 2002 | President, Derby & Derby, Inc. (financial services company); Agent, Transamerica Life Companies; Registered Principal, Transamerica Financial Advisors, Inc.; and Assistant Secretary and Director, Pacific Global Investment Management Company | None | |||||||||||||||
| George A. Henning (67)** | President and Chairman | 1992 | Chairman, President and Director, Pacific Global Investment Management Company; and Chairman and Director, Pacific Global Fund Distributors, Inc. and Pacific Global Investor Services, Inc. | None | |||||||||||||||
Each Director oversees all 6 Pacific Advisors Fund portfolios.
The Fund's Statement of Additional Information contains additional information about the Fund's Directors and Officers and is available without charge upon request by calling (800) 989-6693. The business address for all Directors and officers of the Company is 101 N. Brand Blvd., Suite 1950, Glendale, CA 91203, Attn: Secretary.
89
Pacific Advisors Fund Inc.
Directors and Officers
Other Officers
Name (Age) | Position(s) with the Company | Year elected an officer of the Company | Principal occupations during past 5 years | ||||||||||||
| Catherine L. Henning (37) | Vice President Secretary | 2010 2006 | Senior Vice President, Secretary, Director of Client Services and Director, Pacific Global Investment Management Company; President, Secretary, Chief Compliance Officer and Director, Pacific Global Fund Distributors, Inc.; and Vice President, Secretary and Director, Pacific Global Investor Services, Inc. | ||||||||||||
| Barbara A. Kelley (61) | Vice President and Chief Compliance Officer | 2001 | Executive Vice President, Chief Compliance Officer and Director, Pacific Global Investment Management Company; Director, Pacific Global Fund Distributors, Inc.; President and Director, Pacific Global Investor Services, Inc.; and formerly Treasurer (2001-2014). | ||||||||||||
| Araceli Olea (42) | Assistant Secretary | 2008 | Shareholder Services Manager, Pacific Global Investor Services, Inc.; and Assistant Secretary, Pacific Global Investment Management Company and Pacific Global Investor Services, Inc. | ||||||||||||
| Jingjing Yan (41) | Treasurer | 2014 | Vice President and Treasurer, Pacific Global Investment Management Company; Treasurer, Pacific Global Fund Distributors, Inc. and Pacific Global Investor Services, Inc.; and formerly Assistant Treasurer (2005-2014). | ||||||||||||
1 Each director is elected to serve until the next annual shareholders meeting and until his or her successor is elected or appointed. The Company does not hold regular annual shareholders meetings to elect Directors. Vacancies on the Board can be filled by the action of a majority of the Directors, provided that at least two-thirds of the Directors have been elected by the shareholders.
2 "Interested persons" as defined in the 1940 Act, as amended, based on their affiliation with the Funds' investment manager and its affiliates (including the Funds' principal underwriter).
* Ms. Breen is considered an interested director because (a) she is a registered principal of a registered broker/dealer that engages in sales of Company shares under a selling agreement with the Distributor, and in that capacity she has received commissions on the sale of the Funds' shares; (b) she is an officer of the Company; and (c) she is a shareholder of the Manager and a member of the Manager's Board of Directors.
** Mr. Henning is considered an interested director because (a) he holds the positions described above with the Company, the Manager and its affiliates; (b) by virtue of his ownership of the Manager's shares he may be deemed a "control person" of the Manager; and (c) he is Ms. Henning's father.
90
Pacific Advisors Fund Inc.
Additional Tax Information (Unaudited)
For federal income tax purposes, the following information is furnished with respect to the distributions paid by the Funds during the taxable year ended December 31, 2014. The Funds designated and paid as short-term capital gain and long-term capital gain distributions as follows:
| Government Securities Fund | Income and Equity Fund | Balanced Fund | Large Cap Value Fund | Mid Cap Value Fund | Small Cap Value Fund | ||||||||||||||||||||||
Short-term capital gain distributions | - | - | - | - | - | - | |||||||||||||||||||||
Long-term capital gain distributions | - | - | $ | 556,907 | $ | 94,291 | - | $ | 11,005,620 | ||||||||||||||||||
A percentage of the dividends distributed during the fiscal year for the Funds qualifies for the dividends-received deduction for corporate shareholders:
| Government Securities Fund | Income and Equity Fund | Balanced Fund | Large Cap Value Fund | Mid Cap Value Fund | Small Cap Value Fund | ||||||||||||||||||||||
Corporate dividends-received deduction | N/A | 100.00 | % | N/A | N/A | N/A | N/A | ||||||||||||||||||||
Under the Jobs and Growth Tax Relief Reconciliation Act of 2003 (the "Act"), the following percentage of ordinary dividends paid during the taxable year ended December 31, 2014 are designated as "qualified dividend income," as defined in Act and subject to reduced tax rates in 2014.
| Government Securities Fund | Income and Equity Fund | Balanced Fund | Large Cap Value Fund | Mid Cap Value Fund | Small Cap Value Fund | ||||||||||||||||||||||
Percentage of qualified dividends | N/A | 100.00 | % | N/A | N/A | N/A | N/A | ||||||||||||||||||||
In January 2015, the Funds provided tax information to shareholders for the preceding calendar year.
91
Pacific Advisors Fund Inc.
notes
92

Pacific Advisors Fund Inc.
Directors
George A. Henning, Chairman
Victoria L. Breen
L. Michael Haller, III
Peter C. Hoffman
Gerald E. Miller
Louise K. Taylor, Ph.D.
Officers
George A. Henning, President
Catherine L. Henning, Vice President and Secretary
Victoria L. Breen, Assistant Secretary
Araceli Olea, Assistant Secretary
Barbara A. Kelley, Vice President
Jingjing Yan, Treasurer
Investment Manager
Pacific Global Investment Management Company
101 North Brand Blvd., Suite 1950
Glendale, California 91203
Transfer Agent and Administrator
Pacific Global Investor Services, Inc.
101 North Brand Blvd., Suite 1950
Glendale, California 91203
Distributor
Pacific Global Fund Distributors, Inc.
101 North Brand Blvd., Suite 1950
Glendale, California 91203
(800) 989-6693
Availability of Quarterly Portfolio Schedule
The Fund files its complete schedule of portfolio holdings with the SEC for the first and third quarters of each fiscal year on Form N-Q. The Fund's Forms N-Q are available on the SEC's Web site at http://www.sec.gov. The Fund's Forms N-Q may be reviewed and copied at the SEC's Public Reference Room in Washington, DC. Information about the operation of the Public Reference Room may be obtained by calling the SEC at (800) SEC-0330.
The Fund's complete schedule of portfolio holdings for each fiscal quarter is posted on the Fund's Web site at www.PacificAdvisorsFund.com and is available without charge, upon request by calling (800) 989-6693. Documents will be sent within 3 business days of receipt of your request.
Availability of Proxy Voting Policies and Procedures and Proxy Voting Record
A description of the policies and procedures that the Fund uses to determine how to vote proxies relating to portfolio securities and information regarding how the Fund voted proxies relating to portfolio securities during the most recent 12-month period ended June 30 is available without charge, upon request by calling (800) 989-6693. Documents will be sent within 3 business days of receipt of your request. This information is also available on the SEC's Web site at http://www.sec.gov.

Pacific Global Fund Distributors, Inc.
101 North Brand Blvd., Suite 1950
Glendale, California 91203

Item 2. Code of Ethics
Registrant has adopted a Code of Ethics pursuant to Section 406 of the Sarbanes-Oxley Act of 2002 that applies to Registrant’s principal executive officer, principal financial officer, principal accounting officer or controller. Registrant will provide to any person without charge, upon request, a copy of the Code of Ethics if such person submits a request in writing addressed to the Registrant’s secretary at the principal executive offices listed above.
Item 3. Audit Committee Financial Expert
Registrant’s Audit Committee has three members. While these members are “financially literate,” the Board has determined that none of the members of the Audit Committee meet the technical definition of “audit committee financial expert.” Registrant has determined that an audit committee financial expert is not necessary at this time because (i) the Audit Committee members are financially literate; (ii) they have served on Registrant’s Audit Committee for several years; (iii) the accounting methodologies applicable to registered investment companies and the types of investment activities in which the Funds engage are well established; and (iv) Registrant’s financial statements do not involve the types of complex accounting issues that other types of public companies may have.
Item 4. Principal Accountant Fees and Services
(a)-(d) Ernst & Young LLP (“E&Y”) billed the Registrant aggregate fees for professional services rendered for the fiscal years ending December 31, 2013, and December 31, 2014, as follows:
|
| Audit Fees |
| Audit Related Fees |
| Tax Fees |
| All Other Fees |
| ||||
2014 |
| $ | 173,500 |
| $ | 2,500 |
| $ | 33,500 |
| $ | 0 |
|
2013 |
| $ | 165,500 |
| $ | 2,500 |
| $ | 32,000 |
| $ | 0 |
|
(b) Audit Related Fees are for services rendered to provide consent of the annual update to the Corporation’s Form N1-A and non-routine N1-A filings.
(c) Tax Fees include the services for the review of income tax returns and excise taxes.
(e)(1) The Audit Committee is authorized to pre-approve non-audit services provided by the Corporation’s auditors, if they find it appropriate in light of their fiduciary duties and in the exercise of their good faith business judgment and compatible with the auditors’ independence. The Chairman of the Audit Committee is authorized to approve audit and non-audit services for newly established funds of the Corporation on the same terms as the full Audit Committee previously had approved for the then existing funds, and to approve non-audit services which are permissible under applicable law, provided the estimated fee is not more than $5,000 based on a good faith estimate provided by the auditor. The Chairman shall report any such pre-approval to the Audit Committee at its next following meeting.
(e)(2) None.
(f) None.
(g) None.
(h) Not applicable.
Item 5. Audit Committee of Listed Registrants
Not applicable as Registrant is not a listed issuer as defined in Rule 10A-3 under the Securities Exchange Act of 1934.
Item 6. Statements of Investments
Statements of Investments is included as part of the report to shareholders filed under Item 1 of this form.
Item 7. Disclosure of Proxy Voting Policies and Procedures for Closed-End Management Investment Companies
Not applicable to open-end investment companies.
Item 8. Portfolio Managers of Closed-End Management Investment Companies
Not applicable to open-end investment companies.
Item 9. Purchases of Equity Securities by Managers of Closed-End Management Investment Company and Affiliated Purchasers.
Not applicable to open-end investment companies.
Item 10. Submission of Matters to a Vote of Security Holders
No material changes have been made.
Item 11. Controls and Procedures.
(a) Based upon their evaluation of Registrant’s disclosure controls and procedures (as defined in Rule 30a-3(c) under the Investment Company Act of 1940) as conducted within 90 days of the filing date of this Form N-CSR, Registrant’s principal executive officer and principal financial officer have concluded that those disclosure controls and procedures provide reasonable assurance that the material information required to be disclosed by Registrant on this report is recorded, processed, summarized and reported within the time periods specified in the Securities and Exchange Commission’s rules and forms.
(b) There were no changes in Registrant’s internal control over financial reporting (as defined in Rule 30a-3(d) under the Investment Company Act of 1940) that occurred during the second fiscal quarter of the period covered by this report that have materially affected, or are reasonably likely to materially affect, Registrant’s internal control over financial reporting.
Item 12. Exhibits
(a)(1) Not applicable.
(a)(2) Certifications required by Item 12(a) of Form N-CSR and Section 302 of the Sarbanes-Oxley Act of 2002 (filed herewith).
(b) Certification required by Section 906 of the Sarbanes-Oxley Act of 2002 (filed herewith).
SIGNATURES
Pursuant to the requirements of the Securities Exchange Act of 1934 and the Investment Company Act of 1940, Registrant has duly caused this report to be signed on its behalf by the undersigned, thereunto duly authorized.
Pacific Global Fund Inc. d/b/a Pacific Advisors Fund Inc.
By: | /s/ George A. Henning |
|
| George A. Henning |
|
| Chairman, Pacific Advisors Fund Inc. |
|
|
|
|
Date: | March 5, 2015 |
|
Pursuant to the requirements of the Securities Exchange Act of 1934 and the Investment Company Act of 1940, this report has been signed below by the following persons on behalf of Registrant and in the capacities and on the dates indicated.
By: | /s/ George A. Henning |
|
| George A. Henning |
|
| Chief Executive Officer |
|
|
|
|
Date: | March 5, 2015 |
|
By: | /s/ Jingjing Yan |
|
| Jingjing Yan |
|
| Chief Financial Officer |
|
|
|
|
Date: | March 5, 2015 |
|