UNITED STATES
SECURITIES AND EXCHANGE COMMISSION
Washington, D.C. 20549
FORM N-CSR
CERTIFIED SHAREHOLDER REPORT OF REGISTERED
MANAGEMENT INVESTMENT COMPANIES
Investment Company Act file number | 811-07062 | |||||||
| ||||||||
PACIFIC GLOBAL FUND INC. D/B/A PACIFIC ADVISORS FUND INC. | ||||||||
(Exact name of registrant as specified in charter) | ||||||||
| ||||||||
101 NORTH BRAND BLVD., SUITE 1950 GLENDALE, CALIFORNIA |
| 91203 | ||||||
(Address of principal executive offices) |
| (Zip code) | ||||||
| ||||||||
GEORGE A. HENNING 101 NORTH BRAND BLVD., SUITE 1950 GLENDALE, CA 91203 | ||||||||
(Name and address of agent for service) | ||||||||
| ||||||||
Registrant’s telephone number, including area code: | 818-242-6693 |
| ||||||
| ||||||||
Date of fiscal year end: | December 31 |
| ||||||
| ||||||||
Date of reporting period: | June 30, 2019 |
| ||||||
Item 1. Report to Shareholders
Filed herewith.

semi-annual report
june 30, 2019
income and equity fund
balanced fund
large cap value fund
mid cap value fund
small cap value fund


Pacific Advisors
table of contents
Income and Equity Fund | 1 | ||||||
Balanced Fund | 2 | ||||||
Large Cap Value Fund | 3 | ||||||
Mid Cap Value Fund | 4 | ||||||
Small Cap Value Fund | 5 | ||||||
Expense Examples | 6 | ||||||
Schedule of Investments | 9 | ||||||
Statements of Assets and Liabilities | 26 | ||||||
Statements of Operations | 28 | ||||||
Statements of Changes in Net Assets | 30 | ||||||
Financial Highlights | 32 | ||||||
Notes to Financial Statements | 38 | ||||||
Directors and Officers | 48 | ||||||
BEGINNING ON JANUARY 1, 2021, AS PERMITTED BY REGULATIONS ADOPTED BY THE SECURITIES AND EXCHANGE COMMISSION, PAPER COPIES OF PACIFIC ADVISORS FUND SHAREHOLDER REPORTS LIKE THIS ONE WILL NO LONGER BE SENT BY MAIL, UNLESS YOU SPECIFICALLY REQUEST PAPER COPIES OF THE REPORTS FROM PACIFIC ADVISORS FUND OR FROM YOUR FINANCIAL INTERMEDIARY, SUCH AS A BROKER-DEALER OR BANK. INSTEAD, THE REPORTS WILL BE MADE AVAILABLE ON A WEBSITE, AND YOU WILL BE NOTIFIED BY MAIL EACH TIME A REPORT IS POSTED AND PROVIDED WITH A WEBSITE LINK TO ACCESS THE REPORT.
YOU MAY ELECT TO RECEIVE ALL FUTURE REPORTS IN PAPER FREE OF CHARGE. YOU CAN INFORM PACIFIC ADVISORS FUND OR YOUR FINANCIAL INTERMEDIARY THAT YOU WISH TO CONTINUE RECEIVING PAPER COPIES OF YOUR SHAREHOLDER REPORTS BY CALLING (800)-282-6693 OR CONTACTING YOUR FINANCIAL INTERMEDIARY. YOUR ELECTION TO RECEIVE REPORTS IN PAPER WILL APPLY TO ALL PACIFIC ADVISORS FUND ACCOUNTS HELD BY YOU OR THROUGH YOUR FINANCIAL INTERMEDIARY.
This Report is submitted for the general information of the shareholders of Pacific Advisors Funds. It is not authorized for distribution to prospective investors unless accompanied or preceded by the Funds' current prospectus, which contains information concerning the investment policies of the Funds as well as other pertinent information.
This Report is for informational purposes only and is not a solicitation or recommendation that any particular investor should purchase or sell any particular security. The statements in the Chairman's Letter and the discussions of the Funds' performance are the opinions and beliefs expressed at the time of this commentary and are not intended to represent opinions and beliefs at any other time. These opinions are subject to change at any time based on market or other conditions and are not meant as a market forecast. All economic and performance information referenced is historical. Past performance does not guarantee future results.
For more information on the Pacific Advisors Funds, including information on charges, expenses and other classes offered, please obtain a copy of the prospectus by calling (800) 989-6693. Please read the prospectus and consider carefully the investment risks, objectives, charges and expenses before you invest or send money. Shares of the Pacific Advisors Funds are not deposits or obligations of any bank, are not guaranteed by any bank, are not insured by the FDIC or any other agency, and involve investment risks, including the possible loss of the principal amount invested. The investment return and principal value of an investment will fluctuate so that an investor's shares, when redeemed, may be worth more or less than their original cost.
Pacific Advisors
Income and Equity Fund (unaudited)
Fund Objective: Current income and, secondarily, long-term capital appreciation.
Investment Invests primarily in investment grade U.S. corporate bonds and in dividend-paying
Strategy: stocks.
Investor Profile: Conservative. Some current income required; capital preservation aim.
Portfolio Holdings (As of 06/30/19 based on total investments)
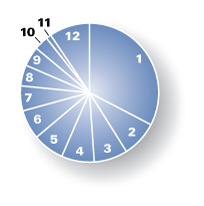
| 1. | Corporate Bonds | 32.63 | % | ||||||||
Equities | 57.88 | % | |||||||||
| 2. | Financials | 8.43 | % | ||||||||
| 3. | Industrials | 7.85 | % | ||||||||
| 4. | Health Care | 7.65 | % | ||||||||
| 5. | Information Technology | 7.34 | % | ||||||||
| 6. | Consumer Discretionary | 6.86 | % | ||||||||
| 7. | Consumer Staples | 5.81 | % | ||||||||
| 8. | Energy | 4.88 | % | ||||||||
| 9. | Communication Services | 4.57 | % | ||||||||
| 10. | Utilities | 3.31 | % | ||||||||
| 11. | Materials | 1.18 | % | ||||||||
| 12. | Preferred Stock | 9.49 | % | ||||||||
| Total Returns (For the six months ended 06/30/19) | |||||||
Class A | 6.37 | % | |||||
Class C | 6.01 | % | |||||
| |||||||
| Barclays Capital U.S. Intermediate Corporate Bond Index1 | 7.08 | % | |||||
S&P 500® Index1 | 18.54 | % | |||||
Current expense ratio: net 4.06% (A), 4.84% (C); gross 4.81% (A), 5.59% (C). Prospectus expense ratio: net 3.25% (A), 4.00% (C); gross 4.00% (A); 4.75% (C).2
Performance quoted is past performance which does not guarantee future results. Current performance may be higher or lower than the performance quoted. Call (800) 989-6693 for performance current to the most recent month-end. The investment return and principal value of an investment will fluctuate so that an investor's shares, when redeemed, may be worth more or less than their original cost. Returns represent the change in value over the stated period assuming reinvestment of dividends and capital gains at net asset value. Returns do not take into account the maximum 4.75% sales charge on Class A shares or the 1% Contingent Deferred Sales Charge (CDSC) for Class C shares sold within one year of purchase. Returns would be lower if the applicable sales charge and CDSC were included. Returns do not take into account individual taxes which may reduce actual returns when shares are sold.
The Fund's investment adviser is waiving a portion of its management fees pursuant to an Expense Limitation Agreement. The waiver may be discontinued at any time with ninety days written notice in consultation with the Fund's board, but is expected to continue at current levels. Please see the Notes to Financial Statements in this report for details. Performance shown reflects the waiver, without which the results would have been lower.
1 The S&P 500® Index is an unmanaged, market capitalization weighted index which measures the performance of the large cap segment of the U.S. equities market, covering approximately 75% of the U.S. equities market. The Index includes 500 leading companies in leading industries of the U.S. economy. Index returns assume the reinvestment of dividends, but, unlike the Fund's returns, do not reflect the effects of management fees or expenses. The Barclays Capital U.S. Intermediate Corporate Bond Index is an unmanaged index of publicly issued investment grade U.S. corporate bonds with one to ten years to maturity. It is not possible to invest directly in either Index.
2 "Current" expense ratio is as of 06/30/19. "Prospectus" expense ratio is for the fiscal year ended 12/31/18.
1
Pacific Advisors
Balanced Fund (unaudited)
Fund Objective: Long-term capital appreciation and income consistent with reduced risk.
Investment Invests primarily in large cap common stocks and investment grade U.S. corporate
Strategy: bonds. Invests at least 25% of its assets in fixed income securities and preferred stocks and at least 25% in equities.
Investor Profile: Moderately conservative. Seeks combination of long-term growth, income, liquidity and reduced risk of price fluctuations.
Portfolio Holdings (As of 06/30/19 based on total investments)
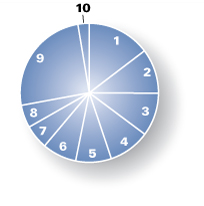
| Equities | 72.10 | % | |||||||||
| 1. | Industrials | 14.68 | % | ||||||||
| 2. | Communication Services | 10.42 | % | ||||||||
| 3. | Consumer Discretionary | 10.07 | % | ||||||||
| 4. | Financials | 9.66 | % | ||||||||
| 5. | Information Technology | 8.34 | % | ||||||||
| 6. | Health Care | 8.00 | % | ||||||||
| 7. | Consumer Staples | 5.62 | % | ||||||||
| 8. | Energy | 5.31 | % | ||||||||
| 9. | Corporate Bonds | 25.25 | % | ||||||||
| 10. | Preferred Stock | 2.65 | % | ||||||||
| Total Returns (For the six months ended 06/30/19) | |||||||
Class A | 9.46 | % | |||||
Class C | 9.01 | % | |||||
| |||||||
S&P 500® Index1 | 18.54 | % | |||||
| Barclays Capital U.S. Intermediate Corporate Bond Index1 | 7.08 | % | |||||
Current expense ratio: 6.34% (A); 7.07% (C). Prospectus expense ratio: 5.16% (A); 5.91% (C).2
Performance quoted is past performance which does not guarantee future results. Current performance may be higher or lower than the performance quoted. Call (800) 989-6693 for performance current to the most recent month-end. The investment return and principal value of an investment will fluctuate so that an investor's shares, when redeemed, may be worth more or less than their original cost. Returns represent the change in value over the stated period assuming reinvestment of dividends and capital gains at net asset value. Returns do not take into account the maximum 5.75% sales charge on Class A shares or the 1% Contingent Deferred Sales Charge (CDSC) for Class C shares sold within one year of purchase. Returns would be lower if the applicable sales charge and CDSC were included. Returns do not take into account individual taxes which may reduce actual returns when shares are sold.
1 The S&P 500® Index is an unmanaged, market capitalization weighted index which measures the performance of the large cap segment of the U.S. equities market, covering approximately 75% of the U.S. equities market. The Index includes 500 leading companies in leading industries of the U.S. economy. Index returns assume the reinvestment of dividends, but, unlike the Fund's returns, do not reflect the effects of management fees or expenses. The Barclays Capital U.S. Intermediate Corporate Bond Index is an unmanaged index of publicly issued investment grade U.S. corporate bonds with one to ten years to maturity. It is not possible to invest directly in either Index.
2 "Current" expense ratio is as of 06/30/19. "Prospectus" expense ratio is for the fiscal year ended 12/31/18.
2
Pacific Advisors
Large Cap Value Fund (unaudited)
Fund Objective: Long-term capital appreciation.
Investment Invests at least 80% of its assets in large cap companies that are, at the time of
Strategy: purchase, within the market cap range of companies in the S&P 500® Index1.
Investor Profile: Conservative equity. Growth-oriented with a long-term investment horizon.
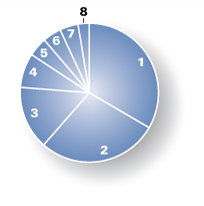
Portfolio Holdings (As of 06/30/19 based on total investments)

| Equities | 100.00 | % | |||||||||
| 1. | Information Technology | 18.72 | % | ||||||||
| 2. | Consumer Staples | 18.62 | % | ||||||||
| 3. | Industrials | 18.26 | % | ||||||||
| 4. | Financials | 14.49 | % | ||||||||
| 5. | Consumer Discretionary | 13.76 | % | ||||||||
| 6. | Communication Services | 11.50 | % | ||||||||
| 7. | Health Care | 4.65 | % | ||||||||
| Total Returns (For the six months ended 06/30/19) | |||||||
Class A | 15.41 | % | |||||
Class C | 15.03 | % | |||||
| |||||||
S&P 500® Index | 18.54 | % | |||||
Current expense ratio: net 5.13% (A), 5.87% (C); gross 5.88% (A), 6.63% (C). Prospectus expense ratio: net 4.12% (A), 4.87% (C); gross 4.87% (A); 5.62% (C).2
Performance quoted is past performance which does not guarantee future results. Current performance may be higher or lower than the performance quoted. Call (800) 989-6693 for performance current to the most recent month-end. The investment return and principal value of an investment will fluctuate so that an investor's shares, when redeemed, may be worth more or less than their original cost. Returns represent the change in value over the stated period assuming reinvestment of dividends and capital gains at net asset value. Returns do not take into account the maximum 5.75% sales charge on Class A shares or the 1% Contingent Deferred Sales Charge (CDSC) for Class C shares sold within one year of purchase. Returns would be lower if the applicable sales charge and CDSC were included. Returns do not take into account individual taxes which may reduce actual returns when shares are sold.
The Fund's investment adviser is waiving a portion of its management fees pursuant to an Expense Limitation Agreement. The waiver may be discontinued at any time with ninety days written notice in consultation with the Fund's board, but is expected to continue at current levels. Please see the Notes to Financial Statements in this report for details. Performance shown reflects the waiver, without which the results would have been lower.
1 The Standard & Poor's 500® Index is an unmanaged, market capitalization weighted index which measures the performance of the large cap segment of the U.S. equities market, covering approximately 75% of the U.S. equities market. The Index includes 500 leading companies in leading industries of the U.S. economy. Index returns assume the reinvestment of dividends, but, unlike the Fund's returns, do not reflect the effects of management fees or expenses. It is not possible to invest directly in the Index.
2 "Current" expense ratio is as of 06/30/19. "Prospectus" expense ratio is for the fiscal year ended 12/31/18.
3
Pacific Advisors
Mid Cap Value Fund (unaudited)
Fund Objective: Long-term capital appreciation.
Investment Invests at least 80% of its assets in mid-cap companies that are, at the time of
Strategy: purchase, within the market cap range of companies in the Russell Midcap® Index.1
Investor Profile: Moderately aggressive. Growth-oriented with a long-term investment horizon.
Portfolio Holdings (As of 06/30/19 based on total investments)
Equities | 100.00 | % | |||||||||
| 1. | Industrials | 33.39 | % | ||||||||
| 2. | Consumer Discretionary | 28.08 | % | ||||||||
| 3. | Energy | 14.77 | % | ||||||||
| 4. | Financials | 8.02 | % | ||||||||
| 5. | Information Technology | 4.46 | % | ||||||||
| 6. | Telecommunication Services | 4.34 | % | ||||||||
| 7. | Health Care | 4.32 | % | ||||||||
| 8. | Materials | 2.62 | % | ||||||||
| Total Returns (For the six months ended 06/30/19) | |||||||
Class A | 15.33 | % | |||||
Class C | 14.80 | % | |||||
| |||||||
Russell Midcap® Index | 21.35 | % | |||||
Current expense ratio: 6.75% (A); 7.40% (C). Prospectus expense ratio: 5.33% (A); 6.08% (C).2
Performance quoted is past performance which does not guarantee future results. Current performance may be higher or lower than the performance quoted. Call (800) 989-6693 for performance current to the most recent month-end. The investment return and principal value of an investment will fluctuate so that an investor's shares, when redeemed, may be worth more or less than their original cost. Returns represent the change in value over the stated period assuming reinvestment of dividends and capital gains at net asset value. Returns do not take into account the maximum 5.75% sales charge on Class A shares or the 1% Contingent Deferred Sales Charge (CDSC) for Class C shares sold within one year of purchase. Returns would be lower if the applicable sales charge and CDSC were included. Returns do not take into account individual taxes which may reduce actual returns when shares are sold.
1 The Russell Midcap® Index is an unmanaged, weighted measure of the 800 smallest companies within the Russell 1000® Index based on a combination of their market cap and current index membership. Index returns assume the reinvestment of dividends, but, unlike the Fund's returns, do not reflect management fees or expenses. It is not possible to invest directly in the Index.
2 "Current" expense ratio is as of 06/30/19. "Prospectus" expense ratio is for the fiscal year ended 12/31/18.
4
Pacific Advisors
Small Cap Value Fund (unaudited)
Fund Objective: Capital appreciation through investment in small cap companies.
Investment Invests at least 80% of its assets in small cap companies which are, at the time of
Strategy: purchase, not greater than the highest market capitalization of companies within the Russell 2000® Index1. Generally invests a significant proportion of its assets in companies with market capitalizations that are, at the time of purchase, not greater than the highest market capitalization of companies in the Russell Microcap® Index1 (which are often referred to as "micro-cap" stocks).
Investor Profile: Aggressive. Opportunity-oriented with a long-term investment horizon.
Portfolio Holdings (As of 06/30/19 based on total investments)
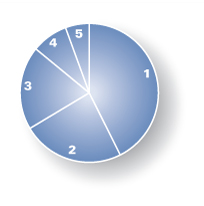
| Equities | 100.00 | % | |||||||||
| 1. | Industrials | 42.61 | % | ||||||||
| 2. | Energy | 23.83 | % | ||||||||
| 3. | Consumer Discretionary | 19.48 | % | ||||||||
| 4. | Financials | 8.50 | % | ||||||||
| 5. | Consumer Staples | 5.58 | % | ||||||||
| Total Returns (For the six months ended 06/30/19) | |||||||
Class A | 7.71 | % | |||||
Class C | 7.31 | % | |||||
Class I | 7.85 | % | |||||
| |||||||
Russell 2000® Index | 16.98 | % | |||||
Current expense ratio: 5.43% (A); 6.14% (C); 5.21% (I). Prospectus expense ratio: 4.40% (A); 5.15% (C); 4.41% (I).2
Performance quoted is past performance which does not guarantee future results. Current performance may be higher or lower than the performance quoted. Call (800) 989-6693 for performance current to the most recent month-end. The investment return and principal value of an investment will fluctuate so that an investor's shares, when redeemed, may be worth more or less than their original cost. Returns represent the change in value over the stated period assuming reinvestment of dividends and capital gains at net asset value. Rankings shown are for Class A shares; rankings for other share classes may be different. Returns and rankings do not take into account the maximum 5.75% sales charge on Class A shares or the 1% Contingent Deferred Sales Charge (CDSC) for Class C shares sold within one year of purchase. Returns would be lower if the applicable sales charge and CDSC were included. Returns do not take into account individual taxes which may reduce actual returns when shares are sold. Small cap companies typically have fewer financial resources and may carry higher investment risks and experience greater stock price volatility than larger stocks.
1 The Russell 2000® Index is an unmanaged, market-weighted measure of the 2,000 smallest companies of the Russell 3000® Index which represents approximately 98% of the investable U.S. equity market. Index returns assume the reinvestment of dividends, but, unlike the Fund's returns, do not reflect management fees or expenses. The Russell Microcap® Index is an unmanaged, market capitalization weighted measure of the 1,000 smallest publicly traded companies within the Russell 2000® Index, plus the next smallest 1,000 U.S. based listed stocksIt is not possible to invest directly in either Index.
2 "Current" expense ratio is as of 06/30/19. "Prospectus" expense ratio is for the fiscal year ended 12/31/18.
5
Expense Examples
As a shareholder of the Fund you incur two types of costs: (1) transaction costs, including sales charges (loads) on purchase payments, reinvested dividends, or other distributions; redemption fees; and exchange fees; and (2) ongoing costs, including management fees; distribution (12b-1) fees; and other Fund expenses. This Example is intended to help you understand your ongoing costs (in dollars) of investing in the Fund and to compare these costs with the ongoing costs of investing in other mutual funds.
The Example is based on an investment of $1,000 invested at the beginning of the period and held for the entire period from January 1, 2019 through June 30, 2019.
Actual Expenses
The first line of the table below provides information about actual account values and actual expenses. You may use the information in this line, together with the amount you invested, to estimate the expenses that you paid over the period. Simply divide your account value by $1,000 (for example, an $8,600 account value divided by $1,000 = 8.6), then multiply the result by the number in the first line under the heading entitled "Expenses Paid During the Period" to estimate the expenses you paid on your account during the period.
The following transaction costs are not included in the expenses shown in the table and, if applicable, would increase the expenses that you paid over the period: (1) a front-end sales charge (load) of 4.75% on Class A shares of the Income and Equity Fund and 5.75% on Class A shares of all other funds; (2) a 2% redemption fee if you sell or exchange shares within 30 days of purchase, with certain exceptions. The redemption fee does not apply to: (a) redemptions under an automatic withdrawal program or periodic asset reallocation plan, required minimum distributions (RMD), employer mandated distributions from a qualified plan, or redemptions under a qualified domestic relations order (QDRO); (b) redemptions to pay for expenses related to terminal illness, extended hospital or nursing home care, or other serious medical conditions, including death; (c) redemptions of shares acquired through dividend or capital gains reinvestments; (d) loans from a qualified plan account; and (e) redemptions initiated by the Fund; and (3) a $10 service fee on each exchange after the first five exchanges in each calendar year.
The following ongoing costs are not included in the expenses shown in the table and, if applicable, would increase the expenses that you paid over the period: (1) a $12 low balance fee on accounts with balances of less than $250 as of September 30th of each calendar year and no investment activity (excluding reinvestment of dividends and/or capital gains) during the prior calendar year or the first nine months of the current calendar year. This fee does not apply to IRAs, qualified plan accounts, or Coverdell Education Savings Accounts; (2) a $15 annual custodial fee on IRAs, SEPs, SIMPLE IRAs, and Coverdell Education Savings Accounts; and (3) a $20 annual custodial fee on 403(b) accounts.
Hypothetical Example for Comparison Purposes
The second line of the table below provides information about hypothetical account values and hypothetical expenses based on the Fund's actual expense ratio and an assumed rate of return of 5% per year before expenses, which in not the Fund's actual return. The hypothetical account values and expenses may not be used to estimate the actual ending account balance or expenses you paid for the period. You may use this information to compare the ongoing costs of investing in the Fund and other funds. To do so, compare this 5% hypothetical example with the 5% hypothetical examples that appear in the shareholder reports of the other funds.
The following transaction costs are not included in the expenses shown in the table and, if applicable, would increase the expenses that you paid over the period: (1) a front-end sales charge (load) of 4.75% on Class A shares of the Income and Equity Fund and 5.75% on Class A shares of all other funds; (2) a 2% redemption fee if you sell or exchange shares within 30 days of purchase, with certain exceptions. The redemption fee does not apply to: (a) redemptions under an automatic withdrawal program or periodic asset reallocation plan, required minimum distributions (RMD), employer mandated distributions from a qualified plan, or redemptions under a qualified domestic relations order (QDRO); (b) redemptions to pay for expenses related to terminal illness, extended hospital or nursing home care, or other serious medical conditions, including death; (c) redemptions of shares acquired through dividend or capital gains reinvestments; (d) loans from a qualified plan account; and (e) redemptions initiated by the Fund; and (3) a $10 service fee on each exchange after the first five exchanges in each calendar year.
The following ongoing costs are not included in the expenses shown in the table and, if applicable, would increase the expenses that you paid over the period: (1) a $12 low balance fee on accounts with balances of less than $250 as of September 30th of each calendar year and no investment activity (excluding reinvestment of dividends and/or capital gains) during the prior calendar year or the first nine months of the current calendar year. This fee does not apply to IRAs, qualified plan accounts, or Coverdell Education Savings Accounts; (2) a $15 annual custodial fee on IRAs, SEPs, SIMPLE IRAs, and Coverdell Education Savings Accounts; and (3) a $20 annual custodial fee on 403(b) accounts.
Please note that the expenses shown in the table are meant to highlight your ongoing costs only and do not reflect any transactional costs, such as sales charges (loads), redemption fees, or exchange fees. Therefore, the second line of the table is useful in comparing ongoing costs only, and will not help you determine the relative total costs of owning different funds. In addition, if these transactional costs were included, your costs would have been higher.
| Beginning Account Value 01/01/19 | Ending Account Value 06/30/19 | Expense Paid During Period 01/01/19 – 06/30/19 | |||||||||||||
Income and Equity Fund Class A | |||||||||||||||
Actual | $ | 1,000.00 | $ | 1,063.70 | $ | 24.61 | |||||||||
Hypothetical (5% return before expense) | $ | 1,000.00 | $ | 1,000.94 | $ | 23.86 | |||||||||
Income and Equity Fund Class C | |||||||||||||||
Actual | $ | 1,000.00 | $ | 1,060.10 | $ | 28.55 | |||||||||
Hypothetical (5% return before expense) | $ | 1,000.00 | $ | 997.07 | $ | 27.68 | |||||||||
6
| Beginning Account Value 01/01/19 | Ending Account Value 06/30/19 | Expense Paid During Period 01/01/19 – 06/30/19 | |||||||||||||
Balanced Fund Class A | |||||||||||||||
Actual | $ | 1,000.00 | $ | 1,094.60 | $ | 32.93 | |||||||||
Hypothetical (5% return before expense) | $ | 1,000.00 | $ | 993.36 | $ | 31.33 | |||||||||
Balanced Fund Class C | |||||||||||||||
Actual | $ | 1,000.00 | $ | 1,090.10 | $ | 36.64 | |||||||||
Hypothetical (5% return before expense) | $ | 1,000.00 | $ | 989.74 | $ | 34.88 | |||||||||
Large Cap Value Fund Class A | |||||||||||||||
Actual | $ | 1,000.00 | $ | 1,154.10 | $ | 31.41 | |||||||||
Hypothetical (5% return before expense) | $ | 1,000.00 | $ | 995.64 | $ | 29.09 | |||||||||
Large Cap Value Fund Class C | |||||||||||||||
Actual | $ | 1,000.00 | $ | 1,150.30 | $ | 35.35 | |||||||||
Hypothetical (5% return before expense) | $ | 1,000.00 | $ | 991.92 | $ | 32.74 | |||||||||
Mid Cap Value Fund Class A | |||||||||||||||
Actual | $ | 1,000.00 | $ | 1,153.30 | $ | 36.04 | |||||||||
Hypothetical (5% return before expense) | $ | 1,000.00 | $ | 991.32 | $ | 33.33 | |||||||||
Mid Cap Value Fund Class C | |||||||||||||||
Actual | $ | 1,000.00 | $ | 1,148.00 | $ | 39.41 | |||||||||
Hypothetical (5% return before expense) | $ | 1,000.00 | $ | 988.10 | $ | 36.48 | |||||||||
Small Cap Value Class A | |||||||||||||||
Actual | $ | 1,000.00 | $ | 1,077.10 | $ | 27.96 | |||||||||
Hypothetical (5% return before expense) | $ | 1,000.00 | $ | 997.87 | $ | 26.90 | |||||||||
Small Cap Value Class C | |||||||||||||||
Actual | $ | 1,000.00 | $ | 1,073.10 | $ | 31.56 | |||||||||
Hypothetical (5% return before expense) | $ | 1,000.00 | $ | 994.35 | $ | 30.36 | |||||||||
Small Cap Value Class I | |||||||||||||||
Actual | $ | 1,000.00 | $ | 1,078.50 | $ | 26.85 | |||||||||
Hypothetical (5% return before expense) | $ | 1,000.00 | $ | 998.96 | $ | 25.82 | |||||||||
Expenses are equal to each Fund's annualized expense ratio (net of expense waivers), as follows, multiplied by the average account value over the period, multiplied by 181/365 days to reflect the one-half year period:
• Income and Equity Fund: 4.81% (A); 5.59% (C)
• Balanced Fund: 6.34% (A); 7.07% (C)
• Large Cap Value Fund: 5.88% (A); 6.63% (C)
• Mid Cap Value Fund: 6.75% (A); 7.40% (C)
• Small Cap Value Fund: 5.43% (A); 6.14% (C); 5.21% (I)
7

Pacific Advisors Fund Inc.
Financial Statements
8
Pacific Advisors Income & Equity Fund
Schedule of Investments (Unaudited)
as of June 30, 2019
| Quantity or Principal** | Description | Variable Rate | Current $ Value** | % of Total Net Assets | |||||||||||||||
COMMON STOCK | |||||||||||||||||||
COMMUNICATION SERVICES | 4.60 | ||||||||||||||||||
DIVERSIFIED TELECOM. SERVICES | |||||||||||||||||||
6,000 | AT&T INC. | 201,060 | |||||||||||||||||
3,400 | VERIZON COMMUNICATIONS INC. | 194,242 | |||||||||||||||||
395,302 | 4.17 | ||||||||||||||||||
MEDIA | |||||||||||||||||||
500 | OMNICOM GROUP INC. | 40,975 | |||||||||||||||||
40,975 | 0.43 | ||||||||||||||||||
CONSUMER DISCRETIONARY | 6.91 | ||||||||||||||||||
DISTRIBUTORS | |||||||||||||||||||
1,750 | GENUINE PARTS CO. | 181,265 | |||||||||||||||||
181,265 | 1.91 | ||||||||||||||||||
MULTILINE RETAIL | |||||||||||||||||||
3,000 | KOHLS CORP. | 142,650 | |||||||||||||||||
2,000 | TARGET CORP. | 173,220 | |||||||||||||||||
315,870 | 3.33 | ||||||||||||||||||
TEXTILES, APPAREL & LUXURY GOODS | |||||||||||||||||||
5,000 | TAPESTRY INC. | 158,650 | |||||||||||||||||
158,650 | 1.67 | ||||||||||||||||||
CONSUMER STAPLES | 5.86 | ||||||||||||||||||
BEVERAGES | |||||||||||||||||||
3,500 | COCA-COLA CO. | 178,220 | |||||||||||||||||
178,220 | 1.88 | ||||||||||||||||||
FOOD & STAPLES RETAILING | |||||||||||||||||||
2,700 | SYSCO CORP. | 190,944 | |||||||||||||||||
190,944 | 2.01 | ||||||||||||||||||
HOUSEHOLD PRODUCTS | |||||||||||||||||||
1,700 | PROCTER & GAMBLE CO. | 186,405 | |||||||||||||||||
186,405 | 1.97 | ||||||||||||||||||
ENERGY | 4.92 | ||||||||||||||||||
ENERGY EQUIPMENT & SERVICES | |||||||||||||||||||
3,000 | SCHLUMBERGER LTD | 119,220 | |||||||||||||||||
119,220 | 1.26 | ||||||||||||||||||
OIL, GAS & CONSUMABLE FUELS | |||||||||||||||||||
1,500 | CHEVRON CORP. | 186,660 | |||||||||||||||||
2,100 | EXXON MOBIL CORP. | 160,923 | |||||||||||||||||
347,583 | 3.66 | ||||||||||||||||||
See Accompanying Notes to Financial Statements which are an integral part of these financial statements.
9
Pacific Advisors Income & Equity Fund
Schedule of Investments (Unaudited)
as of June 30, 2019
| Quantity or Principal** | Description | Variable Rate | Current $ Value** | % of Total Net Assets | |||||||||||||||
COMMON STOCK continued | |||||||||||||||||||
FINANCIALS | 8.50 | ||||||||||||||||||
BANKS | |||||||||||||||||||
3,800 | U.S. BANCORP | 199,120 | |||||||||||||||||
2,000 | WELLS FARGO & CO. | 94,640 | |||||||||||||||||
293,760 | 3.10 | ||||||||||||||||||
CAPITAL MARKETS | |||||||||||||||||||
1,600 | T. ROWE PRICE GROUP INC. | 175,536 | |||||||||||||||||
175,536 | 1.85 | ||||||||||||||||||
INSURANCE | |||||||||||||||||||
2,500 | METLIFE INC. | 124,175 | |||||||||||||||||
2,100 | PRUDENTIAL FINANCIAL | 212,100 | |||||||||||||||||
336,275 | 3.55 | ||||||||||||||||||
HEALTH CARE | 7.71 | ||||||||||||||||||
BIOTECHNOLOGY | |||||||||||||||||||
2,500 | ABBVIE INC. | 181,800 | |||||||||||||||||
181,800 | 1.92 | ||||||||||||||||||
HEALTH CARE PROVIDERS & SERVICES | |||||||||||||||||||
3,000 | CVS HEALTH CORP. | 163,470 | |||||||||||||||||
163,470 | 1.72 | ||||||||||||||||||
PHARMACEUTICALS | |||||||||||||||||||
1,400 | JOHNSON & JOHNSON | 194,992 | |||||||||||||||||
4,400 | PFIZER INC. | 190,608 | |||||||||||||||||
385,600 | 4.07 | ||||||||||||||||||
INDUSTRIALS | 7.91 | ||||||||||||||||||
AEROSPACE & DEFENSE | |||||||||||||||||||
500 | LOCKHEED MARTIN CORP. | 181,770 | |||||||||||||||||
181,770 | 1.92 | ||||||||||||||||||
AIR FREIGHT & LOGISTICS | |||||||||||||||||||
1,750 | UNITED PARCEL SERVICE, INC. B | 180,723 | |||||||||||||||||
180,723 | 1.91 | ||||||||||||||||||
INDUSTRIAL CONGLOMERATES | |||||||||||||||||||
1,100 | HONEYWELL INTERNATIONAL INC. | 192,049 | |||||||||||||||||
192,049 | 2.02 | ||||||||||||||||||
TRADING COMPANIES & DISTRIBUTORS | |||||||||||||||||||
6,000 | FASTENAL COMPANY | 195,540 | |||||||||||||||||
195,540 | 2.06 | ||||||||||||||||||
See Accompanying Notes to Financial Statements which are an integral part of these financial statements.
10
Pacific Advisors Income & Equity Fund
Schedule of Investments (Unaudited)
as of June 30, 2019
| Quantity or Principal** | Description | Variable Rate | Current $ Value** | % of Total Net Assets | |||||||||||||||
COMMON STOCK continued | |||||||||||||||||||
INFORMATION TECHNOLOGY | 7.40 | ||||||||||||||||||
COMMUNICATIONS EQUIPMENT | |||||||||||||||||||
3,500 | CISCO SYSTEMS INC. | 191,555 | |||||||||||||||||
191,555 | 2.02 | ||||||||||||||||||
IT SERVICES | |||||||||||||||||||
1,200 | INT'L BUSINESS MACHINES CORP. | 165,480 | |||||||||||||||||
165,480 | 1.75 | ||||||||||||||||||
SEMICONDUCTORS & EQUIPMENT | |||||||||||||||||||
3,000 | INTEL CORP. | 143,610 | |||||||||||||||||
143,610 | 1.51 | ||||||||||||||||||
SOFTWARE | |||||||||||||||||||
1,500 | MICROSOFT CORP. | 200,940 | |||||||||||||||||
200,940 | 2.12 | ||||||||||||||||||
MATERIALS | 1.19 | ||||||||||||||||||
CHEMICALS | |||||||||||||||||||
735 | CORTEVA INC. | 21,734 | |||||||||||||||||
735 | DOW INC. | 36,243 | |||||||||||||||||
735 | DUPONT DE NEMOURS INC. | 55,176 | |||||||||||||||||
113,153 | 1.19 | ||||||||||||||||||
UTILITIES | 3.33 | ||||||||||||||||||
ELECTRIC UTILITIES | |||||||||||||||||||
1,700 | DUKE ENERGY CORP. | 150,008 | |||||||||||||||||
150,008 | 1.58 | ||||||||||||||||||
MULTI-UTILITIES | |||||||||||||||||||
2,150 | DOMINION ENERGY INC. | 166,238 | |||||||||||||||||
166,238 | 1.75 | ||||||||||||||||||
TOTAL COMMON STOCK (Cost: $3,959,809) | 5,531,941 | 58.33 | |||||||||||||||||
CORPORATE BOND | |||||||||||||||||||
CONSUMER DISCRETIONARY | 1.62 | ||||||||||||||||||
HOUSEHOLD DURABLES | |||||||||||||||||||
150,000 | TUPPERWARE BRANDS CORP. 4.75% 06/01/21 | 154,055 | |||||||||||||||||
154,055 | 1.62 | ||||||||||||||||||
ENERGY | 1.58 | ||||||||||||||||||
ENERGY EQUIPMENT & SERVICES | |||||||||||||||||||
150,000 | ROWAN COMPANY INC. 7.875% 08/01/19 | 150,000 | |||||||||||||||||
150,000 | 1.58 | ||||||||||||||||||
See Accompanying Notes to Financial Statements which are an integral part of these financial statements.
11
Pacific Advisors Income & Equity Fund
Schedule of Investments (Unaudited)
as of June 30, 2019
| Quantity or Principal** | Description | Variable Rate | Current $ Value** | % of Total Net Assets | |||||||||||||||
CORPORATE BOND continued | |||||||||||||||||||
FINANCIALS | 16.26 | ||||||||||||||||||
BANKS | |||||||||||||||||||
100,000 | BANK OF AMERICA CORP. 4.362% 03/19/20*** | CPI YOY+2.50% | 101,250 | ||||||||||||||||
100,000 | BANK OF AMERICA CORP. 4.089% 09/28/20*** | 3 MONTH LIBOR+1.76% | 101,093 | ||||||||||||||||
122,000 | BANK OF AMERICA CORP. 3.612% 07/07/21*** | CPI YOY+1.75% | 123,830 | ||||||||||||||||
150,000 | BARCLAY BANK PLC 4.100% 04/18/21*** | 3 MONTH LIBOR+1.50% | 151,350 | ||||||||||||||||
94,000 | FULTON FINANCIAL CORP. 3.60% 03/16/22 | 95,244 | |||||||||||||||||
125,000 | JPMORGAN CHASE & CO. 3.996% 02/25/21*** | CPI YOY+2.00% | 126,037 | ||||||||||||||||
698,804 | 7.37 | ||||||||||||||||||
CAPITAL MARKETS | |||||||||||||||||||
100,000 | GOLDMAN SACHS GROUP INC. 3.920% 08/26/20*** | 3 MONTH LIBOR+1.40% | 100,518 | ||||||||||||||||
200,000 | HERCULES CAPITAL INC. 4.625% 10/23/22 | 196,753 | |||||||||||||||||
100,000 | MORGAN STANLEY 3.862% 04/25/23*** | CPI YOY+2.00% | 102,250 | ||||||||||||||||
100,000 | MORGAN STANLEY 3.062% 10/28/24*** | CPI YOY+1.20% | 95,375 | ||||||||||||||||
494,896 | 5.22 | ||||||||||||||||||
DIVERSIFIED FINANCIAL SERVICES | |||||||||||||||||||
100,000 | ICAHN ENTERPRISES 6.00% 08/01/20 | 100,150 | |||||||||||||||||
150,000 | JEFFERIES GRP LLC 3.00% 07/27/22 STEP**** | 148,766 | |||||||||||||||||
248,916 | 2.63 | ||||||||||||||||||
INSURANCE | |||||||||||||||||||
100,000 | PRUDENTIAL FINANCIAL INC. 3.863% 11/02/20*** | CPI YOY+2.00% | 98,555 | ||||||||||||||||
98,555 | 1.04 | ||||||||||||||||||
HEALTH CARE | 2.76 | ||||||||||||||||||
BIOTECHNOLOGY | |||||||||||||||||||
114,000 | BAXALTA INC. 3.60% 06/23/22 | 116,983 | |||||||||||||||||
116,983 | 1.23 | ||||||||||||||||||
PHARMACEUTICALS | |||||||||||||||||||
100,000 | TEVA PHARMACEUTICAL 3.65% 11/10/21 | 96,250 | |||||||||||||||||
50,000 | TEVA PHARMACEUTICAL 3.65% 11/10/21 | 48,275 | |||||||||||||||||
144,525 | 1.53 | ||||||||||||||||||
INFORMATION TECHNOLOGY | 3.19 | ||||||||||||||||||
ELECTRONIC EQUIPMENT & INSTRUMENTS | |||||||||||||||||||
150,000 | KEYSIGHT TECHNOLOGIES 3.30% 10/30/19 | 150,167 | |||||||||||||||||
150,000 | TECH DATA CORP. 3.70% 02/15/22 | 152,576 | |||||||||||||||||
302,743 | 3.19 | ||||||||||||||||||
REAL ESTATE | 4.83 | ||||||||||||||||||
HEALTH CARE REITS | |||||||||||||||||||
150,000 | OMEGA HLTHCARE INVESTORS 4.375% 08/01/23 | 155,826 | |||||||||||||||||
155,826 | 1.64 | ||||||||||||||||||
See Accompanying Notes to Financial Statements which are an integral part of these financial statements.
12
Pacific Advisors Income & Equity Fund
Schedule of Investments (Unaudited)
as of June 30, 2019
| Quantity or Principal** | Description | Variable Rate | Current $ Value** | % of Total Net Assets | |||||||||||||||
CORPORATE BOND continued | |||||||||||||||||||
OFFICE REITS | |||||||||||||||||||
150,000 | CORPORATE OFFICE PROP 3.60% 05/15/23 | 151,052 | |||||||||||||||||
150,000 | GOV'T PROPERTIES INC. 4.00% 07/15/22 | 151,641 | |||||||||||||||||
302,693 | 3.19 | ||||||||||||||||||
TOTAL CORPORATE BOND (Cost: $2,861,786) | 2,867,996 | 30.24 | |||||||||||||||||
CONVERTIBLE CORPORATE BOND | |||||||||||||||||||
FINANCIALS | 2.64 | ||||||||||||||||||
CAPITAL MARKETS | |||||||||||||||||||
150,000 | BLACKROCK CAP INV CONV 5.00% 06/15/22 | 150,009 | |||||||||||||||||
100,000 | PROSPECT CAPITAL CORP. 4.95% 07/15/22 | 100,541 | |||||||||||||||||
250,550 | 2.64 | ||||||||||||||||||
TOTAL CONVERTIBLE CORPORATE BOND (Cost: $254,474) | 250,550 | 2.64 | |||||||||||||||||
PREFERRED STOCK | |||||||||||||||||||
FINANCIALS | 9.57 | ||||||||||||||||||
BANKS | |||||||||||||||||||
100,000 | JPMORGAN CHASE & CO. 5.30% PFD***** | 3 MONTH LIBOR+3.80% | 101,157 | ||||||||||||||||
100,000 | JPMORGAN CHASE & CO. 5.00% PFD***** | 3 MONTH LIBOR+3.32% | 99,680 | ||||||||||||||||
150,000 | WELLS FARGO & CO. 6.381% PFD***** | 3 MONTH LIBOR+3.77% | 151,237 | ||||||||||||||||
352,074 | 3.71 | ||||||||||||||||||
CAPITAL MARKETS | |||||||||||||||||||
150,000 | BANK OF NY MELLON 4.95% PFD***** | 3 MONTH LIBOR+3.42% | 152,364 | ||||||||||||||||
200,000 | CHARLES SCHWAB CORP. 4.625% PFD***** | 3 MONTH LIBOR+3.315% | 200,842 | ||||||||||||||||
353,206 | 3.73 | ||||||||||||||||||
INSURANCE | |||||||||||||||||||
200,000 | METLIFE INC. 5.25% PFD***** | 3 MONTH LIBOR+3.575% | 202,230 | ||||||||||||||||
202,230 | 2.13 | ||||||||||||||||||
TOTAL PREFERRED STOCK (Cost: $900,250) | 907,510 | 9.57 | |||||||||||||||||
TOTAL INVESTMENT IN SECURITIES (Cost: $7,976,319) | 9,557,997 | 100.78 | |||||||||||||||||
OTHER ASSETS LESS LIABILITIES | (73,661 | ) | (0.78 | ) | |||||||||||||||
TOTAL NET ASSETS | 9,484,336 | 100.00 | |||||||||||||||||
* Non-income producing
** The principal amount is stated in U.S. dollars unless otherwise indicated.
*** Variable rate security; the interest or dividend rate shown is the rate in effect as of June 30, 2019.
**** Step-Up bond; the interest rate shown is the rate in effect as of June 30, 2019.
***** Fixed to float rate security; the dividend rate is fixed for a certain period and then converts to a floating rate; the dividend rate shown is the rate in effect as of June 30, 2019.
See Accompanying Notes to Financial Statements which are an integral part of these financial statements.
13
Pacific Advisors Balanced Fund
Schedule of Investments (Unaudited)
as of June 30, 2019
| Quantity or Principal** | Description | Variable Rate | Current $ Value** | % of Total Net Assets | |||||||||||||||
COMMON STOCK | |||||||||||||||||||
COMMUNICATION SERVICES | 10.41 | ||||||||||||||||||
DIVERSIFIED TELECOM. SERVICES | |||||||||||||||||||
1,300 | VERIZON COMMUNICATIONS INC. | 74,269 | |||||||||||||||||
74,269 | 1.97 | ||||||||||||||||||
ENTERTAINMENT | |||||||||||||||||||
750 | WALT DISNEY CO. | 104,730 | |||||||||||||||||
104,730 | 2.79 | ||||||||||||||||||
INTERACTIVE MEDIA & SERVICES | |||||||||||||||||||
98 | ALPHABET INC.* | 106,114 | |||||||||||||||||
550 | FACEBOOK, INC.* | 106,150 | |||||||||||||||||
212,264 | 5.65 | ||||||||||||||||||
CONSUMER DISCRETIONARY | 10.06 | ||||||||||||||||||
SPECIALTY RETAIL | |||||||||||||||||||
7,000 | CONN'S INC.* | 124,740 | |||||||||||||||||
275 | O'REILLY AUTOMOTIVE INC.* | 101,563 | |||||||||||||||||
220 | ULTA BEAUTY, INC.* | 76,316 | |||||||||||||||||
302,619 | 8.05 | ||||||||||||||||||
TEXTILES, APPAREL & LUXURY GOODS | |||||||||||||||||||
900 | NIKE INC. | 75,555 | |||||||||||||||||
75,555 | 2.01 | ||||||||||||||||||
CONSUMER STAPLES | 5.61 | ||||||||||||||||||
FOOD & STAPLES RETAILING | |||||||||||||||||||
3,000 | CHEFS' WAREHOUSE INC.* | 105,210 | |||||||||||||||||
400 | COSTCO WHOLESALE | 105,704 | |||||||||||||||||
210,914 | 5.61 | ||||||||||||||||||
ENERGY | 5.32 | ||||||||||||||||||
ENERGY EQUIPMENT & SERVICES | |||||||||||||||||||
800 | CORE LABORATORIES N.V. ADR | 41,824 | |||||||||||||||||
21,200 | NOBLE CORPORATION* | 39,644 | |||||||||||||||||
81,468 | 2.17 | ||||||||||||||||||
OIL, GAS & CONSUMABLE FUELS | |||||||||||||||||||
950 | CHEVRON CORP. | 118,218 | |||||||||||||||||
118,218 | 3.15 | ||||||||||||||||||
See Accompanying Notes to Financial Statements which are an integral part of these financial statements.
14
Pacific Advisors Balanced Fund
Schedule of Investments (Unaudited)
as of June 30, 2019
| Quantity or Principal** | Description | Variable Rate | Current $ Value** | % of Total Net Assets | |||||||||||||||
COMMON STOCK continued | |||||||||||||||||||
FINANCIALS | 9.66 | ||||||||||||||||||
BANKS | |||||||||||||||||||
1,800 | CITIGROUP INC. | 126,054 | |||||||||||||||||
1,500 | EAST WEST BANCORP INC. | 70,155 | |||||||||||||||||
500 | SIGNATURE BANK | 60,420 | |||||||||||||||||
256,629 | 6.83 | ||||||||||||||||||
CAPITAL MARKETS | |||||||||||||||||||
735 | MORNINGSTAR, INC. | 106,310 | |||||||||||||||||
106,310 | 2.83 | ||||||||||||||||||
HEALTH CARE | 7.99 | ||||||||||||||||||
BIOTECHNOLOGY | |||||||||||||||||||
1,000 | ABBVIE INC. | 72,720 | |||||||||||||||||
72,720 | 1.93 | ||||||||||||||||||
HEALTH CARE EQUIPMENT & SUPPLIES | |||||||||||||||||||
200 | DENTSPLY SIRONA INC. | 11,672 | |||||||||||||||||
11,672 | 0.31 | ||||||||||||||||||
HEALTH CARE PROVIDERS & SERVICES | |||||||||||||||||||
300 | ANTHEM INC. | 84,663 | |||||||||||||||||
1,200 | CVS HEALTH CORP. | 65,388 | |||||||||||||||||
150,051 | 3.99 | ||||||||||||||||||
HEALTH CARE TECHNOLOGY | |||||||||||||||||||
900 | CERNER CORPORATION | 65,970 | |||||||||||||||||
65,970 | 1.76 | ||||||||||||||||||
INDUSTRIALS | 14.67 | ||||||||||||||||||
AIRLINES | |||||||||||||||||||
1,900 | SPIRIT AIRLINES INC.* | 90,687 | |||||||||||||||||
90,687 | 2.41 | ||||||||||||||||||
COMMERCIAL SERVICES & SUPPLIES | |||||||||||||||||||
4,000 | TEAM INC.* | 61,280 | |||||||||||||||||
61,280 | 1.63 | ||||||||||||||||||
MACHINERY | |||||||||||||||||||
800 | WABTEC CORP. | 57,408 | |||||||||||||||||
57,408 | 1.53 | ||||||||||||||||||
ROAD & RAIL | |||||||||||||||||||
1,300 | GENESEE & WYOMING INC.* | 130,000 | |||||||||||||||||
130,000 | 3.46 | ||||||||||||||||||
See Accompanying Notes to Financial Statements which are an integral part of these financial statements.
15
Pacific Advisors Balanced Fund
Schedule of Investments (Unaudited)
as of June 30, 2019
| Quantity or Principal** | Description | Variable Rate | Current $ Value** | % of Total Net Assets | |||||||||||||||
COMMON STOCK continued | |||||||||||||||||||
TRADING COMPANIES & DISTRIBUTORS | |||||||||||||||||||
3,000 | DXP ENTERPRISES INC.* | 113,670 | |||||||||||||||||
3,000 | TRITON INTERNATIONAL LIMITED | 98,280 | |||||||||||||||||
211,950 | 5.64 | ||||||||||||||||||
INFORMATION TECHNOLOGY | 8.34 | ||||||||||||||||||
IT SERVICES | |||||||||||||||||||
350 | ACCENTURE PLC | 64,670 | |||||||||||||||||
600 | VISA INC. | 104,130 | |||||||||||||||||
168,800 | 4.49 | ||||||||||||||||||
SOFTWARE | |||||||||||||||||||
800 | ORACLE CORPORATION | 45,576 | |||||||||||||||||
45,576 | 1.21 | ||||||||||||||||||
TECHNOLOGY HARDWARE STORAGE & PERIPHERALS | |||||||||||||||||||
500 | APPLE INC. | 98,960 | |||||||||||||||||
98,960 | 2.64 | ||||||||||||||||||
TOTAL COMMON STOCK (Cost: $2,072,460) | 2,708,050 | 72.06 | |||||||||||||||||
CORPORATE BOND | |||||||||||||||||||
CONSUMER DISCRETIONARY | 2.71 | ||||||||||||||||||
MULTILINE RETAIL | |||||||||||||||||||
100,000 | MACYS RETAIL HLDGS INC. 3.875% 01/15/22 | 101,761 | |||||||||||||||||
101,761 | 2.71 | ||||||||||||||||||
ENERGY | 2.66 | ||||||||||||||||||
ENERGY EQUIPMENT & SERVICES | |||||||||||||||||||
100,000 | ROWAN COMPANY INC. 7.875% 08/01/19 | 100,000 | |||||||||||||||||
100,000 | 2.66 | ||||||||||||||||||
FINANCIALS | 10.64 | ||||||||||||||||||
BANKS | |||||||||||||||||||
100,000 | BARCLAYS BANK PLC 3.00% 04/29/21 | 99,700 | |||||||||||||||||
99,700 | 2.65 | ||||||||||||||||||
CAPITAL MARKETS | |||||||||||||||||||
100,000 | ARES CAPITAL CORP. 3.625% 01/19/22 | 101,050 | |||||||||||||||||
101,050 | 2.69 | ||||||||||||||||||
DIVERSIFIED FINANCIAL SERVICES | |||||||||||||||||||
100,000 | ICAHN ENTERPRISES 6.00% 08/01/20 | 100,150 | |||||||||||||||||
100,000 | JEFFERIES GRP LLC 3.00% 07/27/22 STEP*** | 99,178 | |||||||||||||||||
199,328 | 5.30 | ||||||||||||||||||
See Accompanying Notes to Financial Statements which are an integral part of these financial statements.
16
Pacific Advisors Balanced Fund
Schedule of Investments (Unaudited)
as of June 30, 2019
| Quantity or Principal** | Description | Variable Rate | Current $ Value** | % of Total Net Assets | |||||||||||||||
CORPORATE BOND continued | |||||||||||||||||||
HEALTH CARE | 2.56 | ||||||||||||||||||
PHARMACEUTICALS | |||||||||||||||||||
100,000 | TEVA PHARMACEUTICAL 3.65% 11/10/21 | 96,250 | |||||||||||||||||
96,250 | 2.56 | ||||||||||||||||||
INFORMATION TECHNOLOGY | 3.97 | ||||||||||||||||||
SEMICONDUCTORS & EQUIPMENT | |||||||||||||||||||
50,000 | ANALOG DEVICES INC, 2.95% 01/12/21 | 50,455 | |||||||||||||||||
50,455 | 1.34 | ||||||||||||||||||
TECHNOLOGY HARDWARE STORAGE & PERIPHERALS | |||||||||||||||||||
100,000 | XEROX CORPORATION 2.75% 09/01/20 | 98,750 | |||||||||||||||||
98,750 | 2.63 | ||||||||||||||||||
REAL ESTATE | 2.69 | ||||||||||||||||||
OFFICE REITS | |||||||||||||||||||
100,000 | GOV'T PROPERTIES INC. 4.00% 07/15/22 | 101,094 | |||||||||||||||||
101,094 | 2.69 | ||||||||||||||||||
TOTAL CORPORATE BOND (Cost: $953,840) | 948,388 | 25.23 | |||||||||||||||||
PREFERRED STOCK | |||||||||||||||||||
FINANCIALS | 2.65 | ||||||||||||||||||
CAPITAL MARKETS | |||||||||||||||||||
100,000 | MORGAN STANLEY 5.45% PFD**** | 3 MONTH LIBOR+3.610% | 99,750 | ||||||||||||||||
99,750 | 2.65 | ||||||||||||||||||
TOTAL PREFERRED STOCK (Cost: $99,875) | 99,750 | 2.65 | |||||||||||||||||
TOTAL INVESTMENT IN SECURITIES (Cost: $3,126,175) | 3,756,188 | 99.94 | |||||||||||||||||
CASH OR CASH EQUIVALENT | 2,493 | 0.07 | |||||||||||||||||
OTHER ASSETS LESS LIABILITIES | (400 | ) | (0.01 | ) | |||||||||||||||
TOTAL NET ASSETS | 3,758,281 | 100.00 | |||||||||||||||||
* Non-income producing
** The principal amount is stated in U.S. dollars unless otherwise indicated.
*** Step-Up Bond; the interest rate shown is the rate in effect as of June 30, 2019.
**** Fixed to float rate security; the dividend rate is fixed for a certain period and then converts to a floating rate; the dividend rate shown is the fixed rate in effect as of June 30, 2019.
See Accompanying Notes to Financial Statements which are an integral part of these financial statements.
17
Pacific Advisors Large Cap Value Fund
Schedule of Investments (Unaudited)
as of June 30, 2019
| Quantity or Principal** | Description | Current $ Value** | % of Total Net Assets | ||||||||||||
COMMON STOCK | |||||||||||||||
COMMUNICATION SERVICES | 11.48 | ||||||||||||||
DIVERSIFIED TELECOM. SERVICES | |||||||||||||||
3,525 | AT&T INC. | 118,123 | |||||||||||||
118,123 | 2.07 | ||||||||||||||
ENTERTAINMENT | |||||||||||||||
1,975 | WALT DISNEY CO. | 275,789 | |||||||||||||
275,789 | 4.85 | ||||||||||||||
INTERACTIVE MEDIA & SERVICES | |||||||||||||||
240 | ALPHABET INC. CLASS C* | 259,418 | |||||||||||||
259,418 | 4.56 | ||||||||||||||
CONSUMER DISCRETIONARY | 13.75 | ||||||||||||||
HOTELS, RESTAURANTS & LEISURE | |||||||||||||||
1,300 | MCDONALD'S CORP. | 269,958 | |||||||||||||
269,958 | 4.75 | ||||||||||||||
SPECIALTY RETAIL | |||||||||||||||
2,600 | LOWE'S COMPANIES INC. | 262,366 | |||||||||||||
1,200 | THE HOME DEPOT, INC. | 249,564 | |||||||||||||
511,930 | 9.00 | ||||||||||||||
CONSUMER STAPLES | 18.60 | ||||||||||||||
BEVERAGES | |||||||||||||||
5,120 | COCA-COLA CO. | 260,710 | |||||||||||||
260,710 | 4.58 | ||||||||||||||
FOOD & STAPLES RETAILING | |||||||||||||||
3,800 | SYSCO CORP. | 268,736 | |||||||||||||
2,400 | WALMART INC. | 265,176 | |||||||||||||
533,912 | 9.39 | ||||||||||||||
HOUSEHOLD PRODUCTS | |||||||||||||||
2,400 | PROCTER & GAMBLE CO. | 263,160 | |||||||||||||
263,160 | 4.63 | ||||||||||||||
FINANCIALS | 14.47 | ||||||||||||||
BANKS | |||||||||||||||
7,000 | BANK OF AMERICA CORP. | 203,000 | |||||||||||||
1,650 | CITIGROUP INC. | 115,550 | |||||||||||||
1,663 | WELLS FARGO & CO. | 78,693 | |||||||||||||
397,243 | 6.98 | ||||||||||||||
See Accompanying Notes to Financial Statements which are an integral part of these financial statements.
18
Pacific Advisors Large Cap Value Fund
Schedule of Investments (Unaudited)
as of June 30, 2019
| Quantity or Principal** | Description | Current $ Value** | % of Total Net Assets | ||||||||||||
COMMON STOCK continued | |||||||||||||||
DIVERSIFIED FINANCIAL SERVICES | |||||||||||||||
1,300 | BERKSHIRE HATHAWAY INC. B* | 277,121 | |||||||||||||
277,121 | 4.87 | ||||||||||||||
INSURANCE | |||||||||||||||
3,000 | METLIFE INC. | 149,010 | |||||||||||||
149,010 | 2.62 | ||||||||||||||
HEALTH CARE | 4.65 | ||||||||||||||
PHARMACEUTICALS | |||||||||||||||
1,900 | JOHNSON & JOHNSON | 264,632 | |||||||||||||
264,632 | 4.65 | ||||||||||||||
INDUSTRIALS | 18.24 | ||||||||||||||
AIR FREIGHT & LOGISTICS | |||||||||||||||
1,000 | FEDEX CORP. | 164,190 | |||||||||||||
950 | UNITED PARCEL SERVICE, INC. B | 98,107 | |||||||||||||
262,297 | 4.61 | ||||||||||||||
INDUSTRIAL CONGLOMERATES | |||||||||||||||
1,550 | HONEYWELL INTERNATIONAL INC. | 270,615 | |||||||||||||
270,615 | 4.76 | ||||||||||||||
MACHINERY | |||||||||||||||
1,525 | DEERE & CO. | 252,708 | |||||||||||||
1,670 | ILLINOIS TOOL WORKS INC. | 251,852 | |||||||||||||
| �� | 504,560 | 8.87 | |||||||||||||
INFORMATION TECHNOLOGY | 18.70 | ||||||||||||||
IT SERVICES | |||||||||||||||
1,000 | MASTERCARD INC. | 264,530 | |||||||||||||
264,530 | 4.65 | ||||||||||||||
SEMICONDUCTORS & EQUIPMENT | |||||||||||||||
5,170 | INTEL CORP. | 247,488 | |||||||||||||
247,488 | 4.35 | ||||||||||||||
SOFTWARE | |||||||||||||||
2,050 | MICROSOFT CORP. | 274,618 | |||||||||||||
274,618 | 4.83 | ||||||||||||||
See Accompanying Notes to Financial Statements which are an integral part of these financial statements.
19
Pacific Advisors Large Cap Value Fund
Schedule of Investments (Unaudited)
as of June 30, 2019
| Quantity or Principal** | Description | Current $ Value** | % of Total Net Assets | ||||||||||||
COMMON STOCK continued | |||||||||||||||
TECHNOLOGY HARDWARE STORAGE & PERIPHERALS | |||||||||||||||
1,400 | APPLE INC. | 277,088 | |||||||||||||
277,088 | 4.87 | ||||||||||||||
TOTAL COMMON STOCK (Cost: $2,275,594) | 5,682,202 | 99.89 | |||||||||||||
TOTAL INVESTMENT IN SECURITIES (Cost: $2,275,594) | 5,682,202 | 99.89 | |||||||||||||
CASH OR CASH EQUIVALENT | 3,651 | 0.07 | |||||||||||||
OTHER ASSETS LESS LIABILITIES | 2,506 | 0.04 | |||||||||||||
TOTAL NET ASSETS | 5,688,359 | 100.00 | |||||||||||||
* Non-income producing
** The principal amount is stated in U.S. dollars unless otherwise indicated.
See Accompanying Notes to Financial Statements which are an integral part of these financial statements.
20
Pacific Advisors Mid Cap Value Fund
Schedule of Investments (Unaudited)
as of June 30, 2019
| Quantity or Principal** | Description | Current $ Value** | % of Total Net Assets | ||||||||||||
COMMON STOCK | |||||||||||||||
COMMUNICATION SERVICES | 4.36 | ||||||||||||||
ENTERTAINMENT | |||||||||||||||
300 | MADISON SQUARE GARDEN CO-A* | 83,982 | |||||||||||||
750 | TAKE-TWO INTERACTIVE SOFTWRE* | 85,147 | |||||||||||||
169,129 | 4.36 | ||||||||||||||
CONSUMER DISCRETIONARY | 28.20 | ||||||||||||||
AUTO COMPONENTS | |||||||||||||||
1,000 | LEAR CORP. | 139,270 | |||||||||||||
139,270 | 3.59 | ||||||||||||||
DISTRIBUTORS | |||||||||||||||
600 | POOL CORPORATION | 114,600 | |||||||||||||
114,600 | 2.95 | ||||||||||||||
SPECIALTY RETAIL | |||||||||||||||
10,000 | CONN'S INC.* | 178,200 | |||||||||||||
435 | O'REILLY AUTOMOTIVE INC.* | 160,654 | |||||||||||||
3,700 | PENSKE AUTOMOTIVE GROUP INC. | 175,010 | |||||||||||||
1,350 | TRACTOR SUPPLY COMPANY | 146,880 | |||||||||||||
660,744 | 17.02 | ||||||||||||||
TEXTILES, APPAREL & LUXURY GOODS | |||||||||||||||
1,400 | PVH CORP. | 132,496 | |||||||||||||
1,500 | TAPESTRY INC. | 47,595 | |||||||||||||
180,091 | 4.64 | ||||||||||||||
ENERGY | 14.83 | ||||||||||||||
ENERGY EQUIPMENT & SERVICES | |||||||||||||||
1,200 | CORE LABORATORIES N.V. ADR | 62,736 | |||||||||||||
24,000 | HELIX ENERGY SOLUTIONS GROUP INC.* | 207,120 | |||||||||||||
13,500 | MCDERMOTT INTL INC.* | 130,410 | |||||||||||||
37,000 | NOBLE CORPORATION* | 69,190 | |||||||||||||
4,100 | TECHNIPFMC PLC ADR | 106,354 | |||||||||||||
575,810 | 14.83 | ||||||||||||||
FINANCIALS | 8.05 | ||||||||||||||
BANKS | |||||||||||||||
3,100 | CIT GROUP INC. | 162,874 | |||||||||||||
3,200 | EAST WEST BANCORP INC. | 149,664 | |||||||||||||
312,538 | 8.05 | ||||||||||||||
HEALTH CARE | 4.34 | ||||||||||||||
HEALTH CARE TECHNOLOGY | |||||||||||||||
2,300 | CERNER CORPORATION | 168,590 | |||||||||||||
168,590 | 4.34 | ||||||||||||||
See Accompanying Notes to Financial Statements which are an integral part of these financial statements.
21
Pacific Advisors Mid Cap Value Fund
Schedule of Investments (Unaudited)
as of June 30, 2019
| Quantity or Principal** | Description | Current $ Value** | % of Total Net Assets | ||||||||||||
COMMON STOCK continued | |||||||||||||||
INDUSTRIALS | 33.53 | ||||||||||||||
AIRLINES | |||||||||||||||
3,200 | SPIRIT AIRLINES INC.* | 152,736 | |||||||||||||
152,736 | 3.94 | ||||||||||||||
MACHINERY | |||||||||||||||
5,600 | NAVISTAR INT'L CORP.* | 192,920 | |||||||||||||
2,000 | WABTEC CORP. | 143,520 | |||||||||||||
336,440 | 8.67 | ||||||||||||||
MARINE | |||||||||||||||
2,400 | KIRBY CORP.* | 189,600 | |||||||||||||
189,600 | 4.88 | ||||||||||||||
ROAD & RAIL | |||||||||||||||
1,800 | GENESEE & WYOMING INC.* | 180,000 | |||||||||||||
1,350 | KANSAS CITY SOUTHERN | 164,457 | |||||||||||||
5,024 | KNIGHT-SWIFT TRANSPORTATION HLDG | 164,988 | |||||||||||||
1,050 | LANDSTAR SYSTEM INC. | 113,390 | |||||||||||||
622,835 | 16.04 | ||||||||||||||
INFORMATION TECHNOLOGY | 4.48 | ||||||||||||||
SOFTWARE | |||||||||||||||
1,400 | ASPEN TECHNOLOGY, INC.* | 173,992 | |||||||||||||
173,992 | 4.48 | ||||||||||||||
MATERIALS | 2.63 | ||||||||||||||
CHEMICALS | |||||||||||||||
2,200 | H.B. FULLER CO. | 102,080 | |||||||||||||
102,080 | 2.63 | ||||||||||||||
TOTAL COMMON STOCK (Cost: $2,867,088) | 3,898,455 | 100.42 | |||||||||||||
TOTAL INVESTMENT IN SECURITIES (Cost: $2,867,088) | 3,898,455 | 100.42 | |||||||||||||
CASH OR CASH EQUIVALENT | 71 | - | *** | ||||||||||||
OTHER ASSETS LESS LIABILITIES | (16,422 | ) | (0.42 | ) | |||||||||||
TOTAL NET ASSETS | 3,882,104 | 100.00 | |||||||||||||
* Non-income producing
** The principal amount is stated in U.S. dollars unless otherwise indicated.
***The percentage is too small and rounded to 0.00%.
See Accompanying Notes to Financial Statements which are an integral part of these financial statements.
22
Pacific Advisors Small Cap Value Fund
Schedule of Investments (Unaudited)
as of June 30, 2019
| Quantity or Principal** | Description | Current $ Value** | % of Total Net Assets | ||||||||||||
COMMON STOCK | |||||||||||||||
CONSUMER DISCRETIONARY | 19.57 | ||||||||||||||
AUTO COMPONENTS | |||||||||||||||
14,500 | GENTHERM INC.* | 606,535 | |||||||||||||
606,535 | 4.35 | ||||||||||||||
SPECIALTY RETAIL | |||||||||||||||
15,000 | AT HOME GROUP INC.* | 99,900 | |||||||||||||
83,000 | CONN'S INC.* | 1,479,060 | |||||||||||||
2,200 | LITHIA MOTORS INC. | 261,316 | |||||||||||||
12,000 | SONIC AUTOMOTIVE INC. | 280,200 | |||||||||||||
2,120,476 | 15.22 | ||||||||||||||
CONSUMER STAPLES | 5.61 | ||||||||||||||
FOOD & STAPLES RETAILING | |||||||||||||||
11,500 | CHEFS' WAREHOUSE INC.* | 403,305 | |||||||||||||
403,305 | 2.90 | ||||||||||||||
FOOD PRODUCTS | |||||||||||||||
19,000 | DARLING INGREDIENTS INC.* | 377,910 | |||||||||||||
377,910 | 2.71 | ||||||||||||||
ENERGY | 23.93 | ||||||||||||||
ENERGY EQUIPMENT & SERVICES | |||||||||||||||
22,000 | ARCHROCK INC. | 233,200 | |||||||||||||
75,000 | HELIX ENERGY SOLUTIONS GROUP INC.* | 647,250 | |||||||||||||
140,000 | INDEPENDENCE CONTR DRILLING, INC.* | 221,200 | |||||||||||||
25,000 | MATRIX SERVICE CO.* | 506,500 | |||||||||||||
102,800 | NOBLE CORPORATION* | 192,236 | |||||||||||||
115,000 | NORTH AMERICAN CONSTRUCTION GRP LTD | 1,242,000 | |||||||||||||
19,000 | SOLARIS OILFIELD INFRAST-A | 284,620 | |||||||||||||
3,327,006 | 23.88 | ||||||||||||||
OIL, GAS & CONSUMABLE FUELS | |||||||||||||||
90,000 | INFINITY ENERGY RESOURCES INC.* | 7,650 | |||||||||||||
7,650 | 0.05 | ||||||||||||||
FINANCIALS | 8.53 | ||||||||||||||
BANKS | |||||||||||||||
12,500 | EAST WEST BANCORP INC. | 584,625 | |||||||||||||
584,625 | 4.19 | ||||||||||||||
CONSUMER FINANCE | |||||||||||||||
22,200 | REGIONAL MANAGEMENT CORP.* | 585,414 | |||||||||||||
585,414 | 4.20 | ||||||||||||||
See Accompanying Notes to Financial Statements which are an integral part of these financial statements.
23
Pacific Advisors Small Cap Value Fund
Schedule of Investments (Unaudited)
as of June 30, 2019
| Quantity or Principal** | Description | Current $ Value** | % of Total Net Assets | ||||||||||||
COMMON STOCK continued | |||||||||||||||
DIVERSIFIED FINANCIAL SERVICES | |||||||||||||||
1,000 | COMPASS DIVERSIFIED HOLDINGS | 19,110 | |||||||||||||
19,110 | 0.14 | ||||||||||||||
INDUSTRIALS | 42.79 | ||||||||||||||
COMMERCIAL SERVICES & SUPPLIES | |||||||||||||||
14,000 | MOBILE MINI INC. | 426,020 | |||||||||||||
38,000 | TEAM INC.* | 582,160 | |||||||||||||
1,008,180 | 7.23 | ||||||||||||||
MACHINERY | |||||||||||||||
23,800 | NAVISTAR INT'L CORP.* | 819,910 | |||||||||||||
819,910 | 5.88 | ||||||||||||||
MARINE | |||||||||||||||
8,600 | KIRBY CORP.* | 679,400 | |||||||||||||
679,400 | 4.88 | ||||||||||||||
ROAD & RAIL | |||||||||||||||
6,000 | GENESEE & WYOMING INC.* | 600,000 | |||||||||||||
10,300 | SAIA INC.* | 666,101 | |||||||||||||
1,266,101 | 9.09 | ||||||||||||||
TRADING COMPANIES & DISTRIBUTORS | |||||||||||||||
21,400 | DXP ENTERPRISES INC.* | 810,846 | |||||||||||||
18,900 | RUSH ENTERPRISES INC. | 690,228 | |||||||||||||
21,000 | TRITON INTERNATIONAL LIMITED | 687,960 | |||||||||||||
2,189,034 | 15.71 | ||||||||||||||
TOTAL COMMON STOCK (Cost: $9,477,336) | 13,994,656 | 100.43 | |||||||||||||
TOTAL INVESTMENT IN SECURITIES (Cost: $9,477,336) | 13,994,656 | 100.43 | |||||||||||||
CASH OR CASH EQUIVALENT | 3,220 | 0.02 | |||||||||||||
OTHER ASSETS LESS LIABILITIES | (63,080 | ) | (0.45 | ) | |||||||||||
TOTAL NET ASSETS | 13,934,796 | 100.00 | |||||||||||||
* Non-income producing
** The principal amount is stated in U.S. dollars unless otherwise indicated.
See Accompanying Notes to Financial Statements which are an integral part of these financial statements.
24
(This page has been left blank intentionally.)
25
Pacific Advisors Fund Inc.
Statements of Assets and Liabilities (Unaudited)
June 30, 2019
| Income and Equity Fund | Balanced Fund | Large Cap Value Fund | |||||||||||||
Assets | |||||||||||||||
Investment securities | |||||||||||||||
At cost | $ | 7,976,319 | $ | 3,126,175 | $ | 2,275,594 | |||||||||
At fair value | $ | 9,557,997 | $ | 3,756,188 | $ | 5,682,202 | |||||||||
Cash or cash equivalent, at fair value | - | 2,493 | 3,651 | ||||||||||||
Accrued income receivable | 45,020 | 18,025 | 5,557 | ||||||||||||
Receivable for Fund shares sold | - | - | - | ||||||||||||
Receivable for investments sold | 210,845 | - | 26,039 | ||||||||||||
Total assets | 9,813,862 | 3,776,706 | 5,717,449 | ||||||||||||
Liabilities | |||||||||||||||
Bank borrowings (Note 7) | 286,695 | - | - | ||||||||||||
Payable for Fund shares redeemed | - | - | 6,814 | ||||||||||||
Payable for investment purchased | - | - | - | ||||||||||||
Accounts payable | 39,231 | 14,825 | 18,676 | ||||||||||||
Accounts payable to related parties (Note 3) | 3,600 | 3,600 | 3,600 | ||||||||||||
Total liabilities | 329,526 | 18,425 | 29,090 | ||||||||||||
Net Assets | $ | 9,484,336 | $ | 3,758,281 | $ | 5,688,359 | |||||||||
Summary of Shareholders' Equity | |||||||||||||||
Paid in capital | 7,593,701 | 2,994,438 | 1,333,485 | ||||||||||||
Accumulated earnings | 1,890,635 | 763,843 | 4,354,874 | ||||||||||||
Net assets at June 30, 2019 | $ | 9,484,336 | $ | 3,758,281 | $ | 5,688,359 | |||||||||
Class A: | |||||||||||||||
Net assets | $ | 8,016,568 | $ | 3,055,707 | $ | 5,341,092 | |||||||||
Shares authorized ($0.01 par value) | 50,000,000 | 50,000,000 | 50,000,000 | ||||||||||||
Shares outstanding | 657,008 | 269,548 | 322,775 | ||||||||||||
Net asset value (and redemption price) per share | $ | 12.20 | $ | 11.34 | $ | 16.55 | |||||||||
Maximum offering price per share | $ | 12.81 | $ | 12.03 | $ | 17.56 | |||||||||
Sales load | 4.75 | % | 5.75 | % | 5.75 | % | |||||||||
Class C: | |||||||||||||||
Net assets | $ | 1,467,769 | $ | 702,574 | $ | 347,267 | |||||||||
Shares authorized ($0.01 par value) | 50,000,000 | 50,000,000 | 50,000,000 | ||||||||||||
Shares outstanding | 127,989 | 72,584 | 25,502 | ||||||||||||
Net asset value (and offering and redemption price) per share | $ | 11.47 | $ | 9.68 | $ | 13.62 | |||||||||
Class I: | |||||||||||||||
Net assets | N/A | N/A | N/A | ||||||||||||
Shares authorized ($0.01 par value) | |||||||||||||||
Shares outstanding | |||||||||||||||
Net asset value (and offering and redemption price) per share | N/A | N/A | N/A | ||||||||||||
See Accompanying Notes to Financial Statements which are an integral part of these financial statements.
26
| Mid Cap Value Fund | Small Cap Value Fund | ||||||||||
Assets | |||||||||||
Investment securities | |||||||||||
At cost | $ | 2,867,088 | $ | 9,477,336 | |||||||
At fair value | $ | 3,898,455 | $ | 13,994,656 | |||||||
Cash or cash equivalent, at fair value | 71 | 3,220 | |||||||||
Accrued income receivable | 959 | 2,677 | |||||||||
Receivable for Fund shares sold | - | - | |||||||||
Receivable for investments sold | - | 197,040 | |||||||||
Total assets | 3,899,485 | 14,197,593 | |||||||||
Liabilities | |||||||||||
Bank borrowings (Note 7) | - | - | |||||||||
Payable for Fund shares redeemed | - | 1,234 | |||||||||
Payable for investment purchased | - | 193,192 | |||||||||
Accounts payable | 13,781 | 57,824 | |||||||||
Accounts payable to related parties (Note 3) | 3,600 | 10,547 | |||||||||
Total liabilities | 17,381 | 262,797 | |||||||||
Net Assets | $ | 3,882,104 | $ | 13,934,796 | |||||||
Summary of Shareholders' Equity | |||||||||||
Paid in capital | 2,470,189 | 8,074,536 | |||||||||
Accumulated earnings | 1,411,915 | 5,860,260 | |||||||||
Net assets at June 30, 2019 | $ | 3,882,104 | $ | 13,934,796 | |||||||
Class A: | |||||||||||
Net assets | $ | 3,836,265 | $ | 12,318,470 | |||||||
Shares authorized ($0.01 par value) | 50,000,000 | 50,000,000 | |||||||||
Shares outstanding | 361,666 | 547,866 | |||||||||
Net asset value (and redemption price) per share | $ | 10.61 | $ | 22.48 | |||||||
Maximum offering price per share | $ | 11.26 | $ | 23.85 | |||||||
Sales load | 5.75 | % | 5.75 | % | |||||||
Class C: | |||||||||||
Net assets | $ | 45,839 | $ | 1,003,289 | |||||||
Shares authorized ($0.01 par value) | 50,000,000 | 50,000,000 | |||||||||
Shares outstanding | 5,092 | 67,683 | |||||||||
Net asset value (and offering and redemption price) per share | $ | 9.00 | $ | 14.82 | |||||||
Class I: | |||||||||||
Net assets | N/A | $ | 613,037 | ||||||||
Shares authorized ($0.01 par value) | 50,000,000 | ||||||||||
Shares outstanding | 20,176 | ||||||||||
Net asset value (and offering and redemption price) per share | N/A | $ | 30.38 | ||||||||
27
Pacific Advisors Fund Inc.
Statements of Operations (Unaudited)
For the six months ended June 30, 2019
| Income and Equity Fund | Balanced Fund | Large Cap Value Fund | |||||||||||||
Investment Income | |||||||||||||||
Dividends | $ | 142,027 | $ | 20,584 | $ | 61,498 | |||||||||
Interest | 91,858 | 20,618 | 62 | ||||||||||||
Total investment income | 233,885 | 41,202 | 61,560 | ||||||||||||
Expenses | |||||||||||||||
Investment management fees (Note 3) | 46,566 | 15,383 | 22,302 | ||||||||||||
Transfer agent fees (Note 3) | 71,891 | 38,214 | 56,688 | ||||||||||||
Fund accounting fees (Note 3) | 57,121 | 20,544 | 27,357 | ||||||||||||
Legal fees | 16,764 | 5,538 | 8,028 | ||||||||||||
Audit fees | 13,659 | 8,410 | 9,515 | ||||||||||||
Registration fees | 18,005 | 15,088 | 13,578 | ||||||||||||
Printing | 14,566 | 4,771 | 6,899 | ||||||||||||
Custody fees | 3,273 | 3,508 | 3,445 | ||||||||||||
Interest on borrowings | 2,258 | 594 | 1,015 | ||||||||||||
Director fees/meetings | 12,417 | 4,102 | 5,947 | ||||||||||||
Distribution and service (12b-1) fees (Note 3) | 21,970 | 8,322 | 8,857 | ||||||||||||
Administration fees (Note 3) | 3,104 | 1,026 | 1,487 | ||||||||||||
Compliance fees (Note 3) | 23,458 | 7,589 | 11,017 | ||||||||||||
Total expenses, before fees waived | 305,052 | 133,089 | 176,135 | ||||||||||||
Less fees waived (Note 3) | 46,566 | - | 22,302 | ||||||||||||
Net expenses | 258,486 | 133,089 | 153,833 | ||||||||||||
Net Investment Loss | (24,601 | ) | (91,887 | ) | (92,273 | ) | |||||||||
Net Realized and Unrealized Gain on Investments | |||||||||||||||
Net realized gain on investments | 298,718 | 159,954 | 789,042 | ||||||||||||
Change in net unrealized appreciation on investments | 473,638 | 299,422 | 159,925 | ||||||||||||
Net realized and unrealized gain on investments | 772,356 | 459,376 | 948,967 | ||||||||||||
Net Increase in Net Assets Resulting from Operations | $ | 747,755 | $ | 367,489 | $ | 856,694 | |||||||||
See Accompanying Notes to Financial Statements which are an integral part of these financial statements.
28
| Mid Cap Value Fund | Small Cap Value Fund | ||||||||||
Investment Income | |||||||||||
Dividends | $ | 18,500 | $ | 37,722 | |||||||
Interest | 44 | 36 | |||||||||
Total investment income | 18,544 | 37,758 | |||||||||
Expenses | |||||||||||
Investment management fees (Note 3) | 20,436 | 58,985 | |||||||||
Transfer agent fees (Note 3) | 38,153 | 131,004 | |||||||||
Fund accounting fees (Note 3) | 20,588 | 72,355 | |||||||||
Legal fees | 5,518 | 21,235 | |||||||||
Audit fees | 8,788 | 16,516 | |||||||||
Registration fees | 16,962 | 33,818 | |||||||||
Printing | 4,696 | 17,944 | |||||||||
Custody fees | 4,733 | 4,982 | |||||||||
Interest on borrowings | 172 | 1,310 | |||||||||
Director fees/meetings | 4,087 | 15,729 | |||||||||
Distribution and service (12b-1) fees (Note 3) | 5,798 | 24,541 | |||||||||
Administration fees (Note 3) | 1,022 | 3,932 | |||||||||
Compliance fees (Note 3) | 7,562 | 29,099 | |||||||||
Total expenses, before fees waived | 138,515 | 431,450 | |||||||||
Less fees waived (Note 3) | - | - | |||||||||
Net expenses | 138,515 | 431,450 | |||||||||
Net Investment Loss | (119,971 | ) | (393,692 | ) | |||||||
Net Realized and Unrealized Gain on Investments | |||||||||||
Net realized gain on investments | 380,574 | 551,773 | |||||||||
Change in net unrealized appreciation on investments | 300,826 | 1,063,119 | |||||||||
Net realized and unrealized gain on investments | 681,400 | 1,614,892 | |||||||||
Net Increase in Net Assets Resulting from Operations | $ | 561,429 | $ | 1,221,200 | |||||||
29
Pacific Advisors Fund Inc.
Statements of Changes in Net Assets (Unaudited)
Income and Equity Fund | Balanced Fund | Large Cap Value Fund | |||||||||||||||||||||||||
| Six months ended June 30, 2019 | Year ended December 31, 2018 | Six months ended June 30, 2019 | Year ended December 31, 2018 | Six months ended June 30, 2019 | Year ended December 31, 2018 | ||||||||||||||||||||||
| Increase (Decrease) in Net Assets From Operations | |||||||||||||||||||||||||||
Net investment income (loss) | $ | (24,601 | ) | $ | 25,918 | $ | (91,887 | ) | $ | (177,041 | ) | $ | (92,273 | ) | $ | (154,142 | ) | ||||||||||
Net realized gain on investments | 298,718 | 527,492 | 159,954 | 224,561 | 789,042 | 527,627 | |||||||||||||||||||||
| Change in net unrealized appreciation (depreciation) on investments | 473,638 | (1,210,222 | ) | 299,422 | (489,051 | ) | 159,925 | (946,564 | ) | ||||||||||||||||||
| Increase (decrease) in net assets resulting from operations | 747,755 | (656,812 | ) | 367,489 | (441,531 | ) | 856,694 | (573,079 | ) | ||||||||||||||||||
| From Distributions to Shareholders | |||||||||||||||||||||||||||
Class A | (637 | ) | (845,589 | ) | - | (233,848 | ) | - | (516,768 | ) | |||||||||||||||||
Class C | - | (139,936 | ) | - | (86,193 | ) | - | (47,841 | ) | ||||||||||||||||||
Class I | N/A | N/A | N/A | N/A | N/A | N/A | |||||||||||||||||||||
| Decrease in net assets resulting from distributions | (637 | ) | (985,525 | ) | - | (320,041 | ) | - | (564,609 | ) | |||||||||||||||||
| From Capital Share Transactions (Note 6) | |||||||||||||||||||||||||||
Proceeds from shares sold | 454,401 | 878,874 | 335,505 | 179,711 | 149,159 | 302,432 | |||||||||||||||||||||
| Proceeds from shares purchased by reinvestment of dividends | 541 | 836,379 | - | 293,135 | - | 512,500 | |||||||||||||||||||||
Cost of shares repurchased | (4,553,787 | ) | (1,889,270 | ) | (1,002,365 | ) | (1,166,368 | ) | (1,287,850 | ) | (1,474,822 | ) | |||||||||||||||
| Decreases in net assets resulting from capital share transactions | (4,098,845 | ) | (174,017 | ) | (666,860 | ) | (693,522 | ) | (1,138,691 | ) | (659,890 | ) | |||||||||||||||
Increase (Decrease) in net assets | (3,351,727 | ) | (1,816,354 | ) | (299,371 | ) | (1,455,094 | ) | (281,997 | ) | (1,797,578 | ) | |||||||||||||||
Net Assets | |||||||||||||||||||||||||||
Beginning of period | 12,836,063 | 14,652,417 | 4,057,652 | 5,512,746 | 5,970,356 | 7,767,934 | |||||||||||||||||||||
End of period | $ | 9,484,336 | $ | 12,836,063 | $ | 3,758,280 | $ | 4,057,652 | $ | 5,688,359 | $ | 5,970,356 | |||||||||||||||
See Accompanying Notes to Financial Statements which are an integral part of these financial statements.
30
Mid Cap Value Fund | Small Cap Value Fund | ||||||||||||||||||
| Six months ended June 30, 2019 | Year ended December 31, 2018 | Six months ended June 30, 2019 | Year ended December 31, 2018 | ||||||||||||||||
| Increase (Decrease) in Net Assets From Operations | |||||||||||||||||||
Net investment income (loss) | $ | (119,971 | ) | $ | (212,885 | ) | $ | (393,692 | ) | $ | (904,412 | ) | |||||||
Net realized gain on investments | 380,574 | 482,735 | 551,773 | 2,771,726 | |||||||||||||||
| Change in net unrealized appreciation (depreciation) on investments | 300,826 | (1,158,483 | ) | 1,063,119 | (5,274,931 | ) | |||||||||||||
| Increase (decrease) in net assets resulting from operations | 561,429 | (888,633 | ) | 1,221,200 | (3,407,617 | ) | |||||||||||||
| From Distributions to Shareholders | |||||||||||||||||||
Class A | - | (443,930 | ) | - | (1,523,580 | ) | |||||||||||||
Class C | - | (37,642 | ) | - | (296,033 | ) | |||||||||||||
Class I | N/A | N/A | - | (37,054 | ) | ||||||||||||||
| Decrease in net assets resulting from distributions | - | (481,572 | ) | - | (1,856,667 | ) | |||||||||||||
| From Capital Share Transactions (Note 6) | |||||||||||||||||||
Proceeds from shares sold | 266,105 | 138,523 | 1,017,894 | 1,037,388 | |||||||||||||||
| Proceeds from shares purchased by reinvestment of dividends | - | 466,428 | - | 1,748,306 | |||||||||||||||
Cost of shares repurchased | (687,638 | ) | (1,395,260 | ) | (3,042,440 | ) | (6,027,309 | ) | |||||||||||
| Decreases in net assets resulting from capital share transactions | (421,533 | ) | (790,309 | ) | (2,024,546 | ) | (3,241,615 | ) | |||||||||||
Increase (Decrease) in net assets | 139,896 | (2,160,514 | ) | (803,346 | ) | (8,505,899 | ) | ||||||||||||
Net Assets | |||||||||||||||||||
Beginning of period | 3,742,208 | 5,902,722 | 14,738,142 | 23,244,041 | |||||||||||||||
End of period | $ | 3,882,104 | $ | 3,742,208 | $ | 13,934,796 | $ | 14,738,142 | |||||||||||
31
Pacific Advisors Fund Inc.
Financial Highlights (Unaudited)
(For a share outstanding throughout each period presented)
Income and Equity Fund | |||||||||||||||||||||||||||
Class A | |||||||||||||||||||||||||||
| For the six months ended | For the year ended December 31, | ||||||||||||||||||||||||||
June 30, 2019 | 2018 | 2017 | 2016 | 2015 | 2014 | ||||||||||||||||||||||
Per Share Operating Performance | |||||||||||||||||||||||||||
Net asset value, beginning of period | $ | 11.47 | $ | 13.01 | $ | 12.40 | $ | 11.61 | $ | 12.06 | $ | 11.55 | |||||||||||||||
Income from investing operations | |||||||||||||||||||||||||||
Net investment income (loss) (c) | (0.02 | ) | 0.03 | 0.05 | 0.03 | 0.14 | 0.22 | (d) | |||||||||||||||||||
Net realized and unrealized gain (loss) on securities | 0.75 | (0.64 | ) | 0.60 | 0.78 | (0.45 | ) | 0.51 | (d) | ||||||||||||||||||
Total from investment operations | 0.73 | (0.61 | ) | 0.65 | 0.81 | (0.31 | ) | 0.73 | |||||||||||||||||||
Less distributions | |||||||||||||||||||||||||||
From net investment income | 0.00 | (b) | (0.03 | ) | (0.04 | ) | (0.02 | ) | (0.14 | ) | (0.22 | ) | |||||||||||||||
From net capital gain | - | (0.90 | ) | - | (0.01 | ) | - | - | |||||||||||||||||||
Total distributions | 0.00 | (0.93 | ) | (0.04 | ) | (0.03 | ) | (0.14 | ) | (0.22 | ) | ||||||||||||||||
Redemption fees (c) | - | - | - | (b) | 0.01 | - | (b) | - | (b)(d) | ||||||||||||||||||
Net asset value, end of period | $ | 12.20 | $ | 11.47 | $ | 13.01 | $ | 12.40 | $ | 11.61 | $ | 12.06 | |||||||||||||||
Total Investment Return (a) | 6.37 | %(e) | (4.60 | )% | 5.26 | % | 7.08 | % | (2.57 | )% | 6.41 | % | |||||||||||||||
Ratios/Supplemental Data | |||||||||||||||||||||||||||
Net assets, end of period (000's) | $ | 8,017 | $ | 11,004 | $ | 12,394 | $ | 14,794 | $ | 11,541 | $ | 11,324 | |||||||||||||||
Ratio of net investment income (loss) to average net assets | |||||||||||||||||||||||||||
With expense reductions | (0.29 | )%(f) | 0.29 | % | 0.39 | % | 0.26 | % | 1.23 | % | 1.88 | % | |||||||||||||||
Without expense reductions | (1.04 | )%(f) | (0.46 | )% | (0.36 | )% | (0.49 | )% | 0.48 | % | 1.13 | % | |||||||||||||||
Ratio of expenses to average net assets | |||||||||||||||||||||||||||
With expense reductions | 4.06 | %(f) | 3.25 | % | 2.96 | % | 2.88 | % | 2.06 | % | 1.91 | % | |||||||||||||||
Without expense reductions | 4.81 | %(f) | 4.00 | % | 3.71 | % | 3.63 | % | 2.81 | % | 2.66 | % | |||||||||||||||
Fund portfolio turnover rate | 0 | %(f) | 16 | % | 19 | % | 14 | % | 22 | % | 13 | % | |||||||||||||||
Class C | |||||||||||||||||||||||||||
| For the six months ended | For the year ended December 31, | ||||||||||||||||||||||||||
June 30, 2019 | 2018 | 2017 | 2016 | 2015 | 2014 | ||||||||||||||||||||||
Per Share Operating Performance | |||||||||||||||||||||||||||
Net asset value, beginning of period | $ | 10.82 | $ | 12.38 | $ | 11.86 | $ | 11.16 | $ | 11.59 | $ | 11.11 | |||||||||||||||
Income from investing operations | |||||||||||||||||||||||||||
Net investment income (loss) (c) | (0.06 | ) | (0.06 | ) | (0.04 | ) | (0.06 | ) | 0.05 | 0.13 | (d) | ||||||||||||||||
Net realized and unrealized gain (loss) on securities | 0.71 | (0.60 | ) | 0.56 | 0.75 | (0.42 | ) | 0.48 | (d) | ||||||||||||||||||
Total from investment operations | 0.65 | (0.66 | ) | 0.52 | 0.69 | (0.37 | ) | 0.61 | |||||||||||||||||||
Less distributions | |||||||||||||||||||||||||||
From net investment income | - | - | - | - | (0.06 | ) | (0.13 | ) | |||||||||||||||||||
From net capital gain | - | (0.90 | ) | - | - | - | - | ||||||||||||||||||||
Total distributions | - | (0.90 | ) | - | - | (0.06 | ) | (0.13 | ) | ||||||||||||||||||
Redemption fees (c) | - | - | - | (b) | 0.01 | - | (b) | - | (b)(d) | ||||||||||||||||||
Net asset value, end of period | $ | 11.47 | $ | 10.82 | $ | 12.38 | $ | 11.86 | $ | 11.16 | $ | 11.59 | |||||||||||||||
Total Investment Return | 6.01 | %(e) | (5.26 | )% | 4.38 | % | 6.27 | % | (3.21 | )% | 5.51 | % | |||||||||||||||
Ratios/Supplemental Data | |||||||||||||||||||||||||||
Net assets, end of period (000's) | $ | 1,468 | $ | 1,832 | $ | 2,259 | $ | 2,456 | $ | 2,766 | $ | 2,471 | |||||||||||||||
Ratio of net investment income (loss) to average net assets | |||||||||||||||||||||||||||
With expense reductions | (1.07 | )%(f) | (0.46 | )% | (0.36 | )% | (0.48 | )% | 0.48 | % | 1.14 | % | |||||||||||||||
Without expense reductions | (1.82 | )%(f) | (1.21 | )% | (1.11 | )% | (1.23 | )% | (0.27 | )% | 0.39 | % | |||||||||||||||
Ratio of expenses to average net assets | |||||||||||||||||||||||||||
With expense reductions | 4.84 | %(f) | 4.00 | % | 3.72 | % | 3.64 | % | 2.81 | % | 2.66 | % | |||||||||||||||
Without expense reductions | 5.59 | %(f) | 4.75 | % | 4.47 | % | 4.39 | % | 3.56 | % | 3.41 | % | |||||||||||||||
Fund portfolio turnover rate | 0 | %(f) | 16 | % | 19 | % | 14 | % | 22 | % | 13 | % | |||||||||||||||
(a) The Fund's maximum sales charge is not included in the total return computation.
(b) The amount is less than $0.005 and rounded to zero.
(c) Based on average shares outstanding.
(d) Net investment income, net realized and unrealized gain (loss) on securities and redemptions fees for Class A and Class C for the year ended December 31, 2014 were restated during the year ended December 31, 2015. See Note 2(H).
(e) Not annualized
(f) Annualized
See Accompanying Notes to Financial Statements which are an integral part of these financial statements.
32
Pacific Advisors Fund Inc.
Financial Highlights (Unaudited)
(For a share outstanding throughout each period presented)
Balanced Fund | |||||||||||||||||||||||||||
Class A | |||||||||||||||||||||||||||
| For the six months ended | For the year ended December 31, | ||||||||||||||||||||||||||
June 30, 2019 | 2018 | 2017 | 2016 | 2015 | 2014 | ||||||||||||||||||||||
Per Share Operating Performance | |||||||||||||||||||||||||||
Net asset value, beginning of period | $ | 10.36 | $ | 12.45 | $ | 11.34 | $ | 11.75 | $ | 14.40 | $ | 16.59 | |||||||||||||||
Income from investing operations | |||||||||||||||||||||||||||
Net investment loss (c) | (0.24 | ) | (0.42 | ) | (0.35 | ) | (0.29 | ) | (0.15 | ) | (0.14 | )(d) | |||||||||||||||
Net realized and unrealized gain (loss) on securities | 1.22 | (0.82 | ) | 1.55 | 0.30 | (2.25 | ) | (1.17 | )(d) | ||||||||||||||||||
Total from investment operations | 0.98 | (1.24 | ) | 1.20 | 0.01 | (2.40 | ) | (1.31 | ) | ||||||||||||||||||
Less distributions | |||||||||||||||||||||||||||
From net capital gain | - | (0.85 | ) | (0.09 | ) | (0.42 | ) | (0.25 | ) | (0.88 | ) | ||||||||||||||||
Total distributions | - | (0.85 | ) | (0.09 | ) | (0.42 | ) | (0.25 | ) | (0.88 | ) | ||||||||||||||||
Redemption fees (c) | - | - | (b) | - | (b) | - | (b) | - | (b) | - | (b)(d) | ||||||||||||||||
Net asset value, end of period | $ | 11.34 | $ | 10.36 | $ | 12.45 | $ | 11.34 | $ | 11.75 | $ | 14.40 | |||||||||||||||
Total Investment Return (a) | 9.46 | %(e) | (9.78 | )% | 10.55 | % | 0.08 | % | (16.73 | )% | (7.94 | )% | |||||||||||||||
Ratios/Supplemental Data | |||||||||||||||||||||||||||
Net assets, end of period (000's) | $ | 3,056 | $ | 3,066 | $ | 4,109 | $ | 4,276 | $ | 4,046 | $ | 5,017 | |||||||||||||||
Ratio of net investment loss to average net assets | (4.33 | )%(f) | (3.34 | )% | (3.02 | )% | (2.56 | )% | (1.08 | )% | (0.90 | )% | |||||||||||||||
Ratio of expenses to average net assets | 6.34 | %(f) | 5.16 | % | 4.76 | % | 4.50 | % | 3.27 | % | 2.84 | % | |||||||||||||||
Fund portfolio turnover rate | 18 | %(f) | 23 | % | 26 | % | 55 | % | 28 | % | 22 | % | |||||||||||||||
Class C | |||||||||||||||||||||||||||
| For the six months ended | For the year ended December 31, | ||||||||||||||||||||||||||
June 30, 2019 | 2018 | 2017 | 2016 | 2015 | 2014 | ||||||||||||||||||||||
Per Share Operating Performance | |||||||||||||||||||||||||||
Net asset value, beginning of period | $ | 8.88 | $ | 10.89 | $ | 10.01 | $ | 10.50 | $ | 12.99 | $ | 15.18 | |||||||||||||||
Income from investing operations | |||||||||||||||||||||||||||
Net investment loss (c) | (0.24 | ) | (0.45 | ) | (0.39 | ) | (0.33 | ) | (0.23 | ) | (0.24 | )(d) | |||||||||||||||
Net realized and unrealized gain (loss) on securities | 1.04 | (0.71 | ) | 1.36 | 0.26 | (2.01 | ) | (1.07 | )(d) | ||||||||||||||||||
Total from investment operations | 0.80 | (1.16 | ) | 0.97 | (0.07 | ) | (2.24 | ) | (1.31 | ) | |||||||||||||||||
Less distributions | |||||||||||||||||||||||||||
From net capital gain | - | (0.85 | ) | (0.09 | ) | (0.42 | ) | (0.25 | ) | (0.88 | ) | ||||||||||||||||
Total distributions | - | (0.85 | ) | (0.09 | ) | (0.42 | ) | (0.25 | ) | (0.88 | ) | ||||||||||||||||
Redemption fees (c) | - | - | (b) | - | (b) | - | (b) | - | (b) | - | (b)(d) | ||||||||||||||||
Net asset value, end of period | $ | 9.68 | $ | 8.88 | $ | 10.89 | $ | 10.01 | $ | 10.50 | $ | 12.99 | |||||||||||||||
Total Investment Return | 9.01 | %(e) | (10.45 | )% | 9.65 | % | (0.67 | )% | (17.31 | )% | (8.68 | )% | |||||||||||||||
Ratios/Supplemental Data | |||||||||||||||||||||||||||
Net assets, end of period (000's) | $ | 703 | $ | 991 | $ | 1,403 | $ | 1,724 | $ | 2,679 | $ | 4,203 | |||||||||||||||
Ratio of net investment loss to average net assets | (5.06 | )%(f) | (4.09 | )% | (3.77 | )% | (3.27 | )% | (1.85 | )% | (1.64 | )% | |||||||||||||||
Ratio of expenses to average net assets | 7.07 | %(f) | 5.91 | % | 5.52 | % | 5.25 | % | 4.05 | % | 3.58 | % | |||||||||||||||
Fund portfolio turnover rate | 18 | %(f) | 23 | % | 26 | % | 55 | % | 28 | % | 22 | % | |||||||||||||||
(a) The Fund's maximum sales charge is not included in the total return computation.
(b) The amount is less than $0.005 and rounded to zero.
(c) Based on average shares outstanding.
(d) Net investment income, net realized and unrealized gain (loss) on securities and redemptions fees for Class A and Class C for the year ended December 31, 2014 were restated during the year ended December 31, 2015. See Note 2(H).
(e) Not annualized
(f) Annualized
See Accompanying Notes to Financial Statements which are an integral part of these financial statements.
33
Pacific Advisors Fund Inc.
Financial Highlights (Unaudited)
(For a share outstanding throughout each period presented)
Large Cap Value Fund | |||||||||||||||||||||||||||
Class A | |||||||||||||||||||||||||||
| For the six months ended | For the year ended December 31, | ||||||||||||||||||||||||||
June 30, 2019 | 2018 | 2017 | 2016 | 2015 | 2014 | ||||||||||||||||||||||
Per Share Operating Performance | |||||||||||||||||||||||||||
Net asset value, beginning of period | $ | 14.34 | $ | 17.32 | $ | 15.14 | $ | 13.92 | $ | 14.18 | $ | 13.05 | |||||||||||||||
Income from investing operations | |||||||||||||||||||||||||||
Net investment loss (c) | (0.24 | ) | (0.36 | ) | (0.29 | ) | (0.23 | ) | (0.09 | ) | (0.07 | )(d) | |||||||||||||||
Net realized and unrealized gain (loss) on securities | 2.45 | (1.15 | ) | 2.95 | 1.49 | (0.15 | ) | 1.37 | (d) | ||||||||||||||||||
Total from investment operations | 2.21 | (1.51 | ) | 2.66 | 1.26 | (0.24 | ) | 1.30 | |||||||||||||||||||
Less distributions | |||||||||||||||||||||||||||
From net capital gain | - | (1.47 | ) | (0.48 | ) | (0.04 | ) | (0.02 | ) | (0.17 | ) | ||||||||||||||||
Total distributions | - | (1.47 | ) | (0.48 | ) | (0.04 | ) | (0.02 | ) | (0.17 | ) | ||||||||||||||||
Redemption fees (b)(c) | - | - | - | - | - | - | (d) | ||||||||||||||||||||
Net asset value, end of period | $ | 16.55 | $ | 14.34 | $ | 17.32 | $ | 15.14 | $ | 13.92 | $ | 14.18 | |||||||||||||||
Total Investment Return (a) | 15.41 | %(e) | (8.40 | )% | 17.56 | % | 9.08 | % | (1.68 | )% | 9.94 | % | |||||||||||||||
Ratios/Supplemental Data | |||||||||||||||||||||||||||
Net assets, end of period (000's) | $ | 5,341 | $ | 5,564 | $ | 7,224 | $ | 6,953 | $ | 6,587 | $ | 6,892 | |||||||||||||||
Ratio of net investment loss to average net assets | |||||||||||||||||||||||||||
With expense reductions | (3.06 | )%(f) | (2.11 | )% | (1.80 | )% | (1.60 | )% | (0.64 | )% | (0.55 | )% | |||||||||||||||
Without expense reductions | (3.81 | )%(f) | (2.86 | )% | (2.54 | )% | (2.35 | )% | (1.39 | )% | (1.30 | )% | |||||||||||||||
Ratio of expenses to average net assets | |||||||||||||||||||||||||||
With expense reductions | 5.13 | %(f) | 4.12 | % | 3.78 | % | 3.85 | % | 2.72 | % | 2.64 | % | |||||||||||||||
Without expense reductions | 5.88 | %(f) | 4.87 | % | 4.53 | % | 4.60 | % | 3.47 | % | 3.39 | % | |||||||||||||||
Fund portfolio turnover rate | 0 | %(f) | 0 | % | 0 | % | 0 | % | 7 | % | 3 | % | |||||||||||||||
Class C | |||||||||||||||||||||||||||
| For the six months ended | For the year ended December 31, | ||||||||||||||||||||||||||
June 30, 2019 | 2018 | 2017 | 2016 | 2015 | 2014 | ||||||||||||||||||||||
Per Share Operating Performance | |||||||||||||||||||||||||||
Net asset value, beginning of period | $ | 11.84 | $ | 14.70 | $ | 13.01 | $ | 12.06 | $ | 12.39 | $ | 11.50 | |||||||||||||||
Income from investing operations | |||||||||||||||||||||||||||
Net investment loss (c) | (0.24 | ) | (0.41 | ) | (0.36 | ) | (0.28 | ) | (0.17 | ) | (0.15 | )(d) | |||||||||||||||
Net realized and unrealized gain (loss) on securities | 2.02 | (0.98 | ) | 2.53 | 1.27 | (0.14 | ) | 1.21 | (d) | ||||||||||||||||||
Total from investment operations | 1.78 | (1.39 | ) | 2.17 | 0.99 | (0.31 | ) | 1.06 | |||||||||||||||||||
Less distributions | |||||||||||||||||||||||||||
From net capital gain | - | (1.47 | ) | (0.48 | ) | (0.04 | ) | (0.02 | ) | (0.17 | ) | ||||||||||||||||
Total distributions | - | (1.47 | ) | (0.48 | ) | (0.04 | ) | (0.02 | ) | (0.17 | ) | ||||||||||||||||
Redemption fees (b)(c) | - | - | - | - | - | - | (d) | ||||||||||||||||||||
Net asset value, end of period | $ | 13.62 | $ | 11.84 | $ | 14.70 | $ | 13.01 | $ | 12.06 | $ | 12.39 | |||||||||||||||
Total Investment Return | 15.03 | %(e) | (9.08 | )% | 16.67 | % | 8.24 | % | (2.48 | )% | 9.18 | % | |||||||||||||||
Ratios/Supplemental Data | |||||||||||||||||||||||||||
Net assets, end of period (000's) | $ | 347 | $ | 406 | $ | 544 | $ | 837 | $ | 1,160 | $ | 1,167 | |||||||||||||||
Ratio of net investment loss to average net assets | |||||||||||||||||||||||||||
With expense reductions | (3.78 | )%(f) | (2.85 | )% | (2.57 | )% | (2.34 | )% | (1.41 | )% | (1.29 | )% | |||||||||||||||
Without expense reductions | (4.54 | )%(f) | (3.60 | )% | (3.31 | )% | (3.09 | )% | (2.16 | )% | (2.03 | )% | |||||||||||||||
Ratio of expenses to average net assets | |||||||||||||||||||||||||||
With expense reductions | 5.87 | %(f) | 4.87 | % | 4.53 | % | 4.59 | % | 3.50 | % | 3.38 | % | |||||||||||||||
Without expense reductions | 6.63 | %(f) | 5.62 | % | 5.27 | % | 5.34 | % | 4.25 | % | 4.13 | % | |||||||||||||||
Fund portfolio turnover rate | 0 | %(f) | 0 | % | 0 | % | 0 | % | 7 | % | 3 | % | |||||||||||||||
(a) The Fund's maximum sales charge is not included in the total return computation.
(b) The amount is less than $0.005 and rounded to zero.
(c) Based on average shares outstanding.
(d) Net investment income, net realized and unrealized gain (loss) on securities and redemptions fees for Class A and Class C for the year ended December 31, 2014 were restated during the year ended December 31, 2015. See Note 2(H).
(e) Not annualized
(f) Annualized
See Accompanying Notes to Financial Statements which are an integral part of these financial statements.
34
Pacific Advisors Fund Inc.
Financial Highlights (Unaudited)
(For a share outstanding throughout each period presented)
Mid Cap Value Fund | |||||||||||||||||||||||||||
Class A | |||||||||||||||||||||||||||
| For the six months ended | For the year ended December 31, | ||||||||||||||||||||||||||
June 30, 2019 | 2018 | 2017 | 2016 | 2015 | 2014 | ||||||||||||||||||||||
Per Share Operating Performance | |||||||||||||||||||||||||||
Net asset value, beginning of period | $ | 9.20 | $ | 13.19 | $ | 11.78 | $ | 10.28 | $ | 13.46 | $ | 15.25 | |||||||||||||||
Income from investing operations | |||||||||||||||||||||||||||
Net investment loss (c) | (0.30 | ) | (0.52 | ) | (0.49 | ) | (0.40 | ) | (0.31 | ) | (0.35 | )(d) | |||||||||||||||
Net realized and unrealized gain (loss) on securities | 1.71 | (2.12 | ) | 1.90 | 1.90 | (2.87 | ) | (1.44 | )(d) | ||||||||||||||||||
Total from investment operations | 1.41 | (2.64 | ) | 1.41 | 1.50 | (3.18 | ) | (1.79 | ) | ||||||||||||||||||
Less distributions | |||||||||||||||||||||||||||
From net capital gain | - | (1.35 | ) | - | - | - | - | ||||||||||||||||||||
Total distributions | - | (1.35 | ) | - | - | - | - | ||||||||||||||||||||
Redemption fees (b)(c) | - | - | - | - | - | - | (d) | ||||||||||||||||||||
Net asset value, end of period | $ | 10.61 | $ | 9.20 | $ | 13.19 | $ | 11.78 | $ | 10.28 | $ | 13.46 | |||||||||||||||
Total Investment Return (a) | 15.33 | %(e) | (19.59 | )% | 11.97 | % | 14.59 | % | (23.63 | )% | (11.74 | )% | |||||||||||||||
Ratios/Supplemental Data | |||||||||||||||||||||||||||
Net assets, end of period (000's) | $ | 3,836 | $ | 3,484 | $ | 5,495 | $ | 5,728 | $ | 4,875 | $ | 5,981 | |||||||||||||||
Ratio of net investment loss to average net assets | (5.84 | )%(f) | (3.93 | )% | (4.19 | )% | (3.80 | )% | (2.48 | )% | (2.46 | )% | |||||||||||||||
Ratio of expenses to average net assets | 6.75 | %(f) | 5.33 | % | 4.94 | % | 4.74 | % | 3.68 | % | 3.42 | % | |||||||||||||||
Fund portfolio turnover rate | 14 | %(f) | 2 | % | 9 | % | 13 | % | 25 | % | 22 | % | |||||||||||||||
Class C | |||||||||||||||||||||||||||
| For the six months ended | For the year ended December 31, | ||||||||||||||||||||||||||
June 30, 2019 | 2018 | 2017 | 2016 | 2015 | 2014 | ||||||||||||||||||||||
Per Share Operating Performance | |||||||||||||||||||||||||||
Net asset value, beginning of period | $ | 7.84 | $ | 11.58 | $ | 10.42 | $ | 9.16 | $ | 12.09 | $ | 13.80 | |||||||||||||||
Income from investing operations | |||||||||||||||||||||||||||
Net investment loss (c) | (0.28 | ) | (0.54 | ) | (0.51 | ) | (0.42 | ) | (0.37 | ) | (0.42 | )(d) | |||||||||||||||
Net realized and unrealized gain (loss) on securities | 1.44 | (1.85 | ) | 1.67 | 1.68 | (2.56 | ) | (1.29 | )(d) | ||||||||||||||||||
Total from investment operations | 1.16 | (2.39 | ) | 1.16 | 1.26 | (2.93 | ) | (1.71 | ) | ||||||||||||||||||
Less distributions | |||||||||||||||||||||||||||
From net capital gain | - | (1.35 | ) | - | - | - | - | ||||||||||||||||||||
Total distributions | - | (1.35 | ) | - | - | - | - | ||||||||||||||||||||
Redemption fees (b)(c) | - | - | - | - | - | - | (d) | ||||||||||||||||||||
Net asset value, end of period | $ | 9.00 | $ | 7.84 | $ | 11.58 | $ | 10.42 | $ | 9.16 | $ | 12.09 | |||||||||||||||
Total Investment Return | 14.80 | %(e) | (20.16 | )% | 11.13 | % | 13.76 | % | (24.23 | )% | (12.39 | )% | |||||||||||||||
Ratios/Supplemental Data | |||||||||||||||||||||||||||
Net assets, end of period (000's) | $ | 46 | $ | 258 | $ | 407 | $ | 366 | $ | 661 | $ | 891 | |||||||||||||||
Ratio of net investment loss to average net assets | (6.43 | )%(f) | (4.66 | )% | (4.96 | )% | (4.56 | )% | (3.26 | )% | (3.22 | )% | |||||||||||||||
Ratio of expenses to average net assets | 7.40 | %(f) | 6.08 | % | 5.71 | % | 5.54 | % | 4.46 | % | 4.17 | % | |||||||||||||||
Fund portfolio turnover rate | 14 | %(f) | 2 | % | 9 | % | 13 | % | 25 | % | 22 | % | |||||||||||||||
(a) The Fund's maximum sales charge is not included in the total return computation.
(b) The amount is less than $0.005 and rounded to zero.
(c) Based on average shares outstanding.
(d) Net investment income, net realized and unrealized gain (loss) on securities and redemptions fees for Class A and Class C for the year ended December 31, 2014 were restated during the year ended December 31, 2015. See Note 2(H).
(e) Not annualized
(f) Annualized
See Accompanying Notes to Financial Statements which are an integral part of these financial statements.
35
Pacific Advisors Fund Inc.
Financial Highlights (Unaudited)
(For a share outstanding throughout each period presented)
Small Cap Value Fund | |||||||||||||||||||||||||||
Class A | |||||||||||||||||||||||||||
| For the six months ended | For the year ended December 31, | ||||||||||||||||||||||||||
June 30, 2019 | 2018 | 2017 | 2016 | 2015 | 2014 | ||||||||||||||||||||||
Per Share Operating Performance | |||||||||||||||||||||||||||
Net asset value, beginning of period | $ | 20.87 | $ | 29.29 | $ | 27.23 | $ | 24.72 | $ | 44.51 | $ | 61.41 | |||||||||||||||
Income from investing operations | |||||||||||||||||||||||||||
Net investment loss (c) | (0.58 | ) | (1.25 | ) | (0.99 | ) | (0.92 | ) | (1.06 | ) | (1.11 | )(d) | |||||||||||||||
Net realized and unrealized gain (loss) on securities | 2.19 | (4.40 | ) | 4.38 | 7.66 | (12.25 | ) | (12.20 | )(d) | ||||||||||||||||||
Total from investment operations | 1.61 | (5.65 | ) | 3.39 | 6.74 | (13.31 | ) | (13.31 | ) | ||||||||||||||||||
Less distributions | |||||||||||||||||||||||||||
From net capital gain | - | (2.78 | ) | (1.34 | ) | (4.24 | ) | (6.50 | ) | (3.62 | ) | ||||||||||||||||
Total distributions | - | (2.78 | ) | (1.34 | ) | (4.24 | ) | (6.50 | ) | (3.62 | ) | ||||||||||||||||
Redemption fees (c) | - | (b) | 0.01 | 0.01 | 0.01 | 0.02 | 0.03 | (d) | |||||||||||||||||||
Net asset value, end of period | $ | 22.48 | $ | 20.87 | $ | 29.29 | $ | 27.23 | $ | 24.72 | $ | 44.51 | |||||||||||||||
Total Investment Return (a) | 7.71 | %(e) | (18.74 | )% | 12.47 | % | 27.08 | % | (30.31 | )% | (21.60 | )% | |||||||||||||||
Ratios/Supplemental Data | |||||||||||||||||||||||||||
Net assets, end of period (000's) | $ | 12,318 | $ | 12,583 | $ | 20,439 | $ | 26,420 | $ | 33,942 | $ | 122,642 | |||||||||||||||
Ratio of net investment loss to average net assets | (4.95 | )%(f) | (4.16 | )% | (3.72 | )% | (3.74 | )% | (2.64 | )% | (1.72 | )% | |||||||||||||||
Ratio of expenses to average net assets | 5.43 | %(f) | 4.40 | % | 4.08 | % | 4.19 | % | 3.03 | % | 2.19 | % | |||||||||||||||
Fund portfolio turnover rate | 8 | %(f) | 8 | % | 5 | % | 11 | % | 7 | % | 16 | % | |||||||||||||||
Class C | |||||||||||||||||||||||||||
| For the six months ended | For the year ended December 31, | ||||||||||||||||||||||||||
June 30, 2019 | 2018 | 2017 | 2016 | 2015 | 2014 | ||||||||||||||||||||||
Per Share Operating Performance | |||||||||||||||||||||||||||
Net asset value, beginning of period | $ | 13.81 | $ | 20.75 | $ | 19.79 | $ | 19.01 | $ | 36.59 | $ | 51.70 | |||||||||||||||
Income from investing operations | |||||||||||||||||||||||||||
Net investment loss (c) | (0.44 | ) | (1.04 | ) | (0.86 | ) | (0.85 | ) | (1.11 | ) | (1.29 | )(d) | |||||||||||||||
Net realized and unrealized gain (loss) on securities | 1.45 | (3.12 | ) | 3.15 | 5.87 | (9.99 | ) | (10.23 | )(d) | ||||||||||||||||||
Total from investment operations | 1.01 | (4.16 | ) | 2.29 | 5.02 | (11.10 | ) | (11.52 | ) | ||||||||||||||||||
Less distributions | |||||||||||||||||||||||||||
From net capital gain | - | (2.78 | ) | (1.34 | ) | (4.24 | ) | (6.50 | ) | (3.62 | ) | ||||||||||||||||
Total distributions | - | (2.78 | ) | (1.34 | ) | (4.24 | ) | (6.50 | ) | (3.62 | ) | ||||||||||||||||
Redemption fees (c) | - | (b) | - | (b) | 0.01 | - | (b) | 0.02 | 0.03 | (d) | |||||||||||||||||
Net asset value, end of period | $ | 14.82 | $ | 13.81 | $ | 20.75 | $ | 19.79 | $ | 19.01 | $ | 36.59 | |||||||||||||||
Total Investment Return | 7.31 | %(e) | (19.32 | )% | 11.60 | % | 26.12 | % | (30.83 | )% | (22.19 | )% | |||||||||||||||
Ratios/Supplemental Data | |||||||||||||||||||||||||||
Net assets, end of period (000's) | $ | 1,003 | $ | 1,745 | $ | 2,796 | $ | 3,596 | $ | 5,180 | $ | 10,498 | |||||||||||||||
Ratio of net investment loss to average net assets | (5.68 | )%(f) | (4.91 | )% | (4.48 | )% | (4.51 | )% | (3.45 | )% | (2.47 | )% | |||||||||||||||
Ratio of expenses to average net assets | 6.14 | %(f) | 5.15 | % | 4.84 | % | 4.95 | % | 3.88 | % | 2.95 | % | |||||||||||||||
Fund portfolio turnover rate | 8 | %(f) | 8 | % | 5 | % | 11 | % | 7 | % | 16 | % | |||||||||||||||
(a) The Fund's maximum sales charge is not included in the total return computation.
(b) The amount is less than $0.005 and rounded to zero.
(c) Based on average shares outstanding.
(d) Net investment income, net realized and unrealized gain (loss) on securities and redemptions fees for Class A and Class C for the period ended December 31, 2014 were restated during the period ended December 31, 2015. See Note 2(H).
(e) Not annualized
(f) Annualized
See Accompanying Notes to Financial Statements which are an integral part of these financial statements.
36
Pacific Advisors Fund Inc.
Financial Highlights (Unaudited)
(For a share outstanding throughout each period presented)
Small Cap Value Fund | |||||||||||||||||||||||||||
Class I | |||||||||||||||||||||||||||
| For the six months ended | For the year ended December 31, | ||||||||||||||||||||||||||
June 30, 2019 | 2018 | 2017 | 2016 | 2015 | 2014 | ||||||||||||||||||||||
Per Share Operating Performance | |||||||||||||||||||||||||||
Net asset value, beginning of period | $ | 28.17 | $ | 38.17 | $ | 35.05 | $ | 30.87 | $ | 53.06 | $ | 72.10 | |||||||||||||||
Income from investing operations | |||||||||||||||||||||||||||
Net investment loss (c) | (0.74 | ) | (1.61 | ) | (1.19 | ) | (1.08 | ) | (1.20 | ) | (1.15 | )(d) | |||||||||||||||
Net realized and unrealized gain (loss) on securities | 2.95 | (5.63 | ) | 5.63 | 9.49 | (14.52 | ) | (14.30 | )(d) | ||||||||||||||||||
Total from investment operations | 2.21 | (7.24 | ) | 4.44 | 8.41 | (15.72 | ) | (15.45 | ) | ||||||||||||||||||
Less distributions | |||||||||||||||||||||||||||
From net capital gain | - | (2.78 | ) | (1.34 | ) | (4.24 | ) | (6.50 | ) | (3.62 | ) | ||||||||||||||||
Total distributions | - | (2.78 | ) | (1.34 | ) | (4.24 | ) | (6.50 | ) | (3.62 | ) | ||||||||||||||||
Redemption fees (c) | - | (b) | 0.02 | 0.02 | 0.01 | 0.03 | 0.03 | (d) | |||||||||||||||||||
Net asset value, end of period | $ | 30.38 | $ | 28.17 | $ | 38.17 | $ | 35.05 | $ | 30.87 | $ | 53.06 | |||||||||||||||
Total Investment Return | 7.85 | %(e) | (18.52 | )% | 12.71 | % | 27.10 | % | (29.94 | )% | (21.36 | )% | |||||||||||||||
Ratios/Supplemental Data | |||||||||||||||||||||||||||
Net assets, end of period (000's) | $ | 613 | $ | 411 | $ | 9 | $ | 8 | $ | 155 | $ | 1,402 | |||||||||||||||
Ratio of net investment loss to average net assets | (4.70 | )%(f) | (4.18 | )% | (3.47 | )% | (3.57 | )% | (2.55 | )% | (1.54 | )% | |||||||||||||||
Ratio of expenses to average net assets | 5.21 | %(f) | 4.41 | % | 3.85 | % | 3.93 | % | 2.86 | % | 2.03 | % | |||||||||||||||
Fund portfolio turnover rate | 7 | %(f) | 8 | % | 5 | % | 11 | % | 7 | % | 16 | % | |||||||||||||||
(b) The amount is less than $0.005 and rounded to zero.
(c) Based on average shares outstanding.
(d) Net investment income, net realized and unrealized gain (loss) on securities and redemptions fee for Class I for the year ended December 31, 2014 was restated during the period ended December 31, 2015. See Note 2(H).
(e) Not annualized
(f) Annualized
See Accompanying Notes to Financial Statements which are an integral part of these financial statements.
37
Pacific Advisors Fund Inc.
Notes to Financial Statements (Unaudited)
June 30, 2019
Note 1. Organization
Pacific Advisors Fund Inc. (the "Company") is an open-end diversified investment management company registered under the Investment Company Act of 1940 ("the 40 Act"), as amended. The Company currently offers five Funds: Income and Equity Fund, Balanced Fund, Large Cap Value Fund, Mid Cap Value Fund and Small Cap Value Fund (individually, a "Fund," or collectively, the "Funds"). Each Fund is a separate investment portfolio of the Company with a distinct investment objective, investment program, policies and restrictions.
The Income and Equity Fund seeks to provide current income and, secondarily, long-term capital appreciation. The Balanced Fund seeks to achieve long-term capital appreciation and income consistent with reduced risk. The Large Cap Value Fund seeks to achieve long-term capital appreciation. The Mid Cap Value Fund seeks to achieve long-term capital appreciation. The Small Cap Value Fund seeks to provide capital appreciation through investment in small capitalization companies.
The Funds offer Class A and Class C shares. In addition to Class A and Class C shares, the Small Cap Value Fund also offers Class I shares. Each Class has equal rights as to assets and voting privileges except that Class A and Class C each has exclusive voting rights with respect to its distribution plan. Investment income, realized and unrealized capital gains and losses, and the common expenses of each Fund are allocated on a pro rata basis to each Class based on the relative net assets of each Class to the total net assets of the Fund. Each Class of shares differs in its respective service and distribution expenses and may differ in its transfer agent, registration, and certain other Class-specific fees and expenses.
The Company enters into contracts that contain a variety of indemnifications. The Company's maximum exposure under these arrangements is unknown. However, the Company has not had prior claims or losses pursuant to these contracts and expects the risk of loss to be remote.
The Funds follow the investment company accounting and reporting guidance of the Financial Accounting Standards Board (FASB) Accounting Standard Codification Topic 946 "Financial Services – Investment Companies."
Note 2. Significant Accounting Policies
A. Security Valuation and Fair Value Measurement. Securities, including American Depository Receipts (ADRs), listed on a national securities exchange and certain over-the-counter ("OTC") issues traded on the NASDAQ national market system are valued at the last quoted sale price at the close of the New York Stock Exchange. OTC issues not quoted on the NASDAQ system, and other equity securities for which no sale price is available, are valued at the last bid price as obtained from published sources or real time quote services, where available, and otherwise from brokers who are market makers for such securities. Fixed Income securities, which are typically purchased and held as odd lots (less than $1 million) are valued based on bid prices for institutional round lot positions (typically $1 million or greater); round lot prices often reflect more favorable pricing than odd lot holdings. For securities that mature in 60 days or less, the Funds may utilize the amortized cost method of valuation if it is reasonable to conclude it approximates fair value. In determining the fair value of other debt securities, Pacific Global Investment Management Company, Inc. (the "Investment Manager") utilizes independent pricing services approved by the Board of Directors (the "Board") using one or more of the following valuation techniques:
(1) a matrix pricing approach that considers market inputs including, in approximate order of priority, the following: benchmark yields, reported trades, broker/dealer quotes, issuer spreads, two-sided markets, benchmark securities, bids, offers and reference data including market research publications; market indicators, industry and economic events. Evaluators may prioritize inputs differently on any given day for any security based on market conditions, and not all inputs listed are available for use in the evaluation process for each security evaluation on any given day; (2) a comparison of the value of the borrower's outstanding equity and debt to that of comparable public companies; and/or (3) a discounted cash flow analysis. Fair value determinations are made by the Investment Manager based on the Company's Fair Value Procedure, as adopted by the Board. In conducting its assessment and analysis for the purpose of determining fair value, the Investment Manager uses its discretion and judgment in considering and appraising the relevant factors, including examining the source and nature of the quotations, to validate that the quotations and prices are representative of fair value.
Various inputs are used to determine the fair value of each Fund's investments. For financial statements, these inputs are summarized in the three broad levels listed below. Level 1 inputs are based on quoted prices in active markets for identical securities. Level 2 inputs are based on significant observable market inputs, such as quoted prices for similar securities and quoted prices in inactive markets. Level 3 inputs are significant unobservable inputs that reflect the Fund's own assumptions in determining the fair value of investments. The valuation levels are not necessarily an indication of the risk associated with investing in those securities.
38
Pacific Advisors Fund Inc.
Notes to Financial Statements (Unaudited)
June 30, 2019
The following is a summary of the inputs used to value each Fund's investment securities as of June 30, 2019.
| Income and Equity Fund | Balanced Fund | Large Cap Value Fund | Mid Cap Value Fund | Small Cap Value Fund | |||||||||||||||||||
Level 1 - Quoted Prices | |||||||||||||||||||||||
Common Stock | |||||||||||||||||||||||
Communication Services | $ | 436,277 | $ | 391,263 | $ | 653,330 | $ | 169,129 | $ | - | |||||||||||||
Consumer Discretionary | 655,785 | 378,174 | 781,888 | 1,094,705 | 2,727,011 | ||||||||||||||||||
Consumer Staples | 555,569 | 210,914 | 1,057,782 | - | 781,215 | ||||||||||||||||||
Energy | 466,803 | 199,686 | - | 575,810 | 3,334,656 | ||||||||||||||||||
Financials | 805,571 | 362,939 | 823,375 | 312,538 | 1,189,149 | ||||||||||||||||||
Health Care | 730,870 | 300,413 | 264,632 | 168,590 | - | ||||||||||||||||||
Industrials | 750,082 | 551,325 | 1,037,471 | 1,301,611 | 5,962,625 | ||||||||||||||||||
Information Technology | 701,585 | 313,336 | 1,063,724 | 173,992 | - | ||||||||||||||||||
Materials | 113,153 | - | - | 102,080 | - | ||||||||||||||||||
Utilities | 316,246 | - | - | - | - | ||||||||||||||||||
Preferred Stock | |||||||||||||||||||||||
Financials | 907,510 | 99,750 | - | - | - | ||||||||||||||||||
Level 1 Total | 6,439,451 | 2,807,800 | 5,682,202 | 3,898,455 | 13,994,656 | ||||||||||||||||||
Level 2 - Other significant observable inputs | |||||||||||||||||||||||
Corporate Bond | |||||||||||||||||||||||
Consumer Discretionary | 154,055 | 101,762 | - | - | - | ||||||||||||||||||
Energy | 150,000 | 100,000 | - | - | - | ||||||||||||||||||
Financials | 1,541,171 | 400,077 | - | - | - | ||||||||||||||||||
Health Care | 261,508 | 96,250 | - | - | - | ||||||||||||||||||
Information Technology | 302,743 | 149,205 | - | - | - | ||||||||||||||||||
Real Estate | 458,519 | 101,094 | - | - | - | ||||||||||||||||||
Convertible Corporate Bond | |||||||||||||||||||||||
Financials | 250,550 | - | - | - | - | ||||||||||||||||||
Level 2 Total | 3,118,546 | 948,388 | - | - | - | ||||||||||||||||||
Level 3 - Significant unobservable inputs | - | - | - | - | - | ||||||||||||||||||
Total Investments | $ | 9,557,997 | $ | 3,756,188 | $ | 5,682,202 | $ | 3,898,455 | $ | 13,994,656 | |||||||||||||
Equity securities (common and preferred stock) that are actively traded and market priced are typically classified as Level 1 securities. Fixed income securities are typically classified as Level 2 securities. The Funds had no Level 3 holdings during the period ended June 30, 2019.
B. Cash and Cash Equivalents. The Company considers all highly liquid financial instruments with maturities of less than three months when acquired to be cash equivalents. For cash management purposes, each Fund may concentrate cash with the Fund's custodian, United Missouri Bank, ("UMB"). This typically results in cash balances exceeding the Federal Deposit Insurance Corporation ("FDIC") insurance limits.
C. Security Transactions and Investment Income. Security transactions are accounted for on the trade date. The cost of investments sold is determined by use of the specific identification method for both financial reporting and federal income tax purposes. Dividends are recorded on the ex-dividend date. Interest income is recorded on an accrual basis. Premium or discount on debt securities are amortized or accreted using the effective interest method.
D. Dividends and Distributions to Shareholders. The Income and Equity Fund declares and distributes dividends of its net investment income, if any, quarterly. The Balanced Fund, Large Cap Value Fund, Mid Cap Value Fund and Small Cap Value Fund declare and distribute dividends of their net investment income, if any, annually. In addition, each Fund declares and distributes a capital gain dividend, if any, annually. The Board determines the amount and timing of such payments.
E. Federal Income Tax. The Funds intends to comply with the requirements of Subchapter M of the Internal Revenue Code applicable to regulated investment companies and to distribute substantially all of their taxable income to their shareholders. Therefore, no federal income tax provision is required.
Management has analyzed the Funds' tax positions taken on federal income tax returns for all open tax years and for the period ended June 30, 2019 and has concluded that no provision for income tax is required in the Funds' financial statements. Tax years 2015, 2016, 2017 and 2018 are still subject to examination by major federal jurisdictions. Tax years 2014, 2015, 2016, 2017, and 2018 are still subject to examination by major state jurisdictions.
39
Pacific Advisors Fund Inc.
Notes to Financial Statements (Unaudited)
June 30, 2019
The Funds recognize interest and penalties, if any, related to unrecognized tax benefits as income tax expense in the Statements of Operations. During the period ended June 30, 2019, the Funds did not incur any interest or penalties.
The components of distributable earnings on a tax basis are reported as of the Funds' most recent year-end. At December 31, 2018, components of distributable earnings on a tax basis were as follows:
| Income and Equity Fund | Balanced Fund | Large Cap Value Fund | Mid Cap Value Fund | Small Cap Value Fund | |||||||||||||||||||
Undistributed ordinary income | $ | 634 | $ | - | $ | - | $ | - | $ | - | |||||||||||||
Undistributed long-term gains | 11,127 | 28,099 | 160,108 | 974 | 912,016 | ||||||||||||||||||
Post October loss | (887 | ) | (46,451 | ) | |||||||||||||||||||
Capital loss carry forward* | - | - | - | - | - | ||||||||||||||||||
Net unrealized appreciation on investments | 1,108,039 | 322,819 | 3,245,798 | 730,541 | 3,333,352 | ||||||||||||||||||
Accumulated earnings | $ | 1,118,913 | $ | 304,467 | $ | 3,405,906 | $ | 731,515 | $ | 4,245,368 | |||||||||||||
The difference between book basis and tax basis unrealized appreciation is attributable primarily to the tax deferral of losses on wash sales and characterization of certain income items. The Funds intend to treat post October losses (net capital losses incurred for the period subsequent to October 31, 2018 through the year end December 31, 2018) as having been incurred in the next fiscal year.
As of December 31, 2018, the Funds had no accumulated net realized losses on investment transactions that represent capital loss carryforwards for federal income tax purposes.
During the most recent fiscal year, the Fund had no capital losses carried forward under the provisions of the Act that were utilized.
F. Reclassification of Capital Accounts. Distributions of net investment income and realized gains are determined in accordance with income tax regulations which may differ from GAAP. These differences are due to differing treatments for items such as net operating losses, reclassification of dividends and return of capital. To the extent that these differences are permanent in nature, reclassifications are made among the net asset accounts on the Statements of Assets and Liabilities. Net assets and net asset value per share are not affected by these reclassifications.
For the period ended June 30, 2019, reclassifications among the components of net assets are as follows:
Accumulated Earnings | Paid in Capital | ||||||||||
Income and Equity Fund | $ | 24,604 | $ | (24,604 | ) | ||||||
Balanced Fund | 91,888 | (91,888 | ) | ||||||||
Large Cap Value Fund | 92,273 | (92,273 | ) | ||||||||
Mid Cap Value Fund | 119,971 | (119,971 | ) | ||||||||
Small Cap Value Fund | 393,692 | (393,692 | ) | ||||||||
The reclassifications were due to net investment losses incurred by the Funds, which are not permitted to be carried forward for tax purposes and the expiration of capital loss carryforwards, as well as differing book and tax treatment of certain securities.
G. Use of Estimates. The preparation of financial statements in conformity with U.S. GAAP requires management to make estimates and assumptions that affect the reported amounts in the financial statements and footnotes. Actual results could differ from those estimates.
H. Accounting Method Change. On December 31, 2015, the Funds elected to change their method of determining net investment income (loss) per share to the average shares method, which determines the net investment income (loss) per share by dividing the net investment income (loss) by the average number of shares outstanding during the year. In prior years the net investment income (loss) per share was determined using the SEC method, which compares ending undistributed income (loss) per share to the beginning undistributed income (loss) per share, adjusted for distributions paid per share. The new method of accounting was adopted as a result of management's determination that the average shares method produced a result that was more reflective of the actual net investment income (loss) on a per share basis during each of the years. The financial highlights for each of the years presented have been adjusted to apply this new method retrospectively. The following financial statement line items for the years 2014 was affected by this change in accounting principle.
40
Pacific Advisors Fund Inc.
Notes to Financial Statements (Unaudited)
June 30, 2019
Financial Highlights | |||||||||||||||||||||||
| Income and Equity Fund | Balanced Fund | Large Cap Value Fund | Mid Cap Value Fund | Small Cap Value Fund | |||||||||||||||||||
Class A | |||||||||||||||||||||||
As Computed Under SEC Method | |||||||||||||||||||||||
Net investment income | 0.21 | (0.16 | ) | 0.02 | (0.11 | ) | (2.29 | ) | |||||||||||||||
Net realized and unrealized gain | 0.52 | (1.15 | ) | 1.28 | (1.68 | ) | (10.99 | ) | |||||||||||||||
Redemption Fees | 0.00 | 0.00 | 0.00 | 0.00 | 0.00 | ||||||||||||||||||
As Computed Under Average Shares Method | |||||||||||||||||||||||
Net investment income | 0.22 | (0.14 | ) | (0.07 | ) | (0.35 | ) | (1.11 | ) | ||||||||||||||
Net realized and unrealized gain | 0.51 | (1.17 | ) | 1.37 | (1.44 | ) | (12.20 | ) | |||||||||||||||
Redemption Fees | 0.00 | 0.00 | 0.00 | 0.00 | 0.03 | ||||||||||||||||||
Effect of Change | |||||||||||||||||||||||
Net investment income | 0.01 | 0.02 | (0.09 | ) | (0.24 | ) | 1.18 | ||||||||||||||||
Net realized and unrealized gain (loss) | (0.01 | ) | (0.02 | ) | 0.09 | 0.24 | (1.21 | ) | |||||||||||||||
Redemption Fees | 0.00 | 0.00 | 0.00 | 0.00 | 0.03 | ||||||||||||||||||
Class C | |||||||||||||||||||||||
As Computed Under SEC Method | |||||||||||||||||||||||
Net investment income (loss) | 0.14 | (0.40 | ) | 0.68 | (2.95 | ) | (1.15 | ) | |||||||||||||||
Net realized and unrealized gain | 0.47 | (0.91 | ) | 0.38 | 1.24 | (10.34 | ) | ||||||||||||||||
Redemption Fees | 0.00 | 0.00 | 0.00 | 0.00 | 0.00 | ||||||||||||||||||
As Computed Under Average Shares Method | |||||||||||||||||||||||
Net investment income | 0.13 | (0.24 | ) | (0.15 | ) | (0.42 | ) | (1.29 | ) | ||||||||||||||
Net realized and unrealized gain (loss) | 0.48 | (1.07 | ) | 1.21 | (1.29 | ) | (10.23 | ) | |||||||||||||||
Redemption Fees | 0.00 | 0.00 | 0.00 | 0.00 | 0.03 | ||||||||||||||||||
Effect of Change | |||||||||||||||||||||||
Net investment income (loss) | (0.01 | ) | 0.16 | (0.83 | ) | 2.53 | (0.14 | ) | |||||||||||||||
Net realized and unrealized gain (loss) | 0.01 | (0.16 | ) | 0.83 | (2.53 | ) | 0.11 | ||||||||||||||||
Redemption Fees | 0.00 | 0.00 | 0.00 | 0.00 | 0.03 | ||||||||||||||||||
Class I | |||||||||||||||||||||||
As Computed Under SEC Method | |||||||||||||||||||||||
Net investment income (loss) | N/A | N/A | N/A | N/A | 9.85 | ||||||||||||||||||
Net realized and unrealized gain (loss) | N/A | N/A | N/A | N/A | (25.27 | ) | |||||||||||||||||
Redemption Fees | N/A | N/A | N/A | N/A | 0.00 | ||||||||||||||||||
As Computed Under Average Shares Method | |||||||||||||||||||||||
Net investment loss | N/A | N/A | N/A | N/A | (1.15 | ) | |||||||||||||||||
Net realized and unrealized gain (loss) | N/A | N/A | N/A | N/A | (14.30 | ) | |||||||||||||||||
Redemption Fees | N/A | N/A | N/A | N/A | 0.03 | ||||||||||||||||||
Effect of Change | |||||||||||||||||||||||
Net investment income (loss) | N/A | N/A | N/A | N/A | (11.00 | ) | |||||||||||||||||
Net realized and unrealized gain (loss) | N/A | N/A | N/A | N/A | 10.97 | ||||||||||||||||||
Redemption Fees | N/A | N/A | N/A | N/A | 0.03 | ||||||||||||||||||
Note 3. Investment Management, Distributor and Other Related Party Transactions
The Company and the Funds have entered into investment management agreements ("Management Agreements") with the Investment Manager.
The Management Agreements provide for investment management fees, payable monthly, and calculated at the maximum annual rate of 0.75% of average net assets for the Income and Equity, Balanced, Large Cap Value and Small Cap Value Funds and 1.00% of average net assets for the Mid Cap Value Fund.
In accordance with Expense Limitation Agreements with the Company, the Investment Manager waives its respective management fees to the extent that the actual operating expenses of the following Funds exceed the following thresholds:
Class A | Class C | ||||||||||
Income and Equity Fund | 1.95 | % | 2.70 | % | |||||||
Large Cap Value Fund | 2.65 | % | 3.40 | % | |||||||
41
Pacific Advisors Fund Inc.
Notes to Financial Statements (Unaudited)
June 30, 2019
Pursuant to the Expense Limitation Agreements, providing for the waiver of fees and the assumption of expenses by the Investment Manager, the following amounts were waived for the period ended June 30, 2019.
| Management Fees Waived | |||||||
Income and Equity Fund | $ | 46,566 | |||||
Large Cap Value Fund | 22,302 | ||||||
The Investment Manager does not have any rights to recover fees it waives or expenses it may reimburse, with respect to any of the Funds.
For the period ended June 30, 2019, Pacific Global Fund Distributors, Inc. ("PGFD"), the principal underwriter for the Company and a wholly-owned subsidiary of the Investment Manager, received commissions on sales of capital stock, after deducting amounts allowed to authorized distributors as commissions. In addition, PGFD, as a registered broker-dealer, may act as broker for the Funds, in conformity with Rule 17e-1 under the Investment Company Act of 1940. The Funds may subsidize the amount of commissions charged by the clearing firm for small trades; if so, the Brokerage Commission Received / (Paid) shown below may be negative. The Company's Board has approved procedures for evaluating the reasonableness of commissions paid to PGFD and periodically reviews these procedures. PGFD will not act as principal in effecting any portfolio transactions for the Funds. The amounts of commissions are as follows:
| Underwriting Fees Retained | Commissions Retained | Brokerage Commissions Received/(Paid) | |||||||||||||
Income and Equity Fund | $ | 12 | $ | 65 | $ | (65 | ) | ||||||||
Balanced Fund | 21 | 48 | (383 | ) | |||||||||||
Large Cap Value Fund | 9 | - | (255 | ) | |||||||||||
Mid Cap Value Fund | 443 | 72 | (357 | ) | |||||||||||
Small Cap Value Fund | 581 | 199 | 977 | ||||||||||||
The Company has also entered into separate agreements with Pacific Global Investor Services, Inc. ("PGIS"), Transfer Agent for the Company and a wholly-owned subsidiary of the Investment Manager, that provide for transfer agent fees at a rate of $21 per year per open account and $3.50 per year per closed account, with a minimum charge of $1,800 per month per class for each Fund; fund accounting fees equal to the greater of $1,500 or three basis points for the first hundred million in net assets and one basis point on the balance of net assets for each Fund per month; and annual administrative agent fees of five basis points of average daily net assets of each Fund subject to a maximum annual fee of $50,000 per Fund. The fee is computed and payable monthly. The Company reimburses the Investment Manager for monthly expenses related to the Company's Compliance Program. The Company also reimburses PGIS for applicable out-of-pocket expenses incurred in connection with transfer agent or fund accounting services performed.
On the Statement of Assets and Liabilities, "Accounts payable to related parties" consists of transfer agent fees payable to PGIS.
The Company has adopted a plan of distribution whereby the Funds may pay a service fee to qualified recipients in an amount up to 0.25% per annum of each Fund's average daily net assets for Class A shares. The Company has also adopted a plan of distribution whereby the Funds may pay a service fee to qualified recipients in an amount up to 0.25% per annum of each Fund's average daily net assets for Class C shares and a distribution fee in an amount up to 0.75% per annum of each Fund's average daily net assets for Class C shares. The Company has not adopted a plan of distribution for Class I Shares.
For the period ended June 30, 2019, total distribution and/or service (12b-1) fees were:
Class A | Class C | Total | |||||||||||||
Income and Equity Fund | $ | 13,373 | $ | 8,597 | $ | 21,970 | |||||||||
Balanced Fund | 4,063 | 4,259 | 8,322 | ||||||||||||
Large Cap Value Fund | 6,960 | 1,897 | 8,857 | ||||||||||||
Mid Cap Value Fund | 4,879 | 919 | 5,798 | ||||||||||||
Small Cap Value Fund | 17,091 | 7,450 | 24,541 | ||||||||||||
42
Pacific Advisors Fund Inc.
Notes to Financial Statements (Unaudited)
June 30, 2019
Note 4. Purchase and Sales of Securities
The following summarizes purchases and sales of investment securities, other than short-term investments, and aggregate gross unrealized appreciation and depreciation on a tax basis by each Fund for the period ended and as of June 30, 2019. The difference between book basis and tax basis unrealized appreciation is attributable primarily to the tax deferral of losses on wash sales.
| Period ended June 30, 2019 | As of June 30, 2019 | ||||||||||||||||||||||||||
| Cost of Purchases | Proceeds From Sales | Tax Cost of Securities | Gross Unrealized Appreciation | Gross Unrealized Depreciation | Net Unrealized Appreciation | ||||||||||||||||||||||
Income and Equity Fund | $ | - | $ | 4,031,234 | $ | 7,976,319 | $ | 1,846,732 | $ | 265,054 | $ | 1,581,678 | |||||||||||||||
Balanced Fund | 371,395 | 1,126,375 | 3,126,175 | 800,171 | 170,159 | 630,013 | |||||||||||||||||||||
Large Cap Value Fund | - | 1,254,312 | 2,276,478 | 3,405,724 | - | 3,405,724 | |||||||||||||||||||||
Mid Cap Value Fund | 279,555 | 824,368 | 2,867,089 | 1,568,664 | 537,297 | 1,031,367 | |||||||||||||||||||||
Small Cap Value Fund | 661,568 | 3,356,421 | 9,598,185 | 7,925,486 | 3,529,015 | 4,396,471 | |||||||||||||||||||||
Note 5. Distributions to Shareholders
The tax character of distributions paid during 2019 and 2018 was as follows:
| Income and Equity Fund | Balanced Fund | Large Cap Value Fund | Mid Cap Value Fund | Small Cap Value Fund | |||||||||||||||||||
Period ended June 30, 2019 | |||||||||||||||||||||||
Distributions paid from: | |||||||||||||||||||||||
Ordinary Income | $ | 637 | |||||||||||||||||||||
Total Distributions | $ | 637 | $ | - | $ | - | $ | - | $ | - | |||||||||||||
Year ended December 31, 2018 | |||||||||||||||||||||||
Distributions paid from: | |||||||||||||||||||||||
Ordinary Income | $ | 54,930 | $ | - | $ | - | $ | - | $ | - | |||||||||||||
Long-Term Capital Gain | 930,595 | 320,041 | 564,609 | 481,572 | 1,856,667 | ||||||||||||||||||
Total Distributions | $ | 985,525 | $ | 320,041 | $ | 564,609 | $ | 481,572 | $ | 1,856,667 | |||||||||||||
Note 6. Capital Share Transactions
A 2% redemption fee is assessed on shares of the Income and Equity Fund sold or exchanged within 30 days of purchase or shares of the Balanced Fund, Large Cap Value Fund, Mid Cap Value Fund or Small Cap Value Fund sold or exchanged within 180 days of purchase and is retained in each Fund. The redemption fees collected through June 30, 2019, and through year end 2018, are included in the dollar amount of shares sold in the table below. The amount of the increase is as follows:
| Six months ended June 30, 2019 | Year ended December 31, 2018 | ||||||||||||||||||||||||||
Class A | Class C | Class I | Class A | Class C | Class I | ||||||||||||||||||||||
Income and Equity Fund | $ | - | $ | - | N/A | $ | - | $ | - | N/A | |||||||||||||||||
Balanced Fund | - | - | N/A | 1,251 | 443 | N/A | |||||||||||||||||||||
Large Cap Value Fund | 20 | 1 | N/A | 1,901 | 154 | N/A | |||||||||||||||||||||
Mid Cap Value Fund | 9 | 1 | N/A | 559 | 45 | N/A | |||||||||||||||||||||
Small Cap Value Fund | 48 | 6 | $ | 2 | 3,350 | 463 | $ | 83 | |||||||||||||||||||
43
Pacific Advisors Fund Inc.
Notes to Financial Statements (Unaudited)
June 30, 2019
| Six months ended June 30, 2019 | Year ended December 31, 2018 | ||||||||||||||||||
Shares | Amount | Shares | Amount | ||||||||||||||||
Income and Equity Fund | |||||||||||||||||||
Class A | |||||||||||||||||||
Shares sold | 38,344 | $ | 454,401 | 67,476 | $ | 878,374 | |||||||||||||
Reinvestment of distributions | 45 | 541 | 61,385 | 696,443 | |||||||||||||||
38,389 | 454,942 | 128,861 | 1,574,817 | ||||||||||||||||
Shares repurchased | (340,842 | ) | (4,086,857 | ) | (122,273 | ) | (1,566,404 | ) | |||||||||||
Net increase (decrease) | (302,453 | ) | $ | (3,631,915 | ) | 6,588 | $ | 8,413 | |||||||||||
Class C | |||||||||||||||||||
Shares sold | - | $ | - | 40 | $ | 500 | |||||||||||||
Reinvestment of distributions | - | - | 13,127 | 139,936 | |||||||||||||||
- | - | 13,167 | 140,436 | ||||||||||||||||
Shares repurchased | (41,393 | ) | (466,930 | ) | (26,171 | ) | (322,866 | ) | |||||||||||
Net decrease | (41,393 | ) | $ | (466,930 | ) | (13,004 | ) | $ | (182,430 | ) | |||||||||
| Six months ended June 30, 2019 | Year ended December 31, 2018 | ||||||||||||||||||
Shares | Amount | Shares | Amount | ||||||||||||||||
Balanced Fund | |||||||||||||||||||
Class A | |||||||||||||||||||
Shares sold | 27,331 | $ | 309,694 | 4,932 | $ | 63,768 | |||||||||||||
Reinvestment of distributions | - | - | 20,571 | 206,942 | |||||||||||||||
27,331 | 309,694 | 25,503 | 270,710 | ||||||||||||||||
Shares repurchased | (53,821 | ) | (598,789 | ) | (59,567 | ) | (749,393 | ) | |||||||||||
Net decrease | (26,490 | ) | $ | (289,095 | ) | (34,064 | ) | $ | (478,683 | ) | |||||||||
Class C | |||||||||||||||||||
Shares sold | 2,671 | $ | 25,811 | 10,494 | $ | 115,943 | |||||||||||||
Reinvestment of distributions | - | - | 9,988 | 86,193 | |||||||||||||||
2,671 | 25,811 | 20,482 | 202,136 | ||||||||||||||||
Shares repurchased | (41,764 | ) | (403,576 | ) | (37,683 | ) | (416,975 | ) | |||||||||||
Net decrease | (39,093 | ) | $ | (377,765 | ) | (17,201 | ) | $ | (214,839 | ) | |||||||||
44
Pacific Advisors Fund Inc.
Notes to Financial Statements (Unaudited)
June 30, 2019
| Six months ended June 30, 2019 | Year ended December 31, 2018 | ||||||||||||||||||
Shares | Amount | Shares | Amount | ||||||||||||||||
Large Cap Value Fund | |||||||||||||||||||
Class A | |||||||||||||||||||
Shares sold | 9,490 | $ | 149,158 | 17,199 | $ | 302,278 | |||||||||||||
Reinvestment of distributions | - | - | 35,783 | 493,441 | |||||||||||||||
9,490 | 149,158 | 52,982 | 795,719 | ||||||||||||||||
Shares repurchased | (74,810 | ) | (1,172,411 | ) | (82,053 | ) | (1,411,783 | ) | |||||||||||
Net decrease | (65,320 | ) | $ | (1,023,253 | ) | (29,071 | ) | $ | (616,064 | ) | |||||||||
Class C | |||||||||||||||||||
Shares sold | - | $ | 1 | - | $ | 154 | |||||||||||||
Reinvestment of distributions | - | - | 1,673 | 19,059 | |||||||||||||||
- | 1 | 1,673 | 19,213 | ||||||||||||||||
Shares repurchased | (8,786 | ) | (115,439 | ) | (4,352 | ) | (63,039 | ) | |||||||||||
Net decrease | (8,786 | ) | $ | (115,438 | ) | (2,679 | ) | $ | (43,826 | ) | |||||||||
| Six months ended June 30, 2019 | Year ended December 31, 2018 | ||||||||||||||||||
Shares | Amount | Shares | Amount | ||||||||||||||||
Mid Cap Value Fund | |||||||||||||||||||
Class A | |||||||||||||||||||
Shares sold | 25,386 | $ | 265,904 | 10,331 | $ | 137,278 | |||||||||||||
Reinvestment of distributions | - | - | 48,670 | 428,786 | |||||||||||||||
25,386 | 265,904 | 59,001 | 566,064 | ||||||||||||||||
Shares repurchased | (42,361 | ) | (440,271 | ) | (97,092 | ) | (1,314,598 | ) | |||||||||||
Net decrease | (16,975 | ) | $ | (174,367 | ) | (38,091 | ) | $ | (748,534 | ) | |||||||||
Class C | |||||||||||||||||||
Shares sold | 23 | $ | 201 | 104 | $ | 1,245 | |||||||||||||
Reinvestment of distributions | - | - | 5,012 | 37,642 | |||||||||||||||
23 | 201 | 5,116 | 38,887 | ||||||||||||||||
Shares repurchased | (27,853 | ) | (247,367 | ) | (7,367 | ) | (80,662 | ) | |||||||||||
Net increase (decrease) | (27,830 | ) | $ | (247,166 | ) | (2,251 | ) | $ | (41,775 | ) | |||||||||
45
Pacific Advisors Fund Inc.
Notes to Financial Statements (Unaudited)
June 30, 2019
| Six months ended June 30, 2019 | Year ended December 31, 2018 | ||||||||||||||||||
Shares | Amount | Shares | Amount | ||||||||||||||||
Small Cap Value Fund | |||||||||||||||||||
Class A | |||||||||||||||||||
Shares sold | 31,258 | $ | 749,778 | 13,852 | $ | 419,373 | |||||||||||||
Reinvestment of distributions | - | - | 72,839 | 1,443,664 | |||||||||||||||
31,258 | 749,778 | 86,691 | 1,863,037 | ||||||||||||||||
Shares repurchased | (86,310 | ) | (2,046,350 | ) | (181,697 | ) | (5,374,621 | ) | |||||||||||
Net decrease | (55,052 | ) | $ | (1,296,572 | ) | (95,006 | ) | $ | (3,511,584 | ) | |||||||||
Class C | |||||||||||||||||||
Shares sold | - | $ | 6 | 1,394 | $ | 30,052 | |||||||||||||
Reinvestment of distributions | - | - | 20,650 | 270,715 | |||||||||||||||
- | 6 | 22,044 | 300,767 | ||||||||||||||||
Shares repurchased | (58,651 | ) | (910,661 | ) | (30,444 | ) | (639,644 | ) | |||||||||||
Net decrease | (58,651 | ) | $ | (910,655 | ) | (8,400 | ) | $ | (338,877 | ) | |||||||||
Class I | |||||||||||||||||||
Shares sold | 8,128 | $ | 268,110 | 13,420 | $ | 587,963 | |||||||||||||
Reinvestment of distributions | - | - | 1,269 | 33,927 | |||||||||||||||
8,128 | 268,110 | 14,689 | 621,890 | ||||||||||||||||
Shares repurchased | (2,532 | ) | (85,429 | ) | (338 | ) | (13,044 | ) | |||||||||||
Net increase | 5,596 | $ | 182,681 | 14,351 | $ | 608,846 | |||||||||||||
Note 7. Bank Borrowings
Each Fund may borrow money to the extent permitted by the 1940 Act, as amended, or any rules, exemptions or interpretations thereunder that may be adopted, granted or issued by the Securities and Exchange Commission. Under the 1940 Act, a mutual fund may borrow up to one-third of its total assets (including the amount borrowed) from banks for any purpose, and may borrow up to 5% of its total assets from banks or other lenders for temporary purposes. Each Fund may borrow to facilitate portfolio transactions or meet redemptions. The Large Cap Value Fund, Mid Cap Value Fund, and Small Cap Value Fund also may borrow money to invest in portfolio securities. Each Fund has the ability to borrow, from UMB, on an unsecured basis, at 3.75% over the Federal Funds rate. As of June 30, 2019, Income & Equity Fund had borrowings from UMB with amounts of $286,695, and was paying interest at 6.05% per annum on their outstanding borrowings. For the period ended June 30, 2019, the Income & Equity Fund, Balanced Fund, Large Cap Value Fund, Mid Cap Value Fund and Small Cap Value Fund had a daily average borrowing of $77,170, $21,412, $36,799, $6,145 and $46,989 with a weighted average interest rate of 5.85%, 5.55%, 5.51%, 5.61% and 5.57% per annum, respectively. No compensating balances were required.
Note 8. Recent Pronouncements
In March 2017, the Financial Accounting Standards Board (FASB) issued Accounting Standards Update (ASU) No. 2017-08, Receivables-Nonrefundable Fees and Other Costs (Subtopic 310-20): Premium Amortization on Purchased Callable Debt Securities. The amendments in the ASU shorten the amortization period for certain callable debt securities, held at a premium, to the earliest call date. The ASU does not require an accounting change for securities held at a discount; these continue to be amortized to maturity. The ASU is effective for fiscal years and interim periods within those fiscal years beginning after December 15, 2018. Management has previously adopted this provision.
In August 2018, the FASB issued Accounting Standards Update ("ASU") No. 2018-13, which changes certain fair value measurement disclosure requirements. The new ASU, in addition to other modifications and additions, removes the requirement to disclose the amount and reasons for transfers between Level 1 and Level 2 of the fair value hierarchy, and the policy for the timing of transfers between levels. For investment companies, the amendments are effective for financial statements issued for fiscal years beginning after December 15, 2019, and interim periods within those fiscal years. Early adoption is allowed. At this time, management is evaluating the implications of the ASU and any impact on the financial statement disclosures.
46
Pacific Advisors Fund Inc.
Notes to Financial Statements (Unaudited)
June 30, 2019
In September 2018, the Securities and Exchange Commission adopted amendments to certain disclosure requirements under Regulation S-X to conform to US GAAP, including: (i) an amendment to require presentation of the total, rather than the components, of distributable earnings on the Statement of Assets and Liabilities; and (ii) an amendment to require presentation of the total, rather than the components, of distributions to shareholders, except for tax return of capital distributions, if any, on the Statement of Changes in Net Assets. The amendments also removed the requirement for parenthetical disclosure of undistributed net investment income on the Statement of Changes in Net Assets.
Note 9. Subsequent Events
Subsequent events occurring after the date of this report through the date these financial statements were issued have been evaluated for potential impact and the Fund has had no such events.
47
Pacific Advisors Fund Inc.
Directors and Officers
"Independent" Directors
Name (Age) | Position with the Company1 | Year elected Director of the Company | Principal occupation(s) during past 5 years | Other Directorships held by Director | |||||||||||||||
| L. Michael Haller, III (75) | Director | 1992 | Consultant, d/b/a Asahi Broadcasting Enterprises (software development); Chairman and President, Gammaker Inc. (mobile game developer); Chairman and CEO, AdLib Mediation, Inc. (mobile advertising); and Chairman, President and CEO, Vital Reality, Inc. and Vital Reality USA, Inc. (digital game developer) | Digital Angel, Inc. | |||||||||||||||
| Peter C. Hoffman (68) | Director | 2010 | President, Sierra Autocars, Inc. (auto dealership), Sierra Vehicles, Inc. and Sierra Pursuits, Inc. (management company) | None | |||||||||||||||
| Gerald E. Miller (89) | Director | 1992 | Retired in 1992; and formerly worked for Merrill Lynch for over 30 years and was a Senior Resident Vice President at retirement in 1992 | None | |||||||||||||||
| Louise K. Taylor, PhD (72) | Director | 1992 | Assistant Executive Director, School Employers Association of California; and formerly Superintendent, Monrovia Unified School District (1991-2009) | None | |||||||||||||||
"Interested" Director2
Name (Age) | Positions with the Company1 | Year elected a Director and officer of the Company | Principal occupations during past 5 years | Other Directorships held by Director | |||||||||||||||
| George A. Henning (72)* | President and Chairman | 1992 | Chairman, President and Director, Pacific Global Investment Management Company; and Chairman and Director, Pacific Global Fund Distributors, Inc. and Pacific Global Investor Services, Inc. | None | |||||||||||||||
Each Director oversees all 5 Pacific Advisors Fund portfolios.
The Fund's Statement of Additional Information contains additional information about the Fund's Directors and Officers and is available without charge upon request by calling (800) 989-6693. The business address for all Directors and officers of the Company is 101 N. Brand Blvd., Suite 1950, Glendale, CA 91203, Attn: Secretary.
48
Pacific Advisors Fund Inc.
Directors and Officers
Other Officers
Name (Age) | Position(s) with the Company | Year elected an officer of the Company | Principal occupations during past 5 years | ||||||||||||
| Catherine L. Henning (41) | Vice President Secretary | 2010 2006 | Senior Vice President, Secretary, Director of Client Services and Director, Pacific Global Investment Management Company; President, Secretary, Chief Compliance Officer and Director, Pacific Global Fund Distributors, Inc.; and Vice President, Secretary and Director, Pacific Global Investor Services, Inc. | ||||||||||||
| Barbara A. Kelley (66) | Vice President and Chief Compliance Officer | 2001 | Executive Vice President, Chief Compliance Officer and Director, Pacific Global Investment Management Company; Director, Pacific Global Fund Distributors, Inc.; President and Director, Pacific Global Investor Services, Inc. | ||||||||||||
| Araceli Olea (46) | Assistant Secretary | 2008 | Shareholder Services Manager, Pacific Global Investor Services, Inc.; and Assistant Secretary, Pacific Global Investment Management Company and Pacific Global Investor Services, Inc. | ||||||||||||
| Jingjing Yan (45) | Treasurer | 2014 | Vice President and Treasurer, Pacific Global Investment Management Company; Treasurer, Pacific Global Fund Distributors, Inc. and Pacific Global Investor Services, Inc. | ||||||||||||
1 Each director is elected to serve until the next annual shareholders meeting and until his or her successor is elected or appointed. The Company does not hold regular annual shareholders meetings to elect Directors. Vacancies on the Board can be filled by the action of a majority of the Directors, provided that at least two-thirds of the Directors have been elected by the shareholders.
2 "Interested persons" as defined in the 1940 Act, as amended, based on the director's affiliation with the Funds' investment manager and its affiliates (including the Funds' principal underwriter).
* Mr. Henning is considered an interested director because (a) he holds the positions described above with the Company, the Manager and its affiliates; (b) by virtue of his ownership of the Manager's shares he may be deemed a "control person" of the Manager; and (c) he is Ms. Henning's father.
49
Pacific Advisors Fund Inc.
notes
50
Pacific Advisors Fund Inc.
notes
51
Pacific Advisors Fund Inc.
notes
52

Pacific Advisors Fund Inc.
Directors
George A. Henning, Chairman
L. Michael Haller, III
Peter C. Hoffman
Gerald E. Miller
Louise K. Taylor, Ph.D.
Officers
George A. Henning, President
Barbara A. Kelley, Vice President
Catherine L. Henning, Vice President and Secretary
Araceli Olea, Assistant Secretary
Jingjing Yan, Treasurer
Investment Manager
Pacific Global Investment Management Company
101 North Brand Blvd., Suite 1950
Glendale, California 91203
Transfer Agent and Administrator
Pacific Global Investor Services, Inc.
101 North Brand Blvd., Suite 1950
Glendale, California 91203
Distributor
Pacific Global Fund Distributors, Inc.
101 North Brand Blvd., Suite 1950
Glendale, California 91203
(800) 989-6693
Availability of Quarterly Portfolio Schedule
The Fund files its complete schedule of portfolio holdings with the SEC for the first and third quarters of each fiscal year on Form N-Q. The Fund's Forms N-Q are available on the SEC's Web site at http://www.sec.gov. The Fund's Forms N-Q may be reviewed and copied at the SEC's Public Reference Room in Washington, DC. Information about the operation of the Public Reference Room may be obtained by calling the SEC at (800) SEC-0330.
The Fund's complete schedule of portfolio holdings for each fiscal quarter is posted on the Fund's Web site at www.PacificAdvisorsFund.com and is available without charge, upon request by calling (800) 989-6693. Documents will be sent within 3 business days of receipt of your request.
Availability of Proxy Voting Policies and Procedures and Proxy Voting Record
A description of the policies and procedures that the Fund uses to determine how to vote proxies relating to portfolio securities and information regarding how the Fund voted proxies relating to portfolio securities during the most recent 12-month period ended June 30 is available without charge, upon request by calling (800) 989-6693. Documents will be sent within 3 business days of receipt of your request. This information is also available on the SEC's Web site at http://www.sec.gov.

Pacific Global Fund Distributors, Inc.
101 North Brand Blvd., Suite 1950
Glendale, California 91203

Item 2. Code of Ethics
Not applicable for semi-annual reports.
Item 3. Audit Committee Financial Expert
Not applicable for semi-annual reports.
Item 4. Principal Accountant Fees and Services
Not applicable for semi-annual reports.
Item 5. Audit Committee of Listed Registrants
Not applicable as Registrant is not a listed issuer as defined in Rule 10A-3 under the Securities Exchange Act of 1934.
Item 6. Schedule of Investments
Schedule of Investments is included as part of the report to shareholders filed under Item 1 of this form.
Item 7. Disclosure of Proxy Voting Policies and Procedures for Closed-End Management Investment Companies
Not applicable to open-end investment companies.
Item 8. Portfolio Managers of Closed-End Management Investment Companies
Not applicable to open-end investment companies.
Item 9. Purchases of Equity Securities by Managers of Closed-End Management Investment Company and Affiliated Purchasers.
Not applicable to open-end investment companies.
Item 10. Submission of Matters to a Vote of Security Holders
No material changes have been made.
Item 11. Controls and Procedures.
(a) Based upon their evaluation of Registrant’s disclosure controls and procedures (as defined in Rule 30a-3(c) under the Investment Company Act of 1940) as conducted within 90 days of the filing date of this Form N-CSR, Registrant’s principal executive officer and principal financial officer have concluded that those disclosure controls and procedures provide reasonable assurance that the material information required to be disclosed by Registrant on this report is recorded, processed, summarized and reported within the time periods specified in the Securities and Exchange Commission’s rules and forms.
(b) There were no changes in Registrant’s internal control over financial reporting (as defined in Rule 30a-3(d) under the Investment Company Act of 1940) that occurred during the second fiscal quarter of the period covered by this report that have materially affected, or are reasonably likely to materially affect, Registrant’s internal control over financial reporting.
Item 12. Exhibits
(a)(1) Not applicable.
(a)(2) Certifications required by Item 12(a) of Form N-CSR and Section 302 of the Sarbanes-Oxley Act of 2002 (filed herewith).
(a)(3) Not applicable.
(b) Certification required by Section 906 of the Sarbanes-Oxley Act of 2002 (filed herewith).
SIGNATURES
Pursuant to the requirements of the Securities Exchange Act of 1934 and the Investment Company Act of 1940, Registrant has duly caused this report to be signed on its behalf by the undersigned, thereunto duly authorized.
Pacific Global Fund Inc. d/b/a Pacific Advisors Fund Inc.
By: | /s/ | George A. Henning |
|
| George A. Henning |
| |
| Chairman, Pacific Advisors Fund Inc. |
| |
Date: | September 4, 2019 |
Pursuant to the requirements of the Securities Exchange Act of 1934 and the Investment Company Act of 1940, this report has been signed below by the following persons on behalf of Registrant and in the capacities and on the dates indicated.
By: | /s/ | George A. Henning |
|
| George A. Henning |
| |
| Chief Executive Officer |
| |
|
| ||
Date: | September 4, 2019 |
| |
By: | /s/ | Jingjing Yan |
|
| Jingjing Yan |
| |
| Chief Financial Officer |
| |
|
| ||
Date: | September 4, 2019 |
| |