UNITED STATES
SECURITIES AND EXCHANGE COMMISSION
Washington, D.C. 20549
FORM N-CSR
CERTIFIED SHAREHOLDER REPORT OF REGISTERED
MANAGEMENT INVESTMENT COMPANIES
Investment Company Act file number | 811-07062 | |||||||
| ||||||||
PACIFIC GLOBAL FUND INC. D/B/A PACIFIC ADVISORS FUND INC. | ||||||||
(Exact name of registrant as specified in charter) | ||||||||
| ||||||||
101 NORTH BRAND BLVD., SUITE 1950 GLENDALE, CALIFORNIA |
| 91203 | ||||||
(Address of principal executive offices) |
| (Zip code) | ||||||
| ||||||||
GEORGE A. HENNING 101 NORTH BRAND BLVD., SUITE 1950 GLENDALE, CA 91203 | ||||||||
(Name and address of agent for service) | ||||||||
| ||||||||
Registrant’s telephone number, including area code: | 818-242-6693 |
| ||||||
| ||||||||
Date of fiscal year end: | December 31 |
| ||||||
| ||||||||
Date of reporting period: | June 30, 2017 |
| ||||||
Item 1. |
| Report to Shareholders |
|
| Filed herewith. |

semi-annual report
june 30, 2017
income and equity fund
balanced fund
large cap value fund
mid cap value fund
small cap value fund


Pacific Advisors
table of contents
Message from the Chairman | 1 | ||||||
Income and Equity Fund | 4 | ||||||
Balanced Fund | 8 | ||||||
Large Cap Value Fund | 12 | ||||||
Mid Cap Value Fund | 16 | ||||||
Small Cap Value Fund | 20 | ||||||
Schedule of Investments | 25 | ||||||
Statement of Assets and Liabilities | 44 | ||||||
Statement of Operations | 46 | ||||||
Statement of Changes in Net Assets | 48 | ||||||
Financial Highlights | 52 | ||||||
Notes to Financial Statements | 58 | ||||||
Directors and Officers | 70 | ||||||
This Report is submitted for the general information of the shareholders of Pacific Advisors Funds. It is not authorized for distribution to prospective investors unless accompanied or preceded by the Funds' current prospectus, which contains information concerning the investment policies of the Funds as well as other pertinent information.
This Report is for informational purposes only and is not a solicitation or recommendation that any particular investor should purchase or sell any particular security. The statements in the Chairman's Letter and the discussions of the Funds' performance are the opinions and beliefs expressed at the time of this commentary and are not intended to represent opinions and beliefs at any other time. These opinions are subject to change at any time based on market or other conditions and are not meant as a market forecast. All economic and performance information referenced is historical. Past performance does not guarantee future results.
For more information on the Pacific Advisors Funds, including information on charges, expenses and other classes offered, please obtain a copy of the prospectus by calling (800) 989-6693. Please read the prospectus and consider carefully the investment risks, objectives, charges and expenses before you invest or send money. Shares of the Pacific Advisors Funds are not deposits or obligations of any bank, are not guaranteed by any bank, are not insured by the FDIC or any other agency, and involve investment risks, including the possible loss of the principal amount invested. The investment return and principal value of an investment will fluctuate so that an investor's shares, when redeemed, may be worth more or less than their original cost.


Message
from the chairman
Dear Shareholders,
The bull market continued on the strength of the improving U.S. and global economies. Companies across many sectors cited improving business conditions in support of their willingness to invest in product and geographical expansions, acquisitions, and other growth initiatives. And, though expectations for tax reform and deregulation have faded somewhat, investors seem confident in the prospects for economic growth and rising corporate profits. Market gains were broad-based, with the exception of the Energy sector which lagged due to falling oil prices. Rising crude inventory levels and a rapid increase in U.S. shale oil production triggered renewed fears of oversupply. In May, OPEC, along with Russia and other non-OPEC countries, agreed to continue a production freeze through March 2018 in an effort to hasten the return to more normal inventory levels. More recently, a decline in supply levels suggests that demand may be much stronger than many had forecast.
Economic reports have been broadly positive. In June, the Manufacturing Index rose to its highest level in almost three years; and increases in both production backlogs and export activity point to continued strength. Also, sixteen of the seventeen industries in the services sector expanded. Car sales, while slightly below last year's robust levels, remained strong as auto companies respond to increased demand for trucks and SUVs. Consumer confidence is tracking near post-recession highs, and retail sales increased. Jobs reports also confirmed the health of the U.S. economy as the unemployment rate fell to 4.3% in May, the lowest level since 2001, before rising in June to 4.4%. The Federal Reserve's assessment of the economy remains positive. In commenting on the latest interest rate hike, Fed Chair Janet Yellen stated in June that further rate hikes would be consistent with the transition towards a tighter monetary policy. The Fed also reiterated its intention to closely monitor inflationary developments.
Media attention on the events at home has overshadowed the continued economic improvements in Europe and China. For the first time in several years, Europe outpaced the U.S. in the first half of the year. And, Emmanuel Macron's presidential victory in France, along with the resurgence of support for Angela Merkel ahead of Germany's elections in September, has quelled anti-European Union sentiment. Also, the recent electoral setback for the United Kingdom's Conservative Party raises the prospect for a more moderate approach to upcoming Brexit negotiations. Meanwhile, China's economy continues to expand at nearly 7% annually; Japan and India also posted solid first quarter growth at 1.3% and 6.1%, respectively. And, Brazil appears poised to emerge from recession; the first quarter's –0.4% contraction marked a significant improvement from last year's –5.4% decline.
Many business executives point to growth opportunities as the economy improves. However, market valuations, particularly in the Industrial and Energy sectors, remain somewhat depressed. Indeed, many companies have been under-rewarded for steps they have already taken, including acquisitions, rising sales, and higher earnings. We expect markets will recognize leading companies as the economy strengthens, and that rising investor confidence will encourage a shift towards areas of the market with greater appreciation potential.
Equity Investment Review
All of the major indices reached new record highs during the quarter with the technology-heavy NASDAQ leading the way; mid-cap and small cap stocks lagged. Growth-oriented stocks, even though many of these traded at lofty valuations, outperformed value-oriented stocks. Volatility, as measured by the CBOE Volatility Index, remained near historical lows.
Market Review • June 30, 2017
Index1 | Close | YTD Price Return | |||||||||
Dow Jones Industrial Average | 21,349.63 | 8.03 | % | ||||||||
S&P 500® Index | 2,423.41 | 8.24 | % | ||||||||
NASDAQ | 6,140.42 | 14.07 | % | ||||||||
Russell Midcap® Index | 1,910.05 | 7.07 | % | ||||||||
Russell 2000® Index (small cap) | 1,415.36 | 4.29 | % | ||||||||
06/30/17 | 06/30/16 | ||||||||||
| 10-Year T-Note Yield | 2.31 | % | 1.49 | % | |||||||
Data: Bloomberg; Federal Reserve.
1


Message
from the chairman continued
The lack of market volatility has contributed to the continued momentum of growth stocks, especially for companies with readily identifiable prospects. Among these, the popular FAANG group of stocks has enjoyed a remarkable run. In the second quarter, Facebook gained +6%, Amazon gained +9%, and Alphabet (parent company of Google) gained +10% to soundly beat the broader market's returns. And, although the other members of this group, Apple and Netflix, delivered mediocre second quarter results, they nevertheless gained +24% and +21%, respectively, year-to-date. These FAANG stocks, which represent 10% of the S&P 500® by weight, accounted for 24% of the year-to-date return.
The outlook for further rate hikes benefitted the earnings and growth outlook for Financials. Transportation stocks rose as the industrial economy expanded due, in part, to the recovery in shale-related drilling activity. Energy stocks lagged as West Texas Intermediate crude, the North American benchmark, fell from $53 per barrel in April to a low of $42 in June. Investors are concerned with the increase in U.S. drilling rigs; also, stockpiles remain elevated despite OPEC's decision in May to extend its production freeze agreement into 2018. Most analysts believe the break-even price range for shale oil is $40 to $60 per barrel. Oil prices themselves may be the catalyst to bring supplies into balance as companies will curtail activity until prices recover; indeed, oil prices recovered to $46 by the end of the June.
The impact of these events reflects improving investor sentiment although it has been skewed towards large cap stocks with growth-oriented strategies outpacing value. A more detailed discussion of performance and Fund strategies follows for the Large Cap Value, Mid Cap Value and Small Cap Value Funds.
Fixed Income Investment Review
In June, the Fed, as expected, raised the Federal Funds rate for the third consecutive quarter. The decision reflects the strong labor market, increased business spending and slow but steady economic growth. The Fed anticipates beginning the process of selling its substantial portfolio of bonds accumulated following the financial crisis. Despite the rate increase, the yield on the benchmark 10-year U.S. Treasury Note, which ended the first quarter at 2.40%, fell to a seven-month low of 2.14% in early June before ending the quarter at 2.31%. For now, the strong demand for U.S. Treasuries has more than offset any concerns about future rate increases.
Further information regarding our fixed income strategies is provided in the performance discussion for the Income and Equity and Balanced Funds.
Looking Ahead
Investors may grow increasingly skeptical, given the modest pace of U.S. economic growth, that the bull market will avoid a correction or major recession. Certainly, some stocks in the Technology sector have exceeded their historical valuations; elsewhere, though, many companies remain undervalued and overlooked. Today's market characteristics, such as low interest rates, low inflation and the lack of investor exuberance, are not consistent with the normal signs of a market nearing a severe correction.
Several factors, including an improving economic outlook, the disciplined approach shown by many companies in pursuing growth strategies, and investment-friendly monetary policies across the globe, support a more optimistic view of the market. A recent report from the Organization for Economic Cooperation and Development ("OECD"), which tracks economic growth of forty-five countries, reinforces this outlook. The OECD report states that, for the first time in ten years, all of the countries are on track to grow this year. This report is consistent with the International Monetary Fund ("IMF") which expects 3.5% growth in economic output in 2017 compared to 3.2% in 2016. The IMF projects 3.6% growth in 2018. Certainly, other catalysts could also accelerate growth and provide market momentum.
Investors, while continuing to closely monitor political events in Washington, have seemingly put aside any expectations with respect to legislative action until more concrete developments emerge. Any eventual reforms, for taxes or health care, could provide a stimulus; but, at this point, the markets seem to no longer anticipate such results. Infrastructure spending, another expected growth driver, also faces an uncertain future; even so, spending at the state level continues to increase. Also, the administration's efforts at deregulation may benefit companies by encouraging business expansion and lowering costs.
2


Message
from the chairman continued
Uncertainties are always possible; however, our strategy of selecting market-leading yet undervalued companies provides a level of confidence that each company's management team will pursue opportunities and respond well to unforeseen events. As contrarians, we seek out companies, and market sectors, that are undervalued and largely overlooked despite prospects for long-term growth. We believe that, as the economy continues to expand, investors will increasingly focus on overlooked sectors of the market to identify stocks with significant appreciation potential.
Sincerely,

George A. Henning
1 The Dow Jones Industrial Average is an unmanaged, price weighted measure of 30 U.S. stocks selected by the Averages Committee to represent the performance of all U.S. stocks outside the Transportation and Utilities sectors. The S&P 500® Index is an unmanaged, market capitalization weighted index which measures the performance of the large cap segment of the U.S. equities market, covering approximately 75% of the U.S. equities market. The Index includes 500 leading companies in leading industries of the U.S. economy. The NASDAQ Composite Index is an unmanaged, market capitalization weighted measure of all domestic and international common stocks (currently over 3,000 stocks) listed on The Nasdaq Stock Market. The Russell Indices are unmanaged, market-weighted indices. The Russell Midcap® Index measures the 800 smallest companies within the Russell 1000® Index based on a combination of their market cap and current index membership. The Russell 2000® Index measures the stocks of the 2,000 smallest publicly traded companies of the Russell 3000® Index. These indices are not available for direct investment.
Economic and performance information referenced is historical and past performance does not guarantee future results. The principal value and return of an investment will fluctuate so that an investor's shares may be worth less than the original cost when redeemed. For more information on the Pacific Advisors Funds, including information on charges, expenses and other classes offered, please obtain a copy of the prospectus by calling (800) 989-6693. Please read the prospectus and consider carefully the investment risks, objectives, charges and expenses before you invest or send money.
Shares of the Funds are not deposits or obligations of any bank, are not guaranteed by any bank, are not insured by the FDIC or any other agency, and involve investment risks, including the possible loss of the principal amount invested. The views expressed represent the opinions and beliefs at the time of this commentary and are not meant as a market forecast. These views are subject to change at any time based on market or other conditions. This information may not be relied on as investment advice or as an indication of trading.
3
Pacific Advisors
Income and Equity Fund
Fund Objective: Current income and, secondarily, long-term capital appreciation.
Investment Invests primarily in investment grade U.S. corporate bonds and in dividend-paying
Strategy: stocks.
Investor Profile: Conservative. Some current income required; capital preservation aim.
Please see the Chairman's Letter for a detailed market and economic review
as well as the Manager's general market outlook.
Portfolio Holdings (As of 06/30/17 based on total investments)
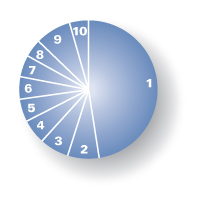
1. | Corporate Bonds | 47.56 | % | ||||||||
Equities | 48.08 | % | |||||||||
2. | Consumer Staples | 7.35 | % | ||||||||
3. | Industrials | 6.84 | % | ||||||||
4. | Information Technology | 5.75 | % | ||||||||
5. | Financials | 5.33 | % | ||||||||
6. | Consumer Discretionary | 5.21 | % | ||||||||
7. | Health Care | 5.05 | % | ||||||||
8. | Utilities | 4.17 | % | ||||||||
9. | Others | 8.38 | % | ||||||||
10. | Preferred Stock | 4.36 | % | ||||||||
| Total Returns (For the six months ended 06/30/17) | |||||||
Class A | 0.11 | % | |||||
Class C | –0.25 | % | |||||
| |||||||
| Barclays Capital U.S. Intermediate Corporate Bond Index1 | 2.67 | % | |||||
S&P 500® Index1 | 9.34 | % | |||||
Current expense ratio: net 3.01% (A), 3.75% (C); gross 3.75% (A), 4.49% (C). Prospectus expense ratio: net 2.88% (A), 3.64% (C); gross 3.63% (A); 4.39% (C).2
Performance quoted is past performance which does not guarantee future results. Current performance may be higher or lower than the performance quoted. Call (800) 989-6693 for performance current to the most recent month-end. The investment return and principal value of an investment will fluctuate so that an investor's shares, when redeemed, may be worth more or less than their original cost. Returns represent the change in value over the stated period assuming reinvestment of dividends and capital gains at net asset value. Returns do not take into account the maximum 4.75% sales charge on Class A shares or the 1% Contingent Deferred Sales Charge (CDSC) for Class C shares sold within one year of purchase. Returns would be lower if the applicable sales charge and CDSC were included. Returns do not take into account individual taxes which may reduce actual returns when shares are sold.
The Fund's investment adviser is waiving a portion of its management fees pursuant to an Expense Limitation Agreement. The waiver may be discontinued at any time with ninety days written notice in consultation with the Fund's board, but is expected to continue at current levels. Please see the Notes to Financial Statements in this report for details. Performance shown reflects the waiver, without which the results would have been lower.
1 The S&P 500® Index is an unmanaged, market capitalization weighted index which measures the performance of the large cap segment of the U.S. equities market, covering approximately 75% of the U.S. equities market. The Index includes 500 leading companies in leading industries of the U.S. economy. Index returns assume the reinvestment of dividends, but, unlike the Fund's returns, do not reflect the effects of management fees or expenses. The Barclays Capital U.S. Intermediate Corporate Bond Index is an unmanaged index of publicly issued investment grade U.S. corporate bonds with one to ten years to maturity. It is not possible to invest directly in either Index.
2 "Current" expense ratio is annualized for the year-to-date as of 06/30/17. "Prospectus" expense ratio is for the fiscal year ended 12/31/16.
4
Discussion with Portfolio Managers August 24, 2017
Charles Suh, CFA and Jingjing Yan, CFA
Fund Strategy
The Fund employs a conservative strategy that seeks to achieve total return through current income and capital appreciation. The Fund's fixed income holdings, typically investment-grade bonds and preferred stocks, are actively managed to seek the greatest income and return potential while minimizing risk. The Fund's equity holdings range from 20% to 40% of assets, or more, depending upon economic and market conditions. When interest rates are low and the economic outlook is optimistic, the Fund's equity allocation generally increases above 40% to capture dividend income as well as opportunities for price appreciation. Equity investments are selected based upon a history of price stability, long-term growth potential and attractive dividend income.
Fund Performance
During the first half of 2017, Class A shares of the Fund rose 0.11% to underperform both its fixed income benchmark, the Barclays Capital U.S. Intermediate Corporate Bond Index (+2.67%) and its equity benchmark, the S&P 500® Index (+9.34%). The Fund's fixed income holdings, and equity holdings, differ from their respective benchmarks; in particular, the performance of the S&P 500® was dominated by the five FAANG stocks (Facebook, Apple, Amazon, Netflix and Google). The Fund's mix of fixed income and equity investments suggests that a blended return of its benchmarks provides an appropriate performance comparison: through June, the blended return1 was 5.86%. The Fund maintained substantially lower volatility than the benchmark as demonstrated by the Fund's one-year beta, as of June 30, of 0.402 while the equity holdings' dividend yield (+3.11%) exceeded the yield of the fixed income benchmark (+2.72%).
What Helped/Hurt Performance3
The Fund's top equity contributors to returns were Coach, Abbvie, and Honeywell International. Luxury accessory designer Coach gained 37% after reporting better than expected earnings and its announced acquisition of competitor Kate Spade. Pharmaceutical company Abbvie rose 18% as worldwide sales of its best-selling drug Humira increased 15%. Honeywell International gained 16% and hit a record high during the period due to higher-than-anticipated sales in its aerospace and energy businesses.
The Fund's most significant detractors from returns were Schlumberger, Kroger, and Target. Oilfield services provider Schlumberger fell 21% as the cost of reactivating equipment idled by low oil prices hurt margins, and seasonal activities in China, Russia, and the North Sea declined more than expected. Despite an increase in overall sales, food retailer Kroger declined 32% due to increased competition and lower operating margins. And, big-box retailer Target fell 26% as sales at brick-and-mortar locations decreased; the company plans to introduce 12 exclusive brands by the end of 2018 as part of its strategy to increase in-store traffic.
Several of the Fund's corporate bonds were called in as issuers retired debt or refinanced bonds at lower rates. The Fund reinvested the proceeds in similar investment-grade bonds of high quality companies,
1 Blended return calculated from the benchmark index returns based on ratio of stocks to fixed-income securities in the Fund's portfolio as of the end of the period.
2 "Beta" measures volatility relative to the stock market (here, the S&P 500® Index) or an alternative benchmark. A beta less than 1.0 indicates lower risk than the market or the benchmark; a beta greater than 1.0 indicates higher risk than the market or the benchmark.
3 For detailed information on Fund holdings, please see the Fund's Schedule of Investments in this Report.
5
Pacific Advisors
Income and Equity Fund continued
such as Tech Data Corp. 3.70% maturing in 2022, and bonds with interest rates that adjust if not called. For example, the Fund purchased a 5-year 3% Jeffries Group LLC bond; the step-up bond, which will provide a 3.19% yield to a 2020 call date; if not called, the yield will adjust to 3.55%. The Fund also holds fixed-to-floating rate preferred stock in several Financials sector firms. These investments provide both principal protection as well as attractive yield; the coupon rate changes to a floating rate at a predetermined dates if the stock is not called.
The Fund's fixed income allocation continued to invest primarily in short-to-intermediate-term bonds (maturing in five years or less) which help preserve principal and lower price volatility. The holdings maintained a weighted average duration (2.16 years as of June 30) that was significantly shorter than the 4.5 year weighted average duration of the benchmark, an unmanaged bond portfolio. Duration measures a portfolio's sensitivity to interest rate movements; when rates increase by 1%, the value of a portfolio with a 4-year duration would decrease by approximately 4%.
Looking Ahead
For the remainder of the year, we anticipate that investors will closely watch the pace of U.S. economic growth, interest rates and market volatility. The Fund's focus on shorter-term bonds may contribute to periods of underperformance; yet these bonds, especially the holdings with step-up or floating rate features, provide flexibility as interest rates change. The Fund anticipates gradually lengthening the average duration of its bond portfolio as rates trend higher. The Fund will continue to identify stocks which present opportunities for price appreciation as well as dividend increases; though, as rates rise, the Fund may decrease the equity allocation and capture higher interest rates by gradually increasing the average maturity of its fixed income holdings.
6
Expense Examples
As a shareholder of the Fund you incur two types of costs: (1) transaction costs, including sales charges (loads) on purchase payments, reinvested dividends, or other distributions; redemption fees; and exchange fees; and (2) ongoing costs, including management fees; distribution (12b-1) fees; and other Fund expenses. This Example is intended to help you understand your ongoing costs (in dollars) of investing in the Fund and to compare these costs with the ongoing costs of investing in other mutual funds.
The Example is based on an investment of $1,000 invested at the beginning of the period and held for the entire period from January 1, 2017 through June 30, 2017.
Actual Expenses
The first line of the table below provides information about actual account values and actual expenses. You may use the information in this line, together with the amount you invested, to estimate the expenses that you paid over the period. Simply divide your account value by $1,000 (for example, an $8,600 account value divided by $1,000 = 8.6), then multiply the result by the number in the first line under the heading entitled "Expenses Paid During the Period" to estimate the expenses you paid on your account during the period.
The following transaction costs are not included in the expenses shown in the table and, if applicable, would increase the expenses that you paid over the period: (1) a front-end sales charge (load) of 4.75% on Class A shares; (2) a 2% redemption fee if you sell or exchange shares within 30 days of purchase, with certain exceptions. The redemption fee does not apply to: (a) redemptions under an automatic withdrawal program or periodic asset reallocation plan, required minimum distributions (RMD), employer mandated distributions from a qualified plan, or redemptions under a qualified domestic relations order (QDRO); (b) redemptions to pay for expenses related to terminal illness, extended hospital or nursing home care, or other serious medical conditions, including death; (c) redemptions of shares acquired through dividend or capital gains reinvestments; (d) loans from a qualified plan account; and (e) redemptions initiated by the Fund; and (3) a $10 service fee on each exchange after the first five exchanges in each calendar year.
The following ongoing costs are not included in the expenses shown in the table and, if applicable, would increase the expenses that you paid over the period: (1) a $12 low balance fee on accounts with balances of less than $250 as of September 30th of each calendar year and no investment activity (excluding reinvestment of dividends and/or capital gains) during the prior calendar year or the first nine months of the current calendar year. This fee does not apply to IRAs, qualified plan accounts, or Coverdell Education Savings Accounts; (2) a $15 annual custodial fee on IRAs, SEPs, SIMPLE IRAs, and Coverdell Education Savings Accounts; and (3) a $20 annual custodial fee on 403(b) accounts.
Hypothetical Example for Comparison Purposes
The second line of the table below provides information about hypothetical account values and hypothetical expenses based on the Fund's actual expense ratio and an assumed rate of return of 5% per year before expenses, which in not the Fund's actual return. The hypothetical account values and expenses may not be used to estimate the actual ending account balance or expenses you paid for the period. You may use this information to compare the ongoing costs of investing in the Fund and other funds. To do so, compare this 5% hypothetical example with the 5% hypothetical examples that appear in the shareholder reports of the other funds.
The following transaction costs are not included in the expenses shown in the table and, if applicable, would increase the expenses that you paid over the period: (1) a front-end sales charge (load) of 4.75% on Class A shares; (2) a 2% redemption fee if you sell or exchange shares within 30 days of purchase, with certain exceptions. The redemption fee does not apply to: (a) redemptions under an automatic withdrawal program or periodic asset reallocation plan, required minimum distributions (RMD), employer mandated distributions from a qualified plan, or redemptions under a qualified domestic relations order (QDRO); (b) redemptions to pay for expenses related to terminal illness, extended hospital or nursing home care, or other serious medical conditions, including death; (c) redemptions of shares acquired through dividend or capital gains reinvestments; (d) loans from a qualified plan account; and (e) redemptions initiated by the Fund; and (3) a $10 service fee on each exchange after the first five exchanges in each calendar year.
The following ongoing costs are not included in the expenses shown in the table and, if applicable, would increase the expenses that you paid over the period: (1) a $12 low balance fee on accounts with balances of less than $250 as of September 30th of each calendar year and no investment activity (excluding reinvestment of dividends and/or capital gains) during the prior calendar year or the first nine months of the current calendar year. This fee does not apply to IRAs, qualified plan accounts, or Coverdell Education Savings Accounts; (2) a $15 annual custodial fee on IRAs, SEPs, SIMPLE IRAs, and Coverdell Education Savings Accounts; and (3) a $20 annual custodial fee on 403(b) accounts.
Please note that the expenses shown in the table are meant to highlight your ongoing costs only and do not reflect any transactional costs, such as sales charges (loads), redemption fees, or exchange fees. Therefore, the second line of the table is useful in comparing ongoing costs only, and will not help you determine the relative total costs of owning different funds. In addition, if these transactional costs were included, your costs would have been higher.
| Beginning Account Value 01/01/17 | Ending Account Value 06/30/17 | Expense Paid During Period 01/01/17 – 06/30/17 | |||||||||||||
Income & Equity Fund Class A | |||||||||||||||
Actual | $ | 1,000.00 | $ | 1,001.10 | $ | 14.93 | |||||||||
Hypothetical (5% return before expense) | $ | 1,000.00 | $ | 1,009.87 | $ | 15.00 | |||||||||
Income & Equity Fund Class C | |||||||||||||||
Actual | $ | 1,000.00 | $ | 997.50 | $ | 18.57 | |||||||||
Hypothetical (5% return before expense) | $ | 1,000.00 | $ | 1,006.20 | $ | 18.65 | |||||||||
4 Expenses are equal to the Fund's annualized expense ratio, net of expense waivers, of 3.01% for Class A shares and 3.75% for Class C shares, multiplied by the average account value over the period, multiplied by 181/365 days to reflect the one-half year period.
7
Pacific Advisors
Balanced Fund
Fund Objective: Long-term capital appreciation and income consistent with reduced risk.
Investment Invests primarily in large cap common stocks and investment grade U.S. corporate
Strategy: bonds. Invests at least 25% of its assets in fixed income securities and preferred stocks and at least 25% in equities.
Investor Profile: Moderately conservative. Seeks combination of long-term growth, income, liquidity and reduced risk of price fluctuations.
Please see the Chairman's Letter for a detailed market and economic review
as well as the Manager's general market outlook.
Portfolio Holdings (As of 06/30/17 based on total investments)
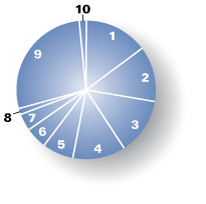
Equities | 70.81 | % | |||||||||
1. | Industrials | 14.52 | % | ||||||||
2. | Consumer Discretionary | 13.26 | % | ||||||||
3. | Information Technology | 13.18 | % | ||||||||
4. | Financials | 12.35 | % | ||||||||
5. | Health Care | 7.20 | % | ||||||||
6. | Energy | 4.83 | % | ||||||||
7. | Consumer Staples | 3.89 | % | ||||||||
8. | Telecommunication Services | 1.58 | % | ||||||||
9. | Corporate Bonds | 27.36 | % | ||||||||
10. | Preferred Stock | 1.83 | % | ||||||||
| Total Returns (For the six months ended 06/30/17) | |||||||
Class A | 2.47 | % | |||||
Class C | 2.00 | % | |||||
S&P 500® Index1 | 9.34 | % | |||||
Barclays Capital U.S. Int Corp Bond Index1 | 2.67 | % | |||||
Current expense ratio: 4.65% (A); 5.39% (C). Prospectus expense ratio: 4.50% (A); 5.25% (C).2
Performance quoted is past performance which does not guarantee future results. Current performance may be higher or lower than the performance quoted. Call (800) 989-6693 for performance current to the most recent month-end. The investment return and principal value of an investment will fluctuate so that an investor's shares, when redeemed, may be worth more or less than their original cost. Returns represent the change in value over the stated period assuming reinvestment of dividends and capital gains at net asset value. Returns do not take into account the maximum 5.75% sales charge on Class A shares or the 1% Contingent Deferred Sales Charge (CDSC) for Class C shares sold within one year of purchase. Returns would be lower if the applicable sales charge and CDSC were included. Returns do not take into account individual taxes which may reduce actual returns when shares are sold.
1 The S&P 500® Index is an unmanaged, market capitalization weighted index which measures the performance of the large cap segment of the U.S. equities market, covering approximately 75% of the U.S. equities market. The Index includes 500 leading companies in leading industries of the U.S. economy. Index returns assume the reinvestment of dividends, but, unlike the Fund's returns, do not reflect the effects of management fees or expenses. The Barclays Capital U.S. Intermediate Corporate Bond Index is an unmanaged index of publicly issued investment grade U.S. corporate bonds with one to ten years to maturity. It is not possible to invest directly in either Index.
2 "Current" expense ratio is annualized for the year-to-date as of 06/30/17. "Prospectus" expense ratio is for the fiscal year ended 12/31/16.
8
Discussion with Portfolio Managers August 24, 2017
Charles Suh, CFA and Jingjing Yan, CFA
Fund Strategy
The Fund is designed for investors seeking to participate in the equity markets with reduced volatility. The Fund's strategy combines high-quality stocks across all market capitalizations with investment-grade corporate bonds. We identify leading, well-managed companies that generate high returns on capital and consistent earnings over a full economic cycle. We look to purchase stocks at a discount to our internal price targets with the expectation that, as the companies' growth strategies unfold, the stocks will appreciate over the medium-to-long-term. The Fund may experience periods of underperformance when short-term market trends overshadow long-term outlooks; yet, over time, performance should reflect the strength of these companies as they demonstrate the ability to grow through various economic and business cycles.
We manage the Fund's asset allocation based on our assessment of risk-appropriate investments in the context of the overall economic, market, and interest rate outlook. This balanced approach enables the Fund to take advantage of specific growth opportunities while reducing overall risk.
Fund Performance
During the first half of 2017, Class A shares of the Fund gained 2.47% to underperform the Fund's equity benchmark, the S&P 500® Index (+9.34%); the Fund performed roughly in-line with its fixed income benchmark, the Barclays Capital U.S. Intermediate Corporate Bond Index (+2.67%). The Fund's equity allocation benefitted from strong gains in Industrials and Health Care holdings. In contrast, Energy holdings substantially impacted performance. The sector suffered from falling oil prices as global supplies of crude exceeded demand; OPEC's agreement in May, which extended production cuts by nine months, failed to stem the decline. Meanwhile, the Fund's fixed income holdings remained concentrated in investment-grade issuers and shorter-term maturities (less than five years); the fixed income portion of the Fund added to performance but lagged its benchmark which contains bonds with longer maturities.
What Helped/Hurt Performance1
The Fund's top contributors to returns were Triton International, Conn's, and Cerner. Triton, the world's largest intermodal container leasing company, rose 119% as global trade rebounded and lease rates improved. The company's merger with TAL International, which was announced during a market downturn in 2015, was well timed; its scale and cost structure effectively position the combined company to expand market share at the expense of smaller competitors with fewer financial and operating resources. Conn's, a specialty retailer that provides in-store financing, gained 51% as higher margins and more strict underwriting standards provided confirmation of the company's turnaround. The company plans to maintain retail sales and improve credit performance while slowing new store growth. Cerner, the leading healthcare IT services provider, rose 40% with continued growth in revenues and new orders. The company is leading the digital revolution for hospitals and health care clinics; its contract to overhaul the Department of Defense's health care records to an electronic system went live in February, 2017.
The Fund's most significant detractors to returns were Team, Hornbeck Offshore Services, and Tractor Supply. Team, an industrial services provider, declined 40% as petrochemical and refinery customers continue to defer maintenance work. We believe, though, that the stock may rebound as oil prices stabilize; moreover, refinery maintenance schedules are often mandated by regulatory requirements. Hornbeck, which operates support vessels to the offshore oil industry, fell 61% as investors seemingly abandoned
1 For detailed information on Fund holdings, please see the Fund's Schedule of Investments in this Report.
9
Pacific Advisors
Balanced Fund continued
the prospects for a recovery in offshore drilling activity. Yet, many projects in the Gulf of Mexico, where the company primarily operates, are economic at oil prices as low as $40 per barrel. Most analysts expect oil prices to remain in a range of $40 to $60 per barrel; these prices should support an eventual resumption in offshore activity. Tractor Supply, a retailer catering to the rural lifestyle, fell 28% as a decline in same store sales impacted revenues and earnings; mild winter weather resulted in heavy discounts for excess inventory. Temporary weather impacts aside, the company's growth plans include a nearly 50% expansion from the current base of 1630 stores nationwide.
During the period, the Fund trimmed its holdings in Triton International, Idexx Laboratories, and East West Bancorp following their significant price gains. Our risk management process actively manages exposure to individual holdings as they approach our estimation of fair value. Still, we believe each of these companies maintains a favorable fundamental outlook and, therefore, the Fund continues to hold the positions for their long-term appreciation potential. The Fund did not add any new equity positions, or liquidate any existing equity positions during the period.
Looking Ahead
The equity bull market is poised to continue as economic growth accelerates in the U.S. and around the world. Stocks in certain industries, such as Information Technology, are trading well above historic valuations; stocks in other sectors, such as Retailers and Energy, though, have largely been ignored. This disparity provides opportunities for active managers to identify undervalued companies that offer the potential to outperform. Here, Fund holdings include O'Reilly Automotive, an auto parts retailer that serves both professional and do-it-yourself customers, and Core Laboratories, an energy services company that provides analytics and technologically advanced tools to assist oil companies in maximizing production from complex geologies. Meanwhile, the Fund's fixed income strategy will continue to identify attractively priced investment-grade bonds while maintaining its concentration in shorter-term maturities.
10
Expense Examples
As a shareholder of the Fund you incur two types of costs: (1) transaction costs, including sales charges (loads) on purchase payments, reinvested dividends, or other distributions; redemption fees; and exchange fees; and (2) ongoing costs, including management fees; distribution (12b-1) fees; and other Fund expenses. This Example is intended to help you understand your ongoing costs (in dollars) of investing in the Fund and to compare these costs with the ongoing costs of investing in other mutual funds.
The Example is based on an investment of $1,000 invested at the beginning of the period and held for the entire period from January 1, 2017 through June 30, 2017.
Actual Expenses
The first line of the table below provides information about actual account values and actual expenses. You may use the information in this line, together with the amount you invested, to estimate the expenses that you paid over the period. Simply divide your account value by $1,000 (for example, an $8,600 account value divided by $1,000 = 8.6), then multiply the result by the number in the first line under the heading entitled "Expenses Paid During the Period" to estimate the expenses you paid on your account during the period.
The following transaction costs are not included in the expenses shown in the table and, if applicable, would increase the expenses that you paid over the period: (1) a front-end sales charge (load) of 5.75% on Class A shares; (2) a 2% redemption fee if you sell or exchange shares within 180 days of purchase, with certain exceptions. The redemption fee does not apply to: (a) redemptions under an automatic withdrawal program or periodic asset reallocation plan, required minimum distributions (RMD), employer mandated distributions from a qualified plan, or redemptions under a qualified domestic relations order (QDRO); (b) redemptions to pay for expenses related to terminal illness, extended hospital or nursing home care, or other serious medical conditions, including death; (c) redemptions of shares acquired through dividend or capital gains reinvestments; (d) loans from a qualified plan account, and (e) redemptions initiated by the Fund; and (3) a $10 service fee on each exchange after the first five exchanges in each calendar year.
The following ongoing costs are not included in the expenses shown in the table and, if applicable, would increase the expenses that you paid over the period: (1) a $12 low balance fee on accounts with balances of less than $250 as of September 30th of each calendar year and no investment activity (excluding reinvestment of dividends and/or capital gains) during the prior calendar year or the first nine months of the current calendar year. This fee does not apply to IRAs, qualified plan accounts, or Coverdell Education Savings Accounts; (2) a $15 annual custodial fee on IRAs, SEPs, SIMPLE IRAs, and Coverdell Education Savings Accounts; and (3) a $20 annual custodial fee on 403(b) accounts.
Hypothetical Example for Comparison Purposes
The second line of the table below provides information about hypothetical account values and hypothetical expenses based on the Fund's actual expense ratio and an assumed rate of return of 5% per year before expenses, which in not the Fund's actual return. The hypothetical account values and expenses may not be used to estimate the actual ending account balance or expenses you paid for the period. You may use this information to compare the ongoing costs of investing in the Fund and other funds. To do so, compare this 5% hypothetical example with the 5% hypothetical examples that appear in the shareholder reports of the other funds.
The following transaction costs are not included in the expenses shown in the table and, if applicable, would increase the expenses that you paid over the period: (1) a front-end sales charge (load) of 5.75% on Class A shares; (2) a 2% redemption fee if you sell or exchange shares within 180 days of purchase, with certain exceptions. The redemption fee does not apply to: (a) redemptions under an automatic withdrawal program or periodic asset reallocation plan, required minimum distributions (RMD), employer mandated distributions from a qualified plan, or redemptions under a qualified domestic relations order (QDRO); (b) redemptions to pay for expenses related to terminal illness, extended hospital or nursing home care, or other serious medical conditions, including death; (c) redemptions of shares acquired through dividend or capital gains reinvestments; (d) loans from a qualified plan account, and (e) redemptions initiated by the Fund; and (3) a $10 service fee on each exchange after the first five exchanges in each calendar year.
The following ongoing costs are not included in the expenses shown in the table and, if applicable, would increase the expenses that you paid over the period: (1) a $12 low balance fee on accounts with balances of less than $250 as of September 30th of each calendar year and no investment activity (excluding reinvestment of dividends and/or capital gains) during the prior calendar year or the first nine months of the current calendar year. This fee does not apply to IRAs, qualified plan accounts, or Coverdell Education Savings Accounts; (2) a $15 annual custodial fee on IRAs, SEPs, SIMPLE IRAs, and Coverdell Education Savings Accounts; and (3) a $20 annual custodial fee on 403(b) accounts.
Please note that the expenses shown in the table are meant to highlight your ongoing costs only and do not reflect any transactional costs, such as sales charges (loads), redemption fees, or exchange fees. Therefore, the second line of the table is useful in comparing ongoing costs only, and will not help you determine the relative total costs of owning different funds. In addition, if these transactional costs were included, your costs would have been higher.
| Beginning Account Value 01/01/17 | Ending Account Value 06/30/17 | Expense Paid During Period 01/01/17 – 06/30/17 | |||||||||||||
Balanced Fund Class A | |||||||||||||||
Actual | $ | 1,000.00 | $ | 1,024.70 | $ | 23.34 | |||||||||
Hypothetical (5% return before expense) | $ | 1,000.00 | $ | 1,001.74 | $ | 23.08 | |||||||||
Balanced Fund Class C | |||||||||||||||
Actual | $ | 1,000.00 | $ | 1,020.00 | $ | 27.00 | |||||||||
Hypothetical (5% return before expense) | $ | 1,000.00 | $ | 998.07 | $ | 26.70 | |||||||||
4 Expenses are equal to the Fund's annualized expense ratio of 4.65% for Class A shares and 5.39% for Class C shares, multiplied by the average account value over the period, multiplied by 181/365 days to reflect the one-half year period.
11
Pacific Advisors
Large Cap Value Fund
Fund Objective: Long-term capital appreciation.
Investment Invests at least 80% of its assets in large cap companies that are, at the time of
Strategy: purchase, within the market cap range of companies in the S&P 500® Index1.
Investor Profile: Conservative equity. Growth-oriented with a long-term investment horizon.
Please see the Chairman's Letter for a detailed market and economic review
as well as the Manager's general market outlook.
Portfolio Holdings (As of 06/30/17 based on total investments)
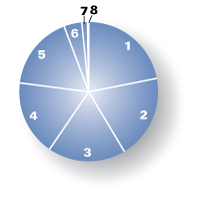
Equities | 100.00 | % | |||||||||
1. | Information Technology | 21.94 | % | ||||||||
2. | Consumer Discretionary | 19.40 | % | ||||||||
3. | Industrials | 18.18 | % | ||||||||
4. | Consumer Staples | 17.54 | % | ||||||||
5. | Financials | 17.26 | % | ||||||||
6. | Health Care | 4.14 | % | ||||||||
7. | Energy | 1.51 | % | ||||||||
8. | Materials | 0.03 | % | ||||||||
| Total Returns (For the six months ended 06/30/17) | |||||||
Class A | 6.67 | % | |||||
Class C | 6.30 | % | |||||
| |||||||
S&P 500® Index | 9.34 | % | |||||
Current expense ratio: net 3.77% (A), 4.50% (C); gross 4.52% (A), 5.24% (C). Prospectus expense ratio: net 3.85% (A), 4.59% (C); gross 4.60% (A); 5.34% (C).2
Performance quoted is past performance which does not guarantee future results. Current performance may be higher or lower than the performance quoted. Call (800) 989-6693 for performance current to the most recent month-end. The investment return and principal value of an investment will fluctuate so that an investor's shares, when redeemed, may be worth more or less than their original cost. Returns represent the change in value over the stated period assuming reinvestment of dividends and capital gains at net asset value. Returns do not take into account the maximum 5.75% sales charge on Class A shares or the 1% Contingent Deferred Sales Charge (CDSC) for Class C shares sold within one year of purchase. Returns would be lower if the applicable sales charge and CDSC were included. Returns do not take into account individual taxes which may reduce actual returns when shares are sold.
The Fund's investment adviser is waiving a portion of its management fees pursuant to an Expense Limitation Agreement. The waiver may be discontinued at any time with ninety days written notice in consultation with the Fund's board, but is expected to continue at current levels. Please see the Notes to Financial Statements in this report for details. Performance shown reflects the waiver, without which the results would have been lower.
1 The Standard & Poor's 500® Index is an unmanaged, market capitalization weighted index which measures the performance of the large cap segment of the U.S. equities market, covering approximately 75% of the U.S. equities market. The Index includes 500 leading companies in leading industries of the U.S. economy. Index returns assume the reinvestment of dividends, but, unlike the Fund's returns, do not reflect the effects of management fees or expenses. It is not possible to invest directly in the Index.
2 "Current" expense ratio is as of 06/30/17. "Prospectus" expense ratio is for the fiscal year ended 12/31/16.
12
Discussion with Portfolio Manager August 24, 2017
Samuel C. Coquillard
Fund Strategy
The Fund uses a value-oriented, focused portfolio strategy (34 holdings as of 06/30/17) to invest in more conservative, less volatile U.S. stocks that pay attractive dividends. The Fund seeks to achieve long-term capital appreciation with reduced volatility. Holdings concentrate on mega-cap stocks of well-managed companies with dominant market positions, strong financials, and track records of steady growth. The weighted average market capitalization of Fund holdings ($217 billion as of 06/30/17) is five times larger than the average of the benchmark S&P 500® Index. The mega-cap emphasis helps achieve stable total returns with less volatility than the broader market; as of June 30th, the Fund's one-year beta1 of 0.95 remains consistently below the Index. The weighted average dividend yield was 1.97%; several holdings, including Coca-Cola, ExxonMobil, General Electric (GE), International Business Machines (IBM), Intel, MetLife, Proctor & Gamble, and UPS, paid dividends in excess of 2.90%.
Fund Performance
During the first half of the year, Class A shares gained 6.67% compared to the S&P 500® Index's gain of 9.34%. The Fund's conservative, value-oriented strategy performed reasonably well in comparison to its benchmark. Underperformance during the period reflected the Fund's lack of concentration in the outperforming FAANG (Facebook, Amazon, Apple, Netflix and Google) stocks which accounted for one third of the S&P 500® Index's performance. The Fund benefitted from holdings in several of these companies; others, though, are high growth stocks which would be inconsistent with the Fund's investment approach. Also, the Fund's sector allocations varied from the benchmark. Specifically, the Fund's allocation to Restaurants, Specialty Retail, and Industrials companies during the period helped performance while the Fund's underallocation to the Health Care sector hurt performance.
Underperformance relative to the benchmark is not unexpected as the Fund's positioning in mega-cap holdings is suitable for investors who want to participate in the equity markets but incur lower volatility. The Fund will typically lag its benchmark during a strong bull market and outperform during a correction or bear market.
What Helped/Hurt Performance2
The Fund's top three contributors to returns during the second half were McDonald's, Oracle, and Illinois Tool Works. McDonald's gained 26% during the period as efforts to update its menu and dining experience led to sales growth, higher guest counts and increased earnings per share. Enterprise software and database company Oracle rose 30% as the company's Cloud-based revenues rose 58%; the "hyper-growth" of its Software as a Service and Platform as a Service business is expanding operating margins. Illinois Tool Works, which manufactures industrial products and equipment, gained 17% after reporting record earnings; the company raised its earnings and profit margin guidance for the year.
The Fund's bottom three detractors to returns were GE, Sysco, and IBM. Industrial company GE continues to transition operations to focus on aviation, power generation, health care, oil and gas, and various other products; the stock fell over 14% as the company reported flat earnings and negative cash
1 "Beta" measures volatility relative to the stock market or an alternative benchmark. A beta less than 1.0 indicates lower risk than the market or the benchmark; a beta greater than 1.0 indicates higher risk than the market or the benchmark.
2 For detailed information on Fund holdings, please see the Fund's Schedule of Investments in this Report.
13
Pacific Advisors
Large Cap Value Fund continued
flows from industrial operations. Sysco, which distributes food products to the foodservice industry in the U.S. and overseas, reported earnings in line with expectations; the stock lost 9% late in the quarter due to concerns over weakening demand. IBM fell 7% after reporting lower revenues, operating margins and earnings per share; revenues for the Cognitive Solutions business, including Watson-related software, rose 2%.
During the period, the Fund realized gains by selling a portion of its holdings in both Wells Fargo and IBM; no new positions were established.
Looking Ahead
We expect Fund holdings to benefit as the U.S. and global economies expand. Economic data, such as job creation, wage growth, consumer spending, and housing, remain encouraging. Meanwhile, interest rates may begin to rise in response to the Federal Reserve's rate hikes. During the first six months of the year, the U.S. dollar declined against other major currencies; the more favorable exchange rate should boost earnings from international operations. The markets will also be focused on the outlook for legislative actions aimed to lower the corporate tax rate for companies repatriating funds to the U.S. If enacted, the program would be especially significant for the Fund's mega cap companies which hold substantial cash in offshore accounts. Together, these factors provide the basis for revenue and earnings growth. The Fund, with considerable holdings in well-known market leaders, should benefit as investors favor companies with strong domestic and international operations that are positioned to participate from economic expansion.
14
Expense Examples
As a shareholder of the Fund you incur two types of costs: (1) transaction costs, including sales charges (loads) on purchase payments, reinvested dividends, or other distributions; redemption fees; and exchange fees; and (2) ongoing costs, including management fees; distribution (12b-1) fees; and other Fund expenses. This Example is intended to help you understand your ongoing costs (in dollars) of investing in the Fund and to compare these costs with the ongoing costs of investing in other mutual funds.
The Example is based on an investment of $1,000 invested at the beginning of the period and held for the entire period from January 1, 2017 through June 30, 2017.
Actual Expenses
The first line of the table below provides information about actual account values and actual expenses. You may use the information in this line, together with the amount you invested, to estimate the expenses that you paid over the period. Simply divide your account value by $1,000 (for example, an $8,600 account value divided by $1,000 = 8.6), then multiply the result by the number in the first line under the heading entitled "Expenses Paid During the Period" to estimate the expenses you paid on your account during the period.
The following transaction costs are not included in the expenses shown in the table and, if applicable, would increase the expenses that you paid over the period: (1) a front-end sales charge (load) of 5.75% on Class A shares; (2) a 2% redemption fee if you sell or exchange shares within 180 days of purchase, with certain exceptions. The redemption fee does not apply to: (a) redemptions under an automatic withdrawal program or periodic asset reallocation plan, required minimum distributions (RMD), employer mandated distributions from a qualified plan, or redemptions under a qualified domestic relations order (QDRO); (b) redemptions to pay for expenses related to terminal illness, extended hospital or nursing home care, or other serious medical conditions, including death; (c) redemptions of shares acquired through dividend or capital gains reinvestments; (d) loans from a qualified plan account, and (e) redemptions initiated by the Fund; and (3) a $10 service fee on each exchange after the first five exchanges in each calendar year.
The following ongoing costs are not included in the expenses shown in the table and, if applicable, would increase the expenses that you paid over the period: (1) a $12 low balance fee on accounts with balances of less than $250 as of September 30th of each calendar year and no investment activity (excluding reinvestment of dividends and/or capital gains) during the prior calendar year or the first nine months of the current calendar year. This fee does not apply to IRAs, qualified plan accounts, or Coverdell Education Savings Accounts; (2) a $15 annual custodial fee on IRAs, SEPs, SIMPLE IRAs, and Coverdell Education Savings Accounts; and (3) a $20 annual custodial fee on 403(b) accounts.
Hypothetical Example for Comparison Purposes
The second line of the table below provides information about hypothetical account values and hypothetical expenses based on the Fund's actual expense ratio and an assumed rate of return of 5% per year before expenses, which in not the Fund's actual return. The hypothetical account values and expenses may not be used to estimate the actual ending account balance or expenses you paid for the period. You may use this information to compare the ongoing costs of investing in the Fund and other funds. To do so, compare this 5% hypothetical example with the 5% hypothetical examples that appear in the shareholder reports of the other funds.
The following transaction costs are not included in the expenses shown in the table and, if applicable, would increase the expenses that you paid over the period: (1) a front-end sales charge (load) of 5.75% on Class A shares; (2) a 2% redemption fee if you sell or exchange shares within 180 days of purchase, with certain exceptions. The redemption fee does not apply to: (a) redemptions under an automatic withdrawal program or periodic asset reallocation plan, required minimum distributions (RMD), employer mandated distributions from a qualified plan, or redemptions under a qualified domestic relations order (QDRO); (b) redemptions to pay for expenses related to terminal illness, extended hospital or nursing home care, or other serious medical conditions, including death; (c) redemptions of shares acquired through dividend or capital gains reinvestments; (d) loans from a qualified plan account, and (e) redemptions initiated by the Fund; and (3) a $10 service fee on each exchange after the first five exchanges in each calendar year.
The following ongoing costs are not included in the expenses shown in the table and, if applicable, would increase the expenses that you paid over the period: (1) a $12 low balance fee on accounts with balances of less than $250 as of September 30th of each calendar year and no investment activity (excluding reinvestment of dividends and/or capital gains) during the prior calendar year or the first nine months of the current calendar year. This fee does not apply to IRAs, qualified plan accounts, or Coverdell Education Savings Accounts; (2) a $15 annual custodial fee on IRAs, SEPs, SIMPLE IRAs, and Coverdell Education Savings Accounts; and (3) a $20 annual custodial fee on 403(b) accounts.
Please note that the expenses shown in the table are meant to highlight your ongoing costs only and do not reflect any transactional costs, such as sales charges (loads), redemption fees, or exchange fees. Therefore, the second line of the table is useful in comparing ongoing costs only, and will not help you determine the relative total costs of owning different funds. In addition, if these transactional costs were included, your costs would have been higher.
| Beginning Account Value 01/01/17 | Ending Account Value 06/30/17 | Expense Paid During Period 01/01/17 – 06/30/17 | |||||||||||||
Large Cap Value Fund Class A | |||||||||||||||
Actual | $ | 1,000.00 | $ | 1,066.70 | $ | 19.32 | |||||||||
Hypothetical (5% return before expense) | $ | 1,000.00 | $ | 1,006.10 | $ | 18.75 | |||||||||
Large Cap Value Fund Class C | |||||||||||||||
Actual | $ | 1,000.00 | $ | 1,063.00 | $ | 23.02 | |||||||||
Hypothetical (5% return before expense) | $ | 1,000.00 | $ | 1,002.48 | $ | 22.34 | |||||||||
5 Expenses are equal to the Fund's annualized expense ratio, net of expense waivers, of 3.77% for Class A shares and 4.50% for Class C shares, multiplied by the average account value over the period, multiplied by 181/365 days to reflect the one-half year period.
15
Pacific Advisors
Mid Cap Value Fund
Fund Objective: Long-term capital appreciation.
Investment Invests at least 80% of its assets in mid-cap companies that are, at the time
Strategy: of purchase, within the market cap range of companies in the Russell Midcap® Index.1
Investor Profile: Moderately aggressive. Growth-oriented with a long-term investment horizon.
Please see the Chairman's Letter for a detailed market and economic review
as well as the Manager's general market outlook.
Portfolio Holdings (As of 06/30/17 based on total investments)
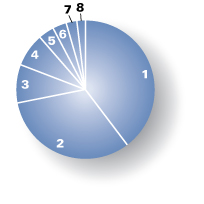
Equities | 100.00 | % | |||||||||
1. | Industrials | 39.74 | % | ||||||||
2. | Consumer Discretionary | 32.24 | % | ||||||||
3. | Energy | 8.73 | % | ||||||||
4. | Financials | 7.92 | % | ||||||||
5. | Information Technology | 3.62 | % | ||||||||
6. | Health Care | 3.21 | % | ||||||||
7. | Consumer Staples | 2.51 | % | ||||||||
8. | Materials | 2.03 | % | ||||||||
| Total Returns (For the six months ended 06/30/17) | |||||||
Class A | –3.31 | % | |||||
Class C | –3.65 | % | |||||
| |||||||
Russell Midcap® Index | 7.99 | % | |||||
Current expense ratio: 4.84% (A); 5.59% (C). Prospectus expense ratio: 4.74% (A); 5.54% (C).2
Performance quoted is past performance which does not guarantee future results. Current performance may be higher or lower than the performance quoted. Call (800) 989-6693 for performance current to the most recent month-end. The investment return and principal value of an investment will fluctuate so that an investor's shares, when redeemed, may be worth more or less than their original cost. Returns represent the change in value over the stated period assuming reinvestment of dividends and capital gains at net asset value. Returns do not take into account the maximum 5.75% sales charge on Class A shares or the 1% Contingent Deferred Sales Charge (CDSC) for Class C shares sold within one year of purchase. Returns would be lower if the applicable sales charge and CDSC were included. Returns do not take into account individual taxes which may reduce actual returns when shares are sold.
1 The Russell Midcap® Index is an unmanaged, weighted measure of the 800 smallest companies within the Russell 1000® Index based on a combination of their market cap and current index membership. Index returns assume the reinvestment of dividends, but, unlike the Fund's returns, do not reflect management fees or expenses. It is not possible to invest directly in the Index.
2 "Current" expense ratio is annualized for the year-to-date as of 06/30/17. "Prospectus" expense ratio is for the fiscal year ended 12/31/16.
16
Discussion with Portfolio Manager August 24, 2017
George A. Henning
Fund Strategy
Mid-cap companies provide distinctive advantages for long-term investors by combining the strategic flexibility of smaller businesses with the economies of scale typically enjoyed by large corporations. The Fund uses a fundamental, bottom-up strategy to identify leading mid-cap companies with attractive opportunities for long-term appreciation. Our focused, value-oriented approach selects approximately 30 to 40 stocks; we expect to hold each investment for 3 to 5 years, or longer. Our long-term investment horizon and focus on well-managed, industry-leading companies with opportunities for substantial share price appreciation typically reduces turnover and minimizes the realization of short-term gains. As of the period end, the Fund's annualized turnover rate of 17% was consistent with its five-year average annual turnover rate of 19.8%1.
Fund Performance
Following 2016, when the Fund's 14.59% gain outperformed the benchmark Russell Midcap® Index's 13.80% gain, Class A shares declined 3.31% in the first half of 2017 to underperform the benchmark's 7.99% gain. The Fund's underperformance resulted from several factors including the downturn in energy stocks; a decline in investor expectations for legislative action; concerns that several Fund holdings would suffer due to competition from Amazon; and temporary setbacks for several companies. The Fund anticipates improving performance in the second half of the year. The holdings with company-specific challenges are likely to realize the benefits of corrective actions. The stocks which were impacted by the presumed Amazon threat should recover as investors acknowledge that these companies offer vital services which offset online price discounts; and, these companies have already withstood several years of online competition.
The Fund is actively positioned toward companies and sectors, including Industrials and specialty retailers, that will respond well to economic growth. The Fund's sector allocation notably differs from the benchmark as the Fund uses a bottom-up investment process to identify the best long-term opportunities. Typically, Fund holdings represent different sector allocations than those in the Index; for example, certain sectors, such as Technology, Financials, Real Estate, Health Care and Utilities cumulatively represent more than 40% of the benchmark as of June 30th; in contrast, these sectors represent 10% of the Fund while Industrials, Retail, Energy, and other value-oriented sectors represent over 80% of Fund holdings. This variance from the benchmark can lead to Fund underperformance during periods, such as the recent period, when investors remain cautious.
What Helped/Hurt Performance2
The Fund's top contributors to returns during the first half of the year were Conn's, PVH, and Graco. Conn's, a specialty retailer, rose 51% as improved operating results underscored the company's turnaround. In particular, the company reported improved credit performance, higher finance charges, and lower borrowing costs. PVH, owner of Calvin Klein and Tommy Hilfiger, rose 27% on strong international sales for these flagship brands and an improving economic outlook in Europe. The Tommy Hilfiger brand is especially popular in both Europe and China. Graco, which manufactures equipment to dispense fluids and coatings for industrial applications, gained 33% as the company reported sales growth in every geographic region and business segment, and increased gross profit margins.
1 Annual turnover: 13% (2016); 25% (2015); 22% (2014); 15% (2013); and 24% (2012).
2 For detailed information on Fund holdings, please see the Fund's Schedule of Investments in this Report.
17
Pacific Advisors
Mid Cap Value Fund continued
The Fund's most significant detractors to returns were Helix Energy Solutions Group, Chicago Bridge & Iron, and Noble. Helix declined 36% as investor sentiment soured on the offshore oilfield services sector. The company, though, is advantageously positioned as the low-cost leader for well intervention projects; its specialized vessels can produce cost savings in excess of 30% compared to traditional drilling rigs. Chicago Bridge & Iron, an engineering and construction services firm, fell 37% following the disclosure of cost overruns on construction projects. The company continues to receive significant new business contracts, but shares will likely remain under pressure until resolution of the troubled projects. Noble, an offshore drilling contractor, lost 39% as investors discounted prospects for a recovery in offshore activity. Still, most deep-water projects are profitable at current oil prices; we believe, therefore, that the long-term strategies of major oil producers will likely include both shale oil and deepwater wells.
During the period, the Fund added new positions in Core Laboratories, TechnipFMC, and Monro Muffler Brake. Core Laboratories utilizes advanced technologies to help shale oil producers analyze and maximize profitability from oil wells. TechnipFMC manufactures equipment for, and provides engineering and construction services to, energy companies. The industry leader is well-positioned for the eventual recovery in onshore and offshore projects. Monro Muffler is the nation's largest chain store of automotive repair and tire services. The company is rapidly consolidating and should benefit from favorable trends including an increase in the average age of automobiles. The Fund liquidated holdings in GameStop, W.W. Grainger, and Stericycle to focus on companies with more immediate prospects for price appreciation.
Looking Ahead
The market momentum that drove performance in the second half of 2016 faltered in 2017 as investors reassessed their outlook for President Trump's pro-growth legislative agenda. Nevertheless, the global economy continues to grow and companies are reporting improving sales and earnings. The Fund, which is actively positioned in areas such as manufacturing, construction, and transportation, should benefit in the second half of the year as Fund holdings experience stronger demand for their goods and services. Oil prices, meanwhile, appear to have settled within a range of $40 to $60 per barrel; these levels should enable major oil and gas companies to move forward with operating and capital spending plans that were delayed during the energy downturn. During the first half of the year, investor sentiment focused primarily on technology and financial sectors; many of these stocks are now approaching, or above, fair value. We anticipate that Fund holdings which demonstrate improving financial results will attract the interest of investors search for new opportunities.
18
Expense Examples
As a shareholder of the Fund you incur two types of costs: (1) transaction costs, including sales charges (loads) on purchase payments, reinvested dividends, or other distributions; redemption fees; and exchange fees; and (2) ongoing costs, including management fees; distribution (12b-1) fees; and other Fund expenses. This Example is intended to help you understand your ongoing costs (in dollars) of investing in the Fund and to compare these costs with the ongoing costs of investing in other mutual funds.
The Example is based on an investment of $1,000 invested at the beginning of the period and held for the entire period from January 1, 2017 through June 30, 2017.
Actual Expenses
The first line of the table below provides information about actual account values and actual expenses. You may use the information in this line, together with the amount you invested, to estimate the expenses that you paid over the period. Simply divide your account value by $1,000 (for example, an $8,600 account value divided by $1,000 = 8.6), then multiply the result by the number in the first line under the heading entitled "Expenses Paid During the Period" to estimate the expenses you paid on your account during the period.
The following transaction costs are not included in the expenses shown in the table and, if applicable, would increase the expenses that you paid over the period: (1) a front-end sales charge (load) of 5.75% on Class A shares; (2) a 2% redemption fee if you sell or exchange shares within 180 days of purchase, with certain exceptions. The redemption fee does not apply to: (a) redemptions under an automatic withdrawal program or periodic asset reallocation plan, required minimum distributions (RMD), employer mandated distributions from a qualified plan, or redemptions under a qualified domestic relations order (QDRO); (b) redemptions to pay for expenses related to terminal illness, extended hospital or nursing home care, or other serious medical conditions, including death; (c) redemptions of shares acquired through dividend or capital gains reinvestments; (d) loans from a qualified plan account, and (e) redemptions initiated by the Fund; and (3) a $10 service fee on each exchange after the first five exchanges in each calendar year.
The following ongoing costs are not included in the expenses shown in the table and, if applicable, would increase the expenses that you paid over the period: (1) a $12 low balance fee on accounts with balances of less than $250 as of September 30th of each calendar year and no investment activity (excluding reinvestment of dividends and/or capital gains) during the prior calendar year or the first nine months of the current calendar year. This fee does not apply to IRAs, qualified plan accounts, or Coverdell Education Savings Accounts; (2) a $15 annual custodial fee on IRAs, SEPs, SIMPLE IRAs, and Coverdell Education Savings Accounts; and (3) a $20 annual custodial fee on 403(b) accounts.
Hypothetical Example for Comparison Purposes
The second line of the table below provides information about hypothetical account values and hypothetical expenses based on the Fund's actual expense ratio and an assumed rate of return of 5% per year before expenses, which in not the Fund's actual return. The hypothetical account values and expenses may not be used to estimate the actual ending account balance or expenses you paid for the period. You may use this information to compare the ongoing costs of investing in the Fund and other funds. To do so, compare this 5% hypothetical example with the 5% hypothetical examples that appear in the shareholder reports of the other funds.
The following transaction costs are not included in the expenses shown in the table and, if applicable, would increase the expenses that you paid over the period: (1) a front-end sales charge (load) of 5.75% on Class A shares; (2) a 2% redemption fee if you sell or exchange shares within 180 days of purchase, with certain exceptions. The redemption fee does not apply to: (a) redemptions under an automatic withdrawal program or periodic asset reallocation plan, required minimum distributions (RMD), employer mandated distributions from a qualified plan, or redemptions under a qualified domestic relations order (QDRO); (b) redemptions to pay for expenses related to terminal illness, extended hospital or nursing home care, or other serious medical conditions, including death; (c) redemptions of shares acquired through dividend or capital gains reinvestments; (d) loans from a qualified plan account, and (e) redemptions initiated by the Fund; and (3) a $10 service fee on each exchange after the first five exchanges in each calendar year.
The following ongoing costs are not included in the expenses shown in the table and, if applicable, would increase the expenses that you paid over the period: (1) a $12 low balance fee on accounts with balances of less than $250 as of September 30th of each calendar year and no investment activity (excluding reinvestment of dividends and/or capital gains) during the prior calendar year or the first nine months of the current calendar year. This fee does not apply to IRAs, qualified plan accounts, or Coverdell Education Savings Accounts; (2) a $15 annual custodial fee on IRAs, SEPs, SIMPLE IRAs, and Coverdell Education Savings Accounts; and (3) a $20 annual custodial fee on 403(b) accounts.
Please note that the expenses shown in the table are meant to highlight your ongoing costs only and do not reflect any transactional costs, such as sales charges (loads), redemption fees, or exchange fees. Therefore, the second line of the table is useful in comparing ongoing costs only, and will not help you determine the relative total costs of owning different funds. In addition, if these transactional costs were included, your costs would have been higher.
| Beginning Account Value 01/01/17 | Ending Account Value 06/30/17 | Expense Paid During Period 01/01/17 – 06/30/17 | |||||||||||||
Mid Cap Value Fund Class A | |||||||||||||||
Actual | $ | 1,000.00 | $ | 966.90 | $ | 23.60 | |||||||||
Hypothetical (5% return before expense) | $ | 1,000.00 | $ | 1,000.79 | $ | 24.01 | |||||||||
Mid Cap Value Fund Class C | |||||||||||||||
Actual | $ | 1,000.00 | $ | 963.50 | $ | 27.21 | |||||||||
Hypothetical (5% return before expense) | $ | 1,000.00 | $ | 997.07 | $ | 27.68 | |||||||||
3 Expenses are equal to the Fund's annualized expense ratio of 4.84% for Class A shares and 5.59% for Class C shares, multiplied by the average account value over the period, multiplied by 181/365 days to reflect the one-half year period.
19
Pacific Advisors
Small Cap Value Fund
Fund Objective: Capital appreciation through investment in small cap companies.
Investment Invests at least 80% of its assets in small cap companies which are, at the time of
Strategy: purchase, not greater than the highest market capitalization of companies within the Russell 2000® Index1. Generally invests a significant proportion of its assets in companies with market capitalizations that are, at the time of purchase, not greater than the highest market capitalization of companies in the Russell Microcap® Index1 (which are often referred to as "micro-cap" stocks).
Investor Profile: Aggressive. Opportunity-oriented with a long-term investment horizon.
Please see the Chairman's Letter for a detailed market and economic review
as well as the Manager's general market outlook.
Portfolio Holdings (As of 06/30/17 based on total investments)
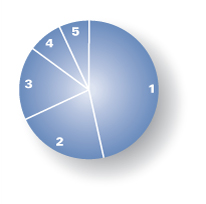
Equities | 100.00 | % | |||||||||
1. | Industrials | 46.52 | % | ||||||||
2. | Consumer Discretionary | 21.46 | % | ||||||||
3. | Energy | 17.12 | % | ||||||||
4. | Financials | 8.07 | % | ||||||||
5. | Consumer Staples | 6.82 | % | ||||||||
| Total Returns (For the six months ended 06/30/17) | |||||||
Class A | –5.25 | % | |||||
Class C | –5.61 | % | |||||
Class I | –5.16 | % | |||||
| |||||||
Russell 2000® Index | 4.99 | % | |||||
Current expense ratio: 4.06% (A); 4.81% (C); 3.84% (I). Prospectus expense ratio: 4.19% (A); 4.95% (C); 3.93% (I).2
Performance quoted is past performance which does not guarantee future results. Current performance may be higher or lower than the performance quoted. Call (800) 989-6693 for performance current to the most recent month-end. The investment return and principal value of an investment will fluctuate so that an investor's shares, when redeemed, may be worth more or less than their original cost. Returns represent the change in value over the stated period assuming reinvestment of dividends and capital gains at net asset value. Rankings shown are for Class A shares; rankings for other share classes may be different. Returns and rankings do not take into account the maximum 5.75% sales charge on Class A shares or the 1% Contingent Deferred Sales Charge (CDSC) for Class C shares sold within one year of purchase. Returns would be lower if the applicable sales charge and CDSC were included. Returns do not take into account individual taxes which may reduce actual returns when shares are sold. Small cap companies typically have fewer financial resources and may carry higher investment risks and experience greater stock price volatility than larger stocks.
1 The Russell 2000® Index is an unmanaged, market-weighted measure of the 2,000 smallest companies of the Russell 3000® Index which represents approximately 98% of the investable U.S. equity market. Index returns assume the reinvestment of dividends, but, unlike the Fund's returns, do not reflect management fees or expenses. The Russell Microcap® Index is an unmanaged, market capitalization weighted measure of the 1,000 smallest publicly traded companies within the Russell 2000® Index, plus the next smallest 1,000 U.S. based listed stocksIt is not possible to invest directly in either Index.
2 "Current" expense ratio is annualized for the year-to-date as of 06/30/17. "Prospectus" expense ratio is for the fiscal year ended 12/31/16.
20
Discussion with Portfolio Manager August 24, 2017
George A. Henning
Fund Strategy
The Fund employs a value-oriented approach to identify when high-quality, well-managed companies with attractive growth outlooks become undervalued. Periods of heightened market volatility often create opportunities to strategically invest in these companies for long-term appreciation. The Fund takes a business ownership view in seeking to identify stocks that are undervalued or temporarily out-of-favor and have a catalyst for multi-year growth. The Fund focuses on a limited number of small cap stocks (typically 25 to 50 holdings), including a significant number of micro-cap stocks which tend to attract limited analyst attention. Investing in small and micro-cap stocks may contribute to above-average volatility; yet, smaller, well-positioned companies can provide superior long-term results. Partly due to the strategic allocation to undervalued micro-cap stocks, the Fund's one-year beta1 was 1.42, as of June 30th, in comparison to the Russell 2000® Index.
Fund Performance
Class A shares declined 5.25% in the first half of 2017, compared to a 4.99% gain for the Russell 2000® Index. The Fund's strong 2016 performance (+27.08%) compared to the benchmark's gain of 21.31% carried over into the first part of the year. Then, as investors became concerned that the new administration's legislative action might be delayed, they shifted toward the market's more conservative sectors. This rotation significantly impacted performance since the Fund is underweighted in Financials, Health Care and Information Technology, three of the benchmark's four largest sectors. During the period, Health Care and Information Technology accounted for nearly 90% of the benchmark's return. The Fund's overweighted allocation to the Energy sector underperformed; holdings experienced significant selling pressure as oil prices re-entered a bear market. The Fund is positioned in favor of areas such as transportation, manufacturing, construction, and energy services that are directly tied to economic growth. Company fundamentals for many of the Fund's holdings in these sectors improved markedly during the period as industrial activity strengthened; despite these operating results, stock price performance remained lackluster.
What Helped/Hurt Performance2
The Fund's top contributors to returns during the first half of the year were Triton International, Conn's, and North American Energy Partners. Triton International, the world's largest intermodal container leasing company, rose 119% as operating results demonstrated the company's market-leading scale and cost structure. Increased shipping volumes and rising steel prices contributed to higher lease rates; management expects favorable market conditions to continue as the supply/demand balance for containers remains tight. Conn's, a specialty retailer, soared 51%; improved credit performance, a favorable rate for its latest securitization of credit receivables, and the introduction of a partnership offering a lease-to-own platform underscore the company's impressive turnaround. The results validated management's decision to slow new store growth while focusing on credit operations and maintaining retail profits. North American Energy Partners rose 15% as prospects for Canadian oil sands activity improved. In February, the civil and industrial contractor renewed a 5-year master services agreement with a major oil sands operator.
The Fund's most significant detractors to returns were Matrix Service, Team, and Hibbett Sports. Matrix, an industrial construction contractor, fell 59% after the company warned about losses on a large project that had experienced significant cost overruns. These episodes, while not unusual in the engineering
1 "Beta" measures volatility relative to the stock market or an alternative benchmark. A beta less than 1.0 indicates lower risk than the market or the benchmark and a beta greater than 1.0 indicates higher risk than the market or the benchmark.
2 For detailed information on Fund holdings, please see the Fund's Schedule of Investments in this Report.
21
Pacific Advisors
Small Cap Value Fund continued
and construction industry, can weigh on the share price until resolved. In July, the company announced an agreement with the customer that is not expected to negatively impact future earnings. Team, an industrial services provider, declined 40% as petrochemical and refinery customers continue to defer maintenance work. We believe, though, that the stock may rebound as oil prices stabilize; moreover, refinery maintenance schedules are often mandated by regulatory requirements. Hibbett, a sporting goods retailer focused on small town markets, dropped 44%. Sentiment soured as same store sales declined; also, Nike announced an agreement with Amazon which investors believed would hurt brick-and-mortar stores. Nike's strategy, though, by introducing a limited product line on Amazon, will minimize the risk of becoming overly reliant on one distributor while exerting greater control over online merchandizing. In July, Hibbett launched a fully-integrated e-commerce strategy to provide a seamless shipping experience.
During the period, the Fund trimmed holdings in Triton International, North American Energy Partners, East West Bancorp, and Rush Enterprises following significant price gains. The Fund's risk management process actively manages exposure to individual holdings as they approach our estimation of fair value. We believe that each of these companies maintains a favorable fundamental outlook; therefore, the Fund continues to hold the positions for long-term appreciation potential. During the period, the Fund liquidated its position in Morningstar, and did not initiate any new holdings; the Fund added to several existing holdings.
Looking Ahead
The Fund anticipates improved performance in the second half of 2017; the portfolio is well-positioned to benefit from ongoing economic growth, both in the U.S. and around the world. In particular, the recent rebound in industrial activity should support top and bottom line growth at companies such as Rush Enterprises, a commercial truck dealer; DXP Enterprises, a distributor of industrial parts and services; and Mobile Mini, a lessor of portable storage units often used for construction projects. Oil prices will continue to drive investor sentiment; here, market has begun to embrace a "new normal" of $40 to $60 per barrel; at these prices, companies have indicated that previously-shelved drilling programs can move forward; and, a recovery in offshore activity would likely spur a rally in such Energy holdings as Helix Energy Solutions, Parker Drilling, and Hornbeck Offshore Services. The favorable outlook for the Industrial and Energy sectors should have an outsized impact on the Fund, which is heavily weighted toward these areas.
As confidence in the economy improves, we expect that investors will acknowledge the opportunities in undervalued small cap stocks which historically outperform larger companies during periods of economic expansion.
22
Expense Examples
As a shareholder of the Fund you incur two types of costs: (1) transaction costs, including sales charges (loads) on purchase payments, reinvested dividends, or other distributions; redemption fees; and exchange fees; and (2) ongoing costs, including management fees; distribution (12b-1) fees; and other Fund expenses. This Example is intended to help you understand your ongoing costs (in dollars) of investing in the Fund and to compare these costs with the ongoing costs of investing in other mutual funds.
The Example is based on an investment of $1,000 invested at the beginning of the period and held for the entire period from January 1, 2017 through June 30, 2017.
Actual Expenses
The first line of the table below provides information about actual account values and actual expenses. You may use the information in this line, together with the amount you invested, to estimate the expenses that you paid over the period. Simply divide your account value by $1,000 (for example, an $8,600 account value divided by $1,000 = 8.6), then multiply the result by the number in the first line under the heading entitled "Expenses Paid During the Period" to estimate the expenses you paid on your account during the period.
The following transaction costs are not included in the expenses shown in the table and, if applicable, would increase the expenses that you paid over the period: (1) a front-end sales charge (load) of 5.75% on Class A shares; (2) a 2% redemption fee if you sell or exchange shares within 180 days of purchase, with certain exceptions. The redemption fee does not apply to: (a) redemptions under an automatic withdrawal program or periodic asset reallocation plan, required minimum distributions (RMD), employer mandated distributions from a qualified plan, or redemptions under a qualified domestic relations order (QDRO); (b) redemptions to pay for expenses related to terminal illness, extended hospital or nursing home care, or other serious medical conditions, including death; (c) redemptions of shares acquired through dividend or capital gains reinvestments; (d) loans from a qualified plan account, and (e) redemptions initiated by the Fund; and (3) a $10 service fee on each exchange after the first five exchanges in each calendar year.
The following ongoing costs are not included in the expenses shown in the table and, if applicable, would increase the expenses that you paid over the period: (1) a $12 low balance fee on accounts with balances of less than $250 as of September 30th of each calendar year and no investment activity (excluding reinvestment of dividends and/or capital gains) during the prior calendar year or the first nine months of the current calendar year. This fee does not apply to IRAs, qualified plan accounts, or Coverdell Education Savings Accounts; (2) a $15 annual custodial fee on IRAs, SEPs, SIMPLE IRAs, and Coverdell Education Savings Accounts; and (3) a $20 annual custodial fee on 403(b) accounts.
Hypothetical Example for Comparison Purposes
The second line of the table below provides information about hypothetical account values and hypothetical expenses based on the Fund's actual expense ratio and an assumed rate of return of 5% per year before expenses, which in not the Fund's actual return. The hypothetical account values and expenses may not be used to estimate the actual ending account balance or expenses you paid for the period. You may use this information to compare the ongoing costs of investing in the Fund and other funds. To do so, compare this 5% hypothetical example with the 5% hypothetical examples that appear in the shareholder reports of the other funds.
The following transaction costs are not included in the expenses shown in the table and, if applicable, would increase the expenses that you paid over the period: (1) a front-end sales charge (load) of 5.75% on Class A shares; (2) a 2% redemption fee if you sell or exchange shares within 180 days of purchase, with certain exceptions. The redemption fee does not apply to: (a) redemptions under an automatic withdrawal program or periodic asset reallocation plan, required minimum distributions (RMD), employer mandated distributions from a qualified plan, or redemptions under a qualified domestic relations order (QDRO); (b) redemptions to pay for expenses related to terminal illness, death, extended hospital or nursing home care, or other serious medical conditions; (c) redemptions of shares acquired through dividend or capital gains reinvestments; (d) loans from a qualified plan account; and (e) redemptions initiated by the Fund; and (3) a $10 service fee on each exchange after the first five exchanges in each calendar year.
The following ongoing costs are not included in the expenses shown in the table and, if applicable, would increase the expenses that you paid over the period: (1) a $12 low balance fee on accounts with balances of less than $250 as of September 30th of each calendar year and no investment activity (excluding reinvestment of dividends and/or capital gains) during the prior calendar year or the first nine months of the current calendar year. This fee does not apply to IRAs, qualified plan accounts, or Coverdell Education Savings Accounts; (2) a $15 annual custodial fee on IRAs, SEPs, SIMPLE IRAs, and Coverdell Education Savings Accounts; and (3) a $20 annual custodial fee on 403(b) accounts.
Please note that the expenses shown in the table are meant to highlight your ongoing costs only and do not reflect any transactional costs, such as sales charges (loads), redemption fees, or exchange fees. Therefore, the second line of the table is useful in comparing ongoing costs only, and will not help you determine the relative total costs of owning different funds. In addition, if these transactional costs were included, your costs would have been higher.
| Beginning Account Value 01/01/17 | Ending Account Value 06/30/17 | Expense Paid During Period 01/01/17 – 06/30/17 | |||||||||||||
Small Cap Value Class A | |||||||||||||||
Actual | $ | 1,000.00 | $ | 947.50 | $ | 19.60 | |||||||||
Hypothetical (5% return before expense) | $ | 1,000.00 | $ | 1,004.66 | $ | 20.18 | |||||||||
Small Cap Value Class C | |||||||||||||||
Actual | $ | 1,000.00 | $ | 943.90 | $ | 23.18 | |||||||||
Hypothetical (5% return before expense) | $ | 1,000.00 | $ | 1,000.94 | $ | 23.86 | |||||||||
Small Cap Value Class I | |||||||||||||||
Actual | $ | 1,000.00 | $ | 948.40 | $ | 18.55 | |||||||||
Hypothetical (5% return before expense) | $ | 1,000.00 | $ | 1,005.75 | $ | 19.10 | |||||||||
3 Expenses are equal to the Fund's annualized expense ratio of 4.06% for Class A shares, 4.81% for Class C shares and 3.84% for Class I shares, multiplied by the average account value over the period, multiplied by 181/365 days to reflect the one-half year period.
23

Pacific Advisors Fund Inc.
Financial Statements
24
Pacific Advisors Income & Equity Fund
Schedule of Investments (Unaudited)
as of June 30, 2017
| Quantity or Principal** | Description | Current $ Value** | % of Total Net Assets | ||||||||||||
COMMON STOCK | |||||||||||||||
CONSUMER DISCRETIONARY | 5.18 | ||||||||||||||
DISTRIBUTORS | |||||||||||||||
1,750 | GENUINE PARTS CO. | 162,330 | |||||||||||||
162,330 | 0.97 | ||||||||||||||
MEDIA | |||||||||||||||
2,500 | OMNICOM GROUP INC. | 207,250 | |||||||||||||
207,250 | 1.24 | ||||||||||||||
MULTILINE RETAIL | |||||||||||||||
5,000 | TARGET CORP. | 261,450 | |||||||||||||
261,450 | 1.56 | ||||||||||||||
TEXTILES, APPAREL & LUXURY GOODS | |||||||||||||||
5,000 | COACH, INC. | 236,700 | |||||||||||||
236,700 | 1.41 | ||||||||||||||
CONSUMER STAPLES | 7.31 | ||||||||||||||
BEVERAGES | |||||||||||||||
4,000 | COCA-COLA CO. | 179,400 | |||||||||||||
179,400 | 1.07 | ||||||||||||||
FOOD & STAPLES RETAILING | |||||||||||||||
3,000 | CVS HEALTH CORP. | 241,380 | |||||||||||||
4,000 | SYSCO CORP. | 201,320 | |||||||||||||
9,000 | THE KROGER CO. | 209,880 | |||||||||||||
3,000 | WAL-MART STORES INC. | 227,040 | |||||||||||||
879,620 | 5.25 | ||||||||||||||
HOUSEHOLD PRODUCTS | |||||||||||||||
1,900 | PROCTER & GAMBLE CO. | 165,585 | |||||||||||||
165,585 | 0.99 | ||||||||||||||
ENERGY | 2.82 | ||||||||||||||
ENERGY EQUIPMENT & SERVICES | |||||||||||||||
3,500 | SCHLUMBERGER LTD | 230,440 | |||||||||||||
230,440 | 1.37 | ||||||||||||||
OIL, GAS & CONSUMABLE FUELS | |||||||||||||||
3,000 | EXXON MOBIL CORP. | 242,190 | |||||||||||||
242,190 | 1.45 | ||||||||||||||
See Accompanying Notes to Financial Statements which are an integral part of these financial statements.
25
Pacific Advisors Income & Equity Fund
Schedule of Investments (Unaudited)
as of June 30, 2017
| Quantity or Principal** | Description | Current $ Value** | % of Total Net Assets | ||||||||||||
COMMON STOCK continued | |||||||||||||||
FINANCIALS | 5.31 | ||||||||||||||
BANKS | |||||||||||||||
4,500 | U.S. BANCORP | 233,640 | |||||||||||||
4,000 | WELLS FARGO & CO. | 221,640 | |||||||||||||
455,280 | 2.72 | ||||||||||||||
CAPITAL MARKETS | |||||||||||||||
2,500 | T. ROWE PRICE GROUP INC. | 185,525 | |||||||||||||
185,525 | 1.11 | ||||||||||||||
INSURANCE | |||||||||||||||
4,500 | METLIFE INC. | 247,230 | |||||||||||||
247,230 | 1.48 | ||||||||||||||
HEALTH CARE | 5.01 | ||||||||||||||
BIOTECHNOLOGY | |||||||||||||||
4,000 | ABBVIE INC. | 290,040 | |||||||||||||
290,040 | 1.73 | ||||||||||||||
PHARMACEUTICALS | |||||||||||||||
2,000 | JOHNSON & JOHNSON | 264,580 | |||||||||||||
8,500 | PFIZER INC. | 285,515 | |||||||||||||
550,095 | 3.28 | ||||||||||||||
INDUSTRIALS | 6.80 | ||||||||||||||
AIR FREIGHT & LOGISTICS | |||||||||||||||
2,250 | UNITED PARCEL SERVICE, INC. B | 248,828 | |||||||||||||
248,828 | 1.48 | ||||||||||||||
COMMERCIAL SERVICES & SUPPLIES | |||||||||||||||
2,000 | WASTE MANAGEMENT INC. | 146,700 | |||||||||||||
146,700 | 0.88 | ||||||||||||||
INDUSTRIAL CONGLOMERATES | |||||||||||||||
8,000 | GENERAL ELECTRIC CO. | 216,080 | |||||||||||||
2,000 | HONEYWELL INT'L INC. | 266,580 | |||||||||||||
482,660 | 2.88 | ||||||||||||||
TRADING COMPANIES & DISTRIBUTORS | |||||||||||||||
6,000 | FASTENAL COMPANY | 261,180 | |||||||||||||
261,180 | 1.56 | ||||||||||||||
See Accompanying Notes to Financial Statements which are an integral part of these financial statements.
26
Pacific Advisors Income & Equity Fund
Schedule of Investments (Unaudited)
as of June 30, 2017
| Quantity or Principal** | Description | Current $ Value** | % of Total Net Assets | ||||||||||||
COMMON STOCK continued | |||||||||||||||
INFORMATION TECHNOLOGY | 5.72 | ||||||||||||||
COMMUNICATIONS EQUIPMENT | |||||||||||||||
8,000 | CISCO SYSTEMS INC. | 250,400 | |||||||||||||
250,400 | 1.49 | ||||||||||||||
IT SERVICES | |||||||||||||||
1,500 | INT'L BUSINESS MACHINES CORP. | 230,745 | |||||||||||||
230,745 | 1.38 | ||||||||||||||
SEMICONDUCTORS & EQUIPMENT | |||||||||||||||
7,000 | INTEL CORP. | 236,180 | |||||||||||||
236,180 | 1.41 | ||||||||||||||
SOFTWARE | |||||||||||||||
3,500 | MICROSOFT CORP. | 241,255 | |||||||||||||
241,255 | 1.44 | ||||||||||||||
MATERIALS | 2.56 | ||||||||||||||
CHEMICALS | |||||||||||||||
2,500 | DUPONT DE NEMOURS & CO. | 201,775 | |||||||||||||
201,775 | 1.21 | ||||||||||||||
CONTAINERS & PACKAGING | |||||||||||||||
4,000 | INTERNATIONAL PAPER COMPANY | 226,440 | |||||||||||||
226,440 | 1.35 | ||||||||||||||
TELECOMMUNICATION SERVICES | 2.95 | ||||||||||||||
DIVERSIFIED TELECOM. SERVICES | |||||||||||||||
6,000 | AT&T INC. | 226,380 | |||||||||||||
6,000 | VERIZON COMMUNICATIONS INC. | 267,960 | |||||||||||||
494,340 | 2.95 | ||||||||||||||
UTILITIES | 4.15 | ||||||||||||||
ELECTRIC UTILITIES | |||||||||||||||
2,500 | DUKE ENERGY CORP. | 208,975 | |||||||||||||
3,500 | XCEL ENERGY INC. | 160,580 | |||||||||||||
369,555 | 2.21 | ||||||||||||||
MULTI-UTILITIES | |||||||||||||||
2,000 | DOMINION ENERGY INC. | 153,260 | |||||||||||||
4,000 | PUBLIC SERVICE ENTERPRISE GROUP INC. | 172,040 | |||||||||||||
325,300 | 1.94 | ||||||||||||||
TOTAL COMMON STOCK (Cost: $6,023,277) | 8,008,493 | 47.81 | |||||||||||||
See Accompanying Notes to Financial Statements which are an integral part of these financial statements.
27
Pacific Advisors Income & Equity Fund
Schedule of Investments (Unaudited)
as of June 30, 2017
| Quantity or Principal** | Description | Current $ Value** | % of Total Net Assets | ||||||||||||
CORPORATE BOND | |||||||||||||||
CONSUMER DISCRETIONARY | 7.06 | ||||||||||||||
AUTO COMPONENTS | |||||||||||||||
150,000 | LEAR CORP. 4.75% 01/15/23 | 155,196 | |||||||||||||
155,196 | 0.93 | ||||||||||||||
AUTOMOBILES | |||||||||||||||
130,000 | GENERAL MOTORS FINL CO. 4.75% 08/15/17 | 130,443 | |||||||||||||
130,443 | 0.78 | ||||||||||||||
DIVERSIFIED CONSUMER SERVICES | |||||||||||||||
150,000 | BLOCK FINANCIAL LLC 4.125% 10/01/20 | 154,815 | |||||||||||||
154,815 | 0.92 | ||||||||||||||
HOTELS, RESTAURANTS & LEISURE | |||||||||||||||
100,000 | INTL GAME TECHNOLOGY 7.50% 06/15/19 | 109,750 | |||||||||||||
150,000 | YUM! BRANDS INC. 5.30% 09/15/19 | 158,250 | |||||||||||||
268,000 | 1.60 | ||||||||||||||
HOUSEHOLD DURABLES | |||||||||||||||
150,000 | TUPPERWARE BRANDS CORP. 4.75% 06/01/21 | 159,941 | |||||||||||||
159,941 | 0.96 | ||||||||||||||
INTERNET & CATALOG RETAIL | |||||||||||||||
150,000 | EXPEDIA INC. 5.95% 08/15/20 | 163,919 | |||||||||||||
163,919 | 0.98 | ||||||||||||||
MULTILINE RETAIL | |||||||||||||||
150,000 | MACYS RETAIL 3.45% 01/15/21 | 149,578 | |||||||||||||
149,578 | 0.89 | ||||||||||||||
CONSUMER STAPLES | 0.91 | ||||||||||||||
FOOD & STAPLES RETAILING | |||||||||||||||
150,000 | DELHAIZE GROUP SA 4.125% 04/10/19 | 152,864 | |||||||||||||
152,864 | 0.91 | ||||||||||||||
ENERGY | 3.69 | ||||||||||||||
ENERGY EQUIPMENT & SERVICES | |||||||||||||||
100,000 | PRIDE INTERNATIONAL INC. 6.875% 08/15/20 | 102,500 | |||||||||||||
150,000 | ROWAN COMPANY INC. 7.875% 08/01/19 | 156,750 | |||||||||||||
150,000 | SESI LLC 6.375% 05/01/19 | 148,125 | |||||||||||||
100,000 | WEATHERFORD BERMUDA 6.00% 03/15/18 | 100,750 | |||||||||||||
508,125 | 3.03 | ||||||||||||||
OIL, GAS & CONSUMABLE FUELS | |||||||||||||||
100,000 | ENERGY TRANSFER PARTNERS 9.00% 04/15/19 | 111,207 | |||||||||||||
111,207 | 0.66 | ||||||||||||||
See Accompanying Notes to Financial Statements which are an integral part of these financial statements.
28
Pacific Advisors Income & Equity Fund
Schedule of Investments (Unaudited)
as of June 30, 2017
| Quantity or Principal** | Description | Current $ Value** | % of Total Net Assets | ||||||||||||
CORPORATE BOND continued | |||||||||||||||
FINANCIALS | 16.06 | ||||||||||||||
BANKS | |||||||||||||||
100,000 | BANK OF AMERICA CORP. 4.881% 03/19/20 FLOAT | 104,250 | |||||||||||||
100,000 | BANK OF AMERICA CORP. 3.055% 09/28/20 FLOAT | 100,229 | |||||||||||||
122,000 | BANK OF AMERICA CORP. 4.131% 07/07/21 FLOAT | 123,354 | |||||||||||||
150,000 | BARCLAY BANK PLC 2.658% 04/18/21 FLOAT | 146,850 | |||||||||||||
125,000 | JPMORGAN CHASE & CO. 4.200% 02/25/21 FLOAT | 123,950 | |||||||||||||
94,000 | FULTON FINANCIAL CORP. 3.60% 03/16/22 | 95,110 | |||||||||||||
693,743.00 | 4.14 | ||||||||||||||
CAPITAL MARKETS | |||||||||||||||
150,000 | ARES CAPITAL CORP. 4.875% 11/30/18 | 155,246 | |||||||||||||
150,000 | BGC PARTNERS INC. 5.375% 12/09/19 | 157,985 | |||||||||||||
250,000 | E*TRADE FINANCIAL CORP. 5.375% 11/15/22 | 262,801 | |||||||||||||
100,000 | FIFTH STREET FINANCE CORP. 4.875% 03/01/19 | 100,090 | |||||||||||||
100,000 | GOLDMAN SACHS GROUP INC. 2.598% 08/26/20 FLOAT | 99,943 | |||||||||||||
100,000 | MORGAN STANLEY 3.796% 09/30/17 FLOAT | 100,428 | |||||||||||||
100,000 | MORGAN STANLEY 4.67% 10/27/18 FLOAT | 101,500 | |||||||||||||
100,000 | MORGAN STANLEY 4.381% 04/25/23 FLOAT | 103,250 | |||||||||||||
100,000 | MORGAN STANLEY 3.581% 10/28/24 FLOAT | 93,250 | |||||||||||||
100,000 | NASDAQ OMX GROUP 5.55% 01/15/20 | 108,082 | |||||||||||||
100,000 | PROSPECT CAPITAL CORP. 5.00% 07/15/19 | 102,167 | |||||||||||||
150,000 | STIFEL FINANCIAL CORP. 3.50% 12/01/20 | 153,071 | |||||||||||||
1,537,813 | 9.18 | ||||||||||||||
DIVERSIFIED FINANCIAL SERVICES | |||||||||||||||
100,000 | ICAHN ENTERPRISES 6.00% 08/01/20 | 102,938 | |||||||||||||
100,000 | JEFFERIES GROUP INC. 5.125% 04/13/18 | 102,572 | |||||||||||||
150,000 | JEFFERIES GROUP LLC 3.00% STEP-UP 07/27/22 | 149,347 | |||||||||||||
354,857.00 | 2.12 | ||||||||||||||
INSURANCE | |||||||||||||||
100,000 | PRUDENTIAL FINANCIAL INC. 4.381% 11/02/20 FLOAT | 103,100 | |||||||||||||
103,100 | 0.62 | ||||||||||||||
HEALTH CARE | 1.51 | ||||||||||||||
BIOTECHNOLOGY | |||||||||||||||
114,000 | BAXALTA INC. 3.60% 06/23/22 | 118,051 | |||||||||||||
118,051 | 0.71 | ||||||||||||||
PHARMACEUTICALS | |||||||||||||||
130,000 | ZOETIS INC. 3.45% 11/13/20 | 134,443 | |||||||||||||
134,443 | 0.80 | ||||||||||||||
See Accompanying Notes to Financial Statements which are an integral part of these financial statements.
29
Pacific Advisors Income & Equity Fund
Schedule of Investments (Unaudited)
as of June 30, 2017
| Quantity or Principal** | Description | Current $ Value** | % of Total Net Assets | ||||||||||||
CORPORATE BOND continued | |||||||||||||||
INDUSTRIALS | 7.51 | ||||||||||||||
AEROSPACE & DEFENSE | |||||||||||||||
150,000 | L-3 COMMUNICATIONS CORP. 5.20% 10/15/19 | 160,126 | |||||||||||||
150,000 | SPIRIT AEROSYSTEMS INC. 5.25% 03/15/22 | 155,641 | |||||||||||||
315,767 | 1.89 | ||||||||||||||
BUILDING PRODUCTS | |||||||||||||||
115,000 | OWENS CORNING INC. 9.00% 06/15/19 | 129,011 | |||||||||||||
129,011 | 0.77 | ||||||||||||||
MACHINERY | |||||||||||||||
150,000 | AGCO CORP. 5.875% 12/01/21 | 164,622 | |||||||||||||
150,000 | HILLENBRAND INC. 5.50% 07/15/20 | 159,807 | |||||||||||||
324,429 | 1.94 | ||||||||||||||
PROFESSIONAL SERVICES | |||||||||||||||
150,000 | DUN & BRADSTREET CORP. 4.25% 06/15/20 | 154,563 | |||||||||||||
154,563 | 0.92 | ||||||||||||||
TRADING COMPANIES & DISTRIBUTORS | |||||||||||||||
150,000 | GATX CORP. 2.60% 03/30/20 | 151,553 | |||||||||||||
170,000 | INTL LEASE FINANCE CORP. 4.625% 04/15/21 | 180,939 | |||||||||||||
332,492 | 1.99 | ||||||||||||||
INFORMATION TECHNOLOGY | 4.28 | ||||||||||||||
ELECTRONIC EQUIPMENT & INSTRUMENTS | |||||||||||||||
100,000 | INGRAM MICRO INC. 5.25% 09/01/17 | 100,427 | |||||||||||||
150,000 | KEYSIGHT TECHNOLOGIES 3.30% 10/30/19 | 152,790 | |||||||||||||
150,000 | TECH DATA CORP. 3.70% 02/15/22 | 153,062 | |||||||||||||
406,279 | 2.42 | ||||||||||||||
IT SERVICES | |||||||||||||||
150,000 | FIDELITY NATIONAL INFORMATION 3.625% 10/15/20 | 157,131 | |||||||||||||
157,131 | 0.94 | ||||||||||||||
SEMICONDUCTORS & EQUIPMENT | |||||||||||||||
150,000 | QUALCOMM INC. 3.00% 05/20/22 | 153,830 | |||||||||||||
153,830 | 0.92 | ||||||||||||||
MATERIALS | 1.33 | ||||||||||||||
CHEMICALS | |||||||||||||||
112,000 | CF INDUSTRIES INC. 6.875% 05/01/18 | 116,340 | |||||||||||||
116,340 | 0.70 | ||||||||||||||
See Accompanying Notes to Financial Statements which are an integral part of these financial statements.
30
Pacific Advisors Income & Equity Fund
Schedule of Investments (Unaudited)
as of June 30, 2017
| Quantity or Principal** | Description | Current $ Value** | % of Total Net Assets | ||||||||||||
CORPORATE BOND continued | |||||||||||||||
METALS & MINING | |||||||||||||||
100,000 | COMMERCIAL METALS CO. 7.35% 08/15/18 | 105,875 | |||||||||||||
105,875 | 0.63 | ||||||||||||||
REAL ESTATE | 4.35 | ||||||||||||||
HEALTH CARE REITS | |||||||||||||||
150,000 | OMEGA HEALTHCARE INVESTORS 4.375% 08/01/23 | 153,818 | |||||||||||||
153,818 | 0.92 | ||||||||||||||
HOTEL & RESORT REITS | |||||||||||||||
105,000 | HOSPITALITY PROP TRUST 6.70% 01/15/18 | 105,441 | |||||||||||||
105,441 | 0.63 | ||||||||||||||
OFFICE REITS | |||||||||||||||
150,000 | CORPORATE OFFICE PROP 3.60% 05/15/23 | 149,071 | |||||||||||||
160,000 | SL GREEN REALTY CORP. 4.50% 12/01/22 | 164,780 | |||||||||||||
313,851 | 1.87 | ||||||||||||||
REAL ESTATE SERVICES | |||||||||||||||
150,000 | CBRE SERVICES INC. 5.00% 03/15/23 | 156,279 | |||||||||||||
156,279 | 0.93 | ||||||||||||||
UTILITIES | 0.60 | ||||||||||||||
ELECTRIC UTILITIES | |||||||||||||||
100,000 | PPL ENERGY SUPPLY LLC 6.50% 05/01/18 | 101,000 | |||||||||||||
101,000 | 0.60 | ||||||||||||||
TOTAL CORPORATE BOND (Cost: $7,853,536) | 7,922,200 | 47.30 | |||||||||||||
PREFERRED STOCK | |||||||||||||||
FINANCIALS | 4.34 | ||||||||||||||
BANKS | |||||||||||||||
100,000 | JPMORGAN CHASE & CO. 5.30% PFD FIX-FLOAT*** | 104,125 | |||||||||||||
100,000 | JPMORGAN CHASE & CO. 5.00% PFD FIX-FLOAT*** | 102,250 | |||||||||||||
150,000 | WELLS FARGO & CO. 7.98% PFD FIX-FLOAT*** | 155,812 | |||||||||||||
362,187 | 2.16 | ||||||||||||||
CAPITAL MARKETS | |||||||||||||||
150,000 | BANK OF NY MELLON 4.95% PFD FIX-FLOAT*** | 156,450 | |||||||||||||
156,450 | 0.94 | ||||||||||||||
See Accompanying Notes to Financial Statements which are an integral part of these financial statements.
31
Pacific Advisors Income & Equity Fund
Schedule of Investments (Unaudited)
as of June 30, 2017
| Quantity or Principal** | Description | Current $ Value** | % of Total Net Assets | ||||||||||||
PREFERRED STOCK continued | |||||||||||||||
INSURANCE | |||||||||||||||
200,000 | METLIFE INC. 5.25% PFD FIX-FLOAT*** | 207,644 | |||||||||||||
207,644 | 1.24 | ||||||||||||||
TOTAL PREFERRED STOCK (Cost: $700,321) | 726,281 | 4.34 | |||||||||||||
TOTAL INVESTMENT IN SECURITIES (Cost: $14,577,134) | 16,656,974 | 99.45 | |||||||||||||
OTHER ASSETS LESS LIABILITIES | 92,526 | 0.55 | |||||||||||||
TOTAL NET ASSETS | 16,749,500 | 100.00 | |||||||||||||
* Non-income producing
** The principal amount and value are stated in U.S. dollars unless otherwise indicated.
*** These securities' coupon rates and/or dividends are fixed for a certain period and then convert to floating rates.
See Accompanying Notes to Financial Statements which are an integral part of these financial statements.
32
Pacific Advisors Balanced Fund
Schedule of Investments (Unaudited)
as of June 30, 2017
| Quantity or Principal** | Description | Current $ Value** | % of Total Net Assets | ||||||||||||
COMMON STOCK | |||||||||||||||
CONSUMER DISCRETIONARY | 13.21 | ||||||||||||||
MEDIA | |||||||||||||||
1,235 | WALT DISNEY CO. | 131,219 | |||||||||||||
131,219 | 2.31 | ||||||||||||||
SPECIALTY RETAIL | |||||||||||||||
10,000 | CONN'S INC.* | 191,000 | |||||||||||||
600 | O'REILLY AUTOMOTIVE INC.* | 131,244 | |||||||||||||
2,500 | TRACTOR SUPPLY COMPANY | 135,525 | |||||||||||||
457,769 | 8.05 | ||||||||||||||
TEXTILES, APPAREL & LUXURY GOODS | |||||||||||||||
2,750 | NIKE INC. | 162,250 | |||||||||||||
162,250 | 2.85 | ||||||||||||||
CONSUMER STAPLES | 3.87 | ||||||||||||||
FOOD & STAPLES RETAILING | |||||||||||||||
7,500 | CHEFS' WAREHOUSE INC.* | 97,500 | |||||||||||||
1,400 | PRICESMART, INC. | 122,640 | |||||||||||||
220,140 | 3.87 | ||||||||||||||
ENERGY | 4.81 | ||||||||||||||
ENERGY EQUIPMENT & SERVICES | |||||||||||||||
900 | CORE LABORATORIES N.V. | 91,143 | |||||||||||||
15,000 | HORNBECK OFFSHORE SERVICES INC.* | 42,450 | |||||||||||||
15,000 | NOBLE CORPORATION | 54,300 | |||||||||||||
1,300 | SCHLUMBERGER LTD | 85,592 | |||||||||||||
273,485 | 4.81 | ||||||||||||||
FINANCIALS | 12.30 | ||||||||||||||
BANKS | |||||||||||||||
1,750 | EAST WEST BANCORP INC. | 102,515 | |||||||||||||
1,000 | SIGNATURE BANK* | 143,530 | |||||||||||||
246,045 | 4.33 | ||||||||||||||
CAPITAL MARKETS | |||||||||||||||
850 | FACTSET RESEARCH SYSTEMS INC. | 141,253 | |||||||||||||
500 | MARKETAXESS HOLDINGS INC. | 100,550 | |||||||||||||
1,500 | MORNINGSTAR, INC. | 117,510 | |||||||||||||
1,750 | SEI INVESTMENTS COMPANY | 94,115 | |||||||||||||
453,428 | 7.97 | ||||||||||||||
See Accompanying Notes to Financial Statements which are an integral part of these financial statements.
33
Pacific Advisors Balanced Fund
Schedule of Investments (Unaudited)
as of June 30, 2017
| Quantity or Principal** | Description | Current $ Value** | % of Total Net Assets | ||||||||||||
COMMON STOCK continued | |||||||||||||||
HEALTH CARE | 7.18 | ||||||||||||||
HEALTH CARE TECHNOLOGY | |||||||||||||||
2,000 | CERNER CORPORATION* | 132,940 | |||||||||||||
132,940 | 2.34 | ||||||||||||||
HEALTH CARE PROVIDERS & SERVICES | |||||||||||||||
500 | HENRY SCHEIN INC.* | 91,510 | |||||||||||||
91,510 | 1.61 | ||||||||||||||
HEALTH CARE EQUIPMENT & SUPPLIES | |||||||||||||||
500 | IDEXX LABORATORIES, INC.* | 80,710 | |||||||||||||
80,710 | 1.42 | ||||||||||||||
PHARMACEUTICALS | |||||||||||||||
1,650 | ZOETIS, INC. | 102,927 | |||||||||||||
102,927 | 1.81 | ||||||||||||||
INDUSTRIALS | 14.46 | ||||||||||||||
AIRLINES | |||||||||||||||
2,500 | SPIRIT AIRLINES INC.* | 129,125 | |||||||||||||
129,125 | 2.27 | ||||||||||||||
COMMERCIAL SERVICES & SUPPLIES | |||||||||||||||
3,500 | HEALTHCARE SERVICES GROUP, INC. | 163,905 | |||||||||||||
5,500 | TEAM INC.* | 128,975 | |||||||||||||
292,880 | 5.15 | ||||||||||||||
MACHINERY | |||||||||||||||
1,500 | WABTEC CORP. | 137,250 | |||||||||||||
137,250 | 2.41 | ||||||||||||||
PROFESSIONAL SERVICES | |||||||||||||||
700 | EQUIFAX INC. | 96,194 | |||||||||||||
96,194 | 1.69 | ||||||||||||||
TRADING COMPANIES & DISTRIBUTORS | |||||||||||||||
5,000 | TRITON INTERNATIONAL LIMITED | 167,200 | |||||||||||||
167,200 | 2.94 | ||||||||||||||
INFORMATION TECHNOLOGY | 13.12 | ||||||||||||||
INTERNET SOFTWARE & SERVICES | |||||||||||||||
175 | ALPHABET INC.* | 162,694 | |||||||||||||
1,150 | FACEBOOK, INC.* | 173,627 | |||||||||||||
2,000 | SHUTTERSTOCK, INC.* | 88,160 | |||||||||||||
424,481 | 7.46 | ||||||||||||||
See Accompanying Notes to Financial Statements which are an integral part of these financial statements.
34
Pacific Advisors Balanced Fund
Schedule of Investments (Unaudited)
as of June 30, 2017
| Quantity or Principal** | Description | Current $ Value** | % of Total Net Assets | ||||||||||||
COMMON STOCK continued | |||||||||||||||
IT SERVICES | |||||||||||||||
1,315 | ACCENTURE PLC | 162,639 | |||||||||||||
1,700 | VISA INC. | 159,426 | |||||||||||||
322,065 | 5.66 | ||||||||||||||
TELECOMMUNICATION SERVICES | 1.57 | ||||||||||||||
DIVERSIFIED TELECOM. SERVICES | |||||||||||||||
2,000 | VERIZON COMMUNICATIONS INC. | 89,320 | |||||||||||||
89,320 | 1.57 | ||||||||||||||
TOTAL COMMON STOCK (Cost: $3,670,467) | 4,010,938 | 70.52 | |||||||||||||
CORPORATE BOND | |||||||||||||||
CONSUMER DISCRETIONARY | 1.88 | ||||||||||||||
DIVERSIFIED CONSUMER SERVICES | |||||||||||||||
100,000 | WASHINGTON POST CO. 7.25% 02/01/19 | 106,875 | |||||||||||||
106,875 | 1.88 | ||||||||||||||
ENERGY | 11.03 | ||||||||||||||
ENERGY EQUIPMENT & SERVICES | |||||||||||||||
105,000 | NOBLE HOLDING INTL LTD 5.75% 03/16/18 FLOAT | 105,636 | |||||||||||||
100,000 | PRIDE INTERNATIONAL INC. 8.50% 06/15/19 | 106,000 | |||||||||||||
100,000 | ROWAN COMPANY INC. 7.875% 08/01/19 | 104,500 | |||||||||||||
100,000 | SEACOR HOLDING 7.375% 10/01/19 | 101,000 | |||||||||||||
100,000 | SESI LLC 6.375% 05/01/19 | 98,750 | |||||||||||||
515,886 | 9.07 | ||||||||||||||
OIL, GAS & CONSUMABLE FUELS | |||||||||||||||
100,000 | ENERGY TRANSFER PARTNERS 9.00% 04/15/19 | 111,207 | |||||||||||||
111,207 | 1.96 | ||||||||||||||
FINANCIALS | 5.32 | ||||||||||||||
BANKS | |||||||||||||||
100,000 | BANK OF AMERICA 2.922% 07/28/17 FLOAT | 100,043 | |||||||||||||
100,043 | 1.76 | ||||||||||||||
DIVERSIFIED FINANCIAL SERVICES | |||||||||||||||
100,000 | ICAHN ENTERPRISES 6.00% 08/01/20 | 102,938 | |||||||||||||
100,000 | JEFFERIES GROUP LLC 3.00% STEP-UP 07/27/22 | 99,564 | |||||||||||||
202,502 | 3.56 | ||||||||||||||
See Accompanying Notes to Financial Statements which are an integral part of these financial statements.
35
Pacific Advisors Balanced Fund
Schedule of Investments (Unaudited)
as of June 30, 2017
| Quantity or Principal** | Description | Current $ Value** | % of Total Net Assets | ||||||||||||
CORPORATE BOND continued | |||||||||||||||
HEALTH CARE | 1.76 | ||||||||||||||
HEALTH CARE PROVIDERS & SERVICES | |||||||||||||||
100,000 | FRESENIUS MED CARE US 6.875% 07/15/17 | 100,160 | |||||||||||||
100,160 | 1.76 | ||||||||||||||
INFORMATION TECHNOLOGY | 3.42 | ||||||||||||||
INTERNET SOFTWARE & SERVICES | |||||||||||||||
82,000 | IAC/INTERACTIVECORP 4.875% 11/30/18 | 82,738 | |||||||||||||
82,738 | 1.45 | ||||||||||||||
SEMICONDUCTORS & EQUIPMENT | |||||||||||||||
100,000 | MICRON TECHNOLOGY INC. 7.50% 09/15/23 | 111,800 | |||||||||||||
111,800 | 1.97 | ||||||||||||||
MATERIALS | 1.86 | ||||||||||||||
METALS & MINING | |||||||||||||||
100,000 | COMMERCIAL METALS CO. 7.35% 08/15/18 | 105,875 | |||||||||||||
105,875 | 1.86 | ||||||||||||||
REAL ESTATE | 1.99 | ||||||||||||||
SPECIALIZED REITS | |||||||||||||||
100,000 | EPR PROPERTIES 7.75% 07/15/20 | 113,388 | |||||||||||||
113,388 | 1.99 | ||||||||||||||
TOTAL CORPORATE BOND (Cost: $1,546,486) | 1,550,474 | 27.26 | |||||||||||||
PREFERRED STOCK | |||||||||||||||
FINANCIALS | 1.82 | ||||||||||||||
CAPITAL MARKETS | |||||||||||||||
100,000 | MORGAN STANLEY 5.45% PFD FIX -FLOAT*** | 103,550 | |||||||||||||
103,550 | 1.82 | ||||||||||||||
TOTAL PREFERRED STOCK (Cost: $99,875.00) | 103,550 | 1.82 | |||||||||||||
TOTAL INVESTMENT IN SECURITIES (Cost: $5,316,828) | 5,664,962 | 99.60 | |||||||||||||
OTHER ASSETS LESS LIABILITIES | 22,878 | 0.40 | |||||||||||||
TOTAL NET ASSETS | 5,687,840 | 100.00 | |||||||||||||
* Non-income producing
** The principal amount and value are stated in U.S. dollars unless otherwise indicated.
*** These securities' coupon rates and/or dividends are fixed for a certain period and then convert to floating rates.
See Accompanying Notes to Financial Statements which are an integral part of these financial statements.
36
Pacific Advisors Large Cap Value Fund
Schedule of Investments (Unaudited)
as of June 30, 2017
| Quantity or Principal** | Description | Current $ Value** | % of Total Net Assets | ||||||||||||
COMMON STOCK | |||||||||||||||
CONSUMER DISCRETIONARY | 19.38 | ||||||||||||||
HOTELS, RESTAURANTS & LEISURE | |||||||||||||||
2,000 | MCDONALD'S CORP. | 306,320 | |||||||||||||
306,320 | 3.81 | ||||||||||||||
MEDIA | |||||||||||||||
3,175 | TIME WARNER INC. | 318,802 | |||||||||||||
3,100 | WALT DISNEY CO. | 329,375 | |||||||||||||
648,177 | 8.06 | ||||||||||||||
SPECIALTY RETAIL | |||||||||||||||
3,750 | LOWE'S COMPANIES INC. | 290,738 | |||||||||||||
2,040 | THE HOME DEPOT, INC. | 312,936 | |||||||||||||
603,674 | 7.51 | ||||||||||||||
CONSUMER STAPLES | 17.53 | ||||||||||||||
BEVERAGES | |||||||||||||||
5,120 | COCA-COLA CO. | 229,632 | |||||||||||||
975 | PEPSICO, INC. | 112,603 | |||||||||||||
| �� | 342,235 | 4.26 | |||||||||||||
FOOD & STAPLES RETAILING | |||||||||||||||
5,000 | SYSCO CORP. | 251,650 | |||||||||||||
2,950 | WAL-MART STORES INC. | 223,256 | |||||||||||||
474,906 | 5.91 | ||||||||||||||
FOOD PRODUCTS | |||||||||||||||
2,700 | MONDELEZ INT'L INC. | 116,613 | |||||||||||||
3,000 | THE KRAFT HEINZ COMPANY | 256,920 | |||||||||||||
373,533 | 4.65 | ||||||||||||||
HOUSEHOLD PRODUCTS | |||||||||||||||
2,500 | PROCTER & GAMBLE CO. | 217,875 | |||||||||||||
217,875 | 2.71 | ||||||||||||||
ENERGY | 1.51 | ||||||||||||||
OIL, GAS & CONSUMABLE FUELS | |||||||||||||||
1,500 | EXXON MOBIL CORP. | 121,095 | |||||||||||||
121,095 | 1.51 | ||||||||||||||
FINANCIALS | 17.24 | ||||||||||||||
BANKS | |||||||||||||||
7,000 | BANK OF AMERICA CORP. | 169,820 | |||||||||||||
2,850 | CITIGROUP INC. | 190,608 | |||||||||||||
3,070 | WELLS FARGO & CO. | 170,109 | |||||||||||||
530,537 | 6.60 | ||||||||||||||
See Accompanying Notes to Financial Statements which are an integral part of these financial statements.
37
Pacific Advisors Large Cap Value Fund
Schedule of Investments (Unaudited)
as of June 30, 2017
| Quantity or Principal** | Description | Current $ Value** | % of Total Net Assets | ||||||||||||
COMMON STOCK continued | |||||||||||||||
DIVERSIFIED FINANCIAL SERVICES | |||||||||||||||
1,952 | BERKSHIRE HATHAWAY INC. B* | 330,610 | |||||||||||||
330,610 | 4.11 | ||||||||||||||
INSURANCE | |||||||||||||||
4,000 | AMERICAN INT'L GROUP INC. | 250,080 | |||||||||||||
5,000 | METLIFE INC. | 274,700 | |||||||||||||
524,780 | 6.53 | ||||||||||||||
HEALTH CARE | 4.14 | ||||||||||||||
PHARMACEUTICALS | |||||||||||||||
2,515 | JOHNSON & JOHNSON | 332,709 | |||||||||||||
332,709 | 4.14 | ||||||||||||||
INDUSTRIALS | 18.16 | ||||||||||||||
AIR FREIGHT & LOGISTICS | |||||||||||||||
1,000 | FEDEX CORP. | 217,330 | |||||||||||||
1,200 | UNITED PARCEL SERVICE, INC. B | 132,708 | |||||||||||||
350,038 | 4.36 | ||||||||||||||
INDUSTRIAL CONGLOMERATES | |||||||||||||||
9,605 | GENERAL ELECTRIC CO. | 259,431 | |||||||||||||
2,000 | HONEYWELL INTERNATIONAL INC. | 266,580 | |||||||||||||
526,011 | 6.54 | ||||||||||||||
MACHINERY | |||||||||||||||
2,000 | DEERE & CO. | 247,180 | |||||||||||||
2,350 | ILLINOIS TOOL WORKS INC. | 336,638 | |||||||||||||
583,818 | 7.26 | ||||||||||||||
INFORMATION TECHNOLOGY | 21.92 | ||||||||||||||
INTERNET SOFTWARE & SERVICES | |||||||||||||||
300 | ALPHABET INC. CLASS C* | 272,619 | |||||||||||||
272,619 | 3.39 | ||||||||||||||
IT SERVICES | |||||||||||||||
500 | INT'L BUSINESS MACHINES CORP. | 76,915 | |||||||||||||
2,200 | MASTERCARD INC. | 267,190 | |||||||||||||
344,105 | 4.28 | ||||||||||||||
SEMICONDUCTORS & EQUIPMENT | |||||||||||||||
5,600 | INTEL CORP. | 188,944 | |||||||||||||
188,944 | 2.35 | ||||||||||||||
See Accompanying Notes to Financial Statements which are an integral part of these financial statements.
38
Pacific Advisors Large Cap Value Fund
Schedule of Investments (Unaudited)
as of June 30, 2017
| Quantity or Principal** | Description | Current $ Value** | % of Total Net Assets | ||||||||||||
COMMON STOCK continued | |||||||||||||||
SOFTWARE | |||||||||||||||
4,887 | MICROSOFT CORP. | 336,861 | |||||||||||||
5,710 | ORACLE CORPORATION | 286,300 | |||||||||||||
623,161 | 7.75 | ||||||||||||||
TECHNOLOGY HARDWARE STORAGE & PERPHERALS | |||||||||||||||
2,313 | APPLE INC. | 333,118 | |||||||||||||
333,118 | 4.15 | ||||||||||||||
MATERIALS | 0.03 | ||||||||||||||
CHEMICALS | |||||||||||||||
80 | ADVANSIX INC.* | 2,499 | |||||||||||||
2,499 | 0.03 | ||||||||||||||
TOTAL COMMON STOCK (Cost: $4,321,893) | 8,030,763 | 99.91 | |||||||||||||
TOTAL INVESTMENT IN SECURITIES (Cost: $4,321,893) | 8,030,763 | 99.91 | |||||||||||||
OTHER ASSETS LESS LIABILITIES | 6,974 | 0.09 | |||||||||||||
TOTAL NET ASSETS | 8,037,737 | 100.00 | |||||||||||||
* Non-income producing
** The principal amount and value are stated in U.S. dollars unless otherwise indicated.
See Accompanying Notes to Financial Statements which are an integral part of these financial statements.
39
Pacific Advisors Mid Cap Value Fund
Schedule of Investments (Unaudited)
as of June 30, 2017
| Quantity or Principal** | Description | Current $ Value** | % of Total Net Assets | ||||||||||||
COMMON STOCK | |||||||||||||||
CONSUMER DISCRETIONARY | 32.22 | ||||||||||||||
AUTO COMPONENTS | |||||||||||||||
1,600 | LEAR CORP. | 227,328 | |||||||||||||
227,328 | 3.92 | ||||||||||||||
DISTRIBUTORS | |||||||||||||||
1,800 | POOL CORPORATION | 211,626 | |||||||||||||
211,626 | 3.64 | ||||||||||||||
SPECIALTY RETAIL | |||||||||||||||
21,000 | CONN'S INC.* | 401,100 | |||||||||||||
3,600 | MONRO MUFFLER BRAKE, INC. | 150,300 | |||||||||||||
850 | O'REILLY AUTOMOTIVE INC.* | 185,929 | |||||||||||||
5,600 | PENSKE AUTOMOTIVE GROUP INC. | 245,896 | |||||||||||||
3,400 | TRACTOR SUPPLY COMPANY | 184,314 | |||||||||||||
1,167,539 | 20.12 | ||||||||||||||
TEXTILES, APPAREL & LUXURY GOODS | |||||||||||||||
2,300 | PVH CORP. | 263,350 | |||||||||||||
263,350 | 4.54 | ||||||||||||||
CONSUMER STAPLES | 2.51 | ||||||||||||||
BEVERAGES | |||||||||||||||
1,600 | DR PEPPER SNAPPLE GROUP INC. | 145,776 | |||||||||||||
145,776 | 2.51 | ||||||||||||||
ENERGY | 8.72 | ||||||||||||||
ENERGY EQUIPMENT & SERVICES | |||||||||||||||
1,000 | CORE LABORATORIES N.V. | 101,270 | |||||||||||||
31,000 | HELIX ENERGY SOLUTIONS GROUP INC.* | 174,840 | |||||||||||||
41,000 | NOBLE CORPORATION | 148,420 | |||||||||||||
3,000 | TECHNIPFMC PLC* | 81,600 | |||||||||||||
506,130 | 8.72 | ||||||||||||||
FINANCIALS | 7.91 | ||||||||||||||
BANKS | |||||||||||||||
4,500 | CIT GROUP INC. | 219,150 | |||||||||||||
4,100 | EAST WEST BANCORP INC. | 240,178 | |||||||||||||
459,328 | 7.91 | ||||||||||||||
HEALTH CARE | 3.21 | ||||||||||||||
HEALTH CARE TECHNOLOGY | |||||||||||||||
2,800 | CERNER CORPORATION* | 186,116 | |||||||||||||
186,116 | 3.21 | ||||||||||||||
See Accompanying Notes to Financial Statements which are an integral part of these financial statements.
40
Pacific Advisors Mid Cap Value Fund
Schedule of Investments (Unaudited)
as of June 30, 2017
| Quantity or Principal** | Description | Current $ Value** | % of Total Net Assets | ||||||||||||
COMMON STOCK continued | |||||||||||||||
INDUSTRIALS | 39.71 | ||||||||||||||
AIRLINES | |||||||||||||||
4,700 | SPIRIT AIRLINES INC.* | 242,755 | |||||||||||||
242,755 | 4.18 | ||||||||||||||
CONSTRUCTION & ENGINEERING | |||||||||||||||
7,500 | CHICAGO BRIDGE & IRON CO. N.V. | 147,975 | |||||||||||||
147,975 | 2.55 | ||||||||||||||
MACHINERY | |||||||||||||||
1,900 | GRACO INC. | 207,632 | |||||||||||||
9,500 | NAVISTAR INT'L CORP.* | 249,185 | |||||||||||||
3,100 | WABTEC CORP. | 283,650 | |||||||||||||
740,467 | 12.76 | ||||||||||||||
MARINE | |||||||||||||||
3,800 | KIRBY CORP.* | 254,030 | |||||||||||||
254,030 | 4.38 | ||||||||||||||
ROAD & RAIL | |||||||||||||||
3,800 | GENESEE & WYOMING INC.* | 259,882 | |||||||||||||
2,300 | KANSAS CITY SOUTHERN | 240,695 | |||||||||||||
1,800 | LANDSTAR SYSTEM INC. | 154,080 | |||||||||||||
10,000 | SWIFT TRANSPORTATION CO.* | 265,000 | |||||||||||||
919,657 | 15.84 | ||||||||||||||
INFORMATION TECHNOLOGY | 3.62 | ||||||||||||||
SOFTWARE | |||||||||||||||
3,800 | ASPEN TECHNOLOGY, INC.* | 209,988 | |||||||||||||
209,988 | 3.62 | ||||||||||||||
MATERIALS | 2.03 | ||||||||||||||
CHEMICALS | |||||||||||||||
2,300 | H.B. FULLER CO. | 117,553 | |||||||||||||
117,553 | 2.03 | ||||||||||||||
TOTAL COMMON STOCK (Cost: $4,568,816) | 5,799,618 | 99.93 | |||||||||||||
TOTAL INVESTMENT IN SECURITIES (Cost: $4,568,816) | 5,799,618 | 99.93 | |||||||||||||
OTHER ASSETS LESS LIABILITIES | 4,033 | 0.07 | |||||||||||||
TOTAL NET ASSETS | 5,803,651 | 100.00 | |||||||||||||
* Non-income producing
** The principal amount and value are stated in U.S. dollars unless otherwise indicated.
See Accompanying Notes to Financial Statements which are an integral part of these financial statements.
41
Pacific Advisors Small Cap Value Fund
Schedule of Investments (Unaudited)
as of June 30, 2017
| Quantity or Principal** | Description | Current $ Value** | % of Total Net Assets | ||||||||||||
COMMON STOCK | |||||||||||||||
CONSUMER DISCRETIONARY | 21.59 | ||||||||||||||
AUTO COMPONENTS | |||||||||||||||
30,000 | GENTHERM INC.* | 1,164,000 | |||||||||||||
1,164,000 | 4.64 | ||||||||||||||
SPECIALTY RETAIL | |||||||||||||||
140,000 | CONN'S INC.* | 2,674,000 | |||||||||||||
30,000 | HIBBETT SPORTS INC.* | 622,500 | |||||||||||||
49,000 | SONIC AUTOMOTIVE INC. | 953,050 | |||||||||||||
4,249,550 | 16.95 | ||||||||||||||
CONSUMER STAPLES | 6.86 | ||||||||||||||
FOOD & STAPLES RETAILING | |||||||||||||||
65,812 | CHEFS' WAREHOUSE INC.* | 855,556 | |||||||||||||
855,556 | 3.41 | ||||||||||||||
FOOD PRODUCTS | |||||||||||||||
55,000 | DARLING INGREDIENTS INC.* | 865,700 | |||||||||||||
865,700 | 3.45 | ||||||||||||||
ENERGY | 17.22 | ||||||||||||||
ENERGY EQUIPMENT & SERVICES | |||||||||||||||
135,000 | HELIX ENERGY SOLUTIONS GROUP INC.* | 761,400 | |||||||||||||
95,000 | HORNBECK OFFSHORE SERVICES INC.* | 268,850 | |||||||||||||
61,000 | MATRIX SERVICE CO.* | 570,350 | |||||||||||||
43,000 | NATURAL GAS SERVICES GROUP, INC.* | 1,068,550 | |||||||||||||
274,172 | NORTH AMERICAN ENERGY PARTNERS INC. | 1,206,357 | |||||||||||||
325,000 | PARKER DRILLING CO.* | 438,750 | |||||||||||||
4,314,257 | 17.20 | ||||||||||||||
OIL, GAS & CONSUMABLE FUELS | |||||||||||||||
100,000 | INFINITY ENERGY RESOURCES INC.* | 5,000 | |||||||||||||
5,000 | 0.02 | ||||||||||||||
FINANCIALS | 8.12 | ||||||||||||||
BANKS | |||||||||||||||
17,000 | EAST WEST BANCORP INC. | 995,860 | |||||||||||||
995,860 | 3.97 | ||||||||||||||
CONSUMER FINANCE | |||||||||||||||
44,000 | REGIONAL MANAGEMENT CORP.* | 1,039,720 | |||||||||||||
1,039,720 | 4.15 | ||||||||||||||
See Accompanying Notes to Financial Statements which are an integral part of these financial statements.
42
Pacific Advisors Small Cap Value Fund
Schedule of Investments (Unaudited)
as of June 30, 2017
| Quantity or Principal** | Description | Current $ Value** | % of Total Net Assets | ||||||||||||
COMMON STOCK continued | |||||||||||||||
INDUSTRIALS | 46.79 | ||||||||||||||
BUILDING PRODUCTS | |||||||||||||||
26,195 | INSTEEL INDUSTRIES, INC. | 863,649 | |||||||||||||
863,649 | 3.45 | ||||||||||||||
COMMERCIAL SERVICES & SUPPLIES | |||||||||||||||
31,000 | MOBILE MINI INC. | 925,350 | |||||||||||||
39,000 | TEAM INC.* | 914,550 | |||||||||||||
1,839,900 | 7.34 | ||||||||||||||
CONSTRUCTION & ENGINEERING | |||||||||||||||
131,000 | ORION GROUP HOLDINGS, INC.* | 978,570 | |||||||||||||
978,570 | 3.90 | ||||||||||||||
MACHINERY | |||||||||||||||
42,000 | NAVISTAR INT'L CORP.* | 1,101,660 | |||||||||||||
1,101,660 | 4.39 | ||||||||||||||
MARINE | |||||||||||||||
17,000 | KIRBY CORP.* | 1,136,450 | |||||||||||||
1,136,450 | 4.53 | ||||||||||||||
ROAD & RAIL | |||||||||||||||
16,000 | GENESEE & WYOMING INC.* | 1,094,240 | |||||||||||||
22,000 | SAIA INC.* | 1,128,600 | |||||||||||||
2,222,840 | 8.86 | ||||||||||||||
TRADING COMPANIES & DISTRIBUTORS | |||||||||||||||
33,000 | DXP ENTERPRISES INC.* | 1,138,500 | |||||||||||||
30,000 | RUSH ENTERPRISES INC.* | 1,115,400 | |||||||||||||
40,000 | TRITON INTERNATIONAL LIMITED | 1,337,600 | |||||||||||||
3,591,500 | 14.32 | ||||||||||||||
TOTAL COMMON STOCK (Cost: $22,256,668) | 25,224,212 | 100.58 | |||||||||||||
TOTAL INVESTMENT IN SECURITIES (Cost: $22,256,668) | 25,224,212 | 100.58 | |||||||||||||
OTHER ASSETS LESS LIABILITIES | (145,687 | ) | (0.58 | ) | |||||||||||
TOTAL NET ASSETS | 25,078,525 | 100.00 | |||||||||||||
* Non-income producing
** The principal amount and value are stated in U.S. dollars unless otherwise indicated.
See Accompanying Notes to Financial Statements which are an integral part of these financial statements.
43
Pacific Advisors Fund Inc.
Statement of Assets and Liabilities (Unaudited)
June 30, 2017
| Income and Equity Fund | Balanced Fund | Large Cap Value Fund | |||||||||||||
Assets | |||||||||||||||
Investment securities | |||||||||||||||
At cost | $ | 14,577,134 | $ | 5,316,828 | $ | 4,321,893 | |||||||||
At fair value | $ | 16,656,974 | $ | 5,664,962 | $ | 8,030,763 | |||||||||
Accrued income receivable | 103,662 | 33,445 | 7,940 | ||||||||||||
Receivable for investments sold | 150,738 | - | 59,831 | ||||||||||||
Total assets | 16,911,374 | 5,698,407 | 8,098,534 | ||||||||||||
Liabilities | |||||||||||||||
Bank borrowings (Note 7) | 134,409 | 1,917 | 45,619 | ||||||||||||
Payable for fund shares redeemed | - | - | - | ||||||||||||
Accounts payable | 23,865 | 5,050 | 11,578 | ||||||||||||
Accounts payable to related parties (Note 3) | 3,600 | 3,600 | 3,600 | ||||||||||||
Total liabilities | 161,874 | 10,567 | 60,797 | ||||||||||||
Net Assets | $ | 16,749,500 | $ | 5,687,840 | $ | 8,037,737 | |||||||||
Summary of Shareholders' Equity | |||||||||||||||
Paid in capital | 14,796,563 | 5,160,403 | 4,256,788 | ||||||||||||
Accumulated undistributed net investment income | 2,951 | - | - | ||||||||||||
Accumulated undistributed net realized gain (loss) on security transactions | (129,854 | ) | 179,303 | 72,079 | |||||||||||
Net unrealized appreciation of investments | 2,079,840 | 348,134 | 3,708,870 | ||||||||||||
Net assets at June 30, 2017 | $ | 16,749,500 | $ | 5,687,840 | $ | 8,037,737 | |||||||||
Class A: | |||||||||||||||
Net assets | $ | 14,480,594 | $ | 4,189,007 | $ | 7,403,012 | |||||||||
Shares authorized ($0.01 par value) | 50,000,000 | 50,000,000 | 50,000,000 | ||||||||||||
Shares outstanding | 1,167,667 | 360,488 | 458,288 | ||||||||||||
Net asset value (and redemption price) per share | $ | 12.40 | $ | 11.62 | $ | 16.15 | |||||||||
Maximum offering price per share | $ | 13.02 | $ | 12.33 | $ | 17.14 | |||||||||
Sales load | 4.75 | % | 5.75 | % | 5.75 | % | |||||||||
Class C: | |||||||||||||||
Net assets | $ | 2,268,906 | $ | 1,498,833 | $ | 634,725 | |||||||||
Shares authorized ($0.01 par value) | 50,000,000 | 50,000,000 | 50,000,000 | ||||||||||||
Shares outstanding | 191,832 | 146,768 | 45,888 | ||||||||||||
Net asset value (and offering and redemption price) per share | $ | 11.83 | $ | 10.21 | $ | 13.83 | |||||||||
Class I: | |||||||||||||||
Net assets | N/A | N/A | N/A | ||||||||||||
Shares authorized ($0.01 par value) | |||||||||||||||
Shares outstanding | |||||||||||||||
Net asset value (and offering and redemption price) per share | N/A | N/A | N/A | ||||||||||||
* Net assets divided by shares outstanding does not equal net asset value per share due to rounding.
See Accompanying Notes to Financial Statements which are an integral part of these financial statements.
44
| Mid Cap Value Fund | Small Cap Value Fund | ||||||||||
Assets | |||||||||||
Investment securities | |||||||||||
At cost | $ | 4,568,816 | $ | 22,256,668 | |||||||
At fair value | $ | 5,799,618 | $ | 25,224,212 | |||||||
Accrued income receivable | 1,687 | 6,254 | |||||||||
Receivable for investments sold | 50,992 | 322,809 | |||||||||
Total assets | 5,852,297 | 25,553,275 | |||||||||
Liabilities | |||||||||||
Bank borrowings (Note 7) | 43,160 | 406,602 | |||||||||
Payable for fund shares redeemed | - | 17,923 | |||||||||
Accounts payable | 1,886 | 38,652 | |||||||||
Accounts payable to related parties (Note 3) | 3,600 | 11,574 | |||||||||
Total liabilities | 48,646 | 474,751 | |||||||||
Net Assets | $ | 5,803,651 | $ | 25,078,524 | |||||||
Summary of Shareholders' Equity | |||||||||||
Paid in capital | 5,314,920 | 19,109,066 | |||||||||
Accumulated undistributed net investment income | - | - | |||||||||
Accumulated undistributed net realized gain (loss) on security transactions | (742,071 | ) | 3,001,915 | ||||||||
Net unrealized appreciation of investments | 1,230,802 | 2,967,544 | |||||||||
Net assets at June 30, 2017 | $ | 5,803,651 | $ | 25,078,525 | |||||||
Class A: | |||||||||||
Net assets | $ | 5,450,077 | $ | 22,109,159 | |||||||
Shares authorized ($0.01 par value) | 50,000,000 | 50,000,000 | |||||||||
Shares outstanding | 478,292 | 857,073 | |||||||||
Net asset value (and redemption price) per share | $ | 11.39 | $ | 25.80 | |||||||
Maximum offering price per share | $ | 12.08 | $ | 27.37 | |||||||
Sales load | 5.75 | % | 5.75 | % | |||||||
Class C: | |||||||||||
Net assets | $ | 353,574 | $ | 2,961,995 | |||||||
Shares authorized ($0.01 par value) | 50,000,000 | 50,000,000 | |||||||||
Shares outstanding | 35,200 | 158,598 | |||||||||
Net asset value (and offering and redemption price) per share | $ | 10.04 | $ | 18.68 | |||||||
Class I: | |||||||||||
Net assets | N/A | $ | 7,371 | ||||||||
Shares authorized ($0.01 par value) | 50,000,000 | ||||||||||
Shares outstanding | 222 | ||||||||||
Net asset value (and offering and redemption price) per share | N/A | $ | 33.24 | * | |||||||
45
Pacific Advisors Fund Inc.
Statement of Operations (Unaudited)
For the six months ended June 30, 2017
| Income and Equity Fund | Balanced Fund | Large Cap Value Fund | |||||||||||||
Investment Income | |||||||||||||||
Dividends | $ | 148,686 | $ | 17,556 | $ | 75,277 | |||||||||
Interest | 140,751 | 32,088 | 1 | ||||||||||||
Total investment income | 289,437 | 49,644 | 75,278 | ||||||||||||
Expenses | |||||||||||||||
Investment management fees (Note 3) | 64,815 | 21,723 | 29,631 | ||||||||||||
Transfer agent fees (Note 3) | 66,539 | 36,661 | 53,207 | ||||||||||||
Fund accounting fees (Note 3) | 66,544 | 22,302 | 30,422 | ||||||||||||
Legal fees | 20,741 | 6,951 | 9,482 | ||||||||||||
Audit fees | 14,161 | 5,998 | 7,477 | ||||||||||||
Registration fees | 17,284 | 13,903 | 12,643 | ||||||||||||
Printing | 7,778 | 2,607 | 3,556 | ||||||||||||
Custody fees | 4,004 | 3,739 | 3,556 | ||||||||||||
Interest on borrowings | 317 | 316 | 790 | ||||||||||||
Director fees/meetings | 12,928 | 4,055 | 5,531 | ||||||||||||
Distribution and service (12b-1) fees (Note 3) | 30,707 | 13,003 | 12,753 | ||||||||||||
Administration fees (Note 3) | 4,321 | 1,448 | 1,975 | ||||||||||||
Compliance fees (Note 3) | 24,934 | 8,335 | 11,260 | ||||||||||||
Total expenses, before fees waived | 335,073 | 141,041 | 182,283 | ||||||||||||
Less fees waived (Note 3) | 64,815 | - | 29,631 | ||||||||||||
Net expenses | 270,258 | 141,041 | 152,652 | ||||||||||||
Net Investment Income (Loss) | 19,179 | (91,397 | ) | (77,374 | ) | ||||||||||
Net Realized and Unrealized Gain (Loss) on Investments | |||||||||||||||
Net realized gain (loss) on investments | 155,486 | 148,079 | 60,605 | ||||||||||||
Change in net unrealized appreciation (depreciation) on investments | (165,860 | ) | 81,272 | 526,018 | |||||||||||
Net realized and unrealized gain (loss) on investments | (10,374 | ) | 229,351 | 586,623 | |||||||||||
Net Increase (Decrease) in Net Assets Resulting from Operations | $ | 8,805 | $ | 137,954 | $ | 509,249 | |||||||||
See Accompanying Notes to Financial Statements which are an integral part of these financial statements.
46
| Mid Cap Value Fund | Small Cap Value Fund | ||||||||||
Investment Income | |||||||||||
Dividends | $ | 23,587 | $ | 39,521 | |||||||
Interest | - | 1 | |||||||||
Total investment income | 23,587 | 39,522 | |||||||||
Expenses | |||||||||||
Investment management fees (Note 3) | 29,506 | 103,160 | |||||||||
Transfer agent fees (Note 3) | 36,943 | 141,358 | |||||||||
Fund accounting fees (Note 3) | 22,720 | 105,910 | |||||||||
Legal fees | 7,082 | 33,011 | |||||||||
Audit fees | 6,104 | 21,526 | |||||||||
Registration fees | 12,983 | 30,260 | |||||||||
Printing | 2,655 | 12,379 | |||||||||
Custody fees | 3,620 | 7,146 | |||||||||
Interest on borrowings | 511 | 5,233 | |||||||||
Director fees/meetings | 4,131 | 19,257 | |||||||||
Distribution and service (12b-1) fees (Note 3) | 8,710 | 46,339 | |||||||||
Administration fees (Note 3) | 1,475 | 6,877 | |||||||||
Compliance fees (Note 3) | 8,587 | 40,308 | |||||||||
Total expenses, before fees waived | 145,027 | 572,764 | |||||||||
Less fees waived (Note 3) | - | - | |||||||||
Net expenses | 145,027 | 572,764 | |||||||||
Net Investment Income (Loss) | (121,440 | ) | (533,242 | ) | |||||||
Net Realized and Unrealized Gain (Loss) on Investments | |||||||||||
Net realized gain (loss) on investments | (101,904 | ) | 2,148,494 | ||||||||
Change in net unrealized appreciation (depreciation) on investments | 22,400 | (3,289,344 | ) | ||||||||
Net realized and unrealized gain (loss) on investments | (79,504 | ) | (1,140,850 | ) | |||||||
Net Increase (Decrease) in Net Assets Resulting from Operations | $ | (200,944 | ) | $ | (1,674,092 | ) | |||||
47
Pacific Advisors Fund Inc.
Statements of Changes in Net Assets (Unaudited)
Income and Equity Fund | Balanced Fund | ||||||||||||||||||
| Six months ended June 30, 2017 | Year ended December 31, 2016 | Six months ended June 30, 2017 | Year ended December 31, 2016 | ||||||||||||||||
| Increase (Decrease) in Net Assets From Operations | |||||||||||||||||||
Net investment income (loss) | $ | 19,179 | $ | 21,268 | $ | (91,397 | ) | $ | (173,862 | ) | |||||||||
Net realized gain (loss) on investments | 155,486 | 126,786 | 148,079 | 207,753 | |||||||||||||||
Change in net unrealized appreciation (depreciation) on investments | (165,860 | ) | 883,905 | 81,272 | (67,001 | ) | |||||||||||||
Increase (decrease) in net assets resulting from operations | 8,805 | 1,031,959 | 137,954 | (33,110 | ) | ||||||||||||||
From Distributions to Shareholders | |||||||||||||||||||
Class A: | |||||||||||||||||||
Net investment income | (16,228 | ) | (23,421 | ) | - | - | |||||||||||||
Net capital gains | - | - | - | (155,274 | ) | ||||||||||||||
Return of Capital | - | (11,626 | ) | - | - | ||||||||||||||
Class C: | |||||||||||||||||||
Net capital gains | - | - | - | (69,979 | ) | ||||||||||||||
Class I: | |||||||||||||||||||
Net capital gains | N/A | N/A | N/A | N/A | |||||||||||||||
Decrease in net assets resulting from distributions | (16,228 | ) | (35,047 | ) | - | (225,253 | ) | ||||||||||||
From Capital Share Transactions (Note 6) | |||||||||||||||||||
Proceeds from shares sold | 1,023,026 | 4,599,494 | 139,046 | 849,404 | |||||||||||||||
Proceeds from shares purchased by reinvestment of dividends | 14,381 | 31,280 | - | 208,156 | |||||||||||||||
Cost of shares repurchased | (1,531,200 | ) | (2,684,739 | ) | (589,536 | ) | (1,523,942 | ) | |||||||||||
Decreases in net assets resulting from capital share transactions | (493,793 | ) | 1,946,035 | (450,490 | ) | (466,382 | ) | ||||||||||||
Increase (decrease) in net assets | (501,216 | ) | 2,942,947 | (312,536 | ) | (724,745 | ) | ||||||||||||
Net Assets | |||||||||||||||||||
Beginning of year | 17,250,716 | 14,307,769 | 6,000,376 | 6,725,121 | |||||||||||||||
End of year | $ | 16,749,500 | $ | 17,250,716 | $ | 5,687,840 | $ | 6,000,376 | |||||||||||
Including undistributed net investment income | $ | 2,951 | $ | - | $ | - | $ | - | |||||||||||
See Accompanying Notes to Financial Statements which are an integral part of these financial statements.
48
Large Cap Value Fund | |||||||||||
| Six months ended June 30, 2017 | Year ended December 31, 2016 | ||||||||||
| Increase (Decrease) in Net Assets From Operations | |||||||||||
Net investment income (loss) | $ | (77,374 | ) | $ | (126,115 | ) | |||||
Net realized gain (loss) on investments | 60,605 | 99,141 | |||||||||
Change in net unrealized appreciation (depreciation) on investments | 526,018 | 650,331 | |||||||||
Increase (decrease) in net assets resulting from operations | 509,249 | 623,357 | |||||||||
From Distributions to Shareholders | |||||||||||
Class A: | |||||||||||
Net investment income | - | - | |||||||||
Net capital gains | - | (20,212 | ) | ||||||||
Return of Capital | - | - | |||||||||
Class C: | |||||||||||
Net capital gains | - | (2,847 | ) | ||||||||
Class I: | |||||||||||
Net capital gains | N/A | N/A | |||||||||
Decrease in net assets resulting from distributions | - | (23,059 | ) | ||||||||
From Capital Share Transactions (Note 6) | |||||||||||
Proceeds from shares sold | 289,117 | 737,466 | |||||||||
Proceeds from shares purchased by reinvestment of dividends | - | 20,835 | |||||||||
Cost of shares repurchased | (550,353 | ) | (1,316,655 | ) | |||||||
Decreases in net assets resulting from capital share transactions | (261,236 | ) | (558,354 | ) | |||||||
Increase (decrease) in net assets | 248,013 | 41,944 | |||||||||
Net Assets | |||||||||||
Beginning of year | 7,789,724 | 7,747,780 | |||||||||
End of year | $ | 8,037,737 | $ | 7,789,724 | |||||||
Including undistributed net investment income | $ | - | $ | - | |||||||
49
Pacific Advisors Fund Inc.
Statements of Changes in Net Assets (Unaudited)
Mid Cap Value Fund | |||||||||||
| Six months ended June 30, 2017 | Year ended December 31, 2016 | ||||||||||
| Increase (Decrease) in Net Assets From Operations | |||||||||||
Net investment income (loss) | $ | (121,440 | ) | $ | (219,294 | ) | |||||
Net realized gain (loss) on investments | (101,904 | ) | 125,190 | ||||||||
Change in net unrealized appreciation (depreciation) on investments | 22,400 | 885,408 | |||||||||
Increase (decrease) in net assets resulting from operations | (200,944 | ) | 791,304 | ||||||||
From Distributions to Shareholders | |||||||||||
Class A: | |||||||||||
Net investment income | - | - | |||||||||
Net capital gains | - | - | |||||||||
Return of Capital | - | - | |||||||||
Class C: | |||||||||||
Net capital gains | - | - | |||||||||
Class I: | |||||||||||
Net capital gains | N/A | N/A | |||||||||
Decrease in net assets resulting from distributions | - | - | |||||||||
From Capital Share Transactions (Note 6) | |||||||||||
Proceeds from shares sold | 130,028 | 574,094 | |||||||||
Proceeds from shares purchased by reinvestment of dividends | - | - | |||||||||
Cost of shares repurchased | (219,241 | ) | (808,187 | ) | |||||||
Decreases in net assets resulting from capital share transactions | (89,213 | ) | (234,093 | ) | |||||||
Increase (decrease) in net assets | (290,157 | ) | 557,211 | ||||||||
Net Assets | |||||||||||
Beginning of year | 6,093,808 | 5,536,597 | |||||||||
End of year | $ | 5,803,651 | $ | 6,093,808 | |||||||
Including undistributed net investment income | $ | - | $ | - | |||||||
See Accompanying Notes to Financial Statements which are an integral part of these financial statements.
50
Small Cap Value Fund | |||||||||||
| Six months ended June 30, 2017 | Year ended December 31, 2016 | ||||||||||
| Increase (Decrease) in Net Assets From Operations | |||||||||||
Net investment income (loss) | $ | (533,242 | ) | $ | (1,191,012 | ) | |||||
Net realized gain (loss) on investments | 2,148,494 | 1,188,133 | |||||||||
Change in net unrealized appreciation (depreciation) on investments | (3,289,344 | ) | 6,332,333 | ||||||||
Increase (decrease) in net assets resulting from operations | (1,674,092 | ) | 6,329,454 | ||||||||
From Distributions to Shareholders | |||||||||||
Class A: | |||||||||||
Net investment income | - | - | |||||||||
Net capital gains | - | (3,617,413 | ) | ||||||||
Return of Capital | - | - | |||||||||
Class C: | |||||||||||
Net capital gains | - | (648,113 | ) | ||||||||
Class I: | |||||||||||
Net capital gains | - | (840 | ) | ||||||||
Decrease in net assets resulting from distributions | - | (4,266,366 | ) | ||||||||
From Capital Share Transactions (Note 6) | |||||||||||
Proceeds from shares sold | 1,522,817 | 1,705,215 | |||||||||
Proceeds from shares purchased by reinvestment of dividends | - | 3,949,069 | |||||||||
Cost of shares repurchased | (4,793,865 | ) | (16,971,079 | ) | |||||||
Decreases in net assets resulting from capital share transactions | (3,271,048 | ) | (11,316,795 | ) | |||||||
Increase (decrease) in net assets | (4,945,140 | ) | (9,253,707 | ) | |||||||
Net Assets | |||||||||||
Beginning of year | 30,023,666 | 39,277,373 | |||||||||
End of year | $ | 25,078,526 | $ | 30,023,666 | |||||||
Including undistributed net investment income | $ | - | $ | - | |||||||
51
Pacific Advisors Fund Inc.
Financial Highlights (Unaudited)
(For a share outstanding throughout the period)
Income and Equity Fund | |||||||||||||||||||||||||||
Class A | |||||||||||||||||||||||||||
| For the six months ended | For the year ended December 31, | ||||||||||||||||||||||||||
June 30, 2017 | 2016 | 2015 | 2014 | 2013 | 2012 | ||||||||||||||||||||||
Per Share Operating Performance | |||||||||||||||||||||||||||
Net asset value, beginning of period | $ | 12.40 | $ | 11.61 | $ | 12.06 | $ | 11.55 | $ | 10.30 | $ | 9.84 | |||||||||||||||
Income from investing operations | |||||||||||||||||||||||||||
Net investment income (c) | 0.02 | 0.03 | 0.14 | 0.22 | (d) | 0.14 | (d) | 0.15 | (d) | ||||||||||||||||||
Net realized and unrealized gain (loss) on securities | (0.01 | ) | 0.78 | (0.45 | ) | 0.51 | (d) | 1.24 | (d) | 0.48 | (d) | ||||||||||||||||
Total from investment operations | 0.01 | 0.81 | (0.31 | ) | 0.73 | 1.38 | 0.63 | ||||||||||||||||||||
Less distributions | |||||||||||||||||||||||||||
From net investment income | (0.01 | ) | (0.02 | ) | (0.14 | ) | (0.22 | ) | (0.13 | ) | (0.17 | ) | |||||||||||||||
From net capital gain | - | (0.01 | ) | - | - | - | - | ||||||||||||||||||||
Total distributions | (0.01 | ) | (0.03 | ) | (0.14 | ) | (0.22 | ) | (0.13 | ) | (0.17 | ) | |||||||||||||||
Redemption fees (c) | - | (b) | 0.01 | - | (b) | - | (b,d) | - | (b,d) | - | (b,d) | ||||||||||||||||
Net asset value, end of period | $ | 12.40 | $ | 12.40 | $ | 11.61 | $ | 12.06 | $ | 11.55 | $ | 10.30 | |||||||||||||||
Total Investment Return (a) | 0.11 | %(e) | 7.08 | % | (2.57 | )% | 6.41 | % | 13.40 | % | 6.46 | % | |||||||||||||||
Ratios/Supplemental Data | |||||||||||||||||||||||||||
Net assets, end of period (000's) | $ | 14,481 | $ | 14,794 | $ | 11,541 | $ | 11,324 | $ | 9,247 | $ | 4,659 | |||||||||||||||
Ratio of net investment income (loss) to average net assets | |||||||||||||||||||||||||||
With expense reductions | 0.32 | %(f) | 0.26 | % | 1.23 | % | 1.88 | % | 1.27 | % | 1.56 | % | |||||||||||||||
Without expense reductions | (0.42 | )%(f) | (0.49 | )% | 0.48 | % | 1.13 | % | 0.52 | % | 0.81 | % | |||||||||||||||
Ratio of expenses to average net assets | |||||||||||||||||||||||||||
With expense reductions | 3.01 | %(f) | 2.88 | % | 2.06 | % | 1.91 | % | 2.23 | % | 2.68 | % | |||||||||||||||
Without expense reductions | 3.75 | %(f) | 3.63 | % | 2.81 | % | 2.66 | % | 2.98 | % | 3.42 | % | |||||||||||||||
Fund portfolio turnover rate | 22 | %(f) | 14 | % | 22 | % | 13 | % | 20 | % | 29 | % | |||||||||||||||
Class C | |||||||||||||||||||||||||||
| For the six months ended | For the year ended December 31, | ||||||||||||||||||||||||||
June 30, 2017 | 2016 | 2015 | 2014 | 2013 | 2012 | ||||||||||||||||||||||
Per Share Operating Performance | |||||||||||||||||||||||||||
Net asset value, beginning of period | $ | 11.86 | $ | 11.16 | $ | 11.59 | $ | 11.11 | $ | 9.91 | $ | 9.42 | |||||||||||||||
Income from investing operations | |||||||||||||||||||||||||||
Net investment income (loss) (c) | (0.02 | ) | (0.06 | ) | 0.05 | 0.13 | (d) | 0.05 | (d) | 0.08 | (d) | ||||||||||||||||
Net realized and unrealized gain (loss) on securities | (0.01 | ) | 0.75 | (0.42 | ) | 0.48 | (d) | 1.19 | (d) | 0.46 | (d) | ||||||||||||||||
Total from investment operations | (0.03 | ) | 0.69 | (0.37 | ) | 0.61 | 1.24 | 0.54 | |||||||||||||||||||
Less distributions | |||||||||||||||||||||||||||
From net investment income | - | - | (0.06 | ) | (0.13 | ) | (0.04 | ) | (0.05 | ) | |||||||||||||||||
Total distributions | - | - | (0.06 | ) | (0.13 | ) | (0.04 | ) | (0.05 | ) | |||||||||||||||||
Redemption fees (c) | - | (b) | 0.01 | - | (b) | - | (b,d) | - | (b,d) | - | (b,d) | ||||||||||||||||
Net asset value, end of period | $ | 11.83 | $ | 11.86 | $ | 11.16 | $ | 11.59 | $ | 11.11 | $ | 9.91 | |||||||||||||||
Total Investment Return | (0.25 | )%(e) | 6.27 | % | (3.21 | )% | 5.51 | % | 12.55 | % | 5.74 | % | |||||||||||||||
Ratios/Supplemental Data | |||||||||||||||||||||||||||
Net assets, end of period (000's) | $ | 2,269 | $ | 2,456 | $ | 2,766 | $ | 2,471 | $ | 2,234 | $ | 1,906 | |||||||||||||||
Ratio of net investment income (loss) to average net assets | |||||||||||||||||||||||||||
With expense reductions | (0.42 | )%(f) | (0.48 | )% | 0.48 | % | 1.14 | % | 0.49 | % | 0.80 | % | |||||||||||||||
Without expense reductions | (1.16 | )%(f) | (1.23 | )% | (0.27 | )% | 0.39 | % | (0.26 | )% | 0.05 | % | |||||||||||||||
Ratio of expenses to average net assets | |||||||||||||||||||||||||||
With expense reductions | 3.75 | %(f) | 3.64 | % | 2.81 | % | 2.66 | % | 3.03 | % | 3.45 | % | |||||||||||||||
Without expense reductions | 4.49 | %(f) | 4.39 | % | 3.56 | % | 3.41 | % | 3.78 | % | 4.20 | % | |||||||||||||||
Fund portfolio turnover rate | 22 | %(f) | 14 | % | 22 | % | 13 | % | 20 | % | 29 | % | |||||||||||||||
(a) The Fund's maximum sales charge is not included in the total return computation.
(b) The amount is less than $0.005 and rounded to zero.
(c) Based on average shares outstanding.
(d) Net investment income, net realized and unrealized gain (loss) on securities and redemptions fees for Class A and Class C for the years ended December 31, 2012 to December 31, 2014 were restated during the year ended December 31, 2015. See Note 2(H).
(e) Not annualized
(f) Annualized
See Accompanying Notes to Financial Statements which are an integral part of these financial statements.
52
Pacific Advisors Fund Inc.
Financial Highlights (Unaudited)
(For a share outstanding throughout the period)
Balanced Fund | |||||||||||||||||||||||||||
Class A | |||||||||||||||||||||||||||
| For the six months ended | For the year ended December 31, | ||||||||||||||||||||||||||
June 30, 2017 | 2016 | 2015 | 2014 | 2013 | 2012 | ||||||||||||||||||||||
Per Share Operating Performance | |||||||||||||||||||||||||||
Net asset value, beginning of period | $ | 11.34 | $ | 11.75 | $ | 14.40 | $ | 16.59 | $ | 14.13 | $ | 13.47 | |||||||||||||||
Income from investing operations | |||||||||||||||||||||||||||
Net investment loss (c) | (0.17 | ) | (0.29 | ) | (0.15 | ) | (0.14 | )(d) | (0.15 | )(d) | (0.04 | )(d) | |||||||||||||||
Net realized and unrealized gain (loss) on securities | 0.45 | 0.30 | (2.25 | ) | (1.17 | )(d) | 4.17 | (d) | 1.35 | (d) | |||||||||||||||||
Total from investment operations | 0.28 | 0.01 | (2.40 | ) | (1.31 | ) | 4.02 | 1.31 | |||||||||||||||||||
Less distributions | |||||||||||||||||||||||||||
From net capital gain | - | (0.42 | ) | (0.25 | ) | (0.88 | ) | (1.57 | ) | (0.65 | ) | ||||||||||||||||
Total distributions | - | (0.42 | ) | (0.25 | ) | (0.88 | ) | (1.57 | ) | (0.65 | ) | ||||||||||||||||
Redemption fees (c) | - | (b) | - | (b) | - | (b) | - | (b,d) | 0.01 | (d) | - | (b,d) | |||||||||||||||
Net asset value, end of period | $ | 11.62 | $ | 11.34 | $ | 11.75 | $ | 14.40 | $ | 16.59 | $ | 14.13 | |||||||||||||||
Total Investment Return (a) | 2.47 | %(e) | 0.08 | % | (16.73 | )% | (7.94 | )% | 28.68 | % | 9.69 | % | |||||||||||||||
Ratios/Supplemental Data | |||||||||||||||||||||||||||
Net assets, end of period (000's) | $ | 4,189 | $ | 4,276 | $ | 4,046 | $ | 5,017 | $ | 5,144 | $ | 3,919 | |||||||||||||||
Ratio of net investment loss to average net assets | (2.94 | )%(f) | (2.56 | )% | (1.08 | )% | (0.90 | )% | (0.93 | )% | (0.27 | )% | |||||||||||||||
Ratio of expenses to average net assets | 4.65 | %(f) | 4.50 | % | 3.27 | % | 2.84 | % | 3.07 | % | 3.30 | % | |||||||||||||||
Fund portfolio turnover rate | 11 | %(f) | 55 | % | 28 | % | 22 | % | 23 | % | 34 | % | |||||||||||||||
Class C | |||||||||||||||||||||||||||
| For the six months ended | For the year ended December 31, | ||||||||||||||||||||||||||
June 30, 2017 | 2016 | 2015 | 2014 | 2013 | 2012 | ||||||||||||||||||||||
Per Share Operating Performance | |||||||||||||||||||||||||||
Net asset value, beginning of period | $ | 10.01 | $ | 10.50 | $ | 12.99 | $ | 15.18 | $ | 13.13 | $ | 12.66 | |||||||||||||||
Income from investing operations | |||||||||||||||||||||||||||
Net investment loss (c) | (0.19 | ) | (0.33 | ) | (0.23 | ) | (0.24 | )(d) | (0.25 | )(d) | (0.13 | )(d) | |||||||||||||||
Net realized and unrealized gain (loss) on securities | 0.39 | 0.26 | (2.01 | ) | (1.07 | )(d) | 3.87 | (d) | 1.25 | (d) | |||||||||||||||||
Total from investment operations | 0.20 | (0.07 | ) | (2.24 | ) | (1.31 | ) | 3.62 | 1.12 | ||||||||||||||||||
Less distributions | |||||||||||||||||||||||||||
From net capital gain | - | (0.42 | ) | (0.25 | ) | (0.88 | ) | (1.57 | ) | (0.65 | ) | ||||||||||||||||
Total distributions | - | (0.42 | ) | (0.25 | ) | (0.88 | ) | (1.57 | ) | (0.65 | ) | ||||||||||||||||
Redemption fees (b)(c) | - | - | - | - | (d) | - | (d) | - | (d) | ||||||||||||||||||
Net asset value, end of period | $ | 10.21 | $ | 10.01 | $ | 10.50 | $ | 12.99 | $ | 15.18 | $ | 13.13 | |||||||||||||||
Total Investment Return | 2.00 | %(e) | (0.67 | )% | (17.31 | )% | (8.68 | )% | 27.75 | % | 8.81 | % | |||||||||||||||
Ratios/Supplemental Data | |||||||||||||||||||||||||||
Net assets, end of period (000's) | $ | 1,499 | $ | 1,724 | $ | 2,679 | $ | 4,203 | $ | 5,471 | $ | 6,647 | |||||||||||||||
Ratio of net investment loss to average net assets | (3.68 | )%(f) | (3.27 | )% | (1.85 | )% | (1.64 | )% | (1.70 | )% | (0.97 | )% | |||||||||||||||
Ratio of expenses to average net assets | 5.39 | %(f) | 5.25 | % | 4.05 | % | 3.58 | % | 3.86 | % | 4.02 | % | |||||||||||||||
Fund portfolio turnover rate | 11 | %(f) | 55 | % | 28 | % | 22 | % | 23 | % | 34 | % | |||||||||||||||
(a) The Fund's maximum sales charge is not included in the total return computation.
(b) The amount is less than $0.005 and rounded to zero.
(c) Based on average shares outstanding.
(d) Net investment income, net realized and unrealized gain (loss) on securities and redemptions fees for Class A and Class C for the years ended December 31, 2012 to December 31, 2014 were restated during the year ended December 31, 2015. See Note 2(H).
(e) Not annualized
(f) Annualized
See Accompanying Notes to Financial Statements which are an integral part of these financial statements.
53
Pacific Advisors Fund Inc.
Financial Highlights (Unaudited)
(For a share outstanding throughout the period)
Large Cap Value Fund | |||||||||||||||||||||||||||
Class A | |||||||||||||||||||||||||||
| For the six months ended | For the year ended December 31, | ||||||||||||||||||||||||||
June 30, 2017 | 2016 | 2015 | 2014 | 2013 | 2012 | ||||||||||||||||||||||
Per Share Operating Performance | |||||||||||||||||||||||||||
Net asset value, beginning of period | $ | 15.14 | $ | 13.92 | $ | 14.18 | $ | 13.05 | $ | 10.34 | $ | 9.30 | |||||||||||||||
Income from investing operations | |||||||||||||||||||||||||||
Net investment loss (c) | (0.15 | ) | (0.23 | ) | (0.09 | ) | (0.07 | )(d) | (0.02 | )(d) | (0.02 | )(d) | |||||||||||||||
Net realized and unrealized gain (loss) on securities | 1.16 | 1.49 | (0.15 | ) | 1.37 | (d) | 2.99 | (d) | 1.06 | (d) | |||||||||||||||||
Total from investment operations | 1.01 | 1.26 | (0.24 | ) | 1.30 | 2.97 | 1.04 | ||||||||||||||||||||
Less distributions | |||||||||||||||||||||||||||
From net capital gain | - | (0.04 | ) | (0.02 | ) | (0.17 | ) | (0.26 | ) | - | |||||||||||||||||
Total distributions | - | (0.04 | ) | (0.02 | ) | (0.17 | ) | (0.26 | ) | - | |||||||||||||||||
Redemption fees (b)(c) | - | - | - | - | (d) | - | (d) | - | (d) | ||||||||||||||||||
Net asset value, end of period | $ | 16.15 | $ | 15.14 | $ | 13.92 | $ | 14.18 | $ | 13.05 | $ | 10.34 | |||||||||||||||
Total Investment Return (a) | 6.67 | %(e) | 9.08 | % | (1.68 | )% | 9.94 | % | 28.72 | % | 11.18 | % | |||||||||||||||
Ratios/Supplemental Data | |||||||||||||||||||||||||||
Net assets, end of period (000's) | $ | 7,403 | $ | 6,953 | $ | 6,587 | $ | 6,892 | $ | 5,453 | $ | 3,973 | |||||||||||||||
Ratio of net investment loss to average net assets | |||||||||||||||||||||||||||
With expense reductions | (1.88 | )%(f) | (1.60 | )% | (0.64 | )% | (0.55 | )% | (0.17 | )% | (0.18 | )% | |||||||||||||||
Without expense reductions | (2.62 | )%(f) | (2.35 | )% | (1.39 | )% | (1.30 | )% | (1.72 | )% | (1.91 | )% | |||||||||||||||
Ratio of expenses to average net assets | |||||||||||||||||||||||||||
With expense reductions | 3.77 | %(f) | 3.85 | % | 2.72 | % | 2.64 | % | 2.47 | % | 2.61 | % | |||||||||||||||
Without expense reductions | 4.52 | %(f) | 4.60 | % | 3.47 | % | 3.39 | % | 4.02 | % | 4.34 | % | |||||||||||||||
Fund portfolio turnover rate | 0 | %(f) | 0 | % | 7 | % | 3 | % | 24 | % | 9 | % | |||||||||||||||
Class C | |||||||||||||||||||||||||||
| For the six months ended | For the year ended December 31, | ||||||||||||||||||||||||||
June 30, 2017 | 2016 | 2015 | 2014 | 2013 | 2012 | ||||||||||||||||||||||
Per Share Operating Performance | |||||||||||||||||||||||||||
Net asset value, beginning of period | $ | 13.01 | $ | 12.06 | $ | 12.39 | $ | 11.50 | $ | 9.20 | $ | 8.34 | |||||||||||||||
Income from investing operations | |||||||||||||||||||||||||||
Net investment loss (c) | (0.18 | ) | (0.28 | ) | (0.17 | ) | (0.15 | )(d) | (0.10 | )(d) | (0.09 | )(d) | |||||||||||||||
Net realized and unrealized gain (loss) on securities | 1.00 | 1.27 | (0.14 | ) | 1.21 | (d) | 2.66 | (d) | 0.95 | (d) | |||||||||||||||||
Total from investment operations | 0.82 | 0.99 | (0.31 | ) | 1.06 | 2.56 | 0.86 | ||||||||||||||||||||
Less distributions | |||||||||||||||||||||||||||
From net capital gain | - | (0.04 | ) | (0.02 | ) | (0.17 | ) | (0.26 | ) | - | |||||||||||||||||
Total distributions | - | (0.04 | ) | (0.02 | ) | (0.17 | ) | (0.26 | ) | - | |||||||||||||||||
Redemption fees (c) | - | (b) | - | (b) | - | (b) | - | (b,d) | - | (d) | - | (b,d) | |||||||||||||||
Net asset value, end of period | $ | 13.83 | $ | 13.01 | $ | 12.06 | $ | 12.39 | $ | 11.50 | $ | 9.20 | |||||||||||||||
Total Investment Return | 6.30 | %(e) | 8.24 | % | (2.48 | )% | 9.18 | % | 27.83 | % | 10.31 | % | |||||||||||||||
Ratios/Supplemental Data | |||||||||||||||||||||||||||
Net assets, end of period (000's) | $ | 635 | $ | 837 | $ | 1,160 | $ | 1,167 | $ | 816 | $ | 578 | |||||||||||||||
Ratio of net investment loss to average net assets | |||||||||||||||||||||||||||
With expense reductions | (2.61 | )%(f) | (2.34 | )% | (1.41 | )% | (1.29 | )% | (0.92 | )% | (1.01 | )% | |||||||||||||||
Without expense reductions | (3.36 | )%(f) | (3.09 | )% | (2.16 | )% | (2.03 | )% | (2.47 | )% | (2.74 | )% | |||||||||||||||
Ratio of expenses to average net assets | |||||||||||||||||||||||||||
With expense reductions | 4.50 | %(f) | 4.59 | % | 3.50 | % | 3.38 | % | 3.22 | % | 3.43 | % | |||||||||||||||
Without expense reductions | 5.24 | %(f) | 5.34 | % | 4.25 | % | 4.13 | % | 4.77 | % | 5.15 | % | |||||||||||||||
Fund portfolio turnover rate | 0 | %(f) | 0 | % | 7 | % | 3 | % | 24 | % | 9 | % | |||||||||||||||
(a) The Fund's maximum sales charge is not included in the total return computation.
(b) The amount is less than $0.005 and rounded to zero.
(c) Based on average shares outstanding.
(d) Net investment income, net realized and unrealized gain (loss) on securities and redemptions fees for Class A and Class C for the years ended December 31, 2012 to December 31, 2014 were restated during the year ended December 31, 2015. See Note 2(H).
(e) Not annualized
(f) Annualized
See Accompanying Notes to Financial Statements which are an integral part of these financial statements.
54
Pacific Advisors Fund Inc.
Financial Highlights (Unaudited)
(For a share outstanding throughout the period)
Mid Cap Value Fund | |||||||||||||||||||||||||||
Class A | |||||||||||||||||||||||||||
| For the six months ended | For the year ended December 31, | ||||||||||||||||||||||||||
June 30, 2017 | 2016 | 2015 | 2014 | 2013 | 2012 | ||||||||||||||||||||||
Per Share Operating Performance | |||||||||||||||||||||||||||
Net asset value, beginning of period | $ | 11.78 | $ | 10.28 | $ | 13.46 | $ | 15.25 | $ | 11.47 | $ | 10.88 | |||||||||||||||
Income from investing operations | |||||||||||||||||||||||||||
Net investment loss (c) | (0.23 | ) | (0.40 | ) | (0.31 | ) | (0.35 | )(d) | (0.39 | )(d) | (0.33 | )(d) | |||||||||||||||
Net realized and unrealized gain (loss) on securities | (0.16 | ) | 1.90 | (2.87 | ) | (1.44 | )(d) | 4.17 | (d) | 0.92 | (d) | ||||||||||||||||
Total from investment operations | (0.39 | ) | 1.50 | (3.18 | ) | (1.79 | ) | 3.78 | 0.59 | ||||||||||||||||||
Redemption fees (c) | - | (b) | - | (b) | - | (b) | - | (b,d) | - | (d) | - | (b,d) | |||||||||||||||
Net asset value, end of period | $ | 11.39 | $ | 11.78 | $ | 10.28 | $ | 13.46 | $ | 15.25 | $ | 11.47 | |||||||||||||||
Total Investment Return (a) | (3.31 | )%(e) | 14.59 | % | (23.63 | )% | (11.74 | )% | 32.96 | % | 5.42 | % | |||||||||||||||
Ratios/Supplemental Data | |||||||||||||||||||||||||||
Net assets, end of period (000's) | $ | 5,450 | $ | 5,728 | $ | 4,875 | $ | 5,981 | $ | 6,058 | $ | 4,500 | |||||||||||||||
Ratio of net investment loss to average net assets | (4.05 | )%(f) | (3.80 | )% | (2.48 | )% | (2.46 | )% | (2.88 | )% | (3.01 | )% | |||||||||||||||
Ratio of expenses to average net assets | 4.84 | %(f) | 4.74 | % | 3.68 | % | 3.42 | % | 3.69 | % | 4.19 | % | |||||||||||||||
Fund portfolio turnover rate | 17 | %(f) | 13 | % | 25 | % | 22 | % | 15 | % | 24 | % | |||||||||||||||
Class C | |||||||||||||||||||||||||||
| For the six months ended | For the year ended December 31, | ||||||||||||||||||||||||||
June 30, 2017 | 2016 | 2015 | 2014 | 2013 | 2012 | ||||||||||||||||||||||
Per Share Operating Performance | |||||||||||||||||||||||||||
Net asset value, beginning of period | $ | 10.42 | $ | 9.16 | $ | 12.09 | $ | 13.80 | $ | 10.46 | $ | 10.00 | |||||||||||||||
Income from investing operations | |||||||||||||||||||||||||||
Net investment loss (c) | (0.24 | ) | (0.42 | ) | (0.37 | ) | (0.42 | )(d) | (0.45 | )(d) | (0.38 | )(d) | |||||||||||||||
Net realized and unrealized gain (loss) on securities | (0.14 | ) | 1.68 | (2.56 | ) | (1.29 | )(d) | 3.79 | (d) | 0.84 | (d) | ||||||||||||||||
Total from investment operations | (0.38 | ) | 1.26 | (2.93 | ) | (1.71 | ) | 3.34 | 0.46 | ||||||||||||||||||
Redemption fees (c) | - | (b) | - | (b) | - | (b) | - | (b,d) | - | (d) | - | (b,d) | |||||||||||||||
Net asset value, end of period | $ | 10.04 | $ | 10.42 | $ | 9.16 | $ | 12.09 | $ | 13.80 | $ | 10.46 | |||||||||||||||
Total Investment Return | (3.65 | )%(e) | 13.76 | % | (24.23 | )% | (12.39 | )% | 31.93 | % | 4.60 | % | |||||||||||||||
Ratios/Supplemental Data | |||||||||||||||||||||||||||
Net assets, end of period (000's) | $ | 354 | $ | 366 | $ | 661 | $ | 891 | $ | 1,204 | $ | 854 | |||||||||||||||
Ratio of net investment loss to average net assets | (4.80 | )%(f) | (4.56 | )% | (3.26 | )% | (3.22 | )% | (3.61 | )% | (3.77 | )% | |||||||||||||||
Ratio of expenses to average net assets | 5.59 | %(f) | 5.54 | % | 4.46 | % | 4.17 | % | 4.42 | % | 4.95 | % | |||||||||||||||
Fund portfolio turnover rate | 17 | %(f) | 13 | % | 25 | % | 22 | % | 15 | % | 24 | % | |||||||||||||||
(a) The Fund's maximum sales charge is not included in the total return computation.
(b) The amount is less than $0.005 and rounded to zero.
(c) Based on average shares outstanding.
(d) Net investment income, net realized and unrealized gain (loss) on securities and redemptions fees for Class A and Class C for the years ended December 31, 2012 to December 31, 2014 were restated during the year ended December 31, 2015. See Note 2(H).
(e) Not annualized
(f) Annualized
See Accompanying Notes to Financial Statements which are an integral part of these financial statements.
55
Pacific Advisors Fund Inc.
Financial Highlights (Unaudited)
(For a share outstanding throughout the period)
Small Cap Value Fund | |||||||||||||||||||||||||||
Class A | |||||||||||||||||||||||||||
| For the six months ended | For the year ended December 31, | ||||||||||||||||||||||||||
June 30, 2017 | 2016 | 2015 | 2014 | 2013 | 2012 | ||||||||||||||||||||||
Per Share Operating Performance | |||||||||||||||||||||||||||
Net asset value, beginning of period | $ | 27.23 | $ | 24.72 | $ | 44.51 | $ | 61.41 | $ | 38.50 | $ | 34.42 | |||||||||||||||
Income from investing operations | |||||||||||||||||||||||||||
Net investment loss (c) | (0.49 | ) | (0.92 | ) | (1.06 | ) | (1.11 | )(d) | (0.99 | )(d) | (0.76 | )(d) | |||||||||||||||
Net realized and unrealized gain (loss) on securities | (0.95 | ) | 7.66 | (12.25 | ) | (12.20 | )(d) | 23.87 | (d) | 4.79 | (d) | ||||||||||||||||
Total from investment operations | (1.44 | ) | 6.74 | (13.31 | ) | (13.31 | ) | 22.88 | 4.03 | ||||||||||||||||||
Less distributions | |||||||||||||||||||||||||||
From net capital gain | - | (4.24 | ) | (6.50 | ) | (3.62 | ) | - | - | ||||||||||||||||||
Total distributions | - | (4.24 | ) | (6.50 | ) | (3.62 | ) | - | - | ||||||||||||||||||
Redemption fees (c) | 0.01 | 0.01 | 0.02 | 0.03 | (d) | 0.03 | (d) | 0.05 | (d) | ||||||||||||||||||
Net asset value, end of period | $ | 25.80 | $ | 27.23 | $ | 24.72 | $ | 44.51 | $ | 61.41 | $ | 38.50 | |||||||||||||||
Total Investment Return (a) | (5.25 | )%(e) | 27.08 | % | (30.31 | )% | (21.60 | )% | 59.51 | % | 11.85 | % | |||||||||||||||
Ratios/Supplemental Data | |||||||||||||||||||||||||||
Net assets, end of period (000's) | $ | 22,109 | $ | 26,420 | $ | 33,942 | $ | 122,642 | $ | 199,163 | $ | 85,607 | |||||||||||||||
Ratio of net investment loss to average net assets | (3.77 | )%(f) | (3.74 | )% | (2.64 | )% | (1.72 | )% | (1.93 | )% | (2.06 | )% | |||||||||||||||
Ratio of expenses to average net assets | 4.06 | %(f) | 4.19 | % | 3.03 | % | 2.19 | % | 2.31 | % | 2.71 | % | |||||||||||||||
Fund portfolio turnover rate | 5 | %(f) | 11 | % | 7 | % | 16 | % | 9 | % | 12 | % | |||||||||||||||
Class C | |||||||||||||||||||||||||||
| For the six months ended | For the year ended December 31, | ||||||||||||||||||||||||||
June 30, 2017 | 2016 | 2015 | 2014 | 2013 | 2012 | ||||||||||||||||||||||
Per Share Operating Performance | |||||||||||||||||||||||||||
Net asset value, beginning of period | $ | 19.79 | $ | 19.01 | $ | 36.59 | $ | 51.70 | $ | 32.65 | $ | 29.41 | |||||||||||||||
Income from investing operations | |||||||||||||||||||||||||||
Net investment loss (c) | (0.43 | ) | (0.85 | ) | (1.11 | ) | (1.29 | )(d) | (1.16 | )(d) | (0.88 | )(d) | |||||||||||||||
Net realized and unrealized gain (loss) on securities | (0.69 | ) | 5.87 | (9.99 | ) | (10.23 | )(d) | 20.19 | (d) | 4.08 | (d) | ||||||||||||||||
Total from investment operations | (1.12 | ) | 5.02 | (11.10 | ) | (11.52 | ) | 19.03 | 3.20 | ||||||||||||||||||
Less distributions | |||||||||||||||||||||||||||
From net capital gain | - | (4.24 | ) | (6.50 | ) | (3.62 | ) | - | - | ||||||||||||||||||
Total distributions | - | (4.24 | ) | (6.50 | ) | (3.62 | ) | - | - | ||||||||||||||||||
Redemption fees (c) | 0.01 | - | (b) | 0.02 | 0.03 | (d) | 0.02 | (d) | 0.04 | (d) | |||||||||||||||||
Net asset value, end of period | $ | 18.68 | $ | 19.79 | $ | 19.01 | $ | 36.59 | $ | 51.70 | $ | 32.65 | |||||||||||||||
Total Investment Return | (5.61 | )%(e) | 26.12 | % | (30.83 | )% | (22.19 | )% | 58.35 | % | 11.02 | % | |||||||||||||||
Ratios/Supplemental Data | |||||||||||||||||||||||||||
Net assets, end of period (000's) | $ | 2,962 | $ | 3,596 | $ | 5,180 | $ | 10,498 | $ | 14,646 | $ | 6,912 | |||||||||||||||
Ratio of net investment loss to average net assets | (4.52 | )%(f) | (4.51 | )% | (3.45 | )% | (2.47 | )% | (2.69 | )% | (2.80 | )% | |||||||||||||||
Ratio of expenses to average net assets | 4.81 | %(f) | 4.95 | % | 3.88 | % | 2.95 | % | 3.08 | % | 3.45 | % | |||||||||||||||
Fund portfolio turnover rate | 5 | %(f) | 11 | % | 7 | % | 16 | % | 9 | % | 12 | % | |||||||||||||||
(a) The Fund's maximum sales charge is not included in the total return computation.
(b) The amount is less than $0.005 and rounded to zero.
(c) Based on average shares outstanding.
(d) Net investment loss, net realized and unrealized gain (loss) on securities and redemptions fees for Class A and Class C for the years ended December 31, 2012 to December 31, 2014 were restated during the year ended December 31, 2015. See Note 2(H).
(e) Not annualized
(f) Annualized
See Accompanying Notes to Financial Statements which are an integral part of these financial statements.
56
Pacific Advisors Fund Inc.
Financial Highlights (Unaudited)
(For a share outstanding throughout the period)
Small Cap Value Fund | |||||||||||||||||||||||||||
Class I | |||||||||||||||||||||||||||
| For the six months ended | For the year ended December 31, | ||||||||||||||||||||||||||
June 30, 2017 | 2016 | 2015 | 2014 | 2013 | 2012 | ||||||||||||||||||||||
Per Share Operating Performance | |||||||||||||||||||||||||||
Net asset value, beginning of period | $ | 35.05 | $ | 30.87 | $ | 53.06 | $ | 72.10 | $ | 45.13 | $ | 39.15 | |||||||||||||||
Income from investing operations | |||||||||||||||||||||||||||
Net investment loss (c) | (0.59 | ) | (1.08 | ) | (1.20 | ) | (1.15 | )(d) | (1.32 | )(d) | (0.85 | )(d) | |||||||||||||||
Net realized and unrealized gain (loss) on securities | (1.23 | ) | 9.49 | (14.52 | ) | (14.30 | )(d) | 28.27 | (d) | 6.76 | (d) | ||||||||||||||||
Total from investment operations | (1.82 | ) | 8.41 | (15.72 | ) | (15.45 | ) | 26.95 | 5.91 | ||||||||||||||||||
Less distributions | |||||||||||||||||||||||||||
From net capital gain | - | (4.24 | ) | (6.50 | ) | (3.62 | ) | - | - | ||||||||||||||||||
Total distributions | - | (4.24 | ) | (6.50 | ) | (3.62 | ) | - | - | ||||||||||||||||||
Redemption fees (c) | 0.01 | 0.01 | 0.03 | 0.03 | (d) | 0.02 | (d) | 0.07 | (d) | ||||||||||||||||||
Net asset value, end of period | $ | 33.24 | $ | 35.05 | $ | 30.87 | $ | 53.06 | $ | 72.10 | $ | 45.13 | |||||||||||||||
Total Investment Return | (5.16 | )%(e) | 27.10 | % | (29.94 | )% | (21.36 | )% | 59.76 | % | 15.27 | % | |||||||||||||||
Ratios/Supplemental Data | |||||||||||||||||||||||||||
Net assets, end of period (000's) | $ | 7 | $ | 8 | $ | 155 | $ | 1,402 | $ | 380 | $ | 7 | |||||||||||||||
Ratio of net investment loss to average net assets | (3.55 | )%(f) | (3.57 | )% | (2.55 | )% | (1.54 | )% | (1.93 | )% | (2.02 | )% | |||||||||||||||
Ratio of expenses to average net assets | 3.84 | %(f) | 3.93 | % | 2.86 | % | 2.03 | % | 2.06 | % | 2.63 | % | |||||||||||||||
Fund portfolio turnover rate | 5 | %(f) | 11 | % | 7 | % | 16 | % | 9 | % | 12 | % | |||||||||||||||
(c) Based on average shares outstanding.
(d) Net investment income, net realized and unrealized gain (loss) on securities and redemptions fees for Class A and Class C for the years ended December 31, 2012 to December 31, 2014 were restated during the year ended December 31, 2015. See Note 2(H).
(e) Not annualized
(f) Annualized
See Accompanying Notes to Financial Statements which are an integral part of these financial statements.
57
Pacific Advisors Fund Inc.
Notes to Financial Statements (Unaudited)
June 30, 2017
Note 1. Organization
Pacific Advisors Fund Inc. (the "Company") is an open-end diversified investment management company registered under the Investment Company Act of 1940 ("the 40 Act"), as amended. The Company currently offers five Funds: Income and Equity Fund, Balanced Fund, Large Cap Value Fund, Mid Cap Value Fund and Small Cap Value Fund (individually, a "Fund," or collectively, the "Funds"). Each Fund is a separate investment portfolio of the Company with a distinct investment objective, investment program, policies and restrictions.
The Income and Equity Fund seeks to provide current income and, secondarily, long-term capital appreciation. The Balanced Fund seeks to achieve long-term capital appreciation and income consistent with reduced risk. The Large Cap Value Fund seeks to achieve long-term capital appreciation. The Mid Cap Value Fund seeks to achieve long-term capital appreciation. The Small Cap Value Fund seeks to provide capital appreciation through investment in small capitalization companies.
The Funds offer Class A and Class C shares. In addition to Class A and Class C shares, the Small Cap Value Fund also offers Class I shares. Each Class has equal rights as to assets and voting privileges except that Class A and Class C each has exclusive voting rights with respect to its distribution plan. Investment income, realized and unrealized capital gains and losses, and the common expenses of each Fund are allocated on a pro rata basis to each Class based on the relative net assets of each Class to the total net assets of the Fund. Each Class of shares differs in its respective service and distribution expenses and may differ in its transfer agent, registration, and certain other Class-specific fees and expenses.
The Company enters into contracts that contain a variety of indemnifications. The Company's maximum exposure under these arrangements is unknown. However, the Company has not had prior claims or losses pursuant to these contracts and expects the risk of loss to be remote.
The Funds follow the investment company accounting and reporting guidance of the Financial Accounting Standards Board (FASB) Accounting Standard Codification Topic 946 "Financial Services – Investment Companies."
Note 2. Significant Accounting Policies
A. Security Valuation and Fair Value Measurement. Securities, including American Depository Receipts (ADRs), listed on a national securities exchange and certain over-the-counter ("OTC") issues traded on the NASDAQ national market system are valued at the last quoted sale price at the close of the New York Stock Exchange. OTC issues not quoted on the NASDAQ system, and other equity securities for which no sale price is available, are valued at the last bid price as obtained from published sources or real time quote services, where available, and otherwise from brokers who are market makers for such securities. For securities that mature in 60 days or less, the Funds may utilize the amortized cost method of valuation if it is reasonable to conclude it approximates fair value. In determining the fair value of other debt securities, Pacific Global Investment Management Company, Inc. (the "Investment Manager") utilizes independent pricing services approved by the Board of Directors (the "Board") using one or more of the following valuation techniques:
(1) a matrix pricing approach that considers market inputs including, in approximate order of priority, the following: benchmark yields, reported trades, broker/dealer quotes, issuer spreads, two-sided markets, benchmark securities, bids, offers and reference data including market research publications; market indicators, industry and economic events. Evaluators may prioritize inputs differently on any given day for any security based on market conditions, and not all inputs listed are available for use in the evaluation process for each security evaluation on any given day; (2) a comparison of the value of the borrower's outstanding equity and debt to that of comparable public companies; and/or (3) a discounted cash flow analysis. Fair value determinations are made by the Investment Manager based on the Company's Fair Value Procedure, as adopted by the Board. In conducting its assessment and analysis for purpose of determining fair value, the Investment Manager uses its discretion and judgment in considering and appraising the relevant factors, including examining the source and nature of the quotations, to validate that the quotations and prices are representative of fair value.
Various inputs are used to determine the fair value of each Fund's investments. For financial statements, these inputs are summarized in the three broad levels listed below. Level 1 inputs are based on quoted prices in active markets for identical securities. Level 2 inputs are based on significant observable market inputs, such as quoted prices for similar securities and quoted prices in inactive markets. Level 3 inputs are significant unobservable inputs that reflect the Fund's own assumptions in determining the fair value of investments. The valuation levels are not necessarily an indication of the risk associated with investing in those securities.
58
Pacific Advisors Fund Inc.
Notes to Financial Statements (Unaudited)
June 30, 2017
The following is a summary of the inputs used to value each Fund's investment securities as of June 30, 2017.
| Income and Equity Fund | Balanced Fund | Large Cap Value Fund | Mid Cap Value Fund | Small Cap Value Fund | |||||||||||||||||||
Level 1 - Quoted Prices | |||||||||||||||||||||||
Common Stock | |||||||||||||||||||||||
Consumer Discretionary | $ | 867,730 | $ | 751,238 | $ | 1,558,170 | $ | 1,869,843 | $ | 5,413,550 | |||||||||||||
Consumer Staples | 1,224,605 | 220,140 | 1,408,549 | 145,776 | 1,721,256 | ||||||||||||||||||
Energy | 472,630 | 273,485 | 121,095 | 506,130 | 4,319,257 | ||||||||||||||||||
Financials | 888,035 | 699,473 | 1,385,927 | 459,328 | 2,035,580 | ||||||||||||||||||
Health Care | 840,135 | 408,087 | 332,709 | 186,116 | - | ||||||||||||||||||
Industrials | 1,139,368 | 822,649 | 1,459,867 | 2,304,884 | 11,734,569 | ||||||||||||||||||
Information Technology | 958,580 | 746,546 | 1,761,947 | 209,988 | - | ||||||||||||||||||
Materials | 428,215 | - | 2,499 | 117,553 | - | ||||||||||||||||||
Telecommunication Services | 494,340 | 89,320 | - | - | - | ||||||||||||||||||
Utilities | 694,855 | - | - | - | - | ||||||||||||||||||
Preferred Stock | |||||||||||||||||||||||
Financials | 726,281 | 103,550 | - | - | - | ||||||||||||||||||
Level 1 Total | 8,734,774 | 4,114,488 | 8,030,763 | 5,799,618 | 25,224,212 | ||||||||||||||||||
Level 2 - Other significant observable inputs | |||||||||||||||||||||||
Corporate Bond | |||||||||||||||||||||||
Consumer Discretionary | 1,181,892 | 106,875 | - | - | - | ||||||||||||||||||
Consumer Staples | 152,864 | - | - | - | - | ||||||||||||||||||
Energy | 619,332 | 627,093 | - | - | - | ||||||||||||||||||
Financials | 2,689,512 | 302,545 | - | - | - | ||||||||||||||||||
Health Care | 252,494 | 100,160 | - | - | - | ||||||||||||||||||
Industrials | 1,256,262 | - | - | - | - | ||||||||||||||||||
Information Technology | 717,240 | 194,538 | - | - | - | ||||||||||||||||||
Materials | 222,215 | 105,875 | - | - | - | ||||||||||||||||||
Utilities | 101,000 | - | - | - | - | ||||||||||||||||||
Real Estate | 729,389 | 113,388 | - | - | - | ||||||||||||||||||
Level 2 Total | 7,922,200 | 1,550,474 | - | - | - | ||||||||||||||||||
Level 3 - Significant unobservable inputs | - | - | - | - | - | ||||||||||||||||||
Total Investments | $ | 16,656,974 | $ | 5,664,962 | $ | 8,030,763 | $ | 5,799,618 | $ | 25,224,212 | |||||||||||||
Equity securities (common and preferred stock) that are actively traded and market priced are typically classified as Level 1 securities. Fixed income securities are typically classified as Level 2 securities. The Funds had no Level 3 holdings during the period ended June 30, 2017. In addition, the Funds are required to disclose the amounts of significant transfers between Level 1 and Level 2 of the fair value hierarchy and the reasons for these transfers. The Investment Manager has evaluated the Funds' positions for the period ended June 30, 2017, and determined that, for purposes of fair value pricing measurement, there were no transfers between Level 1 and Level 2.
B. Cash and Cash Equivalents. The Company considers all highly liquid financial instruments with maturities of less than three months when acquired to be cash equivalents. For cash management purposes, each Fund may concentrate cash with the Fund's custodian, United Missouri Bank, n.a. ("UMB"). This typically results in cash balances exceeding the Federal Deposit Insurance Corporation ("FDIC") insurance limits.
C. Security Transactions and Investment Income. Security transactions are accounted for on the trade date. The cost of investments sold is determined by use of the specific identification method for both financial reporting and federal income tax purposes. Dividends are recorded on the ex-dividend date. Interest income is recorded on an accrual basis. Premium or discount on debt securities are amortized or accreted using the effective interest method.
D. Dividends and Distributions to Shareholders. The Income and Equity Fund declares and distributes dividends of its net investment income, if any, quarterly. The Balanced Fund, Large Cap Value Fund, Mid Cap Value Fund and Small Cap Value Fund declare and distribute dividends of their net investment income, if any, annually. In addition, each Fund declares and distributes a capital gain dividend, if any, annually. The Board determines the amount and timing of such payments.
59
Pacific Advisors Fund Inc.
Notes to Financial Statements (Unaudited)
June 30, 2017
E. Federal Income Tax. The Funds intends to comply with the requirements of Subchapter M of the Internal Revenue Code applicable to regulated investment companies and to distribute substantially all of their taxable income to their shareholders. Therefore, no federal income tax provision is required.
Management has analyzed the Funds' tax positions taken on federal income tax returns for all open tax years and for the year ended December 31, 2016 and has concluded that no provision for income tax is required in the Funds' financial statements. Tax years 2013, 2014, 2015 and 2016 are still subject to examination by major federal jurisdictions. Tax years 2012, 2013, 2014, 2015, and 2016 are still subject to examination by major state jurisdictions.
The Funds recognize interest and penalties, if any, related to unrecognized tax benefits as income tax expense in the Statement of Operations. During the year, the Funds did not incur any interest or penalties.
At December 31, 2016, components of distributable earnings on a tax basis were as follows:
| Income and Equity Fund | Balanced Fund | Large Cap Value Fund | Mid Cap Value Fund | Small Cap Value Fund | |||||||||||||||||||
Undistributed long-term gains | $ | - | $ | 31,224 | $ | 12,358 | $ | - | $ | 1,077,138 | |||||||||||||
Capital loss carry forward* | (285,340 | ) | - | - | (640,167 | ) | - | ||||||||||||||||
Net unrealized appreciation on investments | 2,245,700 | 266,862 | 3,181,968 | 1,208,402 | 6,033,171 | ||||||||||||||||||
Accumulated earnings | $ | 1,960,360 | $ | 298,086 | $ | 3,194,326 | $ | 568,235 | $ | 7,110,309 | |||||||||||||
The difference between book basis and tax basis unrealized appreciation is attributable primarily to the tax deferral of losses on wash sales and characterization of certain income items. The Funds intend to treat post October losses (net capital losses incurred for the period subsequent to October 31, 2016 through the year end December 31, 2016) as having been incurred in the next fiscal year.
The Funds intend to utilize provisions of the federal income tax laws which allow them to carry a capital loss realized prior to 2011 forward for eight years following the year of the loss and offset such losses against any future realized capital gains. During the most recent fiscal year, the following capital losses carried forward have been utilized:
| Income and Equity Fund | Balanced Fund | Large Cap Value Fund | Mid Cap Value Fund | Small Cap Value Fund | |||||||||||||||||||
Capital loss carryforward utilized | $ | 126,786 | $ | - | $ | - | $ | 15,195 | $ | - | |||||||||||||
* As of December 31, 2016, the following Funds had accumulated net realized losses on investment transactions that represent capital loss carryforwards for federal income tax purposes, which expire as follows:
Capital losses expiring in: | |||||||||||||||
2017 | 2018 | Total | |||||||||||||
Income and Equity Fund | $ | 285,340 | $ | - | $ | 285,340 | |||||||||
Mid Cap Value Fund | 640,167 | - | 640,167 | ||||||||||||
During the year ended December 31, 2016, the Mid Cap Value Fund had a capital loss carryforward in the amount of $527,469 that expired.
The Regulated Investment Company Modernization Act of 2010 (the "Act") changed various technical rules governing the tax treatment of regulated investment companies ("RICs") including the Funds. Under the Act, each Fund is permitted to carry forward capital losses incurred in taxable years beginning in 2011 for an unlimited period. However, any losses incurred during those future taxable years will be required to be utilized prior to the losses incurred in pre-enactment taxable years, which carry an expiration date. As a result of this ordering rule, pre-enactment capital loss carryforwards may be more likely to expire unused. Additionally, post-enactment capital loss carryforwards will retain their character as either short-term or long-term capital losses rather than being considered all short-term as permitted under previous regulation.
Finally, the Act contains several provisions aimed at preserving the character of distributions made by a fiscal year RIC during the portion of its taxable year ending after October 31 or December 31, reducing the circumstances under which a RIC might be required to file amended Forms 1099 to restate previously reported distributions.
60
Pacific Advisors Fund Inc.
Notes to Financial Statements (Unaudited)
June 30, 2017
During the most recent fiscal year, the following capital losses carried forward under the provisions of the Act were utilized:
| Loss Carryforward Utilized | |||||||||||
Short Term | Long Term | ||||||||||
Mid Cap Value Fund | $ | 63,496 | $ | 46,499 | |||||||
No losses will be carried forward under the provisions of the Act.
F. Reclassification of Capital Accounts. Distributions of net investment income and realized gains are determined in accordance with income tax regulations which may differ from GAAP. These differences are due to differing treatments for items such as net operating losses, reclassification of dividends and return of capital. To the extent that these differences are permanent in nature, reclassifications are made among the net asset accounts on the Statement of Assets and Liabilities. Net assets and net asset value per share are not affected by these reclassifications.
For the year ended December 31, 2016, reclassifications among the components of net assets are as follows:
| Accumulated Undistributed Net Investment Income | Paid in Capital | Accumulated Undistributed Net Realized Gain (Loss) on Security Transactions | |||||||||||||
Balanced Fund | $ | 173,862 | $ | (173,862 | ) | $ | - | ||||||||
Large Cap Value Fund | 126,115 | (126,115 | ) | - | |||||||||||
Mid Cap Value Fund | 219,294 | (746,763 | ) | 527,469 | |||||||||||
Small Cap Value Fund | 1,191,012 | (1,080,017 | ) | (110,995 | ) | ||||||||||
The reclassifications were due to net investment losses incurred by the Funds, which are not permitted to be carried forward for tax purposes and the expiration of capital loss carryforwards, as well as differing book and tax treatment of certain securities.
G. Use of Estimates. The preparation of financial statements in conformity with U.S. GAAP requires management to make estimates and assumptions that affect the reported amounts in the financial statements and footnotes. Actual results could differ from those estimates.
H. Accounting Method Change. On December 31, 2015, the Funds elected to change their method of determining net investment income (loss) per share to the average shares method, which determines the net investment income (loss) per share by dividing the net investment income (loss) by the average number of shares outstanding during the year. In prior years the net investment income (loss) per share was determined using the SEC method, which compares ending undistributed income (loss) per share to the beginning undistributed income (loss) per share, adjusted for distributions paid per share. The new method of accounting was adopted as a result of management's determination that the average shares method produced a result that was more reflective of the actual net investment income (loss) on a per share basis during each of the years. The financial highlights for each of the years presented have been adjusted to apply this new method retrospectively. The following financial statement line items for the years 2012-2014 were affected by this change in accounting principle.
Financial Highlights | |||||||||||||||
| Income and Equity Fund (Class A) | 2014 | 2013 | 2012 | ||||||||||||
As Computed Under SEC Method | |||||||||||||||
Net investment income | 0.21 | 0.10 | 0.15 | ||||||||||||
Net realized and unrealized gain | 0.52 | 1.28 | 0.48 | ||||||||||||
Redemption Fees | 0.00 | 0.00 | 0.00 | ||||||||||||
As Computed Under Average Shares Method | |||||||||||||||
Net investment income | 0.22 | 0.14 | 0.15 | ||||||||||||
Net realized and unrealized gain | 0.51 | 1.24 | 0.48 | ||||||||||||
Redemption Fees | 0.00 | 0.00 | 0.00 | ||||||||||||
Effect of Change | |||||||||||||||
Net investment income | 0.01 | 0.04 | 0.00 | ||||||||||||
Net realized and unrealized gain (loss) | (0.01 | ) | (0.04 | ) | 0.00 | ||||||||||
Redemption Fees | 0.00 | 0.00 | 0.00 | ||||||||||||
61
Pacific Advisors Fund Inc.
Notes to Financial Statements (Unaudited)
June 30, 2017
| Income and Equity Fund (Class C) | 2014 | 2013 | 2012 | ||||||||||||
As Computed Under SEC Method | |||||||||||||||
Net investment income (loss) | 0.14 | 0.06 | (0.01 | ) | |||||||||||
Net realized and unrealized gain | 0.47 | 1.18 | 0.55 | ||||||||||||
Redemption Fees | 0.00 | 0.00 | 0.00 | ||||||||||||
As Computed Under Average Shares Method | |||||||||||||||
Net investment income | 0.13 | 0.05 | 0.08 | ||||||||||||
Net realized and unrealized gain (loss) | 0.48 | 1.19 | 0.46 | ||||||||||||
Redemption Fees | 0.00 | 0.00 | 0.00 | ||||||||||||
Effect of Change | |||||||||||||||
Net investment income (loss) | (0.01 | ) | (0.01 | ) | 0.09 | ||||||||||
Net realized and unrealized gain (loss) | 0.01 | 0.01 | (0.09 | ) | |||||||||||
Redemption Fees | 0.00 | 0.00 | 0.00 | ||||||||||||
| Balanced Fund (Class A) | |||||||||||||||
As Computed Under SEC Method | |||||||||||||||
Net investment income (loss) | (0.16 | ) | (0.18 | ) | (0.03 | ) | |||||||||
Net realized and unrealized gain (loss) | (1.15 | ) | 4.21 | 1.34 | |||||||||||
Redemption Fees | 0.00 | 0.00 | 0.00 | ||||||||||||
As Computed Under Average Shares Method | |||||||||||||||
Net investment income (loss) | (0.14 | ) | (0.15 | ) | (0.04 | ) | |||||||||
Net realized and unrealized gain (loss) | (1.17 | ) | 4.17 | 1.35 | |||||||||||
Redemption Fees | 0.00 | 0.01 | 0.00 | ||||||||||||
Effect of Change | |||||||||||||||
Net investment income (loss) | 0.02 | 0.03 | (0.01 | ) | |||||||||||
Net realized and unrealized gain (loss) | (0.02 | ) | (0.04 | ) | 0.01 | ||||||||||
Redemption Fees | 0.00 | 0.01 | 0.00 | ||||||||||||
| Balanced Fund (Class C) | |||||||||||||||
As Computed Under SEC Method | |||||||||||||||
Net investment loss | (0.40 | ) | (0.54 | ) | (0.39 | ) | |||||||||
Net realized and unrealized gain (loss) | (0.91 | ) | 4.16 | 1.51 | |||||||||||
Redemption Fees | 0.00 | 0.00 | 0.00 | ||||||||||||
As Computed Under Average Shares Method | |||||||||||||||
Net investment loss | (0.24 | ) | (0.25 | ) | (0.13 | ) | |||||||||
Net realized and unrealized gain (loss) | (1.07 | ) | 3.87 | 1.25 | |||||||||||
Redemption Fees | 0.00 | 0.00 | 0.00 | ||||||||||||
Effect of Change | |||||||||||||||
Net investment income | 0.16 | 0.29 | 0.26 | ||||||||||||
Net realized and unrealized loss | (0.16 | ) | (0.29 | ) | (0.26 | ) | |||||||||
Redemption Fees | 0.00 | 0.00 | 0.00 | ||||||||||||
| Large Cap Value Fund (Class A) | |||||||||||||||
As Computed Under SEC Method | |||||||||||||||
Net investment income | 0.02 | 0.03 | 0.04 | ||||||||||||
Net realized and unrealized gain | 1.28 | 2.94 | 1.00 | ||||||||||||
Redemption Fees | 0.00 | 0.00 | 0.00 | ||||||||||||
As Computed Under Average Shares Method | |||||||||||||||
Net investment loss | (0.07 | ) | (0.02 | ) | (0.02 | ) | |||||||||
Net realized and unrealized gain | 1.37 | 2.99 | 1.06 | ||||||||||||
Redemption Fees | 0.00 | 0.00 | 0.00 | ||||||||||||
Effect of Change | |||||||||||||||
Net investment loss | (0.09 | ) | (0.05 | ) | (0.06 | ) | |||||||||
Net realized and unrealized gain | 0.09 | 0.05 | 0.06 | ||||||||||||
Redemption Fees | 0.00 | 0.00 | 0.00 | ||||||||||||
| Large Cap Value Fund (Class C) | |||||||||||||||
As Computed Under SEC Method | |||||||||||||||
Net investment income (loss) | 0.68 | 0.32 | (0.69 | ) | |||||||||||
Net realized and unrealized gain | 0.38 | 2.24 | 1.55 | ||||||||||||
Redemption Fees | 0.00 | 0.00 | 0.00 | ||||||||||||
62
Pacific Advisors Fund Inc.
Notes to Financial Statements (Unaudited)
June 30, 2017
2014 | 2013 | 2012 | |||||||||||||
As Computed Under Average Shares Method | |||||||||||||||
Net investment loss | (0.15 | ) | (0.10 | ) | (0.09 | ) | |||||||||
Net realized and unrealized gain | 1.21 | 2.66 | 0.95 | ||||||||||||
Redemption Fees | 0.00 | 0.00 | 0.00 | ||||||||||||
Effect of Change | |||||||||||||||
Net investment income (loss) | (0.83 | ) | (0.42 | ) | 0.60 | ||||||||||
Net realized and unrealized gain (loss) | 0.83 | 0.42 | (0.60 | ) | |||||||||||
Redemption Fees | 0.00 | 0.00 | 0.00 | ||||||||||||
| Mid Cap Value Fund (Class A) | |||||||||||||||
As Computed Under SEC Method | |||||||||||||||
Net investment loss | (0.11 | ) | (0.36 | ) | (0.25 | ) | |||||||||
Net realized and unrealized gain (loss) | (1.68 | ) | 4.14 | 0.84 | |||||||||||
Redemption Fees | 0.00 | 0.00 | 0.00 | ||||||||||||
As Computed Under Average Shares Method | |||||||||||||||
Net investment loss | (0.35 | ) | (0.39 | ) | (0.33 | ) | |||||||||
Net realized and unrealized gain (loss) | (1.44 | ) | 4.17 | 0.92 | |||||||||||
Redemption Fees | 0.00 | 0.00 | 0.00 | ||||||||||||
Effect of Change | |||||||||||||||
Net investment loss | (0.24 | ) | (0.03 | ) | (0.08 | ) | |||||||||
Net realized and unrealized gain | 0.24 | 0.03 | 0.08 | ||||||||||||
Redemption Fees | 0.00 | 0.00 | 0.00 | ||||||||||||
| Mid Cap Value Fund (Class C) | |||||||||||||||
As Computed Under SEC Method | |||||||||||||||
Net investment income (loss) | (2.95 | ) | 0.48 | (3.40 | ) | ||||||||||
Net realized and unrealized gain | 1.24 | 2.86 | 3.86 | ||||||||||||
Redemption Fees | 0.00 | 0.00 | 0.00 | ||||||||||||
As Computed Under Average Shares Method | |||||||||||||||
Net investment loss | (0.42 | ) | (0.45 | ) | (0.38 | ) | |||||||||
Net realized and unrealized gain (loss) | (1.29 | ) | 3.79 | 0.84 | |||||||||||
Redemption Fees | 0.00 | 0.00 | 0.00 | ||||||||||||
Effect of Change | |||||||||||||||
Net investment income (loss) | 2.53 | (0.93 | ) | 3.02 | |||||||||||
Net realized and unrealized gain (loss) | (2.53 | ) | 0.93 | (3.02 | ) | ||||||||||
Redemption Fees | 0.00 | 0.00 | 0.00 | ||||||||||||
| Small Cap Value Fund (Class A) | |||||||||||||||
As Computed Under SEC Method | |||||||||||||||
Net investment income (loss) | (2.29 | ) | 1.44 | (1.70 | ) | ||||||||||
Net realized and unrealized gain (loss) | (10.99 | ) | 21.47 | 5.78 | |||||||||||
Redemption Fees | 0.00 | 0.00 | 0.00 | ||||||||||||
As Computed Under Average Shares Method | |||||||||||||||
Net investment loss | (1.11 | ) | (0.99 | ) | (0.76 | ) | |||||||||
Net realized and unrealized gain (loss) | (12.20 | ) | 23.87 | 4.79 | |||||||||||
Redemption Fees | 0.03 | 0.03 | 0.05 | ||||||||||||
Effect of Change | |||||||||||||||
Net investment income (loss) | 1.18 | (2.43 | ) | 0.94 | |||||||||||
Net realized and unrealized gain (loss) | (1.21 | ) | 2.40 | (0.99 | ) | ||||||||||
Redemption Fees | 0.03 | 0.03 | 0.05 | ||||||||||||
| Small Cap Value Fund (Class C) | |||||||||||||||
As Computed Under SEC Method | |||||||||||||||
Net investment income (loss) | (1.15 | ) | 3.10 | (2.53 | ) | ||||||||||
Net realized and unrealized gain (loss) | (10.34 | ) | 15.95 | 5.77 | |||||||||||
Redemption Fees | 0.00 | 0.00 | 0.00 | ||||||||||||
63
Pacific Advisors Fund Inc.
Notes to Financial Statements (Unaudited)
June 30, 2017
2014 | 2013 | 2012 | |||||||||||||
As Computed Under Average Shares Method | |||||||||||||||
Net investment loss | (1.29 | ) | (1.16 | ) | (0.88 | ) | |||||||||
Net realized and unrealized gain (loss) | (10.23 | ) | 20.19 | 4.08 | |||||||||||
Redemption Fees | 0.03 | 0.02 | 0.04 | ||||||||||||
Effect of Change | |||||||||||||||
Net investment income (loss) | (0.14 | ) | (4.26 | ) | 1.65 | ||||||||||
Net realized and unrealized gain (loss) | 0.11 | 4.24 | (1.69 | ) | |||||||||||
Redemption Fees | 0.03 | 0.02 | 0.04 | ||||||||||||
| Small Cap Value Fund (Class I) | |||||||||||||||
As Computed Under SEC Method | |||||||||||||||
Net investment income (loss) | 9.85 | 431.95 | (120.29 | ) | |||||||||||
Net realized and unrealized gain (loss) | (25.27 | ) | (404.98 | ) | 126.27 | ||||||||||
Redemption Fees | 0.00 | 0.00 | 0.00 | ||||||||||||
As Computed Under Average Shares Method | |||||||||||||||
Net investment loss | (1.15 | ) | (1.32 | ) | (0.85 | ) | |||||||||
Net realized and unrealized gain (loss) | (14.30 | ) | 28.27 | 6.76 | |||||||||||
Redemption Fees | 0.03 | 0.02 | 0.07 | ||||||||||||
Effect of Change | |||||||||||||||
Net investment income (loss) | (11.00 | ) | (433.27 | ) | 119.44 | ||||||||||
Net realized and unrealized gain (loss) | 10.97 | 433.25 | (119.51 | ) | |||||||||||
Redemption Fees | 0.03 | 0.02 | 0.07 | ||||||||||||
Note 3. Investment Management, Distributor and Other Related Party Transactions
The Company and the Funds have entered into investment management agreements ("Management Agreements") with the Investment Manager.
The Management Agreements provide for investment management fees, payable monthly, and calculated at the maximum annual rate of 0.75% of average net assets for the Income and Equity, Balanced, Large Cap Value and Small Cap Value Funds and 1.00% of average net assets for the Mid Cap Value Fund.
In accordance with Expense Limitation Agreements with the Company, the Investment Manager waives its respective management fees to the extent that the actual operating expenses of the following Funds exceed the following thresholds:
Class A | Class C | ||||||||||
Income and Equity Fund | 1.95 | % | 2.70 | % | |||||||
Large Cap Value Fund | 2.65 | % | 3.40 | % | |||||||
Pursuant to the Expense Limitation Agreements, providing for the waiver of fees and the assumption of expenses by the Investment Manager, the following amounts were waived for the period ended June 30, 2017.
| Management Fees Waived | |||||||
Income and Equity Fund | $ | 64,815 | |||||
Large Cap Value Fund | 29,631 | ||||||
The Investment Manager does not have any rights to recover fees it waives or expenses it may reimburse, with respect to any of the Funds.
For the period ended June 30, 2017, Pacific Global Fund Distributors, Inc. ("PGFD"), the principal underwriter for the Company and a wholly-owned subsidiary of the Investment Manager, received commissions on sales of capital stock, after deducting amounts allowed to authorized distributors as commissions. In addition, PGFD, as a registered broker-dealer, may act as broker for the Funds, in conformity with Rule 17e-1 under the Investment Company Act of 1940. The Company's Board has approved procedures for
64
Pacific Advisors Fund Inc.
Notes to Financial Statements (Unaudited)
June 30, 2017
evaluating the reasonableness of commissions paid to PGFD and periodically reviews these procedures. PGFD will not act as principal in effecting any portfolio transactions for the Funds. The amounts of commissions are as follows:
| Underwriting Fees Retained | Commissions Retained | Brokerage Commissions Received | |||||||||||||
Income and Equity Fund | $ | 113 | $ | - | $ | 491 | |||||||||
Balanced Fund | 123 | 194 | (511 | ) | |||||||||||
Large Cap Value Fund | 850 | 1,755 | (22 | ) | |||||||||||
Mid Cap Value Fund | 442 | 181 | (280 | ) | |||||||||||
Small Cap Value Fund | 502 | 439 | 1,035 | ||||||||||||
The Company has also entered into separate agreements with Pacific Global Investor Services, Inc. ("PGIS"), Transfer Agent for the Company and a wholly-owned subsidiary of the Investment Manager, that provide for transfer agent fees at a rate of $21 per year per open account and $3.50 per year per closed account, with a minimum charge of $1,800 per month per class for each Fund; fund accounting fees equal to the greater of $1,500 or three basis points for the first hundred million in net assets and one basis point on the balance of net assets for each Fund per month; and annual administrative agent fees of five basis points of average daily net assets of each Fund subject to a maximum annual fee of $50,000 per Fund. The fee is computed and payable monthly. The Company reimburses the Investment Manager for monthly expenses related to the Company's Compliance Program.
On the Statement of Assets and Liabilities, "Accounts payable to related parties" consists of transfer agent fees payable to PGIS.
The Company has adopted a plan of distribution whereby the Funds may pay a service fee to qualified recipients in an amount up to 0.25% per annum of each Fund's average daily net assets for Class A shares. The Company has also adopted a plan of distribution whereby the Funds may pay a service fee to qualified recipients in an amount up to 0.25% per annum of each Fund's average daily net assets for Class C shares and a distribution fee in an amount up to 0.75% per annum of each Fund's average daily net assets for Class C shares. The Company has not adopted a plan of distribution for Class I Shares.
For the period ended June 30, 2017, total distribution and/or service (12b-1) fees were:
Class A | Class C | Total | |||||||||||||
Income and Equity Fund | $ | 18,644 | $ | 12,063 | $ | 30,707 | |||||||||
Balanced Fund | 5,265 | 7,738 | 13,003 | ||||||||||||
Large Cap Value Fund | 8,922 | 3,831 | 12,753 | ||||||||||||
Mid Cap Value Fund | 6,935 | 1,775 | 8,710 | ||||||||||||
Small Cap Value Fund | 30,184 | 16,155 | 46,339 | ||||||||||||
Note 4. Purchase and Sales of Securities
The following summarizes purchases and sales of investment securities, other than short-term investments, and aggregate gross unrealized appreciation and depreciation on a tax basis by each Fund for the period ended and as of June 30, 2017. The difference between book basis and tax basis unrealized appreciation is attributable primarily to the tax deferral of losses on wash sales.
| Period ended June 30, 2017 | As of June 30, 2017 | ||||||||||||||||||||||||||
| Cost of Purchases | Proceeds From Sales | Tax Cost of Securities | Gross Unrealized Appreciation | Gross Unrealized Depreciation | Net Unrealized Appreciation (Depreciation) | ||||||||||||||||||||||
Income and Equity Fund | $ | 1,842,132 | $ | 1,944,734 | $ | 14,577,134 | $ | 2,274,114 | $ | 194,274 | $ | 2,079,840 | |||||||||||||||
Balanced Fund | 311,878 | 832,624 | 5,316,828 | 861,006 | 512,872 | 348,134 | |||||||||||||||||||||
Large Cap Value Fund | - | 257,198 | 4,322,777 | 3,707,986 | - | 3,707,986 | |||||||||||||||||||||
Mid Cap Value Fund | 505,743 | 771,960 | 4,568,816 | 2,084,772 | 853,970 | 1,230,802 | |||||||||||||||||||||
Small Cap Value Fund | 708,469 | 4,421,606 | 22,480,385 | 12,093,970 | 9,350,143 | 2,743,827 | |||||||||||||||||||||
65
Pacific Advisors Fund Inc.
Notes to Financial Statements (Unaudited)
June 30, 2017
Note 5. Distributions to Shareholders
The tax character of distributions paid during 2017 and 2016 was as follows:
| Income and Equity Fund | Balanced Fund | Large Cap Value Fund | Mid Cap Value Fund | Small Cap Value Fund | |||||||||||||||||||
Period ended June 30, 2017 | |||||||||||||||||||||||
Distributions paid from: | |||||||||||||||||||||||
Ordinary Income | $ | 16,228 | $ | - | $ | - | $ | - | $ | - | |||||||||||||
Total Distributions | $ | 16,228 | $ | - | $ | - | $ | - | $ | - | |||||||||||||
Year ended December 31, 2016 | |||||||||||||||||||||||
Distributions paid from: | |||||||||||||||||||||||
Ordinary Income | $ | 23,421 | $ | - | $ | - | $ | - | $ | - | |||||||||||||
Long-Term Capital Gain | - | 225,253 | 23,059 | - | 4,266,366 | ||||||||||||||||||
Return of Capital | 11,626 | - | - | - | - | ||||||||||||||||||
Total Distributions | $ | 35,047 | $ | 225,253 | $ | 23,059 | $ | - | $ | 4,266,366 | |||||||||||||
Note 6. Capital Share Transactions
A 2% redemption fee is assessed on shares of the Income and Equity Fund sold or exchanged within 30 days of purchase or shares of the Balanced Fund, Large Cap Value Fund, Mid Cap Value Fund or Small Cap Value Fund sold or exchanged within 180 days of purchase and is retained in each Fund. The redemption fees collected through Jun 30, 2017, and through year end 2016, are included in the dollar amount of shares sold in the table below. The amount of the increase is as follows:
| Six months ended June 30, 2017 | Year ended December 31, 2016 | ||||||||||||||||||||||||||
Class A | Class C | Class I | Class A | Class C | Class I | ||||||||||||||||||||||
Income and Equity Fund | $ | 3 | $ | 1 | N/A | $ | 6,856 | $ | 1,503 | N/A | |||||||||||||||||
Balanced Fund | 43 | 27 | N/A | 330 | 173 | N/A | |||||||||||||||||||||
Large Cap Value Fund | 250 | 26 | N/A | 348 | 58 | N/A | |||||||||||||||||||||
Mid Cap Value Fund | 46 | 3 | N/A | 258 | 29 | N/A | |||||||||||||||||||||
Small Cap Value Fund | 9,773 | 1,293 | $ | 3 | 5,429 | 866 | $ | 26 | |||||||||||||||||||
| Six months ended June 30, 2017 | Year ended December 31, 2016 | ||||||||||||||||||
Shares | Amount | Shares | Amount | ||||||||||||||||
Income and Equity Fund | |||||||||||||||||||
Class A | |||||||||||||||||||
Shares sold | 81,739 | $ | 1,019,025 | 370,091 | $ | 4,478,478 | |||||||||||||
Reinvestment of distributions | 1,156 | 14,381 | 2,551 | 31,280 | |||||||||||||||
82,895 | 1,033,406 | 372,642 | 4,509,758 | ||||||||||||||||
Shares repurchased | (107,927 | ) | (1,346,017 | ) | (174,172 | ) | (2,090,689 | ) | |||||||||||
Net increase (decrease) | (25,032 | ) | $ | (312,611 | ) | 198,470 | $ | 2,419,069 | |||||||||||
Class C | |||||||||||||||||||
Shares sold | 336 | $ | 4,001 | 10,277 | $ | 121,016 | |||||||||||||
Reinvestment of distributions | - | - | - | - | |||||||||||||||
336 | 4,001 | 10,277 | 121,016 | ||||||||||||||||
Shares repurchased | (15,587 | ) | (185,183 | ) | (51,170 | ) | (594,050 | ) | |||||||||||
Net decrease | (15,251 | ) | $ | (181,182 | ) | (40,893 | ) | $ | (473,034 | ) | |||||||||
66
Pacific Advisors Fund Inc.
Notes to Financial Statements (Unaudited)
June 30, 2017
| Six months ended June 30, 2017 | Year ended December 31, 2016 | ||||||||||||||||||
Shares | Amount | Shares | Amount | ||||||||||||||||
Balanced Fund | |||||||||||||||||||
Class A | |||||||||||||||||||
Shares sold | 5,968 | $ | 69,363 | 64,938 | $ | 747,487 | |||||||||||||
Reinvestment of distributions | - | - | 12,295 | 140,652 | |||||||||||||||
5,968 | 69,363 | 77,233 | 888,139 | ||||||||||||||||
Shares repurchased | (22,391 | ) | (258,724 | ) | (44,591 | ) | (508,739 | ) | |||||||||||
Net increase (decrease) | (16,423 | ) | $ | (189,361 | ) | 32,642 | $ | 379,400 | |||||||||||
Class C | |||||||||||||||||||
Shares sold | 6,785 | $ | 69,683 | 10,017 | $ | 101,917 | |||||||||||||
Reinvestment of distributions | - | - | 6,690 | 67,504 | |||||||||||||||
6,785 | 69,683 | 16,707 | 169,421 | ||||||||||||||||
Shares repurchased | (32,340 | ) | (330,812 | ) | (99,644 | ) | (1,015,203 | ) | |||||||||||
Net decrease | (25,555 | ) | $ | (261,129 | ) | (82,937 | ) | $ | (845,782 | ) | |||||||||
| Six months ended June 30, 2017 | Year ended December 31, 2016 | ||||||||||||||||||
Shares | Amount | Shares | Amount | ||||||||||||||||
Large Cap Value Fund | |||||||||||||||||||
Class A | |||||||||||||||||||
Shares sold | 17,802 | $ | 284,391 | 47,998 | $ | 697,236 | |||||||||||||
Reinvestment of distributions | - | - | 1,244 | 19,074 | |||||||||||||||
17,802 | 284,391 | 49,242 | 716,310 | ||||||||||||||||
Shares repurchased | (18,676 | ) | (294,966 | ) | (63,389 | ) | (879,751 | ) | |||||||||||
Net decrease | (874 | ) | $ | (10,575 | ) | (14,147 | ) | $ | (163,441 | ) | |||||||||
Class C | |||||||||||||||||||
Shares sold | 347 | $ | 4,726 | 3,237 | $ | 40,230 | |||||||||||||
Reinvestment of distributions | - | - | 134 | 1,761 | |||||||||||||||
347 | 4,726 | 3,371 | 41,991 | ||||||||||||||||
Shares repurchased | (18,771 | ) | (255,387 | ) | (35,298 | ) | (436,904 | ) | |||||||||||
Net decrease | (18,424 | ) | $ | (250,661 | ) | (31,927 | ) | $ | (394,913 | ) | |||||||||
67
Pacific Advisors Fund Inc.
Notes to Financial Statements (Unaudited)
June 30, 2017
| Six months ended June 30, 2017 | Year ended December 31, 2016 | ||||||||||||||||||
Shares | Amount | Shares | Amount | ||||||||||||||||
Mid Cap Value Fund | |||||||||||||||||||
Class A | |||||||||||||||||||
Shares sold | 11,160 | $ | 128,925 | 53,336 | $ | 562,552 | |||||||||||||
Reinvestment of distributions | - | - | - | - | |||||||||||||||
11,160 | 128,925 | 53,336 | 562,552 | ||||||||||||||||
Shares repurchased | (19,128 | ) | (219,241 | ) | (41,408 | ) | (452,469 | ) | |||||||||||
Net increase (decrease) | (7,968 | ) | $ | (90,316 | ) | 11,928 | $ | 110,083 | |||||||||||
Class C | |||||||||||||||||||
Shares sold | 108 | $ | 1,103 | 1,236 | $ | 11,542 | |||||||||||||
Reinvestment of distributions | - | - | - | - | |||||||||||||||
108 | 1,103 | 1,236 | 11,542 | ||||||||||||||||
Shares repurchased | - | - | (38,319 | ) | (355,718 | ) | |||||||||||||
Net increase (decrease) | 108 | $ | 1,103 | (37,083 | ) | $ | (344,176 | ) | |||||||||||
| Six months ended June 30, 2017 | Year ended December 31, 2016 | ||||||||||||||||||
Shares | Amount | Shares | Amount | ||||||||||||||||
Small Cap Value Fund | |||||||||||||||||||
Class A | |||||||||||||||||||
Shares sold | 54,978 | $ | 1,518,019 | 68,311 | $ | 1,671,143 | |||||||||||||
Reinvestment of distributions | - | - | 121,832 | 3,362,552 | |||||||||||||||
54,978 | 1,518,019 | 190,143 | 5,033,695 | ||||||||||||||||
Shares repurchased | (168,089 | ) | (4,362,010 | ) | (592,790 | ) | (14,443,161 | ) | |||||||||||
Net decrease | (113,111 | ) | $ | (2,843,991 | ) | (402,647 | ) | $ | (9,409,466 | ) | |||||||||
Class C | |||||||||||||||||||
Shares sold | 180 | $ | 4,795 | 1,745 | $ | 34,046 | |||||||||||||
Reinvestment of distributions | - | - | 29,196 | 585,677 | |||||||||||||||
180 | 4,795 | 30,941 | 619,723 | ||||||||||||||||
Shares repurchased | (23,272 | ) | (431,855 | ) | (121,755 | ) | (2,351,201 | ) | |||||||||||
Net decrease | (23,092 | ) | $ | (427,060 | ) | (90,814 | ) | $ | (1,731,478 | ) | |||||||||
Class I | |||||||||||||||||||
Shares sold | - | $ | 3 | - | $ | 26 | |||||||||||||
Reinvestment of distributions | - | - | 24 | 840 | |||||||||||||||
- | 3 | 24 | 866 | ||||||||||||||||
Shares repurchased | - | - | (4,824 | ) | (176,717 | ) | |||||||||||||
Net increase (decrease) | - | $ | 3 | (4,800 | ) | $ | (175,851 | ) | |||||||||||
68
Pacific Advisors Fund Inc.
Notes to Financial Statements (Unaudited)
June 30, 2017
Note 7. Bank Borrowings
Each Fund may borrow money to the extent permitted by the 1940 Act, as amended, or any rules, exemptions or interpretations thereunder that may be adopted, granted or issued by the Securities and Exchange Commission. Under the 1940 Act, a mutual fund may borrow up to one-third of its total assets (including the amount borrowed) from banks for any purpose, and may borrow up to 5% of its total assets from banks or other lenders for temporary purposes. Each Fund may borrow to facilitate portfolio transactions or meet redemptions. The Large Cap Value Fund, Mid Cap Value Fund, and Small Cap Value Fund also may borrow money to invest in portfolio securities. Each Fund has the ability to borrow, from UMB, on an unsecured basis, at 2.75% over the Federal Funds rate. As of June 30, 2017, Income and Equity Fund, Balanced Fund, Large Cap Value Fund, Mid Cap Value Fund and Small Cap Value Fund had borrowings from UMB with amounts of $134,409, $1,917, $45,619, $43,160 and $406,602, respectively, and were paying interest at 3.79% per annum on their outstanding borrowings. For the period ended June 30, 2017, the Income and Equity Fund, Balanced Fund, Large Cap Value Fund, Mid Cap Value Fund and Small Cap Value Fund had a daily average borrowing of $16,714, $18,885, $45,742, $29,482 and $299,890, respectively, with a weighted average interest rate of 3.79%, 3.35%, 3.45%, 3.47% and 3.49% per annum, respectively. No compensating balances were required.
Note 8. Subsequent Events
Subsequent events occurring after the date of this report through the date these financial statements were issued have been evaluated for potential impact and the Fund has had no such events.
69
Pacific Advisors Fund Inc.
Directors and Officers
"Independent" Directors
Name (Age) | Position with the Company1 | Year elected Director of the Company | Principal occupation(s) during past 5 years | Other Directorships held by Director | |||||||||||||||
| L. Michael Haller, III (73) | Director | 1992 | Consultant, d/b/a Asahi Broadcasting Enterprises (software development); Chairman and President, Gammaker Pte. Ltd. (mobile game developer); Chairman and CEO, AdLib Mediation, Inc. (mobile advertising); and formerly Executive Vice President, MGT Capital Investments (mobile game developer) (2013); and CEO, Digital Angel, Inc. (communications equipment distributor) (2012-2013) | Digital Angel, Inc. | |||||||||||||||
| Peter C. Hoffman (66) | Director | 2010 | President, Sierra Autocars, Inc. (auto dealership), Sierra Vehicles, Inc. (auto dealership), Sierra Automotive Enterprises, Inc. (auto dealership) and Sierra Pursuits, Inc. (management company) | None | |||||||||||||||
| Gerald E. Miller (87) | Director | 1992 | Retired in 1992; and formerly worked for Merrill Lynch for over 30 years and was a Senior Resident Vice President at retirement in 1992 | None | |||||||||||||||
| Louise K. Taylor, PhD (70) | Director | 1992 | Assistant Executive Director, Employers Association of California; and formerly Superintendent, Monrovia Unified School District (1991-2009) | None | |||||||||||||||
"Interested" Director2
Name (Age) | Positions with the Company1 | Year elected a Director and officer of the Company | Principal occupations during past 5 years | Other Directorships held by Director | |||||||||||||||
| George A. Henning (70)* | President and Chairman | 1992 | Chairman, President and Director, Pacific Global Investment Management Company; and Chairman and Director, Pacific Global Fund Distributors, Inc. and Pacific Global Investor Services, Inc. | None | |||||||||||||||
Each Director oversees all 5 Pacific Advisors Fund portfolios.
The Fund's Statement of Additional Information contains additional information about the Fund's Directors and Officers and is available without charge upon request by calling (800) 989-6693. The business address for all Directors and officers of the Company is 101 N. Brand Blvd., Suite 1950, Glendale, CA 91203, Attn: Secretary.
70
Pacific Advisors Fund Inc.
Directors and Officers
Other Officers
Name (Age) | Position(s) with the Company | Year elected an officer of the Company | Principal occupations during past 5 years | ||||||||||||
| Catherine L. Henning (39) | Vice President Secretary | 2010 2006 | Senior Vice President, Secretary, Director of Client Services and Director, Pacific Global Investment Management Company; President, Secretary, Chief Compliance Officer and Director, Pacific Global Fund Distributors, Inc.; and Vice President, Secretary and Director, Pacific Global Investor Services, Inc. | ||||||||||||
| Barbara A. Kelley (64) | Vice President and Chief Compliance Officer | 2001 | Executive Vice President, Chief Compliance Officer and Director, Pacific Global Investment Management Company; Director, Pacific Global Fund Distributors, Inc.; President and Director, Pacific Global Investor Services, Inc.; and formerly Treasurer (2001-2014). | ||||||||||||
| Araceli Olea (44) | Assistant Secretary | 2008 | Shareholder Services Manager, Pacific Global Investor Services, Inc.; and Assistant Secretary, Pacific Global Investment Management Company and Pacific Global Investor Services, Inc. | ||||||||||||
| Jingjing Yan (43) | Treasurer | 2014 | Vice President and Treasurer, Pacific Global Investment Management Company; Treasurer, Pacific Global Fund Distributors, Inc. and Pacific Global Investor Services, Inc.; and formerly Assistant Treasurer (2005-2014). | ||||||||||||
1 Each director is elected to serve until the next annual shareholders meeting and until his or her successor is elected or appointed. The Company does not hold regular annual shareholders meetings to elect Directors. Vacancies on the Board can be filled by the action of a majority of the Directors, provided that at least two-thirds of the Directors have been elected by the shareholders.
2 "Interested persons" as defined in the 1940 Act, as amended, based on the director's affiliation with the Funds' investment manager and its affiliates (including the Funds' principal underwriter).
* Mr. Henning is considered an interested director because (a) he holds the positions described above with the Company, the Manager and its affiliates; (b) by virtue of his ownership of the Manager's shares he may be deemed a "control person" of the Manager; and (c) he is Ms. Henning's father.
71
Pacific Advisors Fund Inc.
notes
72

Pacific Advisors Fund Inc.
Directors
George A. Henning, Chairman
L. Michael Haller, III
Peter C. Hoffman
Gerald E. Miller
Louise K. Taylor, Ph.D.
Officers
George A. Henning, President
Barbara A. Kelley, Vice President
Catherine L. Henning, Vice President and Secretary
Araceli Olea, Assistant Secretary
Jingjing Yan, Treasurer
Investment Manager
Pacific Global Investment Management Company
101 North Brand Blvd., Suite 1950
Glendale, California 91203
Transfer Agent and Administrator
Pacific Global Investor Services, Inc.
101 North Brand Blvd., Suite 1950
Glendale, California 91203
Distributor
Pacific Global Fund Distributors, Inc.
101 North Brand Blvd., Suite 1950
Glendale, California 91203
(800) 989-6693
Availability of Quarterly Portfolio Schedule
The Fund files its complete schedule of portfolio holdings with the SEC for the first and third quarters of each fiscal year on Form N-Q. The Fund's Forms N-Q are available on the SEC's Web site at http://www.sec.gov. The Fund's Forms N-Q may be reviewed and copied at the SEC's Public Reference Room in Washington, DC. Information about the operation of the Public Reference Room may be obtained by calling the SEC at (800) SEC-0330.
The Fund's complete schedule of portfolio holdings for each fiscal quarter is posted on the Fund's Web site at www.PacificAdvisorsFund.com and is available without charge, upon request by calling (800) 989-6693. Documents will be sent within 3 business days of receipt of your request.
Availability of Proxy Voting Policies and Procedures and Proxy Voting Record
A description of the policies and procedures that the Fund uses to determine how to vote proxies relating to portfolio securities and information regarding how the Fund voted proxies relating to portfolio securities during the most recent 12-month period ended June 30 is available without charge, upon request by calling (800) 989-6693. Documents will be sent within 3 business days of receipt of your request. This information is also available on the SEC's Web site at http://www.sec.gov.

Pacific Global Fund Distributors, Inc.
101 North Brand Blvd., Suite 1950
Glendale, California 91203

Item 2. |
| Code of Ethics |
|
| Not applicable for semi-annual reports. |
|
|
|
Item 3. |
| Audit Committee Financial Expert |
|
| Not applicable for semi-annual reports. |
|
|
|
Item 4. |
| Principal Accountant Fees and Services |
|
| Not applicable for semi-annual reports. |
|
|
|
Item 5. |
| Audit Committee of Listed Registrants |
|
| Not applicable as Registrant is not a listed issuer as defined in Rule 10A-3 under the Securities Exchange Act of 1934. |
|
|
|
Item 6. |
| Schedule of Investments |
|
| Schedule of Investments is included as part of the report to shareholders filed under Item 1 of this form. |
|
|
|
Item 7. |
| Disclosure of Proxy Voting Policies and Procedures for Closed-End Management Investment Companies |
|
| Not applicable to open-end investment companies. |
|
|
|
Item 8. |
| Portfolio Managers of Closed-End Management Investment Companies |
|
| Not applicable to open-end investment companies. |
|
|
|
Item 9. |
| Purchases of Equity Securities by Managers of Closed-End Management Investment Company and Affiliated Purchasers. |
|
| Not applicable to open-end investment companies. |
|
|
|
Item 10. |
| Submission of Matters to a Vote of Security Holders |
|
| No material changes have been made. |
|
|
|
Item 11. |
| Controls and Procedures. |
|
| (a) Based upon their evaluation of Registrant’s disclosure controls and procedures (as defined in Rule 30a-3(c) under the Investment Company Act of 1940) as conducted within 90 days of the filing date of this Form N-CSR, Registrant’s principal executive officer and principal financial officer have concluded that those disclosure controls and procedures provide reasonable assurance that the material information required to be disclosed by Registrant on this report is recorded, processed, summarized and reported within the time periods specified in the Securities and Exchange Commission’s rules and forms. |
|
|
|
|
| (b) There were no changes in Registrant’s internal control over financial reporting (as defined in Rule 30a-3(d) under the Investment Company Act of 1940) that occurred during the second fiscal quarter of the period covered by this report that have materially affected, or are reasonably likely to materially affect, Registrant’s internal control over financial reporting. |
|
|
|
Item 12. |
| Exhibits |
|
| (a)(1) Not applicable. |
|
|
|
|
| (a)(2) Certifications required by Item 12(a) of Form N-CSR and Section 302 of the Sarbanes-Oxley Act of 2002 (filed herewith). |
|
|
|
|
| (a)(3) Not applicable. |
|
|
|
|
| (b) Certification required by Section 906 of the Sarbanes-Oxley Act of 2002 (filed herewith). |
SIGNATURES
Pursuant to the requirements of the Securities Exchange Act of 1934 and the Investment Company Act of 1940, Registrant has duly caused this report to be signed on its behalf by the undersigned, thereunto duly authorized.
Pacific Global Fund Inc. d/b/a Pacific Advisors Fund Inc.
By: | /s/ George A. Henning |
|
| George A. Henning |
|
| Chairman, Pacific Advisors Fund Inc. |
|
|
|
|
Date: | September 1, 2017 |
|
Pursuant to the requirements of the Securities Exchange Act of 1934 and the Investment Company Act of 1940, this report has been signed below by the following persons on behalf of Registrant and in the capacities and on the dates indicated.
By: | /s/ George A. Henning |
|
| George A. Henning |
|
| Chief Executive Officer |
|
|
|
|
Date: | September 1, 2017 |
|
|
|
|
By: | /s/ Jingjing Yan |
|
| Jingjing Yan |
|
| Chief Financial Officer |
|
|
|
|
Date: | September 1, 2017 |
|