UNITED STATES
SECURITIES AND EXCHANGE COMMISSION
Washington, D.C. 20549
FORM N-CSR
CERTIFIED SHAREHOLDER REPORT OF REGISTERED
MANAGEMENT INVESTMENT COMPANIES
Investment Company Act file number | 811-07062 | |||||||
| ||||||||
PACIFIC GLOBAL FUND INC. D/B/A PACIFIC ADVISORS FUND INC. | ||||||||
(Exact name of registrant as specified in charter) | ||||||||
| ||||||||
101 NORTH BRAND BLVD., SUITE 1950 GLENDALE, CALIFORNIA |
| 91203 | ||||||
(Address of principal executive offices) |
| (Zip code) | ||||||
| ||||||||
GEORGE A. HENNING 101 NORTH BRAND BLVD., SUITE 1950 GLENDALE, CA 91203 | ||||||||
(Name and address of agent for service) | ||||||||
| ||||||||
Registrant’s telephone number, including area code: | 818-242-6693 |
| ||||||
| ||||||||
Date of fiscal year end: | December 31 |
| ||||||
| ||||||||
Date of reporting period: | June 30, 2014 |
| ||||||
Item 1. | Report to Shareholders |
| Filed herewith. |

semi-annual report
june 30, 2014
government securities fund
income and equity fund
balanced fund
large cap value fund
mid cap value fund
small cap value fund


Pacific Advisors
table of contents
Message from the Chairman | 1 | ||||||
Government Securities Fund | 5 | ||||||
Income and Equity Fund | 9 | ||||||
Balanced Fund | 14 | ||||||
Large Cap Value Fund | 19 | ||||||
Mid Cap Value Fund | 23 | ||||||
Small Cap Value Fund | 28 | ||||||
Schedule of Investments | 33 | ||||||
Statement of Assets and Liabilities | 56 | ||||||
Statement of Operations | 58 | ||||||
Statement of Changes in Net Assets | 60 | ||||||
Financial Highlights | 64 | ||||||
Notes to Financial Statements | 71 | ||||||
Directors and Officers | 81 | ||||||
This Report is submitted for the general information of the shareholders of Pacific Advisors Funds. It is not authorized for distribution to prospective investors unless accompanied or preceded by the Funds' current prospectus, which contains information concerning the investment policies of the Funds as well as other pertinent information.
This Report is for informational purposes only and is not a solicitation or recommendation that any particular investor should purchase or sell any particular security. The statements in the Chairman's Letter and the discussions of the Funds' performance are the opinions and beliefs expressed at the time of this commentary and are not intended to represent opinions and beliefs at any other time. These opinions are subject to change at any time based on market or other conditions and are not meant as a market forecast. All economic and performance information referenced is historical. Past performance does not guarantee future results.
For more information on the Pacific Advisors Funds, including information on charges, expenses and other classes offered, please obtain a copy of the prospectus by calling (800) 989-6693. Please read the prospectus and consider carefully the investment risks, objectives, charges and expenses before you invest or send money. Shares of the Pacific Advisors Funds are not deposits or obligations of any bank, are not guaranteed by any bank, are not insured by the FDIC or any other agency, and involve investment risks, including the possible loss of the principal amount invested. The investment return and principal value of an investment will fluctuate so that an investor's shares, when redeemed, may be worth more or less than their original cost.


Message
from the chairman
Dear Shareholders,
Equity markets faced a number of challenges during the first six months of 2014. At the beginning of the year, some investors locked in profits from the prior year and took time to assess the outlook for the New Year. Extremely harsh winter weather in the first quarter had a chilling effect on the markets as business activity was disrupted and consumer spending declined. Many feared that the early year selloff might trigger the long-predicted correction. Yet, the market began to recover in the second quarter as business conditions improved along with the weather.
Investors maintained a generally positive outlook on the direction of the economy; their measured optimism looked past issues such as geopolitical concerns in Ukraine and Iraq which, in other times, might well have been more disruptive. We believe that the energy revolution in the U.S., which has reduced our dependence on oil and gas imports, significantly influenced the markets' more sanguine attitude. The equity markets continued to inch higher as stocks seemingly followed the path of least resistance.
The market's upward bias continued even in the absence of any obvious catalysts. Economic data were generally positive, but not overwhelmingly so. Private sector employment and domestic motor vehicle sales reached pre-recession highs and the housing industry regained strength in the spring after weakening in the first quarter. However, first quarter GDP declined 2.9% and growth in the manufacturing sector eased. Yet, investors largely shrugged off the negative data.
The relatively benign economic conditions during the first six months provided an instructive reminder that, from time to time, positive or negative market momentum may propel stocks without any obvious reason. Markets may continue to behave unpredictably as the global economies transition from recession to growth. The Federal Reserve's prominent role in the recovery adds further ambiguity to markets' reaction to events. For example, the equity markets generally react positively to strong economic data; in the current environment, however, the markets may appear to disregard the data or may temporarily fall on fears that the Fed will raise interest rates sooner-than-expected. Conversely, the equity markets might rise on negative news which might suggest further monetary intervention.
In the second quarter, both the S&P 500® Index and Dow Jones Industrial Average reached record highs; while some areas of the market advanced, though, others lagged. The more conservative areas of the market outperformed. For example, large cap stocks significantly outperformed small cap stocks. Similarly, sectors with relatively stable growth and lower volatility, such as Utilities, outperformed. In contrast, sectors such as Retail, Restaurants and Transportation, offer significant growth opportunities as the economy expands but tend to underperform during periods of weakness or uncertainty. We believe the shift toward more conservative equities is temporary; stocks which respond to economic growth should regain traction as the recovery regains momentum.
Demand for bonds remained high in the first half of the year as fixed income investors preferred their relative safety in response to uneven global economic growth and geopolitical tensions. Interest rates remained low as economic data and geopolitical uncertainty provided no incentive for these investors to exit bonds. Many fixed income investors appeared content to await clear evidence of rising rates; over the next several months, though, they will pay close attention to economic reports and the actions of the Federal Reserve.
Investors continue to debate whether or not "the market" has run too far ahead of itself. Yet, these conversations are largely commentaries on investor sentiment rather than market fundamentals. To be sure, some stocks have likely risen beyond prices justified by their fundamental value; just as the high-flying technology and biotech companies came under pressure during the second quarter, these over-valued stocks may too sell off. The question, then, is not whether the market is overvalued or undervalued but whether the prices for individual stocks reflect their long-term appreciation potential. From this viewpoint, we remain encouraged by the growth initiatives among high-quality companies.
1


Message
from the chairman continued
Market Review
All of the major equity markets rose during the second quarter. The S&P 500® Index gained 5.23%, the Dow Jones Industrial Average rose 2.83% and the NASDAQ gained 5.32%. Smaller companies ended higher as well; the Russell Midcap® Index rose 4.97%, and the Russell 2000® Index gained 2.05%.1 The somewhat modest year-to-date returns reflect weak first quarter results followed by stronger second quarter performance.
Interest rates were, despite expectations for long-awaited increases, generally stable while decreasing slightly in the second quarter. Continued strong demand for fixed income investments has maintained downward pressure on rates. Another factor keeping interest rates low was the record-breaking purchase of $107.2 billion of U.S. Treasuries by the Chinese government during the first five months of 2014. These significant purchases were made with the intention of weakening the yuan to aid China's export-driven economy. The yield on the 10-year U.S. Treasury Note fell to a low of 2.44% at the end of May before increasing slightly and hovering below 2.66% for the remainder of the period. Rates on corporate bonds also fell; the combination of strong demand and limited supply tightened the already-narrow yield spread between U.S. Treasuries and corporate bonds. The narrow spread reflects the willingness of some investors to accept lower yields even as these positions expose holders to potential losses when rates increase.
Equity Investment Review
Many companies have strengthened their competitive positioning over the past several years to enhance their long-term growth prospects. The combination of the rebound in stock prices, low interest rates and an improving economic outlook has also rekindled growth through mergers and acquisitions. The significant increase in mergers and acquisitions is an important milestone; they reveal the growing conviction amongst corporate executives that economic conditions are improving. Often, strategic acquisitions provide immediate profitability to facilitate rapidly expanding businesses to quickly add scale to their operations. The severe winter weather delayed many projects for Energy and Industrial companies. Growth in these areas should recover over the remainder of the year. The synergy between Energy companies and various Industrials is an emerging economic trend: the lower cost, and ample supply, of oil and natural gas are emerging as significant catalysts for the U.S. economy; their impact in providing an incentive for companies to expand operations in North America can be felt across many sectors. Other areas, such as Transportation, performed well during the second quarter. Automobile and Truck manufacturers, suppliers and dealerships reported strong sales while trucking, rail and marine transportation continue to benefit from high demand and revenue growth.
Residential and commercial construction has gained momentum as low interest rates and economic growth created demand for remodeling and new construction. Even so, tighter credit conditions impede first time buyers in obtaining mortgages; but, we anticipate that, as employment trends improve and wages grow, home sales for these first timers will improve.
Five years after the "Great Recession," economic growth continues at a modest pace. Unlike many previous economic recoveries, companies and investors remain cautious; corporate executives carefully evaluate growth initiatives. Anxious Investors voice concerns about overvaluations or that geopolitical and economic events may disrupt the markets. We view these cautious attitudes positively as they provide a catalyst for a longer period of sustainable economic growth which should, in turn, provide continued momentum in the equity markets.
Fixed Income Investment Review
Interest rates declined as investors preferred the "safe haven" of fixed income assets. Demand for bonds rose in response to concerns that geopolitical events, economic trends and fears of an overvalued equity
Market Review • June 30, 2014
Index1 | Close | YTD Return | |||||||||
Dow Jones Industrial Avg | 16,826.60 | 2.68 | % | ||||||||
S&P 500® | 1,960.23 | 7.12 | % | ||||||||
NASDAQ | 4,408.18 | 6.20 | % | ||||||||
Russell 2000® (small cap) | 1,192.96 | 3.19 | % | ||||||||
06/30/14 | 06/30/13 | ||||||||||
| 10-Year T-Note Yield | 2.53 | % | 2.52 | % | |||||||
Data: Bloomberg; Federal Reserve
Index returns include reinvested dividends.
2

market might lead to a significant correction. The Fed however, continued to reduce its monthly bond-buying program; absent any major market disruptions, the central bank plans to conclude the program in October. Fed Chair Janet Yellen has also stated that if the labor market continues to improve more quickly than anticipated, the Fed may increase interest rates sooner than expected.
Our fixed income strategy focused on fundamentally-sound government and corporate bonds with shorter durations; as the fixed income markets transition from the Fed's low interest rate policies, these holdings offer the flexibility to identify timely opportunities to adapt to increasing interest rates.
Many factors, such as changes in Fed policies and unforeseen geopolitical or economic events, can affect interest rate movements. Consequently, we anticipate that interest rates will maintain an upward bias although they may also remain somewhat volatile.
Looking Ahead
Led by the U.S. and China, the major global economies are expanding; Europe and Japan continue to struggle with the economic reforms needed to successfully compete in the international markets. For both, growth in the near-to-intermediate-term may be anemic; concerns of a double dip recession, perhaps reminiscent of those voiced during the early stages of the U.S. recovery, may surface. Nevertheless, even modest growth will provide important momentum for the world economies.
In the U.S., businesses, having rebuilt their finances, are turning their focus toward growth initiatives. Companies are actively pursuing strategies to grow through mergers and acquisitions, investments in new plants and equipment and geographic expansions. This focus on capital spending is an important shift; in the last few years, many businesses emphasized less growth-oriented uses of capital such as stock buybacks and dividend increases. Historically, investors would have expected the upturn in plant and equipment spending to have occurred earlier in the economic recovery. However, businesses maintained a more cautious attitude in response to the lackluster economic growth. Their outlook is shifting with the overall improvement in the global economies and the pent-up demand for goods and services in the U.S. and Europe.
Along with an improving economy, the U.S. labor market is beginning to experience shortages; employees now have more willingness to leave for better paying jobs. Companies are reporting increased efforts to retain employees and attract new talent to support their growth initiatives. Customers are demonstrating willingness to accept pricing increases to cover the higher employee costs. In certain industries, companies are addressing shortages of skilled workers by expanding job training programs on their own or with local educational institutions. Increases in employee wages, which has been in abeyance during the economic recovery, will be an important catalyst for consumer spending growth.
Meanwhile, the "shale revolution" has been a game changer for the global energy industry and, in particular, for the competitiveness of the U.S. economy. Companies that are attracted to the prospect of cheap and secure domestic sources of oil and natural gas are bringing manufacturing facilities and jobs back home. These, and other activities that anticipate the benefits of low-cost energy, are in their early stages; they should contribute to economic growth for years, and perhaps decades, to come.
We expect a healthy recovery; yet, healthy does not suggest that we expect the growth rate to rapidly accelerate. Instead, we anticipate a "slower for longer" pace of economic expansion as households and businesses continue to proceed with caution. Today's investing environment requires a measured, sustainable approach. These conditions may temper the excesses that usually accompany rapid economic growth. Such an environment favors the strongest, most disciplined companies; they pursue growth initiatives while maintaining market-leading positions. Weaker competitors, on the other hand, typically benefit only when a rising tide of strong economic growth "lifts all boats." We believe, therefore, that the best-run companies will continue to outperform in a "slower for longer" growth period.
3


Message
from the chairman continued
The interviews which follow provide more detail on the investment strategies of each Fund and a detailed discussion of performance for individual companies and their growth potential. We believe that, even though the first half of 2014 was somewhat challenging, economic growth will continue to provide attractive investment opportunities for our Funds.
Sincerely,

George A. Henning
1 The Dow Jones Industrial Average is an unmanaged, price weighted measure of 30 U.S. stocks selected by the Averages Committee to represent the performance of all U.S. stocks outside the Transportation and Utilities sectors. The S&P 500® Index is an unmanaged, market capitalization weighted index which measures the performance of the large cap segment of the U.S. equities market, covering approximately 75% of the U.S. equities market. The Index includes 500 leading companies in leading industries of the U.S. economy. The NASDAQ Composite Index is an unmanaged, market capitalization weighted measure of all domestic and international common stocks (currently over 3,000 stocks) listed on The Nasdaq Stock Market. The Russell 2000® Index is an unmanaged, market-weighted measure of the 2,000 smallest publicly traded companies of the Russell 3000® Index. The Russell Midcap® Index is an unmanaged, weighted measure of the 800 smallest companies within the Russell 1000® Index based on a combination of their market cap and current index membership. The Russell 2000® Growth Index includes those Russell 2000® Index companies with higher price-to-value ratios and higher forecasted growth values; the Russell 2000® Value Index includes those Russell 2000® Index companies with lower price-to-book ratios and lower forecasted growth values. These indices are not available for direct investment. Index returns assume the reinvestment of dividends.
Economic and performance information referenced is historical and past performance does not guarantee future results. The principal value and return of an investment will fluctuate so that an investor's shares may be worth less than the original cost when redeemed. For more information on the Pacific Advisors Funds, including information on charges, expenses and other classes offered, please obtain a copy of the prospectus by calling (800) 989-6693. Please read the prospectus and consider carefully the investment risks, objectives, charges and expenses before you invest or send money.
Shares of the Funds are not deposits or obligations of any bank, are not guaranteed by any bank, are not insured by the FDIC or any other agency, and involve investment risks, including the possible loss of the principal amount invested. The views expressed represent the opinions and beliefs at the time of this commentary and are not meant as a market forecast. These views are subject to change at any time based on market or other conditions. This information may not be relied on as investment advice or as an indication of trading intent on behalf of any Fund. Fund investments may change at any time.
4
Pacific Advisors
Government Securities Fund
Fund Objective: High current income, preservation of capital, and rising future income consistent with prudent investment risk.
Investment Invests at least 80% of its assets in U.S. Government fixed income securities.
Strategy: These include securities issued or guaranteed by the U.S. Treasury; issued by a U.S. Government agency; or issued by a Government-Sponsored Enterprise (GSE). May also invest in high quality dividend-paying common stocks.
Investor Profile: Conservative. Income-focused; capital preservation aim.
TOTAL RETURNS | EXPENSE RATIOS1 | ||||||||||||||||||||||||||
For the six months ended June 30, 2014 | Current | Prospectus | |||||||||||||||||||||||||
Net | Gross | Net | Gross | ||||||||||||||||||||||||
Class A | 0.44 | % | Class A | 3.24 | % | 6.06 | % | 3.39 | % | 6.09 | % | ||||||||||||||||
Class C | 0.00 | % | Class C | 3.97 | % | 6.79 | % | 4.16 | % | 6.82 | % | ||||||||||||||||
Barclays Capital U.S. Int T-Bond Index2 | 1.55 | % | |||||||||||||||||||||||||
Performance quoted is past performance which does not guarantee future results. Current performance may be higher or lower than the performance quoted. Call (800) 989-6693 for performance current to the most recent month-end. The investment return and principal value of an investment will fluctuate so that an investor's shares, when redeemed, may be worth more or less than their original cost. Returns represent the change in value over the stated period assuming reinvestment of dividends and capital gains at net asset value. Rankings shown are for Class A shares; rankings for other share classes may be different. Returns and rankings do not take into account the maximum 4.75% sales charge on Class A shares or the 1% Contingent Deferred Sales Charge (CDSC) for Class C shares sold within one year of purchase. Returns would be lower if the applicable sales charge and CDSC were included. Returns do not take into account individual taxes which may reduce actual returns when shares are sold.
The Fund's investment adviser is waiving a portion of its management fees pursuant to an Expense Limitation Agreement. The waiver may be discontinued at any time with ninety days written notice in consultation with the Fund's board, but is expected to continue at current levels. Please see the Notes to Financial Statements in this report for details. Performance shown reflects the waiver, without which the results would have been lower.
Discussion with Portfolio Manager August 22, 2014
Jingjing Yan, CFA
Please see the Chairman's Letter at the beginning of this Report for a detailed market and economic review
as well as the Manager's general market outlook.
Fund Performance
The Fund's investment strategy is to manage interest rate risk for both long-term and short-term investors seeking to protect principal. In response to the slow economic recovery and the extended period of low interest rates, the Fund's fixed income investments were concentrated in short- to intermediate-term bonds.
For the first half of the year, Class A shares of the Fund returned 0.44% compared to 1.55% for its benchmark, the Barclays Capital U.S. Intermediate T-Bond Index. Unlike the Fund, however, the benchmark is an unmanaged portfolio. Furthermore, the benchmark's longer average duration reflects a significantly greater exposure to interest rate risk.
During the period, the Fund maintained an average duration of approximately 0.7 years; in contrast, the benchmark's average duration was 3.6 years. Duration measures a portfolio's sensitivity to interest
1 "Current" expense ratio is annualized for the year-to-date as of 06/30/14. "Prospectus" expense ratio is for the fiscal year ended 12/31/13.
2 The Barclays Capital U.S. Intermediate Treasury Bond Index is an unmanaged index of U.S. government securities with one to ten years to maturity. It is not possible to invest directly in the Index.
5
Pacific Advisors
Government Securities Fund continued
rate movements; when interest rates increase by 1%, a portfolio with a 4-year duration would decline by approximately 4%. The Fund's short average duration reflected our commitment to minimize the negative effects of rising interest rates on bond portfolios. Also, the Fund's strategy to invest in shorter-term bonds provides price stability and the flexibility to respond timely as investment opportunities develop.
The Fund's investments include a small allocation to common stocks; these holdings contribute to total return by providing dividend income and the potential for price appreciation. The Fund selects high-quality, dividend-paying securities which help manage volatility by counteracting price changes in U.S. government securities holdings.
Market Overview
Most investors anticipated that interest rates, which had inched higher towards the end of 2013, would continue to rise as the Federal Reserve tapered its monthly bond-buying program. Instead, a confluence of issues kept the demand for U.S. Treasuries strong. Geopolitical tensions and mixed economic reports including a slowdown in factory output in China and, back at home, a negative reading for first quarter GDP provided no incentive for investors to exit bonds. Also, yields fell as record-breaking bond-purchasing activity by the Chinese government inflated bond prices. These purchases, totaling over $107 billion in the first five months of 2014, sought to aid China's export-driven economy by weakening the value of the Yuan. Stronger-than-expected domestic employment data and a rebound in Chinese manufacturing temporarily reversed the trend. Then, escalating tensions in Ukraine and accommodative monetary policies by the European Central Bank once again pressured rates. The yield on the 10-year U.S. Treasury Note, which closed 2013 at 3.04%, fell to 2.61% in early February. During the remainder of the period, Treasuries rose in February and March (reaching 2.82% in early April) before falling to 2.44% in May and closing the second quarter at 2.53%.
The Fed continued to reduce its monthly bond-buyback program although the effects of tapering were mostly overshadowed. Meanwhile, inflation remained subdued. The current interest rate environment is unusual in that the major central banks around the world are simultaneously utilizing low interest rates to spur growth; such a coordinated action on interest rate policy is virtually unprecedented. Nevertheless, prevailing interest rates are likely headed higher; changes in interest rates, though, will reflect investors' reactions to current events well in advance of central banks' policy changes. Consequently, we continue to invest in shorter-term government securities which offer principal protection as rates rise. Bonds with longer durations may offer higher yields, but we believe that the long-term risk tradeoff of higher yields versus falling prices is unfavorable. Indeed, when rates rose in 2013, portfolios that were invested in longer-term securities suffered significant losses.
Fund Strategy
Fixed Income Strategy
Over 80% of the Fund's holdings were invested in U.S. government agency bonds. These agency bonds offer higher coupon rates than U.S. Treasuries which enabled the Fund to increase income without materially increasing risk. The Fund captured additional yield by primarily purchasing callable government agency bonds with short-to-intermediate maturities. The callable bonds had higher coupon rates than non-callable bonds because they allowed the issuing agencies to call back the bonds on pre-set call dates. The Fund purchased callable bonds which included a "step-up" feature; here, the bonds' interest rates increase if the bonds are not called away. Also, the day-to-day prices for step-up callable bonds tend to be less volatile than for non-callable bonds. Even so, and given the low interest rate environment, we expected these bonds would be called back in less than a year. The frequent replacement of these callable bonds enabled the Fund to quickly respond to interest rate changes. As expected, many of these bonds were called and the proceeds were reinvested in other callable government agency bonds with step-up features.
The Fund does not employ higher-risk strategies to enhance return. For example, the Fund does not purchase bonds with extended durations, utilize leverage strategies or invest in mortgage-backed securities.
6
Equity Positioning
The Fund invests a minor portion of its portfolio (less than 18%) in high-quality, dividend-paying common stocks. Equity holdings focus on stocks that are relatively less sensitive than the overall market to economic disruptions while offering attractive dividends and the potential for price appreciation. Stock price appreciation added to the Fund's performance and offset the low interest rates on short- to intermediate-term U.S. government securities. We anticipate that the Fund's allocation to equities may be reduced as interest rates rise and the Fund repositions the portfolio toward longer-term U.S. government securities.
Several Fund holdings, including Unilever and Johnson & Johnson, performed well as investors favored the more conservative sectors of the market. During the period, the Fund took advantage of the equity markets' strong appreciation to trim positions in companies such as McDonald's, Chevron, and Microsoft; also, the Fund sold positions in Safeway and 3M.3 The Fund increased its positions in Unilever and Eli Lilly and added PepsiCo.
Looking Ahead
We expect that demand for U.S. government securities will, in the absence of major geopolitical turmoil, diminish somewhat in the second half of 2014. We also anticipate that investors will actively trade government bonds in response to various catalysts such as economic data, Fed policies and global concerns; as a result, interest rates will likely be volatile in the upcoming months. The Fed intends to conclude its quantitative easing ("QE") program in October; the central bank has also stated that it anticipates keeping the federal funds (or "fed funds") rate low for a considerable time after the QE program of bond purchasing ends. Fed officials expect to raise the fed funds rate sometime in 2015; even so, they may decide to raise the rate sooner should the labor market improve more quickly than anticipated. Moreover, the recent purchases of U.S. Treasuries by the Chinese are unlikely to continue at their record-high pace; the Chinese government now owns approximately 11% of the $12 trillion U.S. Treasury market. Interest rates will undoubtedly increase as these purchases decrease; clearly, though, the timing of these events is unknown and unpredictable. Also, the upcoming November elections for the U.S. Senate and House may add another element of uncertainty and volatility.
Investor response to the events and economic data over the remainder of the year will strongly influence interest rates. These reactions, however, are likely temporary; rates should resume their upward trend following the protracted period of historically low levels. As a result, we believe that the Fund's prudent strategy of investing in shorter-term U.S. government securities remains appropriate. We will monitor changing market conditions and manage the Fund accordingly. We expect to migrate the Fund's investments toward longer-term U.S. government securities to capture higher yields as interest rates increase. The Fund's adaptive strategy provides the flexibility to adjust portfolio holdings according to the market environment while keeping the current bias of increasing interest rates in mind.
Portfolio Holdings as of 06/30/14 (Based on Total Investments)
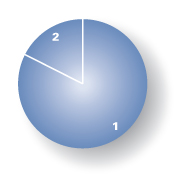
1. | U.S. Government Securities | 82.29 | % | ||||||||
2. | Equities | 17.71 | % | ||||||||
3 For detailed information on Fund holdings, please see the Fund's Schedule of Investments in this Report.
7
Pacific Advisors
Government Securities Fund continued
Expense Examples
As a shareholder of the Fund you incur two types of costs: (1) transaction costs, including sales charges (loads) on purchase payments, reinvested dividends, or other distributions; redemption fees; and exchange fees; and (2) ongoing costs, including management fees; distribution (12b-1) fees; and other Fund expenses. This Example is intended to help you understand your ongoing costs (in dollars) of investing in the Fund and to compare these costs with the ongoing costs of investing in other mutual funds.
The Example is based on an investment of $1,000 invested at the beginning of the period and held for the entire period from January 1, 2014 through June 30, 2014.
Actual Expenses
The first line of the table below provides information about actual account values and actual expenses. You may use the information in this line, together with the amount you invested, to estimate the expenses that you paid over the period. Simply divide your account value by $1,000 (for example, an $8,600 account value divided by $1,000 = 8.6), then multiply the result by the number in the first line under the heading entitled "Expenses Paid During the Period" to estimate the expenses you paid on your account during the period.
The following transaction costs are not included in the expenses shown in the table and, if applicable, would increase the expenses that you paid over the period: (1) a front-end sales charge (load) of 4.75% on Class A shares; (2) a 2% redemption fee if you sell or exchange shares within 30 days of purchase, with certain exceptions. The redemption fee does not apply to: (a) redemptions under an automatic withdrawal program or periodic asset reallocation plan, required minimum distributions (RMD), employer mandated distributions from a qualified plan, or redemptions under a qualified domestic relations order (QDRO); (b) redemptions to pay for expenses related to terminal illness, extended hospital or nursing home care, or other serious medical conditions, including death; (c) redemptions of shares acquired through dividend or capital gains reinvestments; (d) loans from a qualified plan account; and (e) redemptions initiated by the Fund; and (3) a $10 service fee on each exchange after the first five exchanges in each calendar year.
The following ongoing costs are not included in the expenses shown in the table and, if applicable, would increase the expenses that you paid over the period: (1) a $12 low balance fee on accounts with balances of less than $250 as of September 30th of each calendar year and no investment activity (excluding reinvestment of dividends and/or capital gains) during the prior calendar year or the first nine months of the current calendar year. This fee does not apply to IRAs, qualified plan accounts, or Coverdell Education Savings Accounts; (2) a $15 annual custodial fee on IRAs, SEPs, SIMPLE IRAs, and Coverdell Education Savings Accounts; and (3) a $20 annual custodial fee on 403(b) accounts.
Hypothetical Example for Comparison Purposes
The second line of the table below provides information about hypothetical account values and hypothetical expenses based on the Fund's actual expense ratio and an assumed rate of return of 5% per year before expenses, which in not the Fund's actual return. The hypothetical account values and expenses may not be used to estimate the actual ending account balance or expenses you paid for the period. You may use this information to compare the ongoing costs of investing in the Fund and other funds. To do so, compare this 5% hypothetical example with the 5% hypothetical examples that appear in the shareholder reports of the other funds.
The following transaction costs are not included in the expenses shown in the table and, if applicable, would increase the expenses that you paid over the period: (1) a front-end sales charge (load) of 4.75% on Class A shares; (2) a 2% redemption fee if you sell or exchange shares within 30 days of purchase, with certain exceptions. The redemption fee does not apply to: (a) redemptions under an automatic withdrawal program or periodic asset reallocation plan, required minimum distributions (RMD), employer mandated distributions from a qualified plan, or redemptions under a qualified domestic relations order (QDRO); (b) redemptions to pay for expenses related to terminal illness, extended hospital or nursing home care, or other serious medical conditions, including death; (c) redemptions of shares acquired through dividend or capital gains reinvestments; (d) loans from a qualified plan account; and (e) redemptions initiated by the Fund; and (3) a $10 service fee on each exchange after the first five exchanges in each calendar year.
The following ongoing costs are not included in the expenses shown in the table and, if applicable, would increase the expenses that you paid over the period: (1) a $12 low balance fee on accounts with balances of less than $250 as of September 30th of each calendar year and no investment activity (excluding reinvestment of dividends and/or capital gains) during the prior calendar year or the first nine months of the current calendar year. This fee does not apply to IRAs, qualified plan accounts, or Coverdell Education Savings Accounts; (2) a $15 annual custodial fee on IRAs, SEPs, SIMPLE IRAs, and Coverdell Education Savings Accounts; and (3) a $20 annual custodial fee on 403(b) accounts.
Please note that the expenses shown in the table are meant to highlight your ongoing costs only and do not reflect any transactional costs, such as sales charges (loads), redemption fees, or exchange fees. Therefore, the second line of the table is useful in comparing ongoing costs only, and will not help you determine the relative total costs of owning different funds. In addition, if these transactional costs were included, your costs would have been higher.
| Beginning Account Value 01/01/14 | Ending Account Value 06/30/14 | Expense Paid During Period 01/01/14 – 06/30/14 | |||||||||||||
Government Secs Fund Class A | |||||||||||||||
Actual | $ | 1,000.00 | $ | 1,004.40 | $ | 16.10 | |||||||||
Hypothetical (5% return before expense) | $ | 1,000.00 | $ | 1,008.73 | $ | 16.14 | |||||||||
Government Secs Fund Class C | |||||||||||||||
Actual | $ | 1,000.00 | $ | 1,000.00 | $ | 19.69 | |||||||||
Hypothetical (5% return before expense) | $ | 1,000.00 | $ | 1,005.11 | $ | 19.74 | |||||||||
3 Expenses are equal to the Fund's annualized expense ratio, net of expense waivers, of 3.24% for Class A shares and 3.97% for Class C shares, multiplied by the average account value over the period, multiplied by 181/365 days to reflect the one-half year period.
8
Pacific Advisors
Income and Equity Fund
Fund Objective: Current income and, secondarily, long-term capital appreciation.
Investment Invests primarily in investment grade U.S. corporate bonds and in
Strategy: dividend-paying stocks.
Investor Profile: Conservative. Some current income required; capital preservation aim.
TOTAL RETURNS | EXPENSE RATIOS1 | ||||||||||||||||||||||||||
For the six months ended June 30, 2014 | Current | Prospectus | |||||||||||||||||||||||||
Net | Gross | Net | Gross | ||||||||||||||||||||||||
Class A | 4.09 | % | Class A | 1.93 | % | 2.68 | % | 2.23 | % | 2.98 | % | ||||||||||||||||
Class C | 3.59 | % | Class C | 2.68 | % | 3.43 | % | 3.03 | % | 3.78 | % | ||||||||||||||||
Barclays Capital U.S. Int Corp Bond Index2 | 3.61 | % | |||||||||||||||||||||||||
S&P 500® Index3 | 7.12 | % | |||||||||||||||||||||||||
Performance quoted is past performance which does not guarantee future results. Current performance may be higher or lower than the performance quoted. Call (800) 989-6693 for performance current to the most recent month-end. The investment return and principal value of an investment will fluctuate so that an investor's shares, when redeemed, may be worth more or less than their original cost. Returns represent the change in value over the stated period assuming reinvestment of dividends and capital gains at net asset value. Rankings are shown for Class A shares; rankings for other share classes may be different. Returns and rankings do not take into account the maximum 4.75% sales charge on Class A shares or the 1% Contingent Deferred Sales Charge (CDSC) for Class C shares sold within one year of purchase. Returns would be lower if the applicable sales charge and CDSC were included. Returns do not take into account individual taxes which may reduce actual returns when shares are sold.
The Fund's investment adviser is waiving a portion of its management fees pursuant to an Expense Limitation Agreement. The waiver may be discontinued at any time with ninety days written notice in consultation with the Fund's board, but is expected to continue at current levels. Please see the Notes to Financial Statements in this report for details. Performance shown reflects the waiver, without which the results would have been lower.
Discussion with Portfolio Managers August 22, 2014
Charles Suh, CFA
Jingjing Yan, CFA
Please see the Chairman's Letter at the beginning of this Report for a detailed market and economic review
as well as the Manager's general market outlook.
Fund Performance
During the first half of the year, the Fund's conservative approach provided modest gains. Interest rates had hit historical lows in May 2013 before trending higher following the Federal Reserve's announced decision to begin tapering its accommodative monetary policies. The yield on the 10-year U.S. Treasury Note, which hit a low of 1.66% in early May, rose to end the year at 3.04%. Yet, in 2014, investor demand for Treasuries increased in response to the slow economic recovery and various geopolitical tensions. As a result, the much-anticipated increase in long-term interest rates temporarily reversed direction; rates ended the period at 2.53%. The Fund's fixed income strategy remained focused on short- to intermediate-term investment grade bonds; these conservative bonds provide not only valuable protection against price volatility but also better maintain their valuations as interest rates rise. Class A shares
1 "Current" expense ratio is annualized for the year-to-date as of 06/30/14. "Prospectus" expense ratio is for the fiscal year ended 12/31/13.
2 The Barclays Capital U.S. Intermediate Corporate Bond Index is an unmanaged index of publicly issued investment grade U.S. corporate bonds with one to ten years to maturity. It is not possible to invest directly in the Index.
3 The S&P 500® Index is an unmanaged, market capitalization weighted index which measures the performance of the large cap segment of the U.S. equities market, covering approximately 75% of the U.S. equities market. The Index includes 500 leading companies in leading industries of the U.S. economy. Index returns assume the reinvestment of dividends, but, unlike the Fund's returns, do not reflect the effects of management fees or expenses. It is not possible to invest directly in the Index.
9
Pacific Advisors
Income and Equity Fund continued
of the Fund gained 4.09%. Notably, the Fund generated these returns with substantially less risk than the broader market as demonstrated by the Fund's one-year beta4 of 0.41, as of June 30th, versus the S&P 500® Index.
The average maturity of the Fund's fixed income holdings, at 3.6 years, reflects our strategy of protecting principal against volatility and rising interest rates. In comparison, the Fund's fixed income benchmark, the Barclays Capital U.S. Intermediate Corporate Bond Index, an unmanaged bond portfolio, maintains an average maturity of 5.0 years.
The Fund's equity portfolio benefitted from the strong performance of individual stocks as well as the solid gains in the stock market. Equity holdings remained concentrated in 30 to 40 high-quality, dividend-paying stocks with relatively low volatility and stable growth patterns; in contrast, the Fund's equity benchmark, the S&P 500® Index, is comprised of companies across a wide range of quality, risk factors and volatility. Also, the companies represented in the Fund are, on average, approximately three times larger than the companies in the Index.
Even though the Fund's fixed income and equity portfolios differ from their respective benchmarks, Fund performance is best compared to a blended return based on the two benchmarks. During the period, the blended return was 5.26%.
Fund Strategy
The Fund actively managed the allocation between fixed income and equity securities to find the most attractive, risk-appropriate opportunities for income and price appreciation. Corporate bond holdings remained at approximately 50% of the portfolio while the equity portion increased slightly to 46% during the period. The Fund's fixed income holdings in short- to intermediate-term investment grade corporate bonds provide both principal protection and the opportunity to reinvest at higher yields when interest rates rise. For the equity portfolio, Fund holdings include a diverse selection of dividend-paying blue-chip stocks; the relatively high dividends compensate for low yields offered by short- to intermediate-term corporate bonds. This equity strategy has been critical to the Fund's performance during the extended period of low interest rates as the dividend yields for portfolio stocks were often higher than the yields on corporate bonds issued by those same companies. We anticipate that the equity allocation may decrease as interest rates resume their upward trend and we reinvest capital in higher-yielding bonds.
Interest rates fell toward the beginning of the year as investors preferred the "safe haven" of U.S. Treasuries and quality corporate bonds. Demand rose in response to uneven global economic data, including the slowdown in China's manufacturing sector, and conflicts in Ukraine and elsewhere. Additionally, the Chinese government, in an attempt to weaken its own currency in order to encourage exports, purchased a record-breaking $107+ billion of U.S. Treasuries during the first five months of 2014. The continuing strong demand for bonds, combined with muted inflationary pressures, left fixed income investors inclined to maintain bonds holdings rather than migrate to riskier investments.
Fixed income investors sought both U.S. Treasuries and corporate bonds, which drove yields for Treasuries, investment grade and high-yield (or "junk" bonds) lower. And, the differences in yields (or "spread") between these types of bonds narrowed. During the first six months of 2014, the average yields of investment grade bonds fell 0.40% to 3.46% while the average yields on junk bonds fell 0.62% to 5.33%. The narrow spread reflects the willingness of some investors to accept lower yields on riskier bonds even though these higher-risk bonds have greater exposure to potential losses when rates increase. Not surprisingly, the inventory of quality bonds decreased as demand increased. Even so, the Fund does not use speculative or aggressive investments such as derivatives or leverage to enhance yield; and, no more than 5% of the Fund may be invested in below investment grade bonds. Consequently, the Fund selected bonds that we determined, after reviewing the financials, history and cash flow expectations of each company, presented attractive investment opportunities.
4 "Beta" measures volatility relative to the stock market or an alternative benchmark. A beta less than 1.0 indicates lower risk than the market or the benchmark; a beta greater than 1.0 indicates higher risk than the market or the benchmark.
10
Fixed Income Strategy
The Fund's fixed income strategy anticipates that interest rates may remain somewhat volatile with an upward bias. Fixed income holdings, therefore, are focused on corporate bonds with short-to-intermediate maturities; these securities also provide the flexibility to identify timely investment opportunities as the fixed income market transitions to higher rates. Shorter-term bonds continued to enjoy strong demand as many institutional buyers, including other bond mutual fund managers, also favored these securities; as a result, the supply of attractive fixed income securities tightened further. As of June 30th, the average yield on 5-year investment grade U.S. corporate bonds was 2.29%; in this limited-supply, low-yield environment, the Fund also sought to enhance returns by identifying opportunities in good-quality corporate bonds with distinctive characteristics.
The Fund's strategy continued to utilize callable corporate bonds. Callable bonds are securities that can be bought back, or "called," by the issuer prior to maturity at predefined dates and at prices which generally include a premium over the bond's issue price. These types of bonds typically have higher yields due to their call features. The Fund's callable bonds provide higher returns and, when called, they enable the Fund to potentially reinvest in higher-yielding bonds. If, on the other hand, a callable bond is not called back, the Fund may have the opportunity to generate higher returns as the bond's yield increases.
The Fund may also purchase bonds with attractive yields due to company-specific issues or economic conditions. For example, in May, we purchased a callable bond maturing in 6 years that was issued by Ball Corporation.5 The yield until the first call date in early 2015 is approximately 1.75%; if the bond is not called on that date, the yield to maturity increases to 5.35%. The company, which supplies metal, plastic and glass packaging to the beverage, food and personal care industries, was under pressure as increasingly health-conscious consumers lessened the demand for carbonated soft drinks. Investors seemed somewhat disinterested in the company's bond offerings, yet our analysis concluded that the company's improving financials will likely continue to strengthen as the company expands into higher-margin products.
Equity Strategy
The Fund's equity holdings provide an important complement to corporate bonds especially during the current period of historically low interest rates. Our equity strategy focuses on total return through dividend income and capital appreciation. We select high-quality, blue-chip companies across a wide array of industries. During the period, we increased our allocation to companies which generally provide better growth opportunities during periods of global economic expansion; for example, we added to several industrial and telecommunications holdings.
We also continued to favor well-established stocks with attractive dividends. Lately, few firms have been inclined to increase dividend rates. Companies have been able to borrow or refinance at extremely low rates; as a result, the difference between a company's bond yield and its dividend yield may have narrowed. In some cases, the dividend yields of Fund holdings exceeded the yields of the corporate bonds issued by these same companies. For example, as of June 30th, Vodafone's dividend yield of 6.63% was significantly higher than the the approximate 2.46% yield of the company's corporate bond maturing in June 2019.
The weighted average yield for the Fund's equity holdings is 3.09% which is notably higher than the 2.29% average yield for 5-year investment grade corporate bonds. Stocks with a dividend yield over 4.5% included AT&T and Vodafone; companies with a dividend yield between 3.5% and 4.5% included Duke Energy, Verizon, Mattel, Xcel Energy and Public Services Enterprise Group.
We anticipate that, as the global economy further improves and interest rates trend higher, our allocations will adjust. We expect to manage portfolio risk and increase investment returns by reducing the Fund's equity holdings in favor of fixed income holdings with higher coupon yields as interest rates increase.
5 For detailed information on Fund holdings, please see the Fund's Schedule of Investments in this Report.
11
Pacific Advisors
Income and Equity Fund continued
Looking Ahead
Our outlook for the U.S. and global economies remains positive. Consistently strengthening economic data will enable the Fed to remain on track to end its monthly bond-buying program in October; improving employment statistics may spur the central bank to raise the federal funds rate sooner than later. Overall market conditions will determine how far, and how quickly, interest rates will rise. The shifting interest rate environment should prompt conservative investors to reevaluate their willingness to hold long-term bonds as interest rates increase.
The Fund's adaptive strategy provides the flexibility to manage the risk of higher interest rates. The approach also enables the Fund to gradually increase yield by reinvesting capital at the prevailing higher interest rates as bond holdings mature or are called away. Furthermore, the flexibility allows us to proactively adjust to changing market environments while acknowledging the upward bias of interest rates. We believe that the Fund is well-positioned for developing economic and market conditions including the transition from historically low interest rates to higher interest rates.
Portfolio Holdings as of 06/30/14 (Based on Total Investments)
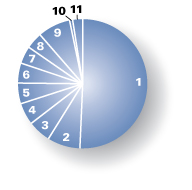
1. | Corporate Bonds | 50.48 | % | ||||||||
Equities | 46.49 | % | |||||||||
2. | Consumer Staples | 8.25 | % | ||||||||
3. | Industrials | 5.76 | % | ||||||||
4. | Utilities | 5.61 | % | ||||||||
5. | Information Technology | 5.20 | % | ||||||||
6. | Consumer Discretionary | 4.88 | % | ||||||||
7. | Health Care | 4.43 | % | ||||||||
8. | Telecommunication Services | 4.19 | % | ||||||||
9. | Others | 8.17 | % | ||||||||
10. | Preferred Stock | 0.60 | % | ||||||||
11. | Cash and Cash Equivalents | 2.43 | % | ||||||||
12
Expense Examples
As a shareholder of the Fund you incur two types of costs: (1) transaction costs, including sales charges (loads) on purchase payments, reinvested dividends, or other distributions; redemption fees; and exchange fees; and (2) ongoing costs, including management fees; distribution (12b-1) fees; and other Fund expenses. This Example is intended to help you understand your ongoing costs (in dollars) of investing in the Fund and to compare these costs with the ongoing costs of investing in other mutual funds.
The Example is based on an investment of $1,000 invested at the beginning of the period and held for the entire period from January 1, 2014 through June 30, 2014.
Actual Expenses
The first line of the table below provides information about actual account values and actual expenses. You may use the information in this line, together with the amount you invested, to estimate the expenses that you paid over the period. Simply divide your account value by $1,000 (for example, an $8,600 account value divided by $1,000 = 8.6), then multiply the result by the number in the first line under the heading entitled "Expenses Paid During the Period" to estimate the expenses you paid on your account during the period.
The following transaction costs are not included in the expenses shown in the table and, if applicable, would increase the expenses that you paid over the period: (1) a front-end sales charge (load) of 4.75% on Class A shares; (2) a 2% redemption fee if you sell or exchange shares within 30 days of purchase, with certain exceptions. The redemption fee does not apply to: (a) redemptions under an automatic withdrawal program or periodic asset reallocation plan, required minimum distributions (RMD), employer mandated distributions from a qualified plan, or redemptions under a qualified domestic relations order (QDRO); (b) redemptions to pay for expenses related to terminal illness, extended hospital or nursing home care, or other serious medical conditions, including death; (c) redemptions of shares acquired through dividend or capital gains reinvestments; (d) loans from a qualified plan account; and (e) redemptions initiated by the Fund; and (3) a $10 service fee on each exchange after the first five exchanges in each calendar year.
The following ongoing costs are not included in the expenses shown in the table and, if applicable, would increase the expenses that you paid over the period: (1) a $12 low balance fee on accounts with balances of less than $250 as of September 30th of each calendar year and no investment activity (excluding reinvestment of dividends and/or capital gains) during the prior calendar year or the first nine months of the current calendar year. This fee does not apply to IRAs, qualified plan accounts, or Coverdell Education Savings Accounts; (2) a $15 annual custodial fee on IRAs, SEPs, SIMPLE IRAs, and Coverdell Education Savings Accounts; and (3) a $20 annual custodial fee on 403(b) accounts.
Hypothetical Example for Comparison Purposes
The second line of the table below provides information about hypothetical account values and hypothetical expenses based on the Fund's actual expense ratio and an assumed rate of return of 5% per year before expenses, which in not the Fund's actual return. The hypothetical account values and expenses may not be used to estimate the actual ending account balance or expenses you paid for the period. You may use this information to compare the ongoing costs of investing in the Fund and other funds. To do so, compare this 5% hypothetical example with the 5% hypothetical examples that appear in the shareholder reports of the other funds.
The following transaction costs are not included in the expenses shown in the table and, if applicable, would increase the expenses that you paid over the period: (1) a front-end sales charge (load) of 4.75% on Class A shares; (2) a 2% redemption fee if you sell or exchange shares within 30 days of purchase, with certain exceptions. The redemption fee does not apply to: (a) redemptions under an automatic withdrawal program or periodic asset reallocation plan, required minimum distributions (RMD), employer mandated distributions from a qualified plan, or redemptions under a qualified domestic relations order (QDRO); (b) redemptions to pay for expenses related to terminal illness, extended hospital or nursing home care, or other serious medical conditions, including death; (c) redemptions of shares acquired through dividend or capital gains reinvestments; (d) loans from a qualified plan account; and (e) redemptions initiated by the Fund; and (3) a $10 service fee on each exchange after the first five exchanges in each calendar year.
The following ongoing costs are not included in the expenses shown in the table and, if applicable, would increase the expenses that you paid over the period: (1) a $12 low balance fee on accounts with balances of less than $250 as of September 30th of each calendar year and no investment activity (excluding reinvestment of dividends and/or capital gains) during the prior calendar year or the first nine months of the current calendar year. This fee does not apply to IRAs, qualified plan accounts, or Coverdell Education Savings Accounts; (2) a $15 annual custodial fee on IRAs, SEPs, SIMPLE IRAs, and Coverdell Education Savings Accounts; and (3) a $20 annual custodial fee on 403(b) accounts.
Please note that the expenses shown in the table are meant to highlight your ongoing costs only and do not reflect any transactional costs, such as sales charges (loads), redemption fees, or exchange fees. Therefore, the second line of the table is useful in comparing ongoing costs only, and will not help you determine the relative total costs of owning different funds. In addition, if these transactional costs were included, your costs would have been higher.
| Beginning Account Value 01/01/14 | Ending Account Value 06/30/14 | Expense Paid During Period 01/01/14 – 06/30/14 | |||||||||||||
Income & Equity Fund Class A | |||||||||||||||
Actual | $ | 1,000.00 | $ | 1,040.90 | $ | 9.77 | |||||||||
Hypothetical (5% return before expense) | $ | 1,000.00 | $ | 1,015.22 | $ | 9.64 | |||||||||
Income & Equity Fund Class C | |||||||||||||||
Actual | $ | 1,000.00 | $ | 1,035.90 | $ | 13.53 | |||||||||
Hypothetical (5% return before expense) | $ | 1,000.00 | $ | 1,011.50 | $ | 13.37 | |||||||||
4 Expenses are equal to the Fund's annualized expense ratio, net of expense waivers, of 1.93% for Class A shares and 2.68% for Class C shares, multiplied by the average account value over the period, multiplied by 181/365 days to reflect the one-half year period.
13
Pacific Advisors
Balanced Fund
Fund Objective: Long-term capital appreciation and income consistent with reduced risk.
Investment Invests primarily in large cap common stocks and investment grade U.S. corporate
Strategy: bonds. Invests at least 25% of its assets in fixed income securities and preferred stocks and at least 25% in equities.
Investor Profile: Moderately conservative. Seeks combination of long-term growth, income, liquidity and reduced risk of price fluctuations.
TOTAL RETURNS | EXPENSE RATIOS1 | ||||||||||||||||||
For the six months ended June 30, 2014 | Current | Prospectus | |||||||||||||||||
Class A | –0.18 | % | Class A | 2.80 | % | 3.07 | % | ||||||||||||
Class C | –0.59 | % | Class C | 3.55 | % | 3.86 | % | ||||||||||||
S&P 500® Index2 | 7.12 | % | |||||||||||||||||
Barclays Capital U.S. Int Corp Bond Index3 | 3.61 | % | |||||||||||||||||
Performance quoted is past performance which does not guarantee future results. Current performance may be higher or lower than the performance quoted. Call (800) 989-6693 for performance current to the most recent month-end. The investment return and principal value of an investment will fluctuate so that an investor's shares, when redeemed, may be worth more or less than their original cost. Returns represent the change in value over the stated period assuming reinvestment of dividends and capital gains at net asset value. Rankings are shown for Class A shares; rankings for other share classes may be different. Returns and rankings do not take into account the maximum 5.75% sales charge on Class A shares or the 1% Contingent Deferred Sales Charge (CDSC) for Class C shares sold within one year of purchase. Returns would be lower if the applicable sales charge and CDSC were included. Returns do not take into account individual taxes which may reduce actual returns when shares are sold.
Discussion with Portfolio Managers August 22, 2014
Charles Suh, CFA
Jingjing Yan, CFA
Samuel C. Coquillard
Please see the Chairman's Letter at the beginning of this Report for a detailed market and economic review
as well as the Manager's general market outlook.
Fund Performance
Overall performance reflects the combined results of the Fund's diversified "all cap" equity strategy and "total return" approach to fixed income investing. The Fund experienced mixed results in the first half of 2014; many of the Fund's large cap stocks performed well while several mid-cap and small cap holdings disappointed. Disappointing first quarter economic reports and escalating geopolitical tensions prompted investors to favor more conservative areas of the market, including large cap stocks and stocks with relatively high dividends. During the period, the Fund's fixed income holdings were concentrated in shorter-term investment grade corporate bonds; these bonds, which were selected to protect principal and minimize price volatility, trailed the fixed income benchmark which includes bonds with longer maturities. Bonds with shorter maturities typically underperform when interest rates fall as they did during the period.
1 "Current" expense ratio is annualized for the year-to-date as of 06/30/14. "Prospectus" expense ratio is for the fiscal year ended 12/31/13.
2 The S&P 500® Index is an unmanaged, market capitalization weighted index which measures the performance of the large cap segment of the U.S. equities market, covering approximately 75% of the U.S. equities market. The Index includes 500 leading companies in leading industries of the U.S. economy. Index returns assume the reinvestment of dividends, but, unlike the Fund's returns, do not reflect the effects of management fees or expenses. It is not possible to invest directly in the Index.
3 The Barclays Capital U.S. Intermediate Corporate Bond Index is an unmanaged index of publicly issued investment grade U.S. corporate bonds with one to ten years to maturity. It is not possible to invest directly in the Index.
14
The Fund underperformed during the first half of the year; Class A shares declined slightly (–0.18%) to trail both the S&P 500® Index, which rose 7.12%, and the Barclays Capital U.S. Intermediate Corporate Bond Index, which rose 3.61%. The Fund's combination of equity and fixed income securities suggests that its performance would be best viewed against a blend of its equity and fixed income benchmarks. Fund volatility remained below average, with a one-year beta4 of 0.85, as of June 30th, compared to the S&P 500® Index. The Fund's bond holdings and, to a lesser extent, large cap equity holdings contributed to its relatively modest volatility; mid-cap and small cap holdings, however, experienced periods of heightened volatility during the period.
Fund Strategy
The Fund's conservative strategy seeks to provide long-term capital appreciation with limited risk and volatility. We actively manage the allocation between equity and fixed income investments to seek the best opportunities for long-term growth. The Fund combines high-quality stocks across all market capitalizations with fixed income holdings, primarily in investment grade corporate bonds, that provide income and appreciation potential. This balanced approach enables the Fund to take advantage of specific growth opportunities while reducing price volatility.
During the first quarter, economic growth stalled due primarily to unusually harsh winter weather. Business activity improved throughout the second quarter yet the increasing geopolitical tensions in Ukraine and Iraq contributed to a cautious equity market environment. Meanwhile, the Federal Reserve cited improved employment data and modest inflationary pressures in continuing to wind down its bond-buying program. Global conditions remained favorable, with an ongoing recovery in Europe, impressive growth in China and a gradually improving Japanese economy. Given the positive economic outlook, we maintained the Fund's equity allocation (71% of total assets) near the high end of its historical range.
Equity Strategy
The Fund's "all cap" equity strategy focuses on high-quality, well-managed companies that have proven track records of growth. Large cap stocks, which accounted for approximately 45% of the equity holdings, favor prominent global companies which provide a combination of stability and moderate growth potential. Mid-cap holdings, representing approximately 42% of the equity holdings, feature industry leaders benefiting from favorable trends and company-specific opportunities. Small cap holdings focus on established companies with long-term growth prospects.
Many of the Fund's large cap holdings benefitted from the market environment that favored large cap stocks. Individual stocks enjoyed strong performance; oilfield services companies Halliburton and National Oilwell Varco rose as activity related to the North American "shale revolution" and deepwater offshore drilling increased.5 The latter also completed the spinoff of its distribution operation which will enable the company to focus on more profitable business lines. Disney gained on impressive second quarter results led by strong box office and DVD sales of its animated film "Frozen." Truck engine manufacturer Cummins rose as companies are once again investing in and expanding their truck fleets; heavy duty commercial truck sales are on pace to grow more than 20% this year. And, shares of Microsoft rose on higher PC sales as corporations and consumers migrated to newer versions of Windows and Office.
Several of the Fund's mid-cap and small cap holdings lagged as investors sought to avoid risk; stocks which provided disappointing news or results were particularly hard-hit. Engineering and construction company Chicago Bridge & Iron sold off following criticism of its accounting treatment for last year's acquisition of Shaw Industries. Industrial parts distributor DXP Enterprises fell after a lackluster first quarter earnings report which headlined weak performance in a newly acquired business. And, home furnishings retailer Conn's slid when a slight deterioration in credit trends triggered a steep selloff in the shares. We believe these situations reflect the market's short-term orientation rather than significant setbacks for the
4 "Beta" measures volatility relative to the stock market or an alternative benchmark. A beta less than 1.0 indicates lower risk than the market or the benchmark; a beta greater than 1.0 indicates higher risk than the market or the benchmark.
5 For detailed information on Fund holdings, please see the Fund's Schedule of Investments in this Report.
15
Pacific Advisors
Balanced Fund continued
companies. Accordingly, and in affirming our long-term positive view on these stocks, we added to our positions in Chicago Bridge & Iron, DXP Enterprises, and Conn's during the period.
The Fund added two new positions, Nike and Lithia Motors, during the quarter. Nike, the dominant franchise in the athletic apparel industry, benefits from advanced manufacturing capabilities and a sizable marketing budget. We believe that, with these advantages, the company will increase its global market share; China, in particular, represents a significant long-term growth opportunity. Lithia Motors, the eighth largest automotive retailer in the U.S., has typically operated in smaller towns where the company maintains market leadership. The recent acquisition of DCH Auto Group, which owns 27 new car facilities in New York, New Jersey, and California, expands the company's reach into faster growing metropolitan areas as well. We believe Nike and Lithia represent model Fund investments: Nike, as a dominant global franchise that should benefit from demographic and emerging market trends; and Lithia, as a medium-sized leader in an attractive industry with prospects for both near-term and long-term growth.
Fixed Income Strategy
The Fund's "total return" approach actively manages fixed income holdings in response to current interest rate trends. In selecting appropriate bonds, we examine each company's fundamentals including trends in cash flows, liquidity ratios, and debt maturity schedules. We then assess each bond's income and capital appreciation prospects based on its market price and yield. The extended period of low interest rates and our expectation that rates will rise contributed to our decision to maintain the Fund's fixed income allocation near the lower end of its historical range.
Rates on the 10-year U.S. Treasury Note declined from 3.04% at the end of 2013 to 2.53% by the end of June. Investors flocked to Treasuries in response to geopolitical concerns and the slow economy which stemmed, in part, from the harsh winter weather. Yet, another important but largely unreported factor in the decline was the record-breaking purchase of U.S. Treasuries by the Chinese government; during the first five months of the year, China purchased over $107 billion Treasuries to weaken its currency in order to support the country's export-based economy. Continued purchases of this magnitude may be unlikely; moreover, they may have temporarily distorted the market.
The decline in interest rates during the period benefitted bonds with longer maturities. As rates fell, longer-dated bonds gained in value. The Fund's shorter-term investment grade corporate bonds provided stability but less appreciation. Despite the underperformance, we continue to believe that the Fund's current positioning offers price protection should interest rates increase. Recent data point to a strengthening U.S. economy; and, the Fed is winding down its bond-buying program. Thus, current conditions suggest that interest rates are biased to the upside.
Looking Ahead
In the second half of the year, investors will likely focus on the eventual normalization of monetary policy as the Fed is expected to end its bond-buying program before the end of 2014. Further, most Fed watchers believe the first interest rate hikes will take place sometime in late 2015. Still, the low interest rate environment has persisted longer than most envisioned; indeed, the Fed may hold rates lower for longer, particularly in light of rising geopolitical risks and subdued inflation. Nevertheless, last year's "taper tantrum" is a stark reminder of how abruptly markets can change course; then, rates rose sharply as investors reacted to the Fed's decision to begin winding down its bond-buying program.
Importantly, the U.S. economy remains on firm footing and is expected to generate solid growth for the remainder of the year. Rising confidence in the economic outlook should support the Fund's equity investments in economically sensitive areas of the market, such as transportation. Railroad companies CSX and Kansas City Southern, for example, will handle increased shipments of merchandise, grains, and crude oil. Likewise, manufacturers, including General Electric, will benefit from higher capital spending as businesses invest for growth. In addition, long-term trends favoring the information technology and mobile computing industries should drive strong results at IBM and Qualcomm.
16
Smaller company shares underperformed during the first half of the year as investors pulled back from riskier areas of the market. Improved investor sentiment, supported by a healthy and expanding economy, could lead to a rebound in these stocks. Here, fast-growing companies such as Helix Energy, which owns and operates deepwater oilfield service rigs, and Team, which provides maintenance and repair services for refineries, should enjoy renewed investor interest. Thus, given our positive economic and market outlook, we believe that the Fund's emphasis towards equity holdings, in general, as well as its meaningful exposure to smaller and mid-sized companies, remains appropriate.
Portfolio Holdings as of 06/30/14 (Based on Total Investments)
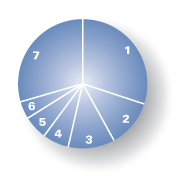
Equities | 70.58 | % | |||||||||
1. | Industrials | 30.02 | % | ||||||||
2. | Consumer Discretionary | 11.83 | % | ||||||||
3. | Energy | 11.60 | % | ||||||||
4. | Financials | 6.71 | % | ||||||||
5. | Information Technology | 5.97 | % | ||||||||
6. | Consumer Staples | 4.45 | % | ||||||||
7. | Corporate Bonds | 29.42 | % | ||||||||
17
Pacific Advisors
Balanced Fund continued
Expense Examples
As a shareholder of the Fund you incur two types of costs: (1) transaction costs, including sales charges (loads) on purchase payments, reinvested dividends, or other distributions; redemption fees; and exchange fees; and (2) ongoing costs, including management fees; distribution (12b-1) fees; and other Fund expenses. This Example is intended to help you understand your ongoing costs (in dollars) of investing in the Fund and to compare these costs with the ongoing costs of investing in other mutual funds.
The Example is based on an investment of $1,000 invested at the beginning of the period and held for the entire period from January 1, 2014 through June 30, 2014.
Actual Expenses
The first line of the table below provides information about actual account values and actual expenses. You may use the information in this line, together with the amount you invested, to estimate the expenses that you paid over the period. Simply divide your account value by $1,000 (for example, an $8,600 account value divided by $1,000 = 8.6), then multiply the result by the number in the first line under the heading entitled "Expenses Paid During the Period" to estimate the expenses you paid on your account during the period.
The following transaction costs are not included in the expenses shown in the table and, if applicable, would increase the expenses that you paid over the period: (1) a front-end sales charge (load) of 5.75% on Class A shares; (2) a 2% redemption fee if you sell or exchange shares within 180 days of purchase, with certain exceptions. The redemption fee does not apply to: (a) redemptions under an automatic withdrawal program or periodic asset reallocation plan, required minimum distributions (RMD), employer mandated distributions from a qualified plan, or redemptions under a qualified domestic relations order (QDRO); (b) redemptions to pay for expenses related to terminal illness, extended hospital or nursing home care, or other serious medical conditions, including death; (c) redemptions of shares acquired through dividend or capital gains reinvestments; (d) loans from a qualified plan account, and (e) redemptions initiated by the Fund; and (3) a $10 service fee on each exchange after the first five exchanges in each calendar year.
The following ongoing costs are not included in the expenses shown in the table and, if applicable, would increase the expenses that you paid over the period: (1) a $12 low balance fee on accounts with balances of less than $250 as of September 30th of each calendar year and no investment activity (excluding reinvestment of dividends and/or capital gains) during the prior calendar year or the first nine months of the current calendar year. This fee does not apply to IRAs, qualified plan accounts, or Coverdell Education Savings Accounts; (2) a $15 annual custodial fee on IRAs, SEPs, SIMPLE IRAs, and Coverdell Education Savings Accounts; and (3) a $20 annual custodial fee on 403(b) accounts.
Hypothetical Example for Comparison Purposes
The second line of the table below provides information about hypothetical account values and hypothetical expenses based on the Fund's actual expense ratio and an assumed rate of return of 5% per year before expenses, which in not the Fund's actual return. The hypothetical account values and expenses may not be used to estimate the actual ending account balance or expenses you paid for the period. You may use this information to compare the ongoing costs of investing in the Fund and other funds. To do so, compare this 5% hypothetical example with the 5% hypothetical examples that appear in the shareholder reports of the other funds.
The following transaction costs are not included in the expenses shown in the table and, if applicable, would increase the expenses that you paid over the period: (1) a front-end sales charge (load) of 5.75% on Class A shares; (2) a 2% redemption fee if you sell or exchange shares within 180 days of purchase, with certain exceptions. The redemption fee does not apply to: (a) redemptions under an automatic withdrawal program or periodic asset reallocation plan, required minimum distributions (RMD), employer mandated distributions from a qualified plan, or redemptions under a qualified domestic relations order (QDRO); (b) redemptions to pay for expenses related to terminal illness, extended hospital or nursing home care, or other serious medical conditions, including death; (c) redemptions of shares acquired through dividend or capital gains reinvestments; (d) loans from a qualified plan account, and (e) redemptions initiated by the Fund; and (3) a $10 service fee on each exchange after the first five exchanges in each calendar year.
The following ongoing costs are not included in the expenses shown in the table and, if applicable, would increase the expenses that you paid over the period: (1) a $12 low balance fee on accounts with balances of less than $250 as of September 30th of each calendar year and no investment activity (excluding reinvestment of dividends and/or capital gains) during the prior calendar year or the first nine months of the current calendar year. This fee does not apply to IRAs, qualified plan accounts, or Coverdell Education Savings Accounts; (2) a $15 annual custodial fee on IRAs, SEPs, SIMPLE IRAs, and Coverdell Education Savings Accounts; and (3) a $20 annual custodial fee on 403(b) accounts.
Please note that the expenses shown in the table are meant to highlight your ongoing costs only and do not reflect any transactional costs, such as sales charges (loads), redemption fees, or exchange fees. Therefore, the second line of the table is useful in comparing ongoing costs only, and will not help you determine the relative total costs of owning different funds. In addition, if these transactional costs were included, your costs would have been higher.
| Beginning Account Value 01/01/14 | Ending Account Value 06/30/14 | Expense Paid During Period 01/01/14 – 06/30/14 | |||||||||||||
Balanced Fund Class A | |||||||||||||||
Actual | $ | 1,000.00 | $ | 998.20 | $ | 13.87 | |||||||||
Hypothetical (5% return before expense) | $ | 1,000.00 | $ | 1,010.91 | $ | 13.96 | |||||||||
Balanced Fund Class C | |||||||||||||||
Actual | $ | 1,000.00 | $ | 994.10 | $ | 17.55 | |||||||||
Hypothetical (5% return before expense) | $ | 1,000.00 | $ | 1,007.19 | $ | 17.67 | |||||||||
4 Expenses are equal to the Fund's annualized expense ratio of 2.80% for Class A shares and 3.55% for Class C shares, multiplied by the average account value over the period, multiplied by 181/365 days to reflect the one-half year period.
18
Pacific Advisors
Large Cap Value Fund
Fund Objective: Long-term capital appreciation.
Investment Invests at least 80% of its assets in large cap companies that are, at the time of
Strategy: purchase, within the market cap range of companies in the S&P 500® Index1.
Investor Profile: Conservative equity. Growth-oriented with a long-term investment horizon.
TOTAL RETURNS | EXPENSE RATIOS2 | ||||||||||||||||||||||||||
For the six months ended June 30, 2014 | Current | Prospectus | |||||||||||||||||||||||||
Net | Gross | Net | Gross | ||||||||||||||||||||||||
Class A | 4.06 | % | Class A | 2.65 | % | 3.52 | % | 2.47 | % | 4.02 | % | ||||||||||||||||
Class C | 3.74 | % | Class C | 3.40 | % | 4.27 | % | 3.22 | % | 4.77 | % | ||||||||||||||||
S&P 500® Index | 7.12 | % | |||||||||||||||||||||||||
Performance quoted is past performance which does not guarantee future results. Current performance may be higher or lower than the performance quoted. Call (800) 989-6693 for performance current to the most recent month-end. The investment return and principal value of an investment will fluctuate so that an investor's shares, when redeemed, may be worth more or less than their original cost. Returns represent the change in value over the stated period assuming reinvestment of dividends and capital gains at net asset value. Returns do not take into account the maximum 5.75% sales charge on Class A shares or the 1% Contingent Deferred Sales Charge (CDSC) for Class C shares sold within one year of purchase. Returns would be lower if the applicable sales charge and CDSC were included. Returns do not take into account individual taxes which may reduce actual returns when shares are sold.
The Fund's investment adviser is waiving a portion of its management fees pursuant to an Expense Limitation Agreement. The waiver may be discontinued at any time with ninety days written notice in consultation with the Fund's board, but is expected to continue at current levels. Please see the Notes to Financial Statements in this report for details. Performance shown reflects the waiver, without which the results would have been lower.
Discussion with Portfolio Manager August 22, 2014
Samuel C. Coquillard
Please see the Chairman's Letter at the beginning of this Report for a detailed market and economic review
as well as the Manager's general market outlook.
Fund Performance
Equity markets continued to trend higher during the first half of the year; the Fund's benchmark, the S&P 500® Index, and the Dow Jones Industrial Average3 reached record highs during the first half of the year as investors favored large cap stocks. The Fund performed well, and with limited volatility, in this market environment, but lagged the benchmark. During the period, Class A shares gained 4.06% compared to the benchmark's gain of 7.12%. The Fund's conservative strategy focuses on managing risk and minimizing volatility; as a result, the Fund typically performs well but appreciates more slowly than the benchmark during market rallies, and outperforms relative to the benchmark during periods of market decline.
1 The Standard & Poor's 500® Index is an unmanaged, market capitalization weighted index which measures the performance of the large cap segment of the U.S. equities market, covering approximately 75% of the U.S. equities market. The Index includes 500 leading companies in leading industries of the U.S. economy. Index returns assume the reinvestment of dividends, but, unlike the Fund's returns, do not reflect the effects of management fees or expenses. It is not possible to invest directly in the Index.
2 "Current" expense ratio is annualized for the year-to-date as of 06/30/14. "Prospectus" expense ratio is for the fiscal year ended 12/31/13.
3 The Dow Jones Industrial Average is an unmanaged, price weighted measure of 30 U.S. stocks selected by the Averages Committee to represent the performance of all U.S. stocks outside the Transportation and Utilities sectors.
19
Pacific Advisors
Large Cap Value Fund continued
Fund holdings4 that contributed to Fund performance in the first half of the year included the following:
• Apple rose over 17% during the period as strong iPhone demand drove better-than-expected revenues and earnings. Also, shareholder-friendly actions included a dividend increase, a 7-for-1 stock split, and stock buybacks. Apple is known for reshaping entire industries with its superior technology and marketing savvy. Moreover, the company's financials stand out: industry-leading margins, considerable cash holdings, and solid earnings growth opportunities. One might expect the stock to trade at a premium; instead, the stock has languished over the past two years. As value-oriented investors, we find the stock remarkably attractive.
• Microsoft gained over 11% as recent positive momentum from its CEO transition continued; the company benefitted from solid growth in all product lines and a stabilizing PC market. In recent years, Microsoft seemingly lost investor interest; the investment community appeared to overlook the company's products, profit margins, and vast cash balances. The company's transformation included high-level management changes, a higher dividend, and a stock repurchase program. Thus, Microsoft, the former epitome of a growth stock, gradually evolved into an attractive opportunity for value investors.
• Shares of Johnson & Johnson increased almost 16% as the company reported surprisingly strong results. After enduring numerous product-related challenges and leadership issues, the company's outlook is once again promising: sales in the pharmaceutical area, the company's largest division, rose more than 20% year-over-year. The consumer products division, with such well-known products as Tylenol®, Neutrogena®, Aveeno® and Listerine®, enjoys tremendous worldwide name recognition. The company has become an attractive value investment as it seeks to regain blue-chip status.
• MasterCard, the world's second largest payment network, fell about 12% in the first half of the year; still, after a 60% gain last year, the pause is not surprising. So far this year, the company increased its dividend, split its stock (10-for-1), and continued a stock repurchase program. The company, in noting that well over 80% of financial transactions use cash or checks, identifies significant growth opportunities as it works "toward a world beyond cash."
Fund Strategy
The Fund's focused portfolio strategy invests in 35 to 50 stocks which are typically less volatile than the overall market. Holdings concentrate on mega-cap stocks of well-managed companies with dominant market positions, strong financials, attractive dividends, and track records of steady growth. The Fund's mega-cap emphasis, as evidenced by its weighted average market cap that is approximately four times larger than the average of the S&P 500® Index, helps achieve stable total returns with less volatility than that of the broader market The Fund's weighted average dividend yield was over 2% as of the end of June. Several holdings, including Kraft Foods, McDonald's, General Electric, Sysco, Proctor & Gamble, and Coca-Cola pay dividends in excess of 3.0%.
Equity markets continued their upswing during the first half of the year as the domestic and global economies improved. The Fund increased exposure to several sectors of the market, including retail, energy, and industrial companies, which should benefit from the continuing economic recovery. The higher allocation to these economically sensitive sectors resulted in a modest increase in the Fund's volatility; the one-year beta5 rose from 0.92 a year ago to 0.97, as of June 30th, but still remains below the Index. In addition, the prospect of rising interest rates is prompting some fixed-income investors whose bond holdings are vulnerable to price declines to seek alternatives. We anticipate that these conservatively-oriented investors will migrate from bonds into equities including the mega-cap stocks such as those in which the Fund invests.
4 For detailed information on Fund holdings, please see the Fund's Schedule of Investments in this Report.
5 "Beta" measures volatility relative to the stock market or an alternative benchmark. A beta less than 1.0 indicates lower risk than the market or the benchmark; a beta greater than 1.0 indicates higher risk than the market or the benchmark.
20
During the period, the fund added several new positions:
• Home Depot, the largest home improvement retailer, is well positioned to participate in the housing industry recovery. The company is committed to stringent cost controls and disciplined growth. The stock dividend yield, as of June 30th, is 2.3%.
• National Oilwell Varco is a worldwide leader in the design, manufacture and sale of equipment used in oil and gas drilling and production. Demand for the company's products and services should increase longer-term given robust activity related to the North American "shale revolution" and deepwater offshore drilling. The Fund purchased the stock following a business realignment; we believe that the stock represents good growth opportunities and provides an attractive 2.2% dividend yield (as of June 30th).
• Now, Inc., a spin-off of National Oilwell Varco, is the second largest distributor of pipes, valves, fittings, and other products to the energy industry. The company's long-term outlook is positive as a result of the emerging energy industry expansion; its debt-free balance sheet also offers the opportunity for acquisitions.
The Fund also sold several positions during the period including Time Inc., which was spun-off by Time Warner Inc.; Sotheby's; and Clorox.
Looking Ahead
We expect the global economic recovery to continue at a modest pace as businesses and consumers proceed with caution. Growth may be sluggish and, at time, uneven. Companies with a measured, sustainable approach should be well-equipped to pursue growth initiatives. The Fund's multi-national mega-cap companies, such as Berkshire Hathaway, Deere & Company, Disney, General Electric, and Honeywell International, with broad geographic footprints and diversified product lines, should perform well in this environment.
We anticipate that, over the next year, the interest rate environment will prompt investors to rotate capital from bonds to equities. The Fund stands to gain as conservatively-oriented investors are likely to seek equity investments that are consistent with the Fund's holdings. Leading large cap stocks should appeal to risk-averse investors; these mega-cap companies offer opportunities to capture long-term growth potential with lower volatility and dividends that rival Treasury yields. The Fund, with considerable holdings in well-known market leaders, should benefit as these conservatively-oriented investors migrate to equities.
Portfolio Holdings as of 06/30/14 (Based on Total Investments)
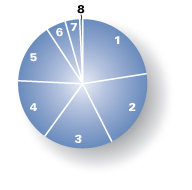
Equities | 99.39 | % | |||||||||
1. | Industrials | 22.42 | % | ||||||||
2. | Information Technology | 20.09 | % | ||||||||
3. | Financials | 17.50 | % | ||||||||
4. | Consumer Discretionary | 15.96 | % | ||||||||
5. | Consumer Staples | 14.97 | % | ||||||||
6. | Energy | 4.74 | % | ||||||||
7. | Health Care | 3.71 | % | ||||||||
8. | Cash and Cash Equivalents | 0.61 | % | ||||||||
21
Pacific Advisors
Large Cap Value Fund continued
Expense Examples
As a shareholder of the Fund you incur two types of costs: (1) transaction costs, including sales charges (loads) on purchase payments, reinvested dividends, or other distributions; redemption fees; and exchange fees; and (2) ongoing costs, including management fees; distribution (12b-1) fees; and other Fund expenses. This Example is intended to help you understand your ongoing costs (in dollars) of investing in the Fund and to compare these costs with the ongoing costs of investing in other mutual funds.
The Example is based on an investment of $1,000 invested at the beginning of the period and held for the entire period from January 1, 2014 through June 30, 2014.
Actual Expenses
The first line of the table below provides information about actual account values and actual expenses. You may use the information in this line, together with the amount you invested, to estimate the expenses that you paid over the period. Simply divide your account value by $1,000 (for example, an $8,600 account value divided by $1,000 = 8.6), then multiply the result by the number in the first line under the heading entitled "Expenses Paid During the Period" to estimate the expenses you paid on your account during the period.
The following transaction costs are not included in the expenses shown in the table and, if applicable, would increase the expenses that you paid over the period: (1) a front-end sales charge (load) of 5.75% on Class A shares; (2) a 2% redemption fee if you sell or exchange shares within 180 days of purchase, with certain exceptions. The redemption fee does not apply to: (a) redemptions under an automatic withdrawal program or periodic asset reallocation plan, required minimum distributions (RMD), employer mandated distributions from a qualified plan, or redemptions under a qualified domestic relations order (QDRO); (b) redemptions to pay for expenses related to terminal illness, extended hospital or nursing home care, or other serious medical conditions, including death; (c) redemptions of shares acquired through dividend or capital gains reinvestments; (d) loans from a qualified plan account, and (e) redemptions initiated by the Fund; and (3) a $10 service fee on each exchange after the first five exchanges in each calendar year.
The following ongoing costs are not included in the expenses shown in the table and, if applicable, would increase the expenses that you paid over the period: (1) a $12 low balance fee on accounts with balances of less than $250 as of September 30th of each calendar year and no investment activity (excluding reinvestment of dividends and/or capital gains) during the prior calendar year or the first nine months of the current calendar year. This fee does not apply to IRAs, qualified plan accounts, or Coverdell Education Savings Accounts; (2) a $15 annual custodial fee on IRAs, SEPs, SIMPLE IRAs, and Coverdell Education Savings Accounts; and (3) a $20 annual custodial fee on 403(b) accounts.
Hypothetical Example for Comparison Purposes
The second line of the table below provides information about hypothetical account values and hypothetical expenses based on the Fund's actual expense ratio and an assumed rate of return of 5% per year before expenses, which in not the Fund's actual return. The hypothetical account values and expenses may not be used to estimate the actual ending account balance or expenses you paid for the period. You may use this information to compare the ongoing costs of investing in the Fund and other funds. To do so, compare this 5% hypothetical example with the 5% hypothetical examples that appear in the shareholder reports of the other funds.
The following transaction costs are not included in the expenses shown in the table and, if applicable, would increase the expenses that you paid over the period: (1) a front-end sales charge (load) of 5.75% on Class A shares; (2) a 2% redemption fee if you sell or exchange shares within 180 days of purchase, with certain exceptions. The redemption fee does not apply to: (a) redemptions under an automatic withdrawal program or periodic asset reallocation plan, required minimum distributions (RMD), employer mandated distributions from a qualified plan, or redemptions under a qualified domestic relations order (QDRO); (b) redemptions to pay for expenses related to terminal illness, extended hospital or nursing home care, or other serious medical conditions, including death; (c) redemptions of shares acquired through dividend or capital gains reinvestments; (d) loans from a qualified plan account, and (e) redemptions initiated by the Fund; and (3) a $10 service fee on each exchange after the first five exchanges in each calendar year.
The following ongoing costs are not included in the expenses shown in the table and, if applicable, would increase the expenses that you paid over the period: (1) a $12 low balance fee on accounts with balances of less than $250 as of September 30th of each calendar year and no investment activity (excluding reinvestment of dividends and/or capital gains) during the prior calendar year or the first nine months of the current calendar year. This fee does not apply to IRAs, qualified plan accounts, or Coverdell Education Savings Accounts; (2) a $15 annual custodial fee on IRAs, SEPs, SIMPLE IRAs, and Coverdell Education Savings Accounts; and (3) a $20 annual custodial fee on 403(b) accounts.
Please note that the expenses shown in the table are meant to highlight your ongoing costs only and do not reflect any transactional costs, such as sales charges (loads), redemption fees, or exchange fees. Therefore, the second line of the table is useful in comparing ongoing costs only, and will not help you determine the relative total costs of owning different funds. In addition, if these transactional costs were included, your costs would have been higher.
| Beginning Account Value 01/01/14 | Ending Account Value 06/30/14 | Expense Paid During Period 01/01/14 – 06/30/14 | |||||||||||||
Large Cap Value Fund Class A | |||||||||||||||
Actual | $ | 1,000.00 | $ | 1,040.60 | $ | 13.41 | |||||||||
Hypothetical (5% return before expense) | $ | 1,000.00 | $ | 1,011.65 | $ | 13.22 | |||||||||
Large Cap Value Fund Class C | |||||||||||||||
Actual | $ | 1,000.00 | $ | 1,037.40 | $ | 17.18 | |||||||||
Hypothetical (5% return before expense) | $ | 1,000.00 | $ | 1,007.93 | $ | 16.93 | |||||||||
5 Expenses are equal to the Fund's annualized expense ratio, net of expense waivers, of 2.65% for Class A shares and 3.40% for Class C shares, multiplied by the average account value over the period, multiplied by 181/365 days to reflect the one-half year period.
22
Pacific Advisors
Mid Cap Value Fund
Fund Objective: Long-term capital appreciation.
Investment Invests at least 80% of its assets in mid-cap companies that are, at the time of
Strategy: purchase, within the market cap range of companies in the Russell Midcap Index®.1
Investor Profile: Moderately aggressive. Growth-oriented with a long-term investment horizon.
TOTAL RETURNS | EXPENSE RATIOS2 | ||||||||||||||||||
For the six months ended June 30, 2014 | Current | Prospectus | |||||||||||||||||
Class A | –0.46 | % | Class A | 3.48 | % | 3.69 | % | ||||||||||||
Class C | –0.80 | % | Class C | 4.22 | % | 4.42 | % | ||||||||||||
Russell Midcap Index® | 8.67 | % | |||||||||||||||||
Performance quoted is past performance which does not guarantee future results. Current performance may be higher or lower than the performance quoted. Call (800) 989-6693 for performance current to the most recent month-end. The investment return and principal value of an investment will fluctuate so that an investor's shares, when redeemed, may be worth more or less than their original cost. Returns represent the change in value over the stated period assuming reinvestment of dividends and capital gains at net asset value. Returns do not take into account the maximum 5.75% sales charge on Class A shares or the 1% Contingent Deferred Sales Charge (CDSC) for Class C shares sold within one year of purchase. Returns would be lower if the applicable sales charge and CDSC were included. Returns do not take into account individual taxes which may reduce actual returns when shares are sold.
Discussion with Portfolio Manager August 22, 2014
George A. Henning
Please see the Chairman's Letter at the beginning of this Report for a detailed market and economic
review as well as the Manager's general market outlook.
Fund Performance
The equity market rally that began in 2009 continued despite investor fatigue following last year's impressive results; both the S&P 500® Index and Dow Jones Industrial Average3 reached record highs. However, while some areas of the market advanced, others lagged. Specifically, the more conservative areas of the market, including less volatile sectors such as utilities, food and beverage companies, and household products, outperformed. In contrast, sectors, which may offer significant growth opportunities but tend to underperform during challenging economic periods, trailed. The Fund is actively positioned to benefit from the slow and steady pace of economic growth; Fund holdings, including transportation, construction and retail stocks, hurt performance. During the first half of the year, Class A shares of the Fund declined 0.46%; in comparison, the benchmark gained 8.67%.
Despite this, several holdings4, particularly in the airline, automotive, energy, and transportation industries, outperformed:
• Shares of Spirit Airlines, the ultra-low base fare airline, have more than doubled since the Fund's initial investment in June 2013. Spirit's gains reflect impressive operational results for the first half of 2014 including 20% growth in revenues and over 41% growth in net income. The airline's outlook remains positive as the company looks to expand its fleet to add capacity and expand its service to new destinations.
1 The Russell Midcap® Index is an unmanaged, weighted measure of the 800 smallest companies within the Russell 1000® Index based on a combination of their market cap and current index membership. Index returns assume the reinvestment of dividends, but, unlike the Fund's returns, do not reflect management fees or expenses. It is not possible to invest directly in the Index.
2 "Current" expense ratio is annualized for the year-to-date as of 06/30/14. "Prospectus" expense ratio is for the fiscal year ended 12/31/13.
3 The Dow Jones Industrial Average is an unmanaged, price weighted measure of 30 U.S. stocks selected by the Averages Committee to represent the performance of all U.S. stocks outside the Transportation and Utilities sectors.
4 For detailed information on Fund holdings, please see the Fund's Schedule of Investments in this Report.
23
Pacific Advisors
Mid Cap Value Fund continued
• Accelerating sales activity in the automotive and truck markets benefitted several Fund holdings: Dana Holding manufactures high-quality automotive drivelines for light vehicles, commercial, and off-road vehicles. The company operates forty facilities worldwide and recently received multiple customer awards for product quality and customer satisfaction. Auto parts retailer O'Reilly Automotive, which offers top-quality products and services to both do-it-yourselfers and professionals, experienced record revenues and earnings. The company, which operates over 4,200 stores in 42 states, benefits as the average age of cars and light trucks in the U.S., at 11+ years, increases the demand for auto parts. Lear, a leading global manufacturer of automotive seats and electrical systems, reported record sales including a 12% production increase in China and 4% increase in North America.
• Additionally, other holdings contributed to Fund performance. Wabtec, a global provider of technology-based products for locomotives, freight cars, and transit cars, rose on strong earnings and growing confidence in global rail transportation spending. Helix Energy Solutions, an offshore energy company, provides well intervention and robotics services to maximize productivity and efficiency of deepwater wells; the company reported 100% utilization of several well vessels and 89% utilization for the robotics fleet.
Two engineering and construction companies, Chicago Bridge & Iron and KBR, Inc., underperformed during the period. We scaled back our holding in Chicago Bridge & Iron early in the year due to the stock's strong price appreciation. This decision proved timely as shares declined sharply in June following criticism of the firm's accounting treatment for last year's acquisition of Shaw Industries. Management addressed the issue and believes its practices were fair and appropriate; more importantly, the company continues to win major project awards and grow its record backlog. We believe Chicago Bridge & Iron remains well positioned to benefit from the global construction of chemical and petrochemical facilities; accordingly, we used the price decrease as an opportunity to increase our position. In contrast, KBR is undergoing a comprehensive strategic review and restructuring. Operating results have suffered along with a diminishing project backlog. With the company's outlook unclear, we elected to sell our position.
Shares of a new holding, regional specialty retailer Conn's, tumbled in February after the company announced preliminary fiscal fourth quarter results showing strong sales growth but a slight deterioration in credit trends. We took advantage of the price decline to increase the Fund's position as we remain confident in the company's future growth through the addition of new stores and products; and, we view the credit issues as temporary. Indeed, shares rebounded during the second quarter after the company's fiscal first quarter earnings highlighted strong sales growth and lower delinquency rates. We expect the stock price recovery to continue as credit trends improve and business operations expand.
Similarly, long-term prospects for other Fund holdings remain favorable despite temporary setbacks. MRC Global, a leading distributor of pipe, valve, and fitting products and services to the energy and industrial markets, reported weak operating results that reflected delays in customer orders. Indeed, the company recently announced a 15% increase in sales for the latest quarter as well as a record $1.1 billion in project backlogs. Kansas City Southern, an operator of railroads in the U.S. and Mexico, suffered when the Mexican House passed a bill in February that would end the company's exclusive track rights in the country. Mexico's Senate is expected to consider a favorably revised bill in September; even so, the high barriers to entry of the railroad industry effectively limit the potential for increased competition. The company is poised for long-term growth as U.S. energy production continues to flourish; and, as the exclusive rail provider for Mexico's largest deep water seaport Port Lázaro Cárdenas; the Port continues to expand along with increasing automobile plant production in Mexico.
Fund Strategy
Mid-cap companies offer distinctive advantages for long-term investors by combining the economies of scale typically enjoyed by large corporations with the strategic flexibility of smaller businesses. Our fundamental, bottom-up investment approach identifies companies with exceptional long-term growth
24
prospects. The Fund's long-term strategy typically results in low annual turnover as reflected in the Fund's five-year average annual turnover rate of 18%5.
The Fund added several new positions during the period. Swift Transportation, the largest truckload carrier in North America, should benefit from strong demand, rate increases as well as debt restructuring. The company anticipates a healthy pricing environment, including projected fee increases of 4% to 5% year-over-year; the increase will expand service offerings as well as improve driver compensation. Pool Corporation is the world's largest wholesale distributor of swimming pool supplies, equipment, and related leisure products. The company enjoys a significant size advantage over competitors as Pool is larger than its top 52 competitors combined. Pool's largest source of revenues and earnings is maintenance and repair; additionally, installations should accelerate over the next 4-7 years as the housing and home improvement markets return to normal. W.W. Grainger is a business-to-business distributor of products to maintain, repair and operate facilities. The company operates in 23 countries and is the leading North American supplier of products such as ladders, janitorial products, hand tools, and safety equipment; customers include healthcare, manufacturing, government, and hospitality industries. Grainger earns customer loyalty in a highly fragmented industry with its extensive product line of over 1.2 million products, expert sales force, and extensive e-retailing options.
During the period, the Fund exited its two smallest positions. ION Geophysical had previously operated as a seismic contractor before dramatically changing its business to supply seismic data and technology; Mitcham Industries leases and sells seismic equipment to the global oil and gas industry. The Fund used the proceeds from these sales to further diversify Fund holdings.
We take an active buy-and-hold approach to portfolio management. During the period, the Fund trimmed several holdings to lock in profits, adjust allocations and rebalance the portfolio. These included Lear, Navistar International, Penske Automotive Group, Spirit Airlines, and Wabtec. We also bought additional shares of Chicago Bridge & Iron, Conn's, Denbury Resources, Noble Corporation, and Helix Energy Solutions as we determined that the discounted prices offered attractive opportunities to acquire shares for long-term appreciation.
Looking Ahead
We expect the global economic recovery to continue at a measured pace as businesses and consumers proceed with caution. As opposed to a rapidly accelerating economy, a "slower for longer" pace of expansion will favor the best-run companies; as industry-leaders, they are able to pursue meaningful growth initiatives. We anticipate that the global recovery should increase demand for consumer products, automobiles, energy and other materials. The Fund is strongly oriented toward these economically-sensitive areas and is, therefore, well positioned as economic conditions around the world improve.
Consistent with our investment strategy, we seek to invest long-term in high-quality companies that enjoy strong competitive positioning and market leadership. Although several Fund holdings underperformed during the first six months of the year, these stocks should, over time, reward patient investors. Specifically, we believe that the price declines in Chicago Bridge & Iron and Conn's reflect the market's short-term focus rather than fundamental problems with the businesses.
During the second half of the year, several Fund holdings, including Helix Energy Solutions, Tidewater, Noble, Chesapeake Energy and Denbury Resources should benefit as energy production is expected to expand in the U.S. and abroad. Continued growth in the global economies should also benefit industrial companies such as W.W. Grainger, Graco, Lear and Wabtec. Our ownership perspective and long-term investment horizon allow us to focus on the quality of each business, its management team, competitive positioning, and growth prospects. Going forward, we anticipate that other investment opportunities for the Fund will emerge with potential for significant price appreciation.
5 Annual turnover: 15% (2013); 24% (2012); 12% (2011); 18% (2010); and 21% (2009).
25
Pacific Advisors
Mid Cap Value Fund continued
Portfolio Holdings as of 06/30/14 (Based on Total Investments)
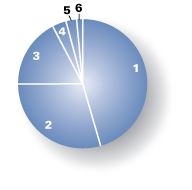
| Equities | 100 | % | |||||||||
| 1. | Industrials | 45.58 | % | ||||||||
| 2. | Consumer Discretionary | 29.38 | % | ||||||||
| 3. | Energy | 17.26 | % | ||||||||
| 4. | Materials | 3.48 | % | ||||||||
| 5. | Financials | 2.55 | % | ||||||||
| 6. | Consumer Staples | 1.75 | % | ||||||||
26
Expense Examples
As a shareholder of the Fund you incur two types of costs: (1) transaction costs, including sales charges (loads) on purchase payments, reinvested dividends, or other distributions; redemption fees; and exchange fees; and (2) ongoing costs, including management fees; distribution (12b-1) fees; and other Fund expenses. This Example is intended to help you understand your ongoing costs (in dollars) of investing in the Fund and to compare these costs with the ongoing costs of investing in other mutual funds.
The Example is based on an investment of $1,000 invested at the beginning of the period and held for the entire period from January 1, 2014 through June 30, 2014.
Actual Expenses
The first line of the table below provides information about actual account values and actual expenses. You may use the information in this line, together with the amount you invested, to estimate the expenses that you paid over the period. Simply divide your account value by $1,000 (for example, an $8,600 account value divided by $1,000 = 8.6), then multiply the result by the number in the first line under the heading entitled "Expenses Paid During the Period" to estimate the expenses you paid on your account during the period.
The following transaction costs are not included in the expenses shown in the table and, if applicable, would increase the expenses that you paid over the period: (1) a front-end sales charge (load) of 5.75% on Class A shares; (2) a 2% redemption fee if you sell or exchange shares within 180 days of purchase, with certain exceptions. The redemption fee does not apply to: (a) redemptions under an automatic withdrawal program or periodic asset reallocation plan, required minimum distributions (RMD), employer mandated distributions from a qualified plan, or redemptions under a qualified domestic relations order (QDRO); (b) redemptions to pay for expenses related to terminal illness, extended hospital or nursing home care, or other serious medical conditions, including death; (c) redemptions of shares acquired through dividend or capital gains reinvestments; (d) loans from a qualified plan account, and (e) redemptions initiated by the Fund; and (3) a $10 service fee on each exchange after the first five exchanges in each calendar year.
The following ongoing costs are not included in the expenses shown in the table and, if applicable, would increase the expenses that you paid over the period: (1) a $12 low balance fee on accounts with balances of less than $250 as of September 30th of each calendar year and no investment activity (excluding reinvestment of dividends and/or capital gains) during the prior calendar year or the first nine months of the current calendar year. This fee does not apply to IRAs, qualified plan accounts, or Coverdell Education Savings Accounts; (2) a $15 annual custodial fee on IRAs, SEPs, SIMPLE IRAs, and Coverdell Education Savings Accounts; and (3) a $20 annual custodial fee on 403(b) accounts.
Hypothetical Example for Comparison Purposes
The second line of the table below provides information about hypothetical account values and hypothetical expenses based on the Fund's actual expense ratio and an assumed rate of return of 5% per year before expenses, which in not the Fund's actual return. The hypothetical account values and expenses may not be used to estimate the actual ending account balance or expenses you paid for the period. You may use this information to compare the ongoing costs of investing in the Fund and other funds. To do so, compare this 5% hypothetical example with the 5% hypothetical examples that appear in the shareholder reports of the other funds.
The following transaction costs are not included in the expenses shown in the table and, if applicable, would increase the expenses that you paid over the period: (1) a front-end sales charge (load) of 5.75% on Class A shares; (2) a 2% redemption fee if you sell or exchange shares within 180 days of purchase, with certain exceptions. The redemption fee does not apply to: (a) redemptions under an automatic withdrawal program or periodic asset reallocation plan, required minimum distributions (RMD), employer mandated distributions from a qualified plan, or redemptions under a qualified domestic relations order (QDRO); (b) redemptions to pay for expenses related to terminal illness, extended hospital or nursing home care, or other serious medical conditions, including death; (c) redemptions of shares acquired through dividend or capital gains reinvestments; (d) loans from a qualified plan account, and (e) redemptions initiated by the Fund; and (3) a $10 service fee on each exchange after the first five exchanges in each calendar year.
The following ongoing costs are not included in the expenses shown in the table and, if applicable, would increase the expenses that you paid over the period: (1) a $12 low balance fee on accounts with balances of less than $250 as of September 30th of each calendar year and no investment activity (excluding reinvestment of dividends and/or capital gains) during the prior calendar year or the first nine months of the current calendar year. This fee does not apply to IRAs, qualified plan accounts, or Coverdell Education Savings Accounts; (2) a $15 annual custodial fee on IRAs, SEPs, SIMPLE IRAs, and Coverdell Education Savings Accounts; and (3) a $20 annual custodial fee on 403(b) accounts.
Please note that the expenses shown in the table are meant to highlight your ongoing costs only and do not reflect any transactional costs, such as sales charges (loads), redemption fees, or exchange fees. Therefore, the second line of the table is useful in comparing ongoing costs only, and will not help you determine the relative total costs of owning different funds. In addition, if these transactional costs were included, your costs would have been higher.
| Beginning Account Value 01/01/14 | Ending Account Value 06/30/14 | Expense Paid During Period 01/01/14 – 06/30/14 | |||||||||||||
Mid Cap Value Fund Class A | |||||||||||||||
Actual | $ | 1,000.00 | $ | 995.40 | $ | 17.22 | |||||||||
Hypothetical (5% return before expense) | $ | 1,000.00 | $ | 1,007.54 | $ | 17.32 | |||||||||
Mid Cap Value Fund Class C | |||||||||||||||
Actual | $ | 1,000.00 | $ | 992.00 | $ | 20.84 | |||||||||
Hypothetical (5% return before expense) | $ | 1,000.00 | $ | 1,003.87 | $ | 20.97 | |||||||||
3 Expenses are equal to the Fund's annualized expense ratio of 3.48% for Class A shares and 4.22% for Class C shares, multiplied by the average account value over the period, multiplied by 181/365 days to reflect the one-half year period.
27
Pacific Advisors
Small Cap Value Fund
Fund Objective: Capital appreciation through investment in small cap companies.
Investment Invests at least 80% of its assets in small cap companies which are, at the time
Strategy: of purchase, not greater than the highest market capitalization of companies within the
Russell 2000® Index1. Generally invests a significant proportion of its assets in companies with market capitalizations that are, at the time of purchase, not greater than the highest market capitalization of companies in the Russell Microcap® Index2 (which are often referred to as "micro-cap stocks").
Investor Profile: Aggressive. Opportunity-oriented with a long-term investment horizon.
TOTAL RETURNS | EXPENSE RATIOS3 | ||||||||||||||||||
For the six months ended June 30, 2014 | Current | Prospectus | |||||||||||||||||
Class A | 0.42 | % | Class A | 2.10 | % | 2.31 | % | ||||||||||||
Class C | 0.04 | % | Class C | 2.85 | % | 3.08 | % | ||||||||||||
Class I | 0.58 | % | Class I | 1.85 | % | 2.06 | % | ||||||||||||
Russell 2000® Index | 3.19 | % | �� | ||||||||||||||||
Performance quoted is past performance which does not guarantee future results. Current performance may be higher or lower than the performance quoted. Call (800) 989-6693 for performance current to the most recent month-end. The investment return and principal value of an investment will fluctuate so that an investor's shares, when redeemed, may be worth more or less than their original cost. Returns represent the change in value over the stated period assuming reinvestment of dividends and capital gains at net asset value. Rankings shown are for Class A shares; rankings for other share classes may be different. Returns and rankings do not take into account the maximum 5.75% sales charge on Class A shares or the 1% Contingent Deferred Sales Charge (CDSC) for Class C shares sold within one year of purchase. Returns would be lower if the applicable sales charge and CDSC were included. Returns do not take into account individual taxes which may reduce actual returns when shares are sold. Small cap companies typically have fewer financial resources and may carry higher investment risks and experience greater stock price volatility than larger stocks.
Discussion with Portfolio Manager August 22, 2014
George A. Henning
Please see the Chairman's Letter at the beginning of this Report for a detailed market and economic
review as well as the Manager's general market outlook.
Fund Performance
Following last year's stellar results, the Fund trailed its benchmark in the first half of 2014; Class A shares rose 0.42% compared to a 3.19% gain in the Russell 2000® Index of small companies. Notably, small cap stocks lagged the broader market; both the Fund and its benchmark trailed the S&P 500® Index4, which rose 7.12%. Several factors may have contributed to the relative underperformance of small cap stocks during the period: concerns related to the strength of the economic recovery in light of the weather-related decline in first quarter GDP; increased geopolitical tensions in Ukraine, Iraq and the Middle East; anxiety surrounding the impact of the Federal Reserve's monetary policy on interest rates; and concerns
1 The Russell 2000® Index is an unmanaged, market-weighted measure of the 2,000 smallest companies of the Russell 3000® Index which represents approximately 98% of the investable U.S. equity market. Index returns assume the reinvestment of dividends, but, unlike the Fund's returns, do not reflect management fees or expenses. It is not possible to invest directly in the Index.
2 The Russell Microcap® Index is an unmanaged, market capitalization weighted measure of the 1,000 smallest publicly traded companies within the Russell 2000® Index, plus the next smallest 1,000 U.S. based listed stocks.
3 "Current" expense ratio is annualized for the year-to-date as of 06/30/14. "Prospectus" expense ratio is for the fiscal year ended 12/31/13.
4 The Standard & Poor's 500® Index is an unmanaged, market capitalization weighted index which measures the performance of the large cap segment of the U.S. equities market, covering approximately 75% of the U.S. equities market. The Index includes 500 leading companies in leading industries of the U.S. economy. Index returns assume the reinvestment of dividends, but, unlike the Fund's returns, do not reflect the effects of management fees or expenses. It is not possible to invest directly in the Index.
28
that stocks might have become overpriced due to the strong rally in 2013. These factors contributed to a shift in market sentiment in favor of more conservative areas such as large cap stocks and stocks with relative price stability and high dividends. Increased volatility in the small cap stock arena provided opportunities for the Fund to selectively purchase shares of current holdings, as well as initiate new positions, at attractive prices. As a result of these strategic purchases, the Fund's annualized portfolio turnover rate, as of June 30th, increased modestly to 20% from a five-year average of 11%5.
The continued expansion of the domestic economy spurred impressive growth among well-positioned companies. Gentherm, the global leader of innovative thermal management technologies, including climate-controlled car seats and heated steering wheels, rose on stellar first quarter results.6 The company continues to identify new markets for its thermoelectric devices in areas such as bedding and telecommunications; indeed, a recent acquisition provides an entrée into the lucrative oil and gas industry. Saia, a regional trucking company, gained on robust shipping activity. The company's relatively young truck fleet, which uses advanced in-cab technologies such as optimal route guidance, contributed to improved fuel efficiency and utilization. Management further noted that business from e-commerce retailers has been beneficial; the typically smaller parcels garner premium rates compared to bulk shipments by traditional brick-and-mortar stores.
Still, several company-specific issues hampered Fund performance during the period. Installment lender Regional Management sold-off as the company's rapid growth stretched collections operations which led to increased delinquencies. Steps to better manage account growth are underway; we believe that operating results will improve over the next several quarters. Conn's, a regional specialty home furnishings retailer, encountered similar challenges as rapid expansion, and the disruptive effects of the harsh winter weather, led to a slight deterioration in credit trends for in-store accounts. Shares recovered somewhat during the second quarter on strong sales growth and improving credit performance. Lastly, shares of industrial parts distributor and service provider DXP Enterprises fell due to weak performance in a recently acquired business. As a result of our subsequent analysis, including a recent meeting with company management in their Houston offices, we concluded that the long-term outlook remains positive and the disappointing results were principally due to temporary delays in customer orders.
Fund Strategy
The Fund employs a value-oriented approach to identify when high-quality, well-run companies with attractive growth outlooks become undervalued. Periods of heightened market volatility often create opportunities to strategically invest in these companies for long-term appreciation. The Fund takes an ownership view of each stock with the expectation of owning the company for at least two to five years. The selection process seeks companies that are undervalued or temporarily out-of-favor and have a catalyst for multi-year growth. The Fund focuses on a limited number of stocks (31 holdings as of June 30th), including a significant number of micro-cap stocks. Investing in smaller cap stocks may contribute to above-average volatility; yet, smaller, well-positioned companies can provide superior long-term results. We note the Fund's relatively modest one-year beta7 of 1.04 in comparison to the Russell 2000® Index.
As long-term investors, we understand that growing businesses encounter setbacks from time to time as they expand into new products and geographies. The Fund's two-to-five-year investment horizon acknowledges these periodic ebbs and flows. In contrast to the market's short-term orientation, which typically punishes stocks when company-specific challenges arise, we view these situations differently. For example, during the first half of 2014, we determined that that the selloffs of both Conn's and DXP Enterprises provided attractive opportunities for long-term appreciation; consequently, we acquired additional shares at discounted prices. During the period, we also bought shares to increase the Fund's allocations to East West Bancorp, Hornbeck Offshore Services, and Natural Gas Services; and, we trimmed positions in Gentherm, Saia, and Matrix as these stocks appreciated. Our risk management process includes monitoring each holding as stock prices change in order to realize profits, adjust allocations and maintain a well-diversified portfolio.
The Fund added two new positions during the period: Orion Marine Group and Hibbett Sports. Orion Marine Group is a marine infrastructure contractor based primarily along the Gulf Coast. The company is poised to benefit from
5 Annual turnover: 9% (2013); 12% (2012); 9% (2011); 9% (2010); 17% (2009).
6 For detailed information on Fund holdings, please see the Fund's Schedule of Investments in this Report.
7 "Beta" measures volatility relative to the stock market or an alternative benchmark. A beta less than 1.0 indicates lower risk than the market or the benchmark and a beta greater than 1.0 indicates higher risk than the market or the benchmark.
29
Pacific Advisors
Small Cap Value Fund continued
ongoing port expansion projects related to increased export activity as well as the widening of the Panama Canal. Public construction work, which has been anemic in recent years, is also expected to increase in the second half of 2014. A record backlog of work under contract suggests strong demand for the company's services. Hibbett Sports dominates the small town sporting goods market. The company sells premium-branded merchandise with an emphasis on team athletic equipment and regional apparel products. Management believes the company could support more than 1,500 stores, a significant expansion from its current footprint of 939 stores across 31 states. A recently opened distribution center should support this growth while also improving inventory management.
The Fund recently sold its relatively small position in EZCORP due to concerns about the company's direction following a recent change in management and regulatory uncertainty due to policy changes under consideration at the Consumer Financial Protection Bureau. The Fund decided to sell and use the proceeds to establish its position in Hibbett Sports.
Looking Ahead
The first half of the year presented challenges for small cap stocks in general; conditions, though, remain favorable for Fund holdings. A slow but steady pace of economic growth should favor industries such as transportation, construction, and retail. Marine transportation company Kirby is attractively positioned for continued growth along its inland marine and coastal shipping lanes. Increased movements of crude oil and petrochemicals are creating lucrative opportunities for this age-old industry. Portable storage leasing company Mobile Mini should benefit from renewed strength in commercial and residential construction. The company intends to add more than 50 new leasing locations over the next several years. And, truck dealership group Rush Enterprises forecasts increased sales of heavy-duty commercial vehicles as companies replace aging fleets and add capacity.
Energy services companies should also profit from robust drilling activities in unconventional shale and oil sands regions; North American Energy Partners, Matrix Service, and Natural Gas Services Group are particularly well positioned for growth in these areas. Moreover, the recent tensions in Russia and Iraq underscore the significance of the North American "energy renaissance." The U.S. government has, for many years, prohibited the export of crude oil; yet recently, the administration has revised export rules to allow the shipment of ultralight crude to foreign buyers. The administration has also awarded permits to build liquefied natural gas (LNG) export facilities. Any further rule revisions to allow unrefined oil exports, coupled with LNG shipments, would have broad geopolitical and economic ramifications. Indeed, we believe we are in the early stages of what could ultimately be a multi-decade investment cycle with benefits far beyond the energy industry into areas including transportation, industrial manufacturing, and power generation.
Portfolio Holdings as of 06/30/14 (Based on Total Investments)

Equities | 99.97 | % | |||||||||
1. | Industrials | 45.52 | % | ||||||||
2. | Energy | 19.56 | % | ||||||||
3. | Consumer Discretionary | 17.30 | % | ||||||||
4. | Financials | 7.54 | % | ||||||||
5. | Consumer Staples | 4.47 | % | ||||||||
6. | Telecommunication Services | 3.57 | % | ||||||||
7. | Materials | 2.01 | % | ||||||||
8. | Cash and Cash Equivalents | 0.03 | % | ||||||||
30
Expense Examples
As a shareholder of the Fund you incur two types of costs: (1) transaction costs, including sales charges (loads) on purchase payments, reinvested dividends, or other distributions; redemption fees; and exchange fees; and (2) ongoing costs, including management fees; distribution (12b-1) fees; and other Fund expenses. This Example is intended to help you understand your ongoing costs (in dollars) of investing in the Fund and to compare these costs with the ongoing costs of investing in other mutual funds.
The Example is based on an investment of $1,000 invested at the beginning of the period and held for the entire period from January 1, 2014 through June 30, 2014.
Actual Expenses
The first line of the table below provides information about actual account values and actual expenses. You may use the information in this line, together with the amount you invested, to estimate the expenses that you paid over the period. Simply divide your account value by $1,000 (for example, an $8,600 account value divided by $1,000 = 8.6), then multiply the result by the number in the first line under the heading entitled "Expenses Paid During the Period" to estimate the expenses you paid on your account during the period.
The following transaction costs are not included in the expenses shown in the table and, if applicable, would increase the expenses that you paid over the period: (1) a front-end sales charge (load) of 5.75% on Class A shares; (2) a 2% redemption fee if you sell or exchange shares within 180 days of purchase, with certain exceptions. The redemption fee does not apply to: (a) redemptions under an automatic withdrawal program or periodic asset reallocation plan, required minimum distributions (RMD), employer mandated distributions from a qualified plan, or redemptions under a qualified domestic relations order (QDRO); (b) redemptions to pay for expenses related to terminal illness, extended hospital or nursing home care, or other serious medical conditions, including death; (c) redemptions of shares acquired through dividend or capital gains reinvestments; (d) loans from a qualified plan account, and (e) redemptions initiated by the Fund; and (3) a $10 service fee on each exchange after the first five exchanges in each calendar year.
The following ongoing costs are not included in the expenses shown in the table and, if applicable, would increase the expenses that you paid over the period: (1) a $12 low balance fee on accounts with balances of less than $250 as of September 30th of each calendar year and no investment activity (excluding reinvestment of dividends and/or capital gains) during the prior calendar year or the first nine months of the current calendar year. This fee does not apply to IRAs, qualified plan accounts, or Coverdell Education Savings Accounts; (2) a $15 annual custodial fee on IRAs, SEPs, SIMPLE IRAs, and Coverdell Education Savings Accounts; and (3) a $20 annual custodial fee on 403(b) accounts.
Hypothetical Example for Comparison Purposes
The second line of the table below provides information about hypothetical account values and hypothetical expenses based on the Fund's actual expense ratio and an assumed rate of return of 5% per year before expenses, which in not the Fund's actual return. The hypothetical account values and expenses may not be used to estimate the actual ending account balance or expenses you paid for the period. You may use this information to compare the ongoing costs of investing in the Fund and other funds. To do so, compare this 5% hypothetical example with the 5% hypothetical examples that appear in the shareholder reports of the other funds.
The following transaction costs are not included in the expenses shown in the table and, if applicable, would increase the expenses that you paid over the period: (1) a front-end sales charge (load) of 5.75% on Class A shares; (2) a 2% redemption fee if you sell or exchange shares within 180 days of purchase, with certain exceptions. The redemption fee does not apply to: (a) redemptions under an automatic withdrawal program or periodic asset reallocation plan, required minimum distributions (RMD), employer mandated distributions from a qualified plan, or redemptions under a qualified domestic relations order (QDRO); (b) redemptions to pay for expenses related to terminal illness, death, extended hospital or nursing home care, or other serious medical conditions; (c) redemptions of shares acquired through dividend or capital gains reinvestments; (d) loans from a qualified plan account; and (e) redemptions initiated by the Fund; and (3) a $10 service fee on each exchange after the first five exchanges in each calendar year.
The following ongoing costs are not included in the expenses shown in the table and, if applicable, would increase the expenses that you paid over the period: (1) a $12 low balance fee on accounts with balances of less than $250 as of September 30th of each calendar year and no investment activity (excluding reinvestment of dividends and/or capital gains) during the prior calendar year or the first nine months of the current calendar year. This fee does not apply to IRAs, qualified plan accounts, or Coverdell Education Savings Accounts; (2) a $15 annual custodial fee on IRAs, SEPs, SIMPLE IRAs, and Coverdell Education Savings Accounts; and (3) a $20 annual custodial fee on 403(b) accounts.
Please note that the expenses shown in the table are meant to highlight your ongoing costs only and do not reflect any transactional costs, such as sales charges (loads), redemption fees, or exchange fees. Therefore, the second line of the table is useful in comparing ongoing costs only, and will not help you determine the relative total costs of owning different funds. In addition, if these transactional costs were included, your costs would have been higher.
| Beginning Account Value 01/01/14 | Ending Account Value 06/30/14 | Expense Paid During Period 01/01/14 – 06/30/14 | |||||||||||||
Small Cap Value Class A | |||||||||||||||
Actual | $ | 1,000.00 | $ | 1,004.20 | $ | 10.44 | |||||||||
Hypothetical (5% return before expense) | $ | 1,000.00 | $ | 1,014.38 | $ | 10.49 | |||||||||
Small Cap Value Class C | |||||||||||||||
Actual | $ | 1,000.00 | $ | 1,000.40 | $ | 14.14 | |||||||||
Hypothetical (5% return before expense) | $ | 1,000.00 | $ | 1,010.66 | $ | 14.21 | |||||||||
Small Cap Value Class I | |||||||||||||||
Actual | $ | 1,000.00 | $ | 1,005.80 | $ | 9.20 | |||||||||
Hypothetical (5% return before expense) | $ | 1,000.00 | $ | 1,015.62 | $ | 9.25 | |||||||||
3 Expenses are equal to the Fund's annualized expense ratio of 2.10% for Class A shares, 2.85% for Class C shares and 1.85% for Class I shares, multiplied by the average account value over the period, multiplied by 181/365 days to reflect the one-half year period.
31

Pacific Advisors Fund Inc.
Financial Statements
32
Pacific Advisors Government Securities Fund
Schedule of Investments (Unaudited)
as of June 30, 2014
| Quantity or Principal | Description | Current $ Value** | % of Total Net Assets | ||||||||||||
COMMON STOCK | |||||||||||||||
CONSUMER DISCRETIONARY | 1.30 | ||||||||||||||
HOTELS, RESTAURANTS & LEISURE | |||||||||||||||
250 | MCDONALD'S CORP. | 25,185 | |||||||||||||
25,185 | 1.30 | ||||||||||||||
CONSUMER STAPLES | 5.16 | ||||||||||||||
BEVERAGES | |||||||||||||||
250 | PEPSICO INC. | 22,335 | |||||||||||||
22,335 | 1.15 | ||||||||||||||
FOOD PRODUCTS | |||||||||||||||
500 | GENERAL MILLS INC. | 26,270 | |||||||||||||
650 | UNILEVER PLC | 29,451 | |||||||||||||
55,721 | 2.87 | ||||||||||||||
HOUSEHOLD PRODUCTS | |||||||||||||||
200 | KIMBERLY-CLARK CORP. | 22,244 | |||||||||||||
22,244 | 1.14 | ||||||||||||||
ENERGY | 1.34 | ||||||||||||||
OIL, GAS & CONSUMABLE FUELS | |||||||||||||||
200 | CHEVRON CORP. | 26,110 | |||||||||||||
26,110 | 1.34 | ||||||||||||||
HEALTH CARE | 2.35 | ||||||||||||||
PHARMACEUTICALS | |||||||||||||||
400 | ELI LILLY & CO. | 24,868 | |||||||||||||
200 | JOHNSON & JOHNSON | 20,924 | |||||||||||||
45,792 | 2.35 | ||||||||||||||
INFORMATION TECHNOLOGY | 1.29 | ||||||||||||||
SOFTWARE | |||||||||||||||
600 | MICROSOFT CORP. | 25,020 | |||||||||||||
25,020 | 1.29 | ||||||||||||||
TELECOMMUNICATION SERVICES | 1.64 | ||||||||||||||
DIVERSIFIED TELECOM. SERVICES | |||||||||||||||
900 | AT&T INC. | 31,824 | |||||||||||||
31,824 | 1.64 | ||||||||||||||
See Accompanying Notes to Financial Statements which are an integral part of these financial statements.
33
Pacific Advisors Government Securities Fund
Schedule of Investments (Unaudited)
as of June 30, 2014
| Quantity or Principal | Description | Current $ Value** | % of Total Net Assets | ||||||||||||
COMMON STOCK continued | |||||||||||||||
UTILITIES | 4.64 | ||||||||||||||
ELECTRIC UTILITIES | |||||||||||||||
900 | PPL CORP. | 31,977 | |||||||||||||
650 | SOUTHERN CO. | 29,497 | |||||||||||||
61,474 | 3.16 | ||||||||||||||
MULTI-UTILITIES | |||||||||||||||
500 | CONSOLIDATED EDISON INC. | 28,870 | |||||||||||||
28,870 | 1.48 | ||||||||||||||
TOTAL COMMON STOCK (Cost: $244,536) | 344,575 | 17.72 | |||||||||||||
US GOVERNMENT SECURITIES | |||||||||||||||
US GOVERNMENT AGENCY | 82.28 | ||||||||||||||
US GOVERNMENT AGENCY | |||||||||||||||
175,000 | FEDERAL HOME LOAN MTG CORP. 1.50% 04/23/21 STEP | 175,099 | |||||||||||||
250,000 | FEDERAL HOME LOAN MTG CORP. 0.50% 05/27/16 | 249,909 | |||||||||||||
100,000 | FEDERAL HOME LOAN BANK 3.25% 09/12/14 | 100,624 | |||||||||||||
300,000 | FEDERAL HOME LOAN BANK 0.50% 12/18/17 STEP | 299,834 | |||||||||||||
300,000 | FEDERAL HOME LOAN BANK 0.625% 01/30/19 STEP | 300,041 | |||||||||||||
475,000 | FEDERAL HOME LOAN BANK 0.50% 05/21/19 STEP | 475,029 | |||||||||||||
1,600,536 | 82.28 | ||||||||||||||
TOTAL US GOVERNMENT SECURITIES (Cost: $1,600,921) | 1,600,536 | 82.28 | |||||||||||||
TOTAL INVESTMENT IN SECURITIES (Cost: $1,845,457) | 1,945,111 | 100.00 | |||||||||||||
OTHER ASSETS LESS LIABILITIES | 37 | 0.00 | |||||||||||||
TOTAL NET ASSETS | 1,945,148 | 100.00 | |||||||||||||
* Non-income producing
** The principal amount is stated in U.S. dollars unless otherwise indicated.
See Accompanying Notes to Financial Statements which are an integral part of these financial statements.
34
Pacific Advisors Income and Equity Fund
Schedule of Investments (Unaudited)
as of June 30, 2014
| Quantity or Principal | Description | Current $ Value** | % of Total Net Assets | ||||||||||||
COMMON STOCK | |||||||||||||||
CONSUMER DISCRETIONARY | 4.85 | ||||||||||||||
DISTRIBUTORS | |||||||||||||||
1,750 | GENUINE PARTS CO. | 153,650 | |||||||||||||
153,650 | 1.19 | ||||||||||||||
HOTELS, RESTAURANTS & LEISURE | |||||||||||||||
1,650 | MCDONALD'S CORP. | 166,221 | |||||||||||||
166,221 | 1.29 | ||||||||||||||
LEISURE EQUIPMENT & PRODUCTS | |||||||||||||||
3,500 | MATTEL INC. | 136,395 | |||||||||||||
136,395 | 1.05 | ||||||||||||||
MEDIA | |||||||||||||||
2,400 | OMNICOM GROUP INC. | 170,928 | |||||||||||||
170,928 | 1.32 | ||||||||||||||
CONSUMER STAPLES | 8.20 | ||||||||||||||
BEVERAGES | |||||||||||||||
4,500 | COCA-COLA CO. | 190,620 | |||||||||||||
190,620 | 1.47 | ||||||||||||||
FOOD & STAPLES RETAILING | |||||||||||||||
2,600 | CVS CAREMARK CORP. | 195,962 | |||||||||||||
4,000 | SYSCO CORP. | 149,800 | |||||||||||||
4,250 | KROGER CO. | 210,077 | |||||||||||||
2,200 | WAL-MART STORES INC. | 165,154 | |||||||||||||
720,993 | 5.57 | ||||||||||||||
HOUSEHOLD PRODUCTS | |||||||||||||||
1,900 | PROCTER & GAMBLE CO. | 149,321 | |||||||||||||
149,321 | 1.16 | ||||||||||||||
ENERGY | 3.48 | ||||||||||||||
ENERGY EQUIPMENT & SERVICES | |||||||||||||||
2,000 | SCHLUMBERGER LTD | 235,900 | |||||||||||||
235,900 | 1.82 | ||||||||||||||
OIL, GAS & CONSUMABLE FUELS | |||||||||||||||
2,500 | CONOCOPHILLIPS | 214,325 | |||||||||||||
214,325 | 1.66 | ||||||||||||||
See Accompanying Notes to Financial Statements which are an integral part of these financial statements.
35
Pacific Advisors Income and Equity Fund
Schedule of Investments (Unaudited)
as of June 30, 2014
| Quantity or Principal | Description | Current $ Value** | % of Total Net Assets | ||||||||||||
COMMON STOCK continued | |||||||||||||||
FINANCIALS | 3.13 | ||||||||||||||
COMMERCIAL BANKS | |||||||||||||||
4,000 | WELLS FARGO & CO. | 210,240 | |||||||||||||
210,240 | 1.63 | ||||||||||||||
INSURANCE | |||||||||||||||
3,500 | METLIFE INC. | 194,460 | |||||||||||||
194,460 | 1.50 | ||||||||||||||
HEALTH CARE | 4.41 | ||||||||||||||
PHARMACEUTICALS | |||||||||||||||
3,500 | ABBVIE INC. | 197,540 | |||||||||||||
2,000 | JOHNSON & JOHNSON | 209,240 | |||||||||||||
5,500 | PFIZER INC. | 163,240 | |||||||||||||
570,020 | 4.41 | ||||||||||||||
INDUSTRIALS | 5.72 | ||||||||||||||
AEROSPACE & DEFENSE | |||||||||||||||
1,750 | HONEYWELL INT'L INC. | 162,662 | |||||||||||||
162,662 | 1.26 | ||||||||||||||
AIR FREIGHT & LOGISTICS | |||||||||||||||
1,750 | UNITED PARCEL SERVICE INC. B | 179,655 | |||||||||||||
179,655 | 1.39 | ||||||||||||||
COMMERCIAL SERVICES & SUPPLIES | |||||||||||||||
4,500 | WASTE MANAGEMENT INC. | 201,285 | |||||||||||||
201,285 | 1.55 | ||||||||||||||
INDUSTRIAL CONGLOMERATES | |||||||||||||||
7,500 | GENERAL ELECTRIC CO. | 197,100 | |||||||||||||
197,100 | 1.52 | ||||||||||||||
INFORMATION TECHNOLOGY | 5.17 | ||||||||||||||
COMMUNICATIONS EQUIPMENT | |||||||||||||||
9,000 | CISCO SYSTEMS INC. | 223,650 | |||||||||||||
223,650 | 1.73 | ||||||||||||||
SEMICONDUCTORS & EQUIPMENT | |||||||||||||||
8,000 | INTEL CORP. | 247,200 | |||||||||||||
247,200 | 1.91 | ||||||||||||||
See Accompanying Notes to Financial Statements which are an integral part of these financial statements.
36
Pacific Advisors Income and Equity Fund
Schedule of Investments (Unaudited)
as of June 30, 2014
| Quantity or Principal | Description | Current $ Value** | % of Total Net Assets | ||||||||||||
COMMON STOCK continued | |||||||||||||||
SOFTWARE | |||||||||||||||
4,750 | MICROSOFT CORP. | 198,075 | |||||||||||||
198,075 | 1.53 | ||||||||||||||
MATERIALS | 1.52 | ||||||||||||||
CHEMICALS | |||||||||||||||
3,000 | DUPONT DE NEMOURS & CO. | 196,320 | |||||||||||||
196,320 | 1.52 | ||||||||||||||
TELECOMMUNICATION SERVICES | 4.16 | ||||||||||||||
DIVERSIFIED TELECOM. SERVICES | |||||||||||||||
6,000 | AT&T INC. | 212,160 | |||||||||||||
4,815 | VERIZON COMMUNICATIONS INC. | 235,598 | |||||||||||||
447,758 | 3.46 | ||||||||||||||
WIRELESS TELECOM. SERVICES | |||||||||||||||
2,727 | VODAFONE GROUP PLC | 91,055 | |||||||||||||
91,055 | 0.70 | ||||||||||||||
UTILITIES | 5.57 | ||||||||||||||
ELECTRIC UTILITIES | |||||||||||||||
2,500 | DUKE ENERGY CORP. | 185,475 | |||||||||||||
6,000 | XCEL ENERGY INC. | 193,380 | |||||||||||||
378,855 | 2.93 | ||||||||||||||
MULTI-UTILITIES | |||||||||||||||
2,500 | DOMINION RESOURCES INC. | 178,800 | |||||||||||||
4,000 | PUBLIC SERVICE ENTERPRISE GROUP INC. | 163,160 | |||||||||||||
341,960 | 2.64 | ||||||||||||||
TOTAL COMMON STOCK (Cost: $4,399,888) | 5,978,648 | 46.21 | |||||||||||||
CORPORATE BOND | |||||||||||||||
CONSUMER DISCRETIONARY | 4.40 | ||||||||||||||
HOTELS, RESTAURANTS & LEISURE | |||||||||||||||
100,000 | DARDEN RESTAURANTS INC. 6.20% 10/15/17 | 114,440 | |||||||||||||
100,000 | INTL GAME TECHNOLOGY 7.50% 06/15/19 | 113,675 | |||||||||||||
100,000 | WYNDHAM WORLDWIDE 2.95% 03/01/17 | 103,868 | |||||||||||||
100,000 | WYNN LAS VEGAS LLC 7.75% 08/15/20 | 109,000 | |||||||||||||
440,983 | 3.41 | ||||||||||||||
MEDIA | |||||||||||||||
100,000 | TIME WARNER CABLE INC. 8.75% 02/14/19 | 128,247 | |||||||||||||
128,247 | 0.99 | ||||||||||||||
See Accompanying Notes to Financial Statements which are an integral part of these financial statements.
37
Pacific Advisors Income and Equity Fund
Schedule of Investments (Unaudited)
as of June 30, 2014
| Quantity or Principal | Description | Current $ Value** | % of Total Net Assets | ||||||||||||
CORPORATE BOND continued | |||||||||||||||
ENERGY | 4.15 | ||||||||||||||
ENERGY EQUIPMENT & SERVICES | |||||||||||||||
100,000 | SESI LLC 6.375% 05/01/19 | 106,750 | |||||||||||||
100,000 | WEATHERFORD BERMUDA 6.00% 03/15/18 | 113,783 | |||||||||||||
220,533 | 1.70 | ||||||||||||||
OIL, GAS & CONSUMABLE FUELS | |||||||||||||||
150,000 | CONTINENTAL RESOURCES 7.375% 10/01/20 | 167,250 | |||||||||||||
150,000 | PETROBRAS GLOBAL FINANCE 2.00% 05/20/16 | 150,217 | |||||||||||||
317,467 | 2.45 | ||||||||||||||
FINANCIALS | 17.76 | ||||||||||||||
CAPITAL MARKETS | |||||||||||||||
150,000 | ARES CAPITAL CORP. 4.875% 11/30/18 | 159,457 | |||||||||||||
100,000 | GOLDMAN SACHS GROUP INC. 1.63% 08/26/20 FLOAT | 100,355 | |||||||||||||
100,000 | JANUS CAPITAL GROUP INC. 6.70% 06/15/17 | 113,194 | |||||||||||||
100,000 | JEFFERIES GROUP INC. 5.125% 04/13/18 | 109,562 | |||||||||||||
100,000 | MORGAN STANLEY 3.50% 09/30/17 FLOAT | 105,912 | |||||||||||||
100,000 | MORGAN STANLEY 4.50% 10/27/18 FLOAT | 109,500 | |||||||||||||
100,000 | PROSPECT CAPITAL CORP. 5.00% 07/15/19 | 102,959 | |||||||||||||
800,939 | 6.19 | ||||||||||||||
COMMERCIAL BANKS | |||||||||||||||
100,000 | BANK OF AMERICA 1.99% 09/28/20 FIX-FLOAT | 100,944 | |||||||||||||
100,000 | JPMORGAN CHASE & CO. 1.44% 09/01/15 FLOAT | 99,988 | |||||||||||||
125,000 | JPMORGAN CHASE & CO. 3.95% 02/25/21 FLOAT | 131,675 | |||||||||||||
332,607 | 2.57 | ||||||||||||||
DIVERSIFIED FINANCIAL SERVICES | |||||||||||||||
100,000 | ICAHN ENTERPRISES 6.00% 08/01/20 | 107,125 | |||||||||||||
100,000 | LEUCADIA NATIONAL CORP. 8.125% 09/15/15 | 107,875 | |||||||||||||
100,000 | NASDAQ OMX GROUP 5.25% 01/16/18 | 109,517 | |||||||||||||
100,000 | NASDAQ OMX GROUP 5.55% 01/15/20 | 110,953 | |||||||||||||
435,470 | 3.37 | ||||||||||||||
INSURANCE | |||||||||||||||
115,000 | GENWORTH FINANCIAL INC. 8.625% 12/15/16 | 134,447 | |||||||||||||
100,000 | PRUDENTIAL FINANCIAL INC. 3.51% 11/02/20 FLOAT | 105,515 | |||||||||||||
239,962 | 1.85 | ||||||||||||||
See Accompanying Notes to Financial Statements which are an integral part of these financial statements.
38
Pacific Advisors Income and Equity Fund
Schedule of Investments (Unaudited)
as of June 30, 2014
| Quantity or Principal | Description | Current $ Value** | % of Total Net Assets | ||||||||||||
CORPORATE BOND continued | |||||||||||||||
REAL ESTATE INVESTMENT TRUSTS | |||||||||||||||
105,000 | HOSPITALITY PROPERTIES TRUST 6.70% 01/15/18 | 118,276 | |||||||||||||
100,000 | HRPT PROPERTIES 6.25% 08/15/16 | 105,919 | |||||||||||||
150,000 | OMEGA HEALTHCARE INVESTORS 7.50% 02/15/20 | 161,250 | |||||||||||||
100,000 | SENIOR HOUSING PROP TRUST 4.30% 01/15/16 | 103,615 | |||||||||||||
489,060 | 3.78 | ||||||||||||||
HEALTH CARE | 1.79 | ||||||||||||||
PHARMACEUTICALS | |||||||||||||||
110,000 | HOSPIRA INC. 6.05% 03/30/17 | 121,354 | |||||||||||||
105,000 | WARNER CHILCOTT CO LLC 7.75% 09/15/18 | 110,385 | |||||||||||||
231,739 | 1.79 | ||||||||||||||
INDUSTRIALS | 5.79 | ||||||||||||||
AIRLINES | |||||||||||||||
50,000 | SOUTHWEST AIRLINES CO. 5.25% 10/01/14 | 50,529 | |||||||||||||
50,529 | 0.39 | ||||||||||||||
BUILDING PRODUCTS | |||||||||||||||
115,000 | OWENS CORNING INC. 9.00% 06/15/19 | 144,605 | |||||||||||||
144,605 | 1.12 | ||||||||||||||
MACHINERY | |||||||||||||||
100,000 | CNH AMERICA LLC 7.25% 01/15/16 | 107,500 | |||||||||||||
100,000 | HARSCO CORP. 5.75% 05/15/18 | 108,250 | |||||||||||||
115,000 | JOY GLOBAL INC. 6.00% 11/15/16 | 127,386 | |||||||||||||
343,136 | 2.65 | ||||||||||||||
TRADING COMPANIES & DISTRIBUTORS | |||||||||||||||
100,000 | AIR LEASE CORP. 5.625% 04/01/17 | 109,625 | |||||||||||||
100,000 | INTL LEASE FINANCE CORP. 2.18% 06/15/16 FLOAT | 100,625 | |||||||||||||
210,250 | 1.63 | ||||||||||||||
INFORMATION TECHNOLOGY | 4.58 | ||||||||||||||
COMPUTERS & PERIPHERALS | |||||||||||||||
80,000 | LEXMARK INT'L INC. 6.65% 06/01/18 | 90,753 | |||||||||||||
150,000 | SEAGATE HDD CAYMAN 6.875% 05/01/20 | 162,188 | |||||||||||||
252,941 | 1.95 | ||||||||||||||
ELECTRONIC EQUIPMENT & INSTRUMENTS | |||||||||||||||
102,000 | ARROW ELECTRONICS INC. 6.875% 06/01/18 | 118,084 | |||||||||||||
100,000 | INGRAM MICRO INC. 5.25% 09/01/17 | 108,678 | |||||||||||||
100,000 | JABIL CIRCUIT INC. 7.75% 07/15/16 | 113,125 | |||||||||||||
339,887 | 2.63 | ||||||||||||||
See Accompanying Notes to Financial Statements which are an integral part of these financial statements.
39
Pacific Advisors Income and Equity Fund
Schedule of Investments (Unaudited)
as of June 30, 2014
| Quantity or Principal | Description | Current $ Value** | % of Total Net Assets | ||||||||||||
CORPORATE BOND continued | |||||||||||||||
MATERIALS | 8.98 | ||||||||||||||
CHEMICALS | |||||||||||||||
75,000 | NOVA CHEMICALS CORP. 8.625% 11/01/19 | 80,100 | |||||||||||||
80,100 | 0.62 | ||||||||||||||
CONTAINERS & PACKAGING | |||||||||||||||
100,000 | BALL CORP. 6.75% 09/15/20 | 106,625 | |||||||||||||
106,625 | 0.82 | ||||||||||||||
METALS & MINING | |||||||||||||||
100,000 | ALCOA INC. 5.55% 02/01/17 | 109,108 | |||||||||||||
100,000 | CLIFFS NATURAL RESOURCES 3.95% 01/15/18 | 101,333 | |||||||||||||
100,000 | COMMERCIAL METALS CO. 7.35% 08/15/18 | 114,500 | |||||||||||||
100,000 | PETROHAWK ENERGY CORP. 7.25% 08/15/18 | 104,500 | |||||||||||||
100,000 | PLAINS EXPLORATION & PRODUCTION 7.625% 04/01/20 | 109,250 | |||||||||||||
150,000 | RELIANCE STEEL & ALUMINUM 6.20% 11/15/16 | 162,959 | |||||||||||||
150,000 | VALE OVERSEAS LIMITED 6.25% 01/23/17 | 167,850 | |||||||||||||
869,500 | 6.72 | ||||||||||||||
PAPER & FOREST PRODUCTS | |||||||||||||||
100,000 | DOMTAR CORP. 7.125% 08/15/15 | 105,971 | |||||||||||||
105,971 | 0.82 | ||||||||||||||
TELECOMMUNICATION SERVICES | 0.66 | ||||||||||||||
DIVERSIFIED TELECOM. SERVICES | |||||||||||||||
82,625 | BELLSOUTH TELECOM. 6.30% 12/15/15 | 84,607 | |||||||||||||
84,607 | 0.66 | ||||||||||||||
UTILITIES | 2.06 | ||||||||||||||
ELECTRIC UTILITIES | |||||||||||||||
49,000 | CLEVELAND ELECTRIC ILLUMINATING 5.70% 04/01/17 | 53,471 | |||||||||||||
100,000 | OGE ENERGY CORP. 5.00% 11/15/14 | 101,542 | |||||||||||||
100,000 | PPL ENERGY SUPPLY LLC 6.50% 05/01/18 | 111,546 | |||||||||||||
266,559 | 2.06 | ||||||||||||||
TOTAL CORPORATE BOND (Cost: $6,334,796) | 6,491,717 | 50.17 | |||||||||||||
PREFERRED STOCK | |||||||||||||||
FINANCIALS | 0.59 | ||||||||||||||
INSURANCE | |||||||||||||||
3,000 | METLIFE INC. 6.50% PFD | 76,620 | |||||||||||||
76,620 | 0.59 | ||||||||||||||
TOTAL PREFERRED STOCK (Cost: $75,000) | 76,620 | 0.59 | |||||||||||||
See Accompanying Notes to Financial Statements which are an integral part of these financial statements.
40
Pacific Advisors Income and Equity Fund
Schedule of Investments (Unaudited)
as of June 30, 2014
| Quantity or Principal | Description | Current $ Value** | % of Total Net Assets | ||||||||||||
SHORT TERM INVESTMENTS | |||||||||||||||
MONEY MARKET | 2.41 | ||||||||||||||
312,045 | UMB MONEY MARKET FIDUCIARY | 312,045 | |||||||||||||
312,045 | 2.41 | ||||||||||||||
TOTAL SHORT TERM INVESTMENTS (Cost: $312,045) | 312,045 | 2.41 | |||||||||||||
TOTAL INVESTMENT IN SECURITIES (Cost: $11,121,729) | 12,859,030 | 99.38 | |||||||||||||
OTHER ASSETS LESS LIABILITIES | 80,716 | 0.62 | |||||||||||||
TOTAL NET ASSETS | 12,939,746 | 100.00 | |||||||||||||
* Non-income producing
** The principal amount is stated in U.S. dollars unless otherwise indicated.
See Accompanying Notes to Financial Statements which are an integral part of these financial statements.
41
Pacific Advisors Balanced Fund
Schedule of Investments (Unaudited)
as of June 30, 2014
| Quantity or Principal | Description | Current $ Value** | % of Total Net Assets | ||||||||||||
COMMON STOCK | |||||||||||||||
CONSUMER DISCRETIONARY | 12.06 | ||||||||||||||
MEDIA | |||||||||||||||
3,000 | WALT DISNEY CO. | 257,220 | |||||||||||||
257,220 | 2.39 | ||||||||||||||
SPECIALTY RETAIL | |||||||||||||||
5,000 | CONN'S INC.* | 246,950 | |||||||||||||
2,750 | LITHIA MOTORS INC. A | 258,693 | |||||||||||||
1,250 | O'REILLY AUTOMOTIVE INC.* | 188,250 | |||||||||||||
693,893 | 6.44 | ||||||||||||||
TEXTILES, APPAREL & LUXURY GOODS | |||||||||||||||
2,000 | NIKE INC. | 155,100 | |||||||||||||
1,650 | PVH CORP. | 192,390 | |||||||||||||
347,490 | 3.23 | ||||||||||||||
CONSUMER STAPLES | 4.54 | ||||||||||||||
FOOD & STAPLES RETAILING | |||||||||||||||
3,250 | CVS CAREMARK CORP. | 244,953 | |||||||||||||
3,250 | WAL-MART STORES INC. | 243,977 | |||||||||||||
488,930 | 4.54 | ||||||||||||||
ENERGY | 11.83 | ||||||||||||||
ENERGY EQUIPMENT & SERVICES | |||||||||||||||
4,000 | HALLIBURTON CO. | 284,040 | |||||||||||||
10,700 | HELIX ENERGY SOLUTIONS GROUP INC.* | 281,517 | |||||||||||||
4,250 | HORNBECK OFFSHORE SERVICES INC.* | 199,410 | |||||||||||||
3,100 | NATIONAL OILWELL VARCO INC. | 255,285 | |||||||||||||
4,500 | TIDEWATER INC. | 252,675 | |||||||||||||
1,272,927 | 11.83 | ||||||||||||||
FINANCIALS | 6.84 | ||||||||||||||
COMMERCIAL BANKS | |||||||||||||||
7,250 | EAST WEST BANCORP INC. | 253,677 | |||||||||||||
3,850 | JPMORGAN CHASE & CO. | 221,837 | |||||||||||||
475,514 | 4.42 | ||||||||||||||
CONSUMER FINANCE | |||||||||||||||
2,750 | AMERICAN EXPRESS CO. | 260,892 | |||||||||||||
260,892 | 2.42 | ||||||||||||||
See Accompanying Notes to Financial Statements which are an integral part of these financial statements.
42
Pacific Advisors Balanced Fund
Schedule of Investments (Unaudited)
as of June 30, 2014
| Quantity or Principal | Description | Current $ Value** | % of Total Net Assets | ||||||||||||
COMMON STOCK continued | |||||||||||||||
INDUSTRIALS | 30.60 | ||||||||||||||
AIR FREIGHT & LOGISTICS | |||||||||||||||
1,750 | UNITED PARCEL SERVICE INC. B | 179,655 | |||||||||||||
179,655 | 1.67 | ||||||||||||||
COMMERCIAL SERVICES & SUPPLIES | |||||||||||||||
4,000 | TEAM INC.* | 164,080 | |||||||||||||
164,080 | 1.52 | ||||||||||||||
CONSTRUCTION & ENGINEERING | |||||||||||||||
3,850 | CHICAGO BRIDGE & IRON CO. N.V. | 262,570 | |||||||||||||
262,570 | 2.44 | ||||||||||||||
INDUSTRIAL CONGLOMERATES | |||||||||||||||
9,250 | GENERAL ELECTRIC CO. | 243,090 | |||||||||||||
243,090 | 2.26 | ||||||||||||||
MACHINERY | |||||||||||||||
1,700 | CUMMINS INC. | 262,293 | |||||||||||||
6,250 | NAVISTAR INT'L CORP.* | 234,250 | |||||||||||||
3,150 | WABTEC CORP. | 260,159 | |||||||||||||
756,702 | 7.03 | ||||||||||||||
MARINE | |||||||||||||||
2,500 | KIRBY CORP.* | 292,850 | |||||||||||||
292,850 | 2.72 | ||||||||||||||
ROAD & RAIL | |||||||||||||||
8,000 | CSX CORP. | 246,480 | |||||||||||||
2,500 | GENESEE & WYOMING INC.* | 262,500 | |||||||||||||
2,000 | KANSAS CITY SOUTHERN | 215,020 | |||||||||||||
724,000 | 6.72 | ||||||||||||||
TRADING COMPANIES & DISTRIBUTORS | |||||||||||||||
2,850 | DXP ENTERPRISES INC.* | 215,289 | |||||||||||||
8,500 | MRC GLOBAL INC.* | 240,465 | |||||||||||||
775 | NOW INC.* | 28,063 | |||||||||||||
4,250 | TAL INT'L GROUP INC. | 188,530 | |||||||||||||
672,347 | 6.24 | ||||||||||||||
INFORMATION TECHNOLOGY | 6.09 | ||||||||||||||
COMMUNICATIONS EQUIPMENT | |||||||||||||||
2,750 | QUALCOMM INC. | 217,800 | |||||||||||||
217,800 | 2.02 | ||||||||||||||
See Accompanying Notes to Financial Statements which are an integral part of these financial statements.
43
Pacific Advisors Balanced Fund
Schedule of Investments (Unaudited)
as of June 30, 2014
| Quantity or Principal | Description | Current $ Value** | % of Total Net Assets | ||||||||||||
COMMON STOCK continued | |||||||||||||||
IT SERVICES | |||||||||||||||
1,150 | INT'L BUSINESS MACHINES CORP. | 208,460 | |||||||||||||
208,460 | 1.94 | ||||||||||||||
SOFTWARE | |||||||||||||||
5,500 | MICROSOFT CORP. | 229,350 | |||||||||||||
229,350 | 2.13 | ||||||||||||||
TOTAL COMMON STOCK (Cost: $4,993,218) | 7,747,770 | 71.96 | |||||||||||||
CORPORATE BOND | |||||||||||||||
CONSUMER DISCRETIONARY | 4.28 | ||||||||||||||
AUTO COMPONENTS | |||||||||||||||
100,000 | DELPHI CORP. 6.125% 05/15/21 | 111,760 | |||||||||||||
100,000 | LEAR CORP. 8.125% 03/15/20 | 107,625 | |||||||||||||
219,385 | 2.04 | ||||||||||||||
DIVERSIFIED CONSUMER SERVICES | |||||||||||||||
100,000 | WASHINGTON POST CO. 7.25% 02/01/19 | 117,733 | |||||||||||||
117,733 | 1.09 | ||||||||||||||
MEDIA | |||||||||||||||
110,000 | TIME WARNER CABLE INC. 5.85% 05/01/17 | 123,714 | |||||||||||||
123,714 | 1.15 | ||||||||||||||
ENERGY | 3.56 | ||||||||||||||
ENERGY EQUIPMENT & SERVICES | |||||||||||||||
100,000 | SESI LLC 6.375% 05/01/19 | 106,750 | |||||||||||||
106,750 | 0.99 | ||||||||||||||
OIL, GAS & CONSUMABLE FUELS | |||||||||||||||
100,000 | CONTINENTAL RESOURCES 7.375% 10/01/20 | 111,500 | |||||||||||||
150,000 | PEABODY ENERGY CORP. 7.375% 11/01/16 | 164,812 | |||||||||||||
276,312 | 2.57 | ||||||||||||||
FINANCIALS | 10.93 | ||||||||||||||
CAPITAL MARKETS | |||||||||||||||
100,000 | JEFFERIES GROUP INC. 5.50% 03/15/16 | 106,655 | |||||||||||||
161,000 | MORGAN STANLEY 3.66% 07/01/14 FLOAT | 161,000 | |||||||||||||
267,655 | 2.49 | ||||||||||||||
COMMERCIAL BANKS | |||||||||||||||
100,000 | BANK OF AMERICA 1.98% 07/28/17 FLOAT | 102,430 | |||||||||||||
102,430 | 0.95 | ||||||||||||||
See Accompanying Notes to Financial Statements which are an integral part of these financial statements.
44
Pacific Advisors Balanced Fund
Schedule of Investments (Unaudited)
as of June 30, 2014
| Quantity or Principal | Description | Current $ Value** | % of Total Net Assets | ||||||||||||
COMMON STOCK continued | |||||||||||||||
CONSUMER FINANCE | |||||||||||||||
150,000 | FORD MOTOR CREDIT CO. 7.00% 04/15/15 | 157,518 | |||||||||||||
157,518 | 1.46 | ||||||||||||||
DIVERSIFIED FINANCIAL SERVICES | |||||||||||||||
100,000 | ICAHN ENTERPRISES 6.00% 08/01/20 | 107,125 | |||||||||||||
100,000 | LEUCADIA NATIONAL CORP. 8.125% 09/15/15 | 107,875 | |||||||||||||
150,000 | NASDAQ OMX GROUP 5.25% 01/16/18 | 164,276 | |||||||||||||
379,276 | 3.52 | ||||||||||||||
REAL ESTATE INVESTMENT TRUSTS | |||||||||||||||
125,000 | CORRECTIONS CORP. OF AMERICA 4.125% 04/01/20 | 124,062 | |||||||||||||
140,000 | HEALTH CARE REIT INC. 3.625% 03/15/16 | 146,329 | |||||||||||||
270,391 | 2.51 | ||||||||||||||
HEALTH CARE | 1.05 | ||||||||||||||
HEALTH CARE PROVIDERS & SERVICES | |||||||||||||||
100,000 | FRESENIUS MED CARE US 6.875% 07/15/17 | 113,250 | |||||||||||||
113,250 | 1.05 | ||||||||||||||
INDUSTRIALS | 4.15 | ||||||||||||||
AEROSPACE & DEFENSE | |||||||||||||||
100,000 | B/E AEROSPACE INC. 6.875% 10/01/20 | 108,625 | |||||||||||||
108,625 | 1.01 | ||||||||||||||
MACHINERY | |||||||||||||||
100,000 | CASE NEW HOLLAND INC. 7.875% 12/01/17 | 116,500 | |||||||||||||
116,500 | 1.08 | ||||||||||||||
TRADING COMPANIES & DISTRIBUTORS | |||||||||||||||
100,000 | AIRCASTLE 6.75% 04/15/17 | 111,000 | |||||||||||||
95,000 | INTL LEASE FINANCE CORP. 8.75% 03/15/17 | 110,437 | |||||||||||||
221,437 | 2.06 | ||||||||||||||
INFORMATION TECHNOLOGY | 2.05 | ||||||||||||||
COMPUTERS & PERIPHERALS | |||||||||||||||
100,000 | SEAGATE HDD CAYMAN 6.875% 05/01/20 | 108,125 | |||||||||||||
108,125 | 1.00 | ||||||||||||||
ELECTRONIC EQUIPMENT & INSTRUMENTS | |||||||||||||||
100,000 | JABIL CIRCUIT INC. 7.75% 07/15/16 | 113,125 | |||||||||||||
113,125 | 1.05 | ||||||||||||||
See Accompanying Notes to Financial Statements which are an integral part of these financial statements.
45
Pacific Advisors Balanced Fund
Schedule of Investments (Unaudited)
as of June 30, 2014
| Quantity or Principal | Description | Current $ Value** | % of Total Net Assets | ||||||||||||
COMMON STOCK continued | |||||||||||||||
MATERIALS | 3.98 | ||||||||||||||
CHEMICALS | |||||||||||||||
105,000 | ALBEMARLE CORP. 5.10% 02/01/15 | 107,693 | |||||||||||||
107,693 | 1.00 | ||||||||||||||
METALS & MINING | |||||||||||||||
100,000 | CLIFFS NATURAL RESOURCES 3.95% 01/15/18 | 101,333 | |||||||||||||
100,000 | COMMERCIAL METALS CO. 7.35% 08/15/18 | 114,500 | |||||||||||||
100,000 | PETROHAWK ENERGY CORP. 7.25% 08/15/18 | 104,500 | |||||||||||||
320,333 | 2.98 | ||||||||||||||
TOTAL CORPORATE BOND (Cost: $3,153,083) | 3,230,252 | 30.00 | |||||||||||||
TOTAL INVESTMENT IN SECURITIES (Cost: $8,146,301) | 10,978,022 | 101.96 | |||||||||||||
OTHER ASSETS LESS LIABILITIES | (210,806 | ) | (1.96 | ) | |||||||||||
TOTAL NET ASSETS | 10,767,216 | 100.00 | |||||||||||||
* Non-income producing
** The principal amount is stated in U.S. dollars unless otherwise indicated.LCV
See Accompanying Notes to Financial Statements which are an integral part of these financial statements.
46
Pacific Advisors Large Cap Value Fund
Schedule of Investments (Unaudited)
as of June 30, 2014
| Quantity or Principal | Description | Current $ Value** | % of Total Net Assets | ||||||||||||
COMMON STOCK | |||||||||||||||
CONSUMER DISCRETIONARY | 15.96 | ||||||||||||||
AUTO COMPONENTS | |||||||||||||||
1,550 | JOHNSON CONTROLS INC. | 77,391 | |||||||||||||
77,391 | 1.05 | ||||||||||||||
HOTELS, RESTAURANTS & LEISURE | |||||||||||||||
2,000 | MCDONALD'S CORP. | 201,480 | |||||||||||||
201,480 | 2.73 | ||||||||||||||
MEDIA | |||||||||||||||
3,250 | TIME WARNER INC. | 228,313 | |||||||||||||
3,000 | WALT DISNEY CO. | 257,220 | |||||||||||||
485,533 | 6.59 | ||||||||||||||
SPECIALTY RETAIL | |||||||||||||||
3,750 | LOWE'S COMPANIES INC. | 179,963 | |||||||||||||
2,870 | THE HOME DEPOT, INC. | 232,355 | |||||||||||||
412,318 | 5.59 | ||||||||||||||
CONSUMER STAPLES | 14.97 | ||||||||||||||
BEVERAGES | |||||||||||||||
5,120 | COCA-COLA CO. | 216,883 | |||||||||||||
216,883 | 2.94 | ||||||||||||||
FOOD & STAPLES RETAILING | |||||||||||||||
5,000 | SYSCO CORP. | 187,250 | |||||||||||||
2,950 | WAL-MART STORES INC. | 221,456 | |||||||||||||
408,706 | 5.54 | ||||||||||||||
FOOD PRODUCTS | |||||||||||||||
3,000 | KRAFT FOODS GROUP INC. | 179,850 | |||||||||||||
2,700 | MONDELEZ INT'L INC. | 101,547 | |||||||||||||
281,397 | 3.82 | ||||||||||||||
HOUSEHOLD PRODUCTS | |||||||||||||||
2,500 | PROCTER & GAMBLE CO. | 196,475 | |||||||||||||
196,475 | 2.67 | ||||||||||||||
ENERGY | 4.74 | ||||||||||||||
ENERGY EQUIPMENT & SERVICES | |||||||||||||||
1,675 | NATIONAL OILWELL VARCO INC. | 137,936 | |||||||||||||
137,936 | 1.87 | ||||||||||||||
See Accompanying Notes to Financial Statements which are an integral part of these financial statements.
47
Pacific Advisors Large Cap Value Fund
Schedule of Investments (Unaudited)
as of June 30, 2014
| Quantity or Principal | Description | Current $ Value** | % of Total Net Assets | ||||||||||||
COMMON STOCK continued | |||||||||||||||
OIL, GAS & CONSUMABLE FUELS | |||||||||||||||
2,100 | EXXON MOBIL CORP. | 211,428 | |||||||||||||
211,428 | 2.87 | ||||||||||||||
FINANCIALS | 17.49 | ||||||||||||||
CAPITAL MARKETS | |||||||||||||||
4,000 | LEGG MASON INC. | 205,240 | |||||||||||||
205,240 | 2.78 | ||||||||||||||
COMMERCIAL BANKS | |||||||||||||||
4,225 | WELLS FARGO & CO. | 222,066 | |||||||||||||
222,066 | 3.01 | ||||||||||||||
DIVERSIFIED FINANCIAL SERVICES | |||||||||||||||
2,000 | BERKSHIRE HATHAWAY INC. B* | 253,120 | |||||||||||||
2,400 | CITIGROUP INC. | 113,040 | |||||||||||||
366,160 | 4.97 | ||||||||||||||
INSURANCE | |||||||||||||||
4,000 | AMERICAN INT'L GROUP INC. | 218,320 | |||||||||||||
5,000 | METLIFE INC. | 277,800 | |||||||||||||
496,120 | 6.73 | ||||||||||||||
HEALTH CARE | 3.71 | ||||||||||||||
PHARMACEUTICALS | |||||||||||||||
2,615 | JOHNSON & JOHNSON | 273,581 | |||||||||||||
273,581 | 3.71 | ||||||||||||||
INDUSTRIALS | 22.42 | ||||||||||||||
AEROSPACE & DEFENSE | |||||||||||||||
2,000 | HONEYWELL INT'L INC. | 185,900 | |||||||||||||
185,900 | 2.52 | ||||||||||||||
AIR FREIGHT & LOGISTICS | |||||||||||||||
1,000 | FEDEX CORP. | 151,380 | |||||||||||||
1,200 | UNITED PARCEL SERVICE INC. B | 123,192 | |||||||||||||
274,572 | 3.72 | ||||||||||||||
INDUSTRIAL CONGLOMERATES | |||||||||||||||
9,750 | GENERAL ELECTRIC CO. | 256,230 | |||||||||||||
256,230 | 3.48 | ||||||||||||||
See Accompanying Notes to Financial Statements which are an integral part of these financial statements.
48
Pacific Advisors Large Cap Value Fund
Schedule of Investments (Unaudited)
as of June 30, 2014
| Quantity or Principal | Description | Current $ Value** | % of Total Net Assets | ||||||||||||
COMMON STOCK continued | |||||||||||||||
MACHINERY | |||||||||||||||
2,700 | DEERE & CO. | 244,485 | |||||||||||||
2,350 | ILLINOIS TOOL WORKS INC. | 205,766 | |||||||||||||
1,250 | SPX CORP. | 135,263 | |||||||||||||
2,500 | TIMKEN CO. | 169,600 | |||||||||||||
755,114 | 10.24 | ||||||||||||||
TRADING COMPANIES & DISTRIBUTORS | |||||||||||||||
5,000 | NOW INC.* | 181,050 | |||||||||||||
181,050 | 2.46 | ||||||||||||||
INFORMATION TECHNOLOGY | 20.09 | ||||||||||||||
COMPUTERS & PERIPHERALS | |||||||||||||||
3,290 | APPLE INC. | 305,740 | |||||||||||||
305,740 | 4.15 | ||||||||||||||
IT SERVICES | |||||||||||||||
1,350 | INT'L BUSINESS MACHINES CORP. | 244,714 | |||||||||||||
2,200 | MASTERCARD INC. | 161,634 | |||||||||||||
406,348 | 5.51 | ||||||||||||||
SEMICONDUCTORS & EQUIPMENT | |||||||||||||||
5,600 | INTEL CORP. | 173,040 | |||||||||||||
173,040 | 2.35 | ||||||||||||||
SOFTWARE | |||||||||||||||
7,000 | MICROSOFT CORP. | 291,900 | |||||||||||||
7,500 | ORACLE CORPORATION | 303,975 | |||||||||||||
595,875 | 8.08 | ||||||||||||||
TOTAL COMMON STOCK (Cost: $5,197,988) | 7,326,583 | 99.38 | |||||||||||||
SHORT TERM INVESTMENTS | |||||||||||||||
MONEY MARKET | 0.61 | ||||||||||||||
44,843 | UMB MONEY MARKET FIDUCIARY | 44,843 | |||||||||||||
44,843 | 0.61 | ||||||||||||||
TOTAL SHORT TERM INVESTMENTS (Cost: $44,843) | 44,843 | 0.61 | |||||||||||||
TOTAL INVESTMENT IN SECURITIES (Cost: $5,242,831) | 7,371,426 | 99.99 | |||||||||||||
OTHER ASSETS LESS LIABILITIES | 383 | 0.01 | |||||||||||||
TOTAL NET ASSETS | 7,371,809 | 100.00 | |||||||||||||
* Non-income producing
** The principal amount is stated in U.S. dollars unless otherwise indicated.
See Accompanying Notes to Financial Statements which are an integral part of these financial statements.
49
Pacific Advisors Mid Cap Value Fund
Schedule of Investments (Unaudited)
as of June 30, 2014
| Quantity or Principal | Description | Current $ Value** | % of Total Net Assets | ||||||||||||
COMMON STOCK | |||||||||||||||
CONSUMER DISCRETIONARY | 29.58 | ||||||||||||||
AUTO COMPONENTS | |||||||||||||||
13,000 | DANA HOLDING CORP. | 317,460 | |||||||||||||
4,100 | LEAR CORP. | 366,212 | |||||||||||||
683,672 | 8.92 | ||||||||||||||
DISTRIBUTORS | |||||||||||||||
2,000 | POOL CORPORATION | 113,120 | |||||||||||||
113,120 | 1.47 | ||||||||||||||
SPECIALTY RETAIL | |||||||||||||||
7,000 | CONN'S INC.* | 345,730 | |||||||||||||
5,500 | GAMESTOP CORP. A | 222,585 | |||||||||||||
2,000 | O'REILLY AUTOMOTIVE INC.* | 301,200 | |||||||||||||
6,500 | PENSKE AUTOMOTIVE GROUP INC. | 321,750 | |||||||||||||
1,191,265 | 15.54 | ||||||||||||||
TEXTILES, APPAREL & LUXURY GOODS | |||||||||||||||
2,400 | PVH CORP. | 279,840 | |||||||||||||
279,840 | 3.65 | ||||||||||||||
CONSUMER STAPLES | 1.76 | ||||||||||||||
BEVERAGES | |||||||||||||||
2,300 | DR PEPPER SNAPPLE GROUP INC. | 134,734 | |||||||||||||
134,734 | 1.76 | ||||||||||||||
ENERGY | 17.38 | ||||||||||||||
ENERGY EQUIPMENT & SERVICES | |||||||||||||||
10,500 | HELIX ENERGY SOLUTIONS GROUP INC.* | 276,255 | |||||||||||||
8,000 | NOBLE CORPORATION | 268,480 | |||||||||||||
6,000 | TIDEWATER INC. | 336,900 | |||||||||||||
881,635 | 11.50 | ||||||||||||||
OIL, GAS & CONSUMABLE FUELS | |||||||||||||||
5,000 | CHESAPEAKE ENERGY CORP. | 155,400 | |||||||||||||
16,000 | DENBURY RESOURCES INC. | 295,360 | |||||||||||||
450,760 | 5.88 | ||||||||||||||
FINANCIALS | 2.57 | ||||||||||||||
COMMERCIAL BANKS | |||||||||||||||
7,700 | CATHAY GENERAL BANCORP | 196,812 | |||||||||||||
196,812 | 2.57 | ||||||||||||||
See Accompanying Notes to Financial Statements which are an integral part of these financial statements.
50
Pacific Advisors Mid Cap Value Fund
Schedule of Investments (Unaudited)
as of June 30, 2014
| Quantity or Principal | Description | Current $ Value** | % of Total Net Assets | ||||||||||||
COMMON STOCK continued | |||||||||||||||
INDUSTRIALS | 45.89 | ||||||||||||||
AIRLINES | |||||||||||||||
5,500 | SPIRIT AIRLINES INC.* | 347,820 | |||||||||||||
347,820 | 4.54 | ||||||||||||||
COMMERCIAL SERVICES & SUPPLIES | |||||||||||||||
3,500 | COPART INC.* | 125,860 | |||||||||||||
125,860 | 1.64 | ||||||||||||||
CONSTRUCTION & ENGINEERING | |||||||||||||||
4,800 | CHICAGO BRIDGE & IRON CO. N.V. | 327,360 | |||||||||||||
327,360 | 4.27 | ||||||||||||||
MACHINERY | |||||||||||||||
1,800 | GRACO INC. | 140,544 | |||||||||||||
4,000 | JOY GLOBAL INC. | 246,320 | |||||||||||||
9,000 | NAVISTAR INT'L CORP.* | 337,320 | |||||||||||||
4,100 | WABTEC CORP. | 338,619 | |||||||||||||
1,062,803 | 13.86 | ||||||||||||||
ROAD & RAIL | |||||||||||||||
4,000 | GENESEE & WYOMING INC.* | 420,000 | |||||||||||||
2,700 | KANSAS CITY SOUTHERN | 290,277 | |||||||||||||
3,300 | LANDSTAR SYSTEM INC. | 211,200 | |||||||||||||
12,000 | SWIFT TRANSPORTATION CO.* | 302,760 | |||||||||||||
1,224,237 | 15.97 | ||||||||||||||
TRADING COMPANIES & DISTRIBUTORS | |||||||||||||||
10,500 | MRC GLOBAL INC.* | 297,045 | |||||||||||||
525 | W.W. GRAINGER, INC. | 133,492 | |||||||||||||
430,537 | 5.61 | ||||||||||||||
MATERIALS | 3.51 | ||||||||||||||
CHEMICALS | |||||||||||||||
3,000 | H.B. FULLER CO. | 144,300 | |||||||||||||
144,300 | 1.88 | ||||||||||||||
See Accompanying Notes to Financial Statements which are an integral part of these financial statements.
51
Pacific Advisors Mid Cap Value Fund
Schedule of Investments (Unaudited)
as of June 30, 2014
| Quantity or Principal | Description | Current $ Value** | % of Total Net Assets | ||||||||||||
COMMON STOCK continued | |||||||||||||||
METALS & MINING | |||||||||||||||
7,200 | COMMERCIAL METALS CO. | 124,632 | |||||||||||||
124,632 | 1.63 | ||||||||||||||
TOTAL COMMON STOCK (Cost: $5,023,682) | 7,719,387 | 100.69 | |||||||||||||
TOTAL INVESTMENT IN SECURITIES (Cost: $5,023,682) | 7,719,387 | 100.69 | |||||||||||||
OTHER ASSETS LESS LIABILITIES | (52,899 | ) | (0.69 | ) | |||||||||||
TOTAL NET ASSETS | 7,666,488 | 100.00 | |||||||||||||
* Non-income producing
** The principal amount is stated in U.S. dollars unless otherwise indicated.
See Accompanying Notes to Financial Statements which are an integral part of these financial statements.
52
Pacific Advisors Small Cap Value Fund
Schedule of Investments (Unaudited)
as of June 30, 2014
| Quantity or Principal | Description | Current $ Value** | % of Total Net Assets | ||||||||||||
COMMON STOCK | |||||||||||||||
CONSUMER DISCRETIONARY | 17.32 | ||||||||||||||
AUTO COMPONENTS | |||||||||||||||
252,000 | GENTHERM INC.* | 11,201,400 | |||||||||||||
11,201,400 | 5.00 | ||||||||||||||
HOTELS, RESTAURANTS & LEISURE | |||||||||||||||
440,000 | BRAVO BRIO RESTAURANT GROUP INC.* | 6,868,400 | |||||||||||||
6,868,400 | 3.07 | ||||||||||||||
SPECIALTY RETAIL | |||||||||||||||
225,000 | CONN'S INC.* | 11,112,750 | |||||||||||||
62,000 | HIBBETT SPORTS INC.* | 3,358,540 | |||||||||||||
235,000 | SONIC AUTOMOTIVE INC. | 6,269,800 | |||||||||||||
20,741,090 | 9.25 | ||||||||||||||
CONSUMER STAPLES | 4.48 | ||||||||||||||
FOOD PRODUCTS | |||||||||||||||
480,000 | DARLING INGREDIENTS INC.* | 10,032,000 | |||||||||||||
10,032,000 | 4.48 | ||||||||||||||
ENERGY | 19.58 | ||||||||||||||
ENERGY EQUIPMENT & SERVICES | |||||||||||||||
215,000 | HORNBECK OFFSHORE SERVICES INC.* | 10,087,800 | |||||||||||||
300,000 | MATRIX SERVICE CO.* | 9,837,000 | |||||||||||||
235,200 | MITCHAM INDUSTRIES INC.* | 3,288,096 | |||||||||||||
225,000 | NATURAL GAS SERVICES GROUP* | 7,438,500 | |||||||||||||
910,000 | NORTH AMERICAN ENERGY PARTNERS INC. | 7,325,500 | |||||||||||||
730,000 | PARKER DRILLING CO.* | 4,759,600 | |||||||||||||
42,736,496 | 19.06 | ||||||||||||||
OIL, GAS & CONSUMABLE FUELS | |||||||||||||||
1,000,000 | INFINITY ENERGY RESOURCES INC.* | 1,160,000 | |||||||||||||
1,160,000 | 0.52 | ||||||||||||||
FINANCIALS | 7.54 | ||||||||||||||
COMMERCIAL BANKS | |||||||||||||||
280,000 | BBCN BANCORP INC. | 4,466,000 | |||||||||||||
245,000 | EAST WEST BANCORP INC. | 8,572,550 | |||||||||||||
13,038,550 | 5.81 | ||||||||||||||
CONSUMER FINANCE | |||||||||||||||
250,000 | REGIONAL MANAGEMENT CORP.* | 3,867,500 | |||||||||||||
3,867,500 | 1.73 | ||||||||||||||
See Accompanying Notes to Financial Statements which are an integral part of these financial statements.
53
Pacific Advisors Small Cap Value Fund
Schedule of Investments (Unaudited)
as of June 30, 2014
| Quantity or Principal | Description | Current $ Value** | % of Total Net Assets | ||||||||||||
COMMON STOCK continued | |||||||||||||||
INDUSTRIALS | 45.58 | ||||||||||||||
BUILDING PRODUCTS | |||||||||||||||
165,595 | INSTEEL INDUSTRIES INC. | 3,253,942 | |||||||||||||
430,000 | NCI BUILDING SYSTEMS INC.* | 8,354,900 | |||||||||||||
11,608,842 | 5.18 | ||||||||||||||
COMMERCIAL SERVICES & SUPPLIES | |||||||||||||||
180,000 | MOBILE MINI INC. | 8,620,200 | |||||||||||||
195,000 | TEAM INC.* | 7,998,900 | |||||||||||||
16,619,100 | 7.42 | ||||||||||||||
CONSTRUCTION & ENGINEERING | |||||||||||||||
810,000 | FURMANITE CORP.* | 9,428,400 | |||||||||||||
190,000 | ORION MARINE GROUP INC.* | 2,057,700 | |||||||||||||
11,486,100 | 5.12 | ||||||||||||||
MACHINERY | |||||||||||||||
170,000 | NAVISTAR INT'L CORP.* | 6,371,600 | |||||||||||||
6,371,600 | 2.84 | ||||||||||||||
MARINE | |||||||||||||||
100,000 | KIRBY CORP.* | 11,714,000 | |||||||||||||
11,714,000 | 5.23 | ||||||||||||||
ROAD & RAIL | |||||||||||||||
245,000 | SAIA INC.* | 10,762,850 | |||||||||||||
10,762,850 | 4.80 | ||||||||||||||
TRADING COMPANIES & DISTRIBUTORS | |||||||||||||||
130,000 | DXP ENTERPRISES INC.* | 9,820,200 | |||||||||||||
283,000 | MRC GLOBAL INC.* | 8,006,070 | |||||||||||||
250,000 | RUSH ENTERPRISES INC.* | 8,667,500 | |||||||||||||
160,000 | TAL INT'L GROUP INC. | 7,097,600 | |||||||||||||
33,591,370 | 14.99 | ||||||||||||||
MATERIALS | 2.01 | ||||||||||||||
METALS & MINING | |||||||||||||||
210,000 | SUNCOKE ENERGY INC.* | 4,515,000 | |||||||||||||
4,515,000 | 2.01 | ||||||||||||||
See Accompanying Notes to Financial Statements which are an integral part of these financial statements.
54
Pacific Advisors Small Cap Value Fund
Schedule of Investments (Unaudited)
as of June 30, 2014
| Quantity or Principal | Description | Current $ Value** | % of Total Net Assets | ||||||||||||
COMMON STOCK continued | |||||||||||||||
TELECOMMUNICATION SERVICES | 3.57 | ||||||||||||||
DIVERSIFIED TELECOM. SERVICES | |||||||||||||||
600,000 | PREMIERE GLOBAL SERVICES INC.* | 8,010,000 | |||||||||||||
8,010,000 | 3.57 | ||||||||||||||
TOTAL COMMON STOCK (Cost: $138,368,500) | 224,324,298 | 100.08 | |||||||||||||
SHORT TERM INVESTMENTS | |||||||||||||||
MONEY MARKET | 0.03 | ||||||||||||||
77,073 | UMB MONEY MARKET FIDUCIARY | 77,072 | |||||||||||||
77,072 | 0.03 | ||||||||||||||
TOTAL SHORT TERM INVESTMENTS (Cost: $77,073) | 77,072 | 0.03 | |||||||||||||
TOTAL INVESTMENT IN SECURITIES (Cost: $138,445,572) | 224,401,370 | 100.11 | |||||||||||||
OTHER ASSETS LESS LIABILITIES | (257,722 | ) | (0.11 | ) | |||||||||||
TOTAL NET ASSETS | 224,143,648 | 100.00 | |||||||||||||
* Non-income producing
** The principal amount is stated in U.S. dollars unless otherwise indicated.
See Accompanying Notes to Financial Statements which are an integral part of these financial statements.
55
Pacific Advisors Fund Inc.
Statement of Assets and Liabilities (Unaudited)
June 30, 2014
| Government Securities Fund | Income and Equity Fund | Balanced Fund | |||||||||||||
Assets | |||||||||||||||
Investment securities | |||||||||||||||
At cost | $ | 1,845,457 | $ | 10,809,684 | $ | 8,146,301 | |||||||||
At fair value | $ | 1,945,111 | $ | 12,546,985 | $ | 10,978,022 | |||||||||
Cash or cash equivalent, at fair value | - | 312,045 | - | ||||||||||||
Accrued income receivable | 2,739 | 97,844 | 54,772 | ||||||||||||
Receivable for capital shares sold | - | - | - | ||||||||||||
Other assets | 1,773 | - | - | ||||||||||||
Total assets | 1,949,623 | 12,956,874 | 11,032,794 | ||||||||||||
Liabilities | |||||||||||||||
Bank borrowings (Note 7) | 4,475 | - | 114,538 | ||||||||||||
Payable for investments purchased | - | - | 127,022 | ||||||||||||
Payable for fund shares redeemed | - | 500 | 1,500 | ||||||||||||
Accounts payable | - | 13,028 | 18,918 | ||||||||||||
Accounts payable to related parties (Note 3) | - | 3,600 | 3,600 | ||||||||||||
Total liabilities | 4,475 | 17,128 | 265,578 | ||||||||||||
Net Assets | $ | 1,945,148 | $ | 12,939,746 | $ | 10,767,216 | |||||||||
Summary of Shareholders' Equity | |||||||||||||||
Paid in capital | 1,992,171 | 11,683,241 | 7,625,929 | ||||||||||||
Accumulated undistributed net investment income | - | 6,057 | 21,495 | ||||||||||||
Accumulated undistributed net realized gain (loss) on security transactions | (146,677 | ) | (486,853 | ) | 288,071 | ||||||||||
Net unrealized appreciation of investments | 99,654 | 1,737,301 | 2,831,721 | ||||||||||||
Net assets at June 30, 2014 | $ | 1,945,148 | $ | 12,939,746 | $ | 10,767,216 | |||||||||
Class A: | |||||||||||||||
Net assets | $ | 1,728,314 | $ | 10,547,882 | $ | 5,439,855 | |||||||||
Shares authorized | 50,000,000 | 50,000,000 | 50,000,000 | ||||||||||||
Shares outstanding | 187,814 | 889,594 | 328,396 | ||||||||||||
Net asset value and redemption price per share | $ | 9.20 | $ | 11.86 | $ | 16.56 | |||||||||
Maximum offering price per share | $ | 9.66 | $ | 12.45 | $ | 17.57 | |||||||||
Sales load | 4.75 | % | 4.75 | % | 5.75 | % | |||||||||
Class C: | |||||||||||||||
Net assets | $ | 216,834 | $ | 2,391,864 | $ | 5,327,361 | |||||||||
Shares authorized | 50,000,000 | 50,000,000 | 50,000,000 | ||||||||||||
Shares outstanding | 24,462 | 209,907 | 352,939 | ||||||||||||
Net asset value and redemption price per share | $ | 8.86 | $ | 11.39 | $ | 15.09 | |||||||||
Class I: | |||||||||||||||
Net assets | N/A | N/A | N/A | ||||||||||||
Shares authorized | |||||||||||||||
Shares outstanding | |||||||||||||||
Net asset value and redemption price per share | N/A | N/A | N/A | ||||||||||||
See Accompanying Notes to Financial Statements which are an integral part of these financial statements.
56
| Large Cap Value Fund | Mid Cap Value Fund | Small Cap Value Fund | |||||||||||||
Assets | |||||||||||||||
Investment securities | |||||||||||||||
At cost | $ | 5,197,988 | $ | 5,023,682 | $ | 138,368,500 | |||||||||
At fair value | $ | 7,326,583 | $ | 7,719,387 | $ | 224,324,298 | |||||||||
Cash or cash equivalent, at fair value | 44,843 | - | 77,073 | ||||||||||||
Accrued income receivable | 8,345 | 1,699 | 22,621 | ||||||||||||
Receivable for capital shares sold | - | - | 179,220 | ||||||||||||
Other assets | - | - | 338 | ||||||||||||
Total assets | 7,379,771 | 7,721,086 | 224,603,550 | ||||||||||||
Liabilities | |||||||||||||||
Bank borrowings (Note 7) | - | 45,448 | - | ||||||||||||
Payable for investments purchased | - | - | 174,279 | ||||||||||||
Payable for fund shares redeemed | - | - | 54,054 | ||||||||||||
Accounts payable | 6,744 | 5,550 | 209,803 | ||||||||||||
Accounts payable to related parties (Note 3) | 1,218 | 3,600 | 21,766 | ||||||||||||
Total liabilities | 7,962 | 54,598 | 459,902 | ||||||||||||
Net Assets | $ | 7,371,809 | $ | 7,666,488 | $ | 224,143,648 | |||||||||
Summary of Shareholders' Equity | |||||||||||||||
Paid in capital | 5,149,838 | 6,331,389 | 132,249,395 | ||||||||||||
Accumulated undistributed net investment income | - | - | 957,546 | ||||||||||||
Accumulated undistributed net realized gain (loss) on security transactions | 93,376 | (1,360,606 | ) | 4,980,909 | |||||||||||
Net unrealized appreciation of investments | 2,128,595 | 2,695,705 | 85,955,798 | ||||||||||||
Net assets at June 30, 2014 | $ | 7,371,809 | $ | 7,666,488 | $ | 224,143,648 | |||||||||
Class A: | |||||||||||||||
Net assets | $ | 6,292,472 | $ | 6,545,096 | $ | 206,543,144 | |||||||||
Shares authorized | 50,000,000 | 50,000,000 | 50,000,000 | ||||||||||||
Shares outstanding | 463,312 | 431,233 | 3,349,223 | ||||||||||||
Net asset value and redemption price per share | $ | 13.58 | $ | 15.18 | $ | 61.67 | |||||||||
Maximum offering price per share | $ | 14.41 | $ | 16.11 | $ | 65.43 | |||||||||
Sales load | 5.75 | % | 5.75 | % | 5.75 | % | |||||||||
Class C: | |||||||||||||||
Net assets | $ | 1,079,337 | $ | 1,121,391 | $ | 15,436,459 | |||||||||
Shares authorized | 50,000,000 | 50,000,000 | 50,000,000 | ||||||||||||
Shares outstanding | 90,508 | 81,911 | 298,466 | ||||||||||||
Net asset value and redemption price per share | $ | 11.93 | $ | 13.69 | $ | 51.72 | |||||||||
Class I: | |||||||||||||||
Net assets | N/A | N/A | $ | 2,164,044 | |||||||||||
Shares authorized | 50,000,000 | ||||||||||||||
Shares outstanding | 29,839 | ||||||||||||||
Net asset value and redemption price per share | N/A | N/A | $ | 72.52 | |||||||||||
57
Pacific Advisors Fund Inc.
Statement of Operations (Unaudited)
For the six months ended June 30, 2014
| Government Securities Fund | Income and Equity Fund | Balanced Fund | |||||||||||||
Investment Income | |||||||||||||||
Dividends | $ | 6,773 | $ | 175,647 | $ | 45,728 | |||||||||
Interest | 803 | 112,541 | 54,983 | ||||||||||||
Total investment income | 7,576 | 288,188 | 100,711 | ||||||||||||
Expenses | |||||||||||||||
Investment management fees (Note 3) | 6,467 | 45,703 | 39,024 | ||||||||||||
Transfer agent fees (Note 3) | 24,274 | 35,181 | 32,344 | ||||||||||||
Fund accounting fees (Note 3) | 10,505 | 29,663 | 24,995 | ||||||||||||
Legal fees | 956 | 5,328 | 4,289 | ||||||||||||
Audit fees | 896 | 5,484 | 4,683 | ||||||||||||
Registration fees | 9,452 | 12,188 | 14,049 | ||||||||||||
Printing | 183 | 914 | 731 | ||||||||||||
Custody fees | 3,199 | 4,228 | 4,618 | ||||||||||||
Interest on borrowings | 85 | 38 | 65 | ||||||||||||
Director fees/meetings | 274 | 1,585 | 1,369 | ||||||||||||
Distribution and service (12b-1) fees (Note 3) | 3,409 | 23,970 | 32,900 | ||||||||||||
Other expenses | 1,452 | 7,818 | 6,418 | ||||||||||||
Total expenses, before fees waived | 61,152 | 172,100 | 165,485 | ||||||||||||
Less fees waived (Note 3) | 28,067 | 45,703 | - | ||||||||||||
Net expenses | 33,085 | 126,397 | 165,485 | ||||||||||||
Net Investment Income (Loss) | (25,509 | ) | 161,791 | (64,774 | ) | ||||||||||
Net Realized and Unrealized Gain on Investments | |||||||||||||||
Net realized gain on investments | 31,383 | 3,386 | 176,296 | ||||||||||||
Change in net unrealized appreciation (depreciation) on investments | 2,081 | 321,610 | (138,265 | ) | |||||||||||
Net realized and unrealized gain on investments | 33,464 | 324,996 | 38,031 | ||||||||||||
Net Increase (Decrease) in Net Assets Resulting from Operations | $ | 7,955 | $ | 486,787 | $ | (26,743 | ) | ||||||||
See Accompanying Notes to Financial Statements which are an integral part of these financial statements.
58
| Large Cap Value Fund | Mid Cap Value Fund | Small Cap Value Fund | |||||||||||||
Investment Income | |||||||||||||||
Dividends | $ | 65,415 | $ | 32,331 | $ | 473,870 | |||||||||
Interest | 11 | - | 16 | ||||||||||||
Total investment income | 65,426 | 32,331 | 473,886 | ||||||||||||
Expenses | |||||||||||||||
Investment management fees (Note 3) | 24,317 | 35,401 | 788,897 | ||||||||||||
Transfer agent fees (Note 3) | 38,779 | 29,789 | 364,278 | ||||||||||||
Fund accounting fees (Note 3) | 16,395 | 17,568 | 382,837 | ||||||||||||
Legal fees | 3,178 | 3,198 | 94,329 | ||||||||||||
Audit fees | 2,918 | 3,186 | 94,901 | ||||||||||||
Registration fees | 10,699 | 15,036 | 31,634 | ||||||||||||
Printing | 548 | 548 | 15,376 | ||||||||||||
Custody fees | 3,890 | 3,774 | 16,114 | ||||||||||||
Interest on borrowings | - | 120 | 4,975 | ||||||||||||
Director fees/meetings | 852 | 936 | 27,760 | ||||||||||||
Distribution and service (12b-1) fees (Note 3) | 11,175 | 12,950 | 317,192 | ||||||||||||
Other expenses | 4,484 | 4,633 | 130,188 | ||||||||||||
Total expenses, before fees waived | 117,235 | 127,139 | 2,268,481 | ||||||||||||
Less fees waived (Note 3) | 28,247 | - | - | ||||||||||||
Net expenses | 88,988 | 127,139 | 2,268,481 | ||||||||||||
Net Investment Income (Loss) | (23,562 | ) | (94,808 | ) | (1,794,595 | ) | |||||||||
Net Realized and Unrealized Gain on Investments | |||||||||||||||
Net realized gain on investments | 24,142 | 113,451 | 6,917,451 | ||||||||||||
Change in net unrealized appreciation (depreciation) on investments | 281,166 | (31,055 | ) | (3,973,587 | ) | ||||||||||
Net realized and unrealized gain on investments | 305,308 | 82,396 | 2,943,864 | ||||||||||||
Net Increase (Decrease) in Net Assets Resulting from Operations | $ | 281,746 | $ | (12,412 | ) | $ | 1,149,269 | ||||||||
59
Pacific Advisors Fund Inc.
Statements of Changes in Net Assets (Unaudited)
Government Securities Fund | Income and Equity Fund | ||||||||||||||||||
| Six months ended June 30, 2014 | Year ended December 31, 2013 | Six months ended June 30, 2014 | Year ended December 31, 2013 | ||||||||||||||||
| Increase (Decrease) in Net Assets From Operations | |||||||||||||||||||
Net investment income (loss) | $ | (25,509 | ) | $ | (53,912 | ) | $ | 161,791 | $ | 105,221 | |||||||||
Net realized gain on investments | 31,383 | 22,305 | 3,386 | 157,675 | |||||||||||||||
Change in net unrealized appreciation (depreciation) of investments | 2,081 | 44,376 | 321,610 | 852,476 | |||||||||||||||
Increase (decrease) in net assets resulting from operations | 7,955 | 12,769 | 486,787 | 1,115,372 | |||||||||||||||
From Distributions to Shareholders | |||||||||||||||||||
Class A: | |||||||||||||||||||
Net investment income | - | - | (136,886 | ) | (92,081 | ) | |||||||||||||
Net capital gains | - | - | - | - | |||||||||||||||
Return of capital | - | - | - | - | |||||||||||||||
Class C: | |||||||||||||||||||
Net investment income | - | - | (24,264 | ) | (8,152 | ) | |||||||||||||
Net capital gains | - | - | - | - | |||||||||||||||
Return of capital | - | - | - | - | |||||||||||||||
Class I: | N/A | N/A | N/A | N/A | |||||||||||||||
Net investment income | |||||||||||||||||||
Net capital gains | |||||||||||||||||||
Return of capital | |||||||||||||||||||
Decrease in net assets resulting from distributions | - | - | (161,150 | ) | (100,233 | ) | |||||||||||||
From Capital Share Transactions (Note 6) | |||||||||||||||||||
Proceeds from shares sold | 32,851 | 357,237 | 3,317,518 | 6,884,497 | |||||||||||||||
Proceeds from shares purchased by reinvestment of dividends | - | - | 140,256 | 88,260 | |||||||||||||||
Cost of shares repurchased | (201,513 | ) | (462,725 | ) | (2,324,608 | ) | (3,072,137 | ) | |||||||||||
Increase (decrease) in net assets resulting from capital share transactions | (168,662 | ) | (105,488 | ) | 1,133,166 | 3,900,620 | |||||||||||||
Increase (decrease) in net assets | (160,707 | ) | (92,719 | ) | 1,458,803 | 4,915,759 | |||||||||||||
Net Assets | |||||||||||||||||||
Beginning of period | 2,105,855 | 2,198,574 | 11,480,943 | 6,565,184 | |||||||||||||||
End of period | $ | 1,945,148 | $ | 2,105,855 | $ | 12,939,746 | $ | 11,480,943 | |||||||||||
Including undistributed net investment income | $ | - | $ | - | $ | 6,057 | $ | 5,416 | |||||||||||
See Accompanying Notes to Financial Statements which are an integral part of these financial statements.
60
Balanced Fund | |||||||||||
| Six months ended June 30, 2014 | Year ended December 31, 2013 | ||||||||||
| Increase (Decrease) in Net Assets From Operations | |||||||||||
Net investment income (loss) | $ | (64,774 | ) | $ | (136,702 | ) | |||||
Net realized gain on investments | 176,296 | 942,114 | |||||||||
Change in net unrealized appreciation (depreciation) of investments | (138,265 | ) | 1,732,863 | ||||||||
Increase (decrease) in net assets resulting from operations | (26,743 | ) | 2,538,275 | ||||||||
From Distributions to Shareholders | |||||||||||
Class A: | |||||||||||
Net investment income | - | - | |||||||||
Net capital gains | - | (450,051 | ) | ||||||||
Return of capital | - | - | |||||||||
Class C: | |||||||||||
Net investment income | - | - | |||||||||
Net capital gains | - | (516,508 | ) | ||||||||
Return of capital | - | - | |||||||||
Class I: | N/A | N/A | |||||||||
Net investment income | |||||||||||
Net capital gains | |||||||||||
Return of capital | |||||||||||
Decrease in net assets resulting from distributions | - | (966,559 | ) | ||||||||
From Capital Share Transactions (Note 6) | |||||||||||
Proceeds from shares sold | 1,079,683 | 873,959 | |||||||||
Proceeds from shares purchased by reinvestment of dividends | - | 879,476 | |||||||||
Cost of shares repurchased | (901,550 | ) | (3,274,852 | ) | |||||||
Increase (decrease) in net assets resulting from capital share transactions | 178,133 | (1,521,417 | ) | ||||||||
Increase (decrease) in net assets | 151,390 | 50,299 | |||||||||
Net Assets | |||||||||||
Beginning of period | 10,615,826 | 10,565,527 | |||||||||
End of period | $ | 10,767,216 | $ | 10,615,826 | |||||||
Including undistributed net investment income | $ | 21,495 | $ | 15,375 | |||||||
61
Pacific Advisors Fund Inc.
Statements of Changes in Net Assets (Unaudited)
Large Cap Value Fund | Mid Cap Value Fund | ||||||||||||||||||
| Six months ended June 30, 2014 | Year ended December 31, 2013 | Six months ended June 30, 2014 | Year ended December 31, 2013 | ||||||||||||||||
| Increase (Decrease) in Net Assets From Operations | |||||||||||||||||||
Net investment income (loss) | $ | (23,562 | ) | $ | (14,366 | ) | $ | (94,808 | ) | $ | (189,782 | ) | |||||||
Net realized gain on investments | 24,142 | 387,459 | 113,451 | 183,442 | |||||||||||||||
Change in net unrealized appreciation (depreciation) of investments | 281,166 | 978,296 | (31,055 | ) | 1,754,608 | ||||||||||||||
Increase (decrease) in net assets resulting from operations | 281,746 | 1,351,389 | (12,412 | ) | 1,748,268 | ||||||||||||||
From Distributions to Shareholders | |||||||||||||||||||
Class A: | |||||||||||||||||||
Net investment income | - | - | - | - | |||||||||||||||
Net capital gains | - | (104,170 | ) | - | - | ||||||||||||||
Return of capital | - | - | - | - | |||||||||||||||
Class C: | |||||||||||||||||||
Net investment income | - | - | - | - | |||||||||||||||
Net capital gains | - | (17,794 | ) | - | - | ||||||||||||||
Return of capital | - | - | - | - | |||||||||||||||
Class I: | N/A | N/A | N/A | N/A | |||||||||||||||
Net investment income | |||||||||||||||||||
Net capital gains | |||||||||||||||||||
Return of capital | |||||||||||||||||||
Decrease in net assets resulting from distributions | - | (121,964 | ) | - | - | ||||||||||||||
From Capital Share Transactions (Note 6) | |||||||||||||||||||
Proceeds from shares sold | 915,441 | 678,348 | 632,238 | 662,676 | |||||||||||||||
Proceeds from shares purchased by reinvestment of dividends | - | 115,965 | - | - | |||||||||||||||
Cost of shares repurchased | (94,878 | ) | (305,719 | ) | (215,313 | ) | (503,149 | ) | |||||||||||
Increase (decrease) in net assets resulting from capital share transactions | 820,563 | 488,594 | 416,925 | 159,527 | |||||||||||||||
Increase (decrease) in net assets | 1,102,309 | 1,718,019 | 404,513 | 1,907,795 | |||||||||||||||
Net Assets | |||||||||||||||||||
Beginning of period | 6,269,500 | 4,551,481 | 7,261,975 | 5,354,180 | |||||||||||||||
End of period | $ | 7,371,809 | $ | 6,269,500 | $ | 7,666,488 | $ | 7,261,975 | |||||||||||
Including undistributed net investment income | $ | - | $ | - | $ | - | $ | - | |||||||||||
See Accompanying Notes to Financial Statements which are an integral part of these financial statements.
62
Small Cap Value Fund | |||||||||||
| Six months ended June 30, 2014 | Year ended December 31, 2013 | ||||||||||
| Increase (Decrease) in Net Assets From Operations | |||||||||||
Net investment income (loss) | $ | (1,794,595 | ) | $ | (2,827,751 | ) | |||||
Net realized gain on investments | 6,917,451 | 5,025,568 | |||||||||
Change in net unrealized appreciation (depreciation) of investments | (3,973,587 | ) | 61,375,400 | ||||||||
Increase (decrease) in net assets resulting from operations | 1,149,269 | 63,573,217 | |||||||||
From Distributions to Shareholders | |||||||||||
Class A: | |||||||||||
Net investment income | - | - | |||||||||
Net capital gains | - | - | |||||||||
Return of capital | - | - | |||||||||
Class C: | |||||||||||
Net investment income | - | - | |||||||||
Net capital gains | - | - | |||||||||
Return of capital | - | - | |||||||||
Class I: | |||||||||||
Net investment income | - | - | |||||||||
Net capital gains | - | - | |||||||||
Return of capital | - | - | |||||||||
Decrease in net assets resulting from distributions | - | - | |||||||||
From Capital Share Transactions (Note 6) | |||||||||||
Proceeds from shares sold | 40,697,721 | 87,929,777 | |||||||||
Proceeds from shares purchased by reinvestment of dividends | - | - | |||||||||
Cost of shares repurchased | (31,892,338 | ) | (29,840,356 | ) | |||||||
Increase (decrease) in net assets resulting from capital share transactions | 8,805,383 | 58,089,421 | |||||||||
Increase (decrease) in net assets | 9,954,652 | 121,662,638 | |||||||||
Net Assets | |||||||||||
Beginning of period | 214,188,996 | 92,526,358 | |||||||||
End of period | $ | 224,143,648 | $ | 214,188,996 | |||||||
Including undistributed net investment income | $ | 957,546 | $ | 727,146 | |||||||
63
Pacific Advisors Fund Inc.
Financial Highlights (Unaudited)
(For a share outstanding throughout the period)
Government Securities Fund | |||||||||||||||||||||||||||
Class A | |||||||||||||||||||||||||||
| For the six months ended | For the year ended December 31, | ||||||||||||||||||||||||||
June 30, 2014 | 2013 | 2012 | 2011 | 2010 | 2009 | ||||||||||||||||||||||
Per Share Operating Performance | |||||||||||||||||||||||||||
Net asset value, beginning of period | $ | 9.16 | $ | 9.09 | $ | 9.13 | $ | 9.13 | $ | 8.99 | $ | 8.94 | |||||||||||||||
Income from investing operations | |||||||||||||||||||||||||||
Net investment income (loss) | (0.13 | ) | (0.20 | ) | (0.17 | ) | (0.02 | ) | 0.05 | 0.18 | |||||||||||||||||
Net realized and unrealized gain on securities | 0.17 | 0.27 | 0.13 | 0.02 | 0.14 | 0.02 | |||||||||||||||||||||
Total from investment operations | 0.04 | 0.07 | (0.04 | ) | - | 0.19 | 0.20 | ||||||||||||||||||||
Less distributions | |||||||||||||||||||||||||||
From net investment income | - | - | - | - | (0.02 | ) | (0.15 | ) | |||||||||||||||||||
From net capital gain | - | - | - | - | - | - | |||||||||||||||||||||
From return of capital | - | - | - | - | (0.03 | ) | - | ||||||||||||||||||||
Total distributions | - | - | - | - | (0.05 | ) | (0.15 | ) | |||||||||||||||||||
Net asset value, end of period | $ | 9.20 | $ | 9.16 | $ | 9.09 | $ | 9.13 | $ | 9.13 | $ | 8.99 | |||||||||||||||
Total Investment Return (a) | 0.44 | %(b) | 0.77 | % | (0.44 | )% | 0.00 | % | 2.16 | % | 2.26 | % | |||||||||||||||
Ratios/Supplemental Data | |||||||||||||||||||||||||||
Net assets, end of period (000's) | $ | 1,728 | $ | 1,801 | $ | 1,723 | $ | 1,873 | $ | 2,375 | $ | 2,537 | |||||||||||||||
Ratio of net investment income (loss) to average net assets | |||||||||||||||||||||||||||
With expense reductions | (2.47 | )%(c) | (2.39 | )% | (1.82 | )% | (0.54 | )% | 0.49 | % | 1.69 | % | |||||||||||||||
Without expense reductions | (5.29 | )%(c) | (5.09 | )% | (4.14 | )% | (2.39 | )% | (1.10 | )% | 0.25 | % | |||||||||||||||
Ratio of expenses to average net assets | |||||||||||||||||||||||||||
With expense reductions | 3.24 | %(c) | 3.39 | % | 3.12 | % | 2.42 | % | 2.09 | % | 1.69 | % | |||||||||||||||
Without expense reductions | 6.06 | %(c) | 6.09 | % | 5.44 | % | 4.26 | % | 3.69 | % | 3.13 | % | |||||||||||||||
Fund portfolio turnover rate | 231 | %(c) | 135 | % | 181 | % | 115 | % | 156 | % | 224 | % | |||||||||||||||
Class C | |||||||||||||||||||||||||||
| For the six months ended | For the year ended December 31, | ||||||||||||||||||||||||||
June 30, 2014 | 2013 | 2012 | 2011 | 2010 | 2009 | ||||||||||||||||||||||
Per Share Operating Performance | |||||||||||||||||||||||||||
Net asset value, beginning of period | $ | 8.86 | $ | 8.86 | $ | 8.96 | $ | 9.02 | $ | 8.90 | $ | 8.87 | |||||||||||||||
Income from investing operations | |||||||||||||||||||||||||||
Net investment income (loss) | (1.28 | ) | (1.24 | ) | (0.94 | ) | (0.33 | ) | (0.09 | ) | 0.09 | ||||||||||||||||
Net realized and unrealized gain on securities | 1.28 | 1.24 | 0.84 | 0.27 | 0.23 | 0.04 | |||||||||||||||||||||
Total from investment operations | - | - | (0.10 | ) | (0.06 | ) | 0.14 | 0.13 | |||||||||||||||||||
Less distributions | |||||||||||||||||||||||||||
From net investment income | - | - | - | - | (0.01 | ) | (0.10 | ) | |||||||||||||||||||
From net capital gain | - | - | - | - | - | - | |||||||||||||||||||||
From return of capital | - | - | - | - | (0.01 | ) | - | ||||||||||||||||||||
Total distributions | - | - | - | - | (0.02 | ) | (0.10 | ) | |||||||||||||||||||
Net asset value, end of period | $ | 8.86 | $ | 8.86 | $ | 8.86 | $ | 8.96 | $ | 9.02 | $ | 8.90 | |||||||||||||||
Total Investment Return | 0.00 | %(b) | 0.00 | % | (1.12 | )% | (0.67 | )% | 1.49 | % | 1.44 | % | |||||||||||||||
Ratios/Supplemental Data | |||||||||||||||||||||||||||
Net assets, end of period (000's) | $ | 217 | $ | 305 | $ | 476 | $ | 1,011 | $ | 1,740 | $ | 2,594 | |||||||||||||||
Ratio of net investment income (loss) to average net assets | |||||||||||||||||||||||||||
With expense reductions | (3.23 | )%(c) | (3.17 | )% | (2.48 | )% | (1.27 | )% | (0.18 | )% | 0.96 | % | |||||||||||||||
Without expense reductions | (6.05 | )%(c) | (5.84 | )% | (4.92 | )% | (3.14 | )% | (1.80 | )% | (0.47 | )% | |||||||||||||||
Ratio of expenses to average net assets | |||||||||||||||||||||||||||
With expense reductions | 3.97 | %(c) | 4.16 | % | 3.85 | % | 3.16 | % | 2.80 | % | 2.41 | % | |||||||||||||||
Without expense reductions | 6.79 | %(c) | 6.82 | % | 6.29 | % | 5.03 | % | 4.42 | % | 3.85 | % | |||||||||||||||
Fund portfolio turnover rate | 231 | %(c) | 135 | % | 181 | % | 115 | % | 156 | % | 224 | % | |||||||||||||||
(a) The Fund's maximum sales charge is not included in the total return computation.
(b) Not annualized
(c) Annualized
See Accompanying Notes to Financial Statements which are an integral part of these financial statements.
64
Pacific Advisors Fund Inc.
Financial Highlights (Unaudited)
(For a share outstanding throughout the period)
Income and Equity Fund | |||||||||||||||||||||||||||
Class A | |||||||||||||||||||||||||||
| For the six months ended | For the year ended December 31, | ||||||||||||||||||||||||||
June 30, 2014 | 2013 | 2012 | 2011 | 2010 | 2009 | ||||||||||||||||||||||
Per Share Operating Performance | |||||||||||||||||||||||||||
Net asset value, beginning of period | $ | 11.55 | $ | 10.30 | $ | 9.84 | $ | 9.87 | $ | 9.49 | $ | 8.48 | |||||||||||||||
Income from investing operations | |||||||||||||||||||||||||||
Net investment income | 0.16 | 0.10 | 0.15 | 0.21 | 0.19 | 0.30 | |||||||||||||||||||||
Net realized and unrealized gain on securities | 0.31 | 1.28 | 0.48 | 0.01 | 0.45 | 0.98 | |||||||||||||||||||||
Total from investment operations | 0.47 | 1.38 | 0.63 | 0.22 | 0.64 | 1.28 | |||||||||||||||||||||
Less distributions | |||||||||||||||||||||||||||
From net investment income | (0.16 | ) | (0.13 | ) | (0.17 | ) | (0.25 | ) | (0.26 | ) | (0.27 | ) | |||||||||||||||
From net capital gain | - | - | - | - | - | - | |||||||||||||||||||||
From return of capital | - | - | - | - | - | (d) | - | ||||||||||||||||||||
Total distributions | (0.16 | ) | (0.13 | ) | (0.17 | ) | (0.25 | ) | (0.26 | ) | (0.27 | ) | |||||||||||||||
Net asset value, end of period | $ | 11.86 | $ | 11.55 | $ | 10.30 | $ | 9.84 | $ | 9.87 | $ | 9.49 | |||||||||||||||
Total Investment Return (a) | 4.09 | %(b) | 13.40 | % | 6.46 | % | 2.24 | % | 6.88 | % | 15.37 | % | |||||||||||||||
Ratios/Supplemental Data | |||||||||||||||||||||||||||
Net assets, end of period (000's) | $ | 10,548 | $ | 9,247 | $ | 4,659 | $ | 4,235 | $ | 3,922 | $ | 2,865 | |||||||||||||||
Ratio of net investment income to average net assets | |||||||||||||||||||||||||||
With expense reductions | 2.80 | %(c) | 1.27 | % | 1.56 | % | 2.27 | % | 2.57 | % | 3.22 | % | |||||||||||||||
Without expense reductions | 2.05 | %(c) | 0.52 | % | 0.81 | % | 1.52 | % | 1.81 | % | 2.47 | % | |||||||||||||||
Ratio of expenses to average net assets | |||||||||||||||||||||||||||
With expense reductions | 1.93 | %(c) | 2.23 | % | 2.68 | % | 2.59 | % | 2.34 | % | 2.32 | % | |||||||||||||||
Without expense reductions | 2.68 | %(c) | 2.98 | % | 3.42 | % | 3.34 | % | 3.09 | % | 3.07 | % | |||||||||||||||
Fund portfolio turnover rate | 12 | %(c) | 20 | % | 29 | % | 16 | % | 21 | % | 29 | % | |||||||||||||||
Class C | |||||||||||||||||||||||||||
| For the six months ended | For the year ended December 31, | ||||||||||||||||||||||||||
June 30, 2014 | 2013 | 2012 | 2011 | 2010 | 2009 | ||||||||||||||||||||||
Per Share Operating Performance | |||||||||||||||||||||||||||
Net asset value, beginning of period | $ | 11.11 | $ | 9.91 | $ | 9.42 | $ | 9.40 | $ | 9.03 | $ | 8.09 | |||||||||||||||
Income from investing operations | |||||||||||||||||||||||||||
Net investment income (loss) | 0.12 | 0.06 | (0.01 | ) | 0.09 | 0.15 | 0.21 | ||||||||||||||||||||
Net realized and unrealized gain on securities | 0.28 | 1.18 | 0.55 | 0.05 | 0.38 | 0.95 | |||||||||||||||||||||
Total from investment operations | 0.40 | 1.24 | 0.54 | 0.14 | 0.53 | 1.16 | |||||||||||||||||||||
Less distributions | |||||||||||||||||||||||||||
From net investment income | (0.12 | ) | (0.04 | ) | (0.05 | ) | (0.12 | ) | (0.16 | ) | (0.22 | ) | |||||||||||||||
From net capital gain | - | - | - | - | - | - | |||||||||||||||||||||
From return of capital | - | - | - | - | - | (d) | - | ||||||||||||||||||||
Total distributions | (0.12 | ) | (0.04 | ) | (0.05 | ) | (0.12 | ) | (0.16 | ) | (0.22 | ) | |||||||||||||||
Net asset value, end of period | $ | 11.39 | $ | 11.11 | $ | 9.91 | $ | 9.42 | $ | 9.40 | $ | 9.03 | |||||||||||||||
Total Investment Return | 3.59 | %(b) | 12.55 | % | 5.74 | % | 1.54 | % | 5.95 | % | 14.56 | % | |||||||||||||||
Ratios/Supplemental Data | |||||||||||||||||||||||||||
Net assets, end of period (000's) | $ | 2,392 | $ | 2,234 | $ | 1,906 | $ | 3,049 | $ | 4,774 | $ | 5,129 | |||||||||||||||
Ratio of net investment income to average net assets | |||||||||||||||||||||||||||
With expense reductions | 2.03 | %(c) | 0.49 | % | 0.80 | % | 1.52 | % | 1.82 | % | 2.47 | % | |||||||||||||||
Without expense reductions | 1.28 | %(c) | (0.26 | )% | 0.05 | % | 0.77 | % | 1.07 | % | 1.72 | % | |||||||||||||||
Ratio of expenses to average net assets | |||||||||||||||||||||||||||
With expense reductions | 2.68 | %(c) | 3.03 | % | 3.45 | % | 3.33 | % | 3.07 | % | 3.06 | % | |||||||||||||||
Without expense reductions | 3.43 | %(c) | 3.78 | % | 4.20 | % | 4.08 | % | 3.82 | % | 3.81 | % | |||||||||||||||
Fund portfolio turnover rate | 12 | %(c) | 20 | % | 29 | % | 16 | % | 21 | % | 29 | % | |||||||||||||||
(a) The Fund's maximum sales charge is not included in the total return computation.
(b) Not annualized
(c) Annualized
(d) The amount is less than $0.005 and rounded to zero
See Accompanying Notes to Financial Statements which are an integral part of these financial statements.
65
Pacific Advisors Fund Inc.
Financial Highlights (Unaudited)
(For a share outstanding throughout the period)
Balanced Fund | |||||||||||||||||||||||||||
Class A | |||||||||||||||||||||||||||
| For the six months ended | For the year ended December 31, | ||||||||||||||||||||||||||
June 30, 2014 | 2013 | 2012 | 2011 | 2010 | 2009 | ||||||||||||||||||||||
Per Share Operating Performance | |||||||||||||||||||||||||||
Net asset value, beginning of period | $ | 16.59 | $ | 14.13 | $ | 13.47 | $ | 14.56 | $ | 14.91 | $ | 12.41 | |||||||||||||||
Income from investing operations | |||||||||||||||||||||||||||
Net investment income (loss) | (0.08 | ) | (0.18 | ) | (0.03 | ) | - | 0.13 | 0.22 | ||||||||||||||||||
Net realized and unrealized gain (loss) on securities | 0.05 | 4.21 | 1.34 | (0.16 | ) | 1.02 | 2.48 | ||||||||||||||||||||
Total from investment operations | (0.03 | ) | 4.03 | 1.31 | (0.16 | ) | 1.15 | 2.70 | |||||||||||||||||||
Less distributions | |||||||||||||||||||||||||||
From net investment income | - | - | - | - | (0.01 | ) | (0.20 | ) | |||||||||||||||||||
From net capital gain | - | (1.57 | ) | (0.65 | ) | (0.93 | ) | (1.49 | ) | - | |||||||||||||||||
Total distributions | - | (1.57 | ) | (0.65 | ) | (0.93 | ) | (1.50 | ) | (0.20 | ) | ||||||||||||||||
Net asset value, end of period | $ | 16.56 | $ | 16.59 | $ | 14.13 | $ | 13.47 | $ | 14.56 | $ | 14.91 | |||||||||||||||
Total Investment Return (a) | (0.18 | )%(b) | 28.68 | % | 9.69 | % | (1.14 | )% | 7.71 | % | 21.76 | % | |||||||||||||||
Ratios/Supplemental Data | |||||||||||||||||||||||||||
Net assets, end of period (000's) | $ | 5,440 | $ | 5,144 | $ | 3,919 | $ | 3,801 | $ | 3,789 | $ | 4,362 | |||||||||||||||
Ratio of net investment income (loss) to average net assets | (0.86 | )%(c) | (0.93 | )% | (0.27 | )% | 0.29 | % | 0.55 | % | 1.58 | % | |||||||||||||||
Ratio of expenses to average net assets | 2.80 | %(c) | 3.07 | % | 3.30 | % | 3.13 | % | 2.77 | % | 2.47 | % | |||||||||||||||
Fund portfolio turnover rate | 23 | %(c) | 23 | % | 34 | % | 14 | % | 36 | % | 10 | % | |||||||||||||||
Class C | |||||||||||||||||||||||||||
| For the six months ended | For the year ended December 31, | ||||||||||||||||||||||||||
June 30, 2014 | 2013 | 2012 | 2011 | 2010 | 2009 | ||||||||||||||||||||||
Per Share Operating Performance | |||||||||||||||||||||||||||
Net asset value, beginning of period | $ | 15.18 | $ | 13.13 | $ | 12.66 | $ | 13.84 | $ | 14.35 | $ | 11.96 | |||||||||||||||
Income from investing operations | |||||||||||||||||||||||||||
Net investment income (loss) | (0.15 | ) | (0.54 | ) | (0.39 | ) | (0.15 | ) | (0.06 | ) | 0.10 | ||||||||||||||||
Net realized and unrealized gain (loss) on securities | 0.06 | 4.16 | 1.51 | (0.10 | ) | 1.04 | 2.39 | ||||||||||||||||||||
Total from investment operations | (0.09 | ) | 3.62 | 1.12 | (0.25 | ) | 0.98 | 2.49 | |||||||||||||||||||
Less distributions | |||||||||||||||||||||||||||
From net investment income | - | - | - | - | - | (d) | (0.10 | ) | |||||||||||||||||||
From net capital gain | - | (1.57 | ) | (0.65 | ) | (0.93 | ) | (1.49 | ) | - | |||||||||||||||||
Total distributions | - | (1.57 | ) | (0.65 | ) | (0.93 | ) | (1.49 | ) | (0.10 | ) | ||||||||||||||||
Net asset value, end of period | $ | 15.09 | $ | 15.18 | $ | 13.13 | $ | 12.66 | $ | 13.84 | $ | 14.35 | |||||||||||||||
Total Investment Return | (0.59 | )%(b) | 27.75 | % | 8.81 | % | (1.86 | )% | 6.88 | % | 20.84 | % | |||||||||||||||
Ratios/Supplemental Data | |||||||||||||||||||||||||||
Net assets, end of period (000's) | $ | 5,327 | $ | 5,471 | $ | 6,647 | $ | 10,768 | $ | 18,035 | $ | 24,828 | |||||||||||||||
Ratio of net investment income (loss) to average net assets | (1.61 | )%(c) | (1.70 | )% | (0.97 | )% | (0.42 | )% | (0.18 | )% | 0.82 | % | |||||||||||||||
Ratio of expenses to average net assets | 3.55 | %(c) | 3.86 | % | 4.02 | % | 3.83 | % | 3.50 | % | 3.23 | % | |||||||||||||||
Fund portfolio turnover rate | 23 | %(c) | 23 | % | 34 | % | 14 | % | 36 | % | 10 | % | |||||||||||||||
(a) The Fund's maximum sales charge is not included in the total return computation.
(b) Not annualized
(c) Annualized
(d) The amount is less than $0.005 and rounded to zero
See Accompanying Notes to Financial Statements which are an integral part of these financial statements.
66
Pacific Advisors Fund Inc.
Financial Highlights (Unaudited)
(For a share outstanding throughout the period)
Large Cap Value Fund | |||||||||||||||||||||||||||
Class A | |||||||||||||||||||||||||||
| For the six months ended | For the year ended December 31, | ||||||||||||||||||||||||||
June 30, 2014 | 2013 | 2012 | 2011 | 2010 | 2009 | ||||||||||||||||||||||
Per Share Operating Performance | |||||||||||||||||||||||||||
Net asset value, beginning of period | $ | 13.05 | $ | 10.34 | $ | 9.30 | $ | 8.98 | $ | 8.33 | $ | 6.51 | |||||||||||||||
Income from investing operations | |||||||||||||||||||||||||||
Net investment income (loss) | 0.02 | 0.03 | 0.04 | 0.11 | (0.06 | ) | (0.24 | ) | |||||||||||||||||||
Net realized and unrealized gain on securities | 0.51 | 2.94 | 1.00 | 0.21 | 0.71 | 2.06 | |||||||||||||||||||||
Total from investment operations | 0.53 | 2.97 | 1.04 | 0.32 | 0.65 | 1.82 | |||||||||||||||||||||
Less distributions | |||||||||||||||||||||||||||
From net investment income | - | - | - | - | - | - | |||||||||||||||||||||
From net capital gain | - | (0.26 | ) | - | - | - | - | ||||||||||||||||||||
Total distributions | - | (0.26 | ) | - | - | - | - | ||||||||||||||||||||
Net asset value, end of period | $ | 13.58 | $ | 13.05 | $ | 10.34 | $ | 9.30 | $ | 8.98 | $ | 8.33 | |||||||||||||||
Total Investment Return (a) | 4.06 | %(b) | 28.72 | % | 11.18 | % | 3.56 | % | 7.80 | % | 27.96 | % | |||||||||||||||
Ratios/Supplemental Data | |||||||||||||||||||||||||||
Net assets, end of period (000's) | $ | 6,292 | $ | 5,453 | $ | 3,973 | $ | 3,278 | $ | 2,511 | $ | 2,176 | |||||||||||||||
Ratio of net investment loss to average net assets | |||||||||||||||||||||||||||
With expense reductions | (0.63 | )%(c) | (0.17 | )% | (0.18 | )% | (0.66 | )% | (1.32 | )% | (2.06 | )% | |||||||||||||||
Without expense reductions | (1.50 | )%(c) | (1.72 | )% | (1.91 | )% | (2.61 | )% | (3.50 | )% | (4.31 | )% | |||||||||||||||
Ratio of expenses to average net assets | |||||||||||||||||||||||||||
With expense reductions | 2.65 | %(c) | 2.47 | % | 2.61 | % | 3.05 | % | 3.64 | % | 3.46 | % | |||||||||||||||
Without expense reductions | 3.52 | %(c) | 4.02 | % | 4.34 | % | 4.99 | % | 5.82 | % | 5.71 | % | |||||||||||||||
Fund portfolio turnover rate | 5 | %(c) | 24 | % | 9 | % | 7 | % | 106 | % | 5 | % | |||||||||||||||
Class C | |||||||||||||||||||||||||||
| For the six months ended | For the year ended December 31, | ||||||||||||||||||||||||||
June 30, 2014 | 2013 | 2012 | 2011 | 2010 | 2009 | ||||||||||||||||||||||
Per Share Operating Performance | |||||||||||||||||||||||||||
Net asset value, beginning of period | $ | 11.50 | $ | 9.20 | $ | 8.34 | $ | 8.12 | $ | 7.58 | $ | 5.97 | |||||||||||||||
Income from investing operations | |||||||||||||||||||||||||||
Net investment income (loss) | 0.65 | 0.32 | (0.69 | ) | (0.42 | ) | (0.17 | ) | (1.36 | ) | |||||||||||||||||
Net realized and unrealized gain (loss) on securities | (0.22 | ) | 2.24 | 1.55 | 0.64 | 0.71 | 2.97 | ||||||||||||||||||||
Total from investment operations | 0.43 | 2.56 | 0.86 | 0.22 | 0.54 | 1.61 | |||||||||||||||||||||
Less distributions | |||||||||||||||||||||||||||
From net investment income | - | - | - | - | - | - | |||||||||||||||||||||
From net capital gain | - | (0.26 | ) | - | - | - | - | ||||||||||||||||||||
Total distributions | - | (0.26 | ) | - | - | - | - | ||||||||||||||||||||
Net asset value, end of period | $ | 11.93 | $ | 11.50 | $ | 9.20 | $ | 8.34 | $ | 8.12 | $ | 7.58 | |||||||||||||||
Total Investment Return | 3.74 | %(b) | 27.83 | % | 10.31 | % | 2.71 | % | 7.12 | % | 26.97 | % | |||||||||||||||
Ratios/Supplemental Data | |||||||||||||||||||||||||||
Net assets, end of period (000's) | $ | 1,079 | $ | 816 | $ | 578 | $ | 630 | $ | 681 | $ | 637 | |||||||||||||||
Ratio of net investment loss to average net assets | |||||||||||||||||||||||||||
With expense reductions | (1.38 | )%(c) | (0.92 | )% | (1.01 | )% | (1.53 | )% | (2.03 | )% | (2.69 | )% | |||||||||||||||
Without expense reductions | (2.25 | )%(c) | (2.47 | )% | (2.74 | )% | (3.46 | )% | (4.23 | )% | (4.96 | )% | |||||||||||||||
Ratio of expenses to average net assets | |||||||||||||||||||||||||||
With expense reductions | 3.40 | %(c) | 3.22 | % | 3.43 | % | 3.89 | % | 4.37 | % | 4.11 | % | |||||||||||||||
Without expense reductions | 4.27 | %(c) | 4.77 | % | 5.15 | % | 5.82 | % | 6.57 | % | 6.39 | % | |||||||||||||||
Fund portfolio turnover rate | 5 | %(c) | 24 | % | 9 | % | 7 | % | 106 | % | 5 | % | |||||||||||||||
(a) The Fund's maximum sales charge is not included in the total return computation.
(b) Not annualized
(c) Annualized
See Accompanying Notes to Financial Statements which are an integral part of these financial statements.
67
Pacific Advisors Fund Inc.
Financial Highlights (Unaudited)
(For a share outstanding throughout the period)
Mid Cap Value Fund | |||||||||||||||||||||||||||
Class A | |||||||||||||||||||||||||||
| For the six months ended | For the year ended December 31, | ||||||||||||||||||||||||||
June 30, 2014 | 2013 | 2012 | 2011 | 2010 | 2009 | ||||||||||||||||||||||
Per Share Operating Performance | |||||||||||||||||||||||||||
Net asset value, beginning of period | $ | 15.25 | $ | 11.47 | $ | 10.88 | $ | 11.57 | $ | 8.78 | $ | 6.75 | |||||||||||||||
Income from investing operations | |||||||||||||||||||||||||||
Net investment loss | (0.01 | ) | (0.36 | ) | (0.25 | ) | (0.13 | ) | (0.48 | ) | (0.40 | ) | |||||||||||||||
Net realized and unrealized gain (loss) on securities | (0.06 | ) | 4.14 | 0.84 | (0.56 | ) | 3.27 | 2.43 | |||||||||||||||||||
Total from investment operations | (0.07 | ) | 3.78 | 0.59 | (0.69 | ) | 2.79 | 2.03 | |||||||||||||||||||
Less distributions | |||||||||||||||||||||||||||
From net investment income | - | - | - | - | - | - | |||||||||||||||||||||
From net capital gain | - | - | - | - | - | - | |||||||||||||||||||||
Total distributions | - | - | - | - | - | - | |||||||||||||||||||||
Net asset value, end of period | $ | 15.18 | $ | 15.25 | $ | 11.47 | $ | 10.88 | $ | 11.57 | $ | 8.78 | |||||||||||||||
Total Investment Return (a) | (0.46 | )%(b) | 32.96 | % | 5.42 | % | (5.96 | )% | 31.78 | % | 30.07 | % | |||||||||||||||
Ratios/Supplemental Data | |||||||||||||||||||||||||||
Net assets, end of period (000's) | $ | 6,545 | $ | 6,058 | $ | 4,500 | $ | 4,052 | $ | 3,672 | $ | 3,194 | |||||||||||||||
Ratio of net investment loss to average net assets | (2.56 | )%(c) | (2.88 | )% | (3.01 | )% | (3.11 | )% | (3.39 | )% | (2.11 | )% | |||||||||||||||
Ratio of expenses to average net assets | 3.48 | %(c) | 3.69 | % | 4.19 | % | 4.16 | % | 4.35 | % | 3.69 | % | |||||||||||||||
Fund portfolio turnover rate | 20 | %(c) | 15 | % | 24 | % | 12 | % | 18 | % | 21 | % | |||||||||||||||
Class C | |||||||||||||||||||||||||||
| For the six months ended | For the year ended December 31, | ||||||||||||||||||||||||||
June 30, 2014 | 2013 | 2012 | 2011 | 2010 | 2009 | ||||||||||||||||||||||
Per Share Operating Performance | |||||||||||||||||||||||||||
Net asset value, beginning of period | $ | 13.80 | $ | 10.46 | $ | 10.00 | $ | 10.72 | $ | 8.21 | $ | 6.36 | |||||||||||||||
Income from investing operations | |||||||||||||||||||||||||||
Net investment income (loss) | (1.10 | ) | 0.48 | (3.40 | ) | (4.28 | ) | (3.84 | ) | (1.04 | ) | ||||||||||||||||
Net realized and unrealized gain on securities | 0.99 | 2.86 | 3.86 | 3.56 | 6.35 | 2.89 | |||||||||||||||||||||
Total from investment operations | (0.11 | ) | 3.34 | 0.46 | (0.72 | ) | 2.51 | 1.85 | |||||||||||||||||||
Less distributions | |||||||||||||||||||||||||||
From net investment income | - | - | - | - | - | - | |||||||||||||||||||||
From net capital gain | - | - | - | - | - | - | |||||||||||||||||||||
Total distributions | - | - | - | - | - | - | |||||||||||||||||||||
Net asset value, end of period | $ | 13.69 | $ | 13.80 | $ | 10.46 | $ | 10.00 | $ | 10.72 | $ | 8.21 | |||||||||||||||
Total Investment Return | (0.80 | )%(b) | 31.93 | % | 4.60 | % | (6.72 | )% | 30.57 | % | 29.09 | % | |||||||||||||||
Ratios/Supplemental Data | |||||||||||||||||||||||||||
Net assets, end of period (000's) | $ | 1,121 | $ | 1,204 | $ | 854 | $ | 1,044 | $ | 1,784 | $ | 3,151 | |||||||||||||||
Ratio of net investment loss to average net assets | (3.30 | )%(c) | (3.61 | )% | (3.77 | )% | (3.92 | )% | (3.91 | )% | (2.87 | )% | |||||||||||||||
Ratio of expenses to average net assets | 4.22 | %(c) | 4.42 | % | 4.95 | % | 4.91 | % | 4.88 | % | 4.47 | % | |||||||||||||||
Fund portfolio turnover rate | 20 | %(c) | 15 | % | 24 | % | 12 | % | 18 | % | 21 | % | |||||||||||||||
(a) The Fund's maximum sales charge is not included in the total return computation.
(b) Not annualized
(c) Annualized
See Accompanying Notes to Financial Statements which are an integral part of these financial statements.
68
Pacific Advisors Fund Inc.
Financial Highlights (Unaudited)
(For a share outstanding throughout the period)
Small Cap Value Fund | |||||||||||||||||||||||||||
Class A | |||||||||||||||||||||||||||
| For the six months ended | For the year ended December 31, | ||||||||||||||||||||||||||
June 30, 2014 | 2013 | 2012 | 2011 | 2010 | 2009 | ||||||||||||||||||||||
Per Share Operating Performance | |||||||||||||||||||||||||||
Net asset value, beginning of period | $ | 61.41 | $ | 38.50 | $ | 34.42 | $ | 31.68 | $ | 26.37 | $ | 19.21 | |||||||||||||||
Income from investing operations | |||||||||||||||||||||||||||
Net investment income (loss) | (0.30 | ) | 1.44 | (1.70 | ) | (1.35 | ) | (1.87 | ) | (0.50 | ) | ||||||||||||||||
Net realized and unrealized gain on securities | 0.56 | 21.47 | 5.78 | 4.09 | 7.18 | 7.66 | |||||||||||||||||||||
Total from investment operations | 0.26 | 22.91 | 4.08 | 2.74 | 5.31 | 7.16 | |||||||||||||||||||||
Less distributions | |||||||||||||||||||||||||||
From net investment income | - | - | - | - | - | - | |||||||||||||||||||||
From net capital gain | - | - | - | - | - | - | |||||||||||||||||||||
From return of capital | - | - | - | - | - | - | |||||||||||||||||||||
Total distributions | - | - | - | - | - | - | |||||||||||||||||||||
Net asset value, end of period | $ | 61.67 | $ | 61.41 | $ | 38.50 | $ | 34.42 | $ | 31.68 | $ | 26.37 | |||||||||||||||
Total Investment Return (a) | 0.42 | %(b) | 59.51 | % | 11.85 | % | 8.65 | % | 20.14 | % | 37.27 | % | |||||||||||||||
Ratios/Supplemental Data | |||||||||||||||||||||||||||
Net assets, end of period (000's) | $ | 206,543 | $ | 199,163 | $ | 85,607 | $ | 88,323 | $ | 92,830 | $ | 117,456 | |||||||||||||||
Ratio of net investment loss to average net assets | (1.65 | )%(c) | (1.93 | )% | (2.06 | )% | (2.31 | )% | (2.14 | )% | (2.05 | )% | |||||||||||||||
Ratio of expenses to average net assets | �� | 2.10 | %(c) | 2.31 | % | 2.71 | % | 2.88 | % | 2.66 | % | 2.49 | % | ||||||||||||||
Fund portfolio turnover rate | 20 | %(c) | 9 | % | 12 | % | 9 | % | 9 | % | 17 | % | |||||||||||||||
Class C | |||||||||||||||||||||||||||
| For the six months ended | For the year ended December 31, | ||||||||||||||||||||||||||
June 30, 2014 | 2013 | 2012 | 2011 | 2010 | 2009 | ||||||||||||||||||||||
Per Share Operating Performance | |||||||||||||||||||||||||||
Net asset value, beginning of period | $ | 51.70 | $ | 32.65 | $ | 29.41 | $ | 27.26 | $ | 22.87 | $ | 16.79 | |||||||||||||||
Income from investing operations | |||||||||||||||||||||||||||
Net investment income (loss) | 0.08 | 3.10 | (2.53 | ) | (6.46 | ) | (3.31 | ) | (1.40 | ) | |||||||||||||||||
Net realized and unrealized gain (loss) on securities | (0.06 | ) | 15.95 | 5.77 | 8.61 | 7.70 | 7.48 | ||||||||||||||||||||
Total from investment operations | 0.02 | 19.05 | 3.24 | 2.15 | 4.39 | 6.08 | |||||||||||||||||||||
Less distributions | |||||||||||||||||||||||||||
From net investment income | - | - | - | - | - | - | |||||||||||||||||||||
From net capital gain | - | - | - | - | - | - | |||||||||||||||||||||
From return of capital | - | - | - | - | - | - | |||||||||||||||||||||
Total distributions | - | - | - | - | - | - | |||||||||||||||||||||
Net asset value, end of period | $ | 51.72 | $ | 51.70 | $ | 32.65 | $ | 29.41 | $ | 27.26 | $ | 22.87 | |||||||||||||||
Total Investment Return | 0.04 | %(b) | 58.35 | % | 11.02 | % | 7.89 | % | 19.20 | % | 36.21 | % | |||||||||||||||
Ratios/Supplemental Data | |||||||||||||||||||||||||||
Net assets, end of period (000's) | $ | 15,436 | $ | 14,646 | $ | 6,912 | $ | 6,949 | $ | 11,355 | $ | 15,593 | |||||||||||||||
Ratio of net investment loss to average net assets | (2.40 | )%(c) | (2.69 | )% | (2.80 | )% | (3.05 | )% | (2.89 | )% | (2.79 | )% | |||||||||||||||
Ratio of expenses to average net assets | 2.85 | %(c) | 3.08 | % | 3.45 | % | 3.62 | % | 3.40 | % | 3.24 | % | |||||||||||||||
Fund portfolio turnover rate | 20 | %(c) | 9 | % | 12 | % | 9 | % | 9 | % | 17 | % | |||||||||||||||
(a) The Fund's maximum sales charge is not included in the total return computation.
See Accompanying Notes to Financial Statements which are an integral part of these financial statements.
69
Pacific Advisors Fund Inc.
Financial Highlights (Unaudited)
(For a share outstanding throughout the period)
Small Cap Value Fund | |||||||||||||||||||||||||||
Class I | |||||||||||||||||||||||||||
| For the six months ended | For the year ended December 31, | ||||||||||||||||||||||||||
June 30, 2014 | 2013 | 2012 | 2011 | 2010 | 2009 | ||||||||||||||||||||||
Per Share Operating Performance | |||||||||||||||||||||||||||
Net asset value, beginning of period | $ | 72.10 | $ | 45.13 | $ | 39.15 | $ | 35.95 | $ | 29.86 | $ | 21.72 | |||||||||||||||
Income from investing operations | |||||||||||||||||||||||||||
Net investment income (loss) | 10.74 | * | 431.95 | * | (120.29 | )* | (0.77 | ) | (0.60 | ) | (0.45 | ) | |||||||||||||||
Net realized and unrealized gain (loss) on securities | (10.32 | )* | (404.98 | )* | 126.27 | * | 3.97 | 6.69 | 8.59 | ||||||||||||||||||
Total from investment operations | 0.42 | 26.97 | 5.98 | 3.20 | 6.09 | 8.14 | |||||||||||||||||||||
Less distributions | |||||||||||||||||||||||||||
From net investment income | - | - | - | - | - | - | |||||||||||||||||||||
From net capital gain | - | - | - | - | - | - | |||||||||||||||||||||
From return of capital | - | - | - | - | - | - | |||||||||||||||||||||
Total distributions | - | - | - | - | - | - | |||||||||||||||||||||
Net asset value, end of period | $ | 72.52 | $ | 72.10 | $ | 45.13 | $ | 39.15 | $ | 35.95 | $ | 29.86 | |||||||||||||||
Total Investment Return | 0.58 | %(b) | 59.76 | % | 15.27 | % | 8.90 | % | 20.40 | % | 37.48 | % | |||||||||||||||
Ratios/Supplemental Data | |||||||||||||||||||||||||||
Net assets, end of period (000's) | $ | 2,164 | $ | 380 | $ | 7 | $ | 6 | $ | 6 | $ | 5 | |||||||||||||||
Ratio of net investment loss to average net assets | (1.40 | )%(c) | (1.93 | )% | (2.02 | )% | (2.08 | )% | (1.97 | )% | (1.80 | )% | |||||||||||||||
Ratio of expenses to average net assets | 1.85 | %(c) | 2.06 | % | 2.63 | % | 2.65 | % | 2.50 | % | 2.24 | % | |||||||||||||||
Fund portfolio turnover rate | 20 | %(c) | 9 | % | 12 | % | 9 | % | 9 | % | 17 | % | |||||||||||||||
(b) Not annualized
(c) Annualized
* Numbers reflected allocations to Class I due to significant subscription and redemption activity during the period.
See Accompanying Notes to Financial Statements which are an integral part of these financial statements.
70
Pacific Advisors Fund Inc.
Notes to Financial Statements (Unaudited)
June 30, 2014
Note 1. Organization
Pacific Advisors Fund Inc. (the "Company") is an open-end diversified investment management company registered under the Investment Company Act of 1940, as amended. The Company currently offers six Funds: Government Securities Fund, Income and Equity Fund, Balanced Fund, Large Cap Value Fund, Mid Cap Value Fund and Small Cap Value Fund (individually, a "Fund," or collectively, the "Funds"). Each Fund is a separate investment portfolio of the Company with a distinct investment objective, investment program, policies and restrictions.
The Government Securities Fund seeks to provide high current income, preservation of capital, and rising future income, consistent with prudent investment risk. The Income and Equity Fund seeks to provide current income and, secondarily, long-term capital appreciation. The Balanced Fund seeks to achieve long-term capital appreciation and income consistent with reduced risk. The Large Cap Value Fund seeks to achieve long-term capital appreciation. The Mid Cap Value Fund seeks to achieve long-term capital appreciation. The Small Cap Value Fund seeks to provide capital appreciation through investment in small capitalization companies.
The Funds offer Class A and Class C shares. In addition to Class A and Class C shares, the Small Cap Value Fund also offers Class I shares. Each Class has equal rights as to assets and voting privileges except that Class A and Class C each has exclusive voting rights with respect to its distribution plan. Investment income, realized and unrealized capital gains and losses, and the common expenses of each Fund are allocated on a pro rata basis to each Class based on the relative net assets of each Class to the total net assets of the Fund. Each Class of shares differs in its respective service and distribution expenses and may differ in its transfer agent, registration, and certain other Class-specific fees and expenses.
The Company enters into contracts that contain a variety of indemnifications. The Company's maximum exposure under these arrangements is unknown. However, the Company has not had prior claims or losses pursuant to these contracts and expects the risk of loss to be remote.
Note 2. Significant Accounting Policies
A. Security Valuation and Fair Value Measurement. Securities, including American Depository Receipts (ADRs), listed on a national securities exchange and certain over-the-counter ("OTC") issues traded on the NASDAQ national market system are valued at the last quoted sale price at the close of the New York Stock Exchange. OTC issues not quoted on the NASDAQ system, and other equity securities for which no sale price is available, are valued at the last bid price as obtained from published sources or real time quote services, where available, and otherwise from brokers who are market makers for such securities. Debt securities with a maturity less than 60 days are valued on an amortized cost basis, which approximates fair market value. In determining the fair value of other debt securities, Pacific Global Investment Management Company, Inc. (the "Investment Manager") utilizes independent pricing services approved by the Board of Directors using one or more of the following valuation techniques:
(1) a matrix pricing approach that considers market inputs including, in approximate order of priority, the following: benchmark yields, reported trades, broker/dealer quotes, issuer spreads, two-sided markets, benchmark securities, bids, offers and reference data including market research publications; market indicators, industry and economic events. Evaluators may prioritize inputs differently on any given day for any security based on market conditions, and not all inputs listed are available for use in the evaluation process for each security evaluation on any given day; (2) a comparison of the value of the borrower's outstanding equity and debt to that of comparable public companies; (3) a discounted cash flow analysis. Fair value determinations are made by the Investment Manager based on the Company's Fair Value Procedure, as adopted by the Board of Directors. In conducting its assessment and analysis for purpose of determining fair value, the Investment Manager uses its discretion and judgment in considering and appraising the relevant factors, including examining the source and nature of the quotations, to validate that the quotations and prices are representative of fair value.
Various inputs are used to determine the fair value of each Fund's investments. For financial statements, these inputs are summarized in the three broad levels listed below. Level 1 inputs are based on quoted prices in active markets for identical securities. Level 2 inputs are based on significant observable market inputs, such as quoted prices for similar securities and quoted prices in inactive markets. Level 3 inputs are significant unobservable inputs that reflect the Fund's own assumptions in determining the fair value of investments. The valuation levels are not necessarily an indication of the risk associated with investing in those securities.
71
Pacific Advisors Fund Inc.
Notes to Financial Statements (Unaudited)
June 30, 2014
The following is a summary of the inputs used to value each Fund's investment securities and cash and cash equivalents as of June 30, 2014.
| Government Securities Fund | Income and Equity Fund | Balanced Fund | Large Cap Value Fund | Mid Cap Value Fund | Small Cap Value Fund | ||||||||||||||||||||||
Level 1 - Quoted Prices | |||||||||||||||||||||||||||
Common Stock | |||||||||||||||||||||||||||
Energy | $ | 26,110 | $ | 450,225 | $ | 1,272,927 | $ | 349,364 | $ | 1,332,395 | $ | 43,896,496 | |||||||||||||||
Materials | - | 196,320 | - | - | 268,932 | 4,515,000 | |||||||||||||||||||||
Industrials | - | 740,702 | 3,295,294 | 1,652,866 | 3,518,617 | 102,153,862 | |||||||||||||||||||||
Consumer Discretionary | 25,185 | 627,194 | 1,298,603 | 1,176,722 | 2,267,897 | 38,810,890 | |||||||||||||||||||||
Consumer Staples | 100,300 | 1,060,934 | 488,930 | 1,103,461 | 134,734 | 10,032,000 | |||||||||||||||||||||
Health Care | 45,792 | 570,020 | - | 273,581 | - | - | |||||||||||||||||||||
Financials | - | 404,700 | 736,406 | 1,289,586 | 196,812 | 16,906,050 | |||||||||||||||||||||
Information Technology | 25,020 | 668,925 | 655,610 | 1,481,003 | - | - | |||||||||||||||||||||
Telecommunication Services | 31,824 | 538,813 | - | - | - | 8,010,000 | |||||||||||||||||||||
Utilities | 90,344 | 720,815 | - | - | - | - | |||||||||||||||||||||
Preferred Stock | |||||||||||||||||||||||||||
Financials | - | 76,620 | - | - | - | - | |||||||||||||||||||||
Level 1 Total | 344,575 | 6,055,268 | 7,747,770 | 7,326,583 | 7,719,387 | 224,324,298 | |||||||||||||||||||||
Level 2 - Other significant observable inputs | |||||||||||||||||||||||||||
Bonds and notes | |||||||||||||||||||||||||||
Corporate Bonds | - | 6,491,717 | 3,230,252 | - | - | - | |||||||||||||||||||||
U.S. Government Fixed Income Securities | 1,600,536 | - | - | - | - | - | |||||||||||||||||||||
Short Term Investments | |||||||||||||||||||||||||||
Money Market | - | 312,045 | - | 44,843 | - | 77,073 | |||||||||||||||||||||
Level 2 Total | 1,600,536 | 6,803,762 | 3,230,252 | 44,843 | - | 77,073 | |||||||||||||||||||||
Level 3 - Significant unobservable inputs | - | - | - | - | - | - | |||||||||||||||||||||
Total Investments | $ | 1,945,111 | $ | 12,859,030 | $ | 10,978,022 | $ | 7,371,426 | $ | 7,719,387 | $ | 224,401,371 | |||||||||||||||
Equity securities (common and preferred stock) that are actively traded and market priced are classified as Level 1 securities. All fixed income securities are classified as Level 2 securities and are valued using either amortized cost or the matrix pricing approach. The Funds had no Level 3 holdings during the period ended June 30, 2014. In addition, the Funds are required to disclose the amounts of significant transfers between Level 1 and Level 2 of the fair value hierarchy and the reasons for these transfers. The Investment Manager has evaluated the Funds' positions for the period ended June 30, 2014, and determined that, for purposes of fair value pricing measurement, there were no transfers between Level 1 and Level 2.
B. Cash and Cash Equivalents. The Company considers all highly liquid financial instruments with maturities of less than three months when acquired to be cash equivalents.
C. Security Transactions and Investment Income. Security transactions are accounted for on the trade date. The cost of investments sold is determined by use of the specific identification method for both financial reporting and federal income tax purposes. Dividends are recorded on the ex-dividend date. Interest income is recorded on an accrual basis. Premium or discount on debt securities are amortized using the effective interest amortization method.
D. Dividends and Distributions to Shareholders. The Government Securities Fund and Income and Equity Fund declare and distribute dividends of their net investment income, if any, quarterly. The Balanced Fund, Large Cap Value Fund, Mid Cap Value Fund and Small Cap Value Fund declare and distribute dividends of their net investment income, if any, annually. In addition, each Fund declares and distributes a capital gain dividend, if any, annually. The Board of Directors determines the amount and timing of such payments.
E. Federal Income Tax. The Company intends to comply with the requirements of Subchapter M of the Internal Revenue Code applicable to regulated investment companies and to distribute substantially all of their taxable income to their shareholders. Therefore, no federal income tax provision is required.
Management has analyzed the Funds' tax positions taken on federal income tax returns for all open tax years and for the year ended December 31, 2013 and has concluded that no provision for income tax is required in the Funds' financial statements. Tax years 2010, 2011, 2012 and 2013 are still subject to examination by major federal jurisdictions. Tax years 2009, 2010, 2011, 2012 and 2013 are still subject to examination by major state jurisdictions.
72
Pacific Advisors Fund Inc.
Notes to Financial Statements (Unaudited)
June 30, 2014
The Funds recognize interest and penalties, if any, related to unrecognized tax benefits as income tax expense in the Statement of Operations. During the period, the Funds did not incur any interest or penalties.
The components of distributable earnings (accumulated deficits) on a tax basis are reported as of the Funds' most recent year end. As of December 31, 2013, distributable earnings (accumulated deficits) on a tax basis were as follows:
| Government Securities Fund | Income and Equity Fund | Balanced Fund | Large Cap Value Fund | Mid Cap Value Fund | Small Cap Value Fund | ||||||||||||||||||||||
Undistributed ordinary income | $ | - | $ | 376 | $ | - | $ | - | $ | - | $ | - | |||||||||||||||
Undistributed long-term gains | - | - | 111,775 | 70,118 | - | - | |||||||||||||||||||||
Capital loss carry forward* | (178,060 | ) | (490,239 | ) | - | - | (1,474,057 | ) | (1,798,458 | ) | |||||||||||||||||
| Net unrealized appreciation on investments | 97,573 | 1,420,731 | 2,985,361 | 1,846,545 | 2,726,760 | 90,518,447 | |||||||||||||||||||||
Accumulated earnings (deficits) | $ | (80,487 | ) | $ | 930,868 | $ | 3,097,136 | $ | 1,916,663 | $ | 1,252,703 | $ | 88,719,989 | ||||||||||||||
The difference between book basis and tax basis unrealized appreciation (depreciation) is attributable primarily to the tax deferral of losses on wash sales and characterization of certain income items. The Funds intend to treat post October losses (net capital losses incurred for the period subsequent to October 31, 2013 through the fiscal year end December 31, 2013) as having been incurred in the next fiscal year.
The Funds intend to utilize provisions of the federal income tax laws which allow them to carry a realized capital loss forward for eight years following the year of the loss and offset such losses against any future realized capital gains. During the current fiscal year, the following capital losses carried forward have been utilized:
| Government Securities Fund | Income and Equity Fund | Balanced Fund | Large Cap Value Fund | Mid Cap Value Fund | Small Cap Value Fund | ||||||||||||||||||||||
Capital loss carryforward utilized | $ | 22,305 | $ | 95,365 | $ | - | $ | 167,591 | $ | - | $ | 5,117,592 | |||||||||||||||
* As of December 31, 2013, the following Funds had accumulated net realized losses on investment transactions that represent capital loss carryforwards for federal income tax purposes, which expire as follows:
Capital losses expiring in: | |||||||||||||||||||||||||||
2014 | 2015 | 2016 | 2017 | 2018 | Total | ||||||||||||||||||||||
Government Securities Fund | $ | 88,644 | $ | 1,178 | $ | 9,585 | $ | 73,971 | $ | 4,682 | $ | 178,060 | |||||||||||||||
Income and Equity Fund | - | - | 102,173 | 388,066 | - | 490,239 | |||||||||||||||||||||
Balanced Fund | - | - | - | - | - | - | |||||||||||||||||||||
Large Cap Value Fund | - | - | - | - | - | - | |||||||||||||||||||||
Mid Cap Value Fund | - | - | 785,984 | 640,167 | - | 1,426,151 | |||||||||||||||||||||
Small Cap Value Fund | - | - | - | - | 1,798,458 | 1,798,458 | |||||||||||||||||||||
During the year ended December 31, 2013, the Government Securities Fund had a capital loss carryforward in the amount of $27,190 that expired.
The Regulated Investment Company Modernization Act of 2010 (the "Act") changed various technical rules governing the tax treatment of regulated investment companies ("RICs") including the Funds. Under the Act, each Fund is permitted to carry forward capital losses incurred in taxable years beginning in 2011 for an unlimited period. However, any losses incurred during those future taxable years will be required to be utilized prior to the losses incurred in pre-enactment taxable years, which carry an expiration date. As a result of this ordering rule, pre-enactment capital loss carryforwards may be more likely to expire unused. Additionally, post-enactment capital loss carryforwards will retain their character as either short-term or long-term capital losses rather than being considered all short-term as permitted under previous regulation.
Finally, the Modernization Act contains several provisions aimed at preserving the character of distributions made by a fiscal year RIC during the portion of its taxable year ending after October 31 or December 31, reducing the circumstances under which a RIC might be required to file amended Forms 1099 to restate previously reported distributions.
73
Pacific Advisors Fund Inc.
Notes to Financial Statements (Unaudited)
June 30, 2014
During the most recent fiscal year, the following capital losses carried forward under the provisions of the Modernization Act were utilized:
| Loss Carryforward Utilized | |||||||||||
Short Term | Long Term | ||||||||||
Income and Equity Fund | $ | 12,577 | $ | 49,733 | |||||||
Large Cap Value Fund | 6,933 | 7,680 | |||||||||
Mid Cap Value Fund | - | 210,558 | |||||||||
Losses that will be carried forward under the provisions of the Modernization Act are as follows:
| Loss Carryforward Character | |||||||||||
Short Term | Long Term | ||||||||||
Mid Cap Value Fund | $ | 27,116 | $ | 20,790 | |||||||
F. Reclassification of Capital Accounts. Distributions of net investment income and realized gains are determined in accordance with income tax regulations which may differ from GAAP. These differences are due to differing treatments for items such as net operating losses, reclassification of dividends and return of capital. To the extent that these differences are permanent in nature, reclassifications are made among the net asset accounts on the Statement of Assets and Liabilities. Net assets and net asset value per share are not affected by this classification.
For the period ended June 30, 2014, reclassifications among the components of net assets are as follows:
| Accumulated Undistributed Net Investment Income | Paid in Capital | Accumulated Capital Gain/(Loss) | |||||||||||||
Government Securities Fund | $ | 25,509 | $ | (25,509 | ) | $ | - | ||||||||
Income and Equity Fund | - | - | - | ||||||||||||
Balanced Fund | 70,894 | (70,894 | ) | - | |||||||||||
Large Cap Value Fund | 23,562 | (23,562 | ) | - | |||||||||||
Mid Cap Value Fund | 94,808 | (94,808 | ) | - | |||||||||||
Small Cap Value Fund | 2,024,995 | (2,024,995 | ) | - | |||||||||||
The reclassifications were due to net investment losses incurred by the Funds, which are not permitted to be carried forward for tax purposes and differing book and tax treatment of certain securities.
G. Use of Estimates. The preparation of financial statements in conformity with U.S. GAAP requires management to make estimates and assumptions that affect the reported amounts in the financial statements and footnotes. Actual results could differ from those estimates.
Note 3. Investment Management, Distributor and Other Related Party Transactions
The Company and the Funds have entered into investment management agreements ("Management Agreements") with the Investment Manager.
The Management Agreements provide for investment management fees, payable monthly, and calculated at the maximum annual rate of 0.65% of average net assets for the Government Securities Fund, 0.75% of average net assets for the Income and Equity, Balanced, Large Cap Value and Small Cap Value Funds and 1.00% of average net assets for the Mid Cap Value Fund.
In accordance with Expense Limitation Agreements with the Company, the Investment Manager waives its respective management fees to the extent that the actual operating expenses of the following Funds exceed the following thresholds:
Class A | Class C | ||||||||||
Government Securities Fund | 1.65 | % | 2.40 | % | |||||||
Income and Equity Fund | 1.95 | % | 2.70 | % | |||||||
Large Cap Value Fund | 2.65 | % | 3.40 | % | |||||||
74
Pacific Advisors Fund Inc.
Notes to Financial Statements (Unaudited)
June 30, 2014
For the Government Securities Fund only, if net expenses exceed the above thresholds after waiver of the entire management fee, Pacific Global Investor Services, Inc. ("PGIS"), Transfer Agent for the Company, will waive its transfer agency fee to the extent necessary to reduce Class expenses to the above thresholds. This agreement may be terminated by either party upon 90 days prior written notice. For the Large Cap Value Fund only, if net expenses exceed the above thresholds after waiver of the entire management fee, PGIS will waive its transfer agency fee through December 31, 2014 to the extent necessary to reduce Class expenses to the above thresholds. The Transfer Agent does not, however, waive out of pocket expenses.
Pursuant to the Expense Limitation Agreements, providing for the voluntary waiver of fees and the assumption of expenses by the Investment Manager and Transfer Agent, the following amounts were waived for the period ended June 30, 2014.
PGIS is a wholly-owned subsidiary of the Investment Manager.
| Management Fees Waived | Transfer Agent Fees Waived | Total | |||||||||||||
Government Securities Fund | $ | 6,467 | $ | 21,600 | $ | 28,067 | |||||||||
Income and Equity Fund | 45,703 | N/A | 45,703 | ||||||||||||
Large Cap Value Fund | 24,316 | 3,931 | 28,247 | ||||||||||||
The Investment Manager does not have any rights to recover fees it waives or expenses it may reimburse, with respect to any of the Funds.
For the period ended June 30, 2014, Pacific Global Fund Distributors, Inc. ("PGFD"), the principal underwriter for the Company, received commissions on sales of capital stock, after deducting amounts allowed to authorized distributors as commissions. In addition, PGFD, as a registered broker-dealer, may act as broker for the Funds, in conformity with Rule 17e-1 under the Investment Company Act of 1940. The Company's Board of Directors has approved procedures for evaluating the reasonableness of commissions paid to PGFD and periodically reviews these procedures. PGFD will not act as principal in effecting any portfolio transactions for the Funds. The amounts of commissions are as follows:
| Underwriting Fees Retained | Commissions Retained | Brokerage Commissions Received (Paid) | |||||||||||||
Government Securities Fund | $ | 1 | $ | 6 | $ | (253 | ) | ||||||||
Income and Equity Fund | 245 | 12 | 100 | ||||||||||||
Balanced Fund | 1,058 | 1,818 | (375 | ) | |||||||||||
Large Cap Value Fund | 1,579 | 2,058 | 293 | ||||||||||||
Mid Cap Value Fund | 1,670 | 506 | 683 | ||||||||||||
Small Cap Value Fund | 44,397 | 3,438 | 11,310 | ||||||||||||
PGFD is a wholly-owned subsidiary of the Investment Manager.
The Company has also entered into separate agreements with PGIS that provide for transfer agent fees at a rate of $21 per year per open account and $3.50 per year per closed account, with a minimum charge of $1,800 per month per class for each fund; fund accounting fees equal to the greater of $1,500 or three basis points for the first hundred million in net assets and one basis point on the balance of net assets for each fund per month; and annual administrative agent fees of five basis points of average daily net assets of each fund subject to a maximum annual fee of $50,000 per fund. The fee is computed and payable monthly.
On the Statement of Assets and Liabilities, "Accounts payable to related parties" consist of transfer agent fees payable to PGIS.
The Company has adopted a plan of distribution whereby the Funds may pay a service fee to qualified recipients in an amount up to 0.25% per annum of each Fund's average daily net assets for Class A shares. The Company has also adopted a plan of distribution whereby the Funds may pay a service fee to qualified recipients in an amount up to 0.25% per annum of each Fund's average daily net assets for Class C shares and a distribution fee in an amount up to 0.75% per annum of each Fund's average daily net assets for Class C shares. The Company has not adopted a plan of distribution for Class I Shares.
For the period ended June 30, 2014, total distribution and/or service (12b-1) fees were:
Class A | Class C | Total | |||||||||||||
Government Securities Fund | $ | 2,180 | $ | 1,229 | $ | 3,409 | |||||||||
Income and Equity Fund | 12,323 | 11,647 | 23,970 | ||||||||||||
Balanced Fund | 6,377 | 26,523 | 32,900 | ||||||||||||
Large Cap Value Fund | 7,082 | 4,093 | 11,175 | ||||||||||||
Mid Cap Value Fund | 7,484 | 5,466 | 12,950 | ||||||||||||
Small Cap Value Fund | 245,070 | 72,122 | 317,192 | ||||||||||||
75
Pacific Advisors Fund Inc.
Notes to Financial Statements (Unaudited)
June 30, 2014
Note 4. Purchase and Sales of Securities
The following summarizes purchases and sales of investment securities, other than short-term investments, and aggregate gross unrealized appreciation and depreciation on a tax basis by each Fund for the period ended and as of June 30, 2014. The difference between book basis and tax basis unrealized appreciation is attributable primarily to the tax deferral of losses on wash sales.
| Period ended June 30, 2014 | As of June 30, 2014 | ||||||||||||||||||||||||||
| Cost of Purchases | Proceeds From Sales | Tax Cost of Securities | Gross Unrealized Appreciation | Gross Unrealized Depreciation | Net Unrealized Appreciation | ||||||||||||||||||||||
Government Securities Fund | $ | 2,307,254 | $ | 2,349,467 | $ | 1,845,457 | $ | 100,090 | $ | 436 | $ | 99,654 | |||||||||||||||
Income and Equity Fund | 2,186,432 | 697,481 | 10,804,644 | 1,806,102 | 63,761 | 1,742,341 | |||||||||||||||||||||
Balanced Fund | 1,579,597 | 1,206,167 | 8,124,806 | 2,857,119 | 3,903 | 2,853,216 | |||||||||||||||||||||
Large Cap Value Fund | 945,069 | 158,159 | 5,198,873 | 2,129,367 | 1,656 | 2,127,711 | |||||||||||||||||||||
Mid Cap Value Fund | 1,136,247 | 719,146 | 5,023,682 | 2,819,923 | 124,218 | 2,695,705 | |||||||||||||||||||||
Small Cap Value Fund | 29,938,428 | 21,162,335 | 137,428,801 | 94,604,301 | 7,708,804 | 86,895,497 | |||||||||||||||||||||
Note 5. Distributions to Shareholders
The tax character of distributions paid during 2014 and 2013 was as follows:
| Government Securities Fund | Income and Equity Fund | Balanced Fund | Large Cap Value Fund | Mid Cap Value Fund | Small Cap Value Fund | ||||||||||||||||||||||
Six months ended June 30, 2014 | |||||||||||||||||||||||||||
Distributions paid from: | |||||||||||||||||||||||||||
Ordinary Income | $ | - | $ | 161,150 | $ | - | $ | - | $ | - | $ | - | |||||||||||||||
Long-Term Capital Gain | - | - | - | - | - | - | |||||||||||||||||||||
Return of Capital | - | - | - | - | - | - | |||||||||||||||||||||
Total Distributions | $ | - | $ | 161,150 | $ | - | $ | - | $ | - | $ | - | |||||||||||||||
Year ended December 31, 2013 | |||||||||||||||||||||||||||
Distributions paid from: | |||||||||||||||||||||||||||
Ordinary Income | $ | - | $ | 100,233 | $ | 122,053 | $ | - | $ | - | $ | - | |||||||||||||||
Long-Term Capital Gain | - | - | 844,506 | 121,964 | - | - | |||||||||||||||||||||
Return of Capital | - | - | - | - | - | - | |||||||||||||||||||||
Total Distributions | $ | - | $ | 100,233 | $ | 966,559 | $ | 121,964 | $ | - | $ | - | |||||||||||||||
Note 6. Capital Share Transactions
A 2% redemption fee is assessed on shares of the Government Securities Fund or Income and Equity Fund sold or exchanged within 30 days of purchase or shares of the Balanced Fund, Large Cap Value Fund, Mid Cap Value Fund or Small Cap Value Fund sold or exchanged within 180 days of purchase and is retained in each Fund. The redemption fees collected through June 30, 2014 are included in the dollar amount of shares sold in the table below. The amount of the increase is as follows:
Class A | Class C | Class I | |||||||||||||
Government Securities Fund | $ | - | $ | - | N/A | ||||||||||
Income and Equity Fund | 99 | 23 | N/A | ||||||||||||
Balanced Fund | 63 | 67 | N/A | ||||||||||||
Large Cap Value Fund | 17 | 3 | N/A | ||||||||||||
Mid Cap Value Fund | 8 | 1 | N/A | ||||||||||||
Small Cap Value Fund | 64,116 | 4,712 | $ | 125 | |||||||||||
76
Pacific Advisors Fund Inc.
Notes to Financial Statements (Unaudited)
June 30, 2014
| Six months ended June 30, 2014 | Year ended December 31, 2013 | ||||||||||||||||||
Shares | Amount | Shares | Amount | ||||||||||||||||
Government Securities Fund | |||||||||||||||||||
Class A | |||||||||||||||||||
Shares sold | 3,589 | $ | 32,851 | 26,886 | $ | 246,630 | |||||||||||||
Reinvestment of distributions | - | - | - | - | |||||||||||||||
3,589 | 32,851 | 26,886 | 246,630 | ||||||||||||||||
Shares repurchased | (12,414 | ) | (113,488 | ) | (19,765 | ) | (181,572 | ) | |||||||||||
Net increase (decrease) | (8,825 | ) | $ | (80,637 | ) | 7,121 | $ | 65,058 | |||||||||||
Class C | |||||||||||||||||||
Shares sold | - | $ | - | 12,308 | $ | 110,607 | |||||||||||||
Reinvestment of distributions | - | - | - | - | |||||||||||||||
- | - | 12,308 | 110,607 | ||||||||||||||||
Shares repurchased | (9,976 | ) | (88,025 | ) | (31,588 | ) | (281,153 | ) | |||||||||||
Net decrease | (9,976 | ) | $ | (88,025 | ) | (19,280 | ) | $ | (170,546 | ) | |||||||||
| Six months ended June 30, 2014 | Year ended December 31, 2013 | ||||||||||||||||||
Shares | Amount | Shares | Amount | ||||||||||||||||
Income and Equity Fund | |||||||||||||||||||
Class A | |||||||||||||||||||
Shares sold | 249,755 | $ | 2,890,015 | 543,079 | $ | 5,971,466 | |||||||||||||
Reinvestment of distributions | 10,053 | 116,512 | 7,163 | 80,318 | |||||||||||||||
259,808 | 3,006,527 | 550,242 | 6,051,784 | ||||||||||||||||
Shares repurchased | (170,592 | ) | (1,969,363 | ) | (202,114 | ) | (2,253,619 | ) | |||||||||||
Net increase | 89,216 | $ | 1,037,164 | 348,128 | $ | 3,798,165 | |||||||||||||
Class C | |||||||||||||||||||
Shares sold | 38,551 | $ | 427,503 | 86,434 | $ | 913,031 | |||||||||||||
Reinvestment of distributions | 2,140 | 23,744 | 733 | 7,942 | |||||||||||||||
40,691 | 451,247 | 87,167 | 920,973 | ||||||||||||||||
Shares repurchased | (31,904 | ) | (355,245 | ) | (78,464 | ) | (818,518 | ) | |||||||||||
Net increase | 8,787 | $ | 96,002 | 8,703 | $ | 102,455 | |||||||||||||
77
Pacific Advisors Fund Inc.
Notes to Financial Statements (Unaudited)
June 30, 2014
| Six months ended June 30, 2014 | Year ended December 31, 2013 | ||||||||||||||||||
Shares | Amount | Shares | Amount | ||||||||||||||||
Balanced Fund | |||||||||||||||||||
Class A | |||||||||||||||||||
Shares sold | 32,996 | $ | 527,903 | 26,192 | $ | 440,990 | |||||||||||||
Reinvestment of distributions | - | - | 23,621 | 386,678 | |||||||||||||||
32,996 | 527,903 | 49,813 | 827,668 | ||||||||||||||||
Shares repurchased | (14,713 | ) | (237,829 | ) | (17,005 | ) | (277,869 | ) | |||||||||||
Net increase | 18,283 | $ | 290,074 | 32,808 | $ | 549,799 | |||||||||||||
Class C | |||||||||||||||||||
Shares sold | 37,785 | $ | 551,780 | 28,778 | $ | 432,969 | |||||||||||||
Reinvestment of distributions | - | - | 32,897 | 492,798 | |||||||||||||||
37,785 | 551,780 | 61,675 | 925,767 | ||||||||||||||||
Shares repurchased | (45,362 | ) | (663,721 | ) | (207,273 | ) | (2,996,983 | ) | |||||||||||
Net decrease | (7,577 | ) | $ | (111,941 | ) | (145,598 | ) | $ | (2,071,216 | ) | |||||||||
| Six months ended June 30, 2014 | Year ended December 31, 2013 | ||||||||||||||||||
Shares | Amount | Shares | Amount | ||||||||||||||||
Large Cap Value Fund | |||||||||||||||||||
Class A | |||||||||||||||||||
Shares sold | 52,780 | $ | 682,388 | 50,422 | $ | 598,660 | |||||||||||||
Reinvestment of distributions | - | - | 7,743 | 99,578 | |||||||||||||||
52,780 | 682,388 | 58,165 | 698,238 | ||||||||||||||||
Shares repurchased | (7,292 | ) | (94,878 | ) | (24,768 | ) | (296,250 | ) | |||||||||||
Net increase | 45,488 | $ | 587,510 | 33,397 | $ | 401,988 | |||||||||||||
Class C | |||||||||||||||||||
Shares sold | 19,563 | $ | 233,053 | 7,591 | $ | 79,688 | |||||||||||||
Reinvestment of distributions | - | - | 1,445 | 16,387 | |||||||||||||||
19,563 | 233,053 | 9,036 | 96,075 | ||||||||||||||||
Shares repurchased | - | - | (941 | ) | (9,469 | ) | |||||||||||||
Net increase | 19,563 | $ | 233,053 | 8,095 | $ | 86,606 | |||||||||||||
78
Pacific Advisors Fund Inc.
Notes to Financial Statements (Unaudited)
June 30, 2014
| Six months ended June 30, 2014 | Year ended December 31, 2013 | ||||||||||||||||||
Shares | Amount | Shares | Amount | ||||||||||||||||
Mid Cap Value Fund | |||||||||||||||||||
Class A | |||||||||||||||||||
Shares sold | 43,181 | $ | 622,021 | 37,733 | $ | 524,759 | |||||||||||||
Reinvestment of distributions | - | - | - | - | |||||||||||||||
43,181 | 622,021 | 37,733 | 524,759 | ||||||||||||||||
Shares repurchased | (9,321 | ) | (136,158 | ) | (32,613 | ) | (439,410 | ) | |||||||||||
Net increase | 33,860 | $ | 485,863 | 5,120 | $ | 85,349 | |||||||||||||
Class C | |||||||||||||||||||
Shares sold | 781 | $ | 10,217 | 11,069 | $ | 137,917 | |||||||||||||
Reinvestment of distributions | - | - | - | - | |||||||||||||||
781 | 10,217 | 11,069 | 137,917 | ||||||||||||||||
Shares repurchased | (6,080 | ) | (79,155 | ) | (5,473 | ) | (63,739 | ) | |||||||||||
Net increase (decrease) | (5,299 | ) | $ | (68,938 | ) | 5,596 | $ | 74,178 | |||||||||||
| Six months ended June 30, 2014 | Year ended December 31, 2013 | ||||||||||||||||||
Shares | Amount | Shares | Amount | ||||||||||||||||
Small Cap Value Fund | |||||||||||||||||||
Class A | |||||||||||||||||||
Shares sold | 623,296 | $ | 36,753,534 | 1,580,059 | $ | 82,261,860 | |||||||||||||
Reinvestment of distributions | - | - | - | - | |||||||||||||||
623,296 | 36,753,534 | 1,580,059 | 82,261,860 | ||||||||||||||||
Shares repurchased | (517,254 | ) | (30,457,888 | ) | (560,706 | ) | (27,816,000 | ) | |||||||||||
Net increase | 106,042 | $ | 6,295,646 | 1,019,353 | $ | 54,445,860 | |||||||||||||
Class C | |||||||||||||||||||
Shares sold | 44,261 | $ | 2,194,062 | 120,471 | $ | 5,317,905 | |||||||||||||
Reinvestment of distributions | - | - | - | - | |||||||||||||||
44,261 | 2,194,062 | 120,471 | 5,317,905 | ||||||||||||||||
Shares repurchased | (29,093 | ) | (1,434,450 | ) | (48,891 | ) | (2,024,356 | ) | |||||||||||
Net increase | 15,168 | $ | 759,612 | 71,580 | $ | 3,293,549 | |||||||||||||
Class I | |||||||||||||||||||
Shares sold | 24,572 | $ | 1,750,125 | 5,113 | $ | 350,012 | |||||||||||||
Reinvestment of distributions | - | - | - | - | |||||||||||||||
24,572 | 1,750,125 | 5,113 | 350,012 | ||||||||||||||||
Shares repurchased | - | - | - | - | |||||||||||||||
Net increase | 24,572 | $ | 1,750,125 | 5,113 | $ | 350,012 | |||||||||||||
79
Pacific Advisors Fund Inc.
Notes to Financial Statements (Unaudited)
June 30, 2014
Note 7. Bank Borrowings
Each Fund may borrow money to the extent permitted by the 1940 Act, as amended, or any rules, exemptions or interpretations thereunder that may be adopted, granted or issued by the Securities and Exchange Commission. Under the 1940 Act, a mutual fund may borrow up to one-third of its total assets (including the amount borrowed) from banks for any purpose, and may borrow up to 5% of its total assets from banks or other lenders for temporary purposes. Each Fund may borrow to facilitate portfolio transactions or meet redemptions. The Large Cap Value Fund, Mid Cap Value Fund, and Small Cap Value Fund also may borrow money to invest in portfolio securities. Each Fund has the ability to borrow, from UMB Bank, n.a. (UMB), on an unsecured basis, at 1.50% over the Federal Funds rate. As of June 30, 2014, the Balanced Fund, Government Securities Fund and Mid Cap Value Fund had borrowings from UMB with amounts of $114,538, $4,475 and $45,448, respectively, and were paying interest at 1.56% per annum on their outstanding borrowings. No compensating balances were required.
Note 8. Subsequent Event
On August 8, 2014, the Company's Board of Directors approved an amendment to, and continuation of, the Expense Limitation Agreement for the Large Cap Value Fund. Effective January 1, 2015, PGIS will no longer be a party to the Expense Limitation Agreement or be required to waive any portion of its transfer agent fees.
80
Pacific Advisors Fund Inc.
Directors and Officers
"Independent" Directors
Name (Age) | Position with the Company1 | Year elected Director of the Company | Principal occupation(s) during past 5 years | Other Directorships held by Director | |||||||||||||||
| L. Michael Haller, III (70) | Director | 1992 | Consultant, d/b/a Asahi Broadcasting Enterprises (software development); Chairman and President, Gammaker Pte. Ltd. (mobile game developer); and formerly Executive Vice President, MGT Capital Investments (mobile game developer) (2013); CEO, Digital Angel, Inc. (communications equipment distributor) (2012-2013); Chairman, Kapitall, Inc. (online introducing brokerage) (2011-2012); President, Bionic Games, Inc. (game software development company) (2008-2011); and Vice President and General Manager, Kapitall Studio (division of Kapitall, Inc.) (2010-2011) | Digital Angel, Inc. | |||||||||||||||
| Peter C. Hoffman (63) | Director | 2010 | President, Sierra Autocars, Inc. (auto dealership), Sierra Vehicles, Inc. (auto dealership), Sierra Automotive Enterprises, Inc. (auto dealership) and Sierra Pursuits, Inc. (management company) | None | |||||||||||||||
| Gerald E. Miller (84) | Director | 1992 | Retired in 1992; and formerly worked for Merrill Lynch for over 30 years and was a Senior Resident Vice President at retirement in 1992 | None | |||||||||||||||
| Louise K. Taylor, PhD (67) | Director | 1992 | Assistant Executive Director, Employers Association of California; and formerly Superintendent, Monrovia Unified School District (1991-2009) | None | |||||||||||||||
"Interested" Directors2
Name (Age) | Positions with the Company1 | Year elected a Director and officer of the Company | Principal occupations during past 5 years | Other Directorships held by Director | |||||||||||||||
| Victoria L. Breen (63)* | Director Assistant Secretary | 1992 2002 | President, Derby & Derby, Inc. (financial services company); Agent, Transamerica Life Companies; Registered Principal, Transamerica Financial Advisors, Inc.; and Assistant Secretary and Director, Pacific Global Investment Management Company | None | |||||||||||||||
| George A. Henning (67)** | President and Chairman | 1992 | Chairman, President and Director, Pacific Global Investment Management Company; and Chairman and Director, Pacific Global Fund Distributors, Inc. and Pacific Global Investor Services, Inc. | None | |||||||||||||||
Each Director oversees all 6 Pacific Advisors Fund portfolios.
The Fund's Statement of Additional Information contains additional information about the Fund's Directors and Officers and is available without charge upon request by calling (800) 989-6693. The business address for all Directors and officers of the Company is 101 N. Brand Blvd., Suite 1950, Glendale, CA 91203, Attn: Secretary.
81
Pacific Advisors Fund Inc.
Directors and Officers
Other Officers
Name (Age) | Position(s) with the Company | Year elected an officer of the Company | Principal occupations during past 5 years | ||||||||||||
| Catherine L. Henning (36) | Vice President Secretary | 2010 2006 | Senior Vice President, Secretary, Director of Client Services and Director, Pacific Global Investment Management Company; President, Secretary, Chief Compliance Officer and Director, Pacific Global Fund Distributors, Inc.; and Vice President, Secretary and Director, Pacific Global Investor Services, Inc. | ||||||||||||
| Barbara A. Kelley (61) | Vice President and Chief Compliance Officer | 2001 | Executive Vice President, Chief Compliance Officer and Director, Pacific Global Investment Management Company; Director, Pacific Global Fund Distributors, Inc.; President and Director, Pacific Global Investor Services, Inc.; and formerly Treasurer (2001-2014). | ||||||||||||
| Araceli Olea (41) | Assistant Secretary | 2008 | Shareholder Services Manager, Pacific Global Investor Services, Inc.; and Assistant Secretary, Pacific Global Investment Management Company and Pacific Global Investor Services, Inc. | ||||||||||||
| Jingjing Yan (40) | Treasurer | 2014 | Vice President and Treasurer, Pacific Global Investment Management Company; Treasurer, Pacific Global Fund Distributors, Inc. and Pacific Global Investor Services, Inc.; and formerly Assistant Treasurer (2005-2014). | ||||||||||||
1 Each director is elected to serve until the next annual shareholders meeting and until his or her successor is elected or appointed. The Company does not hold regular annual shareholders meetings to elect Directors. Vacancies on the Board can be filled by the action of a majority of the Directors, provided that at least two-thirds of the Directors have been elected by the shareholders.
2 "Interested persons" as defined in the 1940 Act, as amended, based on their affiliation with the Funds' investment manager and its affiliates (including the Funds' principal underwriter).
* Ms. Breen is considered an interested director because (a) she is a registered principal of a registered broker/dealer that engages in sales of Company shares under a selling agreement with the Distributor, and in that capacity she has received commissions on the sale of the Funds' shares; (b) she is an officer of the Company; and (c) she is a shareholder of the Manager and a member of the Manager's Board of Directors.
** Mr. Henning is considered an interested director because (a) he holds the positions described above with the Company, the Manager and its affiliates; (b) by virtue of his ownership of the Manager's shares he may be deemed a "control person" of the Manager; and (c) he is Ms. Henning's father.
82
Pacific Advisors Fund Inc.
notes
83
Pacific Advisors Fund Inc.
notes
84

Pacific Advisors Fund Inc.
Directors
George A. Henning, Chairman
Victoria L. Breen
L. Michael Haller, III
Peter C. Hoffman
Gerald E. Miller
Louise K. Taylor, Ph.D.
Officers
George A. Henning, President
Barbara A. Kelley, Vice President
Catherine L. Henning, Vice President and Secretary
Victoria L. Breen, Assistant Secretary
Araceli Olea, Assistant Secretary
Jingjing Yan, Treasurer
Investment Manager
Pacific Global Investment Management Company
101 North Brand Blvd., Suite 1950
Glendale, California 91203
Transfer Agent and Administrator
Pacific Global Investor Services, Inc.
101 North Brand Blvd., Suite 1950
Glendale, California 91203
Distributor
Pacific Global Fund Distributors, Inc.
101 North Brand Blvd., Suite 1950
Glendale, California 91203
(800) 989-6693
Availability of Quarterly Portfolio Schedule
The Fund files its complete schedule of portfolio holdings with the SEC for the first and third quarters of each fiscal year on Form N-Q. The Fund's Forms N-Q are available on the SEC's Web site at http://www.sec.gov. The Fund's Forms N-Q may be reviewed and copied at the SEC's Public Reference Room in Washington, DC. Information about the operation of the Public Reference Room may be obtained by calling the SEC at (800) SEC-0330.
The Fund's complete schedule of portfolio holdings for each fiscal quarter is posted on the Fund's Web site at www.PacificAdvisorsFund.com and is available without charge, upon request by calling (800) 989-6693. Documents will be sent within 3 business days of receipt of your request.
Availability of Proxy Voting Policies and Procedures and Proxy Voting Record
A description of the policies and procedures that the Fund uses to determine how to vote proxies relating to portfolio securities and information regarding how the Fund voted proxies relating to portfolio securities during the most recent 12-month period ended June 30 is available without charge, upon request by calling (800) 989-6693. Documents will be sent within 3 business days of receipt of your request. This information is also available on the SEC's Web site at http://www.sec.gov.

Pacific Global Fund Distributors, Inc.
101 North Brand Blvd., Suite 1950
Glendale, California 91203

Item 2. | Code of Ethics |
| Not applicable for semi-annual reports. |
|
|
Item 3. | Audit Committee Financial Expert |
| Not applicable for semi-annual reports. |
|
|
Item 4. | Principal Accountant Fees and Services |
| Not applicable for semi-annual reports. |
|
|
Item 5. | Audit Committee of Listed Registrants |
| Not applicable as Registrant is not a listed issuer as defined in Rule 10A-3 under the Securities Exchange Act of 1934. |
|
|
Item 6. | Schedule of Investments |
| Schedule of Investments is included as part of the report to shareholders filed under Item 1 of this form. |
|
|
Item 7. | Disclosure of Proxy Voting Policies and Procedures for Closed-End Management Investment Companies |
| Not applicable to open-end investment companies. |
|
|
Item 8. | Portfolio Managers of Closed-End Management Investment Companies |
| Not applicable to open-end investment companies. |
|
|
Item 9. | Purchases of Equity Securities by Managers of Closed-End Management Investment Company and Affiliated Purchasers. |
| Not applicable to open-end investment companies. |
|
|
Item 10. | Submission of Matters to a Vote of Security Holders |
| No material changes have been made. |
|
|
Item 11. | Controls and Procedures. |
| (a) Based upon their evaluation of Registrant’s disclosure controls and procedures (as defined in Rule 30a-3(c) under the Investment Company Act of 1940) as conducted within 90 days of the filing date of this Form N-CSR, Registrant’s principal executive officer and principal financial officer have concluded that those disclosure controls and procedures provide reasonable assurance that the material information required to be disclosed by Registrant on this report is recorded, processed, summarized and reported within the time periods specified in the Securities and Exchange Commission’s rules and forms. |
|
|
| (b) There were no changes in Registrant’s internal control over financial reporting (as defined in Rule 30a-3(d) under the Investment Company Act of 1940) that occurred during the second fiscal quarter of the period covered by this report that have materially affected, or are reasonably likely to materially affect, Registrant’s internal control over financial reporting. |
|
|
Item 12. | Exhibits |
| (a)(1) Not applicable. |
|
|
| (a)(2) Certifications required by Item 12(a) of Form N-CSR and Section 302 of the Sarbanes-Oxley Act of 2002 (filed herewith). |
|
|
| (a)(3) Not applicable. |
|
|
| (b) Certification required by Section 906 of the Sarbanes-Oxley Act of 2002 (filed herewith). |
SIGNATURES
Pursuant to the requirements of the Securities Exchange Act of 1934 and the Investment Company Act of 1940, Registrant has duly caused this report to be signed on its behalf by the undersigned, thereunto duly authorized.
Pacific Global Fund Inc. d/b/a Pacific Advisors Fund Inc. |
| |
|
|
|
By: | /s/ George A. Henning |
|
| George A. Henning |
|
| Chairman, Pacific Advisors Fund Inc. |
|
|
|
|
Date: | September 3, 2014 |
|
Pursuant to the requirements of the Securities Exchange Act of 1934 and the Investment Company Act of 1940, this report has been signed below by the following persons on behalf of Registrant and in the capacities and on the dates indicated.
By: | /s/ George A. Henning |
|
| George A. Henning |
|
| Chief Executive Officer |
|
|
|
|
Date: | September 3, 2014 |
|
|
|
|
By: | /s/ Jingjing Yan |
|
| Jingjing Yan |
|
| Chief Financial Officer |
|
|
|
|
Date: | September 3, 2014 |
|