UNITED STATES
SECURITIES AND EXCHANGE COMMISSION
Washington, D.C. 20549
FORM N-CSR
CERTIFIED SHAREHOLDER REPORT OF REGISTERED
MANAGEMENT INVESTMENT COMPANIES
Investment Company Act file number | 811-07062 | |||||||
| ||||||||
PACIFIC GLOBAL FUND INC. D/B/A PACIFIC ADVISORS FUND INC. | ||||||||
(Exact name of registrant as specified in charter) | ||||||||
| ||||||||
101 NORTH BRAND BLVD., SUITE 1950 GLENDALE, CALIFORNIA |
| 91203 | ||||||
(Address of principal executive offices) |
| (Zip code) | ||||||
| ||||||||
GEORGE A. HENNING 101 NORTH BRAND BLVD., SUITE 1950 GLENDALE, CA 91203 | ||||||||
(Name and address of agent for service) | ||||||||
| ||||||||
Registrant’s telephone number, including area code: | 818-242-6693 |
| ||||||
| ||||||||
Date of fiscal year end: | December 31 |
| ||||||
| ||||||||
Date of reporting period: | June 30, 2011 |
| ||||||
Item 1. | Report to Shareholders |
| Filed herewith. |


semi-annual report
june 30, 2011
government securities fund
income and equity fund
balanced fund
large cap value fund
mid cap value fund
small cap value fund

Pacific Advisors
table of contents
| Message from the Chairman | 1 | ||||||
| Government Securities Fund | 4 | ||||||
| Income and Equity Fund | 8 | ||||||
| Balanced Fund | 12 | ||||||
| Large Cap Value Fund | 16 | ||||||
| Mid Cap Value Fund | 20 | ||||||
| Small Cap Value Fund | 24 | ||||||
| Statement of Investments | 30 | ||||||
| Statement of Assets and Liabilities | 52 | ||||||
| Statement of Operations | 54 | ||||||
| Statement of Changes in Net Assets | 56 | ||||||
| Financial Highlights | 60 | ||||||
| Notes to Financial Statements | 67 | ||||||
| Directors and Officers | 76 | ||||||
This Report is submitted for the general information of the shareholders of Pacific Advisors Funds. It is not authorized for distribution to prospective investors unless accompanied or preceded by the Funds' copy of the prospectus, which contains information concerning the investment policies of the Funds as well as other pertinent information.
This Report is for informational purposes only and is not a solicitation, or the Funds' recommendation that any particular investor should purchase or sell any particular security. The statements in the Chairman's Letter and the discussions of the Funds' performance are the opinions and beliefs expressed at the time of this commentary and are not intended to represent opinions and beliefs at any other time. These opinions are subject to change at any time based on market or other conditions and are not meant as a market forecast. All economic and performance information referenced is historical. Past performance does not guarantee future results.
For more information on the Pacific Advisors Funds, including information on charges, expenses and other classes offered, please obtain a copy of the prospectus by calling (800) 989-6693. Please read the prospectus and consider carefully the investment risks, objectives, charges and expenses before you invest or send money. Shares of the Pacific Advisors Funds are not deposits or obligations of any bank, are not guaranteed by any bank, are not insured by the FDIC or any other agency, and involve investment risks, including the possible loss of the principal amount invested. The investment return and principal value of an investment will fluctuate so that an investor's shares, when redeemed, may be worth more or less than their original cost.

Message
from the chairman
Dear Shareholders,
Investor sentiment in the first half of the year seemed to be déjà vu all over again. In a repeat of 2010, the year began strongly as earnings results significantly beat market expectations. In May, however, the markets retreated largely in response to the Greek sovereign debt crisis. Investors also remained concerned about the prospects for economic growth and the completion of the Federal Reserve's QE2 stimulus package. Despite these headwinds, the markets rebounded as the first half of the year came to a close.
Disappointing economic data and the escalating European sovereign debt crisis tested investor fortitude. Yet, strong, well-managed companies continued to grow their businesses despite subdued economic growth; these companies were rewarded with higher market valuations. Dominant companies were able to benefit from industry growth, or, in some cases, from industry contraction as well as from geographic expansion; mergers and acquisitions; new product launches and operational improvements. Weaker counterparts were unable to keep pace.
Geopolitical and economic events around the world create a challenging investment environment. The cascade of headline news often paints a confusing picture. Investors must navigate a global economy that is highly interdependent even as individual countries govern their own economies. The resulting uncertainty reinforces the importance of a longer-term investment strategy focused on companies adept at managing in a diverse and ever-changing global economy. We believe the most capable firms are those with experienced management teams, solid financing and strong competitive positioning.
The slow recovery from the 2008 bear market continues to advance with ebbs and flows that are triggered by seemingly contradictory data. The volatility accompanying these events, while unsettling, can provide attractive opportunities to take profits or to buy at significant discounts. The specific investment discussions in the Fund commentaries highlight some of the situations that enabled the Funds to benefit from irrational market behavior.
Market & Economic Review
Markets enjoyed a solid first quarter as strong corporate profits inspired confidence in a global economic recovery. During the second quarter, various unsettling economic issues, sapped investor confidence and prompted a market pullback during the second quarter. These included the deterioration in domestic economic data, ongoing fears of a sovereign debt default in Europe, geopolitical unrest in North Africa, and the threat of a real estate bubble in China. Many investors, wary of taking on additional risk, moved from equities to safe-haven investments such as U.S. Treasuries. Then, at the end of June, the passage of austerity measures in Greece triggered a reversal of these trends and prompted a market rally during the final days of the quarter. In the first six months of 2011, the S&P 500 Index rose 6.02%.
GDP growth softened from 3.1% in the final quarter of 2010 to 0.4% in the first quarter. In the second quarter, GDP growth improved modestly but, at 1.3%, remained sluggish. Unusual factors, including severe weather disruptions in many parts of the country and supply chain constraints in Japan, likely distorted the underlying strength of the economy. At the same time, the economy faced continued challenges from the depressed housing market, rising inflationary pressures and persistently high unemployment. The Fed, in light of these trends, continued its accommodative monetary policy which kept interest rates at historic lows. Nervous investors, nevertheless, fled to the safety of U.S. government securities and investment grade corporate bonds. The increase in demand drove market interest rates lower.
Market Review – June 30, 2011
| Index1 | Close | YTD Return | |||||||||
| Dow Jones Industrial Avg | 12,414.34 | 7.20 | % | ||||||||
| S&P 500 | 1320.64 | 6.02 | % | ||||||||
| NASDAQ | 2773.52 | 4.55 | % | ||||||||
| Russell 2000 (small cap) | 827.43 | 6.21 | % | ||||||||
| 06/30/11 | 06/30/10 | ||||||||||
| 10-Year T-Note Yield | 3.18 | % | 2.97 | % | |||||||
Data: The Wall Street Journal
1 The Dow Jones Industrial Average is an unmanaged, price weighted measure of 30 U.S. stocks selected by the Averages Committee to represent the performance of all U.S. stocks outside the Transportation and Utilities sectors. The Standard & Poor's 500 Index is an unmanaged, market capitalization weighted index which measures the performance of the large cap segment of the U.S. equities market, covering approximately 75% of the U.S. equities market. The Index includes 500 leading companies in leading industries of the U.S. economy.The NASDAQ Composite Index is an unmanaged, market capitalization weighted measure of all domestic and international common stocks (currently over 3,000 stocks) listed on The Nasdaq Stock Market. The Russell 2000 Stock Index is an unmanaged, market-weighted measure of the 2,000 smallest publicly traded companies of the Russell 3000 Index. These indices are not available for direct investment. Index returns assume the reinvestment of dividends.

1


Message
from the chairman continued
Against a challenging economic backdrop, leading companies continued to deliver solid performance. Strong companies continued to benefit from diminished competition within their industries. Additionally, growing demand in certain markets provided opportunities for well-positioned firms. These trends reinforce the value of identifying companies with superior management teams. The ability of company management to navigate through challenges, identify opportunities and execute growth strategies is an important component in assessing a stock's appreciation potential.
Equity Investment Review
Performance of large, mid and small cap stocks varied during the first six months of 2011. By the end of June, however, their year-to-date performances were similar. Consistent with recent quarters, companies representing a range of industries contributed to portfolio gains for the Large Cap Value, Mid Cap Value and Small Cap Value Funds. In the first half of 2011, many companies began to shift their focus from cutting costs to implementing growth initiatives. The markets rewarded companies that demonstrated their ability to grow through acquisitions, new products, capital investments, or geographic expansion. The common characteristics among these companies are dominant positions in their markets, strong management teams and the financial resources to take advantage of growth opportunities.
In contrast, the slower pace of U.S. economic growth has taken its toll on weaker companies. In this recovery, they have not experienced the typical rebound in revenue; consequently, they have been unable to make the investments necessary to maintain market share. As a result, many sectors have contracted to a point where demand is exceeding supply.
For example, in the transportation industry, freight costs continue to escalate as carriers have regained pricing power from their customers. For car dealers, the decline in the number of U.S. dealerships has increased profitability in new and used car sales. We believe the slow growth economy will perpetuate this divergence.
Also, we are finding industry-specific opportunities. For example, higher energy prices reflect the increasing costs of finding oil. More supply is coming from offshore and remote locations which creates significant opportunities for specialized energy service companies. For investors, these examples are particularly important; investment performance will likely depend more on the quality of the individual portfolio holdings rather than on overall market performance.
Emerging countries remain the primary drivers of global economic growth. In addition to China, India and Brazil, as well as other Asian, South American and African nations are growing their economies. While the pace of growth in these countries may slow periodically, the opportunity for long-term growth is nevertheless substantial.
Geopolitical events will continue to play a significant role in the markets and in shaping the global economy. In particular, developments in the ongoing European financial crisis and unrest in the Middle East and North Africa will weigh heavily on the markets. Our investment focus, while not ignoring the relevance of these events, remains on individual companies that are well-positioned to grow despite the marketplace challenges. Many of these companies are still in the early stages of implementing their growth initiatives and, more importantly, of achieving their revenue and earnings growth potential.
Fixed Income Investment Review
Interest rate volatility continued throughout the first half of the year. Weaker U.S. economic data and international concerns had investors favoring U.S. government securities and high quality corporate bonds over equities for most of the period. The yield on the benchmark 10-year Treasury Note, which traded between 3.74% and 2.88% during the period, ended the second quarter at 3.18%.
Persistent uncertainty and the resulting interest rate volatility reinforce the importance of having active portfolio management. Fixed income holdings in the Funds were concentrated in short to intermediate-term bonds to protect against heightened interest rate volatility. Indeed, the significant spike in rates coinciding with the market rally at the end of June highlights the considerable risk of potential price depreciation on longer-term and higher yielding bonds. During the period, we continued to seek opportunities created by market volatility to purchase high quality bonds with attractive yields at discounted prices.
We expect interest rate volatility will persist as markets respond to uncertainty surrounding economic growth, inflation, and the European sovereign debt crisis. Longer-term, we believe market forces will ultimately drive a

2

Message
from the chairman
sustained rise in interest rates. Until a clear trend in interest rates emerges, however, we believe it is prudent to maintain a strategy of protecting principal by concentrating portfolios in high quality, shorter-term bonds.
Looking Ahead
Second quarter earnings season has seen many companies report strong growth and positive business outlooks. However, whatever optimism may have been generated by their commentaries has been overshadowed by other economic concerns. The debate over raising the U.S. debt ceiling has put more focus on growing budget deficits. And, not unlike a year ago, the slow pace of economic growth has also brought back the debate on a double dip recession.
In June, the Fed lowered its GDP growth expectations and raised its inflation forecast for 2011 and 2012. The slow housing market remains a drag on the economy and the unemployment levels. The reduction of government jobs has put additional pressure on employment conditions. Furthermore, smaller companies have been wary of aggressively hiring during the slow economic recovery; they continue to rely on fewer employees to get the job done. We believe, therefore, that a substantial improvement in employment will take some time.
Since the end of the second quarter, the equity markets have reversed course. Fears of a global recession re-emerged amid concerns about European banks' ability to manage the sovereign debt issues facing the most highly leveraged eurozone economies.
Near-term, the current slow-growth environment will likely persist; however, we do not believe a double dip recession is inevitable. Other factors portend a more positive environment in the second half of the year: a rapid recovery in Japan's manufacturing capacity should significantly contribute to global economic activity; the passage of pending trade pacts with South Korea, Colombia, and Panama would create new markets for American goods; and, business activity should bounce back in U.S. regions that were impacted by severe spring weather. However, we anticipate that the recovery will likely progress in fits and starts; as a result, overall market performance will likely remain unspectacular.
International economic and geopolitical concerns in Europe, the Middle East and Asia are contributing to heightened market volatility. Another significant contributor has been the emergence of High Frequency Trading which reportedly accounts for over 50% of daily trading volumes. These complex, automated computer trading platforms seek to take advantage of price movements. They can drive, and exacerbate, sharp movements in individual stocks or the overall market. Some estimates measure the average holding period for these 'investments' in seconds. The resulting wild market swings are disconcerting. These trading strategies, which do not consider company fundamentals, often distort the relationship between a company's value and its stock price. We believe that the proliferation of these short-term trading strategies will lead to a new norm of heightened volatility. Nevertheless, the Funds' long-term investment strategies can take advantage of this volatility to buy and sell at attractive prices.
We anticipate that companies' continued confidence in improving business conditions will drive increased investment and accelerated earnings growth. Leading companies remain significantly more competitive than industry laggards. This differential will likely widen as companies use cash reserves for strategic acquisitions and to expand their market presence. We believe many companies will continue to post solid results as they take advantage of industry-specific economic conditions to grow their businesses. Our investment strategy remains focused on the longer-term growth potential of the companies in the Funds' portfolios and their ability to manage through a variety of economic conditions. It is important to be vigilant to changing market conditions but respond in a manner consistent with the Funds' longer-term investment strategies. Over time, we believe this perspective will serve the Funds well.
Sincerely,

George A. Henning
The views expressed represent the opinions and beliefs at the time of this commentary and are not meant as a market forecast. These views are subject to change at any time based on market or other conditions. This information may not be relied on as investment advice or as an indication of trading intent on behalf of any Fund. Fund investments may change at any time. Economic and performance information referenced is historical and past performance does not guarantee future results.
3
Pacific Advisors
Government Securities Fund
Fund Objective: High current income, preservation of capital, and rising future income consistent with prudent investment risk.
Investment Invests at least 80% of its assets in U.S. Government fixed income
Strategy: securities. These include securities issued or guaranteed by the U.S. Treasury; issued by a U.S. Government agency; or issued by a Government-Sponsored Enterprise (GSE). May also invest in high quality dividend-paying common stocks.
Investor Profile: Conservative. Income-focused; capital preservation aim.
| TOTAL RETURNS | EXPENSE RATIOS | ||||||||||||||||||
| For the six months ended June 30, 2011 | For the fiscal year ended December 31, 2010 | ||||||||||||||||||
| Net Expense Ratio | Expense Ratio | ||||||||||||||||||
| Class A | 0.66 | % | Class A | 2.09 | % | 3.69 | % | ||||||||||||
| Class C | 0.33 | % | Class C | 2.80 | % | 4.42 | % | ||||||||||||
| Barclays Capital U.S. Int T-Bond Index1 | 2.10 | % | |||||||||||||||||
Performance quoted is past performance which does not guarantee future results. Current performance may be higher or lower than the performance quoted. Call (800) 989-6693 for performance current to the most recent month-end. The investment return and principal value of an investment will fluctuate so that an investor's shares, when redeemed, may be worth more or less than their original cost. Returns represent the change in value over the stated period assuming reinvestment of dividends and capital gains at net asset value. Returns do not take into account the maximum 4.75% sales charge on Class A shares or the 1% Contingent Deferred Sales Charge (CDSC) for Class C shares sold within one year of purchase. Returns would be lower if the applicable sales charge and CDSC were included. Returns do not take into account individual taxes which may reduce actual returns when shares are sold.
The Fund's investment adviser is waiving a portion of its management fees pursuant to an Expense Limitation Agreement. The waiver may be discontinued at any time with ninety days written notice in consultation with the Fund's board, but is expected to continue at current levels. Please see the Fund's most recent Annual Report for details. Performance shown reflects the waiver, without which the results would have been lower.
Discussion with Portfolio Manager August 19, 2011
Jingjing Yan, CFA
Please see the Chairman's Letter at the beginning of this Report for a detailed market and economic review
as well as the Manager's general market outlook.
Fund Performance
The Fund is designed for conservative long-term investors and those with shorter investment horizons who need current income. Accordingly, the Fund seeks to protect capital while using a total return approach to provide current income. Economic uncertainty and the resulting interest rate volatility during the first half of the year reinforced the importance of active portfolio management. In implementing the Fund's strategy of preserving capital and minimizing portfolio volatility, holdings remained concentrated in short to intermediate-term bonds. This strategy was effective in reducing the Fund's sensitivity to interest rate changes.
The Fund's exposure to interest rate volatility can be measured by its "duration": the shorter the duration, the less sensitive an investment is to interest rate movements. For example, if market interest rates rise 0.75%, a portfolio with a 4-year duration would be expected to lose approximately 3% of its value. To protect principal, the Fund maintained an average duration of approximately 1 year.
1 The Barclays Capital U.S. Intermediate Treasury Bond Index is an unmanaged index of U.S. government securities with one to ten years to maturity. It is not possible to invest directly in the Index.
4
For the six-month period, the Fund's Class A shares returned 0.66% in comparison to 2.10% for its benchmark, the Barclay Capital U.S. Intermediate T-Bond Index. Unlike the Fund, however, the benchmark is an unmanaged portfolio. Also, with an average duration of 3.7 years, its exposure to interest rate changes is significantly greater than the Fund's.
Market Overview
Interest rates, under pressure from competing forces, remained volatile throughout the first half of the year. In the first quarter, the strength of the global economy and concerns about the U.S. fiscal deficit initially pushed interest rates higher. However, downward pressure on interest rates escalated throughout the quarter. Geopolitical unrest, the earthquake in Japan, and the European sovereign debt crisis heightened the demand for safety; as a result, investors' interest in U.S. government securities ballooned.
For most of the second quarter, weaker U.S. economic data and international concerns had investors favoring U.S. government securities over equities. Interest rates, however, spiked at the end of June when investors anticipated a resolution to the sovereign debt crisis in Greece. The yield on the benchmark 10-year Treasury Note, which traded between 3.74% and 2.88% during the first half of the year, ended the period at 3.18%.
Fund Strategy
Fixed Income Strategy
The turbulent interest rate environment continued to warrant a defensive strategy. Long-term bonds, which offered the most attractive yields, also carried the greatest risk of principal losses due to changes in interest rates. In order to protect principal, the Fund continued to concentrate in shorter-term government securities.
In particular, the Fund continued to focus on one-time callable government agency bonds. These bonds provided better yields than short-term Treasuries, yet, due to the call feature, they also have a short expected life. That is, these bonds can be called back on one specific date prior to maturity. If the bonds are not called back, they instead convert to non-callable bonds with higher interest rates. Investors face the risk that, if interest rates on the call date have fallen, or if they remained relatively unchanged, or even if they are modestly higher, the bonds would be called back. In exchange for the call feature, these investors received the benefit of a higher yield. The Fund also invested in shorter-term government agency bonds with yields that increase at fixed intervals over the life of the bond. These "step-up bonds" also help protect principal while providing increasing income.
Given the low interest rate environment, many other government funds have utilized more aggressive investments, such as leverage or mortgage-backed securities, to enhance return. We do not believe, however, that the risks associated with these strategies are appropriate for the Fund's more conservative investors. Alternatively, we continued to surface less well-known, risk-appropriate investments that provided the best total return potential in this challenging environment.
Equity Positioning
The Fund invests a minor portion of its portfolio in high quality, dividend-paying stocks. These equity holdings help provide stability for the Fund by counterbalancing price movements in the fixed income markets. In addition to providing meaningful income (with a current weighted average dividend yield of approximately 4.0%), the Fund's equity investments offer capital appreciation potential. As evidenced by the Fund's average one-year beta2 of 0.07, versus the S&P 500 Index3, these equity investments do not significantly increase risk.
2 "Beta" measures volatility relative to the stock market or an alternative benchmark. A beta less than 1.0 indicates lower risk than the market or the benchmark and a beta greater than 1.0 indicates higher risk than the market or the benchmark.
3 The Standard & Poor's 500 Index is an unmanaged, market capitalization weighted measure of 500 widely held common stocks listed on the New York and American Stock Exchanges and The Nasdaq Stock Market. It is not possible to invest directly in the Index.
5
Pacific Advisors
Government Securities Fund continued
During the first half of the year, common stock holdings continued to represent approximately 12% of the portfolio. Higher dividend yields provided a conservative alternative to bonds and helped enhance total return. Equity investments included stocks such as AT&T and Consolidated Edison, with yields of 5.5% and 4.5%, respectively. Additionally, the Fund's equity investments include consumer staples companies, such as Kimberly-Clark, which are less sensitive to economic changes; and blue-chip stocks, such as Chevron, with excellent growth prospects and capital appreciation potential.
Looking Ahead
We expect interest rates will remain volatile in response to conflicting economic pressures. Near-term, interest rates may remain low. Concerns about inflation or the federal deficit would typically drive interest rates higher to compensate for increased risk. On the other hand, investors will likely respond to troubling economic and geopolitical developments by fleeing to the safety of U.S. Treasuries. Presently, however, investors' desire for safety will likely have a greater influence on interest rates.
Yet, as long as interest rates remain at historical lows the risk of a market-driven jump in interest rates remains significant. Ultimately, market forces will drive interest rates higher. The timing of, and catalyst for, the market reaction cannot be predicted; but history shows that rates typically rise quickly and with little warning. Furthermore, the significant spike in rates at the end of June highlights the considerable risk of price depreciation on longer-term and higher yielding bonds.
Given interest rate volatility, the Fund will maintain its strategy to protect principal by concentrating in shorter-term bonds. When a clear trend in interest rates emerges, we will reallocate to longer-term bonds to lock in higher yields and appreciation potential. In the interim, we anticipate maintaining the Fund's equity allocation to help minimize volatility while providing favorable dividend income and the potential for price appreciation.
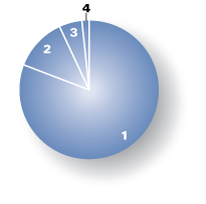
Portfolio Holdings as of 06/30/11 (Based on Total Investments)
| 1. U.S. Government Agencies | 80.95 | % | |||||
| 2. Equities | 12.34 | % | |||||
| 3. Preferred Stock | 5.30 | % | |||||
| 4. Cash and Cash Equivalents | 1.41 | % | |||||
6
Expense Examples
As a shareholder of the Fund you incur two types of costs: (1) transaction costs, including sales charges (loads) on purchase payments, reinvested dividends, or other distributions; redemption fees; and exchange fees; and (2) ongoing costs, including management fees; distribution (12b-1) fees; and other Fund expenses. This Example is intended to help you understand your ongoing costs (in dollars) of investing in the Fund and to compare these costs with the ongoing costs of investing in other mutual funds.
The Example is based on an investment of $1,000 invested at the beginning of the period and held for the entire period from January 1, 2011 through June 30, 2011.
Actual Expenses
The first line of the table below provides information about actual account values and actual expenses. You may use the information in this line, together with the amount you invested, to estimate the expenses that you paid over the period. Simply divide your account value by $1,000 (for example, an $8,600 account value divided by $1,000 = 8.6), then multiply the result by the number in the first line under the heading entitled "Expenses Paid During the Period" to estimate the expenses you paid on your account during the period.
The following transaction costs are not included in the expenses shown in the table and, if applicable, would increase the expenses that you paid over the period: (1) a front-end sales charge (load) of 4.75% on Class A shares; (2) a 2% redemption fee if you sell or exchange shares within 30 days of purchase, with certain exceptions. The redemption fee does not apply to: (a) redemptions under an automatic withdrawal program or periodic asset reallocation plan, required minimum distributions (RMD), employer mandated distributions from a qualified plan, or redemptions under a qualified domestic relations order (QDRO); (b) redemptions to pay for expenses related to terminal illness, extended hospital or nursing home care, or other serious medical conditions, including death; (c) redemptions of shares acquired through dividend or capital gains reinvestments; (d) loans from a qualified plan account; and (e) redemptions initiated by the Fund; and (3) a $10 service fee on each exchange after the first five exchanges in each calendar year.
The following ongoing costs are not included in the expenses shown in the table and, if applicable, would increase the expenses that you paid over the period: (1) a $12 low balance fee on accounts with balances of less than $250 as of September 30th of each calendar year and no investment activity (excluding reinvestment of dividends and/or capital gains) during the prior calendar year or the first nine months of the current calendar year. This fee does not apply to IRAs, qualified plan accounts, or Coverdell Education Savings Accounts; (2) a $15 annual custodial fee on IRAs, SEPs, SIMPLE IRAs, and Coverdell Education Savings Accounts; and (3) a $20 annual custodial fee on 403(b) accounts.
Hypothetical Example for Comparison Purposes
The second line of the table below provides information about hypothetical account values and hypothetical expenses based on the Fund's actual expense ratio and an assumed rate of return of 5% per year before expenses, which in not the Fund's actual return. The hypothetical account values and expenses may not be used to estimate the actual ending account balance or expenses you paid for the period. You may use this information to compare the ongoing costs of investing in the Fund and other funds. To do so, compare this 5% hypothetical example with the 5% hypothetical examples that appear in the shareholder reports of the other funds.
The following transaction costs are not included in the expenses shown in the table and, if applicable, would increase the expenses that you paid over the period: (1) a front-end sales charge (load) of 4.75% on Class A shares; (2) a 2% redemption fee if you sell or exchange shares within 30 days of purchase, with certain exceptions. The redemption fee does not apply to: (a) redemptions under an automatic withdrawal program or periodic asset reallocation plan, required minimum distributions (RMD), employer mandated distributions from a qualified plan, or redemptions under a qualified domestic relations order (QDRO); (b) redemptions to pay for expenses related to terminal illness, extended hospital or nursing home care, or other serious medical conditions, including death; (c) redemptions of shares acquired through dividend or capital gains reinvestments; (d) loans from a qualified plan account; and (e) redemptions initiated by the Fund; and (3) a $10 service fee on each exchange after the first five exchanges in each calendar year.
The following ongoing costs are not included in the expenses shown in the table and, if applicable, would increase the expenses that you paid over the period: (1) a $12 low balance fee on accounts with balances of less than $250 as of September 30th of each calendar year and no investment activity (excluding reinvestment of dividends and/or capital gains) during the prior calendar year or the first nine months of the current calendar year. This fee does not apply to IRAs, qualified plan accounts, or Coverdell Education Savings Accounts; (2) a $15 annual custodial fee on IRAs, SEPs, SIMPLE IRAs, and Coverdell Education Savings Accounts; and (3) a $20 annual custodial fee on 403(b) accounts.
Please note that the expenses shown in the table are meant to highlight your ongoing costs only and do not reflect any transactional costs, such as sales charges (loads), redemption fees, or exchange fees. Therefore, the second line of the table is useful in comparing ongoing costs only, and will not help you determine the relative total costs of owning different funds. In addition, if these transactional costs were included, your costs would have been higher.
| Beginning Account Value 01/01/11 | Ending Account Value 06/30/11 | Expense Paid During Period 01/01/11 – 06/30/11 | |||||||||||||
| Government Securities Fund Class A | |||||||||||||||
| Actual | $ | 1,000.00 | $ | 1,006.60 | $ | 12.09 | |||||||||
| Hypothetical (5% return before expense) | $ | 1,000.00 | $ | 1,012.74 | $ | 12.13 | |||||||||
| Government Securities Fund Class C | |||||||||||||||
| Actual | $ | 1,000.00 | $ | 1,003.30 | $ | 15.80 | |||||||||
| Hypothetical (5% return before expense) | $ | 1,000.00 | $ | 1,009.03 | $ | 15.84 | |||||||||
3 Expenses are equal to the Fund's annualized expense ratio, net of expense waivers, of 2.43% for Class A shares and 3.18% for Class C shares, multiplied by the average account value over the period, multiplied by 181/365 days to reflect the one-half year period.
7
Pacific Advisors
Income and Equity Fund
Fund Objective: Current income and, secondarily, long-term capital appreciation.
Investment Invests primarily in investment grade U.S. corporate bonds and in dividend-paying
Strategy: stocks.
Investor Profile: Conservative. Some current income required; capital preservation aim.
| TOTAL RETURNS | EXPENSE RATIOS | ||||||||||||||||||
| For the six months ended June 30, 2011 | For the fiscal year ended December 31, 2010 | ||||||||||||||||||
| Net Expense Ratio | Expense Ratio | ||||||||||||||||||
| Class A | 3.44 | % | Class A | 2.34 | % | 3.09 | % | ||||||||||||
| Class C | 3.09 | % | Class C | 3.07 | % | 3.82 | % | ||||||||||||
| Barclays Capital U.S. Int Corp Bond Index1 | 3.26 | % | |||||||||||||||||
| S&P 500 Index2 | 6.02 | % | |||||||||||||||||
Performance quoted is past performance which does not guarantee future results. Current performance may be higher or lower than the performance quoted. Call (800) 989-6693 for performance current to the most recent month-end. The investment return and principal value of an investment will fluctuate so that an investor's shares, when redeemed, may be worth more or less than their original cost. Returns represent the change in value over the stated period assuming reinvestment of dividends and capital gains at net asset value. Returns do not take into account the maximum 4.75% sales charge on Class A shares or the 1% Contingent Deferred Sales Charge (CDSC) for Class C shares sold within one year of purchase. Returns would be lower if the applicable sales charge and CDSC were included. Returns do not take into account individual taxes which may reduce actual returns when shares are sold.
The Fund's investment adviser is waiving a portion of its management fees pursuant to an Expense Limitation Agreement. The waiver may be discontinued at any time with ninety days written notice in consultation with the Fund's board, but is expected to continue at current levels. Please see the Fund's most recent Annual Report for details. Performance shown reflects the waiver, without which the results would have been lower.
Discussion with Portfolio Managers August 19, 2011
Charles Suh, CFA
Jingjing Yan, CFA
Please see the Chairman's Letter at the beginning of this Report for a detailed market and economic review
as well as the Manager's general market outlook.
Fund Performance
During the first half of 2011, the Fund effectively minimized the impact of interest rate volatility due to heightened global and domestic economic uncertainty. For the period, Class A shares returned 3.44%. The Fund achieved this performance with substantially reduced volatility in comparison to the broader market, as evidenced by its average one-year beta3 of 0.29 versus the S&P 500 Index.
Interest rate volatility combined with a low interest rate environment continued to warrant a conservative strategy. Fixed income holdings, therefore, remained concentrated in short to intermediate-term investment grade bonds. The Fund avoided longer-term bonds; while these bonds offered higher
1 The Barclays Capital U.S. Intermediate Corporate Bond Index is an unmanaged index of publicly issued investment grade U.S. corporate bonds with one to ten years to maturity. It is not possible to invest directly in the Index.
2 The Standard & Poor's 500 Index is an unmanaged, market capitalization weighted index which measures the performance of the large cap segment of the U.S. equities market, covering approximately 75% of the U.S. equities market. The Index includes 500 leading companies in leading industries of the U.S. economy. Index returns assume the reinvestment of dividends, but, unlike the Fund's returns, do not reflect the effects of management fees or expenses. It is not possible to invest directly in the Index.
3 "Beta" measures volatility relative to the stock market or an alternative benchmark. A beta less than 1.0 indicates lower risk than the market or the benchmark and a beta greater than 1.0 indicates higher risk than the market or the benchmark.
8
yields, they represented too much risk to principal. High quality dividend-paying common stocks remained a risk-appropriate alternative to help support the Fund's total return.
The Fund's blend of fixed income and equity securities suggests that its performance be viewed against a blend of its benchmarks. Notably, the Fund outperformed Barclays Capital U.S. Intermediate Corporate Bond Index while maintaining a substantially shorter average maturity of 3.3 years. The average maturity for the Index was 5.2 years. The Fund's equity holdings are selected for stable growth. The concentration in these conservative, low volatility stocks accounted for the Fund's lower performance relative to the S&P 500 Index.
Fund Strategy
We actively manage the Fund's fixed income and equity allocations to take advantage of the best risk-appropriate opportunities for income and growth. We typically increase exposure to equities when a positive economic climate presents good capital appreciation opportunities and dividend income.
During the first half of 2011, interest rate volatility increased dramatically. Global uncertainty grew amid myriad economic crosswinds: the expiration of QE2; geopolitical unrest in North Africa and the Middle East; escalating inflationary pressures; an economic slowdown in China; fallout from the earthquake in Japan; and the European sovereign debt crisis. Interest rates spiked in response. The impact on bond prices posed a significant threat to longer-term bond holders. To protect against this volatility, the Fund's fixed income holdings remained concentrated in high-quality bonds with short maturities.
To minimize price volatility, and in response to a relatively positive economic outlook, we increased the Fund's equity allocation from approximately 41% to 44%. The higher equity allocation allowed the Fund to take advantage of opportunities in the equity market for capital appreciation and dividend income without significantly increasing risk. In fact, the Fund's average dividend rate is 3.74% with more than 60% of the Fund's equity holdings paying a dividend in excess of 3.0%. The Fund also benefited from capital appreciation in these superior companies. For example, AT&T appreciated 6.9% during the period in addition to paying a dividend of 5.50%. Other holdings with outstanding dividend rates in excess of 4.0% include Altria Group, Xcel Energy, Public Service Enterprise Group, and Duke Energy.
Fixed Income Strategy
Attractive investment opportunities in high quality corporate bonds remained limited. Low interest rates kept the spread between Treasuries and corporate bonds unusually narrow; as a result, corporate bonds offered low yields with higher risk in comparison to Treasuries. In this challenging environment, we were nevertheless able to benefit from temporary market unrest and purchase investment grade bonds at higher rates.
For example, with inflationary pressures rising, floating rate bonds linked to the Consumer Price Index (CPI) became more attractive in the first quarter. Our active management efforts surfaced a deeply discounted, CPI-linked bond from Prudential Financial with a current interest rate of 5.6%. Also, in the second quarter, we selectively added high-quality fixed rate bonds from solid companies including MDC Holdings and Reliance Steel. These bonds, each with approximately three to five-year maturities, provided yields of more than 4.0%.
Overall, the Fund remained focused on intermediate-term (approximately three to five years) investment grade corporate bonds. To protect principal, we actively managed the portfolio to maintain an average maturity of approximately 3.3 years. This strategy also provides the Fund with the flexibility to adapt to changes in the economic environment.
Consistent with its conservative orientation, the Fund did not invest in speculative or aggressive investments such as derivatives, leverage or high-yield "junk" bonds to enhance total return. Increasing the Fund's allocation to high quality dividend-paying stocks provided a more appropriate means to both seek additional income and capture price appreciation potential.
9
Pacific Advisors
Income and Equity Fund continued
Equity Strategy
The Fund's equity holdings focus on superior, well-established companies across various sectors and industries. The increase in the equity allocation during the first half of the year resulted from appreciation in the Fund's holdings as well as new acquisitions. In the first quarter, we took advantage of the market rally to trim positions in Johnson & Johnson and Home Depot. Proceeds from these sales were reallocated to new holdings such as Pitney Bowes, the world's largest provider of mailing solutions, and Vodafone, a telecommunications firm that owns a 45% stake in Verizon Wireless. These companies stand to benefit from renewed demand in their industries; they also pay dividend rates of 6.5% and 5.4%, respectively.
Several Fund holdings, including Pfizer, McDonald's, Automatic Data Processing and Sysco, also provided meaningful capital appreciation. In particular, McDonald's benefitted from increasing sales in the U.S. as well as emerging markets such as China. Automatic Data Processing shares appreciated substantially as demand for its payroll processing services rebounded.
Looking Ahead
We expect interest rate volatility will increase near-term. Market uncertainty surrounding economic growth, rising inflationary pressures, the European sovereign debt crisis, and Federal Reserve policy will likely continue to produce rapid, but short-lived, interest rate movements. This underlying uncertainty and the resulting volatility reinforce the importance of active portfolio management.
Long-term, we expect market forces will ultimately lead to a rise in interest rates. However, until a clear trend emerges, the Fund will maintain a strategy focused on protecting principal. To minimize the impact of interest changes, the fixed income portfolio will remain concentrated on shorter-term investment grade bonds; also, the Fund will maintain a higher equity allocation. We will continue to be opportunistic, seeking both high-quality corporate bonds with attractive yields and superior large cap stocks with outstanding dividend income.
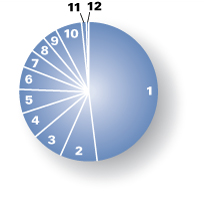
Portfolio Holdings as of 06/30/11 (Based on Total Investments)
| 1. | Corporate Bonds | 48.27 | % | ||||||||
| Equities | 44.21 | % | |||||||||
| 2. | Consumer Discretionary | 8.51 | % | ||||||||
| 3. | Consumer Staples | 7.18 | % | ||||||||
| 4. | Industrials | 6.25 | % | ||||||||
| 5. | Health Care | 5.50 | % | ||||||||
| 6. | Telecommunication Services | 5.33 | % | ||||||||
| 7. | Utilities | 4.07 | % | ||||||||
| 8. | Information Technology | 3.78 | % | ||||||||
| 9. | Others | 3.59 | % | ||||||||
| 10. | Preferred Stock | 6.05 | % | ||||||||
| 11. | U.S. Government Agencies | 1.13 | % | ||||||||
| 12. | Cash and Cash Equivalents | 0.34 | % | ||||||||
10
Expense Examples
As a shareholder of the Fund you incur two types of costs: (1) transaction costs, including sales charges (loads) on purchase payments, reinvested dividends, or other distributions; redemption fees; and exchange fees; and (2) ongoing costs, including management fees; distribution (12b-1) fees; and other Fund expenses. This Example is intended to help you understand your ongoing costs (in dollars) of investing in the Fund and to compare these costs with the ongoing costs of investing in other mutual funds.
The Example is based on an investment of $1,000 invested at the beginning of the period and held for the entire period from January 1, 2011 through June 30, 2011.
Actual Expenses
The first line of the table below provides information about actual account values and actual expenses. You may use the information in this line, together with the amount you invested, to estimate the expenses that you paid over the period. Simply divide your account value by $1,000 (for example, an $8,600 account value divided by $1,000 = 8.6), then multiply the result by the number in the first line under the heading entitled "Expenses Paid During the Period" to estimate the expenses you paid on your account during the period.
The following transaction costs are not included in the expenses shown in the table and, if applicable, would increase the expenses that you paid over the period: (1) a front-end sales charge (load) of 4.75% on Class A shares; (2) a 2% redemption fee if you sell or exchange shares within 30 days of purchase, with certain exceptions. The redemption fee does not apply to: (a) redemptions under an automatic withdrawal program or periodic asset reallocation plan, required minimum distributions (RMD), employer mandated distributions from a qualified plan, or redemptions under a qualified domestic relations order (QDRO); (b) redemptions to pay for expenses related to terminal illness, extended hospital or nursing home care, or other serious medical conditions, including death; (c) redemptions of shares acquired through dividend or capital gains reinvestments; (d) loans from a qualified plan account; and (e) redemptions initiated by the Fund; and (3) a $10 service fee on each exchange after the first five exchanges in each calendar year.
The following ongoing costs are not included in the expenses shown in the table and, if applicable, would increase the expenses that you paid over the period: (1) a $12 low balance fee on accounts with balances of less than $250 as of September 30th of each calendar year and no investment activity (excluding reinvestment of dividends and/or capital gains) during the prior calendar year or the first nine months of the current calendar year. This fee does not apply to IRAs, qualified plan accounts, or Coverdell Education Savings Accounts; (2) a $15 annual custodial fee on IRAs, SEPs, SIMPLE IRAs, and Coverdell Education Savings Accounts; and (3) a $20 annual custodial fee on 403(b) accounts.
Hypothetical Example for Comparison Purposes
The second line of the table below provides information about hypothetical account values and hypothetical expenses based on the Fund's actual expense ratio and an assumed rate of return of 5% per year before expenses, which in not the Fund's actual return. The hypothetical account values and expenses may not be used to estimate the actual ending account balance or expenses you paid for the period. You may use this information to compare the ongoing costs of investing in the Fund and other funds. To do so, compare this 5% hypothetical example with the 5% hypothetical examples that appear in the shareholder reports of the other funds.
The following transaction costs are not included in the expenses shown in the table and, if applicable, would increase the expenses that you paid over the period: (1) a front-end sales charge (load) of 4.75% on Class A shares; (2) a 2% redemption fee if you sell or exchange shares within 30 days of purchase, with certain exceptions. The redemption fee does not apply to: (a) redemptions under an automatic withdrawal program or periodic asset reallocation plan, required minimum distributions (RMD), employer mandated distributions from a qualified plan, or redemptions under a qualified domestic relations order (QDRO); (b) redemptions to pay for expenses related to terminal illness, extended hospital or nursing home care, or other serious medical conditions, including death; (c) redemptions of shares acquired through dividend or capital gains reinvestments; (d) loans from a qualified plan account; and (e) redemptions initiated by the Fund; and (3) a $10 service fee on each exchange after the first five exchanges in each calendar year.
The following ongoing costs are not included in the expenses shown in the table and, if applicable, would increase the expenses that you paid over the period: (1) a $12 low balance fee on accounts with balances of less than $250 as of September 30th of each calendar year and no investment activity (excluding reinvestment of dividends and/or capital gains) during the prior calendar year or the first nine months of the current calendar year. This fee does not apply to IRAs, qualified plan accounts, or Coverdell Education Savings Accounts; (2) a $15 annual custodial fee on IRAs, SEPs, SIMPLE IRAs, and Coverdell Education Savings Accounts; and (3) a $20 annual custodial fee on 403(b) accounts.
Please note that the expenses shown in the table are meant to highlight your ongoing costs only and do not reflect any transactional costs, such as sales charges (loads), redemption fees, or exchange fees. Therefore, the second line of the table is useful in comparing ongoing costs only, and will not help you determine the relative total costs of owning different funds. In addition, if these transactional costs were included, your costs would have been higher.
| Beginning Account Value 01/01/11 | Ending Account Value 06/30/11 | Expense Paid During Period 01/01/11 – 06/30/11 | |||||||||||||
| Income & Equity Fund Class A | |||||||||||||||
| Actual | $ | 1,000.00 | $ | 1,034.40 | $ | 12.71 | |||||||||
| Hypothetical (5% return before expense) | $ | 1,000.00 | $ | 1,012.30 | $ | 12.57 | |||||||||
| Income & Equity Fund Class C | |||||||||||||||
| Actual | $ | 1,000.00 | $ | 1,030.90 | $ | 16.47 | |||||||||
| Hypothetical (5% return before expense) | $ | 1,000.00 | $ | 1,008.58 | $ | 16.29 | |||||||||
4 Expenses are equal to the Fund's annualized expense ratio, net of expense waivers, of 2.52% for Class A shares and 3.27% for Class C shares, multiplied by the average account value over the period, multiplied by 181/365 days to reflect the one-half year period.
11
Pacific Advisors
Balanced Fund
Fund Objective: Long-term capital appreciation and income consistent with reduced risk.
Investment Invests primarily in large cap common stocks and investment grade
Strategy: U.S. corporate bonds. Invests at least 25% of its assets in fixed income securities and preferred stocks and at least 25% in equities.
Investor Profile: Moderately conservative. Seeks combination of long-term growth, income, liquidity and reduced risk of price fluctuations.
| TOTAL RETURNS | EXPENSE RATIOS | ||||||||||||||||||
| For the six months ended June 30, 2011 | For the fiscal year ended December 31, 2010 | ||||||||||||||||||
| Class A | 4.81 | % | Class A | 2.77 | % | ||||||||||||||
| Class C | 4.41 | % | Class C | 3.50 | % | ||||||||||||||
| S&P 500 Index1 | 6.02 | % | |||||||||||||||||
| Barclays Capital U.S. Int Corp Bond Index2 | 3.26 | % | |||||||||||||||||
Performance quoted is past performance which does not guarantee future results. Current performance may be higher or lower than the performance quoted. Call (800) 989-6693 for performance current to the most recent month-end. The investment return and principal value of an investment will fluctuate so that an investor's shares, when redeemed, may be worth more or less than their original cost. Returns represent the change in value over the stated period assuming reinvestment of dividends and capital gains at net asset value. Returns do not take into account the maximum 5.75% sales charge on Class A shares or the 1% Contingent Deferred Sales Charge (CDSC) for Class C shares sold within one year of purchase. Returns would be lower if the applicable sales charge and CDSC were included. Returns do not take into account individual taxes which may reduce actual returns when shares are sold.
Discussion with Portfolio Managers August 19, 2011
Samuel C. Coquillard
Charles Suh, CFA
Jingjing Yan, CFA
Please see the Chairman's Letter at the beginning of this Report for a detailed market and economic review
as well as the Manager's general market outlook.
Fund Performance
The Fund is designed to enable conservative investors to participate in the equity markets with limited risk. We actively manage the Fund's equity and fixed income allocations based on our general economic outlook and identification of risk-appropriate investments. We believe this approach provides opportunities to take advantage of specific growth opportunities in the market while also minimizing the Fund's price volatility.
During the first half of 2011, the Fund's Class A shares gained 4.81% which closely tracked the benchmarks. Overall market volatility remained elevated in reaction to geopolitical unrest in the Middle East and North Africa, the catastrophic earthquake and tsunami in Japan and the Greek sovereign debt crisis. Also, the markets reflected concerns over trends suggesting a modest economic slowdown in the U.S. and China. In contrast, the level of volatility in the Fund was significantly lower; the Fund's average one-year beta3 of 0.64 compared favorably to the S&P 500 Index.
1 The Standard & Poor's 500 Index is an unmanaged, market capitalization weighted index which measures the performance of the large cap segment of the U.S. equities market, covering approximately 75% of the U.S. equities market. The Index includes 500 leading companies in leading industries of the U.S. economy. Index returns assume the reinvestment of dividends, but, unlike the Fund's returns, do not reflect the effects of management fees or expenses. It is not possible to invest directly in the Index.
2 The Barclays Capital U.S. Intermediate Corporate Bond Index is an unmanaged index of publicly issued investment grade U.S. corporate bonds with one to ten years to maturity. It is not possible to invest directly in the Index.
3 "Beta" measures volatility relative to the stock market or an alternative benchmark. A beta less than 1.0 indicates lower risk than the market or the benchmark and a beta greater than 1.0 indicates higher risk than the market or the benchmark.
12
The Fund's conservative strategy served it well in the first half of the year. Defensive equity and fixed income holdings acted as ballast during market pullbacks. At the same time, strong stock selection in sectors benefitting from economic recovery such as Energy and Industrials delivered favorable returns. Holdings including Halliburton, National Oilwell Varco, CSX, and Norfolk Southern contributed to strong gains in these areas. Financials also performed well; American Express, in particular, benefited from a recovery in consumer spending.
Fund Strategy
The Fund's conservative strategy seeks to provide long-term capital appreciation with reduced risk and volatility. We actively manage the allocation between equity and fixed income investments to seek the best opportunities for total return. In the first half of the year, the Fund's equity allocation remained at approximately 73%.
The Fund's equity investments focus on large, multinational companies that combine stability and growth. During the first half of 2011, and given continuing evidence of economic recovery, we marginally increased the Fund's exposure to those companies expected to benefit from an improving economy.
The Fund's fixed income investments primarily focus on investment grade corporate bonds supplemented by high quality preferred stocks. The fixed income portfolio is actively managed based on our outlook for interest rates. The Fund continued to invest in short-term debt instruments during the period; we believed that the risks associated with higher yielding instruments were inconsistent with the Fund's objectives.
Equity Strategy
The Fund utilizes a long-term, value-oriented equity strategy. Accordingly, it maintains a concentrated portfolio of high quality companies with dominant market positions, superior management teams, and exceptional growth prospects.
During the first half of the year, we continued to see evidence of a sustainable, albeit slow, economic recovery. Leading companies continue to significantly outperform industry laggards. This differential will likely widen as stronger companies use their cash reserves to expand their market positions through strategic acquisitions and other initiatives. Therefore, while economic challenges remain, our strategy of focusing on individual companies and identifiable industry trends has successfully identified growth opportunities.
The Fund added two new equity positions: Dow Chemical and Qualcomm. Dow Chemical is a leading manufacturer of industrial materials including plastics and petrochemicals. The recent acceleration of domestic natural gas supplies has significantly reduced the company's costs to power its plants; as a result, the company has gained a cost advantage in the global marketplace. Additionally, Dow has announced plans to expand and build new manufacturing plants to further capitalize on its position. Chip manufacturer Qualcomm is a primary beneficiary of the emerging smartphone and tablet PC trends; its technology increasingly powers the most popular devices, including the iPhone. We believe mobile computing represents the next evolution in personal and enterprise technology.
We also see significant value in existing holdings including Best Buy, CSX, Halliburton, and Microsoft. Best Buy's strategy is also capitalizing on emerging technology trends. In particular, the company is focused on delivering ease-of-use for connected devices such as mobile phones and home networks. CSX continues to enjoy strong volume and pricing gains due to improved railroad efficiency; also, high gas prices deter the use of long-haul trucks. Halliburton's North American land drilling activities are growing impressively while its international oil and gas markets are also strengthening. And, Microsoft recently released its Office 365 cloud-based productivity suite. In addition, it should begin to benefit from its partnership with Nokia on Windows Phone 7 in the second half of the year.
13
Pacific Advisors
Balanced Fund continued
Fixed Income Strategy
The Fund's fixed income portfolio is actively managed for total return. We utilize a combination of investment grade corporate bonds and high quality preferred stocks to provide current income and capital appreciation potential.
During the first half of 2011, geopolitical unrest in the Middle East and North Africa and the Greek sovereign debt crisis resulted in continued interest rate volatility. The Fund remained positioned in shorter-term investment grade bonds which offered modest income while protecting against market volatility. Furthermore, with rates remaining near historically low levels, the risks of owning higher yielding instruments outweighed the potential benefits. For example, long-term and non-investment grade corporate bonds offered appealing current income; however, they would have exposed the Fund to significant principal losses in the event of even modestly higher interest rates.
Persistently low interest rates and sustained interest rate volatility have created a challenging environment in which to identify attractive high quality bonds. While we continue to seek opportunities to obtain higher yields, we do so only when we believe the risks and rewards are properly balanced. Against this backdrop, we did not add to the fixed income portfolio during the first half of the year. However, we sold select bonds, such as TCI Communication and Estee Lauder, to lock in market appreciation.
We expect interest rates will remain volatile in response to global economic uncertainty and geopolitical events. Nevertheless, we anticipate interest rates will ultimately increase as other investments, such as equities, offer more attractive returns. Even a minor rise in interest rates can result in a substantial loss of principal on longer-term fixed income securities. Indeed, the significant spike in rates during the final week of the period, following the successful passing of austerity measures in Greece, highlights the significant risk underlying longer-term bonds.
Looking Ahead
Our favorable outlook on the broader economy contributes to our expectation that interest rates, while experiencing heightened volatility in the near to mid-term, will rise over time. We believe these conditions continue to warrant a conservative fixed income strategy; consequently, investments will likely remain focused in short to intermediate-term high quality corporate bonds and preferred stocks. When our assessment of interest rates changes, we expect to adjust our fixed income strategy to invest in longer-term bonds with attractive interest rates.
Consistent with our expectations for continued economic growth, we anticipate maintaining the Fund's higher allocation toward equities. We will continue to emphasize holdings in sectors poised to benefit from economic recovery while maintaining a significant allocation to defensive stocks for stability. As the economic recovery progresses, we see increasingly attractive investment opportunities in select industries including Energy, Industrials, and Technology. Our equity strategy remains focused on companies with dominant market positions, superior management teams, and exceptional growth outlooks.
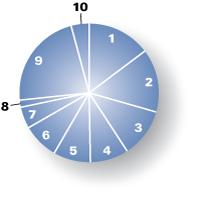
Portfolio Holdings as of 06/30/11 (Based on Total Investments)
| Equities | 73.34 | % | |||||||||
| 1. | Industrials | 14.92 | % | ||||||||
| 2. | Information Technology | 14.69 | % | ||||||||
| 3. | Consumer Staples | 11.41 | % | ||||||||
| 4. | Energy | 8.96 | % | ||||||||
| 5. | Health Care | 8.39 | % | ||||||||
| 6. | Financials | 8.30 | % | ||||||||
| 7. | Consumer Discretionary | 5.16 | % | ||||||||
| 8. | Materials | 1.51 | % | ||||||||
| 9. | Corporate Bonds | 22.58 | % | ||||||||
| 10. | Preferred Stock | 4.08 | % | ||||||||
14
Expense Examples
As a shareholder of the Fund you incur two types of costs: (1) transaction costs, including sales charges (loads) on purchase payments, reinvested dividends, or other distributions; redemption fees; and exchange fees; and (2) ongoing costs, including management fees; distribution (12b-1) fees; and other Fund expenses. This Example is intended to help you understand your ongoing costs (in dollars) of investing in the Fund and to compare these costs with the ongoing costs of investing in other mutual funds.
The Example is based on an investment of $1,000 invested at the beginning of the period and held for the entire period from January 1, 2011 through June 30, 2011.
Actual Expenses
The first line of the table below provides information about actual account values and actual expenses. You may use the information in this line, together with the amount you invested, to estimate the expenses that you paid over the period. Simply divide your account value by $1,000 (for example, an $8,600 account value divided by $1,000 = 8.6), then multiply the result by the number in the first line under the heading entitled "Expenses Paid During the Period" to estimate the expenses you paid on your account during the period.
The following transaction costs are not included in the expenses shown in the table and, if applicable, would increase the expenses that you paid over the period: (1) a front-end sales charge (load) of 5.75% on Class A shares; (2) a 2% redemption fee if you sell or exchange shares within 180 days of purchase, with certain exceptions. The redemption fee does not apply to: (a) redemptions under an automatic withdrawal program or periodic asset reallocation plan, required minimum distributions (RMD), employer mandated distributions from a qualified plan, or redemptions under a qualified domestic relations order (QDRO); (b) redemptions to pay for expenses related to terminal illness, extended hospital or nursing home care, or other serious medical conditions, including death; (c) redemptions of shares acquired through dividend or capital gains reinvestments; (d) loans from a qualified plan account, and (e) redemptions initiated by the Fund; and (3) a $10 service fee on each exchange after the first five exchanges in each calendar year.
The following ongoing costs are not included in the expenses shown in the table and, if applicable, would increase the expenses that you paid over the period: (1) a $12 low balance fee on accounts with balances of less than $250 as of September 30th of each calendar year and no investment activity (excluding reinvestment of dividends and/or capital gains) during the prior calendar year or the first nine months of the current calendar year. This fee does not apply to IRAs, qualified plan accounts, or Coverdell Education Savings Accounts; (2) a $15 annual custodial fee on IRAs, SEPs, SIMPLE IRAs, and Coverdell Education Savings Accounts; and (3) a $20 annual custodial fee on 403(b) accounts.
Hypothetical Example for Comparison Purposes
The second line of the table below provides information about hypothetical account values and hypothetical expenses based on the Fund's actual expense ratio and an assumed rate of return of 5% per year before expenses, which in not the Fund's actual return. The hypothetical account values and expenses may not be used to estimate the actual ending account balance or expenses you paid for the period. You may use this information to compare the ongoing costs of investing in the Fund and other funds. To do so, compare this 5% hypothetical example with the 5% hypothetical examples that appear in the shareholder reports of the other funds.
The following transaction costs are not included in the expenses shown in the table and, if applicable, would increase the expenses that you paid over the period: (1) a front-end sales charge (load) of 5.75% on Class A shares; (2) a 2% redemption fee if you sell or exchange shares within 180 days of purchase, with certain exceptions. The redemption fee does not apply to: (a) redemptions under an automatic withdrawal program or periodic asset reallocation plan, required minimum distributions (RMD), employer mandated distributions from a qualified plan, or redemptions under a qualified domestic relations order (QDRO); (b) redemptions to pay for expenses related to terminal illness, extended hospital or nursing home care, or other serious medical conditions, including death; (c) redemptions of shares acquired through dividend or capital gains reinvestments; (d) loans from a qualified plan account, and (e) redemptions initiated by the Fund; and (3) a $10 service fee on each exchange after the first five exchanges in each calendar year.
The following ongoing costs are not included in the expenses shown in the table and, if applicable, would increase the expenses that you paid over the period: (1) a $12 low balance fee on accounts with balances of less than $250 as of September 30th of each calendar year and no investment activity (excluding reinvestment of dividends and/or capital gains) during the prior calendar year or the first nine months of the current calendar year. This fee does not apply to IRAs, qualified plan accounts, or Coverdell Education Savings Accounts; (2) a $15 annual custodial fee on IRAs, SEPs, SIMPLE IRAs, and Coverdell Education Savings Accounts; and (3) a $20 annual custodial fee on 403(b) accounts.
Please note that the expenses shown in the table are meant to highlight your ongoing costs only and do not reflect any transactional costs, such as sales charges (loads), redemption fees, or exchange fees. Therefore, the second line of the table is useful in comparing ongoing costs only, and will not help you determine the relative total costs of owning different funds. In addition, if these transactional costs were included, your costs would have been higher.
| Beginning Account Value 01/01/11 | Ending Account Value 06/30/11 | Expense Paid During Period 01/01/11 – 06/30/11 | |||||||||||||
| Balanced Fund Class A | |||||||||||||||
| Actual | $ | 1,000.00 | $ | 1,048.10 | $ | 14.63 | |||||||||
| Hypothetical (5% return before expense) | $ | 1,000.00 | $ | 1,010.51 | $ | 14.36 | |||||||||
| Balanced Fund Class C | |||||||||||||||
| Actual | $ | 1,000.00 | $ | 1,044.10 | $ | 18.40 | |||||||||
| Hypothetical (5% return before expense) | $ | 1,000.00 | $ | 1,006.79 | $ | 18.06 | |||||||||
4 Expenses are equal to the Fund's annualized expense ratio of 2.88% for Class A shares and 3.63% for Class C shares, multiplied by the average account value over the period, multiplied by 181/365 days to reflect the one-half year period.
15
Pacific Advisors
Large Cap Value Fund
Fund Objective: Long-term capital appreciation.
Investment Invests at least 80% of its assets in large cap companies that are, at the time of
Strategy: purchase, within the market cap range of companies in the S&P 500 Index1.
Investor Profile: Conservative equity. Growth-oriented with a long-term investment horizon.
| TOTAL RETURNS | EXPENSE RATIOS | ||||||||||||||||||
| For the six months ended June 30, 2011 | For the fiscal year ended December 31, 2010 | ||||||||||||||||||
| Net Expense Ratio | Expense Ratio | ||||||||||||||||||
| Class A | 3.23 | % | Class A | 3.64 | % | 5.82 | % | ||||||||||||
| Class C | 2.83 | % | Class C | 4.37 | % | 6.57 | % | ||||||||||||
| S&P 500 Index | 6.02 | % | |||||||||||||||||
Performance quoted is past performance which does not guarantee future results. Current performance may be higher or lower than the performance quoted. Call (800) 989-6693 for performance current to the most recent month-end. The investment return and principal value of an investment will fluctuate so that an investor's shares, when redeemed, may be worth more or less than their original cost. Returns represent the change in value over the stated period assuming reinvestment of dividends and capital gains at net asset value. Returns do not take into account the maximum 5.75% sales charge on Class A shares or the 1% Contingent Deferred Sales Charge (CDSC) for Class C shares sold within one year of purchase. Returns would be lower if the applicable sales charge and CDSC were included. Returns do not take into account individual taxes which may reduce actual returns when shares are sold.
The Fund's investment adviser is waiving a portion of its management fees pursuant to an Expense Limitation Agreement. The waiver may be discontinued at any time with ninety days written notice in consultation with the Fund's board, but is expected to continue at current levels. Please see the Fund's most recent Annual Report for details. Performance shown reflects the waiver, without which the results would have been lower.
Discussion with Portfolio Manager August 19, 2011
Samuel C. Coquillard
Fund Performance
The Fund invests in leading blue-chip stocks with long-term capital appreciation potential and reduced price volatility. This stock selection approach focuses on purchasing high quality stocks with attractive dividend rates when those stocks are trading at advantageous prices. The Fund's conservative equity strategy delivered modest gains during the first half of the year; Class A shares returned 3.23%.
The Fund's strongest performers included:
• Kraft which gained 11.8% during the period on growth in its core businesses. We continue to like this long-term portfolio position for several reasons: in addition to its generous dividend yield of 3.33%, the company continues to benefit from its acquisition of Cadbury.
• IBM which rose 16.9% as it continued to capitalize on the global expansion of information technology. Despite its massive size, the company has, throughout its 100-year history, consistently reinvented itself. Continuing this track record, IBM is well positioned to take advantage of current growth trends
1 The Standard & Poor's 500 Index is an unmanaged, market capitalization weighted index which measures the performance of the large cap segment of the U.S. equities market, covering approximately 75% of the U.S. equities market. The Index includes 500 leading companies in leading industries of the U.S. economy. Index returns assume the reinvestment of dividends, but, unlike the Fund's returns, do not reflect the effects of management fees or expenses. It is not possible to invest directly in the Index.
16
in cloud computing and in emerging markets such as China. Further, its focus on higher margin businesses, such as consulting and business software, continues to reap rewards for shareholders.
• McDonald's gained 9.9% as its value-priced offerings continued to resonate with cost-conscious consumers. At the same time, geographic expansions into new markets, such as China, are providing a new avenue of growth for the world's largest restaurant company.
Other notable Fund performers included: Dell, Intel, Sysco, Clorox, HJ Heinz, Time Warner, Cardinal Health, and Johnson & Johnson.
As a Fund designed for more conservative equity investors seeking stable growth, the portfolio is managed to minimize volatility. This orientation is evidenced by its average one-year beta2 of 0.83 versus the S&P 500 Index. With this emphasis on minimizing volatility, the Fund may grow at a slower rate in rising markets while providing better downside protection in falling markets.
Unlike its benchmark, the Fund primarily focuses on mega-cap companies with strong franchises and solid balance sheets whose size and strength typically result in more measured growth over time. In comparison, the S&P 500 Index is comprised of 500 widely-held companies across a variety of sectors and industries. In fact, the Fund's average market cap of approximately $100 billion is substantially greater than the $24 billion for the S&P 500 Index. The Fund, by concentrating on 30 to 50 of the most attractive companies, seeks to consistently provide superior risk-adjusted returns with lower volatility.
Fund Strategy
We believe that high quality, domestic large cap stocks offer significant value for equity investors. The Fund's portfolio predominantly consists of dividend paying stocks in areas of the market that are less sensitive to economic changes. We closely monitor investor behavior to take advantage of buying opportunities when large cap stocks are out-of-favor.
The first half of the year was a tale of two quarters for the Fund. In the market advance during the first quarter, investors favored small and mid-cap companies in areas most responsive to economic recovery. Stocks in the Energy, Industrials, Materials, Information Technology, and Financials sectors outperformed. The market paid little attention to high quality large cap stocks. Their financial strength, expanding global business opportunities, increasing dividend payments, and stock repurchase programs held little attraction. Against this backdrop, we took advantage of discounted pricing to increase the Fund's positions in firms such as Cisco Systems, Sysco and McDonald's. These firms enjoy large cash reserves which give them stability and the flexibility to strategically expand their businesses.
The Fund, which lagged its benchmark in the first quarter, gained on the market in the second quarter. As concerns of a global economic slowdown spread in the second quarter, the market lost momentum. Investors turned to larger stocks in sectors such as Telecommunication Services, Health Care, Utilities, and Consumer Staples; the low volatility and high dividend yields offered by stocks in these sectors are particularly attractive to investors during turbulent markets. The Fund's concentration in larger cap companies translated into market outperformance in the second quarter as investors gravitated to the strength and stability of well-known companies.
The Fund's investment strategy centers on selecting large cap stocks with high dividend rates to support total return. During the first half of the year, companies with dividend rates in excess of 3.5% included Clorox, Abbott Laboratories, HJ Heinz and Intel. Firms paying dividend yields over 3.0% included Johnson & Johnson, General Electric, Sysco, Procter & Gamble and Genuine Parts.
During the period, the Fund exited select positions to lock in gains or rotate capital to firms with greater long-term value. New positions included pharmaceutical giant Abbott Laboratories, defense contractor Northrop Grumman, industrial conglomerate ITT and financial powerhouses Wells Fargo and MasterCard.
2 "Beta" measures volatility relative to the stock market or an alternative benchmark. A beta less than 1.0 indicates lower risk than the market or the benchmark and a beta greater than 1.0 indicates higher risk than the market or the benchmark.
17
Pacific Advisors
Large Cap Value Fund continued
Looking Ahead
Leading large cap stocks continue to offer compelling prospects for long-term growth with lower volatility. Our selection process emphasizes financially sound companies with moderate downside risk and relatively high dividend rates. Additionally, we often identify growth opportunities that are associated with companies involved in pending mergers, acquisitions or spin-offs or other "special situations." These companies are often ignored or misunderstood because of their perceived complexity. As a result, the stock may trade at a significant discount to the company's value.
For example, Northrop Grumman is one of the nation's largest defense contractors. In recent years, the company has been aggressively buying back stock to create shareholder value. Additionally, the firm recently spun off a subsidiary, Huntington Ingalls Industries. As a result, we believe Northrop's finances will improve dramatically due to the advantageous terms of the spin-off agreement.
Our investment strategy continues to seek companies that have been significantly undervalued by the market that, nevertheless, offer compelling long-term appreciation potential and attractive dividend yields. A primary example would be Cisco Systems which continues to dominate in its communications and information technology business and generate large amounts of cash. The firm enjoys broad exposure to both corporate and consumer technology markets where we anticipate meaningful long-term growth. The firm's seasoned management team recently embarked on a strategic turnaround operation to refocus on the company's core business. We added to the Fund's position following a disappointing earnings report which deeply discounted the stock price.
Investor confidence has been sorely tested in 2011. The uncertainty created by slower economic growth, the European sovereign debt crisis, fallout from the Japanese earthquake, geopolitical tensions and other global economic concerns will continue to test investor fortitude in the coming months. We expect heightened market volatility to persist as investors respond to economic reports and assess the impact of global events. However, we also expect that any periods of volatility will create good investment opportunities for the Fund.
Portfolio Holdings as of 06/30/11 (Based on Total Investments)
| Equities | 100.00 | % | |||||||||
| 1. | Consumer Staples | 24.76 | % | ||||||||
| 2. | Information Technology | 21.78 | % | ||||||||
| 3. | Industrials | 17.38 | % | ||||||||
| 4. | Consumer Discretionary | 12.22 | % | ||||||||
| 5. | Financials | 11.02 | % | ||||||||
| 6. | Health Care | 8.40 | % | ||||||||
| 7. | Energy | 4.44 | % | ||||||||

18
Expense Examples
As a shareholder of the Fund you incur two types of costs: (1) transaction costs, including sales charges (loads) on purchase payments, reinvested dividends, or other distributions; redemption fees; and exchange fees; and (2) ongoing costs, including management fees; distribution (12b-1) fees; and other Fund expenses. This Example is intended to help you understand your ongoing costs (in dollars) of investing in the Fund and to compare these costs with the ongoing costs of investing in other mutual funds.
The Example is based on an investment of $1,000 invested at the beginning of the period and held for the entire period from January 1, 2011 through June 30, 2011.
Actual Expenses
The first line of the table below provides information about actual account values and actual expenses. You may use the information in this line, together with the amount you invested, to estimate the expenses that you paid over the period. Simply divide your account value by $1,000 (for example, an $8,600 account value divided by $1,000 = 8.6), then multiply the result by the number in the first line under the heading entitled "Expenses Paid During the Period" to estimate the expenses you paid on your account during the period.
The following transaction costs are not included in the expenses shown in the table and, if applicable, would increase the expenses that you paid over the period: (1) a front-end sales charge (load) of 5.75% on Class A shares; (2) a 2% redemption fee if you sell or exchange shares within 180 days of purchase, with certain exceptions. The redemption fee does not apply to: (a) redemptions under an automatic withdrawal program or periodic asset reallocation plan, required minimum distributions (RMD), employer mandated distributions from a qualified plan, or redemptions under a qualified domestic relations order (QDRO); (b) redemptions to pay for expenses related to terminal illness, extended hospital or nursing home care, or other serious medical conditions, including death; (c) redemptions of shares acquired through dividend or capital gains reinvestments; (d) loans from a qualified plan account, and (e) redemptions initiated by the Fund; and (3) a $10 service fee on each exchange after the first five exchanges in each calendar year.
The following ongoing costs are not included in the expenses shown in the table and, if applicable, would increase the expenses that you paid over the period: (1) a $12 low balance fee on accounts with balances of less than $250 as of September 30th of each calendar year and no investment activity (excluding reinvestment of dividends and/or capital gains) during the prior calendar year or the first nine months of the current calendar year. This fee does not apply to IRAs, qualified plan accounts, or Coverdell Education Savings Accounts; (2) a $15 annual custodial fee on IRAs, SEPs, SIMPLE IRAs, and Coverdell Education Savings Accounts; and (3) a $20 annual custodial fee on 403(b) accounts.
Hypothetical Example for Comparison Purposes
The second line of the table below provides information about hypothetical account values and hypothetical expenses based on the Fund's actual expense ratio and an assumed rate of return of 5% per year before expenses, which in not the Fund's actual return. The hypothetical account values and expenses may not be used to estimate the actual ending account balance or expenses you paid for the period. You may use this information to compare the ongoing costs of investing in the Fund and other funds. To do so, compare this 5% hypothetical example with the 5% hypothetical examples that appear in the shareholder reports of the other funds.
The following transaction costs are not included in the expenses shown in the table and, if applicable, would increase the expenses that you paid over the period: (1) a front-end sales charge (load) of 5.75% on Class A shares; (2) a 2% redemption fee if you sell or exchange shares within 180 days of purchase, with certain exceptions. The redemption fee does not apply to: (a) redemptions under an automatic withdrawal program or periodic asset reallocation plan, required minimum distributions (RMD), employer mandated distributions from a qualified plan, or redemptions under a qualified domestic relations order (QDRO); (b) redemptions to pay for expenses related to terminal illness, extended hospital or nursing home care, or other serious medical conditions, including death; (c) redemptions of shares acquired through dividend or capital gains reinvestments; (d) loans from a qualified plan account, and (e) redemptions initiated by the Fund; and (3) a $10 service fee on each exchange after the first five exchanges in each calendar year.
The following ongoing costs are not included in the expenses shown in the table and, if applicable, would increase the expenses that you paid over the period: (1) a $12 low balance fee on accounts with balances of less than $250 as of September 30th of each calendar year and no investment activity (excluding reinvestment of dividends and/or capital gains) during the prior calendar year or the first nine months of the current calendar year. This fee does not apply to IRAs, qualified plan accounts, or Coverdell Education Savings Accounts; (2) a $15 annual custodial fee on IRAs, SEPs, SIMPLE IRAs, and Coverdell Education Savings Accounts; and (3) a $20 annual custodial fee on 403(b) accounts.
Please note that the expenses shown in the table are meant to highlight your ongoing costs only and do not reflect any transactional costs, such as sales charges (loads), redemption fees, or exchange fees. Therefore, the second line of the table is useful in comparing ongoing costs only, and will not help you determine the relative total costs of owning different funds. In addition, if these transactional costs were included, your costs would have been higher.
| Beginning Account Value 01/01/11 | Ending Account Value 06/30/11 | Expense Paid During Period 01/01/11 – 06/30/11 | |||||||||||||
| Large Cap Value Fund Class A | |||||||||||||||
| Actual | $ | 1,000.00 | $ | 1,032.30 | $ | 17.43 | |||||||||
| Hypothetical (5% return before expense) | $ | 1,000.00 | $ | 1,007.64 | $ | 17.22 | |||||||||
| Large Cap Value Fund Class C | |||||||||||||||
| Actual | $ | 1,000.00 | $ | 1,028.30 | $ | 21.22 | |||||||||
| Hypothetical (5% return before expense) | $ | 1,000.00 | $ | 1,003.87 | $ | 20.97 | |||||||||
5 Expenses are equal to the Fund's annualized expense ratio, net of expense waivers, of 3.46% for Class A shares and 4.22% for Class C shares, multiplied by the average account value over the period, multiplied by 181/365 days to reflect the one-half year period.
19
Pacific Advisors
Mid Cap Value Fund
Fund Objective: Long-term capital appreciation.
Investment Invests at least 80% of its assets in mid-cap companies that are, at the time of
Strategy: purchase, within the market cap range of companies in the Russell Midcap Index1.
Investor Profile: Moderately aggressive. Growth-oriented with a long-term investment horizon.
| TOTAL RETURNS | EXPENSE RATIOS | ||||||||||||||||||
| For the six months ended June 30, 2011 | For the fiscal year ended December 31, 2010 | ||||||||||||||||||
| Class A | 10.46 | % | Class A | 4.35 | % | ||||||||||||||
| Class C | 10.17 | % | Class C | 4.88 | % | ||||||||||||||
| Russell Midcap Index | 8.08 | % | |||||||||||||||||
Performance quoted is past performance which does not guarantee future results. Current performance may be higher or lower than the performance quoted. Call (800) 989-6693 for performance current to the most recent month-end. The investment return and principal value of an investment will fluctuate so that an investor's shares, when redeemed, may be worth more or less than their original cost. Returns represent the change in value over the stated period assuming reinvestment of dividends and capital gains at net asset value. Returns do not take into account the maximum 5.75% sales charge on Class A shares or the 1% Contingent Deferred Sales Charge (CDSC) for Class C shares sold within one year of purchase. Returns would be lower if the applicable sales charge and CDSC were included. Returns do not take into account individual taxes which may reduce actual returns when shares are sold.
Discussion with Portfolio Manager August 19, 2011
George A. Henning
Please see the Chairman's Letter at the beginning of this Report for a detailed market and economic
review as well as the Manager's general market outlook.
Fund Performance
The Fund's focus on individual companies and specific growth opportunities provided impressive returns. Class A shares gained 10.46% in the first half of 2011, compared to 8.08% for the benchmark. The outperformance was even greater when compared to the overall market, as measured by the S&P 500 Index2, which returned 6.02%. We believe mid-cap stocks provide advantages that can enhance a diversified portfolio by accessing market ranges not captured by large or small cap strategies. Our approach identifies leading companies in stable or growing industries that combine the economies of scale of large corporations with the strategic flexibility of smaller operations.
Energy holdings, led by Lufkin Industries, performed particularly well during the period. We maintain a favorable outlook on the global energy industry, owing to the growth in emerging market demand from nations such as China and India. Our focused investment strategy seeks to identify companies with dominant market positions or proprietary technologies that enable them to fully capitalize on these growth trends. Lufkin, a global provider of oilfield equipment including pumps, is an ideal example. The expansion of drilling activity, particularly among unconventional shale formations, continues to drive business for the company.
Other strong performers included Penske Automotive Group, Graco, and Copart. Penske is an automotive retailer that concentrates in luxury brands. The company adapted to supply disruptions affecting the Japanese auto industry by increasing sales of other brands and used cars. Moreover, auto dealerships are poised to benefit from less competition as the industry now supports approximately a third fewer dealerships than
1 The Russell Midcap Index is an unmanaged, weighted measure of the 800 smallest companies within the Russell 1000 Index based on a combination of their market cap and current index membership. Index returns assume the reinvestment of dividends, but, unlike the Fund's returns, do not reflect management fees or expenses. It is not possible to invest directly in the Index.
2 The Standard & Poor's 500 Index is an unmanaged, market capitalization weighted index which measures the performance of the large cap segment of the U.S. equities market, covering approximately 75% of the U.S. equities market. The Index includes 500 leading companies in leading industries of the U.S. economy. Index returns assume the reinvestment of dividends, but, unlike the Fund's returns, do not reflect the effects of management fees or expenses. It is not possible to invest directly in the Index.
20
before the financial crisis. Graco enjoyed continued strength as a world leader in fluid handling systems for products such as paints or oils; investments made throughout the recession have driven the company's growth during the recovery. And, Copart, which auctions used and salvaged vehicles, enjoyed strong business trends on elevated scrap metal prices as well as its continued expansion into new geographies.
Fund Strategy
The Fund utilizes a fundamental, bottom-up investment process that seeks to identify companies with long-term growth prospects. Presently, these opportunities have been focused in the Industrials, Energy, and Consumer Discretionary sectors. These segments of the economy are benefiting from global growth trends, such as the rapid expansion of emerging economies, as well as a gradual recovery in developed economies. However, stocks in these sectors typically experience higher volatility than the overall market. Indeed, the Fund's one-year beta3 of 1.28, compared to the Russell Midcap Index, underscores this recent volatility of these sectors. Compared to the S&P 500 Index, the Fund's one-year beta of 1.41 also reflects the greater volatility that typically accompanies smaller stocks. While this market volatility can be unsettling, it nevertheless plays an important role in creating investment opportunities; our active buy-and-hold strategy seeks to take advantage of broad price changes by buying and selling at attractive prices.
During the period, we added two new positions: automotive parts supplier Lear and office equipment supplier Pitney Bowes. These two stocks highlight the wide-ranging opportunities surfaced by our investment strategy. Lear emerged from bankruptcy in late 2009 following the downturn in the auto industry. Throughout, it retained its key customers and leading market position. Now, the company, with a vastly improved capital structure, is expanding its customer base in emerging markets such as China and Brazil. Pitney Bowes, the iconic office mailroom supply firm, continues to adapt to changing business operations with electronic and print mailing solutions. The stock provides solid growth potential along with a generous 6.5% dividend yield.
We routinely review our holdings to evaluate appreciation potential against other investment opportunities. As part of this process, we trimmed positions in Copart and Ion Geophysical. Although we continue to believe both companies are attractively positioned in their respective markets, we took profits to invest in other holdings. We did not exit any positions during the period.
Looking Ahead
Company-specific growth initiatives continue to offer significant appreciation opportunities. Despite consumer spending pressures, apparel companies, Phillips-van Heusen and K-Swiss, have seen significant expansions in their product lines. In particular, Phillips-van Heusen is capitalizing on the recent acquisition of Tommy Hilfiger by aggressively expanding into international markets. Meanwhile, K-Swiss has expanded beyond its legacy tennis footwear products to include running and fitness shoes. Also, Gamestop continues to defy investor skepticism with impressive sales and profits. The company has succeeded in maintaining its status, despite the best efforts of competitors, as the destination for gaming enthusiasts.
The Fund's significant weighting in economically-sensitive areas reflects our belief that the global economic recovery continues to progress, albeit slowly. Industrial companies such as Chicago Bridge & Iron and KBR should continue to benefit from the ongoing investment in global energy infrastructure. Improved trucking fundamentals will benefit Landstar System, Marten Transport, and Navistar International. And, oilfield services companies, including Tidewater and Ion Geophysical, continue to be well-positioned to profit from improved exploration activity.
The Fund's focus on high quality mid-cap companies with favorable long-term outlooks is well-suited for the current environment. Our investment strategy seeks to identify attractive investment candidates with significant growth potential. These long-term opportunities may materialize from global and sector growth trends, or from individual company developments. Still, we expect that macroeconomic and geopolitical pressures will contribute to heightened volatility near-term. In the midst of this challenging environment, we nevertheless believe that select mid-cap companies continue to offer compelling investment opportunities. Accordingly, we would anticipate using market volatility to actively manage portfolio positions by opportunistically buying and selling at attractive prices.
3 "Beta" measures volatility relative to the stock market or an alternative benchmark. A beta less than 1.0 indicates lower risk than the market or the benchmark and a beta greater than 1.0 indicates higher risk than the market or the benchmark.
21
Pacific Advisors
Mid Cap Value Fund
Pacific Advisors
Mid Cap Value Fund continued
Portfolio Holdings as of 06/30/11 (Based on Total Investments)
| Equities | 100.00 | % | |||||||||
| 1. | Industrials | 41.95 | % | ||||||||
| 2. | Energy | 27.71 | % | ||||||||
| 3. | Consumer Discretionary | 18.75 | % | ||||||||
| 4. | Materials | 5.02 | % | ||||||||
| 5. | Financials | 3.61 | % | ||||||||
| 6. | Consumer Staples | 2.96 | % | ||||||||
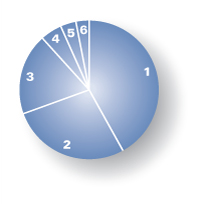
22
Expense Examples
As a shareholder of the Fund you incur two types of costs: (1) transaction costs, including sales charges (loads) on purchase payments, reinvested dividends, or other distributions; redemption fees; and exchange fees; and (2) ongoing costs, including management fees; distribution (12b-1) fees; and other Fund expenses. This Example is intended to help you understand your ongoing costs (in dollars) of investing in the Fund and to compare these costs with the ongoing costs of investing in other mutual funds.
The Example is based on an investment of $1,000 invested at the beginning of the period and held for the entire period from January 1, 2011 through June 30, 2011.
Actual Expenses
The first line of the table below provides information about actual account values and actual expenses. You may use the information in this line, together with the amount you invested, to estimate the expenses that you paid over the period. Simply divide your account value by $1,000 (for example, an $8,600 account value divided by $1,000 = 8.6), then multiply the result by the number in the first line under the heading entitled "Expenses Paid During the Period" to estimate the expenses you paid on your account during the period.
The following transaction costs are not included in the expenses shown in the table and, if applicable, would increase the expenses that you paid over the period: (1) a front-end sales charge (load) of 5.75% on Class A shares; (2) a 2% redemption fee if you sell or exchange shares within 180 days of purchase, with certain exceptions. The redemption fee does not apply to: (a) redemptions under an automatic withdrawal program or periodic asset reallocation plan, required minimum distributions (RMD), employer mandated distributions from a qualified plan, or redemptions under a qualified domestic relations order (QDRO); (b) redemptions to pay for expenses related to terminal illness, extended hospital or nursing home care, or other serious medical conditions, including death; (c) redemptions of shares acquired through dividend or capital gains reinvestments; (d) loans from a qualified plan account, and (e) redemptions initiated by the Fund; and (3) a $10 service fee on each exchange after the first five exchanges in each calendar year.
The following ongoing costs are not included in the expenses shown in the table and, if applicable, would increase the expenses that you paid over the period: (1) a $12 low balance fee on accounts with balances of less than $250 as of September 30th of each calendar year and no investment activity (excluding reinvestment of dividends and/or capital gains) during the prior calendar year or the first nine months of the current calendar year. This fee does not apply to IRAs, qualified plan accounts, or Coverdell Education Savings Accounts; (2) a $15 annual custodial fee on IRAs, SEPs, SIMPLE IRAs, and Coverdell Education Savings Accounts; and (3) a $20 annual custodial fee on 403(b) accounts.
Hypothetical Example for Comparison Purposes
The second line of the table below provides information about hypothetical account values and hypothetical expenses based on the Fund's actual expense ratio and an assumed rate of return of 5% per year before expenses, which in not the Fund's actual return. The hypothetical account values and expenses may not be used to estimate the actual ending account balance or expenses you paid for the period. You may use this information to compare the ongoing costs of investing in the Fund and other funds. To do so, compare this 5% hypothetical example with the 5% hypothetical examples that appear in the shareholder reports of the other funds.
The following transaction costs are not included in the expenses shown in the table and, if applicable, would increase the expenses that you paid over the period: (1) a front-end sales charge (load) of 5.75% on Class A shares; (2) a 2% redemption fee if you sell or exchange shares within 180 days of purchase, with certain exceptions. The redemption fee does not apply to: (a) redemptions under an automatic withdrawal program or periodic asset reallocation plan, required minimum distributions (RMD), employer mandated distributions from a qualified plan, or redemptions under a qualified domestic relations order (QDRO); (b) redemptions to pay for expenses related to terminal illness, extended hospital or nursing home care, or other serious medical conditions, including death; (c) redemptions of shares acquired through dividend or capital gains reinvestments; (d) loans from a qualified plan account, and (e) redemptions initiated by the Fund; and (3) a $10 service fee on each exchange after the first five exchanges in each calendar year.
The following ongoing costs are not included in the expenses shown in the table and, if applicable, would increase the expenses that you paid over the period: (1) a $12 low balance fee on accounts with balances of less than $250 as of September 30th of each calendar year and no investment activity (excluding reinvestment of dividends and/or capital gains) during the prior calendar year or the first nine months of the current calendar year. This fee does not apply to IRAs, qualified plan accounts, or Coverdell Education Savings Accounts; (2) a $15 annual custodial fee on IRAs, SEPs, SIMPLE IRAs, and Coverdell Education Savings Accounts; and (3) a $20 annual custodial fee on 403(b) accounts.
Please note that the expenses shown in the table are meant to highlight your ongoing costs only and do not reflect any transactional costs, such as sales charges (loads), redemption fees, or exchange fees. Therefore, the second line of the table is useful in comparing ongoing costs only, and will not help you determine the relative total costs of owning different funds. In addition, if these transactional costs were included, your costs would have been higher.
| Beginning Account Value 01/01/11 | Ending Account Value 06/30/11 | Expense Paid During Period 01/01/11 – 06/30/11 | |||||||||||||
| Mid Cap Value Fund Class A | |||||||||||||||
| Actual | $ | 1,000.00 | $ | 1,104.60 | $ | 21.50 | |||||||||
| Hypothetical (5% return before expense) | $ | 1,000.00 | $ | 1,004.36 | $ | 20.48 | |||||||||
| Mid Cap Value Fund Class C | |||||||||||||||
| Actual | $ | 1,000.00 | $ | 1,101.70 | $ | 25.38 | |||||||||
| Hypothetical (5% return before expense) | $ | 1,000.00 | $ | 1,000.64 | $ | 24.16 | |||||||||
3 Expenses are equal to the Fund's annualized expense ratio of 4.12% for Class A shares and 4.87% for Class C shares, multiplied by the average account value over the period, multiplied by 181/365 days to reflect the one-half year period.
23
Pacific Advisors
Small Cap Value Fund
Fund Objective: Capital appreciation through investment in small cap companies.
Investment Invests at least 80% of its assets in small cap companies (i.e., with market caps of
Strategy: up to $2 billion at the time of purchase). Generally invests a significant proportion of its assets in companies with market caps under $500 million at the time of purchase, which are often referred to as "micro-cap stocks."
Investor Profile: Aggressive. Opportunity-oriented with a long-term investment horizon.
| TOTAL RETURNS | EXPENSE RATIOS | ||||||||||||||||||
| For the six months ended June 30, 2011 | For the fiscal year ended December 31, 2010 | ||||||||||||||||||
| Class A | 16.07 | % | Class A | 2.66 | % | ||||||||||||||
| Class C | 15.70 | % | Class C | 3.40 | % | ||||||||||||||
| Class I | 16.22 | % | Class I | 2.50 | % | ||||||||||||||
| Russell 2000 Index1 | 6.21 | % | |||||||||||||||||
Performance quoted is past performance which does not guarantee future results. Current performance may be higher or lower than the performance quoted. Call (800) 989-6693 for performance current to the most recent month-end. The investment return and principal value of an investment will fluctuate so that an investor's shares, when redeemed, may be worth more or less than their original cost. Returns represent the change in value over the stated period assuming reinvestment of dividends and capital gains at net asset value. Returns do not take into account the maximum 5.75% sales charge on Class A shares or the 1% Contingent Deferred Sales Charge (CDSC) for Class C shares sold within one year of purchase. Returns would be lower if the applicable sales charge and CDSC were included. Returns do not take into account individual taxes which may reduce actual returns when shares are sold.
Discussion with Portfolio Manager August 19, 2011
George A. Henning
Please see the Chairman's Letter at the beginning of this Report for a detailed market and economic
review as well as the Manager's general market outlook.
Fund Performance
The Fund's ability to identify individual companies with attractive growth prospects delivered exceptional returns during the first half of 2011. Class A shares gained 16.07% which was nearly ten full percentage points better than the benchmark. We continue to find areas of growth that, despite the slow pace of the economic recovery, provide meaningful investment opportunities. These include: global growth trends, such as energy and mining, as well as areas related to a gradual economic recovery including transportation and industrial activity. Individual company developments, such as acquisitions, geographic expansion, and new product or service offerings, provide additional catalysts for long-term appreciation. We believe a strategy of focusing on market leaders with identifiable growth opportunities can provide meaningful returns for long-term investors. Performance of the benchmark, in contrast, will likely be held back by struggling companies and industries with lackluster growth prospects.
The Fund's top performing holdings included Conn's and America Service Group. These two positions exemplify the Fund's long-term investment strategy. Both companies have been core holdings in the Fund for over seven years; each had weathered several ups and downs as market and company-specific developments impacted their stock prices. Throughout, we maintained an owner's perspective and, when the markets reacted disproportionately to events, we took advantage by adjusting the Fund's holdings. Our active long-term approach was rewarded during the first half of 2011 when America Service Group
1 The Russell 2000 Index is an unmanaged, market-weighted measure of the 2,000 smallest companies of the Russell 3000 Index which represents approximately 98% of the investable U.S. equity market. Index returns assume the reinvestment of dividends, but, unlike the Fund's returns, do not reflect management fees or expenses. It is not possible to invest directly in the Index.
24
was acquired by a competitor at a significant premium. Conn's, meanwhile, appreciated more than 100% following an equity rights offering last Fall that enabled the company to restructure its credit facilities and reposition its operations.
Other strong performers included Amerigon, Mitcham Industries, and Bravo Brio Restaurant Group. Amerigon, in a bid to consolidate the technology for temperature-controlled automotive seating, has initiated a tender offer for its primary competitor. When complete, it will advance the company's prospects in this rapidly growing industry. Mitcham has rebounded from the economic downturn with impressive business momentum. The company's seismic data equipment plays an integral role in energy exploration. Based on growing demand, the company recently raised additional equity capital in order to fund purchases of new equipment.
Bravo Brio is a new position in the Fund and has already delivered impressive results. We typically avoid restaurant stocks as they tend to be challenged, on the cost side, by commodity prices and, on the revenue side, by intense competition. However, we identified qualities in Bravo that made for a compelling investment. The company was founded in 1987 and had most recently been privately owned. In 2010, Bravo raised capital through an initial public offering and used the proceeds to pay down debt. As a result, the company is now in a position to use internal cash flow to expand from its core markets in the southern States. A critical part of this growth strategy is its attractive customer demographic; the Italian-themed restaurants are especially popular among upper middle-class women. Bravo uses this market position to extract attractive lease terms and tenant improvements from shopping mall landlords. In this way, the company is able to achieve profitable growth in a challenging industry.
Fund Strategy
The Fund utilizes a bottom-up investment process to identify companies with specific opportunities for long-term capital appreciation. These can arise from broad global trends, opportunities related to the current economic cycle, or developments that are specific to an individual company or industry. Presently, the Fund's investments are concentrated in the Industrials, Energy, and Consumer Discretionary sectors. These areas offer exposure to the rapid growth in emerging nations, including China and India, as well as a gradual economic recovery in developed nations. These sectors, however, due to their sensitivity to changes in underlying economic trends, typically experience greater volatility than the overall market.
These investments, along with the Fund's focus on smaller capitalization stocks, which are less frequently traded than large cap stocks, contributed to elevated volatility during the period. In comparison to the Russell 2000 Index of small companies, the Fund's one-year beta2 of 1.07 signifies slightly higher volatility. In comparison to the S&P 500 Index3, the Fund's one-year beta was 1.47 which suggests that small cap stocks were especially volatile during the period.
Broad price changes, while often disconcerting, nevertheless create opportunities to strategically invest in strong companies at attractive prices. We believe that shareholders seeking long-term capital appreciation are willing to withstand short-term price movements to benefit from opportunistic investing. We anticipate that these areas will continue to offer the best long-term opportunities while we also recognize that the Fund's volatility may remain somewhat elevated.
In addition to Bravo Brio, we added a new position in Rush Enterprises. Rush owns and operates a national network of freight truck dealerships. The company suffered during the economic downturn as truck operators, opting to defer equipment replacement, put off new purchases. We expect that, as shipping volumes rebound and trucking profitability improves, Rush will benefit as truckers return to dealer showrooms.
We also added significantly to our position in North American Energy, an energy services firm operating primarily in the Canadian Oil Sands. The company owns a leading market share for critical services including site preparation and reclamation services. Recently, due to a dispute related to built-in cost inflation issues, North American Energy was required to write down the value of one of its contracts. Subsequently, the
2 "Beta" measures volatility relative to the stock market or an alternative benchmark. A beta less than 1.0 indicates lower risk than the market or the benchmark and a beta greater than 1.0 indicates higher risk than the market or the benchmark.
3 The Standard & Poor's 500 Index is an unmanaged, market capitalization weighted index which measures the performance of the large cap segment of the U.S. equities market, covering approximately 75% of the U.S. equities market. The Index includes 500 leading companies in leading industries of the U.S. economy. It is not possible to invest directly in the Index.
25
Pacific Advisors
Small Cap Value Fund continued
stock fell more than 30%. Following conversations with management and our consideration of possible outcomes, we determined the most likely resolution would be a favorable near-term contract renegotiation. We also determined that, even if the companies were to be unable to reach an agreement, the stock would still trade at a significant discount to its remaining book of business. As a result, we aggressively built a position in the company.
During the period, we exited our position in pawn shop operator First Cash Financial. Importantly, we remain invested in EZCorp which also owns and operates pawn shops around the world. Our decision to maintain our investment in EZCorp while exiting First Cash rested primarily on differences in valuation as well as our assessment of the risks associated with each company's global growth strategy. While EZCorp retains interests across the globe, including Canada, the UK, and Australia, First Cash's international expansion is concentrated principally in Mexico. Political or regulatory development in the country would have a material impact on the company's operations. We believed the risk-reward relationship was appropriately priced into the stock and opted to rotate funds to other attractive opportunities.
Looking Ahead
The Fund is focused on identifying long-term growth opportunities despite a challenging economic backdrop. These may include companies, such as energy service firms Mitcham Industries and Parker Drilling, which have operations in growing international markets. Conversely, industries that have undergone contraction in recent years also present investment opportunities. Leading businesses, such as Sonic Automotive, which owns auto dealerships, and industrial parts distributor DXP Enterprises, are able to gain at the expense of weakened competitors. Individual company initiatives can also prepare a path towards growth. For example, companies such as Premiere Global Services in the technology field and Rochester Medical in the health care field have embarked on meaningful new product sales strategies and are poised to profit from their investments.
Furthermore, we continue to see significant value in select equities and believe the Fund is positioned to benefit from a continued slow economic recovery. Engineering and construction companies such as Matrix Service are important players in the rapidly expanding energy infrastructure industry. Likewise, rising industrial activity is creating more demand for maintenance companies such as Furmanite and Team.
Transportation also continues to be an attractive area of investment. Regional truckers, including Saia and Vitran, are enjoying gains in shipping volumes as well as contract pricing. Other areas of transportation are growing as well. TAL International Group continues to see record demand for its leased maritime shipping containers. And, Kirby, an operator of river transport barges, recently added a new line of service along the Mississippi.
Overall market growth, particularly in struggling sectors such as housing and construction, will be difficult to achieve. Therefore, a broad index approach is likely to deliver lackluster results. In contrast, a portfolio strategy focused on identifying specific areas of growth can, even in a challenging economic environment, achieve impressive returns for long-term investors. The Fund's focus on market leading companies with identifiable growth opportunities is well-suited for the challenges facing the economy. Indeed, many companies are finding unique opportunities for expansion. Investors, however, remain focused on macroeconomic developments, ignoring progress made by leading small cap businesses. Contrary to popular perception, these well-capitalized companies are in the early stages of long-term growth cycles.
26
Portfolio Holdings as of 06/30/11 (Based on Total Investments)
| Equities | 100.00 | % | |||||||||
| 1. | Industrials | 37.07 | % | ||||||||
| 2. | Energy | 20.42 | % | ||||||||
| 3. | Consumer Discretionary | 18.53 | % | ||||||||
| 4. | Financials | 12.09 | % | ||||||||
| 5. | Consumer Staples | 3.93 | % | ||||||||
| 6. | Telecommunication Services | 3.50 | % | ||||||||
| 7. | Health Care | 2.65 | % | ||||||||
| 8. | Materials | 1.81 | % | ||||||||
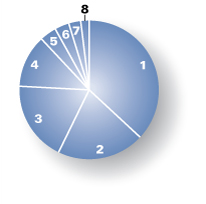
27
Pacific Advisors
Small Cap Value Fund continued
Expense Examples
As a shareholder of the Fund you incur two types of costs: (1) transaction costs, including sales charges (loads) on purchase payments, reinvested dividends, or other distributions; redemption fees; and exchange fees; and (2) ongoing costs, including management fees; distribution (12b-1) fees; and other Fund expenses. This Example is intended to help you understand your ongoing costs (in dollars) of investing in the Fund and to compare these costs with the ongoing costs of investing in other mutual funds.
The Example is based on an investment of $1,000 invested at the beginning of the period and held for the entire period from January 1, 2011 through June 30, 2011.
Actual Expenses
The first line of the table below provides information about actual account values and actual expenses. You may use the information in this line, together with the amount you invested, to estimate the expenses that you paid over the period. Simply divide your account value by $1,000 (for example, an $8,600 account value divided by $1,000 = 8.6), then multiply the result by the number in the first line under the heading entitled "Expenses Paid During the Period" to estimate the expenses you paid on your account during the period.
The following transaction costs are not included in the expenses shown in the table and, if applicable, would increase the expenses that you paid over the period: (1) a front-end sales charge (load) of 5.75% on Class A shares; (2) a 2% redemption fee if you sell or exchange shares within 180 days of purchase, with certain exceptions. The redemption fee does not apply to: (a) redemptions under an automatic withdrawal program or periodic asset reallocation plan, required minimum distributions (RMD), employer mandated distributions from a qualified plan, or redemptions under a qualified domestic relations order (QDRO); (b) redemptions to pay for expenses related to terminal illness, extended hospital or nursing home care, or other serious medical conditions, including death; (c) redemptions of shares acquired through dividend or capital gains reinvestments; (d) loans from a qualified plan account, and (e) redemptions initiated by the Fund; and (3) a $10 service fee on each exchange after the first five exchanges in each calendar year.
The following ongoing costs are not included in the expenses shown in the table and, if applicable, would increase the expenses that you paid over the period: (1) a $12 low balance fee on accounts with balances of less than $250 as of September 30th of each calendar year and no investment activity (excluding reinvestment of dividends and/or capital gains) during the prior calendar year or the first nine months of the current calendar year. This fee does not apply to IRAs, qualified plan accounts, or Coverdell Education Savings Accounts; (2) a $15 annual custodial fee on IRAs, SEPs, SIMPLE IRAs, and Coverdell Education Savings Accounts; and (3) a $20 annual custodial fee on 403(b) accounts.
Hypothetical Example for Comparison Purposes
The second line of the table below provides information about hypothetical account values and hypothetical expenses based on the Fund's actual expense ratio and an assumed rate of return of 5% per year before expenses, which in not the Fund's actual return. The hypothetical account values and expenses may not be used to estimate the actual ending account balance or expenses you paid for the period. You may use this information to compare the ongoing costs of investing in the Fund and other funds. To do so, compare this 5% hypothetical example with the 5% hypothetical examples that appear in the shareholder reports of the other funds.
The following transaction costs are not included in the expenses shown in the table and, if applicable, would increase the expenses that you paid over the period: (1) a front-end sales charge (load) of 5.75% on Class A shares; (2) a 2% redemption fee if you sell or exchange shares within 180 days of purchase, with certain exceptions. The redemption fee does not apply to: (a) redemptions under an automatic withdrawal program or periodic asset reallocation plan, required minimum distributions (RMD), employer mandated distributions from a qualified plan, or redemptions under a qualified domestic relations order (QDRO); (b) redemptions to pay for expenses related to terminal illness, death, extended hospital or nursing home care, or other serious medical conditions; (c) redemptions of shares acquired through dividend or capital gains reinvestments; (d) loans from a qualified plan account; and (e) redemptions initiated by the Fund; and (3) a $10 service fee on each exchange after the first five exchanges in each calendar year.
The following ongoing costs are not included in the expenses shown in the table and, if applicable, would increase the expenses that you paid over the period: (1) a $12 low balance fee on accounts with balances of less than $250 as of September 30th of each calendar year and no investment activity (excluding reinvestment of dividends and/or capital gains) during the prior calendar year or the first nine months of the current calendar year. This fee does not apply to IRAs, qualified plan accounts, or Coverdell Education Savings Accounts; (2) a $15 annual custodial fee on IRAs, SEPs, SIMPLE IRAs, and Coverdell Education Savings Accounts; and (3) a $20 annual custodial fee on 403(b) accounts.
Please note that the expenses shown in the table are meant to highlight your ongoing costs only and do not reflect any transactional costs, such as sales charges (loads), redemption fees, or exchange fees. Therefore, the second line of the table is useful in comparing ongoing costs only, and will not help you determine the relative total costs of owning different funds. In addition, if these transactional costs were included, your costs would have been higher.
| Beginning Account Value 01/01/11 | Ending Account Value 06/30/11 | Expense Paid During Period 01/01/11 – 06/30/11 | |||||||||||||
| Small Cap Value Fund Class A | |||||||||||||||
| Actual | $ | 1,000.00 | $ | 1,160.70 | $ | 15.21 | |||||||||
| Hypothetical (5% return before expense) | $ | 1,000.00 | $ | 1,010.71 | $ | 14.16 | |||||||||
| Small Cap Value Fund Class C | |||||||||||||||
| Actual | $ | 1,000.00 | $ | 1,157.00 | $ | 19.20 | |||||||||
| Hypothetical (5% return before expense) | $ | 1,000.00 | $ | 1,006.99 | $ | 17.86 | |||||||||
| Small Cap Value Fund Class I | |||||||||||||||
| Actual | $ | 1,000.00 | $ | 1,162.20 | $ | 13.89 | |||||||||
| Hypothetical (5% return before expense) | $ | 1,000.00 | $ | 1,011.95 | $ | 12.92 | |||||||||
3 Expenses are equal to the Fund's annualized expense ratio of 2.84% for Class A shares, 3.59% for Class C shares and 2.59% for Class I shares, multiplied by the average account value over the period, multiplied by 181/365 days to reflect the one-half year period.
28

Pacific Advisors Fund Inc.
Financial Statements
29
Pacific Advisors Government Securities Fund
Statement of Investments (Unaudited)
as of June 30, 2011
| Quantity or Principal | Description | Current $ Value** | % of Total Net Assets | ||||||||||||
| COMMON STOCK | |||||||||||||||
| CONSUMER DISCRETIONARY | 1.57 | ||||||||||||||
| HOTELS, RESTAURANTS & LEISURE | |||||||||||||||
| 700 | MCDONALD'S CORP. | 59,024 | |||||||||||||
| 59,024 | 1.57 | ||||||||||||||
| CONSUMER STAPLES | 1.96 | ||||||||||||||
| HOUSEHOLD PRODUCTS | |||||||||||||||
| 1,100 | KIMBERLY-CLARK CORP. | 73,216 | |||||||||||||
| 73,216 | 1.96 | ||||||||||||||
| ENERGY | 1.65 | ||||||||||||||
| OIL, GAS & CONSUMABLE FUELS | |||||||||||||||
| 600 | CHEVRON CORP. | 61,704 | |||||||||||||
| 61,704 | 1.65 | ||||||||||||||
| INFORMATION TECHNOLOGY | 1.73 | ||||||||||||||
| SOFTWARE | |||||||||||||||
| 2,500 | MICROSOFT CORP. | 65,000 | |||||||||||||
| 65,000 | 1.73 | ||||||||||||||
| TELECOMMUNICATION SERVICES | 1.60 | ||||||||||||||
| DIVERSIFIED TELECOM. SERVICES | |||||||||||||||
| 1,900 | AT&T INC. | 59,679 | |||||||||||||
| 59,679 | 1.60 | ||||||||||||||
| UTILITIES | 3.78 | ||||||||||||||
| ELECTRIC UTILITIES | |||||||||||||||
| 1,000 | PPL CORP. | 27,830 | |||||||||||||
| 1,500 | SOUTHERN CO. | 60,570 | |||||||||||||
| 88,400 | 2.36 | ||||||||||||||
| MULTI-UTILITIES | |||||||||||||||
| 1,000 | CONSOLIDATED EDISON INC. | 53,240 | |||||||||||||
| 53,240 | 1.42 | ||||||||||||||
| TOTAL COMMON STOCK (Cost: $398,095) | 460,263 | 12.30 | |||||||||||||
| US GOVT SECURITIES | |||||||||||||||
| US GOVERNMENT AGENCY | 80.70 | ||||||||||||||
| US GOVERNMENT AGENCY | |||||||||||||||
| 90,000 | FEDERAL HOME LN MTG CORP. 1.50% 07/15/16 STEP | 90,054 | |||||||||||||
| 200,000 | FEDERAL HOME LN MTG CORP. 3.00% 08/24/18 STEP | 200,750 | |||||||||||||
| 100,000 | FEDERAL HOME LN MTG CORP. 3.00% 01/28/19 STEP | 100,201 | |||||||||||||
| 100,000 | FEDERAL HOME LOAN BANK 1.70% 03/19/14 STEP | 101,002 | |||||||||||||
See Accompanying Notes to Financial Statements which are an integral part of these financial statements.
30
Pacific Advisors Government Securities Fund
Statement of Investments (Unaudited)
as of June 30, 2011
| Quantity or Principal | Description | Current $ Value** | % of Total Net Assets | ||||||||||||
| US GOVT SECURITIES continued | |||||||||||||||
| 100,000 | FEDERAL HOME LOAN BANK 2.00% 07/17/14 STEP | 101,000 | |||||||||||||
| 250,000 | FEDERAL HOME LOAN BANK 2.00% 09/16/15 STEP | 253,247 | |||||||||||||
| 150,000 | FEDERAL HOME LOAN BANK 2.00% 11/17/15 STEP | 152,443 | |||||||||||||
| 270,000 | FEDERAL HOME LOAN BANK 5.25% 12/05/16 | 275,375 | |||||||||||||
| 350,000 | FEDERAL HOME LOAN BANK 1.00% 10/27/17 STEP | 348,659 | |||||||||||||
| 150,000 | FEDERAL HOME LOAN BANK 4.00% 12/29/17 | 151,163 | |||||||||||||
| 100,000 | FEDERAL HOME LOAN BANK 4.50% 02/28/18 | 102,606 | |||||||||||||
| 150,000 | FEDERAL HOME LOAN BANK 1.00% 03/28/18 STEP | 150,099 | |||||||||||||
| 290,000 | FEDERAL HOME LOAN BANK 5.875% 07/14/23 | 290,504 | |||||||||||||
| 100,000 | FEDERAL NATL MTG ASSOC. 1.25% 04/27/17 STEP | 100,256 | |||||||||||||
| 600,000 | FEDERAL NATL MTG ASSOC. 2.00% 10/28/19 STEP | 601,799 | |||||||||||||
| 3,019,157 | 80.70 | ||||||||||||||
| TOTAL US GOVT SECURITIES (Cost: $3,014,621) | 3,019,157 | 80.70 | |||||||||||||
| PREFERRED STOCK | |||||||||||||||
| FINANCIALS | 5.28 | ||||||||||||||
| CAPITAL MARKETS | |||||||||||||||
| 2,000 | DEUTSCHE BANK 7.35% PFD | 50,800 | |||||||||||||
| 50,800 | 1.36 | ||||||||||||||
| COMMERCIAL BANKS | |||||||||||||||
| 4,000 | BARCLAYS BANK PLC 6.625% PFD | 96,160 | |||||||||||||
| 2,000 | BARCLAYS BANK PLC 7.10% PFD | 50,700 | |||||||||||||
| 146,860 | 3.93 | ||||||||||||||
| TOTAL PREFERRED STOCK (Cost: $200,000) | 197,660 | 5.28 | |||||||||||||
| SHORT TERM INVESTMENTS | |||||||||||||||
| MONEY MARKET | 1.40 | ||||||||||||||
| 52,420 | UMB MONEY MARKET FIDUCIARY | 52,420 | |||||||||||||
| 52,420 | 1.40 | ||||||||||||||
| TOTAL SHORT TERM INVESTMENTS (Cost: $52,420) | 52,420 | 1.40 | |||||||||||||
| TOTAL INVESTMENT IN SECURITIES (Cost: $3,665,136) | 3,729,500 | 99.68 | |||||||||||||
| OTHER ASSETS LESS LIABILITIES | 11,915 | 0.32 | |||||||||||||
| TOTAL NET ASSETS | 3,741,415 | 100.00 | |||||||||||||
** The principal amount is stated in U.S. dollars unless otherwise indicated.
See Accompanying Notes to Financial Statements which are an integral part of these financial statements.
31
Pacific Advisors Income and Equity Fund
Statement of Investments (Unaudited)
as of June 30, 2011
| Quantity or Principal | Description | Current $ Value** | % of Total Net Assets | ||||||||||||
| COMMON STOCK | |||||||||||||||
| CONSUMER DISCRETIONARY | 8.48 | ||||||||||||||
| DISTRIBUTORS | |||||||||||||||
| 3,000 | GENUINE PARTS CO. | 163,200 | |||||||||||||
| 163,200 | 1.83 | ||||||||||||||
| HOTELS, RESTAURANTS & LEISURE | |||||||||||||||
| 2,000 | MCDONALD'S CORP. | 168,640 | |||||||||||||
| 168,640 | 1.89 | ||||||||||||||
| LEISURE EQUIPMENT & PRODUCTS | |||||||||||||||
| 7,000 | MATTEL INC. | 192,430 | |||||||||||||
| 192,430 | 2.16 | ||||||||||||||
| SPECIALTY RETAIL | |||||||||||||||
| 4,500 | BEST BUY CO. INC. | 141,345 | |||||||||||||
| 2,500 | HOME DEPOT INC. | 90,550 | |||||||||||||
| 231,895 | 2.60 | ||||||||||||||
| CONSUMER STAPLES | 7.15 | ||||||||||||||
| FOOD & STAPLES RETAILING | |||||||||||||||
| 6,000 | SYSCO CORP. | 187,080 | |||||||||||||
| 3,000 | WAL-MART STORES INC. | 159,420 | |||||||||||||
| 346,500 | 3.89 | ||||||||||||||
| HOUSEHOLD PRODUCTS | |||||||||||||||
| 2,500 | PROCTER & GAMBLE CO. | 158,925 | |||||||||||||
| 158,925 | 1.78 | ||||||||||||||
| TOBACCO | |||||||||||||||
| 5,000 | ALTRIA GROUP INC. | 132,050 | |||||||||||||
| 132,050 | 1.48 | ||||||||||||||
| ENERGY | 1.27 | ||||||||||||||
| OIL, GAS & CONSUMABLE FUELS | |||||||||||||||
| 1,500 | CONOCOPHILLIPS | 112,785 | |||||||||||||
| 112,785 | 1.27 | ||||||||||||||
| FINANCIALS | 0.49 | ||||||||||||||
| DIVERSIFIED FINANCIAL SERVICES | |||||||||||||||
| 4,000 | BANK OF AMERICA CORP. | 43,840 | |||||||||||||
| 43,840 | 0.49 | ||||||||||||||
See Accompanying Notes to Financial Statements which are an integral part of these financial statements.
32
Pacific Advisors Income and Equity Fund
Statement of Investments (Unaudited)
as of June 30, 2011
| Quantity or Principal | Description | Current $ Value** | % of Total Net Assets | ||||||||||||
| COMMON STOCK continued | |||||||||||||||
| HEALTH CARE | 5.49 | ||||||||||||||
| PHARMACEUTICALS | |||||||||||||||
| 3,000 | ABBOTT LABORATORIES | 157,860 | |||||||||||||
| 2,500 | JOHNSON & JOHNSON | 166,300 | |||||||||||||
| 8,000 | PFIZER INC. | 164,800 | |||||||||||||
| 488,960 | 5.49 | ||||||||||||||
| INDUSTRIALS | 6.23 | ||||||||||||||
| AEROSPACE & DEFENSE | |||||||||||||||
| 2,250 | HONEYWELL INT'L INC. | 134,078 | |||||||||||||
| 134,078 | 1.50 | ||||||||||||||
| AIR FREIGHT & LOGISTICS | |||||||||||||||
| 1,500 | UNITED PARCEL SERVICE INC. B | 109,395 | |||||||||||||
| 109,395 | 1.23 | ||||||||||||||
| COMMERCIAL SERVICES & SUPPLIES | |||||||||||||||
| 7,000 | PITNEY BOWES INC. | 160,930 | |||||||||||||
| 160,930 | 1.81 | ||||||||||||||
| INDUSTRIAL CONGLOMERATES | |||||||||||||||
| 8,000 | GENERAL ELECTRIC CO. | 150,880 | |||||||||||||
| 150,880 | 1.69 | ||||||||||||||
| INFORMATION TECHNOLOGY | 3.77 | ||||||||||||||
| COMMUNICATIONS EQUIPMENT | |||||||||||||||
| 7,500 | NOKIA CORP. ADR A | 48,150 | |||||||||||||
| 48,150 | 0.54 | ||||||||||||||
| IT SERVICES | |||||||||||||||
| 2,500 | AUTOMATIC DATA PROCESSING INC. | 131,700 | |||||||||||||
| 131,700 | 1.48 | ||||||||||||||
| SOFTWARE | |||||||||||||||
| 6,000 | MICROSOFT CORP. | 156,000 | |||||||||||||
| 156,000 | 1.75 | ||||||||||||||
| MATERIALS | 1.82 | ||||||||||||||
| CHEMICALS | |||||||||||||||
| 3,000 | DUPONT DE NEMOURS & CO. | 162,150 | |||||||||||||
| 162,150 | 1.82 | ||||||||||||||
See Accompanying Notes to Financial Statements which are an integral part of these financial statements.
33
Pacific Advisors Income and Equity Fund
Statement of Investments (Unaudited)
as of June 30, 2011
| Quantity or Principal | Description | Current $ Value** | % of Total Net Assets | ||||||||||||
| COMMON STOCK continued | |||||||||||||||
| TELECOMMUNICATION SERVICES | 5.32 | ||||||||||||||
| DIVERSIFIED TELECOM. SERVICES | |||||||||||||||
| 5,500 | AT&T INC. | 172,755 | |||||||||||||
| 4,500 | VERIZON COMMUNICATIONS INC. | 167,535 | |||||||||||||
| 340,290 | 3.82 | ||||||||||||||
| WIRELESS TELECOM. SERVICES | |||||||||||||||
| 5,000 | VODAFONE GROUP PLC | 133,600 | |||||||||||||
| 133,600 | 1.50 | ||||||||||||||
| UTILITIES | 4.06 | ||||||||||||||
| ELECTRIC UTILITIES | |||||||||||||||
| 5,000 | DUKE ENERGY CORP. | 94,150 | |||||||||||||
| 94,150 | 1.06 | ||||||||||||||
| MULTI-UTILITIES | |||||||||||||||
| 2,000 | DOMINION RESOURCES INC. | 96,540 | |||||||||||||
| 3,000 | PUBLIC SERVICE ENTERPRISE GROUP INC. | 97,920 | |||||||||||||
| 3,000 | XCEL ENERGY INC. | 72,900 | |||||||||||||
| 267,360 | 3.00 | ||||||||||||||
| TOTAL COMMON STOCK (Cost: $3,675,944) | 3,927,908 | 44.08 | |||||||||||||
| CORPORATE BOND | |||||||||||||||
| CONSUMER DISCRETIONARY | 9.63 | ||||||||||||||
| HOTELS, RESTAURANTS & LEISURE | |||||||||||||||
| 50,000 | MARRIOTT INT'L 5.625% 02/15/13 | 53,327 | |||||||||||||
| 53,327 | 0.60 | ||||||||||||||
| HOUSEHOLD DURABLES | |||||||||||||||
| 100,000 | MDC HOLDINGS INC. 5.375% 12/15/14 | 105,915 | |||||||||||||
| 100,000 | WHIRLPOOL CORP. 6.50% 06/15/16 | 113,402 | |||||||||||||
| 219,318 | 2.46 | ||||||||||||||
| LEISURE EQUIPMENT & PRODUCTS | |||||||||||||||
| 50,000 | EQUIFAX INC. 6.30% 07/01/17 | 55,292 | |||||||||||||
| 55,292 | 0.62 | ||||||||||||||
| MULTILINE RETAIL | |||||||||||||||
| 35,000 | NORDSTROM INC. 6.75% 06/01/14 | 40,054 | |||||||||||||
| 281,000 | TARGET CORP. 8.60% 01/15/12 | 292,936 | |||||||||||||
| 332,990 | 3.74 | ||||||||||||||
See Accompanying Notes to Financial Statements which are an integral part of these financial statements.
34
Pacific Advisors Income and Equity Fund
Statement of Investments (Unaudited)
as of June 30, 2011
| Quantity or Principal | Description | Current $ Value** | % of Total Net Assets | ||||||||||||
| CORPORATE BOND continued | |||||||||||||||
| SPECIALTY RETAIL | |||||||||||||||
| 100,000 | AUTOZONE INC. 5.50% 11/15/15 | 111,362 | |||||||||||||
| 80,000 | STAPLES INC. 7.375% 10/01/12 | 85,841 | |||||||||||||
| 197,204 | 2.21 | ||||||||||||||
| CONSUMER STAPLES | 0.89 | ||||||||||||||
| TOBACCO | |||||||||||||||
| 75,000 | ALTRIA GROUP INC. 4.125% 09/11/15 | 79,477 | |||||||||||||
| 79,477 | 0.89 | ||||||||||||||
| ENERGY | 2.29 | ||||||||||||||
| OIL, GAS & CONSUMABLE FUELS | |||||||||||||||
| 143,000 | ATLANTIC RICHFIELD 8.50% 04/01/12 | 151,084 | |||||||||||||
| 50,000 | VALERO ENERGY CORP. 4.50% 02/01/15 | 53,375 | |||||||||||||
| 204,460 | 2.29 | ||||||||||||||
| FINANCIALS | 17.79 | ||||||||||||||
| CAPITAL MARKETS | |||||||||||||||
| 50,000 | CHARLES SCHWAB CORP. 6.375% 09/01/17 | 58,800 | |||||||||||||
| 95,000 | GOLDMAN SACHS GROUP 5.00% 10/01/14 | 101,754 | |||||||||||||
| 100,000 | JANUS CAPITAL GROUP INC. 6.70% 06/15/17 | 109,626 | |||||||||||||
| 270,179 | 3.03 | ||||||||||||||
| CONSUMER FINANCE | |||||||||||||||
| 300,000 | AIG 6.00% 11/15/14 | 284,918 | |||||||||||||
| 200,000 | AMERICAN EXPRESS CO. 7.30% 08/20/13 | 222,598 | |||||||||||||
| 106,000 | HSBC 11/10/13 FLOAT | 108,561 | |||||||||||||
| 616,077 | 6.91 | ||||||||||||||
| DIVERSIFIED FINANCIAL SERVICES | |||||||||||||||
| 371,000 | GENERAL ELECTRIC CAP 8.125% 05/15/12 | 389,983 | |||||||||||||
| 150,000 | GENERAL ELECTRIC CAP 5.50% 09/30/16 STEP | 150,230 | |||||||||||||
| 540,213 | 6.06 | ||||||||||||||
| INSURANCE | |||||||||||||||
| 100,000 | PRUDENTIAL FINANCIAL INC. 11/02/20 FLOAT | 103,591 | |||||||||||||
| 103,591 | 1.16 | ||||||||||||||
| REAL ESTATE INVESTMENT TRUSTS | |||||||||||||||
| 50,000 | HOSPITALITY PROPERTIES TRUST 7.875% 08/15/14 | 56,415 | |||||||||||||
| 56,415 | 0.63 | ||||||||||||||
See Accompanying Notes to Financial Statements which are an integral part of these financial statements.
35
Pacific Advisors Income and Equity Fund
Statement of Investments (Unaudited)
as of June 30, 2011
| Quantity or Principal | Description | Current $ Value** | % of Total Net Assets | ||||||||||||
| CORPORATE BOND continued | |||||||||||||||
| HEALTH CARE | 0.57 | ||||||||||||||
| HEALTH CARE PROVIDERS & SERVICES | |||||||||||||||
| 46,000 | WELLPOINT INC. 5.00% 12/15/14 | 50,680 | |||||||||||||
| 50,680 | 0.57 | ||||||||||||||
| INDUSTRIALS | 3.21 | ||||||||||||||
| AIRLINES | |||||||||||||||
| 50,000 | SOUTHWEST AIRLINES CO. 5.25% 10/01/14 | 54,103 | |||||||||||||
| 54,103 | 0.61 | ||||||||||||||
| MACHINERY | |||||||||||||||
| 115,000 | JOY GLOBAL INC. 6.00% 11/15/16 | 129,546 | |||||||||||||
| 129,546 | 1.45 | ||||||||||||||
| TRADING COMPANIES & DISTRIBUTORS | |||||||||||||||
| 100,000 | GATX FINANCIAL CORP. 5.50% 02/15/12 | 102,241 | |||||||||||||
| 102,241 | 1.15 | ||||||||||||||
| INFORMATION TECHNOLOGY | 2.78 | ||||||||||||||
| COMPUTERS & PERIPHERALS | |||||||||||||||
| 50,000 | DELL INC. 5.65% 04/15/18 | 55,451 | |||||||||||||
| 55,451 | 0.62 | ||||||||||||||
| ELECTRONIC EQUIPMENT & INSTRUMENTS | |||||||||||||||
| 80,000 | CORNING INC. 7.53% 03/01/23 | 87,489 | |||||||||||||
| 50,000 | INGRAM MICRO INC. 5.25% 09/01/17 | 52,412 | |||||||||||||
| 139,900 | 1.57 | ||||||||||||||
| OFFICE ELECTRONICS | |||||||||||||||
| 50,000 | XEROX CORP. 5.50% 05/15/12 | 51,986 | |||||||||||||
| 51,986 | 0.59 | ||||||||||||||
| MATERIALS | 3.99 | ||||||||||||||
| CONTAINERS & PACKAGING | |||||||||||||||
| 25,000 | PACKAGING CORP. OF AMERICA 5.75% 08/01/13 | 26,709 | |||||||||||||
| 26,709 | 0.30 | ||||||||||||||
| METALS & MINING | |||||||||||||||
| 50,000 | ARCELORMITTAL USA INC. 6.50% 04/15/14 | 55,446 | |||||||||||||
| 50,000 | COMMERCIAL METALS CO. 7.35% 08/15/18 | 53,385 | |||||||||||||
| 50,000 | FREEPORT-MCMORAN C&G INC. 8.375% 04/01/17 | 54,625 | |||||||||||||
| 150,000 | RELIANCE STEEL & ALUMINUM 6.20% 11/15/16 | 164,618 | |||||||||||||
| 328,074 | 3.69 | ||||||||||||||
See Accompanying Notes to Financial Statements which are an integral part of these financial statements.
36
Pacific Advisors Income and Equity Fund
Statement of Investments (Unaudited)
as of June 30, 2011
| Quantity or Principal | Description | Current $ Value** | % of Total Net Assets | ||||||||||||
| CORPORATE BOND continued | |||||||||||||||
| TELECOMMUNICATION SERVICES | 5.08 | ||||||||||||||
| DIVERSIFIED TELECOM. SERVICES | |||||||||||||||
| 100,000 | AT&T CORP. 7.30% 11/15/11 | 102,422 | |||||||||||||
| 226,498 | BELLSOUTH TELECOM 6.30% 12/15/15 | 242,509 | |||||||||||||
| 100,000 | VERIZON FLORIDA 6.125% 01/15/13 | 107,349 | |||||||||||||
| 452,280 | 5.08 | ||||||||||||||
| UTILITIES | 1.91 | ||||||||||||||
| MULTI-UTILITIES | |||||||||||||||
| 55,000 | CONSUMERS ENERGY CO. 6.00% 02/15/14 | 61,172 | |||||||||||||
| 100,000 | OGE ENERGY CORP. 5.00% 11/15/14 | 108,540 | |||||||||||||
| 169,712 | 1.91 | ||||||||||||||
| TOTAL CORPORATE BOND (Cost: $4,099,306) | 4,289,224 | 48.14 | |||||||||||||
| US GOVT SECURITIES | |||||||||||||||
| US GOVERNMENT AGENCY | 1.13 | ||||||||||||||
| US GOVERNMENT AGENCY | |||||||||||||||
| 100,000 | FEDERAL HOME LOAN BANK 6.00% 07/19/17 | 100,270 | |||||||||||||
| 100,270 | 1.13 | ||||||||||||||
| TOTAL US GOVT SECURITIES (Cost: $100,000) | 100,270 | 1.13 | |||||||||||||
| PREFERRED STOCK | |||||||||||||||
| FINANCIALS | 5.46 | ||||||||||||||
| CAPITAL MARKETS | |||||||||||||||
| 3,000 | DEUTSCHE BANK 6.625% PFD | 72,090 | |||||||||||||
| 72,090 | 0.81 | ||||||||||||||
| COMMERCIAL BANKS | |||||||||||||||
| 2,000 | BARCLAYS BANK PLC 6.625% PFD | 48,080 | |||||||||||||
| 2,000 | BARCLAYS BANK PLC 7.10% PFD | 50,700 | |||||||||||||
| 4,000 | HSBC HOLDINGS PLC 6.20% PFD A | 97,680 | |||||||||||||
| 196,460 | 2.21 | ||||||||||||||
| DIVERSIFIED FINANCIAL SERVICES | |||||||||||||||
| 2,000 | BANK OF AMERICA 7.25% PFD | 50,380 | |||||||||||||
| 2,000 | BANK OF AMERICA 6.375% PFD | 45,620 | |||||||||||||
| 2,000 | MERRILL LYNCH 6.45% PFD | 47,400 | |||||||||||||
| 143,400 | 1.60 | ||||||||||||||
| INSURANCE | |||||||||||||||
| 3,000 | METLIFE INC. 6.50% PFD | 75,000 | |||||||||||||
| 75,000 | 0.84 | ||||||||||||||
See Accompanying Notes to Financial Statements which are an integral part of these financial statements.
37
Pacific Advisors Income and Equity Fund
Statement of Investments (Unaudited)
as of June 30, 2011
| Quantity or Principal | Description | Current $ Value** | % of Total Net Assets | ||||||||||||
| PREFERRED STOCK continued | |||||||||||||||
| UTILITIES | 0.57 | ||||||||||||||
| ELECTRIC UTILITIES | |||||||||||||||
| 2,000 | NEXTERA ENERGY CAPITAL 6.60% PFD A | 50,700 | |||||||||||||
| 50,700 | 0.57 | ||||||||||||||
| TOTAL PREFERRED STOCK (Cost: $550,000) | 537,650 | 6.03 | |||||||||||||
| SHORT TERM INVESTMENTS | |||||||||||||||
| MONEY MARKET | 0.34 | ||||||||||||||
| 30,130 | UMB MONEY MARKET FIDUCIARY | 30,130 | |||||||||||||
| 30,130 | 0.34 | ||||||||||||||
| TOTAL SHORT TERM INVESTMENTS (Cost: $30,130) | 30,130 | 0.34 | |||||||||||||
| TOTAL INVESTMENT IN SECURITIES (Cost: $8,455,380) | 8,885,182 | 99.72 | |||||||||||||
| OTHER ASSETS LESS LIABILITIES | 25,072 | 0.28 | |||||||||||||
| TOTAL NET ASSETS | 8,910,254 | 100.00 | |||||||||||||
** The principal amount is stated in U.S. dollars unless otherwise indicated.
See Accompanying Notes to Financial Statements which are an integral part of these financial statements.
38
Pacific Advisors Balanced Fund
Statement of Investments (Unaudited)
as of June 30, 2011
| Quantity or Principal | Description | Current $ Value** | % of Total Net Assets | ||||||||||||
| COMMON STOCK | |||||||||||||||
| CONSUMER DISCRETIONARY | 5.22 | ||||||||||||||
| HOTELS, RESTAURANTS & LEISURE | |||||||||||||||
| 6,300 | MCDONALD'S CORP. | 531,216 | |||||||||||||
| 531,216 | 2.81 | ||||||||||||||
| SPECIALTY RETAIL | |||||||||||||||
| 14,500 | BEST BUY CO. INC. | 455,445 | |||||||||||||
| 455,445 | 2.41 | ||||||||||||||
| CONSUMER STAPLES | 11.53 | ||||||||||||||
| BEVERAGES | |||||||||||||||
| 8,100 | COCA-COLA CO. | 545,049 | |||||||||||||
| 545,049 | 2.88 | ||||||||||||||
| FOOD & STAPLES RETAILING | |||||||||||||||
| 15,000 | CVS CAREMARK CORP. | 563,700 | |||||||||||||
| 10,000 | WAL-MART STORES INC. | 531,400 | |||||||||||||
| 1,095,100 | 5.79 | ||||||||||||||
| HOUSEHOLD PRODUCTS | |||||||||||||||
| 8,500 | PROCTER & GAMBLE CO. | 540,345 | |||||||||||||
| 540,345 | 2.86 | ||||||||||||||
| ENERGY | 9.05 | ||||||||||||||
| ENERGY EQUIPMENT & SERVICES | |||||||||||||||
| 12,500 | HALLIBURTON CO. | 637,500 | |||||||||||||
| 7,500 | NATIONAL OILWELL VARCO INC. | 586,575 | |||||||||||||
| 1,224,075 | 6.47 | ||||||||||||||
| OIL, GAS & CONSUMABLE FUELS | |||||||||||||||
| 6,500 | CONOCOPHILLIPS | 488,735 | |||||||||||||
| 488,735 | 2.58 | ||||||||||||||
| FINANCIALS | 8.38 | ||||||||||||||
| CONSUMER FINANCE | |||||||||||||||
| 11,000 | AMERICAN EXPRESS CO. | 568,700 | |||||||||||||
| 568,700 | 3.01 | ||||||||||||||
| DIVERSIFIED FINANCIAL SERVICES | |||||||||||||||
| 13,500 | JPMORGAN CHASE & CO. | 552,690 | |||||||||||||
| 552,690 | 2.92 | ||||||||||||||
| INSURANCE | |||||||||||||||
| 4 | BERKSHIRE HATHAWAY INC. A* | 464,420 | |||||||||||||
| 464,420 | 2.45 | ||||||||||||||
See Accompanying Notes to Financial Statements which are an integral part of these financial statements.
39
Pacific Advisors Balanced Fund
Statement of Investments (Unaudited)
as of June 30, 2011
| Quantity or Principal | Description | Current $ Value** | % of Total Net Assets | ||||||||||||
| COMMON STOCK continued | |||||||||||||||
| HEALTH CARE | 8.48 | ||||||||||||||
| PHARMACEUTICALS | |||||||||||||||
| 7,000 | ABBOTT LABORATORIES | 368,340 | |||||||||||||
| 8,000 | JOHNSON & JOHNSON | 532,160 | |||||||||||||
| 10,000 | MERCK & COMPANY INC. | 352,900 | |||||||||||||
| 17,000 | PFIZER INC. | 350,200 | |||||||||||||
| 1,603,600 | 8.48 | ||||||||||||||
| INDUSTRIALS | 15.06 | ||||||||||||||
| AEROSPACE & DEFENSE | |||||||||||||||
| 3,000 | BOEING CO. | 221,790 | |||||||||||||
| 221,790 | 1.17 | ||||||||||||||
| AIR FREIGHT & LOGISTICS | |||||||||||||||
| 7,500 | UNITED PARCEL SERVICE INC. B | 546,975 | |||||||||||||
| 546,975 | 2.89 | ||||||||||||||
| INDUSTRIAL CONGLOMERATES | |||||||||||||||
| 28,000 | GENERAL ELECTRIC CO. | 528,080 | |||||||||||||
| 528,080 | 2.79 | ||||||||||||||
| MACHINERY | |||||||||||||||
| 4,500 | CATERPILLAR INC. | 479,070 | |||||||||||||
| 479,070 | 2.53 | ||||||||||||||
| ROAD & RAIL | |||||||||||||||
| 21,000 | CSX CORP. | 550,620 | |||||||||||||
| 7,000 | NORFOLK SOUTHERN CORP. | 524,510 | |||||||||||||
| 1,075,130 | 5.68 | ||||||||||||||
| INFORMATION TECHNOLOGY | 14.84 | ||||||||||||||
| COMMUNICATIONS EQUIPMENT | |||||||||||||||
| 40,000 | NOKIA CORP. ADR A | 256,800 | |||||||||||||
| 7,000 | QUALCOMM INC. | 397,530 | |||||||||||||
| 654,330 | 3.46 | ||||||||||||||
| COMPUTERS & PERIPHERALS | |||||||||||||||
| 10,000 | HEWLETT-PACKARD CO. | 364,000 | |||||||||||||
| 3,850 | INT'L BUSINESS MACHINES CORP. | 660,468 | |||||||||||||
| 1,024,468 | 5.41 | ||||||||||||||
| ELECTRONIC EQUIPMENT & INSTRUMENTS | |||||||||||||||
| 30,000 | CORNING INC. | 544,500 | |||||||||||||
| 544,500 | 2.88 | ||||||||||||||
See Accompanying Notes to Financial Statements which are an integral part of these financial statements.
40
Pacific Advisors Balanced Fund
Statement of Investments (Unaudited)
as of June 30, 2011
| Quantity or Principal | Description | Current $ Value** | % of Total Net Assets | ||||||||||||
| COMMON STOCK continued | |||||||||||||||
| SOFTWARE | |||||||||||||||
| 22,500 | MICROSOFT CORP. | 585,000 | |||||||||||||
| 585,000 | 3.09 | ||||||||||||||
| MATERIALS | 1.52 | ||||||||||||||
| CHEMICALS | |||||||||||||||
| 8,000 | DOW CHEMICAL CO. | 288,000 | |||||||||||||
| 288,000 | 1.52 | ||||||||||||||
| TOTAL COMMON STOCK (Cost: $12,485,494) | 14,016,718 | 74.08 | |||||||||||||
| CORPORATE BOND | |||||||||||||||
| CONSUMER DISCRETIONARY | 3.63 | ||||||||||||||
| AUTO COMPONENTS | |||||||||||||||
| 100,000 | BORG WARNER 8.00% 10/01/19 | 120,730 | |||||||||||||
| 120,730 | 0.64 | ||||||||||||||
| HOTELS, RESTAURANTS & LEISURE | |||||||||||||||
| 100,000 | MARRIOTT INT'L 5.625% 02/15/13 | 106,654 | |||||||||||||
| 106,654 | 0.56 | ||||||||||||||
| HOUSEHOLD DURABLES | |||||||||||||||
| 150,000 | FORTUNE BRANDS INC. 6.375% 06/15/14 | 166,758 | |||||||||||||
| 166,758 | 0.88 | ||||||||||||||
| MULTILINE RETAIL | |||||||||||||||
| 178,000 | TARGET CORP. 8.60% 01/15/12 | 185,561 | |||||||||||||
| 185,561 | 0.98 | ||||||||||||||
| SPECIALTY RETAIL | |||||||||||||||
| 100,000 | STAPLES INC. 7.375% 10/01/12 | 107,302 | |||||||||||||
| 107,302 | 0.57 | ||||||||||||||
| CONSUMER STAPLES | 1.48 | ||||||||||||||
| BEVERAGES | |||||||||||||||
| 100,000 | ANHEUSER-BUSCH COS INC. 4.95% 01/15/14 | 108,418 | |||||||||||||
| 108,418 | 0.57 | ||||||||||||||
| TOBACCO | |||||||||||||||
| 150,000 | REYNOLDS AMERICA 6.75% 06/15/17 | 173,187 | |||||||||||||
| 173,187 | 0.91 | ||||||||||||||
See Accompanying Notes to Financial Statements which are an integral part of these financial statements.
41
Pacific Advisors Balanced Fund
Statement of Investments (Unaudited)
as of June 30, 2011
| Quantity or Principal | Description | Current $ Value** | % of Total Net Assets | ||||||||||||
| CORPORATE BOND continued | |||||||||||||||
| FINANCIALS | 13.06 | ||||||||||||||
| CAPITAL MARKETS | |||||||||||||||
| 150,000 | CHARLES SCHWAB CORP. 6.375% 09/01/17 | 176,399 | |||||||||||||
| 150,000 | GOLDMAN SACHS GROUP 3.00% 12/22/17 STEP | 149,163 | |||||||||||||
| 161,000 | MORGAN STANLEY 07/01/14 FLOAT | 165,064 | |||||||||||||
| 490,625 | 2.59 | ||||||||||||||
| CONSUMER FINANCE | |||||||||||||||
| 300,000 | AIG 6.00% 10/15/14 | 286,832 | |||||||||||||
| 450,000 | AIG 6.00% 11/15/14 | 427,377 | |||||||||||||
| 155,000 | HOUSEHOLD FINANCE CO. 09/15/13 FLOAT | 158,838 | |||||||||||||
| 873,047 | 4.62 | ||||||||||||||
| DIVERSIFIED FINANCIAL SERVICES | |||||||||||||||
| 250,000 | AIG 07/11/11 FLOAT | 250,000 | |||||||||||||
| 300,000 | GENERAL ELECTRIC CAP 5.50% 11/15/11 | 305,321 | |||||||||||||
| 311,000 | GENERAL ELECTRIC CAP 8.125% 05/15/12 | 326,913 | |||||||||||||
| 100,000 | GENERAL ELECTRIC CAP 5.65% 06/09/14 | 110,288 | |||||||||||||
| 992,522 | 5.25 | ||||||||||||||
| REAL ESTATE INVESTMENT TRUSTS | |||||||||||||||
| 100,000 | HOSPITALITY PROPERTIES TRUST 7.875% 08/15/14 | 112,830 | |||||||||||||
| 112,830 | 0.60 | ||||||||||||||
| HEALTH CARE | 1.54 | ||||||||||||||
| HEALTH CARE PROVIDERS & SERVICES | |||||||||||||||
| 160,000 | AMERISOURCEBERGEN CORP. 5.875% 09/15/15 | 181,711 | |||||||||||||
| 100,000 | WELLPOINT INC. 5.00% 12/15/14 | 110,174 | |||||||||||||
| 291,885 | 1.54 | ||||||||||||||
| INFORMATION TECHNOLOGY | 0.58 | ||||||||||||||
| COMPUTERS & PERIPHERALS | |||||||||||||||
| 100,000 | DIGITAL EQUIPMENT 7.75% 04/01/23 | 109,801 | |||||||||||||
| 109,801 | 0.58 | ||||||||||||||
| MATERIALS | 2.32 | ||||||||||||||
| CHEMICALS | |||||||||||||||
| 105,000 | ALBEMARLE CORP. 5.10% 02/01/15 | 113,878 | |||||||||||||
| 113,878 | 0.60 | ||||||||||||||
| METALS & MINING | |||||||||||||||
| 100,000 | COMMERCIAL METALS CO. 7.35% 08/15/18 | 106,770 | |||||||||||||
| 100,000 | FREEPORT-MCMORAN C&G INC. 8.375% 04/01/17 | 109,250 | |||||||||||||
| 100,000 | RIO TINTO ALCAN INC. 5.20% 01/15/14 | 108,646 | |||||||||||||
| 324,665 | 1.72 | ||||||||||||||
See Accompanying Notes to Financial Statements which are an integral part of these financial statements.
42
Pacific Advisors Balanced Fund
Statement of Investments (Unaudited)
as of June 30, 2011
| Quantity or Principal | Description | Current $ Value** | % of Total Net Assets | ||||||||||||
| CORPORATE BOND continued | |||||||||||||||
| UTILITIES | 0.19 | ||||||||||||||
| INDEPENDENT POWER PRODUCERS & TRADERS | |||||||||||||||
| 33,999 | RELIANT ENERGY MID ATL 9.237% 07/02/17 | 36,379 | |||||||||||||
| 36,379 | 0.19 | ||||||||||||||
| TOTAL CORPORATE BOND (Cost: $4,187,958) | 4,314,241 | 22.80 | |||||||||||||
| PREFERRED STOCK | |||||||||||||||
| FINANCIALS | 4.12 | ||||||||||||||
| COMMERCIAL BANKS | |||||||||||||||
| 5,000 | BARCLAYS BANK PLC 8.125% PFD | 131,700 | |||||||||||||
| 5,000 | BARCLAYS BANK PLC 7.10% PFD | 126,750 | |||||||||||||
| 5,000 | HSBC HOLDING PLC 8.125% PFD | 133,050 | |||||||||||||
| 10,000 | WACHOVIA 7.85% PFD | 257,500 | |||||||||||||
| 649,000 | 3.43 | ||||||||||||||
| DIVERSIFIED FINANCIAL SERVICES | |||||||||||||||
| 5,000 | BANK OF AMERICA 8.20% PFD | 130,850 | |||||||||||||
| 130,850 | 0.69 | ||||||||||||||
| TOTAL PREFERRED STOCK (Cost: $750,000) | 779,850 | 4.12 | |||||||||||||
| TOTAL INVESTMENT IN SECURITIES (Cost: $17,423,452) | 19,110,808 | 101.00 | |||||||||||||
| OTHER ASSETS LESS LIABILITIES | (189,657 | ) | (1.00 | ) | |||||||||||
| TOTAL NET ASSETS | 18,921,151 | 100.00 | |||||||||||||
* Non-income producing
** The principal amount is stated in U.S. dollars unless otherwise indicated.
See Accompanying Notes to Financial Statements which are an integral part of these financial statements.
43
Pacific Advisors Large Cap Value Fund
Statement of Investments (Unaudited)
as of June 30, 2011
| Quantity or Principal | Description | Current $ Value** | % of Total Net Assets | ||||||||||||
| COMMON STOCK | |||||||||||||||
| CONSUMER DISCRETIONARY | 12.28 | ||||||||||||||
| DISTRIBUTORS | |||||||||||||||
| 1,000 | GENUINE PARTS CO. | 54,400 | |||||||||||||
| 54,400 | 1.42 | ||||||||||||||
| HOTELS, RESTAURANTS & LEISURE | |||||||||||||||
| 2,000 | MCDONALD'S CORP. | 168,640 | |||||||||||||
| 168,640 | 4.41 | ||||||||||||||
| INTERNET & CATALOG RETAIL | |||||||||||||||
| 1,200 | EXPEDIA INC. | 34,788 | |||||||||||||
| 34,788 | 0.91 | ||||||||||||||
| MEDIA | |||||||||||||||
| 3,250 | TIME WARNER INC. | 118,203 | |||||||||||||
| 118,203 | 3.09 | ||||||||||||||
| MULTILINE RETAIL | |||||||||||||||
| 2,000 | TARGET CORP. | 93,820 | |||||||||||||
| 93,820 | 2.45 | ||||||||||||||
| CONSUMER STAPLES | 24.92 | ||||||||||||||
| BEVERAGES | |||||||||||||||
| 2,560 | COCA-COLA CO. | 172,262 | |||||||||||||
| 172,262 | 4.51 | ||||||||||||||
| FOOD & STAPLES RETAILING | |||||||||||||||
| 5,500 | SYSCO CORP. | 171,490 | |||||||||||||
| 3,000 | WAL-MART STORES INC. | 159,420 | |||||||||||||
| 330,910 | 8.66 | ||||||||||||||
| FOOD PRODUCTS | |||||||||||||||
| 750 | H.J. HEINZ CO. | 39,960 | |||||||||||||
| 2,700 | KRAFT FOODS INC. | 95,121 | |||||||||||||
| 135,081 | 3.53 | ||||||||||||||
| HOUSEHOLD PRODUCTS | |||||||||||||||
| 2,500 | PROCTER & GAMBLE CO. | 158,925 | |||||||||||||
| 2,300 | THE CLOROX CO. | 155,112 | |||||||||||||
| 314,037 | 8.22 | ||||||||||||||
| ENERGY | 4.47 | ||||||||||||||
| OIL, GAS & CONSUMABLE FUELS | |||||||||||||||
| 2,100 | EXXON MOBIL CORP. | 170,898 | |||||||||||||
| 170,898 | 4.47 | ||||||||||||||
See Accompanying Notes to Financial Statements which are an integral part of these financial statements.
44
Pacific Advisors Large Cap Value Fund
Statement of Investments (Unaudited)
as of June 30, 2011
| Quantity or Principal | Description | Current $ Value** | % of Total Net Assets | ||||||||||||
| COMMON STOCK continued | |||||||||||||||
| FINANCIALS | 11.08 | ||||||||||||||
| COMMERCIAL BANKS | |||||||||||||||
| 3,250 | WELLS FARGO & CO. | 91,195 | |||||||||||||
| 91,195 | 2.39 | ||||||||||||||
| DIVERSIFIED FINANCIAL SERVICES | |||||||||||||||
| 620 | JPMORGAN CHASE & CO. | 25,383 | |||||||||||||
| 25,383 | 0.66 | ||||||||||||||
| INSURANCE | |||||||||||||||
| 2,000 | BERKSHIRE HATHAWAY INC. B* | 154,780 | |||||||||||||
| 3,470 | METLIFE INC. | 152,229 | |||||||||||||
| 307,009 | 8.03 | ||||||||||||||
| HEALTH CARE | 8.45 | ||||||||||||||
| HEALTH CARE PROVIDERS & SERVICES | |||||||||||||||
| 2,000 | CARDINAL HEALTH INC. | 90,840 | |||||||||||||
| 90,840 | 2.38 | ||||||||||||||
| PHARMACEUTICALS | |||||||||||||||
| 1,250 | ABBOTT LABORATORIES | 65,775 | |||||||||||||
| 2,500 | JOHNSON & JOHNSON | 166,300 | |||||||||||||
| 232,075 | 6.07 | ||||||||||||||
| INDUSTRIALS | 17.49 | ||||||||||||||
| AEROSPACE & DEFENSE | |||||||||||||||
| 2,000 | HONEYWELL INT'L INC. | 119,180 | |||||||||||||
| 2,400 | ITT CORP. | 141,432 | |||||||||||||
| 750 | NORTHROP GRUMMAN CORP. | 52,013 | |||||||||||||
| 312,625 | 8.18 | ||||||||||||||
| AIR FREIGHT & LOGISTICS | |||||||||||||||
| 1,000 | FEDEX CORP. | 94,850 | |||||||||||||
| 1,200 | UNITED PARCEL SERVICE INC. B | 87,516 | |||||||||||||
| 182,366 | 4.77 | ||||||||||||||
| INDUSTRIAL CONGLOMERATES | |||||||||||||||
| 9,200 | GENERAL ELECTRIC CO. | 173,512 | |||||||||||||
| 173,512 | 4.54 | ||||||||||||||
| INFORMATION TECHNOLOGY | 21.91 | ||||||||||||||
| COMMUNICATIONS EQUIPMENT | |||||||||||||||
| 4,700 | CISCO SYSTEMS INC. | 73,367 | |||||||||||||
| 73,367 | 1.92 | ||||||||||||||
See Accompanying Notes to Financial Statements which are an integral part of these financial statements.
45
Pacific Advisors Large Cap Value Fund
Statement of Investments (Unaudited)
as of June 30, 2011
| Quantity or Principal | Description | Current $ Value** | % of Total Net Assets | ||||||||||||
| COMMON STOCK continued | |||||||||||||||
| COMPUTERS & PERIPHERALS | |||||||||||||||
| 400 | APPLE INC.* | 134,268 | |||||||||||||
| 5,500 | DELL INC.* | 91,685 | |||||||||||||
| 1,085 | INT'L BUSINESS MACHINES CORP. | 186,132 | |||||||||||||
| 412,085 | 10.78 | ||||||||||||||
| IT SERVICES | |||||||||||||||
| 200 | MASTERCARD INC. | 60,268 | |||||||||||||
| 60,268 | 1.57 | ||||||||||||||
| SEMICONDUCTORS & EQUIPMENT | |||||||||||||||
| 5,600 | INTEL CORP. | 124,096 | |||||||||||||
| 124,096 | 3.25 | ||||||||||||||
| SOFTWARE | |||||||||||||||
| 6,450 | MICROSOFT CORP. | 167,700 | |||||||||||||
| 167,700 | 4.39 | ||||||||||||||
| TOTAL COMMON STOCK (Cost: $3,465,594) | 3,845,559 | 100.60 | |||||||||||||
| TOTAL INVESTMENT IN SECURITIES (Cost: $3,465,594) | 3,845,559 | 100.60 | |||||||||||||
| OTHER ASSETS LESS LIABILITIES | (23,033 | ) | (0.60 | ) | |||||||||||
| TOTAL NET ASSETS | 3,822,526 | 100.00 | |||||||||||||
* Non-income producing
** The principal amount is stated in U.S. dollars unless otherwise indicated.
See Accompanying Notes to Financial Statements which are an integral part of these financial statements.
46
Pacific Advisors Mid Cap Value Fund
Statement of Investments (Unaudited)
as of June 30, 2011
| Quantity or Principal | Description | Current $ Value** | % of Total Net Assets | ||||||||||||
| COMMON STOCK | |||||||||||||||
| CONSUMER DISCRETIONARY | 19.33 | ||||||||||||||
| AUTO COMPONENTS | |||||||||||||||
| 4,600 | LEAR CORP. | 246,008 | |||||||||||||
| 246,008 | 3.99 | ||||||||||||||
| SPECIALTY RETAIL | |||||||||||||||
| 8,300 | GAMESTOP CORP. A* | 221,361 | |||||||||||||
| 13,700 | PENSKE AUTOMOTIVE GROUP INC. | 311,538 | |||||||||||||
| 532,899 | 8.65 | ||||||||||||||
| TEXTILES, APPAREL & LUXURY GOODS | |||||||||||||||
| 16,000 | K-SWISS INC.* | 170,080 | |||||||||||||
| 3,700 | PVH CORP. | 242,239 | |||||||||||||
| 412,319 | 6.69 | ||||||||||||||
| CONSUMER STAPLES | 3.06 | ||||||||||||||
| BEVERAGES | |||||||||||||||
| 4,500 | DR PEPPER SNAPPLE GROUP INC. | 188,685 | |||||||||||||
| 188,685 | 3.06 | ||||||||||||||
| ENERGY | 28.57 | ||||||||||||||
| ENERGY EQUIPMENT & SERVICES | |||||||||||||||
| 23,000 | ION GEOPHYSICAL CORP.* | 217,580 | |||||||||||||
| 3,900 | LUFKIN INDUSTRIES INC. | 335,595 | |||||||||||||
| 15,000 | MITCHAM INDUSTRIES INC.* | 259,500 | |||||||||||||
| 4,400 | TIDEWATER INC. | 236,764 | |||||||||||||
| 1,049,439 | 17.03 | ||||||||||||||
| OIL, GAS & CONSUMABLE FUELS | |||||||||||||||
| 1,000 | APACHE CORP. | 123,390 | |||||||||||||
| 7,700 | ARCH COAL INC. | 205,282 | |||||||||||||
| 7,000 | CHESAPEAKE ENERGY CORP. | 207,830 | |||||||||||||
| 1,700 | CHEVRON CORP. | 174,828 | |||||||||||||
| 711,330 | 11.54 | ||||||||||||||
| FINANCIALS | 3.72 | ||||||||||||||
| COMMERCIAL BANKS | |||||||||||||||
| 14,000 | CATHAY GENERAL BANCORP | 229,460 | |||||||||||||
| 229,460 | 3.72 | ||||||||||||||
| INDUSTRIALS | 43.25 | ||||||||||||||
| COMMERCIAL SERVICES & SUPPLIES | |||||||||||||||
| 3,000 | COPART INC.* | 139,800 | |||||||||||||
| 9,000 | PITNEY BOWES INC. | 206,910 | |||||||||||||
| 346,710 | 5.63 | ||||||||||||||
See Accompanying Notes to Financial Statements which are an integral part of these financial statements.
47
Pacific Advisors Mid Cap Value Fund
Statement of Investments (Unaudited)
as of June 30, 2011
| Quantity or Principal | Description | Current $ Value** | % of Total Net Assets | ||||||||||||
| COMMON STOCK continued | |||||||||||||||
| CONSTRUCTION & ENGINEERING | |||||||||||||||
| 7,300 | CHICAGO BRIDGE & IRON CO. NV | 283,970 | |||||||||||||
| 6,700 | KBR INC. | 252,523 | |||||||||||||
| 536,493 | 8.70 | ||||||||||||||
| MACHINERY | |||||||||||||||
| 5,000 | GRACO INC. | 253,300 | |||||||||||||
| 2,600 | JOY GLOBAL INC. | 247,624 | |||||||||||||
| 4,600 | NAVISTAR INT'L CORP.* | 259,716 | |||||||||||||
| 760,640 | 12.34 | ||||||||||||||
| MARINE | |||||||||||||||
| 14,000 | DRYSHIPS INC.* | 58,660 | |||||||||||||
| 58,660 | 0.95 | ||||||||||||||
| ROAD & RAIL | |||||||||||||||
| 4,800 | GENESEE & WYOMING INC.* | 281,472 | |||||||||||||
| 4,000 | KANSAS CITY SOUTHERN* | 237,320 | |||||||||||||
| 5,100 | LANDSTAR SYSTEM INC. | 237,048 | |||||||||||||
| 9,600 | MARTEN TRANSPORT LTD. | 207,360 | |||||||||||||
| 963,200 | 15.63 | ||||||||||||||
| MATERIALS | 5.18 | ||||||||||||||
| CHEMICALS | |||||||||||||||
| 6,300 | H.B. FULLER CO. | 153,846 | |||||||||||||
| 153,846 | 2.50 | ||||||||||||||
| METALS & MINING | |||||||||||||||
| 11,500 | COMMERCIAL METALS CO. | 165,025 | |||||||||||||
| 165,025 | 2.68 | ||||||||||||||
| TOTAL COMMON STOCK (Cost: $5,188,925) | 6,354,714 | 103.11 | |||||||||||||
| TOTAL INVESTMENT IN SECURITIES (Cost: $5,188,925) | 6,354,714 | 103.11 | |||||||||||||
| OTHER ASSETS LESS LIABILITIES | (191,403 | ) | (3.11 | ) | |||||||||||
| TOTAL NET ASSETS | 6,163,311 | 100.00 | |||||||||||||
* Non-income producing
** The principal amount is stated in U.S. dollars unless otherwise indicated.
See Accompanying Notes to Financial Statements which are an integral part of these financial statements.
48
Pacific Advisors Small Cap Value Fund
Statement of Investments (Unaudited)
as of June 30, 2011
| Quantity or Principal | Description | Current $ Value** | % of Total Net Assets | ||||||||||||
| COMMON STOCK | |||||||||||||||
| CONSUMER DISCRETIONARY | 19.39 | ||||||||||||||
| AUTO COMPONENTS | |||||||||||||||
| 275,000 | AMERIGON INC.* | 4,779,500 | |||||||||||||
| 4,779,500 | 4.67 | ||||||||||||||
| HOTELS, RESTAURANTS & LEISURE | |||||||||||||||
| 165,000 | BRAVO BRIO RESTAURANT GROUP INC.* | 4,030,950 | |||||||||||||
| 4,030,950 | 3.94 | ||||||||||||||
| SPECIALTY RETAIL | |||||||||||||||
| 620,000 | CONNS INC.* | 5,363,000 | |||||||||||||
| 40,000 | RUSH ENTERPRISES INC.* | 761,200 | |||||||||||||
| 335,000 | SONIC AUTOMOTIVE INC. | 4,907,750 | |||||||||||||
| 11,031,950 | 10.78 | ||||||||||||||
| CONSUMER STAPLES | 4.12 | ||||||||||||||
| FOOD PRODUCTS | |||||||||||||||
| 238,000 | DARLING INT'L INC.* | 4,212,600 | |||||||||||||
| 4,212,600 | 4.12 | ||||||||||||||
| ENERGY | 21.37 | ||||||||||||||
| ENERGY EQUIPMENT & SERVICES | |||||||||||||||
| 85,000 | HORNBECK OFFSHORE SERVICES INC.* | 2,337,500 | |||||||||||||
| 307,000 | MATRIX SERVICE CO.* | 4,107,660 | |||||||||||||
| 325,000 | MITCHAM INDUSTRIES INC.* | 5,622,500 | |||||||||||||
| 150,000 | NATURAL GAS SERVICES GROUP* | 2,424,000 | |||||||||||||
| 355,000 | NORTH AMERICAN ENERGY PARTNERS INC.* | 2,719,300 | |||||||||||||
| 590,000 | PARKER DRILLING CO.* | 3,451,500 | |||||||||||||
| 20,662,460 | 20.20 | ||||||||||||||
| OIL, GAS & CONSUMABLE FUELS | |||||||||||||||
| 654,500 | INFINITY ENERGY RESOURCES INC.* | 1,197,735 | |||||||||||||
| 1,197,735 | 1.17 | ||||||||||||||
| FINANCIALS | 12.66 | ||||||||||||||
| COMMERCIAL BANKS | |||||||||||||||
| 208,000 | EAST WEST BANCORP INC. | 4,203,680 | |||||||||||||
| 310,000 | NARA BANCORP INC.* | 2,520,300 | |||||||||||||
| 300,000 | WILSHIRE BANCORP INC. | 882,000 | |||||||||||||
| 7,605,980 | 7.44 | ||||||||||||||
| CONSUMER FINANCE | |||||||||||||||
| 150,000 | EZCORP INC. A* | 5,336,250 | |||||||||||||
| 5,336,250 | 5.22 | ||||||||||||||
See Accompanying Notes to Financial Statements which are an integral part of these financial statements.
49
Pacific Advisors Small Cap Value Fund
Statement of Investments (Unaudited)
as of June 30, 2011
| Quantity or Principal | Description | Current $ Value** | % of Total Net Assets | ||||||||||||
| COMMON STOCK continued | |||||||||||||||
| HEALTH CARE | 2.77 | ||||||||||||||
| HEALTH CARE EQUIPMENT & SUPPLIES | |||||||||||||||
| 310,000 | ROCHESTER MEDICAL CORP.* | 2,802,400 | |||||||||||||
| 197,800 | UNITED AMERICAN HEALTHCARE CORP.* | 29,670 | |||||||||||||
| 2,832,070 | 2.77 | ||||||||||||||
| INDUSTRIALS | 38.80 | ||||||||||||||
| COMMERCIAL SERVICES & SUPPLIES | |||||||||||||||
| 199,000 | MOBILE MINI INC.* | 4,216,810 | |||||||||||||
| 149,000 | TEAM INC.* | 3,595,370 | |||||||||||||
| 170,000 | US ECOLOGY INC. | 2,907,000 | |||||||||||||
| 10,719,180 | 10.48 | ||||||||||||||
| CONSTRUCTION & ENGINEERING | |||||||||||||||
| 432,000 | FURMANITE CORP.* | 3,430,080 | |||||||||||||
| 211,000 | ORION MARINE GROUP INC.* | 1,985,510 | |||||||||||||
| 5,415,590 | 5.29 | ||||||||||||||
| MARINE | |||||||||||||||
| 96,000 | KIRBY CORP.* | 5,440,320 | |||||||||||||
| 5,440,320 | 5.32 | ||||||||||||||
| ROAD & RAIL | |||||||||||||||
| 300,000 | SAIA INC.* | 5,085,000 | |||||||||||||
| 320,000 | VITRAN CORPORATION INC.* | 4,064,000 | |||||||||||||
| 9,149,000 | 8.94 | ||||||||||||||
| TRADING COMPANIES & DISTRIBUTORS | |||||||||||||||
| 155,000 | DXP ENTERPRISES INC.* | 3,929,250 | |||||||||||||
| 146,000 | TAL INT'L GROUP INC. | 5,041,380 | |||||||||||||
| 8,970,630 | 8.77 | ||||||||||||||
| MATERIALS | 1.89 | ||||||||||||||
| METALS & MINING | |||||||||||||||
| 135,000 | COMMERCIAL METALS CO. | 1,937,250 | |||||||||||||
| 1,937,250 | 1.89 | ||||||||||||||
See Accompanying Notes to Financial Statements which are an integral part of these financial statements.
50
Pacific Advisors Small Cap Value Fund
Statement of Investments (Unaudited)
as of June 30, 2011
| Quantity or Principal | Description | Current $ Value** | % of Total Net Assets | ||||||||||||
| COMMON STOCK continued | |||||||||||||||
| TELECOMMUNICATION SERVICES | 3.67 | ||||||||||||||
| DIVERSIFIED TELECOM. SERVICES | |||||||||||||||
| 470,000 | PREMIERE GLOBAL SERVICES INC.* | 3,750,600 | |||||||||||||
| 3,750,600 | 3.67 | ||||||||||||||
| TOTAL COMMON STOCK (Cost: $76,265,541) | 107,072,065 | 104.67 | |||||||||||||
| TOTAL INVESTMENT IN SECURITIES (Cost: $76,265,541) | 107,072,065 | 104.67 | |||||||||||||
| OTHER ASSETS LESS LIABILITIES | (4,779,738 | ) | (4.67 | ) | |||||||||||
| TOTAL NET ASSETS | 102,292,327 | 100.00 | |||||||||||||
* Non-income producing
** The principal amount is stated in U.S. dollars unless otherwise indicated.
See Accompanying Notes to Financial Statements which are an integral part of these financial statements.
51
Pacific Advisors Fund Inc.
Statement of Assets and Liabilities (Unaudited)
June 30, 2011
| Government Securities Fund | Income and Equity Fund | Balanced Fund | Large Cap Value Fund | Mid Cap Value Fund | Small Cap Value Fund | ||||||||||||||||||||||
| Assets | |||||||||||||||||||||||||||
| Investment securities | |||||||||||||||||||||||||||
| At cost | $ | 3,612,716 | $ | 8,425,250 | $ | 17,423,452 | $ | 3,465,594 | $ | 5,188,926 | $ | 76,265,541 | |||||||||||||||
| At fair value | $ | 3,677,080 | $ | 8,855,052 | $ | 19,110,808 | $ | 3,845,559 | $ | 6,354,714 | $ | 107,072,065 | |||||||||||||||
| Cash or cash equivalents, at fair value | 52,420 | 30,130 | - | - | - | - | |||||||||||||||||||||
| Accrued income receivable | 22,157 | 73,164 | 72,414 | 6,766 | 3,768 | 24,575 | |||||||||||||||||||||
| Receivable for capital shares sold | - | - | 538 | - | - | 9,039 | |||||||||||||||||||||
| Receivable for investments sold | - | - | 193,554 | - | - | 864,103 | |||||||||||||||||||||
| Total assets | 3,751,657 | 8,958,346 | 19,377,314 | 3,852,325 | 6,358,482 | 107,969,782 | |||||||||||||||||||||
| Liabilities | |||||||||||||||||||||||||||
| Bank borrowings (Note 7) | - | - | 371,574 | 11,860 | 187,060 | 4,440,061 | |||||||||||||||||||||
| Payable for Investments Purchased | - | - | - | - | - | 1,007,719 | |||||||||||||||||||||
| Payable for fund shares redeemed | - | 25,899 | 36,410 | - | - | 62,222 | |||||||||||||||||||||
| Accounts payable | 10,242 | 18,593 | 44,579 | 17,939 | 4,511 | 151,600 | |||||||||||||||||||||
| Accounts payable to related parties (Note 3) | - | 3,600 | 3,600 | - | 3,600 | 15,853 | |||||||||||||||||||||
| Total liabilities | 10,242 | 48,092 | 456,163 | 29,799 | 195,171 | 5,677,455 | |||||||||||||||||||||
| Net Assets | $ | 3,741,415 | $ | 8,910,254 | $ | 18,921,151 | $ | 3,822,526 | $ | 6,163,311 | $ | 102,292,327 | |||||||||||||||
| Summary of Shareholders' Equity | |||||||||||||||||||||||||||
| Paid in capital | $ | 4,844,887 | $ | 9,142,662 | $ | 16,117,245 | $ | 3,616,952 | $ | 6,404,190 | $ | 87,836,352 | |||||||||||||||
| Accumulated undistributed net investment income | - | 7,615 | (909 | ) | - | - | - | ||||||||||||||||||||
| Accumulated undistributed net realized gains (losses) on security transactions | (1,167,836 | ) | (669,825 | ) | 1,117,459 | (174,391 | ) | (1,406,667 | ) | (16,350,549 | ) | ||||||||||||||||
| Net unrealized appreciation of investments | 64,364 | 429,802 | 1,687,356 | 379,965 | 1,165,788 | 30,806,524 | |||||||||||||||||||||
| Net assets at June 30, 2011 | $ | 3,741,415 | $ | 8,910,254 | $ | 18,921,151 | $ | 3,822,526 | $ | 6,163,311 | $ | 102,292,327 | |||||||||||||||
| Total authorized capital stock per class: 50,000,000 ($0.01 par value) | |||||||||||||||||||||||||||
| Class A: | |||||||||||||||||||||||||||
| Net assets | $ | 2,349,570 | $ | 4,712,158 | $ | 4,070,222 | $ | 3,056,982 | $ | 4,774,633 | $ | 93,489,141 | |||||||||||||||
| Shares outstanding | 255,689 | 466,550 | 266,769 | 329,793 | 373,484 | 2,542,350 | |||||||||||||||||||||
| Net asset value and redemption price per share | $ | 9.19 | $ | 10.10 | $ | 15.26 | $ | 9.27 | $ | 12.78 | $ | 36.77 | |||||||||||||||
| Maximum offering price per share | $ | 9.65 | $ | 10.60 | $ | 16.19 | $ | 9.84 | $ | 13.56 | $ | 39.01 | |||||||||||||||
| Sales load | 4.75 | % | 4.75 | % | 5.75 | % | 5.75 | % | 5.75 | % | 5.75 | % | |||||||||||||||
| Class C: | |||||||||||||||||||||||||||
| Net assets | $ | 1,391,845 | $ | 4,198,096 | $ | 14,850,929 | $ | 765,544 | $ | 1,388,678 | $ | 8,796,754 | |||||||||||||||
| Shares outstanding | 153,741 | 435,771 | 1,027,733 | 91,702 | 117,617 | 278,907 | |||||||||||||||||||||
| Net asset value and redemption price per share | $ | 9.05 | $ | 9.63 | $ | 14.45 | $ | 8.35 | $ | 11.81 | $ | 31.54 | |||||||||||||||
| Class I: | |||||||||||||||||||||||||||
| Net assets | N/A | N/A | N/A | N/A | N/A | $ | 6,432 | ||||||||||||||||||||
| Shares outstanding | 154 | ||||||||||||||||||||||||||
| Net asset value and redemption price per share | N/A | N/A | N/A | N/A | N/A | $ | 41.77 | ||||||||||||||||||||
See Accompanying Notes to Financial Statements which are an integral part of these financial statements.
52
53
Pacific Advisors Fund Inc.
Statement of Operations (Unaudited)
For the six months ended June 30, 2011
| Government Securities Fund | Income and Equity Fund | Balanced Fund | Large Cap Value Fund | Mid Cap Value Fund | Small Cap Value Fund | ||||||||||||||||||||||
| Investment Income | |||||||||||||||||||||||||||
| Dividends | $ | 17,070 | $ | 91,785 | $ | 210,349 | $ | 40,690 | $ | 25,271 | $ | 273,650 | |||||||||||||||
| Interest | 21,756 | 122,484 | 129,288 | - | - | - | |||||||||||||||||||||
| Total investment income | 38,826 | 214,269 | 339,637 | 40,690 | 25,271 | 273,650 | |||||||||||||||||||||
| Expenses | |||||||||||||||||||||||||||
| Investment management fees | 13,093 | 33,287 | 76,038 | 13,012 | 28,868 | 374,653 | |||||||||||||||||||||
| Transfer agent fees | 28,851 | 37,578 | 58,098 | 40,685 | 31,993 | 275,509 | |||||||||||||||||||||
| Fund accounting fees | 12,021 | 22,635 | 51,706 | 11,602 | 14,723 | 252,501 | |||||||||||||||||||||
| Legal fees | 4,432 | 9,764 | 22,305 | 3,817 | 6,351 | 109,898 | |||||||||||||||||||||
| Audit fees | 2,619 | 5,770 | 13,180 | 2,255 | 3,753 | 64,940 | |||||||||||||||||||||
| Registration fees | 8,057 | 9,349 | 13,216 | 10,063 | 12,733 | 30,058 | |||||||||||||||||||||
| Printing | 806 | 1,775 | 4,056 | 694 | 1,155 | 19,982 | |||||||||||||||||||||
| Custody fees | 4,069 | 3,965 | 3,401 | 4,334 | 4,823 | 16,654 | |||||||||||||||||||||
| Interest on borrowings | 161 | 30 | 1,668 | 177 | 951 | 38,295 | |||||||||||||||||||||
| Director fees/meetings | 1,007 | 2,219 | 5,069 | 868 | 1,443 | 24,977 | |||||||||||||||||||||
| Distribution and service (12b-1) fees (Note 3) | 11,361 | 28,077 | 86,956 | 7,167 | 13,293 | 160,510 | |||||||||||||||||||||
| Other expenses | 3,424 | 7,545 | 17,235 | 2,949 | 4,907 | 84,921 | |||||||||||||||||||||
| Total expenses, before fees waived | 89,901 | 161,994 | 352,928 | 97,623 | 124,993 | 1,452,898 | |||||||||||||||||||||
| Less fees waived (Note 3) | 34,693 | 33,287 | - | 34,612 | - | - | |||||||||||||||||||||
| Net expenses | 55,208 | 128,707 | 352,928 | 63,011 | 124,993 | 1,452,898 | |||||||||||||||||||||
| Net Investment Income (Loss) | (16,382 | ) | 85,562 | (13,291 | ) | (22,321 | ) | (99,722 | ) | (1,179,248 | ) | ||||||||||||||||
| Net Realized and Unrealized Gain (Loss) on Investments | |||||||||||||||||||||||||||
| Net realized gain (loss) on investments | 11,125 | 48,607 | 954,023 | 9,165 | 33,590 | (519,223 | ) | ||||||||||||||||||||
| Change in net unrealized appreciation (depreciation) of investments | 25,268 | 149,004 | (25,376 | ) | 116,296 | 596,695 | 16,580,526 | ||||||||||||||||||||
| Net realized and unrealized gain on investments | 36,393 | 197,611 | 928,647 | 125,461 | 630,285 | 16,061,303 | |||||||||||||||||||||
| Net Increase in Net Assets Resulting from Operations | $ | 20,011 | $ | 283,173 | $ | 915,356 | $ | 103,140 | $ | 530,563 | $ | 14,882,055 | |||||||||||||||
See Accompanying Notes to Financial Statements which are an integral part of these financial statements.
54
55
Pacific Advisors Fund Inc.
Statements of Changes in Net Assets (Unaudited)
| Government Securities Fund | Income and Equity Fund | Balanced Fund | |||||||||||||||||||||||||
| Six months ended June 30, 2011 | Year ended December 31, 2010 | Six months ended June 30, 2011 | Year ended December 31, 2010 | Six months ended June 30, 2011 | Year ended December 31, 2010 | ||||||||||||||||||||||
| Increase (Decrease) in Net Assets From Operations | |||||||||||||||||||||||||||
| Net investment income (loss) | $ | (16,382 | ) | $ | 7,595 | $ | 85,562 | $ | 183,430 | $ | (13,291 | ) | $ | (15,419 | ) | ||||||||||||
| Net realized gain (loss) on investments | 11,125 | 11,389 | 48,607 | 67,205 | 954,023 | 3,857,418 | |||||||||||||||||||||
| Change in net unrealized appreciation (depreciation) of investments | 25,268 | 68,210 | 149,004 | 275,458 | (25,376 | ) | (2,295,332 | ) | |||||||||||||||||||
| Increase in net assets resulting from operations | 20,011 | 87,194 | 283,173 | 526,093 | 915,356 | 1,546,667 | |||||||||||||||||||||
| From Distributions to Shareholders | |||||||||||||||||||||||||||
| Class A: | |||||||||||||||||||||||||||
| Net investment income | - | (6,629 | ) | (48,957 | ) | (97,430 | ) | - | (1,264 | ) | |||||||||||||||||
| Net capital gains | - | - | - | - | - | (359,087 | ) | ||||||||||||||||||||
| Return of capital | - | (7,491 | ) | - | (1,389 | ) | - | - | |||||||||||||||||||
| Class C: | |||||||||||||||||||||||||||
| Net investment income | - | (1,530 | ) | (27,278 | ) | (86,808 | ) | - | (4,725 | ) | |||||||||||||||||
| Net capital gains | - | - | - | - | - | (1,768,006 | ) | ||||||||||||||||||||
| Return of capital | - | (1,728 | ) | - | (1,237 | ) | - | - | |||||||||||||||||||
| Class I: | N/A | N/A | N/A | N/A | N/A | N/A | |||||||||||||||||||||
| Net investment income | |||||||||||||||||||||||||||
| Net capital gains | |||||||||||||||||||||||||||
| Return of capital | |||||||||||||||||||||||||||
| Decrease in net assets resulting from distributions | - | (17,378 | ) | (76,235 | ) | (186,864 | ) | - | (2,133,082 | ) | |||||||||||||||||
| From Capital Share Transactions (Note 6) | |||||||||||||||||||||||||||
| Proceeds from shares sold | 451,695 | 973,230 | 960,509 | 1,706,840 | 627,399 | 758,726 | |||||||||||||||||||||
| Proceeds from shares purchased by reinvestment of dividends | - | 15,208 | 70,552 | 173,489 | - | 2,071,269 | |||||||||||||||||||||
| Cost of shares repurchased | (844,966 | ) | (2,074,113 | ) | (1,024,052 | ) | (1,517,350 | ) | (4,445,985 | ) | (9,609,397 | ) | |||||||||||||||
| Increase (decrease) in net assets resulting from capital share transactions | (393,271 | ) | (1,085,675 | ) | 7,009 | 362,979 | (3,818,586 | ) | (6,779,402 | ) | |||||||||||||||||
| Increase (decrease) in net assets | (373,260 | ) | (1,015,859 | ) | 213,947 | 702,208 | (2,903,230 | ) | (7,365,817 | ) | |||||||||||||||||
| Net Assets | |||||||||||||||||||||||||||
| Beginning of period | 4,114,675 | 5,130,534 | 8,696,307 | 7,994,099 | 21,824,381 | 29,190,198 | |||||||||||||||||||||
| End of period | $ | 3,741,415 | $ | 4,114,675 | $ | 8,910,254 | $ | 8,696,307 | $ | 18,921,151 | $ | 21,824,381 | |||||||||||||||
| Including undistributed net investment income | $ | - | $ | - | $ | 7,615 | $ | (1,713 | ) | $ | (909 | ) | $ | (1,436 | ) | ||||||||||||
See Accompanying Notes to Financial Statements which are an integral part of these financial statements.
56
57
Pacific Advisors Fund Inc.
Statements of Changes in Net Assets (Unaudited)
| Large Cap Value Fund | Mid Cap Value Fund | Small Cap Value Fund | |||||||||||||||||||||||||
| Six months ended June 30, 2011 | Year ended December 31, 2010 | Six months ended June 30, 2011 | Year ended December 31, 2010 | Six months ended June 30, 2011 | Year ended December 31, 2010 | ||||||||||||||||||||||
| Increase (Decrease) in Net Assets From Operations | |||||||||||||||||||||||||||
| Net investment income (loss) | $ | (22,321 | ) | $ | (44,617 | ) | $ | (99,722 | ) | $ | (198,130 | ) | $ | (1,179,248 | ) | $ | (2,573,889 | ) | |||||||||
| Net realized gain (loss) on investments | 9,165 | 161,332 | 33,590 | 261,557 | (519,223 | ) | (3,640,855 | ) | |||||||||||||||||||
| Change in net unrealized appreciation (depreciation) of investments | 116,296 | 110,894 | 596,695 | 1,372,193 | 16,580,526 | 23,928,300 | |||||||||||||||||||||
| Increase in net assets resulting from operations | 103,140 | 227,609 | 530,563 | 1,435,620 | 14,882,055 | 17,713,556 | |||||||||||||||||||||
| From Distributions to Shareholders | |||||||||||||||||||||||||||
| Class A: | |||||||||||||||||||||||||||
| Net investment income | - | - | - | - | - | - | |||||||||||||||||||||
| Net capital gains | - | - | - | - | - | - | |||||||||||||||||||||
| Return of capital | - | - | - | - | - | - | |||||||||||||||||||||
| Class C: | |||||||||||||||||||||||||||
| Net investment income | - | - | - | - | - | - | |||||||||||||||||||||
| Net capital gains | - | - | - | - | - | - | |||||||||||||||||||||
| Return of capital | - | - | - | - | - | - | |||||||||||||||||||||
| Class I: | N/A | N/A | N/A | N/A | |||||||||||||||||||||||
| Net investment income | - | - | |||||||||||||||||||||||||
| Net capital gains | - | - | |||||||||||||||||||||||||
| Return of capital | - | - | |||||||||||||||||||||||||
| Decrease in net assets resulting from distributions | - | - | - | - | - | - | |||||||||||||||||||||
| From Capital Share Transactions (Note 6) | |||||||||||||||||||||||||||
| Proceeds from shares sold | 717,896 | 914,546 | 1,013,139 | 376,408 | 6,903,510 | 15,210,757 | |||||||||||||||||||||
| Proceeds from shares purchased by reinvestment of dividends | - | - | - | - | - | - | |||||||||||||||||||||
| Cost of shares repurchased | (190,507 | ) | (763,971 | ) | (836,638 | ) | (2,700,767 | ) | (23,683,380 | ) | (61,787,155 | ) | |||||||||||||||
| Increase (decrease) in net assets resulting from capital share transactions | 527,389 | 150,575 | 176,501 | (2,324,359 | ) | (16,779,870 | ) | (46,576,398 | ) | ||||||||||||||||||
| Increase (decrease) in net assets | 630,529 | 378,184 | 707,064 | (888,739 | ) | (1,897,815 | ) | (28,862,842 | ) | ||||||||||||||||||
| Net Assets | |||||||||||||||||||||||||||
| Beginning of period | 3,191,997 | 2,813,813 | 5,456,247 | 6,344,986 | 104,190,142 | 133,052,984 | |||||||||||||||||||||
| End of period | $ | 3,822,526 | $ | 3,191,997 | $ | 6,163,311 | $ | 5,456,247 | $ | 102,292,327 | $ | 104,190,142 | |||||||||||||||
| Including undistributed net investment income | $ | - | $ | - | $ | - | $ | - | $ | - | $ | - | |||||||||||||||
See Accompanying Notes to Financial Statements which are an integral part of these financial statements.
58
59
Pacific Advisors Fund Inc.
Financial Highlights (Unaudited)
(For a share outstanding throughout the period)
| Government Securities Fund | |||||||||||||||||||||||||||
| Class A | |||||||||||||||||||||||||||
| For the six months ended | For the year ended December 31, | ||||||||||||||||||||||||||
| June 30, 2011 | 2010 | 2009 | 2008 | 2007 | 2006 | ||||||||||||||||||||||
| Per Share Operating Performance | |||||||||||||||||||||||||||
| Net asset value, beginning of period | $ | 9.13 | $ | 8.99 | $ | 8.94 | $ | 9.42 | $ | 9.24 | $ | 9.27 | |||||||||||||||
| Income from investing operations | |||||||||||||||||||||||||||
| Net investment income (loss) | (0.02 | ) | 0.05 | 0.18 | 0.32 | 0.29 | 0.23 | ||||||||||||||||||||
| Net realized and unrealized gains (losses) on securities | 0.08 | 0.14 | 0.02 | (0.53 | ) | 0.22 | 0.05 | ||||||||||||||||||||
| Total from investment operations | 0.06 | 0.19 | 0.20 | (0.21 | ) | 0.51 | 0.28 | ||||||||||||||||||||
| Less distributions | |||||||||||||||||||||||||||
| From net investment income | - | (0.02 | ) | (0.15 | ) | (0.27 | ) | (0.33 | ) | (0.31 | ) | ||||||||||||||||
| From net capital gains | - | - | - | - | - | - | |||||||||||||||||||||
| From return of capital | - | (0.03 | ) | - | - | - | - | ||||||||||||||||||||
| Total distributions | - | (0.05 | ) | (0.15 | ) | (0.27 | ) | (0.33 | ) | (0.31 | ) | ||||||||||||||||
| Net asset value, end of period | $ | 9.19 | $ | 9.13 | $ | 8.99 | $ | 8.94 | $ | 9.42 | $ | 9.24 | |||||||||||||||
| Total Investment Return (a) | 0.66 | %(b) | 2.16 | % | 2.26 | % | (2.28 | )% | 5.54 | % | 3.14 | % | |||||||||||||||
| Ratios/Supplemental Data | |||||||||||||||||||||||||||
| Net assets, end of period (000's) | $ | 2,350 | $ | 2,375 | $ | 2,537 | $ | 3,054 | $ | 3,817 | $ | 2,467 | |||||||||||||||
| Ratio of net investment income (loss) to average net assets | |||||||||||||||||||||||||||
| With expense reductions | (0.51 | )%(c) | 0.49 | % | 1.69 | % | 3.33 | % | 3.57 | % | 2.70 | % | |||||||||||||||
| Without expense reductions | (2.23 | )%(c) | (1.10 | )% | 0.25 | % | 1.87 | % | 2.21 | % | 2.04 | % | |||||||||||||||
| Ratio of expenses to average net assets | |||||||||||||||||||||||||||
| With expense reductions | 2.43 | %(c) | 2.09 | % | 1.69 | % | 1.65 | % | 1.62 | % | 2.51 | % | |||||||||||||||
| Without expense reductions | 4.15 | %(c) | 3.69 | % | 3.13 | % | 3.11 | % | 2.98 | % | 3.17 | % | |||||||||||||||
| Fund portfolio turnover rate | 91 | %(c) | 156 | % | 224 | % | 173 | % | 59 | % | 16 | % | |||||||||||||||
| Class C | |||||||||||||||||||||||||||
| For the six months ended | For the year ended December 31, | ||||||||||||||||||||||||||
| June 30, 2011 | 2010 | 2009 | 2008 | 2007 | 2006 | ||||||||||||||||||||||
| Per Share Operating Performance | |||||||||||||||||||||||||||
| Net asset value, beginning of period | $ | 9.02 | $ | 8.90 | $ | 8.87 | $ | 9.45 | $ | 9.23 | $ | 9.13 | |||||||||||||||
| Income from investing operations | |||||||||||||||||||||||||||
| Net investment income (loss) | (0.13 | ) | (0.09 | ) | 0.09 | 0.28 | 0.25 | 0.08 | |||||||||||||||||||
| Net realized and unrealized gains (losses) on securities | 0.16 | 0.23 | 0.04 | (0.56 | ) | 0.18 | 0.14 | ||||||||||||||||||||
| Total from investment operations | 0.03 | 0.14 | 0.13 | (0.28 | ) | 0.43 | 0.22 | ||||||||||||||||||||
| Less distributions | |||||||||||||||||||||||||||
| From net investment income | - | (0.01 | ) | (0.10 | ) | (0.30 | ) | (0.21 | ) | (0.12 | ) | ||||||||||||||||
| From net capital gains | - | - | - | - | - | - | |||||||||||||||||||||
| From return of capital | - | (0.01 | ) | - | - | - | - | ||||||||||||||||||||
| Total distributions | - | (0.02 | ) | (0.10 | ) | (0.30 | ) | (0.21 | ) | (0.12 | ) | ||||||||||||||||
| Net asset value, end of period | $ | 9.05 | $ | 9.02 | $ | 8.90 | $ | 8.87 | $ | 9.45 | $ | 9.23 | |||||||||||||||
| Total Investment Return | 0.33 | %(b) | 1.49 | % | 1.44 | % | (3.02 | )% | 4.73 | % | 2.47 | % | |||||||||||||||
| Ratios/Supplemental Data | |||||||||||||||||||||||||||
| Net assets, end of period (000's) | $ | 1,392 | $ | 1,740 | $ | 2,594 | $ | 2,456 | $ | 1,595 | $ | 1,731 | |||||||||||||||
| Ratio of net investment income (loss) to average net assets | |||||||||||||||||||||||||||
| With expense reductions | (1.24 | )%(c) | (0.18 | )% | 0.96 | % | 2.56 | % | 2.77 | % | 1.97 | % | |||||||||||||||
| Without expense reductions | (2.97 | )%(c) | (1.80 | )% | (0.47 | )% | 1.10 | % | 1.41 | % | 1.32 | % | |||||||||||||||
| Ratio of expenses to average net assets | |||||||||||||||||||||||||||
| With expense reductions | 3.18 | %(c) | 2.80 | % | 2.41 | % | 2.43 | % | 2.40 | % | 3.21 | % | |||||||||||||||
| Without expense reductions | 4.91 | %(c) | 4.42 | % | 3.85 | % | 3.89 | % | 3.76 | % | 3.86 | % | |||||||||||||||
| Fund portfolio turnover rate | 91 | %(c) | 156 | % | 224 | % | 173 | % | 59 | % | 16 | % | |||||||||||||||
(a) The Fund's maximum sales charge is not included in the total return computation
(b) Not annualized
(c) Annualized
See Accompanying Notes to Financial Statements which are an integral part of these financial statements.
60
Pacific Advisors Fund Inc.
Financial Highlights (Unaudited)
(For a share outstanding throughout the period)
| Income and Equity Fund | |||||||||||||||||||||||||||
| Class A | |||||||||||||||||||||||||||
| For the six months ended | For the year ended December 31, | ||||||||||||||||||||||||||
| June 30, 2011 | 2010 | 2009 | 2008 | 2007 | 2006 | ||||||||||||||||||||||
| Per Share Operating Performance | |||||||||||||||||||||||||||
| Net asset value, beginning of period | $ | 9.87 | $ | 9.49 | $ | 8.48 | $ | 10.61 | $ | 10.74 | $ | 10.19 | |||||||||||||||
| Income from investing operations | |||||||||||||||||||||||||||
| Net investment income | 0.09 | 0.19 | 0.30 | 0.33 | 0.31 | 0.20 | |||||||||||||||||||||
| Net realized and unrealized gains (losses) on securities | 0.25 | 0.45 | 0.98 | (2.16 | ) | (0.05 | ) | 0.53 | |||||||||||||||||||
| Total from investment operations | 0.34 | 0.64 | 1.28 | (1.83 | ) | 0.26 | 0.73 | ||||||||||||||||||||
| Less distributions | |||||||||||||||||||||||||||
| From net investment income | (0.11 | ) | (0.26 | ) | (0.27 | ) | (0.30 | ) | (0.28 | ) | (0.18 | ) | |||||||||||||||
| From net capital gains | - | - | - | - | (0.11 | ) | - | ||||||||||||||||||||
| From return of capital | - | (d) | - | - | - | - | |||||||||||||||||||||
| Total distributions | (0.11 | ) | (0.26 | ) | (0.27 | ) | (0.30 | ) | (0.39 | ) | (0.18 | ) | |||||||||||||||
| Net asset value, end of period | $ | 10.10 | $ | 9.87 | $ | 9.49 | $ | 8.48 | $ | 10.61 | $ | 10.74 | |||||||||||||||
| Total Investment Return (a) | 3.44 | %(b) | 6.88 | % | 15.37 | % | (17.49 | )% | 2.39 | % | 7.25 | % | |||||||||||||||
| Ratios/Supplemental Data | |||||||||||||||||||||||||||
| Net assets, end of period (000's) | $ | 4,712 | $ | 3,922 | $ | 2,865 | $ | 2,737 | $ | 3,663 | $ | 3,973 | |||||||||||||||
| Ratio of net investment income to average net assets | |||||||||||||||||||||||||||
| With expense reductions | 2.30 | %(c) | 2.57 | % | 3.22 | % | 3.22 | % | 2.78 | % | 1.74 | % | |||||||||||||||
| Without expense reductions | 1.55 | %(c) | 1.81 | % | 2.47 | % | 2.47 | % | 2.16 | % | 0.99 | % | |||||||||||||||
| Ratio of expenses to average net assets | |||||||||||||||||||||||||||
| With expense reductions | 2.52 | %(c) | 2.34 | % | 2.32 | % | 2.05 | % | 1.95 | % | 2.06 | % | |||||||||||||||
| Without expense reductions | 3.27 | %(c) | 3.09 | % | 3.07 | % | 2.80 | % | 2.57 | % | 2.80 | % | |||||||||||||||
| Fund portfolio turnover rate | 25 | %(c) | 21 | % | 29 | % | 39 | % | 46 | % | 23 | % | |||||||||||||||
| Class C | |||||||||||||||||||||||||||
| For the six months ended | For the year ended December 31, | ||||||||||||||||||||||||||
| June 30, 2011 | 2010 | 2009 | 2008 | 2007 | 2006 | ||||||||||||||||||||||
| Per Share Operating Performance | |||||||||||||||||||||||||||
| Net asset value, beginning of period | $ | 9.40 | $ | 9.03 | $ | 8.09 | $ | 10.14 | $ | 10.31 | $ | 9.80 | |||||||||||||||
| Income from investing operations | |||||||||||||||||||||||||||
| Net investment income | 0.06 | 0.15 | 0.21 | 0.23 | 0.22 | 0.08 | |||||||||||||||||||||
| Net realized and unrealized gains (losses) on securities | 0.23 | 0.38 | 0.95 | (2.04 | ) | (0.05 | ) | 0.54 | |||||||||||||||||||
| Total from investment operations | 0.29 | 0.53 | 1.16 | (1.81 | ) | 0.17 | 0.62 | ||||||||||||||||||||
| Less distributions | |||||||||||||||||||||||||||
| From net investment income | (0.06 | ) | (0.16 | ) | (0.22 | ) | (0.24 | ) | (0.23 | ) | (0.11 | ) | |||||||||||||||
| From net capital gains | - | - | - | - | (0.11 | ) | - | ||||||||||||||||||||
| From return of capital | - | - | (d) | - | - | - | - | ||||||||||||||||||||
| Total distributions | (0.06 | ) | (0.16 | ) | (0.22 | ) | (0.24 | ) | (0.34 | ) | (0.11 | ) | |||||||||||||||
| Net asset value, end of period | $ | 9.63 | $ | 9.40 | $ | 9.03 | $ | 8.09 | $ | 10.14 | $ | 10.31 | |||||||||||||||
| Total Investment Return | 3.09 | %(b) | 5.95 | % | 14.56 | % | (18.10 | )% | 1.63 | % | 6.40 | % | |||||||||||||||
| Ratios/Supplemental Data | |||||||||||||||||||||||||||
| Net assets, end of period (000's) | $ | 4,198 | $ | 4,774 | $ | 5,129 | $ | 4,697 | $ | 5,990 | $ | 5,743 | |||||||||||||||
| Ratio of net investment income to average net assets | |||||||||||||||||||||||||||
| With expense reductions | 1.54 | %(c) | 1.82 | % | 2.47 | % | 2.48 | % | 2.06 | % | 1.04 | % | |||||||||||||||
| Without expense reductions | 0.79 | %(c) | 1.07 | % | 1.72 | % | 1.73 | % | 1.43 | % | 0.28 | % | |||||||||||||||
| Ratio of expenses to average net assets | |||||||||||||||||||||||||||
| With expense reductions | 3.27 | %(c) | 3.07 | % | 3.06 | % | 2.81 | % | 2.70 | % | 2.81 | % | |||||||||||||||
| Without expense reductions | 4.02 | %(c) | 3.82 | % | 3.81 | % | 3.56 | % | 3.32 | % | 3.56 | % | |||||||||||||||
| Fund portfolio turnover rate | 25 | %(c) | 21 | % | 29 | % | 39 | % | 46 | % | 23 | % | |||||||||||||||
(a) The Fund's maximum sales charge is not included in the total return computation
(b) Not annualized
(c) Annualized
(d) The amount is less than $0.005 and rounded to zero
See Accompanying Notes to Financial Statements which are an integral part of these financial statements.
61
Pacific Advisors Fund Inc.
Financial Highlights (Unaudited)
(For a share outstanding throughout the period)
| Balanced Fund | |||||||||||||||||||||||||||
| Class A | |||||||||||||||||||||||||||
| For the six months ended | For the year ended December 31, | ||||||||||||||||||||||||||
| June 30, 2011 | 2010 | 2009 | 2008 | 2007 | 2006 | ||||||||||||||||||||||
| Per Share Operating Performance | |||||||||||||||||||||||||||
| Net asset value, beginning of period | $ | 14.56 | $ | 14.91 | $ | 12.41 | $ | 18.58 | $ | 18.42 | $ | 17.39 | |||||||||||||||
| Income from investing operations | |||||||||||||||||||||||||||
| Net investment income | 0.02 | 0.13 | 0.22 | 0.31 | 0.24 | 0.07 | |||||||||||||||||||||
| Net realized and unrealized gains (losses) on securities | 0.68 | 1.02 | 2.48 | (6.00 | ) | 0.97 | 1.40 | ||||||||||||||||||||
| Total from investment operations | 0.70 | 1.15 | 2.70 | (5.69 | ) | 1.21 | 1.47 | ||||||||||||||||||||
| Less distributions | |||||||||||||||||||||||||||
| From net investment income | - | (0.01 | ) | (0.20 | ) | (0.28 | ) | (0.20 | ) | - | |||||||||||||||||
| From net capital gains | - | (1.49 | ) | - | (0.20 | ) | (0.85 | ) | (0.44 | ) | |||||||||||||||||
| Total distributions | - | (1.50 | ) | (0.20 | ) | (0.48 | ) | (1.05 | ) | (0.44 | ) | ||||||||||||||||
| Net asset value, end of period | $ | 15.26 | $ | 14.56 | $ | 14.91 | $ | 12.41 | $ | 18.58 | $ | 18.42 | |||||||||||||||
| Total Investment Return (a) | 4.81 | %(b) | 7.71 | % | 21.76 | % | (30.51 | )% | 6.53 | % | 8.47 | % | |||||||||||||||
| Ratios/Supplemental Data | |||||||||||||||||||||||||||
| Net assets, end of period (000's) | $ | 4,070 | $ | 3,789 | $ | 4,362 | $ | 3,774 | $ | 5,918 | $ | 6,787 | |||||||||||||||
| Ratio of net investment income to average net assets | 0.48 | %(c) | 0.55 | % | 1.58 | % | 1.73 | % | 1.02 | % | 0.43 | % | |||||||||||||||
| Ratio of expenses to average net assets | 2.88 | %(c) | 2.77 | % | 2.47 | % | 2.31 | % | 2.21 | % | 2.54 | % | |||||||||||||||
| Fund portfolio turnover rate | 9 | %(c) | 36 | % | 10 | % | 32 | % | 44 | % | 16 | % | |||||||||||||||
| Class C | |||||||||||||||||||||||||||
| For the six months ended | For the year ended December 31, | ||||||||||||||||||||||||||
| June 30, 2011 | 2010 | 2009 | 2008 | 2007 | 2006 | ||||||||||||||||||||||
| Per Share Operating Performance | |||||||||||||||||||||||||||
| Net asset value, beginning of period | $ | 13.84 | $ | 14.35 | $ | 11.96 | $ | 17.88 | $ | 17.77 | $ | 16.92 | |||||||||||||||
| Income from investing operations | |||||||||||||||||||||||||||
| Net investment income (loss) | (0.06 | ) | (0.06 | ) | 0.10 | 0.16 | 0.05 | (0.06 | ) | ||||||||||||||||||
| Net realized and unrealized gains (losses) on securities | 0.67 | 1.04 | 2.39 | (5.72 | ) | 0.96 | 1.35 | ||||||||||||||||||||
| Total from investment operations | 0.61 | 0.98 | 2.49 | (5.56 | ) | 1.01 | 1.29 | ||||||||||||||||||||
| Less distributions | |||||||||||||||||||||||||||
| From net investment income | - | - | (d) | (0.10 | ) | (0.16 | ) | (0.05 | ) | - | |||||||||||||||||
| From net capital gains | - | (1.49 | ) | - | (0.20 | ) | (0.85 | ) | (0.44 | ) | |||||||||||||||||
| Total distributions | - | (1.49 | ) | (0.10 | ) | (0.36 | ) | (0.90 | ) | (0.44 | ) | ||||||||||||||||
| Net asset value, end of period | $ | 14.45 | $ | 13.84 | $ | 14.35 | $ | 11.96 | $ | 17.88 | $ | 17.77 | |||||||||||||||
| Total Investment Return | 4.41 | %(b) | 6.88 | % | 20.84 | % | (31.03 | )% | 5.67 | % | 7.65 | % | |||||||||||||||
| Ratios/Supplemental Data | |||||||||||||||||||||||||||
| Net assets, end of period (000's) | $ | 14,851 | $ | 18,035 | $ | 24,828 | $ | 22,407 | $ | 34,960 | $ | 35,593 | |||||||||||||||
| Ratio of net investment income (loss) to average net assets | (0.28 | )%(c) | (0.18 | )% | 0.82 | % | 0.96 | % | 0.27 | % | (0.33 | )% | |||||||||||||||
| Ratio of expenses to average net assets | 3.63 | %(c) | 3.50 | % | 3.23 | % | 3.09 | % | 2.97 | % | 3.30 | % | |||||||||||||||
| Fund portfolio turnover rate | 9 | %(c) | 36 | % | 10 | % | 32 | % | 44 | % | 16 | % | |||||||||||||||
(a) The Fund's maximum sales charge is not included in the total return computation
(b) Not annualized
(c) Annualized
(d) The amount is less than $0.005 and rounded to zero
See Accompanying Notes to Financial Statements which are an integral part of these financial statements.
62
Pacific Advisors Fund Inc.
Financial Highlights (Unaudited)
(For a share outstanding throughout the period)
| Large Cap Value Fund | |||||||||||||||||||||||||||
| Class A | |||||||||||||||||||||||||||
| For the six months ended | For the year ended December 31, | ||||||||||||||||||||||||||
| June 30, 2011 | 2010 | 2009 | 2008 | 2007 | 2006 | ||||||||||||||||||||||
| Per Share Operating Performance | |||||||||||||||||||||||||||
| Net asset value, beginning of period | $ | 8.98 | $ | 8.33 | $ | 6.51 | $ | 10.83 | $ | 9.21 | $ | 8.54 | |||||||||||||||
| Income from investing operations | |||||||||||||||||||||||||||
| Net investment gain (loss) | 0.08 | (0.06 | ) | (0.24 | ) | (0.07 | ) | (0.07 | ) | (0.04 | ) | ||||||||||||||||
| Net realized and unrealized gains (losses) on securities | 0.21 | 0.71 | 2.06 | (4.25 | ) | 1.69 | 0.71 | ||||||||||||||||||||
| Total from investment operations | 0.29 | 0.65 | 1.82 | (4.32 | ) | 1.62 | 0.67 | ||||||||||||||||||||
| Less distributions | |||||||||||||||||||||||||||
| From net investment income | - | - | - | - | - | - | |||||||||||||||||||||
| From net capital gains | - | - | - | - | - | - | |||||||||||||||||||||
| Total distributions | - | - | - | - | - | - | |||||||||||||||||||||
| Net asset value, end of period | $ | 9.27 | $ | 8.98 | $ | 8.33 | $ | 6.51 | $ | 10.83 | $ | 9.21 | |||||||||||||||
| Total Investment Return (a) | 3.23 | %(b) | 7.80 | % | 27.96 | % | (39.89 | )% | 17.59 | % | 7.85 | % | |||||||||||||||
| Ratios/Supplemental Data | |||||||||||||||||||||||||||
| Net assets, end of period (000's) | $ | 3,057 | $ | 2,511 | $ | 2,176 | $ | 1,984 | $ | 2,889 | $ | 2,101 | |||||||||||||||
| Ratio of net investment loss to average net assets | |||||||||||||||||||||||||||
| With expense reductions | (1.12 | )%(c) | (1.32 | )% | (2.06 | )% | (1.38 | )% | (1.33 | )% | (1.11 | )% | |||||||||||||||
| Without expense reductions | (3.11 | )%(c) | (3.50 | )% | (4.31 | )% | (2.41 | )% | (1.85 | )% | (2.14 | )% | |||||||||||||||
| Ratio of expenses to average net assets | |||||||||||||||||||||||||||
| With expense reductions | 3.46 | %(c) | 3.64 | % | 3.46 | % | 2.62 | % | 2.65 | % | 2.64 | % | |||||||||||||||
| Without expense reductions | 5.46 | %(c) | 5.82 | % | 5.71 | % | 3.65 | % | 3.17 | % | 3.68 | % | |||||||||||||||
| Fund portfolio turnover rate | 9 | %(c) | 106 | % | 5 | % | 14 | % | 14 | % | 23 | % | |||||||||||||||
| Class C | |||||||||||||||||||||||||||
| For the six months ended | For the year ended December 31, | ||||||||||||||||||||||||||
| June 30, 2011 | 2010 | 2009 | 2008 | 2007 | 2006 | ||||||||||||||||||||||
| Per Share Operating Performance | |||||||||||||||||||||||||||
| Net asset value, beginning of period | $ | 8.12 | $ | 7.58 | $ | 5.97 | $ | 10.03 | $ | 8.59 | $ | 8.02 | |||||||||||||||
| Income from investing operations | |||||||||||||||||||||||||||
| Net investment gain (loss) | 0.13 | (0.17 | ) | (1.36 | ) | (0.31 | ) | (0.21 | ) | (0.12 | ) | ||||||||||||||||
| Net realized and unrealized gains (losses) on securities | 0.10 | 0.71 | 2.97 | (3.75 | ) | 1.65 | 0.69 | ||||||||||||||||||||
| Total from investment operations | 0.23 | 0.54 | 1.61 | (4.06 | ) | 1.44 | 0.57 | ||||||||||||||||||||
| Less distributions | |||||||||||||||||||||||||||
| From net investment income | - | - | - | - | - | - | |||||||||||||||||||||
| From net capital gains | - | - | - | - | - | - | |||||||||||||||||||||
| Total distributions | - | - | - | - | - | - | |||||||||||||||||||||
| Net asset value, end of period | $ | 8.35 | $ | 8.12 | $ | 7.58 | $ | 5.97 | $ | 10.03 | $ | 8.59 | |||||||||||||||
| Total Investment Return | 2.83 | %(b) | 7.12 | % | 26.97 | % | (40.48 | )% | 16.76 | % | 7.11 | % | |||||||||||||||
| Ratios/Supplemental Data | |||||||||||||||||||||||||||
| Net assets, end of period (000's) | $ | 766 | $ | 681 | $ | 637 | $ | 1,072 | $ | 2,096 | $ | 1,856 | |||||||||||||||
| Ratio of net investment loss to average net assets | |||||||||||||||||||||||||||
| With expense reductions | (1.87 | )%(c) | (2.03 | )% | (2.69 | )% | (2.18 | )% | (2.07 | )% | (1.87 | )% | |||||||||||||||
| Without expense reductions | (3.87 | )%(c) | (4.23 | )% | (4.96 | )% | (3.19 | )% | (2.60 | )% | (2.91 | )% | |||||||||||||||
| Ratio of expenses to average net assets | |||||||||||||||||||||||||||
| With expense reductions | 4.22 | %(c) | 4.37 | % | 4.11 | % | 3.40 | % | 3.40 | % | 3.40 | % | |||||||||||||||
| Without expense reductions | 6.21 | %(c) | 6.57 | % | 6.39 | % | 4.42 | % | 3.93 | % | 4.44 | % | |||||||||||||||
| Fund portfolio turnover rate | 9 | %(c) | 106 | % | 5 | % | 14 | % | 14 | % | 23 | % | |||||||||||||||
(a) The Fund's maximum sales charge is not included in the total return computation
(b) Not annualized
(c) Annualized
See Accompanying Notes to Financial Statements which are an integral part of these financial statements.
63
Pacific Advisors Fund Inc.
Financial Highlights (Unaudited)
(For a share outstanding throughout the period)
| Mid Cap Value Fund | |||||||||||||||||||||||||||
| Class A | |||||||||||||||||||||||||||
| For the six months ended | For the year ended December 31, | ||||||||||||||||||||||||||
| June 30, 2011 | 2010 | 2009 | 2008 | 2007 | 2006 | ||||||||||||||||||||||
| Per Share Operating Performance | |||||||||||||||||||||||||||
| Net asset value, beginning of period | $ | 11.57 | $ | 8.78 | $ | 6.75 | $ | 12.50 | $ | 12.77 | $ | 12.27 | |||||||||||||||
| Income from investing operations | |||||||||||||||||||||||||||
| Net investment income (loss) | 0.04 | (0.48 | ) | (0.40 | ) | (0.16 | ) | 0.01 | (0.09 | ) | |||||||||||||||||
| Net realized and unrealized gains (losses) on securities | 1.17 | 3.27 | 2.43 | (5.56 | ) | 0.17 | 1.68 | ||||||||||||||||||||
| Total from investment operations | 1.21 | 2.79 | 2.03 | (5.72 | ) | 0.18 | 1.59 | ||||||||||||||||||||
| Less distributions | |||||||||||||||||||||||||||
| From net investment income | - | - | - | - | - | - | |||||||||||||||||||||
| From net capital gains | - | - | - | (0.03 | ) | (0.45 | ) | (1.09 | ) | ||||||||||||||||||
| Total distributions | - | - | - | (0.03 | ) | (0.45 | ) | (1.09 | ) | ||||||||||||||||||
| Net asset value, end of period | $ | 12.78 | $ | 11.57 | $ | 8.78 | $ | 6.75 | $ | 12.50 | $ | 12.77 | |||||||||||||||
| Total Investment Return (a) | 10.46 | %(b) | 31.78 | % | 30.07 | % | (45.78 | )% | 1.40 | % | 12.91 | % | |||||||||||||||
| Ratios/Supplemental Data | |||||||||||||||||||||||||||
| Net assets, end of period (000's) | $ | 4,775 | $ | 3,672 | $ | 3,194 | $ | 3,291 | $ | 6,315 | $ | 4,341 | |||||||||||||||
| Ratio of net investment loss to average net assets | (3.23 | )%(c) | (3.39 | )% | (2.11 | )% | (1.33 | )% | (1.21 | )% | (1.66 | )% | |||||||||||||||
| Ratio of expenses to average net assets | 4.12 | %(c) | 4.35 | % | 3.69 | % | 3.20 | % | 2.82 | % | 3.02 | % | |||||||||||||||
| Fund portfolio turnover rate | 13 | %(c) | 18 | % | 21 | % | 12 | % | 53 | % | 47 | % | |||||||||||||||
| Class C | |||||||||||||||||||||||||||
| For the six months ended | For the year ended December 31, | ||||||||||||||||||||||||||
| June 30, 2011 | 2010 | 2009 | 2008 | 2007 | 2006 | ||||||||||||||||||||||
| Per Share Operating Performance | |||||||||||||||||||||||||||
| Net asset value, beginning of period | $ | 10.72 | $ | 8.21 | $ | 6.36 | $ | 11.90 | $ | 12.28 | $ | 11.93 | |||||||||||||||
| Income from investing operations | |||||||||||||||||||||||||||
| Net investment loss | (2.91 | ) | (3.84 | ) | (1.04 | ) | (0.45 | ) | (0.36 | ) | (0.18 | ) | |||||||||||||||
| Net realized and unrealized gains (losses) on securities | 4.00 | 6.35 | 2.89 | (5.06 | ) | 0.43 | 1.62 | ||||||||||||||||||||
| Total from investment operations | 1.09 | 2.51 | 1.85 | (5.51 | ) | 0.07 | 1.44 | ||||||||||||||||||||
| Less distributions | |||||||||||||||||||||||||||
| From net investment income | - | - | - | - | - | - | |||||||||||||||||||||
| From net capital gains | - | - | - | (0.03 | ) | (0.45 | ) | (1.09 | ) | ||||||||||||||||||
| Total distributions | - | - | - | (0.03 | ) | (0.45 | ) | (1.09 | ) | ||||||||||||||||||
| Net asset value, end of period | $ | 11.81 | $ | 10.72 | $ | 8.21 | $ | 6.36 | $ | 11.90 | $ | 12.28 | |||||||||||||||
| Total Investment Return | 10.17 | %(b) | 30.57 | % | 29.09 | % | (46.33 | )% | 0.57 | % | 12.02 | % | |||||||||||||||
| Ratios/Supplemental Data | |||||||||||||||||||||||||||
| Net assets, end of period (000's) | $ | 1,389 | $ | 1,784 | $ | 3,151 | $ | 3,761 | $ | 8,494 | $ | 9,958 | |||||||||||||||
| Ratio of net investment loss to average net assets | (4.03 | )%(c) | (3.91 | )% | (2.87 | )% | (2.11 | )% | (1.93 | )% | (2.43 | )% | |||||||||||||||
| Ratio of expenses to average net assets | 4.87 | %(c) | 4.88 | % | 4.47 | % | 3.96 | % | 3.56 | % | 3.79 | % | |||||||||||||||
| Fund portfolio turnover rate | 13 | %(c) | 18 | % | 21 | % | 12 | % | 53 | % | 47 | % | |||||||||||||||
(a) The Fund's maximum sales charge is not included in the total return computation
(b) Not annualized
(c) Annualized
See Accompanying Notes to Financial Statements which are an integral part of these financial statements.
64
Pacific Advisors Fund Inc.
Financial Highlights (Unaudited)
(For a share outstanding throughout the period)
| Small Cap Value Fund | |||||||||||||||||||||||||||
| Class A | |||||||||||||||||||||||||||
| For the six months ended | For the year ended December 31, | ||||||||||||||||||||||||||
| June 30, 2011 | 2010 | 2009 | 2008 | 2007 | 2006 | ||||||||||||||||||||||
| Per Share Operating Performance | |||||||||||||||||||||||||||
| Net asset value, beginning of period | $ | 31.68 | $ | 26.37 | $ | 19.21 | $ | 34.70 | $ | 33.52 | $ | 25.73 | |||||||||||||||
| Income from investing operations | |||||||||||||||||||||||||||
| Net investment income (loss) | (1.02 | ) | (1.87 | ) | (0.50 | ) | 0.10 | 0.27 | 2.71 | ||||||||||||||||||
| Net realized and unrealized gains (losses) on securities | 6.11 | 7.18 | 7.66 | (15.23 | ) | 1.78 | 6.29 | ||||||||||||||||||||
| Total from investment operations | 5.09 | 5.31 | 7.16 | (15.13 | ) | 2.05 | 9.00 | ||||||||||||||||||||
| Less distributions | |||||||||||||||||||||||||||
| From net investment income | - | - | - | - | - | - | |||||||||||||||||||||
| From net capital gains | - | - | - | (0.35 | ) | (0.87 | ) | (1.21 | ) | ||||||||||||||||||
| From return of capital | - | - | - | (0.01 | ) | - | - | ||||||||||||||||||||
| Total distributions | - | - | - | (0.36 | ) | (0.87 | ) | (1.21 | ) | ||||||||||||||||||
| Net asset value, end of period | $ | 36.77 | $ | 31.68 | $ | 26.37 | $ | 19.21 | $ | 34.70 | $ | 33.52 | |||||||||||||||
| Total Investment Return (a) | 16.07 | %(b) | 20.14 | % | 37.27 | % | (43.52 | )% | 6.10 | % | 35.05 | % | |||||||||||||||
| Ratios/Supplemental Data | |||||||||||||||||||||||||||
| Net assets, end of period (000's) | $ | 93,489 | $ | 92,830 | $ | 117,456 | $ | 87,800 | $ | 112,938 | $ | 62,735 | |||||||||||||||
| Ratio of net investment loss to average net assets | (2.29 | )%(c) | (2.14 | )% | (2.05 | )% | (1.83 | )% | (1.94 | )% | (2.40 | )% | |||||||||||||||
| Ratio of expenses to average net assets | 2.84 | %(c) | 2.66 | % | 2.49 | % | 2.44 | % | 2.34 | % | 2.78 | % | |||||||||||||||
| Fund portfolio turnover rate | 13 | %(c) | 9 | % | 17 | % | 23 | % | 15 | % | 20 | % | |||||||||||||||
| Class C | |||||||||||||||||||||||||||
| For the six months ended | For the year ended December 31, | ||||||||||||||||||||||||||
| June 30, 2011 | 2010 | 2009 | 2008 | 2007 | 2006 | ||||||||||||||||||||||
| Per Share Operating Performance | |||||||||||||||||||||||||||
| Net asset value, beginning of period | $ | 27.26 | $ | 22.87 | $ | 16.79 | $ | 30.70 | $ | 30.00 | $ | 23.32 | |||||||||||||||
| Income from investing operations | |||||||||||||||||||||||||||
| Net investment income (loss) | (4.00 | ) | (3.31 | ) | (1.40 | ) | (0.90 | ) | (0.21 | ) | 0.83 | ||||||||||||||||
| Net realized and unrealized gains (losses) on securities | 8.28 | 7.70 | 7.48 | (12.65 | ) | 1.78 | 7.06 | ||||||||||||||||||||
| Total from investment operations | 4.28 | 4.39 | 6.08 | (13.55 | ) | 1.57 | 7.89 | ||||||||||||||||||||
| Less distributions | |||||||||||||||||||||||||||
| From net investment income | - | - | - | - | - | - | |||||||||||||||||||||
| From net capital gains | - | - | - | (0.35 | ) | (0.87 | ) | (1.21 | ) | ||||||||||||||||||
| From return of capital | - | - | - | (0.01 | ) | - | - | ||||||||||||||||||||
| Total distributions | - | - | - | (0.36 | ) | (0.87 | ) | (1.21 | ) | ||||||||||||||||||
| Net asset value, end of period | $ | 31.54 | $ | 27.26 | $ | 22.87 | $ | 16.79 | $ | 30.70 | $ | 30.00 | |||||||||||||||
| Total Investment Return | 15.70 | %(b) | 19.20 | % | 36.21 | % | (44.05 | )% | 5.22 | % | 33.91 | % | |||||||||||||||
| Ratios/Supplemental Data | |||||||||||||||||||||||||||
| Net assets, end of period (000's) | $ | 8,797 | $ | 11,355 | $ | 15,593 | $ | 15,368 | $ | 31,589 | $ | 17,337 | |||||||||||||||
| Ratio of net investment loss to average net assets | (3.05 | )%(c) | (2.89 | )% | (2.79 | )% | (2.57 | )% | (2.69 | )% | (3.15 | )% | |||||||||||||||
| Ratio of expenses to average net assets | 3.59 | %(c) | 3.40 | % | 3.24 | % | 3.17 | % | 3.09 | % | 3.54 | % | |||||||||||||||
| Fund portfolio turnover rate | 13 | %(c) | 9 | % | 17 | % | 23 | % | 15 | % | 20 | % | |||||||||||||||
(a) The Fund's maximum sales charge is not included in the total return computation
(b) Not annualized
(c) Annualized
See Accompanying Notes to Financial Statements which are an integral part of these financial statements.
65
Pacific Advisors Fund Inc.
Financial Highlights (Unaudited)
(For a share outstanding throughout the period)
| Small Cap Value Fund | |||||||||||||||||||||||||||
| Class I | |||||||||||||||||||||||||||
| For the six months ended | For the year ended December 31, | October 31, 2006 (d) to | |||||||||||||||||||||||||
| June 30, 2011 | 2010 | 2009 | 2008 | 2007 | December 31, 2006 | ||||||||||||||||||||||
| Per Share Operating Performance | |||||||||||||||||||||||||||
| Net asset value, beginning of period | $ | 35.95 | $ | 29.86 | $ | 21.72 | $ | 37.50 | $ | 36.13 | $ | 35.00 | |||||||||||||||
| Income from investing operations | |||||||||||||||||||||||||||
| Net investment income (loss) | (0.40 | ) | (0.60 | ) | (0.45 | ) | (0.32 | )* | (0.33 | ) | 0.45 | ||||||||||||||||
| Net realized and unrealized gains (losses) on securities | 6.23 | 6.69 | 8.59 | (15.10 | )* | 2.57 | 1.89 | ||||||||||||||||||||
| Total from investment operations | 5.83 | 6.09 | 8.14 | (15.42 | ) | 2.24 | 2.34 | ||||||||||||||||||||
| Less distributions | |||||||||||||||||||||||||||
| From net investment income | - | - | - | - | - | - | |||||||||||||||||||||
| From net capital gains | - | - | - | (0.35 | ) | (0.87 | ) | (1.21 | ) | ||||||||||||||||||
| From return of capital | - | - | - | (0.01 | ) | - | - | ||||||||||||||||||||
| Total distributions | - | - | - | (0.36 | ) | (0.87 | ) | (1.21 | ) | ||||||||||||||||||
| Net asset value, end of period | $ | 41.78 | $ | 35.95 | $ | 29.86 | $ | 21.72 | $ | 37.50 | $ | 36.13 | |||||||||||||||
| Total Investment Return | 16.22 | %(b) | 20.40 | % | 37.48 | % | (41.00 | )% | 6.19 | % | 6.74 | %(b) | |||||||||||||||
| Ratios/Supplemental Data | |||||||||||||||||||||||||||
| Net assets, end of period (000's) | $ | 6 | $ | 6 | $ | 5 | $ | 3 | $ | 1,902 | $ | 5 | |||||||||||||||
| Ratio of net investment loss to average net assets | (2.04 | )%(c) | (1.97 | )% | (1.80 | )% | (1.56 | )% | (1.72 | )% | (2.48 | )%(c) | |||||||||||||||
| Ratio of expenses to average net assets | 2.59 | %(c) | 2.50 | % | 2.24 | % | 2.16 | % | 2.10 | % | 2.74 | %(c) | |||||||||||||||
| Fund portfolio turnover rate | 13 | %(c) | 9 | % | 17 | % | 23 | % | 15 | % | 20 | % | |||||||||||||||
(b) Not annualized
(c) Annualized
(d) Commencement of operations
* Numbers were calculated using a weighted-average number of shares outstanding basis as a result of a significant change in Class I assets immediately prior to end of period.
See Accompanying Notes to Financial Statements which are an integral part of these financial statements.
66
Pacific Advisors Fund Inc.
Notes to Financial Statements (Unaudited)
June 30, 2011
Note 1. Organization
Pacific Advisors Fund Inc. (the "Company") is an open-end diversified investment management company registered under the Investment Company Act of 1940, as amended. The Company currently offers six Funds: Government Securities Fund, Income and Equity Fund, Balanced Fund, Large Cap Value Fund, Mid Cap Value Fund and Small Cap Value Fund (individually, a "Fund," or collectively, the "Funds"). Effective December 29, 2010, the Growth Fund was renamed the Large Cap Value Fund; the Multi-Cap Value Fund was renamed the Mid Cap Value Fund; and the Small Cap Fund was renamed the Small Cap Value Fund. Each Fund is a separate investment portfolio of the Company with a distinct investment objective, investment program, policies and restrictions.
The Government Securities Fund seeks to provide high current income, preservation of capital, and rising future income, consistent with prudent investment risk. The Income and Equity Fund seeks to provide current income and, secondarily, long-term capital appreciation. The Balanced Fund seeks to achieve long-term capital appreciation and income consistent with reduced risk. The Large Cap Value Fund seeks to achieve long-term capital appreciation. The Mid Cap Value Fund seeks to achieve long-term capital appreciation. The Small Cap Value Fund seeks to provide capital appreciation through investment in small capitalization companies.
The Funds offer class A and class C shares. In addition to Class A and Class C shares, the Small Cap Value Fund introduced Class I shares on October 9, 2006. Each class has equal rights as to assets and voting privileges except that Class A and Class C each has exclusive voting rights with respect to its distribution plan. Investment income, realized and unrealized capital gains and losses, and the common expenses of each Fund are allocated on a pro rata basis to each class based on the relative net assets of each class to the total net assets of the Fund. Each Class of shares differs in its respective service and distribution expenses and may differ in its transfer agent, registration, and certain other class-specific fees and expenses.
The Company enters into contracts that contain a variety of indemnifications. The Company's maximum exposure under these arrangements is unknown. However, the Company has not had prior claims or losses pursuant to these contracts and expects the risk of loss to be remote.
Note 2. Significant Accounting Policies
A. Security Valuation and Fair Value Measurement. Securities, including American Depository Receipts (ADRs), listed on a national securities exchange and certain over-the-counter ("OTC") issues traded on the NASDAQ national market system are valued at the last quoted sale price at the close of the New York Stock Exchange. OTC issues not quoted on the NASDAQ system, and other equity securities for which no sale price is available, are valued at the last bid price as obtained from published sources or real time quote services, where available, and otherwise from brokers who are market makers for such securities. Debt securities with a maturity less than 60 days are valued on an amortized cost basis, which approximates market value. In determining the fair value of other debt securities, Pacific Global Investment Management Company, Inc. (the "Investment Manager") utilizes independent pricing services approved by the Board of Directors using one or more of the following valuation techniques:
(1) a matrix pricing approach that considers market inputs including, in approximate order of priority, the following: benchmark yields, reported trades, broker/dealer quotes, issuer spreads, two-sided markets, benchmark securities, bids, offers and reference data including market research publications; market indicators, industry and economic events. Evaluators may prioritize inputs differently on any given day for any security based on market conditions, and not all inputs listed are available for use in the evaluation process for each security evaluation on any given day; (2) a comparison of the value of the borrower's outstanding equity and debt to that of comparable public companies; (3) a discounted cash flow analysis. In conducting its assessment and analysis for purpose of determining fair value, the Investment Manager uses its discretion and judgment in considering and appraising relevant factors. Fair value determinations are made by the Investment Manager based on the Company's Fair Value Procedure, as adopted by the Board of Directors.
67
Pacific Advisors Fund Inc.
Notes to Financial Statements (Unaudited)
June 30, 2011
Various inputs are used to determine the fair value of each Fund's investments. For financial statements, these inputs are summarized in the three broad levels listed below. Level 1 inputs are based on quoted prices in active markets for identical securities. Level 2 inputs are based on significant observable market inputs, such as quoted prices for similar securities and quoted prices in inactive markets. Level 3 inputs are significant unobservable inputs that reflect the Fund's own assumptions in determining the fair value of investments. The valuation levels are not necessarily an indication of the risk associated with investing in those securities. The following is a summary of the inputs used to value each Fund's investment securities and cash and cash equivalents as of June 30, 2011:
| Government Securities Fund | Income and Equity Fund | Balanced Fund | Large Cap Value Fund | Mid Cap Value Fund | Small Cap Value Fund | ||||||||||||||||||||||
| Level 1 - Quoted Prices | |||||||||||||||||||||||||||
| Common Stock | |||||||||||||||||||||||||||
| Energy | $ | 61,704 | $ | 112,785 | $ | 1,712,810 | $ | 170,898 | $ | 1,760,769 | $ | 21,860,195 | |||||||||||||||
| Material | - | 162,150 | 288,000 | - | 318,871 | 1,937,250 | |||||||||||||||||||||
| Industrials | - | 555,283 | 2,851,045 | 668,503 | 2,665,703 | 39,694,720 | |||||||||||||||||||||
| Consumer Discretionary | 59,024 | 756,165 | 986,661 | 469,851 | 1,191,226 | 19,842,400 | |||||||||||||||||||||
| Consumer Staples | 73,216 | 637,475 | 2,180,494 | 952,290 | 188,685 | 4,212,600 | |||||||||||||||||||||
| Health Care | - | 488,960 | 1,603,600 | 322,915 | - | 2,832,070 | |||||||||||||||||||||
| Financials | - | 43,840 | 1,585,810 | 423,587 | 229,460 | 12,942,230 | |||||||||||||||||||||
| Information Technology | 65,000 | 335,850 | 2,808,297 | 837,516 | - | - | |||||||||||||||||||||
| Telecommunication Services | 59,679 | 473,890 | - | - | - | 3,750,600 | |||||||||||||||||||||
| Utilities | 141,640 | 361,510 | - | - | - | - | |||||||||||||||||||||
| Preferred Stock | |||||||||||||||||||||||||||
| Financials | 197,660 | 486,950 | 779,850 | - | - | - | |||||||||||||||||||||
| Utilities | - | 50,700 | - | - | - | - | |||||||||||||||||||||
| Level 1 Total | 657,923 | 4,465,558 | 14,796,567 | 3,845,559 | 6,354,714 | 107,072,065 | |||||||||||||||||||||
| Level 2 - Other significant observable inputs | |||||||||||||||||||||||||||
| Bonds and notes | |||||||||||||||||||||||||||
| Corporate Bonds | - | 4,289,224 | 4,277,862 | - | - | - | |||||||||||||||||||||
| Asset-backed Obligations | - | - | 36,379 | - | - | - | |||||||||||||||||||||
| U.S. Government Fixed Income Securities | 3,019,157 | 100,270 | - | - | - | - | |||||||||||||||||||||
| Short Term Investments | |||||||||||||||||||||||||||
| Money Market | 52,420 | 30,130 | - | - | - | - | |||||||||||||||||||||
| Level 2 Total | 3,071,577 | 4,419,624 | 4,314,241 | - | - | - | |||||||||||||||||||||
| Level 3 - Significant unobservable inputs | - | - | - | - | - | - | |||||||||||||||||||||
| Total Investments | $ | 3,729,500 | $ | 8,885,182 | $ | 19,110,808 | $ | 3,845,559 | $ | 6,354,714 | $ | 107,072,065 | |||||||||||||||
Equity securities (common and preferred stock) that are actively traded and market priced are classified as Level 1 Securities. All fixed income securities are classified as Level 2 securities and are valued using either amortized cost or the matrix pricing approach. The Funds had no Level 3 holdings during the six months ended June 30, 2011. In January 2010, the Financial Accounting Standards Board issued Accounting Standard Update No. 2010-06 "Improving Disclosures about Fair Value Measurements," which requires entities to disclose the amounts of significant transfers between Level 1 and Level 2 of the fair value hierarchy and the reasons for these transfers. This guidance was effective for interim and annual reporting period beginning after December 15, 2009. Management has evaluated the Funds' positions for the period ended June 30, 2011, and determined that, for purposes of fair value pricing measurement, there were no transfers between Level 1 and Level 2.
B. Cash and Cash Equivalents. The Company considers all highly liquid financial instruments with maturities of less than three months when acquired to be cash equivalents.
C. Security Transactions and Investment Income. Security transactions are accounted for on the trade date. The cost of investments sold is determined by use of the specific identification method for both financial reporting and federal income tax purposes. Dividends are recorded on the ex-dividend date. Interest income is recorded on an accrual basis. Premium or discount on debt securities are amortized.
D. Dividends and Distributions to Shareholders. The Government Securities Fund and Income and Equity Fund declare and distribute dividends of their net investment income, if any, quarterly. The Balanced Fund, Large Cap Value Fund, Mid Cap Value Fund and Small Cap Value Fund declare and distribute dividends of their net investment income, if any, annually. The Board of Directors determines the amount and timing of such payments.
68
Pacific Advisors Fund Inc.
Notes to Financial Statements (Unaudited)
June 30, 2011
E. Federal Income Tax. The Company intends to comply with the requirements of Subchapter M of the Internal Revenue Code applicable to regulated investment companies and to distribute substantially all of their taxable income to their shareholders. Therefore, no federal income tax provision is required.
Management has analyzed the Funds' tax positions taken on federal income tax returns for all open tax years and for the year ended December 31, 2010 and has concluded that no provision for income tax is required in the Funds' financial statements. Tax years 2007, 2008, 2009 and 2010 are still subject to examination by major federal jurisdictions. Tax years 2006, 2007, 2008, 2009 and 2010 are still subject to examination by major state jurisdictions.
The Funds recognize interest and penalties, if any, related to unrecognized tax benefits as income tax expense in the Statement of Operations. During the period, the Funds did not incur any interest or penalties.
At December 31, 2010, components of distributable earnings (accumulated deficits) on a tax basis were as follows:
| Government Securities Fund | Income and Equity Fund | Balanced Fund | Large Cap Value Fund | Mid Cap Value Fund | Small Cap Value Fund | ||||||||||||||||||||||
| Undistributed ordinary income | $ | - | $ | - | $ | 20,178 | $ | - | $ | - | $ | - | |||||||||||||||
| Undistributed long-term gains | - | - | 143,258 | - | - | - | |||||||||||||||||||||
| Capital loss carry forward* | (1,178,338 | ) | (718,431 | ) | - | (181,858 | ) | (1,426,151 | ) | (15,831,326 | ) | ||||||||||||||||
| Post October Loss | (623 | ) | - | - | (725 | ) | (14,106 | ) | - | ||||||||||||||||||
| Net unrealized appreciation on investments | 39,096 | 279,085 | 1,711,297 | 262,696 | 569,093 | 14,225,998 | |||||||||||||||||||||
| Accumulated earnings (deficits) | $ | (1,139,865 | ) | $ | (439,346 | ) | $ | 1,874,733 | $ | 80,113 | $ | (871,164 | ) | $ | (1,605,328 | ) | |||||||||||
The difference between book basis and tax basis unrealized appreciation (depreciation) is attributable primarily to the tax deferral of losses on wash sales and characterization of certain income items. The Fund intends to treat Post October losses, net capital losses occurred for the period subsequent to October 31, 2010 through the fiscal year end December 31, 2010, as having been incurred in the next fiscal year.
The Funds intend to utilize provisions of the federal income tax laws which allow them to carry a realized capital loss forward for eight years following the year of the loss and offset such losses against any future realized capital gains. During the current fiscal year, the following capital losses carried forward have been utilized:
| Government Securities Fund | Income and Equity Fund | Balanced Fund | Large Cap Value Fund | Mid Cap Value Fund | Small Cap Value Fund | ||||||||||||||||||||||
| Capital Loss carry forward utilized | - | $ | 66,085 | $ | 1,557,453 | $ | 163,220 | $ | 275,663 | - | |||||||||||||||||
* At December 31, 2010, the following Funds had accumulated net realized losses on investment transactions that represent capital loss carry forwards for federal income tax purposes, which expire as follows:
| Capital losses expiring in: | |||||||||||||||||||||||||||||||||||||||
| 2011 | 2012 | 2013 | 2014 | 2015 | 2016 | 2017 | 2018 | Total | |||||||||||||||||||||||||||||||
| Government Securities Fund | $ | 855,711 | $ | 95,072 | $ | 49,495 | $ | 88,644 | $ | 1,178 | $ | 9,585 | $ | 73,971 | $ | 4,682 | $ | 1,178,338 | |||||||||||||||||||||
| Income and Equity Fund | - | - | - | - | - | 330,365 | 388,066 | - | 718,431 | ||||||||||||||||||||||||||||||
| Balanced Fund | - | - | - | - | - | - | - | - | - | ||||||||||||||||||||||||||||||
| Large Cap Value Fund | - | - | - | - | - | - | 181,858 | - | 181,858 | ||||||||||||||||||||||||||||||
| Mid Cap Value Fund | - | - | - | - | - | 785,984 | 640,167 | - | 1,426,151 | ||||||||||||||||||||||||||||||
| Small Cap Value Fund | - | - | - | - | - | - | 12,029,758 | 3,801,568 | 15,831,326 | ||||||||||||||||||||||||||||||
F. Reclassification of Capital Accounts. Distributions of net investment income and realized gains are determined in accordance with income tax regulations which may differ from generally accepted accounting principles. These differences are due to differing treatments for items such as net operating losses, reclassification of dividends and return of capital. To the extent that these differences are permanent in nature, reclassifications are made among the net asset accounts on the Statement of Assets and Liabilities.
69
Pacific Advisors Fund Inc.
Notes to Financial Statements (Unaudited)
June 30, 2011
For the year ended December 31, 2010, reclassifications among the components of net assets are as follows:
| Accumulated Undistributed Net Investment Income | Paid in Capital | Accumulated Capital Gain | |||||||||||||
| Government Securities Fund | $ | - | $ | - | $ | - | |||||||||
| Income and Equity Fund | - | - | - | ||||||||||||
| Balanced Fund | 4,216 | - | (4,216 | ) | |||||||||||
| Large Cap Value Fund | 44,427 | (44,617 | ) | 190 | |||||||||||
| Mid Cap Value Fund | 198,130 | (198,130 | ) | - | |||||||||||
| Small Cap Value Fund | 2,573,889 | (2,573,889 | ) | - | |||||||||||
The reclassifications were due to net investment losses incurred by the Fund, which are not permitted to be carried forward for tax purposes.
G. Use of Estimates. The preparation of financial statements in conformity with generally accepted accounting principles in the United States requires management to make estimates and assumptions that affect the reported amounts in the financial statements and footnotes. Actual results could differ from those estimates.
Note 3. Investment Management, Distributor and Other Related Party Transactions
The Company and the Funds have entered into investment management agreements ("Management Agreements") with the Investment Manager.
The Management Agreements provide for investment management fees, payable monthly, and calculated at the maximum annual rate of 0.65% of average net assets for the Government Securities Fund, 0.75% of average net assets for the Income and Equity, Balanced, Large Cap Value and Small Cap Value Funds and 1.00% of average net assets for the Mid Cap Value Fund.
In accordance with Expense Limitation Agreements with the Company, the Investment Manager waives its respective management fees to the extent that the actual operating expenses of the following Funds exceed the following thresholds:
| Class A | Class C | ||||||||||
| Government Securities Fund | 1.65 | % | 2.40 | % | |||||||
| Income and Equity Fund | 1.95 | % | 2.70 | % | |||||||
| Large Cap Value Fund | 2.65 | % | 3.40 | % | |||||||
For the Government Securities Fund and Large Cap Value Fund only, if net expenses exceed the above thresholds after waiver of the entire management fee, Pacific Global Investor Services, Inc. ("PGIS"), Transfer Agent for the Company, will waive its transfer agency fee to the extent necessary to reduce Class expenses to the above thresholds. The Transfer Agent does not, however, waive out of pocket expenses. These agreements may be terminated by either party upon 90 days prior written notice.
Pursuant to the Expense Limitation Agreements, providing for the voluntary waiver of fees and the assumption of expenses by the Investment Manager and Transfer Agent, the following amounts were waived for the six months ended June 30, 2011.
| Management Fees Waived | Transfer Agent Fees Waived | Total | |||||||||||||
| Government Securities Fund | $ | 13,093 | $ | 21,600 | $ | 34,693 | |||||||||
| Income and Equity Fund | 33,287 | - | 33,287 | ||||||||||||
| Large Cap Value Fund | 13,012 | 21,600 | 34,612 | ||||||||||||
Effective 2004, the Investment Manager terminated all of its rights under the Expense Limitation Agreements with respect to potential recoupment from the Funds of all management fees previously waived and all expenses previously reimbursed. In the future, the Investment Manager will not have any rights to recover fees it waives or expenses it may reimburse, with respect to any of the Funds.
for the six months ended June 30, 2011, Pacific Global Fund Distributors, Inc. ("PGFD"), the principal underwriter for the Company, received commissions on sales of capital stock, after deducting amounts allowed to authorized distributors as commissions. In addition, PGFD, as a registered broker-dealer, may act as broker for the Funds, in conformity with Rule 17e-1 under the Investment Company Act of 1940. The Company's Board of Directors has approved procedures for evaluating the reasonableness of
70
Pacific Advisors Fund Inc.
Notes to Financial Statements (Unaudited)
June 30, 2011
commissions paid to PGFD and periodically reviews these procedures. PGFD will not act as principal in effecting any portfolio transactions for the Funds. The amounts of commissions are as follows:
| Underwriting Fees Retained | Commissions Retained | Brokerage Commissions Received | |||||||||||||
| Government Securities Fund | $ | 36 | $ | - | $ | (139 | ) | ||||||||
| Income and Equity Fund | 3 | 6 | 396 | ||||||||||||
| Balanced Fund | 115 | 343 | 2,111 | ||||||||||||
| Large Cap Value Fund | 185 | 533 | (777 | ) | |||||||||||
| Mid Cap Value Fund | 269 | 146 | 400 | ||||||||||||
| Small Cap Value Fund | 4,627 | 522 | 18,960 | ||||||||||||
PGFD is a wholly-owned subsidiary of the Investment Manager.
The Company has also entered into agreements with PGIS to provide fund accounting services at the monthly fee of three basis points for the first one hundred million in net assets and one basis point on the balance of net assets or a minimum of $1,500 per month. In addition, agreements to provide transfer agent services has also been entered into at a rate of $21.00 per year per open account and $3.50 per year per closed account with minimum charges of $1,800 per month for class A, C, and I share accounts. PGIS is a wholly-owned subsidiary of the Investment Manager.
Accounts payable to related parties consist of transfer agent fees payable to PGIS.
The Company has adopted a plan of distribution, whereby the Funds may pay a service fee to qualified recipients in an amount up to 0.25% per annum of each Fund's daily net assets for Class A shares and Class C shares. Under the plan of the distribution, the Funds may pay a distribution fee to qualified recipients in an amount up to 0.75% per annum of each Fund's daily net assets for Class C shares. The Company has not adopted a plan of distribution for Class I Shares.
For the six months ended June 30, 2011, total distribution and/or service (12b-1) fees were:
| Class A | Class C | Total | |||||||||||||
| Government Securities Fund | $ | 2,927 | $ | 8,434 | $ | 11,361 | |||||||||
| Income and Equity Fund | 5,435 | 22,642 | 28,077 | ||||||||||||
| Balanced Fund | 4,810 | 82,146 | 86,956 | ||||||||||||
| Large Cap Value Fund | 3,394 | 3,772 | 7,166 | ||||||||||||
| Mid Cap Value Fund | 5,192 | 8,101 | 13,293 | ||||||||||||
| Small Cap Value Fund | 113,000 | 47,510 | 160,510 | ||||||||||||
Note 4. Purchase and Sales of Securities
The following summarizes purchases and sales of investment securities, other than short-term investments, and aggregate gross unrealized appreciation and depreciation on a tax basis by each Fund for the six months ended and as of June 30, 2011. The difference between book basis and tax basis unrealized appreciation is attributable primarily to the tax deferral of losses on wash sales.
| Six months ended | As of June 30, 2011 June 30, 2011 | ||||||||||||||||||||||||||
| Cost of Purchases | Proceeds From Sales | Tax Cost of Securities | Gross Unrealized Appreciation | Gross Unrealized Depreciation | Net Unrealized Appreciation | ||||||||||||||||||||||
| Government Securities Fund | $ | 1,814,871 | $ | 2,178,597 | $ | 3,612,716 | $ | 77,442 | $ | 13,078 | $ | 64,364 | |||||||||||||||
| Income and Equity Fund | 1,215,749 | 1,078,547 | 8,426,335 | 811,926 | 383,209 | 428,717 | |||||||||||||||||||||
| Balanced Fund | 951,815 | 4,728,896 | 17,424,361 | 2,566,583 | 880,136 | 1,686,447 | |||||||||||||||||||||
| Large Cap Value Fund | 688,014 | 166,530 | 3,467,292 | 487,776 | 108,784 | 378,992 | |||||||||||||||||||||
| Mid Cap Value Fund | 587,594 | 384,674 | 5,203,031 | 2,062,277 | 896,489 | 1,165,788 | |||||||||||||||||||||
| Small Cap Value Fund | 6,901,344 | 25,552,277 | 76,265,541 | 38,425,927 | 7,619,403 | 30,806,524 | |||||||||||||||||||||
71
Pacific Advisors Fund Inc.
Notes to Financial Statements (Unaudited)
June 30, 2011
Note 5. Distributions to Shareholders
The tax character of distributions paid during 2011 and 2010 was as follows:
| Government Securities Fund | Income and Equity Fund | Balanced Fund | Large Cap Value Fund | Mid Cap Value Fund | Small Cap Value Fund | ||||||||||||||||||||||
| Six months ended June 30, 2011 | |||||||||||||||||||||||||||
| Distributions paid from: | |||||||||||||||||||||||||||
| Ordinary Income | $ | - | $ | 76,235 | $ | - | $ | - | $ | - | $ | - | |||||||||||||||
| Long-Term Capital Gain | - | - | - | - | - | - | |||||||||||||||||||||
| Return of Capital | - | - | - | - | - | - | |||||||||||||||||||||
| Total Distributions | $ | - | $ | 76,235 | $ | - | $ | - | $ | - | $ | - | |||||||||||||||
| Year ended December 31, 2010 | |||||||||||||||||||||||||||
| Distributions paid from: | |||||||||||||||||||||||||||
| Ordinary Income | $ | 8,159 | $ | 184,238 | $ | 5,989 | $ | - | $ | - | $ | - | |||||||||||||||
| Long-Term Capital Gain | - | - | 2,127,093 | - | - | - | |||||||||||||||||||||
| Return of Capital | 9,219 | 2,626 | - | - | - | - | |||||||||||||||||||||
| Total Distributions | $ | 17,378 | $ | 186,864 | $ | 2,133,082 | $ | - | $ | - | $ | - | |||||||||||||||
Note 6. Capital Share Transactions
A 2% redemption fee is assessed on shares of the Government Securities Fund or Income and Equity Fund sold or exchanged within 30 days of purchase or shares of the Balanced Fund, Large Cap Value Fund, Mid Cap Value Fund or Small Cap Value Fund sold or exchanged within 180 days of purchase and is retained in each Fund. The redemption fees collected through June 30, 2011 are included in the dollar amount of shares sold in the table below. The amount of the increase is as follows:
| Class A | Class C | ||||||||||
| Government Securities Fund | $ | - | $ | 750 | |||||||
| Income and Equity Fund | - | 200 | |||||||||
| Balanced Fund | 104 | 667 | |||||||||
| Large Cap Value Fund | 334 | 384 | |||||||||
| Mid Cap Value Fund | 883 | - | |||||||||
| Small Cap Value Fund | 12,511 | 6,678 | |||||||||
| Six months ended June 30, 2011 | Year ended December 31, 2010 | ||||||||||||||||||
| Shares | Amount | Shares | Amount | ||||||||||||||||
| Government Securities Fund | |||||||||||||||||||
| Class A | |||||||||||||||||||
| Shares sold | 12,986 | $ | 118,718 | 50,282 | $ | 456,951 | |||||||||||||
| Reinvestment of distributions | - | - | 1,359 | 12,284 | |||||||||||||||
| 12,986 | 118,718 | 51,641 | 469,235 | ||||||||||||||||
| Shares repurchased | (17,458 | ) | (159,749 | ) | (73,787 | ) | (669,139 | ) | |||||||||||
| Net decrease | (4,472 | ) | $ | (41,031 | ) | (22,146 | ) | $ | (199,904 | ) | |||||||||
| Class C | |||||||||||||||||||
| Shares sold | 36,912 | $ | 332,977 | 57,256 | $ | 516,279 | |||||||||||||
| Reinvestment of distributions | - | - | 326 | 2,924 | |||||||||||||||
| 36,912 | 332,977 | 57,582 | 519,203 | ||||||||||||||||
| Shares repurchased | (75,941 | ) | (685,217 | ) | (156,253 | ) | (1,404,974 | ) | |||||||||||
| Net decrease | (39,029 | ) | $ | (352,240 | ) | (98,671 | ) | $ | (885,771 | ) | |||||||||
72
Pacific Advisors Fund Inc.
Notes to Financial Statements (Unaudited)
June 30, 2011
| Six months ended June 30, 2011 | Year ended December 31, 2010 | ||||||||||||||||||
| Shares | Amount | Shares | Amount | ||||||||||||||||
| Income and Equity Fund | |||||||||||||||||||
| Class A | |||||||||||||||||||
| Shares sold | 93,416 | $ | 940,049 | 130,489 | $ | 1,256,197 | |||||||||||||
| Reinvestment of distributions | 4,411 | 44,179 | 9,145 | 88,250 | |||||||||||||||
| 97,827 | 984,228 | 139,634 | 1,344,447 | ||||||||||||||||
| Shares repurchased | (28,823 | ) | (290,173 | ) | (43,821 | ) | (424,015 | ) | |||||||||||
| Net increase | 69,004 | $ | 694,055 | 95,813 | $ | 920,432 | |||||||||||||
| Class C | |||||||||||||||||||
| Shares sold | 2,102 | $ | 20,460 | 49,147 | $ | 450,643 | |||||||||||||
| Reinvestment of distributions | 2,764 | 26,373 | 9,279 | 85,239 | |||||||||||||||
| 4,866 | 46,833 | 58,426 | 535,882 | ||||||||||||||||
| Shares repurchased | (76,769 | ) | (733,879 | ) | (118,858 | ) | (1,093,335 | ) | |||||||||||
| Net decrease | (71,903 | ) | $ | (687,046 | ) | (60,432 | ) | $ | (557,453 | ) | |||||||||
| Six months ended June 30, 2011 | Year ended December 31, 2010 | ||||||||||||||||||
| Shares | Amount | Shares | Amount | ||||||||||||||||
| Balanced Fund | |||||||||||||||||||
| Class A | |||||||||||||||||||
| Shares sold | 24,247 | $ | 366,676 | 17,732 | $ | 264,207 | |||||||||||||
| Reinvestment of distributions | - | - | 22,441 | 325,843 | |||||||||||||||
| 24,247 | 366,676 | 40,173 | 590,050 | ||||||||||||||||
| Shares repurchased | (17,770 | ) | (266,757 | ) | (72,398 | ) | (1,106,615 | ) | |||||||||||
| Net increase (decrease) | 6,477 | $ | 99,919 | (32,225 | ) | $ | (516,565 | ) | |||||||||||
| Class C | |||||||||||||||||||
| Shares sold | 18,404 | $ | 260,723 | 34,207 | $ | 494,519 | |||||||||||||
| Reinvestment of distributions | - | - | 126,389 | 1,745,426 | |||||||||||||||
| 18,404 | 260,723 | 160,596 | 2,239,945 | ||||||||||||||||
| Shares repurchased | (293,967 | ) | (4,179,228 | ) | (587,264 | ) | (8,502,782 | ) | |||||||||||
| Net decrease | (275,563 | ) | $ | (3,918,505 | ) | (426,668 | ) | $ | (6,262,837 | ) | |||||||||
73
Pacific Advisors Fund Inc.
Notes to Financial Statements (Unaudited)
June 30, 2011
| Six months ended June 30, 2011 | Year ended December 31, 2010 | ||||||||||||||||||
| Shares | Amount | Shares | Amount | ||||||||||||||||
| Large Cap Value Fund | |||||||||||||||||||
| Class A | |||||||||||||||||||
| Shares sold | 62,882 | $ | 579,085 | 66,887 | $ | 572,386 | |||||||||||||
| Reinvestment of distributions | - | - | - | - | |||||||||||||||
| 62,882 | 579,085 | 66,887 | 572,386 | ||||||||||||||||
| Shares repurchased | (12,590 | ) | (114,520 | ) | (48,630 | ) | (421,975 | ) | |||||||||||
| Net increase | 50,292 | $ | 464,565 | 18,257 | $ | 150,411 | |||||||||||||
| Class C | |||||||||||||||||||
| Shares sold | 16,903 | $ | 138,811 | 43,873 | $ | 342,160 | |||||||||||||
| Reinvestment of distributions | - | - | - | - | |||||||||||||||
| 16,903 | 138,811 | 43,873 | 342,160 | ||||||||||||||||
| Shares repurchased | (9,161 | ) | (75,987 | ) | (44,022 | ) | (341,996 | ) | |||||||||||
| Net increase (decrease) | 7,742 | $ | 62,824 | (149 | ) | $ | 164 | ||||||||||||
| Six months ended June 30, 2011 | Year ended December 31, 2010 | ||||||||||||||||||
| Shares | Amount | Shares | Amount | ||||||||||||||||
| Mid Cap Value Fund | |||||||||||||||||||
| Class A | |||||||||||||||||||
| Shares sold | 79,072 | $ | 998,467 | 32,966 | $ | 315,202 | |||||||||||||
| Reinvestment of distributions | - | - | - | - | |||||||||||||||
| 79,072 | 998,467 | 32,966 | 315,202 | ||||||||||||||||
| Shares repurchased | (23,041 | ) | (276,366 | ) | (79,054 | ) | (752,197 | ) | |||||||||||
| Net increase (decrease) | 56,031 | $ | 722,101 | (46,088 | ) | $ | (436,995 | ) | |||||||||||
| Class C | |||||||||||||||||||
| Shares sold | 1,280 | $ | 14,672 | 7,123 | $ | 61,206 | |||||||||||||
| Reinvestment of distributions | - | - | - | - | |||||||||||||||
| 1,280 | 14,672 | 7,123 | 61,206 | ||||||||||||||||
| Shares repurchased | (50,022 | ) | (560,272 | ) | (224,836 | ) | (1,948,570 | ) | |||||||||||
| Net decrease | (48,742 | ) | $ | (545,600 | ) | (217,713 | ) | $ | (1,887,364 | ) | |||||||||
74
Pacific Advisors Fund Inc.
Notes to Financial Statements (Unaudited)
June 30, 2011
| Six months ended June 30, 2011 | Year ended December 31, 2010 | ||||||||||||||||||
| Shares | Amount | Shares | Amount | ||||||||||||||||
| Small Cap Value Fund | |||||||||||||||||||
| Class A | |||||||||||||||||||
| Shares sold | 190,915 | $ | 6,669,532 | 541,960 | $ | 14,532,455 | |||||||||||||
| Reinvestment of distributions | - | - | - | - | |||||||||||||||
| 190,915 | 6,669,532 | 541,960 | 14,532,455 | ||||||||||||||||
| Shares repurchased | (578,934 | ) | (19,491,975 | ) | (2,065,755 | ) | (54,928,017 | ) | |||||||||||
| Net decrease | (388,019 | ) | $ | (12,822,443 | ) | (1,523,795 | ) | $ | (40,395,562 | ) | |||||||||
| Class C | |||||||||||||||||||
| Shares sold | 7,643 | $ | 233,978 | 30,039 | $ | 678,302 | |||||||||||||
| Reinvestment of distributions | - | - | - | - | |||||||||||||||
| 7,643 | 233,978 | 30,039 | 678,302 | ||||||||||||||||
| Shares repurchased | (145,304 | ) | (4,191,405 | ) | (295,354 | ) | (6,859,138 | ) | |||||||||||
| Net decrease | (137,661 | ) | $ | (3,957,427 | ) | (265,315 | ) | $ | (6,180,836 | ) | |||||||||
| Class I | |||||||||||||||||||
| Shares sold | - | $ | - | - | $ | - | |||||||||||||
| Reinvestment of distributions | - | - | - | - | |||||||||||||||
| - | - | - | - | ||||||||||||||||
| Shares repurchased | - | - | - | - | |||||||||||||||
| Net increase (decrease) | - | $ | - | - | $ | - | |||||||||||||
Note 7. Bank Borrowings
Each Fund may borrow money to the extent permitted by the 1940 Act, as amended, or any rules, exemptions or interpretations thereunder that may be adopted, granted or issued by the SEC. Under the 1940 Act, a mutual fund may borrow up to one-third of its total assets (including the amount borrowed) from banks for any purpose, and may borrow up to 5% of its total assets from banks or other lenders for temporary purposes. Each Fund may borrow to facilitate portfolio transactions or meet redemptions. The Large Cap Value Fund, Mid Cap Value Fund, and Small Cap Value Fund also may borrow money to invest in portfolio securities. Each Fund has the ability to borrow, from UMB Bank, n.a. (UMB), on an unsecured basis, at 1.50% over the Federal Funds rate. As of June 30, 2011, the Balanced Fund, Large Cap Value Fund, Mid Cap Value Fund and Small Cap Value Fund had borrowings from UMB with amounts of $371,574, $11,860, $187,060 and $4,440,061 respectively, and were paying interest at 1.52% per annum on their outstanding borrowings. No compensating balances are required.
75
Pacific Advisors Fund Inc.
Directors and Officers
"Independent" Directors
| Name (Age) | Position with the Company1 | Year elected Director of the Company | Principal occupation(s) during past 5 years | Other Directorships held by Director | |||||||||||||||
| L. Michael Haller, III (67) | Director | 1992 | Consultant; Chairman, Stereo Scope, Inc. (web application company); Chairman, Kapitall (software development company); President, Bionic Games, Inc. (game software development company); President, High Impact Games, Inc. (game software development company); and Owner, Asahi Broadcasting Enterprises (game software development company) | None | |||||||||||||||
| Peter C. Hoffman (60) | Director | 2010 | President, Sierra Autocars, Inc. (auto dealership), Sierra Vehicles, Inc. (auto dealership), Sierra Automotive Enterprises, Inc. (auto dealership) and Sierra Pursuits, Inc. (management company) | None | |||||||||||||||
| Takashi Makinodan, PhD (86) | Director | 1995 | Retired in 2007; and formerly Director, Medical Treatment Effectiveness Program (MEDTEP), Center on Asian and Pacific Islanders (1992-2007); and Associate Director of Research, Geriatric Research Education Clinic Center, VA Medical Center (1991-2007) | None | |||||||||||||||
| Gerald E. Miller (81) | Director | 1992 | Retired in 1992; and formerly worked for Merrill Lynch for over 30 years and was a Senior Resident Vice President at retirement in 1992 | None | |||||||||||||||
| Louise K. Taylor, PhD (64) | Director | 1992 | Retired in 2009; and formerly Superintendent, Monrovia Unified School District (1991-2009) | None | |||||||||||||||
"Interested" Directors2
| Name (Age) | Positions with the Company1 | Year elected a Director and Officer of the Company | Principal occupations during past 5 years | Other Directorships held by Director | |||||||||||||||
| Victoria L. Breen (60)* | Director Assistant Secretary | 1992 2002 | President, Derby & Derby, Inc. (financial services company); Agent, Transamerica Life Companies; Registered Principal, Transamerica Financial Advisors, Inc.; and Assistant Secretary and Director, Pacific Global Investment Management Company | None | |||||||||||||||
| George A. Henning (64)** | President and Chairman | 1992 | Chairman, President and Director, Pacific Global Investment Management Company; and Chairman and Director, Pacific Global Fund Distributors, Inc. and Pacific Global Investor Services, Inc. | None | |||||||||||||||
Each Director oversees all 6 Pacific Advisors Fund portfolios.
The Fund's Statement of Additional Information contains additional information about the Fund's Directors and Officers and is available without charge upon request by calling (800) 989-6693. The business address for all Directors and officers of the Company is 101 N. Brand Blvd., Suite 1950, Glendale, CA 91203, Attn: Secretary.
76
Pacific Advisors Fund Inc.
Directors and Officers
Other Officers
| Name (Age) | Position(s) with the Company | Year elected an officer of the Company | Principal occupations during past 5 years | ||||||||||||
| Catherine L. Henning (33) | Vice President Secretary | 2010 2006 | Vice President, Secretary, Director of Client Services and Director, Pacific Global Investment Management Company; President, Secretary, Chief Compliance Officer and Director, Pacific Global Fund Distributors, Inc.; and Vice President, Secretary and Director, Pacific Global Investor Services, Inc. | ||||||||||||
| Barbara A. Kelley (58) | Vice President, Treasurer and Chief Compliance Officer | 2001 | Executive Vice President, Chief Compliance Officer and Director, Pacific Global Investment Management Company; Director, Pacific Global Fund Distributors, Inc.; President and Director, Pacific Global Investor Services, Inc.; and formerly Treasurer, Pacific Global Investment Management Company, Pacific Global Fund Distributors, Inc. and Pacific Global Investor Services, Inc. (2001-2007) | ||||||||||||
| Araceli Olea (38) | Assistant Secretary | 2008 | Shareholder Services Manager, Pacific Global Investor Services, Inc.; and Assistant Secretary, Pacific Global Investment Management Company and Pacific Global Investor Services, Inc. | ||||||||||||
| Jingjing Yan (37) | Assistant Treasurer | 2005 | Vice President and Treasurer, Pacific Global Investment Management Company; Treasurer, Pacific Global Fund Distributors, Inc. and Pacific Global Investor Services, Inc.; and formerly Fund Accounting Manager, Pacific Global Investor Services, Inc. (2001-2007); and Assistant Treasurer, Pacific Global Investment Management Company, Pacific Global Fund Distributors, Inc. and Pacific Global Investor Services, Inc. (2005-2007) | ||||||||||||
1 Each director is elected to serve until the next annual shareholders meeting and until his or her successor is elected or appointed. The Company does not hold regular annual shareholders meetings to elect Directors. Vacancies on the Board can be filled by the action of a majority of the Directors, provided that at least two-thirds of the Directors have been elected by the shareholders.
2 "Interested persons" as defined in the 1940 Act, as amended, based on their affiliation with the Funds' investment manager and its affiliates (including the Funds' principal underwriter).
* Ms. Breen is considered an interested director because (a) she is a registered principal of a registered broker/dealer that engages in sales of Company shares under a selling agreement with the Distributor, and in that capacity she has received commissions on the sale of the Funds' shares; (b) she is an officer of the Company; and (c) she is a shareholder of the Manager and a member of the Manager's Board of Directors.
** Mr. Henning is considered an interested director because (a) he holds the positions described above with the Company, the Manager and its affiliates; (b) by virtue of his ownership of the Manager's shares he may be deemed a "control person" of the Manager; and (c) he is Ms. Henning's father.
77
Pacific Advisors Fund Inc.
notes
78
Pacific Advisors Fund Inc.
notes
79
Pacific Advisors Fund Inc.
notes
80

Pacific Advisors Fund Inc.
Directors
George A. Henning, Chairman
Victoria L. Breen
L. Michael Haller, III
Peter C. Hoffman
Takashi Makinodan, Ph.D.
Gerald E. Miller
Louise K. Taylor, Ph.D.
Officers
George A. Henning, President
Catherine L. Henning, Vice President and Secretary
Victoria L. Breen, Assistant Secretary
Araceli Olea, Assistant Secretary
Barbara A. Kelley, Treasurer
Jingjing Yan, Assistant Treasurer
Investment Manager
Pacific Global Investment Management Company
101 North Brand Blvd., Suite 1950
Glendale, California 91203
Transfer Agent and Administrator
Pacific Global Investor Services, Inc.
101 North Brand Blvd., Suite 1950
Glendale, California 91203
Distributor
Pacific Global Fund Distributors, Inc.
101 North Brand Blvd., Suite 1950
Glendale, California 91203
(800) 989-6693
Availability of Quarterly Portfolio Schedule
The Fund files its complete schedule of portfolio holdings with the SEC for the first and third quarters of each fiscal year on Form N-Q. The Fund's Forms N-Q are available on the SEC's Web site at http://www.sec.gov. The Fund's Forms N-Q may be reviewed and copied at the SEC's Public Reference Room in Washington, DC. Information about the operation of the Public Reference Room may be obtained by calling the SEC at (800) SEC-0330.
The Fund's complete schedule of portfolio holdings for each fiscal quarter is posted on the Fund's Web site at www.PacificAdvisorsFund.com and is available without charge, upon request by calling (800) 989-6693. Documents will be sent within 3 business days of receipt of your request.
Availability of Proxy Voting Policies and Procedures and Proxy Voting Record
A description of the policies and procedures that the Fund uses to determine how to vote proxies relating to portfolio securities and information regarding how the Fund voted proxies relating to portfolio securities during the most recent 12-month period ended June 30 is available without charge, upon request by calling (800) 989-6693. Documents will be sent within 3 business days of receipt of your request. This information is also available on the SEC's Web site at http://www.sec.gov.

Pacific Global Fund Distributors, Inc.
101 North Brand Blvd., Suite 1950
Glendale, California 91203

Item 2. |
| Code of Ethics |
|
| Not applicable for semi-annual reports. |
|
|
|
Item 3. |
| Audit Committee Financial Expert |
|
| Not applicable for semi-annual reports. |
|
|
|
Item 4. |
| Principal Accountant Fees and Services |
|
| Not applicable for semi-annual reports. |
|
|
|
Item 5. |
| Audit Committee of Listed Registrants |
|
| Not applicable as Registrant is not a listed issuer as defined in Rule 10A-3 under the Securities Exchange Act of 1934. |
|
|
|
Item 6. |
| Schedule of Investments |
|
| Schedule of Investments is included as part of the report to shareholders filed under Item 1 of this form. |
|
|
|
Item 7. |
| Disclosure of Proxy Voting Policies and Procedures for Closed-End Management Investment Companies |
|
| Not applicable to open-end investment companies. |
|
|
|
Item 8. |
| Portfolio Managers of Closed-End Management Investment Companies |
|
| Not applicable to open-end investment companies. |
|
|
|
Item 9. |
| Purchases of Equity Securities by Managers of Closed-End Management Investment Company and Affiliated Purchasers. |
|
| Not applicable to open-end investment companies. |
|
|
|
Item 10. |
| Submission of Matters to a Vote of Security Holders |
|
| No material changes have been made. |
|
|
|
Item 11. |
| Controls and Procedures. |
|
| (a) Based upon their evaluation of Registrant’s disclosure controls and procedures (as defined in Rule 30a-3(c) under the Investment Company Act of 1940) as conducted within 90 days of the filing date of this Form N-CSR, Registrant’s principal executive officer and principal financial officer have concluded that those disclosure controls and procedures provide reasonable assurance that the material information required to be disclosed by Registrant on this report is recorded, processed, summarized and reported within the time periods specified in the Securities and Exchange Commission’s rules and forms. |
|
|
|
|
| (b) There were no changes in Registrant’s internal control over financial reporting (as defined in Rule 30a-3(d) under the Investment Company Act of 1940) that occurred during the second fiscal quarter of the period covered by this report that have materially affected, or are reasonably likely to materially affect, Registrant’s internal control over financial reporting. |
|
|
|
Item 12. |
| Exhibits |
|
| (a)(1) Not applicable. |
|
|
|
|
| (a)(2) Certifications required by Item 12(a) of Form N-CSR and Section 302 of the Sarbanes-Oxley Act of 2002 (filed herewith). |
|
|
|
|
| (a)(3) Not applicable. |
|
|
|
|
| (b) Certification required by Section 906 of the Sarbanes-Oxley Act of 2002 (filed herewith). |
SIGNATURES
Pursuant to the requirements of the Securities Exchange Act of 1934 and the Investment Company Act of 1940, Registrant has duly caused this report to be signed on its behalf by the undersigned, thereunto duly authorized.
Pacific Global Fund Inc. d/b/a Pacific Advisors Fund Inc.
By: | /s/ George A. Henning |
|
| George A. Henning |
|
| Chairman, Pacific Advisors Fund Inc. |
|
|
|
|
Date: | September 6, 2011 |
|
Pursuant to the requirements of the Securities Exchange Act of 1934 and the Investment Company Act of 1940, this report has been signed below by the following persons on behalf of Registrant and in the capacities and on the dates indicated.
By: | /s/ George A. Henning |
|
| George A. Henning |
|
| Chief Executive Officer |
|
|
|
|
Date: | September 6, 2011 |
|
By: | /s/ Barbara A. Kelley |
|
| Barbara A. Kelley |
|
| Chief Financial Officer |
|
|
|
|
Date: | September 6, 2011 |
|