UNITED STATES
SECURITIES AND EXCHANGE COMMISSION
Washington, D.C. 20549
FORM N-CSR
CERTIFIED SHAREHOLDER REPORT OF REGISTERED
MANAGEMENT INVESTMENT COMPANIES
Investment Company Act file number | 811-07062 | |||||||
| ||||||||
PACIFIC GLOBAL FUND INC. D/B/A PACIFIC ADVISORS FUND INC. | ||||||||
(Exact name of registrant as specified in charter) | ||||||||
| ||||||||
101 NORTH BRAND BLVD., SUITE 1950 GLENDALE, CALIFORNIA |
| 91203 | ||||||
(Address of principal executive offices) |
| (Zip code) | ||||||
| ||||||||
GEORGE A. HENNING 101 NORTH BRAND BLVD., SUITE 1950 GLENDALE, CA 91203 | ||||||||
(Name and address of agent for service) | ||||||||
| ||||||||
Registrant’s telephone number, including area code: | 818-242-6693 |
| ||||||
| ||||||||
Date of fiscal year end: | December 31 |
| ||||||
| ||||||||
Date of reporting period: | June 30, 2009 |
| ||||||
Item 1. Report to Shareholders
Filed herewith.

semi-annual report
june 30, 2009
government securities fund
income and equity fund
balanced fund
growth fund
multi-cap value fund
small cap fund


Pacific Advisors
table of contents
| Message from the Chairman | 1 | ||||||
| Government Securities Fund | 5 | ||||||
| Income and Equity Fund | 9 | ||||||
| Balanced Fund | 14 | ||||||
| Growth Fund | 19 | ||||||
| Multi-Cap Value Fund | 23 | ||||||
| Small Cap Fund | 28 | ||||||
| Statement of Investments | 34 | ||||||
| Statement of Assets and Liabilities | 58 | ||||||
| Statement of Operations | 60 | ||||||
| Statement of Changes in Net Assets | 62 | ||||||
| Notes to Financial Statements | 66 | ||||||
| Financial Highlights | 75 | ||||||
| Directors and Officers | 82 | ||||||
This Report is submitted for the general information of the shareholders of the Fund. It is not authorized for distribution to prospective investors unless accompanied or preceded by a current effective prospectus of the Fund, which contains information concerning the investment policies of the Fund as well as other pertinent information.
This Report is for informational purposes only and is not a solicitation, or a recommendation that any particular investor should purchase or sell any particular security. The statements in the Report are the opinions and beliefs expressed at the time of this commentary and are not intended to represent opinions and beliefs at any other time. These opinions are subject to change with market conditions and are not meant as a market forecast. All economic and performance information referenced is historical. Past performance does not guarantee future results.
For more information on the Pacific Advisors Funds, including information on charges, expenses and other classes offered, please obtain a copy of the prospectus by calling (800) 989-6693. Please read the prospectus and consider carefully the investment risks, objectives, charges and expenses before you invest or send money. Shares of the Pacific Advisors Funds are not deposits or obligations of any bank, are not guaranteed by any bank, are not insured by the FDIC or any other agency, and involve investment risks, including the possible loss of the principal amount invested. The investment return and principal value of an investment will fluctuate so that an investor's shares, when redeemed, may be worth more or less than their original cost.

Message
from the chairman
Dear Shareholders,
This year, investors have been on an emotional roller coaster. The continuing credit crisis weighed on the markets during the first quarter. Uncertainty about the government's response to the economic and financial crises caused a "buyers strike" in the equity market. As a result, the equity markets dropped to significant lows in early March. The Dow Jones Industrial Average fell to 6,440 while the S&P 500 Index declined to 666, marking a loss of over 26% for each index since the beginning of the year. Fears of a "great depression" led many investors to "give up" on equities and sell into the market downturn.
The market downturn in the first quarter was the result of a lack of information rather than a significant change in economic conditions. While the credit markets were showing improvement, investors worried that conditions would deteriorate if governments and central banks failed to provide enough support through intervention. While the major market indices reached major lows in the first quarter, these numbers did not reflect the results of all market participants. Indeed, many companies did not return to the lows experienced last Fall. Trading volumes were also lower suggesting that many investors had moved to the sidelines. However, these statistics did little to give investors confidence in an eventual market rebound.
As governments around the world enacted economic stimulus programs and several banks pre- annnounced first quarter earnings, investors saw signs of encouragement. As they began to ease back into the equity markets, they were surprised when many companies beat earnings estimates. Opportunistic investors uncovered undervalued companies which, in some cases, had declined to levels anticipating bankruptcy. The strong market rally that followed caught the more cautious investors by surprise.
The equity markets posted impressive gains during the second quarter. While several factors contributed to the strong performance, the most prevalent was the growing sense that the global recession had begun to ease. As investors moved beyond fear, the "buyer's strike" that had crippled securities markets gave way to strategic investing. As confidence grew in response to early signs of economic recovery, investors were once again willing to accept risk.
The Funds' equity strategies, which focus on investments in high quality companies with experienced management teams; strong balance sheets; and solid growth prospects; trading at favorable valuations, were rewarded. While the strong rally might suggest that the market recovery is complete, the market remains well off of its October 2007 high. More significantly, stocks in strong companies are still trading at significantly depressed valuations. Such companies offer opportunities for long-term investors.
Market & Economic Review
The market rebound that began in March continued impressively through May. Investors were initially encouraged in mid-March when the Federal Reserve, Treasury, and FDIC announced programs to inject much-needed liquidity into the frozen credit markets. This unprecedented intervention sent a strong message that the government would take the steps necessary to stabilize the financial sector and the economy.
Additionally, packages implemented by foreign governments and central banks were important catalysts to reignite the global economy. In particular, China approved a massive package that will produce GDP growth of over 7% in 2009. This growth initiative triggered a recovery in basic materials which provided a foundation for global economic recovery.
The markets rallied in earnest at the end of March after Fed Chairman Ben Bernanke characterized the economy as exhibiting "green shoots" of recovery. This comment, followed by positive earnings pre-announcements by major banks and better-than-expected first quarter earnings, set in motion a wave of enthusiastic buying. The markets moved solidly higher in April and May as investors saw that stronger companies were surviving the downturn. These companies benefited from disciplined fiscal management,
Market Review
| June 30, 2009 | Close | YTD Return | |||||||||
| Dow Jones | 8,447.00 | -3.8 | % | ||||||||
| S&P 500 | 919.32 | 3.2 | % | ||||||||
| NASDAQ | 1,835.04 | 16.4 | % | ||||||||
| Russell 2000 (small cap) | 508.28 | 2.6 | % | ||||||||
| 06/30/09 | 06/30/08 | ||||||||||
| 10-Year T-Note Yield | 3.53 | % | 3.99 | % | |||||||
Data: The Wall Street Journal; Standard & Poor's; Russell Investments
1

Message
from the chairman continued
flexible business models and improved productivity which allowed them to implement cost controls to manage to new economic realities.
With the notable exception of unemployment, most official statistics pointed to a slower pace of economic contraction. Yet, while certain sectors of the economy showed signs of strength, others continued to lag. The market's bullish trend eased in June as investors turned their attention to second quarter earnings for better clarity on the direction of the economy. Nevertheless, the S&P 500 and other major indices ended the second quarter in positive territory for the year.
The market resumed its upward march in July as companies across a variety of sectors issued positive second quarter earnings reports. In another encouraging sign, companies began to report an uptick in business from the depressed levels in the first half of 2009. Through the end of July, the S&P 500 had gained a remarkable 48% from its March low.
Recovery Taking Shape
Growing evidence suggests that an economic recovery is under way, albeit at a slower pace than past recoveries. Positive signs include stabilization in the financial services sector; improved access to capital; low business inventories which will need replenishing; better-than-expected corporate earnings; a modest drop in unemployment claims; increases in home prices and sales; an increase in auto sales; and growing demand for commodities such as steel and coal.
A robust economic recovery, as seen after past recessions, is unlikely given the severity of the recession and credit crisis. The high cost of government spending and the projected deficits will likely result in higher federal and state taxes. These headwinds will probably continue for some time resulting in slow to moderate economic growth.
This economic environment creates opportunities for stronger businesses to strengthen their market positions and grow their franchises. This is accomplished as tighter industry economics force weaker competitors out of the market; distressed valuations create acquisition and consolidation opportunities; and companies with strong balance sheets opportunistically invest in new assets, new products, and new relationships. We believe these dynamics will result in a significant divergence between the strong and marginal performers in each industry.
Slower growth may have a dampening effect on the equity indices for the foreseeable future. Rather than a general recovery in which "a rising tide raises all boats," we expect that this recovery will reward the stronger companies. Therefore, individual stock selection will be an important factor in investment performance.
The benefits of the Funds' focused equity strategies are especially evident in this environment. Our focus on a relatively small number of companies enables us to closely monitor each holding to identify unusual market conditions and investment opportunities. As a result, market volatility can provide opportunities for timely investment decisions. The Funds' long-term horizon provides opportunities to realize significant returns as the market recovers.
Equity Investment Review
While broad-based, the market rally between March and May was driven by companies expected to benefit in the early stages of recovery. Many of these firms were in the Basic Materials, Technology, Consumer Discretionary, Industrial, and Energy sectors. Companies reacted to the economic slowdown by reassessing business operations, controlling costs and managing inventory levels. As a result, strong competitors have successfully weathered substantial revenue declines and reported better-than-expected earnings.
The rebound in the equity Funds during the quarter was the result of timely investment decisions as well as the strong market rally. While the market recovered from its March lows, many portfolio holdings significantly outperformed the overall market. The best performers included companies that we expected to benefit in the early recovery stage as well as companies that were industry leaders through the downturn.
The Funds' investment strategies continue to focus on holdings in stocks that traditionally perform well during slow economic periods; those that will benefit from the early stages of recovery as well as stocks which stand to benefit from economic stimulus programs. In addition to these themes which address the current
2

economic climate, we continue to target traditional value opportunities and special situations consistent with our core investment strategies. Given the extreme pressures of the credit crisis and the likelihood of a slow economic recovery, the growth opportunities for the best companies may occur as their weaker competitors lack the resources or capital necessary to recover.
We believe the portfolios are well-positioned to benefit from the developing economic recovery, with strong positions in Industrials, Energy, and Materials. A significant component of the Industrials sector is transportation stocks. Historically, transportation is generally a market leader in an economic recovery. We anticipate that trend will develop at slower pace to the benefit of the stronger companies. Many of the weaker companies have avoided bankruptcy or liquidation as creditors have been slow to repossess equipment in a weak market hoping an economic recovery will enable these companies to survive. This appears to be an unlikely scenario which may shrink supply and provide potentially strong growth in revenues to the surviving companies.
As economic recovery develops, we will increasingly focus on early recovery names, including Energy companies. Crude oil prices, while often volatile, are expected to move higher. As economies recover, the global appetite for energy will continue to grow. Investments in exploration and natural resource production will be rewarded. Additionally, we look to commodities, including energy products; copper; and steel, to provide a hedge against inflation. While oil prices fell to near $30 per barrel earlier this year, oil prices have recently moved higher to near $70 per barrel. We believe that, as economic conditions improve and supplies fall, higher oil prices are inevitable. Much of the world's oil supplies are in remote areas that require oil prices above $70 to $90 per barrel to be economicall y viable.
While many of the Financials stocks are beginning to rebound, we believe their primary focus for the remainder of this year will be to improve their balance sheets by raising capital, increasing deposits and writing off or selling problem loan portfolios. As stronger banks improve their balance sheets, they may seek opportunities for acquisitions or mergers with problem banks shut down by the FDIC. The larger banks are benefitting from their diversification through corporate debt financing and other investment banking business. During the recent quarter, several banks have been able to repay their government financing under TARP1 with new capital or earnings from improved business conditions.
Many of the companies in the portfolios are well positioned to experience strong growth even in a slower economy. They have aggressively cut costs, pared inventory and maintained strong balance sheets to initiate growth strategies. We believe these measures will enable them to leverage any improvement in business into more robust earnings. As economic conditions improve, we believe the upside potential for well managed companies is substantial.
Fixed Income Investment Review
The fixed income markets improved substantially over the six-month period. As access to the credit markets eased and investor appetite for risk increased, many companies responded with debt offerings. Recent downgrades of many corporate issues to lower investment grade levels have increased the interest rates on many new offerings.
Interest rates on government securities also trended higher during the period. At the height of the market panic in the first quarter, the rates on short-term Treasury Bills fell to zero, and even below zero. During the second quarter, the rate on the benchmark 10-year Treasury Note rose approximately 0.75% in response to the surging government debt. The interest rates demanded by investors to finance the stimulus spending have, so far, increased modestly. Much of the funding has been provided by foreign investors who currently hold approximately 55% of all U.S. Treasuries. The massive amounts of stimulus spending, however, are expected to test investor appetite for government bonds.
We expect interest rates to rise further as investors will demand higher returns on government bonds. As U.S. government bonds are a safe haven for many investors, we anticipate the stock market recovery will attract a significant amount of capital that has been invested in government bonds as a temporary investment vehicle. Any significant increase in rates will impact the economic recovery as interest rates for loans and mortgages will increase and inflationary pressures may reappear.
1 Troubled Asset Relief Program.
3

Message
from the chairman continued
Near-term, interest rates and the fixed income markets will remain volatile as economic recovery develops. As a result, the Funds' fixed income holdings remain concentrated in short to intermediate-term issues. We will continue to maintain this defensive strategy to protect capital while seeking reasonable income opportunities.
Looking Ahead
While uncertainties remain, we believe the market recovery is sustainable. We anticipate that the market will continue to "take two steps forward and one step back" in response to mixed economic data. Therefore, we expect performance will come from industry leaders rather than the overall market. Individual companies may post stellar returns as they successfully navigate a difficult economy. Our strategy will remain focused on these companies where we believe the best portfolio opportunities exist.
The past year has been particularly difficult. Investors feared that it would take years for their portfolios to recover from the global credit crisis and deep recession. We have encouraged investors to be patient and disciplined in maintaining their investment strategies. While the recovery is ongoing, the dramatic events during the first six months of the year demonstrate the ability of the equity markets to rapidly improve from their lows in a short period of time. We anticipate the global markets and global economies will continue to improve. We also recognize the importance of being diligent and will continue to adapt to changing market conditions consistent with the Funds' long-term investment strategies.
Sincerely,

George A. Henning
This report is for informational purposes only and is not a solicitation, or a recommendation that any investor should purchase or sell any particular security. Statements are the opinions and beliefs expressed at the time of this commentary and are not intended to represent opinions and beliefs at any other time. Opinions are subject to change and are not meant as a market forecast. All economic and performance information referenced is historical. Past performance does not guarantee future results.
4
Pacific Advisors
Government Securities Fund
Seeks to provide high current income, preservation of capital, and rising future income, consistent with prudent investment risk. Invests at least 80% of its assets in U.S. Government fixed income securities and may invest in other income-producing instruments including dividend paying common stocks, for income and capital appreciation.
| TOTAL RETURNS | EXPENSE RATIOS | ||||||||||||||||||
| For the six months ended June 30, 2009 | For the fiscal year ended December 31, 2008 | ||||||||||||||||||
| Expense Ratio | Net Expense Ratio | ||||||||||||||||||
| Class A | 0.33 | % | Class A | 3.11 | % | 1.65 | % | ||||||||||||
| Class C | – 0.03 | % | Class C | 3.89 | % | 2.43 | % | ||||||||||||
| Barclays Capital U.S. Int T-Bond Index1 | – 1.52 | % | |||||||||||||||||
Performance quoted is past performance which does not guarantee future results. Current performance may be higher or lower than the performance quoted. Call (800) 989-6693 for performance current to the most recent month-end. The investment return and principal value of an investment will fluctuate so that an investor's shares, when redeemed, may be worth more or less than their original cost. Returns represent the change in value over the stated period assuming reinvestment of dividends and capital gains at net asset value. Returns do not take into account the maximum 4.75% sales charge on Class A shares or the 1% Contingent Deferred Sales Charge (CDSC) for Class C shares sold within one year of purchase. Returns would be lower if the applicable sales charge and CDSC were included. Returns do not take into account individual taxes which may reduce actua l returns when shares are sold.
The Fund's investment adviser is waiving a portion of its management fees pursuant to an Expense Limitation Agreement. The waiver may be discontinued at any time with ninety days written notice in consultation with the Fund's Board of Directors, but is expected to continue at current levels. Please see the Fund's most recent Annual Report for details. Performance shown reflects the waiver, without which the results would have been lower.
Discussion with Portfolio Manager
Thomas H. Hanson
Market Overview
Deteriorating economic conditions and continued fallout from the credit crisis put severe pressure on the markets at the beginning of the year. Industrial production, consumer spending and economic output continued to decline, while unemployment continued to rise. In addition, creditors remained reluctant to lend in light of ongoing instability in the economy and the financial sector. Seeking safety and liquidity, investors sold equities and other investments and flocked to U.S. government securities, especially short-term Treasuries. Strong demand pushed prices higher while Treasury rates dropped to historically low levels.
Throughout the first quarter, the U.S. government, Treasury and Federal Reserve continued to take dramatic steps to stimulate economic growth; ease credit conditions; and stabilize the financial sector. The Fed kept its target range for the federal funds rate at zero to 0.25% and stated that "economic conditions are likely to warrant exceptionally low levels of the federal funds rate for an extended period." In mid-March, the Fed announced plans to buy up to $300 billion in longer-term Treasuries to reduce the government's borrowing costs and stimulate lending by financial institutions. The Fed also expanded its efforts to support the housing markets; accommodate the credit needs of consumers and small businesses; and foster improved conditions in financial markets.
Late in the first quarter, the government's various efforts began to yield improved credit conditions and prospects for economic recovery. In turn, investor sentiment began to shift from acute pessimism to guarded optimism. This sparked a rally in the equity markets which continued in the second quarter. While
1 The Barclays Capital U.S. Intermediate Treasury Bond Index is an unmanaged index of U.S. government securities with one to ten years to maturity.
5
Pacific Advisors
Government Securities Fund continued
investors began to cautiously move back into equities and corporate bonds, demand for government securities remained relatively strong through the end of the second quarter.
Interest Rate Trends
During the first six months, Treasury rates were volatile in response to competing market forces. Broad economic weakness, aggressive government intervention, and increased investor demand put downward pressure on Treasury rates. Demand was particularly strong in the first quarter as investors fled the equity and fixed income markets for the safety of U.S. Treasuries. The desire to protect capital was so great that investors were willing to accept flat or negative rates on short-term Treasuries.
In mid-March, the tide began to turn when Fed Chairman Ben Bernanke characterized the economy as exhibiting "green shoots" of recovery. A number of factors subsequently pushed Treasury rates higher. Mounting data foreshadowing economic recovery; the threat of inflation; record-breaking Treasury auctions; and burgeoning federal deficits to fund stimulus initiatives put upward pressure on rates throughout the second quarter. Reflecting the diverging trends during the period, the rate on benchmark 10-year Treasury Note traded between a low of 2.12% in January and a high of 3.94% in June.
Fixed Income Strategy
We actively manage the portfolio with a conservative strategy designed to protect principal and provide current income. During the period, the Fund was primarily invested in intermediate-term government agencies. This strategy helped minimize the risk of depreciation in a rising interest rate environment. Additionally, intermediate-term bonds provided higher current income relative to short-term government securities.
In the first quarter, higher yielding bonds were limited due to the high demand for government securities. In order to maximize current income, the Fund primarily invested in continuously callable intermediate-term government agencies which offered higher coupon rates. Given the low interest rate environment, we anticipated that these bonds would be called back, providing the Fund with opportunities to purchase higher yielding bonds. As expected, many of these bonds were called during the period and proceeds were reinvested in intermediate-term government agencies with higher coupons.
As interest rates rose in second quarter, our strategy continued to emphasize preservation of capital to protect against market risk. As existing holdings were called away, we focused on purchasing government agencies with features to preserve principle. These purchases included bonds with coupon rates that gradually increase over the life of the bond. Furthermore, we purchased more government agencies with fixed call features. These bonds provided greater flexibility in managing the portfolio because, in comparison to continuously callable bonds, they are easier to sell in a rising interest rate environment. The Fund benefited from this strategy by preserving capital and enhancing income levels.
Equity Positioning
A relatively small portion of the portfolio is invested in high quality dividend paying common and preferred stocks to help provide a hedge against inflation and support total return. These investments provide additional current income and potential capital appreciation. During the period, the Fund maintained 4% to 5% of the portfolio in dividend paying common stocks and 4% to 5% in preferred stocks.
The severe market downturn in the first part of the year pushed equity valuations to extreme lows. We maintained the Fund' equity holdings as our internal research confirmed the underlying value and income potential of these well established companies. As anticipated, valuations for these holdings began to recover as the equity markets rebounded in the second quarter. In particular, the Fund benefited from a strong recovery in its preferred stock positions. For example, collectively, preferred stock in financial companies recovered 28% during the period in addition to providing strong dividend yield.
Despite the price recovery in the second quarter, we believe many of these holdings remain undervalued. The Fund's equity positions should see continued improvement as the economy recovers. We
6
believe the income and capital appreciation potential of these holdings will continue to contribute to the Fund's long-term total return objectives.
Fund Performance
As a conservative investment, the Fund seeks to preserve capital and provide current income. Risk management was paramount during the period given the volatile investment environment and trend toward rising interest rates. The Fund outperformed its benchmark during the period, which, unlike the Fund, is not actively managed to protect against risk. By actively managing the portfolio and concentrating holding in intermediate-term government agencies, we successfully managed risk while generating attractive income. Recovery in the Fund's preferred stock positions also contributed to the Fund's outperformance.
Looking Ahead
The significant stimulus initiatives by the government and the Fed have yielded an improving economic outlook. Recent data have confirmed a slowing in the pace of contraction while certain sectors of the economy are even demonstrating renewed strength. Likewise, the credit markets continue to improve in response to positive economic data and stabilization in the financial sector.
As economic recovery develops, investors will likely continue to gravitate from Treasuries toward other fixed income investments offering higher rates and greater appreciation potential. In response to this trend, rates on Treasuries and government agencies are expected to rise in order to remain competitive with other fixed income investments. Furthermore, concerns surrounding the burgeoning federal deficit and the strength of the U.S. dollar may also push rates higher.
At the same time, competing pressures may create continued interest rate volatility. While recovery is on the horizon, significant economic challenges remain including higher unemployment; continued weakness in the housing sector; moderate consumer spending; and higher mortgage and credit card default rates. For conservative investors, Treasuries may continue to provide attractive options. This popularity, if sufficiently widespread, may limit the upward pressure on interest rates. As the largest foreign holder of U.S. Treasuries, China's investment decisions may also influence the direction of Treasury rates.
In this environment, we will continue to implement a strategy focused on managing risk and protecting principal. The Fund will remain concentrated in short and intermediate-term government agencies many of which include call features. While we do not anticipate a significant change in the Fund's equity allocation, we will continue to utilize high quality dividend paying common and preferred stocks to increase income and capital appreciation potential. We will continue to actively manage the Fund's fixed income holdings in accordance with the market conditions to capture the most favorable return potential with the least vulnerability to the prevailing market risks.
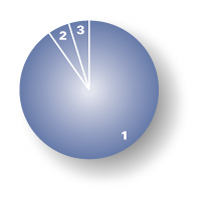
Portfolio Holdings as of 06/30/09 (Based on Total Investments)
| 1. | U.S. Government Agencies | 90.36 | % | ||||||||
| 2. | Preferred Stock | 5.10 | % | ||||||||
| 3. | Equities | 4.54 | % | ||||||||
7
Pacific Advisors
Government Securities Fund continued
Expense Examples
As a shareholder of the Fund you incur two types of costs: (1) transaction costs, including sales charges (loads) on purchase payments, reinvested dividends, or other distributions; redemption fees; and exchange fees; and (2) ongoing costs, including management fees; distribution (12b-1) fees; and other Fund expenses. This Example is intended to help you understand your ongoing costs (in dollars) of investing in the Fund and to compare these costs with the ongoing costs of investing in other mutual funds.
The Example is based on an investment of $1,000 invested at the beginning of the period and held for the entire period from January 1, 2009 through June 30, 2009.
Actual Expenses
The first line of the table below provides information about actual account values and actual expenses. You may use the information in this line, together with the amount you invested, to estimate the expenses that you paid over the period. Simply divide your account value by $1,000 (for example, an $8,600 account value divided by $1,000 = 8.6), then multiply the result by the number in the first line under the heading entitled "Expenses Paid During the Period" to estimate the expenses you paid on your account during the period.
The following transaction costs are not included in the expenses shown in the table and, if applicable, would increase the expenses that you paid over the period: (1) a front-end sales charge (load) of 4.75% on Class A shares; (2) a 2% redemption fee if you sell or exchange shares within 60 days of purchase, with certain exceptions. The redemption fee does not apply to: (a) redemptions under an automatic withdrawal program or periodic asset reallocation plan, required minimum distributions (RMD), employer mandated distributions from a qualified plan, or redemptions under a qualified domestic relations order (QDRO); (b) redemptions to pay for expenses related to terminal illness, extended hospital or nursing home care, or other serious medical conditions, including death; (c) redemptions of shares acquired through dividend or capital gains reinvestments, and (d) redemptions initiated by the Fund; and (3) a $10 service fee on each exchange aft er the first five exchanges in each calendar year.
The following ongoing costs are not included in the expenses shown in the table and, if applicable, would increase the expenses that you paid over the period: (1) a $12 low balance fee on accounts with balances of less than $250 as of September 30th of each calendar year and no investment activity (excluding reinvestment of dividends and/or capital gains) during the prior calendar year or the first nine months of the current calendar year. This fee does not apply to IRAs, qualified plan accounts, or Coverdell Education Savings Accounts; (2) a $15 annual custodial fee on IRAs, SEPs, SIMPLE IRAs, and Coverdell Education Savings Accounts; and (3) a $20 annual custodial fee on 403(b) accounts.
Hypothetical Example for Comparison Purposes
The second line of the table below provides information about hypothetical account values and hypothetical expenses based on the Fund's actual expense ratio and an assumed rate of return of 5% per year before expenses, which in not the Fund's actual return. The hypothetical account values and expenses may not be used to estimate the actual ending account balance or expenses you paid for the period. You may use this information to compare the ongoing costs of investing in the Fund and other funds. To do so, compare this 5% hypothetical example with the 5% hypothetical examples that appear in the shareholder reports of the other funds.
The following transaction costs are not included in the expenses shown in the table and, if applicable, would increase the expenses that you paid over the period: (1) a front-end sales charge (load) of 4.75% on Class A shares; (2) a 2% redemption fee if you sell or exchange shares within 60 days of purchase, with certain exceptions. The redemption fee does not apply to: (a) redemptions under an automatic withdrawal program or periodic asset reallocation plan, required minimum distributions (RMD), employer mandated distributions from a qualified plan, or redemptions under a qualified domestic relations order (QDRO); (b) redemptions to pay for expenses related to terminal illness, extended hospital or nursing home care, or other serious medical conditions, including death; (c) redemptions of shares acquired through dividend or capital gains reinvestments, and (d) redemptions initiated by the Fund; and (3) a $10 service fee on each exchange aft er the first five exchanges in each calendar year.
The following ongoing costs are not included in the expenses shown in the table and, if applicable, would increase the expenses that you paid over the period: (1) a $12 low balance fee on accounts with balances of less than $250 as of September 30th of each calendar year and no investment activity (excluding reinvestment of dividends and/or capital gains) during the prior calendar year or the first nine months of the current calendar year. This fee does not apply to IRAs, qualified plan accounts, or Coverdell Education Savings Accounts; (2) a $15 annual custodial fee on IRAs, SEPs, SIMPLE IRAs, and Coverdell Education Savings Accounts; and (3) a $20 annual custodial fee on 403(b) accounts.
Please note that the expenses shown in the table are meant to highlight your ongoing costs only and do not reflect any transactional costs, such as sales charges (loads), redemption fees, or exchange fees. Therefore, the second line of the table is useful in comparing ongoing costs only, and will not help you determine the relative total costs of owning different funds. In addition, if these transactional costs were included, your costs would have been higher.
| Beginning Account Value 01/01/09 | Ending Account Value 06/30/09 | Expense Paid During Period 01/01/09 – 06/30/09 | |||||||||||||
| Government Securities Fund Class A | |||||||||||||||
| Actual | $ | 1,000.00 | $ | 1,003.30 | $ | 9.83 | |||||||||
| Hypothetical (5% return before expense) | $ | 1,000.00 | $ | 1,024.79 | $ | 9.94 | |||||||||
| Government Securities Fund Class C | |||||||||||||||
| Actual | $ | 1,000.00 | $ | 999.70 | $ | 13.54 | |||||||||
| Hypothetical (5% return before expense) | $ | 1,000.00 | $ | 1,024.79 | $ | 13.71 | |||||||||
3 Expenses are equal to the Fund's annualized expense ratio of 1.98% for Class A shares and 2.73% for Class C shares, multiplied by the average account value over the period, multiplied by 181/365 days to reflect the one-half year period.
8
Pacific Advisors
Income and Equity Fund
Seeks to provide current income and, secondarily, long-term capital appreciation. Invests primarily in investment grade fixed income securities and dividend paying stocks.
| TOTAL RETURNS | EXPENSE RATIOS | ||||||||||||||||||
| For the six months ended June 30, 2009 | For the fiscal year ended December 31, 2008 | ||||||||||||||||||
| Expense Ratio | Net Expense Ratio | ||||||||||||||||||
| Class A | 4.94 | % | Class A | 2.80 | % | 2.05 | % | ||||||||||||
| Class C | 4.58 | % | Class C | 3.56 | % | 2.81 | % | ||||||||||||
| Barclays Capital U.S. Int Corp Bond Index1 | 9.04 | % | |||||||||||||||||
| S&P 500 Index2 | 3.16 | % | |||||||||||||||||
Performance quoted is past performance which does not guarantee future results. Current performance may be higher or lower than the performance quoted. Call (800) 989-6693 for performance current to the most recent month-end. The investment return and principal value of an investment will fluctuate so that an investor's shares, when redeemed, may be worth more or less than their original cost. Returns represent the change in value over the stated period assuming reinvestment of dividends and capital gains at net asset value. Returns do not take into account the maximum 4.75% sales charge on Class A shares or the 1% Contingent Deferred Sales Charge (CDSC) for Class C shares sold within one year of purchase. Returns would be lower if the applicable sales charge and CDSC were included. Returns do not take into account individual taxes which may reduce actua l returns when shares are sold.
The Fund's investment adviser is waiving a portion of its management fees pursuant to an Expense Limitation Agreement. The waiver may be discontinued at any time with ninety days written notice in consultation with the Fund's Board of Directors, but is expected to continue at current levels. Please see the Fund's most recent Annual Report for details. Performance shown reflects the waiver, without which the results would have been lower.
Discussion with Portfolio Manager
Thomas H. Hanson
Market Overview
The markets began 2009 mired in the crippling credit crisis. While short-term U.S. Treasuries and government agencies enjoyed unprecedented popularity, the corporate bond market was effectively closed. Lack of corporate finance opportunities impacted both businesses and consumers and placed enormous stress on the global economy. Investor sentiment swayed from one extreme to the other, causing tremendous volatility in both the fixed income and equity markets. In response, a series of forceful actions by the Treasury, Federal Reserve, and FDIC breathed life back into the credit markets and ignited a strong market rebound at the end of the first quarter.
Investor confidence improved in response to better-than-expected first quarter earnings and economic data which indicated a slowing in the pace of contraction. The market recovery extended through the second quarter benefiting all asset classes, including equities, fixed income, and commodities. Equities in particular staged an impressive comeback and seemed poised to extend their run.
1 The Barclays Capital U.S. Intermediate Corporate Bond Index is an unmanaged index of publicly issued investment grade U.S. corporate bonds with one to ten years to maturity.
2 The Standard & Poor's 500 Index is an unmanaged, market capitalization weighted measure of 500 widely held common stocks listed on the New York Stock Exchange, American Stock Exchange and The NASDAQ Stock Market. Index returns assume the reinvestment of dividends, but, unlike the Fund's returns, do not reflect the effects of management fees or expenses.
9
Pacific Advisors
Income and Equity Fund continued
Corporate Bond Market
At the turn of the year, opportunities in the corporate bond market were in especially short supply. Limited access to debt financing and higher financing costs resulted in significantly fewer corporate issuances. Investment opportunities were further limited when rating agencies issued mass downgrades of corporate debt in a belated reaction to their role in the credit crisis and the weak economy. The corporate bond market was also challenged as investors fled to the safety of U.S. Treasuries and government agencies.
Volatility played a major role in portfolio management during the first half of 2009. Corporate bond prices fluctuated in response to fragile investor confidence and deteriorating economic conditions. However, in the midst of this challenging environment, unique opportunities arose. The ratings downgrades, coupled with a lack of investor demand, drove yields among investment grade bonds to abnormally high levels. In comparison to rates for Treasuries, corporate bonds were trading at attractive levels. We believed that the market was temporarily mispricing the risk of these issues. As a result, these bonds presented valuable investment opportunities.
In mid-February, credit conditions began to improve in response to various government initiatives. As investors gained confidence, they returned to the corporate bond market; as a result, yields on investment grade corporate debt began to fall. A wave of corporate refinancing activity ensued as companies took advantage of renewed investor demand and historically low interest rates. The impressive yields found earlier in the year were no longer available as prices for corporate bonds rose in response to heightened demand. Stabilization in the credit markets allowed portfolio managers to refocus on more traditional factors in fixed income analysis: interest rates and inflation.
Equity Market
The selloff in the equity market continued well into the first quarter of 2009. Stocks languished as the economic outlook remained clouded and investors questioned the administration's ability to handle the worst economic crisis in a generation. Bearish sentiment peaked in mid-March, as the S&P 500 Index fell to a 13-year low. Markets began to turn following the government's various initiatives aimed at recapitalizing banks and supporting critical credit markets.
The strong upward move in equities continued into the second quarter following better-than-expected first quarter earnings reports. A growing list of economic reports suggesting the recession was beginning to ease further contributed to the bullish mood. The strong momentum pushed equities into positive territory for the year. By the end of the second quarter, investors turned their focus to earnings results for clarity on the direction of the economy and the markets. Reports that many companies successfully weathered the economic decline with better-than-expected earnings confirmed to many investors that a sustainable market recovery is underway.
Fund Performance
The Fund performed well in the first half of the year given the extreme volatility in the fixed income and equity markets. While the Fund outperformed the overall market as measured by the S&P 500, performance was limited as a result of the Fund's conservative investment strategy. In particular, performance was impacted by the Fund's allocation to shorter-term bonds to protect principal as well as the continued impact of the credit market disruption on portfolio holdings in the Financials sector. We believe that the valuations of these holdings will continue to improve as the economic recovery develops.
Fund Strategy
The Fund seeks to provide current income and capital appreciation while maintaining a lower risk profile. Fixed income securities (corporate bonds and preferred stocks) typically make up at least 65% of the portfolio and provide a stable income base. The remainder of the portfolio is invested in high quality dividend paying stocks which contribute to current income and offer long-term capital appreciation potential.
10
The Fund's allocation to fixed income securities, at approximately 75%, was essentially unchanged during the first half of 2009. The mix of securities, however, changed when most of the Fund's U.S. government agency bonds were called or matured. At the beginning of the year, these agency bonds, which paid relatively high interest rates, represented almost 10% of the portfolio. With the proceeds, we expanded the Fund's portfolio of investment grade corporate bonds with new holdings in the Consumer Discretionary, Energy, Materials, Industrials and Technology sectors.
Preferred stocks represented approximately 7% of the portfolio while equity holdings varied during the period between 21% and 25%. The relatively modest allocation to equities was a direct reflection of the market upheaval. During periods of volatility and low valuations, the Fund will favor fixed income investing to mitigate the impact of price fluctuations.
Fixed Income Strategy
The first six months of the year presented two dramatically different investment environments. Suitable corporate bond investments were severely limited in the first part of the year. Corporations looking to issue debt faced higher financing costs in the wake of widespread ratings downgrades. Demand was also light as nervous investors avoided risk in favor of U.S. Treasuries. Nevertheless, we took advantage of select opportunities to purchase bonds of quality issuers such as Alcoa, Xerox and Staples. Reflecting the difficult environment, these investment grade bonds offered yields in excess of 7%, compared to 10-year Treasury rates of less than 3%.
As the credit markets stabilized in the second quarter and investor appetite for risk returned, many companies responded with debt offerings. Interest rates fluctuated within a fairly narrow range as investors weighed the pros and cons of an improving global economic outlook. The massive fiscal deficits taken on to combat the downturn also raised concerns about the threat of inflation and higher interest rates.
To minimize the potential impact of rising interest rates, the Fund focused new purchases in shorter-term bonds, primarily with maturities of two to five years. At the same time, we remain mindful that the pace of economic recovery is uncertain. Accordingly, we continued to hold the Fund's existing longer-term bonds to maintain current income.
Equity Strategy
We continued to maintain a focused but diversified portfolio with an emphasis on stocks that exhibit low volatility relative to the broader market. The Fund maintained a reduced equity exposure during the period to limit the impact of the equity downturn on the portfolio. As market conditions improved in the second quarter, we sold several positions in defensive stocks, including health care companies GlaxoSmithKline and Pfizer. The Fund's energy holdings, led by XTO Energy and Ultra Petroleum, performed well during the period.
The Fund continued to hold select securities despite lagging performance in the first quarter. For example, we maintained the Fund's position in Frontier Communications. The company owns and operates regional telecommunications lines and recently purchased assets from Verizon. Despite its recent difficulty, we believe that Frontier's experienced management team; strong dividend; and strong cash flows will positively impact performance.
Looking Ahead
Interest rates are likely to remain volatile as the economy recovers. Rates will be impacted by competing factors, such as the record supply of U.S. Treasuries to finance the stimulus programs and support the credit markets; the strong demand for government bonds; the emerging economic recovery; and the potential onset of inflation. As global economic conditions improve, however, interest rates are likely to begin a longer-term upward trend. Economic "green shoots" suggest the pace of global recession is easing. Although, given the severity of the recession and credit crisis, economic improvement is expected to progress at a slower rate than in recent recoveries.
11
Pacific Advisors
Income and Equity Fund continued
In this investment environment, the Fund's strategy will focus on actively managing the portfolio to minimize interest rate risk. We will seek to reduce the effect of higher rates by investing in shorter-term corporate bonds. These investment grade bonds will help minimize the impact of price volatility while limiting losses associated with changes in interest rates.
As the economy recovers, equities are poised to deliver favorable returns. Our equity strategy seeks to supplement the Fund's larger bond allocation by providing current income with the potential for capital appreciation. As fixed income securities mature, are called, or sold, we anticipate increasing the Fund's equity investments to approximately 30%. We expect to invest in sectors that should benefit from the developing recovery such as Technology, Energy, Materials and Consumer Discretionary. We will maintain our disciplined focus of selecting stocks with stable dividends and below average market volatility.
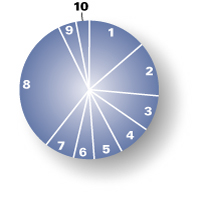
Portfolio Holdings as of 06/30/09 (Based on Total Investments)
| 1. | Corporate Bonds | 64.58 | % | ||||||||
| Equities | 21.64 | % | |||||||||
| 2. | Energy | 5.04 | % | ||||||||
| 3. | Health Care | 3.13 | % | ||||||||
| 4. | Telecommunication Services | 2.74 | % | ||||||||
| 5. | Industrials | 2.48 | % | ||||||||
| 6. | Utilities | 2.02 | % | ||||||||
| 7. | Consumer Staples | 1.99 | % | ||||||||
| 8. | Other Equities | 4.24 | % | ||||||||
| 9. | Preferred Stock | 7.35 | % | ||||||||
| 10. | Cash and Cash Equivalents | 4.95 | % | ||||||||
| 11. | U.S. Government Agencies | 1.48 | % | ||||||||

12
Expense Examples
As a shareholder of the Fund you incur two types of costs: (1) transaction costs, including sales charges (loads) on purchase payments, reinvested dividends, or other distributions; redemption fees; and exchange fees; and (2) ongoing costs, including management fees; distribution (12b-1) fees; and other Fund expenses. This Example is intended to help you understand your ongoing costs (in dollars) of investing in the Fund and to compare these costs with the ongoing costs of investing in other mutual funds.
The Example is based on an investment of $1,000 invested at the beginning of the period and held for the entire period from January 1, 2009 through June 30, 2009.
Actual Expenses
The first line of the table below provides information about actual account values and actual expenses. You may use the information in this line, together with the amount you invested, to estimate the expenses that you paid over the period. Simply divide your account value by $1,000 (for example, an $8,600 account value divided by $1,000 = 8.6), then multiply the result by the number in the first line under the heading entitled "Expenses Paid During the Period" to estimate the expenses you paid on your account during the period.
The following transaction costs are not included in the expenses shown in the table and, if applicable, would increase the expenses that you paid over the period: (1) a front-end sales charge (load) of 4.75% on Class A shares; (2) a 2% redemption fee if you sell or exchange shares within 60 days of purchase, with certain exceptions. The redemption fee does not apply to: (a) redemptions under an automatic withdrawal program or periodic asset reallocation plan, required minimum distributions (RMD), employer mandated distributions from a qualified plan, or redemptions under a qualified domestic relations order (QDRO); (b) redemptions to pay for expenses related to terminal illness, extended hospital or nursing home care, or other serious medical conditions, including death; (c) redemptions of shares acquired through dividend or capital gains reinvestments, and (d) redemptions initiated by the Fund; and (3) a $10 service fee on each exchange aft er the first five exchanges in each calendar year.
The following ongoing costs are not included in the expenses shown in the table and, if applicable, would increase the expenses that you paid over the period: (1) a $12 low balance fee on accounts with balances of less than $250 as of September 30th of each calendar year and no investment activity (excluding reinvestment of dividends and/or capital gains) during the prior calendar year or the first nine months of the current calendar year. This fee does not apply to IRAs, qualified plan accounts, or Coverdell Education Savings Accounts; (2) a $15 annual custodial fee on IRAs, SEPs, SIMPLE IRAs, and Coverdell Education Savings Accounts; and (3) a $20 annual custodial fee on 403(b) accounts.
Hypothetical Example for Comparison Purposes
The second line of the table below provides information about hypothetical account values and hypothetical expenses based on the Fund's actual expense ratio and an assumed rate of return of 5% per year before expenses, which in not the Fund's actual return. The hypothetical account values and expenses may not be used to estimate the actual ending account balance or expenses you paid for the period. You may use this information to compare the ongoing costs of investing in the Fund and other funds. To do so, compare this 5% hypothetical example with the 5% hypothetical examples that appear in the shareholder reports of the other funds.
The following transaction costs are not included in the expenses shown in the table and, if applicable, would increase the expenses that you paid over the period: (1) a front-end sales charge (load) of 4.75% on Class A shares; (2) a 2% redemption fee if you sell or exchange shares within 60 days of purchase, with certain exceptions. The redemption fee does not apply to: (a) redemptions under an automatic withdrawal program or periodic asset reallocation plan, required minimum distributions (RMD), employer mandated distributions from a qualified plan, or redemptions under a qualified domestic relations order (QDRO); (b) redemptions to pay for expenses related to terminal illness, extended hospital or nursing home care, or other serious medical conditions, including death; (c) redemptions of shares acquired through dividend or capital gains reinvestments, and (d) redemptions initiated by the Fund; and (3) a $10 service fee on each exchange aft er the first five exchanges in each calendar year.
The following ongoing costs are not included in the expenses shown in the table and, if applicable, would increase the expenses that you paid over the period: (1) a $12 low balance fee on accounts with balances of less than $250 as of September 30th of each calendar year and no investment activity (excluding reinvestment of dividends and/or capital gains) during the prior calendar year or the first nine months of the current calendar year. This fee does not apply to IRAs, qualified plan accounts, or Coverdell Education Savings Accounts; (2) a $15 annual custodial fee on IRAs, SEPs, SIMPLE IRAs, and Coverdell Education Savings Accounts; and (3) a $20 annual custodial fee on 403(b) accounts.
Please note that the expenses shown in the table are meant to highlight your ongoing costs only and do not reflect any transactional costs, such as sales charges (loads), redemption fees, or exchange fees. Therefore, the second line of the table is useful in comparing ongoing costs only, and will not help you determine the relative total costs of owning different funds. In addition, if these transactional costs were included, your costs would have been higher.
| Beginning Account Value 01/01/09 | Ending Account Value 06/30/09 | Expense Paid During Period 01/01/09 – 06/30/09 | |||||||||||||
| Income & Equity Fund Class A | |||||||||||||||
| Actual | $ | 1,000.00 | $ | 1,049.40 | $ | 12.45 | |||||||||
| Hypothetical (5% return before expense) | $ | 1,000.00 | $ | 1,024.79 | $ | 12.30 | |||||||||
| Income & Equity Fund Class C | |||||||||||||||
| Actual | $ | 1,000.00 | $ | 1,045.80 | $ | 16.23 | |||||||||
| Hypothetical (5% return before expense) | $ | 1,000.00 | $ | 1,024.79 | $ | 16.07 | |||||||||
4 Expenses are equal to the Fund's annualized expense ratio of 2.45% for Class A shares and 3.20% for Class C shares, multiplied by the average account value over the period, multiplied by 181/365 days to reflect the one-half year period.
13
Pacific Advisors
Balanced Fund
Seeks to achieve long-term capital appreciation and income consistent with reduced risk. Invests primarily in large and medium cap common stocks with at least 25% of its assets invested in fixed income securities and preferred stocks.
| TOTAL RETURNS | EXPENSE RATIOS | ||||||||||||||
| For the six months ended June 30, 2009 | For the fiscal year ended December 31, 2008 | ||||||||||||||
| Class A | 4.11 | % | Class A | 2.31 | % | ||||||||||
| Class C | 3.68 | % | Class C | 3.09 | % | ||||||||||
| S&P 500 Index1 | 3.16 | % | |||||||||||||
| Barclays Capital U.S. Int Corp Bond Index2 | 9.04 | % | |||||||||||||
Performance quoted is past performance which does not guarantee future results. Current performance may be higher or lower than the performance quoted. Call (800) 989-6693 for performance current to the most recent month-end. The investment return and principal value of an investment will fluctuate so that an investor's shares, when redeemed, may be worth more or less than their original cost. Returns represent the change in value over the stated period assuming reinvestment of dividends and capital gains at net asset value. Returns do not take into account the maximum 5.75% sales charge on Class A shares or the 1% Contingent Deferred Sales Charge (CDSC) for Class C shares sold within one year of purchase. Returns would be lower if the applicable sales charge and CDSC were included. Returns do not take into account individual taxes which may reduce actua l returns when shares are sold.
Discussion with Portfolio Managers
Thomas H. Hanson
George A. Henning
Samuel C. Coquillard
Market Overview
The equity and fixed income markets started 2009 mired in uncertainty. Fear surged on questions surrounding the extent of the global economic contraction, U.S. economic stimulus plans, and the stumbling credit markets. As investors sought safety in short-term U.S. Treasuries, stock valuations fell to levels not seen since 1996.
As signs of economic recovery emerged late in the first quarter, investor sentiment transitioned from extreme pessimism to cautious optimism. Government stimulus programs began to provide some relief to the financial, consumer and housing sectors. Capital injections by the Federal Reserve and foreign central banks improved liquidity in the credit markets. Additionally, first quarter earnings revealed that many companies were weathering the recession better than expected. An uptick in merger and acquisition activity and a rise in corporate bond offerings provided further evidence that corporate America was beginning to regain its footing. As investor confidence improved, capital moved back into the markets.
Equity Market
Stock prices tumbled in the first quarter on excessive fear as investors sold without regard for the actual strength of individual companies. While market volatility presented a major challenge, this environment also provided unique opportunities to invest in good companies at unprecedentedly low
1 The Standard & Poor's 500 Index is an unmanaged, market capitalization weighted measure of 500 widely held common stocks listed on the New York Stock Exchange, American Stock Exchange and The NASDAQ Stock Market. Index returns assume the reinvestment of dividends, but, unlike the Fund's returns, do not reflect the effects of management fees or expenses.
2 The Barclays Capital U.S. Intermediate Corporate Bond Index is an unmanaged index of publicly issued investment grade U.S. corporate bonds with one to ten years to maturity.
14
prices. During the quarter, the Fed used every tool at its disposal to restore confidence in the financial sector, stimulate the languishing economy, and expand liquidity in the credit markets. Additionally, the U.S. Treasury implemented various stimulus initiatives and the administration provided greater detail on its economic recovery plans. These actions helped ignite a market rally late in the first quarter.
As concrete evidence of economic improvement mounted, investors began to revisit their risk assumptions. Domestically, most economic data pointed to a slowing rate of contraction. Internationally, China led the way by pouring massive amounts of capital into its economy to stimulate growth. Projects aimed at infrastructure building, industrial production and manufacturing put China on course for economic growth of 7% to 8% this year. Following China's lead, other countries injected more capital into their economies which improved the outlook for global economic recovery.
First quarter earnings further buoyed investor sentiment and strengthened the market recovery. Many companies demonstrated that they were effectively weathering the slowdown. Furthermore, stronger firms used the downturn to strategically position for future growth by streamlining operations, cutting costs, and expanding market share. Stock prices experienced a significant rebound in the second quarter as evidenced by the S&P 500 Index which recovered nearly 42% from its March low by June 30th.
Corporate Bond Market
The corporate bond market remained challenging in the first half of 2009. Fallout from the credit crisis continued to curtail new corporate bond issues. Additionally, bond investors found few opportunities to buy or sell as bonds in the secondary market were in short supply. Investors primarily chose safety over income. Short-term U.S. Treasuries were in high demand even though they offered zero or sometimes slightly negative returns.
In response to actions by the Fed and other government agencies, liquidity started to improve late in the first quarter. New corporate bond offerings subsequently increased during the second quarter. Additionally, firms took advantage of lower interest rates to refinance higher coupon, longer-term debt. Investors gradually began to reassess their appetite for risk as they gained confidence in the sustainability of the recovery. As interest rates ticked upward, capital began to move out of short-term Treasuries into other fixed income investments.
Fund Performance
The Fund outperformed the S&P 500 through the first half of the year. By maintaining a disciplined investment approach through the market downturn, the Fund was well positioned to benefit from the ensuing recovery. Performance was primarily supported by appreciation in the Fund's Energy and Basic Materials equity holdings. Higher yields on investment grade corporate paper and appreciation in the Fund's preferred stock holdings also supported total return. The Fund achieved this outperformance while maintaining lower risk and volatility than the S&P 500 as measured by the Fund's beta3 of 0.79 as of June 30th.
Fund Strategy
The Fund's equity and fixed income holdings are actively managed to seek capital appreciation while managing risk. In 2009, we maintained approximately 61% of the portfolio in equities which continued to offer the best opportunities for long-term growth. As corporate bonds matured, proceeds were reallocated into select equities. Equity and fixed income holdings remained diversified across sectors and industries to further manage risk.
3 "Beta" measures volatility relative to the stock market or an alternative benchmark. A beta less than 1.0 indicates lower volatility than the market or the benchmark; and a beta greater than 1.0 indicates greater volatility than the market or the benchmark.
15
Pacific Advisors
Balanced Fund continued
Equity Strategy
The Fund is designed to serve as a core holding and therefore uses a more conservative equity strategy. The Fund seeks to provide long-term growth while limiting risk and volatility. To this end, equities remained concentrated in dividend paying stocks from well established, larger cap companies.
The Fund continued to invest in fundamentally strong companies from a diverse mix of sectors and industries. Greater weight was given to holdings in stronger performing sectors such as Energy, Basic Materials, Information Technology and Health Care. Renewed demand for energy and other natural resources pushed energy and commodity prices higher during period. The Fund's Energy holdings performed especially well in the first half of the year. In particular, companies in energy related areas such as equipment and refining experienced good growth. This included Fund holdings Cameron International, which manufactures offshore oil and natural gas equipment; and Suncor Energy, a multinational oil producer and refiner. Cameron benefited from increased demand for offshore drilling in Brazil while Suncor benefited from the rise in oil prices during the second quarter.
Holdings in the Basic Materials sector also supported the Fund's investment objectives. This included, Reliance Steel & Aluminum, which is the largest distributor of metal products in the U.S. Reliance experienced price appreciation as global and domestic infrastructure projects increased demand for its products.
Fixed Income Strategy
The Fund's fixed income strategy seeks to achieve total return while mitigating risk. Given the risk for higher interest rates in 2009, to the Fund remained invested in short to intermediate-term investment grade corporate bonds. New purchases were concentrated in bonds with two to four-year maturities to protect against depreciation. Additionally, investment grade corporate bonds offered better yields than U.S. Treasuries or government agencies. This provided additional income to the Fund without significantly increasing risk.
The Fund also benefited from a recovery in its financial holdings. Specifically, preferred stock of financial firms saw marked price appreciation. Additionally, General Electric Capital bonds rebounded significantly as the market recovery took hold in the second quarter. At the same time, we further diversified the portfolio by investing new monies in bonds from well known Consumer Discretionary firms such as Staples and Ho me Depot.
Looking Ahead
While challenges to recovery remain, recent reports suggest that the worst of the recession may be over. Indeed, select sectors are showing signs of renewed growth. In particular, stimulus initiatives in the U.S., China and other countries should support demand in the Energy, Basic Materials and Industrials sectors. Investor confidence will continue to be a determining factor of market momentum. While the market will remain more volatile, continued economic improvement should create additional opportunities in the equity and fixed income markets.
We expect to modestly increase the Fund's equity allocation to approximately 65% to seek additional opportunities for capital appreciation. There will be opportunities for stronger, well positioned companies to grow their businesses, even in a slow-growth economy. Near-term, the Fund's equity portfolio will remain positioned to take advantage of sectors and companies benefiting from economic recovery.
Fixed income holdings will be managed to protect capital in anticipation of rising interest rates. We do not anticipate making any significant changes to the Fund's fixed income portfolio in the next six months. We will continue to manage the portfolio to maximize total return while limiting risk. Accordingly, the portfolio will remain primarily invested in short to intermediate-term, investment grade corporate bonds to manage volatility.
16
Portfolio Holdings as of 06/30/09 (Based on Total Investments)
| Equities | 60.73 | % | |||||||||
| 1. | Energy | 13.78 | % | ||||||||
| 2. | Industrials | 12.82 | % | ||||||||
| 3. | Consumer Staples | 8.18 | % | ||||||||
| 4. | Financials | 7.54 | % | ||||||||
| 5. | Health Care | 6.58 | % | ||||||||
| 6. | Information Technology | 4.92 | % | ||||||||
| 7. | Other Equities | 6.91 | % | ||||||||
| 8. | Corporate Bonds | 32.08 | % | ||||||||
| 9. | Preferred Stock | 4.40 | % | ||||||||
| 10. | Cash and Cash Equivalents | 2.79 | % | ||||||||
17
Pacific Advisors
Balanced Fund continued
Expense Examples
As a shareholder of the Fund you incur two types of costs: (1) transaction costs, including sales charges (loads) on purchase payments, reinvested dividends, or other distributions; redemption fees; and exchange fees; and (2) ongoing costs, including management fees; distribution (12b-1) fees; and other Fund expenses. This Example is intended to help you understand your ongoing costs (in dollars) of investing in the Fund and to compare these costs with the ongoing costs of investing in other mutual funds.
The Example is based on an investment of $1,000 invested at the beginning of the period and held for the entire period from January 1, 2009 through June 30, 2009.
Actual Expenses
The first line of the table below provides information about actual account values and actual expenses. You may use the information in this line, together with the amount you invested, to estimate the expenses that you paid over the period. Simply divide your account value by $1,000 (for example, an $8,600 account value divided by $1,000 = 8.6), then multiply the result by the number in the first line under the heading entitled "Expenses Paid During the Period" to estimate the expenses you paid on your account during the period.
The following transaction costs are not included in the expenses shown in the table and, if applicable, would increase the expenses that you paid over the period: (1) a front-end sales charge (load) of 5.75% on Class A shares; (2) a 2% redemption fee if you sell or exchange shares within six months of purchase, with certain exceptions. The redemption fee does not apply to: (a) redemptions under an automatic withdrawal program or periodic asset reallocation plan, required minimum distributions (RMD), employer mandated distributions from a qualified plan, or redemptions under a qualified domestic relations order (QDRO); (b) redemptions to pay for expenses related to terminal illness, extended hospital or nursing home care, or other serious medical conditions, including death; (c) redemptions of shares acquired through dividend or capital gains reinvestments, and (d) redemptions initiated by the Fund; and (3) a $10 service fee on each exchange after the first five exchanges in each calendar year.
The following ongoing costs are not included in the expenses shown in the table and, if applicable, would increase the expenses that you paid over the period: (1) a $12 low balance fee on accounts with balances of less than $250 as of September 30th of each calendar year and no investment activity (excluding reinvestment of dividends and/or capital gains) during the prior calendar year or the first nine months of the current calendar year. This fee does not apply to IRAs, qualified plan accounts, or Coverdell Education Savings Accounts; (2) a $15 annual custodial fee on IRAs, SEPs, SIMPLE IRAs, and Coverdell Education Savings Accounts; and (3) a $20 annual custodial fee on 403(b) accounts.
Hypothetical Example for Comparison Purposes
The second line of the table below provides information about hypothetical account values and hypothetical expenses based on the Fund's actual expense ratio and an assumed rate of return of 5% per year before expenses, which in not the Fund's actual return. The hypothetical account values and expenses may not be used to estimate the actual ending account balance or expenses you paid for the period. You may use this information to compare the ongoing costs of investing in the Fund and other funds. To do so, compare this 5% hypothetical example with the 5% hypothetical examples that appear in the shareholder reports of the other funds.
The following transaction costs are not included in the expenses shown in the table and, if applicable, would increase the expenses that you paid over the period: (1) a front-end sales charge (load) of 5.75% on Class A shares; (2) a 2% redemption fee if you sell or exchange shares within six months of purchase, with certain exceptions. The redemption fee does not apply to: (a) redemptions under an automatic withdrawal program or periodic asset reallocation plan, required minimum distributions (RMD), employer mandated distributions from a qualified plan, or redemptions under a qualified domestic relations order (QDRO); (b) redemptions to pay for expenses related to terminal illness, extended hospital or nursing home care, or other serious medical conditions, including death; (c) redemptions of shares acquired through dividend or capital gains reinvestments, and (d) redemptions initiated by the Fund; and (3) a $10 service fee on each exchange after the first five exchanges in each calendar year.
The following ongoing costs are not included in the expenses shown in the table and, if applicable, would increase the expenses that you paid over the period: (1) a $12 low balance fee on accounts with balances of less than $250 as of September 30th of each calendar year and no investment activity (excluding reinvestment of dividends and/or capital gains) during the prior calendar year or the first nine months of the current calendar year. This fee does not apply to IRAs, qualified plan accounts, or Coverdell Education Savings Accounts; (2) a $15 annual custodial fee on IRAs, SEPs, SIMPLE IRAs, and Coverdell Education Savings Accounts; and (3) a $20 annual custodial fee on 403(b) accounts.
Please note that the expenses shown in the table are meant to highlight your ongoing costs only and do not reflect any transactional costs, such as sales charges (loads), redemption fees, or exchange fees. Therefore, the second line of the table is useful in comparing ongoing costs only, and will not help you determine the relative total costs of owning different funds. In addition, if these transactional costs were included, your costs would have been higher.
| Beginning Account Value 01/01/09 | Ending Account Value 06/30/09 | Expense Paid During Period 01/01/09 – 06/30/09 | |||||||||||||
| Balanced Fund Class A | |||||||||||||||
| Actual | $ | 1,000.00 | $ | 1,041.10 | $ | 13.26 | |||||||||
| Hypothetical (5% return before expense) | $ | 1,000.00 | $ | 1,024.79 | $ | 13.15 | |||||||||
| Balanced Fund Class C | |||||||||||||||
| Actual | $ | 1,000.00 | $ | 1,036.80 | $ | 17.02 | |||||||||
| Hypothetical (5% return before expense) | $ | 1,000.00 | $ | 1,024.79 | $ | 16.92 | |||||||||
4 Expenses are equal to the Fund's annualized expense ratio of 2.62% for Class A shares and 3.37% for Class C shares, multiplied by the average account value over the period, multiplied by 181/365 days to reflect the one-half year period.
18
Pacific Advisors
Growth Fund
Seeks to achieve long-term capital appreciation. Invests primarily in medium to large capitalization companies whose stocks are a part of the S&P 500 Index1 or the NASDAQ 100 Index2.
| TOTAL RETURNS | EXPENSE RATIOS | ||||||||||||||||||
| For the six months ended June 30, 2009 | For the fiscal year ended December 31, 2008 | ||||||||||||||||||
| Expense Ratio | Net Expense Ratio | ||||||||||||||||||
| Class A | 5.07 | % | Class A | 3.65 | % | 2.62 | % | ||||||||||||
| Class C | 4.52 | % | Class C | 4.42 | % | 3.40 | % | ||||||||||||
| S&P 500 Index | 3.16 | % | |||||||||||||||||
| Russell 1000 Index3 | 4.32 | % | |||||||||||||||||
Performance quoted is past performance which does not guarantee future results. Current performance may be higher or lower than the performance quoted. Call (800) 989-6693 for performance current to the most recent month-end. The investment return and principal value of an investment will fluctuate so that an investor's shares, when redeemed, may be worth more or less than their original cost. Returns represent the change in value over the stated period assuming reinvestment of dividends and capital gains at net asset value. Returns do not take into account the maximum 5.75% sales charge on Class A shares or the 1% Contingent Deferred Sales Charge (CDSC) for Class C shares sold within one year of purchase. Returns would be lower if the applicable sales charge and CDSC were included. Returns do not take into account individual taxes which may reduce actua l returns when shares are sold.
The Fund's investment adviser is waiving a portion of its management fees pursuant to an Expense Limitation Agreement. The waiver may be discontinued at any time with ninety days written notice in consultation with the Fund's Board of Directors, but is expected to continue at current levels. Please see the Fund's most recent Annual Report for details. Performance shown reflects the waiver, without which the results would have been lower.
Discussion with Portfolio Manager
Thomas H. Hanson
Market Overview
The markets began 2009 constrained by fears of a prolonged global recession. Rising unemployment, contraction in the housing sector and ongoing turmoil in the financial sector contributed to these fears. Investors were also concerned by the lack of details regarding the government's stimulus programs. In response, investors fled the equity market for the safety of short-term U.S. Treasuries. No area of the market was immune from elevated volatility and severe depreciation as stocks fell to levels not seen since 1996.
Initial promises of recovery began to emerge toward the end of the first quarter. The administration provided details on its various fiscal and economic stimulus plans while the Federal Reserve's efforts to unlock the credit markets improved lending conditions. Additionally, first quarter earnings from many corporations exceeded expectations. Some companies even benefited from a change in consumer spending habits.
1 The Standard & Poor's 500 Index is an unmanaged, market capitalization weighted measure of 500 widely held common stocks listed on the New York Stock Exchange, American Stock Exchange and The NASDAQ Stock Market. Index returns assume the reinvestment of dividends, but, unlike the Fund's returns, do not reflect the effects of management fees or expenses.
2 The NASDAQ 100 Index is an unmanaged, market capitalization weighted measure of the 100 largest non-financial domestic and international common stocks listed on The NASDAQ Stock Market. Index returns assume the reinvestment of dividends, but, unlike the Fund's returns, do not reflect management fees or expenses.
3 The Russell 1000 Index is an unmanaged, market capitalization weighted measure of the 1,000 largest publicly traded companies within the Russell 3000 Index. Index returns assume the reinvestment of dividends, but, unlike the Fund's returns, do not reflect the effects of capital gains, management fees, or expenses.
19
Pacific Advisors
Growth Fund continued
Throughout the second quarter, investor sentiment moved from dire pessimism to hopeful optimism. Where investors had once sought only to protect principal, they began to re-enter the market in anticipation of economic recovery. As confidence returned, equities rebounded with most of the major indices closing the first half of the year in positive territory. Market gains were led by the Energy, Basic Materials, Health Care, Financials and Technology sectors.
Fund Performance
The Fund outperformed both of its benchmarks in the first half of the year. Performance was primarily the result of the portfolio's emphasis on holdings in the leading sectors of Energy, Basic Materials and Health Care. Energy holdings profited as energy prices rose in the second quarter. In particular, the portfolio benefited from FMC Technologies, which builds and repairs offshore oil rigs. The development of deepwater oil fields in Brazil produced new contracts for subsea and offshore oil platforms. FMC was awarded some these contracts which resulted in a significant increase in its stock price. Additionally, performance was enhanced by positions in Marathon Oil, a large integrated oil and gas company; and National Oilwell Varco, the largest supplier of drilling equipment to the oil and gas industry.
Domestic and global stimulus initiatives to promote infrastructure building increased demand for basic materials during the first half of the year. The Fund was rewarded by investments in this area including Commercial Metals, a recycler, manufacturer and distributor of steel products; and BHP Billiton, one of the world's largest mining companies.
The traditionally defensive Health Care sector was also a standout performer for the Fund. In particular, the Fund benefited from positions in WellPoint, the nation's largest health insurer, and St. Jude Medical, which produces medical equipment, including the world's most widely used mechanical heart valve.
During the period, the Fund maintained select positions in the Technology and Financial sectors. Although these holdings, including Microsoft and Cisco, strengthened during the second quarter, the pace of their continued recovery is unclear. Given this uncertainty, we anticipate the Fund will continue to hold these securities; however, additional in vestments in these sectors may be delayed until further evidence of recovery is available.
Fund Strategy
The Fund seeks to invest in stocks that offer strong growth potential and are reasonably priced. We analyze market conditions and trends to determine the areas of the market which stand to benefit most from the current economic environment. We then identify leading companies from those areas that are fairly valued in relation to the market. This "growth-at-a reasonable-price" strategy represents a more conservative approach to growth investing versus a typical "momentum" style.
Risk management was the priority during the first quarter. We maintained a cash position between 6% and 8% of the portfolio to buffer against volatility. This strategy enabled the Fund to take advantage of opportunities that developed in the second quarter. The Fund was fully invested by the end of the second quarter.
When signs of recovery began to emerge and market conditions improved, we made strategic investments to position the portfolio for future growth. We continued to focus new investments in areas positioned for long-term growth such as health care equipment. For example, we added to the Fund's position in Becton Dickinson, the world's largest manufacturer of medical supplies. With a large baby boomer population approaching their prime years for medical care, firms such as Becton Dickinson stand to benefit from increased demand for their products.
While we added to select health care equipment positions, we trimmed the portfolio holdings in areas likely to be significantly impacted by proposed health care reforms. For instance, we sold the Fund's position in GlaxoSmithKline to reduce exposure to big pharmaceuticals which may experience stricter price controls and higher government regulation under current proposals.
20
Looking Ahead
Recent data show continued improvement in the economy. The Fed has indicated that it will maintain a low interest rate environment to support economic recovery. Additionally, neither inflation nor deflation currently poses a significant threat to the economy. GDP growth, continued improvement in corporate revenues and earnings, and improvement in the employment picture would further strengthen the market. Economic recovery, however, will take time and will likely progress in a pattern of "two steps forward, one step back."
Many corporations have used this recessionary period to streamline their businesses, expand their market share and lay groundwork for future growth. While we believe that the prospects for recovery in corporate America look hopeful, we expect that the pace of recovery will be moderate to slow. As a result, we anticipate that performance will come from the strongest firms within each industry.
Overall, we anticipate that the Industrials, Energy, Basic Materials, Technology, and Financials sectors will lead the market. Continued global and domestic efforts to stimulate growth through infrastructure building should benefit the Industrials and Basic Materials sectors. Demand for energy resources and a renewal of the long-term upward trend in oil prices should bolster the Energy sector. Technology, historically an early recovery sector, should benefit as businesses make upgrades to enhance and streamline their operations. Finally, Financials have experienced such dramatic devaluations that we anticipate the sector will strengthen especially as the overall economy improves.
Given the current prospects for economic recovery, we anticipate that the Fund will remain fully invested. We continue to identify opportunities to add quality names to the portfolio at reasonable valuations. As the market recovery progresses, we will judiciously adjust portfolio holdings to take advantage of those sectors leading the recovery. While we will retain significant investment in the Energy sector, we may reduce select Energy positions and diversify into other market leaders in the areas such as Technology and Basic Materials.
Portfolio Holdings as of 06/30/09 (Based on Total Investments)
| Equities | 100 | % | |||||||||
| 1. | Health Care | 33.21 | % | ||||||||
| 2. | Energy | 28.69 | % | ||||||||
| 3. | Industrials | 15.00 | % | ||||||||
| 4. | Information Technology | 11.47 | % | ||||||||
| 5. | Consumer Staples | 4.76 | % | ||||||||
| 6. | Materials | 4.71 | % | ||||||||
| 7. | Telecommunication Services | 1.25 | % | ||||||||
| 8. | Financials | 0.91 | % | ||||||||
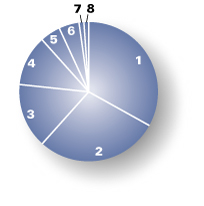
21
Pacific Advisors
Growth Fund continued
Expense Examples
As a shareholder of the Fund you incur two types of costs: (1) transaction costs, including sales charges (loads) on purchase payments, reinvested dividends, or other distributions; redemption fees; and exchange fees; and (2) ongoing costs, including management fees; distribution (12b-1) fees; and other Fund expenses. This Example is intended to help you understand your ongoing costs (in dollars) of investing in the Fund and to compare these costs with the ongoing costs of investing in other mutual funds.
The Example is based on an investment of $1,000 invested at the beginning of the period and held for the entire period from January 1, 2009 through June 30, 2009.
Actual Expenses
The first line of the table below provides information about actual account values and actual expenses. You may use the information in this line, together with the amount you invested, to estimate the expenses that you paid over the period. Simply divide your account value by $1,000 (for example, an $8,600 account value divided by $1,000 = 8.6), then multiply the result by the number in the first line under the heading entitled "Expenses Paid During the Period" to estimate the expenses you paid on your account during the period.
The following transaction costs are not included in the expenses shown in the table and, if applicable, would increase the expenses that you paid over the period: (1) a front-end sales charge (load) of 5.75% on Class A shares; (2) a 2% redemption fee if you sell or exchange shares within six months of purchase, with certain exceptions. The redemption fee does not apply to: (a) redemptions under an automatic withdrawal program or periodic asset reallocation plan, required minimum distributions (RMD), employer mandated distributions from a qualified plan, or redemptions under a qualified domestic relations order (QDRO); (b) redemptions to pay for expenses related to terminal illness, extended hospital or nursing home care, or other serious medical conditions, including death; (c) redemptions of shares acquired through dividend or capital gains reinvestments, and (d) redemptions initiated by the Fund; and (3) a $10 service fee on each exchange after the first five exchanges in each calendar year.
The following ongoing costs are not included in the expenses shown in the table and, if applicable, would increase the expenses that you paid over the period: (1) a $12 low balance fee on accounts with balances of less than $250 as of September 30th of each calendar year and no investment activity (excluding reinvestment of dividends and/or capital gains) during the prior calendar year or the first nine months of the current calendar year. This fee does not apply to IRAs, qualified plan accounts, or Coverdell Education Savings Accounts; (2) a $15 annual custodial fee on IRAs, SEPs, SIMPLE IRAs, and Coverdell Education Savings Accounts; and (3) a $20 annual custodial fee on 403(b) accounts.
Hypothetical Example for Comparison Purposes
The second line of the table below provides information about hypothetical account values and hypothetical expenses based on the Fund's actual expense ratio and an assumed rate of return of 5% per year before expenses, which in not the Fund's actual return. The hypothetical account values and expenses may not be used to estimate the actual ending account balance or expenses you paid for the period. You may use this information to compare the ongoing costs of investing in the Fund and other funds. To do so, compare this 5% hypothetical example with the 5% hypothetical examples that appear in the shareholder reports of the other funds.
The following transaction costs are not included in the expenses shown in the table and, if applicable, would increase the expenses that you paid over the period: (1) a front-end sales charge (load) of 5.75% on Class A shares; (2) a 2% redemption fee if you sell or exchange shares within six months of purchase, with certain exceptions. The redemption fee does not apply to: (a) redemptions under an automatic withdrawal program or periodic asset reallocation plan, required minimum distributions (RMD), employer mandated distributions from a qualified plan, or redemptions under a qualified domestic relations order (QDRO); (b) redemptions to pay for expenses related to terminal illness, extended hospital or nursing home care, or other serious medical conditions, including death; (c) redemptions of shares acquired through dividend or capital gains reinvestments, and (d) redemptions initiated by the Fund; and (3) a $10 service fee on each exchange after the first five exchanges in each calendar year.
The following ongoing costs are not included in the expenses shown in the table and, if applicable, would increase the expenses that you paid over the period: (1) a $12 low balance fee on accounts with balances of less than $250 as of September 30th of each calendar year and no investment activity (excluding reinvestment of dividends and/or capital gains) during the prior calendar year or the first nine months of the current calendar year. This fee does not apply to IRAs, qualified plan accounts, or Coverdell Education Savings Accounts; (2) a $15 annual custodial fee on IRAs, SEPs, SIMPLE IRAs, and Coverdell Education Savings Accounts; and (3) a $20 annual custodial fee on 403(b) accounts.
Please note that the expenses shown in the table are meant to highlight your ongoing costs only and do not reflect any transactional costs, such as sales charges (loads), redemption fees, or exchange fees. Therefore, the second line of the table is useful in comparing ongoing costs only, and will not help you determine the relative total costs of owning different funds. In addition, if these transactional costs were included, your costs would have been higher.
| Beginning Account Value 01/01/09 | Ending Account Value 06/30/09 | Expense Paid During Period 01/01/09 – 06/30/09 | |||||||||||||
| Growth Fund Class A | |||||||||||||||
| Actual | $ | 1,000.00 | $ | 1,050.70 | $ | 15.86 | |||||||||
| Hypothetical (5% return before expense) | $ | 1,000.00 | $ | 1,024.79 | $ | 15.66 | |||||||||
| Growth Fund Class C | |||||||||||||||
| Actual | $ | 1,000.00 | $ | 1,045.20 | $ | 19.42 | |||||||||
| Hypothetical (5% return before expense) | $ | 1,000.00 | $ | 1,024.79 | $ | 19.23 | |||||||||
5 Expenses are equal to the Fund's annualized expense ratio of 3.12% for Class A shares and 3.83% for Class C shares, multiplied by the average account value over the period, multiplied by 181/365 days to reflect the one-half year period.
22
Pacific Advisors
Multi-Cap Value Fund
Seeks to achieve long-term capital appreciation. Invests in a diversified portfolio of large to small capitalization companies using an actively managed, value investment approach.
| TOTAL RETURNS | EXPENSE RATIOS | ||||||||||||||
| For the six months ended June 30, 2009 | For the fiscal year ended December 31, 2008 | ||||||||||||||
| Class A | 3.70 | % | Class A | 3.20 | % | ||||||||||
| Class C | 3.30 | % | Class C | 3.96 | % | ||||||||||
| S&P 500 Index1 | 3.16 | % | |||||||||||||
Performance quoted is past performance which does not guarantee future results. Current performance may be higher or lower than the performance quoted. Call (800) 989-6693 for performance current to the most recent month-end. The investment return and principal value of an investment will fluctuate so that an investor's shares, when redeemed, may be worth more or less than their original cost. Returns represent the change in value over the stated period assuming reinvestment of dividends and capital gains at net asset value. Returns do not take into account the maximum 5.75% sales charge on Class A shares or the 1% Contingent Deferred Sales Charge (CDSC) for Class C shares sold within one year of purchase. Returns would be lower if the applicable sales charge and CDSC were included. Returns do not take into account individual taxes which may reduce actua l returns when shares are sold.
Discussion with Portfolio Managers
George A. Henning
Samuel C. Coquillard
Market Overview
The most significant event of the first half of 2009 was the thawing of various credit markets. Corporations rely on the smooth functioning of these markets to fund their daily operations. Any prolonged inaccessibility would have paralyzed industries across the country, threatening a systemic collapse of the economy. The dramatic selloff in the equity markets that started at the beginning of the year and continued through early March was, in part, rooted in these fears. However, various programs initiated by the Treasury, Federal Reserve, and FDIC throughout the first quarter alleviated these fears and sowed the seeds for a remarkable market recovery.
Investor spirits were further buoyed by signs of improvement across corporate America. Many companies demonstrated their resiliency with stronger than expected first quarter earnings. Economic data also began pointing to a slowing pace of contraction, the first indication the recession was losing strength. In response to these developments, investor psychology improved markedly during the second quarter of 2009. Equities recouped much of the value lost during the previous quarter, and broad market indices ended the first half of the year roughly where they started.
The S&P 500 Index rose just over 3% in the first half of the year. Clearly, this moderate change inadequately reflects the enormous volatility that occurred during the first six months of the year. While investors began 2009 in a state of panic and anxiety, they entered the second half of the year with cautious optimism. This stark difference speaks to the dramatic shift in psychology that occurred during the period.
The dynamic between large, mid and small cap stocks played out in textbook form over the first six months of 2009. As risk aversion peaked in March, funds flowed out of equities and into safe-haven assets, primarily U.S. Treasuries. Within the equity universe, investors behaved in a similar fashion. Larger stocks, seen as a safer alternative to small cap stocks, retained investor interest and, as a result, held their
1 The Standard & Poor's 500 Index is an unmanaged, market capitalization weighted measure of 500 widely held common stocks listed on the New York Stock Exchange, American Stock Exchange and The NASDAQ Stock Market. Index returns assume the reinvestment of dividends, but, unlike the Fund's returns, do not reflect the effects of management fees or expenses.
23
Pacific Advisors
Multi-Cap Value Fund continued
value better than smaller stocks. However, as investor confidence returned and risk appetites grew, these trends reversed. Smaller stocks recovered more robustly, with particular strength in areas geared to early economic recovery, including Commodities, Consumer Discretionary, and Transportation.
The flexibility and benefits of mid-cap stocks were highlighted during the period. As market conditions deteriorated, the performance of mid-sized companies largely resembled those of large corporations. They outperformed small caps as premiums were placed on safety and protection of principal. As markets recovered and risk returned to vogue, mid-cap stocks aligned more favorably with small caps, and outperformed large cap stocks.
Fund Performance
The Fund performed largely in line with its benchmark during the first half of 2009. Markets exhibited extreme volatility during this period, with stocks trading at dramatic discounts to fair value. Pessimism peaked in March, followed by a sharp recovery through the second quarter. The rebound in stock prices signaled a return to fundamental measures of stock valuation. Despite the significant volatility during the period, several holdings, including Group 1 Automotive, Goldman Sachs, and Chattem performed admirably and quickly recovered off their lows.
Group 1 Automotive owns and operates auto dealerships, mostly in the U.S. As the industry felt the full impact of the economic downturn, investors shunned the company. However, the strength of the dealership business model lies in its diverse revenue streams, including new and used car sales, as well as parts and service work. Equally importantly, Group 1 maintains a strategically limited exposure to domestic car brands. After falling to a low of $7.14 in February, shares rallied on positive industry developments to end the first half of 2009 at $26.02.
Following the significant consolidation in the financial industry, Goldman Sachs emerged as the preeminent investment bank. While the company certainly was not exempt from the impact of the credit crunch, it has demonstrated time and again its role as standard bearer, with a proven management team; superior talent acquisition; and savvy risk management. These factors helped the firm recover well ahead of its peers. Goldman's shares, which traded as low as $59.20 in January at the nadir of the financial crisis, finished the first half of 2009 at $147.44.
Chattem manages a portfolio of well recognized over-the-counter healthcare products, including Icy Hot, Gold Bond, and Selsun Blue. The company's growth strategy involves acquiring secondary brands from larger personal care companies and investing in marketing those brands. The defensive nature of these products provides a steady source of business in good times and bad. Additionally, Chattem is able to achieve sales growth by expanding its product lines. We purchased shares in March between $53 and $58, which then recovered to $68.10 by the end of June.
The Fund's energy holdings also provided strength during the period, as hints of an economic recovery renewed interest in the sector. We believe the long-term supply and demand outlook for energy use suggests profitable opportunities for key industry players. These include Chesapeake Energy, a leader in the exploration and production of natural gas; Lufkin Industries, which provides pumping units that extract oil and gas from reservoirs; and Tidewater, an oilfield service company that provides ves sels that support offshore drilling activity.
Fund Strategy
The Fund uses a focused portfolio strategy with a long-term investment horizon that seeks to identify leading businesses with strong management teams and favorable growth prospects. Assets are primarily focused in mid-cap companies with market capitalizations between $2 billion and $10 billion. Select small and large cap opportunities are also used to supplement the portfolio. Mid-cap companies are an attractive area of investment. They offer a blend of the stability of larger market leading corporations and the agility of smaller organizations.
24
During the first six months of 2009, we increased the Fund's mid-cap holdings as opportunities for investment increased during the period. Due to the extreme volatility and distressed valuations in equities during the first half of 2009, we expanded the Fund's mid-cap focus to include larger small cap companies with market caps between $1 billion and $2 billion. As markets recover, we believe these stocks will develop into solid mid-cap companies with significant long-term potential. Over time, the Fund will become increasingly concentrated in the mid-cap universe. Recent purchases, including C.H. Robinson Worldwide, KBR, Landstar Systems, Chattem, and Copart, have brought the Fund significantly closer to this objective.
New mid-cap names were judiciously added to the portfolio by rotating out of certain large cap holdings into companies that offered similar portfolio characteristics and more favorable growth opportunities. Examples include Johnson & Johnson, which was replaced with Chattem; and SAIC, which was replaced with Copart. Johnson & Johnson enjoyed broad support with its strong brand awareness among consumers. We believed the same characteristics were applicable for Chattem which offered the added potential for product expansions and acquisitions that could dramatically impact the bottom line. Similarly, SAIC has a fairly defensive business providing consulting services to the government. This steady stream of work was only moderately impacted by the economic downturn. Copart, an auto reseller servicing the insurance industry, has a similarly defensive business, but with clearer opportunities for near-term growth.
The Fund also maintained its significant position in the Energy sector. With the price of oil appearing to stabilize in the $60 to $70 range, we believe companies are likely to restart exploration activities that were halted as prices fell throughout 2008. Additionally, as the economy begins to recover, we believe capital programs to increase production and storage capacity will also resume. Given the current distressed valuations of energy holdings, the Fund is likely to maintain a greater weighting in this sector for the near-term. As energy company valuations recover, we anticipate reducing the Fund's Energy exposure and rotating into other a reas of economic strength.
Looking Ahead
Near-term, we believe the equity markets are likely to move in response to corporate earnings and economic data. Given the distressed valuations across the equity landscape, significant room for appreciation remains. However, with the weakened state of consumer spending and elevated unemployment rate, longer-term, economic growth will likely be somewhat subdued.
Against this challenging backdrop, industries are likely to undergo a refining process in which stronger companies excel at the expense of weaker ones. This dynamic is already underway and is expected to result in a spike in merger and acquisition activity over the next twelve months. Healthier companies will be able to leverage their strengths to expand their market share, broaden their product mix, or simply acquire competitors. We will look to actively position the portfolio in companies that can take advantage of this trend.
For the remainder of 2009, we will look to increase the Fund's investment in early recovery holdings while reducing its relative exposure to defensive companies. Areas designated as early recovery include Transportation, Energy, Commodities, and Consumer Discretionary. Additionally, financial companies are expected to rebound as credit losses decrease, capital bases are rebuilt, and profitable lending activity is renewed.
Over the long-term, broad market indices tend to mirror overall economic activity. Given the outlook for modest economic growth, individual stock selection will likely play an increasingly important role in equity portfolio management. For this reason, we believe the Fund will benefit from its strategy of maintaining a focused portfolio of superior franchises with strong management teams and favorable growth opportunities.
25
Pacific Advisors
Multi-Cap Value Fund continued
Portfolio Holdings as of 06/30/09 (Based on Total Investments)
| Equities | 100 | % | |||||||||
| 1. | Energy | 31.33 | % | ||||||||
| 2. | Industrials | 30.19 | % | ||||||||
| 3. | Consumer Discretionary | 11.28 | % | ||||||||
| 4. | Consumer Staples | 10.69 | % | ||||||||
| 5. | Materials | 8.95 | % | ||||||||
| 6. | Financials | 5.30 | % | ||||||||
| 7. | Information Technology | 2.26 | % | ||||||||

26
Expense Examples
As a shareholder of the Fund you incur two types of costs: (1) transaction costs, including sales charges (loads) on purchase payments, reinvested dividends, or other distributions; redemption fees; and exchange fees; and (2) ongoing costs, including management fees; distribution (12b-1) fees; and other Fund expenses. This Example is intended to help you understand your ongoing costs (in dollars) of investing in the Fund and to compare these costs with the ongoing costs of investing in other mutual funds.
The Example is based on an investment of $1,000 invested at the beginning of the period and held for the entire period from January 1, 2009 through June 30, 2009.
Actual Expenses
The first line of the table below provides information about actual account values and actual expenses. You may use the information in this line, together with the amount you invested, to estimate the expenses that you paid over the period. Simply divide your account value by $1,000 (for example, an $8,600 account value divided by $1,000 = 8.6), then multiply the result by the number in the first line under the heading entitled "Expenses Paid During the Period" to estimate the expenses you paid on your account during the period.
The following transaction costs are not included in the expenses shown in the table and, if applicable, would increase the expenses that you paid over the period: (1) a front-end sales charge (load) of 5.75% on Class A shares; (2) a 2% redemption fee if you sell or exchange shares within six months of purchase, with certain exceptions. The redemption fee does not apply to: (a) redemptions under an automatic withdrawal program or periodic asset reallocation plan, required minimum distributions (RMD), employer mandated distributions from a qualified plan, or redemptions under a qualified domestic relations order (QDRO); (b) redemptions to pay for expenses related to terminal illness, extended hospital or nursing home care, or other serious medical conditions, including death; (c) redemptions of shares acquired through dividend or capital gains reinvestments, and (d) redemptions initiated by the Fund; and (3) a $10 service fee on each exchange after the first five exchanges in each calendar year.
The following ongoing costs are not included in the expenses shown in the table and, if applicable, would increase the expenses that you paid over the period: (1) a $12 low balance fee on accounts with balances of less than $250 as of September 30th of each calendar year and no investment activity (excluding reinvestment of dividends and/or capital gains) during the prior calendar year or the first nine months of the current calendar year. This fee does not apply to IRAs, qualified plan accounts, or Coverdell Education Savings Accounts; (2) a $15 annual custodial fee on IRAs, SEPs, SIMPLE IRAs, and Coverdell Education Savings Accounts; and (3) a $20 annual custodial fee on 403(b) accounts.
Hypothetical Example for Comparison Purposes
The second line of the table below provides information about hypothetical account values and hypothetical expenses based on the Fund's actual expense ratio and an assumed rate of return of 5% per year before expenses, which in not the Fund's actual return. The hypothetical account values and expenses may not be used to estimate the actual ending account balance or expenses you paid for the period. You may use this information to compare the ongoing costs of investing in the Fund and other funds. To do so, compare this 5% hypothetical example with the 5% hypothetical examples that appear in the shareholder reports of the other funds.
The following transaction costs are not included in the expenses shown in the table and, if applicable, would increase the expenses that you paid over the period: (1) a front-end sales charge (load) of 5.75% on Class A shares; (2) a 2% redemption fee if you sell or exchange shares within six months of purchase, with certain exceptions. The redemption fee does not apply to: (a) redemptions under an automatic withdrawal program or periodic asset reallocation plan, required minimum distributions (RMD), employer mandated distributions from a qualified plan, or redemptions under a qualified domestic relations order (QDRO); (b) redemptions to pay for expenses related to terminal illness, extended hospital or nursing home care, or other serious medical conditions, including death; (c) redemptions of shares acquired through dividend or capital gains reinvestments, and (d) redemptions initiated by the Fund; and (3) a $10 service fee on each exchange after the first five exchanges in each calendar year.
The following ongoing costs are not included in the expenses shown in the table and, if applicable, would increase the expenses that you paid over the period: (1) a $12 low balance fee on accounts with balances of less than $250 as of September 30th of each calendar year and no investment activity (excluding reinvestment of dividends and/or capital gains) during the prior calendar year or the first nine months of the current calendar year. This fee does not apply to IRAs, qualified plan accounts, or Coverdell Education Savings Accounts; (2) a $15 annual custodial fee on IRAs, SEPs, SIMPLE IRAs, and Coverdell Education Savings Accounts; and (3) a $20 annual custodial fee on 403(b) accounts.
Please note that the expenses shown in the table are meant to highlight your ongoing costs only and do not reflect any transactional costs, such as sales charges (loads), redemption fees, or exchange fees. Therefore, the second line of the table is useful in comparing ongoing costs only, and will not help you determine the relative total costs of owning different funds. In addition, if these transactional costs were included, your costs would have been higher.
| Beginning Account Value 01/01/09 | Ending Account Value 06/30/09 | Expense Paid During Period 01/01/09 – 06/30/09 | |||||||||||||
| Multi-Cap Value Fund Class A | |||||||||||||||
| Actual | $ | 1,000.00 | $ | 1,037.00 | $ | 18.49 | |||||||||
| Hypothetical (5% return before expense) | $ | 1,000.00 | $ | 1,024.79 | $ | 18.37 | |||||||||
| Multi-Cap Value Fund Class C | |||||||||||||||
| Actual | $ | 1,000.00 | $ | 1,033.00 | $ | 22.28 | |||||||||
| Hypothetical (5% return before expense) | $ | 1,000.00 | $ | 1,024.79 | $ | 22.19 | |||||||||
3 Expenses are equal to the Fund's annualized expense ratio of 3.66% for Class A shares and 4.42% for Class C shares, multiplied by the average account value over the period, multiplied by 181/365 days to reflect the one-half year period.
27
Pacific Advisors
Small Cap Fund
Seeks to achieve long-term capital appreciation. Invests in small company stocks with strong earnings growth potential using a value investment approach with a focus on companies whose market capitalization is below $500 million.
| TOTAL RETURNS | EXPENSE RATIOS | ||||||||||||||
| For the six months ended June 30, 2009 | For the fiscal year ended December 31, 2008 | ||||||||||||||
| Class A | 22.59 | % | Class A | 2.44 | % | ||||||||||
| Class C | 22.10 | % | Class C | 3.17 | % | ||||||||||
| Class I | 22.70 | % | Class I | 2.16 | % | ||||||||||
| Russell 2000 Index1 | 2.64 | % | |||||||||||||
Performance quoted is past performance which does not guarantee future results. Current performance may be higher or lower than the performance quoted. Call (800) 989-6693 for performance current to the most recent month-end. The investment return and principal value of an investment will fluctuate so that an investor's shares, when redeemed, may be worth more or less than their original cost. Returns represent the change in value over the stated period assuming reinvestment of dividends and capital gains at net asset value. Returns do not take into account the maximum 5.75% sales charge on Class A shares or the 1% Contingent Deferred Sales Charge (CDSC) for Class C shares sold within one year of purchase. Returns would be lower if the applicable sales charge and CDSC were included. Returns do not take into account individual taxes which may reduce actua l returns when shares are sold.
Discussion with Portfolio Manager
George A. Henning
Market Overview
Markets started 2009 caught in the grips of the credit crisis that resulted from the fall of Lehman Brothers. While measures were taken to address the most pressing issues of short-term liquidity, the corporate landscape was still on shaky ground for much of the first quarter. Reflecting this uncertain environment, equities languished, falling to levels not seen since 1996. Indeed, from its all-time high in October 2007 to its March 2009 low, the S&P 500 Index lost over 57% of its value.
In mid-March, various programs were announced by the Treasury, Federal Reserve, and FDIC to jumpstart the frozen credit markets. Investors responded positively to these developments and fears of a systemic collapse abated. Correspondingly, equities staged a strong rally, rising nearly 25% off March lows by the end of the month. The rally continued on strong first quarter earnings reports that, by and large, came in ahead of expectations. With the exception of the financial industry, companies were weathering the recession reasonably well.
Fed Chairman Ben Bernanke further emboldened investors with his characterization of "green shoots" of an economic recovery. While his comment did not yet cite economic growth, it was the first reliable indication of a positive inflection point in the economy. Fear gave way to renewed confidence and the S&P 500 ended the first half of the year nearly 42% above its March low, a remarkable rally. As a whole, markets finished the first six months of 2009 largely where they began, with the S&P 500 gaining just over 3% during this time frame. However, this belies the incredible volatility and shift in market sentiment that accompanied the period.
Small caps underperformed large caps through most of the first quarter, as risk aversion peaked in tandem with market lows established in early March. This supports our belief that equities languished
1 The Russell 2000 Index is an unmanaged, market-weighted measure of the 2,000 smallest publicly traded companies of the Russell 3000 Index. Index returns assume the reinvestment of dividends, but, unlike the Fund's returns, do not reflect management fees or expenses.
28
broadly during the market downturn, ignoring individual company fundamentals. However, as market confidence returned and risk appetites grew, small caps led the way, outperforming large caps by more than ten percentage points over the final three and a half months. This is consistent with historical trends in which small cap companies outperform the broader market as evidence of a recovery emerges.
Fund Performance
The Fund enjoyed excellent performance during the first six months of 2009, both in absolute terms and against its benchmark, the Russell 2000 Index. Class A shares returned 22.59% in the six-month period, outperforming the benchmark by nearly 20 percentage points. The significant performance differential occurred primarily after market lows were established in early March. As confidence returned, investors became increasingly discriminating in their analyses, rewarding stronger companies over weaker ones. We believe this contributed significantly to the Fund's stellar performance during the period.
From the end of 2008 through the first several months of 2009, we actively adjusted the portfolio to be more aggressive in response to distressed valuations. The overriding pessimism in the market caused prices to become disconnected from company fundamentals, providing an attractive opportunity to purchase high quality equities at discounts to fair value. Examples of significant add-on purchases during the period include Sonic Automotive, Vitran, and Team.
Sonic Automotive owns and operates auto dealerships across the country. After trading above $10 in September 2008, the stock price fell to below $1 in March on concerns about the company's ability to meet its loan obligations. However, our proprietary research strongly suggested that the company would win concessions from its lenders and avoid default. We aggressively accumulated shares in March and April. The stock rebounded and ended a profitable second quarter at $10.16, adding significantly to the Fund's return.
Vitran provides regional shipping and logistics services. The economic downturn severely impacted its business. However, various initiatives helped the company remain competitive and gain market share during these turbulent times. Some of its weaker competitors are on the verge of bankruptcy which will likely result in a healthier industry and improve prospects for surviving companies. With the economy showing signs of improvement, Vitran is poised for growth. Reflecting this positive sentiment, the stock ended June at $9.90 after trading as low as $2.26 in March.
Team provides maintenance and repair services for industrial plants, including refineries and paper mills. The economic downturn has delayed customer activity, but these are services that must eventually be performed. While relative stability of this revenue stream provides a solid foundation, the company is also focused on growth. The industry is in the midst of consolidation and Team is a likely beneficiary of this trend. The shares, which traded at a low of $9.18 in March, finished the first half of the year at $15.67.
The Fund also sold or trimmed positions that performed well during the period, including Terra Industries, Tetra Tech, and Tyler Technologies. While business prospects remained favorable for these companies, other holdings, including those mentioned above, presented more attractive investment opportunities and we reinvested assets accordingly. This form of active management serves to take full advantage of our deep knowledge of portfolio holdings and the Fund's focused, long-term investment strategy.
Fund Strategy
As the first half of 2009 came to a close, markets ended essentially where they began the year. However, the period was marked by extreme volatility as investor sentiment shifted from desperate pessimism to hopeful optimism. The Fund's core strategy played well into this dynamic and made it possible to capitalize on select opportunities. Utilizing a focused, long-term investment philosophy, we rely heavily on fundamental analysis and a deep knowledge of portfolio holdings. This results in a high level of conviction that allows us to leverage our research efforts and act aggressively when appropriate.
29
Pacific Advisors
Small Cap Fund continued
During the first half of 2009, we extended and modified the strategy of allocating Fund assets across: early recovery, stimulus, traditional value, special situation, and defensive stocks. As markets languished early in the first quarter, defensive stocks acted as ballast against portfolio volatility. Anticipating a shift in investor sentiment toward the end of March, we began to take profits in the Fund's defensive holdings and reallocated assets to early recovery areas. These sectors, including Transportation, Commodities, Energy, and Consumer Discretionary, tend to be among the first to benefit from signs of an economic recovery. Indeed, as the market began to recover during the end of the first quarter and through much of the second quarter, repositioning the portfolio into these areas added significantly to the Fund's return.
Looking Ahead
Market Outlook
Early into the third quarter, markets have continued their strong run, owing in large part to impressive second quarter earnings across the corporate landscape. Importantly, financial companies were among the strongest performers, having rebuilt their capital bases on more solid footing. Additionally, newly released economic data continue to lend support to the belief that the worst of the recession is behind us. Signs of economic recovery are also beginning to emerge internationally. Strong growth in China has served as a catalyst for the equity markets and will continue to aid the global recovery.
While the economy is showing signs of stabilization, future growth will be challenged by a number of significant long-term issues including above average unemployment; expanding federal deficits; and underfunded entitlement programs. These factors contribute to our expectation for moderate long-term economic growth. The threat of inflation with any significant upturn in economic activity also factors into our long-term outlook.
Against this broad backdrop, however, the performance of individual companies will vary greatly. As industries are "right-sized" to accommodate lower levels of demand and growth, marginal players will find it increasingly difficult to remain competitive. As a result, we expect an increase in corporate bankruptcies as well as merger and acquisition activity. Industry leaders will be able to increase their competitive advantage and better position themselves for the future.
Unlike the bull markets of the 1980s or 1990s, which were driven by strong economic growth and productivity gains, today's equities markets will likely operate in a relatively stagnant economic environment. While broad market indices can remain underwhelming for a period of time, significant opportunities do exist. Investors tend to view stocks as moving in unison; in reality, stock selection matters a great deal, particularly within the context of a challenging economy. We believe the Fund's investment strategy of holding superior franchises with strong management teams, solid balance sheets, and favorable growth prospects, is especially approp riate in this setting.
Investment Strategy
For the remainder of 2009, the Fund will continue its focus on those areas geared toward an economic recovery. As holdings approach fair value, we will reallocate assets into more attractive sectors, including Financials; Energy; and Consumer Discretionary. Financial companies, with the continuing stabilization of the economy, are expected to exhibit improved business trends. Given the long term supply-demand dynamics of global energy use, Energy and related industries will also remain attractive areas for investment. Finally, Consumer Discretionary companies will benefit as improving confidence spurs consumer spending.
Due to the market's downturn, significant discount remains within the portfolio. Given the familiarity and high confidence with the current portfolio, we will initially seek to augment existing holdings. However, we maintain an active list of "on deck" names and continue to identify new opportunities in which to invest over the second half of the year. New positions will provide exposure to areas not currently addressed in the portfolio. Throughout, the Fund's focus will remain on investment in superior franchises with strong management teams, solid balance sheets, and favorable growth prospects.
30
Portfolio Holdings as of 06/30/09 (Based on Total Investments)
| Equities | 100 | % | |||||||||
| 1. | Industrials | 35.52 | % | ||||||||
| 2. | Energy | 14.90 | % | ||||||||
| 3. | Consumer Discretionary | 14.69 | % | ||||||||
| 4. | Financials | 12.15 | % | ||||||||
| 5. | Health Care | 9.46 | % | ||||||||
| 6. | Consumer Staples | 4.58 | % | ||||||||
| 7. | Utilities | 3.95 | % | ||||||||
| 8. | Materials | 3.48 | % | ||||||||
| 9. | Information Technology | 1.27 | % | ||||||||
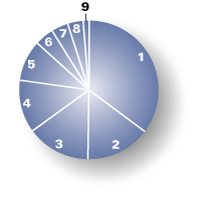
31
Pacific Advisors
Small Cap Fund continued
Expense Examples
As a shareholder of the Fund you incur two types of costs: (1) transaction costs, including sales charges (loads) on purchase payments, reinvested dividends, or other distributions; redemption fees; and exchange fees; and (2) ongoing costs, including management fees; distribution (12b-1) fees; and other Fund expenses. This Example is intended to help you understand your ongoing costs (in dollars) of investing in the Fund and to compare these costs with the ongoing costs of investing in other mutual funds.
The Example is based on an investment of $1,000 invested at the beginning of the period and held for the entire period from January 1, 2009 through June 30, 2009.
Actual Expenses
The first line of the table below provides information about actual account values and actual expenses. You may use the information in this line, together with the amount you invested, to estimate the expenses that you paid over the period. Simply divide your account value by $1,000 (for example, an $8,600 account value divided by $1,000 = 8.6), then multiply the result by the number in the first line under the heading entitled "Expenses Paid During the Period" to estimate the expenses you paid on your account during the period.
The following transaction costs are not included in the expenses shown in the table and, if applicable, would increase the expenses that you paid over the period: (1) a front-end sales charge (load) of 5.75% on Class A shares; (2) a 2% redemption fee if you sell or exchange shares within six months of purchase, with certain exceptions. The redemption fee does not apply to: (a) redemptions under an automatic withdrawal program or periodic asset reallocation plan, required minimum distributions (RMD), employer mandated distributions from a qualified plan, or redemptions under a qualified domestic relations order (QDRO); (b) redemptions to pay for expenses related to terminal illness, extended hospital or nursing home care, or other serious medical conditions, including death; (c) redemptions of shares acquired through dividend or capital gains reinvestments, and (d) redemptions initiated by the Fund; and (3) a $10 service fee on each exchange after the first five exchanges in each calendar year.
The following ongoing costs are not included in the expenses shown in the table and, if applicable, would increase the expenses that you paid over the period: (1) a $12 low balance fee on accounts with balances of less than $250 as of September 30th of each calendar year and no investment activity (excluding reinvestment of dividends and/or capital gains) during the prior calendar year or the first nine months of the current calendar year. This fee does not apply to IRAs, qualified plan accounts, or Coverdell Education Savings Accounts; (2) a $15 annual custodial fee on IRAs, SEPs, SIMPLE IRAs, and Coverdell Education Savings Accounts; and (3) a $20 annual custodial fee on 403(b) accounts.
Hypothetical Example for Comparison Purposes
The second line of the table below provides information about hypothetical account values and hypothetical expenses based on the Fund's actual expense ratio and an assumed rate of return of 5% per year before expenses, which in not the Fund's actual return. The hypothetical account values and expenses may not be used to estimate the actual ending account balance or expenses you paid for the period. You may use this information to compare the ongoing costs of investing in the Fund and other funds. To do so, compare this 5% hypothetical example with the 5% hypothetical examples that appear in the shareholder reports of the other funds.
The following transaction costs are not included in the expenses shown in the table and, if applicable, would increase the expenses that you paid over the period: (1) a front-end sales charge (load) of 5.75% on Class A shares; (2) a 2% redemption fee if you sell or exchange shares within six months of purchase, with certain exceptions. The redemption fee does not apply to: (a) redemptions under an automatic withdrawal program or periodic asset reallocation plan, required minimum distributions (RMD), employer mandated distributions from a qualified plan, or redemptions under a qualified domestic relations order (QDRO); (b) redemptions to pay for expenses related to terminal illness, extended hospital or nursing home care, or other serious medical conditions, including death; (c) redemptions of shares acquired through dividend or capital gains reinvestments, and (d) redemptions initiated by the Fund; and (3) a $10 service fee on each exchange after the first five exchanges in each calendar year.
The following ongoing costs are not included in the expenses shown in the table and, if applicable, would increase the expenses that you paid over the period: (1) a $12 low balance fee on accounts with balances of less than $250 as of September 30th of each calendar year and no investment activity (excluding reinvestment of dividends and/or capital gains) during the prior calendar year or the first nine months of the current calendar year. This fee does not apply to IRAs, qualified plan accounts, or Coverdell Education Savings Accounts; (2) a $15 annual custodial fee on IRAs, SEPs, SIMPLE IRAs, and Coverdell Education Savings Accounts; and (3) a $20 annual custodial fee on 403(b) accounts.
Please note that the expenses shown in the table are meant to highlight your ongoing costs only and do not reflect any transactional costs, such as sales charges (loads), redemption fees, or exchange fees. Therefore, the second line of the table is useful in comparing ongoing costs only, and will not help you determine the relative total costs of owning different funds. In addition, if these transactional costs were included, your costs would have been higher.
| Beginning Account Value 01/01/09 | Ending Account Value 06/30/09 | Expense Paid During Period 01/01/09 – 06/30/09 | |||||||||||||
| Small Cap Fund Class A | |||||||||||||||
| Actual | $ | 1,000.00 | $ | 1,225.90 | $ | 14.13 | |||||||||
| Hypothetical (5% return before expense) | $ | 1,000.00 | $ | 1,024.79 | $ | 12.85 | |||||||||
| Small Cap Fund Class C | |||||||||||||||
| Actual | $ | 1,000.00 | $ | 1,221.00 | $ | 18.23 | |||||||||
| Hypothetical (5% return before expense) | $ | 1,000.00 | $ | 1,024.79 | $ | 16.62 | |||||||||
| Small Cap Fund Class I | |||||||||||||||
| Actual | $ | 1,000.00 | $ | 1,227.00 | $ | 12.76 | |||||||||
| Hypothetical (5% return before expense) | $ | 1,000.00 | $ | 1,024.79 | $ | 11.60 | |||||||||
3 Expenses are equal to the Fund's annualized expense ratio of 2.56% for Class A shares, 3.31% for Class C shares and 2.31% for Class I shares, multiplied by the average account value over the period, multiplied by 181/365 days to reflect the one-half year period.
32

Pacific Advisors Fund Inc.
financial statements
33
Pacific Advisors Government Securities Fund
Statement of Investments (Unaudited)
as of June 30, 2009
| Quantity or Principal | Description | Current $ Value** | % of Total Net Assets | ||||||||||||
| COMMON STOCK | |||||||||||||||
| INDUSTRIALS | 1.09 | ||||||||||||||
| INDUSTRIAL CONGLOMERATES | |||||||||||||||
| 5,000 | GENERAL ELECTRIC CO. | 58,600 | |||||||||||||
| 58,600 | 1.09 | ||||||||||||||
| TELECOMMUNICATION SERVICES | 1.32 | ||||||||||||||
| DIVERSIFIED TELECOM. SERVICES | |||||||||||||||
| 10,000 | FRONTIER COMMUNICATIONS CORP. | 71,400 | |||||||||||||
| 71,400 | 1.32 | ||||||||||||||
| UTILITIES | 2.45 | ||||||||||||||
| ELECTRIC UTILITIES | |||||||||||||||
| 4,000 | PPL CORP. | 131,840 | |||||||||||||
| 131,840 | 2.45 | ||||||||||||||
| TOTAL COMMON STOCK (Cost: $343,800) | 261,840 | 4.86 | |||||||||||||
| US GOVT SECURITIES | |||||||||||||||
| US GOVERNMENT AGENCY | 96.75 | ||||||||||||||
| US GOVERNMENT AGENCY | |||||||||||||||
| 200,000 | FEDERAL FARM CREDIT BANK 4.10% 07/07/11 | 200,129 | |||||||||||||
| 100,000 | FEDERAL FARM CREDIT BANK 5.37% 09/11/18 | 100,099 | |||||||||||||
| 132,000 | FEDERAL HOME LN MTG CORP. 2.50% 03/23/12 | 132,869 | |||||||||||||
| 100,000 | FEDERAL HOME LN MTG CORP. 2.125% 04/02/12 | 100,403 | |||||||||||||
| 200,000 | FEDERAL HOME LN MTG CORP. 3.25% 02/18/14 | 198,985 | |||||||||||||
| 200,000 | FEDERAL HOME LN MTG CORP. 3.25% 03/03/14 | 198,747 | |||||||||||||
| 200,000 | FEDERAL HOME LN MTG CORP. 5.25% 02/27/23 | 198,397 | |||||||||||||
| 100,000 | FEDERAL HOME LOAN BANK 3.625% 02/25/11 | 100,486 | |||||||||||||
| 80,000 | FEDERAL HOME LOAN BANK 1.85% 03/25/11 | 80,509 | |||||||||||||
| 300,000 | FEDERAL HOME LOAN BANK 2.00% 01/05/12 | 300,190 | |||||||||||||
| 100,000 | FEDERAL HOME LOAN BANK 2.25% 06/22/12 | 100,641 | |||||||||||||
| 100,000 | FEDERAL HOME LOAN BANK 5.00% 07/02/13 | 100,013 | |||||||||||||
| 100,000 | FEDERAL HOME LOAN BANK 4.27% 09/17/13 | 103,656 | |||||||||||||
| 300,000 | FEDERAL HOME LOAN BANK 3.05% 05/12/14 | 295,791 | |||||||||||||
| 200,000 | FEDERAL HOME LOAN BANK 2.00% 06/30/14 STEP | 199,753 | |||||||||||||
| 115,000 | FEDERAL HOME LOAN BANK 2.50% 07/02/14 STEP | 114,943 | |||||||||||||
| 100,000 | FEDERAL HOME LOAN BANK 4.60% 01/14/15 | 101,842 | |||||||||||||
| 100,000 | FEDERAL HOME LOAN BANK 4.875% 01/16/15 | 100,170 | |||||||||||||
| 200,000 | FEDERAL HOME LOAN BANK 4.10% 01/28/16 | 200,373 | |||||||||||||
| 125,000 | FEDERAL HOME LOAN BANK 5.35% 09/27/17 | 129,862 | |||||||||||||
| 500,000 | FEDERAL HOME LOAN BANK 4.875% 02/13/18 | 497,420 | |||||||||||||
| 425,000 | FEDERAL HOME LOAN BANK 4.50% 02/15/18 | 428,448 | |||||||||||||
| 100,000 | FEDERAL HOME LOAN BANK 5.00% 05/08/18 | 100,045 | |||||||||||||
| 100,000 | FEDERAL HOME LOAN BANK 5.20% 06/25/18 | 101,493 | |||||||||||||
See accompanying Notes to Financial Statements which are an integral part of these financial statements.
34
Pacific Advisors Government Securities Fund
Statement of Investments (Unaudited)
as of June 30, 2009
| Quantity or Principal | Description | Current $ Value** | % of Total Net Assets | ||||||||||||
| US GOVT SECURITIES continued | |||||||||||||||
| 100,000 | FEDERAL HOME LOAN BANK 5.00% 06/26/18 STEP | 100,753 | |||||||||||||
| 100,000 | FEDERAL HOME LOAN BANK 5.85% 07/09/18 | 100,106 | |||||||||||||
| 100,000 | FEDERAL HOME LOAN BANK 5.50% 11/08/18 | 103,090 | |||||||||||||
| 200,000 | FEDERAL HOME LOAN BANK 6.375% 06/29/22 | 206,967 | |||||||||||||
| 100,000 | FEDERAL NATL MTG ASSOC. 2.50% 02/17/12 | 100,303 | |||||||||||||
| 100,000 | FEDERAL NATL MTG ASSOC. 3.00% 06/23/14 STEP | 100,070 | |||||||||||||
| 215,000 | FEDERAL NATL MTG ASSOC. 5.50% 01/24/22 | 215,227 | |||||||||||||
| 100,000 | FEDERAL NATL MTG ASSOC. 5.75% 05/11/22 | 102,806 | |||||||||||||
| 5,214,585 | 96.75 | ||||||||||||||
| TOTAL US GOVT SECURITIES (Cost: $5,238,817) | 5,214,585 | 96.75 | |||||||||||||
| PREFERRED STOCK | |||||||||||||||
| FINANCIALS | 3.57 | ||||||||||||||
| COMMERCIAL BANKS | |||||||||||||||
| 4,000 | BARCLAYS BANK PLC 6.625% PFD | 70,640 | |||||||||||||
| 2,000 | BARCLAYS BANK PLC 7.10% PFD | 36,580 | |||||||||||||
| 2,500 | CITIGROUP INC. 8.125% PFD | 46,700 | |||||||||||||
| 153,920 | 2.86 | ||||||||||||||
| DIVERSIFIED FINANCIAL SERVICES | |||||||||||||||
| 2,000 | DEUTSCHE BANK 7.35% PFD | 38,480 | |||||||||||||
| 38,480 | 0.71 | ||||||||||||||
| TELECOMMUNICATION SERVICES | 1.89 | ||||||||||||||
| DIVERSIFIED TELECOM. SERVICES | |||||||||||||||
| 4,000 | AT&T INC. 6.375% PFD | 101,960 | |||||||||||||
| 101,960 | 1.89 | ||||||||||||||
| TOTAL PREFERRED STOCK (Cost: $362,500) | 294,360 | 5.46 | |||||||||||||
| TOTAL INVESTMENTS (Cost: $5,945,117) | 5,770,785 | 107.07 | |||||||||||||
| OTHER ASSETS LESS LIABILITIES | (380,904 | ) | (7.07 | ) | |||||||||||
| TOTAL NET ASSETS | 5,389,881 | 100.00 | |||||||||||||
* Non-income producing
** The principal amount is stated in U.S. dollars unless otherwise indicated.
See accompanying Notes to Financial Statements which are an integral part of these financial statements.
35
Pacific Advisors Income and Equity Fund
Statement of Investments (Unaudited)
as of June 30, 2009
| Quantity or Principal | Description | Current $ Value** | % of Total Net Assets | ||||||||||||
| COMMON STOCK | |||||||||||||||
| CONSUMER DISCRETIONARY | 0.78 | ||||||||||||||
| DISTRIBUTORS | |||||||||||||||
| 1,000 | GENUINE PARTS CO. | 33,560 | |||||||||||||
| 33,560 | 0.46 | ||||||||||||||
| SPECIALTY RETAIL | |||||||||||||||
| 1,000 | HOME DEPOT INC. | 23,630 | |||||||||||||
| 23,630 | 0.32 | ||||||||||||||
| CONSUMER STAPLES | 1.97 | ||||||||||||||
| HOUSEHOLD PRODUCTS | |||||||||||||||
| 2,500 | PROCTER & GAMBLE CO. | 127,750 | |||||||||||||
| 127,750 | 1.75 | ||||||||||||||
| TOBACCO | |||||||||||||||
| 1,000 | ALTRIA GROUP INC. | 16,390 | |||||||||||||
| 16,390 | 0.22 | ||||||||||||||
| ENERGY | 5.01 | ||||||||||||||
| OIL, GAS & CONSUMABLE FUELS | |||||||||||||||
| 1,000 | APACHE CORP. | 72,150 | |||||||||||||
| 1,000 | BRITISH PETROLEUM PLC ADR | 47,680 | |||||||||||||
| 1,000 | CONOCOPHILLIPS | 42,060 | |||||||||||||
| 3,000 | MARATHON OIL CORP. | 90,390 | |||||||||||||
| 1,000 | OCCIDENTAL PETROLEUM CORP. | 65,810 | |||||||||||||
| 1,250 | XTO ENERGY INC. | 47,675 | |||||||||||||
| 365,765 | 5.01 | ||||||||||||||
| FINANCIALS | 1.46 | ||||||||||||||
| COMMERCIAL BANKS | |||||||||||||||
| 1,000 | WILMINGTON TRUST CORP. | 13,660 | |||||||||||||
| 13,660 | 0.19 | ||||||||||||||
| DIVERSIFIED FINANCIAL SERVICES | |||||||||||||||
| 4,000 | BANK OF AMERICA CORP. | 52,800 | |||||||||||||
| 52,800 | 0.72 | ||||||||||||||
| INSURANCE | |||||||||||||||
| 1,000 | CHUBB CORP. | 39,880 | |||||||||||||
| 39,880 | 0.55 | ||||||||||||||
See accompanying Notes to Financial Statements which are an integral part of these financial statements.
36
Pacific Advisors Income and Equity Fund
Statement of Investments (Unaudited)
as of June 30, 2009
| Quantity or Principal | Description | Current $ Value** | % of Total Net Assets | ||||||||||||
| COMMON STOCK continued | |||||||||||||||
| HEALTH CARE | 3.11 | ||||||||||||||
| PHARMACEUTICALS | |||||||||||||||
| 4,000 | JOHNSON & JOHNSON | 227,200 | |||||||||||||
| 227,200 | 3.11 | ||||||||||||||
| INDUSTRIALS | 2.47 | ||||||||||||||
| AEROSPACE & DEFENSE | |||||||||||||||
| 2,000 | HONEYWELL INT'L INC. | 62,800 | |||||||||||||
| 62,800 | 0.86 | ||||||||||||||
| INDUSTRIAL CONGLOMERATES | |||||||||||||||
| 10,000 | GENERAL ELECTRIC CO. | 117,200 | |||||||||||||
| 117,200 | 1.61 | ||||||||||||||
| INFORMATION TECHNOLOGY | 1.63 | ||||||||||||||
| SOFTWARE | |||||||||||||||
| 5,000 | MICROSOFT CORP. | 118,850 | |||||||||||||
| 118,850 | 1.63 | ||||||||||||||
| MATERIALS | 0.35 | ||||||||||||||
| CHEMICALS | |||||||||||||||
| 1,000 | DUPONT DE NEMOURS & CO. | 25,620 | |||||||||||||
| 25,620 | 0.35 | ||||||||||||||
| TELECOMMUNICATION SERVICES | 2.72 | ||||||||||||||
| DIVERSIFIED TELECOM. SERVICES | |||||||||||||||
| 1,000 | AT&T INC. | 24,840 | |||||||||||||
| 20,000 | FRONTIER COMMUNICATIONS CORP. | 142,800 | |||||||||||||
| 1,000 | VERIZON COMMUNICATIONS INC. | 30,730 | |||||||||||||
| 198,370 | 2.72 | ||||||||||||||
| UTILITIES | 2.01 | ||||||||||||||
| ELECTRIC UTILITIES | |||||||||||||||
| 1,000 | DUKE ENERGY CORP. | 14,590 | |||||||||||||
| 14,590 | 0.20 | ||||||||||||||
| MULTI-UTILITIES | |||||||||||||||
| 2,000 | DOMINION RESOURCES INC. | 66,840 | |||||||||||||
| 2,000 | PUBLIC SERVICE ENTERPRISE GROUP INC. | 65,260 | |||||||||||||
| 132,100 | 1.81 | ||||||||||||||
| TOTAL COMMON STOCK (Cost: $2,058,019) | 1,570,165 | 21.51 | |||||||||||||
See accompanying Notes to Financial Statements which are an integral part of these financial statements.
37
Pacific Advisors Income and Equity Fund
Statement of Investments (Unaudited)
as of June 30, 2009
| Quantity or Principal | Description | Current $ Value** | % of Total Net Assets | ||||||||||||
| CORPORATE BONDS | |||||||||||||||
| CONSUMER DISCRETIONARY | 12.59 | ||||||||||||||
| MEDIA | |||||||||||||||
| 419,000 | LIBERTY MEDIA CORP. 7.75% 07/15/09 | 416,381 | |||||||||||||
| 416,381 | 5.70 | ||||||||||||||
| MULTILINE RETAIL | |||||||||||||||
| 281,000 | TARGET CORP. 8.60% 01/15/12 | 315,678 | |||||||||||||
| 315,678 | 4.32 | ||||||||||||||
| SPECIALTY RETAIL | |||||||||||||||
| 100,000 | HOME DEPOT INC. 5.20% 03/01/11 | 103,511 | |||||||||||||
| 80,000 | STAPLES INC. 7.375% 10/01/12 | 83,582 | |||||||||||||
| 187,093 | 2.56 | ||||||||||||||
| ENERGY | 5.35 | ||||||||||||||
| ENERGY EQUIPMENT & SERVICES | |||||||||||||||
| 50,000 | WEATHERFORD INT'L LTD. 5.95% 06/15/12 | 52,205 | |||||||||||||
| 52,205 | 0.72 | ||||||||||||||
| OIL, GAS & CONSUMABLE FUELS | |||||||||||||||
| 143,000 | ATLANTIC RICHFIELD 8.50% 04/01/12 | 161,999 | |||||||||||||
| 170,000 | TEXACO CAPITAL 8.625% 06/30/10 | 176,039 | |||||||||||||
| 338,038 | 4.63 | ||||||||||||||
| FINANCIALS | 23.97 | ||||||||||||||
| COMMERCIAL BANKS | |||||||||||||||
| 100,000 | AMERICAN EXPRESS CO. 10/20/09 FLOAT | 99,989 | |||||||||||||
| 99,989 | 1.37 | ||||||||||||||
| DIVERSIFIED FINANCIAL SERVICES | |||||||||||||||
| 300,000 | AIG 6.00% 11/15/14 | 129,714 | |||||||||||||
| 30,000 | AMERICAN EXPRESS CO. 5.00% 12/02/10 | 30,142 | |||||||||||||
| 200,000 | AMERICAN EXPRESS CO. 7.30% 08/20/13 | 207,942 | |||||||||||||
| 371,000 | GENERAL ELECTRIC CAP 8.125% 05/15/12 | 415,813 | |||||||||||||
| 150,000 | GENERAL ELECTRIC CAP 5.50% 09/30/16 STEP | 150,533 | |||||||||||||
| 100,000 | GENERAL ELECTRIC CAP 5.40% 02/15/17 | 96,822 | |||||||||||||
| 95,000 | GOLDMAN SACHS GROUP 5.00% 10/01/14 | 95,484 | |||||||||||||
| 100,000 | HOUSEHOLD FINANCE CO. 09/10/09 FLOAT | 99,316 | |||||||||||||
| 106,000 | HSBC 11/10/13 FLOAT | 92,166 | |||||||||||||
| 100,000 | NATIONAL RURAL UTIL 5.75% 08/28/09 | 100,657 | |||||||||||||
| 50,000 | SCHWAB CORP. 6.375% 09/01/17 | 51,945 | |||||||||||||
| 1,470,532 | 20.14 | ||||||||||||||
See accompanying Notes to Financial Statements which are an integral part of these financial statements.
38
Pacific Advisors Income and Equity Fund
Statement of Investments (Unaudited)
as of June 30, 2009
| Quantity or Principal | Description | Current $ Value** | % of Total Net Assets | ||||||||||||
| CORPORATE BONDS continued | |||||||||||||||
| INSURANCE | |||||||||||||||
| 28,000 | HARTFORD LIFE INSURANCE 6.00% 09/15/21 | 19,196 | |||||||||||||
| 75,000 | HARTFORD LIFE GLOBAL FUND 6.00% 07/15/15 | 64,847 | |||||||||||||
| 100,000 | PROTECTIVE LIFE 05/10/10 FLOAT | 94,880 | |||||||||||||
| 178,923 | 2.45 | ||||||||||||||
| INDUSTRIALS | 1.47 | ||||||||||||||
| MACHINERY | |||||||||||||||
| 115,000 | JOY GLOBAL INC. 6.00% 11/15/16 | 107,150 | |||||||||||||
| 107,150 | 1.47 | ||||||||||||||
| INFORMATION TECHNOLOGY | 1.38 | ||||||||||||||
| COMPUTERS & PERIPHERALS | |||||||||||||||
| 50,000 | DELL INC. 5.65% 04/15/18 | 50,790 | |||||||||||||
| 50,790 | 0.70 | ||||||||||||||
| OFFICE ELECTRONICS | |||||||||||||||
| 50,000 | XEROX CORP. 5.50% 05/15/12 | 49,863 | |||||||||||||
| 49,863 | 0.68 | ||||||||||||||
| MATERIALS | 5.04 | ||||||||||||||
| CHEMICALS | |||||||||||||||
| 50,000 | DOW CHEMICAL CO. 5.00% 06/15/13 | 44,848 | |||||||||||||
| 50,000 | DOW CHEMICAL CO. 5.90% 09/15/15 | 46,597 | |||||||||||||
| 91,445 | 1.25 | ||||||||||||||
| CONTAINERS/PACKAGING | |||||||||||||||
| 25,000 | PACKAGING CORP. OF AMERICA 5.75% 08/01/13 | 24,028 | |||||||||||||
| 24,028 | 0.33 | ||||||||||||||
| METALS & MINING | |||||||||||||||
| 100,000 | ALCOA INC. 7.375% 08/01/10 | 102,917 | |||||||||||||
| 75,000 | ALCOA INC. 6.50% 06/01/11 | 76,461 | |||||||||||||
| 75,000 | ALCOA INC. 6.00% 07/15/13 | 73,275 | |||||||||||||
| 252,653 | 3.46 | ||||||||||||||
| TELECOMMUNICATION SERVICES | 8.04 | ||||||||||||||
| DIVERSIFIED TELECOM. SERVICES | |||||||||||||||
| 100,000 | AT&T CORP. 7.30% 11/15/11 | 109,664 | |||||||||||||
| 308,575 | BELLSOUTH TELECOM. 6.30% 12/15/15 | 317,517 | |||||||||||||
| 53,000 | VERIZON 6.50% 09/15/11 | 56,414 | |||||||||||||
| 100,000 | VERIZON FLORIDA 6.125% 01/15/13 | 103,404 | |||||||||||||
| 587,000 | 8.04 | ||||||||||||||
See accompanying Notes to Financial Statements which are an integral part of these financial statements.
39
Pacific Advisors Income and Equity Fund
Statement of Investments (Unaudited)
as of June 30, 2009
| Quantity or Principal | Description | Current $ Value** | % of Total Net Assets | ||||||||||||
| CORPORATE BONDS continued | |||||||||||||||
| UTILITIES | 6.34 | ||||||||||||||
| ELECTRIC UTILITIES | |||||||||||||||
| 232,000 | SOUTH CAROLINA ELEC 6.70% 02/01/11 | 247,936 | |||||||||||||
| 247,936 | 3.40 | ||||||||||||||
| GAS UTILITIES | |||||||||||||||
| 150,000 | PIEDMONT NATURAL GAS 7.80% 09/29/10 | 157,052 | |||||||||||||
| 157,052 | 2.15 | ||||||||||||||
| MULTI-UTILITIES | |||||||||||||||
| 55,000 | CONSUMERS ENERGY CO. 6.00% 02/15/14 | 58,026 | |||||||||||||
| 58,026 | 0.79 | ||||||||||||||
| TOTAL CORPORATE BONDS (Cost: $4,773,679) | 4,684,782 | 64.18 | |||||||||||||
| US GOVT SECURITIES | |||||||||||||||
| US GOVERNMENT AGENCY | 1.47 | ||||||||||||||
| US GOVERNMENT AGENCY | |||||||||||||||
| 100,000 | FEDERAL HOME LOAN BANK 6.00% 07/19/17 | 107,061 | |||||||||||||
| 107,061 | 1.47 | ||||||||||||||
| TOTAL US GOVT SECURITIES (Cost: $100,000) | 107,061 | 1.47 | |||||||||||||
| PREFERRED STOCK | |||||||||||||||
| FINANCIALS | 5.92 | ||||||||||||||
| COMMERCIAL BANKS | |||||||||||||||
| 2,000 | BANK OF AMERICA 7.25% PFD | 36,800 | |||||||||||||
| 2,000 | BANK OF AMERICA 6.375% PFD | 32,620 | |||||||||||||
| 2,000 | BARCLAYS BANK PLC 6.625% PFD | 35,320 | |||||||||||||
| 2,000 | BARCLAYS BANK PLC 7.10% PFD | 36,580 | |||||||||||||
| 2,500 | CITIGROUP INC. 8.125% PFD | 46,700 | |||||||||||||
| 4,000 | HSBC HOLDINGS PLC 6.20% PFD A | 72,320 | |||||||||||||
| 260,340 | 3.57 | ||||||||||||||
| DIVERSIFIED FINANCIAL SERVICES | |||||||||||||||
| 3,000 | DEUTSCHE BANK 6.625% PFD | 55,500 | |||||||||||||
| 2,000 | MERRILL LYNCH 6.45% PFD | 32,500 | |||||||||||||
| 88,000 | 1.21 | ||||||||||||||
| INSURANCE | |||||||||||||||
| 3,000 | METLIFE INC. 6.50% PFD | 61,650 | |||||||||||||
| 2,500 | PHOENIX COMPANIES INC. 7.45% PFD | 22,400 | |||||||||||||
| 84,050 | 1.15 | ||||||||||||||
See accompanying Notes to Financial Statements which are an integral part of these financial statements.
40
Pacific Advisors Income and Equity Fund
Statement of Investments (Unaudited)
as of June 30, 2009
| Quantity or Principal | Description | Current $ Value** | % of Total Net Assets | ||||||||||||
| PREFERRED STOCK continued | |||||||||||||||
| TELECOMMUNICATION SERVICES | 0.70 | ||||||||||||||
| DIVERSIFIED TELECOM. SERVICES | |||||||||||||||
| 2,000 | AT&T INC. 6.375% PFD | 50,980 | |||||||||||||
| 50,980 | 0.70 | ||||||||||||||
| UTILITIES | 0.68 | ||||||||||||||
| ELECTRIC UTILITIES | |||||||||||||||
| 2,000 | FPL GROUP CAPITAL 6.60% PFD A | 49,800 | |||||||||||||
| 49,800 | 0.68 | ||||||||||||||
| TOTAL PREFERRED STOCK (Cost: $725,060) | 533,170 | 7.30 | |||||||||||||
| SHORT TERM INVESTMENTS | |||||||||||||||
| MONEY MARKET | 4.92 | ||||||||||||||
| 359,359 | UMB MONEY MARKET FIDUCIARY | 359,359 | |||||||||||||
| 359,359 | 4.92 | ||||||||||||||
| TOTAL SHORT TERM INVESTMENTS (Cost: $359,359) | 359,359 | 4.92 | |||||||||||||
| TOTAL INVESTMENTS (Cost: $8,016,117) | 7,254,537 | 99.38 | |||||||||||||
| OTHER ASSETS LESS LIABILITIES | 45,421 | 0.62 | |||||||||||||
| TOTAL NET ASSETS | 7,299,958 | 100.00 | |||||||||||||
* Non-income producing
** The principal amount is stated in U.S. dollars unless otherwise indicated.
See accompanying Notes to Financial Statements which are an integral part of these financial statements.
41
Pacific Advisors Balanced Fund
Statement of Investments (Unaudited)
as of June 30, 2009
| Quantity or Principal | Description | Current $ Value** | % of Total Net Assets | ||||||||||||
| COMMON STOCK | |||||||||||||||
| CONSUMER DISCRETIONARY | 1.11 | ||||||||||||||
| HOTELS, RESTAURANTS & LEISURE | |||||||||||||||
| 5,000 | MCDONALD'S CORP. | 287,450 | |||||||||||||
| 287,450 | 1.11 | ||||||||||||||
| CONSUMER STAPLES | 8.15 | ||||||||||||||
| BEVERAGES | |||||||||||||||
| 15,000 | COCA-COLA CO. | 719,850 | |||||||||||||
| 719,850 | 2.78 | ||||||||||||||
| FOOD PRODUCTS | |||||||||||||||
| 7,500 | MCCORMICK & COMPANY INC. | 243,975 | |||||||||||||
| 12,000 | JM SMUCKER CO. | 583,920 | |||||||||||||
| 827,895 | 3.20 | ||||||||||||||
| HOUSEHOLD PRODUCTS | |||||||||||||||
| 11,053 | PROCTER & GAMBLE CO. | 564,808 | |||||||||||||
| 564,808 | 2.18 | ||||||||||||||
| ENERGY | 13.74 | ||||||||||||||
| ENERGY EQUIPMENT & SERVICES | |||||||||||||||
| 24,000 | CAMERON INT'L CORP.* | 679,200 | |||||||||||||
| 10,000 | HALLIBURTON CO. | 207,000 | |||||||||||||
| 5,000 | NATIONAL OILWELL VARCO INC.* | 163,300 | |||||||||||||
| 1,049,500 | 4.05 | ||||||||||||||
| OIL, GAS & CONSUMABLE FUELS | |||||||||||||||
| 6,000 | BRITISH PETROLEUM PLC ADR | 286,080 | |||||||||||||
| 8,000 | CONOCOPHILLIPS | 336,480 | |||||||||||||
| 15,000 | DEVON ENERGY CORP. | 817,500 | |||||||||||||
| 8,750 | SPECTRA ENERGY CORP. | 148,050 | |||||||||||||
| 15,000 | SUNCOR ENERGY INC. | 455,100 | |||||||||||||
| 30,000 | WILLIAMS COMPANIES INC. | 468,300 | |||||||||||||
| 2,511,510 | 9.69 | ||||||||||||||
| FINANCIALS | 7.52 | ||||||||||||||
| COMMERCIAL BANKS | |||||||||||||||
| 35,000 | BANCO LATINOAMERICANO DE EXPORTACIONES E | 435,050 | |||||||||||||
| 435,050 | 1.68 | ||||||||||||||
| CONSUMER FINANCE | |||||||||||||||
| 10,000 | AMERICAN EXPRESS CO. | 232,400 | |||||||||||||
| 232,400 | 0.90 | ||||||||||||||
See accompanying Notes to Financial Statements which are an integral part of these financial statements.
42
Pacific Advisors Balanced Fund
Statement of Investments (Unaudited)
as of June 30, 2009
| Quantity or Principal | Description | Current $ Value** | % of Total Net Assets | ||||||||||||
| COMMON STOCK continued | |||||||||||||||
| DIVERSIFIED FINANCIAL SERVICES | |||||||||||||||
| 10,000 | MOODYS CORP. | 263,500 | |||||||||||||
| 263,500 | 1.02 | ||||||||||||||
| INSURANCE | |||||||||||||||
| 6 | BERKSHIRE HATHAWAY INC. A* | 540,000 | |||||||||||||
| 12,000 | CHUBB CORP. | 478,560 | |||||||||||||
| 1,018,560 | 3.93 | ||||||||||||||
| HEALTH CARE | 6.56 | ||||||||||||||
| HEALTH CARE EQUIPMENT & SUPPLIES | |||||||||||||||
| 5,000 | BAXTER INT'L INC. | 264,800 | |||||||||||||
| 5,000 | BECTON DICKINSON & CO. | 356,550 | |||||||||||||
| 5,000 | COVIDIEN PLC. | 187,200 | |||||||||||||
| 808,550 | 3.12 | ||||||||||||||
| LIFE SCIENCES TOOLS & SERVICES | |||||||||||||||
| 12,000 | PERKINELMER INC. | 208,800 | |||||||||||||
| 208,800 | 0.81 | ||||||||||||||
| PHARMACEUTICALS | |||||||||||||||
| 12,000 | JOHNSON & JOHNSON | 681,600 | |||||||||||||
| 681,600 | 2.63 | ||||||||||||||
| INDUSTRIALS | 12.79 | ||||||||||||||
| AEROSPACE & DEFENSE | |||||||||||||||
| 10,000 | BOEING CO. | 425,000 | |||||||||||||
| 15,000 | CUBIC CORP. | 536,850 | |||||||||||||
| 961,850 | 3.71 | ||||||||||||||
| AIR FREIGHT & LOGISTICS | |||||||||||||||
| 5,000 | UNITED PARCEL SERVICE INC. B | 249,950 | |||||||||||||
| 249,950 | 0.96 | ||||||||||||||
| INDUSTRIAL CONGLOMERATES | |||||||||||||||
| 40,000 | GENERAL ELECTRIC CO. | 468,800 | |||||||||||||
| 468,800 | 1.81 | ||||||||||||||
| MACHINERY | |||||||||||||||
| 6,000 | CATERPILLAR INC. | 198,240 | |||||||||||||
| 10,000 | INGERSOLL-RAND COMPANY LTD. A | 209,000 | |||||||||||||
| 407,240 | 1.57 | ||||||||||||||
See accompanying Notes to Financial Statements which are an integral part of these financial statements.
43
Pacific Advisors Balanced Fund
Statement of Investments (Unaudited)
as of June 30, 2009
| Quantity or Principal | Description | Current $ Value** | % of Total Net Assets | ||||||||||||
| COMMON STOCK continued | |||||||||||||||
| ROAD & RAIL | |||||||||||||||
| 5,000 | BURLINGTON NORTHERN SANTA FE CORP. | 367,700 | |||||||||||||
| 6,000 | CSX CORP. | 207,780 | |||||||||||||
| 7,000 | NORFOLK SOUTHERN CORP. | 263,690 | |||||||||||||
| 839,170 | 3.24 | ||||||||||||||
| TRADING COMPANIES & DISTRIBUTORS | |||||||||||||||
| 15,000 | GATX CORP. | 385,800 | |||||||||||||
| 385,800 | 1.49 | ||||||||||||||
| INFORMATION TECHNOLOGY | 4.90 | ||||||||||||||
| COMMUNICATIONS EQUIPMENT | |||||||||||||||
| 25,000 | NOKIA CORP. ADR A | 364,500 | |||||||||||||
| 364,500 | 1.41 | ||||||||||||||
| COMPUTERS & PERIPHERALS | |||||||||||||||
| 10,000 | SANDISK CORP.* | 146,900 | |||||||||||||
| 146,900 | 0.57 | ||||||||||||||
| IT SERVICES | |||||||||||||||
| 8,000 | AUTOMATIC DATA PROCESSING INC. | 283,520 | |||||||||||||
| 283,520 | 1.09 | ||||||||||||||
| SOFTWARE | |||||||||||||||
| 20,000 | MICROSOFT CORP. | 475,400 | |||||||||||||
| 475,400 | 1.83 | ||||||||||||||
| MATERIALS | 2.37 | ||||||||||||||
| METALS & MINING | |||||||||||||||
| 16,000 | RELIANCE STEEL & ALUMINUM CO. | 614,240 | |||||||||||||
| 614,240 | 2.37 | ||||||||||||||
| TELECOMMUNICATION SERVICES | 1.65 | ||||||||||||||
| DIVERSIFIED TELECOM. SERVICES | |||||||||||||||
| 60,000 | FRONTIER COMMUNICATIONS CORP. | 428,400 | |||||||||||||
| 428,400 | 1.65 | ||||||||||||||
| UTILITIES | 1.76 | ||||||||||||||
| ELECTRIC UTILITIES | |||||||||||||||
| 7,000 | ALLETE INC. | 201,250 | |||||||||||||
| 17,500 | DUKE ENERGY CORP. | 255,325 | |||||||||||||
| 456,575 | 1.76 | ||||||||||||||
| TOTAL COMMON STOCK (Cost: $15,493,717) | 15,691,818 | 60.56 | |||||||||||||
See accompanying Notes to Financial Statements which are an integral part of these financial statements.
44
Pacific Advisors Balanced Fund
Statement of Investments (Unaudited)
as of June 30, 2009
| Quantity or Principal | Description | Current $ Value** | % of Total Net Assets | ||||||||||||
| CORPORATE BONDS | |||||||||||||||
| CONSUMER DISCRETIONARY | 2.52 | ||||||||||||||
| AUTO COMPONENTS | |||||||||||||||
| 100,000 | BORG WARNER 8.00% 10/01/19 | 90,173 | |||||||||||||
| 90,173 | 0.35 | ||||||||||||||
| MULTILINE RETAIL | |||||||||||||||
| 178,000 | TARGET CORP. 8.60% 01/15/12 | �� | 199,967 | ||||||||||||
| 199,967 | 0.77 | ||||||||||||||
| SPECIALTY RETAIL | |||||||||||||||
| 100,000 | HOME DEPOT INC. 4.625% 08/15/10 | 101,880 | |||||||||||||
| 150,000 | HOME DEPOT INC. 5.20% 03/01/11 | 155,267 | |||||||||||||
| 100,000 | STAPLES INC. 7.375% 10/01/12 | 104,478 | |||||||||||||
| 361,624 | 1.40 | ||||||||||||||
| ENERGY | 7.16 | ||||||||||||||
| ENERGY EQUIPMENT & SERVICES | |||||||||||||||
| 120,000 | KINDER MORGAN 6.50% 09/01/13 | 115,986 | |||||||||||||
| 100,000 | WEATHERFORD INT'L LTD. 5.95% 06/15/12 | 104,410 | |||||||||||||
| 220,396 | 0.85 | ||||||||||||||
| OIL, GAS & CONSUMABLE FUELS | |||||||||||||||
| 501,000 | ATLANTIC RICHFIELD 9.125% 03/01/11 | 556,950 | |||||||||||||
| 255,000 | BURLINGTON RESOURCES 6.40% 08/15/11 | 274,979 | |||||||||||||
| 190,000 | DEVON ENERGY CORP. 10.125% 11/15/09 | 193,086 | |||||||||||||
| 50,000 | PREMCOR REFINING 6.75% 05/01/14 | 49,512 | |||||||||||||
| 296,000 | PREMCOR REFINING 7.50% 06/15/15 | 307,108 | |||||||||||||
| 250,000 | SPECTRA ENERGY CORP. 7.50% 10/01/09 | 252,826 | |||||||||||||
| 1,634,461 | 6.31 | ||||||||||||||
| FINANCIALS | 12.40 | ||||||||||||||
| COMMERCIAL BANKS | |||||||||||||||
| 161,000 | MORGAN STANLEY 07/01/14 FLOAT | 128,410 | |||||||||||||
| 128,410 | 0.50 | ||||||||||||||
| DIVERSIFIED FINANCIAL SERVICES | |||||||||||||||
| 250,000 | AIG 07/11/11 FLOAT | 203,104 | |||||||||||||
| 300,000 | AIG 6.00% 10/15/14 | 131,130 | |||||||||||||
| 450,000 | AIG 6.00% 11/15/14 | 194,571 | |||||||||||||
| 300,000 | GENERAL ELECTRIC CAP 5.50% 11/15/11 | 300,742 | |||||||||||||
| 311,000 | GENERAL ELECTRIC CAP 8.125% 05/15/12 | 348,566 | |||||||||||||
| 155,000 | HOUSEHOLD FINANCE CO. 09/15/13 FLOAT | 134,642 | |||||||||||||
| 200,000 | GENERAL ELECTRIC CAP 5.65% 06/09/14 | 198,754 | |||||||||||||
| 601,000 | GENERAL ELECTRIC CAP 5.40% 02/15/17 | 581,897 | |||||||||||||
| 250,000 | HOUSEHOLD FINANCE CO. 6.375% 11/27/12 | 254,287 | |||||||||||||
See accompanying Notes to Financial Statements which are an integral part of these financial statements.
45
Pacific Advisors Balanced Fund
Statement of Investments (Unaudited)
as of June 30, 2009
| Quantity or Principal | Description | Current $ Value** | % of Total Net Assets | ||||||||||||
| CORPORATE BONDS continued | |||||||||||||||
| 505,000 | NATIONAL RURAL UTIL 5.70% 01/15/10 | 513,051 | |||||||||||||
| 100,000 | SLM CORP. 09/15/09 FLOAT | 98,480 | |||||||||||||
| 2,959,222 | 11.42 | ||||||||||||||
| INSURANCE | |||||||||||||||
| 130,000 | AIG 7.50% 08/11/10 | 123,813 | |||||||||||||
| 123,813 | 0.48 | ||||||||||||||
| INDUSTRIALS | 6.39 | ||||||||||||||
| AEROSPACE & DEFENSE | |||||||||||||||
| 300,000 | LOCKHEED MARTIN 8.20% 12/01/09 | 307,687 | |||||||||||||
| 307,687 | 1.19 | ||||||||||||||
| COMMERCIAL SERVICES & SUPPLIES | |||||||||||||||
| 100,000 | ALLIED WASTE NORTH AMERICA INC. 7.875% 04/15/13 | 102,000 | |||||||||||||
| 102,000 | 0.39 | ||||||||||||||
| ELECTRICAL EQUIPMENT | |||||||||||||||
| 250,000 | EMERSON ELECTRIC CO. 7.125% 08/15/10 | 264,859 | |||||||||||||
| 264,859 | 1.02 | ||||||||||||||
| INDUSTRIAL CONGLOMERATES | |||||||||||||||
| 1,000,000 | GENERAL ELECTRIC CO. 5.25% 12/06/17 | 982,045 | |||||||||||||
| 982,045 | 3.79 | ||||||||||||||
| INFORMATION TECHNOLOGY | 1.04 | ||||||||||||||
| COMPUTERS & PERIPHERALS | |||||||||||||||
| 150,000 | DELL INC. 4.70% 04/15/13 | 154,372 | |||||||||||||
| 100,000 | DIGITAL EQUIPMENT 7.75% 04/01/23 | 114,479 | |||||||||||||
| 268,851 | 1.04 | ||||||||||||||
| MATERIALS | 0.97 | ||||||||||||||
| METALS & MINING | |||||||||||||||
| 250,000 | ALCOA INC. 6.00% 01/15/12 | 252,167 | |||||||||||||
| 252,167 | 0.97 | ||||||||||||||
| TELECOMMUNICATION SERVICES | 1.37 | ||||||||||||||
| DIVERSIFIED TELECOM. SERVICES | |||||||||||||||
| 250,000 | NEXTEL COMMUNICATIONS 7.375% 08/01/15 | 199,375 | |||||||||||||
| 150,000 | VERIZON FLORIDA 6.125% 01/15/13 | 155,106 | |||||||||||||
| 354,481 | 1.37 | ||||||||||||||
See accompanying Notes to Financial Statements which are an integral part of these financial statements.
46
Pacific Advisors Balanced Fund
Statement of Investments (Unaudited)
as of June 30, 2009
| Quantity or Principal | Description | Current $ Value** | % of Total Net Assets | ||||||||||||
| CORPORATE BONDS continued | |||||||||||||||
| UTILITIES | 0.15 | ||||||||||||||
| ELECTRIC UTILITIES | |||||||||||||||
| 39,787 | RELIANT ENERGY MID ATL 9.237% 07/02/17 | 38,196 | |||||||||||||
| 38,196 | 0.15 | ||||||||||||||
| TOTAL CORPORATE BONDS (Cost: $8,813,146) | 8,288,353 | 31.99 | |||||||||||||
| PREFERRED STOCK | |||||||||||||||
| FINANCIALS | 3.40 | ||||||||||||||
| COMMERCIAL BANKS | |||||||||||||||
| 8,000 | BANK OF AMERICA 8.20% PFD | 158,000 | |||||||||||||
| 5,000 | BARCLAYS BANK PLC 8.125% PFD | 103,250 | |||||||||||||
| 5,000 | BARCLAYS BANK PLC 7.10% PFD | 91,450 | |||||||||||||
| 5,000 | CITIGROUP INC. 8.50% PFD F | 93,400 | |||||||||||||
| 5,000 | CITIGROUP INC. 8.125% PFD | 93,400 | |||||||||||||
| 5,000 | HSBC HOLDING PLC 8.125% PFD | 118,950 | |||||||||||||
| 10,000 | WACHOVIA 7.85% PFD | 223,500 | |||||||||||||
| 881,950 | 3.40 | ||||||||||||||
| TELECOMMUNICATION SERVICES | 0.98 | ||||||||||||||
| DIVERSIFIED TELECOM. SERVICES | |||||||||||||||
| 10,000 | AT&T INC. 6.375% PFD | 254,900 | |||||||||||||
| 254,900 | 0.98 | ||||||||||||||
| TOTAL PREFERRED STOCK (Cost: $1,324,938) | 1,136,850 | 4.39 | |||||||||||||
| SHORT TERM INVESTMENTS | |||||||||||||||
| MONEY MARKET | 2.78 | ||||||||||||||
| 719,694 | UMB MONEY MARKET FIDUCIARY | 719,694 | |||||||||||||
| 719,694 | 2.78 | ||||||||||||||
| TOTAL SHORT TERM INVESTMENTS (Cost: $719,694) | 719,694 | 2.78 | |||||||||||||
| TOTAL INVESTMENTS (Cost: $26,351,495) | 25,836,715 | 99.72 | |||||||||||||
| OTHER ASSETS LESS LIABILITIES | 71,764 | 0.28 | |||||||||||||
| TOTAL NET ASSETS | 25,908,479 | 100.00 | |||||||||||||
* Non-income producing
** The principal amount is stated in U.S. dollars unless otherwise indicated.
See accompanying Notes to Financial Statements which are an integral part of these financial statements.
47
Pacific Advisors Growth Fund
Statement of Investments (Unaudited)
as of June 30, 2009
| Quantity or Principal | Description | Current $ Value** | % of Total Net Assets | ||||||||||||
| COMMON STOCK | |||||||||||||||
| CONSUMER STAPLES | 4.92 | ||||||||||||||
| PERSONAL PRODUCTS | |||||||||||||||
| 2,000 | CHATTEM INC.* | 136,200 | |||||||||||||
| 136,200 | 4.92 | ||||||||||||||
| ENERGY | 29.68 | ||||||||||||||
| ENERGY EQUIPMENT & SERVICES | |||||||||||||||
| 4,000 | FMC TECHNOLOGIES INC.* | 150,320 | |||||||||||||
| 4,000 | HORNBECK OFFSHORE SERVICES INC.* | 85,560 | |||||||||||||
| 2,000 | NATIONAL OILWELL VARCO INC.* | 65,320 | |||||||||||||
| 301,200 | 10.88 | ||||||||||||||
| OIL, GAS & CONSUMABLE FUELS | |||||||||||||||
| 2,000 | APACHE CORP. | 144,300 | |||||||||||||
| 2,000 | CHESAPEAKE ENERGY CORP. | 39,660 | |||||||||||||
| 1,500 | CONOCOPHILLIPS | 63,090 | |||||||||||||
| 4,000 | MARATHON OIL CORP. | 120,520 | |||||||||||||
| 1,000 | OCCIDENTAL PETROLEUM CORP. | 65,810 | |||||||||||||
| 1,000 | ULTRA PETROLEUM CORP.* | 39,000 | |||||||||||||
| 1,250 | XTO ENERGY INC. | 47,675 | |||||||||||||
| 520,055 | 18.79 | ||||||||||||||
| FINANCIALS | 0.94 | ||||||||||||||
| COMMERCIAL BANKS | |||||||||||||||
| 4,000 | EAST WEST BANCORP INC. | 25,960 | |||||||||||||
| 25,960 | 0.94 | ||||||||||||||
| HEALTH CARE | 34.35 | ||||||||||||||
| HEALTH CARE EQUIPMENT & SUPPLIES | |||||||||||||||
| 1,500 | BECTON DICKINSON & CO. | 106,965 | |||||||||||||
| 1,500 | MCKESSON CORP. | 66,000 | |||||||||||||
| 2,000 | QUEST DIAGNOSTICS INC. | 112,860 | |||||||||||||
| 3,000 | ST. JUDE MEDICAL INC.* | 123,300 | |||||||||||||
| 3,000 | UNITEDHEALTH GROUP INC. | 74,940 | |||||||||||||
| 2,750 | WELLPOINT INC.* | 139,948 | |||||||||||||
| 3,000 | ZIMMER HOLDINGS INC.* | 127,800 | |||||||||||||
| 751,813 | 27.17 | ||||||||||||||
| PHARMACEUTICALS | |||||||||||||||
| 3,500 | JOHNSON & JOHNSON | 198,800 | |||||||||||||
| 198,800 | 7.18 | ||||||||||||||
See accompanying Notes to Financial Statements which are an integral part of these financial statements.
48
Pacific Advisors Growth Fund
Statement of Investments (Unaudited)
as of June 30, 2009
| Quantity or Principal | Description | Current $ Value** | % of Total Net Assets | ||||||||||||
| COMMON STOCK continued | |||||||||||||||
| INDUSTRIALS | 15.52 | ||||||||||||||
| AEROSPACE & DEFENSE | |||||||||||||||
| 1,000 | BOEING CO. | 42,500 | |||||||||||||
| 1,000 | HONEYWELL INT'L INC. | 31,400 | |||||||||||||
| 73,900 | 2.67 | ||||||||||||||
| CONSTRUCTION & ENGINEERING | |||||||||||||||
| 3,000 | CHICAGO BRIDGE & IRON CO. NV* | 37,200 | |||||||||||||
| 37,200 | 1.34 | ||||||||||||||
| INDUSTRIAL CONGLOMERATES | |||||||||||||||
| 8,000 | GENERAL ELECTRIC CO. | 93,760 | |||||||||||||
| 93,760 | 3.39 | ||||||||||||||
| MACHINERY | |||||||||||||||
| 1,000 | ITT CORP. | 44,500 | |||||||||||||
| 44,500 | 1.61 | ||||||||||||||
| MARINE | |||||||||||||||
| 4,000 | KIRBY CORP.* | 127,160 | |||||||||||||
| 127,160 | 4.60 | ||||||||||||||
| ROAD & RAIL | |||||||||||||||
| 2,000 | GENESEE & WYOMING INC.* | 53,020 | |||||||||||||
| 53,020 | 1.92 | ||||||||||||||
| INFORMATION TECHNOLOGY | 11.86 | ||||||||||||||
| COMMUNICATIONS EQUIPMENT | |||||||||||||||
| 2,500 | CISCO SYSTEMS INC.* | 46,600 | |||||||||||||
| 1,000 | QUALCOMM INC. | 45,200 | |||||||||||||
| 91,800 | 3.32 | ||||||||||||||
| ELECTRONIC EQUIPMENT & INSTRUMENTS | |||||||||||||||
| 3,000 | ITRON INC.* | 165,210 | |||||||||||||
| 165,210 | 5.97 | ||||||||||||||
| SOFTWARE | |||||||||||||||
| 3,000 | MICROSOFT CORP. | 71,310 | |||||||||||||
| 71,310 | 2.58 | ||||||||||||||
| MATERIALS | 4.87 | ||||||||||||||
| METALS & MINING | |||||||||||||||
| 1,000 | BHP BILLITON LTD. | 54,730 | |||||||||||||
| 5,000 | COMMERCIAL METALS CO. | 80,150 | |||||||||||||
| 134,880 | 4.87 | ||||||||||||||
See accompanying Notes to Financial Statements which are an integral part of these financial statements.
49
Pacific Advisors Growth Fund
Statement of Investments (Unaudited)
as of June 30, 2009
| Quantity or Principal | Description | Current $ Value** | % of Total Net Assets | ||||||||||||
| COMMON STOCK continued | |||||||||||||||
| TELECOMMUNICATION SERVICES | 1.29 | ||||||||||||||
| DIVERSIFIED TELECOM. SERVICES | |||||||||||||||
| 5,000 | FRONTIER COMMUNICATIONS CORP. | 35,700 | |||||||||||||
| 35,700 | 1.29 | ||||||||||||||
| TOTAL COMMON STOCK (Cost: $3,338,353) | 2,862,467 | 103.44 | |||||||||||||
| TOTAL INVESTMENTS (Cost: $3,338,353) | 2,862,467 | 103.44 | |||||||||||||
| OTHER ASSETS LESS LIABILITIES | (95,260 | ) | (3.44 | ) | |||||||||||
| TOTAL NET ASSETS | 2,767,207 | 100.00 | |||||||||||||
* Non-income producing
** The principal amount is stated in U.S. dollars unless otherwise indicated.
See accompanying Notes to Financial Statements which are an integral part of these financial statements.
50
Pacific Advisors Multi-Cap Value Fund
Statement of Investments (Unaudited)
as of June 30, 2009
| Quantity or Principal | Description | Current $ Value** | % of Total Net Assets | ||||||||||||
| COMMON STOCK | |||||||||||||||
| CONSUMER DISCRETIONARY | 12.53 | ||||||||||||||
| SPECIALTY RETAIL | |||||||||||||||
| 15,000 | GROUP 1 AUTOMOTIVE INC.* | 390,300 | |||||||||||||
| 11,000 | HOME DEPOT INC. | 259,930 | |||||||||||||
| 650,230 | 9.94 | ||||||||||||||
| TEXTILES, APPAREL & LUXURY GOODS | |||||||||||||||
| 20,000 | K-SWISS INC.* | 170,000 | |||||||||||||
| 170,000 | 2.60 | ||||||||||||||
| CONSUMER STAPLES | 11.88 | ||||||||||||||
| BEVERAGES | |||||||||||||||
| 15,000 | DR PEPPER SNAPPLE GROUP INC.* | 317,850 | |||||||||||||
| 317,850 | 4.86 | ||||||||||||||
| FOOD PRODUCTS | |||||||||||||||
| 7,000 | ARCHER DANIELS MIDLAND CO. | 187,390 | |||||||||||||
| 187,390 | 2.86 | ||||||||||||||
| PERSONAL PRODUCTS | |||||||||||||||
| 4,000 | CHATTEM INC.* | 272,400 | |||||||||||||
| 272,400 | 4.16 | ||||||||||||||
| ENERGY | 34.82 | ||||||||||||||
| ENERGY EQUIPMENT & SERVICES | |||||||||||||||
| 34,000 | ION GEOPHYSICAL CORP.* | 87,380 | |||||||||||||
| 7,000 | LUFKIN INDUSTRIES INC. | 294,350 | |||||||||||||
| 27,000 | MITCHAM INDUSTRIES INC.* | 140,130 | |||||||||||||
| 8,000 | TIDEWATER INC. | 342,960 | |||||||||||||
| 864,820 | 13.21 | ||||||||||||||
| OIL, GAS & CONSUMABLE FUELS | |||||||||||||||
| 4,000 | APACHE CORP. | 288,600 | |||||||||||||
| 15,000 | ARCH COAL INC. | 230,550 | |||||||||||||
| 12,000 | CHESAPEAKE ENERGY CORP. | 237,960 | |||||||||||||
| 6,000 | CHEVRON CORP. | 397,500 | |||||||||||||
| 8,600 | MARATHON OIL CORP. | 259,118 | |||||||||||||
| 1,413,728 | 21.60 | ||||||||||||||
| FINANCIALS | 5.89 | ||||||||||||||
| CAPITAL MARKETS | |||||||||||||||
| 1,000 | GOLDMAN SACHS GROUP INC. | 147,440 | |||||||||||||
| 147,440 | 2.25 | ||||||||||||||
See accompanying Notes to Financial Statements which are an integral part of these financial statements.
51
Pacific Advisors Multi-Cap Value Fund
Statement of Investments (Unaudited)
as of June 30, 2009
| Quantity or Principal | Description | Current $ Value** | % of Total Net Assets | ||||||||||||
| COMMON STOCK continued | |||||||||||||||
| COMMERCIAL BANKS | |||||||||||||||
| 25,000 | CATHAY GENERAL BANCORP | 237,750 | |||||||||||||
| 237,750 | 3.63 | ||||||||||||||
| INDUSTRIALS | 33.54 | ||||||||||||||
| AEROSPACE & DEFENSE | |||||||||||||||
| 9,000 | HONEYWELL INT'L INC. | 282,600 | |||||||||||||
| 282,600 | 4.32 | ||||||||||||||
| AIR FREIGHT & LOGISTICS | |||||||||||||||
| 4,000 | CH ROBINSON WORLDWIDE INC. | 208,600 | |||||||||||||
| 208,600 | 3.19 | ||||||||||||||
| COMMERCIAL SERVICES & SUPPLIES | |||||||||||||||
| 8,000 | COPART INC.* | 277,360 | |||||||||||||
| 277,360 | 4.24 | ||||||||||||||
| CONSTRUCTION & ENGINEERING | |||||||||||||||
| 15,000 | KBR INC. | 276,600 | |||||||||||||
| 276,600 | 4.23 | ||||||||||||||
| MACHINERY | |||||||||||||||
| 14,500 | GRACO INC. | 319,290 | |||||||||||||
| 319,290 | 4.88 | ||||||||||||||
| MARINE | |||||||||||||||
| 14,000 | DRYSHIPS INC.* | 80,920 | |||||||||||||
| 80,920 | 1.24 | ||||||||||||||
| ROAD & RAIL | |||||||||||||||
| 13,000 | GENESEE & WYOMING INC.* | 344,630 | |||||||||||||
| 14,000 | KANSAS CITY SOUTHERN* | 225,540 | |||||||||||||
| 5,000 | LANDSTAR SYSTEM INC. | 179,550 | |||||||||||||
| 749,720 | 11.46 | ||||||||||||||
| INFORMATION TECHNOLOGY | 2.51 | ||||||||||||||
| IT SERVICES | |||||||||||||||
| 10,000 | WESTERN UNION CO. | 164,000 | |||||||||||||
| 164,000 | 2.51 | ||||||||||||||
| MATERIALS | 9.95 | ||||||||||||||
| CHEMICALS | |||||||||||||||
| 21,000 | H.B. FULLER CO. | 394,380 | |||||||||||||
| 394,380 | 6.03 | ||||||||||||||
See accompanying Notes to Financial Statements which are an integral part of these financial statements.
52
Pacific Advisors Multi-Cap Value Fund
Statement of Investments (Unaudited)
as of June 30, 2009
| Quantity or Principal | Description | Current $ Value** | % of Total Net Assets | ||||||||||||
| COMMON STOCK continued | |||||||||||||||
| METALS & MINING | |||||||||||||||
| 16,000 | COMMERCIAL METALS CO. | 256,480 | |||||||||||||
| 256,480 | 3.92 | ||||||||||||||
| TOTAL COMMON STOCK (Cost: $9,413,500) | 7,271,558 | 111.11 | |||||||||||||
| TOTAL INVESTMENTS (Cost: $9,413,500) | 7,271,558 | 111.11 | |||||||||||||
| OTHER ASSETS LESS LIABILITIES | (727,136 | ) | (11.11 | ) | |||||||||||
| TOTAL NET ASSETS | 6,544,422 | 100.00 | |||||||||||||
* Non-income producing
** The principal amount is stated in U.S. dollars unless otherwise indicated.
See accompanying Notes to Financial Statements which are an integral part of these financial statements.
53
Pacific Advisors Small Cap Fund
Statement of Investments (Unaudited)
as of June 30, 2009
| Quantity or Principal | Description | Current $ Value** | % of Total Net Assets | ||||||||||||
| COMMON STOCK | |||||||||||||||
| CONSUMER DISCRETIONARY | 15.30 | ||||||||||||||
| AUTO COMPONENTS | |||||||||||||||
| 740,000 | AMERIGON INC.* | 4,514,000 | |||||||||||||
| 4,514,000 | 3.64 | ||||||||||||||
| SPECIALTY RETAIL | |||||||||||||||
| 350,000 | CONNS INC.* | 4,375,000 | |||||||||||||
| 863,000 | SONIC AUTOMOTIVE INC.* | 8,768,080 | |||||||||||||
| 13,143,080 | 10.61 | ||||||||||||||
| TEXTILES, APPAREL & LUXURY GOODS | |||||||||||||||
| 45,000 | PHILLIPS VAN HEUSEN CORP. | 1,291,050 | |||||||||||||
| 1,291,050 | 1.04 | ||||||||||||||
| CONSUMER STAPLES | 4.77 | ||||||||||||||
| FOOD PRODUCTS | |||||||||||||||
| 520,000 | DARLING INTERNATIONAL INC.* | 3,432,000 | |||||||||||||
| 610,000 | OMEGA PROTEIN CORP.* | 2,476,600 | |||||||||||||
| 5,908,600 | 4.77 | ||||||||||||||
| ENERGY | 15.51 | ||||||||||||||
| ENERGY EQUIPMENT & SERVICES | |||||||||||||||
| 2,600,000 | BOOTS & COOTS INC.* | 3,614,000 | |||||||||||||
| 185,000 | HORNBECK OFFSHORE SERVICES INC.* | 3,957,150 | |||||||||||||
| 265,000 | MATRIX SERVICE CO.* | 3,042,200 | |||||||||||||
| 540,000 | MITCHAM INDUSTRIES INC.* | 2,802,600 | |||||||||||||
| 800,000 | PARKER DRILLING CO.* | 3,472,000 | |||||||||||||
| 16,887,950 | 13.63 | ||||||||||||||
| OIL, GAS & CONSUMABLE FUELS | |||||||||||||||
| 455,000 | INFINITY ENERGY RESOURCES INC.* | 309,400 | |||||||||||||
| 770,000 | QUEST RESOURCE CORP.* | 254,100 | |||||||||||||
| 263,600 | TOREADOR RESOURCES CORP.* | 1,766,120 | |||||||||||||
| 2,329,620 | 1.88 | ||||||||||||||
| FINANCIALS | 12.64 | ||||||||||||||
| COMMERCIAL BANKS | |||||||||||||||
| 490,000 | EAST WEST BANCORP INC. | 3,180,100 | |||||||||||||
| 270,000 | NARA BANCORP INC. | 1,398,600 | |||||||||||||
| 4,578,700 | 3.70 | ||||||||||||||
| CONSUMER FINANCE | |||||||||||||||
| 450,000 | EZCORP INC. A* | 4,851,000 | |||||||||||||
| 355,700 | FIRST CASH FINANCIAL SERVICES INC.* | 6,231,864 | |||||||||||||
| 11,082,864 | 8.95 | ||||||||||||||
See accompanying Notes to Financial Statements which are an integral part of these financial statements.
54
Pacific Advisors Small Cap Fund
Statement of Investments (Unaudited)
as of June 30, 2009
| Quantity or Principal | Description | Current $ Value** | % of Total Net Assets | ||||||||||||
| COMMON STOCK continued | |||||||||||||||
| HEALTH CARE | 9.84 | ||||||||||||||
| HEALTH CARE PROVIDERS & SERVICES | |||||||||||||||
| 530,000 | AMERICA SERVICE GROUP INC.* | 8,517,100 | |||||||||||||
| 230,100 | ROCHESTER MEDICAL CORP.* | 3,083,340 | |||||||||||||
| 360,000 | UNITED AMERICAN HEALTHCARE CORP.* | 594,000 | |||||||||||||
| 12,194,440 | 9.84 | ||||||||||||||
| INDUSTRIALS | 36.97 | ||||||||||||||
| BUILDING PRODUCTS | |||||||||||||||
| 280,000 | APOGEE ENTERPRISES INC. | 3,444,000 | |||||||||||||
| 3,444,000 | 2.78 | ||||||||||||||
| COMMERCIAL SERVICES & SUPPLIES | |||||||||||||||
| 250,000 | AMERICAN ECOLOGY CORP. | 4,480,000 | |||||||||||||
| 330,000 | MOBILE MINI INC.* | 4,841,100 | |||||||||||||
| 294,000 | TEAM INC.* | 4,606,980 | |||||||||||||
| 13,928,080 | 11.24 | ||||||||||||||
| CONSTRUCTION & ENGINEERING | |||||||||||||||
| 470,000 | FURMANITE CORP.* | 2,096,200 | |||||||||||||
| 375,000 | ORION MARINE GROUP INC.* | 7,125,000 | |||||||||||||
| 9,221,200 | 7.44 | ||||||||||||||
| MARINE | |||||||||||||||
| 160,000 | KIRBY CORP.* | 5,086,400 | |||||||||||||
| 5,086,400 | 4.11 | ||||||||||||||
| ROAD & RAIL | |||||||||||||||
| 270,000 | FROZEN FOOD EXPRESS INDUSTRIES INC. | 858,600 | |||||||||||||
| 390,000 | SAIA INC.* | 7,023,900 | |||||||||||||
| 630,000 | VITRAN CORPORATION INC.* | 6,237,000 | |||||||||||||
| 14,119,500 | 11.40 | ||||||||||||||
| INFORMATION TECHNOLOGY | 1.32 | ||||||||||||||
| SOFTWARE | |||||||||||||||
| 105,000 | TYLER TECHNOLOGIES INC.* | 1,640,100 | |||||||||||||
| 1,640,100 | 1.32 | ||||||||||||||
| MATERIALS | 3.62 | ||||||||||||||
| METALS & MINING | |||||||||||||||
| 280,000 | COMMERCIAL METALS CO. | 4,488,400 | |||||||||||||
| 4,488,400 | 3.62 | ||||||||||||||
See accompanying Notes to Financial Statements which are an integral part of these financial statements.
55
Pacific Advisors Small Cap Fund
Statement of Investments (Unaudited)
as of June 30, 2009
| Quantity or Principal | Description | Current $ Value** | % of Total Net Assets | ||||||||||||
| COMMON STOCK continued | |||||||||||||||
| TELECOMMUNICATION SERVICES | 4.11 | ||||||||||||||
| DIVERSIFIED TELECOM. SERVICES | |||||||||||||||
| 470,000 | PREMIERE GLOBAL SERVICES INC.* | 5,094,800 | |||||||||||||
| 5,094,800 | 4.11 | ||||||||||||||
| TOTAL COMMON STOCK (Cost: $156,388,112) | 128,952,784 | 104.10 | |||||||||||||
| TOTAL INVESTMENTS (Cost: $156,388,112) | 128,952,784 | 104.10 | |||||||||||||
| OTHER ASSETS LESS LIABILITIES | (5,082,664 | ) | (4.10 | ) | |||||||||||
| TOTAL NET ASSETS | 123,870,120 | 100.00 | |||||||||||||
* Non-income producing
** The principal amount is stated in U.S. dollars unless otherwise indicated.
See accompanying Notes to Financial Statements which are an integral part of these financial statements.
56
(This page has been left blank intentionally.)
57
Pacific Advisors Fund Inc.
Statement of Assets and Liabilities (Unaudited)
June 30, 2009
| Government Securities Fund | Income and Equity Fund | Balanced Fund | |||||||||||||
| Assets | |||||||||||||||
| Investment securities | |||||||||||||||
| At cost | $ | 5,945,117 | $ | 7,656,758 | $ | 25,631,801 | |||||||||
| At fair value | $ | 5,770,785 | $ | 6,895,178 | $ | 25,117,021 | |||||||||
| Cash or cash equivalent, at fair value | - | 359,359 | 719,694 | ||||||||||||
| Accrued income receivable | 64,461 | 90,719 | 156,727 | ||||||||||||
| Receivable for capital shares sold | - | - | 699 | ||||||||||||
| Receivable for investments sold | - | - | - | ||||||||||||
| Other assets | - | 3,341 | - | ||||||||||||
| Total assets | 5,835,246 | 7,348,597 | 25,994,141 | ||||||||||||
| Liabilities | |||||||||||||||
| Bank borrowings (Note 7) | 310,486 | - | - | ||||||||||||
| Payable for investments purchased | 114,943 | 25,478 | - | ||||||||||||
| Payable for fund shares redeemed | - | 914 | 2,062 | ||||||||||||
| Accounts payable | 19,936 | 18,647 | 80,000 | ||||||||||||
| Accounts payable to related parties (Note 3) | - | 3,600 | 3,600 | ||||||||||||
| Total liabilities | 445,365 | 48,639 | 85,662 | ||||||||||||
| Net Assets | $ | 5,389,881 | $ | 7,299,958 | $ | 25,908,479 | |||||||||
| Summary of Shareholders' Equity | |||||||||||||||
| Paid in capital | 6,661,786 | 8,684,919 | 27,482,345 | ||||||||||||
| Accumulated undistributed net investment income | 822 | 3,604 | 169,044 | ||||||||||||
| Accumulated undistributed net realized losses on security transactions | (1,098,395 | ) | (626,985 | ) | (1,228,130 | ) | |||||||||
| Net unrealized depreciation of investments | (174,332 | ) | (761,580 | ) | (514,780 | ) | |||||||||
| Net assets at June 30, 2009 | $ | 5,389,881 | $ | 7,299,958 | $ | 25,908,479 | |||||||||
| Class A: | |||||||||||||||
| Net assets | $ | 2,785,648 | $ | 2,692,524 | $ | 3,862,759 | |||||||||
| Shares authorized | 50,000,000 | 50,000,000 | 50,000,000 | ||||||||||||
| Shares outstanding | 313,248 | 307,591 | 299,023 | ||||||||||||
| Net asset value and redemption price per share | $ | 8.89 | $ | 8.75 | $ | 12.92 | |||||||||
| Maximum offering price per share | $ | 9.33 | $ | 9.19 | $ | 13.71 | |||||||||
| Sales load | 4.75 | % | 4.75 | % | 5.75 | % | |||||||||
| Class C: | |||||||||||||||
| Net assets | $ | 2,604,233 | $ | 4,607,434 | $ | 22,045,720 | |||||||||
| Shares authorized | 50,000,000 | 50,000,000 | 50,000,000 | ||||||||||||
| Shares outstanding | 295,233 | 552,465 | 1,777,446 | ||||||||||||
| Net asset value and redemption price per share | $ | 8.82 | $ | 8.34 | $ | 12.40 | |||||||||
| Class I: | |||||||||||||||
| Net assets | N/A | N/A | N/A | ||||||||||||
| Shares authorized | |||||||||||||||
| Shares outstanding | |||||||||||||||
| Net asset value and redemption price per share | N/A | N/A | N/A | ||||||||||||
See accompanying Notes to Financial Statements which are an integral part of these financial statements.
58
| Growth Fund | Multi-Cap Value Fund | Small Cap Fund | |||||||||||||
| Assets | |||||||||||||||
| Investment securities | |||||||||||||||
| At cost | $ | 3,338,353 | $ | 9,413,500 | $ | 156,388,112 | |||||||||
| At fair value | $ | 2,862,467 | $ | 7,271,558 | $ | 128,952,784 | |||||||||
| Cash or cash equivalent, at fair value | - | - | - | ||||||||||||
| Accrued income receivable | 2,444 | 4,628 | 33,600 | ||||||||||||
| Receivable for capital shares sold | - | - | 594,022 | ||||||||||||
| Receivable for investments sold | 61,678 | 330,778 | - | ||||||||||||
| Other assets | 5,131 | - | - | ||||||||||||
| Total assets | 2,931,720 | 7,606,964 | 129,580,406 | ||||||||||||
| Liabilities | |||||||||||||||
| Bank borrowings (Note 7) | 107,597 | 347,432 | 4,886,137 | ||||||||||||
| Payable for investments purchased | - | - | 306,582 | ||||||||||||
| Payable for fund shares redeemed | 56,038 | 702,626 | 320,781 | ||||||||||||
| Accounts payable | 878 | 8,884 | 183,786 | ||||||||||||
| Accounts payable to related parties (Note 3) | - | 3,600 | 13,000 | ||||||||||||
| Total liabilities | 164,513 | 1,062,542 | 5,710,286 | ||||||||||||
| Net Assets | $ | 2,767,207 | $ | 6,544,422 | $ | 123,870,120 | |||||||||
| Summary of Shareholders' Equity | |||||||||||||||
| Paid in capital | 3,877,458 | 10,642,198 | 161,756,755 | ||||||||||||
| Accumulated undistributed net investment income | 190 | - | - | ||||||||||||
| Accumulated undistributed net realized losses on security transactions | (634,555 | ) | (1,955,834 | ) | (10,451,307 | ) | |||||||||
| Net unrealized depreciation of investments | (475,886 | ) | (2,141,942 | ) | (27,435,328 | ) | |||||||||
| Net assets at June 30, 2009 | $ | 2,767,207 | $ | 6,544,422 | $ | 123,870,120 | |||||||||
| Class A: | |||||||||||||||
| Net assets | $ | 1,915,986 | $ | 3,300,964 | $ | 108,554,531 | |||||||||
| Shares authorized | 50,000,000 | 50,000,000 | 50,000,000 | ||||||||||||
| Shares outstanding | 280,284 | 471,660 | 4,609,575 | ||||||||||||
| Net asset value and redemption price per share | $ | 6.84 | $ | 7.00 | $ | 23.55 | |||||||||
| Maximum offering price per share | $ | 7.26 | $ | 7.43 | $ | 24.99 | |||||||||
| Sales load | 5.75 | % | 5.75 | % | 5.75 | % | |||||||||
| Class C: | |||||||||||||||
| Net assets | $ | 851,221 | $ | 3,243,458 | $ | 15,311,487 | |||||||||
| Shares authorized | 50,000,000 | 50,000,000 | 50,000,000 | ||||||||||||
| Shares outstanding | 136,334 | 493,364 | 746,741 | ||||||||||||
| Net asset value and redemption price per share | $ | 6.24 | $ | 6.57 | $ | 20.50 | |||||||||
| Class I: | |||||||||||||||
| Net assets | N/A | N/A | $ | 4,102 | |||||||||||
| Shares authorized | 50,000,000 | ||||||||||||||
| Shares outstanding | 154 | ||||||||||||||
| Net asset value and redemption price per share | N/A | N/A | $ | 26.65 | |||||||||||
59
Pacific Advisors Fund Inc.
Statement of Operations (Unaudited)
For the six months ended June 30, 2009
| Government Securities Fund | Income and Equity Fund | Balanced Fund | |||||||||||||
| Investment Income | |||||||||||||||
| Dividends | $ | 22,462 | $ | 64,119 | $ | 313,533 | |||||||||
| Interest | 80,810 | 147,079 | 247,156 | ||||||||||||
| Total income | 103,272 | 211,198 | 560,689 | ||||||||||||
| Expenses | |||||||||||||||
| Investment management fees | 18,068 | 26,485 | 91,756 | ||||||||||||
| Transfer agent fees | 28,271 | 28,956 | 47,982 | ||||||||||||
| Fund accounting fees | 13,898 | 17,656 | 63,349 | ||||||||||||
| Legal fees | 3,336 | 4,238 | 14,681 | ||||||||||||
| Audit fees | 3,058 | 3,884 | 13,457 | ||||||||||||
| Registration fees | 7,783 | 8,122 | 13,458 | ||||||||||||
| Printing | 3,058 | 3,885 | 13,458 | ||||||||||||
| Custody fees | 4,118 | 3,394 | 6,065 | ||||||||||||
| Interest on borrowings | 329 | 137 | 52 | ||||||||||||
| Director fees/meetings | 1,390 | 1,766 | 6,117 | ||||||||||||
| Distribution and service (12b-1) fees (Note 3) | 16,857 | 25,418 | 108,895 | ||||||||||||
| Other expenses | 4,447 | 5,650 | 19,575 | ||||||||||||
| Total expenses, before fees waived | 104,613 | 129,591 | 398,845 | ||||||||||||
| Less fees waived (Note 3) | 39,668 | 26,485 | - | ||||||||||||
| Net expenses | 64,945 | 103,106 | 398,845 | ||||||||||||
| Net Investment Income (Loss) | 38,327 | 108,092 | 161,844 | ||||||||||||
| Net Realized and Unrealized Loss on Investments | |||||||||||||||
| Net realized gain (losses) on investments | 1,290 | (118,990 | ) | (286,268 | ) | ||||||||||
| Change in net unrealized appreciation (depreciation) of investments | (19,474 | ) | 325,763 | 959,288 | |||||||||||
| (18,184 | ) | 206,773 | 673,020 | ||||||||||||
| Net Increase in Net Assets Resulting from Operations | $ | 20,144 | $ | 314,865 | $ | 834,864 | |||||||||
See accompanying Notes to Financial Statements which are an integral part of these financial statements.
60
| Growth Fund | Multi-Cap Value Fund | Small Cap Fund | |||||||||||||
| Investment Income | |||||||||||||||
| Dividends | $ | 22,847 | $ | 63,160 | $ | 262,279 | |||||||||
| Interest | 64 | 4 | - | ||||||||||||
| Total income | 22,911 | 63,164 | 262,279 | ||||||||||||
| Expenses | |||||||||||||||
| Investment management fees | 10,954 | 34,468 | 371,913 | ||||||||||||
| Transfer agent fees | 29,396 | 28,036 | 183,477 | ||||||||||||
| Fund accounting fees | 11,045 | 19,141 | 253,133 | ||||||||||||
| Legal fees | 1,753 | 4,136 | 59,506 | ||||||||||||
| Audit fees | 1,607 | 3,791 | 54,547 | ||||||||||||
| Registration fees | 11,644 | 11,719 | 29,753 | ||||||||||||
| Printing | 1,607 | 3,792 | 54,547 | ||||||||||||
| Custody fees | 3,213 | 2,911 | 11,385 | ||||||||||||
| Interest on borrowings | 0 | 2,949 | 28,286 | ||||||||||||
| Director fees/meetings | 730 | 1,723 | 27,196 | ||||||||||||
| Distribution and service (12b-1) fees (Note 3) | 7,144 | 21,003 | 174,674 | ||||||||||||
| Other expenses | 2,337 | 4,870 | 71,749 | ||||||||||||
| Total expenses, before fees waived | 81,430 | 138,539 | 1,320,166 | ||||||||||||
| Less fees waived (Note 3) | 32,554 | - | - | ||||||||||||
| Net expenses | 48,876 | 138,539 | 1,320,166 | ||||||||||||
| Net Investment Income (Loss) | (25,965 | ) | (75,375 | ) | (1,057,887 | ) | |||||||||
| Net Realized and Unrealized Loss on Investments | |||||||||||||||
| Net realized gain (losses) on investments | (39,788 | ) | (844,468 | ) | (9,376,767 | ) | |||||||||
| Change in net unrealized appreciation (depreciation) of investments | 181,963 | 1,353,316 | 30,866,747 | ||||||||||||
| 142,175 | 508,848 | 21,489,980 | |||||||||||||
| Net Increase in Net Assets Resulting from Operations | $ | 116,210 | $ | 433,473 | $ | 20,432,093 | |||||||||
61
Pacific Advisors Fund Inc.
Statement of Changes in Net Assets (Unaudited)
| Government Securities Fund | Income and Equity Fund | ||||||||||||||||||
| Six months ended June 30, 2009 | Year ended December 31, 2008 | Six months ended June 30, 2009 | Year ended December 31, 2008 | ||||||||||||||||
| Increase (Decrease) in Net Assets From Operations | |||||||||||||||||||
| Net investment income (loss) | $ | 38,327 | $ | 162,524 | $ | 108,092 | $ | 240,238 | |||||||||||
| Net realized gain (loss) on investments | 1,290 | (9,585 | ) | (118,990 | ) | (313,298 | ) | ||||||||||||
| Change in net unrealized appreciation (depreciation) of investments | (19,474 | ) | (287,855 | ) | 325,763 | (1,583,785 | ) | ||||||||||||
| Increase (decrease) in net assets resulting from operations | 20,143 | (134,916 | ) | 314,865 | (1,656,845 | ) | |||||||||||||
| From Distributions to Shareholders | |||||||||||||||||||
| Class A: | |||||||||||||||||||
| Net investment income | (25,604 | ) | (99,427 | ) | (44,127 | ) | (99,717 | ) | |||||||||||
| Net capital gains | - | - | - | - | |||||||||||||||
| Return of capital | - | - | - | - | |||||||||||||||
| Class C: | |||||||||||||||||||
| Net investment income | (15,033 | ) | (65,190 | ) | (63,806 | ) | (137,200 | ) | |||||||||||
| Net capital gains | - | - | - | - | |||||||||||||||
| Return of capital | - | - | - | - | |||||||||||||||
| Class I: | N/A | N/A | N/A | N/A | |||||||||||||||
| Net investment income | |||||||||||||||||||
| Net capital gains | |||||||||||||||||||
| Return of capital | |||||||||||||||||||
| Decrease in net assets resulting from distributions | (40,637 | ) | (164,617 | ) | (107,933 | ) | (236,917 | ) | |||||||||||
| From Capital Share Transactions (Note 6) | |||||||||||||||||||
| Proceeds from shares sold | 730,626 | 1,595,008 | 292,971 | 990,420 | |||||||||||||||
| Proceeds from shares purchased by reinvestment of dividends | 34,782 | 134,993 | 100,876 | 219,783 | |||||||||||||||
| Cost of shares repurchased | (865,704 | ) | (1,331,466 | ) | (735,335 | ) | (1,534,918 | ) | |||||||||||
| Increase (decrease) in net assets resulting from capital share transactions | (100,296 | ) | 398,535 | (341,488 | ) | (324,715 | ) | ||||||||||||
| Increase (decrease) in net assets | (120,790 | ) | 99,002 | (134,556 | ) | (2,218,477 | ) | ||||||||||||
| Net Assets | |||||||||||||||||||
| Beginning of period | 5,510,671 | 5,411,669 | 7,434,514 | 9,652,991 | |||||||||||||||
| End of period | $ | 5,389,881 | $ | 5,510,671 | $ | 7,299,958 | $ | 7,434,514 | |||||||||||
| Including undistributed net investment income | $ | 822 | $ | 3,132 | $ | 3,604 | $ | 3,445 | |||||||||||
See accompanying Notes to Financial Statements which are an integral part of these financial statements.
62
| Balanced Fund | |||||||||||
| Six months ended June 30, 2009 | Year ended December 31, 2008 | ||||||||||
| Increase (Decrease) in Net Assets From Operations | |||||||||||
| Net investment income (loss) | $ | 161,844 | $ | 377,442 | |||||||
| Net realized gain (loss) on investments | (286,268 | ) | (927,201 | ) | |||||||
| Change in net unrealized appreciation (depreciation) of investments | 959,288 | (11,647,593 | ) | ||||||||
| Increase (decrease) in net assets resulting from operations | 834,864 | (12,197,352 | ) | ||||||||
| From Distributions to Shareholders | |||||||||||
| Class A: | |||||||||||
| Net investment income | - | (84,449 | ) | ||||||||
| Net capital gains | - | (60,574 | ) | ||||||||
| Return of capital | - | - | |||||||||
| Class C: | |||||||||||
| Net investment income | - | (287,256 | ) | ||||||||
| Net capital gains | - | (371,189 | ) | ||||||||
| Return of capital | - | - | |||||||||
| Class I: | N/A | N/A | |||||||||
| Net investment income | |||||||||||
| Net capital gains | |||||||||||
| Return of capital | |||||||||||
| Decrease in net assets resulting from distributions | - | (803,468 | ) | ||||||||
| From Capital Share Transactions (Note 6) | |||||||||||
| Proceeds from shares sold | 945,780 | 2,696,993 | |||||||||
| Proceeds from shares purchased by reinvestment of dividends | - | 773,434 | |||||||||
| Cost of shares repurchased | (2,053,640 | ) | (5,166,207 | ) | |||||||
| Increase (decrease) in net assets resulting from capital share transactions | (1,107,860 | ) | (1,695,780 | ) | |||||||
| Increase (decrease) in net assets | (272,996 | ) | (14,696,600 | ) | |||||||
| Net Assets | |||||||||||
| Beginning of period | 26,181,475 | 40,878,075 | |||||||||
| End of period | $ | 25,908,479 | $ | 26,181,475 | |||||||
| Including undistributed net investment income | $ | 169,044 | $ | 7,200 | |||||||
63
Pacific Advisors Fund Inc.
Statement of Changes in Net Assets (Unaudited)
| Growth Fund | Multi-Cap Value Fund | ||||||||||||||||||
| Six months ended June 30, 2009 | Year ended December 31, 2008 | Six months ended June 30, 2009 | Year ended December 31, 2008 | ||||||||||||||||
| Increase (Decrease) in Net Assets From Operations | |||||||||||||||||||
| Net investment income (loss) | $ | (25,965 | ) | $ | (72,764 | ) | $ | (75,375 | ) | $ | (215,096 | ) | |||||||
| Net realized gain (loss) on investments | (39,788 | ) | (161,949 | ) | (844,468 | ) | (1,109,157 | ) | |||||||||||
| Change in net unrealized appreciation (depreciation) of investments | 181,963 | (1,868,088 | ) | 1,353,316 | (5,076,937 | ) | |||||||||||||
| Increase (decrease) in net assets resulting from operations | 116,210 | (2,102,801 | ) | 433,473 | (6,401,190 | ) | |||||||||||||
| From Distributions to Shareholders | |||||||||||||||||||
| Class A: | |||||||||||||||||||
| Net investment income | - | - | - | - | |||||||||||||||
| Net capital gains | - | - | - | (12,355 | ) | ||||||||||||||
| Return of capital | - | - | - | - | |||||||||||||||
| Class C: | |||||||||||||||||||
| Net investment income | - | - | - | - | |||||||||||||||
| Net capital gains | - | - | - | (15,265 | ) | ||||||||||||||
| Return of capital | - | - | - | - | |||||||||||||||
| Class I: | N/A | N/A | N/A | N/A | |||||||||||||||
| Net investment income | |||||||||||||||||||
| Net capital gains | |||||||||||||||||||
| Return of capital | |||||||||||||||||||
| Decrease in net assets resulting from distributions | - | - | - | (27,620 | ) | ||||||||||||||
| From Capital Share Transactions (Note 6) | |||||||||||||||||||
| Proceeds from shares sold | 202,557 | 1,138,930 | 936,269 | 1,688,581 | |||||||||||||||
| Proceeds from shares purchased by reinvestment of dividends | - | - | - | 25,075 | |||||||||||||||
| Cost of shares repurchased | (607,781 | ) | (965,224 | ) | (1,877,806 | ) | (3,041,075 | ) | |||||||||||
| Increase (decrease) in net assets resulting from capital share transactions | (405,224 | ) | 173,706 | (941,537 | ) | (1,327,419 | ) | ||||||||||||
| Increase (decrease) in net assets | (289,014 | ) | (1,929,095 | ) | (508,064 | ) | (7,756,229 | ) | |||||||||||
| Net Assets | |||||||||||||||||||
| Beginning of period | 3,056,221 | 4,985,316 | 7,052,486 | 14,808,715 | |||||||||||||||
| End of period | $ | 2,767,207 | $ | 3,056,221 | $ | 6,544,422 | $ | 7,052,486 | |||||||||||
| Including undistributed net investment income | $ | 190 | $ | 190 | $ | - | $ | - | |||||||||||
See accompanying Notes to Financial Statements which are an integral part of these financial statements.
64
| Small Cap Fund | |||||||||||
| Six months ended June 30, 2009 | Year ended December 31, 2008 | ||||||||||
| Increase (Decrease) in Net Assets From Operations | |||||||||||
| Net investment income (loss) | $ | (1,057,887 | ) | $ | (2,561,476 | ) | |||||
| Net realized gain (loss) on investments | (9,376,767 | ) | (303,734 | ) | |||||||
| Change in net unrealized appreciation (depreciation) of investments | 30,866,747 | (74,888,308 | ) | ||||||||
| Increase (decrease) in net assets resulting from operations | 20,432,093 | (77,753,518 | ) | ||||||||
| From Distributions to Shareholders | |||||||||||
| Class A: | |||||||||||
| Net investment income | - | - | |||||||||
| Net capital gains | - | (1,558,363 | ) | ||||||||
| Return of capital | - | (20,200 | ) | ||||||||
| Class C: | |||||||||||
| Net investment income | - | - | |||||||||
| Net capital gains | - | (327,293 | ) | ||||||||
| Return of capital | - | (4,242 | ) | ||||||||
| Class I: | |||||||||||
| Net investment income | - | - | |||||||||
| Net capital gains | - | (17,914 | ) | ||||||||
| Return of capital | - | (232 | ) | ||||||||
| Decrease in net assets resulting from distributions | - | (1,928,244 | ) | ||||||||
| From Capital Share Transactions (Note 6) | |||||||||||
| Proceeds from shares sold | 20,607,875 | 89,039,262 | |||||||||
| Proceeds from shares purchased by reinvestment of dividends | - | 1,815,640 | |||||||||
| Cost of shares repurchased | (20,340,900 | ) | (54,430,999 | ) | |||||||
| Increase (decrease) in net assets resulting from capital share transactions | 266,975 | 36,423,903 | |||||||||
| Increase (decrease) in net assets | 20,699,068 | (43,257,859 | ) | ||||||||
| Net Assets | |||||||||||
| Beginning of period | 103,171,052 | 146,428,911 | |||||||||
| End of period | $ | 123,870,120 | $ | 103,171,052 | |||||||
| Including undistributed net investment income | $ | - | $ | - | |||||||
65
Pacific Advisors Fund Inc.
Notes to Financial Statements (Unaudited)
June 30, 2009
Note 1. Organization
Pacific Advisors Fund Inc. (the "Company") is an open-end diversified investment management company registered under the Investment Company Act of 1940, as amended. The Company currently offers six Funds: Government Securities Fund, Income and Equity Fund, Balanced Fund, Growth Fund, Multi-Cap Value Fund and Small Cap Fund. Each Fund is a separate investment portfolio of the Company with a distinct investment objective, investment program, policies and restrictions.
The Government Securities Fund seeks to provide high current income, preservation of capital, and rising future income, consistent with prudent investment risk. The Income and Equity Fund seeks to provide current income and, secondarily, long-term capital appreciation. The Balanced Fund seeks to achieve long-term capital appreciation and income consistent with reduced market risk. The Growth Fund seeks to achieve long-term capital appreciation through investment in medium to large capitalization companies. The Multi-Cap Value Fund seeks long-term capital appreciation by investing in a diversified portfolio of large to small capitalization companies. The Small Cap Fund seeks to provide capital appreciation through investment in small capitalization companies.
In addition to Class A and Class C shares, the Small Cap Fund introduced Class I shares on October 9, 2006. Each class has equal rights as to assets and voting privileges except that Class A and Class C each has exclusive voting rights with respect to its distribution plan. Investment income, realized and unrealized capital gains and losses, and the common expenses of each Fund are allocated on a pro rata basis to each class based on the relative net assets of each class to the total net assets of the Fund. Each Class of shares differs in its respective service and distribution expenses and may differ in its transfer agent, registration, and certain other class-specific fees and expenses.
The Company enters into contracts that contain a variety of indemnifications. The Company's maximum exposure under these arrangements is unknown. However, the Company has not had prior claims or losses pursuant to these contracts and expects the risk of loss to be remote.
Note 2. Significant Accounting Policies
A. Security Valuation and Fair Value Measurement. Securities, including American Depository Receipts (ADRs), listed on a national securities exchange and certain over-the-counter ("OTC") issues traded on the NASDAQ national market system are valued at the last quoted sale price at the close of the New York Stock Exchange. OTC issues not quoted on the NASDAQ system, and other equity securities for which no sale price is available, are valued at the last bid price as obtained from published sources or real time quote services, where available, and otherwise from brokers who are market makers for such securities. Debt securities with a maturity less than 60 days are valued on an amortized cost basis, which approximates market value. Premium or discount on debt securities are amortized. In determining the fair value of other debt securities, Pacific Globa l Investment Management Company, Inc. (the "Investment Manager") utilizes independent pricing services approved by the Board of Directors using one or more of the following valuation techniques:
(1) a matrix pricing approach that considers market inputs including, in approximate order of priority, the following: benchmark yields, reported trades, broker/dealer quotes, issuer spreads, two-sided markets, benchmark securities, bids, offers and reference data including market research publications; market indicators, industry and economic events. Evaluators may prioritize inputs differently on any given day for any security based on market conditions, and not all inputs listed are available for use in the evaluation process for each security evaluation on any given day; (2) a comparison of the value of the borrower's outstanding equity and debt to that of comparable public companies; (3) a discounted cash flow analysis. In conducting its assessment and analysis for purpose of determining fair value, the Investment Manager uses its discretion and judgment in considering and appraising relevant factors. Fair value determinati ons are made by the Investment Manager based on the Company's Fair Value Procedure.
The Company implemented Financial Accounting Standards Board (FASB) Statement No. 157 "Fair Value Measurement" (FAS 157) for the fiscal year beginning January 1, 2008 and interim periods. The adoption of FAS 157 did not impact the amounts reported in the financial statements. FAS 157 requires the fund to classify its assets based on valuation method, using three levels. Level 1 investment securities are valued based on quoted prices in active markets for identical securities. Level 2 investment securities are valued based on significant observable market inputs, such as quoted prices for similar securities and quoted prices in inactive markets. Level 3 investment securities are valued using significant unobservable inputs that reflect the Fund's own assumptions in determining the fair value of investments. The valuation levels are not necessarily an indication of the risk associated with investing
66
Pacific Advisors Fund Inc.
Notes to Financial Statements (Unaudited)
June 30, 2009
in those securities. The following is a summary of the inputs used to value the Fund's investment securities and cash and cash equivalents as of June 30, 2009:
| Government Securities Fund | Income and Equity Fund | Balanced Fund | Growth Fund | Multi-Cap Value Fund | Small Cap Fund | ||||||||||||||||||||||
| Level 1 - Quoted Prices | |||||||||||||||||||||||||||
| Common Stock | |||||||||||||||||||||||||||
| Energy | $ | - | $ | 365,765 | $ | 3,561,010 | $ | 821,255 | $ | 2,278,548 | $ | 19,217,570 | |||||||||||||||
| Material | - | 25,620 | 614,240 | 134,880 | 650,860 | 4,488,400 | |||||||||||||||||||||
| Industrials | 58,600 | 180,000 | 3,312,810 | 429,540 | 2,195,090 | 45,799,180 | |||||||||||||||||||||
| Consumer Discretionary | - | 57,190 | 287,450 | - | 820,230 | 18,948,130 | |||||||||||||||||||||
| Consumer Staples | - | 144,140 | 2,112,553 | 136,200 | 777,640 | 5,908,600 | |||||||||||||||||||||
| Health Care | - | 227,200 | 1,698,950 | 950,612 | - | 12,194,440 | |||||||||||||||||||||
| Financials | - | 106,340 | 1,949,510 | 25,960 | 385,190 | 15,661,564 | |||||||||||||||||||||
| Information Technology | - | 118,850 | 1,270,320 | 328,320 | 164,000 | 1,640,100 | |||||||||||||||||||||
| Telecommunication Services | 71,400 | 198,370 | 428,400 | 35,700 | - | 5,094,800 | |||||||||||||||||||||
| Utilities | 131,840 | 146,690 | 456,575 | - | - | - | |||||||||||||||||||||
| Preferred Stock | |||||||||||||||||||||||||||
| Financials | 192,400 | 432,390 | 881,950 | - | - | - | |||||||||||||||||||||
| Telecommunication Services | 101,960 | 50,980 | - | - | - | - | |||||||||||||||||||||
| Utilities | - | 49,800 | 254,900 | - | - | - | |||||||||||||||||||||
| Level 1 Total | 556,200 | 2,103,335 | 16,828,668 | 2,862,467 | 7,271,558 | 128,952,784 | |||||||||||||||||||||
| Level 2 - Other significant observable inputs | |||||||||||||||||||||||||||
| Corporate Bonds | |||||||||||||||||||||||||||
| Energy | - | 390,243 | 1,854,857 | - | - | - | |||||||||||||||||||||
| Material | - | 368,126 | 252,167 | - | - | - | |||||||||||||||||||||
| Industrials | - | 107,150 | 1,656,591 | - | - | - | |||||||||||||||||||||
| Consumer Discretionary | - | 919,152 | 651,764 | - | - | - | |||||||||||||||||||||
| Financials | - | 1,749,444 | 3,211,445 | - | - | - | |||||||||||||||||||||
| Information Technology | - | 100,653 | 268,852 | - | - | - | |||||||||||||||||||||
| Telecommunication Services | - | 587,000 | 354,481 | - | - | - | |||||||||||||||||||||
| Utilities | - | 463,014 | 38,196 | - | - | - | |||||||||||||||||||||
| US Government Securities | |||||||||||||||||||||||||||
| US Government Agency | 5,214,585 | 107,061 | - | - | - | - | |||||||||||||||||||||
| Short Term Investments | |||||||||||||||||||||||||||
| Money Market | - | 359,359 | 719,694 | - | - | - | |||||||||||||||||||||
| Level 2 Total | 5,214,585 | 5,151,202 | 9,008,047 | - | - | - | |||||||||||||||||||||
| Level 3 - Significant unobservable inputs | - | - | - | - | - | - | |||||||||||||||||||||
| Total Investments | $ | 5,770,785 | $ | 7,254,537 | $ | 25,836,715 | $ | 2,862,467 | $ | 7,271,558 | $ | 128,952,784 | |||||||||||||||
Equity securities (common and preferred stock) that are actively traded and market priced are classified as Level 1 Securities. All fixed income securities are classified as Level 2 securities and are valued using either amortized cost or the matrix pricing approach. The Funds had no Level 3 holdings at both the beginning and the end of the reporting period.
B. Cash and Cash Equivalents. The Company considers all highly liquid financial instruments with maturities of less than three months when acquired to be cash equivalents.
C. Security Transactions and Investment Income. Security transactions are accounted for on the trade date. The cost of investments sold is determined by use of the specific identification method for both financial reporting and federal income tax purposes. Dividends are recorded on the ex-dividend date. Interest income is recorded on an accrual basis.
D. Dividends and Distributions to Shareholders. The Government Securities Fund and Income and Equity Fund declare and distribute dividends of their net investment income, if any, quarterly. The Balanced Fund, Growth Fund, Multi-Cap Value Fund and Small Cap Fund declare and distribute dividends of their net investment income, if any, annually. The Board of Directors will determine the amount and timing of such payments. Income dividends and capital gains distributions are determined in accordance with income tax regulations which may differ from generally accepted accounting principles. These differences are primarily due to differing treatments of income and gain on various investment securities held by the Funds, timing differences and differing characterization of distributions made by the Funds.
67
Pacific Advisors Fund Inc.
Notes to Financial Statements (Unaudited)
June 30, 2009
E. Federal Income Tax. The Company intends to comply with the requirements of Subchapter M of the Internal Revenue Code applicable to regulated investment companies and to distribute substantially all of their taxable income to their shareholders. Therefore, no federal income tax provision is required.
The Company implemented FASB Interpretation No. 48 "Accounting for Uncertainty in Income Taxes" (FIN 48). FIN 48 provides guidance for how uncertain tax positions should be recognized, measured, presented and disclosed in the financial statements. FIN 48 requires the evaluation of tax positions taken or expected to be taken in the course of preparing the Funds' tax returns to determine whether the tax positions are "more-likely-than-not" of being sustained by the applicable tax authority. Tax positions not deemed to meet the more-likely-than-not threshold would be recorded as a expense in the current year. Management has analyzed the Funds' tax positions taken on federal income tax returns for all open tax years and for the six months ended June 30, 2009 for purpose of implementing FIN 48, and has concluded that no provision for income tax is required in the Funds' financial statements. Tax years 2006, 2007 and 2008 are still su bject to examination by major federal jurisdictions. Tax years 2004, 2005, 2006 and 2007 are still subject to examination by major state jurisdictions.
The Funds recognize interest and penalties, if any, related to unrecognized tax benefits as income tax expense in the statement of operations. During the period, the Funds did not incur any interest or penalties.
The components of distributable earning/(accumulated deficits) on a tax basis are reported as of the Funds' most recent fiscal year-end. As of December 31, 2008, components of distributable earnings/(accumulated deficits) on a tax basis were as follows:
| Government Securities Fund | Income and Equity Fund | Balanced Fund | Growth Fund | Multi-Cap Value Fund | Small Cap Fund | ||||||||||||||||||||||
| Undistributed ordinary income | $ | 3,132 | $ | 3,445 | $ | - | $ | - | $ | - | $ | - | |||||||||||||||
| Undistributed long-term gains | - | - | - | - | - | - | |||||||||||||||||||||
| Capital loss carryforward* | (1,099,685 | ) | (396,450 | ) | (431,086 | ) | (432,026 | ) | (1,061,647 | ) | - | ||||||||||||||||
| Post October Loss | - | (111,545 | ) | (496,115 | ) | (162,741 | ) | (49,719 | ) | (1,074,540 | ) | ||||||||||||||||
| Net unrealized depreciation on investments | (154,858 | ) | (1,087,343 | ) | (1,481,529 | ) | (657,659 | ) | (3,495,258 | ) | (58,302,075 | ) | |||||||||||||||
| Accumulated deficits | (1,251,411 | ) | (1,591,893 | ) | (2,408,730 | ) | (1,252,426 | ) | (4,606,624 | ) | (59,376,615 | ) | |||||||||||||||
The difference between book basis and tax-basis unrealized appreciation (depreciation) is attributable primarily to the tax deferral of losses on wash sales.
* As of December 31, 2008, the following had accumulated net realized losses on investment transactions that represent capital loss carryforwards for federal income tax purposes, which expire as follows:
| Capital losses expiring in: | |||||||||||||||||||||||||||||||||||||||
| 2009 | 2010 | 2011 | 2012 | 2013 | 2014 | 2015 | 2016 | Total | |||||||||||||||||||||||||||||||
| Government Securities Fund | $ | - | $ | - | $ | 855,711 | $ | 95,072 | $ | 49,495 | $ | 88,644 | $ | 1,178 | $ | 9,585 | $ | 1,099,685 | |||||||||||||||||||||
| Income and Equity Fund | - | - | - | - | - | - | - | 396,450 | 396,450 | ||||||||||||||||||||||||||||||
| Balanced Fund | - | - | - | - | - | - | - | 431,086 | 431,086 | ||||||||||||||||||||||||||||||
| Growth Fund | 340,292 | 91,734 | - | - | - | - | - | - | 432,026 | ||||||||||||||||||||||||||||||
| Multi-Cap Value Fund | - | - | - | - | - | - | - | 1,061,647 | 1,061,647 | ||||||||||||||||||||||||||||||
F. Use of Estimates. The preparation of financial statements in conformity with accounting principles generally accepted in the United States requires management to make estimates and assumptions that affect the reported amounts in the financial statements and footnotes. Actual results could differ from those estimates.
Note 3. Investment Management, Distributor and Other Related Party Transactions
The Company and the Funds have entered into investment management agreements ("Management Agreements") with the Investment Manager.
The Management Agreements provide for investment management fees, payable monthly, and calculated at the maximum annual rate of 0.65% of average net assets for the Government Securities Fund, 0.75% of average net assets for the Income and Equity, Balanced, Growth and Small Cap Funds and 1.00% of average net assets for the Multi-Cap Value Fund.
68
Pacific Advisors Fund Inc.
Notes to Financial Statements (Unaudited)
June 30, 2009
In accordance with Expense Limitation Agreements with the Company, the Investment Manager will waive its respective management fees to the extent that the actual operating expenses of the following Funds exceed the following thresholds:
| Class A | Class C | ||||||||||
| Government Securities Fund | 1.65 | % | 2.40 | % | |||||||
| Income and Equity Fund | 1.95 | % | 2.70 | % | |||||||
| Growth Fund | 2.65 | % | 3.40 | % | |||||||
For the Government Securities Fund and Growth Fund only, if net expenses exceed the above thresholds after waiver of the entire management fee, the Transfer Agent will waive its transfer agency fee to the extent necessary to reduce Class expenses to the above thresholds. These agreements may be terminated by either party upon 90 days prior written notice.
Pursuant to the Expense Limitation Agreements, providing for the voluntary waiver of fees and the assumption of expenses by the Investment Manager and Transfer Agent, the following amounts were waived for the six months ended June 30, 2009.
| Management Fees Waived | Transfer Agent Fees Waived | ||||||||||
| Government Securities Fund | $ | 18,068 | $ | 21,600 | |||||||
| Income and Equity Fund | 26,485 | - | |||||||||
| Growth Fund | 10,954 | 21,600 | |||||||||
Effective 2004, the Investment Manager terminated all of its rights under the expense limitation agreements with respect to potential recoupment from the Funds of all management fees previously waived and all expenses previously reimbursed. In the future, the Investment Manager will not have any rights to recover fees it waives or expenses it may reimburse, with respect to any of the Funds.
For the six months ended June 30, 2009, Pacific Global Fund Distributors, Inc. ("PGFD"), the principal underwriter for the Company, received commissions on sales of capital stock, after deducting amounts allowed to authorized distributors as commissions. The amounts are as follows:
| Underwriting Fees Retained | Commissions Paid | ||||||||||
| Government Securities Fund | $ | 78 | $ | 2 | |||||||
| Income and Equity Fund | 5 | 6 | |||||||||
| Balanced Fund | 217 | 372 | |||||||||
| Growth Fund | 916 | 81 | |||||||||
| Multi-Cap Value Fund | 1,851 | 368 | |||||||||
| Small Cap Fund | 7,501 | 316 | |||||||||
PGFD is a wholly-owned subsidiary of the Investment Manager.
The Company and the Funds have entered into agreements with Pacific Global Investor Services, Inc. ("PGIS") to provide fund accounting services at the monthly fee of three basis points for the first one hundred million in net assets or a minimum of $1,500. In addition, agreements to provide transfer agent services has also been entered into at a rate of $21.00 per year per open account and $3.50 per year per closed account with minimum charges of $1,800 per month for A, C, and I share accounts. PGIS is a wholly-owned subsidiary of the Investment Manager.
Accounts payable to related parties consist of transfer agent fees payable to PGIS.
The Company has adopted a plan of distribution, whereby the Funds may pay a service fee to qualified recipients in an amount up to 0.25% per annum of each Fund's daily net assets for Class A shares and Class C shares. Under the plan of the distribution, the Funds may pay a distribution fee to qualified recipients in an amount up to 0.75% per annum of each Fund's daily net assets for Class C shares. The Company has not adopted a plan of distribution for Class I Shares.
For the six months ended June 30, 2009, total distribution and/or service (12b-1) fees were:
| Class A | Class C | ||||||||||
| Government Securities Fund | $ | 3,646 | $ | 13,211 | |||||||
| Income and Equity Fund | 3,298 | 22,120 | |||||||||
| Balanced Fund | 4,482 | 104,413 | |||||||||
| Growth Fund | 2,487 | 4,657 | |||||||||
| Multi-Cap Value Fund | 4,489 | 16,514 | |||||||||
| Small Cap Fund | 107,064 | 67,610 | |||||||||
69
Pacific Advisors Fund Inc.
Notes to Financial Statements (Unaudited)
June 30, 2009
Note 4. Purchases and Sales of Securities
The following summarizes purchases and sales of investment securities, other than short-term investments, and aggregate gross unrealized appreciation and depreciation on a tax basis by each Fund for the six months ended and as of June 30, 2009. The difference between book basis and tax-basis unrealized appreciation (depreciation) is attributable primarily to the tax deferral of losses on wash sales.
| Six months ended June 30, 2009 | As of June 30, 2009 | ||||||||||||||||||||||||||
| Cost of Purchases | Proceeds From Sales | Tax Cost of Securities | Gross Unrealized Appreciation | Gross Unrealized Depreciation | Net Unrealized Depreciation | ||||||||||||||||||||||
| Government Securities Fund | $ | 8,886,025 | $ | 8,026,304 | $ | 5,945,117 | $ | 53,611 | $ | 227,943 | $ | 174,332 | |||||||||||||||
| Income and Equity Fund | 787,292 | 1,146,639 | 7,656,758 | 286,868 | 986,483 | 761,580 | |||||||||||||||||||||
| Balanced Fund | 782,106 | 2,351,490 | 25,639,262 | 3,306,924 | 3,829,165 | 522,241 | |||||||||||||||||||||
| Growth Fund | 34,752 | 159,793 | 3,338,163 | 286,868 | 762,564 | 475,696 | |||||||||||||||||||||
| Multi-Cap Value Fund | 911,975 | 1,921,062 | 9,413,500 | 902,020 | 3,043,962 | 2,141,942 | |||||||||||||||||||||
| Small Cap Fund | 11,055,061 | 11,436,274 | 156,388,112 | 15,785,534 | 43,220,862 | 27,435,328 | |||||||||||||||||||||
Note 5. Distributions to Shareholders
The tax character of distributions paid was as follows:
| Government Securities Fund | Income and Equity Fund | Balanced Fund | Growth Fund | Multi-Cap Value Fund | Small Cap Fund | ||||||||||||||||||||||
| Six months ended June 30, 2009 | |||||||||||||||||||||||||||
| Distributions paid from: | |||||||||||||||||||||||||||
| Ordinary Income | $ | 40,637 | $ | 107,933 | $ | - | $ | - | $ | - | $ | - | |||||||||||||||
| Long-Term Capital Gain | - | - | - | - | - | - | |||||||||||||||||||||
| Return of Capital | - | - | - | - | - | - | |||||||||||||||||||||
| Total Distributions | $ | 40,637 | $ | 107,933 | $ | - | $ | - | $ | - | $ | - | |||||||||||||||
| Year ended December 31, 2008 | |||||||||||||||||||||||||||
| Distributions paid from: | |||||||||||||||||||||||||||
| Ordinary Income | $ | 164,617 | $ | 236,917 | $ | 371,701 | $ | - | $ | - | $ | - | |||||||||||||||
| Long-Term Capital Gain | - | - | 431,767 | - | 27,620 | 1,903,570 | |||||||||||||||||||||
| Return of Capital | - | - | - | - | - | 24,674 | |||||||||||||||||||||
| Total Distributions | $ | 164,617 | $ | 236,917 | $ | 803,468 | $ | - | $ | 27,620 | $ | 1,928,244 | |||||||||||||||
Note 6. Capital Share Transactions
A 2% redemption fee is assessed on shares of the Government Securities Fund or Income and Equity Fund sold or exchanged within 30 days of purchase or shares of the Balanced Fund, Growth Fund, Multi-Cap Value Fund or Small Cap Fund sold or exchanged within 180 days of purchase and is retained in each Fund. The redemption fees collected through June 30, 2009 are included in the dollar amount of shares sold in the table below. The amount of the increase is as follows:
| Class A | Class C | ||||||||||
| Government Securities Fund | $ | 11 | $ | - | |||||||
| Income and Equity Fund | - | - | |||||||||
| Balanced Fund | 254 | 803 | |||||||||
| Growth Fund | 435 | - | |||||||||
| Multi-Cap Value Fund | 2,249 | 64 | |||||||||
| Small Cap Fund | 42,264 | 2,183 | |||||||||
70
Pacific Advisors Fund Inc.
Notes to Financial Statements (Unaudited)
June 30, 2009
| Six months ended June 30, 2009 | Year ended December 31, 2008 | ||||||||||||||||||
| Shares | Amount | Shares | Amount | ||||||||||||||||
| Government Securities Fund | |||||||||||||||||||
| Class A | |||||||||||||||||||
| Shares sold | 12,248 | $ | 107,569 | 41,348 | $ | 387,423 | |||||||||||||
| Reinvestment of distributions | 2,376 | 20,982 | 8,448 | 77,592 | |||||||||||||||
| 14,624 | 128,551 | 49,796 | 465,015 | ||||||||||||||||
| Shares repurchased | (43,149 | ) | (381,591 | ) | (113,106 | ) | (1,054,835 | ) | |||||||||||
| Net decrease | (28,525 | ) | $ | (253,040 | ) | (63,310 | ) | $ | (589,820 | ) | |||||||||
| Class C | |||||||||||||||||||
| Shares sold | 71,750 | $ | 623,057 | 131,789 | $ | 1,207,585 | |||||||||||||
| Reinvestment of distributions | 1,578 | 13,800 | 6,311 | 57,401 | |||||||||||||||
| 73,328 | 636,857 | 138,100 | 1,264,986 | ||||||||||||||||
| Shares repurchased | (55,147 | ) | (484,113 | ) | (29,782 | ) | (276,631 | ) | |||||||||||
| Net increase | 18,181 | $ | 152,744 | 108,318 | $ | 988,355 | |||||||||||||
| Six months ended June 30, 2009 | Year ended December 31, 2008 | ||||||||||||||||||
| Shares | Amount | Shares | Amount | ||||||||||||||||
| Income and Equity Fund | |||||||||||||||||||
| Class A | |||||||||||||||||||
| Shares sold | 11,892 | $ | 100,021 | 36,807 | $ | 367,820 | |||||||||||||
| Reinvestment of distributions | 4,780 | 39,850 | 9,366 | 88,730 | |||||||||||||||
| 16,672 | 139,871 | 46,173 | 456,550 | ||||||||||||||||
| Shares repurchased | (32,004 | ) | (271,897 | ) | (68,508 | ) | (684,121 | ) | |||||||||||
| Net decrease | (15,332 | ) | $ | (132,026 | ) | (22,335 | ) | $ | (227,571 | ) | |||||||||
| Class C | |||||||||||||||||||
| Shares sold | 23,941 | $ | 192,950 | 65,511 | $ | 622,600 | |||||||||||||
| Reinvestment of distributions | 7,673 | 61,026 | 14,485 | 131,053 | |||||||||||||||
| 31,614 | 253,976 | 79,996 | 753,653 | ||||||||||||||||
| Shares repurchased | (60,034 | ) | (463,438 | ) | (89,895 | ) | (850,797 | ) | |||||||||||
| Net decrease | (28,420 | ) | $ | (209,462 | ) | (9,899 | ) | $ | (97,144 | ) | |||||||||
71
Pacific Advisors Fund Inc.
Notes to Financial Statements (Unaudited)
June 30, 2009
| Six months ended June 30, 2009 | Year ended December 31, 2008 | ||||||||||||||||||
| Shares | Amount | Shares | Amount | ||||||||||||||||
| Balanced Fund | |||||||||||||||||||
| Class A | |||||||||||||||||||
| Shares sold | 29,553 | $ | 365,535 | 34,352 | $ | 576,332 | |||||||||||||
| Reinvestment of distributions | - | - | 10,240 | 123,396 | |||||||||||||||
| 29,553 | 365,535 | 44,592 | 699,728 | ||||||||||||||||
| Shares repurchased | (34,624 | ) | (425,684 | ) | (59,042 | ) | (973,634 | ) | |||||||||||
| Net decrease | (5,071 | ) | $ | (60,149 | ) | (14,450 | ) | $ | (273,906 | ) | |||||||||
| Class C | |||||||||||||||||||
| Shares sold | 49,560 | $ | 580,245 | 133,496 | $ | 2,120,661 | |||||||||||||
| Reinvestment of distributions | - | - | 55,941 | 650,038 | |||||||||||||||
| 49,560 | 580,245 | 189,437 | 2,770,699 | ||||||||||||||||
| Shares repurchased | (145,383 | ) | (1,627,956 | ) | (271,078 | ) | (4,192,573 | ) | |||||||||||
| Net decrease | (95,823 | ) | $ | (1,047,711 | ) | (81,641 | ) | $ | (1,421,874 | ) | |||||||||
| Six months ended June 30, 2009 | Year ended December 31, 2008 | ||||||||||||||||||
| Shares | Amount | Shares | Amount | ||||||||||||||||
| Growth Fund | |||||||||||||||||||
| Class A | |||||||||||||||||||
| Shares sold | 32,167 | $ | 202,557 | 104,226 | $ | 950,912 | |||||||||||||
| Reinvestment of distributions | - | - | - | - | |||||||||||||||
| 32,167 | 202,557 | 104,226 | 950,912 | ||||||||||||||||
| Shares repurchased | (56,662 | ) | (361,378 | ) | (66,306 | ) | (513,431 | ) | |||||||||||
| Net increase (decrease) | (24,495 | ) | $ | (158,821 | ) | 37,920 | $ | 437,481 | |||||||||||
| Class C | |||||||||||||||||||
| Shares sold | - | $ | - | 26,337 | $ | 188,018 | |||||||||||||
| Reinvestment of distributions | - | - | - | - | |||||||||||||||
| - | - | 26,337 | 188,018 | ||||||||||||||||
| Shares repurchased | (43,166 | ) | (246,403 | ) | (55,898 | ) | (451,793 | ) | |||||||||||
| Net decrease | (43,166 | ) | $ | (246,403 | ) | (29,561 | ) | $ | (263,775 | ) | |||||||||
72
Pacific Advisors Fund Inc.
Notes to Financial Statements (Unaudited)
June 30, 2009
| Six months ended June 30, 2009 | Year ended December 31, 2008 | ||||||||||||||||||
| Shares | Amount | Shares | Amount | ||||||||||||||||
| Multi-Cap Value Fund | |||||||||||||||||||
| Class A | |||||||||||||||||||
| Shares sold | 168,708 | $ | 908,450 | 102,907 | $ | 1,089,521 | |||||||||||||
| Reinvestment of distributions | - | - | 1,562 | 9,884 | |||||||||||||||
| 168,708 | 908,450 | 104,469 | 1,099,405 | ||||||||||||||||
| Shares repurchased | (184,965 | ) | (1,261,940 | ) | (121,745 | ) | (1,325,969 | ) | |||||||||||
| Net decrease | (16,257 | ) | $ | (353,490 | ) | (17,276 | ) | $ | (226,564 | ) | |||||||||
| Class C | |||||||||||||||||||
| Shares sold | 4,817 | $ | 27,819 | 53,399 | $ | 599,061 | |||||||||||||
| Reinvestment of distributions | - | - | 2,545 | 15,191 | |||||||||||||||
| 4,817 | 27,819 | 55,944 | 614,252 | ||||||||||||||||
| Shares repurchased | (102,534 | ) | (615,866 | ) | (178,566 | ) | (1,715,107 | ) | |||||||||||
| Net decrease | (97,717 | ) | $ | (588,047 | ) | (122,622 | ) | $ | (1,100,855 | ) | |||||||||
| Six months ended June 30, 2009 | Year ended December 31, 2008 | ||||||||||||||||||
| Shares | Amount | Shares | Amount | ||||||||||||||||
| Small Cap Fund | |||||||||||||||||||
| Class A | |||||||||||||||||||
| Shares sold | 1,016,731 | $ | 20,169,536 | 2,875,586 | $ | 83,272,527 | |||||||||||||
| Reinvestment of distributions | - | - | 84,464 | 1,495,008 | |||||||||||||||
| 1,016,731 | 20,169,536 | 2,960,050 | 84,767,535 | ||||||||||||||||
| Shares repurchased | (978,749 | ) | (17,360,908 | ) | (1,642,912 | ) | (44,814,386 | ) | |||||||||||
| Net increase | 37,982 | $ | 2,808,628 | 1,317,138 | $ | 39,953,149 | |||||||||||||
| Class C | |||||||||||||||||||
| Shares sold | 24,466 | $ | 438,339 | 215,321 | $ | 5,766,735 | |||||||||||||
| Reinvestment of distributions | - | - | 19,540 | 302,486 | |||||||||||||||
| 24,466 | 438,339 | 234,861 | 6,069,221 | ||||||||||||||||
| Shares repurchased | (192,932 | ) | (2,979,992 | ) | (348,462 | ) | (8,637,137 | ) | |||||||||||
| Net decrease | (168,466 | ) | $ | (2,541,653 | ) | (113,601 | ) | $ | (2,567,916 | ) | |||||||||
| Class I | |||||||||||||||||||
| Shares sold | - | $ | - | - | $ | - | |||||||||||||
| Reinvestment of distributions | - | - | 948 | 18,146 | |||||||||||||||
| - | - | 948 | 18,146 | ||||||||||||||||
| Shares repurchased | - | - | (51,524 | ) | (979,476 | ) | |||||||||||||
| Net decrease | - | $ | - | (50,576 | ) | $ | (961,330 | ) | |||||||||||
73
Pacific Advisors Fund Inc.
Notes to Financial Statements (Unaudited)
June 30, 2009
Note 7. Bank Borrowings
Each Fund may borrow up to 15% of its total assets. Each Fund will not borrow money except temporarily from banks to facilitate redemption requests that might otherwise require untimely disposition of portfolio securities. No securities will be purchased for a Fund when borrowed money exceeds 5% of the Fund's total assets. Each Fund has the ability to borrow, from UMB Bank, n.a., on an unsecured basis, at 1.5% over the Federal Funds rate. As of June 30, 2009, the Small Cap Fund and Multi-Cap Value Fund were paying interest at 1.53% per annum on their outstanding borrowings. No compensating balances are required.
74
Pacific Advisors Fund Inc.
Financial Highlights (Unaudited)
(For a share outstanding throughout the period)
| Government Securities Fund | |||||||||||||||||||||||||||
| Class A | |||||||||||||||||||||||||||
| For the six months ended | For the year ended December 31, | ||||||||||||||||||||||||||
| June 30, 2009 | 2008 | 2007 | 2006 | 2005 | 2004 | ||||||||||||||||||||||
| Per Share Operating Performance | |||||||||||||||||||||||||||
| Net asset value, beginning of period | $ | 8.94 | $ | 9.42 | $ | 9.24 | $ | 9.27 | $ | 9.51 | $ | 9.68 | |||||||||||||||
| Income from investing operations | |||||||||||||||||||||||||||
| Net investment income | 0.09 | 0.32 | 0.29 | 0.23 | 0.28 | 0.23 | |||||||||||||||||||||
| Net realized and unrealized gains (losses) on securities | (0.06 | ) | (0.53 | ) | 0.22 | 0.05 | (0.18 | ) | (0.20 | ) | |||||||||||||||||
| Total from investment operations | 0.03 | (0.21 | ) | 0.51 | 0.28 | 0.10 | 0.03 | ||||||||||||||||||||
| Less distributions | |||||||||||||||||||||||||||
| From net investment income | (0.08 | ) | (0.27 | ) | (0.33 | ) | (0.31 | ) | (0.34 | ) | (0.20 | ) | |||||||||||||||
| From net capital gains | - | - | - | - | - | - | |||||||||||||||||||||
| Total distributions | (0.08 | ) | (0.27 | ) | (0.33 | ) | (0.31 | ) | (0.34 | ) | (0.20 | ) | |||||||||||||||
| Net asset value, end of period | $ | 8.89 | $ | 8.94 | $ | 9.42 | $ | 9.24 | $ | 9.27 | $ | 9.51 | |||||||||||||||
| Total Investment Return (a) | 0.33 | %(b) | (2.28 | )% | 5.54 | % | 3.14 | % | 1.08 | % | 0.26 | % | |||||||||||||||
| Ratios/Supplemental Data | |||||||||||||||||||||||||||
| Net assets, end of period (000's) | $ | 2,786 | $ | 3,054 | $ | 3,817 | $ | 2,467 | $ | 2,219 | $ | 2,488 | |||||||||||||||
| Ratio of net investment income to average net assets | |||||||||||||||||||||||||||
| With expense reductions | 1.74 | %(c) | 3.33 | % | 3.57 | % | 2.70 | % | 2.68 | % | 1.89 | % | |||||||||||||||
| Without expense reductions | 0.31 | %(c) | 1.87 | % | 2.21 | % | 2.04 | % | 2.03 | % | 1.23 | % | |||||||||||||||
| Ratio of expenses to average net assets | |||||||||||||||||||||||||||
| With expense reductions | 1.98 | %(c) | 1.65 | % | 1.62 | % | 2.51 | % | 2.26 | % | 1.81 | % | |||||||||||||||
| Without expense reductions | 3.41 | %(c) | 3.11 | % | 2.98 | % | 3.17 | % | 2.91 | % | 2.46 | % | |||||||||||||||
| Fund portfolio turnover rate | 291 | %(c) | 173 | % | 59 | % | 16 | % | 88 | % | 403 | % | |||||||||||||||
| Class C | |||||||||||||||||||||||||||
| For the six months ended | For the year ended December 31, | ||||||||||||||||||||||||||
| June 30, 2009 | 2008 | 2007 | 2006 | 2005 | 2004 | ||||||||||||||||||||||
| Per Share Operating Performance | |||||||||||||||||||||||||||
| Net asset value, beginning of period | $ | 8.87 | $ | 9.45 | $ | 9.23 | $ | 9.13 | $ | 9.27 | $ | 9.43 | |||||||||||||||
| Income from investing operations | |||||||||||||||||||||||||||
| Net investment income | 0.05 | 0.28 | 0.25 | 0.08 | 0.14 | 0.09 | |||||||||||||||||||||
| Net realized and unrealized gains (losses) on securities | (0.05 | ) | (0.56 | ) | 0.18 | 0.14 | (0.11 | ) | (0.14 | ) | |||||||||||||||||
| Total from investment operations | - | (0.28 | ) | 0.43 | 0.22 | 0.03 | (0.05 | ) | |||||||||||||||||||
| Less distributions | |||||||||||||||||||||||||||
| From net investment income | (0.05 | ) | (0.30 | ) | (0.21 | ) | (0.12 | ) | (0.17 | ) | (0.11 | ) | |||||||||||||||
| From net capital gains | - | - | - | - | - | - | |||||||||||||||||||||
| Total distributions | (0.05 | ) | (0.30 | ) | (0.21 | ) | (0.12 | ) | (0.17 | ) | (0.11 | ) | |||||||||||||||
| Net asset value, end of period | $ | 8.82 | $ | 8.87 | $ | 9.45 | $ | 9.23 | $ | 9.13 | $ | 9.27 | |||||||||||||||
| Total Investment Return | (0.03 | )%(b) | (3.02 | )% | 4.73 | % | 2.47 | % | 0.28 | % | (0.50 | )% | |||||||||||||||
| Ratios/Supplemental Data | |||||||||||||||||||||||||||
| Net assets, end of period (000's) | $ | 2,604 | $ | 2,456 | $ | 1,595 | $ | 1,731 | $ | 3,780 | $ | 7,424 | |||||||||||||||
| Ratio of net investment income to average net assets | |||||||||||||||||||||||||||
| With expense reductions | 0.98 | %(c) | 2.56 | % | 2.77 | % | 1.97 | % | 2.03 | % | 1.10 | % | |||||||||||||||
| Without expense reductions | (0.45 | )%(c) | 1.10 | % | 1.41 | % | 1.32 | % | 1.38 | % | 0.45 | % | |||||||||||||||
| Ratio of expenses to average net assets | |||||||||||||||||||||||||||
| With expense reductions | 2.73 | %(c) | 2.43 | % | 2.40 | % | 3.21 | % | 2.90 | % | 2.57 | % | |||||||||||||||
| Without expense reductions | 4.16 | %(c) | 3.89 | % | 3.76 | % | 3.86 | % | 3.55 | % | 3.22 | % | |||||||||||||||
| Fund portfolio turnover rate | 291 | %(c) | 173 | % | 59 | % | 16 | % | 88 | % | 403 | % | |||||||||||||||
(a) The Fund's maximum sales charge is not included in the total return computation
(b) Not annualized
(c) Annualized
See accompanying Notes to Financial Statements which are an integral part of these financial statements.
75
Pacific Advisors Fund Inc.
Financial Highlights (Unaudited)
(For a share outstanding throughout the period)
| Income and Equity Fund | |||||||||||||||||||||||||||
| Class A | |||||||||||||||||||||||||||
| For the six months ended | For the year ended December 31, | ||||||||||||||||||||||||||
| June 30, 2009 | 2008 | 2007 | 2006 | 2005 | 2004 | ||||||||||||||||||||||
| Per Share Operating Performance | |||||||||||||||||||||||||||
| Net asset value, beginning of period | $ | 8.48 | $ | 10.61 | $ | 10.74 | $ | 10.19 | $ | 10.46 | $ | 10.33 | |||||||||||||||
| Income from investing operations | |||||||||||||||||||||||||||
| Net investment income | 0.16 | 0.33 | 0.31 | 0.20 | 0.20 | 0.07 | |||||||||||||||||||||
| Net realized and unrealized gains (losses) on securities | 0.25 | (2.16 | ) | (0.05 | ) | 0.53 | (0.20 | ) | 0.29 | ||||||||||||||||||
| Total from investment operations | 0.41 | (1.83 | ) | 0.26 | 0.73 | - | 0.36 | ||||||||||||||||||||
| Less distributions | |||||||||||||||||||||||||||
| From net investment income | (0.14 | ) | (0.30 | ) | (0.28 | ) | (0.18 | ) | (0.26 | ) | (0.21 | ) | |||||||||||||||
| From net capital gains | - | - | (0.11 | ) | - | (0.01 | ) | (0.02 | ) | ||||||||||||||||||
| From return of capital | - | - | - | - | - | - | |||||||||||||||||||||
| Total distributions | (0.14 | ) | (0.30 | ) | (0.39 | ) | (0.18 | ) | (0.27 | ) | (0.23 | ) | |||||||||||||||
| Net asset value, end of period | $ | 8.75 | $ | 8.48 | $ | 10.61 | $ | 10.74 | $ | 10.19 | $ | 10.46 | |||||||||||||||
| Total Investment Return (a) | 4.94 | %(b) | (17.49 | )% | 2.39 | % | 7.25 | % | 0.01 | % | 3.51 | % | |||||||||||||||
| Ratios/Supplemental Data | |||||||||||||||||||||||||||
| Net assets, end of period (000's) | $ | 2,693 | $ | 2,737 | $ | 3,663 | $ | 3,973 | $ | 4,436 | $ | 3,611 | |||||||||||||||
| Ratio of net investment income to average net assets | |||||||||||||||||||||||||||
| With expense reductions | 3.53 | %(c) | 3.22 | % | 2.78 | % | 1.74 | % | 2.33 | % | 2.18 | % | |||||||||||||||
| Without expense reductions | 2.78 | %(c) | 2.47 | % | 2.16 | % | 0.99 | % | 1.65 | % | 1.49 | % | |||||||||||||||
| Ratio of expenses to average net assets | |||||||||||||||||||||||||||
| With expense reductions | 2.45 | %(c) | 2.05 | % | 1.95 | % | 2.06 | % | 1.93 | % | 1.94 | % | |||||||||||||||
| Without expense reductions | 3.20 | %(c) | 2.80 | % | 2.57 | % | 2.80 | % | 2.60 | % | 2.63 | % | |||||||||||||||
| Fund portfolio turnover rate | 23 | %(c) | 39 | % | 46 | % | 23 | % | 40 | % | 40 | % | |||||||||||||||
| Class C | |||||||||||||||||||||||||||
| For the six months ended | For the year ended December 31, | ||||||||||||||||||||||||||
| June 30, 2009 | 2008 | 2007 | 2006 | 2005 | 2004 | ||||||||||||||||||||||
| Per Share Operating Performance | |||||||||||||||||||||||||||
| Net asset value, beginning of period | $ | 8.09 | $ | 10.14 | $ | 10.31 | $ | 9.80 | $ | 10.02 | $ | 9.90 | |||||||||||||||
| Income from investing operations | |||||||||||||||||||||||||||
| Net investment income | 0.11 | 0.23 | 0.22 | 0.08 | 0.15 | 0.16 | |||||||||||||||||||||
| Net realized and unrealized gains (losses) on securities | 0.26 | (2.04 | ) | (0.05 | ) | 0.54 | (0.22 | ) | 0.11 | ||||||||||||||||||
| Total from investment operations | 0.37 | (1.81 | ) | 0.17 | 0.62 | (0.07 | ) | 0.27 | |||||||||||||||||||
| Less distributions | |||||||||||||||||||||||||||
| From net investment income | (0.12 | ) | (0.24 | ) | (0.23 | ) | (0.11 | ) | (0.14 | ) | (0.13 | ) | |||||||||||||||
| From net capital gains | - | - | (0.11 | ) | - | (0.01 | ) | (0.02 | ) | ||||||||||||||||||
| From return of capital | - | - | - | - | - | - | |||||||||||||||||||||
| Total distributions | (0.12 | ) | (0.24 | ) | (0.34 | ) | (0.11 | ) | (0.15 | ) | (0.15 | ) | |||||||||||||||
| Net asset value, end of period | $ | 8.34 | $ | 8.09 | $ | 10.14 | $ | 10.31 | $ | 9.80 | $ | 10.02 | |||||||||||||||
| Total Investment Return | 4.58 | %(b) | (18.10 | )% | 1.63 | % | 6.40 | % | (0.67 | )% | 2.74 | % | |||||||||||||||
| Ratios/Supplemental Data | |||||||||||||||||||||||||||
| Net assets, end of period (000's) | $ | 4,607 | $ | 4,697 | $ | 5,990 | $ | 5,743 | $ | 7,265 | $ | 7,738 | |||||||||||||||
| Ratio of net investment income to average net assets | |||||||||||||||||||||||||||
| With expense reductions | 2.78 | %(c) | 2.48 | % | 2.06 | % | 1.04 | % | 1.57 | % | 1.38 | % | |||||||||||||||
| Without expense reductions | 2.03 | %(c) | 1.73 | % | 1.43 | % | 0.28 | % | 0.90 | % | 0.70 | % | |||||||||||||||
| Ratio of expenses to average net assets | |||||||||||||||||||||||||||
| With expense reductions | 3.20 | %(c) | 2.81 | % | 2.70 | % | 2.81 | % | 2.70 | % | 2.69 | % | |||||||||||||||
| Without expense reductions | 3.95 | %(c) | 3.56 | % | 3.32 | % | 3.56 | % | 3.37 | % | 3.37 | % | |||||||||||||||
| Fund portfolio turnover rate | 23 | %(c) | 39 | % | 46 | % | 23 | % | 40 | % | 40 | % | |||||||||||||||
(a) The Fund's maximum sales charge is not included in the total return computation
(b) Not annualized
(c) Annualized
See accompanying Notes to Financial Statements which are an integral part of these financial statements.
76
Pacific Advisors Fund Inc.
Financial Highlights (Unaudited)
(For a share outstanding throughout the period)
| Balanced Fund | |||||||||||||||||||||||||||
| Class A | |||||||||||||||||||||||||||
| For the six months ended | For the year ended December 31, | ||||||||||||||||||||||||||
| June 30, 2009 | 2008 | 2007 | 2006 | 2005 | 2004 | ||||||||||||||||||||||
| Per Share Operating Performance | |||||||||||||||||||||||||||
| Net asset value, beginning of period | $ | 12.41 | $ | 18.58 | $ | 18.42 | $ | 17.39 | $ | 16.57 | $ | 15.88 | |||||||||||||||
| Income from investing operations | |||||||||||||||||||||||||||
| Net investment income | 0.12 | 0.31 | 0.24 | 0.07 | 0.16 | 0.12 | |||||||||||||||||||||
| Net realized and unrealized gains (losses) on securities | 0.39 | (6.00 | ) | 0.97 | 1.40 | 0.82 | 0.75 | ||||||||||||||||||||
| Total from investment operations | 0.51 | (5.69 | ) | 1.21 | 1.47 | 0.98 | 0.87 | ||||||||||||||||||||
| Less distributions | |||||||||||||||||||||||||||
| From net investment income | - | (0.28 | ) | (0.20 | ) | - | (0.11 | ) | (0.13 | ) | |||||||||||||||||
| From net capital gains | - | (0.20 | ) | (0.85 | ) | (0.44 | ) | (0.01 | ) | (0.05 | ) | ||||||||||||||||
| From return of capital | - | - | - | - | (0.04 | ) | - | ||||||||||||||||||||
| Total distributions | - | (0.48 | ) | (1.05 | ) | (0.44 | ) | (0.16 | ) | (0.18 | ) | ||||||||||||||||
| Net asset value, end of period | $ | 12.92 | $ | 12.41 | $ | 18.58 | $ | 18.42 | $ | 17.39 | $ | 16.57 | |||||||||||||||
| Total Investment Return (a) | 4.11 | %(b) | (30.51 | )% | 6.53 | % | 8.47 | % | 5.90 | % | 5.50 | % | |||||||||||||||
| Ratios/Supplemental Data | |||||||||||||||||||||||||||
| Net assets, end of period (000's) | $ | 3,863 | $ | 3,774 | $ | 5,918 | $ | 6,787 | $ | 6,323 | $ | 5,863 | |||||||||||||||
| Ratio of net investment income to average net assets | 1.97 | %(c) | 1.73 | % | 1.02 | % | 0.43 | % | 0.97 | % | 0.98 | % | |||||||||||||||
| Ratio of expenses to average net assets | 2.62 | %(c) | 2.31 | % | 2.21 | % | 2.54 | % | 2.53 | % | 2.67 | % | |||||||||||||||
| Fund portfolio turnover rate | 6 | %(c) | 32 | % | 44 | % | 16 | % | 25 | % | 40 | % | |||||||||||||||
| Class C | |||||||||||||||||||||||||||
| For the six months ended | For the year ended December 31, | ||||||||||||||||||||||||||
| June 30, 2009 | 2008 | 2007 | 2006 | 2005 | 2004 | ||||||||||||||||||||||
| Per Share Operating Performance | |||||||||||||||||||||||||||
| Net asset value, beginning of period | $ | 11.96 | $ | 17.88 | $ | 17.77 | $ | 16.92 | $ | 16.13 | $ | 15.49 | |||||||||||||||
| Income from investing operations | |||||||||||||||||||||||||||
| Net investment income | 0.07 | 0.16 | 0.05 | (0.06 | ) | 0.03 | 0.04 | ||||||||||||||||||||
| Net realized and unrealized gains (losses) on securities | 0.37 | (5.72 | ) | 0.96 | 1.35 | 0.80 | 0.68 | ||||||||||||||||||||
| Total from investment operations | 0.44 | (5.56 | ) | 1.01 | 1.29 | 0.83 | 0.72 | ||||||||||||||||||||
| Less distributions | |||||||||||||||||||||||||||
| From net investment income | - | (0.16 | ) | (0.05 | ) | - | (0.02 | ) | (0.03 | ) | |||||||||||||||||
| From net capital gains | - | (0.20 | ) | (0.85 | ) | (0.44 | ) | (0.01 | ) | (0.05 | ) | ||||||||||||||||
| From return of capital | - | - | - | - | (0.01 | ) | - | ||||||||||||||||||||
| Total distributions | - | (0.36 | ) | (0.90 | ) | (0.44 | ) | (0.04 | ) | (0.08 | ) | ||||||||||||||||
| Net asset value, end of period | $ | 12.40 | $ | 11.96 | $ | 17.88 | $ | 17.77 | $ | 16.92 | $ | 16.13 | |||||||||||||||
| Total Investment Return | 3.68 | %(b) | (31.03 | )% | 5.67 | % | 7.65 | % | 5.16 | % | 4.62 | % | |||||||||||||||
| Ratios/Supplemental Data | |||||||||||||||||||||||||||
| Net assets, end of period (000's) | $ | 22,046 | $ | 22,407 | $ | 34,960 | $ | 35,593 | $ | 33,185 | $ | 29,304 | |||||||||||||||
| Ratio of net investment income to average net assets | 1.21 | %(c) | 0.96 | % | 0.27 | % | (0.33 | )% | 0.19 | % | 0.21 | % | |||||||||||||||
| Ratio of expenses to average net assets | 3.37 | %(c) | 3.09 | % | 2.97 | % | 3.30 | % | 3.30 | % | 3.44 | % | |||||||||||||||
| Fund portfolio turnover rate | 6 | %(c) | 32 | % | 44 | % | 16 | % | 25 | % | 40 | % | |||||||||||||||
(a) The Fund's maximum sales charge is not included in the total return computation
(b) Not annualized
(c) Annualized
See accompanying Notes to Financial Statements which are an integral part of these financial statements.
77
Pacific Advisors Fund Inc.
Financial Highlights (Unaudited)
(For a share outstanding throughout the period)
| Growth Fund | |||||||||||||||||||||||||||
| Class A | |||||||||||||||||||||||||||
| For the six months ended | For the year ended December 31, | ||||||||||||||||||||||||||
| June 30, 2009 | 2008 | 2007 | 2006 | 2005 | 2004 | ||||||||||||||||||||||
| Per Share Operating Performance | |||||||||||||||||||||||||||
| Net asset value, beginning of period | $ | 6.51 | $ | 10.83 | $ | 9.21 | $ | 8.54 | $ | 8.22 | $ | 7.14 | |||||||||||||||
| Income from investing operations | |||||||||||||||||||||||||||
| Net investment income (expense) | (0.10 | ) | (0.07 | ) | (0.07 | ) | (0.04 | ) | (0.01 | ) | 0.02 | ||||||||||||||||
| Net realized and unrealized gains (losses) on securities | 0.43 | (4.25 | ) | 1.69 | 0.71 | 0.33 | 1.06 | ||||||||||||||||||||
| Total from investment operations | 0.33 | (4.32 | ) | 1.62 | 0.67 | 0.32 | 1.08 | ||||||||||||||||||||
| Less distributions | |||||||||||||||||||||||||||
| From net investment income | - | - | - | - | - | - | |||||||||||||||||||||
| From net capital gains | - | - | - | - | - | - | |||||||||||||||||||||
| Total distributions | - | - | - | - | - | - | |||||||||||||||||||||
| Net asset value, end of period | $ | 6.84 | $ | 6.51 | $ | 10.83 | $ | 9.21 | $ | 8.54 | $ | 8.22 | |||||||||||||||
| Total Investment Return (a) | 5.07 | %(b) | (39.89 | )% | 17.59 | % | 7.85 | % | 3.89 | % | 15.13 | % | |||||||||||||||
| Ratios/Supplemental Data | |||||||||||||||||||||||||||
| Net assets, end of period (000's) | $ | 1,916 | $ | 1,984 | $ | 2,889 | $ | 2,101 | $ | 1,650 | $ | 1,155 | |||||||||||||||
| Ratio of net investment income to average net assets | |||||||||||||||||||||||||||
| With expense reductions | (1.55 | )%(c) | (1.38 | )% | (1.33 | )% | (1.11 | )% | (1.37 | )% | (1.51 | )% | |||||||||||||||
| Without expense reductions | (3.78 | )%(c) | (2.41 | )% | (1.85 | )% | (2.14 | )% | (3.06 | )% | (4.98 | )% | |||||||||||||||
| Ratio of expenses to average net assets | |||||||||||||||||||||||||||
| With expense reductions | 3.12 | %(c) | 2.62 | % | 2.65 | % | 2.64 | % | 2.63 | % | 2.83 | % | |||||||||||||||
| Without expense reductions | 5.35 | %(c) | 3.65 | % | 3.17 | % | 3.68 | % | 4.32 | % | 6.30 | % | |||||||||||||||
| Fund portfolio turnover rate | 3 | %(c) | 14 | % | 14 | % | 23 | % | 31 | % | 12.96 | % | |||||||||||||||
| Class C | |||||||||||||||||||||||||||
| For the six months ended | For the year ended December 31, | ||||||||||||||||||||||||||
| June 30, 2009 | 2008 | 2007 | 2006 | 2005 | 2004 | ||||||||||||||||||||||
| Per Share Operating Performance | |||||||||||||||||||||||||||
| Net asset value, beginning of period | $ | 5.97 | $ | 10.03 | $ | 8.59 | $ | 8.02 | $ | 7.79 | $ | 6.83 | |||||||||||||||
| Income from investing operations | |||||||||||||||||||||||||||
| Net investment income (expense) | (0.38 | ) | (0.31 | ) | (0.21 | ) | (0.12 | ) | 0.37 | 0.22 | |||||||||||||||||
| Net realized and unrealized gains (losses) on securities | 0.65 | (3.75 | ) | 1.65 | 0.69 | (0.14 | ) | 0.74 | |||||||||||||||||||
| Total from investment operations | 0.27 | (4.06 | ) | 1.44 | 0.57 | 0.23 | 0.96 | ||||||||||||||||||||
| Less distributions | |||||||||||||||||||||||||||
| From net investment income | - | - | - | - | - | - | |||||||||||||||||||||
| From net capital gains | - | - | - | - | - | - | |||||||||||||||||||||
| Total distributions | - | - | - | - | - | - | |||||||||||||||||||||
| Net asset value, end of period | $ | 6.24 | $ | 5.97 | $ | 10.03 | $ | 8.59 | $ | 8.02 | $ | 7.79 | |||||||||||||||
| Total Investment Return | 4.52 | %(b) | (40.48 | )% | 16.76 | % | 7.11 | % | 2.95 | % | 14.06 | % | |||||||||||||||
| Ratios/Supplemental Data | |||||||||||||||||||||||||||
| Net assets, end of period (000's) | $ | 851 | $ | 1,072 | $ | 2,096 | $ | 1,856 | $ | 1,532 | $ | 445 | |||||||||||||||
| Ratio of net investment income to average net assets | |||||||||||||||||||||||||||
| With expense reductions | (2.27 | )%(c) | (2.18 | )% | (2.07 | )% | (1.87 | )% | (2.13 | )% | (2.27 | )% | |||||||||||||||
| Without expense reductions | (4.49 | )%(c) | (3.19 | )% | (2.60 | )% | (2.91 | )% | (3.83 | )% | 5.61 | % | |||||||||||||||
| Ratio of expenses to average net assets | |||||||||||||||||||||||||||
| With expense reductions | 3.83 | %(c) | 3.40 | % | 3.40 | % | 3.40 | % | 3.40 | % | 3.54 | % | |||||||||||||||
| Without expense reductions | 6.05 | %(c) | 4.42 | % | 3.93 | % | 4.44 | % | 5.11 | % | 6.88 | % | |||||||||||||||
| Fund portfolio turnover rate | 3 | %(c) | 14 | % | 14 | % | 23 | % | 31 | % | 12.96 | % | |||||||||||||||
(a) The Fund's maximum sales charge is not included in the total return computation
(b) Not annualized
(c) Annualized
See accompanying Notes to Financial Statements which are an integral part of these financial statements.
78
Pacific Advisors Fund Inc.
Financial Highlights (Unaudited)
(For a share outstanding throughout the period)
| Multi-Cap Value Fund | |||||||||||||||||||||||||||
| Class A | |||||||||||||||||||||||||||
| For the six months ended | For the year ended December 31, | ||||||||||||||||||||||||||
| June 30, 2009 | 2008 | 2007 | 2006 | 2005 | 2004 | ||||||||||||||||||||||
| Per Share Operating Performance | |||||||||||||||||||||||||||
| Net asset value, beginning of period | $ | 6.75 | $ | 12.50 | $ | 12.77 | $ | 12.27 | $ | 11.77 | $ | 11.46 | |||||||||||||||
| Income from investing operations | |||||||||||||||||||||||||||
| Net investment income (expense) | (0.09 | ) | (0.16 | ) | 0.01 | (0.09 | ) | (0.14 | ) | (0.03 | ) | ||||||||||||||||
| Net realized and unrealized gains (losses) on securities | 0.34 | (5.56 | ) | 0.17 | 1.68 | 1.29 | 0.70 | ||||||||||||||||||||
| Total from investment operations | 0.25 | (5.72 | ) | 0.18 | 1.59 | 1.15 | 0.67 | ||||||||||||||||||||
| Less distributions | |||||||||||||||||||||||||||
| From net investment income | - | - | - | - | - | - | |||||||||||||||||||||
| From net capital gains | (0.03 | ) | (0.45 | ) | (1.09 | ) | (0.65 | ) | (0.36 | ) | |||||||||||||||||
| Total distributions | - | (0.03 | ) | (0.45 | ) | (1.09 | ) | (0.65 | ) | (0.36 | ) | ||||||||||||||||
| Net asset value, end of period | $ | 7.00 | $ | 6.75 | $ | 12.50 | $ | 12.77 | $ | 12.27 | $ | 11.77 | |||||||||||||||
| Total Investment Return (a) | 3.70 | %(b) | (45.78 | )% | 1.40 | % | 12.91 | % | 9.71 | % | 5.84 | % | |||||||||||||||
| Ratios/Supplemental Data | |||||||||||||||||||||||||||
| Net assets, end of period (000's) | $ | 3,301 | $ | 3,291 | $ | 6,315 | $ | 4,341 | $ | 3,073 | $ | 2,313 | |||||||||||||||
| Ratio of net investment income to average net assets | |||||||||||||||||||||||||||
| With expense reductions | (1.85 | )%(c) | (1.33 | )% | (1.21 | )% | (1.66 | )% | (1.70 | )% | (1.15 | )% | |||||||||||||||
| Without expense reductions | (1.85 | )%(c) | (1.33 | )% | (1.21 | )% | (1.66 | )% | (1.73 | )% | (1.15 | )% | |||||||||||||||
| Ratio of expenses to average net assets | |||||||||||||||||||||||||||
| With expense reductions | 3.66 | %(c) | 3.20 | % | 2.82 | % | 3.02 | % | 3.05 | % | 2.63 | % | |||||||||||||||
| Without expense reductions | 3.66 | %(c) | 3.20 | % | 2.82 | % | 3.02 | % | 3.08 | % | 3.07 | % | |||||||||||||||
| Fund portfolio turnover rate | 25 | %(c) | 12 | % | 53 | % | 47 | % | 49 | % | 49.30 | % | |||||||||||||||
| Class C | |||||||||||||||||||||||||||
| For the six months ended | For the year ended December 31, | ||||||||||||||||||||||||||
| June 30, 2009 | 2008 | 2007 | 2006 | 2005 | 2004 | ||||||||||||||||||||||
| Per Share Operating Performance | |||||||||||||||||||||||||||
| Net asset value, beginning of period | $ | 6.36 | $ | 11.90 | $ | 12.28 | $ | 11.93 | $ | 11.54 | $ | 11.33 | |||||||||||||||
| Income from investing operations | |||||||||||||||||||||||||||
| Net investment income (expense) | (0.38 | ) | (0.45 | ) | (0.36 | ) | (0.18 | ) | (0.19 | ) | (0.10 | ) | |||||||||||||||
| Net realized and unrealized gains (losses) on securities | 0.59 | (5.06 | ) | 0.43 | 1.62 | 1.23 | 0.67 | ||||||||||||||||||||
| Total from investment operations | 0.21 | (5.51 | ) | 0.07 | 1.44 | 1.04 | 0.57 | ||||||||||||||||||||
| Less distributions | |||||||||||||||||||||||||||
| From net investment income | - | - | - | - | - | - | |||||||||||||||||||||
| From net capital gains | (0.03 | ) | (0.45 | ) | (1.09 | ) | (0.65 | ) | (0.36 | ) | |||||||||||||||||
| Total distributions | - | (0.03 | ) | (0.45 | ) | (1.09 | ) | (0.65 | ) | (0.36 | ) | ||||||||||||||||
| Net asset value, end of period | $ | 6.57 | $ | 6.36 | $ | 11.90 | $ | 12.28 | $ | 11.93 | $ | 11.54 | |||||||||||||||
| Total Investment Return | 3.30 | %(b) | (46.33 | )% | 0.57 | % | 12.02 | % | 8.94 | % | 5.02 | % | |||||||||||||||
| Ratios/Supplemental Data | |||||||||||||||||||||||||||
| Net assets, end of period (000's) | $ | 3,243 | $ | 3,761 | $ | 8,494 | $ | 9,958 | $ | 7,894 | $ | 6,122 | |||||||||||||||
| Ratio of net investment income to average net assets | |||||||||||||||||||||||||||
| With expense reductions | (2.56 | )%(c) | (2.11 | )% | (1.93 | )% | (2.43 | )% | (2.46 | )% | (1.94 | )% | |||||||||||||||
| Without expense reductions | (2.56 | )%(c) | (2.11 | )% | (1.93 | )% | (2.43 | )% | (2.49 | )% | (2.37 | )% | |||||||||||||||
| Ratio of expenses to average net assets | |||||||||||||||||||||||||||
| With expense reductions | 4.42 | %(c) | 3.96 | % | 3.56 | % | 3.79 | % | 3.82 | % | 3.40 | % | |||||||||||||||
| Without expense reductions | 4.42 | %(c) | 3.96 | % | 3.56 | % | 3.79 | % | 3.84 | % | 3.83 | % | |||||||||||||||
| Fund portfolio turnover rate | 25 | %(c) | 12 | % | 53 | % | 47 | % | 49 | % | 49.30 | % | |||||||||||||||
(a) The Fund's maximum sales charge is not included in the total return computation
(b) Not annualized
(c) Annualized
See accompanying Notes to Financial Statements which are an integral part of these financial statements.
79
Pacific Advisors Fund Inc.
Financial Highlights (Unaudited)
(For a share outstanding throughout the period)
| Small Cap Fund | |||||||||||||||||||||||||||
| Class A | |||||||||||||||||||||||||||
| For the six months ended | For the year ended December 31, | ||||||||||||||||||||||||||
| June 30, 2009 | 2008 | 2007 | 2006 | 2005 | 2004 | ||||||||||||||||||||||
| Per Share Operating Performance | |||||||||||||||||||||||||||
| Net asset value, beginning of period | $ | 19.21 | $ | 34.70 | $ | 33.52 | $ | 25.73 | $ | 25.47 | $ | 18.77 | |||||||||||||||
| Income from investing operations | |||||||||||||||||||||||||||
| Net investment income (expense) | (0.18 | ) | 0.10 | 0.27 | 2.71 | (1.15 | ) | 0.73 | |||||||||||||||||||
| Net realized and unrealized gains (losses) on securities | 4.52 | (15.23 | ) | 1.78 | 6.29 | 3.38 | 6.14 | ||||||||||||||||||||
| Total from investment operations | 4.34 | (15.13 | ) | 2.05 | 9.00 | 2.23 | 6.87 | ||||||||||||||||||||
| Less distributions | |||||||||||||||||||||||||||
| From net investment income | - | - | - | - | - | - | |||||||||||||||||||||
| From net capital gains | - | (0.35 | ) | (0.87 | ) | (1.21 | ) | (1.97 | ) | (0.17 | ) | ||||||||||||||||
| From return of capital | - | (0.01 | ) | - | - | - | - | ||||||||||||||||||||
| Total distributions | - | (0.36 | ) | (0.87 | ) | (1.21 | ) | (1.97 | ) | (0.17 | ) | ||||||||||||||||
| Net asset value, end of period | $ | 23.55 | $ | 19.21 | $ | 34.70 | $ | 33.52 | $ | 25.73 | $ | 25.47 | |||||||||||||||
| Total Investment Return (a) | 22.59 | %(b) | (43.52 | )% | 6.10 | % | 35.05 | % | 8.64 | % | 36.60 | % | |||||||||||||||
| Ratios/Supplemental Data | |||||||||||||||||||||||||||
| Net assets, end of period (000's) | $ | 108,555 | $ | 87,800 | $ | 112,938 | $ | 62,735 | $ | 15,884 | $ | 17,376 | |||||||||||||||
| Ratio of net investment income to average net assets | (2.03 | )%(c) | (1.83 | )% | (1.94 | )% | (2.40 | )% | (3.14 | )% | (3.08 | )% | |||||||||||||||
| Ratio of expenses to average net assets | 2.56 | %(c) | 2.44 | % | 2.34 | % | 2.78 | % | 3.36 | % | 3.32 | % | |||||||||||||||
| Fund portfolio turnover rate | 21 | %(c) | 23 | % | 15 | % | 20 | % | 21 | % | 7.23 | % | |||||||||||||||
| Class C | |||||||||||||||||||||||||||
| For the six months ended | For the year ended December 31, | ||||||||||||||||||||||||||
| June 30, 2009 | 2008 | 2007 | 2006 | 2005 | 2004 | ||||||||||||||||||||||
| Per Share Operating Performance | |||||||||||||||||||||||||||
| Net asset value, beginning of period | $ | 16.79 | $ | 30.70 | $ | 30.00 | $ | 23.32 | $ | 23.44 | $ | 17.41 | |||||||||||||||
| Income from investing operations | |||||||||||||||||||||||||||
| Net investment income (expense) | (0.78 | ) | (0.90 | ) | (0.21 | ) | 0.83 | (0.56 | ) | 0.66 | |||||||||||||||||
| Net realized and unrealized gains (losses) on securities | 4.49 | (12.65 | ) | 1.78 | 7.06 | 2.41 | 5.54 | ||||||||||||||||||||
| Total from investment operations | 3.71 | (13.55 | ) | 1.57 | 7.89 | 1.85 | 6.20 | ||||||||||||||||||||
| Less distributions | |||||||||||||||||||||||||||
| From net investment income | - | - | - | - | - | - | |||||||||||||||||||||
| From net capital gains | - | (0.35 | ) | (0.87 | ) | (1.21 | ) | (1.97 | ) | (0.17 | ) | ||||||||||||||||
| From return of capital | - | (0.01 | ) | - | - | - | - | ||||||||||||||||||||
| Total distributions | - | (0.36 | ) | (0.87 | ) | (1.21 | ) | (1.97 | ) | (0.17 | ) | ||||||||||||||||
| Net asset value, end of period | $ | 20.50 | $ | 16.79 | $ | 30.70 | $ | 30.00 | $ | 23.32 | $ | 23.44 | |||||||||||||||
| Total Investment Return | 22.10 | %(b) | (44.05 | )% | 5.22 | % | 33.91 | % | 7.76 | % | 35.62 | % | |||||||||||||||
| Ratios/Supplemental Data | |||||||||||||||||||||||||||
| Net assets, end of period (000's) | $ | 15,311 | $ | 15,368 | $ | 31,589 | $ | 17,337 | $ | 4,602 | $ | 3,848 | |||||||||||||||
| Ratio of net investment income to average net assets | (2.77 | )%(c) | (2.57 | )% | (2.69 | )% | (3.15 | )% | (3.95 | )% | (3.85 | )% | |||||||||||||||
| Ratio of expenses to average net assets | 3.31 | %(c) | 3.17 | % | 3.09 | % | 3.54 | % | 4.19 | % | 4.10 | % | |||||||||||||||
| Fund portfolio turnover rate | 21 | %(c) | 23 | % | 15 | % | 20 | % | 21 | % | 7.23 | % | |||||||||||||||
(a) The Fund's maximum sales charge is not included in the total return computation
(b) Not annualized
(c) Commencement of operations
See accompanying Notes to Financial Statements which are an integral part of these financial statements.
80
Pacific Advisors Fund Inc.
Financial Highlights (Unaudited)
(For a share outstanding throughout the period)
| Small Cap Fund | |||||||||||||||||||
| Class I | |||||||||||||||||||
| For the period ended June 30, 2009 | For the year ended December 31, 2008 | For the year ended December 31, 2007 | October 31, 2006(c) December 31, 2006 | ||||||||||||||||
| Per Share Operating Performance | |||||||||||||||||||
| Net asset value, beginning of period | $ | 21.72 | $ | 37.50 | $ | 36.13 | $ | 35.00 | |||||||||||
| Income from investing operations | |||||||||||||||||||
| Net investment income (expense) | (0.19 | ) | (0.32 | )* | (0.33 | ) | 0.45 | ||||||||||||
| Net realized and unrealized gains (losses) on securities | 5.12 | (15.10 | )* | 2.57 | 1.89 | ||||||||||||||
| Total from investment operations | 4.93 | (15.42 | ) | 2.24 | 2.34 | ||||||||||||||
| Less distributions | |||||||||||||||||||
| From net investment income | - | - | - | - | |||||||||||||||
| From net capital gains | - | (0.35 | ) | (0.87 | ) | (1.21 | ) | ||||||||||||
| From return of capital | - | (0.01 | ) | - | - | ||||||||||||||
| Total distributions | - | (0.36 | ) | (0.87 | ) | (1.21 | ) | ||||||||||||
| Net asset value, end of period | $ | 26.65 | $ | 21.72 | $ | 37.50 | $ | 36.13 | |||||||||||
| Total Investment Return | 22.70 | %(b) | (41.00 | )% | 6.19 | % | 6.74 | %(b) | |||||||||||
| Ratios/Supplemental Data | |||||||||||||||||||
| Net assets, end of period (000's) | $ | 4 | $ | 3 | $ | 1,902 | $ | 5 | |||||||||||
| Ratio of net investment income to average net assets | (1.78 | )%(c) | (1.56 | )% | (1.72 | )% | (2.48 | )%(d) | |||||||||||
| Ratio of expenses to average net assets | 2.31 | %(c) | 2.16 | % | 2.10 | % | 2.74 | %(d) | |||||||||||
| Fund portfolio turnover rate | 21 | %(c) | 23 | % | 15 | % | 20 | % | |||||||||||
(b) Not annualized
(c) Commencement of operations
(d) Annualized
* Numbers were calculated using a weighted-average number of shares outstanding basis as a result of a significant change in Class I assets immediately prior to end of period.
See accompanying Notes to Financial Statements which are an integral part of these financial statements.
81
Pacific Advisors Fund Inc.
Directors and Officers
| Name, Address and Age | Position(s) Held with the Company | Term of Offices and Length of Time Served | Principal Occupations During Past 5 Years | Number of Portfolios in Fund Complex Overseen by Trustee | Other Directorships Held by Trustee | ||||||||||||||||||
| Victoria L. Breen (58) 603 West Ojai Avenue Ojai, CA 93023 | Director and Assistant Secretary | Since 1992 | 1992 - Present: Assistant Secretary and Director Pacific Global Investment Management Company 1994 - Present: Agent, Transamerica Life Companies; Registered Principal, Transamerica Financial Advisors, Inc. 1986 - Present: President, Derby & Derby, Inc. (Financial Services Company) | 6 Pacific Advisors Mutual Funds | None | ||||||||||||||||||
| Thomas M. Brinker (75) 1 North Ormond Avenue Havertown, PA 19083 | Director | Since 1992 | 2007 - Present: Retired 1970 - 2007: Registered Representative, Transamerica Financial Advisors, Inc. 1970 - 2007: President, Fringe Benefits, Inc. and Financial Foresight, Ltd. d/b/a The Brinker Organization (Financial Services Companies) | 6 Pacific Advisors Mutual Funds | None | ||||||||||||||||||
82
Pacific Advisors Fund Inc.
Directors and Officers
| Name, Address and Age | Position(s) Held with the Company | Term of Offices and Length of Time Served | Principal Occupations During Past 5 Years | Number of Portfolios in Fund Complex Overseen by Trustee | Other Directorships Held by Trustee | ||||||||||||||||||
| L. Michael Haller (65) 5924 Colodny Agoura, CA 91301 | Director | Since 1992 | 2008 - Present: Chairman, Stereo Scope, Inc. (Web Application Company) 2008 - Present: Chairman, Kapitall (Software Development Company) 2007 - Present: President, Bionic Games, Inc. (Game Software Development Company) 2004 - Present: Consultant 2002 - Present: President, High Impact Games, Inc. (Game Software Development Company) 1979 - Present: Owner, Asahi Broadcasting Enterprises (Game Software Development Company) 2003 - 2005: Executive Vice President, Sammy Studios, Inc. (Entertainment Company) | 6 Pacific Advisors Mutual Funds | None | ||||||||||||||||||
| Thomas H. Hanson (59) 101 N. Brand Blvd. Suite 1950 Glendale, CA 91203 | Vice President | Since 1992 | 1992 - Present: Executive Vice President and Director, Pacific Global Investment Management Company; President and Director; Pacific Global Fund Distributors, Inc.; Director, Pacific Global Investor Services, Inc. 2001 - Present: Vice President, Pacific Global Investor Services, Inc. 1993 - Present: Owner, Director, Chairman, President, and CEO of TriVest Capital Management, Inc. 1992 - 2006: Secretary, Pacific Global Fund Inc. d/b/a Pacific Advisors Fund Inc. | 6 Pacific Advisors Mutual Funds | None | ||||||||||||||||||
83
Pacific Advisors Fund Inc.
Directors and Officers
| Name, Address and Age | Position(s) Held with the Company | Term of Offices and Length of Time Served | Principal Occupations During Past 5 Years | Number of Portfolios in Fund Complex Overseen by Trustee | Other Directorships Held by Trustee | ||||||||||||||||||
| Catherine L. Henning (31) 101 N. Brand Blvd. Suite 1950 Glendale, CA 91203 | Secretary | Since 2006 | 2007 - Present: Vice President, Pacific Global Investment Management Company 2006 - Present: Secretary, Pacific Global Fund Distributors, Inc. and Pacific Global Investor Services, Inc. 2004 - Present: Secretary, Pacific Global Investment Management Company; Chief Compliance Officer, Pacific Global Fund Distributors, Inc. 2001 - Present: Director of Private Client Services, Pacific Global Investment Management Company 2004 - 2006: Assistant Secretary, Pacific Global Fund Inc. d/b/a Pacific Advisors Fund Inc. 2002 - 2006: Assistant Secretary, Pacific Global Fund Distributor s, Inc. and Pacific Global Investor Services, Inc. | 6 Pacific Advisors Mutual Funds | None | ||||||||||||||||||
| George A. Henning (62) 101 N. Brand Blvd. Suite 1950 Glendale, CA 91203 | President and Chairman | Since 1992 | 1991 - Present: Chairman, President, and Director, Pacific Global Investment Management Company; Chairman and Director, Pacific Global Fund Distributors, Inc.; Chairman and Director, Pacific Global Investor Services, Inc. 1992 - 2006: Secretary, Pacific Global Fund Distributors, Inc. and Pacific Global Investor Services, Inc. | 6 Pacific Advisors Mutual Funds | None | ||||||||||||||||||
84
Pacific Advisors Fund Inc.
Directors and Officers
| Name, Address and Age | Position(s) Held with the Company | Term of Offices and Length of Time Served | Principal Occupations During Past 5 Years | Number of Portfolios in Fund Complex Overseen by Trustee | Other Directorships Held by Trustee | ||||||||||||||||||
| Barbara A. Kelley (56) 101 N. Brand Blvd. Suite 1950 Glendale, CA 91203 | Vice President, Chief Compliance Officer and Treasurer | Since 2001 | 2004 - Present: Chief Compliance Officer, Pacific Advisors Fund Inc. and Pacific Global Investment Management Company 2001 - Present: Executive Vice President, Pacific Global Investment Management Company; Director, Pacific Global Fund Distributors, Inc.; President, Pacific Global Investor Services, Inc. 1999 - Present: Director, Pacific Global Investment Management Company 2001 - 2007: Treasurer, Pacific Global Investment Management Company, Pacific Global Fund Distributors, Inc. and Pacific Global Investor Services, Inc. | 6 Pacific Advisors Mutual Funds | None | ||||||||||||||||||
| Takashi Makinodan, PhD (84) 1506 S. Bentley Avenue PH #5 Los Angeles, CA 90025 | Director | Since 1995 | 2007 - Present: Retired 1992 - 2007: Director, Medical Treatment Effectiveness Program (MEDTEP), Center on Asian and Pacific Islanders 1991 - 2007: Associate Director of Research, Geriatric Research Education Clinic Center, VA Medical Center | 6 Pacific Advisors Mutual Fund | None | ||||||||||||||||||
| Gerald E. Miller (79) 5262 Bridgetown Place Westlake Village, CA 91362 | Director | Since 1992 | 1992 - Present: Retired | 6 Pacific Advisors Mutual Funds | None | ||||||||||||||||||
85
Pacific Advisors Fund Inc.
Directors and Officers
| Name, Address and Age | Position(s) Held with the Company | Term of Offices and Length of Time Served | Principal Occupations During Past 5 Years | Number of Portfolios in Fund Complex Overseen by Trustee | Other Directorships Held by Trustee | ||||||||||||||||||
| Araceli Olea (36) 101 N. Brand Blvd. Suite 1950 Glendale, CA 91203 | Assistant Secretary | Since 2008 | 1997 - Present: Shareholder Services Manager, Pacific Global Investor Services, Inc. 1997 - Present: Assistant Secretary, Pacific Global Investor Services, Inc. | 6 Pacific Advisors Mutual Funds | None | ||||||||||||||||||
| Louise K. Taylor, PhD (62) 325 East Huntington Dr. Monrovia, CA 91016 | Director | Since 1992 | 2009 - Present: Retired 1991 - 2009: Superintendent, Monrovia Unified School District | 6 Pacific Advisors Mutual Funds | None | ||||||||||||||||||
| Jingjing Yan (35) 101 N. Brand Blvd. Suite 1950 Glendale, CA 91203 | Assistant Treasurer | Since 2005 | 2007 - Present: Treasurer, Pacific Global Investment Management Company, Pacific Global Fund Distributors, Inc. and Pacific Global Investor Services, Inc. 2001 - 2007: Fund Accounting Manager, Pacific Global Investor Services, Inc. 2005 - 2007: Assistant Treasurer, Pacific Global Investment Management Company, Pacific Global Fund Distributors, Inc. and Pacific Global Investor Services, Inc. | 6 Pacific Advisors Mutual Funds | None | ||||||||||||||||||
The Fund's Statement of Additional Information contains additional information about the Fund's Directors and Officers and is available without charge upon request by calling (800) 989-6693.
Each director is elected to serve until the next annual shareholders meeting and until his or her successor is elected or appointed. The Company does not hold regular annual shareholders meetings to elect Directors. Vacancies on the Board can be filled by the action of a majority of the Directors, provided that at least two-thirds of the Directors have been elected by the shareholders. Certain Directors are considered "interested persons" of the Company as defined in the 1940 Act. All directors oversee all six Funds of the Company.
86
Pacific Advisors Fund Inc.
notes
87
Pacific Advisors Fund Inc.
notes
88

Pacific Advisors Fund Inc.
Directors
George A. Henning, Chairman
Victoria L. Breen
Thomas M. Brinker
L. Michael Haller, III
Takashi Makinodan, Ph.D.
Gerald E. Miller
Louise K. Taylor, Ph.D.
Officers
George A. Henning, President
Thomas H. Hanson, Vice President
Catherine L. Henning, Secretary
Victoria L. Breen, Assistant Secretary
Araceli Olea, Assistant Secretary
Barbara A. Kelley, Treasurer
Jingjing Yan, Assistant Treasurer
Investment Manager
Pacific Global Investment Management Company
101 North Brand Blvd., Suite 1950
Glendale, California 91203
Transfer Agent and Administrator
Pacific Global Investor Services, Inc.
101 North Brand Blvd., Suite 1950
Glendale, California 91203
Distributor
Pacific Global Fund Distributors, Inc.
101 North Brand Blvd., Suite 1950
Glendale, California 91203
(800) 989-6693
Availability of Quarterly Portfolio Schedule
The Fund files its complete schedule of portfolio holdings with the SEC for the first and third quarters of each fiscal year on Form N-Q. The Fund's Forms N-Q are available on the SEC's Web site at http://www.sec.gov. The Fund's Forms N-Q may be reviewed and copied at the SEC's Public Reference Room in Washington, DC. Information about the operation of the Public Reference Room may be obtained by calling the SEC at (800) SEC-0330.
The Fund's complete schedule of portfolio holdings for each fiscal quarter is posted on the Fund's Web site at www.PacificAdvisorsFund.com and is available without charge, upon request by calling (800) 989-6693. Documents will be sent within 3 business days of receipt of your request.
Availability of Proxy Voting Policies and Procedures and Proxy Voting Record
A description of the policies and procedures that the Fund uses to determine how to vote proxies relating to portfolio securities and information regarding how the Fund voted proxies relating to portfolio securities during the most recent 12-month period ended June 30 is available without charge, upon request by calling (800) 989-6693. Documents will be sent within 3 business days of receipt of your request. This information is also available on the SEC's Web site at http://www.sec.gov.
Pacific Global Fund Distributors, Inc.
101 North Brand Blvd., Suite 1950
Glendale, California 91203


Item 2. Code of Ethics
Not applicable for semi-annual reports.
Item 3. Audit Committee Financial Expert
Not applicable for semi-annual reports.
Item 4. Principal Accountant Fees and Services
Not applicable for semi-annual reports.
Item 5. Audit Committee of Listed Registrants
Not applicable as Registrant is not a listed issuer as defined in Rule 10A-3 under the Securities Exchange Act of 1934.
Item 6. Schedule of Investments
Schedule of Investments is included as part of the report to shareholders filed under Item 1 of this form.
Item 7. Disclosure of Proxy Voting Policies and Procedures for Closed-End Management Investment Companies
Not applicable to open-end investment companies.
Item 8. Portfolio Managers of Closed-End Management Investment Companies
Not applicable to open-end investment companies.
Item 9. Purchases of Equity Securities by Managers of Closed-End Management Investment Company and Affiliated Purchasers.
Not applicable to open-end investment companies.
Item 10. Submission of Matters to a Vote of Security Holders
No material changes have been made.
Item 11. Controls and Procedures.
(a) Based upon their evaluation of Registrant’s disclosure controls and procedures (as defined in Rule 30a-3(c) under the Investment Company Act of 1940) as conducted within 90 days of the filing date of this Form N-CSR, Registrant’s principal executive officer and principal financial officer have concluded that those disclosure controls and procedures provide reasonable assurance that the material information required to be disclosed by Registrant on this report is recorded, processed, summarized and reported within the time periods specified in the Securities and Exchange Commission’s rules and forms.
(b) There were no changes in Registrant’s internal control over financial reporting (as defined in Rule 30a-3(d) under the Investment Company Act of 1940) that occurred during the second fiscal quarter of the period covered by this report that have materially affected, or are reasonably likely to materially affect, Registrant’s internal control over financial reporting.
Item 12. Exhibits
(a)(1) Not applicable.
(a)(2) Certifications required by Item 12(a) of Form N-CSR and Section 302 of the Sarbanes-Oxley Act of 2002 (filed herewith).
(a)(3) Not applicable.
(b) Certification required by Section 906 of the Sarbanes-Oxley Act of 2002 (filed herewith).
SIGNATURES
Pursuant to the requirements of the Securities Exchange Act of 1934 and the Investment Company Act of 1940, Registrant has duly caused this report to be signed on its behalf by the undersigned, thereunto duly authorized.
Pacific Global Fund Inc. d/b/a Pacific Advisors Fund Inc.
By: | /s/ George A. Henning |
|
| George A. Henning | |
| Chairman, Pacific Advisors Fund Inc. | |
|
| |
Date: | September 3, 2009 | |
Pursuant to the requirements of the Securities Exchange Act of 1934 and the Investment Company Act of 1940, this report has been signed below by the following persons on behalf of Registrant and in the capacities and on the dates indicated.
By: | /s/ George A. Henning |
|
| George A. Henning | |
| Chief Executive Officer | |
|
| |
Date: | September 3, 2009 | |
By: | /s/ Barbara A. Kelley |
|
| Barbara A. Kelley | |
| Chief Financial Officer | |
|
| |
Date: | September 3, 2009 | |