UNITED STATES
SECURITIES AND EXCHANGE COMMISSION
Washington, D.C. 20549
FORM N-CSR
CERTIFIED SHAREHOLDER REPORT OF REGISTERED
MANAGEMENT INVESTMENT COMPANIES
Investment Company Act file number | 811-07062 | |||||||
| ||||||||
PACIFIC GLOBAL FUND INC. D/B/A PACIFIC ADVISORS FUND INC. | ||||||||
(Exact name of registrant as specified in charter) | ||||||||
| ||||||||
101 NORTH BRAND BLVD., SUITE 1950 GLENDALE, CALIFORNIA |
| 91203 | ||||||
(Address of principal executive offices) |
| (Zip code) | ||||||
| ||||||||
GEORGE A. HENNING 101 NORTH BRAND BLVD., SUITE 1950 GLENDALE, CA 91203 | ||||||||
(Name and address of agent for service) | ||||||||
| ||||||||
Registrant’s telephone number, including area code: | 818-242-6693 |
| ||||||
| ||||||||
Date of fiscal year end: | December 31 |
| ||||||
| ||||||||
Date of reporting period: | June 30, 2012 |
| ||||||
Item 1. | Report to Shareholders |
| Filed herewith. |

semi-annual report
june 30, 2012
government securities fund
income and equity fund
balanced fund
large cap value fund
mid cap value fund
small cap value fund


Pacific Advisors
table of contents
| Message from the Chairman | 1 | ||||||
| Government Securities Fund | 5 | ||||||
| Income and Equity Fund | 9 | ||||||
| Balanced Fund | 13 | ||||||
| Large Cap Value Fund | 18 | ||||||
| Mid Cap Value Fund | 22 | ||||||
| Small Cap Value Fund | 26 | ||||||
| Schedule of Investments | 32 | ||||||
| Statement of Assets and Liabilities | 54 | ||||||
| Statement of Operations | 56 | ||||||
| Statement of Changes in Net Assets | 58 | ||||||
| Financial Highlights | 62 | ||||||
| Notes to Financial Statements | 69 | ||||||
| Directors and Officers | 79 | ||||||
This Report is submitted for the general information of the shareholders of Pacific Advisors Funds. It is not authorized for distribution to prospective investors unless accompanied or preceded by the Funds' current prospectus, which contains information concerning the investment policies of the Funds as well as other pertinent information.
This Report is for informational purposes only and is not a solicitation or recommendation that any particular investor should purchase or sell any particular security. The statements in the Chairman's Letter and the discussions of the Funds' performance are the opinions and beliefs expressed at the time of this commentary and are not intended to represent opinions and beliefs at any other time. These opinions are subject to change at any time based on market or other conditions and are not meant as a market forecast. All economic and performance information referenced is historical. Past performance does not guarantee future results.
For more information on the Pacific Advisors Funds, including information on charges, expenses and other classes offered, please obtain a copy of the prospectus by calling (800) 989-6693. Please read the prospectus and consider carefully the investment risks, objectives, charges and expenses before you invest or send money. Shares of the Pacific Advisors Funds are not deposits or obligations of any bank, are not guaranteed by any bank, are not insured by the FDIC or any other agency, and involve investment risks, including the possible loss of the principal amount invested. The investment return and principal value of an investment will fluctuate so that an investor's shares, when redeemed, may be worth more or less than their original cost.


Message
from the chairman
Dear Shareholders,
The first two quarters of 2012 were a study in contrasts. The first quarter began with the strongest rally in the past fifteen years for most of the major equity indices; it caught many investors by surprise. The rally was fueled by a belief that Europe was coping with its sovereign debt crisis and that most of the major world economies were showing at least modest growth. However, the euphoria was short-lived as Greece again took center stage in the second quarter. Fears that new elections would bring to power an anti-Europe leadership pushed the equity markets into a correction. Fortunately, in June, Greece elected a new government committed to the European Union and the markets began a modest recovery.
European headlines grabbed most of the attention; yet, investors faced other challenges as well. In addition to slowing growth in Asia, tensions in the Middle East remained high, and the U.S. economic recovery plodded along. Drought conditions in the Midwest led to anxiety about crop yields and the potential escalation of food prices. Businesses also began weighing the potential ramifications of the upcoming elections on the U.S. economy; emerging evidence suggests that many companies are delaying capital investments until after the election. The major concern, however, is that the slow pace of economic reform in Europe will likely to lead to a recession with uncertain repercussions for the global economy.
By itself, the equity market correction in May should be viewed as part of a normal bull market cycle. In the absence of periodic pullbacks, the markets can become severely overvalued. This increases the probability of a more significant correction or a bear market such as the technology bubble of the 1990s. Investors, however, have been discouraged by headline events that cloud the outlook for global markets and economies and create uncertainty and price volatility. For many investors, the markets have seemingly made little progress since the "Great Recession."
Closer examination, however, reveals a silver lining: global economies are implementing important structural changes. Some may argue that the pace of change is too slow; others acknowledge that entrenched economic policies of sovereign nations will not, realistically, be quickly or calmly restructured. In most political situations, progress unfortunately occurs as a result of a crisis; and, even then, building a political consensus for reform takes time.
We believe the euro zone economies are gradually taking the necessary actions. Thus far, the most significant step is the preliminary agreement to shift oversight of major European banks to a regulatory body governed by the European Central Bank rather than the countries in which each bank is domiciled. This should significantly lessen the sovereign debt crises by providing centralized regulation while limiting the ability of individual countries to exert authority over national banks for their own political purposes. Additionally, many euro zone countries have adopted austerity programs that will curtail government spending. Further, leaders of these troubled nations are also introducing policies which will remove many of the barriers to economic growth by reducing red tape and onerous regulations that impede business development. The speed of activity may appear painfully slow; yet, leaders are increasingly recognizing that economic reform will be essential to compete in the global economy.
In developing countries such as China, India and Brazil, economic growth over the past several years has been phenomenal; as a result, these countries are now reassessing their economic policies to identify changes that will be needed to manage further growth. While these transitions unfold, the countries are, not surprisingly, experiencing a modest slowdown. Similarly, the U.S. economy has undergone significant structural changes since the "Great Recession." As industries contracted, the forced downsizing brought supply and demand into balance and created greater pricing power for the well-capitalized survivors. While the economy has begun to recover, this new supply and demand relationship has remained. Also, advances in technology have created significant growth opportunities in communications, energy exploration and other industries. Even the housing industry, which has been an economic drag since 2008, is showing improvement; in many parts of the country, the inventory of homes has normalized and new home construction is gaining some traction.
Many corporate executives with whom we have recently met continue to identify meaningful growth opportunities despite the headwinds from current global events. The slower pace of economic growth continues to benefit stronger companies; they can better weather challenges, adapt more easily to changing business conditions, and take advantage of growth opportunities. In comparison, their weaker competitors may not have the ability, in the current slow-growing economy, to keep pace, let alone to successfully improve
1


Message
from the chairman continued
revenues. We believe that, while the stock prices of these leading companies may not immediately reflect these benefits, the long-term outlook for select companies is compelling.
Market & Economic Review
Equities sold off in the second quarter as European sovereign debt crises monopolized investor sentiment. Most of the selling occurred in May when Greek elections sparked fears of a disorderly break-up of the euro. Still, softening economic data around the world underscored the impact of the European saga. Crude oil prices, which are often seen as an indicator of world demand, fell from $105 per barrel to $77 during the late spring. And, equity markets, despite the modest recovery in June, remained somewhat depressed entering the second half of the year.
While the global news was cautionary, the U.S. economy continued to grow at a modest pace. Consumer and corporate spending continued to improve. One example is the rebound in automobile sales which are expected to reach 14 million units this year. Within the next couple of years, forecasters anticipate a sales rate of approximately 17 million units which would reach prerecession levels. Consumer spending, especially for technology, consumer staples and other consumer discretionary products and services, continues to improve. In addition, the growing energy sector provides an important long-term growth opportunity.
Equity performance during the first six months varied across market capitalizations. The NASDAQ Index, which is heavily weighted towards technology stocks, led the way followed by the broader S&P 500 Index. The small cap Russell 2000 Index followed closely behind large cap stocks as of June 30th. While the correction mitigated gains achieved early in the year, the first half of the year was a significant improvement over 2010 and 2011. Despite disappointing headline news, equity investors continued to show resilience and a belief that economic conditions would improve over time; this is a notable change in market sentiment since the recession.
The U.S. economy, even with mixed economic data and slow growth, nevertheless remains one of the more stable economies in the world. Rising investor uncertainty during the second quarter prompted some to favor U.S. government securities over other investments as safety became a high priority. Investors demanded U.S. government securities even as the Federal Reserve remained committed to economic stimulus by maintaining a low interest rate environment. The demand for U.S. government securities pushed the interest rate on the benchmark 10-year U.S. Treasury Note to a historical low of 1.45% in early June. Clearly, the U.S. dollar has, despite recent speculation to the contrary, maintained its status as the international currency of choice.
Equity Investment Review
Even as the equity markets sold off in the spring, many companies continued to take advantage of record low interest rates to focus on acquisitions as well as productivity enhancements and to expand current business operations. In addition, many companies took shareholder-friendly actions, such as stock buybacks and higher dividend payments.
When the markets are dominated by economic events, investors tend to view stocks as part of an asset class rather than individual businesses. As a result, stocks may suddenly fall out of favor regardless of the quality of the companies. This pattern occurred not only in the second quarter but also repeatedly over the past several years. Therefore, the market value of individual companies may be more reflective of prevailing market conditions and concerns rather than the underlying strength of the company.
At Pacific Advisors Funds, our investment strategies focus on the business operations of the companies in which we invest, set against the backdrop of the overall economy. Short-term volatility may be frustrating to investors; yet, we often find that it provides the opportunity to buy and sell equities at more attractive
Market Review • June 30, 2012
| Index1 | Close | YTD Return | |||||||||
| Dow Jones Industrial Avg | 12,880.09 | 5.4 | % | ||||||||
| S&P 500 | 1,362.16 | 9.5 | % | ||||||||
| NASDAQ | 2,935.05 | 12.7 | % | ||||||||
| Russell 2000 (small cap) | 798.49 | 8.5 | % | ||||||||
| 06/30/12 | 06/30/11 | ||||||||||
| 10-Year T-Note Yield | 1.65 | % | 3.18 | % | |||||||
Data: Bloomberg
2

prices. Our investment focus is on the longer-term growth potential of companies in the portfolios; therefore, we frequently take a contrarian view in comparison to short-term market sentiment.
We continue to focus on actual business conditions rather than prevailing market concerns. In monitoring and reassessing companies, we regularly converse with management, discuss company and industry updates with analysts, and attend investor conferences. Some companies have reported slower business activity; nevertheless, they remain confident that the slowdown was a short-term situation caused by anemic economic growth or temporary, industry-specific events. Our due diligence enables us to take advantage of market volatility. Recent market turbulence has provided opportunities to contrast our assessment of individual companies with the market's asset class perspective. We believe that the growth opportunities for portfolio holdings remain strong and will be realized as global headwinds subside.
The individual discussions with each of the Funds' portfolio managers that follow my letter provide more detailed discussions of our equity investment strategies and examples of companies that exemplify the growth opportunities developing in various industries around the world.
Fixed Income Investment Review
During the first quarter, strong U.S. economic data and corporate earnings bolstered investor confidence. Robust equity returns and inflationary trends led bond investors to other investments which provided higher potential returns. The resulting selloff in U.S. Treasuries pushed the interest rate on the benchmark 10-year Treasury Note from 1.88% to 2.21% during the period. However, in the second quarter, investors favored U.S. government securities in response to the market turbulence related to the ongoing European debt saga and other global issues. The interest rate on the 10-year U.S. Treasury Note fell during the quarter from 2.21% to 1.65%. The dramatic shift in interest rates highlights the rapid speed with which interest rates can change in response to changing market conditions.
Fixed income investment opportunities remained limited due to the continuing, and unprecedented, low interest rate environment. High quality bonds became more expensive as nervous equity investors sought the safety of U.S. government securities and high quality corporate bonds. As prices rose, and interest rates on U.S. government securities fell to historical lows, so too did the risk of principal loss that would result from price and interest rate volatility. In response, our fixed income strategies continued to focus on protecting principal while generating attractive income.
We expect that the Fed's commitment to low interest rates may continue for an extended period. However, given the uncertainties surrounding Europe and China, as well as the domestic economy, we anticipate that interest rates will remain volatile. To protect principal, our fixed income strategies will continue to focus on shorter-term high quality bonds until market conditions change. Further details about our government securities and corporate bond investment strategies follow in the discussions with the portfolio managers of the Government Securities, Income and Equity and Balanced Funds.
Looking Ahead
2012 got off to a great start as investors responded to individual companies' strong results and sensed that economic conditions were improving despite European sovereign debt issues. Looking back, companies began to talk about growth opportunities during the second half of 2010 in contrast to their "bunker mentality" during the financial crisis and recession. During 2011, companies implemented growth initiatives and began to show results as the year progressed. When investors saw tangible results, they rallied their support behind these businesses' accomplishments.
In the second quarter, equity investors once again retreated as the European sovereign debt issues overshadowed a growing U.S. economy. Investors have become weary of the lack of clear resolution. Some have remarked on the striking contrast between Europe's inability to stabilize its banking sector and the U.S. response to its 2009 banking crisis. Here, leaders acted decisively and with determination, employing TARP, quantitative easing, and fiscal stimulus to avert disaster and jump-start the economy. So far, European leaders have not reached a consensus on politically and economically viable solutions. The drawn out crisis response, while frustrating, has been somewhat successful. We believe that the euro zone is reaching a critical phase and recognizes the need for a sustainable solution.
3


Message
from the chairman continued
The recession, as it migrated around the world over the past four years, has impacted economies to varying degrees. The European recession began to emerge as the U.S. entered recovery; their financial and economic restructuring process will take time. Yet the signs of significant economic growth are evident. Corporations and individuals have been deferring capital investments; the delay will create a potentially strong period of economic growth as spending on maintenance and equipment improves. The timing and magnitude of recovery are difficult to predict; yet growth opportunities will become apparent once policy changes to support economic revitalization inspire investor confidence.
The market selloff during the second quarter was disappointing; but, portfolio holdings were impacted more by global events than significant changes in company operations. A recovery in valuations will occur as companies demonstrate that their business strategies are successful and as economic conditions improve. As we have experienced in the past, a slow-growing global economy rewards strong companies. If such conditions endure, weaker competitors will struggle to maintain market share. In the past, equity markets have exhibited an upward bias only to be disrupted by external factors. However, considering the challenges confronting Europe and the prospect of slowing growth in Asia, the U.S. is becoming more attractive to long-term investors. We continue to believe that the ebb and flow of a slow growth economy will be beneficial to the "best of class" companies in their respective industries.
As investors in a global economy, we continue to monitor and respond to changing economic and market events. We believe the long-term focus and discipline of our investment strategies will continue to succeed. Our goal is to manage risk and invest in high quality companies that will help you, our shareholders, achieve your financial objectives.
Sincerely,

George A. Henning
1 The Dow Jones Industrial Average is an unmanaged, price weighted measure of 30 U.S. stocks selected by the Averages Committee to represent the performance of all U.S. stocks outside the Transportation and Utilities sectors. The Standard & Poor's 500 Index is an unmanaged, market capitalization weighted index which measures the performance of the large cap segment of the U.S. equities market, covering approximately 75% of the U.S. equities market. The Index includes 500 leading companies in leading industries of the U.S. economy. The NASDAQ Composite Index is an unmanaged, market capitalization weighted measure of all domestic and international common stocks (currently over 3,000 stocks) listed on The Nasdaq Stock Market. The Russell 2000 Index® is an unmanaged, market-weighted measure of the 2,000 smallest publicly traded companies of the Russell 3000 Index®. These indices are not available for direct investment. Index returns assume the reinvestment of dividends.
Economic and performance information referenced is historical and past performance does not guarantee future results. The principal value and return of an investment will fluctuate so that an investor's shares may be worth less than the original cost when redeemed. For more information on the Pacific Advisors Funds, including information on charges, expenses and other classes offered, please obtain a copy of the prospectus by calling (800) 989-6693. Please read the prospectus and consider carefully the investment risks, objectives, charges and expenses before you invest or send money.
Shares of the Funds are not deposits or obligations of any bank, are not guaranteed by any bank, are not insured by the FDIC or any other agency, and involve investment risks, including the possible loss of the principal amount invested. The views expressed represent the opinions and beliefs at the time of this commentary and are not meant as a market forecast. These views are subject to change at any time based on market or other conditions. This information may not be relied on as investment advice or as an indication of trading intent on behalf of any Fund. Fund investments may change at any time.
4
Pacific Advisors
Government Securities Fund
Fund Objective: High current income, preservation of capital, and rising future income consistent with prudent investment risk.
Investment Invests at least 80% of its assets in U.S. Government fixed income
Strategy: securities. These include securities issued or guaranteed by the U.S. Treasury; issued by a U.S. Government agency; or issued by a Government-Sponsored Enterprise (GSE). May also invest in high quality dividend-paying common stocks.
Investor Profile: Conservative. Income-focused; capital preservation aim.
| TOTAL RETURNS | EXPENSE RATIOS | ||||||||||||||||||
| For the six months ended June 30, 2012 | For the fiscal year ended December 31, 2011 | ||||||||||||||||||
| Net Expense Ratio | Expense Ratio | ||||||||||||||||||
| Class A | 0.99 | % | Class A | 2.42 | % | 4.26 | % | ||||||||||||
| Class C | 0.67 | % | Class C | 3.16 | % | 5.03 | % | ||||||||||||
| Barclays Capital U.S. Int T-Bond Index1 | 1.07 | % | |||||||||||||||||
Performance quoted is past performance which does not guarantee future results. Current performance may be higher or lower than the performance quoted. Call (800) 989-6693 for performance current to the most recent month-end. The investment return and principal value of an investment will fluctuate so that an investor's shares, when redeemed, may be worth more or less than their original cost. Returns represent the change in value over the stated period assuming reinvestment of dividends and capital gains at net asset value. Returns do not take into account the maximum 4.75% sales charge on Class A shares or the 1% Contingent Deferred Sales Charge (CDSC) for Class C shares sold within one year of purchase. Returns would be lower if the applicable sales charge and CDSC were included. Returns do not take into account individual taxes which may reduce actual returns when shares are sold.
The Fund's investment adviser is waiving a portion of its management fees pursuant to an Expense Limitation Agreement. The waiver may be discontinued at any time with ninety days written notice in consultation with the Fund's board, but is expected to continue at current levels. Please see the Notes to Financial Statements in this Report for details. Performance shown reflects the waiver, without which the results would have been lower.
Discussion with Portfolio Manager August 24, 2012
Jingjing Yan, CFA
Please see the Chairman's Letter at the beginning of this Report for a detailed market and economic review
as well as the Manager's general market outlook.
Fund Performance
The Fund is designed for conservative long-term investors and shorter-term investors who need current income. Interest rate volatility during the first half of the year reinforced the importance of the Fund's total return approach to protect principal. The Fund's strategy to continue to concentrate holdings in short to intermediate-term bonds was effective in reducing the portfolio's sensitivity to interest rate changes.
The Fund maintained its unusually short duration of approximately 1 year. Duration measures a portfolio's sensitivity to interest rate movements; for example, if market interest rates rise 1%, a portfolio with a 5-year duration will lose approximately 5%; by comparison, a portfolio with a one-year duration would decline only 1%. When interest rates fluctuate abruptly, as they did in the first half of the year, a short duration strategy helps provide stability and the flexibility to respond to market changes.
1 The Barclays Capital U.S. Intermediate Treasury Bond Index is an unmanaged index of U.S. government securities with one to ten years to maturity. It is not possible to invest directly in the Index.
5
Pacific Advisors
Government Securities Fund continued
The Fund's minor allocation to high quality, dividend-paying common stocks provided attractive dividend income with the added potential for market appreciation. In addition, these holdings helped manage volatility by counterbalancing price movements in the fixed income markets.
During the period, the 0.99% return for the Fund's Class A shares was competitive with the 1.07% return for the benchmark. Notably, unlike the Fund, the benchmark is an unmanaged portfolio. With an average duration of 4 years, its exposure to interest rate changes is significantly greater than the Fund's.
Market Overview
During the first quarter, strong U.S. economic data and corporate earnings bolstered investor confidence. The robust stock market and inflationary trends prompted investors to abandon government securities in favor of other investments, such as equities, with higher potential returns. The resulting selloff of U.S. Treasuries pushed the interest rate on the benchmark U.S. 10-year Treasury Note from 1.88% to 2.21% during the quarter.
In a reversal of the first quarter, euro zone concerns helped reignite a flight to safety in the second quarter. Additional concerns about slower growth in Asia and the U.S. further unnerved investors. Demand for U.S. government securities increased as investors once again sought a "safe haven" from market and economic uncertainties. As a result, in early June, the interest rate on the 10-year U.S. Treasury Note fell to a historical low of 1.45% before rebounding to 1.65% by the end of the period.
Fund Strategy
Fixed Income Strategy
Attractive, risk-appropriate investment opportunities remained limited during the period. Heightened interest rate volatility coupled with the unprecedented low interest rate environment challenged conservative fixed income investors. Longer-term bonds, while offering relatively higher yields than shorter-term bonds, were still much lower than their historical average. Furthermore, as demand escalated and longer-term bonds became increasingly more expensive, the risk of losing principal rose significantly.
To protect principal and manage volatility, the Fund maintained a defensive strategy to concentrate holdings in shorter-term bonds. During the period, the Fund continued to focus on callable, "step-up" government agency bonds. The yield on a "step-up" bond increases at fixed intervals over the life of the bond. Consequently, these bonds provided better yields than short-term Treasuries while helping to protect principal.
Many government securities funds may use aggressive strategies in response to the challenging interest rate environment. For example, funds may extend the portfolio's duration, invest in mortgage-backed securities or leverage the portfolio to enhance yield and total return. We believe the risks associated with these strategies are not appropriate for the Fund's more conservative investors. For these same reasons, we did not actively trade the portfolio. In addition to increasing trading costs, the Fund could have incurred significant losses as a result of interest rate movements.
Equity Positioning
The Fund invests a minor portion of its portfolio in high quality dividend-paying common stocks. These stocks provide appreciation potential and, in the current environment, have offered more attractive income than intermediate-term bonds. Importantly, equity holdings help provide stability by offsetting price movements in the fixed income market without significantly increasing risk to the Fund.
During the period, we sold the Fund's preferred stock holdings after they regained market value to reduce exposure to market volatility. In turn, we increased the common stock holdings to approximately 17% of the portfolio. Higher dividend yields provided a conservative alternative to bonds and helped enhance total return. New positions were well-diversified and include Safeway, General Mills, Eli Lilly, and Johnson & Johnson.2 These blue-chip stocks had annualized dividend yields of more than 3.5% as of June 30th.
2 For detailed information on Fund holdings, please see the Fund's Schedule of Investments in this Report.
6
Looking Ahead
We believe that, in the short-term, demand for U.S. government securities will remain strong. The euro zone will likely remain volatile as European leaders work toward long-term resolutions to the region's financial crises. Emerging economies, notably China and India, also need to address their own financial and political issues. In the midst of these challenges, the U.S. offers stability which will remain attractive to long-term investors. As a result of these market dynamics, we expect interest rates may remain low for an extended period of time.
At the same time, interest rate volatility, and the risk for rising interest rates, remain concerns. The Federal Reserve has made clear its intention to maintain low interest rates and "take further action as appropriate" to bolster the U.S. economy. Even so, the Fed has limited ability to control market interest rates. Various other factors that impact investor demand, including changes in global economic conditions, currency values and alternative investment opportunities, can have a significant impact on interest rates. Demand for U.S. government securities can change suddenly and dramatically as in the first quarter of the year. For example, improvement in the U.S. economy and/or in the euro zone could result in an abrupt selloff of U.S. government securities as investors seek higher return opportunities in other investments. As a result, longer-term interest rates could easily rise even as the Fed keeps short-term rates close to zero.
In light of current market uncertainties, the Fund will maintain its conservative strategy concentrated on short to intermediate-term callable agency bonds. This strategy manages risk while providing flexibility to respond to interest rate changes. Additionally, the Fund's holdings in high quality equities will continue to help counterbalance interest rate volatility while providing income and capital appreciation potential.
Portfolio Holdings as of 06/30/12 (Based on Total Investments)
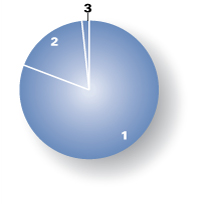
| 1. | U.S. Government Agencies | 81.03 | % | ||||||||
| 2. | Equities | 17.48 | % | ||||||||
| 3. | Cash and Cash Equivalents | 1.49 | % | ||||||||
7
Pacific Advisors
Government Securities Fund continued
Expense Examples
As a shareholder of the Fund you incur two types of costs: (1) transaction costs, including sales charges (loads) on purchase payments, reinvested dividends, or other distributions; redemption fees; and exchange fees; and (2) ongoing costs, including management fees; distribution (12b-1) fees; and other Fund expenses. This Example is intended to help you understand your ongoing costs (in dollars) of investing in the Fund and to compare these costs with the ongoing costs of investing in other mutual funds.
The Example is based on an investment of $1,000 invested at the beginning of the period and held for the entire period from January 1, 2012 through June 30, 2012.
Actual Expenses
The first line of the table below provides information about actual account values and actual expenses. You may use the information in this line, together with the amount you invested, to estimate the expenses that you paid over the period. Simply divide your account value by $1,000 (for example, an $8,600 account value divided by $1,000 = 8.6), then multiply the result by the number in the first line under the heading entitled "Expenses Paid During the Period" to estimate the expenses you paid on your account during the period.
The following transaction costs are not included in the expenses shown in the table and, if applicable, would increase the expenses that you paid over the period: (1) a front-end sales charge (load) of 4.75% on Class A shares; (2) a 2% redemption fee if you sell or exchange shares within 30 days of purchase, with certain exceptions. The redemption fee does not apply to: (a) redemptions under an automatic withdrawal program or periodic asset reallocation plan, required minimum distributions (RMD), employer mandated distributions from a qualified plan, or redemptions under a qualified domestic relations order (QDRO); (b) redemptions to pay for expenses related to terminal illness, extended hospital or nursing home care, or other serious medical conditions, including death; (c) redemptions of shares acquired through dividend or capital gains reinvestments; (d) loans from a qualified plan account; and (e) redemptions initiated by the Fund; and (3) a $10 service fee on each exchange after the first five exchanges in each calendar year.
The following ongoing costs are not included in the expenses shown in the table and, if applicable, would increase the expenses that you paid over the period: (1) a $12 low balance fee on accounts with balances of less than $250 as of September 30th of each calendar year and no investment activity (excluding reinvestment of dividends and/or capital gains) during the prior calendar year or the first nine months of the current calendar year. This fee does not apply to IRAs, qualified plan accounts, or Coverdell Education Savings Accounts; (2) a $15 annual custodial fee on IRAs, SEPs, SIMPLE IRAs, and Coverdell Education Savings Accounts; and (3) a $20 annual custodial fee on 403(b) accounts.
Hypothetical Example for Comparison Purposes
The second line of the table below provides information about hypothetical account values and hypothetical expenses based on the Fund's actual expense ratio and an assumed rate of return of 5% per year before expenses, which in not the Fund's actual return. The hypothetical account values and expenses may not be used to estimate the actual ending account balance or expenses you paid for the period. You may use this information to compare the ongoing costs of investing in the Fund and other funds. To do so, compare this 5% hypothetical example with the 5% hypothetical examples that appear in the shareholder reports of the other funds.
The following transaction costs are not included in the expenses shown in the table and, if applicable, would increase the expenses that you paid over the period: (1) a front-end sales charge (load) of 4.75% on Class A shares; (2) a 2% redemption fee if you sell or exchange shares within 30 days of purchase, with certain exceptions. The redemption fee does not apply to: (a) redemptions under an automatic withdrawal program or periodic asset reallocation plan, required minimum distributions (RMD), employer mandated distributions from a qualified plan, or redemptions under a qualified domestic relations order (QDRO); (b) redemptions to pay for expenses related to terminal illness, extended hospital or nursing home care, or other serious medical conditions, including death; (c) redemptions of shares acquired through dividend or capital gains reinvestments; (d) loans from a qualified plan account; and (e) redemptions initiated by the Fund; and (3) a $10 service fee on each exchange after the first five exchanges in each calendar year.
The following ongoing costs are not included in the expenses shown in the table and, if applicable, would increase the expenses that you paid over the period: (1) a $12 low balance fee on accounts with balances of less than $250 as of September 30th of each calendar year and no investment activity (excluding reinvestment of dividends and/or capital gains) during the prior calendar year or the first nine months of the current calendar year. This fee does not apply to IRAs, qualified plan accounts, or Coverdell Education Savings Accounts; (2) a $15 annual custodial fee on IRAs, SEPs, SIMPLE IRAs, and Coverdell Education Savings Accounts; and (3) a $20 annual custodial fee on 403(b) accounts.
Please note that the expenses shown in the table are meant to highlight your ongoing costs only and do not reflect any transactional costs, such as sales charges (loads), redemption fees, or exchange fees. Therefore, the second line of the table is useful in comparing ongoing costs only, and will not help you determine the relative total costs of owning different funds. In addition, if these transactional costs were included, your costs would have been higher.
| Beginning Account Value 01/01/12 | Ending Account Value 06/30/12 | Expense Paid During Period 01/01/12 – 06/30/12 | |||||||||||||
| Government Securities Fund Class A | |||||||||||||||
| Actual | $ | 1,000.00 | $ | 1,009.90 | $ | 15.09 | |||||||||
| Hypothetical (5% return before expense) | $ | 1,000.00 | $ | 1,009.85 | $ | 15.09 | |||||||||
| Government Securities Fund Class C | |||||||||||||||
| Actual | $ | 1,000.00 | $ | 1,006.70 | $ | 18.76 | |||||||||
| Hypothetical (5% return before expense) | $ | 1,000.00 | $ | 1,006.17 | $ | 18.75 | |||||||||
3 Expenses are equal to the Fund's annualized expense ratio, net of expense waivers, of 3.02% for Class A shares and 3.76% for Class C shares, multiplied by the average account value over the period, multiplied by 182/366 days to reflect the one-half year period.
8
Pacific Advisors
Income and Equity Fund
Fund Objective: Current income and, secondarily, long-term capital appreciation.
Investment Invests primarily in investment grade U.S. corporate bonds and in dividend-paying
Strategy: stocks.
Investor Profile: Conservative. Some current income required; capital preservation aim.
| TOTAL RETURNS | EXPENSE RATIOS | ||||||||||||||||||
| For the six months ended June 30, 2012 | For the fiscal year ended December 31, 2011 | ||||||||||||||||||
| Net Expense Ratio | Expense Ratio | ||||||||||||||||||
| Class A | 4.78 | % | Class A | 2.59 | % | 3.34 | % | ||||||||||||
| Class C | 4.47 | % | Class C | 3.33 | % | 4.08 | % | ||||||||||||
| Barclays Capital U.S. Int Corp Bond Index1 | 4.37 | % | |||||||||||||||||
| S&P 500 Index2 | 9.49 | % | |||||||||||||||||
Performance quoted is past performance which does not guarantee future results. Current performance may be higher or lower than the performance quoted. Call (800) 989-6693 for performance current to the most recent month-end. The investment return and principal value of an investment will fluctuate so that an investor's shares, when redeemed, may be worth more or less than their original cost. Returns represent the change in value over the stated period assuming reinvestment of dividends and capital gains at net asset value. Returns do not take into account the maximum 4.75% sales charge on Class A shares or the 1% Contingent Deferred Sales Charge (CDSC) for Class C shares sold within one year of purchase. Returns would be lower if the applicable sales charge and CDSC were included. Returns do not take into account individual taxes which may reduce actual returns when shares are sold.
The Fund's investment adviser is waiving a portion of its management fees pursuant to an Expense Limitation Agreement. The waiver may be discontinued at any time with ninety days written notice in consultation with the Fund's board, but is expected to continue at current levels. Please see the Notes to Financial Statements in this Report for details. Performance shown reflects the waiver, without which the results would have been lower.
Discussion with Portfolio Managers August 24, 2012
Charles Suh, CFA
Jingjing Yan, CFA
Please see the Chairman's Letter at the beginning of this Report for a detailed market and economic review
as well as the Manager's general market outlook.
Fund Performance
During the first half of 2012, interest rate volatility increased as global economic uncertainty led investors to weigh safety versus opportunity. The equity markets faced headwinds including the sovereign debt crisis in Europe, fears of slower economic growth in China and mixed U.S. economic data. For the period, Class A shares returned 4.78% with substantially less volatility than the broader market, as evidenced by its one-year beta3 of 0.37, as of June 30th, versus the S&P 500 Index.
The Fund's performance is best viewed in comparison to a blend of its two benchmarks. Notably, the Fund outperformed the Barclays Capital U.S. Intermediate Corporate Bond Index while maintaining a substantially shorter average maturity of 3.8 years. In comparison the average maturity for the Index was
1 The Barclays Capital U.S. Intermediate Corporate Bond Index is an unmanaged index of publicly issued investment grade U.S. corporate bonds with one to ten years to maturity. It is not possible to invest directly in the Index.
2 The Standard & Poor's 500 Index is an unmanaged, market capitalization weighted index which measures the performance of the large cap segment of the U.S. equities market, covering approximately 75% of the U.S. equities market. The Index includes 500 leading companies in leading industries of the U.S. economy. Index returns assume the reinvestment of dividends, but, unlike the Fund's returns, do not reflect the effects of management fees or expenses. It is not possible to invest directly in the Index.
3 "Beta" measures volatility relative to the stock market or an alternative benchmark. A beta less than 1.0 indicates lower risk than the market or the benchmark; a beta greater than 1.0 indicates higher risk than the market or the benchmark.
9
Pacific Advisors
Income and Equity Fund continued
5.2 years. By design, the Fund's equity portfolio is more concentrated and conservative than its equity benchmark. The Fund's focus on dividend-paying stocks with low volatility and stable growth potential accounted for the difference between the Fund's performance and the S&P 500 Index.
Fund Strategy
Heightened interest rate volatility in the midst of a low interest rate environment has presented challenges for conservative investors seeking steady income. In spite of the Federal Reserve's low interest rate policy, interest rates can rise suddenly and rapidly in response to market forces. Rising interest rates, as seen early in the year, pose a significant risk to principal. In the first half of the year, the Fund remained focused in high quality, intermediate-term bonds to mitigate the impact of interest rate swings and protect principal.
We actively manage the fixed income and equity allocations to manage risk while seeking the best opportunities for income and growth. The Fund's equity position is typically higher when the economic outlook is favorable in order to capture dividend income and opportunities for price appreciation; recently, we have continued a higher-than-normal equity allocation.
To support total return, the Fund also maintained a significant allocation to low volatility stocks with attractive dividends. In the current environment, the dividend rates paid by high quality companies often exceed the interest rates paid on the investment grade bonds offered by the same companies. For example, as of June 30th, AT&T had an annualized dividend yield of 5% compared to a yield of approximately 1.7% on its five-year bond.4 During the period, dividend income continued to play an important role for the Fund; as of June 30th, the Fund's average dividend rate was 3.82% with 75% of the equity holdings paying a dividend in excess of 3%.
Fixed Income Strategy
As a conservatively-oriented Fund, the fixed income strategy seeks first and foremost to protect principal. Elevated interest rate volatility in the first half of 2012 meant that longer-term bonds, which offered higher yields, carried greater risk. To protect principal, the Fund made few changes to its fixed income portfolio which concentrated in shorter-term bonds.
In the first quarter, U.S. Treasury rates rose in response to lower demand as investors moved into equities. Yet, intermediate to longer-term corporate bonds remained in high demand for conservative investors. As a result, corporate bond rates, rather than rising along with U.S. Treasuries, remained relatively stable. Subsequently, interest rates fell as renewed concerns about the European debt crises compelled investors to move out of equities and back into bonds in the second quarter. By maintaining a shorter average maturity of approximately 3.8 years, the Fund successfully navigated the risks created by interest rate volatility.
The Fund employs risk-appropriate investment strategies; it does not use speculative or aggressive investments such as derivatives or leverage to enhance yield. We continued to seek high quality corporate bonds at undervalued prices. In particular, we purchased investment grade bonds from superior companies such as Motorola Solutions, Sheraton, and Wyndham Worldwide.
Equity Strategy
The Fund's equity holdings support total return through dividend income and the potential for price appreciation. Equities focus on high quality large cap stocks of well-established companies across a broad range of industries. The Fund invests approximately 45% of its portfolio in equities; each holding typically comprises approximately 1% to 2% of the portfolio. This type of portfolio construction enables the Fund to remain well-diversified while promoting stability and reducing volatility.
During the first half of 2012, equity investments continued to concentrate on blue-chip companies with attractive dividends. Fund holdings with annualized dividend yields in excess of 4%, as of June 30th,
4 For detailed information on Fund holdings, please see the Fund's Schedule of Investments in this Report.
10
included ConocoPhillips, Vodafone, AT&T, Duke Energy and Public Service Enterprise Group. Companies paying an annualized dividend of over 3.5% included Procter & Gamble, Sysco, Mattel, Pfizer, Xcel Energy and Dominion Resources.
Looking Ahead
Interest rate volatility and a low interest rate environment will continue to present challenges for investors seeking stable income with lower risk. While the Fed is determined to continue its low interest rate policies, it has limited ability to control market interest rates. Other political and economic forces may have a greater impact on interest rates. We anticipate that interest rates will remain volatile as investors work through the uncertainties surrounding Europe and China. Additional headwinds may arise from uncertainty surrounding domestic issues including political elections, budgetary issues, inflation, the Fed's monetary policy and the national debt. As was the case in the first half of the year, investor demand for bonds can change quickly and frequently in response to headline news. The resulting changes in interest rates can be perilous for unwary, conservatively-oriented investors.
The current interest rate environment necessitates a careful and cautious investment approach. Until a clear interest rate direction emerges, the Fund will concentrate in shorter-term investment grade bonds to protect principal. Additionally, the Fund will maintain its significant equity allocation to support total return with dividend income and capital appreciation opportunities.
Portfolio Holdings as of 06/30/12 (Based on Total Investments)
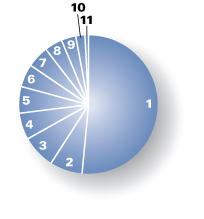
| 1. | Corporate Bonds | 51.88 | % | ||||||||
| Equities | 45.16 | % | |||||||||
| 2. | Consumer Discretionary | 7.54 | % | ||||||||
| 3. | Consumer Staples | 7.54 | % | ||||||||
| 4. | Industrials | 6.29 | % | ||||||||
| 5. | Health Care | 6.10 | % | ||||||||
| 6. | Utilities | 5.36 | % | ||||||||
| 7. | Telecommunication Services | 4.80 | % | ||||||||
| 8. | Information Technology | 4.29 | % | ||||||||
| 9. | Others | 3.24 | % | ||||||||
| 10. | Preferred Stock | 2.39 | % | ||||||||
| 11. | Cash and Cash Equivalents | 0.57 | % | ||||||||
11
Pacific Advisors
Income and Equity Fund continued
Expense Examples
As a shareholder of the Fund you incur two types of costs: (1) transaction costs, including sales charges (loads) on purchase payments, reinvested dividends, or other distributions; redemption fees; and exchange fees; and (2) ongoing costs, including management fees; distribution (12b-1) fees; and other Fund expenses. This Example is intended to help you understand your ongoing costs (in dollars) of investing in the Fund and to compare these costs with the ongoing costs of investing in other mutual funds.
The Example is based on an investment of $1,000 invested at the beginning of the period and held for the entire period from January 1, 2012 through June 30, 2012.
Actual Expenses
The first line of the table below provides information about actual account values and actual expenses. You may use the information in this line, together with the amount you invested, to estimate the expenses that you paid over the period. Simply divide your account value by $1,000 (for example, an $8,600 account value divided by $1,000 = 8.6), then multiply the result by the number in the first line under the heading entitled "Expenses Paid During the Period" to estimate the expenses you paid on your account during the period.
The following transaction costs are not included in the expenses shown in the table and, if applicable, would increase the expenses that you paid over the period: (1) a front-end sales charge (load) of 4.75% on Class A shares; (2) a 2% redemption fee if you sell or exchange shares within 30 days of purchase, with certain exceptions. The redemption fee does not apply to: (a) redemptions under an automatic withdrawal program or periodic asset reallocation plan, required minimum distributions (RMD), employer mandated distributions from a qualified plan, or redemptions under a qualified domestic relations order (QDRO); (b) redemptions to pay for expenses related to terminal illness, extended hospital or nursing home care, or other serious medical conditions, including death; (c) redemptions of shares acquired through dividend or capital gains reinvestments; (d) loans from a qualified plan account; and (e) redemptions initiated by the Fund; and (3) a $10 service fee on each exchange after the first five exchanges in each calendar year.
The following ongoing costs are not included in the expenses shown in the table and, if applicable, would increase the expenses that you paid over the period: (1) a $12 low balance fee on accounts with balances of less than $250 as of September 30th of each calendar year and no investment activity (excluding reinvestment of dividends and/or capital gains) during the prior calendar year or the first nine months of the current calendar year. This fee does not apply to IRAs, qualified plan accounts, or Coverdell Education Savings Accounts; (2) a $15 annual custodial fee on IRAs, SEPs, SIMPLE IRAs, and Coverdell Education Savings Accounts; and (3) a $20 annual custodial fee on 403(b) accounts.
Hypothetical Example for Comparison Purposes
The second line of the table below provides information about hypothetical account values and hypothetical expenses based on the Fund's actual expense ratio and an assumed rate of return of 5% per year before expenses, which in not the Fund's actual return. The hypothetical account values and expenses may not be used to estimate the actual ending account balance or expenses you paid for the period. You may use this information to compare the ongoing costs of investing in the Fund and other funds. To do so, compare this 5% hypothetical example with the 5% hypothetical examples that appear in the shareholder reports of the other funds.
The following transaction costs are not included in the expenses shown in the table and, if applicable, would increase the expenses that you paid over the period: (1) a front-end sales charge (load) of 4.75% on Class A shares; (2) a 2% redemption fee if you sell or exchange shares within 30 days of purchase, with certain exceptions. The redemption fee does not apply to: (a) redemptions under an automatic withdrawal program or periodic asset reallocation plan, required minimum distributions (RMD), employer mandated distributions from a qualified plan, or redemptions under a qualified domestic relations order (QDRO); (b) redemptions to pay for expenses related to terminal illness, extended hospital or nursing home care, or other serious medical conditions, including death; (c) redemptions of shares acquired through dividend or capital gains reinvestments; (d) loans from a qualified plan account; and (e) redemptions initiated by the Fund; and (3) a $10 service fee on each exchange after the first five exchanges in each calendar year.
The following ongoing costs are not included in the expenses shown in the table and, if applicable, would increase the expenses that you paid over the period: (1) a $12 low balance fee on accounts with balances of less than $250 as of September 30th of each calendar year and no investment activity (excluding reinvestment of dividends and/or capital gains) during the prior calendar year or the first nine months of the current calendar year. This fee does not apply to IRAs, qualified plan accounts, or Coverdell Education Savings Accounts; (2) a $15 annual custodial fee on IRAs, SEPs, SIMPLE IRAs, and Coverdell Education Savings Accounts; and (3) a $20 annual custodial fee on 403(b) accounts.
Please note that the expenses shown in the table are meant to highlight your ongoing costs only and do not reflect any transactional costs, such as sales charges (loads), redemption fees, or exchange fees. Therefore, the second line of the table is useful in comparing ongoing costs only, and will not help you determine the relative total costs of owning different funds. In addition, if these transactional costs were included, your costs would have been higher.
| Beginning Account Value 01/01/12 | Ending Account Value 06/30/12 | Expense Paid During Period 01/01/12 – 06/30/12 | |||||||||||||
| Income & Equity Fund Class A | |||||||||||||||
| Actual | $ | 1,000.00 | $ | 1,047.80 | $ | 14.15 | |||||||||
| Hypothetical (5% return before expense) | $ | 1,000.00 | $ | 1,011.04 | $ | 13.90 | |||||||||
| Income & Equity Fund Class C | |||||||||||||||
| Actual | $ | 1,000.00 | $ | 1,044.70 | $ | 17.95 | |||||||||
| Hypothetical (5% return before expense) | $ | 1,000.00 | $ | 1,007.31 | $ | 17.62 | |||||||||
4 Expenses are equal to the Fund's annualized expense ratio, net of expense waivers, of 2.78% for Class A shares and 3.53% for Class C shares, multiplied by the average account value over the period, multiplied by 182/366 days to reflect the one-half year period.
12
Pacific Advisors
Balanced Fund
Fund Objective: Long-term capital appreciation and income consistent with reduced risk.
Investment Invests primarily in large cap common stocks and investment grade U.S. corporate
Strategy: bonds. Invests at least 25% of its assets in fixed income securities and preferred stocks and at least 25% in equities.
Investor Profile: Moderately conservative. Seeks combination of long-term growth, income, liquidity and reduced risk of price fluctuations.
| TOTAL RETURNS | EXPENSE RATIOS | ||||||||||||||
| For the six months ended June 30, 2012 | For the fiscal year ended December 31, 2011 | ||||||||||||||
| Class A | 4.90 | % | Class A | 3.13 | % | ||||||||||
| Class C | 4.50 | % | Class C | 3.83 | % | ||||||||||
| S&P 500 Index1 | 9.49 | % | |||||||||||||
| Barclays Capital U.S. Int Corp Bond Index2 | 4.37 | % | |||||||||||||
Performance quoted is past performance which does not guarantee future results. Current performance may be higher or lower than the performance quoted. Call (800) 989-6693 for performance current to the most recent month-end. The investment return and principal value of an investment will fluctuate so that an investor's shares, when redeemed, may be worth more or less than their original cost. Returns represent the change in value over the stated period assuming reinvestment of dividends and capital gains at net asset value. Returns do not take into account the maximum 5.75% sales charge on Class A shares or the 1% Contingent Deferred Sales Charge (CDSC) for Class C shares sold within one year of purchase. Returns would be lower if the applicable sales charge and CDSC were included. Returns do not take into account individual taxes which may reduce actual returns when shares are sold.
Discussion with Portfolio Managers August 24, 2012
Charles Suh, CFA
Jingjing Yan, CFA
Samuel C. Coquillard
Please see the Chairman's Letter at the beginning of this Report for a detailed market and economic review
as well as the Manager's general market outlook.
Fund Performance
The Fund is designed to enable conservative investors to participate in the equity markets with reduced risk. The portfolio combines equity holdings in well-established companies that offer attractive growth prospects and dividend income with investment grade corporate bonds that provide income and appreciation potential. The overall asset allocation is based on our identification of risk-appropriate investments in the context of the overall economic and market outlook. This approach enables the Fund to take advantage of specific growth opportunities while reducing price volatility.
The prolonged European debt saga, coupled with signs of economic slowdowns in the U.S. and China, dampened enthusiasm for stocks in the first half of the year. Energy stocks, in particular, were negatively impacted as oil prices fell roughly 30%. Conversely, and despite market pressures, holdings in Consumer Staples, Health Care, and Financials generally managed solid gains. These companies are typically
1 The Standard & Poor's 500 Index is an unmanaged, market capitalization weighted index which measures the performance of the large cap segment of the U.S. equities market, covering approximately 75% of the U.S. equities market. The Index includes 500 leading companies in leading industries of the U.S. economy. Index returns assume the reinvestment of dividends, but, unlike the Fund's returns, do not reflect the effects of management fees or expenses. It is not possible to invest directly in the Index.
2 The Barclays Capital U.S. Intermediate Corporate Bond Index is an unmanaged index of publicly issued investment grade U.S. corporate bonds with one to ten years to maturity. It is not possible to invest directly in the Index.
13
Pacific Advisors
Balanced Fund continued
characterized by recognizable consumer brands, products and/or services that consumers demand regardless of economic conditions, and attractive dividends.
Due in part to the Fund's focus on well-established business with global operations, Fund volatility remained relatively subdued during the period; economic slowdowns in one area of the world were often offset by growth in others. Holdings in investment grade corporate bonds also served to lessen price volatility by counterbalancing equity market movements. The Fund's one-year beta3 of 0.76, as of June 30th, compared to the S&P 500, reflects its conservative investment strategy.
The Fund's blend of equity and fixed income securities suggests that its performance be viewed against a blend of its benchmarks. The Fund's concentration in more conservative, low volatility stocks accounted for the Fund's lower performance relative to the S&P 500 Index.
Fund Strategy
We actively manage the allocation between equity and fixed income investments based on our expectations for economic growth and our outlook for interest rates. During the period, the Fund's equity allocation stayed near the high end of its historical range at approximately 73%. The asset allocation reflects our confidence in the underlying businesses of the Fund's equity holdings as well as expectations for continued interest rate volatility in the midst of an extended period of low interest rates.
Equity investments are typically balanced between defensive sectors, those areas of the economy that typically perform well in good times and bad, and cyclical sectors which offer attractive growth opportunities but tend to be more sensitive to changes in economic conditions. We believe market expectations for a prolonged slowdown in the global economy are overstated. As a result, the Fund adopted a slightly more assertive equity strategy while maintaining its focus on well-established, high quality businesses. In response to low valuations along with our anticipation of improving economic performance, holdings during the period increasingly focused on cyclical areas of the market.
Fixed income markets remained volatile and challenging during the first half of 2012. The low interest rate environment offered few attractive investment opportunities. The Fund's fixed income investments focused on shorter-term bonds to protect against heightened interest rate volatility.
Equity Strategy
Equity investments focus on high quality companies with well-established market presences, experienced management teams, and significant growth opportunities. Leading companies have, despite the subdued economic recovery in the U.S. and Western Europe, continued to grow; often, their success has been at the expense of weaker competitors. Furthermore, the rise of emerging economies, such as China and India, presents meaningful new markets for dominant global consumer and industrial businesses.
These leading franchises served as relative safe havens for investors, particularly during the market selloff in the second quarter. Dominant global businesses, such as American Express, led in performance.4 The company enjoys a sterling reputation that enables it to attract and retain customers. Wal-Mart's focus on low-cost leadership has proven to be the right message in a struggling economy; sales at the discount retailer continue to set all-time records. And, General Electric, having de-emphasized its financial unit, is once again receiving recognition for its broad reach across the worldwide industrial economy.
Some global market leaders experienced pullbacks during the period. Shares of McDonald's declined after reporting decelerating sales trends. However, a modest slowdown was not surprising following revenue growth in 2011 of over 12%. Google continued to generate stellar growth, primarily from its search advertising business; still, investors focused on competitive threats from Apple and Facebook. We believe that the business opportunities in mobile computing and internet advertising are large enough for many companies to be successful. The fall in oil prices to $77 per barrel negatively impacted shares of
3 "Beta" measures volatility relative to the stock market or an alternative benchmark. A beta less than 1.0 indicates lower risk than the market or the benchmark; a beta greater than 1.0 indicates higher risk than the market or the benchmark.
4 For detailed information on Fund holdings, please see the Fund's Schedule of Investments in this Report.
14
Halliburton. Nevertheless, the recent decline is unlikely to cause significant disruptions to exploration activity as most energy programs are economically viable at $65 or lower.
During the first half of 2012, the Fund added positions in Walt Disney and Tiffany. Walt Disney enjoys broad access to consumers through its theme parks, television networks, movie studios, and cruise lines. Shares briefly pulled back after the dismal box office showing for "John Carter." The company subsequently demonstrated the strength of its diversity when stellar first quarter results surpassed analysts' expectations. Tiffany, another leading, iconic brand, is synonymous with luxury and prestige. Management believes that opportunities in Asia potentially exceed the size of its established markets in the U.S. and Europe. Shares pulled back on concerns about decelerating growth in China. We remain confident in the long-term opportunity for Tiffany and purchased shares during the pullback.
Fixed Income Strategy
The Fund's fixed income portfolio is actively managed for total return. Investors favored stocks over bonds in the beginning of the year when the equity market performed well. As money moved out of corporate bonds, interest rates increased slightly; we were able to purchase several attractive, risk-appropriate bonds that we believed were temporarily undervalued. During the second quarter, investors once again sought the safety of bonds in response to the euro zone crises and slowdowns in China and India. Interest rates declined in response and attractive investment opportunities in high quality bonds became scarcer.
Early in the first quarter, the Fund added bonds of Ford Motor Company which had improved its financial strength. Ratings agencies shared our positive view and upgraded the company's bonds in April. Seagate Technology, one of the world's largest manufacturers of hard disk drives, was another short-term bond that offered attractive income and the flexibility to respond to interest rate changes.
We believe that the demand for corporate bonds will remain strong as investors seek protection from the financial crises abroad. We expect the interest rate volatility that the markets experienced during the first half of the year to continue in response to economic developments. Therefore, to protect principal, fixed income investments will focus on short-term maturities which offer protection from interest rate changes.
Looking Ahead
We remain confident in the prospects for Fund holdings. Significant growth opportunities abound for these leading businesses despite sovereign debt concerns in Europe and an apparent slowdown in China. Indeed, market valuations suggest a more dramatic global downturn than we anticipate. As a result, stocks may be poised to rally in response to positive developments.
A focus on individual businesses remains the central component of the Fund's investment strategy; the superior quality of the underlying companies as well as the dominant positions in their respective markets confirms our favorable outlook. As economic conditions evolve, we anticipate seeking similarly positioned companies across various market capitalizations, including small and mid-cap stocks. Furthermore, we continue to see strong evidence of long-term growth cycles in Energy, Technology, and various commodity markets. Many of these trends are driven by the rise of emerging economies, such as China, India, and Brazil. We believe that internal and geopolitical pressures in these regions will encourage continued pro-growth initiatives that will lead these economies, and the world, forward.
15
Pacific Advisors
Balanced Fund continued
Portfolio Holdings as of 06/30/12 (Based on Total Investments)
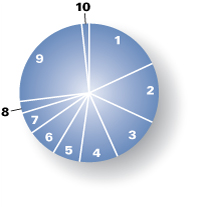
| Equities | 73.18 | % | |||||||||
| 1. | Industrials | 18.20 | % | ||||||||
| 2. | Information Technology | 13.89 | % | ||||||||
| 3. | Consumer Staples | 11.42 | % | ||||||||
| 4. | Health Care | 8.78 | % | ||||||||
| 5. | Energy | 6.54 | % | ||||||||
| 6. | Financials | 6.45 | % | ||||||||
| 7. | Consumer Discretionary | 5.14 | % | ||||||||
| 8. | Materials | 2.76 | % | ||||||||
| 9. | Corporate Bonds | 25.33 | % | ||||||||
| 10. | Preferred Stock | 1.49 | % | ||||||||
16
Expense Examples
As a shareholder of the Fund you incur two types of costs: (1) transaction costs, including sales charges (loads) on purchase payments, reinvested dividends, or other distributions; redemption fees; and exchange fees; and (2) ongoing costs, including management fees; distribution (12b-1) fees; and other Fund expenses. This Example is intended to help you understand your ongoing costs (in dollars) of investing in the Fund and to compare these costs with the ongoing costs of investing in other mutual funds.
The Example is based on an investment of $1,000 invested at the beginning of the period and held for the entire period from January 1, 2012 through June 30, 2012.
Actual Expenses
The first line of the table below provides information about actual account values and actual expenses. You may use the information in this line, together with the amount you invested, to estimate the expenses that you paid over the period. Simply divide your account value by $1,000 (for example, an $8,600 account value divided by $1,000 = 8.6), then multiply the result by the number in the first line under the heading entitled "Expenses Paid During the Period" to estimate the expenses you paid on your account during the period.
The following transaction costs are not included in the expenses shown in the table and, if applicable, would increase the expenses that you paid over the period: (1) a front-end sales charge (load) of 5.75% on Class A shares; (2) a 2% redemption fee if you sell or exchange shares within 180 days of purchase, with certain exceptions. The redemption fee does not apply to: (a) redemptions under an automatic withdrawal program or periodic asset reallocation plan, required minimum distributions (RMD), employer mandated distributions from a qualified plan, or redemptions under a qualified domestic relations order (QDRO); (b) redemptions to pay for expenses related to terminal illness, extended hospital or nursing home care, or other serious medical conditions, including death; (c) redemptions of shares acquired through dividend or capital gains reinvestments; (d) loans from a qualified plan account, and (e) redemptions initiated by the Fund; and (3) a $10 service fee on each exchange after the first five exchanges in each calendar year.
The following ongoing costs are not included in the expenses shown in the table and, if applicable, would increase the expenses that you paid over the period: (1) a $12 low balance fee on accounts with balances of less than $250 as of September 30th of each calendar year and no investment activity (excluding reinvestment of dividends and/or capital gains) during the prior calendar year or the first nine months of the current calendar year. This fee does not apply to IRAs, qualified plan accounts, or Coverdell Education Savings Accounts; (2) a $15 annual custodial fee on IRAs, SEPs, SIMPLE IRAs, and Coverdell Education Savings Accounts; and (3) a $20 annual custodial fee on 403(b) accounts.
Hypothetical Example for Comparison Purposes
The second line of the table below provides information about hypothetical account values and hypothetical expenses based on the Fund's actual expense ratio and an assumed rate of return of 5% per year before expenses, which in not the Fund's actual return. The hypothetical account values and expenses may not be used to estimate the actual ending account balance or expenses you paid for the period. You may use this information to compare the ongoing costs of investing in the Fund and other funds. To do so, compare this 5% hypothetical example with the 5% hypothetical examples that appear in the shareholder reports of the other funds.
The following transaction costs are not included in the expenses shown in the table and, if applicable, would increase the expenses that you paid over the period: (1) a front-end sales charge (load) of 5.75% on Class A shares; (2) a 2% redemption fee if you sell or exchange shares within 180 days of purchase, with certain exceptions. The redemption fee does not apply to: (a) redemptions under an automatic withdrawal program or periodic asset reallocation plan, required minimum distributions (RMD), employer mandated distributions from a qualified plan, or redemptions under a qualified domestic relations order (QDRO); (b) redemptions to pay for expenses related to terminal illness, extended hospital or nursing home care, or other serious medical conditions, including death; (c) redemptions of shares acquired through dividend or capital gains reinvestments; (d) loans from a qualified plan account, and (e) redemptions initiated by the Fund; and (3) a $10 service fee on each exchange after the first five exchanges in each calendar year.
The following ongoing costs are not included in the expenses shown in the table and, if applicable, would increase the expenses that you paid over the period: (1) a $12 low balance fee on accounts with balances of less than $250 as of September 30th of each calendar year and no investment activity (excluding reinvestment of dividends and/or capital gains) during the prior calendar year or the first nine months of the current calendar year. This fee does not apply to IRAs, qualified plan accounts, or Coverdell Education Savings Accounts; (2) a $15 annual custodial fee on IRAs, SEPs, SIMPLE IRAs, and Coverdell Education Savings Accounts; and (3) a $20 annual custodial fee on 403(b) accounts.
Please note that the expenses shown in the table are meant to highlight your ongoing costs only and do not reflect any transactional costs, such as sales charges (loads), redemption fees, or exchange fees. Therefore, the second line of the table is useful in comparing ongoing costs only, and will not help you determine the relative total costs of owning different funds. In addition, if these transactional costs were included, your costs would have been higher.
| Beginning Account Value 01/01/12 | Ending Account Value 06/30/12 | Expense Paid During Period 01/01/12 – 06/30/12 | |||||||||||||
| Balanced Fund Class A | |||||||||||||||
| Actual | $ | 1,000.00 | $ | 1,049.00 | $ | 16.10 | |||||||||
| Hypothetical (5% return before expense) | $ | 1,000.00 | $ | 1,009.15 | $ | 15.79 | |||||||||
| Balanced Fund Class C | |||||||||||||||
| Actual | $ | 1,000.00 | $ | 1,045.00 | $ | 19.88 | |||||||||
| Hypothetical (5% return before expense) | $ | 1,000.00 | $ | 1,005.42 | $ | 19.50 | |||||||||
4 Expenses are equal to the Fund's annualized expense ratio of 3.16% for Class A shares and 3.91% for Class C shares, multiplied by the average account value over the period, multiplied by 182/366 days to reflect the one-half year period.
17
Pacific Advisors
Large Cap Value Fund
Fund Objective: Long-term capital appreciation.
Investment Invests at least 80% of its assets in large cap companies that are, at the
Strategy: time of purchase, within the market cap range of companies in the S&P 500 Index1.
Investor Profile: Conservative equity. Growth-oriented with a long-term investment horizon.
| TOTAL RETURNS | EXPENSE RATIOS | ||||||||||||||||||
| For the six months ended June 30, 2012 | For the fiscal year ended December 31, 2011 | ||||||||||||||||||
| Net Expense Ratio | Expense Ratio | ||||||||||||||||||
| Class A | 8.17 | % | Class A | 3.05 | % | 4.99 | % | ||||||||||||
| Class C | 7.79 | % | Class C | 3.89 | % | 5.82 | % | ||||||||||||
| S&P 500 Index | 9.49 | % | |||||||||||||||||
Performance quoted is past performance which does not guarantee future results. Current performance may be higher or lower than the performance quoted. Call (800) 989-6693 for performance current to the most recent month-end. The investment return and principal value of an investment will fluctuate so that an investor's shares, when redeemed, may be worth more or less than their original cost. Returns represent the change in value over the stated period assuming reinvestment of dividends and capital gains at net asset value. Returns do not take into account the maximum 5.75% sales charge on Class A shares or the 1% Contingent Deferred Sales Charge (CDSC) for Class C shares sold within one year of purchase. Returns would be lower if the applicable sales charge and CDSC were included. Returns do not take into account individual taxes which may reduce actual returns when shares are sold.
The Fund's investment adviser is waiving a portion of its management fees pursuant to an Expense Limitation Agreement. The waiver may be discontinued at any time with ninety days written notice in consultation with the Fund's board, but is expected to continue at current levels. Please see the Notes to Financial Statements in this Report for details. Performance shown reflects the waiver, without which the results would have been lower.
Discussion with Portfolio Manager August 24, 2012
Samuel C. Coquillard
Please see the Chairman's Letter at the beginning of this Report for a detailed market and economic review
as well as the Manager's general market outlook.
Fund Performance
The Fund focuses on 35 to 50 leading large cap stocks with long-term growth potential and lower price volatility. Holdings are primarily mega-cap companies with superior franchises, strong financial positions, and track records of steady growth and attractive dividends.
With an emphasis on risk management, the Fund seeks to minimize volatility. In the first half of the year, the Fund's more conservative approach to equity investing delivered favorable risk-adjusted returns; Class A shares returned 8.17%. The Fund achieved these gains with nearly 15% less volatility than the market as evidenced by its one-year beta2 of 0.86, as of June 30th, versus the S&P 500 Index.
1 The Standard & Poor's 500 Index is an unmanaged, market capitalization weighted index which measures the performance of the large cap segment of the U.S. equities market, covering approximately 75% of the U.S. equities market. The Index includes 500 leading companies in leading industries of the U.S. economy. Index returns assume the reinvestment of dividends, but, unlike the Fund's returns, do not reflect the effects of management fees or expenses. It is not possible to invest directly in the Index.
2 "Beta" measures volatility relative to the stock market or an alternative benchmark. A beta less than 1.0 indicates lower risk than the market or the benchmark; a beta greater than 1.0 indicates higher risk than the market or the benchmark.
18
Fund holdings which contributed to performance in the first half of the year included:3
• Wal-Mart. Sales for the discount retailer reached all-time records as a result of the company's low-cost leadership. Moreover, it successfully managed growth throughout the economic slowdown by tempering its expansion plans, increasing its dividend and instituting an aggressive stock buyback program.
• Coca-Cola. The beverage giant's brands are available worldwide with the only exceptions of North Korea and Cuba. The company has continued to implement strategic growth initiatives including plans to increase spending in China by $4 billion over the next year.
• Target. The nation's second largest retailer by sales continued to draw shoppers with its "cheap chic" positioning. The company recently announced a partnership with Neiman Marcus to produce, distribute and sell a limited holiday-season collection from prominent American designers. The move could prove highly beneficial to Target as it emphasizes exclusive lines at affordable prices.
• Microsoft. The company's cloud-based software services are opening new revenue and profit opportunities. The impending launch of Windows 8 has laid the groundwork to enter new markets including mobile phones and tablets. In the past, Microsoft has successfully competed against well-established names in new markets. For example, the Xbox 360 initially generated little fanfare but soon captured a large market share from rivals Sony and Nintendo. Microsoft's foray into the mobile phone and tablet industries could yield similar results.
• MasterCard. The ongoing global shift from cash and check transactions to electronic payments has benefitted the company. Additionally, it has gained a significant foothold in the rapidly growing debit-card transaction business. MasterCard's portfolio of operations is well-diversified with half of the company's revenues coming from foreign countries.
Fund Strategy
Investors reacted to the many headwinds facing the global economy in the first half of the year by favoring large cap stocks for much of the period. In the first quarter, an optimistic climate favored equities; large, multinational companies benefitted from this capital inflow. Their well-known brands and large market presence attracted investors who sought exposure to stocks with lower price volatility. The appetite for large cap stocks increased in the second quarter when market volatility rose.
The Fund focuses on minimizing volatility; consequently, the Fund may grow at a slower rate in rising markets while providing better downside protection in falling markets. The Fund's performance for the first and second quarters of 2012 demonstrates this positioning. During the market rally in the first quarter, Fund performance slightly lagged its benchmark. Then, as investors sought the stability and strength of larger, more established companies during the market downturn in the second quarter, the Fund made up ground.
The Fund's conservative equity investment strategy centers on high quality, mega-cap, blue-chip stocks. We look to invest in companies with sound fundamentals, including manageable debt balances and strong cash flow, good management and a solid track record of growth. Holdings are often multinational companies which benefit from global diversification.
The Fund's portfolio predominately consists of dividend-paying stocks from areas of the market with relatively stable demand for goods and services despite changes in the economic climate. We seek to purchase these stocks when they are trading at depressed prices with the anticipation that the market will likely restore the stocks to full valuations within three to five years.
The positive climate for large cap stocks warranted few changes to the Fund's portfolio in the first half of the year. The Fund trimmed select positions and increased its cash holding to almost 5%. This larger cash position provided the Fund with short-term flexibility to capitalize on developing buying opportunities.
3 For detailed information on Fund holdings, please see the Fund's Schedule of Investments in this Report.
19
Pacific Advisors
Large Cap Value Fund continued
Many Fund holdings continued to provide attractive dividend rates which supported total return. As of June 30th, holdings with annualized dividend rates over 3.5% include Clorox, Sysco, HJ Heinz and Northrop Grumman. Additionally, companies including General Electric, Abbott Laboratories, Genuine Parts, Intel, Kraft and McDonald's, paid annualized dividends in excess of 3%.
We continue to see good long-term prospects for Fund holdings including Procter & Gamble and Johnson & Johnson. These mega-cap companies have faced operational, branding and marketing challenges over the last four years as the economic slowdown shifted consumer focus to lower cost products. Both firms struggled to adapt their highly innovative and convenience-oriented product lines to compete with low cost alternatives; yet, both companies, in recognizing the need for change, modified their business strategies to combat the loss of market share. With their vast resources, well-known brands and the breadth of their global reach, these manufacturing powerhouses should be back on track in time. Meanwhile, they pay healthy dividends: Procter & Gamble's annualized dividend rate is 3.75%; Johnson & Johnson's is 3.65%.
Looking Ahead
We believe that leading large cap stocks will continue to offer attractive long-term growth opportunities with lower volatility. Market conditions will likely remain volatile in the second half of 2012 as investors respond to geopolitical uncertainty in the Middle East as well as political and economic changes in Europe and China. Mega-cap, multinational companies stand to benefit from their flexibility to focus on the strongest areas of the global market. These firms have worldwide diversification that enables them to adapt their business strategies to address changing economic conditions around the globe. Moreover, large cap companies have continued to benefit shareholders by effectively managing their market share, initiating stock buybacks, or increasing dividends.
Dividends are an attractive characteristic of mega-cap companies; combined, their product diversification, global reach, well-known brands, and resource depth have the ability to generate significant cash. Today, many companies have vast cash reserves and they are beginning to feel pressured to put it to use. The likelihood of companies using cash to buy back stock and increase dividend payments continues to grow; companies that pay attractive dividends may recognize the opportunity to appeal to conservative investors while interest rates remain near historic lows. As a result, we believe that dividend rates will become increasingly attractive. Therefore, we believe that investing in high quality, large cap, dividend-paying stocks remains a superior approach for more conservative equity investors to gain equity exposure.
Portfolio Holdings as of 06/30/12 (Based on Total Investments)

| Equities | 95.26 | % | |||||||||
| 1. | Information Technology | 23.33 | % | ||||||||
| 2. | Consumer Staples | 21.75 | % | ||||||||
| 3. | Industrials | 14.54 | % | ||||||||
| 4. | Consumer Discretionary | 14.27 | % | ||||||||
| 5. | Financials | 10.02 | % | ||||||||
| 6. | Health Care | 7.38 | % | ||||||||
| 7. | Energy | 3.97 | % | ||||||||
| 8. | Cash and Cash Equivalents | 4.74 | % | ||||||||
20
Expense Examples
As a shareholder of the Fund you incur two types of costs: (1) transaction costs, including sales charges (loads) on purchase payments, reinvested dividends, or other distributions; redemption fees; and exchange fees; and (2) ongoing costs, including management fees; distribution (12b-1) fees; and other Fund expenses. This Example is intended to help you understand your ongoing costs (in dollars) of investing in the Fund and to compare these costs with the ongoing costs of investing in other mutual funds.
The Example is based on an investment of $1,000 invested at the beginning of the period and held for the entire period from January 1, 2012 through June 30, 2012.
Actual Expenses
The first line of the table below provides information about actual account values and actual expenses. You may use the information in this line, together with the amount you invested, to estimate the expenses that you paid over the period. Simply divide your account value by $1,000 (for example, an $8,600 account value divided by $1,000 = 8.6), then multiply the result by the number in the first line under the heading entitled "Expenses Paid During the Period" to estimate the expenses you paid on your account during the period.
The following transaction costs are not included in the expenses shown in the table and, if applicable, would increase the expenses that you paid over the period: (1) a front-end sales charge (load) of 5.75% on Class A shares; (2) a 2% redemption fee if you sell or exchange shares within 180 days of purchase, with certain exceptions. The redemption fee does not apply to: (a) redemptions under an automatic withdrawal program or periodic asset reallocation plan, required minimum distributions (RMD), employer mandated distributions from a qualified plan, or redemptions under a qualified domestic relations order (QDRO); (b) redemptions to pay for expenses related to terminal illness, extended hospital or nursing home care, or other serious medical conditions, including death; (c) redemptions of shares acquired through dividend or capital gains reinvestments; (d) loans from a qualified plan account, and (e) redemptions initiated by the Fund; and (3) a $10 service fee on each exchange after the first five exchanges in each calendar year.
The following ongoing costs are not included in the expenses shown in the table and, if applicable, would increase the expenses that you paid over the period: (1) a $12 low balance fee on accounts with balances of less than $250 as of September 30th of each calendar year and no investment activity (excluding reinvestment of dividends and/or capital gains) during the prior calendar year or the first nine months of the current calendar year. This fee does not apply to IRAs, qualified plan accounts, or Coverdell Education Savings Accounts; (2) a $15 annual custodial fee on IRAs, SEPs, SIMPLE IRAs, and Coverdell Education Savings Accounts; and (3) a $20 annual custodial fee on 403(b) accounts.
Hypothetical Example for Comparison Purposes
The second line of the table below provides information about hypothetical account values and hypothetical expenses based on the Fund's actual expense ratio and an assumed rate of return of 5% per year before expenses, which in not the Fund's actual return. The hypothetical account values and expenses may not be used to estimate the actual ending account balance or expenses you paid for the period. You may use this information to compare the ongoing costs of investing in the Fund and other funds. To do so, compare this 5% hypothetical example with the 5% hypothetical examples that appear in the shareholder reports of the other funds.
The following transaction costs are not included in the expenses shown in the table and, if applicable, would increase the expenses that you paid over the period: (1) a front-end sales charge (load) of 5.75% on Class A shares; (2) a 2% redemption fee if you sell or exchange shares within 180 days of purchase, with certain exceptions. The redemption fee does not apply to: (a) redemptions under an automatic withdrawal program or periodic asset reallocation plan, required minimum distributions (RMD), employer mandated distributions from a qualified plan, or redemptions under a qualified domestic relations order (QDRO); (b) redemptions to pay for expenses related to terminal illness, extended hospital or nursing home care, or other serious medical conditions, including death; (c) redemptions of shares acquired through dividend or capital gains reinvestments; (d) loans from a qualified plan account, and (e) redemptions initiated by the Fund; and (3) a $10 service fee on each exchange after the first five exchanges in each calendar year.
The following ongoing costs are not included in the expenses shown in the table and, if applicable, would increase the expenses that you paid over the period: (1) a $12 low balance fee on accounts with balances of less than $250 as of September 30th of each calendar year and no investment activity (excluding reinvestment of dividends and/or capital gains) during the prior calendar year or the first nine months of the current calendar year. This fee does not apply to IRAs, qualified plan accounts, or Coverdell Education Savings Accounts; (2) a $15 annual custodial fee on IRAs, SEPs, SIMPLE IRAs, and Coverdell Education Savings Accounts; and (3) a $20 annual custodial fee on 403(b) accounts.
Please note that the expenses shown in the table are meant to highlight your ongoing costs only and do not reflect any transactional costs, such as sales charges (loads), redemption fees, or exchange fees. Therefore, the second line of the table is useful in comparing ongoing costs only, and will not help you determine the relative total costs of owning different funds. In addition, if these transactional costs were included, your costs would have been higher.
| Beginning Account Value 01/01/12 | Ending Account Value 06/30/12 | Expense Paid During Period 01/01/12 – 06/30/12 | |||||||||||||
| Large Cap Value Fund Class A | |||||||||||||||
| Actual | $ | 1,000.00 | $ | 1,081.70 | $ | 16.41 | |||||||||
| Hypothetical (5% return before expense) | $ | 1,000.00 | $ | 1,009.10 | $ | 15.84 | |||||||||
| Large Cap Value Fund Class C | |||||||||||||||
| Actual | $ | 1,000.00 | $ | 1,077.90 | $ | 20.30 | |||||||||
| Hypothetical (5% return before expense) | $ | 1,000.00 | $ | 1,005.32 | $ | 19.59 | |||||||||
5 Expenses are equal to the Fund's annualized expense ratio, net of expense waivers, of 3.17% for Class A shares and 3.93% for Class C shares, multiplied by the average account value over the period, multiplied by 182/366 days to reflect the one-half year period.
21
Pacific Advisors
Mid Cap Value Fund
Fund Objective: Long-term capital appreciation.
Investment Invests at least 80% of its assets in mid-cap companies that are, at the time of
Strategy: purchase, within the market cap range of companies in the Russell Midcap Index®1.
Investor Profile: Moderately aggressive. Growth-oriented with a long-term investment horizon.
| TOTAL RETURNS | EXPENSE RATIOS | ||||||||||||||
| For the six months ended June 30, 2012 | For the fiscal year ended December 31, 2011 | ||||||||||||||
| Class A | – 6.16 | % | Class A | 4.16 | % | ||||||||||
| Class C | – 6.60 | % | Class C | 4.91 | % | ||||||||||
| Russell Midcap Index® | 7.97 | % | |||||||||||||
Performance quoted is past performance which does not guarantee future results. Current performance may be higher or lower than the performance quoted. Call (800) 989-6693 for performance current to the most recent month-end. The investment return and principal value of an investment will fluctuate so that an investor's shares, when redeemed, may be worth more or less than their original cost. Returns represent the change in value over the stated period assuming reinvestment of dividends and capital gains at net asset value. Returns do not take into account the maximum 5.75% sales charge on Class A shares or the 1% Contingent Deferred Sales Charge (CDSC) for Class C shares sold within one year of purchase. Returns would be lower if the applicable sales charge and CDSC were included. Returns do not take into account individual taxes which may reduce actual returns when shares are sold.
Discussion with Portfolio Manager August 24, 2012
George A. Henning
Please see the Chairman's Letter at the beginning of this Report for a detailed market and economic review
as well as the Manager's general market outlook.
Fund Performance
The Fund performed well in the first quarter on improving domestic economic data. In the second quarter, however, Fund performance suffered as equities sold off with the European sovereign debt crisis once again dominating headlines and market action. The selloff was particularly acute in cyclical sectors, areas that tend to be economically sensitive, such as Energy and Industrials. The market's focus on economic developments overshadowed the underlying strength of the Fund's holdings. Despite economic challenges, these leading companies continued to identify and pursue growth strategies, oftentimes at the expense of weakened competitors. Indeed, lackluster economic conditions have created many of these opportunities.
The Fund's Materials, Consumer Staples, and Financials stocks enjoyed strong performance during the period. Shares of HB Fuller rose following the company's acquisition of an industrial adhesives business.2 The combination will allow the company to reorganize and restructure parts of its European and Middle Eastern operations. Dr Pepper Snapple delivered strong earnings growth driven by gains in its Canada Dry and Snapple beverage units. And, Cathay General Bancorp continued to see improvements in its loan portfolio; it also anticipates repaying the government's TARP investment in the fall which would enable the company to reinstate its dividend and more aggressively pursue loan growth.
Energy stocks were negatively impacted by the drop in oil prices and concerns of a global economic slowdown, particularly in Europe and China. Mitcham Industries leases equipment to seismic contractors during oil and gas exploration. Despite record levels of activity, the stock sold off along with the broader
1 The Russell Midcap Index® is an unmanaged, weighted measure of the 800 smallest companies within the Russell 1000 Index® based on a combination of their market cap and current index membership. Index returns assume the reinvestment of dividends, but, unlike the Fund's returns, do not reflect management fees or expenses. It is not possible to invest directly in the Index.
2 For detailed information on Fund holdings, please see the Fund's Schedule of Investments in this Report.
22
industry on fears of reduced exploration activity. Meanwhile, low natural gas prices and warm winter weather negatively impacted coal markets. Arch Coal, a leading producer of thermal and metallurgical coal, sold off as electric utilities are increasingly favoring natural gas over coal due to low prices as well as environmental concerns. Nevertheless, the long-term outlook for cost-advantaged coal remains bright as increasing demand from emerging markets should offset declining domestic demand. Moreover, prices for natural gas are starting to rise which may reduce the incentive for electric utilities to switch fuel sources. A recovery in gas prices should also benefit Chesapeake Energy; its shares faltered when the company encountered funding shortfalls for its vast holdings of natural gas drilling rights.
Consumer Discretionary holdings largely pulled back on deteriorating consumer sentiment and spending trends. Gamestop has suffered as gamers increasingly flock to new entertainment devices, including mobile phones and tablet computers. Nevertheless, the video game retailer is repositioning to benefit from these trends by developing a digital gaming product; also, its stores are now selling the iPhone which has emerged as a competitive gaming platform. Furthermore, used games continue to generate significant cash flow for the company, which, in turn, pays an attractive dividend; as of June 30th, the annualized dividend yield was 3.4%. In contrast, shares of PVH rose as sales of the company's Calvin Klein and Tommy Hilfiger brands continued to outpace the industry. Management sees significant opportunity despite economic challenges; it recently entered into a licensing agreement to increase the presence of its Arrow brand in Europe.
Concerns of an economic slowdown, and certain company-specific issues, negatively impacted Industrials holdings. Mining equipment manufacturer Joy Global fell as investors anticipated reduced demand for mining activity in China and Australia; yet, we believe that market fears of a hard economic landing in China are overblown. Navistar encountered challenges related to its newly-developed engine technology that was designed to meet increasingly tough environmental requirements. Despite near-term business pressures, Navistar remains a top-shelf brand with an extremely loyal customer base. We believe the stock will recover as management moves to resolve the engine issue.
Fund Strategy
Mid-cap companies offer unique advantages for long-term investors: they combine the economies of scale typically enjoyed by large corporations with the strategic flexibility of smaller operations. Our fundamental, bottom-up investment process identifies leading companies with strong long-term growth prospects. The Fund's long-term approach typically results in a low annual turnover rate of less than 25%.3
The Fund remains positioned for a gradual economic recovery. We believe that the global economy's long-term outlook, despite the near-term challenges in Europe, remains encouraging. Emerging economies will continue to deliver most of the world's growth. The ongoing recovery in the U.S. and the eventual, post-debt crisis resolution recovery in Europe will supplement growth from the emerging economies.
We believe that the growth opportunities for companies in the portfolio remain strong and will be realized as global headwinds subside. Tidewater and Helix Energy Solutions are both ideally positioned to benefit from growth in the development of deepwater offshore oilfields. These oilfields are among the most attractive opportunities in the Energy sector due to their favorable economics and the extended duration of the projects. Kansas City Southern should continue to profit from its operations in Mexico. New automobile plants in the country should dramatically increase utilization of Kansas City Southern's north-south rail lines; the country's relatively strong economy is also driving increased shipping volumes. And, the increased emphasis on water preservation and management should provide Xylem, a water technology company, significant new opportunities in the U.S. and abroad.
Acquisitions continue to play a significant role in company growth strategies as evidenced by two major acquisition announcements in July. Fund holding, Genesee & Wyoming announced an agreement to acquire RailAmerica which will essentially double the size of the company. The combined entity will own the largest portfolio of short-line railroads in the world. Management highlighted integration opportunities that will significantly contribute to earnings growth. Separately, Chicago Bridge & Iron
3 See the Financial Highlights in this Report for detailed information.
23
Pacific Advisors
Mid Cap Value Fund continued
announced an agreement to acquire Shaw Group to expand its construction and engineering operations in the energy sector. The transaction gives Chicago Bridge & Iron a leading position in power generation to supplement the company's leading presence in oil and natural gas infrastructure. In the absence of a robust economic recovery, business combinations enable companies to expand existing service and product offerings. We believe these transactions will position both companies for meaningful growth over the next several years.
During the period, the Fund added positions in O'Reilly Automotive and Wabtec. The increased age of vehicles on the road is supporting strong business trends at O'Reilly, a specialty retailer of aftermarket parts, equipment, and accessories. The company has enjoyed strong growth as car owners look to save money by repairing their own vehicles. The company has also been consolidating the industry over the past several years which has further contributed to growth. Wabtec supplies parts to the railcar industry; its products can be found on passenger and cargo cars as well as locomotives. We believe Wabtec is ideally positioned to benefit from strong cargo growth in the U.S. and passenger growth in Europe and Asia.
Looking Ahead
The first half of 2012 was marked by events in Europe which impacted the global economy. Signs of a slowdown are apparent as we enter the second half of the year. Notably, China has experienced reduced trade activity while the U.S. has been constrained by reduced business and consumer spending. Nevertheless, we are encouraged by signs of progress in Europe; crucially, the region's faltering growth is altering the course of the austerity debate towards more growth-oriented policies. We believe Fund holdings will continue to find attractive opportunities to expand their businesses. Given the lack of a robust domestic recovery, acquisitions will likely continue to play a significant role in corporate growth strategies.
The areas of the market that experienced challenges during the first half of the year could be poised for a significant recovery. In particular, we believe Energy holdings ended the second quarter at significant discounts to their fair values. The mild winter resulted in vast stockpiles of coal and natural gas as electricity usage declined. However, record-high temperatures in the summer will likely reverse this trend and may lead to stock price recoveries for companies such as Arch Coal and Chesapeake Energy. Similarly, ongoing strength in oil exploration and production should support activity levels for Tidewater and Ion Geophysical. Meanwhile, Consumer Discretionary and Industrials companies, including Dana Corp. and Joy Global, respectively, will benefit from a general recovery in the global economy. Indeed, we remain confident in the outlook for individual Fund holdings and believe they are well-positioned with significant medium to long-term growth potential.
Portfolio Holdings as of 06/30/12 (Based on Total Investments)
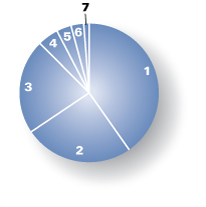
| Equities | 98.63 | % | |||||||||
| 1. | Industrials | 40.50 | % | ||||||||
| 2. | Energy | 25.30 | % | ||||||||
| 3. | Consumer Discretionary | 21.86 | % | ||||||||
| 4. | Materials | 5.05 | % | ||||||||
| 5. | Financials | 3.30 | % | ||||||||
| 6. | Consumer Staples | 2.62 | % | ||||||||
| 7. | Cash and Cash Equivalents | 1.37 | % | ||||||||
24
Expense Examples
As a shareholder of the Fund you incur two types of costs: (1) transaction costs, including sales charges (loads) on purchase payments, reinvested dividends, or other distributions; redemption fees; and exchange fees; and (2) ongoing costs, including management fees; distribution (12b-1) fees; and other Fund expenses. This Example is intended to help you understand your ongoing costs (in dollars) of investing in the Fund and to compare these costs with the ongoing costs of investing in other mutual funds.
The Example is based on an investment of $1,000 invested at the beginning of the period and held for the entire period from January 1, 2012 through June 30, 2012.
Actual Expenses
The first line of the table below provides information about actual account values and actual expenses. You may use the information in this line, together with the amount you invested, to estimate the expenses that you paid over the period. Simply divide your account value by $1,000 (for example, an $8,600 account value divided by $1,000 = 8.6), then multiply the result by the number in the first line under the heading entitled "Expenses Paid During the Period" to estimate the expenses you paid on your account during the period.
The following transaction costs are not included in the expenses shown in the table and, if applicable, would increase the expenses that you paid over the period: (1) a front-end sales charge (load) of 5.75% on Class A shares; (2) a 2% redemption fee if you sell or exchange shares within 180 days of purchase, with certain exceptions. The redemption fee does not apply to: (a) redemptions under an automatic withdrawal program or periodic asset reallocation plan, required minimum distributions (RMD), employer mandated distributions from a qualified plan, or redemptions under a qualified domestic relations order (QDRO); (b) redemptions to pay for expenses related to terminal illness, extended hospital or nursing home care, or other serious medical conditions, including death; (c) redemptions of shares acquired through dividend or capital gains reinvestments; (d) loans from a qualified plan account, and (e) redemptions initiated by the Fund; and (3) a $10 service fee on each exchange after the first five exchanges in each calendar year.
The following ongoing costs are not included in the expenses shown in the table and, if applicable, would increase the expenses that you paid over the period: (1) a $12 low balance fee on accounts with balances of less than $250 as of September 30th of each calendar year and no investment activity (excluding reinvestment of dividends and/or capital gains) during the prior calendar year or the first nine months of the current calendar year. This fee does not apply to IRAs, qualified plan accounts, or Coverdell Education Savings Accounts; (2) a $15 annual custodial fee on IRAs, SEPs, SIMPLE IRAs, and Coverdell Education Savings Accounts; and (3) a $20 annual custodial fee on 403(b) accounts.
Hypothetical Example for Comparison Purposes
The second line of the table below provides information about hypothetical account values and hypothetical expenses based on the Fund's actual expense ratio and an assumed rate of return of 5% per year before expenses, which in not the Fund's actual return. The hypothetical account values and expenses may not be used to estimate the actual ending account balance or expenses you paid for the period. You may use this information to compare the ongoing costs of investing in the Fund and other funds. To do so, compare this 5% hypothetical example with the 5% hypothetical examples that appear in the shareholder reports of the other funds.
The following transaction costs are not included in the expenses shown in the table and, if applicable, would increase the expenses that you paid over the period: (1) a front-end sales charge (load) of 5.75% on Class A shares; (2) a 2% redemption fee if you sell or exchange shares within 180 days of purchase, with certain exceptions. The redemption fee does not apply to: (a) redemptions under an automatic withdrawal program or periodic asset reallocation plan, required minimum distributions (RMD), employer mandated distributions from a qualified plan, or redemptions under a qualified domestic relations order (QDRO); (b) redemptions to pay for expenses related to terminal illness, extended hospital or nursing home care, or other serious medical conditions, including death; (c) redemptions of shares acquired through dividend or capital gains reinvestments; (d) loans from a qualified plan account, and (e) redemptions initiated by the Fund; and (3) a $10 service fee on each exchange after the first five exchanges in each calendar year.
The following ongoing costs are not included in the expenses shown in the table and, if applicable, would increase the expenses that you paid over the period: (1) a $12 low balance fee on accounts with balances of less than $250 as of September 30th of each calendar year and no investment activity (excluding reinvestment of dividends and/or capital gains) during the prior calendar year or the first nine months of the current calendar year. This fee does not apply to IRAs, qualified plan accounts, or Coverdell Education Savings Accounts; (2) a $15 annual custodial fee on IRAs, SEPs, SIMPLE IRAs, and Coverdell Education Savings Accounts; and (3) a $20 annual custodial fee on 403(b) accounts.
Please note that the expenses shown in the table are meant to highlight your ongoing costs only and do not reflect any transactional costs, such as sales charges (loads), redemption fees, or exchange fees. Therefore, the second line of the table is useful in comparing ongoing costs only, and will not help you determine the relative total costs of owning different funds. In addition, if these transactional costs were included, your costs would have been higher.
| Beginning Account Value 01/01/12 | Ending Account Value 06/30/12 | Expense Paid During Period 01/01/12 – 06/30/12 | |||||||||||||
| Mid Cap Value Fund Class A | |||||||||||||||
| Actual | $ | 1,000.00 | $ | 938.40 | $ | 20.72 | |||||||||
| Hypothetical (5% return before expense) | $ | 1,000.00 | $ | 1,003.48 | $ | 21.42 | |||||||||
| Mid Cap Value Fund Class C | |||||||||||||||
| Actual | $ | 1,000.00 | $ | 934.00 | $ | 24.28 | |||||||||
| Hypothetical (5% return before expense) | $ | 1,000.00 | $ | 999.75 | $ | 25.11 | |||||||||
3 Expenses are equal to the Fund's annualized expense ratio of 4.30% for Class A shares and 5.05% for Class C shares, multiplied by the average account value over the period, multiplied by 182/366 days to reflect the one-half year period.
25
Pacific Advisors
Small Cap Value Fund
Fund Objective: Capital appreciation through investment in small cap companies.
Investment Invests at least 80% of its assets in small cap companies (i.e., with market caps
Strategy: of up to $2 billion at the time of purchase). Generally invests a significant proportion of its assets in companies with market caps under $500 million at the time of purchase, which are often referred to as "micro-cap stocks."
Investor Profile: Aggressive. Opportunity-oriented with a long-term investment horizon.
| TOTAL RETURNS | EXPENSE RATIOS | ||||||||||||||
| For the six months ended June 30, 2012 | For the fiscal year ended December 31, 2011 | ||||||||||||||
| Class A | 0.29 | % | Class A | 2.88 | % | ||||||||||
| Class C | – 0.10 | % | Class C | 3.62 | % | ||||||||||
| Class I | 0.38 | % | Class I | 2.65 | % | ||||||||||
| Russell 2000 Index®1 | 8.53 | % | |||||||||||||
Performance quoted is past performance which does not guarantee future results. Current performance may be higher or lower than the performance quoted. Call (800) 989-6693 for performance current to the most recent month-end. The investment return and principal value of an investment will fluctuate so that an investor's shares, when redeemed, may be worth more or less than their original cost. Returns represent the change in value over the stated period assuming reinvestment of dividends and capital gains at net asset value. Returns do not take into account the maximum 5.75% sales charge on Class A shares or the 1% Contingent Deferred Sales Charge (CDSC) for Class C shares sold within one year of purchase. Returns would be lower if the applicable sales charge and CDSC were included. Returns do not take into account individual taxes which may reduce actual returns when shares are sold.
Discussion with Portfolio Manager August 24, 2012
George A. Henning
Please see the Chairman's Letter at the beginning of this Report for a detailed market and economic review
as well as the Manager's general market outlook.
Fund Performance
For the first half of 2012, Class A shares returned 0.29% compared to 8.53% for the benchmark. The Fund gained significantly in the first quarter on improving domestic economic data; however, in the second quarter, equities sold off as the latest flare-up of the European sovereign debt crises monopolized investor sentiment. The Fund is oriented toward expectations for a continued, albeit uneven, expansion in the global economy, including: a gradual recovery in the U.S.; an eventual resolution to the European sovereign debt crisis; and sustained growth in emerging markets, such as China, India, and Brazil. Portfolio companies remained confident in their future business opportunities; several, despite the difficult market conditions during the period, invested in plants and equipment and acquisitions. We believe the current slow-growth environment is benefitting leading companies. They have grown and strengthened their market positions and business operations; these actions would have been more challenging in a stronger economy when higher growth would help support weaker competitors.
Consumer Staples and Health Care stocks, keeping with their reputation as stable, economically-resilient businesses, enjoyed particularly strong performance during the period. Darling International, which recycles waste from restaurants and the meat-processing industry, benefitted from rising prices for its products.2 This environmentally-friendly company converts waste into proteins, fats and oils for the animal
1 The Russell 2000 Index® is an unmanaged, market-weighted measure of the 2,000 smallest companies of the Russell 3000 Index® which represents approximately 98% of the investable U.S. equity market. Index returns assume the reinvestment of dividends, but, unlike the Fund's returns, do not reflect management fees or expenses. It is not possible to invest directly in the Index.
2 For detailed information on Fund holdings, please see the Fund's Schedule of Investments in this Report.
26
feed industry and many other products. Investors are also likely anticipating the 2013 launch of its biodiesel plant, a joint venture with Valero Energy which will provide an additional income stream from the sale of the refined goods. Rochester Medical is steadily gaining market share in continence care products. The medical devices company is the world's leading developer and manufacturer of silicone urology products that are bacteria-resistant.
The temporary decline in oil prices during the period prompted investors to flee Energy stocks. Long-term, the outlook for oil and gas exploration and production activity remains strong; therefore, we continue to favor the sector despite near-term pricing pressures. Shares of North American Energy fell after the company experienced weather-related challenges. The service contractor relies on icy conditions to perform some of its heavy construction and mining work in western Canada; the early seasonal melt disrupted these operations. We recently visited the Canadian oil sands to meet with management and review progress on these projects. We observed robust activity levels and believe the company is well-positioned to benefit from record investment in the region. Conversely, shares of Hornbeck Offshore Services rose during the period despite the fall in oil prices. The company's offshore supply vessels primarily operate in the Gulf of Mexico. Drilling activity in the area has rebounded sharply and recovered to levels prior to the 2010 Macondo oil spill. The increased exploration and production has driven day rates higher; moreover, stringent regulatory requirements are benefitting Hornbeck's fleet of newer support vessels.
Consumer Discretionary holdings suffered losses as investors avoided stocks viewed as vulnerable to a weakening domestic economy. Shares of Amerigon, an auto parts manufacturer, and Sonic Automotive, an auto retailer, slid on concerns over consumer spending. Ironically, auto sales have been a rare bright spot for the U.S. economy. New car sales, after falling to 10.4 million units in 2009, have rebounded to a 14 million units pace in 2012. Furthermore, at 10.8 years, the average age of vehicles on the road is currently more than two years higher than the historical average. For these reasons, we believe that the auto industry will continue to perform well. Meanwhile, regional specialty retailer Conn's bucked the selling pressure in the Consumer Discretionary sector by executing on its turnaround and growth plans. The company, which provides customers flexible in-house credit options, is one of few brick and mortar retailers actively opening new stores.
The Fund's Industrials holdings also pulled back on fears of an economic slowdown. Concerns, including the potential impact of slowing growth in Europe and Asia, reflected the global reach of many of these companies. Kirby, which transports products on the U.S. inland and coastal waterways, experienced a moderate slowdown in some of its businesses tied to the energy industry. Shares of Rush Enterprises fell as customers delayed orders for the truck retailer. In both cases, management identified these challenges as temporary and confirmed that the underlying trends supporting their businesses remained intact. With oil prices back above $90, energy activity is already rebounding. And, truck sales can be delayed for only so long; the costs of maintaining older fleets will become prohibitive.
Fund Strategy
The Fund utilizes a bottom-up investment process that seeks to identify companies with specific opportunities for long-term capital appreciation. Overall economic developments factor into the decision-making process; but, they do not, by themselves, determine investment decisions. During the period, Fund holdings remained concentrated in the Energy and Industrials sectors as these securities met our investment criteria. However, these areas tend to experience greater volatility as they are more sensitive to changing economic conditions. Micro-cap stocks and small cap stocks also tend to be more volatile than stocks of larger companies. During the period, the Fund's focus on micro-cap and small cap stocks also contributed to above-average volatility.
When economic events dominate the markets, investors tend to view companies as part of an asset class rather than as an individual businesses. As a result, small cap stocks, and micro-cap stocks in particular, may suddenly fall out of favor regardless of the quality of the underlying operations. This pattern occurred not only in the second quarter but repeatedly over the past several years as investors rushed to buy and then sell stocks in response to various global economic developments. These included
27
Pacific Advisors
Small Cap Value Fund continued
the European debt crises, the threat of a double dip recession, and fears of slower growth in emerging markets. The resulting market turbulence has provided opportunities to contrast our assessment of individual companies against the market's asset class perspective. During these periods of volatility, our investment strategy remains focused on the long-term opportunities for companies we own; we may use negative short-term market conditions to increase our ownership for long-term growth. For example, in the first half of the year we took opportunities to add to the Fund's positions in Hornbeck Offshore Services, Bravo Brio Restaurant Group, Darling International, Amerigon and Rush Enterprises.
We believe that the growth opportunities for Fund holdings remain strong and will be realized as global headwinds subside. Bravo Brio Restaurant Group continues to expand its Italian-themed establishments into new geographies. Like all restaurateurs, the company is confronting elevated commodity costs. However, management has successfully adjusted menu offerings to offset these pressures. Importantly, the company is funding its new restaurants from existing operations; the company maintains zero debt. Saia, a trucking company, is reaping the benefits of multi-year investments in its vehicle fleet; initiatives including the installation of onboard computers that monitor fuel efficiency, idle time, and route optimization have significantly improved operational efficiency. Over the past several years, DXP Enterprises has been acquiring industrial parts distributors and service providers in the U.S. More recently, the company's consolidation spree has focused its efforts in Canada where the market offers exciting new possibilities.
Our active buy-and-hold strategy utilizes periods of elevated volatility to opportunistically invest in new companies for the long-term. During the first half of 2012, the Fund added two new positions: Suncoke Energy and Insteel Industries. Suncoke takes metallurgical coal and manufactures industrial coke which is then used to create steel. The company maintains long-term contracts for most of its production. We believed that, beyond the company's inherent growth prospects, management could provide additional shareholder value by restructuring certain assets. In July, Suncoke announced such a restructuring; its stock has responded strongly. Insteel manufactures wire products used in infrastructure construction. The company enjoys a pricing advantage over its competitors; however, the company's plants have remained underutilized due to the Congressional stalemate over infrastructure spending programs. We believe the deteriorating conditions of U.S. roads and bridges will eventually require significant expenditures, and that Insteel will benefit significantly. Indeed, the U.S. highway bill which will fund large construction projects recently received a two-year extension.
Looking Ahead
The market selloff during the second quarter was disappointing; but, Fund holdings were impacted more by global events than by significant changes in company operations. We believe that stock prices will recover as companies demonstrate that their business strategies are successful and as economic conditions improve. As we have experienced in the past, a slow-growing global economy rewards strong companies. If such a condition endures, weaker competitors will struggle to maintain market share. In the past, equity markets have exhibited an upward bias only to be disrupted by external factors. However, considering the challenges confronting Europe and the prospect of slowing growth in Asia, the U.S. is becoming more attractive to long-term investors. We continue to believe that the ebb and flow of a slow growth economy will benefit the "best of class" companies in their respective industries.
Leading small cap businesses continue to grow at the expense of weakened competitors. Nevertheless, several misperceptions about small cap stocks persist. These include concerns that smaller companies lack access to capital, are subject to significant business risk, and have limited geographic presence. Our stock selection process identifies small cap companies that successfully manage each of these concerns. More importantly, small cap stocks often provide the potential for greater price appreciation than larger companies as they can achieve higher growth rates as they expand their business operations. For these reasons, a strategy focused on identifying high quality small cap companies can provide compelling investment opportunities for long-term investors.
28
Portfolio Holdings as of 06/30/12 (Based on Total Investments)
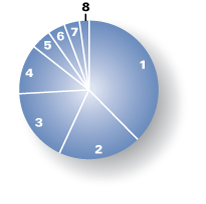
| Equities | 100.00 | % | |||||||||
| 1. | Industrials | 37.90 | % | ||||||||
| 2. | Consumer Discretionary | 19.05 | % | ||||||||
| 3. | Energy | 17.29 | % | ||||||||
| 4. | Financials | 11.59 | % | ||||||||
| 5. | Consumer Staples | 4.65 | % | ||||||||
| 6. | Telecommunication Services | 3.91 | % | ||||||||
| 7. | Health Care | 3.39 | % | ||||||||
| 8. | Materials | 2.22 | % | ||||||||
29
Pacific Advisors
Small Cap Value Fund continued
Expense Examples
As a shareholder of the Fund you incur two types of costs: (1) transaction costs, including sales charges (loads) on purchase payments, reinvested dividends, or other distributions; redemption fees; and exchange fees; and (2) ongoing costs, including management fees; distribution (12b-1) fees; and other Fund expenses. This Example is intended to help you understand your ongoing costs (in dollars) of investing in the Fund and to compare these costs with the ongoing costs of investing in other mutual funds.
The Example is based on an investment of $1,000 invested at the beginning of the period and held for the entire period from January 1, 2012 through June 30, 2012.
Actual Expenses
The first line of the table below provides information about actual account values and actual expenses. You may use the information in this line, together with the amount you invested, to estimate the expenses that you paid over the period. Simply divide your account value by $1,000 (for example, an $8,600 account value divided by $1,000 = 8.6), then multiply the result by the number in the first line under the heading entitled "Expenses Paid During the Period" to estimate the expenses you paid on your account during the period.
The following transaction costs are not included in the expenses shown in the table and, if applicable, would increase the expenses that you paid over the period: (1) a front-end sales charge (load) of 5.75% on Class A shares; (2) a 2% redemption fee if you sell or exchange shares within 180 days of purchase, with certain exceptions. The redemption fee does not apply to: (a) redemptions under an automatic withdrawal program or periodic asset reallocation plan, required minimum distributions (RMD), employer mandated distributions from a qualified plan, or redemptions under a qualified domestic relations order (QDRO); (b) redemptions to pay for expenses related to terminal illness, extended hospital or nursing home care, or other serious medical conditions, including death; (c) redemptions of shares acquired through dividend or capital gains reinvestments; (d) loans from a qualified plan account, and (e) redemptions initiated by the Fund; and (3) a $10 service fee on each exchange after the first five exchanges in each calendar year.
The following ongoing costs are not included in the expenses shown in the table and, if applicable, would increase the expenses that you paid over the period: (1) a $12 low balance fee on accounts with balances of less than $250 as of September 30th of each calendar year and no investment activity (excluding reinvestment of dividends and/or capital gains) during the prior calendar year or the first nine months of the current calendar year. This fee does not apply to IRAs, qualified plan accounts, or Coverdell Education Savings Accounts; (2) a $15 annual custodial fee on IRAs, SEPs, SIMPLE IRAs, and Coverdell Education Savings Accounts; and (3) a $20 annual custodial fee on 403(b) accounts.
Hypothetical Example for Comparison Purposes
The second line of the table below provides information about hypothetical account values and hypothetical expenses based on the Fund's actual expense ratio and an assumed rate of return of 5% per year before expenses, which in not the Fund's actual return. The hypothetical account values and expenses may not be used to estimate the actual ending account balance or expenses you paid for the period. You may use this information to compare the ongoing costs of investing in the Fund and other funds. To do so, compare this 5% hypothetical example with the 5% hypothetical examples that appear in the shareholder reports of the other funds.
The following transaction costs are not included in the expenses shown in the table and, if applicable, would increase the expenses that you paid over the period: (1) a front-end sales charge (load) of 5.75% on Class A shares; (2) a 2% redemption fee if you sell or exchange shares within 180 days of purchase, with certain exceptions. The redemption fee does not apply to: (a) redemptions under an automatic withdrawal program or periodic asset reallocation plan, required minimum distributions (RMD), employer mandated distributions from a qualified plan, or redemptions under a qualified domestic relations order (QDRO); (b) redemptions to pay for expenses related to terminal illness, death, extended hospital or nursing home care, or other serious medical conditions; (c) redemptions of shares acquired through dividend or capital gains reinvestments; (d) loans from a qualified plan account; and (e) redemptions initiated by the Fund; and (3) a $10 service fee on each exchange after the first five exchanges in each calendar year.
The following ongoing costs are not included in the expenses shown in the table and, if applicable, would increase the expenses that you paid over the period: (1) a $12 low balance fee on accounts with balances of less than $250 as of September 30th of each calendar year and no investment activity (excluding reinvestment of dividends and/or capital gains) during the prior calendar year or the first nine months of the current calendar year. This fee does not apply to IRAs, qualified plan accounts, or Coverdell Education Savings Accounts; (2) a $15 annual custodial fee on IRAs, SEPs, SIMPLE IRAs, and Coverdell Education Savings Accounts; and (3) a $20 annual custodial fee on 403(b) accounts.
Please note that the expenses shown in the table are meant to highlight your ongoing costs only and do not reflect any transactional costs, such as sales charges (loads), redemption fees, or exchange fees. Therefore, the second line of the table is useful in comparing ongoing costs only, and will not help you determine the relative total costs of owning different funds. In addition, if these transactional costs were included, your costs would have been higher.
| Beginning Account Value 01/01/12 | Ending Account Value 06/30/12 | Expense Paid During Period 01/01/12 – 06/30/12 | |||||||||||||
| Small Cap Value Fund Class A | |||||||||||||||
| Actual | $ | 1,000.00 | $ | 1,002.90 | $ | 14.34 | |||||||||
| Hypothetical (5% return before expense) | $ | 1,000.00 | $ | 1,010.54 | $ | 14.40 | |||||||||
| Small Cap Value Fund Class C | |||||||||||||||
| Actual | $ | 1,000.00 | $ | 999.00 | $ | 18.04 | |||||||||
| Hypothetical (5% return before expense) | $ | 1,000.00 | $ | 1,006.81 | $ | 18.11 | |||||||||
| Small Cap Value Fund Class I | |||||||||||||||
| Actual | $ | 1,000.00 | $ | 1,003.80 | $ | 13.10 | |||||||||
| Hypothetical (5% return before expense) | $ | 1,000.00 | $ | 1,011.79 | $ | 13.16 | |||||||||
3 Expenses are equal to the Fund's annualized expense ratio of 2.88% for Class A shares, 3.63% for Class C shares and 2.63% for Class I shares, multiplied by the average account value over the period, multiplied by 182/366 days to reflect the one-half year period.
30

Pacific Advisors Fund Inc.
Financial Statements
31
Pacific Advisors Government Securities Fund
Schedule of Investments (Unaudited)
as of June 30, 2012
| Quantity or Principal | Description | Current $ Value** | % of Total Net Assets | ||||||||||||
| COMMON STOCK | |||||||||||||||
| CONSUMER DISCRETIONARY | 1.62 | ||||||||||||||
| HOTELS, RESTAURANTS & LEISURE | |||||||||||||||
| 450 | MCDONALD'S CORP. | 39,838 | |||||||||||||
| 39,838 | 1.62 | ||||||||||||||
| CONSUMER STAPLES | 3.90 | ||||||||||||||
| FOOD & STAPLES RETAILING | |||||||||||||||
| 1,500 | SAFEWAY INC. | 27,225 | |||||||||||||
| 27,225 | 1.11 | ||||||||||||||
| FOOD PRODUCTS | |||||||||||||||
| 800 | GENERAL MILLS INC. | 30,832 | |||||||||||||
| 30,832 | 1.26 | ||||||||||||||
| HOUSEHOLD PRODUCTS | |||||||||||||||
| 450 | KIMBERLY-CLARK CORP. | 37,697 | |||||||||||||
| 37,697 | 1.54 | ||||||||||||||
| ENERGY | 1.51 | ||||||||||||||
| OIL, GAS & CONSUMABLE FUELS | |||||||||||||||
| 350 | CHEVRON CORP. | 36,925 | |||||||||||||
| 36,925 | 1.51 | ||||||||||||||
| HEALTH CARE | 1.08 | ||||||||||||||
| PHARMACEUTICALS | |||||||||||||||
| 300 | ELI LILLY & CO. | 12,873 | |||||||||||||
| 200 | JOHNSON & JOHNSON | 13,512 | |||||||||||||
| 26,385 | 1.08 | ||||||||||||||
| INDUSTRIALS | 0.91 | ||||||||||||||
| INDUSTRIAL CONGLOMERATES | |||||||||||||||
| 250 | 3M CO. | 22,400 | |||||||||||||
| 22,400 | 0.91 | ||||||||||||||
| INFORMATION TECHNOLOGY | 1.87 | ||||||||||||||
| SOFTWARE | |||||||||||||||
| 1,500 | MICROSOFT CORP. | 45,885 | |||||||||||||
| 45,885 | 1.87 | ||||||||||||||
| TELECOMMUNICATION SERVICES | 2.33 | ||||||||||||||
| DIVERSIFIED TELECOM. SERVICES | |||||||||||||||
| 1,600 | AT&T INC. | 57,056 | |||||||||||||
| 57,056 | 2.33 | ||||||||||||||
See Accompanying Notes to Financial Statements which are an integral part of these financial statements.
32
Pacific Advisors Government Securities Fund
Schedule of Investments (Unaudited)
as of June 30, 2012
| Quantity or Principal | Description | Current $ Value** | % of Total Net Assets | ||||||||||||
| COMMON STOCK continued | |||||||||||||||
| UTILITIES | 4.39 | ||||||||||||||
| ELECTRIC UTILITIES | |||||||||||||||
| 1,000 | PPL CORP. | 27,810 | |||||||||||||
| 850 | SOUTHERN CO. | 39,355 | |||||||||||||
| 67,165 | 2.74 | ||||||||||||||
| MULTI-UTILITIES | |||||||||||||||
| 650 | CONSOLIDATED EDISON INC. | 40,424 | |||||||||||||
| 40,424 | 1.65 | ||||||||||||||
| TOTAL COMMON STOCK (Cost: $354,054) | 431,832 | 17.60 | |||||||||||||
| US GOVT SECURITIES | |||||||||||||||
| US GOVERNMENT AGENCY | 81.63 | ||||||||||||||
| US GOVERNMENT AGENCY | |||||||||||||||
| 100,000 | FEDERAL HOME LOAN BANK 1.00% 04/19/17 STEP | 100,039 | |||||||||||||
| 400,000 | FEDERAL HOME LOAN BANK 2.50% 08/08/17 | 400,666 | |||||||||||||
| 100,000 | FEDERAL HOME LOAN BANK 1.00% 09/28/17 STEP | 100,190 | |||||||||||||
| 100,000 | FEDERAL HOME LOAN BANK 2.00% 10/05/17 STEP | 100,294 | |||||||||||||
| 450,000 | FEDERAL HOME LOAN BANK 0.50% 10/30/17 STEP | 450,049 | |||||||||||||
| 100,000 | FEDERAL HOME LOAN MTG CORP. 1.125% 01/30/20 STEP | 100,429 | |||||||||||||
| 200,000 | FEDERAL NATL MTG ASSOC. 0.625% 01/10/17 STEP | 200,347 | |||||||||||||
| 350,000 | FEDERAL NATL MTG ASSOC. 2.25% 08/09/21 STEP | 350,546 | |||||||||||||
| 200,000 | FEDERAL NATL MTG ASSOC. 1.00% 05/24/27 STEP | 199,688 | |||||||||||||
| 2,002,247 | 81.63 | ||||||||||||||
| TOTAL US GOVT SECURITIES (Cost: $2,002,022) | 2,002,247 | 81.63 | |||||||||||||
| SHORT TERM INVESTMENTS | |||||||||||||||
| MONEY MARKET | 1.50 | ||||||||||||||
| 36,752 | UMB MONEY MARKET FIDUCIARY | 36,752 | |||||||||||||
| 36,752 | 1.50 | ||||||||||||||
| TOTAL SHORT TERM INVESTMENTS (Cost: $36,752) | 36,752 | 1.50 | |||||||||||||
| TOTAL INVESTMENT IN SECURITIES (Cost: $2,392,828) | 2,470,831 | 100.73 | |||||||||||||
| OTHER ASSETS LESS LIABILITIES | (17,853 | ) | (0.73 | ) | |||||||||||
| TOTAL NET ASSETS | 2,452,978 | 100.00 | |||||||||||||
* Non-income producing
** The principal amount is stated in U.S. dollars unless otherwise indicated.
See Accompanying Notes to Financial Statements which are an integral part of these financial statements.
33
Pacific Advisors Income and Equity Fund
Schedule of Investments (Unaudited)
as of June 30, 2012
| Quantity or Principal | Description | Current $ Value** | % of Total Net Assets | ||||||||||||
| COMMON STOCK | |||||||||||||||
| CONSUMER DISCRETIONARY | 7.50 | ||||||||||||||
| DISTRIBUTORS | |||||||||||||||
| 2,250 | GENUINE PARTS CO. | 135,563 | |||||||||||||
| 135,563 | 1.78 | ||||||||||||||
| HOTELS, RESTAURANTS & LEISURE | |||||||||||||||
| 1,400 | MCDONALD'S CORP. | 123,942 | |||||||||||||
| 123,942 | 1.63 | ||||||||||||||
| LEISURE EQUIPMENT & PRODUCTS | |||||||||||||||
| 5,500 | MATTEL INC. | 178,420 | |||||||||||||
| 178,420 | 2.35 | ||||||||||||||
| SPECIALTY RETAIL | |||||||||||||||
| 2,500 | HOME DEPOT INC. | 132,475 | |||||||||||||
| 132,475 | 1.74 | ||||||||||||||
| CONSUMER STAPLES | 7.51 | ||||||||||||||
| FOOD & STAPLES RETAILING | |||||||||||||||
| 4,600 | SYSCO CORP. | 137,126 | |||||||||||||
| 2,800 | WAL-MART STORES INC. | 195,216 | |||||||||||||
| 332,342 | 4.37 | ||||||||||||||
| HOUSEHOLD PRODUCTS | |||||||||||||||
| 1,750 | PROCTER & GAMBLE CO. | 107,187 | |||||||||||||
| 107,187 | 1.41 | ||||||||||||||
| TOBACCO | |||||||||||||||
| 3,800 | ALTRIA GROUP INC. | 131,290 | |||||||||||||
| 131,290 | 1.73 | ||||||||||||||
| ENERGY | 1.43 | ||||||||||||||
| OIL, GAS & CONSUMABLE FUELS | |||||||||||||||
| 1,500 | CONOCOPHILLIPS | 83,820 | |||||||||||||
| 750 | PHILLIPS 66 | 24,930 | |||||||||||||
| 108,750 | 1.43 | ||||||||||||||
| HEALTH CARE | 6.08 | ||||||||||||||
| PHARMACEUTICALS | |||||||||||||||
| 2,750 | ABBOTT LABORATORIES | 177,292 | |||||||||||||
| 2,000 | JOHNSON & JOHNSON | 135,120 | |||||||||||||
| 6,500 | PFIZER INC. | 149,500 | |||||||||||||
| 461,912 | 6.08 | ||||||||||||||
See Accompanying Notes to Financial Statements which are an integral part of these financial statements.
34
Pacific Advisors Income and Equity Fund
Schedule of Investments (Unaudited)
as of June 30, 2012
| Quantity or Principal | Description | Current $ Value** | % of Total Net Assets | ||||||||||||
| COMMON STOCK continued | |||||||||||||||
| INDUSTRIALS | 6.26 | ||||||||||||||
| AEROSPACE & DEFENSE | |||||||||||||||
| 2,250 | HONEYWELL INT'L INC. | 125,640 | |||||||||||||
| 125,640 | 1.65 | ||||||||||||||
| AIR FREIGHT & LOGISTICS | |||||||||||||||
| 1,000 | UNITED PARCEL SERVICE INC. B | 78,760 | |||||||||||||
| 78,760 | 1.04 | ||||||||||||||
| COMMERCIAL SERVICES & SUPPLIES | |||||||||||||||
| 7,000 | PITNEY BOWES INC. | 104,790 | |||||||||||||
| 104,790 | 1.38 | ||||||||||||||
| INDUSTRIAL CONGLOMERATES | |||||||||||||||
| 8,000 | GENERAL ELECTRIC CO. | 166,720 | |||||||||||||
| 166,720 | 2.19 | ||||||||||||||
| INFORMATION TECHNOLOGY | 4.27 | ||||||||||||||
| COMMUNICATIONS EQUIPMENT | |||||||||||||||
| 7,500 | NOKIA CORP. ADR A | 15,525 | |||||||||||||
| 15,525 | 0.20 | ||||||||||||||
| IT SERVICES | |||||||||||||||
| 2,250 | AUTOMATIC DATA PROCESSING INC. | 125,235 | |||||||||||||
| 125,235 | 1.65 | ||||||||||||||
| SOFTWARE | |||||||||||||||
| 6,000 | MICROSOFT CORP. | 183,540 | |||||||||||||
| 183,540 | 2.41 | ||||||||||||||
| MATERIALS | 1.80 | ||||||||||||||
| CHEMICALS | |||||||||||||||
| 2,700 | DUPONT DE NEMOURS & CO. | 136,539 | |||||||||||||
| 136,539 | 1.80 | ||||||||||||||
| TELECOMMUNICATION SERVICES | 4.78 | ||||||||||||||
| DIVERSIFIED TELECOM. SERVICES | |||||||||||||||
| 5,000 | AT&T INC. | 178,300 | |||||||||||||
| 1,000 | VERIZON COMMUNICATIONS INC. | 44,440 | |||||||||||||
| 222,740 | 2.93 | ||||||||||||||
| WIRELESS TELECOM. SERVICES | |||||||||||||||
| 5,000 | VODAFONE GROUP PLC | 140,900 | |||||||||||||
| 140,900 | 1.85 | ||||||||||||||
See Accompanying Notes to Financial Statements which are an integral part of these financial statements.
35
Pacific Advisors Income and Equity Fund
Schedule of Investments (Unaudited)
as of June 30, 2012
| Quantity or Principal | Description | Current $ Value** | % of Total Net Assets | ||||||||||||
| COMMON STOCK continued | |||||||||||||||
| UTILITIES | 5.34 | ||||||||||||||
| ELECTRIC UTILITIES | |||||||||||||||
| 5,000 | DUKE ENERGY CORP. | 115,300 | |||||||||||||
| 115,300 | 1.52 | ||||||||||||||
| MULTI-UTILITIES | |||||||||||||||
| 2,000 | DOMINION RESOURCES INC. | 108,000 | |||||||||||||
| 3,000 | PUBLIC SERVICE ENTERPRISE GROUP INC. | 97,500 | |||||||||||||
| 3,000 | XCEL ENERGY INC. | 85,230 | |||||||||||||
| 290,730 | 3.82 | ||||||||||||||
| TOTAL COMMON STOCK (Cost: $2,876,266) | 3,418,300 | 44.96 | |||||||||||||
| CORPORATE BOND | |||||||||||||||
| CONSUMER DISCRETIONARY | 9.74 | ||||||||||||||
| HOTELS, RESTAURANTS & LEISURE | |||||||||||||||
| 100,000 | INT'L GAME TECHNOLOGY 7.50% 06/15/19 | 119,165 | |||||||||||||
| 50,000 | MARRIOTT INT'L 5.625% 02/15/13 | 51,369 | |||||||||||||
| 100,000 | SHERATON HOLDING CORP. 7.375% 11/15/15 | 114,768 | |||||||||||||
| 100,000 | WYNDHAM WORLDWIDE 2.95% 03/01/17 | 99,477 | |||||||||||||
| 384,777 | 5.06 | ||||||||||||||
| HOUSEHOLD DURABLES | |||||||||||||||
| 100,000 | MDC HOLDINGS INC. 5.375% 12/15/14 | 105,179 | |||||||||||||
| 100,000 | WHIRLPOOL CORP. 6.50% 06/15/16 | 111,269 | |||||||||||||
| 216,448 | 2.85 | ||||||||||||||
| LEISURE EQUIPMENT & PRODUCTS | |||||||||||||||
| 50,000 | EQUIFAX INC. 6.30% 07/01/17 | 57,790 | |||||||||||||
| 57,790 | 0.76 | ||||||||||||||
| SPECIALTY RETAIL | |||||||||||||||
| 80,000 | STAPLES INC. 7.375% 10/01/12 | 81,242 | |||||||||||||
| 81,242 | 1.07 | ||||||||||||||
| ENERGY | 2.88 | ||||||||||||||
| ENERGY EQUIPMENT & SERVICES | |||||||||||||||
| 100,000 | SESI LLC. 6.375% 05/01/19 | 104,750 | |||||||||||||
| 100,000 | WEATHERFORD BERMUDA 6.00% 03/15/18 | 114,013 | |||||||||||||
| 218,763 | 2.88 | ||||||||||||||
See Accompanying Notes to Financial Statements which are an integral part of these financial statements.
36
Pacific Advisors Income and Equity Fund
Schedule of Investments (Unaudited)
as of June 30, 2012
| Quantity or Principal | Description | Current $ Value** | % of Total Net Assets | ||||||||||||
| CORPORATE BOND continued | |||||||||||||||
| FINANCIALS | 15.23 | ||||||||||||||
| CAPITAL MARKETS | |||||||||||||||
| 50,000 | CHARLES SCHWAB CORP. 6.375% 09/01/17 | 59,606 | |||||||||||||
| 95,000 | GOLDMAN SACHS GROUP 5.00% 10/01/14 | 99,047 | |||||||||||||
| 100,000 | JANUS CAPITAL GROUP INC. 6.70% 06/15/17 | 107,267 | |||||||||||||
| 100,000 | MORGAN STANLEY 09/30/17 FLOAT | 95,060 | |||||||||||||
| 360,980 | 4.75 | ||||||||||||||
| COMMERCIAL BANKS | |||||||||||||||
| 100,000 | CITIGROUP INC. 6.00% 12/13/13 | 105,095 | |||||||||||||
| 105,095 | 1.38 | ||||||||||||||
| CONSUMER FINANCE | |||||||||||||||
| 106,000 | HSBC 11/10/13 FLOAT | 107,212 | |||||||||||||
| 107,212 | 1.41 | ||||||||||||||
| DIVERSIFIED FINANCIAL SERVICES | |||||||||||||||
| 100,000 | ICAHN ENTERPRISES 7.75% 01/15/16 | 105,125 | |||||||||||||
| 100,000 | NASDAQ OMX GROUP 5.25% 01/16/18 | 106,549 | |||||||||||||
| 211,674 | 2.78 | ||||||||||||||
| INSURANCE | |||||||||||||||
| 100,000 | AMERICAN INT'L GROUP 4.25% 09/15/14 | 103,633 | |||||||||||||
| 100,000 | PRUDENTIAL FINANCIAL INC. 11/02/20 FLOAT | 103,045 | |||||||||||||
| 206,678 | 2.72 | ||||||||||||||
| REAL ESTATE INVESTMENT TRUSTS | |||||||||||||||
| 50,000 | HOSPITALITY PROPERTIES TRUST 7.875% 08/15/14 | 54,079 | |||||||||||||
| 100,000 | PROLOGIS 6.25% 03/15/17 | 112,398 | |||||||||||||
| 166,476 | 2.19 | ||||||||||||||
| HEALTH CARE | 2.78 | ||||||||||||||
| HEALTH CARE PROVIDERS & SERVICES | |||||||||||||||
| 100,000 | SENIOR HOUSING PROPERTIES TRUST 4.30% 01/15/16 | 100,093 | |||||||||||||
| 100,093 | 1.32 | ||||||||||||||
| PHARMACEUTICALS | |||||||||||||||
| 100,000 | HOSPIRA INC. 6.40% 05/15/15 | 111,216 | |||||||||||||
| 111,216 | 1.46 | ||||||||||||||
| INDUSTRIALS | 3.90 | ||||||||||||||
| AIRLINES | |||||||||||||||
| 50,000 | SOUTHWEST AIRLINES CO. 5.25% 10/01/14 | 54,116 | |||||||||||||
| 54,116 | 0.71 | ||||||||||||||
See Accompanying Notes to Financial Statements which are an integral part of these financial statements.
37
Pacific Advisors Income and Equity Fund
Schedule of Investments (Unaudited)
as of June 30, 2012
| Quantity or Principal | Description | Current $ Value** | % of Total Net Assets | ||||||||||||
| CORPORATE BOND continued | |||||||||||||||
| MACHINERY | |||||||||||||||
| 100,000 | HARSCO CORP. 5.75% 05/15/18 | 110,592 | |||||||||||||
| 115,000 | JOY GLOBAL INC. 6.00% 11/15/16 | 131,421 | |||||||||||||
| 242,013 | 3.18 | ||||||||||||||
| INFORMATION TECHNOLOGY | 4.21 | ||||||||||||||
| COMMUNICATIONS EQUIPMENT | |||||||||||||||
| 100,000 | MOTOROLA SOLUTIONS INC. 6.00% 11/15/17 | 113,578 | |||||||||||||
| 113,578 | 1.49 | ||||||||||||||
| COMPUTERS & PERIPHERALS | |||||||||||||||
| 50,000 | DELL INC. 5.65% 04/15/18 | 57,634 | |||||||||||||
| 57,634 | 0.76 | ||||||||||||||
| ELECTRONIC EQUIPMENT & INSTRUMENTS | |||||||||||||||
| 80,000 | CORNING INC. 7.53% 03/01/23 | 95,030 | |||||||||||||
| 50,000 | INGRAM MICRO INC. 5.25% 09/01/17 | 53,602 | |||||||||||||
| 148,633 | 1.96 | ||||||||||||||
| MATERIALS | 6.81 | ||||||||||||||
| CHEMICALS | |||||||||||||||
| 100,000 | ASHLAND INC. 9.125% 06/01/17 | 110,000 | |||||||||||||
| 110,000 | 1.45 | ||||||||||||||
| CONTAINERS & PACKAGING | |||||||||||||||
| 25,000 | PACKAGING CORP. OF AMERICA 5.75% 08/01/13 | 26,369 | |||||||||||||
| 26,369 | 0.35 | ||||||||||||||
| METALS & MINING | |||||||||||||||
| 50,000 | ARCELORMITTAL USA INC. 6.50% 04/15/14 | 53,026 | |||||||||||||
| 50,000 | COMMERCIAL METALS CO. 7.35% 08/15/18 | 51,125 | |||||||||||||
| 150,000 | RELIANCE STEEL & ALUMINUM 6.20% 11/15/16 | 164,518 | |||||||||||||
| 268,669 | 3.53 | ||||||||||||||
| PAPER & FOREST PRODUCTS | |||||||||||||||
| 100,000 | DOMTAR CORP. 7.125% 08/15/15 | 112,784 | |||||||||||||
| 112,784 | 1.48 | ||||||||||||||
| TELECOMMUNICATION SERVICES | 2.52 | ||||||||||||||
| DIVERSIFIED TELECOM. SERVICES | |||||||||||||||
| 181,484 | BELLSOUTH TELECOM. 6.30% 12/15/15 | 191,472 | |||||||||||||
| 191,472 | 2.52 | ||||||||||||||
See Accompanying Notes to Financial Statements which are an integral part of these financial statements.
38
Pacific Advisors Income and Equity Fund
Schedule of Investments (Unaudited)
as of June 30, 2012
| Quantity or Principal | Description | Current $ Value** | % of Total Net Assets | ||||||||||||
| CORPORATE BOND continued | |||||||||||||||
| UTILITIES | 3.59 | ||||||||||||||
| ELECTRIC UTILITIES | |||||||||||||||
| 95,000 | CLEVELAND ELECTRIC ILLUMINATING 5.70% 04/01/17 | 106,824 | |||||||||||||
| 106,824 | 1.41 | ||||||||||||||
| MULTI-UTILITIES | |||||||||||||||
| 55,000 | CONSUMERS ENERGY CO. 6.00% 02/15/14 | 59,396 | |||||||||||||
| 100,000 | OGE ENERGY CORP. 5.00% 11/15/14 | 106,844 | |||||||||||||
| 166,241 | 2.19 | ||||||||||||||
| TOTAL CORPORATE BOND (Cost: $3,802,754) | 3,926,776 | 51.65 | |||||||||||||
| PREFERRED STOCK | |||||||||||||||
| FINANCIALS | 1.68 | ||||||||||||||
| DIVERSIFIED FINANCIAL SERVICES | |||||||||||||||
| 2,000 | BANK OF AMERICA 7.25% PFD | 50,680 | |||||||||||||
| 50,680 | 0.67 | ||||||||||||||
| INSURANCE | |||||||||||||||
| 3,000 | METLIFE INC. 6.50% PFD | 77,400 | |||||||||||||
| 77,400 | 1.02 | ||||||||||||||
| UTILITIES | 0.69 | ||||||||||||||
| ELECTRIC UTILITIES | |||||||||||||||
| 2,000 | NEXTERA ENERGY CAPITAL 6.60% PFD A | 52,640 | |||||||||||||
| 52,640 | 0.69 | ||||||||||||||
| TOTAL PREFERRED STOCK (Cost: $175,000) | 180,720 | 2.38 | |||||||||||||
| SHORT TERM INVESTMENTS | |||||||||||||||
| MONEY MARKET | 0.57 | ||||||||||||||
| 43,086 | UMB MONEY MARKET FIDUCIARY | 43,086 | |||||||||||||
| 43,086 | 0.57 | ||||||||||||||
| TOTAL SHORT TERM INVESTMENTS (Cost: $43,086) | 43,086 | 0.57 | |||||||||||||
| TOTAL INVESTMENT IN SECURITIES (Cost: $6,897,106) | 7,568,882 | 99.56 | |||||||||||||
| OTHER ASSETS LESS LIABILITIES | 33,190 | 0.44 | |||||||||||||
| TOTAL NET ASSETS | 7,602,072 | 100.00 | |||||||||||||
* Non-income producing
** The principal amount is stated in U.S. dollars unless otherwise indicated.
See Accompanying Notes to Financial Statements which are an integral part of these financial statements.
39
Pacific Advisors Balanced Fund
Schedule of Investments (Unaudited)
as of June 30, 2012
| Quantity or Principal | Description | Current $ Value** | % of Total Net Assets | ||||||||||||
| COMMON STOCK | |||||||||||||||
| CONSUMER DISCRETIONARY | 5.24 | ||||||||||||||
| HOTELS, RESTAURANTS & LEISURE | |||||||||||||||
| 4,250 | MCDONALD'S CORP. | 376,252 | |||||||||||||
| 376,252 | 2.80 | ||||||||||||||
| MEDIA | |||||||||||||||
| 4,000 | WALT DISNEY CO. | 194,000 | |||||||||||||
| 194,000 | 1.45 | ||||||||||||||
| SPECIALTY RETAIL | |||||||||||||||
| 2,500 | TIFFANY & CO. | 132,375 | |||||||||||||
| 132,375 | 0.99 | ||||||||||||||
| CONSUMER STAPLES | 11.64 | ||||||||||||||
| BEVERAGES | |||||||||||||||
| 5,500 | COCA-COLA CO. | 430,045 | |||||||||||||
| 430,045 | 3.20 | ||||||||||||||
| FOOD & STAPLES RETAILING | |||||||||||||||
| 9,500 | CVS CAREMARK CORP. | 443,935 | |||||||||||||
| 7,750 | WAL-MART STORES INC. | 540,330 | |||||||||||||
| 984,265 | 7.33 | ||||||||||||||
| FOOD PRODUCTS | |||||||||||||||
| 5,000 | ARCHER DANIELS MIDLAND CO. | 147,600 | |||||||||||||
| 147,600 | 1.10 | ||||||||||||||
| ENERGY | 6.67 | ||||||||||||||
| ENERGY EQUIPMENT & SERVICES | |||||||||||||||
| 12,500 | HALLIBURTON CO. | 354,875 | |||||||||||||
| 5,000 | NATIONAL OILWELL VARCO INC. | 322,200 | |||||||||||||
| 677,075 | 5.05 | ||||||||||||||
| OIL, GAS & CONSUMABLE FUELS | |||||||||||||||
| 3,000 | CONOCOPHILLIPS | 167,640 | |||||||||||||
| 1,500 | PHILLIPS 66 | 49,860 | |||||||||||||
| 217,500 | 1.62 | ||||||||||||||
| FINANCIALS | 6.58 | ||||||||||||||
| CONSUMER FINANCE | |||||||||||||||
| 7,800 | AMERICAN EXPRESS CO. | 454,038 | |||||||||||||
| 454,038 | 3.38 | ||||||||||||||
| DIVERSIFIED FINANCIAL SERVICES | |||||||||||||||
| 12,000 | JPMORGAN CHASE & CO. | 428,760 | |||||||||||||
| 428,760 | 3.19 | ||||||||||||||
See Accompanying Notes to Financial Statements which are an integral part of these financial statements.
40
Pacific Advisors Balanced Fund
Schedule of Investments (Unaudited)
as of June 30, 2012
| Quantity or Principal | Description | Current $ Value** | % of Total Net Assets | ||||||||||||
| COMMON STOCK continued | |||||||||||||||
| HEALTH CARE | 8.95 | ||||||||||||||
| PHARMACEUTICALS | |||||||||||||||
| 4,500 | ABBOTT LABORATORIES | 290,115 | |||||||||||||
| 6,000 | JOHNSON & JOHNSON | 405,360 | |||||||||||||
| 5,500 | MERCK & COMPANY INC. | 229,625 | |||||||||||||
| 12,000 | PFIZER INC. | 276,000 | |||||||||||||
| 1,201,100 | 8.95 | ||||||||||||||
| INDUSTRIALS | 18.55 | ||||||||||||||
| AEROSPACE & DEFENSE | |||||||||||||||
| 2,700 | BOEING CO. | 200,610 | |||||||||||||
| 200,610 | 1.49 | ||||||||||||||
| AIR FREIGHT & LOGISTICS | |||||||||||||||
| 5,550 | UNITED PARCEL SERVICE INC. B | 437,118 | |||||||||||||
| 437,118 | 3.26 | ||||||||||||||
| INDUSTRIAL CONGLOMERATES | |||||||||||||||
| 20,000 | GENERAL ELECTRIC CO. | 416,800 | |||||||||||||
| 416,800 | 3.11 | ||||||||||||||
| MACHINERY | |||||||||||||||
| 3,600 | CATERPILLAR INC. | 305,676 | |||||||||||||
| 3,000 | CUMMINS INC. | 290,730 | |||||||||||||
| 596,406 | 4.44 | ||||||||||||||
| ROAD & RAIL | |||||||||||||||
| 19,500 | CSX CORP. | 436,020 | |||||||||||||
| 5,600 | NORFOLK SOUTHERN CORP. | 401,912 | |||||||||||||
| 837,932 | 6.24 | ||||||||||||||
| INFORMATION TECHNOLOGY | 14.16 | ||||||||||||||
| COMMUNICATIONS EQUIPMENT | |||||||||||||||
| 6,750 | QUALCOMM INC. | 375,840 | |||||||||||||
| 375,840 | 2.80 | ||||||||||||||
| COMPUTERS & PERIPHERALS | |||||||||||||||
| 2,450 | INT'L BUSINESS MACHINES CORP. | 479,171 | |||||||||||||
| 479,171 | 3.57 | ||||||||||||||
| ELECTRONIC EQUIPMENT & INSTRUMENTS | |||||||||||||||
| 25,000 | CORNING INC. | 323,250 | |||||||||||||
| 323,250 | 2.41 | ||||||||||||||
See Accompanying Notes to Financial Statements which are an integral part of these financial statements.
41
Pacific Advisors Balanced Fund
Schedule of Investments (Unaudited)
as of June 30, 2012
| Quantity or Principal | Description | Current $ Value** | % of Total Net Assets | ||||||||||||
| COMMON STOCK continued | |||||||||||||||
| INTERNET SOFTWARE & SERVICES | |||||||||||||||
| 400 | GOOGLE INC.* | 232,028 | |||||||||||||
| 232,028 | 1.73 | ||||||||||||||
| SOFTWARE | |||||||||||||||
| 16,000 | MICROSOFT CORP. | 489,440 | |||||||||||||
| 489,440 | 3.65 | ||||||||||||||
| MATERIALS | 2.82 | ||||||||||||||
| CHEMICALS | |||||||||||||||
| 12,000 | DOW CHEMICAL CO. | 378,000 | |||||||||||||
| 378,000 | 2.82 | ||||||||||||||
| TOTAL COMMON STOCK (Cost: $8,525,032) | 10,009,605 | 74.59 | |||||||||||||
| CORPORATE BOND | |||||||||||||||
| CONSUMER DISCRETIONARY | 5.93 | ||||||||||||||
| AUTO COMPONENTS | |||||||||||||||
| 100,000 | BORG WARNER 8.00% 10/01/19 | 121,824 | |||||||||||||
| 121,824 | 0.91 | ||||||||||||||
| HOTELS, RESTAURANTS & LEISURE | |||||||||||||||
| 100,000 | MARRIOTT INT'L 5.625% 02/15/13 | 102,737 | |||||||||||||
| 150,000 | ROYAL CARIBBEAN CRUISES 7.00% 06/15/13 | 156,000 | |||||||||||||
| 258,737 | 1.93 | ||||||||||||||
| HOUSEHOLD DURABLES | |||||||||||||||
| 48,000 | BEAM INC. 6.375% 06/15/14 | 52,578 | |||||||||||||
| 52,578 | 0.39 | ||||||||||||||
| MEDIA | |||||||||||||||
| 100,000 | WASHINGTON POST CO. 7.25% 02/01/19 | 114,513 | |||||||||||||
| 114,513 | 0.85 | ||||||||||||||
| MULTILINE RETAIL | |||||||||||||||
| 150,000 | JC PENNEY CORP. INC. 7.95% 04/01/17 | 150,000 | |||||||||||||
| 150,000 | 1.12 | ||||||||||||||
| SPECIALTY RETAIL | |||||||||||||||
| 100,000 | BEST BUY CO. INC. 3.75% 03/15/16 | 97,631 | |||||||||||||
| 97,631 | 0.73 | ||||||||||||||
| CONSUMER STAPLES | 1.34 | ||||||||||||||
| TOBACCO | |||||||||||||||
| 150,000 | REYNOLDS AMERICA 6.75% 06/15/17 | 180,086 | |||||||||||||
| 180,086 | 1.34 | ||||||||||||||
See Accompanying Notes to Financial Statements which are an integral part of these financial statements.
42
Pacific Advisors Balanced Fund
Schedule of Investments (Unaudited)
as of June 30, 2012
| Quantity or Principal | Description | Current $ Value** | % of Total Net Assets | ||||||||||||
| CORPORATE BOND continued | |||||||||||||||
| ENERGY | 1.23 | ||||||||||||||
| OIL, GAS & CONSUMABLE FUELS | |||||||||||||||
| 150,000 | PEABODY ENERGY CORP. 7.375% 11/01/16 | 165,000 | |||||||||||||
| 165,000 | 1.23 | ||||||||||||||
| FINANCIALS | 9.54 | ||||||||||||||
| CAPITAL MARKETS | |||||||||||||||
| 150,000 | CHARLES SCHWAB CORP. 6.375% 09/01/17 | 178,819 | |||||||||||||
| 161,000 | MORGAN STANLEY 07/01/14 FLOAT | 160,908 | |||||||||||||
| 339,727 | 2.53 | ||||||||||||||
| CONSUMER FINANCE | |||||||||||||||
| 150,000 | FORD MOTOR CREDIT CO. 7.00% 04/15/15 | 166,707 | |||||||||||||
| 155,000 | HOUSEHOLD FINANCE CO. 09/15/13 FLOAT | 156,302 | |||||||||||||
| 323,009 | 2.41 | ||||||||||||||
| DIVERSIFIED FINANCIAL SERVICES | |||||||||||||||
| 100,000 | GENERAL ELECTRIC CAP 5.65% 06/09/14 | 108,023 | |||||||||||||
| 150,000 | NASDAQ OMX GROUP 5.25% 01/16/18 | 159,824 | |||||||||||||
| 267,846 | 2.00 | ||||||||||||||
| INSURANCE | |||||||||||||||
| 100,000 | HARTFORD LIFE GLOBAL FUND 06/16/14 FLOAT | 98,166 | |||||||||||||
| 98,166 | 0.73 | ||||||||||||||
| REAL ESTATE INVESTMENT TRUSTS | |||||||||||||||
| 140,000 | HEALTH CARE REIT INC. 3.625% 03/15/16 | 143,919 | |||||||||||||
| 100,000 | HOSPITALITY PROPERTIES TRUST 7.875% 08/15/14 | 108,157 | |||||||||||||
| 252,076 | 1.88 | ||||||||||||||
| INFORMATION TECHNOLOGY | 4.98 | ||||||||||||||
| COMMUNICATIONS EQUIPMENT | |||||||||||||||
| 100,000 | MOTOROLA SOLUTIONS INC. 6.00% 11/15/17 | 113,578 | |||||||||||||
| 113,578 | 0.85 | ||||||||||||||
| COMPUTERS & PERIPHERALS | |||||||||||||||
| 100,000 | DIGITAL EQUIPMENT 7.75% 04/01/23 | 114,463 | |||||||||||||
| 150,000 | SEAGATE TECHNOLOGY 6.80% 10/01/16 | 166,688 | |||||||||||||
| 281,150 | 2.09 | ||||||||||||||
| ELECTRONIC EQUIPMENT & INSTRUMENTS | |||||||||||||||
| 100,000 | JABIL CIRCUIT INC. 7.75% 07/15/16 | 114,000 | |||||||||||||
| 114,000 | 0.85 | ||||||||||||||
See Accompanying Notes to Financial Statements which are an integral part of these financial statements.
43
Pacific Advisors Balanced Fund
Schedule of Investments (Unaudited)
as of June 30, 2012
| Quantity or Principal | Description | Current $ Value** | % of Total Net Assets | ||||||||||||
| CORPORATE BOND continued | |||||||||||||||
| IT SERVICES | |||||||||||||||
| 150,000 | COMPUTER SCIENCES CORP. 6.50% 03/15/18 | 160,125 | |||||||||||||
| 160,125 | 1.19 | ||||||||||||||
| MATERIALS | 1.61 | ||||||||||||||
| CHEMICALS | |||||||||||||||
| 105,000 | ALBEMARLE CORP. 5.10% 02/01/15 | 114,157 | |||||||||||||
| 114,157 | 0.85 | ||||||||||||||
| METALS & MINING | |||||||||||||||
| 100,000 | COMMERCIAL METALS CO. 7.35% 08/15/18 | 102,250 | |||||||||||||
| 102,250 | 0.76 | ||||||||||||||
| UTILITIES | 1.18 | ||||||||||||||
| INDEPENDENT POWER PRODUCERS & TRADERS | |||||||||||||||
| 150,000 | AMERENENERGY GENERATING 7.00% 04/15/18 | 129,750 | |||||||||||||
| 29,713 | RELIANT ENERGY MID ATL 9.237% 07/02/17 | 29,267 | |||||||||||||
| 159,017 | 1.18 | ||||||||||||||
| TOTAL CORPORATE BOND (Cost: $3,395,240) | 3,465,471 | 25.82 | |||||||||||||
| PREFERRED STOCK | |||||||||||||||
| FINANCIALS | 1.52 | ||||||||||||||
| COMMERCIAL BANKS | |||||||||||||||
| 3,000 | BARCLAYS BANK PLC 7.10% PFD | 74,400 | |||||||||||||
| 74,400 | 0.55 | ||||||||||||||
| DIVERSIFIED FINANCIAL SERVICES | |||||||||||||||
| 5,000 | BANK OF AMERICA 8.20% PFD | 129,250 | |||||||||||||
| 129,250 | 0.96 | ||||||||||||||
| TOTAL PREFERRED STOCK (Cost: $200,000) | 203,650 | 1.52 | |||||||||||||
| TOTAL INVESTMENT IN SECURITIES (Cost: $12,120,272) | 13,678,726 | 101.93 | |||||||||||||
| OTHER ASSETS LESS LIABILITIES | (258,506 | ) | (1.93 | ) | |||||||||||
| TOTAL NET ASSETS | 13,420,220 | 100.00 | |||||||||||||
* Non-income producing
** The principal amount is stated in U.S. dollars unless otherwise indicated.
See Accompanying Notes to Financial Statements which are an integral part of these financial statements.
44
Pacific Advisors Large Cap Value Fund
Schedule of Investments (Unaudited)
as of June 30, 2012
| Quantity or Principal | Description | Current $ Value** | % of Total Net Assets | ||||||||||||
| COMMON STOCK | |||||||||||||||
| CONSUMER DISCRETIONARY | 14.29 | ||||||||||||||
| DISTRIBUTORS | |||||||||||||||
| 1,000 | GENUINE PARTS CO. | 60,250 | |||||||||||||
| 60,250 | 1.34 | ||||||||||||||
| HOTELS, RESTAURANTS & LEISURE | |||||||||||||||
| 2,000 | MCDONALD'S CORP. | 177,060 | |||||||||||||
| 177,060 | 3.93 | ||||||||||||||
| INTERNET & CATALOG RETAIL | |||||||||||||||
| 1,425 | EXPEDIA INC. | 68,500 | |||||||||||||
| 1,425 | TRIPADVISOR INC.* | 63,683 | |||||||||||||
| 132,183 | 2.93 | ||||||||||||||
| MEDIA | |||||||||||||||
| 750 | THE MCGRAW-HILL COMPANIES INC. | 33,750 | |||||||||||||
| 3,250 | TIME WARNER INC. | 125,125 | |||||||||||||
| 158,875 | 3.52 | ||||||||||||||
| MULTILINE RETAIL | |||||||||||||||
| 2,000 | TARGET CORP. | 116,380 | |||||||||||||
| 116,380 | 2.58 | ||||||||||||||
| CONSUMER STAPLES | 21.79 | ||||||||||||||
| BEVERAGES | |||||||||||||||
| 2,560 | COCA-COLA CO. | 200,166 | |||||||||||||
| 200,166 | 4.44 | ||||||||||||||
| FOOD & STAPLES RETAILING | |||||||||||||||
| 5,500 | SYSCO CORP. | 163,955 | |||||||||||||
| 3,150 | WAL-MART STORES INC. | 219,618 | |||||||||||||
| 383,573 | 8.50 | ||||||||||||||
| FOOD PRODUCTS | |||||||||||||||
| 750 | H.J. HEINZ CO. | 40,785 | |||||||||||||
| 2,700 | KRAFT FOODS INC. | 104,274 | |||||||||||||
| 220 | POST HOLDIING INC.* | 6,765 | |||||||||||||
| 151,824 | 3.37 | ||||||||||||||
| HOUSEHOLD PRODUCTS | |||||||||||||||
| 2,500 | PROCTER & GAMBLE CO. | 153,125 | |||||||||||||
| 1,300 | THE CLOROX CO. | 94,198 | |||||||||||||
| 247,323 | 5.48 | ||||||||||||||
See Accompanying Notes to Financial Statements which are an integral part of these financial statements.
45
Pacific Advisors Large Cap Value Fund
Schedule of Investments (Unaudited)
as of June 30, 2012
| Quantity or Principal | Description | Current $ Value** | % of Total Net Assets | ||||||||||||
| COMMON STOCK continued | |||||||||||||||
| ENERGY | 3.98 | ||||||||||||||
| OIL, GAS & CONSUMABLE FUELS | |||||||||||||||
| 2,100 | EXXON MOBIL CORP. | 179,697 | |||||||||||||
| 179,697 | 3.98 | ||||||||||||||
| FINANCIALS | 10.04 | ||||||||||||||
| COMMERCIAL BANKS | |||||||||||||||
| 3,250 | WELLS FARGO & CO. | 108,680 | |||||||||||||
| 108,680 | 2.41 | ||||||||||||||
| INSURANCE | |||||||||||||||
| 1,200 | AMERICAN INT'L GROUP INC.* | 38,508 | |||||||||||||
| 2,000 | BERKSHIRE HATHAWAY INC. B* | 166,660 | |||||||||||||
| 4,500 | METLIFE INC. | 138,825 | |||||||||||||
| 343,993 | 7.63 | ||||||||||||||
| HEALTH CARE | 7.39 | ||||||||||||||
| HEALTH CARE PROVIDERS & SERVICES | |||||||||||||||
| 2,000 | CARDINAL HEALTH INC. | 84,000 | |||||||||||||
| 84,000 | 1.86 | ||||||||||||||
| PHARMACEUTICALS | |||||||||||||||
| 1,250 | ABBOTT LABORATORIES | 80,587 | |||||||||||||
| 2,500 | JOHNSON & JOHNSON | 168,900 | |||||||||||||
| 249,487 | 5.53 | ||||||||||||||
| INDUSTRIALS | 14.57 | ||||||||||||||
| AEROSPACE & DEFENSE | |||||||||||||||
| 1,200 | EXELIS INC. | 11,832 | |||||||||||||
| 2,000 | HONEYWELL INT'L INC. | 111,680 | |||||||||||||
| 750 | NORTHROP GRUMMAN CORP. | 47,843 | |||||||||||||
| 171,355 | 3.80 | ||||||||||||||
| AIR FREIGHT & LOGISTICS | |||||||||||||||
| 1,000 | FEDEX CORP. | 91,610 | |||||||||||||
| 1,200 | UNITED PARCEL SERVICE INC. B | 94,512 | |||||||||||||
| 186,122 | 4.13 | ||||||||||||||
| INDUSTRIAL CONGLOMERATES | |||||||||||||||
| 9,200 | GENERAL ELECTRIC CO. | 191,728 | |||||||||||||
| 500 | TYCO INT'L LTD. | 26,425 | |||||||||||||
| 218,153 | 4.84 | ||||||||||||||
See Accompanying Notes to Financial Statements which are an integral part of these financial statements.
46
Pacific Advisors Large Cap Value Fund
Schedule of Investments (Unaudited)
as of June 30, 2012
| Quantity or Principal | Description | Current $ Value** | % of Total Net Assets | ||||||||||||
| COMMON STOCK continued | |||||||||||||||
| MACHINERY | |||||||||||||||
| 1,200 | ITT CORP. | 21,120 | |||||||||||||
| 2,400 | XYLEM INC. | 60,408 | |||||||||||||
| 81,528 | 1.81 | ||||||||||||||
| INFORMATION TECHNOLOGY | 23.38 | ||||||||||||||
| COMMUNICATIONS EQUIPMENT | |||||||||||||||
| 5,750 | CISCO SYSTEMS INC. | 98,728 | |||||||||||||
| 98,728 | 2.19 | ||||||||||||||
| COMPUTERS & PERIPHERALS | |||||||||||||||
| 400 | APPLE INC. | 233,600 | |||||||||||||
| 5,500 | DELL INC. | 68,860 | |||||||||||||
| 1,085 | INT'L BUSINESS MACHINES CORP. | 212,204 | |||||||||||||
| 514,664 | 11.41 | ||||||||||||||
| IT SERVICES | |||||||||||||||
| 220 | MASTERCARD INC. | 94,624 | |||||||||||||
| 94,624 | 2.10 | ||||||||||||||
| SEMICONDUCTORS & EQUIPMENT | |||||||||||||||
| 5,600 | INTEL CORP. | 149,240 | |||||||||||||
| 149,240 | 3.31 | ||||||||||||||
| SOFTWARE | |||||||||||||||
| 6,450 | MICROSOFT CORP. | 197,306 | |||||||||||||
| 197,306 | 4.37 | ||||||||||||||
| TOTAL COMMON STOCK (Cost: $3,565,930) | 4,305,211 | 95.44 | |||||||||||||
| SHORT TERM INVESTMENTS | |||||||||||||||
| MONEY MARKET | 4.75 | ||||||||||||||
| 214,102 | UMB MONEY MARKET FIDUCIARY | 214,102 | |||||||||||||
| 214,102 | 4.75 | ||||||||||||||
| TOTAL SHORT TERM INVESTMENTS (Cost: $214,102) | 214,102 | 4.75 | |||||||||||||
| TOTAL INVESTMENT IN SECURITIES (Cost: $3,780,032) | 4,519,313 | 100.19 | |||||||||||||
| OTHER ASSETS LESS LIABILITIES | (8,452 | ) | (0.19 | ) | |||||||||||
| TOTAL NET ASSETS | 4,510,861 | 100.00 | |||||||||||||
* Non-income producing
** The principal amount is stated in U.S. dollars unless otherwise indicated.
See Accompanying Notes to Financial Statements which are an integral part of these financial statements.
47
Pacific Advisors Mid Cap Value Fund
Schedule of Investments (Unaudited)
as of June 30, 2012
| Quantity or Principal | Description | Current $ Value** | % of Total Net Assets | ||||||||||||
| COMMON STOCK | |||||||||||||||
| CONSUMER DISCRETIONARY | 22.16 | ||||||||||||||
| AUTO COMPONENTS | |||||||||||||||
| 13,000 | DANA HOLDING CORP. | 166,530 | |||||||||||||
| 5,400 | LEAR CORP. | 203,742 | |||||||||||||
| 370,272 | 7.50 | ||||||||||||||
| SPECIALTY RETAIL | |||||||||||||||
| 8,300 | GAMESTOP CORP. A | 152,388 | |||||||||||||
| 2,000 | O'REILLY AUTOMOTIVE INC.* | 167,540 | |||||||||||||
| 8,000 | PENSKE AUTOMOTIVE GROUP INC. | 169,920 | |||||||||||||
| 489,848 | 9.93 | ||||||||||||||
| TEXTILES, APPAREL & LUXURY GOODS | |||||||||||||||
| 3,000 | PVH CORP. | 233,370 | |||||||||||||
| 233,370 | 4.73 | ||||||||||||||
| CONSUMER STAPLES | 2.66 | ||||||||||||||
| BEVERAGES | |||||||||||||||
| 3,000 | DR PEPPER SNAPPLE GROUP INC. | 131,250 | |||||||||||||
| 131,250 | 2.66 | ||||||||||||||
| ENERGY | 25.65 | ||||||||||||||
| ENERGY EQUIPMENT & SERVICES | |||||||||||||||
| 10,000 | HELIX ENERGY SOLUTIONS GROUP INC.* | 164,100 | |||||||||||||
| 23,000 | ION GEOPHYSICAL CORP.* | 151,570 | |||||||||||||
| 3,500 | LUFKIN INDUSTRIES INC. | 190,120 | |||||||||||||
| 10,000 | MITCHAM INDUSTRIES INC.* | 169,700 | |||||||||||||
| 4,700 | TIDEWATER INC. | 217,892 | |||||||||||||
| 893,382 | 18.11 | ||||||||||||||
| OIL, GAS & CONSUMABLE FUELS | |||||||||||||||
| 1,000 | APACHE CORP. | 87,890 | |||||||||||||
| 17,000 | ARCH COAL INC. | 117,130 | |||||||||||||
| 9,000 | CHESAPEAKE ENERGY CORP. | 167,400 | |||||||||||||
| 372,420 | 7.55 | ||||||||||||||
| FINANCIALS | 3.35 | ||||||||||||||
| COMMERCIAL BANKS | |||||||||||||||
| 10,000 | CATHAY GENERAL BANCORP | 165,100 | |||||||||||||
| 165,100 | 3.35 | ||||||||||||||
See Accompanying Notes to Financial Statements which are an integral part of these financial statements.
48
Pacific Advisors Mid Cap Value Fund
Schedule of Investments (Unaudited)
as of June 30, 2012
| Quantity or Principal | Description | Current $ Value** | % of Total Net Assets | ||||||||||||
| COMMON STOCK continued | |||||||||||||||
| INDUSTRIALS | 41.07 | ||||||||||||||
| COMMERCIAL SERVICES & SUPPLIES | |||||||||||||||
| 5,000 | COPART INC.* | 118,450 | |||||||||||||
| 6,500 | PITNEY BOWES INC. | 97,305 | |||||||||||||
| 215,755 | 4.37 | ||||||||||||||
| CONSTRUCTION & ENGINEERING | |||||||||||||||
| 5,000 | CHICAGO BRIDGE & IRON CO. N.V. | 189,800 | |||||||||||||
| 6,000 | KBR INC. | 148,260 | |||||||||||||
| 338,060 | 6.85 | ||||||||||||||
| MACHINERY | |||||||||||||||
| 3,400 | GRACO INC. | 156,672 | |||||||||||||
| 3,000 | JOY GLOBAL INC. | 170,190 | |||||||||||||
| 6,000 | NAVISTAR INT'L CORP.* | 170,220 | |||||||||||||
| 2,400 | WABTEC CORP. | 187,224 | |||||||||||||
| 4,800 | XYLEM INC. | 120,816 | |||||||||||||
| 805,122 | 16.32 | ||||||||||||||
| ROAD & RAIL | |||||||||||||||
| 4,500 | GENESEE & WYOMING INC.* | 237,780 | |||||||||||||
| 3,500 | KANSAS CITY SOUTHERN | 243,460 | |||||||||||||
| 3,600 | LANDSTAR SYSTEM INC. | 186,192 | |||||||||||||
| 667,432 | 13.53 | ||||||||||||||
| MATERIALS | 5.12 | ||||||||||||||
| CHEMICALS | |||||||||||||||
| 3,500 | H.B. FULLER CO. | 107,450 | |||||||||||||
| 107,450 | 2.18 | ||||||||||||||
| METALS & MINING | |||||||||||||||
| 11,500 | COMMERCIAL METALS CO. | 145,360 | |||||||||||||
| 145,360 | 2.95 | ||||||||||||||
| TOTAL COMMON STOCK (Cost: $4,603,759) | 4,934,821 | 100.01 | |||||||||||||
| SHORT TERM INVESTMENTS | |||||||||||||||
| MONEY MARKET | 1.39 | ||||||||||||||
| 68,413 | UMB MONEY MARKET FIDUCIARY | 68,413 | |||||||||||||
| 68,413 | 1.39 | ||||||||||||||
| TOTAL SHORT TERM INVESTMENTS (Cost: $68,414) | 68,413 | 1.39 | |||||||||||||
| TOTAL INVESTMENT IN SECURITIES (Cost: $4,672,173) | 5,003,234 | 101.40 | |||||||||||||
| OTHER ASSETS LESS LIABILITIES | (69,204 | ) | (1.40 | ) | |||||||||||
| TOTAL NET ASSETS | 4,934,030 | 100.00 | |||||||||||||
* Non-income producing
** The principal amount is stated in U.S. dollars unless otherwise indicated.
See Accompanying Notes to Financial Statements which are an integral part of these financial statements.
49
Pacific Advisors Small Cap Value Fund
Schedule of Investments (Unaudited)
as of June 30, 2012
| Quantity or Principal | Description | Current $ Value** | % of Total Net Assets | ||||||||||||
| COMMON STOCK | |||||||||||||||
| CONSUMER DISCRETIONARY | 19.31 | ||||||||||||||
| AUTO COMPONENTS | |||||||||||||||
| 300,000 | AMERIGON INC.* | 3,447,000 | |||||||||||||
| 3,447,000 | 3.46 | ||||||||||||||
| HOTELS, RESTAURANTS & LEISURE | |||||||||||||||
| 215,000 | BRAVO BRIO RESTAURANT GROUP INC.* | 3,833,450 | |||||||||||||
| 3,833,450 | 3.85 | ||||||||||||||
| SPECIALTY RETAIL | |||||||||||||||
| 313,000 | CONN'S INC.* | 4,632,400 | |||||||||||||
| 205,000 | RUSH ENTERPRISES INC.* | 3,351,750 | |||||||||||||
| 290,000 | SONIC AUTOMOTIVE INC. | 3,964,300 | |||||||||||||
| 11,948,450 | 12.00 | ||||||||||||||
| CONSUMER STAPLES | 4.72 | ||||||||||||||
| FOOD PRODUCTS | |||||||||||||||
| 285,000 | DARLING INT'L INC.* | 4,699,650 | |||||||||||||
| 4,699,650 | 4.72 | ||||||||||||||
| ENERGY | 17.53 | ||||||||||||||
| ENERGY EQUIPMENT & SERVICES | |||||||||||||||
| 110,000 | HORNBECK OFFSHORE SERVICES INC.* | 4,265,800 | |||||||||||||
| 290,000 | MATRIX SERVICE CO.* | 3,291,500 | |||||||||||||
| 239,500 | MITCHAM INDUSTRIES INC.* | 4,064,315 | |||||||||||||
| 102,000 | NATURAL GAS SERVICES GROUP* | 1,511,640 | |||||||||||||
| 450,000 | NORTH AMERICAN ENERGY PARTNERS INC.* | 1,161,000 | |||||||||||||
| 530,000 | PARKER DRILLING CO.* | 2,390,300 | |||||||||||||
| 16,684,555 | 16.76 | ||||||||||||||
| OIL, GAS & CONSUMABLE FUELS | |||||||||||||||
| 654,500 | INFINITY ENERGY RESOURCES INC.* | 772,310 | |||||||||||||
| 772,310 | 0.78 | ||||||||||||||
| FINANCIALS | 11.75 | ||||||||||||||
| COMMERCIAL BANKS | |||||||||||||||
| 310,000 | BBCN BANCORP INC.* | 3,375,900 | |||||||||||||
| 198,000 | EAST WEST BANCORP INC. | 4,645,080 | |||||||||||||
| 8,020,980 | 8.06 | ||||||||||||||
| CONSUMER FINANCE | |||||||||||||||
| 157,000 | EZCORP INC. A* | 3,683,220 | |||||||||||||
| 3,683,220 | 3.70 | ||||||||||||||
See Accompanying Notes to Financial Statements which are an integral part of these financial statements.
50
Pacific Advisors Small Cap Value Fund
Schedule of Investments (Unaudited)
as of June 30, 2012
| Quantity or Principal | Description | Current $ Value** | % of Total Net Assets | ||||||||||||
| COMMON STOCK continued | |||||||||||||||
| HEALTH CARE | 3.43 | ||||||||||||||
| HEALTH CARE EQUIPMENT & SUPPLIES | |||||||||||||||
| 317,821 | ROCHESTER MEDICAL CORP.* | 3,419,754 | |||||||||||||
| 3,419,754 | 3.43 | ||||||||||||||
| INDUSTRIALS | 38.43 | ||||||||||||||
| BUILDING PRODUCTS | |||||||||||||||
| 180,000 | INSTEEL INDUSTRIES INC. | 2,007,000 | |||||||||||||
| 2,007,000 | 2.02 | ||||||||||||||
| COMMERCIAL SERVICES & SUPPLIES | |||||||||||||||
| 199,000 | MOBILE MINI INC.* | 2,865,600 | |||||||||||||
| 147,000 | TEAM INC.* | 4,583,460 | |||||||||||||
| 170,000 | US ECOLOGY INC. | 3,015,800 | |||||||||||||
| 10,464,860 | 10.51 | ||||||||||||||
| CONSTRUCTION & ENGINEERING | |||||||||||||||
| 432,000 | FURMANITE CORP.* | 2,099,520 | |||||||||||||
| 2,099,520 | 2.11 | ||||||||||||||
| MARINE | |||||||||||||||
| 95,000 | KIRBY CORP.* | 4,472,600 | |||||||||||||
| 4,472,600 | 4.49 | ||||||||||||||
| ROAD & RAIL | |||||||||||||||
| 280,500 | SAIA INC.* | 6,140,145 | |||||||||||||
| 550,000 | VITRAN CORP. INC.* | 3,300,000 | |||||||||||||
| 9,440,145 | 9.48 | ||||||||||||||
| TRADING COMPANIES & DISTRIBUTORS | |||||||||||||||
| 118,000 | DXP ENTERPRISES INC.* | 4,895,820 | |||||||||||||
| 146,000 | TAL INT'L GROUP INC. | 4,889,540 | |||||||||||||
| 9,785,360 | 9.83 | ||||||||||||||
| MATERIALS | 2.25 | ||||||||||||||
| METALS & MINING | |||||||||||||||
| 153,000 | SUNCOKE ENERGY INC.* | 2,241,450 | |||||||||||||
| 2,241,450 | 2.25 | ||||||||||||||
See Accompanying Notes to Financial Statements which are an integral part of these financial statements.
51
Pacific Advisors Small Cap Value Fund
Schedule of Investments (Unaudited)
as of June 30, 2012
| Quantity or Principal | Description | Current $ Value** | % of Total Net Assets | ||||||||||||
| COMMON STOCK continued | |||||||||||||||
| TELECOMMUNICATION SERVICES | 3.96 | ||||||||||||||
| DIVERSIFIED TELECOM. SERVICES | |||||||||||||||
| 470,000 | PREMIERE GLOBAL SERVICES INC.* | 3,943,300 | |||||||||||||
| 3,943,300 | 3.96 | ||||||||||||||
| TOTAL COMMON STOCK (Cost: $75,649,929) | 100,963,604 | 101.39 | |||||||||||||
| TOTAL INVESTMENT IN SECURITIES (Cost: $75,649,929) | 100,963,604 | 101.39 | |||||||||||||
| OTHER ASSETS LESS LIABILITIES | (1,387,377 | ) | (1.39 | ) | |||||||||||
| TOTAL NET ASSETS | 99,576,227 | 100.00 | |||||||||||||
* Non-income producing
** The principal amount is stated in U.S. dollars unless otherwise indicated.
See Accompanying Notes to Financial Statements which are an integral part of these financial statements.
52
(This page has been left blank intentionally.)
53
Pacific Advisors Fund Inc.
Statement of Assets and Liabilities (Unaudited)
June 30, 2012
| Government Securities Fund | Income and Equity Fund | Balanced Fund | |||||||||||||
| Assets | |||||||||||||||
| Investment securities | |||||||||||||||
| At cost | $ | 2,356,076 | $ | 6,854,020 | $ | 12,120,272 | |||||||||
| At fair value | $ | 2,434,079 | $ | 7,525,796 | $ | 13,678,726 | |||||||||
| Cash or cash equivalents, at fair value | 36,752 | 43,086 | - | ||||||||||||
| Accrued income receivable | 10,627 | 54,222 | 61,481 | ||||||||||||
| Receivable for capital shares sold | - | - | 22,699 | ||||||||||||
| Receivable for investments sold | - | - | - | ||||||||||||
| Total assets | 2,481,458 | 7,623,104 | 13,762,906 | ||||||||||||
| Liabilities | |||||||||||||||
| Bank borrowings (Note 7) | - | - | 101,688 | ||||||||||||
| Payable for investments purchased | 25,906 | - | - | ||||||||||||
| Payable for fund shares redeemed | - | 1,000 | 199,089 | ||||||||||||
| Accounts payable | 2,574 | 16,432 | 38,309 | ||||||||||||
| Accounts payable to related parties (Note 3) | - | 3,600 | 3,600 | ||||||||||||
| Total liabilities | 28,480 | 21,032 | 342,686 | ||||||||||||
| Net Assets | $ | 2,452,978 | $ | 7,602,072 | $ | 13,420,220 | |||||||||
| Summary of Shareholders' Equity | |||||||||||||||
| Paid in capital | $ | 2,697,721 | $ | 7,753,404 | $ | 12,011,510 | |||||||||
| Accumulated undistributed net investment income | - | 2,804 | - | ||||||||||||
| Accumulated undistributed net realized losses on security transactions | (322,746 | ) | (825,912 | ) | (149,744 | ) | |||||||||
| Net unrealized appreciation of investments | 78,003 | 671,776 | 1,558,454 | ||||||||||||
| Net assets at June 30, 2012 | $ | 2,452,978 | $ | 7,602,072 | $ | 13,420,220 | |||||||||
| Total authorized capital stock per class: 50,000,000 ($0.01 par value) | |||||||||||||||
| Class A: | |||||||||||||||
| Net assets | $ | 1,906,410 | $ | 4,888,552 | $ | 3,804,295 | |||||||||
| Shares outstanding | 206,762 | 477,806 | 269,173 | ||||||||||||
| Net asset value and redemption price per share | $ | 9.22 | $ | 10.23 | $ | 14.13 | |||||||||
| Maximum offering price per share | $ | 9.68 | $ | 10.74 | $ | 14.99 | |||||||||
| Sales load | 4.75 | % | 4.75 | % | 5.75 | % | |||||||||
| Class C: | |||||||||||||||
| Net assets | $ | 546,568 | $ | 2,713,520 | $ | 9,615,925 | |||||||||
| Shares outstanding | 60,612 | 276,997 | 726,893 | ||||||||||||
| Net asset value and redemption price per share | $ | 9.02 | $ | 9.80 | $ | 13.23 | |||||||||
| Class I: | |||||||||||||||
| Net assets | N/A | N/A | N/A | ||||||||||||
| Shares outstanding | |||||||||||||||
| Net asset value and redemption price per share | N/A | N/A | N/A | ||||||||||||
See Accompanying Notes to Financial Statements which are an integral part of these financial statements.
54
| Large Cap Value Fund | Mid Cap Value Fund | Small Cap Value Fund | |||||||||||||
| Assets | |||||||||||||||
| Investment securities | |||||||||||||||
| At cost | $ | 3,565,930 | $ | 4,603,759 | $ | 75,649,929 | |||||||||
| At fair value | $ | 4,305,211 | $ | 4,934,821 | $ | 100,963,604 | |||||||||
| Cash or cash equivalents, at fair value | 214,102 | 68,413 | - | ||||||||||||
| Accrued income receivable | 5,383 | 2,023 | 7,250 | ||||||||||||
| Receivable for capital shares sold | - | - | 8,571 | ||||||||||||
| Receivable for investments sold | - | 101,815 | - | ||||||||||||
| Total assets | 4,524,696 | 5,107,072 | 100,979,425 | ||||||||||||
| Liabilities | |||||||||||||||
| Bank borrowings (Note 7) | - | - | 250,210 | ||||||||||||
| Payable for investments purchased | - | 163,764 | - | ||||||||||||
| Payable for fund shares redeemed | - | - | 868,606 | ||||||||||||
| Accounts payable | 13,835 | 5,678 | 267,565 | ||||||||||||
| Accounts payable to related parties (Note 3) | - | 3,600 | 16,817 | ||||||||||||
| Total liabilities | 13,835 | 173,042 | 1,403,198 | ||||||||||||
| Net Assets | $ | 4,510,861 | $ | 4,934,030 | $ | 99,576,227 | |||||||||
| Summary of Shareholders' Equity | |||||||||||||||
| Paid in capital | $ | 3,949,734 | $ | 6,289,911 | $ | 89,257,836 | |||||||||
| Accumulated undistributed net investment income | - | - | 144,979 | ||||||||||||
| Accumulated undistributed net realized losses on security transactions | (178,154 | ) | (1,686,943 | ) | (15,140,263 | ) | |||||||||
| Net unrealized appreciation of investments | 739,281 | 331,062 | 25,313,675 | ||||||||||||
| Net assets at June 30, 2012 | $ | 4,510,861 | $ | 4,934,030 | $ | 99,576,227 | |||||||||
| Total authorized capital stock per class: 50,000,000 ($0.01 par value) | |||||||||||||||
| Class A: | |||||||||||||||
| Net assets | $ | 3,830,669 | $ | 4,046,373 | $ | 90,851,985 | |||||||||
| Shares outstanding | 380,895 | 396,373 | 2,631,933 | ||||||||||||
| Net asset value and redemption price per share | $ | 10.06 | $ | 10.21 | $ | 34.52 | |||||||||
| Maximum offering price per share | $ | 10.67 | $ | 10.83 | $ | 36.63 | |||||||||
| Sales load | 5.75 | % | 5.75 | % | 5.75 | % | |||||||||
| Class C: | |||||||||||||||
| Net assets | $ | 680,192 | $ | 887,657 | $ | 6,997,368 | |||||||||
| Shares outstanding | 75,678 | 95,024 | 238,130 | ||||||||||||
| Net asset value and redemption price per share | $ | 8.99 | $ | 9.34 | $ | 29.38 | |||||||||
| Class I: | |||||||||||||||
| Net assets | N/A | N/A | $ | 1,726,874 | |||||||||||
| Shares outstanding | 43,946 | ||||||||||||||
| Net asset value and redemption price per share | N/A | N/A | $ | 39.30 | |||||||||||
55
Pacific Advisors Fund Inc.
Statement of Operations (Unaudited)
For the six months ended June 30, 2012
| Government Securities Fund | Income and Equity Fund | Balanced Fund | |||||||||||||
| Investment Income | |||||||||||||||
| Dividends | $ | 10,439 | $ | 75,646 | $ | 137,695 | |||||||||
| Interest | 10,530 | 90,995 | 94,348 | ||||||||||||
| Total investment income | 20,969 | 166,641 | 232,043 | ||||||||||||
| Expenses | |||||||||||||||
| Investment management fees | 8,917 | 28,076 | 53,622 | ||||||||||||
| Transfer agent fees | 25,853 | 33,205 | 43,764 | ||||||||||||
| Fund accounting fees | 11,469 | 20,215 | 38,608 | ||||||||||||
| Legal fees | 2,470 | 6,738 | 12,869 | ||||||||||||
| Audit fees | 2,058 | 5,615 | 10,724 | ||||||||||||
| Registration fees | 9,329 | 11,230 | 15,014 | ||||||||||||
| Printing | 1,646 | 4,492 | 8,579 | ||||||||||||
| Custody fees | 3,483 | 4,487 | 7,477 | ||||||||||||
| Interest on borrowings | 84 | 5 | 1,103 | ||||||||||||
| Director fees/meetings | 823 | 2,246 | 4,290 | ||||||||||||
| Distribution and service (12b-1) fees (Note 3) | 6,494 | 20,100 | 56,608 | ||||||||||||
| Other expenses | 2,332 | 6,364 | 12,154 | ||||||||||||
| Total expenses, before fees waived | 74,958 | 142,773 | 264,812 | ||||||||||||
| Less fees waived (Note 3) | 30,517 | 28,076 | - | ||||||||||||
| Net expenses | 44,441 | 114,697 | 264,812 | ||||||||||||
| Net Investment Income (Loss) | (23,472 | ) | 51,944 | (32,769 | ) | ||||||||||
| Net Realized and Unrealized Gain (Loss) on Investments | |||||||||||||||
| Net realized gain (loss) on investments | (118 | ) | (97,263 | ) | 175,724 | ||||||||||
| Change in net unrealized appreciation (depreciation) of investments | 50,624 | 384,591 | 540,138 | ||||||||||||
| Net realized and unrealized gain (loss) on investments | 50,506 | 287,328 | 715,862 | ||||||||||||
| Net Increase (Decrease) in Net Assets Resulting from Operations | $ | 27,034 | $ | 339,272 | $ | 683,093 | |||||||||
See Accompanying Notes to Financial Statements which are an integral part of these financial statements.
56
| Large Cap Value Fund | Mid Cap Value Fund | Small Cap Value Fund | |||||||||||||
| Investment Income | |||||||||||||||
| Dividends | $ | 46,880 | $ | 33,624 | $ | 321,380 | |||||||||
| Interest | 3 | 2 | 3 | ||||||||||||
| Total investment income | 46,883 | 33,626 | 321,383 | ||||||||||||
| Expenses | |||||||||||||||
| Investment management fees | 15,784 | 26,798 | 400,022 | ||||||||||||
| Transfer agent fees | 40,962 | 29,907 | 264,808 | ||||||||||||
| Fund accounting fees | 12,788 | 14,553 | 278,884 | ||||||||||||
| Legal fees | 3,788 | 4,824 | 96,005 | ||||||||||||
| Audit fees | 3,157 | 4,020 | 80,004 | ||||||||||||
| Registration fees | 10,943 | 13,399 | 37,335 | ||||||||||||
| Printing | 2,525 | 3,216 | 64,005 | ||||||||||||
| Custody fees | 3,756 | 5,083 | 42,597 | ||||||||||||
| Interest on borrowings | 453 | 545 | 16,073 | ||||||||||||
| Director fees/meetings | 1,263 | 1,608 | 32,002 | ||||||||||||
| Distribution and service (12b-1) fees (Note 3) | 7,694 | 10,527 | 159,682 | ||||||||||||
| Other expenses | 3,578 | 4,556 | 90,672 | ||||||||||||
| Total expenses, before fees waived | 106,691 | 119,036 | 1,562,089 | ||||||||||||
| Less fees waived (Note 3) | 37,384 | - | - | ||||||||||||
| Net expenses | 69,307 | 119,036 | 1,562,089 | ||||||||||||
| Net Investment Income (Loss) | (22,424 | ) | (85,410 | ) | (1,240,706 | ) | |||||||||
| Net Realized and Unrealized Gain (Loss) on Investments | |||||||||||||||
| Net realized gain (loss) on investments | (9,679 | ) | 393,108 | 1,807,550 | |||||||||||
| Change in net unrealized appreciation (depreciation) of investments | 348,648 | (628,655 | ) | (891,939 | ) | ||||||||||
| Net realized and unrealized gain (loss) on investments | 338,969 | (235,547 | ) | 915,611 | |||||||||||
| Net Increase (Decrease) in Net Assets Resulting from Operations | $ | 316,545 | $ | (320,957 | ) | $ | (325,095 | ) | |||||||
57
Pacific Advisors Fund Inc.
Statements of Changes in Net Assets (Unaudited)
| Government Securities Fund | Income and Equity Fund | ||||||||||||||||||
| Six months ended June 30, 2012 | Year ended December 31, 2011 | Six months ended June 30, 2012 | Year ended December 31, 2011 | ||||||||||||||||
| Increase (Decrease) in Net Assets From Operations | |||||||||||||||||||
| Net investment income (loss) | $ | (23,472 | ) | $ | (30,005 | ) | $ | 51,944 | $ | 159,702 | |||||||||
| Net realized gain (loss) on investments | (118 | ) | 34,669 | (97,263 | ) | (10,219 | ) | ||||||||||||
| Change in net unrealized appreciation (depreciation) of investments | 50,624 | (11,716 | ) | 384,591 | 6,387 | ||||||||||||||
| Increase (decrease) in net assets resulting from operations | 27,034 | (7,052 | ) | 339,272 | 155,870 | ||||||||||||||
| From Distributions to Shareholders | |||||||||||||||||||
| Class A: | |||||||||||||||||||
| Net investment income | - | - | (37,899 | ) | (107,934 | ) | |||||||||||||
| Net capital gains | - | - | - | - | |||||||||||||||
| Return of capital | - | - | - | - | |||||||||||||||
| Class C: | |||||||||||||||||||
| Net investment income | - | - | (11,427 | ) | (49,870 | ) | |||||||||||||
| Net capital gains | - | - | - | - | |||||||||||||||
| Return of capital | - | - | - | - | |||||||||||||||
| Class I: | N/A | N/A | N/A | N/A | |||||||||||||||
| Net investment income | |||||||||||||||||||
| Net capital gains | |||||||||||||||||||
| Return of capital | |||||||||||||||||||
| Decrease in net assets resulting from distributions | - | - | (49,326 | ) | (157,804 | ) | |||||||||||||
| From Capital Share Transactions (Note 6) | |||||||||||||||||||
| Proceeds from shares sold | 117,610 | 546,879 | 705,118 | 1,485,061 | |||||||||||||||
| Proceeds from shares purchased by reinvestment of dividends | - | - | 44,290 | 145,377 | |||||||||||||||
| Cost of shares repurchased | (575,582 | ) | (1,770,586 | ) | (721,334 | ) | (3,040,759 | ) | |||||||||||
| Increase (decrease) in net assets resulting from capital share transactions | (457,972 | ) | (1,223,707 | ) | 28,074 | (1,410,321 | ) | ||||||||||||
| Increase (decrease) in net assets | (430,938 | ) | (1,230,759 | ) | 318,020 | (1,412,255 | ) | ||||||||||||
| Net Assets | |||||||||||||||||||
| Beginning of period | 2,883,916 | 4,114,675 | 7,284,052 | 8,696,307 | |||||||||||||||
| End of period | $ | 2,452,978 | $ | 2,883,916 | $ | 7,602,072 | $ | 7,284,052 | |||||||||||
| Including undistributed net investment income | $ | - | $ | - | $ | 2,804 | $ | 186 | |||||||||||
See Accompanying Notes to Financial Statements which are an integral part of these financial statements.
58
| Balanced Fund | |||||||||||
| Six months ended June 30, 2012 | Year ended December 31, 2011 | ||||||||||
| Increase (Decrease) in Net Assets From Operations | |||||||||||
| Net investment income (loss) | $ | (32,769 | ) | $ | (48,341 | ) | |||||
| Net realized gain (loss) on investments | 175,724 | 499,229 | |||||||||
| Change in net unrealized appreciation (depreciation) of investments | 540,138 | (694,416 | ) | ||||||||
| Increase (decrease) in net assets resulting from operations | 683,093 | (243,528 | ) | ||||||||
| From Distributions to Shareholders | |||||||||||
| Class A: | |||||||||||
| Net investment income | - | - | |||||||||
| Net capital gains | - | (247,245 | ) | ||||||||
| Return of capital | - | - | |||||||||
| Class C: | |||||||||||
| Net investment income | - | - | |||||||||
| Net capital gains | - | (740,888 | ) | ||||||||
| Return of capital | - | - | |||||||||
| Class I: | N/A | N/A | |||||||||
| Net investment income | |||||||||||
| Net capital gains | |||||||||||
| Return of capital | |||||||||||
| Decrease in net assets resulting from distributions | - | (988,133 | ) | ||||||||
| From Capital Share Transactions (Note 6) | |||||||||||
| Proceeds from shares sold | 349,414 | 1,144,916 | |||||||||
| Proceeds from shares purchased by reinvestment of dividends | - | 948,827 | |||||||||
| Cost of shares repurchased | (2,181,407 | ) | (8,117,343 | ) | |||||||
| Increase (decrease) in net assets resulting from capital share transactions | (1,831,993 | ) | (6,023,600 | ) | |||||||
| Increase (decrease) in net assets | (1,148,900 | ) | (7,255,261 | ) | |||||||
| Net Assets | |||||||||||
| Beginning of period | 14,569,120 | 21,824,381 | |||||||||
| End of period | $ | 13,420,220 | $ | 14,569,120 | |||||||
| Including undistributed net investment income | $ | - | $ | (351 | ) | ||||||
59
Pacific Advisors Fund Inc.
Statements of Changes in Net Assets (Unaudited)
| Large Cap Value Fund | Mid Cap Value Fund | ||||||||||||||||||
| Six months ended June 30, 2012 | Year ended December 31, 2011 | Six months ended June 30, 2012 | Year ended December 31, 2011 | ||||||||||||||||
| Increase (Decrease) in Net Assets From Operations | |||||||||||||||||||
| Net investment income (loss) | $ | (22,424 | ) | $ | (29,942 | ) | $ | (85,410 | ) | $ | (181,370 | ) | |||||||
| Net realized gain (loss) on investments | (9,679 | ) | 15,081 | 393,108 | (639,793 | ) | |||||||||||||
| Change in net unrealized appreciation (depreciation) of investments | 348,648 | 126,964 | (628,655 | ) | 390,623 | ||||||||||||||
| Increase (decrease) in net assets resulting from operations | 316,545 | 112,103 | (320,957 | ) | (430,540 | ) | |||||||||||||
| From Distributions to Shareholders | |||||||||||||||||||
| Class A: | |||||||||||||||||||
| Net investment income | - | - | - | - | |||||||||||||||
| Net capital gains | - | - | - | - | |||||||||||||||
| Return of capital | - | - | - | - | |||||||||||||||
| Class C: | |||||||||||||||||||
| Net investment income | - | - | - | - | |||||||||||||||
| Net capital gains | - | - | - | - | |||||||||||||||
| Return of capital | - | - | - | - | |||||||||||||||
| Class I: | N/A | N/A | |||||||||||||||||
| Net investment income | |||||||||||||||||||
| Net capital gains | |||||||||||||||||||
| Return of capital | |||||||||||||||||||
| Decrease in net assets resulting from distributions | - | - | - | - | |||||||||||||||
| From Capital Share Transactions (Note 6) | |||||||||||||||||||
| Proceeds from shares sold | 524,325 | 1,023,186 | 645,434 | 1,539,519 | |||||||||||||||
| Proceeds from shares purchased by reinvestment of dividends | - | - | - | - | |||||||||||||||
| Cost of shares repurchased | (237,327 | ) | (419,968 | ) | (486,430 | ) | (1,469,243 | ) | |||||||||||
| Increase (decrease) in net assets resulting from capital share transactions | 286,998 | 603,218 | 159,004 | 70,276 | |||||||||||||||
| Increase (decrease) in net assets | 603,543 | 715,321 | (161,953 | ) | (360,264 | ) | |||||||||||||
| Net Assets | |||||||||||||||||||
| Beginning of period | 3,907,318 | 3,191,997 | 5,095,983 | 5,456,247 | |||||||||||||||
| End of period | $ | 4,510,861 | $ | 3,907,318 | $ | 4,934,030 | $ | 5,095,983 | |||||||||||
| Including undistributed net investment income | $ | - | $ | - | $ | - | $ | - | |||||||||||
See Accompanying Notes to Financial Statements which are an integral part of these financial statements.
60
| Small Cap Value Fund | |||||||||||
| Six months ended June 30, 2012 | Year ended December 31, 2011 | ||||||||||
| Increase (Decrease) in Net Assets From Operations | |||||||||||
| Net investment income (loss) | $ | (1,240,706 | ) | $ | (2,242,685 | ) | |||||
| Net realized gain (loss) on investments | 1,807,550 | (1,116,487 | ) | ||||||||
| Change in net unrealized appreciation (depreciation) of investments | (891,939 | ) | 11,979,617 | ||||||||
| Increase (decrease) in net assets resulting from operations | (325,095 | ) | 8,620,445 | ||||||||
| From Distributions to Shareholders | |||||||||||
| Class A: | |||||||||||
| Net investment income | - | - | |||||||||
| Net capital gains | - | - | |||||||||
| Return of capital | - | - | |||||||||
| Class C: | |||||||||||
| Net investment income | - | - | |||||||||
| Net capital gains | - | - | |||||||||
| Return of capital | - | - | |||||||||
| Class I: | N/A | N/A | |||||||||
| Net investment income | - | - | |||||||||
| Net capital gains | - | - | |||||||||
| Return of capital | - | - | |||||||||
| Decrease in net assets resulting from distributions | - | - | |||||||||
| From Capital Share Transactions (Note 6) | |||||||||||
| Proceeds from shares sold | 22,099,852 | 20,450,558 | |||||||||
| Proceeds from shares purchased by reinvestment of dividends | - | - | |||||||||
| Cost of shares repurchased | (17,476,923 | ) | (37,982,752 | ) | |||||||
| Increase (decrease) in net assets resulting from capital share transactions | 4,622,929 | (17,532,194 | ) | ||||||||
| Increase (decrease) in net assets | 4,297,834 | (8,911,749 | ) | ||||||||
| Net Assets | |||||||||||
| Beginning of period | 95,278,393 | 104,190,142 | |||||||||
| End of period | $ | 99,576,227 | $ | 95,278,393 | |||||||
| Including undistributed net investment income | $ | 144,979 | $ | - | |||||||
61
Pacific Advisors Fund Inc.
Financial Highlights (Unaudited)
(For a share outstanding throughout the period)
| Government Securities Fund | |||||||||||||||||||||||||||
| Class A | |||||||||||||||||||||||||||
| For the six months ended | For the year ended December 31, | ||||||||||||||||||||||||||
| June 30, 2012 | 2011 | 2010 | 2009 | 2008 | 2007 | ||||||||||||||||||||||
| Per Share Operating Performance | |||||||||||||||||||||||||||
| Net asset value, beginning of period | $ | 9.13 | $ | 9.13 | $ | 8.99 | $ | 8.94 | $ | 9.42 | $ | 9.24 | |||||||||||||||
| Income from investing operations | |||||||||||||||||||||||||||
| Net investment income (loss) | (0.07 | ) | (0.02 | ) | 0.05 | 0.18 | 0.32 | 0.29 | |||||||||||||||||||
| Net realized and unrealized gains (losses) on securities | 0.16 | 0.02 | 0.14 | 0.02 | (0.53 | ) | 0.22 | ||||||||||||||||||||
| Total from investment operations | 0.09 | - | 0.19 | 0.20 | (0.21 | ) | 0.51 | ||||||||||||||||||||
| Less distributions | |||||||||||||||||||||||||||
| From net investment income | - | - | (0.02 | ) | (0.15 | ) | (0.27 | ) | (0.33 | ) | |||||||||||||||||
| From net capital gains | - | - | - | - | - | - | |||||||||||||||||||||
| From return of capital | - | - | (0.03 | ) | - | - | - | ||||||||||||||||||||
| Total distributions | - | - | (0.05 | ) | (0.15 | ) | (0.27 | ) | (0.33 | ) | |||||||||||||||||
| Net asset value, end of period | $ | 9.22 | $ | 9.13 | $ | 9.13 | $ | 8.99 | $ | 8.94 | $ | 9.42 | |||||||||||||||
| Total Investment Return (a) | 0.99 | %(b) | 0.00 | % | 2.16 | % | 2.26 | % | (2.28 | )% | 5.54 | % | |||||||||||||||
| Ratios/Supplemental Data | |||||||||||||||||||||||||||
| Net assets, end of period (000's) | $ | 1,906 | $ | 1,873 | $ | 2,375 | $ | 2,537 | $ | 3,054 | $ | 3,817 | |||||||||||||||
| Ratio of net investment income (loss) to average net assets | |||||||||||||||||||||||||||
| With expense reductions | (1.50 | )%(c) | (0.54 | )% | 0.49 | % | 1.69 | % | 3.33 | % | 3.57 | % | |||||||||||||||
| Without expense reductions | (3.71 | )%(c) | (2.39 | )% | (1.10 | )% | 0.25 | % | 1.87 | % | 2.21 | % | |||||||||||||||
| Ratio of expenses to average net assets | |||||||||||||||||||||||||||
| With expense reductions | 3.02 | %(c) | 2.42 | % | 2.09 | % | 1.69 | % | 1.65 | % | 1.62 | % | |||||||||||||||
| Without expense reductions | 5.23 | %(c) | 4.26 | % | 3.69 | % | 3.13 | % | 3.11 | % | 2.98 | % | |||||||||||||||
| Fund portfolio turnover rate | 184 | %(c) | 115 | % | 156 | % | 224 | % | 173 | % | 59 | % | |||||||||||||||
| Class C | |||||||||||||||||||||||||||
| For the six months ended | For the year ended December 31, | ||||||||||||||||||||||||||
| June 30, 2012 | 2011 | 2010 | 2009 | 2008 | 2007 | ||||||||||||||||||||||
| Per Share Operating Performance | |||||||||||||||||||||||||||
| Net asset value, beginning of period | $ | 8.96 | $ | 9.02 | $ | 8.90 | $ | 8.87 | $ | 9.45 | $ | 9.23 | |||||||||||||||
| Income from investing operations | |||||||||||||||||||||||||||
| Net investment income (loss) | (0.64 | ) | (0.33 | ) | (0.09 | ) | 0.09 | 0.28 | 0.25 | ||||||||||||||||||
| Net realized and unrealized gains (losses) on securities | 0.70 | 0.27 | 0.23 | 0.04 | (0.56 | ) | 0.18 | ||||||||||||||||||||
| Total from investment operations | 0.06 | (0.06 | ) | 0.14 | 0.13 | (0.28 | ) | 0.43 | |||||||||||||||||||
| Less distributions | |||||||||||||||||||||||||||
| From net investment income | - | - | (0.01 | ) | (0.10 | ) | (0.30 | ) | (0.21 | ) | |||||||||||||||||
| From net capital gains | - | - | - | - | - | - | |||||||||||||||||||||
| From return of capital | - | - | (0.01 | ) | - | - | - | ||||||||||||||||||||
| Total distributions | - | - | (0.02 | ) | (0.10 | ) | (0.30 | ) | (0.21 | ) | |||||||||||||||||
| Net asset value, end of period | $ | 9.02 | $ | 8.96 | $ | 9.02 | $ | 8.90 | $ | 8.87 | $ | 9.45 | |||||||||||||||
| Total Investment Return | 0.67 | %(b) | (0.67 | )% | 1.49 | % | 1.44 | % | (3.02 | )% | 4.73 | % | |||||||||||||||
| Ratios/Supplemental Data | |||||||||||||||||||||||||||
| Net assets, end of period (000's) | $ | 547 | $ | 1,011 | $ | 1,740 | $ | 2,594 | $ | 2,456 | $ | 1,595 | |||||||||||||||
| Ratio of net investment income (loss) to average net assets | |||||||||||||||||||||||||||
| With expense reductions | (2.21 | )%(c) | (1.27 | )% | (0.18 | )% | 0.96 | % | 2.56 | % | 2.77 | % | |||||||||||||||
| Without expense reductions | (4.47 | )%(c) | (3.14 | )% | (1.80 | )% | (0.47 | )% | 1.10 | % | 1.41 | % | |||||||||||||||
| Ratio of expenses to average net assets | |||||||||||||||||||||||||||
| With expense reductions | 3.76 | %(c) | 3.16 | % | 2.80 | % | 2.41 | % | 2.43 | % | 2.40 | % | |||||||||||||||
| Without expense reductions | 6.03 | %(c) | 5.03 | % | 4.42 | % | 3.85 | % | 3.89 | % | 3.76 | % | |||||||||||||||
| Fund portfolio turnover rate | 184 | %(c) | 115 | % | 156 | % | 224 | % | 173 | % | 59 | % | |||||||||||||||
(a) The Fund's maximum sales charge is not included in the total return computation.
(b) Not annualized
(c) Annualized
See Accompanying Notes to Financial Statements which are an integral part of these financial statements.
62
Pacific Advisors Fund Inc.
Financial Highlights (Unaudited)
(For a share outstanding throughout the period)
| Income and Equity Fund | |||||||||||||||||||||||||||
| Class A | |||||||||||||||||||||||||||
| For the six months ended | For the year ended December 31, | ||||||||||||||||||||||||||
| June 30, 2012 | 2011 | 2010 | 2009 | 2008 | 2007 | ||||||||||||||||||||||
| Per Share Operating Performance | |||||||||||||||||||||||||||
| Net asset value, beginning of period | $ | 9.84 | $ | 9.87 | $ | 9.49 | $ | 8.48 | $ | 10.61 | $ | 10.74 | |||||||||||||||
| Income from investing operations | |||||||||||||||||||||||||||
| Net investment income | 0.07 | 0.21 | 0.19 | 0.30 | 0.33 | 0.31 | |||||||||||||||||||||
| Net realized and unrealized gains (losses) on securities | 0.40 | 0.01 | 0.45 | 0.98 | (2.16 | ) | (0.05 | ) | |||||||||||||||||||
| Total from investment operations | 0.47 | 0.22 | 0.64 | 1.28 | (1.83 | ) | 0.26 | ||||||||||||||||||||
| Less distributions | |||||||||||||||||||||||||||
| From net investment income | (0.08 | ) | (0.25 | ) | (0.26 | ) | (0.27 | ) | (0.30 | ) | (0.28 | ) | |||||||||||||||
| From net capital gains | - | - | - | - | - | (0.11 | ) | ||||||||||||||||||||
| From return of capital | - | - | - | (d) | - | - | - | ||||||||||||||||||||
| Total distributions | (0.08 | ) | (0.25 | ) | (0.26 | ) | (0.27 | ) | (0.30 | ) | (0.39 | ) | |||||||||||||||
| Net asset value, end of period | $ | 10.23 | $ | 9.84 | $ | 9.87 | $ | 9.49 | $ | 8.48 | $ | 10.61 | |||||||||||||||
| Total Investment Return (a) | 4.78 | %(b) | 2.24 | % | 6.88 | % | 15.37 | % | (17.49 | )% | 2.39 | % | |||||||||||||||
| Ratios/Supplemental Data | |||||||||||||||||||||||||||
| Net assets, end of period (000's) | $ | 4,889 | $ | 4,235 | $ | 3,922 | $ | 2,865 | $ | 2,737 | $ | 3,663 | |||||||||||||||
| Ratio of net investment income to average net assets | |||||||||||||||||||||||||||
| With expense reductions | 1.66 | %(c) | 2.27 | % | 2.57 | % | 3.22 | % | 3.22 | % | 2.78 | % | |||||||||||||||
| Without expense reductions | 0.91 | %(c) | 1.52 | % | 1.81 | % | 2.47 | % | 2.47 | % | 2.16 | % | |||||||||||||||
| Ratio of expenses to average net assets | |||||||||||||||||||||||||||
| With expense reductions | 2.78 | %(c) | 2.59 | % | 2.34 | % | 2.32 | % | 2.05 | % | 1.95 | % | |||||||||||||||
| Without expense reductions | 3.53 | %(c) | 3.34 | % | 3.09 | % | 3.07 | % | 2.80 | % | 2.57 | % | |||||||||||||||
| Fund portfolio turnover rate | 48 | %(c) | 16 | % | 21 | % | 29 | % | 39 | % | 46 | % | |||||||||||||||
| Class C | |||||||||||||||||||||||||||
| For the six months ended | For the year ended December 31, | ||||||||||||||||||||||||||
| June 30, 2012 | 2011 | 2010 | 2009 | 2008 | 2007 | ||||||||||||||||||||||
| Per Share Operating Performance | |||||||||||||||||||||||||||
| Net asset value, beginning of period | $ | 9.42 | $ | 9.40 | $ | 9.03 | $ | 8.09 | $ | 10.14 | $ | 10.31 | |||||||||||||||
| Income from investing operations | |||||||||||||||||||||||||||
| Net investment income | 0.02 | 0.09 | 0.15 | 0.21 | 0.23 | 0.22 | |||||||||||||||||||||
| Net realized and unrealized gains (losses) on securities | 0.40 | 0.05 | 0.38 | 0.95 | (2.04 | ) | (0.05 | ) | |||||||||||||||||||
| Total from investment operations | 0.42 | 0.14 | 0.53 | 1.16 | (1.81 | ) | 0.17 | ||||||||||||||||||||
| Less distributions | |||||||||||||||||||||||||||
| From net investment income | (0.04 | ) | (0.12 | ) | (0.16 | ) | (0.22 | ) | (0.24 | ) | (0.23 | ) | |||||||||||||||
| From net capital gains | - | - | - | - | - | (0.11 | ) | ||||||||||||||||||||
| From return of capital | - | - | - | (d) | - | - | - | ||||||||||||||||||||
| Total distributions | (0.04 | ) | (0.12 | ) | (0.16 | ) | (0.22 | ) | (0.24 | ) | (0.34 | ) | |||||||||||||||
| Net asset value, end of period | $ | 9.80 | $ | 9.42 | $ | 9.40 | $ | 9.03 | $ | 8.09 | $ | 10.14 | |||||||||||||||
| Total Investment Return | 4.47 | %(b) | 1.54 | % | 5.95 | % | 14.56 | % | (18.10 | )% | 1.63 | % | |||||||||||||||
| Ratios/Supplemental Data | |||||||||||||||||||||||||||
| Net assets, end of period (000's) | $ | 2,714 | $ | 3,049 | $ | 4,774 | $ | 5,129 | $ | 4,697 | $ | 5,990 | |||||||||||||||
| Ratio of net investment income to average net assets | |||||||||||||||||||||||||||
| With expense reductions | 0.91 | %(c) | 1.52 | % | 1.82 | % | 2.47 | % | 2.48 | % | 2.06 | % | |||||||||||||||
| Without expense reductions | 0.16 | %(c) | 0.77 | % | 1.07 | % | 1.72 | % | 1.73 | % | 1.43 | % | |||||||||||||||
| Ratio of expenses to average net assets | |||||||||||||||||||||||||||
| With expense reductions | 3.53 | %(c) | 3.33 | % | 3.07 | % | 3.06 | % | 2.81 | % | 2.70 | % | |||||||||||||||
| Without expense reductions | 4.28 | %(c) | 4.08 | % | 3.82 | % | 3.81 | % | 3.56 | % | 3.32 | % | |||||||||||||||
| Fund portfolio turnover rate | 48 | %(c) | 16 | % | 21 | % | 29 | % | 39 | % | 46 | % | |||||||||||||||
(a) The Fund's maximum sales charge is not included in the total return computation
(b) Not annualized
(c) Annualized
(d) The amount is less than $0.005 and rounded to zero
See Accompanying Notes to Financial Statements which are an integral part of these financial statements.
63
Pacific Advisors Fund Inc.
Financial Highlights (Unaudited)
(For a share outstanding throughout the period)
| Balanced Fund | |||||||||||||||||||||||||||
| Class A | |||||||||||||||||||||||||||
| For the six months ended | For the year ended December 31, | ||||||||||||||||||||||||||
| June 30, 2012 | 2011 | 2010 | 2009 | 2008 | 2007 | ||||||||||||||||||||||
| Per Share Operating Performance | |||||||||||||||||||||||||||
| Net asset value, beginning of period | $ | 13.47 | $ | 14.56 | $ | 14.91 | $ | 12.41 | $ | 18.58 | $ | 18.42 | |||||||||||||||
| Income from investing operations | |||||||||||||||||||||||||||
| Net investment income | 0.03 | - | 0.13 | 0.22 | 0.31 | 0.24 | |||||||||||||||||||||
| Net realized and unrealized gains (losses) on securities | 0.63 | (0.16 | ) | 1.02 | 2.48 | (6.00 | ) | 0.97 | |||||||||||||||||||
| Total from investment operations | 0.66 | (0.16 | ) | 1.15 | 2.70 | (5.69 | ) | 1.21 | |||||||||||||||||||
| Less distributions | |||||||||||||||||||||||||||
| From net investment income | - | - | (0.01 | ) | (0.20 | ) | (0.28 | ) | (0.20 | ) | |||||||||||||||||
| From net capital gains | - | (0.93 | ) | (1.49 | ) | - | (0.20 | ) | (0.85 | ) | |||||||||||||||||
| Total distributions | - | (0.93 | ) | (1.50 | ) | (0.20 | ) | (0.48 | ) | (1.05 | ) | ||||||||||||||||
| Net asset value, end of period | $ | 14.13 | $ | 13.47 | $ | 14.56 | $ | 14.91 | $ | 12.41 | $ | 18.58 | |||||||||||||||
| Total Investment Return (a) | 4.90 | %(b) | (1.14 | )% | 7.71 | % | 21.76 | % | (30.51 | )% | 6.53 | % | |||||||||||||||
| Ratios/Supplemental Data | |||||||||||||||||||||||||||
| Net assets, end of period (000's) | $ | 3,804 | $ | 3,801 | $ | 3,789 | $ | 4,362 | $ | 3,774 | $ | 5,918 | |||||||||||||||
| Ratio of net investment income to average net assets | 0.08 | %(c) | 0.29 | % | 0.55 | % | 1.58 | % | 1.73 | % | 1.02 | % | |||||||||||||||
| Ratio of expenses to average net assets | 3.16 | %(c) | 3.13 | % | 2.77 | % | 2.47 | % | 2.31 | % | 2.21 | % | |||||||||||||||
| Fund portfolio turnover rate | 22 | %(c) | 14 | % | 36 | % | 10 | % | 32 | % | 44 | % | |||||||||||||||
| Class C | |||||||||||||||||||||||||||
| For the six months ended | For the year ended December 31, | ||||||||||||||||||||||||||
| June 30, 2012 | 2011 | 2010 | 2009 | 2008 | 2007 | ||||||||||||||||||||||
| Per Share Operating Performance | |||||||||||||||||||||||||||
| Net asset value, beginning of period | $ | 12.66 | $ | 13.84 | $ | 14.35 | $ | 11.96 | $ | 17.88 | $ | 17.77 | |||||||||||||||
| Income from investing operations | |||||||||||||||||||||||||||
| Net investment income (loss) | (0.10 | ) | (0.15 | ) | (0.06 | ) | 0.10 | 0.16 | 0.05 | ||||||||||||||||||
| Net realized and unrealized gains (losses) on securities | 0.67 | (0.10 | ) | 1.04 | 2.39 | (5.72 | ) | 0.96 | |||||||||||||||||||
| Total from investment operations | 0.57 | (0.25 | ) | 0.98 | 2.49 | (5.56 | ) | 1.01 | |||||||||||||||||||
| Less distributions | |||||||||||||||||||||||||||
| From net investment income | - | - | - | (d) | (0.10 | ) | (0.16 | ) | (0.05 | ) | |||||||||||||||||
| From net capital gains | - | (0.93 | ) | (1.49 | ) | - | (0.20 | ) | (0.85 | ) | |||||||||||||||||
| Total distributions | - | (0.93 | ) | (1.49 | ) | (0.10 | ) | (0.36 | ) | (0.90 | ) | ||||||||||||||||
| Net asset value, end of period | $ | 13.23 | $ | 12.66 | $ | 13.84 | $ | 14.35 | $ | 11.96 | $ | 17.88 | |||||||||||||||
| Total Investment Return | 4.50 | %(b) | (1.86 | )% | 6.88 | % | 20.84 | % | (31.03 | )% | 5.67 | % | |||||||||||||||
| Ratios/Supplemental Data | |||||||||||||||||||||||||||
| Net assets, end of period (000's) | $ | 9,616 | $ | 10,768 | $ | 18,035 | $ | 24,828 | $ | 22,407 | $ | 34,960 | |||||||||||||||
| Ratio of net investment income (loss) to average net assets | (0.67 | )%(c) | (0.42 | )% | (0.18 | )% | 0.82 | % | 0.96 | % | 0.27 | % | |||||||||||||||
| Ratio of expenses to average net assets | 3.91 | %(c) | 3.83 | % | 3.50 | % | 3.23 | % | 3.09 | % | 2.97 | % | |||||||||||||||
| Fund portfolio turnover rate | 22 | %(c) | 14 | % | 36 | % | 10 | % | 32 | % | 44 | % | |||||||||||||||
(a) The Fund's maximum sales charge is not included in the total return computation
(b) Not annualized
(c) Annualized
(d) The amount is less than $0.005 and rounded to zero
See Accompanying Notes to Financial Statements which are an integral part of these financial statements.
64
Pacific Advisors Fund Inc.
Financial Highlights (Unaudited)
(For a share outstanding throughout the period)
| Large Cap Value Fund | |||||||||||||||||||||||||||
| Class A | |||||||||||||||||||||||||||
| For the six months ended | For the year ended December 31, | ||||||||||||||||||||||||||
| June 30, 2012 | 2011 | 2010 | 2009 | 2008 | 2007 | ||||||||||||||||||||||
| Per Share Operating Performance | |||||||||||||||||||||||||||
| Net asset value, beginning of period | $ | 9.30 | $ | 8.98 | $ | 8.33 | $ | 6.51 | $ | 10.83 | $ | 9.21 | |||||||||||||||
| Income from investing operations | |||||||||||||||||||||||||||
| Net investment income (loss) | 0.01 | 0.11 | (0.06 | ) | (0.24 | ) | (0.07 | ) | (0.07 | ) | |||||||||||||||||
| Net realized and unrealized gains (losses) on securities | 0.75 | 0.21 | 0.71 | 2.06 | (4.25 | ) | 1.69 | ||||||||||||||||||||
| Total from investment operations | 0.76 | 0.32 | 0.65 | 1.82 | (4.32 | ) | 1.62 | ||||||||||||||||||||
| Less distributions | |||||||||||||||||||||||||||
| From net investment income | - | - | - | - | - | - | |||||||||||||||||||||
| From net capital gains | - | - | - | - | - | - | |||||||||||||||||||||
| Total distributions | - | - | - | - | - | - | |||||||||||||||||||||
| Net asset value, end of period | $ | 10.06 | $ | 9.30 | $ | 8.98 | $ | 8.33 | $ | 6.51 | $ | 10.83 | |||||||||||||||
| Total Investment Return (a) | 8.17 | %(b) | 3.56 | % | 7.80 | % | 27.96 | % | (39.89 | )% | 17.59 | % | |||||||||||||||
| Ratios/Supplemental Data | |||||||||||||||||||||||||||
| Net assets, end of period (000's) | $ | 3,831 | $ | 3,278 | $ | 2,511 | $ | 2,176 | $ | 1,984 | $ | 2,889 | |||||||||||||||
| Ratio of net investment loss to average net assets | |||||||||||||||||||||||||||
| With expense reductions | (0.95 | )%(c) | (0.66 | )% | (1.32 | )% | (2.06 | )% | (1.38 | )% | (1.33 | )% | |||||||||||||||
| Without expense reductions | (2.72 | )%(c) | (2.61 | )% | (3.50 | )% | (4.31 | )% | (2.41 | )% | (1.85 | )% | |||||||||||||||
| Ratio of expenses to average net assets | |||||||||||||||||||||||||||
| With expense reductions | 3.17 | %(c) | 3.05 | % | 3.64 | % | 3.46 | % | 2.62 | % | 2.65 | % | |||||||||||||||
| Without expense reductions | 4.95 | %(c) | 4.99 | % | 5.82 | % | 5.71 | % | 3.65 | % | 3.17 | % | |||||||||||||||
| Fund portfolio turnover rate | 3 | %(c) | 7 | % | 106 | % | 5 | % | 14 | % | 14 | % | |||||||||||||||
| Class C | |||||||||||||||||||||||||||
| For the six months ended | For the year ended December 31, | ||||||||||||||||||||||||||
| June 30, 2012 | 2011 | 2010 | 2009 | 2008 | 2007 | ||||||||||||||||||||||
| Per Share Operating Performance | |||||||||||||||||||||||||||
| Net asset value, beginning of period | $ | 8.34 | $ | 8.12 | $ | 7.58 | $ | 5.97 | $ | 10.03 | $ | 8.59 | |||||||||||||||
| Income from investing operations | |||||||||||||||||||||||||||
| Net investment loss | (0.07 | ) | (0.42 | ) | (0.17 | ) | (1.36 | ) | (0.31 | ) | (0.21 | ) | |||||||||||||||
| Net realized and unrealized gains (losses) on securities | 0.72 | 0.64 | 0.71 | 2.97 | (3.75 | ) | 1.65 | ||||||||||||||||||||
| Total from investment operations | 0.65 | 0.22 | 0.54 | 1.61 | (4.06 | ) | 1.44 | ||||||||||||||||||||
| Less distributions | |||||||||||||||||||||||||||
| From net investment income | - | - | - | - | - | - | |||||||||||||||||||||
| From net capital gains | - | - | - | - | - | - | |||||||||||||||||||||
| Total distributions | - | - | - | - | - | - | |||||||||||||||||||||
| Net asset value, end of period | $ | 8.99 | $ | 8.34 | $ | 8.12 | $ | 7.58 | $ | 5.97 | $ | 10.03 | |||||||||||||||
| Total Investment Return | 7.79 | %(b) | 2.71 | % | 7.12 | % | 26.97 | % | (40.48 | )% | 16.76 | % | |||||||||||||||
| Ratios/Supplemental Data | |||||||||||||||||||||||||||
| Net assets, end of period (000's) | $ | 680 | $ | 630 | $ | 681 | $ | 637 | $ | 1,072 | $ | 2,096 | |||||||||||||||
| Ratio of net investment loss to average net assets | |||||||||||||||||||||||||||
| With expense reductions | (1.71 | )%(c) | (1.53 | )% | (2.03 | )% | (2.69 | )% | (2.18 | )% | (2.07 | )% | |||||||||||||||
| Without expense reductions | (3.48 | )%(c) | (3.46 | )% | (4.23 | )% | (4.96 | )% | (3.19 | )% | (2.60 | )% | |||||||||||||||
| Ratio of expenses to average net assets | |||||||||||||||||||||||||||
| With expense reductions | 3.93 | %(c) | 3.89 | % | 4.37 | % | 4.11 | % | 3.40 | % | 3.40 | % | |||||||||||||||
| Without expense reductions | 5.69 | %(c) | 5.82 | % | 6.57 | % | 6.39 | % | 4.42 | % | 3.93 | % | |||||||||||||||
| Fund portfolio turnover rate | 3 | %(c) | 7 | % | 106 | % | 5 | % | 14 | % | 14 | % | |||||||||||||||
(a) The Fund's maximum sales charge is not included in the total return computation
(b) Not annualized
(c) Annualized
See Accompanying Notes to Financial Statements which are an integral part of these financial statements.
65
Pacific Advisors Fund Inc.
Financial Highlights (Unaudited)
(For a share outstanding throughout the period)
| Mid Cap Value Fund | |||||||||||||||||||||||||||
| Class A | |||||||||||||||||||||||||||
| For the six months ended | For the year ended December 31, | ||||||||||||||||||||||||||
| June 30, 2012 | 2011 | 2010 | 2009 | 2008 | 2007 | ||||||||||||||||||||||
| Per Share Operating Performance | |||||||||||||||||||||||||||
| Net asset value, beginning of period | $ | 10.88 | $ | 11.57 | $ | 8.78 | $ | 6.75 | $ | 12.50 | $ | 12.77 | |||||||||||||||
| Income from investing operations | |||||||||||||||||||||||||||
| Net investment income (loss) | (0.07 | ) | (0.13 | ) | (0.48 | ) | (0.40 | ) | (0.16 | ) | 0.01 | ||||||||||||||||
| Net realized and unrealized gains (losses) on securities | (0.60 | ) | (0.56 | ) | 3.27 | 2.43 | (5.56 | ) | 0.17 | ||||||||||||||||||
| Total from investment operations | (0.67 | ) | (0.69 | ) | 2.79 | 2.03 | (5.72 | ) | 0.18 | ||||||||||||||||||
| Less distributions | |||||||||||||||||||||||||||
| From net investment income | - | - | - | - | - | - | |||||||||||||||||||||
| From net capital gains | - | - | - | - | (0.03 | ) | (0.45 | ) | |||||||||||||||||||
| Total distributions | - | - | - | - | (0.03 | ) | (0.45 | ) | |||||||||||||||||||
| Net asset value, end of period | $ | 10.21 | $ | 10.88 | $ | 11.57 | $ | 8.78 | $ | 6.75 | $ | 12.50 | |||||||||||||||
| Total Investment Return (a) | (6.16 | )%(b) | (5.96 | )% | 31.78 | % | 30.07 | % | (45.78 | )% | 1.40 | % | |||||||||||||||
| Ratios/Supplemental Data | |||||||||||||||||||||||||||
| Net assets, end of period (000's) | $ | 4,046 | $ | 4,052 | $ | 3,672 | $ | 3,194 | $ | 3,291 | $ | 6,315 | |||||||||||||||
| Ratio of net investment loss to average net assets | (3.04 | )%(c) | (3.11 | )% | (3.39 | )% | (2.11 | )% | (1.33 | )% | (1.21 | )% | |||||||||||||||
| Ratio of expenses to average net assets | 4.30 | %(c) | 4.16 | % | 4.35 | % | 3.69 | % | 3.20 | % | 2.82 | % | |||||||||||||||
| Fund portfolio turnover rate | 39 | %(c) | 12 | % | 18 | % | 21 | % | 12 | % | 53 | % | |||||||||||||||
| Class C | |||||||||||||||||||||||||||
| For the six months ended | For the year ended December 31, | ||||||||||||||||||||||||||
| June 30, 2012 | 2011 | 2010 | 2009 | 2008 | 2007 | ||||||||||||||||||||||
| Per Share Operating Performance | |||||||||||||||||||||||||||
| Net asset value, beginning of period | $ | 10.00 | $ | 10.72 | $ | 8.21 | $ | 6.36 | $ | 11.90 | $ | 12.28 | |||||||||||||||
| Income from investing operations | |||||||||||||||||||||||||||
| Net investment loss | (1.26 | ) | (4.28 | ) | (3.84 | ) | (1.04 | ) | (0.45 | ) | (0.36 | ) | |||||||||||||||
| Net realized and unrealized gains (losses) on securities | 0.60 | 3.56 | 6.35 | 2.89 | (5.06 | ) | 0.43 | ||||||||||||||||||||
| Total from investment operations | (0.66 | ) | (0.72 | ) | 2.51 | 1.85 | (5.51 | ) | 0.07 | ||||||||||||||||||
| Less distributions | |||||||||||||||||||||||||||
| From net investment income | - | - | - | - | - | - | |||||||||||||||||||||
| From net capital gains | - | - | - | - | (0.03 | ) | (0.45 | ) | |||||||||||||||||||
| Total distributions | - | - | - | - | (0.03 | ) | (0.45 | ) | |||||||||||||||||||
| Net asset value, end of period | $ | 9.34 | $ | 10.00 | $ | 10.72 | $ | 8.21 | $ | 6.36 | $ | 11.90 | |||||||||||||||
| Total Investment Return | (6.60 | )%(b) | (6.72 | )% | 30.57 | % | 29.09 | % | (46.33 | )% | 0.57 | % | |||||||||||||||
| Ratios/Supplemental Data | |||||||||||||||||||||||||||
| Net assets, end of period (000's) | $ | 888 | $ | 1,044 | $ | 1,784 | $ | 3,151 | $ | 3,761 | $ | 8,494 | |||||||||||||||
| Ratio of net investment loss to average net assets | (3.80 | )%(c) | (3.92 | )% | (3.91 | )% | (2.87 | )% | (2.11 | )% | (1.93 | )% | |||||||||||||||
| Ratio of expenses to average net assets | 5.05 | %(c) | 4.91 | % | 4.88 | % | 4.47 | % | 3.96 | % | 3.56 | % | |||||||||||||||
| Fund portfolio turnover rate | 39 | %(c) | 12 | % | 18 | % | 21 | % | 12 | % | 53 | % | |||||||||||||||
(a) The Fund's maximum sales charge is not included in the total return computation
(b) Not annualized
(c) Annualized
See Accompanying Notes to Financial Statements which are an integral part of these financial statements.
66
Pacific Advisors Fund Inc.
Financial Highlights (Unaudited)
(For a share outstanding throughout the period)
| Small Cap Value Fund | |||||||||||||||||||||||||||
| Class A | |||||||||||||||||||||||||||
| For the six months ended | For the year ended December 31, | ||||||||||||||||||||||||||
| June 30, 2012 | 2011 | 2010 | 2009 | 2008 | 2007 | ||||||||||||||||||||||
| Per Share Operating Performance | |||||||||||||||||||||||||||
| Net asset value, beginning of period | $ | 34.42 | $ | 31.68 | $ | 26.37 | $ | 19.21 | $ | 34.70 | $ | 33.52 | |||||||||||||||
| Income from investing operations | |||||||||||||||||||||||||||
| Net investment income (loss) | (0.29 | ) | (1.35 | ) | (1.87 | ) | (0.50 | ) | 0.10 | 0.27 | |||||||||||||||||
| Net realized and unrealized gains (losses) on securities | 0.39 | 4.09 | 7.18 | 7.66 | (15.23 | ) | 1.78 | ||||||||||||||||||||
| Total from investment operations | 0.10 | 2.74 | 5.31 | 7.16 | (15.13 | ) | 2.05 | ||||||||||||||||||||
| Less distributions | |||||||||||||||||||||||||||
| From net investment income | - | - | - | - | - | - | |||||||||||||||||||||
| From net capital gains | - | - | - | - | (0.35 | ) | (0.87 | ) | |||||||||||||||||||
| From return of capital | - | - | - | - | (0.01 | ) | - | ||||||||||||||||||||
| Total distributions | - | - | - | - | (0.36 | ) | (0.87 | ) | |||||||||||||||||||
| Net asset value, end of period | $ | 34.52 | $ | 34.42 | $ | 31.68 | $ | 26.37 | $ | 19.21 | $ | 34.70 | |||||||||||||||
| Total Investment Return (a) | 0.29 | %(b) | 8.65 | % | 20.14 | % | 37.27 | % | (43.52 | )% | 6.10 | % | |||||||||||||||
| Ratios/Supplemental Data | |||||||||||||||||||||||||||
| Net assets, end of period (000's) | $ | 90,852 | $ | 88,323 | $ | 92,830 | $ | 117,456 | $ | 87,800 | $ | 112,938 | |||||||||||||||
| Ratio of net investment loss to average net assets | (2.28 | )%(c) | (2.31 | )% | (2.14 | )% | (2.05 | )% | (1.83 | )% | (1.94 | )% | |||||||||||||||
| Ratio of expenses to average net assets | 2.88 | %(c) | 2.88 | % | 2.66 | % | 2.49 | % | 2.44 | % | 2.34 | % | |||||||||||||||
| Fund portfolio turnover rate | 18 | %(c) | 9 | % | 9 | % | 17 | % | 23 | % | 15 | % | |||||||||||||||
| Class C | |||||||||||||||||||||||||||
| For the six months ended | For the year ended December 31, | ||||||||||||||||||||||||||
| June 30, 2012 | 2011 | 2010 | 2009 | 2008 | 2007 | ||||||||||||||||||||||
| Per Share Operating Performance | |||||||||||||||||||||||||||
| Net asset value, beginning of period | $ | 29.41 | $ | 27.26 | $ | 22.87 | $ | 16.79 | $ | 30.70 | $ | 30.00 | |||||||||||||||
| Income from investing operations | |||||||||||||||||||||||||||
| Net investment loss | (0.37 | ) | (6.46 | ) | (3.31 | ) | (1.40 | ) | (0.90 | ) | (0.21 | ) | |||||||||||||||
| Net realized and unrealized gains (losses) on securities | 0.34 | 8.61 | 7.70 | 7.48 | (12.65 | ) | 1.78 | ||||||||||||||||||||
| Total from investment operations | (0.03 | ) | 2.15 | 4.39 | 6.08 | (13.55 | ) | 1.57 | |||||||||||||||||||
| Less distributions | |||||||||||||||||||||||||||
| From net investment income | - | - | - | - | - | - | |||||||||||||||||||||
| From net capital gains | - | - | - | - | (0.35 | ) | (0.87 | ) | |||||||||||||||||||
| From return of capital | - | - | - | - | (0.01 | ) | - | ||||||||||||||||||||
| Total distributions | - | - | - | - | (0.36 | ) | (0.87 | ) | |||||||||||||||||||
| Net asset value, end of period | $ | 29.38 | $ | 29.41 | $ | 27.26 | $ | 22.87 | $ | 16.79 | $ | 30.70 | |||||||||||||||
| Total Investment Return | (0.10 | )%(b) | 7.89 | % | 19.20 | % | 36.21 | % | (44.05 | )% | 5.22 | % | |||||||||||||||
| Ratios/Supplemental Data | |||||||||||||||||||||||||||
| Net assets, end of period (000's) | $ | 6,997 | $ | 6,949 | $ | 11,355 | $ | 15,593 | $ | 15,368 | $ | 31,589 | |||||||||||||||
| Ratio of net investment loss to average net assets | (3.03 | )%(c) | (3.05 | )% | (2.89 | )% | (2.79 | )% | (2.57 | )% | (2.69 | )% | |||||||||||||||
| Ratio of expenses to average net assets | 3.63 | %(c) | 3.62 | % | 3.40 | % | 3.24 | % | 3.17 | % | 3.09 | % | |||||||||||||||
| Fund portfolio turnover rate | 18 | %(c) | 9 | % | 9 | % | 17 | % | 23 | % | 15 | % | |||||||||||||||
(a) The Fund's maximum sales charge is not included in the total return computation.
(b) Not annualized
(c) Annualized
See Accompanying Notes to Financial Statements which are an integral part of these financial statements.
67
Pacific Advisors Fund Inc.
Financial Highlights (Unaudited)
(For a share outstanding throughout the period)
| Small Cap Value Fund | |||||||||||||||||||||||||||
| Class I | |||||||||||||||||||||||||||
| For the six months ended | For the year ended December 31, | ||||||||||||||||||||||||||
| June 30, 2012 | 2011 | 2010 | 2009 | 2008 | 2007 | ||||||||||||||||||||||
| Per Share Operating Performance | |||||||||||||||||||||||||||
| Net asset value, beginning of period | $ | 39.15 | $ | 35.95 | $ | 29.86 | $ | 21.72 | $ | 37.50 | $ | 36.13 | |||||||||||||||
| Income from investing operations | |||||||||||||||||||||||||||
| Net investment loss | 323.32 | ** | (0.77 | ) | (0.60 | ) | (0.45 | ) | (0.32 | )* | (0.33 | ) | |||||||||||||||
| Net realized and unrealized gains (losses) on securities | (323.17 | )** | 3.97 | 6.69 | 8.59 | (15.10 | )* | 2.57 | |||||||||||||||||||
| Total from investment operations | 0.15 | 3.20 | 6.09 | 8.14 | (15.42 | ) | 2.24 | ||||||||||||||||||||
| Less distributions | |||||||||||||||||||||||||||
| From net investment income | - | - | - | - | - | - | |||||||||||||||||||||
| From net capital gains | - | - | - | - | (0.35 | ) | (0.87 | ) | |||||||||||||||||||
| From return of capital | - | - | - | - | (0.01 | ) | - | ||||||||||||||||||||
| Total distributions | - | - | - | - | (0.36 | ) | (0.87 | ) | |||||||||||||||||||
| Net asset value, end of period | $ | 39.30 | $ | 39.15 | $ | 35.95 | $ | 29.86 | $ | 21.72 | $ | 37.50 | |||||||||||||||
| Total Investment Return | 0.38 | %(b) | 8.90 | % | 20.40 | % | 37.48 | % | (41.00 | )% | 6.19 | % | |||||||||||||||
| Ratios/Supplemental Data | |||||||||||||||||||||||||||
| Net assets, end of period (000's) | $ | 1,727 | $ | 6 | $ | 6 | $ | 5 | $ | 3 | $ | 1,902 | |||||||||||||||
| Ratio of net investment loss to average net assets | (2.01 | )%(c) | (2.08 | )% | (1.97 | )% | (1.80 | )% | (1.56 | )% | (1.72 | )% | |||||||||||||||
| Ratio of expenses to average net assets | 2.63 | %(c) | 2.65 | % | 2.50 | % | 2.24 | % | 2.16 | % | 2.10 | % | |||||||||||||||
| Fund portfolio turnover rate | 18 | %(c) | 9 | % | 9 | % | 17 | % | 23 | % | 15 | % | |||||||||||||||
(b) Not annualized
(c) Annualized
* Numbers were calculated using a weighted-average number of shares outstanding basis as a result of a significant change in Class I assets immediately prior to end of period.
** Numbers reflected significant subscription and redemption activity during the period.
See Accompanying Notes to Financial Statements which are an integral part of these financial statements.
68
Pacific Advisors Fund Inc.
Notes to Financial Statements (Unaudited)
June 30, 2012
Note 1. Organization
Pacific Advisors Fund Inc. (the "Company") is an open-end diversified investment management company registered under the Investment Company Act of 1940, as amended. The Company currently offers six Funds: Government Securities Fund, Income and Equity Fund, Balanced Fund, Large Cap Value Fund, Mid Cap Value Fund and Small Cap Value Fund (individually, a "Fund," or collectively, the "Funds"). Each Fund is a separate investment portfolio of the Company with a distinct investment objective, investment program, policies and restrictions.
The Government Securities Fund seeks to provide high current income, preservation of capital, and rising future income, consistent with prudent investment risk. The Income and Equity Fund seeks to provide current income and, secondarily, long-term capital appreciation. The Balanced Fund seeks to achieve long-term capital appreciation and income consistent with reduced risk. The Large Cap Value Fund seeks to achieve long-term capital appreciation. The Mid Cap Value Fund seeks to achieve long-term capital appreciation. The Small Cap Value Fund seeks to provide capital appreciation through investment in small capitalization companies.
The Funds offer Class A and Class C shares. In addition to Class A and Class C shares, the Small Cap Value Fund introduced Class I shares on October 9, 2006. Each class has equal rights as to assets and voting privileges except that Class A and Class C each has exclusive voting rights with respect to its distribution plan. Investment income, realized and unrealized capital gains and losses, and the common expenses of each Fund are allocated on a pro rata basis to each class based on the relative net assets of each class to the total net assets of the Fund. Each Class of shares differs in its respective service and distribution expenses and may differ in its transfer agent, registration, and certain other class-specific fees and expenses.
The Company enters into contracts that contain a variety of indemnifications. The Company's maximum exposure under these arrangements is unknown. However, the Company has not had prior claims or losses pursuant to these contracts and expects the risk of loss to be remote.
Note 2. Significant Accounting Policies
A. Security Valuation and Fair Value Measurement. Securities, including American Depository Receipts (ADRs), listed on a national securities exchange and certain over-the-counter ("OTC") issues traded on the NASDAQ national market system are valued at the last quoted sale price at the close of the New York Stock Exchange. OTC issues not quoted on the NASDAQ system, and other equity securities for which no sale price is available, are valued at the last bid price as obtained from published sources or real time quote services, where available, and otherwise from brokers who are market makers for such securities. Debt securities with a maturity less than 60 days are valued on an amortized cost basis, which approximates market value. In determining the fair value of other debt securities, Pacific Global Investment Management Company, Inc. (the "Investment Manager") utilizes independent pricing services approved by the Board of Directors using one or more of the following valuation techniques:
(1) a matrix pricing approach that considers market inputs including, in approximate order of priority, the following: benchmark yields, reported trades, broker/dealer quotes, issuer spreads, two-sided markets, benchmark securities, bids, offers and reference data including market research publications; market indicators, industry and economic events. Evaluators may prioritize inputs differently on any given day for any security based on market conditions, and not all inputs listed are available for use in the evaluation process for each security evaluation on any given day; (2) a comparison of the value of the borrower's outstanding equity and debt to that of comparable public companies; (3) a discounted cash flow analysis. In conducting its assessment and analysis for purpose of determining fair value, the Investment Manager uses its discretion and judgment in considering and appraising relevant factors. Fair value determinations are made by the Investment Manager based on the Company's Fair Value Procedure, as adopted by the Board of Directors.
Various inputs are used to determine the fair value of each Fund's investments. For financial statements, these inputs are summarized in the three broad levels listed below. Level 1 inputs are based on quoted prices in active markets for identical securities. Level 2 inputs are based on significant observable market inputs, such as quoted prices for similar securities and quoted prices in inactive markets. Level 3 inputs are significant unobservable inputs that reflect the Fund's own assumptions in determining the fair value of investments. The valuation levels are not necessarily an indication of the risk associated with investing in those securities.
69
Pacific Advisors Fund Inc.
Notes to Financial Statements (Unaudited)
June 30, 2012
The following is a summary of the inputs used to value each Fund's investment securities and cash and cash equivalents as of June 30, 2012:
| Government Securities Fund | Income and Equity Fund | Balanced Fund | Large Cap Value Fund | Mid Cap Value Fund | Small Cap Value Fund | ||||||||||||||||||||||
| Level 1 - Quoted Prices | |||||||||||||||||||||||||||
| Common Stock | |||||||||||||||||||||||||||
| Energy | $ | 36,925 | $ | 108,750 | $ | 894,575 | $ | 179,697 | $ | 1,265,802 | $ | 17,456,865 | |||||||||||||||
| Material | - | 136,539 | 378,000 | - | 252,810 | 2,241,450 | |||||||||||||||||||||
| Industrials | 22,400 | 475,910 | 2,488,866 | 657,158 | 2,026,369 | 38,269,485 | |||||||||||||||||||||
| Consumer Discretionary | 39,838 | 570,400 | 702,627 | 644,748 | 1,093,490 | 19,228,900 | |||||||||||||||||||||
| Consumer Staples | 95,754 | 570,819 | 1,561,910 | 982,886 | 131,250 | 4,699,650 | |||||||||||||||||||||
| Health Care | 26,385 | 461,912 | 1,201,100 | 333,487 | - | 3,419,754 | |||||||||||||||||||||
| Financials | - | - | 882,798 | 452,673 | 165,100 | 11,704,200 | |||||||||||||||||||||
| Information Technology | 45,885 | 324,300 | 1,899,729 | 1,054,562 | - | - | |||||||||||||||||||||
| Telecommunication Services | 57,056 | 363,640 | - | - | - | 3,943,300 | |||||||||||||||||||||
| Utilities | 107,589 | 406,030 | - | - | - | - | |||||||||||||||||||||
| Preferred Stock | |||||||||||||||||||||||||||
| Financials | - | 128,080 | 203,650 | - | - | - | |||||||||||||||||||||
| Utilities | - | 52,640 | - | - | - | - | |||||||||||||||||||||
| Level 1 Total | 431,832 | 3,599,020 | 10,213,255 | 4,305,211 | 4,934,821 | 100,963,604 | |||||||||||||||||||||
| Level 2 - Other significant observable inputs | |||||||||||||||||||||||||||
| Bonds and notes | |||||||||||||||||||||||||||
| Corporate Bonds | - | 3,926,776 | 3,465,471 | - | - | - | |||||||||||||||||||||
| U.S. Government Fixed Income Securities | 2,002,247 | - | - | - | - | - | |||||||||||||||||||||
| Short Term Investments | |||||||||||||||||||||||||||
| Money Market | 36,752 | 43,086 | - | 214,102 | 68,413 | - | |||||||||||||||||||||
| Level 2 Total | 2,038,999 | 3,969,862 | 3,465,471 | 214,102 | 68,413 | - | |||||||||||||||||||||
| Level 3 - Significant unobservable inputs | - | - | - | - | - | - | |||||||||||||||||||||
| Total Investments | $ | 2,470,831 | $ | 7,568,882 | $ | 13,678,726 | $ | 4,519,313 | $ | 5,003,234 | $ | 100,963,604 | |||||||||||||||
Equity securities (common and preferred stock) that are actively traded and market priced are classified as Level 1 securities. All fixed income securities are classified as Level 2 securities and are valued using either amortized cost or the matrix pricing approach. The Funds had no Level 3 holdings during the period ended June 30, 2012. In January 2010, the Financial Accounting Standards Board (FASB) issued Accounting Standards Update ("ASU") 2010-06, "Improving Disclosures about Fair Value Measurements," which amended Accounting Standard Codification 820 ("Topic 820") and required entities to disclose the amounts of significant transfers between Level 1 and Level 2 of the fair value hierarchy and the reasons for these transfers. The Investment Manager has evaluated the Funds' positions for the period ended June 30, 2012, and determined that, for purposes of fair value pricing measurement, there were no transfers between Level 1 and Level 2.
In May 2011, the FASB issued ASU 2011-04, Fair Value Measurement (Topic 820) to update requirements for measuring fair value and for disclosing information about fair value measurements in accordance with U.S. Generally Accepted Accounting Principles (GAAP) and International Financial Reporting Standards (IFRS). The amendment included clarifications and also changes to a particular principle or requirement for measuring fair value or disclosing information about fair value measurements. The update results in common principles and requirements for measuring fair value and for disclosing information about fair value measurements in accordance with U.S. GAAP and IFRS. In assessing the requirements and clarifications of the most recent announcement, the Investment Manager believes that the Fair Value Measurement update will not have a material impact on the Funds' operating results, financial position or result in additional disclosures.
B. Cash and Cash Equivalents. The Company considers all highly liquid financial instruments with maturities of less than three months when acquired to be cash equivalents.
C. Security Transactions and Investment Income. Security transactions are accounted for on the trade date. The cost of investments sold is determined by use of the specific identification method for both financial reporting and federal income tax purposes. Dividends are recorded on the ex-dividend date. Interest income is recorded on an accrual basis. Premium or discount on debt securities are amortized using the effective interest amortization method.
D. Dividends and Distributions to Shareholders. The Government Securities Fund and Income and Equity Fund declare and distribute dividends of their net investment income, if any, quarterly. The Balanced Fund, Large Cap Value Fund, Mid Cap
70
Pacific Advisors Fund Inc.
Notes to Financial Statements (Unaudited)
June 30, 2012
Value Fund and Small Cap Value Fund declare and distribute dividends of their net investment income, if any, annually. The Board of Directors determines the amount and timing of such payments.
E. Federal Income Tax. The Company intends to comply with the requirements of Subchapter M of the Internal Revenue Code applicable to regulated investment companies and to distribute substantially all of their taxable income to their shareholders. Therefore, no federal income tax provision is required.
Management has analyzed the Funds' tax positions taken on federal income tax returns for all open tax years and for the year ended December 31, 2011 and has concluded that no provision for income tax is required in the Funds' financial statements. Tax years 2008, 2009, 2010 and 2011 are still subject to examination by major federal jurisdictions. Tax years 2007, 2008, 2009, 2010 and 2011 are still subject to examination by major state jurisdictions.
The Funds recognize interest and penalties, if any, related to unrecognized tax benefits as income tax expense in the Statement of Operations. During the period, the Funds did not incur any interest or penalties.
At December 31, 2011, components of distributable earnings (accumulated deficits) on a tax basis were as follows:
| Government Securities Fund | Income and Equity Fund | Balanced Fund | Large Cap Value Fund | Mid Cap Value Fund | Small Cap Value Fund | ||||||||||||||||||||||
| Undistributed ordinary income | $ | - | $ | 605 | $ | - | $ | - | $ | - | $ | - | |||||||||||||||
| Undistributed long-term gains | - | - | 16,159 | - | - | - | |||||||||||||||||||||
| Capital loss carry forward* | (322,627 | ) | (585,604 | ) | - | (167,591 | ) | (1,756,562 | ) | (16,512,561 | ) | ||||||||||||||||
| Post October loss | - | (143,046 | ) | (341,627 | ) | - | (323,488 | ) | (435,252 | ) | |||||||||||||||||
| Net unrealized appreciation on investments | 27,379 | 286,766 | 1,017,965 | 389,749 | 959,717 | 26,205,614 | |||||||||||||||||||||
| Accumulated earnings (deficits) | $ | (295,248 | ) | $ | (441,279 | ) | $ | 692,497 | $ | 222,158 | $ | (1,120,333 | ) | $ | 9,257,801 | ||||||||||||
The difference between book basis and tax basis unrealized appreciation (depreciation) is attributable primarily to the tax deferral of losses on wash sales and characterization of certain income items. The Funds intend to treat post October losses (net capital losses occurred for the period subsequent to October 31, 2011 through the fiscal year end December 31, 2011) as having been incurred in the next fiscal year.
The Funds intend to utilize provisions of the federal income tax laws which allow them to carry a realized capital loss forward for eight years following the year of the loss and offset such losses against any future realized capital gains. During the current fiscal year, the following capital losses carried forward have been utilized:
| Government Securities Fund | Income and Equity Fund | Balanced Fund | Large Cap Value Fund | Mid Cap Value Fund | Small Cap Value Fund | ||||||||||||||||||||||
| Capital loss carryforward utilized | $ | 34,046 | $ | 132,827 | $ | - | $ | 14,267 | $ | - | $ | - | |||||||||||||||
* At December 31, 2011, the following Funds had accumulated net realized losses on investment transactions that represent capital loss carryforwards for federal income tax purposes, which expire as follows:
| Capital losses expiring in: | |||||||||||||||||||||||||||||||||||
| 2012 | 2013 | 2014 | 2015 | 2016 | 2017 | 2018 | Total | ||||||||||||||||||||||||||||
| Government Securities Fund | $ | 95,072 | $ | 49,495 | $ | 88,644 | $ | 1,178 | $ | 9,585 | $ | 73,971 | $ | 4,682 | $ | 322,627 | |||||||||||||||||||
| Income and Equity Fund | - | - | - | - | 197,538 | 388,066 | - | 585,604 | |||||||||||||||||||||||||||
| Balanced Fund | - | - | - | - | - | - | - | - | |||||||||||||||||||||||||||
| Large Cap Value Fund | - | - | - | - | - | 167,591 | - | 167,591 | |||||||||||||||||||||||||||
| Mid Cap Value Fund | - | - | - | - | 785,984 | 640,167 | - | 1,426,151 | |||||||||||||||||||||||||||
| Small Cap Value Fund | - | - | - | - | - | 12,029,758 | 3,801,568 | 15,831,326 | |||||||||||||||||||||||||||
During the year ended December 31, 2011, the Government Securities Fund had a capital loss carryforward in the amount of $821,665 that expired.
On December 22, 2010, the Regulated Investment Company Modernization Act of 2010 (the "Act") was enacted, which changed various technical rules governing the tax treatment of regulated investment companies ("RICs") including the Funds. The changes are generally effective for taxable years beginning after the date of enactment. One of the more prominent changes addresses capital loss carryforwards. Under the Act, each Fund will be permitted to carry forward capital losses incurred in taxable years beginning after the date of enactment for an unlimited period. However, any losses incurred during those future taxable years
71
Pacific Advisors Fund Inc.
Notes to Financial Statements (Unaudited)
June 30, 2012
will be required to be utilized prior to the losses incurred in pre-enactment taxable years, which carry an expiration date. As a result of this ordering rule, pre-enactment capital loss carryforwards may be more likely to expire unused. Additionally, post-enactment capital loss carryforwards will retain their character as either short-term or long-term capital losses rather than being considered all short-term as permitted under previous regulation.
Finally, the Modernization Act contains several provisions aimed at preserving the character of distributions made by a fiscal year RIC during the portion of its taxable year ending after October 31 or December 31, reducing the circumstances under which a RIC might be required to file amended Forms 1099 to restate previously reported distributions. Except for the simplification provisions related to RIC qualification, the Modernization Act is effective for taxable years beginning after December 22, 2010. The provisions related to RIC qualification are effective for taxable years for which the extended due date of the tax return is after December 22, 2010.
Losses incurred that will be carried forward under the provisions of the Modernization Act are as follows:
| Loss Carryforward Character | |||||||||||
| Short Term | Long Term | ||||||||||
| Mid Cap Value Fund | $ | - | $ | 330,411 | |||||||
| Small Cap Value Fund | - | 681,235 | |||||||||
F. Reclassification of Capital Accounts. Distributions of net investment income and realized gains are determined in accordance with income tax regulations which may differ from GAAP. These differences are due to differing treatments for items such as net operating losses, reclassification of dividends and return of capital. To the extent that these differences are permanent in nature, reclassifications are made among the net asset accounts on the Statement of Assets and Liabilities.
For the year ended December 31, 2011, reclassifications among the components of net assets are as follows:
| Accumulated Undistributed Net Investment Income | Paid in Capital | Accumulated Capital Loss | |||||||||||||
| Government Securities Fund | $ | 30,005 | $ | (851,670 | ) | $ | 821,665 | ||||||||
| Income and Equity Fund | - | - | - | ||||||||||||
| Balanced Fund | 49,426 | (49,426 | ) | - | |||||||||||
| Large Cap Value Fund | 29,942 | (29,942 | ) | - | |||||||||||
| Mid Cap Value Fund | 181,370 | (181,370 | ) | - | |||||||||||
| Small Cap Value Fund | 2,242,685 | (2,242,685 | ) | - | |||||||||||
The reclassifications were due to net investment losses incurred by the Funds, which are not permitted to be carried forward for tax purposes. The Government Securities Fund's reclassification was also a result of the expiration of capital losses previously carried-forward.
G. Use of Estimates. The preparation of financial statements in conformity with U.S. GAAP requires management to make estimates and assumptions that affect the reported amounts in the financial statements and footnotes. Actual results could differ from those estimates.
Note 3. Investment Management, Distributor and Other Related Party Transactions
The Company and the Funds have entered into investment management agreements ("Management Agreements") with the Investment Manager.
The Management Agreements provide for investment management fees, payable monthly, and calculated at the maximum annual rate of 0.65% of average net assets for the Government Securities Fund, 0.75% of average net assets for the Income and Equity, Balanced, Large Cap Value and Small Cap Value Funds and 1.00% of average net assets for the Mid Cap Value Fund.
In accordance with Expense Limitation Agreements with the Company, the Investment Manager waives its respective management fees to the extent that the actual operating expenses of the following Funds exceed the following thresholds:
| Class A | Class C | ||||||||||
| Government Securities Fund | 1.65 | % | 2.40 | % | |||||||
| Income and Equity Fund | 1.95 | % | 2.70 | % | |||||||
| Large Cap Value Fund | 2.65 | % | 3.40 | % | |||||||
72
Pacific Advisors Fund Inc.
Notes to Financial Statements (Unaudited)
June 30, 2012
For the Government Securities Fund and Large Cap Value Fund only, if net expenses exceed the above thresholds after waiver of the entire management fee, Pacific Global Investor Services, Inc. ("PGIS"), Transfer Agent for the Company, will waive its transfer agency fee to the extent necessary to reduce Class expenses to the above thresholds. The Transfer Agent does not, however, waive out of pocket expenses. These agreements may be terminated by either party upon 90 days prior written notice.
Pursuant to the Expense Limitation Agreements, providing for the voluntary waiver of fees and the assumption of expenses by the Investment Manager and Transfer Agent, the following amounts were waived for the period ended June 30, 2012.
| Management Fees Waived | Transfer Agent Fees Waived | Total | |||||||||||||
| Government Securities Fund | $ | 8,917 | $ | 21,600 | $ | 30,517 | |||||||||
| Income and Equity Fund | 28,076 | - | 28,076 | ||||||||||||
| Large Cap Value Fund | 15,784 | 21,600 | 37,384 | ||||||||||||
Effective 2004, the Investment Manager terminated all of its rights under the Expense Limitation Agreements with respect to potential recoupment from the Funds of all management fees and transfer agent fees previously waived and all expenses previously reimbursed. In the future, the Investment Manager will not have any rights to recover fees it waives or expenses it may reimburse, with respect to any of the Funds.
For the period ended June 30, 2012, Pacific Global Fund Distributors, Inc. ("PGFD"), the principal underwriter for the Company, received commissions on sales of capital stock, after deducting amounts allowed to authorized distributors as commissions. In addition, PGFD, as a registered broker-dealer, may act as broker for the Funds, in conformity with Rule 17e-1 under the Investment Company Act of 1940. The Company's Board of Directors has approved procedures for evaluating the reasonableness of commissions paid to PGFD and periodically reviews these procedures. PGFD will not act as principal in effecting any portfolio transactions for the Funds. The amounts of commissions are as follows:
| Underwriting Fees Retained | Commissions Retained | Brokerage Commissions Received | |||||||||||||
| Government Securities Fund | $ | 1 | $ | 7 | $ | (146 | ) | ||||||||
| Income and Equity Fund | 232 | 7 | 336 | ||||||||||||
| Balanced Fund | 299 | 338 | (78 | ) | |||||||||||
| Large Cap Value Fund | 1,078 | 820 | 72 | ||||||||||||
| Mid Cap Value Fund | 1,182 | 463 | 1,315 | ||||||||||||
| Small Cap Value Fund | 7,030 | 563 | 11,967 | ||||||||||||
PGFD is a wholly-owned subsidiary of the Investment Manager.
The Company has also entered into an agreement with PGIS to provide fund accounting services at the monthly fee of three basis points for the first one hundred million in net assets and one basis point on the balance of net assets or a minimum of $1,500 per month. In addition, an agreement to provide transfer agent services has also been entered into at a rate of $21.00 per year per open account and $3.50 per year per closed account with minimum charges of $1,800 per month for Class A, C, and I share accounts. PGIS is a wholly-owned subsidiary of the Investment Manager.
Accounts payable to related parties consist of transfer agent fees payable to PGIS.
The Company has adopted a plan of distribution, whereby the Funds may pay a service fee to qualified recipients in an amount up to 0.25% per annum of each Fund's daily net assets for Class A shares and Class C shares. Under the plan of the distribution, the Funds may pay a distribution fee to qualified recipients in an amount up to 0.75% per annum of each Fund's daily net assets for Class C shares. The Company has not adopted a plan of distribution for Class I Shares.
For the period ended June 30, 2012, total distribution and/or service (12b-1) fees were:
| Class A | Class C | Total | |||||||||||||
| Government Securities Fund | $ | 2,408 | $ | 4,086 | $ | 6,494 | |||||||||
| Income and Equity Fund | 5,778 | 14,322 | 20,100 | ||||||||||||
| Balanced Fund | 4,962 | 51,646 | 56,608 | ||||||||||||
| Large Cap Value Fund | 4,450 | 3,244 | 7,694 | ||||||||||||
| Mid Cap Value Fund | 5,424 | 5,103 | 10,527 | ||||||||||||
| Small Cap Value Fund | 121,865 | 37,817 | 159,682 | ||||||||||||
73
Pacific Advisors Fund Inc.
Notes to Financial Statements (Unaudited)
June 30, 2012
Note 4. Purchase and Sales of Securities
The following summarizes purchases and sales of investment securities, other than short-term investments, and aggregate gross unrealized appreciation and depreciation on a tax basis by each Fund for the six months ended and as of June 30, 2012. The difference between book basis and tax basis unrealized appreciation is attributable primarily to the tax deferral of losses on wash sales.
| Six months ended June 30, 2012 | As of June 30, 2012 | ||||||||||||||||||||||||||
| Cost of Purchases | Proceeds From Sales | Tax Cost of Securities | Gross Unrealized Appreciation | Gross Unrealized Depreciation | Net Unrealized Appreciation | ||||||||||||||||||||||
| Government Securities Fund | $ | 2,462,127 | $ | 2,943,006 | $ | 2,356,076 | $ | 79,027 | $ | (1,024 | ) | $ | 78,003 | ||||||||||||||
| Income and Equity Fund | 1,841,844 | 1,746,135 | 6,854,020 | 923,183 | (251,407 | ) | 671,776 | ||||||||||||||||||||
| Balanced Fund | 1,558,834 | 3,670,884 | 12,120,272 | 1,993,689 | (435,235 | ) | 1,558,454 | ||||||||||||||||||||
| Large Cap Value Fund | 70,401 | 112,950 | 3,566,814 | 877,580 | (139,183 | ) | 738,397 | ||||||||||||||||||||
| Mid Cap Value Fund | 1,047,804 | 1,102,344 | 4,603,759 | 1,201,930 | (870,868 | ) | 331,062 | ||||||||||||||||||||
| Small Cap Value Fund | 10,143,865 | 9,702,422 | 75,504,950 | 34,678,813 | (9,220,159 | ) | 25,458,654 | ||||||||||||||||||||
Note 5. Distributions to Shareholders
The tax character of distributions paid during 2012 and 2011 was as follows:
| Government Securities Fund | Income and Equity Fund | Balanced Fund | Large Cap Value Fund | Mid Cap Value Fund | Small Cap Value Fund | ||||||||||||||||||||||
| Six months ended June 30, 2012 | |||||||||||||||||||||||||||
| Distributions paid from: | |||||||||||||||||||||||||||
| Ordinary Income | $ | - | $ | 49,326 | $ | - | $ | - | $ | - | $ | - | |||||||||||||||
| Long-Term Capital Gain | - | - | - | - | - | - | |||||||||||||||||||||
| Return of Capital | - | - | - | - | - | - | |||||||||||||||||||||
| Total Distributions | $ | - | $ | 49,326 | $ | - | $ | - | $ | - | $ | - | |||||||||||||||
| Year ended December 31, 2011 | |||||||||||||||||||||||||||
| Distributions paid from: | |||||||||||||||||||||||||||
| Ordinary Income | $ | - | $ | 157,804 | $ | 20,178 | $ | - | $ | - | $ | - | |||||||||||||||
| Long-Term Capital Gain | - | - | 967,955 | - | - | - | |||||||||||||||||||||
| Return of Capital | - | - | - | - | - | - | |||||||||||||||||||||
| Total Distributions | $ | - | $ | 157,804 | $ | 988,133 | $ | - | $ | - | $ | - | |||||||||||||||
Note 6. Capital Share Transactions
A 2% redemption fee is assessed on shares of the Government Securities Fund or Income and Equity Fund sold or exchanged within 30 days of purchase or shares of the Balanced Fund, Large Cap Value Fund, Mid Cap Value Fund or Small Cap Value Fund sold or exchanged within 180 days of purchase and is retained in each Fund. The redemption fees collected through June 30, 2012 are included in the dollar amount of shares sold in the table below. The amount of the increase is as follows:
| Class A | Class C | Class I | |||||||||||||
| Government Securities Fund | $ | - | $ | - | $ | - | |||||||||
| Income and Equity Fund | - | - | - | ||||||||||||
| Balanced Fund | 154 | 187 | - | ||||||||||||
| Large Cap Value Fund | 66 | - | - | ||||||||||||
| Mid Cap Value Fund | 2,194 | - | - | ||||||||||||
| Small Cap Value Fund | 47,842 | 3,134 | 276 | ||||||||||||
74
Pacific Advisors Fund Inc.
Notes to Financial Statements (Unaudited)
June 30, 2012
| Six months ended June 30, 2012 | Year ended December 31, 2011 | ||||||||||||||||||
| Shares | Amount | Shares | Amount | ||||||||||||||||
| Government Securities Fund | |||||||||||||||||||
| Class A | |||||||||||||||||||
| Shares Sold | 12,734 | $ | 117,610 | 23,376 | $ | 213,903 | |||||||||||||
| Reinvestment of Distributions | - | - | - | - | |||||||||||||||
| 12,734 | 117,610 | 23,376 | 213,903 | ||||||||||||||||
| Shares Repurchased | (11,144 | ) | (102,673 | ) | (78,365 | ) | (718,805 | ) | |||||||||||
| Net Increase (Decrease) | 1,590 | $ | 14,937 | (54,989 | ) | $ | (504,902 | ) | |||||||||||
| Class C | |||||||||||||||||||
| Shares Sold | - | $ | - | 36,912 | $ | 332,976 | |||||||||||||
| Reinvestment of Distributions | - | - | - | - | |||||||||||||||
| - | - | 36,912 | 332,976 | ||||||||||||||||
| Shares Repurchased | (52,280 | ) | (472,909 | ) | (116,789 | ) | (1,051,781 | ) | |||||||||||
| Net Decrease | (52,280 | ) | $ | (472,909 | ) | (79,877 | ) | $ | (718,805 | ) | |||||||||
| Six months ended June 30, 2012 | Year ended December 31, 2011 | ||||||||||||||||||
| Shares | Amount | Shares | Amount | ||||||||||||||||
| Income and Equity Fund | |||||||||||||||||||
| Class A | |||||||||||||||||||
| Shares Sold | 68,369 | $ | 691,376 | 144,731 | $ | 1,442,276 | |||||||||||||
| Reinvestment of Distributions | 3,276 | 33,328 | 9,872 | 97,367 | |||||||||||||||
| 71,645 | 724,704 | 154,603 | 1,539,643 | ||||||||||||||||
| Shares Repurchased | (24,260 | ) | (245,540 | ) | (121,729 | ) | (1,208,741 | ) | |||||||||||
| Net Increase | 47,385 | $ | 479,164 | 32,874 | $ | 330,902 | |||||||||||||
| Class C | |||||||||||||||||||
| Shares Sold | 1,415 | $ | 13,742 | 4,488 | $ | 42,785 | |||||||||||||
| Reinvestment of Distributions | 1,126 | 10,962 | 5,108 | 48,010 | |||||||||||||||
| 2,541 | 24,704 | 9,596 | 90,795 | ||||||||||||||||
| Shares Repurchased | (49,171 | ) | (475,794 | ) | (193,642 | ) | (1,832,018 | ) | |||||||||||
| Net Decrease | (46,630 | ) | $ | (451,090 | ) | (184,046 | ) | $ | (1,741,223 | ) | |||||||||
75
Pacific Advisors Fund Inc.
Notes to Financial Statements (Unaudited)
June 30, 2012
| Six months ended June 30, 2012 | Year ended December 31, 2011 | ||||||||||||||||||
| Shares | Amount | Shares | Amount | ||||||||||||||||
| Balanced Fund | |||||||||||||||||||
| Class A | |||||||||||||||||||
| Shares Sold | 14,517 | $ | 207,187 | 51,150 | $ | 753,280 | |||||||||||||
| Reinvestment of Distributions | - | - | 16,892 | 228,721 | |||||||||||||||
| 14,517 | 207,187 | 68,042 | 982,001 | ||||||||||||||||
| Shares Repurchased | (27,533 | ) | (386,572 | ) | (46,144 | ) | (679,760 | ) | |||||||||||
| Net Increase (Decrease) | (13,016 | ) | $ | (179,385 | ) | 21,898 | $ | 302,241 | |||||||||||
| Class C | |||||||||||||||||||
| Shares Sold | 10,719 | $ | 142,227 | 28,030 | $ | 391,636 | |||||||||||||
| Reinvestment of Distributions | - | - | 56,612 | 720,106 | |||||||||||||||
| 10,719 | 142,227 | 84,642 | 1,111,742 | ||||||||||||||||
| Shares Repurchased | (134,648 | ) | (1,794,835 | ) | (537,116 | ) | (7,437,583 | ) | |||||||||||
| Net Decrease | (123,929 | ) | $ | (1,652,608 | ) | (452,474 | ) | $ | (6,325,841 | ) | |||||||||
| Six months ended June 30, 2012 | Year ended December 31, 2011 | ||||||||||||||||||
| Shares | Amount | Shares | Amount | ||||||||||||||||
| Large Cap Value Fund | |||||||||||||||||||
| Class A | |||||||||||||||||||
| Shares Sold | 42,171 | $ | 417,857 | 96,622 | $ | 884,375 | |||||||||||||
| Reinvestment of Distributions | - | - | - | - | |||||||||||||||
| 42,171 | 417,857 | 96,622 | 884,375 | ||||||||||||||||
| Shares Repurchased | (13,731 | ) | (135,258 | ) | (23,669 | ) | (215,152 | ) | |||||||||||
| Net Increase | 28,440 | $ | 282,599 | 72,953 | $ | 669,223 | |||||||||||||
| Class C | |||||||||||||||||||
| Shares Sold | 11,795 | $ | 106,468 | 16,903 | $ | 138,811 | |||||||||||||
| Reinvestment of Distributions | - | - | - | - | |||||||||||||||
| 11,795 | 106,468 | 16,903 | 138,811 | ||||||||||||||||
| Shares Repurchased | (11,610 | ) | (102,069 | ) | (25,370 | ) | (204,816 | ) | |||||||||||
| Net Increase (Decrease) | 185 | $ | 4,399 | (8,467 | ) | $ | (66,005 | ) | |||||||||||
76
Pacific Advisors Fund Inc.
Notes to Financial Statements (Unaudited)
June 30, 2012
| Six months ended June 30, 2012 | Year ended December 31, 2011 | ||||||||||||||||||
| Shares | Amount | Shares | Amount | ||||||||||||||||
| Mid Cap Value Fund | |||||||||||||||||||
| Class A | |||||||||||||||||||
| Shares Sold | 54,573 | $ | 626,807 | 123,348 | $ | 1,514,987 | |||||||||||||
| Reinvestment of Distributions | - | - | - | - | |||||||||||||||
| 54,573 | 626,807 | 123,348 | 1,514,987 | ||||||||||||||||
| Shares Repurchased | (30,728 | ) | (362,476 | ) | (68,273 | ) | (769,508 | ) | |||||||||||
| Net Increase | 23,845 | $ | 264,331 | 55,075 | $ | 745,479 | |||||||||||||
| Class C | |||||||||||||||||||
| Shares Sold | 1,870 | $ | 18,627 | 2,272 | $ | 24,532 | |||||||||||||
| Reinvestment of Distributions | - | - | - | - | |||||||||||||||
| 1,870 | 18,627 | 2,272 | 24,532 | ||||||||||||||||
| Shares Repurchased | (11,269 | ) | (123,954 | ) | (64,208 | ) | (699,735 | ) | |||||||||||
| Net Decrease | (9,399 | ) | $ | (105,327 | ) | (61,936 | ) | $ | (675,203 | ) | |||||||||
| Six months ended June 30, 2012 | Year ended December 31, 2011 | ||||||||||||||||||
| Shares | Amount | Shares | Amount | ||||||||||||||||
| Small Cap Value Fund | |||||||||||||||||||
| Class A | |||||||||||||||||||
| Shares Sold | 479,386 | $ | 18,109,135 | 609,616 | $ | 20,049,412 | |||||||||||||
| Reinvestment of Distributions | - | - | - | - | |||||||||||||||
| 479,386 | 18,109,135 | 609,616 | 20,049,412 | ||||||||||||||||
| Shares Repurchased | (413,183 | ) | (15,692,008 | ) | (974,254 | ) | (32,481,084 | ) | |||||||||||
| Net Increase (Decrease) | 66,203 | $ | 2,417,127 | (364,638 | ) | $ | (12,431,672 | ) | |||||||||||
| Class C | |||||||||||||||||||
| Shares Sold | 31,227 | $ | 990,441 | 13,228 | $ | 401,146 | |||||||||||||
| Reinvestment of Distributions | - | - | - | - | |||||||||||||||
| 31,227 | 990,441 | 13,228 | 401,146 | ||||||||||||||||
| Shares Repurchased | (29,339 | ) | (925,715 | ) | (193,554 | ) | (5,501,668 | ) | |||||||||||
| Net Increase (Decrease) | 1,888 | $ | 64,726 | (180,326 | ) | $ | (5,100,522 | ) | |||||||||||
| Class I | |||||||||||||||||||
| Shares Sold | 66,395 | $ | 3,000,276 | - | $ | - | |||||||||||||
| Reinvestment of Distributions | - | - | - | - | |||||||||||||||
| 66,395 | 3,000,276 | - | - | ||||||||||||||||
| Shares Repurchased | (22,603 | ) | (859,200 | ) | - | - | |||||||||||||
| Net Increase | 43,792 | $ | 2,141,076 | - | $ | - | |||||||||||||
77
Pacific Advisors Fund Inc.
Notes to Financial Statements (Unaudited)
June 30, 2012
Note 7. Bank Borrowings
Each Fund may borrow money to the extent permitted by the 1940 Act, as amended, or any rules, exemptions or interpretations thereunder that may be adopted, granted or issued by the SEC. Under the 1940 Act, a mutual fund may borrow up to one-third of its total assets (including the amount borrowed) from banks for any purpose, and may borrow up to 5% of its total assets from banks or other lenders for temporary purposes. Each Fund may borrow to facilitate portfolio transactions or meet redemptions. The Large Cap Value Fund, Mid Cap Value Fund, and Small Cap Value Fund also may borrow money to invest in portfolio securities. Each Fund has the ability to borrow, from UMB Bank, n.a. (UMB), on an unsecured basis, at 1.50% over the Federal Funds rate. As of June 30, 2012, the Balanced Fund and Small Cap Value Fund had borrowings from UMB with amounts of $101,688 and $250,210 respectively, and were paying interest at 1.55% per annum on their outstanding borrowings. No compensating balances are required.
78
Pacific Advisors Fund Inc.
Directors and Officers
"Independent" Directors
| Name (Age) | Position with the Company1 | Year elected Director of the Company | Principal occupation(s) during past 5 years | Other Directorships held by Director | |||||||||||||||
| L. Michael Haller, III (68) | Director | 1992 | CEO, Digital Angel, Inc. (communications equipment distributor); Consultant, d/b/a Asahi Broadcasting Enterprises (software development); Chairman and President, Gammaker Pte. Ltd. (mobile game developer); and formerly Chairman, Kapitall, Inc. (online introducing brokerage) (2011-2012); President, Bionic Games, Inc. (game software development company) (2008-2011); and Vice President and General Manager, Kapitall Studio (division of Kapitall, Inc.) (2010-2011) | None | |||||||||||||||
| Peter C. Hoffman (61) | Director | 2010 | President, Sierra Autocars, Inc. (auto dealership), Sierra Vehicles, Inc. (auto dealership), Sierra Automotive Enterprises, Inc. (auto dealership) and Sierra Pursuits, Inc. (management company) | None | |||||||||||||||
| Gerald E. Miller (82) | Director | 1992 | Retired in 1992; and formerly worked for Merrill Lynch for over 30 years and was a Senior Resident Vice President at retirement in 1992 | None | |||||||||||||||
| Louise K. Taylor, PhD (65) | Director | 1992 | Retired in 2009; and formerly Superintendent, Monrovia Unified School District (1991-2009) | None | |||||||||||||||
"Interested" Directors2
| Name (Age) | Positions with the Company1 | Year elected a Director and officer of the Company | Principal occupations during past 5 years | Other Directorships held by Director | |||||||||||||||
| Victoria L. Breen (61)* | Director Assistant Secretary | 1992 2002 | President, Derby & Derby, Inc. (financial services company); Agent, Transamerica Life Companies; Registered Principal, Transamerica Financial Advisors, Inc.; and Assistant Secretary and Director, Pacific Global Investment Management Company | None | |||||||||||||||
| George A. Henning (65)** | President and Chairman | 1992 | Chairman, President and Director, Pacific Global Investment Management Company; and Chairman and Director, Pacific Global Fund Distributors, Inc. and Pacific Global Investor Services, Inc. | None | |||||||||||||||
Each Director oversees all 6 Pacific Advisors Fund portfolios.
The Fund's Statement of Additional Information contains additional information about the Fund's Directors and Officers and is available without charge upon request by calling (800) 989-6693. The business address for all Directors and officers of the Company is 101 N. Brand Blvd., Suite 1950, Glendale, CA 91203, Attn: Secretary.
79
Pacific Advisors Fund Inc.
Directors and Officers
Other Officers
| Name (Age) | Position(s) with the Company | Year elected an officer of the Company | Principal occupations during past 5 years | ||||||||||||
| Catherine L. Henning (34) | Vice President Secretary | 2010 2006 | Senior Vice President, Secretary, Director of Client Services and Director, Pacific Global Investment Management Company; President, Secretary, Chief Compliance Officer and Director, Pacific Global Fund Distributors, Inc.; and Vice President, Secretary and Director, Pacific Global Investor Services, Inc. | ||||||||||||
| Barbara A. Kelley (59) | Vice President, Treasurer and Chief Compliance Officer | 2001 | Executive Vice President, Chief Compliance Officer and Director, Pacific Global Investment Management Company; Director, Pacific Global Fund Distributors, Inc.; President and Director, Pacific Global Investor Services, Inc. | ||||||||||||
| Araceli Olea (39) | Assistant Secretary | 2008 | Shareholder Services Manager, Pacific Global Investor Services, Inc.; and Assistant Secretary, Pacific Global Investment Management Company and Pacific Global Investor Services, Inc. | ||||||||||||
| Jingjing Yan (38) | Assistant Treasurer | 2005 | Vice President and Treasurer, Pacific Global Investment Management Company; Treasurer, Pacific Global Fund Distributors, Inc. and Pacific Global Investor Services, Inc. | ||||||||||||
1 Each director is elected to serve until the next annual shareholders meeting and until his or her successor is elected or appointed. The Company does not hold regular annual shareholders meetings to elect Directors. Vacancies on the Board can be filled by the action of a majority of the Directors, provided that at least two-thirds of the Directors have been elected by the shareholders.
2 "Interested persons" as defined in the 1940 Act, as amended, based on their affiliation with the Funds' investment manager and its affiliates (including the Funds' principal underwriter).
* Ms. Breen is considered an interested director because (a) she is a registered principal of a registered broker/dealer that engages in sales of Company shares under a selling agreement with the Distributor, and in that capacity she has received commissions on the sale of the Funds' shares; (b) she is an officer of the Company; and (c) she is a shareholder of the Manager and a member of the Manager's Board of Directors.
** Mr. Henning is considered an interested director because (a) he holds the positions described above with the Company, the Manager and its affiliates; (b) by virtue of his ownership of the Manager's shares he may be deemed a "control person" of the Manager; and (c) he is Ms. Henning's father.
80

Pacific Advisors Fund Inc.
Directors
George A. Henning, Chairman
Victoria L. Breen
L. Michael Haller, III
Peter C. Hoffman
Gerald E. Miller
Louise K. Taylor, Ph.D.
Officers
George A. Henning, President
Catherine L. Henning, Vice President and Secretary
Victoria L. Breen, Assistant Secretary
Araceli Olea, Assistant Secretary
Barbara A. Kelley, Treasurer
Jingjing Yan, Assistant Treasurer
Investment Manager
Pacific Global Investment Management Company
101 North Brand Blvd., Suite 1950
Glendale, California 91203
Transfer Agent and Administrator
Pacific Global Investor Services, Inc.
101 North Brand Blvd., Suite 1950
Glendale, California 91203
Distributor
Pacific Global Fund Distributors, Inc.
101 North Brand Blvd., Suite 1950
Glendale, California 91203
(800) 989-6693
Availability of Quarterly Portfolio Schedule
The Fund files its complete schedule of portfolio holdings with the SEC for the first and third quarters of each fiscal year on Form N-Q. The Fund's Forms N-Q are available on the SEC's Web site at http://www.sec.gov. The Fund's Forms N-Q may be reviewed and copied at the SEC's Public Reference Room in Washington, DC. Information about the operation of the Public Reference Room may be obtained by calling the SEC at (800) SEC-0330.
The Fund's complete schedule of portfolio holdings for each fiscal quarter is posted on the Fund's Web site at www.PacificAdvisorsFund.com and is available without charge, upon request by calling (800) 989-6693. Documents will be sent within 3 business days of receipt of your request.
Availability of Proxy Voting Policies and Procedures and Proxy Voting Record
A description of the policies and procedures that the Fund uses to determine how to vote proxies relating to portfolio securities and information regarding how the Fund voted proxies relating to portfolio securities during the most recent 12-month period ended June 30 is available without charge, upon request by calling (800) 989-6693. Documents will be sent within 3 business days of receipt of your request. This information is also available on the SEC's Web site at http://www.sec.gov.

Pacific Global Fund Distributors, Inc.
101 North Brand Blvd., Suite 1950
Glendale, California 91203

Item 2. | Code of Ethics |
| Not applicable for semi-annual reports. |
|
|
Item 3. | Audit Committee Financial Expert |
| Not applicable for semi-annual reports. |
|
|
Item 4. | Principal Accountant Fees and Services |
| Not applicable for semi-annual reports. |
|
|
Item 5. | Audit Committee of Listed Registrants |
| Not applicable as Registrant is not a listed issuer as defined in Rule 10A-3 under the Securities Exchange Act of 1934. |
|
|
Item 6. | Schedule of Investments |
| Schedule of Investments is included as part of the report to shareholders filed under Item 1 of this form. |
|
|
Item 7. | Disclosure of Proxy Voting Policies and Procedures for Closed-End Management Investment Companies |
| Not applicable to open-end investment companies. |
|
|
Item 8. | Portfolio Managers of Closed-End Management Investment Companies |
| Not applicable to open-end investment companies. |
|
|
Item 9. | Purchases of Equity Securities by Managers of Closed-End Management Investment Company and Affiliated Purchasers. |
| Not applicable to open-end investment companies. |
|
|
Item 10. | Submission of Matters to a Vote of Security Holders |
| No material changes have been made. |
|
|
Item 11. | Controls and Procedures. |
| (a) Based upon their evaluation of Registrant’s disclosure controls and procedures (as defined in Rule 30a-3(c) under the Investment Company Act of 1940) as conducted within 90 days of the filing date of this Form N-CSR, Registrant’s principal executive officer and principal financial officer have concluded that those disclosure controls and procedures provide reasonable assurance that the material information required to be disclosed by Registrant on this report is recorded, processed, summarized and reported within the time periods specified in the Securities and Exchange Commission’s rules and forms. |
|
|
| (b) There were no changes in Registrant’s internal control over financial reporting (as defined in Rule 30a-3(d) under the Investment Company Act of 1940) that occurred during the second fiscal quarter of the period covered by this report that have materially affected, or are reasonably likely to materially affect, Registrant’s internal control over financial reporting. |
|
|
Item 12. | Exhibits |
| (a)(1) Not applicable. |
|
|
| (a)(2) Certifications required by Item 12(a) of Form N-CSR and Section 302 of the Sarbanes-Oxley Act of 2002 (filed herewith). |
|
|
| (a)(3) Not applicable. |
|
|
| (b) Certification required by Section 906 of the Sarbanes-Oxley Act of 2002 (filed herewith). |
SIGNATURES
Pursuant to the requirements of the Securities Exchange Act of 1934 and the Investment Company Act of 1940, Registrant has duly caused this report to be signed on its behalf by the undersigned, thereunto duly authorized.
Pacific Global Fund Inc. d/b/a Pacific Advisors Fund Inc.
By: | /s/ George A. Henning |
|
| George A. Henning | |
| Chairman, Pacific Advisors Fund Inc. | |
|
| |
Date: | September 4, 2012 | |
Pursuant to the requirements of the Securities Exchange Act of 1934 and the Investment Company Act of 1940, this report has been signed below by the following persons on behalf of Registrant and in the capacities and on the dates indicated.
By: | /s/ George A. Henning |
|
| George A. Henning | |
| Chief Executive Officer | |
|
| |
Date: | September 4, 2012 | |
|
| |
By: | /s/ Barbara A. Kelley |
|
| Barbara A. Kelley | |
| Chief Financial Officer | |
|
| |
Date: | September 4, 2012 | |