UNITED STATES
SECURITIES AND EXCHANGE COMMISSION
Washington, D.C. 20549
FORM N-CSR
CERTIFIED SHAREHOLDER REPORT OF REGISTERED
MANAGEMENT INVESTMENT COMPANIES
Investment Company Act file number | 811-07062 | |||||||
| ||||||||
PACIFIC GLOBAL FUND INC. D/B/A PACIFIC ADVISORS FUND INC. | ||||||||
(Exact name of registrant as specified in charter) | ||||||||
| ||||||||
101 NORTH BRAND BLVD., SUITE 1950 GLENDALE, CALIFORNIA |
| 91203 | ||||||
(Address of principal executive offices) |
| (Zip code) | ||||||
| ||||||||
GEORGE A. HENNING 101 NORTH BRAND BLVD., SUITE 1950 GLENDALE, CA 91203 | ||||||||
(Name and address of agent for service) | ||||||||
| ||||||||
Registrant’s telephone number, including area code: | 818-242-6693 |
| ||||||
| ||||||||
Date of fiscal year end: | December 31 |
| ||||||
| ||||||||
Date of reporting period: | June 30, 2015 |
| ||||||
Item 1. Report to Shareholders
Filed herewith.

semi-annual report
june 30, 2015
government securities fund
income and equity fund
balanced fund
large cap value fund
mid cap value fund
small cap value fund


Pacific Advisors
table of contents
Message from the Chairman | 1 | ||||||
Government Securities Fund | 4 | ||||||
Income and Equity Fund | 8 | ||||||
Balanced Fund | 13 | ||||||
Large Cap Value Fund | 18 | ||||||
Mid Cap Value Fund | 22 | ||||||
Small Cap Value Fund | 27 | ||||||
Schedule of Investments | 33 | ||||||
Statement of Assets and Liabilities | 54 | ||||||
Statement of Operations | 56 | ||||||
Statement of Changes in Net Assets | 58 | ||||||
Financial Highlights | 62 | ||||||
Notes to Financial Statements | 69 | ||||||
Directors and Officers | 79 | ||||||
This Report is submitted for the general information of the shareholders of Pacific Advisors Funds. It is not authorized for distribution to prospective investors unless accompanied or preceded by the Funds' current prospectus, which contains information concerning the investment policies of the Funds as well as other pertinent information.
This Report is for informational purposes only and is not a solicitation or recommendation that any particular investor should purchase or sell any particular security. The statements in the Chairman's Letter and the discussions of the Funds' performance are the opinions and beliefs expressed at the time of this commentary and are not intended to represent opinions and beliefs at any other time. These opinions are subject to change at any time based on market or other conditions and are not meant as a market forecast. All economic and performance information referenced is historical. Past performance does not guarantee future results.
For more information on the Pacific Advisors Funds, including information on charges, expenses and other classes offered, please obtain a copy of the prospectus by calling (800) 989-6693. Please read the prospectus and consider carefully the investment risks, objectives, charges and expenses before you invest or send money. Shares of the Pacific Advisors Funds are not deposits or obligations of any bank, are not guaranteed by any bank, are not insured by the FDIC or any other agency, and involve investment risks, including the possible loss of the principal amount invested. The investment return and principal value of an investment will fluctuate so that an investor's shares, when redeemed, may be worth more or less than their original cost.


Message
from the chairman
Dear Shareholders,
"Is the glass half full or half empty?" Many investors seemed unable to look beyond the headlines during the first half of the year. Following a lackluster first quarter, stocks began to recover as the European Central Bank initiated quantitative easing, the U.S. economy rebounded, and energy prices began to show signs of stabilizing. Momentum stalled in late June, however, as world news took center stage. Stocks traded within a narrow range; through June, the 6.7% price range in the S&P 500® Index was the smallest differential in 20 years. Weak trading volumes further underscored the lack of conviction as investors opted for a 'wait-and-see' approach.
Several factors, including severe weather, the West Coast ports strike, and the strengthening dollar influenced the U.S. markets in the first quarter. The underlying strength of the U.S. economy began to emerge in the second quarter. Consumer spending in May rose at the fastest pace since August 2009, and consumer sentiment in June reached its second highest level since January 2007. The housing sector re-emerged as a growth engine, while the U.S. auto industry is on pace for its strongest sales year since 2005. And, during the first six months of the year, merger and acquisitions activity in the U.S. hit an all-time record.
In its June meeting, the Federal Reserve decided to keep interest rates unchanged while upgrading its assessment of the economy, noting in particular improved labor market conditions. The modest increase in the Consumer Price Index readings indicated that the stronger employment numbers have not yet led to inflation. Fed Chair Janet Yellen indicated that the first interest rate increase since the "Great Recession" will likely occur later in the year.
Internationally, the European and Japanese economies grew modestly while China's GDP, at near 7%, continued. Not surprisingly, month-to-month variations, as China transitions from an export-driven to a consumer-driven economy, have led to concerns of a slowdown. And, frenzied selling in the Chinese stock markets, following an equally dramatic 150% gain since July 2014, led to worries about containment. More recently, markets have been fixated on China's decision to loosen the yuan's daily exchange rate tie to the U.S. dollar. Due to the dollar's recent strength, which has effectively raised prices for China's exports, many analysts had anticipated a devaluation at some point. Also, China has been positioning the yuan to join the dollar, the euro, the yen and the pound as an 'official reserve currency'; the inclusion of market forces in determining the yuan's value is a prerequisite. Yet despite the near-term focus on the yuan's relevance to the health of the Chinese economy, we view the devaluation as a necessary and predictable action as the country seeks to integrate into the world marketplace.
The Greek debt drama, though, eclipsed all other matters. Near the end of June, Greek voters rejected the creditors' funding offer in exchange for various budget reforms. Greek banks and the stock market had closed due to lack of liquidity. A Greek default and subsequent exit from the euro zone looked increasingly likely; and, even though Greece represents only a minor contribution to Europe's GDP, a Grexit nevertheless created uncertainty for the European and global economies. The unfolding drama coupled with concerns about an interest rate increase in the U.S. and a potential slowdown in China overshadowed positive data. Investors largely chose to remain on the sidelines until the impact of these events became clearer.
Market Review
The broader markets1 struggled to move higher in the second quarter; the S&P 500® gained just 0.3% and the Dow Jones Industrial Average fell 0.3%. The technology-heavy NASDAQ rose 2.0% to extend its relative outperformance from the first quarter. The Russell Midcap® Index fell 1.5% while the Russell 2000® Index of small companies gained 0.4%.
Interest rates trended higher; the yield on the 10-year U.S. Treasury Note increased from 1.94% to 2.50%, the highest level since September 2014, before ending the quarter at 2.35%. Yields on investment grade corporate bonds rose further as the spread between corporate and government bond yields expanded to its widest level since June 2013.
Market Review • June 30, 2015
Index1 | Close | YTD Return | |||||||||
Dow Jones Industrial Avg | 17,619.51 | 0.03 | % | ||||||||
S&P 500® | 2,063.11 | 1.23 | % | ||||||||
NASDAQ | 4,986.87 | 5.99 | % | ||||||||
Russell 2000® (small cap) | 1,689.26 | 4.75 | % | ||||||||
06/30/15 | 06/30/14 | ||||||||||
| 10-Year T-Note Yield | 2.35 | % | 2.53 | % | |||||||
Data: Bloomberg; Russell Investments; Federal Reserve. Returns include reinvested dividends.
1


Message
from the chairman continued
Equity Investment Review
Through June, growth has significantly outpaced value; the Russell 3000® Growth Index has gained 4.3% while the Russell 3000® Value Index has lost 0.5%.1 The considerable differential stems primarily from Information Technology and Health Care. These sectors have outperformed the broader market; more importantly, they account for 47% of the Growth Index compared to just 23% of the Value Index. Strong demand for high-growth companies has driven up technology valuations, while mergers and acquisition activity has led to a speculative surge in health care stocks. Large cap stocks experienced more modest appreciation as the stronger dollar reduced revenue and earnings from their international operations. The strong dollar had less impact on most mid- and small cap stocks as they tend to have more limited international exposure.
Financials rose as expectations for rising interest rates and a strengthening economy supported banks and insurers. Amongst consumer-related stocks, auto sales led the way with particularly strong increase in the sale of SUVs and pickup trucks due to lower gas prices. Meanwhile, Industrials lagged; low energy prices curtailed manufacturing and transportation activity. Also, severe winter weather, West Coast ports strike, and suppressed export activity due to the strengthening dollar subdued investor interest in transportation, machinery, and construction-related stocks. Energy stocks recovered somewhat in the second quarter as preliminary signs of sector stabilization emerged. The number of active land drilling rigs in the U.S., which had fallen over 55% from November 2014 through April 2015, began to level out by the end of June. At the same time, significantly reduced investments in new and existing oil fields around the world will curtail future global supply growth. Once oil supply and demand rebalances, we expect market prices to anticipate improving industry fundamentals; Energy holdings would then be poised for recovery from heavily discounted levels.
Our equity strategy since "The Great Recession" has anticipated moderate economic expansion. This assumption acknowledges various ebbs and flows due to geopolitical or financial events. Nevertheless, over the longer-term, well-managed companies will be positioned to pursue business development initiatives. More in-depth information about our equity strategies for our Funds is provided in the discussions that follow.
Fixed Income Investment Review
Interest rates reversed the trend of the previous five quarters when U.S. Treasuries recorded higher end-of-quarter yields. Investment-grade corporate bond yields rose as well in response to mounting evidence of economic expansion in the U.S., Europe and Asia and the growing expectation for the Fed to initiate an increase to the fed funds rate before the end of the year.
In the near-term, interest rates may remain volatile as investors anticipate the Fed's first rate increase since 2008. Fed Chair Janet Yellen has reiterated that interest rate increases will be undertaken only if the U.S. and global economies are healthy enough to support higher borrowing costs. The eventual move should, therefore, be viewed positively as the decision will signal confidence in the U.S. and other regions.
Our investment strategy has remained focused on shorter-term fixed income investments to protect principal as interest rates increase. In the near-term, we are accepting lower yields to provide the flexibility to reinvest in higher yielding fixed income assets over time. A further discussion of our fixed income strategies is provided in the discussions for our Funds following this letter.
Looking Ahead
Investors may be dismayed by the lack of market movement thus far in 2015; yet, we have seen similar patterns in recent years. In 2010, for example, as investors fretted over the European debt crisis, the S&P 500® fell 7.9% during the first half of the year. Then, following the creation of the European Financial Stability Facility, markets rallied 22.0% over the final six months of the year. Similarly, in 2012, when a potential unraveling of the euro preoccupied investors, the S&P 500® gained only 1.6% through the beginning of June. Then, following the ECB's announcement to do "whatever it takes" to support the euro zone, markets rallied 11.6% over through the end of the year.
This year, investors have fixated on the Greek bailout negotiations and the timing of the Fed's interest rate increase. Since the Greek referendum, events have come full circle with the government approving a bailout proposal that largely accepts creditor demands; negotiations will begin towards a resolution which provides on-going monetary support.
2


The World Bank's most recent update anticipates 2.8% global growth in 2015 and 3.3% in 2016. Europe continues to mend with a 1.0% gain in the first quarter, its sixth consecutive quarter of positive GDP; Spain's 2.7% GDP led the region's recovery. The U.S. economy is gaining momentum. Steady employment gains, positive consumer sentiment and spending point to improving conditions. The housing market, which has lagged the overall recovery, is emerging as a growth leader; an increase in first-time buyers and more accommodative credit terms are supporting sales activity. Also, business activity, capital expansion projects, and mergers and acquisition deals, suggest increased confidence in the overall economy.
Oil prices have come under pressure amid concerns over excess supply and the potential lifting of sanctions against Iran. Yet, a leading reservoir company expects natural depletion to reduce global crude production over the next year; also, the dramatic reduction of rig counts in the U.S. and abroad will also impact production. And, the push for all-out production in Russia, Mexico and Venezuela resulted in underinvestment in their oil fields; in the absence of new supply, production levels will inevitably decline. Furthermore, only six new sizeable projects moved forward in 2014, 30% of the previous decade's average. Meanwhile, global demand remains strong; through June, China's oil purchases are up 5.7%, including a 3.5% increase in June.
Geopolitics and the energy bear market have dominated the financial headlines over the first half of the year. In the absence of positive momentum, many investors have taken a 'wait-and-see' approach. As a result, stock valuations remain depressed, in many cases, significantly so. Our strategy focuses on long-term investments in quality companies with industry leading products and services; during periods of market uncertainty, we look for opportunities to invest at significant discounts. We see ample evidence that the global economy will expand at a modest rate. The performance of the markets in 2010 and 2012 provide a reminder that markets can move quickly as sentiment improves. In anticipation of such times, the conviction to position portfolios for early gains as market conditions improve can provide rewards over the long term.
Sincerely,

George A. Henning
1 The Dow Jones Industrial Average is an unmanaged, price weighted measure of 30 U.S. stocks selected by the Averages Committee to represent the performance of all U.S. stocks outside the Transportation and Utilities sectors. The S&P 500® Index is an unmanaged, market capitalization weighted index which measures the performance of the large cap segment of the U.S. equities market, covering approximately 75% of the U.S. equities market. The Index includes 500 leading companies in leading industries of the U.S. economy. The NASDAQ Composite Index is an unmanaged, market capitalization weighted measure of all domestic and international common stocks (currently over 3,000 stocks) listed on The Nasdaq Stock Market. The Russell 2000® Index is an unmanaged, market-weighted measure of the 2,000 smallest publicly traded companies of the Russell 3000® Index. The Russell Midcap® Index is an unmanaged, weighted measure of the 800 smallest companies within the Russell 1000® Index based on a combination of their market cap and current index membership. The Russell 3000® Growth and Value Indices measure the performance of the broad growth and value segments, respectlively, of the U.S. equity universe. The Russell 3000® Growth Index includes those Russell 3000® companies with higher price-to-book ratios and higher forecasted growth values. The Russell 3000® Value Index includes those Russell 3000 companies with lower price-to-book ratios and lower forecasted growth values. The Russell 3000® Index measures the performance of the largest 3,000 U.S. companies representing approximately 98% of the investable U.S. equity market. These indices are not available for direct investment. Index returns assume the reinvestment of dividends.
Economic and performance information referenced is historical and past performance does not guarantee future results. The principal value and return of an investment will fluctuate so that an investor's shares may be worth less than the original cost when redeemed. For more information on the Pacific Advisors Funds, including information on charges, expenses and other classes offered, please obtain a copy of the prospectus by calling (800) 989-6693. Please read the prospectus and consider carefully the investment risks, objectives, charges and expenses before you invest or send money.
Shares of the Funds are not deposits or obligations of any bank, are not guaranteed by any bank, are not insured by the FDIC or any other agency, and involve investment risks, including the possible loss of the principal amount invested. The views expressed represent the opinions and beliefs at the time of this commentary and are not meant as a market forecast. These views are subject to change at any time based on market or other conditions. This information may not be relied on as investment advice or as an indication of trading
3
Pacific Advisors
Government Securities Fund
Fund Objective: High current income, preservation of capital, and rising future income consistent with prudent investment risk.
Investment Invests at least 80% of its assets in U.S. Government fixed income
Strategy: securities. These include securities issued or guaranteed by the U.S. Treasury; issued by a U.S. Government agency; or issued by a Government-Sponsored Enterprise (GSE). May also invest in high quality dividend-paying common stocks.
Investor Profile: Conservative. Income-focused; capital preservation aim.
TOTAL RETURNS | EXPENSE RATIOS1 | ||||||||||||||||||||||||||
For the six months ended June 30, 2015 | Current | Prospectus | |||||||||||||||||||||||||
Net | Gross | Net | Gross | ||||||||||||||||||||||||
Class A | –1.75 | % | Class A | 3.89 | % | 7.00 | % | 3.50 | % | 6.37 | % | ||||||||||||||||
Class C | –2.06 | % | Class C | 4.60 | % | 7.71 | % | 4.23 | % | 7.09 | % | ||||||||||||||||
Barclays Capital U.S. Int T-Bond Index2 | 0.82 | % | |||||||||||||||||||||||||
Performance quoted is past performance which does not guarantee future results. Current performance may be higher or lower than the performance quoted. Call (800) 989-6693 for performance current to the most recent month-end. The investment return and principal value of an investment will fluctuate so that an investor's shares, when redeemed, may be worth more or less than their original cost. Returns represent the change in value over the stated period assuming reinvestment of dividends and capital gains at net asset value. Rankings shown are for Class A shares; rankings for other share classes may be different. Returns and rankings do not take into account the maximum 4.75% sales charge on Class A shares or the 1% Contingent Deferred Sales Charge (CDSC) for Class C shares sold within one year of purchase. Returns would be lower if the applicable sales charge and CDSC were included. Returns do not take into account individual taxes which may reduce actual returns when shares are sold.
The Fund's investment adviser is waiving a portion of its management fees pursuant to an Expense Limitation Agreement. The waiver may be discontinued at any time with ninety days written notice in consultation with the Fund's board, but is expected to continue at current levels. Please see the Notes to Financial Statements in this report for details. Performance shown reflects the waiver, without which the results would have been lower.
Discussion with Portfolio Manager August 24, 2015
Jingjing Yan, CFA
Please see the Chairman's Letter at the beginning of this Report for a detailed market and economic review
as well as the Manager's general market outlook.
Fund Performance
The Fund's investment strategy is to manage interest rate risk for long-term and short-term investors who seek principal protection. In response to the slow economic recovery, the extended period of low interest rates and uncertainty surrounding the Federal Reserve's timeline for interest rate increases, the Fund's fixed income investments were concentrated in short-to-intermediate-term bonds.
For the first half of the year, Class A shares of the Fund returned -1.75% compared to 0.82% for its benchmark, the Barclays Capital U.S. Intermediate T-Bond Index. However, unlike the Fund, the benchmark is an unmanaged portfolio. Furthermore, the Index's longer average duration reveals a substantially greater exposure to principal loss as interest rates rise.
During the period, the Fund maintained an average duration below 1 year which contrasts with the benchmark's average duration of 3.7 years. Duration measures a portfolio's sensitivity to interest rate
1 "Current" expense ratio as of 06/30/15. "Prospectus" expense ratio is for the fiscal year ended 12/31/14.
2 The Barclays Capital U.S. Intermediate Treasury Bond Index is an unmanaged index of U.S. government securities with one to ten years to maturity. It is not possible to invest directly in the Index.
4
movements; when rates increase by 1%, a portfolio with a 5-year duration would decrease by approximately 5%. As demonstrated by the Fund's short average duration, we remained committed to minimizing the negative effects of rising interest rates on bond portfolios. The Fund's strategy provides price stability as well as flexibility to respond to investment opportunities that may arise.
The Fund's portfolio includes a small allocation to common stocks; these equities contribute to total return by providing dividend income and the potential for price appreciation. The Fund invests in high-quality, dividend-paying securities which help curtail volatility by counteracting price changes in U.S. government securities holdings.
Market Overview
Early in the period, interest rates defied expectations by falling as signs of an economic slowdown increased demand for "safe haven" investments. The yield on the 10-year U.S. Treasury Note, which ended the 2014 at 2.17%, fell as low as 1.68% at the end of January.
In the second quarter, Treasury yields rose as emerging evidence of a rebound raised expectations that the Fed might increase interest rates before year-end. Towards the end of the period, uncertainty surrounding the Greek debt crisis added volatility in fixed income markets as investors vacillated between hope of a resolution and fear of Greece's exit from the euro. The prospect of a third bailout that would keep Greece in the euro placed upward pressure on rates. In early June, the yield on the 10-year U.S. Treasury Note rose to 2.50%, its highest level since September 2014, before dropping to 2.35% at the end of June. The higher rates at the end of the second quarter reversed the trend of the previous five quarters when the 10-year U.S. Treasury Note recorded higher end-of-quarter yields.
In acknowledging the Fed's intention of raising rates, the Fund maintained its strategy of investing in shorter-term bonds which offer protection in a rising rate environment; specifically, the Fund's government security holdings are agency bonds with a "step-up" feature of predetermined interest rate increases. The Fund's strategy in managing the risk of principal loss as interest rates increase is similar to its strategy in 2013; then, the Fund also maintained a shorter average maturity in anticipation of higher interest rates as the economy improved. When interest rates did, in fact, increase, Fund performance quickly rebounded.
Fund Strategy
Fixed Income Strategy
The Fund invested over 80% of its assets in U.S. government agency bonds. These securities, which have higher coupon rates than U.S. Treasuries, enabled the Fund to generate additional income without significantly increasing risk. The Fund invested in callable government agency bonds with short-to-intermediate maturities; these bonds offer higher coupon rates than non-callable bonds because their issuing agencies are allowed to buy back, or "call," the bonds before maturity. To capture higher yields, the Fund invested in bonds maturing in three- to five-year callable bonds that also included a "step-up" feature. Yields for step-up bonds increase at fixed intervals if they are not called back on the predefined call dates; furthermore, as interest rates rise, they will preserve their value better than fixed-rate government securities with comparable maturities. We believed that, given the low interest rate environment, these bonds would be called back within a year. Indeed, all of these bonds were called; we reinvested the proceeds in other government agency securities with similar call and step-up features.
The Fund does not utilize higher-risk strategies to enhance return. For example, the Fund does not purchase bonds with extended durations, use leverage strategies, or invest in mortgage-backed securities. Also, the Fund, while acknowledging that higher yields may be obtained by investing in bonds with longer durations, determined that the long-term risk tradeoff of higher yields versus falling prices is not favorable.
5
Pacific Advisors
Government Securities Fund
Equity Positioning
The Fund invests a small portion of its portfolio in high-quality, dividend-paying common stocks; as of year-end, approximately 17% of the Fund's assets were invested in these securities. Yet, these holdings provided important opportunities for long-term price appreciation to offset the low interest rates on short-to-intermediate-term U.S. government securities. Equity investments focus on stocks that are less sensitive than the overall market to economic developments; in addition, they provide attractive dividends and appreciation potential. As of the end of June, the 3.74% average dividend yield of the Fund's equity holdings far surpassed the yield on the 10-year U.S. Treasury Note of 2.35%. These blue-chip stocks offer stability by counterbalancing price movements in the fixed income markets without materially increasing the Fund's exposure to risk. We anticipate that, as interest rates rise, the Fund may reduce its allocation to equities and reposition the portfolio toward longer-term U.S. government securities.
Several Fund holdings3, including Eli Lilly, AT&T and Unilever, had strong performance as investors preferred the more conservative areas of the equity market. During the period, the Fund took profits in McDonald's.
Looking Ahead
The Fed's guidance and eventual actions to increase short-term interest rates will continue to strongly influence the markets. Several factors, including wage growth at home and the impact of higher interest rates on the global economy, will affect the schedule and pace of the Fed's "liftoff" policy. Additionally, market forces in response to geopolitical concerns and economic growth will likely influence longer-term rates separate and apart from any Fed actions. Regardless, the Fed's eventual move to raise short-term interest rates should be viewed positively; the return to a more normal interest rate environment will reflect the Fed's confidence in the U.S. and world economies. A shift in the interest rate environment should pressure conservative investors to reconsider their willingness to hold longer-term bonds as interest rates increase.
The Fund will continue utilizing the conservative strategy of investing in short-to-intermediate-term U.S. government securities while monitoring opportunities to reinvest in suitable higher-yielding government bonds as interest rates increase. Over time, as interest rates trend higher, the Fund's portfolio will migrate toward longer-term U.S. government securities. The Fund's flexibility to adjust holdings according to economic and market conditions positions the Fund to successfully manage an upward trend in rates and provide improved performance.
Portfolio Holdings as of 06/30/15 (Based on Total Investments)
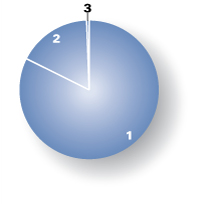
1. | U.S. Government Agencies | 82.75 | % | ||||||||
2. | Equities | 17.09 | % | ||||||||
3. | Cash and Cash Equivalents | 0.16 | % | ||||||||
3 For detailed information on Fund holdings, please see the Fund's Schedule of Investments in this Report.
6
Expense Examples
As a shareholder of the Fund you incur two types of costs: (1) transaction costs, including sales charges (loads) on purchase payments, reinvested dividends, or other distributions; redemption fees; and exchange fees; and (2) ongoing costs, including management fees; distribution (12b-1) fees; and other Fund expenses. This Example is intended to help you understand your ongoing costs (in dollars) of investing in the Fund and to compare these costs with the ongoing costs of investing in other mutual funds.
The Example is based on an investment of $1,000 invested at the beginning of the period and held for the entire period from January 1, 2015 through June 30, 2015.
Actual Expenses
The first line of the table below provides information about actual account values and actual expenses. You may use the information in this line, together with the amount you invested, to estimate the expenses that you paid over the period. Simply divide your account value by $1,000 (for example, an $8,600 account value divided by $1,000 = 8.6), then multiply the result by the number in the first line under the heading entitled "Expenses Paid During the Period" to estimate the expenses you paid on your account during the period.
The following transaction costs are not included in the expenses shown in the table and, if applicable, would increase the expenses that you paid over the period: (1) a front-end sales charge (load) of 4.75% on Class A shares; (2) a 2% redemption fee if you sell or exchange shares within 30 days of purchase, with certain exceptions. The redemption fee does not apply to: (a) redemptions under an automatic withdrawal program or periodic asset reallocation plan, required minimum distributions (RMD), employer mandated distributions from a qualified plan, or redemptions under a qualified domestic relations order (QDRO); (b) redemptions to pay for expenses related to terminal illness, extended hospital or nursing home care, or other serious medical conditions, including death; (c) redemptions of shares acquired through dividend or capital gains reinvestments; (d) loans from a qualified plan account; and (e) redemptions initiated by the Fund; and (3) a $10 service fee on each exchange after the first five exchanges in each calendar year.
The following ongoing costs are not included in the expenses shown in the table and, if applicable, would increase the expenses that you paid over the period: (1) a $12 low balance fee on accounts with balances of less than $250 as of September 30th of each calendar year and no investment activity (excluding reinvestment of dividends and/or capital gains) during the prior calendar year or the first nine months of the current calendar year. This fee does not apply to IRAs, qualified plan accounts, or Coverdell Education Savings Accounts; (2) a $15 annual custodial fee on IRAs, SEPs, SIMPLE IRAs, and Coverdell Education Savings Accounts; and (3) a $20 annual custodial fee on 403(b) accounts.
Hypothetical Example for Comparison Purposes
The second line of the table below provides information about hypothetical account values and hypothetical expenses based on the Fund's actual expense ratio and an assumed rate of return of 5% per year before expenses, which in not the Fund's actual return. The hypothetical account values and expenses may not be used to estimate the actual ending account balance or expenses you paid for the period. You may use this information to compare the ongoing costs of investing in the Fund and other funds. To do so, compare this 5% hypothetical example with the 5% hypothetical examples that appear in the shareholder reports of the other funds.
The following transaction costs are not included in the expenses shown in the table and, if applicable, would increase the expenses that you paid over the period: (1) a front-end sales charge (load) of 4.75% on Class A shares; (2) a 2% redemption fee if you sell or exchange shares within 30 days of purchase, with certain exceptions. The redemption fee does not apply to: (a) redemptions under an automatic withdrawal program or periodic asset reallocation plan, required minimum distributions (RMD), employer mandated distributions from a qualified plan, or redemptions under a qualified domestic relations order (QDRO); (b) redemptions to pay for expenses related to terminal illness, extended hospital or nursing home care, or other serious medical conditions, including death; (c) redemptions of shares acquired through dividend or capital gains reinvestments; (d) loans from a qualified plan account; and (e) redemptions initiated by the Fund; and (3) a $10 service fee on each exchange after the first five exchanges in each calendar year.
The following ongoing costs are not included in the expenses shown in the table and, if applicable, would increase the expenses that you paid over the period: (1) a $12 low balance fee on accounts with balances of less than $250 as of September 30th of each calendar year and no investment activity (excluding reinvestment of dividends and/or capital gains) during the prior calendar year or the first nine months of the current calendar year. This fee does not apply to IRAs, qualified plan accounts, or Coverdell Education Savings Accounts; (2) a $15 annual custodial fee on IRAs, SEPs, SIMPLE IRAs, and Coverdell Education Savings Accounts; and (3) a $20 annual custodial fee on 403(b) accounts.
Please note that the expenses shown in the table are meant to highlight your ongoing costs only and do not reflect any transactional costs, such as sales charges (loads), redemption fees, or exchange fees. Therefore, the second line of the table is useful in comparing ongoing costs only, and will not help you determine the relative total costs of owning different funds. In addition, if these transactional costs were included, your costs would have been higher.
| Beginning Account Value 01/01/15 | Ending Account Value 06/30/15 | Expense Paid During Period 01/01/15 – 06/30/15 | |||||||||||||
Government Secs Fund Class A | |||||||||||||||
Actual | $ | 1,000.00 | $ | 982.50 | $ | 19.12 | |||||||||
Hypothetical (5% return before expense) | $ | 1,000.00 | $ | 1,005.50 | $ | 19.34 | |||||||||
Government Secs Fund Class C | |||||||||||||||
Actual | $ | 1,000.00 | $ | 979.40 | $ | 22.58 | |||||||||
Hypothetical (5% return before expense) | $ | 1,000.00 | $ | 1,001.98 | $ | 22.83 | |||||||||
3 Expenses are equal to the Fund's annualized expense ratio, net of expense waivers, of 3.89% for Class A shares and 4.60% for Class C shares, multiplied by the average account value over the period, multiplied by 181/365 days to reflect the one-half year period.
7
Pacific Advisors
Income and Equity Fund
Fund Objective: Current income and, secondarily, long-term capital appreciation.
Investment Invests primarily in investment grade U.S. corporate bonds and in dividend-paying
Strategy: stocks.
Investor Profile: Conservative. Some current income required; capital preservation aim.
TOTAL RETURNS | EXPENSE RATIOS1 | ||||||||||||||||||||||||||
For the six months ended June 30, 2015 | Current | Prospectus | |||||||||||||||||||||||||
Net | Gross | Net | Gross | ||||||||||||||||||||||||
Class A | –1.64 | % | Class A | 2.23 | % | 2.98 | % | 1.91 | % | 2.66 | % | ||||||||||||||||
Class C | –2.01 | % | Class C | 2.98 | % | 3.73 | % | 2.66 | % | 3.41 | % | ||||||||||||||||
Barclays Capital U.S. Int Corp Bond Index2 | 0.79 | % | |||||||||||||||||||||||||
S&P 500® Index3 | 1.23 | % | |||||||||||||||||||||||||
Performance quoted is past performance which does not guarantee future results. Current performance may be higher or lower than the performance quoted. Call (800) 989-6693 for performance current to the most recent month-end. The investment return and principal value of an investment will fluctuate so that an investor's shares, when redeemed, may be worth more or less than their original cost. Returns represent the change in value over the stated period assuming reinvestment of dividends and capital gains at net asset value. Rankings are shown for Class A shares; rankings for other share classes may be different. Returns and rankings do not take into account the maximum 4.75% sales charge on Class A shares or the 1% Contingent Deferred Sales Charge (CDSC) for Class C shares sold within one year of purchase. Returns would be lower if the applicable sales charge and CDSC were included. Returns do not take into account individual taxes which may reduce actual returns when shares are sold.
The Fund's investment adviser is waiving a portion of its management fees pursuant to an Expense Limitation Agreement. The waiver may be discontinued at any time with ninety days written notice in consultation with the Fund's board, but is expected to continue at current levels. Please see the Notes to Financial Statements in this report for details. Performance shown reflects the waiver, without which the results would have been lower.
Discussion with Portfolio Managers August 24, 2015
Charles Suh, CFA
Jingjing Yan, CFA
Please see the Chairman's Letter at the beginning of this Report for a detailed market and economic review as well as the Manager's general market outlook.
Fund Performance
For the first six months of 2015, Class A shares declined 1.64%. After a lackluster first quarter, investors seemed unable to look beyond the headlines during the second quarter. The Fund's fixed income and equity holdings reflected geopolitical concerns, the market's fixation on Federal Reserve policy and the expected timing of the Fed's first interest rate increase since 2008. The first quarter slowdown in the U.S. economy seemed to support those who expected the Fed to delay raising rates; however, the rebound in the second quarter hastened expectations for a policy "liftoff" prior to the end of the year. As a result, the yield on the benchmark 10-year Treasury Note, which had fallen from 2.17% at the start of
1 "Current" expense ratio is annualized for the year-to-date as of 06/30/15. "Prospectus" expense ratio is for the fiscal year ended 12/31/14.
2 The Barclays Capital U.S. Intermediate Corporate Bond Index is an unmanaged index of publicly issued investment grade U.S. corporate bonds with one to ten years to maturity. It is not possible to invest directly in the Index.
3 The S&P 500® Index is an unmanaged, market capitalization weighted index which measures the performance of the large cap segment of the U.S. equities market, covering approximately 75% of the U.S. equities market. The Index includes 500 leading companies in leading industries of the U.S. economy. Index returns assume the reinvestment of dividends, but, unlike the Fund's returns, do not reflect the effects of management fees or expenses. It is not possible to invest directly in the Index.
8
the year to 1.68% in late January, rose to 2.50% in early June and ended the quarter at 2.35%. The spread between corporate and government bonds widened to its highest level since 2013. Stocks traded within a narrow range; through June, the 6.7% price range in the S&P 500® Index was the smallest differential in 20 years. Weak trading volumes further underscored the lack of conviction as investors opted for a wait-and-see approach. The leading market sectors during the period were growth-oriented health care and technology stocks rather than the more conservative, high-dividend stocks which outperformed in 2014.
Despite the challenging start to 2015, the Fund remains well-positioned for rising interest rates. Fixed income holdings are concentrated among short-to-intermediate-term investment-grade bonds. These conservative debt securities offer price protection during periods of pronounced volatility; in addition, they preserve their valuations better than longer-term bonds as interest rates increase. The average duration of the Fund's fixed income holdings, at 1.94 years, reflects our priority of protecting principal against volatility and rising rates. In contrast, the Fund's fixed income benchmark, the Barclays Capital U.S. Intermediate Corporate Bond Index, an unmanaged bond portfolio, maintained an average duration of 4.42 years which represents a greater risk of principal loss as rates move higher. Likewise, the Fund's equity holdings focus on 30 to 40 high-quality, dividend-paying stocks with stable growth patterns and low volatility. In contrast, the Fund's equity benchmark, the S&P 500® Index, consists of companies across a broad range of quality, risk factors and volatility. The market capitalization of the Fund's equity holdings are, on average, approximately three times4 the average for companies in the Index; this substantial size variance highlights a fundamental difference between the Fund and the Index.
The Fund's fixed income and equity portfolios differ from their respective benchmarks; nevertheless, Fund performance is best compared to a blended return based on the two benchmarks. For the six-month period, the Fund's blended return5 for Class A shares was 1.00%. Importantly, the Fund maintained significantly lower volatility than the overall market as demonstrated by its one-year beta6 of 0.40, as of June 30th, versus the S&P 500® Index.
Fund Strategy
The Fund actively manages the allocation between fixed income and equity holdings to create a risk-appropriate portfolio with the most attractive opportunities for both income and capital appreciation. The Fund seeks investment-quality bonds that offer current income and principal protection. In addition, the Fund invests in a diverse selection of dividend-paying, blue-chip stocks. This equity approach has been an important contributor to Fund performance during the long period of low interest rates since the dividend yields for portfolio stocks were often higher than the yields on corporate bonds issued by those same companies. We anticipate that the Fund's allocation to equities may decrease as interest rates rise and we reinvest capital in bonds with prevailing higher yields.
During the first half of 2015, interest rates fluctuated in response to economic and geopolitical developments. U.S. economic growth stalled in the first quarter as a result of harsh winter weather, the West Coast ports disruption, a stronger dollar, and continued declines in energy-related activity. Bond yields fell as investors sought out the safe havens of government and investment-grade corporate debt. Many seemed to interpret the economic weakness early in the year as confirmation that the Fed would wait an extended period before raising interest rates. The 2-year Treasury bill, which closely tracks the official Fed Funds Rate, peaked at 0.725% in early March before dropping to 0.486% a month later as soft first quarter economic data were released. Yields began to rise again in late April as evidence of a second quarter rebound emerged; employment and housing data, in particular, pointed to economic strengthening that supported expectations for a rate hike as early as September. The upward trend in
4 As of 06/30/15, the median market cap was $115.2 billion for the Fund and $39.4 billion for the S&P 500® Index.
5 Blended return calculated from the benchmark index returns based on ratio of stocks to fixed-income securities in the Fund's portfolio as of the end of the period.
6 "Beta" measures volatility relative to the stock market or an alternative benchmark. A beta less than 1.0 indicates lower risk than the market or the benchmark; a beta greater than 1.0 indicates higher risk than the market or the benchmark.
9
Pacific Advisors
Income and Equity Fund continued
yields, though, faltered in June when the Greek bailout negotiations dominated headlines and reignited "safe haven" demand for bonds.
The equity markets struggled to move higher as the economic slowdown in the first quarter, the downturn in energy, and Greek bailout negotiations weighed on investor sentiment. The threat of rising interest rates dampened the appeal of high-dividend paying stocks. Some of these stocks, including many utility companies, had enjoyed significant price appreciation and were, perhaps, ready for a modest pullback. Yet, others, such as industrial distributors and transportation companies, fell even as the economy grew; price declines in these areas seemed to reflect market anxiety rather concerns about long-term fundamentals.
Fixed Income Strategy
The Fund's fixed income strategy concentrated on corporate bonds with short-to-intermediate maturities, some with step-up or call features. These securities provide better principal protection than longer-term bonds while also providing the flexibility to identify timely investment opportunities as fixed income markets evolve. As of June 30th, the average yield on 5-year investment-grade U.S. corporate bonds was approximately 2.97%; to enhance returns in the low-yield environment, the Fund identified risk-appropriate opportunities in high-quality corporate bonds with distinctive characteristics.
During the period, several of the Fund's corporate bonds were called in by their issuers as companies sought to retire debt or refinance existing bonds. The Fund reinvested proceeds from these transactions in similar investment-grade bonds7 of high-quality companies, including L-3 Communications and General Motors. The Fund also identified investment-grade bonds of select energy services companies which offered above-market yields due to lack of investor interest. These include Pride International, which provides offshore contract drilling services, and Energy Transfer Partners, which owns and operates oil and gas pipelines throughout North America. The selloff in crude oil prices and the continued industry slowdown sapped demand for these bonds which created opportunities to invest at discounted prices.
The Fund also purchased Goldman Sachs "step-up" bonds and JPMorgan Chase "fixed-to-floating" preferred stocks in anticipation of rising interest rates. These securities periodically increase interest and/or dividends over time. In general, the Fund remains invested primarily in short-to-intermediate-term bonds which will help protect against a principal loss as rates increase.
Equity Strategy
The Fund's equity portfolio is an important complement to corporate bond holdings especially during the current period of historically low interest rates. The strategy seeks stocks that offer dividend income and price appreciation; we select high-quality, well-established companies across a broad range of industries.
The Fund maintained its strategy of focusing on a select number of high-quality, low volatility, dividend-paying companies. The Fund's equity holdings had a weighted average dividend yield of 3.19%, as of June 30th. This compares favorably to the average yield on 5-year investment-grade bond of 2.97%. We believe the Fund's equity holdings offer attractive opportunities for total return compared to bonds, especially, during periods of rising interest rates.
During the period, the Fund added three new positions: Fastenal, International Paper and Target, and added to its holdings in Schlumberger and ConocoPhillips; these energy stocks became heavily discounted as oil prices fell even though their long-term prospects remain attractive.
Looking Ahead
The Fed has emphasized its intention to increase rates gradually and in response to economic data. The Fed's deliberate process should prevent market rates from rising too rapidly at first. Yet, history has
7 For detailed information on Fund holdings, please see the Fund's Schedule of Investments in this Report.
10
shown that the fixed income markets, especially the prices on longer-term bonds, often move ahead of the Fed. During such transitional phases, the Fund's focus on shorter-term bonds to reduce price volatility may result in underperformance for a period of time. As the transition to higher interest rates take hold, the flexibility offered by the shorter-term bonds will benefit longer-term performance.
The Fund anticipates that, as its shorter-term bonds mature or are called, the proceeds will be invested at higher yields. As prevailing interest rates increase, the Fund expects to gradually extend the average maturity of its bond portfolio and, over time, increase the allocation to fixed income securities.
Meanwhile, the domestic economy continues to expand while Europe is on the mend. The European Central Bank's quantitative easing program should support the region's recovery by lowering borrowing costs and encouraging risk-taking. China has recently shown signs of slowing; in response, government policies will continue to direct resources towards growth as the nation evolves from an export-driven economy to one more reliant on internal consumer demand. Separately, economic and political reforms in both Japan and India have helped reinvigorate these countries. In this environment, the Fund will look to identify stocks which are likely, over time, to increase dividend payouts and provide price appreciation. As the Fed raises rates, though, we anticipate gradually reducing the equity allocation to increase the Fund's fixed income holdings to take advantage of higher yields.
Portfolio Holdings as of 06/30/15 (Based on Total Investments)

1. | Corporate Bonds | 50.82 | % | ||||||||
Equities | 47.57 | % | |||||||||
2. | Consumer Staples | 8.40 | % | ||||||||
3. | Industrials | 7.66 | % | ||||||||
4. | Consumer Discretionary | 5.18 | % | ||||||||
5. | Utilities | 4.83 | % | ||||||||
6. | Information Technology | 4.68 | % | ||||||||
7. | Health Care | 4.48 | % | ||||||||
8. | Others | 12.34 | % | ||||||||
9. | Preferred Stock | 0.72 | % | ||||||||
10. | Cash and Cash Equivalents | 0.89 | % | ||||||||
11
Pacific Advisors
Income and Equity Fund continued
Expense Examples
As a shareholder of the Fund you incur two types of costs: (1) transaction costs, including sales charges (loads) on purchase payments, reinvested dividends, or other distributions; redemption fees; and exchange fees; and (2) ongoing costs, including management fees; distribution (12b-1) fees; and other Fund expenses. This Example is intended to help you understand your ongoing costs (in dollars) of investing in the Fund and to compare these costs with the ongoing costs of investing in other mutual funds.
The Example is based on an investment of $1,000 invested at the beginning of the period and held for the entire period from January 1, 2015 through June 30, 2015.
Actual Expenses
The first line of the table below provides information about actual account values and actual expenses. You may use the information in this line, together with the amount you invested, to estimate the expenses that you paid over the period. Simply divide your account value by $1,000 (for example, an $8,600 account value divided by $1,000 = 8.6), then multiply the result by the number in the first line under the heading entitled "Expenses Paid During the Period" to estimate the expenses you paid on your account during the period.
The following transaction costs are not included in the expenses shown in the table and, if applicable, would increase the expenses that you paid over the period: (1) a front-end sales charge (load) of 4.75% on Class A shares; (2) a 2% redemption fee if you sell or exchange shares within 30 days of purchase, with certain exceptions. The redemption fee does not apply to: (a) redemptions under an automatic withdrawal program or periodic asset reallocation plan, required minimum distributions (RMD), employer mandated distributions from a qualified plan, or redemptions under a qualified domestic relations order (QDRO); (b) redemptions to pay for expenses related to terminal illness, extended hospital or nursing home care, or other serious medical conditions, including death; (c) redemptions of shares acquired through dividend or capital gains reinvestments; (d) loans from a qualified plan account; and (e) redemptions initiated by the Fund; and (3) a $10 service fee on each exchange after the first five exchanges in each calendar year.
The following ongoing costs are not included in the expenses shown in the table and, if applicable, would increase the expenses that you paid over the period: (1) a $12 low balance fee on accounts with balances of less than $250 as of September 30th of each calendar year and no investment activity (excluding reinvestment of dividends and/or capital gains) during the prior calendar year or the first nine months of the current calendar year. This fee does not apply to IRAs, qualified plan accounts, or Coverdell Education Savings Accounts; (2) a $15 annual custodial fee on IRAs, SEPs, SIMPLE IRAs, and Coverdell Education Savings Accounts; and (3) a $20 annual custodial fee on 403(b) accounts.
Hypothetical Example for Comparison Purposes
The second line of the table below provides information about hypothetical account values and hypothetical expenses based on the Fund's actual expense ratio and an assumed rate of return of 5% per year before expenses, which in not the Fund's actual return. The hypothetical account values and expenses may not be used to estimate the actual ending account balance or expenses you paid for the period. You may use this information to compare the ongoing costs of investing in the Fund and other funds. To do so, compare this 5% hypothetical example with the 5% hypothetical examples that appear in the shareholder reports of the other funds.
The following transaction costs are not included in the expenses shown in the table and, if applicable, would increase the expenses that you paid over the period: (1) a front-end sales charge (load) of 4.75% on Class A shares; (2) a 2% redemption fee if you sell or exchange shares within 30 days of purchase, with certain exceptions. The redemption fee does not apply to: (a) redemptions under an automatic withdrawal program or periodic asset reallocation plan, required minimum distributions (RMD), employer mandated distributions from a qualified plan, or redemptions under a qualified domestic relations order (QDRO); (b) redemptions to pay for expenses related to terminal illness, extended hospital or nursing home care, or other serious medical conditions, including death; (c) redemptions of shares acquired through dividend or capital gains reinvestments; (d) loans from a qualified plan account; and (e) redemptions initiated by the Fund; and (3) a $10 service fee on each exchange after the first five exchanges in each calendar year.
The following ongoing costs are not included in the expenses shown in the table and, if applicable, would increase the expenses that you paid over the period: (1) a $12 low balance fee on accounts with balances of less than $250 as of September 30th of each calendar year and no investment activity (excluding reinvestment of dividends and/or capital gains) during the prior calendar year or the first nine months of the current calendar year. This fee does not apply to IRAs, qualified plan accounts, or Coverdell Education Savings Accounts; (2) a $15 annual custodial fee on IRAs, SEPs, SIMPLE IRAs, and Coverdell Education Savings Accounts; and (3) a $20 annual custodial fee on 403(b) accounts.
Please note that the expenses shown in the table are meant to highlight your ongoing costs only and do not reflect any transactional costs, such as sales charges (loads), redemption fees, or exchange fees. Therefore, the second line of the table is useful in comparing ongoing costs only, and will not help you determine the relative total costs of owning different funds. In addition, if these transactional costs were included, your costs would have been higher.
| Beginning Account Value 01/01/15 | Ending Account Value 06/30/15 | Expense Paid During Period 01/01/15 – 06/30/15 | |||||||||||||
Income & Equity Fund Class A | |||||||||||||||
Actual | $ | 1,000.00 | $ | 983.60 | $ | 10.97 | |||||||||
Hypothetical (5% return before expense) | $ | 1,000.00 | $ | 1,013.74 | $ | 11.13 | |||||||||
Income & Equity Fund Class C | |||||||||||||||
Actual | $ | 1,000.00 | $ | 979.90 | $ | 14.63 | |||||||||
Hypothetical (5% return before expense) | $ | 1,000.00 | $ | 1,010.02 | $ | 14.85 | |||||||||
4 Expenses are equal to the Fund's annualized expense ratio, net of expense waivers, of 2.23% for Class A shares and 2.98% for Class C shares, multiplied by the average account value over the period, multiplied by 181/365 days to reflect the one-half year period.
12
Pacific Advisors
Balanced Fund
Fund Objective: Long-term capital appreciation and income consistent with reduced risk.
Investment Invests primarily in large cap common stocks and investment grade U.S. corporate
Strategy: bonds. Invests at least 25% of its assets in fixed income securities and preferred stocks and at least 25% in equities.
Investor Profile: Moderately conservative. Seeks combination of long-term growth, income, liquidity and reduced risk of price fluctuations.
TOTAL RETURNS | EXPENSE RATIOS1 | ||||||||||||||||||
| For the six months ended June 30, 2015 | Current | Prospectus | |||||||||||||||||
Class A | –0.56 | % | Class A | 3.22 | % | 2.84 | % | ||||||||||||
Class C | –0.92 | % | Class C | 4.02 | % | 3.58 | % | ||||||||||||
S&P 500® Index2 | 1.23 | % | |||||||||||||||||
Barclays Capital U.S. Int Corp Bond Index3 | 0.79 | % | |||||||||||||||||
Performance quoted is past performance which does not guarantee future results. Current performance may be higher or lower than the performance quoted. Call (800) 989-6693 for performance current to the most recent month-end. The investment return and principal value of an investment will fluctuate so that an investor's shares, when redeemed, may be worth more or less than their original cost. Returns represent the change in value over the stated period assuming reinvestment of dividends and capital gains at net asset value. Rankings are shown for Class A shares; rankings for other share classes may be different. Returns and rankings do not take into account the maximum 5.75% sales charge on Class A shares or the 1% Contingent Deferred Sales Charge (CDSC) for Class C shares sold within one year of purchase. Returns would be lower if the applicable sales charge and CDSC were included. Returns do not take into account individual taxes which may reduce actual returns when shares are sold.
Discussion with Portfolio Managers August 24, 2015
Charles Suh, CFA
Jingjing Yan, CFA
Samuel C. Coquillard
Please see the Chairman's Letter at the beginning of this Report for a detailed market and economic review as well as the Manager's general market outlook.
Fund Performance
Class A shares declined 0.56% for the first half of 2015 to slightly lag both the equity and fixed income benchmarks. The Fund is positioned to perform well during periods of economic expansion. Through June, for example, the Fund's top performing holdings included several retail and automotive companies as well as financial and industrial stocks. During the period, however, the U.S. economic slowdown in the first quarter and the Greek bailout drama in the second quarter undermined investor confidence. A decline in transportation stocks, which are often viewed as barometers of economic strength, triggered concerns about market sentiment. Also, the downturn in Energy and Energy-related stocks continued to impact Fund holdings. Meanwhile, the Fund's fixed income holdings in shorter-term, investment-grade companies were well-positioned during the period; yields on corporate bond rose as
1 "Current" expense ratio is annualized for the year-to-date as of 06/30/15. "Prospectus" expense ratio is for the fiscal year ended 12/31/14.
2 The S&P 500® Index is an unmanaged, market capitalization weighted index which measures the performance of the large cap segment of the U.S. equities market, covering approximately 75% of the U.S. equities market. The Index includes 500 leading companies in leading industries of the U.S. economy. Index returns assume the reinvestment of dividends, but, unlike the Fund's returns, do not reflect the effects of management fees or expenses. It is not possible to invest directly in the Index.
3 The Barclays Capital U.S. Intermediate Corporate Bond Index is an unmanaged index of publicly issued investment grade U.S. corporate bonds with one to ten years to maturity. It is not possible to invest directly in the Index.
13
Pacific Advisors
Balanced Fund continued
companies rushed to issue bonds prior to the much anticipated move by the Federal Reserve to begin raising interest rates. Fund volatility remained below average, with the one-year beta4 falling from 0.88 at the end of 2014 to 0.81 as of June 30th, compared to the S&P 500® Index.
Fund Strategy
The Fund is designed for conservative investors seeking to participate in the equity markets with reduced risk. The Fund's strategy combines high-quality stocks across all market capitalizations with investment-grade corporate bonds that provide additional income and appreciation potential. This balanced approach enables the Fund to take advantage of specific growth opportunities while reducing overall price volatility. We identify leading, well-managed companies whose stocks trade at a discount to our internal price targets; in most cases, we anticipate that the stocks will appreciate over a medium-to-long-term time horizon as the companies' growth strategies unfold. The Fund may experience periods of underperformance when short-term market trends overshadow long-term outlooks; yet, over time, the Fund's performance should reflect the strength of these companies as they demonstrate the ability to grow during various economic and business cycles. We manage the Fund's asset allocation based on our assessment of risk-appropriate investments in the context of the overall economic, market, and interest rate outlook. This approach enables the Fund to take advantage of specific growth opportunities while reducing overall price volatility.
U.S. economic growth stalled in the first quarter of 2015 as a result of harsh winter weather, the West Coast ports disruption, a stronger dollar, and the continued decline in activities related to the energy industry. In the second quarter, the economy began to rebound led by notable strength in employment and housing. Ongoing Greek bailout negotiations during the period, though, undermined investor confidence. As a result, equities languished; the S&P 500® Index gained just 1.23% through the first six months of the year. At the same time, investors seemed fixated on the timing of the Fed's first interest rate increase since 2008. Bond yields, in reflecting the varying "liftoff" expectations, fell as soft first quarter economic data suggested an extended time frame for the rate increase; rates rose later in the period as evidence of a second quarter rebound emerged. Corporate bond spreads widened as an increase in new bond offerings, and declining demand, drove yields higher. The Fund's 71% equity allocation reflected our confidence in the steadily growing economy and the appreciation potential of individual stocks.
Equity Strategy
The Fund's "all cap" equity strategy diversifies investments among high-quality, well-managed companies with proven growth track records. Large cap investments, which accounted for approximately 34% of the equity allocation, favor prominent global companies that offer stability with moderate growth potential. Mid-cap holdings, which represented approximately 33% of the equity allocation, feature industry leaders that are well-positioned to participate in sector or economic trends. The remainder of the Fund's equity allocation is invested in established small cap companies with attractive long-term growth prospects.
Large cap holdings5, led by The Walt Disney Company and Nike, performed well as investors rewarded leading global companies. Disney reported increased attendance at its parks and resorts; the company's new Shanghai Disneyland Park is scheduled to open in December. Nike reported higher earnings with double-digit sales growth in North America and China and higher profit margins from the company's increased emphasis on direct-to-consumer Nike Brand stores. Mid-cap and small cap performance was mixed, with gains in retail companies offset by losses in transportation and energy. Conn's, an appliances and furniture retailer, jumped after reporting strong retail results and improving credit trends. Lithia Motors, an auto retailer operating 129 stores in 14 states, reported record revenues and earnings following its 2014 acquisition of DCH Auto Group. Chicago Bridge & Iron, a construction company in the energy,
4 "Beta" measures volatility relative to the stock market or an alternative benchmark. A beta less than 1.0 indicates lower risk than the market or the benchmark; a beta greater than 1.0 indicates higher risk than the market or the benchmark.
5 For detailed information on Fund holdings, please see the Fund's Schedule of Investments in this Report.
14
chemical and natural resource sectors, rebounded with improved earnings; also, the award of new projects added to its impressive backlog. However, railroad operators Kansas City Southern and Genesee & Wyoming suffered as the first quarter slowdown and downturn in energy-related activity impacted shipment volumes. Despite improved results, commercial truck manufacturer Navistar continued to underperform as the company continues to recover from legacy issues related to engine problems on older truck models.
The global oversupply of oil continued to impact energy stocks; valuations, including several of the Fund's financially secure Energy holdings, have fallen to historically depressed levels. For example, National Oilwell Varco trades at just below book value, a level not seen since the financial crisis. And, Tidewater trades at its lowest valuation in over 25 years which is less than half of its book value. Fund holdings in the refinery and petrochemicals industries have also come under pressure even though lower oil prices have benefitted these businesses.
Our active management approach seeks to adjust portfolio positions in response to our evaluation of each company's potential for delivering total return over a medium-to-long-term. During the period, we sold the Fund's positions in American Express and Wal-Mart Stores as these companies approached our internal price targets. Also, we trimmed positions in Disney, East West Bancorp, Lithia Motors, and O'Reilly Automotive following each company's strong earnings results; we used proceeds to add to Fund holdings that we believed offered greater return potential, including Conn's, Google, Navistar, and Perrigo.
Fixed Income Strategy
The Fund's "total return" approach actively manages fixed income holdings in response to current interest rate trends. In selecting bonds, we examine each company's fundamentals including cash flow trends, liquidity ratios and debt maturity schedules, and then assess the income and capital appreciation potential. The Fund's investments have continued to focus on shorter-term bonds that are less sensitive to interest rate changes while avoiding higher risk investments. The extended period of low interest rates and our expectation for higher interest rates contributed to our decision to maintain the Fund's fixed income allocation near the lower end of its historical range.
Interest rates were volatile during the period; the yield on the U.S. 10-year Treasury Note fell from 2.17% at the end of 2014 to 1.68% at the end of January before rising to 2.50%, the highest level in almost a year, before dropping to 2.35% at the end of June. Treasuries sold off in the second quarter as strong economic data seemed to support investor expectations for a Fed interest rate increase. The emergence of the Greek bailout negotiations temporarily drove yields lower as investors demand for "safe haven" bonds rose. Yet, Fed Chair Janet Yellen's comments regarding a likely "liftoff" sometime this year kept upward pressure on yields. The timing of the Fed's move remains undetermined, however, as the central bank intends to consider factors including wage growth, global economic growth, and the deflationary impact of low oil prices in determining the timing and pace of rate increases. More importantly, Ms. Yellen has reiterated that future rate hikes will be undertaken gradually and in response to economic conditions.
The Fund has continued to invest in shorter-term investment-grade corporate bonds which are designed to protect principal value in a rising interest rate environment. In contrast, the Fund's benchmark, the Barclays Capital U.S. Intermediate Corporate Bond Index, includes longer-term and lower quality bonds; these bonds are more susceptible to losses in value in response to rising interest rates. As Fund holdings mature or are called in, we anticipate reinvesting proceeds at more attractive yields, and, as the Fed raises interest rates, we anticipate reinvesting in bonds with intermediate-to-longer-term maturities. The Fund's allocation strategy will continue to reflect not only our outlook for the economy and interest rates but also our assessment of the relative contributions of equity and fixed income holdings.
15
Pacific Advisors
Balanced Fund continued
Looking Ahead
The mix of equities between large, mid, and small cap companies, and the allocation mix between equities and investment-grade corporate bonds, provides a balanced approach to the Fund's performance; additionally, the combination offers the potential for price appreciation and income that is well-positioned for economic growth and rising interest rates. Increased business spending as a result of economic expansion, and to provide compliance with recent regulatory initiatives, will likely translate into greater business opportunities for industrial stocks such as Chicago Bridge & Iron, Swift, Wabtec, and Navistar. Increased consumer spending would benefit holdings such as Lithia Motors, Nike and PVH while higher interest rates would lead to increased revenues and earnings for financial companies East West Bancorp and JPMorgan Chase.
Over the past year, the Fund's small and mid-cap holdings struggled while large cap holdings performed well. Recently, however, large cap stocks have been impacted by the strength of the dollar. Many large cap companies operate internationally; their overseas earnings are discounted by currency valuations. Small and mid-cap companies are typically U.S.-based so their earnings are less impacted by changes in the relative value of the dollar. Over the long-term, small cap and mid-cap stocks, both of which offer greater growth potential than stocks of larger companies, have outperformed large cap stocks; we expect the Fund's small and mid-cap holdings to attract interest as investors identify the appreciation potential of these smaller market cap stocks.
Some of the Fund's holdings have performed extraordinarily well in response to strong earnings growth. We anticipate trimming or selling these positions as they approach our internal price targets and reallocating the proceeds to other areas that offer stronger capital appreciation potential. Energy represents significant value for long-term investors as valuations for many stocks in the sector remain at historically depressed prices. The Fund's Energy and Energy-related stocks continue to offer extraordinary value; we anticipate a sharp rebound from current discounted prices as the current supply/demand imbalance subsides and oil prices rise. We believe that the Fund's focus on high-quality, well-managed businesses will prove an important distinction as the bear market cycle in oil runs its course.
Portfolio Holdings as of 06/30/15 (Based on Total Investments)

Equities | 71.04 | % | |||||||||
1. | Industrials | 25.91 | % | ||||||||
2. | Consumer Discretionary | 19.42 | % | ||||||||
3. | Energy | 9.15 | % | ||||||||
4. | Information Technology | 5.73 | % | ||||||||
5. | Financials | 5.50 | % | ||||||||
6. | Consumer Staples | 3.13 | % | ||||||||
7. | Health Care | 2.20 | % | ||||||||
8. | Corporate Bonds | 28.82 | % | ||||||||
9. | Cash and Cash Equivalents | 0.14 | % | ||||||||
16
Expense Examples
As a shareholder of the Fund you incur two types of costs: (1) transaction costs, including sales charges (loads) on purchase payments, reinvested dividends, or other distributions; redemption fees; and exchange fees; and (2) ongoing costs, including management fees; distribution (12b-1) fees; and other Fund expenses. This Example is intended to help you understand your ongoing costs (in dollars) of investing in the Fund and to compare these costs with the ongoing costs of investing in other mutual funds.
The Example is based on an investment of $1,000 invested at the beginning of the period and held for the entire period from January 1, 2015 through June 30, 2015.
Actual Expenses
The first line of the table below provides information about actual account values and actual expenses. You may use the information in this line, together with the amount you invested, to estimate the expenses that you paid over the period. Simply divide your account value by $1,000 (for example, an $8,600 account value divided by $1,000 = 8.6), then multiply the result by the number in the first line under the heading entitled "Expenses Paid During the Period" to estimate the expenses you paid on your account during the period.
The following transaction costs are not included in the expenses shown in the table and, if applicable, would increase the expenses that you paid over the period: (1) a front-end sales charge (load) of 5.75% on Class A shares; (2) a 2% redemption fee if you sell or exchange shares within 180 days of purchase, with certain exceptions. The redemption fee does not apply to: (a) redemptions under an automatic withdrawal program or periodic asset reallocation plan, required minimum distributions (RMD), employer mandated distributions from a qualified plan, or redemptions under a qualified domestic relations order (QDRO); (b) redemptions to pay for expenses related to terminal illness, extended hospital or nursing home care, or other serious medical conditions, including death; (c) redemptions of shares acquired through dividend or capital gains reinvestments; (d) loans from a qualified plan account, and (e) redemptions initiated by the Fund; and (3) a $10 service fee on each exchange after the first five exchanges in each calendar year.
The following ongoing costs are not included in the expenses shown in the table and, if applicable, would increase the expenses that you paid over the period: (1) a $12 low balance fee on accounts with balances of less than $250 as of September 30th of each calendar year and no investment activity (excluding reinvestment of dividends and/or capital gains) during the prior calendar year or the first nine months of the current calendar year. This fee does not apply to IRAs, qualified plan accounts, or Coverdell Education Savings Accounts; (2) a $15 annual custodial fee on IRAs, SEPs, SIMPLE IRAs, and Coverdell Education Savings Accounts; and (3) a $20 annual custodial fee on 403(b) accounts.
Hypothetical Example for Comparison Purposes
The second line of the table below provides information about hypothetical account values and hypothetical expenses based on the Fund's actual expense ratio and an assumed rate of return of 5% per year before expenses, which in not the Fund's actual return. The hypothetical account values and expenses may not be used to estimate the actual ending account balance or expenses you paid for the period. You may use this information to compare the ongoing costs of investing in the Fund and other funds. To do so, compare this 5% hypothetical example with the 5% hypothetical examples that appear in the shareholder reports of the other funds.
The following transaction costs are not included in the expenses shown in the table and, if applicable, would increase the expenses that you paid over the period: (1) a front-end sales charge (load) of 5.75% on Class A shares; (2) a 2% redemption fee if you sell or exchange shares within 180 days of purchase, with certain exceptions. The redemption fee does not apply to: (a) redemptions under an automatic withdrawal program or periodic asset reallocation plan, required minimum distributions (RMD), employer mandated distributions from a qualified plan, or redemptions under a qualified domestic relations order (QDRO); (b) redemptions to pay for expenses related to terminal illness, extended hospital or nursing home care, or other serious medical conditions, including death; (c) redemptions of shares acquired through dividend or capital gains reinvestments; (d) loans from a qualified plan account, and (e) redemptions initiated by the Fund; and (3) a $10 service fee on each exchange after the first five exchanges in each calendar year.
The following ongoing costs are not included in the expenses shown in the table and, if applicable, would increase the expenses that you paid over the period: (1) a $12 low balance fee on accounts with balances of less than $250 as of September 30th of each calendar year and no investment activity (excluding reinvestment of dividends and/or capital gains) during the prior calendar year or the first nine months of the current calendar year. This fee does not apply to IRAs, qualified plan accounts, or Coverdell Education Savings Accounts; (2) a $15 annual custodial fee on IRAs, SEPs, SIMPLE IRAs, and Coverdell Education Savings Accounts; and (3) a $20 annual custodial fee on 403(b) accounts.
Please note that the expenses shown in the table are meant to highlight your ongoing costs only and do not reflect any transactional costs, such as sales charges (loads), redemption fees, or exchange fees. Therefore, the second line of the table is useful in comparing ongoing costs only, and will not help you determine the relative total costs of owning different funds. In addition, if these transactional costs were included, your costs would have been higher.
| Beginning Account Value 01/01/15 | Ending Account Value 06/30/15 | Expense Paid During Period 01/01/15 – 06/30/15 | |||||||||||||
Balanced Fund Class A | |||||||||||||||
Actual | $ | 1,000.00 | $ | 994.40 | $ | 15.92 | |||||||||
Hypothetical (5% return before expense) | $ | 1,000.00 | $ | 1,008.83 | $ | 16.04 | |||||||||
Balanced Fund Class C | |||||||||||||||
Actual | $ | 1,000.00 | $ | 990.80 | $ | 19.84 | |||||||||
Hypothetical (5% return before expense) | $ | 1,000.00 | $ | 1,004.86 | $ | 19.98 | |||||||||
4 Expenses are equal to the Fund's annualized expense ratio of 3.22% for Class A shares and 4.02% for Class C shares, multiplied by the average account value over the period, multiplied by 181/365 days to reflect the one-half year period.
17
Pacific Advisors
Large Cap Value Fund
Fund Objective: Long-term capital appreciation.
Investment Invests at least 80% of its assets in large cap companies that are, at the time of
Strategy: purchase, within the market cap range of companies in the S&P 500® Index1.
Investor Profile: Conservative equity. Growth-oriented with a long-term investment horizon.
TOTAL RETURNS | EXPENSE RATIOS2 | ||||||||||||||||||||||||||
For the six months ended June 30, 2015 | Current | Prospectus | |||||||||||||||||||||||||
Net | Gross | Net | Gross | ||||||||||||||||||||||||
Class A | –0.78 | % | Class A | 2.80 | % | 3.55 | % | 2.64 | % | 3.39 | % | ||||||||||||||||
Class C | –1.21 | % | Class C | 3.60 | % | 4.35 | % | 3.38 | % | 4.13 | % | ||||||||||||||||
S&P 500® Index | 1.23 | % | |||||||||||||||||||||||||
Performance quoted is past performance which does not guarantee future results. Current performance may be higher or lower than the performance quoted. Call (800) 989-6693 for performance current to the most recent month-end. The investment return and principal value of an investment will fluctuate so that an investor's shares, when redeemed, may be worth more or less than their original cost. Returns represent the change in value over the stated period assuming reinvestment of dividends and capital gains at net asset value. Returns do not take into account the maximum 5.75% sales charge on Class A shares or the 1% Contingent Deferred Sales Charge (CDSC) for Class C shares sold within one year of purchase. Returns would be lower if the applicable sales charge and CDSC were included. Returns do not take into account individual taxes which may reduce actual returns when shares are sold.
The Fund's investment adviser is waiving a portion of its management fees pursuant to an Expense Limitation Agreement. The waiver may be discontinued at any time with ninety days written notice in consultation with the Fund's board, but is expected to continue at current levels. Please see the Notes to Financial Statements in this report for details. Performance shown reflects the waiver, without which the results would have been lower.
Discussion with Portfolio Manager August 24, 2015
Samuel C. Coquillard
Please see the Chairman's Letter at the beginning of this Report for a detailed market and economic review as well as the Manager's general market outlook.
Fund Performance
Stocks traded within a narrow range during the first half of 2015 as investors wrestled with uneven U.S. economic growth, the prospect of the Federal Reserve's interest rate hike, and concerns over Greece's fiscal crisis and China's slowdown. During the period, the 6.7% variance from peak to trough in the S&P 500® Index was the smallest differential in 20 years. Weak trading volumes further underscored the lack of conviction as investors opted for a wait-and-see approach. Fund performance was relatively flat during the first half of the year, but lagged the benchmark; Class A shares declined 0.78% compared to the benchmark's gain of 1.23%.
Fund holdings3 that contributed to performance in the first half of the year included:
• Kraft Heinz Company (formerly Kraft Foods Group, Inc.) rose over 38% following the announcement, in March, of its merger agreement with H.J. Heinz Co. The deal created one of the world's largest
1 The Standard & Poor's 500® Index is an unmanaged, market capitalization weighted index which measures the performance of the large cap segment of the U.S. equities market, covering approximately 75% of the U.S. equities market. The Index includes 500 leading companies in leading industries of the U.S. economy. Index returns assume the reinvestment of dividends, but, unlike the Fund's returns, do not reflect the effects of management fees or expenses. It is not possible to invest directly in the Index.
2 "Current" expense ratio is annualized for the year-to-date as of 06/30/15. "Prospectus" expense ratio is for the fiscal year ended 12/31/14.
3 For detailed information on Fund holdings, please see the Fund's Schedule of Investments in this Report.
18
food and beverage companies, with combined revenues approximating $28 billion, and products offerings including namesake Kraft cheese products, Heinz® Ketchup, and well-known brands such as Oscar Mayer meats, Maxwell House coffee, Jell-O, and Planters nuts. More importantly, the combination provides opportunities for marketing, product innovation and cost synergies.
• A new Fund holding, Houghton Mifflin Harcourt, a global provider of Pre-K-12 education solutions and one of the longest-established publishing houses, gained 31% during the period. The company is well-positioned to benefit as education spending rebounds over the next several years. Further, a transition from print to digital content should lead to cost savings and increased growth and profitability. The company's acquisition, in May, of the Educational Technology and Services business from Scholastic Corporation adds education technology and services and early learning products.
• The Walt Disney Company reported broad strength across its business segments including Studio Entertainment (with distributions of Cinderella and Marvel's Avengers), Consumer Products merchandising, and Parks and Resorts. The new Shanghai Disneyland Park, scheduled to open in December, and film releases from Pixar and Star Wars at the end of the year provide a positive outlook.
• Apple reported strong sales and profitability, driven mostly by increases in iPhone® and iMac® shipments and the launch of Apple WatchTM. International sales account for approximately two-thirds of revenues as new and replacement sales reinforce the company's loyal customer base.
Other outperformers included American International Group (AIG) and Home Depot. AIG, a leading global underwriter of commercial, institutional and individual insurance products, is improving profitability by reducing risk, leverage and asset volatility and increasing investments in technology. Home improvement retailer Home Depot reported comparable store sales growth above 6% as it continues to benefit from the ongoing housing recovery; the company raised its sales and earnings guidance for the remainder of the year.
In contrast, Fund holdings in the Energy sector detracted from returns. Shares of NOW, Inc., National Oilwell Varco and ExxonMobil fell as the volatility in crude oil prices continued. The long-term prospects for these companies remain favorable; however, without a clear sense of timing for the energy sector's recovery, the Fund sold NOW, Inc. and National Oilwell Varco. The Fund continues to hold ExxonMobil; the company, while impacted by falling oil prices, nevertheless remains well-positioned with its refineries and chemical businesses.
Wal-Mart Stores, although reporting the strongest comparable store sales growth in two years, declined over 15% during the period as the company provided a disappointing outlook for 2016. Increased costs for employee compensation and training have hurt near-term results but, should support the company's long-term growth. Intel declined due to weaker PC demand. Still, data center chip sales remain strong and the company anticipates improving PC demand highlighted by the launch of Microsoft Windows® 10.
Fund Strategy
The Fund uses a focused portfolio strategy (36 holdings as of 06/30/15) to invest in more conservative, less volatile stocks that pay attractive dividends. Holdings concentrate on mega-cap stocks of well-managed companies with dominant market positions, strong financials, and track records of steady growth. The weighted average market capitalization of Fund holdings ($180 billion as of 06/30/15) is almost five times larger than the average of the benchmark S&P 500® Index. The mega-cap emphasis helps achieve stable total returns with less volatility than the broader market; as of June 30th, the Fund's one-year beta4 of 0.97 remains consistently below the Index. The Fund's weighted average dividend yield was 2.07%;
4 "Beta" measures volatility relative to the stock market or an alternative benchmark. A beta less than 1.0 indicates lower risk than the market or the benchmark; a beta greater than 1.0 indicates higher risk than the market or the benchmark.
19
Pacific Advisors
Large Cap Value Fund continued
several holdings, including McDonald's, ExxonMobil, General Electric, Proctor & Gamble, Cola-Cola, Sysco, IBM, Intel, and Johnson & Johnson pay dividends in excess of 3%.
In addition to Houghton Mifflin Harcourt mentioned above, the Fund also added two new positions. Google, the dominant global search provider, is well-positioned to capitalize on mobile computing, brand advertising, and e-commerce. The stock lagged other technology companies through much of the period; the Fund used the opportunity to acquire shares at reasonable valuations. PepsiCo holds the #2 position worldwide in soft drinks and a 30% market share in savory snacks. The Fund found the shares attractive long-term despite several shorter-term global challenges including the impact of the strengthening dollar on foreign earnings.
Looking Ahead
We expect global economic growth to continue at a modest pace; meanwhile, momentum in the U.S. is gaining following a lackluster start in the first quarter. The Fund will remain focused on companies with strong international operations that are positioned to participate as global and domestic expansions continue. These multinational mega-cap companies, such as MasterCard, Procter & Gamble, Honeywell International, FedEx, United Parcel Services, and PepsiCo, have the broad geographic footprint, product, and distribution diversity to effectively manage changing conditions. Steady employment growth and consumer spending should benefit companies such as Wal-Mart Stores, The Walt Disney Company and Apple. A rebound in housing should continue to benefit Home Depot and Lowe's. And, industrial and manufacturing expansion will support sales and earnings growth for Illinois Tool Works, General Electric and Deere & Company.
Meanwhile, the Fed upgraded its economic assessment noting, in particular, the recent string of improving data. We anticipate that the Fed will raise interest rates before the end of the year. A higher interest rate environment should benefit financial holdings, including Wells Fargo, Citigroup and Bank of America, as these companies earn higher rates on loan portfolios. Some fixed income investors, especially those holding long-term bonds, may seek to protect against principal losses by migrating to conservative equities. Leading large cap stocks ought to appeal to these risk-averse investors; the Fund, with considerable holdings in well-known market leaders, would likely benefit as these investors move into equities.
Portfolio Holdings as of 06/30/15 (Based on Total Investments)
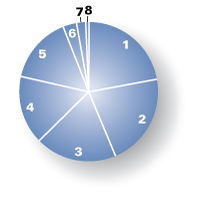
Equities | 99.37 | % | |||||||||
1. | Information Technology | 22.13 | % | ||||||||
2. | Consumer Discretionary | 21.54 | % | ||||||||
3. | Financials | 18.94 | % | ||||||||
4. | Industrials | 15.90 | % | ||||||||
5. | Consumer Staples | 15.50 | % | ||||||||
6. | Health Care | 3.18 | % | ||||||||
7. | Energy | 2.18 | % | ||||||||
8. | Cash and Cash Equivalents | 0.63 | % | ||||||||
20
Expense Examples
As a shareholder of the Fund you incur two types of costs: (1) transaction costs, including sales charges (loads) on purchase payments, reinvested dividends, or other distributions; redemption fees; and exchange fees; and (2) ongoing costs, including management fees; distribution (12b-1) fees; and other Fund expenses. This Example is intended to help you understand your ongoing costs (in dollars) of investing in the Fund and to compare these costs with the ongoing costs of investing in other mutual funds.
The Example is based on an investment of $1,000 invested at the beginning of the period and held for the entire period from January 1, 2015 through June 30, 2015.
Actual Expenses
The first line of the table below provides information about actual account values and actual expenses. You may use the information in this line, together with the amount you invested, to estimate the expenses that you paid over the period. Simply divide your account value by $1,000 (for example, an $8,600 account value divided by $1,000 = 8.6), then multiply the result by the number in the first line under the heading entitled "Expenses Paid During the Period" to estimate the expenses you paid on your account during the period.
The following transaction costs are not included in the expenses shown in the table and, if applicable, would increase the expenses that you paid over the period: (1) a front-end sales charge (load) of 5.75% on Class A shares; (2) a 2% redemption fee if you sell or exchange shares within 180 days of purchase, with certain exceptions. The redemption fee does not apply to: (a) redemptions under an automatic withdrawal program or periodic asset reallocation plan, required minimum distributions (RMD), employer mandated distributions from a qualified plan, or redemptions under a qualified domestic relations order (QDRO); (b) redemptions to pay for expenses related to terminal illness, extended hospital or nursing home care, or other serious medical conditions, including death; (c) redemptions of shares acquired through dividend or capital gains reinvestments; (d) loans from a qualified plan account, and (e) redemptions initiated by the Fund; and (3) a $10 service fee on each exchange after the first five exchanges in each calendar year.
The following ongoing costs are not included in the expenses shown in the table and, if applicable, would increase the expenses that you paid over the period: (1) a $12 low balance fee on accounts with balances of less than $250 as of September 30th of each calendar year and no investment activity (excluding reinvestment of dividends and/or capital gains) during the prior calendar year or the first nine months of the current calendar year. This fee does not apply to IRAs, qualified plan accounts, or Coverdell Education Savings Accounts; (2) a $15 annual custodial fee on IRAs, SEPs, SIMPLE IRAs, and Coverdell Education Savings Accounts; and (3) a $20 annual custodial fee on 403(b) accounts.
Hypothetical Example for Comparison Purposes
The second line of the table below provides information about hypothetical account values and hypothetical expenses based on the Fund's actual expense ratio and an assumed rate of return of 5% per year before expenses, which in not the Fund's actual return. The hypothetical account values and expenses may not be used to estimate the actual ending account balance or expenses you paid for the period. You may use this information to compare the ongoing costs of investing in the Fund and other funds. To do so, compare this 5% hypothetical example with the 5% hypothetical examples that appear in the shareholder reports of the other funds.
The following transaction costs are not included in the expenses shown in the table and, if applicable, would increase the expenses that you paid over the period: (1) a front-end sales charge (load) of 5.75% on Class A shares; (2) a 2% redemption fee if you sell or exchange shares within 180 days of purchase, with certain exceptions. The redemption fee does not apply to: (a) redemptions under an automatic withdrawal program or periodic asset reallocation plan, required minimum distributions (RMD), employer mandated distributions from a qualified plan, or redemptions under a qualified domestic relations order (QDRO); (b) redemptions to pay for expenses related to terminal illness, extended hospital or nursing home care, or other serious medical conditions, including death; (c) redemptions of shares acquired through dividend or capital gains reinvestments; (d) loans from a qualified plan account, and (e) redemptions initiated by the Fund; and (3) a $10 service fee on each exchange after the first five exchanges in each calendar year.
The following ongoing costs are not included in the expenses shown in the table and, if applicable, would increase the expenses that you paid over the period: (1) a $12 low balance fee on accounts with balances of less than $250 as of September 30th of each calendar year and no investment activity (excluding reinvestment of dividends and/or capital gains) during the prior calendar year or the first nine months of the current calendar year. This fee does not apply to IRAs, qualified plan accounts, or Coverdell Education Savings Accounts; (2) a $15 annual custodial fee on IRAs, SEPs, SIMPLE IRAs, and Coverdell Education Savings Accounts; and (3) a $20 annual custodial fee on 403(b) accounts.
Please note that the expenses shown in the table are meant to highlight your ongoing costs only and do not reflect any transactional costs, such as sales charges (loads), redemption fees, or exchange fees. Therefore, the second line of the table is useful in comparing ongoing costs only, and will not help you determine the relative total costs of owning different funds. In addition, if these transactional costs were included, your costs would have been higher.
| Beginning Account Value 01/01/15 | Ending Account Value 06/30/15 | Expense Paid During Period 01/01/15 – 06/30/15 | |||||||||||||
Large Cap Value Fund Class A | |||||||||||||||
Actual | $ | 1,000.00 | $ | 992.20 | $ | 13.83 | |||||||||
Hypothetical (5% return before expense) | $ | 1,000.00 | $ | 1,010.91 | $ | 13.96 | |||||||||
Large Cap Value Fund Class C | |||||||||||||||
Actual | $ | 1,000.00 | $ | 987.90 | $ | 17.74 | |||||||||
Hypothetical (5% return before expense) | $ | 1,000.00 | $ | 1,006.94 | $ | 17.91 | |||||||||
5 Expenses are equal to the Fund's annualized expense ratio, net of expense waivers, of 2.80% for Class A shares and 3.60% for Class C shares, multiplied by the average account value over the period, multiplied by 181/365 days to reflect the one-half year period.
21
Pacific Advisors
Mid Cap Value Fund
Fund Objective: Long-term capital appreciation.
Investment Invests at least 80% of its assets in mid-cap companies that are, at the time of
Strategy: purchase, within the market cap range of companies in the Russell Midcap Index®.1
Investor Profile: Moderately aggressive. Growth-oriented with a long-term investment horizon.
TOTAL RETURNS | EXPENSE RATIOS2 | ||||||||||||||||||
| For the six months ended June 30, 2015 | Current | Prospectus | |||||||||||||||||
Class A | –2.38 | % | Class A | 3.72 | % | 3.42 | % | ||||||||||||
Class C | –2.73 | % | Class C | 4.53 | % | 4.17 | % | ||||||||||||
Russell Midcap Index® | 2.35 | % | |||||||||||||||||
Performance quoted is past performance which does not guarantee future results. Current performance may be higher or lower than the performance quoted. Call (800) 989-6693 for performance current to the most recent month-end. The investment return and principal value of an investment will fluctuate so that an investor's shares, when redeemed, may be worth more or less than their original cost. Returns represent the change in value over the stated period assuming reinvestment of dividends and capital gains at net asset value. Returns do not take into account the maximum 5.75% sales charge on Class A shares or the 1% Contingent Deferred Sales Charge (CDSC) for Class C shares sold within one year of purchase. Returns would be lower if the applicable sales charge and CDSC were included. Returns do not take into account individual taxes which may reduce actual returns when shares are sold.
Discussion with Portfolio Manager August 24, 2015
George A. Henning
Please see the Chairman's Letter at the beginning of this Report for a detailed market and economic review as well as the Manager's general market outlook.
Fund Performance
The Fund is actively positioned to benefit from a steady pace of economic growth. During the period, the Fund underperformed as concerns of a global slowdown emerged. Several factors, including severe winter weather, the West Coast ports strike, a decline in commodity prices, and the strengthening dollar, negatively impacted economic activity. During the first half of the year, Class A shares of the Fund declined 2.38%; in comparison, the benchmark gained 2.35%.
Even so, several of the Fund's retail holdings3 outperformed as steady employment gains and improving consumer sentiment led to strong consumer spending.
• Specialty retailer, Conn's, the Fund's top performer, gained 112% during the period as its recovery continues. Last year, the stock tumbled after rapid store expansion and sales increases led to significant operational and credit challenges. The company has since tightened underwriting standards; same-store sales have continued to improve while delinquency rates have trended lower. The company announced a strategic assessment including a possible sale of its loan portfolio; a potential transaction would significantly lower the company's debt levels, lessen credit-related volatility, and improve earnings predictability.
• Shares of video game retailer GameStop rose on better-than-expected results. During the most recent quarter, the company captured a record 45% market share for new software. Also, revenues for the
1 The Russell Midcap® Index is an unmanaged, weighted measure of the 800 smallest companies within the Russell 1000® Index based on a combination of their market cap and current index membership. Index returns assume the reinvestment of dividends, but, unlike the Fund's returns, do not reflect management fees or expenses. It is not possible to invest directly in the Index.
2 "Current" expense ratio is annualized for the year-to-date as of 06/30/15. "Prospectus" expense ratio is for the fiscal year ended 12/31/14.
3 For detailed information on Fund holdings, please see the Fund's Schedule of Investments in this Report.
22
Technology Brands segment, which includes Simply Mac and Spring Mobile stores, rose 70%; Simply Mac's 71 stores sell the full line of Apple products and provide certified warranty and repair services while Spring Mobile is now AT&T's second largest authorized reseller in the U.S.
• Tractor Supply Company, the country's "largest rural lifestyle retail chain" with over 1,400 stores, continues to do well; shares have gained 47% since the Fund's initial purchase last fall. For the first half of the year, earnings per share grew by 18.5% as net sales, same-store sales and profit margins increased. The company opened 58 new stores during the period and plans to open 100 more before year-end. Management credits marketing and merchandising initiatives, and inventory controls in recent acceleration in same-store sales.
• Strong automotive sales benefited both Lear and O'Reilly Automotive. Lear, a leading global manufacturer of automotive seats and electrical systems, advanced in response to improving market share and profit margins due to its industry-leading cost structure. O'Reilly Automotive, an auto parts retailer offering top-quality products and services to do-it-yourselfers and professionals, reported twenty-six consecutive quarters of earnings per share growth in excess of 15%. The company's record revenues and earnings reflect its strong distribution network, parts availability and service-oriented staffing.
Also, Aspen Technology, initially purchased last December, has appreciated over 10% so far this year. The company provides software to more than 1,750 companies in engineering and manufacturing industries ranging from energy and chemicals to pharmaceuticals, food, and beverages; licensing sales remains strong despite concerns about the impact of lower oil prices. Similarly, engineering and construction company, Chicago Bridge & Iron reported "solid performance despite a volatile commodity market and geopolitical issues." The company's construction backlog includes a new LNG project in Mozambique, engineering projects in Russia and Mexico and multiple projects in North and South America.
In contrast, the Fund's significant allocation to the Energy and related Industrial businesses detracted from returns. Energy holdings, while concentrated among leading oil field service providers rather than the more volatile exploration and production companies, continued to languish from severely discounted valuations. For example, Tidewater owns and operates a modern fleet of offshore service vessels that support the energy industry; its shares are trading at 40% of tangible book value. The Fund is maintaining its position, awaiting stronger operational performance once industry conditions improve; in the meantime, the stock provides a dividend yield of approximately 5%. Also, the stock of offshore oil and gas drilling contractor Noble Corp. trades at 50% of tangible book value and pays a 12% dividend yield. Helix Energy Solutions, which provides well intervention services and robotics to maximize productivity and efficiency of deepwater wells, reported a quarterly loss due to weak industry conditions and customers delays. One beneficial outcome of the Energy sector's downturn is industry-wide efficiency improvements and the potential for mergers or acquisitions to expand their business and increase their competitive advantages.
Similarly, the underperformance of the Fund's Industrials holdings lowered returns during the period. In particular, the slowdown in energy and manufacturing sectors impacted transportation-related stocks.
• Results for rail companies Genesee & Wyoming and Kansas City Southern were negatively impacted by lower-than-expected shipments of goods including coal, crude oil, agricultural products, and steel. Longer-term outlooks for these transportation companies remain positive. Genesee & Wyoming owns or leases 120 railroads worldwide and operates in North America, Australia, and, most recently, the U.K. and continental Europe. As a long-time industry consolidator, the company is well-positioned for continued expansion in current operations and through opportunistic acquisitions. Likewise, opportunities for Kansas City Southern are compelling: the company's rail lines and alliances are primary components of a NAFTA Railway system linking the commercial and industrial centers of the U.S., Mexico and Canada. Its railroads are often the only available shipping option in some shale oil and gas regions and its north-south lines connecting Mexico and the U.S. will benefit from the increased migration of manufacturing activity from Asia to lower-cost Mexico.
23
Pacific Advisors
Mid Cap Value Fund continued
• The largest truckload carrier in North America, Swift Transportation, has been able to command higher pricing due to tight supply and demand dynamics as the industry continues to face driver shortages. Upcoming regulatory changes requiring electronic driver logs can further impact available trucking supply. Commercial truck manufacturer Navistar International's newest trucks offer a suite of advanced technologies designed to reduce downtime as well as improved fuel efficiency. Demand for commercial trucks should remain strong as trucking companies expanding and upgrading their fleets.
• Shares of airlines, including ultra-low base fare Spirit Airlines, fell in response to concerns about increased pricing competition. In the most recent quarter, Spirit's distinctive à la carte "Bare Fare" and "Frill Control" pricing structure generated over 40% of operating revenues from non-ticket items such as baggage fees and preferred seat assignments. We believe that the company's positioning (as the 2015 "Value Airline of the Year") will improve its market share.
Fund Strategy
Mid-cap companies offer distinctive advantages for long-term investors by combining the economies of scale typically enjoyed by large corporations with the strategic flexibility of smaller businesses. The Fund's fundamental, bottom-up investment approach identifies companies with exceptional opportunities for long-term appreciation. The Fund's long-term horizon typically results in a low turnover; as of June 30th, the Fund's annualized portfolio turnover rate increased modestly to 29% from a five-year average4 of 18%.
The Fund added several new positions during the period, including two which were formerly small cap companies that were long-time holdings in the Small Cap Value Fund; the businesses have expanded over the years; now, both stocks are mid-cap holdings.
• East West Bancorp focuses exclusively on the U.S. and greater China markets; its advantaged position facilitates opportunities in the technology, entertainment, and private equity industries and profitability that outpace the industry average.
• Now, Inc., a spin-off of National Oilwell Varco, is the second largest distributor (after MRC Global) of pipes, valves and fittings to the energy industry. Despite the current downturn in energy markets, we remain positive on the company's long-term outlook and acquisition opportunities.
• Kirby Corporation operates barges and towing vessels that transport petrochemicals, refined petroleum products, and agricultural chemicals throughout the U.S. inland waterway system. Kirby is attractively positioned as increased movements of crude oil and petrochemicals are creating lucrative opportunities for this age-old industry.
During the period, the Fund sold positions in MRC Global and Cathay General Bancorp to reposition to Now, Inc. and East West Bancorp, respectively, as described above. The Fund also sold Joy Global, a mining equipment manufacturer and servicing company, and Chesapeake Energy, a natural gas and oil exploration and production company. Both companies were impacted by deteriorating commodity prices.
The Fund's active buy-and-hold approach monitors each holding; we modify positions to realize profits, adjust allocations and maintain a well-diversified portfolio. During the period, the Fund trimmed several positions, including Dana Holdings, Penske Automotive Group, Lear, Wabtec, and O'Reilly Automotive. We also added to Aspen Technology, Conn's, Graco, Helix Energy Solutions, Noble Corporation, and Tidewater as the discounted prices offered attractive opportunities to acquire shares for long-term appreciation.
Looking Ahead
The global outlook remains positive. The World Bank's recently updated forecast anticipates 2.8% global growth in 2015 and 3.3% in 2016. The U.S. economy, meanwhile, is expected to gain momentum
4 Annual turnover: 22% (2014); 15% (2013); 24% (2012); 12% (2011); and 18% (2010).
24
in the second half of 2015. Improving employment and wages coupled with lower gas prices should benefit retailers such as Tractor Supply Company, GameStop and PVH, which owns Calvin Klein, Tommy Hilfiger, and other brands. The housing market, which has lagged the overall recovery, is emerging as a growth leader. A rebound in housing should aid Pool Corporation and Graco, which manufactures fluids and coating products and technologies for the manufacturing, processing, construction and maintenance industries.
Meanwhile, the Federal Reserve's recently upgraded assessment noted, in particular, improving economic data. The Fed has indicated that the first interest rate increase will likely occur later in the year. Higher interest rates should benefit net interest margins for East West Bancorp and CIT Group.
Oil prices, which stabilized during the second quarter, have fallen again amid continuing concerns over excess supply. Yet, a leading reservoir analyst expects natural depletion to reduce global crude production; they concluded that "worldwide crude-oil supply will likely fall in the second half of 2015." The dramatic reduction of rig counts in the U.S. and abroad will impact production. We believe that a recovery in oil prices should, over time, provide significant upside potential for the Fund's Energy and energy-related Industrial companies.
Consistent with our long-term ownership perspective, we seek to invest in high-quality companies that enjoy strong competitive positioning, market leadership and growth opportunities. Going forward, we anticipate that other investments in the Fund will emerge with the potential for significant price appreciation.
Portfolio Holdings as of 06/30/15 (Based on Total Investments)
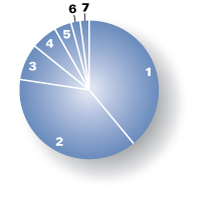
Equities | 100.00 | % | |||||||||
1. | Industrials | 39.02 | % | ||||||||
2. | Consumer Discretionary | 38.38 | % | ||||||||
3. | Energy | 8.42 | % | ||||||||
4. | Financials | 6.01 | % | ||||||||
5. | Information Technology | 3.98 | % | ||||||||
6. | Consumer Staples | 2.12 | % | ||||||||
7. | Materials | 2.07 | % | ||||||||
25
Pacific Advisors
Mid Cap Value Fund continued
Expense Examples
As a shareholder of the Fund you incur two types of costs: (1) transaction costs, including sales charges (loads) on purchase payments, reinvested dividends, or other distributions; redemption fees; and exchange fees; and (2) ongoing costs, including management fees; distribution (12b-1) fees; and other Fund expenses. This Example is intended to help you understand your ongoing costs (in dollars) of investing in the Fund and to compare these costs with the ongoing costs of investing in other mutual funds.
The Example is based on an investment of $1,000 invested at the beginning of the period and held for the entire period from January 1, 2015 through June 30, 2015.
Actual Expenses
The first line of the table below provides information about actual account values and actual expenses. You may use the information in this line, together with the amount you invested, to estimate the expenses that you paid over the period. Simply divide your account value by $1,000 (for example, an $8,600 account value divided by $1,000 = 8.6), then multiply the result by the number in the first line under the heading entitled "Expenses Paid During the Period" to estimate the expenses you paid on your account during the period.
The following transaction costs are not included in the expenses shown in the table and, if applicable, would increase the expenses that you paid over the period: (1) a front-end sales charge (load) of 5.75% on Class A shares; (2) a 2% redemption fee if you sell or exchange shares within 180 days of purchase, with certain exceptions. The redemption fee does not apply to: (a) redemptions under an automatic withdrawal program or periodic asset reallocation plan, required minimum distributions (RMD), employer mandated distributions from a qualified plan, or redemptions under a qualified domestic relations order (QDRO); (b) redemptions to pay for expenses related to terminal illness, extended hospital or nursing home care, or other serious medical conditions, including death; (c) redemptions of shares acquired through dividend or capital gains reinvestments; (d) loans from a qualified plan account, and (e) redemptions initiated by the Fund; and (3) a $10 service fee on each exchange after the first five exchanges in each calendar year.
The following ongoing costs are not included in the expenses shown in the table and, if applicable, would increase the expenses that you paid over the period: (1) a $12 low balance fee on accounts with balances of less than $250 as of September 30th of each calendar year and no investment activity (excluding reinvestment of dividends and/or capital gains) during the prior calendar year or the first nine months of the current calendar year. This fee does not apply to IRAs, qualified plan accounts, or Coverdell Education Savings Accounts; (2) a $15 annual custodial fee on IRAs, SEPs, SIMPLE IRAs, and Coverdell Education Savings Accounts; and (3) a $20 annual custodial fee on 403(b) accounts.
Hypothetical Example for Comparison Purposes
The second line of the table below provides information about hypothetical account values and hypothetical expenses based on the Fund's actual expense ratio and an assumed rate of return of 5% per year before expenses, which in not the Fund's actual return. The hypothetical account values and expenses may not be used to estimate the actual ending account balance or expenses you paid for the period. You may use this information to compare the ongoing costs of investing in the Fund and other funds. To do so, compare this 5% hypothetical example with the 5% hypothetical examples that appear in the shareholder reports of the other funds.
The following transaction costs are not included in the expenses shown in the table and, if applicable, would increase the expenses that you paid over the period: (1) a front-end sales charge (load) of 5.75% on Class A shares; (2) a 2% redemption fee if you sell or exchange shares within 180 days of purchase, with certain exceptions. The redemption fee does not apply to: (a) redemptions under an automatic withdrawal program or periodic asset reallocation plan, required minimum distributions (RMD), employer mandated distributions from a qualified plan, or redemptions under a qualified domestic relations order (QDRO); (b) redemptions to pay for expenses related to terminal illness, extended hospital or nursing home care, or other serious medical conditions, including death; (c) redemptions of shares acquired through dividend or capital gains reinvestments; (d) loans from a qualified plan account, and (e) redemptions initiated by the Fund; and (3) a $10 service fee on each exchange after the first five exchanges in each calendar year.
The following ongoing costs are not included in the expenses shown in the table and, if applicable, would increase the expenses that you paid over the period: (1) a $12 low balance fee on accounts with balances of less than $250 as of September 30th of each calendar year and no investment activity (excluding reinvestment of dividends and/or capital gains) during the prior calendar year or the first nine months of the current calendar year. This fee does not apply to IRAs, qualified plan accounts, or Coverdell Education Savings Accounts; (2) a $15 annual custodial fee on IRAs, SEPs, SIMPLE IRAs, and Coverdell Education Savings Accounts; and (3) a $20 annual custodial fee on 403(b) accounts.
Please note that the expenses shown in the table are meant to highlight your ongoing costs only and do not reflect any transactional costs, such as sales charges (loads), redemption fees, or exchange fees. Therefore, the second line of the table is useful in comparing ongoing costs only, and will not help you determine the relative total costs of owning different funds. In addition, if these transactional costs were included, your costs would have been higher.
| Beginning Account Value 01/01/15 | Ending Account Value 06/30/15 | Expense Paid During Period 01/01/15 – 06/30/15 | |||||||||||||
Mid Cap Value Fund Class A | |||||||||||||||
Actual | $ | 1,000.00 | $ | 976.20 | $ | 18.23 | |||||||||
Hypothetical (5% return before expense) | $ | 1,000.00 | $ | 1,006.35 | $ | 18.51 | |||||||||
Mid Cap Value Fund Class C | |||||||||||||||
Actual | $ | 1,000.00 | $ | 972.70 | $ | 22.16 | |||||||||
Hypothetical (5% return before expense) | $ | 1,000.00 | $ | 1,002.33 | $ | 22.49 | |||||||||
3 Expenses are equal to the Fund's annualized expense ratio of 3.72% for Class A shares and 4.53% for Class C shares, multiplied by the average account value over the period, multiplied by 181/365 days to reflect the one-half year period.
26
Pacific Advisors
Small Cap Value Fund
Fund Objective: Capital appreciation through investment in small cap companies.
Investment Invests at least 80% of its assets in small cap companies which are, at the time of
Strategy: purchase, not greater than the highest market capitalization of companies within the Russell 2000® Index1. Generally invests a significant proportion of its assets in companies with market capitalizations that are, at the time of purchase, not greater than the highest market capitalization of companies in the Russell Microcap® Index2 (which are often referred to as "micro-cap" stocks).
Investor Profile: Aggressive. Opportunity-oriented with a long-term investment horizon.
TOTAL RETURNS | EXPENSE RATIOS3 | ||||||||||||||||||
| For the six months ended June 30, 2015 | Current | Prospectus | |||||||||||||||||
Class A | –4.43 | % | Class A | 2.82 | % | 2.19 | % | ||||||||||||
Class C | –4.78 | % | Class C | 3.59 | % | 2.95 | % | ||||||||||||
Class I | –4.05 | % | Class I | 2.57 | % | 2.03 | % | ||||||||||||
Russell 2000® Index | 4.75 | % | |||||||||||||||||
Performance quoted is past performance which does not guarantee future results. Current performance may be higher or lower than the performance quoted. Call (800) 989-6693 for performance current to the most recent month-end. The investment return and principal value of an investment will fluctuate so that an investor's shares, when redeemed, may be worth more or less than their original cost. Returns represent the change in value over the stated period assuming reinvestment of dividends and capital gains at net asset value. Rankings shown are for Class A shares; rankings for other share classes may be different. Returns and rankings do not take into account the maximum 5.75% sales charge on Class A shares or the 1% Contingent Deferred Sales Charge (CDSC) for Class C shares sold within one year of purchase. Returns would be lower if the applicable sales charge and CDSC were included. Returns do not take into account individual taxes which may reduce actual returns when shares are sold. Small cap companies typically have fewer financial resources and may carry higher investment risks and experience greater stock price volatility than larger stocks.
Discussion with Portfolio Manager August 24, 2015
George A. Henning
Please see the Chairman's Letter at the beginning of this Report for a detailed market and economic review as well as the Manager's general market outlook.
Fund Performance
The Fund lagged its benchmark in the first half of 2015 as growth-oriented stocks, particularly in technology and biotech, attracted investor attention. The Russell 2000® Growth Index's 8.74% gain compared to the 0.76% rise in the Russell 2000® Value Index highlights the outperformance of growth-oriented equity investments. A slowdown in manufacturing activity pressured the Fund's transportation holdings while the continued underperformance in energy-related activity also weighed on performance. Class A shares declined 4.43%, compared to a 4.75% gain in the benchmark.
The Fund invests in high-quality, well-managed companies with identifiable long-term growth opportunities; the Fund's anticipated holding period (3 to 5 years or longer) typically results in reduced
1 The Russell 2000® Index is an unmanaged, market-weighted measure of the 2,000 smallest companies of the Russell 3000® Index which represents approximately 98% of the investable U.S. equity market. Index returns assume the reinvestment of dividends, but, unlike the Fund's returns, do not reflect management fees or expenses. It is not possible to invest directly in the Index.
2 The Russell Microcap® Index is an unmanaged, market capitalization weighted measure of the 1,000 smallest publicly traded companies within the Russell 2000® Index, plus the next smallest 1,000 U.S. based listed stocks.
3 "Current" expense ratio is annualized for the year-to-date as of 06/30/15. "Prospectus" expense ratio is for the fiscal year ended 12/31/14.
27
Pacific Advisors
Small Cap Value Fund continued
turnover; for example, the Fund's annual turnover rate, as of June 30th, was only 3%, less than its five-year average annual turnover rate4 of 11%. Based on the Fund's investment approach, therefore, performance is best viewed over a multi-year time frame. Notwithstanding the disappointing results in the first half of 2015, we anticipate that the Fund's strategy will deliver attractive returns over the long-term as global economies grow and the supply/demand imbalance in oil supplies subsides.
Two of the Fund's top performers were holdings5 which recovered from operational missteps last year. Conn's shares tumbled in 2014 in response to significant credit-related challenges; since then, the company tightened underwriting standards while continuing to open new stores and expanding same-store sales. During the first six months of 2015, shares jumped 112%. Also, management announced a strategic assessment of the company's loan portfolio; a potential sale would provide capital for new store openings while lowering credit risk. Installment lender Regional Management similarly regained its footing as new management enhanced marketing and underwriting practices. Large installment loans, which tend to experience reduced delinquency rates, grew more than 50% year-over-year. The company also plans to expand its branch network of 306 locations by opening 20 to 25 new offices by year-end.
Gentherm, which develops innovative products using its patent-protected thermal electric technology, also outperformed. The company supplies heated and cooled seats to the major auto manufacturers; other products include heated steering wheels, temperature-controlled mattresses, and remote power generation for oil and gas pipelines. In late 2014, shares sold off when the markets interpreted comments from Ford citing weaker auto sales in Europe and Latin America as impacting Gentherm even though its Ford-related exposure in those areas was limited. Following strong earnings results, the stock recovered. Looking ahead, increased auto sales in Europe and, at home, the growing popularity of SUVs and pickup trucks as a result of lower gasoline costs will boost business. Recently, management announced plans to open new manufacturing facilities in Macedonia and Vietnam. Research and development provides the foundation for the company's product development and expansion into new markets; indeed, the company is still in the early stages of long-term growth.
The Fund's energy-related stocks hurt performance as oil price volatility continued. Shares of Hornbeck Offshore Services fell as concerns over slowing activity in offshore oilfield development impacted utilization and contract rates for the company's offshore service vessels. Yet, Hornbeck is particularly well-positioned for the downturn; the company, having completed a shipbuilding program, has low capital commitments over the next several years; and, its technically advanced fleet is predominantly concentrated in the Gulf of Mexico which is widely viewed as the most attractive offshore region. The stock fell to less than 50% of tangible book value even as the company recently sold four vessels to the U.S. Navy at a premium to book value. Shares of North American Energy Partners, a heavy construction and mining services company, pulled back over fears that, at current oil prices, Canadian oil sands projects were no longer economically viable. New projects will likely be delayed but existing construction and mining programs will proceed uninterrupted. Moreover, North American Energy is seeking to diversify operations beyond the Canadian oil sands into civil construction and infrastructure projects. Despite the company's high-quality assets, the stock trades below tangible book value.
Industrial holdings underperformed as a slowdown in manufacturing activity impacted transportation, machinery, and construction-related stocks. Several temporary factors, including the severe winter weather and the West Coast ports strike, contributed to the decline; also, the dollar strengthened which suppressed trade activity through most of April. Shares of Saia, a regional trucking company, fell despite delivering impressive results. Management noted rate increases and improved operating efficiency which helped drive a 47% year-over-year increase in first quarter net income. Commercial truck retailer Rush Enterprises pulled back on concerns that the energy downturn would impact truck sales even though parts and service activity generate the majority of company's profits. Meanwhile, the underlying strength of the U.S. economy, points to improvements ahead. Consumer spending in May rose at the fastest pace since August 2009, and consumer sentiment in June reached its second highest level since January 2007. Likewise, the housing sector, with impressive new and existing home sales, is re-emerging as a growth
4 Annual turnover: 16% (2014); 9% (2013); 12% (2012); 9% (2011) and 9% (2010).
5 For detailed information on Fund holdings, please see the Fund's Schedule of Investments in this Report.
28
engine. We expect ongoing economic growth, and a stabilizing dollar, to support manufacturing activity and, by extension, industrial stocks.
Fund Strategy
The Fund employs a value-oriented approach to identify when high-quality, well-managed companies with attractive growth outlooks become undervalued. Periods of heightened market volatility often create opportunities to strategically invest in these companies for long-term appreciation. The Fund takes an ownership view in seeking to identify stocks that are undervalued or temporarily out-of-favor and have a catalyst for multi-year growth. The Fund focuses on a limited number of small cap stocks (typically 30 to 50 holdings), including a significant number of micro-cap stocks. Micro-caps often attract limited analyst attention; as a result, these under-followed companies can offer significant upside appreciation potential. Investing in small and micro-cap stocks may contribute to above-average volatility; yet, smaller, well-positioned companies can provide superior long-term results. Despite its strategic allocation to micro-cap stocks, we note the Fund's relatively modest one-year beta6 of 1.09, as of June 30th, in comparison to the Russell 2000® Index.
During the period, the Fund increased its position in Regional Management as the company's credit trends improved, new loans increased, and the new management strengthened its leadership team and operations. Importantly, the company recruited executives from a substantially larger organization with success on a national scale; their proven track record and purposeful turnaround plan supported the company's growth plans to become a substantial regional provider of small and large installment loans. The Fund's allocation to Conn's also increased as the company similarly demonstrated progress; improved operating results and a steady growth plan reinforced our long-term view on the shares.
In assessing the bear market for Energy-related companies, a review of Fund holdings identified those that we anticipated would rebound more quickly as the markets recover. As a result of this analysis, the Fund sold two energy-services companies during the quarter: MRC Global, a distributor of pipes and valves, and Mitcham Industries, a seismic equipment leasing firm to oil and gas exploration companies. Both companies are well-managed with strong cash flows; however, each may face relatively slow recoveries. The Fund increased its allocation in companies with stronger recovery potential, including Hornbeck Offshore Services and marine transportation company Kirby. Kirby's management recently noted that shipments for refined products remain strong, with vessel utilization rates over 90%; investors, however, have heavily discounted the company's exposure to crude oil prices. Market cycles represent growth opportunities for Kirby; for example, during the financial crisis, the company made several acquisitions to expand along the Gulf and East Coasts. Other companies, such as Matrix, an engineering and construction firm, should benefit from strong demand for oil and gas storage tanks as well as electrical infrastructure projects. At the same time, refinery maintenance service providers, such as Team and Furmanite, should benefit as low oil prices have encouraged refineries to increase production. Current market sentiment has negatively impacted many companies with operations that are not directly tied to oil exploration; once oil supply and demand rebalances, these undervalued stocks will likely rebound more quickly. Additionally, each company is well-positioned for acquisitions to enhance their long-term potential.
Looking Ahead
Despite the subdued market environment, companies in which the Fund invests continue to pursue growth initiatives. Commercial truck operators, including Rush Enterprises, and manufacturers, such as Navistar, are introducing technologies to improve customer service and fuel efficiency. Engineering and construction firms are bidding on infrastructure projects such as roads, bridges, and ports; Insteel Industries, Orion Marine Group and North American Energy Partners are well-positioned for new projects from Alberta, Canada to the Gulf of Mexico. And, energy companies are adjusting to lower oil prices and positioning their operations in advance of a recovery. The Fund's Energy holdings are concentrated among
6 "Beta" measures volatility relative to the stock market or an alternative benchmark. A beta less than 1.0 indicates lower risk than the market or the benchmark and a beta greater than 1.0 indicates higher risk than the market or the benchmark.
29
Pacific Advisors
Small Cap Value Fund continued
leading service providers which are well-equipped to manage through the downturn; some are utilizing low borrowing costs to finance expansion or acquisition opportunities.
The outlook for the energy markets may remain clouded; but, the valuations for individual companies are extremely compelling. Some stocks trade at a fraction of their tangible book value while others, with limited exposure to low oil prices, have been tossed into the energy basket. The current discounts for energy-related stocks are similar to the deep discounts during the financial crisis; looking back, the most attractive buying opportunities occurred when market sentiment remained overwhelmingly negative. We believe that a recovery in energy-related stocks may emerge even before evidence of a fundamental shift in supply-demand conditions takes place. Typically, the most significant price gains occur early in the recovery cycle as stocks recover from depression-level valuations; therefore, the Fund will remain patient as the sector recovers from its severe underperformance.
The U.S. economy is gaining momentum after the harsh winter and West Coast ports disruption impacted the first quarter. Steady employment growth, positive consumer sentiment and spending, and strong housing sales point to improving conditions. In particular, the housing market, which has lagged the overall recovery, is emerging as a growth leader; an increase in first time buyers and more accommodative credit terms are supporting sales activity. Meanwhile, capital expansion projects, mergers and acquisitions, and strengthening business activity suggest continued confidence in the domestic economy. We expect that, as concerns over geopolitical risks and the Federal Reserve's interest rate increases abate, the markets will refocus on the company fundamentals and the global outlook. The Fund expects to utilize periods of market volatility to add to holdings at discounted prices. Over time, Fund performance will reflect the long-term business results of individual portfolio companies.
Portfolio Holdings as of 06/30/15 (Based on Total Investments)
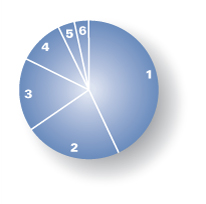
Equities | 100.00 | % | |||||||||
1. | Industrials | 42.98 | % | ||||||||
2. | Consumer Discretionary | 22.40 | % | ||||||||
3. | Energy | 16.96 | % | ||||||||
4. | Financials | 10.49 | % | ||||||||
5. | Telecommunication Services | 3.81 | % | ||||||||
6. | Consumer Staples | 3.36 | % | ||||||||
30
Expense Examples
As a shareholder of the Fund you incur two types of costs: (1) transaction costs, including sales charges (loads) on purchase payments, reinvested dividends, or other distributions; redemption fees; and exchange fees; and (2) ongoing costs, including management fees; distribution (12b-1) fees; and other Fund expenses. This Example is intended to help you understand your ongoing costs (in dollars) of investing in the Fund and to compare these costs with the ongoing costs of investing in other mutual funds.
The Example is based on an investment of $1,000 invested at the beginning of the period and held for the entire period from January 1, 2015 through June 30, 2015.
Actual Expenses
The first line of the table below provides information about actual account values and actual expenses. You may use the information in this line, together with the amount you invested, to estimate the expenses that you paid over the period. Simply divide your account value by $1,000 (for example, an $8,600 account value divided by $1,000 = 8.6), then multiply the result by the number in the first line under the heading entitled "Expenses Paid During the Period" to estimate the expenses you paid on your account during the period.
The following transaction costs are not included in the expenses shown in the table and, if applicable, would increase the expenses that you paid over the period: (1) a front-end sales charge (load) of 5.75% on Class A shares; (2) a 2% redemption fee if you sell or exchange shares within 180 days of purchase, with certain exceptions. The redemption fee does not apply to: (a) redemptions under an automatic withdrawal program or periodic asset reallocation plan, required minimum distributions (RMD), employer mandated distributions from a qualified plan, or redemptions under a qualified domestic relations order (QDRO); (b) redemptions to pay for expenses related to terminal illness, extended hospital or nursing home care, or other serious medical conditions, including death; (c) redemptions of shares acquired through dividend or capital gains reinvestments; (d) loans from a qualified plan account, and (e) redemptions initiated by the Fund; and (3) a $10 service fee on each exchange after the first five exchanges in each calendar year.
The following ongoing costs are not included in the expenses shown in the table and, if applicable, would increase the expenses that you paid over the period: (1) a $12 low balance fee on accounts with balances of less than $250 as of September 30th of each calendar year and no investment activity (excluding reinvestment of dividends and/or capital gains) during the prior calendar year or the first nine months of the current calendar year. This fee does not apply to IRAs, qualified plan accounts, or Coverdell Education Savings Accounts; (2) a $15 annual custodial fee on IRAs, SEPs, SIMPLE IRAs, and Coverdell Education Savings Accounts; and (3) a $20 annual custodial fee on 403(b) accounts.
Hypothetical Example for Comparison Purposes
The second line of the table below provides information about hypothetical account values and hypothetical expenses based on the Fund's actual expense ratio and an assumed rate of return of 5% per year before expenses, which in not the Fund's actual return. The hypothetical account values and expenses may not be used to estimate the actual ending account balance or expenses you paid for the period. You may use this information to compare the ongoing costs of investing in the Fund and other funds. To do so, compare this 5% hypothetical example with the 5% hypothetical examples that appear in the shareholder reports of the other funds.
The following transaction costs are not included in the expenses shown in the table and, if applicable, would increase the expenses that you paid over the period: (1) a front-end sales charge (load) of 5.75% on Class A shares; (2) a 2% redemption fee if you sell or exchange shares within 180 days of purchase, with certain exceptions. The redemption fee does not apply to: (a) redemptions under an automatic withdrawal program or periodic asset reallocation plan, required minimum distributions (RMD), employer mandated distributions from a qualified plan, or redemptions under a qualified domestic relations order (QDRO); (b) redemptions to pay for expenses related to terminal illness, death, extended hospital or nursing home care, or other serious medical conditions; (c) redemptions of shares acquired through dividend or capital gains reinvestments; (d) loans from a qualified plan account; and (e) redemptions initiated by the Fund; and (3) a $10 service fee on each exchange after the first five exchanges in each calendar year.
The following ongoing costs are not included in the expenses shown in the table and, if applicable, would increase the expenses that you paid over the period: (1) a $12 low balance fee on accounts with balances of less than $250 as of September 30th of each calendar year and no investment activity (excluding reinvestment of dividends and/or capital gains) during the prior calendar year or the first nine months of the current calendar year. This fee does not apply to IRAs, qualified plan accounts, or Coverdell Education Savings Accounts; (2) a $15 annual custodial fee on IRAs, SEPs, SIMPLE IRAs, and Coverdell Education Savings Accounts; and (3) a $20 annual custodial fee on 403(b) accounts.
Please note that the expenses shown in the table are meant to highlight your ongoing costs only and do not reflect any transactional costs, such as sales charges (loads), redemption fees, or exchange fees. Therefore, the second line of the table is useful in comparing ongoing costs only, and will not help you determine the relative total costs of owning different funds. In addition, if these transactional costs were included, your costs would have been higher.
| Beginning Account Value 01/01/15 | Ending Account Value 06/30/15 | Expense Paid During Period 01/01/15 – 06/30/15 | |||||||||||||
Small Cap Value Class A | |||||||||||||||
Actual | $ | 1,000.00 | $ | 955.70 | $ | 13.67 | |||||||||
Hypothetical (5% return before expense) | $ | 1,000.00 | $ | 1,010.81 | $ | 14.06 | |||||||||
Small Cap Value Class C | |||||||||||||||
Actual | $ | 1,000.00 | $ | 952.20 | $ | 17.38 | |||||||||
Hypothetical (5% return before expense) | $ | 1,000.00 | $ | 1,006.99 | $ | 17.86 | |||||||||
Small Cap Value Class I | |||||||||||||||
Actual | $ | 1,000.00 | $ | 959.50 | $ | 12.49 | |||||||||
Hypothetical (5% return before expense) | $ | 1,000.00 | $ | 1,012.05 | $ | 12.82 | |||||||||
3 Expenses are equal to the Fund's annualized expense ratio of 2.82% for Class A shares, 3.59% for Class C shares and 2.57% for Class I shares, multiplied by the average account value over the period, multiplied by 181/365 days to reflect the one-half year period.
31

Pacific Advisors Fund Inc.
Financial Statements
32
Pacific Advisors Government Securities Fund
Schedule of Investments (Unaudited)
as of June 30, 2015
| Quantity or Principal | Description | Current $ Value** | % of Total Net Assets | ||||||||||||
COMMON STOCK | |||||||||||||||
CONSUMER STAPLES | 5.80 | ||||||||||||||
BEVERAGES | |||||||||||||||
250 | PEPSICO, INC. | 23,335 | |||||||||||||
23,335 | 1.38 | ||||||||||||||
FOOD PRODUCTS | |||||||||||||||
500 | GENERAL MILLS INC. | 27,860 | |||||||||||||
600 | UNILEVER PLC | 25,776 | |||||||||||||
53,636 | 3.17 | ||||||||||||||
HOUSEHOLD PRODUCTS | |||||||||||||||
200 | KIMBERLY-CLARK CORP. | 21,194 | |||||||||||||
21,194 | 1.25 | ||||||||||||||
ENERGY | 1.14 | ||||||||||||||
OIL, GAS & CONSUMABLE FUELS | |||||||||||||||
200 | CHEVRON CORP. | 19,294 | |||||||||||||
19,294 | 1.14 | ||||||||||||||
HEALTH CARE | 3.12 | ||||||||||||||
PHARMACEUTICALS | |||||||||||||||
400 | ELI LILLY & CO. | 33,396 | |||||||||||||
200 | JOHNSON & JOHNSON | 19,492 | |||||||||||||
52,888 | 3.12 | ||||||||||||||
INFORMATION TECHNOLOGY | 1.30 | ||||||||||||||
SOFTWARE | |||||||||||||||
500 | MICROSOFT CORP. | 22,075 | |||||||||||||
22,075 | 1.30 | ||||||||||||||
TELECOMMUNICATION SERVICES | 1.68 | ||||||||||||||
DIVERSIFIED TELECOM. SERVICES | |||||||||||||||
800 | AT&T INC. | 28,416 | |||||||||||||
28,416 | 1.68 | ||||||||||||||
UTILITIES | 4.03 | ||||||||||||||
ELECTRIC UTILITIES | |||||||||||||||
750 | PPL CORP. | 22,103 | |||||||||||||
550 | SOUTHERN CO. | 23,045 | |||||||||||||
45,148 | 2.66 | ||||||||||||||
See Accompanying Notes to Financial Statements which are an integral part of these financial statements.
33
Pacific Advisors Government Securities Fund
Schedule of Investments (Unaudited)
as of June 30, 2015
| Quantity or Principal | Description | Current $ Value** | % of Total Net Assets | ||||||||||||
COMMON STOCK continued | |||||||||||||||
MULTI-UTILITIES | |||||||||||||||
400 | CONSOLIDATED EDISON INC. | 23,152 | |||||||||||||
23,152 | 1.37 | ||||||||||||||
TOTAL COMMON STOCK (Cost: $207,632) | 289,138 | 17.06 | |||||||||||||
US GOVT SECURITIES | |||||||||||||||
US GOVERNMENT AGENCY | 82.61 | ||||||||||||||
US GOVERNMENT AGENCY | |||||||||||||||
300,000 | FEDERAL HOME LOAN MTG CORP. 0.50% 05/26/18 STEP | 299,818 | |||||||||||||
100,000 | FEDERAL HOME LOAN MTG CORP. 0.50% 07/30/18 STEP | 100,018 | |||||||||||||
300,000 | FEDERAL HOME LOAN MTG CORP. 1.00% 06/29/20 STEP | 299,832 | |||||||||||||
350,000 | FEDERAL HOME LOAN BANK 0.75% 01/30/19 STEP | 350,121 | |||||||||||||
200,000 | FEDERAL HOME LOAN BANK 0.75% 05/27/20 STEP | 200,054 | |||||||||||||
150,000 | FEDERAL HOME LOAN BANK 0.50% 06/18/20 STEP | 149,954 | |||||||||||||
1,399,796 | 82.61 | ||||||||||||||
TOTAL US GOVT SECURITIES (Cost: $1,400,000) | 1,399,796 | 82.61 | |||||||||||||
SHORT TERM INVESTMENTS | |||||||||||||||
MONEY MARKET | 0.16 | ||||||||||||||
2,696 | UMB MONEY MARKET FIDUCIARY | 2,696 | |||||||||||||
2,696 | 0.16 | ||||||||||||||
TOTAL SHORT TERM INVESTMENTS (Cost: $2,696) | 2,696 | 0.16 | |||||||||||||
TOTAL INVESTMENT IN SECURITIES (Cost: $1,610,328) | 1,691,630 | 99.83 | |||||||||||||
OTHER ASSETS LESS LIABILITIES | 2,765 | 0.17 | |||||||||||||
TOTAL NET ASSETS | 1,694,395 | 100.00 | |||||||||||||
* Non-income producing
** The principal amount is stated in U.S. dollars unless otherwise indicated.
See Accompanying Notes to Financial Statements which are an integral part of these financial statements.
34
Pacific Advisors Income and Equity Fund
Schedule of Investments (Unaudited)
as of June 30, 2015
| Quantity or Principal | Description | Current $ Value** | % of Total Net Assets | ||||||||||||
COMMON STOCK | |||||||||||||||
CONSUMER DISCRETIONARY | 5.19 | ||||||||||||||
DISTRIBUTORS | |||||||||||||||
1,750 | GENUINE PARTS CO. | 156,678 | |||||||||||||
156,678 | 1.15 | ||||||||||||||
LEISURE PRODUCTS | |||||||||||||||
5,500 | MATTEL INC. | 141,295 | |||||||||||||
141,295 | 1.03 | ||||||||||||||
MEDIA | |||||||||||||||
3,000 | OMNICOM GROUP INC. | 208,470 | |||||||||||||
208,470 | 1.52 | ||||||||||||||
MULTILINE RETAIL | |||||||||||||||
2,500 | TARGET CORP. | 204,075 | |||||||||||||
204,075 | 1.49 | ||||||||||||||
CONSUMER STAPLES | 8.43 | ||||||||||||||
BEVERAGES | |||||||||||||||
4,500 | COCA-COLA CO. | 176,535 | |||||||||||||
176,535 | 1.29 | ||||||||||||||
FOOD & STAPLES RETAILING | |||||||||||||||
2,400 | CVS HEALTH CORP. | 251,712 | |||||||||||||
5,000 | SYSCO CORP. | 180,500 | |||||||||||||
2,800 | THE KROGER CO. | 203,028 | |||||||||||||
2,700 | WAL-MART STORES INC. | 191,511 | |||||||||||||
826,751 | 6.05 | ||||||||||||||
HOUSEHOLD PRODUCTS | |||||||||||||||
1,900 | PROCTER & GAMBLE CO. | 148,656 | |||||||||||||
148,656 | 1.09 | ||||||||||||||
ENERGY | 2.93 | ||||||||||||||
ENERGY EQUIPMENT & SERVICES | |||||||||||||||
2,500 | SCHLUMBERGER LTD | 215,475 | |||||||||||||
215,475 | 1.58 | ||||||||||||||
OIL, GAS & CONSUMABLE FUELS | |||||||||||||||
3,000 | CONOCOPHILLIPS | 184,230 | |||||||||||||
184,230 | 1.35 | ||||||||||||||
See Accompanying Notes to Financial Statements which are an integral part of these financial statements.
35
Pacific Advisors Income and Equity Fund
Schedule of Investments (Unaudited)
as of June 30, 2015
| Quantity or Principal | Description | Current $ Value** | % of Total Net Assets | ||||||||||||
COMMON STOCK continued | |||||||||||||||
FINANCIALS | 3.28 | ||||||||||||||
BANKS | |||||||||||||||
4,000 | WELLS FARGO & CO. | 224,960 | |||||||||||||
224,960 | 1.64 | ||||||||||||||
INSURANCE | |||||||||||||||
4,000 | METLIFE INC. | 223,960 | |||||||||||||
223,960 | 1.64 | ||||||||||||||
HEALTH CARE | 4.49 | ||||||||||||||
PHARMACEUTICALS | |||||||||||||||
3,500 | ABBVIE INC. | 235,165 | |||||||||||||
2,000 | JOHNSON & JOHNSON | 194,920 | |||||||||||||
5,500 | PFIZER INC. | 184,415 | |||||||||||||
614,500 | 4.49 | ||||||||||||||
INDUSTRIALS | 7.67 | ||||||||||||||
AEROSPACE & DEFENSE | |||||||||||||||
2,000 | HONEYWELL INT'L INC. | 203,940 | |||||||||||||
203,940 | 1.49 | ||||||||||||||
AIR FREIGHT & LOGISTICS | |||||||||||||||
2,250 | UNITED PARCEL SERVICE INC. B | 218,048 | |||||||||||||
218,048 | 1.59 | ||||||||||||||
COMMERCIAL SERVICES & SUPPLIES | |||||||||||||||
3,500 | WASTE MANAGEMENT INC. | 162,225 | |||||||||||||
162,225 | 1.19 | ||||||||||||||
INDUSTRIAL CONGLOMERATES | |||||||||||||||
8,000 | GENERAL ELECTRIC CO. | 212,560 | |||||||||||||
212,560 | 1.55 | ||||||||||||||
TRADING COMPANIES & DISTRIBUTORS | |||||||||||||||
6,000 | FASTENAL COMPANY | 253,080 | |||||||||||||
253,080 | 1.85 | ||||||||||||||
INFORMATION TECHNOLOGY | 4.70 | ||||||||||||||
COMMUNICATIONS EQUIPMENT | |||||||||||||||
8,000 | CISCO SYSTEMS INC. | 219,680 | |||||||||||||
219,680 | 1.61 | ||||||||||||||
SEMICONDUCTORS & EQUIPMENT | |||||||||||||||
7,000 | INTEL CORP. | 212,905 | |||||||||||||
212,905 | 1.56 | ||||||||||||||
See Accompanying Notes to Financial Statements which are an integral part of these financial statements.
36
Pacific Advisors Income and Equity Fund
Schedule of Investments (Unaudited)
as of June 30, 2015
| Quantity or Principal | Description | Current $ Value** | % of Total Net Assets | ||||||||||||
COMMON STOCK continued | |||||||||||||||
SOFTWARE | |||||||||||||||
4,750 | MICROSOFT CORP. | 209,713 | |||||||||||||
209,713 | 1.53 | ||||||||||||||
MATERIALS | 2.97 | ||||||||||||||
CHEMICALS | |||||||||||||||
3,000 | DUPONT DE NEMOURS & CO. | 191,850 | |||||||||||||
191,850 | 1.40 | ||||||||||||||
PAPER & FOREST PRODUCTS | |||||||||||||||
4,500 | INTERNATIONAL PAPER COMPANY | 214,155 | |||||||||||||
214,155 | 1.57 | ||||||||||||||
TELECOMMUNICATION SERVICES | 3.20 | ||||||||||||||
DIVERSIFIED TELECOM. SERVICES | |||||||||||||||
6,000 | AT&T INC. | 213,120 | |||||||||||||
4,815 | VERIZON COMMUNICATIONS INC. | 224,427 | |||||||||||||
437,547 | 3.20 | ||||||||||||||
UTILITIES | 4.84 | ||||||||||||||
ELECTRIC UTILITIES | |||||||||||||||
2,500 | DUKE ENERGY CORP. | 176,550 | |||||||||||||
5,000 | XCEL ENERGY INC. | 160,900 | |||||||||||||
337,450 | 2.47 | ||||||||||||||
MULTI-UTILITIES | |||||||||||||||
2,500 | DOMINION RESOURCES INC. | 167,175 | |||||||||||||
4,000 | PUBLIC SERVICE ENTERPRISE GROUP INC. | 157,120 | |||||||||||||
324,295 | 2.37 | ||||||||||||||
TOTAL COMMON STOCK (Cost: $5,018,366) | 6,523,032 | 47.70 | |||||||||||||
CORPORATE BOND | |||||||||||||||
CONSUMER DISCRETIONARY | 4.10 | ||||||||||||||
AUTOMOBILES | |||||||||||||||
130,000 | GENERAL MOTORS FINL CO. 4.75% 08/15/17 | 137,191 | |||||||||||||
137,191 | 1.00 | ||||||||||||||
HOTELS, RESTAURANTS & LEISURE | |||||||||||||||
100,000 | DARDEN RESTAURANTS INC. 6.45% 10/15/17 | 110,946 | |||||||||||||
100,000 | INTL GAME TECHNOLOGY 7.50% 06/15/19 | 106,500 | |||||||||||||
100,000 | WYNDHAM WORLDWIDE 2.95% 03/01/17 | 101,510 | |||||||||||||
100,000 | WYNN LAS VEGAS LLC 7.75% 08/15/20 | 104,625 | |||||||||||||
423,581 | 3.10 | ||||||||||||||
See Accompanying Notes to Financial Statements which are an integral part of these financial statements.
37
Pacific Advisors Income and Equity Fund
Schedule of Investments (Unaudited)
as of June 30, 2015
| Quantity or Principal | Description | Current $ Value** | % of Total Net Assets | ||||||||||||
CORPORATE BOND continued | |||||||||||||||
ENERGY | 6.79 | ||||||||||||||
ENERGY EQUIPMENT & SERVICES | |||||||||||||||
100,000 | PRIDE INTERNATIONAL INC. 6.875% 08/15/20 | 114,367 | |||||||||||||
150,000 | ROWAN COMPANY INC. 7.875% 08/01/19 | 169,910 | |||||||||||||
150,000 | SESI LLC 6.375% 05/01/19 | 152,550 | |||||||||||||
100,000 | WEATHERFORD BERMUDA 6.00% 03/15/18 | 106,453 | |||||||||||||
543,280 | 3.97 | ||||||||||||||
OIL, GAS & CONSUMABLE FUELS | |||||||||||||||
150,000 | CONTINENTAL RESOURCES 7.375% 10/01/20 | 156,750 | |||||||||||||
100,000 | ENERGY TRANSFER PARTNERS 9.00% 04/15/19 | 119,982 | |||||||||||||
100,000 | PENN VIRGINIA RESOURCE 8.375% 06/01/20 | 108,500 | |||||||||||||
385,232 | 2.82 | ||||||||||||||
FINANCIALS | 19.19 | ||||||||||||||
CAPITAL MARKETS | |||||||||||||||
150,000 | ARES CAPITAL CORP. 4.875% 11/30/18 | 157,259 | |||||||||||||
100,000 | FIFTH STREET FINANCE CORP. 4.875% 03/01/19 | 101,847 | |||||||||||||
100,000 | GOLDMAN SACHS GROUP INC. 1.00% 02/12/18 STEP | 99,711 | |||||||||||||
100,000 | GOLDMAN SACHS GROUP INC. 1.68% 08/26/20 FLOAT | 99,997 | |||||||||||||
100,000 | JANUS CAPITAL GROUP INC. 6.70% 06/15/17 | 108,828 | |||||||||||||
100,000 | JEFFERIES GROUP INC. 5.125% 04/13/18 | 106,189 | |||||||||||||
100,000 | MORGAN STANLEY 3.50% 09/30/17 FLOAT | 103,989 | |||||||||||||
100,000 | MORGAN STANLEY 4.50% 10/27/18 FLOAT | 103,000 | |||||||||||||
100,000 | PROSPECT CAPITAL CORP. 5.00% 07/15/19 | 103,265 | |||||||||||||
984,084 | 7.20 | ||||||||||||||
BANKS | |||||||||||||||
100,000 | BANK OF AMERICA CORP. 2.43% 03/19/20 FLOAT | 100,750 | |||||||||||||
100,000 | BANK OF AMERICA CORP. 2.04% 09/28/20 FIX-FLOAT | 102,503 | |||||||||||||
125,000 | JPMORGAN CHASE & CO. 1.80% 02/25/21 FLOAT | 123,650 | |||||||||||||
150,000 | SUNTRUST BANKS INC. 1.28% 11/22/16 FLOAT | 150,762 | |||||||||||||
477,665 | 3.49 | ||||||||||||||
DIVERSIFIED FINANCIAL SERVICES | |||||||||||||||
100,000 | ICAHN ENTERPRISES 6.00% 08/01/20 | 103,250 | |||||||||||||
100,000 | LEUCADIA NATIONAL CORP. 8.125% 09/15/15 | 101,187 | |||||||||||||
100,000 | NASDAQ OMX GROUP 5.25% 01/16/18 | 107,982 | |||||||||||||
100,000 | NASDAQ OMX GROUP 5.55% 01/15/20 | 110,690 | |||||||||||||
423,109 | 3.09 | ||||||||||||||
INSURANCE | |||||||||||||||
115,000 | GENWORTH FINANCIAL INC. 8.625% 12/15/16 | 123,625 | |||||||||||||
100,000 | PRUDENTIAL FINANCIAL INC. 1.96% 11/02/20 FLOAT | 103,634 | |||||||||||||
227,259 | 1.66 | ||||||||||||||
See Accompanying Notes to Financial Statements which are an integral part of these financial statements.
38
Pacific Advisors Income and Equity Fund
Schedule of Investments (Unaudited)
as of June 30, 2015
| Quantity or Principal | Description | Current $ Value** | % of Total Net Assets | ||||||||||||
CORPORATE BOND continued | |||||||||||||||
REAL ESTATE INVESTMENT TRUSTS | |||||||||||||||
105,000 | HOSPITALITY PROP TRUST 6.70% 01/15/18 | 113,896 | |||||||||||||
150,000 | HRPT PROPERTIES 6.25% 08/15/16 | 154,094 | |||||||||||||
125,000 | MACK-CALI REALTY LP 7.75% 08/15/19 | 143,884 | |||||||||||||
100,000 | SENIOR HOUSING PROP TRUST 4.30% 01/15/16 | 100,727 | |||||||||||||
512,601 | 3.75 | ||||||||||||||
HEALTH CARE | 0.87 | ||||||||||||||
PHARMACEUTICALS | |||||||||||||||
110,000 | HOSPIRA INC. 6.05% 03/30/17 | 118,355 | |||||||||||||
118,355 | 0.87 | ||||||||||||||
INDUSTRIALS | 7.19 | ||||||||||||||
AEROSPACE & DEFENSE | |||||||||||||||
150,000 | L-3 COMMUNICATIONS CORP. 5.20% 10/15/19 | 162,542 | |||||||||||||
162,542 | 1.19 | ||||||||||||||
BUILDING PRODUCTS | |||||||||||||||
115,000 | OWENS CORNING INC. 9.00% 06/15/19 | 137,167 | |||||||||||||
137,167 | 1.00 | ||||||||||||||
MACHINERY | |||||||||||||||
100,000 | CNH AMERICA LLC 7.25% 01/15/16 | 102,000 | |||||||||||||
100,000 | HARSCO CORP. 5.75% 05/15/18 | 103,000 | |||||||||||||
115,000 | JOY GLOBAL INC. 6.00% 11/15/16 | 121,953 | |||||||||||||
326,953 | 2.39 | ||||||||||||||
PROFESSIONAL SERVICES | |||||||||||||||
150,000 | DUN & BRADSTREET CORP. 4.00% 06/15/20 | 150,714 | |||||||||||||
150,714 | 1.10 | ||||||||||||||
TRADING COMPANIES & DISTRIBUTORS | |||||||||||||||
100,000 | AIR LEASE CORP. 5.625% 04/01/17 | 106,000 | |||||||||||||
100,000 | INTL LEASE FINANCE CORP. 2.24% 06/15/16 FLOAT | 99,875 | |||||||||||||
205,875 | 1.51 | ||||||||||||||
INFORMATION TECHNOLOGY | 3.55 | ||||||||||||||
TECHNOLOGY HARDWARE, STORAGE & PERIPHERALS | |||||||||||||||
145,000 | LEXMARK INT'L INC. 6.65% 06/01/18 | 159,493 | |||||||||||||
159,493 | 1.17 | ||||||||||||||
See Accompanying Notes to Financial Statements which are an integral part of these financial statements.
39
Pacific Advisors Income and Equity Fund
Schedule of Investments (Unaudited)
as of June 30, 2015
| Quantity or Principal | Description | Current $ Value** | % of Total Net Assets | ||||||||||||
CORPORATE BOND continued | |||||||||||||||
ELECTRONIC EQUIPMENT & INSTRUMENTS | |||||||||||||||
102,000 | ARROW ELECTRONICS INC. 6.875% 06/01/18 | 113,263 | |||||||||||||
100,000 | INGRAM MICRO INC. 5.25% 09/01/17 | 106,997 | |||||||||||||
100,000 | JABIL CIRCUIT INC. 7.75% 07/15/16 | 104,750 | |||||||||||||
325,010 | 2.38 | ||||||||||||||
MATERIALS | 6.91 | ||||||||||||||
CHEMICALS | |||||||||||||||
150,000 | ROCKWOOD SPECIALTIES 4.625% 10/15/20 | 156,188 | |||||||||||||
156,188 | 1.14 | ||||||||||||||
METALS & MINING | |||||||||||||||
100,000 | ALCOA INC. 5.55% 02/01/17 | 105,028 | |||||||||||||
100,000 | COMMERCIAL METALS CO. 7.35% 08/15/18 | 108,250 | |||||||||||||
150,000 | FREEPORT-MCMORAN OIL & GAS LLC. 6.125% 06/15/19 | 158,438 | |||||||||||||
150,000 | RELIANCE STEEL & ALUMINUM 6.20% 11/15/16 | 157,894 | |||||||||||||
150,000 | VALE OVERSEAS LIMITED 6.25% 01/23/17 | 158,637 | |||||||||||||
688,247 | 5.03 | ||||||||||||||
PAPER & FOREST PRODUCTS | |||||||||||||||
100,000 | DOMTAR CORP. 7.125% 08/15/15 | 100,568 | |||||||||||||
100,568 | 0.74 | ||||||||||||||
TELECOMMUNICATION SERVICES | 1.20 | ||||||||||||||
DIVERSIFIED TELECOM. SERVICES | |||||||||||||||
28,397 | BELLSOUTH TELECOM. 6.30% 12/15/15 | 28,965 | |||||||||||||
125,000 | QWEST CORP. 6.50% 06/01/17 | 135,145 | |||||||||||||
164,110 | 1.20 | ||||||||||||||
UTILITIES | 1.16 | ||||||||||||||
ELECTRIC UTILITIES | |||||||||||||||
49,000 | CLEVELAND ELECTRIC ILLUMINATING 5.70% 04/01/17 | 52,306 | |||||||||||||
100,000 | PPL ENERGY SUPPLY LLC 6.50% 05/01/18 | 107,000 | |||||||||||||
159,306 | 1.16 | ||||||||||||||
TOTAL CORPORATE BOND (Cost: $6,928,394) | 6,968,528 | 50.96 | |||||||||||||
PREFERRED STOCK | |||||||||||||||
FINANCIALS | 0.73 | ||||||||||||||
BANKS | |||||||||||||||
100,000 | JPMORGAN CHASE & CO 5.30% PFD | 99,260 | |||||||||||||
99,260 | 0.73 | ||||||||||||||
TOTAL PREFERRED STOCK (Cost: $99,750) | 99,260 | 0.73 | |||||||||||||
See Accompanying Notes to Financial Statements which are an integral part of these financial statements.
40
Pacific Advisors Income and Equity Fund
Schedule of Investments (Unaudited)
as of June 30, 2015
| Quantity or Principal | Description | Current $ Value** | % of Total Net Assets | ||||||||||||
SHORT TERM INVESTMENTS | |||||||||||||||
MONEY MARKET | 0.90 | ||||||||||||||
122,596 | UMB MONEY MARKET FIDUCIARY | 122,596 | |||||||||||||
122,596 | 0.90 | ||||||||||||||
TOTAL SHORT TERM INVESTMENTS (Cost: $122,596) | 122,596 | 0.90 | |||||||||||||
TOTAL INVESTMENT IN SECURITIES (Cost: $12,169,106) | 13,713,416 | 100.29 | |||||||||||||
OTHER ASSETS LESS LIABILITIES | (37,700 | ) | (0.29 | ) | |||||||||||
TOTAL NET ASSETS | 13,675,716 | 100.00 | |||||||||||||
* Non-income producing
** The principal amount is stated in U.S. dollars unless otherwise indicated.
See Accompanying Notes to Financial Statements which are an integral part of these financial statements.
41
Pacific Advisors Balanced Fund
Schedule of Investments (Unaudited)
as of June 30, 2015
| Quantity or Principal | Description | Current $ Value** | % of Total Net Assets | ||||||||||||
COMMON STOCK | |||||||||||||||
CONSUMER DISCRETIONARY | 19.37 | ||||||||||||||
MEDIA | |||||||||||||||
2,300 | OMNICOM GROUP INC. | 159,827 | |||||||||||||
2,300 | WALT DISNEY CO. | 262,522 | |||||||||||||
422,349 | 5.02 | ||||||||||||||
SPECIALTY RETAIL | |||||||||||||||
7,500 | CONN'S INC.* | 297,750 | |||||||||||||
2,300 | LITHIA MOTORS INC. | 260,268 | |||||||||||||
1,000 | O'REILLY AUTOMOTIVE INC.* | 225,980 | |||||||||||||
783,998 | 9.32 | ||||||||||||||
TEXTILES, APPAREL & LUXURY GOODS | |||||||||||||||
2,000 | NIKE INC. | 216,040 | |||||||||||||
1,800 | PVH CORP. | 207,360 | |||||||||||||
423,400 | 5.03 | ||||||||||||||
CONSUMER STAPLES | 3.12 | ||||||||||||||
FOOD & STAPLES RETAILING | |||||||||||||||
2,500 | CVS HEALTH CORP. | 262,200 | |||||||||||||
262,200 | 3.12 | ||||||||||||||
ENERGY | 9.13 | ||||||||||||||
ENERGY EQUIPMENT & SERVICES | |||||||||||||||
4,000 | HALLIBURTON CO. | 172,280 | |||||||||||||
11,000 | HELIX ENERGY SOLUTIONS GROUP INC.* | 138,930 | |||||||||||||
8,000 | HORNBECK OFFSHORE SERVICES INC.* | 164,240 | |||||||||||||
3,000 | NATIONAL OILWELL VARCO INC. | 144,840 | |||||||||||||
6,500 | TIDEWATER INC. | 147,745 | |||||||||||||
768,035 | 9.13 | ||||||||||||||
FINANCIALS | 5.48 | ||||||||||||||
BANKS | |||||||||||||||
5,300 | EAST WEST BANCORP INC. | 237,546 | |||||||||||||
3,300 | JPMORGAN CHASE & CO. | 223,608 | |||||||||||||
461,154 | 5.48 | ||||||||||||||
HEALTH CARE | 2.20 | ||||||||||||||
PHARMACEUTICALS | |||||||||||||||
1,000 | PERRIGO CO PLC | 184,830 | |||||||||||||
184,830 | 2.20 | ||||||||||||||
See Accompanying Notes to Financial Statements which are an integral part of these financial statements.
42
Pacific Advisors Balanced Fund
Schedule of Investments (Unaudited)
as of June 30, 2015
| Quantity or Principal | Description | Current $ Value** | % of Total Net Assets | ||||||||||||
COMMON STOCK continued | |||||||||||||||
INDUSTRIALS | 25.83 | ||||||||||||||
COMMERCIAL SERVICES & SUPPLIES | |||||||||||||||
5,000 | TEAM INC.* | 201,250 | |||||||||||||
201,250 | 2.39 | ||||||||||||||
CONSTRUCTION & ENGINEERING | |||||||||||||||
4,800 | CHICAGO BRIDGE & IRON CO. N.V. | 240,192 | |||||||||||||
240,192 | 2.85 | ||||||||||||||
INDUSTRIAL CONGLOMERATES | |||||||||||||||
8,000 | GENERAL ELECTRIC CO. | 212,560 | |||||||||||||
212,560 | 2.53 | ||||||||||||||
MACHINERY | |||||||||||||||
1,400 | CUMMINS INC. | 183,666 | |||||||||||||
7,000 | NAVISTAR INT'L CORP.* | 158,410 | |||||||||||||
2,400 | WABTEC CORP. | 226,176 | |||||||||||||
568,252 | 6.75 | ||||||||||||||
MARINE | |||||||||||||||
3,000 | KIRBY CORP.* | 229,980 | |||||||||||||
229,980 | 2.73 | ||||||||||||||
ROAD & RAIL | |||||||||||||||
6,000 | CSX CORP. | 195,900 | |||||||||||||
2,500 | GENESEE & WYOMING INC.* | 190,450 | |||||||||||||
1,900 | KANSAS CITY SOUTHERN | 173,280 | |||||||||||||
559,630 | 6.65 | ||||||||||||||
TRADING COMPANIES & DISTRIBUTORS | |||||||||||||||
3,500 | DXP ENTERPRISES INC.* | 162,750 | |||||||||||||
162,750 | 1.93 | ||||||||||||||
INFORMATION TECHNOLOGY | 5.72 | ||||||||||||||
COMMUNICATIONS EQUIPMENT | |||||||||||||||
2,500 | QUALCOMM INC. | 156,575 | |||||||||||||
156,575 | 1.86 | ||||||||||||||
INTERNET SOFTWARE & SERVICES | |||||||||||||||
300 | GOOGLE INC.* | 162,012 | |||||||||||||
162,012 | 1.93 | ||||||||||||||
IT SERVICES | |||||||||||||||
1,000 | INT'L BUSINESS MACHINES CORP. | 162,660 | |||||||||||||
162,660 | 1.93 | ||||||||||||||
TOTAL COMMON STOCK (Cost: $4,605,283) | 5,961,827 | 70.85 | |||||||||||||
See Accompanying Notes to Financial Statements which are an integral part of these financial statements.
43
Pacific Advisors Balanced Fund
Schedule of Investments (Unaudited)
as of June 30, 2015
| Quantity or Principal | Description | Current $ Value** | % of Total Net Assets | ||||||||||||
CORPORATE BOND | |||||||||||||||
CONSUMER DISCRETIONARY | 1.32 | ||||||||||||||
DIVERSIFIED CONSUMER SERVICES | |||||||||||||||
100,000 | WASHINGTON POST CO. 7.25% 02/01/19 | 111,486 | |||||||||||||
111,486 | 1.32 | ||||||||||||||
ENERGY | 8.95 | ||||||||||||||
ENERGY EQUIPMENT & SERVICES | |||||||||||||||
100,000 | PRIDE INTERNATIONAL INC. 8.50% 06/15/19 | 118,048 | |||||||||||||
100,000 | ROWAN COMPANY INC. 7.875% 08/01/19 | 113,273 | |||||||||||||
100,000 | SEACOR HOLDING 7.375% 10/01/19 | 104,250 | |||||||||||||
100,000 | SESI LLC 6.375% 05/01/19 | 101,700 | |||||||||||||
437,271 | 5.20 | ||||||||||||||
OIL, GAS & CONSUMABLE FUELS | |||||||||||||||
100,000 | CHESAPEAKE ENERGY 3.53% 04/15/19 FLOAT | 91,500 | |||||||||||||
100,000 | CONTINENTAL RESOURCES 7.375% 10/01/20 | 104,500 | |||||||||||||
100,000 | ENERGY TRANSFER PARTNERS 9.00% 04/15/19 | 119,982 | |||||||||||||
315,982 | 3.75 | ||||||||||||||
FINANCIALS | 8.39 | ||||||||||||||
CAPITAL MARKETS | |||||||||||||||
100,000 | JEFFERIES GROUP INC. 5.50% 03/15/16 | 102,343 | |||||||||||||
102,343 | 1.22 | ||||||||||||||
BANKS | |||||||||||||||
100,000 | BANK OF AMERICA CORP. 2.03% 07/28/17 FLOAT | 101,960 | |||||||||||||
101,960 | 1.21 | ||||||||||||||
DIVERSIFIED FINANCIAL SERVICES | |||||||||||||||
100,000 | ICAHN ENTERPRISES 6.00% 08/01/20 | 103,250 | |||||||||||||
100,000 | LEUCADIA NATIONAL CORP. 8.125% 09/15/15 | 101,187 | |||||||||||||
50,000 | NASDAQ OMX GROUP 5.25% 01/16/18 | 53,991 | |||||||||||||
258,428 | 3.07 | ||||||||||||||
REAL ESTATE INVESTMENT TRUSTS | |||||||||||||||
125,000 | CORRECTIONS CORP. OF AMERICA 4.125% 04/01/20 | 124,375 | |||||||||||||
100,000 | EPR PROPERTIES 7.75% 07/15/20 | 118,780 | |||||||||||||
243,155 | 2.89 | ||||||||||||||
HEALTH CARE | 1.29 | ||||||||||||||
HEALTH CARE PROVIDERS & SERVICES | |||||||||||||||
100,000 | FRESENIUS MED CARE US 6.875% 07/15/17 | 108,250 | |||||||||||||
108,250 | 1.29 | ||||||||||||||
See Accompanying Notes to Financial Statements which are an integral part of these financial statements.
44
Pacific Advisors Balanced Fund
Schedule of Investments (Unaudited)
as of June 30, 2015
| Quantity or Principal | Description | Current $ Value** | % of Total Net Assets | ||||||||||||
CORPORATE BOND continued | |||||||||||||||
INDUSTRIALS | 3.80 | ||||||||||||||
MACHINERY | |||||||||||||||
100,000 | CASE NEW HOLLAND INC. 7.875% 12/01/17 | 109,500 | |||||||||||||
109,500 | 1.30 | ||||||||||||||
TRADING COMPANIES & DISTRIBUTORS | |||||||||||||||
100,000 | AIRCASTLE 6.75% 04/15/17 | 106,500 | |||||||||||||
95,000 | INTL LEASE FINANCE CORP. 8.75% 03/15/17 | 103,940 | |||||||||||||
210,440 | 2.50 | ||||||||||||||
INFORMATION TECHNOLOGY | 2.47 | ||||||||||||||
ELECTRONIC EQUIPMENT & INSTRUMENTS | |||||||||||||||
100,000 | JABIL CIRCUIT INC. 7.75% 07/15/16 | 104,750 | |||||||||||||
104,750 | 1.24 | ||||||||||||||
INTERNET SOFTWARE & SERVICES | |||||||||||||||
100,000 | IAC/INTERACTIVECORP 4.875% 11/30/18 | 103,125 | |||||||||||||
103,125 | 1.23 | ||||||||||||||
MATERIALS | 2.53 | ||||||||||||||
CHEMICALS | |||||||||||||||
100,000 | ROCKWOOD SPECIALTIES 4.625% 10/15/20 | 104,125 | |||||||||||||
104,125 | 1.24 | ||||||||||||||
METALS & MINING | |||||||||||||||
100,000 | COMMERCIAL METALS CO. 7.35% 08/15/18 | 108,250 | |||||||||||||
108,250 | 1.29 | ||||||||||||||
TOTAL CORPORATE BOND (Cost: $2,414,498) | 2,419,065 | 28.75 | |||||||||||||
SHORT TERM INVESTMENTS | |||||||||||||||
MONEY MARKET | 0.14 | ||||||||||||||
11,558 | UMB MONEY MARKET FIDUCIARY | 11,558 | |||||||||||||
11,558 | 0.14 | ||||||||||||||
TOTAL SHORT TERM INVESTMENTS (Cost: $11,558) | 11,558 | 0.14 | |||||||||||||
TOTAL INVESTMENT IN SECURITIES (Cost: $7,031,339) | 8,392,450 | 99.74 | |||||||||||||
OTHER ASSETS LESS LIABILITIES | 23,539 | 0.26 | |||||||||||||
TOTAL NET ASSETS | 8,415,989 | 100.00 | |||||||||||||
* Non-income producing
** The principal amount is stated in U.S. dollars unless otherwise indicated.
See Accompanying Notes to Financial Statements which are an integral part of these financial statements.
45
Pacific Advisors Large Cap Value Fund
Schedule of Investments (Unaudited)
as of June 30, 2015
| Quantity or Principal | Description | Current $ Value** | % of Total Net Assets | ||||||||||||
COMMON STOCK | |||||||||||||||
CONSUMER DISCRETIONARY | 21.57 | ||||||||||||||
AUTO COMPONENTS | |||||||||||||||
2,500 | JOHNSON CONTROLS INC. | 123,825 | |||||||||||||
123,825 | 1.55 | ||||||||||||||
DIVERSIFIED CONSUMER SERVICES | |||||||||||||||
5,000 | HOUGHTON MIFFLIN HARCOURT COMPANY* | 126,000 | |||||||||||||
126,000 | 1.57 | ||||||||||||||
HOTELS, RESTAURANTS & LEISURE | |||||||||||||||
2,000 | MCDONALD'S CORP. | 190,140 | |||||||||||||
190,140 | 2.37 | ||||||||||||||
MEDIA | |||||||||||||||
3,650 | TIME WARNER INC. | 319,047 | |||||||||||||
3,500 | WALT DISNEY CO. | 399,490 | |||||||||||||
718,537 | 8.97 | ||||||||||||||
SPECIALTY RETAIL | |||||||||||||||
3,750 | LOWE'S COMPANIES INC. | 251,138 | |||||||||||||
2,870 | THE HOME DEPOT, INC. | 318,943 | |||||||||||||
570,081 | 7.11 | ||||||||||||||
CONSUMER STAPLES | 15.51 | ||||||||||||||
BEVERAGES | |||||||||||||||
5,120 | COCA-COLA CO. | 200,858 | |||||||||||||
975 | PEPSICO, INC. | 91,007 | |||||||||||||
291,864 | 3.64 | ||||||||||||||
FOOD & STAPLES RETAILING | |||||||||||||||
5,000 | SYSCO CORP. | 180,500 | |||||||||||||
2,950 | WAL-MART STORES INC. | 209,244 | |||||||||||||
389,744 | 4.86 | ||||||||||||||
FOOD PRODUCTS | |||||||||||||||
3,000 | KRAFT FOODS GROUP INC. | 255,420 | |||||||||||||
2,700 | MONDELEZ INT'L INC. | 111,078 | |||||||||||||
366,498 | 4.57 | ||||||||||||||
HOUSEHOLD PRODUCTS | |||||||||||||||
2,500 | PROCTER & GAMBLE CO. | 195,600 | |||||||||||||
195,600 | 2.44 | ||||||||||||||
See Accompanying Notes to Financial Statements which are an integral part of these financial statements.
46
Pacific Advisors Large Cap Value Fund
Schedule of Investments (Unaudited)
as of June 30, 2015
| Quantity or Principal | Description | Current $ Value** | % of Total Net Assets | ||||||||||||
COMMON STOCK continued | |||||||||||||||
ENERGY | 2.18 | ||||||||||||||
OIL, GAS & CONSUMABLE FUELS | |||||||||||||||
2,100 | EXXON MOBIL CORP. | 174,720 | |||||||||||||
174,720 | 2.18 | ||||||||||||||
FINANCIALS | 18.97 | ||||||||||||||
CAPITAL MARKETS | |||||||||||||||
4,000 | LEGG MASON INC. | 206,120 | |||||||||||||
206,120 | 2.57 | ||||||||||||||
BANKS | |||||||||||||||
7,000 | BANK OF AMERICA CORP. | 119,140 | |||||||||||||
2,850 | CITIGROUP INC. | 157,434 | |||||||||||||
4,225 | WELLS FARGO & CO. | 237,614 | |||||||||||||
514,188 | 6.42 | ||||||||||||||
DIVERSIFIED FINANCIAL SERVICES | |||||||||||||||
2,000 | BERKSHIRE HATHAWAY INC. B* | 272,220 | |||||||||||||
272,220 | 3.40 | ||||||||||||||
INSURANCE | |||||||||||||||
4,000 | AMERICAN INT'L GROUP INC. | 247,280 | |||||||||||||
5,000 | METLIFE INC. | 279,950 | |||||||||||||
527,230 | 6.58 | ||||||||||||||
HEALTH CARE | 3.18 | ||||||||||||||
PHARMACEUTICALS | |||||||||||||||
2,615 | JOHNSON & JOHNSON | 254,858 | |||||||||||||
254,858 | 3.18 | ||||||||||||||
INDUSTRIALS | 15.93 | ||||||||||||||
AEROSPACE & DEFENSE | |||||||||||||||
2,000 | HONEYWELL INT'L INC. | 203,940 | |||||||||||||
203,940 | 2.55 | ||||||||||||||
AIR FREIGHT & LOGISTICS | |||||||||||||||
1,000 | FEDEX CORP. | 170,400 | |||||||||||||
1,200 | UNITED PARCEL SERVICE INC. B | 116,292 | |||||||||||||
286,692 | 3.58 | ||||||||||||||
INDUSTRIAL CONGLOMERATES | |||||||||||||||
9,750 | GENERAL ELECTRIC CO. | 259,058 | |||||||||||||
259,058 | 3.23 | ||||||||||||||
See Accompanying Notes to Financial Statements which are an integral part of these financial statements.
47
Pacific Advisors Large Cap Value Fund
Schedule of Investments (Unaudited)
as of June 30, 2015
| Quantity or Principal | Description | Current $ Value** | % of Total Net Assets | ||||||||||||
COMMON STOCK continued | |||||||||||||||
MACHINERY | |||||||||||||||
3,200 | DEERE & CO. | 310,560 | |||||||||||||
2,350 | ILLINOIS TOOL WORKS INC. | 215,707 | |||||||||||||
526,267 | 6.57 | ||||||||||||||
INFORMATION TECHNOLOGY | 22.17 | ||||||||||||||
TECHNOLOGY HARDWARE, STORAGE & PERIPHERALS | |||||||||||||||
3,290 | APPLE INC. | 412,648 | |||||||||||||
412,648 | 5.15 | ||||||||||||||
INTERNET SOFTWARE & SERVICES | |||||||||||||||
300 | GOOGLE INC. CLASS C* | 156,153 | |||||||||||||
156,153 | 1.95 | ||||||||||||||
IT SERVICES | |||||||||||||||
1,350 | INT'L BUSINESS MACHINES CORP. | 219,591 | |||||||||||||
2,200 | MASTERCARD INC. | 205,656 | |||||||||||||
425,247 | 5.31 | ||||||||||||||
SEMICONDUCTORS & EQUIPMENT | |||||||||||||||
5,600 | INTEL CORP. | 170,324 | |||||||||||||
170,324 | 2.13 | ||||||||||||||
SOFTWARE | |||||||||||||||
7,000 | MICROSOFT CORP. | 309,050 | |||||||||||||
7,500 | ORACLE CORP. | 302,250 | |||||||||||||
611,300 | 7.63 | ||||||||||||||
TOTAL COMMON STOCK (Cost: $5,336,904) | 7,973,252 | 99.50 | |||||||||||||
SHORT TERM INVESTMENTS | |||||||||||||||
MONEY MARKET | 0.63 | ||||||||||||||
50,567 | UMB MONEY MARKET FIDUCIARY | 50,567 | |||||||||||||
50,567 | 0.63 | ||||||||||||||
TOTAL SHORT TERM INVESTMENTS (Cost: $50,567) | 50,567 | 0.63 | |||||||||||||
TOTAL INVESTMENT IN SECURITIES (Cost: $5,387,471) | 8,023,819 | 100.14 | |||||||||||||
OTHER ASSETS LESS LIABILITIES | (10,571 | ) | (0.14 | ) | |||||||||||
TOTAL NET ASSETS | 8,013,248 | 100.00 | |||||||||||||
* Non-income producing
** The principal amount is stated in U.S. dollars unless otherwise indicated.
See Accompanying Notes to Financial Statements which are an integral part of these financial statements.
48
Pacific Advisors Mid Cap Value Fund
Schedule of Investments (Unaudited)
as of June 30, 2015
| Quantity or Principal | Description | Current $ Value** | % of Total Net Assets | ||||||||||||
COMMON STOCK | |||||||||||||||
CONSUMER DISCRETIONARY | 38.43 | ||||||||||||||
AUTO COMPONENTS | |||||||||||||||
10,000 | DANA HOLDING CORP. | 205,800 | |||||||||||||
2,500 | LEAR CORP. | 280,650 | |||||||||||||
486,450 | 7.08 | ||||||||||||||
DISTRIBUTORS | |||||||||||||||
3,500 | POOL CORPORATION | 245,630 | |||||||||||||
245,630 | 3.58 | ||||||||||||||
SPECIALTY RETAIL | |||||||||||||||
11,000 | CONN'S INC.* | 436,700 | |||||||||||||
5,000 | GAMESTOP CORP. A | 214,800 | |||||||||||||
1,400 | O'REILLY AUTOMOTIVE INC.* | 316,372 | |||||||||||||
5,800 | PENSKE AUTOMOTIVE GROUP INC. | 302,238 | |||||||||||||
4,000 | TRACTOR SUPPLY COMPANY | 359,760 | |||||||||||||
1,629,870 | 23.74 | ||||||||||||||
TEXTILES, APPAREL & LUXURY GOODS | |||||||||||||||
2,400 | PVH CORP. | 276,480 | |||||||||||||
276,480 | 4.03 | ||||||||||||||
CONSUMER STAPLES | 2.12 | ||||||||||||||
BEVERAGES | |||||||||||||||
2,000 | DR PEPPER SNAPPLE GROUP INC. | 145,800 | |||||||||||||
145,800 | 2.12 | ||||||||||||||
ENERGY | 8.43 | ||||||||||||||
ENERGY EQUIPMENT & SERVICES | |||||||||||||||
13,000 | HELIX ENERGY SOLUTIONS GROUP INC.* | 164,190 | |||||||||||||
12,900 | NOBLE CORP. | 198,531 | |||||||||||||
9,500 | TIDEWATER INC. | 215,935 | |||||||||||||
578,656 | 8.43 | ||||||||||||||
FINANCIALS | 6.02 | ||||||||||||||
BANKS | |||||||||||||||
3,300 | CIT GROUP INC. | 153,417 | |||||||||||||
5,800 | EAST WEST BANCORP INC. | 259,956 | |||||||||||||
413,373 | 6.02 | ||||||||||||||
INDUSTRIALS | 39.08 | ||||||||||||||
AIRLINES | |||||||||||||||
4,000 | SPIRIT AIRLINES INC.* | 248,400 | |||||||||||||
248,400 | 3.62 | ||||||||||||||
See Accompanying Notes to Financial Statements which are an integral part of these financial statements.
49
Pacific Advisors Mid Cap Value Fund
Schedule of Investments (Unaudited)
as of June 30, 2015
| Quantity or Principal | Description | Current $ Value** | % of Total Net Assets | ||||||||||||
COMMON STOCK continued | |||||||||||||||
CONSTRUCTION & ENGINEERING | |||||||||||||||
5,100 | CHICAGO BRIDGE & IRON CO. N.V. | 255,204 | |||||||||||||
255,204 | 3.72 | ||||||||||||||
MACHINERY | |||||||||||||||
2,500 | GRACO INC. | 177,575 | |||||||||||||
8,200 | NAVISTAR INT'L CORP.* | 185,566 | |||||||||||||
3,300 | WABTEC CORP. | 310,992 | |||||||||||||
674,133 | 9.82 | ||||||||||||||
MARINE | |||||||||||||||
3,400 | KIRBY CORP.* | 260,644 | |||||||||||||
260,644 | 3.80 | ||||||||||||||
ROAD & RAIL | |||||||||||||||
3,000 | GENESEE & WYOMING INC.* | 228,540 | |||||||||||||
2,100 | KANSAS CITY SOUTHERN | 191,520 | |||||||||||||
3,100 | LANDSTAR SYSTEM INC. | 207,297 | |||||||||||||
11,500 | SWIFT TRANSPORTATION CO.* | 260,705 | |||||||||||||
888,062 | 12.93 | ||||||||||||||
TRADING COMPANIES & DISTRIBUTORS | |||||||||||||||
6,000 | NOW INC.* | 119,460 | |||||||||||||
1,000 | W.W. GRAINGER, INC. | 236,650 | |||||||||||||
356,110 | 5.19 | ||||||||||||||
INFORMATION TECHNOLOGY | 3.98 | ||||||||||||||
SOFTWARE | |||||||||||||||
6,000 | ASPEN TECHNOLOGY, INC.* | 273,300 | |||||||||||||
273,300 | 3.98 | ||||||||||||||
MATERIALS | 2.07 | ||||||||||||||
CHEMICALS | |||||||||||||||
3,500 | H.B. FULLER CO. | 142,170 | |||||||||||||
142,170 | 2.07 | ||||||||||||||
TOTAL COMMON STOCK (Cost: $5,314,453) | 6,874,282 | 100.13 | |||||||||||||
TOTAL INVESTMENT IN SECURITIES (Cost: $5,314,453) | 6,874,282 | 100.13 | |||||||||||||
OTHER ASSETS LESS LIABILITIES | (8,352 | ) | (0.13 | ) | |||||||||||
TOTAL NET ASSETS | 6,865,930 | 100.00 | |||||||||||||
* Non-income producing
** The principal amount is stated in U.S. dollars unless otherwise indicated.
See Accompanying Notes to Financial Statements which are an integral part of these financial statements.
50
Pacific Advisors Small Cap Value Fund
Schedule of Investments (Unaudited)
as of June 30, 2015
| Quantity or Principal | Description | Current $ Value** | % of Total Net Assets | ||||||||||||
COMMON STOCK | |||||||||||||||
CONSUMER DISCRETIONARY | 22.67 | ||||||||||||||
AUTO COMPONENTS | |||||||||||||||
75,000 | GENTHERM INC.* | 4,118,250 | |||||||||||||
4,118,250 | 4.54 | ||||||||||||||
HOTELS, RESTAURANTS & LEISURE | |||||||||||||||
230,000 | BRAVO BRIO RESTAURANT GROUP INC.* | 3,116,500 | |||||||||||||
3,116,500 | 3.44 | ||||||||||||||
SPECIALTY RETAIL | |||||||||||||||
172,000 | CONN'S INC.* | 6,828,400 | |||||||||||||
65,000 | HIBBETT SPORTS INC.* | 3,027,700 | |||||||||||||
145,000 | SONIC AUTOMOTIVE INC. | 3,455,350 | |||||||||||||
13,311,450 | 14.69 | ||||||||||||||
CONSUMER STAPLES | 3.40 | ||||||||||||||
FOOD PRODUCTS | |||||||||||||||
210,000 | DARLING INGREDIENTS INC.* | 3,078,600 | |||||||||||||
3,078,600 | 3.40 | ||||||||||||||
ENERGY | 17.16 | ||||||||||||||
ENERGY EQUIPMENT & SERVICES | |||||||||||||||
195,000 | HORNBECK OFFSHORE SERVICES INC.* | 4,003,350 | |||||||||||||
205,000 | MATRIX SERVICE CO.* | 3,747,400 | |||||||||||||
140,000 | NATURAL GAS SERVICES GROUP, INC.* | 3,194,800 | |||||||||||||
910,000 | NORTH AMERICAN ENERGY PARTNERS INC. | 2,211,300 | |||||||||||||
600,000 | PARKER DRILLING CO.* | 1,992,000 | |||||||||||||
15,148,850 | 16.72 | ||||||||||||||
OIL, GAS & CONSUMABLE FUELS | |||||||||||||||
1,000,000 | INFINITY ENERGY RESOURCES INC.* | 400,000 | |||||||||||||
400,000 | 0.44 | ||||||||||||||
FINANCIALS | 10.61 | ||||||||||||||
BANKS | |||||||||||||||
130,000 | BBCN BANCORP INC. | 1,922,700 | |||||||||||||
78,000 | EAST WEST BANCORP INC. | 3,495,960 | |||||||||||||
5,418,660 | 5.98 | ||||||||||||||
CONSUMER FINANCE | |||||||||||||||
235,000 | REGIONAL MANAGEMENT CORP.* | 4,197,100 | |||||||||||||
4,197,100 | 4.63 | ||||||||||||||
See Accompanying Notes to Financial Statements which are an integral part of these financial statements.
51
Pacific Advisors Small Cap Value Fund
Schedule of Investments (Unaudited)
as of June 30, 2015
| Quantity or Principal | Description | Current $ Value** | % of Total Net Assets | ||||||||||||
COMMON STOCK continued | |||||||||||||||
INDUSTRIALS | 43.49 | ||||||||||||||
BUILDING PRODUCTS | |||||||||||||||
90,000 | INSTEEL INDUSTRIES INC. | 1,683,000 | |||||||||||||
212,000 | NCI BUILDING SYSTEMS INC.* | 3,194,840 | |||||||||||||
4,877,840 | 5.38 | ||||||||||||||
COMMERCIAL SERVICES & SUPPLIES | |||||||||||||||
98,000 | MOBILE MINI INC. | 4,119,920 | |||||||||||||
104,000 | TEAM INC.* | 4,186,000 | |||||||||||||
8,305,920 | 9.16 | ||||||||||||||
CONSTRUCTION & ENGINEERING | |||||||||||||||
375,000 | FURMANITE CORP.* | 3,045,000 | |||||||||||||
210,000 | ORION MARINE GROUP INC.* | 1,516,200 | |||||||||||||
4,561,200 | 5.03 | ||||||||||||||
MACHINERY | |||||||||||||||
123,000 | NAVISTAR INT'L CORP.* | 2,783,490 | |||||||||||||
2,783,490 | 3.07 | ||||||||||||||
MARINE | |||||||||||||||
60,000 | KIRBY CORP.* | 4,599,600 | |||||||||||||
4,599,600 | 5.08 | ||||||||||||||
ROAD & RAIL | |||||||||||||||
95,000 | SAIA INC.* | 3,732,550 | |||||||||||||
3,732,550 | 4.12 | ||||||||||||||
TRADING COMPANIES & DISTRIBUTORS | |||||||||||||||
92,000 | DXP ENTERPRISES INC.* | 4,278,000 | |||||||||||||
131,000 | RUSH ENTERPRISES INC.* | 3,433,510 | |||||||||||||
90,000 | TAL INT'L GROUP INC. | 2,844,000 | |||||||||||||
10,555,510 | 11.65 | ||||||||||||||
TELECOMMUNICATION SERVICES | 3.86 | ||||||||||||||
DIVERSIFIED TELECOM. SERVICES | |||||||||||||||
340,000 | PREMIERE GLOBAL SERVICES INC.* | 3,498,600 | |||||||||||||
3,498,600 | 3.86 | ||||||||||||||
TOTAL COMMON STOCK (Cost: $66,809,727) | 91,704,120 | 101.19 | |||||||||||||
TOTAL INVESTMENT IN SECURITIES (Cost: $66,809,727) | 91,704,120 | 101.19 | |||||||||||||
OTHER ASSETS LESS LIABILITIES | (1,075,478 | ) | (1.19 | ) | |||||||||||
TOTAL NET ASSETS | 90,628,642 | 100.00 | |||||||||||||
* Non-income producing
** The principal amount is stated in U.S. dollars unless otherwise indicated.
See Accompanying Notes to Financial Statements which are an integral part of these financial statements.
52
(This page has been left blank intentionally.)
53
Pacific Advisors Fund Inc.
Statement of Assets and Liabilities (Unaudited)
June 30, 2015
| Government Securities Fund | Income and Equity Fund | Balanced Fund | |||||||||||||
Assets | |||||||||||||||
Investment securities | |||||||||||||||
At cost | $ | 1,607,632 | $ | 12,046,510 | $ | 7,019,781 | |||||||||
At fair value | $ | 1,688,934 | $ | 13,590,820 | $ | 8,380,892 | |||||||||
Cash or cash equivalent, at fair value | 2,696 | 122,596 | 11,558 | ||||||||||||
Accrued income receivable | 2,128 | 100,790 | 46,728 | ||||||||||||
Receivable for capital shares sold | - | - | 1,002 | ||||||||||||
Receivable for investments sold | - | - | - | ||||||||||||
Other assets | 5,527 | 7,864 | 9,937 | ||||||||||||
Total assets | 1,699,285 | 13,822,070 | 8,450,117 | ||||||||||||
Liabilities | |||||||||||||||
Bank borrowings (Note 7) | - | - | - | ||||||||||||
Payable for investments purchased | - | 100,795 | - | ||||||||||||
Payable for fund shares redeemed | - | - | 1,288 | ||||||||||||
Accounts payable | 4,890 | 41,959 | 29,240 | ||||||||||||
Accounts payable to related parties (Note 3) | - | 3,600 | 3,600 | ||||||||||||
Total liabilities | 4,890 | 146,354 | 34,128 | ||||||||||||
Net Assets | $ | 1,694,395 | $ | 13,675,716 | $ | 8,415,989 | |||||||||
Summary of Shareholders' Equity | |||||||||||||||
Paid in capital | 1,693,959 | 12,488,775 | 6,587,395 | ||||||||||||
Accumulated undistributed net investment income | - | - | - | ||||||||||||
Accumulated undistributed net realized gain (loss) on security transactions | (80,866 | ) | (357,369 | ) | 467,483 | ||||||||||
Net unrealized appreciation of investments | 81,302 | 1,544,310 | 1,361,111 | ||||||||||||
Net assets at June 30, 2015 | $ | 1,694,395 | $ | 13,675,716 | $ | 8,415,989 | |||||||||
Class A: | |||||||||||||||
Net assets | $ | 1,515,493 | $ | 10,950,810 | $ | 4,924,144 | |||||||||
Shares authorized | 50,000,000 | 50,000,000 | 50,000,000 | ||||||||||||
Shares outstanding | 169,181 | 927,583 | 343,873 | ||||||||||||
Net asset value and redemption price per share | $ | 8.96 | $ | 11.81 | $ | 14.32 | |||||||||
Maximum offering price per share | $ | 9.41 | $ | 12.40 | $ | 15.19 | |||||||||
Sales load | 4.75 | % | 4.75 | % | 5.75 | % | |||||||||
Class C: | |||||||||||||||
Net assets | $ | 178,902 | $ | 2,724,906 | $ | 3,491,845 | |||||||||
Shares authorized | 50,000,000 | 50,000,000 | 50,000,000 | ||||||||||||
Shares outstanding | 20,886 | 240,193 | 271,375 | ||||||||||||
Net asset value and redemption price per share | $ | 8.57 | $ | 11.34 | $ | 12.87 | |||||||||
Class I: | |||||||||||||||
Net assets | N/A | N/A | N/A | ||||||||||||
Shares authorized | |||||||||||||||
Shares outstanding | |||||||||||||||
Net asset value and redemption price per share | N/A | N/A | N/A | ||||||||||||
See Accompanying Notes to Financial Statements which are an integral part of these financial statements.
54
| Large Cap Value Fund | Mid Cap Value Fund | Small Cap Value Fund | |||||||||||||
Assets | |||||||||||||||
Investment securities | |||||||||||||||
At cost | $ | 5,336,904 | $ | 5,314,453 | $ | 66,809,727 | |||||||||
At fair value | $ | 7,973,252 | $ | 6,874,282 | $ | 91,704,120 | |||||||||
Cash or cash equivalent, at fair value | 50,567 | - | - | ||||||||||||
Accrued income receivable | 10,959 | 1,653 | 16,156 | ||||||||||||
Receivable for capital shares sold | - | 10,000 | 10,165 | ||||||||||||
Receivable for investments sold | - | - | 413,352 | ||||||||||||
Other assets | 7,649 | 9,939 | 46,068 | ||||||||||||
Total assets | 8,042,427 | 6,895,874 | 92,189,861 | ||||||||||||
Liabilities | |||||||||||||||
Bank borrowings (Note 7) | - | 6,683 | 1,365,156 | ||||||||||||
Payable for investments purchased | - | - | - | ||||||||||||
Payable for fund shares redeemed | - | - | 24,951 | ||||||||||||
Accounts payable | 25,579 | 19,661 | 155,722 | ||||||||||||
Accounts payable to related parties (Note 3) | 3,600 | 3,600 | 15,390 | ||||||||||||
Total liabilities | 29,179 | 29,944 | 1,561,219 | ||||||||||||
Net Assets | $ | 8,013,248 | $ | 6,865,930 | $ | 90,628,642 | |||||||||
Summary of Shareholders' Equity | |||||||||||||||
Paid in capital | 5,479,151 | 6,394,556 | 58,461,296 | ||||||||||||
Accumulated undistributed net investment income | - | - | - | ||||||||||||
Accumulated undistributed net realized gain (loss) on security transactions | (102,251 | ) | (1,088,455 | ) | 7,272,953 | ||||||||||
Net unrealized appreciation of investments | 2,636,348 | 1,559,829 | 24,894,393 | ||||||||||||
Net assets at June 30, 2015 | $ | 8,013,248 | $ | 6,865,930 | $ | 90,628,642 | |||||||||
Class A: | |||||||||||||||
Net assets | $ | 6,833,287 | $ | 6,022,729 | $ | 81,929,518 | |||||||||
Shares authorized | 50,000,000 | 50,000,000 | 50,000,000 | ||||||||||||
Shares outstanding | 485,722 | 458,275 | 1,925,833 | ||||||||||||
Net asset value and redemption price per share | $ | 14.07 | $ | 13.14 | $ | 42.54 | |||||||||
Maximum offering price per share | $ | 14.93 | $ | 13.94 | $ | 45.14 | |||||||||
Sales load | 5.75 | % | 5.75 | % | 5.75 | % | |||||||||
Class C: | |||||||||||||||
Net assets | $ | 1,179,961 | $ | 843,201 | $ | 8,445,158 | |||||||||
Shares authorized | 50,000,000 | 50,000,000 | 50,000,000 | ||||||||||||
Shares outstanding | 96,432 | 71,689 | 242,409 | ||||||||||||
Net asset value and redemption price per share | $ | 12.24 | $ | 11.76 | $ | 34.84 | |||||||||
Class I: | |||||||||||||||
Net assets | N/A | N/A | $ | 253,966 | |||||||||||
Shares authorized | 50,000,000 | ||||||||||||||
Shares outstanding | 4,989 | ||||||||||||||
Net asset value and redemption price per share | N/A | N/A | $ | 50.91 | |||||||||||
55
Pacific Advisors Fund Inc.
Statement of Operations (Unaudited)
For the six months ended June 30, 2015
| Government Securities Fund | Income and Equity Fund | Balanced Fund | |||||||||||||
Investment Income | |||||||||||||||
Dividends | $ | 5,558 | $ | 103,094 | $ | 38,187 | |||||||||
Interest | 4,178 | 111,778 | 59,954 | ||||||||||||
Total investment income | 9,736 | 214,872 | 98,141 | ||||||||||||
Expenses | |||||||||||||||
Investment management fees (Note 3) | 5,718 | 51,330 | 33,345 | ||||||||||||
Transfer agent fees (Note 3) | 24,327 | 42,816 | 35,383 | ||||||||||||
Fund accounting fees (Note 3) | 10,759 | 38,326 | 24,897 | ||||||||||||
Legal fees | 1,160 | 8,366 | 5,169 | ||||||||||||
Audit fees | 1,328 | 9,775 | 6,650 | ||||||||||||
Registration fees | 10,204 | 12,319 | 12,449 | ||||||||||||
Printing | 352 | 2,738 | 1,778 | ||||||||||||
Custody fees | 3,341 | 4,106 | 3,476 | ||||||||||||
Interest on borrowings | 90 | - | 525 | ||||||||||||
Director fees/meetings | 557 | 4,362 | 2,845 | ||||||||||||
Distribution and service (12b-1) fees (Note 3) | 2,804 | 26,747 | 23,639 | ||||||||||||
Other expenses | 1,567 | 12,851 | 8,614 | ||||||||||||
Total expenses, before fees waived | 62,207 | 213,736 | 158,770 | ||||||||||||
Less fees waived (Note 3) | 27,318 | 51,330 | - | ||||||||||||
Net expenses | 34,889 | 162,406 | 158,770 | ||||||||||||
Net Investment Income (Loss) | (25,153 | ) | 52,466 | (60,629 | ) | ||||||||||
Net Realized and Unrealized Gain (Loss) on Investments | |||||||||||||||
Net realized gain (loss) on investments | 8,550 | 140,396 | 396,737 | ||||||||||||
Change in net unrealized appreciation (depreciation) on investments | (15,488 | ) | (432,106 | ) | (389,868 | ) | |||||||||
Net realized and unrealized gain (loss) on investments | (6,938 | ) | (291,710 | ) | 6,869 | ||||||||||
Net Decrease in Net Assets Resulting from Operations | $ | (32,091 | ) | $ | (239,244 | ) | $ | (53,760 | ) | ||||||
See Accompanying Notes to Financial Statements which are an integral part of these financial statements.
56
| Large Cap Value Fund | Mid Cap Value Fund | Small Cap Value Fund | |||||||||||||
Investment Income | |||||||||||||||
Dividends | $ | 78,534 | $ | 41,388 | $ | 149,423 | |||||||||
Interest | 1 | - | 5 | ||||||||||||
Total investment income | 78,535 | 41,388 | 149,428 | ||||||||||||
Expenses | |||||||||||||||
Investment management fees (Note 3) | 30,103 | 34,508 | 382,387 | ||||||||||||
Transfer agent fees (Note 3) | 44,880 | 32,297 | 268,730 | ||||||||||||
Fund accounting fees (Note 3) | 22,477 | 19,324 | 300,375 | ||||||||||||
Legal fees | 5,421 | 4,276 | 61,478 | ||||||||||||
Audit fees | 5,714 | 5,068 | 79,520 | ||||||||||||
Registration fees | 10,837 | 12,768 | 35,690 | ||||||||||||
Printing | 1,605 | 1,380 | 20,394 | ||||||||||||
Custody fees | 3,426 | 3,459 | 8,887 | ||||||||||||
Interest on borrowings | 186 | 337 | 16,605 | ||||||||||||
Director fees/meetings | 2,499 | 2,157 | 34,474 | ||||||||||||
Distribution and service (12b-1) fees (Note 3) | 13,084 | 9,971 | 158,360 | ||||||||||||
Other expenses | 7,022 | 6,421 | 101,576 | ||||||||||||
Total expenses, before fees waived | 147,254 | 131,966 | 1,468,476 | ||||||||||||
Less fees waived (Note 3) | 30,103 | - | - | ||||||||||||
Net expenses | 117,151 | 131,966 | 1,468,476 | ||||||||||||
Net Investment Income (Loss) | (38,616 | ) | (90,578 | ) | (1,319,048 | ) | |||||||||
Net Realized and Unrealized Gain (Loss) on Investments | |||||||||||||||
Net realized gain (loss) on investments | (113,726 | ) | 116,159 | 2,155,629 | |||||||||||
Change in net unrealized appreciation (depreciation) on investments | 84,611 | (190,656 | ) | (7,293,745 | ) | ||||||||||
Net realized and unrealized gain (loss) on investments | (29,115 | ) | (74,497 | ) | (5,138,116 | ) | |||||||||
Net Decrease in Net Assets Resulting from Operations | $ | (67,731 | ) | $ | (165,075 | ) | $ | (6,457,164 | ) | ||||||
57
Pacific Advisors Fund Inc.
Statements of Changes in Net Assets (Unaudited)
Government Securities Fund | Income and Equity Fund | ||||||||||||||||||
| Six months ended June 30, 2015 | Year ended December 31, 2014 | Six months ended June 30, 2015 | Year ended December 31, 2014 | ||||||||||||||||
| Increase (Decrease) in Net Assets From Operations | |||||||||||||||||||
Net investment income (loss) | $ | (25,153 | ) | $ | (51,865 | ) | $ | 52,466 | $ | 223,003 | |||||||||
Net realized gain (loss) on investments | 8,550 | 42,268 | 140,396 | (7,526 | ) | ||||||||||||||
Change in net unrealized appreciation (depreciation) on investments | (15,488 | ) | (783 | ) | (432,106 | ) | 555,686 | ||||||||||||
Increase (decrease) in net assets resulting from operations | (32,091 | ) | (10,380 | ) | (239,244 | ) | 771,163 | ||||||||||||
From Distributions to Shareholders | |||||||||||||||||||
Class A: | |||||||||||||||||||
Net investment income | - | - | (49,802 | ) | (196,112 | ) | |||||||||||||
Net capital gains | - | - | - | - | |||||||||||||||
Return of capital | - | - | - | - | |||||||||||||||
Class C: | |||||||||||||||||||
Net investment income | - | - | (3,998 | ) | (26,605 | ) | |||||||||||||
Net capital gains | - | - | - | - | |||||||||||||||
Return of capital | - | - | - | - | |||||||||||||||
Class I: | N/A | N/A | N/A | N/A | |||||||||||||||
Net investment income | |||||||||||||||||||
Net capital gains | |||||||||||||||||||
Return of capital | |||||||||||||||||||
Decrease in net assets resulting from distributions | - | - | (53,800 | ) | (222,717 | ) | |||||||||||||
From Capital Share Transactions (Note 6) | |||||||||||||||||||
Proceeds from shares sold | 151 | 41,597 | 1,219,200 | 4,371,535 | |||||||||||||||
Proceeds from shares purchased by reinvestment of dividends | - | - | 47,036 | 193,524 | |||||||||||||||
Cost of shares repurchased | (95,941 | ) | (314,796 | ) | (1,092,183 | ) | (2,799,741 | ) | |||||||||||
Increase (decrease) in net assets resulting from capital share transactions | (95,790 | ) | (273,199 | ) | 174,053 | 1,765,318 | |||||||||||||
Increase (decrease) in net assets | (127,881 | ) | (283,579 | ) | (118,991 | ) | 2,313,764 | ||||||||||||
Net Assets | |||||||||||||||||||
Beginning of period | 1,822,276 | 2,105,855 | 13,794,707 | 11,480,943 | |||||||||||||||
End of period | $ | 1,694,395 | $ | 1,822,276 | $ | 13,675,716 | $ | 13,794,707 | |||||||||||
Including undistributed net investment income | $ | - | $ | - | $ | - | $ | 662 | |||||||||||
See Accompanying Notes to Financial Statements which are an integral part of these financial statements.
58
Balanced Fund | |||||||||||
| Six months ended June 30, 2015 | Year ended December 31, 2014 | ||||||||||
| Increase (Decrease) in Net Assets From Operations | |||||||||||
Net investment income (loss) | $ | (60,629 | ) | $ | (128,864 | ) | |||||
Net realized gain (loss) on investments | 396,737 | 492,224 | |||||||||
Change in net unrealized appreciation (depreciation) on investments | (389,868 | ) | (1,219,005 | ) | |||||||
Increase (decrease) in net assets resulting from operations | (53,760 | ) | (855,645 | ) | |||||||
From Distributions to Shareholders | |||||||||||
Class A: | |||||||||||
Net investment income | - | - | |||||||||
Net capital gains | - | (289,923 | ) | ||||||||
Return of capital | - | - | |||||||||
Class C: | |||||||||||
Net investment income | - | - | |||||||||
Net capital gains | - | (266,984 | ) | ||||||||
Return of capital | - | - | |||||||||
Class I: | N/A | N/A | |||||||||
Net investment income | |||||||||||
Net capital gains | |||||||||||
Return of capital | |||||||||||
Decrease in net assets resulting from distributions | - | (556,907 | ) | ||||||||
From Capital Share Transactions (Note 6) | |||||||||||
Proceeds from shares sold | 403,888 | 1,503,714 | |||||||||
Proceeds from shares purchased by reinvestment of dividends | - | 507,337 | |||||||||
Cost of shares repurchased | (1,154,559 | ) | (1,993,905 | ) | |||||||
Increase (decrease) in net assets resulting from capital share transactions | (750,671 | ) | 17,146 | ||||||||
Increase (decrease) in net assets | (804,431 | ) | (1,395,406 | ) | |||||||
Net Assets | |||||||||||
Beginning of period | 9,220,420 | 10,615,826 | |||||||||
End of period | $ | 8,415,989 | $ | 9,220,420 | |||||||
Including undistributed net investment income | $ | - | $ | - | |||||||
59
Pacific Advisors Fund Inc.
Statements of Changes in Net Assets (Unaudited)
Large Cap Value Fund | Mid Cap Value Fund | ||||||||||||||||||
| Six months ended June 30, 2015 | Year ended December 31, 2014 | Six months ended June 30, 2015 | Year ended December 31, 2014 | ||||||||||||||||
| Increase (Decrease) in Net Assets From Operations | |||||||||||||||||||
Net investment income (loss) | $ | (38,616 | ) | $ | (45,854 | ) | $ | (90,578 | ) | $ | (184,779 | ) | |||||||
Net realized gain (loss) on investments | (113,726 | ) | 36,532 | 116,159 | 269,443 | ||||||||||||||
Change in net unrealized appreciation (depreciation) on investments | 84,611 | 704,309 | (190,656 | ) | (976,275 | ) | |||||||||||||
Increase (decrease) in net assets resulting from operations | (67,731 | ) | 694,987 | (165,075 | ) | (891,611 | ) | ||||||||||||
From Distributions to Shareholders | |||||||||||||||||||
Class A: | |||||||||||||||||||
Net investment income | - | - | - | - | |||||||||||||||
Net capital gains | - | (78,849 | ) | - | - | ||||||||||||||
Return of capital | - | - | - | - | |||||||||||||||
Class C: | |||||||||||||||||||
Net investment income | - | - | - | - | |||||||||||||||
Net capital gains | - | (15,442 | ) | - | - | ||||||||||||||
Return of capital | - | - | - | - | |||||||||||||||
Class I: | N/A | N/A | N/A | N/A | |||||||||||||||
Net investment income | |||||||||||||||||||
Net capital gains | |||||||||||||||||||
Return of capital | |||||||||||||||||||
Decrease in net assets resulting from distributions | - | (94,291 | ) | - | - | ||||||||||||||
From Capital Share Transactions (Note 6) | |||||||||||||||||||
Proceeds from shares sold | 384,702 | 1,756,401 | 393,531 | 1,085,293 | |||||||||||||||
Proceeds from shares purchased by reinvestment of dividends | - | 84,055 | - | - | |||||||||||||||
Cost of shares repurchased | (363,300 | ) | (651,075 | ) | (234,178 | ) | (584,005 | ) | |||||||||||
Increase (decrease) in net assets resulting from capital share transactions | 21,402 | 1,189,381 | 159,353 | 501,288 | |||||||||||||||
Increase (decrease) in net assets | (46,329 | ) | 1,790,077 | (5,722 | ) | (390,323 | ) | ||||||||||||
Net Assets | |||||||||||||||||||
Beginning of period | 8,059,577 | 6,269,500 | 6,871,652 | 7,261,975 | |||||||||||||||
End of period | $ | 8,013,248 | $ | 8,059,577 | $ | 6,865,930 | $ | 6,871,652 | |||||||||||
Including undistributed net investment income | $ | - | $ | - | $ | - | $ | - | |||||||||||
See Accompanying Notes to Financial Statements which are an integral part of these financial statements.
60
Small Cap Value Fund | |||||||||||
| Six months ended June 30, 2015 | Year ended December 31, 2014 | ||||||||||
| Increase (Decrease) in Net Assets From Operations | |||||||||||
Net investment income (loss) | $ | (1,319,048 | ) | $ | (3,939,835 | ) | |||||
Net realized gain (loss) on investments | 2,155,629 | 17,799,597 | |||||||||
Change in net unrealized appreciation (depreciation) on investments | (7,293,745 | ) | (58,208,503 | ) | |||||||
Increase (decrease) in net assets resulting from operations | (6,457,164 | ) | (44,348,741 | ) | |||||||
From Distributions to Shareholders | |||||||||||
Class A: | |||||||||||
Net investment income | - | - | |||||||||
Net capital gains | - | (9,943,412 | ) | ||||||||
Return of capital | - | - | |||||||||
Class C: | |||||||||||
Net investment income | - | - | |||||||||
Net capital gains | - | (972,804 | ) | ||||||||
Return of capital | - | - | |||||||||
Class I: | |||||||||||
Net investment income | - | - | |||||||||
Net capital gains | - | (89,404 | ) | ||||||||
Return of capital | - | - | |||||||||
Decrease in net assets resulting from distributions | - | (11,005,620 | ) | ||||||||
From Capital Share Transactions (Note 6) | |||||||||||
Proceeds from shares sold | 10,225,478 | 59,591,254 | |||||||||
Proceeds from shares purchased by reinvestment of dividends | - | 10,270,298 | |||||||||
Cost of shares repurchased | (47,681,698 | ) | (94,154,161 | ) | |||||||
Increase (decrease) in net assets resulting from capital share transactions | (37,456,220 | ) | (24,292,609 | ) | |||||||
Increase (decrease) in net assets | (43,913,384 | ) | (79,646,970 | ) | |||||||
Net Assets | |||||||||||
Beginning of period | 134,542,026 | 214,188,996 | |||||||||
End of period | $ | 90,628,642 | $ | 134,542,026 | |||||||
Including undistributed net investment income | $ | - | $ | - | |||||||
61
Pacific Advisors Fund Inc.
Financial Highlights (Unaudited)
(For a share outstanding throughout the period)
Government Securities Fund | |||||||||||||||||||||||||||
Class A | |||||||||||||||||||||||||||
| For the six months ended | For the year ended December 31, | ||||||||||||||||||||||||||
June 30, 2015 | 2014 | 2013 | 2012 | 2011 | 2010 | ||||||||||||||||||||||
Per Share Operating Performance | |||||||||||||||||||||||||||
Net asset value, beginning of period | $ | 9.12 | $ | 9.16 | $ | 9.09 | $ | 9.13 | $ | 9.13 | $ | 8.99 | |||||||||||||||
Income from investing operations | |||||||||||||||||||||||||||
Net investment income (loss) | (0.16 | ) | (0.28 | ) | (0.20 | ) | (0.17 | ) | (0.02 | ) | 0.05 | ||||||||||||||||
Net realized and unrealized gain on securities | - | (d) | 0.24 | 0.27 | 0.13 | 0.02 | 0.14 | ||||||||||||||||||||
Total from investment operations | (0.16 | ) | (0.04 | ) | 0.07 | (0.04 | ) | - | 0.19 | ||||||||||||||||||
Less distributions | |||||||||||||||||||||||||||
From net investment income | - | - | - | - | - | (0.02 | ) | ||||||||||||||||||||
From net capital gain | - | - | - | - | - | - | |||||||||||||||||||||
From return of capital | - | - | - | - | - | (0.03 | ) | ||||||||||||||||||||
Total distributions | - | - | - | - | - | (0.05 | ) | ||||||||||||||||||||
Net asset value, end of period | $ | 8.96 | $ | 9.12 | $ | 9.16 | $ | 9.09 | $ | 9.13 | $ | 9.13 | |||||||||||||||
Total Investment Return (a) | (1.75 | )%(b) | (0.44 | )% | 0.77 | % | (0.44 | )% | 0.00 | % | 2.16 | % | |||||||||||||||
Ratios/Supplemental Data | |||||||||||||||||||||||||||
Net assets, end of period (000's) | $ | 1,515 | $ | 1,620 | $ | 1,801 | $ | 1,723 | $ | 1,873 | $ | 2,375 | |||||||||||||||
Ratio of net investment income (loss) to average net assets | |||||||||||||||||||||||||||
With expense reductions | (2.78 | )%(c) | (2.58 | )% | (2.39 | )% | (1.82 | )% | (0.54 | )% | 0.49 | % | |||||||||||||||
Without expense reductions | (5.89 | )%(c) | (5.45 | )% | (5.09 | )% | (4.14 | )% | (2.39 | )% | (1.10 | )% | |||||||||||||||
Ratio of expenses to average net assets | |||||||||||||||||||||||||||
With expense reductions | 3.89 | %(c) | 3.50 | % | 3.39 | % | 3.12 | % | 2.42 | % | 2.09 | % | |||||||||||||||
Without expense reductions | 7.00 | %(c) | 6.37 | % | 6.09 | % | 5.44 | % | 4.26 | % | 3.69 | % | |||||||||||||||
Fund portfolio turnover rate | 192 | %(c) | 183 | % | 135 | % | 181 | % | 115 | % | 156 | % | |||||||||||||||
Class C | |||||||||||||||||||||||||||
| For the six months ended | For the year ended December 31, | ||||||||||||||||||||||||||
June 30, 2015 | 2014 | 2013 | 2012 | 2011 | 2010 | ||||||||||||||||||||||
Per Share Operating Performance | |||||||||||||||||||||||||||
Net asset value, beginning of period | $ | 8.75 | $ | 8.86 | $ | 8.86 | $ | 8.96 | $ | 9.02 | $ | 8.90 | |||||||||||||||
Income from investing operations | |||||||||||||||||||||||||||
Net investment loss | (0.62 | ) | (1.68 | ) | (1.24 | ) | (0.94 | ) | (0.33 | ) | (0.09 | ) | |||||||||||||||
Net realized and unrealized gain on securities | 0.44 | 1.57 | 1.24 | 0.84 | 0.27 | 0.23 | |||||||||||||||||||||
Total from investment operations | (0.18 | ) | (0.11 | ) | - | (0.10 | ) | (0.06 | ) | 0.14 | |||||||||||||||||
Less distributions | |||||||||||||||||||||||||||
From net investment income | - | - | - | - | - | (0.01 | ) | ||||||||||||||||||||
From net capital gain | - | - | - | - | - | - | |||||||||||||||||||||
From return of capital | - | - | - | - | - | (0.01 | ) | ||||||||||||||||||||
Total distributions | - | - | - | - | - | (0.02 | ) | ||||||||||||||||||||
Net asset value, end of period | $ | 8.57 | $ | 8.75 | $ | 8.86 | $ | 8.86 | $ | 8.96 | $ | 9.02 | |||||||||||||||
Total Investment Return | (2.06 | )%(b) | (1.24 | )% | 0.00 | % | (1.12 | )% | (0.67 | )% | 1.49 | % | |||||||||||||||
Ratios/Supplemental Data | |||||||||||||||||||||||||||
Net assets, end of period (000's) | $ | 179 | $ | 202 | $ | 305 | $ | 476 | $ | 1,011 | $ | 1,740 | |||||||||||||||
Ratio of net investment loss to average net assets | |||||||||||||||||||||||||||
With expense reductions | (3.49 | )%(c) | (3.33 | )% | (3.17 | )% | (2.48 | )% | (1.27 | )% | (0.18 | )% | |||||||||||||||
Without expense reductions | (6.60 | )%(c) | (6.20 | )% | (5.84 | )% | (4.92 | )% | (3.14 | )% | (1.80 | )% | |||||||||||||||
Ratio of expenses to average net assets | |||||||||||||||||||||||||||
With expense reductions | 4.60 | %(c) | 4.23 | % | 4.16 | % | 3.85 | % | 3.16 | % | 2.80 | % | |||||||||||||||
Without expense reductions | 7.71 | %(c) | 7.09 | % | 6.82 | % | 6.29 | % | 5.03 | % | 4.42 | % | |||||||||||||||
Fund portfolio turnover rate | 192 | %(c) | 183 | % | 135 | % | 181 | % | 115 | % | 156 | % | |||||||||||||||
(a) The Fund's maximum sales charge is not included in the total return computation.
(b) Not annualized
(c) Annualized
(d) The amount is less than $0.005 and rounded to zero
See Accompanying Notes to Financial Statements which are an integral part of these financial statements.
62
Pacific Advisors Fund Inc.
Financial Highlights (Unaudited)
(For a share outstanding throughout the period)
Income and Equity Fund | |||||||||||||||||||||||||||
Class A | |||||||||||||||||||||||||||
| For the six months ended | For the year ended December 31, | ||||||||||||||||||||||||||
June 30, 2015 | 2014 | 2013 | 2012 | 2011 | 2010 | ||||||||||||||||||||||
Per Share Operating Performance | |||||||||||||||||||||||||||
Net asset value, beginning of period | $ | 12.06 | $ | 11.55 | $ | 10.30 | $ | 9.84 | $ | 9.87 | $ | 9.49 | |||||||||||||||
Income from investing operations | |||||||||||||||||||||||||||
Net investment income | 0.05 | 0.21 | 0.10 | 0.15 | 0.21 | 0.19 | |||||||||||||||||||||
Net realized and unrealized gain (loss) on securities | (0.25 | ) | 0.52 | 1.28 | 0.48 | 0.01 | 0.45 | ||||||||||||||||||||
Total from investment operations | (0.20 | ) | 0.73 | 1.38 | 0.63 | 0.22 | 0.64 | ||||||||||||||||||||
Less distributions | |||||||||||||||||||||||||||
From net investment income | (0.05 | ) | (0.22 | ) | (0.13 | ) | (0.17 | ) | (0.25 | ) | (0.26 | ) | |||||||||||||||
From net capital gain | - | - | - | - | - | - | |||||||||||||||||||||
From return of capital | - | - | - | - | - | - | (d) | ||||||||||||||||||||
Total distributions | (0.05 | ) | (0.22 | ) | (0.13 | ) | (0.17 | ) | (0.25 | ) | (0.26 | ) | |||||||||||||||
Net asset value, end of period | $ | 11.81 | $ | 12.06 | $ | 11.55 | $ | 10.30 | $ | 9.84 | $ | 9.87 | |||||||||||||||
Total Investment Return (a) | (1.64 | )%(b) | 6.41 | % | 13.40 | % | 6.46 | % | 2.24 | % | 6.88 | % | |||||||||||||||
Ratios/Supplemental Data | |||||||||||||||||||||||||||
Net assets, end of period (000's) | $ | 10,951 | $ | 11,324 | $ | 9,247 | $ | 4,659 | $ | 4,235 | $ | 3,922 | |||||||||||||||
Ratio of net investment income to average net assets | |||||||||||||||||||||||||||
With expense reductions | 0.91 | %(c) | 1.88 | % | 1.27 | % | 1.56 | % | 2.27 | % | 2.57 | % | |||||||||||||||
Without expense reductions | 0.16 | %(c) | 1.13 | % | 0.52 | % | 0.81 | % | 1.52 | % | 1.81 | % | |||||||||||||||
Ratio of expenses to average net assets | |||||||||||||||||||||||||||
With expense reductions | 2.23 | %(c) | 1.91 | % | 2.23 | % | 2.68 | % | 2.59 | % | 2.34 | % | |||||||||||||||
Without expense reductions | 2.98 | %(c) | 2.66 | % | 2.98 | % | 3.42 | % | 3.34 | % | 3.09 | % | |||||||||||||||
Fund portfolio turnover rate | 21 | %(c) | 13 | % | 20 | % | 29 | % | 16 | % | 21 | % | |||||||||||||||
Class C | |||||||||||||||||||||||||||
| For the six months ended | For the year ended December 31, | ||||||||||||||||||||||||||
June 30, 2015 | 2014 | 2013 | 2012 | 2011 | 2010 | ||||||||||||||||||||||
Per Share Operating Performance | |||||||||||||||||||||||||||
Net asset value, beginning of period | $ | 11.59 | $ | 11.11 | $ | 9.91 | $ | 9.42 | $ | 9.40 | $ | 9.03 | |||||||||||||||
Income from investing operations | |||||||||||||||||||||||||||
Net investment income (loss) | 0.03 | 0.14 | 0.06 | (0.01 | ) | 0.09 | 0.15 | ||||||||||||||||||||
Net realized and unrealized gain (loss) on securities | (0.26 | ) | 0.47 | 1.18 | 0.55 | 0.05 | 0.38 | ||||||||||||||||||||
Total from investment operations | (0.23 | ) | 0.61 | 1.24 | 0.54 | 0.14 | 0.53 | ||||||||||||||||||||
Less distributions | |||||||||||||||||||||||||||
From net investment income | (0.02 | ) | (0.13 | ) | (0.04 | ) | (0.05 | ) | (0.12 | ) | (0.16 | ) | |||||||||||||||
From net capital gain | - | - | - | - | - | - | |||||||||||||||||||||
From return of capital | - | - | - | - | - | - | (d) | ||||||||||||||||||||
Total distributions | (0.02 | ) | (0.13 | ) | (0.04 | ) | (0.05 | ) | (0.12 | ) | (0.16 | ) | |||||||||||||||
Net asset value, end of period | $ | 11.34 | $ | 11.59 | $ | 11.11 | $ | 9.91 | $ | 9.42 | $ | 9.40 | |||||||||||||||
Total Investment Return | (2.01 | )%(b) | 5.51 | % | 12.55 | % | 5.74 | % | 1.54 | % | 5.95 | % | |||||||||||||||
Ratios/Supplemental Data | |||||||||||||||||||||||||||
Net assets, end of period (000's) | $ | 2,725 | $ | 2,471 | $ | 2,234 | $ | 1,906 | $ | 3,049 | $ | 4,774 | |||||||||||||||
Ratio of net investment income to average net assets | |||||||||||||||||||||||||||
With expense reductions | 0.16 | %(c) | 1.14 | % | 0.49 | % | 0.80 | % | 1.52 | % | 1.82 | % | |||||||||||||||
Without expense reductions | (0.59 | )%(c) | 0.39 | % | (0.26 | )% | 0.05 | % | 0.77 | % | 1.07 | % | |||||||||||||||
Ratio of expenses to average net assets | |||||||||||||||||||||||||||
With expense reductions | 2.98 | %(c) | 2.66 | % | 3.03 | % | 3.45 | % | 3.33 | % | 3.07 | % | |||||||||||||||
Without expense reductions | 3.73 | %(c) | 3.41 | % | 3.78 | % | 4.20 | % | 4.08 | % | 3.82 | % | |||||||||||||||
Fund portfolio turnover rate | 21 | %(c) | 13 | % | 20 | % | 29 | % | 16 | % | 21 | % | |||||||||||||||
(a) The Fund's maximum sales charge is not included in the total return computation.
(b) Not annualized
(c) Annualized
(d) The amount is less than $0.005 and rounded to zero
See Accompanying Notes to Financial Statements which are an integral part of these financial statements.
63
Pacific Advisors Fund Inc.
Financial Highlights (Unaudited)
(For a share outstanding throughout the period)
Balanced Fund | |||||||||||||||||||||||||||
Class A | |||||||||||||||||||||||||||
| For the six months ended | For the year ended December 31, | ||||||||||||||||||||||||||
June 30, 2015 | 2014 | 2013 | 2012 | 2011 | 2010 | ||||||||||||||||||||||
Per Share Operating Performance | |||||||||||||||||||||||||||
Net asset value, beginning of period | $ | 14.40 | $ | 16.59 | $ | 14.13 | $ | 13.47 | $ | 14.56 | $ | 14.91 | |||||||||||||||
Income from investing operations | |||||||||||||||||||||||||||
Net investment income (loss) | (0.07 | ) | (0.16 | ) | (0.18 | ) | (0.03 | ) | - | 0.13 | |||||||||||||||||
Net realized and unrealized gain (loss) on securities | (0.01 | ) | (1.15 | ) | 4.21 | 1.34 | (0.16 | ) | 1.02 | ||||||||||||||||||
Total from investment operations | (0.08 | ) | (1.31 | ) | 4.03 | 1.31 | (0.16 | ) | 1.15 | ||||||||||||||||||
Less distributions | |||||||||||||||||||||||||||
From net investment income | - | - | - | - | - | (0.01 | ) | ||||||||||||||||||||
From net capital gain | - | (0.88 | ) | (1.57 | ) | (0.65 | ) | (0.93 | ) | (1.49 | ) | ||||||||||||||||
Total distributions | - | (0.88 | ) | (1.57 | ) | (0.65 | ) | (0.93 | ) | (1.50 | ) | ||||||||||||||||
Net asset value, end of period | $ | 14.32 | $ | 14.40 | $ | 16.59 | $ | 14.13 | $ | 13.47 | $ | 14.56 | |||||||||||||||
Total Investment Return (a) | (0.56 | )%(b) | (7.94 | )% | 28.68 | % | 9.69 | % | (1.14 | )% | 7.71 | % | |||||||||||||||
Ratios/Supplemental Data | |||||||||||||||||||||||||||
Net assets, end of period (000's) | $ | 4,924 | $ | 5,017 | $ | 5,144 | $ | 3,919 | $ | 3,801 | $ | 3,789 | |||||||||||||||
Ratio of net investment income (loss) to average net assets | (1.02 | )%(c) | (0.90 | )% | (0.93 | )% | (0.27 | )% | 0.29 | % | 0.55 | % | |||||||||||||||
Ratio of expenses to average net assets | 3.22 | %(c) | 2.84 | % | 3.07 | % | 3.30 | % | 3.13 | % | 2.77 | % | |||||||||||||||
Fund portfolio turnover rate | 29 | %(c) | 22 | % | 23 | % | 34 | % | 14 | % | 36 | % | |||||||||||||||
Class C | |||||||||||||||||||||||||||
| For the six months ended | For the year ended December 31, | ||||||||||||||||||||||||||
June 30, 2015 | 2014 | 2013 | 2012 | 2011 | 2010 | ||||||||||||||||||||||
Per Share Operating Performance | |||||||||||||||||||||||||||
Net asset value, beginning of period | $ | 12.99 | $ | 15.18 | $ | 13.13 | $ | 12.66 | $ | 13.84 | $ | 14.35 | |||||||||||||||
Income from investing operations | |||||||||||||||||||||||||||
Net investment loss | (0.44 | ) | (0.40 | ) | (0.54 | ) | (0.39 | ) | (0.15 | ) | (0.06 | ) | |||||||||||||||
Net realized and unrealized gain (loss) on securities | 0.32 | (0.91 | ) | 4.16 | 1.51 | (0.10 | ) | 1.04 | |||||||||||||||||||
Total from investment operations | (0.12 | ) | (1.31 | ) | 3.62 | 1.12 | (0.25 | ) | 0.98 | ||||||||||||||||||
Less distributions | |||||||||||||||||||||||||||
From net investment income | - | - | - | - | - | - | (d) | ||||||||||||||||||||
From net capital gain | - | (0.88 | ) | (1.57 | ) | (0.65 | ) | (0.93 | ) | (1.49 | ) | ||||||||||||||||
Total distributions | - | (0.88 | ) | (1.57 | ) | (0.65 | ) | (0.93 | ) | (1.49 | ) | ||||||||||||||||
Net asset value, end of period | $ | 12.87 | $ | 12.99 | $ | 15.18 | $ | 13.13 | $ | 12.66 | $ | 13.84 | |||||||||||||||
Total Investment Return | (0.92 | )%(b) | (8.68 | )% | 27.75 | % | 8.81 | % | (1.86 | )% | 6.88 | % | |||||||||||||||
Ratios/Supplemental Data | |||||||||||||||||||||||||||
Net assets, end of period (000's) | $ | 3,492 | $ | 4,203 | $ | 5,471 | $ | 6,647 | $ | 10,768 | $ | 18,035 | |||||||||||||||
Ratio of net investment loss to average net assets | (1.80 | )%(c) | (1.64 | )% | (1.70 | )% | (0.97 | )% | (0.42 | )% | (0.18 | )% | |||||||||||||||
Ratio of expenses to average net assets | 4.02 | %(c) | 3.58 | % | 3.86 | % | 4.02 | % | 3.83 | % | 3.50 | % | |||||||||||||||
Fund portfolio turnover rate | 29 | %(c) | 22 | % | 23 | % | 34 | % | 14 | % | 36 | % | |||||||||||||||
(a) The Fund's maximum sales charge is not included in the total return computation.
(b) Not annualized
(c) Annualized
(d) The amount is less than $0.005 and rounded to zero
See Accompanying Notes to Financial Statements which are an integral part of these financial statements.
64
Pacific Advisors Fund Inc.
Financial Highlights (Unaudited)
(For a share outstanding throughout the period)
Large Cap Value Fund | |||||||||||||||||||||||||||
Class A | |||||||||||||||||||||||||||
| For the six months ended | For the year ended December 31, | ||||||||||||||||||||||||||
June 30, 2015 | 2014 | 2013 | 2012 | 2011 | 2010 | ||||||||||||||||||||||
Per Share Operating Performance | |||||||||||||||||||||||||||
Net asset value, beginning of period | $ | 14.18 | $ | 13.05 | $ | 10.34 | $ | 9.30 | $ | 8.98 | $ | 8.33 | |||||||||||||||
Income from investing operations | |||||||||||||||||||||||||||
Net investment income (loss) | (0.06 | ) | 0.02 | 0.03 | 0.04 | 0.11 | (0.06 | ) | |||||||||||||||||||
Net realized and unrealized gain (loss) on securities | (0.05 | ) | 1.28 | 2.94 | 1.00 | 0.21 | 0.71 | ||||||||||||||||||||
Total from investment operations | (0.11 | ) | 1.30 | 2.97 | 1.04 | 0.32 | 0.65 | ||||||||||||||||||||
Less distributions | |||||||||||||||||||||||||||
From net investment income | - | - | - | - | - | - | |||||||||||||||||||||
From net capital gain | - | (0.17 | ) | (0.26 | ) | - | - | - | |||||||||||||||||||
Total distributions | - | (0.17 | ) | (0.26 | ) | - | - | - | |||||||||||||||||||
Net asset value, end of period | $ | 14.07 | $ | 14.18 | $ | 13.05 | $ | 10.34 | $ | 9.30 | $ | 8.98 | |||||||||||||||
Total Investment Return (a) | (0.78 | )%(b) | 9.94 | % | 28.72 | % | 11.18 | % | 3.56 | % | 7.80 | % | |||||||||||||||
Ratios/Supplemental Data | |||||||||||||||||||||||||||
Net assets, end of period (000's) | $ | 6,833 | $ | 6,892 | $ | 5,453 | $ | 3,973 | $ | 3,278 | $ | 2,511 | |||||||||||||||
Ratio of net investment loss to average net assets | |||||||||||||||||||||||||||
With expense reductions | (0.85 | )%(c) | (0.55 | )% | (0.17 | )% | (0.18 | )% | (0.66 | )% | (1.32 | )% | |||||||||||||||
Without expense reductions | (1.60 | )%(c) | (1.30 | )% | (1.72 | )% | (1.91 | )% | (2.61 | )% | (3.50 | )% | |||||||||||||||
Ratio of expenses to average net assets | |||||||||||||||||||||||||||
With expense reductions | 2.80 | %(c) | 2.64 | % | 2.47 | % | 2.61 | % | 3.05 | % | 3.64 | % | |||||||||||||||
Without expense reductions | 3.55 | %(c) | 3.39 | % | 4.02 | % | 4.34 | % | 4.99 | % | 5.82 | % | |||||||||||||||
Fund portfolio turnover rate | 10 | %(c) | 3 | % | 24 | % | 9 | % | 7 | % | 106 | % | |||||||||||||||
Class C | |||||||||||||||||||||||||||
| For the six months ended | For the year ended December 31, | ||||||||||||||||||||||||||
June 30, 2015 | 2014 | 2013 | 2012 | 2011 | 2010 | ||||||||||||||||||||||
Per Share Operating Performance | |||||||||||||||||||||||||||
Net asset value, beginning of period | $ | 12.39 | $ | 11.50 | $ | 9.20 | $ | 8.34 | $ | 8.12 | $ | 7.58 | |||||||||||||||
Income from investing operations | |||||||||||||||||||||||||||
Net investment income (loss) | (0.04 | ) | 0.68 | 0.32 | (0.69 | ) | (0.42 | ) | (0.17 | ) | |||||||||||||||||
Net realized and unrealized gain (loss) on securities | (0.11 | ) | 0.38 | 2.24 | 1.55 | 0.64 | 0.71 | ||||||||||||||||||||
Total from investment operations | (0.15 | ) | 1.06 | 2.56 | 0.86 | 0.22 | 0.54 | ||||||||||||||||||||
Less distributions | |||||||||||||||||||||||||||
From net investment income | - | - | - | - | - | - | |||||||||||||||||||||
From net capital gain | - | (0.17 | ) | (0.26 | ) | - | - | - | |||||||||||||||||||
Total distributions | - | (0.17 | ) | (0.26 | ) | - | - | - | |||||||||||||||||||
Net asset value, end of period | $ | 12.24 | $ | 12.39 | $ | 11.50 | $ | 9.20 | $ | 8.34 | $ | 8.12 | |||||||||||||||
Total Investment Return | (1.21 | )%(b) | 9.18 | % | 27.83 | % | 10.31 | % | 2.71 | % | 7.12 | % | |||||||||||||||
Ratios/Supplemental Data | |||||||||||||||||||||||||||
Net assets, end of period (000's) | $ | 1,180 | $ | 1,167 | $ | 816 | $ | 578 | $ | 630 | $ | 681 | |||||||||||||||
Ratio of net investment loss to average net assets | |||||||||||||||||||||||||||
With expense reductions | (1.64 | )%(c) | (1.29 | )% | (0.92 | )% | (1.01 | )% | (1.53 | )% | (2.03 | )% | |||||||||||||||
Without expense reductions | (2.39 | )%(c) | (2.03 | )% | (2.47 | )% | (2.74 | )% | (3.46 | )% | (4.23 | )% | |||||||||||||||
Ratio of expenses to average net assets | |||||||||||||||||||||||||||
With expense reductions | 3.60 | %(c) | 3.38 | % | 3.22 | % | 3.43 | % | 3.89 | % | 4.37 | % | |||||||||||||||
Without expense reductions | 4.35 | %(c) | 4.13 | % | 4.77 | % | 5.15 | % | 5.82 | % | 6.57 | % | |||||||||||||||
Fund portfolio turnover rate | 10 | %(c) | 3 | % | 24 | % | 9 | % | 7 | % | 106 | % | |||||||||||||||
(a) The Fund's maximum sales charge is not included in the total return computation.
(b) Not annualized
(c) Annualized
See Accompanying Notes to Financial Statements which are an integral part of these financial statements.
65
Pacific Advisors Fund Inc.
Financial Highlights (Unaudited)
(For a share outstanding throughout the period)
Mid Cap Value Fund | |||||||||||||||||||||||||||
Class A | |||||||||||||||||||||||||||
| For the six months ended | For the year ended December 31, | ||||||||||||||||||||||||||
June 30, 2015 | 2014 | 2013 | 2012 | 2011 | 2010 | ||||||||||||||||||||||
Per Share Operating Performance | |||||||||||||||||||||||||||
Net asset value, beginning of period | $ | 13.46 | $ | 15.25 | $ | 11.47 | $ | 10.88 | $ | 11.57 | $ | 8.78 | |||||||||||||||
Income from investing operations | |||||||||||||||||||||||||||
Net investment loss | (0.10 | ) | (0.11 | ) | (0.36 | ) | (0.25 | ) | (0.13 | ) | (0.48 | ) | |||||||||||||||
Net realized and unrealized gain (loss) on securities | (0.22 | ) | (1.68 | ) | 4.14 | 0.84 | (0.56 | ) | 3.27 | ||||||||||||||||||
Total from investment operations | (0.32 | ) | (1.79 | ) | 3.78 | 0.59 | (0.69 | ) | 2.79 | ||||||||||||||||||
Less distributions | |||||||||||||||||||||||||||
From net investment income | - | - | - | - | - | - | |||||||||||||||||||||
From net capital gain | - | - | - | - | - | - | |||||||||||||||||||||
Total distributions | - | - | - | - | - | - | |||||||||||||||||||||
Net asset value, end of period | $ | 13.14 | $ | 13.46 | $ | 15.25 | $ | 11.47 | $ | 10.88 | $ | 11.57 | |||||||||||||||
Total Investment Return (a) | (2.38 | )%(b) | (11.74 | )% | 32.96 | % | 5.42 | % | (5.96 | )% | 31.78 | % | |||||||||||||||
Ratios/Supplemental Data | |||||||||||||||||||||||||||
Net assets, end of period (000's) | $ | 6,023 | $ | 5,981 | $ | 6,058 | $ | 4,500 | $ | 4,052 | $ | 3,672 | |||||||||||||||
Ratio of net investment loss to average net assets | (2.52 | )%(c) | (2.46 | )% | (2.88 | )% | (3.01 | )% | (3.11 | )% | (3.39 | )% | |||||||||||||||
Ratio of expenses to average net assets | 3.72 | %(c) | 3.42 | % | 3.69 | % | 4.19 | % | 4.16 | % | 4.35 | % | |||||||||||||||
Fund portfolio turnover rate | 29 | %(c) | 22 | % | 15 | % | 24 | % | 12 | % | 18 | % | |||||||||||||||
Class C | |||||||||||||||||||||||||||
| For the six months ended | For the year ended December 31, | ||||||||||||||||||||||||||
June 30, 2015 | 2014 | 2013 | 2012 | 2011 | 2010 | ||||||||||||||||||||||
Per Share Operating Performance | |||||||||||||||||||||||||||
Net asset value, beginning of period | $ | 12.09 | $ | 13.80 | $ | 10.46 | $ | 10.00 | $ | 10.72 | $ | 8.21 | |||||||||||||||
Income from investing operations | |||||||||||||||||||||||||||
Net investment income (loss) | (0.66 | ) | (2.95 | ) | 0.48 | (3.40 | ) | (4.28 | ) | (3.84 | ) | ||||||||||||||||
Net realized and unrealized gain on securities | 0.33 | 1.24 | 2.86 | 3.86 | 3.56 | 6.35 | |||||||||||||||||||||
Total from investment operations | (0.33 | ) | (1.71 | ) | 3.34 | 0.46 | (0.72 | ) | 2.51 | ||||||||||||||||||
Less distributions | |||||||||||||||||||||||||||
From net investment income | - | - | - | - | - | - | |||||||||||||||||||||
From net capital gain | - | - | - | - | - | - | |||||||||||||||||||||
Total distributions | - | - | - | - | - | - | |||||||||||||||||||||
Net asset value, end of period | $ | 11.76 | $ | 12.09 | $ | 13.80 | $ | 10.46 | $ | 10.00 | $ | 10.72 | |||||||||||||||
Total Investment Return | (2.73 | )%(b) | (12.39 | )% | 31.93 | % | 4.60 | % | (6.72 | )% | 30.57 | % | |||||||||||||||
Ratios/Supplemental Data | |||||||||||||||||||||||||||
Net assets, end of period (000's) | $ | 843 | $ | 891 | $ | 1,204 | $ | 854 | $ | 1,044 | $ | 1,784 | |||||||||||||||
Ratio of net investment loss to average net assets | (3.33 | )%(c) | (3.22 | )% | (3.61 | )% | (3.77 | )% | (3.92 | )% | (3.91 | )% | |||||||||||||||
Ratio of expenses to average net assets | 4.53 | %(c) | 4.17 | % | 4.42 | % | 4.95 | % | 4.91 | % | 4.88 | % | |||||||||||||||
Fund portfolio turnover rate | 29 | %(c) | 22 | % | 15 | % | 24 | % | 12 | % | 18 | % | |||||||||||||||
(a) The Fund's maximum sales charge is not included in the total return computation.
(b) Not annualized
(c) Annualized
See Accompanying Notes to Financial Statements which are an integral part of these financial statements.
66
Pacific Advisors Fund Inc.
Financial Highlights (Unaudited)
(For a share outstanding throughout the period)
Small Cap Value Fund | |||||||||||||||||||||||||||
Class A | |||||||||||||||||||||||||||
| For the six months ended | For the year ended December 31, | ||||||||||||||||||||||||||
June 30, 2015 | 2014 | 2013 | 2012 | 2011 | 2010 | ||||||||||||||||||||||
Per Share Operating Performance | |||||||||||||||||||||||||||
Net asset value, beginning of period | $ | 44.51 | $ | 61.41 | $ | 38.50 | $ | 34.42 | $ | 31.68 | $ | 26.37 | |||||||||||||||
Income from investing operations | |||||||||||||||||||||||||||
Net investment income (loss) | (4.02 | ) | (2.29 | ) | 1.44 | (1.70 | ) | (1.35 | ) | (1.87 | ) | ||||||||||||||||
Net realized and unrealized gain (loss) on securities | 2.05 | (10.99 | ) | 21.47 | 5.78 | 4.09 | 7.18 | ||||||||||||||||||||
Total from investment operations | (1.97 | ) | (13.28 | ) | 22.91 | 4.08 | 2.74 | 5.31 | |||||||||||||||||||
Less distributions | |||||||||||||||||||||||||||
From net investment income | - | - | - | - | - | - | |||||||||||||||||||||
From net capital gain | - | (3.62 | ) | - | - | - | - | ||||||||||||||||||||
From return of capital | - | - | - | - | - | - | |||||||||||||||||||||
Total distributions | - | (3.62 | ) | - | - | - | - | ||||||||||||||||||||
Net asset value, end of period | $ | 42.54 | $ | 44.51 | $ | 61.41 | $ | 38.50 | $ | 34.42 | $ | 31.68 | |||||||||||||||
Total Investment Return (a) | (4.43 | )%(b) | (21.60 | )% | 59.51 | % | 11.85 | % | 8.65 | % | 20.14 | % | |||||||||||||||
Ratios/Supplemental Data | |||||||||||||||||||||||||||
Net assets, end of period (000's) | $ | 81,930 | $ | 122,642 | $ | 199,163 | $ | 85,607 | $ | 88,323 | $ | 92,830 | |||||||||||||||
Ratio of net investment loss to average net assets | (2.53 | )%(c) | (1.95 | )% | (1.93 | )% | (2.06 | )% | (2.31 | )% | (2.14 | )% | |||||||||||||||
Ratio of expenses to average net assets | 2.82 | %(c) | 2.19 | % | 2.31 | % | 2.71 | % | 2.88 | % | 2.66 | % | |||||||||||||||
Fund portfolio turnover rate | 3 | %(c) | 16 | % | 9 | % | 12 | % | 9 | % | 9 | % | |||||||||||||||
Class C | |||||||||||||||||||||||||||
| For the six months ended | For the year ended December 31, | ||||||||||||||||||||||||||
June 30, 2015 | 2014 | 2013 | 2012 | 2011 | 2010 | ||||||||||||||||||||||
Per Share Operating Performance | |||||||||||||||||||||||||||
Net asset value, beginning of period | $ | 36.59 | $ | 51.70 | $ | 32.65 | $ | 29.41 | $ | 27.26 | $ | 22.87 | |||||||||||||||
Income from investing operations | |||||||||||||||||||||||||||
Net investment income (loss) | (3.21 | ) | (1.15 | ) | 3.10 | (2.53 | ) | (6.46 | ) | (3.31 | ) | ||||||||||||||||
Net realized and unrealized gain (loss) on securities | 1.46 | (10.34 | ) | 15.95 | 5.77 | 8.61 | 7.70 | ||||||||||||||||||||
Total from investment operations | (1.75 | ) | (11.49 | ) | 19.05 | 3.24 | 2.15 | 4.39 | |||||||||||||||||||
Less distributions | |||||||||||||||||||||||||||
From net investment income | - | - | - | - | - | - | |||||||||||||||||||||
From net capital gain | - | (3.62 | ) | - | - | - | - | ||||||||||||||||||||
From return of capital | - | - | - | - | - | - | |||||||||||||||||||||
Total distributions | - | (3.62 | ) | - | - | - | - | ||||||||||||||||||||
Net asset value, end of period | $ | 34.84 | $ | 36.59 | $ | 51.70 | $ | 32.65 | $ | 29.41 | $ | 27.26 | |||||||||||||||
Total Investment Return | (4.78 | )%(b) | (22.19 | )% | 58.35 | % | 11.02 | % | 7.89 | % | 19.20 | % | |||||||||||||||
Ratios/Supplemental Data | |||||||||||||||||||||||||||
Net assets, end of period (000's) | $ | 8,445 | $ | 10,498 | $ | 14,646 | $ | 6,912 | $ | 6,949 | $ | 11,355 | |||||||||||||||
Ratio of net investment loss to average net assets | (3.29 | )%(c) | (2.70 | )% | (2.69 | )% | (2.80 | )% | (3.05 | )% | (2.89 | )% | |||||||||||||||
Ratio of expenses to average net assets | 3.59 | %(c) | 2.95 | % | 3.08 | % | 3.45 | % | 3.62 | % | 3.40 | % | |||||||||||||||
Fund portfolio turnover rate | 3 | %(c) | 16 | % | 9 | % | 12 | % | 9 | % | 9 | % | |||||||||||||||
(a) The Fund's maximum sales charge is not included in the total return computation.
(b) Not annualized
(c) Annualized
See Accompanying Notes to Financial Statements which are an integral part of these financial statements.
67
Pacific Advisors Fund Inc.
Financial Highlights (Unaudited)
(For a share outstanding throughout the period)
Small Cap Value Fund | |||||||||||||||||||||||||||
Class I | |||||||||||||||||||||||||||
| For the six months ended | For the year ended December 31, | ||||||||||||||||||||||||||
June 30, 2015 | 2014 | 2013 | 2012 | 2011 | 2010 | ||||||||||||||||||||||
Per Share Operating Performance | |||||||||||||||||||||||||||
Net asset value, beginning of period | $ | 53.06 | $ | 72.10 | $ | 45.13 | $ | 39.15 | $ | 35.95 | $ | 29.86 | |||||||||||||||
Income from investing operations | |||||||||||||||||||||||||||
Net investment income (loss) | (15.02 | ) | 9.85 | 431.95 | (120.29 | ) | (0.77 | ) | (0.60 | ) | |||||||||||||||||
Net realized and unrealized gain (loss) on securities | 12.87 | (25.27 | )* | (404.98 | )* | 126.27 | * | 3.97 | 6.69 | ||||||||||||||||||
Total from investment operations | (2.15 | ) | (15.42 | ) | 26.97 | 5.98 | 3.20 | 6.09 | |||||||||||||||||||
Less distributions | |||||||||||||||||||||||||||
From net investment income | - | - | - | - | - | - | |||||||||||||||||||||
From net capital gain | - | (3.62 | ) | - | - | - | - | ||||||||||||||||||||
From return of capital | - | - | - | - | - | - | |||||||||||||||||||||
Total distributions | - | (3.62 | ) | - | - | - | - | ||||||||||||||||||||
Net asset value, end of period | $ | 50.91 | $ | 53.06 | $ | 72.10 | $ | 45.13 | $ | 39.15 | $ | 35.95 | |||||||||||||||
Total Investment Return | (4.05 | )%(b) | (21.36 | )% | 59.76 | % | 15.27 | % | 8.90 | % | 20.40 | % | |||||||||||||||
Ratios/Supplemental Data | |||||||||||||||||||||||||||
Net assets, end of period (000's) | $ | 254 | $ | 1,402 | $ | 380 | $ | 7 | $ | 6 | $ | 6 | |||||||||||||||
Ratio of net investment loss to average net assets | (2.47 | )%(c) | (1.77 | )% | (1.93 | )% | (2.02 | )% | (2.08 | )% | (1.97 | )% | |||||||||||||||
Ratio of expenses to average net assets | 2.57 | %(c) | 2.03 | % | 2.06 | % | 2.63 | % | 2.65 | % | 2.50 | % | |||||||||||||||
Fund portfolio turnover rate | 3 | %(c) | 16 | % | 9 | % | 12 | % | 9 | % | 9 | % | |||||||||||||||
(b) Not annualized
(c) Annualized
* Numbers reflected allocations to Class I due to significant subscription and redemption activity during the period.
See Accompanying Notes to Financial Statements which are an integral part of these financial statements.
68
Pacific Advisors Fund Inc.
Notes to Financial Statements (Unaudited)
June 30, 2015
Note 1. Organization
Pacific Advisors Fund Inc. (the "Company") is an open-end diversified investment management company registered under the Investment Company Act of 1940 ("the 40 Act"), as amended. The Company currently offers six Funds: Government Securities Fund, Income and Equity Fund, Balanced Fund, Large Cap Value Fund, Mid Cap Value Fund and Small Cap Value Fund (individually, a "Fund," or collectively, the "Funds"). Each Fund is a separate investment portfolio of the Company with a distinct investment objective, investment program, policies and restrictions.
The Government Securities Fund seeks to provide high current income, preservation of capital, and rising future income, consistent with prudent investment risk. The Income and Equity Fund seeks to provide current income and, secondarily, long-term capital appreciation. The Balanced Fund seeks to achieve long-term capital appreciation and income consistent with reduced risk. The Large Cap Value Fund seeks to achieve long-term capital appreciation. The Mid Cap Value Fund seeks to achieve long-term capital appreciation. The Small Cap Value Fund seeks to provide capital appreciation through investment in small capitalization companies.
The Funds offer Class A and Class C shares. In addition to Class A and Class C shares, the Small Cap Value Fund also offers Class I shares. Each Class has equal rights as to assets and voting privileges except that Class A and Class C each has exclusive voting rights with respect to its distribution plan. Investment income, realized and unrealized capital gains and losses, and the common expenses of each Fund are allocated on a pro rata basis to each Class based on the relative net assets of each Class to the total net assets of the Fund. Each Class of shares differs in its respective service and distribution expenses and may differ in its transfer agent, registration, and certain other Class-specific fees and expenses.
The Company enters into contracts that contain a variety of indemnifications. The Company's maximum exposure under these arrangements is unknown. However, the Company has not had prior claims or losses pursuant to these contracts and expects the risk of loss to be remote.
Note 2. Significant Accounting Policies
A. Security Valuation and Fair Value Measurement. Securities, including American Depository Receipts (ADRs), listed on a national securities exchange and certain over-the-counter ("OTC") issues traded on the NASDAQ national market system are valued at the last quoted sale price at the close of the New York Stock Exchange. OTC issues not quoted on the NASDAQ system, and other equity securities for which no sale price is available, are valued at the last bid price as obtained from published sources or real time quote services, where available, and otherwise from brokers who are market makers for such securities. For securities that mature in 60 days or less, the Funds may utilize the amortized cost method of valuation if it is reasonable to conclude it approximates fair value. In determining the fair value of other debt securities, Pacific Global Investment Management Company, Inc. (the "Investment Manager") utilizes independent pricing services approved by the Board of Directors using one or more of the following valuation techniques:
(1) a matrix pricing approach that considers market inputs including, in approximate order of priority, the following: benchmark yields, reported trades, broker/dealer quotes, issuer spreads, two-sided markets, benchmark securities, bids, offers and reference data including market research publications; market indicators, industry and economic events. Evaluators may prioritize inputs differently on any given day for any security based on market conditions, and not all inputs listed are available for use in the evaluation process for each security evaluation on any given day; (2) a comparison of the value of the borrower's outstanding equity and debt to that of comparable public companies; (3) a discounted cash flow analysis. Fair value determinations are made by the Investment Manager based on the Company's Fair Value Procedure, as adopted by the Board of Directors. In conducting its assessment and analysis for purpose of determining fair value, the Investment Manager uses its discretion and judgment in considering and appraising the relevant factors, including examining the source and nature of the quotations, to validate that the quotations and prices are representative of fair value.
Various inputs are used to determine the fair value of each Fund's investments. For financial statements, these inputs are summarized in the three broad levels listed below. Level 1 inputs are based on quoted prices in active markets for identical securities. Level 2 inputs are based on significant observable market inputs, such as quoted prices for similar securities and quoted prices in inactive markets. Level 3 inputs are significant unobservable inputs that reflect the Fund's own assumptions in determining the fair value of investments. The valuation levels are not necessarily an indication of the risk associated with investing in those securities.
69
Pacific Advisors Fund Inc.
Notes to Financial Statements (Unaudited)
June 30, 2015
The following is a summary of the inputs used to value each Fund's investment securities and cash and cash equivalents as of June 30, 2015.
| Government Securities Fund | Income and Equity Fund | Balanced Fund | Large Cap Value Fund | Mid Cap Value Fund | Small Cap Value Fund | ||||||||||||||||||||||
Level 1 - Quoted Prices | |||||||||||||||||||||||||||
Common Stock | |||||||||||||||||||||||||||
Energy | $ | 19,294 | $ | 399,705 | $ | 768,035 | $ | 174,720 | $ | 578,656 | $ | 15,548,850 | |||||||||||||||
Materials | - | 406,005 | - | - | 142,170 | - | |||||||||||||||||||||
Industrials | - | 1,049,853 | 2,174,614 | 1,275,956 | 2,682,553 | 39,416,110 | |||||||||||||||||||||
Consumer Discretionary | - | 710,518 | 1,629,747 | 1,728,582 | 2,638,430 | 20,546,200 | |||||||||||||||||||||
Consumer Staples | 98,165 | 1,151,942 | 262,200 | 1,243,706 | 145,800 | 3,078,600 | |||||||||||||||||||||
Health Care | 52,888 | 614,500 | 184,830 | 254,858 | - | - | |||||||||||||||||||||
Financials | - | 448,920 | 461,154 | 1,519,758 | 413,373 | 9,615,760 | |||||||||||||||||||||
Information Technology | 22,075 | 642,297 | 481,247 | 1,775,672 | 273,300 | - | |||||||||||||||||||||
Telecommunication Services | 28,416 | 437,547 | - | - | - | 3,498,600 | |||||||||||||||||||||
Utilities | 68,300 | 661,745 | - | - | - | - | |||||||||||||||||||||
Preferred Stock | |||||||||||||||||||||||||||
Financials | - | 99,260 | - | - | - | - | |||||||||||||||||||||
Level 1 Total | 289,138 | 6,622,292 | 5,961,827 | 7,973,252 | 6,874,282 | 91,704,120 | |||||||||||||||||||||
Level 2 - Other Significant Observable Inputs | |||||||||||||||||||||||||||
Bonds and Notes | |||||||||||||||||||||||||||
Corporate Bonds | - | 6,968,528 | 2,419,065 | - | - | - | |||||||||||||||||||||
U.S. Government Fixed Income Securities | 1,399,796 | - | - | - | - | - | |||||||||||||||||||||
Short Term Investments | |||||||||||||||||||||||||||
Money Market | 2,696 | 122,596 | 11,558 | 50,567 | - | - | |||||||||||||||||||||
Level 2 Total | 1,402,492 | 7,091,124 | 2,430,623 | 50,567 | - | - | |||||||||||||||||||||
Level 3 - Significant Unobservable Inputs | - | - | - | - | - | - | |||||||||||||||||||||
Total Investments | $ | 1,691,630 | $ | 13,713,416 | $ | 8,392,450 | $ | 8,023,819 | $ | 6,874,282 | $ | 91,704,120 | |||||||||||||||
Equity securities (common and preferred stock) that are actively traded and market priced are classified as Level 1 securities. All fixed income securities are classified as Level 2 securities. The Funds had no Level 3 holdings during the period ended June 30, 2015. In addition, the Funds are required to disclose the amounts of significant transfers between Level 1 and Level 2 of the fair value hierarchy and the reasons for these transfers. The Investment Manager has evaluated the Funds' positions for the period ended June 30, 2015, and determined that, for purposes of fair value pricing measurement, there were no transfers between Level 1 and Level 2.
B. Cash and Cash Equivalents. The Company considers all highly liquid financial instruments with maturities of less than three months when acquired to be cash equivalents.
C. Security Transactions and Investment Income. Security transactions are accounted for on the trade date. The cost of investments sold is determined by use of the specific identification method for both financial reporting and federal income tax purposes. Dividends are recorded on the ex-dividend date. Interest income is recorded on an accrual basis. Premium or discount on debt securities are amortized using the effective interest amortization method.
D. Dividends and Distributions to Shareholders. The Government Securities Fund and Income and Equity Fund declare and distribute dividends of their net investment income, if any, quarterly. The Balanced Fund, Large Cap Value Fund, Mid Cap Value Fund and Small Cap Value Fund declare and distribute dividends of their net investment income, if any, annually. In addition, each Fund declares and distributes a capital gain dividend, if any, annually. The Board of Directors determines the amount and timing of such payments.
E. Federal Income Tax. The Company intends to comply with the requirements of Subchapter M of the Internal Revenue Code applicable to regulated investment companies and to distribute substantially all of their taxable income to their shareholders. Therefore, no federal income tax provision is required.
Management has analyzed the Funds' tax positions taken on federal income tax returns for all open tax years and for the year ended December 31, 2014 and has concluded that no provision for income tax is required in the Funds' financial statements. Tax years 2011, 2012, 2013 and 2014 are still subject to examination by major federal jurisdictions. Tax years 2010, 2011, 2012, 2013 and 2014 are still subject to examination by major state jurisdictions.
70
Pacific Advisors Fund Inc.
Notes to Financial Statements (Unaudited)
June 30, 2015
The Funds recognize interest and penalties, if any, related to unrecognized tax benefits as income tax expense in the Statement of Operations. During the period, the Funds did not incur any interest or penalties.
The components of distributable earnings (accumulated deficits) on a tax basis are reported as of the Funds' most recent year end. As of December 31, 2014, distributable earnings (accumulated deficits) on a tax basis were as follows:
| Government Securities Fund | Income and Equity Fund | Balanced Fund | Large Cap Value Fund | Mid Cap Value Fund | Small Cap Value Fund | ||||||||||||||||||||||
Undistributed ordinary income | $ | - | $ | 662 | $ | - | $ | - | $ | - | $ | - | |||||||||||||||
Undistributed long-term gains | - | - | 70,746 | 12,359 | - | 5,397,013 | |||||||||||||||||||||
Capital loss carry forward* | (89,416 | ) | (497,765 | ) | - | - | (1,182,831 | ) | - | ||||||||||||||||||
Post October loss | - | - | - | - | (21,783 | ) | - | ||||||||||||||||||||
| Net unrealized appreciation on investments | 96,790 | 1,976,416 | 1,750,979 | 2,550,853 | 1,750,485 | 31,908,450 | |||||||||||||||||||||
Accumulated earnings | $ | 7,374 | $ | 1,479,313 | $ | 1,821,725 | $ | 2,563,212 | $ | 545,871 | $ | 37,305,463 | |||||||||||||||
The difference between book basis and tax basis unrealized appreciation (depreciation) is attributable primarily to the tax deferral of losses on wash sales and characterization of certain income items. The Funds intend to treat post October losses (net capital losses incurred for the period subsequent to October 31, 2014 through the fiscal year end December 31, 2014) as having been incurred in the next fiscal year.
The Funds intend to utilize provisions of the federal income tax laws which allow them to carry a realized capital loss forward for eight years following the year of the loss and offset such losses against any future realized capital gains. During the most recent fiscal year, the following capital losses carried forward have been utilized:
| Government Securities Fund | Income and Equity Fund | Balanced Fund | Large Cap Value Fund | Mid Cap Value Fund | Small Cap Value Fund | ||||||||||||||||||||||
Capital loss carryforward utilized | $ | 42,268 | - | - | - | $ | 243,320 | $ | 1,798,458 | ||||||||||||||||||
* As of December 31, 2014, the following Funds had accumulated net realized losses on investment transactions that represent capital loss carryforwards for federal income tax purposes, which expire as follows:
Capital losses expiring in: | |||||||||||||||||||||||
2015 | 2016 | 2017 | 2018 | Total | |||||||||||||||||||
Government Securities Fund | $ | 1,178 | $ | 9,585 | $ | 73,971 | $ | 4,682 | $ | 89,416 | |||||||||||||
Income and Equity Fund | - | 102,173 | 388,066 | - | 490,239 | ||||||||||||||||||
Balanced Fund | - | - | - | - | - | ||||||||||||||||||
Large Cap Value Fund | - | - | - | - | - | ||||||||||||||||||
Mid Cap Value Fund | - | 542,664 | 640,167 | - | 1,182,831 | ||||||||||||||||||
Small Cap Value Fund | - | - | - | - | - | ||||||||||||||||||
During the year ended December 31, 2014, the Government Securities Fund had a capital loss carryforward in the amount of $46,376 that expired.
The Regulated Investment Company Modernization Act of 2010 (the "Act") changed various technical rules governing the tax treatment of regulated investment companies ("RICs") including the Funds. Under the Act, each Fund is permitted to carry forward capital losses incurred in taxable years beginning in 2011 for an unlimited period. However, any losses incurred during those future taxable years will be required to be utilized prior to the losses incurred in pre-enactment taxable years, which carry an expiration date. As a result of this ordering rule, pre-enactment capital loss carryforwards may be more likely to expire unused. Additionally, post-enactment capital loss carryforwards will retain their character as either short-term or long-term capital losses rather than being considered all short-term as permitted under previous regulation.
Finally, the Act contains several provisions aimed at preserving the character of distributions made by a fiscal year RIC during the portion of its taxable year ending after October 31 or December 31, reducing the circumstances under which a RIC might be required to file amended Forms 1099 to restate previously reported distributions.
71
Pacific Advisors Fund Inc.
Notes to Financial Statements (Unaudited)
June 30, 2015
During the most recent fiscal year, the following capital losses carried forward under the provisions of the Act were utilized:
| Loss Carryforward Utilized | |||||||||||
Short Term | Long Term | ||||||||||
Mid Cap Value Fund | $ | 27,116 | $ | 20,790 | |||||||
Losses that will be carried forward under the provisions of the Act are as follows:
| Loss Carryforward Character | |||||||||||
Short Term | Long Term | ||||||||||
Income and Equity Fund | $ | 7,526 | - | ||||||||
F. Reclassification of Capital Accounts. Distributions of net investment income and realized gains are determined in accordance with income tax regulations which may differ from GAAP. These differences are due to differing treatments for items such as net operating losses, reclassification of dividends and return of capital. To the extent that these differences are permanent in nature, reclassifications are made among the net asset accounts on the Statement of Assets and Liabilities. Net assets and net asset value per share are not affected by this classification.
For the period ended June 30, 2015, reclassifications among the components of net assets are as follows:
| Accumulated Undistributed Net Investment Income | Paid in Capital | Accumulated Capital Gain/(Loss) | |||||||||||||
Government Securities Fund | $ | 25,153 | $ | (25,153 | ) | - | |||||||||
Income and Equity Fund | 672 | (672 | ) | - | |||||||||||
Balanced Fund | 60,629 | (60,629 | ) | - | |||||||||||
Large Cap Value Fund | 38,616 | (38,616 | ) | - | |||||||||||
Mid Cap Value Fund | 90,578 | (90,578 | ) | - | |||||||||||
Small Cap Value Fund | 1,319,047 | (1,319,047 | ) | - | |||||||||||
The reclassifications were due to net investment losses incurred by the Funds, which are not permitted to be carried forward for tax purposes and differing book and tax treatment of certain securities.
G. Use of Estimates. The preparation of financial statements in conformity with U.S. GAAP requires management to make estimates and assumptions that affect the reported amounts in the financial statements and footnotes. Actual results could differ from those estimates.
Note 3. Investment Management, Distributor and Other Related Party Transactions
The Company and the Funds have entered into investment management agreements ("Management Agreements") with the Investment Manager.
The Management Agreements provide for investment management fees, payable monthly, and calculated at the maximum annual rate of 0.65% of average net assets for the Government Securities Fund, 0.75% of average net assets for the Income and Equity, Balanced, Large Cap Value and Small Cap Value Funds and 1.00% of average net assets for the Mid Cap Value Fund.
In accordance with Expense Limitation Agreements with the Company, the Investment Manager waives its respective management fees to the extent that the actual operating expenses of the following Funds exceed the following thresholds:
Class A | Class C | ||||||||||
Government Securities Fund | 1.65 | % | 2.40 | % | |||||||
Income and Equity Fund | 1.95 | % | 2.70 | % | |||||||
Large Cap Value Fund | 2.65 | % | 3.40 | % | |||||||
For the Government Securities Fund only, if net expenses exceed the above thresholds after waiver of the entire management fee, Pacific Global Investor Services, Inc. ("PGIS"), Transfer Agent for the Company and a wholly-owned subsidiary of the Investment Manager, will waive its transfer agency fee to the extent necessary to reduce Class expenses to the above thresholds. For the Large Cap Value Fund only, if net expenses exceeded the above threshold after the waiver of the entire management fee, PGIS
72
Pacific Advisors Fund Inc.
Notes to Financial Statements (Unaudited)
June 30, 2015
waived its transfer agent fee through December 31, 2014 to the extent necessary to reduce Class expenses to the above threshold. As amended and restated in 2014, the Expense Limitation Agreement for the Large Cap Value Fund was continued as of January 1, 2015 for only the management fee to the extent that the actual operating expenses exceed the thresholds shown above. These agreements may be terminated by either party upon 90 days prior written notice. The Transfer Agent does not waive out of pocket expenses.
Pursuant to the Expense Limitation Agreements, providing for the voluntary waiver of fees and the assumption of expenses by the Investment Manager and Transfer Agent, the following amounts were waived for the period ended June 30, 2015.
| Management Fees Waived | Transfer Agent Fees Waived | Total | |||||||||||||
Government Securities Fund | $ | 5,718 | $ | 21,600 | $ | 27,318 | |||||||||
Income and Equity Fund | 51,330 | N/A | 51,330 | ||||||||||||
Large Cap Value Fund | 30,103 | N/A | 30,103 | ||||||||||||
The Investment Manager does not have any rights to recover fees it waives or expenses it may reimburse, with respect to any of the Funds.
For the period ended June 30, 2015, Pacific Global Fund Distributors, Inc. ("PGFD"), the principal underwriter for the Company and a wholly-owned subsidiary of the Investment Manager, received commissions on sales of capital stock, after deducting amounts allowed to authorized distributors as commissions. In addition, PGFD, as a registered broker-dealer, may act as broker for the Funds, in conformity with Rule 17e-1 under the Investment Company Act of 1940. The Company's Board of Directors has approved procedures for evaluating the reasonableness of commissions paid to PGFD and periodically reviews these procedures. PGFD will not act as principal in effecting any portfolio transactions for the Funds. The amounts of commissions are as follows:
| Underwriting Fees Retained | Commissions Retained | Brokerage Commissions Received (Paid) | |||||||||||||
Government Securities Fund | $ | - | $ | - | $ | (36 | ) | ||||||||
Income and Equity Fund | 343 | 6 | 220 | ||||||||||||
Balanced Fund | 601 | 1,156 | (489 | ) | |||||||||||
Large Cap Value Fund | 851 | 2,113 | 237 | ||||||||||||
Mid Cap Value Fund | 633 | 607 | 522 | ||||||||||||
Small Cap Value Fund | 4,031 | 762 | 3,184 | ||||||||||||
The Company has also entered into separate agreements with PGIS that provide for transfer agent fees at a rate of $21 per year per open account and $3.50 per year per closed account, with a minimum charge of $1,800 per month per class for each fund; fund accounting fees equal to the greater of $1,500 or three basis points for the first hundred million in net assets and one basis point on the balance of net assets for each fund per month; and annual administrative agent fees of five basis points of average daily net assets of each fund subject to a maximum annual fee of $50,000 per fund. The fee is computed and payable monthly.
On the Statement of Assets and Liabilities, "Accounts payable to related parties" consists of transfer agent fees payable to PGIS.
The Company has adopted a plan of distribution whereby the Funds may pay a service fee to qualified recipients in an amount up to 0.25% per annum of each Fund's average daily net assets for Class A shares. The Company has also adopted a plan of distribution whereby the Funds may pay a service fee to qualified recipients in an amount up to 0.25% per annum of each Fund's average daily net assets for Class C shares and a distribution fee in an amount up to 0.75% per annum of each Fund's average daily net assets for Class C shares. The Company has not adopted a plan of distribution for Class I Shares.
For the period ended June 30, 2015, total distribution and/or service (12b-1) fees were:
Class A | Class C | Total | |||||||||||||
Government Securities Fund | $ | 1,905 | $ | 899 | $ | 2,804 | |||||||||
Income and Equity Fund | 13,871 | 12,876 | 26,747 | ||||||||||||
Balanced Fund | 4,404 | 19,235 | 23,639 | ||||||||||||
Large Cap Value Fund | 7,209 | 5,875 | 13,084 | ||||||||||||
Mid Cap Value Fund | 5,654 | 4,317 | 9,971 | ||||||||||||
Small Cap Value Fund | 112,180 | 46,180 | 158,360 | ||||||||||||
73
Pacific Advisors Fund Inc.
Notes to Financial Statements (Unaudited)
June 30, 2015
Note 4. Purchase and Sales of Securities
The following summarizes purchases and sales of investment securities, other than short-term investments, and aggregate gross unrealized appreciation and depreciation on a tax basis by each Fund for the period ended and as of June 30, 2015. The difference between book basis and tax basis unrealized appreciation is attributable primarily to the tax deferral of losses on wash sales.
| Period ended June 30, 2015 | As of June 30, 2015 | ||||||||||||||||||||||||||
| Cost of Purchases | Proceeds From Sales | Tax Cost of Securities | Gross Unrealized Appreciation | Gross Unrealized Depreciation | Net Unrealized Appreciation | ||||||||||||||||||||||
Government Securities Fund | $ | 1,700,075 | $ | 1,826,623 | $ | 1,607,632 | $ | 81,698 | $ | 396 | $ | 81,302 | |||||||||||||||
Income and Equity Fund | 2,284,210 | 1,437,568 | 12,046,510 | 1,613,550 | 69,240 | 1,544,310 | |||||||||||||||||||||
Balanced Fund | 1,290,698 | 2,009,558 | 7,019,781 | 1,722,411 | 361,300 | 1,361,111 | |||||||||||||||||||||
Large Cap Value Fund | 419,607 | 382,042 | 5,337,788 | 2,653,249 | 17,785 | 2,635,464 | |||||||||||||||||||||
Mid Cap Value Fund | 1,033,129 | 1,019,067 | 5,314,453 | 2,217,140 | 657,311 | 1,559,829 | |||||||||||||||||||||
Small Cap Value Fund | 1,516,445 | 44,320,900 | 67,071,570 | 39,365,708 | 14,733,158 | 24,632,550 | |||||||||||||||||||||
Note 5. Distributions to Shareholders
The tax character of distributions paid during 2015 and 2014 was as follows:
| Government Securities Fund | Income and Equity Fund | Balanced Fund | Large Cap Value Fund | Mid Cap Value Fund | Small Cap Value Fund | ||||||||||||||||||||||
Period ended June 30, 2015 | |||||||||||||||||||||||||||
Distributions paid from: | |||||||||||||||||||||||||||
Ordinary Income | $ | - | $ | 53,800 | $ | - | $ | - | $ | - | $ | - | |||||||||||||||
Long-Term Capital Gain | - | - | - | - | - | - | |||||||||||||||||||||
Return of Capital | - | - | - | - | - | - | |||||||||||||||||||||
Total Distributions | $ | - | $ | 53,800 | $ | - | $ | - | $ | - | $ | - | |||||||||||||||
Year ended December 31, 2014 | |||||||||||||||||||||||||||
Distributions paid from: | |||||||||||||||||||||||||||
Ordinary Income | $ | - | $ | 222,717 | $ | - | $ | - | $ | - | $ | - | |||||||||||||||
Long-Term Capital Gain | - | - | 556,907 | 94,291 | - | 11,005,620 | |||||||||||||||||||||
Return of Capital | - | - | - | - | - | - | |||||||||||||||||||||
Total Distributions | $ | - | $ | 222,717 | $ | 556,907 | $ | 94,291 | $ | - | $ | 11,005,620 | |||||||||||||||
Note 6. Capital Share Transactions
A 2% redemption fee is assessed on shares of the Government Securities Fund or Income and Equity Fund sold or exchanged within 30 days of purchase or shares of the Balanced Fund, Large Cap Value Fund, Mid Cap Value Fund or Small Cap Value Fund sold or exchanged within 180 days of purchase and is retained in each Fund. The redemption fees collected through June 30, 2015 are included in the dollar amount of shares sold in the table below. The amount of the increase is as follows:
Class A | Class C | Class I | |||||||||||||
Government Securities Fund | $ | - | $ | - | N/A | ||||||||||
Income and Equity Fund | 53 | 12 | N/A | ||||||||||||
Balanced Fund | 716 | 573 | N/A | ||||||||||||
Large Cap Value Fund | 97 | 17 | N/A | ||||||||||||
Mid Cap Value Fund | - | - | N/A | ||||||||||||
Small Cap Value Fund | 28,520 | 2,810 | $ | 115 | |||||||||||
74
Pacific Advisors Fund Inc.
Notes to Financial Statements (Unaudited)
June 30, 2015
| Six months ended June 30, 2015 | Year ended December 31, 2014 | ||||||||||||||||||
Shares | Amount | Shares | Amount | ||||||||||||||||
Government Securities Fund | |||||||||||||||||||
Class A | |||||||||||||||||||
Shares sold | 17 | $ | 151 | 4,544 | $ | 41,597 | |||||||||||||
Reinvestment of distributions | - | - | - | - | |||||||||||||||
17 | 151 | 4,544 | 41,597 | ||||||||||||||||
Shares repurchased | (8,525 | ) | (76,959 | ) | (23,494 | ) | (214,588 | ) | |||||||||||
Net decrease | (8,508 | ) | $ | (76,808 | ) | (18,950 | ) | $ | (172,991 | ) | |||||||||
Class C | |||||||||||||||||||
Shares sold | - | $ | - | - | $ | - | |||||||||||||
Reinvestment of distributions | - | - | - | - | |||||||||||||||
- | - | - | - | ||||||||||||||||
Shares repurchased | (2,190 | ) | (18,982 | ) | (11,362 | ) | (100,208 | ) | |||||||||||
Net decrease | (2,190 | ) | $ | (18,982 | ) | (11,362 | ) | $ | (100,208 | ) | |||||||||
| Six months ended June 30, 2015 | Year ended December 31, 2014 | ||||||||||||||||||
Shares | Amount | Shares | Amount | ||||||||||||||||
Income and Equity Fund | |||||||||||||||||||
Class A | |||||||||||||||||||
Shares sold | 65,595 | $ | 788,738 | 310,822 | $ | 3,641,453 | |||||||||||||
Reinvestment of distributions | 3,615 | 43,038 | 14,324 | 167,480 | |||||||||||||||
69,210 | 831,776 | 325,146 | 3,808,933 | ||||||||||||||||
Shares repurchased | (80,823 | ) | (968,880 | ) | (186,327 | ) | (2,172,749 | ) | |||||||||||
Net increase (decrease) | (11,613 | ) | $ | (137,104 | ) | 138,819 | $ | 1,636,184 | |||||||||||
Class C | |||||||||||||||||||
Shares sold | 37,376 | $ | 430,462 | 65,292 | $ | 730,082 | |||||||||||||
Reinvestment of distributions | 349 | 3,998 | 2,342 | 26,044 | |||||||||||||||
37,725 | 434,460 | 67,634 | 756,126 | ||||||||||||||||
Shares repurchased | (10,674 | ) | (123,303 | ) | (55,612 | ) | (626,992 | ) | |||||||||||
Net increase | 27,051 | $ | 311,157 | 12,022 | $ | 129,134 | |||||||||||||
75
Pacific Advisors Fund Inc.
Notes to Financial Statements (Unaudited)
June 30, 2015
| Six months ended June 30, 2015 | Year ended December 31, 2014 | ||||||||||||||||||
Shares | Amount | Shares | Amount | ||||||||||||||||
Balanced Fund | |||||||||||||||||||
Class A | |||||||||||||||||||
Shares sold | 13,583 | $ | 195,519 | 44,611 | $ | 712,675 | |||||||||||||
Reinvestment of distributions | - | - | 17,557 | 253,878 | |||||||||||||||
13,583 | 195,519 | 62,168 | 966,553 | ||||||||||||||||
Shares repurchased | (18,229 | ) | (264,058 | ) | (23,763 | ) | (378,167 | ) | |||||||||||
Net increase (decrease) | (4,646 | ) | $ | (68,539 | ) | 38,405 | $ | 588,386 | |||||||||||
Class C | |||||||||||||||||||
Shares sold | 16,068 | $ | 208,369 | 54,268 | $ | 791,039 | |||||||||||||
Reinvestment of distributions | - | - | 19,422 | 253,459 | |||||||||||||||
16,068 | 208,369 | 73,690 | 1,044,498 | ||||||||||||||||
Shares repurchased | (68,305 | ) | (890,501 | ) | (110,595 | ) | (1,615,738 | ) | |||||||||||
Net decrease | (52,237 | ) | $ | (682,132 | ) | (36,905 | ) | $ | (571,240 | ) | |||||||||
| Six months ended June 30, 2015 | Year ended December 31, 2014 | ||||||||||||||||||
Shares | Amount | Shares | Amount | ||||||||||||||||
Large Cap Value Fund | |||||||||||||||||||
Class A | |||||||||||||||||||
Shares sold | 24,317 | $ | 340,913 | 103,317 | $ | 1,392,376 | |||||||||||||
Reinvestment of distributions | - | - | 5,050 | 72,769 | |||||||||||||||
24,317 | 340,913 | 108,367 | 1,465,145 | ||||||||||||||||
Shares repurchased | (24,459 | ) | (346,294 | ) | (40,278 | ) | (554,467 | ) | |||||||||||
Net increase (decrease) | (142 | ) | $ | (5,381 | ) | 68,089 | $ | 910,678 | |||||||||||
Class C | |||||||||||||||||||
Shares sold | 3,534 | $ | 43,789 | 30,432 | $ | 364,025 | |||||||||||||
Reinvestment of distributions | - | - | 897 | 11,286 | |||||||||||||||
3,534 | 43,789 | 31,329 | 375,311 | ||||||||||||||||
Shares repurchased | (1,353 | ) | (17,006 | ) | (8,022 | ) | (96,608 | ) | |||||||||||
Net increase | 2,181 | $ | 26,783 | 23,307 | $ | 278,703 | |||||||||||||
76
Pacific Advisors Fund Inc.
Notes to Financial Statements (Unaudited)
June 30, 2015
| Six months ended June 30, 2015 | Year ended December 31, 2014 | ||||||||||||||||||
Shares | Amount | Shares | Amount | ||||||||||||||||
Mid Cap Value Fund | |||||||||||||||||||
Class A | |||||||||||||||||||
Shares sold | 28,661 | $ | 382,471 | 74,713 | $ | 1,068,126 | |||||||||||||
Reinvestment of distributions | - | - | - | - | |||||||||||||||
28,661 | 382,471 | 74,713 | 1,068,126 | ||||||||||||||||
Shares repurchased | (14,824 | ) | (198,947 | ) | (27,647 | ) | (392,096 | ) | |||||||||||
Net increase | 13,837 | $ | 183,524 | 47,066 | $ | 676,030 | |||||||||||||
Class C | |||||||||||||||||||
Shares sold | 928 | $ | 11,060 | 1,324 | $ | 17,167 | |||||||||||||
Reinvestment of distributions | - | - | - | - | |||||||||||||||
928 | 11,060 | 1,324 | 17,167 | ||||||||||||||||
Shares repurchased | (2,913 | ) | (35,231 | ) | (14,861 | ) | (191,909 | ) | |||||||||||
Net decrease | (1,985 | ) | $ | (24,171 | ) | (13,537 | ) | $ | (174,742 | ) | |||||||||
| Six months ended June 30, 2015 | Year ended December 31, 2014 | ||||||||||||||||||
Shares | Amount | Shares | Amount | ||||||||||||||||
Small Cap Value Fund | |||||||||||||||||||
Class A | |||||||||||||||||||
Shares sold | 225,496 | $ | 9,581,079 | 969,631 | $ | 55,073,377 | |||||||||||||
Reinvestment of distributions | - | - | 210,424 | 9,311,267 | |||||||||||||||
225,496 | 9,581,079 | 1,180,055 | 64,384,644 | ||||||||||||||||
Shares repurchased | (1,055,020 | ) | (44,458,329 | ) | (1,667,878 | ) | (90,313,780 | ) | |||||||||||
Net decrease | (829,524 | ) | $ | (34,877,250 | ) | (487,823 | ) | $ | (25,929,136 | ) | |||||||||
Class C | |||||||||||||||||||
Shares sold | 11,041 | $ | 394,284 | 56,369 | $ | 2,767,368 | |||||||||||||
Reinvestment of distributions | - | - | 23,904 | 869,627 | |||||||||||||||
11,041 | 394,284 | 80,273 | 3,636,995 | ||||||||||||||||
Shares repurchased | (55,558 | ) | (1,947,062 | ) | (76,645 | ) | (3,479,336 | ) | |||||||||||
Net increase (decrease) | (44,517 | ) | $ | (1,552,778 | ) | 3,628 | $ | 157,659 | |||||||||||
Class I | |||||||||||||||||||
Shares sold | 4,824 | $ | 250,115 | 24,572 | $ | 1,750,509 | |||||||||||||
Reinvestment of distributions | - | - | 1,695 | 89,404 | |||||||||||||||
4,824 | 250,115 | 26,267 | 1,839,913 | ||||||||||||||||
Shares repurchased | (26,256 | ) | (1,276,307 | ) | (5,113 | ) | (361,045 | ) | |||||||||||
Net increase (decrease) | (21,432 | ) | $ | (1,026,192 | ) | 21,154 | $ | 1,478,868 | |||||||||||
77
Pacific Advisors Fund Inc.
Notes to Financial Statements (Unaudited)
June 30, 2015
Note 7. Bank Borrowings
Each Fund may borrow money to the extent permitted by the 1940 Act, as amended, or any rules, exemptions or interpretations thereunder that may be adopted, granted or issued by the Securities and Exchange Commission. Under the 1940 Act, a mutual fund may borrow up to one-third of its total assets (including the amount borrowed) from banks for any purpose, and may borrow up to 5% of its total assets from banks or other lenders for temporary purposes. Each Fund may borrow to facilitate portfolio transactions or meet redemptions. The Large Cap Value Fund, Mid Cap Value Fund, and Small Cap Value Fund also may borrow money to invest in portfolio securities. Each Fund has the ability to borrow, from UMB Bank, n.a. (UMB), on an unsecured basis, at 1.50% over the Federal Funds rate. As of June 30, 2015, the Mid Cap Value Fund and Small Cap Value Fund had borrowings from UMB with amounts of $6,683 and $1,365,156, respectively, and were paying interest at 1.56% per annum on their outstanding borrowings. No compensating balances were required.
78
Pacific Advisors Fund Inc.
Directors and Officers
"Independent" Directors
Name (Age) | Position with the Company1 | Year elected Director of the Company | Principal occupation(s) during past 5 years | Other Directorships held by Director | |||||||||||||||
| L. Michael Haller, III (71) | Director | 1992 | Consultant, d/b/a Asahi Broadcasting Enterprises (software development); Chairman and President, Gammaker Pte. Ltd. (mobile game developer); Chairman and CEO, AdLib Mediation, Inc. (mobile advertising); and formerly Executive Vice President, MGT Capital Investments (mobile game developer) (2013); CEO, Digital Angel, Inc. (communications equipment distributor) (2012-2013); Chairman, Kapitall, Inc. (online introducing brokerage) (2011-2012); President, Bionic Games, Inc. (game software development company) (2008-2011); and Vice President and General Manager, Kapitall Studio (division of Kapitall, Inc.) (2010-2011) | Digital Angel, Inc. | |||||||||||||||
| Peter C. Hoffman (64) | Director | 2010 | President, Sierra Autocars, Inc. (auto dealership), Sierra Vehicles, Inc. (auto dealership), Sierra Automotive Enterprises, Inc. (auto dealership) and Sierra Pursuits, Inc. (management company) | None | |||||||||||||||
| Gerald E. Miller (85) | Director | 1992 | Retired in 1992; and formerly worked for Merrill Lynch for over 30 years and was a Senior Resident Vice President at retirement in 1992 | None | |||||||||||||||
| Louise K. Taylor, PhD (68) | Director | 1992 | Assistant Executive Director, Employers Association of California; and formerly Superintendent, Monrovia Unified School District (1991-2009) | None | |||||||||||||||
"Interested" Directors2
Name (Age) | Positions with the Company1 | Year elected a Director and officer of the Company | Principal occupations during past 5 years | Other Directorships held by Director | |||||||||||||||
| Victoria L. Breen (64)* | Director Assistant Secretary | 1992 2002 | President, Derby & Derby, Inc. (financial services company); Registered Principal, Foothill Securities, Inc.; and Assistant Secretary and Director, Pacific Global Investment Management Company; and formerly Agent, Transamerica Life Companies (1994-2015); Registered Principal, Transamerica Financial Advisors, Inc. (1994-2015) | None | |||||||||||||||
| George A. Henning (68)** | President and Chairman | 1992 | Chairman, President and Director, Pacific Global Investment Management Company; and Chairman and Director, Pacific Global Fund Distributors, Inc. and Pacific Global Investor Services, Inc. | None | |||||||||||||||
Each Director oversees all 6 Pacific Advisors Fund portfolios.
The Fund's Statement of Additional Information contains additional information about the Fund's Directors and Officers and is available without charge upon request by calling (800) 989-6693. The business address for all Directors and officers of the Company is 101 N. Brand Blvd., Suite 1950, Glendale, CA 91203, Attn: Secretary.
79
Pacific Advisors Fund Inc.
Directors and Officers
Other Officers
Name (Age) | Position(s) with the Company | Year elected an officer of the Company | Principal occupations during past 5 years | ||||||||||||
| Catherine L. Henning (37) | Vice President Secretary | 2010 2006 | Senior Vice President, Secretary, Director of Client Services and Director, Pacific Global Investment Management Company; President, Secretary, Chief Compliance Officer and Director, Pacific Global Fund Distributors, Inc.; and Vice President, Secretary and Director, Pacific Global Investor Services, Inc. | ||||||||||||
| Barbara A. Kelley (62) | Vice President and Chief Compliance Officer | 2001 | Executive Vice President, Chief Compliance Officer and Director, Pacific Global Investment Management Company; Director, Pacific Global Fund Distributors, Inc.; President and Director, Pacific Global Investor Services, Inc.; and formerly Treasurer (2001-2014). | ||||||||||||
| Araceli Olea (42) | Assistant Secretary | 2008 | Shareholder Services Manager, Pacific Global Investor Services, Inc.; and Assistant Secretary, Pacific Global Investment Management Company and Pacific Global Investor Services, Inc. | ||||||||||||
| Jingjing Yan (41) | Treasurer | 2014 | Vice President and Treasurer, Pacific Global Investment Management Company; Treasurer, Pacific Global Fund Distributors, Inc. and Pacific Global Investor Services, Inc.; and formerly Assistant Treasurer (2005-2014). | ||||||||||||
1 Each director is elected to serve until the next annual shareholders meeting and until his or her successor is elected or appointed. The Company does not hold regular annual shareholders meetings to elect Directors. Vacancies on the Board can be filled by the action of a majority of the Directors, provided that at least two-thirds of the Directors have been elected by the shareholders.
2 "Interested persons" as defined in the 1940 Act, as amended, based on their affiliation with the Funds' investment manager and its affiliates (including the Funds' principal underwriter).
* Ms. Breen is considered an interested director because (a) she is a registered principal of a registered broker/dealer that engages in sales of Company shares under a selling agreement with the Distributor, and in that capacity she has received commissions on the sale of the Funds' shares; (b) she is an officer of the Company; and (c) she is a shareholder of the Manager and a member of the Manager's Board of Directors.
** Mr. Henning is considered an interested director because (a) he holds the positions described above with the Company, the Manager and its affiliates; (b) by virtue of his ownership of the Manager's shares he may be deemed a "control person" of the Manager; and (c) he is Ms. Henning's father.
80

Pacific Advisors Fund Inc.
Directors
George A. Henning, Chairman
Victoria L. Breen
L. Michael Haller, III
Peter C. Hoffman
Gerald E. Miller
Louise K. Taylor, Ph.D.
Officers
George A. Henning, President
Barbara A. Kelley, Vice President
Catherine L. Henning, Vice President and Secretary
Victoria L. Breen, Assistant Secretary
Araceli Olea, Assistant Secretary
Jingjing Yan, Treasurer
Investment Manager
Pacific Global Investment Management Company
101 North Brand Blvd., Suite 1950
Glendale, California 91203
Transfer Agent and Administrator
Pacific Global Investor Services, Inc.
101 North Brand Blvd., Suite 1950
Glendale, California 91203
Distributor
Pacific Global Fund Distributors, Inc.
101 North Brand Blvd., Suite 1950
Glendale, California 91203
(800) 989-6693
Availability of Quarterly Portfolio Schedule
The Fund files its complete schedule of portfolio holdings with the SEC for the first and third quarters of each fiscal year on Form N-Q. The Fund's Forms N-Q are available on the SEC's Web site at http://www.sec.gov. The Fund's Forms N-Q may be reviewed and copied at the SEC's Public Reference Room in Washington, DC. Information about the operation of the Public Reference Room may be obtained by calling the SEC at (800) SEC-0330.
The Fund's complete schedule of portfolio holdings for each fiscal quarter is posted on the Fund's Web site at www.PacificAdvisorsFund.com and is available without charge, upon request by calling (800) 989-6693. Documents will be sent within 3 business days of receipt of your request.
Availability of Proxy Voting Policies and Procedures and Proxy Voting Record
A description of the policies and procedures that the Fund uses to determine how to vote proxies relating to portfolio securities and information regarding how the Fund voted proxies relating to portfolio securities during the most recent 12-month period ended June 30 is available without charge, upon request by calling (800) 989-6693. Documents will be sent within 3 business days of receipt of your request. This information is also available on the SEC's Web site at http://www.sec.gov.

Pacific Global Fund Distributors, Inc.
101 North Brand Blvd., Suite 1950
Glendale, California 91203

Item 2. | Code of Ethics |
| Not applicable for semi-annual reports. |
|
|
Item 3. | Audit Committee Financial Expert |
| Not applicable for semi-annual reports. |
|
|
Item 4. | Principal Accountant Fees and Services |
| Not applicable for semi-annual reports. |
|
|
Item 5. | Audit Committee of Listed Registrants |
| Not applicable as Registrant is not a listed issuer as defined in Rule 10A-3 under the Securities Exchange Act of 1934. |
|
|
Item 6. | Schedule of Investments |
| Schedule of Investments is included as part of the report to shareholders filed under Item 1 of this form. |
|
|
Item 7. | Disclosure of Proxy Voting Policies and Procedures for Closed-End Management Investment Companies |
| Not applicable to open-end investment companies. |
|
|
Item 8. | Portfolio Managers of Closed-End Management Investment Companies |
| Not applicable to open-end investment companies. |
|
|
Item 9. | Purchases of Equity Securities by Managers of Closed-End Management Investment Company and Affiliated Purchasers. |
| Not applicable to open-end investment companies. |
|
|
Item 10. | Submission of Matters to a Vote of Security Holders |
| No material changes have been made. |
|
|
Item 11. | Controls and Procedures. |
| (a) Based upon their evaluation of Registrant’s disclosure controls and procedures (as defined in Rule 30a-3(c) under the Investment Company Act of 1940) as conducted within 90 days of the filing date of this Form N-CSR, Registrant’s principal executive officer and principal financial officer have concluded that those disclosure controls and procedures provide reasonable assurance that the material information required to be disclosed by Registrant on this report is recorded, processed, summarized and reported within the time periods specified in the Securities and Exchange Commission’s rules and forms. |
|
|
| (b) There were no changes in Registrant’s internal control over financial reporting (as defined in Rule 30a-3(d) under the Investment Company Act of 1940) that occurred during the second fiscal quarter of the period covered by this report that have materially affected, or are reasonably likely to materially affect, Registrant’s internal control over financial reporting. |
|
|
Item 12. | Exhibits |
| (a)(1) Not applicable. |
|
|
| (a)(2) Certifications required by Item 12(a) of Form N-CSR and Section 302 of the Sarbanes-Oxley Act of 2002 (filed herewith). |
|
|
| (a)(3) Not applicable. |
|
|
| (b) Certification required by Section 906 of the Sarbanes-Oxley Act of 2002 (filed herewith). |
SIGNATURES
Pursuant to the requirements of the Securities Exchange Act of 1934 and the Investment Company Act of 1940, Registrant has duly caused this report to be signed on its behalf by the undersigned, thereunto duly authorized.
Pacific Global Fund Inc. d/b/a Pacific Advisors Fund Inc. |
| |
|
| |
By: | /s/ George A. Henning |
|
| George A. Henning |
|
| Chairman, Pacific Advisors Fund Inc. |
|
|
|
|
Date: | September 1, 2015 |
|
Pursuant to the requirements of the Securities Exchange Act of 1934 and the Investment Company Act of 1940, this report has been signed below by the following persons on behalf of Registrant and in the capacities and on the dates indicated.
By: | /s/ George A. Henning |
|
| George A. Henning |
|
| Chief Executive Officer |
|
|
|
|
Date: | September 1, 2015 |
|
|
|
|
By: | /s/ Jingjing Yan |
|
| Jingjing Yan |
|
| Chief Financial Officer |
|
|
|
|
Date: | September 1, 2015 |
|