UNITED STATES
SECURITIES AND EXCHANGE COMMISSION
Washington, D.C. 20549
FORM N-CSR
CERTIFIED SHAREHOLDER REPORT OF REGISTERED
MANAGEMENT INVESTMENT COMPANIES
Investment Company Act file number | 811-07062 | |||||||
| ||||||||
PACIFIC GLOBAL FUND INC. D/B/A PACIFIC ADVISORS FUND INC. | ||||||||
(Exact name of registrant as specified in charter) | ||||||||
| ||||||||
101 NORTH BRAND BLVD., SUITE 1950 GLENDALE, CALIFORNIA |
| 91203 | ||||||
(Address of principal executive offices) |
| (Zip code) | ||||||
| ||||||||
GEORGE A. HENNING 101 NORTH BRAND BLVD., SUITE 1950 GLENDALE, CA 91203 | ||||||||
(Name and address of agent for service) | ||||||||
| ||||||||
Registrant’s telephone number, including area code: | 818-242-6693 |
| ||||||
| ||||||||
Date of fiscal year end: | December 31 |
| ||||||
| ||||||||
Date of reporting period: | June 30, 2010 |
| ||||||
Item 1. | Report to Shareholders |
| Filed herewith. |
semi-annual report
june 30, 2010
government securities fund
income and equity fund
balanced fund
growth fund
multi-cap value fund
small cap fund

Pacific Advisors
table of contents
| Message from the Chairman | 1 | ||||||
| Government Securities Fund | 4 | ||||||
| Income and Equity Fund | 8 | ||||||
| Balanced Fund | 13 | ||||||
| Growth Fund | 18 | ||||||
| Multi-Cap Value Fund | 22 | ||||||
| Small Cap Fund | 26 | ||||||
| Statement of Investments | 31 | ||||||
| Statement of Assets and Liabilities | 56 | ||||||
| Statement of Operations | 58 | ||||||
| Statement of Changes in Net Assets | 60 | ||||||
| Financial Highlights | 64 | ||||||
| Notes to Financial Statements | 71 | ||||||
| Directors and Officers | 80 | ||||||
This Report is submitted for the general information of the shareholders of Pacific Advisors Fund. It is not authorized for distribution to prospective investors unless accompanied or preceded by a copy of the prospectus, which contains information concerning the investment policies of the Funds as well as other pertinent information.
This Report is for informational purposes only and is not a solicitation, or a recommendation that any particular investor should purchase or sell any particular security. The statements in the Chairman's Letter and the discussions of the Funds' performance are the opinions and beliefs expressed at the time of this commentary and are not intended to represent opinions and beliefs at any other time. These opinions are subject to change at any time based on market or other conditions and are not meant as a market forecast. All economic and performance information referenced is historical. Past performance does not guarantee future results.
For more information on the Pacific Advisors Funds, including information on charges, expenses and other classes offered, please obtain a copy of the prospectus by calling (800) 989-6693. Please read the prospectus and consider carefully the investment risks, objectives, charges and expenses before you invest or send money. Shares of the Pacific Advisors Funds are not deposits or obligations of any bank, are not guaranteed by any bank, are not insured by the FDIC or any other agency, and involve investment risks, including the possible loss of the principal amount invested. The investment return and principal value of an investment will fluctuate so that an investor's shares, when redeemed, may be worth more or less than their original cost.

Message
from the chairman
Dear Shareholders,
The "tug of war" between the bull and bear markets has left many investors uncertain about what investment strategies to employ. Despite modest U.S. economic growth in 2010, unemployment remains elevated and consumers remain cautious. Ongoing challenges continue to increase investor unease, including the struggling housing market; sovereign debt threats in Europe; and a moderating growth rate in China. Many investors have fled to the safety of cash or fixed income securities as they await a clearer picture of the direction of the U.S. economy.
The market recovery which began in March 2009 gave way to a correction in the second quarter of 2010. A confluence of events raised concerns about the sustainability of the global economic recovery and triggered a market correction that was more severe than anticipated. The pullback impacted every area of the market and left many companies significantly undervalued. During events such as these, the best strategy for long-term investors is to weather market volatility and remain positioned to benefit from the strong growth potential of individual companies.
The broad market pullback belied the fact that many individual companies continued to grow revenue and earnings. Second quarter earnings results released in July confirmed these positive trends. Over 75% of the S&P 500 companies beat revenue and earnings expectations. These results enabled the market to begin recovering from the correction which started in May. We believe that the economy will continue to improve; however, a slower growth rate will yield mixed results month-to-month. The weaker economic recovery has actually provided opportunities for financially strong companies; they can cost-effectively invest in growth initiatives to improve their competitive positions.
Market & Economic Review
During the first quarter, the equity markets pulled back as investors became concerned about economic growth prospects. However, the second quarter began on a positive note as expectations for continued economic improvement lifted the equity market. Encouraging macroeconomic data, including GDP growth of 2.7% in the first quarter, and initial first quarter earnings reports bolstered investor sentiment. As investors became more confident in the recovery, they moved out of safe havens, such as U.S. Treasuries, and into equities. At the end of April, the S&P 500 Index reached its highest level since September 2008. Unfortunately, this represented the high for the first half of 2010.
Challenges to economic recovery began to emerge in early May. Downgrades of Greek, Portuguese and Spanish debt overshadowed generally positive first quarter earnings and improving domestic economic data. Negative sentiment intensified on disappointing housing reports following the April expiration of federal tax incentive programs. Persistent weakness in the labor market and finance reform legislation further eroded investor confidence, which had already begun to weaken following the Gulf of Mexico oil spill. Investors responded to this uncertainty by selling equities and moving back to more conservative alternatives. Heightened volatility during the period underscored the fragile state of the equity markets.
Year-to-date through June 30, the S&P 500 Index fell 7.6%, the Dow Jones Industrial Average dropped 6.3%, the NASDAQ Composite lost 7.0%, the S&P MidCap 400 Index fell 2.1%, and the Russell 2000 Index of small companies dropped 2.5%. The similarity of the losses among these various indices reflected the breadth of the selloff.
Market Review — June 30, 2010
| Index1 | Close | YTD Return | |||||||||
| Dow Jones Industrial Avg | 9774.02 | – 6.3 | % | ||||||||
| S&P 500 | 1030.71 | – 7.6 | % | ||||||||
| NASDAQ | 2109.24 | – 7.0 | % | ||||||||
| Russell 2000 (small cap) | 609.49 | – 2.5 | % | ||||||||
| 06/30/10 | 06/30/09 | ||||||||||
| 10-Year T-Note Yield | 2.97 | % | 3.53 | % | |||||||
Data: The Wall Street Journal
1 The Dow Jones Industrial Average is an unmanaged, price weighted measure of 30 U.S. stocks selected by the Averages Committee to represent the performance of all U.S. stocks outside the Transportation and Utilities sectors. The Standard & Poor's 500 Index is an unmanaged, market capitalization weighted measure of 500 widely held common stocks listed on the New York Stock Exchange, American Stock Exchange and The Nasdaq Stock Market. The NASDAQ Composite Index is an unmanaged, market capitalization weighted measure of all domestic and international common stocks (currently over 3,000 stocks) listed on The Nasdaq Stock Market. The Russell 2000 Stock Index is an unmanaged, market-weighted measure of the 2,000 smallest publicly traded companies of the Russell 3000 Index. These indices are not available for direct investment. Index returns assume the reinvestment of dividends.

1


Message
from the chairman continued
Every market sector experienced a loss during the second quarter further evidencing a market environment that paid little attention to specific company developments. Defensive sectors including Telecommunication Services, Utilities and Consumer Staples outperformed relative to cyclical sectors such as Consumer Discretionary, Energy and Materials.
Heightened market volatility obscured significant developments across the corporate landscape and among individual companies. Improvement in industries typically regarded as early recovery indicators, including transportation and mining equipment, suggests underlying strength in the economy. Furthermore, companies began signing long-term service contracts, entering into joint venture partnerships and finding new business opportunities in emerging markets. Stronger firms also continued to make strategic acquisitions to expand their businesses.
The current cloud of uncertainty will likely temper market momentum in the near-term. Investors remain cautious and continue to seek confirmation that the economic recovery is on track. As a result, the market will remain sensitive to macroeconomic data and global developments, particularly growth forecasts for Europe and China. In contrast to the uncertainty associated with the global economy, second quarter earnings, especially the accompanying management commentaries and outlooks, provide important insights into the prospects for corporate America. Many companies are seeing growth in their industries or indications of a bottoming process; additionally, they have accumulated significant cash reserves for business expansion; acquisitions; and share buybacks or to increase dividends.
Equity Investment Review
Concerns of a double-dip recession fueled the broad selloff in the equity markets as investors reacted to various domestic and global economic reports. Despite encouraging news from individual companies, investors feared that global events would threaten the positive trends emerging for many firms. Investors remain concerned that a jobless recovery may stifle U.S. economic growth.
Many challenges remain; however, the economic prospects are encouraging. Many emerging countries, including China, Brazil and India, continue to experience rapid economic growth. Also, several European countries are beginning to recover. We believe the recent selloff overstates the likelihood of a double-dip recession in the U.S. Furthermore, we expect that the global and domestic economic growth will continue at a modest rate. This will likely create remarkable growth opportunities for companies with strong balance sheets and market leadership. Indeed, certain individual companies may see more significant opportunities than they perhaps would in a more robust recovery.
Economic growth has been slower than in prior recoveries. In this environment, weaker companies are not able to generate the revenue necessary to reduce debt and make capital investments. Given the severity of the credit crisis and the recession, many companies delayed capital investments to replace obsolete equipment. As a result, some industries are experiencing significant shortages. Well-situated companies will be able to capitalize on these imbalances between supply and demand. Such companies may also benefit as budgetary problems lead many federal, state and municipal agencies to privatize or outsource services to save money.
Early recovery sectors such as Consumer Discretionary, Industrials and Energy remain attractive. Our equity strategies, as we discussed in our 2009 Annual Report, continue to focus on positions in these areas with an overall emphasis on strong companies with effective management teams and solid growth potential. The individual Fund commentaries discuss our investment strategies in detail.
Our Funds remain well-positioned in companies poised to take advantage of opportunities in a slower growing economy. We believe many of the stocks in our equity Funds are trading at significant discounts to their fundamental values even before considering their growth potential. In time, we anticipate the market will begin to recognize these undervalued companies as they demonstrate their ability to successfully implement growth strategies. Investors have temporarily accepted lackluster returns from cash and fixed income securities. We believe, however, that maintaining our investment discipline with patience will be rewarding as the desire for better investment results leads investors to focus on other investment opportunities including the equity markets.
Fixed Income Investment Review
Early in the second quarter, as prospects for economic recovery led investors back into the equity market, interest rates on U.S. Treasuries and high quality investment grade bonds initially trended higher. Rates abruptly

2

reversed course in May as investors became concerned that the European debt crisis would spread across the globe. Investors abandoned investments such as corporate bonds and equities as they reverted to the safety of U.S. government securities or cash. As a result of this "flight to safety," an unsustainable amount of capital flowed into government securities which pushed interest rates lower. The yield on the benchmark 10-year Treasury Note, after reaching 4% in early April, dropped below 3% by the end of the period.
When investors regain confidence in the economic recovery, their focus will shift from safety to opportunity. As capital moves out of cash and government securities into other investments that offer higher returns, interest rates will rise. Rising interest rates present a significant risk to fixed income holdings, especially longer-term investments. Investors who hold low interest rate bonds will lose principal as the markets drive interest rates higher. We believe the substantial risk of rising interest rates warrants a conservative strategy. Therefore, the fixed income strategies for our Funds primarily focus on protecting principal and managi ng risk by concentrating investments in short to intermediate-term bonds of high quality issuers.
It appears that the Federal Reserve's commitment to maintaining a low interest policy for the foreseeable future has created a misplaced assumption about the safety of fixed income investments. Even without a rate increase by the Fed, interest rates are increasingly likely to rise in response to external factors such as record fiscal deficits, inflationary pressures, or currency changes. The overwhelming amount of capital flowing into the bond markets has greatly distorted the spreads between interest rates on U.S. government securities, investment grade corporate bonds and high yield bonds. For example, the return to a 4% interest rate on the 10-year Treasury Note (as seen as recently as April) will result in significant losses for investors who sought safety in the bond mark ets.
Looking Ahead
We continue to believe the U.S. economy will grow at a modest, but uneven, pace. Ongoing weakness in the labor and housing markets, the growing fiscal deficit and the impact of the recent finance reform will continue to challenge economic growth. Nevertheless, signs of progress, including expansion in early recovery areas such as manufacturing and transportation, are undeniable.
Second quarter earnings provided a positive catalyst for the market. The broad selloff leading into this critical period created relatively modest earnings expectations. Better than expected results have given investors greater clarity about growth expectations for many companies. In addition, companies were more willing than in previous quarters to provide guidance; also, as they see business conditions improving, they are increasing their assumptions for the remainder of the year. Their willingness to employ capital for internal expansion or acquisitions and to increase dividends or repurchase shares demonstrates a more optimistic outlook.
The market may remain more volatile in the coming months as investors respond to economic data, assess the impact (on Energy companies) of the Gulf oil spill and anticipate the results of mid-term elections. We expect that broad market indices will continue to reflect the fragility of investor sentiment and the uncertainty that typically accompanies a slow-growth economy. Individual companies, however, continue to offer significant growth opportunities. Stronger companies are well-positioned with cash or access to the credit needed to grow their businesses. Furthermore, these companies are demonstrating the ability to respond to industry-specific and broad market events in ways that improve prospects for thei r operations and, as a result, their shareholders.
Global and domestic events during the past two years have challenged investors; it has been difficult to understand and evaluate the prospects for an economic recovery. The lack of solid growth and persistently high unemployment make it hard to remain optimistic. Nevertheless, low interest rates and low inflation put the economy in a better position to grow. Furthermore, many companies are well positioned to take capitalize on opportunities during these difficult times. Investors who adhere to a value-oriented investment strategy and remain patient may be greatly rewarded as economic conditions improve.
Sincerely,

George A. Henning
3
Pacific Advisors
Government Securities Fund
Seeks to provide high current income, preservation of capital, and rising future income, consistent with prudent investment risk. Invests at least 80% of its assets in U.S. Government fixed income securities and may invest in other income-producing instruments including dividend paying common stocks, for income and capital appreciation.
| TOTAL RETURNS | EXPENSE RATIOS | ||||||||||||||||||
| For the six months ended June 30, 2010 | For the fiscal year ended December 31, 2009 | ||||||||||||||||||
| Expense Ratio | Net Expense Ratio | ||||||||||||||||||
| Class A | 0.30 | % | Class A | 3.13 | % | 1.69 | % | ||||||||||||
| Class C | 0.01 | % | Class C | 3.85 | % | 2.41 | % | ||||||||||||
| Barclays Capital U.S. Int T-Bond Index1 | 4.41 | % | |||||||||||||||||
Performance quoted is past performance which does not guarantee future results. Current performance may be higher or lower than the performance quoted. Call (800) 989-6693 for performance current to the most recent month-end. The investment return and principal value of an investment will fluctuate so that an investor's shares, when redeemed, may be worth more or less than their original cost. Returns represent the change in value over the stated period assuming reinvestment of dividends and capital gains at net asset value. Returns do not take into account the maximum 4.75% sales charge on Class A shares or the 1% Contingent Deferred Sales Charge (CDSC) for Class C shares sold within one year of purchase. Returns would be lower if the applicable sales charge and CDSC were included. Returns do not take into account individual taxes which may reduce actua l returns when shares are sold.
The Fund's investment adviser is waiving a portion of its management fees pursuant to an Expense Limitation Agreement. The waiver may be discontinued at any time with ninety days written notice in consultation with the Fund's Board of Directors, but is expected to continue at current levels. Performance shown reflects the waiver, without which the results would have been lower.
Discussion with Portfolio Manager August 20, 2010
Jingjing Yan, CFA
Fund Performance
The Fund successfully managed through a volatile period in the market with a defensive strategy designed to preserve capital and provide current income. Through April, market, pressures, including competition from the well-performing stock and corporate bond markets, drove interest rates on U.S. Treasuries higher. As investors reacted to economic uncertainty in the second quarter, interest rates declined. Despite this temporary decline, market pressures remain weighted toward higher interest rates.
Even a minor rise in interest rates can result in a substantial loss of principal on longer-term fixed income securities. Therefore, we positioned the Fund in shorter-term holdings reflecting the general outlook for higher rates. The portfolio remained concentrated in callable intermediate-term U.S. government agencies to lessen the Fund's sensitivity to price declines as interest rates increase. Furthermore, we modestly increased the Fund's allocation to high quality dividend paying stocks to supplement current income in the low interest rate environment. Through the first six months, Class A shares returned 0.30% which reflects the Fund's conservative strategy to protect against market volatility.
In contrast, the Fund's benchmark, the Barclays Capital U.S. Intermediate T-Bond Index, only includes U.S. government securities and maintains a greater allocation in longer-term bonds. While this unmanaged index benefited from the decline in interest rates at the end of the period, it is at risk for greater price depreciation when interest rates rise.
1 The Barclays Capital U.S. Intermediate Treasury Bond Index is an unmanaged index of U.S. government securities with one to ten years to maturity.
4
Market Overview
Interest rates on U.S. government securities continued to rise during the first quarter. Improving economic data and corporate earnings confirmed that the economy is in recovery. Investors demonstrated a greater tolerance for risk as they moved out of U.S. Treasuries and sought higher returns in equities and corporate bonds. Concerns about the U.S. government's mounting fiscal deficit also tempered demand for government securities. As prices on government securities declined in response to weaker demand, interest rates, which move in the opposite direction of prices, rose. The rate on the benchmark 10-year Treasury Note rose from 3.2% in the fourth quarter to 4% in early April
Investor sentiment, however, changed dramatically in the second quarter. The Greek debt crisis in May triggered concerns about the sustainability of the global economic recovery. Fears that Greece's problems would spread to other economies mounted and triggered a "flight to safety." Investors began selling out of equities and reinvesting in U.S. Treasuries and cash. Negative sentiment deepened in response to slower growth in China and high unemployment, soft housing numbers, and tepid consumer confidence in the U.S. Ongoing improvement in other areas of the U.S. economy and predominantly strong first quarter earnings did little to assuage investor concern. By quarter-end, a significant, and unsustainable, amount of capital had moved into U.S. Treasuries. Accelerated downward market pressure pushed the interest rate on the 10-year Treasury Note below 3% by the end of the period.
The Federal Reserve maintained the fed funds rate between 0% and 0.25% throughout the period to support economic recovery. While the Fed does not anticipate raising short-term interest rates in the near future, the first half of the year illustrates how suddenly and dramatically interest rates can change in response to market forces. Interest rates are increasingly likely to rise in response to pressures including continued economic growth, the rising federal deficit, inflationary pressures and/or currency changes. Indeed, the considerable amount of capital invested in U.S. Treasuries at the end of the period only adds to these pressures.
Fixed Income Strategy
The market environment during the period presented unique challenges. Short-term government securities offered little current income. For example, the interest rate on 2-year Treasury Note remained, for the most part, below 1%. Longer-term bonds offered higher yields but with significantly greater risk of price declines when interest rates rise.
We maintained a conservative strategy by concentrating the Fund in government agencies with maturities from four to eight years to provide reasonable income while minimizing volatility. Furthermore, we continued to invest in callable bonds which offered higher income without significantly increasing risk. When interest rates rose during February and April, we took the opportunity to purchase higher yielding one-time callable bonds to enhance total return. Since these bonds are only callable on one specific date before maturity, they typically appreciate more than other callable bonds when interest rates decline. These holdings, which represent approximately 20% of the portfolio, appreciated as interest rates declined in the latter part of the period.
Many government securities funds are increasingly using aggressive investment strategies, including leverage and option strategies, to boost yield during this period of historically low interest rates. While these strategies may enhance total return, they can also significantly increase risk to fund shareholders. We do not use leverage as we believe that it would be inconsistent with the conservative objectives of the Fund and its shareholders.
Equity Strategy
The Fund's equity component provides a conservative and important buffer against volatile bond prices. While we maintain at least 80% of the Fund's holdings in U.S. government securities, we invest a portion of the portfolio in high quality dividend-paying stocks of well-established companies with strong fundamentals and favorable long-term growth prospects. We typically increase the equity allocation when the economic outlook is favorable. This strategy provides current income and capital appreciation potential
5
Pacific Advisors
Government Securities Fund continued
to help balance against generally weaker performance in the fixed income market during periods of economic growth.
In the beginning of the year, we incrementally added to the Fund's equity allocation in anticipation of improving economic trends. Investments remained concentrated in high quality stocks in defensive sectors. We principally focused on holdings such as Consolidated Edison, Kimberly-Clark, and AT&T in the Utilities, Consumer Staples, and Telecommunications Services sectors. Amid a low interest rate environment, the Fund's average dividend yield of 4.5% provided an attractive, and risk-appropriate, source for current income. As the economy recovers, we believe the Fund will also benefit from capital appreciation in its equity holdings.
Looking Ahead
We believe the extreme pessimism in the second quarter does not reflect the real prospects for economic recovery. Without a doubt, the U.S. economy faces headwinds from high unemployment, a sluggish housing market and stagnant consumer confidence. Nevertheless, improvements in key areas including manufacturing, transportation and productivity support expectations for continued economic growth. Furthermore, high quality companies successfully managed through the recession by controlling costs and building cash reserves. As weaker companies struggle or go out of business, the strongest companies in each industry are well positioned to take advantage of opportunities to grow their businesses.
Interest rates cannot remain at their current low levels. As investors regain confidence in the economy, they will increasingly migrate toward investments offering higher returns such as equities and corporate bonds. Demand for U.S. Treasuries may also decline in response to other factors including concerns about budget deficits, inflationary pressures or currency values. At the same time, in order to fund the growing federal deficit, the supply of Treasuries will only increase. Any one or more of these pressures could tip the balance between supply and demand and trigger a rise in interest rates.
Given the expectation that interest rates will inevitably increase, the Fund will maintain a defensive strategy focused on protecting capital. We expect holdings will remain concentrated in short to intermediate-term government agencies to help minimize the Fund's sensitivity to rising interest rates. When interest rates stabilize at a higher level, we will rotate the Fund's holdings into longer-term bonds to lock in higher interest rates. We anticipate maintaining the Fund's current equity allocation to help provide a hedge against future inflation and take advantage of good dividend yields.
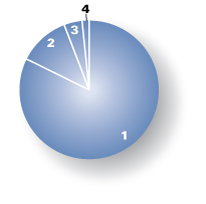
Portfolio Holdings as of 6/30/10 (Based on Total Investments)
| 1. | U.S. Government Agencies | 82.32 | % | ||||||||
| 2. | Equities | 12.08 | % | ||||||||
| 3. | Preferred Stock | 3.96 | % | ||||||||
| 4. | Cash and Cash Equivalents | 1.64 | % | ||||||||
6
Expense Examples
As a shareholder of the Fund you incur two types of costs: (1) transaction costs, including sales charges (loads) on purchase payments, reinvested dividends, or other distributions; redemption fees; and exchange fees; and (2) ongoing costs, including management fees; distribution (12b-1) fees; and other Fund expenses. This Example is intended to help you understand your ongoing costs (in dollars) of investing in the Fund and to compare these costs with the ongoing costs of investing in other mutual funds.
The Example is based on an investment of $1,000 invested at the beginning of the period and held for the entire period from January 1, 2010 through June 30, 2010.
Actual Expenses
The first line of the table below provides information about actual account values and actual expenses. You may use the information in this line, together with the amount you invested, to estimate the expenses that you paid over the period. Simply divide your account value by $1,000 (for example, an $8,600 account value divided by $1,000 = 8.6), then multiply the result by the number in the first line under the heading entitled "Expenses Paid During the Period" to estimate the expenses you paid on your account during the period.
The following transaction costs are not included in the expenses shown in the table and, if applicable, would increase the expenses that you paid over the period: (1) a front-end sales charge (load) of 4.75% on Class A shares; (2) a 2% redemption fee if you sell or exchange shares within 60 days of purchase, with certain exceptions. The redemption fee does not apply to: (a) redemptions under an automatic withdrawal program or periodic asset reallocation plan, required minimum distributions (RMD), employer mandated distributions from a qualified plan, or redemptions under a qualified domestic relations order (QDRO); (b) redemptions to pay for expenses related to terminal illness, extended hospital or nursing home care, or other serious medical conditions, including death; (c) redemptions of shares acquired through dividend or capital gains reinvestments, and (d) redemptions initiated by the Fund; and (3) a $10 service fee on each exchange aft er the first five exchanges in each calendar year.
The following ongoing costs are not included in the expenses shown in the table and, if applicable, would increase the expenses that you paid over the period: (1) a $12 low balance fee on accounts with balances of less than $250 as of September 30th of each calendar year and no investment activity (excluding reinvestment of dividends and/or capital gains) during the prior calendar year or the first nine months of the current calendar year. This fee does not apply to IRAs, qualified plan accounts, or Coverdell Education Savings Accounts; (2) a $15 annual custodial fee on IRAs, SEPs, SIMPLE IRAs, and Coverdell Education Savings Accounts; and (3) a $20 annual custodial fee on 403(b) accounts.
Hypothetical Example for Comparison Purposes
The second line of the table below provides information about hypothetical account values and hypothetical expenses based on the Fund's actual expense ratio and an assumed rate of return of 5% per year before expenses, which in not the Fund's actual return. The hypothetical account values and expenses may not be used to estimate the actual ending account balance or expenses you paid for the period. You may use this information to compare the ongoing costs of investing in the Fund and other funds. To do so, compare this 5% hypothetical example with the 5% hypothetical examples that appear in the shareholder reports of the other funds.
The following transaction costs are not included in the expenses shown in the table and, if applicable, would increase the expenses that you paid over the period: (1) a front-end sales charge (load) of 4.75% on Class A shares; (2) a 2% redemption fee if you sell or exchange shares within 60 days of purchase, with certain exceptions. The redemption fee does not apply to: (a) redemptions under an automatic withdrawal program or periodic asset reallocation plan, required minimum distributions (RMD), employer mandated distributions from a qualified plan, or redemptions under a qualified domestic relations order (QDRO); (b) redemptions to pay for expenses related to terminal illness, extended hospital or nursing home care, or other serious medical conditions, including death; (c) redemptions of shares acquired through dividend or capital gains reinvestments, and (d) redemptions initiated by the Fund; and (3) a $10 service fee on each exchange aft er the first five exchanges in each calendar year.
The following ongoing costs are not included in the expenses shown in the table and, if applicable, would increase the expenses that you paid over the period: (1) a $12 low balance fee on accounts with balances of less than $250 as of September 30th of each calendar year and no investment activity (excluding reinvestment of dividends and/or capital gains) during the prior calendar year or the first nine months of the current calendar year. This fee does not apply to IRAs, qualified plan accounts, or Coverdell Education Savings Accounts; (2) a $15 annual custodial fee on IRAs, SEPs, SIMPLE IRAs, and Coverdell Education Savings Accounts; and (3) a $20 annual custodial fee on 403(b) accounts.
Please note that the expenses shown in the table are meant to highlight your ongoing costs only and do not reflect any transactional costs, such as sales charges (loads), redemption fees, or exchange fees. Therefore, the second line of the table is useful in comparing ongoing costs only, and will not help you determine the relative total costs of owning different funds. In addition, if these transactional costs were included, your costs would have been higher.
| Beginning Account Value 01/01/10 | Ending Account Value 06/30/10 | Expense Paid During Period 01/01/10 – 06/30/10 | |||||||||||||
| Government Securities Fund Class A | |||||||||||||||
| Actual | $ | 1,000.00 | $ | 1,003.00 | $ | 9.24 | |||||||||
| Hypothetical (5% return before expense) | $ | 1,000.00 | $ | 1,024.79 | $ | 9.34 | |||||||||
| Government Securities Fund Class C | |||||||||||||||
| Actual | $ | 1,000.00 | $ | 1,000.10 | $ | 12.94 | |||||||||
| Hypothetical (5% return before expense) | $ | 1,000.00 | $ | 1,024.79 | $ | 13.10 | |||||||||
3 Expenses are equal to the Fund's annualized expense ratio, net of expense waivers, of 1.86% for Class A shares and 2.61% for Class C shares, multiplied by the average account value over the period, multiplied by 181/365 days to reflect the one-half year period.
7
Pacific Advisors
Income and Equity Fund
Seeks to provide current income and, secondarily, long-term capital appreciation. Invests primarily in investment grade fixed income securities and dividend paying stocks.
| TOTAL RETURNS | EXPENSE RATIOS | ||||||||||||||||||
| For the six months ended June 30, 2010 | For the fiscal year ended December 31, 2009 | ||||||||||||||||||
| Expense Ratio | Net Expense Ratio | ||||||||||||||||||
| Class A | – 1.50 | % | Class A | 3.07 | % | 2.32 | % | ||||||||||||
| Class C | – 1.85 | % | Class C | 3.81 | % | 3.06 | % | ||||||||||||
| Barclays Capital U.S. Int Corp Bond Index1 | 5.05 | % | |||||||||||||||||
| S&P 500 Index 2 | – 6.65 | % | |||||||||||||||||
Performance quoted is past performance which does not guarantee future results. Current performance may be higher or lower than the performance quoted. Call (800) 989-6693 for performance current to the most recent month-end. The investment return and principal value of an investment will fluctuate so that an investor's shares, when redeemed, may be worth more or less than their original cost. Returns represent the change in value over the stated period assuming reinvestment of dividends and capital gains at net asset value. Returns do not take into account the maximum 4.75% sales charge on Class A shares or the 1% Contingent Deferred Sales Charge (CDSC) for Class C shares sold within one year of purchase. Returns would be lower if the applicable sales charge and CDSC were included. Returns do not take into account individual taxes which may reduce actua l returns when shares are sold.
The Fund's investment adviser is waiving a portion of its management fees pursuant to an Expense Limitation Agreement. The waiver may be discontinued at any time with ninety days written notice in consultation with the Fund's board, but is expected to continue at current levels. Please see the Fund's most recent Annual Report for details. Performance shown reflects the waiver, without which the results would have been lower.
Discussion with Portfolio Managers August 20, 2010
Charles Suh, CFA
Jingjing Yan, CFA
Fund Performance
The Fund managed interest rate risk and acute market volatility by maintaining a defensive strategy during the first half of 2010. With interest rates at historical lows, the likelihood of a rise in rates continues to increase as a result of a multitude of factors including economic recovery and the growing fiscal deficit. Even a nominal rise in interest rates can result in a significant loss of principal on longer-term fixed income securities. Therefore, we maintained a conservative fixed income strategy by concentrating investments in high quality shorter-term bonds.
As of June 30th, the Fund had a notably shorter average maturity of 3.1 years compared to 5.4 years for its benchmark, the Barclays Capital U.S. Intermediate Corporate Bond Index. This disparity highlights the conservative positioning of the Fund; its shorter average maturity reduces its sensitivity to price declines as interest rates increase. While Class A shares declined 1.54% in the first half of the year, we successfully reduced volatility by maintaining investments that experienced significantly less price instability than the market, as evidenced by the Fund's 0.39 beta3 versus the S&P 500 Index. The Fund utilizes a mix of investment grade corporate bonds and high quality stocks and, therefore, its performance would be more comparable to a blended return of its two benchmarks.
1 The Barclays Capital U.S. Intermediate Corporate Bond Index is an unmanaged index of publicly issued investment grade U.S. corporate bonds with one to ten years to maturity.
2 The Standard & Poor's 500 Index is an unmanaged, market capitalization weighted measure of 500 widely held common stocks listed on the New York Stock Exchange, American Stock Exchange and The Nasdaq Stock Market. Index returns assume the reinvestment of dividends, but, unlike the Fund's returns, do not reflect the effects of management fees or expenses.
3 "Beta" measures volatility relative to the stock market or an alternative benchmark. A beta less than 1.0 indicates lower risk than the market or the benchmark and a beta greater than 1.0 indicates higher risk than the market or the benchmark.
8
Fund Strategy
The Fund seeks to provide conservative investors with income and long-term capital appreciation. While the Fund principally invests in investment grade corporate bonds, we also invest a portion of the portfolio in dividend-paying stocks of blue chip companies. The Fund's equity component provides additional income, which is particularly beneficial given the current low interest rates on high quality corporate bonds. In addition, the Fund's equity holdings provide the potential for conservative growth.
We actively manage the allocation between fixed income and equity securities to manage risk and position the Fund for the best opportunities for income and total return. While we maintain the majority of the Fund's holdings in corporate bonds, we generally increase the equity allocation when the economic outlook is positive. Given evidence of economic recovery and expectations for continued growth, we modestly increased the Fund's equity holdings during the first half of the year. Common stocks rose from approximately 29% to 36% of the portfolio while the fixed income allocation decreased from approximately 68% to 63%.
Market Overview
Corporate Bond Market
Investor confidence strengthened during the first quarter as data supported a favorable economic outlook. Investors were willing to take on more risk and sought higher returns in equities and high yield bonds. As demand for U.S. Treasuries and high quality corporate bonds diminished, interest rates, which move in the opposite direction of prices, rose.
In May, sovereign debt issues in Greece undermined confidence in the global economic recovery and triggered a "flight to safety." Investor pessimism deepened throughout the quarter as ongoing weakness in the labor and housing markets fueled fears of a double-dip recession in the U.S. Capital moved out of equities and high yield bonds into U.S. Treasuries and, to a lesser extent, high quality corporate bonds. As strong demand pushed prices higher during the last two months of the quarter, interest rates on U.S. Treasuries and high quality corporate bonds declined. Conversely, rates for high yield bonds increased to compensate for the greater risk associated with these investments.
Despite lower financing costs, issuances of high quality corporate bonds remained modest through the first half of the year. Many companies with investment grade ratings have maintained ample cash reserves; consequently, they did not need to issue debt to finance their businesses or fund growth initiatives.
Fixed Income Strategy
The events of the second quarter underscore how quickly interest rates can change in response to market pressure. Even without a direct increase in short-term rates by the Federal Reserve, interest rates are increasingly likely to move higher in response to outside forces including continued economic recovery, the growing fiscal deficit, inflationary pressures and/or currency changes.
Longer-term investments are most sensitive to interest rate changes. The principal value of long-term fixed income holdings can decline significantly when interest rates rise. A 1% increase in rates could result in a decline of 5% or more in the value of a long-term bond portfolio. In this event, bond fund investors who take regular withdrawals from their accounts could experience a loss of principal as well as a lower return on their investments.
The conservative nature of the Fund warranted a defensive fixed income strategy in the first half of the year. We sought to protect principal by concentrating holdings in investment grade bonds with maturities between two and seven years. This included bonds in diverse companies such as Target, Verizon, Hartford Life Global, General Electric Capital and Atlantic Richfield. We also added several new positions including bonds of Southwest Airlines, Reliance Steel and Aluminum, and DIRECTV Holdings which yielded between 4.0% to 5.4% at the time of purchase.
9
Pacific Advisors
Income and Equity Fund continued
Given the challenging market environment, many fixed income funds are utilizing high yield bonds, leveraging or other aggressive investment strategies to seek income and higher returns. These types of investments and strategies carry higher risks that would not be consistent with the Fund which is designed for more conservative investors.
Equity Market
The equity market rallied in the first quarter as strong corporate earnings and positive economic data strengthened investor confidence. Market momentum abruptly reversed course in the second quarter when sovereign debt crises in several European countries ignited concerns about the sustainability of economic recovery. These fears were exacerbated by the potential impact of the Gulf of Mexico oil spill, high unemployment and finance reform on the U.S. economy. Investors fled equities and sought safety in U.S. Treasuries and cash resulting in the broad market pullback during the quarter.
Equity Strategy
Despite the market pullback, high quality equities continue to offer attractive dividend rates and compelling long-term growth potential. Equity holdings remained concentrated in stocks of well-established companies with lower volatility and high dividend rates. Indeed, dividend rates exceeded 5% for holdings including Duke Energy, Altria Group, Nokia, Pfizer, AT&T, and Verizon Communications. We maintained a diverse portfolio of companies that are undisputed leaders in their industries and, therefore, should perform well in a slower growing economy. Such holdings, including Johnson & Johnson; McDonald's; Procter & Gamble; and Home Depot, provided a defensive buffer against market volatility in the second quarter. The Fund's equity allocation was increased with new positions in Sysco Corp., Mattel and Automatic Data Processing. We also added to several existing holdings including Genuine Parts and Home Depot.
Looking Ahead
We believe the prospects for continued economic recovery are favorable. Key areas of the economy continue to show improvement; corporate earnings remain largely positive; and foreign economies are making progress in addressing structural challenges. Nevertheless, we expect that domestic and global economic growth will progress at a slower pace than in prior recoveries. Various factors may weigh on economic growth including domestic legislative issues, the growing federal deficit, high unemployment and a sluggish housing market. The equity and fixed income markets may experience continued volatility as investors respond to developments in these areas.
Nearly every scenario we envision points to rising interest rates. The potential for higher rates warrants a conservative strategy that protects principal and manages volatility. As investors regain confidence in the economic recovery, we would expect capital to move out of cash and government securities into other investments offering higher returns. We will maintain the Fund's fixed income holdings in high quality, shorter-term bonds with maturities of two to seven years until interest rates stabilize at higher levels. Additionally, we will continue to take advantage of opportunities in the equity market through investments in well-established companies with stable dividends and good prospects for long-term price appreciation.
10
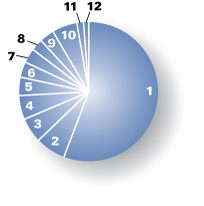
Portfolio Holdings as of 6/30/10 (Based on Total Investments)
| 1. | Corporate Bonds | 55.96 | % | ||||||||
| Equities | 35.64 | % | |||||||||
| 2. | Consumer Discretionary | 7.05 | % | ||||||||
| 3. | Consumer Staples | 5.80 | % | ||||||||
| 4. | Health Care | 5.60 | % | ||||||||
| 5. | Industrials | 4.03 | % | ||||||||
| 6. | Information Technology | 3.56 | % | ||||||||
| 7. | Telecommunication Services | 3.29 | % | ||||||||
| 8. | Utilities | 2.80 | % | ||||||||
| 9. | Others | 3.51 | % | ||||||||
| 10. | Preferred Stock | 5.74 | % | ||||||||
| 11. | Cash and Cash Equivalents | 1.40 | % | ||||||||
| 12. | U.S. Government Agencies | 1.26 | % | ||||||||
11
Pacific Advisors
Income and Equity Fund continued
Expense Examples
As a shareholder of the Fund you incur two types of costs: (1) transaction costs, including sales charges (loads) on purchase payments, reinvested dividends, or other distributions; redemption fees; and exchange fees; and (2) ongoing costs, including management fees; distribution (12b-1) fees; and other Fund expenses. This Example is intended to help you understand your ongoing costs (in dollars) of investing in the Fund and to compare these costs with the ongoing costs of investing in other mutual funds.
The Example is based on an investment of $1,000 invested at the beginning of the period and held for the entire period from January 1, 2010 through June 30, 2010.
Actual Expenses
The first line of the table below provides information about actual account values and actual expenses. You may use the information in this line, together with the amount you invested, to estimate the expenses that you paid over the period. Simply divide your account value by $1,000 (for example, an $8,600 account value divided by $1,000 = 8.6), then multiply the result by the number in the first line under the heading entitled "Expenses Paid During the Period" to estimate the expenses you paid on your account during the period.
The following transaction costs are not included in the expenses shown in the table and, if applicable, would increase the expenses that you paid over the period: (1) a front-end sales charge (load) of 4.75% on Class A shares; (2) a 2% redemption fee if you sell or exchange shares within 60 days of purchase, with certain exceptions. The redemption fee does not apply to: (a) redemptions under an automatic withdrawal program or periodic asset reallocation plan, required minimum distributions (RMD), employer mandated distributions from a qualified plan, or redemptions under a qualified domestic relations order (QDRO); (b) redemptions to pay for expenses related to terminal illness, extended hospital or nursing home care, or other serious medical conditions, including death; (c) redemptions of shares acquired through dividend or capital gains reinvestments, and (d) redemptions initiated by the Fund; and (3) a $10 service fee on each exchange aft er the first five exchanges in each calendar year.
The following ongoing costs are not included in the expenses shown in the table and, if applicable, would increase the expenses that you paid over the period: (1) a $12 low balance fee on accounts with balances of less than $250 as of September 30th of each calendar year and no investment activity (excluding reinvestment of dividends and/or capital gains) during the prior calendar year or the first nine months of the current calendar year. This fee does not apply to IRAs, qualified plan accounts, or Coverdell Education Savings Accounts; (2) a $15 annual custodial fee on IRAs, SEPs, SIMPLE IRAs, and Coverdell Education Savings Accounts; and (3) a $20 annual custodial fee on 403(b) accounts.
Hypothetical Example for Comparison Purposes
The second line of the table below provides information about hypothetical account values and hypothetical expenses based on the Fund's actual expense ratio and an assumed rate of return of 5% per year before expenses, which in not the Fund's actual return. The hypothetical account values and expenses may not be used to estimate the actual ending account balance or expenses you paid for the period. You may use this information to compare the ongoing costs of investing in the Fund and other funds. To do so, compare this 5% hypothetical example with the 5% hypothetical examples that appear in the shareholder reports of the other funds.
The following transaction costs are not included in the expenses shown in the table and, if applicable, would increase the expenses that you paid over the period: (1) a front-end sales charge (load) of 4.75% on Class A shares; (2) a 2% redemption fee if you sell or exchange shares within 60 days of purchase, with certain exceptions. The redemption fee does not apply to: (a) redemptions under an automatic withdrawal program or periodic asset reallocation plan, required minimum distributions (RMD), employer mandated distributions from a qualified plan, or redemptions under a qualified domestic relations order (QDRO); (b) redemptions to pay for expenses related to terminal illness, extended hospital or nursing home care, or other serious medical conditions, including death; (c) redemptions of shares acquired through dividend or capital gains reinvestments, and (d) redemptions initiated by the Fund; and (3) a $10 service fee on each exchange aft er the first five exchanges in each calendar year.
The following ongoing costs are not included in the expenses shown in the table and, if applicable, would increase the expenses that you paid over the period: (1) a $12 low balance fee on accounts with balances of less than $250 as of September 30th of each calendar year and no investment activity (excluding reinvestment of dividends and/or capital gains) during the prior calendar year or the first nine months of the current calendar year. This fee does not apply to IRAs, qualified plan accounts, or Coverdell Education Savings Accounts; (2) a $15 annual custodial fee on IRAs, SEPs, SIMPLE IRAs, and Coverdell Education Savings Accounts; and (3) a $20 annual custodial fee on 403(b) accounts.
Please note that the expenses shown in the table are meant to highlight your ongoing costs only and do not reflect any transactional costs, such as sales charges (loads), redemption fees, or exchange fees. Therefore, the second line of the table is useful in comparing ongoing costs only, and will not help you determine the relative total costs of owning different funds. In addition, if these transactional costs were included, your costs would have been higher.
| Beginning Account Value 01/01/10 | Ending Account Value 06/30/10 | Expense Paid During Period 01/01/10 – 06/30/10 | |||||||||||||
| Income & Equity Fund Class A | |||||||||||||||
| Actual | $ | 1,000.00 | $ | 985.00 | $ | 10.83 | |||||||||
| Hypothetical (5% return before expense) | $ | 1,000.00 | $ | 1,024.79 | $ | 11.04 | |||||||||
| Income & Equity Fund Class C | |||||||||||||||
| Actual | $ | 1,000.00 | $ | 981.50 | $ | 14.49 | |||||||||
| Hypothetical (5% return before expense) | $ | 1,000.00 | $ | 1,024.79 | $ | 14.81 | |||||||||
4 Expenses are equal to the Fund's annualized expense ratio, net of expense waivers, of 2.20% for Class A shares and 2.95% for Class C shares, multiplied by the average account value over the period, multiplied by 181/365 days to reflect the one-half year period.
12
Pacific Advisors
Balanced Fund
Seeks to achieve long-term capital appreciation and income consistent with reduced risk. Invests in a flexible mix of common stocks and investment grade fixed income securities with at least 25% of its assets invested in fixed income securities and preferred stocks.
| TOTAL RETURNS | EXPENSE RATIOS | ||||||||||||||
| For the six months ended June 30, 2010 | For the fiscal year ended December 31, 2009 | ||||||||||||||
| Class A | – 5.16 | % | Class A | 2.47 | % | ||||||||||
| Class C | – 5.51 | % | Class C | 3.23 | % | ||||||||||
| S&P 500 Index1 | – 6.65 | % | |||||||||||||
| Barclays Capital U.S. Int Corp Bond Index2 | 5.05 | % | |||||||||||||
Performance quoted is past performance which does not guarantee future results. Current performance may be higher or lower than the performance quoted. Call (800) 989-6693 for performance current to the most recent month-end. The investment return and principal value of an investment will fluctuate so that an investor's shares, when redeemed, may be worth more or less than their original cost. Returns represent the change in value over the stated period assuming reinvestment of dividends and capital gains at net asset value. Returns do not take into account the maximum 5.75% sales charge on Class A shares or the 1% Contingent Deferred Sales Charge (CDSC) for Class C shares sold within one year of purchase. Returns would be lower if the applicable sales charge and CDSC were included. Returns do not take into account individual taxes which may reduce actua l returns when shares are sold.
Discussion with Portfolio Managers August 20, 2010
Samuel C. Coquillard
Charles Suh, CFA
Jingjing Yan, CFA
Fund Performance
The Fund's conservative investment strategy helped mitigate the impact of the downturn in equity market during a period of historically low interest rates. Equity holdings in defensive sectors, including Consumer Staples, Health Care and Utilities, combined with fixed income investments to provide stability and income. We focused the Fund's equity holdings on high quality stocks with lower than average volatility across a variety of industries. This strategy benefitted the Fund when the equity market sold off during the second quarter as the Fund's equity holdings outperformed the S&P 500 Index. Overall, the Fund successfully managed heighte ned market volatility as demonstrated by its beta3 of 0.76 compared to the S&P 500 Index.
Interest rates remained at historical lows as concerns about the economy continued to unsettle investors. The Fund's fixed income holdings, therefore, were selected to generate income while managing for price stability. Our strategy anticipated the likelihood that interest rates will increase from these historically low levels. Rising interest rates present a significant risk to fixed income investments, especially longer-term bonds. Consequently, during the first half of the year, we concentrated our fixed income holdings in shorter-term investment grade corporate bonds.
In contrast, the Fund's benchmark, the Barclays Capital Intermediate Corporate Bond Index includes longer-term securities. Consequently, the holdings in the Index generated higher yield while risking price declines when interest rates rise. As a balanced fund which combines conservative equity and fixed income investments, the Fund's total return is best compared against a blended return for its benchmarks.
1 The Standard & Poor's 500 Index is an unmanaged, market capitalization weighted measure of 500 widely held common stocks listed on the New York Stock Exchange, American Stock Exchange and The Nasdaq Stock Market. Index returns assume the reinvestment of dividends, but, unlike the Fund's returns, do not reflect the effects of management fees or expenses.
2 The Barclays Capital U.S. Intermediate Corporate Bond Index is an unmanaged index of publicly issued investment grade U.S. corporate bonds with one to ten years to maturity.
3 "Beta" measures volatility relative to the stock market or an alternative benchmark. A beta less than 1.0 indicates lower risk than the market or the benchmark and a beta greater than 1.0 indicates higher risk than the market or the benchmark.
13
Pacific Advisors
Balanced Fund continued
Fund Strategy
The Fund's conservative strategy seeks to provide long-term capital appreciation with limited risk and volatility. We actively manage the allocation between equity and fixed income investments to seek the best opportunities for long-term growth. Given expectations of a gradual economic recovery combined with an eventual and inevitable increase in interest rates, the Fund's portfolio remained weighted toward equities. As corporate bonds matured we used the proceeds to increase the Fund's common stock allocation from 65% to 69%.
The Fund managed risk by selecting high quality investments. The equity portfolio included dividend-paying stocks of well-established companies such as Johnson & Johnson, J.M. Smucker, and Caterpillar. These companies have strong fundamentals and favorable long-term growth prospects. The Fund's equity positions held up well during periods of market volatility and continued to offer compelling investment opportunities.
Among fixed income securities, we target investment grade corporate bonds and high quality preferred stocks. In contrast, many other balanced funds utilize more aggressive investment strategies including significant holdings in higher risk bonds. For example, below investment grade bonds (also known as "junk" bonds) may generate higher returns but they may also lose more value when interest rates increase or when the issuing companies experience difficulties. Consequently, we believe that these below investment grade bonds are unsuitable for the Fund's conservative investors.
Market Overview
A dramatic reversal in investment trends marked the first half of 2010. Signs that the global economic recovery remained on track bolstered investor confidence through most of the first quarter. Investors reallocated money that had been on the sidelines, in cash and U.S. Treasuries, into equities. However, the second quarter saw an abrupt change in market sentiment following the emergence of sovereign debt concerns in Europe and the prospect of an economic slowdown in China. Exacerbating matters, U.S. unemployment remained high and the housing market faltered after the April expiration of federal tax incentives. Fears of a double-dip recession mounted, triggering a flight back toward the safety of U.S. Treasuries and an increase in volatility in the equity market.
Equity Overview
Stocks rallied in the first quarter, with particular strength among cyclical sectors such as Consumer Discretionary and Technology. In fact, within the S&P 500 Index, only the highly defensive Utilities and Telecommunication Services sectors suffered losses in the first quarter. The portfolio benefited from this rally with strong performance from holdings including United Parcel Service in the Industrials sector, American Express in the Financials sector, and McDonald's in the Consumer Discretionary sector.
The market quickly reversed course in May as fears of a double-dip recession led to a broad selloff. Sectors that enjoyed the best gains in the first quarter suffered the worst losses in the second quarter. In addition, the Gulf of Mexico oil spill negatively impacted large segments of the Energy sector. Concerns over the impact of financial reform legislation, downward revisions of first quarter GDP growth, and disappointing economic reports fueled market volatility through the end of the quarter.
Equity Strategy
We continued to target companies with the ability to succeed in a slow growing economy, while maintaining diversification across sectors. New investments included Best Buy and CVS Caremark; both are superior franchises which pay meaningful dividends and offer compelling growth prospects. Best Buy should experience ongoing benefits from last year's bankruptcy of its main rival, Circuit City. Also, the company continues to expand into Canada, Mexico, Europe, and China. CVS has been successful with its unique approach to its pharmaceutical benefits management business which reduces employer costs while maintaining excellent service levels. The company should also benefit from a wave of generic drugs entering the market over the next several years.
During the period, we trimmed the Fund's Energy positions as part of an ongoing diversification process. As details of the Gulf oil spill surfaced, we analyzed the potential risk against the possible reward for
14
maintaining the Fund's investments in the Oil & Gas area. We sold positions in BP and Cameron International in their entirety as the oil spill presented considerable risks to their businesses. We maintained positions in other holdings, including Halliburton Co. and National Oilwell Varco, as our analysis estimated that financial losses from the spill would not impact the long-term prospects for these companies. In line with the Fund's diversified strategy, these were modest positions which limited the impact of sector volatility.
Corporate Bond Overview & Strategy
Corporate bond issuances rose in the first quarter as many companies took advantage of low interest rates to lock in long-term borrowing costs. Strong investor demand for corporate debt kept bond yields low, while increased investor appetite for risk supported financing activity for both investment grade and high-yield issuers.
The second quarter brought a temporary reversal of these trends. Sovereign debt crises in Europe and concerns about economic growth pushed rates higher as capital moved out of corporate bonds, particularly high yield bonds, and into safer alternatives such as U.S. Treasuries. In addition, corporate bond issuances slowed as financing costs rose.
Our strategy remained focused on investment grade debt of high quality companies with maturities ranging from three to seven years. We believe this strategy provides the best balance between maintaining current income and providing principal protection. During the period, we took opportunities created by market volatility to adjust the Fund's holdings. To maintain diversification, we trimmed some existing positions and added new positions including bonds of Estee Lauder, Charles Schwab, and Albemarle Corp. with yields of 4% to 5%.
While interest rates have remained at historical lows for the better part of two years, we continue to believe significant upside risk remains. A low interest rate environment is unsustainable given the current economic realities. Should global economies continue to recover, as expected, investors will inevitably reallocate money from bonds to equities. This migration will result in a market-driven adjustment to higher interest rates. Furthermore, growing fiscal deficits and inflationary pressures are likely to drive up the cost of credit. The rapid rise in European interest rates in response to Greece's debt concerns serves as a potent reminder of the speed with which market interest rates may rise in response to heightened uncertainty. For this reason, we continue to believe a conservative strategy centered on shorter-term holdings will provide better principal protection over the long-term.
Looking Ahead
Broad global trends are encouraging and global and domestic economic growth will likely continue, albeit at a modest pace. Austerity programs in Europe will facilitate economic recovery in the region. China's currency revaluation will help rebalance global trade flows. And, a growing middle class in emerging markets including China, India and Brazil will create new opportunities for leading multi-national corporations. Domestically, industries continue to shed their weakest competitors which paves the way for improved performance for market leaders.
At the same time, broad market performance will likely be tempered by lingering uncertainty. Notable concerns, including the progress in many European countries to deal with large fiscal deficits; China's ability to sustain growth while controlling inflation; and, in the U.S., the impact of finance reform, the rising fiscal deficits, continued high unemployment and November's mid-term elections.
As investors regain confidence in the economic recovery, we expect capital will once again move away from Treasuries toward investments that offer higher potential returns, including equities and corporate bonds. In a slow growth economy, we believe stock performance will come primarily from specific company developments rather than broad market moves. For this reason, we believe our focus on individual stock selection will be an important factor contributing to long-term performance. We anticipate maintaining the Fund's current weighting toward equities with a focus on leading companies with strong balance sheets, superior management, and favorable long-term growth prospects. As opportunities arise, we will look to reposition holdings toward areas likely to benefit from a recovery, such as Industrials. Given the increasing likelihood of higher interest rates, fixed income holdings will remain concentrated in high quality securities with shorter maturities (2 to 7 years) until interest rates stabilize at higher levels.
15
Pacific Advisors
Balanced Fund continued
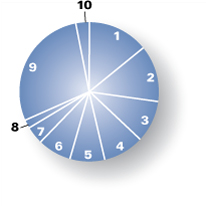
Portfolio Holdings as of 6/30/10 (Based on Total Investments)
| Equities | 68.55 | % | |||||||||
| 1. | Consumer Staples | 14.34 | % | ||||||||
| 2. | Industrials | 12.89 | % | ||||||||
| 3. | Health Care | 9.77 | % | ||||||||
| 4. | Information Technology | 9.64 | % | ||||||||
| 5. | Energy | 7.95 | % | ||||||||
| 6. | Financials | 7.79 | % | ||||||||
| 7. | Consumer Discretionary | 4.04 | % | ||||||||
| 8. | Utilities | 2.13 | % | ||||||||
| 9. | Corporate Bonds | 28.46 | % | ||||||||
| 10. | Preferred Stock | 2.99 | % | ||||||||
16
Expense Examples
As a shareholder of the Fund you incur two types of costs: (1) transaction costs, including sales charges (loads) on purchase payments, reinvested dividends, or other distributions; redemption fees; and exchange fees; and (2) ongoing costs, including management fees; distribution (12b-1) fees; and other Fund expenses. This Example is intended to help you understand your ongoing costs (in dollars) of investing in the Fund and to compare these costs with the ongoing costs of investing in other mutual funds.
The Example is based on an investment of $1,000 invested at the beginning of the period and held for the entire period from January 1, 2010 through June 30, 2010.
Actual Expenses
The first line of the table below provides information about actual account values and actual expenses. You may use the information in this line, together with the amount you invested, to estimate the expenses that you paid over the period. Simply divide your account value by $1,000 (for example, an $8,600 account value divided by $1,000 = 8.6), then multiply the result by the number in the first line under the heading entitled "Expenses Paid During the Period" to estimate the expenses you paid on your account during the period.
The following transaction costs are not included in the expenses shown in the table and, if applicable, would increase the expenses that you paid over the period: (1) a front-end sales charge (load) of 5.75% on Class A shares; (2) a 2% redemption fee if you sell or exchange shares within six months of purchase, with certain exceptions. The redemption fee does not apply to: (a) redemptions under an automatic withdrawal program or periodic asset reallocation plan, required minimum distributions (RMD), employer mandated distributions from a qualified plan, or redemptions under a qualified domestic relations order (QDRO); (b) redemptions to pay for expenses related to terminal illness, extended hospital or nursing home care, or other serious medical conditions, including death; (c) redemptions of shares acquired through dividend or capital gains reinvestments, and (d) redemptions initiated by the Fund; and (3) a $10 service fee on each exchange after the first five exchanges in each calendar year.
The following ongoing costs are not included in the expenses shown in the table and, if applicable, would increase the expenses that you paid over the period: (1) a $12 low balance fee on accounts with balances of less than $250 as of September 30th of each calendar year and no investment activity (excluding reinvestment of dividends and/or capital gains) during the prior calendar year or the first nine months of the current calendar year. This fee does not apply to IRAs, qualified plan accounts, or Coverdell Education Savings Accounts; (2) a $15 annual custodial fee on IRAs, SEPs, SIMPLE IRAs, and Coverdell Education Savings Accounts; and (3) a $20 annual custodial fee on 403(b) accounts.
Hypothetical Example for Comparison Purposes
The second line of the table below provides information about hypothetical account values and hypothetical expenses based on the Fund's actual expense ratio and an assumed rate of return of 5% per year before expenses, which in not the Fund's actual return. The hypothetical account values and expenses may not be used to estimate the actual ending account balance or expenses you paid for the period. You may use this information to compare the ongoing costs of investing in the Fund and other funds. To do so, compare this 5% hypothetical example with the 5% hypothetical examples that appear in the shareholder reports of the other funds.
The following transaction costs are not included in the expenses shown in the table and, if applicable, would increase the expenses that you paid over the period: (1) a front-end sales charge (load) of 5.75% on Class A shares; (2) a 2% redemption fee if you sell or exchange shares within six months of purchase, with certain exceptions. The redemption fee does not apply to: (a) redemptions under an automatic withdrawal program or periodic asset reallocation plan, required minimum distributions (RMD), employer mandated distributions from a qualified plan, or redemptions under a qualified domestic relations order (QDRO); (b) redemptions to pay for expenses related to terminal illness, extended hospital or nursing home care, or other serious medical conditions, including death; (c) redemptions of shares acquired through dividend or capital gains reinvestments, and (d) redemptions initiated by the Fund; and (3) a $10 service fee on each exchange after the first five exchanges in each calendar year.
The following ongoing costs are not included in the expenses shown in the table and, if applicable, would increase the expenses that you paid over the period: (1) a $12 low balance fee on accounts with balances of less than $250 as of September 30th of each calendar year and no investment activity (excluding reinvestment of dividends and/or capital gains) during the prior calendar year or the first nine months of the current calendar year. This fee does not apply to IRAs, qualified plan accounts, or Coverdell Education Savings Accounts; (2) a $15 annual custodial fee on IRAs, SEPs, SIMPLE IRAs, and Coverdell Education Savings Accounts; and (3) a $20 annual custodial fee on 403(b) accounts.
Please note that the expenses shown in the table are meant to highlight your ongoing costs only and do not reflect any transactional costs, such as sales charges (loads), redemption fees, or exchange fees. Therefore, the second line of the table is useful in comparing ongoing costs only, and will not help you determine the relative total costs of owning different funds. In addition, if these transactional costs were included, your costs would have been higher.
| Beginning Account Value 01/01/10 | Ending Account Value 06/30/10 | Expense Paid During Period 01/01/10 – 06/30/10 | |||||||||||||
| Balanced Fund Class A | |||||||||||||||
| Actual | $ | 1,000.00 | $ | 948.40 | $ | 11.45 | |||||||||
| Hypothetical (5% return before expense) | $ | 1,000.00 | $ | 1,024.79 | $ | 11.90 | |||||||||
| Balanced Fund Class C | |||||||||||||||
| Actual | $ | 1,000.00 | $ | 944.90 | $ | 15.05 | |||||||||
| Hypothetical (5% return before expense) | $ | 1,000.00 | $ | 1,024.79 | $ | 15.66 | |||||||||
4 Expenses are equal to the Fund's annualized expense ratio of 2.37% for Class A shares and 3.12% for Class C shares, multiplied by the average account value over the period, multiplied by 181/365 days to reflect the one-half year period.
17
Pacific Advisors
Growth Fund
Seeks to achieve long-term capital appreciation. Invests primarily in medium to large capitalization companies whose stocks are a part of the S&P 500 Index1 or the NASDAQ 100 Index2.
| TOTAL RETURNS | EXPENSE RATIOS | ||||||||||||||||||
| For the period ended June 30, 2010 | For the fiscal year ended December 31, 2009 | ||||||||||||||||||
| Expense Ratio | Net Expense Ratio | ||||||||||||||||||
| Class A | – 5.16 | % | Class A | 5.71 | % | 3.46 | % | ||||||||||||
| Class C | – 5.54 | % | Class C | 6.39 | % | 4.11 | % | ||||||||||||
| S&P 500 Index | – 6.65 | % | |||||||||||||||||
| Russell 1000 Index3 | – 6.40 | % | |||||||||||||||||
Performance quoted is past performance which does not guarantee future results. Current performance may be higher or lower than the performance quoted. Call (800) 989-6693 for performance current to the most recent month-end. The investment return and principal value of an investment will fluctuate so that an investor's shares, when redeemed, may be worth more or less than their original cost. Returns represent the change in value over the stated period assuming reinvestment of dividends and capital gains at net asset value. Returns do not take into account the maximum 5.75% sales charge on Class A shares or the 1% Contingent Deferred Sales Charge (CDSC) for Class C shares sold within one year of purchase. Returns would be lower if the applicable sales charge and CDSC were included. Returns do not take into account individual taxes which may reduce actua l returns when shares are sold.
The Fund's investment adviser is waiving a portion of its management fees pursuant to an Expense Limitation Agreement. The waiver may be discontinued at any time with ninety days written notice in consultation with the Fund's board, but is expected to continue at current levels. Please see the Fund's most recent Annual Report for details. Performance shown reflects the waiver, without which the results would have been lower.
Discussion with Portfolio Manager August 20, 2010
Samuel C. Coquillard4
Fund Performance
The Fund's conservative investment strategy helped minimize the impact of market volatility during the first half of the year. The equity market started the year on a strong note as investors gained confidence in the economic recovery. Concerns about the strength and stability of the recovery shook investor confidence in the second quarter. Investors sold out of equities in favor of more conservative investments; the result was a broad market pullback.
Heightened volatility permeated every area of the market. However, the Fund's focus on stocks of high quality large cap companies with below average volatility provided some defense against the market downturn. Class A shares fell 5.16% versus a 6.65% decline for the S&P 500 Index and 6.40 for the Russell 1000 Index.
Market Overview
During the first quarter, investors grew increasingly confident in the economic recovery. Economic data revealed notable improvements including robust growth in the manufacturing sector and strengthening
1 The Standard & Poor's 500 Index is an unmanaged, market capitalization weighted measure of 500 widely held common stocks listed on the New York Stock Exchange, American Stock Exchange and The NASDAQ Stock Market. Index returns assume the reinvestment of dividends, but, unlike the Fund's returns, do not reflect the effects of management fees or expenses.
2 The NASDAQ 100 Stock Index is an unmanaged, market capitalization weighted measure of the 100 largest non-financial domestic and international common stocks listed on The NASDAQ Stock Market. Index returns assume the reinvestment of dividends, but, unlike the Fund's returns, do not reflect management fees or expenses.
3 The Russell 1000 Stock Index is an unmanaged, market capitalization weighted measure of the 1,000 largest publicly traded companies within the Russell 3000 Index which represents approximately 98% of the investable U.S. equity market. Index returns assume the reinvestment of dividends, but, unlike the Fund's returns, do not reflect the effects of capital gains, management fees, or expenses.
4 Effective February 1, 2010, Mr. Coquillard became portfolio manager of the Fund.
18
consumer confidence. In addition, strong fourth quarter earnings underscored the resilience of corporate America and the strength of the business recovery. Stocks rallied as investors were willing to accept additional risk in search of better returns. The first quarter delivered solid returns for stocks overall with particularly strong performance for small and mid-cap stocks.
Market momentum reversed in the second quarter as challenges to recovery emerged. Concerns were ignited by the sovereign debt crises in Greece, Spain and Portugal which cast doubt on Europe's ability to stave off a double-dip recession. Moderating growth in China further highlighted the challenges to global economic recovery. At home, rising deficit spending; financial reform legislation; disappointing unemployment figures; weakness in the housing market and the Gulf of Mexico oil spill weighed on investor confidence. While first quarter earnings reports were largely positive, cautious guidance from management added to concerns about the strength of the recovery. The resulting selloff in the second quarter impacted all areas of the equity market evidencing an environment that paid little attention to company-specific developments.
Fund Strategy
The Fund's strategy remained focused on investments in reasonably-priced, well-known large cap stocks with long-term growth potential and lower volatility. In many cases, these stocks also paid attractive dividends. This strategy continued to provide a conservative, less volatile approach to investing in large cap stocks.
Following the change in portfolio managers during the first quarter, we sold a number of existing holdings to reposition the Fund in larger cap stocks which we believed would offer the best opportunities for long-term capital appreciation. We further diversified the portfolio with new positions in a variety of industries and sectors including Procter & Gamble, Coca-Cola, and Clorox Co. in the Consumer Staples sector; Target and Genuine Parts in the Consumer Discretionary sector; Intel, Automatic Data Processing, and IBM in Information Technology; and Bristol-Myers Squibb and Merck in Health Care. We also added to several existing positions including Boeing, Microsoft and Honeywell.
The stocks in the portfolio represent financially sound firms with proven business models that are leaders in their respective markets. Even in a slower economy, these types of firms should continue to perform well. Indeed, these companies may even thrive and gain greater market recognition as a slower growing economy constrains weaker competitors.
In spite of market volatility, many of the Fund's holdings performed well. In addition, many holdings maintained good dividend rates including companies such as Eli Lilly & Co.; Pfizer, Kraft Foods; H.J. Heinz Co. and Chevron with yields of 4% to 5%. Other notable holdings include:
• Apple, which enjoys a strong competitive position. The company is effectively controlling costs while continuing to successfully execute its growth strategy. We believe the market is excessively discounting the company's long-term prospects for consistent revenue and profit growth.
• Sysco, which is the preeminent leader in the food services industry. The company markets and distributes a broad range of food and food-related products to government facilities, school cafeterias and airports. Sysco's strong financial position has enabled it to expand its market share in a highly fragmented industry. With its unparalleled distribution infrastructure, Sysco continues to grow year-over-year as weaker competitors struggle to survive. Sysco also provides an attracti ve income opportunity with a dividend yield above 4%.
• ExxonMobil, which presents an attractive long-term growth opportunity and provides a dividend yield of approximately 3%. The stock came under pressure due to general market pessimism and concerns about a 2009 acquisition. Along with other Energy companies, ExxonMobil's stock suffered in the wake of the Gulf oil spill. We believe, however, that, given its strong balance sheet, experienced management team and sound business model, the company will work through current challenges and provide long-term value.
19
Pacific Advisors
Growth Fund continued
• Berkshire Hathaway, the Warren-Buffet-run conglomerate which owns a diverse portfolio of leading businesses. Over the past 20 years, the company has benefited from its superior management, expert acquisition strategies, and efficient business model. We took advantage of an opportunity to add this stock to the Fund when its valuation was temporarily depressed by market volatility.
Looking Ahead
Market Outlook
We believe the economy will continue to grow, albeit at a slower rate than in past recoveries. Key areas of the economy continue to improve, most notably early recovery sectors including manufacturing and transportation. At the same time, important challenges to economic growth and to investor confidence remain including persistent high unemployment and a weak housing market, as well as the uncertain impact of legislative reform and mid-term elections. As a result, we expect the market may remain more volatile until investors gain greater confidence in the economic recovery.
We believe that, while the broad market performance may remain lackluster, select individual stocks present compelling investment prospects. The strongest companies continue to report good earnings and recognize opportunities to grow their businesses. Stock selection will remain essential to managing risk and achieving long-term capital appreciation. Leading companies, including the Fund's holdings, should successfully navigate market challenges and prove their leadership in the coming months.
Fund Strategy
We will maintain our focus on risk management as we seek to provide a conservative investment for shareholders seeking long-term growth. Investments will remain concentrated in established, large cap companies with lower volatility. In addition to relative price stability, we will also continue to seek firms with attractive dividends to support total return.
The portfolio will remain diversified among select companies with strong growth prospects in a range of sectors and industries. For example, growing demand for transportation services bodes well for holdings such as FedEx and United Parcel Service, while strategic acquisitions should benefit holdings in leading financial services companies including MetLife and JPMorgan Chase. Additionally, improved management should strengthen the outlook for Fund holdings including Wal-Mart and Boeing.
Portfolio Holdings as of 6/30/10 (Based on Total Investments)
| Equities | 100 | % | |||||||||
| 1. | Consumer Staples | 28.70 | % | ||||||||
| 2. | Information Technology | 20.11 | % | ||||||||
| 3. | Industrials | 13.03 | % | ||||||||
| 4. | Consumer Discretionary | 11.85 | % | ||||||||
| 5. | Financials | 11.38 | % | ||||||||
| 6. | Health Care | 11.28 | % | ||||||||
| 7. | Energy | 3.65 | % | ||||||||

20
Expense Examples
As a shareholder of the Fund you incur two types of costs: (1) transaction costs, including sales charges (loads) on purchase payments, reinvested dividends, or other distributions; redemption fees; and exchange fees; and (2) ongoing costs, including management fees; distribution (12b-1) fees; and other Fund expenses. This Example is intended to help you understand your ongoing costs (in dollars) of investing in the Fund and to compare these costs with the ongoing costs of investing in other mutual funds.
The Example is based on an investment of $1,000 invested at the beginning of the period and held for the entire period from January 1, 2010 through June 30, 2010.
Actual Expenses
The first line of the table below provides information about actual account values and actual expenses. You may use the information in this line, together with the amount you invested, to estimate the expenses that you paid over the period. Simply divide your account value by $1,000 (for example, an $8,600 account value divided by $1,000 = 8.6), then multiply the result by the number in the first line under the heading entitled "Expenses Paid During the Period" to estimate the expenses you paid on your account during the period.
The following transaction costs are not included in the expenses shown in the table and, if applicable, would increase the expenses that you paid over the period: (1) a front-end sales charge (load) of 5.75% on Class A shares; (2) a 2% redemption fee if you sell or exchange shares within six months of purchase, with certain exceptions. The redemption fee does not apply to: (a) redemptions under an automatic withdrawal program or periodic asset reallocation plan, required minimum distributions (RMD), employer mandated distributions from a qualified plan, or redemptions under a qualified domestic relations order (QDRO); (b) redemptions to pay for expenses related to terminal illness, extended hospital or nursing home care, or other serious medical conditions, including death; (c) redemptions of shares acquired through dividend or capital gains reinvestments, and (d) redemptions initiated by the Fund; and (3) a $10 service fee on each exchange after the first five exchanges in each calendar year.
The following ongoing costs are not included in the expenses shown in the table and, if applicable, would increase the expenses that you paid over the period: (1) a $12 low balance fee on accounts with balances of less than $250 as of September 30th of each calendar year and no investment activity (excluding reinvestment of dividends and/or capital gains) during the prior calendar year or the first nine months of the current calendar year. This fee does not apply to IRAs, qualified plan accounts, or Coverdell Education Savings Accounts; (2) a $15 annual custodial fee on IRAs, SEPs, SIMPLE IRAs, and Coverdell Education Savings Accounts; and (3) a $20 annual custodial fee on 403(b) accounts.
Hypothetical Example for Comparison Purposes
The second line of the table below provides information about hypothetical account values and hypothetical expenses based on the Fund's actual expense ratio and an assumed rate of return of 5% per year before expenses, which in not the Fund's actual return. The hypothetical account values and expenses may not be used to estimate the actual ending account balance or expenses you paid for the period. You may use this information to compare the ongoing costs of investing in the Fund and other funds. To do so, compare this 5% hypothetical example with the 5% hypothetical examples that appear in the shareholder reports of the other funds.
The following transaction costs are not included in the expenses shown in the table and, if applicable, would increase the expenses that you paid over the period: (1) a front-end sales charge (load) of 5.75% on Class A shares; (2) a 2% redemption fee if you sell or exchange shares within six months of purchase, with certain exceptions. The redemption fee does not apply to: (a) redemptions under an automatic withdrawal program or periodic asset reallocation plan, required minimum distributions (RMD), employer mandated distributions from a qualified plan, or redemptions under a qualified domestic relations order (QDRO); (b) redemptions to pay for expenses related to terminal illness, extended hospital or nursing home care, or other serious medical conditions, including death; (c) redemptions of shares acquired through dividend or capital gains reinvestments, and (d) redemptions initiated by the Fund; and (3) a $10 service fee on each exchange after the first five exchanges in each calendar year.
The following ongoing costs are not included in the expenses shown in the table and, if applicable, would increase the expenses that you paid over the period: (1) a $12 low balance fee on accounts with balances of less than $250 as of September 30th of each calendar year and no investment activity (excluding reinvestment of dividends and/or capital gains) during the prior calendar year or the first nine months of the current calendar year. This fee does not apply to IRAs, qualified plan accounts, or Coverdell Education Savings Accounts; (2) a $15 annual custodial fee on IRAs, SEPs, SIMPLE IRAs, and Coverdell Education Savings Accounts; and (3) a $20 annual custodial fee on 403(b) accounts.
Please note that the expenses shown in the table are meant to highlight your ongoing costs only and do not reflect any transactional costs, such as sales charges (loads), redemption fees, or exchange fees. Therefore, the second line of the table is useful in comparing ongoing costs only, and will not help you determine the relative total costs of owning different funds. In addition, if these transactional costs were included, your costs would have been higher.
| Beginning Account Value 01/01/10 | Ending Account Value 06/30/10 | Expense Paid During Period 01/01/10 – 06/30/10 | |||||||||||||
| Growth Fund Class A | |||||||||||||||
| Actual | $ | 1,000.00 | $ | 948.40 | $ | 16.23 | |||||||||
| Hypothetical (5% return before expense) | $ | 1,000.00 | $ | 1,024.79 | $ | 16.87 | |||||||||
| Growth Fund Class C | |||||||||||||||
| Actual | $ | 1,000.00 | $ | 944.60 | $ | 19.82 | |||||||||
| Hypothetical (5% return before expense) | $ | 1,000.00 | $ | 1,024.79 | $ | 20.63 | |||||||||
5 Expenses are equal to the Fund's annualized expense ratio, net of expense waivers, of 3.36% for Class A shares and 4.11% for Class C shares, multiplied by the average account value over the period, multiplied by 181/365 days to reflect the one-half year period.
21
Pacific Advisors
Multi-Cap Value Fund
Seeks to achieve long-term capital appreciation. Invests in a diversified portfolio of large to small capitalization companies using an actively managed, value investment approach.
| TOTAL RETURNS | EXPENSE RATIOS | ||||||||||||||
| For the period ended June 30, 2010 | For the fiscal year ended December 31, 2009 | ||||||||||||||
| Class A | – 5.47 | % | Class A | 3.69 | % | ||||||||||
| Class C | – 5.97 | % | Class C | 4.47 | % | ||||||||||
| S&P 500 Index1 | – 6.65 | % | |||||||||||||
Performance quoted is past performance which does not guarantee future results. Current performance may be higher or lower than the performance quoted. Call (800) 989-6693 for performance current to the most recent month-end. The investment return and principal value of an investment will fluctuate so that an investor's shares, when redeemed, may be worth more or less than their original cost. Returns represent the change in value over the stated period assuming reinvestment of dividends and capital gains at net asset value. Returns do not take into account the maximum 5.75% sales charge on Class A shares or the 1% Contingent Deferred Sales Charge (CDSC) for Class C shares sold within one year of purchase. Returns would be lower if the applicable sales charge and CDSC were included. Returns do not take into account individual taxes which may reduce actua l returns when shares are sold.
Discussion with Portfolio Manager August 20, 2010
George A. Henning
Fund Performance
The market entered 2010 on the strength of a remarkable rally as investors abandoned fears of a depression and rediscovered attractive corporate equities. Momentum gained steam throughout the first quarter as evidence of a recovery emerged. The bullishness did not last, however, as the Greek debt crisis, prospects for slower growth in China, and the Gulf of Mexico oil spill chipped away at investor confidence.
By focusing on leading mid-cap companies, the Fund effectively managed market volatility. Class A shares declined 5.47%, outpacing the 6.65% loss in the S&P 500 Index. The Fund benefited from effective stock selection in the Financials, Consumer Staples, and Industrials sectors. Strong performers included Cathay General Bancorp, a prominent community bank; Dr Pepper Snapple; Navistar International, a manufacturer of truck engines; and Phillips-Van Heusen, owner of popular fashion brands such as Calvin Klein.
Furthermore, strong rebounds in the Fund's Transportation stocks, such as Genesee & Wyoming, Marten Transport, and Kansas City Southern, validated our strategy of positioning the Fund for economic recovery and highlighted the benefits of our focused investment philosophy. In contrast to a passive strategy, which aims to broadly mimic a market in dex, our focused approach seeks to concentrate holdings in areas that offer the most compelling opportunities. We believe that, given our expectations for slow economic growth, an active strategy will remain particularly important in identifying select investment opportunities.
Market Overview
Following a turbulent 2009, the market began 2010 poised to rise. As improvements across a variety of industries emerged during the first quarter, investor confidence reached new heights. Investors who had remained on the sidelines during the previous market run up, and were afraid of missing another substantial rally, began deploying capital aggressively into equities.
1 The Standard & Poor's 500 Index is an unmanaged, market capitalization weighted measure of 500 widely held common stocks listed on the New York Stock Exchange, American Stock Exchange and The NASDAQ Stock Market.Index returns assume the reinvestment of dividends, but, unlike the Fund's returns, do not reflect the effects of management fees or expenses.
22
In May, the Greek sovereign debt crisis served as a stark reminder that the global economy remained in a weakened state. Fears of growing contagion across European economies and financial institutions culminated in the "flash crash" on May 6. Investors abandoned stocks and flocked to perceived safe-havens such as U.S. Treasuries. Meanwhile, the growing disaster in the Gulf of Mexico damaged prospects for the Energy sector and triggered further losses. Finally, weaker-than-expected reports on the nation's labor and housing markets sent stocks to fresh lows as the first half of 2010 came to a close.
Overall, stocks experienced moderate losses during the first six months. Large cap companies underperformed mid and small cap companies, with the S&P 500 Index declining 6.65% compared to declines of 2.06% and 1.95% for the Russell Midcap and Russell 2000 Indices, respectively. The variance can be attributed to superior performance among mid and small cap stocks during the first quarter, followed by largely equivalent losses across stocks of all sizes during the second quarter.
Fund Strategy
The Fund maintained an investment strategy targeting mid-cap companies with market capitalizations between $2 and $10 billion. The portfolio remained positioned to benefit from economic recovery, with significant holdings in the Industrials, Energy, and Consumer Discretionary sectors. Importantly, we actively positioned the Fund away from traditionally defensive areas including Utilities, Health Care, and Telecommunication Services.
The Fund benefited during the first half of the year from its emphasis on holdings in the Transportation industry. By virtue of their interrelationships with manufacturers, wholesalers, and retailers, these companies function as an important barometer of economic activity. They typically feel the first effects of a downturn and experience, as they have this year, the initial impact of a recovery. Improving economic conditions resulted in increased shipping volumes and higher rates for railroad holdings Kansas City Southern and Genesee & Wyoming. C.H. Robison, Landstar, and Marten Transport experienced similar strength across their trucking fleets. Moreover, the recovery extended beyond immediate service providers with companies such as Navistar International reporting growing demand for its truck engines. The company's newest line offers improved energy efficiency that complies with tough emissions standards. These trends benefited company share prices and reinforced our expectations of an economic rebound.
Consumer-oriented companies also performed well. K-Swiss benefited from a rebound in consumer spending as well as excellent inventory management and cost controls. During the second quarter, Phillips-Van Heusen took advantage of its strong financial position to acquire Tommy Hilfiger which added to its stable of desirable fashion lines and provided access to important overseas markets. Dr Pepper Snapple, maker of Nantucket Nectars; Mott's Apple Juice; and 7-Up, in addition to its namesake beverage s, delivered strong earnings results and was recently named "Company of the Year" by an industry trade group. The company also increased its marketing presence by expanding its distribution relationships with Coca Cola and Pepsi which will give it access to the largest beverage distribution channels in the world.
In order to focus on select mid-cap opportunities, we sold several large cap holdings during the first half of 2010. Proceeds from these and other sales were reallocated to new positions such as Phillips-Van Heusen and Navistar International, as well as Bucyrus International and Joy Global, manufacturers of mining equipment; Chicago Bridge & Iron, an engineering and construction firm; and GameStop, a leading video game retailer.
Looking Ahead
We believe current equity valuations overstate the risk of a double-dip recession. Nevertheless, we expect mixed economic data and modest growth to continue. Consequently, market volatility will likely persist. Important events in the latter half of the year include second and third quarter earnings, mid-term elections, and developments in the nation's housing and employment landscape. We view the trend of an underlying economic recovery as decidedly positive although we expect that the domestic economy will advance in fits and starts. We are further encouraged by renewed fiscal responsibility among European nations and resilient growth in emerging economies including China.
23
Pacific Advisors
Multi-Cap Value Fund continued
We believe that the underlying fundamentals of corporate America, particularly among industry leaders and companies with strong business franchises, are impressive. We remain confident in the Fund's holdings and believe significant growth opportunities will be recognized by the market. Some examples include:
• Bucyrus and Joy Global which manufacture trucks, excavators and other equipment integral to the extraction of key resources such as iron and coal. With emerging markets continuing to grow, and developed markets recovering from recession, demand for mining equipment should remain strong.
• Copart, which provides car auction services for the insurance industry as well as auto dealerships, banks and private sellers. The company's online virtual bidding network delivers convenience and value to its customers. In addition, Copart recently became the exclusive national provider of salvage services for a major auto insurer.
• Ion Geophysical, which manufactures geological measuring tools used in the energy exploration industry. These devices are critical in drawing 3-D maps of potential resource formations. Last year, the company entered into a joint venture with the leading Chinese seismic contractor which opens vast new market opportunities.
We note that individual stock performance is not dependent upon robust economic growth. Performance in a slower growing economy will come from the strongest companies within each sector and industry. These companies will find opportunities to grow their businesses while their weaker competitors struggle.
Given expectations for continued economic recovery, our investment strategy remains focused on those sectors and companies most likely to benefit from a rebound in economic activity. For example, Transportation remains a significant area of investment. However, as shares of these companies appreciate, we will look to rotate assets into new areas of investments. In doing so, we will seek leading mid-cap companies in niche industries, with superior management teams, strong balance sheets, and favorable growth prospects.
Portfolio Holdings as of 6/30/10 (Based on Total Investments)
| Equities | 100 | % | |||||||||
| 1. | Industrials | 42.15 | % | ||||||||
| 2. | Energy | 30.65 | % | ||||||||
| 3. | Consumer Discretionary | 13.29 | % | ||||||||
| 4. | Materials | 6.24 | % | ||||||||
| 5. | Consumer Staples | 3.87 | % | ||||||||
| 6. | Financials | 3.80 | % | ||||||||

24
Expense Examples
As a shareholder of the Fund you incur two types of costs: (1) transaction costs, including sales charges (loads) on purchase payments, reinvested dividends, or other distributions; redemption fees; and exchange fees; and (2) ongoing costs, including management fees; distribution (12b-1) fees; and other Fund expenses. This Example is intended to help you understand your ongoing costs (in dollars) of investing in the Fund and to compare these costs with the ongoing costs of investing in other mutual funds.
The Example is based on an investment of $1,000 invested at the beginning of the period and held for the entire period from January 1, 2010 through June 30, 2010.
Actual Expenses
The first line of the table below provides information about actual account values and actual expenses. You may use the information in this line, together with the amount you invested, to estimate the expenses that you paid over the period. Simply divide your account value by $1,000 (for example, an $8,600 account value divided by $1,000 = 8.6), then multiply the result by the number in the first line under the heading entitled "Expenses Paid During the Period" to estimate the expenses you paid on your account during the period.
The following transaction costs are not included in the expenses shown in the table and, if applicable, would increase the expenses that you paid over the period: (1) a front-end sales charge (load) of 5.75% on Class A shares; (2) a 2% redemption fee if you sell or exchange shares within six months of purchase, with certain exceptions. The redemption fee does not apply to: (a) redemptions under an automatic withdrawal program or periodic asset reallocation plan, required minimum distributions (RMD), employer mandated distributions from a qualified plan, or redemptions under a qualified domestic relations order (QDRO); (b) redemptions to pay for expenses related to terminal illness, extended hospital or nursing home care, or other serious medical conditions, including death; (c) redemptions of shares acquired through dividend or capital gains reinvestments, and (d) redemptions initiated by the Fund; and (3) a $10 service fee on each exchange after the first five exchanges in each calendar year.
The following ongoing costs are not included in the expenses shown in the table and, if applicable, would increase the expenses that you paid over the period: (1) a $12 low balance fee on accounts with balances of less than $250 as of September 30th of each calendar year and no investment activity (excluding reinvestment of dividends and/or capital gains) during the prior calendar year or the first nine months of the current calendar year. This fee does not apply to IRAs, qualified plan accounts, or Coverdell Education Savings Accounts; (2) a $15 annual custodial fee on IRAs, SEPs, SIMPLE IRAs, and Coverdell Education Savings Accounts; and (3) a $20 annual custodial fee on 403(b) accounts.
Hypothetical Example for Comparison Purposes
The second line of the table below provides information about hypothetical account values and hypothetical expenses based on the Fund's actual expense ratio and an assumed rate of return of 5% per year before expenses, which in not the Fund's actual return. The hypothetical account values and expenses may not be used to estimate the actual ending account balance or expenses you paid for the period. You may use this information to compare the ongoing costs of investing in the Fund and other funds. To do so, compare this 5% hypothetical example with the 5% hypothetical examples that appear in the shareholder reports of the other funds.
The following transaction costs are not included in the expenses shown in the table and, if applicable, would increase the expenses that you paid over the period: (1) a front-end sales charge (load) of 5.75% on Class A shares; (2) a 2% redemption fee if you sell or exchange shares within six months of purchase, with certain exceptions. The redemption fee does not apply to: (a) redemptions under an automatic withdrawal program or periodic asset reallocation plan, required minimum distributions (RMD), employer mandated distributions from a qualified plan, or redemptions under a qualified domestic relations order (QDRO); (b) redemptions to pay for expenses related to terminal illness, extended hospital or nursing home care, or other serious medical conditions, including death; (c) redemptions of shares acquired through dividend or capital gains reinvestments, and (d) redemptions initiated by the Fund; and (3) a $10 service fee on each exchange after the first five exchanges in each calendar year.
The following ongoing costs are not included in the expenses shown in the table and, if applicable, would increase the expenses that you paid over the period: (1) a $12 low balance fee on accounts with balances of less than $250 as of September 30th of each calendar year and no investment activity (excluding reinvestment of dividends and/or capital gains) during the prior calendar year or the first nine months of the current calendar year. This fee does not apply to IRAs, qualified plan accounts, or Coverdell Education Savings Accounts; (2) a $15 annual custodial fee on IRAs, SEPs, SIMPLE IRAs, and Coverdell Education Savings Accounts; and (3) a $20 annual custodial fee on 403(b) accounts.
Please note that the expenses shown in the table are meant to highlight your ongoing costs only and do not reflect any transactional costs, such as sales charges (loads), redemption fees, or exchange fees. Therefore, the second line of the table is useful in comparing ongoing costs only, and will not help you determine the relative total costs of owning different funds. In addition, if these transactional costs were included, your costs would have been higher.
| Beginning Account Value 01/01/10 | Ending Account Value 06/30/10 | Expense Paid During Period 01/01/10 – 06/30/10 | |||||||||||||
| Multi-Cap Value Fund Class A | |||||||||||||||
| Actual | $ | 1,000.00 | $ | 945.30 | $ | 17.36 | |||||||||
| Hypothetical (5% return before expense) | $ | 1,000.00 | $ | 1,024.79 | $ | 18.07 | |||||||||
| Multi-Cap Value Fund Class C | |||||||||||||||
| Actual | $ | 1,000.00 | $ | 940.30 | $ | 20.93 | |||||||||
| Hypothetical (5% return before expense) | $ | 1,000.00 | $ | 1,024.79 | $ | 21.84 | |||||||||
3 Expenses are equal to the Fund's annualized expense ratio of 3.60% for Class A shares and 4.35% for Class C shares, multiplied by the average account value over the period, multiplied by 181/365 days to reflect the one-half year period.
25
Pacific Advisors
Small Cap Fund
Seeks to achieve long-term capital appreciation. Invests in small company stocks with strong earnings growth potential using a value investment approach with a focus on companies with market capitalizations below $500 million.
| TOTAL RETURNS | EXPENSE RATIOS | ||||||||||||||
| For the period ended June 30, 2010 | For the fiscal year ended December 31, 2009 | ||||||||||||||
| Class A | – 5.80 | % | Class A | 2.49 | % | ||||||||||
| Class C | – 6.17 | % | Class C | 3.24 | % | ||||||||||
| Class I | – 5.69 | % | Class I | 2.24 | % | ||||||||||
| Russell 2000 Index1 | – 1.95 | % | |||||||||||||
Performance quoted is past performance which does not guarantee future results. Current performance may be higher or lower than the performance quoted. Call (800) 989-6693 for performance current to the most recent month-end. The investment return and principal value of an investment will fluctuate so that an investor's shares, when redeemed, may be worth more or less than their original cost. Returns represent the change in value over the stated period assuming reinvestment of dividends and capital gains at net asset value. Returns do not take into account the maximum 5.75% sales charge on Class A shares or the 1% Contingent Deferred Sales Charge (CDSC) for Class C shares sold within one year of purchase. Returns would be lower if the applicable sales charge and CDSC were included. Returns do not take into account individual taxes which may reduce actua l returns when shares are sold.
Discussion with Portfolio Manager August 20, 2010
George A. Henning
Fund Performance
2010 began with a strong rally centered on improving global economic conditions and corporate fundamentals. However, the emergence of sovereign debt concerns in Greece toward the beginning of the second quarter triggered fears of a double-dip recession that escalated throughout the rest of the period. The Fund enjoyed solid performance in the first quarter, but performance lagged in the second quarter as investors abandoned economically sensitive companies and micro-cap stocks in favor of more conservative alternatives.
For the first six months, Class A shares declined 5.80%. Performance lagged the benchmark, which declined 1.95%, as a result of the Fund's active positioning toward sectors geared to an economic recovery. Additionally, the selloff in the Energy sector resulting from the Gulf of Mexico oil spill and increased volatility among micro-cap stocks impacted several Fund holdings. Nevertheless, long-term prospects for the companies in the Fund's portfolio remain intact as they are well-positioned to benefit from a continued gradual economic recovery.
A number of Fund positions performed well led by America Service Group. Holdings in the Industrials sector also delivered solid results, with notable gains in transportation companies Vitran Corp. and Kirby Corp., as well as industrial service companies DXP Enterprises and Mo bile Mini. The Fund's Financials holdings also contributed positively to performance, led by gains in EZCORP and Wilshire Bancorp.
Market Overview
The equity market entered 2010 on the heels of a remarkable rally that saw various indices double over a nine-month period. Momentum continued into the new year on strong economic data and buoyant expectations for first quarter earnings. At the end of April, the S&P 500 Index reached its highest level since September 2008. In early May, however, downgrades of Greek, Portuguese and Spanish debt sent global markets into a tailspin. Escalating concerns over the spread of sovereign debt defaults culminated in the
1 The Russell 2000 Index is an unmanaged, market-weighted measure of the 2,000 smallest publicly traded companies of the Russell 3000 Index which represents approximately 98% of the investable U.S. equity market. Index returns assume the reinvestment of dividends, but, unlike the Fund's returns, do not reflect management fees or expenses.
26
"flash crash" on May 6 which saw the Dow Jones Industrial Average plunge nearly 1,000 points before recovering much of its losses.
Investor sentiment grew increasingly negative throughout the second quarter. The market selloff continued despite a strong first quarter earnings season and evidence of ongoing recovery in most segments of the U.S. economy. The growing disaster in the Gulf of Mexico, persistent weakness in the employment outlook, and a stagnant housing market kept investors on the sidelines. By the end of the second quarter, the market was in the throes of a classic "buyer's strike." The relative dearth of major economic data provided a vacuum within which negative sentiment flourished. Fears of a double-dip recession dominated headlines, causing valuations of excellent companies to fall to distressed levels.
Overall, stocks ended the first six months lower, with the S&P 500 Index declining 6.65%. The Russell 2000 Index of small companies performed significantly better, declining just 1.96%. The outperformance of the Russell 2000 compared to the S&P 500 reflected strong first quarter gains in small cap stocks as evidence of a recovery mounted. In the second quarter, however, similar losses in both indices underscored the breadth of the selloff.
Fund Strategy
We continued to position the Fund for economic recovery with significant allocations to companies in the Industrials, Energy, and Consumer Discretionary sectors. These areas accounted for over 60% of the portfolio. Conversely, defensive sectors, such as Utilities, Consumer Staples, and Health Care represented just 14% of the portfolio. Portfolio hol ding Boots & Coots was acquired by Halliburton in April at a 27.7% premium to the prior day's closing price and an 81.8% premium to its price at the end of 2009. We subsequently sold the position and used the proceeds to add to existing holdings as well as introduce new positions in TAL International, which leases shipping containers, and energy services companies Natural Gas Services and North American Energy Partners.
Although not yet reflected by the market, several of the Fund's holdings enjoyed stellar operating results over the first six months of the year. Holdings in the transportation industry performed particularly well, including trucking companies Vitran and Saia; marine transport firm Kirby; and TAL International. The severe recession left inventories at retailers, wholesalers, and manufacturers severely depleted. As the economy recovered, firms scrambled to secure transportation services to rebuild their supplies. At the same time, shipping capacity contracted through the recession as the challenging operating environment drove out weaker competitors. The resurgence in demand coupled with the contraction in supply of critical transportation services resulted in a dramatic return to profitability across the industry.
In light of the increasing demand for global energy resources, Energy remains an attractive area of investment. Fund holdings focus primarily on oilfield services companies such as Hornbeck Offshore Services, Mitcham Industries and North American Energy Partners. These service companies typically exhibit more consistent levels of business activity a nd earnings stability than their exploration and production counterparts. Fund holdings also include companies poised to benefit from increased use of natural gas including Natural Gas Services and Matrix Service Co.
None of the portfolio companies had a direct role in the Gulf oil spill. We believe that the Fund's Energy holdings remain solid long-term investments. Repercussions from the spill may actually result in additional business for some service companies. For example, heightened safety requirements and emergency response capabilities would likely increase demand for Hornbeck's service vessels which have been used extensively as part of the ongoing cleanup effort.
Looking Ahead
We believe the recent market selloff overstates the likelihood of a double-dip recession. Broad economic data as well as company-specific reports point to a gradually improving economy. Most notably, recovery in areas regarded as early indicators, including transportation, suggest underlying strength in the economy. Indeed, companies are once again signing long-term service contracts, entering into joint venture partnerships and finding new business opportunities in emerging markets. Moreover, management teams
27
Pacific Advisors
Small Cap Fund continued
are increasingly willing to provide business outlooks and earnings guidance signaling improved confidence in the current economic environment.
On the heels of the severe recession and credit crisis, many companies deferred capital spending. As a result, significant supply shortages are developing across several industries, creating opportunities for well-capitalized companies. Weaker companies have not experienced a normal recovery growth spurt that would enable them to reduce debt or make essential capital investments. consequently, stronger companies are benefiting from supply-demand imbalances despite a slow economic recovery.
We remain confident in the Fund's overall positioning and current holdings. Performance of individual companies is not necessarily contingent upon a strong economic rebound. Rather, success will be dependent on the ability of each company to capitalize on unique growth opportunities and competitive positioning. Specific company developments should benefit Fund holdings across a variety of sectors. In particular, positions in the Industrials, Energy, and Consumer Discretionary sectors should benefit as the economic recovery progresses. Some specific examples include:
• America Service Group expects demand for its prison health care services to grow as states and counties struggle with mounting budget shortfalls. Privatization of prison health care offers a win-win solution to improve service levels while reducing costs.
• Rochester Medical, a medical devices company, is at the forefront of several exciting domestic and international business opportunities. The company's anti-infection technology offers important safety advantages and will likely benefit from new Medicare reimbursement guidelines.
• Premiere Global Services, a teleconferencing provider, anticipates releasing its new flagship product in the second half of the year. The platform will offer a virtual online meeting room for corporate conference calls. As business spending recovers, we expect the company to capture a significant share of the teleconferencing market.
• EZCORP and First Cash Financial Services, pawnshop and payday lenders, continue to realize incredible overseas growth opportunities. These new markets offer compelling economics while also providing important diversification against potential payday lending reform in the U.S.
We expect that the U.S. economy will continue to grow at a modest and uneven pace. While signs of continued recovery are undeniable, speed bumps remain in the form of finance reform and the upcoming mid-term elections. Furthermore, the growing fiscal deficit threatens the economy's ability to return to prior levels of activity. We hope the recent increase in public discourse focused on fiscal responsibility and the nation's debt will lead to policies that promote economic growth. We continue to believe a strategy of owning the best companies in niche industries with strong competitive advantages and attractive growth prospects provides the best opportunities for long-term investors.
Portfolio Holdings as of 6/30/10 (Based on Total Investments)
| Equities | 100 | % | |||||||||
| 1. | Industrials | 39.41 | % | ||||||||
| 2. | Financials | 19.63 | % | ||||||||
| 3. | Energy | 12.39 | % | ||||||||
| 4. | Consumer Discretionary | 10.03 | % | ||||||||
| 5. | Health Care | 8.13 | % | ||||||||
| 6. | Consumer Staples | 4.73 | % | ||||||||
| 7. | Materials | 3.15 | % | ||||||||
| 8. | Telecommunication Services | 2.53 | % | ||||||||
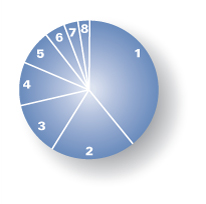
28
Expense Examples
As a shareholder of the Fund you incur two types of costs: (1) transaction costs, including sales charges (loads) on purchase payments, reinvested dividends, or other distributions; redemption fees; and exchange fees; and (2) ongoing costs, including management fees; distribution (12b-1) fees; and other Fund expenses. This Example is intended to help you understand your ongoing costs (in dollars) of investing in the Fund and to compare these costs with the ongoing costs of investing in other mutual funds.
The Example is based on an investment of $1,000 invested at the beginning of the period and held for the entire period from January 1, 2010 through June 30, 2010.
Actual Expenses
The first line of the table below provides information about actual account values and actual expenses. You may use the information in this line, together with the amount you invested, to estimate the expenses that you paid over the period. Simply divide your account value by $1,000 (for example, an $8,600 account value divided by $1,000 = 8.6), then multiply the result by the number in the first line under the heading entitled "Expenses Paid During the Period" to estimate the expenses you paid on your account during the period.
The following transaction costs are not included in the expenses shown in the table and, if applicable, would increase the expenses that you paid over the period: (1) a front-end sales charge (load) of 5.75% on Class A shares; (2) a 2% redemption fee if you sell or exchange shares within six months of purchase, with certain exceptions. The redemption fee does not apply to: (a) redemptions under an automatic withdrawal program or periodic asset reallocation plan, required minimum distributions (RMD), employer mandated distributions from a qualified plan, or redemptions under a qualified domestic relations order (QDRO); (b) redemptions to pay for expenses related to terminal illness, extended hospital or nursing home care, or other serious medical conditions, including death; (c) redemptions of shares acquired through dividend or capital gains reinvestments, and (d) redemptions initiated by the Fund; and (3) a $10 service fee on each exchange after the first five exchanges in each calendar year.
The following ongoing costs are not included in the expenses shown in the table and, if applicable, would increase the expenses that you paid over the period: (1) a $12 low balance fee on accounts with balances of less than $250 as of September 30th of each calendar year and no investment activity (excluding reinvestment of dividends and/or capital gains) during the prior calendar year or the first nine months of the current calendar year. This fee does not apply to IRAs, qualified plan accounts, or Coverdell Education Savings Accounts; (2) a $15 annual custodial fee on IRAs, SEPs, SIMPLE IRAs, and Coverdell Education Savings Accounts; and (3) a $20 annual custodial fee on 403(b) accounts.
Hypothetical Example for Comparison Purposes
The second line of the table below provides information about hypothetical account values and hypothetical expenses based on the Fund's actual expense ratio and an assumed rate of return of 5% per year before expenses, which in not the Fund's actual return. The hypothetical account values and expenses may not be used to estimate the actual ending account balance or expenses you paid for the period. You may use this information to compare the ongoing costs of investing in the Fund and other funds. To do so, compare this 5% hypothetical example with the 5% hypothetical examples that appear in the shareholder reports of the other funds.
The following transaction costs are not included in the expenses shown in the table and, if applicable, would increase the expenses that you paid over the period: (1) a front-end sales charge (load) of 5.75% on Class A shares; (2) a 2% redemption fee if you sell or exchange shares within six months of purchase, with certain exceptions. The redemption fee does not apply to: (a) redemptions under an automatic withdrawal program or periodic asset reallocation plan, required minimum distributions (RMD), employer mandated distributions from a qualified plan, or redemptions under a qualified domestic relations order (QDRO); (b) redemptions to pay for expenses related to terminal illness, extended hospital or nursing home care, or other serious medical conditions, including death; (c) redemptions of shares acquired through dividend or capital gains reinvestments, and (d) redemptions initiated by the Fund; and (3) a $10 service fee on each exchange after the first five exchanges in each calendar year.
The following ongoing costs are not included in the expenses shown in the table and, if applicable, would increase the expenses that you paid over the period: (1) a $12 low balance fee on accounts with balances of less than $250 as of September 30th of each calendar year and no investment activity (excluding reinvestment of dividends and/or capital gains) during the prior calendar year or the first nine months of the current calendar year. This fee does not apply to IRAs, qualified plan accounts, or Coverdell Education Savings Accounts; (2) a $15 annual custodial fee on IRAs, SEPs, SIMPLE IRAs, and Coverdell Education Savings Accounts; and (3) a $20 annual custodial fee on 403(b) accounts.
Please note that the expenses shown in the table are meant to highlight your ongoing costs only and do not reflect any transactional costs, such as sales charges (loads), redemption fees, or exchange fees. Therefore, the second line of the table is useful in comparing ongoing costs only, and will not help you determine the relative total costs of owning different funds. In addition, if these transactional costs were included, your costs would have been higher.
| Beginning Account Value 01/01/10 | Ending Account Value 06/30/10 | Expense Paid During Period 01/01/10 – 06/30/10 | |||||||||||||
| Small Cap Fund Class A | |||||||||||||||
| Actual | $ | 1,000.00 | $ | 942.00 | $ | 11.27 | |||||||||
| Hypothetical (5% return before expense) | $ | 1,000.00 | $ | 1,024.79 | $ | 11.75 | |||||||||
| Small Cap Fund Class C | |||||||||||||||
| Actual | $ | 1,000.00 | $ | 938.30 | $ | 14.85 | |||||||||
| Hypothetical (5% return before expense) | $ | 1,000.00 | $ | 1,024.79 | $ | 15.51 | |||||||||
| Small Cap Fund Class I | |||||||||||||||
| Actual | $ | 1,000.00 | $ | 943.10 | $ | 10.07 | |||||||||
| Hypothetical (5% return before expense) | $ | 1,000.00 | $ | 1,024.79 | $ | 10.49 | |||||||||
3 Expenses are equal to the Fund's annualized expense ratio of 2.34% for Class A shares, 3.09% for Class C shares and 2.09% for Class I shares, multiplied by the average account value over the period, multiplied by 181/365 days to reflect the one-half year period.
29

Pacific Advisors Fund Inc.
financial statements
30
Pacific Advisors Government Securities Fund
Statement of Investments (Unaudited)
as of June 30, 2010
| Quantity or Principal | Description | Current $ Value** | % of Total Net Assets | ||||||||||||
| COMMON STOCK | |||||||||||||||
| CONSUMER DISCRETIONARY | 1.52 | ||||||||||||||
| HOTELS, RESTAURANTS & LEISURE | |||||||||||||||
| 1,000 | MCDONALD'S CORP. | 65,870 | |||||||||||||
| 65,870 | 1.52 | ||||||||||||||
| CONSUMER STAPLES | 2.90 | ||||||||||||||
| FOOD PRODUCTS | |||||||||||||||
| 1,500 | H.J. HEINZ CO. | 64,830 | |||||||||||||
| 64,830 | 1.50 | ||||||||||||||
| HOUSEHOLD PRODUCTS | |||||||||||||||
| 1,000 | KIMBERLY-CLARK CORP. | 60,630 | |||||||||||||
| 60,630 | 1.40 | ||||||||||||||
| ENERGY | 1.57 | ||||||||||||||
| OIL, GAS & CONSUMABLE FUELS | |||||||||||||||
| 1,000 | CHEVRON CORP. | 67,860 | |||||||||||||
| 67,860 | 1.57 | ||||||||||||||
| FINANCIALS | 0.58 | ||||||||||||||
| INSURANCE | |||||||||||||||
| 500 | THE CHUBB CORP. | 25,005 | |||||||||||||
| 25,005 | 0.58 | ||||||||||||||
| INFORMATION TECHNOLOGY | 1.33 | ||||||||||||||
| SOFTWARE | |||||||||||||||
| 2,500 | MICROSOFT CORP. | 57,525 | |||||||||||||
| 57,525 | 1.33 | ||||||||||||||
| TELECOMMUNICATION SERVICES | 1.40 | ||||||||||||||
| DIVERSIFIED TELECOM. SERVICES | |||||||||||||||
| 2,500 | AT&T INC. | 60,475 | |||||||||||||
| 60,475 | 1.40 | ||||||||||||||
| UTILITIES | 2.73 | ||||||||||||||
| ELECTRIC UTILITIES | |||||||||||||||
| 1,000 | PPL CORP. | 24,950 | |||||||||||||
| 1,500 | SOUTHERN CO. | 49,920 | |||||||||||||
| 74,870 | 1.73 | ||||||||||||||
| MULTI-UTILITIES | |||||||||||||||
| 1,000 | CONSOLIDATED EDISON INC. | 43,100 | |||||||||||||
| 43,100 | 1.00 | ||||||||||||||
| TOTAL COMMON STOCK (Cost: $548,915) | 520,165 | 12.02 | |||||||||||||
See Accompanying Notes to Financial Statements
31
Pacific Advisors Government Securities Fund
Statement of Investments (Unaudited)
as of June 30, 2010
| Quantity or Principal | Description | Current $ Value** | % of Total Net Assets | ||||||||||||
| US GOVT SECURITIES | |||||||||||||||
| US GOVERNMENT AGENCY | 81.90 | ||||||||||||||
| US GOVERNMENT AGENCY | |||||||||||||||
| 200,000 | FEDERAL FARM CREDIT BANK 3.55% 06/07/17 | 200,879 | |||||||||||||
| 150,000 | FEDERAL FARM CREDIT BANK 3.50% 06/21/17 | 150,780 | |||||||||||||
| 200,000 | FEDERAL FARM CREDIT BANK 3.34% 06/28/17 | 200,989 | |||||||||||||
| 100,000 | FEDERAL FARM CREDIT BANK 4.50% 10/01/19 | 100,968 | |||||||||||||
| 100,000 | FEDERAL HOME LN MTG CORP. 3.30% 08/11/15 | 100,265 | |||||||||||||
| 200,000 | FEDERAL HOME LN MTG CORP. 3.80% 03/09/16 | 204,124 | |||||||||||||
| 100,000 | FEDERAL HOME LN MTG CORP. 3.00% 07/15/17 STEP | 100,094 | |||||||||||||
| 100,000 | FEDERAL HOME LOAN BANK 4.27% 09/17/13 | 100,822 | |||||||||||||
| 100,000 | FEDERAL HOME LOAN BANK 1.00% 06/30/14 STEP | 100,000 | |||||||||||||
| 100,000 | FEDERAL HOME LOAN BANK 2.00% 07/17/14 STEP | 102,437 | |||||||||||||
| 100,000 | FEDERAL HOME LOAN BANK 2.52% 09/02/14 | 101,500 | |||||||||||||
| 150,000 | FEDERAL HOME LOAN BANK 3.625% 10/14/16 | 151,294 | |||||||||||||
| 270,000 | FEDERAL HOME LOAN BANK 5.25% 12/05/16 | 286,735 | |||||||||||||
| 100,000 | FEDERAL HOME LOAN BANK 3.75% 04/26/17 | 100,824 | |||||||||||||
| 125,000 | FEDERAL HOME LOAN BANK 5.35% 09/27/17 | 126,418 | |||||||||||||
| 100,000 | FEDERAL HOME LOAN BANK 5.20% 12/21/17 | 102,174 | |||||||||||||
| 425,000 | FEDERAL HOME LOAN BANK 4.50% 02/15/18 | 435,314 | |||||||||||||
| 100,000 | FEDERAL HOME LOAN BANK 5.50% 11/08/18 | 101,698 | |||||||||||||
| 150,000 | FEDERAL NATL MTG ASSOC. 2.25% 08/26/15 STEP | 150,323 | |||||||||||||
| 100,000 | FEDERAL NATL MTG ASSOC. 3.10% 10/29/15 | 100,780 | |||||||||||||
| 100,000 | FEDERAL NATL MTG ASSOC. 2.00% 03/24/16 STEP | 100,301 | |||||||||||||
| 100,000 | FEDERAL NATL MTG ASSOC. 3.00% 10/27/17 STEP | 100,783 | |||||||||||||
| 325,000 | FEDERAL NATL MTG ASSOC. 2.00% 09/10/18 STEP | 325,894 | |||||||||||||
| 3,545,395 | 81.90 | ||||||||||||||
| TOTAL US GOVT SECURITIES (Cost: $3,521,961) | 3,545,395 | 81.90 | |||||||||||||
| PREFERRED STOCK | |||||||||||||||
| FINANCIALS | 3.94 | ||||||||||||||
| COMMERCIAL BANKS | |||||||||||||||
| 4,000 | BARCLAYS BANK PLC 6.625% PFD | 81,360 | |||||||||||||
| 2,000 | BARCLAYS BANK PLC 7.10% PFD | 44,060 | |||||||||||||
| 125,420 | 2.90 | ||||||||||||||
| DIVERSIFIED FINANCIAL SERVICES | |||||||||||||||
| 2,000 | DEUTSCHE BANK 7.35% PFD | 45,100 | |||||||||||||
| 45,100 | 1.04 | ||||||||||||||
| TOTAL PREFERRED STOCK (Cost: $200,000) | 170,520 | 3.94 | |||||||||||||
See Accompanying Notes to Financial Statements
32
Pacific Advisors Government Securities Fund
Statement of Investments (Unaudited)
as of June 30, 2010
| Quantity or Principal | Description | Current $ Value** | % of Total Net Assets | ||||||||||||
| SHORT TERM INVESTMENTS | |||||||||||||||
| MONEY MARKET | 1.64 | ||||||||||||||
| 70,846 | UMB MONEY MARKET FIDUCIARY | 70,846 | |||||||||||||
| 70,846 | 1.64 | ||||||||||||||
| TOTAL SHORT TERM INVESTMENTS (Cost: $70,846) | 70,846 | 1.63 | |||||||||||||
| TOTAL GOVERNMENT SECURITIES FUND (Cost: $4,341,722) | 4,306,926 | 99.49 | |||||||||||||
| OTHER ASSETS LESS LIABILITIES | 22,117 | 0.51 | |||||||||||||
| TOTAL NET ASSETS | 4,329,043 | 100.00 | |||||||||||||
* Non-income producing
** The principal amount is stated in U.S. dollars unless otherwise indicated.
See Accompanying Notes to Financial Statements
33
Pacific Advisors Income and Equity Fund
Statement of Investments (Unaudited)
as of June 30, 2010
| Quantity or Principal | Description | Current $ Value** | % of Total Net Assets | ||||||||||||
| COMMON STOCK | |||||||||||||||
| CONSUMER DISCRETIONARY | 6.99 | ||||||||||||||
| DISTRIBUTORS | |||||||||||||||
| 2,000 | GENUINE PARTS CO. | 78,900 | |||||||||||||
| 78,900 | 0.94 | ||||||||||||||
| HOTELS, RESTAURANTS & LEISURE | |||||||||||||||
| 2,500 | MCDONALD'S CORP. | 164,675 | |||||||||||||
| 164,675 | 1.96 | ||||||||||||||
| LEISURE EQUIPMENT & PRODUCTS | |||||||||||||||
| 7,000 | MATTEL INC. | 148,120 | |||||||||||||
| 148,120 | 1.76 | ||||||||||||||
| SPECIALTY RETAIL | |||||||||||||||
| 2,500 | BEST BUY CO. INC. | 84,650 | |||||||||||||
| 4,000 | HOME DEPOT INC. | 112,280 | |||||||||||||
| 196,930 | 2.34 | ||||||||||||||
| CONSUMER STAPLES | 5.76 | ||||||||||||||
| FOOD & STAPLES RETAILING | |||||||||||||||
| 4,000 | SYSCO CORP. | 114,280 | |||||||||||||
| 2,500 | WAL-MART STORES INC. | 120,175 | |||||||||||||
| 234,455 | 2.78 | ||||||||||||||
| HOUSEHOLD PRODUCTS | |||||||||||||||
| 2,500 | PROCTER & GAMBLE CO. | 149,950 | |||||||||||||
| 149,950 | 1.78 | ||||||||||||||
| TOBACCO | |||||||||||||||
| 5,000 | ALTRIA GROUP INC. | 100,200 | |||||||||||||
| 100,200 | 1.19 | ||||||||||||||
| ENERGY | 1.79 | ||||||||||||||
| OIL, GAS & CONSUMABLE FUELS | |||||||||||||||
| 1,500 | CONOCOPHILLIPS | 73,635 | |||||||||||||
| 1,000 | OCCIDENTAL PETROLEUM CORP. | 77,150 | |||||||||||||
| 150,785 | 1.79 | ||||||||||||||
| FINANCIALS | 1.28 | ||||||||||||||
| DIVERSIFIED FINANCIAL SERVICES | |||||||||||||||
| 4,000 | BANK OF AMERICA CORP. | 57,480 | |||||||||||||
| 57,480 | 0.68 | ||||||||||||||
See Accompanying Notes to Financial Statements
34
Pacific Advisors Income and Equity Fund
Statement of Investments (Unaudited)
as of June 30, 2010
| Quantity or Principal | Description | Current $ Value** | % of Total Net Assets | ||||||||||||
| COMMON STOCK continued | |||||||||||||||
| INSURANCE | |||||||||||||||
| 1,000 | THE CHUBB CORP. | 50,010 | |||||||||||||
| 50,010 | 0.59 | ||||||||||||||
| HEALTH CARE | 5.55 | ||||||||||||||
| PHARMACEUTICALS | |||||||||||||||
| 2,500 | ABBOTT LABORATORIES | 116,950 | |||||||||||||
| 4,000 | JOHNSON & JOHNSON | 236,240 | |||||||||||||
| 8,000 | PFIZER INC. | 114,080 | |||||||||||||
| 467,270 | 5.55 | ||||||||||||||
| INDUSTRIALS | 3.99 | ||||||||||||||
| AEROSPACE & DEFENSE | |||||||||||||||
| 2,000 | HONEYWELL INT'L INC. | 78,060 | |||||||||||||
| 78,060 | 0.93 | ||||||||||||||
| AIR FREIGHT & LOGISTICS | |||||||||||||||
| 2,000 | UNITED PARCEL SERVICE INC. B | 113,780 | |||||||||||||
| 113,780 | 1.35 | ||||||||||||||
| INDUSTRIAL CONGLOMERATES | |||||||||||||||
| 10,000 | GENERAL ELECTRIC CO. | 144,200 | |||||||||||||
| 144,200 | 1.71 | ||||||||||||||
| INFORMATION TECHNOLOGY | 3.53 | ||||||||||||||
| COMMUNICATIONS EQUIPMENT | |||||||||||||||
| 7,500 | NOKIA CORP. ADR A | 61,125 | |||||||||||||
| 61,125 | 0.73 | ||||||||||||||
| IT SERVICES | |||||||||||||||
| 3,000 | AUTOMATIC DATA PROCESSING INC. | 120,780 | |||||||||||||
| 120,780 | 1.43 | ||||||||||||||
| SOFTWARE | |||||||||||||||
| 5,000 | MICROSOFT CORP. | 115,050 | |||||||||||||
| 115,050 | 1.37 | ||||||||||||||
| MATERIALS | 0.41 | ||||||||||||||
| CHEMICALS | |||||||||||||||
| 1,000 | DUPONT DE NEMOURS & CO. | 34,590 | |||||||||||||
| 34,590 | 0.41 | ||||||||||||||
See Accompanying Notes to Financial Statements
35
Pacific Advisors Income and Equity Fund
Statement of Investments (Unaudited)
as of June 30, 2010
| Quantity or Principal | Description | Current $ Value** | % of Total Net Assets | ||||||||||||
| COMMON STOCK continued | |||||||||||||||
| TELECOMMUNICATION SERVICES | 3.27 | ||||||||||||||
| DIVERSIFIED TELECOM. SERVICES | |||||||||||||||
| 5,000 | AT&T INC. | 120,950 | |||||||||||||
| 5,500 | VERIZON COMMUNICATIONS INC. | 154,110 | |||||||||||||
| 275,060 | 3.27 | ||||||||||||||
| UTILITIES | 2.78 | ||||||||||||||
| ELECTRIC UTILITIES | |||||||||||||||
| 2,000 | DUKE ENERGY CORP. | 32,000 | |||||||||||||
| 32,000 | 0.38 | ||||||||||||||
| MULTI-UTILITIES | |||||||||||||||
| 2,000 | DOMINION RESOURCES INC. | 77,480 | |||||||||||||
| 2,000 | PUBLIC SERVICE ENTERPRISE GROUP INC. | 62,660 | |||||||||||||
| 3,000 | XCEL ENERGY INC. | 61,830 | |||||||||||||
| 201,970 | 2.40 | ||||||||||||||
| TOTAL COMMON STOCK (Cost: $3,341,901) | 2,975,390 | 35.34 | |||||||||||||
| CORPORATE BOND | |||||||||||||||
| CONSUMER DISCRETIONARY | 8.35 | ||||||||||||||
| HOTELS, RESTAURANTS & LEISURE | |||||||||||||||
| 50,000 | MARRIOTT INT'L 5.625% 02/15/13 | 53,269 | |||||||||||||
| 53,269 | 0.63 | ||||||||||||||
| LEISURE EQUIPMENT & PRODUCTS | |||||||||||||||
| 50,000 | EQUIFAX INC. 6.30% 07/01/17 | 55,400 | |||||||||||||
| 55,400 | 0.66 | ||||||||||||||
| MEDIA | |||||||||||||||
| 50,000 | DIRECTV HOLDINGS 6.375% 06/15/15 | 51,750 | |||||||||||||
| 51,750 | 0.61 | ||||||||||||||
| MULTILINE RETAIL | |||||||||||||||
| 35,000 | NORDSTROM INC. 6.75% 06/01/14 | 40,672 | |||||||||||||
| 281,000 | TARGET CORP. 8.60% 01/15/12 | 310,369 | |||||||||||||
| 351,041 | 4.17 | ||||||||||||||
| SPECIALTY RETAIL | |||||||||||||||
| 100,000 | HOME DEPOT INC. 5.20% 03/01/11 | 102,518 | |||||||||||||
| 80,000 | STAPLES INC. 7.375% 10/01/12 | 89,119 | |||||||||||||
| 191,637 | 2.28 | ||||||||||||||
See Accompanying Notes to Financial Statements
36
Pacific Advisors Income and Equity Fund
Statement of Investments (Unaudited)
as of June 30, 2010
| Quantity or Principal | Description | Current $ Value** | % of Total Net Assets | ||||||||||||
| CORPORATE BOND continued | |||||||||||||||
| CONSUMER STAPLES | 0.91 | ||||||||||||||
| TOBACCO | |||||||||||||||
| 75,000 | ALTRIA GROUP INC. 4.125% 09/11/15 | 76,415 | |||||||||||||
| 76,415 | 0.91 | ||||||||||||||
| ENERGY | 2.98 | ||||||||||||||
| ENERGY EQUIPMENT & SERVICES | |||||||||||||||
| 50,000 | WEATHERFORD INT'L LTD. 5.95% 06/15/12 | 53,555 | |||||||||||||
| 53,555 | 0.64 | ||||||||||||||
| OIL, GAS & CONSUMABLE FUELS | |||||||||||||||
| 143,000 | ATLANTIC RICHFIELD 8.50% 04/01/12 | 146,047 | |||||||||||||
| 50,000 | VALERO ENERGY CORP. 4.50% 02/01/15 | 51,378 | |||||||||||||
| 197,425 | 2.34 | ||||||||||||||
| FINANCIALS | 17.12 | ||||||||||||||
| CAPITAL MARKETS | |||||||||||||||
| 50,000 | CHARLES SCHWAB CORP. 6.375% 09/01/17 | 56,954 | |||||||||||||
| 95,000 | GOLDMAN SACHS GROUP 5.00% 10/01/14 | 98,746 | |||||||||||||
| 155,700 | 1.85 | ||||||||||||||
| CONSUMER FINANCE | |||||||||||||||
| 300,000 | AIG 6.00% 11/15/14 | 234,569 | |||||||||||||
| 30,000 | AMERICAN EXPRESS CO. 5.00% 12/02/10 | 30,389 | |||||||||||||
| 200,000 | AMERICAN EXPRESS CO. 7.30% 08/20/13 | 226,441 | |||||||||||||
| 491,399 | 5.84 | ||||||||||||||
| DIVERSIFIED FINANCIAL SERVICES | |||||||||||||||
| 371,000 | GENERAL ELECTRIC CAP 8.125% 05/15/12 | 408,734 | |||||||||||||
| 150,000 | GENERAL ELECTRIC CAP 5.50% 09/30/16 STEP | 150,709 | |||||||||||||
| 106,000 | HSBC 11/10/13 FLOAT | 104,626 | |||||||||||||
| 664,069 | 7.89 | ||||||||||||||
| INSURANCE | |||||||||||||||
| 75,000 | HARTFORD LIFE GLOBAL FUND 6.00% 07/15/15 | 75,066 | |||||||||||||
| 75,066 | 0.89 | ||||||||||||||
| REAL ESTATE INVESTMENT TRUSTS | |||||||||||||||
| 50,000 | HOSPITALITY PROPERTIES TRUST 7.875% 08/15/14 | 55,124 | |||||||||||||
| 55,124 | 0.65 | ||||||||||||||
| HEALTH CARE | 1.21 | ||||||||||||||
| HEALTH CARE PROVIDERS & SERVICES | |||||||||||||||
| 46,000 | WELLPOINT INC. 5.00% 12/15/14 | 49,978 | |||||||||||||
| 49,978 | 0.59 | ||||||||||||||
See Accompanying Notes to Financial Statements
37
Pacific Advisors Income and Equity Fund
Statement of Investments (Unaudited)
as of June 30, 2010
| Quantity or Principal | Description | Current $ Value** | % of Total Net Assets | ||||||||||||
| CORPORATE BOND continued | |||||||||||||||
| LIFE SCIENCES TOOLS & SERVICES | |||||||||||||||
| 50,000 | FISHER SCIENTIFIC INT'L. 6.125% 07/01/15 | 51,500 | |||||||||||||
| 51,500 | 0.61 | ||||||||||||||
| INDUSTRIALS | 4.41 | ||||||||||||||
| AIRLINES | |||||||||||||||
| 50,000 | SOUTHWEST AIRLINES CO. 5.25% 10/01/14 | 52,629 | |||||||||||||
| 52,629 | 0.63 | ||||||||||||||
| MACHINERY | |||||||||||||||
| 115,000 | JOY GLOBAL INC. 6.00% 11/15/16 | 123,953 | |||||||||||||
| 90,000 | TRINITY INDUSTRIES INC. 6.50% 03/15/14 | 90,675 | |||||||||||||
| 214,628 | 2.55 | ||||||||||||||
| TRADING COMPANIES & DISTRIBUTORS | |||||||||||||||
| 100,000 | GATX FINANCIAL CORP. 5.50% 02/15/12 | 104,332 | |||||||||||||
| 104,332 | 1.24 | ||||||||||||||
| INFORMATION TECHNOLOGY | 1.29 | ||||||||||||||
| COMPUTERS & PERIPHERALS | |||||||||||||||
| 50,000 | DELL INC. 5.65% 04/15/18 | 55,632 | |||||||||||||
| 55,632 | 0.66 | ||||||||||||||
| OFFICE ELECTRONICS | |||||||||||||||
| 50,000 | XEROX CORP. 5.50% 05/15/12 | 53,298 | |||||||||||||
| 53,298 | 0.63 | ||||||||||||||
| MATERIALS | 7.18 | ||||||||||||||
| CHEMICALS | |||||||||||||||
| 50,000 | DOW CHEMICAL CO. 5.00% 06/15/13 | 50,341 | |||||||||||||
| 50,000 | DOW CHEMICAL CO. 5.90% 09/15/15 | 50,201 | |||||||||||||
| 100,543 | 1.19 | ||||||||||||||
| CONTAINERS & PACKAGING | |||||||||||||||
| 25,000 | PACKAGING CORP. OF AMERICA 5.75% 08/01/13 | 26,951 | |||||||||||||
| 26,951 | 0.32 | ||||||||||||||
| METALS & MINING | |||||||||||||||
| 100,000 | ALCOA INC. 7.375% 08/01/10 | 100,415 | |||||||||||||
| 75,000 | ALCOA INC. 6.50% 06/01/11 | 77,086 | |||||||||||||
| 50,000 | ARCELORMITTAL USA INC. 6.50% 04/15/14 | 53,514 | |||||||||||||
| 50,000 | COMMERCIAL METALS CO. 7.35% 08/15/18 | 52,481 | |||||||||||||
| 50,000 | FREEPORT-MCMORAN C&G INC. 8.25% 04/01/15 | 54,250 | |||||||||||||
| 50,000 | FREEPORT-MCMORAN C&G INC. 8.375% 04/01/17 | 55,000 | |||||||||||||
| 80,000 | RELIANCE STEEL & ALUMINUM 6.20% 11/15/16 | 84,438 | |||||||||||||
| 477,183 | 5.67 | ||||||||||||||
See Accompanying Notes to Financial Statements
38
Pacific Advisors Income and Equity Fund
Statement of Investments (Unaudited)
as of June 30, 2010
| Quantity or Principal | Description | Current $ Value** | % of Total Net Assets | ||||||||||||
| CORPORATE BOND continued | |||||||||||||||
| TELECOMMUNICATION SERVICES | 6.64 | ||||||||||||||
| DIVERSIFIED TELECOM. SERVICES | |||||||||||||||
| 100,000 | AT&T CORP. 7.30% 11/15/11 | 108,091 | |||||||||||||
| 268,809 | BELLSOUTH TELECOM. 6.30% 12/15/15 | 286,024 | |||||||||||||
| 53,000 | VERIZON 6.50% 09/15/11 | 55,973 | |||||||||||||
| 100,000 | VERIZON FLORIDA 6.125% 01/15/13 | 109,104 | |||||||||||||
| 559,193 | 6.64 | ||||||||||||||
| UTILITIES | 5.39 | ||||||||||||||
| ELECTRIC UTILITIES | |||||||||||||||
| 55,000 | CONSUMERS ENERGY CO. 6.00% 02/15/14 | 61,510 | |||||||||||||
| 232,000 | SOUTH CAROLINA ELEC 6.70% 02/01/11 | 239,477 | |||||||||||||
| 300,987 | 3.58 | ||||||||||||||
| GAS UTILITIES | |||||||||||||||
| 150,000 | PIEDMONT NATURAL GAS 7.80% 09/29/10 | 152,546 | |||||||||||||
| 152,546 | 1.81 | ||||||||||||||
| TOTAL CORPORATE BOND (Cost: $4,513,703) | 4,671,249 | 55.48 | |||||||||||||
| US GOVT SECURITIES | |||||||||||||||
| US GOVERNMENT AGENCY | 1.25 | ||||||||||||||
| US GOVERNMENT AGENCY | |||||||||||||||
| 100,000 | FEDERAL HOME LOAN BANK 6.00% 07/19/17 | 105,348 | |||||||||||||
| 105,348 | 1.25 | ||||||||||||||
| TOTAL US GOVT SECURITIES (Cost: $100,000) | 105,348 | 1.25 | |||||||||||||
| PREFERRED STOCK | |||||||||||||||
| FINANCIALS | 5.09 | ||||||||||||||
| COMMERCIAL BANKS | |||||||||||||||
| 2,000 | BARCLAYS BANK PLC 6.625% PFD | 40,680 | |||||||||||||
| 2,000 | BARCLAYS BANK PLC 7.10% PFD | 44,060 | |||||||||||||
| 4,000 | HSBC HOLDINGS PLC 6.20% PFD A | 85,800 | |||||||||||||
| 170,540 | 2.03 | ||||||||||||||
| DIVERSIFIED FINANCIAL SERVICES | |||||||||||||||
| 2,000 | BANK OF AMERICA 7.25% PFD | 45,640 | |||||||||||||
| 2,000 | BANK OF AMERICA 6.375% PFD | 38,500 | |||||||||||||
| 3,000 | DEUTSCHE BANK 6.625% PFD | 63,930 | |||||||||||||
| 2,000 | MERRILL LYNCH 6.45% PFD | 39,760 | |||||||||||||
| 187,830 | 2.23 | ||||||||||||||
| INSURANCE | |||||||||||||||
| 3,000 | METLIFE INC. 6.50% PFD | 69,780 | |||||||||||||
| 69,780 | 0.83 | ||||||||||||||
See Accompanying Notes to Financial Statements
39
Pacific Advisors Income and Equity Fund
Statement of Investments (Unaudited)
as of June 30, 2010
| Quantity or Principal | Description | Current $ Value** | % of Total Net Assets | ||||||||||||
| PREFERRED STOCK continued | |||||||||||||||
| UTILITIES | 0.60 | ||||||||||||||
| ELECTRIC UTILITIES | |||||||||||||||
| 2,000 | FPL GROUP CAPITAL 6.60% PFD A | 50,860 | |||||||||||||
| 50,860 | 0.60 | ||||||||||||||
| TOTAL PREFERRED STOCK (Cost: $550,000) | 479,010 | 5.69 | |||||||||||||
| SHORT TERM INVESTMENTS | |||||||||||||||
| MONEY MARKET | 1.39 | ||||||||||||||
| 116,678 | UMB MONEY MARKET FIDUCIARY | 116,678 | |||||||||||||
| 116,678 | 1.39 | ||||||||||||||
| TOTAL SHORT TERM INVESTMENTS (Cost: $116,678) | 116,678 | 1.39 | |||||||||||||
| TOTAL INCOME & EQUITY FUND (Cost: $8,622,282) | 8,347,675 | 99.15 | |||||||||||||
| OTHER ASSETS LESS LIABILITIES | 71,360 | 0.85 | |||||||||||||
| TOTAL NET ASSETS | 8,419,035 | 100.00 | |||||||||||||
* Non-income producing
** The principal amount is stated in U.S. dollars unless otherwise indicated.
See Accompanying Notes to Financial Statements
40
Pacific Advisors Balanced Fund
Statement of Investments (Unaudited)
as of June 30, 2010
| Quantity or Principal | Description | Current $ Value** | % of Total Net Assets | ||||||||||||
| COMMON STOCK | |||||||||||||||
| CONSUMER DISCRETIONARY | 4.02 | ||||||||||||||
| HOTELS, RESTAURANTS & LEISURE | |||||||||||||||
| 10,000 | MCDONALD'S CORP. | 658,700 | |||||||||||||
| 658,700 | 2.66 | ||||||||||||||
| SPECIALTY RETAIL | |||||||||||||||
| 10,000 | BEST BUY CO. INC. | 338,600 | |||||||||||||
| 338,600 | 1.37 | ||||||||||||||
| CONSUMER STAPLES | 14.30 | ||||||||||||||
| BEVERAGES | |||||||||||||||
| 15,000 | COCA-COLA CO. | 751,800 | |||||||||||||
| 751,800 | 3.03 | ||||||||||||||
| FOOD & STAPLES RETAILING | |||||||||||||||
| 18,000 | CVS CAREMARK CORP. | 527,760 | |||||||||||||
| 527,760 | 2.13 | ||||||||||||||
| FOOD PRODUCTS | |||||||||||||||
| 15,000 | CAMPBELL SOUP CO. | 537,450 | |||||||||||||
| 12,000 | J.M. SMUCKER CO. | 722,640 | |||||||||||||
| 7,500 | MCCORMICK & COMPANY INC. | 284,700 | |||||||||||||
| 1,544,790 | 6.23 | ||||||||||||||
| HOUSEHOLD PRODUCTS | |||||||||||||||
| 12,000 | PROCTER & GAMBLE CO. | 719,760 | |||||||||||||
| 719,760 | 2.90 | ||||||||||||||
| ENERGY | 7.93 | ||||||||||||||
| ENERGY EQUIPMENT & SERVICES | |||||||||||||||
| 15,000 | HALLIBURTON CO. | 368,250 | |||||||||||||
| 10,000 | NATIONAL OILWELL VARCO INC. | 330,700 | |||||||||||||
| 698,950 | 2.82 | ||||||||||||||
| OIL, GAS & CONSUMABLE FUELS | |||||||||||||||
| 10,000 | CONOCOPHILLIPS | 490,900 | |||||||||||||
| 5,000 | DEVON ENERGY CORP. | 304,600 | |||||||||||||
| 8,750 | SPECTRA ENERGY CORP. | 175,613 | |||||||||||||
| 10,000 | SUNCOR ENERGY INC. | 294,400 | |||||||||||||
| 1,265,513 | 5.11 | ||||||||||||||
| FINANCIALS | 7.76 | ||||||||||||||
| CONSUMER FINANCE | |||||||||||||||
| 12,500 | AMERICAN EXPRESS CO. | 496,250 | |||||||||||||
| 496,250 | 2.00 | ||||||||||||||
See Accompanying Notes to Financial Statements
41
Pacific Advisors Balanced Fund
Statement of Investments (Unaudited)
as of June 30, 2010
| Quantity or Principal | Description | Current $ Value** | % of Total Net Assets | ||||||||||||
| COMMON STOCK continued | |||||||||||||||
| DIVERSIFIED FINANCIAL SERVICES | |||||||||||||||
| 12,500 | JPMORGAN CHASE & CO. | 457,625 | |||||||||||||
| 457,625 | 1.85 | ||||||||||||||
| INSURANCE | |||||||||||||||
| 6 | BERKSHIRE HATHAWAY INC. A* | 720,000 | |||||||||||||
| 5,000 | THE CHUBB CORP. | 250,050 | |||||||||||||
| 970,050 | 3.91 | ||||||||||||||
| HEALTH CARE | 9.74 | ||||||||||||||
| HEALTH CARE EQUIPMENT & SUPPLIES | |||||||||||||||
| 5,000 | BAXTER INT'L INC. | 203,200 | |||||||||||||
| 5,000 | BECTON DICKINSON & CO. | 338,100 | |||||||||||||
| 5,000 | COVIDIEN PLC. | 200,900 | |||||||||||||
| 742,200 | 2.99 | ||||||||||||||
| PHARMACEUTICALS | |||||||||||||||
| 7,000 | ABBOTT LABORATORIES | 327,460 | |||||||||||||
| 12,000 | JOHNSON & JOHNSON | 708,720 | |||||||||||||
| 10,000 | MERCK & COMPANY INC. | 349,700 | |||||||||||||
| 20,000 | PFIZER INC. | 285,200 | |||||||||||||
| 1,671,080 | 6.74 | ||||||||||||||
| INDUSTRIALS | 12.85 | ||||||||||||||
| AEROSPACE & DEFENSE | |||||||||||||||
| 6,000 | BOEING CO. | 376,500 | |||||||||||||
| 376,500 | 1.52 | ||||||||||||||
| AIR FREIGHT & LOGISTICS | |||||||||||||||
| 10,000 | UNITED PARCEL SERVICE INC. B | 568,900 | |||||||||||||
| 568,900 | 2.30 | ||||||||||||||
| INDUSTRIAL CONGLOMERATES | |||||||||||||||
| 40,000 | GENERAL ELECTRIC CO. | 576,800 | |||||||||||||
| 576,800 | 2.33 | ||||||||||||||
| MACHINERY | |||||||||||||||
| 6,000 | CATERPILLAR INC. | 360,420 | |||||||||||||
| 360,420 | 1.45 | ||||||||||||||
| ROAD & RAIL | |||||||||||||||
| 8,000 | CSX CORP. | 397,040 | |||||||||||||
| 7,000 | NORFOLK SOUTHERN CORP. | 371,350 | |||||||||||||
| 768,390 | 3.10 | ||||||||||||||
See Accompanying Notes to Financial Statements
42
Pacific Advisors Balanced Fund
Statement of Investments (Unaudited)
as of June 30, 2010
| Quantity or Principal | Description | Current $ Value** | % of Total Net Assets | ||||||||||||
| COMMON STOCK continued | |||||||||||||||
| TRADING COMPANIES & DISTRIBUTORS | |||||||||||||||
| 20,000 | GATX CORP. | 533,600 | |||||||||||||
| 533,600 | 2.15 | ||||||||||||||
| INFORMATION TECHNOLOGY | 9.61 | ||||||||||||||
| COMMUNICATIONS EQUIPMENT | |||||||||||||||
| 40,000 | NOKIA CORP. ADR A | 326,000 | |||||||||||||
| 326,000 | 1.32 | ||||||||||||||
| COMPUTERS & PERIPHERALS | |||||||||||||||
| 12,500 | HEWLETT-PACKARD CO. | 541,000 | |||||||||||||
| 5,000 | INT'L BUSINESS MACHINES CORP. | 617,400 | |||||||||||||
| 1,158,400 | 4.67 | ||||||||||||||
| IT SERVICES | |||||||||||||||
| 8,000 | AUTOMATIC DATA PROCESSING INC. | 322,080 | |||||||||||||
| 322,080 | 1.30 | ||||||||||||||
| SOFTWARE | |||||||||||||||
| 25,000 | MICROSOFT CORP. | 575,250 | |||||||||||||
| 575,250 | 2.32 | ||||||||||||||
| UTILITIES | 2.12 | ||||||||||||||
| ELECTRIC UTILITIES | |||||||||||||||
| 20,000 | DUKE ENERGY CORP. | 320,000 | |||||||||||||
| 320,000 | 1.29 | ||||||||||||||
| MULTI-UTILITIES | |||||||||||||||
| 5,000 | PG&E CORP. | 205,500 | |||||||||||||
| 205,500 | 0.83 | ||||||||||||||
| TOTAL COMMON STOCK (Cost: $17,525,286) | 16,934,918 | 68.32 | |||||||||||||
| CORPORATE BOND | |||||||||||||||
| CONSUMER DISCRETIONARY | 4.46 | ||||||||||||||
| AUTO COMPONENTS | |||||||||||||||
| 100,000 | BORG WARNER 8.00% 10/01/19 | 114,392 | |||||||||||||
| 114,392 | 0.46 | ||||||||||||||
| HOTELS, RESTAURANTS & LEISURE | |||||||||||||||
| 100,000 | MARRIOTT INT'L 5.625% 02/15/13 | 106,539 | |||||||||||||
| 106,539 | 0.43 | ||||||||||||||
| HOUSEHOLD DURABLES | |||||||||||||||
| 150,000 | FORTUNE BRANDS INC. 6.375% 06/15/14 | 166,963 | |||||||||||||
| 166,963 | 0.67 | ||||||||||||||
See Accompanying Notes to Financial Statements
43
Pacific Advisors Balanced Fund
Statement of Investments (Unaudited)
as of June 30, 2010
| Quantity or Principal | Description | Current $ Value** | % of Total Net Assets | ||||||||||||
| CORPORATE BOND continued | |||||||||||||||
| MEDIA | |||||||||||||||
| 126,000 | TCI COMMUNICATIONS INC. 8.75% 08/01/15 | 155,065 | |||||||||||||
| 155,065 | 0.63 | ||||||||||||||
| MULTILINE RETAIL | |||||||||||||||
| 178,000 | TARGET CORP. 8.60% 01/15/12 | 196,604 | |||||||||||||
| 196,604 | 0.79 | ||||||||||||||
| SPECIALTY RETAIL | |||||||||||||||
| 100,000 | HOME DEPOT INC. 4.625% 08/15/10 | 100,392 | |||||||||||||
| 150,000 | HOME DEPOT INC. 5.20% 03/01/11 | 153,777 | |||||||||||||
| 100,000 | STAPLES INC. 7.375% 10/01/12 | 111,399 | |||||||||||||
| 365,567 | 1.47 | ||||||||||||||
| CONSUMER STAPLES | 2.47 | ||||||||||||||
| BEVERAGES | |||||||||||||||
| 100,000 | ANHEUSER-BUSCH COMPANIES INC. 4.95% 01/15/14 | 107,958 | |||||||||||||
| 107,958 | 0.44 | ||||||||||||||
| PERSONAL PRODUCTS | |||||||||||||||
| 150,000 | ESTEE LAUDER INC. 5.55% 05/15/17 | 166,739 | |||||||||||||
| 166,739 | 0.67 | ||||||||||||||
| TOBACCO | |||||||||||||||
| 150,000 | ALTRIA GROUP INC. 8.50% 11/10/13 | 175,102 | |||||||||||||
| 150,000 | REYNOLDS AMERICA 6.75% 06/15/17 | 162,508 | |||||||||||||
| 337,610 | 1.36 | ||||||||||||||
| ENERGY | 3.65 | ||||||||||||||
| ENERGY EQUIPMENT & SERVICES | |||||||||||||||
| 22,000 | KINDER MORGAN 6.50% 09/01/13 | 21,639 | |||||||||||||
| 100,000 | WEATHERFORD INT'L LTD. 5.95% 06/15/12 | 107,110 | |||||||||||||
| 128,750 | 0.52 | ||||||||||||||
| OIL, GAS & CONSUMABLE FUELS | |||||||||||||||
| 501,000 | ATLANTIC RICHFIELD 9.125% 03/01/11 | 507,784 | |||||||||||||
| 255,000 | BURLINGTON RESOURCES 6.40% 08/15/11 | 267,355 | |||||||||||||
| 775,139 | 3.13 | ||||||||||||||
| FINANCIALS | 11.44 | ||||||||||||||
| CAPITAL MARKETS | |||||||||||||||
| 150,000 | CHARLES SCHWAB CORP. 6.375% 09/01/17 | 170,862 | |||||||||||||
| 161,000 | MORGAN STANLEY 07/01/14 FLOAT | 158,366 | |||||||||||||
| 329,228 | 1.33 | ||||||||||||||
See Accompanying Notes to Financial Statements
44
Pacific Advisors Balanced Fund
Statement of Investments (Unaudited)
as of June 30, 2010
| Quantity or Principal | Description | Current $ Value** | % of Total Net Assets | ||||||||||||
| CORPORATE BOND continued | |||||||||||||||
| CONSUMER FINANCE | |||||||||||||||
| 300,000 | AIG 6.00% 10/15/14 | 235,372 | |||||||||||||
| 450,000 | AIG 6.00% 11/15/14 | 351,854 | |||||||||||||
| 587,226 | 2.37 | ||||||||||||||
| DIVERSIFIED FINANCIAL SERVICES | |||||||||||||||
| 250,000 | AIG 07/11/11 FLOAT | 230,661 | |||||||||||||
| 300,000 | GENERAL ELECTRIC CAP 5.50% 11/15/11 | 303,436 | |||||||||||||
| 311,000 | GENERAL ELECTRIC CAP 8.125% 05/15/12 | 342,631 | |||||||||||||
| 200,000 | GENERAL ELECTRIC CAP 5.65% 06/09/14 | 220,301 | |||||||||||||
| 250,000 | HOUSEHOLD FINANCE CO. 6.375% 11/27/12 | 269,985 | |||||||||||||
| 155,000 | HOUSEHOLD FINANCE CO. 09/15/13 FLOAT | 153,075 | |||||||||||||
| 1,520,089 | 6.13 | ||||||||||||||
| INSURANCE | |||||||||||||||
| 130,000 | AIG 7.50% 08/11/10 | 130,325 | |||||||||||||
| 130,325 | 0.53 | ||||||||||||||
| REAL ESTATE INVESTMENT TRUSTS | |||||||||||||||
| 100,000 | HOSPITALITY PROPERTIES TRUST 7.875% 08/15/14 | 110,248 | |||||||||||||
| 150,000 | SIMON PROPERTY GROUP INC. 5.25% 12/01/16 | 159,736 | |||||||||||||
| 269,984 | 1.09 | ||||||||||||||
| HEALTH CARE | 1.16 | ||||||||||||||
| HEALTH CARE PROVIDERS & SERVICES | |||||||||||||||
| 160,000 | AMERISOURCEBERGEN CORP. 5.875% 09/15/15 | 179,004 | |||||||||||||
| 100,000 | WELLPOINT INC. 5.00% 12/15/14 | 108,648 | |||||||||||||
| 287,651 | 1.16 | ||||||||||||||
| INFORMATION TECHNOLOGY | 1.12 | ||||||||||||||
| COMPUTERS & PERIPHERALS | |||||||||||||||
| 150,000 | DELL INC. 4.70% 04/15/13 | 162,422 | |||||||||||||
| 100,000 | DIGITAL EQUIPMENT 7.75% 04/01/23 | 114,932 | |||||||||||||
| 277,354 | 1.12 | ||||||||||||||
| MATERIALS | 3.25 | ||||||||||||||
| CHEMICALS | |||||||||||||||
| 105,000 | ALBEMARLE CORP. 5.10% 02/01/15 | 114,395 | |||||||||||||
| 114,395 | 0.46 | ||||||||||||||
See Accompanying Notes to Financial Statements
45
Pacific Advisors Balanced Fund
Statement of Investments (Unaudited)
as of June 30, 2010
| Quantity or Principal | Description | Current $ Value** | % of Total Net Assets | ||||||||||||
| CORPORATE BOND continued | |||||||||||||||
| METALS & MINING | |||||||||||||||
| 250,000 | ALCOA INC. 6.00% 01/15/12 | 260,745 | |||||||||||||
| 100,000 | COMMERCIAL METALS CO. 7.35% 08/15/18 | 104,961 | |||||||||||||
| 100,000 | FREEPORT-MCMORAN C&G INC. 8.25% 04/01/15 | 108,500 | |||||||||||||
| 100,000 | FREEPORT-MCMORAN C&G INC. 8.375% 04/01/17 | 110,000 | |||||||||||||
| 100,000 | RIO TINTO ALCAN INC. 5.20% 01/15/14 | 107,328 | |||||||||||||
| 691,534 | 2.79 | ||||||||||||||
| TELECOMMUNICATION SERVICES | 0.66 | ||||||||||||||
| DIVERSIFIED TELECOM. SERVICES | |||||||||||||||
| 150,000 | VERIZON FLORIDA 6.125% 01/15/13 | 163,655 | |||||||||||||
| 163,655 | 0.66 | ||||||||||||||
| UTILITIES | 0.15 | ||||||||||||||
| ELECTRIC UTILITIES | |||||||||||||||
| 36,150 | RELIANT ENERGY MID ATL 9.237% 07/02/17 | 37,596 | |||||||||||||
| 37,596 | 0.15 | ||||||||||||||
| TOTAL CORPORATE BOND (Cost: $6,977,041) | 7,030,362 | 28.36 | |||||||||||||
| PREFERRED STOCK | |||||||||||||||
| FINANCIALS | 2.99 | ||||||||||||||
| COMMERCIAL BANKS | |||||||||||||||
| 5,000 | BARCLAYS BANK PLC 8.125% PFD | 122,500 | |||||||||||||
| 5,000 | BARCLAYS BANK PLC 7.10% PFD | 110,150 | |||||||||||||
| 5,000 | HSBC HOLDING PLC 8.125% PFD | 127,000 | |||||||||||||
| 10,000 | WACHOVIA 7.85% PFD | 255,600 | |||||||||||||
| 615,250 | 2.48 | ||||||||||||||
| DIVERSIFIED FINANCIAL SERVICES | |||||||||||||||
| 5,000 | BANK OF AMERICA 8.20% PFD | 124,750 | |||||||||||||
| 124,750 | 0.50 | ||||||||||||||
| TOTAL PREFERRED STOCK (Cost: $750,000) | 740,000 | 2.99 | |||||||||||||
| TOTAL BALANCED FUND (Cost: $25,252,327) | 24,705,280 | 99.67 | |||||||||||||
| OTHER ASSETS LESS LIABILITIES | 82,808 | 0.33 | |||||||||||||
| TOTAL NET ASSETS | 24,788,088 | 100.00 | |||||||||||||
* Non-income producing
** The principal amount is stated in U.S. dollars unless otherwise indicated.
See Accompanying Notes to Financial Statements
46
Pacific Advisors Growth Fund
Statement of Investments (Unaudited)
as of June 30, 2010
| Quantity or Principal | Description | Current $ Value** | % of Total Net Assets | ||||||||||||
| COMMON STOCK | |||||||||||||||
| CONSUMER DISCRETIONARY | 11.89 | ||||||||||||||
| DISTRIBUTORS | |||||||||||||||
| 1,000 | GENUINE PARTS CO. | 39,450 | |||||||||||||
| 39,450 | 1.35 | ||||||||||||||
| HOTELS, RESTAURANTS & LEISURE | |||||||||||||||
| 1,750 | MCDONALD'S CORP. | 115,272 | |||||||||||||
| 115,272 | 3.95 | ||||||||||||||
| MEDIA | |||||||||||||||
| 3,250 | TIME WARNER INC. | 93,958 | |||||||||||||
| 93,958 | 3.22 | ||||||||||||||
| MULTILINE RETAIL | |||||||||||||||
| 2,000 | TARGET CORP. | 98,340 | |||||||||||||
| 98,340 | 3.37 | ||||||||||||||
| CONSUMER STAPLES | 28.78 | ||||||||||||||
| BEVERAGES | |||||||||||||||
| 3,050 | COCA-COLA CO. | 152,866 | |||||||||||||
| 152,866 | 5.24 | ||||||||||||||
| FOOD & STAPLES RETAILING | |||||||||||||||
| 4,335 | SYSCO CORP. | 123,851 | |||||||||||||
| 3,000 | WAL-MART STORES INC. | 144,210 | |||||||||||||
| 268,061 | 9.18 | ||||||||||||||
| FOOD PRODUCTS | |||||||||||||||
| 750 | H.J. HEINZ CO. | 32,415 | |||||||||||||
| 2,700 | KRAFT FOODS INC. | 75,600 | |||||||||||||
| 108,015 | 3.70 | ||||||||||||||
| HOUSEHOLD PRODUCTS | |||||||||||||||
| 2,600 | PROCTER & GAMBLE CO. | 155,948 | |||||||||||||
| 2,500 | THE CLOROX CO. | 155,400 | |||||||||||||
| 311,348 | 10.66 | ||||||||||||||
| ENERGY | 3.66 | ||||||||||||||
| OIL, GAS & CONSUMABLE FUELS | |||||||||||||||
| 650 | CHEVRON CORP. | 44,109 | |||||||||||||
| 1,100 | EXXON MOBIL CORP. | 62,777 | |||||||||||||
| 106,886 | 3.66 | ||||||||||||||
See Accompanying Notes to Financial Statements
47
Pacific Advisors Growth Fund
Statement of Investments (Unaudited)
as of June 30, 2010
| Quantity or Principal | Description | Current $ Value** | % of Total Net Assets | ||||||||||||
| COMMON STOCK continued | |||||||||||||||
| FINANCIALS | 11.40 | ||||||||||||||
| DIVERSIFIED FINANCIAL SERVICES | |||||||||||||||
| 2,000 | BANK OF AMERICA CORP. | 28,740 | |||||||||||||
| 620 | JPMORGAN CHASE & CO. | 22,698 | |||||||||||||
| 51,438 | 1.76 | ||||||||||||||
| INSURANCE | |||||||||||||||
| 2,000 | BERKSHIRE HATHAWAY INC. B* | 159,380 | |||||||||||||
| 3,235 | METLIFE INC. | 122,154 | |||||||||||||
| 281,534 | 9.64 | ||||||||||||||
| HEALTH CARE | 11.31 | ||||||||||||||
| HEALTH CARE PROVIDERS & SERVICES | |||||||||||||||
| 2,000 | CARDINAL HEALTH INC. | 67,220 | |||||||||||||
| 67,220 | 2.30 | ||||||||||||||
| PHARMACEUTICALS | |||||||||||||||
| 765 | BRISTOL-MYERS SQUIBB CO. | 19,079 | |||||||||||||
| 1,000 | ELI LILLY & CO. | 33,500 | |||||||||||||
| 2,750 | JOHNSON & JOHNSON | 162,415 | |||||||||||||
| 800 | MERCK & COMPANY INC. | 27,976 | |||||||||||||
| 1,400 | PFIZER INC. | 19,964 | |||||||||||||
| 262,934 | 9.01 | ||||||||||||||
| INDUSTRIALS | 13.06 | ||||||||||||||
| AEROSPACE & DEFENSE | |||||||||||||||
| 1,250 | BOEING CO. | 78,438 | |||||||||||||
| 2,000 | HONEYWELL INT'L INC. | 78,060 | |||||||||||||
| 156,498 | 5.36 | ||||||||||||||
| AIR FREIGHT & LOGISTICS | |||||||||||||||
| 1,000 | FEDEX CORP. | 70,110 | |||||||||||||
| 1,200 | UNITED PARCEL SERVICE INC. B | 68,268 | |||||||||||||
| 138,378 | 4.74 | ||||||||||||||
| INDUSTRIAL CONGLOMERATES | |||||||||||||||
| 6,000 | GENERAL ELECTRIC CO. | 86,520 | |||||||||||||
| 86,520 | 2.96 | ||||||||||||||
| INFORMATION TECHNOLOGY | 20.17 | ||||||||||||||
| COMPUTERS & PERIPHERALS | |||||||||||||||
| 525 | APPLE INC.* | 132,053 | |||||||||||||
| 1,200 | INT'L BUSINESS MACHINES CORP. | 148,176 | |||||||||||||
| 280,229 | 9.60 | ||||||||||||||
See Accompanying Notes to Financial Statements
48
Pacific Advisors Growth Fund
Statement of Investments (Unaudited)
as of June 30, 2010
| Quantity or Principal | Description | Current $ Value** | % of Total Net Assets | ||||||||||||
| COMMON STOCK continued | |||||||||||||||
| IT SERVICES | |||||||||||||||
| 1,000 | AUTOMATIC DATA PROCESSING INC. | 40,260 | |||||||||||||
| 1,000 | PAYCHEX INC. | 25,970 | |||||||||||||
| 66,230 | 2.27 | ||||||||||||||
| SEMICONDUCTORS & EQUIPMENT | |||||||||||||||
| 5,600 | INTEL CORP. | 108,920 | |||||||||||||
| 108,920 | 3.73 | ||||||||||||||
| SOFTWARE | |||||||||||||||
| 5,800 | MICROSOFT CORP. | 133,458 | |||||||||||||
| 133,458 | 4.57 | ||||||||||||||
| TOTAL COMMON STOCK (Cost: $3,108,356) | 2,927,555 | 100.28 | |||||||||||||
| TOTAL GROWTH FUND (Cost: $3,108,356) | 2,927,555 | 100.28 | |||||||||||||
| OTHER ASSETS LESS LIABILITIES | (8,198 | ) | (0.28 | ) | |||||||||||
| TOTAL NET ASSETS | 2,919,357 | 100.00 | |||||||||||||
* Non-income producing
** The principal amount is stated in U.S. dollars unless otherwise indicated.
See Accompanying Notes to Financial Statements
49
Pacific Advisors Multi-Cap Value Fund
Statement of Investments (Unaudited)
as of June 30, 2010
| Quantity or Principal | Description | Current $ Value** | % of Total Net Assets | ||||||||||||
| COMMON STOCK | |||||||||||||||
| CONSUMER DISCRETIONARY | 13.98 | ||||||||||||||
| SPECIALTY RETAIL | |||||||||||||||
| 8,500 | GAMESTOP CORP. A* | 159,715 | |||||||||||||
| 14,000 | PENSKE AUTOMOTIVE GROUP INC.* | 159,040 | |||||||||||||
| 318,755 | 6.67 | ||||||||||||||
| TEXTILES, APPAREL & LUXURY GOODS | |||||||||||||||
| 13,000 | K-SWISS INC.* | 145,990 | |||||||||||||
| 4,400 | PHILLIPS-VAN HEUSEN CORP. | 203,588 | |||||||||||||
| 349,578 | 7.31 | ||||||||||||||
| CONSUMER STAPLES | 4.07 | ||||||||||||||
| BEVERAGES | |||||||||||||||
| 5,200 | DR PEPPER SNAPPLE GROUP INC. | 194,428 | |||||||||||||
| 194,428 | 4.07 | ||||||||||||||
| ENERGY | 32.25 | ||||||||||||||
| ENERGY EQUIPMENT & SERVICES | |||||||||||||||
| 45,000 | ION GEOPHYSICAL CORP.* | 156,600 | |||||||||||||
| 5,500 | LUFKIN INDUSTRIES INC. | 214,445 | |||||||||||||
| 27,000 | MITCHAM INDUSTRIES INC.* | 182,250 | |||||||||||||
| 5,600 | TIDEWATER INC. | 216,832 | |||||||||||||
| 770,127 | 16.11 | ||||||||||||||
| OIL, GAS & CONSUMABLE FUELS | |||||||||||||||
| 2,300 | APACHE CORP. | 193,637 | |||||||||||||
| 9,400 | ARCH COAL INC. | 186,214 | |||||||||||||
| 8,000 | CHESAPEAKE ENERGY CORP. | 167,600 | |||||||||||||
| 3,300 | CHEVRON CORP. | 223,938 | |||||||||||||
| 771,389 | 16.14 | ||||||||||||||
| FINANCIALS | 4.00 | ||||||||||||||
| COMMERCIAL BANKS | |||||||||||||||
| 18,500 | CATHAY GENERAL BANCORP | 191,105 | |||||||||||||
| 191,105 | 4.00 | ||||||||||||||
| INDUSTRIALS | 44.36 | ||||||||||||||
| AIR FREIGHT & LOGISTICS | |||||||||||||||
| 2,500 | CH ROBINSON WORLDWIDE INC. | 139,150 | |||||||||||||
| 139,150 | 2.91 | ||||||||||||||
| COMMERCIAL SERVICES & SUPPLIES | |||||||||||||||
| 6,200 | COPART INC.* | 222,022 | |||||||||||||
| 222,022 | 4.65 | ||||||||||||||
See Accompanying Notes to Financial Statements
50
Pacific Advisors Multi-Cap Value Fund
Statement of Investments (Unaudited)
as of June 30, 2010
| Quantity or Principal | Description | Current $ Value** | % of Total Net Assets | ||||||||||||
| COMMON STOCK continued | |||||||||||||||
| CONSTRUCTION & ENGINEERING | |||||||||||||||
| 8,000 | CHICAGO BRIDGE & IRON CO. NV* | 150,480 | |||||||||||||
| 7,800 | KBR INC. | 158,652 | |||||||||||||
| 309,132 | 6.47 | ||||||||||||||
| MACHINERY | |||||||||||||||
| 2,500 | BUCYRUS INT'L INC. | 118,625 | |||||||||||||
| 5,000 | GRACO INC. | 140,950 | |||||||||||||
| 2,600 | JOY GLOBAL INC. | 130,234 | |||||||||||||
| 3,500 | NAVISTAR INT'L CORP.* | 172,200 | |||||||||||||
| 562,009 | 11.76 | ||||||||||||||
| MARINE | |||||||||||||||
| 14,000 | DRYSHIPS INC.* | 49,980 | |||||||||||||
| 49,980 | 1.05 | ||||||||||||||
| ROAD & RAIL | |||||||||||||||
| 6,300 | GENESEE & WYOMING INC.* | 235,053 | |||||||||||||
| 4,500 | KANSAS CITY SOUTHERN* | 163,575 | |||||||||||||
| 5,400 | LANDSTAR SYSTEM INC. | 210,546 | |||||||||||||
| 11,000 | MARTEN TRANSPORT LTD.* | 228,580 | |||||||||||||
| 837,754 | 17.53 | ||||||||||||||
| MATERIALS | 6.57 | ||||||||||||||
| CHEMICALS | |||||||||||||||
| 7,000 | H.B. FULLER CO. | 132,930 | |||||||||||||
| 132,930 | 2.78 | ||||||||||||||
| METALS & MINING | |||||||||||||||
| 13,700 | COMMERCIAL METALS CO. | 181,114 | |||||||||||||
| 181,114 | 3.79 | ||||||||||||||
| TOTAL COMMON STOCK (Cost: $6,101,511) | 5,029,473 | 105.23 | |||||||||||||
| TOTAL MULTI-CAP VALUE FUND (Cost: $6,101,511) | 5,029,473 | 105.23 | |||||||||||||
| OTHER ASSETS LESS LIABILITIES | (249,901 | ) | (5.23 | ) | |||||||||||
| TOTAL NET ASSETS | 4,779,572 | 100.00 | |||||||||||||
* Non-income producing
** The principal amount is stated in U.S. dollars unless otherwise indicated.
See Accompanying Notes to Financial Statements
51
Pacific Advisors Small Cap Fund
Statement of Investments (Unaudited)
as of June 30, 2010
| Quantity or Principal | Description | Current $ Value** | % of Total Net Assets | ||||||||||||
| COMMON STOCK | |||||||||||||||
| CONSUMER DISCRETIONARY | 10.63 | ||||||||||||||
| AUTO COMPONENTS | |||||||||||||||
| 425,000 | AMERIGON INC.* | 3,136,500 | |||||||||||||
| 3,136,500 | 2.82 | ||||||||||||||
| SPECIALTY RETAIL | |||||||||||||||
| 484,000 | CONNS INC.* | 2,845,920 | |||||||||||||
| 680,000 | SONIC AUTOMOTIVE INC.* | 5,820,800 | |||||||||||||
| 8,666,720 | 7.80 | ||||||||||||||
| CONSUMER STAPLES | �� | 5.01 | |||||||||||||
| FOOD PRODUCTS | |||||||||||||||
| 420,000 | DARLING INT'L INC.* | 3,154,200 | |||||||||||||
| 600,000 | OMEGA PROTEIN CORP.* | 2,406,000 | |||||||||||||
| 5,560,200 | 5.01 | ||||||||||||||
| ENERGY | 13.13 | ||||||||||||||
| ENERGY EQUIPMENT & SERVICES | |||||||||||||||
| 85,000 | HORNBECK OFFSHORE SERVICES INC.* | 1,241,000 | |||||||||||||
| 340,000 | MATRIX SERVICE CO.* | 3,165,400 | |||||||||||||
| 540,000 | MITCHAM INDUSTRIES INC.* | 3,645,000 | |||||||||||||
| 150,000 | NATURAL GAS SERVICES GROUP* | 2,269,500 | |||||||||||||
| 85,000 | NORTH AMERICAN ENERGY PARTNERS INC.* | 750,550 | |||||||||||||
| 710,000 | PARKER DRILLING CO.* | 2,804,500 | |||||||||||||
| 13,875,950 | 12.49 | ||||||||||||||
| OIL, GAS & CONSUMABLE FUELS | |||||||||||||||
| 455,000 | INFINITY ENERGY RESOURCES INC.* | 491,400 | |||||||||||||
| 44,275 | POSTROCK ENERGY CORP.* | 212,520 | |||||||||||||
| 703,920 | 0.63 | ||||||||||||||
| FINANCIALS | 20.80 | ||||||||||||||
| COMMERCIAL BANKS | |||||||||||||||
| 418,000 | EAST WEST BANCORP INC. | 6,374,500 | |||||||||||||
| 290,000 | NARA BANCORP INC.* | 2,444,700 | |||||||||||||
| 385,000 | WILSHIRE BANCORP INC. | 3,368,750 | |||||||||||||
| 12,187,950 | 10.97 | ||||||||||||||
| CONSUMER FINANCE | |||||||||||||||
| 359,000 | EZCORP INC. A* | 6,659,450 | |||||||||||||
| 195,000 | FIRST CASH FINANCIAL SERVICES INC.* | 4,251,000 | |||||||||||||
| 10,910,450 | 9.82 | ||||||||||||||
See Accompanying Notes to Financial Statements
52
Pacific Advisors Small Cap Fund
Statement of Investments (Unaudited)
as of June 30, 2010
| Quantity or Principal | Description | Current $ Value** | % of Total Net Assets | ||||||||||||
| COMMON STOCK continued | |||||||||||||||
| HEALTH CARE | 8.61 | ||||||||||||||
| HEALTH CARE PROVIDERS & SERVICES | |||||||||||||||
| 395,000 | AMERICA SERVICE GROUP INC. | 6,794,000 | |||||||||||||
| 280,000 | ROCHESTER MEDICAL CORP.* | 2,646,000 | |||||||||||||
| 197,800 | UNITED AMERICAN HEALTHCARE CORP.* | 118,680 | |||||||||||||
| 9,558,680 | 8.61 | ||||||||||||||
| INDUSTRIALS | 41.74 | ||||||||||||||
| COMMERCIAL SERVICES & SUPPLIES | |||||||||||||||
| 345,000 | MOBILE MINI INC.* | 5,616,600 | |||||||||||||
| 314,000 | TEAM INC.* | 4,097,700 | |||||||||||||
| 180,000 | US ECOLOGY INC. | 2,622,600 | |||||||||||||
| 12,336,900 | 11.11 | ||||||||||||||
| CONSTRUCTION & ENGINEERING | |||||||||||||||
| 560,000 | FURMANITE CORP.* | 2,223,200 | |||||||||||||
| 370,000 | ORION MARINE GROUP INC.* | 5,254,000 | |||||||||||||
| 7,477,200 | 6.73 | ||||||||||||||
| MARINE | |||||||||||||||
| 139,000 | KIRBY CORP.* | 5,316,750 | |||||||||||||
| 5,316,750 | 4.79 | ||||||||||||||
| ROAD & RAIL | |||||||||||||||
| 101,600 | FROZEN FOOD EXPRESS INDUSTRIES INC.* | 355,600 | |||||||||||||
| 390,000 | SAIA INC.* | 5,850,000 | |||||||||||||
| 574,600 | VITRAN CORPORATION INC.* | 7,601,958 | |||||||||||||
| 13,807,558 | 12.43 | ||||||||||||||
| TRADING COMPANIES & DISTRIBUTORS | |||||||||||||||
| 230,000 | DXP ENTERPRISES INC.* | 3,599,500 | |||||||||||||
| 170,000 | TAL INTERNATIONAL GROUP INC. | 3,819,900 | |||||||||||||
| 7,419,400 | 6.68 | ||||||||||||||
| MATERIALS | 3.33 | ||||||||||||||
| METALS & MINING | |||||||||||||||
| 280,000 | COMMERCIAL METALS CO. | 3,701,600 | |||||||||||||
| 3,701,600 | 3.33 | ||||||||||||||
See Accompanying Notes to Financial Statements
53
Pacific Advisors Small Cap Fund
Statement of Investments (Unaudited)
as of June 30, 2010
| Quantity or Principal | Description | Current $ Value** | % of Total Net Assets | ||||||||||||
| COMMON STOCK continued | |||||||||||||||
| TELECOMMUNICATION SERVICES | 2.68 | ||||||||||||||
| DIVERSIFIED TELECOM. SERVICES | |||||||||||||||
| 470,000 | PREMIERE GLOBAL SERVICES INC.* | 2,979,800 | |||||||||||||
| 2,979,800 | 2.68 | ||||||||||||||
| TOTAL COMMON STOCK (Cost: $130,431,570) | 117,639,578 | 105.91 | |||||||||||||
| TOTAL SMALL CAP FUND (Cost: $130,431,570) | 117,639,578 | 105.91 | |||||||||||||
| OTHER ASSETS LESS LIABILITIES | (6,563,891 | ) | (5.91 | ) | |||||||||||
| TOTAL NET ASSETS | 111,075,687 | 100.00 | |||||||||||||
* Non-income producing
** The principal amount is stated in U.S. dollars unless otherwise indicated.
See Accompanying Notes to Financial Statements
54
(This page has been left blank intentionally.)
55
Pacific Advisors Fund Inc.
Statement of Assets and Liabilities (Unaudited)
June 30, 2010
| Government Securities Fund | Income and Equity Fund | Balanced Fund | Growth Fund | Multi-Cap Value Fund | Small Cap Fund | ||||||||||||||||||||||
| Assets | |||||||||||||||||||||||||||
| Investment securities | |||||||||||||||||||||||||||
| At cost | �� | $ | 4,270,876 | $ | 8,505,604 | $ | 25,252,327 | $ | 3,108,356 | $ | 6,101,511 | $ | 130,431,570 | ||||||||||||||
| At fair value | $ | 4,236,080 | $ | 8,230,997 | $ | 24,705,280 | $ | 2,927,555 | $ | 5,029,473 | $ | 117,639,578 | |||||||||||||||
| Cash or cash equivalent, at fair value | 70,846 | 116,678 | - | - | - | - | |||||||||||||||||||||
| Accrued income receivable | 29,254 | 88,819 | 136,012 | 5,933 | 4,659 | 33,600 | |||||||||||||||||||||
| Receivable for capital shares sold | - | - | - | - | - | 10,914 | |||||||||||||||||||||
| Receivable for investments sold | - | - | - | - | 53,761 | 41,643 | |||||||||||||||||||||
| Other assets | - | - | - | - | 7,115 | - | |||||||||||||||||||||
| Total assets | 4,336,180 | 8,436,494 | 24,841,292 | 2,933,488 | 5,095,008 | 117,725,735 | |||||||||||||||||||||
| Liabilities | |||||||||||||||||||||||||||
| Bank borrowings (Note 7) | - | - | 16,125 | 3,248 | 311,836 | 6,403,985 | |||||||||||||||||||||
| Payable for fund shares redeemed | - | - | - | - | - | 199,194 | |||||||||||||||||||||
| Accounts payable | 7,137 | 13,859 | 33,479 | 10,883 | - | 31,343 | |||||||||||||||||||||
| Accounts payable to related parties (Note 3) | - | 3,600 | 3,600 | - | 3,600 | 15,526 | |||||||||||||||||||||
| Total liabilities | 7,137 | 17,459 | 53,204 | 14,131 | 315,436 | 6,650,048 | |||||||||||||||||||||
| Net Assets | $ | 4,329,043 | $ | 8,419,035 | $ | 24,788,088 | $ | 2,919,357 | $ | 4,779,572 | $ | 111,075,687 | |||||||||||||||
| Summary of Shareholders' Equity | |||||||||||||||||||||||||||
| Paid in capital | 5,550,898 | 9,448,598 | 23,749,372 | 3,257,031 | 7,419,159 | 138,145,453 | |||||||||||||||||||||
| Accumulated undistributed net investment income | 141 | 526 | 66,929 | 190 | - | - | |||||||||||||||||||||
| Accumulated undistributed net realized gains (losses) on security transactions | (1,187,200 | ) | (755,482 | ) | 1,518,834 | (157,063 | ) | (1,567,549 | ) | (14,277,774 | ) | ||||||||||||||||
| Net unrealized depreciation of investments | (34,796 | ) | (274,607 | ) | (547,047 | ) | (180,801 | ) | (1,072,038 | ) | (12,791,992 | ) | |||||||||||||||
| Net assets at June 30, 2010 | $ | 4,329,043 | $ | 8,419,035 | $ | 24,788,088 | $ | 2,919,357 | $ | 4,779,572 | $ | 111,075,687 | |||||||||||||||
| Class A: | |||||||||||||||||||||||||||
| Net assets | $ | 2,238,063 | $ | 3,574,886 | $ | 4,039,182 | $ | 2,201,402 | $ | 2,718,542 | $ | 98,357,138 | |||||||||||||||
| Shares authorized | 50,000,000 | 50,000,000 | 50,000,000 | 50,000,000 | 50,000,000 | 50,000,000 | |||||||||||||||||||||
| Shares outstanding | 249,563 | 387,605 | 285,612 | 278,698 | 327,591 | 3,959,696 | |||||||||||||||||||||
| Net asset value and redemption price per share | $ | 8.97 | $ | 9.22 | $ | 14.14 | $ | 7.90 | $ | 8.30 | $ | 24.84 | |||||||||||||||
| Maximum offering price per share | $ | 9.42 | $ | 9.68 | $ | 15.00 | $ | 8.38 | $ | 8.81 | $ | 26.36 | |||||||||||||||
| Sales load | 4.75 | % | 4.75 | % | 5.75 | % | 5.75 | % | 5.75 | % | 5.75 | % | |||||||||||||||
| Class C: | |||||||||||||||||||||||||||
| Net assets | $ | 2,090,980 | $ | 4,844,149 | $ | 20,748,906 | $ | 717,955 | $ | 2,061,030 | $ | 12,714,214 | |||||||||||||||
| Shares authorized | 50,000,000 | 50,000,000 | 50,000,000 | 50,000,000 | 50,000,000 | 50,000,000 | |||||||||||||||||||||
| Shares outstanding | 235,090 | 551,892 | 1,530,112 | 100,278 | 266,876 | 592,549 | |||||||||||||||||||||
| Net asset value and redemption price per share | $ | 8.89 | $ | 8.78 | $ | 13.56 | $ | 7.16 | $ | 7.72 | $ | 21.46 | |||||||||||||||
| Class I: | |||||||||||||||||||||||||||
| Net assets | N/A | N/A | N/A | N/A | N/A | $ | 4,335 | ||||||||||||||||||||
| Shares authorized | 50,000,000 | ||||||||||||||||||||||||||
| Shares outstanding | 154 | ||||||||||||||||||||||||||
| Net asset value and redemption price per share | N/A | N/A | N/A | N/A | N/A | $ | 28.16 | ||||||||||||||||||||
See Accompanying Notes to Financial Statements which are an integral part of these financial statements.
56
57
Pacific Advisors Fund Inc.
Statement of Operations (Unaudited)
For the six months ended June 30, 2010
| Government Securities Fund | Income and Equity Fund | Balanced Fund | Growth Fund | Multi-Cap Value Fund | Small Cap Fund | ||||||||||||||||||||||
| Investment Income | |||||||||||||||||||||||||||
| Dividends | $ | 18,143 | $ | 67,268 | $ | 267,807 | $ | 31,138 | $ | 30,900 | $ | 304,850 | |||||||||||||||
| Interest | 49,880 | 139,949 | 202,618 | 20 | - | - | |||||||||||||||||||||
| Other Income | - | - | - | - | - | 393 | |||||||||||||||||||||
| Total income | 68,023 | 207,217 | 470,425 | 31,158 | 30,900 | 305,243 | |||||||||||||||||||||
| Expenses | |||||||||||||||||||||||||||
| Investment management fees | 15,445 | 31,336 | 104,648 | 10,936 | 29,724 | 482,419 | |||||||||||||||||||||
| Transfer agent fees | 24,712 | 30,918 | 48,835 | 37,620 | 26,157 | 205,832 | |||||||||||||||||||||
| Fund accounting fees | 11,168 | 19,637 | 65,579 | 10,936 | 13,970 | 302,316 | |||||||||||||||||||||
| Legal fees | 2,139 | 3,760 | 12,558 | 1,312 | 2,675 | 57,890 | |||||||||||||||||||||
| Audit fees | 2,376 | 4,178 | 13,953 | 1,458 | 2,972 | 64,323 | |||||||||||||||||||||
| Registration fees | 7,841 | 9,192 | 12,558 | 9,478 | 10,403 | 19,297 | |||||||||||||||||||||
| Printing | 1,663 | 2,925 | 9,767 | 1,021 | 2,081 | 45,026 | |||||||||||||||||||||
| Custody fees | 4,277 | 3,719 | 4,186 | 3,500 | 3,985 | 14,726 | |||||||||||||||||||||
| Interest on borrowings | - | 41 | - | - | 2,257 | 43,164 | |||||||||||||||||||||
| Director fees/meetings | 950 | 1,671 | 5,581 | 583 | 1,189 | 25,729 | |||||||||||||||||||||
| Distribution and service (12b-1) fees (Note 3) | 14,863 | 29,650 | 123,448 | 6,175 | 17,840 | 216,177 | |||||||||||||||||||||
| Other expenses | 3,089 | 5,432 | 18,139 | 1,895 | 3,864 | 83,619 | |||||||||||||||||||||
| Total expenses, before fees waived | 88,523 | 142,459 | 419,252 | 84,914 | 117,117 | 1,560,518 | |||||||||||||||||||||
| Less fees waived (Note 3) | 35,404 | 31,336 | - | 33,391 | - | - | |||||||||||||||||||||
| Net expenses | 53,119 | 111,123 | 419,252 | 51,523 | 117,117 | 1,560,518 | |||||||||||||||||||||
| Net Investment Income (Loss) | 14,904 | 96,094 | 51,173 | (20,365 | ) | (86,217 | ) | (1,255,275 | ) | ||||||||||||||||||
| Net Realized and Unrealized Loss on Investments | |||||||||||||||||||||||||||
| Net realized gain (loss) on investments | 3,150 | 30,154 | 3,081,507 | 188,015 | 134,265 | (2,087,303 | ) | ||||||||||||||||||||
| Change in net unrealized depreciation of investments | (5,681 | ) | (279,947 | ) | (4,555,112 | ) | (333,575 | ) | (268,938 | ) | (3,089,689 | ) | |||||||||||||||
| (2,531 | ) | (249,793 | ) | (1,473,605 | ) | (145,560 | ) | (134,673 | ) | (5,176,992 | ) | ||||||||||||||||
| Net Increase in Net Assets Resulting from Operations | $ | 12,373 | $ | (153,699 | ) | $ | (1,422,432 | ) | $ | (165,925 | ) | $ | (220,890 | ) | $ | (6,432,267 | ) | ||||||||||
See Accompanying Notes to Financial Statements which are an integral part of these financial statements.
58
59
Pacific Advisors Fund Inc.
Statement of Changes in Net Assets (Unaudited)
| Government Securities Fund | Income and Equity Fund | Balanced Fund | |||||||||||||||||||||||||
| Six months ended June 30, 2010 | Year ended December 31, 2009 | Six months ended June 30, 2010 | Year ended December 31, 2009 | Six months ended June 30, 2010 | Year ended December 31, 2009 | ||||||||||||||||||||||
| Increase (Decrease) in Net Assets From Operations | |||||||||||||||||||||||||||
| Net investment income (loss) | $ | 14,904 | $ | 73,484 | $ | 96,094 | $ | 200,643 | $ | 51,173 | $ | 242,435 | |||||||||||||||
| Net realized gain (loss) on investments | 3,150 | (90,665 | ) | 30,154 | (277,641 | ) | 3,081,507 | (620,811 | ) | ||||||||||||||||||
| Change in net unrealized appreciation (depreciation) of investments | (5,681 | ) | 125,743 | (279,947 | ) | 1,092,683 | (4,555,112 | ) | 5,482,133 | ||||||||||||||||||
| Increase (decrease) in net assets resulting from operations | 12,373 | 108,562 | (153,699 | ) | 1,015,685 | (1,422,432 | ) | 5,103,757 | |||||||||||||||||||
| From Distributions to Shareholders | |||||||||||||||||||||||||||
| Class A: | |||||||||||||||||||||||||||
| Net investment income | (12,497 | ) | (46,545 | ) | (46,905 | ) | (82,954 | ) | - | (58,061 | ) | ||||||||||||||||
| Net capital gains | - | - | - | - | - | - | |||||||||||||||||||||
| Class C: | |||||||||||||||||||||||||||
| Net investment income | (2,830 | ) | (29,507 | ) | (47,759 | ) | (122,038 | ) | - | (175,818 | ) | ||||||||||||||||
| Net capital gains | - | - | - | - | - | - | |||||||||||||||||||||
| Class I: | N/A | N/A | N/A | N/A | N/A | N/A | |||||||||||||||||||||
| Net investment income | |||||||||||||||||||||||||||
| Net capital gains | |||||||||||||||||||||||||||
| Decrease in net assets resulting from distributions | (15,327 | ) | (76,052 | ) | (94,664 | ) | (204,992 | ) | - | (233,879 | ) | ||||||||||||||||
| From Capital Share Transactions (Note 6) | |||||||||||||||||||||||||||
| Proceeds from shares sold | 455,799 | 988,257 | 1,243,876 | 823,243 | 342,278 | 1,837,042 | |||||||||||||||||||||
| Proceeds from shares purchased by reinvestment of dividends | 13,447 | 65,602 | 88,705 | 191,512 | - | 222,990 | |||||||||||||||||||||
| Cost of shares repurchased | (1,267,783 | ) | (1,466,506 | ) | (659,282 | ) | (1,265,863 | ) | (3,321,956 | ) | (3,921,187 | ) | |||||||||||||||
| Increase (decrease) in net assets resulting from capital share transactions | (798,537 | ) | (412,647 | ) | 673,299 | (251,108 | ) | (2,979,678 | ) | (1,861,155 | ) | ||||||||||||||||
| Increase (decrease) in net assets | (801,491 | ) | (380,137 | ) | 424,936 | 559,585 | (4,402,110 | ) | 3,008,723 | ||||||||||||||||||
| Net Assets | |||||||||||||||||||||||||||
| Beginning of period | 5,130,534 | 5,510,671 | 7,994,099 | 7,434,514 | 29,190,198 | 26,181,475 | |||||||||||||||||||||
| End of period | $ | 4,329,043 | $ | 5,130,534 | $ | 8,419,035 | $ | 7,994,099 | $ | 24,788,088 | $ | 29,190,198 | |||||||||||||||
| Including undistributed net investment income | $ | 141 | $ | 564 | $ | 526 | $ | (904 | ) | $ | 66,929 | $ | 15,756 | ||||||||||||||
See Accompanying Notes to Financial Statements which are an integral part of these financial statements.
60
61
Pacific Advisors Fund Inc.
Statement of Changes in Net Assets (Unaudited)
| Growth Fund | Multi-Cap Value Fund | Small Cap Fund | |||||||||||||||||||||||||
| Six months ended June 30, 2010 | Year ended December 31, 2009 | Six months ended June 30, 2010 | Year ended December 31, 2009 | Six months ended June 30, 2010 | Year ended December 31, 2009 | ||||||||||||||||||||||
| Increase (Decrease) in Net Assets From Operations | |||||||||||||||||||||||||||
| Net investment income (loss) | $ | (20,365 | ) | $ | (64,435 | ) | $ | (86,217 | ) | $ | (169,451 | ) | $ | (1,255,275 | ) | $ | (2,445,187 | ) | |||||||||
| Net realized gain (loss) on investments | 188,015 | (90,603 | ) | 134,265 | (590,448 | ) | (2,087,303 | ) | (11,115,931 | ) | |||||||||||||||||
| Change in net unrealized appreciation (depreciation) of investments | (333,575 | ) | 810,623 | (268,938 | ) | 2,692,158 | (3,089,689 | ) | 48,599,772 | ||||||||||||||||||
| Increase (decrease) in net assets resulting from operations | (165,925 | ) | 655,585 | (220,890 | ) | 1,932,259 | (6,432,267 | ) | 35,038,654 | ||||||||||||||||||
| From Distributions to Shareholders | |||||||||||||||||||||||||||
| Class A: | |||||||||||||||||||||||||||
| Net investment income | - | - | - | - | - | - | |||||||||||||||||||||
| Net capital gains | - | - | - | - | - | - | |||||||||||||||||||||
| Class C: | |||||||||||||||||||||||||||
| Net investment income | - | - | - | - | - | - | |||||||||||||||||||||
| Net capital gains | - | - | - | - | - | - | |||||||||||||||||||||
| Class I: | N/A | N/A | N/A | N/A | |||||||||||||||||||||||
| Net investment income | - | - | |||||||||||||||||||||||||
| Net capital gains | - | - | |||||||||||||||||||||||||
| Decrease in net assets resulting from distributions | - | - | - | - | - | - | |||||||||||||||||||||
| From Capital Share Transactions (Note 6) | |||||||||||||||||||||||||||
| Proceeds from shares sold | 645,846 | 244,428 | 228,085 | 1,075,173 | 9,627,795 | 39,655,691 | |||||||||||||||||||||
| Proceeds from shares purchased by reinvestment of dividends | - | - | - | - | - | - | |||||||||||||||||||||
| Cost of shares repurchased | (374,377 | ) | (1,142,421 | ) | (1,572,609 | ) | (3,714,932 | ) | (25,172,825 | ) | (44,812,413 | ) | |||||||||||||||
| Increase (decrease) in net assets resulting from capital share transactions | 271,469 | (897,993 | ) | (1,344,524 | ) | (2,639,759 | ) | (15,545,030 | ) | (5,156,722 | ) | ||||||||||||||||
| Increase (decrease) in net assets | 105,544 | (242,408 | ) | (1,565,414 | ) | (707,500 | ) | (21,977,297 | ) | 29,881,932 | |||||||||||||||||
| Net Assets | |||||||||||||||||||||||||||
| Beginning of period | 2,813,813 | 3,056,221 | 6,344,986 | 7,052,486 | 133,052,984 | 103,171,052 | |||||||||||||||||||||
| End of period | $ | 2,919,357 | $ | 2,813,813 | $ | 4,779,572 | $ | 6,344,986 | $ | 111,075,687 | $ | 133,052,984 | |||||||||||||||
| Including undistributed net investment income | $ | 190 | $ | 190 | $ | - | $ | - | $ | - | $ | - | |||||||||||||||
See Accompanying Notes to Financial Statements which are an integral part of these financial statements.
62
63
Pacific Advisors Fund Inc.
Financial Highlights (Unaudited)
(For a share outstanding throughout the period)
| Government Securities Fund | |||||||||||||||||||||||||||
| Class A | |||||||||||||||||||||||||||
| For the six months ended | For the year ended December 31, | ||||||||||||||||||||||||||
| June 30, 2010 | 2009 | 2008 | 2007 | 2006 | 2005 | ||||||||||||||||||||||
| Per Share Operating Performance | |||||||||||||||||||||||||||
| Net asset value, beginning of period | $ | 8.99 | $ | 8.94 | $ | 9.42 | $ | 9.24 | $ | 9.27 | $ | 9.51 | |||||||||||||||
| Income from investing operations | |||||||||||||||||||||||||||
| Net investment income | 0.06 | 0.18 | 0.32 | 0.29 | 0.23 | 0.28 | |||||||||||||||||||||
| Net realized and unrealized gains (losses) on securities | (0.03 | ) | 0.02 | (0.53 | ) | 0.22 | 0.05 | (0.18 | ) | ||||||||||||||||||
| Total from investment operations | 0.03 | 0.20 | (0.21 | ) | 0.51 | 0.28 | 0.10 | ||||||||||||||||||||
| Less distributions | |||||||||||||||||||||||||||
| From net investment income | (0.05 | ) | (0.15 | ) | (0.27 | ) | (0.33 | ) | (0.31 | ) | (0.34 | ) | |||||||||||||||
| From net capital gains | - | - | - | - | - | - | |||||||||||||||||||||
| Total distributions | (0.05 | ) | (0.15 | ) | (0.27 | ) | (0.33 | ) | (0.31 | ) | (0.34 | ) | |||||||||||||||
| Net asset value, end of period | $ | 8.97 | $ | 8.99 | $ | 8.94 | $ | 9.42 | $ | 9.24 | $ | 9.27 | |||||||||||||||
| Total Investment Return (a) | 0.30 | %(b) | 2.26 | % | (2.28 | )% | 5.54 | % | 3.14 | % | 1.08 | % | |||||||||||||||
| Ratios/Supplemental Data | |||||||||||||||||||||||||||
| Net assets, end of period (000's) | $ | 2,238 | $ | 2,537 | $ | 3,054 | $ | 3,817 | $ | 2,467 | $ | 2,219 | |||||||||||||||
| Ratio of net investment income to average net assets | |||||||||||||||||||||||||||
| With expense reductions | 1.00 | %(c) | 1.69 | % | 3.33 | % | 3.57 | % | 2.70 | % | 2.68 | % | |||||||||||||||
| Without expense reductions | (0.49 | )%(c) | 0.25 | % | 1.87 | % | 2.21 | % | 2.04 | % | 2.03 | % | |||||||||||||||
| Ratio of expenses to average net assets | |||||||||||||||||||||||||||
| With expense reductions | 1.86 | %(c) | 1.69 | % | 1.65 | % | 1.62 | % | 2.51 | % | 2.26 | % | |||||||||||||||
| Without expense reductions | 3.35 | %(c) | 3.13 | % | 3.11 | % | 2.98 | % | 3.17 | % | 2.91 | % | |||||||||||||||
| Fund portfolio turnover rate | 192 | %(c) | 224 | % | 173 | % | 59 | % | 16 | % | 88 | % | |||||||||||||||
| Class C | |||||||||||||||||||||||||||
| For the six months ended | For the year ended December 31, | ||||||||||||||||||||||||||
| June 30, 2010 | 2009 | 2008 | 2007 | 2006 | 2005 | ||||||||||||||||||||||
| Per Share Operating Performance | |||||||||||||||||||||||||||
| Net asset value, beginning of period | $ | 8.90 | $ | 8.87 | $ | 9.45 | $ | 9.23 | $ | 9.13 | $ | 9.27 | |||||||||||||||
| Income from investing operations | |||||||||||||||||||||||||||
| Net investment income (expense) | (0.02 | ) | 0.09 | 0.28 | 0.25 | 0.08 | 0.14 | ||||||||||||||||||||
| Net realized and unrealized gains (losses) on securities | 0.02 | 0.04 | (0.56 | ) | 0.18 | 0.14 | (0.11 | ) | |||||||||||||||||||
| Total from investment operations | - | 0.13 | (0.28 | ) | 0.43 | 0.22 | 0.03 | ||||||||||||||||||||
| Less distributions | |||||||||||||||||||||||||||
| From net investment income | (0.01 | ) | (0.10 | ) | (0.30 | ) | (0.21 | ) | (0.12 | ) | (0.17 | ) | |||||||||||||||
| From net capital gains | - | - | - | - | - | - | |||||||||||||||||||||
| Total distributions | (0.01 | ) | (0.10 | ) | (0.30 | ) | (0.21 | ) | (0.12 | ) | (0.17 | ) | |||||||||||||||
| Net asset value, end of period | $ | 8.89 | $ | 8.90 | $ | 8.87 | $ | 9.45 | $ | 9.23 | $ | 9.13 | |||||||||||||||
| Total Investment Return | 0.01 | %(b) | 1.44 | % | (3.02 | )% | 4.73 | % | 2.47 | % | 0.28 | % | |||||||||||||||
| Ratios/Supplemental Data | |||||||||||||||||||||||||||
| Net assets, end of period (000's) | $ | 2,091 | $ | 2,594 | $ | 2,456 | $ | 1,595 | $ | 1,731 | $ | 3,780 | |||||||||||||||
| Ratio of net investment income to average net assets | |||||||||||||||||||||||||||
| With expense reductions | 0.25 | %(c) | 0.96 | % | 2.56 | % | 2.77 | % | 1.97 | % | 2.03 | % | |||||||||||||||
| Without expense reductions | (1.24 | )%(c) | (0.47 | )% | 1.10 | % | 1.41 | % | 1.32 | % | 1.38 | % | |||||||||||||||
| Ratio of expenses to average net assets | |||||||||||||||||||||||||||
| With expense reductions | 2.61 | %(c) | 2.41 | % | 2.43 | % | 2.40 | % | 3.21 | % | 2.90 | % | |||||||||||||||
| Without expense reductions | 4.11 | %(c) | 3.85 | % | 3.89 | % | 3.76 | % | 3.86 | % | 3.55 | % | |||||||||||||||
| Fund portfolio turnover rate | 192 | %(c) | 224 | % | 173 | % | 59 | % | 16 | % | 88 | % | |||||||||||||||
(a) The Fund's maximum sales charge is not included in the total return computation
(b) Not annualized
(c) Annualized
See Accompanying Notes to Financial Statements which are an integral part of these financial statements.
64
Pacific Advisors Fund Inc.
Financial Highlights (Unaudited)
(For a share outstanding throughout the period)
| Income and Equity Fund | |||||||||||||||||||||||||||
| Class A | |||||||||||||||||||||||||||
| For the six months ended | For the year ended December 31, | ||||||||||||||||||||||||||
| June 30, 2010 | 2009 | 2008 | 2007 | 2006 | 2005 | ||||||||||||||||||||||
| Per Share Operating Performance | |||||||||||||||||||||||||||
| Net asset value, beginning of period | $ | 9.49 | $ | 8.48 | $ | 10.61 | $ | 10.74 | $ | 10.19 | $ | 10.46 | |||||||||||||||
| Income from investing operations | |||||||||||||||||||||||||||
| Net investment income | 0.08 | 0.30 | 0.33 | 0.31 | 0.20 | 0.20 | |||||||||||||||||||||
| Net realized and unrealized gains (losses) on securities | (0.22 | ) | 0.98 | (2.16 | ) | (0.05 | ) | 0.53 | (0.20 | ) | |||||||||||||||||
| Total from investment operations | (0.14 | ) | 1.28 | (1.83 | ) | 0.26 | 0.73 | - | |||||||||||||||||||
| Less distributions | |||||||||||||||||||||||||||
| From net investment income | (0.13 | ) | (0.27 | ) | (0.30 | ) | (0.28 | ) | (0.18 | ) | (0.26 | ) | |||||||||||||||
| From net capital gains | - | - | - | (0.11 | ) | - | (0.01 | ) | |||||||||||||||||||
| From return of capital | - | - | - | - | - | - | |||||||||||||||||||||
| Total distributions | (0.13 | ) | (0.27 | ) | (0.30 | ) | (0.39 | ) | (0.18 | ) | (0.27 | ) | |||||||||||||||
| Net asset value, end of period | $ | 9.22 | $ | 9.49 | $ | 8.48 | $ | 10.61 | $ | 10.74 | $ | 10.19 | |||||||||||||||
| Total Investment Return (a) | (1.50 | )%(b) | 15.37 | % | (17.49 | )% | 2.39 | % | 7.25 | % | 0.01 | % | |||||||||||||||
| Ratios/Supplemental Data | |||||||||||||||||||||||||||
| Net assets, end of period (000's) | $ | 3,575 | $ | 2,865 | $ | 2,737 | $ | 3,663 | $ | 3,973 | $ | 4,436 | |||||||||||||||
| Ratio of net investment income to average net assets | |||||||||||||||||||||||||||
| With expense reductions | 2.76 | %(c) | 3.22 | % | 3.22 | % | 2.78 | % | 1.74 | % | 2.33 | % | |||||||||||||||
| Without expense reductions | 2.01 | %(c) | 2.47 | % | 2.47 | % | 2.16 | % | 0.99 | % | 1.65 | % | |||||||||||||||
| Ratio of expenses to average net assets | |||||||||||||||||||||||||||
| With expense reductions | 2.20 | %(c) | 2.32 | % | 2.05 | % | 1.95 | % | 2.06 | % | 1.93 | % | |||||||||||||||
| Without expense reductions | 2.95 | %(c) | 3.07 | % | 2.80 | % | 2.57 | % | 2.80 | % | 2.60 | % | |||||||||||||||
| Fund portfolio turnover rate | 24 | %(c) | 29 | % | 39 | % | 46 | % | 23 | % | 40 | % | |||||||||||||||
| Class C | |||||||||||||||||||||||||||
| For the six months ended | For the year ended December 31, | ||||||||||||||||||||||||||
| June 30, 2010 | 2009 | 2008 | 2007 | 2006 | 2005 | ||||||||||||||||||||||
| Per Share Operating Performance | |||||||||||||||||||||||||||
| Net asset value, beginning of period | $ | 9.03 | $ | 8.09 | $ | 10.14 | $ | 10.31 | $ | 9.80 | $ | 10.02 | |||||||||||||||
| Income from investing operations | |||||||||||||||||||||||||||
| Net investment income | 0.09 | 0.21 | 0.23 | 0.22 | 0.08 | 0.15 | |||||||||||||||||||||
| Net realized and unrealized gains (losses) on securities | (0.25 | ) | 0.95 | (2.04 | ) | (0.05 | ) | 0.54 | (0.22 | ) | |||||||||||||||||
| Total from investment operations | (0.16 | ) | 1.16 | (1.81 | ) | 0.17 | 0.62 | (0.07 | ) | ||||||||||||||||||
| Less distributions | |||||||||||||||||||||||||||
| From net investment income | (0.09 | ) | (0.22 | ) | (0.24 | ) | (0.23 | ) | (0.11 | ) | (0.14 | ) | |||||||||||||||
| From net capital gains | - | - | - | (0.11 | ) | - | (0.01 | ) | |||||||||||||||||||
| From return of capital | - | - | - | - | - | - | |||||||||||||||||||||
| Total distributions | (0.09 | ) | (0.22 | ) | (0.24 | ) | (0.34 | ) | (0.11 | ) | (0.15 | ) | |||||||||||||||
| Net asset value, end of period | $ | 8.78 | $ | 9.03 | $ | 8.09 | $ | 10.14 | $ | 10.31 | $ | 9.80 | |||||||||||||||
| Total Investment Return | (1.85 | )%(b) | 14.56 | % | (18.10 | )% | 1.63 | % | 6.40 | % | (0.67 | )% | |||||||||||||||
| Ratios/Supplemental Data | |||||||||||||||||||||||||||
| Net assets, end of period (000's) | $ | 4,844 | $ | 5,129 | $ | 4,697 | $ | 5,990 | $ | 5,743 | $ | 7,265 | |||||||||||||||
| Ratio of net investment income to average net assets | |||||||||||||||||||||||||||
| With expense reductions | 1.98 | %(c) | 2.47 | % | 2.48 | % | 2.06 | % | 1.04 | % | 1.57 | % | |||||||||||||||
| Without expense reductions | 1.23 | %(c) | 1.72 | % | 1.73 | % | 1.43 | % | 0.28 | % | 0.90 | % | |||||||||||||||
| Ratio of expenses to average net assets | |||||||||||||||||||||||||||
| With expense reductions | 2.95 | %(c) | 3.06 | % | 2.81 | % | 2.70 | % | 2.81 | % | 2.70 | % | |||||||||||||||
| Without expense reductions | 3.70 | %(c) | 3.81 | % | 3.56 | % | 3.32 | % | 3.56 | % | 3.37 | % | |||||||||||||||
| Fund portfolio turnover rate | 24 | %(c) | 29 | % | 39 | % | 46 | % | 23 | % | 40 | % | |||||||||||||||
(a) The Fund's maximum sales charge is not included in the total return computation
(b) Not annualized
(c) Annualized
See Accompanying Notes to Financial Statements which are an integral part of these financial statements.
65
Pacific Advisors Fund Inc.
Financial Highlights (Unaudited)
(For a share outstanding throughout the period)
| Balanced Fund | |||||||||||||||||||||||||||
| Class A | |||||||||||||||||||||||||||
| For the six months ended | For the year ended December 31, | ||||||||||||||||||||||||||
| June 30, 2010 | 2009 | 2008 | 2007 | 2006 | 2005 | ||||||||||||||||||||||
| Per Share Operating Performance | |||||||||||||||||||||||||||
| Net asset value, beginning of period | $ | 14.91 | $ | 12.41 | $ | 18.58 | $ | 18.42 | $ | 17.39 | $ | 16.57 | |||||||||||||||
| Income from investing operations | |||||||||||||||||||||||||||
| Net investment income | 0.08 | 0.22 | 0.31 | 0.24 | 0.07 | 0.16 | |||||||||||||||||||||
| Net realized and unrealized gains (losses) on securities | (0.85 | ) | 2.48 | (6.00 | ) | 0.97 | 1.40 | 0.82 | |||||||||||||||||||
| Total from investment operations | (0.77 | ) | 2.70 | (5.69 | ) | 1.21 | 1.47 | 0.98 | |||||||||||||||||||
| Less distributions | |||||||||||||||||||||||||||
| From net investment income | - | (0.20 | ) | (0.28 | ) | (0.20 | ) | - | (0.11 | ) | |||||||||||||||||
| From net capital gains | - | - | (0.20 | ) | (0.85 | ) | (0.44 | ) | (0.01 | ) | |||||||||||||||||
| From return of capital | - | - | - | - | - | (0.04 | ) | ||||||||||||||||||||
| Total distributions | - | (0.20 | ) | (0.48 | ) | (1.05 | ) | (0.44 | ) | (0.16 | ) | ||||||||||||||||
| Net asset value, end of period | $ | 14.14 | $ | 14.91 | $ | 12.41 | $ | 18.58 | $ | 18.42 | $ | 17.39 | |||||||||||||||
| Total Investment Return (a) | (5.16 | )%(b) | 21.76 | % | (30.51 | )% | 6.53 | % | 8.47 | % | 5.90 | % | |||||||||||||||
| Ratios/Supplemental Data | |||||||||||||||||||||||||||
| Net assets, end of period (000's) | $ | 4,039 | $ | 4,362 | $ | 3,774 | $ | 5,918 | $ | 6,787 | $ | 6,323 | |||||||||||||||
| Ratio of net investment income to average net assets | 1.00 | %(c) | 1.58 | % | 1.73 | % | 1.02 | % | 0.43 | % | 0.97 | % | |||||||||||||||
| Ratio of expenses to average net assets | 2.37 | %(c) | 2.47 | % | 2.31 | % | 2.21 | % | 2.54 | % | 2.53 | % | |||||||||||||||
| Fund portfolio turnover rate | 59 | %(c) | 10 | % | 32 | % | 44 | % | 16 | % | 25 | % | |||||||||||||||
| Class C | |||||||||||||||||||||||||||
| For the six months ended | For the year ended December 31, | ||||||||||||||||||||||||||
| June 30, 2010 | 2009 | 2008 | 2007 | 2006 | 2005 | ||||||||||||||||||||||
| Per Share Operating Performance | |||||||||||||||||||||||||||
| Net asset value, beginning of period | $ | 14.35 | $ | 11.96 | $ | 17.88 | $ | 17.77 | $ | 16.92 | $ | 16.13 | |||||||||||||||
| Income from investing operations | |||||||||||||||||||||||||||
| Net investment income (expense) | 0.01 | 0.10 | 0.16 | 0.05 | (0.06 | ) | 0.03 | ||||||||||||||||||||
| Net realized and unrealized gains (losses) on securities | (0.80 | ) | 2.39 | (5.72 | ) | 0.96 | 1.35 | 0.80 | |||||||||||||||||||
| Total from investment operations | (0.79 | ) | 2.49 | (5.56 | ) | 1.01 | 1.29 | 0.83 | |||||||||||||||||||
| Less distributions | |||||||||||||||||||||||||||
| From net investment income | - | (0.10 | ) | (0.16 | ) | (0.05 | ) | - | (0.02 | ) | |||||||||||||||||
| From net capital gains | - | - | (0.20 | ) | (0.85 | ) | (0.44 | ) | (0.01 | ) | |||||||||||||||||
| From return of capital | - | - | - | - | - | (0.01 | ) | ||||||||||||||||||||
| Total distributions | - | (0.10 | ) | (0.36 | ) | (0.90 | ) | (0.44 | ) | (0.04 | ) | ||||||||||||||||
| Net asset value, end of period | $ | 13.56 | $ | 14.35 | $ | 11.96 | $ | 17.88 | $ | 17.77 | $ | 16.92 | |||||||||||||||
| Total Investment Return | (5.51 | )%(b) | 20.84 | % | (31.03 | )% | 5.67 | % | 7.65 | % | 5.16 | % | |||||||||||||||
| Ratios/Supplemental Data | |||||||||||||||||||||||||||
| Net assets, end of period (000's) | $ | 20,749 | $ | 24,828 | $ | 22,407 | $ | 34,960 | $ | 35,593 | $ | 33,185 | |||||||||||||||
| Ratio of net investment income to average net assets | 0.25 | %(c) | 0.82 | % | 0.96 | % | 0.27 | % | (0.33 | )% | 0.19 | % | |||||||||||||||
| Ratio of expenses to average net assets | 3.12 | %(c) | 3.23 | % | 3.09 | % | 2.97 | % | 3.30 | % | 3.30 | % | |||||||||||||||
| Fund portfolio turnover rate | 59 | %(c) | 10 | % | 32 | % | 44 | % | 16 | % | 25 | % | |||||||||||||||
(a) The Fund's maximum sales charge is not included in the total return computation
(b) Not annualized
(c) Annualized
See Accompanying Notes to Financial Statements which are an integral part of these financial statements.
66
Pacific Advisors Fund Inc.
Financial Highlights (Unaudited)
(For a share outstanding throughout the period)
| Growth Fund | |||||||||||||||||||||||||||
| Class A | |||||||||||||||||||||||||||
| For the six months ended | For the year ended December 31, | ||||||||||||||||||||||||||
| June 30, 2010 | 2009 | 2008 | 2007 | 2006 | 2005 | ||||||||||||||||||||||
| Per Share Operating Performance | |||||||||||||||||||||||||||
| Net asset value, beginning of period | $ | 8.33 | $ | 6.51 | $ | 10.83 | $ | 9.21 | $ | 8.54 | $ | 8.22 | |||||||||||||||
| Income from investing operations | |||||||||||||||||||||||||||
| Net investment income (expense) | - | (0.24 | ) | (0.07 | ) | (0.07 | ) | (0.04 | ) | (0.01 | ) | ||||||||||||||||
| Net realized and unrealized gains (losses) on securities | (0.43 | ) | 2.06 | (4.25 | ) | 1.69 | 0.71 | 0.33 | |||||||||||||||||||
| Total from investment operations | (0.43 | ) | 1.82 | (4.32 | ) | 1.62 | 0.67 | 0.32 | |||||||||||||||||||
| Less distributions | |||||||||||||||||||||||||||
| From net investment income | - | - | - | - | - | - | |||||||||||||||||||||
| From net capital gains | - | - | - | - | - | - | |||||||||||||||||||||
| Total distributions | - | - | - | - | - | - | |||||||||||||||||||||
| Net asset value, end of period | $ | 7.90 | $ | 8.33 | $ | 6.51 | $ | 10.83 | $ | 9.21 | $ | 8.54 | |||||||||||||||
| Total Investment Return (a) | (5.16 | )%(b) | 27.96 | % | (39.89 | )% | 17.59 | % | 7.85 | % | 3.89 | % | |||||||||||||||
| Ratios/Supplemental Data | |||||||||||||||||||||||||||
| Net assets, end of period (000's) | $ | 2,201 | $ | 2,176 | $ | 1,984 | $ | 2,889 | $ | 2,101 | $ | 1,650 | |||||||||||||||
| Ratio of net investment income to average net assets | |||||||||||||||||||||||||||
| With expense reductions | (1.23 | )%(c) | (2.06 | )% | (1.38 | )% | (1.33 | )% | (1.11 | )% | (1.37 | )% | |||||||||||||||
| Without expense reductions | (3.51 | )%(c) | (4.31 | )% | (2.41 | )% | (1.85 | )% | (2.14 | )% | (3.06 | )% | |||||||||||||||
| Ratio of expenses to average net assets | |||||||||||||||||||||||||||
| With expense reductions | 3.36 | %(c) | 3.46 | % | 2.62 | % | 2.65 | % | 2.64 | % | 2.63 | % | |||||||||||||||
| Without expense reductions | 5.64 | %(c) | 5.71 | % | 3.65 | % | 3.17 | % | 3.68 | % | 4.32 | % | |||||||||||||||
| Fund portfolio turnover rate | 189 | %(c) | 5 | % | 14 | % | 14 | % | 23 | % | 31 | % | |||||||||||||||
| Class C | |||||||||||||||||||||||||||
| For the six months ended | For the year ended December 31, | ||||||||||||||||||||||||||
| June 30, 2010 | 2009 | 2008 | 2007 | 2006 | 2005 | ||||||||||||||||||||||
| Per Share Operating Performance | |||||||||||||||||||||||||||
| Net asset value, beginning of period | $ | 7.58 | $ | 5.97 | $ | 10.03 | $ | 8.59 | $ | 8.02 | $ | 7.79 | |||||||||||||||
| Income from investing operations | |||||||||||||||||||||||||||
| Net investment income (expense) | 0.31 | (1.36 | ) | (0.31 | ) | (0.21 | ) | (0.12 | ) | 0.37 | |||||||||||||||||
| Net realized and unrealized gains (losses) on securities | (0.73 | ) | 2.97 | (3.75 | ) | 1.65 | 0.69 | (0.14 | ) | ||||||||||||||||||
| Total from investment operations | (0.42 | ) | 1.61 | (4.06 | ) | 1.44 | 0.57 | 0.23 | |||||||||||||||||||
| Less distributions | |||||||||||||||||||||||||||
| From net investment income | - | - | - | - | - | - | |||||||||||||||||||||
| From net capital gains | - | - | - | - | - | - | |||||||||||||||||||||
| Total distributions | - | - | - | - | - | - | |||||||||||||||||||||
| Net asset value, end of period | $ | 7.16 | $ | 7.58 | $ | 5.97 | $ | 10.03 | $ | 8.59 | $ | 8.02 | |||||||||||||||
| Total Investment Return | (5.54 | )%(b) | 26.97 | % | (40.48 | )% | 16.76 | % | 7.11 | % | 2.95 | % | |||||||||||||||
| Ratios/Supplemental Data | |||||||||||||||||||||||||||
| Net assets, end of period (000's) | $ | 718 | $ | 637 | $ | 1,072 | $ | 2,096 | $ | 1,856 | $ | 1,532 | |||||||||||||||
| Ratio of net investment income to average net assets | |||||||||||||||||||||||||||
| With expense reductions | (1.94 | )%(c) | (2.69 | )% | (2.18 | )% | (2.07 | )% | (1.87 | )% | (2.13 | )% | |||||||||||||||
| Without expense reductions | (4.27 | )%(c) | (4.96 | )% | (3.19 | )% | (2.60 | )% | (2.91 | )% | (3.83 | )% | |||||||||||||||
| Ratio of expenses to average net assets | |||||||||||||||||||||||||||
| With expense reductions | 4.11 | %(c) | 4.11 | % | 3.40 | % | 3.40 | % | 3.40 | % | 3.40 | % | |||||||||||||||
| Without expense reductions | 6.44 | %(c) | 6.39 | % | 4.42 | % | 3.93 | % | 4.44 | % | 5.11 | % | |||||||||||||||
| Fund portfolio turnover rate | 189 | %(c) | 5 | % | 14 | % | 14 | % | 23 | % | 31 | % | |||||||||||||||
(a) The Fund's maximum sales charge is not included in the total return computation
(b) Not annualized
(c) Annualized
See Accompanying Notes to Financial Statements which are an integral part of these financial statements.
67
Pacific Advisors Fund Inc.
Financial Highlights (Unaudited)
(For a share outstanding throughout the period)
| Multi-Cap Value Fund | |||||||||||||||||||||||||||
| Class A | |||||||||||||||||||||||||||
| For the six months ended | For the year ended December 31, | ||||||||||||||||||||||||||
| June 30, 2010 | 2009 | 2008 | 2007 | 2006 | 2005 | ||||||||||||||||||||||
| Per Share Operating Performance | |||||||||||||||||||||||||||
| Net asset value, beginning of period | $ | 8.78 | $ | 6.75 | $ | 12.50 | $ | 12.77 | $ | 12.27 | $ | 11.77 | |||||||||||||||
| Income from investing operations | |||||||||||||||||||||||||||
| Net investment income (expense) | (0.23 | ) | (0.40 | ) | (0.16 | ) | 0.01 | (0.09 | ) | (0.14 | ) | ||||||||||||||||
| Net realized and unrealized gains (losses) on securities | (0.25 | ) | 2.43 | (5.56 | ) | 0.17 | 1.68 | 1.29 | |||||||||||||||||||
| Total from investment operations | (0.48 | ) | 2.03 | (5.72 | ) | 0.18 | 1.59 | 1.15 | |||||||||||||||||||
| Less distributions | |||||||||||||||||||||||||||
| From net investment income | - | - | - | - | - | - | |||||||||||||||||||||
| From net capital gains | - | - | (0.03 | ) | (0.45 | ) | (1.09 | ) | (0.65 | ) | |||||||||||||||||
| Total distributions | - | - | (0.03 | ) | (0.45 | ) | (1.09 | ) | (0.65 | ) | |||||||||||||||||
| Net asset value, end of period | $ | 8.30 | $ | 8.78 | $ | 6.75 | $ | 12.50 | $ | 12.77 | $ | 12.27 | |||||||||||||||
| Total Investment Return (a) | (5.47 | )%(b) | 30.07 | % | (45.78 | )% | 1.40 | % | 12.91 | % | 9.71 | % | |||||||||||||||
| Ratios/Supplemental Data | |||||||||||||||||||||||||||
| Net assets, end of period (000's) | $ | 2,719 | $ | 3,194 | $ | 3,291 | $ | 6,315 | $ | 4,341 | $ | 3,073 | |||||||||||||||
| Ratio of net investment income to average net assets | |||||||||||||||||||||||||||
| With expense reductions | (2.55 | )%(c) | (2.11 | )% | (1.33 | )% | (1.21 | )% | (1.66 | )% | (1.70 | )% | |||||||||||||||
| Without expense reductions | (2.55 | )%(c) | (2.11 | )% | (1.33 | )% | (1.21 | )% | (1.66 | )% | (1.73 | )% | |||||||||||||||
| Ratio of expenses to average net assets | |||||||||||||||||||||||||||
| With expense reductions | 3.60 | %(c) | 3.69 | % | 3.20 | % | 2.82 | % | 3.02 | % | 3.05 | % | |||||||||||||||
| Without expense reductions | 3.60 | %(c) | 3.69 | % | 3.20 | % | 2.82 | % | 3.02 | % | 3.08 | % | |||||||||||||||
| Fund portfolio turnover rate | 34 | %(c) | 21 | % | 12 | % | 53 | % | 47 | % | 49 | % | |||||||||||||||
| Class C | |||||||||||||||||||||||||||
| For the six months ended | For the year ended December 31, | ||||||||||||||||||||||||||
| June 30, 2010 | 2009 | 2008 | 2007 | 2006 | 2005 | ||||||||||||||||||||||
| Per Share Operating Performance | |||||||||||||||||||||||||||
| Net asset value, beginning of period | $ | 8.21 | $ | 6.36 | $ | 11.90 | $ | 12.28 | $ | 11.93 | $ | 11.54 | |||||||||||||||
| Income from investing operations | |||||||||||||||||||||||||||
| Net investment income (expense) | (1.28 | ) | (1.04 | ) | (0.45 | ) | (0.36 | ) | (0.18 | ) | (0.19 | ) | |||||||||||||||
| Net realized and unrealized gains (losses) on securities | 0.79 | 2.89 | (5.06 | ) | 0.43 | 1.62 | 1.23 | ||||||||||||||||||||
| Total from investment operations | (0.49 | ) | 1.85 | (5.51 | ) | 0.07 | 1.44 | 1.04 | |||||||||||||||||||
| Less distributions | |||||||||||||||||||||||||||
| From net investment income | - | - | - | - | - | - | |||||||||||||||||||||
| From net capital gains | - | - | (0.03 | ) | (0.45 | ) | (1.09 | ) | (0.65 | ) | |||||||||||||||||
| Total distributions | - | - | (0.03 | ) | (0.45 | ) | (1.09 | ) | (0.65 | ) | |||||||||||||||||
| Net asset value, end of period | $ | 7.72 | $ | 8.21 | $ | 6.36 | $ | 11.90 | $ | 12.28 | $ | 11.93 | |||||||||||||||
| Total Investment Return | (5.97 | )%(b) | 29.09 | % | (46.33 | )% | 0.57 | % | 12.02 | % | 8.94 | % | |||||||||||||||
| Ratios/Supplemental Data | |||||||||||||||||||||||||||
| Net assets, end of period (000's) | $ | 2,061 | $ | 3,151 | $ | 3,761 | $ | 8,494 | $ | 9,958 | $ | 7,894 | |||||||||||||||
| Ratio of net investment income to average net assets | |||||||||||||||||||||||||||
| With expense reductions | (3.31 | )%(c) | (2.87 | )% | (2.11 | )% | (1.93 | )% | (2.43 | )% | (2.46 | )% | |||||||||||||||
| Without expense reductions | (3.31 | )%(c) | (2.87 | )% | (2.11 | )% | (1.93 | )% | (2.43 | )% | (2.49 | )% | |||||||||||||||
| Ratio of expenses to average net assets | |||||||||||||||||||||||||||
| With expense reductions | 4.35 | %(c) | 4.47 | % | 3.96 | % | 3.56 | % | 3.79 | % | 3.82 | % | |||||||||||||||
| Without expense reductions | 4.35 | %(c) | 4.47 | % | 3.96 | % | 3.56 | % | 3.79 | % | 3.84 | % | |||||||||||||||
| Fund portfolio turnover rate | 34 | %(c) | 21 | % | 12 | % | 53 | % | 47 | % | 49 | % | |||||||||||||||
(a) The Fund's maximum sales charge is not included in the total return computation
(b) Not annualized
(c) Annualized
See Accompanying Notes to Financial Statements which are an integral part of these financial statements.
68
Pacific Advisors Fund Inc.
Financial Highlights (Unaudited)
(For a share outstanding throughout the period)
| Small Cap Fund | |||||||||||||||||||||||||||
| Class A | |||||||||||||||||||||||||||
| For the six months ended | For the year ended December 31, | ||||||||||||||||||||||||||
| June 30, 2010 | 2009 | 2008 | 2007 | 2006 | 2005 | ||||||||||||||||||||||
| Per Share Operating Performance | |||||||||||||||||||||||||||
| Net asset value, beginning of period | $ | 26.37 | $ | 19.21 | $ | 34.70 | $ | 33.52 | $ | 25.73 | $ | 25.47 | |||||||||||||||
| Income from investing operations | |||||||||||||||||||||||||||
| Net investment income (expense) | (0.54 | ) | (0.50 | ) | 0.10 | 0.27 | 2.71 | (1.15 | ) | ||||||||||||||||||
| Net realized and unrealized gains (losses) on securities | (0.99 | ) | 7.66 | (15.23 | ) | 1.78 | 6.29 | 3.38 | |||||||||||||||||||
| Total from investment operations | (1.53 | ) | 7.16 | (15.13 | ) | 2.05 | 9.00 | 2.23 | |||||||||||||||||||
| Less distributions | |||||||||||||||||||||||||||
| From net investment income | - | - | - | - | - | - | |||||||||||||||||||||
| From net capital gains | - | - | (0.35 | ) | (0.87 | ) | (1.21 | ) | (1.97 | ) | |||||||||||||||||
| From return of capital | - | - | (0.01 | ) | - | - | - | ||||||||||||||||||||
| Total distributions | - | - | (0.36 | ) | (0.87 | ) | (1.21 | ) | (1.97 | ) | |||||||||||||||||
| Net asset value, end of period | $ | 24.84 | $ | 26.37 | $ | 19.21 | $ | 34.70 | $ | 33.52 | $ | 25.73 | |||||||||||||||
| Total Investment Return (a) | (5.80 | )%(b) | 37.27 | % | (43.52 | )% | 6.10 | % | 35.05 | % | 8.64 | % | |||||||||||||||
| Ratios/Supplemental Data | |||||||||||||||||||||||||||
| Net assets, end of period (000's) | $ | 98,357 | $ | 117,456 | $ | 87,800 | $ | 112,938 | $ | 62,735 | $ | 15,884 | |||||||||||||||
| Ratio of net investment income to average net assets | (1.87 | )%(c) | (2.05 | )% | (1.83 | )% | (1.94 | )% | (2.40 | )% | (3.14 | )% | |||||||||||||||
| Ratio of expenses to average net assets | 2.34 | %(c) | 2.49 | % | 2.44 | % | 2.34 | % | 2.78 | % | 3.36 | % | |||||||||||||||
| Fund portfolio turnover rate | 14 | %(c) | 17 | % | 23 | % | 15 | % | 20 | % | 21 | % | |||||||||||||||
| Class C | |||||||||||||||||||||||||||
| For the six months ended | For the year ended December 31, | ||||||||||||||||||||||||||
| June 30, 2010 | 2009 | 2008 | 2007 | 2006 | 2005 | ||||||||||||||||||||||
| Per Share Operating Performance | |||||||||||||||||||||||||||
| Net asset value, beginning of period | $ | 22.87 | $ | 16.79 | $ | 30.70 | $ | 30.00 | $ | 23.32 | $ | 23.44 | |||||||||||||||
| Income from investing operations | |||||||||||||||||||||||||||
| Net investment income (expense) | (0.89 | ) | (1.40 | ) | (0.90 | ) | (0.21 | ) | 0.83 | (0.56 | ) | ||||||||||||||||
| Net realized and unrealized gains (losses) on securities | (0.52 | ) | 7.48 | (12.65 | ) | 1.78 | 7.06 | 2.41 | |||||||||||||||||||
| Total from investment operations | (1.41 | ) | 6.08 | (13.55 | ) | 1.57 | 7.89 | 1.85 | |||||||||||||||||||
| Less distributions | |||||||||||||||||||||||||||
| From net investment income | - | - | - | - | - | - | |||||||||||||||||||||
| From net capital gains | - | - | (0.35 | ) | (0.87 | ) | (1.21 | ) | (1.97 | ) | |||||||||||||||||
| From return of capital | - | - | (0.01 | ) | - | - | - | ||||||||||||||||||||
| Total distributions | - | - | (0.36 | ) | (0.87 | ) | (1.21 | ) | (1.97 | ) | |||||||||||||||||
| Net asset value, end of period | $ | 21.46 | $ | 22.87 | $ | 16.79 | $ | 30.70 | $ | 30.00 | $ | 23.32 | |||||||||||||||
| Total Investment Return | (6.17 | )%(b) | 36.21 | % | (44.05 | )% | 5.22 | % | 33.91 | % | 7.76 | % | |||||||||||||||
| Ratios/Supplemental Data | |||||||||||||||||||||||||||
| Net assets, end of period (000's) | $ | 12,714 | $ | 15,593 | $ | 15,368 | $ | 31,589 | $ | 17,337 | $ | 4,602 | |||||||||||||||
| Ratio of net investment income to average net assets | (2.62 | )%(c) | (2.79 | )% | (2.57 | )% | (2.69 | )% | (3.15 | )% | (3.95 | )% | |||||||||||||||
| Ratio of expenses to average net assets | 3.09 | %(c) | 3.24 | % | 3.17 | % | 3.09 | % | 3.54 | % | 4.19 | % | |||||||||||||||
| Fund portfolio turnover rate | 14 | %(c) | 17 | % | 23 | % | 15 | % | 20 | % | 21 | % | |||||||||||||||
(a) The Fund's maximum sales charge is not included in the total return computation
(b) Not annualized
(c) Annualized
See Accompanying Notes to Financial Statements which are an integral part of these financial statements.
69
Pacific Advisors Fund Inc.
Financial Highlights (Unaudited)
(For a share outstanding throughout the period)
| Small Cap Fund | |||||||||||||||||||||||
| Class I | |||||||||||||||||||||||
| For the period ended | For the year ended December 31, | October 31, 2006(d) to | |||||||||||||||||||||
| June 30, 2010 | 2009 | 2008 | 2007 | December 31, 2006 | |||||||||||||||||||
| Per Share Operating Performance | |||||||||||||||||||||||
| Net asset value, beginning of period | $ | 29.86 | $ | 21.72 | $ | 37.50 | $ | 36.13 | $ | 35.00 | |||||||||||||
| Income from investing operations | |||||||||||||||||||||||
| Net investment income (expense) | (0.25 | ) | (0.45 | ) | (0.32 | )* | (0.33 | ) | 0.45 | ||||||||||||||
| Net realized and unrealized gains (losses) on securities | (1.45 | ) | 8.59 | (15.10 | )* | 2.57 | 1.89 | ||||||||||||||||
| Total from investment operations | (1.70 | ) | 8.14 | (15.42 | ) | 2.24 | 2.34 | ||||||||||||||||
| Less distributions | |||||||||||||||||||||||
| From net investment income | - | - | - | - | - | ||||||||||||||||||
| From net capital gains | - | - | (0.35 | ) | (0.87 | ) | (1.21 | ) | |||||||||||||||
| From return of capital | - | - | (0.01 | ) | - | - | |||||||||||||||||
| Total distributions | - | - | (0.36 | ) | (0.87 | ) | (1.21 | ) | |||||||||||||||
| Net asset value, end of period | $ | 28.16 | $ | 29.86 | $ | 21.72 | $ | 37.50 | $ | 36.13 | |||||||||||||
| Total Investment Return | (5.69 | )%(b) | 37.48 | % | (41.00 | )% | 6.19 | % | 6.74 | %(b) | |||||||||||||
| Ratios/Supplemental Data | |||||||||||||||||||||||
| Net assets, end of period (000's) | $ | 4 | $ | 5 | $ | 3 | $ | 1,902 | $ | 5 | |||||||||||||
| Ratio of net investment income to average net assets | (1.62 | )%(c) | (1.80 | )% | (1.56 | )% | (1.72 | )% | (2.48 | )%(c) | |||||||||||||
| Ratio of expenses to average net assets | 2.09 | %(c) | 2.24 | % | 2.16 | % | 2.10 | % | 2.74 | %(c) | |||||||||||||
| Fund portfolio turnover rate | 14 | %(c) | 17 | % | 23 | % | 15 | % | 20 | % | |||||||||||||
(b) Not annualized
(c) Annualized
(d) Commencement of operations
* Numbers were calculated using a weighted-average number of shares outstanding basis as a result of a significant change in Class I assets immediately prior to end of period.
See Accompanying Notes to Financial Statements which are an integral part of these financial statements.
70
Pacific Advisors Fund Inc.
Notes to Financial Statements (Unaudited)
June 30, 2010
Note 1. Organization
Pacific Advisors Fund Inc. (the "Company") is an open-end diversified investment management company registered under the Investment Company Act of 1940, as amended. The Company currently offers six Funds: Government Securities Fund, Income and Equity Fund, Balanced Fund, Growth Fund, Multi-Cap Value Fund and Small Cap Fund. Each Fund is a separate investment portfolio of the Company with a distinct investment objective, investment program, policies and restrictions.
The Government Securities Fund seeks to provide high current income, preservation of capital, and rising future income, consistent with prudent investment risk. The Income and Equity Fund seeks to provide current income and, secondarily, long-term capital appreciation. The Balanced Fund seeks to achieve long-term capital appreciation and income consistent with reduced market risk. The Growth Fund seeks to achieve long-term capital appreciation through investment in medium to large capitalization companies. The Multi-Cap Value Fund seeks long-term capital appreciation by investing in a diversified portfolio of large to small capitalization companies. The Small Cap Fund seeks to provide capital appreciation through investment in small capitalization companies.
In addition to Class A and Class C shares, the Small Cap Fund introduced Class I shares on October 9, 2006. Each class has equal rights as to assets and voting privileges except that Class A and Class C each has exclusive voting rights with respect to its distribution plan. Investment income, realized and unrealized capital gains and losses, and the common expenses of each Fund are allocated on a pro rata basis to each class based on the relative net assets of each class to the total net assets of the Fund. Each Class of shares differs in its respective service and distribution expenses and may differ in its transfer agent, registration, and certain other class-specific fees and expenses.
The Company enters into contracts that contain a variety of indemnifications. The Company's maximum exposure under these arrangements is unknown. However, the Company has not had prior claims or losses pursuant to these contracts and expects the risk of loss to be remote.
Note 2. Significant Accounting Policies
A. Security Valuation and Fair Value Measurement. Securities, including American Depository Receipts (ADRs), listed on a national securities exchange and certain over-the-counter ("OTC") issues traded on the NASDAQ national market system are valued at the last quoted sale price at the close of the New York Stock Exchange. OTC issues not quoted on the NASDAQ system, and other equity securities for which no sale price is available, are valued at the last bid price as obtained from published sources or real time quote services, where available, and otherwise from brokers who are market makers for such securities. Debt securities with a maturity less than 60 days are valued on an amortized cost basis, which approximates market value. Premium or discount on debt securities are amortized. In determining the fair value of other debt securities, Pacific Globa l Investment Management Company, Inc. (the "Investment Manager") utilizes independent pricing services approved by the Board of Directors using one or more of the following valuation techniques:
(1) a matrix pricing approach that considers market inputs including, in approximate order of priority, the following: benchmark yields, reported trades, broker/dealer quotes, issuer spreads, two-sided markets, benchmark securities, bids, offers and reference data including market research publications; market indicators, industry and economic events. Evaluators may prioritize inputs differently on any given day for any security based on market conditions, and not all inputs listed are available for use in the evaluation process for each security evaluation on any given day; (2) a comparison of the value of the borrower's outstanding equity and debt to that of comparable public companies; (3) a discounted cash flow analysis. In conducting its assessment and analysis for purpose of determining fair value, the Investment Manager uses its discretion and judgment in considering and appraising relevant factors. Fair value determinati ons are made by the Investment Manager based on the Company's Fair Value Procedure.
Various inputs are used to determine the fair value of the Fund's investments. For financial statements, these inputs are summarized in the three broad levels listed below. Level 1 investment securities are valued based on quoted prices in active markets for identical securities. Level 2 investment securities are valued based on significant observable market inputs, such as quoted prices for similar securities and quoted prices in inactive markets. Level 3 investment securities are valued using significant unobservable inputs that reflect the Fund's own assumptions in determining the fair value of investments. The valuation levels are not necessarily an
71
Pacific Advisors Fund Inc.
Notes to Financial Statements (Unaudited)
June 30, 2010
indication of the risk associated with investing in those securities. The following is a summary of the inputs used to value the Fund's investment securities and cash and cash equivalents as of June 30, 2010:
| Government Securities Fund | Income and Equity Fund | Balanced Fund | Growth Fund | Multi-Cap Value Fund | Small Cap Fund | ||||||||||||||||||||||
| Level 1 - Quoted Prices | |||||||||||||||||||||||||||
| Common Stock | |||||||||||||||||||||||||||
| Energy | $ | 67,860 | $ | 150,785 | $ | 1,964,463 | $ | 106,886 | $ | 1,541,516 | $ | 14,579,870 | |||||||||||||||
| Material | - | 34,590 | - | - | 314,044 | 3,701,600 | |||||||||||||||||||||
| Industrials | - | 336,040 | 3,184,610 | 381,396 | 2,120,047 | 46,357,808 | |||||||||||||||||||||
| Consumer Discretionary | 65,870 | 588,625 | 997,300 | 347,020 | 668,333 | 11,803,220 | |||||||||||||||||||||
| Consumer Staples | 125,460 | 484,605 | 3,544,110 | 840,290 | 194,428 | 5,560,200 | |||||||||||||||||||||
| Health Care | - | 467,270 | 2,413,280 | 330,154 | - | 9,558,680 | |||||||||||||||||||||
| Financials | 25,005 | 107,490 | 1,923,925 | 332,972 | 191,105 | 23,098,400 | |||||||||||||||||||||
| Information Technology | 57,525 | 296,955 | 2,381,730 | 588,837 | - | - | |||||||||||||||||||||
| Telecommunication Services | 60,475 | 275,060 | - | - | - | 2,979,800 | |||||||||||||||||||||
| Utilities | 117,970 | 233,970 | 525,500 | - | - | - | |||||||||||||||||||||
| Preferred Stock | |||||||||||||||||||||||||||
| Financials | 170,520 | 428,150 | 740,000 | - | - | - | |||||||||||||||||||||
| Telecommunication Services | - | - | - | - | - | - | |||||||||||||||||||||
| Utilities | - | 50,860 | - | - | - | - | |||||||||||||||||||||
| Level 1 Total | 690,685 | 3,454,400 | 17,674,918 | 2,927,555 | 5,029,473 | 117,639,578 | |||||||||||||||||||||
| Level 2 - Other significant observable inputs | |||||||||||||||||||||||||||
| Bonds and notes | |||||||||||||||||||||||||||
| Corporate Bonds | - | 4,671,249 | 6,992,766 | - | - | - | |||||||||||||||||||||
| Asset-backed Obligations | - | - | 37,596 | - | - | - | |||||||||||||||||||||
| U.S. Government Fixed Income Securities | 3,545,395 | 105,348 | - | - | - | - | |||||||||||||||||||||
| Short Term Investments | |||||||||||||||||||||||||||
| Money Market | 70,846 | 116,678 | - | - | - | - | |||||||||||||||||||||
| Level 2 Total | 3,616,241 | 4,893,275 | 7,030,362 | - | - | - | |||||||||||||||||||||
| Level 3 - Significant unobservable inputs | - | - | - | - | - | - | |||||||||||||||||||||
| Total Investments | $ | 4,306,926 | $ | 8,347,675 | $ | 24,705,280 | $ | 2,927,555 | $ | 5,029,473 | $ | 117,639,578 | |||||||||||||||
Equity securities (common and preferred stock) that are actively traded and market priced are classified as Level 1 Securities. All fixed income securities are classified as Level 2 securities and are valued using either amortized cost or the matrix pricing approach. The Funds had no Level 3 holdings during the period ended June 30, 2010.
B. Cash and Cash Equivalents. The Company considers all highly liquid financial instruments with maturities of less than three months when acquired to be cash equivalents.
C. Security Transactions and Investment Income. Security transactions are accounted for on the trade date. The cost of investments sold is determined by use of the specific identification method for both financial reporting and federal income tax purposes. Dividends are recorded on the ex-dividend date. Interest income is recorded on an accrual basis.
D. Dividends and Distributions to Shareholders. The Government Securities Fund and Income and Equity Fund declare and distribute dividends of their net investment income, if any, quarterly. The Balanced Fund, Growth Fund, Multi-Cap Value Fund and Small Cap Fund declare and distribute dividends of their net investment income, if any, annually. The Board of Directors will determine the amount and timing of such payments. Income dividends and capital gains distributions are determined in accordance with income tax regulations which may differ from generally accepted accounting principles. These differences are primarily due to differing treatments of income and gain on various investment securities held by the Funds, timing differences and differing characterization of distributions made by the Funds.
E. Federal Income Tax. The Company intends to comply with the requirements of Subchapter M of the Internal Revenue Code applicable to regulated investment companies and to distribute substantially all of their taxable income to their shareholders. Therefore, no federal income tax provision is required.
Management has analyzed the Funds' tax positions taken on federal income tax returns for all open tax years and for the year ended December 31, 2009 and has concluded that no provision for income tax is required in the Funds' financial statements. Tax years 2006, 2007, 2008 and 2009 are still subject to examination by major federal jurisdictions. Tax years 2005, 2006, 2007, 2008 and 2009 are still subject to examination by major state jurisdictions.
72
Pacific Advisors Fund Inc.
Notes to Financial Statements (Unaudited)
June 30, 2010
The Funds recognize interest and penalties, if any, related to unrecognized tax benefits as income tax expense in the Statement of Operations. During the period, the Funds did not incur any interest or penalties.
At December 31, 2009, components of distributable earnings/(accumulated deficits) on a tax basis were as follows:
| Government Securities Fund | Income and Equity Fund | Balanced Fund | Growth Fund | Multi-Cap Value Fund | Small Cap Fund | ||||||||||||||||||||||
| Undistributed ordinary income | $ | 564 | $ | 1,998 | $ | 5,989 | $ | - | $ | - | $ | - | |||||||||||||||
| Undistributed long-term gains | - | - | - | - | - | - | |||||||||||||||||||||
| Capital loss carryforward* | (1,173,656 | ) | (784,516 | ) | (1,557,453 | ) | (345,078 | ) | (1,701,814 | ) | (12,029,758 | ) | |||||||||||||||
| Post October Loss | (16,694 | ) | (1,120 | ) | - | - | - | (160,713 | ) | ||||||||||||||||||
| Net unrealized appreciation (depreciation) on investments | (29,115 | ) | 2,438 | 4,012,612 | 152,964 | (803,100 | ) | (9,702,303 | ) | ||||||||||||||||||
| Accumulated earnings (deficits) | $ | (1,218,901 | ) | $ | (781,200 | ) | $ | 2,461,148 | $ | (192,114 | ) | $ | (2,504,914 | ) | $ | (21,892,774 | ) | ||||||||||
The difference between book basis and tax-basis unrealized appreciation (depreciation) is attributable primarily to the tax deferral of losses on wash sales, return of capital distribution from ADRs and realization for tax purpose of interest income on investments. The Fund intends to treat Post-October losses, net capital losses occurred for the period subsequent to October 31, 2009 through the fiscal year end December 31, 2009, as having been incurred in the next fiscal year.
The Funds intend to utilize provisions of the federal income tax laws which allow them to carry a realized capital loss forward for eight years following the year of the loss and offset such losses against any future realized capital gains. During the current fiscal year, no capital losses carried forward have been utilized.
* At December 31, 2009, the following had accumulated net realized losses on investment transactions that represent capital loss carryforwards for federal income tax purposes, which expire as follows:
| Capital losses expiring in: | |||||||||||||||||||||||||||||||||||||||
| 2010 | 2011 | 2012 | 2013 | 2014 | 2015 | 2016 | 2017 | Total | |||||||||||||||||||||||||||||||
| Government Securities Fund | $ | - | $ | 855,711 | $ | 95,072 | $ | 49,495 | $ | 88,644 | $ | 1,178 | $ | 9,585 | $ | 73,971 | $ | 1,173,656 | |||||||||||||||||||||
| Income and Equity Fund | - | - | - | - | - | - | 396,450 | 388,066 | 784,516 | ||||||||||||||||||||||||||||||
| Balanced Fund | - | - | - | - | - | 431,086 | 1,126,367 | 1,557,453 | |||||||||||||||||||||||||||||||
| Growth Fund | 91,734 | - | - | - | - | - | - | 253,344 | 345,078 | ||||||||||||||||||||||||||||||
| Multi-Cap Value Fund | - | - | - | - | - | - | 1,061,647 | 640,167 | 1,701,814 | ||||||||||||||||||||||||||||||
| Small Cap Fund | - | - | - | - | - | - | - | 12,029,758 | 12,029,758 | ||||||||||||||||||||||||||||||
During the year ended December 31, 2009, the Growth Fund had a capital loss carryforward in the amount of $340,292 that expired.
F. Reclassification of Capital Accounts. Distributions of net investment income and realized gains are determined in accordance with income tax regulations which may differ from generally accepted accounting principles. These differences are due to differing treatments for items such as net operating losses, reclassification of dividends and return of capital. To the extent that these differences are permanent in nature, reclassifications are made among the net asset accounts on the Statement of Assets and Liabilities.
For the year ended December 31, 2009, reclassifications among the components of net assets are as follows:
| Accumulated Undistributed Net Investment Income | Paid in Capital | Accumulated Capital Gain | |||||||||||||
| Government Securities Fund | $ | - | $ | - | $ | - | |||||||||
| Income and Equity Fund | - | - | - | ||||||||||||
| Balanced Fund | - | - | - | ||||||||||||
| Growth Fund | 64,435 | (404,727 | ) | 340,292 | |||||||||||
| Multi-Cap Value Fund | 169,451 | (169,451 | ) | - | |||||||||||
| Small Cap Fund | 2,445,187 | (2,445,187 | ) | - | |||||||||||
The reclassifications were due to net investment losses incurred by the Fund, which are not permitted to be carried forward for tax purposes. The Growth Fund's reclassification was also a result of the expiry of capital losses previously carried-forward.
73
Pacific Advisors Fund Inc.
Notes to Financial Statements (Unaudited)
June 30, 2010
G. Use of Estimates. The preparation of financial statements in conformity with generally accepted accounting principles in the United States requires management to make estimates and assumptions that affect the reported amounts in the financial statements and footnotes. Actual results could differ from those estimates.
Note 3. Investment Management, Distributor and Other Related Party Transactions
The Company and the Funds have entered into investment management agreements ("Management Agreements") with the Investment Manager.
The Management Agreements provide for investment management fees, payable monthly, and calculated at the maximum annual rate of 0.65% of average net assets for the Government Securities Fund, 0.75% of average net assets for the Income and Equity, Balanced, Growth and Small Cap Funds and 1.00% of average net assets for the Multi-Cap Value Fund.
In accordance with Expense Limitation Agreements with the Company, the Investment Manager will waive its respective management fees to the extent that the actual operating expenses of the following Funds exceed the following thresholds:
| Class A | Class C | ||||||||||
| Government Securities Fund | 1.65 | % | 2.40 | % | |||||||
| Income and Equity Fund | 1.95 | % | 2.70 | % | |||||||
| Growth Fund | 2.65 | % | 3.40 | % | |||||||
For the Government Securities Fund and Growth Fund only, if net expenses exceed the above thresholds after waiver of the entire management fee, the Transfer Agent will waive its transfer agency fee to the extent necessary to reduce Class expenses to the above thresholds. These agreements may be terminated by either party upon 90 days prior written notice.
Pursuant to the Expense Limitation Agreements, providing for the voluntary waiver of fees and the assumption of expenses by the Investment Manager and Transfer Agent, the following amounts were waived for the six months ended June 30, 2010.
| Management Fees Waived | Transfer Agent Fees Waived | ||||||||||
| Government Securities Fund | $ | 15,445 | $ | 19,959 | |||||||
| Income and Equity Fund | 31,336 | - | |||||||||
| Growth Fund | 10,936 | 22,455 | |||||||||
Effective 2004, the Investment Manager terminated all of its rights under the expense limitation agreements with respect to potential recoupment from the Funds of all management fees previously waived and all expenses previously reimbursed. In the future, the Investment Manager will not have any rights to recover fees it waives or expenses it may reimburse, with respect to any of the Funds.
For the six months ended June 30, 2010, Pacific Global Fund Distributors, Inc. ("PGFD"), the principal underwriter for the Company, received commissions on sales of capital stock, after deducting amounts allowed to authorized distributors as commissions. In addition, PGFD, as a registered broker-dealer, may act as broker for the Funds, in conformity with Rule 17e-1 under the Investment Company Act of 1940. The Fund's Board of Directors has approved procedures for evaluating the reasonableness of commissions paid to PGFD and periodically reviews these procedures. PGFD will not act as principal in effecting any portfolio transactions for the Funds. The amounts of commissions are as follows:
| Underwriting Fees Retained | Commissions Paid | Brokerage Commissions Received | |||||||||||||
| Government Securities Fund | $ | 8 | $ | - | $ | 101 | |||||||||
| Income and Equity Fund | 198 | 500 | 1,116 | ||||||||||||
| Balanced Fund | 501 | 903 | 8,394 | ||||||||||||
| Growth Fund | 626 | 484 | (717 | ) | |||||||||||
| Multi-Cap Value Fund | 1,012 | 374 | 312 | ||||||||||||
| Small Cap Fund | 5,710 | 344 | 36,172 | ||||||||||||
PGFD is a wholly-owned subsidiary of the Investment Manager.
The Company and the Funds have entered into agreements with Pacific Global Investor Services, Inc. ("PGIS") to provide fund accounting services at the monthly fee of three basis points for the first one hundred million in net assets and one basis point on the balance of net assets or a minimum of $1,500. In addition, agreements to provide transfer agent services has also been entered into at
74
Pacific Advisors Fund Inc.
Notes to Financial Statements (Unaudited)
June 30, 2010
a rate of $21.00 per year per open account and $3.50 per year per closed account with minimum charges of $1,800 per month for A, C, and I share accounts. PGIS is a wholly-owned subsidiary of the Investment Manager.
Accounts payable to related parties consist of transfer agent fees payable to PGIS.
The Company has adopted a plan of distribution, whereby the Funds may pay a service fee to qualified recipients in an amount up to 0.25% per annum of each Fund's daily net assets for Class A shares and Class C shares. Under the plan of the distribution, the Funds may pay a distribution fee to qualified recipients in an amount up to 0.75% per annum of each Fund's daily net assets for Class C shares. The Company has not adopted a plan of distribution for Class I Shares.
For the six months ended June 30, 2010, total distribution and/or service (12b-1) fees were:
| Class A | Class C | ||||||||||
| Government Securities Fund | $ | 2,966 | $ | 11,897 | |||||||
| Income and Equity Fund | 4,043 | 25,607 | |||||||||
| Balanced Fund | 5,361 | 118,087 | |||||||||
| Growth Fund | 2,802 | 3,373 | |||||||||
| Multi-Cap Value Fund | 3,961 | 13,879 | |||||||||
| Small Cap Fund | 142,334 | 73,843 | |||||||||
Note 4. Purchases and Sales of Securities
The following summarizes purchases and sales of investment securities, other than short-term investments, and aggregate gross unrealized appreciation and depreciation on a tax basis by each Fund for the six months ended and as of June 30, 2010. The difference between book basis and tax-basis unrealized appreciation (depreciation) is attributable primarily to the tax deferral of losses on wash sales.
| Six months ended June 30, 2010 | As of June 30, 2010 | ||||||||||||||||||||||||||
| Cost of Purchases | Proceeds From Sales | Tax Cost of Securities | Gross Unrealized Appreciation | Gross Unrealized Depreciation | Net Unrealized Depreciation | ||||||||||||||||||||||
| Government Securities Fund | $ | 4,545,683 | $ | 5,420,301 | $ | 4,270,876 | $ | 30,294 | $ | 65,090 | $ | 34,796 | |||||||||||||||
| Income and Equity Fund | 1,612,788 | 959,283 | 8,507,929 | 375,428 | 652,360 | 276,932 | |||||||||||||||||||||
| Balanced Fund | 8,042,199 | 10,487,961 | 25,247,296 | 1,908,680 | 2,450,696 | 542,016 | |||||||||||||||||||||
| Growth Fund | 3,035,843 | 2,662,734 | 3,108,166 | 51,548 | 232,159 | 180,611 | |||||||||||||||||||||
| Multi-Cap Value Fund | 1,037,693 | 2,289,259 | 6,101,511 | 789,211 | 1,861,249 | 1,072,038 | |||||||||||||||||||||
| Small Cap Fund | 8,993,182 | 26,766,948 | 130,431,570 | 19,560,389 | 32,352,381 | 12,791,992 | |||||||||||||||||||||
Note 5. Distributions to Shareholders
The tax character of distributions paid was as follows:
| Government Securities Fund | Income and Equity Fund | Balanced Fund | Growth Fund | Multi-Cap Value Fund | Small Cap Fund | ||||||||||||||||||||||
| Six months ended June 30, 2010 | |||||||||||||||||||||||||||
| Distributions paid from: | |||||||||||||||||||||||||||
| Ordinary Income | $ | 15,327 | $ | 94,664 | $ | - | $ | - | $ | - | $ | - | |||||||||||||||
| Long-Term Capital Gain | - | - | - | - | - | - | |||||||||||||||||||||
| Return of Capital | - | - | - | - | - | - | |||||||||||||||||||||
| Total Distributions | $ | 15,327 | $ | 94,664 | $ | - | $ | - | $ | - | $ | - | |||||||||||||||
| Year ended December 31, 2009 | |||||||||||||||||||||||||||
| Distributions paid from: | |||||||||||||||||||||||||||
| Ordinary Income | $ | 76,052 | $ | 204,992 | $ | 233,879 | $ | - | $ | - | $ | - | |||||||||||||||
| Long-Term Capital Gain | - | - | - | - | - | - | |||||||||||||||||||||
| Return of Capital | - | - | - | - | - | - | |||||||||||||||||||||
| Total Distributions | $ | 76,052 | $ | 204,992 | $ | 233,879 | $ | - | $ | - | $ | - | |||||||||||||||
75
Pacific Advisors Fund Inc.
Notes to Financial Statements (Unaudited)
June 30, 2010
Note 6. Capital Share Transactions
A 2% redemption fee is assessed on shares of the Government Securities Fund or Income and Equity Fund sold or exchanged within 30 days of purchase or shares of the Balanced Fund, Growth Fund, Multi-Cap Value Fund or Small Cap Fund sold or exchanged within 180 days of purchase and is retained in each Fund. The redemption fees collected through June 30, 2010 are included in the dollar amount of shares sold in the table below. The amount of the increase is as follows:
| Class A | Class C | ||||||||||
| Government Securities Fund | $ | - | $ | 2,574 | |||||||
| Income and Equity Fund | - | - | |||||||||
| Balanced Fund | 10 | 55 | |||||||||
| Growth Fund | 5 | - | |||||||||
| Multi-Cap Value Fund | 373 | 304 | |||||||||
| Small Cap Fund | 20,516 | 245 | |||||||||
| Six months ended June 30, 2010 | Year ended December 31, 2009 | ||||||||||||||||||
| Shares | Amount | Shares | Amount | ||||||||||||||||
| Government Securities Fund | |||||||||||||||||||
| Class A | |||||||||||||||||||
| Shares Sold | 25,597 | $ | 231,500 | 23,048 | $ | 203,753 | |||||||||||||
| Reinvestment of Distributions | 1,208 | 10,900 | 4,331 | 38,586 | |||||||||||||||
| 26,805 | 242,400 | 27,379 | 242,339 | ||||||||||||||||
| Shares Repurchased | (59,550 | ) | (539,092 | ) | (86,844 | ) | (774,281 | ) | |||||||||||
| Net Decrease | (32,745 | ) | $ | (296,692 | ) | (59,465 | ) | $ | (531,942 | ) | |||||||||
| Class C | |||||||||||||||||||
| Shares Sold | 24,887 | $ | 224,299 | 89,877 | $ | 784,504 | |||||||||||||
| Reinvestment of Distributions | 285 | 2,547 | 3,058 | 27,016 | |||||||||||||||
| 25,172 | 226,846 | 92,935 | 811,520 | ||||||||||||||||
| Shares Repurchased | (81,522 | ) | (728,691 | ) | (78,546 | ) | (692,225 | ) | |||||||||||
| Net Increase (Decrease) | (56,350 | ) | $ | (501,845 | ) | 14,389 | $ | 119,295 | |||||||||||
| Six months ended June 30, 2010 | Year ended December 31, 2009 | ||||||||||||||||||
| Shares | Amount | Shares | Amount | ||||||||||||||||
| Income and Equity Fund | |||||||||||||||||||
| Class A | |||||||||||||||||||
| Shares Sold | 102,575 | $ | 984,231 | 26,638 | $ | 237,006 | |||||||||||||
| Reinvestment of Distributions | 4,474 | 42,400 | 8,429 | 74,219 | |||||||||||||||
| 107,049 | 1,026,631 | 35,067 | 311,225 | ||||||||||||||||
| Shares Repurchased | (21,177 | ) | (203,493 | ) | (56,257 | ) | (495,430 | ) | |||||||||||
| Net Increase (Decrease) | 85,872 | $ | 823,138 | (21,190 | ) | $ | (184,205 | ) | |||||||||||
| Class C | |||||||||||||||||||
| Shares Sold | 28,655 | $ | 259,645 | 67,794 | $ | 586,237 | |||||||||||||
| Reinvestment of Distributions | 5,113 | 46,305 | 13,943 | 117,293 | |||||||||||||||
| 33,768 | 305,950 | 81,737 | 703,530 | ||||||||||||||||
| Shares Repurchased | (49,982 | ) | (455,789 | ) | (94,516 | ) | (770,433 | ) | |||||||||||
| Net Decrease | (16,214 | ) | $ | (149,839 | ) | (12,779 | ) | $ | (66,903 | ) | |||||||||
76
Pacific Advisors Fund Inc.
Notes to Financial Statements (Unaudited)
June 30, 2010
| Six months ended June 30, 2010 | Year ended December 31, 2009 | ||||||||||||||||||
| Shares | Amount | Shares | Amount | ||||||||||||||||
| Balanced Fund | |||||||||||||||||||
| Class A | |||||||||||||||||||
| Shares Sold | 6,989 | $ | 104,586 | 40,117 | $ | 516,878 | |||||||||||||
| Reinvestment of Distributions | - | - | 3,375 | 50,596 | |||||||||||||||
| 6,989 | 104,586 | 43,492 | 567,474 | ||||||||||||||||
| Shares Repurchased | (13,894 | ) | (210,779 | ) | (55,070 | ) | (715,500 | ) | |||||||||||
| Net Decrease | (6,905 | ) | $ | (106,193 | ) | (11,578 | ) | $ | (148,026 | ) | |||||||||
| Class C | |||||||||||||||||||
| Shares Sold | 16,481 | $ | 237,692 | 106,153 | $ | 1,320,164 | |||||||||||||
| Reinvestment of Distributions | - | - | 11,955 | 172,394 | |||||||||||||||
| 16,481 | 237,692 | 118,108 | 1,492,558 | ||||||||||||||||
| Shares Repurchased | (216,334 | ) | (3,111,177 | ) | (261,411 | ) | (3,205,687 | ) | |||||||||||
| Net Decrease | (199,853 | ) | $ | (2,873,485 | ) | (143,303 | ) | $ | (1,713,129 | ) | |||||||||
| Six months ended June 30, 2010 | Year ended December 31, 2009 | ||||||||||||||||||
| Shares | Amount | Shares | Amount | ||||||||||||||||
| Growth Fund | |||||||||||||||||||
| Class A | |||||||||||||||||||
| Shares Sold | 39,072 | $ | 335,642 | 37,678 | $ | 244,428 | |||||||||||||
| Reinvestment of Distributions | - | - | - | - | |||||||||||||||
| 39,072 | 335,642 | 37,678 | 244,428 | ||||||||||||||||
| Shares Repurchased | (21,619 | ) | (188,919 | ) | (81,212 | ) | (543,996 | ) | |||||||||||
| Net Increase (Decrease) | 17,453 | $ | 146,723 | (43,534 | ) | $ | (299,568 | ) | |||||||||||
| Class C | |||||||||||||||||||
| Shares Sold | 39,864 | $ | 310,204 | - | $ | - | |||||||||||||
| Reinvestment of Distributions | - | - | - | - | |||||||||||||||
| 39,864 | 310,204 | - | - | ||||||||||||||||
| Shares Repurchased | (23,696 | ) | (185,458 | ) | (95,391 | ) | (598,425 | ) | |||||||||||
| Net Increase (Decrease) | 16,168 | $ | 124,746 | (95,391 | ) | $ | (598,425 | ) | |||||||||||
77
Pacific Advisors Fund Inc.
Notes to Financial Statements (Unaudited)
June 30, 2010
| Six months ended June 30, 2010 | Year ended December 31, 2009 | ||||||||||||||||||
| Shares | Amount | Shares | Amount | ||||||||||||||||
| Multi-Cap Value Fund | |||||||||||||||||||
| Class A | |||||||||||||||||||
| Shares Sold | 19,859 | $ | 179,316 | 183,600 | $ | 1,032,777 | |||||||||||||
| Reinvestment of Distributions | - | - | - | - | |||||||||||||||
| 19,859 | 179,316 | 183,600 | 1,032,777 | ||||||||||||||||
| Shares Repurchased | (55,810 | ) | (523,344 | ) | (307,975 | ) | (2,249,246 | ) | |||||||||||
| Net Decrease | (35,951 | ) | $ | (344,028 | ) | (124,375 | ) | $ | (1,216,469 | ) | |||||||||
| Class C | |||||||||||||||||||
| Shares Sold | 5,714 | $ | 48,769 | 6,780 | $ | 42,396 | |||||||||||||
| Reinvestment of Distributions | - | - | - | - | |||||||||||||||
| 5,714 | 48,769 | 6,780 | 42,396 | ||||||||||||||||
| Shares Repurchased | (122,910 | ) | (1,049,265 | ) | (213,789 | ) | (1,465,686 | ) | |||||||||||
| Net Decrease | (117,196 | ) | $ | (1,000,496 | ) | (207,009 | ) | $ | (1,423,290 | ) | |||||||||
| Six months ended June 30, 2010 | Year ended December 31, 2009 | ||||||||||||||||||
| Shares | Amount | Shares | Amount | ||||||||||||||||
| Small Cap Fund | |||||||||||||||||||
| Class A | |||||||||||||||||||
| Shares Sold | 341,452 | $ | 9,265,833 | 1,756,008 | $ | 38,687,567 | |||||||||||||
| Reinvestment of Distributions | - | - | - | - | |||||||||||||||
| 341,452 | 9,265,833 | 1,756,008 | 38,687,567 | ||||||||||||||||
| Shares Repurchased | (835,919 | ) | (22,718,186 | ) | (1,873,438 | ) | (39,920,852 | ) | |||||||||||
| Net Decrease | (494,467 | ) | $ | (13,452,353 | ) | (117,430 | ) | $ | (1,233,285 | ) | |||||||||
| Class C | |||||||||||||||||||
| Shares Sold | 15,764 | $ | 361,962 | 48,957 | $ | 968,124 | |||||||||||||
| Reinvestment of Distributions | - | - | - | - | |||||||||||||||
| 15,764 | 361,962 | 48,957 | 968,124 | ||||||||||||||||
| Shares Repurchased | (105,097 | ) | (2,454,639 | ) | (282,281 | ) | (4,891,561 | ) | |||||||||||
| Net Decrease | (89,333 | ) | $ | (2,092,677 | ) | (233,324 | ) | $ | (3,923,437 | ) | |||||||||
| Class I | |||||||||||||||||||
| Shares Sold | - | $ | - | - | $ | - | |||||||||||||
| Reinvestment of Distributions | - | - | - | - | |||||||||||||||
| - | - | - | - | ||||||||||||||||
| Shares Repurchased | - | - | - | - | |||||||||||||||
| Net Decrease | - | $ | - | - | $ | - | |||||||||||||
78
Pacific Advisors Fund Inc.
Notes to Financial Statements (Unaudited)
June 30, 2010
Note 7. Bank Borrowings
Each Fund may borrow up to 15% of its total assets. Each Fund will not borrow money except temporarily from banks to facilitate redemption requests that might otherwise require untimely disposition of portfolio securities. No securities will be purchased for a Fund when borrowed money exceeds 5% of the Fund's total assets. Each Fund has the ability to borrow, from UMB Bank, n.a., on an unsecured basis, at 1.5% over the Federal Funds rate. As of June 30, 2010, the Balanced Fund, Growth Fund, Multi-Cap Value Fund and Small Cap Fund were paying interest at 1.53% per annum on their outstanding borrowings. No compensating balances are required.
79
Pacific Advisors Fund Inc.
Directors and Officers
"Independent" Directors
| Name (Age) | Position with the Company | Year elected Director of the Company | Principal occupation(s) during past 5 years | Other Directorships held by Director | |||||||||||||||
| L. Michael Haller, III (66) | Director | 1992 | Consultant; Chairman, Stereo Scope, Inc. (web application company); Chairman, Kapitall (software development company); President, Bionic Games, Inc. (game software development company); President, High Impact Games, Inc. (game software development company); and Owner, Asahi Broadcasting Enterprises (game software development company) | None | |||||||||||||||
| Takashi Makinodan, PhD (85) | Director | 1995 | Retired; and formerly Director, Medical Treatment Effectiveness Program (MEDTEP), Center on Asian and Pacific Islanders (1992-2007); and Associate Director of Research, Geriatric Research Education Clinic Center, VA Medical Center (1991-2007) | None | |||||||||||||||
| Gerald E. Miller (80) | Director | 1992 | Retired; and formerly worked for Merrill Lynch for over 30 years and was a Senior Resident Vice President at retirement in 1992 | None | |||||||||||||||
| Louise K. Taylor, PhD (63) | Director | 1992 | Retired; and formerly Superintendent, Monrovia Unified School District (1991-2009) | None | |||||||||||||||
"Interested" Directors2
| Name (Age) | Position with the Company1 | Year elected Director of the Company | Principal occupations during past 5 years | Other Directorships held by Director | |||||||||||||||
| Victoria L. Breen (59)* | Director Assistant Secretary | 1992 2002 | President, Derby & Derby, Inc. (financial services company); Agent, Transamerica Life Companies; Registered Principal, Transamerica Financial Advisors, Inc.; and Assistant Secretary and Director, Pacific Global Investment Management Company | None | |||||||||||||||
| George A. Henning (63)** | President and Chairman | 1992 | Chairman, President and Director, Pacific Global Investment Management Company; Chairman and Director, Pacific Global Fund Distributors, Inc. and Pacific Global Investor Services, Inc.; and formerly Secretary, Pacific Global Fund Distributors, Inc. and Pacific Global Investor Services, Inc. (1992-2006) | None | |||||||||||||||
Each Director oversees all 6 Pacific Advisors Fund portfolios.
The Fund's Statement of Additional Information contains additional information about the Fund's Directors and Officers and is available without charge upon request by calling (800) 989-6693. The business address for all Directors and officers of the Company is 101 N. Brand Blvd., Suite 1950, Glendale, CA 91203, Attn: Secretary.
80
Pacific Advisors Fund Inc.
Directors and Officers
Other Officers
| Name (Age) | Position(s) with the Company | Year elected an officer of the Company | Principal occupations during past 5 years | ||||||||||||
| Catherine L. Henning (32) | Vice President Secretary | 2010 2006 | Vice President, Secretary, Director of Client Services and Director, Pacific Global Investment Management Company; President, Secretary, Chief Compliance Officer and Director, Pacific Global Fund Distributors, Inc.; Vice President, Secretary and Director, Pacific Global Investor Services, Inc.; and formerly Assistant Secretary, Pacific Advisors Fund Inc. (2004-2006); and Assistant Secretary, Pacific Global Fund Distributors, Inc. and Pacific Global Investor Services, Inc. (2002-2006) | ||||||||||||
| Barbara A. Kelley (57) | Vice President, Treasurer and Chief Compliance Officer | 2001 | Executive Vice President, Chief Compliance Officer and Director, Pacific Global Investment Management Company; Director, Pacific Global Fund Distributors, Inc.; President and Director, Pacific Global Investor Services, Inc.; and formerly Treasurer, Pacific Global Investment Management Company, Pacific Global Fund Distributors, Inc. and Pacific Global Investor Services, Inc. (2001-2007) | ||||||||||||
| Araceli Olea (37) | Assistant Secretary | 2008 | Shareholder Services Manager, Pacific Global Investor Services, Inc.; and Assistant Secretary, Pacific Global Investment Management Company and Pacific Global Investor Services, Inc. | ||||||||||||
| Jingjing Yan (36) | Assistant Treasurer | 2005 | Vice President and Treasurer, Pacific Global Investment Management Company; Treasurer, Pacific Global Fund Distributors, Inc. and Pacific Global Investor Services, Inc.; and formerly Fund Accounting Manager, Pacific Global Investor Services, Inc. (2001-2007); and Assistant Treasurer, Pacific Global Investment Management Company, Pacific Global Fund Distributors, Inc. and Pacific Global Investor Services, Inc. (2005-2007) | ||||||||||||
1 Each director is elected to serve until the next annual shareholders meeting and until his or her successor is elected or appointed. The Company does not hold regular annual shareholders meetings to elect Directors. Vacancies on the Board can be filled by the action of a majority of the Directors, provided that at least two-thirds of the Directors have been elected by the shareholders.
2 "Interested persons" as defined in the 1940 Act, as amended, based on their affiliation with the Funds' investment manager and its affiliates (including the Funds' principal underwriter).
* Ms. Breen is considered an interested director because (a) she is a registered principal of a registered broker/dealer that engages in sales of Company shares under a selling agreement with the Distributor, and in that capacity she has received commissions on the sale of the Funds' shares; (b) she is an officer of the Company; and (c) she is a shareholder of the Manager and a member of the Manager's Board of Directors.
** Mr. Henning is considered an interested director because (a) he holds the positions described above with the Company, the Manager and its affiliates; (b) by virtue of his ownership of the Manager's shares he may be deemed a "control person" of the Manager; and (c) he is Ms. Henning's father.
81
Pacific Advisors Fund Inc.
notes
82
Pacific Advisors Fund Inc.
notes
83
Pacific Advisors Fund Inc.
notes
84

Pacific Advisors Fund Inc.
Directors
George A. Henning, Chairman
Victoria L. Breen
L. Michael Haller, III
Takashi Makinodan, Ph.D.
Gerald E. Miller
Louise K. Taylor, Ph.D.
Officers
George A. Henning, President
Catherine L. Henning, Vice President and Secretary
Victoria L. Breen, Assistant Secretary
Araceli Olea, Assistant Secretary
Barbara A. Kelley, Treasurer
Jingjing Yan, Assistant Treasurer
Investment Manager
Pacific Global Investment Management Company
101 North Brand Blvd., Suite 1950
Glendale, California 91203
Transfer Agent and Administrator
Pacific Global Investor Services, Inc.
101 North Brand Blvd., Suite 1950
Glendale, California 91203
Distributor
Pacific Global Fund Distributors, Inc.
101 North Brand Blvd., Suite 1950
Glendale, California 91203
(800) 989-6693
Availability of Quarterly Portfolio Schedule
The Fund files its complete schedule of portfolio holdings with the SEC for the first and third quarters of each fiscal year on Form N-Q. The Fund's Forms N-Q are available on the SEC's Web site at http://www.sec.gov. The Fund's Forms N-Q may be reviewed and copied at the SEC's Public Reference Room in Washington, DC. Information about the operation of the Public Reference Room may be obtained by calling the SEC at (800) SEC-0330.
The Fund's complete schedule of portfolio holdings for each fiscal quarter is posted on the Fund's Web site at www.PacificAdvisorsFund.com and is available without charge, upon request by calling (800) 989-6693. Documents will be sent within 3 business days of receipt of your request.
Availability of Proxy Voting Policies and Procedures and Proxy Voting Record
A description of the policies and procedures that the Fund uses to determine how to vote proxies relating to portfolio securities and information regarding how the Fund voted proxies relating to portfolio securities during the most recent 12-month period ended June 30 is available without charge, upon request by calling (800) 989-6693. Documents will be sent within 3 business days of receipt of your request. This information is also available on the SEC's Web site at http://www.sec.gov.

Pacific Global Fund Distributors, Inc.
101 North Brand Blvd., Suite 1950
Glendale, California 91203

Item 2. | Code of Ethics |
| Not applicable for semi-annual reports. |
|
|
Item 3. | Audit Committee Financial Expert |
| Not applicable for semi-annual reports. |
|
|
Item 4. | Principal Accountant Fees and Services |
| Not applicable for semi-annual reports. |
|
|
Item 5. | Audit Committee of Listed Registrants |
| Not applicable as Registrant is not a listed issuer as defined in Rule 10A-3 under the Securities Exchange Act of 1934. |
|
|
Item 6. | Schedule of Investments |
| Schedule of Investments is included as part of the report to shareholders filed under Item 1 of this form. |
|
|
Item 7. | Disclosure of Proxy Voting Policies and Procedures for Closed-End Management Investment Companies |
| Not applicable to open-end investment companies. |
|
|
Item 8. | Portfolio Managers of Closed-End Management Investment Companies |
| Not applicable to open-end investment companies. |
|
|
Item 9. | Purchases of Equity Securities by Managers of Closed-End Management Investment Company and Affiliated Purchasers. |
| Not applicable to open-end investment companies. |
|
|
Item 10. | Submission of Matters to a Vote of Security Holders |
| No material changes have been made. |
|
|
Item 11. | Controls and Procedures. |
| (a) Based upon their evaluation of Registrant’s disclosure controls and procedures (as defined in Rule 30a-3(c) under the Investment Company Act of 1940) as conducted within 90 days of the filing date of this Form N-CSR, Registrant’s principal executive officer and principal financial officer have concluded that those disclosure controls and procedures provide reasonable assurance that the material information required to be disclosed by Registrant on this report is recorded, processed, summarized and reported within the time periods specified in the Securities and Exchange Commission’s rules and forms. |
|
|
| (b) There were no changes in Registrant’s internal control over financial reporting (as defined in Rule 30a-3(d) under the Investment Company Act of 1940) that occurred during the second fiscal quarter of the period covered by this report that have materially affected, or are reasonably likely to materially affect, Registrant’s internal control over financial reporting. |
|
|
Item 12. | Exhibits |
| (a)(1) Not applicable. |
|
|
| (a)(2) Certifications required by Item 12(a) of Form N-CSR and Section 302 of the Sarbanes-Oxley Act of 2002 (filed herewith). |
|
|
| (a)(3) Not applicable. |
|
|
| (b) Certification required by Section 906 of the Sarbanes-Oxley Act of 2002 (filed herewith). |
SIGNATURES
Pursuant to the requirements of the Securities Exchange Act of 1934 and the Investment Company Act of 1940, Registrant has duly caused this report to be signed on its behalf by the undersigned, thereunto duly authorized.
Pacific Global Fund Inc. d/b/a Pacific Advisors Fund Inc.
By: | /s/ George A. Henning |
|
| George A. Henning |
|
| Chairman, Pacific Advisors Fund Inc. |
|
|
|
|
Date: | September 3, 2010 |
|
|
|
|
Pursuant to the requirements of the Securities Exchange Act of 1934 and the Investment Company Act of 1940, this report has been signed below by the following persons on behalf of Registrant and in the capacities and on the dates indicated. | ||
|
|
|
By: | /s/ George A. Henning |
|
| George A. Henning |
|
| Chief Executive Officer |
|
|
|
|
Date: | September 3, 2010 |
|
|
|
|
By: | /s/ Barbara A. Kelley |
|
| Barbara A. Kelley |
|
| Chief Financial Officer |
|
|
|
|
Date: | September 3, 2010 |
|