UNITED STATES
SECURITIES AND EXCHANGE COMMISSION
Washington, D.C. 20549
FORM N-CSR
CERTIFIED SHAREHOLDER REPORT OF REGISTERED
MANAGEMENT INVESTMENT COMPANIES
Investment Company Act file number | 811-7062 | |||||||
| ||||||||
PACIFIC GLOBAL FUND INC. D/B/A PACIFIC ADVISORS FUND INC. | ||||||||
(Exact name of registrant as specified in charter) | ||||||||
| ||||||||
101 NORTH BRAND BLVD., |
| 91203 | ||||||
(Address of principal executive offices) |
| (Zip code) | ||||||
| ||||||||
GEORGE A. HENNING | ||||||||
(Name and address of agent for service) | ||||||||
| ||||||||
Registrant’s telephone number, including area code: | 818-242-6693 |
| ||||||
| ||||||||
Date of fiscal year end: | December 31 |
| ||||||
| ||||||||
Date of reporting period: | June 30, 2006 |
| ||||||
Item 1. Report to Shareholders
Filed herewith.


semi-annual report
june 30, 2006
government securities fund
income and equity fund
balanced fund
growth fund
multi-cap value fund
small cap fund

Pacific Advisors
table of contents
| Message from the Chairman | 1 | ||||||
| Government Securities Fund | 3 | ||||||
| Income and Equity Fund | 7 | ||||||
| Balanced Fund | 11 | ||||||
| Growth Fund | 16 | ||||||
| Multi-Cap Value Fund | 20 | ||||||
| Small Cap Fund | 24 | ||||||
| Statement of Investments | 29 | ||||||
| Statement of Assets and Liabilities | 56 | ||||||
| Statement of Operations | 58 | ||||||
| Statement of Changes in Net Assets | 60 | ||||||
| Notes to Financial Statements | 64 | ||||||
| Financial Highlights | 69 | ||||||
This Report is submitted for the general information of the shareholders of the Fund. It is not authorized for distribution to prospective investors unless accompanied or preceded by a current effective prospectus of the Fund, which contains information concerning the investment policies of the Fund as well as other pertinent information.
This Report is for informational purposes only and is not a solicitation, or a recommendation that any particular investor should purchase or sell any particular security. The statements in the Report are the opinions and beliefs expressed at the time of this commentary and are not intended to represent opinions and beliefs at any other time. These opinions are subject to change with market conditions and are not meant as a market forecast. All economic and performance information referenced is historical. Past performance does not guarantee future results.
For more information on the Pacific Advisors Funds, including information on charges, expenses and other classes offered, please obtain a copy of the prospectus by calling (800) 989-6693. Please read the prospectus carefully before you invest or send money. Shares of the Pacific Advisors Funds are not deposits or obligations of any bank, are not guaranteed by any bank, are not insured by the FDIC or any other agency, and involve investment risks, including the possible loss of the principal amount invested. The investment return and principal value of an investment will fluctuate so that an investor's shares, when redeemed, may be worth more or less than their original cost.

Message
from the chairman
Dear Shareholders:
The market continued to send mixed messages to investors during the first half of 2006. The New Year started well with the equity markets rallying as the economy continued to grow and corporate earnings remained strong. The positive market outlook was enhanced by the anticipation that the Federal Reserve was nearing an end to the current series of interest rate increases implemented to keep inflation under control.
In the second quarter, however, economic data indicated that inflationary pressures remained a problem as a result of rising energy prices and strong economic growth. Investors feared that the Federal Reserve would continue raising interest rates and thereby send the U.S. economy into a recession. As the Fed continued to raise rates and express concern about inflation, market optimism gave way to a more pessimistic outlook.
Economic Perspective
After pausing during the fourth quarter of 2005, the U.S. economy rebounded quickly in the first quarter of 2006 growing at a robust 5.6%. Corporate coffers remained flush with cash as profits surged. This provided companies with the resources to grow their businesses while maintaining lower debt on their balance sheets. In addition, many companies utilized the cash to initiate share repurchase programs to buy back undervalued stock or increase dividends to shareholders. Large cash reserves also left companies well positioned to increase capital spending and make strategic acquisitions without diluting shareholder value.
Inflation concerns aside, near-term economic growth prospects remain bright. Unemployment remains low at 4.8% and consumer confidence remains strong. Second quarter corporate earnings were encouraging. While this bodes well for future growth, earnings growth will likely moderate through the second half of the year. In the second quarter, economic growth slowed to an annual rate of 2.5%. As a result, the Fed has paused to see if recent interest rate increases will sufficiently slow inflation. Economic indicators suggest growth will moderate over the course of the year to healthy and more sustainable rate of approximately 3.0%.
Market Perspective
Hawkish inflation comments by the Fed brought increased volatility and uncertainty to the markets during the first six months. Uncertainty drove the market down as investors feared the Fed would overreach in its rate hiking campaign and stall economic expansion. The Fed is seeking to strike a delicate balance between an economy that is neither too hot (inflationary) nor too cool (recessionary) and maintain an economy with moderate growth and limited inflation. Consequently, investors will remain sensitive to any interest rate or inflation related statements by the Fed. While the equity markets experienced a steep correction in response to inflationary fears, the fixed income markets did not experience a significant rise in long-term interest rates. This would suggest that bond investors do not believe inflation will be a long-term problem.
Equity Markets
Despite strong economic growth and robust corporate earnings in the first quarter, investors remained cautious in response to higher energy prices, growing inflation and rising interest rates. In the second quarter, rising energy costs pushed inflation higher to a 2.3% annualized rate. The rise in the core inflation rate heightened concerns on Wall Street that the Fed would continue raising interest rates causing consumer spending and economic growth to slow precipitously.
As a result, fear and uncertainty drove the equity markets into a steep correction beginning in mid-May. While this level of volatility is always disconcerting, we believe this market correction represented a reasonable response to the uncertainties facing investors. We believe this correction was necessary to remove excess valuations from the market and reduce investor speculation.
Market Review
| June 30, 2006 | Close | YTD Return | |||||||||
| Dow Jones | 11,150.22 | +4.04 | % | ||||||||
| S&P 500 | 1,270.20 | +1.76 | % | ||||||||
| NASDAQ | 2,172.09 | – 1.51 | % | ||||||||
| Russell 2000 (small cap) | 724.67 | +7.64 | % | ||||||||
| 06/30/06 | 06/30/05 | ||||||||||
| 10-Year T-Note Yield | 5.14 | % | 3.94 | % | |||||||
Data: The Wall Street Journal
1

Message
from the chairman continued
The markets rallied briefly toward the end of June when signs of slower economic growth once again raised expectations of an end to interest rate increases by the Fed. The rally, however, was brief as investors hesitated over the strength of the economy, inflation, and the prospects of a recession. The economic impact of geopolitical problems in North Korea and the Middle East also weighed on investor sentiment.
In July, the market retested the low it established earlier in the year and reached an oversold position. While unsettling, this process of retesting a market low is a positive sign that the equity markets may be forming a base which may set the stage for a more sustainable rally later in the year. If inflationary concerns ease, the more moderate pace of economic growth and the pause in the Fed's interest rate increases could help provide the basis for a rally in the second half of the year.
The equity markets have remained in a trading range which reinforces the importance of careful stock selection to achieve performance. While still challenging, equity performance remained strongest for positions in the energy, industrial, transportation, and healthcare sectors along with a few select technology firms. Equity markets are expected to remain trading range bound for the foreseeable future. Any index driven investment gains will likely be limited. We reiterate our view that achieving above-average performance will remain dependent upon identifying individual companies with strong, long-term growth potential. These periods of market volatility provide opportunities to acquire long-term investments at more attractive prices.
Fixed Income Markets
Fixed income markets remained volatile in the first half of the year as the Fed pushed rates to 5.25%. As a result, yields on such short-term investments as money markets, CDs, and U.S. Treasury bills rose. Surprisingly, yields on long-term corporate and U.S. Treasury bonds remained comparatively flat, encouraging investors to stay in shorter-term securities.
Given that long-term bond yields are expected to rise sooner rather than later, we will continue to maintain a defensive investment position. This defensive strategy calls for preserving capital and limiting risk by buying shorter to intermediate-term maturities. Once long-term rates adjust upward and peak, we will concentrate fixed income holdings in longer-term bonds to lock in better yields and capture the potential for capital appreciation.
Looking Ahead
We believe the U.S. economy remains on a firm footing. Prospects appear good for solid economic and corporate earnings growth to continue in the second half of the year. The wildcards for both the economy and the market include energy prices, inflation, the Federal Reserve, and any significant geo-political instability.
Asian countries such as China and Japan continue to see strong economic expansion. In Europe, the economic growth has been more muted as countries such as France, Germany and Italy have had a more difficult time making economic reforms to compete more effectively in a global marketplace. Overall, global economic growth has been positive which provides multi-national and U.S. companies with the potential to continue their growth strategies.
At Pacific Advisors Fund, our investment strategy has been to adapt to changing market conditions in a manner consistent with the investment objectives for each of our Funds. The following interviews with our portfolio managers will provide more insight into the investment strategies being employed for each of our Funds.
While there is a great deal of uncertainty in the current markets, we believe that the broad investment outlook remains positive. Our investment strategies have always focused on a longer-term investment horizon recognizing that periods of uncertainty are inevitable. Our goal is to use these periods of market volatility to selectively make investments that have good long-term growth potential.
Sincerely,
George A. Henning
2
Pacific Advisors
Government Securities Fund
Seeks to provide high current income, preservation of capital, and rising future income, consistent with prudent investment risk. Invests at least 80% of its assets in U.S. Government fixed income securities and may invest in other income-producing instruments including dividend paying common stocks, for income and capital appreciation.
Interview with Portfolio Manager
Thomas H. Hanson
For the six months ended June 30, 2006, the Fund had a total return of – 0.87% for Class A shares, and – 1.14% for Class C shares. The Fund's benchmark, the Lehman Intermediate Treasury Bond Index1, returned 0.01% during the same period.
Q What was the interest rate environment in the first half of the year?
A The fixed income markets remained volatile over the past six months. The Federal Reserve Board continued its methodical interest rate increases to control inflation and moderate U.S. economic growth. Additionally, an expanding trade imbalance, coupled with a high domestic budget deficit, weighed on the market. The fixed income markets also had to integrate the reality of a declining dollar and administrative changes at the Fed under new Chairman Ben Bernanke. All of these factors raised market uncertainty and put pressure on longer-term bond prices.
Q How have growing inflationary factors effected the interest rate environment?
A Today, the marketplace is global. Countries around the world depend on one another for the exchange of goods and services. When global demand exceeds supply, economies experience price increases. This occurred over the last six months as worldwide demand for energy, basic commodities and industrial goods exceeded supplies. This imbalance resulted in higher prices across a broad range of manufactured goods and services. These cost increases amplified inflationary pressures, not only on the U.S. economy, but on those of other countries as well.
Changing the fed funds rate is one of the primary tools the Fed uses to control inflationary pressures. By increasing or decreasing this rate, the Fed makes the cost of borrowing money more or less expensive. This, in turn, impacts the rate of economic growth and affects underlying inflationary pressures. Over the past few years, the Fed has found it necessary to increase this key interest rate in order to temper an otherwise robustly expanding U.S. marketplace. Its goal is to keep inflation at a moderate level without stifling current economic growth. More importantly, rising interest rates not only affect the economy and inflation, they also impact the value of the dollar.
Q How does the value of the dollar impact management of the Fund?
A The value of the dollar is of growing importance to the Fund because it dictates the attractiveness of U.S. securities investments to potential buyers. When the dollar weakens significantly, foreign investors often shy away from U.S. investments, as they can find better opportunities elsewhere. This is especially true for fixed income securities that must actively compete for both domestic and international investors by offering competitive interest rates. Foreign investors remain critically important to the U.S. Treasury program to fund our domestic budget deficit. Additionally, a weak dollar makes imports more expensive which can increase inflation. Therefore, the falling dollar, along with these related pressures, is increasing the likelihood of higher rates for U.S. Government securities to keep them competitive in the world markets.
Q How did the Fund respond to interest rate changes and economic shifts during the first six months of the year?
A The steady increases in interest rates have eroded the price of long U.S. Government bonds. In 2005, we shortened maturities and increased cash levels to preserve principal in this rising interest
1 The Lehman Intermediate Treasury Bond Index is an unmanaged index of intermediate term government bonds since 12/31/80.
3
Pacific Advisors
Government Securities Fund continued
rate environment. With this more defensive posture already in place, few changes were made in the portfolio holdings over the first half of 2006. We reinvested proceeds from select bond sales into better yielding, short-term government securities. Our adaptive strategy continued to focus on managing interest rate risk to protect the portfolio from price declines in longer-term bonds.
Q How does the Fund seek to meet the needs of fixed income investors by managing for total return?
A Total return is the entire amount an investment generates over a specific time period. It includes all dividends, interest, and any appreciation or depreciation in price. Total return takes the Fund's whole financial performance into account instead of focusing on just one component, such as a dividend or yield. A fixed income investor is often a conservative investor whose primary objectives are capital preservation and the creation of a reliable income stream. By managing the Fund for total return, we seek to provide shareholders with not only a consistent source of income, but also competitive long-term performance. We carefully scrutinize each holding to determine its potential for long-term capital appreciation as well as income production.
As conservative fixed-income investors, our shareholders require protection of principal, low levels of risk, and a stable flow of income. A total return approach allows us to address each of these needs without overlooking opportunities for capital appreciation. We seek to protect principal and manage risk by actively analyzing interest rate changes and managing their effect on our current and prospective holdings. We manage maturities within the portfolio using an adaptive, active strategy; shortening maturities in a rising interest rate environment and lengthening maturities during times of stable or declining interest rates.
While bond holdings provide the primary source of income for the Fund, a small portion of the portfolio is allocated to dividend-paying equities and preferred stocks. This small, high-quality equity portion helps create a hedge against the deteriorating effects of inflation and supports the Fund's overall total return objective. Bringing all these investment components together, the Fund offers a total return approach that seeks to actively controls risk and provide reliable income to shareholders.
Q What is the outlook for the Fund during the remainder of 2006?
A For now, we are adopting a "wait and see" attitude. The Fed has indicated that interest rates may peak relatively soon. However, the presence of inflation has become a key factor in determining when and at what level rates will peak. Therefore, if rising inflationary pressures continue, determining when the interest rate cycle has peaked may become more uncertain.
Once interest rates do top, we should see sustained upward movement in long-term rates. At that point, we would seek to extend average maturities to capture higher yields. We are positioning the Fund for this opportunity and would expect to raise the Fund's cash levels to have investment capital available. Since we do not expect the interest rate environment to change dramatically through the end of the year, we do not anticipate any major changes to the portfolio holdings.
Past performance does not guarantee future results. Performance quoted represents past performance. Current performance may be higher or lower than the performance data quoted. Returns do not take into account the maximum 4.75% sales charge on Class A shares and would be lower if the sales charge were included. Returns represent the change in value over the stated period assuming reinvestment of dividends and capital gains at net asset value. Returns do not take into account individual taxes which may reduce actual returns when shares are sold. The investment return and principal value of an investment will fluctuate so that an investor's shares, when redeemed, may be worth more or less than their original cost. For performance current to the most recent month-end call (800) 989-6693.
4
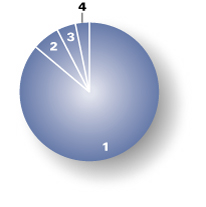
Portfolio Holdings as of 06/30/06 (Based on Total Investments)
| 1. | U.S. Government Agencies | 86.15 | % | ||||||||
| 2. | Equities | 6.30 | % | ||||||||
| 3. | Preferred Stock | 4.35 | % | ||||||||
| 4. | Cash and Cash Equivalents | 3.20 | % | ||||||||
5
Pacific Advisors
Government Securities Fund continued
Expense Examples
As a shareholder of the Fund you incur two types of costs: (1) transaction costs, including sales charges (loads) on purchase payments, reinvested dividends, or other distributions; redemption fees; and exchange fees; and (2) ongoing costs, including management fees; distribution (12b-1) fees; and other Fund expenses. This Example is intended to help you understand your ongoing costs (in dollars) of investing in the Fund and to compare these costs with the ongoing costs of investing in other mutual funds.
The Example is based on an investment of $1,000 invested at the beginning of the period and held for the entire period from January 1, 2006 through June 30, 2006.
Actual Expenses
The first line of the table below provides information about actual account values and actual expenses. You may use the information in this line, together with the amount you invested, to estimate the expenses that you paid over the period. Simply divide your account value by $1,000 (for example, an $8,600 account value divided by $1,000 = 8.6), then multiply the result by the number in the first line under the heading entitled "Expenses Paid During the Period" to estimate the expenses you paid on your account during the period.
The following transaction costs are not included in the expenses shown in the table and, if applicable, would increase the expenses that you paid over the period: (1) a front-end sales charge (load) of 4.75% on Class A shares; (2) a 2% redemption fee if you sell or exchange shares of the Fund within sixty days of purchase, with four exceptions. The fee does not apply to redemptions made under an automatic withdrawal program or periodic asset reallocation plan; redemptions to pay for expenses related to terminal illness, extended hospital or nursing home care, or other serious medical conditions; redemptions of shares acquired through dividend reinvestments; and redemptions of shares purchased before July 1, 2004; and (3) a $10 service fee on each exchange after the first five exchanges in each calendar year.
The following ongoing costs are not included in the expenses shown in the table and, if applicable, would increase the expenses that you paid over the period: (1) a $12 low balance fee on accounts with balances of less than $250 as of September 30th of each calendar year and no investment activity (excluding reinvestment of dividends and/or capital gains) during the prior calendar year or the first nine months of the current calendar year. This fee does not apply to IRAs, qualified plan accounts, or Coverdell Education Savings Accounts; (2) a $15 annual custodial fee on IRAs, SEPs, SIMPLE IRAs, and Coverdell Education Savings Accounts; and (3) a $20 annual custodial fee on 403(b) accounts.
Hypothetical Example for Comparison Purposes
The second line of the table below provides information about hypothetical account values and hypothetical expenses based on the Fund's actual expense ratio and an assumed rate of return of 5% per year before expenses, which in not the Fund's actual return. The hypothetical account values and expenses may not be used to estimate the actual ending account balance or expenses you paid for the period. You may use this information to compare the ongoing costs of investing in the Fund and other funds. To do so, compare this 5% hypothetical example with the 5% hypothetical examples that appear in the shareholder reports of the other funds.
The following transaction costs are not included in the expenses shown in the table and, if applicable, would increase the expenses that you paid over the period: (1) a front-end sales charge (load) of 4.75% on Class A shares; (2) a 2% redemption fee if you sell or exchange shares of the Fund within sixty days of purchase, with four exceptions. The fee does not apply to redemptions made under an automatic withdrawal program or periodic asset reallocation plan; redemptions to pay for expenses related to terminal illness, extended hospital or nursing home care, or other serious medical conditions; redemptions of shares acquired through dividend reinvestments; and redemptions of shares purchased before July 1, 2004; and (3) a $10 service fee on each exchange after the first five exchanges in each calendar year.
The following ongoing costs are not included in the expenses shown in the table and, if applicable, would increase the expenses that you paid over the period: (1) a $12 low balance fee on accounts with balances of less than $250 as of September 30th of each calendar year and no investment activity (excluding reinvestment of dividends and/or capital gains) during the prior calendar year or the first nine months of the current calendar year. This fee does not apply to IRAs, qualified plan accounts, or Coverdell Education Savings Accounts; (2) a $15 annual custodial fee on IRAs, SEPs, SIMPLE IRAs, and Coverdell Education Savings Accounts; and (3) a $20 annual custodial fee on 403(b) accounts.
Please note that the expenses shown in the table are meant to highlight your ongoing costs only and do not reflect any transactional costs, such as sales charges (loads), redemption fees, or exchange fees. Therefore, the second line of the table is useful in comparing ongoing costs only, and will not help you determine the relative total costs of owning different funds. In addition, if these transactional costs were included, your costs would have been higher.
| Beginning Account Value 01/01/06 | Ending Account Value 06/30/06 | Expense Paid During Period 01/01/06 – 06/30/06 | |||||||||||||
| Class A Shares | |||||||||||||||
| Actual | $ | 1,000 | $ | 991.30 | $ | 11.65 | |||||||||
| Hypothetical (5% return before expense) | $ | 1,000 | $ | 1,024.79 | $ | 11.85 | |||||||||
| Class C Shares | |||||||||||||||
| Actual | $ | 1,000 | $ | 988.60 | $ | 15.33 | |||||||||
| Hypothetical (5% return before expense) | $ | 1,000 | $ | 1,024.79 | $ | 15.61 | |||||||||
3 Expenses are equal to the Fund's annualized expense ratio of 2.36% for Class A shares and 3.11% for Class C shares, multiplied by the average account value over the period, multiplied by 181/365 days to reflect the one-half year period.
6
Pacific Advisors
Income and Equity Fund
Seeks to provide current income and, secondarily, long-term capital appreciation. Invests primarily in investment grade fixed income securities and dividend paying stocks.
Interview with Portfolio Managers
Thomas H. Hanson
Stephen K. Bache, CFA
For the six months ended June 30, 2006, the Fund returned 1.62% for Class A shares, and 1.18% for Class C shares. The Fund's benchmarks, the S&P 5001 and the Lehman Intermediate Corporate Bond Index2, returned 2.71% and – 0.49%, respectively.
Q What economic factors impacted the Fund's fixed income holdings in the first half of 2006?
A During the past six months, the bond market continued to suffer under rising interest rates and an expanding U.S. trade deficit. Inflation concerns around the world escalated and many countries, including the U.S., raised key interest rates to help check inflationary pressures. Additionally, the fixed income market saw the re-introduction of the 30-year Treasury bond which relieved pressure on the 10-year Treasury note. This reintroduction added liquidity to the market and provided institutional investors with an alternative for funding their long-term obligations.
The Fund's fixed income investments remained concentrated in shorter-term bonds. We fine-tuned these investments by further shortening maturities while retaining higher-quality and higher-yielding positions. We maintained a defensive stance against rising interest rates by keeping the portfolio's average maturity at less than six years. By protecting principal during these periods of higher interest rate risk, we are strategically positioning the Fund for better yield and capital appreciation opportunities in the future. Overall, we made few changes to the Fund's fixed income holdings. This defensive posture continued to benefit Fund performance through the first half of the year.
Q What were the primary economic factors that affected the Fund's equity holdings during the first half of 2006?
A The equity markets endured periods of growth and decline in the first six months, resulting in elevated market volatility. The Fund's equity investments remained targeted to high-quality, dividend-paying stocks to enhance the Fund's total return. We did, however, raise the allocation to equities from 25% to approximately 35% of the portfolio. This strategic move sought to capture the potential for longer-term performance offered by the equity market; particularly in view of declining bond prices. Specifically, global demand for energy and basic materials continued to create investment opportunities for the Fund. We gained exposure to these stronger performing sectors with holdings such as integrated oil producers British Petroleum and Marathon Oil.
Q What is the Fund's investment objective and for what kind of investor is this Fund suitable?
A The Fund's allocation of fixed income securities and equity holdings are actively managed to produce total return. We employ an adaptive investment strategy that makes the Fund a more distinctive player in the mutual fund universe. The Fund is neither a pure bond, nor a pure equity fund. As the name implies, the Income and Equity Fund is a hybrid of these two types of funds. The Fund is constructed to maximize yield like a fixed income fund, while seeking selective growth opportunities like a large cap equity fund. The Fund seeks exposure to a broad spectrum of high-quality, yield-producing or dividend-oriented securities that can be effectively managed in all types of market environments. This s trategy is designed to meet the investment objectives of more conservative investors. Therefore, the Fund primarily seeks to provide current income while providing growth to serve as a hedge against inflation. This allows conservative investors to enjoy the benefits of total return with limited risk.
Q How does the Fund's distinctive investment strategy meet the needs of its investors?
A Receiving a consistent income stream and maintaining a stable investment valuation are often the primary concerns of more conservative or retired investors. We buy high-quality corporate and government bonds and we actively manage the
1 The Standard & Poor's 500 Index is an unmanaged, market capitalization weighted measure of 500 widely held common stocks listed on the New York Stock Exchange, American Stock Exchange and The Nasdaq Stock Market. Index returns assume the reinvestment of dividends, but, unlike the Fund's returns, do not reflect the effects of management fees or expenses.
2 The Lehman Intermediate Corporate Bond Index is an unmanaged index of intermediate term U.S. corporate bonds since 01/01/73.
7
Pacific Advisors
Income and Equity Fund continued
Fund's investments to minimize risk and maximize capital appreciation opportunities. Our active management seeks to produce a consistent source of income. Using a total return approach, we invest a smaller portion of the Fund's holdings in high-quality equities. Equity holdings typically account for between 20% and 35% of the portfolio and provide an important hedge against inflation. This total return approach affords investors the opportunity to create a more stable income stream in contrast to traditional laddered portfolios and more volatile yield-oriented strategies.
Q How does the Fund manage risk in the bond and equity portions of the portfolio?
A Limiting risk is a key tenet of the Fund's investment strategy. As market conditions change, we actively manage the Fund's portfolio to protect capital while seeking opportunities to improve performance. Specific risk management strategies vary depending on whether the investment is a bond or equity.
We seek to control bond risk by adjusting the maturity and duration of the portfolio's fixed income holdings to the "sweet spot" on the yield curve. The "sweet spot" is the point at which we can achieve the greatest yield for the least amount of risk relative to overall market conditions. Finding that spot often means shortening or lengthening maturities as interest rates rise and fall. For example, over the past year, interest rates continued to climb. In response, we shortened maturities defensively to decrease the Fund's exposure to interest rate risk and protect principal. While sacrificing yield short-term, once interest rates peak, we will seek to lengthen maturities and lock-in higher yields for a longer period of time.
The equity component of the Fund manages a different kind of risk. Over time, as the prices of goods and services rise, an investor's purchasing power is reduced. While not immediately noticeable, this slow deterioration of buying power can significantly impact an investor's future financial security. By investing in high-quality, dividend-paying stocks with the potential for capital appreciation, the Fund seeks to help alleviate shareholders' inflation risk.
Q Why are dividend-paying stocks important to the Fund?
A Dividend-paying stocks can provide shareholders with a relatively steady source of income. Equity holdings that pay a regular dividend are an important component of total return. This is especially true during periods when fixed income performance is low due to rising interest rates and declining bond prices. Dividend-paying equities create the opportunity to enhance the Fund's total return by offering the additional potential for capital appreciation. This year, dividend yields improved enough to warrant an increase in the Fund's equity allocation to approximately 35% of the portfolio. This allocation is higher than we have reached in the past. However, we saw a unique opportunity to improve performance given the depressed nature of bond prices with their relatively low historical yields. Once bond prices stabilize and begin to rise, we will likely decrease exposure to the equity markets while repositioning the Fund in longer-t erm, better-yielding bonds.
Q What challenges will the Fund face through the end of the year?
A The main challenge going forward will be navigating a less robust equity market while responding to any further price declines in bonds. We expect the interest rate market to remain volatile. In order to position the Fund for opportunities once interest rates top, we anticipate increasing cash levels near term. Realizing that we are in a period of higher volatility, our focus will remain on preserving capital while seeking select opportunities to enhance total return.
Past performance does not guarantee future results. Performance quoted represents past performance. Current performance may be higher or lower than the performance data quoted. Returns do not take into account the maximum 4.75% sales charge on Class A shares and would be lower if the sales charge were included. Returns represent the change in value over the stated period assuming reinvestment of dividends and capital gains at net asset value. Returns do not take into account individual taxes which may reduce actual returns when shares are sold. The investment return and principal value of an investment will fluctuate so that an investor's shares, when redeemed, may be worth more or less than their original cost. For performance current to the most recent month-end call (800) 989-6693.
8
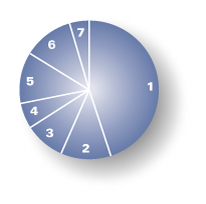
Portfolio Holdings as of 06/30/06 (Based on Total Investments)
| 1. | Corporate Bonds | 44.96 | % | ||||||||
| Equities | 38.84 | % | |||||||||
| 2. | Financials | 11.61 | % | ||||||||
| 3. | Energy | 9.34 | % | ||||||||
| 4. | Industrials | 5.95 | % | ||||||||
| 5. | Other Equities | 11.94 | % | ||||||||
| 6. | U.S. Government Agencies | 11.66 | % | ||||||||
| 7. | Preferred Stock | 4.54 | % | ||||||||
9
Pacific Advisors
Income and Equity Fund continued
Expense Examples
As a shareholder of the Fund you incur two types of costs: (1) transaction costs, including sales charges (loads) on purchase payments, reinvested dividends, or other distributions; redemption fees; and exchange fees; and (2) ongoing costs, including management fees; distribution (12b-1) fees; and other Fund expenses. This Example is intended to help you understand your ongoing costs (in dollars) of investing in the Fund and to compare these costs with the ongoing costs of investing in other mutual funds.
The Example is based on an investment of $1,000 invested at the beginning of the period and held for the entire period from January 1, 2006 through June 30, 2006.
Actual Expenses
The first line of the table below provides information about actual account values and actual expenses. You may use the information in this line, together with the amount you invested, to estimate the expenses that you paid over the period. Simply divide your account value by $1,000 (for example, an $8,600 account value divided by $1,000 = 8.6), then multiply the result by the number in the first line under the heading entitled "Expenses Paid During the Period" to estimate the expenses you paid on your account during the period.
The following transaction costs are not included in the expenses shown in the table and, if applicable, would increase the expenses that you paid over the period: (1) a front-end sales charge (load) of 4.75% on Class A shares; (2) a 2% redemption fee if you sell or exchange shares of the Fund within sixty days of purchase, with four exceptions. The fee does not apply to redemptions made under an automatic withdrawal program or periodic asset reallocation plan; redemptions to pay for expenses related to terminal illness, extended hospital or nursing home care, or other serious medical conditions; redemptions of shares acquired through dividend reinvestments; and redemptions of shares purchased before July 1, 2004; and (3) a $10 service fee on each exchange after the first five exchanges in each calendar year.
The following ongoing costs are not included in the expenses shown in the table and, if applicable, would increase the expenses that you paid over the period: (1) a $12 low balance fee on accounts with balances of less than $250 as of September 30th of each calendar year and no investment activity (excluding reinvestment of dividends and/or capital gains) during the prior calendar year or the first nine months of the current calendar year. This fee does not apply to IRAs, qualified plan accounts, or Coverdell Education Savings Accounts; (2) a $15 annual custodial fee on IRAs, SEPs, SIMPLE IRAs, and Coverdell Education Savings Accounts; and (3) a $20 annual custodial fee on 403(b) accounts.
Hypothetical Example for Comparison Purposes
The second line of the table below provides information about hypothetical account values and hypothetical expenses based on the Fund's actual expense ratio and an assumed rate of return of 5% per year before expenses, which in not the Fund's actual return. The hypothetical account values and expenses may not be used to estimate the actual ending account balance or expenses you paid for the period. You may use this information to compare the ongoing costs of investing in the Fund and other funds. To do so, compare this 5% hypothetical example with the 5% hypothetical examples that appear in the shareholder reports of the other funds.
The following transaction costs are not included in the expenses shown in the table and, if applicable, would increase the expenses that you paid over the period: (1) a front-end sales charge (load) of 4.75% on Class A shares; (2) a 2% redemption fee if you sell or exchange shares of the Fund within sixty days of purchase, with four exceptions. The fee does not apply to redemptions made under an automatic withdrawal program or periodic asset reallocation plan; redemptions to pay for expenses related to terminal illness, extended hospital or nursing home care, or other serious medical conditions; redemptions of shares acquired through dividend reinvestments; and redemptions of shares purchased before July 1, 2004; and (3) a $10 service fee on each exchange after the first five exchanges in each calendar year.
The following ongoing costs are not included in the expenses shown in the table and, if applicable, would increase the expenses that you paid over the period: (1) a $12 low balance fee on accounts with balances of less than $250 as of September 30th of each calendar year and no investment activity (excluding reinvestment of dividends and/or capital gains) during the prior calendar year or the first nine months of the current calendar year. This fee does not apply to IRAs, qualified plan accounts, or Coverdell Education Savings Accounts; (2) a $15 annual custodial fee on IRAs, SEPs, SIMPLE IRAs, and Coverdell Education Savings Accounts; and (3) a $20 annual custodial fee on 403(b) accounts.
Please note that the expenses shown in the table are meant to highlight your ongoing costs only and do not reflect any transactional costs, such as sales charges (loads), redemption fees, or exchange fees. Therefore, the second line of the table is useful in comparing ongoing costs only, and will not help you determine the relative total costs of owning different funds. In addition, if these transactional costs were included, your costs would have been higher.
| Beginning Account Value 01/01/06 | Ending Account Value 06/30/06 | Expense Paid During Period 01/01/06 – 06/30/06 | |||||||||||||
| Class A Shares | |||||||||||||||
| Actual | $ | 1,000 | $ | 1,016.20 | $ | 10.25 | |||||||||
| Hypothetical (5% return before expense) | $ | 1,000 | $ | 1,024.79 | $ | 10.29 | |||||||||
| Class C Shares | |||||||||||||||
| Actual | $ | 1,000 | $ | 1,011.80 | $ | 13.97 | |||||||||
| Hypothetical (5% return before expense) | $ | 1,000 | $ | 1,024.79 | $ | 14.06 | |||||||||
4 Expenses are equal to the Fund's annualized expense ratio of 2.05% for Class A shares and 2.80% for Class C shares, multiplied by the average account value over the period, multiplied by 181/365 days to reflect the one-half year period.
10
Pacific Advisors
Balanced Fund
Seeks to achieve long-term capital appreciation and income consistent with reduced risk. Invests primarily in large and medium cap common stocks with at least 25% of its assets invested in fixed income securities and preferred stocks.
Interview with Portfolio Manager
Stephen K. Bache, CFA
For the six months ended June 30, 2006, the Fund returned 1.78% for Class A shares, and 1.36% for Class C shares. The Fund's benchmarks, the S&P 5001 and the Lehman Intermediate Corporate Bond Index2, returned 2.71% and – 0.49%, respectively.
Q How did the economic climate in the first six months impact the equity market?
A The U.S. economy continued to grow at a healthy, albeit slower pace, in the first half of the year. Growth reached an annual rate of 5.6% in the first quarter but slowed to 2.5% in the second quarter. Despite solid growth and low unemployment, the equity markets remained trading-range bound in the first six months. Concerns about rising interest rates, higher energy prices and inflation created market volatility and culminated in a steep market correction in May.
While these conditions made for a challenging investment environment, individual stocks continued to offer attractive investment opportunities. In particular, stocks in the energy, financial, and basic materials sectors performed well. Careful stock selection remained paramount to capitalizing on individual investment opportunities while minimizing exposure to elevated market risk.
Q Why did the corporate bond market continue to lag behind the equity market?
A Rising interest rates, increased demand, and limited supply weighed heavily on corporate bond performance. Focused on debt management and flush with large cash reserves, corporations continued to issue fewer bonds in the first six months of the year. Demand for corporate bonds continued to outpace supply keeping yields relatively low. Corporate bond performance also suffered as a result of increased investment competition from lower risk government securities offering similar interest rates.
In addition, corporate bonds continued to carry elevated investment risk. The Federal Reserve continued raising interest rates in the first half of the year to manage economic growth and control inflation. The imbalance between supply and demand prevented corporate bond rates from rising in tandem with short-term interest rates. However, this imbalance has only delayed an eventual rise in corporate bond rates. As a result, the growing likelihood of rising interest rates continued to elevate interest rate and market risk for corporate bonds.
Q How did the allocation mix between bonds and equities change over the past six months?
A We actively manage the mix between equities and bonds based on our analysis of current and near-term market conditions and economic trends. By adjusting the stock-bond mix of the portfolio we can expand the Fund's opportunities for growth while managing risk exposure specific to each area of the market. At the beginning of the year, the Fund's portfolio consisted of approximately 59% in equities, 31% in bonds and the remainder in cash. Given muted performance and elevated risk in the corporate bond market, equities continued to offer more attractive investment opportunities over the last six months. In response, we raised the Fund's equity holdings to 62% while lowering the bond exposure to 26%. To manage risk, equity holdings remained concentrated in high-quality common and preferred stocks offering solid long-term growth potential.
We expect we will begin to see the long-awaited rise in corporate bond rates in the near future. The Fed has signaled an impending pause in its interest rate hikes which should provide a catalyst for a rise in longer-term rates. As we already began to see in the first half of the year, rates will eventually have to rise in order for corporate bonds to remain competitive with government bonds. Once long-term rates reach a
1 The Standard & Poor's 500 Index is an unmanaged, market capitalization weighted measure of 500 widely held common stocks listed on the New York Stock Exchange, American Stock Exchange and The Nasdaq Stock Market. Index returns assume the reinvestment of dividends, but, unlike the Fund's returns, do not reflect the effects of management fees or expenses.
2 The Lehman Intermediate Corporate Bond Index is an unmanaged index of intermediate term U.S. corporate bonds since 01/01/73.
11
Pacific Advisors
Balanced Fund continued
peak, we will look to increase the Fund's bond exposure and lock-in higher yields for capital appreciation potential on longer-term bonds.
Q Where did the Fund find performance opportunities in the first part of the year?
A The Fund's equity investments continued to provide the greatest opportunities in the first half of the year. Specifically, the energy and commodities sectors continued to produce performance for the Fund. An emphasis on domestic oil and natural gas producers such as Devon Energy and Suncor Energy served the Fund well. Significant gains were also captured with the sale of Lucent Technologies following the announcement of its merger with French telecom provider Alcatel. Additionally, short-term market volatility provided the Fund with opportunities to selectively add positions in deeply discounted holdings such as media giant CBS. We believe this firm has a unique growth opportunity due to increased media activity for the 2006 and 2008 elections. Short-term volatility provided buying opportunities in other areas including White Mountains Insurance Group in the financial services sector and Johnson & Johnson in the healthcare sector.
In this constricted corporate bond market, we found few attractive investment choices and limited performance opportunities. Fixed income positions remained concentrated in high-quality, investment grade corporate bonds. To manage risk, we kept bond maturities at 2 to 3 years, reduced the Fund's overall bond allocation, and raised cash levels to shield the portfolio from the declining price pressures in the bond market.
Q How does the Fund balance risk and reward?
A The Balanced Fund is designed to provide a broad range of investors with a core investment that offers diversified exposure to equity and fixed investments. The Fund aims to provide capital appreciation and income while managing risk. A key component of the Fund's investment strategy is active management of the allocation between equities and corporate bonds. We monitor and rebalance the portfolio allocation to emphasize the area of the market with the strongest performance and limit exposure to areas with elevated risk and limited performance. For example, in the first six months of the year we increased the Fund's equity exposure to benefit from stronger equity performance and minimize exposure to weaker performance in the corporate bond market.
Specific investment decisions are primarily based on the intrinsic worth of each individual holding. In the equity portfolio, we seek to maintain a well diversified portfolio of hand-picked, long-term investments. The merits of potential investments are weighed based on earnings and dividend stability, potential profitability, and the underlying value of each holding in light of the portfolio as a whole.
In addition, we manage equity risk by diversifying across market capitalizations, industries and sectors. As of June 30th, the Fund's equity investments were spread over 30 industries in 9 different sectors. The Fund primarily invests in blue chip, dividend-paying large cap stocks to provide a cushion against price volatility. These core holdings include companies such as Pfizer, General Electric, and Microsoft. For added diversification, the portfolio also includes select mid and small cap positions.
Fixed income investments are concentrated in high-quality, investment grade bonds. Furthermore, we actively manage the average maturity of the Fund's bond portfolio to the "sweet spot" on the yield curve. Put simply, this means investing in bonds that offer the best yield and capital appreciation opportunities with the lowest risk. Given the elevated risk in the bond market during the first half of the year, this meant maintaining a relatively short average maturity of 2 to 3 years in the Fund's bond portfolio.
Q What changes do you expect to make to the portfolio through the end of the year?
A Data suggest the prospects for continued global and domestic economic growth remain good. The rate of U.S. economic growth will likely remain more moderate at around 3%. Long-term supply and demand issues will keep energy prices high and more volatile. Nevertheless, with the Fed's interest rate hikes having their intended effect, inflation is expected to remain at a manageable level.
The equity market will likely remain volatile and trading range bound which will continue to limit overall market performance. Careful stock selection
12
will remain vital to managing volatility and capitalizing on individual investment opportunities. Given the expectation for higher energy prices, we expect the energy sector will continue to lead market performance. The Fund will maintain appropriate exposure to this sector while remaining diversified with investments in other industries and sectors. As it did in the first six months, we believe short-term market volatility will continue to provide opportunities to acquire positions with long-term growth potential at discounted prices.
Through 17 consecutive increases, the Fed has raised short-term interest rates to 5.25%. We expect the Fed will reach an end to its current rate increases before the year-end with short-term rates reaching a peak between 5.50% and 6.00%. A peak in short-term rates should result in a sustained rise in long-term rates. We expect corporate bond rates will eventually reach a peak between 6% and 7%.
While we foresee improved conditions in the corporate bond market, they will take time to develop. We expect to maintain a greater weighting in equities for the foreseeable future to capitalize on stronger performance in the equity market. Likewise, we expect to maintain a shorter average maturity and limited exposure to the corporate bond market until rates begin to peak. When corporate bond rates peak, we anticipate increasing bond exposure to capture yield and capital appreciation potential through investments in longer-term bonds.
Past performance does not guarantee future results. Performance quoted represents past performance. Current performance may be higher or lower than the performance data quoted. Returns do not take into account the maximum 5.75% sales charge on Class A shares and would be lower if the sales charge were included. Returns represent the change in value over the stated period assuming reinvestment of dividends and capital gains at net asset value. Returns do not take into account individual taxes which may reduce actual returns when shares are sold. The investment return and principal value of an investment will fluctuate so that an investor's shares, when redeemed, may be worth more or less than their original cost. For performance current to the most recent month-end call (800) 989-6693.
13
Pacific Advisors
Balanced Fund continued
Portfolio Holdings as of 06/30/06 (Based on Total Investments)
| Equities | 62.45 | % | |||||||||
| 1. | Energy | 12.86 | % | ||||||||
| 2. | Industrials | 10.21 | % | ||||||||
| 3. | Financials | 9.45 | % | ||||||||
| 4. | Health Care | 8.32 | % | ||||||||
| 5. | Materials | 5.88 | % | ||||||||
| 6. | Consumer Discretionary | 5.73 | % | ||||||||
| 7. | Information Technology | 5.49 | % | ||||||||
| 8. | Other Equities | 4.51 | % | ||||||||
| 9. | Corporate Bonds | 25.78 | % | ||||||||
| 10. | U.S. Government Agencies | 10.61 | % | ||||||||
| 11. | Cash and Cash Equivalents | 1.16 | % | ||||||||

14
Expense Examples
As a shareholder of the Fund you incur two types of costs: (1) transaction costs, including sales charges (loads) on purchase payments, reinvested dividends, or other distributions; redemption fees; and exchange fees; and (2) ongoing costs, including management fees; distribution (12b-1) fees; and other Fund expenses. This Example is intended to help you understand your ongoing costs (in dollars) of investing in the Fund and to compare these costs with the ongoing costs of investing in other mutual funds.
The Example is based on an investment of $1,000 invested at the beginning of the period and held for the entire period from January 1, 2006 through June 30, 2006.
Actual Expenses
The first line of the table below provides information about actual account values and actual expenses. You may use the information in this line, together with the amount you invested, to estimate the expenses that you paid over the period. Simply divide your account value by $1,000 (for example, an $8,600 account value divided by $1,000 = 8.6), then multiply the result by the number in the first line under the heading entitled "Expenses Paid During the Period" to estimate the expenses you paid on your account during the period.
The following transaction costs are not included in the expenses shown in the table and, if applicable, would increase the expenses that you paid over the period: (1) a front-end sales charge (load) of 5.75% on Class A shares; (2) a 2% redemption fee if you sell or exchange shares of the Fund within six months of purchase, with four exceptions. The fee does not apply to redemptions made under an automatic withdrawal program or periodic asset reallocation plan; redemptions to pay for expenses related to terminal illness, extended hospital or nursing home care, or other serious medical conditions; redemptions of shares acquired through dividend reinvestments; and redemptions of shares purchased before July 1, 2004; and (3) a $10 service fee on each exchange after the first five exchanges in each calendar year.
The following ongoing costs are not included in the expenses shown in the table and, if applicable, would increase the expenses that you paid over the period: (1) a $12 low balance fee on accounts with balances of less than $250 as of September 30th of each calendar year and no investment activity (excluding reinvestment of dividends and/or capital gains) during the prior calendar year or the first nine months of the current calendar year. This fee does not apply to IRAs, qualified plan accounts, or Coverdell Education Savings Accounts; (2) a $15 annual custodial fee on IRAs, SEPs, SIMPLE IRAs, and Coverdell Education Savings Accounts; and (3) a $20 annual custodial fee on 403(b) accounts.
Hypothetical Example for Comparison Purposes
The second line of the table below provides information about hypothetical account values and hypothetical expenses based on the Fund's actual expense ratio and an assumed rate of return of 5% per year before expenses, which in not the Fund's actual return. The hypothetical account values and expenses may not be used to estimate the actual ending account balance or expenses you paid for the period. You may use this information to compare the ongoing costs of investing in the Fund and other funds. To do so, compare this 5% hypothetical example with the 5% hypothetical examples that appear in the shareholder reports of the other funds.
The following transaction costs are not included in the expenses shown in the table and, if applicable, would increase the expenses that you paid over the period: (1) a front-end sales charge (load) of 5.75% on Class A shares; (2) a 2% redemption fee if you sell or exchange shares of the Fund within six months of purchase, with four exceptions. The fee does not apply to redemptions made under an automatic withdrawal program or periodic asset reallocation plan; redemptions to pay for expenses related to terminal illness, extended hospital or nursing home care, or other serious medical conditions; redemptions of shares acquired through dividend reinvestments; and redemptions of shares purchased before July 1, 2004; and (3) a $10 service fee on each exchange after the first five exchanges in each calendar year.
The following ongoing costs are not included in the expenses shown in the table and, if applicable, would increase the expenses that you paid over the period: (1) a $12 low balance fee on accounts with balances of less than $250 as of September 30th of each calendar year and no investment activity (excluding reinvestment of dividends and/or capital gains) during the prior calendar year or the first nine months of the current calendar year. This fee does not apply to IRAs, qualified plan accounts, or Coverdell Education Savings Accounts; (2) a $15 annual custodial fee on IRAs, SEPs, SIMPLE IRAs, and Coverdell Education Savings Accounts; and (3) a $20 annual custodial fee on 403(b) accounts.
Please note that the expenses shown in the table are meant to highlight your ongoing costs only and do not reflect any transactional costs, such as sales charges (loads), redemption fees, or exchange fees. Therefore, the second line of the table is useful in comparing ongoing costs only, and will not help you determine the relative total costs of owning different funds. In addition, if these transactional costs were included, your costs would have been higher.
| Beginning Account Value 01/01/06 | Ending Account Value 06/30/06 | Expense Paid During Period 01/01/06 – 06/30/06 | |||||||||||||
| Class A Shares | |||||||||||||||
| Actual | $ | 1,000.00 | $ | 1,017.80 | $ | 12.56 | |||||||||
| Hypothetical (5% return before expense) | $ | 1,000.00 | $ | 1,024.79 | $ | 12.60 | |||||||||
| Class C Shares | |||||||||||||||
| Actual | $ | 1,000.00 | $ | 1,013.60 | $ | 16.28 | |||||||||
| Hypothetical (5% return before expense) | $ | 1,000.00 | $ | 1,024.79 | $ | 16.37 | |||||||||
4 Expenses are equal to the Fund's annualized expense ratio of 2.51% for Class A shares and 3.26% for Class C shares, multiplied by the average account value over the period, multiplied by 181/365 days to reflect the one-half year period.
15
Pacific Advisors
Growth Fund
Seeks to achieve long-term capital appreciation. Invests primarily in medium to large capitalization companies whose stocks are a part of the S&P 500 Index1 or the Nasdaq 100 Index2.
Interview with Portfolio Manager
Thomas H. Hanson
For the six months ended June 30, 2006, the Fund returned 2.69% for Class A shares, and 2.37% for Class C shares. The Fund's benchmarks, the S&P 500 and the Russell 10003, changed 2.71% and 2.76%, respectively, during the same period.
Q How did the economic climate in the first half of 2006 impact large cap growth stocks?
A Economic growth continued at the strong pace set in 2005 through the first quarter of 2006. U.S. businesses remained profitable and consumer confidence was solid. At the same time, a number of problematic issues loomed in the background including the expanding U.S. trade and budget deficits, creeping inflationary pressures, skyrocketing energy prices and a change in leadership at the Federal Reserve. The market presented many opportunities to investors but was neither overly bullish, nor bearish. Large cap stocks enjoyed the benefits of strong corporate revenues and good quarterly earnings across most industries and sectors. In particular, large cap growth stocks in the energy, industrial, and basic materials sectors outperformed the market due to substantial increases in global demand for their products and services.
Escalating inflation and the reality of over-speculation in the market caught up with investors in mid-May and the market's momentum abruptly changed course. The Fed continued to raise interest rates beyond what many investors had hoped raising fears of an economic slowdown. The market reacted negatively as it became apparent that the Fed would act firmly to keep inflation at bay and bring economic growth to a more sustainable pace. Central banks around the globe also adjusted their monetary policies in an attempt to rein in advancing inflationary pressures in their own economies. As a result, the stock market pulled back and entered a period of more intense volatility.
Q How did the Fund respond to these market and economic pressures?
A Large cap growth stocks as a whole suffered during this market correction. Even as the market pulled back, we saw areas of growth emerge among large cap stocks. Energy and energy-related companies, as well as those in the healthcare sector, continued to perform well. We used the mid-May correction to take new or larger positions in companies which fit our growth-at-a-reasonable price, focused-fund strategy. Specifically, we found opportunities in the energy, commodity-related, and healthcare sectors and added to positions in companies such as Lyondell Chemical, BHP Billiton and United Health Group.
Q Why have large cap stocks experienced slower earnings growth than small cap stocks?
A A company's market capitalization can dictate how soon it benefits or fails to benefit financially from changes in the economy. Large cap stocks often require large scale catalysts, such as a merger or acquisition, the beginning of a new economic cycle or the release of new technology, to produce significant earnings growth. Conversely, small cap stocks can be dramatically impacted by the slightest of economic or company-specific changes which directly impact their revenue. Therefore, while large cap growth stocks typically grow earnings more slowly, they generally offer greater price stability than small cap stocks. Comparatively, small cap stocks must typically endure greater volatility and higher risk to achieve their accelerated growth rates.
To identify large cap growth opportunities, we use both technical and fundamental analysis to identify major market trends and catalysts. We seek
1 The Standard & Poor's 500 Index is an unmanaged, market capitalization weighted measure of 500 widely held common stocks listed on the New York Stock Exchange, American Stock Exchange and The Nasdaq Stock Market. Index returns assume the reinvestment of dividends, but, unlike the Fund's returns, do not reflect the effects of management fees or expenses.
2 The Nasdaq 100 Stock Index is an unmanaged, market capitalization weighted measure of the 100 largest non-financial domestic and international common stocks listed on The Nasdaq Stock Market. Index returns assume the reinvestment of dividends, but, unlike the Fund's returns, do not reflect management fees or expenses.
3 The Russell 1000 Stock Index is an unmanaged, market capitalization weighted measure of stock market performance. It contains the stocks of the 1,000 largest publicly traded companies within the Russell 3000 Index. Index returns assume the reinvestment of dividends, but, unlike the Fund's returns, do not reflect the effects of capital gains, management fees, or expenses.
16
to produce total return for the Fund by surfacing the strongest performing large cap stocks in the best performing sectors. During the first half of the year, companies in the energy and basic materials sectors continued to grow at rapid rates. We capitalized on this trend by reestablishing positions in some of the biggest companies in those sectors. In particular, we used market pullbacks to add to companies that offered long-term growth potential at reasonable prices. We do not chase stocks that have already experienced significant price appreciation beyond our risk tolerance. Instead, we look to invest in firms that are just beginning their growth cycles and are still reasonably priced.
Q Some investors view index funds as an ideal way to gain market exposure. What added value does the Growth Fund provide to investors compared to an index fund?
A An index fund is a passively managed investment. Stocks are not individually selected as part of a larger investment strategy. Instead, the portfolio mirrors that of a specific financial index, such as the S&P 500. Therefore, an index fund cannot manage market risk and its performance can only mimic that of its underlying index. Performance may be great in bull markets, but it will typically be bad in bear markets and relatively flat in sideways-moving markets.
In contrast, the Growth Fund is actively managed and seeks to produce returns superior to those of the market or its benchmarks, the S&P 500 and the Russell 1000 Indices. Equity holdings are hand-picked to play a specific role in achieving the Fund's long-term investment goals. In addition, the Fund actively manages risk by maintaining a diversified portfolio and through its strategic use of cash. In downward-trending markets, we raise cash levels to lock in profits and limit losses. Conversely, in upward-trending markets, we seek to reduce cash holdings to remain fully invested in equities. For example, the Fund was relatively fully invested during the first portion of 2006. During the period, we began raising the level of cash to position the Fund for opportunities expected in the second half of the year. Through this active management style we attempt to protect gains and minimize losses. By their nature, however, index funds must ful ly absorb all the risks and losses the market offers.
Q Where do you see potential growth opportunities emerging over the next six months?
A Energy and energy-related sectors should continue to hold the greatest opportunities for large cap growth stocks for the remainder of 2006. As the world's thirst for oil continues to grow, companies with direct links to energy resources should have the best opportunities to enhance their revenue and profitability. The Fund has increased exposure to this sector with holdings in Apache Corp., an oil exploration and production company, and ConocoPhillips, the third largest oil company in the U.S. The far-reaching effects of energy on the economy will also provide growth opportunities in sectors such as industrials and transportation. T ransporting energy and building an infrastructure to transport energy will become a key component of the energy situation around the world. Positions in companies such as Chicago Bridge & Iron, which designs and builds structures to both store and transport petroleum resources, places the Fund in a position to capitalize on growth in these sectors.
The healthcare sector should also continue to produce substantial long-term growth. The confluence of an aging baby-boomer population with expectations for longer life has produced a demographic-based investment opportunity in companies that provide healthcare services and equipment. We increased the Fund's positions in firms such as WellPoint, the largest health insurer in the U.S., and St. Jude Medical, a cardiovascular equipment manufacturer which produces the world's most widely used heart valve. As an additional benefit, this sector is typically less sensitive to swings in the overall market. Therefore, these holdings not only offer growth opportunities, but also provide an element of stability to the Fund.
Past performance does not guarantee future results. Performance quoted represents past performance. Current performance may be higher or lower than the performance data quoted. Returns do not take into account the maximum 5.75% sales charge on Class A shares and would be lower if the sales charge were included. Returns represent the change in value over the stated period assuming reinvestment of dividends and capital gains at net asset value. Returns do not take into account individual taxes which may reduce actual returns when shares are sold. The investment return and principal value of an investment will fluctuate so that an investor's shares, when redeemed, may be worth more or less than their original cost. For performance current to the most recent month-end call (800) 989-6693.
17
Pacific Advisors
Growth Fund continued
Portfolio Holdings as of 06/30/06 (Based on Total Investments)
| Equities | 92.77 | % | |||||||||
| 1. | Energy | 27.30 | % | ||||||||
| 2. | Health Care | 25.43 | % | ||||||||
| 3. | Materials | 12.68 | % | ||||||||
| 4. | Industrials | 12.67 | % | ||||||||
| 5. | Information Technology | 9.32 | % | ||||||||
| 6. | Other Equities | 5.37 | % | ||||||||
| 7. | Cash and Cash Equivalents | 7.23 | % | ||||||||

18
Expense Examples
As a shareholder of the Fund you incur two types of costs: (1) transaction costs, including sales charges (loads) on purchase payments, reinvested dividends, or other distributions; redemption fees; and exchange fees; and (2) ongoing costs, including management fees; distribution (12b-1) fees; and other Fund expenses. This Example is intended to help you understand your ongoing costs (in dollars) of investing in the Fund and to compare these costs with the ongoing costs of investing in other mutual funds.
The Example is based on an investment of $1,000 invested at the beginning of the period and held for the entire period from January 1, 2006 through June 30, 2006.
Actual Expenses
The first line of the table below provides information about actual account values and actual expenses. You may use the information in this line, together with the amount you invested, to estimate the expenses that you paid over the period. Simply divide your account value by $1,000 (for example, an $8,600 account value divided by $1,000 = 8.6), then multiply the result by the number in the first line under the heading entitled "Expenses Paid During the Period" to estimate the expenses you paid on your account during the period.
The following transaction costs are not included in the expenses shown in the table and, if applicable, would increase the expenses that you paid over the period: (1) a front-end sales charge (load) of 5.75% on Class A shares; (2) a 2% redemption fee if you sell or exchange shares of the Fund within six months of purchase, with three exceptions. The fee does not apply to redemptions made under an automatic withdrawal program or periodic asset reallocation plan; redemptions to pay for expenses related to terminal illness, extended hospital or nursing home care, or other serious medical conditions; and redemptions of shares acquired through dividend reinvestments; and (3) a $10 service fee on each exchange after the first five exchanges in each calendar year.
The following ongoing costs are not included in the expenses shown in the table and, if applicable, would increase the expenses that you paid over the period: (1) a $12 low balance fee on accounts with balances of less than $250 as of September 30th of each calendar year and no investment activity (excluding reinvestment of dividends and/or capital gains) during the prior calendar year or the first nine months of the current calendar year. This fee does not apply to IRAs, qualified plan accounts, or Coverdell Education Savings Accounts; (2) a $15 annual custodial fee on IRAs, SEPs, SIMPLE IRAs, and Coverdell Education Savings Accounts; and (3) a $20 annual custodial fee on 403(b) accounts.
Hypothetical Example for Comparison Purposes
The second line of the table below provides information about hypothetical account values and hypothetical expenses based on the Fund's actual expense ratio and an assumed rate of return of 5% per year before expenses, which in not the Fund's actual return. The hypothetical account values and expenses may not be used to estimate the actual ending account balance or expenses you paid for the period. You may use this information to compare the ongoing costs of investing in the Fund and other funds. To do so, compare this 5% hypothetical example with the 5% hypothetical examples that appear in the shareholder reports of the other funds.
The following transaction costs are not included in the expenses shown in the table and, if applicable, would increase the expenses that you paid over the period: (1) a front-end sales charge (load) of 5.75% on Class A shares; (2) a 2% redemption fee if you sell or exchange shares of the Fund within six months of purchase, with three exceptions. The fee does not apply to redemptions made under an automatic withdrawal program or periodic asset reallocation plan; redemptions to pay for expenses related to terminal illness, extended hospital or nursing home care, or other serious medical conditions; and redemptions of shares acquired through dividend reinvestments; and (3) a $10 service fee on each exchange after the first five exchanges in each calendar year.
The following ongoing costs are not included in the expenses shown in the table and, if applicable, would increase the expenses that you paid over the period: (1) a $12 low balance fee on accounts with balances of less than $250 as of September 30th of each calendar year and no investment activity (excluding reinvestment of dividends and/or capital gains) during the prior calendar year or the first nine months of the current calendar year. This fee does not apply to IRAs, qualified plan accounts, or Coverdell Education Savings Accounts; (2) a $15 annual custodial fee on IRAs, SEPs, SIMPLE IRAs, and Coverdell Education Savings Accounts; and (3) a $20 annual custodial fee on 403(b) accounts.
Please note that the expenses shown in the table are meant to highlight your ongoing costs only and do not reflect any transactional costs, such as sales charges (loads), redemption fees, or exchange fees. Therefore, the second line of the table is useful in comparing ongoing costs only, and will not help you determine the relative total costs of owning different funds. In addition, if these transactional costs were included, your costs would have been higher.
| Beginning Account Value 01/01/06 | Ending Account Value 06/30/06 | Expense Paid During Period 01/01/06 – 06/30/06 | |||||||||||||
| Class A Shares | |||||||||||||||
| Actual | $ | 1,000 | $ | 1,026.90 | $ | 13.32 | |||||||||
| Hypothetical (5% return before expense) | $ | 1,000 | $ | 1,024.79 | $ | 13.30 | |||||||||
| Class C Shares | |||||||||||||||
| Actual | $ | 1,000 | $ | 1,023.70 | $ | 17.06 | |||||||||
| Hypothetical (5% return before expense) | $ | 1,000 | $ | 1,024.79 | $ | 17.07 | |||||||||
5 Expenses are equal to the Fund's annualized expense ratio of 2.65% for Class A shares and 3.40% for Class C shares, multiplied by the average account value over the period, multiplied by 181/365 days to reflect the one-half year period.
19
Pacific Advisors
Multi-Cap Value Fund
Seeks to achieve long-term capital appreciation. Invests in a diversified portfolio of large to small capitalization companies using an actively managed, value investment approach.
Interview with Portfolio Managers
Shelly J. Meyers
Samuel C. Coquillard
For the six months ended June 30, 2006, the Fund returned – 0.90% for Class A shares, and – 1.26% for Class C shares. The Fund's benchmark, the S&P 5001 changed 2.71% during the same period.
Q How was the Fund impacted by market conditions in the first half of 2006?
A The first quarter of 2006 brought strong economic expansion. Companies across a variety of industries, sectors and market capitalizations continued to see increased revenues. The second quarter, however, presented a more challenging economic environment. Soaring energy costs and a steady up-tick in inflation led investors to wonder how far the Federal Reserve would raise interest rates. Concerns about the future of economic growth emerged, adding a layer of uncertainty to the market and increasing volatility.
Few changes were made to the Fund's holdings during the first part of the year. We navigated the inflation-oriented market by maintaining a healthy exposure to energy and energy-related stocks. The Fund selectively locked in profits gained on companies where growing risk outweighed potential returns. For example, the Fund's position in United States Steel, a highly volatile steel producer, rapidly rose in value. Consequently, we sold this holding to not only capture capital appreciation, but to eliminate an element of volatility from the portfolio.
As a value Fund, patience is key to executing the Fund's investment strategy. Some primary healthcare and technology positions suffered during the recent market pullback. Nevertheless, these firms continued to soundly meet the Fund's value investment criteria so we maintained the Fund's investment in these companies. Furthermore, the aging baby-boomer population is creating significant demand in the healthcare sector. We used the market correction to increase the Fund's exposure to expected performance opportunities in this sector based on our long-term, value-oriented investment strategy.
Q What is the primary benefit of a multi-cap approach to investing?
A By investing across a variety of market capitalizations – large cap, mid cap, and small cap – the Fund seeks to gain broad diversification across the equity spectrum. We do not try to be market-cap neutral and allocate a specific, pre-determined percentage of the portfolio to each capitalization range. This freedom of stock selection allows the Fund to overweight or underweight in a capitalization category to seek above-average performance opportunities. To manage risk, however, the Fund typically holds at least 60% of its portfolio in large cap companies which are usually less sensitive to market volatility,. As the market pulled back in the second quarter, we found several large cap value opportunities in healthcare companies such as Amgen and Johnson & Johnson. These holdings increased the Fund's large cap exposure which helped lower volatility while positioning the Fund for future performance opportunities. A multi-cap approach, therefore, allows for added diversification while affording wide latitude to seek out the best value investments from among all market capitalizations.
Q How does the Fund view volatility and manage risk?
A Volatility and risk have become synonymous terms to many investors. Market volatility, however, does not always equal risk. A stock price that bounces up and down can be frustrating, but price fluctuations can also create long-term value opportunities. Short-term volatility produced many valuable investment opportunities for the Fund this year. For example, earlier this year video game manufacturer, Activision, was going
1 The Standard & Poor's 500 Index is an unmanaged, market capitalization weighted measure of 500 widely held common stocks listed on the New York Stock Exchange, American Stock Exchange and The Nasdaq Stock Market. Index returns assume the reinvestment of dividends, but, unlike the Fund's returns, do not reflect the effects of management fees or expenses.
20
through a process of transitioning from old to new models of gaming hardware. The company's performance lagged as consumers awaited the release of the new models creating short-term volatility which depressed the stock's price. This volatility enabled us to add the stock to the Fund's holdings at a discounted price.
We define "risk" as a permanent loss of capital as opposed to fluctuations caused by temporary situations. We attempt to limit the loss of capital by diversifying the portfolio among market capitalizations, sectors and industries. Additionally, we manage risk by limiting each investment to typically less than 4% of the total portfolio. This prevents the performance of any one holding from having a dramatic impact on the Fund's overall performance.
Q Why is a long-term perspective important for investors in this Fund?
A The Fund's value-oriented approach means that investments are attractive when their market value has yet to be fully realized. We look for opportunities where we believe market growth will occur, but where prices may be currently depressed or stocks are out of favor. Investing ahead of the market means that the Fund will endure periods of underperformance when market attention is focused elsewhere. Keeping this in mind, investors must be willing to weather periods of Fund volatility with the knowledge that, over the long-term, the Fund is seeking to achieve above-average performance.
Q Where will the Fund look for value opportunities in the next six months?
A Going forward in 2006, we will continue to monitor the energy and commodities sectors. The potential for additional appreciation still exists in these areas due to the long-term nature of global energy issues. Nevertheless, even with higher energy prices providing opportunity for increased revenue, an economic slowdown could significantly impact these sectors. To buffer the Fund from this potential risk, we are also investing in areas which are less sensitive to economic cycles such as healthcare and broadly diversified companies such as Tyco. We believe the portfolio is well positioned to produce long-term growth for the Fund. We will continue to monitor existing positions for consistency with our investment criteria while seeking to identify new value opportunities.
Past performance does not guarantee future results. Performance quoted represents past performance. Current performance may be higher or lower than the performance data quoted. Returns do not take into account the maximum 5.75% sales charge on Class A shares and would be lower if the sales charge were included. Returns represent the change in value over the stated period assuming reinvestment of dividends and capital gains at net asset value. Returns do not take into account individual taxes which may reduce actual returns when shares are sold. The investment return and principal value of an investment will fluctuate so that an investor's shares, when redeemed, may be worth more or less than their original cost. For performance current to the most recent month-end call (800) 989-6693.
21
Pacific Advisors
Multi-Cap Value Fund continued
Portfolio Holdings as of 06/30/06 (Based on Total Investments)
| Equities | 97.62 | % | |||||||||
| 1. | Energy | 21.42 | % | ||||||||
| 2. | Information Technology | 20.38 | % | ||||||||
| 3. | Health Care | 15.14 | % | ||||||||
| 4. | Financials | 14.83 | % | ||||||||
| 5. | Industrials | 11.72 | % | ||||||||
| 6. | Consumer Staples | 6.03 | % | ||||||||
| 7. | Consumer Discretionary | 5.24 | % | ||||||||
| 8. | Other Equities | 2.86 | % | ||||||||
| 9. | Cash and Cash Equivalents | 2.38 | % | ||||||||
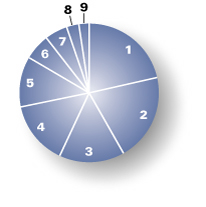
22
Expense Examples
As a shareholder of the Fund you incur two types of costs: (1) transaction costs, including sales charges (loads) on purchase payments, reinvested dividends, or other distributions; redemption fees; and exchange fees; and (2) ongoing costs, including management fees; distribution (12b-1) fees; and other Fund expenses. This Example is intended to help you understand your ongoing costs (in dollars) of investing in the Fund and to compare these costs with the ongoing costs of investing in other mutual funds.
The Example is based on an investment of $1,000 invested at the beginning of the period and held for the entire period from January 1, 2006 through June 30, 2006.
Actual Expenses
The first line of the table below provides information about actual account values and actual expenses. You may use the information in this line, together with the amount you invested, to estimate the expenses that you paid over the period. Simply divide your account value by $1,000 (for example, an $8,600 account value divided by $1,000 = 8.6), then multiply the result by the number in the first line under the heading entitled "Expenses Paid During the Period" to estimate the expenses you paid on your account during the period.
The following transaction costs are not included in the expenses shown in the table and, if applicable, would increase the expenses that you paid over the period: (1) a front-end sales charge (load) of 5.75% on Class A shares; (2) a 2% redemption fee if you sell or exchange shares of the Fund within six months of purchase, with four exceptions. The fee does not apply to redemptions made under an automatic withdrawal program or periodic asset reallocation plan; redemptions to pay for expenses related to terminal illness, extended hospital or nursing home care, or other serious medical conditions; redemptions of shares acquired through dividend reinvestments; and redemptions of shares purchased before July 1, 2004; and (3) a $10 service fee on each exchange after the first five exchanges in each calendar year.
The following ongoing costs are not included in the expenses shown in the table and, if applicable, would increase the expenses that you paid over the period: (1) a $12 low balance fee on accounts with balances of less than $250 as of September 30th of each calendar year and no investment activity (excluding reinvestment of dividends and/or capital gains) during the prior calendar year or the first nine months of the current calendar year. This fee does not apply to IRAs, qualified plan accounts, or Coverdell Education Savings Accounts; (2) a $15 annual custodial fee on IRAs, SEPs, SIMPLE IRAs, and Coverdell Education Savings Accounts; and (3) a $20 annual custodial fee on 403(b) accounts.
Hypothetical Example for Comparison Purposes
The second line of the table below provides information about hypothetical account values and hypothetical expenses based on the Fund's actual expense ratio and an assumed rate of return of 5% per year before expenses, which in not the Fund's actual return. The hypothetical account values and expenses may not be used to estimate the actual ending account balance or expenses you paid for the period. You may use this information to compare the ongoing costs of investing in the Fund and other funds. To do so, compare this 5% hypothetical example with the 5% hypothetical examples that appear in the shareholder reports of the other funds.
The following transaction costs are not included in the expenses shown in the table and, if applicable, would increase the expenses that you paid over the period: (1) a front-end sales charge (load) of 5.75% on Class A shares; (2) a 2% redemption fee if you sell or exchange shares of the Fund within six months of purchase, with four exceptions. The fee does not apply to redemptions made under an automatic withdrawal program or periodic asset reallocation plan; redemptions to pay for expenses related to terminal illness, extended hospital or nursing home care, or other serious medical conditions; redemptions of shares acquired through dividend reinvestments; and redemptions of shares purchased before July 1, 2004; and (3) a $10 service fee on each exchange after the first five exchanges in each calendar year.
The following ongoing costs are not included in the expenses shown in the table and, if applicable, would increase the expenses that you paid over the period: (1) a $12 low balance fee on accounts with balances of less than $250 as of September 30th of each calendar year and no investment activity (excluding reinvestment of dividends and/or capital gains) during the prior calendar year or the first nine months of the current calendar year. This fee does not apply to IRAs, qualified plan accounts, or Coverdell Education Savings Accounts; (2) a $15 annual custodial fee on IRAs, SEPs, SIMPLE IRAs, and Coverdell Education Savings Accounts; and (3) a $20 annual custodial fee on 403(b) accounts.
Please note that the expenses shown in the table are meant to highlight your ongoing costs only and do not reflect any transactional costs, such as sales charges (loads), redemption fees, or exchange fees. Therefore, the second line of the table is useful in comparing ongoing costs only, and will not help you determine the relative total costs of owning different funds. In addition, if these transactional costs were included, your costs would have been higher.
| Beginning Account Value 01/01/06 | Ending Account Value 06/30/06 | Expense Paid During Period 01/01/06 – 06/30/06 | |||||||||||||
| Class A Shares | |||||||||||||||
| Actual | $ | 1,000 | $ | 991.00 | $ | 15.06 | |||||||||
| Hypothetical (5% return before expense) | $ | 1,000 | $ | 1,024.79 | $ | 15.31 | |||||||||
| Class C Shares | |||||||||||||||
| Actual | $ | 1,000 | $ | 987.40 | $ | 18.73 | |||||||||
| Hypothetical (5% return before expense) | $ | 1,000 | $ | 1,024.79 | $ | 19.08 | |||||||||
3 Expenses are equal to the Fund's annualized expense ratio of 3.05% for Class A shares and 3.80% for Class C shares, multiplied by the average account value over the period, multiplied by 181/365 days to reflect the one-half year period.
23
Pacific Advisors
Small Cap Fund
Seeks to achieve long-term capital appreciation. Invests in small company stocks with strong earnings growth potential using a value investment approach with a focus on companies whose market capitalization is below $500 million.
Interview with Portfolio Manager
George A. Henning
For the six months ended June 30, 2006, the Fund returned 20.68% for Class A shares, and 20.15% for Class C shares. The Fund's benchmark, the Russell 2000 Stock Index1 changed 8.21% during the same period.
Pacific Advisors Small Cap Fund (A) ranked as the #1 small cap value fund out of 246 funds based on its one-year return of 20.68% as of June 30, 2006 according to Lipper. The Fund ranked 11 out of 145 funds based on its average annual five-year return of 16.61%; and 44 out of 51 funds based on its average annual ten-year return of 10.35% for the same period.
Q What factors contributed to the Fund's strong performance during the first six months?
A The Fund's long-term investment strategy laid the groundwork for continued solid performance in 2006. Early on, we anticipated that the pace of the current U.S. economic expansion would be more moderate than the speculative growth seen in the late 1990s. Consequently, over the past several years we have focused the Fund in a limited number of strong companies in sectors that would be more likely to prosper from this type of economic environment. Building on these longer-term economic trends, we selected companies with strong fundamentals that were undervalued by the market. In particular, we focused on investment opportunities in the energy, basic materials, transportation, financials and consumer discretionary sectors.
Our small cap investment discipline continued to flourish in the first six months of this year. Small cap companies excelled at paying down their debt, executing their business strategies and remaining focused in their business models. The Fund weathered a market pullback in May by focusing on a limited number of stocks with strong underlying current and future valuations. Maintaining a limited number of holdings often enables the Fund to recover more quickly from market pullbacks. We continually review the Fund's holdings to balance risk and potential reward to shareholders. We aim to use periods of short-term volatility to position the Fund for long-term performance over three to five years.
Q What investment changes were made in the first half of the year?
A The first half of 2006 was a busy time for the Fund. We selectively pruned stocks from the portfolio that reached their profit potential. We locked-in these profits and reinvested these monies into new leading companies with strong, long-term growth plans such as Amerigon. This firm developed the first electronic device to both heat and cool automobile seats using electric energy. We recognized this company's tremendous growth potential due to its unique advantages such as patented technology, limited competition, and broad-based product applications. We buy companies such as Amerigon to position the Fund for growth in the next 3 to 5 years.
The focused nature of the Fund allows us the ability to gain an intimate knowledge of the 35 to 45 companies which compose the portfolio. We use this knowledge to evaluate opportune moments to adjust stock weightings in order to manage risk and position the Fund for future growth. Based on our knowledge of these companies, we also use periods of market volatility to re-establish a a position in a company if its value becomes attractive again.
For example, in the beginning of the year, we sold a portion of the Fund's holdings in Conns, a regional electronic and home appliance retailer. The sale resulted in substantial profits and allowed us to reduce exposure to a company that had become more fully valued. When the market pulled back in the second quarter of 2006, we began to repurchase shares of Conns at a discounted price. We believe this company is well positioned to grow through
1 The Russell 2000 Stock Index is an unmanaged, market-weighted measure of stock market performance. It contains stocks of the 2,000 smallest publicly traded companies of the Russell 3000 Index. Index returns assume the reinvestment of dividends, but, unlike the Fund's returns, do not reflect management fees or expenses.
24
store expansion and same store sales growth. The recent depression of its stock price reflected a delayed and temporary impact on earnings from Hurricane Katrina rather than weakness in the company's underlying fundamentals.
Q How does the Fund uncover investments with long-term value?
A The Fund's buying discipline is guided by a bottom-up approach that emphasizes the merits of an individual company rather than shorter-term market trends. First, we look at a prospective company and gauge the strength of its underlying fundamentals. We thoroughly examine the company's management, business model and long-term profitability potential. Then, we assess the value of the firm in light of larger economic trends or anticipated changes within the market.
Once we identify a company with the qualities we desire, the Fund's value-oriented investment strategy determines the appropriate discounted price at which to buy the stock. For example, after Hurricane Katrina, roofing-manufacturer ElkCorp stood to gain from increased product demand for repairs to damaged homes and businesses. However, delays by insurance adjusters in issuing checks slowed the repair cycle. ElkCorp's immediate business plan stalled and the stock price declined. We recognized this price drop as a unique opportunity to buy, understanding the setback would be temporary. Firms such as ElkCorp hold tremendous long-term growth potential. Replacement shingles account for 80% of its business so storm damage has a greater impact on sales growth than a slowdown in the new home building market. The shingle market has a historical growth rate of 10% annually, which demonstrates the strength of this sector as a long-term holding.
Q Small cap stocks are known for their volatility. How does the Fund manage volatility in a risky area of the market?
A Small cap stocks often experience higher levels of volatility than companies with larger market capitalizations. This volatility can create a challenging operating environment for the Fund. Understanding the nature of small cap volatility, however, allows us to balance the risks posed by these investments with their potential rewards. The Fund's investment strategy is to hold fewer stocks so we can follow each company more closely. This puts us in a better position to evaluate the impact of short-term business trends and take significant advantage of the opportunities for future growth.
Additionally, we diversify the Fund's portfolio across sectors, industries and companies. The Fund may hold several stocks in a sector so that if one experiences a decline, the Fund maintains exposure to performance opportunities from the remaining companies. From time to time, our focused investment strategy may create somewhat greater volatility. Nevertheless, this strategy enables us to allocate assets to the companies that we believe have the greatest growth potential based on current valuations. Our objective is to achieve long-term growth by taking advantage of short-term weaknesses in the market.
Q What is the expectation for small cap stocks over the next six months?
A Through the end of 2006, we expect the equity market to remain trading-range bound. In this environment, good stock selection will remain a key to overall performance whether it comes from small, mid or large cap companies. The overall economic trends remain positive and we believe that the growth potential for small cap stocks is good.
Many small cap companies have improved their debt management. Therefore, recent interest rate increases have had less of an impact than in previous interest rate cycles. This management discipline provides individual companies the flexibility to take advantage of the best growth opportunities. We expect the Fund will continue to benefit from a strategy that continues to focus on individual companies rather than on small cap stocks as a sector.
Past performance does not guarantee future results. Performance quoted represents past performance. Current performance may be higher or lower than the performance data quoted. Returns do not take into account the maximum 5.75% sales charge on Class A shares and would be lower if the sales charge were included. Rankings do not take sales loads into account. Returns represent the change in value over the stated period assuming reinvestment of dividends and capital gains at net asset value. Returns do not take into account individual taxes which may reduce actual returns when shares are sold. The investment return and principal value of an investment will fluctuate so that an investor's shares, when redeemed, may be worth more or less than their original cost. Small cap stocks typically have fewer financial resources and may carry higher risks and experience greater volatility than large cap stocks. For performance current to the most recent month-end call (800) 989-6693.
25
Pacific Advisors
Small Cap Fund continued
Portfolio Holdings as of 06/30/06 (Based on Total Investments)
| Equities | 100.00 | % | |||||||||
| 1. | Industrials | 30.72 | % | ||||||||
| 2. | Energy | 22.22 | % | ||||||||
| 3. | Consumer Discretionary | 10.55 | % | ||||||||
| 4. | Financials | 11.84 | % | ||||||||
| 5. | Materials | 6.97 | % | ||||||||
| 6. | Health Care | 5.37 | % | ||||||||
| 7. | Other Equities | 12.33 | % | ||||||||
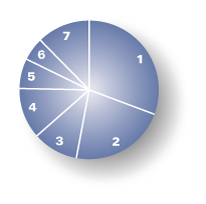
26
Expense Examples
As a shareholder of the Fund you incur two types of costs: (1) transaction costs, including sales charges (loads) on purchase payments, reinvested dividends, or other distributions; redemption fees; and exchange fees; and (2) ongoing costs, including management fees; distribution (12b-1) fees; and other Fund expenses. This Example is intended to help you understand your ongoing costs (in dollars) of investing in the Fund and to compare these costs with the ongoing costs of investing in other mutual funds.
The Example is based on an investment of $1,000 invested at the beginning of the period and held for the entire period from January 1, 2006 through June 30, 2006.
Actual Expenses
The first line of the table below provides information about actual account values and actual expenses. You may use the information in this line, together with the amount you invested, to estimate the expenses that you paid over the period. Simply divide your account value by $1,000 (for example, an $8,600 account value divided by $1,000 = 8.6), then multiply the result by the number in the first line under the heading entitled "Expenses Paid During the Period" to estimate the expenses you paid on your account during the period.
The following transaction costs are not included in the expenses shown in the table and, if applicable, would increase the expenses that you paid over the period: (1) a front-end sales charge (load) of 5.75% on Class A shares; (2) a 2% redemption fee if you sell or exchange shares of the Fund within six months of purchase, with three exceptions. The fee does not apply to redemptions made under an automatic withdrawal program or periodic asset reallocation plan; redemptions to pay for expenses related to terminal illness, extended hospital or nursing home care, or other serious medical conditions; and redemptions of shares acquired through dividend reinvestments; and (3) a $10 service fee on each exchange after the first five exchanges in each calendar year.
The following ongoing costs are not included in the expenses shown in the table and, if applicable, would increase the expenses that you paid over the period: (1) a $12 low balance fee on accounts with balances of less than $250 as of September 30th of each calendar year and no investment activity (excluding reinvestment of dividends and/or capital gains) during the prior calendar year or the first nine months of the current calendar year. This fee does not apply to IRAs, qualified plan accounts, or Coverdell Education Savings Accounts; (2) a $15 annual custodial fee on IRAs, SEPs, SIMPLE IRAs, and Coverdell Education Savings Accounts; and (3) a $20 annual custodial fee on 403(b) accounts.
Hypothetical Example for Comparison Purposes
The second line of the table below provides information about hypothetical account values and hypothetical expenses based on the Fund's actual expense ratio and an assumed rate of return of 5% per year before expenses, which in not the Fund's actual return. The hypothetical account values and expenses may not be used to estimate the actual ending account balance or expenses you paid for the period. You may use this information to compare the ongoing costs of investing in the Fund and other funds. To do so, compare this 5% hypothetical example with the 5% hypothetical examples that appear in the shareholder reports of the other funds.
The following transaction costs are not included in the expenses shown in the table and, if applicable, would increase the expenses that you paid over the period: (1) a front-end sales charge (load) of 5.75% on Class A shares; (2) a 2% redemption fee if you sell or exchange shares of the Fund within six months of purchase, with three exceptions. The fee does not apply to redemptions made under an automatic withdrawal program or periodic asset reallocation plan; redemptions to pay for expenses related to terminal illness, extended hospital or nursing home care, or other serious medical conditions; and redemptions of shares acquired through dividend reinvestments; and (3) a $10 service fee on each exchange after the first five exchanges in each calendar year.
The following ongoing costs are not included in the expenses shown in the table and, if applicable, would increase the expenses that you paid over the period: (1) a $12 low balance fee on accounts with balances of less than $250 as of September 30th of each calendar year and no investment activity (excluding reinvestment of dividends and/or capital gains) during the prior calendar year or the first nine months of the current calendar year. This fee does not apply to IRAs, qualified plan accounts, or Coverdell Education Savings Accounts; (2) a $15 annual custodial fee on IRAs, SEPs, SIMPLE IRAs, and Coverdell Education Savings Accounts; and (3) a $20 annual custodial fee on 403(b) accounts.
Please note that the expenses shown in the table are meant to highlight your ongoing costs only and do not reflect any transactional costs, such as sales charges (loads), redemption fees, or exchange fees. Therefore, the second line of the table is useful in comparing ongoing costs only, and will not help you determine the relative total costs of owning different funds. In addition, if these transactional costs were included, your costs would have been higher.
| Beginning Account Value 01/01/06 | Ending Account Value 06/30/06 | Expense Paid During Period 01/01/06 – 06/30/06 | |||||||||||||
| Class A Shares | |||||||||||||||
| Actual | $ | 1,000 | $ | 1,206.80 | $ | 14.55 | |||||||||
| Hypothetical (5% return before expense) | $ | 1,000 | $ | 1,024.79 | $ | 13.35 | |||||||||
| Class C Shares | |||||||||||||||
| Actual | $ | 1,000 | $ | 1,201.50 | $ | 18.67 | |||||||||
| Hypothetical (5% return before expense) | $ | 1,000 | $ | 1,024.79 | $ | 17.17 | |||||||||
3 Expenses are equal to the Fund's annualized expense ratio of 2.66% for Class A shares and 3.42% for Class C shares, multiplied by the average account value over the period, multiplied by 181/365 days to reflect the one-half year period.
27

Pacific Advisors Fund Inc.
financial statements
28
Pacific Advisors Government Securities Fund
Statement of Investments
as of June 30, 2006 (Unaudited)
| Quantity or Principal | Description | Current $ Value** | % of Net Assets | ||||||||||||
| COMMON STOCK | |||||||||||||||
| INFORMATION TECHNOLOGY | 2.03 | ||||||||||||||
| SYSTEMS: SOFTWARE | |||||||||||||||
| 4,000 | MICROSOFT | 93,200 | |||||||||||||
| 93,200 | 2.02 | ||||||||||||||
| TELECOMMUNICATION SERVICES | 1.42 | ||||||||||||||
| INTG TELECOMM SRVCS | |||||||||||||||
| 5,000 | CITIZENS COMMUNICATIONS CO. | 65,250 | |||||||||||||
| 65,250 | 1.42 | ||||||||||||||
| UTILITIES | 2.81 | ||||||||||||||
| ELECTRIC UTILITIES | |||||||||||||||
| 4,000 | PPL CORPORATION | 129,200 | |||||||||||||
| 129,200 | 2.81 | ||||||||||||||
| TOTAL COMMON STOCK (Cost: $262,790) | 287,650 | 6.26 | |||||||||||||
| US GOVT SECURITIES | |||||||||||||||
| US GOVERNMENT AGENCY | 85.67 | ||||||||||||||
| US GOVERNMENT AGENCY | |||||||||||||||
| 50,000 | FED HOME LN MTG CORP 4.75% 12/15/17 | 48,350 | |||||||||||||
| 25,000 | FED HOME LN MTG CORP 5.00% 01/17/12 | 24,204 | |||||||||||||
| 500,000 | FED HOME LN MTG CORP 5.00% 12/23/11 | 484,183 | |||||||||||||
| 100,000 | FED HOME LN MTG CORP 5.05% 04/27/12 | 96,835 | |||||||||||||
| 150,000 | FED HOME LN MTG CORP 5.15% 02/20/13 | 145,112 | |||||||||||||
| 50,000 | FED HOME LN MTG CORP 5.20% 05/09/13 | 48,372 | |||||||||||||
| 50,000 | FED HOME LN MTG CORP 5.25% 02/18/14 | 48,308 | |||||||||||||
| 100,000 | FED HOME LN MTG CORP 5.25% 04/25/12 | 97,429 | |||||||||||||
| 100,000 | FED HOME LN MTG CORP 5.33% 09/03/13 | 97,097 | |||||||||||||
| 65,000 | FED HOME LN MTG CORP 5.35% 01/27/15 | 62,844 | |||||||||||||
| 45,000 | FED HOME LN MTG CORP 5.35% 02/05/15 | 43,490 | |||||||||||||
| 100,000 | FED HOME LN MTG CORP 5.45% 08/09/13 | 97,593 | |||||||||||||
| 50,000 | FED HOME LN MTG CORP 5.50% 12/30/14 | 48,610 | |||||||||||||
| 150,000 | FED HOME LN MTG CORP 6.125% 12/01/15 | 148,404 | |||||||||||||
| 15,000 | FED HOME LN MTG CORP 6.25% 03/05/12 | 15,040 | |||||||||||||
| 70,000 | FED HOME LOAN BANK 4.30% 05/05/09 | 67,880 | |||||||||||||
| 37,500 | FED HOME LOAN BANK 4.55% 5/26/09 | 36,567 | |||||||||||||
| 180,000 | FED HOME LOAN BANK 5.09% 10/22/12 | 173,961 | |||||||||||||
| 100,000 | FED HOME LOAN BANK 5.23% 09/01/11 | 97,747 | |||||||||||||
| 44,912 | FED HOME LOAN BANK 5.24% 12/17/12 | 43,606 | |||||||||||||
| 100,000 | FED HOME LOAN BANK 5.30% 12/3/2013 | 96,852 | |||||||||||||
| 115,000 | FED HOME LOAN BANK 5.35% 05/09/12 | 112,178 | |||||||||||||
| 550,909 | FED HOME LOAN BANK 5.35% 12/24/12 | 536,914 | |||||||||||||
| 100,000 | FED HOME LOAN BANK 6.00% 09/28/12 | 99,288 | |||||||||||||
See Accompanying Notes to Financial Statements
29
Pacific Advisors Government Securities Fund
Statement of Investments
as of June 30, 2006 (Unaudited)
| Quantity or Principal | Description | Current $ Value** | % of Net Assets | ||||||||||||
| US GOVT SECURITIES continued | |||||||||||||||
| 75,000 | FED NATL MTG ASSOC. 5.00% 02/27/13 | 72,092 | |||||||||||||
| 100,000 | FED NATL MTG ASSOC. 5.00% 12/08/11 | 96,882 | |||||||||||||
| 50,000 | FED NATL MTG ASSOC. 5.125% 02/27/13 | 48,304 | |||||||||||||
| 50,000 | FED NATL MTG ASSOC. 5.25% 01/28/13 | 48,558 | |||||||||||||
| 535,000 | FED NATL MTG ASSOC. 5.25% 01/28/13 | 519,711 | |||||||||||||
| 200,000 | FED NATL MTG ASSOC. 5.25% 12/26/12 | 194,361 | |||||||||||||
| 48,000 | FED NATL MTG ASSOC. 5.375% 08/23/12 | 46,901 | |||||||||||||
| 30,000 | FED NATL MTG ASSOC. 5.625% 02/28/12 | 29,445 | |||||||||||||
| 112,000 | FED NATL MTG ASSOC. 5.75% 11/07/17 | 106,485 | |||||||||||||
| 3,933,603 | 85.67 | ||||||||||||||
| TOTAL US GOVT SECURITIES (Cost: $4,046,874) | 3,933,603 | 85.67 | |||||||||||||
| PREFERRED STOCK | |||||||||||||||
| FINANCIALS | 4.33 | ||||||||||||||
| DIVERSIFIED BANKS | |||||||||||||||
| 4,000 | BARCLAYS BANK 6.625% PFD | 100,120 | |||||||||||||
| 100,120 | 2.18 | ||||||||||||||
| LIFE/HEALTH INSUR | |||||||||||||||
| 4,000 | METLIFE INC. 6.50% PFD | 98,520 | |||||||||||||
| 98,520 | 2.15 | ||||||||||||||
| TOTAL PREFERRED STOCK (Cost: $200,000) | 198,640 | 4.33 | |||||||||||||
| SHORT TERM INVESTMENTS | |||||||||||||||
| MONEY MARKET | 3.18 | ||||||||||||||
| INVESTMENTS | |||||||||||||||
| 146,194 | UMB MONEY MARKET FIDUCIARY | 146,194 | |||||||||||||
| 146,194 | 3.18 | ||||||||||||||
| TOTAL SHORT TERM INVESTMENTS (Cost: $146,194) | 146,194 | 3.18 | |||||||||||||
| TOTAL INVESTMENTS (Cost: $4,655,858) | 4,566,087 | 99.44 | |||||||||||||
| OTHER ASSETS LESS LIABILITIES | 25,596 | 0.56 | |||||||||||||
| TOTAL NET ASSETS | 4,591,683 | 100.00 | |||||||||||||
* Non-income producing.
** The principal amount is stated in U.S. dollars unless otherwise indicated.
See Accompanying Notes to Financial Statements
30
Pacific Advisors Income and Equity Fund
Statement of Investments
as of June 30, 2006 (Unaudited)
| Quantity or Principal | Description | Current $ Value** | % of Net Assets | ||||||||||||
| COMMON STOCK | |||||||||||||||
| CONSUMER DISCRETIONARY | 0.78 | ||||||||||||||
| DISTRIBUTORS | |||||||||||||||
| 1,000 | GENUINE PARTS CO. | 41,660 | |||||||||||||
| 41,660 | 0.42 | ||||||||||||||
| HOME IMPROVEMENT | |||||||||||||||
| 1,000 | HOME DEPOT, INC. | 35,790 | |||||||||||||
| 35,790 | 0.36 | ||||||||||||||
| CONSUMER STAPLES | 1.79 | ||||||||||||||
| HOUSEHOLD PRODUCTS | |||||||||||||||
| 2,000 | PROCTER & GAMBLE CO. | 111,200 | |||||||||||||
| 111,200 | 1.12 | ||||||||||||||
| PACKAGED FOODS/MEATS | |||||||||||||||
| 2,000 | MCCORMICK | 67,100 | |||||||||||||
| 67,100 | 0.67 | ||||||||||||||
| ENERGY | 9.29 | ||||||||||||||
| INTEGRATED OIL & GAS | |||||||||||||||
| 2,000 | BRITISH PETROLEUM | 139,220 | |||||||||||||
| 2,721 | CONOCOPHILLIPS | 178,307 | |||||||||||||
| 3,000 | MARATHON OIL CORP. | 249,900 | |||||||||||||
| 1,000 | OCCIDENTAL PETROLEUM | 102,550 | |||||||||||||
| 669,977 | 6.73 | ||||||||||||||
| OIL & GAS DRILLING | |||||||||||||||
| 1,000 | ENCANA | 52,640 | |||||||||||||
| 1,000 | ULTRA PETROLEUM* | 59,270 | |||||||||||||
| 111,910 | 1.13 | ||||||||||||||
| OIL & GAS EXPLR/PROD | |||||||||||||||
| 1,000 | APACHE CORP. | 68,250 | |||||||||||||
| 1,000 | XTO ENERGY INC. | 44,270 | |||||||||||||
| 112,520 | 1.13 | ||||||||||||||
| OIL&GAS REF/MKT/TRAN | |||||||||||||||
| 2,000 | EL PASO ENERGY CORP. | 30,000 | |||||||||||||
| 30,000 | 0.30 | ||||||||||||||
See Accompanying Notes to Financial Statements
31
Pacific Advisors Income and Equity Fund
Statement of Investments
as of June 30, 2006 (Unaudited)
| Quantity or Principal | Description | Current $ Value** | % of Net Assets | ||||||||||||
| COMMON STOCK continued | |||||||||||||||
| FINANCIALS | 11.57 | ||||||||||||||
| DIVERSIFIED BANKS | |||||||||||||||
| 4,000 | BANK OF AMERICA | 192,400 | |||||||||||||
| 2,000 | WACHOVIA CORP. | 108,160 | |||||||||||||
| 300,560 | 3.02 | ||||||||||||||
| MULTI LINE INSURANCE | |||||||||||||||
| 2,000 | AMERICAN INT'L GROUP INC. | 118,100 | |||||||||||||
| 118,100 | 1.19 | ||||||||||||||
| PROPERTY & CAS INSUR | |||||||||||||||
| 1,000 | CHUBB CORP. | 49,900 | |||||||||||||
| 49,900 | 0.50 | ||||||||||||||
| REAL ESTATE INV TRST | |||||||||||||||
| 12,500 | HOSPITALITY PROPERTIES | 549,000 | |||||||||||||
| 549,000 | 5.52 | ||||||||||||||
| REGIONAL BANKS | |||||||||||||||
| 1,000 | WILMINGTON TRUST CO. | 42,180 | |||||||||||||
| 42,180 | 0.42 | ||||||||||||||
| THRIFTS&MTG FINANCE | |||||||||||||||
| 2,000 | WASHINGTON MUTUAL | 91,160 | |||||||||||||
| 91,160 | 0.92 | ||||||||||||||
| HEALTH CARE | 3.33 | ||||||||||||||
| HEALTH CARE EQUIP | |||||||||||||||
| 1,984 | BOSTON SCIENTIFIC CO.* | 33,410 | |||||||||||||
| 33,410 | 0.34 | ||||||||||||||
| PHARMACEUTICALS | |||||||||||||||
| 3,000 | JOHNSON & JOHNSON | 179,760 | |||||||||||||
| 5,000 | PFIZER INC. | 117,350 | |||||||||||||
| 297,110 | 2.99 | ||||||||||||||
| INDUSTRIALS | 5.92 | ||||||||||||||
| AEROSPACE & DEFENSE | |||||||||||||||
| 2,000 | HONEYWELL INTERNATIONAL INC. | 80,600 | |||||||||||||
| 80,600 | 0.81 | ||||||||||||||
| CONSTRUCTION & MACH | |||||||||||||||
| 1,500 | CATERPILLAR | 111,720 | |||||||||||||
| 111,720 | 1.12 | ||||||||||||||
See Accompanying Notes to Financial Statements
32
Pacific Advisors Income and Equity Fund
Statement of Investments
as of June 30, 2006 (Unaudited)
| Quantity or Principal | Description | Current $ Value** | % of Net Assets | ||||||||||||
| COMMON STOCK continued | |||||||||||||||
| INDUSTRIAL CONGLOMER | |||||||||||||||
| 10,375 | GENERAL ELECTRIC | 341,960 | |||||||||||||
| 2,000 | TYCO INTERNATIONAL LTD. | 55,000 | |||||||||||||
| 396,960 | 3.99 | ||||||||||||||
| INFORMATION TECHNOLOGY | 2.76 | ||||||||||||||
| INTG TELECOMM SRVCS | |||||||||||||||
| 1,000 | AT&T, INC. | 27,890 | |||||||||||||
| 10,000 | CITIZENS COMMUNICATIONS CO. | 130,500 | |||||||||||||
| 158,390 | 1.59 | ||||||||||||||
| SYSTEMS: SOFTWARE | |||||||||||||||
| 5,000 | MICROSOFT | 116,500 | |||||||||||||
| 116,500 | 1.17 | ||||||||||||||
| MATERIALS | 1.13 | ||||||||||||||
| DIVERSIFIED CHEMICAL | |||||||||||||||
| 1,000 | E.I. DUPONT DE NEMOURS & CO. | 41,600 | |||||||||||||
| 41,600 | 0.42 | ||||||||||||||
| SPECIALTY CHEMICALS | |||||||||||||||
| 2,000 | INT. FLAVORS AND FRAGRANCES | 70,480 | |||||||||||||
| 70,480 | 0.71 | ||||||||||||||
| UTILITIES | 2.08 | ||||||||||||||
| MULTI UTILITIES/POWR | |||||||||||||||
| 1,000 | DOMINION RESOURCES | 74,790 | |||||||||||||
| 1,000 | DUKE ENERGY CORP. | 29,370 | |||||||||||||
| 1,000 | MDU RESOURCES GROUP | 36,610 | |||||||||||||
| 1,000 | PUBLIC SERVICE ENTERPRISE GROUP INC. | 66,120 | |||||||||||||
| 206,890 | 2.08 | ||||||||||||||
| TOTAL COMMON STOCK (Cost: $3,600,339) | 3,844,717 | 38.65 | |||||||||||||
| CORPORATE BONDS | |||||||||||||||
| CONSUMER DISCRETIONARY | 10.66 | ||||||||||||||
| BROADCAST & CABLE TV | |||||||||||||||
| 519,000 | LIBERTY MEDIA CORP. 7.75% 07/15/09 | 534,698 | |||||||||||||
| 534,698 | 5.37 | ||||||||||||||
| GENL MERCHANDISE STR | |||||||||||||||
| 281,000 | DAYTON HUDSON CO. 8.60% 01/15/12 | 319,077 | |||||||||||||
| 319,077 | 3.21 | ||||||||||||||
See Accompanying Notes to Financial Statements
33
Pacific Advisors Income and Equity Fund
Statement of Investments
as of June 30, 2006 (Unaudited)
| Quantity or Principal | Description | Current $ Value** | % of Net Assets | ||||||||||||
| CORPORATE BONDS continued | |||||||||||||||
| HOTELS, RESORTS | |||||||||||||||
| 203,000 | MARRIOTT CORP. 9.375% 06/15/07 | 207,047 | |||||||||||||
| 207,047 | 2.08 | ||||||||||||||
| CONSUMER STAPLES | 5.49 | ||||||||||||||
| BREWERS | |||||||||||||||
| 165,000 | ANHEUSER-BUSCH 7.125% 07/01/17 | 171,342 | |||||||||||||
| 171,342 | 1.72 | ||||||||||||||
| HYPERMKTS/SUPER CTRS | |||||||||||||||
| 50,000 | WAL-MART STORES 8.00% 09/15/06 | 50,208 | |||||||||||||
| 50,208 | 0.50 | ||||||||||||||
| PACKAGED FOODS/MEATS | |||||||||||||||
| 323,000 | GERBER PRODUCTS 9.00% 10/15/06 | 325,057 | |||||||||||||
| 325,057 | 3.27 | ||||||||||||||
| ENERGY | 6.23 | ||||||||||||||
| INTEGRATED OIL & GAS | |||||||||||||||
| 381,000 | OCCIDENTAL PETROLEUM 10.125% 09/15/09 | 431,053 | |||||||||||||
| 170,000 | TEXACO CAPITAL 8.625% 06/30/10 | 188,579 | |||||||||||||
| 619,632 | 6.23 | ||||||||||||||
| FINANCIALS | 7.60 | ||||||||||||||
| CONSUMER FINANCE | |||||||||||||||
| 150,000 | GENL MOTORS ACCEPT CORP. 6.125% 09/15/06 | 149,778 | |||||||||||||
| 85,000 | TRANSAMERICA CORP. 9.375% 03/01/08 | 89,104 | |||||||||||||
| 238,882 | 2.40 | ||||||||||||||
| DIVERSIFIED FINANCL | |||||||||||||||
| 50,000 | GENERAL ELECTRIC CAP 8.875% 05/15/09 | 53,973 | |||||||||||||
| 50,000 | GENERAL ELECTRIC CAP 10/01/53 | 49,740 | |||||||||||||
| 371,000 | GENERAL ELECTRIC CAP 8.125% 05/15/12 | 413,602 | |||||||||||||
| 517,315 | 5.20 | ||||||||||||||
| INDUSTRIALS | 1.16 | ||||||||||||||
| DIVERSIFIED CHEMICAL | |||||||||||||||
| 25,000 | DOW CHEMICAL CO. 5.60% 11/15/09 | 24,744 | |||||||||||||
| 90,000 | NORFOLK SOUTHERN CRP 7.40% 09/15/06 | 90,308 | |||||||||||||
| 115,052 | 1.16 | ||||||||||||||
See Accompanying Notes to Financial Statements
34
Pacific Advisors Income and Equity Fund
Statement of Investments
as of June 30, 2006 (Unaudited)
| Quantity or Principal | Description | Current $ Value** | % of Net Assets | ||||||||||||
| CORPORATE BONDS continued | |||||||||||||||
| TELECOMMUNICATION SERVICES | 6.88 | ||||||||||||||
| INTG TELECOMM SRVCS | |||||||||||||||
| 85,000 | BELLSOUTH CAP 6.04% 11/15/26 | 85,079 | |||||||||||||
| 414,083 | BELLSOUTH TELECOMMUN 6.30% 12/15/15 | 413,376 | |||||||||||||
| 100,000 | GTE CALIFORNIA INC. 5.50% 01/15/09 | 98,817 | |||||||||||||
| 35,000 | SBC COMMUNICATIONS 7.39% 05/24/10 | 36,651 | |||||||||||||
| 50,000 | WISCONSIN BELL 6.35% 12/01/26 | 50,050 | |||||||||||||
| 683,973 | 6.88 | ||||||||||||||
| UTILITIES | 6.76 | ||||||||||||||
| ELECTRIC UTILITIES | |||||||||||||||
| 255,000 | COMMMONWEALTH EDISON 8.00% 05/15/08 | 264,798 | |||||||||||||
| 264,798 | 2.66 | ||||||||||||||
| GAS UTILITIES | |||||||||||||||
| 150,000 | PIEDMONT NATURAL GAS 7.80% 09/29/10 | 160,274 | |||||||||||||
| 160,274 | 1.61 | ||||||||||||||
| MULTI UTILITIES/POWR | |||||||||||||||
| 119,000 | POTOMAC ELEC. POWER 5.875% 10/15/08 | 118,923 | |||||||||||||
| 128,000 | PUB SVC ELEC & GAS 6.25% 01/01/07 | 128,340 | |||||||||||||
| 247,263 | 2.49 | ||||||||||||||
| TOTAL CORPORATE BOND (Cost: $4,634,418) | 4,454,618 | 44.78 | |||||||||||||
| US GOVT SECURITIES | |||||||||||||||
| US GOVERNMENT AGENCY | 11.61 | ||||||||||||||
| US GOVERNMENT AGENCY | |||||||||||||||
| 100,000 | FED HOME LN MTG CORP 4.125% 09/01/09 | 95,885 | |||||||||||||
| 50,000 | FED HOME LN MTG CORP 5.00% 09/10/12 | 48,194 | |||||||||||||
| 200,000 | FED HOME LN MTG CORP 5.00% 12/23/11 | 193,673 | |||||||||||||
| 100,000 | FED HOME LN MTG CORP 5.05% 12/08/2008 | 99,016 | |||||||||||||
| 33,000 | FED HOME LN MTG CORP 5.125% 03/10/14 | 31,434 | |||||||||||||
| 50,000 | FED HOME LN MTG CORP 6.125% 12/01/15 | 49,468 | |||||||||||||
| 130,000 | FED HOME LOAN BANK 5.05% 02/14/13 | 125,243 | |||||||||||||
| 100,000 | FED HOME LOAN BANK 5.25% 06/15/09 | 98,981 | |||||||||||||
| 100,000 | FED HOME LOAN BANK 5.25% 10/27/10 | 98,092 | |||||||||||||
| 50,000 | FED HOME LOAN BANK 5.375% 09/07/12 | 48,846 | |||||||||||||
| 100,000 | FED NATL MTG ASSOC. 5.00% 01/27/12 | 96,784 | |||||||||||||
| 75,000 | FED NATL MTG ASSOC. 5.00% 03/11/13 | 71,868 | |||||||||||||
| 100,000 | FED NATL MTG ASSOC. 5.50% 11/17/14 | 97,230 | |||||||||||||
| 1,154,714 | 11.61 | ||||||||||||||
| TOTAL US GOVT SECURITIES (Cost: $1,186,586) | 1,154,714 | 11.61 | |||||||||||||
See Accompanying Notes to Financial Statements
35
Pacific Advisors Income and Equity Fund
Statement of Investments
as of June 30, 2006 (Unaudited)
| Quantity or Principal | Description | Current $ Value** | % of Net Assets | ||||||||||||
| PREFERRED STOCK | |||||||||||||||
| FINANCIALS | 4.51 | ||||||||||||||
| DIVERSIFIED BANKS | |||||||||||||||
| 2,000 | BAC TRUST VIII 6.00% PFD | 44,260 | |||||||||||||
| 2,000 | BARCLAYS BK 6.625% PFD | 50,060 | |||||||||||||
| 5,000 | HSBC HOLDINGS PLC 6.20% PFD A | 116,200 | |||||||||||||
| 210,520 | 2.11 | ||||||||||||||
| LIFE/HEALTH INSUR | |||||||||||||||
| 3,000 | METLIFE INC. 6.50% PFD | 73,890 | |||||||||||||
| 2,500 | PHOENIX COMPANIES INC. 7.45% 01/15/32 PFD. | 61,525 | |||||||||||||
| 135,415 | 1.36 | ||||||||||||||
| REAL ESTATE INV TRST | |||||||||||||||
| 3,700 | PRICE LEGACY CORP. 6.82% PFD A | 53,280 | |||||||||||||
| 53,280 | 0.54 | ||||||||||||||
| INVESTMENT BANK/BRKG | |||||||||||||||
| 2,000 | MERRILL LYNCH 6.375% PFD | 49,540 | |||||||||||||
| 49,540 | 0.50 | ||||||||||||||
| TOTAL PREFERRED STOCK (Cost: $473,368) | 448,755 | 4.51 | |||||||||||||
| TOTAL INVESTMENTS (Cost: $9,894,711) | 9,902,804 | 99.55 | |||||||||||||
| OTHER ASSETS LESS LIABILITIES | 45,200 | 0.45 | |||||||||||||
| TOTAL NET ASSETS | 9,948,004 | 100.00 | |||||||||||||
* Non-income producing.
** The principal amount is stated in U.S. dollars unless otherwise indicated.
See Accompanying Notes to Financial Statements
36
Pacific Advisors Balanced Fund
Statement of Investments
as of June 30, 2006 (Unaudited)
| Quantity or Principal | Description | Current $ Value** | % of Net Assets | ||||||||||||
| COMMON STOCK | |||||||||||||||
| CONSUMER DISCRETIONARY | 5.73 | ||||||||||||||
| ADVERTISING | |||||||||||||||
| 30,000 | INTERPUBLIC GROUP* | 250,500 | |||||||||||||
| 250,500 | 0.61 | ||||||||||||||
| BROADCAST & CABLE TV | |||||||||||||||
| 7,200 | LIBERTY GLOBAL* | 154,800 | |||||||||||||
| 6,631 | LIBERTY GLOBAL C* | 136,399 | |||||||||||||
| 291,199 | 0.71 | ||||||||||||||
| MOVIES/ENTERTAINMENT | |||||||||||||||
| 10,000 | CBS CORP. | 270,500 | |||||||||||||
| 10,000 | DISNEY | 300,000 | |||||||||||||
| 2,250 | LIBERTY CAPITAL SERIES-A* | 188,482 | |||||||||||||
| 11,250 | LIBERTY INTERACTIVE SERIES-A* | 194,175 | |||||||||||||
| 18,000 | TIME WARNER | 311,400 | |||||||||||||
| 3,750 | VIACOM INC.* | 134,813 | |||||||||||||
| 1,399,370 | 3.41 | ||||||||||||||
| SPECIALTY STORES | |||||||||||||||
| 10,000 | MICHAELS STORES INC. | 412,400 | |||||||||||||
| 412,400 | 1.00 | ||||||||||||||
| CONSUMER STAPLES | 2.11 | ||||||||||||||
| SOFT DRINKS | |||||||||||||||
| 9,000 | CADBURY SCHWEPPES | 349,380 | |||||||||||||
| 12,000 | COCA-COLA | 516,240 | |||||||||||||
| 865,620 | 2.11 | ||||||||||||||
| ENERGY | 12.86 | ||||||||||||||
| INTEGRATED OIL & GAS | |||||||||||||||
| 12,000 | BRITISH PETROLEUM | 835,320 | |||||||||||||
| 8,000 | CONOCOPHILLIPS | 524,240 | |||||||||||||
| 1,359,560 | 3.31 | ||||||||||||||
| OIL & GAS EQUIP/SERV | |||||||||||||||
| 12,000 | COOPER CAMERON* | 573,240 | |||||||||||||
| 5,000 | GRANT PRIDECO* | 223,750 | |||||||||||||
| 796,990 | 1.94 | ||||||||||||||
| OIL & GAS EXPLR/PROD | |||||||||||||||
| 20,000 | DEVON ENERGY CORP. | 1,208,200 | |||||||||||||
| 15,000 | SUNCOR ENERGY INC. | 1,215,150 | |||||||||||||
| 2,423,350 | 5.90 | ||||||||||||||
| OIL&GAS REF/MKT/TRAN | |||||||||||||||
| 30,000 | WILLIAMS COMPANIES INC. | 700,800 | |||||||||||||
| 700,800 | 1.71 | ||||||||||||||
See Accompanying Notes to Financial Statements
37
Pacific Advisors Balanced Fund
Statement of Investments
as of June 30, 2006 (Unaudited)
| Quantity or Principal | Description | Current $ Value** | % of Net Assets | ||||||||||||
| COMMON STOCK continued | |||||||||||||||
| FINANCIALS | 9.43 | ||||||||||||||
| DIVERSIFIED BANKS | |||||||||||||||
| 35,000 | BANCO LATINAMERICANO DE EXPORTACIONES | 547,050 | |||||||||||||
| 547,050 | 1.33 | ||||||||||||||
| LIFE/HEALTH INSUR | |||||||||||||||
| 7,500 | METLIFE, INC. | 384,075 | |||||||||||||
| 384,075 | 0.93 | ||||||||||||||
| MULTI LINE INSURANCE | |||||||||||||||
| 5 | BERKSHIRE HATHAWAY INC. - CL A* | 458,295 | |||||||||||||
| 1,000 | WHITE MOUNTAIN INSUR | 487,000 | |||||||||||||
| 945,295 | 2.30 | ||||||||||||||
| PROPERTY & CAS INSUR | |||||||||||||||
| 8,000 | CHUBB CORP. | 399,200 | |||||||||||||
| 399,200 | 0.97 | ||||||||||||||
| REAL ESTATE INV TRST | |||||||||||||||
| 7,158 | PROLOGIS | 373,075 | |||||||||||||
| 373,075 | 0.91 | ||||||||||||||
| SPECIALIZED FINANCE | |||||||||||||||
| 10,000 | MOODYS CORP. | 544,600 | |||||||||||||
| 544,600 | 1.33 | ||||||||||||||
| THRIFTS&MTG FINANCE | |||||||||||||||
| 6,000 | FED HOME LN MTG ASSOC. | 342,060 | |||||||||||||
| 7,500 | WASHINGTON MUTUAL | 341,850 | |||||||||||||
| 683,910 | 1.66 | ||||||||||||||
| HEALTH CARE | 8.30 | ||||||||||||||
| HEALTH CARE EQUIP | |||||||||||||||
| 12,000 | PERKIN ELMER | 250,800 | |||||||||||||
| 250,800 | 0.61 | ||||||||||||||
| HEALTH CARE SUPPLIES | |||||||||||||||
| 16,000 | CAMBREX CORP. | 333,280 | |||||||||||||
| 20,000 | INVERNESS MEDICAL INNOVATIONS INC.* | 564,600 | |||||||||||||
| 15,000 | BRISTOL-MYERS SQUIBB CO. | 387,900 | |||||||||||||
| 7,500 | JOHNSON & JOHNSON | 449,400 | |||||||||||||
| 15,000 | MYLAN LABORATORIES | 300,000 | |||||||||||||
| 10,000 | PAR PHARMACEUTICAL INC.* | 184,600 | |||||||||||||
| 25,000 | PFIZER INC. | 586,750 | |||||||||||||
| 8,000 | WYETH | 355,280 | |||||||||||||
| 3,161,810 | 7.69 | ||||||||||||||
See Accompanying Notes to Financial Statements
38
Pacific Advisors Balanced Fund
Statement of Investments
as of June 30, 2006 (Unaudited)
| Quantity or Principal | Description | Current $ Value** | % of Net Assets | ||||||||||||
| COMMON STOCK continued | |||||||||||||||
| INDUSTRIALS | 10.18 | ||||||||||||||
| AEROSPACE & DEFENSE | |||||||||||||||
| 7,500 | BOEING COMPANY | 614,325 | |||||||||||||
| 15,000 | CUBIC CORP. | 294,150 | |||||||||||||
| 908,475 | 2.21 | ||||||||||||||
| AIR FREIGHT/SHIPPING | |||||||||||||||
| 5,000 | UNITED PARCEL SERV. | 411,650 | |||||||||||||
| 411,650 | 1.00 | ||||||||||||||
| COMMERCIAL PRINTING | |||||||||||||||
| 5,000 | R H DONNELLEY CORP.* | 270,350 | |||||||||||||
| 270,350 | 0.66 | ||||||||||||||
| DIVERSIFIED COML SRV | |||||||||||||||
| 15,000 | GATX CORPORATION | 637,500 | |||||||||||||
| 16,000 | H & R BLOCK | 381,760 | |||||||||||||
| 1,019,260 | 2.48 | ||||||||||||||
| INDUSTRIAL | |||||||||||||||
| 20,000 | FARO TECHNOLOGIES* | 328,600 | |||||||||||||
| 8,000 | INGERSOLL-RAND | 342,240 | |||||||||||||
| 670,840 | 1.63 | ||||||||||||||
| INDUSTRIAL CONGLOMER | |||||||||||||||
| 15,000 | GENERAL ELECTRIC | 494,400 | |||||||||||||
| 15,000 | TYCO INTERNATIONAL LTD. | 412,500 | |||||||||||||
| 906,900 | 2.20 | ||||||||||||||
| INFORMATION TECHNOLOGY | 5.48 | ||||||||||||||
| APPLICATION SOFTWARE | |||||||||||||||
| 10,000 | REYNOLDS & REYNOLDS | 306,700 | |||||||||||||
| 306,700 | 0.75 | ||||||||||||||
| COMMUNICATIONS EQUIP | |||||||||||||||
| 30,000 | NOKIA CORP - ADR A | 607,800 | |||||||||||||
| 607,800 | 1.48 | ||||||||||||||
| COMPUTER STORAGE/PER | |||||||||||||||
| 10,000 | SANDISK CORP.* | 509,800 | |||||||||||||
| 509,800 | 1.24 | ||||||||||||||
| DATA PROCESSING SRV | |||||||||||||||
| 8,000 | AUTOMATIC DATA PROCESSING | 362,800 | |||||||||||||
| 362,800 | 0.88 | ||||||||||||||
See Accompanying Notes to Financial Statements
39
Pacific Advisors Balanced Fund
Statement of Investments
as of June 30, 2006 (Unaudited)
| Quantity or Principal | Description | Current $ Value** | % of Net Assets | ||||||||||||
| COMMON STOCK continued | |||||||||||||||
| SYSTEMS: SOFTWARE | |||||||||||||||
| 20,000 | MICROSOFT | 466,000 | |||||||||||||
| 466,000 | 1.13 | ||||||||||||||
| MATERIALS | 5.87 | ||||||||||||||
| DIVERSIFD METAL/MNG | |||||||||||||||
| 4,000 | RIO TINTO PLC | 838,840 | |||||||||||||
| 838,840 | 2.04 | ||||||||||||||
| FOREST PRODUCTS | |||||||||||||||
| 16,024 | RAYONIER INC. | 607,470 | |||||||||||||
| 607,470 | 1.48 | ||||||||||||||
| SPECIALTY CHEMICALS | |||||||||||||||
| 10,000 | CABOT MICRO ELECTRONICS INC.* | 303,100 | |||||||||||||
| 303,100 | 0.74 | ||||||||||||||
| STEEL | |||||||||||||||
| 8,000 | RELIANCE STEEL | 663,600 | |||||||||||||
| 663,600 | 1.61 | ||||||||||||||
| UTILITIES | 2.40 | ||||||||||||||
| ELECTRIC UTILITIES | |||||||||||||||
| 10,000 | ALLETE INC. | 473,500 | |||||||||||||
| 473,500 | 1.15 | ||||||||||||||
| MULTI UTILITIES/POWR | |||||||||||||||
| 17,500 | DUKE ENERGY CORP. | 513,975 | |||||||||||||
| 513,975 | 1.25 | ||||||||||||||
| TOTAL COMMON STOCK (Cost: $16,849,863) | 25,630,664 | 62.36 | |||||||||||||
| CORPORATE BONDS | |||||||||||||||
| CONSUMER DISCRETIONARY | 1.21 | ||||||||||||||
| AUTO PARTS & EQUIP | |||||||||||||||
| 100,000 | BORG WARNER 8.00% 10/01/19 | 110,440 | |||||||||||||
| 130,000 | DANA CORP. 6.50% 03/01/09 | 109,200 | |||||||||||||
| 219,640 | 0.54 | ||||||||||||||
| GENL MERCHANDISE STR | |||||||||||||||
| 141,000 | DAYTON HUDSON CO. 8.60% 01/15/12 | 160,106 | |||||||||||||
| 160,106 | 0.39 | ||||||||||||||
| HOME FURNISHINGS | |||||||||||||||
| 110,000 | WHIRLPOOL CORP 9.10% 02/01/08 | 114,624 | |||||||||||||
| 114,624 | 0.28 | ||||||||||||||
See Accompanying Notes to Financial Statements
40
Pacific Advisors Balanced Fund
Statement of Investments
as of June 30, 2006 (Unaudited)
| Quantity or Principal | Description | Current $ Value** | % of Net Assets | ||||||||||||
| CORPORATE BONDS continued | |||||||||||||||
| CONSUMER STAPLES | 4.10 | ||||||||||||||
| DISTILLERS & VINTNER | |||||||||||||||
| 310,000 | SEAGRAMS & SONS 7% 04/15/08 | 309,187 | |||||||||||||
| 309,187 | 0.75 | ||||||||||||||
| FOOD: RETAIL | |||||||||||||||
| 371,000 | SAFEWAY INC. 9.30% 02/01/07 | 376,810 | |||||||||||||
| 200,000 | SAFEWAY INC.7% 09/15/07 | 202,729 | |||||||||||||
| 579,539 | 1.41 | ||||||||||||||
| PACKAGED FOODS/MEATS | |||||||||||||||
| 794,000 | GERBER PRODUCTS 9.00% 10/15/06 | 799,057 | |||||||||||||
| 799,057 | 1.94 | ||||||||||||||
| ENERGY | 5.56 | ||||||||||||||
| INTEGRATED OIL & GAS | |||||||||||||||
| 501,000 | ATLANTIC RICHFIELD 9.125% 03/01/11 | 572,177 | |||||||||||||
| 833,000 | OCCIDENTAL PETROLEUM 10.125% 09/15/09 | 942,433 | |||||||||||||
| 199,000 | PHILLIPS PETE 7.125% 03/15/28 | 199,475 | |||||||||||||
| 1,714,085 | 4.17 | ||||||||||||||
| OIL & GAS EXPLR/PROD | |||||||||||||||
| 190,000 | DEVON ENERGY CORP. 10.125% 11/15/09 | 212,634 | |||||||||||||
| 75,000 | HUSKY OIL LTD. 7.125% 11/15/06 | 75,321 | |||||||||||||
| 287,955 | 0.70 | ||||||||||||||
| OIL & GAS REF/MKT/TRAN | |||||||||||||||
| 289,000 | KINDER MORGAN 6.50% 09/01/13 | 283,110 | |||||||||||||
| 283,110 | 0.69 | ||||||||||||||
| FINANCIALS | 5.32 | ||||||||||||||
| CONSUMER FINANCE | |||||||||||||||
| 450,000 | JOHN DEERE CAPITAL 3.63% 05/25/07 | 441,846 | |||||||||||||
| 441,846 | 1.08 | ||||||||||||||
| DIVERSIFIED FINANCL | |||||||||||||||
| 269,000 | GENERAL ELECTRIC CAP 8.125% 05/15/12 | 299,889 | |||||||||||||
| 299,889 | 0.73 | ||||||||||||||
| DIVERSIFIED | |||||||||||||||
| 505,000 | NATIONAL RURAL UTIL 5.70% 01/15/10 | 505,149 | |||||||||||||
| 505,149 | 1.23 | ||||||||||||||
| LIFE/HEALTH INSUR | |||||||||||||||
| 325,000 | TRANSAMERICA CORP. 9.375% 03/01/08 | 340,693 | |||||||||||||
| 340,693 | 0.83 | ||||||||||||||
See Accompanying Notes to Financial Statements
41
Pacific Advisors Balanced Fund
Statement of Investments
as of June 30, 2006 (Unaudited)
| Quantity or Principal | Description | Current $ Value** | % of Net Assets | ||||||||||||
| CORPORATE BONDS continued | |||||||||||||||
| PROPERTY & CAS INSUR | |||||||||||||||
| 435,000 | OLD REPUBLIC INTL 7.00% 06/15/07 | 437,443 | |||||||||||||
| 437,443 | 1.06 | ||||||||||||||
| SPECIALIZED FINANCE | |||||||||||||||
| 155,000 | BENEFICIAL CORP. 8.40% 05/15/08 | 162,152 | |||||||||||||
| 162,152 | 0.39 | ||||||||||||||
| HEALTH CARE | 1.18 | ||||||||||||||
| HEALTH CARE EQUIP | |||||||||||||||
| 380,000 | MALLINCKRODT 6.50% 11/15/07 | 382,834 | |||||||||||||
| 382,834 | 0.93 | ||||||||||||||
| MANAGED HEALTH CARE | |||||||||||||||
| 100,000 | CIGNA CORP. 7.40% 05/15/07 | 101,136 | |||||||||||||
| 101,136 | 0.25 | ||||||||||||||
| INDUSTRIALS | 0.42 | ||||||||||||||
| CONSTRUCTION & MACH | |||||||||||||||
| 100,000 | CATERPILLAR INC. 5.25% 03/15/07 | 99,050 | |||||||||||||
| 99,050 | 0.24 | ||||||||||||||
| INDUSTRIAL | |||||||||||||||
| 71,000 | TENNECO CORP. 10.20% 03/15/08 | 74,473 | |||||||||||||
| 74,473 | 0.18 | ||||||||||||||
| INFORMATION TECHNOLOGY | 0.26 | ||||||||||||||
| COMPUTER HARDWARE | |||||||||||||||
| 100,000 | DIGITAL EQUIPMENT 7.75% 04/01/23 | 105,284 | |||||||||||||
| 105,284 | 0.26 | ||||||||||||||
| TELECOMMUNICATION SERVICES | 3.71 | ||||||||||||||
| INTG TELECOMM SRVCS | |||||||||||||||
| 469,838 | BELLSOUTH TELECOMMUN 6.30% 12/15/15 | 469,035 | |||||||||||||
| 400,000 | GTE SOUTH INC. 6.00% 02/15/08 | 399,589 | |||||||||||||
| 657,000 | GTE SOUTH INC. 6.125% 06/15/07 | 657,633 | |||||||||||||
| 1,526,257 | 3.71 | ||||||||||||||
| UTILITIES | 3.99 | ||||||||||||||
| ELECTRIC UTILITIES | |||||||||||||||
| 240,000 | CAROLINA POWER&LIGHT 6.80% 08/15/07 | 242,693 | |||||||||||||
| 100,000 | KENTUCKY UTILITIES 7.92% 05/15/07 | 101,442 | |||||||||||||
| 344,135 | 0.84 | ||||||||||||||
See Accompanying Notes to Financial Statements
42
Pacific Advisors Balanced Fund
Statement of Investments
as of June 30, 2006 (Unaudited)
| Quantity or Principal | Description | Current $ Value** | % of Net Assets | ||||||||||||
| CORPORATE BONDS continued | |||||||||||||||
| MULTI UTILITIES/POWR | |||||||||||||||
| 75,000 | BALTIMORE GAS & ELEC 7.50% 01/15/07 | 75,635 | |||||||||||||
| 200,000 | FLORIDA PWR & LT 6.0% 06/01/08 | 200,936 | |||||||||||||
| 250,000 | NORTHWESTERN CORP. 7.00% 08/15/23 | 251,250 | |||||||||||||
| 155,000 | POTOMAC ELEC. POWER 5.875% 10/15/08 | 154,899 | |||||||||||||
| 150,000 | POTOMAC ELEC. POWER 6.25% 10/15/07 | 150,833 | |||||||||||||
| 55,000 | POTOMAC ELEC. POWER 6.50% 03/15/08 | 55,533 | |||||||||||||
| 350,000 | PUB SVC ELEC & GAS 6.25% 01/01/07 | 350,931 | |||||||||||||
| 49,281 | RELIANT ENER MID ATL 9.237% 07/02/17 | 53,223 | |||||||||||||
| 1,293,240 | 3.15 | ||||||||||||||
| TOTAL CORPORATE BOND (Cost: $10,841,531) | 10,580,884 | 25.75 | |||||||||||||
| US GOVT SECURITIES | |||||||||||||||
| US GOVERNMENT AGENCY | 0.47 | ||||||||||||||
| US GOVERNMENT AGENCY | |||||||||||||||
| 200,000 | FED HOME LOAN BANK 4.46% 10/28/09 | 193,897 | |||||||||||||
| 193,897 | 0.47 | ||||||||||||||
| TOTAL US GOVT SECURITIES (Cost: $200,000) | 193,897 | 0.47 | |||||||||||||
| SHORT TERM INVESTMENTS | |||||||||||||||
| MONEY MARKET | 1.16 | ||||||||||||||
| SHORT-TERM INVESTMENTS | |||||||||||||||
| 476,509 | UMB MONEY MARKET FIDUCIARY | 476,509 | |||||||||||||
| 476,509 | 1.16 | ||||||||||||||
| FOREIGN GOVERNMENT BOND | 0.73 | ||||||||||||||
| 300,000 | CANADIAN GOVERNMENT 6.75% 08/28/06 | 300,686 | 0.73 | ||||||||||||
| 300,686 | 0.73 | ||||||||||||||
| US TREASURY BILL | 9.39 | ||||||||||||||
| 3,100,000 | US TREASURY BILL 09/28/06 | 3,064,037 | |||||||||||||
| 800,000 | US TREASURY BILL 08/24/06 | 794,530 | |||||||||||||
| 3,858,567 | 9.39 | ||||||||||||||
| TOTAL SHORT TERM INVESTMENTS (Cost: $4,636,793) | 4,635,762 | 11.28 | |||||||||||||
| TOTAL INVESTMENTS (Cost: 32,528,187) | 41,041,207 | 99.86 | |||||||||||||
| OTHER ASSETS LESS LIABILITIES | 56,929 | 0.14 | |||||||||||||
| TOTAL NET ASSETS | 41,098,136 | 100.00 | |||||||||||||
* Non-income producing.
** The principal amount is stated in U.S. dollars unless otherwise indicated.
See Accompanying Notes to Financial Statements
43
Pacific Advisors Growth Fund
Statement of Investments
as of June 30, 2006 (Unaudited)
| Quantity or Principal | Description | Current $ Value** | % of Net Assets | ||||||||||||
| COMMON STOCK | |||||||||||||||
| CONSUMER DISCRETIONARY | 0.50 | ||||||||||||||
| HOME IMPROVEMENT | |||||||||||||||
| 500 | HOME DEPOT, INC. | 17,895 | |||||||||||||
| 17,895 | 0.50 | ||||||||||||||
| ENERGY | 27.38 | ||||||||||||||
| INTEGRATED OIL & GAS | |||||||||||||||
| 1,000 | BRITISH PETROLEUM | 69,610 | |||||||||||||
| 1,500 | CONOCOPHILLIPS | 98,295 | |||||||||||||
| 400 | EXXON MOBIL CORP. | 24,540 | |||||||||||||
| 2,000 | MARATHON OIL CORP. | 166,600 | |||||||||||||
| 1,000 | OCCIDENTAL PETROLEUM | 102,550 | |||||||||||||
| 461,595 | 12.77 | ||||||||||||||
| OIL & GAS DRILLING | |||||||||||||||
| 1,000 | ENCANA | 52,640 | |||||||||||||
| 1,000 | ULTRA PETROLEUM* | 59,270 | |||||||||||||
| 111,910 | 3.10 | ||||||||||||||
| OIL & GAS EQUIP/SERV | |||||||||||||||
| 1,500 | CARBO CERAMICS INC. | 73,695 | |||||||||||||
| 1,000 | FMC TECHNOLOGIES* | 67,460 | |||||||||||||
| 5,000 | MITCHAM INDUSTRIES INC.* | 63,850 | |||||||||||||
| 205,005 | 5.67 | ||||||||||||||
| OIL & GAS EXPLR/PROD | |||||||||||||||
| 2,000 | APACHE CORP. | 136,500 | |||||||||||||
| 1,000 | CHESAPEAKE ENERGY CORP. | 30,250 | |||||||||||||
| 1,000 | XTO ENERGY INC. | 44,270 | |||||||||||||
| 211,020 | 5.84 | ||||||||||||||
| FINANCIALS | 3.07 | ||||||||||||||
| DIVERSIFIED BANKS | |||||||||||||||
| 1,000 | WACHOVIA | 54,080 | |||||||||||||
| 54,080 | 1.50 | ||||||||||||||
| REGIONAL BANKS | |||||||||||||||
| 1,500 | EAST WEST BANCORP, INC. | 56,865 | |||||||||||||
| 56,865 | 1.57 | ||||||||||||||
| HEALTH CARE | 25.52 | ||||||||||||||
| HEALTH CARE EQUIP | |||||||||||||||
| 500 | BECTON DICKINSON | 30,565 | |||||||||||||
| 3,000 | ST. JUDE MEDICAL INC.* | 97,260 | |||||||||||||
| 2,000 | ZIMMER HOLDINGS INC.* | 113,440 | |||||||||||||
| 241,265 | 6.68 | ||||||||||||||
See Accompanying Notes to Financial Statements
44
Pacific Advisors Growth Fund
Statement of Investments
as of June 30, 2006 (Unaudited)
| Quantity or Principal | Description | Current $ Value** | % of Net Assets | ||||||||||||
| COMMON STOCK continued | |||||||||||||||
| HEALTH CARE SERVICES | |||||||||||||||
| 2,500 | CAREMARK RX INC. | 124,675 | |||||||||||||
| 1,000 | QUEST DIAGNOSTICS, INC. | 59,920 | |||||||||||||
| 184,595 | 5.11 | ||||||||||||||
| MANAGED HEALTH CARE | |||||||||||||||
| 5,000 | AMERICA SVC GROUP* | 77,600 | |||||||||||||
| 2,000 | UNITED HEALTH GROUP INC. | 89,560 | |||||||||||||
| 2,750 | WELLPOINT* | 200,117 | |||||||||||||
| 367,277 | 10.16 | ||||||||||||||
| PHARMACEUTICALS | |||||||||||||||
| 1,200 | JOHNSON & JOHNSON | 71,904 | |||||||||||||
| 3,100 | NATURE'S SUNSHINE | 28,923 | |||||||||||||
| 1,200 | PFIZER INC. | 28,164 | |||||||||||||
| 128,991 | 3.57 | ||||||||||||||
| INDUSTRIALS | 12.70 | ||||||||||||||
| AEROSPACE & DEFENSE | |||||||||||||||
| 1,000 | BOEING COMPANY | 81,910 | |||||||||||||
| 1,000 | HONEYWELL INTERNATIONAL INC. | 40,300 | |||||||||||||
| 122,210 | 3.38 | ||||||||||||||
| BUILDING PRODUCTS | |||||||||||||||
| 2,000 | ELKCORP | 55,540 | |||||||||||||
| 55,540 | 1.54 | ||||||||||||||
| CONSTRUCTION & MACH | |||||||||||||||
| 3,000 | CHICAGO BRIDGE&IRON | 72,450 | |||||||||||||
| 72,450 | 2.00 | ||||||||||||||
| INDUSTRIAL CONGLOMER | |||||||||||||||
| 4,000 | GENERAL ELECTRIC | 131,840 | |||||||||||||
| 1,000 | TYCO INTERNATIONAL LTD. | 27,500 | |||||||||||||
| 159,340 | 4.41 | ||||||||||||||
| INDUSTRIAL MACHINERY | |||||||||||||||
| 1,000 | ITT INDUSTRIES | 49,500 | |||||||||||||
| 49,500 | 1.37 | ||||||||||||||
| INFORMATION TECHNOLOGY | 9.32 | ||||||||||||||
| APPLICATION SOFTWARE | |||||||||||||||
| 2,000 | INTERVOICE INC.* | 14,240 | |||||||||||||
| 14,240 | 0.39 | ||||||||||||||
See Accompanying Notes to Financial Statements
45
Pacific Advisors Growth Fund
Statement of Investments
as of June 30, 2006 (Unaudited)
| Quantity or Principal | Description | Current $ Value** | % of Net Assets | ||||||||||||
| COMMON STOCK continued | |||||||||||||||
| COMMUNICATIONS EQUIP | |||||||||||||||
| 1,500 | CISCO SYSTEMS INC.* | 29,295 | |||||||||||||
| 1,500 | QUALCOMM INC. | 60,105 | |||||||||||||
| 89,400 | 2.47 | ||||||||||||||
| COMPUTER HARDWARE | |||||||||||||||
| 200 | INTL. BUSINESS MACHINES CORP. | 15,364 | |||||||||||||
| 15,364 | 0.43 | ||||||||||||||
| COMPUTER STORAGE/PER | |||||||||||||||
| 1,500 | SEAGATE TECHNOLOGY* | 33,960 | |||||||||||||
| 33,960 | 0.94 | ||||||||||||||
| ELECTRONIC EQ MANUF | |||||||||||||||
| 2,000 | ITRON INC.* | 118,520 | |||||||||||||
| 118,520 | 3.28 | ||||||||||||||
| SEMICONDUCTORS | |||||||||||||||
| 1,000 | INTEL CORPORATION | 18,950 | |||||||||||||
| 18,950 | 0.52 | ||||||||||||||
| SYSTEMS: SOFTWARE | |||||||||||||||
| 2,000 | MICROSOFT | 46,600 | |||||||||||||
| 46,600 | 1.29 | ||||||||||||||
| MATERIALS | 12.72 | ||||||||||||||
| DIVERSIFD METAL/MNG | |||||||||||||||
| 1,500 | BHP BILLITON LTD. | 64,605 | |||||||||||||
| 3,000 | COMPANHIA VALE DO RIO DOCE | 72,120 | |||||||||||||
| 1,000 | PHELPS DODGE CORP. | 82,160 | |||||||||||||
| 218,885 | 6.06 | ||||||||||||||
| FOREST PRODUCTS | |||||||||||||||
| 1,000 | LOUISIANA PACIFIC CORP. | 21,900 | |||||||||||||
| 21,900 | 0.60 | ||||||||||||||
| SPECIALTY CHEMICALS | |||||||||||||||
| 4,000 | LYONDELL CHEMICAL CO. | 90,640 | |||||||||||||
| 90,640 | 2.51 | ||||||||||||||
| STEEL | |||||||||||||||
| 5,000 | COMMERCIAL METALS CO. | 128,500 | |||||||||||||
| 128,500 | 3.55 | ||||||||||||||
See Accompanying Notes to Financial Statements
46
Pacific Advisors Growth Fund
Statement of Investments
as of June 30, 2006 (Unaudited)
| Quantity or Principal | Description | Current $ Value** | % of Net Assets | ||||||||||||
| COMMON STOCK continued | |||||||||||||||
| TELECOMMUNICATION SERVICES | 1.81 | ||||||||||||||
| INTG TELECOMM SRVCS | |||||||||||||||
| 5,000 | CITIZENS COMMUNICATIONS | 65,250 | |||||||||||||
| 65,250 | 1.81 | ||||||||||||||
| TOTAL COMMON STOCK (Cost: $2,939,144) | 3,361,747 | 93.02 | |||||||||||||
| SHORT TERM INVESTMENTS | |||||||||||||||
| MONEY MARKET | 7.24 | ||||||||||||||
| SHORT-TERM INVESTMENTS | |||||||||||||||
| 261,489 | UMB MONEY MARKET FIDUCIARY | 261,489 | |||||||||||||
| 261,489 | 7.24 | ||||||||||||||
| TOTAL SHORT TERM INVESTMENTS (Cost: $261,489) | 261,489 | 7.24 | |||||||||||||
| TOTAL INVESTMENTS (Cost: $3,200,633) | 3,623,236 | 100.26 | |||||||||||||
| OTHER ASSETS LESS LIABILITIES | (9,237 | ) | (0.26 | ) | |||||||||||
| TOTAL NET ASSETS | 3,613,999 | 100.00 | |||||||||||||
* Non-income producing.
** The principal amount is stated in U.S. dollars unless otherwise indicated.
See Accompanying Notes to Financial Statements
47
Pacific Advisors Multi-Cap Value Fund
Statement of Investments
as of June 30, 2006 (Unaudited)
| Quantity or Principal | Description | Current $ Value** | % of Net Assets | ||||||||||||
| COMMON STOCK | |||||||||||||||
| CONSUMER DISCRETIONARY | 5.26 | ||||||||||||||
| INTEFNET; RETAIL | |||||||||||||||
| 9,000 | E BAY* | 263,610 | |||||||||||||
| 263,610 | 2.17 | ||||||||||||||
| MOVIES/ENTERTAINMENT | |||||||||||||||
| 33,000 | ACTIVISION INC.* | 375,540 | |||||||||||||
| 375,540 | 3.09 | ||||||||||||||
| CONSUMER STAPLES | 6.05 | ||||||||||||||
| FOOD | |||||||||||||||
| 13,500 | UNITED NATURAL FOODS* | 445,770 | |||||||||||||
| 445,770 | 3.67 | ||||||||||||||
| HYPERMKTS/SUPER CTRS | |||||||||||||||
| 6,000 | WAL-MART STORES INC. | 289,020 | |||||||||||||
| 289,020 | 2.38 | ||||||||||||||
| ENERGY | 21.51 | ||||||||||||||
| INTEGRATED OIL & GAS | |||||||||||||||
| 6,000 | CHEVRONTEXACO CORP. | 372,360 | |||||||||||||
| 6,000 | MARATHON OIL CORP. | 499,800 | |||||||||||||
| 4,000 | ROYAL DUTCH SHELL A | 267,920 | |||||||||||||
| 1,140,080 | 9.40 | ||||||||||||||
| OIL & GAS EQUIP/SERV | |||||||||||||||
| 27,000 | MITCHAM INDUSTRIES INC.* | 344,790 | |||||||||||||
| 344,790 | 2.84 | ||||||||||||||
| OIL & GAS EXPLR/PROD | |||||||||||||||
| 5,500 | APACHE CORP. | 375,375 | |||||||||||||
| 10,000 | CHESAPEAKE ENERGY CORP. | 302,500 | |||||||||||||
| 677,875 | 5.58 | ||||||||||||||
| OIL & GAS REF/MKT/TRAN | |||||||||||||||
| 18,000 | MARITRANS INC. | 448,200 | |||||||||||||
| 448,200 | 3.69 | ||||||||||||||
| FINANCIALS | 14.89 | ||||||||||||||
| DIVERSIFIED BANKS | |||||||||||||||
| 8,006 | BANK OF AMERICA | 385,088 | |||||||||||||
| 385,088 | 3.17 | ||||||||||||||
| DIVERSIFIED FINANCL | |||||||||||||||
| 8,500 | CITIGROUP INC. | 410,040 | |||||||||||||
| 410,040 | 3.38 | ||||||||||||||
See Accompanying Notes to Financial Statements
48
Pacific Advisors Multi-Cap Value Fund
Statement of Investments
as of June 30, 2006 (Unaudited)
| Quantity or Principal | Description | Current $ Value** | % of Net Assets | ||||||||||||
| COMMON STOCK continued | |||||||||||||||
| MULTI LINE INSURANCE | |||||||||||||||
| 5,000 | AMERICAN INT'L GROUP INC. | 295,250 | |||||||||||||
| 295,250 | 2.43 | ||||||||||||||
| THRIFTS & MTG FINANCE | |||||||||||||||
| 7,500 | WASHINGTON MUTUAL | 341,850 | |||||||||||||
| 341,850 | 2.81 | ||||||||||||||
| INVESTMENT BANK/BRKG | |||||||||||||||
| 2,500 | GOLDMAN SACHS GROUP | 376,075 | |||||||||||||
| 376,075 | 3.10 | ||||||||||||||
| HEALTH CARE | 15.20 | ||||||||||||||
| BIOTECHNOLOGY | |||||||||||||||
| 5,500 | AMGEN INC.* | 358,765 | |||||||||||||
| 5,500 | BIOGEN IDEC | 254,815 | |||||||||||||
| 613,580 | 5.05 | ||||||||||||||
| PHARMACEUTICALS | |||||||||||||||
| 14,000 | ENDO PHARMACEUTICALS* | 461,720 | |||||||||||||
| 7,000 | JOHNSON & JOHNSON | 419,440 | |||||||||||||
| 881,160 | 7.25 | ||||||||||||||
| HEALTH CARE EQUIP | |||||||||||||||
| 6,200 | ZIMMER HOLDINGS INC.* | 351,664 | |||||||||||||
| 351,664 | 2.90 | ||||||||||||||
| INDUSTRIALS | 11.76 | ||||||||||||||
| AEROSPACE & DEFENSE | |||||||||||||||
| 5,000 | HONEYWELL INTERNATIONAL INC. | 201,500 | |||||||||||||
| 201,500 | 1.66 | ||||||||||||||
| BUILDING PRODUCTS | |||||||||||||||
| 13,000 | ELKCORP | 361,010 | |||||||||||||
| 361,010 | 2.97 | ||||||||||||||
| INDUSTRIAL CONGLOMER | |||||||||||||||
| 15,500 | TYCO INTERNATIONAL LTD. | 426,250 | |||||||||||||
| 426,250 | 3.51 | ||||||||||||||
| ELECTRICAL COMPON/EQ | |||||||||||||||
| 37,000 | GRAFTECH INTL. LTD.* | 214,600 | |||||||||||||
| 15,000 | METROLOGIC INSTRUMTS* | 225,150 | |||||||||||||
| 439,750 | 3.62 | ||||||||||||||
See Accompanying Notes to Financial Statements
49
Pacific Advisors Multi-Cap Value Fund
Statement of Investments
as of June 30, 2006 (Unaudited)
| Quantity or Principal | Description | Current $ Value** | % of Net Assets | ||||||||||||
| COMMON STOCK continued | |||||||||||||||
| INFORMATION TECHNOLOGY | 20.46 | ||||||||||||||
| COMPUTER HARDWARE | |||||||||||||||
| 14,000 | DELL COMPUTER CORP.* | 341,740 | |||||||||||||
| 341,740 | 2.81 | ||||||||||||||
| COMMUNICATIONS EQUIP | |||||||||||||||
| 15,000 | CISCO SYSTEMS INC.* | 292,950 | |||||||||||||
| 20,000 | LUCENT TECHNOLOGIES* | 48,400 | |||||||||||||
| 8,000 | QUALCOMM INC. | 320,560 | |||||||||||||
| 661,910 | 5.45 | ||||||||||||||
| COMPUTER STORAGE/PER | |||||||||||||||
| 32,500 | EMC CORPORATION* | 356,525 | |||||||||||||
| 356,525 | 2.94 | ||||||||||||||
| SEMICONDUCTORS | |||||||||||||||
| 22,000 | INTEL CORPORATION | 416,900 | |||||||||||||
| 416,900 | 3.43 | ||||||||||||||
| SYSTEMS: SOFTWARE | |||||||||||||||
| 12,000 | MICROSOFT | 279,600 | |||||||||||||
| 279,600 | 2.30 | ||||||||||||||
| SOFTWARE & PROCESSING | |||||||||||||||
| 13,000 | YAHOO* | 429,000 | |||||||||||||
| 429,000 | 3.53 | ||||||||||||||
| TELECOMMUNICATION SERVICES | 2.87 | ||||||||||||||
| INTG TELECOMM SRVCS | |||||||||||||||
| 12,500 | AT&T, INC. | 348,625 | |||||||||||||
| 348,625 | 2.87 | ||||||||||||||
| TOTAL COMMON STOCK (Cost: $10,810,502) | 11,902,402 | 98.00 | |||||||||||||
See Accompanying Notes to Financial Statements
50
Pacific Advisors Multi-Cap Value Fund
Statement of Investments
as of June 30, 2006 (Unaudited)
| Quantity or Principal | Description | Current $ Value** | % of Net Assets | ||||||||||||
| SHORT TERM INVESTMENTS | |||||||||||||||
| MONEY MARKET | 2.38 | ||||||||||||||
| SHORT-TERM INVESTMENTS | |||||||||||||||
| 289,611 | UMB MONEY MARKET FIDUCIARY | 289,611 | |||||||||||||
| 289,611 | 2.38 | ||||||||||||||
| TOTAL SHORT TERM INVESTMENTS (Cost: $289,611) | 289,611 | 2.38 | |||||||||||||
| TOTAL INVESTMENTS (Cost:11,100,113) | 12,192,013 | 100.38 | |||||||||||||
| OTHER ASSETS LESS LIABILITIES | (45,440 | ) | (0.38 | ) | |||||||||||
| TOTAL NET ASSETS | 12,146,573 | 100.00 | |||||||||||||
* Non-income producing.
** The principal amount is stated in U.S. dollars unless otherwise indicated.
See Accompanying Notes to Financial Statements
51
Pacific Advisors Small Cap Fund
Statement of Investments
as of June 30, 2006 (Unaudited)
| Quantity or Principal | Description | Current $ Value** | % of Net Assets | ||||||||||||
| COMMON STOCK | |||||||||||||||
| CONSUMER DISCRETIONARY | 10.80 | ||||||||||||||
| APPAREL - RETAIL | |||||||||||||||
| 65,000 | ASHWORTH, INC.* | 585,000 | |||||||||||||
| 585,000 | 1.27 | ||||||||||||||
| AUTO PARTS & EQUIP | |||||||||||||||
| 216,000 | AMERIGON INC.* | 1,937,520 | |||||||||||||
| 1,937,520 | 4.20 | ||||||||||||||
| HOME FURNISHINGS | |||||||||||||||
| 80,000 | CRAFTMADE INTERNATIONAL INC. | 1,340,000 | |||||||||||||
| 1,340,000 | 2.91 | ||||||||||||||
| SPECIALTY STORES | |||||||||||||||
| 42,000 | CONNS INC.* | 1,115,100 | |||||||||||||
| 1,115,100 | 2.42 | ||||||||||||||
| CONSUMER STAPLES | 3.30 | ||||||||||||||
| COSMETIC/PERSONAL CARE | |||||||||||||||
| 50,000 | CHATTEM INC.* | 1,518,500 | |||||||||||||
| 1,518,500 | 3.30 | ||||||||||||||
| ENERGY | 22.78 | ||||||||||||||
| OIL & GAS DRILLING | |||||||||||||||
| 160,000 | INFINITY ENERGY RESOURCES INC.* | 1,112,000 | |||||||||||||
| 1,112,000 | 2.41 | ||||||||||||||
| OIL & GAS EQUIP/SERV | |||||||||||||||
| 140,000 | MATRIX SERVICE COMPANY* | 1,601,600 | |||||||||||||
| 119,000 | MITCHAM INDUSTRIES INC.* | 1,519,630 | |||||||||||||
| 3,121,230 | 6.78 | ||||||||||||||
| OIL & GAS EXPLR/PROD | |||||||||||||||
| 37,000 | CHESAPEAKE ENERGY CORP. | 1,119,250 | |||||||||||||
| 34,000 | DENBURY RES. INC.* | 1,076,780 | |||||||||||||
| 91,000 | QUEST RESOURCE INC.* | 1,233,050 | |||||||||||||
| 3,429,080 | 7.45 | ||||||||||||||
| OIL&GAS REF/MKT/TRAN | |||||||||||||||
| 66,000 | MARITRANS INC. | 1,643,400 | |||||||||||||
| 30,000 | KIRBY CORP.* | 1,185,000 | |||||||||||||
| 2,828,400 | 6.14 | ||||||||||||||
See Accompanying Notes to Financial Statements
52
Pacific Advisors Small Cap Fund
Statement of Investments
as of June 30, 2006 (Unaudited)
| Quantity or Principal | Description | Current $ Value** | % of Net Assets | ||||||||||||
| COMMON STOCK continued | |||||||||||||||
| FINANCIALS | 12.12 | ||||||||||||||
| REGIONAL BANKS | |||||||||||||||
| 28,000 | EAST WEST BANCORP, INC. | 1,061,480 | |||||||||||||
| 64,000 | NARA BANK NATIONAL ASSOC. | 1,200,000 | |||||||||||||
| 2,261,480 | 4.90 | ||||||||||||||
| SPECIALIZED FINANCE | |||||||||||||||
| 60,000 | EZCORP INC.* | 2,261,400 | |||||||||||||
| 54,000 | FIRST CASH FINANCIAL SERVICES, INC.* | 1,066,500 | |||||||||||||
| 3,327,900 | 7.22 | ||||||||||||||
| HEALTH CARE | 5.50 | ||||||||||||||
| MANAGED HEALTH CARE | |||||||||||||||
| 135,000 | AMERICA SVC GROUP* | 2,095,200 | |||||||||||||
| 115,000 | UNITED AMERICAN HEALTH CARE* | 437,000 | |||||||||||||
| 2,532,200 | 5.50 | ||||||||||||||
| INDUSTRIALS | 31.46 | ||||||||||||||
| BUILDING PRODUCTS | |||||||||||||||
| 80,000 | APOGEE ENTERPRISES, INC. | 1,176,000 | |||||||||||||
| 65,000 | ELKCORP. | 1,805,050 | |||||||||||||
| 2,981,050 | 6.47 | ||||||||||||||
| DIVERSIFIED COML SRV | |||||||||||||||
| 195,000 | DARLING INTERNATIONA INC.* | 883,350 | |||||||||||||
| 38,000 | MOBILE MINI INC.* | 1,111,880 | |||||||||||||
| 26,000 | TEAM INC.* | 651,300 | |||||||||||||
| 2,646,530 | 5.74 | ||||||||||||||
| ELECTRICAL COMPON/EQ | |||||||||||||||
| 12,000 | ENCORE WIRE CORP.* | 431,280 | |||||||||||||
| 431,280 | 0.93 | ||||||||||||||
| ENVIROMENTAL SERVICE | |||||||||||||||
| 40,000 | AMERICAN ECOLOGY CORPORATION | 1,060,000 | |||||||||||||
| 60,000 | TETRA TECH INC.* | 1,064,400 | |||||||||||||
| 2,124,400 | 4.61 | ||||||||||||||
| RAILROADS & TRUCKING | |||||||||||||||
| 58,000 | FROZEN FOOD EXPRESSS INDUSTRIES INC* | 639,160 | |||||||||||||
| 111,000 | RAILAMERICA INC.* | 1,161,060 | |||||||||||||
| 45,000 | SCS TRANSPORTATION* | 1,238,850 | |||||||||||||
| 76,000 | US XPRESS ENTERPRISE* | 2,053,520 | |||||||||||||
| 52,100 | VITRAN CORPORATION, INC.* | 1,223,829 | |||||||||||||
| 6,316,419 | 13.71 | ||||||||||||||
See Accompanying Notes to Financial Statements
53
Pacific Advisors Small Cap Fund
Statement of Investments
as of June 30, 2006 (Unaudited)
| Quantity or Principal | Description | Current $ Value** | % of Net Assets | ||||||||||||
| COMMON STOCK continued | |||||||||||||||
| INFORMATION TECHNOLOGY | 4.26 | ||||||||||||||
| APPLICATION SOFTWARE | |||||||||||||||
| 166,000 | INTERVOICE INC.* | 1,181,920 | |||||||||||||
| 1,181,920 | 2.56 | ||||||||||||||
| SYSTEMS: SOFTWARE | |||||||||||||||
| 70,000 | TYLER TECHNOLOGIES* | 784,000 | |||||||||||||
| 784,000 | 1.70 | ||||||||||||||
| MATERIALS | 7.13 | ||||||||||||||
| SPECIALTY CHEMICALS | |||||||||||||||
| 230,000 | TERRA INDUSTRIES INC.* | 1,465,100 | |||||||||||||
| 1,465,100 | 3.18 | ||||||||||||||
| STEEL | |||||||||||||||
| 71,000 | COMMERCIAL METALS CO. | 1,824,700 | |||||||||||||
| 1,824,700 | 3.95 | ||||||||||||||
| TELECOMMUNICATION SERVICES | 5.06 | ||||||||||||||
| INTG TELECOMM SRVCS | |||||||||||||||
| 225,000 | PREMIER GLOBAL* | 1,698,750 | |||||||||||||
| 102,000 | TALK AMERICA HOLDING INC.* | 631,380 | |||||||||||||
| 2,330,130 | 5.06 | ||||||||||||||
| TOTAL COMMON STOCK (Cost: $35,427,546) | 47,193,939 | 102.41 | |||||||||||||
| TOTAL INVESTMENTS (COST: $35,427,546) | 47,193,939 | 102.41 | |||||||||||||
| OTHER ASSETS LESS LIABILITIES | (1,112,062 | ) | (2.41 | ) | |||||||||||
| TOTAL NET ASSETS | 46,081,877 | 100.00 | |||||||||||||
* Non-income producing.
** The principal amount is stated in U.S. dollars unless otherwise indicated.
See Accompanying Notes to Financial Statements
54
(This page has been left blank intentionally.)
55
Pacific Advisors Fund Inc.
Statement of Assets and Liabilities (Unaudited)
June 30, 2006
| Government Securities Fund | Income and Equity Fund | Balanced Fund | Growth Fund | Multi-Cap Value Fund | Small Cap Fund | ||||||||||||||||||||||
| Assets | |||||||||||||||||||||||||||
| Investment Securities | |||||||||||||||||||||||||||
| At cost | $ | 4,509,664 | $ | 9,894,711 | $ | 32,051,678 | $ | 2,939,144 | $ | 10,810,502 | $ | 35,427,546 | |||||||||||||||
| At market value | $ | 4,419,893 | $ | 9,902,804 | $ | 40,564,698 | $ | 3,361,747 | $ | 11,902,402 | $ | 47,193,939 | |||||||||||||||
| Cash or cash equivalent, at market value | 146,194 | - | 476,509 | 261,489 | 289,611 | - | |||||||||||||||||||||
| Accrued income receivable | 42,007 | 103,115 | 220,263 | 2,719 | 2,676 | 12,860 | |||||||||||||||||||||
| Receivable for capital shares sold | 1,000 | - | 30,153 | 230 | 100 | 1,834,790 | |||||||||||||||||||||
| Other assets | - | 14,000 | - | - | - | - | |||||||||||||||||||||
| Total assets | 4,609,094 | 10,019,919 | 41,291,623 | 3,626,185 | 12,194,789 | 49,041,589 | |||||||||||||||||||||
| Liabilities | |||||||||||||||||||||||||||
| Bank Borrowings (Note 6) | - | 15,322 | - | - | - | 1,801,699 | |||||||||||||||||||||
| Payable for investments purchased | - | - | - | - | - | 1,017,419 | |||||||||||||||||||||
| Payable for fund shares redeemed | - | 20,000 | 30,000 | - | - | 23,691 | |||||||||||||||||||||
| Accounts payable | 13,058 | 30,417 | 122,104 | 9,147 | 32,514 | 72,668 | |||||||||||||||||||||
| Accounts payable to related parties (Note 3) | 4,353 | 6,176 | 16,438 | 3,039 | 6,844 | 18,358 | |||||||||||||||||||||
| Payable to investment manager (Note 3) | - | - | 24,945 | - | 9,858 | 25,877 | |||||||||||||||||||||
| Total liabilities | 17,411 | 71,915 | 193,487 | 12,186 | 49,216 | 2,959,712 | |||||||||||||||||||||
| Net Assets | $ | 4,591,683 | $ | 9,948,004 | $ | 41,098,136 | $ | 3,613,999 | $ | 12,145,573 | $ | 46,081,877 | |||||||||||||||
| Summary of Shareholders' Equity | |||||||||||||||||||||||||||
| Paid in capital | 5,751,077 | 9,968,931 | 32,544,604 | 3,806,923 | 10,594,753 | 31,893,558 | |||||||||||||||||||||
| Accumulated undistributed net investment income | 5,313 | 5,892 | 9,242 | - | - | - | |||||||||||||||||||||
| Accumulated undistributed net realized gain (losses) on security transactions | (1,074,936 | ) | (34,912 | ) | 31,270 | (615,527 | ) | 458,920 | 2,421,926 | ||||||||||||||||||
| Net unrealized appreciation of investments | (89,771 | ) | 8,093 | 8,513,020 | 422,603 | 1,091,900 | 11,766,393 | ||||||||||||||||||||
| Net assets at June 30, 2006 | $ | 4,591,683 | $ | 9,948,004 | $ | 41,098,136 | $ | 3,613,999 | $ | 12,145,573 | $ | 46,081,877 | |||||||||||||||
| Class A: | |||||||||||||||||||||||||||
| Net assets | $ | 2,269,924 | $ | 3,839,713 | $ | 6,199,478 | $ | 1,759,132 | $ | 3,389,232 | $ | 36,591,439 | |||||||||||||||
| Shares authorized | 50,000,000 | 50,000,000 | 50,000,000 | 50,000,000 | 50,000,000 | 50,000,000 | |||||||||||||||||||||
| Shares outstanding | 250,724 | 374,931 | 350,220 | 200,650 | 278,669 | 1,178,364 | |||||||||||||||||||||
| Net asset value and redemption price per share | $ | 9.05 | $ | 10.24 | $ | 17.70 | $ | 8.77 | $ | 12.16 | $ | 31.05 | |||||||||||||||
| Maximum offering price per share | $ | 9.50 | $ | 10.75 | $ | 18.78 | $ | 9.31 | $ | 12.90 | $ | 32.94 | |||||||||||||||
| Sales load | 4.75 | % | 4.75 | % | 5.75 | % | 5.75 | % | 5.75 | % | 5.75 | % | |||||||||||||||
| Class C: | |||||||||||||||||||||||||||
| Net assets | $ | 2,321,759 | $ | 6,108,291 | $ | 34,898,658 | $ | 1,854,867 | $ | 8,756,341 | $ | 9,490,438 | |||||||||||||||
| Shares authorized | 50,000,000 | 50,000,000 | 50,000,000 | 50,000,000 | 50,000,000 | 50,000,000 | |||||||||||||||||||||
| Shares outstanding | 259,387 | 620,464 | 2,034,323 | 225,972 | 743,375 | 338,762 | |||||||||||||||||||||
| Net asset value and redemption price per share | $ | 8.95 | $ | 9.84 | $ | 17.15 | $ | 8.21 | $ | 11.78 | $ | 28.02 | |||||||||||||||
See Accompanying Notes to Financial Statements
56
57
Pacific Advisors Fund Inc.
Statement of Operations (Unaudited)
For the period ended June 30, 2006
| Government Securities Fund | Income and Equity Fund | Balanced Fund | Growth Fund | Multi-Cap Value Fund | Small Cap Fund | ||||||||||||||||||||||
| Investment Income | |||||||||||||||||||||||||||
| Dividends | $ | 8,670 | $ | 77,171 | $ | 270,959 | $ | 23,824 | $ | 77,793 | $ | 62,967 | |||||||||||||||
| Interest | 128,691 | 159,520 | 365,892 | 5,030 | 3,368 | 3,543 | |||||||||||||||||||||
| Total Income | 137,361 | 236,691 | 636,851 | 28,854 | 81,161 | 66,510 | |||||||||||||||||||||
| Expenses | |||||||||||||||||||||||||||
| Investment Management Fees | 17,244 | 40,911 | 152,915 | 13,130 | 59,921 | 122,869 | |||||||||||||||||||||
| Transfer Agent Fees | 20,810 | 24,582 | 51,101 | 20,689 | 26,753 | 54,787 | |||||||||||||||||||||
| Fund Accounting Fees | 14,055 | 29,664 | 116,362 | 12,072 | 32,451 | 87,023 | |||||||||||||||||||||
| Legal Fees | 2,273 | 5,646 | 23,448 | 1,722 | 6,507 | 20,773 | |||||||||||||||||||||
| Audit Fees | 3,714 | 7,637 | 28,544 | 2,451 | 8,389 | 22,936 | |||||||||||||||||||||
| Registration Fees | 4,558 | 8,284 | 26,782 | 4,053 | 14,290 | 26,169 | |||||||||||||||||||||
| Printing | 3,184 | 6,546 | 25,792 | 2,151 | 7,190 | 23,120 | |||||||||||||||||||||
| Custody Fees | 3,631 | 4,221 | 4,679 | 3,360 | 3,765 | 9,666 | |||||||||||||||||||||
| Interest on Borrowings | - | - | - | - | - | 5,468 | |||||||||||||||||||||
| Director Fees/Meetings | 796 | 1,636 | 6,117 | 525 | 1,798 | 4,915 | |||||||||||||||||||||
| Distribution and Service (12b-1) Fees (Note 3) | 18,418 | 39,229 | 180,497 | 10,989 | 47,295 | 66,924 | |||||||||||||||||||||
| Other Expenses | 2,894 | 9,754 | 25,105 | 1,902 | 6,737 | 18,849 | |||||||||||||||||||||
| Total Expenses, before fees waived | 91,577 | 178,110 | 641,342 | 73,044 | 215,096 | 463,499 | |||||||||||||||||||||
| Less fees waived (Note 3) | 17,244 | 40,911 | - | 20,039 | - | - | |||||||||||||||||||||
| Net Expenses | 74,333 | 137,199 | 641,342 | 53,005 | 215,096 | 463,499 | |||||||||||||||||||||
| Net Investment Income (Loss) | 63,028 | 99,492 | (4,491 | ) | (24,151 | ) | (133,935 | ) | (396,989 | ) | |||||||||||||||||
| Net Realized and Unrealized Gain (Loss) on Investments | |||||||||||||||||||||||||||
| Net realized gain (loss) on investments | (62,826 | ) | (20,107 | ) | 105,191 | 77,855 | 324,309 | 2,389,863 | |||||||||||||||||||
| Change in net unrealized appreciation (depreciation) of investments | (55,235 | ) | 77,825 | 464,409 | 18,783 | (364,167 | ) | 2,658,140 | |||||||||||||||||||
| (118,061 | ) | 57,718 | 569,600 | 96,638 | (39,858 | ) | 5,048,003 | ||||||||||||||||||||
| Net Increase (Decrease) in Net Assets Resulting from Operations | $ | (55,033 | ) | $ | 157,210 | $ | 565,109 | $ | 72,487 | $ | (173,793 | ) | $ | 4,651,014 | |||||||||||||
See Accompanying Notes to Financial Statements
58
59
Pacific Advisors Fund Inc.
Statement of Changes in Net Assets (Unaudited)
| Government Securities Fund | Income and Equity Fund | Balanced Fund | |||||||||||||||||||||||||
| Period ended June 30, 2006 | Year ended December 31, 2005 | Period ended June 30, 2006 | Year ended December 31, 2005 | Period ended June 30, 2006 | Year ended December 31, 2005 | ||||||||||||||||||||||
| Increase (Decrease) in Net Assets From Operations | |||||||||||||||||||||||||||
| Net investment income (loss) | $ | 63,028 | $ | 177,860 | $ | 99,492 | $ | 214,303 | $ | (4,491 | ) | $ | 116,445 | ||||||||||||||
| Net realized gain (loss) on investments | (62,826 | ) | (38,401 | ) | (20,107 | ) | (17,091 | ) | 105,191 | (102,313 | ) | ||||||||||||||||
| Change in net unrealized appreciation (depreciation) of investments | (55,235 | ) | (91,625 | ) | 77,825 | (247,573 | ) | 464,409 | 1,904,889 | ||||||||||||||||||
| Increase (decrease) in net assets resulting from operations | (55,033 | ) | 47,834 | 157,210 | (50,361 | ) | 565,109 | 1,919,021 | |||||||||||||||||||
| From Distributions to Shareholders | |||||||||||||||||||||||||||
| Class A: | |||||||||||||||||||||||||||
| Net investment income | (33,762 | ) | (82,832 | ) | (44,564 | ) | (102,321 | ) | - | (38,021 | ) | ||||||||||||||||
| Net capital gains | - | - | - | (4,792 | ) | - | (5,033 | ) | |||||||||||||||||||
| Return of capital | - | (176 | ) | - | (60 | ) | - | (14,023 | ) | ||||||||||||||||||
| Class C: | |||||||||||||||||||||||||||
| Net investment income | (23,965 | ) | (99,301 | ) | (49,811 | ) | (112,720 | ) | - | (41,559 | ) | ||||||||||||||||
| Net capital gains | - | - | - | (8,205 | ) | - | (27,266 | ) | |||||||||||||||||||
| Return of capital | - | (212 | ) | - | (67 | ) | - | (15,327 | ) | ||||||||||||||||||
| Decrease in net assets resulting from distributions | (57,727 | ) | (182,521 | ) | (94,375 | ) | (228,165 | ) | - | (141,229 | ) | ||||||||||||||||
| From Capital Share Transactions (Note 6) | |||||||||||||||||||||||||||
| Proceeds from shares sold | 282,117 | 696,585 | 311,728 | 2,902,515 | 2,962,521 | 5,727,049 | |||||||||||||||||||||
| Proceeds from shares purchased by reinvestment of dividends | 45,480 | 155,459 | 90,991 | 221,250 | - | 135,769 | |||||||||||||||||||||
| Cost of shares repurchased | (1,621,864 | ) | (4,629,907 | ) | (2,218,506 | ) | (2,493,208 | ) | (1,937,021 | ) | (3,299,888 | ) | |||||||||||||||
| Increase (decrease) in net assets derived from capital share transactions | (1,294,267 | ) | (3,777,863 | ) | (1,815,787 | ) | 630,557 | 1,025,500 | 2,562,930 | ||||||||||||||||||
| Increase (decrease) in net assets | (1,407,027 | ) | (3,912,550 | ) | (1,752,952 | ) | 352,031 | 1,590,609 | 4,340,722 | ||||||||||||||||||
| Net Assets | |||||||||||||||||||||||||||
| Beginning of period | 5,998,710 | 9,911,260 | 11,700,956 | 11,348,925 | 39,507,527 | 35,166,805 | |||||||||||||||||||||
| End of period | $ | 4,591,683 | $ | 5,998,710 | $ | 9,948,004 | $ | 11,700,956 | $ | 41,098,136 | $ | 39,507,527 | |||||||||||||||
| Including undistributed net investment income of | $ | 5,313 | $ | - | $ | 5,892 | $ | 775 | $ | 9,242 | $ | 13,733 | |||||||||||||||
See Accompanying Notes to Financial Statements
60
61
Pacific Advisors Fund Inc.
Statement of Changes in Net Assets (Unaudited)
| Growth Fund | Multi-Cap Value Fund | Small Cap Fund | |||||||||||||||||||||||||
| Period ended June 30, 2006 | Year ended December 31, 2005 | Period ended June 30, 2006 | Year ended December 31, 2005 | Period ended June 30, 2006 | Year ended December 31, 2005 | ||||||||||||||||||||||
| Increase (Decrease) in Net Assets From Operations | |||||||||||||||||||||||||||
| Net investment income (loss) | $ | (24,151 | ) | $ | (42,058 | ) | $ | (133,935 | ) | $ | (209,204 | ) | $ | (396,989 | ) | $ | (640,379 | ) | |||||||||
| Net realized gain (loss) on investments | 77,855 | 2,648 | 324,309 | 694,567 | 2,389,863 | 1,654,549 | |||||||||||||||||||||
| Change in net unrealized appreciation (depreciation) of investments | 18,783 | 149,899 | (364,167 | ) | 385,782 | 2,658,140 | (77,742 | ) | |||||||||||||||||||
| Increase (decrease) in net assets resulting from operations | 72,487 | 110,489 | (173,793 | ) | 871,145 | 4,651,014 | 936,428 | ||||||||||||||||||||
| From Distributions to Shareholders | |||||||||||||||||||||||||||
| Class A: | |||||||||||||||||||||||||||
| Net investment income | - | - | - | - | - | - | |||||||||||||||||||||
| Net capital gains | - | - | - | (155,830 | ) | - | (1,090,218 | ) | |||||||||||||||||||
| Return of capital | - | - | - | - | - | - | |||||||||||||||||||||
| Class C: | |||||||||||||||||||||||||||
| Net investment income | - | - | - | - | - | - | |||||||||||||||||||||
| Net capital gains | - | - | - | (404,126 | ) | - | (358,968 | ) | |||||||||||||||||||
| Return of capital | - | - | - | - | - | - | |||||||||||||||||||||
| Decrease in net assets resulting from distributions | - | - | - | (559,956 | ) | - | (1,449,186 | ) | |||||||||||||||||||
| From Capital Share Transactions (Note 6) | |||||||||||||||||||||||||||
| Proceeds from shares sold | 461,913 | 1,624,248 | 1,885,092 | 2,317,376 | 25,047,933 | 6,023,951 | |||||||||||||||||||||
| Proceeds from shares purchased by reinvestment of dividends | - | - | - | 549,246 | �� | - | 1,359,862 | ||||||||||||||||||||
| Cost of shares repurchased | (102,663 | ) | (152,606 | ) | (532,623 | ) | (645,378 | ) | (4,103,337 | ) | (7,609,034 | ) | |||||||||||||||
| Increase (decrease) in net assets derived from capital share transactions | 359,250 | 1,471,642 | 1,352,469 | 2,221,244 | 20,944,596 | (225,221 | ) | ||||||||||||||||||||
| Increase (decrease) in net assets | 431,737 | 1,582,131 | 1,178,676 | 2,532,433 | 25,595,610 | (737,979 | ) | ||||||||||||||||||||
| Net Assets | |||||||||||||||||||||||||||
| Beginning of period | 3,182,262 | 1,600,131 | 10,966,897 | 8,434,464 | 20,486,267 | 21,224,246 | |||||||||||||||||||||
| End of period | $ | 3,613,999 | $ | 3,182,262 | $ | 12,145,573 | $ | 10,966,897 | $ | 46,081,877 | $ | 20,486,267 | |||||||||||||||
| Including undistributed net investment income of | $ | - | $ | - | $ | - | $ | - | $ | - | $ | - | |||||||||||||||
See Accompanying Notes to Financial Statements
62
63
Pacific Advisors Fund Inc.
Notes to Financial Statements (Unaudited)
June 30, 2006
Note 1. Organization
Pacific Advisors Fund Inc. (the "Company") is an open-end diversified investment management company registered under the Investment Company Act of 1940, as amended. The Company currently offers six Funds: Government Securities Fund, Income and Equity Fund, Balanced Fund, Growth Fund, Multi-Cap Value Fund and Small Cap Fund. Each Fund is a separate investment portfolio of the Company with a distinct investment objective, investment program, policies and restrictions. The Government Securities Fund seeks to provide high current income, preservation of capital, and rising future income, consistent with prudent investment risk. The Income and Equity Fund seeks to provide current income and, secondarily, long-term capital appreciation. The Balanced Fund seeks to achieve long-term capital appreciation and income consistent with reduced market risk. The Growth Fund seeks to achieve long-term capital appreciation through investment in m edium to large capitalization companies. The Multi-Cap Value Fund seeks long-term capital appreciation by investing in a diversified portfolio of large to small capitalization companies. The Small Cap Fund seeks to provide capital appreciation through investment in small capitalization companies.
Effective April 1, 1998, the Funds offer Class A and Class C shares, each of which has equal rights as to assets and voting privileges except that Class A and Class C each has exclusive voting rights with respect to its distribution plan. Investment income, realized and unrealized capital gains and losses, and the common expenses of each Fund are allocated on a pro rata basis to each class based on the relative net assets of each class to the total net assets of the Fund. Each Class of shares differs in its respective service and distribution expenses and may differ in its transfer agent, registration, and certain other class-specific fees and expenses.
The Company enters into contracts that contain a variety of indemnifications. The Company's maximum exposure under these arrangements is unknown. However, the Company has not had prior claims or losses pursuant to these contracts and expects the risk of loss to be remote.
Note 2. Significant Accounting Policies
A. Security Valuation. Securities listed on a national securities exchange and certain over-the-counter ("OTC") issues traded on the NASDAQ national market system are valued at the last quoted sale price at the close of the New York Stock Exchange. OTC issues not quoted on the NASDAQ system, and other equity securities for which no sale price is available, are valued at the last bid price as obtained from published sources or real time quote services, where available, and otherwise from brokers who are market makers for such securities. Debt securities with a maturity of less than 60 days are valued on an amortized cost basis. Premium or discount on debt securities are amortized.
B. Security Transactions and Investment Income. Security transactions are accounted for on the trade date. The cost of investments sold is determined by use of the specific identification method for both financial reporting and federal income tax purposes. Dividends are recorded on the ex-dividend date. Interest income is recorded on an accrual basis.
C. Dividends and Distributions to Shareholders. The Government Securities Fund and Income and Equity Fund declare and distribute dividends of their net investment income, if any, quarterly. The Balanced Fund, Growth Fund, Multi-Cap Value Fund and Small Cap Fund declare and distribute dividends of their net investment income, if any, annually. The Board of Directors will determine the amount and timing of such payments. Income dividends and capital gains distributions are determined in accordance with income tax regulations which may differ from generally accepted accounting principles. These differences are primarily due to differing treatments of income and gain on various investment securities held by the Funds, timing differences and differing characterization of distributions made by the Funds.
E. Use of Estimates. The preparation of financial statements in conformity with accounting principles generally accepted in the United States requires management to make estimates and assumptions that affect the reported amounts in the financial statements and footnotes. Actual results could differ from those estimates.
Note 3. Investment Management, Distributor and Other Related Party Transactions
The Company and the Funds have entered into investment management agreements ("Management Agreements") with Pacific Global Investment Management Company, Inc. ("Investment Manager").
The Management Agreements provide for investment management fees, payable monthly, and calculated at the maximum annual rate of 0.65% of average net assets for the Government Securities Fund, 0.75% of average net assets for the Income and Equity, Balanced, Growth and Small Cap Funds and 1.00% of average net assets for the Multi-Cap Value Fund. The Investment Manager has entered into a sub-advisory agreement with Bache Capital Management ("Sub-Advisor") for the Balanced Fund. It has also entered into a co-management agreement with Bache Capital Management ("Co-Manager") for the Income and Equity Fund.
The Investment Manager is solely responsible for the payment of these fees to Bache Capital Management.
In accordance with Expense Limitation Agreements with the Company, the Investment Manager, and with respect to the Income and Equity Fund only, the Co-Manager, will waive their respective management fees to the extent that the actual operating expenses of the following Funds exceed the following thresholds:
| Class A | Class C | ||||||||||
| Government Securities Fund | 1.75 | % | 2.50 | % | |||||||
| Income and Equity Fund | 1.95 | % | 2.70 | % | |||||||
| Growth Fund | 2.65 | % | 3.40 | % | |||||||
| Multi-Cap Value Fund | 2.65 | % | 3.40 | % | |||||||
For the Growth Fund only, if net expenses exceed the above thresholds after waiver of the entire management fee, the transfer agent will waive its transfer agency fee to the extent necessary to reduce Class expenses to the above thresholds. These agreements may be terminated by either party upon 90-days prior written notice.
64
Pacific Advisors Fund Inc.
Notes to Financial Statements (Unaudited)
June 30, 2006
Pursuant to the Expense Limitation Agreements, providing for the voluntary waiver of fees and the assumption of expenses by the Investment Manager and Transfer Agent, and, with respect to the Income and Equity Fund, the Co-Manager, the following amounts were waived for the period ended June 30, 2006.
| Management Fees Waived | Transfer Agent Fees Waived | ||||||||||
| Government Securities Fund | $ | 17,244 | $ | - | |||||||
| Income and Equity Fund | 40,911 | - | |||||||||
| Growth Fund | 13,130 | 6,909 | |||||||||
Effective 2004, the Investment Manager and the Co-Manager terminated all of their rights under the expense limitation agreements with respect to potential recoupment from the Funds of all management fees previously waived and all expenses previously reimbursed. In the future, the Investment Manager and Co-Manager will not have any rights to recover fees they waive or expenses they may reimburse, with respect to any of the Funds.
For the period ended June 30, 2006, Pacific Global Fund Distributors, Inc. ("PGFD"), the principal underwriter for the Company, received commissions on sales of capital stock, after deducting amounts allowed to authorized distributors as commissions. The amounts are as follows:
| Underwriting Fees Retained | Commissions Paid | ||||||||||
| Government Securities Fund | $ | 39 | $ | 211 | |||||||
| Income and Equity Fund | 57 | 306 | |||||||||
| Balanced Fund | 798 | 3,770 | |||||||||
| Growth Fund | 666 | 3,140 | |||||||||
| Multi-Cap Value Fund | 746 | 3,510 | |||||||||
| Small Cap Fund | 20,742 | 105,193 | |||||||||
PGFD is a wholly-owned subsidiary of the Investment Manager.
The Company and the Funds have entered into agreements with Pacific Global Investor Services, Inc. ("PGIS") to provide fund accounting services at the monthly fee of three basis points for the first one hundred million in net assets or a minimum of $1,500. In addition, agreements to provide transfer agent services has also been entered into at a rate of $18.00 per year per open account and $3.00 per year per closed account with minimum charges of $1,400 per month for A and C share accounts. PGIS is a wholly-owned subsidiary of the Investment Manager.
Accounts payable to related parties consist of management fees payable to the Investment Manager and fund accounting and transfer agent fees payable to PGIS.
The Company has adopted a plan of distribution, whereby the Funds may pay a service fee to qualified recipients in an amount up to 0.25% per annum of each Fund's daily net assets for Class A shares and Class C shares. Under the plan of the distribution, the Funds may pay a distribution fee to qualified recipients in an amount up to 75% per annum of each Fund's daily net assets for Class C shares.
For the period ended June 30, 2006, total distribution and/or service (12b-1) fees were:
| Class A | Class C | ||||||||||
| Government Securities Fund | $ | 2,704 | $ | 15,714 | |||||||
| Income and Equity Fund | 5,106 | 34,123 | |||||||||
| Balanced Fund | 7,797 | 172,700 | |||||||||
| Growth Fund | 2,173 | 8,816 | |||||||||
| Multi-Cap Value Fund | 4,208 | 43,087 | |||||||||
| Small Cap Fund | 32,301 | 34,623 | |||||||||
Note 4. Purchase and Sales of Securities
The following summarizes purchases and sales of investment securities, other than short-term investments, and aggregate gross unrealized appreciation and depreciation on a tax basis by each Fund for the period ended and as of June 30, 2006.
| Period ended June 30, 2006 | As of June 30, 2006 | ||||||||||||||||||||||
| Cost of Purchases | Proceeds From Sales | Gross Unrealized Appreciation | Gross Unrealized Depreciation | Net Unrealized Appreciation (Depreciation) | |||||||||||||||||||
| Government Securities Fund | $ | 364,988 | $ | 1,725,808 | $ | 45,100 | $ | 134,871 | $ | (89,771 | ) | ||||||||||||
| Income and Equity Fund | 490,642 | 1,576,657 | 458,754 | 450,661 | 8,093 | ||||||||||||||||||
| Balanced Fund | 2,248,825 | 5,020,326 | 9,269,408 | 756,388 | 8,513,020 | ||||||||||||||||||
| Growth Fund | 752,830 | 294,284 | 571,990 | 149,387 | 422,603 | ||||||||||||||||||
| Multi-Cap Value Fund | 3,980,593 | 2,585,011 | 1,617,651 | 525,751 | 1,091,900 | ||||||||||||||||||
| Small Cap Fund | 25,442,534 | 4,560,196 | 13,424,544 | 1,658,151 | 11,766,393 | ||||||||||||||||||
65
Pacific Advisors Fund Inc.
Notes to Financial Statements (Unaudited)
June 30, 2006
Note 5. Capital Share Transactions
A 2% redemption fee is assessed on shares of the Government Securities Fund or the Income and Equity Fund sold or exchanged within sixty days of purchase or shares of the Balanced Fund, Growth Fund, Multi-Cap Value Fund or the Small Cap Fund sold or exchanged within six months of purchase and is retained in each Fund.
The redemption fees collected through June 30, 2006 are included as a reduction to the shares repurchased in the table below. The amount of the reduction is as follows:
| Government Securities Fund (Class A) | $ | 9 | Government Securities Fund (Class C) | $ | 187 | ||||||||||
| Income and Equity Fund (Class A) | - | Income and Equity Fund (Class C) | 41 | ||||||||||||
| Balanced Fund (Class A) | 15 | Balanced Fund (Class C) | 339 | ||||||||||||
| Growth Fund (Class A) | 29 | Growth Fund (Class C) | 98 | ||||||||||||
| Multi-Cap Value Fund (Class A) | 90 | Multi-Cap Value Fund (Class C) | 2 | ||||||||||||
| Small Cap Fund (Class A) | 33,708 | Small Cap Fund (Class C) | 4,460 | ||||||||||||
| Period ended June 30, 2006 | Year ended December 31, 2005 | ||||||||||||||||||
| Shares | Amount | Shares | Amount | ||||||||||||||||
| Government Securities Fund | |||||||||||||||||||
| Class A | |||||||||||||||||||
| Shares Sold | 26,024 | $ | 237,990 | 16,128 | $ | 151,978 | |||||||||||||
| Reinvestment of Distributions | 2,516 | 22,840 | 6,109 | 57,375 | |||||||||||||||
| 28,540 | 260,830 | 22,237 | 209,353 | ||||||||||||||||
| Shares Repurchased | (17,230 | ) | (158,577 | ) | (44,347 | ) | (419,880 | ) | |||||||||||
| Net Increase (Decrease) | 11,310 | $ | 102,253 | (22,110 | ) | $ | (210,527 | ) | |||||||||||
| Class C | |||||||||||||||||||
| Shares Sold | 4,832 | $ | 44,127 | 58,959 | $ | 544,607 | |||||||||||||
| Reinvestment of Distributions | 2,517 | 22,640 | 10,659 | 98,084 | |||||||||||||||
| 7,349 | 66,767 | 69,618 | 642,691 | ||||||||||||||||
| Shares Repurchased | (161,887 | ) | (1,463,287 | ) | (456,191 | ) | (4,210,027 | ) | |||||||||||
| Net Decrease | (154,538 | ) | $ | (1,396,520 | ) | (386,573 | ) | $ | (3,567,336 | ) | |||||||||
| Period ended June 30, 2006 | Year ended December 31, 2005 | ||||||||||||||||||
| Shares | Amount | Shares | Amount | ||||||||||||||||
| Income and Equity Fund | |||||||||||||||||||
| Class A | |||||||||||||||||||
| Shares Sold | 22,712 | $ | 232,592 | 165,357 | $ | 1,712,422 | |||||||||||||
| Reinvestment of Distributions | 4,169 | 42,712 | 10,021 | 103,004 | |||||||||||||||
| 26,881 | 275,304 | 175,378 | 1,815,426 | ||||||||||||||||
| Shares Repurchased | (87,054 | ) | (897,460 | ) | (85,674 | ) | (887,106 | ) | |||||||||||
| Net Increase | (60,173 | ) | $ | (622,156 | ) | 89,704 | $ | 928,320 | |||||||||||
| Class C | |||||||||||||||||||
| Shares Sold | 7,963 | $ | 79,136 | 120,065 | $ | 1,190,093 | |||||||||||||
| Reinvestment of Distributions | 4,899 | 48,279 | 11,985 | 118,246 | |||||||||||||||
| 12,862 | 127,415 | 132,050 | 1,308,339 | ||||||||||||||||
| Shares Repurchased | (133,646 | ) | (1,321,046 | ) | (162,893 | ) | (1,606,102 | ) | |||||||||||
| Net Increase (Decrease) | (120,784 | ) | $ | (1,193,631 | ) | (30,843 | ) | $ | (297,763 | ) | |||||||||
66
Pacific Advisors Fund Inc.
Notes to Financial Statements (Unaudited)
June 30, 2006
| Period ended June 30, 2006 | Year ended December 31, 2005 | ||||||||||||||||||
| Shares | Amount | Shares | Amount | ||||||||||||||||
| Balanced Fund | |||||||||||||||||||
| Class A | |||||||||||||||||||
| Shares Sold | 18,356 | $ | 327,746 | 46,117 | $ | 773,374 | |||||||||||||
| Reinvestment of Distributions | - | - | 2,991 | 52,312 | |||||||||||||||
| 18,356 | 327,746 | 49,108 | 825,686 | ||||||||||||||||
| Shares Repurchased | (31,646 | ) | (564,943 | ) | (39,519 | ) | (661,714 | ) | |||||||||||
| Net Increase | (13,290 | ) | $ | (237,197 | ) | 9,589 | $ | 163,972 | |||||||||||
| Class C | |||||||||||||||||||
| Shares Sold | 152,370 | $ | 2,634,775 | 300,889 | $ | 4,953,675 | |||||||||||||
| Reinvestment of Distributions | - | - | 4,903 | 83,457 | |||||||||||||||
| 152,370 | 2,634,775 | 305,792 | 5,037,132 | ||||||||||||||||
| Shares Repurchased | (79,291 | ) | (1,372,078 | ) | (160,861 | ) | (2,638,174 | ) | |||||||||||
| Net Increase | 73,079 | $ | 1,262,697 | 144,931 | $ | 2,398,958 | |||||||||||||
| Period ended June 30, 2006 | Year ended December 31, 2005 | ||||||||||||||||||
| Shares | Amount | Shares | Amount | ||||||||||||||||
| Growth Fund | |||||||||||||||||||
| Class A | |||||||||||||||||||
| Shares Sold | 17,548 | $ | 156,486 | 60,280 | $ | 496,292 | |||||||||||||
| Reinvestment of Distributions | - | - | - | - | |||||||||||||||
| 17,548 | 156,486 | 60,280 | 496,292 | ||||||||||||||||
| Shares Repurchased | (10,228 | ) | (91,384 | ) | (7,365 | ) | (61,805 | ) | |||||||||||
| Net Increase | 7,320 | $ | 65,102 | 52,915 | $ | 434,487 | |||||||||||||
| Class C | |||||||||||||||||||
| Shares Sold | 36,429 | $ | 305,427 | 145,253 | $ | 1,127,956 | |||||||||||||
| Reinvestment of Distributions | - | - | - | - | |||||||||||||||
| 36,429 | 305,427 | 145,253 | 1,127,956 | ||||||||||||||||
| Shares Repurchased | (1,370 | ) | (11,279 | ) | (11,524 | ) | (90,801 | ) | |||||||||||
| Net Increase | 35,059 | $ | 294,148 | 133,729 | $ | 1,037,155 | |||||||||||||
67
Pacific Advisors Fund Inc.
Notes to Financial Statements (Unaudited)
June 30, 2006
| Period ended June 30, 2006 | Year ended December 31, 2005 | ||||||||||||||||||
| Shares | Amount | Shares | Amount | ||||||||||||||||
| Multi-Cap Value Fund | |||||||||||||||||||
| Class A | |||||||||||||||||||
| Shares Sold | 51,587 | $ | 652,305 | 58,819 | $ | 700,709 | |||||||||||||
| Reinvestment of Distributions | - | - | 12,031 | 150,266 | |||||||||||||||
| 51,587 | 652,305 | 70,850 | 850,975 | ||||||||||||||||
| Shares Repurchased | (23,380 | ) | (297,817 | ) | (16,947 | ) | (203,978 | ) | |||||||||||
| Net Increase | 28,207 | $ | 354,488 | 53,903 | $ | 646,997 | |||||||||||||
| Class C | |||||||||||||||||||
| Shares Sold | 100,593 | $ | 1,232,787 | 137,262 | $ | 1,616,667 | |||||||||||||
| Reinvestment of Distributions | - | - | 32,838 | 398,980 | |||||||||||||||
| 100,593 | 1,232,787 | 170,100 | 2,015,647 | ||||||||||||||||
| Shares Repurchased | (19,174 | ) | (234,806 | ) | (38,404 | ) | (441,400 | ) | |||||||||||
| Net Increase | 81,419 | $ | 997,981 | 131,696 | $ | 1,574,247 | |||||||||||||
| Period ended June 30, 2006 | Year ended December 31, 2005 | ||||||||||||||||||
| Shares | Amount | Shares | Amount | ||||||||||||||||
| Small Cap Fund | |||||||||||||||||||
| Class A | |||||||||||||||||||
| Shares Sold | 681,981 | $ | 20,668,812 | 209,773 | $ | 5,274,588 | |||||||||||||
| Reinvestment of Distributions | - | - | 38,838 | 1,015,602 | |||||||||||||||
| 681,981 | 20,668,812 | 248,611 | 6,290,190 | ||||||||||||||||
| Shares Repurchased | (120,882 | ) | (3,619,148 | ) | (313,442 | ) | (7,299,997 | ) | |||||||||||
| Net Increase (Decrease) | 561,099 | $ | 17,049,664 | (64,831 | ) | $ | (1,009,807 | ) | |||||||||||
| Class C | |||||||||||||||||||
| Shares Sold | 159,196 | $ | 4,379,121 | 32,605 | $ | 749,363 | |||||||||||||
| Reinvestment of Distributions | - | - | 14,526 | 344,260 | |||||||||||||||
| 159,196 | 4,379,121 | 47,131 | 1,093,623 | ||||||||||||||||
| Shares Repurchased | (17,830 | ) | (484,189 | ) | (13,887 | ) | (309,037 | ) | |||||||||||
| Net Increase | 141,366 | $ | 3,894,932 | 33,244 | $ | 784,586 | |||||||||||||
Note 6. Bank Borrowings
Each Fund may borrow up to 15% of its total assets. Each Fund will not borrow money except temporarily from banks to facilitate redemption requests that might otherwise require untimely disposition of portfolio securities. No securities will be purchased for a Fund when borrowed money exceeds 5% of the Fund's total assets. Each Fund has an unsecured loan from UMB Bank, n.a. bearing interest at 1.5% over the Federal Funds rate. As of June 30, 2006 the Small Cap Fund was paying interest at 6.61% per annum on its outstanding borrowings. No compensating balances are required.
68
Pacific Advisors Fund Inc.
Financial Highlights (Unaudited)
(For a share outstanding throughout the period)
| Government Securities Fund | |||||||||||||||||||||||
| Class A | |||||||||||||||||||||||
| For the six months ended | For the year ended December 31, | ||||||||||||||||||||||
| June 30, 2006 | 2005 | 2004 | 2003 | 2002 | |||||||||||||||||||
| Per Share Operating Performance | |||||||||||||||||||||||
| Net asset value, beginning of period | $ | 9.27 | $ | 9.51 | $ | 9.68 | $ | 10.20 | $ | 10.15 | |||||||||||||
| Income from investing operations | |||||||||||||||||||||||
| Net investment income | 0.12 | 0.28 | 0.23 | 0.35 | 0.31 | ||||||||||||||||||
| Net realized and unrealized gains (losses) on securities | (0.20 | ) | (0.18 | ) | (0.20 | ) | (0.57 | ) | (0.04 | ) | |||||||||||||
| Total from investment operations | (0.08 | ) | 0.10 | 0.03 | (0.22 | ) | 0.27 | ||||||||||||||||
| Less distributions | |||||||||||||||||||||||
| From net investment income | (0.14 | ) | (0.34 | ) | (0.20 | ) | (0.30 | ) | (0.21 | ) | |||||||||||||
| From net capital gains | - | - | - | - | (0.01 | ) | |||||||||||||||||
| Total distributions | (0.14 | ) | (0.34 | ) | (0.20 | ) | (0.30 | ) | (0.22 | ) | |||||||||||||
| Net asset value, end of period | $ | 9.05 | $ | 9.27 | $ | 9.51 | $ | 9.68 | $ | 10.20 | |||||||||||||
| Total Investment Return (a) | (0.87 | )%(b) | 1.08 | % | 0.26 | % | (2.20 | )% | 2.78 | % | |||||||||||||
| Ratios/Supplemental Data | |||||||||||||||||||||||
| Net assets, end of year (000's) | $ | 2,270 | $ | 2,219 | $ | 2,488 | $ | 3,025 | $ | 4,125 | |||||||||||||
| Ratio of net investment income to average net assets | |||||||||||||||||||||||
| With expense reductions | 2.84 | %(c) | 2.68 | % | 1.89 | % | 2.88 | % | 2.57 | % | |||||||||||||
| Without expense reductions | 2.19 | %(c) | 2.03 | % | 1.23 | % | 2.33 | % | 1.42 | % | |||||||||||||
| Ratio of expenses to average net assets | |||||||||||||||||||||||
| With expense reductions | 2.36 | %(c) | 2.26 | % | 1.81 | % | 1.65 | % | 1.65 | % | |||||||||||||
| Without expense reductions | 3.01 | %(c) | 2.91 | % | 2.46 | % | 2.20 | % | 2.80 | % | |||||||||||||
| Fund portfolio turnover rate | 14.16 | %(c) | 88.26 | % | 402.70 | % | 206.55 | % | 212.10 | % | |||||||||||||
| Class C | |||||||||||||||||||||||
| For the six months ended | For the year ended December 31, | ||||||||||||||||||||||
| June 30, 2006 | 2005 | 2004 | 2003 | 2002 | |||||||||||||||||||
| Per Share Operating Performance | |||||||||||||||||||||||
| Net asset value, beginning of period | $ | 9.13 | $ | 9.27 | $ | 9.43 | $ | 9.95 | $ | 9.96 | |||||||||||||
| Income from investing operations | |||||||||||||||||||||||
| Net investment income | 0.05 | 0.14 | 0.09 | 0.21 | 0.23 | ||||||||||||||||||
| Net realized and unrealized gains (losses) on securities | (0.15 | ) | (0.11 | ) | (0.14 | ) | (0.50 | ) | (0.04 | ) | |||||||||||||
| Total from investment operations | (0.10 | ) | 0.03 | (0.05 | ) | (0.29 | ) | 0.19 | |||||||||||||||
| Less distributions | |||||||||||||||||||||||
| From net investment income | (0.08 | ) | (0.17 | ) | (0.11 | ) | (0.23 | ) | (0.19 | ) | |||||||||||||
| From net capital gains | - | - | - | - | (0.01 | ) | |||||||||||||||||
| Total distributions | (0.08 | ) | (0.17 | ) | (0.11 | ) | (0.23 | ) | (0.20 | ) | |||||||||||||
| Net asset value, end of period | $ | 8.95 | $ | 9.13 | $ | 9.27 | $ | 9.43 | $ | 9.95 | |||||||||||||
| Total Investment Return (a) | (1.14 | )%(b) | 0.28 | % | (0.50 | )% | (2.98 | )% | 1.98 | % | |||||||||||||
| Ratios/Supplemental Data | |||||||||||||||||||||||
| Net assets, end of year (000's) | $ | 2,322 | $ | 3,780 | $ | 7,424 | $ | 11,423 | $ | 10,858 | |||||||||||||
| Ratio of net investment income to average net assets | |||||||||||||||||||||||
| With expense reductions | 2.06 | %(c) | 2.03 | % | 1.10 | % | 2.23 | % | 1.90 | % | |||||||||||||
| Without expense reductions | 1.41 | %(c) | 1.38 | % | 0.45 | % | 1.67 | % | 0.81 | % | |||||||||||||
| Ratio of expenses to average net assets | |||||||||||||||||||||||
| With expense reductions | 3.11 | %(c) | 2.90 | % | 2.57 | % | 2.39 | % | 2.40 | % | |||||||||||||
| Without expense reductions | 3.76 | %(c) | 3.55 | % | 3.22 | % | 2.95 | % | 3.49 | % | |||||||||||||
| Fund portfolio turnover rate | 14.16 | %(c) | 88.26 | % | 402.70 | % | 206.55 | % | 212.10 | % | |||||||||||||
(a) The Fund's maximum sales charge is not included in the total return computation
(b) Not annualized
(c) Annualized
See Accompanying Notes to Financial Statements
69
Pacific Advisors Fund Inc.
Financial Highlights (Unaudited)
(For a share outstanding throughout the period)
| Income and Equity Fund | |||||||||||||||||||||||
| Class A | |||||||||||||||||||||||
| For the six months ended | For the year ended December 31, | ||||||||||||||||||||||
| June 30, 2006 | 2005 | 2004 | 2003 | 2002 | |||||||||||||||||||
| Per Share Operating Performance | |||||||||||||||||||||||
| Net asset value, beginning of period | $ | 10.19 | $ | 10.46 | $ | 10.33 | $ | 9.91 | $ | 10.31 | |||||||||||||
| Income from investing operations | |||||||||||||||||||||||
| Net investment income | 0.14 | 0.20 | 0.07 | 0.33 | 0.39 | ||||||||||||||||||
| Net realized and unrealized gains (losses) on securities | 0.03 | (0.20 | ) | 0.29 | 0.31 | (0.49 | ) | ||||||||||||||||
| Total from investment operations | 0.17 | - | 0.36 | 0.64 | (0.10 | ) | |||||||||||||||||
| Less distributions | |||||||||||||||||||||||
| From net investment income | (0.12 | ) | (0.26 | ) | (0.21 | ) | (0.20 | ) | (0.30 | ) | |||||||||||||
| From net capital gains | - | (0.01 | ) | (0.02 | ) | - | - | ||||||||||||||||
| From return of capital | - | - | - | (0.02 | ) | - | |||||||||||||||||
| Total distributions | (0.12 | ) | (0.27 | ) | (0.23 | ) | (0.22 | ) | (0.30 | ) | |||||||||||||
| Net asset value, end of period | $ | 10.24 | $ | 10.19 | $ | 10.46 | $ | 10.33 | $ | 9.91 | |||||||||||||
| Total Investment Return (a) | 1.62 | %(b) | 0.01 | % | 3.51 | % | 6.63 | % | (0.92 | )% | |||||||||||||
| Ratios/Supplemental Data | |||||||||||||||||||||||
| Net assets, end of year (000's) | $ | 3,840 | $ | 4,436 | $ | 3,611 | $ | 1,835 | $ | 2,117 | |||||||||||||
| Ratio of net investment income to average net assets | |||||||||||||||||||||||
| With expense reductions | 2.29 | %(c) | 2.33 | % | 2.18 | % | 2.92 | % | 3.43 | % | |||||||||||||
| Without expense reductions | 1.61 | %(c) | 1.65 | % | 1.49 | % | 1.84 | % | 1.75 | % | |||||||||||||
| Ratio of expenses to average net assets | |||||||||||||||||||||||
| With expense reductions | 2.05 | %(c) | 1.93 | % | 1.94 | % | 1.85 | % | 1.85 | % | |||||||||||||
| Without expense reductions | 2.73 | %(c) | 2.60 | % | 2.63 | % | 2.94 | % | 3.53 | % | |||||||||||||
| Fund portfolio turnover rate | 9.14 | %(c) | 39.57 | % | 40.48 | % | 71.02 | % | 91.50 | % | |||||||||||||
| Class C | |||||||||||||||||||||||
| For the six months ended | For the year ended December 31, | ||||||||||||||||||||||
| June 30, 2006 | 2005 | 2004 | 2003 | 2002 | |||||||||||||||||||
| Per Share Operating Performance | |||||||||||||||||||||||
| Net asset value, beginning of period | $ | 9.80 | $ | 10.02 | $ | 9.90 | $ | 9.60 | $ | 10.03 | |||||||||||||
| Income from investing operations | |||||||||||||||||||||||
| Net investment income | 0.07 | 0.15 | 0.16 | 0.24 | 0.34 | ||||||||||||||||||
| Net realized and unrealized gains (losses) on securities | 0.05 | (0.22 | ) | 0.11 | 0.32 | (0.51 | ) | ||||||||||||||||
| Total from investment operations | 0.12 | (0.07 | ) | 0.27 | 0.56 | (0.17 | ) | ||||||||||||||||
| Less distributions | |||||||||||||||||||||||
| From net investment income | (0.08 | ) | (0.14 | ) | (0.13 | ) | (0.22 | ) | (0.26 | ) | |||||||||||||
| From net capital gains | - | (0.01 | ) | (0.02 | ) | - | - | ||||||||||||||||
| From return of capital | - | - | - | (0.02 | ) | - | |||||||||||||||||
| Total distributions | (0.08 | ) | (0.15 | ) | (0.15 | ) | (0.24 | ) | (0.26 | ) | |||||||||||||
| Net asset value, end of period | $ | 9.84 | $ | 9.80 | $ | 10.02 | $ | 9.90 | $ | 9.60 | |||||||||||||
| Total Investment Return (a) | 1.18 | %(b) | (0.67 | )% | 2.74 | % | 5.88 | % | (1.60 | )% | |||||||||||||
| Ratios/Supplemental Data | |||||||||||||||||||||||
| Net assets, end of year (000's) | $ | 6,108 | $ | 7,265 | $ | 7,738 | $ | 5,416 | $ | 3,284 | |||||||||||||
| Ratio of net investment income to average net assets | |||||||||||||||||||||||
| With expense reductions | 1.55 | %(c) | 1.57 | % | 1.38 | % | 2.10 | % | 2.95 | % | |||||||||||||
| Without expense reductions | 0.86 | %(c) | 0.90 | % | 0.70 | % | 1.03 | % | 1.15 | % | |||||||||||||
| Ratio of expenses to average net assets | |||||||||||||||||||||||
| With expense reductions | 2.80 | %(c) | 2.70 | % | 2.69 | % | 2.60 | % | 2.60 | % | |||||||||||||
| Without expense reductions | 3.48 | %(c) | 3.37 | % | 3.37 | % | 3.67 | % | 4.39 | % | |||||||||||||
| Fund portfolio turnover rate | 9.14 | %(c) | 39.57 | % | 40.48 | % | 71.02 | % | 91.50 | % | |||||||||||||
(a) The Fund's maximum sales charge is not included in the total return computation
(b) Not annualized
(c) Annualized
See Accompanying Notes to Financial Statements
70
Pacific Advisors Fund Inc.
Financial Highlights (Unaudited)
(For a share outstanding throughout the period)
| Balanced Fund | |||||||||||||||||||||||
| Class A | |||||||||||||||||||||||
| For the six months ended | For the year ended December 31, | ||||||||||||||||||||||
| June 30, 2006 | 2005 | 2004 | 2003 | 2002 | |||||||||||||||||||
| Per Share Operating Performance | |||||||||||||||||||||||
| Net asset value, beginning of period | $ | 17.39 | $ | 16.57 | $ | 15.88 | $ | 13.69 | $ | 14.42 | |||||||||||||
| Income from investing operations | |||||||||||||||||||||||
| Net investment income | 0.06 | 0.16 | 0.12 | 0.21 | 0.06 | ||||||||||||||||||
| Net realized and unrealized gains (losses) on securities | 0.25 | 0.82 | 0.75 | 2.34 | (0.79 | ) | |||||||||||||||||
| Total from investment operations | 0.31 | 0.98 | 0.87 | 2.55 | (0.73 | ) | |||||||||||||||||
| Less distributions | |||||||||||||||||||||||
| From net investment income | - | (0.11 | ) | (0.13 | ) | (0.16 | ) | - | |||||||||||||||
| From net capital gains | - | (0.01 | ) | (0.05 | ) | (0.18 | ) | - | |||||||||||||||
| From return of capital | - | (0.04 | ) | - | (0.02 | ) | - | ||||||||||||||||
| Total distributions | - | (0.16 | ) | (0.18 | ) | (0.36 | ) | - | |||||||||||||||
| Net asset value, end of period | $ | 17.70 | $ | 17.39 | $ | 16.57 | $ | 15.88 | $ | 13.69 | |||||||||||||
| Total Investment Return (a) | 1.78 | %(b) | 5.90 | % | 5.50 | % | 18.63 | % | (5.05 | )% | |||||||||||||
| Ratios/Supplemental Data | |||||||||||||||||||||||
| Net assets, end of year (000's) | $ | 6,199 | $ | 6,323 | $ | 5,863 | $ | 4,739 | $ | 3,977 | |||||||||||||
| Ratio of net investment income to average net assets | 0.61 | %(c) | 0.97 | % | 0.98 | % | 1.44 | % | 0.30 | % | |||||||||||||
| Ratio of expenses to average net assets | 2.51 | %(c) | 2.53 | % | 2.67 | % | 2.86 | % | 3.47 | % | |||||||||||||
| Fund portfolio turnover rate | 12.30 | %(c) | 25.47 | % | 39.60 | % | 58.73 | % | 57.74 | % | |||||||||||||
| Class C | |||||||||||||||||||||||
| For the six months ended | For the year ended December 31, | ||||||||||||||||||||||
| June 30, 2006 | 2005 | 2004 | 2003 | 2002 | |||||||||||||||||||
| Per Share Operating Performance | |||||||||||||||||||||||
| Net asset value, beginning of period | $ | 16.92 | $ | 16.13 | $ | 15.49 | $ | 13.40 | $ | 14.18 | |||||||||||||
| Income from investing operations | |||||||||||||||||||||||
| Net investment income | (0.01 | ) | 0.03 | 0.04 | 0.09 | 0.01 | |||||||||||||||||
| Net realized and unrealized gains (losses) on securities | 0.24 | 0.80 | 0.68 | 2.26 | (0.79 | ) | |||||||||||||||||
| Total from investment operations | 0.23 | 0.83 | 0.72 | 2.35 | (0.78 | ) | |||||||||||||||||
| Less distributions | |||||||||||||||||||||||
| From net investment income | - | (0.02 | ) | (0.03 | ) | (0.06 | ) | - | |||||||||||||||
| From net capital gains | - | (0.01 | ) | (0.05 | ) | (0.18 | ) | - | |||||||||||||||
| From return of capital | - | (0.01 | ) | - | (0.02 | ) | - | ||||||||||||||||
| Total distributions | - | (0.04 | ) | (0.08 | ) | (0.26 | ) | - | |||||||||||||||
| Net asset value, end of period | $ | 17.15 | $ | 16.92 | $ | 16.13 | $ | 15.49 | $ | 13.40 | |||||||||||||
| Total Investment Return (a) | 1.36 | %(b) | 5.16 | % | 4.62 | % | 17.58 | % | (5.49 | )% | |||||||||||||
| Ratios/Supplemental Data | |||||||||||||||||||||||
| Net assets, end of year (000's) | $ | 34,899 | $ | 33,185 | $ | 29,304 | $ | 23,353 | $ | 14,035 | |||||||||||||
| Ratio of net investment income to average net assets | (0.14 | )%(c) | 0.19 | % | 0.21 | % | 0.67 | % | (0.16 | )% | |||||||||||||
| Ratio of expenses to average net assets | 3.26 | %(c) | 3.30 | % | 3.44 | % | 3.66 | % | 4.15 | % | |||||||||||||
| Fund portfolio turnover rate | 12.30 | %(c) | 25.47 | % | 39.60 | % | 58.73 | % | 57.74 | % | |||||||||||||
(a) The Fund's maximum sales charge is not included in the total return computation
(b) Not annualized
(c) Annualized
See Accompanying Notes to Financial Statements
71
Pacific Advisors Fund Inc.
Financial Highlights (Unaudited)
(For a share outstanding throughout the period)
| Growth Fund | |||||||||||||||||||||||
| Class A | |||||||||||||||||||||||
| For the six months ended | For the year ended December 31, | ||||||||||||||||||||||
| June 30, 2006 | 2005 | 2004 | 2003 | 2002 | |||||||||||||||||||
| Per Share Operating Performance | |||||||||||||||||||||||
| Net asset value, beginning of period | $ | 8.54 | $ | 8.22 | $ | 7.14 | $ | 5.48 | $ | 7.04 | |||||||||||||
| Income from investing operations | |||||||||||||||||||||||
| Net investment income (expense) | (0.03 | ) | (0.01 | ) | 0.02 | (0.07 | ) | (0.12 | ) | ||||||||||||||
| Net realized and unrealized gains (losses) on securities | 0.26 | 0.33 | 1.06 | 1.73 | (1.44 | ) | |||||||||||||||||
| Total from investment operations | 0.23 | 0.32 | 1.08 | 1.66 | (1.56 | ) | |||||||||||||||||
| Less distributions | |||||||||||||||||||||||
| From net investment income | - | - | - | - | - | ||||||||||||||||||
| From net capital gains | - | - | - | - | - | ||||||||||||||||||
| Total distributions | - | - | - | - | - | ||||||||||||||||||
| Net asset value, end of period | $ | 8.77 | $ | 8.54 | $ | 8.22 | $ | 7.14 | $ | 5.48 | |||||||||||||
| Total Investment Return (a) | 2.69 | %(b) | 3.89 | % | 15.13 | % | 30.29 | % | (22.16 | )% | |||||||||||||
| Ratios/Supplemental Data | |||||||||||||||||||||||
| Net assets, end of year (000's) | $ | 1,759 | $ | 1,650 | $ | 1,155 | $ | 669 | $ | 464 | |||||||||||||
| Ratio of net investment income to average net assets | |||||||||||||||||||||||
| With expense reductions | (1.01 | )%(c) | (1.37 | )% | (1.51 | )% | (1.69 | )% | (1.97 | )% | |||||||||||||
| Without expense reductions | (2.15 | )%(c) | (3.06 | )% | (4.98 | )% | (7.44 | )% | (8.25 | )% | |||||||||||||
| Ratio of expenses to average net assets | |||||||||||||||||||||||
| With expense reductions | 2.65 | %(c) | 2.63 | % | 2.83 | % | 2.48 | % | 2.50 | % | |||||||||||||
| Without expense reductions | 3.79 | %(c) | 4.32 | % | 6.30 | % | 8.23 | % | 8.77 | % | |||||||||||||
| Fund portfolio turnover rate | 18.32 | %(c) | 30.54 | % | 12.96 | % | 34.58 | % | 78.06 | % | |||||||||||||
| Class C | |||||||||||||||||||||||
| For the six months ended | For the year ended December 31, | ||||||||||||||||||||||
| June 30, 2006 | 2005 | 2004 | 2003 | 2002 | |||||||||||||||||||
| Per Share Operating Performance | |||||||||||||||||||||||
| Net asset value, beginning of period | $ | 8.02 | $ | 7.79 | $ | 6.83 | $ | 5.33 | $ | 6.89 | |||||||||||||
| Income from investing operations | |||||||||||||||||||||||
| Net investment income (expense) | (0.02 | ) | 0.37 | 0.22 | (0.16 | ) | (0.44 | ) | |||||||||||||||
| Net realized and unrealized gains (losses) on securities | 0.21 | (0.14 | ) | 0.74 | 1.66 | (1.12 | ) | ||||||||||||||||
| Total from investment operations | 0.19 | 0.23 | 0.96 | 1.50 | (1.56 | ) | |||||||||||||||||
| Less distributions | |||||||||||||||||||||||
| From net investment income | - | - | - | - | - | ||||||||||||||||||
| From net capital gains | - | - | - | - | - | ||||||||||||||||||
| Total distributions | - | - | - | - | - | ||||||||||||||||||
| Net asset value, end of period | $ | 8.21 | $ | 8.02 | $ | 7.79 | $ | 6.83 | $ | 5.33 | |||||||||||||
| Total Investment Return (a) | 2.37 | %(b) | 2.95 | % | 14.06 | % | 28.14 | % | (22.64 | )% | |||||||||||||
| Ratios/Supplemental Data | |||||||||||||||||||||||
| Net assets, end of year (000's) | $ | 1,855 | $ | 1,532 | $ | 445 | $ | 251 | $ | 190 | |||||||||||||
| Ratio of net investment income to average net assets | |||||||||||||||||||||||
| With expense reductions | (1.75 | )%(c) | (2.13 | )% | (2.27 | )% | (2.47 | )% | (2.75 | )% | |||||||||||||
| Without expense reductions | (2.89 | )%(c) | (3.83 | )% | 5.61 | % | (8.18 | )% | (8.67 | )% | |||||||||||||
| Ratio of expenses to average net assets | |||||||||||||||||||||||
| With expense reductions | 3.40 | %(c) | 3.40 | % | 3.54 | % | 3.25 | % | 3.25 | % | |||||||||||||
| Without expense reductions | 4.55 | %(c) | 5.11 | % | 6.88 | % | 8.96 | % | 9.17 | % | |||||||||||||
| Fund portfolio turnover rate | 18.32 | %(c) | 30.54 | % | 12.96 | % | 34.58 | % | 78.06 | % | |||||||||||||
(a) The Fund's maximum sales charge is not included in the total return computation
(b) Not annualized
(c) Annualized
See Accompanying Notes to Financial Statements
72
Pacific Advisors Fund Inc.
Financial Highlights (Unaudited)
(For a share outstanding throughout the period)
| Multi-Cap Value Fund | |||||||||||||||||||||||
| Class A | |||||||||||||||||||||||
| For the six months ended | For the year ended December 31, | April 1, 2002(c) to | |||||||||||||||||||||
| June 30, 2006 | 2005 | 2004 | 2003 | December 31, 2002 | |||||||||||||||||||
| Per Share Operating Performance | |||||||||||||||||||||||
| Net asset value, beginning of period | $ | 12.27 | $ | 11.77 | $ | 11.46 | $ | 7.95 | $ | 10.00 | |||||||||||||
| Income from investing operations | |||||||||||||||||||||||
| Net investment income (expense) | (0.07 | ) | (0.14 | ) | (0.03 | ) | (0.09 | ) | (0.07 | ) | |||||||||||||
| Net realized and unrealized gains (losses) on securities | (0.04 | ) | 1.29 | 0.70 | 3.60 | (1.98 | ) | ||||||||||||||||
| Total from investment operations | (0.11 | ) | 1.15 | 0.67 | 3.51 | (2.05 | ) | ||||||||||||||||
| Less distributions | |||||||||||||||||||||||
| From net investment income | - | - | - | - | - | ||||||||||||||||||
| From net capital gains | - | (0.65 | ) | (0.36 | ) | - | - | ||||||||||||||||
| Total distributions | - | (0.65 | ) | (0.36 | ) | - | - | ||||||||||||||||
| Net asset value, end of period | $ | 12.16 | $ | 12.27 | $ | 11.77 | $ | 11.46 | $ | 7.95 | |||||||||||||
| Total Investment Return (a) | (0.90 | )%(b) | 9.71 | % | 5.84 | % | 44.15 | % | (20.50 | )% | |||||||||||||
| Ratios/Supplemental Data | |||||||||||||||||||||||
| Net assets, end of year (000's) | $ | 3,389 | $ | 3,073 | $ | 2,313 | $ | 1,180 | $ | 503 | |||||||||||||
| Ratio of net investment income to average net assets | |||||||||||||||||||||||
| With expense reductions | (1.70 | )%(d) | (1.70 | )% | (1.15 | )% | (1.67 | )% | (1.44 | )% | |||||||||||||
| Without expense reductions | (1.70 | )%(d) | (1.73 | )% | (1.15 | )% | (3.14 | )% | (5.65 | )% | |||||||||||||
| Ratio of expenses to average net assets | |||||||||||||||||||||||
| With expense reductions | 3.05 | %(d) | 3.05 | % | 2.63 | % | 2.49 | % | 2.49 | % | |||||||||||||
| Without expense reductions | 3.05 | %(d) | 3.08 | % | 3.07 | % | 3.96 | % | 6.69 | % | |||||||||||||
| Fund portfolio turnover rate | 43.70 | %(d) | 48.97 | % | 49.30 | % | 20.16 | % | 8.23 | % | |||||||||||||
| Class C | |||||||||||||||||||||||
| For the six months ended | For the year ended December 31, | April 1, 2002(c) to | |||||||||||||||||||||
| June 30, 2006 | 2005 | 2004 | 2003 | December 31, 2002 | |||||||||||||||||||
| Per Share Operating Performance | |||||||||||||||||||||||
| Net asset value, beginning of period | $ | 11.93 | $ | 11.54 | $ | 11.33 | $ | 7.91 | $ | 10.00 | |||||||||||||
| Income from investing operations | |||||||||||||||||||||||
| Net investment income (expense) | (0.09 | ) | (0.19 | ) | (0.10 | ) | 0.32 | (0.52 | ) | ||||||||||||||
| Net realized and unrealized gains (losses) on securities | (0.06 | ) | 1.23 | 0.67 | 3.10 | (1.57 | ) | ||||||||||||||||
| Total from investment operations | (0.15 | ) | 1.04 | 0.57 | 3.42 | (2.09 | ) | ||||||||||||||||
| Less distributions | |||||||||||||||||||||||
| From net investment income | - | - | - | - | - | ||||||||||||||||||
| From net capital gains | - | (0.65 | ) | (0.36 | ) | - | - | ||||||||||||||||
| Total distributions | - | (0.65 | ) | (0.36 | ) | - | - | ||||||||||||||||
| Net asset value, end of period | $ | 11.78 | $ | 11.93 | $ | 11.54 | $ | 11.33 | $ | 7.91 | |||||||||||||
| Total Investment Return (a) | (1.26 | )%(b) | 8.94 | % | 5.02 | % | 43.24 | % | (20.90 | )%(a) | |||||||||||||
| Ratios/Supplemental Data | |||||||||||||||||||||||
| Net assets, end of year (000's) | $ | 8,756 | $ | 7,894 | $ | 6,122 | $ | 3,537 | $ | 1,247 | |||||||||||||
| Ratio of net investment income to average net assets | |||||||||||||||||||||||
| With expense reductions | (2.44 | )%(d) | (2.46 | )% | (1.94 | )% | (2.41 | )% | (2.20 | )%(d) | |||||||||||||
| Without expense reductions | (2.44 | )%(d) | (2.49 | )% | (2.37 | )% | (3.90 | )% | (6.08 | )%(d) | |||||||||||||
| Ratio of expenses to average net assets | |||||||||||||||||||||||
| With expense reductions | 3.80 | %(d) | 3.82 | % | 3.40 | % | 3.24 | % | 3.23 | %(d) | |||||||||||||
| Without expense reductions | 3.80 | %(d) | 3.84 | % | 3.83 | % | 4.74 | % | 7.11 | %(d) | |||||||||||||
| Fund portfolio turnover rate | 43.70 | %(d) | 48.97 | % | 49.30 | % | 20.16 | % | 8.23 | %(d) | |||||||||||||
(a) The Fund's maximum sales charge is not included in the total return computation
(b) Not annualized
(c) Commencement of operations
(d) Annualized
See Accompanying Notes to Financial Statements
73
Pacific Advisors Fund Inc.
Financial Highlights (Unaudited)
(For a share outstanding throughout the period)
| Small Cap Fund | |||||||||||||||||||||||
| Class A | |||||||||||||||||||||||
| For the six months ended | For the year ended December 31, | ||||||||||||||||||||||
| June 30, 2006 | 2005 | 2004 | 2003 | 2002 | |||||||||||||||||||
| Per Share Operating Performance | |||||||||||||||||||||||
| Net asset value, beginning of period | $ | 25.73 | $ | 25.47 | $ | 18.77 | $ | 10.32 | $ | 15.23 | |||||||||||||
| Income from investing operations | |||||||||||||||||||||||
| Net investment income (expense) | 2.01 | (1.15 | ) | 0.73 | (0.37 | ) | (0.85 | ) | |||||||||||||||
| Net realized and unrealized gains (losses) on securities | 3.31 | 3.38 | 6.14 | 8.95 | (4.05 | ) | |||||||||||||||||
| Total from investment operations | 5.32 | 2.23 | 6.87 | 8.58 | (4.90 | ) | |||||||||||||||||
| Less distributions | |||||||||||||||||||||||
| From net investment income | - | - | - | - | - | ||||||||||||||||||
| From net capital gains | - | (1.97 | ) | (0.17 | ) | (0.13 | ) | (0.01 | ) | ||||||||||||||
| Total distributions | - | (1.97 | ) | (0.17 | ) | (0.13 | ) | (0.01 | ) | ||||||||||||||
| Net asset value, end of period | $ | 31.05 | $ | 25.73 | $ | 25.47 | $ | 18.77 | $ | 10.32 | |||||||||||||
| Total Investment Return (a) | 20.68 | %(b) | 8.64 | % | 36.60 | % | 83.21 | % | (32.20 | )% | |||||||||||||
| Ratios/Supplemental Data | |||||||||||||||||||||||
| Net assets, end of year (000's) | $ | 36,591 | $ | 15,884 | $ | 17,376 | $ | 8,961 | $ | 4,763 | |||||||||||||
| Ratio of net investment income to average net assets | (2.26 | )%(c) | (3.14 | )% | (3.08 | )% | (4.06 | )% | (4.01 | )% | |||||||||||||
| Ratio of expenses to average net assets | 2.66 | %(c) | 3.36 | % | 3.32 | % | 4.44 | % | 4.52 | % | |||||||||||||
| Fund portfolio turnover rate | 26.50 | %(c) | 20.73 | % | 7.23 | % | 39.95 | % | 23.39 | % | |||||||||||||
| Class C | |||||||||||||||||||||||
| For the six months ended | For the year ended December 31, | ||||||||||||||||||||||
| June 30, 2006 | 2005 | 2004 | 2003 | 2002 | |||||||||||||||||||
| Per Share Operating Performance | |||||||||||||||||||||||
| Net asset value, beginning of period | $ | 23.32 | $ | 23.44 | $ | 17.41 | $ | 9.65 | $ | 14.47 | |||||||||||||
| Income from investing operations | |||||||||||||||||||||||
| Net investment income (expense) | 0.55 | (0.56 | ) | 0.66 | 0.04 | (0.88 | ) | ||||||||||||||||
| Net realized and unrealized gains (losses) on securities | 4.15 | 2.41 | 5.54 | 7.85 | (3.93 | ) | |||||||||||||||||
| Total from investment operations | 4.70 | 1.85 | 6.20 | 7.89 | (4.81 | ) | |||||||||||||||||
| Less distributions | |||||||||||||||||||||||
| From net investment income | - | - | - | - | - | ||||||||||||||||||
| From net capital gains | - | (1.97 | ) | (0.17 | ) | (0.13 | ) | (0.01 | ) | ||||||||||||||
| Total distributions | - | (1.97 | ) | (0.17 | ) | (0.13 | ) | (0.01 | ) | ||||||||||||||
| Net asset value, end of period | $ | 28.02 | $ | 23.32 | $ | 23.44 | $ | 17.41 | $ | 9.65 | |||||||||||||
| Total Investment Return (a) | 20.15 | %(b) | 7.76 | % | 35.62 | % | 81.83 | % | (33.27 | )% | |||||||||||||
| Ratios/Supplemental Data | |||||||||||||||||||||||
| Net assets, end of year (000's) | $ | 9,490 | $ | 4,602 | $ | 3,848 | $ | 1,274 | $ | 543 | |||||||||||||
| Ratio of net investment income to average net assets | (3.02 | )%(c) | (3.95 | )% | (3.85 | )% | (4.88 | )% | (5.47 | )% | |||||||||||||
| Ratio of expenses to average net assets | 3.42 | %(c) | 4.19 | % | 4.10 | % | 5.26 | % | 5.97 | % | |||||||||||||
| Fund portfolio turnover rate | 26.50 | %(c) | 20.73 | % | 7.23 | % | 39.95 | % | 23.39 | % | |||||||||||||
(a) The Fund's maximum sales charge is not included in the total return computation
(b) Not annualized
(c) Annualized
See Accompanying Notes to Financial Statements
74
Pacific Advisors Fund Inc.
Directors and Officers
| Name, Address and Age | Position(s) Held with the Company | Term of Offices and Length of Time Served | Principal Occupations During Past 5 Years | Number of Portfolios in Fund Complex Overseen by Trustee | Other Directorships Held by Trustee | ||||||||||||||||||
| Thomas M. Brinker (72) 1 North Ormond Avenue Havertown, PA 19083 | Director | Since 1992 | 1970 - Present: Registered Representative, Transamerica Financial Advisors, Inc. 1970 - Present: President, Fringe Benefits, Inc. and Financial Foresight, Ltd. d/b/a The Brinker Organization (Financial Services Companies) | 6 Pacific Advisors Mutual Funds | None | ||||||||||||||||||
| Victoria Breen (55) 603 West Ojai Avenue Ojai, CA 93023 | Director and Assistant Secretary | Since 1992 | 1992 - Present: Assistant Secretary and Director, Pacific Global Investment Management Company 1994 - Present: Agent, Transamerica Life Companies; Registered Principal, Transamerica Financial Advisors, Inc. 1986 - Present: President, Derby & Derby, Inc. (Financial Services Company) 1992 - 2002: Assistant Secretary, Pacific Global Investor Services, Inc. | 6 Pacific Advisors Mutual Funds | None | ||||||||||||||||||
| Thomas H. Hanson (56) 101 N. Brand Blvd. Suite 1950 Glendale, CA 91203 | Vice President and Secretary | Since 1992 | 1992 - Present: Executive Vice President and Director, Pacific Global Investment Management Company; President and Director; Pacific Global Fund Distributors, Inc.; Director, Pacific Global Investor Services, Inc. 2001 - Present: Vice President, Pacific Global Investor Services, Inc. 1993 - Present: Owner, Director, Chairman, President, and CEO of TriVest Capital Management, Inc. | 6 Pacific Advisors Mutual Funds | None | ||||||||||||||||||
75
Pacific Advisors Fund Inc.
Directors and Officers
| Name, Address and Age | Position(s) Held with the Company | Term of Offices and Length of Time Served | Principal Occupations During Past 5 Years | Number of Portfolios in Fund Complex Overseen by Trustee | Other Directorships Held by Trustee | ||||||||||||||||||
| Catherine L. Henning (28) 101 N. Brand Blvd. Suite 1950 Glendale, CA 91203 | Assistant Secretary | Since 2002 | 2004 - Present: Secretary, Pacific Global Investment Management Company 2002 - 2004: Assistant Secretary, Pacific Global Investment Management Company 2002 - Present: Assistant Secretary, Pacific Global Fund Distributors, Inc. and Pacific Global Investor Services, Inc. 2001 - Present: Director of Private Client Services, Pacific Global Investment Management Company | 6 Pacific Advisors Mutual Funds | None | ||||||||||||||||||
| George A. Henning (59) 101 N. Brand Blvd. Suite 1950 Glendale, CA 91203 | President and Chairman | Since 1992 | 1991 - Present: Chairman, President, and Director, Pacific Global Investment Management Company; Chairman and Director, Pacific Global Fund Distributors, Inc.; Chairman and Director, Pacific Global Investor Services, Inc. | 6 Pacific Advisors Mutual Funds | None | ||||||||||||||||||
| Barbara A. Kelley (53) 101 N. Brand Blvd. Suite 1950 Glendale, CA 91203 | Vice President, Chief Compliance Officer and Treasurer | Since 2001 | 2004 - Present: Chief Compliance Officer, Pacific Advisors Fund Inc. and Pacific Global Investment Management Company 2001 - Present: Executive Vice President, Treasurer, Pacific Global Investment Management Company; Treasurer and Director, Pacific Global Fund Distributors, Inc.; President and Treasurer, Pacific Global Investor Services, Inc. 1999 - Present: Director, Pacific Global Investment Management Company | 6 Pacific Advisors Mutual Funds | None | ||||||||||||||||||
76
Pacific Advisors Fund Inc.
Directors and Officers
| Name, Address and Age | Position(s) Held with the Company | Term of Offices and Length of Time Served | Principal Occupations During Past 5 Years | Number of Portfolios in Fund Complex Overseen by Trustee | Other Directorships Held by Trustee | ||||||||||||||||||
| L. Michael Haller (62) 5924 Colodny Agoura, CA 91301 | Director | Since 1992 | 2004 - Present: Consultant 2002 - 2003: Executive Vice President, Sammy Studios, Inc. (Entertainment Company) 2001 - 2002: Vice President and Executive Producer, Electronic Arts; President, International Media Group, Inc. (Entertainment Company) | 6 Pacific Advisors Mutual Funds | None | ||||||||||||||||||
| Takashi Makinodan, PhD (81) 1506 S. Bentley Avenue PH #5 Los Angeles, CA 90025 | Director | Since 1995 | 1992 - Present: Director, Medical Treatment Effectiveness Program (MEDTEP), Center on Asian and Pacific Islanders 1991 - Present: Associate Director of Research, Geriatric Research Education Clinic Center, VA Medical Center | 6 Pacific Advisors Mutual Funds | None | ||||||||||||||||||
| Gerald E. Miller (76) 5262 Bridgetown Place Westlake Village, CA 91362 | Director | Since 1992 | 1992 - | Present: Retired | 6 Pacific Advisors Mutual Funds | None | |||||||||||||||||
| Louise K. Taylor, PhD (59) 325 East Huntington Dr. Monrovia, CA 91016 | Director | Since 1992 | 1991 - Present: Superintendent, Monrovia Unified School District | 6 Pacific Advisors Mutual Funds | None | ||||||||||||||||||
| Jingjing Yan (32) 101 N. Brand Blvd. Suite 1950 Glendale, CA 91203 | Assistant Treasurer | Since 2005 | 2005 - Present: Assistant Treasurer, Pacific Global Investment Management Company, Pacific Global Fund Distributors, Inc. and Pacific Global Investor Services, Inc. 2001 - Present: Fund Accounting Manager, Pacific Global Investor Services, Inc. | 6 Pacific Advisors Mutual Funds | None | ||||||||||||||||||
| Each director is elected to serve until the next annual shareholders meeting and until his or her successor is elected or appointed. The Company does not hold regular annual shareholders meetings to elect Directors. Vacancies on the Board can be filled by the action of a majority of the Directors, provided that at least two-thirds of the Directors have been elected by the shareholders. Certain Directors are considered "interested persons" of the Company as defined in the 1940 Act. All directors oversee all six Funds of the Company. | |||||||||||||||||||||||
77
Pacific Advisors Fund Inc.
notes
78
Pacific Advisors Fund Inc.
notes
79
Pacific Advisors Fund Inc.
notes
80

Pacific Advisors
Fund Inc
Directors
George A. Henning, Chairman
Victoria L. Breen
Thomas M. Brinker
L. Michael Haller, III
Takashi Makinodan, Ph.D.
Gerald E. Miller
Louise K. Taylor, Ph.D.
Officers
George A. Henning, President
Thomas H. Hanson, Vice President and Secretary
Victoria L. Breen, Assistant Secretary
Catherine L. Henning, Assistant Secretary
Barbara A. Kelley, Treasurer
Jingjing Yan, Assistant Treasurer
Investment Manager
Pacific Global Investment Management Company
101 North Brand Blvd., Suite 1950
Glendale, California 91203
Income and Equity Fund Co-Manager and Balanced Fund Sub-Adviser
Bache Capital Management, Inc.
101 North Brand Blvd., Suite 1950
Glendale, California 91203
Transfer Agent and Administrator
Pacific Global Investor Services, Inc.
101 North Brand Blvd., Suite 1950
Glendale, California 91203
Distributor
Pacific Global Fund Distributors, Inc.
101 North Brand Blvd., Suite 1950
Glendale, California 91203
(800) 989-6693
Availability of Quarterly Portfolio Schedule
The Fund files its complete schedule of portfolio holdings with the SEC for the first and third quarters of each fiscal year on Form N-Q. The Fund's Forms N-Q are available on the SEC's Web site at http://www.sec.gov. The Fund's Forms N-Q may be reviewed and copied at the SEC's Public Reference Room in Washington, DC. Information about the operation of the Public Reference Room may be obtained by calling the SEC at (800) SEC-0330.
The Fund's complete schedule of portfolio holdings for each fiscal quarter is posted on the Fund's Web site at www.PacificAdvisorsFund.com and is available without charge, upon request by calling (800) 989-6693. Documents will be sent within 3 business days of receipt of your request.
Availability of Proxy Voting Policies and Procedures and Proxy Voting Record
A description of the policies and procedures that the Fund uses to determine how to vote proxies relating to portfolio securities and information regarding how the Fund voted proxies relating to portfolio securities during the most recent 12-month period ended June 30 is available without charge, upon request by calling (800) 989-6693. Documents will be sent within 3 business days of receipt of your request. This information is also available on the SEC's Web site at http://www.sec.gov.
PRSRT STD
U. S. POSTAGE
PAID
Glendale, CA PERMIT NO. 1090
Pacific Global Fund Distributors, Inc.
101 North Brand Blvd., Suite 1950
Glendale, California 91203


Pacific Global Fund Distributors, Inc.
101 North Brand Blvd., Suite 1950
Glendale, California 91203


Item 2. Code of Ethics
Not applicable for semi-annual reports.
Item 3. �� Audit Committee Financial Expert
Not applicable for semi-annual reports.
Item 4. Principal Accountant Fees and Services
Not applicable for semi-annual reports.
Item 5. Audit Committee of Listed Registrants
Not applicable as Registrant is not a listed issuer as defined in Rule 10A-3 under the Securities Exchange Act of 1934.
Item 6. Schedule of Investments
Schedule of Investments is included as part of the report to shareholders filed under Item 1 of this form.
Item 7. Disclosure of Proxy Voting Policies and Procedures for Closed-End Management Investment Companies
Not applicable to open-end investment companies.
Item 8. Portfolio Managers of Closed-End Management Investment Companies
Not applicable to open-end investment companies.
Item 9. Purchases of Equity Securities by Managers of Closed-End Management Investment Company and Affiliated Purchasers.
Not applicable to open-end investment companies.
Item 10. Submission of Matters to a Vote of Security Holders
No material changes have been made.
Item 11. Controls and Procedures.
(a) Based upon their evaluation of Registrant’s disclosure controls and procedures (as defined in Rule 30a-3(c) under the Investment Company Act of 1940) as conducted within 90 days of the filing date of this Form N-CSR, Registrant’s principal executive officer and principal financial officer have concluded that those disclosure controls and procedures provide reasonable assurance that the material information required to be disclosed by Registrant on this report is recorded, processed, summarized and reported within the time periods specified in the Securities and Exchange Commission’s rules and forms.
(b) There were no changes in Registrant’s internal control over financial reporting (as defined in Rule 30a-3(d) under the Investment Company Act of 1940) that occurred during the second fiscal quarter of the period covered by this report that have materially affected, or are reasonably likely to materially affect, Registrant’s internal control over financial reporting.
Item 12. Exhibits
(a)(1) Not applicable.
(a)(2) Certifications required by Item 12(a) of Form N-CSR and Section 302 of the Sarbanes-Oxley Act of 2002 (filed herewith).
(b) Certification required by Section 906 of the Sarbanes-Oxley Act of 2002 (filed herewith).
SIGNATURES
Pursuant to the requirements of the Securities Exchange Act of 1934 and the Investment Company Act of 1940, Registrant has duly caused this report to be signed on its behalf by the undersigned, thereunto duly authorized.
Pacific Global Fund Inc. d/b/a Pacific Advisors Fund Inc. | |||
| |||
By: | /s/ George A. Henning |
| |
| George A. Henning | ||
| Chairman, Pacific Advisors Fund Inc. | ||
|
| ||
Date: | September 8, 2006 |
| |
Pursuant to the requirements of the Securities Exchange Act of 1934 and the Investment Company Act of 1940, this report has been signed below by the following persons on behalf of Registrant and in the capacities and on the dates indicated.
By: | /s/ George A. Henning |
| |
| George A. Henning | ||
| Chief Executive Officer | ||
|
| ||
Date: | September 7, 2005 |
| |
By: | /s/ Barbara A. Kelley |
| |
| Barbara A. Kelley | ||
| Chief Financial Officer | ||
| |||
Date: | September 8, 2006 |
| |