UNITED STATES
SECURITIES AND EXCHANGE COMMISSION
Washington, D.C. 20549
FORM N-CSR
CERTIFIED SHAREHOLDER REPORT OF REGISTERED MANAGEMENT
INVESTMENT COMPANIES
Investment Company Act file number 811-01976
Sequoia Fund, Inc.
(Exact name of registrant as specified in charter)
9 West 57th Street, Suite 5000
New York, NY 10019
(Address of principal executive offices) (Zip code)
John B. Harris
Ruane, Cunniff & Goldfarb L.P.
9 West 57th Street
Suite 5000
New York, NY 10019
(Name and address of agent for service)
Registrant’s telephone number, including area code: (800) 686-6884
Date of fiscal year end: December 31, 2022
Date of reporting period: December 31, 2022
Form N-CSR is to be used by management investment companies to file reports with the Commission not later than 10 days after the transmission to stockholders of any report that is required to be transmitted to stockholders under Rule 30e-1 under the Investment Company Act of 1940 (17 CFR 270.30e-1). The Commission may use the information provided on Form N-CSR in its regulatory, disclosure review, inspection, and policymaking roles.
A registrant is required to disclose the information specified by Form N-CSR, and the Commission will make this information public. A registrant is not required to respond to the collection of information contained in Form N-CSR unless the Form displays a currently valid Office of Management and Budget (“OMB”) control number. Please direct comments concerning the accuracy of the information collection burden estimate and any suggestions for reducing the burden to Secretary, Securities and Exchange Commission, 450 Fifth Street, NW, Washington, DC 20549-0609. The OMB has reviewed this collection of information under the clearance requirements of 44 U.S.C. § 3507.
Item 1. Reports to Stockholders.
(a) | Report to Stockholders. |
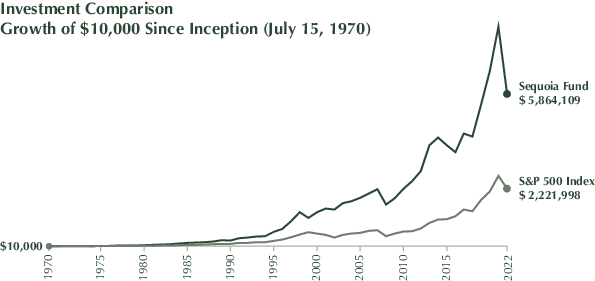
Year ended December 31, 2022 | Sequoia Fund | S&P 500 Index* | ||
1 Year | -30.52% | -18.11% | ||
5 Years (Annualized) | 6.22% | 9.42% | ||
10 Years (Annualized) | 7.33% | 12.56% | ||
Since inception (Annualized)** | 12.92% | 10.85% |
Company | % of Net Assets 12/31/22 | Total Return | % of Net Assets 12/31/21 | |||
Charles Schwab Corp. | 7.4% | + 0.2% | 5.1% | |||
The Liberty Media Corp.-Liberty Formula One | 6.9% | -5.5% | 4.9% | |||
UnitedHealth Group, Inc. | 6.8% | + 7.0% | 6.7% | |||
Universal Music Group | 6.4% | -13.2% | 4.2% | |||
Intercontinental Exchange, Inc. | 6.2% | -24.1% | 3.5% | |||
Eurofins Scientific SE | 6.1% | -41.5% | 3.8% | |||
Alphabet, Inc. | 5.8% | -38.8% | 8.3% | |||
Constellation Software, Inc. | 5.8% | -15.9% | 4.7% | |||
Elevance Health, Inc. | 5.1% | + 12.0% | 5.7% | |||
Credit Acceptance Corp. | 4.7% | -31.0% | 4.3% |
Management Fees | 1.00% |
Other Expenses | 0.07% |
Total Annual Fund Operating Expenses* | 1.07% |
Expense Reimbursement by Investment Adviser* | -0.07% |
Net Annual Fund Operating Expenses* | 1.00% |
Beginning Account Value July 1, 2022 | Ending Account Value December 31, 2022 | Expenses Paid During Period** July 1, 2022 through December 31, 2022 | |||
Actual | $1,000 | $ 982.70 | $5.00 | ||
Hypothetical (5% return per year before expenses) | $1,000 | $1,020.16 | $5.09 |
December 31, 2022
Shares | Value (Note 1) | |
Aerospace & Defense (2.7%) | ||
71,249,483 | Rolls-Royce Holdings PLC (United Kingdom)(a) | $ 80,279,742 |
Application Software (9.6%) | ||
111,427 | Constellation Software, Inc. (Canada) | 173,967,667 |
1,082,791 | SAP SE (Germany) | 111,723,107 |
285,690,774 | ||
Automotive Retail (4.6%) | ||
2,255,975 | CarMax, Inc.(a) | 137,366,318 |
Cable & Satellite (2.9%) | ||
350,539 | Liberty Broadband Corp. - Class A(a) | 26,588,383 |
785,200 | Liberty Broadband Corp. - Class C(a) | 59,887,204 |
86,475,587 | ||
Consumer Finance (7.8%) | ||
997,857 | Capital One Financial Corp. | 92,760,787 |
298,244 | Credit Acceptance Corp.(a) | 141,486,953 |
234,247,740 | ||
Financial Exchanges & Data (6.2%) | ||
1,807,536 | Intercontinental Exchange, Inc. | 185,435,118 |
Interactive Media & Services (10.2%) | ||
1,973,840 | Alphabet, Inc. - Class A(a) | 174,151,903 |
1,074,307 | Meta Platforms, Inc. - Class A(a) | 129,282,105 |
303,434,008 | ||
Investment Banking & Brokerage (7.4%) | ||
2,638,524 | The Charles Schwab Corp. | 219,683,508 |
Life Sciences Tools & Services (6.1%) | ||
2,554,212 | Eurofins Scientific SE (Luxembourg) | 183,352,517 |
Managed Health Care (11.9%) | ||
295,662 | Elevance Health, Inc. | 151,665,736 |
385,874 | UnitedHealth Group, Inc. | 204,582,678 |
356,248,414 | ||
Movies & Entertainment (15.5%) | ||
43,481 | Liberty Media Corp.-Liberty Formula One - Class A(a) | 2,323,190 |
3,400,120 | Liberty Media Corp.-Liberty Formula One - Class C(a) | 203,259,174 |
225,165 | Netflix, Inc.(a) | 66,396,655 |
7,948,025 | Universal Music Group NV (Netherlands) | 191,514,255 |
463,493,274 | ||
Multi-Sector Holdings (1.6%) | ||
153,616 | Berkshire Hathaway, Inc. - Class B(a) | 47,451,982 |
Research & Consulting Services (4.1%) | ||
1,020,323 | Jacobs Solutions, Inc. | 122,510,183 |
December 31, 2022
Shares | Value (Note 1) | |
Semiconductors (6.8%) | ||
1,683,406 | Micron Technology, Inc. | $ 84,136,632 |
1,593,433 | Taiwan Semiconductor Manufacturing Co., Ltd. - SP ADR (Taiwan) | 118,694,824 |
202,831,456 | ||
Total Common Stocks (Cost $1,961,073,886) | 2,908,500,621 | |
Total Investments (97.4%) (Cost $1,961,073,886)(b) | 2,908,500,621 | |
Other Assets Less Liabilities (2.6%) | 78,759,830 | |
Net Assets (100.0%) | $ 2,987,260,451 |
(a) | Non-income producing security. |
(b) | The cost for federal income tax purposes is $2,000,133,973. The difference between book cost and tax cost is attributable to financial and tax accounting differences on a corporate spin-off. |
Abbreviation: | |
SP ADR | Sponsored American Depository Receipt |
Level 1 − | unadjusted quoted prices in active markets for identical securities. |
Level 2 − | other significant observable inputs (including, but not limited to, quoted prices for similar securities, interest rates, prepayment speeds and credit risk). |
Level 3 − | unobservable inputs (including the Fund’s own assumptions in determining the fair value of investments). |
December 31, 2022
Assets | |
Investments in securities, at value (cost $1,961,073,886)(Note 1) | $2,908,500,621 |
Cash on deposit | 81,513,948 |
Receivable for capital stock sold | 182,406 |
Dividends receivable | 1,375,351 |
Other assets | 162,746 |
Total assets | 2,991,735,072 |
Liabilities | |
Payable for capital stock repurchased | 1,878,733 |
Accrued investment advisory fee | 2,355,300 |
Accrued professional fees | 26,972 |
Accrued transfer agent fees | 59,236 |
Accrued custodian fees | 20,833 |
Accrued independent Directors fees and expenses | 90,856 |
Accrued other expenses | 42,691 |
Total liabilities | 4,474,621 |
Net Assets | $2,987,260,451 |
Net Assets Consist of | |
Capital (par value and paid in surplus) $.10 par value capital stock, 100,000,000 shares authorized, 23,951,580 shares outstanding | $2,225,560,752 |
Total distributable earnings (loss) | 761,699,699 |
Net Assets | $2,987,260,451 |
Net asset value per share | $ 124.72 |
Year Ended December 31, 2022
Investment Income | |
Income | |
Dividends, net of $1,581,425 foreign tax withheld | $ 20,534,156 |
Total investment income | 20,534,156 |
Expenses | |
Investment advisory fee(Note 2) | 36,045,879 |
Professional fees | 460,574 |
Transfer agent fees | 667,926 |
Independent Directors fees and expenses | 647,053 |
Custodian fees | 123,911 |
Other | 1,254,524 |
Total expenses | 39,199,867 |
Less expenses reimbursed by Investment Adviser(Note 2) | 3,003,986 |
Net expenses | 36,195,881 |
Net investment loss | (15,661,725) |
Realized and Unrealized Gain (Loss) on Investments and Foreign Currency Transactions | |
Realized gain (loss) on | |
Investments(Note 3) | (93,128,325) |
Foreign currency transactions | (1,064,149) |
Net realized losses on investments and foreign currency transactions | (94,192,474) |
Net change in unrealized appreciation/(depreciation) on | |
Investments | (1,359,563,887) |
Foreign currency translations | (26,206) |
Net decrease in unrealized appreciation/(depreciation) on investments and foreign currency translations | (1,359,590,093) |
Net realized and unrealized losses on investments, foreign currency transactions and translations | (1,453,782,567) |
Net decrease in net assets from operations | $(1,469,444,292) |
Year Ended December 31, | |||
2022 | 2021 | ||
Increase (Decrease) in Net Assets | |||
From operations | |||
Net investment loss | $ (15,661,725) | $ (12,975,889) | |
Net realized gain (loss) on investments and foreign currency transactions | (94,192,474) | 749,406,703 | |
Net increase (decrease) in unrealized appreciation/(depreciation) on investments and foreign currency translations | (1,359,590,093) | 337,323,837 | |
Net increase (decrease) in net assets from operations | (1,469,444,292) | 1,073,754,651 | |
Distributions to shareholders from: | |||
Total distributable earnings | (98,740,477) | (674,733,986) | |
Capital share transactions | |||
Shares sold | 60,386,448 | 120,159,208 | |
Shares issued to shareholders on reinvestment of net income and net realized gain distributions | 79,067,771 | 532,377,789 | |
Shares repurchased | (483,104,107) | (482,858,696) | |
Net increase (decrease) from capital shares transactions | (343,649,888) | 169,678,301 | |
Total increase (decrease) in net assets | (1,911,834,657) | 568,698,966 | |
Net Assets | |||
Beginning of year | 4,899,095,108 | 4,330,396,142 | |
End of year | $ 2,987,260,451 | $4,899,095,108 | |
Share transactions | |||
Shares sold | 410,327 | 640,337 | |
Shares issued to shareholders on reinvestment of net income and net realized gain distributions | 626,031 | 2,866,958 | |
Shares repurchased | (3,567,802) | (2,554,813) | |
Net increase (decrease) from capital share transactions | (2,531,444) | 952,482 |
Year Ended December 31, | |||||||||
2022 | 2021 | 2020 | 2019 | 2018 | |||||
Per Share Operating Performance (for a share outstanding throughout the year) | |||||||||
Net asset value, beginning of year | $184.99 | $169.62 | $157.27 | $132.20 | $169.55 | ||||
Income from investment operations | |||||||||
Net investment loss | (0.66) | (0.13) | (0.95) | (0.62) | (0.69) | ||||
Net realized and unrealized gains (losses) on investments | (55.76) | 42.92 | 36.20 | 38.50 | (2.67) | ||||
Net increase (decrease) in net asset value from operations | (56.42) | 42.79 | 35.25 | 37.88 | (3.36) | ||||
Less distributions from | |||||||||
Net investment income | (0.02)(a) | (4.93)(a) | — | (1.16)(a) | — | ||||
Net realized gains | (3.83) | (22.49) | (22.90) | (11.65) | (33.99) | ||||
Total distributions | (3.85) | (27.42) | (22.90) | (12.81) | (33.99) | ||||
Net asset value, end of year | $124.72 | $184.99 | $169.62 | $157.27 | $132.20 | ||||
Total Return | (30.52)%(b) | 25.48% | 23.33% | 29.12% | (2.62)% | ||||
Ratios/Supplementary data | |||||||||
Net assets, end of year (in millions) | $ 2,987 | $ 4,899 | $ 4,330 | $ 3,980 | $ 3,436 | ||||
Ratio of expenses to average net assets | |||||||||
Before expenses reimbursed by Investment Adviser | 1.09% | 1.07% | 1.09%(c) | 1.07%(c) | 1.06%(c) | ||||
After expenses reimbursed by Investment Adviser | 1.00% | 1.00% | 1.00% | 1.00% | 1.00% | ||||
Ratio of net investment loss to average net assets | (0.43)% | (0.27)% | (0.63)% | (0.42)% | (0.42)% | ||||
Portfolio turnover rate | 16% | 23% | 28% | 16% | 27% |
(a) | The difference of net investment income/(loss) for financial and tax reporting is attributable to financial and tax accounting differences on a corporate spin–off. As a result, the Fund was required to make a distribution from net investment income for tax purposes. |
(b) | Includes the impact of proceeds received and credited to the Fund resulting from a class action settlement, which enhanced the Fund’s performance for the year ended December 31, 2022 by 0.08%. |
(c) | Reflects reductions of 0.00%, 0.02% and 0.05% for expenses reimbursed by insurance company for the years ended December 31, 2020, 2019 and 2018, respectively. |
A. | Valuation of investments: Investments for which market quotations are readily available are valued at market value, and other investments are valued at “fair value” as determined in accordance with procedures approved by the Fund’s Board of Directors (the “Board”). Pursuant to Rule 2a-5 under the 1940 Act, the Board has designated Ruane, Cunniff & Goldfarb L.P. (the “Investment Adviser”) as valuation designee to perform fair value determinations relating to the Fund’s portfolio investments, subject to the Board’s oversight. |
Securities traded on a national securities exchange are valued at the last reported sales price on the principal exchange on which the security is listed; securities traded in the NASDAQ Stock Market (”NASDAQ“) are valued in accordance with the NASDAQ Official Closing Price. Securities for which there is no sale or Official Closing Price are valued at the mean of the last reported bid and asked prices. | |
Securities traded on a foreign exchange are valued at the closing price on the last business day of the period on the principal exchange on which the security is primarily traded. The value is then converted into its U.S. dollar equivalent at the foreign exchange rate in effect at the close of the New York Stock Exchange on the date of valuation. | |
U.S. Treasury Bills with remaining maturities of 60 days or less are valued at their amortized cost, provided that the amortized cost value is approximately the same as the fair value as determined without the use of amortized cost valuation. U.S. Treasury Bills that when purchased have a remaining maturity in excess of 60 days are valued on the basis of market quotations and estimates until the sixtieth day prior to maturity, at which point they are valued at amortized cost. Fixed-income securities, other than U.S. Treasury Bills, are valued at prices supplied by an independent pricing service. | |
When reliable market quotations are insufficient or not readily available at the time of valuation or when the Investment Adviser determines that the prices or values available do not represent the fair value of a security, such security is valued at fair value as determined in good faith by the Investment Adviser, in accordance with procedures approved by the Board. | |
B. | Foreign currency translations: Investment securities and other assets and liabilities denominated in foreign currencies are translated into U.S. dollar amounts at the date of valuation. Purchases and sales of foreign securities are translated into U.S. dollars at the rates of exchange prevailing when such securities are acquired or sold. Income and expenses are translated into U.S. dollars at the rates of exchange prevailing when accrued. The Fund does not isolate that portion of the results of operations resulting from changes in foreign exchange rates on investments from the fluctuations arising from changes in market prices of securities held. Such fluctuations are included with the net realized and unrealized gain or loss from investments. Reported net realized gains or losses on foreign currency transactions arise from the difference between the amounts of dividends, interest, and foreign withholding taxes recorded on the Fund’s books and the U.S. dollar equivalent of the amounts actually received or paid. Net unrealized gains and losses on foreign currency transactions and translations arise from changes in the fair values of assets and liabilities, other than investments in securities at fiscal period end, resulting from changes in exchange rates. |
C. | Investment transactions and investment income: Investment transactions are accounted for on the trade date and dividend income is recorded on the ex-dividend date. Interest income is accrued as earned. Premiums and discounts on fixed income securities are amortized over the life of the respective security. The net realized gain or loss on security transactions is determined for accounting and tax purposes on the specific identification basis. |
D. | Federal income taxes: The Fund’s policy is to comply with the requirements of the Internal Revenue Code applicable to regulated investment companies, and it intends to distribute all of its taxable income to its stockholders. Therefore, no federal income tax provision is required. |
E. | Use of estimates: The preparation of financial statements in conformity with GAAP requires management to make estimates and assumptions that affect the reported amounts of assets and liabilities and disclosure of contingent assets and liabilities at the date of the financial statements and the reported amounts of increases and decreases in net assets from operations during the reporting period. Actual results could differ from those estimates. |
F. | Dividends and distributions: Dividends and distributions are recorded by the Fund on the ex-dividend date. |
2022 | 2021 | ||
Distributions paid from | |||
Ordinary income | $ 619,402 | $121,822,116 | |
Long-term capital gains | 98,121,075 | 552,911,870 | |
$98,740,477 | $674,733,986 |
2022 | 2021 | ||
Undistributed ordinary income | $ — | $ 617,065 | |
Undistributed long-term gains | — | 98,119,600 | |
Capital loss carryforwards | (146,619,723) | — | |
Unrealized appreciation | 908,319,422 | 2,269,762,305 | |
$ 761,699,699 | $2,368,498,970 |
Sequoia Fund, Inc.:
Name, Age, and Address | Position Held with Fund(1) | Length of Time Served(2) | Principal Occupation during Past 5 Years | Other Directorships Held by Director | ||||
Interested Directors and Officer(3) | ||||||||
John B. Harris, 46 9 West 57th Street New York, NY 10019 | President, CEO & Director | 6 Years | Managing Director of the Investment Adviser since 2018; Analyst of the Investment Adviser; Managing Member of Wishbone Management, LP (SEC-registered investment adviser). | None | ||||
Gregory W. Steinmetz, 61 9 West 57th Street New York, NY 10019 | Director | 4 Years | Analyst of the Investment Adviser. | None | ||||
Independent Directors | ||||||||
Melissa Crandall, 43 9 West 57th Street New York, NY 10019 | Chairperson of the Board and Director | 5 Years | Head of Talent Advisory, C Street Advisory (Talent Management) (2021-2022); Principal, Executive Recruiter, Third Street Partners (Talent Management) (2018-2020); Principal, Executive Recruiter, BraddockMatthews, LLC (Talent Management) (2015-2017). | None | ||||
Peter Atkins, 59 9 West 57th Street New York, NY 10019 | Director | 6 Years | Managing Director, Permian Partners (Investment Manager). | None | ||||
Edward Lazarus, 63 9 West 57th Street New York, NY 10019 | Director | 8 Years | Interim Chief Financial Officer, Sonos, Inc. (Consumer Electronics) since September 2022; Chief Legal Officer and Corporate Secretary, Sonos, Inc. since January 2019; Former Executive Vice President and General Counsel of Tribune Media Co. (2013-2018). | None | ||||
Roger Lowenstein, 69 9 West 57th Street New York, NY 10019 | Director | 24 Years | Writer for Major Financial and News Publications. | None |
Name, Age, and Address | Position Held with Fund(1) | Length of Time Served(2) | Principal Occupation during Past 5 Years | Other Directorships Held by Director | ||||
Independent Directors (Continued) | ||||||||
Katharine Weymouth, 56 9 West 57th Street New York, NY 10019 | Director | 2 Years | Chief Operating Officer, FamilyCare since 2021; Chief Operating Officer and President of DineXpert, Inc. (2018-2020); Publisher, The Washington Post (2008-2014); Chief Executive Officer, Washington Post Media (2008-2014). | Republic Services, Inc. (Waste Management); Graham Holdings Company (Education and Media); Cable One, Inc. (Internet and Cable); Xometry, Inc. (AI Marketplace). | ||||
Additional Officers | ||||||||
Wendy Goodrich, 57 9 West 57th Street New York, NY 10019 | Executive Vice President | 6 Years | Executive Vice President of the Investment Adviser since 2016; Managing Member of Absolute Return Consulting LLC until 2016. | None | ||||
Patrick Dennis, 52 9 West 57th Street New York, NY 10019 | Treasurer | 5 Years | Chief Financial Officer of the Investment Adviser since 2017; Chief Financial Officer of Associated Capital Group, Inc. (2015-2017); Global Head of Operations - Hedge Fund Administration at J.P. Morgan Chase (2013-2015). | None | ||||
Yau Dun Lee, 33 9 West 57th Street New York, NY 10019 | Chief Compliance Officer & Secretary | Since May 20, 2022 | Chief Compliance Officer of the Investment Adviser since 2022; Compliance Associate of the Investment Adviser (2021-2022); Compliance Associate at Black Diamond Capital Management, LLC (2019-2021); Compliance Officer at Paradigm Capital Management, Inc. (2018-2019); Compliance Associate at C.L. King & Associates (2015-2018). | None | ||||
Michael Valenti, 53 9 West 57th Street New York, NY 10019 | Assistant Secretary | 16 Years | Administrator of the Investment Adviser. | None |
(1) | There are no other funds in the complex. |
(2) | Directors serve until their resignation, removal or death. |
(3) | Mr. Harris and Mr. Steinmetz are ”interested persons“ of the Fund, as defined by the 1940 Act, based on their positions with the Investment Adviser. |
9 West 57th Street, Suite 5000
New York, New York 10019-2701
1-800-686-6884
Website: www.sequoiafund.com
Gregory W. Steinmetz
Peter Atkins
Edward Lazarus
Roger Lowenstein
Katharine Weymouth
John B. Harris | — | President & CEO |
Wendy Goodrich | — | Executive Vice President |
Patrick Dennis | — | Treasurer |
Yau Dun Lee | — | Chief Compliance Officer & Secretary |
Michael Valenti | — | Assistant Secretary |
9 West 57th Street, Suite 5000
New York, New York 10019-2701
Three Canal Plaza, Suite 100
Portland, Maine 04101
MF Custody Administration Department
225 Liberty Street, 25th Floor
New York, New York 10286
P.O. Box 219477
Kansas City, Missouri 64121
4400 Computer Drive
Westborough, Massachusetts 01581
901 K Street, NW
Washington, DC 20001
New York, NY 10019
(212) 832-5280
please visit www.ruanecunniff.com and www.sequoiafund.com.
(b) | Not applicable. |
Item 2. Code of Ethics.
(a) | The registrant, as of the end of the period covered by this report, has adopted a code of ethics that applies to the registrant’s principal executive officer, principal financial officer, principal accounting officer or controller, or persons performing similar functions, regardless of whether these individuals are employed by the registrant or a third party. A copy of this code of ethics is attached as an exhibit to this Form N-CSR and also made available on the registrant’s website at www.sequoiafund.com. |
(c) | There have been no amendments, during the period covered by this report, to a provision of the code of ethics that applies to the registrant’s principal executive officer, principal financial officer, principal accounting officer or controller, or persons performing similar functions, regardless of whether these individuals are employed by the registrant or a third party, and that relates to any element of the code of ethics definition. |
(d) | The registrant has not granted any waivers, including an implicit waiver, from a provision of the code of ethics that applies to the registrant’s principal executive officer, principal financial officer, principal accounting officer or controller, or persons performing similar functions, regardless of whether these individuals are employed by the registrant or a third party, that relates to one or more of the items set forth in paragraph (b) of this item’s instructions. |
Item 3. Audit Committee Financial Expert.
The registrant’s Board of Directors has determined that the registrant does not have an audit committee financial expert serving on its audit committee. The registrant’s Board of Directors has determined that, based on the background and extensive experience of each of the members of the audit committee in the financial services industry, a designated audit committee financial expert is unnecessary. The members of the audit committee are well-known and respected members of the investment management industry and the registrant is satisfied that their collective knowledge and experience is sufficient for them to perform their duties as audit committee members.
Item 4. Principal Accountant Fees and Services.
Audit Fees
(a) | The aggregate fees billed for each of the last two fiscal years for professional services rendered by the principal accountant for the audit of the registrant’s annual financial statements or services |
that are normally provided by the accountant in connection with statutory and regulatory filings or engagements for those fiscal years are $92,106 for 2021 and $99,202 for 2022. |
Audit-Related Fees
(b) | The aggregate fees billed in each of the last two fiscal years for assurance and related services by the principal accountant that are reasonably related to the performance of the audit of the registrant’s financial statements and are not reported under paragraph (a) of this Item are $0 for 2021 and $0 for 2022. |
Tax Fees
(c) | The aggregate fees billed in each of the last two fiscal years for professional services rendered by the principal accountant for tax compliance, tax advice, and tax planning are $6,650 for 2021 and $10,800 for 2022. |
All Other Fees
(d) | The aggregate fees billed in each of the last two fiscal years for products and services provided by the principal accountant, other than the services reported in paragraphs (a) through (c) of this Item are $0 for 2021 and $0 for 2022. |
(e)(1) | The registrant’s audit committee has the responsibility to pre-approve all audit and non-audit services provided to the registrant by its independent auditor in advance at regularly scheduled audit committee meetings. The registrant’s audit committee also has the responsibility to pre-approve all non-audit services provided by the registrant’s independent auditor to the registrant’s investment adviser and any entity controlling, controlled by, or under common control with the investment adviser that provides ongoing services to the registrant, if the engagement relates directly to the operations and financial reporting of the registrant, in advance at regularly scheduled audit committee meetings. | |
(e)(2) | The percentage of services described in each of paragraphs (b) through (d) of this Item that were approved by the audit committee pursuant to paragraph (c)(7)(i)(C) of Rule 2-01 of Regulation S-X are as follows: |
(b) None
(c) None
(d) None
(f) | Not Applicable. |
(g) | The aggregate non-audit fees billed by the registrant’s accountant for services rendered to the registrant, and rendered to the registrant’s investment adviser (not including any sub-adviser whose role is primarily portfolio management and is subcontracted with or overseen by another investment adviser), and any entity controlling, controlled by, or under common control with the adviser that provides ongoing services to the registrant for each of the last two fiscal years of the registrant was $30,650 for 2021 and $17,300 for 2022. |
(h) | Not applicable. |
(i) | Not applicable. |
(j) | Not applicable. |
Item 5. Audit Committee of Listed Registrants.
Not applicable.
Item 6. Investments.
(a) | Schedule of Investments in securities of unaffiliated issuers as of the close of the reporting period is included as part of the report to shareholders filed under Item 1(a) of this form. |
(b) | Not applicable. |
Item 7. | Disclosure of Proxy Voting Policies and Procedures for Closed-End Management Investment Companies. |
Not applicable.
Item 8. Portfolio Managers of Closed-End Management Investment Companies.
Not applicable.
Item 9. | Purchases of Equity Securities by Closed-End Management Investment Company and Affiliated Purchasers. |
Not applicable.
Item 10. Submission of Matters to a Vote of Security Holders.
Not applicable.
Item 11. Controls and Procedures.
(a) | The registrant’s principal executive and principal financial officers, or persons performing similar functions, have concluded that the registrant’s disclosure controls and procedures (as defined in Rule 30a-3(c) under the Investment Company Act of 1940, as amended (the “1940 Act)) are effective, as of a date within 90 days of the filing date of this report, based on their evaluation of these controls and procedures required by Rule 30a-3(b) under the 1940 Act and Rules 13a-15(b) or 15d-15(b) under the Securities Exchange Act of 1934, as amended. |
(b) | There were no changes in the registrant’s internal control over financial reporting (as defined in Rule 30a-3(d) under the 1940 Act) that occurred during the period covered by this report that have materially affected, or are reasonably likely to materially affect, the registrant’s internal control over financial reporting. |
Item 12. | Disclosure of Securities Lending Activities for Closed-End Management Investment Companies. |
Not applicable.
Item 13. Exhibits.
(a)(1) | ||
(a)(2) | ||
(a)(3) | Not applicable. | |
(a)(4) | Not applicable. | |
(b) |
SIGNATURES
Pursuant to the requirements of the Securities Exchange Act of 1934 and the Investment Company Act of 1940, the registrant has duly caused this report to be signed on its behalf by the undersigned, thereunto duly authorized.
(Registrant) Sequoia Fund, Inc. | ||||
By (Signature and Title)* | /s/ John B. Harris | |||
John B. Harris, President and CEO | ||||
(principal executive officer) | ||||
Date February 27, 2023 |
Pursuant to the requirements of the Securities Exchange Act of 1934 and the Investment Company Act of 1940, this report has been signed below by the following persons on behalf of the registrant and in the capacities and on the dates indicated.
By (Signature and Title)* | /s/ John B. Harris | |||
John B. Harris, President and CEO | ||||
(principal executive officer) | ||||
Date February 27, 2023 | ||||
By (Signature and Title)* | /s/ Patrick Dennis | |||
Patrick Dennis, Treasurer | ||||
(principal financial officer) | ||||
Date February 27, 2023 |
* Print the name and title of each signing officer under his or her signature.