UNITED STATES
SECURITIES AND EXCHANGE COMMISSION
Washington, D.C. 20549
FORM N-CSR
CERTIFIED SHAREHOLDER REPORT OF REGISTERED MANAGEMENT
INVESTMENT COMPANIES
Investment Company Act file number 811-07076
| Wilshire Mutual Funds, Inc. |
| (Exact name of registrant as specified in charter) |
| |
Wilshire Associates Incorporated 1299 Ocean Avenue, Suite 700 Santa Monica, CA 90401-1085 |
| (Address of principal executive offices) (Zip code) |
| |
Jason A. Schwarz, President 1299 Ocean Avenue, Suite 700 Santa Monica, CA 90401-1085 |
| (Name and address of agent for service) |
Registrant’s telephone number, including area code: 310-260-6639
Date of fiscal year end: December 31
Date of reporting period: June 30, 2013
Form N-CSR is to be used by management investment companies to file reports with the Commission not later than 10 days after the transmission to stockholders of any report that is required to be transmitted to stockholders under Rule 30e-1 under the Investment Company Act of 1940 (17 CFR 270.30e-1). The Commission may use the information provided on Form N-CSR in its regulatory, disclosure review, inspection, and policymaking roles.
A registrant is required to disclose the information specified by Form N-CSR, and the Commission will make this information public. A registrant is not required to respond to the collection of information contained in Form N-CSR unless the Form displays a currently valid Office of Management and Budget (“OMB”) control number. Please direct comments concerning the accuracy of the information collection burden estimate and any suggestions for reducing the burden to Secretary, Securities and Exchange Commission, 100 F Street, NE, Washington, DC 20549. The OMB has reviewed this collection of information under the clearance requirements of 44 U.S.C. § 3507.
| Item 1. | Reports to Stockholders. |
The Report to Shareholders is attached herewith.
| Wilshire Mutual Funds SEMI-ANNUAL REPORT (Unaudited) Large Company Growth Portfolio Large Company Value Portfolio Small Company Growth Portfolio Small Company Value Portfolio Wilshire 5000 Indexsm Fund Wilshire International Equity Fund (Formerly Wilshire Large Cap Core Plus Fund) June 30, 2013
http://advisor.wilshire.com |
Wilshire Mutual Funds Table of Contents |  |
Shareholder Letter | 1 |
| Commentary: | |
Large Company Growth Portfolio | 3 |
Large Company Value Portfolio | 7 |
Small Company Growth Portfolio | 11 |
Small Company Value Portfolio | 15 |
Wilshire 5000 IndexSM Fund | 19 |
Wilshire International Equity Fund | 25 |
Disclosure of Fund Expenses | 29 |
| Condensed Schedules of Investments: | |
Large Company Growth Portfolio | 32 |
Large Company Value Portfolio | 34 |
Small Company Growth Portfolio | 36 |
Small Company Value Portfolio | 38 |
Wilshire 5000 IndexSM Fund | 40 |
Wilshire International Equity Fund | 42 |
Statements of Assets and Liabilities | 46 |
Statements of Operations | 49 |
Statements of Changes in Net Assets | 51 |
| Financial Highlights: | |
Large Company Growth Portfolio | 57 |
Large Company Value Portfolio | 59 |
Small Company Growth Portfolio | 61 |
Small Company Value Portfolio | 63 |
Wilshire 5000 IndexSM Fund | 65 |
Wilshire International Equity Fund | 69 |
Notes to Financial Statements | 71 |
Additional Fund Information | 83 |
Board Approval of Subadvisory Agreements | 84 |
This report is for the general information of the shareholders of Large Company Growth Portfolio, Large Company Value Portfolio, Small Company Growth Portfolio, Small Company Value Portfolio, Wilshire 5000 IndexSM Fund and Wilshire International Equity Fund. Its use in connection with any offering of a Portfolio’s shares is authorized only if accompanied or preceded by the Portfolio’s current prospectus.
Wilshire Mutual Funds, Inc. are distributed by SEI Investments Distribution Co.
Wilshire Mutual Funds Letter to Shareholders | |
Dear Wilshire Mutual Fund Shareholder:
We are pleased to present this semi-annual report to all shareholders of the Wilshire Mutual Funds. This report covers the period from January 1, 2013 to June 30, 2013, for all share classes of the Large Company Growth Portfolio, Large Company Value Portfolio, Small Company Growth Portfolio, Small Company Value Portfolio, Wilshire 5000 IndexSM Fund, and Wilshire International Equity Fund.
Market Environment
U.S. Equity Market
The U.S. stock market, represented by the Wilshire 5000 IndexSM, posted a total return of 13.98% during the first half of the year. Small-cap growth stocks gained the most year-to-date, as the Wilshire U.S. Small-Cap Growth IndexSM added 18.55%. The market’s rise was realized despite giving back 1.27% in June, its first monthly loss since October 2012. Solid gains in April and May – up 1.93% and 2.34%, respectively – propelled U.S. stocks to an impressive 13.98% advance through the end of June. This marked the best first half of a calendar year since 1998, when the U.S. stock market was up 15.47% through the first six months of that year. Small capitalization stocks outperformed larger stocks in the first half of 2013, and on a style basis, micro-cap stocks have enjoyed an outstanding 2013 so far.
International Equity Market
International equities also advanced in the first half of the year as the MSCI EAFE Index rose 4.10%. However, emerging markets equities struggled year-to-date, with the MSCI Emerging Markets Index losing (9.57%). Through the first half of the year, the European Union continued to struggle with political uncertainty in Greece as well as lackluster economic expansion and/or recession throughout the region. The announced upcoming wind-down of the U.S. Federal Reserve’s programs of accommodative lending sent markets reeling worldwide. Japan’s 2013 rally plunged into a volatile bear run after the Nikkei hit a five-year high on May 22; however, Japanese stocks remain among the strongest performers this year. Emerging markets stocks continued to find performance held back by concerns over China’s slowing domestic economy. Additionally, political unrest in Egypt, Brazil, and Turkey late in the second quarter weighed on emerging markets.
Bond Market
Bond returns were mixed in the first half of the year. The broad fixed-income market posted positive returns as the Barclays Aggregate Bond Index returned 2.44% year-to-date. High yield bonds also did well on a relative basis, as the Barclays U.S. Corporate High Yield Index gained 1.42% in the same period. Long-term U.S. Treasuries lost value, with the Barclays Long Term Treasury Index losing (7.97%) in the first two quarters. Bond yields began to drift lower in April, with the bellwether 10-year U.S. Treasury hitting a near-term low of 1.66% on May 1. Subsequently, yields climbed sharply higher, with the 10-year Treasury closing the second quarter at 2.52%, fully 65 basis points higher than its first quarter close. With the end of the Federal Reserve’s “easy money” policy looming on the horizon, interest rate-sensitive assets in general suffered losses; corporate spreads widened over the quarter as well. Non-U.S. fixed income performed roughly on par with U.S.-based paper, although the strength of the U.S. dollar eroded performance on unhedged assets.
Fund Performance Review
The Wilshire Mutual Funds turned in mostly positive relative performance in the first half of 2013. The Large Company Growth Portfolio Institutional Class returned 9.02% underperforming the Russell 1000 Growth Index by 2.78%, Large Company Value Portfolio Institutional Class returned 18.57% outperforming the Russell 1000 Value Index by 2.67%, Small Company Growth Portfolio Institutional Class returned 17.89% outperforming the Russell 2000 Growth Index by 0.45%, Small Company Value Portfolio Institutional Class returned 18.43% outperforming the Russell 2000 Value Index by 4.04%, Wilshire 5000 IndexSM Fund Institutional Class returned 13.86% underperforming the Wilshire 5000 IndexSM by
Wilshire Mutual Funds Letter to Shareholders - (Continued) | |
0.12%, and Wilshire International Equity Fund Institutional Class returned 4.42% outperforming the MSCI EAFE Index by 0.32%. While Wilshire Large Company Growth Portfolio’s and the Wilshire 5000 IndexSM Fund’s Institutional Classes underperformed their respective benchmarks, we are confident that each Portfolio is well positioned for future growth.
As always, we sincerely appreciate your continued support and confidence in Wilshire Associates.
Sincerely,
Jason Schwarz
President
Wilshire Mutual Funds, Inc.
The performance data quoted represents past performance and does not guarantee future results. Current performance may be lower or higher. Performance data current to the most recent month end may be obtained at http://advisor.wilshire.com. The investment return and principal value of an investment will fluctuate so that shares, when redeemed, may be worth more or less than their original cost.
Index performance is presented for general comparative purposes. Unlike a mutual fund, the performance of an index assumes no taxes, transaction costs, management fees or other expenses. An individual cannot directly invest in any index.
This material represents an assessment of the market environment at a specific point in time and is not intended to be a forecast of future events, or a guarantee of future results. This information should not be relied upon by the reader as research or investment advice regarding the funds or any stock in particular. There are risks involved with investing, including loss of principal.
There are risks involved with investing, including loss of principal. International investments may involve risk of capital loss from unfavorable fluctuation in currency values, from differences in generally accepted accounting principals or from social, economic or political instability in other nations. Investments in smaller companies typically exhibit higher volatility.
Large Company Growth Portfolio Commentary | |
INVESTMENT CLASS SHARES
Average Annual Total Return*
Six Months Ended 06/30/13** | 8.85% |
One Year Ended 06/30/13 | 12.44% |
Five Years Ended 06/30/13 | 4.97% |
Ten Years Ended 06/30/13 | 6.05% |
RUSSELL 1000® GROWTH INDEX(1)
Average Annual Total Return
Six Months Ended 06/30/13** | 11.80% |
One Year Ended 06/30/13 | 17.07% |
Five Years Ended 06/30/13 | 7.47% |
Ten Years Ended 06/30/13 | 7.40% |
The performance data quoted represents past performance and does not guarantee future results. Current performance may be lower or higher. Performance data current to the most recent month end may be obtained at http://advisor.wilshire.com. The investment return and principal value of an investment will fluctuate so that shares, when redeemed, may be worth more or less than their original cost. The table above does not reflect the deduction of taxes that a shareholder would pay on Portfolio distributions or the redemption of Portfolio shares.
| * | Assumes reinvestment of all distributions. During certain periods since inception, certain fees and expenses were waived or reimbursed. Without waivers and reimbursements, historical total returns would have been lower. For the six months ended June 30, 2013, there were no waivers. |
| ** | Not annualized. |
| (1) | The Russell 1000® Growth Index is an unmanaged index that measures the performance of the largest 1,000 U.S. companies with higher price-to-book ratios and higher forecasted growth values. Index performance is presented for general comparative purposes. Unlike a mutual fund, the performance of an index assumes no taxes, transaction costs, management fees or other expenses. An individual cannot directly invest in any index. |
Large Company Growth Portfolio Commentary - (Continued) | |
INSTITUTIONAL CLASS SHARES
Average Annual Total Return*
Six Months Ended 06/30/13** | 9.02% |
One Year Ended 06/30/13 | 12.75% |
Five Years Ended 06/30/13 | 5.31% |
Ten Years Ended 06/30/13 | 6.42% |
RUSSELL 1000® GROWTH INDEX(1)
Average Annual Total Return
Six Months Ended 06/30/13** | 11.80% |
One Year Ended 06/30/13 | 17.07% |
Five Years Ended 06/30/13 | 7.47% |
Ten Years Ended 06/30/13 | 4.40% |
The performance data quoted represents past performance and does not guarantee future results. Current performance may be lower or higher. Performance data current to the most recent month end may be obtained at http://advisor.wilshire.com. The investment return and principal value of an investment will fluctuate so that shares, when redeemed, may be worth more or less than their original cost. The table above does not reflect the deduction of taxes that a shareholder would pay on Portfolio distributions or the redemption of Portfolio shares.
| * | Assumes reinvestment of all distributions. During certain periods since inception, certain fees and expenses were waived or reimbursed. Without waivers and reimbursements, historical total returns would have been lower. For the six months ended June 30, 2013, there were no waivers. |
| ** | Not annualized. |
| (1) | The Russell 1000® Growth Index is an unmanaged index that measures the performance of the largest 1,000 U.S. companies with higher price-to-book ratios and higher forecasted growth values. Index performance is presented for general comparative purposes. Unlike a mutual fund, the performance of an index assumes no taxes, transaction costs, management fees or other expenses. An individual cannot directly invest in any index. |
Large Company Growth Portfolio Commentary - (Continued) | |
The U.S. stock market got off to its strongest start since 1998 as the S&P 500 Index rose 13.84% through June 2013. The market rallied in the first quarter with the S&P 500 Index hitting new all-time highs as investors cheered the news of a “Fiscal Cliff” resolution, a positive fourth quarter GDP estimate marking the 14th consecutive quarter of economic expansion, and signs of improvement within the housing sector. The second quarter saw more modest but still positive gains as investors grappled with the possibility of the Federal Reserve “tapering” its quantitative easing program earlier than anticipated. However, the U.S. market again hit new all-time highs during the second quarter. Both large and small capitalization stocks posted strong gains during the first six months of the year, however small capitalization securities modestly outpaced their large capitalization counterparts with the Russell 2000 Index and Russell 1000 Index returning 15.86% and 13.90%, respectively.
Within the large capitalization space, value stocks outperformed growth securities, and within the small capitalization space, growth stocks outperformed value securities. All sectors within the Wilshire 5000 IndexSM were positive year-to-date. Consumer Discretionary (20.47%), Health Care (20.42%) and Financials (17.95%) were the top performers, while Materials (2.06%) and Information Technology (6.62%) lagged the broader market during the first half of the year.
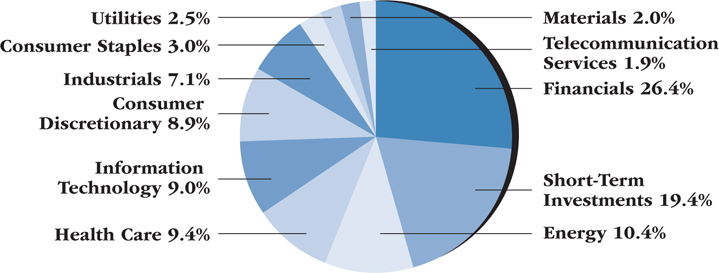
The Wilshire Large Company Growth Portfolio Institutional Class (the “Fund”) returned 9.02% for the first six months of 2013, underperforming the Russell 1000 Growth Index return of 11.80% by 2.78%. The Fund benefited from positive stock selection in Financials and a slight overweight allocation to Consumer Discretionary; performance was offset by poor stock selection in Industrials, Consumer Discretionary and Health Care.
Despite the Fund’s underperformance versus its benchmark, we believe the Fund is well positioned going into the second half of 2013 as the market deals with ongoing macroeconomic and geopolitical issues.
Large Company Growth Portfolio Commentary - (Continued) | |
PORTFOLIO SECTOR WEIGHTING†
(As of June 30, 2013)
| † | Based on percent of the Portfolio’s total investments in securities, at value. |
Large Company Value Portfolio Commentary | |
INVESTMENT CLASS SHARES
Average Annual Total Return*
Six Months Ended 06/30/13** | 18.47% |
One Year Ended 06/30/13 | 27.64% |
Five Years Ended 06/30/13 | 5.70% |
Ten Years Ended 06/30/13 | 6.45% |
RUSSELL 1000® VALUE INDEX(1)
Average Annual Total Return
Six Months Ended 06/30/13** | 15.90% |
One Year Ended 06/30/13 | 25.32% |
Five Years Ended 06/30/13 | 6.67% |
Ten Years Ended 06/30/13 | 7.79% |
The performance data quoted represents past performance and does not guarantee future results. Current performance may be lower or higher. Performance data current to the most recent month end may be obtained at http://advisor.wilshire.com. The investment return and principal value of an investment will fluctuate so that shares, when redeemed, may be worth more or less than their original cost. The table above does not reflect the deduction of taxes that a shareholder would pay on Portfolio distributions or the redemption of Portfolio shares.
| * | Assumes reinvestment of all distributions. During certain periods since inception, certain fees and expenses were waived or reimbursed. Without waivers and reimbursements, historical total returns would have been lower. For the six months ended June 30, 2013, there were no waivers. |
| ** | Not annualized. |
| (1) | The Russell 1000® Value Index is an unmanaged index that measures the performance of the largest 1,000 U.S. companies with lower price-to-book ratios and lower forecasted growth values. Index performance is presented for general comparative purposes. Unlike a mutual fund, the performance of an index assumes no taxes, transaction costs, management fees or other expenses. An individual cannot directly invest in any index. |
Large Company Value Portfolio Commentary - (Continued) | |
INSTITUTIONAL CLASS SHARES
Average Annual Total Return*
Six Months Ended 06/30/13** | 18.57% |
One Year Ended 06/30/13 | 27.95% |
Five Years Ended 06/30/13 | 5.93% |
Ten Years Ended 06/30/13 | 6.70% |
RUSSELL 1000® VALUE INDEX(1)
Average Annual Total Return
Six Months Ended 06/30/13** | 15.90% |
One Year Ended 06/30/13 | 25.32% |
Five Years Ended 06/30/13 | 6.67% |
Ten Years Ended 06/30/13 | 7.79% |
The performance data quoted represents past performance and does not guarantee future results. Current performance may be lower or higher. Performance data current to the most recent month end may be obtained at http://advisor.wilshire.com. The investment return and principal value of an investment will fluctuate so that shares, when redeemed, may be worth more or less than their original cost. The table above does not reflect the deduction of taxes that a shareholder would pay on Portfolio distributions or the redemption of Portfolio shares.
| * | Assumes reinvestment of all distributions. During certain periods since inception, certain fees and expenses were waived or reimbursed. Without waivers and reimbursements, historical total returns would have been lower. For the six months ended June 30, 2013, there were no waivers. |
| ** | Not annualized. |
| (1) | The Russell 1000® Value Index is an unmanaged index that measures the performance of the largest 1,000 U.S. companies with lower price-to-book ratios and lower forecasted growth values. Index performance is presented for general comparative purposes. Unlike a mutual fund, the performance of an index assumes no taxes, transaction costs, management fees or other expenses. An individual cannot directly invest in any index. |
Large Company Value Portfolio Commentary - (Continued) | |
The U.S. stock market got off to its strongest start since 1998 as the S&P 500 Index rose 13.84% through June 2013. The market rallied in the first quarter with the S&P 500 Index hitting new all-time highs as investors cheered the news of a “Fiscal Cliff” resolution, a positive fourth quarter GDP estimate marking the 14th consecutive quarter of economic expansion, and signs of improvement within the housing sector. The second quarter saw more modest but still positive gains as investors grappled with the possibility of the Federal Reserve “tapering” its quantitative easing program earlier than anticipated. However, the U.S. market again hit new all-time highs during the second quarter. Both large and small capitalization stocks posted strong gains during the first six months of the year, however small capitalization securities modestly outpaced their large capitalization counterparts with the Russell 2000 Index and Russell 1000 Index returning 15.86% and 13.90%, respectively.
Within the large capitalization space, value stocks outperformed growth securities, and within the small capitalization space, growth stocks outperformed value securities. All sectors within the Wilshire 5000 IndexSM were positive year-to-date. Consumer Discretionary (20.47%), Health Care (20.42%) and Financials (17.95%) were the top performers, while Materials (2.06%) and Information Technology (6.62%) lagged the broader market during the first half of the year.
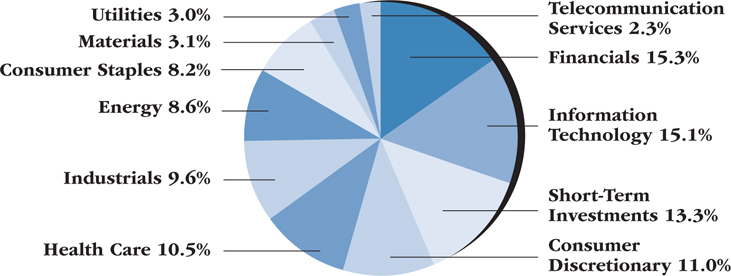
The Wilshire Large Company Value Portfolio Institutional Class (the (“Fund”) returned 18.57% for the first six months of 2013, outperforming the Russell 1000 Value Index return of 15.90% by 2.67%. The Fund benefited from positive stock selection in Financials and Consumer Discretionary as well as an underweight allocation to Information Technology; performance was partially offset by poor stock selection in Energy.
We are pleased with the Fund’s outperformance for the year-to-date period and believe the Fund is well positioned going into the second half of 2013 as the market deals with ongoing macroeconomic and geopolitical uncertainties.
Large Company Value Portfolio Commentary - (Continued) | |
PORTFOLIO SECTOR WEIGHTING†
(As of June 30, 2013)
| † | Based on percent of the Portfolio’s total investments in securities, at value. |
Small Company Growth Portfolio Commentary | |
INVESTMENT CLASS SHARES
Average Annual Total Return*
Six Months Ended 06/30/13** | 17.83% |
One Year Ended 06/30/13 | 25.18% |
Five Years Ended 06/30/13 | 7.71% |
Ten Years Ended 06/30/13 | 9.01% |
RUSSELL 2000® GROWTH INDEX(1)
Average Annual Total Return
Six Months Ended 06/30/13** | 17.44% |
One Year Ended 06/30/13 | 23.67% |
Five Years Ended 06/30/13 | 8.89% |
Ten Years Ended 06/30/13 | 9.62% |
The performance data quoted represents past performance and does not guarantee future results. Current performance may be lower or higher. Performance data current to the most recent month end may be obtained at http://advisor.wilshire.com. The investment return and principal value of an investment will fluctuate so that shares, when redeemed, may be worth more or less than their original cost. The table above does not reflect the deduction of taxes that a shareholder would pay on Portfolio distributions or the redemption of Portfolio shares.
| * | Assumes reinvestment of all distributions. During certain periods since inception, certain fees and expenses were waived or reimbursed. Without waivers and reimbursements, historical total returns would have been lower. For the six months ended June 30, 2013, fees totaling 0.34% of average net assets were waived for the Investment Class Shares. |
| ** | Not annualized. |
| (1) | The Russell 2000® Growth Index is an unmanaged index that measures the performance of the 2,000 smallest U.S. companies with higher price-to-book ratios and higher forecasted growth values. Index performance is presented for general comparative purposes. Unlike a mutual fund, the performance of an index assumes no taxes, transaction costs, management fees or other expenses. An individual cannot directly invest in any index. |
Small Company Growth Portfolio Commentary - (Continued) | |
INSTITUTIONAL CLASS SHARES
Average Annual Total Return*
Six Months Ended 06/30/13** | 17.89% |
One Year Ended 06/30/13 | 25.25% |
Five Years Ended 06/30/13 | 7.98% |
Ten Years Ended 06/30/13 | 9.27% |
RUSSELL 2000® GROWTH INDEX(1)
Average Annual Total Return
Six Months Ended 06/30/13** | 17.44% |
One Year Ended 06/30/13 | 23.67% |
Five Years Ended 06/30/13 | 8.89% |
Ten Years Ended 06/30/13 | 9.62% |
The performance data quoted represents past performance and does not guarantee future results. Current performance may be lower or higher. Performance data current to the most recent month end may be obtained at http://advisor.wilshire.com. The investment return and principal value of an investment will fluctuate so that shares, when redeemed, may be worth more or less than their original cost. The table above does not reflect the deduction of taxes that a shareholder would pay on Portfolio distributions or the redemption of Portfolio shares.
| * | Assumes reinvestment of all distributions. During certain periods since inception, certain fees and expenses were waived or reimbursed. Without waivers and reimbursements, historical total returns would have been lower. For the six months ended June 30, 2013, fees totaling 0.09% of average net assets were waived for the Institutional Class Shares. |
| ** | Not annualized. |
| (1) | The Russell 2000® Growth Index is an unmanaged index that measures the performance of the 2,000 smallest U.S. companies with higher price-to-book ratios and higher forecasted growth values. Index performance is presented for general comparative purposes. Unlike a mutual fund, the performance of an index assumes no taxes, transaction costs, management fees or other expenses. An individual cannot directly invest in any index. |
Small Company Growth Portfolio Commentary - (Continued) | |
The U.S. stock market got off to its strongest start since 1998 as the S&P 500 Index rose 13.84% through June 2013. The market rallied in the first quarter with the S&P 500 Index hitting new all-time highs as investors cheered the news of a “Fiscal Cliff” resolution, a positive fourth quarter GDP estimate marking the 14th consecutive quarter of economic expansion, and signs of improvement within the housing sector. The second quarter saw more modest but still positive gains as investors grappled with the possibility of the Federal Reserve “tapering” its quantitative easing program earlier than anticipated. However, the U.S. market again hit new all-time highs during the second quarter. Both large and small capitalization stocks posted strong gains during the first six months of the year, however small capitalization securities modestly outpaced their large capitalization counterparts with the Russell 2000 Index and Russell 1000 Index returning 15.86% and 13.90%, respectively.
Within the large capitalization space, value stocks outperformed growth securities, and within the small capitalization space, growth stocks outperformed value securities. All sectors within the Wilshire 5000 IndexSM were positive year-to-date. Consumer Discretionary (20.47%), Health Care (20.42%) and Financials (17.95%) were the top performers, while Materials (2.06%) and Information Technology (6.62%) lagged the broader market during the first half of the year.
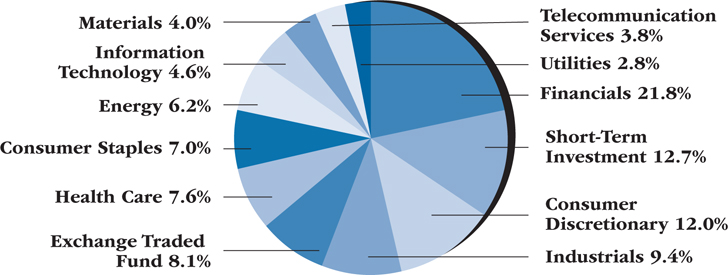
The Wilshire Small Company Growth Portfolio Institutional Class (the “Fund”) returned 17.89% for the first six months of 2013, outperforming the Russell 2000 Growth Index return of 17.44% by 0.45%. The Fund benefited from positive stock selection in Financials and Industrials; performance was partially offset by poor stock selection in Health Care and Energy.
We are pleased with the Fund’s outperformance for the year-to-date period and believe the Fund is well positioned going into the second half of 2013 as the market deals with ongoing macroeconomic and geopolitical uncertainties.
Small Company Growth Portfolio Commentary - (Continued) | |
PORTFOLIO SECTOR WEIGHTING†
(As of June 30, 2013)
| † | Based on percent of the Portfolio’s total investments in securities, at value. |
Small Company Value Portfolio Commentary | |
INVESTMENT CLASS SHARES
Average Annual Total Return*
Six Months Ended 06/30/13** | 18.33% |
One Year Ended 06/30/13 | 29.72% |
Five Years Ended 06/30/13 | 7.83% |
Ten Years Ended 06/30/13 | 9.12% |
RUSSELL 2000® VALUE INDEX(1)
Average Annual Total Return
Six Months Ended 06/30/13** | 14.39% |
One Year Ended 06/30/13 | 24.76% |
Five Years Ended 06/30/13 | 8.59% |
Ten Years Ended 06/30/13 | 9.30% |
The performance data quoted represents past performance and does not guarantee future results. Current performance may be lower or higher. Performance data current to the most recent month end may be obtained at http://advisor.wilshire.com. The investment return and principal value of an investment will fluctuate so that shares, when redeemed, may be worth more or less than their original cost. The table above does not reflect the deduction of taxes that a shareholder would pay on Portfolio distributions or the redemption of Portfolio shares.
| * | Assumes reinvestment of all distributions. During certain periods since inception, certain fees and expenses were waived or reimbursed. Without waivers and reimbursements, historical total returns would have been lower. For the six months ended June 30, 2013, fees totaling 0.21% of average net assets were waived in the Investment Class Shares. |
| ** | Not annualized. |
| (1) | The Russell 2000® Value Index is an unmanaged index that measures the performance of the 2,000 smallest U.S. companies with lower price-to-book ratios and lower forecasted growth values. Index performance is presented for general comparative purposes. Unlike a mutual fund, the performance of an index assumes no taxes, transaction costs, management fees or other expenses. An individual cannot directly invest in any index. |
Small Company Value Portfolio Commentary - (Continued) | |
INSTITUTIONAL CLASS SHARES
Average Annual Total Return*
Six Months Ended 06/30/13** | 18.43% |
One Year Ended 06/30/13 | 29.98% |
Five Years Ended 06/30/13 | 8.17% |
Ten Years Ended 06/30/13 | 9.48% |
RUSSELL 2000® VALUE INDEX(1)
Average Annual Total Return
Six Months Ended 06/30/13** | 14.39% |
One Year Ended 06/30/13 | 24.76% |
Five Years Ended 06/30/13 | 8.59% |
Ten Years Ended 06/30/13 | 9.30% |
The performance data quoted represents past performance and does not guarantee future results. Current performance may be lower or higher. Performance data current to the most recent month end may be obtained at http://advisor.wilshire.com. The investment return and principal value of an investment will fluctuate so that shares, when redeemed, may be worth more or less than their original cost. The table above does not reflect the deduction of taxes that a shareholder would pay on Portfolio distributions or the redemption of Portfolio shares.
| * | Assumes reinvestment of all distributions. During certain periods since inception, certain fees and expenses were waived or reimbursed. Without waivers and reimbursements, historical total returns would have been lower. For the six months ended June 30, 2013, fees totaling 0.03% of average net assets were waived in the Institutional Class Shares. |
| ** | Not annualized. |
| (1) | The Russell 2000® Value Index is an unmanaged index that measures the performance of the 2,000 smallest U.S. companies with lower price-to-book ratios and lower forecasted growth values. Index performance is presented for general comparative purposes. Unlike a mutual fund, the performance of an index assumes no taxes, transaction costs, management fees or other expenses. An individual cannot directly invest in any index. |
Small Company Value Portfolio Commentary - (Continued) | |
The U.S. stock market got off to its strongest start since 1998 as the S&P 500 Index rose 13.84% through June 2013. The market rallied in the first quarter with the S&P 500 Index hitting new all-time highs as investors cheered the news of a “Fiscal Cliff” resolution, a positive fourth quarter GDP estimate marking the 14th consecutive quarter of economic expansion, and signs of improvement within the housing sector. The second quarter saw more modest but still positive gains as investors grappled with the possibility of the Federal Reserve “tapering” its quantitative easing program earlier than anticipated. However, the U.S. market again hit new all-time highs during the second quarter. Both large and small capitalization stocks posted strong gains during the first six months of the year, however small capitalization securities modestly outpaced their large capitalization counterparts with the Russell 2000 Index and Russell 1000 Index returning 15.86% and 13.90%, respectively.
Within the large capitalization space, value stocks outperformed growth securities, and within the small capitalization space, growth stocks outperformed value securities. All sectors within the Wilshire 5000 IndexSM were positive year-to-date. Consumer Discretionary (20.47%), Health Care (20.42%) and Financials (17.95%) were the top performers, while Materials (2.06%) and Information Technology (6.62%) lagged the broader market during the first half of the year.
The Wilshire Small Company Value Portfolio Institutional Class (the “Fund”) returned 18.43% for the first six months of 2013, outperforming the Russell 2000 Value Index return of 14.39% by 4.04%. The Fund benefited from positive stock selection in Financials, Industrials and Materials as well as underweight allocations to Financials and Energy.
We are pleased with the Fund’s outperformance for the year-to-date period and believe the Fund is well positioned going into the second half of 2013 as the market deals with ongoing macroeconomic and geopolitical uncertainties.
Small Company Value Portfolio Commentary - (Continued) | |
PORTFOLIO SECTOR WEIGHTING†
(As of June 30, 2013)
| † | Based on percent of the Portfolio’s total investments in securities, at value. |
Wilshire 5000 Indexsm Fund Commentary | |
INVESTMENT CLASS SHARES
Average Annual Total Return*
Six Months Ended 06/30/13** | 13.60% |
One Year Ended 06/30/13 | 20.46% |
Five Years Ended 06/30/13 | 6.61% |
Ten Years Ended 06/30/13 | 7.12% |
WILSHIRE 5000 INDEXSM(1)
Average Annual Total Return
Six Months Ended 06/30/13** | 13.98% |
| One Year Ended 06/30/13 | 21.13% |
| Five Years Ended 06/30/13 | 7.19% |
| Ten Years Ended 06/30/13 | 7.96% |
The performance data quoted represents past performance and does not guarantee future results. Current performance may be lower or higher. Performance data current to the most recent month end may be obtained at http://advisor.wilshire.com. The investment return and principal value of an investment will fluctuate so that shares, when redeemed, may be worth more or less than their original cost. The table above does not reflect the deduction of taxes that a shareholder would pay on Fund distributions or the redemption of Fund shares.
| * | Assumes reinvestment of all distributions. During certain periods since inception, certain fees and expenses were waived or reimbursed. Without waivers and reimbursements, historical total returns would have been lower. For the six months ended June 30, 2013, there were no waivers. |
| ** | Not annualized. |
| (1) | The Wilshire 5000 IndexSM is an unmanaged index that measures the performance of all U.S. headquartered equity securities with readily available price data. Index performance is presented for general comparative purposes. Unlike a mutual fund, the performance of an index assumes no taxes, transaction costs, management fees or other expenses. An individual cannot directly invest in any index. |
Wilshire 5000 Indexsm Fund Commentary - (Continued) | |
INSTITUTIONAL CLASS SHARES
Average Annual Total Return*
Six Months Ended 06/30/13** | 13.86% |
One Year Ended 06/30/13 | 20.72% |
Five Years Ended 06/30/13 | 6.81% |
Ten Years Ended 06/30/13 | 7.36% |
WILSHIRE 5000 INDEXSM(1)
Average Annual Total Return
Six Months Ended 06/30/13** | 13.98% |
| One Year Ended 06/30/13 | 21.13% |
| Five Years Ended 06/30/13 | 7.19% |
| Ten Years Ended 06/30/13 | 7.96% |
The performance data quoted represents past performance and does not guarantee future results. Current performance may be lower or higher. Performance data current to the most recent month end may be obtained at http://advisor.wilshire.com. The investment return and principal value of an investment will fluctuate so that shares, when redeemed, may be worth more or less than their original cost. The table above does not reflect the deduction of taxes that a shareholder would pay on Fund distributions or the redemption of Fund shares.
| * | Assumes reinvestment of all distributions. During certain periods since inception, certain fees and expenses were waived or reimbursed. Without waivers and reimbursements, historical total returns would have been lower. For the six months ended June 30, 2013, there were no waivers. |
| ** | Not annualized. |
| (1) | The Wilshire 5000 IndexSM is an unmanaged index that measures the performance of all U.S. headquartered equity securities with readily available price data. Index performance is presented for general comparative purposes. Unlike a mutual fund, the performance of an index assumes no taxes, transaction costs, management fees or other expenses. An individual cannot directly invest in any index. |
Wilshire 5000 Indexsm Fund Commentary - (Continued) | |
QUALIFIED CLASS SHARES
Average Annual Total Return*
| Six Months Ended 06/30/13** | 14.00% |
| One Year Ended 06/30/13 | 21.23% |
| Five Years Ended 06/30/13 | 6.88% |
| Ten Years Ended 06/30/13 | 7.18% |
WILSHIRE 5000 INDEXSM(1)
Average Annual Total Return
| Six Months Ended 06/30/13** | 13.98% |
| One Year Ended 06/30/13 | 21.13% |
| Five Years Ended 06/30/13 | 7.19% |
| Ten Years Ended 06/30/13 | 7.96% |
The performance data quoted represents past performance and does not guarantee future results. Current performance may be lower or higher. Performance data current to the most recent month end may be obtained at http://advisor.wilshire.com. The investment return and principal value of an investment will fluctuate so that shares, when redeemed, may be worth more or less than their original cost. The table above does not reflect the deduction of taxes that a shareholder would pay on Fund distributions or the redemption of Fund shares.
| * | Assumes reinvestment of all distributions. During certain periods since inception, certain fees and expenses were waived or reimbursed. Without waivers and reimbursements, historical total returns would have been lower. For the six months ended June 30, 2013, there were no waivers. |
| ** | Not annualized. |
| (1) | The Wilshire 5000 IndexSM is an unmanaged index that measures the performance of all U.S. headquartered equity securities with readily available price data. Index performance is presented for general comparative purposes. Unlike a mutual fund, the performance of an index assumes no taxes, transaction costs, management fees or other expenses. An individual cannot directly invest in any index. |
Wilshire 5000 Indexsm Fund Commentary - (Continued) | |
HORACE MANN CLASS SHARES
Average Annual Total Return*
| Six Months Ended 06/30/13** | 13.63% |
| One Year Ended 06/30/13 | 20.43% |
| Five Years Ended 06/30/13 | 6.59% |
| Ten Years Ended 06/30/13 | 7.06% |
WILSHIRE 5000 INDEXSM(1)
Average Annual Total Return
| Six Months Ended 06/30/13** | 13.98% |
| One Year Ended 06/30/13 | 21.13% |
| Five Years Ended 06/30/13 | 7.19% |
| Ten Years Ended 06/30/13 | 7.96% |
The performance data quoted represents past performance and does not guarantee future results. Current performance may be lower or higher. Performance data current to the most recent month end may be obtained at http://advisor.wilshire.com. The investment return and principal value of an investment will fluctuate so that shares, when redeemed, may be worth more or less than their original cost. The table above does not reflect the deduction of taxes that a shareholder would pay on Fund distributions or the redemption of Fund shares.
| * | Assumes reinvestment of all distributions. During certain periods since inception, certain fees and expenses were waived or reimbursed. Without waivers and reimbursements, historical total returns would have been lower. For the six months ended June 30, 2013, there were no waivers. |
| ** | Not annualized. |
| (1) | The Wilshire 5000 IndexSM is an unmanaged index that measures the performance of all U.S. headquartered equity securities with readily available price data. Index performance is presented for general comparative purposes. Unlike a mutual fund, the performance of an index assumes no taxes, transaction costs, management fees or other expenses. An individual cannot directly invest in any index. |
Wilshire 5000 Indexsm Fund Commentary - (Continued) | |
The U.S. stock market got off to its strongest start since 1998 as the S&P 500 Index rose 13.84% through June 2013. The market rallied in the first quarter with the S&P 500 Index hitting new all-time highs as investors cheered the news of a “Fiscal Cliff” resolution, a positive fourth quarter GDP estimate marking the 14th consecutive quarter of economic expansion, and signs of improvement within the housing sector. The second quarter saw more modest but still positive gains as investors grappled with the possibility of the Federal Reserve “tapering” its quantitative easing program earlier than anticipated. However, the U.S. market again hit new all-time highs during the second quarter. Both large and small capitalization stocks posted strong gains during the first six months of the year, however small capitalization securities modestly outpaced their large capitalization counterparts with the Russell 2000 Index and Russell 1000 Index returning 15.86% and 13.90%, respectively.
Within the large capitalization space, value stocks outperformed growth securities, and within the small capitalization space, growth stocks outperformed value securities. All sectors within the Wilshire 5000 IndexSM were positive year-to-date. Consumer Discretionary (20.47%), Health Care (20.42%) and Financials (17.95%) were the top performers, while Materials (2.06%) and Information Technology (6.62%) lagged the broader market during the first half of the year.
The Wilshire 5000 IndexSM Fund Institutional Class (the “Fund”) returned 13.86% for the first six months of 2013, slightly trailing the Fund’s benchmark (the Wilshire 5000 IndexSM) return of 13.98% by 0.12%. The underperformance is attributable to the optimization approach utilized by Los Angeles Capital Management and Equity Research Inc. and is well within the range of historical experience.
Wilshire 5000 Indexsm Fund Commentary - (Continued) | |
PORTFOLIO SECTOR WEIGHTING†
(As of June 30, 2013)
| † | Based on percent of the Fund’s total investments in securities, at value. |
Wilshire International Equity Fund Commentary | |
INVESTMENT CLASS SHARES
Average Annual Total Return**
| Six Months Ended 06/30/13*** | 4.32% |
| One Year Ended 06/30/13 | 10.16% |
| Five Years Ended 06/30/13 | 1.23% |
| Inception (11/16/07) through 06/30/13 | (0.82)% |
MSCI EAFE INDEX(1)
Average Annual Total Return
| Six Months Ended 06/30/13*** | 4.10% |
| One Year Ended 06/30/13 | 18.62% |
| Five Years Ended 06/30/13 | (0.63)% |
| Inception (11/16/07) through 06/30/13 | (5.47)% |
S&P 500 INDEX(2)
Average Annual Total Return
| Six Months Ended 06/30/13*** | 13.82% |
| One Year Ended 06/30/13 | 20.60% |
| Five Years Ended 06/30/13 | 7.01% |
| Inception (11/16/07) through 06/30/13 | 4.01% |
The performance data quoted represents past performance and does not guarantee future results. Current performance may be lower or higher. Performance data current to the most recent month end may be obtained at http://advisor.wilshire.com. The investment return and principal value of an investment will fluctuate so that shares, when redeemed, may be worth more or less than their original cost. The table above does not reflect the deduction of taxes that a shareholder would pay on Fund distributions or the redemption of Fund shares.
| * | Effective April 2, 2013, the Fund changed its investment strategy. Consequently, prior period performance may have been different if the new investment strategy had been in effect during these periods. |
| ** | Assumes reinvestment of all distributions. During certain periods since inception, certain fees and expenses were waived or reimbursed. Without waivers and reimbursements, historical total returns would have been lower. For the six months ended June 30, 2013, fees totaling 0.06% of average net assets were waived in the Investment Class Shares. |
| *** | Not annualized. |
| (1) | Effective April 2, 2013, the Fund changed its benchmark to the MSCI EAFE Index because it is more reflective of the Fund’s investment strategy. The MSCI EAFE Index is an unmanaged capitalization-weighted measure of stock markets in Europe, Australasia and the Far East. An individual cannot invest directly in any index. Index performance is presented for general comparitive purposes. |
| (2) | The S&P 500 Index consists of 500 stocks chosen for market size, liquidity, and industry group representation. It is a market-value weighted index (stock price times the number of shares outstanding), with each stock’s weight in the index proportionate to its market value. Index performance is presented for general comparative purposes. Unlike a mutual fund, the performance of an index assumes no taxes, transaction costs, management fees or other expenses. An individual cannot directly invest in any index. |
Wilshire International Equity Fund Commentary - (Continued) | |
INSTITUTIONAL CLASS SHARES
Average Annual Total Return**
| Six Months Ended 06/30/13*** | 4.42% |
| One Year Ended 06/30/13 | 10.30% |
| Five Years Ended 06/30/13 | 1.52% |
| Inception (11/16/07) through 06/30/13 | (0.54)% |
MSCI EAFE INDEX(1)
Average Annual Total Return
| Six Months Ended 06/30/13*** | 4.10% |
| One Year Ended 06/30/13 | 18.62% |
| Five Years Ended 06/30/13 | (0.63)% |
| Inception (11/16/07) through 06/30/13 | (5.47)% |
S&P 500 INDEX(2)
Average Annual Total Return
| Six Months Ended 06/30/13*** | 13.82% |
| One Year Ended 06/30/13 | 20.60% |
| Five Years Ended 06/30/13 | 7.01% |
| Inception (11/16/07) through 06/30/13 | 4.01% |
The performance data quoted represents past performance and does not guarantee future results. Current performance may be lower or higher. Performance data current to the most recent month end may be obtained at http://advisor.wilshire.com. The investment return and principal value of an investment will fluctuate so that shares, when redeemed, may be worth more or less than their original cost. The table above does not reflect the deduction of taxes that a shareholder would pay on Fund distributions or the redemption of Fund shares.
| * | Effective April 2, 2013, the Fund changed its investment strategy. Consequently, prior period performance may have been different if the new investment strategy had been in effect during these periods. |
| ** | Assumes reinvestment of all distributions. During certain periods since inception, certain fees and expenses were waived or reimbursed. Without waivers and reimbursements, historical total returns would have been lower. For the six months ended June 30, 2013, fees totaling 0.11% of average net assets were waived in the Institutional Class Shares. |
| *** | Not annualized. |
| (1) | Effective April 2, 2013, the Fund changed its benchmark to the MSCI EAFE Index because it is more reflective of the Fund’s investment strategy. The MSCI EAFE Index is an unmanaged capitalization-weighted measure of stock markets in Europe, Australasia and the Far East. An individual cannot invest directly in any index. Index performance is presented for general comparitive purposes. |
| (2) | The S&P 500 Index consists of 500 stocks chosen for market size, liquidity, and industry group representation. It is a market-value weighted index (stock price times the number of shares outstanding), with each stock’s weight in the index proportionate to its market value. Index performance is presented for general comparative purposes. Unlike a mutual fund, the performance of an index assumes no taxes, transaction costs, management fees or other expenses. An individual cannot directly invest in any index. |
Wilshire International Equity Fund Commentary - (Continued) | |
Within the MSCI EAFE Index, sector performance was mixed. Consumer Discretionary (13.68%), Health Care (13.47%) and Telecom Services (11.98%) performed strongly, while Utilities (3.79%) and Information Technology (4.40%) lagged. Hurt by decreasing commodity prices, Materials (12.81%) and Energy (4.48%) were the worst performing sectors during the period.
Effective on April 2, 2013, the “Wilshire Large Cap Core Plus Fund” changed its name to “Wilshire International Equity Fund” (the “Fund”). The Fund has changed its primary benchmark index to the MSCI EAFE Index. The MSCI EAFE Index (Europe, Australasia, Far East) is a free float-adjusted market capitalization index that is designed to measure the equity market performance of developed markets, excluding the U.S. & Canada. In addition, the Fund’s “Principal Investment Strategies” and “Principal Risks” have changed. To view these changes, please refer to the Fund’s Prospectus supplement dated January 23, 2013.
The Fund’s Institutional Class returned 4.42% for the first six months of 2013, outperforming the MSCI EAFE Index return of 4.10% by 0.32%.
The Fund benefited from positive stock selection in Energy and Health Care as well as an underweight allocation to Materials; performance was partially offset by poor stock selection in Information Technology and Consumer Discretionary.
We are pleased with the Fund’s outperformance for the year-to-date period and believe the Fund is well positioned going into the second half of 2013 as the market deals with ongoing macroeconomic and geopolitical uncertainties.
Wilshire International Equity Fund Commentary - (Continued) | |
PORTFOLIO SECTOR WEIGHTING†
(As of June 30, 2013)
| † | Based on percent of the Fund’s total investments in securities, at value. |
Wilshire Mutual Funds, Inc. Disclosure of Fund Expenses For the Six Months Ended June 30, 2013 (Unaudited) | |
All mutual funds have operating expenses. As a shareholder of a portfolio (or a “fund”), you incur ongoing costs, which include costs for investment advisory, administrative services, distribution and/or shareholder services and shareholder reports (like this one), among others. Operating expenses, which are deducted from a fund’s gross income, directly reduce the investment return of the fund. A fund’s expenses are expressed as a percentage of its average net assets. This figure is known as the expense ratio. The following examples are intended to help you understand the ongoing fees (in dollars) of investing in your fund and to compare these costs with those of other mutual funds. The examples are based on an investment of $1,000 made at the beginning of the period shown and held for the entire period.
The table on the next page illustrates your Portfolio’s costs in two ways:
Actual Fund Return: This section helps you to estimate the actual expenses, after any applicable fee waivers, that you paid over the period. The “Ending Account Value” shown is derived from the Portfolio’s actual return for the period. The “Expense Ratio” column shows the period’s annualized expense ratio and the “Expenses Paid During Period” column shows the dollar amount that would have been paid by an investor who started with $1,000 in the Portfolio at the beginning of the period.
You may use the information here, together with your account value, to estimate the expenses that you paid over the period. To do so, simply divide your account value by $1,000 (for example, an $8,600 account value divided by $1,000 = 8.6), then multiply the result by the number given for your Portfolio in the first line under the heading entitled “Expenses Paid During Period.”
Hypothetical 5% Return: This section is intended to help you compare your Portfolio’s costs with those of other mutual funds. The “Ending Account Value” shown is derived from hypothetical account values and hypothetical expenses based on the Portfolio’s actual expense ratio and assumed rate of return. It assumes that the Portfolio had an annual return of 5% before expenses, but that the expense ratio is unchanged. In this case, because the return used is not the Portfolio’s actual return, the results do not apply to your investment. This example is useful in making comparisons to other mutual funds because the Securities and Exchange Commission (“SEC”) requires all mutual funds to calculate expenses based on an assumed 5% annual return. You can assess your Portfolio’s ongoing costs by comparing this hypothetical example with the hypothetical examples that appear in shareholder reports of other funds.
Please note that the expenses shown in the table are meant to highlight and help you compare your ongoing costs only and do not reflect any transactional costs such as sales charges (loads), redemption fees, or exchange fees. Wilshire Mutual Funds, Inc. has no such charges, but these may be present in other funds to which you compare this data. Therefore, the hypothetical portions of the table are useful in comparing ongoing costs only, and will not help you determine the relative total costs of owning different funds.
Wilshire Mutual Funds, Inc. Disclosure of Fund Expenses - (Continued) For the Six Months Ended June 30, 2013 (Unaudited) | |
| | Beginning Account Value 01/01/13 | Ending Account Value 06/30/13 | | Expenses Paid During Period 01/01/13-06/30/13(2) |
Large Company Growth Portfolio |
| Actual Fund Return | | | | |
Investment Class | $1,000.00 | $1,088.50 | 1.38% | $7.17 |
Institutional Class | $1,000.00 | $1,090.20 | 1.05% | $5.46 |
| Hypothetical 5% Return | | | | |
Investment Class | $1,000.00 | $1,017.93 | 1.38% | $6.92 |
| Institutional Class | $1,000.00 | $1,019.57 | 1.05% | $5.28 |
| | | | | |
Large Company Value Portfolio |
| Actual Fund Return | | | | |
Investment Class | $1,000.00 | $1,184.70 | 1.28% | $6.92 |
Institutional Class | $1,000.00 | $1,185.70 | 0.94% | $5.12 |
| Hypothetical 5% Return | | | | |
Investment Class | $1,000.00 | $1,018.46 | 1.28% | $6.39 |
Institutional Class | $1,000.00 | $1,020.11 | 0.94% | $4.73 |
| | | | | |
Small Company Growth Portfolio |
| Actual Fund Return | | | | |
Investment Class | $1,000.00 | $1,178.30 | 1.43% | $7.71 |
Institutional Class | $1,000.00 | $1,178.90 | 1.22% | $6.59 |
| Hypothetical 5% Return | | | | |
Investment Class | $1,000.00 | $1,017.72 | 1.43% | $7.14 |
Institutional Class | $1,000.00 | $1,018.74 | 1.22% | $6.11 |
| | | | | |
Small Company Value Portfolio |
| Actual Fund Return | | | | |
Investment Class | $1,000.00 | $1,183.30 | 1.49% | $8.08 |
Institutional Class | $1,000.00 | $1,184.30 | 1.24% | $6.72 |
| Hypothetical 5% Return | | | | |
Investment Class | $1,000.00 | $1,017.39 | 1.49% | $7.47 |
Institutional Class | $1,000.00 | $1,018.64 | 1.24% | $6.21 |
Wilshire Mutual Funds, Inc. Disclosure of Fund Expenses - (Continued) For the Six Months Ended June 30, 2013 (Unaudited) | |
| | Beginning Account Value 01/01/13 | Ending Account Value 06/30/13 | | Expenses Paid During Period 01/01/13-06/30/13(2) |
Wilshire 5000 IndexSM Fund |
| Actual Fund Return | | | | |
Investment Class | $1,000.00 | $1,136.00 | 0.67% | $3.55 |
Institutional Class | $1,000.00 | $1,138.60 | 0.47% | $2.47 |
Qualified Class | $1,000.00 | $1,140.00 | 0.00%(4) | $0.00 |
Horace Mann Class | $1,000.00 | $1,136.30 | 0.73% | $3.87 |
| Hypothetical 5% Return | | | | |
Investment Class | $1,000.00 | $1,021.47 | 0.67% | $3.36 |
Institutional Class | $1,000.00 | $1,022.48 | 0.47% | $2.34 |
Qualified Class | $1,000.00 | $1,024.79 | 0.00%(4) | $0.00 |
Horace Mann Class | $1,000.00 | $1,021.17 | 0.73% | $3.66 |
| | | | | |
Wilshire International Equity Fund |
| Actual Fund Return | | | | |
Investment Class | $1,000.00 | $1,043.20 | 1.98%(3) | $10.01 |
Institutional Class | $1,000.00 | $1,044.20 | 1.74%(3) | $8.81 |
| Hypothetical 5% Return | | | | |
Investment Class | $1,000.00 | $1,015.00 | 1.98%(3) | $9.87 |
Institutional Class | $1,000.00 | $1,016.18 | 1.74%(3) | $8.69 |
| (1) | Annualized, based on the Portfolio’s most recent fiscal half-year expenses. |
| (2) | Expenses are equal to the Portfolio’s annualized expense ratio multiplied by the average account value over the period, multiplied by the number of days in the period, then divided by 365. |
| (3) | The annualized expense ratios include dividend expense, interest expense and rebates on securities sold short during the six-month period. |
| (4) | There were no expenses accrued in the Wilshire 5000 IndexSM Fund Qualified Class for the six months ended June 30, 2013 due to the low average net assets (of approximately $141) relative to the other classes of this Fund. |
Wilshire Mutual Funds, Inc. Large Company Growth Portfolio Condensed Schedule of Investments | June 30, 2013 (Unaudited) | |
| | | Percentage of Net Assets (%) | | | | |
| COMMON STOCK — 99.1%†† | |
| Consumer Discretionary — 20.5% | | | | | | |
| | 20,512 | | Amazon.com, Inc. | | | 1.9 | | | $ | 5,695,977 | |
| | 54,534 | | Comcast Corp., Class A | | | 0.8 | | | | 2,283,884 | |
| | 48,262 | | Dick's Sporting Goods, Inc.(a) | | | 0.8 | | | | 2,415,996 | |
| | 58,944 | | Johnson Controls, Inc. | | | 0.7 | | | | 2,109,606 | |
| | 44,607 | | Michael Kors Holdings, Ltd.(a) | | | 0.9 | | | | 2,766,526 | |
| | 40,056 | | NIKE, Inc., Class B(a) | | | 0.9 | | | | 2,550,766 | |
| | 3,824 | | priceline.com, Inc.† (a) | | | 1.0 | | | | 3,162,945 | |
| | 14,581 | | Ralph Lauren Corp., Class A | | | 0.8 | | | | 2,533,303 | |
| | 44,417 | | Starbucks Corp. | | | 1.0 | | | | 2,908,869 | |
| | 43,730 | | TJX Cos., Inc.(a) | | | 0.7 | | | | 2,189,124 | |
| | 61,670 | | Walt Disney Co. (The) | | | 1.3 | | | | 3,894,461 | |
| | 675,190 | | Other Securities | | | 9.7 | | | | 29,571,228 | |
| | | | | | | | | | | 62,082,685 | |
| Consumer Staples — 8.0% | | | | | | | | |
| | 86,356 | | Coca-Cola Co. (The) | | | 1.1 | | | | 3,463,739 | |
| | 30,523 | | Diageo PLC ADR(a) | | | 1.2 | | | | 3,508,619 | |
| | 64,021 | | Philip Morris International, Inc. | | | 1.8 | | | | 5,545,499 | |
| | 250,909 | | Other Securities | | | 3.9 | | | | 11,840,322 | |
| | | | | | | | | | | 24,358,179 | |
| Energy — 4.0% | | | | | | | | |
| | 144,192 | | Cobalt International Energy, Inc.† | | | 1.3 | | | | 3,831,181 | |
| | 60,649 | | Schlumberger, Ltd. | | | 1.4 | | | | 4,346,107 | |
| | 69,069 | | Other Securities | | | 1.3 | | | | 4,015,838 | |
| | | | | | | | | | | 12,193,126 | |
| Financials — 5.7% | | | | | | | | |
| | 14,700 | | Affiliated Managers Group, Inc.† (a) | | | 0.8 | | | | 2,409,918 | |
| | 34,354 | | Camden Property Trust‡ (a) | | | 0.8 | | | | 2,375,235 | |
| | 30,155 | | CME Group, Inc., Class A(a) | | | 0.7 | | | | 2,291,177 | |
| | 296,582 | | Other Securities | | | 3.4 | | | | 10,324,734 | |
| | | | | | | | | | | 17,401,064 | |
| Health Care — 14.0% | | | | | | | | |
| | 11,016 | | Biogen Idec, Inc. | | | 0.8 | | | | 2,370,643 | |
| | 64,656 | | Catamaran Corp.(a) | | | 1.0 | | | | 3,150,040 | |
| | 27,602 | | Celgene Corp.† | | | 1.1 | | | | 3,226,950 | |
| | 50,961 | | Edwards Lifesciences Corp.† (a) | | | 1.1 | | | | 3,424,579 | |
| | 52,947 | | Express Scripts Holding Co. | | | 1.1 | | | | 3,266,301 | |
| | 100,044 | | Gilead Sciences, Inc.(a) | | | 1.7 | | | | 5,123,253 | |
| | 202,806 | | Hologic, Inc.(a) | | | 1.3 | | | | 3,914,156 | |
| Shares | | | | Percentage of Net Assets (%) | | | Value | |
| Health Care (continued) | | | | | | | | |
| | 370,791 | | Other Securities | | | 5.9 | | | $ | 18,125,861 | |
| | | | | | | | | | | 42,601,783 | |
| Industrials — 11.3% | | | | | | | | |
| | 44,053 | | Fluor Corp. | | | 0.8 | | | | 2,612,784 | |
| | 40,998 | | Joy Global, Inc.(a) | | | 0.7 | | | | 1,989,633 | |
| | 47,606 | | United Rentals, Inc.(a) | | | 0.8 | | | | 2,376,015 | |
| | 552,949 | | Other Securities | | | 9.0 | | | | 27,331,106 | |
| | | | | | | | | | | 34,309,538 | |
| Information Technology — 28.4% | | | | | | | | |
| | 82,188 | | Altera Corp.(a) | | | 0.9 | | | | 2,711,382 | |
| | 17,797 | | Apple, Inc. | | | 2.3 | | | | 7,049,036 | |
| | 79,514 | | Citrix Systems, Inc. | | | 1.6 | | | | 4,797,080 | |
| | 89,971 | | eBay, Inc.† | | | 1.5 | | | | 4,653,300 | |
| | 92,662 | | EMC Corp.(a) | | | 0.7 | | | | 2,188,676 | |
| | 15,478 | | Google, Inc., Class A† | | | 4.5 | | | | 13,626,367 | |
| | 16,588 | | International Business Machines Corp. | | | 1.0 | | | | 3,170,133 | |
| | 16,822 | | LinkedIn Corp., Class A† | | | 1.0 | | | | 2,999,362 | |
| | 108,161 | | Microsoft Corp. | | | 1.2 | | | | 3,734,799 | |
| | 74,574 | | NetApp, Inc.(a) | | | 0.9 | | | | 2,817,406 | |
| | 157,682 | | QUALCOMM, Inc. | | | 3.2 | | | | 9,631,217 | |
| | 71,449 | | Salesforce.com, Inc.† (a) | | | 0.9 | | | | 2,727,923 | |
| | 43,621 | | Visa, Inc., Class A(a) | | | 2.6 | | | | 7,971,738 | |
| | 267,532 | | Western Union Co. (The)(a) | | | 1.5 | | | | 4,577,473 | |
| | 405,931 | | Other Securities | | | 4.6 | | | | 13,690,338 | |
| | | | | | | | | | | 86,346,230 | |
| Materials — 5.7% | | | | | | | | |
| | 82,507 | | Freeport-McMoRan Copper & Gold, Inc. | | | 0.7 | | | | 2,278,018 | |
| | 32,819 | | Monsanto Co. | | | 1.1 | | | | 3,242,517 | |
| | 45,087 | | Mosaic Co. (The) | | | 0.8 | | | | 2,426,131 | |
| | 21,702 | | Sherwin-Williams Co. (The) | | | 1.3 | | | | 3,832,573 | |
| | 121,475 | | Other Securities | | | 1.8 | | | | 5,539,444 | |
| | | | | | | | | | | 17,318,683 | |
| Telecommunication Services — 1.4% | | | | | | | | |
| | 46,009 | | Verizon Communications, Inc. | | | 0.8 | | | | 2,316,093 | |
| | 95,708 | | Other Securities | | | 0.6 | | | | 1,803,185 | |
| | | | | | | | | | | 4,119,278 | |
| Utilities — 0.1% | | | | | | | | |
| | 3,210 | | Other Securities | | | 0.1 | | | | 132,605 | |
| | | | | | | | | | | | |
| Total Common Stock | | | | | | | | |
| (Cost $259,118,634) | | | | | | | 300,863,171 | |
See Notes to Financial Statements.
Wilshire Mutual Funds, Inc. Large Company Growth Portfolio Condensed Schedule of Investments - (Continued) | June 30, 2013 (Unaudited) | |
| | | Percentage of Net Assets (%) | | | | |
| SHORT-TERM INVESTMENTS (b) — 23.6% | | | | | | |
| | 5,475,716 | | Northern Trust Institutional Government Select Portfolio, 0.010% | | | 1.8 | | | $ | 5,475,716 | |
| | 66,318,438 | | Northern Trust Institutional Liquid Asset Portfolio, 0.010% (c) | | | 21.8 | | | | 66,318,438 | |
| | | | | | | | | | | | |
| Total Short-Term Investments | | | | | | | | |
| (Cost $71,794,154) | | | | | | | 71,794,154 | |
| | | | | | | | | | | | |
| Total Investments — 122.7% | | | | | | | | |
| (Cost $330,912,788) | | | | | | | 372,657,325 | |
| Other Assets & Liabilities, Net — (22.7)% | | | | | | | (68,880,731 | ) |
| | | | | | | | | | | | |
| NET ASSETS — 100.0% | | | | | | $ | 303,776,594 | |
| | Non-income producing security. |
| †† | More narrow industries are utilized for compliance purposes, whereas broad sectors are utilized for reporting purposes. |
| | Real Estate Investment Trust. |
| (a) | This security or a partial position of this security is on loan at June 30, 2013. The total market value of securities on loan at June 30, 2013 was $64,658,559 (Note 6). |
| (b) | Rate shown is the 7-day effective yield as of June 30, 2013. |
| (c) | This security was purchased with cash collateral held from securities on loan. The total value of such security as of June 30, 2013 was $66,318,438 (Note 6). |
ADR — American Depositary Receipt
Ltd. — Limited
PLC — Public Limited Company
The Condensed Schedule of Investments does not reflect the complete portfolio holdings. It includes the Portfolio’s 50 largest holdings and each investment of any issuer that exceeds 1% of the Portfolio’s net assets. “Other Securities” represent all issues not required to be disclosed under the rules adopted by the U.S. Securities and Exchange Commission (“SEC”). The complete schedule of portfolio holdings is available (i) without charge, upon request, by calling (800) 607-2200; (ii) on the SEC’s website at http://www.sec.gov; and (iii) on our website at http://advisor.wilshire.com.
As of June 30, 2013, all of the Portfolio’s investments were considered Level 1. For the six months ended June 30, 2013, there have been no transfers between Level 1 and Level 2 assets and liabilities. For the six months ended June 30, 2013, there have been no transfers between Level 2 and Level 3 assets and liabilities. Please see Note 2 in Notes to Financial Statements for further information regarding fair value measurements.
See Notes to Financial Statements.
Wilshire Mutual Funds, Inc. Large Company Value Portfolio Condensed Schedule of Investments | June 30, 2013 (Unaudited) | |
| | | | Percentage of Net Assets (%) | | | | |
| COMMON STOCK — 98.3%†† | |
| Consumer Discretionary — 10.8% | | | | | | |
| | 23,094 | | Comcast Corp., Class A | | | 0.6 | | | $ | 967,177 | |
| | 23,650 | | Delphi Automotive PLC | | | 0.8 | | | | 1,198,818 | |
| | 42,240 | | General Motors Co.(a) | | | 0.9 | | | | 1,407,014 | |
| | 22,918 | | Omnicom Group, Inc. | | | 0.9 | | | | 1,440,855 | |
| | 120,250 | | Staples, Inc.(a) | | | 1.2 | | | | 1,907,165 | |
| | 287,212 | | Other Securities | | | 6.4 | | | | 9,589,483 | |
| | | | | | | | | | | 16,510,512 | |
| Consumer Staples — 3.7% | | | | | | | | |
| | 23,140 | | CVS Caremark Corp. | | | 0.9 | | | | 1,323,145 | |
| | 12,605 | | Procter & Gamble Co. (The) | | | 0.7 | | | | 970,459 | |
| | 89,279 | | Other Securities | | | 2.1 | | | | 3,315,602 | |
| | | | | | | | | | | 5,609,206 | |
| Energy — 12.6% | | | | | | | | |
| | 30,317 | | Baker Hughes, Inc.(a) | | | 0.9 | | | | 1,398,523 | |
| | 48,578 | | BP PLC ADR | | | 1.3 | | | | 2,027,646 | |
| | 21,228 | | Chevron Corp. | | | 1.7 | | | | 2,512,122 | |
| | 35,608 | | Exxon Mobil Corp. | | | 2.1 | | | | 3,217,183 | |
| | 19,300 | | Hess Corp. | | | 0.8 | | | | 1,283,257 | |
| | 13,486 | | Occidental Petroleum Corp. | | | 0.8 | | | | 1,203,356 | |
| | 31,400 | | Royal Dutch Shell PLC ADR, Class A(a) | | | 1.3 | | | | 2,003,320 | |
| | 138,175 | | Other Securities | | | 3.7 | | | | 5,637,864 | |
| | | | | | | | | | | 19,283,271 | |
| Financials — 32.2% | | | | | | | | |
| | 29,539 | | Allstate Corp. (The) | | | 0.9 | | | | 1,421,417 | |
| | 62,833 | | American International Group, Inc.† (a) | | | 1.8 | | | | 2,808,635 | |
| | 220,884 | | Bank of America Corp. | | | 1.9 | | | | 2,840,568 | |
| | 9,330 | | Berkshire Hathaway, Inc., Class B(a) | | | 0.7 | | | | 1,044,214 | |
| | 61,751 | | Citigroup, Inc. | | | 1.9 | | | | 2,962,195 | |
| | 26,484 | | Discover Financial Services | | | 0.8 | | | | 1,261,698 | |
| | 90,638 | | Fifth Third Bancorp(a) | | | 1.1 | | | | 1,636,016 | |
| | 13,304 | | Goldman Sachs Group, Inc. (The)(a) | | | 1.3 | | | | 2,012,230 | |
| | 38,800 | | Invesco, Ltd. | | | 0.8 | | | | 1,233,840 | |
| | 67,744 | | JPMorgan Chase & Co. | | | 2.3 | | | | 3,576,206 | |
| | 58,163 | | MetLife, Inc. | | | 1.8 | | | | 2,661,539 | |
| | 55,378 | | Morgan Stanley | | | 0.9 | | | | 1,352,885 | |
| | 33,134 | | PNC Financial Services Group, Inc. | | | 1.6 | | | | 2,416,131 | |
| | 121,675 | | Regions Financial Corp. | | | 0.8 | | | | 1,159,563 | |
| Shares | | | | Percentage of Net Assets (%) | | | Value | |
| Financials (continued) | | | | | | | | |
| | 23,420 | | State Street Corp. | | | 1.0 | | | $ | 1,527,218 | |
| | 65,775 | | UBS AG | | | 0.7 | | | | 1,114,886 | |
| | 75,508 | | Wells Fargo & Co. | | | 2.0 | | | | 3,116,215 | |
| | 26,175 | | Willis Group Holdings PLC(a) | | | 0.7 | | | | 1,067,416 | |
| | 440,662 | | Other Securities | | | 9.2 | | | | 13,873,861 | |
| | | | | | | | | | | 49,086,733 | |
| Health Care — 11.5% | | | | | | | | |
| | 31,881 | | Abbott Laboratories | | | 0.7 | | | | 1,112,009 | |
| | 22,300 | | Aetna, Inc. | | | 0.9 | | | | 1,416,942 | |
| | 15,317 | | Becton Dickinson and Co.(a) | | | 1.0 | | | | 1,513,779 | |
| | 18,339 | | Johnson & Johnson(a) | | | 1.0 | | | | 1,574,587 | |
| | 30,643 | | Merck & Co., Inc. | | | 1.0 | | | | 1,423,367 | |
| | 76,569 | | Pfizer, Inc.(a) | | | 1.4 | | | | 2,144,698 | |
| | 214,572 | | Other Securities | | | 5.5 | | | | 8,299,095 | |
| | | | | | | | | | | 17,484,477 | |
| Industrials — 8.7% | | | | | | | | |
| | 128,601 | | General Electric Co.(a) | | | 2.0 | | | | 2,982,257 | |
| | 14,115 | | L-3 Communications Holdings, Inc., Class 3 | | | 0.8 | | | | 1,210,220 | |
| | 14,950 | | Northrop Grumman Corp. | | | 0.8 | | | | 1,237,860 | |
| | 230,900 | | Other Securities | | | 5.1 | | | | 7,860,818 | |
| | | | | | | | | | | 13,291,155 | |
| Information Technology — 11.0% | | | | | | | | |
| | 113,804 | | Cisco Systems, Inc. | | | 1.8 | | | | 2,766,575 | |
| | 135,764 | | Hewlett-Packard Co. | | | 2.2 | | | | 3,366,947 | |
| | 39,273 | | Microsoft Corp. | | | 0.9 | | | | 1,356,097 | |
| | 48,125 | | Oracle Corp. | | | 1.0 | | | | 1,478,400 | |
| | 24,025 | | TE Connectivity, Ltd. | | | 0.7 | | | | 1,094,099 | |
| | 383,126 | | Other Securities | | | 4.4 | | | | 6,729,427 | |
| | | | | | | | | | | 16,791,545 | |
| Materials — 2.5% | | | | | | | | |
| | 103,506 | | Other Securities | | | 2.5 | | | | 3,783,980 | |
| | | | | | | | | | | | |
| Telecommunication Services — 2.3% | | | | | | | | |
| | 65,111 | | AT&T, Inc. | | | 1.5 | | | | 2,304,929 | |
| | 73,994 | | Other Securities | | | 0.8 | | | | 1,172,960 | |
| | | | | | | | | | | 3,477,889 | |
| Utilities — 3.0% | | | | | | | | |
| | 16,450 | | Entergy Corp. | | | 0.7 | | | | 1,146,236 | |
| | 132,412 | | Other Securities | | | 2.3 | | | | 3,473,980 | |
| | | | | | | | | | | 4,620,216 | |
| Total Common Stock | | | | | | | | |
| (Cost $136,326,264) | | | | | | | 149,938,984 | |
See Notes to Financial Statements.
Wilshire Mutual Funds, Inc. Large Company Value Portfolio Condensed Schedule of Investments - (Continued) | June 30, 2013 (Unaudited) | |
| | | | Percentage of Net Assets (%) | | | | |
| SHORT-TERM INVESTMENTS (b) — 23.8% | | | | | | |
| | 2,019,644 | | Northern Trust Institutional Government Select Portfolio, 0.010% | | | 1.3 | | | $ | 2,019,644 | |
| | 34,189,871 | | Northern Trust Institutional Liquid Asset Portfolio, 0.010% (c) | | | 22.5 | | | | 34,189,871 | |
| | | | | | | | | | | | |
| Total Short-Term Investments | | | | | | | | |
| (Cost $36,209,515) | | | | | | | 36,209,515 | |
| | | | | | | | | | | | |
| Total Investments — 122.1% | | | | | | | | |
| (Cost $172,535,779) | | | | | | | 186,148,499 | |
| Other Assets & Liabilities, Net — (22.1)% | | | | | | | (33,631,986 | ) |
| | | | | | | | | | | | |
| NET ASSETS — 100.0% | | | | | | $ | 152,516,513 | |
| | Non-income producing security. |
| †† | More narrow industries are utilized for compliance purposes, whereas broad sectors are utilized for reporting purposes. |
| (a) | This security or a partial position of this security is on loan at June 30, 2013. The total market value of securities on loan at June 30, 2013 was $33,556,400 (Note 6). |
| (b) | Rate shown is the 7-day effective yield as of June 30, 2013. |
| (c) | This security was purchased with cash collateral held from securities on loan. The total value of such security as of June 30, 2013 was $34,189,871. Securities on loan are also collateralized by various U.S. Treasury obligations in the amount of $299,404 (Note 6). |
ADR — American Depositary Receipt
Ltd. — Limited
PLC — Public Limited Company
The Condensed Schedule of Investments does not reflect the complete portfolio holdings. It includes the Portfolio’s 50 largest holdings and each investment of any issuer that exceeds 1% of the Portfolio’s net assets. “Other Securities” represent all issues not required to be disclosed under the rules adopted by the U.S. Securities and Exchange Commission (“SEC”). The complete schedule of portfolio holdings is available (i) without charge, upon request, by calling (800) 607-2200; (ii) on the SEC’s website at http://www.sec.gov; and (iii) on our website at http://advisor.wilshire.com.
As of June 30, 2013, all of the Portfolio’s investments were considered Level 1. For the six months ended June 30, 2013, there have been no transfers between Level 1 and Level 2 assets and liabilities. For the six months ended June 30, 2013, there have been no transfers between Level 2 and Level 3 assets and liabilities. Please see Note 2 in Notes to Financial Statements for further information regarding fair value measurements.
See Notes to Financial Statements.
Wilshire Mutual Funds, Inc. Small Company Growth Portfolio Condensed Schedule of Investments | June 30, 2013 (Unaudited) | |
| | | | Percentage of Net Assets (%) | | | | |
| COMMON STOCK — 98.5%†† | |
| Consumer Discretionary — 18.6% | | | | | | |
| | 8,614 | | Asbury Automotive Group, Inc.(a) | | | 1.5 | | | $ | 345,421 | |
| | 3,949 | | Deckers Outdoor Corp.† | | | 0.9 | | | | 199,464 | |
| | 14,741 | | Express, Inc.† | | | 1.3 | | | | 309,119 | |
| | 5,513 | | Group 1 Automotive, Inc.(a) | | | 1.5 | | | | 354,651 | |
| | 8,264 | | Meritage Homes Corp. | | | 1.5 | | | | 358,327 | |
| | 21,299 | | Pier 1 Imports, Inc. | | | 2.1 | | | | 500,314 | |
| | 3,434 | | Red Robin Gourmet Burgers, Inc.(a) | | | 0.8 | | | | 189,488 | |
| | 12,510 | | Sonic Corp.† (a) | | | 0.8 | | | | 182,146 | |
| | 3,444 | | Steven Madden, Ltd. | | | 0.7 | | | | 166,621 | |
| | 86,137 | | Other Securities | | | 7.5 | | | | 1,840,332 | |
| | | | | | | | | | | 4,445,883 | |
| Consumer Staples — 5.9% | | | | | | | | |
| | 6,160 | | Inter Parfums, Inc.(a) | | | 0.8 | | | | 175,683 | |
| | 10,064 | | Prestige Brands Holdings, Inc.† | | | 1.2 | | | | 293,265 | |
| | 3,794 | | TreeHouse Foods, Inc.(a) | | | 1.0 | | | | 248,659 | |
| | 34,846 | | Other Securities | | | 2.9 | | | | 685,074 | |
| | | | | | | | | | | 1,402,681 | |
| Energy — 5.2% | | | | | | | | |
| | 16,700 | | Approach Resources, Inc.(a) | | | 1.7 | | | | 410,319 | |
| | 8,830 | | Gulfport Energy Corp.† | | | 1.8 | | | | 415,628 | |
| | 18,210 | | Pacific Drilling† | | | 0.8 | | | | 178,094 | |
| | 24,743 | | Other Securities | | | 0.9 | | | | 228,299 | |
| | | | | | | | | | | 1,232,340 | |
| Financials — 12.0% | | | | | | | | |
| | 6,440 | | Bank of the Ozarks, Inc.(a) | | | 1.2 | | | | 279,045 | |
| | 13,890 | | Hilltop Holdings, Inc.† (a) | | | 1.0 | | | | 227,796 | |
| | 10,539 | | Home BancShares, Inc.(a) | | | 1.1 | | | | 273,698 | |
| | 3,215 | | Iberiabank Corp.(a) | | | 0.7 | | | | 172,356 | |
| | 4,771 | | MarketAxess Holdings, Inc. | | | 0.9 | | | | 223,044 | |
| | 21,041 | | PrivateBancorp, Inc., Class A(a) | | | 1.9 | | | | 446,280 | |
| | 2,350 | | Signature Bank(a) | | | 0.8 | | | | 195,097 | |
| | 3,330 | | SVB Financial Group(a) | | | 1.2 | | | | 277,456 | |
| | 4,090 | | Texas Capital Bancshares, Inc.† (a) | | | 0.8 | | | | 181,432 | |
| | 34,533 | | Other Securities | | | 2.4 | | | | 579,447 | |
| | | | | | | | | | | 2,855,651 | |
| Shares | | | | Percentage of Net Assets (%) | | | Value | |
| Health Care — 18.1% | | | | | | | | |
| | 8,895 | | Air Methods Corp.(a) | | | 1.3 | | | $ | 301,363 | |
| | 24,614 | | Akorn, Inc.† (a) | | | 1.4 | | | | 332,781 | |
| | 1,879 | | athenahealth, Inc.(a) | | | 0.7 | | | | 159,189 | |
| | 6,160 | | Centene Corp.† | | | 1.4 | | | | 323,153 | |
| | 11,776 | | HMS Holdings Corp.† (a) | | | 1.2 | | | | 274,381 | |
| | 4,350 | | Medidata Solutions, Inc.† | | | 1.4 | | | | 336,907 | |
| | 7,774 | | PAREXEL International Corp.(a) | | | 1.5 | | | | 357,137 | |
| | 144,924 | | Other Securities | | | 9.2 | | | | 2,233,236 | |
| | | | | | | | | | | 4,318,147 | |
| Industrials — 17.0% | | | | | | | | |
| | 7,620 | | Advisory Board Co. (The) | | | 1.7 | | | | 416,433 | |
| | 7,493 | | Beacon Roofing Supply, Inc.(a) | | | 1.2 | | | | 283,835 | |
| | 3,116 | | Chart Industries, Inc.† (a) | | | 1.2 | | | | 293,184 | |
| | 6,010 | | EnerSys, Inc.(a) | | | 1.2 | | | | 294,731 | |
| | 17,051 | | Healthcare Services Group, Inc.(a) | | | 1.8 | | | | 418,090 | |
| �� | 3,880 | | Triumph Group, Inc.(a) | | | 1.3 | | | | 307,102 | |
| | 3,090 | | Wabtec Corp. | | | 0.7 | | | | 165,099 | |
| | 86,630 | | Other Securities | | | 7.9 | | | | 1,891,801 | |
| | | | | | | | | | | 4,070,275 | |
| Information Technology — 19.1% | | | | | | | | |
| | 27,650 | | Applied Micro Circuits Corp.† (a) | | | 1.0 | | | | 243,320 | |
| | 10,654 | | Aruba Networks, Inc.(a) | | | 0.7 | | | | 163,645 | |
| | 12,400 | | AVG Technologies NV† (a) | | | 1.0 | | | | 241,180 | |
| | 11,370 | | InvenSense, Inc., Class A† (a) | | | 0.7 | | | | 174,871 | |
| | 9,530 | | Ixia(a) | | | 0.7 | | | | 175,352 | |
| | 3,765 | | MAXIMUS, Inc. | | | 1.2 | | | | 280,417 | |
| | 6,140 | | QLIK Technologies, Inc. | | | 0.7 | | | | 173,578 | |
| | 4,070 | | Sourcefire, Inc.(a) | | | 0.9 | | | | 226,088 | |
| | 4,189 | | SPS Commerce, Inc.(a) | | | 1.0 | | | | 230,395 | |
| | 9,982 | | Synchronoss Technologies, Inc.† (a) | | | 1.3 | | | | 308,144 | |
| | 142,795 | | Other Securities | | | 9.9 | | | | 2,349,227 | |
| | | | | | | | | | | 4,566,217 | |
| Materials — 2.0% | | | | | | | | |
| | 27,658 | | Other Securities | | | 2.0 | | | | 480,969 | |
| | | | | | | | | | | | |
| Telecommunication Services — 0.5% | | | | | | | | |
| | 14,841 | | Other Securities | | | 0.5 | | | | 120,821 | |
See Notes to Financial Statements.
Wilshire Mutual Funds, Inc. Small Company Growth Portfolio Condensed Schedule of Investments - (Continued) | June 30, 2013 (Unaudited) | |
| Shares | | | | Percentage of Net Assets (%) | | | Value | |
| Utilities — 0.1% | | | | | | | | |
| | 1,100 | | Other Securities | | | 0.1 | | | $ | 25,872 | |
| | | | | | | | | | | | |
| Total Common Stock | | | | | | | | |
| (Cost $20,828,219) | | | | | | | 23,518,856 | |
| | | | | | | | | | | | |
| SHORT-TERM INVESTMENTS (b) — 50.2% | | | | | | | | |
| | 347,184 | | Northern Trust Institutional Government Select Portfolio, 0.010% | | | 1.5 | | | | 347,184 | |
| | 11,639,687 | | Northern Trust Institutional Liquid Asset Portfolio, 0.010% (c) | | | 48.7 | | | | 11,639,687 | |
| | | | | | | | | | | | |
| Total Short-Term Investments | | | | | | | | |
| (Cost $11,986,871) | | | | | | | 11,986,871 | |
| | | | | | | | | | | | |
| Total Investments — 148.7% | | | | | | | | |
| (Cost $32,815,090) | | | | | | | 35,505,727 | |
| Other Assets & Liabilities, Net — (48.7)% | | | | | | | (11,632,617 | ) |
| | | | | | | | | | | | |
| NET ASSETS — 100.0% | | | | | | $ | 23,873,110 | |
| | Non-income producing security. |
| †† | More narrow industries are utilized for compliance purposes, whereas broad sectors are utilized for reporting purposes. |
| (a) | This security or a partial position of this security is on loan at June 30, 2013. The total market value of securities on loan at June 30, 2013 was $11,303,062 (Note 6). |
| (b) | Rate shown is the 7-day effective yield as of June 30, 2013. |
| (c) | This security was purchased with cash collateral held from securities on loan. The total value of such security as of June 30, 2013 was $11,639,687. Securities on loan are also collateralized by various U.S. Treasury obligations in the amount of $8,871 (Note 6). |
Ltd. — Limited
The Condensed Schedule of Investments does not reflect the complete portfolio holdings. It includes the Portfolio’s 50 largest holdings and each investment of any issuer that exceeds 1% of the Portfolio’s net assets. “Other Securities” represent all issues not required to be disclosed under the rules adopted by the U.S. Securities and Exchange Commission (“SEC”). The complete schedule of portfolio holdings is available (i) without charge, upon request, by calling (800) 607-2200; (ii) on the SEC’s website at http://www.sec.gov; and (iii) on our website at http://advisor.wilshire.com.
As of June 30, 2013, all of the Portfolio’s investments were considered Level 1. For the six months ended June 30, 2013, there have been no transfers between Level 1 and Level 2 assets and liabilities. For the six months ended June 30, 2013, there have been no transfers between Level 2 and Level 3 assets and liabilities. Please see Note 2 in Notes to Financial Statements for further information regarding fair value measurements.
See Notes to Financial Statements.
Wilshire Mutual Funds, Inc. Small Company Value Portfolio Condensed Schedule of Investments | June 30, 2013 (Unaudited) | |
| | | | Percentage of Net Assets (%) | | | | |
| COMMON STOCK — 97.5%†† | |
| Consumer Discretionary — 13.7% | | | | | | |
| | 14,112 | | Bob Evans Farms, Inc.(a) | | | 2.4 | | | $ | 662,982 | |
| | 7,300 | | Harman International Industries, Inc.(a) | | | 1.5 | | | | 395,660 | |
| | 20,100 | | Hooker Furniture Corp. | | | 1.2 | | | | 326,826 | |
| | 11,210 | | Maidenform Brands, Inc. | | | 0.7 | | | | 194,269 | |
| | 127,175 | | Other Securities | | | 7.9 | | | | 2,143,225 | |
| | | | | | | | | | | 3,722,962 | |
| Consumer Staples — 7.8% | | | | | | | | |
| | 14,900 | | Elizabeth Arden, Inc.† (a) | | | 2.5 | | | | 671,543 | |
| | 9,100 | | Inter Parfums, Inc.(a) | | | 1.0 | | | | 259,532 | |
| | 6,905 | | TreeHouse Foods, Inc. | | | 1.7 | | | | 452,554 | |
| | 62,207 | | Other Securities | | | 2.6 | | | | 754,581 | |
| | | | | | | | | | | 2,138,210 | |
| Energy — 3.4% | | | | | | | | |
| | 20,200 | | Carrizo Oil & Gas, Inc.(a) | | | 2.1 | | | | 572,266 | |
| | 21,800 | | McDermott International, Inc.† (a) | | | 0.7 | | | | 178,324 | |
| | 20,867 | | Other Securities | | | 0.6 | | | | 177,768 | |
| | | | | | | | | | | 928,358 | |
| Financials — 28.4% | | | | | | | | |
| | 10,276 | | Ashford Hospitality Trust, Inc.‡ | | | 0.4 | | | | 117,660 | |
| | 11,000 | | Aspen Insurance Holdings, Ltd.(a) | | | 1.5 | | | | 407,990 | |
| | 9,830 | | CNO Financial Group, Inc. | | | 0.5 | | | | 127,397 | |
| | 13,653 | | First Commonwealth Financial Corp.(a) | | | 0.4 | | | | 100,623 | |
| | 26,300 | | Forestar Group, Inc.† (a) | | | 1.9 | | | | 527,578 | |
| | 18,400 | | HomeStreet, Inc.(a) | | | 1.4 | | | | 394,680 | |
| | 4,865 | | MB Financial, Inc. | | | 0.5 | | | | 130,382 | |
| | 11,184 | | National Penn Bancshares, Inc. | | | 0.4 | | | | 113,629 | |
| | 10,616 | | NorthStar Realty Finance Corp.‡ (a) | | | 0.4 | | | | 96,606 | |
| | 6,900 | | PacWest Bancorp(a) | | | 0.8 | | | | 211,485 | |
| | 16,892 | | PrivateBancorp, Inc., Class A(a) | | | 1.3 | | | | 358,279 | |
| | 9,439 | | Texas Capital Bancshares, Inc.† (a) | | | 1.5 | | | | 418,714 | |
| | 5,419 | | Webster Financial Corp. | | | 0.5 | | | | 139,160 | |
| | 21,128 | | Western Alliance Bancorp | | | 1.2 | | | | 334,456 | |
| | 266,310 | | Other Securities | | | 15.7 | | | | 4,242,800 | |
| | | | | | | | | | | 7,721,439 | |
| Shares | | | | Percentage of Net Assets (%) | | | Value | |
| Health Care — 3.1% | | | | | | | | |
| | 1,761 | | Magellan Health Services, Inc.† | | | 0.4 | | | $ | 98,757 | |
| | 55,377 | | Other Securities | | | 2.7 | | | | 749,265 | |
| | | | | | | | | | | 848,022 | |
| Industrials — 20.8% | | | | | | | | |
| | 11,259 | | Aircastle, Ltd.(a) | | | 0.7 | | | | 180,031 | |
| | 15,127 | | Albany International Corp., Class A | | | 1.8 | | | | 498,888 | |
| | 6,370 | | Astronics Corp.† (a) | | | 1.0 | | | | 260,342 | |
| | 4,300 | | EnerSys, Inc.(a) | | | 0.8 | | | | 210,872 | |
| | 17,200 | | GP Strategies Corp.† (a) | | | 1.5 | | | | 409,704 | |
| | 42,367 | | Griffon Corp.(a) | | | 1.8 | | | | 476,629 | |
| | 24,000 | | Marten Transport, Ltd.(a) | | | 1.4 | | | | 376,080 | |
| | 9,800 | | Mistras Group, Inc.(a) | | | 0.6 | | | | 172,284 | |
| | 23,600 | | Orbital Sciences Corp.† | | | 1.5 | | | | 409,932 | |
| | 14,394 | | Orion Marine Group, Inc.(a) | | | 0.6 | | | | 174,023 | |
| | 2,571 | | TAL International Group, Inc.(a) | | | 0.4 | | | | 112,019 | |
| | 9,600 | | TMS International Corp., Class A | | | 0.5 | | | | 142,368 | |
| | 14,300 | | Trimas Corp. | | | 2.0 | | | | 533,104 | |
| | 110,235 | | Other Securities | | | 6.2 | | | | 1,697,262 | |
| | | | | | | | | | | 5,653,538 | |
| Information Technology — 13.8% | | | | | | | | |
| | 8,200 | | Coherent, Inc. | | | 1.7 | | | | 451,574 | |
| | 27,000 | | Entegris, Inc.† | | | 0.9 | | | | 253,530 | |
| | 5,000 | | Euronet Worldwide, Inc.† (a) | | | 0.6 | | | | 159,300 | |
| | 30,300 | | GSI Group, Inc.† (a) | | | 0.9 | | | | 243,612 | |
| | 6,215 | | Measurement Specialties, Inc.(a) | | | 1.1 | | | | 289,184 | |
| | 16,800 | | Methode Electronics, Inc. | | | 1.0 | | | | 285,768 | |
| | 19,130 | | Microsemi Corp.(a) | | | 1.6 | | | | 435,208 | |
| | 12,200 | | MKS Instruments, Inc. | | | 1.2 | | | | 323,788 | |
| | 30,570 | | PMC - Sierra, Inc.† (a) | | | 0.7 | | | | 194,119 | |
| | 105,446 | | Other Securities | | | 4.1 | | | | 1,121,327 | |
| | | | | | | | | | | 3,757,410 | |
| Materials — 4.6% | | | | | | | | |
| | 3,800 | | Deltic Timber Corp. | | | 0.8 | | | | 219,716 | |
| | 11,769 | | Neenah Paper, Inc.(a) | | | 1.4 | | | | 373,901 | |
| | 42,438 | | Other Securities | | | 2.4 | | | | 648,951 | |
| | | | | | | | | | | 1,242,568 | |
See Notes to Financial Statements.
Wilshire Mutual Funds, Inc. Small Company Value Portfolio Condensed Schedule of Investments - (Continued) | June 30, 2013 (Unaudited) | |
| Shares | | | | Percentage of Net Assets (%) | | | Value | |
| Telecommunication Services — 0.6% | | | | | | |
| | 21,839 | | Other Securities | | | 0.6 | | | $ | 175,552 | |
| | | | | | | | | | | | |
| Utilities — 1.3% | | | | | | | | |
| | 10,690 | | Other Securities | | | 1.3 | | | | 364,140 | |
| | | | | | | | | | | | |
| Total Common Stock | | | | | | | | |
| (Cost $23,454,798) | | | | | | | 26,552,199 | |
| | | | | | | | | | | | |
| SHORT-TERM INVESTMENTS (b) — 44.8% | | | | | | | | |
| | 602,584 | | Northern Trust Institutional Government Select Portfolio, 0.010% | | | 2.2 | | | | 602,584 | |
| | 11,588,079 | | Northern Trust Institutional Liquid Asset Portfolio, 0.010% (c) | | | 42.6 | | | | 11,588,079 | |
| | | | | | | | | | | | |
| Total Short-Term Investments | | | | | | | | |
| (Cost $12,190,663) | | | | | | | 12,190,663 | |
| | | | | | | | | | | | |
| Total Investments — 142.3% | | | | | | | | |
| (Cost $35,645,461) | | | | | | | 38,742,862 | |
| Other Assets & Liabilities, Net — (42.3)% | | | | | | | (11,515,286 | ) |
| | | | | | | | | | | | |
| NET ASSETS — 100.0% | | | | | | $ | 27,227,576 | |
| | Non-income producing security. |
| †† | More narrow industries are utilized for compliance purposes, whereas broad sectors are utilized for reporting purposes. |
| | Real Estate Investment Trust. |
| (a) | This security or a partial position of this security is on loan at June 30, 2013. The total market value of securities on loan at June 30, 2013 was $11,303,675 (Note 6). |
| (b) | Rate shown is the 7-day effective yield as of June 30, 2013. |
| (c) | This security was purchased with cash collateral held from securities on loan. The total value of such security as of June 30, 2013 was $11,588,079. Securities on loan are also collateralized by various U.S. Treasury obligations in the amount of $115,176 (Note 6). |
Ltd. — Limited
The Condensed Schedule of Investments does not reflect the complete portfolio holdings. It includes the Portfolio’s 50 largest holdings and each investment of any issuer that exceeds 1% of the Portfolio’s net assets. “Other Securities” represent all issues not required to be disclosed under the rules adopted by the U.S. Securities and Exchange Commission (“SEC”). The complete schedule of portfolio holdings is available (i) without charge, upon request, by calling (800) 607-2200; (ii) on the SEC’s website at http://www.sec.gov; and (iii) on our website at http://advisor.wilshire.com.
As of June 30, 2013, all of the Portfolio’s investments were considered Level 1. For the six months ended June 30, 2013, there have been no transfers between Level 1 and Level 2 assets and liabilities. For the six months ended June 30, 2013, there have been no transfers between Level 2 and Level 3 assets and liabilities. Please see Note 2 in Notes to Financial Statements for further information regarding fair value measurements.
See Notes to Financial Statements.
Wilshire Mutual Funds, Inc. Wilshire 5000 Indexsm Fund Condensed Schedule of Investments | June 30, 2013 (Unaudited) | |
| | | | Percentage of Net Assets (%) | | | | |
| COMMON STOCK — 99.0% | |
| Consumer Discretionary — 12.6% | | | | | | |
| | 3,688 | | Amazon.com, Inc. | | | 0.6 | | | $ | 1,024,121 | |
| | 20,821 | | Comcast Corp., Class A | | | 0.5 | | | | 871,983 | |
| | 13,147 | | Home Depot, Inc. (The) | | | 0.6 | | | | 1,018,498 | |
| | 10,104 | | McDonald's Corp. | | | 0.6 | | | | 1,000,296 | |
| | 17,668 | | Walt Disney Co. (The) | | | 0.6 | | | | 1,115,734 | |
| | 501,748 | | Other Securities | | | 9.7 | | | | 17,119,647 | |
| | | | | | | | | | | 22,150,279 | |
| Consumer Staples — 9.4% | | | | | | | | |
| | 20,175 | | Altria Group, Inc. | | | 0.4 | | | | 705,923 | |
| | 43,140 | | Coca-Cola Co. (The) | | | 1.0 | | | | 1,730,345 | |
| | 13,042 | | CVS Caremark Corp. | | | 0.4 | | | | 745,742 | |
| | 15,591 | | PepsiCo, Inc. | | | 0.7 | | | | 1,275,188 | |
| | 16,525 | | Philip Morris International, Inc. | | | 0.8 | | | | 1,431,396 | |
| | 28,939 | | Procter & Gamble Co. (The) | | | 1.3 | | | | 2,228,014 | |
| | 17,470 | | Wal-Mart Stores, Inc. | | | 0.8 | | | | 1,301,340 | |
| | 164,430 | | Other Securities | | | 4.0 | | | | 7,085,631 | |
| | | | | | | | | | | 16,503,579 | |
| Energy — 9.9% | | | | | | | | |
| | 20,669 | | Chevron Corp. | | | 1.4 | | | | 2,445,969 | |
| | 13,181 | | ConocoPhillips | | | 0.5 | | | | 797,450 | |
| | 47,466 | | Exxon Mobil Corp. | | | 2.5 | | | | 4,288,553 | |
| | 8,680 | | Occidental Petroleum Corp. | | | 0.5 | | | | 774,516 | |
| | 14,224 | | Schlumberger, Ltd. | | | 0.6 | | | | 1,019,292 | |
| | 218,566 | | Other Securities | | | 4.4 | | | | 8,002,676 | |
| | | | | | | | | | | 17,328,456 | |
| Financials — 17.4% | | | | | | | | |
| | 9,475 | | American Express Co. | | | 0.4 | | | | 708,351 | |
| | 115,473 | | Bank of America Corp. | | | 0.8 | | | | 1,484,983 | |
| | 19,584 | | Berkshire Hathaway, Inc., Class B | | | 1.3 | | | | 2,191,841 | |
| | 31,265 | | Citigroup, Inc. | | | 0.9 | | | | 1,499,782 | |
| | 4,783 | | Goldman Sachs Group, Inc. (The) | | | 0.4 | | | | 723,429 | |
| | 40,734 | | JPMorgan Chase & Co. | | | 1.2 | | | | 2,150,348 | |
| | 2,850 | | Northern Trust Corp. | | | 0.1 | | | | 165,015 | |
| | 18,759 | | U.S. Bancorp | | | 0.4 | | | | 678,138 | |
| | 51,892 | | Wells Fargo & Co. | | | 1.2 | | | | 2,141,583 | |
| | 620,641 | | Other Securities | | | 10.7 | | | | 18,897,896 | |
| | | | | | | | | | | 30,641,366 | |
| Shares | | | | Percentage of Net Assets (%) | | | Value | |
| Health Care — 12.0% | | | | | | | | |
| | 17,125 | | AbbVie, Inc. | | | 0.4 | | | $ | 707,947 | |
| | 16,450 | | Bristol-Myers Squibb Co. | | | 0.4 | | | | 735,151 | |
| | 29,685 | | Johnson & Johnson | | | 1.5 | | | | 2,548,754 | |
| | 30,130 | | Merck & Co., Inc. | | | 0.8 | | | | 1,399,539 | |
| | 76,487 | | Pfizer, Inc. | | | 1.2 | | | | 2,142,401 | |
| | 10,380 | | UnitedHealth Group, Inc. | | | 0.4 | | | | 679,682 | |
| | 271,908 | | Other Securities | | | 7.3 | | | | 12,903,719 | |
| | | | | | | | | | | 21,117,193 | |
| Industrials — 10.9% | | | | | | | | |
| | 7,385 | | 3M Co. | | | 0.5 | | | | 807,550 | |
| | 7,515 | | Boeing Co. (The) | | | 0.4 | | | | 769,837 | |
| | 110,646 | | General Electric Co. | | | 1.5 | | | | 2,565,880 | |
| | 4,572 | | Union Pacific Corp. | | | 0.4 | | | | 705,368 | |
| | 7,921 | | United Parcel Service, Inc., Class B | | | 0.4 | | | | 685,008 | |
| | 9,820 | | United Technologies Corp. | | | 0.5 | | | | 912,671 | |
| | 302,155 | | Other Securities | | | 7.2 | | | | 12,772,806 | |
| | | | | | | | | | | 19,219,120 | |
| Information Technology — 17.3% | | | | | | | | |
| | 9,948 | | Apple, Inc. | | | 2.3 | | | | 3,940,204 | |
| | 56,598 | | Cisco Systems, Inc. | | | 0.8 | | | | 1,375,897 | |
| | 2,640 | | Google, Inc., Class A† | | | 1.3 | | | | 2,324,177 | |
| | 53,043 | | Intel Corp.(a) | | | 0.7 | | | | 1,284,701 | |
| | 11,180 | | International Business Machines Corp. | | | 1.2 | | | | 2,136,610 | |
| | 84,662 | | Microsoft Corp. | | | 1.7 | | | | 2,923,379 | |
| | 39,555 | | Oracle Corp. | | | 0.7 | | | | 1,215,130 | |
| | 18,250 | | QUALCOMM, Inc. | | | 0.7 | | | | 1,114,710 | |
| | 5,350 | | Visa, Inc., Class A | | | 0.6 | | | | 977,713 | |
| | 508,548 | | Other Securities | | | 7.3 | | | | 13,026,641 | |
| | | | | | | | | | | 30,319,162 | |
| Materials — 3.5% | | | | | | | | |
| | 163,440 | | Other Securities | | | 3.5 | | | | 6,158,349 | |
| | | | | | | | | | | | |
| Telecommunication Services — 2.6% | | | | | | | | |
| | 58,449 | | AT&T, Inc. | | | 1.2 | | | | 2,069,095 | |
| | 30,438 | | Verizon Communications, Inc. | | | 0.9 | | | | 1,532,249 | |
| | 71,510 | | Other Securities | | | 0.5 | | | | 974,471 | |
| | | | | | | | | | | 4,575,815 | |
See Notes to Financial Statements.
Wilshire Mutual Funds, Inc. Wilshire 5000 Indexsm Fund Condensed Schedule of Investments - (continued) | June 30, 2013 (Unaudited) | |
| Shares | | | | | Percentage of Net Assets (%) | | | | | |
| Utilities — 3.4% | | | | | | | | |
| | 150,780 | | Other Securities | | | 3.4 | | | $ | 5,988,909 | |
| | | | | | | | | | | | |
| Total Common Stock | | | | | | | | |
| (Cost $85,635,347) | | | | | | | 174,002,228 | |
| | | | | | | | | | | | |
| RIGHT — 0.0% | | | | | | | | |
| | | | | | | | | | |
| | 1,500 | | Other Securities (Cost $—) | | | 0.0 | | | | 4,500 | |
| | | | | | | | | | | | |
| WARRANTS — 0.0% | | | | | | | | |
| | 184 | | Other Securities (Cost $5,144) | | | 0.0 | | | | 338 | |
| | | | | | | | | | | | |
| SHORT-TERM INVESTMENTS (b) — 15.1% | | | | | | | | |
| | 1,606,369 | | Northern Trust Institutional Government Select Portfolio, 0.010% | | | 0.9 | | | | 1,606,369 | |
| | 24,991,940 | | Northern Trust Institutional Liquid Asset Portfolio, 0.010% (c) | | | 14.2 | | | | 24,991,940 | |
| | | | | | | | | | | | |
| Total Short-Term Investments | | | | | | | | |
| (Cost $26,598,309) | | | | | | | 26,598,309 | |
| | | | | | | | | | | | |
| Total Investments — 114.1% | | | | | | | | |
| (Cost $112,238,800) | | | | | | | 200,605,375 | |
| Other Assets & Liabilities, Net — (14.1)% | | | | | | | (24,846,156 | ) |
| | | | | | | | | | | | |
| NET ASSETS — 100.0% | | | | | | $ | 175,759,219 | |
| | Non-income producing security. |
| (a) | This security or a partial position of this security is on loan at June 30, 2013. The total market value of securities on loan at June 30, 2013 was $24,351,781 (Note 6). |
| (b) | Rate shown is the 7-day effective yield as of June 30, 2013. |
| (c) | This security was purchased with cash collateral held from securities on loan. The total value of such security as of June 30, 2013 was $24,991,940. Securities on loan are also collateralized by various U.S. Treasury obligations in the amount of $20,293 (Note 6). |
Ltd. — Limited
Amounts designated as “—“ are either $0, or have been rounded to $0.
The Condensed Schedule of Investments does not reflect the complete portfolio holdings. It includes the Portfolio’s 50 largest holdings and each investment of any issuer that exceeds 1% of the Portfolio’s net assets. “Other Securities” represent all issues not required to be disclosed under the rules adopted by the U.S. Securities and Exchange Commission (“SEC”). The complete schedule of portfolio holdings is available (i) without charge, upon request, by calling (800) 607-2200; (ii) on the SEC’s website at http://www.sec.gov; and (iii) on our website at http://advisor.wilshire.com.
As of June 30, 2013, all of the Fund’s investments were considered Level 1, except for AMREP Corp. Rights, Central European Distribution Corp., Hyster-Yale Materials Handling, Inc., Magnum Hunter Resources Corp. Warrant, Orleans Homebuilders, Inc., School Specialty, Inc. and Trico Marine Services, Inc. which are Level 3. At June 30, 2013, these investments were valued at $17,058. The value of Level 3 investments at December 31, 2012 was $9,936. A reconciliation of Level 3 investments is only presented when the Fund has a significant amount of Level 3 investments at the beginning and/or end of the period in relation to net assets. For the six months ended June 30, 2013, there have been no transfers between Level 1 and Level 2 assets and liabilities. For the six months ended June 30, 2013, there have been no transfers between Level 2 and Level 3 assets and liabilities. Please see Note 2 in Notes to Financial Statements for further information regarding fair value measurements.
See Notes to Financial Statements.
Wilshire Mutual Funds, Inc. Wilshire International Equity Fund Condensed Schedule of Investments | June 30, 2013 (Unaudited) | |
| | | | Percentage of Net Assets (%) | | | | |
| COMMON STOCK — 90.8% | |
| Australia — 3.3% | | | | | | |
| | 9,655 | | Australia & New Zealand Banking Group, Ltd. | | | 0.8 | | | $ | 250,639 | |
| | 2,607 | | BHP Billiton, Ltd. | | | 0.3 | | | | 75,037 | |
| | 66,881 | | Other Securities | | | 2.2 | | | | 667,990 | |
| | | | | | | | | | | 993,666 | |
| Austria — 0.1% | | | | | | | | |
| | 901 | | Other Securities | | | 0.1 | | | | 22,774 | |
| | | | | | | | | | | | |
| Belgium — 0.4% | | | | | | | | |
| | 1,674 | | Other Securities | | | 0.4 | | | | 109,692 | |
| | | | | | | | | | | | |
| Brazil — 0.8% | | | | | | | | |
| | 18,920 | | Cia de Saneamento Basico do Estado de Sao Paulo ADR(a) | | | 0.7 | | | | 196,957 | |
| | 3,300 | | Other Securities | | | 0.1 | | | | 42,933 | |
| | | | | | | | | | | 239,890 | |
| Canada — 3.7% | | | | | | | | |
| | 3,300 | | Alimentation Couche Tard, Inc., Class B | | | 0.7 | | | | 195,797 | |
| | 2,250 | | Canadian National Railway Co.(a) | | | 0.7 | | | | 219,074 | |
| | 4,900 | | Royal Bank of Canada(a) | | | 0.9 | | | | 285,511 | |
| | 9,620 | | Other Securities | | | 1.4 | | | | 410,508 | |
| | | | | | | | | | | 1,110,890 | |
| China — 1.6% | | | | | | | | |
| | 444,000 | | Bank of China, Ltd., Class H | | | 0.6 | | | | 181,891 | |
| | 25,200 | | Sinopharm Group Co., Ltd., Class H | | | 0.2 | | | | 62,979 | |
| | 153,052 | | Other Securities | | | 0.8 | | | | 236,506 | |
| | | | | | | | | | | 481,376 | |
| Denmark — 1.2% | | | | | | | | |
| | 8,100 | | Topdanmark A† | | | 0.7 | | | | 206,158 | |
| | 3,838 | | Other Securities | | | 0.5 | | | | 156,029 | |
| | | | | | | | | | | 362,187 | |
| Finland — 1.7% | | | | | | | | |
| | 12,900 | | Pohjola Bank PLC, Class A | | | 0.6 | | | | 189,555 | |
| | 6,747 | | Sampo, Class A | | | 0.9 | | | | 262,726 | |
| | 5,148 | | Other Securities | | | 0.2 | | | | 49,067 | |
| | | | | | | | | | | 501,348 | |
| Shares | | | | Percentage of Net Assets (%) | | | Value | |
| France — 5.2% | | | | | | | | |
| | 1,500 | | Christian Dior SA | | | 0.8 | | | $ | 242,328 | |
| | 3,804 | | Sanofi-Aventis SA | | | 1.3 | | | | 393,258 | |
| | 21,990 | | Other Securities | | | 3.1 | | | | 922,757 | |
| | | | | | | | | | | 1,558,343 | |
| Germany — 8.7% | | | | | | | | |
| | 2,431 | | Adidas AG | | | 0.9 | | | | 262,787 | |
| | 3,449 | | BASF SE | | | 1.0 | | | | 307,627 | |
| | 3,578 | | Bayer AG | | | 1.3 | | | | 380,950 | |
| | 2,607 | | Fresenius SE & Co. KGaA | | | 1.1 | | | | 320,870 | |
| | 1,390 | | Muenchener Rueckversicherungs AG | | | 0.8 | | | | 255,359 | |
| | 4,538 | | SAP AG | | | 1.1 | | | | 331,377 | |
| | 14,985 | | Other Securities | | | 2.5 | | | | 751,906 | |
| | | | | | | | | | | 2,610,876 | |
| Greece — 0.0% | | | | | | | | |
| | 1,254 | | Other Securities | | | 0.0 | | | | 5,477 | |
| | | | | | | | | | | | |
| Guernsey — 0.0% | | | | | | | | |
| | 1,666 | | Other Securities | | | 0.0 | | | | 7,217 | |
| | | | | | | | | | | | |
| Hong Kong — 6.3% | | | | | | | | |
| | 17,651 | | Cheung Kong Holdings, Ltd. | | | 0.8 | | | | 238,014 | |
| | 43,000 | | Cheung Kong Infrastructure Holdings, Ltd. | | | 1.0 | | | | 286,524 | |
| | 28,000 | | China Overseas Land & Investment, Ltd. | | | 0.3 | | | | 72,897 | |
| | 1,084 | | Hang Seng Bank, Ltd. | | | 0.1 | | | | 15,964 | |
| | 14,000 | | Jardine Strategic Holdings, Ltd. | | | 1.7 | | | | 506,954 | |
| | 353,907 | | Other Securities | | | 2.4 | | | | 764,029 | |
| | | | | | | | | | | 1,884,382 | |
| India — 0.4% | | | | | | | | |
| | 3,180 | | Other Securities | | | 0.4 | | | | 120,268 | |
| | | | | | | | | | | | |
| Indonesia — 0.4% | | | | | | | | |
| | 131,000 | | Other Securities | | | 0.4 | | | | 118,154 | |
| | | | | | | | | | | | |
| Ireland — 0.2% | | | | | | | | |
| | 2,452 | | Other Securities | | | 0.2 | | | | 48,176 | |
| | | | | | | | | | | | |
| Isle of Man — 0.0% | | | | | | | | |
| | 6,192 | | Other Securities | | | 0.0 | | | | 6,421 | |
See Notes to Financial Statements.
Wilshire Mutual Funds, Inc. Wilshire International Equity Fund Condensed Schedule of Investments - (continued) | June 30, 2013 (Unaudited) | |
| Shares | | | | Percentage of Net Assets (%) | | | Value | |
| Israel — 0.1% | | | | | | |
| | 2,405 | | Other Securities | | | 0.1 | | | $ | 41,002 | |
| | | | | | | | | | | | |
| Italy — 0.9% | | | | | | | | |
| | 51,967 | | Other Securities | | | 0.9 | | | | 284,767 | |
| | | | | | | | | | | | |
| Japan — 17.0% | | | | | | | | |
| | 258 | | Chugai Pharmaceutical Co., Ltd. | | | 0.0 | | | | 5,340 | |
| | 137,450 | | Mizuho Financial Group, Inc. | | | 1.0 | | | | 285,441 | |
| | 3,761 | | Nippon Telegraph & Telephone Corp. | | | 0.7 | | | | 196,027 | |
| | 19,983 | | Nissan Motor Co., Ltd. | | | 0.7 | | | | 200,282 | |
| | 5,138 | | Sumitomo Mitsui Financial Group, Inc. | | | 0.8 | | | | 235,182 | |
| | 6,318 | | Tokio Marine Holdings, Inc. | | | 0.7 | | | | 199,364 | |
| | 5,258 | | Toyota Industries Corp. | | | 0.7 | | | | 214,726 | |
| | 6,954 | | Toyota Motor Corp. | | | 1.4 | | | | 419,450 | |
| | 3,400 | | Unicharm Corp. | | | 0.6 | | | | 192,299 | |
| | 216,138 | | Other Securities | | | 10.4 | | | | 3,169,775 | |
| | | | | | | | | | | 5,117,886 | |
| Jersey — 0.1% | | | | | | | | |
| | 1,272 | | Other Securities | | | 0.1 | | | | 38,750 | |
| | | | | | | | | | | | |
| Luxembourg — 0.4% | | | | | | | | |
| | 6,009 | | Other Securities | | | 0.4 | | | | 120,529 | |
| | | | | | | | | | | | |
| Macau — 0.0% | | | | | | | | |
| | 2,000 | | Other Securities | | | 0.0 | | | | 5,380 | |
| | | | | | | | | | | | |
| Malaysia — 0.6% | | | | | | | | |
| | 86,500 | | Other Securities | | | 0.6 | | | | 188,881 | |
| | | | | | | | | | | | |
| Mexico — 1.1% | | | | | | | | |
| | 96,100 | | Other Securities | | | 1.1 | | | | 328,880 | |
| | | | | | | | | | | | |
| Netherlands — 2.3% | | | | | | | | |
| | 2,705 | | ASML Holding NV | | | 0.7 | | | | 213,534 | |
| | 23,376 | | Other Securities | | | 1.6 | | | | 489,394 | |
| | | | | | | | | | | 702,928 | |
| New Zealand — 0.0% | | | | | | | | |
| | 4,361 | | Other Securities | | | 0.0 | | | | 7,671 | |
| | | | | | | | | | | | |
| Norway — 2.5% | | | | | | | | |
| | 4,880 | | Seadrill, Ltd. | | | 0.7 | | | | 196,549 | |
| Shares | | | | Percentage of Net Assets (%) | | | Value | |
| Norway (continued) | | | | | | | | |
| | 13,560 | | Statoil ASA | | | 0.9 | | | $ | 280,123 | |
| | 11,398 | | Telenor ASA | | | 0.8 | | | | 226,399 | |
| | 3,289 | | Other Securities | | | 0.1 | | | | 34,068 | |
| | | | | | | | | | | 737,139 | |
| Portugal — 0.0% | | | | | | | | |
| | 4,773 | | Other Securities | | | 0.0 | | | | 9,691 | |
| | | | | | | | | | | | |
| Russia — 0.6% | | | | | | | | |
| | 3,100 | | Other Securities | | | 0.6 | | | | 178,715 | |
| | | | | | | | | | | | |
| Singapore — 3.1% | | | | | | | | |
| | 9,000 | | Jardine Cycle & Carriage, Ltd. | | | 1.0 | | | | 300,906 | |
| | 15,142 | | United Overseas Bank, Ltd. | | | 0.8 | | | | 236,459 | |
| | 100,617 | | Other Securities | | | 1.3 | | | | 394,553 | |
| | | | | | | | | | | 931,918 | |
| South Africa — 2.5% | | | | | | | | |
| | 11,900 | | Remgro, Ltd. | | | 0.8 | | | | 228,602 | |
| | 29,000 | | Woolworths Holdings, Ltd. | | | 0.6 | | | | 189,027 | |
| | 29,200 | | Other Securities | | | 1.1 | | | | 344,207 | |
| | | | | | | | | | | 761,836 | |
| South Korea — 2.0% | | | | | | | | |
| | 820 | | Samsung Electronics Co., Ltd. GDR | | | 1.6 | | | | 476,540 | |
| | 5,800 | | Other Securities | | | 0.4 | | | | 117,914 | |
| | | | | | | | | | | 594,454 | |
| Spain — 1.1% | | | | | | | | |
| | 31,226 | | Other Securities | | | 1.1 | | | | 334,236 | |
| | | | | | | | | | | | |
| Sweden — 3.3% | | | | | | | | |
| | 5,620 | | Svenska Handelsbanken AB, Class A | | | 0.8 | | | | 225,162 | |
| | 17,184 | | Swedbank AB, Class A | | | 1.3 | | | | 393,592 | |
| | 31,902 | | Other Securities | | | 1.2 | | | | 386,929 | |
| | | | | | | | | | | 1,005,683 | |
| Switzerland — 3.8% | | | | | | | | |
| | 1,224 | | Roche Holding AG | | | 1.0 | | | | 303,793 | |
| | 27,501 | | Other Securities | | | 2.8 | | | | 843,968 | |
| | | | | | | | | | | 1,147,761 | |
| Thailand — 1.6% | | | | | | | | |
| | 35,700 | | PTT Exploration & Production PLC | | | 0.6 | | | | 181,581 | |
| | 40,700 | | Other Securities | | | 1.0 | | | | 284,205 | |
| | | | | | | | | | | 465,786 | |
See Notes to Financial Statements.
Wilshire Mutual Funds, Inc. Wilshire International Equity Fund Condensed Schedule of Investments - (continued) | June 30, 2013 (Unaudited) | |
| Shares | | | | Percentage of Net Assets (%) | | | Value | |
| Turkey — 0.3% | | | | | | |
| | 4,050 | | Other Securities | | | 0.3 | | | $ | 96,309 | |
| | | | | | | | | | | | |
| United Kingdom — 12.8% | | | | | | | | |
| | 11,200 | | BHP Billiton PLC | | | 1.0 | | | | 285,577 | |
| | 41,782 | | BP PLC | | | 1.0 | | | | 289,967 | |
| | 6,152 | | British American Tobacco PLC | | | 1.0 | | | | 315,536 | |
| | 34,343 | | HSBC Holdings PLC | | | 1.2 | | | | 355,526 | |
| | 17,026 | | Prudential PLC | | | 0.9 | | | | 277,913 | |
| | 18,670 | | WH Smith PLC | | | 0.7 | | | | 203,892 | |
| | 265,236 | | Other Securities | | | 7.0 | | | | 2,113,045 | |
| | | | | | | | | | | 3,841,456 | |
| United States — 0.7% | | | | | | | | |
| | 3,630 | | Other Securities | | | 0.7 | | | | 202,331 | |
| | | | | | | | | | | | |
| Total Common Stock | | | | | | | | |
| (Cost $29,901,081) | | | | | | | 27,325,126 | |
| | | | | | | | | | | | |
| SHORT-TERM INVESTMENT (b) (c) — 14.7% | | | | | | | | |
| | 4,424,549 | | Northern Trust Institutional Liquid Asset Portfolio, 0.010% | | | 14.7 | | | | 4,424,549 | |
| | | | | | | | | | | | |
| Total Short-Term Investment | | | | | | | | |
| (Cost $4,424,549) | | | | | | | 4,424,549 | |
| | | | | | | | | | | | |
| EXCHANGE TRADED FUND — 9.4% | | | | | | | | |
| | 73,141 | | Vanguard FTSE Emerging Markets ETF(a) | | | 9.4 | | | | 2,836,408 | |
| | | | | | | | | | | | |
| Total Exchange Traded Funds | | | | | | | | |
| (Cost $3,404,942) | | | | | | | 2,836,408 | |
| | | | | | | | | | | | |
| PREFERRED STOCK — 0.8% | | | | | | | | |
| Germany — 0.8% | | | | | | | | |
| | 2,292 | | Henkel AG & Co. KGAA | | | 0.7 | | | | 215,240 | |
| | 245 | | Other Securities | | | 0.1 | | | | 37,259 | |
| | | | | | | | | | | | |
| Total Preferred Stock | | | | | | | | |
| (Cost $259,348) | | | | | | | 252,499 | |
| Shares | | | | Percentage of Net Assets (%) | | | Value | |
| PRIVATE COMPANY — 0.0% | | | | | | | | |
| Malta — 0.0% | | | | | | | | |
| | 4,007 | | Other Securities | | | 0.0 | | | $ | — | |
| | | | | | | | | | | | |
| Total Private Company | | | | | | | | |
| (Cost $—) | | | | | | | — | |
| | | | | | | | | | | | |
| RIGHT — 0.0% | | | | | | | | |
| | | | | | | | | | |
| Hong Kong — 0.0% | | | | | | | | |
| | 31 | | Other Securities | | | 0.0 | | | | — | |
| | | | | | | | | | | | |
| Total Right | | | | | | | | |
| (Cost $—) | | | | | | | — | |
| | | | | | | | | | | | |
| Total Investments — 115.7% | | | | | | | | |
| (Cost $37,989,920) | | | | | | | 34,838,582 | |
| Other Assets & Liabilities, Net — (15.7)% | | | | | | | (4,732,788 | ) |
| | | | | | | | | | | | |
| NET ASSETS — 100.0% | | | | | | $ | 30,105,794 | |
| | Non-income producing security. |
| (a) | This security or a partial position of this security is on loan at June 30, 2013. The total market value of securities on loan at June 30, 2013 was $4,315,072 (Note 6). |
| (b) | Rate shown in the 7-day effective yield as of June 30, 2013. |
| (c) | This security was purchased with cash collateral held from securities on loan. The total value of such security as of June 30, 2013 was $4,424,549. Securities on loan are also collateralized by various U.S. Treasury obligations in the amount of $6,545 (Note 6). |
ADR — American Depositary Receipt
GDR — Global Depositary Receipt
ETF — Exchange Traded Fund
FTSE — Financial Times and the London Stock Exchange
Ltd. — Limited
PLC — Public Limited Company
Amounts designated as “—“ are either $0 or have been rounded to $0.
See Notes to Financial Statements.
Wilshire Mutual Funds, Inc. Wilshire International Equity Fund Condensed Schedule of Investments - (Continued) | June 30, 2013 (Unaudited) | |
The Condensed Schedule of Investments does not reflect the complete portfolio holdings. It includes the Portfolio’s 50 largest holdings and each investment of any issuer that exceeds 1% of the Portfolio’s net assets. “Other Securities” represent all issues not required to be disclosed under the rules adopted by the U.S. Securities and Exchange Commission (“SEC”). The complete schedule of portfolio holdings is available (i) without charge, upon request, by calling (800) 607-2200; (ii) on the SEC’s website at http://www.sec.gov; and (iii) on our website at http://advisor.wilshire.com.
The following is a summary of the inputs used as of June 30, 2013 in valuing the Fund’s investments carried at value:
| Investments in Securities | | | | | | | | | | | | |
| Common Stock | | | | | | | | | | | | |
| Australia | | $ | — | | | $ | 993,666 | * | | $ | — | | | $ | 993,666 | |
| Austria | | | — | | | | 22,774 | * | | | — | | | | 22,774 | |
| Belgium | | | — | | | | 109,692 | * | | | — | | | | 109,692 | |
| Brazil | | | 239,890 | | | | — | | | | — | | | | 239,890 | |
| Canada | | | 1,110,890 | | | | — | | | | — | | | | 1,110,890 | |
| China | | | 2,067 | | | | 479,309 | * | | | — | | | | 481,376 | |
| Denmark | | | — | | | | 362,187 | * | | | — | | | | 362,187 | |
| Finland | | | — | | | | 501,348 | * | | | — | | | | 501,348 | |
| France | | | 136 | | | | 1,558,207 | * | | | — | | | | 1,558,343 | |
| Germany | | | — | | | | 2,610,876 | * | | | — | | | | 2,610,876 | |
| Greece | | | — | | | | 5,477 | * | | | — | | | | 5,477 | |
| Guernsey | | | — | | | | 7,217 | * | | | — | | | | 7,217 | |
| Hong Kong | | | — | | | | 1,884,382 | * | | | — | | | | 1,884,382 | |
| India | | | 120,268 | | | | — | | | | — | | | | 120,268 | |
| Indonesia | | | — | | | | 118,154 | * | | | — | | | | 118,154 | |
| Ireland | | | — | | | | 48,176 | * | | | — | | | | 48,176 | |
| Isle of Man | | | — | | | | 6,421 | * | | | — | | | | 6,421 | |
| Israel | | | — | | | | 41,002 | * | | | — | | | | 41,002 | |
| Italy | | | — | | | | 284,767 | * | | | — | | | | 284,767 | |
| Japan | | | — | | | | 5,117,886 | * | | | — | | | | 5,117,886 | |
| Jersey | | | — | | | | 38,750 | * | | | — | | | | 38,750 | |
| Luxembourg | | | — | | | | 120,529 | * | | | — | | | | 120,529 | |
| Macau | | | — | | | | 5,380 | * | | | — | | | | 5,380 | |
| Malaysia | | | — | | | | 188,881 | * | | | — | | | | 188,881 | |
| Mexico | | | 328,880 | | | | — | | | | — | | | | 328,880 | |
| Netherlands | | | — | | | | 702,928 | * | | | — | | | | 702,928 | |
| New Zealand | | | — | | | | 7,671 | * | | | — | | | | 7,671 | |
| Norway | | | — | | | | 737,139 | * | | | — | | | | 737,139 | |
| Portugal | | | — | | | | 9,691 | * | | | — | | | | 9,691 | |
| Russia | | | 178,715 | | | | — | | | | — | | | | 178,715 | |
| Singapore | | | — | | | | 931,918 | * | | | — | | | | 931,918 | |
| Investments in Securities | | | Level 1 | | | | Level 2 | | | | Level 3 | | | | Level 4 | |
| Common Stock (continued) | | | | | | | | | | | | | |
| South Africa | | $ | — | | | $ | 761,836 | * | | $ | — | | | $ | 761,836 | |
| South Korea | | | 117,914 | | | | 476,540 | * | | | — | | | | 594,454 | |
| Spain | | | — | | | | 334,236 | * | | | — | | | | 334,236 | |
| Sweden | | | — | | | | 1,005,683 | * | | | — | | | | 1,005,683 | |
| Switzerland | | | — | | | | 1,147,761 | * | | | — | | | | 1,147,761 | |
| Thailand | | | — | | | | 465,786 | * | | | — | | | | 465,786 | |
| Turkey | | | 96,309 | | | | — | | | | — | | | | 96,309 | |
| United Kingdom | | | — | | | | 3,841,456 | * | | | — | | | | 3,841,456 | |
| United States | | | 202,331 | | | | — | | | | — | | | | 202,331 | |
| Total Common Stock | | | 2,397,400 | | | | 24,927,726 | | | | — | | | | 27,325,126 | |
| Short-Term Investment | | | 4,424,549 | | | | — | | | | — | | | | 4,424,549 | |
| Exchange Traded Fund | | | 2,836,408 | | | | — | | | | — | | | | 2,836,408 | |
| Preferred Stock | | | — | | | | 252,499 | | | | — | | | | 252,499 | |
| Private Company | | | | | | | | | | | | | | | | |
| Malta | | | — | | | | — | | | | ^ | | | — | |
| Right | | | — | | | | — | | | | — | | | | — | |
| Total Investments in Securities | | $ | 9,658,357 | | | $ | 25,180,225 | | | $ | — | | | $ | 34,838,582 | |
| | Represents securities trading primarily outside the United States, the value of which were adjusted as a result of local trading through the application of a third-party vendor. |
| | This security was categorized as Level 3 and had a market value of $0 as of June 30, 2013 and the value has remained $0 throughout the six months ended June 30, 2013. There were no accrued discounts/premiums, realized gain/(loss), change in unrealized appreciation/(depreciation), purchases, sales or transfers in or out of Level 3 during the six months ended June 30, 2013. |
For the six months ended June 30, 2013, the transfers out of Level 1 and into Level 2 were $24,905,917 and the transfers out of Level 2 into Level 1 were $(0). The transfers were related to the fair value of certain foreign securities.
See Notes to Financial Statements.
Wilshire Mutual Funds, Inc. Statements of Assets and Liabilities June 30, 2013 (Unaudited) | |
| | | LARGE COMPANY GROWTH PORTFOLIO | | | LARGE COMPANY VALUE PORTFOLIO | | | SMALL COMPANY GROWTH PORTFOLIO | | | SMALL COMPANY VALUE PORTFOLIO | | | | | | WILSHIRE INTERNATIONAL EQUITY FUND | |
| ASSETS: | | | | | | | | | | | | | | | | | | |
Investments in securities, at value (Note 2) | | $ | 372,657,325 | * | | $ | 186,148,499 | * | | $ | 35,505,727 | * | | $ | 38,742,862 | * | | $ | 200,605,375 | * | | $ | 34,838,582 | * |
Cash | | | 2,320 | | | | 861 | | | | — | | | | 99 | | | | 62 | | | | — | |
Foreign currency, at value | | | — | | | | — | | | | — | | | | — | | | | — | | | | 9,371 | |
Receivable for investment securities sold | | | 253,348 | | | | 1,130,963 | | | | 171,844 | | | | 144,308 | | | | 232 | | | | — | |
Dividends and interest receivable | | | 340,071 | | | | 230,679 | | | | 4,462 | | | | 24,150 | | | | 217,892 | | | | 49,456 | |
Receivable for Portfolio shares sold | | | 366,531 | | | | 26,168 | | | | — | | | | 3,090 | | | | 63,362 | | | | 100 | |
Dividend reclaim receivable | | | 1,902 | | | | 6,313 | | | | — | | | | — | | | | — | | | | 23,414 | |
Receivable from Adviser (Note 3) | | | — | | | | — | | | | 2,074 | | | | 923 | | | | — | | | | 6,968 | |
| Unrealized gain on foreign spot currency contracts | | | — | | | | — | | | | — | | | | — | | | | — | | | | 446 | |
Prepaid expenses and other assets | | | 28,976 | | | | 18,590 | | | | 11,821 | | | | 11,270 | | | | 27,634 | | | | 27,537 | |
Total Assets | | | 373,650,473 | | | | 187,562,073 | | | | 35,695,928 | | | | 38,926,702 | | | | 200,914,557 | | | | 34,955,874 | |
| | | | | | | | | | | | | | | | | | | | | | | | | |
| LIABILITIES: | | | | | | | | | | | | | | | | | | | | | | | | |
Payable upon return on securities loaned | | | 66,318,438 | | | | 34,189,871 | | | | 11,639,687 | | | | 11,588,079 | | | | 24,991,940 | | | | 4,424,549 | |
Payable for investment securities purchased | | | 2,647,139 | | | | 689,353 | | | | 147,215 | | | | 69,366 | | | | — | | | | — | |
Payable for Portfolio shares redeemed | | | 601,307 | | | | 25,854 | | | | 1,217 | | | | 4,980 | | | | 51,567 | | | | — | |
| Unrealized loss on foreign spot currency contracts | | | — | | | | — | | | | — | | | | — | | | | — | | | | 490 | |
Investment advisory fees payable (Note 3) | | | 189,178 | | | | 94,815 | | | | 16,587 | | | | 19,053 | | | | 14,513 | | | | 25,339 | |
Distribution fees payable (Note 4) | | | 22,545 | | | | 10,684 | | | | 2,854 | | | | 2,995 | | | | 30,584 | | | | — | |
Shareholder Service fees payable (Note 4) | | | 25,282 | | | | 4,070 | | | | — | | | | 1,880 | | | | 9,738 | | | | 29 | |
Administration fees payable | | | 17,657 | | | | 8,849 | | | | 1,366 | | | | 1,626 | | | | 10,159 | | | | 1,774 | |
Directors’ fees payable | | | 6,193 | | | | 3,551 | | | | 552 | | | | 611 | | | | 2,984 | | | | — | |
Chief compliance officer expenses payable | | | 290 | | | | 128 | | | | 20 | | | | 24 | | | | 181 | | | | 99 | |
Cash overdraft | | | — | | | | — | | | | — | | | | — | | | | — | | | | 374,377 | |
Accrued expenses and other payables | | | 45,850 | | | | 18,385 | | | | 13,320 | | | | 10,512 | | | | 43,672 | | | | 23,423 | |
Total Liabilities | | | 69,873,879 | | | | 35,045,560 | | | | 11,822,818 | | | | 11,699,126 | | | | 25,155,338 | | | | 4,850,080 | |
| | | | | | | | | | | | | | | | | | | | | | | | | |
NET ASSETS | | $ | 303,776,594 | | | $ | 152,516,513 | | | $ | 23,873,110 | | | $ | 27,227,576 | | | $ | 175,759,219 | | | $ | 30,105,794 | |
| | | | | | | | | | | | | | | | | | | | | | | | | |
* Includes Market Value of Securities on Loan | | $ | 64,658,559 | | | $ | 33,556,400 | | | $ | 11,303,062 | | | $ | 11,303,675 | | | $ | 24,351,781 | | | $ | 4,315,072 | |
| Amounts designated as “—” are either $0, or have been rounded to $0. |
See Notes to Financial Statements.
Wilshire Mutual Funds, Inc. Statements of Assets and Liabilities - (Continued) June 30, 2013 (Unaudited) | |
| | | LARGE COMPANY GROWTH PORTFOLIO | | | LARGE COMPANY VALUE PORTFOLIO | | | SMALL COMPANY GROWTH PORTFOLIO | | | SMALL COMPANY VALUE PORTFOLIO | | | | | | WILSHIRE INTERNATIONAL EQUITY FUND | |
| NET ASSETS consist of: | | | | | | | | | | | | | | | | | | |
Paid-in capital | | $ | 250,450,902 | | | $ | 146,704,842 | | | $ | 21,063,017 | | | $ | 25,302,848 | | | $ | 128,084,505 | | | $ | (11,971,020 | ) |
| Undistributed net investment income/(accumulated net investment loss) | | | 334,120 | | | | 532,231 | | | | (1,090 | ) | | | (14,443 | ) | | | 1,709,982 | | | | 480,043 | |
Accumulated net realized gain/(loss) on investments sold, securities sold short and foreign currency transactions1 | | | 11,247,035 | | | | (8,333,280 | ) | | | 120,546 | | | | (1,158,230 | ) | | | (42,401,843 | ) | | | 44,749,434 | |
Net unrealized appreciation/(depreciation) of investments, securities sold short and other assets and liabilities denominated in foreign currencies1 | | | 41,744,537 | | | | 13,612,720 | | | | 2,690,637 | | | | 3,097,401 | | | | 88,366,575 | | | | (3,152,663 | ) |
| | | | | | | | | | | | | | | | | | | | | | | | | |
NET ASSETS | | $ | 303,776,594 | | | $ | 152,516,513 | | | $ | 23,873,110 | | | $ | 27,227,576 | | | $ | 175,759,219 | | | $ | 30,105,794 | |
| | | | | | | | | | | | | | | | | | | | | | | | | |
Investments in securities, at cost (Note 2) | | $ | 264,594,350 | | | $ | 138,345,908 | | | $ | 21,175,403 | | | $ | 24,057,382 | | | $ | 87,246,860 | | | $ | 33,565,371 | |
Cash collateral for securities on loan, at cost | | | 66,318,438 | | | | 34,189,871 | | | | 11,639,687 | | | | 11,588,079 | | | | 24,991,940 | | | | 4,424,549 | |
Foreign currency, at cost | | | — | | | | — | | | | — | | | | — | | | | — | | | | 9,371 | |
| | | | | | | | | | | | | | | | | | | | | | | | | |
| NET ASSETS: | | | | | | | | | | | | | | | | | | | | | | | | |
Investment Class shares | | $ | 102,527,245 | | | $ | 52,200,944 | | | $ | 8,347,131 | | | $ | 11,509,722 | | | $ | 119,716,169 | | | $ | 149,880 | |
| (50,000,000 shares authorized, per class, per Portfolio, par value $.001 per share)† | | | | | | | | | | | | | | | | | | | | | | | | |
Institutional Class shares | | $ | 201,249,349 | | | $ | 100,315,569 | | | $ | 15,525,979 | | | $ | 15,717,854 | | | $ | 54,674,101 | | | $ | 29,955,914 | |
| (50,000,000 shares authorized, per class, per Portfolio, par value $.001 per share)† | | | | | | | | | | | | | | | | | | | | | | | | |
Qualified Class shares | | | N/A | | | | N/A | | | | N/A | | | | N/A | | | $ | 146 | | | | N/A | |
| (50,000,000 shares authorized, per class, per Portfolio, par value $.001 per share) | | | | | | | | | | | | | | | | | | | | | | | | |
Horace Mann Class shares | | | N/A | | | | N/A | | | | N/A | | | | N/A | | | $ | 1,368,803 | | | | N/A | |
| (50,000,000 shares authorized, per class, per Portfolio, par value $.001 per share) | | | | | | | | | | | | | | | | | | | | | | | | |
| 1 | Effective April 2, 2013, the Wilshire International Equity Fund no longer engages in securities sold short. |
| † | For the Wilshire International Equity Fund, (40,000,000 shares authorized, per class, par value $.001 per share). |
| * | Difference in net asset value recalculation and net asset value stated is caused by rounding differences. |
| N/A — Not Applicable. Share classes currently not offered. |
See Notes to Financial Statements.
Wilshire Mutual Funds, Inc. Statements of Assets and Liabilities - (Continued) June 30, 2013 (Unaudited) | |
| | | LARGE COMPANY GROWTH PORTFOLIO | | | LARGE COMPANY VALUE PORTFOLIO | | | SMALL COMPANY GROWTH PORTFOLIO | | | SMALL COMPANY VALUE PORTFOLIO | | | | | | WILSHIRE INTERNATIONAL EQUITY FUND | |
| SHARES OUTSTANDING: | | | | | | | | | | | | | | | | | | |
Investment Class shares | | | 2,714,683 | | | | 2,778,110 | | | | 392,323 | | | | 559,058 | | | | 8,476,118 | | | | 17,224 | |
Institutional Class shares | | | 5,136,347 | | | | 5,324,314 | | | | 697,218 | | | | 754,887 | | | | 3,870,644 | | | | 3,422,932 | |
Qualified Class shares | | | N/A | | | | N/A | | | | N/A | | | | N/A | | | | 10 | | | | N/A | |
Horace Mann Class shares | | | N/A | | | | N/A | | | | N/A | | | | N/A | | | | 97,168 | | | | N/A | |
| | | | | | | | | | | | | | | | | | | | | | | | | |
| INVESTMENT CLASS SHARES: | | | | | | | | | | | | | | | | | | | | | | | | |
| Net asset value, offering and redemption price per share | | $ | 37.77 | | | $ | 18.79 | | | $ | 21.28 | | | $ | 20.59 | | | $ | 14.12 | | | $ | 8.70 | |
| | | | | | | | | | | | | | | | | | | | | | | | | |
| INSTITUTIONAL CLASS SHARES: | | | | | | | | | | | | | | | | | | | | | | | | |
| Net asset value, offering and redemption price per share | | $ | 39.18 | | | $ | 18.84 | | | $ | 22.27 | | | $ | 20.82 | | | $ | 14.13 | | | $ | 8.75 | |
| | | | | | | | | | | | | | | | | | | | | | | | | |
| QUALIFIED CLASS SHARES: | | | | | | | | | | | | | | | | | | | | | | | | |
| Net asset value, offering and redemption price per share | | | N/A | | | | N/A | | | | N/A | | | | N/A | | | $ | 14.41 | * | | | N/A | |
| | | | | | | | | | | | | | | | | | | | | | | | | |
| HORACE MANN CLASS SHARES: | | | | | | | | | | | | | | | | | | | | | | | | |
| Net asset value, offering and redemption price per share | | | N/A | | | | N/A | | | | N/A | | | | N/A | | | $ | 14.09 | | | | N/A | |
| * | Difference in net asset value recalculation and net asset value stated is caused by rounding differences. |
| N/A — Not Applicable. Share classes currently not offered. |
See Notes to Financial Statements.
Wilshire Mutual Funds, Inc. Statements of Operations For the Six Months Ended June 30, 2013 (Unaudited) | |
| | | LARGE COMPANY GROWTH PORTFOLIO | | | LARGE COMPANY VALUE PORTFOLIO | | | SMALL COMPANY GROWTH PORTFOLIO | | | SMALL COMPANY VALUE PORTFOLIO | | | | | | WILSHIRE INTERNATIONAL EQUITY FUND | |
| INVESTMENT INCOME: | | | | | | | | | | | | | | | | | | |
Dividends | | $ | 1,745,638 | | | $ | 1,032,564 | | | $ | 41,370 | | | $ | 136,695 | | | $ | 1,728,178 | | | $ | 1,474,063 | |
Interest | | | 226 | | | | 77 | | | | 10 | | | | 18 | | | | 2,409 | | | | 986 | |
Income from Security Lending | | | 36,241 | | | | 10,412 | | | | 17,139 | | | | 5,764 | | | | 32,056 | | | | 20,792 | |
Foreign taxes withheld | | | 1,952 | | | | 8,007 | | | | (24 | ) | | | (258 | ) | | | (107 | ) | | | (32,831 | ) |
Total income | | | 1,784,057 | | | | 1,051,060 | | | | 58,495 | | | | 142,219 | | | | 1,762,536 | | | | 1,463,010 | |
| | | | | | | | | | | | | | | | | | | | | | | | | |
| EXPENSES: | | | | | | | | | | | | | | | | | | | | | | | | |
Investment advisory fee (Note 3) | | | 919,662 | | | | 353,090 | | | | 62,889 | | | | 76,018 | | | | 85,218 | | | | 539,063 | |
| Distribution (12b-1) fees (Note 4) | | | | | | | | | | | | | | | | | | | | | | | | |
Investment Class | | | 128,840 | | | | 60,671 | | | | 7,273 | | | | 13,581 | | | | 131,994 | | | | 48,852 | |
Horace Mann Class | | | N/A | | | | N/A | | | | N/A | | | | N/A | | | | 2,332 | | | | N/A | |
| Shareholder Service fees (Note 4) | | | | | | | | | | | | | | | | | | | | | | | | |
Investment Class | | | 60,011 | | | | 6,789 | | | | 2,976 | | | | 3,401 | | | | 32,208 | | | | 7,580 | |
Institutional Class | | | 29,577 | | | | 408 | | | | 1,766 | | | | 1,808 | | | | 23,193 | | | | 46 | |
Administration and accounting fees (Note 3) | | | 85,835 | | | | 32,955 | | | | 5,179 | | | | 6,317 | | | | 59,652 | | | | 37,734 | |
Directors' fees and expenses (Note 3) | | | 19,906 | | | | 7,536 | | | | 1,194 | | | | 1,437 | | | | 13,930 | | | | 9,348 | |
Chief compliance officer expenses | | | 688 | | | | 264 | | | | 42 | | | | 50 | | | | 477 | | | | 309 | |
Transfer agent fees (Note 3) | | | 80,808 | | | | 10,478 | | | | 3,385 | | | | 4,243 | | | | 37,305 | | | | 16,709 | |
Professional fees | | | 44,883 | | | | 17,611 | | | | 7,715 | | | | 8,100 | | | | 40,410 | | | | 42,438 | |
Printing fees | | | 22,876 | | | | 9,624 | | | | 1,521 | | | | 1,791 | | | | 14,877 | | | | 7,599 | |
Registration and filing fees | | | 21,611 | | | | 16,636 | | | | 14,475 | | | | 14,594 | | | | 23,635 | | | | 18,810 | |
Custodian fees (Note 3) | | | 34,681 | | | | 10,032 | | | | 3,467 | | | | 2,850 | | | | 28,709 | | | | 32,637 | |
Dividend expense on securities sold short1 | | | — | | | | — | | | | — | | | | — | | | | — | | | | 143,945 | |
Interest expense for securities sold short1 | | | — | | | | — | | | | — | | | | — | | | | — | | | | 116,333 | |
Other | | | 14,596 | | | | 5,464 | | | | 3,290 | | | | 3,184 | | | | 19,908 | | | | 11,943 | |
Total expenses | | | 1,463,974 | | | | 531,558 | | | | 115,172 | | | | 137,374 | | | | 513,848 | | | | 1,033,346 | |
Fees waived by investment Adviser (Note 3) | | | — | | | | — | | | | (16,120 | ) | | | (11,701 | ) | | | — | | | | (47,342 | ) |
Fees paid indirectly (Note 4) | | | (1,791 | ) | | | (6,285 | ) | | | (561 | ) | | | (1,039 | ) | | | (263 | ) | | | (3,040 | ) |
Net expenses | | | 1,462,183 | | | | 525,273 | | | | 98,491 | | | | 124,634 | | | | 513,585 | | | | 982,964 | |
| | | | | | | | | | | | | | | | | | | | | | | | | |
Net investment income/(loss) | | | 321,874 | | | | 525,787 | | | | (39,996 | ) | | | 17,585 | | | | 1,248,951 | | | | 480,046 | |
| 1 | Effective April 2, 2013, the Wilshire International Equity Fund no longer engages in securities sold short. |
| Amounts designated as “—” are either $0, or have been rounded to $0. |
See Notes to Financial Statements.
Wilshire Mutual Funds, Inc. Statements of Operations - (Continued) For the Six Months Ended June 30, 2013 (Unaudited) | |
| | | LARGE COMPANY GROWTH PORTFOLIO | | | LARGE COMPANY VALUE PORTFOLIO | | | SMALL COMPANY GROWTH PORTFOLIO | | | SMALL COMPANY VALUE PORTFOLIO | | | | | | WILSHIRE INTERNATIONAL EQUITY FUND | |
| NET REALIZED AND UNREALIZED GAIN/(LOSS) ON INVESTMENTS, SECURITIES SOLD SHORT AND FOREIGN CURRENCY TRANSACTIONS (NOTES 2 and 5): | | | | | | | | | | | | | | | | | | |
| Net realized gain/(loss) from: | | | | | | | | | | | | | | | | | | |
Investments1 | | $ | 9,764,465 | | | $ | 4,298,733 | | | $ | 458,250 | | | $ | 770,059 | | | $ | 2,262,817 | | | $ | 59,881,499 | |
Securities sold short2 | | | — | | | | — | | | | — | | | | — | | | | — | | | | (6,764,407 | ) |
Foreign currency transactions | | | — | | | | — | | | | — | | | | — | | | | — | | | | (21,212 | ) |
| Net change in unrealized appreciation/(depreciation) on: | | | | | | | | | | | | | | | | | | | | | | | | |
Investments | | | 8,661,314 | | | | 9,283,799 | | | | 1,860,796 | | | | 1,963,711 | | | | 18,101,718 | | | | (43,095,787 | ) |
Securities sold short2 | | | — | | | | — | | | | — | | | | — | | | | — | | | | 2,900,339 | |
| Other assets and liabilities denominated in foreign currencies | | | — | | | | — | | | | — | | | | — | | | | — | | | | (1,325 | ) |
| | | | | | | | | | | | | | | | | | | | | | | | | |
| Net realized and unrealized gain on investments, securities sold short and foreign currencies | | | 18,425,779 | | | | 13,582,532 | | | | 2,319,046 | | | | 2,733,770 | | | | 20,364,535 | | | | 12,899,107 | |
| | | | | | | | | | | | | | | | | | | | | | | | | |
| NET INCREASE IN NET ASSETS RESULTING FROM OPERATIONS | | $ | 18,747,653 | | | $ | 14,108,319 | | | $ | 2,279,050 | | | $ | 2,751,355 | | | $ | 21,613,486 | | | $ | 13,379,153 | |
| 1 | Includes realized gain/(loss) as a result of in-kind transactions. See Note 9 in Notes to Financial Statements. |
| 2 | Effective April 2, 2013, the Wilshire International Equity Fund no longer engages in securities sold short. |
| Amounts designated as “—” are either $0, or have been rounded to $0. |
See Notes to Financial Statements.
Wilshire Mutual Funds, Inc. Statements of Changes in Net Assets For the Six Months Ended June 30, 2013 (Unaudited) | |
| | | LARGE COMPANY GROWTH PORTFOLIO | | | LARGE COMPANY VALUE PORTFOLIO | | | SMALL COMPANY GROWTH PORTFOLIO | | | SMALL COMPANY VALUE PORTFOLIO | | | | | | WILSHIRE INTERNATIONAL EQUITY FUND | |
| OPERATIONS: | | | | | | | | | | | | | | | | | | |
Net investment income/(loss) | | $ | 321,874 | | | $ | 525,787 | | | $ | (39,996 | ) | | $ | 17,585 | | | $ | 1,248,951 | | | $ | 480,046 | |
Net realized gain on investments and securities sold short1,2 | | | 9,764,465 | | | | 4,298,733 | | | | 458,250 | | | | 770,059 | | | | 2,262,817 | | | | 53,095,880 | |
Net change in unrealized appreciation/(depreciation) on investments and securities sold short2 | | | 8,661,314 | | | | 9,283,799 | | | | 1,860,796 | | | | 1,963,711 | | | | 18,101,718 | | | | (40,196,773 | ) |
Net increase in net assets resulting from operations | | | 18,747,653 | | | | 14,108,319 | | | | 2,279,050 | | | | 2,751,355 | | | | 21,613,486 | | | | 13,379,153 | |
| | | | | | | | | | | | | | | | | | | | | | | | | |
| DISTRIBUTIONS TO SHAREHOLDERS FROM: | | | | | | | | | | | | | | | | | | | | | | | | |
| Net Investment Income: | | | | | | | | | | | | | | | | | | | | | | | | |
Investment Class shares | | | — | | | | — | | | | — | | | | — | | | | — | | | | — | |
Institutional Class shares | | | — | | | | — | | | | — | | | | — | | | | — | | | | — | |
Qualified Class shares | | | N/A | | | | N/A | | | | N/A | | | | N/A | | | | — | | | | N/A | |
Horace Mann Class shares | | | N/A | | | | N/A | | | | N/A | | | | N/A | | | | — | | | | N/A | |
| Net Realized Capital Gains: | | | | | | | | | | | | | | | | | | | | | | | | |
InvestmenAt Class shares | | | — | | | | — | | | | — | | | | — | | | | — | | | | — | |
Institutional Class shares | | | — | | | | — | | | | — | | | | — | | | | — | | | | — | |
Total Distributions to Shareholders | | | — | | | | — | | | | — | | | | — | | | | — | | | | — | |
| | | | | | | | | | | | | | | | | | | | | | | | | |
CAPITAL STOCK TRANSACTIONS (DOLLARS)3: | | | | | | | | | | | | | | | | | | | | | | | | |
| Investment Class shares: | | | | | | | | | | | | | | | | | | | | | | | | |
Shares sold | | | 4,202,005 | | | | 4,429,965 | | | | 317,797 | | | | 1,152,150 | | | | 6,126,968 | | | | 72,093 | |
Shares issued as reinvestment of distributions | | | — | | | | — | | | | — | | | | — | | | | — | | | | — | |
Shares redeemed | | | (11,280,645 | ) | | | (4,486,045 | ) | | | (480,863 | ) | | | (1,074,575 | ) | | | (8,847,510 | ) | | | (81,827,778 | ) |
| Net increase/(decrease) in net assets from Investment Class share transactions | | | (7,078,640 | ) | | | (56,080 | ) | | | (163,066 | ) | | | 77,575 | | | | (2,720,542 | ) | | | (81,755,685 | ) |
| | | | | | | | | | | | | | | | | | | | | | | | | |
| Institutional Class shares: | | | | | | | | | | | | | | | | | | | | | | | | |
Shares sold | | | 114,909,566 | | | | 96,166,331 | | | | 14,821,463 | | | | 14,998,024 | | | | 1,788,694 | | | | 33,381,079 | |
Shares issued as reinvestment of distributions | | | — | | | | — | | | | — | | | | — | | | | — | | | | — | |
Shares redeemed | | | (9,394,815 | ) | | | (2,722,089 | ) | | | (304,728 | ) | | | (294,248 | ) | | | (4,644,252 | ) | | | (109,003,372 | ) |
| Net increase/(decrease) in net assets from Institutional Class share transactions | | | 105,514,751 | | | | 93,444,242 | | | | 14,516,735 | | | | 14,703,776 | | | | (2,855,558 | ) | | | (75,622,293 | ) |
| 1 | Includes realized gain/(loss) as a result of in-kind transactions. See Note 9 in Notes to Financial Statements. |
| 2 | Effective April 2, 2013, the Wilshire International Equity Fund no longer engages in securities sold short. |
| 3 | Includes shares sold/shares redeemed as a result of in-kind transactions. See Note 9 in Notes to Financial Statements. |
| N/A — Not Applicable. Share classes currently not offered. |
| Amounts designated as “—” are either $0, or have been rounded to $0. |
See Notes to Financial Statements.
Wilshire Mutual Funds, Inc. Statements of Changes in Net Assets - (Continued) For the Six Months Ended June 30, 2013 (Unaudited) | |
| | | LARGE COMPANY GROWTH PORTFOLIO | | | LARGE COMPANY VALUE PORTFOLIO | | | SMALL COMPANY GROWTH PORTFOLIO | | | SMALL COMPANY VALUE PORTFOLIO | | | | | | WILSHIRE INTERNATIONAL EQUITY FUND | |
| CAPITAL STOCK TRANSACTIONS (DOLLARS) (Continued): | | | | | | | | | | | | | | | | | | |
| Qualified Class shares: | | | | | | | | | | | | | | | | | | |
Shares sold | | | N/A | | | | N/A | | | | N/A | | | | N/A | | | | 1 | | | | N/A | |
Shares issued as reinvestment of distributions | | | N/A | | | | N/A | | | | N/A | | | | N/A | | | | — | | | | N/A | |
Shares redeemed | | | N/A | | | | N/A | | | | N/A | | | | N/A | | | | — | | | | N/A | |
| Net increase in net assets from Qualified Class share transactions | | | N/A | | | | N/A | | | | N/A | | | | N/A | | | | 1 | | | | N/A | |
| | | | | | | | | | | | | | | | | | | | | | | | | |
| Horace Mann Class shares: | | | | | | | | | | | | | | | | | | | | | | | | |
Shares sold | | | N/A | | | | N/A | | | | N/A | | | | N/A | | | | 14,400 | | | | N/A | |
Shares issued as reinvestment of distributions | | | N/A | | | | N/A | | | | N/A | | | | N/A | | | | — | | | | N/A | |
Shares redeemed | | | N/A | | | | N/A | | | | N/A | | | | N/A | | | | (56,256 | ) | | | N/A | |
| Net decrease in net assets from Horace Mann Class share transactions | | | N/A | | | | N/A | | | | N/A | | | | N/A | | | | (41,856 | ) | | | N/A | |
| Net increase/(decrease) in net assets from capital stock transactions | | | 98,436,111 | | | | 93,388,162 | | | | 14,353,669 | | | | 14,781,351 | | | | (5,617,955 | ) | | | (157,377,978 | ) |
Net increase/(decrease) in net assets | | | 117,183,764 | | | | 107,496,481 | | | | 16,632,719 | | | | 17,532,706 | | | | 15,995,531 | | | | (143,998,825 | ) |
| | | | | | | | | | | | | | | | | | | | | | | | | |
| NET ASSETS: | | | | | | | | | | | | | | | | | | | | | | | | |
Beginning of period | | | 186,592,830 | | | | 45,020,032 | | | | 7,240,391 | | | | 9,694,870 | | | | 159,763,688 | | | | 174,104,619 | |
End of period | | $ | 303,776,594 | | | $ | 152,516,513 | | | $ | 23,873,110 | | | $ | 27,227,576 | | | $ | 175,759,219 | | | $ | 30,105,794 | |
| Undistributed net investment income/(accumulated net investment loss) at end of period | | $ | 334,120 | | | $ | 532,231 | | | $ | (1,090 | ) | | $ | (14,443 | ) | | $ | 1,709,982 | | | $ | 480,043 | |
| N/A — Not Applicable. Share classes currently not offered. |
| Amounts designated as “—” are either $0, or have been rounded to $0. |
See Notes to Financial Statements.
Wilshire Mutual Funds, Inc. Statements of Changes in Net Assets - (Continued) For the Six Months Ended June 30, 2013 (Unaudited) | |
| | | LARGE COMPANY GROWTH PORTFOLIO | | | LARGE COMPANY VALUE PORTFOLIO | | | SMALL COMPANY GROWTH PORTFOLIO | | | SMALL COMPANY VALUE PORTFOLIO | | | | | | WILSHIRE INTERNATIONAL EQUITY FUND | |
CAPITAL SHARE TRANSACTIONS1: | | | | | | | | | | | | | | | | | | |
| Investment Class shares: | | | | | | | | | | | | | | | | | | |
Shares sold | | | 113,507 | | | | 249,959 | | | | 16,267 | | | | 59,790 | | | | 444,955 | | | | 2,009 | |
Shares issued as reinvestment of distributions | | | — | | | | — | | | | — | | | | — | | | | — | | | | — | |
Shares redeemed | | | (305,278 | ) | | | (259,716 | ) | | | (24,026 | ) | | | (54,811 | ) | | | (651,581 | ) | | | (8,973,646 | ) |
| Net increase/(decrease) in Investment Class shares outstanding | | | (191,771 | ) | | | (9,757 | ) | | | (7,759 | ) | | | 4,979 | | | | (206,626 | ) | | | (8,971,637 | ) |
| | | | | | | | | | | | | | | | | | | | | | | | | |
| Institutional Class shares: | | | | | | | | | | | | | | | | | | | | | | | | |
Shares sold | | | 2,992,197 | | | | 5,421,113 | | | | 710,320 | | | | 766,003 | | | | 130,846 | | | | 3,463,385 | |
Shares issued as reinvestment of distributions | | | — | | | | — | | | | — | | | | — | | | | — | | | | — | |
Shares redeemed | | | (241,385 | ) | | | (147,160 | ) | | | (13,894 | ) | | | (14,176 | ) | | | (338,687 | ) | | | (11,862,502 | ) |
| Net increase/(decrease) in Institutional Class shares outstanding | | | 2,750,812 | | | | 5,273,953 | | | | 696,426 | | | | 751,827 | | | | (207,841 | ) | | | (8,399,117 | ) |
| | | | | | | | | | | | | | | | | | | | | | | | | |
| Qualified Class shares: | | | | | | | | | | | | | | | | | | | | | | | | |
Shares sold | | | N/A | | | | N/A | | | | N/A | | | | N/A | | | | — | | | | N/A | |
Shares issued as reinvestment of distributions | | | N/A | | | | N/A | | | | N/A | | | | N/A | | | | — | | | | N/A | |
Shares redeemed | | | N/A | | | | N/A | | | | N/A | | | | N/A | | | | — | | | | N/A | |
| Net increase/(decrease) in Qualified Class shares outstanding | | | N/A | | | | N/A | | | | N/A | | | | N/A | | | | — | | | | N/A | |
| | | | | | | | | | | | | | | | | | | | | | | | | |
| Horace Mann Class shares: | | | | | | | | | | | | | | | | | | | | | | | | |
Shares sold | | | N/A | | | | N/A | | | | N/A | | | | N/A | | | | 1,059 | | | | N/A | |
Shares issued as reinvestment of distributions | | | N/A | | | | N/A | | | | N/A | | | | N/A | | | | — | | | | N/A | |
Shares redeemed | | | N/A | | | | N/A | | | | N/A | | | | N/A | | | | (4,124 | ) | | | N/A | |
| Net decrease in Horace Mann Class shares outstanding | | | N/A | | | | N/A | | | | N/A | | | | N/A | | | | (3,065 | ) | | | N/A | |
| 1 | Includes shares sold/shares redeemed as a result of in-kind transactions. See Note 9 in Notes to Financial Statements. |
| N/A — Not Applicable. Share classes currently not offered. |
| Amounts designated as “—” are either $0, or have been rounded to $0. |
See Notes to Financial Statements.
Wilshire Mutual Funds, Inc. Statements of Changes in Net Assets For the Year Ended December 31, 2012 | |
| | | LARGE COMPANY GROWTH PORTFOLIO | | | LARGE COMPANY VALUE PORTFOLIO | | | SMALL COMPANY GROWTH PORTFOLIO | | | SMALL COMPANY VALUE PORTFOLIO | | | | | | WILSHIRE INTERNATIONAL EQUITY FUND | |
| OPERATIONS: | | | | | | | | | | | | | | | | | | |
Net investment income | | $ | 623,377 | | | $ | 447,110 | | | $ | 38,710 | | | $ | 112,073 | | | $ | 2,701,456 | | | $ | 1,609,692 | |
| Net realized gain on investments and securities sold short | | | 17,311,562 | | | | 2,505,781 | | | | 563,911 | | | | 689,932 | | | | 4,299,258 | | | | 8,910,470 | |
| Net change in unrealized appreciation on investments and securities sold short | | | 5,203,680 | | | | 2,460,131 | | | | 306,564 | | | | 652,206 | | | | 15,612,259 | | | | 12,460,075 | |
| Net increase in net assets resulting from operations | | | 23,138,619 | | | | 5,413,022 | | | | 909,185 | | | | 1,454,211 | | | | 22,612,973 | | | | 22,980,237 | |
| | | | | | | | | | | | | | | | | | | | | | | | | |
| DISTRIBUTIONS TO SHAREHOLDERS FROM: | | | | | | | | | | | | | | | | | | | | | | | | |
| Net Investment Income: | | | | | | | | | | | | | | | | | | | | | | | | |
Investment Class shares | | | (207,623 | ) | | | (436,965 | ) | | | — | | | | (122,348 | ) | | | (1,516,208 | ) | | | (760,719 | ) |
Institutional Class shares | | | (414,871 | ) | | | (9,553 | ) | | | — | | | | (754 | ) | | | (820,042 | ) | | | (1,293,440 | ) |
Qualified Class shares | | | N/A | | | | N/A | | | | N/A | | | | N/A | | | | (2 | ) | | | N/A | |
Horace Mann Class shares | | | N/A | | | | N/A | | | | N/A | | | | N/A | | | | (17,537 | ) | | | N/A | |
| Net Realized Capital Gains: | | | | | | | | | | | | | | | | | | | | | | | | |
Investment Class shares | | | (3,063,311 | ) | | | — | | | | — | | | | — | | | | — | | | | (1,929,117 | ) |
Institutional Class shares | | | (2,497,458 | ) | | | — | | | | — | | | | — | | | | — | | | | (2,509,275 | ) |
Total Distributions to Shareholders | | | (6,183,263 | ) | | | (446,518 | ) | | | — | | | | (123,102 | ) | | | (2,353,789 | ) | | | (6,492,551 | ) |
| | | | | | | | | | | | | | | | | | | | | | | | | |
| CAPITAL STOCK TRANSACTIONS (DOLLARS): | | | | | | | | | | | | | | | | | | | | | | | | |
| Investment Class shares: | | | | | | | | | | | | | | | | | | | | | | | | |
Shares sold | | | 11,793,130 | | | | 13,519,969 | | | | 786,424 | | | | 1,624,892 | | | | 11,067,308 | | | | 63,126 | |
Shares issued as reinvestment of distributions | | | 3,172,026 | | | | 420,868 | | | | — | | | | 118,798 | | | | 1,464,906 | | | | 2,687,099 | |
Shares redeemed | | | (18,467,813 | ) | | | (5,541,689 | ) | | | (1,281,207 | ) | | | (2,219,348 | ) | | | (17,517,591 | ) | | | (15,416,348 | ) |
| Net increase/(decrease) in net assets from Investment Class share transactions | | | (3,502,657 | ) | | | 8,399,148 | | | | (494,783 | ) | | | (475,658 | ) | | | (4,985,377 | ) | | | (12,666,123 | ) |
| | | | | | | | | | | | | | | | | | | | | | | | | |
| Institutional Class shares: | | | | | | | | | | | | | | | | | | | | | | | | |
Shares sold | | | 19,163,786 | | | | 65,848 | | | | 10,209 | | | | 14,151 | | | | 3,190,784 | | | | 878,374 | |
Shares issued as reinvestment of distributions | | | 1,588,657 | | | | 8,333 | | | | — | | | | 703 | | | | 809,809 | | | | 3,802,713 | |
Shares redeemed | | | (16,685,654 | ) | | | (161,013 | ) | | | (10,419 | ) | | | (52,016 | ) | | | (10,400,423 | ) | | | (7,533,378 | ) |
| Net increase/(decrease) in net assets from Institutional Class share transactions | | | 4,066,789 | | | | (86,832 | ) | | | (210 | ) | | | (37,162 | ) | | | (6,399,830 | ) | | | (2,852,291 | ) |
| N/A — Not Applicable. Share classes currently not offered. |
| Amounts designated as “—” are either $0, or have been rounded to $0. |
See Notes to Financial Statements.
Wilshire Mutual Funds, Inc. Statements of Changes in Net Assets - (Continued) For the Year Ended December 31, 2012 | |
| | | LARGE COMPANY GROWTH PORTFOLIO | | | LARGE COMPANY VALUE PORTFOLIO | | | SMALL COMPANY GROWTH PORTFOLIO | | | SMALL COMPANY VALUE PORTFOLIO | | | | | | WILSHIRE INTERNATIONAL EQUITY FUND | |
| CAPITAL STOCK TRANSACTIONS (DOLLARS) (Continued): | | | | | | | | | | | | | | | | | | |
| Qualified Class shares: | | | | | | | | | | | | | | | | | | |
Shares sold | | | N/A | | | | N/A | | | | N/A | | | | N/A | | | | — | | | | N/A | |
Shares issued as reinvestment of distributions | | | N/A | | | | N/A | | | | N/A | | | | N/A | | | | 1 | | | | N/A | |
Shares redeemed | | | N/A | | | | N/A | | | | N/A | | | | N/A | | | | — | | | | N/A | |
| Net increase in net assets from Qualified Class share transactions | | | N/A | | | | N/A | | | | N/A | | | | N/A | | | | 1 | | | | N/A | |
| | | | | | | | | | | | | | | | | | | | | | | | | |
| Horace Mann Class shares: | | | | | | | | | | | | | | | | | | | | | | | | |
Shares sold | | | N/A | | | | N/A | | | | N/A | | | | N/A | | | | 38,750 | | | | N/A | |
Shares issued as reinvestment of distributions | | | N/A | | | | N/A | | | | N/A | | | | N/A | | | | 17,537 | | | | N/A | |
Shares redeemed | | | N/A | | | | N/A | | | | N/A | | | | N/A | | | | (71,640 | ) | | | N/A | |
| Net decrease in net assets from Horace Mann Class share transactions | | | N/A | | | | N/A | | | | N/A | | | | N/A | | | | (15,353 | ) | | | N/A | |
| Net increase/(decrease) in net assets from capital stock transactions | | | 564,132 | | | | 8,312,316 | | | | (494,993 | ) | | | (512,820 | ) | | | (11,400,559 | ) | | | (15,518,414 | ) |
Net increase in net assets | | | 17,519,488 | | | | 13,278,820 | | | | 414,192 | | | | 818,289 | | | | 8,858,625 | | | | 969,272 | |
| | | | | | | | | | | | | | | | | | | | | | | | | |
| NET ASSETS: | | | | | | | | | | | | | | | | | | | | | | | | |
Beginning of year | | | 169,073,342 | | | | 31,741,212 | | | | 6,826,199 | | | | 8,876,581 | | | | 150,905,063 | | | | 173,135,347 | |
End of year | | $ | 186,592,830 | | | $ | 45,020,032 | | | $ | 7,240,391 | | | $ | 9,694,870 | | | $ | 159,763,688 | | | $ | 174,104,619 | |
| Undistributed net investment income/(accumulated net investment loss) at end of year | | $ | 12,246 | | | $ | 6,444 | | | $ | 38,906 | | | $ | (32,028 | ) | | $ | 461,031 | | | $ | (3 | ) |
| N/A — Not Applicable. Share classes currently not offered. |
| Amounts designated as “—” are either $0, or have been rounded to $0. |
See Notes to Financial Statements.
Wilshire Mutual Funds, Inc. Statements of Changes in Net Assets - (Continued) For the Year Ended December 31, 2012 | |
| | | LARGE COMPANY GROWTH PORTFOLIO | | | LARGE COMPANY VALUE PORTFOLIO | | | SMALL COMPANY GROWTH PORTFOLIO | | | SMALL COMPANY VALUE PORTFOLIO | | | | | | WILSHIRE INTERNATIONAL EQUITY FUND | |
| CAPITAL SHARE TRANSACTIONS: | | | | | | | | | | | | | | | | | | |
| Investment Class shares: | | | | | | | | | | | | | | | | | | |
Shares sold | | | 331,181 | | | | 883,883 | | | | 45,393 | | | | 97,624 | | | | 917,410 | | | | 7,296 | |
Shares issued as reinvestment of distributions | | | 92,654 | | | | 26,996 | | | | — | | | | 6,951 | | | | 119,878 | | | | 322,809 | |
Shares redeemed | | | (525,217 | ) | | | (363,633 | ) | | | (73,894 | ) | | | (135,097 | ) | | | (1,459,038 | ) | | | (1,830,002 | ) |
| Net increase/(decrease) in Investment Class shares outstanding | | | (101,382 | ) | | | 547,246 | | | | (28,501 | ) | | | (30,522 | ) | | | (421,750 | ) | | | (1,499,897 | ) |
| | | | | | | | | | | | | | | | | | | | | | | | | |
| Institutional Class shares: | | | | | | | | | | | | | | | | | | | | | | | | |
Shares sold | | | 524,356 | | | | 4,343 | | | | 563 | | | | 843 | | | | 265,860 | | | | 106,110 | |
Shares issued as reinvestment of distributions | | | 44,711 | | | | 534 | | | | — | | | | 41 | | | | 66,324 | | | | 454,631 | |
Shares redeemed | | | (457,410 | ) | | | (10,396 | ) | | | (560 | ) | | | (3,206 | ) | | | (854,070 | ) | | | (886,522 | ) |
| Net increase/(decrease) in Institutional Class shares outstanding | | | 111,657 | | | | (5,519 | ) | | | 3 | | | | (2,322 | ) | | | (521,886 | ) | | | (325,781 | ) |
| | | | | | | | | | | | | | | | | | | | | | | | | |
| Qualified Class shares: | | | | | | | | | | | | | | | | | | | | | | | | |
Shares sold | | | N/A | | | | N/A | | | | N/A | | | | N/A | | | | — | | | | N/A | |
Shares issued as reinvestment of distributions | | | N/A | | | | N/A | | | | N/A | | | | N/A | | | | — | | | | N/A | |
Shares redeemed | | | N/A | | | | N/A | | | | N/A | | | | N/A | | | | — | | | | N/A | |
| Net increase/(decrease) in Qualified Class shares outstanding | | | N/A | | | | N/A | | | | N/A | | | | N/A | | | | — | | | | N/A | |
| | | | | | | | | | | | | | | | | | | | | | | | | |
| Horace Mann Class shares: | | | | | | | | | | | | | | | | | | | | | | | | |
Shares sold | | | N/A | | | | N/A | | | | N/A | | | | N/A | | | | 3,232 | | | | N/A | |
Shares issued as reinvestment of distributions | | | N/A | | | | N/A | | | | N/A | | | | N/A | | | | 1,439 | | | | N/A | |
Shares redeemed | | | N/A | | | | N/A | | | | N/A | | | | N/A | | | | (5,967 | ) | | | N/A | |
| Net decrease in Horace Mann Class shares outstanding | | | N/A | | | | N/A | | | | N/A | | | | N/A | | | | (1,296 | ) | | | N/A | |
| N/A — Not Applicable. Share classes currently not offered. |
| Amounts designated as “—” are either $0, or have been rounded to $0. |
See Notes to Financial Statements.
Wilshire Mutual Funds, Inc. Large Company Growth Portfolio Financial Highlights | |
| For a Fund Share Outstanding Throughout Each Period. | |
| | | | |
| | | Six Months Ended 06/30/2013 (Unaudited) | | | | | | | | | | | | | | | | |
Net asset value, beginning of period | | $ | 34.70 | | | $ | 31.54 | | | $ | 32.00 | | | $ | 26.88 | | | $ | 20.12 | | | $ | 35.34 | |
| | | | | | | | | | | | | | | | | | | | | | | | | |
| Income/(loss) from investment operations: | | | | | | | | | | | | | | | | | | | | | | | | |
Net investment income/(loss)1 | | | 0.01 | | | | 0.07 | | | | (0.09 | ) | | | 0.01 | | | | 0.00 | | | | (0.09 | ) |
| Net realized and unrealized gain/(loss) on investments | | | 3.06 | | | | 4.24 | | | | (0.37 | ) | | | 5.12 | | | | 6.76 | | | | (14.73 | ) |
Total from investment operations | | | 3.07 | | | | 4.31 | | | | (0.46 | ) | | | 5.13 | | | | 6.76 | | | | (14.82 | ) |
| | | | | | | | | | | | | | | | | | | | | | | | | |
| Less distributions: | | | | | | | | | | | | | | | | | | | | | | | | |
From net investment income | | | 0.00 | | | | (0.07 | ) | | | 0.00 | | | | (0.01 | ) | | | 0.00 | | | | 0.00 | |
Return of capital | | | 0.00 | | | | 0.00 | | | | 0.00 | | | | (0.00 | )2 | | | 0.00 | | | | 0.00 | |
From capital gains | | | 0.00 | | | | (1.08 | ) | | | 0.00 | | | | 0.00 | | | | 0.00 | | | | (0.40 | ) |
Total distributions | | | 0.00 | | | | (1.15 | ) | | | 0.00 | | | | (0.01 | ) | | | 0.00 | | | | (0.40 | ) |
| | | | | | | | | | | | | | | | | | | | | | | | | |
Net asset value, end of period | | $ | 37.77 | | | $ | 34.70 | | | $ | 31.54 | | | $ | 32.00 | | | $ | 26.88 | | | $ | 20.12 | |
| | | | | | | | | | | | | | | | | | | | | | | | | |
Total return | | | 8.85 | %3 | | | 13.72 | % | | | (1.44 | )% | | | 19.10 | % | | | 33.60 | % | | | (41.88 | )% |
| | | | | | | | | | | | | | | | | | | | | | | | | |
| Ratios to average net assets/supplemental data: | | | | | | | | | | | | | | | | | | | | | | | | |
Net assets, end of period (in 000’s) | | $ | 102,527 | | | $ | 100,853 | | | $ | 94,872 | | | $ | 111,904 | | | $ | 116,799 | | | $ | 118,683 | |
| Operating expenses including reimbursement/fees paid indirectly | | | 1.38 | %4 | | | 1.39 | % | | | 1.41 | % | | | 1.42 | % | | | 1.43 | % | | | 1.43 | % |
Operating expenses excluding reimbursement/fees paid indirectly5 | | | 1.39 | %4 | | | 1.39 | % | | | 1.41 | % | | | 1.42 | % | | | 1.43 | % | | | 1.43 | % |
Net investment income/(loss) | | | 0.06 | %4 | | | 0.20 | % | | | (0.27 | )% | | | 0.04 | % | | | (0.02 | )% | | | (0.31 | )% |
Portfolio turnover rate | | | 40 | %3 | | | 71 | % | | | 104 | % | | | 167 | % | | | 84 | % | | | 178 | % |
| 1 | The selected per share data was calculated using the average shares outstanding method for the period. |
| 2 | Amount is less than $0.01 per share. |
| 3 | Not Annualized. |
| 4 | Annualized. |
| 5 | The ratio of operating expenses excluding reimbursement/waiver for the six months ended June 30, 2013, excludes the effect of fees paid indirectly. If this expense offset was included the ratio would have been 1.38%. |
See Notes to Financial Statements.
Wilshire Mutual Funds, Inc. Large Company Growth Portfolio Financial Highlights - (Continued) | |
| For a Fund Share Outstanding Throughout Each Period. | |
| | | Institutional Class Shares | |
| | | Six Months Ended 06/30/2013 (Unaudited) | | | | | | | | | | | | | | | | |
Net asset value, beginning of period | | $ | 35.94 | | | $ | 32.63 | | | $ | 32.99 | | | $ | 27.70 | | | $ | 20.72 | | | $ | 36.25 | |
| | | | | | | | | | | | | | | | | | | | | | | | | |
| Income/(loss) from investment operations: | | | | | | | | | | | | | | | | | | | | | | | | |
Net investment income1 | | | 0.08 | | | | 0.18 | | | | 0.03 | | | | 0.12 | | | | 0.08 | | | | 0.02 | |
| Net realized and unrealized gain/(loss) on investments | | | 3.16 | | | | 4.38 | | | | (0.39 | ) | | | 5.30 | | | | 6.98 | | | | (15.15 | ) |
Total from investment operations | | | 3.24 | | | | 4.56 | | | | (0.36 | ) | | | 5.42 | | | | 7.06 | | | | (15.13 | ) |
| | | | | | | | | | | | | | | | | | | | | | | | | |
| Less distributions: | | | | | | | | | | | | | | | | | | | | | | | | |
From net investment income | | | 0.00 | | | | (0.17 | ) | | | 0.00 | | | | (0.13 | ) | | | (0.08 | ) | | | 0.00 | |
Return of capital | | | 0.00 | | | | 0.00 | | | | 0.00 | | | | (0.00 | )2 | | | 0.00 | | | | 0.00 | |
From capital gains | | | 0.00 | | | | (1.08 | ) | | | 0.00 | | | | 0.00 | | | | 0.00 | | | | (0.40 | ) |
Total distributions | | | 0.00 | | | | (1.25 | ) | | | 0.00 | | | | (0.13 | ) | | | (0.08 | ) | | | (0.40 | ) |
| | | | | | | | | | | | | | | | | | | | | | | | | |
Net asset value, end of period | | $ | 39.18 | | | $ | 35.94 | | | $ | 32.63 | | | $ | 32.99 | | | $ | 27.70 | | | $ | 20.72 | |
| | | | | | | | | | | | | | | | | | | | | | | | | |
Total return | | | 9.02 | %3 | | | 14.04 | % | | | (1.09 | )% | | | 19.55 | % | | | 34.07 | % | | | (41.70 | )% |
| | | | | | | | | | | | | | | | | | | | | | | | | |
| Ratios to average net assets/supplemental data: | | | | | | | | | | | | | | | | | | | | | | | | |
Net assets, end of period (in 000’s) | | $ | 201,249 | | | $ | 85,740 | | | $ | 74,201 | | | $ | 82,007 | | | $ | 89,049 | | | $ | 81,680 | |
| Operating expenses including reimbursement/fees paid indirectly | | | 1.05 | %4 | | | 1.11 | % | | | 1.05 | % | | | 1.05 | % | | | 1.09 | % | | | 1.06 | % |
Operating expenses excluding reimbursement/fees paid indirectly5 | | | 1.06 | %4 | | | 1.11 | % | | | 1.05 | % | | | 1.05 | % | | | 1.09 | % | | | 1.06 | % |
Net investment income | | | 0.41 | %4 | | | 0.50 | % | | | 0.09 | % | | | 0.40 | % | | | 0.33 | % | | | 0.07 | % |
Portfolio turnover rate | | | 40 | %3 | | | 71 | % | | | 104 | % | | | 167 | % | | | 84 | % | | | 178 | % |
| 1 | The selected per share data was calculated using the average shares outstanding method for the period. |
| 2 | Amount is less than $0.01 per share. |
| 3 | Not Annualized. |
| 4 | Annualized. |
| 5 | The ratio of operating expenses excluding reimbursement/waiver for the six months ended June 30, 2013, excludes the effect of fees paid indirectly. If this expense offset was included the ratio would have been 1.05%. |
See Notes to Financial Statements.
Wilshire Mutual Funds, Inc. Large Company Value Portfolio Financial Highlights | |
| For a Fund Share Outstanding Throughout Each Period. | |
| | | | |
| | | Six Months Ended 06/30/2013 (Unaudited) | | | | | | | | | | | | | | | | |
Net asset value, beginning of period | | $ | 15.86 | | | $ | 13.82 | | | $ | 14.42 | | | $ | 12.78 | | | $ | 10.02 | | | $ | 17.51 | |
| | | | | | | | | | | | | | | | | | | | | | | | | |
| Income/(loss) from investment operations: | | | | | | | | | | | | | | | | | | | | | | | | |
Net investment income1 | | | 0.08 | | | | 0.17 | | | | 0.11 | | | | 0.07 | | | | 0.08 | | | | 0.17 | |
| Net realized and unrealized gain/(loss) on investments | | | 2.85 | | | | 2.03 | | | | (0.59 | ) | | | 1.64 | | | | 2.77 | | | | (7.45 | ) |
Total from investment operations | | | 2.93 | | | | 2.20 | | | | (0.48 | ) | | | 1.71 | | | | 2.85 | | | | (7.28 | ) |
| | | | | | | | | | | | | | | | | | | | | | | | | |
| Less distributions: | | | | | | | | | | | | | | | | | | | | | | | | |
From net investment income | | | 0.00 | | | | (0.16 | ) | | | (0.12 | ) | | | (0.07 | ) | | | (0.09 | ) | | | (0.21 | ) |
Return of capital | | | 0.00 | | | | 0.00 | | | | 0.00 | | | | (0.00 | )2 | | | 0.00 | | | | 0.00 | 2 |
From capital gains | | | 0.00 | | | | 0.00 | | | | 0.00 | | | | 0.00 | | | | 0.00 | | | | 0.00 | 2 |
Total distributions | | | 0.00 | | | | (0.16 | ) | | | (0.12 | ) | | | (0.07 | ) | | | (0.09 | ) | | | (0.21 | ) |
| | | | | | | | | | | | | | | | | | | | | | | | | |
Net asset value, end of period | | $ | 18.79 | | | $ | 15.86 | | | $ | 13.82 | | | $ | 14.42 | | | $ | 12.78 | | | $ | 10.02 | |
| | | | | | | | | | | | | | | | | | | | | | | | | |
Total return | | | 18.47 | %3 | | | 15.92 | % | | | (3.36 | )% | | | 13.40 | % | | | 28.48 | % | | | (41.55 | )% |
| | | | | | | | | | | | | | | | | | | | | | | | | |
| Ratios to average net assets/supplemental data: | | | | | | | | | | | | | | | | | | | | | | | | |
Net assets, end of period (in 000’s) | | $ | 52,201 | | | $ | 44,220 | | | $ | 30,968 | | | $ | 33,887 | | | $ | 30,677 | | | $ | 24,791 | |
| Operating expenses including reimbursement/fees paid indirectly | | | 1.28 | %4 | | | 1.35 | % | | | 1.39 | % | | | 1.39 | % | | | 1.48 | % | | | 1.49 | % |
Operating expenses excluding reimbursement/fees paid indirectly5 | | | 1.29 | %4 | | | 1.36 | % | | | 1.39 | % | | | 1.39 | % | | | 1.48 | % | | | 1.49 | % |
Net investment income | | | 0.94 | %4 | | | 1.12 | % | | | 0.77 | % | | | 0.54 | % | | | 0.75 | % | | | 1.22 | % |
Portfolio turnover rate | | | 83 | %3 | | | 97 | % | | | 140 | % | | | 140 | % | | | 188 | % | | | 183 | % |
| 1 | The selected per share data was calculated using the average shares outstanding method for the period. |
| 2 | Amount is less than $0.01 per share. |
| 3 | Not Annualized. |
| 4 | Annualized. |
| 5 | The ratio of operating expenses excluding reimbursement/waiver for the six months ended June 30, 2013 excludes the effect of fees paid indirectly. If this expense offset was included, the ratio would have been 1.28%. |
See Notes to Financial Statements.
Wilshire Mutual Funds, Inc. Large Company Value Portfolio Financial Highlights - (Continued) | |
| For a Fund Share Outstanding Throughout Each Period. | |
| | | Institutional Class Shares | |
| | | Six Months Ended 06/30/2013 (Unaudited) | | | | | | | | | | | | | | | | |
Net asset value, beginning of period | | $ | 15.89 | | | $ | 13.84 | | | $ | 14.44 | | | $ | 12.79 | | | $ | 10.01 | | | $ | 17.49 | |
| | | | | | | | | | | | | | | | | | | | | | | | | |
| Income/(loss) from investment operations: | | | | | | | | | | | | | | | | | | | | | | | | |
Net investment income1 | | | 0.12 | | | | 0.20 | | | | 0.16 | | | | 0.08 | | | | 0.10 | | | | 0.20 | |
| Net realized and unrealized gain/(loss) on investments | | | 2.83 | | | | 2.04 | | | | (0.58 | ) | | | 1.66 | | | | 2.76 | | | | (7.45 | ) |
Total from investment operations | | | 2.95 | | | | 2.24 | | | | (0.42 | ) | | | 1.74 | | | | 2.86 | | | | (7.25 | ) |
| | | | | | | | | | | | | | | | | | | | | | | | | |
| Less distributions: | | | | | | | | | | | | | | | | | | | | | | | | |
From net investment income | | | 0.00 | | | | (0.19 | ) | | | (0.18 | ) | | | (0.09 | ) | | | (0.08 | ) | | | (0.23 | ) |
Return of capital | | | 0.00 | | | | 0.00 | | | | 0.00 | | | | (0.00 | )2 | | | 0.00 | | | | 0.00 | |
From capital gains | | | 0.00 | | | | 0.00 | | | | 0.00 | | | | 0.00 | | | | 0.00 | | | | 0.00 | 2 |
Total distributions | | | 0.00 | | | | (0.19 | ) | | | (0.18 | ) | | | (0.09 | ) | | | (0.08 | ) | | | (0.23 | ) |
| | | | | | | | | | | | | | | | | | | | | | | | | |
Net asset value, end of period | | $ | 18.84 | | | $ | 15.89 | | | $ | 13.84 | | | $ | 14.44 | | | $ | 12.79 | | | $ | 10.01 | |
| | | | | | | | | | | | | | | | | | | | | | | | | |
Total return | | | 18.57 | %3 | | | 16.18 | % | | | (2.95 | )% | | | 13.57 | % | | | 28.60 | % | | | (41.41 | )% |
| | | | | | | | | | | | | | | | | | | | | | | | | |
| Ratios to average net assets/supplemental data: | | | | | | | | | | | | | | | | | | | | | | | | |
Net assets, end of period (in 000’s) | | $ | 100,316 | | | $ | 800 | | | $ | 773 | | | $ | 1,105 | | | $ | 1,461 | | | $ | 4,736 | |
| Operating expenses including reimbursement/fees paid indirectly | | | 0.94 | %4 | | | 1.14 | % | | | 1.00 | % | | | 1.27 | % | | | 1.36 | % | | | 1.30 | % |
Operating expenses excluding reimbursement/fees paid indirectly5 | | | 0.96 | %4 | | | 1.15 | % | | | 1.16 | % | | | 1.27 | % | | | 1.36 | % | | | 1.30 | % |
Net investment income | | | 1.31 | %4 | | | 1.32 | % | | | 1.13 | % | | | 0.65 | % | | | 0.97 | % | | | 1.34 | % |
Portfolio turnover rate | | | 83 | %3 | | | 97 | % | | | 140 | % | | | 140 | % | | | 188 | % | | | 183 | % |
| 1 | The selected per share data was calculated using the average shares outstanding method for the period. |
| 2 | Amount is less than $0.01 per share. |
| 3 | Not Annualized. |
| 4 | Annualized. |
| 5 | The ratio of operating expenses excluding reimbursement/waiver for the six months ended June 30, 2013 excludes the effect of fees paid indirectly. If this expense offset was included, the ratio would have been 0.95%. |
See Notes to Financial Statements.
Wilshire Mutual Funds, Inc. Small Company Growth Portfolio Financial Highlights | |
| For a Fund Share Outstanding Throughout Each Period. | |
| | | | |
| | | Six Months Ended 06/30/2013 (Unaudited) | | | | | | | | | | | | | | | | |
Net asset value, beginning of period | | $ | 18.06 | | | $ | 15.90 | | | $ | 15.95 | | | $ | 12.64 | | | $ | 9.70 | | | $ | 16.94 | |
| | | | | | | | | | | | | | | | | | | | | | | | | |
| Income/(loss) from investment operations: | | | | | | | | | | | | | | | | | | | | | | | | |
Net investment income/(loss)1 | | | (0.05 | ) | | | 0.09 | | | | (0.14 | ) | | | (0.05 | ) | | | (0.08 | ) | | | (0.10 | ) |
| Net realized and unrealized gain/(loss) on investments | | | 3.27 | | | | 2.07 | | | | 0.09 | 2 | | | 3.36 | | | | 3.02 | | | | (6.56 | ) |
Total from investment operations | | | 3.22 | | | | 2.16 | | | | (0.05 | ) | | | 3.31 | | | | 2.94 | | | | (6.66 | ) |
| | | | | | | | | | | | | | | | | | | | | | | | | |
| Less distributions: | | | | | | | | | | | | | | | | | | | | | | | | |
From capital gains | | | 0.00 | | | | 0.00 | | | | 0.00 | | | | 0.00 | | | | 0.00 | | | | (0.58 | ) |
Total distributions | | | 0.00 | | | | 0.00 | | | | 0.00 | | | | 0.00 | | | | 0.00 | | | | (0.58 | ) |
| | | | | | | | | | | | | | | | | | | | | | | | | |
Net asset value, end of period | | $ | 21.28 | | | $ | 18.06 | | | $ | 15.90 | | | $ | 15.95 | | | $ | 12.64 | | | $ | 9.70 | |
| | | | | | | | | | | | | | | | | | | | | | | | | |
Total return | | | 17.83 | %3 | | | 13.58 | % | | | (0.31 | )% | | | 26.19 | % | | | 30.31 | % | | | (39.13 | )% |
| | | | | | | | | | | | | | | | | | | | | | | | | |
| Ratios to average net assets/supplemental data: | | | | | | | | | | | | | | | | | | | | | | | | |
Net assets, end of period (in 000’s) | | $ | 8,347 | | | $ | 7,225 | | | $ | 6,813 | | | $ | 7,521 | | | $ | 6,513 | | | $ | 5,273 | |
| Operating expenses including reimbursement/waiver and fees paid indirectly | | | 1.43 | %4 | | | 1.47 | % | | | 1.50 | % | | | 1.45 | % | | | 1.50 | % | | | 1.47 | % |
Operating expenses excluding reimbursement/waiver and fees paid indirectly5 | | | 1.77 | %4 | | | 1.97 | % | | | 2.02 | % | | | 2.18 | % | | | 2.41 | % | | | 2.07 | % |
Net investment income/(loss) | | | (0.54 | )%4 | | | 0.55 | % | | | (0.85 | )% | | | (0.41 | )% | | | (0.74 | )% | | | (0.66 | )% |
Portfolio turnover rate | | | 48 | %3 | | | 99 | % | | | 177 | % | | | 83 | % | | | 98 | % | | | 87 | % |
| 1 | The selected per share data was calculated using the average shares outstanding method for the period. |
| 2 | The amount shown for a share outstanding throughout the year ended December 31, 2011, does not accord with the aggregate net gains on investments for the year because of the sales and repurchases of Portfolio shares in relation to fluctuating market value of the investments of the Portfolio. |
| 3 | Not Annualized. |
| 4 | Annualized. |
| 5 | The ratio of operating expenses excluding reimbursement/waiver for the six months ended June 30, 2013 excludes the effect of fees paid indirectly. If this expense offset was included, the ratio would have been 1.76%. |
See Notes to Financial Statements.
Wilshire Mutual Funds, Inc. Small Company Growth Portfolio Financial Highlights - (Continued) | |
| For a Fund Share Outstanding Throughout Each Period. | |
| | | Institutional Class Shares | |
| | | Six Months Ended 06/30/2013 (Unaudited) | | | | | | | | | | | | | | | | |
Net asset value, beginning of period | | $ | 18.89 | | | $ | 16.60 | | | $ | 16.61 | | | $ | 13.12 | | | $ | 10.03 | | | $ | 17.50 | |
| | | | | | | | | | | | | | | | | | | | | | | | | |
| Income/(loss) from investment operations: | | | | | | | | | | | | | | | | | | | | | | | | |
Net investment income/(loss)1 | | | (0.06 | ) | | | 0.11 | | | | (0.12 | ) | | | (0.01 | ) | | | (0.04 | ) | | | (0.06 | ) |
| Net realized and unrealized gain/(loss) on investments | | | 3.44 | | | | 2.18 | | | | 0.11 | 2 | | | 3.50 | | | | 3.13 | | | | (6.83 | ) |
Total from investment operations | | | 3.38 | | | | 2.29 | | | | (0.01 | ) | | | 3.49 | | | | 3.09 | | | | (6.89 | ) |
| | | | | | | | | | | | | | | | | | | | | | | | | |
| Less distributions: | | | | | | | | | | | | | | | | | | | | | | | | |
From capital gains | | | 0.00 | | | | 0.00 | | | | 0.00 | | | | 0.00 | | | | 0.00 | | | | (0.58 | ) |
Total distributions | | | 0.00 | | | | 0.00 | | | | 0.00 | | | | 0.00 | | | | 0.00 | | | | (0.58 | ) |
| | | | | | | | | | | | | | | | | | | | | | | | | |
Net asset value, end of period | | $ | 22.27 | | | $ | 18.89 | | | $ | 16.60 | | | $ | 16.61 | | | $ | 13.12 | | | $ | 10.03 | |
| | | | | | | | | | | | | | | | | | | | | | | | | |
Total return | | | 17.89 | %3 | | | 13.80 | % | | | (0.06 | )% | | | 26.60 | % | | | 30.81 | % | | | (39.17 | )% |
| | | | | | | | | | | | | | | | | | | | | | | | | |
| Ratios to average net assets/supplemental data: | | | | | | | | | | | | | | | | | | | | | | | | |
Net assets, end of period (in 000’s) | | $ | 15,526 | | | $ | 15 | | | $ | 13 | | | $ | 179 | | | $ | 135 | | | $ | 154 | |
| Operating expenses including reimbursement/waiver and fees paid indirectly | | | 1.22 | %4 | | | 1.28 | % | | | 1.23 | % | | | 1.15 | % | | | 1.18 | % | | | 1.24 | % |
Operating expenses excluding reimbursement/waiver and fees paid indirectly5 | | | 1.31 | %4 | | | 1.79 | % | | | 1.69 | % | | | 1.87 | % | | | 2.09 | % | | | 1.78 | % |
Net investment income/(loss) | | | (0.54 | )%4 | | | 0.60 | % | | | (0.68 | )% | | | (0.09 | )% | | | (0.43 | )% | | | (0.39 | )% |
Portfolio turnover rate | | | 48 | %3 | | | 99 | % | | | 177 | % | | | 83 | % | | | 98 | % | | | 87 | % |
| 1 | The selected per share data was calculated using the average shares outstanding method for the period. |
| 2 | The amount shown for a share outstanding throughout the year ended December 31, 2011, does not accord with the aggregate net gains on investments for the year because of the sales and repurchases of Portfolio shares in relation to fluctuating market value of the investments of the Portfolio. |
| 3 | Not Annualized. |
| 4 | Annualized. |
| 5 | The ratio of operating expenses excluding reimbursement/waiver for the six months ended June 30, 2013, excludes the effect of fees paid indirectly. If this expense offset was included the ratio would have been 1.30%. |
See Notes to Financial Statements.
Wilshire Mutual Funds, Inc. Small Company Value Portfolio Financial Highlights | |
| For a Fund Share Outstanding Throughout Each Period. | |
| | | | |
| | | Six Months Ended 06/30/2013 (Unaudited) | | | | | | | | | | | | | | | | |
Net asset value, beginning of period | | $ | 17.40 | | | $ | 15.04 | | | $ | 16.34 | | | $ | 13.32 | | | $ | 10.93 | | | $ | 16.49 | |
| | | | | | | | | | | | | | | | | | | | | | | | | |
| Income/(loss) from investment operations: | | | | | | | | | | | | | | | | | | | | | | | | |
Net investment income1 | | | 0.02 | | | | 0.20 | | | | 0.00 | | | | 0.12 | | | | 0.05 | | | | 0.09 | |
| Net realized and unrealized gain/(loss) on investments | | | 3.17 | | | | 2.38 | | | | (1.23 | ) | | | 3.02 | | | | 2.44 | | | | (5.51 | ) |
Total from investment operations | | | 3.19 | | | | 2.58 | | | | (1.23 | ) | | | 3.14 | | | | 2.49 | | | | (5.42 | ) |
| | | | | | | | | | | | | | | | | | | | | | | | | |
| Less distributions: | | | | | | | | | | | | | | | | | | | | | | | | |
From net investment income | | | 0.00 | | | | (0.22 | ) | | | (0.07 | ) | | | (0.12 | ) | | | (0.10 | ) | | | (0.14 | ) |
From capital gains | | | 0.00 | | | | 0.00 | | | | 0.00 | | | | 0.00 | | | | 0.00 | | | | 0.00 | 2 |
Total distributions | | | 0.00 | | | | (0.22 | ) | | | (0.07 | ) | | | (0.12 | ) | | | (0.10 | ) | | | (0.14 | ) |
| | | | | | | | | | | | | | | | | | | | | | | | | |
Net asset value, end of period | | $ | 20.59 | | | $ | 17.40 | | | $ | 15.04 | | | $ | 16.34 | | | $ | 13.32 | | | $ | 10.93 | |
| | | | | | | | | | | | | | | | | | | | | | | | | |
Total return | | | 18.33 | %3 | | | 17.20 | % | | | (7.54 | )% | | | 23.60 | % | | | 22.81 | % | | | (32.81 | )% |
| | | | | | | | | | | | | | | | | | | | | | | | | |
| Ratios to average net assets/supplemental data: | | | | | | | | | | | | | | | | | | | | | | | | |
Net assets, end of period (in 000’s) | | $ | 11,510 | | | $ | 9,641 | | | $ | 8,795 | | | $ | 13,754 | | | $ | 9,511 | | | $ | 8,211 | |
| Operating expenses including reimbursement/waiver and fees paid indirectly | | | 1.49 | %4 | | | 1.49 | % | | | 1.50 | % | | | 1.50 | % | | | 1.50 | % | | | 1.34 | % |
Operating expenses excluding reimbursement/waiver and fees paid indirectly5 | | | 1.70 | %4 | | | 1.84 | % | | | 1.90 | % | | | 1.87 | % | | | 2.01 | % | | | 1.94 | % |
Net investment income/(loss) | | | 0.16 | %4 | | | 1.24 | % | | | (0.02 | )% | | | 0.82 | % | | | 0.49 | % | | | 0.62 | % |
Portfolio turnover rate | | | 32 | %3 | | | 68 | % | | | 118 | % | | | 89 | % | | | 61 | % | | | 83 | % |
| 1 | The selected per share data was calculated using the average shares outstanding method for the period. |
| 2 | Amount is less than $0.01 per share |
| 3 | Not Annualized. |
| 4 | Annualized. |
| 5 | The ratio of operating expenses excluding reimbursement/waiver for the six months ended June 30, 2013, excludes the effect of fees paid indirectly. If this expense offset was included the ratio would have been 1.69%. |
See Notes to Financial Statements.
Wilshire Mutual Funds, Inc. Small Company Value Portfolio Financial Highlights - (Continued) | |
| For a Fund Share Outstanding Throughout Each Period. | |
| | | Institutional Class Shares | |
| | | Six Months Ended 06/30/2013 (Unaudited) | | | | | | | | | | | | | | | | |
Net asset value, beginning of period | | $ | 17.58 | | | $ | 15.19 | | | $ | 16.51 | | | $ | 13.45 | | | $ | 11.02 | | | $ | 16.61 | |
| | | | | | | | | | | | | | | | | | | | | | | | | |
| Income/(loss) from investment operations: | | | | | | | | | | | | | | | | | | | | | | | | |
Net investment income1 | | | 0.03 | | | | 0.22 | | | | 0.09 | | | | 0.14 | | | | 0.07 | | | | 0.12 | |
| Net realized and unrealized gain/(loss) on investments | | | 3.21 | | | | 2.42 | | | | (1.24 | ) | | | 3.06 | | | | 2.48 | | | | (5.51 | ) |
Total from investment operations | | | 3.24 | | | | 2.64 | | | | (1.15 | ) | | | 3.20 | | | | 2.55 | | | | (5.39 | ) |
| | | | | | | | | | | | | | | | | | | | | | | | | |
| Less distributions: | | | | | | | | | | | | | | | | | | | | | | | | |
From net investment income | | | 0.00 | | | | (0.25 | ) | | | (0.17 | ) | | | (0.14 | ) | | | (0.12 | ) | | | (0.20 | ) |
From capital gains | | | 0.00 | | | | 0.00 | | | | 0.00 | | | | 0.00 | | | | 0.00 | | | | 0.00 | 2 |
Total distributions | | | 0.00 | | | | (0.25 | ) | | | (0.17 | ) | | | (0.14 | ) | | | (0.12 | ) | | | (0.20 | ) |
| | | | | | | | | | | | | | | | | | | | | | | | | |
Net asset value, end of period | | $ | 20.82 | | | $ | 17.58 | | | $ | 15.19 | | | $ | 16.51 | | | $ | 13.45 | | | $ | 11.02 | |
| | | | | | | | | | | | | | | | | | | | | | | | | |
Total return | | | 18.43 | %3 | | | 17.41 | % | | | (6.95 | )% | | | 23.80 | % | | | 23.11 | % | | | (32.37 | )% |
| | | | | | | | | | | | | | | | | | | | | | | | | |
| Ratios to average net assets/supplemental data: | | | | | | | | | | | | | | | | | | | | | | | | |
Net assets, end of period (in 000’s) | | $ | 15,718 | | | $ | 54 | | | $ | 82 | | | $ | 156 | | | $ | 170 | | | $ | 441 | |
| Operating expenses including reimbursement/waiver and fees paid indirectly | | | 1.24 | %4 | | | 1.31 | % | | | 0.94 | % | | | 1.29 | % | | | 1.30 | % | | | 1.00 | % |
Operating expenses excluding reimbursement/waiver and fees paid indirectly5 | | | 1.27 | %4 | | | 1.66 | % | | | 1.64 | % | | | 1.67 | % | | | 1.71 | % | | | 1.61 | % |
Net investment income | | | 0.25 | %4 | | | 1.33 | % | | | 0.53 | % | | | 0.96 | % | | | 0.65 | % | | | 0.82 | % |
Portfolio turnover rate | | | 32 | %3 | | | 68 | % | | | 118 | % | | | 89 | % | | | 61 | % | | | 83 | % |
| 1 | The selected per share data was calculated using the average shares outstanding method for the period. |
| 2 | Amount is less than $0.01 per share. |
| 3 | Not Annualized. |
| 4 | Annualized. |
| 5 | The ratio of operating expenses excluding reimbursement/waiver for the six months ended June 30, 2013, excludes the effect of fees paid indirectly. If this expense offset was included the ratio would have been 1.26%. |
See Notes to Financial Statements.
Wilshire Mutual Funds, Inc. Wilshire 5000 Indexsm Fund Financial Highlights | |
| For a Fund Share Outstanding Throughout Each Period. | |
| | | | |
| | | Six Months Ended 06/30/2013 (Unaudited) | | | | | | | | | | | | | | | | |
Net asset value, beginning of period | | $ | 12.43 | | | $ | 10.93 | | | $ | 11.05 | | | $ | 9.61 | | | $ | 7.67 | | | $ | 12.42 | |
| | | | | | | | | | | | | | | | | | | | | | | | | |
| Income/(loss) from investment operations: | | | | | | | | | | | | | | | | | | | | | | | | |
Net investment income1 | | | 0.10 | | | | 0.19 | | | | 0.14 | | | | 0.13 | | | | 0.11 | | | | 0.15 | |
| Net realized and unrealized gain/(loss) on investments | | | 1.59 | | | | 1.49 | | | | (0.12 | ) | | | 1.45 | | | | 1.96 | | | | (4.77 | ) |
Total from investment operations | | | 1.69 | | | | 1.68 | | | | 0.02 | | | | 1.58 | | | | 2.07 | | | | (4.62 | ) |
| | | | | | | | | | | | | | | | | | | | | | | | | |
| Less distributions: | | | | | | | | | | | | | | | | | | | | | | | | |
From net investment income | | | 0.00 | | | | (0.18 | ) | | | (0.14 | ) | | | (0.14 | ) | | | (0.13 | ) | | | (0.13 | ) |
Total distributions | | | 0.00 | | | | (0.18 | ) | | | (0.14 | ) | | | (0.14 | ) | | | (0.13 | ) | | | (0.13 | ) |
| | | | | | | | | | | | | | | | | | | | | | | | | |
Net asset value, end of period | | $ | 14.12 | | | $ | 12.43 | | | $ | 10.93 | | | $ | 11.05 | | | $ | 9.61 | | | $ | 7.67 | |
| | | | | | | | | | | | | | | | | | | | | | | | | |
Total return | | | 13.60 | %2 | | | 15.36 | % | | | 0.21 | % | | | 16.44 | % | | | 26.98 | % | | | (37.11 | )% |
| | | | | | | | | | | | | | | | | | | | | | | | | |
| Ratios to average net assets/supplemental data: | | | | | | | | | | | | | | | | | | | | | | | | |
Net assets, end of period (in 000’s) | | $ | 119,716 | | | $ | 107,888 | | | $ | 99,545 | | | $ | 105,019 | | | $ | 109,304 | | | $ | 98,032 | |
| Operating expenses including reimbursement/fees paid indirectly | | | 0.67 | %3 | | | 0.70 | % | | | 0.74 | % | | | 0.72 | % | | | 0.77 | % | | | 0.78 | % |
| Operating expenses excluding reimbursement/fees paid indirectly | | | 0.67 | %3 | | | 0.70 | % | | | 0.74 | % | | | 0.72 | % | | | 0.77 | % | | | 0.78 | % |
Net investment income | | | 1.40 | %3 | | | 1.61 | % | | | 1.22 | % | | | 1.26 | % | | | 1.36 | % | | | 1.48 | % |
Portfolio turnover rate | | | 0 | %2,4 | | | 2 | % | | | 9 | % | | | 2 | % | | | 57 | % | | | 52 | % |
| 1 | The selected per share data was calculated using the average shares outstanding method for the period. |
| 2 | Not Annualized. |
| 3 | Annualized. |
| 4 | Less than 0.10%. |
See Notes to Financial Statements.
Wilshire Mutual Funds, Inc. Wilshire 5000 Indexsm Fund Financial Highlights - (Continued) | |
| For a Fund Share Outstanding Throughout Each Period. | |
| | | Institutional Class Shares | |
| | | Six Months Ended 06/30/2013 (Unaudited) | | | | | | | | | | | | | | | | |
Net asset value, beginning of period | | $ | 12.41 | | | $ | 10.92 | | | $ | 11.04 | | | $ | 9.60 | | | $ | 7.67 | | | $ | 12.41 | |
| | | | | | | | | | | | | | | | | | | | | | | | | |
| Income/(loss) from investment operations: | | | | | | | | | | | | | | | | | | | | | | | | |
Net investment income1 | | | 0.11 | | | | 0.22 | | | | 0.16 | | | | 0.15 | | | | 0.13 | | | | 0.17 | |
| Net realized and unrealized gain/(loss) on investments | | | 1.61 | | | | 1.47 | | | | (0.11 | ) | | | 1.45 | | | | 1.95 | | | | (4.76 | ) |
Total from investment operations | | | 1.72 | | | | 1.69 | | | | 0.05 | | | | 1.60 | | | | 2.08 | | | | (4.59 | ) |
| | | | | | | | | | | | | | | | | | | | | | | | | |
| Less distributions: | | | | | | | | | | | | | | | | | | | | | | | | |
From net investment income | | | 0.00 | | | | (0.20 | ) | | | (0.17 | ) | | | (0.16 | ) | | | (0.15 | ) | | | (0.15 | ) |
Total distributions | | | 0.00 | | | | (0.20 | ) | | | (0.17 | ) | | | (0.16 | ) | | | (0.15 | ) | | | (0.15 | ) |
| | | | | | | | | | | | | | | | | | | | | | | | | |
Net asset value, end of period | | $ | 14.13 | | | $ | 12.41 | | | $ | 10.92 | | | $ | 11.04 | | | $ | 9.60 | | | $ | 7.67 | |
| | | | | | | | | | | | | | | | | | | | | | | | | |
Total return | | | 13.86 | %2 | | | 15.54 | % | | | 0.43 | % | | | 16.71 | % | | | 27.10 | % | | | (36.95 | )% |
| | | | | | | | | | | | | | | | | | | | | | | | | |
| Ratios to average net assets/supplemental data: | | | | | | | | | | | | | | | | | | | | | | | | |
Net assets, end of period (in 000’s) | | $ | 54,674 | | | $ | 50,633 | | | $ | 50,252 | | | $ | 53,415 | | | $ | 66,764 | | | $ | 55,088 | |
| Operating expenses including reimbursement/fees paid indirectly | | | 0.47 | %3 | | | 0.47 | % | | | 0.53 | % | | | 0.50 | % | | | 0.54 | % | | | 0.59 | % |
| Operating expenses excluding reimbursement/fees paid indirectly | | | 0.47 | %3 | | | 0.47 | % | | | 0.53 | % | | | 0.50 | % | | | 0.54 | % | | | 0.59 | % |
Net investment income | | | 1.60 | %3 | | | 1.84 | % | | | 1.43 | % | | | 1.48 | % | | | 1.59 | % | | | 1.62 | % |
Portfolio turnover rate | | | 0 | %2,4 | | | 2 | % | | | 9 | % | | | 2 | % | | | 57 | % | | | 52 | % |
| 1 | The selected per share data was calculated using the average shares outstanding method for the period. |
| 2 | Not Annualized. |
| 3 | Annualized. |
| 4 | Less than 0.10%. |
See Notes to Financial Statements.
Wilshire Mutual Funds, Inc. Wilshire 5000 Indexsm Fund Financial Highlights - (Continued) | |
| For a Fund Share Outstanding Throughout Each Period. | |
| | | | |
| | | Six Months Ended 06/30/2013 (Unaudited) | | | | | | | | | | | | | | | | |
Net asset value, beginning of period | | $ | 12.64 | | | $ | 11.09 | | | $ | 11.03 | | | $ | 9.59 | | | $ | 7.67 | | | $ | 12.42 | |
| | | | | | | | | | | | | | | | | | | | | | | | | |
| Income/(loss) from investment operations: | | | | | | | | | | | | | | | | | | | | | | | | |
Net investment income1 | | | 0.14 | | | | 0.26 | | | | 0.14 | | | | 0.13 | | | | 0.12 | | | | 0.15 | |
| Net realized and unrealized gain/(loss) on investments | | | 1.63 | | | | 1.50 | | | | (0.08 | ) | | | 1.46 | | | | 1.95 | | | | (4.76 | ) |
Total from investment operations | | | 1.77 | | | | 1.76 | | | | 0.06 | | | | 1.59 | | | | 2.07 | | | | (4.61 | ) |
| | | | | | | | | | | | | | | | | | | | | | | | | |
| Less distributions: | | | | | | | | | | | | | | | | | | | | | | | | |
From net investment income | | | 0.00 | | | | (0.21 | ) | | | 0.00 | | | | (0.15 | ) | | | (0.15 | ) | | | (0.14 | ) |
Total distributions | | | 0.00 | | | | (0.21 | ) | | | 0.00 | | | | (0.15 | ) | | | (0.15 | ) | | | (0.14 | ) |
| | | | | | | | | | | | | | | | | | | | | | | | | |
Net asset value, end of period | | $ | 14.41 | | | $ | 12.64 | | | $ | 11.09 | | | $ | 11.03 | | | $ | 9.59 | | | $ | 7.67 | |
| | | | | | | | | | | | | | | | | | | | | | | | | |
Total return | | | 14.00 | %3,4 | | | 15.93 | %3 | | | 0.54 | % | | | 16.56 | % | | | 26.91 | % | | | (37.09 | )% |
| | | | | | | | | | | | | | | | | | | | | | | | | |
| Ratios to average net assets/supplemental data: | | | | | | | | | | | | | | | | | | | | | | | | |
Net assets, end of period (in 000’s) | | $ | — | 2 | | $ | — | 2 | | $ | — | 2 | | $ | 714 | | | $ | 614 | | | $ | 431 | |
| Operating expenses including reimbursement/fees paid indirectly | | | 0.00 | %3 | | | 0.00 | %3 | | | 0.65 | % | | | 0.66 | % | | | 0.61 | % | | | 0.84 | % |
| Operating expenses excluding reimbursement/fees paid indirectly | | | 0.00 | %3 | | | 0.00 | %3 | | | 0.65 | % | | | 0.66 | % | | | 0.61 | % | | | 0.84 | % |
Net investment income | | | 1.99 | %5 | | | 2.16 | % | | | 1.21 | % | | | 1.32 | % | | | 1.51 | % | | | 1.40 | % |
Portfolio turnover rate | | | 0 | %4,6 | | | 2 | % | | | 9 | % | | | 2 | % | | | 57 | % | | | 52 | % |
| 1 | The selected per share data was calculated using the average shares outstanding method for the period. |
| 2 | Amounts designated as "—" have been rounded to 0. |
| 3 | Results not considered meaningful due to low level of assets. |
| 4 | Not annualized. |
| 5 | Annualized. |
| 6 | Less than 0.10%. |
See Notes to Financial Statements.
Wilshire Mutual Funds, Inc. Wilshire 5000 Indexsm Fund Financial Highlights - (Continued) | |
| For a Fund Share Outstanding Throughout Each Period. | |
| | | | |
| | | Six Months Ended 06/30/2013 (Unaudited) | | | | | | | | | | | | | | | | |
Net asset value, beginning of period | | $ | 12.40 | | | $ | 10.91 | | | $ | 11.02 | | | $ | 9.59 | | | $ | 7.66 | | | $ | 12.38 | |
| | | | | | | | | | | | | | | | | | | | | | | | | |
| Income/(loss) from investment operations: | | | | | | | | | | | | | | | | | | | | | | | | |
Net investment income1 | | | 0.09 | | | | 0.19 | | | | 0.13 | | | | 0.13 | | | | 0.11 | | | | 0.15 | |
| Net realized and unrealized gain/(loss) on investments | | | 1.60 | | | | 1.48 | | | | (0.10 | ) | | | 1.44 | | | | 1.95 | | | | (4.75 | ) |
Total from investment operations | | | 1.69 | | | | 1.67 | | | | 0.03 | | | | 1.57 | | | | 2.06 | | | | (4.60 | ) |
| | | | | | | | | | | | | | | | | | | | | | | | | |
| Less distributions: | | | | | | | | | | | | | | | | | | | | | | | | |
From net investment income | | | 0.00 | | | | (0.18 | ) | | | (0.14 | ) | | | (0.14 | ) | | | (0.13 | ) | | | (0.12 | ) |
Total distributions | | | 0.00 | | | | (0.18 | ) | | | (0.14 | ) | | | (0.14 | ) | | | (0.13 | ) | | | (0.12 | ) |
| | | | | | | | | | | | | | | | | | | | | | | | | |
Net asset value, end of period | | $ | 14.09 | | | $ | 12.40 | | | $ | 10.91 | | | $ | 11.02 | | | $ | 9.59 | | | $ | 7.66 | |
| | | | | | | | | | | | | | | | | | | | | | | | | |
Total return | | | 13.63 | %2 | | | 15.31 | % | | | 0.25 | % | | | 16.39 | % | | | 26.85 | % | | | (37.08 | )% |
| | | | | | | | | | | | | | | | | | | | | | | | | |
| Ratios to average net assets/supplemental data: | | | | | | | | | | | | | | | | | | | | | | | | |
Net assets, end of period (in 000’s) | | $ | 1,369 | | | $ | 1,243 | | | $ | 1,108 | | | $ | 1,204 | | | $ | 1,111 | | | $ | 952 | |
| Operating expenses including reimbursement/fees paid indirectly | | | 0.73 | %3 | | | 0.69 | % | | | 0.78 | % | | | 0.72 | % | | | 0.80 | % | | | 0.82 | % |
| Operating expenses excluding reimbursement/fees paid indirectly | | | 0.73 | %3 | | | 0.69 | % | | | 0.78 | % | | | 0.72 | % | | | 0.80 | % | | | 0.82 | % |
Net investment income | | | 1.34 | %3 | | | 1.62 | % | | | 1.17 | % | | | 1.26 | % | | | 1.34 | % | | | 1.41 | % |
Portfolio turnover rate | | | 0 | %3,4 | | | 2 | % | | | 9 | % | | | 2 | % | | | 57 | % | | | 52 | % |
| 1 | The selected per share data was calculated using the average shares outstanding method for the period. |
| 2 | Not Annualized. |
| 3 | Annualized. |
| 4 | Less than 0.10%. |
See Notes to Financial Statements.
Wilshire Mutual Funds, Inc. Wilshire International Equity Fund Financial Highlights | |
| For a Fund Share Outstanding Throughout Each Period. | |
| | | | |
| | | Six Months Ended 06/30/2013 (Unaudited) | | | | | | | | | | | | | | | | |
Net asset value, beginning of period | | $ | 8.34 | | | $ | 7.63 | | | $ | 8.09 | | | $ | 7.37 | | | $ | 6.23 | | | $ | 10.12 | |
| | | | | | | | | | | | | | | | | | | | | | | | | |
| Income/(loss) from investment operations: | | | | | | | | | | | | | | | | | | | | | | | | |
Net investment income1 | | | 0.02 | | | | 0.06 | | | | 0.00 | 2 | | | 0.00 | 2 | | | 0.04 | | | | 0.02 | |
| Net realized and unrealized gain/(loss) on investments | | | 0.34 | | | | 0.96 | | | | (0.19 | ) | | | 0.84 | | | | 1.13 | | | | (3.90 | ) |
Total from investment operations | | | 0.36 | | | | 1.02 | | | | (0.19 | ) | | | 0.84 | | | | 1.17 | | | | (3.88 | ) |
| | | | | | | | | | | | | | | | | | | | | | | | | |
| Less distributions: | | | | | | | | | | | | | | | | | | | | | | | | |
From net investment income | | | 0.00 | | | | (0.09 | ) | | | (0.06 | ) | | | (0.04 | ) | | | (0.03 | ) | | | (0.01 | ) |
From capital gains | | | 0.00 | | | | (0.22 | ) | | | (0.21 | ) | | | (0.08 | ) | | | 0.00 | | | | 0.00 | |
Total distributions | | | 0.00 | | | | (0.31 | ) | | | (0.27 | ) | | | (0.12 | ) | | | (0.03 | ) | | | (0.01 | ) |
| | | | | | | | | | | | | | | | | | | | | | | | | |
Net asset value, end of period | | $ | 8.70 | | | $ | 8.34 | | | $ | 7.63 | | | $ | 8.09 | | | $ | 7.37 | | | $ | 6.23 | |
| | | | | | | | | | | | | | | | | | | | | | | | | |
Total return | | | 4.32 | %3 | | | 13.36 | % | | | (2.28 | )% | | | 11.47 | % | | | 18.73 | % | | | (38.31 | )% |
| | | | | | | | | | | | | | | | | | | | | | | | | |
Ratios to average net assets/supplemental data4: | | | | | | | | | | | | | | | | | | | | | | | | |
Net assets, end of period (in 000’s) | | $ | 150 | | | $ | 74,999 | | | $ | 80,004 | | | $ | 91,641 | | | $ | 93,553 | | | $ | 36,356 | |
Operating expenses including dividends and rebates on securities sold short and interest expense, after expense reimbursement/waiver and fees paid indirectly5 | | | 1.98 | %6 | | | 2.24 | % | | | 2.27 | % | | | 2.19 | % | | | 2.17 | % | | | 2.70 | % |
Operating expenses including dividends and rebates on securities sold short and interest expense, before expense reimbursement/waiver and fees paid indirectly5,7 | | | 2.03 | %6 | | | 2.29 | % | | | 2.33 | % | | | 2.23 | % | | | 2.33 | % | | | 3.79 | % |
Net investment income | | | 0.38 | %6 | | | 0.77 | % | | | 0.06 | % | | | 0.05 | % | | | 0.61 | % | | | 0.20 | % |
Portfolio turnover rate | | | 212 | %3 | | | 45 | % | | | 134 | % | | | 283 | % | | | 289 | % | | | 175 | % |
| 1 | The selected per share data was calculated using the average shares outstanding method for the period. |
| 2 | Amount is less than $0.01 per share. |
| 3 | Not Annualized. |
| 4 | The operating expense ratios reflect the expenses related to investing in securities sold short. Had these expenses been excluded, the expense ratio (after waiver and fees paid indirectly) would have been 1.50% for each of the last five years. |
| 5 | Effective April 2, 2013, the Wilshire International Equity Fund no longer engages in securities sold short. |
| 6 | Annualized. |
| 7 | The ratio of operating expenses including dividends and rebates on securities sold short and interest expense, before reimbursement/waiver for the six months ended June 30, 2013, excludes the effect of fees paid indirectly. If this expense offset was included the ratio would have been 2.02%. |
See Notes to Financial Statements.
Wilshire Mutual Funds, Inc. Wilshire International Equity Fund Financial Highlights - (Continued) | |
| For a Fund Share Outstanding Throughout Each Period. | |
| | | Institutional Class Shares | |
| | | Six Months Ended 06/30/2013 (Unaudited) | | | | | | | | | | | | | | | | |
Net asset value, beginning of period | | $ | 8.38 | | | $ | 7.67 | | | $ | 8.14 | | | $ | 7.41 | | | $ | 6.25 | | | $ | 10.12 | |
| | | | | | | | | | | | | | | | | | | | | | | | | |
| Income/(loss) from investment operations: | | | | | | | | | | | | | | | | | | | | | | | | |
Net investment income1 | | | 0.05 | | | | 0.09 | | | | 0.02 | | | | 0.02 | | | | 0.06 | | | | 0.04 | |
| Net realized and unrealized gain/(loss) on investments | | | 0.32 | | | | 0.95 | | | | (0.20 | ) | | | 0.85 | | | | 1.14 | | | | (3.89 | ) |
Total from investment operations | | | 0.37 | | | | 1.04 | | | | (0.18 | ) | | | 0.87 | | | | 1.20 | | | | (3.85 | ) |
| | | | | | | | | | | | | | | | | | | | | | | | | |
| Less distributions: | | | | | | | | | | | | | | | | | | | | | | | | |
From net investment income | | | 0.00 | | | | (0.11 | ) | | | (0.08 | ) | | | (0.06 | ) | | | (0.04 | ) | | | (0.02 | ) |
From capital gains | | | 0.00 | | | | (0.22 | ) | | | (0.21 | ) | | | (0.08 | ) | | | 0.00 | | | | 0.00 | |
Total distributions | | | 0.00 | | | | (0.33 | ) | | | (0.29 | ) | | | (0.14 | ) | | | (0.04 | ) | | | (0.02 | ) |
| | | | | | | | | | | | | | | | | | | | | | | | | |
Net asset value, end of period | | $ | 8.75 | | | $ | 8.38 | | | $ | 7.67 | | | $ | 8.14 | | | $ | 7.41 | | | $ | 6.25 | |
| | | | | | | | | | | | | | | | | | | | | | | | | |
Total return | | | 4.42 | %2 | | | 13.63 | % | | | (2.11 | )% | | | 11.82 | % | | | 19.14 | % | | | (38.09 | )% |
| | | | | | | | | | | | | | | | | | | | | | | | | |
Ratios to average net assets/supplemental data3: | | | | | | | | | | | | | | | | | | | | | | | | |
Net assets, end of period (in 000’s) | | $ | 29,956 | | | $ | 99,106 | | | $ | 93,132 | | | $ | 103,526 | | | $ | 110,064 | | | $ | 24,617 | |
Operating expenses including dividends and rebates on securities sold short and interest expense, after expense reimbursement/waiver and fees paid indirectly4 | | | 1.74 | %5 | | | 1.99 | % | | | 2.02 | % | | | 1.94 | % | | | 1.92 | % | | | 2.41 | % |
Operating expenses including dividends and rebates on securities sold short and interest expense, before expense reimbursement/ waiver and fees paid indirectly4,6 | | | 1.85 | %5 | | | 2.01 | % | | | 2.05 | % | | | 1.96 | % | | | 2.03 | % | | | 3.50 | % |
Net investment income | | | 1.18 | %5 | | | 1.03 | % | | | 0.32 | % | | | 0.30 | % | | | 0.85 | % | | | 0.49 | % |
Portfolio turnover rate | | | 212 | %2 | | | 45 | % | | | 134 | % | | | 283 | % | | | 289 | % | | | 175 | % |
| 1 | The selected per share data was calculated using the average shares outstanding method for the period. |
| 2 | Not Annualized. |
| 3 | The operating expense ratios reflect the expenses related to investing in securities sold short. Had these expenses been excluded, the expense ratio (after waiver and fees paid indirectly) would have been 1.25% for each of the last five years. |
| 4 | Effective April 2, 2013, the Wilshire International Equity Fund no longer engages in securities sold short. |
| 5 | Annualized. |
| 6 | The ratio of operating expenses including dividends and rebates on securities sold short and interest expense, before reimbursement/waiver for the six months ended June 30, 2013, excludes the effect of fees paid indirectly. If this expense offset was included, the ratio would have been 1.84%. |
See Notes to Financial Statements.
Wilshire Mutual Funds, Inc. Notes to Financial Statements June 30, 2013 (Unaudited) | |
1. Organization.
Wilshire Mutual Funds, Inc. (the “Company”) is registered under the Investment Company Act of 1940, as amended (the “1940 Act”), as an open-end diversified investment company, which was incorporated under Maryland law on July 30, 1992. The Company operates as a series company and presently offers six series, all of which had operations during the period: Large Company Growth Portfolio, Large Company Value Portfolio, Small Company Growth Portfolio, Small Company Value Portfolio, Wilshire 5000 IndexSM Fund and Wilshire International Equity Fund (formerly the Wilshire Large Cap Core Plus Fund) (each a “Portfolio” and collectively the “Portfolios”). The Company accounts separately for the assets, liabilities and operations of each series.
Each of the Portfolios offers Investment and Institutional Class shares, each of which has equal rights as to voting privileges. The Wilshire 5000 IndexSM Fund also offers Qualified Class Shares and Horace Mann Class Shares. Each of the Investment Class, Qualified Class and Horace Mann Class has exclusive voting rights with respect to its particular service and distribution plan. Investment income, realized and unrealized capital gains and losses and the common expenses of each Portfolio are allocated on a pro-rata basis to each class based on the relative net assets of each class to the total net assets of each Portfolio. Each class of shares differs in its respective service and distribution expenses.
2. Significant Accounting Policies.
Use of estimates – The preparation of financial statements in accordance with accounting principles generally accepted in the United States of America (“U.S. GAAP”) requires management to make estimates and assumptions that affect the reported amounts of assets and liabilities and disclosure of contingent assets and liabilities at the date of the financial statements and the reported amounts of revenues and expenses during the reporting period. Actual results could differ from those estimates and those differences could be material. The following is a summary of significant accounting policies consistently followed by the Portfolios in the preparation of their financial statements.
Security valuation – A security listed or traded on U.S. exchanges is valued at its last sales price on the exchange where it is principally traded. In the absence of a current quotation, the security is valued at the mean between the last bid and asked prices on that exchange. Securities quoted on the National Association of Securities Dealers Automatic Quotation (NASDAQ) System, for which there have been sales, are valued at the NASDAQ official closing price. If there are no such sales, the most recent bid quotation is used. Securities traded over-the-counter (other than on NASDAQ) are valued at the last current sale price; and if there are no such sales, the most recent bid quotation is used. Equity securities primarily traded on a foreign exchange or market are valued daily at the price, which is an estimate of the fair value price, as provided by an independent pricing service. In the event market quotations are not readily available, such securities are valued at fair value according to procedures adopted by the Board of Directors or as determined in good faith by the Pricing Committee, whose members include at least two representatives of Wilshire Associates Incorporated (“Wilshire” or the “Adviser”), one of whom is an officer of the Company, or by the Company’s Valuation Committee. Fair value is defined as the amount the owner of a security might reasonably expect to receive upon a current sale. Securities whose value does not reflect fair value because a significant valuation event has occurred may be valued at fair value by the Pricing Committee or the Valuation Committee in accordance with the Company’s valuation procedures. Significant events may include, but
Wilshire Mutual Funds, Inc. Notes to Financial Statements - (Continued) June 30, 2013 (Unaudited) | |
are not limited to, the following: significant fluctuations in domestic markets, foreign markets or foreign currencies; occurrences not directly tied to the securities markets such as natural disasters, armed conflicts or significant governmental actions; and major announcements affecting a single issuer or an entire market or market sector.
The Wilshire International Equity Fund uses Interactive Data Pricing and Reference Data, Inc. (formerly FT Interactive Data Corp.) (“Interactive Data”) as a third party fair valuation vendor daily. Interactive Data provides a fair value for foreign securities in the Wilshire International Equity Fund based on certain factors and methodologies (involving, generally, tracking valuation correlations between the U.S. market and each non-U.S. security) applied by Interactive Data. These factors are used to value the Wilshire International Equity Fund without holding a Pricing Committee meeting. In the event that the Adviser believes that the fair values provided by Interactive Data are not reliable, the Adviser contacts the Wilshire International Equity Fund’s administrator and may request that a meeting of the Pricing Committee be held.
In accordance with the authoritative guidance on fair value measurements and disclosures under U.S. GAAP, the Portfolios disclose fair value of their investments in a hierarchy that prioritizes the inputs to valuation techniques used to measure the fair value. The objective of a fair value measurement is to determine the price that would be received to sell an asset or paid to transfer a liability in an orderly transaction between market participants at the measurement date (an exit price). Accordingly, the fair value hierarchy gives the highest priority to quoted prices (unadjusted) in active markets for identical assets or liabilities (Level 1) and the lowest priority to unobservable inputs (Level 3). The guidance establishes three levels of the fair value hierarchy as follows:
| | • | Level 1 – Unadjusted quoted prices in active markets for identical, unrestricted assets or liabilities that the Portfolios have the ability to access at the measurement date; |
| | • | Level 2 – Other significant observable inputs (including quoted prices for similar securities, interest rates, prepayment speeds, credit risk, referenced indices, quoted prices in inactive markets, adjusted quoted prices in active markets, etc.); and |
| | • | Level 3 – Prices, inputs or exotic modeling techniques which are both significant to the fair value measurement and unobservable (supported by little or no market activity). |
The inputs or methodology used for valuing securities are not necessarily an indication of the risk associated with investing in those securities. For the six months ended June 30, 2013, there have been no significant changes to the Portfolios’ fair value methodologies.
Fair value measurement classifications are summarized in each Portfolio’s Condensed Schedule of Investments and/or Schedule of Investments, as applicable.
Securities sold short – During the six month period ended June 30, 2013, the Wilshire International Equity Fund engaged in short selling. To complete a short sale transaction, the Portfolio must borrow the security to make delivery to the buyer. The Portfolio then is obligated to replace the security borrowed by purchasing the security at the market price at the time of replacement. The price at such time may be more or less than the price at which the security was sold by the Portfolio. Until the security is replaced, the Portfolio is required to pay to the lender amounts equal to any dividends or interest, which accrue during the period of the loan. To borrow the security,
Wilshire Mutual Funds, Inc. Notes to Financial Statements - (Continued) June 30, 2013 (Unaudited) | |
the Portfolio also may be required to pay a premium, which would increase the cost of the security sold. The Portfolio pays interest to the lender for borrowing the security. This amount is reflected as interest expense in the Statements of Operations.
Until the Portfolio closes its short position or replaces the borrowed security, the Portfolio will: (a) maintain a segregated account containing cash or liquid securities at such a level that (i) the amount deposited in the account plus the amount deposited with the custodian as collateral will equal the current value of the security sold short and (ii) the amount deposited in the segregated account as collateral will not be less than the market value of the security at the time the security was sold short; or (b) otherwise cover the Portfolio’s short position.
Dividends on short positions are recorded on the ex-dividend date as an expense on the Statements of Operations. Short sale transactions result in off-balance sheet risk because the ultimate obligation may exceed the amount shown in the Statements of Assets and Liabilities. The Portfolio will incur a loss if the price of the security increases between the date of the short sale and the date on which the Portfolio replaces the borrowed security. The Portfolio will realize a gain if the price of the security declines between those dates. Short selling involves the risk of a potentially unlimited increase in the market value of the security sold short, which could result in a potentially unlimited loss for the Portfolio.
As of June 30, 2013, the Portfolio did not hold any securities sold short.
Securities transactions and investment income – Securities transactions are recorded on a trade date basis. Realized gains and losses from securities transactions are recorded on the identified cost basis. Dividend income is recognized on the ex-dividend date and interest income, including, where applicable, accretion of discount and amortization of premium on investments, is recognized on the accrual basis from settlement date. Distributions received on securities that represent a return of capital or capital gain are reclassed as a reduction of cost of investments and/or as a realized gain. The actual character of income, realized gain and return of capital distributions received from Real Estate Investment Trusts (“REITs”) is not known until after the end of the fiscal year, at which time such distribution estimates are appropriately adjusted.
Foreign currency transactions — The books and records of the Funds are maintained in U.S. dollars. Foreign currency transactions are translated into U.S. dollars on the following basis:
| | • | market value of investment securities, other assets and other liabilities at the daily rates of exchange and |
| | • | purchases and sales of investment securities, dividend and interest income and certain expenses at the rates of exchange prevailing on the respective dates of such transactions. |
Net realized and unrealized gain (loss) from foreign currency related transactions includes gains and losses between trade and settlement dates on securities transactions, gains and losses arising from the sales of foreign currency and gains and losses between the ex-dividend and payment dates on dividends, interest and foreign withholding taxes. The effect of changes in foreign exchange rates on realized and unrealized gains or losses is reflected as a component of such gains or losses.
Wilshire Mutual Funds, Inc. Notes to Financial Statements - (Continued) June 30, 2013 (Unaudited) | |
Expense policy – Distribution and Service fees directly attributable to a class of shares are charged to that class’ operations. Expenses of the Portfolios other than Distribution and Service fees are prorated among the classes to which the expense relates based on the relative net assets of each class of shares. Expenses directly attributable to a Portfolio are charged to that Portfolio. Expenses not directly attributable to a Portfolio are allocated proportionately among all Portfolios daily in relation to the net assets of each Portfolio or another reasonable basis. Expenses which are attributable to the Company and the Wilshire Variable Insurance Trust are allocated across the Company and the Wilshire Variable Insurance Trust based upon relative net assets or another reasonable basis. Expenses and fees, including the advisory fees, are accrued daily and taken into account for the purpose of determining the net asset value of each Portfolio’s shares.
Investments in REITs – With respect to the Portfolios, dividend income is recorded based on the income included in distributions received from the REIT investments using published REIT reclassifications including some management estimates when actual amounts are not available. Distributions received in excess of these estimated amounts are recorded as a reduction of the cost of investments or reclassified to capital gains. The actual amounts of income, return of capital, and capital gains are only determined by each REIT after its fiscal year end, and may differ from the estimated amounts.
Distributions to shareholders – Distributions to shareholders are recorded on the ex-dividend date. Distributions from net investment income, if any, are declared and paid annually. The Portfolios’ net realized capital gains, unless offset by any available capital loss carryforward, are distributed to shareholders annually. Additional distributions of net investment income and capital gains may be made at the discretion of the Board of Directors in order to avoid the application of a 4% non-deductible Federal excise tax.
3. Investment Advisory Fee and Other Transactions.
Pursuant to the Advisory Agreement (the “Agreement”) between the Company and the Adviser, Wilshire charges annual fees of 0.75% of average daily net assets for the first $1 billion and 0.65% thereafter for the Large Company Growth Portfolio and Large Company Value Portfolio, 0.85% of average daily net assets for the first $1 billion and 0.75% thereafter for the Small Company Growth Portfolio and Small Company Value Portfolio, 0.10% of the average daily net assets for the first $1 billion and 0.07% thereafter for the Wilshire 5000 IndexSM Fund and 1.00% of the average daily net assets for the first $1 billion and 0.90% thereafter for the Wilshire International Equity Fund. Wilshire has entered into contractual expense limitation agreements with the Small Company Growth Portfolio, the Small Company Value Portfolio and the Wilshire International Equity Fund to waive a portion of its management fees to limit expenses of such Portfolios (excluding taxes, brokerage expenses, dividend expenses on short securities, and extraordinary expenses) to 1.50% and 1.25% of average daily net assets for Investment Class Shares and Institutional Class Shares, respectively. These agreements to limit expenses continue through at least April 30, 2014. Wilshire may recoup the amount of any management fee waived within three years after the year in which Wilshire waived the expenses if the recoupment does not exceed the existing expense limitation. At June 30, 2013, the amounts of waivers subject to recoupment for Wilshire International Equity Fund were $47,342 expiring in 2016, $48,140 expiring in 2015, $75,863 expiring in 2014, $63,981, expiring in 2013. As of June 30, 2013, Wilshire had not recouped any management fees previously waived.
Wilshire Mutual Funds, Inc. Notes to Financial Statements - (Continued) June 30, 2013 (Unaudited) | |
For the six months ended June 30, 2013, Wilshire waived advisory fees as follows:
| | | | | | |
Small Company Growth Portfolio | | $ | 16,120 | | | | N/A | |
Small Company Value Portfolio | | | 11,701 | | | | N/A | |
Wilshire International Equity Fund | | | 47,342 | | | | N/A | |
The Board of Directors of the Company has approved Los Angeles Capital Management and Equity Research, Inc. (“L.A. Capital”), Cornerstone Capital Management, Inc. (“Cornerstone”), Victory Capital Management Inc. (“Victory”), Pzena Investment Management, LLC (“Pzena”), PanAgora Asset Management, Inc. (“PanAgora”), Systematic Financial Management, L.P. (“Systematic”), Ranger Investment Management, L.P. (“Ranger”), NWQ Investment Management Company, LP (“NWQ”), and Thomas White International Ltd. (“Thomas White”) (collectively the “Sub-Advisers”) to provide sub-advisory services with respect to the Portfolios. L.A. Capital, Cornerstone and Victory each manage a portion of the Large Company Growth Portfolio. L.A. Capital, Pzena and Systematic each manage a portion of the Large Company Value Portfolio. L.A. Capital and Ranger each manage a portion of the Small Company Growth Portfolio. L.A. Capital and NWQ each manage a portion of the Small Company Value Portfolio. L.A. Capital is the sole sub-adviser for the Wilshire 5000 IndexSM Fund. PanAgora and Thomas White each manage a portion of the Wilshire International Equity Fund.
Wilshire continues to oversee the Sub-Advisers. The fees of the Sub-Advisers are paid by Wilshire.
SEI Investments Global Funds Services (“SEI”) serves as the Company’s administrator and accounting agent pursuant to an administration agreement dated May 31, 2008. DST Systems, Inc. serves as the Company’s transfer agent and dividend disbursing agent. The Northern Trust Company (“NTC”) serves as the Company’s custodian for all Portfolios. SEI Investments Distribution Co. serves as the Company’s distributor.
Officers’ and Directors’ Expenses – The officers of the Company are affiliated with and receive remuneration from the Adviser. The Company does not pay any remuneration to its officers. The Company and the Wilshire Variable Insurance Trust together pay each independent director an annual retainer of $18,000, an annual additional Board chair retainer of $12,000, a Board in-person meeting fee of $2,000, a Board telephonic meeting fee of $1,000, an annual Committee Member retainer of $8,000 and a Committee telephonic meeting fee of $500.
4. Distribution Plan, Shareholder Services Plan and Fees Paid Indirectly.
The Directors of the Company have adopted shareholder services and/or distribution plans (the “Plans”) pursuant to Rule 12b-1 under the 1940 Act, with respect to the Investment Class Shares of each Portfolio and the Qualified Class Shares of the Wilshire 5000 IndexSM Fund. Under the Plans, each such Portfolio reimburses SEI Investments Distribution Co. (the “Distributor”), at an annual rate of up to 0.25% of the value of the average daily net assets attributable to the Investment Class Shares and Qualified Class Shares of each Portfolio for certain services provided by securities dealers or other financial intermediaries or for certain distribution expenses for the purpose of financing any activity intended to result in the sale of Investment Class Shares or Qualified Class Shares. For the six months ended June 30, 2013, the distribution and service fee expenses incurred for each such class of the Large Company Growth Portfolio, Large Company Value Portfolio, Small Company Value Portfolio and
Wilshire Mutual Funds, Inc. Notes to Financial Statements - (Continued) June 30, 2013 (Unaudited) | |
Wilshire International Equity was 0.25% of the respective average net assets of each Portfolio. For the six months ended June 30, 2013, the distribution and services fee expenses incurred for Investment Class Shares of the Small Company Growth Portfolio was 0.18% of its respective average net assets. For the six months ended June 30, 2013, the distribution and services fee expenses incurred for Investment Class Shares of the Wilshire 5000 IndexSM Fund was 0.23% of its respective average net assets.
The Directors of the Company have adopted a shareholder services and distribution plan pursuant to Rule 12b-1 with respect to the Horace Mann Class Shares of the Wilshire 5000 IndexSM Fund. Under such Plan, the Company reimburses the Distributor for its shareholder service and distribution payments at an annual rate of up to 0.35% of the value of the average daily net assets of the Wilshire 5000 IndexSM Fund attributable to the Horace Mann Class Shares. For the six months ended June 30, 2013, the shareholder services and distribution fees for the Horace Mann Class Shares were 0.35% of average net assets.
In addition, Investment Class Shares and Institutional Class Shares pay the expenses associated with certain shareholder servicing arrangements with third parties, provided that payment of such fees does not exceed in any year 0.20% and 0.15% for the Investment and Institutional Class Shares, respectively, of the average net assets of each class. For the six months ended June 30, 2013, the net shareholder service provider fees were as follows (as a percent of average net assets of each class):
| | |
Large Company Growth Portfolio | 0.12% | 0.04% |
Large Company Value Portfolio | 0.03% | 0.00% |
Small Company Growth Portfolio | 0.07% | 0.05% |
Small Company Value Portfolio | 0.06% | 0.05% |
Wilshire 5000 IndexSM Fund | 0.06% | 0.09% |
Wilshire International Equity Fund | 0.04% | 0.00% |
The Directors of the Company have adopted a shareholder services plan with respect to the Qualified Class Shares of the Wilshire 5000 IndexSM Fund which authorizes payments by the Qualified Class Shares of up to 0.15% of the average daily net assets attributable to the Portfolio’s Qualified Class Shares for certain shareholder services provided by insurers or other financial intermediaries. For the six months ended June 30, 2013, there were no shareholder service provider fees for the Qualified Class Shares.
Fees paid indirectly – The Company has entered into a brokerage commission recapture program with the Distributor, pursuant to which a portion of the Portfolios’ commissions generated from transactions directed to the Distributor are used to reduce the Portfolios’ expenses. Under such program, the Distributor, as introducing broker, retains a portion of the Portfolios’ commissions.
Wilshire Mutual Funds, Inc. Notes to Financial Statements - (Continued) June 30, 2013 (Unaudited) | |
Such commissions rebated to the Portfolios for the six months ended June 30, 2013 were as follows:
Wilshire Large Company Growth Portfolio | | $ | 1,791 | |
Wilshire Large Company Value Portfolio | | | 6,285 | |
Wilshire Small Company Growth Portfolio | | | 561 | |
Wilshire Small Company Value Portfolio | | | 1,039 | |
Wilshire 5000 IndexSM Fund | | | 263 | |
Wilshire International Equity Fund | | | 3,040 | |
5. Securities Transactions.
For the six months ended June 30, 2013, aggregate cost of purchases and proceeds from sales of securities, other than short-term investments, short sales and purchases to cover, were as follows:
| | | | | | |
Large Company Growth Portfolio | | $ | 194,125,411 | | | $ | 96,131,105 | |
Large Company Value Portfolio | | | 167,715,689 | | | | 75,803,246 | |
Small Company Growth Portfolio | | | 20,854,398 | | | | 6,832,671 | |
Small Company Value Portfolio | | | 19,781,869 | | | | 5,566,348 | |
Wilshire 5000 IndexSM Fund | | | 81,846 | | | | 4,835,442 | |
Wilshire International Equity Fund | | | 258,313,174 | | | | 452,586,898 | |
For Wilshire International Equity Fund, short sales and purchases to cover were $51,599,914 and $12,396,184, respectively.
6. Securities Lending.
The Portfolios may seek additional income by lending their securities on a short-term basis to banks, brokers and dealers in return for cash collateral, which is invested in short-term securities. A Portfolio may return a portion of the interest earned to the borrower or a third party which is unaffiliated with the Company and acting as a “placing broker.” A Portfolio receives compensation for lending securities in the form of fees. A Portfolio also continues to receive dividends on the securities loaned. Security loans are secured at all times by collateral. It is the Company’s policy that the collateral be equal to at least 102% of the market value of the securities loaned (105% if the collateral and securities loaned are denominated in different currencies) plus accrued interest when the transaction is entered into, and that the collateral supporting loans be valued daily. However, due to market fluctuations during the day, the value of securities loaned on a particular day may, during the course of the day, exceed the value of collateral. On each business day, the amount of collateral is adjusted based on the prior day’s market fluctuations and the current day’s lending activity. Gain or loss in the market price of the securities loaned that may occur during the term of the loan are reflected in the value of the Portfolio. The risks from securities lending are that the borrower may not provide additional collateral when required or return the securities when due or when called for by the Portfolio. Lending securities entails a risk of loss to the Portfolio if and to the extent that the market value of securities loans were to increase and the borrower did not increase the collateral accordingly, and the
Wilshire Mutual Funds, Inc. Notes to Financial Statements - (Continued) June 30, 2013 (Unaudited) | |
borrower fails to return the securities. NTC, the Portfolios’ custodian, acts as the securities lending agent for the Portfolios. The value of the securities on loan and the value of the related collateral at June 30, 2013 are shown on the Statement of Assets and Liabilities. The Northern Trust Institutional Liquid Asset Portfolio was purchased with proceeds from collateral received from securities on loan. At June 30, 2013, $66,318,438, $34,189,871, $11,639,687, $11,588,079, $24,991,940, and $4,424,549 of this cash equivalent represents the collateral received for securities on loan in the Wilshire Large Company Growth Portfolio, Wilshire Large Company Value Portfolio, Wilshire Small Company Growth Portfolio, Wilshire Small Company Value Portfolio, Wilshire 5000 IndexSM Fund, and the Wilshire Interntional Equity Fund, respectively.
7. Significant Shareholder Activity.
On June 30, 2013, the Portfolios had the following concentrations of shareholders holding 10% or more of the outstanding shares of the Portfolios. These represent omnibus shareholder accounts comprised of many individual shareholders.
| |
| Large Company Growth Portfolio (2 omnibus shareholders) | 73% |
| Large Company Value Portfolio (2 omnibus shareholder) | 82% |
| Small Company Growth Portfolio (2 omnibus shareholders) | 61% |
| Small Company Value Portfolio (3 omnibus shareholders) | 75% |
Wilshire 5000 IndexSM Fund (2 omnibus shareholders) | 53% |
| Wilshire International Equity Fund (5 omnibus shareholders) | 91% |
8. Tax Information.
No provision for federal income taxes is required because each Portfolio has qualified and intends to continue to qualify, as a regulated investment company under Subchapter M of the Internal Revenue Code of 1986, as amended, and distributes to shareholders all of its taxable income and gains. Federal income tax regulations differ from accounting principles generally accepted in the United States of America; therefore, distributions determined in accordance with tax regulations may differ in amount or character from net investment income and realized gains for financial reporting purposes. Financial reporting records are adjusted for permanent book/tax differences to reflect tax character. Financial records are not adjusted for temporary differences.
The Portfolios evaluate tax positions taken or expected to be taken in the course of preparing the Portfolios’ tax returns to determine whether it is “more-likely than-not” (i.e., greater than 50 percent) that each tax position will be sustained upon examination by a taxing authority based on the technical merits of the position. Tax positions not deemed to meet the more-likely-than-not threshold are recorded as a tax benefit or expense in the current year. The Portfolios did not record any tax provision in the current period. However, management’s conclusions regarding tax positions taken may be subject to review and adjustment at a later date based on factors including, but not limited to, examination by tax authorities (i.e., the last 3 tax year ends, as applicable), on-going analysis of and changes to tax laws, regulations and interpretations thereof.
Wilshire Mutual Funds, Inc. Notes to Financial Statements - (Continued) June 30, 2013 (Unaudited) | |
Under current tax law, capital and specified losses realized after October 31 may be deferred and treated as occurring on the first day of the following fiscal year. For the year ended December 31, 2012, the following Portfolio had post-October capital loss deferrals as follows:
| | | |
Wilshire International Equity Fund | | $ | 1,420,454 | |
The federal tax cost, unrealized appreciation and depreciation at June 30, 2013 for each Portfolio are as follows:
| | | | | Aggregate Gross Unrealized Appreciation | | | Aggregate Gross Unrealized Depreciation | | | Net Unrealized Appreciation | |
Large Company Growth Portfolio | | $ | 330,912,788 | | | $ | 46,052,216 | | | $ | (4,307,679 | ) | | $ | 41,744,537 | |
Large Company Value Portfolio | | | 172,535,779 | | | | 15,234,245 | | | | (1,621,525 | ) | | | 13,612,720 | |
Small Company Growth Portfolio | | | 32,815,090 | | | | 3,091,025 | | | | (400,388 | ) | | | 2,690,637 | |
Small Company Value Portfolio | | | 35,645,461 | | | | 3,521,645 | | | | (424,244 | ) | | | 3,097,401 | |
Wilshire 5000 IndexSM Fund | | | 112,238,800 | | | | 92,444,590 | | | | (4,078,015 | ) | | | 88,366,575 | |
Wilshire International Equity Fund | | | 37,989,920 | | | | 586,570 | | | | (3,737,908 | ) | | | (3,151,338 | ) |
The differences between book and tax-basis unrealized appreciation/(depreciation) are attributable primarily to the tax deferral of losses on wash sales and investment in passive foreign investment companies, straddles, constructive sales and 263(h) reclassifications.
Under the Regulated Investment Company Modernization Act of 2010 (“RIC Modernization”), the Portfolios are permitted to carry forward capital losses incurred in taxable years beginning after December 22, 2010 for an unlimited period. However, any losses incurred during those future taxable years will be required to be utilized prior to the losses incurred in pre-enactment taxable years. As a result of this ordering rule, pre-enactment capital loss carryforwards may be more likely to expire unused. Additionally, post-enactment capital losses that are carried forward will retain their character as either short-term or long-term capital losses rather than being considered all short-term as under previous law.
Wilshire Mutual Funds, Inc. Notes to Financial Statements - (Continued) June 30, 2013 (Unaudited) | |
The Portfolios intend to retain realized gains to the extent of available capital loss carryforwards. At December 31, 2012, the following Portfolios had available for federal income tax purposes unused capital losses as follows:
| | | | |
| | | | | | | | | | | | |
Large Company Growth Portfolio | | $ | — | | | $ | — | | | $ | — | | | $ | — | |
Large Company Value Portfolio | | | — | | | | 4,967,113 | | | | 6,732,491 | | | | — | |
Small Company Growth Portfolio | | | — | | | | — | | | | 314,984 | | | | — | |
Small Company Value Portfolio | | | — | | | | — | | | | 1,913,980 | | | | — | |
Wilshire 5000 IndexSM Fund | | | 108,266 | | | | 9,735,193 | | | | 30,139,484 | | | | 2,464 | |
During the year ended December 31, 2012, the Large Company Growth Portfolio, the Large Company Value Portfolio, the Small Company Growth Portfolio, the Small Company Value Portfolio, and the Wilshire 5000 IndexSM Fund utilized capital loss carryforwards of $8,205,794, $2,478,884, $561,132, $650,114, and $3,529,176, respectively, to offset capital gains. For the year ended December 31, 2012, the Wilshire 5000 IndexSM Fund had pre-enactment RIC Modernization capital losses expire of $1,980,596.
The tax character of distributions declared during the years ended December 31, 2012 and 2011 were as follows:
| | | | | | | | | | | | | | | | | | |
Large Company Growth Portfolio | | $ | 622,494 | | | $ | 5,560,769 | | | $ | — | | | $ | — | | | $ | — | | | $ | — | |
Large Company Value Portfolio | | | 446,518 | | | | — | | | | — | | | | 266,100 | | | | — | | | | 708 | |
Small Company Growth Portfolio | | | — | | | | — | | | | — | | | | — | | | | — | | | | — | |
Small Company Value Portfolio | | | 123,102 | | | | — | | | | — | | | | 40,413 | | | | — | | | | — | |
Wilshire 5000 IndexSM Fund | | | 2,353,789 | | | | — | | | | — | | | | 2,077,943 | | | | — | | | | — | |
Wilshire International Equity Fund | | | 1,718,664 | | | | 4,773,887 | | | | — | | | | 4,135,949 | | | | 2,022,548 | | | | — | |
At December 31, 2012, the components of distributable earnings/(accumulated losses) on a tax basis were as follows:
| | | Large Company Growth Portfolio | | | Large Company Value Portfolio | | | Small Company Growth Portfolio | | | Small Company Value Portfolio | | | | | | Wilshire International Equity Fund | |
Undistributed ordinary income | | $ | 12,246 | | | $ | 6,459 | | | $ | 42,276 | | | $ | 12,445 | | | $ | 461,743 | | | $ | — | |
Undistributed long-term capital gain | | | 3,138,168 | | | | — | | | | — | | | | — | | | | — | | | | 1,031,307 | |
Capital loss carryforwards | | | — | | | | (11,699,604 | ) | | | (314,984 | ) | | | (1,913,980 | ) | | | (39,985,407 | ) | | | — | |
Post October losses | | | — | | | | — | | | | — | | | | — | | | | — | | | | (1,420,454 | ) |
Unrealized appreciation | | | 31,427,625 | | | | 3,396,498 | | | | 803,752 | | | | 1,074,905 | | | | 65,584,892 | | | | 29,086,808 | |
Other temporary differences | | | — | | | | (1 | ) | | | (1 | ) | | | 3 | | | | — | | | | — | |
| Total distributable earnings/ (accumulated losses) | | $ | 34,578,039 | | | $ | (8,296,648 | ) | | $ | 531,043 | | | $ | (826,627 | ) | | $ | 26,061,228 | | | $ | 28,697,661 | |
Wilshire Mutual Funds, Inc. Notes to Financial Statements - (Continued) June 30, 2013 (Unaudited) | |
9. In-Kind Transfers.
During the six months ended June 30, 2013, the Porfolios issued and redeemed shares of common stock through affiliated in-kind transfers of investment securities and cash. The securities were transferred at their current value on the date of such transactions.
| | | | Value of Investment Securities | | | | | | | | | | | | Realized Gain/ (Loss) Earned from Contributing Portfolio | |
| Large Company Growth Portfolio | VIT Equity Fund | 4/8/2013 | | $ | 64,025,634 | | | $ | 1,097,110 | | | $ | 65,122,744 | | | | 1,695,627 | | | $ | 2,590,858 | |
| Large Company Growth Portfolio | VIT Balanced Fund | 4/8/2013 | | | 29,580,794 | | | | 1,017,251 | | | | 30,598,045 | | | | 796,693 | | | | (251,486 | ) |
| Large Company Value Portfolio | VIT Equity Fund | 4/8/2013 | | | 64,037,268 | | | | 1,432,638 | | | | 65,469,906 | | | | 3,690,691 | | | | 3,344,532 | |
| Large Company Value Portfolio | VIT Balanced Fund | 4/8/2013 | | | 29,678,783 | | | | 1,016,141 | | | | 30,694,924 | | | | 1,730,344 | | | | (122,322 | ) |
| Small Company Growth Portfolio | VIT Small Cap Fund | 4/8/2013 | | | 6,996,577 | | | | 167,384 | | | | 7,163,961 | | | | 343,333 | | | | 1,035,447 | |
| Small Company Growth Portfolio | VIT Balanced Fund | 4/8/2013 | | | 7,279,152 | | | | 378,324 | | | | 7,657,476 | | | | 366,985 | | | | (82,358 | ) |
| Small Company Value Portfolio | VIT Small Cap Fund | 4/8/2013 | | | 6,862,541 | | | | 367,373 | | | | 7,229,914 | | | | 369,257 | | | | 104,637 | |
| Small Company Value Portfolio | VIT Balanced Fund | 4/8/2013 | | | 7,139,924 | | | | 628,186 | | | | 7,768,110 | | | | 396,745 | | | | 15,070 | |
| Wilshire International Equity Fund | VIT International Equity Fund | 4/2/2013 | | | 5,931,173 | | | | — | | | | 5,931,173 | | | | 645,387 | | | | (1,951,869 | ) |
| Wilshire International Equity Fund | VIT Balanced Fund | 4/3/2013 | | | — | | | | 25,551,553 | | | | 25,551,553 | | | | 2,817,958 | | | | — | |
| VIT Equity Fund | Wilshire International Equity Fund | 4/2/2013 | | | 108,142,870 | | | | 279,665 | | | | 108,422,535 | | | | (11,797,754 | ) | | | 22,029,945 | |
| VIT Balanced Fund | Wilshire International Equity Fund | 4/2/2013 | | | 77,077,919 | | | | 212,167 | | | | 77,290,086 | | | | (8,455,321 | ) | | | 25,597,135 | |
| VIT - Wilshire Variable Insurance Trust |
Wilshire Mutual Funds, Inc. Notes to Financial Statements - (Continued) June 30, 2013 (Unaudited) | |
10. Indemnifications.
In the normal course of business, the Company, on behalf of the Portfolios, enters into contracts that provide general indemnifications. The Portfolios’ maximum exposure under these arrangements is dependent on claims that may be made against the Portfolios in the future and, therefore, cannot be estimated; however, based on experience, the risk of material loss from such claims is considered remote.
11. Risks.
Foreign security risk – The Wilshire International Equity Fund invests in securities of foreign issuers in various countries. These investments may involve certain considerations and risks not typically associated with investments in the United States, as a result of, among other factors, the possibility of future political and economic developments and the level of governmental supervision and regulation of securities markets in the respective countries.
12. Contingencies.
The Wilshire 5000 IndexSM Fund was named as a defendant and a putative member of a proposed defendant class of shareholders in a lawsuit filed on December 7, 2010, in the U.S. Bankruptcy Court for the District of Delaware and on March 6, 2012, in the District Court for the Southern District of New York, in connection with Tribune Company’s Chapter 11 bankruptcy proceeding. The 2010 lawsuit was brought by the official Committee of Unsecured Creditors of the Tribune Company and the 2012 lawsuit was brought by Deutsche Bank, as trustee for senior noteholders of Tribune Company. Both lawsuits relate to a leveraged buyout transaction by which Tribune Company converted to a privately-held company in 2007 less than a year prior to Tribune Company’s bankruptcy filing. The putative defendant class is comprised of beneficial owners of shares of Tribune Company who meet certain jurisdictional requirements and received proceeds of the leveraged buyout. The plaintiffs seek to recover those proceeds, together with interest and attorneys’ fees and expenses, as fraudulent transfers under the Bankruptcy Act or various state laws, respectively. The Adviser does not expect the Portfolio to be materially impacted by the lawsuits.
13. Recent Accounting Pronouncement.
In June 2013, the Financial Accounting Standards Board issued an update (“ASU 2013-08”) to ASC Topic 946, Financial Services - Investment Companies (“Topic 946”). ASU 2013-08 amends the guidance in Topic 946 for determining whether an entity qualifies as an investment company and requires certain additional disclosures. ASU 2013-08 is effective for interim and annual reporting periods in fiscal years that begin after December 15, 2013. Management is currently evaluating the impact, if any, of ASU 2013-08 on the Portfolios’ financial statements.
14. Subsequent Event Evaluation.
The Portfolios have evaluated the need for additional disclosures and/or adjustments resulting from subsequent events. Based on this evaluation, no additional disclosures or adjustments were required to the financial statements.
Wilshire Mutual Funds, Inc. Additional Fund Information | |
Information on Proxy Voting
The Securities and Exchange Commission (“SEC”) has adopted the requirement that all funds file their complete proxy voting records with the SEC on an annual basis on Form N-PX. Such filing, for the 12-month period ended June 30, must be made no later than August 31 of each year.
A description of policies and procedures that the Portfolios use to determine how to vote proxies relating to portfolio securities, along with each Portfolio’s proxy voting record relating to portfolio securities held during most recent 12-month period ended June 30 is available at no charge, upon request by calling 1-888-200-6796, by e-mailing us at http://advisor.wilshire.com or on the SEC’s website at http://www.sec.gov.
Information on Form N-Q
The Company files its complete schedule of portfolio holdings with the SEC for the first and third quarters of each fiscal year on Form N-Q within sixty days after the end of period. The Company’s Forms N-Q are available on the SEC’s website at http://www.sec.gov, and may be reviewed and copied at the SEC’s Public Reference Room in Washington, DC. Information on the operation of the Public Reference Room may be obtained by calling 1-202-551-8090.
Householding Policy
In order to reduce printing and mailing expenses, only one copy of each prospectus, annual and semi-annual report will be sent to all related accounts at a common address, unless you have indicated otherwise on your Account Application. Shareholders may revoke their consent to householding at any time by calling 1-888-200-6796. Upon receipt of a shareholder’s revocation, the Company will begin mailing individual copies of the above-referenced documents to the shareholder’s attention within 30 days.
Wilshire Mutual Funds, Inc. Board Approval of Subadvisory Agreements | |
During the six months ended June 30, 2013, the Board of Directors (the “Board”) of Wilshire Mutual Funds, Inc. (the “Company”) approved new subadvisory agreements between Wilshire Associates Incorporated (“Wilshire” or the “Adviser”) and each of the following subadvisers: Los Angeles Capital Management and Equity Research, Inc. (“LA Capital”) with respect to the Large Company Value Portfolio and PanAgora Asset Management, Inc. (“PanAgora”) and Thomas White International Ltd. (“Thomas White”) with respect to the Wilshire International Equity Fund. In the following text, the subadvisers are referred to as “Subadvisers” and the subadvisory agreements between Wilshire and each Subadviser are referred to as “Subadvisory Agreements.”
The information in this summary outlines the Board’s considerations associated with its approval of each of the Subadvisory Agreements. In connection with its deliberations regarding these relationships, the Board considered such information and factors as it believed to be relevant. As described below, the Board considered the nature, extent and quality of the services to be performed by the Subadvisers under the subadvisory arrangements; the profits to be realized by the Subadvisers; the extent to which the Subadviser may realize economies of scale as a Fund grows; and whether any fall-out benefits would be realized by the Subadvisers. In considering these matters, the Board was advised with respect to relevant legal standards by independent counsel. In addition, the Directors who are not “interested persons” of the Company, as defined in the Investment Company Act of 1940 (the “Independent Directors”), discussed the approval of the Subadvisory Agreements with management and in private sessions with counsel at which no representatives of the Subadvisers were present.
As required by the Investment Company Act of 1940, each approval was confirmed by the unanimous separate vote of the Independent Directors. In deciding to approve the Subadvisory Agreements, the Board did not identify any single factor as controlling and this summary does not describe all of the matters considered. However, the Board concluded, after reviewing the various factors, in favor of such approval.
Information Received
The Directors received information from the Adviser regarding the factors underlying the recommendations to approve the Subadvisory Agreement in advance of the meeting. The Directors considered each Subadviser’s investment performance in managing investment products similar to the applicable Fund. The Directors also reviewed information from each Subadviser that they received in connection with contract renewal in August of 2012 describing: (i) the nature, extent and quality of services to be provided, (ii) the financial condition of the Subadviser, (iii) the extent to which economies of scale will be realized as the Fund grows, (iv) whether fee levels reflect any possible economies of scale for the benefit of Fund shareholders, (v) comparisons of services to be rendered and amounts paid by other registered investment companies and any comparable clients, and (vi) benefits to be realized by the Subadviser from its relationship with the Fund. The Independent Directors also received a memorandum from counsel describing their duties in connection with contract approvals, and they were assisted in their review by independent legal counsel.
Nature, Extent and Quality of Services
As to each Subadvisory Agreement, the Board considered the nature, extent and quality of services to be provided. The Board considered the reputation, qualifications and background of the Subadviser, investment approach of the Subadviser, the experience and skills of investment personnel to be responsible for the day-to-day management
Wilshire Mutual Funds, Inc. Board Approval of Subadvisory Agreements - (Continued) | |
of each Fund, and the resources made available to such personnel. In addition, the Board considered the analysis provided by the Adviser, which concluded that each Subadviser would provide reasonable services and recommended that each Subadvisory Agreement for each Fund be approved.
The Board reviewed information comparing each Subadviser’s gross investment performance for managing investment products similar to the Fund to a relevant benchmark and considered the Subadviser’s experience and record in managing other funds managed by the Adviser. Based upon all relevant factors, the Board determined to approve the Subadvisory Agreement with LA Capital, noting that LA Capital outperformed the Fund’s benchmark for the annualized one-, five- and ten-year periods ended December 31, 2012, and therefore performance was satisfactory. The Board determined to approve the Subadvisory Agreement with Thomas White, noting that it outperformed the MSCI ACWI Ex USA Index for the annualized one-, three-, five- and ten-year periods ended December 31, 2012. The Board also concluded that the investment performance of PanAgora, met or exceeded acceptable levels of investment performance relative to the MSCI EAFE Index for the annualized one-, three-, five- and ten-year periods ended December 31, 2012, and therefore, was satisfactory.
Subadvisory Fees
The Board considered each Fund’s subadvisory fee. The Board evaluated the competitiveness of the subadvisory fee based upon data previously supplied by the Subadviser about the fees charged to other clients. The Board considered that the subadvisory fee rate was negotiated at arm’s length between the Adviser and each Subadviser, that the Adviser compensates each Subadviser from its fees and that the aggregate advisory fee was deemed reasonable by the Board. Based upon all of the above, the Board determined that the subadvisory fee for each Fund was reasonable.
Profitability
The Board noted that the Adviser compensates each Subadviser from its own advisory fee and that the fee was negotiated at arm’s length between the Adviser and each Subadviser. In addition, the Board noted that the revenue to each Subadviser would be limited due to the size of the Funds. The Board took these factors into consideration in concluding that the subadvisory fees were reasonable.
Economies of Scale
The Board considered whether there may be economies of scale with respect to the subadvisory services provided to each Fund and whether the subadvisory fee reflects such economies of scale through breakpoints in fees. The Board also considered whether the effective subadvisory fee rate for each Fund under the Subadvisory Agreement is reasonable in relation to the asset size of the Fund. The Board concluded that the fee schedule for each Fund reflects an appropriate recognition of any economies of scale.
Fall-Out Benefits
The Board also considered the character and amount of other incidental benefits to be received by each Subadviser. The Board considered each Subadviser’s soft dollar practices. The Board concluded that, taking into account the benefits arising from these practices, the fee charged under each Subadvisory Agreement was reasonable.
Wilshire Mutual Funds, Inc. Board Approval of Subadvisory Agreements - (Continued) | |
Conclusion
Based upon all of the information considered and the conclusions reached, the Board determined that the terms of each Subadvisory Agreement are fair and reasonable and that the approval of each Subadvisory Agreement is in the best interests of each Fund.
Wilshire Mutual Funds, Inc. Privacy Statement | |
At Wilshire Mutual Funds, Inc., we appreciate the privacy concerns of our customers. We have established the following policies to maintain the privacy of information you share with us.
INFORMATION WE COLLECT
We collect and retain nonpublic personal information about you that may include:
| | • | Information we receive on your account applications or other forms such as your name, address, financial information and/or social security number; |
| | • | Information we receive about your mutual fund transactions, such as purchases, sales, exchanges and account balances; and |
| | • | Information we collect through the use of Internet “cookies” when you access our website. Cookies are a collection of information stored on the local hard drive of an Internet user, used primarily by web servers to identify previous users and their preferences. A web server can not find out a user’s name or email address, or anything about the user’s computer using cookies. |
INFORMATION WE MAY SHARE
We do not sell any of your nonpublic personal information to third parties. We may share the information we collect with affiliates or with non-affiliated third parties only when those parties are acting on our behalf in servicing your account, or as required by law. These third parties may include:
| | • | Administrative service providers who, for example, process transactions for your account, print checks or prepare account statements; |
| | • | Companies that provide services for us to help market our products to you; and |
| | • | Governmental or other legal agencies, as required by law. |
When information is shared with third parties, they are legally obligated to maintain the confidentiality of the information and to limit their use of it to servicing your account, except as permitted or required by law.
CONFIDENTIALITY AND SECURITY
Within our organization, we restrict access to your nonpublic personal information to authorized employees who need to access such information in order to provide services or products to you. We maintain physical, electronic and procedural safeguards to protect your nonpublic personal information.
As previously mentioned, we may collect information through the use of Internet “cookies” on our website. In addition, in order to provide you with access to your account via the web, it is necessary for us to collect certain nonpublic personal information such as your name, social security number and account information. Special measures such as data encryption and authentication apply to all nonpublic personal information and communications on our website.
APPLICABILITY
Our privacy policies apply only to those individual investors who have a direct customer relationship with us. If you are an individual shareholder of record of any of the Portfolios, we consider you to be our customer. Shareholders purchasing or owning shares of any of the Portfolios through their bank, broker, or other financial institution should also consult that financial institution’s privacy policies.
Wilshire Mutual Funds, Inc. values your business. We understand the importance of maintaining the integrity of your personal information and are committed to keeping your trust. Please contact us at 1-888-200-6796 if you have any questions concerning our policy, or visit us at www.wilshirefunds.com for additional copies of this policy.
[This page intentionally left blank]
[This page intentionally left blank]
Wilshire Mutual Funds
Wilshire Associates Incorporated
1299 Ocean Avenue
Santa Monica, CA 90401
1-888-200-6796
http://advisor.wilshire.com
Not applicable.
| Item 3. | Audit Committee Financial Expert. |
Not applicable.
| Item 4. | Principal Accountant Fees and Services. |
Not applicable.
| Item 5. | Audit Committee of Listed Registrants. |
Not applicable.
| Item 6. | Schedule of Investments. |
| (a) | The Schedules of Investments in securities of unaffiliated issuers as of the close of the reporting period for the Wilshire International Equity Fund, Wilshire 5000 IndexSM Fund, the Large Company Growth Portfolio, the Large Company Value Portfolio, the Small Company Growth Portfolio and the Small Company Value Portfolio are listed below. |
Wilshire Mutual Funds, Inc. Large Company Growth Portfolio | |
| Shares | | | | Value | |
| | |
| COMMON STOCK — 99.1%†† | | | |
| Consumer Discretionary — 20.5% | | | |
| | 20,512 | | Amazon.com, Inc. | | $ | 5,695,977 | |
| | 5,780 | | AutoNation, Inc.†(a) | | | 250,794 | |
| | 489 | | AutoZone, Inc.† | | | 207,184 | |
| | 4,190 | | Big Lots, Inc. | | | 132,110 | |
| | 9,981 | | Brinker International, Inc.(a) | | | 393,551 | |
| | 38,182 | | Burberry Group PLC ADR | | | 1,573,099 | |
| | 37,402 | | Cablevision Systems Corp., Class A(a) | | | 629,102 | |
| | 4,346 | | Carnival Corp. | | | 149,024 | |
| | 5,785 | | Charter Communications, Inc., Class A(a) | | | 716,472 | |
| | 3,225 | | Chipotle Mexican Grill, Inc., Class A | | | 1,175,029 | |
| | 54,534 | | Comcast Corp., Class A | | | 2,283,884 | |
| | 7,623 | | Darden Restaurants, Inc.(a) | | | 384,809 | |
| | 3,377 | | Delphi Automotive PLC | | | 171,180 | |
| | 48,262 | | Dick's Sporting Goods, Inc.(a) | | | 2,415,996 | |
| | 14,326 | | DIRECTV† | | | 882,768 | |
| | 6,584 | | Discovery Communications, Inc., Class C† | | | 458,641 | |
| | 3,727 | | Discovery Communications, Inc., Class A†(a) | | | 287,762 | |
| | 19,195 | | DISH Network Corp., Class A | | | 816,171 | |
| | 18,488 | | Dollar General Corp. | | | 932,350 | |
| | 5,910 | | Dunkin' Brands Group, Inc. | | | 253,066 | |
| | 7,680 | | Expedia, Inc.(a) | | | 461,952 | |
| | 8,160 | | Gannett Co., Inc. | | | 199,594 | |
| | 29,180 | | Goodyear Tire & Rubber Co. (The) | | | 446,162 | |
| | 8,130 | | H&R Block, Inc. | | | 225,608 | |
| | 2,360 | | Harley-Davidson, Inc. | | | 129,375 | |
| | 21,521 | | Home Depot, Inc. (The) | | | 1,667,232 | |
| | 9,580 | | Hyatt Hotels Corp., Class A† | | | 386,649 | |
| | 16,010 | | International Game Technology | | | 267,527 | |
| | 16,460 | | Jarden Corp.† | | | 720,125 | |
| | 9,340 | | John Wiley & Sons, Inc., Class A(a) | | | 374,441 | |
| | 58,944 | | Johnson Controls, Inc. | | | 2,109,606 | |
| | 7,304 | | L Brands, Inc. | | | 359,722 | |
| | 12,620 | | Lamar Advertising Co., Class A | | | 547,708 | |
| | 11,115 | | Liberty Global PLC, Class A† | | | 823,407 | |
| | 1,660 | | Liberty Global PLC† | | | 112,698 | |
| | 34,873 | | Liberty Interactive Corp., Class A† | | | 802,428 | |
| | 4,060 | | Lowe's Cos., Inc. | | | 166,054 | |
| | 8,323 | | Marriott International, Inc., Class A | | | 335,999 | |
| | 6,304 | | Mattel, Inc. | | | 285,634 | |
| | 14,035 | | McDonald's Corp. | | | 1,389,465 | |
| | 44,607 | | Michael Kors Holdings, Ltd.(a) | | | 2,766,526 | |
| | 1,110 | | Netflix, Inc.(a) | | | 234,310 | |
| | 8,033 | | News Corp., Class A | | | 261,876 | |
| | 40,056 | | NIKE, Inc., Class B(a) | | | 2,550,766 | |
| | 3,303 | | Nordstrom, Inc. | | | 197,982 | |
| | 9,781 | | Omnicom Group, Inc.(a) | | | 614,931 | |
| | 2,748 | | PetSmart, Inc.(a) | | | 184,089 | |
| | 1,828 | | Polaris Industries, Inc.(a) | | | 173,660 | |
| | 3,824 | | priceline.com, Inc.†(a) | | | 3,162,945 | |
| | 13,970 | | PulteGroup, Inc.(a) | | | 265,011 | |
| | 1,530 | | PVH Corp. | | | 191,327 | |
| | 14,581 | | Ralph Lauren Corp., Class A | | | 2,533,303 | |
| | 6,414 | | Scripps Networks Interactive, Inc., Class A(a) | | | 428,199 | |
| | 9,240 | | Service Corp. International | | | 166,597 | |
| | 11,485 | | Shutterfly, Inc.(a) | | | 640,748 | |
| | 110,187 | | Sirius XM Radio, Inc.(a) | | | 369,126 | |
| | 44,417 | | Starbucks Corp. | | | 2,908,869 | |
| | 2,648 | | Starwood Hotels & Resorts Worldwide, Inc. | | | 167,327 | |
| | 6,260 | | Tempur Sealy International, Inc. | | | 274,814 | |
| Shares | | | | Value | |
| Consumer Discretionary (continued) | | | |
| | 13,501 | | Time Warner Cable, Inc., Class A | | $ | 1,518,592 | |
| | 2,238 | | Time Warner, Inc. | | | 129,401 | |
| | 43,730 | | TJX Cos., Inc.(a) | | | 2,189,124 | |
| | 5,700 | | Toll Brothers, Inc.†(a) | | | 185,991 | |
| | 16,525 | | Tractor Supply Co.(a) | | | 1,943,505 | |
| | 1,239 | | VF Corp.(a) | | | 239,201 | |
| | 8,123 | | Viacom, Inc., Class B | | | 552,770 | |
| | 61,670 | | Walt Disney Co. (The) | | | 3,894,461 | |
| | 2,750 | | Whirlpool Corp. | | | 314,490 | |
| | 7,833 | | Wyndham Worldwide Corp. | | | 448,283 | |
| | 2,767 | | Wynn Resorts, Ltd.(a) | | | 354,176 | |
| | 8,652 | | Yum! Brands, Inc. | | | 599,930 | |
| | | | | | | 62,082,685 | |
| Consumer Staples — 8.0% | | | | |
| | 26,866 | | Altria Group, Inc. | | | 940,041 | |
| | 6,860 | | Avon Products, Inc. | | | 144,266 | |
| | 4,980 | | Bunge, Ltd.(a) | | | 352,435 | |
| | 5,260 | | Campbell Soup Co. | | | 235,595 | |
| | 86,356 | | Coca-Cola Co. (The) | | | 3,463,739 | |
| | 7,640 | | Coca-Cola Enterprises, Inc. | | | 268,623 | |
| | 13,570 | | Colgate-Palmolive Co. | | | 777,425 | |
| | 17,194 | | ConAgra Foods, Inc. | | | 600,586 | |
| | 5,925 | | Costco Wholesale Corp. | | | 655,127 | |
| | 2,788 | | CVS Caremark Corp. | | | 159,418 | |
| | 15,993 | | Dean Foods Co.†(a) | | | 160,250 | |
| | 30,523 | | Diageo PLC ADR(a) | | | 3,508,619 | |
| | 6,544 | | Dr. Pepper Snapple Group, Inc. | | | 300,566 | |
| | 8,003 | | General Mills, Inc. | | | 388,386 | |
| | 1,548 | | Hershey Co. (The) | | | 138,205 | |
| | 6,678 | | Kellogg Co. | | | 428,928 | |
| | 4,826 | | Kimberly-Clark Corp. | | | 468,798 | |
| | 46,968 | | Mondelez International, Inc., Class A | | | 1,339,997 | |
| | 2,568 | | Nu Skin Enterprises, Inc., Class A | | | 156,956 | |
| | 23,975 | | PepsiCo, Inc. | | | 1,960,915 | |
| | 64,021 | | Philip Morris International, Inc. | | | 5,545,499 | |
| | 1,988 | | Procter & Gamble Co. (The) | | | 153,056 | |
| | 2,967 | | Reynolds American, Inc.(a) | | | 143,514 | |
| | 14,043 | | Smithfield Foods, Inc.(a) | | | 459,908 | |
| | 3,966 | | Sysco Corp.(a) | | | 135,479 | |
| | 19,759 | | Wal-Mart Stores, Inc. | | | 1,471,848 | |
| | | | | | | 24,358,179 | |
| Energy — 4.0% | | | | |
| | 8,373 | | Anadarko Petroleum Corp. | | | 719,492 | |
| | 32,100 | | Cameron International Corp. | | | 1,963,236 | |
| | 144,192 | | Cobalt International Energy, Inc.† | | | 3,831,181 | |
| | 4,330 | | Dresser-Rand Group, Inc.† | | | 259,714 | |
| | 2,365 | | EOG Resources, Inc. | | | 311,423 | |
| | 8,952 | | Kinder Morgan, Inc.(a) | | | 341,519 | |
| | 60,649 | | Schlumberger, Ltd. | | | 4,346,107 | |
| | 12,949 | | Williams Cos., Inc. (The) | | | 420,454 | |
| | | | | | | 12,193,126 | |
| Financials — 5.7% | | | | |
| | 14,700 | | Affiliated Managers Group, Inc.†(a) | | | 2,409,918 | |
| | 5,225 | | Aflac, Inc. | | | 303,677 | |
| | 10,347 | | American Express Co. | | | 773,542 | |
| | 7,224 | | American Tower Corp., Class A‡ | | | 528,580 | |
| | 10,442 | | Aon PLC | | | 671,943 | |
| | 3,457 | | Arch Capital Group, Ltd.(a) | | | 177,724 | |
| | 3,317 | | Arthur J. Gallagher & Co. | | | 144,920 | |
| | 5,455 | | Bank of Hawaii Corp.(a) | | | 274,496 | |
| | 34,354 | | Camden Property Trust‡(a) | | | 2,375,235 | |
| | 21,264 | | Capital One Financial Corp. | | | 1,335,592 | |
| | 15,130 | | CBRE Group, Inc., Class A | | | 353,437 | |
| | 74,800 | | Charles Schwab Corp. (The) | | | 1,588,004 | |
Wilshire Mutual Funds, Inc. Large Company Growth Portfolio | |
| Shares | | | | Value | |
| Financials (continued) | | | |
| | 30,155 | | CME Group, Inc., Class A(a) | | $ | 2,291,177 | |
| | 11,160 | | Forest City Enterprises, Inc., Class A† | | | 199,876 | |
| | 1,148 | | IntercontinentalExchange, Inc.(a) | | | 204,068 | |
| | 7,533 | | Marsh & McLennan Cos., Inc. | | | 300,717 | |
| | 11,664 | | MBIA, Inc.(a) | | | 155,248 | |
| | 43,979 | | Morgan Stanley | | | 1,074,407 | |
| | 4,006 | | Plum Creek Timber Co., Inc.‡(a) | | | 186,960 | |
| | 18,893 | | Progressive Corp. (The) | | | 480,260 | |
| | 2,866 | | Simon Property Group, Inc.‡ | | | 452,599 | |
| | 26,057 | | SLM Corp. | | | 595,663 | |
| | 5,052 | | StanCorp Financial Group, Inc.(a) | | | 249,619 | |
| | 7,563 | | U.S. Bancorp | | | 273,402 | |
| | | | | | | 17,401,064 | |
| Health Care — 14.0% | | | | |
| | 23,409 | | Abbott Laboratories | | | 816,506 | |
| | 15,340 | | AbbVie, Inc. | | | 634,156 | |
| | 7,620 | | Agilent Technologies, Inc. | | | 325,831 | |
| | 6,710 | | Alere, Inc.†(a) | | | 164,395 | |
| | 16,422 | | Alexion Pharmaceuticals, Inc.† | | | 1,514,765 | |
| | 5,270 | | Allergan, Inc. | | | 443,945 | |
| | 6,094 | | AmerisourceBergen Corp., Class A(a) | | | 340,228 | |
| | 13,076 | | Amgen, Inc. | | | 1,290,078 | |
| | 5,425 | | Baxter International, Inc. | | | 375,790 | |
| | 4,074 | | Becton Dickinson and Co.(a) | | | 402,633 | |
| | 11,016 | | Biogen Idec, Inc. | | | 2,370,643 | |
| | 43,850 | | Boston Scientific Corp.† | | | 406,489 | |
| | 23,050 | | Bristol-Myers Squibb Co. | | | 1,030,104 | |
| | 3,067 | | Cardinal Health, Inc. | | | 144,763 | |
| | 64,656 | | Catamaran Corp.(a) | | | 3,150,040 | |
| | 27,602 | | Celgene Corp.† | | | 3,226,950 | |
| | 17,350 | | Cerner Corp.(a) | | | 1,667,161 | |
| | 1,698 | | DaVita HealthCare Partners, Inc.† | | | 205,118 | |
| | 50,961 | | Edwards Lifesciences Corp.†(a) | | | 3,424,579 | |
| | 6,774 | | Eli Lilly & Co. | | | 332,739 | |
| | 8,250 | | Endo Health Solutions, Inc.†(a) | | | 303,517 | |
| | 52,947 | | Express Scripts Holding Co. | | | 3,266,301 | |
| | 100,044 | | Gilead Sciences, Inc.(a) | | | 5,123,253 | |
| | 6,896 | | HCA Holdings, Inc. | | | 248,670 | |
| | 10,660 | | Health Management Associates, Inc., Class A(a) | | | 167,575 | |
| | 4,590 | | Health Net, Inc. | | | 146,054 | |
| | 202,806 | | Hologic, Inc.(a) | | | 3,914,156 | |
| | 8,664 | | Hospira, Inc.(a) | | | 331,918 | |
| | 9,769 | | Johnson & Johnson | | | 838,766 | |
| | 4,776 | | McKesson Corp. | | | 546,852 | |
| | 3,357 | | Medivation, Inc.†(a) | | | 165,165 | |
| | 960 | | Mettler-Toledo International, Inc.(a) | | | 193,152 | |
| | 22,656 | | Mylan, Inc.† | | | 703,016 | |
| | 1,858 | | Onyx Pharmaceuticals, Inc.†(a) | | | 161,312 | |
| | 6,177 | | Patterson Cos., Inc.(a) | | | 232,255 | |
| | 4,170 | | PerkinElmer, Inc. | | | 135,525 | |
| | 12,607 | | Tenet Healthcare Corp.†(a) | | | 581,183 | |
| | 39,923 | | Teva Pharmaceutical Industries, Ltd. ADR | | | 1,564,982 | |
| | 4,126 | | United Therapeutics Corp.(a) | | | 271,573 | |
| | 1,577 | | Vertex Pharmaceuticals, Inc. | | | 125,955 | |
| | 5,936 | | Warner Chilcott PLC, Class A | | | 118,008 | |
| | 14,610 | | WellPoint, Inc.(a) | | | 1,195,682 | |
| | | | | | | 42,601,783 | |
| Industrials — 11.3% | | | | |
| | 9,274 | | 3M Co. | | | 1,014,112 | |
| | 8,595 | | AECOM Technology Corp.† | | | 273,235 | |
| | 6,194 | | Air Lease Corp., Class A(a) | | | 170,892 | |
| | 3,627 | | Alliant Techsystems, Inc. | | | 298,611 | |
| Shares | | | | Value | |
| Industrials (continued) | | | |
| | 9,441 | | Babcock & Wilcox Co. (The)(a) | | $ | 283,513 | |
| | 3,025 | | Boeing Co. (The) | | | 309,881 | |
| | 14,725 | | Canadian Pacific Railway, Ltd. | | | 1,787,320 | |
| | 10,121 | | Caterpillar, Inc.(a) | | | 834,881 | |
| | 4,036 | | CH Robinson Worldwide, Inc.(a) | | | 227,267 | |
| | 5,165 | | Crane Co. | | | 309,487 | |
| | 16,200 | | Cummins, Inc. | | | 1,757,052 | |
| | 6,494 | | Danaher Corp. | | | 411,070 | |
| | 5,755 | | Deere & Co.(a) | | | 467,594 | |
| | 36,358 | | Delta Air Lines, Inc. | | | 680,258 | |
| | 4,156 | | Dun & Bradstreet Corp.(a) | | | 405,002 | |
| | 10,630 | | Emerson Electric Co. | | | 579,760 | |
| | 12,149 | | Exelis, Inc. | | | 167,535 | |
| | 33,325 | | Fastenal Co.(a) | | | 1,527,951 | |
| | 2,200 | | FedEx Corp. | | | 216,876 | |
| | 44,053 | | Fluor Corp. | | | 2,612,784 | |
| | 1,748 | | Gardner Denver, Inc.(a) | | | 131,415 | |
| | 7,483 | | GATX Corp. | | | 354,919 | |
| | 9,718 | | General Cable Corp. | | | 298,829 | |
| | 20,882 | | General Electric Co. | | | 484,254 | |
| | 64,850 | | Hertz Global Holdings, Inc.†(a) | | | 1,608,280 | |
| | 10,159 | | Honeywell International, Inc. | | | 806,015 | |
| | 4,313 | | Illinois Tool Works, Inc. | | | 298,330 | |
| | 2,987 | | Ingersoll-Rand PLC | | | 165,838 | |
| | 9,036 | | Iron Mountain, Inc. | | | 240,448 | |
| | 17,415 | | ITT Corp. | | | 512,175 | |
| | 25,400 | | JB Hunt Transport Services, Inc.(a) | | | 1,834,896 | |
| | 40,998 | | Joy Global, Inc.(a) | | | 1,989,633 | |
| | 3,115 | | Lockheed Martin Corp.(a) | | | 337,853 | |
| | 10,331 | | Manitowoc Co., Inc. (The)(a) | | | 185,028 | |
| | 8,755 | | Masco Corp. | | | 170,635 | |
| | 3,767 | | Oshkosh Corp. | | | 143,033 | |
| | 13,313 | | Rockwell Automation, Inc.(a) | | | 1,106,843 | |
| | 2,048 | | Rockwell Collins, Inc. | | | 129,864 | |
| | 2,328 | | Roper Industries, Inc.(a) | | | 289,184 | |
| | 5,106 | | Ryder System, Inc. | | | 310,394 | |
| | 18,710 | | Spirit Aerosystems Holdings, Inc., Class A† | | | 401,891 | |
| | 4,658 | | Terex Corp.(a) | | | 122,506 | |
| | 39,865 | | Textron, Inc.(a) | | | 1,038,483 | |
| | 2,368 | | TransDigm Group, Inc. | | | 371,231 | |
| | 6,987 | | Trinity Industries, Inc. | | | 268,580 | |
| | 5,525 | | Union Pacific Corp. | | | 852,397 | |
| | 23,016 | | United Continental Holdings, Inc.(a) | | | 720,171 | |
| | 11,000 | | United Parcel Service, Inc., Class B | | | 951,280 | |
| | 47,606 | | United Rentals, Inc.(a) | | | 2,376,015 | |
| | 13,858 | | United Technologies Corp. | | | 1,287,962 | |
| | 2,738 | | WESCO International, Inc.(a) | | | 186,075 | |
| | | | | | | 34,309,538 | |
| Information Technology — 28.4% | | | | |
| | 6,514 | | Accenture PLC, Class A | | | 468,747 | |
| | 8,389 | | Alliance Data Systems Corp.†(a) | | | 1,518,661 | |
| | 82,188 | | Altera Corp.(a) | | | 2,711,382 | |
| | 17,797 | | Apple, Inc. | | | 7,049,036 | |
| | 16,000 | | Atmel Corp. | | | 117,600 | |
| | 8,303 | | Automatic Data Processing, Inc. | | | 571,745 | |
| | 5,245 | �� | BMC Software, Inc. | | | 236,759 | |
| | 5,458 | | CA, Inc. | | | 156,262 | |
| | 79,514 | | Citrix Systems, Inc. | | | 4,797,080 | |
| | 2,930 | | Cognizant Technology Solutions Corp., Class A† | | | 183,447 | |
| | 8,940 | | Computer Sciences Corp. | | | 391,304 | |
| | 89,971 | | eBay, Inc.† | | | 4,653,300 | |
| | 92,662 | | EMC Corp.(a) | | | 2,188,676 | |
Wilshire Mutual Funds, Inc. Large Company Growth Portfolio | |
| Shares | | | | Value | |
| Information Technology (continued) | | | |
| | 3,157 | | Fidelity National Information Services, Inc. | | $ | 135,246 | |
| | 2,708 | | Gartner, Inc.† | | | 154,329 | |
| | 15,478 | | Google, Inc., Class A† | | | 13,626,367 | |
| | 13,783 | | Intel Corp.(a) | | | 333,824 | |
| | 16,588 | | International Business Machines Corp. | | | 3,170,133 | |
| | 9,082 | | Intuit, Inc.(a) | | | 554,274 | |
| | 10,040 | | Juniper Networks, Inc.(a) | | | 193,872 | |
| | 4,726 | | Lexmark International, Inc., Class A(a) | | | 144,474 | |
| | 16,822 | | LinkedIn Corp., Class A† | | | 2,999,362 | |
| | 35,750 | | LSI Corp.† | | | 255,255 | |
| | 1,339 | | Mastercard, Inc., Class A | | | 769,255 | |
| | 108,161 | | Microsoft Corp. | | | 3,734,799 | |
| | 3,257 | | Motorola Solutions, Inc. | | | 188,027 | |
| | 16,569 | | NCR Corp. | | | 546,611 | |
| | 74,574 | | NetApp, Inc.(a) | | | 2,817,406 | |
| | 6,731 | | Nuance Communications, Inc.(a) | | | 123,716 | |
| | 70,570 | | ON Semiconductor Corp.† | | | 570,206 | |
| | 58,740 | | Oracle Corp. | | | 1,804,493 | |
| | 7,220 | | Paychex, Inc.(a) | | | 263,674 | |
| | 33,440 | | PMC - Sierra, Inc.† | | | 212,344 | |
| | 157,682 | | QUALCOMM, Inc. | | | 9,631,217 | |
| | 5,470 | | Rovi Corp. | | | 124,935 | |
| | 71,449 | | Salesforce.com, Inc.†(a) | | | 2,727,923 | |
| | 18,397 | | Stratasys, Ltd.(a) | | | 1,540,565 | |
| | 7,370 | | Symantec Corp. | | | 165,604 | |
| | 5,494 | | Tech Data Corp. | | | 258,712 | |
| | 43,621 | | Visa, Inc., Class A(a) | | | 7,971,738 | |
| | 267,532 | | Western Union Co. (The)(a) | | | 4,577,473 | |
| | 30,309 | | Zillow, Inc., Class A(a) | | | 1,706,397 | |
| | | | | | | 86,346,230 | |
| Materials — 5.7% | | | | |
| | 2,887 | | Air Products & Chemicals, Inc.(a) | | | 264,363 | |
| | 4,625 | | Ashland, Inc. | | | 386,187 | |
| | 10,964 | | Ball Corp. | | | 455,445 | |
| | 4,856 | | Cabot Corp. | | | 181,712 | |
| | 15,069 | | Crown Holdings, Inc.(a) | | | 619,788 | |
| | 7,093 | | Dow Chemical Co. (The) | | | 228,182 | |
| | 4,046 | | Ecolab, Inc. | | | 344,679 | |
| | 9,752 | | EI du Pont de Nemours & Co.(a) | | | 511,980 | |
| | 82,507 | | Freeport-McMoRan Copper & Gold, Inc. | | | 2,278,018 | |
| | 32,819 | | Monsanto Co. | | | 3,242,517 | |
| | 45,087 | | Mosaic Co. (The) | | | 2,426,131 | |
| | 11,860 | | Owens-Illinois, Inc. | | | 329,589 | |
| | 1,339 | | PPG Industries, Inc. | | | 196,043 | |
| | 5,133 | | Praxair, Inc. | | | 591,116 | |
| | 20,144 | | Sealed Air Corp. | | | 482,449 | |
| | 21,702 | | Sherwin-Williams Co. (The) | | | 3,832,573 | |
| | 6,970 | | Silgan Holdings, Inc. | | | 327,311 | |
| | 7,217 | | Vulcan Materials Co. | | | 349,375 | |
| | 9,520 | | Weyerhaeuser Co.‡ | | | 271,225 | |
| | | | | | | 17,318,683 | |
| Telecommunication Services — 1.4% | | | | |
| | 3,777 | | AT&T, Inc. | | | 133,706 | |
| | 7,637 | | CenturyLink, Inc.(a) | | | 269,968 | |
| | 5,166 | | Crown Castle International Corp. | | | 373,967 | |
| | 4,788 | | SBA Communications Corp., Class A | | | 354,887 | |
| | 67,295 | | Sprint Nextel Corp.† | | | 472,411 | |
| | 7,045 | | tw telecom, Inc., Class A† | | | 198,246 | |
| | 46,009 | | Verizon Communications, Inc. | | | 2,316,093 | |
| | | | | | | 4,119,278 | |
| Shares | | | | Value | |
| Utilities — 0.1% | | | |
| | 3,210 | | ONEOK, Inc. | | $ | 132,605 | |
| | | | | | | | |
| Total Common Stock | | | | |
| (Cost $259,118,634) | | | 300,863,171 | |
| | |
| SHORT-TERM INVESTMENTS (b) — 23.6% | |
| | 5,475,716 | | Northern Trust Institutional Government Select Portfolio, 0.010% | | | 5,475,716 | |
| | 66,318,438 | | Northern Trust Institutional Liquid Asset Portfolio, 0.010%(c) | | | 66,318,438 | |
| | | | | | | | |
| Total Short-Term Investments | | | | |
| (Cost $71,794,154) | | | 71,794,154 | |
| | | | | |
| Total Investments — 122.7% | | | | |
| (Cost $330,912,788) | | | 372,657,325 | |
| Other Assets & Liabilities, Net — (22.7)% | | | (68,880,731 | ) |
| | | | | |
| NET ASSETS — 100.0% | | $ | 303,776,594 | |
| † | Non-income producing security. |
| †† | More narrow industries are utilized for compliance purposes, whereas broad sectors are utilized for reporting purposes. |
| ‡ | Real Estate Investment Trust. |
| (a) | This security or a partial position of this security is on loan at June 30, 2013. The total market value of securities on loan at June 30, 2013 was $64,658,559. |
| (b) | Rate shown is the 7-day effective yield as of June 30, 2013. |
| (c) | This security was purchased with cash collateral held from securities on loan. The total value of such security as of June 30, 2013 was $66,318,438. |
| ADR — American Depositary Receipt |
| Ltd. — Limited |
| PLC— Public Limited Company |
Wilshire Mutual Funds, Inc. Large Company Value Portfolio | |
| Shares | | | | Value | |
| | |
| COMMON STOCK — 98.3%†† | | | |
| Consumer Discretionary — 10.8% | | | |
| | 9,150 | | Abercrombie & Fitch Co., Class A(a) | | $ | 414,037 | |
| | 1,489 | | Allison Transmission Holdings, Inc. | | | 34,366 | |
| | 13,910 | | Apollo Group, Inc., Class A(a) | | | 246,485 | |
| | 110 | | AutoNation, Inc.†(a) | | | 4,773 | |
| | 397 | | Brinker International, Inc.(a) | | | 15,654 | |
| | 11,438 | | Cablevision Systems Corp., Class A(a) | | | 192,387 | |
| | 1,921 | | Carnival Corp. | | | 65,871 | |
| | 5,700 | | CBS Corp., Class B | | | 278,559 | |
| | 1,170 | | Charter Communications, Inc., Class A(a) | | | 144,904 | |
| | 23,094 | | Comcast Corp., Class A | | | 967,177 | |
| | 63 | | CST Brands, Inc.†(a) | | | 1,941 | |
| | 1,687 | | Darden Restaurants, Inc. | | | 85,160 | |
| | 23,650 | | Delphi Automotive PLC | | | 1,198,818 | |
| | 99 | | DeVry, Inc.(a) | | | 3,071 | |
| | 965 | | DIRECTV† | | | 59,463 | |
| | 99 | | Discovery Communications, Inc., Class A†(a) | | | 7,644 | |
| | 5,459 | | DISH Network Corp., Class A | | | 232,117 | |
| | 100 | | DreamWorks Animation SKG, Inc., Class A(a) | | | 2,566 | |
| | 397 | | Dunkin' Brands Group, Inc. | | | 16,999 | |
| | 220 | | Expedia, Inc. | | | 13,233 | |
| | 18,200 | | Foot Locker, Inc. | | | 639,366 | |
| | 46,625 | | Ford Motor Co. | | | 721,289 | |
| | 13,370 | | Gannett Co., Inc. | | | 327,030 | |
| | 42,240 | | General Motors Co.(a) | | | 1,407,014 | |
| | 8,040 | | Goodyear Tire & Rubber Co. (The) | | | 122,932 | |
| | 992 | | Harman International Industries, Inc. | | | 53,767 | |
| | 1,360 | | Hyatt Hotels Corp., Class A† | | | 54,890 | |
| | 40 | | International Game Technology | | | 668 | |
| | 2,040 | | Interpublic Group of Cos., Inc. (The) | | | 29,682 | |
| | 100 | | Jarden Corp.† | | | 4,375 | |
| | 110 | | John Wiley & Sons, Inc., Class A(a) | | | 4,410 | |
| | 199 | | Johnson Controls, Inc. | | | 7,122 | |
| | 10,925 | | Kohl's Corp.(a) | | | 551,822 | |
| | 1,170 | | Lamar Advertising Co., Class A | | | 50,778 | |
| | 6,050 | | Las Vegas Sands Corp. | | | 320,226 | |
| | 4,500 | | Lear Corp. | | | 272,070 | |
| | 397 | | Leggett & Platt, Inc.(a) | | | 12,343 | |
| | 1,489 | | Liberty Global PLC, Class A† | | | 110,305 | |
| | 11,020 | | Liberty Interactive Corp., Class A† | | | 253,570 | |
| | 298 | | Liberty Ventures† | | | 25,333 | |
| | 2,545 | | Lowe's Cos., Inc. | | | 104,091 | |
| | 8,975 | | Magna International, Inc., Class A(a) | | | 639,200 | |
| | 2,084 | | Marriott International, Inc., Class A | | | 84,131 | |
| | 24,369 | | MGM Resorts International(a) | | | 360,174 | |
| | 9,429 | | News Corp., Class A | | | 307,385 | |
| | 22,918 | | Omnicom Group, Inc. | | | 1,440,855 | |
| | 587 | | PulteGroup, Inc.(a) | | | 11,135 | |
| | 1,687 | | Royal Caribbean Cruises, Ltd. | | | 56,245 | |
| | 233 | | Scripps Networks Interactive, Inc., Class A(a) | | | 15,555 | |
| | 11,293 | | Sirius XM Radio, Inc.(a) | | | 37,832 | |
| | 1,420 | | Stanley Black & Decker, Inc. | | | 109,766 | |
| | 120,250 | | Staples, Inc.(a) | | | 1,907,165 | |
| | 2,184 | | Target Corp.(a) | | | 150,390 | |
| | 3,474 | | Thomson Reuters Corp. | | | 113,148 | |
| | 2,018 | | Time Warner Cable, Inc., Class A | | | 226,985 | |
| | 5,856 | | Time Warner, Inc. | | | 338,594 | |
| | 4,700 | | TRW Automotive Holdings Corp. | | | 312,268 | |
| | 8,222 | | Viacom, Inc., Class B | | | 559,507 | |
| | 953 | | Visteon Corp. | | | 60,153 | |
| | 4,174 | | Walt Disney Co. (The) | | | 263,588 | |
| Shares | | | | Value | |
| Consumer Discretionary (continued) | | | |
| | 7,543 | | Wendy's Co. (The)(a) | | $ | 43,976 | |
| | 3,075 | | Whirlpool Corp.(a) | | | 351,657 | |
| | 1,092 | | Wyndham Worldwide Corp. | | | 62,495 | |
| | | | | | | 16,510,512 | |
| Consumer Staples — 3.7% | | | | |
| | 1,139 | | Altria Group, Inc. | | | 39,854 | |
| | 2,737 | | Bunge, Ltd.(a) | | | 193,697 | |
| | 1,100 | | Campbell Soup Co. | | | 49,269 | |
| | 397 | | Clorox Co. (The)(a) | | | 33,007 | |
| | 199 | | Coca-Cola Co. (The) | | | 7,982 | |
| | 4,210 | | Coca-Cola Enterprises, Inc. | | | 148,024 | |
| | 198 | | Colgate-Palmolive Co. | | | 11,343 | |
| | 9,063 | | ConAgra Foods, Inc. | | | 316,570 | |
| | 1,170 | | Constellation Brands, Inc., Class A† | | | 60,980 | |
| | 23,140 | | CVS Caremark Corp. | | | 1,323,145 | |
| | 2,581 | | Dean Foods Co.†(a) | | | 25,862 | |
| | 993 | | Dr. Pepper Snapple Group, Inc. | | | 45,608 | |
| | 200 | | Energizer Holdings, Inc. | | | 20,102 | |
| | 298 | | General Mills, Inc. | | | 14,462 | |
| | 298 | | JM Smucker Co. (The)(a) | | | 30,739 | |
| | 970 | | Kellogg Co. | | | 62,303 | |
| | 2,221 | | Kraft Foods Group, Inc.(a) | | | 124,087 | |
| | 14,000 | | Kroger Co. (The) | | | 483,560 | |
| | 11,609 | | Molson Coors Brewing Co., Class B(a) | | | 555,607 | |
| | 10,025 | | Mondelez International, Inc., Class A | | | 286,013 | |
| | 993 | | Nu Skin Enterprises, Inc., Class A | | | 60,692 | |
| | 199 | | PepsiCo, Inc. | | | 16,276 | |
| | 12,605 | | Procter & Gamble Co. (The) | | | 970,459 | |
| | 561 | | Reynolds American, Inc.(a) | | | 27,135 | |
| | 2,630 | | Safeway, Inc.(a) | | | 62,226 | |
| | 6,489 | | Smithfield Foods, Inc.(a) | | | 212,515 | |
| | 1,092 | | Sysco Corp.(a) | | | 37,303 | |
| | 11,300 | | Tyson Foods, Inc., Class A | | | 290,184 | |
| | 1,010 | | Wal-Mart Stores, Inc. | | | 75,235 | |
| | 938 | | WhiteWave Foods Co., Class B†(a) | | | 14,258 | |
| | 659 | | WhiteWave Foods Co., Class A(a) | | | 10,709 | |
| | | | | | | 5,609,206 | |
| Energy — 12.6% | | | | |
| | 5,062 | | Alpha Natural Resources, Inc.†(a) | | | 26,525 | |
| | 9,512 | | Anadarko Petroleum Corp. | | | 817,366 | |
| | 11,391 | | Apache Corp. | | | 954,908 | |
| | 30,317 | | Baker Hughes, Inc.(a) | | | 1,398,523 | |
| | 48,578 | | BP PLC ADR | | | 2,027,646 | |
| | 23,350 | | Chesapeake Energy Corp.(a) | | | 475,873 | |
| | 21,228 | | Chevron Corp. | | | 2,512,122 | |
| | 14,232 | | ConocoPhillips | | | 861,036 | |
| | 2,417 | | Consol Energy, Inc. | | | 65,501 | |
| | 1,489 | | Devon Energy Corp. | | | 77,249 | |
| | 850 | | Dresser-Rand Group, Inc.† | | | 50,983 | |
| | 35,608 | | Exxon Mobil Corp. | | | 3,217,183 | |
| | 6,375 | | Halliburton Co. | | | 265,965 | |
| | 19,300 | | Hess Corp. | | | 1,283,257 | |
| | 280 | | HollyFrontier Corp. | | | 11,978 | |
| | 993 | | Kinder Morgan, Inc.(a) | | | 37,883 | |
| | 649 | | Marathon Oil Corp. | | | 22,442 | |
| | 6,359 | | Marathon Petroleum Corp. | | | 451,871 | |
| | 987 | | National Oilwell Varco, Inc. | | | 68,005 | |
| | 993 | | Newfield Exploration Co. | | | 23,723 | |
| | 13,486 | | Occidental Petroleum Corp. | | | 1,203,356 | |
| | 23,509 | | Peabody Energy Corp.(a) | | | 344,172 | |
| | 2,954 | | Phillips 66 | | | 174,020 | |
| | 99 | | QEP Resources, Inc. | | | 2,750 | |
| | 60 | | Rowan PLC, Class A | | | 2,044 | |
| | 31,400 | | Royal Dutch Shell PLC ADR, Class A(a) | | | 2,003,320 | |
Wilshire Mutual Funds, Inc. Large Company Value Portfolio | |
| Shares | | | | Value | |
| Energy (continued) | | | |
| | 893 | | Southwestern Energy Co.(a) | | $ | 32,621 | |
| | 2,238 | | Spectra Energy Corp.(a) | | | 77,121 | |
| | 10 | | Tesoro Corp. | | | 523 | |
| | 760 | | Tidewater, Inc. | | | 43,297 | |
| | 298 | | Unit Corp.(a) | | | 12,689 | |
| | 8,934 | | Valero Energy Corp. | | | 310,635 | |
| | 5,075 | | Whiting Petroleum Corp. | | | 233,907 | |
| | 2,481 | | Williams Cos., Inc. (The) | | | 80,558 | |
| | 5,925 | | WPX Energy, Inc.(a) | | | 112,219 | |
| | | | | | | 19,283,271 | |
| Financials — 32.2% | | | | |
| | 794 | | ACE, Ltd.(a) | | | 71,047 | |
| | 3,474 | | Aflac, Inc. | | | 201,909 | |
| | 397 | | Alexandria Real Estate Equities, Inc.‡ | | | 26,091 | |
| | 29,539 | | Allstate Corp. (The) | | | 1,421,417 | |
| | 1,007 | | American Capital Agency Corp.‡ | | | 23,151 | |
| | 1,766 | | American Capital, Ltd. | | | 22,375 | |
| | 939 | | American Express Co. | | | 70,199 | |
| | 2,581 | | American Financial Group, Inc. | | | 126,237 | |
| | 62,833 | | American International Group, Inc.†(a) | | | 2,808,635 | |
| | 99 | | American Tower Corp., Class A‡ | | | 7,244 | |
| | 893 | | Ameriprise Financial, Inc. | | | 72,226 | |
| | 5,322 | | Annaly Capital Management, Inc.‡(a) | | | 66,897 | |
| | 2,938 | | Aon PLC | | | 189,060 | |
| | 993 | | Arch Capital Group, Ltd.(a) | | | 51,050 | |
| | 5,955 | | Associated Banc-Corp | | | 92,600 | |
| | 2,481 | | Assurant, Inc. | | | 126,308 | |
| | 1,335 | | Assured Guaranty, Ltd.(a) | | | 29,450 | |
| | 18,524 | | Axis Capital Holdings, Ltd.(a) | | | 848,029 | |
| | 220,884 | | Bank of America Corp. | | | 2,840,568 | |
| | 13,039 | | Bank of New York Mellon Corp. (The)(a) | | | 365,744 | |
| | 3,077 | | BB&T Corp. | | | 104,249 | |
| | 9,330 | | Berkshire Hathaway, Inc., Class B(a) | | | 1,044,214 | |
| | 794 | | BOK Financial Corp. | | | 50,856 | |
| | 695 | | Boston Properties, Inc.‡ | | | 73,302 | |
| | 1,390 | | BRE Properties, Inc.‡ | | | 69,528 | |
| | 298 | | Brown & Brown, Inc. | | | 9,607 | |
| | 7,575 | | Capital One Financial Corp. | | | 475,786 | |
| | 21,462 | | CBL & Associates Properties, Inc.‡(a) | | | 459,716 | |
| | 5,160 | | CBRE Group, Inc., Class A | | | 120,538 | |
| | 1,700 | | Charles Schwab Corp. (The)(a) | | | 36,091 | |
| | 1,191 | | Chimera Investment Corp.‡(a) | | | 3,573 | |
| | 1,787 | | Chubb Corp. (The) | | | 151,269 | |
| | 266 | | Cincinnati Financial Corp. | | | 12,209 | |
| | 1,540 | | CIT Group, Inc.† | | | 71,810 | |
| | 61,751 | | Citigroup, Inc. | | | 2,962,195 | |
| | 17 | | CME Group, Inc., Class A | | | 1,292 | |
| | 23,320 | | Comerica, Inc. | | | 928,836 | |
| | 893 | | Cullen/Frost Bankers, Inc.(a) | | | 59,626 | |
| | 26,484 | | Discover Financial Services | | | 1,261,698 | |
| | 6,384 | | E*Trade Financial Corp. | | | 80,822 | |
| | 8,238 | | East West Bancorp, Inc. | | | 226,545 | |
| | 99 | | Federal Realty Investment Trust‡ | | | 10,264 | |
| | 1,191 | | Fidelity National Financial, Inc., Class A | | | 28,358 | |
| | 90,638 | | Fifth Third Bancorp(a) | | | 1,636,016 | |
| | 99 | | First Citizens BancShares, Inc., Class A | | | 19,013 | |
| | 3,275 | | First Horizon National Corp.(a) | | | 36,680 | |
| | 3,672 | | Forest City Enterprises, Inc., Class A† | | | 65,765 | |
| | 5,630 | | Franklin Resources, Inc. | | | 765,793 | |
| | 13,304 | | Goldman Sachs Group, Inc. (The)(a) | | | 2,012,230 | |
| | 12,730 | | Hartford Financial Services Group, Inc. | | | 393,612 | |
| | 1,191 | | HCC Insurance Holdings, Inc. | | | 51,344 | |
| | 797 | | HCP, Inc.‡ | | | 36,216 | |
| | 199 | | Howard Hughes Corp. (The)† | | | 22,306 | |
| | 31,525 | | ING US, Inc.†(a) | | | 853,067 | |
| Shares | | | | Value | |
| Financials (continued) | | | |
| | 38,800 | | Invesco, Ltd. | | $ | 1,233,840 | |
| | 70 | | Jones Lang LaSalle, Inc. | | | 6,380 | |
| | 67,744 | | JPMorgan Chase & Co. | | | 3,576,206 | |
| | 77,385 | | KeyCorp | | | 854,330 | |
| | 2,603 | | Kimco Realty Corp.‡(a) | | | 55,782 | |
| | 12,366 | | Liberty Property Trust‡(a) | | | 457,047 | |
| | 8,960 | | Lincoln National Corp.(a) | | | 326,771 | |
| | 1,390 | | Loews Corp. | | | 61,716 | |
| | 695 | | M&T Bank Corp.(a) | | | 77,666 | |
| | 1,886 | | Marsh & McLennan Cos., Inc. | | | 75,289 | |
| | 4,566 | | MBIA, Inc.(a) | | | 60,773 | |
| | 58,163 | | MetLife, Inc. | | | 2,661,539 | |
| | 55,378 | | Morgan Stanley | | | 1,352,885 | |
| | 3,110 | | NASDAQ OMX Group, Inc. (The)(a) | | | 101,977 | |
| | 4,764 | | New York Community Bancorp, Inc.(a) | | | 66,696 | |
| | 99 | | Northern Trust Corp.(a) | | | 5,732 | |
| | 1,170 | | Old Republic International Corp. | | | 15,058 | |
| | 794 | | PartnerRe, Ltd.(a) | | | 71,905 | |
| | 11,122 | | People's United Financial, Inc.(a) | | | 165,718 | |
| | 199 | | Plum Creek Timber Co., Inc.‡(a) | | | 9,287 | |
| | 33,134 | | PNC Financial Services Group, Inc. | | | 2,416,131 | |
| | 4,764 | | Popular, Inc. | | | 144,492 | |
| | 1,580 | | Principal Financial Group, Inc.(a) | | | 59,171 | |
| | 5,062 | | Progressive Corp. (The) | | | 128,676 | |
| | 1,322 | | Prologis, Inc.‡ | | | 49,866 | |
| | 7,246 | | Protective Life Corp. | | | 278,319 | |
| | 10,372 | | Prudential Financial, Inc. | | | 757,467 | |
| | 1,630 | | Raymond James Financial, Inc. | | | 70,057 | |
| | 199 | | Rayonier, Inc.‡(a) | | | 11,023 | |
| | 810 | | Realogy Holdings Corp.†(a) | | | 38,912 | |
| | 298 | | Regency Centers Corp.‡ | | | 15,141 | |
| | 121,675 | | Regions Financial Corp. | | | 1,159,563 | |
| | 11,514 | | SLM Corp. | | | 263,210 | |
| | 23,420 | | State Street Corp. | | | 1,527,218 | |
| | 5,737 | | SunTrust Banks, Inc. | | | 181,117 | |
| | 275 | | SVB Financial Group | | | 22,913 | |
| | 1,390 | | Synovus Financial Corp. | | | 4,059 | |
| | 4,069 | | TCF Financial Corp.(a) | | | 57,698 | |
| | 5,863 | | Torchmark Corp.(a) | | | 381,916 | |
| | 794 | | Travelers Cos., Inc. (The) | | | 63,456 | |
| | 12,605 | | U.S. Bancorp | | | 455,671 | |
| | 65,775 | | UBS AG | | | 1,114,886 | |
| | 14,207 | | Unum Group(a) | | | 417,260 | |
| | 906 | | Ventas, Inc.‡ | | | 62,931 | |
| | 794 | | Vornado Realty Trust‡(a) | | | 65,783 | |
| | 75,508 | | Wells Fargo & Co. | | | 3,116,215 | |
| | 99 | | White Mountains Insurance Group, Ltd. | | | 56,919 | |
| | 26,175 | | Willis Group Holdings PLC(a) | | | 1,067,416 | |
| | 1,290 | | XL Group PLC, Class A | | | 39,113 | |
| | 7,925 | | Zions Bancorporation(a) | | | 228,874 | |
| | | | | | | 49,086,733 | |
| Health Care — 11.5% | | | | |
| | 31,881 | | Abbott Laboratories | | | 1,112,009 | |
| | 22,300 | | Aetna, Inc. | | | 1,416,942 | |
| | 2,400 | | Alere, Inc.†(a) | | | 58,800 | |
| | 783 | | AmerisourceBergen Corp., Class A(a) | | | 43,715 | |
| | 15,317 | | Becton Dickinson and Co.(a) | | | 1,513,779 | |
| | 52,020 | | Boston Scientific Corp.† | | | 482,225 | |
| | 376 | | Bristol-Myers Squibb Co. | | | 16,803 | |
| | 1,125 | | Brookdale Senior Living, Inc., Class A† | | | 29,745 | |
| | 1,290 | | Cardinal Health, Inc. | | | 60,888 | |
| | 9,750 | | Cigna Corp. | | | 706,777 | |
| | 2,084 | | Community Health Systems, Inc. | | | 97,698 | |
| | 2,581 | | Covidien PLC | | | 162,190 | |
| | 13,398 | | Eli Lilly & Co. | | | 658,110 | |
Wilshire Mutual Funds, Inc. Large Company Value Portfolio | |
| Shares | | | | Value | |
| Health Care (continued) | | | |
| | 1,886 | | Endo Health Solutions, Inc.† | | $ | 69,386 | |
| | 15,337 | | Forest Laboratories, Inc. | | | 628,817 | |
| | 9,450 | | Gilead Sciences, Inc. | | | 483,935 | |
| | 3,681 | | HCA Holdings, Inc. | | | 132,737 | |
| | 5,062 | | Health Management Associates, Inc., Class A(a) | | | 79,575 | |
| | 1,191 | | Health Net, Inc. | | | 37,898 | |
| | 12,179 | | Hologic, Inc. | | | 235,055 | |
| | 19,049 | | Hospira, Inc.(a) | | | 729,767 | |
| | 18,339 | | Johnson & Johnson(a) | | | 1,574,587 | |
| | 5,725 | | Laboratory Corp. of America Holdings†(a) | | | 573,072 | |
| | 1,390 | | LifePoint Hospitals, Inc. | | | 67,887 | |
| | 298 | | McKesson Corp. | | | 34,121 | |
| | 16,735 | | Medtronic, Inc. | | | 861,351 | |
| | 30,643 | | Merck & Co., Inc. | | | 1,423,367 | |
| | 4,189 | | Mylan, Inc.†(a) | | | 129,985 | |
| | 496 | | Patterson Cos., Inc.(a) | | | 18,650 | |
| | 199 | | PerkinElmer, Inc. | | | 6,467 | |
| | 76,569 | | Pfizer, Inc.(a) | | | 2,144,698 | |
| | 5,810 | | QIAGEN NV(a) | | | 115,677 | |
| | 9,794 | | Quest Diagnostics, Inc.(a) | | | 593,810 | |
| | 3,573 | | Tenet Healthcare Corp.†(a) | | | 164,715 | |
| | 9,133 | | Thermo Fisher Scientific, Inc. | | | 772,926 | |
| | 2,893 | | UnitedHealth Group, Inc.(a) | | | 189,434 | |
| | 695 | | WellPoint, Inc.(a) | | | 56,879 | |
| | | | | | | 17,484,477 | |
| Industrials — 8.7% | | | | |
| | 4,169 | | AECOM Technology Corp.† | | | 132,532 | |
| | 6,500 | | AGCO Corp. | | | 326,235 | |
| | 3,077 | | Air Lease Corp., Class A | | | 84,895 | |
| | 390 | | Alaska Air Group, Inc.† | | | 20,280 | |
| | 893 | | Alliant Techsystems, Inc. | | | 73,521 | |
| | 1,085 | | Babcock & Wilcox Co. (The)(a) | | | 32,583 | |
| | 298 | | CH Robinson Worldwide, Inc.(a) | | | 16,780 | |
| | 298 | | Cintas Corp. | | | 13,571 | |
| | 99 | | Clean Harbors, Inc.†(a) | | | 5,002 | |
| | 980 | | CNH Global NV(a) | | | 40,827 | |
| | 993 | | Crane Co. | | | 59,500 | |
| | 794 | | CSX Corp. | | | 18,413 | |
| | 2,283 | | Danaher Corp. | | | 144,514 | |
| | 46,384 | | Delta Air Lines, Inc. | | | 867,845 | |
| | 397 | | Dover Corp. | | | 30,831 | |
| | 1,588 | | Dun & Bradstreet Corp.(a) | | | 154,751 | |
| | 8,500 | | Eaton Corp. PLC | | | 559,385 | |
| | 199 | | Emerson Electric Co. | | | 10,853 | |
| | 3,672 | | Exelis, Inc. | | | 50,637 | |
| | 1,180 | | FedEx Corp. | | | 116,325 | |
| | 298 | | Gardner Denver, Inc. | | | 22,404 | |
| | 2,779 | | GATX Corp.(a) | | | 131,808 | |
| | 860 | | General Cable Corp. | | | 26,445 | |
| | 7,601 | | General Dynamics Corp. | | | 595,386 | |
| | 128,601 | | General Electric Co.(a) | | | 2,982,257 | |
| | 2,084 | | Harsco Corp. | | | 48,328 | |
| | 400 | | Hertz Global Holdings, Inc.†(a) | | | 9,920 | |
| | 1,092 | | Huntington Ingalls Industries, Inc. | | | 61,676 | |
| | 99 | | Ingersoll-Rand PLC | | | 5,496 | |
| | 2,581 | | Iron Mountain, Inc. | | | 68,680 | |
| | 4,466 | | ITT Corp.(a) | | | 131,345 | |
| | 500 | | Joy Global, Inc.(a) | | | 24,265 | |
| | 14,115 | | L-3 Communications Holdings, Inc., Class 3 | | | 1,210,220 | |
| | 1,985 | | Manitowoc Co., Inc. (The)(a) | | | 35,551 | |
| | 49,375 | | Masco Corp. | | | 962,319 | |
| | 298 | | MRC Global, Inc.† | | | 8,231 | |
| Shares | | | | Value | |
| Industrials (continued) | | | |
| | 1,092 | | Navistar International Corp.†(a) | | $ | 30,314 | |
| | 100 | | Nielsen Holdings NV | | | 3,359 | |
| | 99 | | Nordson Corp.(a) | | | 6,862 | |
| | 14,950 | | Northrop Grumman Corp. | | | 1,237,860 | |
| | 2,581 | | Oshkosh Corp. | | | 98,001 | |
| | 7,475 | | Parker Hannifin Corp.(a) | | | 713,115 | |
| | 1,330 | | Pitney Bowes, Inc.(a) | | | 19,524 | |
| | 2,382 | | Republic Services, Inc., Class A | | | 80,845 | |
| | 329 | | Rockwell Collins, Inc. | | | 20,862 | |
| | 37 | | Roper Industries, Inc.(a) | | | 4,596 | |
| | 1,985 | | Ryder System, Inc. | | | 120,668 | |
| | 1,588 | | Southwest Airlines Co. | | | 20,469 | |
| | 7,674 | | Spirit Aerosystems Holdings, Inc., Class A† | | | 164,837 | |
| | 1,340 | | SPX Corp.(a) | | | 96,453 | |
| | 23,735 | | Terex Corp.(a) | | | 624,230 | |
| | 1,410 | | Textron, Inc. | | | 36,731 | |
| | 3,475 | | Towers Watson & Co., Class A | | | 284,742 | |
| | 3,474 | | Trinity Industries, Inc.(a) | | | 133,541 | |
| | 99 | | Triumph Group, Inc.(a) | | | 7,836 | |
| | 5,418 | | United Continental Holdings, Inc.(a) | | | 169,529 | |
| | 2,680 | | URS Corp.(a) | | | 126,550 | |
| | 397 | | Waste Connections, Inc.(a) | | | 16,333 | |
| | 2,812 | | Waste Management, Inc. | | | 113,408 | |
| | 1,092 | | WESCO International, Inc.(a) | | | 74,212 | |
| | 99 | | Xylem, Inc. | | | 2,667 | |
| | | | | | | 13,291,155 | |
| Information Technology — 11.0% | | | | |
| | 1,092 | | Amdocs, Ltd. | | | 40,502 | |
| | 397 | | AOL, Inc. | | | 14,483 | |
| | 50 | | Apple, Inc. | | | 19,804 | |
| | 1,080 | | Arrow Electronics, Inc.† | | | 43,038 | |
| | 5,200 | | Atmel Corp. | | | 38,220 | |
| | 1,700 | | Avnet, Inc.† | | | 57,120 | |
| | 1,290 | | AVX Corp. | | | 15,158 | |
| | 11,811 | | Brocade Communications Systems, Inc. | | | 68,031 | |
| | 113,804 | | Cisco Systems, Inc. | | | 2,766,575 | |
| | 2,220 | | Computer Sciences Corp. | | | 97,170 | |
| | 59,200 | | Dell, Inc. | | | 790,320 | |
| | 2,950 | | Diebold, Inc.(a) | | | 99,386 | |
| | 1,040 | | Freescale Semiconductor, Ltd.† | | | 14,092 | |
| | 950 | | Google, Inc., Class A† | | | 836,351 | |
| | 496 | | Harris Corp. | | | 24,428 | |
| | 135,764 | | Hewlett-Packard Co. | | | 3,366,947 | |
| | 9,256 | | Ingram Micro, Inc., Class A | | | 175,771 | |
| | 3,400 | | Intel Corp.(a) | | | 82,348 | |
| | 397 | | JDS Uniphase Corp. | | | 5,709 | |
| | 4,242 | | Juniper Networks, Inc.(a) | | | 81,913 | |
| | 8,400 | | Lam Research Corp.†(a) | | | 372,456 | |
| | 35,825 | | Marvell Technology Group, Ltd. | | | 419,511 | |
| | 41,250 | | Micron Technology, Inc.(a) | | | 591,112 | |
| | 39,273 | | Microsoft Corp. | | | 1,356,097 | |
| | 3,777 | | NCR Corp. | | | 124,603 | |
| | 54,725 | | Nokia OYJ ADR(a) | | | 204,672 | |
| | 1,418 | | Nuance Communications, Inc.(a) | | | 26,063 | |
| | 17,800 | | NXP Semiconductor NV | | | 551,444 | |
| | 25,862 | | ON Semiconductor Corp.† | | | 208,965 | |
| | 48,125 | | Oracle Corp. | | | 1,478,400 | |
| | 1,090 | | PMC - Sierra, Inc.† | | | 6,922 | |
| | 810 | | Rovi Corp.(a) | | | 18,500 | |
| | 28,225 | | Skyworks Solutions, Inc. | | | 617,845 | |
| | 15,825 | | Symantec Corp. | | | 355,588 | |
| | 24,025 | | TE Connectivity, Ltd. | | | 1,094,099 | |
| | 2,283 | | Tech Data Corp. | | | 107,506 | |
| | 1,320 | | Teradyne, Inc.(a) | | | 23,192 | |
Wilshire Mutual Funds, Inc. Large Company Value Portfolio | |
| Shares | | | | Value | |
| Information Technology (continued) | | | |
| | 1,710 | | Vishay Intertechnology, Inc.(a) | | $ | 23,752 | |
| | 20,660 | | Xerox Corp. | | | 187,386 | |
| | 15,375 | | Yahoo!, Inc. | | | 386,066 | |
| | | | | | | 16,791,545 | |
| Materials — 2.5% | | | | |
| | 1,191 | | Air Products & Chemicals, Inc.(a) | | | 109,060 | |
| | 2,184 | | Alcoa, Inc.(a) | | | 17,079 | |
| | 2,381 | | Ashland, Inc. | | | 198,813 | |
| | 2,382 | | Ball Corp. | | | 98,948 | |
| | 496 | | Bemis Co., Inc.(a) | | | 19,413 | |
| | 2,328 | | Cabot Corp. | | | 87,114 | |
| | 496 | | Celanese Corp., Class A(a) | | | 22,221 | |
| | 11,195 | | Cliffs Natural Resources, Inc.(a) | | | 181,919 | |
| | 5,712 | | Crown Holdings, Inc.(a) | | | 234,935 | |
| | 298 | | Cytec Industries, Inc. | | | 21,828 | |
| | 1,390 | | Domtar Corp. | | | 92,435 | |
| | 4,827 | | Dow Chemical Co. (The)(a) | | | 155,285 | |
| | 26,530 | | Freeport-McMoRan Copper & Gold, Inc. | | | 732,493 | |
| | 5,250 | | International Paper Co. | | | 232,627 | |
| | 13,125 | | LyondellBasell Industries NV, Class A | | | 869,662 | |
| | 1,083 | | Newmont Mining Corp. | | | 32,436 | |
| | 1,687 | | Nucor Corp. | | | 73,081 | |
| | 2,480 | | Owens-Illinois, Inc. | | | 68,919 | |
| | 5,490 | | Sealed Air Corp. | | | 131,486 | |
| | 1,470 | | Silgan Holdings, Inc. | | | 69,031 | |
| | 1,985 | | Sonoco Products Co. | | | 68,622 | |
| | 897 | | United States Steel Corp.(a) | | | 15,724 | |
| | 2,035 | | Vulcan Materials Co.(a) | | | 98,514 | |
| | 1,964 | | Walter Energy, Inc. | | | 20,426 | |
| | 4,630 | | Weyerhaeuser Co.‡ | | | 131,909 | |
| | | | | | | 3,783,980 | |
| Telecommunication Services — 2.3% | | | | |
| | 65,111 | | AT&T, Inc. | | | 2,304,929 | |
| | 5,062 | | CenturyLink, Inc.(a) | | | 178,942 | |
| | 30 | | Crown Castle International Corp. | | | 2,172 | |
| | 500 | | Level 3 Communications, Inc.(a) | | | 10,540 | |
| | 1,099 | | SBA Communications Corp., Class A | | | 81,458 | |
| | 43,077 | | Sprint Nextel Corp.† | | | 302,400 | |
| | 1,877 | | Telephone & Data Systems, Inc.(a) | | | 46,268 | |
| | 560 | | tw telecom, Inc., Class A† | | | 15,758 | |
| | 8,619 | | Verizon Communications, Inc. | | | 433,881 | |
| | 13,170 | | Windstream Corp.(a) | | | 101,541 | |
| | | | | | | 3,477,889 | |
| Utilities — 3.0% | | | | |
| | 53,260 | | AES Corp. (The)(a) | | | 638,587 | |
| | 1,217 | | AGL Resources, Inc.(a) | | | 52,161 | |
| | 199 | | Alliant Energy Corp. | | | 10,034 | |
| | 2,283 | | American Electric Power Co., Inc. | | | 102,233 | |
| | 695 | | American Water Works Co., Inc. | | | 28,655 | |
| | 2,779 | | CenterPoint Energy, Inc.(a) | | | 65,279 | |
| | 199 | | CMS Energy Corp.(a) | | | 5,407 | |
| | 1,092 | | Consolidated Edison, Inc.(a) | | | 63,675 | |
| | 2,581 | | Dominion Resources, Inc.(a) | | | 146,652 | |
| | 695 | | DTE Energy Co.(a) | | | 46,572 | |
| | 2,529 | | Duke Energy Corp.(a) | | | 170,708 | |
| | 100 | | Edison International(a) | | | 4,816 | |
| | 16,450 | | Entergy Corp. | | | 1,146,236 | |
| | 13,650 | | Exelon Corp.(a) | | | 421,512 | |
| | 510 | | FirstEnergy Corp.(a) | | | 19,043 | |
| | 1,964 | | NextEra Energy, Inc. | | | 160,027 | |
| | 397 | | NiSource, Inc. | | | 11,370 | |
| | 920 | | Northeast Utilities(a) | | | 38,658 | |
| | 15,400 | | NRG Energy, Inc. | | | 411,180 | |
| | 610 | | ONEOK, Inc. | | | 25,199 | |
| Shares | | | | Value | |
| Utilities (continued) | | | |
| | 298 | | Pepco Holdings, Inc.(a) | | $ | 6,008 | |
| | 1,489 | | PG&E Corp.(a) | | | 68,092 | |
| | 17,775 | | PPL Corp.(a) | | | 537,871 | |
| | 1,390 | | Public Service Enterprise Group, Inc.(a) | | | 45,397 | |
| | 540 | | Questar Corp.(a) | | | 12,879 | |
| | 298 | | SCANA Corp.(a) | | | 14,632 | |
| | 616 | | Sempra Energy | | | 50,364 | |
| | 3,871 | | Southern Co. (The)(a) | | | 170,827 | |
| | 1,290 | | TECO Energy, Inc.(a) | | | 22,175 | |
| | 787 | | UGI Corp.(a) | | | 30,779 | |
| | 695 | | Wisconsin Energy Corp.(a) | | | 28,488 | |
| | 2,283 | | Xcel Energy, Inc.(a) | | | 64,700 | |
| | | | | | | 4,620,216 | |
| Total Common Stock | | | | |
| (Cost $136,326,264) | | | 149,938,984 | |
| | |
| SHORT-TERM INVESTMENTS (b)— 23.8% | |
| | 2,019,644 | | Northern Trust Institutional Government Select Portfolio, 0.010% | | | 2,019,644 | |
| | 34,189,871 | | Northern Trust Institutional Liquid Asset Portfolio, 0.010%(c) | | | 34,189,871 | |
| | | | | | | | |
| Total Short-Term Investments | | | | |
| (Cost $36,209,515) | | | 36,209,515 | |
| | | | | |
| Total Investments — 122.1% | | | | |
| (Cost $172,535,779) | | | 186,148,499 | |
| Other Assets & Liabilities, Net — (22.1)% | | | (33,631,986 | ) |
| | | | | |
| NET ASSETS — 100.0% | | $ | 152,516,513 | |
| † | Non-income producing security. |
| †† | More narrow industries are utilized for compliance purposes, whereas broad sectors are utilized for reporting purposes. |
| ‡ | Real Estate Investment Trust. |
| (a) | This security or a partial position of this security is on loan at June 30, 2013. The total market value of securities on loan at June 30, 2013 was $33,556,400 (Note 6). |
| (b) | Rate shown is the 7-day effective yield as of June 30, 2013. |
| (c) | This security was purchased with cash collateral held from securities on loan. The total value of such security as of June 30, 2013 was $0. Securities on loan are also collateralized by various U.S. Treasury obligations in the amount of $299,404 (Note 6) |
| ADR — American Depositary Receipt |
| Ltd. — Limited |
| PLC— Public Limited Company |
Wilshire Mutual Funds, Inc. Small Company Growth Portfolio | |
| Shares | | | | Value | |
| | |
| COMMON STOCK — 98.5%†† | | | |
| Consumer Discretionary — 18.6% | | | |
| | 1,860 | | American Axle & Manufacturing Holdings, Inc.†(a) | | $ | 34,652 | |
| | 580 | | American Greetings Corp., Class A | | | 10,568 | |
| | 300 | | American Public Education, Inc.†(a) | | | 11,148 | |
| | 240 | | America's Car-Mart, Inc.†(a) | | | 10,378 | |
| | 346 | | Ameristar Casinos, Inc.(a) | | | 9,096 | |
| | 170 | | Arbitron, Inc. | | | 7,896 | |
| | 8,614 | | Asbury Automotive Group, Inc.(a) | | | 345,421 | |
| | 1,379 | | Belo Corp., Class A(a) | | | 19,237 | |
| | 990 | | Bloomin' Brands, Inc.†(a) | | | 24,631 | |
| | 170 | | Blue Nile, Inc.† | | | 6,422 | |
| | 1,134 | | Boyd Gaming Corp.† | | | 12,814 | |
| | 450 | | Bravo Brio Restaurant Group, Inc.(a) | | | 8,019 | |
| | 480 | | Bright Horizons Family Solutions, Inc.† | | | 16,661 | |
| | 240 | | Brown Shoe Co., Inc.(a) | | | 5,167 | |
| | 727 | | Brunswick Corp. | | | 23,228 | |
| | 1,620 | | Buffalo Wild Wings, Inc.(a) | | | 159,019 | |
| | 250 | | Capella Education Co. | | | 10,412 | |
| | 340 | | Carrols Restaurant Group, Inc.† | | | 2,196 | |
| | 120 | | Cavco Industries, Inc.†(a) | | | 6,054 | |
| | 684 | | CEC Entertainment, Inc.(a) | | | 28,071 | |
| | 646 | | Cheesecake Factory, Inc. (The)(a) | | | 27,061 | |
| | 324 | | Cherokee, Inc.(a) | | | 4,141 | |
| | 3,540 | | Christopher & Banks Corp. | | | 23,860 | |
| | 90 | | Chuy's Holdings, Inc.†(a) | | | 3,451 | |
| | 280 | | Citi Trends, Inc.†(a) | | | 4,068 | |
| | 180 | | Conn's, Inc.†(a) | | | 9,317 | |
| | 1,034 | | Cooper Tire & Rubber Co. | | | 34,298 | |
| | 244 | | Cracker Barrel Old Country Store, Inc.(a) | | | 23,097 | |
| | 1,409 | | Crocs, Inc.(a) | | | 23,248 | |
| | 297 | | Dana Holding Corp. | | | 5,720 | |
| | 3,949 | | Deckers Outdoor Corp.† | | | 199,464 | |
| | 612 | | Domino's Pizza, Inc. | | | 35,588 | |
| | 260 | | Dorman Products, Inc. | | | 11,864 | |
| | 1,710 | | Entravision Communications Corp., Class A | | | 10,516 | |
| | 14,741 | | Express, Inc.† | | | 309,119 | |
| | 230 | | Francesca's Holdings Corp.(a) | | | 6,392 | |
| | 360 | | Geeknet, Inc.† | | | 4,990 | |
| | 434 | | Genesco, Inc.†(a) | | | 29,074 | |
| | 890 | | Gentherm, Inc.† | | | 16,527 | |
| | 800 | | Global Sources, Ltd. | | | 5,368 | |
| | 724 | | Grand Canyon Education, Inc.†(a) | | | 23,334 | |
| | 5,513 | | Group 1 Automotive, Inc.(a) | | | 354,651 | |
| | 220 | | Hibbett Sports, Inc.†(a) | | | 12,210 | |
| | 860 | | Hillenbrand, Inc.(a) | | | 20,391 | |
| | 780 | | Iconix Brand Group, Inc. | | | 22,940 | |
| | 250 | | iRobot Corp.(a) | | | 9,943 | |
| | 230 | | Jack in the Box, Inc.(a) | | | 9,037 | |
| | 380 | | K12, Inc.†(a) | | | 9,983 | |
| | 800 | | Kirkland's, Inc.† | | | 13,800 | |
| | 120 | | Krispy Kreme Doughnuts, Inc.(a) | | | 2,094 | |
| | 1,268 | | LeapFrog Enterprises, Inc., Class A†(a) | | | 12,477 | |
| | 2,269 | | Libbey, Inc.(a) | | | 54,388 | |
| | 724 | | Life Time Fitness, Inc.†(a) | | | 36,280 | |
| | 1,360 | | LIN TV Corp., Class A†(a) | | | 20,808 | |
| | 130 | | Lincoln Educational Services Corp. | | | 685 | |
| | 1,369 | | Lions Gate Entertainment Corp.(a) | | | 37,606 | |
| | 30 | | Lithia Motors, Inc., Class A(a) | | | 1,599 | |
| | 734 | | Loral Space & Communications, Inc.(a) | | | 44,025 | |
| | 436 | | Lumber Liquidators Holdings, Inc.† | | | 33,951 | |
| | 650 | | Matthews International Corp., Class A(a) | | | 24,505 | |
| | 2,014 | | MDC Partners, Inc., Class A(a) | | | 36,333 | |
| | 8,264 | | Meritage Homes Corp. | | | 358,327 | |
| Shares | | | | Value | |
| Consumer Discretionary (continued) | | | |
| | 2,813 | | Morgans Hotel Group Co.† | | $ | 22,673 | |
| | 3,988 | | MTR Gaming Group, Inc.† | | | 13,360 | |
| | 464 | | Multimedia Games Holding Co., Inc.†(a) | | | 12,096 | |
| | 810 | | National CineMedia, Inc.(a) | | | 13,681 | |
| | 680 | | Nexstar Broadcasting Group, Inc., Class A(a) | | | 24,113 | |
| | 2,474 | | Orbitz Worldwide, Inc.†(a) | | | 19,866 | |
| | 2,990 | | Pacific Sunwear of California, Inc.† | | | 10,913 | |
| | 553 | | Papa John's International, Inc.† | | | 36,150 | |
| | 1,210 | | Penske Automotive Group, Inc.(a) | | | 36,953 | |
| | 21,299 | | Pier 1 Imports, Inc. | | | 500,314 | |
| | 2,124 | | Pinnacle Entertainment, Inc.†(a) | | | 41,779 | |
| | 310 | | Pool Corp.(a) | | | 16,247 | |
| | 1,290 | | Quiksilver, Inc.†(a) | | | 8,308 | |
| | 3,434 | | Red Robin Gourmet Burgers, Inc.(a) | | | 189,488 | |
| | 410 | | RG Barry Corp.(a) | | | 6,658 | |
| | 2,093 | | Ruth's Hospitality Group, Inc.(a) | | | 25,263 | |
| | 984 | | Ryland Group, Inc. (The)(a) | | | 39,458 | |
| | 3,664 | | Scientific Games Corp., Class A(a) | | | 41,220 | |
| | 954 | | Sinclair Broadcast Group, Inc., Class A(a) | | | 28,029 | |
| | 966 | | Six Flags Entertainment Corp. | | | 33,965 | |
| | 1,759 | | Smith & Wesson Holding Corp.†(a) | | | 17,555 | |
| | 12,510 | | Sonic Corp.†(a) | | | 182,146 | |
| | 694 | | Sotheby's(a) | | | 26,310 | |
| | 580 | | Stein Mart, Inc.(a) | | | 7,917 | |
| | 3,444 | | Steven Madden, Ltd. | | | 166,621 | |
| | 650 | | Tenneco, Inc. | | | 29,432 | |
| | 1,054 | | Texas Roadhouse, Inc., Class A(a) | | | 26,371 | |
| | 952 | | Tower International, Inc.† | | | 18,840 | |
| | 759 | | Town Sports International Holdings, Inc.(a) | | | 8,174 | |
| | 240 | | True Religion Apparel, Inc.(a) | | | 7,598 | |
| | 230 | | Tumi Holdings, Inc.† | | | 5,520 | |
| | 1,134 | | Valassis Communications, Inc.(a) | | | 27,885 | |
| | 470 | | Valuevision Media, Inc., Class A† | | | 2,402 | |
| | 510 | | Vitamin Shoppe, Inc. | | | 22,868 | |
| | 5,560 | | Wet Seal, Inc. (The), Class A(a) | | | 26,188 | |
| | 910 | | Winnebago Industries, Inc.(a) | | | 19,101 | |
| | 830 | | Wolverine World Wide, Inc.(a) | | | 45,326 | |
| | 260 | | Zumiez, Inc.(a) | | | 7,475 | |
| | | | | | | 4,445,883 | |
| Consumer Staples — 5.9% | | | | |
| | 3,440 | | Annie's, Inc.† | | | 147,026 | |
| | 724 | | B&G Foods, Inc., Class A(a) | | | 24,652 | |
| | 106 | | Boston Beer Co., Inc. (The), Class A(a) | | | 18,088 | |
| | 660 | | Boulder Brands, Inc.†(a) | | | 7,953 | |
| | 284 | | Cal-Maine Foods, Inc. | | | 13,209 | |
| | 230 | | Casey's General Stores, Inc.(a) | | | 13,837 | |
| | 1,349 | | Central Garden and Pet Co., Class A†(a) | | | 9,308 | |
| | 490 | | Coca-Cola Bottling Co. Consolidated(a) | | | 29,963 | |
| | 1,184 | | Craft Brew Alliance, Inc.†(a) | | | 9,756 | |
| | 670 | | Darling International, Inc.† | | | 12,502 | |
| | 534 | | Elizabeth Arden, Inc.† | | | 24,068 | |
| | 474 | | Hain Celestial Group, Inc. (The)(a) | | | 30,796 | |
| | 160 | | Harris Teeter Supermarkets, Inc. | | | 7,498 | |
| | 6,160 | | Inter Parfums, Inc.(a) | | | 175,683 | |
| | 180 | | J&J Snack Foods Corp. | | | 14,004 | |
| | 207 | | Lancaster Colony Corp. | | | 16,144 | |
| | 320 | | Medifast, Inc.(a) | | | 8,243 | |
| | 570 | | Natural Grocers by Vitamin Cottage, Inc.†(a) | | | 17,670 | |
| | 276 | | Nu Skin Enterprises, Inc., Class A | | | 16,869 | |
| | 492 | | Pantry, Inc. (The)(a) | | | 5,992 | |
| | 4,290 | | Pilgrim's Pride Corp.(a) | | | 64,092 | |
| | 270 | | Post Holdings, Inc.† | | | 11,788 | |
| | 10,064 | | Prestige Brands Holdings, Inc.† | | | 293,265 | |
Wilshire Mutual Funds, Inc. Small Company Growth Portfolio | |
| Shares | | | | Value | |
| Consumer Staples (continued) | | | |
| | 60 | | Pricesmart, Inc.(a) | | $ | 5,258 | |
| | 14,847 | | Rite Aid Corp.†(a) | | | 42,462 | |
| | 264 | | Sanderson Farms, Inc. | | | 17,535 | |
| | 330 | | Snyders-Lance, Inc.(a) | | | 9,375 | |
| | 884 | | Spectrum Brands Holdings, Inc.(a) | | | 50,273 | |
| | 370 | | Susser Holdings Corp.(a) | | | 17,716 | |
| | 3,794 | | TreeHouse Foods, Inc.(a) | | | 248,659 | |
| | 424 | | United Natural Foods, Inc.(a) | | | 22,892 | |
| | 657 | | Vector Group, Ltd.(a) | | | 10,657 | |
| | 100 | | WD-40 Co. | | | 5,448 | |
| | | | | | | 1,402,681 | |
| Energy — 5.2% | | | | |
| | 16,700 | | Approach Resources, Inc.(a) | | | 410,319 | |
| | 505 | | Berry Petroleum Co., Class A | | | 21,371 | |
| | 2,678 | | BPZ Resources, Inc.† | | | 4,794 | |
| | 13,296 | | Callon Petroleum Co.†(a) | | | 44,807 | |
| | 564 | | Carrizo Oil & Gas, Inc.(a) | | | 15,978 | |
| | 250 | | Diamondback Energy, Inc.(a) | | | 8,330 | |
| | 117 | | Dril-Quip, Inc.† | | | 10,564 | |
| | 1,590 | | Gastar Exploration, Ltd.†(a) | | | 4,245 | |
| | 8,830 | | Gulfport Energy Corp.† | | | 415,628 | |
| | 2,159 | | Kodiak Oil & Gas Corp. | | | 19,193 | |
| | 570 | | Matador Resources Co.(a) | | | 6,829 | |
| | 880 | | Midstates Petroleum Co., Inc.†(a) | | | 4,761 | |
| | 270 | | Northern Oil and Gas, Inc.†(a) | | | 3,602 | |
| | 864 | | Oasis Petroleum, Inc. | | | 33,584 | |
| | 18,210 | | Pacific Drilling† | | | 178,094 | |
| | 646 | | Rosetta Resources, Inc.† | | | 27,468 | |
| | 354 | | Targa Resources Corp. | | | 22,773 | |
| | | | | | | 1,232,340 | |
| Financials — 12.0% | | | | |
| | 250 | | Acadia Realty Trust‡(a) | | | 6,173 | |
| | 290 | | American Assets Trust, Inc.‡(a) | | | 8,949 | |
| | 6,440 | | Bank of the Ozarks, Inc.(a) | | | 279,045 | |
| | 2,707 | | BGC Partners, Inc., Class A | | | 15,944 | |
| | 1,598 | | CBL & Associates Properties, Inc.‡(a) | | | 34,229 | |
| | 230 | | Coresite Realty Corp.‡(a) | | | 7,316 | |
| | 103 | | Credit Acceptance Corp. | | | 10,787 | |
| | 1,214 | | DFC Global Corp.(a) | | | 16,765 | |
| | 674 | | Encore Capital Group, Inc.†(a) | | | 22,316 | |
| | 510 | | Enterprise Financial Services Corp.(a) | | | 8,139 | |
| | 530 | | Ezcorp, Inc., Class A† | | | 8,947 | |
| | 6,896 | | FelCor Lodging Trust, Inc.‡(a) | | | 40,755 | |
| | 620 | | First American Financial Corp. | | | 13,665 | |
| | 3,293 | | Glimcher Realty Trust‡(a) | | | 35,960 | |
| | 1,714 | | Greenlight Capital Re, Ltd., Class A | | | 42,044 | |
| | 100 | | Gyrodyne Co. of America, Inc.‡ | | | 7,150 | |
| | 294 | | Highwoods Properties, Inc.‡(a) | | | 10,469 | |
| | 13,890 | | Hilltop Holdings, Inc.†(a) | | | 227,796 | |
| | 10,539 | | Home BancShares, Inc.(a) | | | 273,698 | |
| | 3,215 | | Iberiabank Corp.(a) | | | 172,356 | |
| | 930 | | Inland Real Estate Corp.‡(a) | | | 9,505 | |
| | 1,259 | | Investors Bancorp, Inc.(a) | | | 26,540 | |
| | 204 | | Investors Real Estate Trust‡ | | | 1,754 | |
| | 4,771 | | MarketAxess Holdings, Inc. | | | 223,044 | |
| | 910 | | Meadowbrook Insurance Group, Inc.(a) | | | 7,307 | |
| | 173 | | National Health Investors, Inc.‡ | | | 10,356 | |
| | 300 | | Nationstar Mortgage Holdings, Inc.†(a) | | | 11,232 | |
| | 1,054 | | Ocwen Financial Corp.† | | | 43,446 | |
| | 1,394 | | Omega Healthcare Investors, Inc.‡(a) | | | 43,242 | |
| | 184 | | Portfolio Recovery Associates, Inc. | | | 28,268 | |
| | 21,041 | | PrivateBancorp, Inc., Class A(a) | | | 446,280 | |
| | 150 | | PS Business Parks, Inc.‡ | | | 10,826 | |
| | 510 | | Regional Management Corp.† | | | 12,750 | |
| | 200 | | Saul Centers, Inc.‡ | | | 8,892 | |
| Shares | | | | Value | |
| Financials (continued) | | | |
| | 2,350 | | Signature Bank(a) | | $ | 195,097 | |
| | 610 | | State Auto Financial Corp.(a) | | | 11,084 | |
| | 4,367 | | Strategic Hotels & Resorts, Inc.† ‡ | | | 38,692 | |
| | 3,330 | | SVB Financial Group(a) | | | 277,456 | |
| | 4,090 | | Texas Capital Bancshares, Inc.†(a) | | | 181,432 | |
| | 1,265 | | Tower Group International, Ltd.(a) | | | 25,945 | |
| | | | | | | 2,855,651 | |
| Health Care — 18.1% | | | | |
| | 4,233 | | Accuray, Inc.†(a) | | | 24,297 | |
| | 3,600 | | Achillion Pharmaceuticals, Inc.(a) | | | 29,448 | |
| | 389 | | Acorda Therapeutics, Inc.(a) | | | 12,833 | |
| | 70 | | Addus HomeCare Corp.† | | | 1,382 | |
| | 730 | | Aegerion Pharmaceuticals, Inc.(a) | | | 46,238 | |
| | 8,895 | | Air Methods Corp.(a) | | | 301,363 | |
| | 24,614 | | Akorn, Inc.†(a) | | | 332,781 | |
| | 834 | | Align Technology, Inc.(a) | | | 30,891 | |
| | 1,588 | | Alkermes PLC | | | 45,544 | |
| | 1,374 | | Alnylam Pharmaceuticals, Inc.† | | | 42,608 | |
| | 530 | | AMAG Pharmaceuticals, Inc.† | | | 11,792 | |
| | 740 | | AMN Healthcare Services, Inc.† | | | 10,597 | |
| | 624 | | Amsurg Corp., Class A(a) | | | 21,902 | |
| | 1,764 | | Anacor Pharmaceuticals, Inc.†(a) | | | 9,861 | |
| | 150 | | Analogic Corp.(a) | | | 10,924 | |
| | 136 | | ArthroCare Corp. | | | 4,696 | |
| | 1,879 | | athenahealth, Inc.(a) | | | 159,189 | |
| | 1,140 | | Auxilium Pharmaceuticals, Inc. | | | 18,958 | |
| | 1,244 | | AVEO Pharmaceuticals, Inc.†(a) | | | 3,110 | |
| | 1,094 | | Cambrex Corp.(a) | | | 15,283 | |
| | 4,380 | | Cantel Medical Corp.(a) | | | 148,351 | |
| | 930 | | Capital Senior Living Corp.† | | | 22,227 | |
| | 2,350 | | Celldex Therapeutics, Inc.(a) | | | 36,683 | |
| | 1,184 | | Cempra, Inc.†(a) | | | 9,271 | |
| | 6,160 | | Centene Corp.† | | | 323,153 | |
| | 348 | | Cepheid, Inc.(a) | | | 11,978 | |
| | 1,419 | | Cerus Corp.†(a) | | | 6,272 | |
| | 351 | | Chemed Corp.(a) | | | 25,423 | |
| | 490 | | ChemoCentryx, Inc.† | | | 6,929 | |
| | 274 | | Corvel Corp.†(a) | | | 8,020 | |
| | 534 | | Cyberonics, Inc.† | | | 27,747 | |
| | 6,035 | | Depomed, Inc.†(a) | | | 33,856 | |
| | 1,160 | | DexCom, Inc. | | | 26,042 | |
| | 3,223 | | Dyax Corp.†(a) | | | 11,152 | |
| | 3,528 | | Dynavax Technologies Corp.(a) | | | 3,881 | |
| | 1,502 | | Emergent Biosolutions, Inc.(a) | | | 21,659 | |
| | 2,754 | | Emeritus Corp. | | | 63,838 | |
| | 1,124 | | Endocyte, Inc.†(a) | | | 14,758 | |
| | 2,004 | | Exact Sciences Corp.(a) | | | 27,876 | |
| | 740 | | ExamWorks Group, Inc.(a) | | | 15,710 | |
| | 460 | | Furiex Pharmaceuticals, Inc.†(a) | | | 15,672 | |
| | 390 | | Gentiva Health Services, Inc.(a) | | | 3,884 | |
| | 490 | | GTx, Inc.† | | | 3,234 | |
| | 1,760 | | Haemonetics Corp.†(a) | | | 72,776 | |
| | 1,500 | | Halozyme Therapeutics, Inc.(a) | | | 11,910 | |
| | 1,464 | | HealthSouth Corp.(a) | | | 42,163 | |
| | 11,776 | | HMS Holdings Corp.†(a) | | | 274,381 | |
| | 180 | | Hyperion Therapeutics, Inc.†(a) | | | 3,960 | |
| | 4,260 | | ICON PLC† | | | 150,932 | |
| | 160 | | ICU Medical, Inc.(a) | | | 11,530 | |
| | 2,150 | | ImmunoGen, Inc.(a) | | | 35,668 | |
| | 530 | | Impax Laboratories, Inc.†(a) | | | 10,563 | |
| | 1,184 | | Infinity Pharmaceuticals, Inc. | | | 19,240 | |
| | 230 | | IPC The Hospitalist Co., Inc.(a) | | | 11,813 | |
| | 970 | | Ironwood Pharmaceuticals, Inc., Class A†(a) | | | 9,651 | |
| | 516 | | Jazz Pharmaceuticals PLC | | | 35,465 | |
| | 330 | | KYTHERA Biopharmaceuticals, Inc.†(a) | | | 8,927 | |
Wilshire Mutual Funds, Inc. Small Company Growth Portfolio | |
| Shares | | | | Value | |
| Health Care (continued) | | | |
| | 4,709 | | Lexicon Pharmaceuticals, Inc.†(a) | | $ | 10,219 | |
| | 130 | | Magellan Health Services, Inc.† | | | 7,290 | |
| | 1,284 | | MedAssets, Inc.† | | | 22,778 | |
| | 835 | | Medicines Co. (The)†(a) | | | 25,685 | |
| | 4,350 | | Medidata Solutions, Inc.† | | | 336,907 | |
| | 110 | | Medivation, Inc.†(a) | | | 5,412 | |
| | 3,080 | | Merge Healthcare, Inc.†(a) | | | 11,088 | |
| | 1,634 | | Merrimack Pharmaceuticals, Inc.†(a) | | | 10,997 | |
| | 734 | | Molina Healthcare, Inc.†(a) | | | 27,290 | |
| | 970 | | Momenta Pharmaceuticals, Inc.† | | | 14,608 | |
| | 250 | | MWI Veterinary Supply, Inc.† | | | 30,810 | |
| | 2,034 | | Natus Medical, Inc.†(a) | | | 27,764 | |
| | 2,894 | | Nektar Therapeutics | | | 33,426 | |
| | 2,520 | | Neogen Corp. | | | 140,011 | |
| | 1,430 | | Neurocrine Biosciences, Inc.†(a) | | | 19,133 | |
| | 200 | | NPS Pharmaceuticals, Inc.(a) | | | 3,020 | |
| | 914 | | NuVasive, Inc.† | | | 22,658 | |
| | 461 | | Omnicell, Inc.(a) | | | 9,474 | |
| | 1,760 | | OncoGenex Pharmaceutical, Inc.(a) | | | 17,248 | |
| | 3,760 | | Orexigen Therapeutics, Inc.† | | | 21,996 | |
| | 514 | | Owens & Minor, Inc.(a) | | | 17,389 | |
| | 3,548 | | Pain Therapeutics, Inc. | | | 7,841 | |
| | 7,774 | | PAREXEL International Corp.(a) | | | 357,137 | |
| | 3,098 | | PDL BioPharma, Inc.(a) | | | 23,917 | |
| | 22 | | Pharmacyclics, Inc.†(a) | | | 1,748 | |
| | 3,384 | | Pozen, Inc.† | | | 16,954 | |
| | 490 | | Providence Service Corp. (The)†(a) | | | 14,254 | |
| | 1,630 | | Regulus Therapeutics, Inc.†(a) | | | 15,990 | |
| | 2,413 | | Rigel Pharmaceuticals, Inc.†(a) | | | 8,059 | |
| | 166 | | Salix Pharmaceuticals, Ltd. | | | 10,981 | |
| | 1,004 | | Santarus, Inc.† | | | 21,134 | |
| | 873 | | Sciclone Pharmaceuticals, Inc.† | | | 4,330 | |
| | 280 | | Seattle Genetics, Inc.†(a) | | | 8,809 | |
| | 1,105 | | Select Medical Holdings Corp. | | | 9,061 | |
| | 1,789 | | Sequenom, Inc.†(a) | | | 7,532 | |
| | 1,500 | | Skilled Healthcare Group, Inc., Class A†(a) | | | 10,020 | |
| | 1,890 | | Staar Surgical Co.†(a) | | | 19,183 | |
| | 904 | | STERIS Corp. | | | 38,764 | |
| | 2,179 | | Sunesis Pharmaceuticals, Inc.†(a) | | | 11,353 | |
| | 594 | | Synageva BioPharma Corp. | | | 24,948 | |
| | 375 | | Team Health Holdings, Inc. | | | 15,401 | |
| | 190 | | TESARO, Inc.† | | | 6,221 | |
| | 230 | | Theravance, Inc.(a) | | | 8,862 | |
| | 2,538 | | Threshold Pharmaceuticals, Inc.†(a) | | | 13,350 | |
| | 2,110 | | Trius Therapeutics, Inc.(a) | | | 17,133 | |
| | 220 | | U.S. Physical Therapy, Inc.(a) | | | 6,081 | |
| | 4,437 | | Vanda Pharmaceuticals, Inc.†(a) | | | 35,851 | |
| | 1,520 | | Vanguard Health Systems, Inc.† | | | 31,525 | |
| | 660 | | Vascular Solutions, Inc.†(a) | | | 9,709 | |
| | 2,149 | | Vical, Inc.†(a) | | | 6,726 | |
| | 310 | | ViroPharma, Inc.(a) | | | 8,881 | |
| | 176 | | WellCare Health Plans, Inc. | | | 9,777 | |
| | 189 | | West Pharmaceutical Services, Inc. | | | 13,279 | |
| | 1,584 | | XenoPort, Inc. | | | 7,841 | |
| | | | | | | 4,318,147 | |
| Industrials — 17.0% | | | | |
| | 529 | | Acacia Research Corp.(a) | | | 11,823 | |
| | 2,720 | | Accuride Corp. | | | 13,763 | |
| | 989 | | Aceto Corp.(a) | | | 13,777 | |
| | 364 | | Acuity Brands, Inc.(a) | | | 27,489 | |
| | 7,620 | | Advisory Board Co. (The) | | | 416,433 | |
| | 1,117 | | Aircastle, Ltd.(a) | | | 17,861 | |
| | 854 | | Alaska Air Group, Inc.† | | | 44,408 | |
| | 270 | | Altra Holdings, Inc.(a) | | | 7,393 | |
| | 724 | | Applied Industrial Technologies, Inc.(a) | | | 34,991 | |
| Shares | | | | Value | |
| Industrials (continued) | | | |
| | 420 | | ARC Document Solutions, Inc.† | | $ | 1,680 | |
| | 530 | | Argan, Inc. | | | 8,268 | |
| | 604 | | Astronics Corp.† | | | 24,685 | |
| | 1,439 | | Avis Budget Group, Inc.† | | | 41,371 | |
| | 314 | | Barrett Business Services, Inc. | | | 16,394 | |
| | 7,493 | | Beacon Roofing Supply, Inc.(a) | | | 283,835 | |
| | 1,344 | | Belden, Inc.(a) | | | 67,106 | |
| | 2,454 | | Blount International, Inc.(a) | | | 29,006 | |
| | 714 | | Brink's Co. (The) | | | 18,214 | |
| | 2,094 | | Builders FirstSource, Inc.† | | | 12,522 | |
| | 984 | | CAI International, Inc.† | | | 23,193 | |
| | 530 | | Celadon Group, Inc.(a) | | | 9,672 | |
| | 3,116 | | Chart Industries, Inc.†(a) | | | 293,184 | |
| | 140 | | CLARCOR, Inc. | | | 7,309 | |
| | 1,486 | | Coleman Cable, Inc. | | | 26,837 | |
| | 494 | | Corporate Executive Board Co. (The)(a) | | | 31,231 | |
| | 755 | | CPI Aerostructures, Inc.† | | | 8,192 | |
| | 370 | | Cubic Corp.(a) | | | 17,797 | |
| | 224 | | DigitalGlobe, Inc.† | | | 6,946 | |
| | 52 | | DXP Enterprises, Inc.(a) | | | 3,463 | |
| | 350 | | Dycom Industries, Inc.(a) | | | 8,099 | |
| | 930 | | Edgen Group, Inc., Class A† | | | 5,933 | |
| | 600 | | EnerNOC, Inc.†(a) | | | 7,956 | |
| | 6,010 | | EnerSys, Inc.(a) | | | 294,731 | |
| | 194 | | Exponent, Inc.(a) | | | 11,467 | |
| | 2,259 | | Federal Signal Corp.(a) | | | 19,766 | |
| | 1,429 | | Flow International Corp. | | | 5,273 | |
| | 2,944 | | GenCorp, Inc.(a) | | | 47,869 | |
| | 920 | | Generac Holdings, Inc. | | | 34,049 | |
| | 380 | | General Cable Corp. | | | 11,685 | |
| | 531 | | Genessee & Wyoming, Inc., Class A(a) | | | 45,050 | |
| | 1,829 | | Great Lakes Dredge & Dock Corp.(a) | | | 14,303 | |
| | 894 | | H&E Equipment Services, Inc.(a) | | | 18,837 | |
| | 3,294 | | Hawaiian Holdings, Inc.(a) | | | 20,126 | |
| | 17,051 | | Healthcare Services Group, Inc.(a) | | | 418,090 | |
| | 350 | | Heartland Express, Inc. | | | 4,855 | |
| | 927 | | HEICO Corp.(a) | | | 46,693 | |
| | 1,374 | | Hexcel Corp. | | | 46,785 | |
| | 4,340 | | Hub Group, Inc., Class A† | | | 158,063 | |
| | 190 | | Hyster-Yale Materials Handling, Inc.(a) | | | 11,930 | |
| | 148 | | Insperity, Inc.(a) | | | 4,484 | |
| | 694 | | John Bean Technologies Corp.(a) | | | 14,581 | |
| | 540 | | Kforce, Inc. | | | 7,884 | |
| | 914 | | Knight Transportation, Inc.(a) | | | 15,373 | |
| | 295 | | Lindsay Corp.(a) | | | 22,119 | |
| | 1,064 | | MasTec, Inc.(a) | | | 35,006 | |
| | 3,120 | | Meritor, Inc.†(a) | | | 21,996 | |
| | 205 | | Middleby Corp.† | | | 34,868 | |
| | 584 | | Mueller Industries, Inc. | | | 29,451 | |
| | 5,139 | | Mueller Water Products, Inc., Class A | | | 35,511 | |
| | 230 | | Multi-Color Corp.(a) | | | 6,978 | |
| | 80 | | Nortek, Inc.†(a) | | | 5,155 | |
| | 1,109 | | Old Dominion Freight Line, Inc. | | | 46,157 | |
| | 750 | | Pacer International, Inc.†(a) | | | 4,732 | |
| | 410 | | Park-Ohio Holdings Corp.† | | | 13,522 | |
| | 1,429 | | Primoris Services Corp. | | | 28,180 | |
| | 387 | | Raven Industries, Inc.(a) | | | 11,602 | |
| | 159 | | RBC Bearings, Inc. | | | 8,260 | |
| | 2,253 | | Republic Airways Holdings, Inc.† | | | 25,527 | |
| | 1,270 | | Rexnord Corp.(a) | | | 21,400 | |
| | 250 | | Roadrunner Transportation Systems, Inc.† | | | 6,960 | |
| | 830 | | SkyWest, Inc. | | | 11,238 | |
| | 500 | | Spirit Airlines, Inc. | | | 15,885 | |
| | 1,160 | | Standard Parking Corp.(a) | | | 24,894 | |
| | 160 | | Standex International Corp. | | | 8,440 | |
Wilshire Mutual Funds, Inc. Small Company Growth Portfolio | |
| Shares | | | | Value | |
| Industrials (continued) | | | |
| | 470 | | Sterling Construction Co., Inc.† | | $ | 4,258 | |
| | 1,429 | | Swift Transportation Co., Class A | | | 23,636 | |
| | 2,135 | | TAL International Group, Inc.(a) | | | 93,022 | |
| | 1,879 | | Taser International, Inc. | | | 16,009 | |
| | 450 | | Teledyne Technologies, Inc.† | | | 34,808 | |
| | 74 | | Tetra Tech, Inc.†(a) | | | 1,740 | |
| | 521 | | Textainer Group Holdings, Ltd.(a) | | | 20,027 | |
| | 832 | | Titan International, Inc.(a) | | | 14,036 | |
| | 350 | | Titan Machinery, Inc.†(a) | | | 6,870 | |
| | 390 | | TMS International Corp., Class A | | | 5,784 | |
| | 913 | | Trimas Corp.(a) | | | 34,037 | |
| | 3,880 | | Triumph Group, Inc.(a) | | | 307,102 | |
| | 1,484 | | USG Corp.(a) | | | 34,206 | |
| | 2,170 | | UTi Worldwide, Inc. | | | 35,740 | |
| | 1,789 | | Wabash National Corp.(a) | | | 18,212 | |
| | 3,090 | | Wabtec Corp. | | | 165,099 | |
| | 910 | | Werner Enterprises, Inc.(a) | | | 21,995 | |
| | 610 | | Wesco Aircraft Holdings, Inc.† | | | 11,328 | |
| | 294 | | Woodward, Inc. | | | 11,760 | |
| | | | | | | 4,070,275 | |
| Information Technology — 19.1% | | | | |
| | 744 | | ACI Worldwide, Inc.†(a) | | | 34,581 | |
| | 810 | | Active Network, Inc. | | | 6,132 | |
| | 379 | | Advent Software, Inc.† | | | 13,288 | |
| | 590 | | Ambarella, Inc.†(a) | | | 9,930 | |
| | 450 | | Anaren, Inc.† | | | 10,323 | |
| | 403 | | Anixter International, Inc.†(a) | | | 30,551 | |
| | 27,650 | | Applied Micro Circuits Corp.†(a) | | | 243,320 | |
| | 10,654 | | Aruba Networks, Inc.(a) | | | 163,645 | |
| | 420 | | Aspen Technology, Inc.† | | | 12,092 | |
| | 12,400 | | AVG Technologies NV†(a) | | | 241,180 | |
| | 1,618 | | Bazaarvoice, Inc.†(a) | | | 15,242 | |
| | 380 | | Blackbaud, Inc.(a) | | | 12,377 | |
| | 1,204 | | Blucora, Inc.(a) | | | 22,322 | |
| | 130 | | CACI International, Inc., Class A(a) | | | 8,254 | |
| | 1,120 | | Calix, Inc.† | | | 11,312 | |
| | 1,030 | | Callidus Software, Inc.†(a) | | | 6,788 | |
| | 1,086 | | Cardtronics, Inc. | | | 29,974 | |
| | 553 | | Cass Information Systems, Inc.(a) | | | 25,493 | |
| | 1,214 | | Cavium, Inc. | | | 42,939 | |
| | 1,601 | | Ceva, Inc.† | | | 30,995 | |
| | 2,964 | | Ciena Corp.†(a) | | | 57,561 | |
| | 181 | | Cirrus Logic, Inc.(a) | | | 3,142 | |
| | 633 | | CommVault Systems, Inc.† | | | 48,038 | |
| | 730 | | Comverse, Inc. | | | 21,725 | |
| | 160 | | Cornerstone OnDemand, Inc. | | | 6,926 | |
| | 50 | | CoStar Group, Inc. | | | 6,454 | |
| | 620 | | Cray, Inc.(a) | | | 12,177 | |
| | 1,017 | | CSG Systems International, Inc.(a) | | | 22,069 | |
| | 860 | | Datalink Corp.† | | | 9,150 | |
| | 1,350 | | Diodes, Inc. | | | 35,059 | |
| | 754 | | Ellie Mae, Inc.(a) | | | 17,402 | |
| | 4,972 | | Envestnet, Inc.(a) | | | 122,311 | |
| | 440 | | ExactTarget, Inc. | | | 14,837 | |
| | 1,389 | | Exar Corp.† | | | 14,960 | |
| | 888 | | Fair Isaac Corp. | | | 40,697 | |
| | 469 | | FEI Co.(a) | | | 34,232 | |
| | 420 | | FleetMatics Group PLC | | | 13,957 | |
| | 1,744 | | Global Cash Access Holdings, Inc.(a) | | | 10,917 | |
| | 1,879 | | Hackett Group, Inc. (The) | | | 9,752 | |
| | 783 | | Heartland Payment Systems, Inc.(a) | | | 29,167 | |
| | 121 | | Hittite Microwave Corp.†(a) | | | 7,018 | |
| | 1,650 | | iGATE Corp.†(a) | | | 27,093 | |
| | 1,654 | | Immersion Corp.†(a) | | | 21,915 | |
| | 4,937 | | Infinera Corp.†(a) | | | 52,678 | |
| | 470 | | Infoblox, Inc.† | | | 13,752 | |
| Shares | | | | Value | |
| Information Technology (continued) | | | |
| | 13,030 | | Inphi Corp. | | $ | 143,330 | |
| | 394 | | InterDigital, Inc.(a) | | | 17,592 | |
| | 590 | | Internap Network Services Corp.†(a) | | | 4,879 | |
| | 11,370 | | InvenSense, Inc., Class A†(a) | | | 174,871 | |
| | 9,530 | | Ixia(a) | | | 175,352 | |
| | 693 | | j2 Global, Inc.(a) | | | 29,459 | |
| | 270 | | LogMeIn, Inc.†(a) | | | 6,604 | |
| | 585 | | Manhattan Associates, Inc. | | | 45,139 | |
| | 162 | | Market Leader, Inc.† | | | 1,733 | |
| | 3,765 | | MAXIMUS, Inc. | | | 280,417 | |
| | 1,094 | | MaxLinear, Inc., Class A† | | | 7,658 | |
| | 1,370 | | Maxwell Technologies, Inc.†(a) | | | 9,796 | |
| | 1,259 | | Mentor Graphics Corp. | | | 24,613 | |
| | 1,553 | | Microsemi Corp.(a) | | | 35,331 | |
| | 1,734 | | MoneyGram International, Inc.(a) | | | 39,275 | |
| | 340 | | Multi-Fineline Electronix, Inc.(a) | | | 5,035 | |
| | 182 | | NETGEAR, Inc.(a) | | | 5,558 | |
| | 535 | | Netscout Systems, Inc.†(a) | | | 12,487 | |
| | 254 | | OSI Systems, Inc.†(a) | | | 16,363 | |
| | 740 | | PDF Solutions, Inc.†(a) | | | 13,638 | |
| | 909 | | Plexus Corp.†(a) | | | 27,170 | |
| | 1,518 | | PLX Technology, Inc.† | | | 7,226 | |
| | 3,660 | | PMC - Sierra, Inc.† | | | 23,241 | |
| | 480 | | Power Integrations, Inc.(a) | | | 19,469 | |
| | 10,140 | | Procera Networks, Inc.†(a) | | | 139,222 | |
| | 1,090 | | PTC, Inc.† | | | 26,738 | |
| | 6,140 | | QLIK Technologies, Inc. | | | 173,578 | |
| | 4,289 | | Rambus, Inc.(a) | | | 36,843 | |
| | 5,297 | | RF Micro Devices, Inc.(a) | | | 28,339 | |
| | 600 | | Saba Software, Inc. | | | 5,844 | |
| | 720 | | ScanSource, Inc.† | | | 23,040 | |
| | 824 | | Semtech Corp.(a) | | | 28,865 | |
| | 2,124 | | ShoreTel, Inc.†(a) | | | 8,560 | |
| | 310 | | Shutterstock, Inc.(a) | | | 17,292 | |
| | 420 | | Silicon Graphics International Corp.†(a) | | | 5,620 | |
| | 3,998 | | Silicon Image, Inc.† | | | 23,388 | |
| | 4,078 | | Sonus Networks, Inc.(a) | | | 12,275 | |
| | 4,070 | | Sourcefire, Inc.(a) | | | 226,088 | |
| | 4,189 | | SPS Commerce, Inc.(a) | | | 230,395 | |
| | 180 | | SS&C Technologies Holdings, Inc.† | | | 5,922 | |
| | 120 | | Stratasys, Ltd.(a) | | | 10,049 | |
| | 8,038 | | SunEdison, Inc.†(a) | | | 65,670 | |
| | 640 | | SunPower Corp., Class A(a) | | | 13,248 | |
| | 500 | | Super Micro Computer, Inc.†(a) | | | 5,320 | |
| | 3,598 | | support.com, Inc.†(a) | | | 16,443 | |
| | 194 | | Synaptics, Inc.(a) | | | 7,481 | |
| | 9,982 | | Synchronoss Technologies, Inc.†(a) | | | 308,144 | |
| | 119 | | Syntel, Inc. | | | 7,482 | |
| | 1,789 | | Take-Two Interactive Software, Inc.†(a) | | | 26,781 | |
| | 420 | | Tangoe, Inc.(a) | | | 6,481 | |
| | 1,123 | | TeleTech Holdings, Inc. | | | 26,312 | |
| | 4,020 | | TriQuint Semiconductor, Inc.(a) | | | 27,859 | |
| | 300 | | Trulia, Inc. | | | 9,327 | |
| | 250 | | Tyler Technologies, Inc. | | | 17,137 | |
| | 272 | | Ultimate Software Group, Inc.(a) | | | 31,903 | |
| | 980 | | Unisys Corp.(a) | | | 21,629 | |
| | 210 | | Universal Display Corp.(a) | | | 5,903 | |
| | 300 | | ValueClick, Inc.(a) | | | 7,404 | |
| | 384 | | Verint Systems, Inc.† | | | 13,620 | |
| | 350 | | ViaSat, Inc. | | | 25,011 | |
| | 420 | | Virtusa Corp.(a) | | | 9,307 | |
| | 1,110 | | Vocus, Inc.†(a) | | | 11,677 | |
| | 1,444 | | Web.com Group, Inc.(a) | | | 36,966 | |
| | 1,360 | | WebMD Health Corp., Class A | | | 39,943 | |
| | 499 | | WEX, Inc.(a) | | | 38,273 | |
| | 608 | | XO Group, Inc.†(a) | | | 6,810 | |
Wilshire Mutual Funds, Inc. Small Company Growth Portfolio | |
| Shares | | | | Value | |
| Information Technology (continued) | | | |
| | 440 | | Yelp, Inc., Class A | | $ | 15,299 | |
| | 3,018 | | Zix Corp.† | | | 12,766 | |
| | | | | | | 4,566,217 | |
| Materials — 2.0% | | | | |
| | 464 | | American Vanguard Corp.(a) | | | 10,872 | |
| | 220 | | Axiall Corp.(a) | | | 9,368 | |
| | 1,330 | | Berry Plastics Group, Inc.† | | | 29,353 | |
| | 440 | | Calgon Carbon Corp.(a) | | | 7,339 | |
| | 874 | | Chemtura Corp.† | | | 17,742 | |
| | 884 | | Clearwater Paper Corp.(a) | | | 41,601 | |
| | 264 | | Eagle Materials, Inc. | | | 17,495 | |
| | 5,840 | | Graphic Packaging Holding Co.†(a) | | | 45,202 | |
| | 1,329 | | Handy & Harman, Ltd.(a) | | | 23,762 | |
| | 1,044 | | HB Fuller Co.(a) | | | 39,474 | |
| | 1,210 | | Headwaters, Inc.†(a) | | | 10,697 | |
| | 680 | | Landec Corp.†(a) | | | 8,983 | |
| | 203 | | Myers Industries, Inc.(a) | | | 3,047 | |
| | 614 | | Neenah Paper, Inc.(a) | | | 19,507 | |
| | 1,444 | | Olin Corp.(a) | | | 34,540 | |
| | 1,224 | | OMNOVA Solutions, Inc.†(a) | | | 9,804 | |
| | 1,314 | | PH Glatfelter Co. | | | 32,981 | |
| | 1,209 | | PolyOne Corp.(a) | | | 29,959 | |
| | 600 | | SunCoke Energy, Inc.† | | | 8,412 | |
| | 4,877 | | Wausau Paper Corp.(a) | | | 55,598 | |
| | 1,594 | | Zep, Inc.(a) | | | 25,233 | |
| | | | | | | 480,969 | |
| Telecommunication Services — 0.5% | | | | |
| | 5,988 | | Cincinnati Bell, Inc.†(a) | | | 18,323 | |
| | 1,660 | | Consolidated Communications Holdings, Inc.(a) | | | 28,901 | |
| | 3,032 | | General Communication, Inc., Class A† | | | 23,740 | |
| | 230 | | HickoryTech Corp. | | | 2,445 | |
| | 480 | | Inteliquent, Inc.(a) | | | 2,760 | |
| | 668 | | Lumos Networks Corp.(a) | | | 11,423 | |
| | 2,783 | | Primus Telecommunications Group, Inc. | | | 33,229 | |
| | | | | | | 120,821 | |
| Utilities — 0.1% | | | | |
| | 1,100 | | Ormat Technologies, Inc.(a) | | | 25,872 | |
| | | | | | | | |
| Total Common Stock | | | | |
| (Cost $20,828,219) | | | 23,518,856 | |
| | |
| SHORT-TERM INVESTMENTS (b)— 50.2% | |
| | 347,184 | | Northern Trust Institutional Government Select Portfolio, 0.010% | | | 347,184 | |
| | 11,639,687 | | Northern Trust Institutional Liquid Asset Portfolio, 0.010%(c) | | | 11,639,687 | |
| | | | | | | | |
| Total Short-Term Investments | | | | |
| (Cost $11,986,871) | | | 11,986,871 | |
| | | | | |
| Total Investments — 148.7% | | | | |
| (Cost $32,815,090) | | | 35,505,727 | |
| Other Assets & Liabilities, Net — (48.7)% | | | (11,632,617 | ) |
| | | | | |
| NET ASSETS — 100.0% | | $ | 23,873,110 | |
| † | Non-income producing security. |
| †† | More narrow industries are utilized for compliance purposes, whereas broad sectors are utilized for reporting purposes. |
| ‡ | Real Estate Investment Trust. |
| (a) | This security or a partial position of this security is on loan at June 30, 2013. The total market value of securities on loan at June 30, 2013 was $11,303,062 (Note 6). |
| (b) | Rate shown is the 7-day effective yield as of June 30, 2013. |
| (c) | This security was purchased with cash collateral held from securities on loan. The total value of such security as of June 30, 2013 was $11,639,687. Securities on loan are also collateralized by various U.S. Treasury obligations in the amount of $8,871 (Note 6). |
| Ltd. — Limited |
| PLC— Public Limited Company |
Wilshire Mutual Funds, Inc. Small Company Value Portfolio | |
| Shares | | | | Value | |
| | |
| COMMON STOCK — 97.5%†† | | | |
| Consumer Discretionary — 13.7% | | | |
| | 2,848 | | American Axle & Manufacturing Holdings, Inc.†(a) | | $ | 53,058 | |
| | 2,410 | | American Greetings Corp., Class A | | | 43,910 | |
| | 394 | | America's Car-Mart, Inc.†(a) | | | 17,037 | |
| | 815 | | Ameristar Casinos, Inc.(a) | | | 21,426 | |
| | 1,224 | | Asbury Automotive Group, Inc.(a) | | | 49,082 | |
| | 470 | | Ascent Capital Group, Inc., Class A | | | 36,693 | |
| | 2,198 | | Bassett Furniture Industries, Inc. | | | 34,135 | |
| | 60 | | Biglari Holdings, Inc.† | | | 24,624 | |
| | 14,112 | | Bob Evans Farms, Inc.(a) | | | 662,982 | |
| | 1,399 | | Bon-Ton Stores, Inc. (The)(a) | | | 25,252 | |
| | 3,247 | | Boyd Gaming Corp.†(a) | | | 36,691 | |
| | 160 | | Bright Horizons Family Solutions, Inc.† | | | 5,554 | |
| | 5,830 | | Career Education Corp. | | | 16,907 | |
| | 1,190 | | Carriage Services, Inc., Class A | | | 20,170 | |
| | 207 | | Conn's, Inc.†(a) | | | 10,714 | |
| | 200 | | Core-Mark Holding Co., Inc.(a) | | | 12,700 | |
| | 245 | | Cracker Barrel Old Country Store, Inc. | | | 23,192 | |
| | 1,498 | | Dana Holding Corp. | | | 28,851 | |
| | 160 | | DineEquity, Inc. | | | 11,019 | |
| | 3,990 | | Federal-Mogul Corp. | | | 40,738 | |
| | 1,439 | | Flexsteel Industries, Inc. | | | 35,083 | |
| | 794 | | Group 1 Automotive, Inc.(a) | | | 51,078 | |
| | 7,300 | | Harman International Industries, Inc.(a) | | | 395,660 | |
| | 4,383 | | Harte-Hanks, Inc.(a) | | | 37,694 | |
| | 20,100 | | Hooker Furniture Corp. | | | 326,826 | |
| | 1,298 | | Hovnanian Enterprises, Inc., Class A†(a) | | | 7,282 | |
| | 1,574 | | Iconix Brand Group, Inc.(a) | | | 46,291 | |
| | 2,370 | | Isle of Capri Casinos, Inc.(a) | | | 17,775 | |
| | 1,944 | | JAKKS Pacific, Inc. | | | 21,870 | |
| | 930 | | Jones Group, Inc. (The)(a) | | | 12,788 | |
| | 2,470 | | Journal Communications, Inc., Class A(a) | | | 18,500 | |
| | 1,264 | | KB Home | | | 24,812 | |
| | 1,988 | | LeapFrog Enterprises, Inc., Class A†(a) | | | 19,562 | |
| | 2,174 | | Libbey, Inc. | | | 52,111 | |
| | 1,274 | | Lifetime Brands, Inc. | | | 17,301 | |
| | 1,410 | | LIN TV Corp., Class A† | | | 21,573 | |
| | 609 | | Lithia Motors, Inc., Class A(a) | | | 32,466 | |
| | 5,973 | | Live Nation Entertainment, Inc. | | | 92,582 | |
| | 11,210 | | Maidenform Brands, Inc. | | | 194,269 | |
| | 2,972 | | Marcus Corp.(a) | | | 37,804 | |
| | 654 | | Marriott Vacations Worldwide Corp. | | | 28,279 | |
| | 530 | | Matthews International Corp., Class A(a) | | | 19,981 | |
| | 280 | | MDC Holdings, Inc. | | | 9,103 | |
| | 3,654 | | MDC Partners, Inc., Class A | | | 65,918 | |
| | 440 | | Meritage Homes Corp. | | | 19,078 | |
| | 6,210 | | Morgans Hotel Group Co.† | | | 50,052 | |
| | 600 | | National CineMedia, Inc.(a) | | | 10,134 | |
| | 4,061 | | New York Times Co. (The), Class A†(a) | | | 44,915 | |
| | 1,253 | | Nexstar Broadcasting Group, Inc., Class A | | | 44,431 | |
| | 530 | | Orient-Express Hotels, Ltd., Class A(a) | | | 6,445 | |
| | 979 | | Penske Automotive Group, Inc. | | | 29,899 | |
| | 2,873 | | Pinnacle Entertainment, Inc.†(a) | | | 56,512 | |
| | 4,996 | | Reading International, Inc., Class A(a) | | | 31,775 | |
| | 959 | | Red Robin Gourmet Burgers, Inc.(a) | | | 52,918 | |
| | 2,353 | | Regis Corp.(a) | | | 38,636 | |
| | 614 | | Rent-A-Center, Inc., Class A(a) | | | 23,056 | |
| | 854 | | Ryland Group, Inc. (The)(a) | | | 34,245 | |
| | 1,149 | | Saks, Inc.†(a) | | | 15,672 | |
| | 2,065 | | Scholastic Corp.(a) | | | 60,484 | |
| | 6,757 | | Scientific Games Corp., Class A | | | 76,016 | |
| | 1,842 | | Sinclair Broadcast Group, Inc., Class A | | | 54,118 | |
| Shares | | | | Value | |
| Consumer Discretionary (continued) | | | |
| | 904 | | Skechers U.S.A., Inc., Class A† | | $ | 21,705 | |
| | 1,748 | | Sonic Automotive, Inc., Class A | | | 36,953 | |
| | 410 | | Sotheby's(a) | | | 15,543 | |
| | 2,755 | | Spartan Motors, Inc. | | | 16,861 | |
| | 4,721 | | Standard Pacific Corp.(a) | | | 39,326 | |
| | 2,673 | | Stein Mart, Inc.(a) | | | 36,486 | |
| | 3,877 | | Stewart Enterprises, Inc., Class A(a) | | | 50,750 | |
| | 301 | | Tenneco, Inc. | | | 13,629 | |
| | 600 | | Tower International, Inc.† | | | 11,874 | |
| | 558 | | Unifi, Inc.† | | | 11,534 | |
| | 894 | | Valassis Communications, Inc.(a) | | | 21,983 | |
| | 670 | | Wolverine World Wide, Inc.(a) | | | 36,589 | |
| | | | | | | 3,722,962 | |
| Consumer Staples — 7.8% | | | | |
| | 1,880 | | Alliance One International, Inc.† | | | 7,144 | |
| | 364 | | Andersons, Inc. (The)(a) | | | 19,361 | |
| | 1,610 | | Boulder Brands, Inc.†(a) | | | 19,400 | |
| | 3,483 | | Chiquita Brands International, Inc.(a) | | | 38,034 | |
| | 6,600 | | Cott Corp.(a) | | | 51,546 | |
| | 5,313 | | Dole Food Co., Inc. | | | 67,741 | |
| | 14,900 | | Elizabeth Arden, Inc.†(a) | | | 671,543 | |
| | 1,544 | | Fresh Del Monte Produce, Inc. | | | 43,047 | |
| | 5,225 | | Harbinger Group, Inc.† | | | 39,396 | |
| | 1,409 | | Ingles Markets, Inc., Class A(a) | | | 35,577 | |
| | 9,100 | | Inter Parfums, Inc.(a) | | | 259,532 | |
| | 1,369 | | John B. Sanfilippo & Son, Inc.(a) | | | 27,599 | |
| | 1,150 | | Nash Finch Co. | | | 25,312 | |
| | 200 | | Nu Skin Enterprises, Inc., Class A | | | 12,224 | |
| | 4,021 | | Omega Protein Corp.† | | | 36,109 | |
| | 5,107 | | Pantry, Inc. (The)(a) | | | 62,203 | |
| | 1,099 | | Pilgrim's Pride Corp.(a) | | | 16,419 | |
| | 2,480 | | Revlon, Inc., Class A† | | | 54,709 | |
| | 15,550 | | Rite Aid Corp.†(a) | | | 44,473 | |
| | 541 | | Seneca Foods Corp., Class A†(a) | | | 16,598 | |
| | 1,150 | | Spartan Stores, Inc.(a) | | | 21,206 | |
| | 950 | | Spectrum Brands Holdings, Inc. | | | 54,027 | |
| | 478 | | Susser Holdings Corp.(a) | | | 22,887 | |
| | 6,905 | | TreeHouse Foods, Inc. | | | 452,554 | |
| | 684 | | Universal Corp.(a) | | | 39,569 | |
| | | | | | | 2,138,210 | |
| Energy — 3.4% | | | | |
| | 5,920 | | Alpha Natural Resources, Inc.†(a) | | | 31,021 | |
| | 20,200 | | Carrizo Oil & Gas, Inc.(a) | | | 572,266 | |
| | 1,124 | | Comstock Resources, Inc.(a) | | | 17,680 | |
| | 1,049 | | Exterran Holdings, Inc.(a) | | | 29,498 | |
| | 3,040 | | Forest Oil Corp.†(a) | | | 12,434 | |
| | 3,340 | | Global Geophysical Services, Inc. | | | 15,764 | |
| | 697 | | Helix Energy Solutions Group, Inc.†(a) | | | 16,059 | |
| | 21,800 | | McDermott International, Inc.†(a) | | | 178,324 | |
| | 610 | | PDC Energy, Inc.†(a) | | | 31,403 | |
| | 5,087 | | Penn Virginia Corp.(a) | | | 23,909 | |
| | | | | | | 928,358 | |
| Financials — 28.4% | | | | |
| | 950 | | Alexander & Baldwin, Inc.† | | | 37,763 | |
| | 700 | | Allied World Assurance Co. Holdings AG | | | 64,057 | |
| | 1,419 | | American Capital Mortgage Investment Corp.‡ | | | 25,499 | |
| | 6,122 | | American Equity Investment Life Holding Co.(a) | | | 96,115 | |
| | 1,100 | | American Safety Insurance Holdings, Ltd.†(a) | | | 31,845 | |
| | 594 | | Amerisafe, Inc. | | | 19,240 | |
| | 1,339 | | Argo Group International Holdings, Ltd. | | | 56,760 | |
| | 4,701 | | ARMOUR Residential REIT, Inc.‡(a) | | | 22,142 | |
Wilshire Mutual Funds, Inc. Small Company Value Portfolio | |
| Shares | | | | Value | |
| Financials (continued) | | | |
| | 10,276 | | Ashford Hospitality Trust, Inc.‡ | | $ | 117,660 | |
| | 11,000 | | Aspen Insurance Holdings, Ltd.(a) | | | 407,990 | |
| | 1,614 | | AV Homes, Inc.†(a) | | | 28,616 | |
| | 1,783 | | Banco Latinoamericano de Comercio Exterior SA, Class E(a) | | | 39,921 | |
| | 2,260 | | BancorpSouth, Inc. | | | 40,002 | |
| | 3,277 | | Bank Mutual Corp.(a) | | | 18,482 | |
| | 800 | | Bank of the Ozarks, Inc.(a) | | | 34,664 | |
| | 8,049 | | Boston Private Financial Holdings, Inc.(a) | | | 85,641 | |
| | 2,966 | | Capstead Mortgage Corp.‡ | | | 35,889 | |
| | 1,714 | | Cathay General Bancorp | | | 34,880 | |
| | 431 | | CBL & Associates Properties, Inc.‡(a) | | | 9,232 | |
| | 8,258 | | Cedar Realty Trust, Inc.‡ | | | 42,777 | |
| | 1,755 | | Centerstate Banks, Inc. | | | 15,233 | |
| | 830 | | Central Pacific Financial Corp. | | | 14,940 | |
| | 2,214 | | Chemical Financial Corp.(a) | | | 57,542 | |
| | 224 | | City Holding Co.(a) | | | 8,725 | |
| | 9,830 | | CNO Financial Group, Inc. | | | 127,397 | |
| | 1,605 | | Community Bank System, Inc.(a) | | | 49,514 | |
| | 1,714 | | Cousins Properties, Inc.‡(a) | | | 17,311 | |
| | 10,610 | | Cowen Group, Inc., Class A† | | | 30,769 | |
| | 1,976 | | DuPont Fabros Technology, Inc.‡(a) | | | 47,720 | |
| | 6,394 | | Dynex Capital, Inc.‡(a) | | | 65,155 | |
| | 1,153 | | Eagle Bancorp, Inc.† | | | 25,804 | |
| | 1,544 | | Employers Holdings, Inc. | | | 37,751 | |
| | 1,014 | | Enterprise Financial Services Corp.(a) | | | 16,183 | |
| | 1,168 | | EPR Properties‡(a) | | | 58,715 | |
| | 2,956 | | Equity One, Inc.‡(a) | | | 66,894 | |
| | 4,299 | | EverBank Financial Corp.(a) | | | 71,191 | |
| | 1,767 | | FBL Financial Group, Inc., Class A | | | 76,882 | |
| | 960 | | Federal Agricultural Mortgage Corp., Class C(a) | | | 27,725 | |
| | 5,140 | | FelCor Lodging Trust, Inc.‡(a) | | | 30,377 | |
| | 1,074 | | First American Financial Corp. | | | 23,671 | |
| | 2,707 | | First BanCorp(a) | | | 19,166 | |
| | 12,490 | | First Busey Corp. | | | 56,205 | |
| | 287 | | First Citizens BancShares, Inc., Class A | | | 55,118 | |
| | 13,653 | | First Commonwealth Financial Corp.(a) | | | 100,623 | |
| | 1,865 | | First Financial Bancorp | | | 27,789 | |
| | 1,153 | | First Financial Bankshares, Inc.(a) | | | 64,176 | |
| | 2,393 | | First Industrial Realty Trust, Inc.‡(a) | | | 36,302 | |
| | 1,440 | | First Midwest Bancorp, Inc.(a) | | | 19,757 | |
| | 2,828 | | First Potomac Realty Trust‡(a) | | | 36,934 | |
| | 4,607 | | FirstMerit Corp.(a) | | | 92,278 | |
| | 4,593 | | FNB Corp.(a) | | | 55,483 | |
| | 26,300 | | Forestar Group, Inc.†(a) | | | 527,578 | |
| | 954 | | Fox Chase Bancorp, Inc.(a) | | | 16,218 | |
| | 1,870 | | Gain Capital Holdings, Inc.(a) | | | 11,800 | |
| | 1,739 | | Glacier Bancorp, Inc.(a) | | | 38,588 | |
| | 2,188 | | Global Indemnity PLC, Class A(a) | | | 51,527 | |
| | 1,424 | | Greenlight Capital Re, Ltd., Class A | | | 34,931 | |
| | 1,848 | | Hanmi Financial Corp.(a) | | | 32,654 | |
| | 704 | | Heartland Financial USA, Inc.(a) | | | 19,353 | |
| | 810 | | Highwoods Properties, Inc.‡(a) | | | 28,844 | |
| | 4,740 | | Hilltop Holdings, Inc.† | | | 77,736 | |
| | 18,400 | | HomeStreet, Inc.(a) | | | 394,680 | |
| | 740 | | Horace Mann Educators Corp.(a) | | | 18,041 | |
| | 463 | | Infinity Property & Casualty Corp.(a) | | | 27,669 | |
| | 3,352 | | Inland Real Estate Corp.‡(a) | | | 34,258 | |
| | 1,090 | | INTL FCStone, Inc.† | | | 19,021 | |
| | 3,272 | | Invesco Mortgage Capital, Inc.‡(a) | | | 54,184 | |
| | 6,066 | | Investment Technology Group, Inc.(a) | | | 84,803 | |
| | 8,218 | | iStar Financial, Inc.† ‡(a) | | | 92,781 | |
| | 894 | | Lakeland Financial Corp. | | | 24,809 | |
| | 2,450 | | Lexington Realty Trust‡(a) | | | 28,616 | |
| Shares | | | | Value | |
| Financials (continued) | | | |
| | 6,218 | | Maiden Holdings, Ltd.(a) | | $ | 69,766 | |
| | 62 | | Markel Corp. | | | 32,671 | |
| | 4,865 | | MB Financial, Inc. | | | 130,382 | |
| | 3,448 | | Meadowbrook Insurance Group, Inc. | | | 27,688 | |
| | 864 | | Mercantile Bank Corp. | | | 15,526 | |
| | 2,400 | | MFA Financial, Inc.‡(a) | | | 20,280 | |
| | 6,830 | | MGIC Investment Corp.(a) | | | 41,458 | |
| | 1,419 | | Montpelier Re Holdings, Ltd.(a) | | | 35,489 | |
| | 1,833 | | MVC Capital, Inc. | | | 23,077 | |
| | 11,184 | | National Penn Bancshares, Inc. | | | 113,629 | |
| | 194 | | National Western Life Insurance Co., Class A(a) | | | 36,831 | |
| | 424 | | Navigators Group, Inc. (The)(a) | | | 24,185 | |
| | 1,191 | | NBT Bancorp, Inc.(a) | | | 25,213 | |
| | 2,306 | | Nelnet, Inc., Class A | | | 83,224 | |
| | 720 | | New Mountain Finance Corp.(a) | | | 10,195 | |
| | 10,616 | | NorthStar Realty Finance Corp.‡(a) | | | 96,606 | |
| | 1,478 | | Ocwen Financial Corp.† | | | 60,923 | |
| | 1,972 | | Old National Bancorp | | | 27,273 | |
| | 824 | | One Liberty Properties, Inc.‡(a) | | | 18,095 | |
| | 931 | | Oppenheimer Holdings, Inc., Class A(a) | | | 17,726 | |
| | 811 | | Oritani Financial Corp.(a) | | | 12,716 | |
| | 3,012 | | Pacific Continental Corp.(a) | | | 35,542 | |
| | 6,900 | | PacWest Bancorp(a) | | | 211,485 | |
| | 1,489 | | Parkway Properties, Inc.‡(a) | | | 24,956 | |
| | 1,874 | | PHH Corp.†(a) | | | 38,192 | |
| | 535 | | Phoenix, Inc.†(a) | | | 23,005 | |
| | 1,069 | | Pinnacle Financial Partners, Inc.(a) | | | 27,484 | |
| | 774 | | Piper Jaffray Cos.†(a) | | | 24,466 | |
| | 824 | | Platinum Underwriters Holdings, Ltd.(a) | | | 47,149 | |
| | 979 | | Primerica† | | | 36,654 | |
| | 16,892 | | PrivateBancorp, Inc., Class A(a) | | | 358,279 | |
| | 1,934 | | Provident Financial Services, Inc. | | | 30,519 | |
| | 2,498 | | Radian Group, Inc.(a) | | | 29,027 | |
| | 5,183 | | RAIT Financial Trust‡ | | | 38,976 | |
| | 2,314 | | Redwood Trust, Inc.‡(a) | | | 39,338 | |
| | 1,237 | | Republic Bancorp, Inc., Class A(a) | | | 27,115 | |
| | 466 | | RLI Corp.(a) | | | 35,607 | |
| | 1,594 | | RLJ Lodging Trust‡ | | | 35,849 | |
| | 878 | | S&T Bancorp, Inc. | | | 17,209 | |
| | 3,138 | | Safeguard Scientifics, Inc.†(a) | | | 50,365 | |
| | 779 | | Simmons First National Corp., Class A | | | 20,324 | |
| | 922 | | Southwest Bancorp, Inc.†(a) | | | 12,170 | |
| | 844 | | Starwood Property Trust, Inc.‡ | | | 20,889 | |
| | 920 | | State Auto Financial Corp.(a) | | | 16,716 | |
| | 1,409 | | Sterling Financial Corp.(a) | | | 33,506 | |
| | 1,768 | | Strategic Hotels & Resorts, Inc.† ‡ | | | 15,665 | |
| | 5,270 | | Susquehanna Bancshares, Inc.(a) | | | 67,720 | |
| | 840 | | SVB Financial Group(a) | | | 69,989 | |
| | 2,023 | | SWS Group, Inc.† | | | 11,025 | |
| | 9,439 | | Texas Capital Bancshares, Inc.†(a) | | | 418,714 | |
| | 944 | | Trico Bancshares(a) | | | 20,136 | |
| | 3,374 | | TrustCo Bank Corp. | | | 18,355 | |
| | 4,936 | | Two Harbors Investment Corp.‡ | | | 50,594 | |
| | 1,645 | | Union First Market Bankshares Corp.(a) | | | 33,871 | |
| | 701 | | United Fire Group, Inc. | | | 17,406 | |
| | 1,309 | | Walter Investment Management Corp. | | | 44,257 | |
| | 5,419 | | Webster Financial Corp. | | | 139,160 | |
| | 21,128 | | Western Alliance Bancorp | | | 334,456 | |
| | 1,244 | | Western Asset Mortgage Capital Corp.‡(a) | | | 21,720 | |
| | | | | | | 7,721,439 | |
| Health Care — 3.1% | | | | |
| | 550 | | Almost Family, Inc.(a) | | | 10,450 | |
| | 1,354 | | Amedisys, Inc.(a) | | | 15,733 | |
| | 841 | | Amsurg Corp., Class A(a) | | | 29,519 | |
Wilshire Mutual Funds, Inc. Small Company Value Portfolio | |
| Shares | | | | Value | |
| Health Care (continued) | | | |
| | 221 | | Centene Corp.† | | $ | 11,594 | |
| | 924 | | CONMED Corp. | | | 28,866 | |
| | 2,653 | | Emeritus Corp. | | | 61,496 | |
| | 4,730 | | Enzon Pharmaceuticals, Inc. | | | 9,460 | |
| | 874 | | ExamWorks Group, Inc.(a) | | | 18,555 | |
| | 1,712 | | Five Star Quality Care, Inc.†(a) | | | 9,604 | |
| | 1,180 | | Gentiva Health Services, Inc.(a) | | | 11,753 | |
| | 300 | | Haemonetics Corp.† | | | 12,405 | |
| | 1,941 | | HealthSouth Corp.(a) | | | 55,901 | |
| | 1,444 | | Kindred Healthcare, Inc.†(a) | | | 18,960 | |
| | 1,761 | | Magellan Health Services, Inc.† | | | 98,757 | |
| | 1,070 | | MedAssets, Inc.† | | | 18,982 | |
| | 1,398 | | Molina Healthcare, Inc.†(a) | | | 51,978 | |
| | 434 | | National Healthcare Corp. | | | 20,745 | |
| | 1,710 | | Nektar Therapeutics | | | 19,751 | |
| | 580 | | NuVasive, Inc.† | | | 14,378 | |
| | 381 | | Owens & Minor, Inc.(a) | | | 12,889 | |
| | 3,104 | | PDL BioPharma, Inc.(a) | | | 23,963 | |
| | 2,538 | | PharMerica Corp. | | | 35,177 | |
| | 5,945 | | RTI Biologics, Inc.† | | | 22,353 | |
| | 5,649 | | Select Medical Holdings Corp. | | | 46,322 | |
| | 1,792 | | Skilled Healthcare Group, Inc., Class A† | | | 11,971 | |
| | 1,284 | | Triple-S Management Corp., Class B†(a) | | | 27,567 | |
| | 3,607 | | Universal American Corp.(a) | | | 32,066 | |
| | 4,612 | | Vanda Pharmaceuticals, Inc.†(a) | | | 37,265 | |
| | 1,160 | | Vanguard Health Systems, Inc.† | | | 24,058 | |
| | 805 | | ViroPharma, Inc.(a) | | | 23,063 | |
| | 584 | | WellCare Health Plans, Inc. | | | 32,441 | |
| | | | | | | 848,022 | |
| Industrials — 20.8% | | | | |
| | 984 | | AAR Corp.(a) | | | 21,628 | |
| | 4,060 | | Accuride Corp.(a) | | | 20,544 | |
| | 3,840 | | Air Transport Services Group, Inc.† | | | 25,382 | |
| | 11,259 | | Aircastle, Ltd.(a) | | | 180,031 | |
| | 460 | | Alaska Air Group, Inc.† | | | 23,920 | |
| | 15,127 | | Albany International Corp., Class A | | | 498,888 | |
| | 974 | | Ampco-Pittsburgh Corp. | | | 18,282 | |
| | 1,344 | | Argan, Inc. | | | 20,966 | |
| | 960 | | Arkansas Best Corp.(a) | | | 22,032 | |
| | 6,370 | | Astronics Corp.†(a) | | | 260,342 | |
| | 560 | | Atlas Air Worldwide Holdings, Inc.†(a) | | | 24,506 | |
| | 510 | | Avis Budget Group, Inc.† | | | 14,663 | |
| | 1,075 | | Belden, Inc.(a) | | | 53,675 | |
| | 3,432 | | Blount International, Inc.(a) | | | 40,566 | |
| | 515 | | Brady Corp., Class A(a) | | | 15,826 | |
| | 2,057 | | Briggs & Stratton Corp.(a) | | | 40,729 | |
| | 1,943 | | CAI International, Inc.† | | | 45,796 | |
| | 6,539 | | Casella Waste Systems, Inc., Class A†(a) | | | 28,183 | |
| | 3,460 | | CBIZ, Inc.†(a) | | | 23,217 | |
| | 1,768 | | Comfort Systems USA, Inc.(a) | | | 26,379 | |
| | 1,370 | | CRA International, Inc.†(a) | | | 25,304 | |
| | 770 | | Cubic Corp.(a) | | | 37,037 | |
| | 2,260 | | Curtiss-Wright Corp. | | | 83,756 | |
| | 432 | | EMCOR Group, Inc. | | | 17,561 | |
| | 1,240 | | Encore Wire Corp.(a) | | | 42,284 | |
| | 4,300 | | EnerSys, Inc.(a) | | | 210,872 | |
| | 5,217 | | Federal Signal Corp.(a) | | | 45,649 | |
| | 2,359 | | FTI Consulting, Inc.(a) | | | 77,587 | |
| | 1,040 | | General Cable Corp. | | | 31,980 | |
| | 180 | | Genessee & Wyoming, Inc., Class A(a) | | | 15,271 | |
| | 17,200 | | GP Strategies Corp.†(a) | | | 409,704 | |
| | 3,062 | | Great Lakes Dredge & Dock Corp.(a) | | | 23,945 | |
| | 42,367 | | Griffon Corp.(a) | | | 476,629 | |
| | 5,468 | | Hawaiian Holdings, Inc.(a) | | | 33,410 | |
| | 250 | | HEICO Corp.(a) | | | 12,592 | |
| Shares | | | | Value | |
| Industrials (continued) | | | |
| | 604 | | Hyster-Yale Materials Handling, Inc. | | $ | 37,925 | |
| | 630 | | International Shipholding Corp. | | | 14,698 | |
| | 9,813 | | JetBlue Airways Corp.†(a) | | | 61,822 | |
| | 1,123 | | Kelly Services, Inc., Class A(a) | | | 19,619 | |
| | 1,953 | | Layne Christensen Co.(a) | | | 38,103 | |
| | 24,000 | | Marten Transport, Ltd.(a) | | | 376,080 | |
| | 933 | | MasTec, Inc.(a) | | | 30,696 | |
| | 5,940 | | Meritor, Inc.†(a) | | | 41,877 | |
| | 1,034 | | Michael Baker Corp.(a) | | | 28,032 | |
| | 3,214 | | Miller Industries, Inc.(a) | | | 49,431 | |
| | 9,800 | | Mistras Group, Inc.(a) | | | 172,284 | |
| | 693 | | Mueller Industries, Inc. | | | 34,948 | |
| | 844 | | MYR Group, Inc.†(a) | | | 16,416 | |
| | 1,599 | | NCI Building Systems, Inc.† | | | 24,449 | |
| | 1,334 | | NN, Inc.(a) | | | 15,221 | |
| | 23,600 | | Orbital Sciences Corp.† | | | 409,932 | |
| | 14,394 | | Orion Marine Group, Inc.(a) | | | 174,023 | |
| | 660 | | Patrick Industries, Inc.† | | | 13,721 | |
| | 2,230 | | Quality Distribution, Inc.† | | | 19,713 | |
| | 3,502 | | Republic Airways Holdings, Inc.† | | | 39,678 | |
| | 1,614 | | Rexnord Corp.(a) | | | 27,196 | |
| | 1,203 | | Rush Enterprises, Inc., Class A(a) | | | 29,774 | |
| | 2,149 | | SkyWest, Inc. | | | 29,097 | |
| | 2,703 | | Sterling Construction Co., Inc.† | | | 24,489 | |
| | 2,571 | | TAL International Group, Inc.(a) | | | 112,019 | |
| | 500 | | Teledyne Technologies, Inc.† | | | 38,675 | |
| | 604 | | Textainer Group Holdings, Ltd.(a) | | | 23,218 | |
| | 9,600 | | TMS International Corp., Class A | | | 142,368 | |
| | 14,300 | | Trimas Corp. | | | 533,104 | |
| | 1,923 | | Tutor Perini Corp.(a) | | | 34,787 | |
| | 1,210 | | US Airways Group, Inc.(a) | | | 19,868 | |
| | 564 | | USG Corp. | | | 13,000 | |
| | 3,530 | | UTi Worldwide, Inc. | | | 58,139 | |
| | | | | | | 5,653,538 | |
| Information Technology — 13.8% | | | | |
| | 2,174 | | Acxiom Corp.†(a) | | | 49,306 | |
| | 2,210 | | Applied Micro Circuits Corp.† | | | 19,448 | |
| | 560 | | Black Box Corp. | | | 14,179 | |
| | 408 | | CACI International, Inc., Class A(a) | | | 25,904 | |
| | 1,290 | | Checkpoint Systems, Inc.† | | | 18,305 | |
| | 1,160 | | Ciena Corp.†(a) | | | 22,527 | |
| | 8,200 | | Coherent, Inc. | | | 451,574 | |
| | 1,044 | | Comtech Telecommunications Corp. | | | 28,073 | |
| | 2,458 | | Datalink Corp.† | | | 26,153 | |
| | 310 | | Diodes, Inc. | | | 8,051 | |
| | 1,950 | | DSP Group, Inc.†(a) | | | 16,204 | |
| | 2,110 | | EarthLink, Inc. | | | 13,103 | |
| | 27,000 | | Entegris, Inc.† | | | 253,530 | |
| | 5,000 | | Euronet Worldwide, Inc.†(a) | | | 159,300 | |
| | 247 | | First Solar, Inc.†(a) | | | 11,048 | |
| | 2,328 | | FormFactor, Inc.(a) | | | 15,714 | |
| | 30,300 | | GSI Group, Inc.†(a) | | | 243,612 | |
| | 10,920 | | Imation Corp. | | | 46,192 | |
| | 2,012 | | Insight Enterprises, Inc.† | | | 35,693 | |
| | 3,300 | | International Rectifier Corp.† | | | 69,102 | |
| | 6,215 | | Measurement Specialties, Inc.(a) | | | 289,184 | |
| | 16,800 | | Methode Electronics, Inc. | | | 285,768 | |
| | 19,130 | | Microsemi Corp.(a) | | | 435,208 | |
| | 12,200 | | MKS Instruments, Inc. | | | 323,788 | |
| | 2,753 | | MoneyGram International, Inc.(a) | | | 62,355 | |
| | 3,710 | | Monster Worldwide, Inc.† | | | 18,216 | |
| | 534 | | NETGEAR, Inc.(a) | | | 16,309 | |
| | 2,416 | | OmniVision Technologies, Inc.(a) | | | 45,058 | |
| | 3,034 | | Photronics, Inc.†(a) | | | 24,454 | |
| | 400 | | Plexus Corp.†(a) | | | 11,956 | |
Wilshire Mutual Funds, Inc. Small Company Value Portfolio | |
| Shares | | | | Value | |
| Information Technology (continued) | | | |
| | 30,570 | | PMC - Sierra, Inc.†(a) | | $ | 194,119 | |
| | 3,597 | | Rambus, Inc. | | | 30,898 | |
| | 4,256 | | RF Micro Devices, Inc.(a) | | | 22,770 | |
| | 2,245 | | Richardson Electronics, Ltd.(a) | | | 26,356 | |
| | 1,304 | | Sanmina Corp.†(a) | | | 18,713 | |
| | 2,076 | | ScanSource, Inc.†(a) | | | 66,432 | |
| | 6,770 | | Sigma Designs, Inc.† | | | 34,189 | |
| | 2,323 | | Spansion, Inc., Class A† | | | 29,084 | |
| | 7,956 | | SunEdison, Inc.† | | | 65,001 | |
| | 1,254 | | SYNNEX Corp.(a) | | | 53,019 | |
| | 5,770 | | Tellabs, Inc.(a) | | | 11,425 | |
| | 1,980 | | TriQuint Semiconductor, Inc.(a) | | | 13,721 | |
| | 2,568 | | TTM Technologies, Inc.(a) | | | 21,571 | |
| | 640 | | Unisys Corp.(a) | | | 14,125 | |
| | 5,393 | | United Online, Inc.(a) | | | 40,879 | |
| | 1,040 | | Web.com Group, Inc.(a) | | | 26,624 | |
| | 1,030 | | WebMD Health Corp., Class A | | | 30,251 | |
| | 7,916 | | Westell Technologies, Inc., Class A† | | | 18,919 | |
| | | | | | | 3,757,410 | |
| Materials — 4.6% | | | | |
| | 1,184 | | A Schulman, Inc. | | | 31,755 | |
| | 1,260 | | Berry Plastics Group, Inc.† | | | 27,808 | |
| | 5,006 | | Boise, Inc.(a) | | | 42,751 | |
| | 1,748 | | Century Aluminum Co.(a) | | | 16,222 | |
| | 514 | | Clearwater Paper Corp. | | | 24,189 | |
| | 766 | | Coeur Mining, Inc. | | | 10,188 | |
| | 3,800 | | Deltic Timber Corp. | | | 219,716 | |
| | 6,520 | | Graphic Packaging Holding Co.† | | | 50,465 | |
| | 1,714 | | Handy & Harman, Ltd. | | | 30,646 | |
| | 643 | | HB Fuller Co. | | | 24,312 | |
| | 4,436 | | Hecla Mining Co.(a) | | | 13,219 | |
| | 714 | | Kraton Performance Polymers, Inc.† | | | 15,137 | |
| | 1,165 | | Louisiana-Pacific Corp. | | | 17,230 | |
| | 804 | | Minerals Technologies, Inc. | | | 33,237 | |
| | 1,461 | | Myers Industries, Inc.(a) | | | 21,930 | |
| | 11,769 | | Neenah Paper, Inc.(a) | | | 373,901 | |
| | 1,610 | | Olympic Steel, Inc.(a) | | | 39,445 | |
| | 864 | | OM Group, Inc.†(a) | | | 26,715 | |
| | 2,294 | | PH Glatfelter Co. | | | 57,580 | |
| | 773 | | PolyOne Corp.(a) | | | 19,155 | |
| | 2,088 | | Resolute Forest Products, Inc.†(a) | | | 27,499 | |
| | 1,414 | | Sensient Technologies Corp. | | | 57,224 | |
| | 5,460 | | Wausau Paper Corp.(a) | | | 62,244 | |
| | | | | | | 1,242,568 | |
| Telecommunication Services — 0.6% | | | | |
| | 10,610 | | Cincinnati Bell, Inc.†(a) | | | 32,466 | |
| | 2,490 | | Consolidated Communications Holdings, Inc.(a) | | | 43,351 | |
| | 4,370 | | General Communication, Inc., Class A† | | | 34,217 | |
| | 1,440 | | Lumos Networks Corp.(a) | | | 24,624 | |
| | 1,310 | | NTELOS Holdings Corp. | | | 21,563 | |
| | 1,619 | | Primus Telecommunications Group, Inc. | | | 19,331 | |
| | | | | | | 175,552 | |
| Utilities — 1.3% | | | | |
| | 360 | | Avista Corp. | | | 9,727 | |
| | 744 | | Cleco Corp.(a) | | | 34,544 | |
| | 644 | | El Paso Electric Co.(a) | | | 22,740 | |
| | 550 | | Empire District Electric Co.(a) | | | 12,270 | |
| | 484 | | IDACORP, Inc.(a) | | | 23,116 | |
| | 434 | | Laclede Group, Inc.(a) | | | 19,817 | |
| | 222 | | MGE Energy, Inc.(a) | | | 12,157 | |
| | 260 | | NorthWestern Corp. | | | 10,374 | |
| | 2,139 | | Ormat Technologies, Inc.(a) | | | 50,309 | |
| | 504 | | Piedmont Natural Gas Co., Inc.(a) | | | 17,005 | |
| Shares | | | | Value | |
| Utilities (continued) | | | |
| | 904 | | PNM Resources, Inc. | | $ | 20,060 | |
| | 1,339 | | Portland General Electric Co.(a) | | | 40,960 | |
| | 634 | | Southwest Gas Corp. | | | 29,665 | |
| | 564 | | UIL Holdings Corp.(a) | | | 21,573 | |
| | 384 | | UNS Energy Corp. | | | 17,176 | |
| | 524 | | WGL Holdings, Inc.(a) | | | 22,647 | |
| | | | | | | 364,140 | |
| Total Common Stock | | | | |
| (Cost $23,454,798) | | | 26,552,199 | |
| | |
| SHORT-TERM INVESTMENTS (b) — 44.8% | |
| | 602,584 | | Northern Trust Institutional Government Select Portfolio, 0.010% | | | 602,584 | |
| | 11,588,079 | | Northern Trust Institutional Liquid Asset Portfolio, 0.010%(c) | | | 11,588,079 | |
| | | | | | | | |
| Total Short-Term Investments | | | | |
| (Cost $12,190,663) | | | 12,190,663 | |
| | | | | |
| Total Investments — 142.3% | | | | |
| (Cost $35,645,461) | | | 38,742,862 | |
| Other Assets & Liabilities, Net — (42.3)% | | | (11,515,286 | ) |
| | | | | |
| NET ASSETS — 100.0% | | $ | 27,227,576 | |
| † | Non-income producing security. |
| †† | More narrow industries are utilized for compliance purposes, whereas broad sectors are utilized for reporting purposes. |
| ‡ | Real Estate Investment Trust. |
| (a) | This security or a partial position of this security is on loan at June 30, 2013. The total market value of securities on loan at June 30, 2013 was $11,303,675 (Note 6). |
| (b) | Rate shown is the 7-day effective yield as of June 30, 2013. |
| (c) | This security was purchased with cash collateral held from securities on loan. The total value of such security as of June 30, 2013 was $11,588,079. Securities on loan are also collateralized by various U.S. Treasury obligations in the amount of $115,176 (Note 6). |
| Ltd. — Limited |
| PLC— Public Limited Company |
| REIT — Real Estate Investment Trust |
Wilshire Mutual Funds, Inc. Wilshire 5000 IndexSM Fund Schedule of Investments | |
| Shares | | | | Value | |
| | |
| COMMON STOCK — 99.0% | | | |
| Consumer Discretionary — 12.6% | | | |
| | 300 | | 1-800-Flowers.com, Inc., Class A†(a) | | $ | 1,857 | |
| | 975 | | Aaron's, Inc. | | | 27,310 | |
| | 900 | | Abercrombie & Fitch Co., Class A | | | 40,725 | |
| | 800 | | Advance Auto Parts, Inc. | | | 64,936 | |
| | 850 | | Aeropostale, Inc.†(a) | | | 11,730 | |
| | 100 | | AFC Enterprises, Inc.† | | | 3,594 | |
| | 90 | | AH Belo Corp., Class A | | | 617 | |
| | 3,688 | | Amazon.com, Inc. | | | 1,024,121 | |
| | 400 | | Ambassadors Group, Inc. | | | 1,420 | |
| | 656 | | AMC Networks, Inc., Class A† | | | 42,909 | |
| | 3,500 | | American Apparel, Inc.†(a) | | | 6,720 | |
| | 1,400 | | American Axle & Manufacturing Holdings, Inc.†(a) | | | 26,082 | |
| | 2,625 | | American Eagle Outfitters, Inc. | | | 47,932 | |
| | 450 | | American Greetings Corp., Class A | | | 8,199 | |
| | 100 | | Ameristar Casinos, Inc.(a) | | | 2,629 | |
| | 964 | | ANN, Inc.(a) | | | 32,005 | |
| | 1,350 | | Apollo Group, Inc., Class A(a) | | | 23,922 | |
| | 300 | | Arbitron, Inc. | | | 13,935 | |
| | 1,128 | | Ascena Retail Group, Inc. | | | 19,684 | |
| | 200 | | Ascent Capital Group, Inc., Class A | | | 15,614 | |
| | 1,017 | | Autoliv, Inc. | | | 78,706 | |
| | 1,250 | | AutoNation, Inc.†(a) | | | 54,237 | |
| | 406 | | AutoZone, Inc.† | | | 172,018 | |
| | 500 | | Bally Technologies, Inc.(a) | | | 28,210 | |
| | 200 | | Beazer Homes USA, Inc.†(a) | | | 3,504 | |
| | 1,400 | | bebe stores, Inc.(a) | | | 7,854 | |
| | 1,925 | | Bed Bath & Beyond, Inc. | | | 136,482 | |
| | 950 | | Belo Corp., Class A | | | 13,252 | |
| | 3,400 | | Best Buy Co., Inc. | | | 92,922 | |
| | 200 | | Big 5 Sporting Goods Corp. | | | 4,390 | |
| | 500 | | Big Lots, Inc. | | | 15,765 | |
| | 40 | | Biglari Holdings, Inc.† | | | 16,416 | |
| | 250 | | Blue Nile, Inc.† | | | 9,445 | |
| | 224 | | Blyth, Inc.(a) | | | 3,127 | |
| | 400 | | Bon-Ton Stores, Inc. (The)(a) | | | 7,220 | |
| | 100 | | Books-A-Million, Inc., Class A†(a) | | | 262 | |
| | 1,280 | | BorgWarner, Inc. | | | 110,272 | |
| | 2,000 | | Boyd Gaming Corp.† | | | 22,600 | |
| | 1,000 | | Bravo Brio Restaurant Group, Inc. | | | 17,820 | |
| | 500 | | Bridgepoint Education, Inc.†(a) | | | 6,090 | |
| | 775 | | Brinker International, Inc.(a) | | | 30,558 | |
| | 764 | | Brookfield Residential Properties, Inc.†(a) | | | 16,854 | |
| | 500 | | Brunswick Corp. | | | 15,975 | |
| | 500 | | Cabela's, Inc. | | | 32,380 | |
| | 2,625 | | Cablevision Systems Corp., Class A(a) | | | 44,153 | |
| | 200 | | Cache, Inc.†(a) | | | 890 | |
| | 500 | | Callaway Golf Co.(a) | | | 3,290 | |
| | 500 | | Career Education Corp. | | | 1,450 | |
| | 1,755 | | CarMax, Inc. | | | 81,011 | |
| | 3,200 | | Carnival Corp. | | | 109,728 | |
| | 850 | | Carter's, Inc. | | | 62,959 | |
| | 5,983 | | CBS Corp., Class B | | | 292,389 | |
| | 362 | | Charles & Colvard, Ltd.† | | | 1,477 | |
| | 700 | | Charter Communications, Inc., Class A(a) | | | 86,695 | |
| | 600 | | Cheesecake Factory, Inc. (The)(a) | | | 25,134 | |
| | 2,450 | | Chico's FAS, Inc. | | | 41,797 | |
| | 200 | | Children's Place Retail Stores, Inc. (The)† | | | 10,960 | |
| | 237 | | Chipotle Mexican Grill, Inc., Class A | | | 86,351 | |
| | 800 | | Cinemark Holdings, Inc. | | | 22,336 | |
| | 50 | | Citi Trends, Inc.†(a) | | | 726 | |
| | 1,000 | | Clear Channel Outdoor Holdings, Inc., Class A†(a) | | | 7,460 | |
| | 3,150 | | Coach, Inc.(a) | | | 179,833 | |
| | 100 | | Cobra Electronics Corp.† | | | 300 | |
| Shares | | | | Value | |
| Consumer Discretionary (continued) | | | |
| | 362 | | Coldwater Creek, Inc.† | | $ | 905 | |
| | 110 | | Collectors Universe(a) | | | 1,457 | |
| | 200 | | Columbia Sportswear Co.(a) | | | 12,530 | |
| | 20,821 | | Comcast Corp., Class A | | | 871,983 | |
| | 500 | | Conn's, Inc.† | | | 25,880 | |
| | 1,000 | | Cooper Tire & Rubber Co. | | | 33,170 | |
| | 2,450 | | Corinthian Colleges, Inc.†(a) | | | 5,488 | |
| | 1,200 | | Crocs, Inc. | | | 19,800 | |
| | 6,200 | | Crown Media Holdings, Inc., Class A†(a) | | | 15,314 | |
| | 50 | | CSS Industries, Inc. | | | 1,246 | |
| | 679 | | CST Brands, Inc.†(a) | | | 20,920 | |
| | 300 | | Cumulus Media, Inc., Class A†(a) | | | 1,017 | |
| | 1,500 | | Dana Holding Corp. | | | 28,890 | |
| | 1,075 | | Darden Restaurants, Inc. | | | 54,266 | |
| | 450 | | Deckers Outdoor Corp.†(a) | | | 22,730 | |
| | 775 | | DeVry, Inc. | | | 24,041 | |
| | 1,002 | | Dick's Sporting Goods, Inc. | | | 50,160 | |
| | 100 | | Dillard's, Inc., Class A | | | 8,197 | |
| | 5,633 | | DIRECTV† | | | 347,105 | |
| | 1,600 | | Discovery Communications, Inc., Class A†(a) | | | 123,536 | |
| | 2,025 | | DISH Network Corp., Class A | | | 86,103 | |
| | 100 | | Dixie Group, Inc. (The)† | | | 830 | |
| | 1,000 | | Dollar General Corp. | | | 50,430 | |
| | 2,100 | | Dollar Tree, Inc. | | | 106,764 | |
| | 650 | | Domino's Pizza, Inc. | | | 37,797 | |
| | 650 | | Dover Downs Gaming & Entertainment, Inc. | | | 1,007 | |
| | 2,623 | | DR Horton, Inc.(a) | | | 55,817 | |
| | 1,200 | | DreamWorks Animation SKG, Inc., Class A(a) | | | 30,792 | |
| | 642 | | Education Management Corp.†(a) | | | 3,608 | |
| | 219 | | Emmis Communications Corp., Class A† | | | 469 | |
| | 100 | | Empire Resorts, Inc.†(a) | | | 292 | |
| | 250 | | Entercom Communications Corp., Class A(a) | | | 2,360 | |
| | 100 | | Entravision Communications Corp., Class A | | | 615 | |
| | 1,366 | | EW Scripps Co. (The), Class A† | | | 21,282 | |
| | 1,057 | | Expedia, Inc.(a) | | | 63,579 | |
| | 1,000 | | Express, Inc.† | | | 20,970 | |
| | 1,200 | | Family Dollar Stores, Inc. | | | 74,772 | |
| | 200 | | Famous Dave's of America, Inc.†(a) | | | 3,118 | |
| | 1,500 | | Federal-Mogul Corp. | | | 15,315 | |
| | 800 | | Fifth & Pacific Cos., Inc.† | | | 17,872 | |
| | 100 | | Finish Line, Inc. (The), Class A(a) | | | 2,186 | |
| | 1,900 | | Foot Locker, Inc. | | | 66,747 | |
| | 40,485 | | Ford Motor Co. | | | 626,303 | |
| | 300 | | Forward Industries, Inc.†(a) | | | 555 | |
| | 600 | | Fossil Group, Inc.† | | | 61,986 | |
| | 700 | | Fred's, Inc., Class A(a) | | | 10,843 | |
| | 28 | | Furniture Brands International, Inc.† | | | 112 | |
| | 600 | | Gaiam, Inc., Class A† | | | 2,676 | |
| | 1,625 | | GameStop Corp., Class A | | | 68,299 | |
| | 600 | | Gaming Partners International Corp. | | | 4,740 | |
| | 2,800 | | Gannett Co., Inc. | | | 68,488 | |
| | 3,675 | | Gap, Inc. (The) | | | 153,358 | |
| | 6,400 | | General Motors Co.(a) | | | 213,184 | |
| | 275 | | Genesco, Inc.† | | | 18,422 | |
| | 2,010 | | Gentex Corp. | | | 46,330 | |
| | 1,600 | | Genuine Parts Co.(a) | | | 124,912 | |
| | 300 | | GNC Holdings, Inc., Class A | | | 13,263 | |
| | 1,875 | | Goodyear Tire & Rubber Co. (The) | | | 28,669 | |
| | 500 | | Grand Canyon Education, Inc.†(a) | | | 16,115 | |
| | 1,000 | | Gray Television, Inc.† | | | 7,200 | |
| | 200 | | Group 1 Automotive, Inc.(a) | | | 12,866 | |
| | 400 | | Guess, Inc.(a) | | | 12,412 | |
Wilshire Mutual Funds, Inc. Wilshire 5000 IndexSM Fund Schedule of Investments | |
| Shares | | | | Value | |
| Consumer Discretionary (continued) | | | |
| | 2,635 | | H&R Block, Inc. | | $ | 73,121 | |
| | 696 | | Hanesbrands, Inc. | | | 35,788 | |
| | 2,475 | | Harley-Davidson, Inc. | | | 135,680 | |
| | 600 | | Harman International Industries, Inc. | | | 32,520 | |
| | 1,000 | | Harte-Hanks, Inc. | | | 8,600 | |
| | 1,300 | | Hasbro, Inc.(a) | | | 58,279 | |
| | 200 | | Helen of Troy, Ltd. | | | 7,674 | |
| | 500 | | hhgregg, Inc.†(a) | | | 7,985 | |
| | 200 | | Hibbett Sports, Inc.†(a) | | | 11,100 | |
| | 300 | | Hillenbrand, Inc. | | | 7,113 | |
| | 13,147 | | Home Depot, Inc. (The) | | | 1,018,498 | |
| | 200 | | Hooker Furniture Corp. | | | 3,252 | |
| | 1,000 | | Hovnanian Enterprises, Inc., Class A†(a) | | | 5,610 | |
| | 418 | | HSN, Inc. | | | 22,455 | |
| | 600 | | Hyatt Hotels Corp., Class A† | | | 24,216 | |
| | 450 | | Iconix Brand Group, Inc.(a) | | | 13,235 | |
| | 3,450 | | International Game Technology | | | 57,649 | |
| | 237 | | International Speedway Corp., Class A | | | 7,458 | |
| | 5,372 | | Interpublic Group of Cos., Inc. (The) | | | 78,163 | |
| | 743 | | Interval Leisure Group, Inc.(a) | | | 14,801 | |
| | 340 | | ITT Educational Services, Inc.†(a) | | | 8,296 | |
| | 2,292 | | J.C. Penney Co., Inc.(a) | | | 39,147 | |
| | 350 | | Jack in the Box, Inc. | | | 13,752 | |
| | 1,500 | | Jarden Corp.† | | | 65,625 | |
| | 500 | | John Wiley & Sons, Inc., Class A(a) | | | 20,045 | |
| | 6,850 | | Johnson Controls, Inc. | | | 245,161 | |
| | 378 | | Jones Group, Inc. (The) | | | 5,198 | |
| | 300 | | Jos A Bank Clothiers, Inc.†(a) | | | 12,396 | |
| | 600 | | Journal Communications, Inc., Class A | | | 4,494 | |
| | 300 | | K12, Inc.†(a) | | | 7,881 | |
| | 800 | | KB Home | | | 15,704 | |
| | 200 | | Kid Brands, Inc.† | | | 308 | |
| | 2,400 | | Kohl's Corp.(a) | | | 121,224 | |
| | 300 | | Krispy Kreme Doughnuts, Inc. | | | 5,235 | |
| | 2,540 | | L Brands, Inc. | | | 125,095 | |
| | 200 | | Lakes Entertainment, Inc.† | | | 702 | |
| | 500 | | Lamar Advertising Co., Class A | | | 21,700 | |
| | 4,300 | | Las Vegas Sands Corp. | | | 227,599 | |
| | 200 | | La-Z-Boy, Inc., Class Z | | | 4,054 | |
| | 100 | | LeapFrog Enterprises, Inc., Class A†(a) | | | 984 | |
| | 1,183 | | Lear Corp. | | | 71,524 | |
| | 500 | | Learning Tree International, Inc.†(a) | | | 1,525 | |
| | 750 | | Lee Enterprises, Inc.†(a) | | | 1,530 | |
| | 1,410 | | Leggett & Platt, Inc.(a) | | | 43,837 | |
| | 1,200 | | Lennar Corp., Class A(a) | | | 43,248 | |
| | 1,000 | | Libbey, Inc. | | | 23,970 | |
| | 1,887 | | Liberty Global PLC, Class A† | | | 139,772 | |
| | 400 | | Liberty Global PLC† | | | 27,160 | |
| | 4,600 | | Liberty Interactive Corp., Class A† | | | 105,846 | |
| | 1,177 | | Liberty Media Corp.† | | | 149,197 | |
| | 230 | | Liberty Ventures† | | | 19,552 | |
| | 200 | | Life Time Fitness, Inc.†(a) | | | 10,022 | |
| | 700 | | Lifetime Brands, Inc. | | | 9,506 | |
| | 200 | | LIN TV Corp., Class A†(a) | | | 3,060 | |
| | 200 | | Lincoln Educational Services Corp.(a) | | | 1,054 | |
| | 1,350 | | Lions Gate Entertainment Corp. | | | 37,085 | |
| | 2,537 | | Live Nation Entertainment, Inc. | | | 39,324 | |
| | 3,600 | | LKQ Corp.† | | | 92,700 | |
| | 200 | | Loral Space & Communications, Inc. | | | 11,996 | |
| | 11,456 | | Lowe's Cos., Inc. | | | 468,550 | |
| | 4,298 | | Macy's, Inc. | | | 206,304 | |
| | 881 | | Madison Square Garden Co. (The), Class A | | | 52,199 | |
| | 100 | | Marcus Corp. | | | 1,272 | |
| | 700 | | Marine Products Corp.(a) | | | 5,614 | |
| | 2,577 | | Marriott International, Inc., Class A | | | 104,033 | |
| | 257 | | Marriott Vacations Worldwide Corp. | | | 11,113 | |
| Shares | | | | Value | |
| Consumer Discretionary (continued) | | | |
| | 3,100 | | Martha Stewart Living Omnimedia, Class A† | | $ | 7,471 | |
| | 3,255 | | Mattel, Inc. | | | 147,484 | |
| | 100 | | Matthews International Corp., Class A | | | 3,770 | |
| | 496 | | McClatchy Co. (The), Class A†(a) | | | 1,131 | |
| | 10,104 | | McDonald's Corp. | | | 1,000,296 | |
| | 271 | | MDC Holdings, Inc. | | | 8,810 | |
| | 500 | | Media General, Inc., Class A†(a) | | | 5,515 | |
| | 500 | | Meritage Homes Corp. | | | 21,680 | |
| | 4,200 | | MGM Resorts International(a) | | | 62,076 | |
| | 577 | | Mohawk Industries, Inc. | | | 64,907 | |
| | 1,600 | | Monarch Casino & Resort, Inc.†(a) | | | 26,976 | |
| | 150 | | Morgans Hotel Group Co.† | | | 1,209 | |
| | 700 | | MTR Gaming Group, Inc.† | | | 2,345 | |
| | 591 | | Multimedia Games Holding Co., Inc.† | | | 15,407 | |
| | 500 | | National CineMedia, Inc. | | | 8,445 | |
| | 50 | | Nautilus, Inc.† | | | 434 | |
| | 492 | | Netflix, Inc.(a) | | | 103,856 | |
| | 1,300 | | New York & Co., Inc.† | | | 8,255 | |
| | 2,100 | | New York Times Co. (The), Class A†(a) | | | 23,226 | |
| | 2,926 | | Newell Rubbermaid, Inc. | | | 76,808 | |
| | 13,313 | | News Corp., Class A | | | 434,004 | |
| | 200 | | Nexstar Broadcasting Group, Inc., Class A | | | 7,092 | |
| | 7,330 | | NIKE, Inc., Class B | | | 466,774 | |
| | 2,000 | | Nordstrom, Inc. | | | 119,880 | |
| | 40 | | NVR, Inc. | | | 36,880 | |
| | 5,525 | | Office Depot, Inc.(a) | | | 21,382 | |
| | 1,100 | | OfficeMax, Inc.(a) | | | 11,253 | |
| | 2,775 | | Omnicom Group, Inc.(a) | | | 174,464 | |
| | 2,900 | | Orbitz Worldwide, Inc.† | | | 23,287 | |
| | 41 | | Orchard Supply Hardware Stores Corp., Class A†(a) | | | 12 | |
| | 1,142 | | O'Reilly Automotive, Inc. | | | 128,612 | |
| | 650 | | Orleans Homebuilders, Inc.† (b) | | | — | |
| | 200 | | Outerwall, Inc.(a) | | | 11,734 | |
| | 300 | | Overstock.com, Inc.†(a) | | | 8,460 | |
| | 50 | | Oxford Industries, Inc. | | | 3,120 | |
| | 200 | | Pacific Sunwear of California, Inc.†(a) | | | 730 | |
| | 300 | | Panera Bread Co., Class A | | | 55,782 | |
| | 700 | | Penn National Gaming, Inc.(a) | | | 37,002 | |
| | 400 | | Penske Automotive Group, Inc. | | | 12,216 | |
| | 1,500 | | Pep Boys-Manny Moe & Jack (The) | | | 17,370 | |
| | 100 | | Perry Ellis International, Inc. | | | 2,031 | |
| | 950 | | PetSmart, Inc.(a) | | | 63,641 | |
| | 825 | | Pier 1 Imports, Inc. | | | 19,379 | |
| | 800 | | Pinnacle Entertainment, Inc.†(a) | | | 15,736 | |
| | 600 | | Polaris Industries, Inc. | | | 57,000 | |
| | 275 | | Premier Exhibitions, Inc.†(a) | | | 479 | |
| | 525 | | priceline.com, Inc.†(a) | | | 434,243 | |
| | 2,765 | | PulteGroup, Inc. | | | 52,452 | |
| | 691 | | PVH Corp. | | | 86,410 | |
| | 50 | | Quiksilver, Inc.†(a) | | | 322 | |
| | 1,850 | | RadioShack Corp.(a) | | | 5,846 | |
| | 565 | | Ralph Lauren Corp., Class A | | | 98,163 | |
| | 1,000 | | ReachLocal, Inc.(a) | | | 12,260 | |
| | 600 | | Regal Entertainment Group, Class A(a) | | | 10,740 | |
| | 200 | | Regis Corp.(a) | | | 3,284 | |
| | 250 | | Rent-A-Center, Inc., Class A(a) | | | 9,388 | |
| | 1,500 | | Rick's Cabaret International, Inc.† | | | 12,945 | |
| | 100 | | Rocky Brands, Inc. | | | 1,512 | |
| | 2,075 | | Ross Stores, Inc. | | | 134,481 | |
| | 1,625 | | Royal Caribbean Cruises, Ltd. | | | 54,178 | |
| | 500 | | Ruby Tuesday, Inc.(a) | | | 4,615 | |
| | 500 | | Ryland Group, Inc. (The)(a) | | | 20,050 | |
| | 1,800 | | Saks, Inc.†(a) | | | 24,552 | |
| | 100 | | Salem Communications Corp., Class A | | | 749 | |
Wilshire Mutual Funds, Inc. Wilshire 5000 IndexSM Fund Schedule of Investments | |
| Shares | | | | Value | |
| Consumer Discretionary (continued) | | | |
| | 1,000 | | Sally Beauty Holdings, Inc. | | $ | 31,100 | |
| | 400 | | School Specialty, Inc.† (b) | | | — | |
| | 1,500 | | Scientific Games Corp., Class A | | | 16,875 | |
| | 900 | | Scripps Networks Interactive, Inc., Class A(a) | | | 60,084 | |
| | 396 | | Sears Canada, Inc.(a) | | | 4,103 | |
| | 925 | | Sears Holdings Corp.(a) | | | 38,924 | |
| | 188 | | Select Comfort Corp.† | | | 4,711 | |
| | 1,400 | | Service Corp. International | | | 25,242 | |
| | 100 | | SHFL Entertainment, Inc.† | | | 1,771 | |
| | 600 | | Shoe Carnival, Inc. | | | 14,406 | |
| | 776 | | Signet Jewelers, Ltd. | | | 52,326 | |
| | 900 | | Sinclair Broadcast Group, Inc., Class A | | | 26,442 | |
| | 48,100 | | Sirius XM Radio, Inc.(a) | | | 161,135 | |
| | 900 | | Six Flags Entertainment Corp. | | | 31,644 | |
| | 1,000 | | Sonic Automotive, Inc., Class A | | | 21,140 | |
| | 800 | | Sonic Corp.†(a) | | | 11,648 | |
| | 603 | | Sotheby's(a) | | | 22,860 | |
| | 75 | | Spartan Motors, Inc. | | | 459 | |
| | 400 | | Speedway Motorsports, Inc.(a) | | | 6,960 | |
| | 552 | | Stage Stores, Inc.(a) | | | 12,972 | |
| | 1,892 | | Stanley Black & Decker, Inc. | | | 146,252 | |
| | 200 | | Stanley Furniture Co., Inc.† | | | 800 | |
| | 8,075 | | Staples, Inc.(a) | | | 128,070 | |
| | 8,100 | | Starbucks Corp. | | | 530,469 | |
| | 1,973 | | Starwood Hotels & Resorts Worldwide, Inc.(a) | | | 124,674 | |
| | 1,177 | | Starz† | | | 26,012 | |
| | 100 | | Steinway Musical Instruments, Inc.† | | | 3,043 | |
| | 900 | | Stewart Enterprises, Inc., Class A(a) | | | 11,781 | |
| | 150 | | Superior Industries International, Inc. | | | 2,582 | |
| | 600 | | Systemax, Inc. | | | 5,646 | |
| | 6,500 | | Target Corp. | | | 447,590 | |
| | 700 | | Tempur Sealy International, Inc. | | | 30,730 | |
| | 450 | | Tenneco, Inc. | | | 20,376 | |
| | 380 | | Tesla Motors, Inc.†(a) | | | 40,823 | |
| | 1,000 | | Texas Roadhouse, Inc., Class A | | | 25,020 | |
| | 3,700 | | Thomson Reuters Corp. | | | 120,509 | |
| | 500 | | Thor Industries, Inc.(a) | | | 24,590 | |
| | 1,235 | | Tiffany & Co. | | | 89,957 | |
| | 3,016 | | Time Warner Cable, Inc., Class A | | | 339,240 | |
| | 8,983 | | Time Warner, Inc. | | | 519,397 | |
| | 6,850 | | TJX Cos., Inc. | | | 342,911 | |
| | 1,600 | | Toll Brothers, Inc.†(a) | | | 52,208 | |
| | 800 | | Tractor Supply Co. | | | 94,088 | |
| | 200 | | Trans World Entertainment Corp. | | | 972 | |
| | 1,300 | | Trinity Place Holdings, Inc.† | | | 6,370 | |
| | 1,057 | | TripAdvisor, Inc.(a) | | | 64,340 | |
| | 300 | | True Religion Apparel, Inc. | | | 9,498 | |
| | 1,000 | | TRW Automotive Holdings Corp. | | | 66,440 | |
| | 200 | | Tuesday Morning Corp.† | | | 2,074 | |
| | 600 | | Tupperware Brands Corp. | | | 46,614 | |
| | 600 | | Ulta Salon Cosmetics & Fragrance, Inc.(a) | | | 60,096 | |
| | 800 | | Under Armour, Inc., Class A(a) | | | 47,768 | |
| | 200 | | Universal Electronics, Inc. | | | 5,626 | |
| | 500 | | Universal Technical Institute, Inc.(a) | | | 5,165 | |
| | 1,400 | | Urban Outfitters, Inc. | | | 56,308 | |
| | 200 | | Value Line, Inc.(a) | | | 1,700 | |
| | 300 | | Valuevision Media, Inc., Class A† | | | 1,533 | |
| | 950 | | VF Corp. | | | 183,407 | |
| | 4,906 | | Viacom, Inc., Class B | | | 333,853 | |
| | 600 | | Visteon Corp. | | | 37,872 | |
| | 17,668 | | Walt Disney Co. (The) | | | 1,115,734 | |
| | 296 | | Weight Watchers International, Inc.(a) | | | 13,616 | |
| | 4,600 | | Wendy's Co. (The)(a) | | | 26,818 | |
| | 572 | | Whirlpool Corp. | | | 65,414 | |
| | 1,100 | | Williams-Sonoma, Inc.(a) | | | 61,479 | |
| Shares | | | | Value | |
| Consumer Discretionary (continued) | | | |
| | 500 | | Winnebago Industries, Inc.(a) | | $ | 10,495 | |
| | 400 | | Wolverine World Wide, Inc.(a) | | | 21,844 | |
| | 600 | | World Wrestling Entertainment, Inc., Class A | | | 6,186 | |
| | 1,360 | | Wyndham Worldwide Corp. | | | 77,833 | |
| | 650 | | Wynn Resorts, Ltd.(a) | | | 83,200 | |
| | 4,650 | | Yum! Brands, Inc. | | | 322,431 | |
| | 1,900 | | Zale Corp.† | | | 17,290 | |
| | | | | | | 22,150,279 | |
| Consumer Staples — 9.4% | | | | |
| | 200 | | Alico, Inc. | | | 8,022 | |
| | 2,200 | | Alliance One International, Inc.†(a) | | | 8,360 | |
| | 20,175 | | Altria Group, Inc. | | | 705,923 | |
| | 250 | | Andersons, Inc. (The) | | | 13,297 | |
| | 5,986 | | Archer-Daniels-Midland Co. | | | 202,985 | |
| | 3,950 | | Avon Products, Inc. | | | 83,069 | |
| | 1,900 | | Beam, Inc. | | | 119,909 | |
| | 1,350 | | Brown-Forman Corp., Class B | | | 91,193 | |
| | 1,550 | | Bunge, Ltd. | | | 109,694 | |
| | 2,175 | | Campbell Soup Co. | | | 97,418 | |
| | 1,500 | | Central European Distribution Corp.† (b) | | | — | |
| | 1,700 | | Church & Dwight Co., Inc. | | | 104,907 | |
| | 1,200 | | Clorox Co. (The)(a) | | | 99,768 | |
| | 43,140 | | Coca-Cola Co. (The) | | | 1,730,345 | |
| | 2,695 | | Coca-Cola Enterprises, Inc. | | | 94,756 | |
| | 9,136 | | Colgate-Palmolive Co. | | | 523,401 | |
| | 4,573 | | ConAgra Foods, Inc. | | | 159,735 | |
| | 1,550 | | Constellation Brands, Inc., Class A† | | | 80,786 | |
| | 4,150 | | Costco Wholesale Corp. | | | 458,865 | |
| | 250 | | Crimson Wine Group, Ltd.† | | | 2,120 | |
| | 13,042 | | CVS Caremark Corp. | | | 745,742 | |
| | 650 | | Darling International, Inc.† | | | 12,129 | |
| | 2,134 | | Dean Foods Co.†(a) | | | 21,383 | |
| | 1,500 | | Dole Food Co., Inc. | | | 19,125 | |
| | 2,000 | | Dr. Pepper Snapple Group, Inc. | | | 91,860 | |
| | 584 | | Energizer Holdings, Inc. | | | 58,698 | |
| | 2,400 | | Estee Lauder Cos., Inc. (The), Class A | | | 157,848 | |
| | 2,531 | | Flowers Foods, Inc.(a) | | | 55,798 | |
| | 7,100 | | General Mills, Inc. | | | 344,563 | |
| | 962 | | Green Mountain Coffee Roasters, Inc.†(a) | | | 72,208 | |
| | 400 | | Hain Celestial Group, Inc. (The)(a) | | | 25,988 | |
| | 1,200 | | Herbalife, Ltd.(a) | | | 54,168 | |
| | 1,746 | | Hershey Co. (The) | | | 155,883 | |
| | 1,344 | | Hillshire Brands Co. | | | 44,460 | |
| | 1,500 | | Hormel Foods Corp.(a) | | | 57,870 | |
| | 550 | | Ingles Markets, Inc., Class A | | | 13,887 | |
| | 800 | | Ingredion, Inc. | | | 52,496 | |
| | 1,219 | | JM Smucker Co. (The) | | | 125,740 | |
| | 2,725 | | Kellogg Co. | | | 175,027 | |
| | 4,107 | | Kimberly-Clark Corp. | | | 398,954 | |
| | 5,607 | | Kraft Foods Group, Inc.(a) | | | 313,263 | |
| | 5,225 | | Kroger Co. (The) | | | 180,472 | |
| | 3,130 | | Lorillard, Inc.(a) | | | 136,718 | |
| | 70 | | Mannatech, Inc.† | | | 769 | |
| | 750 | | McCormick & Co., Inc.(a) | | | 52,770 | |
| | 2,300 | | Mead Johnson Nutrition Co., Class A | | | 182,229 | |
| | 200 | | MGP Ingredients, Inc.(a) | | | 1,192 | |
| | 1,500 | | Molson Coors Brewing Co., Class B | | | 71,790 | |
| | 16,821 | | Mondelez International, Inc., Class A | | | 479,903 | |
| | 1,600 | | Monster Beverage Corp.(a) | | | 97,232 | |
| | 700 | | Nu Skin Enterprises, Inc., Class A | | | 42,784 | |
| | 15,591 | | PepsiCo, Inc. | | | 1,275,188 | |
| | 16,525 | | Philip Morris International, Inc. | | | 1,431,396 | |
| | 350 | | Post Holdings, Inc.† | | | 15,281 | |
| | 350 | | Prestige Brands Holdings, Inc.† | | | 10,199 | |
| | 28,939 | | Procter & Gamble Co. (The) | | | 2,228,014 | |
| | 100 | | Reliv International, Inc. | | | 128 | |
Wilshire Mutual Funds, Inc. Wilshire 5000 IndexSM Fund Schedule of Investments | |
| Shares | | | | Value | |
| Consumer Staples (continued) | | | |
| | 3,503 | | Reynolds American, Inc.(a) | | $ | 169,440 | |
| | 7,050 | | Rite Aid Corp.†(a) | | | 20,163 | |
| | 70 | | Rocky Mountain Chocolate Factory, Inc. | | | 846 | |
| | 2,800 | | Safeway, Inc.(a) | | | 66,248 | |
| | 50 | | Sanderson Farms, Inc. | | | 3,321 | |
| | 1,350 | | Smithfield Foods, Inc. | | | 44,212 | |
| | 1,000 | | Snyders-Lance, Inc. | | | 28,410 | |
| | 3,036 | | SUPERVALU, Inc.(a) | | | 18,884 | |
| | 6,700 | | Sysco Corp.(a) | | | 228,872 | |
| | 2,930 | | Tyson Foods, Inc., Class A | | | 75,242 | |
| | 450 | | United Natural Foods, Inc. | | | 24,296 | |
| | 198 | | USANA Health Sciences, Inc. | | | 14,331 | |
| | 1,102 | | Vector Group, Ltd.(a) | | | 17,875 | |
| | 9,150 | | Walgreen Co. | | | 404,430 | |
| | 17,470 | | Wal-Mart Stores, Inc. | | | 1,301,340 | |
| | 776 | | WhiteWave Foods Co., Class B†(a) | | | 11,795 | |
| | 545 | | WhiteWave Foods Co., Class A | | | 8,856 | |
| | 3,250 | | Whole Foods Market, Inc. | | | 167,310 | |
| | | | | | | 16,503,579 | |
| Energy — 9.9% | | | | |
| | 250 | | Alon USA Energy, Inc. | | | 3,615 | |
| | 2,272 | | Alpha Natural Resources, Inc.†(a) | | | 11,905 | |
| | 1,000 | | Amyris, Inc.(a) | | | 2,890 | |
| | 5,087 | | Anadarko Petroleum Corp. | | | 437,126 | |
| | 4,091 | | Apache Corp. | | | 342,949 | |
| | 300 | | Approach Resources, Inc.(a) | | | 7,371 | |
| | 3,000 | | Arch Coal, Inc.(a) | | | 11,340 | |
| | 600 | | Atwood Oceanics, Inc.† | | | 31,230 | |
| | 4,245 | | Baker Hughes, Inc. | | | 195,822 | |
| | 600 | | Barnwell Industries, Inc.† | | | 1,890 | |
| | 400 | | Berry Petroleum Co., Class A | | | 16,928 | |
| | 45 | | BioFuel Energy Corp.† | | | 150 | |
| | 900 | | Bolt Technology Corp. | | | 15,372 | |
| | 300 | | BP Prudhoe Bay Royalty Trust | | | 28,881 | |
| | 3,100 | | BPZ Resources, Inc.† | | | 5,549 | |
| | 200 | | Bristow Group, Inc. | | | 13,064 | |
| | 1,800 | | Cabot Oil & Gas Corp. | | | 127,836 | |
| | 1,218 | | Cal Dive International, Inc.(a) | | | 2,290 | |
| | 1,500 | | Callon Petroleum Co.† | | | 5,055 | |
| | 2,450 | | Cameron International Corp. | | | 149,842 | |
| | 150 | | CARBO Ceramics, Inc.(a) | | | 10,115 | |
| | 200 | | Cheniere Energy, Inc.† | | | 5,552 | |
| | 6,600 | | Chesapeake Energy Corp.(a) | | | 134,508 | |
| | 20,669 | | Chevron Corp. | | | 2,445,969 | |
| | 447 | | Cimarex Energy Co. | | | 29,051 | |
| | 600 | | Clean Energy Fuels Corp.(a) | | | 7,920 | |
| | 1,000 | | Cloud Peak Energy, Inc. | | | 16,480 | |
| | 400 | | Comstock Resources, Inc.(a) | | | 6,292 | |
| | 800 | | Concho Resources, Inc. | | | 66,976 | |
| | 13,181 | | ConocoPhillips | | | 797,450 | |
| | 2,600 | | Consol Energy, Inc. | | | 70,460 | |
| | 500 | | Continental Resources, Inc.(a) | | | 43,030 | |
| | 200 | | Cross Timbers Royalty Trust | | | 5,324 | |
| | 500 | | Crosstex Energy, Inc. | | | 9,880 | |
| | 175 | | Delek US Holdings, Inc.(a) | | | 5,036 | |
| | 3,779 | | Denbury Resources, Inc. | | | 65,452 | |
| | 4,336 | | Devon Energy Corp. | | | 224,952 | |
| | 206 | | DHT Holdings, Inc.(a) | | | 923 | |
| | 850 | | Diamond Offshore Drilling, Inc.(a) | | | 58,472 | |
| | 800 | | Dresser-Rand Group, Inc.† | | | 47,984 | |
| | 300 | | Dril-Quip, Inc.† | | | 27,087 | |
| | 890 | | Energen Corp. | | | 46,511 | |
| | 525 | | Energy Transfer Partners, LP(A) | | | 26,533 | |
| | 1,000 | | Energy XXI Bermuda, Ltd.(a) | | | 22,180 | |
| | 2,575 | | EOG Resources, Inc. | | | 339,076 | |
| | 15 | | EPL Oil & Gas, Inc.† | | | 440 | |
| | 1,600 | | EQT Corp. | | | 126,992 | |
| Shares | | | | Value | |
| Energy (continued) | | | |
| | 2,700 | | EXCO Resources, Inc.(a) | | $ | 20,628 | |
| | 812 | | Exterran Holdings, Inc.(a) | | | 22,833 | |
| | 47,466 | | Exxon Mobil Corp. | | | 4,288,553 | |
| | 1,906 | | FMC Technologies, Inc.† | | | 106,126 | |
| | 950 | | Forest Oil Corp.†(a) | | | 3,886 | |
| | 226 | | Geospace Technologies Corp. | | | 15,612 | |
| | 500 | | Goodrich Petroleum Corp. | | | 6,400 | |
| | 1,725 | | Gulf Coast Ultra Deep Royalty Trust†(a) | | | 3,450 | |
| | 381 | | Gulf Island Fabrication, Inc. | | | 7,296 | |
| | 300 | | Gulfmark Offshore, Inc., Class A(a) | | | 13,527 | |
| | 350 | | Gulfport Energy Corp.† | | | 16,475 | |
| | 10,181 | | Halliburton Co. | | | 424,751 | |
| | 1,000 | | Helix Energy Solutions Group, Inc.†(a) | | | 23,040 | |
| | 1,150 | | Helmerich & Payne, Inc.(a) | | | 71,818 | |
| | 1,900 | | Hercules Offshore, Inc. | | | 13,376 | |
| | 3,290 | | Hess Corp. | | | 218,752 | |
| | 1,058 | | HollyFrontier Corp.(a) | | | 45,261 | |
| | 500 | | Hornbeck Offshore Services, Inc.† | | | 26,750 | |
| | 1,750 | | ION Geophysical Corp.(a) | | | 10,535 | |
| | 450 | | James River Coal Co.† | | | 819 | |
| | 2,200 | | Key Energy Services, Inc. | | | 13,090 | |
| | 10,260 | | Kinder Morgan, Inc.(a) | | | 391,419 | |
| | 2,950 | | Kodiak Oil & Gas Corp. | | | 26,226 | |
| | 400 | | Lufkin Industries, Inc.(a) | | | 35,388 | |
| | 9 | | Magnum Hunter Resources Corp.(a) | | | 33 | |
| | 7,572 | | Marathon Oil Corp. | | | 261,840 | |
| | 3,452 | | Marathon Petroleum Corp. | | | 245,299 | |
| | 450 | | Matrix Service Co.† | | | 7,011 | |
| | 2,875 | | McDermott International, Inc.† | | | 23,517 | |
| | 2,075 | | Murphy Oil Corp. | | | 126,347 | |
| | 3,100 | | Nabors Industries, Ltd. | | | 47,461 | |
| | 4,420 | | National Oilwell Varco, Inc. | | | 304,538 | |
| | 1,525 | | Newfield Exploration Co. | | | 36,432 | |
| | 875 | | Newpark Resources, Inc.† | | | 9,616 | |
| | 3,078 | | Noble Energy, Inc. | | | 184,803 | |
| | 1,000 | | Northern Oil and Gas, Inc.†(a) | | | 13,340 | |
| | 400 | | Oasis Petroleum, Inc. | | | 15,548 | |
| | 8,680 | | Occidental Petroleum Corp. | | | 774,516 | |
| | 900 | | Oceaneering International, Inc. | | | 64,980 | |
| | 500 | | Oil States International, Inc.† | | | 46,320 | |
| | 1 | | Pacific Ethanol, Inc.† | | | 4 | |
| | 1,950 | | Patterson-UTI Energy, Inc. | | | 37,742 | |
| | 3,150 | | Peabody Energy Corp.(a) | | | 46,116 | |
| | 2,300 | | PetroQuest Energy, Inc.†(a) | | | 9,108 | |
| | 6,890 | | Phillips 66 | | | 405,890 | |
| | 1,125 | | Pioneer Natural Resources Co. | | | 162,844 | |
| | 1,700 | | Pyramid Oil Co.†(a) | | | 6,834 | |
| | 2,200 | | QEP Resources, Inc. | | | 61,116 | |
| | 1,700 | | Quicksilver Resources, Inc.†(a) | | | 2,856 | |
| | 1,800 | | Range Resources Corp. | | | 139,176 | |
| | 600 | | Rex Energy Corp.†(a) | | | 10,548 | |
| | 600 | | Rosetta Resources, Inc.† | | | 25,512 | |
| | 1,600 | | Rowan PLC, Class A | | | 54,512 | |
| | 1,012 | | RPC, Inc.(a) | | | 13,976 | |
| | 4,400 | | SandRidge Energy, Inc.†(a) | | | 20,944 | |
| | 14,224 | | Schlumberger, Ltd. | | | 1,019,292 | |
| | 1,000 | | Ship Finance International, Ltd.(a) | | | 14,840 | |
| | 750 | | SM Energy Co. | | | 44,985 | |
| | 1,000 | | Solazyme, Inc.†(a) | | | 11,720 | |
| | 4,200 | | Southwestern Energy Co.(a) | | | 153,426 | |
| | 6,641 | | Spectra Energy Corp. | | | 228,849 | |
| | 270 | | Steel Excel, Inc.† | | | 7,830 | |
| | 1,706 | | Superior Energy Services, Inc. | | | 44,254 | |
| | 350 | | Syntroleum Corp.†(a) | | | 2,415 | |
| | 1,500 | | Tesoro Corp. | | | 78,480 | |
| | 233 | | TGC Industries, Inc. | | | 1,915 | |
| | 525 | | Tidewater, Inc.(a) | | | 29,909 | |
Wilshire Mutual Funds, Inc. Wilshire 5000 IndexSM Fund Schedule of Investments | |
| Shares | | | | Value | |
| Energy (continued) | | | |
| | 1,600 | | Trico Marine Services, Inc.† (b) | | $ | — | |
| | 1,000 | | U.S. Energy Corp.† | | | 2,070 | |
| | 1,765 | | Ultra Petroleum Corp.(a) | | | 34,982 | |
| | 500 | | Unit Corp. | | | 21,290 | |
| | 1,100 | | Vaalco Energy, Inc. | | | 6,292 | |
| | 6,114 | | Valero Energy Corp. | | | 212,584 | |
| | 8 | | Verenium Corp.† | | | 18 | |
| | 800 | | W&T Offshore, Inc.(a) | | | 11,432 | |
| | 300 | | Warren Resources, Inc.† | | | 765 | |
| | 500 | | Western Refining, Inc.(a) | | | 14,035 | |
| | 1,400 | | Whiting Petroleum Corp. | | | 64,526 | |
| | 7,050 | | Williams Cos., Inc. (The) | | | 228,914 | |
| | 800 | | World Fuel Services Corp.(a) | | | 31,984 | |
| | 2,350 | | WPX Energy, Inc.(a) | | | 44,509 | |
| | 500 | | ZaZa Energy Corp.†(a) | | | 600 | |
| | | | | | | 17,328,456 | |
| Financials — 17.4% | | | | |
| | 1 | | Acadia Realty Trust‡ | | | 25 | |
| | 600 | | Affiliated Managers Group, Inc.† | | | 98,364 | |
| | 4,800 | | Aflac, Inc. | | | 278,976 | |
| | 450 | | Alexander & Baldwin, Inc.† | | | 17,887 | |
| | 700 | | Alexandria Real Estate Equities, Inc.‡ | | | 46,004 | |
| | 127 | | Alleghany Corp. | | | 48,680 | |
| | 4,650 | | Allstate Corp. (The) | | | 223,758 | |
| | 10 | | Altisource Asset Management Corp.†(a) | | | 2,655 | |
| | 100 | | Altisource Portfolio Solutions SA†(a) | | | 9,408 | |
| | 33 | | Altisource Residential Corp., Class B† | | | 551 | |
| | 807 | | American Campus Communities, Inc.‡ | | | 32,813 | |
| | 3,825 | | American Capital Agency Corp.‡ | | | 87,937 | |
| | 4,200 | | American Capital, Ltd. | | | 53,214 | |
| | 1,100 | | American Equity Investment Life Holding Co.(a) | | | 17,270 | |
| | 9,475 | | American Express Co. | | | 708,351 | |
| | 1,100 | | American Financial Group, Inc. | | | 53,801 | |
| | 4,200 | | American International Group, Inc.† | | | 187,740 | |
| | 300 | | American National Insurance Co. | | | 29,841 | |
| | 4,077 | | American Tower Corp., Class A‡ | | | 298,314 | |
| | 2,280 | | Ameriprise Financial, Inc. | | | 184,406 | |
| | 302 | | Amtrust Financial Services, Inc.(a) | | | 10,781 | |
| | 10,025 | | Annaly Capital Management, Inc.‡(a) | | | 126,014 | |
| | 1,500 | | Anworth Mortgage Asset Corp.‡(a) | | | 8,400 | |
| | 1,256 | | Apartment Investment & Management Co., Class A‡ | | | 37,730 | |
| | 2,200 | | Apollo Investment Corp.†(a) | | | 17,028 | |
| | 200 | | Arbor Realty Trust, Inc.‡ | | | 1,256 | |
| | 1,200 | | Arch Capital Group, Ltd.(a) | | | 61,692 | |
| | 4 | | Arlington Asset Investment Corp., Class A(a) | | | 107 | |
| | 3,325 | | ARMOUR Residential REIT, Inc.‡(a) | | | 15,661 | |
| | 1,150 | | Arthur J. Gallagher & Co. | | | 50,243 | |
| | 544 | | Ashford Hospitality Trust, Inc.‡ | | | 6,229 | |
| | 1,100 | | Aspen Insurance Holdings, Ltd. | | | 40,799 | |
| | 1,354 | | Associated Banc-Corp | | | 21,055 | |
| | 300 | | Associated Estates Realty Corp.‡(a) | | | 4,824 | |
| | 900 | | Assurant, Inc. | | | 45,819 | |
| | 1,600 | | Assured Guaranty, Ltd. | | | 35,296 | |
| | 700 | | Astoria Financial Corp.(a) | | | 7,546 | |
| | 200 | | Atlanticus Holdings Corp.†(a) | | | 716 | |
| | 600 | | AV Homes, Inc.† | | | 10,638 | |
| | 847 | | AvalonBay Communities, Inc.‡ | | | 114,269 | |
| | 1,175 | | Axis Capital Holdings, Ltd. | | | 53,792 | |
| | 50 | | Bancorp, Inc. | | | 749 | |
| | 1,150 | | BancorpSouth, Inc.(a) | | | 20,355 | |
| | 115,473 | | Bank of America Corp. | | | 1,484,983 | |
| | 450 | | Bank of Hawaii Corp.(a) | | | 22,644 | |
| | 11,913 | | Bank of New York Mellon Corp. (The) | | | 334,160 | |
| | 700 | | BankFinancial Corp. | | | 5,950 | |
| Shares | | | | Value | |
| Financials (continued) | | | |
| | 1,000 | | BankUnited, Inc. | | $ | 26,010 | |
| | 7,925 | | BB&T Corp. | | | 268,499 | |
| | 600 | | BBCN Bancorp, Inc. | | | 8,532 | |
| | 16 | | BBX Capital Corp., Class A† | | | 207 | |
| | 500 | | Beneficial Mutual Bancorp, Inc. | | | 4,200 | |
| | 19,584 | | Berkshire Hathaway, Inc., Class B | | | 2,191,841 | |
| | 1,000 | | BGC Partners, Inc., Class A | | | 5,890 | |
| | 2,000 | | BioMed Realty Trust, Inc.‡ | | | 40,460 | |
| | 1,100 | | BlackRock, Inc., Class A(a) | | | 282,535 | |
| | 1,000 | | Boston Private Financial Holdings, Inc. | | | 10,640 | |
| | 1,625 | | Boston Properties, Inc.‡ | | | 171,389 | |
| | 1,988 | | Brandywine Realty Trust‡ | | | 26,878 | |
| | 1,075 | | BRE Properties, Inc.‡ | | | 53,771 | |
| | 3,075 | | Brookfield Office Properties, Inc.(a) | | | 51,291 | |
| | 1,500 | | Brookline Bancorp, Inc. | | | 13,020 | |
| | 1,400 | | Brown & Brown, Inc. | | | 45,136 | |
| | 100 | | Camden National Corp. | | | 3,547 | |
| | 825 | | Camden Property Trust‡ | | | 57,040 | |
| | 30 | | Capital Bank Financial Corp., Class A† | | | 570 | |
| | 350 | | Capital City Bank Group, Inc. | | | 4,035 | |
| | 4,850 | | Capital One Financial Corp. | | | 304,629 | |
| | 3,839 | | CapitalSource, Inc. | | | 36,010 | |
| | 1,000 | | Capitol Federal Financial, Inc. | | | 12,140 | |
| | 700 | | CapLease, Inc.‡ | | | 5,908 | |
| | 1,700 | | Capstead Mortgage Corp.‡ | | | 20,570 | |
| | 100 | | Cardinal Financial Corp. | | | 1,464 | |
| | 288 | | Cathay General Bancorp | | | 5,861 | |
| | 1,780 | | CBL & Associates Properties, Inc.‡(a) | | | 38,128 | |
| | 600 | | CBOE Holdings, Inc. | | | 27,984 | |
| | 3,825 | | CBRE Group, Inc., Class A | | | 89,352 | |
| | 650 | | Cedar Realty Trust, Inc.‡ | | | 3,367 | |
| | 9,964 | | Charles Schwab Corp. (The) | | | 211,536 | |
| | 498 | | Charter Financial Corp. | | | 5,020 | |
| | 500 | | Chemical Financial Corp. | | | 12,995 | |
| | 11,900 | | Chimera Investment Corp.‡(a) | | | 35,700 | |
| | 2,802 | | Chubb Corp. (The) | | | 237,189 | |
| | 23 | | CIFC Corp.†(a) | | | 174 | |
| | 1,394 | | Cincinnati Financial Corp. | | | 63,985 | |
| | 2,150 | | CIT Group, Inc.† | | | 100,254 | |
| | 31,265 | | Citigroup, Inc. | | | 1,499,782 | |
| | 600 | | City National Corp. | | | 38,022 | |
| | 3,300 | | CME Group, Inc., Class A | | | 250,734 | |
| | 300 | | CNA Financial Corp. | | | 9,786 | |
| | 2,900 | | CNO Financial Group, Inc. | | | 37,584 | |
| | 750 | | CoBiz Financial, Inc. | | | 6,225 | |
| | 350 | | Cohen & Steers, Inc.(a) | | | 11,893 | |
| | 1,429 | | Colonial Properties Trust‡ | | | 34,467 | |
| | 276 | | Columbia Banking System, Inc.(a) | | | 6,572 | |
| | 1,783 | | Comerica, Inc. | | | 71,017 | |
| | 1,302 | | Commerce Bancshares, Inc.(a) | | | 56,715 | |
| | 1,293 | | CommonWealth REIT‡(a) | | | 29,894 | |
| | 500 | | Community Bank System, Inc.(a) | | | 15,425 | |
| | 100 | | Community Trust Bancorp, Inc.(a) | | | 3,562 | |
| | 850 | | Corporate Office Properties Trust‡(a) | | | 21,675 | |
| | 899 | | Corrections Corp. of America‡ | | | 30,449 | |
| | 1,863 | | Cousins Properties, Inc.‡ | | | 18,816 | |
| | 199 | | Cowen Group, Inc., Class A† | | | 577 | |
| | 200 | | Crawford & Co., Class B | | | 1,124 | |
| | 937 | | CubeSmart‡ | | | 14,973 | |
| | 600 | | Cullen/Frost Bankers, Inc. | | | 40,062 | |
| | 1,000 | | CVB Financial Corp. | | | 11,760 | |
| | 1,000 | | CYS Investments, Inc.‡ | | | 9,210 | |
| | 3,450 | | DCT Industrial Trust, Inc.‡(a) | | | 24,667 | |
| | 2,995 | | DDR Corp.‡(a) | | | 49,867 | |
| | 2,502 | | DiamondRock Hospitality Co.‡ | | | 23,319 | |
| | 1,000 | | Digital Realty Trust, Inc.‡(a) | | | 61,000 | |
| | 4,875 | | Discover Financial Services | | | 232,245 | |
Wilshire Mutual Funds, Inc. Wilshire 5000 IndexSM Fund Schedule of Investments | |
| Shares | | | | Value | |
| Financials (continued) | | | |
| | 1,100 | | Donegal Group, Inc., Class A | | $ | 15,367 | |
| | 1,100 | | Douglas Emmett, Inc.‡ | | | 27,445 | |
| | 3,101 | | Duke Realty Corp.‡ | | | 48,345 | |
| | 700 | | DuPont Fabros Technology, Inc.‡(a) | | | 16,905 | |
| | 3,778 | | E*Trade Financial Corp. | | | 47,829 | |
| | 2,000 | | East West Bancorp, Inc. | | | 55,000 | |
| | 1,325 | | Eaton Vance Corp.(a) | | | 49,807 | |
| | 1,000 | | Education Realty Trust, Inc.‡ | | | 10,230 | |
| | 175 | | eHealth, Inc.† | | | 3,976 | |
| | 200 | | Encore Capital Group, Inc.†(a) | | | 6,622 | |
| | 700 | | Endurance Specialty Holdings, Ltd. | | | 36,015 | |
| | 50 | | Enterprise Financial Services Corp. | | | 798 | |
| | 300 | | EPR Properties‡ | | | 15,081 | |
| | 500 | | Equity Lifestyle Properties, Inc.‡ | | | 39,295 | |
| | 1,000 | | Equity One, Inc.‡(a) | | | 22,630 | |
| | 3,479 | | Equity Residential‡ | | | 201,991 | |
| | 400 | | Essex Property Trust, Inc.‡ | | | 63,568 | |
| | 536 | | Everest Re Group, Ltd. | | | 68,747 | |
| | 1,500 | | Extra Space Storage, Inc.‡ | | | 62,895 | |
| | 1,000 | | Ezcorp, Inc., Class A† | | | 16,880 | |
| | 625 | | Federal Realty Investment Trust‡ | | | 64,800 | |
| | 1,200 | | Federated Investors, Inc., Class B(a) | | | 32,892 | |
| | 200 | | Federated National Holding Co.(a) | | | 1,950 | |
| | 1,000 | | FelCor Lodging Trust, Inc.‡ | | | 5,910 | |
| | 2,291 | | Fidelity National Financial, Inc., Class A | | | 54,549 | |
| | 10,401 | | Fifth Third Bancorp | | | 187,738 | |
| | 1,200 | | Financial Institutions, Inc. | | | 22,092 | |
| | 100 | | First Acceptance Corp.† | | | 164 | |
| | 827 | | First American Financial Corp. | | | 18,227 | |
| | 300 | | First Bancorp | | | 4,230 | |
| | 166 | | First BanCorp(a) | | | 1,175 | |
| | 500 | | First Cash Financial Services, Inc.† | | | 24,605 | |
| | 800 | | First Commonwealth Financial Corp. | | | 5,896 | |
| | 425 | | First Community Bancshares, Inc. | | | 6,664 | |
| | 100 | | First Financial Corp. | | | 3,099 | |
| | 2,433 | | First Horizon National Corp.(a) | | | 27,250 | |
| | 650 | | First Industrial Realty Trust, Inc.‡ | | | 9,860 | |
| | 50 | | First Marblehead Corp. (The)†(a) | | | 59 | |
| | 3,424 | | First Niagara Financial Group, Inc. | | | 34,480 | |
| | 800 | | First Potomac Realty Trust‡ | | | 10,448 | |
| | 600 | | First Republic Bank | | | 23,088 | |
| | 1,007 | | FirstMerit Corp.(a) | | | 20,170 | |
| | 1,500 | | FNB Corp.(a) | | | 18,120 | |
| | 2,100 | | Forest City Enterprises, Inc., Class A† | | | 37,611 | |
| | 1,557 | | Franklin Resources, Inc. | | | 211,783 | |
| | 950 | | Franklin Street Properties Corp.‡(a) | | | 12,540 | |
| | 2,734 | | Fulton Financial Corp.(a) | | | 31,386 | |
| | 4,665 | | General Growth Properties, Inc.‡ | | | 92,694 | |
| | 5,850 | | Genworth Financial, Inc., Class A† | | | 66,748 | |
| | 1,152 | | Geo Group, Inc. (The)‡ | | | 39,110 | |
| | 400 | | Getty Realty Corp.‡ | | | 8,260 | |
| | 900 | | Glacier Bancorp, Inc.(a) | | | 19,971 | |
| | 50 | | Gleacher & Co., Inc.† | | | 694 | |
| | 800 | | Glimcher Realty Trust‡(a) | | | 8,736 | |
| | 4,783 | | Goldman Sachs Group, Inc. (The) | | | 723,429 | |
| | 435 | | Gramercy Property Trust, Inc.† ‡ | | | 1,957 | |
| | 200 | | Guaranty Bancorp(a) | | | 2,270 | |
| | 100 | | Hallmark Financial Services, Inc.† | | | 914 | |
| | 627 | | Hancock Holding Co. | | | 18,854 | |
| | 69 | | Hanmi Financial Corp. | | | 1,219 | |
| | 700 | | Hanover Insurance Group, Inc. (The) | | | 34,251 | |
| | 4,750 | | Hartford Financial Services Group, Inc. | | | 146,870 | |
| | 1,000 | | Hatteras Financial Corp.‡ | | | 24,640 | |
| | 1,175 | | HCC Insurance Holdings, Inc. | | | 50,654 | |
| | 4,625 | | HCP, Inc.‡ | | | 210,160 | |
| | 2,200 | | Health Care REIT, Inc.‡ | | | 147,466 | |
| | 500 | | Healthcare Realty Trust, Inc.‡ | | | 12,750 | |
| Shares | | | | Value | |
| Financials (continued) | | | |
| | 50 | | Heritage Commerce Corp. | | $ | 350 | |
| | 700 | | Hersha Hospitality Trust, Class A‡ | | | 3,948 | |
| | 650 | | Highwoods Properties, Inc.‡ | | | 23,146 | |
| | 1,500 | | Hilltop Holdings, Inc.† | | | 24,600 | |
| | 1,320 | | Home BancShares, Inc.(a) | | | 34,280 | |
| | 500 | | Home Properties, Inc.‡(a) | | | 32,685 | |
| | 1,000 | | Horace Mann Educators Corp. | | | 24,380 | |
| | 1,500 | | Hospitality Properties Trust‡ | | | 39,420 | |
| | 8,624 | | Host Hotels & Resorts, Inc.‡(a) | | | 145,487 | |
| | 44 | | Howard Hughes Corp. (The)† | | | 4,932 | |
| | 4,301 | | Hudson City Bancorp, Inc. | | | 39,397 | |
| | 9,351 | | Huntington Bancshares, Inc.(a) | | | 73,686 | |
| | 100 | | ICG Group, Inc.† | | | 1,140 | |
| | 85 | | IMPAC Mortgage Holdings, Inc.† ‡ | | | 863 | |
| | 300 | | Infinity Property & Casualty Corp. | | | 17,928 | |
| | 1,100 | | Inland Real Estate Corp.‡ | | | 11,242 | |
| | 1,500 | | Interactive Brokers Group, Inc., Class A | | | 23,955 | |
| | 669 | | IntercontinentalExchange, Inc.(a) | | | 118,921 | |
| | 700 | | International Bancshares Corp. | | | 15,806 | |
| | 550 | | Intervest Bancshares Corp., Class A† | | | 3,674 | |
| | 500 | | INTL FCStone, Inc.†(a) | | | 8,725 | |
| | 1,000 | | Invesco Mortgage Capital, Inc.‡ | | | 16,560 | |
| | 4,800 | | Invesco, Ltd. | | | 152,640 | |
| | 1,000 | | Investment Technology Group, Inc. | | | 13,980 | |
| | 800 | | Investors Bancorp, Inc.(a) | | | 16,864 | |
| | 1,800 | | Investors Real Estate Trust‡ | | | 15,480 | |
| | 1,564 | | iStar Financial, Inc.† ‡ | | | 17,658 | |
| | 2,475 | | Janus Capital Group, Inc.(a) | | | 21,062 | |
| | 500 | | Jones Lang LaSalle, Inc. | | | 45,570 | |
| | 40,734 | | JPMorgan Chase & Co. | | | 2,150,348 | |
| | 600 | | Kearny Financial Corp.†(a) | | | 6,294 | |
| | 350 | | Kemper Corp.(a) | | | 11,988 | |
| | 9,848 | | KeyCorp | | | 108,722 | |
| | 700 | | Kilroy Realty Corp.‡(a) | | | 37,107 | |
| | 4,625 | | Kimco Realty Corp.‡(a) | | | 99,114 | |
| | 800 | | Kite Realty Group Trust‡ | | | 4,824 | |
| | 1,400 | | Knight Capital Group, Inc., Class A | | | 5,026 | |
| | 1,500 | | LaSalle Hotel Properties‡(a) | | | 37,050 | |
| | 1,700 | | Legg Mason, Inc.(a) | | | 52,717 | |
| | 2,882 | | Leucadia National Corp. | | | 75,566 | |
| | 1,626 | | Lexington Realty Trust‡(a) | | | 18,992 | |
| | 1,450 | | Liberty Property Trust‡(a) | | | 53,592 | |
| | 2,875 | | Lincoln National Corp. | | | 104,851 | |
| | 3,300 | | Loews Corp. | | | 146,520 | |
| | 200 | | LPL Financial Holdings, Inc. | | | 7,552 | |
| | 1,372 | | M&T Bank Corp.(a) | | | 153,321 | |
| | 1,287 | | Macerich Co. (The)‡ | | | 78,468 | |
| | 1,500 | | Mack-Cali Realty Corp.‡ | | | 36,735 | |
| | 1,000 | | Maiden Holdings, Ltd. | | | 11,220 | |
| | 135 | | Markel Corp. | | | 71,138 | |
| | 5,370 | | Marsh & McLennan Cos., Inc. | | | 214,370 | |
| | 244 | | MB Financial, Inc. | | | 6,539 | |
| | 1,900 | | MBIA, Inc.(a) | | | 25,289 | |
| | 2,800 | | McGraw Hill Financial, Inc. | | | 148,932 | |
| | 967 | | Meadowbrook Insurance Group, Inc. | | | 7,765 | |
| | 600 | | Medallion Financial Corp.(a) | | | 8,346 | |
| | 1,500 | | Medical Properties Trust, Inc.‡ | | | 21,480 | |
| | 9,421 | | MetLife, Inc. | | | 431,105 | |
| | 4,000 | | MFA Financial, Inc.‡ | | | 33,800 | |
| | 1,500 | | MGIC Investment Corp.(a) | | | 9,105 | |
| | 100 | | Mid-America Apartment Communities, Inc.‡(a) | | | 6,777 | |
| | 400 | | Montpelier Re Holdings, Ltd.(a) | | | 10,004 | |
| | 1,575 | | Moody's Corp. | | | 95,965 | |
| | 15,450 | | Morgan Stanley | | | 377,443 | |
| | 3,800 | | MPG Office Trust, Inc.† ‡ | | | 11,932 | |
| | 1,072 | | MSCI, Inc., Class A† | | | 35,665 | |
Wilshire Mutual Funds, Inc. Wilshire 5000 IndexSM Fund Schedule of Investments | |
| Shares | | | | Value | |
| Financials (continued) | | | |
| | 1,450 | | NASDAQ OMX Group, Inc. (The) | | $ | 47,546 | |
| | 400 | | National Interstate Corp. | | | 11,700 | |
| | 2,500 | | National Penn Bancshares, Inc. | | | 25,400 | |
| | 500 | | National Retail Properties, Inc.‡(a) | | | 17,200 | |
| | 500 | | NBT Bancorp, Inc.(a) | | | 10,585 | |
| | 350 | | New Residential Investment Corp.‡ | | | 2,359 | |
| | 4,312 | | New York Community Bancorp, Inc.(a) | | | 60,368 | |
| | 350 | | Newcastle Investment Corp.‡ | | | 1,830 | |
| | 10 | | North Valley Bancorp† | | | 165 | |
| | 2,850 | | Northern Trust Corp. | | | 165,015 | |
| | 156 | | NorthStar Realty Finance Corp.‡(a) | | | 1,420 | |
| | 875 | | Northwest Bancshares, Inc. | | | 11,821 | |
| | 2,375 | | NYSE Euronext | | | 98,325 | |
| | 300 | | Ocwen Financial Corp.† | | | 12,366 | |
| | 432 | | OFG Bancorp(a) | | | 7,824 | |
| | 1,500 | | Old National Bancorp | | | 20,745 | |
| | 3,236 | | Old Republic International Corp. | | | 41,647 | |
| | 400 | | Old Second Bancorp, Inc.†(a) | | | 2,208 | |
| | 975 | | Omega Healthcare Investors, Inc.‡(a) | | | 30,244 | |
| | 600 | | OneBeacon Insurance Group, Ltd., Class A(a) | | | 8,688 | |
| | 400 | | Oritani Financial Corp. | | | 6,272 | |
| | 200 | | Parkway Properties, Inc.‡ | | | 3,352 | |
| | 625 | | PartnerRe, Ltd. | | | 56,600 | |
| | 1,000 | | Pebblebrook Hotel Trust‡ | | | 25,850 | |
| | 4,347 | | People's United Financial, Inc.(a) | | | 64,770 | |
| | 123 | | PHH Corp.† | | | 2,507 | |
| | 62 | | Phoenix, Inc.† | | | 2,666 | |
| | 2,100 | | Piedmont Office Realty Trust, Inc., Class A‡(a) | | | 37,548 | |
| | 900 | | Pinnacle Financial Partners, Inc. | | | 23,139 | |
| | 500 | | Platinum Underwriters Holdings, Ltd. | | | 28,610 | |
| | 1,884 | | Plum Creek Timber Co., Inc.‡ | | | 87,926 | |
| | 5,675 | | PNC Financial Services Group, Inc. | | | 413,821 | |
| | 1,157 | | Popular, Inc. | | | 35,092 | |
| | 100 | | Portfolio Recovery Associates, Inc.(a) | | | 15,363 | |
| | 600 | | Post Properties, Inc.‡ | | | 29,694 | |
| | 200 | | Preferred Bank(a) | | | 3,296 | |
| | 300 | | Primerica† | | | 11,232 | |
| | 100 | | Primus Guaranty, Ltd.†(a) | | | 1,006 | |
| | 2,750 | | Principal Financial Group, Inc. | | | 102,988 | |
| | 1,222 | | PrivateBancorp, Inc., Class A(a) | | | 25,919 | |
| | 530 | | ProAssurance Corp. | | | 27,645 | |
| | 6,125 | | Progressive Corp. (The) | | | 155,698 | |
| | 4,735 | | Prologis, Inc.‡ | | | 178,604 | |
| | 500 | | Prosperity Bancshares, Inc. | | | 25,895 | |
| | 1,000 | | Protective Life Corp. | | | 38,410 | |
| | 1,500 | | Provident Financial Services, Inc. | | | 23,670 | |
| | 1,050 | | Provident New York Bancorp(a) | | | 9,807 | |
| | 4,975 | | Prudential Financial, Inc. | | | 363,324 | |
| | 1,639 | | Public Storage‡ | | | 251,308 | |
| | 2,077 | | Pzena Investment Management, Inc., Class A(a) | | | 13,542 | |
| | 1,370 | | Radian Group, Inc.(a) | | | 15,919 | |
| | 66 | | RAIT Financial Trust‡ | | | 496 | |
| | 1,000 | | Ramco-Gershenson Properties Trust‡ | | | 15,530 | |
| | 1,200 | | Raymond James Financial, Inc. | | | 51,576 | |
| | 1,501 | | Rayonier, Inc.‡(a) | | | 83,140 | |
| | 1,300 | | Realty Income Corp.‡(a) | | | 54,496 | |
| | 1,200 | | Redwood Trust, Inc.‡ | | | 20,400 | |
| | 1,025 | | Regency Centers Corp.‡ | | | 52,080 | |
| | 13,306 | | Regions Financial Corp. | | | 126,806 | |
| | 850 | | Reinsurance Group of America, Inc., Class A | | | 58,744 | |
| | 400 | | RenaissanceRe Holdings, Ltd. | | | 34,716 | |
| | 50 | | Renasant Corp.(a) | | | 1,217 | |
| | 315 | | Republic Bancorp, Inc., Class A(a) | | | 6,905 | |
| Shares | | | | Value | |
| Financials (continued) | | | |
| | 250 | | Resource America, Inc., Class A | | $ | 2,125 | |
| | 200 | | Resource Capital Corp.‡(a) | | | 1,230 | |
| | 1,000 | | RLJ Lodging Trust‡ | | | 22,490 | |
| | 1,700 | | Roma Financial Corp.(a) | | | 30,872 | |
| | 174 | | Rouse Properties, Inc.‡(a) | | | 3,414 | |
| | 233 | | Sabra Health Care REIT, Inc.‡(a) | | | 6,084 | |
| | 200 | | Saul Centers, Inc.‡ | | | 8,892 | |
| | 750 | | Seacoast Banking Corp. of Florida† | | | 1,650 | |
| | 2,000 | | SEI Investments Co.(c) | | | 56,860 | |
| | 600 | | Selective Insurance Group, Inc. | | | 13,812 | |
| | 1,650 | | Senior Housing Properties Trust‡ | | | 42,785 | |
| | 400 | | Signature Bank | | | 33,208 | |
| | 152 | | Silver Bay Realty Trust Corp.‡(a) | | | 2,517 | |
| | 200 | | Simmons First National Corp., Class A(a) | | | 5,218 | |
| | 3,346 | | Simon Property Group, Inc.‡ | | | 528,400 | |
| | 1,000 | | SL Green Realty Corp.‡(a) | | | 88,190 | |
| | 4,300 | | SLM Corp. | | | 98,298 | |
| | 50 | | Southwest Bancorp, Inc.† | | | 660 | |
| | 316 | | Sovran Self Storage, Inc.‡ | | | 20,474 | |
| | 500 | | St. Joe Co. (The)†(a) | | | 10,525 | |
| | 490 | | StanCorp Financial Group, Inc.(a) | | | 24,211 | |
| | 1,000 | | Starwood Property Trust, Inc.‡ | | | 24,750 | |
| | 400 | | State Auto Financial Corp. | | | 7,268 | |
| | 4,990 | | State Street Corp. | | | 325,398 | |
| | 50 | | Sterling Bancorp, Class N | | | 581 | |
| | 300 | | Stewart Information Services Corp. | | | 7,857 | |
| | 640 | | Stifel Financial Corp.†(a) | | | 22,829 | |
| | 2,100 | | Strategic Hotels & Resorts, Inc.† ‡ | | | 18,606 | |
| | 50 | | Suffolk Bancorp†(a) | | | 817 | |
| | 822 | | Sun Bancorp, Inc.†(a) | | | 2,787 | |
| | 500 | | Sun Communities, Inc.‡(a) | | | 24,880 | |
| | 2,595 | | Sunstone Hotel Investors, Inc.‡ | | | 31,348 | |
| | 5,930 | | SunTrust Banks, Inc. | | | 187,210 | |
| | 1,728 | | Susquehanna Bancshares, Inc. | | | 22,205 | |
| | 450 | | SVB Financial Group | | | 37,494 | |
| | 1,000 | | Symetra Financial Corp.(a) | | | 15,990 | |
| | 10,831 | | Synovus Financial Corp. | | | 31,627 | |
| | 2,625 | | T Rowe Price Group, Inc. | | | 192,019 | |
| | 1,000 | | Tanger Factory Outlet Centers‡ | | | 33,460 | |
| | 500 | | Taubman Centers, Inc.‡ | | | 37,575 | |
| | 500 | | Taylor Capital Group, Inc.† | | | 8,445 | |
| | 1,500 | | TCF Financial Corp.(a) | | | 21,270 | |
| | 3,103 | | TD Ameritrade Holding Corp. | | | 75,372 | |
| | 50 | | Tejon Ranch Co.† | | | 1,425 | |
| | 784 | | Texas Capital Bancshares, Inc.† | | | 34,778 | |
| | 1,250 | | TFS Financial Corp. | | | 14,000 | |
| | 1,100 | | Torchmark Corp.(a) | | | 71,654 | |
| | 103 | | TowneBank(a) | | | 1,516 | |
| | 4,004 | | Travelers Cos., Inc. (The) | | | 320,000 | |
| | 90 | | Tree.com, Inc.(a) | | | 1,543 | |
| | 400 | | Trico Bancshares(a) | | | 8,532 | |
| | 1,208 | | TrustCo Bank Corp. | | | 6,572 | |
| | 1,000 | | Trustmark Corp. | | | 24,580 | |
| | 3,125 | | Two Harbors Investment Corp.‡ | | | 32,031 | |
| | 18,759 | | U.S. Bancorp | | | 678,138 | |
| | 2,328 | | UDR, Inc.‡(a) | | | 59,341 | |
| | 1,300 | | Umpqua Holdings Corp. | | | 19,513 | |
| | 474 | | United Community Banks, Inc. | | | 5,887 | |
| | 317 | | United Community Financial Corp.† | | | 1,474 | |
| | 403 | | United Financial Bancorp, Inc. | | | 6,105 | |
| | 300 | | United Fire Group, Inc. | | | 7,449 | |
| | 357 | | United Security Bancshares† | | | 1,514 | |
| | 200 | | Universal Health Realty Income Trust‡(a) | | | 8,626 | |
| | 2,407 | | Unum Group | | | 70,694 | |
| | 500 | | Urstadt Biddle Properties, Inc., Class A‡ | | | 10,085 | |
| | 483 | | Validus Holdings, Ltd. | | | 17,446 | |
| | 1,831 | | Valley National Bancorp(a) | | | 17,340 | |
Wilshire Mutual Funds, Inc. Wilshire 5000 IndexSM Fund Schedule of Investments | |
| Shares | | | | Value | |
| Financials (continued) | | | |
| | 3,315 | | Ventas, Inc.‡ | | $ | 230,260 | |
| | 565 | | Virginia Commerce Bancorp, Inc. | | | 7,887 | |
| | 48 | | Virtus Investment Partners, Inc.† | | | 8,461 | |
| | 2,132 | | Vornado Realty Trust‡ | | | 176,636 | |
| | 1,187 | | W.R. Berkley Corp. | | | 48,501 | |
| | 825 | | Waddell & Reed Financial, Inc., Class A | | | 35,887 | |
| | 220 | | Walter Investment Management Corp. | | | 7,438 | |
| | 1,333 | | Washington Federal, Inc. | | | 25,167 | |
| | 1,250 | | Washington Real Estate Investment Trust‡(a) | | | 33,638 | |
| | 400 | | Washington Trust Bancorp, Inc. | | | 11,408 | |
| | 550 | | Waterstone Financial, Inc.(a) | | | 5,588 | |
| | 800 | | Webster Financial Corp. | | | 20,544 | |
| | 1,700 | | Weingarten Realty Investors‡(a) | | | 52,309 | |
| | 51,892 | | Wells Fargo & Co. | | | 2,141,583 | |
| | 383 | | Westamerica Bancorporation(a) | | | 17,499 | |
| | 1,150 | | Western Alliance Bancorp(a) | | | 18,204 | |
| | 200 | | Westfield Financial, Inc. | | | 1,400 | |
| | 80 | | White Mountains Insurance Group, Ltd. | | | 45,995 | |
| | 700 | | Wilshire Bancorp, Inc. | | | 4,634 | |
| | 500 | | Wintrust Financial Corp.(a) | | | 19,140 | |
| | 10 | | WP Stewart & Co., Ltd.† | | | 70 | |
| | 1,630 | | Zions Bancorporation(a) | | | 47,074 | |
| | 400 | | ZipRealty, Inc.†(a) | | | 1,252 | |
| | | | | | | 30,641,366 | |
| Health Care — 12.0% | | | | |
| | 17,125 | | Abbott Laboratories | | | 597,320 | |
| | 17,125 | | AbbVie, Inc. | | | 707,947 | |
| | 100 | | ACADIA Pharmaceuticals, Inc.†(a) | | | 1,815 | |
| | 300 | | Accretive Health, Inc.†(a) | | | 3,243 | |
| | 1,350 | | Actavis, Inc.† | | | 170,397 | |
| | 4,219 | | Aetna, Inc. | | | 268,075 | |
| | 200 | | Affymetrix, Inc.(a) | | | 888 | |
| | 3,746 | | Agilent Technologies, Inc. | | | 160,179 | |
| | 300 | | Air Methods Corp.(a) | | | 10,164 | |
| | 400 | | Akorn, Inc.†(a) | | | 5,408 | |
| | 700 | | Albany Molecular Research, Inc.† | | | 8,309 | |
| | 500 | | Alere, Inc.†(a) | | | 12,250 | |
| | 1,800 | | Alexion Pharmaceuticals, Inc.† | | | 166,032 | |
| | 750 | | Align Technology, Inc.(a) | | | 27,780 | |
| | 1,000 | | Alkermes PLC(a) | | | 28,680 | |
| | 3,158 | | Allergan, Inc. | | | 266,030 | |
| | 140 | | Alliance HealthCare Services, Inc.† | | | 2,190 | |
| | 1,500 | | Allscripts Healthcare Solutions, Inc.†(a) | | | 19,410 | |
| | 496 | | Alnylam Pharmaceuticals, Inc.† | | | 15,381 | |
| | 100 | | AMAG Pharmaceuticals, Inc.† | | | 2,225 | |
| | 201 | | Amedisys, Inc.(a) | | | 2,336 | |
| | 600 | | American Caresource Holdings, Inc.† | | | 1,068 | |
| | 2,280 | | AmerisourceBergen Corp., Class A | | | 127,292 | |
| | 6,275 | | Amgen, Inc. | | | 619,091 | |
| | 300 | | Amicus Therapeutics, Inc.†(a) | | | 699 | |
| | 250 | | AMN Healthcare Services, Inc.†(a) | | | 3,580 | |
| | 400 | | Amsurg Corp., Class A | | | 14,040 | |
| | 500 | | Anika Therapeutics, Inc.†(a) | | | 8,500 | |
| | 300 | | Arena Pharmaceuticals, Inc.†(a) | | | 2,310 | |
| | 1,000 | | Ariad Pharmaceuticals, Inc.† | | | 17,490 | |
| | 1,000 | | Auxilium Pharmaceuticals, Inc. | | | 16,630 | |
| | 1,000 | | Baxano Surgical, Inc.† | | | 2,400 | |
| | 5,513 | | Baxter International, Inc. | | | 381,885 | |
| | 2,165 | | Becton Dickinson and Co.(a) | | | 213,967 | |
| | 200 | | Biodel, Inc.†(a) | | | 836 | |
| | 1,905 | | Biogen Idec, Inc. | | | 409,956 | |
| | 1,000 | | BioMarin Pharmaceutical, Inc. | | | 55,790 | |
| | 200 | | Bio-Rad Laboratories, Inc., Class A† | | | 22,440 | |
| | 13,689 | | Boston Scientific Corp.† | | | 126,897 | |
| | 16,450 | | Bristol-Myers Squibb Co. | | | 735,151 | |
| | 1,000 | | Brookdale Senior Living, Inc., Class A† | | | 26,440 | |
| Shares | | | | Value | |
| Health Care (continued) | | | |
| | 1,000 | | Bruker Corp.(a) | | $ | 16,150 | |
| | 200 | | BSD Medical Corp.†(a) | | | 264 | |
| | 825 | | C.R. Bard, Inc. | | | 89,661 | |
| | 700 | | Cadence Pharmaceuticals, Inc.†(a) | | | 4,774 | |
| | 1,850 | | Cambrex Corp. | | | 25,844 | |
| | 100 | | Capital Senior Living Corp.† | | | 2,390 | |
| | 3,211 | | Cardinal Health, Inc. | | | 151,559 | |
| | 2,293 | | CareFusion Corp.† | | | 84,497 | |
| | 1,960 | | Catamaran Corp. | | | 95,491 | |
| | 4,532 | | Celgene Corp.† | | | 529,836 | |
| | 226 | | Cell Therapeutics, Inc.† | | | 237 | |
| | 27 | | Celldex Therapeutics, Inc.(a) | | | 421 | |
| | 500 | | Cepheid, Inc.(a) | | | 17,210 | |
| | 1,600 | | Cerner Corp. | | | 153,744 | |
| | 500 | | Charles River Laboratories International, Inc.† | | | 20,515 | |
| | 3,050 | | Cigna Corp. | | | 221,094 | |
| | 200 | | Cleveland Biolabs, Inc.†(a) | | | 316 | |
| | 37 | | Codexis, Inc.† | | | 82 | |
| | 1,100 | | Community Health Systems, Inc. | | | 51,568 | |
| | 100 | | Computer Programs & Systems, Inc. | | | 4,914 | |
| | 300 | | CONMED Corp.(a) | | | 9,372 | |
| | 400 | | Cooper Cos., Inc. (The) | | | 47,620 | |
| | 1,500 | | Cornerstone Therapeutics, Inc.† | | | 12,000 | |
| | 550 | | Covance, Inc.†(a) | | | 41,877 | |
| | 500 | | Cubist Pharmaceuticals, Inc. | | | 24,150 | |
| | 300 | | Cyberonics, Inc.† | | | 15,588 | |
| | 1,491 | | Cynosure, Inc., Class A(a) | | | 38,739 | |
| | 2,300 | | Cytori Therapeutics, Inc.†(a) | | | 5,290 | |
| | 829 | | DaVita HealthCare Partners, Inc.† | | | 100,143 | |
| | 1,700 | | Dendreon Corp.(a) | | | 7,004 | |
| | 1,075 | | DENTSPLY International, Inc.(a) | | | 44,032 | |
| | 100 | | Dyax Corp.† | | | 346 | |
| | 1,100 | | Edwards Lifesciences Corp.†(a) | | | 73,920 | |
| | 10,645 | | Eli Lilly & Co. | | | 522,882 | |
| | 793 | | Emergent Biosolutions, Inc. | | | 11,435 | |
| | 889 | | Emeritus Corp. | | | 20,607 | |
| | 1,400 | | Endo Health Solutions, Inc.†(a) | | | 51,506 | |
| | 800 | | Exelixis, Inc.(a) | | | 3,632 | |
| | 8,740 | | Express Scripts Holding Co. | | | 539,171 | |
| | 100 | | Five Star Quality Care, Inc.†(a) | | | 561 | |
| | 2,725 | | Forest Laboratories, Inc. | | | 111,725 | |
| | 116 | | Furiex Pharmaceuticals, Inc.† | | | 3,952 | |
| | 500 | | Galena Biopharma, Inc.†(a) | | | 1,110 | |
| | 200 | | Genomic Health, Inc.†(a) | | | 6,342 | |
| | 50 | | Gentiva Health Services, Inc.(a) | | | 498 | |
| | 1,100 | | Geron Corp.(a) | | | 1,650 | |
| | 12,750 | | Gilead Sciences, Inc.(a) | | | 652,928 | |
| | 450 | | GTx, Inc.† | | | 2,970 | |
| | 1,700 | | Halozyme Therapeutics, Inc.(a) | | | 13,498 | |
| | 500 | | HCA Holdings, Inc. | | | 18,030 | |
| | 3,350 | | Health Management Associates, Inc., Class A(a) | | | 52,662 | |
| | 700 | | Health Net, Inc. | | | 22,274 | |
| | 1,100 | | HealthSouth Corp. | | | 31,680 | |
| | 872 | | Henry Schein, Inc.(a) | | | 83,494 | |
| | 300 | | Hill-Rom Holdings, Inc. | | | 10,104 | |
| | 2,452 | | Hologic, Inc. | | | 47,324 | |
| | 1,740 | | Hospira, Inc.(a) | | | 66,659 | |
| | 1,581 | | Humana, Inc. | | | 133,405 | |
| | 200 | | ICU Medical, Inc. | | | 14,412 | |
| | 1,300 | | Idenix Pharmaceuticals, Inc.†(a) | | | 4,693 | |
| | 400 | | IDEXX Laboratories, Inc.(a) | | | 35,912 | |
| | 1,388 | | Illumina, Inc.†(a) | | | 103,878 | |
| | 1,000 | | ImmunoGen, Inc.(a) | | | 16,590 | |
| | 1,000 | | Impax Laboratories, Inc.† | | | 19,930 | |
| | 1,300 | | Incyte Corp., Ltd.(a) | | | 28,600 | |
Wilshire Mutual Funds, Inc. Wilshire 5000 IndexSM Fund Schedule of Investments | |
| Shares | | | | Value | |
| Health Care (continued) | | | |
| | 600 | | Infinity Pharmaceuticals, Inc. | | $ | 9,750 | |
| | 300 | | Integra LifeSciences Holdings Corp.†(a) | | | 10,989 | |
| | 562 | | InterMune, Inc.(a) | | | 5,406 | |
| | 365 | | Intuitive Surgical, Inc. | | | 184,902 | |
| | 1,000 | | Ironwood Pharmaceuticals, Inc., Class A†(a) | | | 9,950 | |
| | 700 | | Isis Pharmaceuticals, Inc.(a) | | | 18,809 | |
| | 29,685 | | Johnson & Johnson | | | 2,548,754 | |
| | 300 | | Keryx Biopharmaceuticals, Inc.†(a) | | | 2,241 | |
| | 1,075 | | Laboratory Corp. of America Holdings†(a) | | | 107,607 | |
| | 200 | | LCA-Vision, Inc.† | | | 604 | |
| | 600 | | LHC Group, Inc.(a) | | | 11,748 | |
| | 1,833 | | Life Technologies Corp. | | | 135,660 | |
| | 565 | | LifePoint Hospitals, Inc. | | | 27,595 | |
| | 16 | | Ligand Pharmaceuticals, Inc., Class B†(a) | | | 599 | |
| | 400 | | Magellan Health Services, Inc.† | | | 22,432 | |
| | 500 | | MAKO Surgical Corp.†(a) | | | 6,025 | |
| | 1,600 | | MannKind Corp.(a) | | | 10,400 | |
| | 600 | | Masimo Corp. | | | 12,720 | |
| | 200 | | Maxygen, Inc. | | | 496 | |
| | 2,475 | | McKesson Corp. | | | 283,388 | |
| | 400 | | MedAssets, Inc.† | | | 7,096 | |
| | 725 | | Medivation, Inc.†(a) | | | 35,670 | |
| | 600 | | MEDNAX, Inc. | | | 54,948 | |
| | 10,297 | | Medtronic, Inc. | | | 529,986 | |
| | 30,130 | | Merck & Co., Inc. | | | 1,399,539 | |
| | 100 | | Merge Healthcare, Inc.† | | | 360 | |
| | 200 | | Mettler-Toledo International, Inc. | | | 40,240 | |
| | 600 | | MGC Diagnostics Corp. | | | 5,010 | |
| | 600 | | Molina Healthcare, Inc.†(a) | | | 22,308 | |
| | 200 | | Momenta Pharmaceuticals, Inc.† | | | 3,012 | |
| | 4,275 | | Mylan, Inc.† | | | 132,653 | |
| | 500 | | Myriad Genetics, Inc.† | | | 13,435 | |
| | 300 | | National Healthcare Corp. | | | 14,340 | |
| | 950 | | Nektar Therapeutics | | | 10,973 | |
| | 200 | | Neurocrine Biosciences, Inc.†(a) | | | 2,676 | |
| | 1,000 | | NuVasive, Inc.† | | | 24,790 | |
| | 1,000 | | NxStage Medical, Inc.† | | | 14,280 | |
| | 128 | | Oculus Innovative Sciences, Inc.†(a) | | | 330 | |
| | 1,300 | | Omnicare, Inc.(a) | | | 62,023 | |
| | 325 | | Onyx Pharmaceuticals, Inc.†(a) | | | 28,217 | |
| | 3,000 | | Opko Health, Inc.†(a) | | | 21,300 | |
| | 1,500 | | Optimer Pharmaceuticals, Inc.(a) | | | 21,705 | |
| | 750 | | Orexigen Therapeutics, Inc.†(a) | | | 4,388 | |
| | 700 | | Owens & Minor, Inc.(a) | | | 23,681 | |
| | 600 | | PAREXEL International Corp.(a) | | | 27,564 | |
| | 950 | | Patterson Cos., Inc.(a) | | | 35,720 | |
| | 800 | | PDI, Inc.† | | | 3,760 | |
| | 1,100 | | PDL BioPharma, Inc.(a) | | | 8,492 | |
| | 1,517 | | PerkinElmer, Inc. | | | 49,303 | |
| | 5 | | Pernix Therapeutics Holdings† | | | 18 | |
| | 850 | | Perrigo Co. | | | 102,850 | |
| | 76,487 | | Pfizer, Inc. | | | 2,142,401 | |
| | 575 | | Pharmacyclics, Inc.† | | | 45,695 | |
| | 381 | | PharMerica Corp. | | | 5,281 | |
| | 400 | | Pozen, Inc.† | | | 2,004 | |
| | 800 | | Progenics Pharmaceuticals, Inc.† | | | 3,568 | |
| | 200 | | Providence Service Corp. (The)†(a) | | | 5,818 | |
| | 1,575 | | Quest Diagnostics, Inc.(a) | | | 95,492 | |
| | 800 | | Questcor Pharmaceuticals, Inc.(a) | | | 36,368 | |
| | 600 | | Regeneron Pharmaceuticals, Inc.(a) | | | 134,928 | |
| | 1,800 | | ResMed, Inc.(a) | | | 81,234 | |
| | 1,600 | | Rigel Pharmaceuticals, Inc.†(a) | | | 5,344 | |
| | 418 | | RTI Biologics, Inc.† | | | 1,572 | |
| | 600 | | Sagent Pharmaceuticals, Inc.†(a) | | | 12,588 | |
| | 600 | | Salix Pharmaceuticals, Ltd. | | | 39,690 | |
| Shares | | | | Value | |
| Health Care (continued) | | | |
| | 300 | | Sangamo Biosciences, Inc.(a) | | $ | 2,343 | |
| | 1,500 | | Seattle Genetics, Inc.†(a) | | | 47,190 | |
| | 1,000 | | Select Medical Holdings Corp. | | | 8,200 | |
| | 1,500 | | Sequenom, Inc.†(a) | | | 6,315 | |
| | 600 | �� | Simulations Plus, Inc. | | | 2,502 | |
| | 350 | | Sirona Dental Systems, Inc. | | | 23,058 | |
| | 700 | | Skilled Healthcare Group, Inc., Class A† | | | 4,676 | |
| | 600 | | Solta Medical, Inc.† | | | 1,368 | |
| | 2,700 | | St. Jude Medical, Inc. | | | 123,201 | |
| | 650 | | STERIS Corp. | | | 27,872 | |
| | 3,720 | | Stryker Corp. | | | 240,610 | |
| | 200 | | Symmetry Medical, Inc.† | | | 1,684 | |
| | 400 | | Synta Pharmaceuticals Corp.†(a) | | | 1,996 | |
| | 1,000 | | Team Health Holdings, Inc. | | | 41,070 | |
| | 500 | | Techne Corp. | | | 34,540 | |
| | 500 | | Teleflex, Inc. | | | 38,745 | |
| | 931 | | Tenet Healthcare Corp.† | | | 42,919 | |
| | 1,000 | | Theravance, Inc.(a) | | | 38,530 | |
| | 3,840 | | Thermo Fisher Scientific, Inc. | | | 324,979 | |
| | 600 | | Thoratec Corp.† | | | 18,786 | |
| | 80 | | Transcept Pharmaceuticals, Inc.† | | | 242 | |
| | 600 | | Triple-S Management Corp., Class B†(a) | | | 12,882 | |
| | 600 | | United Therapeutics Corp.(a) | | | 39,492 | |
| | 10,380 | | UnitedHealth Group, Inc. | | | 679,682 | |
| | 500 | | Universal American Corp.(a) | | | 4,445 | |
| | 1,100 | | Universal Health Services, Inc., Class B | | | 73,656 | |
| | 1,200 | | Varian Medical Systems, Inc.(a) | | | 80,940 | |
| | 500 | | VCA Antech, Inc.† | | | 13,045 | |
| | 17 | | Venaxis, Inc.† | | | 20 | |
| | 1,750 | | Vertex Pharmaceuticals, Inc. | | | 139,773 | |
| | 700 | | ViroPharma, Inc.(a) | | | 20,055 | |
| | 500 | | Volcano Corp.(a) | | | 9,065 | |
| | 1,000 | | Waters Corp. | | | 100,050 | |
| | 3,063 | | WellPoint, Inc. | | | 250,676 | |
| | 2,036 | | Zimmer Holdings, Inc.(a) | | | 152,578 | |
| | | | | | | 21,117,193 | |
| Industrials — 10.9% | | | | |
| | 675 | | 3D Systems Corp.†(a) | | | 29,633 | |
| | 7,385 | | 3M Co. | | | 807,550 | |
| | 300 | | Acacia Research Corp.(a) | | | 6,705 | |
| | 453 | | ACCO Brands Corp.†(a) | | | 2,881 | |
| | 300 | | Acme United Corp.(a) | | | 3,855 | |
| | 590 | | Actuant Corp., Class A(a) | | | 19,452 | |
| | 300 | | Acuity Brands, Inc.(a) | | | 22,656 | |
| | 2,500 | | ADT Corp. | | | 99,625 | |
| | 1,100 | | AECOM Technology Corp.† | | | 34,969 | |
| | 850 | | AGCO Corp. | | | 42,661 | |
| | 1,000 | | Air Lease Corp., Class A(a) | | | 27,590 | |
| | 1,200 | | Aircastle, Ltd. | | | 19,188 | |
| | 600 | | Alaska Air Group, Inc.† | | | 31,200 | |
| | 100 | | Albany International Corp., Class A | | | 3,298 | |
| | 250 | | Alliant Techsystems, Inc. | | | 20,582 | |
| | 100 | | AMERCO | | | 16,190 | |
| | 2,362 | | AMETEK, Inc. | | | 99,912 | |
| | 3,275 | | AMR Corp.† | | | 13,198 | |
| | 1,500 | | AMREP Corp.†(a) | | | 13,875 | |
| | 500 | | Apogee Enterprises, Inc. | | | 12,000 | |
| | 200 | | Armstrong World Industries, Inc. | | | 9,558 | |
| | 200 | | Astec Industries, Inc. | | | 6,858 | |
| | 1,100 | | Avery Dennison Corp. | | | 47,036 | |
| | 992 | | Avis Budget Group, Inc.† | | | 28,520 | |
| | 600 | | AZZ, Inc. | | | 23,136 | |
| | 1,075 | | B/E Aerospace, Inc. | | | 67,811 | |
| | 1,437 | | Babcock & Wilcox Co. (The)(a) | | | 43,153 | |
| | 600 | | Barnes Group, Inc. | | | 17,994 | |
| | 500 | | Blount International, Inc. | | | 5,910 | |
| | 900 | | BlueLinx Holdings, Inc.†(a) | | | 1,935 | |
Wilshire Mutual Funds, Inc. Wilshire 5000 IndexSM Fund Schedule of Investments | |
| Shares | | | | Value | |
| Industrials (continued) | | | |
| | 7,515 | | Boeing Co. (The) | | $ | 769,837 | |
| | 445 | | Brady Corp., Class A | | | 13,675 | |
| | 450 | | Brink's Co. (The) | | | 11,479 | |
| | 450 | | Builders FirstSource, Inc.† | | | 2,691 | |
| | 500 | | Carlisle Cos., Inc. | | | 31,155 | |
| | 100 | | Casella Waste Systems, Inc., Class A† | | | 431 | |
| | 6,606 | | Caterpillar, Inc.(a) | | | 544,929 | |
| | 1,300 | | CBIZ, Inc.†(a) | | | 8,723 | |
| | 400 | | CDI Corp. | | | 5,664 | |
| | 400 | | Ceco Environmental Corp.(a) | | | 4,920 | |
| | 300 | | Celadon Group, Inc. | | | 5,475 | |
| | 800 | | Cenveo, Inc.†(a) | | | 1,704 | |
| | 1,525 | | CH Robinson Worldwide, Inc.(a) | | | 85,873 | |
| | 400 | | Chart Industries, Inc.†(a) | | | 37,636 | |
| | 77 | | Chicago Bridge & Iron Co. NV | | | 4,594 | |
| | 1,032 | | Cintas Corp. | | | 46,997 | |
| | 400 | | CLARCOR, Inc. | | | 20,884 | |
| | 540 | | Clean Harbors, Inc.†(a) | | | 27,286 | |
| | 300 | | Coleman Cable, Inc. | | | 5,418 | |
| | 400 | | Columbus McKinnon Corp. | | | 8,528 | |
| | 900 | | Comfort Systems USA, Inc. | | | 13,428 | |
| | 300 | | Commercial Vehicle Group, Inc.†(a) | | | 2,238 | |
| | 550 | | Con-way, Inc. | | | 21,428 | |
| | 1,400 | | Copart, Inc. | | | 43,120 | |
| | 1,750 | | Covanta Holding Corp.(a) | | | 35,035 | |
| | 100 | | Covenant Transportation Group, Inc., Class A† | | | 624 | |
| | 300 | | Crane Co. | | | 17,976 | |
| | 9,950 | | CSX Corp. | | | 230,741 | |
| | 1,805 | | Cummins, Inc. | | | 195,770 | |
| | 300 | | Curtiss-Wright Corp. | | | 11,118 | |
| | 6,136 | | Danaher Corp. | | | 388,409 | |
| | 3,813 | | Deere & Co.(a) | | | 309,806 | |
| | 10,050 | | Delta Air Lines, Inc. | | | 188,035 | |
| | 1,500 | | Dolan Co. (The)† | | | 2,445 | |
| | 1,225 | | Donaldson Co., Inc.(a) | | | 43,683 | |
| | 1,758 | | Dover Corp. | | | 136,526 | |
| | 500 | | Dun & Bradstreet Corp.(a) | | | 48,725 | |
| | 100 | | DXP Enterprises, Inc.(a) | | | 6,660 | |
| | 400 | | Dynamic Materials Corp.(a) | | | 6,604 | |
| | 450 | | Eagle Bulk Shipping, Inc.† | | | 1,642 | |
| | 3,800 | | Eaton Corp. PLC | | | 250,078 | |
| | 500 | | EMCOR Group, Inc. | | | 20,325 | |
| | 7,353 | | Emerson Electric Co. | | | 401,033 | |
| | 700 | | Empire Resources, Inc.(a) | | | 3,479 | |
| | 550 | | Encore Wire Corp. | | | 18,755 | |
| | 500 | | Energy Recovery, Inc.†(a) | | | 2,065 | |
| | 300 | | EnerNOC, Inc.† | | | 3,978 | |
| | 500 | | EnerSys, Inc. | | | 24,520 | |
| | 179 | | Engility Holdings, Inc.(a) | | | 5,087 | |
| | 50 | | Ennis, Inc. | | | 864 | |
| | 1,375 | | Equifax, Inc. | | | 81,029 | |
| | 200 | | ESCO Technologies, Inc. | | | 6,476 | |
| | 2,200 | | Exelis, Inc. | | | 30,338 | |
| | 2,425 | | Expeditors International of Washington, Inc. | | | 92,174 | |
| | 3,000 | | Fastenal Co.(a) | | | 137,550 | |
| | 1,000 | | Federal Signal Corp. | | | 8,750 | |
| | 2,759 | | FedEx Corp. | | | 271,982 | |
| | 1,515 | | Flowserve Corp.(a) | | | 81,825 | |
| | 1,500 | | Fluor Corp. | | | 88,965 | |
| | 1,900 | | Fortune Brands Home & Security, Inc. | | | 73,606 | |
| | 600 | | Franklin Electric Co., Inc. | | | 20,190 | |
| | 500 | | FreightCar America, Inc.(a) | | | 8,495 | |
| | 100 | | Frozen Food Express Industries† | | | 161 | |
| | 600 | | FTI Consulting, Inc.(a) | | | 19,734 | |
| | 700 | | Fuel Tech, Inc.† | | | 2,681 | |
| Shares | | | | Value | |
| Industrials (continued) | | | |
| | 500 | | FuelCell Energy, Inc.(a) | | $ | 635 | |
| | 300 | | Furmanite Corp.† | | | 2,007 | |
| | 750 | | Gardner Denver, Inc. | | | 56,385 | |
| | 200 | | GATX Corp. | | | 9,486 | |
| | 1,500 | | GenCorp, Inc.(a) | | | 24,390 | |
| | 625 | | General Cable Corp. | | | 19,219 | |
| | 3,240 | | General Dynamics Corp. | | | 253,789 | |
| | 110,646 | | General Electric Co. | | | 2,565,880 | |
| | 475 | | Genessee & Wyoming, Inc., Class A | | | 40,299 | |
| | 406 | | Gorman-Rupp Co. (The)(a) | | | 12,927 | |
| | 487 | | Graco, Inc. | | | 30,783 | |
| | 1,350 | | GrafTech International, Ltd.(a) | | | 9,828 | |
| | 400 | | Granite Construction, Inc. | | | 11,904 | |
| | 1,500 | | Great Lakes Dredge & Dock Corp.(a) | | | 11,730 | |
| | 550 | | Greenbrier Cos., Inc.†(a) | | | 13,403 | |
| | 350 | | Griffon Corp. | | | 3,937 | |
| | 850 | | Hardinge, Inc. | | | 12,563 | |
| | 1,200 | | Harsco Corp. | | | 27,828 | |
| | 1,500 | | Hawaiian Holdings, Inc.(a) | | | 9,165 | |
| | 200 | | Heidrick & Struggles International, Inc. | | | 3,344 | |
| | 600 | | Herman Miller, Inc. | | | 16,242 | |
| | 2,150 | | Hertz Global Holdings, Inc.†(a) | | | 53,320 | |
| | 1,550 | | Hexcel Corp. | | | 52,777 | |
| | 300 | | Hill International, Inc.† | | | 822 | |
| | 400 | | HNI Corp.(a) | | | 14,428 | |
| | 7,925 | | Honeywell International, Inc. | | | 628,770 | |
| | 42 | | Horizon Lines, Inc., Class A† | | | 55 | |
| | 300 | | Hubbell, Inc., Class B | | | 29,700 | |
| | 525 | | Huntington Ingalls Industries, Inc. | | | 29,652 | |
| | 400 | | Hurco Cos., Inc.(a) | | | 11,508 | |
| | 200 | | Huron Consulting Group, Inc. | | | 9,248 | |
| | 200 | | Hyster-Yale Materials Handling, Inc. | | | 12,558 | |
| | 200 | | Hyster-Yale Materials Handling, Inc., Class B(b) | | | 12,558 | |
| | 975 | | IDEX Corp. | | | 52,465 | |
| | 450 | | IHS, Inc., Class A | | | 46,971 | |
| | 1,000 | | II-VI, Inc. | | | 16,260 | |
| | 4,666 | | Illinois Tool Works, Inc. | | | 322,747 | |
| | 875 | | Industrial Services of America, Inc.†(a) | | | 2,214 | |
| | 500 | | InnerWorkings, Inc.†(a) | | | 5,425 | |
| | 100 | | Innovative Solutions & Support, Inc. | | | 640 | |
| | 36 | | Insperity, Inc. | | | 1,091 | |
| | 500 | | Integrated Electrical Services, Inc.† | | | 2,225 | |
| | 1,300 | | Interface, Inc., Class A | | | 22,061 | |
| | 400 | | International Shipholding Corp.(a) | | | 9,332 | |
| | 400 | | Intersections, Inc.(a) | | | 3,508 | |
| | 1,796 | | Iron Mountain, Inc. | | | 47,792 | |
| | 1,100 | | ITT Corp. | | | 32,351 | |
| | 1,000 | | Jacobs Engineering Group, Inc.† | | | 55,130 | |
| | 1,075 | | JB Hunt Transport Services, Inc. | | | 77,658 | |
| | 2,525 | | JetBlue Airways Corp.†(a) | | | 15,908 | |
| | 251 | | John Bean Technologies Corp. | | | 5,274 | |
| | 1,075 | | Joy Global, Inc.(a) | | | 52,170 | |
| | 200 | | Kadant, Inc. | | | 6,034 | |
| | 1,115 | | Kansas City Southern | | | 118,145 | |
| | 1,000 | | KAR Auction Services, Inc. | | | 22,870 | |
| | 1,550 | | KBR, Inc. | | | 50,375 | |
| | 400 | | Kelly Services, Inc., Class A(a) | | | 6,988 | |
| | 500 | | Kennametal, Inc.(a) | | | 19,415 | |
| | 150 | | Kforce, Inc. | | | 2,190 | |
| | 700 | | Kimball International, Inc., Class B | | | 6,797 | |
| | 600 | | Kirby Corp.†(a) | | | 47,724 | |
| | 387 | | Knight Transportation, Inc.(a) | | | 6,509 | |
| | 500 | | Knoll, Inc. | | | 7,105 | |
| | 10 | | Kratos Defense & Security Solutions, Inc.† | | | 65 | |
Wilshire Mutual Funds, Inc. Wilshire 5000 IndexSM Fund Schedule of Investments | |
| Shares | | | | Value | |
| Industrials (continued) | | | |
| | 1,075 | | L-3 Communications Holdings, Inc., Class 3(a) | | $ | 92,171 | |
| | 600 | | Landstar System, Inc.(a) | | | 30,900 | |
| | 600 | | Layne Christensen Co.(a) | | | 11,706 | |
| | 657 | | Lennox International, Inc.(a) | | | 42,403 | |
| | 1,000 | | Lincoln Electric Holdings, Inc. | | | 57,270 | |
| | 200 | | Lindsay Corp.(a) | | | 14,996 | |
| | 100 | | LMI Aerospace, Inc.† | | | 1,874 | |
| | 2,565 | | Lockheed Martin Corp. | | | 278,200 | |
| | 700 | | LSI Industries, Inc. | | | 5,663 | |
| | 1,600 | | Manitowoc Co., Inc. (The)(a) | | | 28,656 | |
| | 1,002 | | Manpowergroup, Inc. | | | 54,910 | |
| | 150 | | Marten Transport, Ltd. | | | 2,351 | |
| | 3,250 | | Masco Corp. | | | 63,343 | |
| | 1,000 | | MasTec, Inc.(a) | | | 32,900 | |
| | 450 | | Matson, Inc. | | | 11,250 | |
| | 1,550 | | Meritor, Inc.† | | | 10,928 | |
| | 3,150 | | Metalico, Inc.†(a) | | | 3,780 | |
| | 300 | | Mfri, Inc.†(a) | | | 3,411 | |
| | 200 | | Michael Baker Corp.(a) | | | 5,422 | |
| | 199 | | Middleby Corp.† | | | 33,848 | |
| | 406 | | Mobile Mini, Inc.† | | | 13,459 | |
| | 300 | | MSC Industrial Direct Co., Inc., Class A(a) | | | 23,238 | |
| | 1,900 | | Mueller Water Products, Inc., Class A | | | 13,129 | |
| | 200 | | NACCO Industries, Inc., Class A | | | 11,456 | |
| | 1,500 | | Navigant Consulting, Inc.† | | | 18,000 | |
| | 700 | | Navistar International Corp.†(a) | | | 19,432 | |
| | 500 | | NCI Building Systems, Inc.† | | | 7,645 | |
| | 600 | | Nordson Corp.(a) | | | 41,586 | |
| | 3,100 | | Norfolk Southern Corp.(a) | | | 225,215 | |
| | 2,300 | | Northrop Grumman Corp. | | | 190,440 | |
| | 900 | | Old Dominion Freight Line, Inc. | | | 37,458 | |
| | 100 | | On Assignment, Inc. | | | 2,672 | |
| | 500 | | Orion Energy Systems, Inc.† | | | 1,240 | |
| | 1,000 | | Oshkosh Corp. | | | 37,970 | |
| | 1,250 | | Owens Corning | | | 48,850 | |
| | 3,755 | | PACCAR, Inc. | | | 201,493 | |
| | 3,000 | | Pacer International, Inc.† | | | 18,930 | |
| | 1,250 | | Pall Corp. | | | 83,038 | |
| | 1,424 | | Parker Hannifin Corp.(a) | | | 135,850 | |
| | 1,300 | | Pentair, Ltd. | | | 74,997 | |
| | 600 | | Pike Electric Corp. | | | 7,380 | |
| | 2,125 | | Pitney Bowes, Inc.(a) | | | 31,195 | |
| | 300 | | Polypore International, Inc.†(a) | | | 12,090 | |
| | 250 | | PowerSecure International, Inc.† | | | 3,757 | |
| | 1,620 | | Precision Castparts Corp. | | | 366,136 | |
| | 1,000 | | Quanex Building Products Corp.(a) | | | 16,840 | |
| | 2,450 | | Quanta Services, Inc.† | | | 64,827 | |
| | 600 | | Raven Industries, Inc. | | | 17,988 | |
| | 3,550 | | Raytheon Co. | | | 234,726 | |
| | 400 | | Regal-Beloit Corp. | | | 25,936 | |
| | 1,500 | | Republic Airways Holdings, Inc.† | | | 16,995 | |
| | 3,218 | | Republic Services, Inc., Class A | | | 109,219 | |
| | 200 | | Resources Connection, Inc. | | | 2,320 | |
| | 1,700 | | Robert Half International, Inc. | | | 56,491 | |
| | 1,540 | | Rockwell Automation, Inc. | | | 128,036 | |
| | 1,425 | | Rockwell Collins, Inc. | | | 90,359 | |
| | 1,050 | | Rollins, Inc. | | | 27,195 | |
| | 913 | | Roper Industries, Inc. | | | 113,413 | |
| | 1,000 | | RPX Corp. | | | 16,800 | |
| | 1,850 | | RR Donnelley & Sons Co.(a) | | | 25,918 | |
| | 75 | | Rush Enterprises, Inc., Class A | | | 1,856 | |
| | 400 | | Ryder System, Inc. | | | 24,316 | |
| | 225 | | Saia, Inc. | | | 6,743 | |
| | 300 | | SIFCO Industries, Inc.(a) | | | 4,854 | |
| | 50 | | Simpson Manufacturing Co., Inc.(a) | | | 1,471 | |
| Shares | | | | Value | |
| Industrials (continued) | | | |
| | 1,100 | | SkyWest, Inc. | | $ | 14,894 | |
| | 600 | | Snap-on, Inc. | | | 53,628 | |
| | 5,574 | | Southwest Airlines Co. | | | 71,849 | |
| | 1,000 | | Spirit Aerosystems Holdings, Inc., Class A† | | | 21,480 | |
| | 1,000 | | Spirit Airlines, Inc. | | | 31,770 | |
| | 584 | | SPX Corp.(a) | | | 42,036 | |
| | 270 | | Standard Register Co.†(a) | | | 778 | |
| | 50 | | Standex International Corp. | | | 2,638 | |
| | 1,000 | | Steelcase, Inc., Class A | | | 14,580 | |
| | 775 | | Stericycle, Inc.† | | | 85,583 | |
| | 1,000 | | Swift Transportation Co., Class A | | | 16,540 | |
| | 100 | | Sypris Solutions, Inc. | | | 321 | |
| | 500 | | TAL International Group, Inc.(a) | | | 21,785 | |
| | 200 | | Taser International, Inc. | | | 1,704 | |
| | 500 | | Team, Inc.† | | | 18,925 | |
| | 500 | | Tecumseh Products Co., Class A† | | | 5,465 | |
| | 250 | | Tennant Co.(a) | | | 12,068 | |
| | 1,300 | | Terex Corp.(a) | | | 34,190 | |
| | 743 | | Tetra Tech, Inc.† | | | 17,468 | |
| | 700 | | Textainer Group Holdings, Ltd.(a) | | | 26,908 | |
| | 2,400 | | Textron, Inc. | | | 62,520 | |
| | 800 | | Timken Co. | | | 45,024 | |
| | 312 | | Titan International, Inc.(a) | | | 5,263 | |
| | 600 | | Toro Co. (The) | | | 27,246 | |
| | 700 | | Towers Watson & Co., Class A | | | 57,358 | |
| | 600 | | TransDigm Group, Inc. | | | 94,062 | |
| | 100 | | TRC Cos., Inc.(a) | | | 700 | |
| | 300 | | Trex Co., Inc.(a) | | | 14,247 | |
| | 100 | | Trimas Corp. | | | 3,728 | |
| | 900 | | Trinity Industries, Inc. | | | 34,596 | |
| | 300 | | Triumph Group, Inc.(a) | | | 23,745 | |
| | 800 | | TrueBlue, Inc. | | | 16,840 | |
| | 500 | | Tutor Perini Corp. | | | 9,045 | |
| | 400 | | Twin Disc, Inc. | | | 9,480 | |
| | 200 | | Ultralife Corp.† | | | 712 | |
| | 200 | | UniFirst Corp. | | | 18,250 | |
| | 4,572 | | Union Pacific Corp. | | | 705,368 | |
| | 2,980 | | United Continental Holdings, Inc. | | | 93,244 | |
| | 7,921 | | United Parcel Service, Inc., Class B | | | 685,008 | |
| | 1,008 | | United Rentals, Inc.(a) | | | 50,309 | |
| | 9,820 | | United Technologies Corp. | | | 912,671 | |
| | 850 | | URS Corp.(a) | | | 40,137 | |
| | 1,500 | | US Airways Group, Inc.(a) | | | 24,630 | |
| | 500 | | US Ecology, Inc. | | | 13,720 | |
| | 900 | | UTi Worldwide, Inc. | | | 14,823 | |
| | 259 | | Valmont Industries, Inc. | | | 37,060 | |
| | 1,500 | | Verisk Analytics, Inc., Class A | | | 89,550 | |
| | 400 | | Viad Corp. | | | 9,808 | |
| | 300 | | Vicor Corp. | | | 2,055 | |
| | 750 | | Volt Information Sciences, Inc.†(a) | | | 5,400 | |
| | 50 | | Wabash National Corp.(a) | | | 509 | |
| | 591 | | WABCO Holdings, Inc. | | | 44,142 | |
| | 600 | | Wabtec Corp. | | | 32,058 | |
| | 1,462 | | Waste Connections, Inc.(a) | | | 60,147 | |
| | 4,050 | | Waste Management, Inc. | | | 163,337 | |
| | 300 | | Watts Water Technologies, Inc., Class A(a) | | | 13,602 | |
| | 250 | | Werner Enterprises, Inc.(a) | | | 6,043 | |
| | 600 | | WESCO International, Inc.(a) | | | 40,776 | |
| | 500 | | Woodward, Inc. | | | 20,000 | |
| | 585 | | WW Grainger, Inc. | | | 147,526 | |
| | 2,200 | | Xylem, Inc. | | | 59,268 | |
| | | | | | | 19,219,120 | |
| Information Technology — 17.3% | | | | |
| | 546 | | Accelrys, Inc.† | | | 4,586 | |
| | 95 | | ACI Worldwide, Inc.†(a) | | | 4,416 | |
Wilshire Mutual Funds, Inc. Wilshire 5000 IndexSM Fund Schedule of Investments | |
| Shares | | | | Value | |
| Information Technology (continued) | | | |
| | 4,638 | | Activision Blizzard, Inc. | | $ | 66,138 | |
| | 800 | | Acxiom Corp.† | | | 18,144 | |
| | 600 | | ADDvantage Technologies Group, Inc.†(a) | | | 1,356 | |
| | 5,087 | | Adobe Systems, Inc. | | | 231,764 | |
| | 600 | | ADTRAN, Inc.(a) | | | 14,766 | |
| | 700 | | Advanced Energy Industries, Inc.† | | | 12,187 | |
| | 6,750 | | Advanced Micro Devices, Inc.(a) | | | 27,540 | |
| | 1,000 | | Advent Software, Inc.† | | | 35,060 | |
| | 500 | | Aehr Test Systems† | | | 645 | |
| | 1,000 | | Aeroflex Holding Corp.†(a) | | | 7,890 | |
| | 500 | | Agilysys, Inc.†(a) | | | 5,645 | |
| | 1,959 | | Akamai Technologies, Inc.† | | | 83,355 | |
| | 650 | | Alliance Data Systems Corp.†(a) | | | 117,669 | |
| | 2,950 | | Altera Corp. | | | 97,320 | |
| | 1,050 | | Amkor Technology, Inc.(a) | | | 4,420 | |
| | 1,625 | | Amphenol Corp., Class A | | | 126,652 | |
| | 300 | | ANADIGICS, Inc.†(a) | | | 660 | |
| | 2,875 | | Analog Devices, Inc. | | | 129,548 | |
| | 200 | | Anaren, Inc.†(a) | | | 4,588 | |
| | 922 | | ANSYS, Inc. | | | 67,398 | |
| | 716 | | AOL, Inc. | | | 26,120 | |
| | 9,948 | | Apple, Inc. | | | 3,940,204 | |
| | 13,633 | | Applied Materials, Inc. | | | 203,268 | |
| | 1,500 | | Applied Micro Circuits Corp.† | | | 13,200 | |
| | 854 | | ARRIS Group, Inc.†(a) | | | 12,255 | |
| | 1,350 | | Arrow Electronics, Inc.† | | | 53,797 | |
| | 1,500 | | Aruba Networks, Inc. | | | 23,040 | |
| | 700 | | Aspen Technology, Inc.† | | | 20,153 | |
| | 100 | | Astea International, Inc.† | | | 203 | |
| | 5,250 | | Atmel Corp. | | | 38,588 | |
| | 486 | | ATMI, Inc.† | | | 11,494 | |
| | 2,200 | | Autodesk, Inc. | | | 74,668 | |
| | 5,165 | | Automatic Data Processing, Inc. | | | 355,662 | |
| | 1,778 | | Aviat Networks, Inc.† | | | 4,658 | |
| | 1,275 | | Avnet, Inc.† | | | 42,840 | |
| | 1,000 | | AVX Corp. | | | 11,750 | |
| | 289 | | Axcelis Technologies, Inc.† | | | 526 | |
| | 200 | | Badger Meter, Inc. | | | 8,910 | |
| | 300 | | Bel Fuse, Inc., Class B | | | 4,035 | |
| | 1,150 | | Benchmark Electronics, Inc. | | | 23,115 | |
| | 298 | | Black Box Corp. | | | 7,545 | |
| | 300 | | Blackbaud, Inc. | | | 9,771 | |
| | 250 | | Blucora, Inc.(a) | | | 4,635 | |
| | 1,392 | | BMC Software, Inc. | | | 62,835 | |
| | 1,000 | | Booz Allen Hamilton Holding Corp., Class A | | | 17,380 | |
| | 5,465 | | Broadcom Corp., Class A | | | 184,498 | |
| | 1,250 | | Broadridge Financial Solutions, Inc.(a) | | | 33,225 | |
| | 7,350 | | Brocade Communications Systems, Inc. | | | 42,336 | |
| | 106 | | Brooks Automation, Inc. | | | 1,031 | |
| | 100 | | BTU International, Inc.† | | | 240 | |
| | 3,472 | | CA, Inc. | | | 99,403 | |
| | 100 | | Cabot Microelectronics Corp.†(a) | | | 3,301 | |
| | 2,402 | | Cadence Design Systems, Inc.(a) | | | 34,781 | |
| | 175 | | Calix, Inc.† | | | 1,768 | |
| | 200 | | Callidus Software, Inc.†(a) | | | 1,318 | |
| | 200 | | Cascade Microtech, Inc.† | | | 1,332 | |
| | 500 | | Cavium, Inc.(a) | | | 17,685 | |
| | 900 | | CIBER, Inc.(a) | | | 3,006 | |
| | 997 | | Ciena Corp.†(a) | | | 19,362 | |
| | 200 | | Cinedigm Digital Cinema Corp., Class A†(a) | | | 284 | |
| | 400 | | Cirrus Logic, Inc.(a) | | | 6,944 | |
| | 56,598 | | Cisco Systems, Inc. | | | 1,375,897 | |
| | 1,800 | | Citrix Systems, Inc. | | | 108,594 | |
| | 500 | | Cognex Corp. | | | 22,610 | |
| Shares | | | | Value | |
| Information Technology (continued) | | | |
| | 3,175 | | Cognizant Technology Solutions Corp., Class A† | | $ | 198,787 | |
| | 400 | | Coherent, Inc.(a) | | | 22,028 | |
| | 375 | | CommVault Systems, Inc.† | | | 28,459 | |
| | 1,330 | | Computer Sciences Corp. | | | 58,214 | |
| | 2,025 | | Compuware Corp. | | | 20,959 | |
| | 400 | | comScore, Inc.† | | | 9,756 | |
| | 100 | | Comtech Telecommunications Corp. | | | 2,689 | |
| | 425 | | Concur Technologies, Inc.†(a) | | | 34,586 | |
| | 400 | | Constant Contact, Inc.(a) | | | 6,428 | |
| | 1,300 | | Convergys Corp. | | | 22,659 | |
| | 1,152 | | CoreLogic, Inc. | | | 26,692 | |
| | 500 | | Cornerstone OnDemand, Inc. | | | 21,645 | |
| | 15,969 | | Corning, Inc. | | | 227,239 | |
| | 25 | | CoStar Group, Inc. | | | 3,227 | |
| | 100 | | Cray, Inc.(a) | | | 1,964 | |
| | 900 | | Cree, Inc. | | | 57,474 | |
| | 200 | | Crexendo, Inc.(a) | | | 540 | |
| | 1,128 | | CSG Systems International, Inc. | | | 24,478 | |
| | 100 | | CTS Corp. | | | 1,364 | |
| | 1,625 | | Cypress Semiconductor Corp.(a) | | | 17,436 | |
| | 800 | | Daktronics, Inc. | | | 8,208 | |
| | 600 | | Datalink Corp.† | | | 6,384 | |
| | 500 | | Dealertrack Technologies, Inc. | | | 17,715 | |
| | 16,700 | | Dell, Inc. | | | 222,945 | |
| | 1,000 | | Demand Media, Inc.(a) | | | 6,000 | |
| | 388 | | Dice Holdings, Inc.(a) | | | 3,574 | |
| | 650 | | Diebold, Inc.(a) | | | 21,898 | |
| | 51 | | Digital Ally, Inc.† | | | 372 | |
| | 700 | | Digital River, Inc.† | | | 13,139 | |
| | 300 | | Diodes, Inc. | | | 7,791 | |
| | 200 | | Document Security Systems, Inc.†(a) | | | 460 | |
| | 600 | | Dolby Laboratories, Inc., Class A(a) | | | 20,070 | |
| | 400 | | DST Systems, Inc. | | | 26,132 | |
| | 1,421 | | EarthLink, Inc.(a) | | | 8,824 | |
| | 12,050 | | eBay, Inc.† | | | 623,226 | |
| | 331 | | Ebix, Inc.(a) | | | 3,065 | |
| | 150 | | Echelon Corp.† | | | 316 | |
| | 400 | | EchoStar Corp., Class A† | | | 15,644 | |
| | 100 | | Electro Scientific Industries, Inc. | | | 1,076 | |
| | 3,600 | | Electronic Arts, Inc.† | | | 82,692 | |
| | 729 | | Electronics for Imaging, Inc. | | | 20,623 | |
| | 22,779 | | EMC Corp.(a) | | | 538,040 | |
| | 125 | | Emcore Corp.†(a) | | | 450 | |
| | 1,000 | | Emulex Corp. | | | 6,520 | |
| | 1,836 | | Entegris, Inc.† | | | 17,240 | |
| | 1,500 | | EPIQ Systems, Inc. | | | 20,205 | |
| | 400 | | Equinix, Inc.(a) | | | 73,888 | |
| | 500 | | Exar Corp.† | | | 5,385 | |
| | 200 | | Extreme Networks | | | 690 | |
| | 900 | | F5 Networks, Inc.† | | | 61,920 | |
| | 4,859 | | Facebook, Inc., Class A† | | | 120,795 | |
| | 550 | | FactSet Research Systems, Inc.(a) | | | 56,067 | |
| | 200 | | Fair Isaac Corp. | | | 9,166 | |
| | 1,250 | | Fairchild Semiconductor International, Inc., Class A | | | 17,250 | |
| | 900 | | FalconStor Software, Inc.† | | | 1,233 | |
| | 200 | | FARO Technologies, Inc.† | | | 6,764 | |
| | 2,610 | | Fidelity National Information Services, Inc. | | | 111,812 | |
| | 1,200 | | Finisar Corp.†(a) | | | 20,340 | |
| | 700 | | First Solar, Inc.†(a) | | | 31,311 | |
| | 1,323 | | Fiserv, Inc. | | | 115,643 | |
| | 350 | | FleetCor Technologies, Inc. | | | 28,455 | |
| | 1,500 | | FLIR Systems, Inc. | | | 40,455 | |
| | 350 | | FormFactor, Inc. | | | 2,363 | |
| | 255 | | Forrester Research, Inc. | | | 9,356 | |
Wilshire Mutual Funds, Inc. Wilshire 5000 IndexSM Fund Schedule of Investments | |
| Shares | | | | Value | |
| Information Technology (continued) | | | |
| | 1,000 | | Fortinet, Inc. | | $ | 17,500 | |
| | 1,000 | | Freescale Semiconductor, Ltd.† | | | 13,550 | |
| | 1,100 | | Gartner, Inc.† | | | 62,689 | |
| | 1,000 | | Genpact, Ltd. | | | 19,240 | |
| | 102 | | GigOptix, Inc.†(a) | | | 133 | |
| | 1,850 | | Global Cash Access Holdings, Inc. | | | 11,581 | |
| | 1,050 | | Global Payments, Inc. | | | 48,636 | |
| | 200 | | Globecomm Systems, Inc.†(a) | | | 2,528 | |
| | 400 | | Glu Mobile, Inc.(a) | | | 880 | |
| | 2,640 | | Google, Inc., Class A† | | | 2,324,177 | |
| | 1,100 | | GT Advanced Technologies, Inc.†(a) | | | 4,565 | |
| | 200 | | Guidance Software, Inc.†(a) | | | 1,748 | |
| | 800 | | Harmonic, Inc.† | | | 5,080 | |
| | 1,225 | | Harris Corp. | | | 60,331 | |
| | 19,927 | | Hewlett-Packard Co. | | | 494,190 | |
| | 300 | | Hittite Microwave Corp.† | | | 17,400 | |
| | 1,100 | | Hutchinson Technology, Inc.† | | | 5,203 | |
| | 1,000 | | IAC/InterActiveCorp. | | | 47,560 | |
| | 100 | | ID Systems, Inc.† | | | 503 | |
| | 8 | | iGO, Inc.† | | | 19 | |
| | 50 | | Ikanos Communications, Inc.† | | | 75 | |
| | 600 | | Infinera Corp.†(a) | | | 6,402 | |
| | 1,075 | | Informatica Corp. | | | 37,603 | |
| | 2,100 | | Ingram Micro, Inc., Class A | | | 39,879 | |
| | 500 | | Insight Enterprises, Inc.† | | | 8,870 | |
| | 1,560 | | Integrated Device Technology, Inc.† | | | 12,386 | |
| | 400 | | Integrated Silicon Solution, Inc.† | | | 4,384 | |
| | 53,043 | | Intel Corp.(a) | | | 1,284,701 | |
| | 350 | | Interactive Intelligence Group, Inc.† | | | 18,060 | |
| | 600 | | InterDigital, Inc. | | | 26,790 | |
| | 200 | | Intermec, Inc.(a) | | | 1,966 | |
| | 371 | | Internap Network Services Corp.†(a) | | | 3,068 | |
| | 11,180 | | International Business Machines Corp. | | | 2,136,610 | |
| | 350 | | International Rectifier Corp.†(a) | | | 7,329 | |
| | 600 | | Interphase Corp.†(a) | | | 1,602 | |
| | 850 | | Intersil Corp., Class A | | | 6,647 | |
| | 2,675 | | Intuit, Inc. | | | 163,255 | |
| | 381 | | IPG Photonics Corp.(a) | | | 23,138 | |
| | 500 | | Itron, Inc.† | | | 21,215 | |
| | 1,200 | | Ixia | | | 22,080 | |
| | 800 | | IXYS Corp.(a) | | | 8,848 | |
| | 450 | | j2 Global, Inc.(a) | | | 19,130 | |
| | 2,400 | | Jabil Circuit, Inc. | | | 48,912 | |
| | 1,000 | | Jack Henry & Associates, Inc. | | | 47,130 | |
| | 3,203 | | JDS Uniphase Corp. | | | 46,059 | |
| | 6,165 | | Juniper Networks, Inc.(a) | | | 119,046 | |
| | 233 | | Kemet Corp.† | | | 958 | |
| | 600 | | Key Tronic Corp.† | | | 6,210 | |
| | 100 | | Keynote Systems, Inc. | | | 1,976 | |
| | 1,275 | | KLA-Tencor Corp. | | | 71,056 | |
| | 400 | | Kulicke & Soffa Industries, Inc. | | | 4,424 | |
| | 1,787 | | Lam Research Corp.† | | | 79,236 | |
| | 200 | | Lattice Semiconductor Corp.†(a) | | | 1,014 | |
| | 500 | | Lender Processing Services, Inc. | | | 16,175 | |
| | 375 | | Lexmark International, Inc., Class A(a) | | | 11,464 | |
| | 2,100 | | Limelight Networks, Inc.†(a) | | | 4,725 | |
| | 1,725 | | Linear Technology Corp.(a) | | | 63,549 | |
| | 900 | | LinkedIn Corp., Class A† | | | 160,470 | |
| | 200 | | Littelfuse, Inc. | | | 14,922 | |
| | 193 | | Local Corp.† | | | 324 | |
| | 200 | | LoJack Corp.†(a) | | | 630 | |
| | 100 | | LRAD Corp.†(a) | | | 113 | |
| | 6,096 | | LSI Corp.† | | | 43,525 | |
| | 200 | | Marchex, Inc., Class B | | | 1,204 | |
| | 700 | | Market Leader, Inc.† | | | 7,490 | |
| | 5,750 | | Marvell Technology Group, Ltd. | | | 67,333 | |
| | 1,073 | | Mastercard, Inc., Class A | | | 616,438 | |
| Shares | | | | Value | |
| Information Technology (continued) | | | |
| | 400 | | Mattson Technology, Inc.†(a) | | $ | 872 | |
| | 1,900 | | Maxim Integrated Products, Inc. | | | 52,782 | |
| | 200 | �� | Measurement Specialties, Inc. | | | 9,306 | |
| | 42 | | Mediabistro, Inc.† | | | 66 | |
| | 1,200 | | Mentor Graphics Corp. | | | 23,460 | |
| | 100 | | Mercury Systems, Inc.†(a) | | | 922 | |
| | 400 | | Methode Electronics, Inc. | | | 6,804 | |
| | 600 | | Micrel, Inc.(a) | | | 5,928 | |
| | 1,537 | | Microchip Technology, Inc.(a) | | | 57,253 | |
| | 10,552 | | Micron Technology, Inc.(a) | | | 151,210 | |
| | 500 | | MICROS Systems, Inc.(a) | | | 21,575 | |
| | 650 | | Microsemi Corp. | | | 14,788 | |
| | 84,662 | | Microsoft Corp. | | | 2,923,379 | |
| | 600 | | MKS Instruments, Inc. | | | 15,924 | |
| | 1,175 | | Molex, Inc.(a) | | | 34,475 | |
| | 662 | | MoneyGram International, Inc. | | | 14,994 | |
| | 500 | | Monolithic Power Systems, Inc. | | | 12,055 | |
| | 1,550 | | Monster Worldwide, Inc.†(a) | | | 7,611 | |
| | 100 | | MoSys, Inc.† | | | 402 | |
| | 2,960 | | Motorola Solutions, Inc. | | | 170,881 | |
| | 1 | | Move, Inc. | | | 13 | |
| | 328 | | Multi-Fineline Electronix, Inc. | | | 4,858 | |
| | 200 | | Nanometrics, Inc.(a) | | | 2,934 | |
| | 900 | | NAPCO Security Technologies, Inc.† | | | 4,302 | |
| | 1,012 | | National Instruments Corp. | | | 28,275 | |
| | 100 | | Navarre Corp.† | | | 276 | |
| | 1,925 | | NCR Corp. | | | 63,506 | |
| | 3,450 | | NetApp, Inc.(a) | | | 130,341 | |
| | 500 | | Netlist, Inc.†(a) | | | 440 | |
| | 400 | | Netscout Systems, Inc.† | | | 9,336 | |
| | 600 | | NetSuite, Inc.† | | | 55,044 | |
| | 750 | | NeuStar, Inc., Class A(a) | | | 36,510 | |
| | 200 | | Newport Corp.† | | | 2,786 | |
| | 1,000 | | NIC, Inc. | | | 16,530 | |
| | 50 | | Novatel Wireless, Inc.† | | | 197 | |
| | 3,050 | | Nuance Communications, Inc.(a) | | | 56,059 | |
| | 100 | | NVE Corp.† | | | 4,682 | |
| | 5,825 | | NVIDIA Corp.(a) | | | 81,725 | |
| | 21 | | Oclaro, Inc.† | | | 25 | |
| | 600 | | OmniVision Technologies, Inc. | | | 11,190 | |
| | 5,105 | | ON Semiconductor Corp.† | | | 41,248 | |
| | 285 | | OpenTable, Inc.†(a) | | | 18,226 | |
| | 39,555 | | Oracle Corp. | | | 1,215,130 | |
| | 200 | | OSI Systems, Inc.† | | | 12,884 | |
| | 33 | | Overland Storage, Inc.† | | | 38 | |
| | 100 | | PAR Technology Corp.† | | | 403 | |
| | 10 | | Parametric Sound Corp.† | | | 163 | |
| | 600 | | Park Electrochemical Corp. | | | 14,406 | |
| | 200 | | Parkervision, Inc.†(a) | | | 910 | |
| | 3,650 | | Paychex, Inc.(a) | | | 133,298 | |
| | 400 | | PCM, Inc.†(a) | | | 3,840 | |
| | 300 | | Pegasystems, Inc. | | | 9,936 | |
| | 100 | | Pericom Semiconductor Corp. | | | 712 | |
| | 8 | | Pfsweb, Inc.† | | | 32 | |
| | 33 | | Pixelworks, Inc.† | | | 113 | |
| | 100 | | Planar Systems, Inc.† | | | 163 | |
| | 450 | | Plantronics, Inc. | | | 19,764 | |
| | 100 | | PLX Technology, Inc.† | | | 476 | |
| | 2,225 | | PMC - Sierra, Inc.† | | | 14,129 | |
| | 1,900 | | Polycom, Inc.† | | | 20,026 | |
| | 300 | | Power Integrations, Inc.(a) | | | 12,168 | |
| | 200 | | Power-One, Inc. | | | 1,264 | |
| | 220 | | PRGX Global, Inc.† | | | 1,208 | |
| | 1,240 | | PTC, Inc.† | | | 30,417 | |
| | 40 | | QAD, Inc., Class B | | | 417 | |
| | 1,000 | | QLIK Technologies, Inc. | | | 28,270 | |
| | 1,650 | | QLogic Corp. | | | 15,774 | |
Wilshire Mutual Funds, Inc. Wilshire 5000 IndexSM Fund Schedule of Investments | |
| Shares | | | | Value | |
| Information Technology (continued) | | | |
| | 18,250 | | QUALCOMM, Inc. | | $ | 1,114,710 | |
| | 900 | | Rackspace Hosting, Inc. | | | 34,101 | |
| | 1,000 | | Rambus, Inc.(a) | | | 8,590 | |
| | 1,000 | | RealD, Inc.(a) | | | 13,900 | |
| | 681 | | RealNetworks, Inc. | | | 5,148 | |
| | 1,490 | | Red Hat, Inc. | | | 71,252 | |
| | 600 | | Relm Wireless Corp.† | | | 1,800 | |
| | 2,627 | | RF Micro Devices, Inc. | | | 14,054 | |
| | 1,427 | | Riverbed Technology, Inc. | | | 22,204 | |
| | 300 | | Rosetta Stone, Inc.† | | | 4,422 | |
| | 1,020 | | Rovi Corp. | | | 23,297 | |
| | 340 | | Rudolph Technologies, Inc.(a) | | | 3,808 | |
| | 3,925 | | SAIC, Inc.(a) | | | 54,675 | |
| | 4,400 | | Salesforce.com, Inc.†(a) | | | 167,992 | |
| | 2,325 | | SanDisk Corp. | | | 142,057 | |
| | 1,833 | | Sanmina Corp.† | | | 26,304 | |
| | 1,650 | | Sapient Corp.† | | | 21,549 | |
| | 300 | | ScanSource, Inc.† | | | 9,600 | |
| | 600 | | Semtech Corp. | | | 21,018 | |
| | 300 | | ShoreTel, Inc.† | | | 1,209 | |
| | 100 | | Silicon Image, Inc.† | | | 585 | |
| | 500 | | Silicon Laboratories, Inc. | | | 20,705 | |
| | 1,707 | | Skyworks Solutions, Inc. | | | 37,366 | |
| | 300 | | Smith Micro Software, Inc.† | | | 318 | |
| | 500 | | SolarWinds, Inc. | | | 19,405 | |
| | 800 | | Solera Holdings, Inc. | | | 44,520 | |
| | 4,725 | | Sonus Networks, Inc. | | | 14,222 | |
| | 300 | | Sourcefire, Inc.(a) | | | 16,665 | |
| | 1,000 | | SS&C Technologies Holdings, Inc.† | | | 32,900 | |
| | 200 | | STEC, Inc.† | | | 1,344 | |
| | 3,575 | | SunEdison, Inc.† | | | 29,208 | |
| | 1,000 | | SunPower Corp., Class A(a) | | | 20,700 | |
| | 102 | | SYKES Enterprises, Inc.† | | | 1,608 | |
| | 7,083 | | Symantec Corp. | | | 159,155 | |
| | 100 | | Symmetricom, Inc.† | | | 449 | |
| | 300 | | SYNNEX Corp.(a) | | | 12,684 | |
| | 1,417 | | Synopsys, Inc. | | | 50,658 | |
| | 300 | | Syntel, Inc. | | | 18,861 | |
| | 550 | | Take-Two Interactive Software, Inc.†(a) | | | 8,233 | |
| | 700 | | Tech Data Corp. | | | 32,963 | |
| | 800 | | TechTarget, Inc.†(a) | | | 3,576 | |
| | 5,404 | | Tellabs, Inc. | | | 10,700 | |
| | 1,800 | | Teradata Corp. | | | 90,414 | |
| | 1,825 | | Teradyne, Inc.(a) | | | 32,065 | |
| | 1,000 | | Tessco Technologies, Inc.(a) | | | 26,400 | |
| | 400 | | Tessera Technologies, Inc. | | | 8,320 | |
| | 9,485 | | Texas Instruments, Inc. | | | 330,742 | |
| | 1,825 | | TIBCO Software, Inc. | | | 39,055 | |
| | 800 | | TiVo, Inc.† | | | 8,840 | |
| | 1,937 | | Total System Services, Inc. | | | 47,418 | |
| | 100 | | Travelzoo, Inc. | | | 2,726 | |
| | 2,534 | | Trimble Navigation, Ltd. | | | 65,909 | |
| | 1,300 | | TriQuint Semiconductor, Inc.(a) | | | 9,009 | |
| | 1,200 | | TTM Technologies, Inc. | | | 10,080 | |
| | 500 | | Tyler Technologies, Inc. | | | 34,275 | |
| | 400 | | Ultimate Software Group, Inc. | | | 46,916 | |
| | 427 | | Unisys Corp.(a) | | | 9,424 | |
| | 800 | | United Online, Inc. | | | 6,064 | |
| | 700 | | Universal Display Corp.(a) | | | 19,677 | |
| | 311 | | Unwired Planet, Inc.†(a) | | | 606 | |
| | 66 | | UTStarcom Holdings Corp.†(a) | | | 176 | |
| | 505 | | ValueClick, Inc.(a) | | | 12,463 | |
| | 450 | | VASCO Data Security International, Inc.† | | | 3,740 | |
| | 1,015 | | VeriFone Systems, Inc. | | | 17,062 | |
| | 1,416 | | VeriSign, Inc.(a) | | | 63,239 | |
| | 55 | | Viasystems Group, Inc.† | | | 634 | |
| | 475 | | VirnetX Holding Corp.(a) | | | 9,495 | |
| Shares | | | | Value | |
| Information Technology (continued) | | | |
| | 1,000 | | Virtusa Corp. | | $ | 22,160 | |
| | 5,350 | | Visa, Inc., Class A | | | 977,713 | |
| | 1,806 | | Vishay Intertechnology, Inc.(a) | | | 25,085 | |
| | 129 | | Vishay Precision Group, Inc. | | | 1,953 | |
| | 585 | | VMware, Inc., Class A(a) | | | 39,189 | |
| | 300 | | Volterra Semiconductor Corp. | | | 4,236 | |
| | 200 | | Web.com Group, Inc. | | | 5,120 | |
| | 958 | | WebMD Health Corp., Class A | | | 28,136 | |
| | 2,150 | | Western Digital Corp. | | | 133,493 | |
| | 6,454 | | Western Union Co. (The)(a) | | | 110,428 | |
| | 15 | | WPCS International, Inc.† | | | 66 | |
| | 13,095 | | Xerox Corp. | | | 118,772 | |
| | 2,175 | | Xilinx, Inc.(a) | | | 86,152 | |
| | 800 | | XO Group, Inc.† | | | 8,960 | |
| | 10,975 | | Yahoo!, Inc. | | | 275,582 | |
| | 825 | | Zebra Technologies Corp., Class A | | | 35,838 | |
| | 1,000 | | Zygo Corp.†(a) | | | 15,810 | |
| | | | | | | 30,319,162 | |
| Materials — 3.5% | | | | |
| | 81 | | A Schulman, Inc. | | | 2,172 | |
| | 1,995 | | Air Products & Chemicals, Inc. | | | 182,682 | |
| | 735 | | Airgas, Inc. | | | 70,163 | |
| | 1,875 | | AK Steel Holding Corp.(a) | | | 5,700 | |
| | 1,000 | | Albemarle Corp.(a) | | | 62,290 | |
| | 12,298 | | Alcoa, Inc.(a) | | | 96,170 | |
| | 1,050 | | Allegheny Technologies, Inc. | | | 27,626 | |
| | 900 | | Allied Nevada Gold Corp.(a) | | | 5,832 | |
| | 500 | | AM Castle & Co.†(a) | | | 7,880 | |
| | 200 | | AMCOL International Corp.(a) | | | 6,338 | |
| | 400 | | American Vanguard Corp. | | | 9,372 | |
| | 850 | | Aptargroup, Inc. | | | 46,929 | |
| | 717 | | Ashland, Inc. | | | 59,869 | |
| | 348 | | Balchem Corp. | | | 15,573 | |
| | 1,600 | | Ball Corp. | | | 66,464 | |
| | 1,150 | | Bemis Co., Inc.(a) | | | 45,011 | |
| | 300 | | Buckeye Technologies, Inc. | | | 11,112 | |
| | 700 | | Cabot Corp. | | | 26,194 | |
| | 500 | | Carpenter Technology Corp. | | | 22,535 | |
| | 1,500 | | Celanese Corp., Class A | | | 67,200 | |
| | 600 | | Century Aluminum Co.(a) | | | 5,568 | |
| | 619 | | CF Industries Holdings, Inc. | | | 106,159 | |
| | 1,005 | | Chemtura Corp.† | | | 20,402 | |
| | 1,400 | | Cliffs Natural Resources, Inc.(a) | | | 22,750 | |
| | 1,110 | | Coeur Mining, Inc. | | | 14,763 | |
| | 1,300 | | Commercial Metals Co. | | | 19,201 | |
| | 400 | | Compass Minerals International, Inc.(a) | | | 33,812 | |
| | 1,800 | | Core Molding Technologies, Inc.† | | | 16,056 | |
| | 2,000 | | Crown Holdings, Inc.(a) | | | 82,260 | |
| | 600 | | Cytec Industries, Inc. | | | 43,950 | |
| | 100 | | Deltic Timber Corp. | | | 5,782 | |
| | 400 | | Domtar Corp. | | | 26,600 | |
| | 10,736 | | Dow Chemical Co. (The)(a) | | | 345,377 | |
| | 1,316 | | Eastman Chemical Co. | | | 92,133 | |
| | 2,800 | | Ecolab, Inc. | | | 238,532 | |
| | 9,996 | | EI du Pont de Nemours & Co.(a) | | | 524,790 | |
| | 1,000 | | Ferro Corp. | | | 6,950 | |
| | 1,300 | | Flotek Industries, Inc.† | | | 23,322 | |
| | 1,275 | | FMC Corp. | | | 77,852 | |
| | 10,169 | | Freeport-McMoRan Copper & Gold, Inc. | | | 280,766 | |
| | 1,000 | | Friedman Industries, Inc.(a) | | | 9,850 | |
| | 500 | | Globe Specialty Metals, Inc.(a) | | | 5,435 | |
| | 2,900 | | Graphic Packaging Holding Co.† | | | 22,446 | |
| | 2,000 | | Headwaters, Inc.† | | | 17,680 | |
| | 3,400 | | Hecla Mining Co.(a) | | | 10,132 | |
| | 300 | | Horsehead Holding Corp.(a) | | | 3,843 | |
| | 2,150 | | Huntsman Corp. | | | 35,604 | |
| | 700 | | International Flavors & Fragrances, Inc. | | | 52,612 | |
Wilshire Mutual Funds, Inc. Wilshire 5000 IndexSM Fund Schedule of Investments | |
| Shares | | | | Value | |
| Materials (continued) | | | |
| | 4,542 | | International Paper Co. | | $ | 201,256 | |
| | 400 | | Intrepid Potash, Inc. | | | 7,620 | |
| | 1,100 | | Louisiana-Pacific Corp. | | | 16,269 | |
| | 400 | | Martin Marietta Materials, Inc. | | | 39,368 | |
| | 1,200 | | McEwen Mining, Inc.(a) | | | 2,016 | |
| | 1,376 | | MeadWestvaco Corp. | | | 46,935 | |
| | 380 | | Minerals Technologies, Inc. | | | 15,709 | |
| | 800 | | Molycorp, Inc.†(a) | | | 4,960 | |
| | 5,445 | | Monsanto Co. | | | 537,966 | |
| | 3,050 | | Mosaic Co. (The) | | | 164,121 | |
| | 200 | | Myers Industries, Inc. | | | 3,002 | |
| | 100 | | NewMarket Corp.(a) | | | 26,256 | |
| | 4,900 | | Newmont Mining Corp. | | | 146,755 | |
| | 100 | | NL Industries, Inc. | | | 1,130 | |
| | 1,000 | | Noranda Aluminum Holding Corp. | | | 3,230 | |
| | 2,670 | | Nucor Corp. | | | 115,664 | |
| | 770 | | Olin Corp.(a) | | | 18,418 | |
| | 1,475 | | Owens-Illinois, Inc. | | | 40,990 | |
| | 975 | | Packaging Corp. of America | | | 47,736 | |
| | 1,000 | | PH Glatfelter Co. | | | 25,100 | |
| | 1,158 | | PolyOne Corp. | | | 28,695 | |
| | 1,361 | | PPG Industries, Inc. | | | 199,264 | |
| | 2,981 | | Praxair, Inc. | | | 343,292 | |
| | 1,000 | | Reliance Steel & Aluminum Co. | | | 65,560 | |
| | 400 | | Rock Tenn Co., Class A | | | 39,952 | |
| | 600 | | Rockwood Holdings, Inc. | | | 38,418 | |
| | 600 | | Royal Gold, Inc.(a) | | | 25,248 | |
| | 1,300 | | RPM International, Inc. | | | 41,522 | |
| | 700 | | Scotts Miracle-Gro Co. (The), Class A(a) | | | 33,817 | |
| | 1,300 | | Sealed Air Corp. | | | 31,135 | |
| | 100 | | Senomyx, Inc.† | | | 218 | |
| | 500 | | Sensient Technologies Corp. | | | 20,235 | |
| | 806 | | Sherwin-Williams Co. (The) | | | 142,339 | |
| | 1,200 | | Sigma-Aldrich Corp.(a) | | | 96,432 | |
| | 700 | | Silgan Holdings, Inc. | | | 32,872 | |
| | 775 | | Sonoco Products Co. | | | 26,792 | |
| | 2,122 | | Southern Copper Corp.(a) | | | 58,610 | |
| | 2,800 | | Steel Dynamics, Inc. | | | 41,748 | |
| | 1,600 | | Stillwater Mining Co.†(a) | | | 17,184 | |
| | 564 | | SunCoke Energy, Inc.† | | | 7,907 | |
| | 192 | | Texas Industries, Inc.†(a) | | | 12,507 | |
| | 671 | | Tredegar Corp.(a) | | | 17,245 | |
| | 500 | | UFP Technologies, Inc.(a) | | | 9,790 | |
| | 50 | | United States Lime & Minerals, Inc.†(a) | | | 2,612 | |
| | 900 | | United States Steel Corp.(a) | | | 15,777 | |
| | 900 | | Valspar Corp. | | | 58,203 | |
| | 1,000 | | Verso Paper Corp.†(a) | | | 1,150 | |
| | 3,200 | | Vista Gold Corp.† | | | 3,104 | |
| | 944 | | Vulcan Materials Co. | | | 45,699 | |
| | 700 | | Walter Energy, Inc. | | | 7,280 | |
| | 1,300 | | Wausau Paper Corp.(a) | | | 14,820 | |
| | 100 | | Westlake Chemical Corp. | | | 9,641 | |
| | 5,508 | | Weyerhaeuser Co.‡ | | | 156,923 | |
| | 1,000 | | Worthington Industries, Inc. | | | 31,710 | |
| | 400 | | WR Grace & Co.†(a) | | | 33,616 | |
| | 50 | | Zep, Inc. | | | 792 | |
| | | | | | | 6,158,349 | |
| Telecommunication Services — 2.6% | | | | |
| | 600 | | Alaska Communications Systems Group, Inc. | | | 1,008 | |
| | 58,449 | | AT&T, Inc. | | | 2,069,095 | |
| | 200 | | Atlantic Tele-Network, Inc. | | | 9,932 | |
| | 5,610 | | CenturyLink, Inc.(a) | | | 198,313 | |
| | 1,425 | | Cincinnati Bell, Inc.† | | | 4,360 | |
| | 4,600 | | Clearwire Corp., Class A | | | 22,908 | |
| | 200 | | Cogent Communications Group, Inc. | | | 5,630 | |
| Shares | | | | Value | |
| Telecommunication Services (continued) | | | |
| | 87 | | Consolidated Communications Holdings, Inc.(a) | | $ | 1,515 | |
| | 3,000 | | Crown Castle International Corp. | | | 217,170 | |
| | 11,886 | | Frontier Communications Corp.(a) | | | 48,138 | |
| | 600 | | General Communication, Inc., Class A† | | | 4,698 | |
| | 16 | | IDT Corp., Class B | | | 299 | |
| | 500 | | Inteliquent, Inc. | | | 2,875 | |
| | 1,500 | | Leap Wireless International, Inc.(a) | | | 10,095 | |
| | 1,374 | | Level 3 Communications, Inc.(a) | | | 28,964 | |
| | 1,825 | | NII Holdings, Inc.†(a) | | | 12,173 | |
| | 1,200 | | SBA Communications Corp., Class A | | | 88,944 | |
| | 25,971 | | Sprint Nextel Corp.† | | | 182,316 | |
| | 1,850 | | T-Mobile US, Inc. | | | 45,899 | |
| | 975 | | tw telecom, Inc., Class A† | | | 27,436 | |
| | 400 | | USA Mobility, Inc. | | | 5,428 | |
| | 30,438 | | Verizon Communications, Inc. | | | 1,532,249 | |
| | 600 | | Vonage Holdings Corp. | | | 1,698 | |
| | 7,091 | | Windstream Corp.(a) | | | 54,672 | |
| | | | | | | 4,575,815 | |
| Utilities — 3.4% | | | | |
| | 6,135 | | AES Corp. (The) | | | 73,559 | |
| | 1,519 | | AGL Resources, Inc. | | | 65,104 | |
| | 1,100 | | Alliant Energy Corp. | | | 55,462 | |
| | 2,800 | | Ameren Corp. | | | 96,432 | |
| | 5,330 | | American Electric Power Co., Inc. | | | 238,677 | |
| | 2,000 | | American Water Works Co., Inc. | | | 82,460 | |
| | 1,721 | | Aqua America, Inc. | | | 53,850 | |
| | 1,100 | | Atmos Energy Corp.(a) | | | 45,166 | |
| | 1,000 | | Avista Corp. | | | 27,020 | |
| | 300 | | Black Hills Corp. | | | 14,625 | |
| | 5,000 | | Calpine Corp.† | | | 106,150 | |
| | 4,600 | | CenterPoint Energy, Inc. | | | 108,054 | |
| | 400 | | Cleco Corp. | | | 18,572 | |
| | 2,350 | | CMS Energy Corp. | | | 63,849 | |
| | 3,250 | | Consolidated Edison, Inc.(a) | | | 189,507 | |
| | 6,040 | | Dominion Resources, Inc. | | | 343,193 | |
| | 1,675 | | DTE Energy Co. | | | 112,242 | |
| | 6,776 | | Duke Energy Corp.(a) | | | 457,380 | |
| | 11 | | Dynegy, Inc.†(a) | | | 248 | |
| | 3,050 | | Edison International | | | 146,888 | |
| | 1,750 | | Entergy Corp. | | | 121,940 | |
| | 9,066 | | Exelon Corp.(a) | | | 279,958 | |
| | 4,280 | | FirstEnergy Corp.(a) | | | 159,815 | |
| | 16 | | Genie Energy, Ltd., Class B | | | 146 | |
| | 1,305 | | Great Plains Energy, Inc. | | | 29,415 | |
| | 750 | | Hawaiian Electric Industries, Inc.(a) | | | 18,983 | |
| | 500 | | IDACORP, Inc.(a) | | | 23,880 | |
| | 700 | | Integrys Energy Group, Inc.(a) | | | 40,971 | |
| | 600 | | ITC Holdings Corp.(a) | | | 54,780 | |
| | 2,125 | | MDU Resources Group, Inc. | | | 55,059 | |
| | 950 | | National Fuel Gas Co.(a) | | | 55,053 | |
| | 4,710 | | NextEra Energy, Inc. | | | 383,771 | |
| | 3,215 | | NiSource, Inc. | | | 92,078 | |
| | 3,117 | | Northeast Utilities(a) | | | 130,976 | |
| | 3,577 | | NRG Energy, Inc. | | | 95,506 | |
| | 2,100 | | NV Energy, Inc. | | | 49,266 | |
| | 1,050 | | OGE Energy Corp. | | | 71,610 | |
| | 2,050 | | ONEOK, Inc. | | | 84,686 | |
| | 1,000 | | Ormat Technologies, Inc.(a) | | | 23,520 | |
| | 2,650 | | Pepco Holdings, Inc.(a) | | | 53,424 | |
| | 4,125 | | PG&E Corp. | | | 188,636 | |
| | 700 | | Piedmont Natural Gas Co., Inc.(a) | | | 23,618 | |
| | 1,300 | | Pinnacle West Capital Corp. | | | 72,111 | |
| | 700 | | PNM Resources, Inc. | | | 15,533 | |
| | 800 | | Portland General Electric Co.(a) | | | 24,472 | |
| | 6,450 | | PPL Corp.(a) | | | 195,177 | |
| | 5,350 | | Public Service Enterprise Group, Inc.(a) | | | 174,731 | |
Wilshire Mutual Funds, Inc. Wilshire 5000 IndexSM Fund Schedule of Investments | |
| Shares | | | | Value | |
| Utilities (continued) | | | |
| | 2,200 | | Questar Corp.(a) | | $ | 52,470 | |
| | 1,379 | | SCANA Corp.(a) | | | 67,709 | |
| | 2,475 | | Sempra Energy | | | 202,356 | |
| | 9,325 | | Southern Co. (The)(a) | | | 411,512 | |
| | 2,700 | | TECO Energy, Inc.(a) | | | 46,413 | |
| | 1,300 | | UGI Corp.(a) | | | 50,843 | |
| | 933 | | Vectren Corp.(a) | | | 31,563 | |
| | 950 | | Westar Energy, Inc.(a) | | | 30,362 | |
| | 350 | | WGL Holdings, Inc. | | | 15,127 | |
| | 2,700 | | Wisconsin Energy Corp.(a) | | | 110,673 | |
| | 5,375 | | Xcel Energy, Inc. | | | 152,328 | |
| | | | | | | 5,988,909 | |
| Total Common Stock | | | | |
| (Cost $85,635,347) | | | 174,002,228 | |
| | |
| RIGHT — 0.0% | |
| | 1,500 | | AMREP Corp.(b) | | | 4,500 | |
| | | | | | | | |
| Total Right (Cost $–) | | | 4,500 | |
| | |
| WARRANTS — 0.0% | |
| | 183 | | Dynegy, Inc., Expires 10/04/17 | | | 338 | |
| | 1 | | Magnum Hunter Resources Corp., Expires 08/29/14(b) | | | — | |
| Total Warrants (Cost $5,144) | | | 338 | |
| SHORT-TERM INVESTMENTS (d)— 15.1% | |
| | 1,606,369 | | Northern Trust Institutional Government Select Portfolio, 0.010% | | | 1,606,369 | |
| | 24,991,940 | | Northern Trust Institutional Liquid Asset Portfolio, 0.010%(e) | | | 24,991,940 | |
| | | | | | | | |
| Total Short-Term Investments | | | | |
| (Cost $26,598,309) | | | 26,598,309 | |
| | | | | |
| Total Investments — 114.1% | | | | |
| (Cost $112,238,800) | | | 200,605,375 | |
| Other Assets & Liabilities, Net — (14.1)% | | | (24,846,156 | ) |
| NET ASSETS — 100.0% | | $ | 175,759,219 | |
| † | Non-income producing security. |
| ‡ | Real Estate Investment Trust. |
| (a) | This security or a partial position of this security is on loan at June 30, 2013. The total market value of securities on loan at June 30, 2013 was $24,351,781 (Note 6). |
| (b) | Securities fair valued using methods determined in good faith by the Pricing Committee. The total market value of such securities as of June 30, 2013 was $17,058. |
| (c) | The Fund may purchase securities of certain companies with which it is affiliated to the extent these companies are represented in its benchmark index. |
| (d) | Rate shown is the 7-day effective yield as of June 30, 2013. |
| (e) | This security was purchased with cash collateral held from securities on loan. The total value of such security as of June 30, 2013 was $24,991,940. Securities on loan are also collateralized by various U.S. Treasury obligations in the amount of $20,293 (Note 6). |
| LP — Limited Partnership Investment |
| Ltd. — Limited |
| PLC— Public Limited Company |
| REIT — Real Estate Investment Trust |
Amounts designated as “—” are either $0, or have been rounded to $0.
Wilshire Mutual Funds, Inc. Wilshire International Equity Fund | |
| Shares | | | | Value | |
| | |
| COMMON STOCK — 90.8% | | | |
| Australia — 3.3% | | | |
| | 506 | | AGL Energy, Ltd. | | $ | 6,695 | |
| | 2,751 | | Alumina, Ltd. | | | 2,448 | |
| | 1,084 | | Amcor, Ltd. | | | 10,018 | |
| | 2,412 | | AMP, Ltd. | | | 9,328 | |
| | 902 | | Aristocrat Leisure, Ltd. | | | 3,525 | |
| | 150 | | ASX, Ltd. | | | 4,523 | |
| | 1,500 | | Aurizon Holdings, Ltd. | | | 5,698 | |
| | 9,655 | | Australia & New Zealand Banking Group, Ltd. | | | 250,639 | |
| | 2,607 | | BHP Billiton, Ltd. | | | 75,037 | |
| | 574 | | BlueScope Steel, Ltd. | | | 2,442 | |
| | 1,336 | | Brambles, Ltd. | | | 11,380 | |
| | 1,275 | | Commonwealth Bank of Australia | | | 80,257 | |
| | 516 | | CSL, Ltd. | | | 28,987 | |
| | 627 | | DuluxGroup, Ltd. | | | 2,412 | |
| | 1,232 | | Echo Entertainment Group, Ltd. | | | 3,454 | |
| | 1,610 | | Fortescue Metals Group, Ltd.(a) | | | 4,432 | |
| | 1,420 | | Goodman Group‡ | | | 6,313 | |
| | 1,092 | | GPT Group‡ | | | 3,834 | |
| | 458 | | Iluka Resources, Ltd.(a) | | | 4,128 | |
| | 1,940 | | Incitec Pivot, Ltd. | | | 5,051 | |
| | 16,919 | | Insurance Australia Group, Ltd. | | | 83,981 | |
| | 176 | | Leighton Holdings, Ltd. | | | 2,467 | |
| | 575 | | Macquarie Atlas Roads Group | | | 1,018 | |
| | 272 | | Macquarie Group, Ltd. | | | 10,374 | |
| | 1,904 | | National Australia Bank, Ltd. | | | 51,503 | |
| | 835 | | Newcrest Mining, Ltd. | | | 7,708 | |
| | 317 | | Orica, Ltd. | | | 5,976 | |
| | 1,092 | | Origin Energy, Ltd. | | | 12,514 | |
| | 831 | | QBE Insurance Group, Ltd. | | | 11,506 | |
| | 408 | | Rio Tinto, Ltd. | | | 19,554 | |
| | 1,083 | | Santos, Ltd. | | | 12,333 | |
| | 2,521 | | Stockland‡ | | | 8,022 | |
| | 1,467 | | Suncorp Group, Ltd. | | | 15,933 | |
| | 1,232 | | Tabcorp Holdings, Ltd. | | | 3,431 | |
| | 4,128 | | Telstra Corp., Ltd. | | | 17,946 | |
| | 800 | | Toll Holdings, Ltd. | | | 3,872 | |
| | 1,343 | | Transurban Group | | | 8,294 | |
| | 999 | | Wesfarmers, Ltd. | | | 36,150 | |
| | 131 | | Wesfarmers, Ltd. PPS | | | 4,830 | |
| | 1,834 | | Westfield Group‡ | | | 19,209 | |
| | 1,834 | | Westfield Retail Trust‡ | | | 5,187 | |
| | 2,947 | | Westpac Banking Corp. | | | 77,373 | |
| | 501 | | Woodside Petroleum, Ltd. | | | 15,956 | |
| | 1,149 | | Woolworths, Ltd. | | | 34,420 | |
| | 198 | | WorleyParsons, Ltd. | | | 3,508 | |
| | | | | | | 993,666 | |
| Austria — 0.1% | | | | |
| | 127 | | Erste Group Bank AG | | | 3,385 | |
| | 134 | | OMV AG | | | 6,045 | |
| | 408 | | Telekom Austria AG | | | 2,582 | |
| | 232 | | Vienna Insurance Group | | | 10,762 | |
| | | | | | | 22,774 | |
| Belgium — 0.4% | | | | |
| | 271 | | Ageas | | | 9,509 | |
| | 726 | | Anheuser-Busch InBev NV | | | 65,364 | |
| | 144 | | Belgacom SA | | | 3,224 | |
| | 102 | | Delhaize Group SA | | | 6,306 | |
| | 70 | | Groupe Bruxelles Lambert SA | | | 5,272 | |
| | 206 | | KBC Groep NV | | | 7,679 | |
| | 52 | | Solvay SA | | | 6,809 | |
| Shares | | | | Value | |
| Belgium (continued) | | | |
| | 103 | | UCB SA | | $ | 5,529 | |
| | | | | | | 109,692 | |
| Brazil — 0.8% | | | | |
| | 3,300 | | Banco Bradesco SA ADR(a) | | | 42,933 | |
| | 18,920 | | Cia de Saneamento Basico do Estado de Sao Paulo ADR(a) | | | 196,957 | |
| | | | | | | 239,890 | |
| Canada — 3.7% | | | | |
| | 300 | | Agrium, Inc. | | | 26,010 | |
| | 3,300 | | Alimentation Couche Tard, Inc., Class B | | | 195,797 | |
| | 2,250 | | Canadian National Railway Co.(a) | | | 219,074 | |
| | 1,220 | | Canadian Pacific Railway, Ltd. | | | 147,938 | |
| | 3,300 | | Husky Energy, Inc.(a) | | | 87,921 | |
| | 1,200 | | Magna International, Inc. | | | 85,416 | |
| | 3,600 | | Pacific Rubiales Energy Corp. | | | 63,223 | |
| | 4,900 | | Royal Bank of Canada(a) | | | 285,511 | |
| | | | | | | 1,110,890 | |
| China — 1.6% | | | | |
| | 23,000 | | Anhui Conch Cement Co., Ltd., Class H | | | 61,833 | |
| | 444,000 | | Bank of China, Ltd., Class H | | | 181,891 | |
| | 12,000 | | Beijing Enterprises Holdings, Ltd. | | | 86,435 | |
| | 66,000 | | Dongyue Group | | | 26,183 | |
| | 3,781 | | FIH Mobile, Ltd.† | | | 2,067 | |
| | — | | Foxconn International Holdings, Ltd.†(a) | | | — | |
| | 46,620 | | PICC Property & Casualty Co., Ltd., Class H | | | 52,273 | |
| | 1,651 | | Sands China, Ltd. | | | 7,715 | |
| | 25,200 | | Sinopharm Group Co., Ltd., Class H | | | 62,979 | |
| | | | | | | 481,376 | |
| Denmark — 1.2% | | | | |
| | 2 | | AP Moller - Maersk A/S, Class B | | | 14,307 | |
| | 98 | | Carlsberg A, Class B | | | 8,763 | |
| | 434 | | Danske Bank A/S† | | | 7,403 | |
| | 2,461 | | DSV A/S | | | 59,950 | |
| | 339 | | Novo Nordisk A/S, Class B | | | 52,702 | |
| | 323 | | Novozymes A, Class B | | | 10,346 | |
| | 8,100 | | Topdanmark A† | | | 206,158 | |
| | 181 | | Vestas Wind Systems A/S†(a) | | | 2,558 | |
| | | | | | | 362,187 | |
| Finland — 1.7% | | | | |
| | 552 | | Fortum OYJ | | | 10,341 | |
| | 134 | | Kone OYJ, Class B(a) | | | 10,628 | |
| | 2,962 | | Nokia OYJ | | | 11,042 | |
| | 12,900 | | Pohjola Bank PLC, Class A | | | 189,555 | |
| | 6,747 | | Sampo, Class A | | | 262,726 | |
| | 748 | | Stora Enso OYJ, Class R(a) | | | 5,009 | |
| | 613 | | UPM-Kymmene OYJ | | | 6,008 | |
| | 139 | | Wartsila OYJ Abp(a) | | | 6,039 | |
| | | | | | | 501,348 | |
| France — 5.2% | | | | |
| | 191 | | Accor SA | | | 6,714 | |
| | 264 | | Air Liquide SA | | | 32,604 | |
| | 2,363 | | Alcatel-Lucent†(a) | | | 4,303 | |
| | 227 | | Alstom SA | | | 7,446 | |
| | 1,465 | | AXA SA | | | 28,879 | |
| | 850 | | BNP Paribas | | | 46,533 | |
| | 232 | | Bouygues SA | | | 5,912 | |
| | 200 | | Bureau Veritas SA | | | 5,179 | |
| | 150 | | Cap Gemini SA | | | 7,284 | |
| | 497 | | Carrefour SA | | | 13,651 | |
| | 1,500 | | Christian Dior SA | | | 242,328 | |
| | 372 | | Cie de St.-Gobain | | | 15,074 | |
Wilshire Mutual Funds, Inc. Wilshire International Equity Fund | |
| Shares | | | | Value | |
| France (continued) | | | |
| | 152 | | Cie Generale de Geophysique-Veritas | | $ | 3,368 | |
| | 1,126 | | Cie Generale des Etablissements Michelin, Class B | | | 100,682 | |
| | 175 | | Cie Generale d'Optique Essilor International SA | | | 18,644 | |
| | 372 | | CNP Assurances | | | 5,341 | |
| | 831 | | Credit Agricole SA | | | 7,152 | |
| | 490 | | Danone SA | | | 36,881 | |
| | 191 | | Edenred | | | 5,848 | |
| | 187 | | Electricite de France SA | | | 4,340 | |
| | 1,802 | | France Telecom SA | | | 17,064 | |
| | 1,093 | | GDF Suez | | | 21,439 | |
| | 52 | | Groupe Fnac† | | | 136 | |
| | 52 | | Kering | | | 10,581 | |
| | 181 | | Lafarge SA | | | 11,114 | |
| | 170 | | Lagardere SCA | | | 4,743 | |
| | 200 | | Legrand SA | | | 9,273 | |
| | 253 | | L'Oreal SA | | | 41,589 | |
| | 203 | | LVMH Moet Hennessy Louis Vuitton SA | | | 32,958 | |
| | 21 | | Neopost SA(a) | | | 1,390 | |
| | 147 | | Pernod-Ricard SA | | | 16,316 | |
| | 268 | | Publicis Groupe SA | | | 19,087 | |
| | 159 | | Renault SA | | | 10,710 | |
| | 190 | | Safran SA | | | 9,919 | |
| | 3,804 | | Sanofi-Aventis SA | | | 393,258 | |
| | 416 | | Schneider Electric SA | | | 30,213 | |
| | 611 | | Societe Generale | | | 21,028 | |
| | 1,819 | | Sodexo | | | 151,449 | |
| | 232 | | Suez Environnement Co. | | | 2,999 | |
| | 83 | | Technip SA | | | 8,435 | |
| | 1,705 | | Total SA | | | 83,277 | |
| | 68 | | Unibail-Rodamco SE‡ | | | 15,837 | |
| | 139 | | Vallourec SA | | | 7,054 | |
| | 447 | | Veolia Environnement SA | | | 5,103 | |
| | 312 | | Vinci SA | | | 15,650 | |
| | 1,032 | | Vivendi SA | | | 19,558 | |
| | | | | | | 1,558,343 | |
| Germany — 8.7% | | | | |
| | 2,431 | | Adidas AG | | | 262,787 | |
| | 383 | | Allianz SE | | | 55,903 | |
| | 3,449 | | BASF SE | | | 307,627 | |
| | 3,578 | | Bayer AG | | | 380,950 | |
| | 1,158 | | Bayerische Motoren Werke AG | | | 101,065 | |
| | 85 | | Beiersdorf AG | | | 7,404 | |
| | 510 | | Brenntag AG | | | 77,516 | |
| | 323 | | Commerzbank AG† | | | 2,806 | |
| | 110 | | Continental AG | | | 14,664 | |
| | 743 | | Daimler AG | | | 44,854 | |
| | 802 | | Deutsche Bank AG | | | 33,630 | |
| | 181 | | Deutsche Boerse AG | | | 11,902 | |
| | 190 | | Deutsche Lufthansa AG | | | 3,849 | |
| | 683 | | Deutsche Post AG | | | 16,951 | |
| | 2,534 | | Deutsche Telekom AG | | | 29,522 | |
| | 1,523 | | E.ON SE | | | 24,960 | |
| | 175 | | Fresenius Medical Care AG & Co. KGAA | | | 12,404 | |
| | 2,607 | | Fresenius SE & Co. KGaA | | | 320,870 | |
| | 150 | | GEA Group AG | | | 5,311 | |
| | 1,950 | | Hannover Rueckversicherung SE | | | 140,218 | |
| | 154 | | HeidelbergCement AG | | | 10,318 | |
| | 108 | | Henkel AG & Co. KGaA | | | 8,459 | |
| | 998 | | Infineon Technologies AG | | | 8,354 | |
| | 208 | | K+S AG | | | 7,687 | |
| | 134 | | Linde AG | | | 24,970 | |
| | 35 | | MAN SE | | | 3,816 | |
| | 55 | | Merck KGAA | | | 8,364 | |
| Shares | | | | Value | |
| Germany (continued) | | | |
| | 160 | | Metro AG | | $ | 5,056 | |
| | 1,390 | | Muenchener Rueckversicherungs AG | | | 255,359 | |
| | 456 | | RWE AG | | | 14,536 | |
| | 4,538 | | SAP AG | | | 331,377 | |
| | 628 | | Siemens AG | | | 63,593 | |
| | 144 | | Solarworld AG | | | 86 | |
| | 372 | | ThyssenKrupp AG | | | 7,292 | |
| | 33 | | Volkswagen AG | | | 6,416 | |
| | | | | | | 2,610,876 | |
| Greece — 0.0% | | | | |
| | 552 | | Alpha Bank AE† | | | 309 | |
| | 351 | | Hellenic Telecommunications Organization SA | | | 2,745 | |
| | 70 | | National Bank of Greece SA† | | | 227 | |
| | 258 | | OPAP SA | | | 2,159 | |
| | 23 | | Piraeus Bank SA† | | | 37 | |
| | | | | | | 5,477 | |
| Guernsey — 0.0% | | | | |
| | 1,666 | | Resolution, Ltd. | | | 7,217 | |
| | | | | | | | |
| Hong Kong — 6.3% | | | | |
| | 7,637 | | AIA Group, Ltd. | | | 32,175 | |
| | 2,497 | | Bank of East Asia, Ltd. | | | 8,937 | |
| | 5,986 | | BOC Hong Kong Holdings, Ltd. | | | 18,312 | |
| | 17,651 | | Cheung Kong Holdings, Ltd. | | | 238,014 | |
| | 43,000 | | Cheung Kong Infrastructure Holdings, Ltd. | | | 286,524 | |
| | 28,000 | | China Overseas Land & Investment, Ltd. | | | 72,897 | |
| | 1,332 | | CLP Holdings, Ltd. | | | 10,768 | |
| | 1,057 | | Esprit Holdings, Ltd. | | | 1,557 | |
| | 2,000 | | Galaxy Entertainment Group, Ltd.† | | | 9,715 | |
| | 1,961 | | Hang Lung Properties, Ltd. | | | 6,793 | |
| | 1,084 | | Hang Seng Bank, Ltd. | | | 15,964 | |
| | 4,438 | | Hong Kong & China Gas Co., Ltd. | | | 10,829 | |
| | 980 | | Hong Kong Exchanges and Clearing, Ltd. | | | 14,719 | |
| | 2,632 | | Hutchison Whampoa, Ltd. | | | 27,537 | |
| | 14,000 | | Jardine Strategic Holdings, Ltd. | | | 506,954 | |
| | 180,000 | | Lenovo Group, Ltd.(a) | | | 162,018 | |
| | 4,261 | | Li & Fung, Ltd.(a) | | | 5,808 | |
| | 2,580 | | Link REIT‡ | | | 12,662 | |
| | 2,464 | | New World Development, Ltd. | | | 3,384 | |
| | 1,600 | | Power Assets Holdings, Ltd. | | | 13,773 | |
| | 60,000 | | SJM Holdings, Ltd. | | | 145,608 | |
| | 980 | | Sun Hung Kai Properties, Ltd. | | | 12,585 | |
| | 722 | | Swire Pacific, Ltd., Class A | | | 8,699 | |
| | 67,000 | | Techtronic Industries Co. | | | 159,059 | |
| | 2,200 | | Tencent Holdings, Ltd. | | | 85,904 | |
| | 1,580 | | Wharf Holdings, Ltd. | | | 13,187 | |
| | | | | | | 1,884,382 | |
| India — 0.4% | | | | |
| | 3,180 | | Dr. Reddy's Laboratories, Ltd. ADR(a) | | | 120,268 | |
| | | | | | | | |
| Indonesia — 0.4% | | | | |
| | 131,000 | | Bank Mandiri | | | 118,154 | |
| | | | | | | | |
| Ireland — 0.2% | | | | |
| | 687 | | CRH PLC | | | 13,900 | |
| | 397 | | Elan Corp. PLC | | | 5,571 | |
| | 1,238 | | Experian PLC | | | 21,516 | |
| | 130 | | Kerry Group PLC, Class A | | | 7,189 | |
| | | | | | | 48,176 | |
Wilshire Mutual Funds, Inc. Wilshire International Equity Fund | |
| Shares | | | | Value | |
| Isle of Man — 0.0% | | | |
| | 6,192 | | Genting Singapore PLC(a) | | $ | 6,421 | |
| | | | | | | | |
| Israel — 0.1% | | | | |
| | 1,000 | | Bank Hapoalim BM† | | | 4,513 | |
| | 631 | | Israel Chemicals, Ltd. | | | 6,197 | |
| | 774 | | Teva Pharmaceutical Industries, Ltd. | | | 30,292 | |
| | | | | | | 41,002 | |
| Italy — 0.9% | | | | |
| | 1,030 | | Assicurazioni Generali SpA | | | 18,004 | |
| | 412 | | Atlantia SpA | | | 6,720 | |
| | 2,405 | | Banca Monte dei Paschi di Siena SPA†(a) | | | 609 | |
| | 789 | | Banco Popolare SC | | | 927 | |
| | 5,583 | | Enel SPA | | | 17,519 | |
| | 7,436 | | Eni SpA | | | 152,615 | |
| | 779 | | Fiat Industrial SpA | | | 8,672 | |
| | 779 | | Fiat SPA | | | 5,433 | |
| | 562 | | Finmeccanica SPA | | | 2,812 | |
| | 8,421 | | Intesa Sanpaolo SpA | | | 13,478 | |
| | 1,125 | | Intesa Sanpaolo SpA, RNC | | | 1,506 | |
| | 150 | | Luxottica Group SpA | | | 7,589 | |
| | 1,192 | | Mediaset SpA | | | 4,490 | |
| | 710 | | Mediobanca SpA | | | 3,692 | |
| | 225 | | Saipem SpA | | | 3,652 | |
| | 2,310 | | Snam Rete Gas SpA | | | 10,518 | |
| | 7,391 | | Telecom Italia SpA | | | 5,152 | |
| | 6,770 | | Telecom Italia SpA, RNC | | | 3,774 | |
| | 3,314 | | UniCredit SpA | | | 15,493 | |
| | 584 | | Unione di Banche Italiane SCPA | | | 2,112 | |
| | | | | | | 284,767 | |
| Japan — 17.0% | | | | |
| | 155 | | Advantest Corp. | | | 2,554 | |
| | 826 | | Aeon Co., Ltd. | | | 10,855 | |
| | 258 | | Aisin Seiki Co., Ltd. | | | 9,851 | |
| | 353 | | Ajinomoto Co., Inc. | | | 5,178 | |
| | 568 | | Amada Co., Ltd. | | | 3,739 | |
| | 361 | | Asahi Breweries, Ltd. | | | 8,943 | |
| | 1,135 | | Asahi Glass Co., Ltd. | | | 7,357 | |
| | 1,858 | | Asahi Kasei Corp. | | | 12,259 | |
| | 2,664 | | Astellas Pharma, Inc. | | | 144,719 | |
| | 2,116 | | Bank of Yokohama, Ltd. (The) | | | 10,916 | |
| | 671 | | Bridgestone Corp. | | | 22,881 | |
| | 928 | | Canon, Inc. | | | 30,414 | |
| | 103 | | Central Japan Railway Co. | | | 12,554 | |
| | 722 | | Chiba Bank, Ltd. (The) | | | 4,926 | |
| | 453 | | Chubu Electric Power Co., Inc. | | | 6,417 | |
| | 258 | | Chugai Pharmaceutical Co., Ltd. | | | 5,340 | |
| | 52 | | Credit Saison Co., Ltd. | | | 1,307 | |
| | 568 | | Dai Nippon Printing Co., Ltd. | | | 5,183 | |
| | 9 | | Dai-ichi Life Insurance Co., Ltd. | | | 12,920 | |
| | 722 | | Daiichi Sankyo Co., Ltd. | | | 12,032 | |
| | 206 | | Daikin Industries, Ltd. | | | 8,326 | |
| | 1,103 | | Daito Trust Construction Co., Ltd. | | | 103,924 | |
| | 159 | | Daiwa House Industry Co., Ltd. | | | 2,962 | |
| | 1,496 | | Daiwa Securities Group, Inc. | | | 12,529 | |
| | 489 | | Denso Corp. | | | 22,990 | |
| | 258 | | Dentsu, Inc. | | | 8,925 | |
| | 1,010 | | East Japan Railway Co. | | | 78,611 | |
| | 258 | | Eisai Co., Ltd. | | | 10,515 | |
| | 103 | | Electric Power Development Co., Ltd. | | | 3,220 | |
| | 155 | | FANUC Corp. | | | 22,433 | |
| | 52 | | Fast Retailing Co., Ltd. | | | 17,550 | |
| | 413 | | FUJIFILM Holdings Corp. | | | 9,083 | |
| | 1,858 | | Fujitsu, Ltd. | | | 7,687 | |
| | 980 | | Fukuoka Financial Group, Inc. | | | 4,168 | |
| Shares | | | | Value | |
| Japan (continued) | | | |
| | 112 | | Hankyu Hanshin Holdings, Inc. | | $ | 637 | |
| | 52 | | Hirose Electric Co., Ltd. | | | 6,849 | |
| | 4,011 | | Hitachi, Ltd. | | | 25,701 | |
| | 263 | | Hokkaido Electric Power Co., Inc. | | | 3,589 | |
| | 826 | | Hokuhoku Financial Group, Inc. | | | 1,687 | |
| | 1,296 | | Honda Motor Co., Ltd. | | | 48,146 | |
| | 464 | | Hoya Corp. | | | 9,544 | |
| | 103 | | Ibiden Co., Ltd. | | | 1,603 | |
| | 2 | | INPEX Corp. | | | 8,313 | |
| | 300 | | Isetan Mitsukoshi Holdings, Ltd. | | | 3,984 | |
| | 1,000 | | Isuzu Motors, Ltd. | | | 6,836 | |
| | 13,087 | | ITOCHU Corp. | | | 151,337 | |
| | 601 | | Japan Steel Works, Ltd. (The) | | | 3,298 | |
| | 5,126 | | Japan Tobacco, Inc. | | | 180,935 | |
| | 361 | | JFE Holdings, Inc. | | | 7,909 | |
| | 4,000 | | JGC Corp. | | | 144,050 | |
| | 1,032 | | Joyo Bank, Ltd. (The) | | | 5,636 | |
| | 619 | | JTEKT Corp. | | | 6,938 | |
| | 2,067 | | JX Holdings, Inc. | | | 9,980 | |
| | 1,187 | | Kajima Corp. | | | 3,935 | |
| | 568 | | Kansai Electric Power Co., Inc. (The) | | | 7,775 | |
| | 516 | | Kao Corp. | | | 17,566 | |
| | 416 | | KDDI Corp. | | | 21,663 | |
| | 524 | | Keio Corp. | | | 3,600 | |
| | 62 | | Keyence Corp. | | | 19,754 | |
| | 1,703 | | Kintetsu Corp. | | | 7,476 | |
| | 980 | | Kirin Holdings Co., Ltd. | | | 15,351 | |
| | 3,148 | | Kobe Steel, Ltd. | | | 3,893 | |
| | 929 | | Komatsu, Ltd. | | | 21,397 | |
| | 568 | | Konica Minolta, Inc. | | | 4,275 | |
| | 585 | | Kubota Corp. | | | 8,514 | |
| | 516 | | Kuraray Co., Ltd. | | | 7,232 | |
| | 155 | | Kyocera Corp. | | | 15,771 | |
| | 361 | | Kyushu Electric Power Co., Inc. | | | 5,441 | |
| | 361 | | LIXIL Group Corp. | | | 8,791 | |
| | 1,500 | | Makita Corp. | | | 80,643 | |
| | 1,651 | | Marubeni Corp. | | | 11,034 | |
| | 464 | | Marui Group Co., Ltd. | | | 4,622 | |
| | 3,000 | | Mazda Motor Corp. | | | 11,860 | |
| | 2,300 | | Miraca Holdings, Inc. | | | 105,692 | |
| | 929 | | Mitsubishi Chemical Holdings Corp. | | | 4,354 | |
| | 3,342 | | Mitsubishi Corp. | | | 57,094 | |
| | 1,651 | | Mitsubishi Electric Corp. | | | 15,427 | |
| | 1,135 | | Mitsubishi Estate Co., Ltd. | | | 30,218 | |
| | 722 | | Mitsubishi Gas Chemical Co., Inc. | | | 5,293 | |
| | 3,096 | | Mitsubishi Heavy Industries, Ltd. | | | 17,212 | |
| | 1,342 | | Mitsubishi Materials Corp. | | | 4,724 | |
| | 10,491 | | Mitsubishi UFJ Financial Group, Inc. | | | 64,791 | |
| | 1,445 | | Mitsui & Co., Ltd. | | | 18,120 | |
| | 826 | | Mitsui Fudosan Co., Ltd. | | | 24,284 | |
| | 1,393 | | Mitsui OSK Lines, Ltd. | | | 5,414 | |
| | 137,450 | | Mizuho Financial Group, Inc. | | | 285,441 | |
| | 387 | | MS&AD Insurance Group Holdings | | | 9,803 | |
| | 206 | | Murata Manufacturing Co., Ltd. | | | 15,669 | |
| | 817 | | NEC Corp. | | | 1,789 | |
| | 52 | | Nidec Corp.(a) | | | 3,638 | |
| | 413 | | Nikon Corp. | | | 9,649 | |
| | 71 | | Nintendo Co., Ltd. | | | 8,359 | |
| | 1 | | Nippon Building Fund, Inc.‡ | | | 11,582 | |
| | 545 | | Nippon Electric Glass Co., Ltd. | | | 2,653 | |
| | 1,084 | | Nippon Express Co., Ltd. | | | 5,147 | |
| | 5,973 | | Nippon Steel & Sumitomo Metal Corp. | | | 16,093 | |
| | 3,761 | | Nippon Telegraph & Telephone Corp. | | | 196,027 | |
| | 1,445 | | Nippon Yusen KK | | | 3,823 | |
| | 19,983 | | Nissan Motor Co., Ltd. | | | 200,282 | |
Wilshire Mutual Funds, Inc. Wilshire International Equity Fund | |
| Shares | | | | Value | |
| Japan (continued) | | | |
| | 206 | | Nitto Denko Corp. | | $ | 13,212 | |
| | 245 | | NKSJ Holdings, Inc. | | | 5,822 | |
| | 3,457 | | Nomura Holdings, Inc. | | | 25,446 | |
| | 568 | | NSK, Ltd. | | | 5,419 | |
| | 2 | | NTT Data Corp. | | | 7,124 | |
| | 12 | | NTT DOCOMO, Inc. | | | 18,668 | |
| | 568 | | Obayashi Corp. | | | 2,945 | |
| | 206 | | Olympus Corp. | | | 6,260 | |
| | 258 | | Omron Corp. | | | 7,692 | |
| | 100 | | Ono Pharmaceutical Co., Ltd. | | | 6,807 | |
| | 930 | | ORIX Corp. | | | 12,691 | |
| | 23,477 | | Osaka Gas Co., Ltd. | | | 99,129 | |
| | 400 | | Otsuka Holdings Co., Ltd. | | | 13,208 | |
| | 2,149 | | Panasonic Corp. | | | 17,304 | |
| | 826 | | Rakuten, Inc. | | | 9,767 | |
| | 2,270 | | Resona Holdings, Inc. | | | 11,055 | |
| | 568 | | Ricoh Co., Ltd. | | | 6,731 | |
| | 103 | | Rohm Co., Ltd. | | | 4,183 | |
| | 155 | | Secom Co., Ltd. | | | 8,428 | |
| | 206 | | Sega Sammy Holdings, Inc. | | | 5,162 | |
| | 155 | | Seiko Epson Corp.(a) | | | 2,117 | |
| | 10,032 | | Sekisui Chemical Co., Ltd. | | | 106,525 | |
| | 877 | | Sekisui House, Ltd. | | | 12,671 | |
| | 4,274 | | Seven & I Holdings Co., Ltd. | | | 156,528 | |
| | 980 | | Sharp Corp. | | | 3,946 | |
| | 361 | | Shin-Etsu Chemical Co., Ltd. | | | 23,893 | |
| | 671 | | Shinsei Bank, Ltd. | | | 1,524 | |
| | 268 | | Shionogi & Co., Ltd. | | | 5,589 | |
| | 361 | | Shiseido Co., Ltd. | | | 5,371 | |
| | 568 | | Shizuoka Bank, Ltd. (The) | | | 6,126 | |
| | 1,445 | | Showa Denko KK | | | 1,906 | |
| | 71 | | SMC Corp. | | | 14,234 | |
| | 774 | | Softbank Corp. | | | 45,055 | |
| | 2,345 | | Sojitz Corp. | | | 3,891 | |
| | 929 | | Sony Corp. | | | 19,626 | |
| | 1,651 | | Sumitomo Chemical Co., Ltd. | | | 5,178 | |
| | 11,987 | | Sumitomo Corp. | | | 149,401 | |
| | 619 | | Sumitomo Electric Industries, Ltd. | | | 7,369 | |
| | 929 | | Sumitomo Heavy Industries, Ltd. | | | 3,901 | |
| | 671 | | Sumitomo Metal Mining Co., Ltd. | | | 7,474 | |
| | 5,138 | | Sumitomo Mitsui Financial Group, Inc. | | | 235,182 | |
| | 2,979 | | Sumitomo Mitsui Trust Holdings, Inc. | | | 13,900 | |
| | 516 | | Sumitomo Realty & Development Co., Ltd. | | | 20,565 | |
| | 2,400 | | Sundrug Co., Ltd. | | | 101,853 | |
| | 316 | | Suzuki Motor Corp. | | | 7,284 | |
| | 310 | | T&D Holdings, Inc. | | | 4,147 | |
| | 671 | | Takashimaya Co., Ltd. | | | 6,801 | |
| | 671 | | Takeda Pharmaceutical Co., Ltd. | | | 30,258 | |
| | 103 | | TDK Corp. | | | 3,549 | |
| | 1,600 | | Teijin, Ltd. | | | 3,505 | |
| | 206 | | Terumo Corp. | | | 10,239 | |
| | 1,290 | | Tobu Railway Co., Ltd. | | | 6,648 | |
| | 464 | | Tohoku Electric Power Co., Inc. | | | 5,793 | |
| | 6,318 | | Tokio Marine Holdings, Inc. | | | 199,364 | |
| | 877 | | Tokyo Electric Power Co., Inc. (The) | | | 4,527 | |
| | 155 | | Tokyo Electron, Ltd. | | | 7,837 | |
| | 2,322 | | Tokyo Gas Co., Ltd. | | | 12,811 | |
| | 1,032 | | Tokyu Corp. | | | 6,757 | |
| | 568 | | Toppan Printing Co., Ltd. | | | 3,940 | |
| | 1,393 | | Toray Industries, Inc. | | | 9,001 | |
| | 3,096 | | Toshiba Corp. | | | 14,841 | |
| | 5,258 | | Toyota Industries Corp. | | | 214,726 | |
| | 6,954 | | Toyota Motor Corp. | | | 419,450 | |
| | 258 | | Toyota Tsusho Corp. | | | 6,634 | |
| Shares | | | | Value | |
| Japan (continued) | | | |
| | 3,400 | | Unicharm Corp. | | $ | 192,299 | |
| | 206 | | West Japan Railway Co. | | | 8,737 | |
| | 18 | | Yahoo Japan Corp. | | | 8,863 | |
| | 98 | | Yamada Denki Co., Ltd. | | | 3,968 | |
| | 310 | | Yamaha Motor Co., Ltd. | | | 4,015 | |
| | 361 | | Yamato Holdings Co., Ltd. | | | 7,603 | |
| | | | | | | 5,117,886 | |
| Jersey — 0.1% | | | | |
| | 366 | | Atrium European Real Estate, Ltd. | | | 1,903 | |
| | 125 | | Randgold Resources, Ltd. | | | 7,921 | |
| | 492 | | Shire PLC | | | 15,592 | |
| | 289 | | Wolseley PLC | | | 13,334 | |
| | | | | | | 38,750 | |
| Luxembourg — 0.4% | | | | |
| | 1 | | APERAM | | | 11 | |
| | 849 | | ArcelorMittal | | | 9,502 | |
| | 89 | | Millicom International Cellular SA | | | 6,410 | |
| | 422 | | SES SA | | | 12,091 | |
| | 237 | | Subsea 7 SA(a) | | | 4,170 | |
| | 4,411 | | Tenaris SA | | | 88,345 | |
| | | | | | | 120,529 | |
| Macau — 0.0% | | | | |
| | 2,000 | | Wynn Macau, Ltd. | | | 5,380 | |
| | | | | | | | |
| Malaysia — 0.6% | | | | |
| | 34,500 | | AMMB Holdings BHD | | | 79,975 | |
| | 52,000 | | Axiata Group BHD | | | 108,906 | |
| | | | | | | 188,881 | |
| Mexico — 1.1% | | | | |
| | 68,700 | | Alfa SAB de CV, Class A | | | 165,209 | |
| | 27,400 | | Grupo Financiero Banorte SAB de CV, Class O | | | 163,671 | |
| | | | | | | 328,880 | |
| Netherlands — 2.3% | | | | |
| | 911 | | Aegon NV | | | 6,112 | |
| | 153 | | Akzo Nobel NV | | | 8,633 | |
| | 2,705 | | ASML Holding NV | | | 213,534 | |
| | 356 | | European Aeronautic Defence and Space Co. NV | | | 19,046 | |
| | 310 | | Heineken NV | | | 19,732 | |
| | 3,840 | | ING Groep NV, CVA | | | 35,094 | |
| | 918 | | Koninklijke Ahold NV | | | 13,653 | |
| | 222 | | Koninklijke DSM NV | | | 14,473 | |
| | 1,214 | | Koninklijke KPN NV | | | 2,519 | |
| | 949 | | Koninklijke Philips Electronics NV | | | 25,871 | |
| | 533 | | PostNL NV | | | 1,485 | |
| | 621 | | Reed Elsevier NV | | | 10,342 | |
| | 2,098 | | Royal Dutch Shell PLC, Class B | | | 69,484 | |
| | 3,020 | | Royal Dutch Shell PLC, Class A | | | 96,471 | |
| | 6,050 | | SBM Offshore NV | | | 101,997 | |
| | 476 | | TNT Express NV | | | 3,566 | |
| | 1,364 | | Unilever NV, CVA | | | 53,693 | |
| | 341 | | Wolters Kluwer NV | | | 7,223 | |
| | | | | | | 702,928 | |
| New Zealand — 0.0% | | | | |
| | 727 | | Chorus, Ltd. | | | 1,343 | |
| | 3,634 | | Telecom Corp. of New Zealand, Ltd. | | | 6,328 | |
| | | | | | | 7,671 | |
| Norway — 2.5% | | | | |
| | 837 | | DnB NOR ASA | | | 12,142 | |
| | 1,135 | | Norsk Hydro ASA(a) | | | 4,551 | |
Wilshire Mutual Funds, Inc. Wilshire International Equity Fund | |
| Shares | | | | Value | |
| Norway (continued) | | | |
| | 1,109 | | Orkla ASA | | $ | 9,080 | |
| | 4,880 | | Seadrill, Ltd. | | | 196,549 | |
| | 13,560 | | Statoil ASA | | | 280,123 | |
| | 11,398 | | Telenor ASA | | | 226,399 | |
| | 208 | | Yara International ASA | | | 8,295 | |
| | | | | | | 737,139 | |
| Portugal — 0.0% | | | | |
| | 1,925 | | Banco Comercial Portugues SA, Class R† | | | 240 | |
| | 2,451 | | Energias de Portugal SA | | | 7,906 | |
| | 397 | | Portugal Telecom SGPS SA(a) | | | 1,545 | |
| | | | | | | 9,691 | |
| Russia — 0.6% | | | | |
| | 3,100 | | Lukoil OAO ADR | | | 178,715 | |
| | | | | | | | |
| Singapore — 3.1% | | | | |
| | 9,288 | | CapitaMalls Asia, Ltd. | | | 13,321 | |
| | 1,548 | | DBS Group Holdings, Ltd. | | | 18,836 | |
| | 9,000 | | Jardine Cycle & Carriage, Ltd. | | | 300,906 | |
| | 7,218 | | Keppel Corp., Ltd. | | | 59,038 | |
| | 1,200 | | Keppel REIT‡ | | | 1,223 | |
| | 3,096 | | Oversea-Chinese Banking Corp., Ltd. | | | 24,338 | |
| | 942 | | SATS, Ltd. | | | 2,441 | |
| | 1,290 | | Singapore Airlines, Ltd. | | | 10,297 | |
| | 2,000 | | Singapore Press Holdings, Ltd.(a) | | | 6,574 | |
| | 2,096 | | Singapore Technologies Engineering, Ltd. | | | 6,905 | |
| | 52,875 | | Singapore Telecommunications, Ltd. | | | 156,606 | |
| | 15,142 | | United Overseas Bank, Ltd. | | | 236,459 | |
| | 17,000 | | UOL Group, Ltd. | | | 89,869 | |
| | 2,064 | | Wilmar International, Ltd. | | | 5,105 | |
| | | | | | | 931,918 | |
| South Africa — 2.5% | | | | |
| | 7,400 | | Aspen Pharmacare Holdings, Ltd. | | | 170,110 | |
| | 19,500 | | Life Healthcare Group Holdings, Ltd. | | | 73,960 | |
| | 11,900 | | Remgro, Ltd. | | | 228,602 | |
| | 2,300 | | Sasol, Ltd. | | | 100,137 | |
| | 29,000 | | Woolworths Holdings, Ltd. | | | 189,027 | |
| | | | | | | 761,836 | |
| South Korea — 2.0% | | | | |
| | 820 | | Samsung Electronics Co., Ltd. GDR | | | 476,540 | |
| | 5,800 | | SK Telecom Co., Ltd. ADR | | | 117,914 | |
| | | | | | | 594,454 | |
| Spain — 1.1% | | | | |
| | 314 | | Abertis Infraestructuras SA | | | 5,471 | |
| | 71 | | Acciona SA | | | 3,743 | |
| | 74 | | ACS Actividades de Construccion y Servicios SA | | | 1,958 | |
| | 4,503 | | Banco Bilbao Vizcaya Argentaria SA | | | 37,842 | |
| | 2,500 | | Banco de Sabadell SA | | | 4,147 | |
| | 777 | | Banco Popular Espanol SA | | | 2,378 | |
| | 8,680 | | Banco Santander SA | | | 55,545 | |
| | 497 | | Distribuidora Internacional de Alimentacion SA | | | 3,754 | |
| | 3,400 | | Enagas SA | | | 84,034 | |
| | 427 | | Ferrovial SA | | | 6,817 | |
| | 108 | | Fomento de Construcciones y Contratas SA(a) | | | 1,006 | |
| | 300 | | Gas Natural SDG SA | | | 6,044 | |
| | 3,948 | | Iberdrola SA | | | 20,864 | |
| | 196 | | Inditex SA | | | 24,176 | |
| | 696 | | Indra Sistemas SA | | | 8,990 | |
| | 795 | | Repsol SA | | | 16,778 | |
| Shares | | | | Value | |
| Spain (continued) | | | |
| | 3,940 | | Telefonica SA | | $ | 50,689 | |
| | | | | | | 334,236 | |
| Sweden — 3.3% | | | | |
| | 413 | | Assa Abloy AB, Class B | | | 16,141 | |
| | 568 | | Atlas Copco AB, Class A | | | 13,690 | |
| | 330 | | Atlas Copco AB, Class B | | | 7,062 | |
| | 310 | | Electrolux AB, Class B | | | 7,823 | |
| | 200 | | Getinge AB, Class B | | | 6,072 | |
| | 872 | | Hennes & Mauritz AB, Class B | | | 28,690 | |
| | 2,683 | | Nordea Bank AB | | | 29,962 | |
| | 1,032 | | Sandvik AB(a) | | | 12,325 | |
| | 258 | | Scania AB, Class B | | | 5,162 | |
| | 568 | | Securitas AB, Class B | | | 4,966 | |
| | 16,881 | | Skandinaviska Enskilda Banken AB, Class A | | | 161,163 | |
| | 413 | | SKF AB, Class B(a) | | | 9,675 | |
| | 412 | | SSAB AB, Class A(a) | | | 2,461 | |
| | 774 | | Svenska Cellulosa AB, Class B | | | 19,411 | |
| | 5,620 | | Svenska Handelsbanken AB, Class A | | | 225,162 | |
| | 17,184 | | Swedbank AB, Class A | | | 393,592 | |
| | 2,894 | | Telefonaktiebolaget LM Ericsson, Class B | | | 32,817 | |
| | 2,116 | | TeliaSonera AB | | | 13,789 | |
| | 1,178 | | Volvo AB, Class B | | | 15,720 | |
| | | | | | | 1,005,683 | |
| Switzerland — 3.8% | | | | |
| | 7,582 | | ABB, Ltd. | | | 164,241 | |
| | 67 | | Actelion, Ltd. | | | 4,036 | |
| | 175 | | Adecco SA | | | 9,967 | |
| | 100 | | Aryzta AG | | | 5,613 | |
| | 400 | | Cie Financiere Richemont SA | | | 35,275 | |
| | 1,020 | | Credit Suisse Group AG | | | 27,004 | |
| | 46 | | Geberit AG | | | 11,395 | |
| | 8,001 | | Glencore Xstrata PLC | | | 33,120 | |
| | 273 | | Holcim, Ltd. | | | 19,003 | |
| | 254 | | Julius Baer Group, Ltd. | | | 9,913 | |
| | 2,614 | | Nestle SA | | | 171,532 | |
| | 168 | | Nobel Biocare Holding AG | | | 2,040 | |
| | 1,820 | | Novartis AG | | | 128,912 | |
| | 1,224 | | Roche Holding AG | | | 303,793 | |
| | 6 | | SGS SA | | | 12,882 | |
| | 50 | | Sonova Holding AG | | | 5,290 | |
| | 759 | | STMicroelectronics NV | | | 6,821 | |
| | 34 | | Swatch Group AG (The) | | | 18,572 | |
| | 34 | | Swiss Life Holding AG | | | 5,519 | |
| | 313 | | Swiss Re, Ltd. | | | 23,287 | |
| | 25 | | Swisscom AG | | | 10,944 | |
| | 86 | | Syngenta AG | | | 33,536 | |
| | 330 | | Transocean, Ltd. | | | 15,846 | |
| | 3,210 | | UBS AG | | | 54,486 | |
| | 134 | | Zurich Insurance Group AG | | | 34,734 | |
| | | | | | | 1,147,761 | |
| Thailand — 1.6% | | | | |
| | 12,900 | | Advanced Info Service PLC | | | 116,622 | |
| | 14,200 | | Bangkok Bank PLC | | | 92,693 | |
| | 35,700 | | PTT Exploration & Production PLC | | | 181,581 | |
| | 13,600 | | Siam Commercial Bank PLC | | | 74,890 | |
| | | | | | | 465,786 | |
| Turkey — 0.3% | | | | |
| | 4,050 | | KOC Holding AS ADR(a) | | | 96,309 | |
| | | | | | | | |
| United Kingdom — 12.8% | | | | |
| | 1,185 | | 3i Group PLC | | | 6,085 | |
| | 12,960 | | Aberdeen Asset Management PLC | | | 75,423 | |
Wilshire Mutual Funds, Inc. Wilshire International Equity Fund | |
| Shares | | | | Value | |
| United Kingdom (continued) | | | |
| | 292 | | Aggreko PLC | | $ | 7,298 | |
| | 1,114 | | Anglo American PLC | | | 21,468 | |
| | 1,222 | | ARM Holdings PLC | | | 14,783 | |
| | 300 | | Associated British Foods PLC | | | 7,914 | |
| | 1,028 | | AstraZeneca PLC | | | 48,603 | |
| | 2,497 | | Aviva PLC | | | 12,870 | |
| | 3,246 | | BAE Systems PLC | | | 18,903 | |
| | 35,446 | | Barclays PLC | | | 150,956 | |
| | 2,836 | | BG Group PLC | | | 48,195 | |
| | 11,200 | | BHP Billiton PLC | | | 285,577 | |
| | 41,782 | | BP PLC | | | 289,967 | |
| | 6,152 | | British American Tobacco PLC | | | 315,536 | |
| | 552 | | British Land Co. PLC‡ | | | 4,755 | |
| | 1,202 | | British Sky Broadcasting Group PLC | | | 14,480 | |
| | 6,279 | | BT Group PLC, Class A | | | 29,478 | |
| | 400 | | Bunzl PLC | | | 7,802 | |
| | 2,282 | | Cable & Wireless Communications PLC | | | 1,421 | |
| | 674 | | Cairn Energy PLC† | | | 2,594 | |
| | 629 | | Capita Group PLC (The) | | | 9,246 | |
| | 206 | | Carnival PLC | | | 7,160 | |
| | 4,320 | | Centrica PLC | | | 23,629 | |
| | 11,964 | | Compass Group PLC | | | 152,872 | |
| | 1,914 | | Diageo PLC | | | 54,887 | |
| | 1,500 | | G4S PLC | | | 5,289 | |
| | 3,915 | | GlaxoSmithKline PLC | | | 97,861 | |
| | 253 | | Hammerson PLC‡ | | | 1,876 | |
| | 1,485 | | Home Retail Group PLC(a) | | | 3,025 | |
| | 34,343 | | HSBC Holdings PLC | | | 355,526 | |
| | 805 | | Imperial Tobacco Group PLC | | | 27,913 | |
| | 298 | | InterContinental Hotels Group PLC | | | 8,190 | |
| | 150 | | Intertek Group PLC | | | 6,668 | |
| | 1,610 | | J Sainsbury PLC | | | 8,702 | |
| | 172 | | Johnson Matthey PLC | | | 6,872 | |
| | 2,554 | | Kingfisher PLC | | | 13,316 | |
| | 501 | | Land Securities Group PLC‡ | | | 6,729 | |
| | 4,785 | | Legal & General Group PLC | | | 12,471 | |
| | 35,782 | | Lloyds Banking Group PLC† | | | 34,362 | |
| | 181 | | London Stock Exchange Group PLC | | | 3,679 | |
| | 1,812 | | Man Group PLC | | | 2,289 | |
| | 1,409 | | Marks & Spencer Group PLC | | | 9,219 | |
| | 2,972 | | National Grid PLC | | | 33,690 | |
| | 1,219 | | Next PLC | | | 84,441 | |
| | 5,526 | | Old Mutual PLC | | | 15,170 | |
| | 691 | | Pearson PLC | | | 12,289 | |
| | 230 | | Petrofac, Ltd. | | | 4,187 | |
| | 17,026 | | Prudential PLC | | | 277,913 | |
| | 525 | | Reckitt Benckiser Group PLC | | | 37,137 | |
| | 996 | | Reed Elsevier PLC | | | 11,327 | |
| | 1,063 | | Rexam PLC | | | 7,715 | |
| | 1,015 | | Rio Tinto PLC | | | 41,279 | |
| | 1,904 | | Rolls-Royce Holdings PLC | | | 32,784 | |
| | 1,473 | | Royal Bank of Scotland Group PLC† | | | 6,113 | |
| | 2,930 | | RSA Insurance Group PLC | | | 5,316 | |
| | 797 | | SABMiller PLC | | | 38,211 | |
| | 1,078 | | Sage Group PLC | | | 5,571 | |
| | 800 | | Scottish & Southern Energy PLC | | | 18,526 | |
| | 258 | | Severn Trent PLC | | | 6,533 | |
| | 537 | | Smith & Nephew PLC | | | 6,014 | |
| | 331 | | Smiths Group PLC | | | 6,585 | |
| | 7,688 | | Standard Chartered PLC | | | 166,911 | |
| | 2,000 | | Standard Life PLC | | | 10,525 | |
| | 6,824 | | Tesco PLC | | | 34,365 | |
| | 754 | | Tullow Oil PLC | | | 11,478 | |
| | 1,017 | | Unilever PLC | | | 41,171 | |
| | 634 | | United Utilities Group PLC | | | 6,596 | |
| Shares | | | | Value | |
| United Kingdom (continued) | | | |
| | 38,881 | | Vodafone Group PLC | | $ | 111,421 | |
| | 2,550 | | Weir Group PLC | | | 83,383 | |
| | 18,670 | | WH Smith PLC | | | 203,892 | |
| | 2,408 | | Whitbread PLC | | | 112,020 | |
| | 24,520 | | William Hill PLC | | | 164,429 | |
| | 2,846 | | WM Morrison Supermarkets PLC | | | 11,328 | |
| | 1,009 | | WPP PLC | | | 17,247 | |
| | | | | | | 3,841,456 | |
| United States — 0.7% | | | | |
| | 1,730 | | Philip Morris International, Inc.(a) | | | 149,853 | |
| | 1,900 | | Southern Copper Corp.(a) | | | 52,478 | |
| | | | | | | 202,331 | |
| Total Common Stock | | | | |
| (Cost $29,901,081) | | | 27,325,126 | |
| | |
| SHORT-TERM INVESTMENT — 14.7% | |
| | 4,424,549 | | Northern Trust Institutional Liquid Asset Portfolio, 0.010%(b)(c) | | | 4,424,549 | |
| | | | | | | | |
| Total Short-Term Investment | | | | |
| (Cost $4,424,549) | | | 4,424,549 | |
| | |
| EXCHANGE TRADED FUND — 9.4% | |
| | 73,141 | | Vanguard FTSE Emerging Markets ETF | | | 2,836,408 | |
| | | | | | | | |
| Total Exchange Traded Fund | | | | |
| (Cost $3,404,942) | | | 2,836,408 | |
| | |
| PREFERRED STOCK — 0.8%†† | | | | |
| Germany — 0.8% | | | | |
| | 2,292 | | Henkel AG & Co. KGAA | | | 215,240 | |
| | 98 | | Porsche Automobil Holding SE | | | 7,568 | |
| | 147 | | Volkswagen AG | | | 29,691 | |
| | | | | | | 252,499 | |
| Total Preferred Stock | | | | |
| (Cost $259,348) | | | 252,499 | |
| | |
| PRIVATE COMPANY — 0.0% | | | | |
| Malta — 0.0% | | | | |
| | 4,007 | | BGP Holdings PLC† (d) | | | — | |
| | | | | | | | |
| Total Private Company | | | | |
| (Cost $–) | | | — | |
| RIGHT — 0.0% | |
| | 31 | | New World Development(d) | | | — | |
| | | | | | | | |
| Total Right (Cost $–) | | | — | |
| | | | | |
| Total Investments — 115.7% | | | | |
| (Cost $37,989,920) | | | 34,838,582 | |
| Other Assets & Liabilities, Net — (15.7)% | | | (4,732,788 | ) |
| NET ASSETS — 100.0% | | $ | 30,105,794 | |
| † | Non-income producing security. |
| ‡ | Real Estate Investment Trust. |
Wilshire Mutual Funds, Inc. Wilshire International Equity Fund | |
| (a) | This security or a partial position of this security is on loan at June 30, 2013. The total market value of securities on loan at June 30, 2013 was $4,315,072 (Note 6). |
| (b) | Rate shown is the 7-day effective yield as of June 30, 2013. |
| (c) | This security was purchased with cash collateral held from securities on loan. The total value of such security as of June 30, 2013 was $4,424,549. Securities on loan are also collateralized by various U.S. Treasury obligations in the amount of $6,545 (Note 6). |
| (d) | Securities fair valued using methods determined in good faith by the Pricing Committee. The total market value of such securities as of June 30, 2013 was $0 and represents 0.0% of Net Assets. |
| ADR — American Depositary Receipt |
| ETF — Exchange Traded Fund |
| FTSE — Financial Times and the London Stock Exchange |
| GDR — Global Depositary Receipt |
| Ltd. — Limited |
| PLC — Public Limited Company |
| REIT — Real Estate Investment Trust |
Amounts designated as “—“ are either $0 or have been rounded to $0.
The following is a summary of the inputs used as of June 30, 2013 in valuing the Fund’s investments carried at value:
Investments in Securities | | | | | | | | | | | | |
| Common Stock | | | | | | | | | | | | |
| Australia | | $ | — | | | $ | 993,666 | * | | $ | — | | | $ | 993,666 | |
| Austria | | | — | | | | 22,774 | * | | | — | | | | 22,774 | |
| Belgium | | | — | | | | 109,692 | * | | | — | | | | 109,692 | |
| Brazil | | | 239,890 | | | | — | | | | — | | | | 239,890 | |
| Canada | | | 1,110,890 | | | | — | | | | — | | | | 1,110,890 | |
| China | | | 2,067 | | | | 479,309 | * | | | — | | | | 481,376 | |
| Denmark | | | — | | | | 362,187 | * | | | — | | | | 362,187 | |
| Finland | | | — | | | | 501,348 | * | | | — | | | | 501,348 | |
| France | | | 136 | | | | 1,558,207 | * | | | — | | | | 1,558,343 | |
| Germany | | | — | | | | 2,610,876 | * | | | — | | | | 2,610,876 | |
| Greece | | | — | | | | 5,477 | * | | | — | | | | 5,477 | |
| Guernsey | | | — | | | | 7,217 | * | | | — | | | | 7,217 | |
| Hong Kong | | | — | | | | 1,884,382 | * | | | — | | | | 1,884,382 | |
| India | | | 120,268 | | | | — | | | | — | | | | 120,268 | |
| Indonesia | | | — | | | | 118,154 | * | | | — | | | | 118,154 | |
| Ireland | | | — | | | | 48,176 | * | | | — | | | | 48,176 | |
| Isle of Man | | | — | | | | 6,421 | * | | | — | | | | 6,421 | |
| Israel | | | — | | | | 41,002 | * | | | — | | | | 41,002 | |
| Italy | | | — | | | | 284,767 | * | | | — | | | | 284,767 | |
| Japan | | | — | | | | 5,117,886 | * | | | — | | | | 5,117,886 | |
| Jersey | | | — | | | | 38,750 | * | | | — | | | | 38,750 | |
| Luxembourg | | | — | | | | 120,529 | * | | | — | | | | 120,529 | |
| Macau | | | — | | | | 5,380 | * | | | — | | | | 5,380 | |
| Malaysia | | | — | | | | 188,881 | * | | | — | | | | 188,881 | |
| Mexico | | | 328,880 | | | | — | | | | — | | | | 328,880 | |
| Netherlands | | | — | | | | 702,928 | * | | | — | | | | 702,928 | |
| New Zealand | | | — | | | | 7,671 | * | | | — | | | | 7,671 | |
| Norway | | | — | | | | 737,139 | * | | | — | | | | 737,139 | |
| Portugal | | | — | | | | 9,691 | * | | | — | | | | 9,691 | |
| Russia | | | 178,715 | | | | — | | | | — | | | | 178,715 | |
| Singapore | | | — | | | | 931,918 | * | | | — | | | | 931,918 | |
| South Africa | | | — | | | | 761,836 | * | | | — | | | | 761,836 | |
| South Korea | | | 117,914 | | | | 476,540 | * | | | — | | | | 594,454 | |
| Spain | | | — | | | | 334,236 | * | | | — | | | | 334,236 | |
| Sweden | | | — | | | | 1,005,683 | * | | | — | | | | 1,005,683 | |
| Switzerland | | | — | | | | 1,147,761 | * | | | — | | | | 1,147,761 | |
| Thailand | | | — | | | | 465,786 | * | | | — | | | | 465,786 | |
| Turkey | | | 96,309 | | | | — | | | | — | | | | 96,309 | |
| United Kingdom | | | — | | | | 3,841,456 | * | | | — | | | | 3,841,456 | |
| United States | | | 202,331 | | | | — | | | | — | | | | 202,331 | |
| Total Common Stock | | | 2,397,400 | | | | 24,927,726 | | | | — | | | | 27,325,126 | |
| Short-Term Investment | | | 4,424,549 | | | | — | | | | — | | | | 4,424,549 | |
| Exchange Traded Fund | | | 2,836,408 | | | | — | | | | — | | | | 2,836,408 | |
| Preferred Stock | | | — | | | | 252,499 | | | | — | | | | 252,499 | |
| Private Company | | | | | | | | | | | | | | | | |
| Malta | | | — | | | | — | | | — | ^ | | | — | |
| | | | | | | | | | | | | | | | | |
| Right | | | — | | | | — | | | | — | | | | — | |
| Total Investments in Securities | | $ | 9,658,357 | | | $ | 25,180,225 | | | $ | — | | | $ | 34,838,582 | |
| * | Represents securities trading primarily outside the United States, the value of which were adjusted as a result of local trading through the application of a third-party vendor. |
| ^ | This security was categorized as Level 3 and had a market value of $0 as of June 30, 2013 and the value has remained $0 throughout the six months ended June 30, 2013. There were no accrued discounts/premiums, realized gain/(loss), change in unrealized appreciation/(depreciation), purchases, sales or transfers in or out of Level 3 during the six months ended June 30, 2013. |
For the six months ended June 30, 2013, the transfers out of Level 1 and into Level 2 were $24,905,917 and the transfers out of Level 2 into Level 1 were $(0). The transfers were related to the fair value of certain foreign securities.
| Item 7. | Disclosure of Proxy Voting Policies and Procedures for Closed-End Management Investment Companies. |
Not applicable.
| Item 8. | Portfolio Managers of Closed-End Management Investment Companies. |
Not applicable.
| Item 9. | Purchases of Equity Securities by Closed-End Management Investment Company and Affiliated Purchasers. |
Not applicable.
| Item 10. | Submission of Matters to a Vote of Security Holders. |
There have been no changes to the procedures by which shareholders may recommend nominees to the Registrant’s Board of Directors since the registrant last disclosed such procedures in the definitive proxy statement filed with the SEC on March 29, 2011.
| Item 11. | Controls and Procedures. |
| | (a) | The registrant's principal executive and principal financial officers, or persons performing similar functions, have concluded that the Registrant's disclosure controls and procedures (as defined in Rule 30a-3(c) under the Investment Company Act of 1940 (the "1940 Act")) are effective as of a date within 90 days of the filing date of this report, based on the evaluation of these controls and procedures required by Rule 30a-3(b) under the 1940 Act and Rules 13a-15(b) or 15d-15(b) under the Securities Exchange Act of 1934. |
| | (b) | There were no significant changes in the registrant's internal control over financial reporting (as defined in Rule 30a-3(d) under the 1940 Act) that occurred during the registrant's second fiscal quarter of the period that have materially affected, or are reasonably likely to materially affect, the registrant's internal control over financial reporting. |
| | (a)(1) | Not applicable. |
| | (a)(2) | Certifications pursuant to Rule 30a-2(a) under the 1940 Act and Section 302 of the Sarbanes-Oxley Act of 2002 are attached hereto. |
| | (a)(3) | Not applicable. |
| | (b) | Certifications pursuant to Rule 30a-2(b) under the 1940 Act and Section 906 of the Sarbanes-Oxley Act of 2002 are attached hereto. |
SIGNATURES
Pursuant to the requirements of the Securities Exchange Act of 1934 and the Investment Company Act of 1940, the registrant has duly caused this report to be signed on its behalf by the undersigned, thereunto duly authorized.
| (Registrant) | Wilshire Mutual Funds, Inc. | |
| | | |
| By (Signature and Title)* | /s/ Jason A. Schwarz | |
| | | Jason A. Schwarz, President | |
| | | (principal executive officer) | |
| | | | |
| Date: | September 4, 2013 | | |
Pursuant to the requirements of the Securities Exchange Act of 1934 and the Investment Company Act of 1940, this report has been signed below by the following persons on behalf of the registrant and in the capacities and on the dates indicated.
| By (Signature and Title)* | /s/ Jason A. Schwarz, | |
| | | Jason A. Schwarz, President | |
| | | (principal executive officer) | |
| | | | |
| Date: | September 4, 2013 | | |
| | | | |
| By (Signature and Title)* | /s/ Michael Wauters | |
| | | Michael Wauters, Treasurer | |
| | | (principal financial officer) | |
| | | | |
| Date: | September 4, 2013 | | |
* Print the name and title of each signing officer under his or her signature.