UNITED STATES
SECURITIES AND EXCHANGE COMMISSION
Washington, D.C. 20549
FORM N-CSR
CERTIFIED SHAREHOLDER REPORT OF REGISTERED
MANAGEMENT INVESTMENT COMPANIES
Investment Company Act file number 811-07076
| |
| Wilshire Mutual Funds, Inc. |
| (Exact name of Registrant as specified in charter) |
| |
Wilshire Associates Incorporated 1299 Ocean Avenue, Suite 700 Santa Monica, CA 90401-1085 |
| (Address of principal executive offices) (Zip code) |
| |
Jason A. Schwarz, President 1299 Ocean Avenue, Suite 700 Santa Monica, CA 90401-1085 |
| (Name and address of agent for service) |
Registrant’s telephone number, including area code: 310-451-3051
Date of fiscal year end: December 31
Date of reporting period: June 30, 2016
| Item 1. | Reports to Stockholders. |
The Report to Shareholders is attached herewith.

Wilshire Mutual Funds |
SEMI-ANNUAL REPORT (Unaudited) Large Company Growth Portfolio Large Company Value Portfolio Small Company Growth Portfolio Small Company Value Portfolio Wilshire 5000 Indexsm Fund Wilshire International Equity Fund Wilshire Income Opportunities Fund |
June 30, 2016
http://advisor.wilshire.com |
Wilshire Mutual Funds Table of Contents | 
|
Letter to Shareholders | 1 |
Commentary: | |
Large Company Growth Portfolio | 3 |
Large Company Value Portfolio | 7 |
Small Company Growth Portfolio | 11 |
Small Company Value Portfolio | 15 |
Wilshire 5000 IndexSM Fund | 19 |
Wilshire International Equity Fund | 25 |
Wilshire Income Opportunities Fund | 29 |
Disclosure of Fund Expenses | 33 |
Schedule of Investments/Condensed Schedules of Investments: | |
Large Company Growth Portfolio | 36 |
Large Company Value Portfolio | 38 |
Small Company Growth Portfolio | 40 |
Small Company Value Portfolio | 42 |
Wilshire 5000 IndexSM Fund | 44 |
Wilshire International Equity Fund | 46 |
Wilshire Income Opportunities Fund | 50 |
Statements of Assets and Liabilities | 67 |
Statements of Operations | 70 |
Statements of Changes in Net Assets | 72 |
Financial Highlights: | |
Large Company Growth Portfolio | 79 |
Large Company Value Portfolio | 81 |
Small Company Growth Portfolio | 83 |
Small Company Value Portfolio | 85 |
Wilshire 5000 IndexSM Fund | 87 |
Wilshire International Equity Fund | 91 |
Wilshire Income Opportunities Fund | 93 |
Notes to Financial Statements | 95 |
Additional Fund Information | 113 |
Board Approval of Advisory and Subadvisory Agreements | 114 |
This report is for the general information of the shareholders of Large Company Growth Portfolio, Large Company Value Portfolio, Small Company Growth Portfolio, Small Company Value Portfolio, Wilshire 5000 IndexSM Fund, Wilshire International Equity Fund and Wilshire Income Opportunities Fund. Its use in connection with any offering of a Portfolio’s shares is authorized only if accompanied or preceded by the Portfolio’s current prospectus.
Wilshire Mutual Funds, Inc. are distributed by SEI Investments Distribution Co.
Wilshire Mutual Funds Letter to Shareholders (Unaudited) |
|
Dear Wilshire Mutual Fund Shareholder:
We are pleased to present this semiannual report to all shareholders of the Wilshire Mutual Funds. This report covers the period from January 1, 2016 to June 30, 2016, for all share classes of the Large Company Growth Portfolio, Large Company Value Portfolio, Small Company Growth Portfolio, Small Company Value Portfolio, Wilshire 5000 IndexSM Fund, Wilshire International Equity Fund and Wilshire Income Opportunities Fund.
Market Environment
U.S. Equity Market
The U.S. stock market, as represented by the Wilshire 5000 Total Market IndexSM, returned 3.98% during the first half of the year. During the first six months of the year, value oriented stocks outpaced growth securities across capitalizations. While large-cap stocks outpaced small-cap stocks in the first quarter, small-cap stocks lead during the second quarter. Sector performance varied during the period, with defensive and cyclically oriented sectors being the top performers. Utilities, Telecom Services, Energy, and Materials returned 23.8%, 23.4%, 15.5%, and 11.0%, respectively. Conversely, Financials were weighed down by decreasing interest yields and Health Care struggled as biotechnology holdings sold off over fears about potential health care reform. The sectors returned -1.0% and -0.7%, respectively.
International Equity Market
International equities trailed domestic equity market during the first half of the year as the MSCI EAFE Index returned -4.4%. Emerging markets surged during the period benefitting from rising energy and commodity prices as well as expectations for continued accommodative policies from central banks around the world. The MSCI Emerging Markets index rose 6.4% through June 30. The period ended with increased volatility as uncertainty regarding the potential political contagion emanating from the “Brexit” vote weighed on markets. Equity markets fell sharply immediately following the referendum, and the British pound slumped to its lowest level in 30 years. As in the U.S., foreign markets bounced back over the last few days of the period erasing some of the earlier losses. Japan was among the worst performing developed international markets for the first six months of the year as a strengthening yen and a sluggish economy weighed on investor sentiment. The MSCI Japan Index retuned -5.6% in U.S. dollar terms and -19.5% in local currency terms for the period.
Bond Market
U.S. Treasury yields plunged during the first six months of 2016 as stock market volatility fed safe-haven trades into longer-term Treasuries. The 10-year U.S. Treasury started the year yielding 2.27%, then steadily fell during the first quarter market decline to 1.64% on February 11 before rising to 1.78% by the end of the first quarter as equities stabilized. Treasury securities extended their rally in the second quarter due to broad investor uncertainty, initially over the outcome of the Brexit vote, then over the details and timetable of the withdrawal of the United Kingdom from the European Union. The 10-year U.S. Treasury ended June yielding 1.49%. Credit spreads tightened somewhat over second half of the period, as investors continued to seek incremental yield wherever they could find it. Globally, sovereigns benefited from overall market uneasiness.
Fund Performance Review
The Large Company Growth Portfolio Institutional Class returned 1.38%, performing in-line with the Russell 1000 Growth Index. The Large Company Value Portfolio Institutional Class returned 1.55%, underperforming the Russell 1000 Value Index by 4.75%. The Small Company Growth Portfolio Institutional Class returned 4.53%, outperforming the Russell 2000 Growth Index by 6.12%. The Small Company Value Portfolio Institutional Class returned 3.46%, underperforming the Russell 2000 Value Index by 2.62%. The Wilshire 5000 IndexSM Fund Institutional Class returned 3.77%, underperforming the Wilshire 5000 Total Market IndexSM by 0.21%. The Wilshire International Equity Fund Institutional Class returned
1
Wilshire Mutual Funds Letter to Shareholders (Unaudited) - (Continued) |
|
0.46%, outperforming the MSCI All Country World ex-U.S. Index by 1.48%. The Wilshire Income Opportunities Fund Institutional Share Class returned 3.10% outperforming the Barclays U.S. Universal Index by 0.32% (for the since inception period). We are pleased with the Funds’ performance for the first half of 2016. While some of the Funds struggled during this period, we are confident that each Fund is well positioned for future growth
As always, we sincerely appreciate your continued support and confidence in Wilshire Associates.
Sincerely,

Jason Schwarz
President, Wilshire Mutual Funds
The performance data quoted represents past performance and does not guarantee future results. Current performance may be lower or higher. The investment return and principal value of an investment will fluctuate so that shares, when redeemed, may be worth more or less than their original cost. Returns assume reinvestment of all distributions.
Index returns are for illustrative purposes only and do not represent actual Fund performance. Index performance returns do not reflect any management fees, transactions costs or expenses. Indexes are unmanaged and one cannot invest directly in an index. Past performance does not guarantee future results.
Bonds and bond funds are subject to interest rate risk and will decline in value as interest rates rise.
In addition to the normal risks associated with investing, international investments may involves risk of capital loss from unfavorable fluctuation in currency values, from differences in generally accepted accounting principles or from social, economic or political instability in other nations. Investments in smaller companies typically exhibit higher volatility.
Investing involves risk including loss of principal. This report identifies the Portfolio’s investments on June 30, 2016. These holdings are subject to change. Not all investments in each Portfolio performed the same, nor is there any guarantee that these investments will perform as well in the future. Market forecasts provided in this report may not occur.
The MSCI EAFE Index is an equity index which captures large and mid-cap representation across Developed Markets countries around the world, excluding the U.S. and Canada.
MSCI Emerging Markets Index is a free float-adjusted market capitalization index that is designed to measure equity market performance of emerging markets.
The MSCI Japan Index is a free float-adjusted market capitalization index that is designed to measure developed market equity performance in Japan.
The Wilshire 5000 Total Market IndexSM is widely accepted as the definitive benchmark for the U.S. equity market, and measures performance of all U.S. equity securities with readily available price data.
2
Large Company Growth Portfolio Commentary (Unaudited) |
|
INVESTMENT CLASS SHARES
Average Annual Total Return*
Six Months Ended 06/30/16** | 1.22% |
One Year Ended 06/30/16 | 3.05% |
Five Years Ended 06/30/16 | 9.94% |
Ten Years Ended 06/30/16 | 6.84% |
RUSSELL 1000® GROWTH INDEX(1)
Average Annual Total Return
Six Months Ended 06/30/16** | 1.36% |
One Year Ended 06/30/16 | 3.02% |
Five Years Ended 06/30/16 | 12.35% |
Ten Years Ended 06/30/16 | 8.78% |
The performance data quoted represents past performance and does not guarantee future results. Current performance may be lower or higher. Performance data current to the most recent month end may be obtained at http://advisor.wilshire.com. The investment return and principal value of an investment will fluctuate so that shares, when redeemed, may be worth more or less than their original cost. The table above does not reflect the deduction of taxes that a shareholder would pay on Portfolio distributions or the redemption of Portfolio shares.
* | Assumes reinvestment of all distributions. |
| | |
** | Not annualized. |
| | |
(1) | The Russell 1000® Growth Index is an unmanaged index that measures the performance of the largest 1,000 U.S. companies with higher price-to-book ratios and higher forecasted growth values. Index performance is presented for general comparative purposes. Unlike a mutual fund, the performance of an index assumes no transaction costs, management fees or other expenses. An individual cannot directly invest in any index. |
3
Large Company Growth Portfolio Commentary (Unaudited) - (Continued) |
|
INSTITUTIONAL CLASS SHARES
Average Annual Total Return*
Six Months Ended 06/30/16** | 1.38% |
One Year Ended 06/30/16 | 3.39% |
Five Years Ended 06/30/16 | 10.29% |
Ten Years Ended 06/30/16 | 7.20% |
RUSSELL 1000® GROWTH INDEX(1)
Average Annual Total Return
Six Months Ended 06/30/16** | 1.36% |
One Year Ended 06/30/16 | 3.02% |
Five Years Ended 06/30/16 | 12.35% |
Ten Years Ended 06/30/16 | 8.78% |
The performance data quoted represents past performance and does not guarantee future results. Current performance may be lower or higher. Performance data current to the most recent month end may be obtained at http://advisor.wilshire.com. The investment return and principal value of an investment will fluctuate so that shares, when redeemed, may be worth more or less than their original cost. The table above does not reflect the deduction of taxes that a shareholder would pay on Portfolio distributions or the redemption of Portfolio shares.
* | Assumes reinvestment of all distributions. |
| | |
** | Not annualized. |
| | |
(1) | The Russell 1000® Growth Index is an unmanaged index that measures the performance of the largest 1,000 U.S. companies with higher price-to-book ratios and higher forecasted growth values. Index performance is presented for general comparative purposes. Unlike a mutual fund, the performance of an index assumes no transaction costs, management fees or other expenses. An individual cannot directly invest in any index. |
4
Large Company Growth Portfolio Commentary (Unaudited) - (Continued) |
|
Markets tumbled globally to start the year as worries over a slowing Chinese economy, falling oil prices, and weakness in U.S. earnings growth rattled investors. The U.S. stock market, as represented by the Wilshire 5000 Total Market IndexSM, fell 9% during the first dozen trading days. The U.S. market eventually rallied from its trough as investor concerns were met with sound economic data and aggressive action by some of the world’s major central banks. In January, the Bank of Japan joined the European Central Bank (ECB) in adopting a negative interest rate policy. In April, markets posted modest returns supported by rising oil prices and increased monetary stimulus measures from the ECB. Equity returns were mixed in May as improving global growth was overshadowed by concerns over a potential increase in U.S. interest rates. The first half of the year closed out with a sharp increase in volatility as the UK referendum to exit the European Union rattled global markets during the last week of trading in June. The U.S. stock market experienced its worst two-day decline since August 2015 before rallying back as investor panic eased. Year to date, value securities have outperformed growth while trends shifted between the first and second quarters in terms of capitalization with large capitalization stock outperforming their smaller capitalization counterparts in the first quarter and smaller capitalization stocks outperforming in the second quarter. Within large capitalization securities, lower beta stocks significantly outperformed their higher beta counterparts, and within small capitalization stocks, low beta and dividend yield were strong performing characteristics over the first six months of the year.
Sector performance for the Wilshire 5000 IndexSM was mixed through June 30. Defensive sectors led with Utilities and Telecom Services returning over 23%. Energy (+15.2%) and Materials (+10.7%) also had strong performance as oil prices rebounded beginning late January. Financials (-1.1%) and Health Care (-0.3%) were the worst performing sectors as banks were weighed down by decreasing interest yields and biotechnology holdings sold off over fears about potential health care reform. Information Technology (-0.3%) also experience negative returns.
The Wilshire Large Company Growth Portfolio Institutional Class returned 1.38% for the first six months of 2016, performing in-line with the Russell 1000 Growth Index return of 1.36%. The Fund benefited from strong stock selection in the Health Care, Industrials, and Information Technology. Weak stock selection in the Consumer Staples sector and an underweight allocation the Telecom Services sector weighed on relative performance.
We are pleased with the Fund’s performance for the year-to-date period and believe the Fund is well positioned going into the second half of 2016 as the market deals with ongoing macroeconomic and geopolitical uncertainties.
5
Large Company Growth Portfolio Commentary (Unaudited) - (Continued) |
|
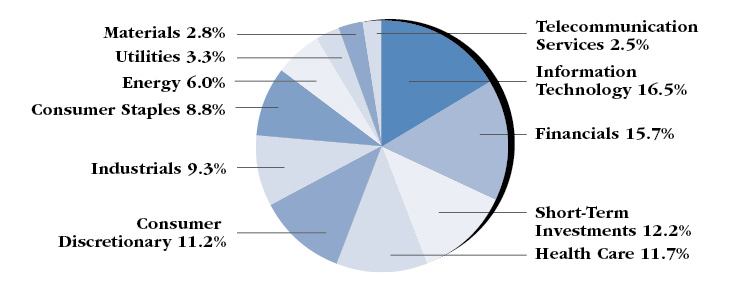
PORTFOLIO SECTOR WEIGHTING†
(As of June 30, 2016)

† | Based on percent of the Portfolio’s total investments in securities, at value. Includes investments held as collateral for securities on loan (see Note 6 in Notes to Financial Statements). |
6
Large Company Value Portfolio Commentary (Unaudited) |
|
INVESTMENT CLASS SHARES
Average Annual Total Return*
Six Months Ended 06/30/16** | 1.40% |
One Year Ended 06/30/16 | -3.78% |
Five Years Ended 06/30/16 | 8.81% |
Ten Years Ended 06/30/16 | 4.39% |
RUSSELL 1000® VALUE INDEX(1)
Average Annual Total Return
Six Months Ended 06/30/16** | 6.30% |
One Year Ended 06/30/16 | 2.86% |
Five Years Ended 06/30/16 | 11.35% |
Ten Years Ended 06/30/16 | 6.13% |
The performance data quoted represents past performance and does not guarantee future results. Current performance may be lower or higher. Performance data current to the most recent month end may be obtained at http://advisor.wilshire.com. The investment return and principal value of an investment will fluctuate so that shares, when redeemed, may be worth more or less than their original cost. The table above does not reflect the deduction of taxes that a shareholder would pay on Portfolio distributions or the redemption of Portfolio shares.
* | Assumes reinvestment of all distributions. |
| | |
** | Not annualized. |
| | |
(1) | The Russell 1000® Value Index is an unmanaged index that measures the performance of the largest 1,000 U.S. companies with lower price-to-book ratios and lower forecasted growth values. Index performance is presented for general comparative purposes. Unlike a mutual fund, the performance of an index assumes no transaction costs, management fees or other expenses. An individual cannot directly invest in any index. |
7
Large Company Value Portfolio Commentary (Unaudited) - (Continued) |
|
INSTITUTIONAL CLASS SHARES
Average Annual Total Return*
Six Months Ended 06/30/16** | 1.55% |
One Year Ended 06/30/16 | -3.50% |
Five Years Ended 06/30/16 | 9.10% |
Ten Years Ended 06/30/16 | 4.64% |
RUSSELL 1000® VALUE INDEX(1)
Average Annual Total Return
Six Months Ended 06/30/16** | 6.30% |
One Year Ended 06/30/16 | 2.86% |
Five Years Ended 06/30/16 | 11.35% |
Ten Years Ended 06/30/16 | 6.13% |
The performance data quoted represents past performance and does not guarantee future results. Current performance may be lower or higher. Performance data current to the most recent month end may be obtained at http://advisor.wilshire.com. The investment return and principal value of an investment will fluctuate so that shares, when redeemed, may be worth more or less than their original cost. The table above does not reflect the deduction of taxes that a shareholder would pay on Portfolio distributions or the redemption of Portfolio shares.
* | Assumes reinvestment of all distributions. |
| | |
** | Not annualized. |
| | |
(1) | The Russell 1000® Value Index is an unmanaged index that measures the performance of the largest 1,000 U.S. companies with lower price-to-book ratios and lower forecasted growth values. Index performance is presented for general comparative purposes. Unlike a mutual fund, the performance of an index assumes no transaction costs, management fees or other expenses. An individual cannot directly invest in any index. |
8
Large Company Value Portfolio Commentary (Unaudited) - (Continued) |
|
Markets tumbled globally to start the year as worries over a slowing Chinese economy, falling oil prices, and weakness in U.S. earnings growth rattled investors. The U.S. stock market, as represented by the Wilshire 5000 Total Market IndexSM, fell 9% during the first dozen trading days. The U.S. market eventually rallied from its trough as investor concerns were met with sound economic data and aggressive action by some of the world’s major central banks. In January, the Bank of Japan joined the European Central Bank (ECB) in adopting a negative interest rate policy. In April, markets posted modest returns supported by rising oil prices and increased monetary stimulus measures from the ECB. Equity returns were mixed in May as improving global growth was overshadowed by concerns over a potential increase in U.S. interest rates. The first half of the year closed out with a sharp increase in volatility as the UK referendum to exit the European Union rattled global markets during the last week of trading in June. The U.S. stock market experienced its worst two-day decline since August 2015 before rallying back as investor panic eased. Year to date, value securities have outperformed growth while trends shifted between the first and second quarters in terms of capitalization with large capitalization stock outperforming their smaller capitalization counterparts in the first quarter and smaller capitalization stocks outperforming in the second quarter. Within large capitalization securities, lower beta stocks significantly outperformed their higher beta counterparts, and within small capitalization stocks, low beta and dividend yield were strong performing characteristics over the first six months of the year.
Sector performance for the Wilshire 5000 IndexSM was mixed through June 30. Defensive sectors led with Utilities and Telecom Services returning over 23%. Energy (+15.2%) and Materials (+10.7%) also had strong performance as oil prices rebounded beginning late January. Financials (-1.1%) and Health Care (-0.3%) were the worst performing sectors as banks were weighed down by decreasing interest yields and biotechnology holdings sold off over fears about potential health care reform. Information Technology (-0.3%) also experience negative returns.
The Wilshire Large Company Value Portfolio Institutional Class returned 1.55% for the first six months of 2016, underperforming the Russell 1000 Value Index return of 6.30% by 4.75%. The Fund was hurt by poor stock selection in the Financials, Industrials, and Energy sectors as well as an overweight allocation to the Financials sector. Strong stock selection in the Consumer Discretionary sector helped mitigate some relative losses.
Despite the Fund’s underperformance versus its benchmark, we believe the Fund is well positioned going into the second half of 2016 as the market deals with ongoing macroeconomic and geopolitical uncertainties.
9
Large Company Value Portfolio Commentary (Unaudited) - (Continued) |
|
PORTFOLIO SECTOR WEIGHTING†
(As of June 30, 2016)

† | Based on percent of the Portfolio’s total investments in securities, at value. |
10
Small Company Growth Portfolio Commentary (Unaudited) |
|
INVESTMENT CLASS SHARES
Average Annual Total Return*
Six Months Ended 06/30/16** | 4.33% |
One Year Ended 06/30/16 | -1.83% |
Five Years Ended 06/30/16 | 9.76% |
Ten Years Ended 06/30/16 | 7.40% |
RUSSELL 2000® GROWTH INDEX(1)
Average Annual Total Return
Six Months Ended 06/30/16** | -1.59% |
One Year Ended 06/30/16 | -10.75% |
Five Years Ended 06/30/16 | 8.51% |
Ten Years Ended 06/30/16 | 7.14% |
The performance data quoted represents past performance and does not guarantee future results. Current performance may be lower or higher. Performance data current to the most recent month end may be obtained at http://advisor.wilshire.com. The investment return and principal value of an investment will fluctuate so that shares, when redeemed, may be worth more or less than their original cost. The table above does not reflect the deduction of taxes that a shareholder would pay on Portfolio distributions or the redemption of Portfolio shares.
* | Assumes reinvestment of all distributions. During the ten years ended June 30, 2016, certain fees and expenses were waived or reimbursed. Without waivers and reimbursements (excluding fees paid indirectly), historical total returns would have been lower. For the six months ended June 30, 2016, 0.08% of average net assets was waived or reimbursed through other expenses in the Investment Class Shares. |
| | |
** | Not annualized. |
| | |
(1) | The Russell 2000® Growth Index is an unmanaged index that measures the performance of the 2,000 smallest U.S. companies with higher price-to-book ratios and higher forecasted growth values. Index performance is presented for general comparative purposes. Unlike a mutual fund, the performance of an index assumes no transaction costs, management fees or other expenses. An individual cannot directly invest in any index. |
11
Small Company Growth Portfolio Commentary (Unaudited) - (Continued) |
|
INSTITUTIONAL CLASS SHARES
Average Annual Total Return*
Six Months Ended 06/30/16** | 4.53% |
One Year Ended 06/30/16 | -1.54% |
Five Years Ended 06/30/16 | 10.04% |
Ten Years Ended 06/30/16 | 7.67% |
RUSSELL 2000® GROWTH INDEX(1)
Average Annual Total Return
Six Months Ended 06/30/16** | -1.59% |
One Year Ended 06/30/16 | -10.75% |
Five Years Ended 06/30/16 | 8.51% |
Ten Years Ended 06/30/16 | 7.14% |
The performance data quoted represents past performance and does not guarantee future results. Current performance may be lower or higher. Performance data current to the most recent month end may be obtained at http://advisor.wilshire.com. The investment return and principal value of an investment will fluctuate so that shares, when redeemed, may be worth more or less than their original cost. The table above does not reflect the deduction of taxes that a shareholder would pay on Portfolio distributions or the redemption of Portfolio shares.
* | Assumes reinvestment of all distributions. During the ten years ended June 30, 2016, certain fees and expenses were waived or reimbursed. Without waivers and reimbursements (excluding fees paid indirectly), historical total returns would have been lower. For the six months ended June 30, 2016, 0.08% of average net assets was waived or reimbursed through other expenses in the Institutional Class Shares. |
| | |
** | Not annualized. |
| | |
(1) | The Russell 2000® Growth Index is an unmanaged index that measures the performance of the 2,000 smallest U.S. companies with higher price-to-book ratios and higher forecasted growth values. Index performance is presented for general comparative purposes. Unlike a mutual fund, the performance of an index assumes no transaction costs, management fees or other expenses. An individual cannot directly invest in any index. |
12
Small Company Growth Portfolio Commentary (Unaudited) - (Continued) |
|
Markets tumbled globally to start the year as worries over a slowing Chinese economy, falling oil prices, and weakness in U.S. earnings growth rattled investors. The U.S. stock market, as represented by the Wilshire 5000 Total Market IndexSM, fell 9% during the first dozen trading days. The U.S. market eventually rallied from its trough as investor concerns were met with sound economic data and aggressive action by some of the world’s major central banks. In January, the Bank of Japan joined the European Central Bank (ECB) in adopting a negative interest rate policy. In April, markets posted modest returns supported by rising oil prices and increased monetary stimulus measures from the ECB. Equity returns were mixed in May as improving global growth was overshadowed by concerns over a potential increase in U.S. interest rates. The first half of the year closed out with a sharp increase in volatility as the UK referendum to exit the European Union rattled global markets during the last week of trading in June. The U.S. stock market experienced its worst two-day decline since August 2015 before rallying back as investor panic eased. Year to date, value securities have outperformed growth while trends shifted between the first and second quarters in terms of capitalization with large capitalization stock outperforming their smaller capitalization counterparts in the first quarter and smaller capitalization stocks outperforming in the second quarter. Within large capitalization securities, lower beta stocks significantly outperformed their higher beta counterparts, and within small capitalization stocks, low beta and dividend yield were strong performing characteristics over the first six months of the year.
Sector performance for the Wilshire 5000 IndexSM was mixed through June 30. Defensive sectors led with Utilities and Telecom Services returning over 23%. Energy (+15.2%) and Materials (+10.7%) also had strong performance as oil prices rebounded beginning late January. Financials (-1.1%) and Health Care (-0.3%) were the worst performing sectors as banks were weighed down by decreasing interest yields and biotechnology holdings sold off over fears about potential health care reform. Information Technology (-0.3%) also experience negative returns.
The Wilshire Small Company Growth Portfolio Institutional Class returned 4.53% for the first six months of 2016, outperforming the Russell 2000 Growth Index return of -1.59% by 6.12%. The Fund benefited from strong stock selection in the Health Care, Industrials, and Information Technology sectors as well as an overweight allocation to the Consumer Staples sector. Weak stock selection in the Consumer Discretionary sector weighed on relative performance.
We are pleased with the Fund’s outperformance for the year-to-date period and believe the Fund is well positioned going into the second half of 2016 as the market deals with ongoing macroeconomic and geopolitical uncertainties.
13
Small Company Growth Portfolio Commentary (Unaudited) - (Continued) |
|
PORTFOLIO SECTOR WEIGHTING†
(As of June 30, 2016)

† | Based on percent of the Portfolio’s total investments in securities, at value. Includes investments held as collateral for securities on loan (see Note 6 in Notes to Financial Statements). |
14
Small Company Value Portfolio Commentary (Unaudited) |
|
INVESTMENT CLASS SHARES
Average Annual Total Return*
Six Months Ended 06/30/16** | 3.28% |
One Year Ended 06/30/16 | -2.34% |
Five Years Ended 06/30/16 | 9.73% |
Ten Years Ended 06/30/16 | 5.73% |
RUSSELL 2000® VALUE INDEX(1)
Average Annual Total Return
Six Months Ended 06/30/16** | 6.08% |
One Year Ended 06/30/16 | -2.58% |
Five Years Ended 06/30/16 | 8.15% |
Ten Years Ended 06/30/16 | 5.15% |
The performance data quoted represents past performance and does not guarantee future results. Current performance may be lower or higher. Performance data current to the most recent month end may be obtained at http://advisor.wilshire.com. The investment return and principal value of an investment will fluctuate so that shares, when redeemed, may be worth more or less than their original cost. The table above does not reflect the deduction of taxes that a shareholder would pay on Portfolio distributions or the redemption of Portfolio shares.
* | Assumes reinvestment of all distributions. During the ten years ended June 30, 2016, certain fees and expenses were waived or reimbursed. Without waivers and reimbursements (excluding fees paid indirectly), historical total returns would have been lower. For the six months ended June 30, 2016, 0.08% of average net assets was waived or reimbursed through other expenses in the Investment Class Shares. |
| | |
** | Not annualized. |
| | |
(1) | The Russell 2000® Value Index is an unmanaged index that measures the performance of the 2,000 smallest U.S. companies with lower price-to-book ratios and lower forecasted growth values. Index performance is presented for general comparative purposes. Unlike a mutual fund, the performance of an index assumes no transaction costs, management fees or other expenses. An individual cannot directly invest in any index. |
15
Small Company Value Portfolio Commentary (Unaudited) - (Continued) |
|
INSTITUTIONAL CLASS SHARES
Average Annual Total Return*
Six Months Ended 06/30/16** | 3.46% |
One Year Ended 06/30/16 | -2.03% |
Five Years Ended 06/30/16 | 10.10% |
Ten Years Ended 06/30/16 | 6.08% |
RUSSELL 2000® VALUE INDEX(1)
Average Annual Total Return
Six Months Ended 06/30/16** | 6.08% |
One Year Ended 06/30/16 | -2.58% |
Five Years Ended 06/30/16 | 8.15% |
Ten Years Ended 06/30/16 | 5.15% |
The performance data quoted represents past performance and does not guarantee future results. Current performance may be lower or higher. Performance data current to the most recent month end may be obtained at http://advisor.wilshire.com. The investment return and principal value of an investment will fluctuate so that shares, when redeemed, may be worth more or less than their original cost. The table above does not reflect the deduction of taxes that a shareholder would pay on Portfolio distributions or the redemption of Portfolio shares.
* | Assumes reinvestment of all distributions. During the ten years ended June 30, 2016, certain fees and expenses were waived or reimbursed. Without waivers and reimbursements (excluding fees paid indirectly), historical total returns would have been lower. For the six months ended June 30, 2016, 0.07% of average net assets was waived or reimbursed through other expenses in the Institutional Class Shares. |
| | |
** | Not annualized. |
| | |
(1) | The Russell 2000® Value Index is an unmanaged index that measures the performance of the 2,000 smallest U.S. companies with lower price-to-book ratios and lower forecasted growth values. Index performance is presented for general comparative purposes. Unlike a mutual fund, the performance of an index assumes no transaction costs, management fees or other expenses. An individual cannot directly invest in any index. |
16
Small Company Value Portfolio Commentary (Unaudited) - (Continued) |
|
Markets tumbled globally to start the year as worries over a slowing Chinese economy, falling oil prices, and weakness in U.S. earnings growth rattled investors. The U.S. stock market, as represented by the Wilshire 5000 Total Market IndexSM, fell 9% during the first dozen trading days. The U.S. market eventually rallied from its trough as investor concerns were met with sound economic data and aggressive action by some of the world’s major central banks. In January, the Bank of Japan joined the European Central Bank (ECB) in adopting a negative interest rate policy. In April, markets posted modest returns supported by rising oil prices and increased monetary stimulus measures from the ECB. Equity returns were mixed in May as improving global growth was overshadowed by concerns over a potential increase in U.S. interest rates. The first half of the year closed out with a sharp increase in volatility as the UK referendum to exit the European Union rattled global markets during the last week of trading in June. The U.S. stock market experienced its worst two-day decline since August 2015 before rallying back as investor panic eased. Year to date, value securities have outperformed growth while trends shifted between the first and second quarters in terms of capitalization with large capitalization stock outperforming their smaller capitalization counterparts in the first quarter and smaller capitalization stocks outperforming in the second quarter. Within large capitalization securities, lower beta stocks significantly outperformed their higher beta counterparts, and within small capitalization stocks, low beta and dividend yield were strong performing characteristics over the first six months of the year.
Sector performance for the Wilshire 5000 IndexSM was mixed through June 30. Defensive sectors led with Utilities and Telecom Services returning over 23%. Energy (+15.2%) and Materials (+10.7%) also had strong performance as oil prices rebounded beginning late January. Financials (-1.1%) and Health Care (-0.3%) were the worst performing sectors as banks were weighed down by decreasing interest yields and biotechnology holdings sold off over fears about potential health care reform. Information Technology (-0.3%) also experience negative returns.
The Wilshire Small Company Value Portfolio Institutional Class returned 3.46% for the first six months of 2016, underperforming the Russell 2000 Value Index return of 6.08% by 2.62%. The Fund was hurt by weak stock selection in the Materials and Consumer Staples sectors. An overweight allocation to the Consumer Staples sector helped mitigate some relative underperformance.
Despite the Fund’s underperformance versus its benchmark, we believe the Fund is well positioned going into the second half of 2016 as the market deals with ongoing macroeconomic and geopolitical uncertainties.
17
Small Company Value Portfolio Commentary (Unaudited) - (Continued) |
|
PORTFOLIO SECTOR WEIGHTING†
(As of June 30, 2016)

† | Based on percent of the Portfolio’s total investments in securities, at value. Includes investments held as collateral for securities on loan (see Note 6 in Notes to Financial Statements). |
18
Wilshire 5000 Indexsm Fund Commentary (Unaudited) |
|
INVESTMENT CLASS SHARES
Average Annual Total Return*
Six Months Ended 06/30/16** | 3.66% |
One Year Ended 06/30/16 | 2.54% |
Five Years Ended 06/30/16 | 10.99% |
Ten Years Ended 06/30/16 | 6.81% |
WILSHIRE 5000 INDEXSM(1)
Average Annual Total Return
Six Months Ended 06/30/16** | 3.98% |
One Year Ended 06/30/16 | 2.97% |
Five Years Ended 06/30/16 | 11.66% |
Ten Years Ended 06/30/16 | 7.47% |
The performance data quoted represents past performance and does not guarantee future results. Current performance may be lower or higher. Performance data current to the most recent month end may be obtained at http://advisor.wilshire.com. The investment return and principal value of an investment will fluctuate so that shares, when redeemed, may be worth more or less than their original cost. The table above does not reflect the deduction of taxes that a shareholder would pay on Fund distributions or the redemption of Fund shares.
* | Assumes reinvestment of all distributions. |
| | |
** | Not annualized. |
| | |
(1) | The Wilshire 5000 IndexSM is an unmanaged index that measures the performance of all U.S. headquartered equity securities with readily available price data. Index performance is presented for general comparative purposes. Unlike a mutual fund, the performance of an index assumes no transaction costs, management fees or other expenses. An individual cannot directly invest in any index. |
19
Wilshire 5000 Indexsm Fund Commentary (Unaudited) - (Continued) |
|
INSTITUTIONAL CLASS SHARES
Average Annual Total Return*
Six Months Ended 06/30/16** | 3.77% |
One Year Ended 06/30/16 | 2.77% |
Five Years Ended 06/30/16 | 11.25% |
Ten Years Ended 06/30/16 | 7.02% |
WILSHIRE 5000 INDEXSM(1)
Average Annual Total Return
Six Months Ended 06/30/16** | 3.98% |
One Year Ended 06/30/16 | 2.97% |
Five Years Ended 06/30/16 | 11.66% |
Ten Years Ended 06/30/16 | 7.47% |
The performance data quoted represents past performance and does not guarantee future results. Current performance may be lower or higher. Performance data current to the most recent month end may be obtained at http://advisor.wilshire.com. The investment return and principal value of an investment will fluctuate so that shares, when redeemed, may be worth more or less than their original cost. The table above does not reflect the deduction of taxes that a shareholder would pay on Fund distributions or the redemption of Fund shares.
* | Assumes reinvestment of all distributions. |
| | |
** | Not annualized. |
| | |
(1) | The Wilshire 5000 IndexSM is an unmanaged index that measures the performance of all U.S. headquartered equity securities with readily available price data. Index performance is presented for general comparative purposes. Unlike a mutual fund, the performance of an index assumes no transaction costs, management fees or other expenses. An individual cannot directly invest in any index. |
20
Wilshire 5000 Indexsm Fund Commentary (Unaudited) - (Continued) |
|
QUALIFIED CLASS SHARES
Average Annual Total Return*
Six Months Ended 06/30/16** | 3.71% |
One Year Ended 06/30/16 | 1.62% |
Five Years Ended 06/30/16 | 11.31% |
Ten Years Ended 06/30/16 | 6.93% |
WILSHIRE 5000 INDEXSM(1)
Average Annual Total Return
Six Months Ended 06/30/16** | 3.98% |
One Year Ended 06/30/16 | 2.97% |
Five Years Ended 06/30/16 | 11.66% |
Ten Years Ended 06/30/16 | 7.47% |
The performance data quoted represents past performance and does not guarantee future results. Current performance may be lower or higher. Performance data current to the most recent month end may be obtained at http://advisor.wilshire.com. The investment return and principal value of an investment will fluctuate so that shares, when redeemed, may be worth more or less than their original cost. The table above does not reflect the deduction of taxes that a shareholder would pay on Fund distributions or the redemption of Fund shares.
* | Assumes reinvestment of all distributions. |
| | |
** | Not annualized. |
| | |
(1) | The Wilshire 5000 IndexSM is an unmanaged index that measures the performance of all U.S. headquartered equity securities with readily available price data. Index performance is presented for general comparative purposes. Unlike a mutual fund, the performance of an index assumes no transaction costs, management fees or other expenses. An individual cannot directly invest in any index. |
21
Wilshire 5000 Indexsm Fund Commentary (Unaudited) - (Continued) |
|
HORACE MANN CLASS SHARES
Average Annual Total Return*
Six Months Ended 06/30/16** | 3.61% |
One Year Ended 06/30/16 | 2.49% |
Five Years Ended 06/30/16 | 10.97% |
Ten Years Ended 06/30/16 | 6.76% |
WILSHIRE 5000 INDEXSM(1)
Average Annual Total Return
Six Months Ended 06/30/16** | 3.98% |
One Year Ended 06/30/16 | 2.97% |
Five Years Ended 06/30/16 | 11.66% |
Ten Years Ended 06/30/16 | 7.47% |
The performance data quoted represents past performance and does not guarantee future results. Current performance may be lower or higher. Performance data current to the most recent month end may be obtained at http://advisor.wilshire.com. The investment return and principal value of an investment will fluctuate so that shares, when redeemed, may be worth more or less than their original cost. The table above does not reflect the deduction of taxes that a shareholder would pay on Fund distributions or the redemption of Fund shares.
* | Assumes reinvestment of all distributions. |
| | |
** | Not annualized. |
| | |
(1) | The Wilshire 5000 IndexSM is an unmanaged index that measures the performance of all U.S. headquartered equity securities with readily available price data. Index performance is presented for general comparative purposes. Unlike a mutual fund, the performance of an index assumes no transaction costs, management fees or other expenses. An individual cannot directly invest in any index. |
22
Wilshire 5000 Indexsm Fund Commentary (Unaudited) - (Continued) |
|
Markets tumbled globally to start the year as worries over a slowing Chinese economy, tumbling oil prices, and weakness in U.S. earnings growth rattled investors. The U.S. stock market, as represented by the Wilshire 5000 Total Market IndexSM, fell 9% during the first dozen trading days. The U.S. market eventually rallied from its trough as investor concerns were met with sound economic data and aggressive action by some of the world’s major central banks. In January, the Bank of Japan joined the European Central Bank (ECB) in adopting a negative interest rate policy. In April, markets posted modest returns supported by rising oil prices and increased monetary stimulus measures from the ECB. Equity returns were mixed in May as improving global growth was overshadowed by concerns over a potential increase in U.S. interest rates. The first half of the year closed out with a sharp increase in volatility as the UK referendum to exit the European Union rattled global markets during the last week of trading in June. The U.S. stock market experienced its worst two-day decline since August 2015, before rallying back as investor panic eased. Year to date, value securities have outperformed growth while trends shifted between the first and second quarters in terms of capitalization with large capitalization stock outperforming their smaller capitalization counterparts in the first quarter and smaller capitalization stocks outperforming in the second quarter. Within large capitalization securities, lower beta stocks significantly outperformed their higher beta counterparts, and within small capitalization stocks, low beta and dividend yield were strong performing characteristics over the six months of the year.
Sector performance for the Wilshire 5000 IndexSM was mixed through June 30. Defensive sectors led with Utilities and Telecom Services returning over 23%. Energy (+15.2%) and Materials (+10.7%) also had strong performance as oil prices rebounded beginning late January. Financials (-1.1%) and Health Care (-0.3%) were the worst performing sectors as banks were weighed down by decreasing interest rates and biotechnology holdings sold off over fears about potential health care reform. Information Technology (-0.3%) also experience negative returns.
The Wilshire 5000 IndexSM Fund Institutional Class returned 3.77% for the first six months of 2016, underperforming the Fund’s benchmark (the Wilshire 5000 IndexSM) return of 3.98% by 0.21%. Underperformance is attributable to both Fund expenses as well as the optimization approach utilized by Los Angeles Capital, the Fund’s sub-advisor, and is well within the range of historical experiences.
23
Wilshire 5000 Indexsm Fund Commentary (Unaudited) - (Continued) |
|
PORTFOLIO SECTOR WEIGHTING†
(As of June 30, 2016)
† | Based on percent of the Fund’s total investments in securities, at value. Includes investments held as collateral for securities on loan (see Note 6 in Notes to Financial Statements). |
24
Wilshire International Equity Fund Commentary (Unaudited) |
|
INVESTMENT CLASS SHARES
Average Annual Total Return*
Six Months Ended 06/30/16** | 0.22% |
One Year Ended 06/30/16 | -5.50% |
Five Years Ended 06/30/16 | 2.99% |
Inception (11/16/07) through 06/30/16 | 0.07% |
MSCI ALL COUNTRY WORLD INDEX EX-U.S.(1)
Average Annual Total Return
Six Months Ended 06/30/16** | -1.02% |
One Year Ended 06/30/16 | -10.24% |
Five Years Ended 06/30/16 | 0.10% |
Inception (11/16/07) through 06/30/16 | -1.26% |
On April 2, 2013, the Wilshire International Equity Fund’s investment strategy was changed. Consequently, prior period performance may have been different if the new investment strategy had been in effect during these periods. Effective May 28, 2014, the MSCI All Country World Index Ex-U.S. replaced the MSCI EAFE Index as the Wilshire International Equity Fund’s primary benchmark index. The adviser believes the MSCI All Country World Index Ex-U.S. is a more appropriate index given the Wilshire International Equity Fund’s investment strategy.
The performance data quoted represents past performance and does not guarantee future results. Current performance may be lower or higher. Performance data current to the most recent month end may be obtained at http://advisor.wilshire.com. The investment return and principal value of an investment will fluctuate so that shares, when redeemed, may be worth more or less than their original cost. The table above does not reflect the deduction of taxes that a shareholder would pay on Fund distributions or the redemption of Fund shares.
* | Assumes reinvestment of all distributions. During certain periods since inception, certain fees and expenses were waived or reimbursed. Without waivers and reimbursements, historical total returns would have been lower. For the six months ended June 30, 2016, 0.0% of average net assets was waived or reimbursed through other expenses in the Investment Class Shares. |
| | |
** | Not annualized. |
| | |
(1) | The MSCI All Country World Ex-U.S. Index is an unmanaged capitalization-weighted measure of stock markets of developed and emerging markets, with the exception of U.S.-based companies. Unlike a mutual fund, the performance of an index assumes no transaction costs, management fees or other expenses. An individual cannot invest directly in an index. Index performance is presented for general comparative purposes. |
25
Wilshire International Equity Fund Commentary (Unaudited) - (Continued) |
|
INSTITUTIONAL CLASS SHARES
Average Annual Total Return*
Six Months Ended 06/30/16** | 0.46% |
One Year Ended 06/30/16 | -5.24% |
Five Years Ended 06/30/16 | 3.24% |
Inception (11/16/07) through 06/30/16 | 0.33% |
MSCI ALL COUNTRY WORLD INDEX EX-U.S.(1)
Average Annual Total Return
Six Months Ended 06/30/16** | -1.02% |
One Year Ended 06/30/16 | -10.24% |
Five Years Ended 06/30/16 | -0.10% |
Inception (11/16/07) through 06/30/16 | -1.26% |
On April 2, 2013, the Wilshire International Equity Fund’s investment strategy was changed. Consequently, prior period performance may have been different if the new investment strategy had been in effect during these periods. Effective May 28, 2014, the MSCI All Country World Index Ex-U.S. replaced the MSCI EAFE Index as the Wilshire International Equity Fund’s primary benchmark index. The adviser believes the MSCI All Country World Index Ex-U.S. is a more appropriate index given the Wilshire International Equity Fund’s investment strategy.
The performance data quoted represents past performance and does not guarantee future results. Current performance may be lower or higher. Performance data current to the most recent month end may be obtained at http://advisor.wilshire.com. The investment return and principal value of an investment will fluctuate so that shares, when redeemed, may be worth more or less than their original cost. The table above does not reflect the deduction of taxes that a shareholder would pay on Fund distributions or the redemption of Fund shares.
* | Assumes reinvestment of all distributions. During certain periods since inception, certain fees and expenses were waived or reimbursed. Without waivers and reimbursements, historical total returns would have been lower. For the six months ended June 30, 2016, 0.0% of average net assets was waived or reimbursed through other expenses in the Institutional Class Shares. |
| | |
** | Not annualized. |
| | |
(1) | The MSCI All Country World Ex-U.S. Index is an unmanaged capitalization-weighted measure of stock markets of developed and emerging markets, with the exception of U.S.-based companies. Unlike a mutual fund, the performance of an index assumes no transaction costs, management fees or other expenses. An individual cannot invest directly in an index. Index performance is presented for general comparative purposes. |
26
Wilshire International Equity Fund Commentary (Unaudited) - (Continued) |
|
International stock markets underperformed the U.S. as the MSCI All Country World ex-U.S. Index returned -1.02% in the first half of the year. More evidence of a Chinese economic slowdown, continued slack in the European economy and an anemic pulse related to Japan’s financial markets reforms all weighed on returns for most of the period. During the first quarter, some of this weakness was offset by stronger language on behalf of the European Central Bank (ECB) as it embarked on a more aggressive quantitative easing campaign to stimulate the regional economy. Currency effects were fairly pronounced as the U.S. dollar weakened against some of the world’s major currencies and contributed to enhancing returns for U.S. dollar-denominated investors. The second quarter started off by recording gains on behalf of European equities, only to retrench later in the period in the wake of the UK’s decision to exit the European Union. In the Pacific region, the Japanese economy’s slack, amid an aggressively monetary policy campaign, was a drag on returns. Japan’s currency appreciated significantly offsetting some of the weakness in this market. Emerging markets outperformed developed international markets by 10.83% for the year to date period. Emerging markets stocks benefitted from rising energy and commodity prices as well as expectations for continued accommodative policies from central banks around the world.
Sector performance for the MSCI All Country World ex-U.S. Index was mixed through June 30. Energy (+18.4%) and Materials (+11.0%) were the leading sectors supported by the rebound in oil prices beginning in late January. Consumer Discretionary (-9.1%), Financials (-8.6%) and Health Care (-3.0%) were the worst performing sectors consumer spending was dampened by global growth fears, banks were weighed down by decreasing interest rates and biotechnology holdings sold off over concerns about potential health care reform.
The Wilshire International Equity Fund Institutional Class returned 0.46% for the first six months of 2016, outperforming the MSCI All Country World ex U.S. Index return of -1.02% by 1.48%. The Fund benefited from strong stock selection in the Consumer Discretionary and Information Technology sectors. Weak stock selection in the Industrials and Materials sectors weighed on relative performance. Regionally, the Fund benefited from strong stock selection in Japan, Switzerland and Germany. Weak stock selection in Canada and an underweight allocation to the country weighed on relative performance.
We are pleased with the Fund’s outperformance for the year-to-date period and believe the Fund is well positioned going into the second half of 2016 as the market deals with ongoing macroeconomic and geopolitical uncertainties.
27
Wilshire International Equity Fund Commentary (Unaudited) - (Continued) |
|
PORTFOLIO SECTOR WEIGHTING†
(As of June 30, 2016)

† | Based on percent of the Fund’s total investments in securities, at value. Includes investments held as collateral for securities on loan (see Note 6 in Notes to Financial Statements). |
28
Wilshire Income Opportunities Fund(1) Commentary (Unaudited) |
|
INVESTMENT CLASS SHARES
Average Annual Total Return*
Inception (03/30/16) through 06/30/16** | 3.30% |
Barclays U.S. Universal Index(2)
Average Annual Total Return
Inception (03/30/16) through 06/30/16** | 2.78% |
The performance data quoted represents past performance and does not guarantee future results. Current performance may be lower or higher. Performance data current to the most recent month end may be obtained at http://advisor.wilshire.com. The investment return and principal value of an investment will fluctuate so that shares, when redeemed, may be worth more or less than their original cost. The table above does not reflect the deduction of taxes that a shareholder would pay on Fund distributions or the redemption of Fund shares.
* | Assumes reinvestment of all distributions. |
| | |
** | Not annualized. |
| | |
(1) | The Fund commenced operations on March 30, 2016. |
| | |
(2) | The Barclays U.S. Universal Index represents the union of the U.S. Aggregate Index, U.S. Corporate High Yield Index, Investment Grade 144A Index, Eurodollar Index, U.S. Emerging Markets Index, and the non-ERISA eligible portion of the CMBS Index. The index covers USD-denominated, taxable bonds that are rated either investment grade or high-yield. Some U.S. Universal Index constituents may be eligible for one or more of its contributing subcomponents that are not mutually exclusive. The Barclays U.S. Universal Index includes Treasury securities, Government agency bonds, Mortgage-backed bonds, corporate bonds, and a small amount of foreign bonds traded in U.S. |
29
Wilshire Income Opportunities Fund(1) Commentary (Unaudited) - (Continued) |
|
INSTITUTIONAL CLASS SHARES
Average Annual Total Return*
Inception (03/30/16) through 06/30/16** | 3.10% |
Barclays U.S. Universal Index(2)
Average Annual Total Return
Inception (03/30/16) through 06/30/16** | 2.78% |
The performance data quoted represents past performance and does not guarantee future results. Current performance may be lower or higher. Performance data current to the most recent month end may be obtained at http://advisor.wilshire.com. The investment return and principal value of an investment will fluctuate so that shares, when redeemed, may be worth more or less than their original cost. The table above does not reflect the deduction of taxes that a shareholder would pay on Fund distributions or the redemption of Fund shares.
* | Assumes reinvestment of all distributions. |
| | |
** | Not annualized. |
| | |
(1) | The Fund commenced operations on March 30, 2016. |
| | |
(2) | The Barclays U.S. Universal Index represents the union of the U.S. Aggregate Index, U.S. Corporate High Yield Index, Investment Grade 144A Index, Eurodollar Index, U.S. Emerging Markets Index, and the non-ERISA eligible portion of the CMBS Index. The index covers USD-denominated, taxable bonds that are rated either investment grade or high-yield. Some U.S. Universal Index constituents may be eligible for one or more of its contributing subcomponents that are not mutually exclusive. The Barclays U.S. Universal Index includes Treasury securities, Government agency bonds, Mortgage-backed bonds, corporate bonds, and a small amount of foreign bonds traded in U.S. |
30
Wilshire Income Opportunities Fund Commentary (Unaudited) - (Continued) |
|
The U.S. fixed income market got off to strong start as the Barclays U.S. Aggregate Bond Index retuned 5.31% for the first six months of the year. Volatility spiked at the start of the year as going concerns heightened for commodity-related companies. Fears of escalating corporate defaults from both investment grade and high yield energy companies caused the market to reprice these securities at distressed levels. Investors pushed US rates lower on the backs of reduced global growth expectations. U.S. Treasury securities extended their rally in the second quarter due to broad investor uncertainty over the United Kingdom’s decision to leave the European Union. Most of the rally occurred after the referendum results as investors sought out safe haven assets in the two trading days after the vote. The bellwether 10-year U.S. Treasury yield fell from 2.27% as of December 31 to 1.49% as of June 30. Credit spreads tightened over the second quarter as well, as investors continued to seek incremental yield wherever they could find it. Globally, sovereigns benefited from overall market uneasiness. Year to date, the Barclays U.S. Aggregate Bond Index returned 5.31%. The best performing sector was Corporate, up 3.57% followed by U.S. Treasury, up 2.10%. Securitized products posted a positive performance as well, up 1.17%. As for non-investment grade, the Barclays High Yield Master II Index returned 9.32% for the period. After retrenching to start the year, high yield rallied in March as oil prices appeared to have bottomed and central banks maintained supportive policy measures. Spreads compressed during the second quarter as demand for risk assets remained strong.
The Wilshire Income Opportunities Fund Institutional Class returned 3.10% for the period since inception, outperforming the Barclays U.S. Universal Index return of 2.78% by 0.32% during that time. A long U.S. Treasury position and positive yield carry boosted overall performance. The Fund also benefited from strong performance from its emerging market debt and collateralized loan obligation holdings. Conversely, Agency mortgage backed securities weighed on returns as the sector lagged others during the since inception period.
We are pleased with the Fund’s outperformance for the since inception period and believe the Fund is well positioned going into the second half of 2016 as the market deals with ongoing macroeconomic and geopolitical uncertainties.
31
Wilshire Income Opportunities Fund Commentary (Unaudited) - (Continued) |
|
PORTFOLIO SECTOR WEIGHTING†
(As of June 30, 2016)

† | Based on percent of the Fund’s total investments in securities, at value. |
32
Wilshire Mutual Funds, Inc. Disclosure of Fund Expenses For the Six Months Ended June 30, 2016 (Unaudited) |
|
All mutual funds have operating expenses. As a shareholder of a portfolio (or a “fund”), you incur ongoing costs, which include costs for investment advisory, administrative services, distribution and/or shareholder services and shareholder reports (like this one), among others. Operating expenses, which are deducted from a fund’s gross income, directly reduce the investment return of the fund. A fund’s expenses are expressed as a percentage of its average net assets. This figure is known as the expense ratio. The following examples are intended to help you understand the ongoing fees (in dollars) of investing in your fund and to compare these costs with those of other mutual funds. The examples are based on an investment of $1,000 made at the beginning of the period and held for the entire period from January 1, 2016 to June 30, 2016.
The table on the next page illustrates your Portfolio’s costs in two ways:
Actual Fund Return: This section helps you to estimate the actual expenses, after any applicable fee waivers, that you paid over the period. The “Ending Account Value” shown is derived from the Portfolio’s actual return for the period. The “Expense Ratio” column shows the period’s annualized expense ratio and the “Expenses Paid During Period” column shows the dollar amount that would have been paid by an investor who started with $1,000 in the Portfolio at the beginning of the period.
You may use the information here, together with your account value, to estimate the expenses that you paid over the period. To do so, simply divide your account value by $1,000 (for example, an $8,600 account value divided by $1,000 = 8.6), then multiply the result by the number given for your Portfolio in the first line under the heading entitled “Expenses Paid During Period.”
Hypothetical 5% Return: This section is intended to help you compare your Portfolio’s costs with those of other mutual funds. The “Ending Account Value” shown is derived from hypothetical account values and hypothetical expenses based on the Portfolio’s actual expense ratio and assumed rate of return. It assumes that the Portfolio had an annual return of 5% before expenses, but that the expense ratio is unchanged. In this case, because the return used is not the Portfolio’s actual return, the results do not apply to your investment. This example is useful in making comparisons to other mutual funds because the Securities and Exchange Commission (“SEC”) requires all mutual funds to calculate expenses based on an assumed 5% annual return. You can assess your Portfolio’s ongoing costs by comparing this hypothetical example with the hypothetical examples that appear in shareholder reports of other funds.
Please note that the expenses shown in the table are meant to highlight and help you compare your ongoing costs only and do not reflect any transactional costs such as sales charges (loads), redemption fees, or exchange fees. Wilshire Mutual Funds, Inc. has no such charges, but these may be present in other funds to which you compare this data. Therefore, the hypothetical portions of the table are useful in comparing ongoing costs only, and will not help you determine the relative total costs of owning different funds.
33
Wilshire Mutual Funds, Inc. Disclosure of Fund Expenses - (Continued) For the Six Months Ended June 30, 2016 (Unaudited) |
|
| | Beginning
Account
Value
01/01/2016 | Ending
Account
Value
06/30/2016 | Expense
Ratio(1) | Expenses Paid
During Period
01/01/16-06/30/2016 |
Large Company Growth Portfolio |
Actual Fund Return | | | | |
Investment Class | $ 1,000.00 | $1,012.20 | 1.30% | $6.53(2) |
Institutional Class | $1,000.00 | $1,013.80 | 0.99% | $4.94(2) |
Hypothetical 5% Return | | | | |
Investment Class | $1,000.00 | $1,018.38 | 1.30% | $6.55(2) |
Institutional Class | $1,000.00 | $1,019.96 | 0.99% | $4.96(2) |
Large Company Value Portfolio |
Actual Fund Return | | | | |
Investment Class | $1,000.00 | $1,014.00 | 1.23% | $6.16(2) |
Institutional Class | $1,000.00 | $1,015.50 | 0.96% | $4.79(2) |
Hypothetical 5% Return | | | | |
Investment Class | $1,000.00 | $1,018.75 | 1.23% | $6.17(2) |
Institutional Class | $1,000.00 | $1,020.11 | 0.96% | $4.80(2) |
Small Company Growth Portfolio |
Actual Fund Return | | | | |
Investment Class | $1,000.00 | $1,043.30 | 1.50% | $7.61(2) |
Institutional Class | $1,000.00 | $1,045.30 | 1.16% | $5.92(2) |
Hypothetical 5% Return | | | | |
Investment Class | $1,000.00 | $1,017.42 | 1.50% | $7.51(2) |
Institutional Class | $1,000.00 | $1,019.08 | 1.16% | $5.84(2) |
Small Company Value Portfolio |
Actual Fund Return | | | | |
Investment Class | $1,000.00 | $1,032.80 | 1.48% | $7.49(2) |
Institutional Class | $1,000.00 | $1,034.60 | 1.16% | $5.85(2) |
Hypothetical 5% Return | | | | |
Investment Class | $1,000.00 | $1,017.49 | 1.48% | $7.44(2) |
Institutional Class | $1,000.00 | $1,019.11 | 1.16% | $5.81(2) |
34
Wilshire Mutual Funds, Inc. Disclosure of Fund Expenses - (Continued) For the Six Months Ended June 30, 2016 (Unaudited) |
|
| | Beginning
Account
Value
01/01/2016 | Ending
Account
Value
06/30/2016 | Expense
Ratio(1) | Expenses Paid
During Period
01/01/16-06/30/2016 |
Wilshire 5000 IndexSM Fund |
Actual Fund Return | | | | |
Investment Class | $ 1,000.00 | $ 1,036.60 | 0.66% | $ 3.36(2) |
Institutional Class | $ 1,000.00 | $ 1,037.70 | 0.36% | $ 1.82(2) |
Qualified Class | $ 1,000.00 | $ 1,037.10 | 0.31% | $ 1.57(2) |
Horace Mann Class | $ 1,000.00 | $ 1,036.10 | 0.71% | $ 3.57(2) |
Hypothetical 5% Return | | | | |
Investment Class | $ 1,000.00 | $ 1,021.57 | 0.66% | $ 3.33(2) |
Institutional Class | $ 1,000.00 | $ 1,023.08 | 0.36% | $ 1.81(2) |
Qualified Class | $ 1,000.00 | $ 1,023.32 | 0.31% | $ 1.56(2) |
Horace Mann Class | $ 1,000.00 | $ 1,021.36 | 0.71% | $ 3.55(2) |
Wilshire International Equity Fund |
Actual Fund Return | | | | |
Investment Class | $ 1,000.00 | $ 1,002.20 | 1.50% | $ 7.49(2) |
Institutional Class | $ 1,000.00 | $ 1,004.60 | 1.25% | $ 6.25(2) |
Hypothetical 5% Return | | | | |
Investment Class | $ 1,000.00 | $ 1,017.38 | 1.50% | $ 7.54(2) |
Institutional Class | $ 1,000.00 | $ 1,018.63 | 1.25% | $ 6.29(2) |
Wilshire Income Opportunity Fund |
Actual Fund Return | | | | |
Investment Class | $ 1,000.00 | $ 1,033.00 | 1.10% | $ 2.80(3) |
Institutional Class | $ 1,000.00 | $ 1,031.00 | 0.85% | $ 2.18(3) |
Hypothetical 5% Return | | | | |
Investment Class | $ 1,000.00 | $ 1,019.41 | 1.10% | $ 5.51(2) |
Institutional Class | $ 1,000.00 | $ 1,020.61 | 0.85% | $ 4.29(2) |
(1) | Annualized, based on the Portfolio’s most recent fiscal half-year expenses. |
| | |
(2) | Expenses are equal to the Portfolio’s annualized expense ratio multiplied by the average account value over the period, multiplied by 182/366 (to reflect one-half year period). |
| | |
(3) | Expenses are equal to the Portfolio’s annualized expense ratio multiplied by the average account value over the period, multiplied by 92/366 (to reflect March 30, 2016 inception). |
35
Wilshire Mutual Funds, Inc. Large Company Growth Portfolio Condensed Schedule of Investments | June 30, 2016 (Unaudited) |
|
Shares | | Percentage of
Net Assets (%) | | | Value | |
COMMON STOCK — 98.5%†† | |
Consumer Discretionary — 17.0% | | | | | | |
| | 17,539 | | Amazon.com, Inc.† | | | 4.5 | | | $ | 12,551,259 | |
| | 45,350 | | NIKE, Inc., Class B | | | 0.9 | | | | 2,503,320 | |
| | 11,475 | | O'Reilly Automotive, Inc.† (a) | | | 1.1 | | | | 3,110,873 | |
| | 53,515 | | Starbucks Corp. | | | 1.1 | | | | 3,056,777 | |
| | 31,875 | | Tractor Supply Co. | | | 1.1 | | | | 2,906,362 | |
| | 17,200 | | Ulta Salon Cosmetics & Fragrance, Inc.† (a) | | | 1.5 | | | | 4,190,608 | |
| | 36,717 | | Yum! Brands, Inc. | | | 1.1 | | | | 3,044,574 | |
| | 204,804 | | Other Securities | | | 5.7 | | | | 15,647,351 | |
| | | | | | | | | | | 47,011,124 | |
Consumer Staples — 13.9% | | | | | | | | |
| | 130,031 | | Coca-Cola Co. (The) | | | 2.1 | | | | 5,894,305 | |
| | 18,600 | | Constellation Brands, Inc., Class A | | | 1.1 | | | | 3,076,440 | |
| | 15,355 | | Costco Wholesale Corp.(a) | | | 0.9 | | | | 2,411,349 | |
| | 254,834 | | Danone SA ADR(a) | | | 1.3 | | | | 3,610,998 | |
| | 50,132 | | Monster Beverage Corp.† (a) | | | 2.9 | | | | 8,056,714 | |
| | 42,432 | | Procter & Gamble Co. (The) | | | 1.3 | | | | 3,592,718 | |
| | 39,941 | | SABMiller PLC ADR(a) | | | 0.9 | | | | 2,338,146 | |
| | 138,761 | | Other Securities | | | 3.4 | | | | 9,568,184 | |
| | | | | | | | | | | 38,548,854 | |
Energy — 1.3% | | | | | | | | |
| | 34,613 | | Schlumberger, Ltd. | | | 1.0 | | | | 2,737,196 | |
| | 26,608 | | Other Securities | | | 0.3 | | | | 898,183 | |
| | | | | | | | | | | 3,635,379 | |
Financials — 4.4% | | | | | | | | |
| | 206,216 | | Other Securities | | | 4.4 | | | | 12,162,527 | |
| | | | | | | | | | | | |
Health Care — 16.0% | | | | | | | | |
| | 21,075 | | Alexion Pharmaceuticals, Inc.† | | | 0.9 | | | | 2,460,717 | |
| | 20,707 | | Amgen, Inc. | | | 1.1 | | | | 3,150,570 | |
| | 53,049 | | Bristol-Myers Squibb Co. | | | 1.4 | | | | 3,901,754 | |
| | 35,158 | | Celgene Corp.† (a) | | | 1.3 | | | | 3,467,633 | |
| | 46,875 | | Centene Corp.† | | | 1.2 | | | | 3,345,469 | |
| | 56,602 | | Cerner Corp.† | | | 1.2 | | | | 3,316,877 | |
| | 26,525 | | Edwards Lifesciences Corp.† | | | 0.9 | | | | 2,645,338 | |
| | 40,999 | | Merck & Co., Inc. | | | 0.9 | | | | 2,361,952 | |
| | 27,884 | | Novartis AG ADR(a) | | | 0.8 | | | | 2,300,709 | |
| | 58,363 | | Novo Nordisk ADR(a) | | | 1.1 | | | | 3,138,762 | |
| | 29,439 | | Varian Medical Systems, Inc.† (a) | | | 0.9 | | | | 2,420,769 | |
| | 165,102 | | Other Securities | | | 4.3 | | | | 11,616,136 | |
| | | | | | | | | | | 44,126,686 | |
Industrials — 6.9% | | | | | | | | |
| | 10,350 | | Acuity Brands, Inc.(a) | | | 0.9 | | | | 2,566,386 | |
| | 21,025 | | Canadian Pacific Railway, Ltd. | | | 1.0 | | | | 2,707,810 | |
| | 63,101 | | Expeditors International of Washington, Inc. | | | 1.1 | | | | 3,094,473 | |
| | 38,165 | | United Parcel Service, Inc., Class B | | | 1.5 | | | | 4,111,134 | |
| | 85,649 | | Other Securities | | | 2.4 | | | | 6,523,361 | |
| | | | | | | | | | | 19,003,164 | |
Information Technology — 35.3% | | | | | | | | |
| | 29,325 | | Adobe Systems, Inc.† | | | 1.0 | | | | 2,809,042 | |
| | 54,586 | | Alibaba Group Holding, Ltd. ADR† (a) | | | 1.6 | | | | 4,341,224 | |
| | 5,562 | | Alphabet, Inc., Class A† | | | 1.4 | | | | 3,913,034 | |
| | 11,099 | | Alphabet, Inc., Class C† | | | 2.8 | | | | 7,681,618 | |
| | 57,032 | | Apple, Inc. | | | 2.0 | | | | 5,452,259 | |
| | 55,973 | | ARM Holdings PLC ADR | | | 0.9 | | | | 2,547,331 | |
| | 53,275 | | Autodesk, Inc.† (a) | | | 1.1 | | | | 2,884,309 | |
| | 173,171 | | Cisco Systems, Inc. | | | 1.8 | | | | 4,968,276 | |
| | 47,250 | | Cognizant Technology Solutions Corp., Class A† | | | 1.0 | | | | 2,704,590 | |
| | 106,838 | | Facebook, Inc., Class A† | | | 4.4 | | | | 12,209,447 | |
| | 77,923 | | Microsoft Corp. | | | 1.4 | | | | 3,987,320 | |
| | 28,600 | | NXP Semiconductors NV† | | | 0.8 | | | | 2,240,524 | |
| | 126,975 | | Oracle Corp. | | | 1.9 | | | | 5,197,087 | |
| | 89,388 | | QUALCOMM, Inc. | | | 1.7 | | | | 4,788,515 | |
| | 96,785 | | Sabre Corp. | | | 0.9 | | | | 2,592,870 | |
| | 37,725 | | salesforce.com, Inc.† | | | 1.1 | | | | 2,995,742 | |
| | 113,321 | | Visa, Inc., Class A(a) | | | 3.1 | | | | 8,405,019 | |
| | 415,444 | | Other Securities | | | 6.4 | | | | 17,792,515 | |
| | | | | | | | | | | 97,510,722 | |
Materials — 3.2% | | | | | | | | |
| | 13,556 | | Sherwin-Williams Co. (The) | | | 1.4 | | | | 3,980,991 | |
| | 65,829 | | Other Securities | | | 1.8 | | | | 4,737,937 | |
| | | | | | | | | | | 8,718,928 | |
Telecommunication Services — 0.5% | | | | | | | | |
| | 24,941 | | Other Securities | | | 0.5 | | | | 1,329,126 | |
| | | | | | | | | | | | |
Total Common Stock | | | | | | | | |
(Cost $212,026,765) | | | | | | | 272,046,510 | |
See Notes to Financial Statements.
36
Wilshire Mutual Funds, Inc. Large Company Growth Portfolio Condensed Schedule of Investments - (Continued) | June 30, 2016 (Unaudited) |
|
Shares | | Percentage of
Net Assets (%) | | | Value | |
SHORT-TERM INVESTMENTS (b) — 22.5% | |
| | 4,012,423 | | Northern Trust Institutional Government Select Portfolio, Institutional Class, 0.240% | | | 1.4 | | | $ | 4,012,423 | |
| | 58,285,375 | | Northern Trust Institutional Liquid Asset Portfolio, Institutional Class,
0.520% (c) | | | 21.1 | | | | 58,285,375 | |
| | | | | | | | | | | | |
Total Short-Term Investments | | | | | | | | |
(Cost $62,297,798) | | | | | | | 62,297,798 | |
| | | | | | | | | | | | |
Total Investments ��� 121.0% | | | | | | | | |
(Cost $274,324,563) | | | | | | | 334,344,308 | |
Other Assets & Liabilities, Net — (21.0)% | | | | | | | (58,079,584 | ) |
| | | | | | | | | | | | |
NET ASSETS — 100.0% | | | | | | $ | 276,264,724 | |
†† | More narrow industries are utilized for compliance purposes, whereas broad sectors are utilized for reporting purposes. |
† | Non-income producing security. |
(a) | This security or a partial position of this security is on loan at June 30, 2016. The total market value of securities on loan at June 30, 2016 was $59,217,936 (Note 6). |
(b) | Rate shown in the 7-day effective yield as of June 30, 2016. |
(c) | This security was purchased with cash collateral held from securities on loan. The total value of such securities as of June 30, 2016 was $58,285,375. Securities on loan are also collateralized by various U.S. Treasury obligations in the amount of $1,960,847 (Note 6). |
ADR — American Depositary Receipt
Ltd. — Limited
PLC — Public Limited Company
The Condensed Schedule of Investments does not reflect the complete portfolio holdings. It includes the Portfolio’s 50 largest holdings and each investment of any issuer that exceeds 1% of the Portfolio’s net assets. “Other Securities” represent all issues not required to be disclosed under the rules adopted by the U.S. Securities and Exchange Commission (“SEC”). The complete schedule of portfolio holdings is available (i) without charge, upon request, by calling (800) 607-2200; (ii) on the SEC’s website at http://www.sec.gov; and (iii) on our website at http://advisor.wilshire.com.
As of June 30, 2016, all of the Portfolio’s investments were considered Level 1. For the six months ended June 30, 2016, there have been no transfers between Level 1 and Level 2 assets and liabilities. For the six months ended June 30, 2016, there have been no transfers between Level 2 and Level 3 assets and liabilities. Please see Note 2 in Notes to Financial Statements for further information regarding fair value measurements.
See Notes to Financial Statements.
37
Wilshire Mutual Funds, Inc. Large Company Value Portfolio Condensed Schedule of Investments | June 30, 2016 (Unaudited) |
|
Shares | | Percentage of
Net Assets (%) | | | Value | |
COMMON STOCK — 98.9%†† | |
Consumer Discretionary — 6.5% | | | | | | |
| | 112,525 | | Ford Motor Co. | | | 0.7 | | | $ | 1,414,439 | |
| | 30,300 | | Lennar Corp., Class A | | | 0.7 | | | | 1,396,830 | |
| | 17,600 | | Omnicom Group, Inc. | | | 0.7 | | | | 1,434,224 | |
| | 24,274 | | Target Corp. | | | 0.8 | | | | 1,694,811 | |
| | 369,287 | | Other Securities | | | 3.6 | | | | 7,450,177 | |
| | | | | | | | | | | 13,390,481 | |
Consumer Staples — 6.9% | | | | | | | | |
| | 32,300 | | Altria Group, Inc. | | | 1.1 | | | | 2,227,408 | |
| | 26,096 | | Philip Morris International, Inc. | | | 1.3 | | | | 2,654,485 | |
| | 20,327 | | Procter & Gamble Co. (The) | | | 0.8 | | | | 1,721,087 | |
| | 57,275 | | Wal-Mart Stores, Inc. | | | 2.1 | | | | 4,182,221 | |
| | 47,794 | | Other Securities | | | 1.6 | | | | 3,368,967 | |
| | | | | | | | | | | 14,154,168 | |
Energy — 13.3% | | | | | | | | |
| | 90,378 | | BP PLC ADR | | | 1.6 | | | | 3,209,323 | |
| | 14,944 | | Chevron Corp. | | | 0.8 | | | | 1,566,579 | |
| | 47,095 | | ConocoPhillips | | | 1.0 | | | | 2,053,342 | |
| | 55,927 | | Exxon Mobil Corp. | | | 2.6 | | | | 5,242,597 | |
| | 42,135 | | Occidental Petroleum Corp. | | | 1.5 | | | | 3,183,721 | |
| | 22,089 | | Phillips 66 | | | 0.8 | | | | 1,752,541 | |
| | 66,151 | | Royal Dutch Shell PLC ADR, Class A | | | 1.8 | | | | 3,652,840 | |
| | 229,430 | | Other Securities | | | 3.2 | | | | 6,573,215 | |
| | | | | | | | | | | 27,234,158 | |
Financials — 28.4% | | | | | | | | |
| | 30,000 | | American Express Co. | | | 0.9 | | | | 1,822,800 | |
| | 36,973 | | American International Group, Inc. | | | 1.0 | | | | 1,955,502 | |
| | 358,873 | | Bank of America Corp. | | | 2.3 | | | | 4,762,245 | |
| | 49,837 | | Citigroup, Inc. | | | 1.0 | | | | 2,112,590 | |
| | 9,300 | | Goldman Sachs Group, Inc. (The) | | | 0.7 | | | | 1,381,794 | |
| | 80,897 | | JPMorgan Chase & Co. | | | 2.5 | | | | 5,026,940 | |
| | 57,930 | | Loews Corp. | | | 1.2 | | | | 2,380,344 | |
| | 33,825 | | MetLife, Inc. | | | 0.7 | | | | 1,347,250 | |
| | 56,375 | | Morgan Stanley | | | 0.7 | | | | 1,464,622 | |
| | 18,099 | | PNC Financial Services Group, Inc. | | | 0.7 | | | | 1,473,077 | |
| | 59,210 | | State Street Corp. | | | 1.6 | | | | 3,192,603 | |
| | 56,828 | | Voya Financial, Inc. | | | 0.7 | | | | 1,407,061 | |
| | 98,388 | | Wells Fargo & Co. | | | 2.3 | | | | 4,656,704 | |
| | 53,950 | | XL Group PLC, Class A | | | 0.9 | | | | 1,797,074 | |
| | 990,581 | | Other Securities | | | 11.2 | | | | 23,327,837 | |
| | | | | | | | | | | 58,108,443 | |
Health Care — 11.7% | | | | | | | | |
| | 29,480 | | Baxter International, Inc. | | | 0.7 | | | | 1,333,086 | |
| | 54,200 | | Johnson & Johnson | | | 3.2 | | | | 6,574,460 | |
| | 25,420 | | Medtronic PLC | | | 1.1 | | | | 2,205,693 | |
| | 99,157 | | Merck & Co., Inc. | | | 2.8 | | | | 5,712,435 | |
| | 137,902 | | Pfizer, Inc. | | | 2.4 | | | | 4,855,529 | |
| | 74,177 | | Other Securities | | | 1.5 | | | | 3,254,557 | |
| | | | | | | | | | | 23,935,760 | |
Industrials — 9.0% | | | | | | | | |
| | 23,225 | | Dover Corp. | | | 0.8 | | | | 1,609,957 | |
| | 15,600 | | Parker-Hannifin Corp. | | | 0.8 | | | | 1,685,580 | |
| | 36,100 | | Southwest Airlines Co. | | | 0.7 | | | | 1,415,481 | |
| | 28,801 | | Stanley Black & Decker, Inc. | | | 1.6 | | | | 3,203,247 | |
| | 152,923 | | Other Securities | | | 5.1 | | | | 10,434,604 | |
| | | | | | | | | | | 18,348,869 | |
Information Technology — 11.5% | | | | | | | | |
| | 71,786 | | Cisco Systems, Inc. | | | 1.0 | | | | 2,059,540 | |
| | 76,725 | | Hewlett Packard Enterprise Co. | | | 0.7 | | | | 1,401,766 | |
| | 86,102 | | Intel Corp. | | | 1.4 | | | | 2,824,146 | |
| | 18,449 | | International Business Machines Corp. | | | 1.4 | | | | 2,800,189 | |
| | 86,590 | | Oracle Corp. | | | 1.7 | | | | 3,544,129 | |
| | 58,431 | | QUALCOMM, Inc. | | | 1.5 | | | | 3,130,149 | |
| | 56,575 | | Seagate Technology PLC | | | 0.7 | | | | 1,378,167 | |
| | 295,272 | | Other Securities | | | 3.1 | | | | 6,341,186 | |
| | | | | | | | | | | 23,479,272 | |
Materials — 3.4% | | | | | | | | |
| | 71,200 | | CRH PLC ADR | | | 1.0 | | | | 2,106,096 | |
| | 100,394 | | Other Securities | | | 2.4 | | | | 4,774,527 | |
| | | | | | | | | | | 6,880,623 | |
Telecommunication Services — 3.7% | | | | | | | | |
| | 109,466 | | AT&T, Inc. | | | 2.3 | | | | 4,730,026 | |
| | 40,700 | | Verizon Communications, Inc. | | | 1.1 | | | | 2,272,688 | |
| | 19,163 | | Other Securities | | | 0.3 | | | | 566,664 | |
| | | | | | | | | | | 7,569,378 | |
See Notes to Financial Statements.
38
Wilshire Mutual Funds, Inc. Large Company Value Portfolio Condensed Schedule of Investments - (Continued) | June 30, 2016 (Unaudited) |
|
Shares | | Percentage of
Net Assets (%) | | | Value | |
Utilities — 4.5% | | | | | | |
| | 43,743 | | Entergy Corp. | | | 1.7 | | | $ | 3,558,493 | |
| | 111,785 | | Other Securities | | | 2.8 | | | | 5,777,437 | |
| | | | | | | | | | | 9,335,930 | |
Total Common Stock | | | | | | | | |
(Cost $189,756,582) | | | | | | | 202,437,082 | |
| | | | | | | | | | | | |
SHORT-TERM INVESTMENT (a) — 1.0% | |
| | 2,042,278 | | Northern Trust Institutional Government Select Portfolio, Institutional Class, 0.240% | | | 1.0 | | | | 2,042,278 | |
| | | | | | | | | | | | |
Total Short-Term Investment | | | | | | | | |
(Cost $2,042,278) | | | | | | | 2,042,278 | |
| | | | | | | | | | | | |
RIGHTS — 0.0% | | | | | | | | |
Number
Of Rights | | | | | | | | | | |
United States — 0.0% | | | | | | | | |
| | 2,236 | | Other Securities | | | 0.0 | | | | 1,189 | |
Total Rights (Cost $—) | | | | | | | 1,189 | |
| | | | | | | | | | | | |
Total Investments — 99.9% | | | | | | | | |
(Cost $191,798,860) | | | | | | | 204,480,549 | |
Other Assets & Liabilities, Net — 0.1% | | | | | | | 291,530 | |
| | | | | | | | | | | | |
NET ASSETS — 100.0% | | | | | | $ | 204,772,079 | |
†† | More narrow industries are utilized for compliance purposes, whereas broad sectors are utilized for reporting purposes. |
(a) | Rate shown is the 7-day effective yield as of June 30, 2016. |
ADR — American Depositary Receipt
PLC — Public Limited Company
Amounts designated as “—” are either $0, or have been rounded to $0.
The Condensed Schedule of Investments does not reflect the complete portfolio holdings. It includes the Portfolio’s 50 largest holdings and each investment of any issuer that exceeds 1% of the Portfolio’s net assets. “Other Securities” represent all issues not required to be disclosed under the rules adopted by the U.S. Securities and Exchange Commission (“SEC”). The complete schedule of portfolio holdings is available (i) without charge, upon request, by calling (800) 607-2200; (ii) on the SEC’s website at http://www.sec.gov; and (iii) on our website at http://advisor.wilshire.com.
As of June 30, 2016, all of the Portfolio’s investments were considered Level 1 except for Safeway Contingent Value Rights - PDC and Safeway Contingent Value Rights – Casa Ley which are Level 3. At June 30, 2016, the value of these Level 3 investments was $1,189. A reconciliation of Level 3 investments is only presented when the Portfolio has over 1% of Level 3 investments at the beginning and/or end of the period in relation to net assets. For the six months ended June 30, 2016 there have been no transfers between Level 1 and Level 2 assets and liabilities. For the six months ended June 30, 2016, there have been no transfers between Level 2 and Level 3 assets and liabilities. Please see Note 2 in Notes to Financial Statements for further information regarding fair value measurements.
See Notes to Financial Statements.
39
Wilshire Mutual Funds, Inc. Small Company Growth Portfolio Condensed Schedule of Investments | June 30, 2016 (Unaudited) |
|
Shares | | Percentage of
Net Assets (%) | | | Value | |
COMMON STOCK — 97.3% | |
Consumer Discretionary — 14.7% | | | | | | |
| | 6,280 | | Dorman Products, Inc.† | | | 0.9 | | | $ | 359,216 | |
| | 5,270 | | Drew Industries, Inc. | | | 1.2 | | | | 447,107 | |
| | 13,207 | | G-III Apparel Group, Ltd.† (a) | | | 1.6 | | | | 603,824 | |
| | 7,430 | | Monro Muffler Brake, Inc.(a) | | | 1.2 | | | | 472,251 | |
| | 12,329 | | Motorcar Parts of America, Inc.† (a) | | | 0.9 | | | | 335,102 | |
| | 8,718 | | Popeyes Louisiana Kitchen, Inc.† (a) | | | 1.3 | | | | 476,351 | |
| | 18,530 | | Sonic Corp.(a) | | | 1.3 | | | | 501,236 | |
| | 16,450 | | Steven Madden, Ltd.† (a) | | | 1.5 | | | | 562,261 | |
| | 81,469 | | Other Securities | | | 4.8 | | | | 1,830,512 | |
| | | | | | | | | | | 5,587,860 | |
Consumer Staples — 6.5% | | | | | | | | |
| | 9,330 | | B&G Foods, Inc., Class A(a) | | | 1.2 | | | | 449,706 | |
| | 7,510 | | Calavo Growers, Inc.(a) | | | 1.3 | | | | 503,170 | |
| | 9,725 | | Inter Parfums, Inc.(a) | | | 0.7 | | | | 277,843 | |
| | 3,670 | | J&J Snack Foods Corp.(a) | | | 1.2 | | | | 437,721 | |
| | 3,410 | | TreeHouse Foods, Inc.† (a) | | | 0.9 | | | | 350,036 | |
| | 9,059 | | Other Securities | | | 1.2 | | | | 467,322 | |
| | | | | | | | | | | 2,485,798 | |
Energy — 3.0% | | | | | | | | |
| | 20,093 | | Callon Petroleum Co.† (a) | | | 0.6 | | | | 225,644 | |
| | 14,345 | | Memorial Resource Development Corp.† | | | 0.6 | | | | 227,799 | |
| | 35,325 | | Other Securities | | | 1.8 | | | | 676,097 | |
| | | | | | | | | | | 1,129,540 | |
Financials — 10.5% | | | | | | | | |
| | 8,360 | | LegacyTexas Financial Group, Inc.(a) | | | 0.6 | | | | 224,968 | |
| | 2,435 | | MarketAxess Holdings, Inc. | | | 0.9 | | | | 354,049 | |
| | 11,560 | | Pinnacle Financial Partners, Inc.(a) | | | 1.5 | | | | 564,706 | |
| | 15,690 | | PrivateBancorp, Inc., Class A | | | 1.8 | | | | 690,831 | |
| | 7,040 | | South State Corp. | | | 1.2 | | | | 479,072 | |
| | 51,007 | | Other Securities | | | 4.5 | | | | 1,685,433 | |
| | | | | | | | | | | 3,999,059 | |
Health Care — 23.8% | | | | | | | | |
| | 15,601 | | Aceto Corp.(a) | | | 0.9 | | | | 341,506 | |
| | 13,654 | | Cambrex Corp.† (a) | | | 1.9 | | | | 706,321 | |
| | 6,135 | | Cantel Medical Corp.(a) | | | 1.1 | | | | 421,659 | |
| | 5,010 | | ICON PLC† | | | 0.9 | | | | 350,750 | |
| | 11,205 | | Medidata Solutions, Inc.† (a) | | | 1.4 | | | | 525,178 | |
| | 8,005 | | Neogen Corp.† (a) | | | 1.2 | | | | 450,281 | |
| | 13,235 | | PRA Health Sciences, Inc.† (a) | | | 1.4 | | | | 552,694 | |
| | 13,894 | | Prestige Brands Holdings, Inc.† | | | 2.0 | | | | 769,727 | |
| | 6,640 | | Providence Service Corp. (The)† (a) | | | 0.8 | | | | 298,003 | |
| | 13,050 | | Repligen Corp.† (a) | | | 0.9 | | | | 357,048 | |
| | 33,065 | | Supernus Pharmaceuticals, Inc.† (a) | | | 1.8 | | | | 673,534 | |
| | 6,222 | | Vascular Solutions, Inc.† (a) | | | 0.7 | | | | 259,209 | |
| | 158,267 | | Other Securities | | | 8.8 | | | | 3,365,945 | |
| | | | | | | | | | | 9,071,855 | |
Industrials — 11.9% | | | | | | | | |
| | 10,650 | | Advanced Drainage Systems, Inc.(a) | | | 0.8 | | | | 291,490 | |
| | 5,837 | | CEB, Inc. | | | 1.0 | | | | 360,026 | |
| | 13,407 | | Knight Transportation, Inc.(a) | | | 1.0 | | | | 356,358 | |
| | 17,365 | | Knoll, Inc. | | | 1.1 | | | | 421,622 | |
| | 8,735 | | Trex Co., Inc.† (a) | | | 1.0 | | | | 392,376 | |
| | 13,515 | | WageWorks, Inc.† | | | 2.1 | | | | 808,332 | |
| | 69,335 | | Other Securities | | | 4.9 | | | | 1,898,977 | |
| | | | | | | | | | | 4,529,181 | |
Information Technology — 22.5% | | | | | | | | |
| | 7,359 | | BroadSoft, Inc.† (a) | | | 0.8 | | | | 301,940 | |
| | 20,330 | | Callidus Software, Inc.† | | | 1.1 | | | | 406,193 | |
| | 7,986 | | Ellie Mae, Inc.† (a) | | | 1.9 | | | | 731,917 | |
| | 7,150 | | LogMeIn, Inc.† (a) | | | 1.2 | | | | 453,524 | |
| | 14,548 | | MAXIMUS, Inc.(a) | | | 2.1 | | | | 805,523 | |
| | 12,610 | | Pegasystems, Inc. | | | 0.9 | | | | 339,839 | |
| | 11,355 | | Qualys, Inc.† (a) | | | 0.9 | | | | 338,493 | |
| | 9,005 | | Silicon Laboratories, Inc.† | | | 1.2 | | | | 438,904 | |
| | 6,260 | | SPS Commerce, Inc.† (a) | | | 1.0 | | | | 379,356 | |
| | 172,612 | | Other Securities | | | 11.4 | | | | 4,387,850 | |
| | | | | | | | | | | 8,583,539 | |
Materials — 2.9% | | | | | | | | |
| | 55,063 | | Other Securities | | | 2.9 | | | | 1,096,116 | |
| | | | | | | | | | | | |
Telecommunication Services — 1.4% | | | | | | | | |
| | 13,405 | | Cogent Communications Holdings, Inc.(a) | | | 1.4 | | | | 537,004 | |
| | 845 | | Other Securities | | | 0.0 | | | | 12,346 | |
| | | | | | | | | | | 549,350 | |
See Notes to Financial Statements.
40
Wilshire Mutual Funds, Inc. Small Company Growth Portfolio Condensed Schedule of Investments - (Continued) | June 30, 2016 (Unaudited) |
|
Shares | | Percentage of
Net Assets (%) | | | Value | |
Utilities — 0.1% | | | | | | |
| | 1,180 | | Other Securities | | | 0.1 | | | $ | 58,563 | |
| | | | | | | | | | | | |
Total Common Stock | | | | | | | | |
(Cost $30,438,505) | | | | | | | 37,090,861 | |
| | | | | | | | | | | | |
SHORT-TERM INVESTMENTS (b) — 50.3% | |
| | 1,125,763 | | Northern Trust Institutional Government Select Portfolio, Institutional Class, 0.240% | | | 2.9 | | | | 1,125,763 | |
| | 18,048,948 | | Northern Trust Institutional Liquid Asset Portfolio, Institutional Class, 0.520% (c) | | | 47.4 | | | | 18,048,948 | |
| | | | | | | | | | | | |
Total Short-Term Investments | | | | | | | | |
(Cost $19,174,711) | | | | | | | 19,174,711 | |
| | | | | | | | | | | | |
RIGHTS — 0.0% | | | | | | | | |
Number
Of Rights | | | | | | | | | | |
United States — 0.0% | | | | | | | | |
| | 1,040 | | Other Securities | | | 0.0 | | | | 360 | |
Total Rights (Cost $—) | | | | | | | 360 | |
| | | | | | | | | | | | |
Total Investments — 147.6% | | | | | | | | |
(Cost $49,613,216) | | | | | | | 56,265,932 | |
Other Assets & Liabilities, Net — (47.6)% | | | | | | | (18,152,044 | ) |
| | | | | | | | | | | | |
NET ASSETS — 100.0% | | | | | | $ | 38,113,888 | |
† | Non-income producing security. |
(a) | This security or a partial position of this security is on loan at June 30, 2016. The total market value of securities on loan at June 30, 2016 was $17,949,709 (Note 6). |
(b) | Rate shown is the 7-day effective yield as of June 30, 2016. |
(c) | This security was purchased with cash collateral held from securities on loan. The total value of such securities as of June 30, 2016 was $18,048,948. Securities on loan are also collateralized by various U.S. Treasury obligations in the amount of $39,400 (Note 6). |
Ltd. — Limited
PLC — Public Limited Company
Amounts designated as “—” are either $0, or have been rounded to $0.
The Condensed Schedule of Investments does not reflect the complete portfolio holdings. It includes the Portfolio’s 50 largest holdings and each investment of any issuer that exceeds 1% of the Portfolio’s net assets. “Other Securities” represent all issues not required to be disclosed under the rules adopted by the U.S. Securities and Exchange Commission (“SEC”). The complete schedule of portfolio holdings is available (i) without charge, upon request, by calling (800) 607-2200; (ii) on the SEC’s website at http://www.sec.gov; and (iii) on our website at http://advisor.wilshire.com.
As of June 30, 2016, all of the Portfolio’s investments were considered Level 1 except for Dyax Contingent Value Rights and Trius Contingent Value Rights, which were Level 3. At June 30, 2016, these investments were valued at $360. A reconciliation of Level 3 investments is only presented when the Portfolio has over 1% of Level 3 investments at the beginning and/or end of the period in relation to net assets. For the six months ended June 30, 2016, there have been no transfers between Level 1 and Level 2 assets and liabilities. For the six months ended June 30, 2016, there have been no transfers between Level 2 and Level 3 assets and liabilities. Please see Note 2 in Notes to Financial Statements for further information regarding fair value measurements.
See Notes to Financial Statements.
41
Wilshire Mutual Funds, Inc. Small Company Value Portfolio Condensed Schedule of Investments | June 30, 2016 (Unaudited) |
|
Shares | | Percentage of
Net Assets (%) | | | Value | |
COMMON STOCK — 98.4%†† | |
Consumer Discretionary — 9.6% | | | | | | |
| | 30,190 | | Fred's, Inc., Class A(a) | | | 1.2 | | | $ | 486,361 | |
| | 21,031 | | Hooker Furniture Corp.(a) | | | 1.1 | | | | 451,956 | |
| | 9,965 | | Select Comfort Corp.† (a) | | | 0.5 | | | | 213,052 | |
| | 39,900 | | Stoneridge, Inc.† (a) | | | 1.5 | | | | 596,106 | |
| | 30,255 | | Taylor Morrison Home Corp., Class A† | | | 1.1 | | | | 448,984 | |
| | 43,680 | | TRI Pointe Group, Inc.† (a) | | | 1.3 | | | | 516,298 | |
| | 72,092 | | Other Securities | | | 2.9 | | | | 1,218,827 | |
| | | | | | | | | | | 3,931,584 | |
Consumer Staples — 7.8% | | | | | | | | |
| | 14,960 | | Aryzta AG ADR | | | 0.7 | | | | 276,461 | |
| | 21,785 | | Britvic PLC ADR | | | 0.8 | | | | 346,896 | |
| | 26,345 | | Elizabeth Arden, Inc.† | | | 0.9 | | | | 362,507 | |
| | 12,328 | | Inter Parfums, Inc.(a) | | | 0.9 | | | | 352,211 | |
| | 9,085 | | John B. Sanfilippo & Son, Inc.(a) | | | 1.0 | | | | 387,294 | |
| | 44,305 | | Landec Corp.† (a) | | | 1.2 | | | | 476,722 | |
| | 7,405 | | TreeHouse Foods, Inc.† (a) | | | 1.9 | | | | 760,123 | |
| | 10,219 | | Other Securities | | | 0.4 | | | | 216,390 | |
| | | | | | | | | | | 3,178,604 | |
Energy — 2.4% | | | | | | | | |
| | 107,338 | | Other Securities | | | 2.4 | | | | 981,082 | |
| | | | | | | | | | | | |
Financials — 32.9% | | | | | | | | |
| | 10,535 | | Ameris Bancorp(a) | | | 0.8 | | | | 312,889 | |
| | 48,455 | | Brandywine Realty Trust(b) | | | 2.0 | | | | 814,044 | |
| | 15,405 | | Capital Bank Financial Corp., Class A(a) | | | 1.1 | | | | 443,664 | |
| | 38,875 | | Forestar Group, Inc.† (a) | | | 1.1 | | | | 462,224 | |
| | 6,009 | | Healthcare Realty Trust, Inc.(a)(b) | | | 0.5 | | | | 210,255 | |
| | 18,160 | | Heritage Financial Corp.(a) | | | 0.8 | | | | 319,253 | |
| | 21,515 | | Investors Bancorp, Inc.(a) | | | 0.6 | | | | 238,386 | |
| | 9,660 | | LaSalle Hotel Properties(a)(b) | | | 0.6 | | | | 227,783 | |
| | 5,950 | | MB Financial, Inc. | | | 0.5 | | | | 215,866 | |
| | 12,269 | | PacWest Bancorp(a) | | | 1.2 | | | | 488,061 | |
| | 11,045 | | PrivateBancorp, Inc., Class A | | | 1.2 | | | | 486,311 | |
| | 38,265 | | Ramco-Gershenson Properties Trust(a)(b) | | | 1.8 | | | | 750,377 | |
| | 17,155 | | Western Alliance Bancorp† | | | 1.4 | | | | 560,111 | |
| | 427,045 | | Other Securities | | | 19.3 | | | | 7,909,541 | |
| | | | | | | | | | | 13,438,765 | |
Health Care — 5.0% | | | | | | | | |
| | 7,830 | | Analogic Corp.(a) | | | 1.5 | | | | 622,015 | |
| | 102,823 | | Other Securities | | | 3.5 | | | | 1,415,598 | |
| | | | | | | | | | | 2,037,613 | |
Industrials — 10.2% | | | | | | | | |
| | 7,255 | | Albany International Corp., Class A(a) | | | 0.7 | | | | 289,692 | |
| | 6,570 | | Brady Corp., Class A | | | 0.5 | | | | 200,779 | |
| | 9,355 | | EnerSys, Inc. | | | 1.4 | | | | 556,342 | |
| | 12,030 | | GP Strategies Corp.† (a) | | | 0.7 | | | | 260,931 | |
| | 11,115 | | Marten Transport, Ltd.(a) | | | 0.6 | | | | 220,077 | |
| | 3,689 | | Orbital ATK, Inc.(a) | | | 0.8 | | | | 314,081 | |
| | 91,955 | | Other Securities | | | 5.5 | | | | 2,327,270 | |
| | | | | | | | | | | 4,169,172 | |
Information Technology — 15.2% | | | | | | | | |
| | 9,775 | | Coherent, Inc.† (a) | | | 2.2 | | | | 897,149 | |
| | 38,315 | | Entegris, Inc.† | | | 1.4 | | | | 554,418 | |
| | 3,075 | | Euronet Worldwide, Inc.† (a) | | | 0.5 | | | | 212,759 | |
| | 21,190 | | Integrated Device Technology, Inc.† (a) | | | 1.0 | | | | 426,555 | |
| | 122,900 | | Lattice Semiconductor Corp.† (a) | | | 1.6 | | | | 657,515 | |
| | 112,195 | | Mitel Networks Corp.† (a) | | | 1.7 | | | | 705,707 | |
| | 43,240 | | Novanta, Inc.† (a) | | | 1.6 | | | | 655,086 | |
| | 141,385 | | Other Securities | | | 5.2 | | | | 2,089,120 | |
| | | | | | | | | | | 6,198,309 | |
Materials — 8.8% | | | | | | | | |
| | 17,940 | | Boise Cascade Co.† (a) | | | 1.0 | | | | 411,723 | |
| | 19,495 | | Louisiana-Pacific Corp.† (a) | | | 0.8 | | | | 338,238 | |
| | 16,820 | | Materion Corp.(a) | | | 1.0 | | | | 416,463 | |
| | 6,219 | | Neenah Paper, Inc.(a) | | | 1.1 | | | | 450,069 | |
| | 10,260 | | PH Glatfelter Co.(a) | | | 0.5 | | | | 200,686 | |
| | 7,100 | | Schweitzer-Mauduit International, Inc. | | | 0.6 | | | | 250,488 | |
| | 91,956 | | Other Securities | | | 3.8 | | | | 1,517,543 | |
| | | | | | | | | | | 3,585,210 | |
Telecommunication Services — 0.2% | | | | | | | | |
| | 18,200 | | Other Securities | | | 0.2 | | | | 83,174 | |
See Notes to Financial Statements.
42
Wilshire Mutual Funds, Inc. Small Company Value Portfolio Condensed Schedule of Investments - (Continued) | June 30, 2016 (Unaudited) |
|
Shares | | Percentage of
Net Assets (%) | | | Value | |
Utilities — 6.3% | | | | | | |
| | 13,699 | | PNM Resources, Inc. | | | 1.2 | | | $ | 485,493 | |
| | 8,480 | | Spire, Inc.(a) | | | 1.5 | | | | 600,723 | |
| | 29,158 | | Other Securities | | | 3.6 | | | | 1,489,913 | |
| | | | | | | | | | | 2,576,129 | |
Total Common Stock | | | | | | | | |
(Cost $35,976,866) | | | | | | | 40,179,642 | |
| | | | | | | | | | | | |
SHORT-TERM INVESTMENTS (c) — 49.8% | |
| | 511,526 | | Northern Trust Institutional Government Select Portfolio, Institutional Class, 0.240% | | | 1.2 | | | | 511,526 | |
| | 19,845,425 | | Northern Trust Institutional Liquid Asset Portfolio, Institutional Class, 0.520% (d) | | | 48.6 | | | | 19,845,425 | |
| | | | | | | | | | | | |
Total Short-Term Investments | | | | | | | | |
(Cost $20,356,951) | | | | | | | 20,356,951 | |
| | | | | | | | | | | | |
Total Investments — 148.2% | | | | | | | | |
(Cost $56,333,817) | | | | | | | 60,536,593 | |
Other Assets & Liabilities, Net — (48.2)% | | | | | | | (19,700,293 | ) |
| | | | | | | | | | | | |
NET ASSETS — 100.0% | | | | | | $ | 40,836,300 | |
†† | More narrow industries are utilized for compliance purposes, whereas broad sectors are utilized for reporting purposes. |
† | Non-income producing security. |
(a) | This security or a partial position of this security is on loan at June 30, 2016. The total market value of securities on loan at June 30, 2016 was $19,951,795 (Note 6). |
(b) | Real Estate Investment Trust. |
(c) | Rate shown in the 7-day effective yield as of June 30, 2016. |
(d) | This security was purchased with cash collateral held from securities on loan. The total value of such securities as of June 30, 2016 was $19,845,425. Securities on loan are also collateralized by various U.S. Treasury obligations in the amount of $322,288 (Note 6). |
ADR. — American Depositary Receipt
Ltd. — Limited
PLC — Public Limited Company
The Condensed Schedule of Investments does not reflect the complete portfolio holdings. It includes the Portfolio’s 50 largest holdings and each investment of any issuer that exceeds 1% of the Portfolio’s net assets. “Other Securities” represent all issues not required to be disclosed under the rules adopted by the U.S. Securities and Exchange Commission (“SEC”). The complete schedule of portfolio holdings is available (i) without charge, upon request, by calling (800) 607-2200; (ii) on the SEC’s website at http://www.sec.gov; and (iii) on our website at http://advisor.wilshire.com.
As of June 30, 2016, all of the Portfolio’s investments were considered Level 1. For the six months ended June 30, 2016, there have been no transfers between Level 1 and Level 2 assets and liabilities. For the six months ended June 30, 2016, there have been no transfers between Level 2 and Level 3 assets and liabilities. Please see Note 2 in Notes to Financial Statements for further information regarding fair value measurements.
See Notes to Financial Statements.
43
Wilshire Mutual Funds, Inc. Wilshire 5000 Indexsm Fund Condensed Schedule of Investments | June 30, 2016 (Unaudited) |
|
Shares | | Percentage of
Net Assets (%) | | | Value | |
COMMON STOCK — 99.2% | |
Consumer Discretionary — 12.7% | | | | | | |
| | 4,279 | | Amazon.com, Inc.† | | | 1.5 | | | $ | 3,062,138 | |
| | 23,796 | | Comcast Corp., Class A | | | 0.8 | | | | 1,551,261 | |
| | 12,084 | | Home Depot, Inc. (The) | | | 0.7 | | | | 1,543,006 | |
| | 8,947 | | McDonald's Corp. | | | 0.5 | | | | 1,076,682 | |
| | 14,273 | | Starbucks Corp. | | | 0.4 | | | | 815,274 | |
| | 15,550 | | Walt Disney Co. (The) | | | 0.7 | | | | 1,521,101 | |
| | 417,472 | | Other Securities | | | 8.1 | | | | 17,188,977 | |
| | | | | | | | | | | 26,758,439 | |
Consumer Staples — 9.8% | | | | | | | | |
| | 19,575 | | Altria Group, Inc. | | | 0.7 | | | | 1,349,892 | |
| | 40,315 | | Coca-Cola Co. (The) | | | 0.9 | | | | 1,827,479 | |
| | 10,947 | | CVS Health Corp. | | | 0.5 | | | | 1,048,066 | |
| | 14,726 | | PepsiCo, Inc. | | | 0.7 | | | | 1,560,072 | |
| | 14,088 | | Philip Morris International, Inc. | | | 0.7 | | | | 1,433,031 | |
| | 27,422 | | Procter & Gamble Co. (The) | | | 1.1 | | | | 2,321,821 | |
| | 9,803 | | Walgreens Boots Alliance, Inc. | | | 0.4 | | | | 816,296 | |
| | 16,404 | | Wal-Mart Stores, Inc. | | | 0.6 | | | | 1,197,820 | |
| | 153,786 | | Other Securities | | | 4.2 | | | | 9,172,330 | |
| | | | | | | | | | | 20,726,807 | |
Energy — 6.8% | | | | | | | | |
| | 19,392 | | Chevron Corp. | | | 1.0 | | | | 2,032,863 | |
| | 42,764 | | Exxon Mobil Corp. | | | 1.9 | | | | 4,008,697 | |
| | 14,384 | | Schlumberger, Ltd. | | | 0.6 | | | | 1,137,487 | |
| | 207,288 | | Other Securities | | | 3.3 | | | | 7,185,739 | |
| | | | | | | | | | | 14,364,786 | |
Financials — 17.7% | | | | | | | | |
| | 106,323 | | Bank of America Corp. | | | 0.7 | | | | 1,410,906 | |
| | 20,295 | | Berkshire Hathaway, Inc., Class B† | | | 1.4 | | | | 2,938,513 | |
| | 30,365 | | Citigroup, Inc. | | | 0.6 | | | | 1,287,172 | |
| | 37,784 | | JPMorgan Chase & Co. | | | 1.1 | | | | 2,347,898 | |
| | 2,350 | | Northern Trust Corp. | | | 0.1 | | | | 155,711 | |
| | 47,267 | | Wells Fargo & Co. | | | 1.1 | | | | 2,237,147 | |
| | 705,532 | | Other Securities | | | 12.7 | | | | 27,033,831 | |
| | | | | | | | | | | 37,411,178 | |
Health Care — 13.2% | | | | | | | | |
| | 15,600 | | AbbVie, Inc.(a) | | | 0.5 | | | | 965,796 | |
| | 3,782 | | Allergan PLC† | | | 0.4 | | | | 873,982 | |
| | 6,787 | | Amgen, Inc. | | | 0.5 | | | | 1,032,642 | |
| | 17,175 | | Bristol-Myers Squibb Co. | | | 0.6 | | | | 1,263,221 | |
| | 8,143 | | Celgene Corp.† | | | 0.4 | | | | 803,144 | |
| | 13,013 | | Gilead Sciences, Inc. | | | 0.5 | | | | 1,085,544 | |
| | 28,036 | | Johnson & Johnson | | | 1.6 | | | | 3,400,767 | |
| | 27,705 | | Merck & Co., Inc. | | | 0.8 | | | | 1,596,085 | |
| | 62,487 | | Pfizer, Inc. | | | 1.0 | | | | 2,200,167 | |
| | 9,269 | | UnitedHealth Group, Inc. | | | 0.6 | | | | 1,308,783 | |
| | 209,619 | | Other Securities | | | 6.3 | | | | 13,353,900 | |
| | | | | | | | | | | 27,884,031 | |
Industrials — 10.5% | | | | | | | | |
| | 6,136 | | 3M Co. | | | 0.5 | | | | 1,074,536 | |
| | 95,746 | | General Electric Co. | | | 1.4 | | | | 3,014,084 | |
| | 8,099 | | Honeywell International, Inc. | | | 0.5 | | | | 942,076 | |
| | 8,713 | | United Technologies Corp. | | | 0.4 | | | | 893,518 | |
| | 281,597 | | Other Securities | | | 7.7 | | | | 16,187,014 | |
| | | | | | | | | | | 22,111,228 | |
Information Technology — 18.7% | | | | | | | | |
| | 5,840 | | Alphabet, Inc., Class C† | | | 1.9 | | | | 4,041,864 | |
| | 56,428 | | Apple, Inc. | | | 2.6 | | | | 5,394,517 | |
| | 51,823 | | Cisco Systems, Inc. | | | 0.7 | | | | 1,486,802 | |
| | 22,067 | | Facebook, Inc., Class A† | | | 1.2 | | | | 2,521,817 | |
| | 48,643 | | Intel Corp.(a) | | | 0.8 | | | | 1,595,490 | |
| | 8,947 | | International Business Machines Corp. | | | 0.6 | | | | 1,357,976 | |
| | 10,094 | | MasterCard, Inc., Class A | | | 0.4 | | | | 888,878 | |
| | 81,437 | | Microsoft Corp. | | | 2.0 | | | | 4,167,131 | |
| | 33,205 | | Oracle Corp. | | | 0.7 | | | | 1,359,081 | |
| | 15,180 | | QUALCOMM, Inc. | | | 0.4 | | | | 813,193 | |
| | 16,166 | | Visa, Inc., Class A(a) | | | 0.6 | | | | 1,199,032 | |
| | 424,661 | | Other Securities | | | 6.8 | | | | 14,584,176 | |
| | | | | | | | | | | 39,409,957 | |
Materials — 3.2% | | | | | | | | |
| | 148,612 | | Other Securities | | | 3.2 | | | | 6,664,073 | |
| | | | | | | | | | | | |
Telecommunication Services — 2.9% | | | | | | | | |
| | 63,350 | | AT&T, Inc. | | | 1.3 | | | | 2,737,354 | |
| | 41,963 | | Verizon Communications, Inc. | | | 1.1 | | | | 2,343,214 | |
| | 43,711 | | Other Securities | | | 0.5 | | | | 988,337 | |
| | | | | | | | | | | 6,068,905 | |
Utilities — 3.7% | | | | | | | | |
| | 146,278 | | Other Securities | | | 3.7 | | | | 7,779,698 | |
| | | | | | | | | | | | |
Total Common Stock | | | | | | | | |
(Cost $87,811,551) | | | | | | | 209,179,102 | |
See Notes to Financial Statements.
44
Wilshire Mutual Funds, Inc. Wilshire 5000 Indexsm Fund Condensed Schedule of Investments - (Continued) | June 30, 2016 (Unaudited) |
|
Shares | | Percentage of
Net Assets (%) | | | Value | |
SHORT-TERM INVESTMENTS (b) — 13.7% | |
| | 60,405 | | Northern Trust Institutional Government Select Portfolio, Institutional Class, 0.240% | | | 0.0 | | | $ | 60,405 | |
| | 28,897,925 | | Northern Trust Institutional Liquid Asset Portfolio, Institutional Class, 0.520% (c) | | | 13.7 | | | | 28,897,925 | |
| | | | | | | | | | | | |
Total Short-Term Investments | | | | | | | | |
(Cost $28,958,330) | | | | | | | 28,958,330 | |
| | | | | | | | | | | | |
WARRANTS — 0.0% | | | | | | | | |
Number Of Warrants | | | | | | | | | | |
United States — 0.0% | | | | | | | | |
| | 9 | | Other Securities | | | 0.0 | | | | 2 | |
Total Warrants (Cost $—) | | | | | | | 2 | |
| | | | | | | | | | | | |
RIGHTS — 0.0% | | | | | | | | |
Number
Of Rights | | | | | | | | | | |
United States — 0.0% | | | | | | | | |
| | 6,850 | | Other Securities | | | 0.0 | | | | 5,987 | |
Total Rights (Cost $—) | | | | | | | 5,987 | |
| | | | | | | | | | | | |
Total Investments — 112.9% | | | | | | | | |
(Cost $116,769,881) | | | | | | | 238,143,421 | |
Other Assets & Liabilities, Net — (12.9)% | | | | | | | (27,235,926 | ) |
| | | | | | | | | | | | |
NET ASSETS — 100.0% | | | | | | $ | 210,907,495 | |
† | Non-income producing security. |
(a) | This security or a partial position of this security is on loan at June 30, 2016. The total market value of securities on loan at June 30, 2016 was $29,344,249 (Note 6). |
(b) | Rate shown in the 7-day effective yield as of June 30, 2016. |
(c) | This security was purchased with cash collateral held from securities on loan. The total value of such securities as of June 30, 2016 was $28,897,925. Securities on loan are also collateralized by various U.S. Treasury obligations in the amount of $787,024 (Note 6). |
Ltd. — Limited
PLC — Public Limited Company
Amounts designated as “—“ are either $0, or have been rounded to $0.
The Condensed Schedule of Investments does not reflect the complete portfolio holdings. It includes the Fund’s 50 largest holdings and each investment of any issuer that exceeds 1% of the Fund’s net assets. “Other Securities” represent all issues not required to be disclosed under the rules adopted by the U.S. Securities and Exchange Commission (“SEC”). The complete schedule of portfolio holdings is available (i) without charge, upon request, by calling (800) 607-2200; (ii) on the SEC’s website at http://www.sec.gov; and (iii) on our website at http://advisor.wilshire.com.
As of June 30, 2016, all of the Fund’s investments were considered Level 1, except for AMR Corp Escrow, DYAX Corp, Leap Wireless Contingent Value Rights, Orleans Homebuilders, Inc., Safeway Contingent Value Rights – CASA Ley, Safeway Contingent Value Rights – PDC and Trico Marine Services, Inc. which were Level 3. At June 30, 2016, the value of these Level 3 investments was $5,987. A reconciliation of Level 3 investments is only presented when the Fund has over 1% of Level 3 investments at the beginning and/or end of the period in relation to net assets. For the six months ended June 30, 2016 there have been no transfers between Level 1 and Level 2 assets and liabilities. For the six months ended June 30, 2016, there have been no transfers between Level 2 and Level 3 assets and liabilities. Please see Note 2 in Notes to Financial Statements for further information regarding fair value measurements.
See Notes to Financial Statements.
45
Wilshire Mutual Funds, Inc. Wilshire International Equity Fund Condensed Schedule of Investments | June 30, 2016 (Unaudited) |
|
Shares | | Percentage of
Net Assets (%) | | | Value | |
COMMON STOCK — 95.5% | |
Australia — 3.9% | | | | | | |
| | 63,713 | | CSL, Ltd. | | | 1.7 | | | $ | 5,373,089 | |
| | 1,515,407 | | Other Securities | | | 2.2 | | | | 7,343,365 | |
| | | | | | | | | | | 12,716,454 | |
Austria — 0.0% | | | | | | | | |
| | 3,226 | | Other Securities | | | 0.0 | | | | 89,201 | |
| | | | | | | | | | | | |
Belgium — 0.5% | | | | | | | | |
| | 26,850 | | Other Securities | | | 0.5 | | | | 1,690,103 | |
| | | | | | | | | | | | |
Bermuda — 0.6% | | | | | | | | |
| | 62,791 | | Other Securities | | | 0.6 | | | | 1,869,916 | |
| | | | | | | | | | | | |
Brazil — 0.3% | | | | | | | | |
| | 170,500 | | Other Securities | | | 0.3 | | | | 957,369 | |
| | | | | | | | | | | | |
Canada — 4.7% | | | | | | | | |
| | 32,698 | | Canadian Pacific Railway, Ltd. | | | 1.3 | | | | 4,211,175 | |
| | 1,060 | | Canadian Pacific Railway, Ltd.* | | | 0.0 | | | | 136,468 | |
| | 7,335 | | Constellation Software, Inc. | | | 0.9 | | | | 2,838,789 | |
| | 305,734 | | Other Securities | | | 2.5 | | | | 7,948,166 | |
| | | | | | | | | | | 15,134,598 | |
China — 3.3% | | | | | | | | |
| | 82,068 | | Ctrip.com International, Ltd. ADR(a) (b) | | | 1.1 | | | | 3,381,202 | |
| | 201,955 | | Tencent Holdings, Ltd. | | | 1.4 | | | | 4,632,782 | |
| | 4,231,300 | | Other Securities | | | 0.8 | | | | 2,491,600 | |
| | | | | | | | | | | 10,505,584 | |
Denmark — 6.2% | | | | | | | | |
| | 28,766 | | Carlsberg A, Class B | | | 0.8 | | | | 2,744,506 | |
| | 52,872 | | Chr Hansen Holding A | | | 1.1 | | | | 3,472,385 | |
| | 49,199 | | Coloplast A, Class B | | | 1.1 | | | | 3,682,772 | |
| | 88,471 | | Novo Nordisk ADR(a) | | | 1.5 | | | | 4,757,970 | |
| | 19,649 | | Novo Nordisk A, Class B | | | 0.3 | | | | 1,058,156 | |
| | 79,342 | | Novozymes A, Class B | | | 1.2 | | | | 3,810,073 | |
| | 59,321 | | Other Securities | | | 0.2 | | | | 522,395 | |
| | | | | | | | | | | 20,048,257 | |
Finland — 0.4% | | | | | | | | |
| | 67,262 | | Other Securities | | | 0.4 | | | | 1,261,986 | |
| | | | | | | | | | | | |
France — 8.1% | | | | | | | | |
| | 35,443 | | Atos SE | | | 0.9 | | | | 2,922,251 | |
| | 26,652 | | Essilor International SA | | | 1.1 | | | | 3,502,863 | |
| | 7,266 | | Hermes International | | | 0.8 | | | | 2,708,618 | |
| | 18,235 | | LVMH Moet Hennessy Louis Vuitton SE | | | 0.9 | | | | 2,748,660 | |
| | 10,292 | | Unibail-Rodamco SE(b) | | | 0.8 | | | | 2,662,491 | |
| | 419,360 | | Other Securities | | | 3.6 | | | | 11,566,870 | |
| | | | | | | | | | | 26,111,753 | |
Germany — 5.6% | | | | | | | | |
| | 17,792 | | adidas AG | | | 0.8 | | | | 2,554,039 | |
| | 82,830 | | Deutsche Post AG | | | 0.7 | | | | 2,333,539 | |
| | 271,345 | | E.ON SE | | | 0.9 | | | | 2,739,190 | |
| | 164,247 | | Infineon Technologies AG | | | 0.7 | | | | 2,377,717 | |
| | 179,599 | | Other Securities | | | 2.5 | | | | 8,138,431 | |
| | | | | | | | | | | 18,142,916 | |
Greece — 0.0% | | | | | | | | |
| | 3,632 | | Other Securities | | | 0.0 | | | | 67,979 | |
| | | | | | | | | | | | |
Hong Kong — 2.5% | | | | | | | | |
| | 40,235 | | China Mobile, Ltd. ADR(a) | | | 0.7 | | | | 2,329,606 | |
| | 2,414,800 | | Other Securities | | | 1.8 | | | | 5,575,994 | |
| | | | | | | | | | | 7,905,600 | |
India — 1.1% | | | | | | | | |
| | 54,816 | | HDFC Bank, Ltd. ADR(a) | | | 1.1 | | | | 3,637,042 | |
| | | | | | | | | | | | |
Indonesia — 0.1% | | | | | | | | |
| | 1,535,000 | | Other Securities | | | 0.1 | | | | 401,028 | |
| | | | | | | | | | | | |
Ireland — 3.6% | | | | | | | | |
| | 210,318 | | Experian PLC | | | 1.2 | | | | 3,990,187 | |
| | 47,913 | | ICON PLC(b) | | | 1.0 | | | | 3,354,389 | |
| | 83,774 | | Other Securities | | | 1.4 | | | | 4,401,912 | |
| | | | | | | | | | | 11,746,488 | |
Israel — 0.1% | | | | | | | | |
| | 29,109 | | Other Securities | | | 0.1 | | | | 326,404 | |
| | | | | | | | | | | | |
Italy — 1.2% | | | | | | | | |
| | 1,438,880 | | Intesa Sanpaolo SpA | | | 0.8 | | | | 2,740,663 | |
| | 832,996 | | Other Securities | | | 0.4 | | | | 1,188,182 | |
| | | | | | | | | | | 3,928,845 | |
Japan — 10.8% | | | | | | | | |
| | 5,830 | | Keyence Corp. | | | 1.2 | | | | 3,977,976 | |
| | 54,400 | | Otsuka Holdings Co., Ltd. | | | 0.8 | | | | 2,506,909 | |
| | 42,175 | | Sysmex Corp. | | | 0.9 | | | | 2,904,106 | |
| | 1,858,600 | | Other Securities | | | 7.9 | | | | 25,511,082 | |
| | | | | | | | | | | 34,900,073 | |
See Notes to Financial Statements.
46
Wilshire Mutual Funds, Inc. Wilshire International Equity Fund Condensed Schedule of Investments - (Continued) | June 30, 2016 (Unaudited) |
|
Shares | | Percentage of
Net Assets (%) | | | Value | |
Jersey — 0.1% | | | | | | |
| | 1,663 | | Other Securities | | | 0.1 | | | $ | 186,619 | |
| | | | | | | | | | | | |
Macao — 0.0% | | | | | | | | |
| | 40,800 | | Other Securities | | | 0.0 | | | | 53,273 | |
| | | | | | | | | | | | |
Malaysia — 0.2% | | | | | | | | |
| | 383,000 | | Other Securities | | | 0.2 | | | | 574,366 | |
| | | | | | | | | | | | |
Mexico — 1.2% | | | | | | | | |
| | 1,558,867 | | Other Securities | | | 1.2 | | | | 3,803,948 | |
| | | | | | | | | | | | |
Netherlands — 6.4% | | | | | | | | |
| | 33,325 | | Core Laboratories NV(a) | | | 1.3 | | | | 4,128,634 | |
| | 37,545 | | Gemalto NV | | | 0.7 | | | | 2,274,634 | |
| | 43,948 | | Koninklijke DSM NV | | | 0.8 | | | | 2,535,390 | |
| | 92,760 | | Koninklijke Philips NV | | | 0.7 | | | | 2,303,823 | |
| | 5,030 | | Royal Dutch Shell PLC, Class A | | | 0.1 | | | | 138,150 | |
| | 70,235 | | Royal Dutch Shell PLC ADR, Class A(a) | | | 1.2 | | | | 3,878,377 | |
| | 1,076,567 | | Other Securities | | | 1.6 | | | | 5,391,021 | |
| | | | | | | | | | | 20,650,029 | |
New Zealand — 0.1% | | | | | | | | |
| | 48,336 | | Other Securities | | | 0.1 | | | | 238,981 | |
| | | | | | | | | | | | |
Norway — 0.3% | | | | | | | | |
| | 60,158 | | Other Securities | | | 0.3 | | | | 822,648 | |
| | | | | | | | | | | | |
Peru — 0.0% | | | | | | | | |
| | 9,100 | | Other Securities | | | 0.0 | | | | 108,745 | |
| | | | | | | | | | | | |
Philippines — 0.0% | | | | | | | | |
| | 213,900 | | Other Securities | | | 0.0 | | | | 67,481 | |
| | | | | | | | | | | | |
Portugal — 0.1% | | | | | | | | |
| | 12,420 | | Other Securities | | | 0.1 | | | | 195,886 | |
| | | | | | | | | | | | |
Russia — 1.0% | | | | | | | | |
| | 127,636 | | Yandex NV, Class A(a) (b) | | | 0.9 | | | | 2,788,847 | |
| | 10,510,478 | | Other Securities | | | 0.1 | | | | 324,285 | |
| | | | | | | | | | | 3,113,132 | |
Singapore — 0.9% | | | | | | | | |
| | 200,910 | | DBS Group Holdings, Ltd. | | | 0.8 | | | | 2,368,914 | |
| | 378,500 | | Other Securities | | | 0.1 | | | | 524,655 | |
| | | | | | | | | | | 2,893,569 | |
South Africa — 0.8% | | | | | | | | |
| | 280,399 | | Other Securities | | | 0.8 | | | | 2,505,297 | |
| | | | | | | | | | | | |
South Korea — 1.8% | | | | | | | | |
| | 189,933 | | Other Securities | | | 1.8 | | | | 5,872,120 | |
| | | | | | | | | | | | |
Spain — 2.0% | | | | | | | | |
| | 655,025 | | Other Securities | | | 2.0 | | | | 6,538,015 | |
| | | | | | | | | | | | |
Sweden — 0.6% | | | | | | | | |
| | 142,720 | | Other Securities | | | 0.6 | | | | 2,075,766 | |
| | | | | | | | | | | | |
Switzerland — 7.0% | | | | | | | | |
| | 78,871 | | Nestle SA | | | 1.9 | | | | 6,110,794 | |
| | 30,270 | | Novartis AG ADR(a) | | | 0.8 | | | | 2,497,578 | |
| | 16,820 | | Novartis AG | | | 0.4 | | | | 1,388,298 | |
| | 15,756 | | Roche Holding AG | | | 1.3 | | | | 4,157,691 | |
| | 1,615 | | SGS SA | | | 1.1 | | | | 3,699,563 | |
| | 85,647 | | Other Securities | | | 1.5 | | | | 4,644,598 | |
| | | | | | | | | | | 22,498,522 | |
Taiwan — 3.2% | | | | | | | | |
| | 226,629 | | Taiwan Semiconductor Manufacturing Co., Ltd. ADR(a) | | | 1.9 | | | | 5,944,479 | |
| | 4,792,239 | | Other Securities | | | 1.3 | | | | 4,233,620 | |
| | | | | | | | | | | 10,178,099 | |
Thailand — 0.1% | | | | | | | | |
| | 1,832,200 | | Other Securities | | | 0.1 | | | | 323,670 | |
| | | | | | | | | | | | |
Turkey — 0.1% | | | | | | | | |
| | 114,045 | | Other Securities | | | 0.1 | | | | 272,431 | |
| | | | | | | | | | | | |
United Kingdom — 12.2% | | | | | | | | |
| | 76,154 | | ARM Holdings PLC ADR(a) | | | 1.1 | | | | 3,465,768 | |
| | 11,748 | | ARM Holdings PLC | | | 0.0 | | | | 178,450 | |
| | 66,260 | | AstraZeneca PLC | | | 1.2 | | | | 3,961,276 | |
| | 197,023 | | Compass Group PLC | | | 1.2 | | | | 3,748,459 | |
| | 235,783 | | National Grid PLC | | | 1.1 | | | | 3,467,284 | |
| | 66,553 | | Reckitt Benckiser Group PLC | | | 2.1 | | | | 6,673,413 | |
See Notes to Financial Statements.
47
Wilshire Mutual Funds, Inc. Wilshire International Equity Fund Condensed Schedule of Investments - (Continued) | June 30, 2016 (Unaudited) |
|
Shares | | Percentage of
Net Assets (%) | | | Value | |
| | 67,785 | | Smith & Nephew PLC ADR(a) | | | 0.7 | | | $ | 2,326,381 | |
| | 1,583,243 | | Other Securities | | | 4.8 | | | | 15,487,450 | |
| | | | | | | | | | | 39,308,481 | |
United States — 4.4% | | | | | | | | |
| | 41,642 | | Chubb, Ltd.(a) | | | 1.7 | | | | 5,443,026 | |
| | 29,755 | | Schlumberger, Ltd. | | | 0.7 | | | | 2,353,025 | |
| | 110,055 | | Vodafone Group PLC ADR(a) | | | 1.1 | | | | 3,399,599 | |
| | 258,609 | | Other Securities | | | 0.9 | | | | 2,920,660 | |
| | | | | | | | | | | 14,116,310 | |
Total Common Stock | | | | | | | | |
(Cost $296,969,201) | | | | | | | 307,838,984 | |
| | | | | | | | | | | | |
SHORT-TERM INVESTMENTS (c) — 19.6% | |
| | 11,013,207 | | Northern Trust Institutional Government Select Portfolio, Institutional Class, 0.240% | | | 3.4 | | | | 11,013,207 | |
| | 52,038,555 | | Northern Trust Institutional Liquid Asset Portfolio, Institutional Class, 0.520% (d) | | | 16.2 | | | | 52,038,555 | |
| | | | | | | | | | | | |
Total Short-Term Investments | | | | | | | | |
(Cost $63,051,762) | | | | | | | 63,051,762 | |
| | | | | | | | | | | | |
EXCHANGE TRADED FUNDS (a) — 0.3% | | | | | | | | |
United States — 0.3% | | | | | | | | |
| | 38,191 | | Other securities | | | 0.3 | | | | 1,143,526 | |
| | | | | | | | | | | | |
Total Exchange Traded Funds
(Cost $1,238,009) | | | | | | | 1,143,526 | |
| | | | | | | | | | | | |
PREFERRED STOCK — 0.3% | | | | | | | | |
Brazil — 0.3% | | | | | | | | |
| | 296,200 | | Other Securities | | | 0.3 | | | | 913,712 | |
| | | | | | | | | | | | |
Total Preferred Stock | | | | | | | | |
(Cost $791,932) | | | | | | | 913,712 | |
Number
Of Rights | | Percentage of
Net Assets (%) | | | Value | |
RIGHTS — 0.0% | | | | | | |
Hong Kong — 0.0% | | | | | | |
| | 496,400 | | Other Securities | | | 0.0 | | | $ | 33,165 | |
Total Rights (Cost $24,299) | | | | | | | 33,165 | |
| | | | | | | | | | | | |
Total Investments — 115.7% | | | | | | | | |
(Cost $362,075,203) | | | | | | | 372,981,149 | |
Other Assets & Liabilities, Net — (15.7)% | | | | | | | (50,487,941 | ) |
| | | | | | | | | | | | |
NET ASSETS — 100.0% | | | | | | $ | 322,493,208 | |
* | Security traded on the Toronto Stock Exchange. |
† | Non-income producing security. |
(a) | This security or a partial position of this security is on loan at June 30, 2016. The total market value of securities on loan at June 30, 2016 was $56,013,973 (Note 6). |
(b) | Real Estate Investment Trust. |
(c) | Rate shown in the 7-day effective yield as of June 30, 2016. |
(d) | This security was purchased with cash collateral held from securities on loan. The total value of such securities as of June 30, 2016 was $52,038,555. Securities on loan are also collateralized by various U.S. Treasury obligations in the amount of $4,518,602 (Note 6). |
ADR – American Depositary Receipt
Ltd. – Limited
PLC – Public Limited Company
The Condensed Schedule of Investments does not reflect the complete portfolio holdings. It includes the Fund’s 50 largest holdings and each investment of any issuer that exceeds 1% of the Fund’s net assets. “Other Securities” represent all issues not required to be disclosed under the rules adopted by the U.S. Securities and Exchange Commission (“SEC”). The complete schedule of portfolio holdings is available (i) without charge, upon request, by calling (800) 607-2200; (ii) on the SEC’s website at http://www.sec.gov; and (iii) on our website at http://advisor.wilshire.com.
See Notes to Financial Statements.
48
Wilshire Mutual Funds, Inc. Wilshire International Equity Fund Condensed Schedule of Investments - (Continued) | June 30, 2016 (Unaudited) |
|
The following is a summary of the level of inputs used as of June 30, 2016 in valuing the Fund’s investments carried at value:
Investments in Securities | | Level 1 | | | Level 2 | | | Level 3 | | | Total | |
Common Stock | | | | | | | | | | | | |
Australia | | $ | — | | | $ | 12,716,454 | * | | $ | — | | | $ | 12,716,454 | |
Austria | | | — | | | | 89,201 | * | | | — | | | | 89,201 | |
Belgium | | | — | | | | 1,690,103 | * | | | — | | | | 1,690,103 | |
Bermuda | | | 1,869,916 | | | | — | | | | — | | | | 1,869,916 | |
Brazil | | | — | | | | 957,369 | * | | | — | | | | 957,369 | |
Canada | | | 15,134,598 | | | | — | | | | — | | | | 15,134,598 | |
China | | | 3,421,464 | | | | 7,084,120 | * | | | — | | | | 10,505,584 | |
Denmark | | | 4,757,970 | | | | 15,290,287 | * | | | — | | | | 20,048,257 | |
Finland | | | — | | | | 1,261,986 | * | | | — | | | | 1,261,986 | |
France | | | 2,235,447 | | | | 23,876,306 | * | | | — | | | | 26,111,753 | |
Germany | | | 201,374 | | | | 17,941,542 | * | | | — | | | | 18,142,916 | |
Greece | | | — | | | | 67,979 | * | | | — | | | | 67,979 | |
Hong Kong | | | 2,329,606 | | | | 5,575,994 | * | | | — | | | | 7,905,600 | |
India | | | 3,637,042 | | | | — | | | | — | | | | 3,637,042 | |
Indonesia | | | — | | | | 401,028 | * | | | — | | | | 401,028 | |
Ireland | | | 7,756,301 | | | | 3,990,187 | * | | | — | | | | 11,746,488 | |
Israel | | | — | | | | 326,404 | * | | | — | | | | 326,404 | |
Italy | | | — | | | | 3,928,845 | * | | | — | | | | 3,928,845 | |
Japan | | | — | | | | 34,900,073 | * | | | — | | | | 34,900,073 | |
Jersey | | | — | | | | 186,619 | * | | | — | | | | 186,619 | |
Macao | | | — | | | | 53,273 | * | | | — | | | | 53,273 | |
Malaysia | | | — | | | | 574,366 | * | | | — | | | | 574,366 | |
Mexico | | | — | | | | 3,803,948 | * | | | — | | | | 3,803,948 | |
Netherlands | | | 8,007,011 | | | | 12,643,018 | * | | | — | | | | 20,650,029 | |
New Zealand | | | — | | | | 238,981 | * | | | — | | | | 238,981 | |
Norway | | | — | | | | 822,648 | * | | | — | | | | 822,648 | |
Peru | | | 108,745 | | | | — | | | | — | | | | 108,745 | |
Philippines | | | — | | | | 67,481 | * | | | — | | | | 67,481 | |
Portugal | | | — | | | | 195,886 | * | | | — | | | | 195,886 | |
Russia | | | 2,946,279 | | | | 166,853 | * | | | — | | | | 3,113,132 | |
Singapore | | | — | | | | 2,893,569 | * | | | — | | | | 2,893,569 | |
South Africa | | | — | | | | 2,505,297 | * | | | — | | | | 2,505,297 | |
South Korea | | | — | | | | 5,872,120 | * | | | — | | | | 5,872,120 | |
Spain | | | 1,753,972 | | | | 4,784,043 | * | | | — | | | | 6,538,015 | |
Sweden | | | — | | | | 2,075,766 | * | | | — | | | | 2,075,766 | |
Switzerland | | | 2,497,578 | | | | 20,000,944 | * | | | — | | | | 22,498,522 | |
Taiwan | | | 5,944,479 | | | | 4,233,620 | * | | | — | | | | 10,178,099 | |
Thailand | | | 8,980 | | | | 314,690 | * | | | — | | | | 323,670 | |
Turkey | | | — | | | | 272,431 | * | | | — | | | | 272,431 | |
Common Stock (continued) | | | | | | | | | | | | | |
United Kingdom | | $ | 10,102,586 | | | $ | 29,205,895 | * | | $ | — | | | $ | 39,308,481 | |
United States | | | 13,202,617 | | | | 913,693 | * | | | — | | | | 14,116,310 | |
Total Common Stock | | | 85,915,965 | | | | 221,923,019 | | | | — | | | | 307,838,984 | |
Short-Term Investments | | | 63,051,762 | | | | — | | | | — | | | | 63,051,762 | |
Exchange Traded Funds | | | 1,143,526 | | | | — | | | | — | | | | 1,143,526 | |
Preferred Stock | | | — | | | | 913,712 | * | | | — | | | | 913,712 | |
Rights | | | — | | | | 33,165 | | | | — | | | | 33,165 | |
Total Investments in Securities | | $ | 150,111,253 | | | $ | 222,869,896 | | | $ | — | | | $ | 372,981,149 | |
* | For the six months ended June 30, 2016, the transfers out of Level 1 and into Level 2 were $53,718,729 and the transfers out of Level 2 into Level 1 were $20,957,961. The transfers in and out of Level 2 were due to securities trading primarily outside the United States, the value of which were adjusted as a result of local trading through the application of a third party vendor (Note 2). All transfers, if any, are recognized by the Fund at the end of each period. |
Amounts designated as “—“ are either $0 or have been rounded to $0.
See Notes to Financial Statements.
49
Wilshire Mutual Funds, Inc. Wilshire Income Opportunities Fund Schedule of Investments | June 30, 2016 (Unaudited) |
|
| | Maturity Date | | Par | | | Value | |
ASSET-BACKED SECURITIES — 25.9% | |
Financials — 2.1% | | | | | | |
ARES XI CLO, Ltd. | | | | | | | |
3.617%(a)(b) | 10/11/21 | | $ | 2,000,000 | | | $ | 1,900,929 | |
ARES XXIII CLO, Ltd. | | | | | | | | |
3.820%(a)(b) | 04/19/23 | | | 1,250,000 | | | | 1,244,126 | |
CIFC Funding, Ltd. | | | | | | | | | |
0.000%(a) | 07/22/26 | | | 500,000 | | | | 275,907 | |
2.121%(a)(b) | 05/10/21 | | | 1,300,000 | | | | 1,238,570 | |
2.536%(a)(b) | 12/05/24 | | | 1,500,000 | | | | 1,482,001 | |
3.688%(a)(b) | 08/14/24 | | | 1,000,000 | | | | 987,075 | |
Voya CLO, Ltd. | | | | | | | | | |
4.932%(a)(b) | 07/19/28 | | | 500,000 | | | | 488,825 | |
| | | | | | | | | 7,617,433 | |
Health Care — 0.3% | | | | | | | | |
Gale Force CLO, Ltd. | | | | | | | | |
4.118%(a)(b) | 08/20/21 | | | 1,250,000 | | | | 1,237,701 | |
| | | | | | | | | | |
Industrials — 0.7% | | | | | | | | |
Gramercy Park CLO, Ltd. | | | | | | | | |
3.570%(a)(b) | 07/17/23 | | | 1,500,000 | | | | 1,488,714 | |
4.670%(a)(b) | 07/17/23 | | | 1,000,000 | | | | 966,788 | |
| | | | | | | | | 2,455,502 | |
Other Asset-Backed Securities — 22.8% | |
AABS, Ltd. | | | | | | | | | |
4.875% | 01/15/38 | | | 413,286 | | | | 410,187 | |
ACAS CLO, Ltd. | | | | | | | | | |
2.943%(a)(b) | 09/20/23 | | | 1,000,000 | | | | 990,410 | |
3.873%(a)(b) | 09/20/23 | | | 1,000,000 | | | | 1,000,090 | |
ALM XIX LLC | | | | | | | | | |
3.634%(a)(b) | 07/15/28 | | | 250,000 | | | | 250,599 | |
AMMC CLO XIII, Ltd. | | | | | | | | | |
3.319%(a)(b) | 01/26/26 | | | 1,500,000 | | | | 1,417,697 | |
Apollo Aviation Securitization Equity Trust | | | | | | | | |
4.875%(b) | 08/15/22 | | | 975,000 | | | | 971,341 | |
5.125%(a) | 12/15/29 | | | 1,326,923 | | | | 1,281,144 | |
7.375%(a) | 12/15/29 | | | 663,462 | | | | 658,486 | |
Babson CLO, Ltd. | | | | | | | | | |
0.000%(b) | 05/15/23 | | | 1,000,000 | | | | 520,471 | |
Baker Street CLO II, Ltd. | | | | | | | | |
1.358%(a)(b) | 10/15/19 | | | 1,500,000 | | | | 1,451,705 | |
BlueMountain CLO, Ltd. | | | | | | | | |
2.089%(a)(b) | 07/20/26 | | | 250,000 | | | | 249,749 | |
Brad CDO, Ltd. | | | | | | | | | |
4.213%(c)(d) | 03/12/26 | | | 895,232 | | | | 920,346 | |
Canyon Capital CLO, Ltd. | | | | | | | | |
3.887%(a)(b) | 04/30/25 | | | 250,000 | | | | 223,254 | |
Carlyle Global Market Strategies CLO, Ltd. | | | | | | | | |
3.476%(a)(b) | 05/15/25 | | | 500,000 | | | | 492,430 | |
Castlelake Aircraft Securitization Trust | | | | | | | | |
4.703%(b) | 12/15/40 | | | 1,409,095 | | | | 1,393,595 | |
5.250%(b) | 02/15/29 | | | 560,873 | | | | 554,142 | |
7.500%(b) | 02/15/29 | | | 497,227 | | | | 491,758 | |
Cent CLO LP | | | | | | | | | |
2.866%(a)(b) | 08/01/24 | | | 500,000 | | | | 498,178 | |
3.816%(a)(b) | 08/01/24 | | | 1,000,000 | | | | 993,852 | |
Cereberus ICQ Levered LLC | | | | | | | | |
3.678%(a)(b) | 11/06/25 | | | 2,000,000 | | | | 1,978,503 | |
Chesterfield Financial Holdings LLC | | | | | | | | |
4.500%(b) | 12/15/34 | | | 941,000 | | | | 935,825 | |
Credit Suisse Mortgage Capital Trust | | | | | | | | |
5.500%(b) | 07/25/56 | | | 985,689 | | | | 985,176 | |
Diamond Head Aviation, Ltd. | | | | | | | | |
3.810%(b) | 07/14/28 | | | 826,298 | | | | 820,850 | |
Drug Royalty III LP | | | | | | | | |
3.979%(b) | 04/15/27 | | | 1,000,000 | | | | 998,958 | |
Dryden 37 Senior Loan Fund | | | | | | | | |
0.000%(b) | 04/15/27 | | | 1,000,000 | | | | 897,626 | |
Duane Street CLO IV, Ltd. | | | | | | | | |
1.618%(a)(b) | 11/14/21 | | | 1,500,000 | | | | 1,442,822 | |
ECAF I, Ltd. | | | | | | | | | |
4.947%(b) | 06/15/40 | | | 991,172 | | | | 975,705 | |
FDF II, Ltd. | | | | | | | | | |
4.285%(b) | 05/12/31 | | | 1,000,000 | | | | 1,018,539 | |
Flagship CLO VI | | | | | | | | | |
3.035%(a)(b) | 06/10/21 | | | 2,000,000 | | | | 1,920,615 | |
Flagship VII, Ltd. | | | | | | | | | |
3.584%(a)(b) | 01/20/26 | | | 1,500,000 | | | | 1,395,632 | |
See Notes to Financial Statements.
50
Wilshire Mutual Funds, Inc. Wilshire Income Opportunities Fund Schedule of Investments - (continued) | June 30, 2016 (Unaudited) |
|
| Maturity Date | | Par | �� | | Value | |
Fortress Credit Investments IV, Ltd. | | | | | | |
2.520%(a) (b) | 07/17/23 | | $ | 1,250,000 | | | $ | 1,216,959 | |
Fortress Credit Opportunities V CLO, Ltd. | | | | | | | | |
3.267%(a) (b) | 10/15/26 | | | 1,000,000 | | | | 959,547 | |
4.179%(a) (b) | 10/15/26 | | | 1,000,000 | | | | 941,838 | |
Galaxy XXII CLO, Ltd. | | | | | | | | |
5.106%(a) (b) | 07/16/28 | | | 500,000 | | | | 492,708 | |
GCAT LLC | | | | | | | | | |
3.721%(b) | 10/25/19 | | | 2,486,319 | | | | 2,471,871 | |
Golub Capital Partners CLO, Ltd. | | | | | | | | |
2.421%(a) (b) | 08/05/27 | | | 1,000,000 | | | | 964,711 | |
3.069%(a) (b) | 10/25/26 | | | 700,000 | | | | 673,782 | |
3.574%(a) (b) | 10/20/21 | | | 2,500,000 | | | | 2,457,002 | |
Great Lakes CLO, Ltd. | | | | | | | | |
2.572%(a) (b) | 07/15/26 | | | 1,000,000 | | | | 1,003,996 | |
GSAA Home Equity Trust | | | | | | | | |
0.716%(a) | 07/25/37 | | | 1,158,788 | | | | 1,026,257 | |
Halcyon Loan Advisors Funding, Ltd. | | | | | | | | |
3.473%(a) (b) | 12/20/24 | | | 1,500,000 | | | | 1,336,535 | |
Helios Series I Multi Asset CBO, Ltd. | | | | | | | | |
1.586%(a) (b) | 12/13/36 | | | 35,104 | | | | 34,638 | |
Highbridge Loan Management, Ltd. | | | | | | | | |
2.873%(a) (b) | 09/20/22 | | | 1,000,000 | | | | 1,001,386 | |
3.873%(a) (b) | 09/20/22 | | | 1,000,000 | | | | 997,238 | |
ING Investment Management CLO, Ltd. | | | | | | | | |
2.819%(a) (b) | 06/14/22 | | | 1,500,000 | | | | 1,413,329 | |
Ivy Hill Middle Market Credit Fund IX, Ltd. | | | | | | | | |
3.070%(a) (b) | 10/18/25 | | | 2,000,000 | | | | 1,961,317 | |
Jamestown CLO III, Ltd. | | | | | | | | |
5.228%(a) (b) | 01/15/26 | | | 1,750,000 | | | | 1,156,600 | |
Keuka Park CLO, Ltd. | | | | | | | | |
0.000%(b) | 10/21/24 | | | 1,250,000 | | | | 655,122 | |
KVK CLO, Ltd. | | | | | | | | | |
0.000%(b) | 04/14/25 | | | 1,150,000 | | | | 412,295 | |
2.728%(a) (b) | 10/15/26 | | | 1,000,000 | | | | 950,907 | |
Madison Park Funding, Ltd. | | | | | | | | |
1.636%(a) (b) | 07/26/21 | | | 250,000 | | | | 239,013 | |
Marea CLO, Ltd. | | | | | | | | | |
2.422%(a) (b) | 10/15/23 | | | 1,250,000 | | | | 1,229,620 | |
Neuberger Berman CLO, Ltd. | | | | | | | | |
0.000%(b) | 07/25/23 | | | 450,000 | | | | 203,468 | |
3.738% | 07/25/23 | | | 1,500,000 | | | | 1,488,788 | |
NewMark Capital Funding CLO, Ltd. | | | | | | | | |
4.129%(a) (b) | 06/30/26 | | | 1,159,000 | | | | 955,791 | |
North End CLO, Ltd. | | | | | | | | |
5.233%(a) (b) | 07/17/25 | | | 1,000,000 | | | | 671,152 | |
Ocean Trails CLO IV | | | | | | | | |
3.618%(a) (b) | 08/13/25 | | | 1,750,000 | | | | 1,671,724 | |
Octagon Investment Partners 27, Ltd. | | | | | | | | |
2.812%(a) (b) | 07/15/27 | | | 250,000 | | | | 248,750 | |
Palmer Square Loan Funding, Ltd. | | | | | | | | |
2.738%(a) (b) | 06/21/24 | | | 250,000 | | | | 248,746 | |
Putnam Structured Product Funding, Ltd. | | | | | | | | |
1.442%(a) (b) | 10/15/38 | | | 2,000,000 | | | | 1,688,846 | |
Rampart CLO, Ltd. | | | | | | | | | |
2.494%(a) (b) | 10/25/21 | | | 1,000,000 | | | | 981,811 | |
Regatta V Funding, Ltd. | | | | | | | | |
3.769%(a) (b) | 10/25/26 | | | 1,500,000 | | | | 1,496,856 | |
Rise Ltd. | | | | | | | | | |
4.750%(a) | 02/15/39 | | | 1,277,464 | | | | 1,259,580 | |
Rockwall CDO II, Ltd. | | | | | | | | |
1.166%(a) (b) | 08/01/24 | | | 1,500,000 | | | | 1,397,856 | |
Silverado CLO II, Ltd. | | | | | | | | |
0.983%(a) (b) | 10/16/20 | | | 300,000 | | | | 293,946 | |
Springleaf Funding Trust | | | | | | | | |
3.160%(b) | 11/15/24 | | | 1,000,000 | | | | 1,005,915 | |
Steele Creek CLO, Ltd. | | | | | | | | |
2.868%(a) (b) | 08/21/26 | | | 2,000,000 | | | | 1,958,993 | |
Symphony CLO XIV, Ltd. | | | | | | | | |
4.230%(a) (b) | 07/14/26 | | | 500,000 | | | | 474,123 | |
TCI-FLATIRON CLO, Ltd. | | | | | | | | |
2.862%(a) (b) | 07/17/28 | | | 250,000 | | | | 248,750 | |
3.712%(a) (b) | 07/17/28 | | | 250,000 | | | | 248,750 | |
TICP CLO II, Ltd. | | | | | | | | | |
3.624%(a) (b) | 07/20/26 | | | 1,000,000 | | | | 967,363 | |
See Notes to Financial Statements.
51
Wilshire Mutual Funds, Inc. Wilshire Income Opportunities Fund Schedule of Investments - (continued) | June 30, 2016 (Unaudited) |
|
| Maturity Date | | Par | | | Value | |
Treman Park CLO LLC | | | | | | |
0.000%(b) | 04/20/27 | | $ | 500,000 | | | $ | 433,520 | |
Triaxx Prime CDO, Ltd. | | | | | | | | |
0.729%(a) (b) | 10/02/39 | | | 1,050,162 | | | | 988,203 | |
Venture VI CDO, Ltd. | | | | | | | | |
2.099%(a) (b) | 08/03/20 | | | 2,250,000 | | | | 2,057,140 | |
Venture XII CLO, Ltd. | | | | | | | | |
3.486%(a) (b) | 02/28/24 | | | 1,000,000 | | | | 979,962 | |
Venture XXIII CLO, Ltd. | | | | | | | | |
2.955%(a) (b) | 07/19/28 | | | 500,000 | | | | 500,000 | |
Vibrant CLO, Ltd. | | | | | | | | | |
2.720%(a) (b) | 07/17/24 | | | 1,000,000 | | | | 990,868 | |
VOLT XXVII LLC | | | | | | | | | |
3.375%(b) | 08/27/57 | | | 802,725 | | | | 797,821 | |
Wachovia Asset Securitization Issuance II LLC | | | | | | | | |
0.583%(a) (b) | 07/25/37 | | | 2,062,469 | | | | 1,784,279 | |
0.593%(a) (b) | 07/25/37 | | | 1,735,031 | | | | 1,434,085 | |
Westcott Park CLO, Ltd. | | | | | | | | |
5.007%(a) (b) | 07/20/28 | | | 500,000 | | | | 494,690 | |
WhiteHorse IV, Ltd. | | | | | | | | | |
2.070%(a) (b) | 01/17/20 | | | 1,500,000 | | | | 1,415,811 | |
WhiteHorse VIII, Ltd. | | | | | | | | |
2.666%(a) (b) | 05/01/26 | | | 1,100,000 | | | | 1,042,283 | |
Wrightwood Capital Real Estate CDO, Ltd. | | | | | | | | |
1.048%(a) (b) | 11/21/40 | | | 1,450,000 | | | | 1,384,174 | |
| | | | | | | | | 83,550,400 | |
Total Asset-Backed Securities | | | | | | | | |
(Cost $97,535,573) | | | | | | | | 94,861,036 | |
| | | | | | | | | | |
U.S. TREASURY OBLIGATIONS — 18.5% | |
U.S. Treasury Bonds | | | | | | | | |
3.000% | 11/15/44 | | | 2,270,000 | | | | 2,609,969 | |
2.921%(e) | 11/15/44 | | | 14,675,000 | | | | 7,348,404 | |
2.750% | 11/15/42 | | | 3,560,000 | | | | 3,916,278 | |
U.S. Treasury Notes | | | | | | | | | |
2.500% | 05/15/24 | | | 2,760,000 | | | | 2,997,727 | |
2.250% | 11/15/24 | | | 3,120,000 | | | | 3,328,163 | |
2.250% | 03/31/21 | | | 3,780,000 | | | | 3,999,860 | |
2.000% | 11/30/20 | | | 4,970,000 | | | | 5,193,456 | |
2.000% | 02/15/25 | | | 3,040,000 | | | | 3,180,600 | |
1.750% | 03/31/22 | | | 1,780,000 | | | | 1,839,171 | |
1.625%(f) | 05/15/26 | | | 13,470,000 | | | | 13,634,698 | |
0.875% | 03/31/18 | | | 10,000,000 | | | | 10,048,830 | |
0.750% | 10/31/17 | | | 4,610,000 | | | | 4,621,165 | |
0.500% | 01/31/17 | | | 640,000 | | | | 640,212 | |
0.500% | 09/30/16 | | | 600,000 | | | | 600,223 | |
0.500% | 11/30/16 | | | 3,750,000 | | | | 3,752,018 | |
| | | | | | | | | | |
Total U.S. Treasury Obligations | | | | | |
(Cost $65,459,908) | | | | | | | | 67,710,774 | |
| | | | | | | | | | |
COLLATERALIZED MORTGAGE OBLIGATIONS — 18.0% | |
Agency Mortgage-Backed Obligation — 4.7% | |
FHLMC | | | | | | | | | |
3.000% | 03/01/46 | | | 493,706 | | | | 512,302 | |
3.000% | 04/01/46 | | | 497,114 | | | | 515,659 | |
3.000% | 05/01/46 | | | 997,683 | | | | 1,034,901 | |
3.500% | 05/01/46 | | | 998,700 | | | | 1,037,994 | |
4.000% | 05/15/44 | | | 4,874,143 | | | | 5,542,821 | |
4.321%(a) | 09/15/43 | | | 1,402,341 | | | | 1,386,333 | |
5.567%(a) | 08/15/42 | | | 2,424,963 | | | | 429,188 | |
FHLMC Multifamily Structured Pass-Through Certificates, IO | | | | | | | | |
1.312%(a) | 03/25/23 | | | 2,281,000 | | | | 160,001 | |
FNMA | | | | | | | | | |
3.000% | 07/01/46 | | | 5,000,000 | | | | 5,133,233 | |
3.500% | 07/01/42 | | | 1,134,553 | | | | 1,211,480 | |
5.554%(a) | 07/25/42 | | | 1,261,904 | | | | 230,865 | |
| | | | | | | | | 17,194,777 | |
Non-Agency Mortgage-Backed Obligation — 13.3% | |
A10 Securitization | | | | | | | | | |
2.460% | 03/15/35 | | | 163,000 | | | | 163,795 | |
ACRE Commercial Mortgage Trust | | | | | | | | |
2.934%(a) (b) | 08/15/31 | | | 1,000,000 | | | | 985,579 | |
Alliance Bancorp Trust | | | | | | | | |
0.686%(a) | 07/25/37 | | | 1,270,625 | | | | 899,116 | |
American Home Mortgage Assets Trust | | | | | | | | |
0.636%(a) | 10/25/46 | | | 1,352,598 | | | | 888,678 | |
Banc of America Commercial Mortgage Trust | | | | | | | | |
2.013%(a) | 06/15/49 | | | 1,123,000 | | | | 145,553 | |
5.451% | 01/15/49 | | | 139,908 | | | | 141,968 | |
See Notes to Financial Statements.
52
Wilshire Mutual Funds, Inc. Wilshire Income Opportunities Fund Schedule of Investments - (continued) | June 30, 2016 (Unaudited) |
|
| Maturity Date | | Par | | | Value | |
Banc of America Funding, Ltd. | | | | | | |
0.657%(a) (b) | 11/03/41 | | $ | 1,419,907 | | | $ | 1,292,568 | |
Banc of America Re-REMIC Trust | | | | | | | | |
5.952%(a) (b) | 05/15/46 | | | 218,000 | | | | — | |
Bear Stearns ARM Trust | | | | | | | | |
2.904%(a) | 01/25/35 | | | 836,678 | | | | 745,959 | |
Bear Stearns Commercial Mortgage Securities Trust | | | | | | | | |
5.331% | 02/11/44 | | | 121,035 | | | | 123,223 | |
5.694%(a) | 06/11/50 | | | 205,129 | | | | 211,978 | |
5.911%(a) | 06/11/40 | | | 368,000 | | | | 380,346 | |
Capmark Military Housing Trust | | | | | | | | |
5.746%(b) (c) (d) | 02/10/52 | | | 1,927,580 | | | | 2,047,334 | |
6.059%(b) (d) | 10/10/52 | | | 483,286 | | | | 496,402 | |
CD Commercial Mortgage Trust | | | | | | | | |
5.366%(a) | 12/11/49 | | | 545,000 | | | | 554,362 | |
CFCRE Commercial Mortgage Trust, IO | | | | | | | | |
1.940%(a) | 03/10/26 | | | 1,302,000 | | | | 160,324 | |
5.040%(a) | 04/10/26 | | | 120,000 | | | | 118,320 | |
CIM Trust | | | | | | | | | |
12.174%(a) (b) | 02/27/56 | | | 1,000,000 | | | | 815,600 | |
12.213%(a) (b) | 02/27/56 | | | 1,000,000 | | | | 815,400 | |
12.251%(a) (b) | 08/26/55 | | | 1,000,000 | | | | 836,000 | |
Citigroup Commercial Mortgage Trust | | | | | | | | |
1.813%(a) | 04/10/49 | | | 3,846,437 | | | | 509,776 | |
2.118%(a) | 05/10/49 | | | 1,184,000 | | | | 164,463 | |
5.889%(a) | 12/10/49 | | | 219,000 | | | | 219,780 | |
5.901%(a) | 12/10/49 | | | 141,000 | | | | 145,135 | |
6.140%(a) | 12/10/49 | | | 120,000 | | | | 123,884 | |
CitiMortgage Alternative Loan Trust Series | | | | | | | | |
6.000% | 05/25/37 | | | 4,294,059 | | | | 3,653,406 | |
6.000% | 04/25/36 | | | 3,787,727 | | | | 3,511,594 | |
COBALT Commercial Mortgage Trust | | | | | | | | |
5.956%(a) | 05/15/46 | | | 120,000 | | | | 123,736 | |
Commercial Mortgage Loan Trust | | | | | | | | |
6.297%(a) | 12/10/49 | | | 260,107 | | | | 269,807 | |
Commercial Mortgage Trust | | | | | | | | |
1.544%(a) | 10/10/46 | | | 4,003,582 | | | | 265,966 | |
1.544%(a) | 10/10/46 | | | 3,999,221 | | | | 265,676 | |
5.475% | 03/10/39 | | | 189,000 | | | | 192,163 | |
Credit Suisse Commercial Mortgage Trust | | | | | | | | |
3.500%(a) (b) | 10/25/44 | | | 925,757 | | | | 951,359 | |
5.343% | 12/15/39 | | | 161,000 | | | | 162,493 | |
5.615%(a) | 01/15/49 | | | 84,000 | | | | 85,535 | |
5.695%(a) | 09/15/40 | | | 78,164 | | | | 80,830 | |
CSAIL Commercial Mortgage Trust, IO | | | | | | | | |
1.977%(a) | 01/15/49 | | | 993,734 | | | | 124,026 | |
FirstKey Mortgage Trust | | | | | | | | |
3.500%(a) (b) | 11/25/44 | | | 617,476 | | | | 631,234 | |
GE Business Loan Trust | | | | | | | | |
0.885%(a) (b) | 04/16/35 | | | 1,094,975 | | | | 956,027 | |
GE Capital Commercial Mortgage Corp. Trust | | | | | | | | |
5.353%(a) | 03/10/44 | | | 57,021 | | | | 56,575 | |
GS Mortgage Securities Trust | | | | | | | | |
1.824%(a) | 05/10/49 | | | 1,042,772 | | | | 123,601 | |
4.684%(a) (b) | 02/15/33 | | | 1,000,000 | | | | 1,001,192 | |
5.560% | 11/10/39 | | | 272,043 | | | | 272,763 | |
5.591% | 11/10/39 | | | 125,000 | | | | 125,652 | |
5.988%(a) | 08/10/45 | | | 285,226 | | | | 292,239 | |
HarborView Mortgage Loan Trust | | | | | | | | |
0.589%(a) | 01/25/47 | | | 1,146,553 | | | | 863,564 | |
Harbour Aircraft Investments, Ltd. | | | | | | | | |
4.703% | 07/15/41 | | | 1,000,000 | | | | 999,973 | |
Hilton USA Trust | | | | | | | | | |
4.602%(a) (b) | 11/05/30 | | | 1,000,000 | | | | 1,006,282 | |
JPMorgan Chase Commercial Mortgage Securities Trust | | | | | | | | |
5.440% | 06/12/47 | | | 61,503 | | | | 62,437 | |
5.480%(a) | 05/15/45 | | | 100,000 | | | | 100,144 | |
5.881%(a) | 02/12/51 | | | 273,000 | | | | 284,916 | |
JPMDB Commercial Mortgage Securities Trust, IO | | | | | | | | |
1.872%(a) | 06/15/49 | | | 1,263,000 | | | | 140,279 | |
See Notes to Financial Statements.
53
Wilshire Mutual Funds, Inc. Wilshire Income Opportunities Fund Schedule of Investments - (continued) | June 30, 2016 (Unaudited) |
|
| Maturity Date | | Par | | | Value | |
LB Commercial Mortgage Trust | | | | | | |
6.118%(a) | 07/15/44 | | $ | 187,538 | | | $ | 194,694 | |
LB-UBS Commercial Mortgage Trust | | | | | | | | |
5.493%(a) | 02/15/40 | | | 273,000 | | | | 276,910 | |
5.866%(a) | 09/15/45 | | | 208,392 | | | | 218,026 | |
5.937%(a) | 06/15/38 | | | 18,383 | | | | 18,373 | |
6.241%(a) | 09/15/45 | | | 120,000 | | | | 120,039 | |
LSTAR Commercial Mortgage Trust, IO | | | | | | | | |
1.957% | 03/10/49 | | | 1,627,000 | | | | 163,590 | |
4.549%(a) (b) | 03/10/49 | | | 274,000 | | | | 264,571 | |
LSTAR Securities Investment Trust | | | | | | | | |
2.434%(a) (b) | 04/01/20 | | | 999,537 | | | | 976,040 | |
2.436%(a) (b) | 03/01/21 | | | 1,401,199 | | | | 1,362,454 | |
2.439%(a) (b) | 04/01/20 | | | 982,475 | | | | 961,577 | |
2.439%(a) (b) | 01/01/20 | | | 1,497,860 | | | | 1,472,261 | |
3.539%(a) (b) | 09/01/21 | | | 2,316,217 | | | | 2,323,629 | |
Luminent Mortgage Trust | | | | | | | | |
0.646%(a) | 02/25/46 | | | 1,637,984 | | | | 1,104,197 | |
Merrill Lynch Mortgage Trust | | | | | | | | |
5.802%(a) | 08/12/43 | | | 161,000 | | | | 160,390 | |
ML-CFC Commercial Mortgage Trust | | | | | | | | |
5.700% | 09/12/49 | | | 206,868 | | | | 215,184 | |
5.810%(a) | 06/12/50 | | | 64,567 | | | | 66,456 | |
Morgan Stanley Bank of America Merrill Lynch Trust, IO | | | | | | | | |
1.052%(a) | 12/15/47 | | | 26,343,221 | | | | 1,821,170 | |
1.150%(a) | 12/15/47 | | | 3,530,690 | | | | 214,944 | |
Morgan Stanley Capital I Trust | | | | | | | | |
0.865%(a) (b) | 07/15/19 | | | 68,327 | | | | 66,844 | |
5.478%(a) | 02/12/44 | | | 100,000 | | | | 101,190 | |
5.793%(a) | 07/12/44 | | | 66,722 | | | | 66,716 | |
6.256%(a) | 12/12/49 | | | 273,000 | | | | 286,117 | |
Morgan Stanley Re-REMIC Trust | | | | | | | | |
0.947%(a) (b) | 06/26/36 | | | 1,053,681 | | | | 737,594 | |
5.988%(a) (b) | 08/15/45 | | | 218,000 | | | | 222,269 | |
PFP, Ltd. | | | | | | | | | |
2.434%(a) (b) | 07/14/34 | | | 1,000,000 | | | | 992,122 | |
RALI Trust | | | | | | | |
6.500% | 10/25/36 | | | 1,834,184 | | | | 1,544,900 | |
SRERS Funding, Ltd. | | | | | | | | |
0.688%(a) (b) | 05/09/46 | | | 813,937 | | | | 790,189 | |
0.688%(a) (b) | 05/09/46 | | | 500,000 | | | | 300,000 | |
Velocity Commercial Capital Loan Trust | | | | | | | | |
3.534%(a) (b) | 04/25/46 | | | 517,894 | | | | 520,632 | |
Wachovia Bank Commercial Mortgage Trust | | | | | | | | |
5.339% | 11/15/48 | | | 382,000 | | | | 385,691 | |
5.383% | 12/15/43 | | | 141,000 | | | | 143,437 | |
5.632%(a) | 10/15/48 | | | 219,000 | | | | 218,550 | |
5.678% | 05/15/46 | | | 259,847 | | | | 267,579 | |
Wells Fargo Commercial Mortgage Trust | | | | | | | | |
5.197%(a) | 05/15/49 | | | 141,000 | | | | 142,486 | |
WinWater Mortgage Loan Trust | | | | | | | | |
3.000%(a) (b) | 12/20/30 | | | 505,214 | | | | 517,015 | |
| | | | | | | | | 48,826,848 | |
Total Collateralized Mortgage Obligations | | | | | |
(Cost $66,242,192) | | | | | | | | 66,021,625 | |
| | | | | | | | | | |
FOREIGN BONDS — 15.9% | |
Australia — 0.2% | | | | | | | | | |
Australia & New Zealand Banking Group, Ltd. MTN | | | | | | | | |
4.875%(b) (g) | 01/12/21 | | | 125,000 | | | | 141,025 | |
Newcrest Finance Pty, Ltd. | | | | | | | | |
4.450%(b) (g) | 11/15/21 | | | 250,000 | | | | 257,513 | |
Westpac Banking Corp. | | | | | | | | |
2.600%(g) | 11/23/20 | | | 140,000 | | | | 144,707 | |
| | | | | | | | | 543,245 | |
Barbados — 0.2% | | | | | | | | | |
Columbus International, Inc. | | | | | | | | |
7.375%(g) | 03/30/21 | | | 500,000 | | | | 528,000 | |
| | | | | | | | | | |
Belgium — 0.0% | | | | | | | | | |
Anheuser-Busch InBev Finance, Inc. | | | | | | | | |
4.900%(g) | 02/01/46 | | | 100,000 | | | | 117,184 | |
See Notes to Financial Statements.
54
Wilshire Mutual Funds, Inc. Wilshire Income Opportunities Fund Schedule of Investments - (continued) | June 30, 2016 (Unaudited) |
|
| Maturity Date | | Par(1) | | | Value | |
Brazil — 0.7% | | | | | | | |
Cosan Overseas, Ltd. | | | | | | |
8.250%(g) | 11/29/49 | | | 1,200,000 | | | $ | 1,134,001 | |
Eldorado International Finance GmbH | | | | | | | | |
8.625%(b) (g) | 06/16/21 | | | 200,000 | | | | 193,570 | |
JBS LLC | | | | | | | | | |
5.750%(b) (g) | 06/15/25 | | | 55,000 | | | | 51,700 | |
Minerva Luxembourg SA | | | | | | | | |
8.750%(a) (g) | 12/29/49 | | | 1,000,000 | | | | 1,005,000 | |
| | | | | | | | | 2,384,271 | |
Canada — 1.0% | | | | | | | | | |
Bank of Montreal MTN | | | | | | | | |
2.375%(g) | 01/25/19 | | | 155,000 | | | | 159,123 | |
Husky Energy, Inc. | | | | | | | | | |
4.000%(g) | 04/15/24 | | | 400,000 | | | | 406,343 | |
3.950%(g) | 04/15/22 | | | 1,090,000 | | | | 1,127,367 | |
Lundin Mining Corp. | | | | | | | | |
7.500%(b) (g) | 11/01/20 | | | 35,000 | | | | 35,700 | |
Open Text Corp. | | | | | | | | | |
5.875%(b) (g) | 06/01/26 | | | 35,000 | | | | 35,088 | |
Royal Bank of Canada MTN | | | | | | | | |
2.500%(g) | 01/19/21 | | | 55,000 | | | | 56,829 | |
Sirius XM Canada Holdings, Inc. | | | | | | | | |
5.625%(b) | 04/23/21 | | CAD 400,000 | | | | 308,061 | |
Toronto-Dominion Bank MTN | | | | | | | | |
2.125%(g) | 04/07/21 | | | 135,000 | | | | 137,387 | |
Yamana Gold, Inc. | | | | | | | | | |
4.950%(g) | 07/15/24 | | | 1,450,000 | | | | 1,426,510 | |
| | | | | | | | | 3,692,408 | |
Chile — 1.2% | | | | | | | | | |
CorpGroup Banking SA | | | | | | | | |
6.750%(g) | 03/15/23 | | | 500,000 | | | | 466,250 | |
Empresa Electrica Angamos SA | | | | | | | | |
4.875%(g) | 05/25/29 | | | 1,000,000 | | | | 982,378 | |
GNL Quintero SA | | | | | | | | | |
4.634%(g) | 07/31/29 | | | 500,000 | | | | 510,000 | |
Guanay Finance, Ltd. | | | | | | | | |
6.000%(g) | 12/15/20 | | | 1,185,296 | | | | 1,176,407 | |
Latam Airlines Group SA | | | | | | | | |
7.250%(g) | 06/09/20 | | | 500,000 | | | | 484,375 | |
Tanner Servicios Financieros SA | | | | | | | | |
4.375%(g) | 03/13/18 | | | 750,000 | | | | 751,875 | |
| | | | | | | | | 4,371,285 | |
Colombia — 2.5% | | | | | | | | | |
Avianca Holdings SA | | | | | | | | |
8.375%(g) | 05/10/20 | | | 500,000 | | | | 405,050 | |
Banco de Bogota SA | | | | | | | | |
6.250%(b) (g) | 05/12/26 | | | 1,260,000 | | | | 1,282,050 | |
Banco GNB Sudameris SA | | | | | | | | |
3.875%(g) | 05/02/18 | | | 800,000 | | | | 786,000 | |
Bancolombia SA | | | | | | | | | |
6.125%(g) | 07/26/20 | | | 30,000 | | | | 32,100 | |
5.950%(g) | 06/03/21 | | | 800,000 | | | | 874,800 | |
Ecopetrol SA | | | | | | | | | |
7.375%(g) | 09/18/43 | | | 800,000 | | | | 798,000 | |
Empresa de Energia de Bogota SA ESP | | | | | | | | |
6.125%(g) | 11/10/21 | | | 800,000 | | | | 833,000 | |
Grupo Aval, Ltd. | | | | | | | | | |
4.750%(g) | 09/26/22 | | | 1,000,000 | | | | 977,500 | |
GrupoSura Finance SA | | | | | | | | |
5.500%(b) (g) | 04/29/26 | | | 1,000,000 | | | | 1,042,500 | |
Oleoducto Central SA | | | | | | | | |
4.000%(g) | 05/07/21 | | | 750,000 | | | | 732,750 | |
SUAM Finance BV | | | | | | | | | |
4.875%(g) | 04/17/24 | | | 500,000 | | | | 518,750 | |
Transportadora de Gas Internacional SA ESP | | | | | | | | |
5.700%(g) | 03/20/22 | | | 800,000 | | | | 834,000 | |
| | | | | | | | | 9,116,500 | |
Costa Rica — 0.6% | | | | | | | | | |
Banco de Costa Rica | | | | | | | | |
5.250%(g) | 08/12/18 | | | 400,000 | | | | 408,500 | |
Banco Nacional de Costa Rica | | | | | | | | |
5.875%(b) (g) | 04/25/21 | | | 1,000,000 | | | | 1,031,700 | |
Instituto Costarricense de Electricidad | | | | | | | | |
6.950%(g) | 11/10/21 | | | 750,000 | | | | 776,250 | |
| | | | | | | | | 2,216,450 | |
Dominican Republic — 0.5% | | | | | | | | |
AES Andres BV | | | | | | | | | |
7.950%(b) (g) | 05/11/26 | | | 500,000 | | | | 520,000 | |
Banco de Reservas de la Republica Dominicana | | | | | | | | |
7.000%(g) | 02/01/23 | | | 500,000 | | | | 495,000 | |
See Notes to Financial Statements.
55
Wilshire Mutual Funds, Inc. Wilshire Income Opportunities Fund Schedule of Investments - (continued) | June 30, 2016 (Unaudited) |
|
| Maturity Date | | Par | | | Value | |
Dominican Republic International Bond | | | | | | |
6.850%(b) (g) | 01/27/45 | | $ | 700,000 | | | $ | 724,500 | |
| | | | | | | | | 1,739,500 | |
France — 0.1% | | | | | | | | | |
Numericable-SFR SAS | | | | | | | | |
6.000%(b) (g) | 05/15/22 | | | 200,000 | | | | 194,500 | |
Orange SA | | | | | | | | | |
2.750%(g) | 02/06/19 | | | 100,000 | | | | 103,050 | |
| | | | | | | | | 297,550 | |
Greece — 0.1% | | | | | | | | | |
Dynagas LNG Partners | | | | | | | | |
6.250%(d) (g) | 10/30/19 | | | 500,000 | | | | 435,000 | |
| | | | | | | | | | |
Guatemala — 0.8% | | | | | | | | |
Cementos Progreso Trust | | | | | | | | |
7.125%(g) | 11/06/23 | | | 800,000 | | | | 848,000 | |
Comcel Trust via Comunicaciones Celulares SA | | | | | | | | |
6.875%(g) | 02/06/24 | | | 1,000,000 | | | | 975,000 | |
Industrial Senior Trust | | | | | | | | |
5.500%(g) | 11/01/22 | | | 1,000,000 | | | | 980,000 | |
| | | | | | | | | 2,803,000 | |
India — 0.8% | | | | | | | | | |
Adani Ports & Special Economic Zone, Ltd. | | | | | | | | |
3.500%(g) | 07/29/20 | | | 800,000 | | | | 795,703 | |
ONGC Videsh, Ltd. | | | | | | | | | |
3.750%(g) | 05/07/23 | | | 800,000 | | | | 816,890 | |
Reliance Industries, Ltd. | | | | | | | | |
5.875%(g) | 02/28/49 | | | 1,000,000 | | | | 1,016,200 | |
Vedanta Resources PLC | | | | | | | | |
8.250%(g) | 06/07/21 | | | 500,000 | | | | 411,250 | |
| | | | | | | | | 3,040,043 | |
Israel — 0.3% | | | | | | | | | |
Delek & Avner Tamar Bond, Ltd. | | | | | | | | |
5.412%(b) (g) | 12/30/25 | | | 1,000,000 | | | | 1,035,000 | |
Teva Pharmaceutical Finance Co. BV | | | | | | | | |
2.950%(g) | 12/18/22 | | | 160,000 | | | | 162,739 | |
| | | | | | | | | 1,197,739 | |
Jamaica — 0.3% | | | | | | | |
Digicel Group, Ltd. | | | | | | | |
7.125%(g) | 04/01/22 | | | 1,200,000 | | | | 892,500 | |
| | | | | | | | | | |
Japan — 0.0% | | | | | | | | | |
Sumitomo Mitsui Financial Group, Inc. | | | | | | | | |
2.934%(g) | 03/09/21 | | | 140,000 | | | | 145,768 | |
| | | | | | | | | | |
Kenya — 0.2% | | | | | | | | | |
Kenya Government International Bond | | | | | | | | |
6.875%(b) (g) | 06/24/24 | | | 900,000 | | | | 832,158 | |
| | | | | | | | | | |
Luxembourg — 0.0% | | | | | | | | |
Intelsat Jackson Holdings SA | | | | | | | | |
8.000%(b) (g) | 02/15/24 | | | 20,000 | | | | 19,700 | |
| | | | | | | | | | |
Malaysia — 0.1% | | | | | | | | | |
IOI Investment L BHD MTN | | | | | | | | |
4.375%(g) | 06/27/22 | | | 400,000 | | | | 416,508 | |
| | | | | | | | | | |
Mexico — 2.4% | | | | | | | | | |
Banco Mercantil del Norte SA | | | | | | | | |
6.862%(a) (g) | 10/13/21 | | | 700,000 | | | | 698,250 | |
Banco Santander Mexico SA Institucion de Banca Multiple | | | | | | | | |
4.125%(g) | 11/09/22 | | | 500,000 | | | | 513,750 | |
BBVA Bancomer SA | | | | | | | | |
6.500%(g) | 03/10/21 | | | 150,000 | | | | 164,625 | |
6.008%(a) (g) | 05/17/22 | | | 500,000 | | | | 497,500 | |
5.350%(a) (g) | 11/12/29 | | | 500,000 | | | | 493,750 | |
Credito Real SAB de CV | | | | | | | | |
7.500%(g) | 03/13/19 | | | 500,000 | | | | 515,000 | |
Fermaca Enterprises S de RL de CV | | | | | | | | |
6.375%(g) | 03/30/38 | | | 1,015,255 | | | | 1,010,179 | |
Grupo Idesa SA de CV | | | | | | | | |
7.875%(g) | 12/18/20 | | | 430,000 | | | | 437,525 | |
Grupo Posadas SAB de CV | | | | | | | | |
7.875%(g) | 06/30/22 | | | 750,000 | | | | 761,250 | |
Mexico Generadora de Energia | | | | | | | | |
5.500%(g) | 12/06/32 | | | 1,141,656 | | | | 1,095,990 | |
See Notes to Financial Statements.
56
Wilshire Mutual Funds, Inc. Wilshire Income Opportunities Fund Schedule of Investments - (continued) | June 30, 2016 (Unaudited) |
|
| Maturity Date | | Par | | | Value | |
Mexico Government International Bond | | | | | | |
4.000%(g) | 10/02/23 | | $ | 190,000 | | | $ | 204,545 | |
Petroleos Mexicanos | | | | | | | | |
6.625%(g) | 09/29/49 | | | 500,000 | | | | 493,750 | |
6.375%(g) | 01/23/45 | | | 500,000 | | | | 502,500 | |
5.625%(g) | 01/23/46 | | | 230,000 | | | | 209,645 | |
Sixsigma Networks Mexico SA de CV | | | | | | | | |
8.250%(g) | 11/07/21 | | | 500,000 | | | | 497,500 | |
Unifin Financiera SAB de CV | | | | | | | | |
6.250%(g) | 07/22/19 | | | 750,000 | | | | 735,750 | |
| | | | | | | | | 8,831,509 | |
Netherlands — 0.8% | | | | | | | | |
Marfrig Holdings Europe BV | | | | | | | | |
8.000%(b) (g) | 06/08/23 | | | 700,000 | | | | 714,350 | |
NXP BV | | | | | | | | | |
4.125%(b) (g) | 06/01/21 | | | 10,000 | | | | 10,150 | |
Shell International Finance BV | | | | | | | | |
6.375%(g) | 12/15/38 | | | 1,000,000 | | | | 1,358,453 | |
1.375%(g) | 05/10/19 | | | 130,000 | | | | 130,452 | |
VTR Finance BV | | | | | | | | | |
6.875%(g) | 01/15/24 | | | 800,000 | | | | 797,584 | |
| | | | | | | | | 3,010,989 | |
Panama — 0.8% | | | | | | | | | |
Aeropuerto Internacional de Tocumen SA | | | | | | | | |
5.750%(g) | 10/09/23 | | | 1,000,000 | | | | 1,045,001 | |
ENA Norte Trust | | | | | | | | | |
4.950%(g) | 04/25/23 | | | 923,403 | | | | 939,562 | |
Global Bank Corp. | | | | | | | | | |
5.125%(g) | 10/30/19 | | | 1,000,000 | | | | 1,032,500 | |
| | | | | | | | | 3,017,063 | |
Paraguay — 0.1% | | | | | | | | | |
Telefonica Celular del Paraguay SA | | | | | | | | |
6.750%(g) | 12/13/22 | | | 500,000 | | | | 502,500 | |
| | | | | | | | | | |
Peru — 1.4% | | | | | | | | | |
Abengoa Transmision Sur SA | | | | | | | | |
6.875%(b) (g) | 04/30/43 | | | 1,000,000 | | | | 1,040,000 | |
Corp. Financiera de Desarrollo SA | | | | | | | | |
5.250%(a) (b) (g) | 07/15/29 | | | 1,350,000 | | | | 1,383,749 | |
| Maturity Date | | Par(1) | | | Value | |
Peru Enhanced Pass-Through Finance, Ltd. | | | | | | |
2.646%(e) (g) | 06/02/25 | | | 1,700,000 | | | $ | 1,343,000 | |
Southern Copper Corp. | | | | | | | | |
5.875%(g) | 04/23/45 | | | 800,000 | | | | 753,658 | |
Volcan Cia Minera SAA | | | | | | | | |
5.375%(g) | 02/02/22 | | | 500,000 | | | | 447,500 | |
| | | | | | | | | 4,967,907 | |
Singapore — 0.5% | | | | | | | | | |
Oversea-Chinese Banking Corp., Ltd. MTN | | | | | | | | |
4.000%(a) (g) | 10/15/24 | | | 800,000 | | | | 834,000 | |
United Overseas Bank, Ltd. MTN | | | | | | | | |
3.500%(a) (g) | 09/16/26 | | | 1,000,000 | | | | 1,019,205 | |
| | | | | | | | | 1,853,205 | |
United Kingdom — 0.3% | | | | | | | | |
AstraZeneca PLC | | | | | | | | | |
2.375%(g) | 11/16/20 | | | 185,000 | | | | 189,813 | |
BP Capital Markets PLC | | | | | | | | |
3.119%(g) | 05/04/26 | | | 160,000 | | | | 163,434 | |
British Telecommunications PLC | | | | | | | | |
5.950%(g) | 01/15/18 | | | 285,000 | | | | 305,030 | |
Delphi Automotive PLC | | | | | | | | |
4.250%(g) | 01/15/26 | | | 100,000 | | | | 109,284 | |
Moto Finance PLC | | | | | | | | | |
6.375%(b) | 09/01/20 | | GBP 300,000 | | | | 408,043 | |
| | | | | | | | | 1,175,604 | |
Total Foreign Bonds | | | | | | | | |
(Cost $57,550,694) | | | | | | | | 58,147,586 | |
| | | | | | | | | | |
CORPORATE BONDS — 8.9% | | | | | |
Consumer Discretionary — 1.0% | | | | | |
21st Century Fox America, Inc. | | | | | | | | |
4.750% | 09/15/44 | | | 85,000 | | | | 94,170 | |
American Axle & Manufacturing, Inc. | | | | | | | | |
6.625% | 10/15/22 | | | 55,000 | | | | 58,850 | |
Asbury Automotive Group, Inc. | | | | | | | | |
6.000% | 12/15/24 | | | 25,000 | | | | 25,188 | |
CCO Holdings LLC | | | | | | | | | |
5.125%(b) | 05/01/23 | | | 15,000 | | | | 15,084 | |
5.250% | 09/30/22 | | | 30,000 | | | | 30,788 | |
See Notes to Financial Statements.
57
Wilshire Mutual Funds, Inc. Wilshire Income Opportunities Fund Schedule of Investments - (continued) | June 30, 2016 (Unaudited) |
|
| Maturity Date | | Par | | | Value | |
Cengage Learning, Inc. | | | | | | |
9.500%(b) | 06/15/24 | | $ | 20,000 | | | $ | 20,350 | |
Comcast Corp. | | | | | | | | | |
4.400% | 08/15/35 | | | 110,000 | | | | 124,080 | |
CSC Holdings LLC | | | | | | | | | |
5.250% | 06/01/24 | | | 20,000 | | | | 18,200 | |
Dana Holding Corp. | | | | | | | | |
5.500% | 12/15/24 | | | 25,000 | | | | 23,750 | |
DISH DBS Corp. | | | | | | | | | |
5.875% | 11/15/24 | | | 450,000 | | | | 418,500 | |
7.750%(b) | 07/01/26 | | | 500,000 | | | | 514,999 | |
Dollar Tree, Inc. | | | | | | | | | |
5.750%(b) | 03/01/23 | | | 10,000 | | | | 10,625 | |
ESH Hospitality, Inc. | | | | | | | | |
5.250%(b) (h) | 05/01/25 | | | 60,000 | | | | 58,425 | |
Ford Motor Co. | | | | | | | | | |
7.450% | 07/16/31 | | | 100,000 | | | | 134,086 | |
General Motors Financial Co., Inc. | | | | | | | | |
2.400% | 05/09/19 | | | 165,000 | | | | 165,460 | |
3.200% | 07/06/21 | | | 30,000 | | | | 30,048 | |
Goodyear Tire & Rubber Co. | | | | | | | | |
5.125% | 11/15/23 | | | 60,000 | | | | 61,950 | |
Gray Television, Inc. | | | | | | | | |
7.500% | 10/01/20 | | | 40,000 | | | | 41,700 | |
5.875%(b) | 07/15/26 | | | 25,000 | | | | 25,063 | |
HD Supply, Inc. | | | | | | | | | |
7.500% | 07/15/20 | | | 50,000 | | | | 52,370 | |
Home Depot, Inc. | | | | | | | | | |
3.000% | 04/01/26 | | | 130,000 | | | | 138,159 | |
Levi Strauss & Co. | | | | | | | | | |
5.000% | 05/01/25 | | | 35,000 | | | | 35,175 | |
MGM Growth Properties Operating Partnership | | | | | | | | |
5.625%(b) | 05/01/24 | | | 10,000 | | | | 10,575 | |
NCL Corp., Ltd. | | | | | | | | | |
5.250%(b) | 11/15/19 | | | 60,000 | | | | 60,600 | |
Neptune Finco Corp. | | | | | | | | |
6.625%(b) | 10/15/25 | | | 700,000 | | | | 734,999 | |
Newell Brands, Inc. | | | | | | | | | |
3.150% | 04/01/21 | | | 75,000 | | | | 78,134 | |
Omnicom Group, Inc. | | | | | | | | |
3.600% | 04/15/26 | | | 100,000 | | | | 105,323 | |
Regal Entertainment Group | | | | | | | | |
5.750% | 03/15/22 | | | 25,000 | | | | 25,563 | |
Sally Holdings LLC | | | | | | | | | |
5.750% | 06/01/22 | | | 50,000 | | | | 51,813 | |
Scientific Games International, Inc. | | | | | | | | |
7.000%(b) | 01/01/22 | | | 55,000 | | | | 55,275 | |
Sinclair Television Group, Inc. | | | | | | | | |
5.625%(b) | 08/01/24 | | | 50,000 | | | | 51,125 | |
Sirius XM Radio, Inc. | | | | | | | | |
5.375%(b) | 07/15/26 | | | 60,000 | | | | 59,400 | |
Station Casinos LLC | | | | | | | | | |
7.500% | 03/01/21 | | | 40,000 | | | | 42,350 | |
TEGNA, Inc. | | | | | | | | | |
4.875%(b) | 09/15/21 | | | 60,000 | | | | 61,500 | |
Tribune Media Co. | | | | | | | | | |
5.875% | 07/15/22 | | | 40,000 | | | | 39,800 | |
Viking Cruises, Ltd. | | | | | | | | | |
8.500%(b) | 10/15/22 | | | 40,000 | | | | 34,100 | |
WMG Acquisition Corp. | | | | | | | | |
6.750%(b) | 04/15/22 | | | 45,000 | | | | 45,338 | |
| | | | | | | | | 3,552,915 | |
Consumer Staples — 1.3% | | | | | | | | |
Air Medical Merger Sub Corp. | | | | | | | | |
6.375%(b) | 05/15/23 | | | 55,000 | | | | 52,250 | |
Bumble Bee Holdings, Inc. | | | | | | | | |
9.000%(b) | 12/15/17 | | | 769,000 | | | | 778,613 | |
Burlington Northern Santa Fe LLC | | | | | | | | |
4.550% | 09/01/44 | | | 150,000 | | | | 172,525 | |
Coca-Cola Co. | | | | | | | | | |
1.650% | 11/01/18 | | | 125,000 | | | | 126,881 | |
1.875% | 10/27/20 | | | 120,000 | | | | 122,645 | |
CVS Health Corp. | | | | | | | | | |
2.875% | 06/01/26 | | | 75,000 | | | | 76,644 | |
Gates Global LLC | | | | | | | | | |
6.000%(b) | 07/15/22 | | | 40,000 | | | | 35,000 | |
HRG Group, Inc. | | | | | | | | | |
7.875% | 07/15/19 | | | 415,000 | | | | 435,231 | |
Kraft Heinz Foods Co. | | | | | | | | |
2.000%(b) | 07/02/18 | | | 160,000 | | | | 162,011 | |
Kroger Co. | | | | | | | | | |
3.400% | 04/15/22 | | | 120,000 | | | | 128,366 | |
See Notes to Financial Statements.
58
Wilshire Mutual Funds, Inc. Wilshire Income Opportunities Fund Schedule of Investments - (continued) | June 30, 2016 (Unaudited) |
|
| Maturity Date | | Par | | | Value | |
Milacron LLC | | | | | | | |
7.750%(b) | 02/15/21 | | $ | 50,000 | | | $ | 51,500 | |
Molex Electronic Technologies LLC | | | | | | | | |
3.900%(b) | 04/15/25 | | | 383,000 | | | | 390,872 | |
MPH Acquisition Holdings LLC | | | | | | | | |
7.125%(b) | 06/01/24 | | | 50,000 | | | | 52,500 | |
OPE KAG Finance Sub, Inc. | | | | | | | | |
7.875%(b) | 07/31/23 | | | 35,000 | | | | 34,475 | |
Pilgrim's Pride Corp. | | | | | | | | |
5.750%(b) | 03/15/25 | | | 15,000 | | | | 14,963 | |
Plastipak Holdings, Inc. | | | | | | | | |
6.500%(b) | 10/01/21 | | | 50,000 | | | | 51,000 | |
Post Holdings, Inc. | | | | | | | | | |
7.375% | 02/15/22 | | | 35,000 | | | | 36,794 | |
Prime Security Services Borrower LLC | | | | | | | | |
9.250%(b) | 05/15/23 | | | 50,000 | | | | 53,000 | |
Quintiles Transnational Corp. | | | | | | | | |
4.875%(b) | 05/15/23 | | | 35,000 | | | | 35,525 | |
RegionalCare Hospital Partners Holdings, Inc. | | | | | | | | |
8.250%(b) | 05/01/23 | | | 15,000 | | | | 15,375 | |
Revlon Consumer Products Corp. | | | | | | | | |
5.750% | 02/15/21 | | | 35,000 | | | | 33,775 | |
Reynolds American, Inc. | | | | | | | | |
4.000% | 06/12/22 | | | 165,000 | | | | 179,320 | |
Rite Aid Corp. | | | | | | | | | |
6.125%(b) | 04/01/23 | | | 35,000 | | | | 37,363 | |
Spectrum Brands, Inc. | | | | | | | | |
5.750% | 07/15/25 | | | 50,000 | | | | 52,063 | |
TreeHouse Foods, Inc. | | | | | | | | |
6.000%(b) | 02/15/24 | | | 15,000 | | | | 15,900 | |
Tyson Foods, Inc. | | | | | | | | | |
3.950% | 08/15/24 | | | 280,000 | | | | 302,244 | |
Vector Group, Ltd. | | | | | | | | | |
7.750% | 02/15/21 | | | 1,000,000 | | | | 1,041,250 | |
Vizient, Inc. | | | | | | | | | |
10.375%(b) | 03/01/24 | | | 30,000 | | | | 32,175 | |
Wal-Mart Stores, Inc. | | | | | | | | | |
4.300% | 04/22/44 | | | 140,000 | | | | 163,366 | |
| | | | | | | | | 4,683,626 | |
Energy — 1.2% | | | | | | | | | |
Apache Corp. | | | | | | | | | |
4.750% | 04/15/43 | | | 75,000 | | | | 77,105 | |
Atlas Energy Holdings Operating Co. LLC | | | | | | | | |
9.250%(d) | 08/15/21 | | | 500,000 | | | | 65,000 | |
Chevron Corp. | | | | | | | | | |
1.561% | 05/16/19 | | | 135,000 | | | | 136,512 | |
ConocoPhillips | | | | | | | | | |
6.500%(f) | 02/01/39 | | | 955,000 | | | | 1,232,237 | |
Energy Transfer Equity | | | | | | | | |
5.500% | 06/01/27 | | | 35,000 | | | | 32,900 | |
Energy Transfer Partners | | | | | | | | |
4.750% | 01/15/26 | | | 140,000 | | | | 143,977 | |
5.200% | 02/01/22 | | | 15,000 | | | | 15,803 | |
Enterprise Products Operating LLC | | | | | | | | |
3.700% | 02/15/26 | | | 110,000 | | | | 114,472 | |
EOG Resources, Inc. | | | | | | | | |
4.150% | 01/15/26 | | | 70,000 | | | | 76,634 | |
EQT Corp. | | | | | | | | | |
4.875% | 11/15/21 | | | 325,000 | | | | 345,580 | |
Gulfstream Natural Gas System LLC | | | | | | | | |
4.600%(b) (f) | 09/15/25 | | | 310,000 | | | | 323,467 | |
Halliburton Co. | | | | | | | | | |
4.850%(f) | 11/15/35 | | | 200,000 | | | | 216,570 | |
Hess Corp. | | | | | | | | | |
8.125%(f) | 02/15/19 | | | 200,000 | | | | 222,882 | |
Kinder Morgan Energy Partners LP MTN | | | | | | | | |
6.950% | 01/15/38 | | | 35,000 | | | | 38,625 | |
MPLX | | | | | | | | | |
5.500%(b) | 02/15/23 | | | 55,000 | | | | 55,880 | |
Occidental Petroleum Corp. | | | | | | | | |
3.400% | 04/15/26 | | | 35,000 | | | | 36,914 | |
Schlumberger Holdings Corp. | | | | | | | | |
2.350%(b) | 12/21/18 | | | 70,000 | | | | 71,366 | |
Sunoco Logistics Partners Operations | | | | | | | | |
5.950% | 12/01/25 | | | 1,150,000 | | | | 1,291,287 | |
Williams Partners | | | | | | | | | |
4.875% | 03/15/24 | | | 40,000 | | | | 38,365 | |
| | | | | | | | | 4,535,576 | |
See Notes to Financial Statements.
59
Wilshire Mutual Funds, Inc. Wilshire Income Opportunities Fund Schedule of Investments - (continued) | June 30, 2016 (Unaudited) |
|
| Maturity Date | | Par | | | Value | |
Financials — 3.0% | | | | | | |
Ally Financial | | | | | | | |
4.125% | 03/30/20 | | $ | 125,000 | | | $ | 125,313 | |
American Express Credit Corp. MTN | | | | | | | | |
2.250% | 08/15/19 | | | 20,000 | | | | 20,416 | |
2.250% | 05/05/21 | | | 245,000 | | | | 249,347 | |
Argos Merger Sub, Inc. | | | | | | | | |
7.125%(b) | 03/15/23 | | | 50,000 | | | | 51,500 | |
Atlantic Marine Corp. Communities LLC | | | | | | | | |
5.433%(b) (d) | 12/01/50 | | | 717,156 | | | | 768,676 | |
Bank of America Corp. | | | | | | | | |
2.000% | 01/11/18 | | | 100,000 | | | | 100,639 | |
2.625% | 04/19/21 | | | 150,000 | | | | 152,301 | |
6.300%(a) | 12/31/49 | | | 300,000 | | | | 318,749 | |
BB&T Corp. MTN | | | | | | | | | |
2.050% | 05/10/21 | | | 200,000 | | | | 202,930 | |
Boston Properties | | | | | | | | | |
4.125%(h) | 05/15/21 | | | 165,000 | | | | 179,879 | |
Citigroup, Inc. | | | | | | | | | |
2.700% | 03/30/21 | | | 230,000 | | | | 234,092 | |
5.875%(a) | 12/29/49 | | | 285,000 | | | | 271,463 | |
5.900%(a) | 12/29/49 | | | 500,000 | | | | 496,250 | |
5.950%(a) | 12/29/49 | | | 140,000 | | | | 136,399 | |
5.950%(a) | 12/31/49 | | | 910,000 | | | | 889,525 | |
Equinix, Inc. | | | | | | | | | |
5.875%(h) | 01/15/26 | | | 35,000 | | | | 36,466 | |
Fort Benning Family Communities LLC | | | | | | | | |
5.810%(b) (d) (h) | 01/15/51 | | | 1,050,000 | | | | 1,031,378 | |
GLP Capital | | | | | | | | | |
5.375% | 04/15/26 | | | 40,000 | | | | 41,200 | |
GMH Military Housing-Navy Northeast LLC | | | | | | | | |
6.298%(c) (d) | 10/15/49 | | | 725,000 | | | | 794,408 | |
Goldman Sachs Group, Inc. | | | | | | | | |
2.875% | 02/25/21 | | | 140,000 | | | | 143,530 | |
Hospitality Properties Trust | | | | | | | | |
5.250%(h) | 02/15/26 | | | 1,300,000 | | | | 1,369,991 | |
Jefferies Finance LLC | | | | | | | | |
7.500%(b) | 04/15/21 | | | 500,000 | | | | 448,925 | |
JPMorgan Chase & Co. | | | | | | | | |
2.400% | 06/07/21 | | | 135,000 | | | | 136,780 | |
4.250% | 10/01/27 | | | 125,000 | | | | 132,254 | |
Kennedy-Wilson, Inc. | | | | | | | | |
5.875% | 04/01/24 | | | 200,000 | | | | 195,000 | |
Liberty Mutual Group, Inc. | | | | | | | | |
6.500%(b) | 05/01/42 | | | 155,000 | | | | 187,725 | |
Morgan Stanley MTN | | | | | | | | |
2.500% | 04/21/21 | | | 135,000 | | | | 136,412 | |
3.875% | 01/27/26 | | | 160,000 | | | | 169,854 | |
National Rural Utilities Cooperative Finance Corp. | | | | | | | | |
10.375% | 11/01/18 | | | 235,000 | | | | 283,951 | |
PNC Funding Corp. | | | | | | | | | |
3.300% | 03/08/22 | | | 130,000 | | | | 138,256 | |
Realogy Group LLC | | | | | | | | | |
4.875%(b) | 06/01/23 | | | 30,000 | | | | 29,625 | |
Simon Property Group | | | | | | | | |
3.300%(h) | 01/15/26 | | | 150,000 | | | | 160,235 | |
State Street Corp. | | | | | | | | | |
2.650% | 05/19/26 | | | 15,000 | | | | 15,306 | |
3.550% | 08/18/25 | | | 100,000 | | | | 108,747 | |
SunTrust Banks, Inc. | | | | | | | | |
5.625%(a) (f) | 12/15/19 | | | 961,000 | | | | 960,999 | |
TIAA Asset Management Finance Co. LLC | | | | | | | | |
2.950%(b) | 11/01/19 | | | 30,000 | | | | 30,734 | |
Wells Fargo & Co. | | | | | | | | | |
3.000% | 04/22/26 | | | 295,000 | | | | 300,709 | |
| | | | | | | | | 11,049,964 | |
Health Care — 0.6% | | | | | | | | |
AbbVie, Inc. | | | | | | | | | |
4.700% | 05/14/45 | | | 175,000 | | | | 185,071 | |
Actavis Funding SCS | | | | | | | | |
2.350% | 03/12/18 | | | 185,000 | | | | 187,521 | |
Anthem, Inc. | | | | | | | | | |
2.300% | 07/15/18 | | | 155,000 | | | | 157,230 | |
Cardinal Health, Inc. | | | | | | | | |
1.950% | 06/15/18 | | | 35,000 | | | | 35,406 | |
Celgene Corp. | | | | | | | | | |
3.875% | 08/15/25 | | | 120,000 | | | | 128,000 | |
Centene Corp. | | | | | | | | | |
5.625%(b) | 02/15/21 | | | 55,000 | | | | 57,338 | |
Eli Lilly & Co. | | | | | | | | | |
3.700% | 03/01/45 | | | 150,000 | | | | 159,761 | |
See Notes to Financial Statements.
60
Wilshire Mutual Funds, Inc. Wilshire Income Opportunities Fund Schedule of Investments - (continued) | June 30, 2016 (Unaudited) |
|
| Maturity Date | | Par | | | Value | |
Express Scripts Holding Co. | | | | | | |
3.400% | 03/01/27 | | $ | 25,000 | | | $ | 24,968 | |
4.500% | 02/25/26 | | | 100,000 | | | | 109,864 | |
HCA, Inc. | | | | | | | | | |
5.875%(f) | 02/15/26 | | | 405,000 | | | | 420,188 | |
Mylan NV | | | | | | | | | |
3.150%(b) | 06/15/21 | | | 165,000 | | | | 167,367 | |
Select Medical Corp. | | | | | | | | |
6.375% | 06/01/21 | | | 55,000 | | | | 52,800 | |
Team Health, Inc. | | | | | | | | | |
7.250%(b) | 12/15/23 | | | 25,000 | | | | 26,753 | |
Tenet Healthcare Corp. | | | | | | | | |
4.153%(a) | 06/15/20 | | | 500,000 | | | | 493,749 | |
6.750% | 06/15/23 | | | 55,000 | | | | 52,663 | |
Zimmer Biomet Holdings, Inc. | | | | | | | | |
2.700% | 04/01/20 | | | 30,000 | | | | 30,364 | |
| | | | | | | | | 2,289,043 | |
Industrials — 0.3% | | | | | | | | |
Air Lease Corp. | | | | | | | | | |
3.750% | 02/01/22 | | | 165,000 | | | | 169,017 | |
FedEx Corp. | | | | | | | | | |
4.750% | 11/15/45 | | | 175,000 | | | | 195,023 | |
Icahn Enterprises | | | | | | | | | |
5.875%(f) | 02/01/22 | | | 700,000 | | | | 659,840 | |
Lockheed Martin Corp. | | | | | | | | | |
4.700% | 05/15/46 | | | 130,000 | | | | 153,240 | |
Terex Corp. | | | | | | | | | |
6.000% | 05/15/21 | | | 50,000 | | | | 50,063 | |
TransDigm, Inc. | | | | | | | | | |
6.000% | 07/15/22 | | | 60,000 | | | | 60,311 | |
Waste Management, Inc. | | | | | | | | |
4.100% | 03/01/45 | | | 35,000 | | | | 38,196 | |
| | | | | | | | | 1,325,690 | |
Information Technology — 0.5% | | | | | |
Activision Blizzard, Inc. | | | | | | | | |
5.625%(b) | 09/15/21 | | | 50,000 | | | | 52,313 | |
Apple, Inc. | | | | | | | | | |
4.650% | 02/23/46 | | | 100,000 | | | | 112,958 | |
Cequel Communications Holdings I LLC | | | | | | | | |
6.375%(b) | 09/15/20 | | | 60,000 | | | | 61,007 | |
Cisco Systems, Inc. | | | | | | | | | |
1.650% | 06/15/18 | | | 180,000 | | | | 182,340 | |
CommScope, Inc. | | | | | | | | | |
5.000%(b) | 06/15/21 | | | 60,000 | | | | 61,290 | |
Diamond 1 Finance Corp. | | | | | | | | |
7.125%(b) | 06/15/24 | | | 40,000 | | | | 41,777 | |
Embarq Corp. | | | | | | | | | |
7.995% | 06/01/36 | | | 30,000 | | | | 30,038 | |
Ensemble S Merger Sub, Inc. | | | | | | | | |
9.000%(b) | 09/30/23 | | | 55,000 | | | | 54,313 | |
Fidelity National Information Services, Inc. | | | | | | | | |
3.625% | 10/15/20 | | | 150,000 | | | | 158,567 | |
First Data Corp. | | | | | | | | | |
5.750%(b) | 01/15/24 | | | 25,000 | | | | 24,813 | |
7.000%(b) | 12/01/23 | | | 25,000 | | | | 25,313 | |
Hewlett Packard Enterprise Co. | | | | | | | | |
3.600%(b) | 10/15/20 | | | 100,000 | | | | 104,378 | |
Infor US, Inc. | | | | | | | | | |
6.500% | 05/15/22 | | | 60,000 | | | | 56,663 | |
Intel Corp. | | | | | | | | | |
4.100% | 05/19/46 | | | 90,000 | | | | 93,574 | |
Lam Research Corp. | | | | | | | | |
2.800% | 06/15/21 | | | 3,000 | | | | 3,071 | |
3.450% | 06/15/23 | | | 109,000 | | | | 112,572 | |
Micron Technology, Inc. | | | | | | | | |
5.250%(b) | 08/01/23 | | | 25,000 | | | | 21,313 | |
Microsoft Corp. | | | | | | | | | |
4.450% | 11/03/45 | | | 100,000 | | | | 112,765 | |
Oracle Corp. | | | | | | | | | |
2.250% | 10/08/19 | | | 305,000 | | | | 314,430 | |
Sabre GLBL, Inc. | | | | | | | | | |
5.250%(b) | 11/15/23 | | | 35,000 | | | | 35,613 | |
Solera LLC | | | | | | | | | |
10.500%(b) | 03/01/24 | | | 25,000 | | | | 26,281 | |
Western Digital Corp. | | | | | | | | |
7.375%(b) | 04/01/23 | | | 20,000 | | | | 21,300 | |
| | | | | | | | | 1,706,689 | |
Materials — 0.4% | | | | | | | | | |
Ashland, Inc. | | | | | | | | | |
4.750% | 08/15/22 | | | 50,000 | | | | 49,750 | |
Berry Plastics Corp. | | | | | | | | | |
5.500% | 05/15/22 | | | 35,000 | | | | 35,831 | |
BHP Billiton Finance USA, Ltd. | | | | | | | | |
6.750%(a) (b) (f) | 10/19/75 | | | 450,000 | | | | 478,125 | |
See Notes to Financial Statements.
61
Wilshire Mutual Funds, Inc. Wilshire Income Opportunities Fund Schedule of Investments - (continued) | June 30, 2016 (Unaudited) |
|
| Maturity Date | | Par | | | Value | |
Freeport-McMoRan, Inc. | | | | | | |
5.450% | 03/15/43 | | $ | 700,000 | | | $ | 561,751 | |
Georgia-Pacific LLC | | | | | | | | | |
3.600%(b) | 03/01/25 | | | 267,000 | | | | 285,574 | |
PQ Corp. | | | | | | | | | |
6.750%(b) | 11/15/22 | | | 25,000 | | | | 26,063 | |
Signode Industrial Group Lux SA | | | | | | | | |
6.375%(b) | 05/01/22 | | | 35,000 | | | | 33,469 | |
| | | | | | | | | 1,470,563 | |
Telecommunication Services — 0.4% | |
AT&T, Inc. | | | | | | | | | |
4.125% | 02/17/26 | | | 145,000 | | | | 155,764 | |
Frontier Communications Corp. | | | | | | | | |
10.500% | 09/15/22 | | | 35,000 | | | | 37,034 | |
Level 3 Communications, Inc. | | | | | | | | |
5.750% | 12/01/22 | | | 50,000 | | | | 50,625 | |
SBA Communications Corp. | | | | | | | | |
5.625% | 10/01/19 | | | 55,000 | | | | 56,788 | |
Sprint Communications, Inc. | | | | | | | | |
7.000%(b) | 03/01/20 | | | 800,000 | | | | 837,592 | |
T-Mobile USA, Inc. | | | | | | | | | |
6.000% | 04/15/24 | | | 200,000 | | | | 207,000 | |
| | | | | | | | | 1,344,803 | |
Utilities — 0.2% | | | | | | | | | |
Berkshire Hathaway Energy Co. | | | | | | | | |
6.500% | 09/15/37 | | | 100,000 | | | | 137,459 | |
Duke Energy Progress LLC | | | | | | | | |
4.150% | 12/01/44 | | | 175,000 | | | | 192,710 | |
Exelon Corp. | | | | | | | | | |
3.400% | 04/15/26 | | | 140,000 | | | | 146,318 | |
NRG Energy, Inc. | | | | | | | | | |
7.250%(b) | 05/15/26 | | | 35,000 | | | | 34,825 | |
Southern Co. | | | | | | | | | |
2.450% | 09/01/18 | | | 196,000 | | | | 200,715 | |
| | | | | | | | | 712,027 | |
Total Corporate Bonds | | | | | | | | |
(Cost $32,463,084) | | | | | | | | 32,670,896 | |
| | | | | | | | | | |
LOAN PARTICIPATIONS — 7.9% | |
011778 B.C. Unlimited Liability Company, Term B-2 Loan (First Lien) | | | | | | | | |
3.750% | 12/10/21 | | | 625,000 | | | | 625,000 | |
AdvancePierre Foods, Inc., Effective Date Loan (First Lien) | | | | | | | | |
4.750% | 05/26/23 | | | 500,000 | | | | 499,375 | |
Albertson's LLC, Term B-4 Loan | | | | | | | | |
5.500% | 08/25/21 | | | 597,737 | | | | 598,006 | |
4.500% | 08/25/21 | | | 450,000 | | | | 450,203 | |
Albertson's LLC, Term B-6 Loan | | | | | | | | |
4.750% | 06/01/23 | | | 300,000 | | | | 299,963 | |
Altice France S.A., Term B-7 Loan | | | | | | | | |
5.000% | 01/15/24 | | | 250,000 | | | | 248,646 | |
Amaya Holdings B.V., Initial Term B Loan (First Lien) | | | | | | | | |
5.000% | 08/01/21 | | | 900,000 | | | | 874,871 | |
Asurion LLC (fka Asurion Corporation), Incremental B-1 Term Loan | | | | | | | | |
5.000% | 05/24/19 | | | 230,000 | | | | 229,234 | |
Asurion LLC (fka Asurion Corporation), Incremental B-4 Term Loan | | | | | | | | |
5.000% | 08/04/22 | | | 345,000 | | | | 340,946 | |
Avago Technologies Cayman Holdings Ltd., Term B-1 Dollar Loan | | | | | | | | |
4.250%(a) | 02/01/23 | | | 1,172,063 | | | | 1,174,905 | |
B/E Aerospace, Inc., Term Loan | | | | | | | | |
3.750% | 12/16/21 | | | 625,000 | | | | 627,891 | |
Berry Plastics Corp., Term F Loan | | | | | | | | |
4.000% | 10/03/22 | | | 625,000 | | | | 626,778 | |
BJ's Wholesale Club, Inc., Replacement Loan (First Lien) | | | | | | | | |
4.500% | 09/26/19 | | | 589,955 | | | | 585,005 | |
Carecore Nationa, LLC, Term Loan | | | | | | | | |
5.500% | 03/05/21 | | | 159,719 | | | | 148,139 | |
See Notes to Financial Statements.
62
Wilshire Mutual Funds, Inc. Wilshire Income Opportunities Fund Schedule of Investments - (continued) | June 30, 2016 (Unaudited) |
|
| Maturity Date | | Par | | | Value | |
Charter Communications Operating LLC (aka CCO Safari LLC), Term I Loan | | | | | | |
3.500% | 01/24/23 | | $ | 625,000 | | | $ | 626,466 | |
CHG Healthcare Services, Inc., Term B Loan (First Lien) | | | | | | | | |
4.750% | 05/19/23 | | | 1,000,000 | | | | 1,001,564 | |
CompuCom Systems, Inc., Term Loan | | | | | | | | |
4.250% | 05/07/20 | | | 328,678 | | | | 221,311 | |
CSC Holdings LLC (fka CSC Holdings, Inc.), Initial Term Loan | | | | | | | | |
5.000% | 09/23/22 | | | 620,000 | | | | 622,170 | |
Dell International LLC, Term B-2 Loan | | | | | | | | |
4.000% | 04/29/20 | | | 230,000 | | | | 229,604 | |
Dell, Inc., Term B Loan (First Lien) | | | | | | | | |
3.250% | 06/02/23 | | | 626,000 | | | | 624,629 | |
DJO Finance LLC, Initial Term Loan | | | | | | | | |
4.250% | 06/08/20 | | | 250,000 | | | | 239,896 | |
Dollar Tree, Inc., Term B-1 Loan | | | | | | | | |
3.500% | 07/06/22 | | | 625,000 | | | | 626,041 | |
EIG Investors Corp., Incremental Term Loan | | | | | | | | |
6.000%(d) | 02/09/23 | | | 475,000 | | | | 446,500 | |
Endo Luxembourg Finance, Incremental Term B Loan | | | | | | | | |
3.750% | 06/24/22 | | | 635,000 | | | | 626,110 | |
First Data Corp., Extended Dollar Term Loan | | | | | | | | |
4.443% | 03/24/21 | | | 625,000 | | | | 623,959 | |
Fitness International, LLC, Term B Loan | | | | | | | | |
5.500% | 07/01/20 | | | 482,736 | | | | 478,963 | |
Gates Global, LLC, Initial Dollar Term Loan | | | | | | | | |
4.250% | 07/06/21 | | | 582,487 | | | | 554,091 | |
Generation Brands Holdings, Inc., Term Loan (First Lien) | | | | | | | | |
6.000% | 05/19/22 | | | 650,000 | | | | 650,000 | |
Hardware Holdings LLC, Term Loan (First Lien) | | | | | | | | |
6.750%(c) (d) | 03/30/20 | | | 640,250 | | | | 627,445 | |
Hearthside Group Holdings LLC, Term Loan | | | | | | | | |
4.500% | 06/02/21 | | | 299,239 | | | | 298,490 | |
Hertz Corp., 1st Lien Term B Loan | | | | | | | | |
2.750% | 06/30/23 | | | 160,000 | | | | 160,100 | |
Jaguar Holding Company I, Initial Term Loan | | | | | | | | |
4.250% | 08/18/22 | | | 915,000 | | | | 907,566 | |
Level 3 Financing, Inc., B-II Term Loan | | | | | | | | |
3.500% | 05/31/22 | | | 625,000 | | | | 623,672 | |
Lineage Logistics LLC, Term Loan | | | | | | | | |
4.500% | 04/07/21 | | | 442,105 | | | | 421,105 | |
Lully Finance LLC, Initial Term B-1 Loan (First Lien) | | | | | | | | |
5.000% | 10/14/22 | | | 575,000 | | | | 573,563 | |
McGraw-Hill Global Education Holdings LLC, Term B Loan (First Lien) | | | | | | | | |
5.000% | 05/02/22 | | | 623,000 | | | | 623,156 | |
MGM Growth Properties Operating Partnership LP, 1st Lien Term B Loan | | | | | | | | |
4.000% | 04/25/23 | | | 625,000 | | | | 627,150 | |
MPH Acquisition Holdings LLC, Initial Term Loan | | | | | | | | |
5.000% | 05/25/23 | | | 623,000 | | | | 625,492 | |
NBTY, Inc., Dollar Term B Loan, First Lien | | | | | | | | |
5.000% | 05/05/23 | | | 625,000 | | | | 621,206 | |
NXP B.V. (NXP Funding LLC), Tranche B Loan | | | | | | | | |
3.750% | 12/07/20 | | | 308 | | | | — | |
PetSmart, Inc., Tranche B-1 Loan | | | | | | | | |
4.250% | 03/11/22 | | | 498,741 | | | | 497,309 | |
Ranpak Cov-Lite, 2nd Lien Term Loan | | | | | | | | |
8.250% | 09/22/22 | | | 200,000 | | | | 179,000 | |
See Notes to Financial Statements.
63
Wilshire Mutual Funds, Inc. Wilshire Income Opportunities Fund Schedule of Investments - (continued) | June 30, 2016 (Unaudited) |
|
| Maturity Date | | Par | | | Value | |
Reynolds Group Holdings, Inc., Incremental Term Loan | | | | | | |
4.000% | 12/01/18 | | $ | 625,000 | | | $ | 625,906 | |
Scientific Games International, Inc., Initial Term B-2 Loan | | | | | | | | |
6.000% | 09/17/21 | | | 630,000 | | | | 622,204 | |
Solera, LLC, Dollar Term Loan | | | | | | | | |
5.750% | 03/03/23 | | | 300,000 | | | | 300,281 | |
T-Mobile USA, Inc., Senior Lien Term Loan | | | | | | | | |
3.500%(a) | 11/03/22 | | | 625,000 | | | | 627,834 | |
Trans Union LLC, Replacement Term Loan | | | | | | | | |
3.500% | 04/09/21 | | | 625,000 | | | | 618,459 | |
Transdigm, Inc., Delayed Draw Tranche F Term Loan | | | | | | | | |
3.750% | 06/07/23 | | | 63,474 | | | | 62,667 | |
Travelport Finance (Luxembourg), Initial Term Loan | | | | | | | | |
5.750% | 09/02/21 | | | 1,041,691 | | | | 1,037,462 | |
Tribune Media, 1st Lien Term B Loan | | | | | | | | |
3.750% | 12/27/20 | | | 630,000 | | | | 629,606 | |
Univar, Inc., Initial Dollar Term Loan | | | | | | | | |
4.250% | 07/01/22 | | | 630,000 | | | | 622,125 | |
Virgin Media Investment Holdings, F Facility | | | | | | | | |
3.649% | 06/30/23 | | | 625,000 | | | | 610,691 | |
York Risk Services Holding Corp. (Onex York Finance LP), Term Loan | | | | | | | | |
4.750%(d) | 10/01/21 | | | 985,000 | | | | 871,725 | |
Yum Brands, 1st Lien Term B Loan | | | | | | | | |
3.192% | 06/02/23 | | | 625,000 | | | | 626,563 | |
| | | | | | | | | | |
Total Loan Participations (Cost $29,266,478) | | | | 28,941,043 | |
| | | | | | | | | | |
| Maturity Date | | Par/
Shares | | | Value | |
U.S. GOVERNMENT AGENCY OBLIGATIONS — 2.5% | |
FHLMC | | | | | | | |
3.068%(e) | 12/14/29 | | $ | 1,450,000 | | | $ | 1,035,330 | |
6.750% | 03/15/31 | | | 249,000 | | | | 386,225 | |
FHLMC STRIPS | | | | | | | | | |
4.288%(e) | 03/15/31 | | | 1,250,000 | | | | 853,431 | |
FNMA | | | | | | | | | |
2.125% | 04/24/26 | | | 2,200,000 | | | | 2,259,517 | |
FNMA STRIPS | | | | | | | | | |
2.948%(e) | 05/15/29 | | | 3,700,000 | | | | 2,652,067 | |
3.018%(e) | 01/15/30 | | | 775,000 | | | | 547,127 | |
Tennessee Valley Authority | | | | | | | | |
4.250% | 09/15/65 | | | 700,000 | | | | 821,496 | |
5.375% | 04/01/56 | | | 410,000 | | | | 570,158 | |
| | | | | | | | | | |
Total U.S. Government Agency Obligations | | | | | |
(Cost $8,526,018) | | | | | | | | 9,125,351 | |
| | | | | | | | | | |
AFFILIATED REGISTERED INVESTMENT COMPANY — 1.3% | |
Open-End Fund — 1.3% | | | | | | | | |
Guggenheim Strategy Fund I, Institutional Class* | | | 185,237 | | | | 4,614,264 | |
| | | | | | | | | | |
Total Affiliated Registered
Investment Company (Cost $4,606,820) | | | | 4,614,264 | |
| | | | | | | | | | |
MUNICIPAL BONDS — 0.8% | |
Chicago, Ser B, GO | | | | | | | | | |
5.432% | 01/01/42 | | | 200,000 | | | | 170,168 | |
Illinois, GO | | | | | | | | | |
5.650% | 12/01/38 | | | 1,310,000 | | | | 1,319,550 | |
State of California, GO | | | | | | | | |
7.600% | 11/01/40 | | | 1,000,000 | | | | 1,610,090 | |
| | | | | | | | | | |
Total Municipal Bonds | | | | | | | | |
(Cost $3,086,547) | | | | | | | | 3,099,808 | |
| | | | | | | | | | |
Total Investments — 99.7% | | | | | | | | |
(Cost $364,737,314) | | | | | | | | 365,192,383 | |
Other Assets & Liabilities, Net — 0.3% | | | | 1,217,038 | |
| | | | | | |
NET ASSETS — 100.0% | | | | | | $ | 366,409,421 | |
See Notes to Financial Statements.
64
Wilshire Mutual Funds, Inc. Wilshire Income Opportunities Fund Schedule of Investments - (continued) | June 30, 2016 (Unaudited) |
|
(1) | In U.S. Dollars unless otherwise indicated. |
(a) | Variable Rate Security - The rate reported on the Schedule of Investments is the rate in effect as of June 30, 2016. The date reported on the Schedule of Investments is the final maturity date. |
(b) | Securities sold within terms of a private placement memorandum, exempt from registration under Section 144A of the Securities Act of 1933, as amended, and may be sold only to dealers in that program or other “qualified institutional buyers”. The total value of such securities as of June 30, 2016 was $131,189,645 and represented 35.8% of Net Assets. |
(c) | Securities fair valued using methods determined in good faith by the Pricing Committee. As of June 30, 2016, the total market value of such securities was $4,389,533 and represented 1.2% of Net Assets. |
(d) | Securities considered illiquid. The total value of such securities as of June 30, 2016 was $8,504,214 and represented 2.3% of Net Assets. |
(e) | Zero coupon security. The rate reported on the Schedule of Investments is the effective yield at time of purchase. |
(f) | Security, or a portion thereof, has been pledged as collateral on open reverse repurchase agreements. |
(g) | Foreign security denominated in U.S. currency. |
(h) | Real Estate Investment Trust |
A list of the outstanding forward foreign currency contracts held by the Fund at June 30, 2016 is as follows:
Counterparty | Settlement Date | Currency
to Deliver | | Currency
to Receive | | Unrealized Appreciation | |
Montgomery/Bank of America | 7/13/16 | CAD | 401,000 | | USD | 315,332 | | $ | 4,931 | |
Montgomery/Bank of America | 7/13/16 | GBP | 315,000 | | USD | 457,706 | | | 38,312 | |
| | | | | | | $ | 43,243 | |
For the period ended June 30, 2016, the total amount of all forward foreign currency contracts, as presented in the table above, are representative of the volume of activity for this derivative type during the period.
ARM — Adjustable-Rate Mortgage
CAD — Canadian Dollar
CDO — Collateralized Debt Obligation
CLO — Collateralized Loan Obligation
FHLMC — Federal Home Loan Mortgage Corporation
FNMA — Federal National Mortgage Association
GBP — British Pound
GO — General Obligation
IO — Interest Only - face amount represents notional amount
LLC — Limited Liability Company
LP — Limited Partnership
Ltd. — Limited
MTN — Medium Term Note
PLC — Public Limited Company
Pty — Proprietary
Re-REMIC — Re-securitization of Real Estate Mortgage Investment Conduit
Ser — Series
STRIPS — Separately Traded Registered Interest and Principal Securities
USD — United States Dollar
The following is a summary of the inputs used as of June 30, 2016 in valuing the Fund’s investments carried at value:
Investments in Securities | | Level 1 | | | Level 2 | | | Level 3 ‡ | | | Total | |
Asset-Backed Securities | | $ | — | | | $ | 93,940,690 | | | $ | 920,346 | | | $ | 94,861,036 | |
U.S. Treasury Obligations | | | — | | | | 67,710,774 | | | | — | | | | 67,710,774 | |
Collateralized Mortgage Obligations | | | — | | | | 63,974,291 | | | | 2,047,334 | | | | 66,021,625 | |
Foreign Bonds | | | — | | | | 58,147,586 | | | | — | | | | 58,147,586 | |
Corporate Bonds | | | — | | | | 31,876,488 | | | | 794,408 | | | | 32,670,896 | |
Loan Participations | | | — | | | | 28,313,598 | | | | 627,445 | | | | 28,941,043 | |
U.S. Government Agency Obligations | | | — | | | | 9,125,351 | | | | — | | | | 9,125,351 | |
Affiliated Registered Investment Company | | | 4,614,264 | | | | — | | | | — | | | | 4,614,264 | |
Municipal Bonds | | | — | | | | 3,099,808 | | | | — | | | | 3,099,808 | |
Total Investments in Securities | | $ | 4,614,264 | | | $ | 356,188,586 | | | $ | 4,389,533 | | | $ | 365,192,383 | |
See Notes to Financial Statements.
65
Wilshire Mutual Funds, Inc. Wilshire Income Opportunities Fund Schedule of Investments - (continued) | June 30, 2016 (Unaudited) |
|
Other Financial Instruments | | Level 1 | | | Level 2 | | | Level 3 | | | Total | |
Forwards Contracts** | | | | | | | | | | | | |
Unrealized Appreciation | | $ | — | | | $ | 43,243 | | | $ | — | | | $ | 43,243 | |
Reverse Repurchase Agreements*** | | | — | | | | (17,293,909 | ) | | | — | | | | (17,293,909 | ) |
Total Other Financial Instruments | | $ | — | | | $ | (17,250,666 | ) | | $ | — | | | $ | (17,250,666 | ) |
** | Forwards contracts are valued at the unrealized appreciation on the instrument. |
*** | See Note 2 for more information on the reverse repurchase agreements. |
‡ | See Note 2 for details on the unobservable inputs and the interrelationships and sensitivity between these inputs for Level 3 securities. |
The following is a reconciliation of investments in which significant unobservable inputs (Level 3) were used in determining fair value:
| | | Asset-Backed Securities | | | Collateralized Mortgage Obligations | | | Corporate Bonds | | | Loan Participations | |
Beginning balance as of March 30, 2016 | | $ | — | | | $ | — | | | $ | — | | | $ | — | |
Change in unrealized appreciation/(depreciation) | | | 25,114 | | | | 139,336 | | | | 35,657 | | | | 1,329 | |
Purchases | | | 895,232 | | | | 1,907,998 | | | | 758,751 | | | | 626,116 | |
Ending balance as of June 30, 2016 | | $ | 920,346 | | | $ | 2,047,334 | | | $ | 794,408 | | | $ | 627,445 | |
Amounts designated as “—” are either $0, or have been rounded to $0.
For the period ended June 30, 2016, there have been no transfers between Level 1 and Level 2 assets and liabilities.
For the period ended June 30, 2016, there were transfers between Level 2 and Level 3 assets and liabilities due to changes in the availability of observable inputs used to determine fair value. All transfers, if any, are recognized by the Fund at the end of each period.
See Notes to Financial Statements.
66
Wilshire Mutual Funds, Inc. Statements of Assets and Liabilities June 30, 2016 (Unaudited) |
|
| | | LARGE
COMPANY
GROWTH PORTFOLIO | | | LARGE
COMPANY
VALUE
PORTFOLIO | | | SMALL
COMPANY
GROWTH
PORTFOLIO | | | SMALL
COMPANY
VALUE
PORTFOLIO | | | WILSHIRE
5000
INDEXSM
FUND | | | WILSHIRE INTERNATIONAL EQUITY
FUND | | | WILSHIRE INCOME OPPORTUNITIES FUND | |
ASSETS: | | | | | | | | | | | | | | | | | | | | | |
Investments in securities, at value (Note 2) | | $ | 334,344,308 | * | | $ | 204,480,549 | | | $ | 56,265,932 | * | | $ | 60,536,593 | * | | $ | 238,143,421 | * | | $ | 372,981,149 | * | | $ | 360,578,119 | |
Investments in affiliated funds, at value | | | — | | | | — | | | | — | | | | — | | | | — | | | | — | | | | 4,614,264 | |
Foreign currency, at value | | | — | | | | — | | | | — | | | | — | | | | — | | | | 276,139 | | | | — | |
Cash | | | — | | | | 66,012 | | | | — | | | | — | | | | — | | | | — | | | | 34,557,625 | |
Receivable for investment securities sold | | | 1,579,420 | | | | 1,192,005 | | | | 480,854 | | | | 451,802 | | | | 1,464,909 | | | | 388,427 | | | | 2,403,354 | |
Dividends and interest receivable | | | 199,937 | | | | 316,423 | | | | 16,376 | | | | 60,374 | | | | 251,642 | | | | 893,629 | | | | 1,978,432 | |
Receivable for Portfolio shares sold | | | 238,025 | | | | 233,938 | | | | 74,675 | | | | 37,314 | | | | 97,584 | | | | 359,265 | | | | 406,566 | |
Shareholder service fees receivable (Note 4) | | | — | | | | 5,323 | | | | — | | | | — | | | | — | | | | 16,737 | | | | — | |
Dividend reclaim receivable | | | 7,088 | | | | 123 | | | | — | | | | — | | | | 206 | | | | 429,995 | | | | — | |
Unrealized gain on forward foreign currency contracts | | | — | | | | — | | | | — | | | | — | | | | — | | | | — | | | | 43,243 | |
Prepaid expenses and other assets | | | 34,199 | | | | 25,872 | | | | 14,380 | | | | 14,263 | | | | 38,534 | | | | 38,301 | | | | 41,733 | |
Total Assets | | | 336,402,977 | | | | 206,320,245 | | | | 56,852,217 | | | | 61,100,346 | | | | 239,996,296 | | | | 375,383,642 | | | | 404,623,336 | |
| | | | | | | | | | | | | | | | | | | | | | | | | | | | | |
LIABILITIES: | | | | | | | | | | | | | | | | | | | | | | | | | | | | |
Payable upon return on securities loaned (Note 6) | | | 58,285,375 | | | | — | | | | 18,048,948 | | | | 19,845,425 | | | | 28,897,925 | | | | 52,038,555 | | | | — | |
Reverse repurchase agreements (Note 2) | | | — | | | | — | | | | — | | | | — | | | | — | | | | — | | | | 17,293,909 | |
Payable for investment securities purchased | | | 1,430,758 | | | | 1,194,202 | | | | 597,835 | | | | 324,207 | | | | — | | | | 227,645 | | | | 20,215,306 | |
Payable for Portfolio shares redeemed | | | 149,644 | | | | 164,874 | | | | 24,761 | | | | 24,274 | | | | 32,903 | | | | 274,534 | | | | 412,098 | |
Investment advisory fees payable (Note 3) | | | 173,382 | | | | 125,020 | | | | 24,913 | | | | 28,621 | | | | 17,205 | | | | 270,276 | | | | 178,495 | |
Distribution fees payable (Note 4) | | | 19,875 | | | | 9,337 | | | | 6,355 | | | | 4,206 | | | | 48,076 | | | | 888 | | | | 202 | |
Shareholder Service fees payable (Note 4) | | | 9,379 | | | | — | | | | 146 | | | | 424 | | | | 17,776 | | | | — | | | | 21,871 | |
Administration fees payable | | | 16,182 | | | | 11,669 | | | | 2,143 | | | | 2,361 | | | | 12,043 | | | | 18,444 | | | | 21,013 | |
Directors’ fees payable | | | 3,738 | | | | 1,954 | | | | 393 | | | | 435 | | | | 3,386 | | | | 3,066 | | | | 4,493 | |
Chief compliance officer expenses payable | | | 1,251 | | | | 674 | | | | 161 | | | | 171 | | | | 1,065 | | | | 1,134 | | | | 346 | |
Accrued expenses and other payables | | | 48,669 | | | | 40,436 | | | | 32,674 | | | | 33,922 | | | | 58,422 | | | | 55,892 | | | | 66,182 | |
Total Liabilities | | | 60,138,253 | | | | 1,548,166 | | | | 18,738,329 | | | | 20,264,046 | | | | 29,088,801 | | | | 52,890,434 | | | | 38,213,915 | |
| | | | | | | | | | | | | | | | | | | | | | | | | | | | | |
NET ASSETS | | $ | 276,264,724 | | | $ | 204,772,079 | | | $ | 38,113,888 | | | $ | 40,836,300 | | | $ | 210,907,495 | | | $ | 322,493,208 | | | $ | 366,409,421 | |
| | | | | | | | | | | | | | | | | | | | | | | | | | | | | |
* Includes Market Value of Securities on Loan | | $ | 59,217,936 | | | $ | — | | | $ | 17,949,709 | | | $ | 19,951,795 | | | $ | 29,344,249 | | | $ | 56,013,973 | | | $ | — | |
Amounts designated as “—” are either $0, or have been rounded to $0. |
See Notes to Financial Statements.
67
Wilshire Mutual Funds, Inc. Statements of Assets and Liabilities - (Continued) June 30, 2016 (Unaudited) |
|
| | | LARGE
COMPANY
GROWTH PORTFOLIO | | | LARGE
COMPANY
VALUE
PORTFOLIO | | | SMALL
COMPANY
GROWTH
PORTFOLIO | | | SMALL
COMPANY
VALUE
PORTFOLIO | | | WILSHIRE
5000
INDEXSM
FUND | | | WILSHIRE INTERNATIONAL EQUITY
FUND | | | WILSHIRE INCOME OPPORTUNITIES FUND | |
NET ASSETS consist of: | | | | | | | | | | | | | | | | | | | | | |
Paid-in capital | | $ | 207,703,053 | | | $ | 185,125,579 | | | $ | 30,309,107 | | | $ | 34,959,592 | | | $ | 107,301,289 | | | $ | 331,841,985 | | | $ | 363,545,202 | |
Undistributed net investment income (accumulated net investment loss) | | | 568,956 | | | | 1,708,707 | | | | (63,581 | ) | | | 131,473 | | | | 2,162,490 | | | | 3,564,872 | | | | 1,856,581 | |
Accumulated net realized gain (loss) on investments sold and foreign currency transactions | | | 7,972,970 | | | | 5,256,104 | | | | 1,215,646 | | | | 1,542,459 | | | | (19,929,824 | ) | | | (23,801,074 | ) | | | 509,397 | |
Net unrealized appreciation on investments | | | 60,019,745 | | | | 12,681,689 | | | | 6,652,716 | | | | 4,202,776 | | | | 121,373,540 | | | | 10,905,946 | | | | 455,069 | |
Net unrealized appreciation (depreciation) on forward foreign currency contracts and other assets and liabilities denominated in foreign currencies | | | — | | | | — | | | | — | | | | — | | | | — | | | | (18,521 | ) | | | 43,172 | |
| | | | | | | | | | | | | | | | | | | | | | | | | | | | | |
NET ASSETS | | $ | 276,264,724 | | | $ | 204,772,079 | | | $ | 38,113,888 | | | $ | 40,836,300 | | | $ | 210,907,495 | | | $ | 322,493,208 | | | $ | 366,409,421 | |
| | | | | | | | | | | | | | | | | | | | | | | | | | | | | |
Investments in securities, at cost (Note 2) | | | 216,039,188 | | | | 191,798,860 | | | | 31,564,268 | | | | 36,488,392 | | | | 87,871,956 | | | | 310,036,648 | | | | 360,130,494 | |
Investments in affiliated funds, at cost | | | — | | | | — | | | | — | | | | — | | | | — | | | | — | | | | 4,606,820 | |
Cash collateral for securities on loan, at cost | | | 58,285,375 | | | | — | | | | 18,048,948 | | | | 19,845,425 | | | | 28,897,925 | | | | 52,038,555 | | | | — | |
Foreign currency, at cost | | | — | | | | — | | | | — | | | | — | | | | — | | | | 276,384 | | | | — | |
| | | | | | | | | | | | | | | | | | | | | | | | | | | | | |
NET ASSETS: | | | | | | | | | | | | | | | | | | | | | | | | | | | | |
Investment Class shares | | $ | 105,191,247 | | | $ | 61,138,225 | | | $ | 12,884,342 | | | $ | 15,592,709 | | | $ | 156,660,955 | | | $ | 7,607,452 | | | $ | 771,227 | |
(50,000,000 shares authorized, per class, per Portfolio, par value $.001 per share)† | | | | | | | | | | | | | | | | | | | | | | | | | | | | |
Institutional Class shares | | $ | 171,073,477 | | | $ | 143,633,854 | | | $ | 25,229,546 | | | $ | 25,243,591 | | | $ | 52,583,262 | | | $ | 314,885,756 | | | $ | 365,638,194 | |
(50,000,000 shares authorized, per class, per Portfolio, par value $.001 per share)† | | | | | | | | | | | | | | | | | | | | | | | | | | | | |
Qualified Class shares | | | N/A | | | | N/A | | | | N/A | | | | N/A | | | $ | 198 | | | | N/A | | | | N/A | |
(10,000,000 shares authorized, per class, per Portfolio, par value $.001 per share) | | | | | | | | | | | | | | | | | | | | | | | | | | | | |
Horace Mann Class shares | | | N/A | | | | N/A | | | | N/A | | | | N/A | | | $ | 1,663,080 | | | | N/A | | | | N/A | |
(10,000,000 shares authorized, per class, per Portfolio, par value $.001 per share) | | | | | | | | | | | | | | | | | | | | | | | | | | | | |
† | For the Wilshire International Equity Fund, (40,000,000 shares authorized, per class, par value $.001 per share). |
N/A — Not Applicable. Share classes currently not offered. |
Amounts designated as “—” are either $0, or have been rounded to $0. |
See Notes to Financial Statements.
68
Wilshire Mutual Funds, Inc. Statements of Assets and Liabilities - (Continued) June 30, 2016 (Unaudited) |
|
| | | LARGE
COMPANY
GROWTH PORTFOLIO | | | LARGE
COMPANY
VALUE
PORTFOLIO | | | SMALL
COMPANY
GROWTH
PORTFOLIO | | | SMALL
COMPANY
VALUE
PORTFOLIO | | | WILSHIRE
5000
INDEXSM
FUND | | | WILSHIRE INTERNATIONAL EQUITY
FUND | | | WILSHIRE INCOME OPPORTUNITIES FUND | |
SHARES OUTSTANDING: | | | | | | | | | | | | | | | | | | | | | |
Investment Class shares | | | 2,822,592 | | | | 3,237,885 | | | | 545,437 | | | | 728,034 | | | | 8,502,544 | | | | 852,693 | | | | 74,691 | |
Institutional Class shares | | | 4,322,427 | | | | 7,576,866 | | | | 1,003,971 | | | | 1,157,600 | | | | 2,850,308 | | | | 35,701,717 | | | | 35,461,905 | |
Qualified Class shares | | | N/A | | | | N/A | | | | N/A | | | | N/A | | | | 12 | | | | N/A | | | | N/A | |
Horace Mann Class shares | | | N/A | | | | N/A | | | | N/A | | | | N/A | | | | 90,478 | | | | N/A | | | | N/A | |
| | | | | | | | | | | | | | | | | | | | | | | | | | | | | |
INVESTMENT CLASS SHARES: | | | | | | | | | | | | | | | | | | | | | | | | | | | | |
Net asset value, offering and redemption price per share | | $ | 37.27 | | | $ | 18.88 | | | $ | 23.62 | | | $ | 21.42 | | | $ | 18.43 | | | $ | 8.92 | | | $ | 10.33 | |
| | | | | | | | | | | | | | | | | | | | | | | | | | | | | |
INSTITUTIONAL CLASS SHARES: | | | | | | | | | | | | | | | | | | | | | | | | | | | | |
Net asset value, offering and redemption price per share | | $ | 39.58 | | | $ | 18.96 | | | $ | 25.13 | | | $ | 21.81 | | | $ | 18.45 | | | $ | 8.82 | | | $ | 10.31 | |
| | | | | | | | | | | | | | | | | | | | | | | | | | | | | |
QUALIFIED CLASS SHARES: | | | | | | | | | | | | | | | | | | | | | | | | | | | | |
Net asset value, offering and redemption price per share | | | N/A | | | | N/A | | | | N/A | | | | N/A | | | $ | 18.73 | * | | | N/A | | | | N/A | |
| | | | | | | | | | | | | | | | | | | | | | | | | | | | | |
HORACE MANN CLASS SHARES: | | | | | | | | | | | | | | | | | | | | | | | | | | | | |
Net asset value, offering and redemption price per share | | | N/A | | | | N/A | | | | N/A | | | | N/A | | | $ | 18.38 | | | | N/A | | | | N/A | |
* | Difference in net asset value recalculation and net asset value stated is caused by rounding differences. |
N/A — Not Applicable. Share classes currently not offered. |
See Notes to Financial Statements.
69
Wilshire Mutual Funds, Inc. Statements of Operations For the Six Months Ended June 30, 2016 (Unaudited) |
|
| | | LARGE
COMPANY
GROWTH PORTFOLIO | | | LARGE
COMPANY
VALUE
PORTFOLIO | | | SMALL
COMPANY
GROWTH
PORTFOLIO | | | SMALL
COMPANY
VALUE
PORTFOLIO | | | WILSHIRE
5000
INDEXSM
FUND | | | WILSHIRE INTERNATIONAL EQUITY
FUND | | | WILSHIRE INCOME OPPORTUNITIES FUND* | |
INVESTMENT INCOME: | | | | | | | | | | | | | | | | | | | | | |
Dividends | | $ | 2,018,894 | | | $ | 2,505,753 | | | $ | 141,165 | | | $ | 309,289 | | | $ | 2,174,523 | | | $ | 5,712,487 | | | $ | 109,469 | |
Dividends from investment companies | | | — | | | | — | | | | — | | | | — | | | | — | | | | 9,085 | | | | — | |
Interest | | | 4,073 | | | | 4,370 | | | | 986 | | | | 1,260 | | | | 1,020 | | | | 10,681 | | | | 2,288,183 | |
Income from Security Lending | | | 56,546 | | | | 37,341 | | | | 24,735 | | | | 32,970 | | | | 54,282 | | | | 65,368 | | | | — | |
Income distributions from affiliated investments | | | — | | | | — | | | | — | | | | — | | | | — | | | | — | | | | 26,245 | |
Foreign taxes withheld | | | (54,202 | ) | | | (2,493 | ) | | | — | | | | — | | | | (168 | ) | | | (630,487 | ) | | | (24,177 | ) |
Total income | | | 2,025,311 | | | | 2,544,971 | | | | 166,886 | | | | 343,519 | | | | 2,229,657 | | | | 5,167,134 | | | | 2,399,720 | |
| | | | | | | | | | | | | | | | | | | | | | | | | | | | | |
EXPENSES: | | | | | | | | | | | | | | | | | | | | | | | | | | | | |
Investment advisory fee (Note 3) | | | 984,295 | | | | 596,877 | | | | 153,577 | | | | 163,812 | | | | 103,441 | | | | 1,350,887 | | | | 371,166 | |
Distribution (12b-1) fees (Note 4) | | | | | | | | | | | | | | | | | | | | | | | | | | | | |
Investment Class | | | 126,881 | | | | 69,223 | | | | 15,144 | | | | 18,360 | | | | 191,958 | | | | 6,332 | | | | 384 | |
Horace Mann Class | | | N/A | | | | N/A | | | | N/A | | | | N/A | | | | 2,768 | | | | N/A | | | | N/A | |
Shareholder Service fees (Note 4) | | | | | | | | | | | | | | | | | | | | | | | | | | | | |
Investment Class | | | 42,243 | | | | 6,855 | | | | 5,647 | | | | 6,280 | | | | 43,758 | | | | 3,712 | | | | 51 | |
Institutional Class | | | 13,638 | | | | 3,045 | | | | 1,380 | | | | 1,432 | | | | 915 | | | | 4,330 | | | | 22,787 | |
Administration and accounting fees (Note 3) | | | 91,868 | | | | 55,709 | | | | 12,648 | | | | 13,490 | | | | 72,408 | | | | 93,690 | | | | 43,492 | |
Directors’ fees and expenses (Note 3) | | | 14,002 | | | | 7,962 | | | | 1,893 | | | | 2,012 | | | | 11,419 | | | | 13,556 | | | | 4,493 | |
Chief compliance officer expenses | | | 498 | | | | 327 | | | | 74 | | | | 79 | | | | 360 | | | | 560 | | | | 346 | |
Transfer agent fees (Note 3) | | | 47,410 | | | | 17,456 | | | | 11,542 | | | | 12,063 | | | | 43,486 | | | | 44,398 | | | | 9,624 | |
Professional fees | | | 39,559 | | | | 27,466 | | | | 15,865 | | | | 16,089 | | | | 34,761 | | | | 38,101 | | | | 14,815 | |
Custodian fees (Note 3) | | | 38,342 | | | | 18,944 | | | | 6,282 | | | | 6,436 | | | | 34,320 | | | | 48,143 | | | | 15,936 | |
Printing fees | | | 23,571 | | | | 12,130 | | | | 2,876 | | | | 3,065 | | | | 15,513 | | | | 22,375 | | | | 7,922 | |
Registration and filing fees | | | 22,474 | | | | 20,281 | | | | 13,229 | | | | 13,523 | | | | 26,603 | | | | 30,270 | | | | 7,664 | |
Interest expense | | | — | | | | — | | | | — | | | | — | | | | — | | | | — | | | | 38,522 | |
Other | | | 17,863 | | | | 10,478 | | | | 4,751 | | | | 4,799 | | | | 25,729 | | | | 27,641 | | | | 5,937 | |
Total expenses | | | 1,462,644 | | | | 846,753 | | | | 244,908 | | | | 261,440 | | | | 607,439 | | | | 1,683,995 | | | | 543,139 | |
Fees waived and/or reimbursed by Investment Adviser (Note 3) | | | — | | | | — | | | | (13,969 | ) | | | (11,106 | ) | | | — | | | | — | | | | — | |
Fees paid indirectly (Note 4) | | | (6,299 | ) | | | (10,502 | ) | | | (475 | ) | | | (3,471 | ) | | | (203 | ) | | | — | | | | — | |
Net expenses | | | 1,456,345 | | | | 836,251 | | | | 230,464 | | | | 246,863 | | | | 607,236 | | | | 1,683,995 | | | | 543,139 | |
| | | | | | | | | | | | | | | | | | | | | | | | | | | | | |
Net investment income (loss) | | $ | 568,966 | | | $ | 1,708,720 | | | $ | (63,578 | ) | | $ | 96,656 | | | $ | 1,622,421 | | | $ | 3,483,139 | | | $ | 1,856,581 | |
* | Commenced operations on March 30, 2016. |
Amounts designated as “—” are either $0, or have been rounded to $0. |
N/A – Not Applicable. Share classes currently not offered. |
See Notes to Financial Statements.
70
Wilshire Mutual Funds, Inc. Statements of Operations - (Continued) For the Six Months Ended June 30, 2016 (Unaudited) |
|
| | | LARGE
COMPANY
GROWTH PORTFOLIO | | | LARGE
COMPANY
VALUE
PORTFOLIO | | | SMALL
COMPANY
GROWTH
PORTFOLIO | | | SMALL
COMPANY
VALUE
PORTFOLIO | | | WILSHIRE
5000
INDEXSM
FUND | | | WILSHIRE INTERNATIONAL EQUITY
FUND | | | WILSHIRE INCOME OPPORTUNITIES FUND* | |
NET REALIZED AND UNREALIZED GAIN (LOSS) ON INVESTMENTS AND FOREIGN CURRENCY TRANSACTIONS (NOTES 2 and 5): | | | | | | | | | | | | | | | | | | | | | |
Net realized gain (loss) from: | | | | | | | | | | | | | | | | | | | | | |
Investments | | $ | 7,397,401 | | | $ | 4,751,363 | | | $ | 1,227,990 | | | $ | 831,516 | | | $ | 5,446,005 | | | $ | (6,559,770 | ) | | $ | 501,376 | |
Sale of affiliated investment company shares | | | — | | | | — | | | | — | | | | — | | | | — | | | | — | | | | 15,724 | |
Foreign currency transactions | | | — | | | | — | | | | — | | | | — | | | | — | | | | 246,171 | | | | (7,703 | ) |
Net change in unrealized appreciation (depreciation) on: | | | | | | | | | | | | | | | | | | | | | | | | | | | | |
Investments | | | (678,618 | ) | | | 1,288,632 | | | | 1,828,127 | | | | 1,528,744 | | | | (144,245 | ) | | | 10,847,968 | | | | 447,625 | |
Investments in affiliated funds | | | — | | | | — | | | | — | | | | — | | | | — | | | | — | | | | 7,444 | |
Forward contracts and foreign currency transactions and translation of other assets and liabilities denominated in foreign currencies | | | — | | | | — | | | | — | | | | — | | | | — | | | | (6,788 | ) | | | 43,172 | |
| | | | | | | | | | | | | | | | | | | | | | | | | | | | | |
Net realized and unrealized gain on investments and foreign currencies | | | 6,718,783 | | | | 6,039,995 | | | | 3,056,117 | | | | 2,360,260 | | | | 5,301,760 | | | | 4,527,581 | | | | 1,007,638 | |
| | | | | | | | | | | | | | | | | | | | | | | | | | | | | |
NET INCREASE IN NET ASSETS RESULTING FROM OPERATIONS | | $ | 7,287,749 | | | $ | 7,748,715 | | | $ | 2,992,539 | | | $ | 2,456,916 | | | $ | 6,924,181 | | | $ | 8,010,720 | | | $ | 2,864,219 | |
* | Commenced operations on March 30, 2016. |
Amounts designated as “—” are either $0, or have been rounded to $0. |
See Notes to Financial Statements.
71
Wilshire Mutual Funds, Inc. Statements of Changes in Net Assets For the Six Months Ended June 30, 2016 (Unaudited) |
|
| | | LARGE
COMPANY
GROWTH PORTFOLIO | | | LARGE
COMPANY
VALUE
PORTFOLIO | | | SMALL
COMPANY
GROWTH
PORTFOLIO | | | SMALL
COMPANY
VALUE
PORTFOLIO | | | WILSHIRE
5000
INDEXSM
FUND | | | WILSHIRE INTERNATIONAL EQUITY
FUND | | | WILSHIRE INCOME OPPORTUNITIES FUND* | |
OPERATIONS: | | | | | | | | | | | | | | | | | | | | | |
Net investment income (loss) | | $ | 568,966 | | | $ | 1,708,720 | | | $ | (63,578 | ) | | $ | 96,656 | | | $ | 1,622,421 | | | $ | 3,483,139 | | | $ | 1,856,581 | |
Net realized gain (loss) on investments, sale of affiliated investment company shares and foreign currency transactions | | | 7,397,401 | | | | 4,751,363 | | | | 1,227,990 | | | | 831,516 | | | | 5,446,005 | | | | (6,313,599 | ) | | | 509,397 | |
Net change in unrealized appreciation (depreciation) on investments and forward contracts and foreign currency transactions and translation of other assets and liabilities denominated in foreign currencies | | | (678,618 | ) | | | 1,288,632 | | | | 1,828,127 | | | | 1,528,744 | | | | (144,245 | ) | | | 10,841,180 | | | | 498,241 | |
Net increase in net assets resulting from operations | | | 7,287,749 | | | | 7,748,715 | | | | 2,992,539 | | | | 2,456,916 | | | | 6,924,181 | | | | 8,010,720 | | | | 2,864,219 | |
| | | | | | | | | | | | | | | | | | | | | | | | | | | | | |
DISTRIBUTIONS TO SHAREHOLDERS FROM: | | | | | | | | | | | | | | | | | | | | | | | | | | | | |
Net Investment Income: | | | | | | | | | | | | | | | | | | | | | | | | | | | | |
Investment Class shares | | | — | | | | — | | | | — | | | | — | | | | — | | | | — | | | | — | |
Institutional Class shares | | | — | | | | — | | | | — | | | | — | | | | — | | | | — | | | | — | |
Qualified Class shares | | | N/A | | | | N/A | | | | N/A | | | | N/A | | | | — | | | | N/A | | | | N/A | |
Horace Mann Class shares | | | N/A | | | | N/A | | | | N/A | | | | N/A | | | | — | | | | N/A | | | | N/A | |
Net Realized Capital Gains: | | | | | | | | | | | | | | | | | | | | | | | | | | | | |
Investment Class shares | | | — | | | | — | | | | — | | | | — | | | | — | | | | — | | | | — | |
Institutional Class shares | | | — | | | | — | | | | — | | | | — | | | | — | | | | — | | | | — | |
Total Distributions to Shareholders | | | — | | | | — | | | | — | | | | — | | | | — | | | | — | | | | — | |
* | Commenced operations on March 30, 2016. |
Amounts designated as “—” are either $0, or have been rounded to $0. |
N/A – Not Applicable. Share classes currently not offered. |
See Notes to Financial Statements.
72
Wilshire Mutual Funds, Inc. Statements of Changes in Net Assets - (Continued) For the Six Months Ended June 30, 2016 (Unaudited) |
|
| | | LARGE
COMPANY
GROWTH PORTFOLIO | | | LARGE
COMPANY
VALUE
PORTFOLIO | | | SMALL
COMPANY
GROWTH
PORTFOLIO | | | SMALL
COMPANY
VALUE
PORTFOLIO | | | WILSHIRE
5000
INDEXSM
FUND | | | WILSHIRE INTERNATIONAL EQUITY
FUND | | | WILSHIRE INCOME OPPORTUNITIES FUND* | |
CAPITAL STOCK TRANSACTIONS (DOLLARS): | | | | | | | | | | | | | | | | | | | | | |
Investment Class shares: | | | | | | | | | | | | | | | | | | | | | |
Shares sold | | | 6,895,524 | | | | 10,996,099 | | | | 3,029,763 | | | | 3,276,029 | | | | 8,532,331 | | | | 5,265,756 | | | | 1,618,302 | |
Issued in connection with in-kind transfer** | | | — | | | | — | | | | — | | | | — | | | | — | | | | — | | | | 10 | |
Shares issued as reinvestment of distributions | | | — | | | | — | | | | — | | | | — | | | | 25 | | | | — | | | | — | |
Redemption fees (Note 2) | | | — | | | | — | | | | — | | | | — | | | | — | | | | 262 | | | | — | |
Shares redeemed | | | (10,209,098 | ) | | | (3,944,069 | ) | | | (3,389,610 | ) | | | (2,549,522 | ) | | | (17,036,030 | ) | | | (1,242,029 | ) | | | (867,101 | ) |
Net increase (decrease) in net assets from Investment Class share transactions | | | (3,313,574 | ) | | | 7,052,030 | | | | (359,847 | ) | | | 726,507 | | | | (8,503,674 | ) | | | 4,023,989 | | | | 751,211 | |
| | | | | | | | | | | | | | | | | | | | | | | | | | | | | |
Institutional Class shares: | | | | | | | | | | | | | | | | | | | | | | | | | | | | |
Shares sold | | | 86,503,753 | | | | 93,191,618 | | | | 17,844,907 | | | | 17,983,264 | | | | 1,531,061 | | | | 162,372,796 | | | | 245,463,812 | |
Issued in connection with in-kind transfer** | | | — | | | | — | | | | — | | | | — | | | | — | | | | — | | | | 147,868,290 | |
Shares issued as reinvestment of distributions | | | — | | | | — | | | | — | | | | — | | | | — | | | | — | | | | — | |
Redemption fees (Note 2) | | | — | | | | — | | | | — | | | | — | | | | — | | | | 670 | | | | — | |
Shares redeemed | | | (43,813,136 | ) | | | (9,427,293 | ) | | | (9,420,251 | ) | | | (8,344,015 | ) | | | (9,424,993 | ) | | | (32,289,632 | ) | | | (30,538,111 | ) |
Net increase (decrease) in net assets from Institutional Class share transactions | | | 42,690,617 | | | | 83,764,325 | | | | 8,424,656 | | | | 9,639,249 | | | | (7,893,932 | ) | | | 130,083,834 | | | | 362,793,991 | |
* | Commenced operations on March 30, 2016. |
** | See Note 9 in Notes to Financial Statements. |
Amounts designated as “—” are either $0, or have been rounded to $0. |
See Notes to Financial Statements.
73
Wilshire Mutual Funds, Inc. Statements of Changes in Net Assets - (Continued) For the Six Months Ended June 30, 2016 (Unaudited) |
|
| | | LARGE
COMPANY
GROWTH PORTFOLIO | | | LARGE
COMPANY
VALUE
PORTFOLIO | | | SMALL
COMPANY
GROWTH
PORTFOLIO | | | SMALL
COMPANY
VALUE
PORTFOLIO | | | WILSHIRE
5000
INDEXSM
FUND | | | WILSHIRE INTERNATIONAL EQUITY
FUND | | | WILSHIRE INCOME OPPORTUNITIES FUND* | |
CAPITAL STOCK TRANSACTIONS (DOLLARS) (Continued): | | | | | | | | | | | | | | | | | | | | | |
Qualified Class shares: | | | | | | | | | | | | | | | | | | | | | |
Shares sold | | | N/A | | | | N/A | | | | N/A | | | | N/A | | | | 1 | | | | N/A | | | | N/A | |
Shares issued as reinvestment of distributions | | | N/A | | | | N/A | | | | N/A | | | | N/A | | | | — | | | | N/A | | | | N/A | |
Shares redeemed | | | N/A | | | | N/A | | | | N/A | | | | N/A | | | | — | | | | N/A | | | | N/A | |
Net increase in net assets from Qualified Class share transactions | | | N/A | | | | N/A | | | | N/A | | | | N/A | | | | 1 | | | | N/A | | | | N/A | |
| | | | | | | | | | | | | | | | | | | | | | | | | | | | | |
Horace Mann Class shares: | | | | | | | | | | | | | | | | | | | | | | | | | | | | |
Shares sold | | | N/A | | | | N/A | | | | N/A | | | | N/A | | | | 13,750 | | | | N/A | | | | N/A | |
Shares issued as reinvestment of distributions | | | N/A | | | | N/A | | | | N/A | | | | N/A | | | | — | | | | N/A | | | | N/A | |
Shares redeemed | | | N/A | | | | N/A | | | | N/A | | | | N/A | | | | (32,678 | ) | | | N/A | | | | N/A | |
Net decrease in net assets from Horace Mann Class share transactions | | | N/A | | | | N/A | | | | N/A | | | | N/A | | | | (18,928 | ) | | | N/A | | | | N/A | |
Net increase (decrease) in net assets from capital stock transactions | | | 39,377,043 | | | | 90,816,355 | | | | 8,064,809 | | | | 10,365,756 | | | | (16,416,533 | ) | | | 134,107,823 | | | | 363,545,202 | |
Net increase (decrease) in net assets | | | 46,664,792 | | | | 98,565,070 | | | | 11,057,348 | | | | 12,822,672 | | | | (9,492,352 | ) | | | 142,118,543 | | | | 366,409,421 | |
| | | | | | | | | | | | | | | | | | | | | | | | | | | | | |
NET ASSETS: | | | | | | | | | | | | | | | | | | | | | | | | | | | | |
Beginning of period | | | 229,599,932 | | | | 106,207,009 | | | | 27,056,540 | | | | 28,013,628 | | | | 220,399,847 | | | | 180,374,665 | | | | — | |
End of the period | | $ | 276,264,724 | | | $ | 204,772,079 | | | $ | 38,113,888 | | | $ | 40,836,300 | | | $ | 210,907,495 | | | $ | 322,493,208 | | | $ | 366,409,421 | |
Undistributed net investment income (accumulated net investment loss) at end of the period | | $ | 568,956 | | | $ | 1,708,707 | | | $ | (63,581 | ) | | $ | 131,473 | | | $ | 2,162,490 | | | $ | 3,564,872 | | | $ | 1,856,581 | |
* | Commenced operations on March 30, 2016. |
N/A — Not Applicable. Share classes currently not offered. |
Amounts designated as “—” are either $0, or have been rounded to $0. |
See Notes to Financial Statements.
74
Wilshire Mutual Funds, Inc. Statements of Changes in Net Assets - (Continued) For the Six Months Ended June 30, 2016 (Unaudited) |
|
| | | LARGE
COMPANY
GROWTH PORTFOLIO | | | LARGE
COMPANY
VALUE
PORTFOLIO | | | SMALL
COMPANY
GROWTH
PORTFOLIO | | | SMALL
COMPANY
VALUE
PORTFOLIO | | | WILSHIRE
5000
INDEXSM
FUND | | | WILSHIRE INTERNATIONAL EQUITY
FUND | | | WILSHIRE INCOME OPPORTUNITIES FUND* | |
CAPITAL SHARE TRANSACTIONS: | | | | | | | | | | | | | | | | | | | | | |
Investment Class shares: | | | | | | | | | | | | | | | | | | | | | |
Shares sold | | | 192,712 | | | | 615,731 | | | | 136,982 | | | | 160,322 | | | | 490,698 | | | | 607,924 | | | | 159,206 | |
Issued in connection with in-kind transfer** | | | — | | | | — | | | | — | | | | — | | | | — | | | | — | | | | 1 | |
Shares issued as reinvestment of distributions | | | — | | | | — | | | | — | | | | — | | | | 1 | | | | — | | | | — | |
Shares redeemed | | | (286,783 | ) | | | (217,130 | ) | | | (150,046 | ) | | | (121,205 | ) | | | (970,793 | ) | | | (141,666 | ) | | | (84,516 | ) |
Net increase (decrease) in Investment Class shares outstanding | | | (94,071 | ) | | | 398,601 | | | | (13,064 | ) | | | 39,117 | | | | (480,094 | ) | | | 466,258 | | | | 74,691 | |
| | | | | | | | | | | | | | | | | | | | | | | | | | | | | |
Institutional Class shares: | | | | | | | | | | | | | | | | | | | | | | | | | | | | |
Shares sold | | | 2,315,754 | | | | 5,237,041 | | | | 796,177 | | | | 899,154 | | | | 88,391 | | | | 19,314,581 | | | | 24,194,808 | |
Issued in connection with in-kind transfer** | | | — | | | | — | | | | — | | | | — | | | | — | | | | — | | | | 14,275,906 | |
Shares issued as reinvestment of distributions | | | — | | | | — | | | | — | | | | — | | | | — | | | | — | | | | — | |
Shares redeemed | | | (1,124,106 | ) | | | (517,679 | ) | | | (391,776 | ) | | | (392,685 | ) | | | (560,896 | ) | | | (3,759,588 | ) | | | (3,008,809 | ) |
Net increase (decrease) in Institutional Class shares outstanding | | | 1,191,648 | | | | 4,719,362 | | | | 404,401 | | | | 506,469 | | | | (472,505 | ) | | | 15,554,993 | | | | 35,461,905 | |
| | | | | | | | | | | | | | | | | | | | | | | | | | | | | |
Qualified Class shares: | | | | | | | | | | | | | | | | | | | | | | | | | | | | |
Shares sold | | | N/A | | | | N/A | | | | N/A | | | | N/A | | | | — | | | | N/A | | | | N/A | |
Shares issued as reinvestment of distributions | | | N/A | | | | N/A | | | | N/A | | | | N/A | | | | — | | | | N/A | | | | N/A | |
Shares redeemed | | | N/A | | | | N/A | | | | N/A | | | | N/A | | | | — | | | | N/A | | | | N/A | |
Net increase (decrease) in Qualified Class shares outstanding | | | N/A | | | | N/A | | | | N/A | | | | N/A | | | | — | | | | N/A | | | | N/A | |
| | | | | | | | | | | | | | | | | | | | | | | | | | | | | |
Horace Mann Class shares: | | | | | | | | | | | | | | | | | | | | | | | | | | | | |
Shares sold | | | N/A | | | | N/A | | | | N/A | | | | N/A | | | | 787 | | | | N/A | | | | N/A | |
Shares issued as reinvestment of distributions | | | N/A | | | | N/A | | | | N/A | | | | N/A | | | | — | | | | N/A | | | | N/A | |
Shares redeemed | | | N/A | | | | N/A | | | | N/A | | | | N/A | | | | (1,950 | ) | | | N/A | | | | N/A | |
Net decrease in Horace Mann Class shares outstanding | | | N/A | | | | N/A | | | | N/A | | | | N/A | | | | (1,163 | ) | | | N/A | | | | N/A | |
* | Commenced operations on March 30, 2016. |
** | See Note 9 in Notes to Financial Statements. |
N/A — Not Applicable. Share classes currently not offered. |
Amounts designated as “—” are either $0, or have been rounded to $0. |
See Notes to Financial Statements.
75
Wilshire Mutual Funds, Inc. Statements of Changes in Net Assets For the Year Ended December 31, 2015* |
|
| | | LARGE
COMPANY
GROWTH PORTFOLIO | | | LARGE
COMPANY
VALUE
PORTFOLIO | | | SMALL
COMPANY
GROWTH
PORTFOLIO | | | SMALL
COMPANY
VALUE
PORTFOLIO | | | WILSHIRE
5000
INDEXSM
FUND | | | WILSHIRE INTERNATIONAL EQUITY
FUND | |
OPERATIONS: | | | | | | | | | | | | | | | | | | |
Net investment income (loss) | | $ | (398,110 | ) | | $ | 1,283,331 | | | $ | (122,687 | ) | | $ | 63,065 | | | $ | 3,259,507 | | | $ | 1,850,892 | |
Net realized gain (loss) on investments and foreign currency transactions | | | 21,237,633 | | | | 6,431,264 | | | | 1,568,318 | | | | 1,708,145 | | | | 12,858,128 | | | | (9,062,137 | ) |
Net change in unrealized appreciation (depreciation) on investments and other assets and liabilities denominated in foreign currencies | | | (6,083,070 | ) | | | (13,725,637 | ) | | | (751,209 | ) | | | (2,915,605 | ) | | | (15,900,180 | ) | | | 3,650,463 | |
Net increase (decrease) in net assets resulting from operations | | | 14,756,453 | | | | (6,011,042 | ) | | | 694,422 | | | | (1,144,395 | ) | | | 217,455 | | | | (3,560,782 | ) |
| | | | | | | | | | | | | | | | | | | | | | | | | |
DISTRIBUTIONS TO SHAREHOLDERS FROM: | | | | | | | | | | | | | | | | | | | | | | | | |
Net Investment Income: | | | | | | | | | | | | | | | | | | | | | | | | |
Investment Class shares | | | — | | | | (559,437 | ) | | | — | | | | (1,177 | ) | | | (2,187,317 | ) | | | (8,401 | ) |
Institutional Class shares | | | — | | | | (692,061 | ) | | | — | | | | (45,631 | ) | | | (944,890 | ) | | | (1,748,013 | ) |
Qualified Class shares | | | N/A | | | | N/A | | | | N/A | | | | N/A | | | | (3 | ) | | | N/A | |
Horace Mann Class shares | | | N/A | | | | N/A | | | | N/A | | | | N/A | | | | (22,310 | ) | | | N/A | |
Net Realized Capital Gains: | | | | | | | | | | | | | | | | | | | | | | | | |
Investment Class shares | | | (11,355,053 | ) | | | (3,397,914 | ) | | | (720,384 | ) | | | (828,980 | ) | | | — | | | | — | |
Institutional Class shares | | | (12,134,652 | ) | | | (3,309,669 | ) | | | (766,658 | ) | | | (762,106 | ) | | | — | | | | — | |
Total Distributions to Shareholders | | | (23,489,705 | ) | | | (7,959,081 | ) | | | (1,487,042 | ) | | | (1,637,894 | ) | | | (3,154,520 | ) | | | (1,756,414 | ) |
| | | | | | | | | | | | | | | | | | | | | | | | | |
CAPITAL STOCK TRANSACTIONS (DOLLARS)2: | | | | | | | | | | | | | | | | | | | | | | | | |
Investment Class shares: | | | | | | | | | | | | | | | | | | | | | | | | |
Shares sold | | | 14,431,823 | | | | 9,017,150 | | | | 5,078,365 | | | | 5,800,048 | | | | 28,001,013 | | | | 4,067,254 | |
Shares issued as reinvestment of distributions | | | 11,150,215 | | | | 3,910,990 | | | | 712,109 | | | | 819,947 | | | | 2,059,887 | | | | 6,973 | |
Redemption fees (Note 2) | | | — | | | | — | | | | — | | | | — | | | | — | | | | 220 | |
Shares redeemed | | | (17,010,216 | ) | | | (14,667,095 | ) | | | (4,087,152 | ) | | | (4,997,495 | ) | | | (72,677,521 | ) | | | (12,701,044 | ) |
Net increase (decrease) in net assets from Investment Class share transactions | | | 8,571,822 | | | | (1,738,955 | ) | | | 1,703,322 | | | | 1,622,500 | | | | (42,616,621 | ) | | | (8,626,597 | ) |
| | | | | | | | | | | | | | | | | | | | | | | | | |
Institutional Class shares: | | | | | | | | | | | | | | | | | | | | | | | | |
Shares sold | | | 5,361,481 | | | | 9,153 | | | | 20,061 | | | | 154,125 | | | | 5,224,542 | | | | 40,029,720 | |
Shares issued as reinvestment of distributions | | | 10,859,881 | | | | 3,996,628 | | | | 766,653 | | | | 807,423 | | | | 459,540 | | | | 1,746,693 | |
Redemption fees (Note 2) | | | — | | | | — | | | | — | | | | — | | | | — | | | | 341 | |
Shares redeemed | | | (24,726,424 | ) | | | (7,155,243 | ) | | | (1,522,249 | ) | | | (1,563,847 | ) | | | (13,339,955 | ) | | | (23,877,118 | ) |
Net increase (decrease) in net assets from Institutional Class share transactions | | | (8,505,062 | ) | | | (3,149,462 | ) | | | (735,535 | ) | | | (602,299 | ) | | | (7,655,873 | ) | | | 17,899,636 | |
* | The Wilshire Income Opportunities Fund had not commenced operations at December 31, 2015. |
N/A — Not Applicable. Share classes currently not offered. |
Amounts designated as “—” are either $0, or have been rounded to $0. |
See Notes to Financial Statements.
76
Wilshire Mutual Funds, Inc. Statements of Changes in Net Assets - (Continued) For the Year Ended December 31, 2015* |
|
| | | LARGE
COMPANY
GROWTH PORTFOLIO | | LARGE
COMPANY
VALUE
PORTFOLIO | | | SMALL
COMPANY
GROWTH
PORTFOLIO | | | SMALL
COMPANY
VALUE
PORTFOLIO | | | WILSHIRE
5000
INDEXSM
FUND | | | WILSHIRE INTERNATIONAL EQUITY
FUND | |
CAPITAL STOCK TRANSACTIONS (DOLLARS) (Continued): | | | | | | | | | | | | | | | | | |
Qualified Class shares: | | | | | | | | | | | | | | | | | |
Shares sold | | | N/A | | | N/A | | | | N/A | | | | N/A | | | | 1 | | | | N/A | |
Shares issued as reinvestment of distributions | | | N/A | | | N/A | | | | N/A | | | | N/A | | | | 2 | | | | N/A | |
Shares redeemed | | | N/A | | | N/A | | | | N/A | | | | N/A | | | | — | | | | N/A | |
Net increase in net assets from Qualified Class share transactions | | | N/A | | | N/A | | | | N/A | | | | N/A | | | | 3 | | | | N/A | |
| | | | | | | | | | | | | | | | | | | | | | | | |
Horace Mann Class shares: | | | | | | | | | | | | | | | | | | | | | | | |
Shares sold | | | N/A | | | N/A | | | | N/A | | | | N/A | | | | 30,775 | | | | N/A | |
Shares issued as reinvestment of distributions | | | N/A | | | N/A | | | | N/A | | | | N/A | | | | 22,309 | | | | N/A | |
Shares redeemed | | | N/A | | | N/A | | | | N/A | | | | N/A | | | | (124,088 | ) | | | N/A | |
Net decrease in net assets from Horace Mann Class share transactions | | | N/A | | | N/A | | | | N/A | | | | N/A | | | | (71,004 | ) | | | N/A | |
Net increase (decrease) in net assets from capital stock transactions | | | 66,760 | | | (4,888,417) | | | | 967,787 | | | | 1,020,201 | | | | (50,343,495 | ) | | | 9,273,039 | |
Net increase (decrease) in net assets | | | (8,666,492) | | | (18,858,540) | | | | 175,167 | | | | (1,762,088) | | | | (53,280,560 | ) | | | 3,955,843 | |
| | | | | | | | | | | | | | | | | | | | | | | | |
NET ASSETS: | | | | | | | | | | | | | | | | | | | | | | | |
Beginning of year | | | 238,266,424 | | | 125,065,549 | | | | 26,881,373 | | | | 29,775,716 | | | | 273,680,407 | | | | 176,418,822 | |
End of year | | $ | 229,599,932 | | $ | 106,207,009 | | | $ | 27,056,540 | | | $ | 28,013,628 | | | $ | 220,399,847 | | | $ | 180,374,665 | |
Undistributed net investment income (accumulated net investment loss) end of year | | $ | (10) | | $ | (13) | | | $ | (3) | | | $ | 34,817 | | | $ | 540,069 | | | $ | 81,733 | |
* | The Wilshire Income Opportunities Fund had not commenced operations at December 31, 2015. |
N/A — Not Applicable. Share classes currently not offered. |
Amounts designated as “—” are either $0, or have been rounded to $0. |
See Notes to Financial Statements.
77
Wilshire Mutual Funds, Inc. Statements of Changes in Net Assets - (Continued) For the Year Ended December 31, 2015* |
|
| | | LARGE
COMPANY
GROWTH PORTFOLIO | | | LARGE
COMPANY
VALUE
PORTFOLIO | | | SMALL
COMPANY
GROWTH
PORTFOLIO | | | SMALL
COMPANY
VALUE
PORTFOLIO | | | WILSHIRE
5000
INDEXSM
FUND | | | WILSHIRE INTERNATIONAL EQUITY
FUND | |
CAPITAL SHARE TRANSACTIONS: | | | | | | | | | | | | | | | | | | |
Investment Class shares: | | | | | | | | | | | | | | | | | | |
Shares sold | | | 362,130 | | | | 438,642 | | | | 207,103 | | | | 255,692 | | | | 1,545,688 | | | | 450,088 | |
Shares issued as reinvestment of distributions | | | 302,995 | | | | 208,652 | | | | 31,233 | | | | 39,706 | | | | 114,741 | | | | 778 | |
Shares redeemed | | | (431,846 | ) | | | (713,809 | ) | | | (166,035 | ) | | | (224,213 | ) | | | (4,033,525 | ) | | | (1,319,953 | ) |
Net increase (decrease) in Investment Class shares outstanding | | | 233,279 | | | | (66,515 | ) | | | 72,301 | | | | 71,185 | | | | (2,373,096 | ) | | | (869,087 | ) |
| | | | | | | | | | | | | | | | | | | | | | | | | |
Institutional Class shares: | | | | | | | | | | | | | | | | | | | | | | | | |
Shares sold | | | 128,974 | | | | 431 | | | | 761 | | | | 6,769 | | | | 287,221 | | | | 4,200,644 | |
Shares issued as reinvestment of distributions | | | 278,388 | | | | 212,174 | | | | 31,653 | | | | 38,323 | | | | 25,615 | | | | 197,366 | |
Shares redeemed | | | (588,546 | ) | | | (344,881 | ) | | | (58,468 | ) | | | (68,327 | ) | | | (740,212 | ) | | | (2,615,097 | ) |
Net increase (decrease) in Institutional Class shares outstanding | | | (181,184 | ) | | | (132,276 | ) | | | (26,054 | ) | | | (23,235 | ) | | | (427,376 | ) | | | 1,782,913 | |
| | | | | | | | | | | | | | | | | | | | | | | | | |
Qualified Class shares: | | | | | | | | | | | | | | | | | | | | | | | | |
Shares sold | | | N/A | | | | N/A | | | | N/A | | | | N/A | | | | 1 | | | | N/A | |
Shares issued as reinvestment of distributions | | | N/A | | | | N/A | | | | N/A | | | | N/A | | | | 1 | | | | N/A | |
Shares redeemed | | | N/A | | | | N/A | | | | N/A | | | | N/A | | | | — | | | | N/A | |
Net increase in Qualified Class shares outstanding | | | N/A | | | | N/A | | | | N/A | | | | N/A | | | | 2 | | | | N/A | |
| | | | | | | | | | | | | | | | | | | | | | | | | |
Horace Mann Class shares: | | | | | | | | | | | | | | | | | | | | | | | | |
Shares sold | | | N/A | | | | N/A | | | | N/A | | | | N/A | | | | 1,699 | | | | N/A | |
Shares issued as reinvestment of distributions | | | N/A | | | | N/A | | | | N/A | | | | N/A | | | | 1,246 | | | | N/A | |
Shares redeemed | | | N/A | | | | N/A | | | | N/A | | | | N/A | | | | (6,773 | ) | | | N/A | |
Net decrease in Horace Mann Class shares outstanding | | | N/A | | | | N/A | | | | N/A | | | | N/A | | | | (3,828 | ) | | | N/A | |
* | The Wilshire Income Opportunities Fund had not commenced operations at December 31, 2015. |
N/A — Not Applicable. Share classes currently not offered. |
Amounts designated as “—” are either $0, or have been rounded to $0. |
See Notes to Financial Statements.
78
Wilshire Mutual Funds, Inc. Large Company Growth Portfolio Financial Highlights |
|
For a Fund Share Outstanding Throughout Each Period. | |
| | |
| | | Investment Class Shares | |
| | | Six Months
Ended
6/30/2016 (Unaudited) | | | Year
Ended
12/31/2015 | | | Year
Ended
12/31/2014 | | | Year
Ended
12/31/2013 | | | Year
Ended
12/31/2012 | | | Year
Ended
12/31/2011 | |
Net asset value, beginning of period | | $ | 36.82 | | | $ | 38.66 | | | $ | 41.60 | | | $ | 34.70 | | | $ | 31.54 | | | $ | 32.00 | |
| | | | | | | | | | | | | | | | | | | | | | | | | |
Income (loss) from investment operations: | | | | | | | | | | | | | | | | | | | | | | | | |
Net investment income (loss)1 | | | 0.04 | | | | (0.14 | ) | | | (0.26 | ) | | | (0.02 | ) | | | 0.07 | | | | (0.09 | ) |
Net realized and unrealized gain (loss) on investments | | | 0.41 | | | | 2.53 | | | | 3.61 | | | | 10.38 | | | | 4.24 | | | | (0.37 | ) |
Total from investment operations | | | 0.45 | | | | 2.39 | | | | 3.35 | | | | 10.36 | | | | 4.31 | | | | (0.46 | ) |
| | | | | | | | | | | | | | | | | | | | | | | | | |
Less distributions: | | | | | | | | | | | | | | | | | | | | | | | | |
From net investment income | | | 0.00 | | | | 0.00 | | | | 0.00 | | | | 0.00 | | | | (0.07 | ) | | | 0.00 | |
From capital gains | | | 0.00 | | | | (4.23 | ) | | | (6.29 | ) | | | (3.46 | ) | | | (1.08 | ) | | | 0.00 | |
Total distributions | | | 0.00 | | | | (4.23 | ) | | | (6.29 | ) | | | (3.46 | ) | | | (1.15 | ) | | | 0.00 | |
| | | | | | | | | | | | | | | | | | | | | | | | | |
Net asset value, end of period | | $ | 37.27 | | | $ | 36.82 | | | $ | 38.66 | | | $ | 41.60 | | | $ | 34.70 | | | $ | 31.54 | |
| | | | | | | | | | | | | | | | | | | | | | | | | |
Total return | | | 1.22 | %2 | | | 6.18 | % | | | 7.97 | % | | | 30.22 | % | | | 13.72 | % | | | (1.44 | )% |
| | | | | | | | | | | | | | | | | | | | | | | | | |
Ratios to average net assets/supplemental data: | | | | | | | | | | | | | | | | | | | | | | | | |
Net assets, end of period (in 000’s) | | $ | 105,191 | | | $ | 107,381 | | | $ | 103,733 | | | $ | 113,495 | | | $ | 100,853 | | | $ | 94,872 | |
Operating expenses including reimbursement/waiver and fees paid indirectly | | | 1.30 | %3 | | | 1.33 | % | | | 1.38 | % | | | 1.36 | % | | | 1.39 | % | | | 1.41 | % |
Operating expenses excluding reimbursement/waiver and fees paid indirectly | | | 1.30 | %3,4 | | | 1.33 | %4 | | | 1.38 | %4 | | | 1.36 | %4 | | | 1.39 | %4 | | | 1.41 | % |
Net investment income (loss) | | | 0.23 | %3 | | | (0.34 | )% | | | (0.61 | )% | | | (0.05 | )% | | | 0.20 | % | | | (0.27 | )% |
Portfolio turnover rate | | | 37 | %2 | | | 104 | % | | | 62 | % | | | 136 | % | | | 71 | % | | | 104 | % |
1 | The selected per share data was calculated using the average shares outstanding method for the period. |
2 | Not Annualized. |
3 | Annualized. |
4 | The ratio of operating expenses excluding reimbursement/waiver excludes the effect of fees paid indirectly. If this expense offset was included, the ratio would have been 1.30%, 1.34%, 1.38%, 1.36% and 1.39% for 2016, 2015, 2014, 2013 and 2012, respectively. |
See Notes to Financial Statements.
79
Wilshire Mutual Funds, Inc. Large Company Growth Portfolio Financial Highlights - (Continued) |
|
For a Fund Share Outstanding Throughout Each Period. | |
| | |
| | | Institutional Class Shares | |
| | | Six Months
Ended
6/30/2016 (Unaudited) | | | Year
Ended
12/31/2015 | | | Year
Ended
12/31/2014 | | | Year
Ended
12/31/2013 | | | Year
Ended
12/31/2012 | | | Year
Ended
12/31/2011 | |
Net asset value, beginning of period | | $ | 39.04 | | | $ | 40.62 | | | $ | 43.28 | | | $ | 35.94 | | | $ | 32.63 | | | $ | 32.99 | |
| | | | | | | | | | | | | | | | | | | | | | | | | |
Income (loss) from investment operations: | | | | | | | | | | | | | | | | | | | | | | | | |
Net investment income (loss)1 | | | 0.11 | | | | (0.01 | ) | | | (0.13 | ) | | | 0.10 | | | | 0.18 | | | | 0.03 | |
Net realized and unrealized gain (loss) on investments | | | 0.43 | | | | 2.66 | | | | 3.76 | | | | 10.77 | | | | 4.38 | | | | (0.39 | ) |
Total from investment operations | | | 0.54 | | | | 2.65 | | | | 3.63 | | | | 10.87 | | | | 4.56 | | | | (0.36 | ) |
| | | | | | | | | | | | | | | | | | | | | | | | | |
Less distributions: | | | | | | | | | | | | | | | | | | | | | �� | | | |
From net investment income | | | 0.00 | | | | 0.00 | | | | (0.00 | )2 | | | (0.07 | ) | | | (0.17 | ) | | | 0.00 | |
From capital gains | | | 0.00 | | | | (4.23 | ) | | | (6.29 | ) | | | (3.46 | ) | | | (1.08 | ) | | | 0.00 | |
Total distributions | | | 0.00 | | | | (4.23 | ) | | | (6.29 | ) | | | (3.53 | ) | | | (1.25 | ) | | | 0.00 | |
| | | | | | | | | | | | | | | | | | | | | | | | | |
Net asset value, end of period | | $ | 39.58 | | | $ | 39.04 | | | $ | 40.62 | | | $ | 43.28 | | | $ | 35.94 | | | $ | 32.63 | |
| | | | | | | | | | | | | | | | | | | | | | | | | |
Total return | | | 1.38 | %3 | | | 6.52 | % | | | 8.32 | % | | | 30.60 | % | | | 14.04 | % | | | (1.09 | )% |
| | | | | | | | | | | | | | | | | | | | | | | | | |
Ratios to average net assets/supplemental data: | | | | | | | | | | | | | | | | | | | | | | | | |
Net assets, end of period (in 000’s) | | $ | 171,074 | | | $ | 122,219 | | | $ | 134,534 | | | $ | 243,622 | | | $ | 85,740 | | | $ | 74,201 | |
Operating expenses including reimbursement/waiver and fees paid indirectly | | | 0.99 | %4 | | | 1.01 | % | | | 1.06 | % | | | 1.05 | % | | | 1.11 | % | | | 1.05 | % |
Operating expenses excluding reimbursement/waiver and fees paid indirectly | | | 0.99 | %4,5 | | | 1.01 | %5 | | | 1.06 | %5 | | | 1.06 | %5 | | | 1.11 | %5 | | | 1.05 | % |
Net investment income (loss) | | | 0.56 | %4 | | | (0.02 | )% | | | (0.29 | )% | | | 0.23 | % | | | 0.50 | % | | | 0.09 | % |
Portfolio turnover rate | | | 37 | %3 | | | 104 | % | | | 62 | % | | | 136 | % | | | 71 | % | | | 104 | % |
1 | The selected per share data was calculated using the average shares outstanding method for the period. |
2 | Amount is less than $0.01 per share. |
3 | Not Annualized. |
4 | Annualized. |
5 | The ratio of operating expenses excluding reimbursement/waiver excludes the effect of fees paid indirectly. If this expense offset was included, the ratio would have been 0.99%, 1.02%, 1.06%, 1.05% and 1.11% for 2016, 2015, 2014, 2013 and 2012, respectively. |
See Notes to Financial Statements.
80
Wilshire Mutual Funds, Inc. Large Company Value Portfolio Financial Highlights |
|
For a Fund Share Outstanding Throughout Each Period. | |
| | |
| | | Investment Class Shares | |
| | | Six Months
Ended
6/30/2016 (Unaudited) | | | Year
Ended
12/31/2015 | | | Year
Ended
12/31/2014 | | | Year
Ended
12/31/2013 | | | Year
Ended
12/31/2012 | | | Year
Ended
12/31/2011 | |
Net asset value, beginning of period | | $ | 18.62 | | | $ | 21.19 | | | $ | 21.44 | | | $ | 15.86 | | | $ | 13.82 | | | $ | 14.42 | |
| | | | | | | | | | | | | | | | | | | | | | | | | |
Income (loss) from investment operations: | | | | | | | | | | | | | | | | | | | | | | | | |
Net investment income1 | | | 0.17 | | | | 0.20 | | | | 0.18 | | | | 0.16 | | | | 0.17 | | | | 0.11 | |
Net realized and unrealized gain (loss) on investments | | | 0.09 | | | | (1.33 | ) | | | 2.14 | | | | 5.64 | | | | 2.03 | | | | (0.59 | ) |
Total from investment operations | | | 0.26 | | | | (1.13 | ) | | | 2.32 | | | | 5.80 | | | | 2.20 | | | | (0.48 | ) |
| | | | | | | | | | | | | | | | | | | | | | | | | |
Less distributions: | | | | | | | | | | | | | | | | | | | | | | | | |
From net investment income | | | 0.00 | | | | (0.19 | ) | | | (0.23 | ) | | | (0.14 | ) | | | (0.16 | ) | | | (0.12 | ) |
From capital gains | | | 0.00 | | | | (1.25 | ) | | | (2.34 | ) | | | (0.08 | ) | | | 0.00 | | | | 0.00 | |
Total distributions | | | 0.00 | | | | (1.44 | ) | | | (2.57 | ) | | | (0.22 | ) | | | (0.16 | ) | | | (0.12 | ) |
| | | | | | | | | | | | | | | | | | | | | | | | | |
Net asset value, end of period | | $ | 18.88 | | | $ | 18.62 | | | $ | 21.19 | | | $ | 21.44 | | | $ | 15.86 | | | $ | 13.82 | |
| | | | | | | | | | | | | | | | | | | | | | | | | |
Total return | | | 1.40 | %2 | | | (5.33 | )% | | | 10.77 | % | | | 36.54 | % | | | 15.92 | % | | | (3.36 | )% |
| | | | | | | | | | | | | | | | | | | | | | | | | |
Ratios to average net assets/supplemental data: | | | | | | | | | | | | | | | | | | | | | | | | |
Net assets, end of period (in 000’s) | | $ | 61,138 | | | $ | 52,864 | | | $ | 61,566 | | | $ | 61,800 | | | $ | 44,220 | | | $ | 30,968 | |
Operating expenses including reimbursement/waiver and fees paid indirectly | | | 1.23 | %3 | | | 1.27 | % | | | 1.29 | % | | | 1.24 | % | | | 1.35 | % | | | 1.39 | % |
Operating expenses excluding reimbursement/waiver and fees paid indirectly | | | 1.24 | %3,4 | | | 1.29 | %4 | | | 1.30 | %4 | | | 1.25 | %4 | | | 1.36 | %4 | | | 1.39 | % |
Net investment income | | | 1.88 | %3 | | | 0.96 | % | | | 0.80 | % | | | 0.87 | % | | | 1.12 | % | | | 0.77 | % |
Portfolio turnover rate | | | 141 | %2 | | | 55 | % | | | 57 | % | | | 101 | % | | | 97 | % | | | 140 | % |
1 | The selected per share data was calculated using the average shares outstanding method for the period. |
2 | Not Annualized. |
3 | Annualized. |
4 | The ratio of operating expenses excluding reimbursement/waiver excludes the effect of fees paid indirectly. If this expense offset was included, the ratio would have been 1.23%, 1.27%, 1.29%, 1.24% and 1.35% for 2016, 2015, 2014, 2013 and 2012, respectively. |
See Notes to Financial Statements.
81
Wilshire Mutual Funds, Inc. Large Company Value Portfolio Financial Highlights - (Continued) |
|
For a Fund Share Outstanding Throughout Each Period. | |
| | |
| | | Institutional Class Shares | |
| | | Six Months
Ended
6/30/2016 (Unaudited) | | | Year
Ended
12/31/2015 | | | Year
Ended
12/31/2014 | | | Year
Ended
12/31/2013 | | | Year
Ended
12/31/2012 | | | Year
Ended
12/31/2011 | |
Net asset value, beginning of period | | $ | 18.67 | | | $ | 21.24 | | | $ | 21.48 | | | $ | 15.89 | | | $ | 13.84 | | | $ | 14.44 | |
| | | | | | | | | | | | | | | | | | | | | | | | | |
Income (loss) from investment operations: | | | | | | | | | | | | | | | | | | | | | | | | |
Net investment income1 | | | 0.21 | | | | 0.26 | | | | 0.24 | | | | 0.22 | | | | 0.20 | | | | 0.16 | |
Net realized and unrealized gain (loss) on investments | | | 0.08 | | | | (1.33 | ) | | | 2.14 | | | | 5.63 | | | | 2.04 | | | | (0.58 | ) |
Total from investment operations | | | 0.29 | | | | (1.07 | ) | | | 2.38 | | | | 5.85 | | | | 2.24 | | | | (0.42 | ) |
| | | | | | | | | | | | | | | | | | | | | | | | | |
Less distributions: | | | | | | | | | | | | | | | | | | | | | | | | |
From net investment income | | | 0.00 | | | | (0.25 | ) | | | (0.28 | ) | | | (0.18 | ) | | | (0.19 | ) | | | (0.18 | ) |
From capital gains | | | 0.00 | | | | (1.25 | ) | | | (2.34 | ) | | | (0.08 | ) | | | 0.00 | | | | 0.00 | |
Total distributions | | | 0.00 | | | | (1.50 | ) | | | (2.62 | ) | | | (0.26 | ) | | | (0.19 | ) | | | (0.18 | ) |
| | | | | | | | | | | | | | | | | | | | | | | | | |
Net asset value, end of period | | $ | 18.96 | | | $ | 18.67 | | | $ | 21.24 | | | $ | 21.48 | | | $ | 15.89 | | | $ | 13.84 | |
| | | | | | | | | | | | | | | | | | | | | | | | | |
Total return | | | 1.55 | %2 | | | (5.07 | )% | | | 11.05 | % | | | 36.85 | % | | | 16.18 | % | | | (2.95 | )% |
| | | | | | | | | | | | | | | | | | | | | | | | | |
Ratios to average net assets/supplemental data: | | | | | | | | | | | | | | | | | | | | | | | | |
Net assets, end of period (in 000’s) | | $ | 143,634 | | | $ | 53,343 | | | $ | 63,499 | | | $ | 111,550 | | | $ | 800 | | | $ | 773 | |
Operating expenses including reimbursement/waiver and fees paid indirectly | | | 0.96 | %3 | | | 1.01 | % | | | 1.00 | % | | | 0.95 | % | | | 1.14 | % | | | 1.00 | % |
Operating expenses excluding reimbursement/waiver and fees paid indirectly | | | 0.97 | %3,4 | | | 1.02 | %4 | | | 1.01 | %4 | | | 0.97 | %4 | | | 1.15 | %4 | | | 1.16 | % |
Net investment income | | | 2.29 | %3 | | | 1.23 | % | | | 1.09 | % | | | 1.13 | % | | | 1.32 | % | | | 1.13 | % |
Portfolio turnover rate | | | 141 | %2 | | | 55 | % | | | 57 | % | | | 101 | % | | | 97 | % | | | 140 | % |
1 | The selected per share data was calculated using the average shares outstanding method for the period. |
2 | Not Annualized. |
3 | Annualized. |
4 | The ratio of operating expenses excluding reimbursement/waiver excludes the effect of fees paid indirectly. If this expense offset was included, the ratio would have been 0.96%, 1.01%, 1.00%, 0.95% and 1.14% for 2016, 2015, 2014, 2013 and 2012, respectively. |
See Notes to Financial Statements.
82
Wilshire Mutual Funds, Inc. Small Company Growth Portfolio Financial Highlights |
|
For a Fund Share Outstanding Throughout Each Period. | |
| | |
| | | Investment Class Shares | |
| | | Six Months
Ended
6/30/2016 (Unaudited) | | | Year
Ended
12/31/2015 | | | Year
Ended
12/31/2014 | | | Year
Ended
12/31/2013 | | | Year
Ended
12/31/2012 | | | Year
Ended
12/31/2011 | |
Net asset value, beginning of period | | $ | 22.64 | | | $ | 23.44 | | | $ | 24.95 | | | $ | 18.06 | | | $ | 15.90 | | | $ | 15.95 | |
| | | | | | | | | | | | | | | | | | | | | | | | | |
Income (loss) from investment operations: | | | | | | | | | | | | | | | | | | | | | | | | |
Net investment income (loss)1 | | | (0.07 | ) | | | (0.15 | ) | | | (0.25 | ) | | | (0.16 | ) | | | 0.09 | | | | (0.14 | ) |
Net realized and unrealized gain on investments | | | 1.05 | | | | 0.70 | | | | 1.09 | | | | 7.59 | | | | 2.07 | | | | 0.09 | 4 |
Total from investment operations | | | 0.98 | | | | 0.55 | | | | 0.84 | | | | 7.43 | | | | 2.16 | | | | (0.05 | ) |
| | | | | | | | | | | | | | | | | | | | | | | | | |
Less distributions: | | | | | | | | | | | | | | | | | | | | | | | | |
From capital gains | | | 0.00 | | | | (1.35 | ) | | | (2.35 | ) | | | (0.54 | ) | | | 0.00 | | | | 0.00 | |
Total distributions | | | 0.00 | | | | (1.35 | ) | | | (2.35 | ) | | | (0.54 | ) | | | 0.00 | | | | 0.00 | |
| | | | | | | | | | | | | | | | | | | | | | | | | |
Net asset value, end of period | | $ | 23.62 | | | $ | 22.64 | | | $ | 23.44 | | | $ | 24.95 | | | $ | 18.06 | | | $ | 15.90 | |
| | | | | | | | | | | | | | | | | | | | | | | | | |
Total return | | | 4.33 | %2 | | | 2.29 | % | | | 3.44 | % | | | 41.25 | % | | | 13.58 | % | | | (0.31 | )% |
| | | | | | | | | | | | | | | | | | | | | | | | | |
Ratios to average net assets/supplemental data: | | | | | | | | | | | | | | | | | | | | | | | | |
Net assets, end of period (in 000’s) | | $ | 12,884 | | | $ | 12,642 | | | $ | 11,398 | | | $ | 9,582 | | | $ | 7,225 | | | $ | 6,813 | |
Operating expenses including reimbursement/waiver and fees paid indirectly | | | 1.50 | %3 | | | 1.46 | % | | | 1.50 | % | | | 1.47 | % | | | 1.47 | % | | | 1.50 | % |
Operating expenses excluding reimbursement/waiver and fees paid indirectly | | | 1.58 | %3,5 | | | 1.64 | %5 | | | 1.55 | %5 | | | 1.62 | %5 | | | 1.97 | %5 | | | 2.02 | % |
Net investment income (loss) | | | (0.62 | )%3 | | | (0.59 | )% | | | (1.00 | )% | | | (0.75 | )% | | | 0.55 | % | | | (0.85 | )% |
Portfolio turnover rate | | | 51 | %2 | | | 63 | % | | | 77 | % | | | 88 | % | | | 99 | % | | | 177 | % |
1 | The selected per share data was calculated using the average shares outstanding method for the period. |
2 | Not Annualized. |
3 | Annualized. |
4 | The amount shown for a share outstanding throughout the year ended December 31, 2011, does not accord with the aggregate net gains on investments for the year because of the sales and repurchases of Portfolio shares in relation to fluctuating market value of the investments of the Portfolio. |
5 | The ratio of operating expenses excluding reimbursement/waiver excludes the effect of fees paid indirectly. If this expense offset was included, the ratio would have been 1.58%, 1.64%, 1.54%, 1.61% and 1.95% for 2016, 2015, 2014, 2013 and 2012, respectively. |
See Notes to Financial Statements.
83
Wilshire Mutual Funds, Inc. Small Company Growth Portfolio Financial Highlights - (Continued) |
|
For a Fund Share Outstanding Throughout Each Period. | |
| | |
| | | Institutional Class Shares | |
| | | Six Months
Ended
6/30/2016 (Unaudited) | | | Year
Ended
12/31/2015 | | | Year
Ended
12/31/2014 | | | Year
Ended
12/31/2013 | | | Year
Ended
12/31/2012 | | | Year
Ended
12/31/2011 | |
Net asset value, beginning of period | | $ | 24.04 | | | $ | 24.75 | | | $ | 26.14 | | | $ | 18.89 | | | $ | 16.60 | | | $ | 16.61 | |
| | | | | | | | | | | | | | | | | | | | | | | | | |
Income (loss) from investment operations: | | | | | | | | | | | | | | | | | | | | | | | | |
Net investment income (loss)1 | | | (0.03 | ) | | | (0.07 | ) | | | (0.18 | ) | | | (0.15 | ) | | | 0.11 | | | | (0.12 | ) |
Net realized and unrealized gain on investments | | | 1.12 | | | | 0.71 | | | | 1.14 | | | | 7.99 | | | | 2.18 | | | | 0.11 | 4 |
Total from investment operations | | | 1.09 | | | | 0.64 | | | | 0.96 | | | | 7.84 | | | | 2.29 | | | | (0.01 | ) |
| | | | | | | | | | | | | | | | | | | | | | | | | |
Less distributions: | | | | | | | | | | | | | | | | | | | | | | | | |
From net investment income | | | 0.00 | | | | 0.00 | | | | 0.00 | | | | (0.05 | ) | | | 0.00 | | | | 0.00 | |
From capital gains | | | 0.00 | | | | (1.35 | ) | | | (2.35 | ) | | | (0.54 | ) | | | 0.00 | | | | 0.00 | |
Total distributions | | | 0.00 | | | | (1.35 | ) | | | (2.35 | ) | | | (0.59 | ) | | | 0.00 | | | | 0.00 | |
| | | | | | | | | | | | | | | | | | | | | | | | | |
Net asset value, end of period | | $ | 25.13 | | | $ | 24.04 | | | $ | 24.75 | | | $ | 26.14 | | | $ | 18.89 | | | $ | 16.60 | |
| | | | | | | | | | | | | | | | | | | | | | | | | |
Total return | | | 4.53 | %2 | | | 2.53 | % | | | 3.75 | % | | | 41.58 | % | | | 13.80 | % | | | (0.06 | )% |
| | | | | | | | | | | | | | | | | | | | | | | | | |
Ratios to average net assets/supplemental data: | | | | | | | | | | | | | | | | | | | | | | | | |
Net assets, end of period (in 000’s) | | $ | 25,230 | | | $ | 14,414 | | | $ | 15,483 | | | $ | 24,013 | | | $ | 15 | | | $ | 13 | |
Operating expenses including reimbursement/waiver and fees paid indirectly | | | 1.16 | %3 | | | 1.19 | % | | | 1.20 | % | | | 1.19 | % | | | 1.28 | % | | | 1.23 | % |
Operating expenses excluding reimbursement/waiver and fees paid indirectly | | | 1.24 | %3,5 | | | 1.36 | %5 | | | 1.24 | %5 | | | 1.20 | %5 | | | 1.79 | %5 | | | 1.69 | % |
Net investment income (loss) | | | (0.22 | )%3 | | | (0.28 | )% | | | (0.70 | )% | | | (0.54 | )% | | | 0.60 | % | | | (0.68 | )% |
Portfolio turnover rate | | | 51 | %2 | | | 63 | % | | | 77 | % | | | 88 | % | | | 99 | % | | | 177 | % |
1 | The selected per share data was calculated using the average shares outstanding method for the period. |
2 | Not Annualized. |
3 | Annualized. |
4 | The amount shown for a share outstanding throughout the year ended December 31, 2011, does not accord with the aggregate net gains on investments for the year because of the sales and repurchases of Portfolio shares in relation to fluctuating market value of the investments of the Portfolio. |
5 | The ratio of operating expenses excluding reimbursement/waiver excludes the effect of fees paid indirectly. If this expense offset was included, the ratio would have been 1.24%, 1.35%, 1.19%, 1.18% and 1.78% for 2016, 2015, 2014, 2013 and 2012, respectively. |
See Notes to Financial Statements.
84
Wilshire Mutual Funds, Inc. Small Company Value Portfolio Financial Highlights |
|
For a Fund Share Outstanding Throughout Each Period. | |
| | |
| | | Investment Class Shares | |
| | | Six Months
Ended
6/30/2016 (Unaudited) | | | Year
Ended
12/31/2015 | | | Year
Ended
12/31/2014 | | | Year
Ended
12/31/2013 | | | Year
Ended
12/31/2012 | | | Year
Ended
12/31/2011 | |
Net asset value, beginning of period | | $ | 20.74 | | | $ | 22.86 | | | $ | 24.33 | | | $ | 17.40 | | | $ | 15.04 | | | $ | 16.34 | |
| | | | | | | | | | | | | | | | | | | | | | | | | |
Income (loss) from investment operations: | | | | | | | | | | | | | | | | | | | | | | | | |
Net investment income (loss)1 | | | 0.03 | | | | 0.01 | | | | (0.08 | ) | | | (0.03 | ) | | | 0.20 | | | | 0.00 | |
Net realized and unrealized gain (loss) on investments | | | 0.65 | | | | (0.89 | ) | | | 1.53 | | | | 7.62 | | | | 2.38 | | | | (1.23 | ) |
Total from investment operations | | | 0.68 | | | | (0.88 | ) | | | 1.45 | | | | 7.59 | | | | 2.58 | | | | (1.23 | ) |
| | | | | | | | | | | | | | | | | | | | | | | | | |
Less distributions: | | | | | | | | | | | | | | | | | | | | | | | | |
From net investment income | | | 0.00 | | | | 0.00 | 2 | | | 0.00 | | | | 0.00 | 2 | | | (0.22 | ) | | | (0.07 | ) |
From capital gains | | | 0.00 | | | | (1.24 | ) | | | (2.92 | ) | | | (0.66 | ) | | | 0.00 | | | | 0.00 | |
Total distributions | | | 0.00 | | | | (1.24 | ) | | | (2.92 | ) | | | (0.66 | ) | | | (0.22 | ) | | | (0.07 | ) |
| | | | | | | | | | | | | | | | | | | | | | | | | |
Net asset value, end of period | | $ | 21.42 | | | $ | 20.74 | | | $ | 22.86 | | | $ | 24.33 | | | $ | 17.40 | | | $ | 15.04 | |
| | | | | | | | | | | | | | | | | | | | | | | | | |
Total return | | | 3.28 | %3 | | | (3.83 | )% | | | 6.17 | % | | | 43.79 | % | | | 17.20 | % | | | (7.54 | )% |
| | | | | | | | | | | | | | | | | | | | | | | | | |
Ratios to average net assets/supplemental data: | | | | | | | | | | | | | | | | | | | | | | | | |
Net assets, end of period (in 000’s) | | $ | 15,593 | | | $ | 14,287 | | | $ | 14,120 | | | $ | 13,688 | | | $ | 9,641 | | | $ | 8,795 | |
Operating expenses including reimbursement/waiver and fees paid indirectly | | | 1.48 | %4 | | | 1.49 | % | | | 1.49 | % | | | 1.49 | % | | | 1.49 | % | | | 1.50 | % |
Operating expenses excluding reimbursement/waiver and fees paid indirectly | | | 1.56 | %4,5 | | | 1.67 | %5 | | | 1.56 | %5 | | | 1.58 | %5 | | | 1.84 | %5 | | | 1.90 | % |
Net investment income (loss) | | | 0.26 | %4 | | | 0.06 | % | | | (0.35 | )% | | | (0.13 | )% | | | 1.24 | % | | | (0.02 | )% |
Portfolio turnover rate | | | 41 | %3 | | | 49 | % | | | 53 | % | | | 60 | % | | | 68 | % | | | 118 | % |
1 | The selected per share data was calculated using the average shares outstanding method for the period. |
2 | Amount is less than $0.01 per share. |
3 | Not Annualized. |
4 | Annualized. |
5 | The ratio of operating expenses excluding reimbursement/waiver excludes the effect of fees paid indirectly. If this expense offset was included, the ratio would have been 1.54%, 1.67%, 1.55%, 1.57% and 1.83% for 2016, 2015, 2014, 2013 and 2012, respectively. |
See Notes to Financial Statements.
85
Wilshire Mutual Funds, Inc. Small Company Value Portfolio Financial Highlights - (Continued) |
|
For a Fund Share Outstanding Throughout Each Period. | |
| | |
| | | Institutional Class Shares | |
| | | Six Months
Ended
6/30/2016 (Unaudited) | | | Year
Ended
12/31/2015 | | | Year
Ended
12/31/2014 | | | Year
Ended
12/31/2013 | | | Year
Ended
12/31/2012 | | | Year
Ended
12/31/2011 | |
Net asset value, beginning of period | | $ | 21.08 | | | $ | 23.21 | | | $ | 24.59 | | | $ | 17.58 | | | $ | 15.19 | | | $ | 16.51 | |
| | | | | | | | | | | | | | | | | | | | | | | | | |
Income (loss) from investment operations: | | | | | | | | | | | | | | | | | | | | | | | | |
Net investment income (loss)1 | | | 0.07 | | | | 0.08 | | | | (0.02 | ) | | | 0.00 | | | | 0.22 | | | | 0.09 | |
Net realized and unrealized gain (loss) on investments | | | 0.66 | | | | (0.90 | ) | | | 1.56 | | | | 7.74 | | | | 2.42 | | | | (1.24 | ) |
Total from investment operations | | | 0.73 | | | | (0.82 | ) | | | 1.54 | | | | 7.74 | | | | 2.64 | | | | (1.15 | ) |
| | | | | | | | | | | | | | | | | | | | | | | | | |
Less distributions: | | | | | | | | | | | | | | | | | | | | | | | | |
From net investment income | | | 0.00 | | | | (0.07 | ) | | | 0.00 | | | | (0.07 | ) | | | (0.25 | ) | | | (0.17 | ) |
From capital gains | | | 0.00 | | | | (1.24 | ) | | | (2.92 | ) | | | (0.66 | ) | | | 0.00 | | | | 0.00 | |
Total distributions | | | 0.00 | | | | (1.31 | ) | | | (2.92 | ) | | | (0.73 | ) | | | (0.25 | ) | | | (0.17 | ) |
| | | | | | | | | | | | | | | | | | | | | | | | | |
Net asset value, end of period | | $ | 21.81 | | | $ | 21.08 | | | $ | 23.21 | | | $ | 24.59 | | | $ | 17.58 | | | $ | 15.19 | |
| | | | | | | | | | | | | | | | | | | | | | | | | |
Total return | | | 3.46 | %2 | | | (3.52 | )% | | | 6.47 | % | | | 44.16 | % | | | 17.41 | % | | | (6.95 | )% |
| | | | | | | | | | | | | | | | | | | | | | | | | |
Ratios to average net assets/supplemental data: | | | | | | | | | | | | | | | | | | | | | | | | |
Net assets, end of period (in 000’s) | | $ | 25,243 | | | $ | 13,727 | | | $ | 15,655 | | | $ | 24,934 | | | $ | 54 | | | $ | 82 | |
Operating expenses including reimbursement/waiver and fees paid indirectly | | | 1.16 | %3 | | | 1.18 | % | | | 1.17 | % | | | 1.20 | % | | | 1.31 | % | | | 0.94 | % |
Operating expenses excluding reimbursement/waiver and fees paid indirectly | | | 1.23 | %3,4 | | | 1.36 | %4 | | | 1.23 | %4 | | | 1.19 | %4 | | | 1.66 | %4 | | | 1.64 | % |
Net investment income (loss) | | | 0.65 | %3 | | | 0.36 | % | | | (0.07 | )% | | | (0.01 | )% | | | 1.33 | % | | | 0.53 | % |
Portfolio turnover rate | | | 41 | %2 | | | 49 | % | | | 53 | % | | | 60 | % | | | 68 | % | | | 118 | % |
1 | The selected per share data was calculated using the average shares outstanding method for the period. |
2 | Not Annualized. |
3 | Annualized. |
4 | The ratio of operating expenses excluding reimbursement/waiver excludes the effect of fees paid indirectly. If this expense offset was included, the ratio would have been 1.21%, 1.35%, 1.21%, 1.18% and 1.65% for 2016, 2015, 2014, 2013 and 2012, respectively. |
See Notes to Financial Statements.
86
Wilshire Mutual Funds, Inc. Wilshire 5000 Indexsm Fund Financial Highlights |
|
For a Fund Share Outstanding Throughout Each Period. | |
| | |
| | | Investment Class Shares | |
| | | Six Months
Ended
6/30/2016 (Unaudited) | | | Year
Ended
12/31/2015 | | | Year
Ended
12/31/2014 | | | Year
Ended
12/31/2013 | | | Year
Ended
12/31/2012 | | | Year
Ended
12/31/2011 | |
Net asset value, beginning of period | | $ | 17.78 | | | $ | 18.01 | | | $ | 16.22 | | | $ | 12.43 | | | $ | 10.93 | | | $ | 11.05 | |
| | | | | | | | | | | | | | | | | | | | | | | | | |
Income (loss) from investment operations: | | | | | | | | | | | | | | | | | | | | | | | | |
Net investment income1 | | | 0.13 | | | | 0.24 | | | | 0.23 | | | | 0.19 | | | | 0.19 | | | | 0.14 | |
Net realized and unrealized gain (loss) on investments | | | 0.52 | | | | (0.22 | ) | | | 1.78 | | | | 3.80 | | | | 1.49 | | | | (0.12 | ) |
Total from investment operations | | | 0.65 | | | | 0.02 | | | | 2.01 | | | | 3.99 | | | | 1.68 | | | | 0.02 | |
| | | | | | | | | | | | | | | | | | | | | | | | | |
Less distributions: | | | | | | | | | | | | | | | | | | | | | | | | |
From net investment income | | | 0.00 | | | | (0.25 | ) | | | (0.22 | ) | | | (0.20 | ) | | | (0.18 | ) | | | (0.14 | ) |
Total distributions | | | 0.00 | | | | (0.25 | ) | | | (0.22 | ) | | | (0.20 | ) | | | (0.18 | ) | | | (0.14 | ) |
| | | | | | | | | | | | | | | | | | | | | | | | | |
Net asset value, end of period | | $ | 18.43 | | | $ | 17.78 | | | $ | 18.01 | | | $ | 16.22 | | | $ | 12.43 | | | $ | 10.93 | |
| | | | | | | | | | | | | | | | | | | | | | | | | |
Total return | | | 3.66 | %2 | | | 0.08 | % | | | 12.38 | % | | | 32.10 | % | | | 15.36 | % | | | 0.21 | % |
| | | | | | | | | | | | | | | | | | | | | | | | | |
Ratios to average net assets/supplemental data: | | | | | | | | | | | | | | | | | | | | | | | | |
Net assets, end of period (in 000’s) | | $ | 156,661 | | | $ | 159,709 | | | $ | 204,465 | | | $ | 139,354 | | | $ | 107,888 | | | $ | 99,545 | |
Operating expenses including reimbursement/fees paid indirectly | | | 0.66 | %3 | | | 0.64 | % | | | 0.65 | % | | | 0.68 | % | | | 0.70 | % | | | 0.74 | % |
Operating expenses excluding reimbursement/fees paid indirectly | | | 0.66 | %3,4 | | | 0.64 | %4 | | | 0.65 | % | | | 0.68 | % | | | 0.70 | % | | | 0.74 | % |
Net investment income | | | 1.49 | %3 | | | 1.35 | % | | | 1.32 | % | | | 1.33 | % | | | 1.61 | % | | | 1.22 | % |
Portfolio turnover rate | | | 1 | %2 | | | 6 | % | | | 3 | % | | | 2 | % | | | 2 | % | | | 9 | % |
1 | The selected per share data was calculated using the average shares outstanding method for the period. |
2 | Not Annualized. |
3 | Annualized. |
4 | The ratio of operating expenses excluding reimbursement/waiver excludes the effect of fees paid indirectly. If this expense offset was included, the ratio would have been 0.66% and 0.64% for 2016 and 2015, respectively. |
See Notes to Financial Statements.
87
Wilshire Mutual Funds, Inc. Wilshire 5000 Indexsm Fund Financial Highlights - (Continued) |
|
For a Fund Share Outstanding Throughout Each Period. | |
| | |
| | | Institutional Class Shares | |
| | | Six Months
Ended
6/30/2016 (Unaudited) | | | Year
Ended
12/31/2015 | | | Year
Ended
12/31/2014 | | | Year
Ended
12/31/2013 | | | Year
Ended
12/31/2012 | | | Year
Ended
12/31/2011 | |
Net asset value, beginning of period | | $ | 17.78 | | | $ | 18.00 | | | $ | 16.21 | | | $ | 12.41 | | | $ | 10.92 | | | $ | 11.04 | |
| | | | | | | | | | | | | | | | | | | | | | | | | |
Income (loss) from investment operations: | | | | | | | | | | | | | | | | | | | | | | | | |
Net investment income1 | | | 0.16 | | | | 0.29 | | | | 0.26 | | | | 0.22 | | | | 0.22 | | | | 0.16 | |
Net realized and unrealized gain (loss) on investments | | | 0.51 | | | | (0.22 | ) | | | 1.79 | | | | 3.81 | | | | 1.47 | | | | (0.11 | ) |
Total from investment operations | | | 0.67 | | | | 0.07 | | | | 2.05 | | | | 4.03 | | | | 1.69 | | | | 0.05 | |
| | | | | | | | | | | | | | | | | | | | | | | | | |
Less distributions: | | | | | | | | | | | | | | | | | | | | | | | | |
From net investment income | | | 0.00 | | | | (0.29 | ) | | | (0.26 | ) | | | (0.23 | ) | | | (0.20 | ) | | | (0.17 | ) |
Total distributions | | | 0.00 | | | | (0.29 | ) | | | (0.26 | ) | | | (0.23 | ) | | | (0.20 | ) | | | (0.17 | ) |
| | | | | | | | | | | | | | | | | | | | | | | | | |
Net asset value, end of period | | $ | 18.45 | | | $ | 17.78 | | | $ | 18.00 | | | $ | 16.21 | | | $ | 12.41 | | | $ | 10.92 | |
| | | | | | | | | | | | | | | | | | | | | | | | | |
Total return | | | 3.77 | %2 | | | 0.36 | % | | | 12.60 | % | | | 32.48 | % | | | 15.54 | % | | | 0.43 | % |
| | | | | | | | | | | | | | | | | | | | | | | | | |
Ratios to average net assets/supplemental data: | | | | | | | | | | | | | | | | | | | | | | | | |
Net assets, end of period (in 000’s) | | $ | 52,583 | | | $ | 59,065 | | | $ | 67,500 | | | $ | 59,565 | | | $ | 50,633 | | | $ | 50,252 | |
Operating expenses including reimbursement/fees paid indirectly | | | 0.36 | %3 | | | 0.41 | % | | | 0.44 | % | | | 0.46 | % | | | 0.47 | % | | | 0.53 | % |
Operating expenses excluding reimbursement/fees paid indirectly | | | 0.36 | %3,4 | | | 0.41 | %4 | | | 0.44 | % | | | 0.46 | % | | | 0.47 | % | | | 0.53 | % |
Net investment income | | | 1.79 | %3 | | | 1.59 | % | | | 1.53 | % | | | 1.55 | % | | | 1.84 | % | | | 1.43 | % |
Portfolio turnover rate | | | 1 | %2 | | | 6 | % | | | 3 | % | | | 2 | % | | | 2 | % | | | 9 | % |
1 | The selected per share data was calculated using the average shares outstanding method for the period. |
2 | Not Annualized. |
3 | Annualized. |
4 | The ratio of operating expenses excluding reimbursement/waiver excludes the effect of fees paid indirectly. If this expense offset was included, the ratio would have been 0.36% and 0.41% for 2016 and 2015, respectively. |
See Notes to Financial Statements.
88
Wilshire Mutual Funds, Inc. Wilshire 5000 Indexsm Fund Financial Highlights - (Continued) |
|
For a Fund Share Outstanding Throughout Each Period. | |
| | |
| | | Qualified Class Shares | |
| | | Six Months
Ended
6/30/2016 (Unaudited) | | | Year
Ended
12/31/2015 | | | Year
Ended
12/31/2014 | | | Year
Ended
12/31/2013 | | | Year
Ended
12/31/2012 | | | Year
Ended
12/31/2011 | |
Net asset value, beginning of period | | $ | 18.06 | | | $ | 18.29 | | | $ | 16.46 | 3 | | $ | 12.59 | 3 | | $ | 11.09 | | | $ | 11.03 | |
| | | | | | | | | | | | | | | | | | | | | | | | | |
Income (loss) from investment operations: | | | | | | | | | | | | | | | | | | | | | | | | |
Net investment income (loss)1 | | | (0.05 | ) | | | 0.30 | | | | 0.27 | 3 | | | 0.23 | 3 | | | 0.21 | 3 | | | 0.14 | |
Net realized and unrealized gain (loss) on investments | | | 0.72 | | | | (0.23 | ) | | | 1.83 | | | | 3.88 | | | | 1.50 | | | | (0.08 | ) |
Total from investment operations | | | 0.67 | | | | 0.07 | | | | 2.10 | 3 | | | 4.11 | 3 | | | 1.71 | 3 | | | 0.06 | |
| | | | | | | | | | | | | | | | | | | | | | | | | |
Less distributions: | | | | | | | | | | | | | | | | | | | | | | | | |
From net investment income | | | 0.00 | | | | (0.30 | ) | | | (0.27 | ) | | | (0.24 | ) | | | (0.21 | ) | | | 0.00 | |
Total distributions | | | 0.00 | | | | (0.30 | ) | | | (0.27 | ) | | | (0.24 | ) | | | (0.21 | ) | | | 0.00 | |
| | | | | | | | | | | | | | | | | | | | | | | | | |
Net asset value, end of period | | $ | 18.73 | | | $ | 18.06 | | | $ | 18.29 | 3 | | $ | 16.46 | 3 | | $ | 12.59 | | | $ | 11.09 | |
| | | | | | | | | | | | | | | | | | | | | | | | | |
Total return | | | 3.71 | %4 | | | 0.34 | % | | | 12.71 | %3 | | | 32.67 | %3 | | | 15.47 | %3 | | | 0.54 | % |
| | | | | | | | | | | | | | | | | | | | | | | | | |
Ratios to average net assets/supplemental data: | | | | | | | | | | | | | | | | | | | | | | | | |
Net assets, end of period (in 000’s) | | $ | — | 2 | | $ | — | 2 | | $ | — | 2 | | $ | — | 2 | | $ | — | 2 | | $ | — | 2 |
Operating expenses including reimbursement/fees paid indirectly | | | 0.31 | %5 | | | 0.36 | % | | | 0.36 | %3 | | | 0.38 | %3 | | | 0.40 | %3 | | | 0.65 | % |
Operating expenses excluding reimbursement/fees paid indirectly | | | 0.31 | %5 | | | 0.36 | % | | | 0.36 | %3 | | | 0.38 | %3 | | | 0.40 | %3 | | | 0.65 | % |
Net investment income (loss) | | | (0.61 | )%5 | | | 1.59 | % | | | 1.52 | %3 | | | 1.54 | %3 | | | 1.76 | %3 | | | 1.21 | % |
Portfolio turnover rate | | | 1 | %4 | | | 6 | % | | | 3 | % | | | 2 | % | | | 2 | % | | | 9 | % |
1 | The selected per share data was calculated using the average shares outstanding method for the period. |
2 | Amounts designated as “—” have been rounded to $0. |
3 | Amounts have been revised to reflect estimation of expenses based on Institutional Class shares due to low asset levels in the Qualified Class shares. |
4 | Not Annualized. |
5 | Annualized. |
See Notes to Financial Statements.
89
Wilshire Mutual Funds, Inc. Wilshire 5000 Indexsm Fund Financial Highlights - (Continued) |
|
For a Fund Share Outstanding Throughout Each Period. | |
| | |
| | | Horace Mann Class Shares | |
| | | Six Months
Ended
6/30/2016 (Unaudited) | | | Year
Ended
12/31/2015 | | | Year
Ended
12/31/2014 | | | Year
Ended
12/31/2013 | | | Year
Ended
12/31/2012 | | | Year
Ended
12/31/2011 | |
Net asset value, beginning of period | | $ | 17.74 | | | $ | 17.97 | | | $ | 16.18 | | | $ | 12.40 | | | $ | 10.91 | | | $ | 11.02 | |
| | | | | | | | | | | | | | | | | | | | | | | | | |
Income (loss) from investment operations: | | | | | | | | | | | | | | | | | | | | | | | | |
Net investment income1 | | | 0.13 | | | | 0.25 | | | | 0.22 | | | | 0.19 | | | | 0.19 | | | | 0.13 | |
Net realized and unrealized gain (loss) on investments | | | 0.51 | | | | (0.23 | ) | | | 1.79 | | | | 3.79 | | | | 1.48 | | | | (0.10 | ) |
Total from investment operations | | | 0.64 | | | | 0.02 | | | | 2.01 | | | | 3.98 | | | | 1.67 | | | | 0.03 | |
| | | | | | | | �� | | | | | | | | | | | | | | | | | |
Less distributions: | | | | | | | | | | | | | | | | | | | | | | | | |
From net investment income | | | 0.00 | | | | (0.25 | ) | | | (0.22 | ) | | | (0.20 | ) | | | (0.18 | ) | | | (0.14 | ) |
Total distributions | | | 0.00 | | | | (0.25 | ) | | | (0.22 | ) | | | (0.20 | ) | | | (0.18 | ) | | | (0.14 | ) |
| | | | | | | | | | | | | | | | | | | | | | | | | |
Net asset value, end of period | | $ | 18.38 | | | $ | 17.74 | | | $ | 17.97 | | | $ | 16.18 | | | $ | 12.40 | | | $ | 10.91 | |
| | | | | | | | | | | | | | | | | | | | | | | | | |
Total return | | | 3.61 | %2 | | | 0.08 | % | | | 12.38 | % | | | 32.07 | % | | | 15.31 | % | | | 0.25 | % |
| | | | | | | | | | | | | | | | | | | | | | | | | |
Ratios to average net assets/supplemental data: | | | | | | | | | | | | | | | | | | | | | | | | |
Net assets, end of period (in 000’s) | | $ | 1,663 | | | $ | 1,626 | | | $ | 1,715 | | | $ | 1,560 | | | $ | 1,243 | | | $ | 1,108 | |
Operating expenses including reimbursement/fees paid indirectly | | | 0.71 | %3 | | | 0.63 | % | | | 0.67 | % | | | 0.70 | % | | | 0.69 | % | | | 0.78 | % |
Operating expenses excluding reimbursement/fees paid indirectly | | | 0.71 | %3,4 | | | 0.63 | %4 | | | 0.67 | % | | | 0.70 | % | | | 0.69 | % | | | 0.78 | % |
Net investment income | | | 1.45 | %3 | | | 1.37 | % | | | 1.30 | % | | | 1.31 | % | | | 1.62 | % | | | 1.17 | % |
Portfolio turnover rate | | | 1 | %2 | | | 6 | % | | | 3 | % | | | 2 | % | | | 2 | % | | | 9 | % |
1 | The selected per share data was calculated using the average shares outstanding method for the period. |
2 | Not Annualized. |
3 | Annualized. |
4 | The ratio of operating expenses excluding reimbursement/waiver excludes the effect of fees paid indirectly. If this expense offset was included, the ratio would have been 0.71% and 0.63% for 2016 and 2015, respectively. |
See Notes to Financial Statements.
90
Wilshire Mutual Funds, Inc. Wilshire International Equity Fund Financial Highlights |
|
For a Fund Share Outstanding Throughout Each Period. | |
| | |
| | | Investment Class Shares | |
| | | Six Months
Ended
6/30/2016 (Unaudited) | | | Year
Ended
12/31/2015 | | | Year
Ended
12/31/2014 | | | Year
Ended
12/31/2013 | | | Year
Ended
12/31/2012 | | | Year
Ended
12/31/2011 | |
Net asset value, beginning of period | | $ | 8.90 | | | $ | 9.06 | | | $ | 9.70 | | | $ | 8.34 | | | $ | 7.63 | | | $ | 8.09 | |
Income (loss) from investment operations: | | | | | | | | | | | | | | | | | | | | | |
Net investment income1 | | | 0.11 | | | | 0.09 | | | | 0.09 | | | | 0.03 | | | | 0.06 | | | | 0.00 | 2 |
Net realized and unrealized gain (loss) on investments and foreign currency transactions | | | (0.09 | )7 | | | (0.23 | ) | | | (0.71 | ) | | | 1.54 | | | | 0.96 | | | | (0.19 | ) |
Total from investment operations | | | 0.02 | | | | (0.14 | ) | | | (0.62 | ) | | | 1.57 | | | | 1.02 | | | | (0.19 | ) |
Less distributions: | | | | | | | | | | | | | | | | | | | | | | | | |
From net investment income | | | 0.00 | | | | (0.02 | ) | | | (0.02 | ) | | | 0.00 | | | | (0.09 | ) | | | (0.06 | ) |
From capital gains | | | 0.00 | | | | 0.00 | | | | 0.00 | | | | (0.21 | ) | | | (0.22 | ) | | | (0.21 | ) |
Redemption fee (Note 2) | | | 0.00 | | | | 0.00 | 2 | | | 0.00 | | | | 0.00 | | | | 0.00 | | | | 0.00 | |
Total distributions | | | 0.00 | | | | (0.02 | ) | | | (0.02 | ) | | | (0.21 | ) | | | (0.31 | ) | | | (0.27 | ) |
Net asset value, end of period | | $ | 8.92 | | | $ | 8.90 | | | $ | 9.06 | | | $ | 9.70 | | | $ | 8.34 | | | $ | 7.63 | |
Total return | | | 0.22 | %5 | | | (1.55 | )% | | | (6.38 | )% | | | 18.95 | % | | | 13.36 | % | | | (2.28 | )% |
Ratios to average net assets/supplemental data: | | | | | | | | | | | | | | | | | |
Net assets, end of period (in 000’s) | | $ | 7,607 | | | $ | 3,438 | | | $ | 11,371 | | | $ | 2,410 | | | $ | 74,999 | | | $ | 80,004 | |
Operating expenses including dividends and rebates on securities sold short and interest expense, after expense reimbursement/waiver and fees paid indirectly4 | | | 1.50 | %6 | | | 1.50 | % | | | 1.50 | % | | | 1.85 | %3 | | | 2.24 | %3 | | | 2.27 | %3 |
Operating expenses including dividends and rebates on securities sold short and interest expense, before expense reimbursement/waiver and fees paid indirectly4 | | | 1.50 | %6 | | | 1.75 | % | | | 1.71 | %8 | | | 1.93 | %8 | | | 2.29 | %8 | | | 2.33 | % |
Net investment income | | | 2.42 | %6 | | | 0.99 | % | | | 0.97 | % | | | 0.38 | % | | | 0.77 | % | | | 0.06 | % |
Portfolio turnover rate | | | 27 | %5 | | | 84 | % | | | 176 | % | | | 368 | % | | | 45 | % | | | 134 | % |
1 | The selected per share data was calculated using the average shares outstanding method for the period. |
2 | Amount is less than $0.01 per share. |
3 | The operating expense ratios reflect the expenses related to investing in securities sold short. Had these expenses been excluded, the expense ratio (after waiver and fees paid indirectly) would have been 1.50% for 2013, 2012 and 2011, respectively. |
4 | Effective April 2, 2013, the Wilshire International Equity Fund no longer engages in short selling. |
5 | Not Annualized. |
6 | Annualized. |
7 | The amount shown for a share outstanding throughout the period ended June 30, 2016, does not accord with the aggregate net gains on investments for the period because of the sales and repurchases of Fund shares in relation to fluctuating market value of the investments of the Fund. |
8 | The ratio of operating expenses including dividends and rebates on securities sold short and interest expense, before reimbursement/waiver excludes the effect of fees paid indirectly. If this expense offset was included, the ratio would have been 1.71%, 1.93% and 2.28% for 2014, 2013 and 2012, respectively. |
See Notes to Financial Statements.
91
Wilshire Mutual Funds, Inc. Wilshire International Equity Fund Financial Highlights - (Continued) |
|
For a Fund Share Outstanding Throughout Each Period. | |
| | | Institutional Class Shares | |
| | | Six Months
Ended
6/30/2016 (Unaudited) | | | Year
Ended
12/31/2015 | | | Year
Ended
12/31/2014 | | | Year
Ended
12/31/2013 | | | Year
Ended 12/31/2012 | | | Year
Ended
12/31/2011 | |
Net asset value, beginning of period | | $ | 8.78 | | | $ | 8.99 | | | $ | 9.64 | | | $ | 8.38 | | | $ | 7.67 | | | $ | 8.14 | |
Income (loss) from investment operations: | | | | | | | | | | | | | | | | | | | | | |
Net investment income1 | | | 0.11 | | | | 0.09 | | | | 0.09 | | | | 0.08 | | | | 0.09 | | | | 0.02 | |
Net realized and unrealized gain (loss) on investments and foreign currency transactions | | | (0.07 | )7 | | | (0.21 | ) | | | (0.68 | ) | | | 1.51 | | | | 0.95 | | | | (0.20 | ) |
Total from investment operations | | | 0.04 | | | | (0.12 | ) | | | (0.59 | ) | | | 1.59 | | | | 1.04 | | | | (0.18 | ) |
Less distributions: | | | | | | | | | | | | | | | | | | | | | | | | |
From net investment income | | | 0.00 | | | | (0.09 | ) | | | (0.06 | ) | | | (0.12 | ) | | | (0.11 | ) | | | (0.08 | ) |
From capital gains | | | 0.00 | | | | 0.00 | | | | 0.00 | | | | (0.21 | ) | | | (0.22 | ) | | | (0.21 | ) |
Redemption fee (Note 2) | | | 0.00 | | | | 0.00 | 2 | | | 0.00 | | | | 0.00 | | | | 0.00 | | | | 0.00 | |
Total distributions | | | 0.00 | | | | (0.09 | ) | | | (0.06 | ) | | | (0.33 | ) | | | (0.33 | ) | | | (0.29 | ) |
Net asset value, end of period | | $ | 8.82 | | | $ | 8.78 | | | $ | 8.99 | | | $ | 9.64 | | | $ | 8.38 | | | $ | 7.67 | |
Total return | | | 0.46 | %5 | | | (1.37 | )% | | | (6.16 | )% | | | 19.10 | % | | | 13.63 | % | | | (2.11 | )% |
Ratios to average net assets/supplemental data2: | | | | | | | | | | | | | | | | | |
Net assets, end of period (in 000’s) | | $ | 314,886 | | | $ | 176,937 | | | $ | 165,048 | | | $ | 45,897 | | | $ | 99,106 | | | $ | 93,132 | |
Operating expenses including dividends and rebates on securities sold short and interest expense, after expense reimbursement/waiver and fees paid indirectly4 | | | 1.25 | %6 | | | 1.25 | % | | | 1.25 | % | | | 1.61 | %3 | | | 1.99 | %3 | | | 2.02 | %3 |
Operating expenses including dividends and rebates on securities sold short and interest expense, before expense reimbursement/ waiver and fees paid indirectly4 | | | 1.25 | %6 | | | 1.29 | % | | | 1.31 | %8 | | | 1.87 | %8 | | | 2.01 | %8 | | | 2.05 | % |
Net investment income | | | 2.61 | %6 | | | 1.00 | % | | | 0.96 | % | | | 0.88 | % | | | 1.03 | % | | | 0.32 | % |
Portfolio turnover rate | | | 27 | %5 | | | 84 | % | | | 176 | % | | | 368 | % | | | 45 | % | | | 134 | % |
1 | The selected per share data was calculated using the average shares outstanding method for the period. |
2 | Amount is less than $0.01 per share. |
3 | The operating expense ratios reflect the expenses related to investing in securities sold short. Had these expenses been excluded, the expense ratio (after waiver and fees paid indirectly) would have been 1.25% for 2013, 2012, 2011 and 2010, respectively. |
4 | Effective April 2, 2013, the Wilshire International Equity Fund no longer engages in short selling. |
5 | Not Annualized. |
6 | Annualized. |
7 | The amount shown for a share outstanding throughout the period ended June 30, 2016, does not accord with the aggregate net gains on investments for the period because of the sales and repurchases of Fund shares in relation to fluctuating market value of the investments of the Fund. |
8 | The ratio of operating expenses including dividends and rebates on securities sold short and interest expense, before reimbursement/waiver excludes the effect of fees paid indirectly. If this expense offset was included, the ratio would have been 1.31%, 1.87% and 2.00% for 2014, 2013 and 2012, respectively. |
See Notes to Financial Statements.
92
Wilshire Mutual Funds, Inc. Wilshire Income Opportunities Fund Financial Highlights |
|
For a Fund Share Outstanding Throughout Each Period. | |
| | | Investment Class Shares | |
| | | Period Ended 6/30/2016* (Unaudited) | |
Net asset value, beginning of period | | $ | 10.00 | |
| | | | | |
Income from investment operations: | | | | |
Net investment income1 | | | 0.06 | |
Net realized and unrealized gain on investments and foreign currency transactions | | | 0.27 | |
Total from investment operations | | | 0.33 | |
| | | | | |
Less distributions: | | | | |
From net investment income | | | 0.00 | |
From capital gains | | | 0.00 | |
Total distributions | | | 0.00 | |
| | | | | |
Net asset value, end of period | | $ | 10.33 | |
| | | | | |
Total return | | | 3.30 | %2 |
| | | | | |
Ratios to average net assets/supplemental data: | | | | |
Net assets, end of period (in 000’s) | | $ | 771 | |
Operating expenses including reimbursement/waiver and fees paid indirectly† | | | 1.10 | %3,4 |
Operating expenses excluding reimbursement/waiver and fees paid indirectly† | | | 1.10 | %3 |
Net investment income | | | 2.40 | %3 |
Portfolio turnover rate | | | 31 | %2 |
* | Commenced operations on March 30, 2016. |
† | These ratios do not include expenses from the underlying funds. |
1 | The selected per share data was calculated using the average shares outstanding method for the period. |
2 | Not Annualized. |
3 | Annualized. |
4 | The operating expense ratio includes interest expense. Had this expense been excluded, the ratio would have been 1.04%. |
See Notes to Financial Statements.
93
Wilshire Mutual Funds, Inc. Wilshire Income Opportunities Fund Financial Highlights - (Continued) |
|
For a Fund Share Outstanding Throughout Each Period. | |
| | | Institutional Class Shares | |
| | | Period Ended 6/30/2016* (Unaudited) | |
Net asset value, beginning of period | | $ | 10.00 | |
| | | | | |
Income from investment operations: | | | | |
Net investment income1 | | | 0.08 | |
Net realized and unrealized gain on investments and foreign currency transactions | | | 0.23 | |
Total from investment operations | | | 0.31 | |
| | | | | |
Less distributions: | | | | |
From net investment income | | | 0.00 | |
From capital gains | | | 0.00 | |
Total distributions | | | 0.00 | |
| | | | | |
Net asset value, end of period | | $ | 10.31 | |
| | | | | |
Total return | | | 3.10 | %2 |
| | | | | |
Ratios to average net assets/supplemental data2: | | | | |
Net assets, end of period (in 000’s) | | $ | 365,638 | |
Operating expenses including reimbursement/waiver and fees paid indirectly† | | | 0.85 | %3,4 |
Operating expenses excluding reimbursement/waiver and fees paid indirectly† | | | 0.85 | %3 |
Net investment income | | | 2.93 | %3 |
Portfolio turnover rate | | | 31 | %2 |
* | Commenced operations on March 30, 2016. |
† | These ratios do not include expenses from the underlying funds. |
1 | The selected per share data was calculated using the average shares outstanding method for the period. |
2 | Not Annualized. |
3 | Annualized. |
4 | The operating expense ratio includes interest expense. Had this expense been excluded, the ratio would have been 0.79%. |
See Notes to Financial Statements.
94
Wilshire Mutual Funds, Inc. Notes to Financial Statements June 30, 2016 (Unaudited) |
|
1. Organization.
Wilshire Mutual Funds, Inc. (the “Company”) is registered under the Investment Company Act of 1940, as amended (the “1940 Act”), as an open-end diversified investment company, which was incorporated under Maryland law on July 30, 1992. The Company operates as a series company and presently offers seven series, all of which had operations during the period: Large Company Growth Portfolio, Large Company Value Portfolio, Small Company Growth Portfolio, Small Company Value Portfolio, Wilshire 5000 IndexSM Fund, Wilshire International Equity Fund and Wilshire Income Opportunities Fund (each a “Portfolio” and collectively the “Portfolios”). The Company accounts separately for the assets, liabilities and operations of each series.
The Wilshire Income Opportunities Fund commenced operations on March 30, 2016.
Each of the Portfolios offers Investment and Institutional Class shares, each of which has equal rights as to voting privileges. The Wilshire 5000 IndexSM Fund also offers Qualified Class Shares and Horace Mann Class Shares. Each of the Investment Class, Qualified Class and Horace Mann Class has exclusive voting rights with respect to its particular service and distribution plan. Investment income, realized and unrealized capital gains and losses and the common expenses of each Portfolio are allocated on a pro-rata basis to each class based on the relative net assets of each class to the total net assets of each Portfolio. Each class of shares differs in its respective service and distribution expenses.
2. Significant Accounting Policies.
Use of estimates – Each Portfolio is an investment company in conformity with U.S. generally accepted accounting principles (“U.S. GAAP”). Therefore, each Portfolio follows the accounting and reporting guidelines for investment companies. The preparation of financial statements in accordance with U.S. GAAP requires management to make estimates and assumptions that affect the reported amounts of assets and liabilities and disclosure of contingent assets and liabilities at the date of the financial statements and the reported amounts of revenues and expenses during the reporting period. Actual results could differ from those estimates and those differences could be material. The following is a summary of significant accounting policies consistently followed by the Portfolios in the preparation of their financial statements.
Security valuation – A security listed or traded on U.S. exchanges is valued at its last sales price on the exchange where it is principally traded. In the absence of a current quotation, the security is valued at the mean between the last bid and asked prices on that exchange. Securities quoted on the National Association of Securities Dealers Automatic Quotation (NASDAQ) System, for which there have been sales, are valued at the NASDAQ official closing price. If there are no such sales, the most recent bid quotation is used. Securities traded over-the-counter (other than on NASDAQ) are valued at the last current sale price; and if there are no such sales, the most recent bid quotation is used. Values of debt securities are generally reported at the last sales price if the security is actively traded. If a debt security is not actively traded it is valued at an evaluated bid price by employing methodologies that utilize actual market transactions, broker-supplied valuations, or other methodologies designed to identify the market value for such securities. Third-party valuation providers often utilize proprietary models that are subjective and require the use of judgment and the application of various assumptions including, but not limited to, interest rates, prepayment speeds, and default rate assumptions. Debt securities that have a remaining maturity of 60 days
95
Wilshire Mutual Funds, Inc. Notes to Financial Statements - (Continued) June 30, 2016 (Unaudited) |
|
or less are valued at prices supplied by the Funds’ pricing agent for such securities, if available, and otherwise are valued at amortized cost if the Pricing Committee concludes it approximates fair value. Equity securities primarily traded on a foreign exchange or market are valued daily at the price, which is an estimate of the fair value price, as provided by an independent pricing service. In the event market quotations are not readily available, such securities are valued at fair value according to procedures adopted by the Board of Directors or as determined in good faith by the Pricing Committee, whose members include at least two representatives of Wilshire Associates Incorporated (“Wilshire” or the “Adviser”), one of whom is an officer of the Company, or by the Company’s Valuation Committee. Fair value is defined as the amount the owner of a security might reasonably expect to receive upon a current sale. Securities whose value does not reflect fair value because a significant valuation event has occurred may be valued at fair value by the Pricing Committee or the Valuation Committee in accordance with the Company’s valuation procedures. Significant events may include, but are not limited to, the following: significant fluctuations in domestic markets, foreign markets or foreign currencies; occurrences not directly tied to the securities markets such as natural disasters, armed conflicts or significant governmental actions; and major announcements affecting a single issuer or an entire market or market sector. The value of fair valued securities may be different from the last sale price (or the mean between the last bid and asked prices), and there is no guarantee that a fair valued security will be sold at the price at which the Fund is carrying the security.
The Wilshire International Equity Fund uses Interactive Data Pricing and Reference Data, Inc. (“Interactive Data”) as a third party fair valuation vendor daily. Interactive Data provides a fair value for foreign securities in the Wilshire International Equity Fund based on certain factors and methodologies (involving, generally, tracking valuation correlations between the U.S. market and each non-U.S. security) applied by Interactive Data. These factors are used to value the Wilshire International Equity Fund without holding a Pricing Committee meeting. In the event that the Adviser believes that the fair values provided by Interactive Data are not reliable, the Adviser contacts the Wilshire International Equity Fund’s administrator and may request that a meeting of the Pricing Committee be held.
In accordance with the authoritative guidance on fair value measurements and disclosures under U.S. GAAP, the Portfolios disclose fair value of their investments in a hierarchy that prioritizes the inputs to valuation techniques used to measure the fair value. The objective of a fair value measurement is to determine the price that would be received to sell an asset or paid to transfer a liability in an orderly transaction between market participants at the measurement date (an exit price). Accordingly, the fair value hierarchy gives the highest priority to quoted prices (unadjusted) in active markets for identical assets or liabilities (Level 1) and the lowest priority to unobservable inputs (Level 3). The guidance establishes three levels of the fair value hierarchy as follows:
| | ● | Level 1 – Unadjusted quoted prices in active markets for identical, unrestricted assets or liabilities that the Portfolios have the ability to access at the measurement date; |
| | ● | Level 2 – Other significant observable inputs (including quoted prices for similar securities, interest rates, prepayment speeds, credit risk, referenced indices, quoted prices in inactive markets, adjusted quoted prices in active markets, etc.); and |
| | ● | Level 3 – Prices, inputs or exotic modeling techniques which are both significant to the fair value measurement and unobservable (supported by little or no market activity). |
96
Wilshire Mutual Funds, Inc. Notes to Financial Statements - (Continued) June 30, 2016 (Unaudited) |
|
The inputs or methodology used for valuing securities are not necessarily an indication of the risk associated with investing in those securities. For the six months ended June 30, 2016, there have been no significant changes to the Portfolios’ fair value methodologies.
Fair value measurement classifications are summarized in each Portfolio’s Schedule of Investments, as applicable.
The following table summarizes the quantitative inputs and assumptions used for items categorized as material Level 3 investments as of June 30, 2016. The disclosures below also include qualitative information on the sensitivity of the fair value measurements to changes in the significant unobservable inputs.
Wilshire Income Opportunities Fund | | | | | | | |
Assets | | Fair Value at 06/30/2016 | | Valuation Technique(s) | Unobservable
Input | | Range
(Weighted Average) | |
Asset-Backed Security | | $ | 920,346 | | Broker Quote | Broker Quote | | | 102 | |
Collateralized Mortgage Obligations | | | 2,047,334 | | Broker Quote | Broker Quote | | | 104 | |
Corporate Obligations | | | 794,408 | | Broker Quote | Broker Quote | | | 107 | |
Loan Participations | | | 627,445 | | Broker Quote | Broker Quote | | | 98 | |
The unobservable input used to determine fair value of the Level 3 asset may have similar or diverging impacts on valuation. Significant increases and decreases in this input could result in significantly higher or lower fair value measurement.
Option Transactions – The Wilshire Income Opportunities Fund may purchase and write call and put options on securities, securities indices, swaps (“swaptions”) and foreign currencies, provided such options are traded on a national securities exchange or an over-the-counter market. When the Portfolio writes or purchases a covered call or put option, an amount equal to the premium received is included in the Portfolio’s statement of assets and liabilities as a liability. The amount of the liability is subsequently marked-to-market to reflect the current market value of the option. If an option expires on its stipulated expiration date or if the Portfolio enters into a closing purchase transaction, a gain or loss is realized. If a written call option is exercised, a gain or loss is realized for the sale of the underlying security and the proceeds from the sale are increased by the premium originally received. If a written put option is exercised, the cost of the security acquired is decreased by the premium originally received. As a writer of an option, the Portfolio has no control over whether the underlying securities are subsequently sold (call) or purchased (put) and, as a result, bears the market risk of an unfavorable change in the price of the security or index underlying the written option. When the Portfolio purchases a call or put option, an amount equal to the premium paid is included in the Portfolio’s statement of assets and liabilities as an investment, and is subsequently marked-to-market to reflect the current market value of the option. If an option expires on the stipulated expiration date or if the Portfolio enters into a closing sale transaction, a gain or loss is realized. If the Portfolio exercises a call, the cost of the security acquired is increased by the premium paid for the call. If the Portfolio exercises a put option, a gain or loss is realized from the sale of the underlying security, and the proceeds from such sale are decreased by the premium originally paid. Written and purchased options are non-income producing securities. The option techniques utilized are generally to hedge against changes in interest rates, foreign currency exchange rates or securities prices in order to establish more definitely the effective return on securities or currencies held
97
Wilshire Mutual Funds, Inc. Notes to Financial Statements - (Continued) June 30, 2016 (Unaudited) |
|
or intended to be acquired by the Portfolio, to reduce the volatility of the currency exposure associated with an investment in non-U.S. securities, or as an efficient means of adjusting exposure to the bond, equity and currency markets.
As of, and during the six months ended June 30, 2016, there were no written options transactions.
Reverse Repurchase Agreements – The Wilshire Income Opportunities Fund may enter into reverse repurchase agreements for investment purposes. A reverse repurchase agreement involves the sale of portfolio assets together with an agreement to repurchase the same assets later at a fixed price. At the time the Portfolio enters into a reverse repurchase agreement, the Portfolio segregates cash, cash equivalents, or other liquid assets, including equity securities and debt securities, at least equal in value to the repurchase price. In the event the buyer of securities under a reverse repurchase agreement files for bankruptcy or becomes insolvent, the Portfolio’s use of the proceeds under the agreement may be restricted pending a determination by the other party, or its trustee or receiver, whether to enforce the obligation to repurchase the securities. Reverse repurchase agreements outstanding as of June 30, 2016 were as follows:
| | | Reverse Repurchase Agreements | |
| | | Remaining Contractual Maturity of the Agreements | |
Counterparty | | Overnight and Continuous | | | Up to 30 days | | | 30-90 days | | | Greater than
90 days | | | Total | | | Rate | |
Bank of America | | | | | | | | | | | | | | | | | | |
Corporate Bonds | | $ | — | | | $ | — | | | $ | (361,384 | ) | | $ | — | | | $ | (361,384 | ) | | | 1.730 | % |
U.S. Treasury Obligations | | | (8,120,000 | ) | | | — | | | | — | | | | — | | | | (8,120,000 | ) | | | -3.000 | % |
Barclays | | | | | | | | | | | | | | | | | | | | | | | | |
U.S. Treasury Obligations | | | (4,764,625 | ) | | | — | | | | — | | | | — | | | | (4,764,625 | ) | | | -0.300 | % |
BNP Paribas | | | | | | | | | | | | | | | | | | | | | | | | |
Corporate Bonds | | | — | | | | (1,119,000 | ) | | | — | | | | — | | | | (1,119,000 | ) | | | 1.450 | % |
Corporate Bonds | | | — | | | | (1,122,000 | ) | | | — | | | | — | | | | (1,122,000 | ) | | | 1.450 | % |
Corporate Bonds | | | — | | | | (588,000 | ) | | | — | | | | — | | | | (588,000 | ) | | | 1.400 | % |
Corporate Bonds | | | — | | | | (522,000 | ) | | | — | | | | — | | | | (522,000 | ) | | | 1.100 | % |
Credit Suisse First Boston | | | | | | | | | | | | | | | | | | | | | | | | |
Corporate Bonds | | | — | | | | — | | | | (205,500 | ) | | | — | | | | (205,500 | ) | | | 1.000 | % |
Corporate Bonds | | | — | | | | — | | | | (200,000 | ) | | | — | | | | (200,000 | ) | | | 0.900 | % |
Corporate Bonds | | | — | | | | — | | | | (291,400 | ) | | | — | | | | (291,400 | ) | | | 0.900 | % |
Total reverse repurchase agreements | | $ | (12,884,625 | ) | | $ | (3,351,000 | ) | | $ | (1,058,284 | ) | | $ | — | | | $ | (17,293,909 | ) | | | | |
When-issued and delayed delivery investments – The Wilshire Income Opportunities Fund may purchase or sell securities on a when-issued or delayed-delivery basis and make contracts to purchase or sell securities for a fixed price at a future date beyond customary settlement time. Securities purchased or sold on a when-issued, delayed-delivery or forward commitment basis involve a risk of loss if the value of the security to be purchased declines prior to the settlement date. Although the Portfolio would generally purchase securities on a when-
98
Wilshire Mutual Funds, Inc. Notes to Financial Statements - (Continued) June 30, 2016 (Unaudited) |
|
issued, delayed-delivery or forward commitment basis with the intention of acquiring the securities, the Portfolio may dispose of such securities prior to settlement if a sub-adviser deems it appropriate to do so. The Portfolio may dispose of or negotiate a when-issued or forward commitment after entering into these transactions. Such transactions are generally considered to be derivative transactions. The Portfolio will normally realize a capital gain or loss in connection with these transactions. When the Portfolio purchases securities on a when-issued, delayed-delivery or forward commitment basis, the Portfolio’s custodian will maintain cash or liquid securities having a value (determined daily) at least equal to the amount of the Portfolio’s purchase commitments. In the case of a forward commitment to sell portfolio securities, the custodian will hold the portfolio securities themselves while the commitment is outstanding. These procedures are designed to ensure that the Portfolio will maintain sufficient assets at all times to cover its obligations under when-issued purchases, forward commitments and delayed-delivery transactions. The when-issued market is commonly associated with government bonds that are to be issued as a pending auction. The Portfolio uses when-issued investments as a way to participate in a new issuance. As of, and during the six months ended June 30, 2016, the Portfolio held no when-issued and delayed delivery investments.
Securities transactions and investment income – Securities transactions are recorded on a trade date basis. Realized gains and losses from securities transactions are recorded on the identified cost basis. Dividend income is recognized on the ex-dividend date and interest income, including, where applicable, accretion of discount and amortization of premium on investments, is recognized on the accrual basis from settlement date. Distributions received on securities that represent a return of capital or capital gain are reclassed as a reduction of cost of investments and/or as a realized gain. The actual character of income, realized gain and return of capital distributions received from Real Estate Investment Trusts (“REITs”) is not known until after the end of the fiscal year, at which time such distribution estimates are appropriately adjusted.
Asset-backed and mortgage securities – The Wilshire Income Opportunities Fund may invest in mortgage and asset-backed securities which represent shares in a pool of mortgages or other debt. These securities are generally pass-through securities, which means that principal and interest payments on the underlying securities (less servicing fees) are passed through to shareholders on a pro rata basis. These securities involve prepayment risk, which is the risk that the underlying mortgages or other debt may be refinanced or paid off before they mature, particularly during periods of declining interest rates. In that case, a sub-adviser may have to reinvest the proceeds from the securities at a lower interest rate. This could lower the Portfolio’s return and result in losses to the Portfolio if some securities were acquired at a premium. Potential market gains on a security subject to prepayment risk may be more limited than potential market gains on a comparable security that is not subject to prepayment risk. The Portfolio may also invest in collateralized mortgage obligations (“CMOs”). In a CMO, a series of bonds or certificates is issued in multiple classes, which have varying levels of risks.
Foreign currency transactions – The books and records of the Portfolios are maintained in U.S. dollars. Foreign currency transactions are translated into U.S. dollars on the following basis:
| | ● | market value of investment securities, other assets and other liabilities at the daily rates of exchange and |
| | ● | purchases and sales of investment securities, dividend and interest income and certain expenses at the rates of exchange prevailing on the respective dates of such transactions. |
99
Wilshire Mutual Funds, Inc. Notes to Financial Statements - (Continued) June 30, 2016 (Unaudited) |
|
Net realized and unrealized gain (loss) from foreign currency related transactions includes gains and losses between trade and settlement dates on securities transactions, gains and losses arising from the sales of foreign currency and gains and losses between the ex-dividend and payment dates on dividends, interest and foreign withholding taxes. The effect of changes in foreign exchange rates on realized and unrealized gains or losses is reflected as a component of such gains or losses.
Forward Foreign Currency Contracts – The Wilshire Income Opportunities Fund may enter into forward foreign currency contracts as hedges against either specific transactions, Portfolio positions or anticipated Portfolio positions. The Portfolio may also engage in currency transactions to enhance the Portfolio’s returns. All commitments are “marked-to-market” daily at the applicable foreign exchange rate, and any resulting unrealized gains or losses are recorded currently. The Portfolio realizes gains and losses at the time forward contracts are extinguished. Unrealized gains or losses on outstanding positions in forward foreign currency contracts held at the close of the period are recognized as ordinary income or loss for Federal income tax purposes. The Portfolio could be exposed to risk if the counterparties to the contracts are unable to meet the terms of the contract and from unanticipated movements in the value of a foreign currency relative to the U.S. dollar. Finally, the risk exists that losses could exceed amounts disclosed on the Statements of Assets and Liabilities. Refer to the Portfolio’s Schedule of Investments for details regarding open forward foreign currency contracts as of June 30, 2016.
For the six months ended June 30, 2016, the average volume of activity of forward foreign currency contracts was as follows:
Average Monthly Notional Amount Purchased | $ 301,599 |
Average Monthly Notional Amount Sold | 372,515 |
Over-the-Counter (“OTC”) Derivative Contracts – To reduce counterparty risk with respect to OTC transactions, the Wilshire Income Opportunities Fund has entered into master netting arrangements, established within the International Swap Dealers Association, Inc. (“ISDA”) master agreements, which allow the Portfolio to make (or to have an entitlement to receive) a single net payment in the event of default (close-out netting) for outstanding payables and receivables with respect to certain OTC positions for each individual counterparty. In addition, the Portfolio may require that certain counterparties post cash and/or securities in collateral accounts to cover their net payment obligations for those derivative contracts subject to ISDA master agreements. If the counterparty fails to perform under these contracts and agreements, the cash and/or securities will be made available to the Portfolio. For financial reporting purposes, the Portfolio does not offset derivative assets and derivative liabilities that are subject to netting arrangements in the Statement of Assets and Liabilities. Bankruptcy or insolvency laws of a particular jurisdiction may impose restrictions on or prohibitions against the right of offset in bankruptcy, insolvency or other events.
Collateral terms are contract specific for OTC derivatives. For derivatives traded under an ISDA master agreement or other similar agreement, the collateral requirements are typically calculated by netting the mark to market amount of each transaction under such agreement and comparing that amount to the value of any collateral currently pledged by the Portfolio or the counterparty.
100
Wilshire Mutual Funds, Inc. Notes to Financial Statements - (Continued) June 30, 2016 (Unaudited) |
|
For financial reporting purposes, cash collateral that has been pledged to cover obligations of the Portfolio, if any, is reported separately on the Statement of Assets and Liabilities as cash pledged as collateral. Non-cash collateral pledged by the Portfolio, if any, is noted in the Schedule of Investments. Generally, the amount of collateral due from or to a party must exceed a minimum transfer amount threshold before a transfer has to be made. To the extent amounts due to the Portfolio from its counterparties are not fully collateralized, contractually or otherwise, the Portfolio bears the risk of loss from counterparty nonperformance.
The following table presents, by derivative type, the Portfolio’s OTC financial derivative instruments net of the related collateral (received)/pledged by counterparty at June 30, 2016:
Counterparty | | Financial Derivative Assets | | | Financial Derivative Liabilities | | | Derivatives Available for Offset | | | Collateral Pledged or (Received)* | | | Net
Amount | |
Forward foreign currency contracts | | | | | | | | | | | | | | | |
Montgomery/Bank of America | | $ | 43,243 | | | $ | — | | | $ | 43,243 | | | $ | — | | | $ | 43,243 | |
Reverse repurchase agreements | | | | | | | | | | | | | | | | | | | | |
Bank of America | | | — | | | | (8,481,384 | ) | | | (8,481,384 | ) | | | 8,481,384 | | | | — | |
Barclays | | | — | | | | (4,764,625 | ) | | | (4,764,625 | ) | | | 4,764,625 | | | | — | |
BNP Paribas | | | — | | | | (3,351,000 | ) | | | (3,351,000 | ) | | | 3,351,000 | | | | — | |
Credit Suisse First Boston | | | — | | | | (696,900 | ) | | | (696,900 | ) | | | 696,900 | | | | — | |
Total | | $ | 43,243 | | | $ | (17,293,909 | ) | | $ | (17,250,666 | ) | | $ | 17,293,909 | | | $ | 43,243 | |
* | Collateral pledged is limited to the net outstanding amount from an individual counterparty. The actual collateral amount pledged may exceed the amount and may fluctuate in value. |
Expense policy – Distribution and Service fees directly attributable to a class of shares are charged to that class’ operations. Expenses of the Portfolios other than Distribution and Service fees are prorated among the classes to which the expense relates based on the relative net assets of each class of shares. Expenses directly attributable to a Portfolio are charged to that Portfolio. Expenses not directly attributable to a Portfolio are allocated proportionately among all Portfolios daily in relation to the net assets of each Portfolio or another reasonable basis. Expenses which are attributable to the Company and the Wilshire Variable Insurance Trust are allocated across the Company and the Wilshire Variable Insurance Trust based upon relative net assets or another reasonable basis. Expenses and fees, including the advisory fees, are accrued daily and taken into account for the purpose of determining the net asset value of each Portfolio’s shares.
Investments in REITs – With respect to the Portfolios, dividend income is recorded based on the income included in distributions received from the REIT investments using published REIT reclassifications including some management estimates when actual amounts are not available. Distributions received in excess of these estimated amounts are recorded as a reduction of the cost of investments or reclassified to capital gains. The actual amounts of income, return of capital, and capital gains are only determined by each REIT after its fiscal year end, and may differ from the estimated amounts.
101
Wilshire Mutual Funds, Inc. Notes to Financial Statements - (Continued) June 30, 2016 (Unaudited) |
|
Distributions to shareholders – Distributions to shareholders are recorded on the ex-dividend date. Distributions from net investment income, if any, are declared and paid annually. The Portfolios’ net realized capital gains, unless offset by any available capital loss carryforward, are distributed to shareholders annually. Additional distributions of net investment income and capital gains may be made at the discretion of the Board of Directors in order to avoid the application of a 4% non-deductible Federal excise tax.
Master Limited Partnerships – The Portfolios may invest in master limited partnerships (“MLPs”). MLPs are limited partnerships or limited liability companies, whose partnership units or limited liability interests are listed and traded on a U.S. securities exchange, and are treated as publicly traded partnerships for federal income tax purposes. To qualify to be treated as a partnership for tax purposes, an MLP must receive at least 90% of its income from qualifying sources as set forth in Section 7704(d) of the Internal Revenue Code of 1986, as amended (the “Code”). These qualifying sources include activities such as the exploration, development, mining, production, processing, refining, transportation, storage and marketing of mineral or natural resources. MLPs generally have two classes of owners, the general partner and limited partners. MLPs that are formed as limited liability companies generally have two analogous classes of owners, the managing member and the members. For purposes of this section, references to general partners also apply to managing members and references to limited partners also apply to members. The general partner is typically owned by a major energy company, an investment fund, the direct management of the MLP or is an entity owned by one or more of such parties. The general partner may be structured as a private or publicly traded corporation or other entity. The general partner typically controls the operations and management of the MLP through an equity interest of as much as 2% in the MLP plus, in many cases, ownership of common units and subordinated units. Limited partners own the remainder of the MLP through ownership of common units and have a limited role in the MLP’s operations and management.
Redemption fees – The Wilshire International Equity Fund charges a redemption fee of 1% on redemption of capital shares held for sixty days or less, subject to certain exceptions. For the year ended December 31, 2015, the Wilshire International Equity Fund charged $561 in redemption fees. For the six months ended June 30, 2016, the Wilshire International Equity Fund charged $932 in redemption fees.
3. Investment Advisory Fee and Other Transactions.
Pursuant to the Advisory Agreement (the “Agreement”) between the Company and the Adviser, Wilshire charges annual fees of 0.75% of average daily net assets for the first $1 billion and 0.65% thereafter for the Large Company Growth Portfolio and Large Company Value Portfolio, 0.85% of average daily net assets for the first $1 billion and 0.75% thereafter for the Small Company Growth Portfolio and Small Company Value Portfolio, 0.10% of the average daily net assets for the first $1 billion and 0.07% thereafter for the Wilshire 5000 IndexSM Fund, 1.00% of the average daily net assets for the first $1 billion and 0.90% thereafter for the Wilshire International Equity Fund and 0.60% of average daily net assets for the Wilshire Income Opportunities Fund.
Wilshire has entered into contractual expense limitation agreements with the Small Company Growth Portfolio, the Small Company Value Portfolio and the Wilshire International Equity Fund to waive a portion of its management fees or reimburse expenses to limit expenses of such Portfolios (excluding taxes, brokerage expenses, dividend expenses on short securities, and extraordinary expenses) to 1.50% and 1.25% of average daily net assets for Investment Class Shares and Institutional Class Shares, respectively. These agreements to limit expenses continue through at
102
Wilshire Mutual Funds, Inc. Notes to Financial Statements - (Continued) June 30, 2016 (Unaudited) |
|
least April 30, 2017. Wilshire may recoup the amount of any management fee waived or expenses reimbursed within three years after the year in which Wilshire waived fees or reimbursed the expenses if the recoupment does not exceed the expense limitation that was in place at the time of the waiver/expense reimbursement. At June 30, 2016, the amounts of waivers/reimbursements subject to recoupment for Small Company Growth Portfolio were $13,969 expiring in 2019, $48,753 expiring in 2018 and $16,159 expiring in 2017. At June 30, 2016, the amounts of waivers/reimbursements subject to recoupment for Small Company Value Portfolio were $11,106 expiring in 2019, $52,909 expiring in 2018 and $17,655 expiring in 2017. At June 30, 2016, the amounts of waivers/reimbursements subject to recoupment for Wilshire International Equity Fund were $81,678 expiring in 2018, $78,351 expiring in 2017 and $152,161, expiring in 2016.
Wilshire has entered into a contractual expense limitation agreements with the Wilshire Income Opportunities Fund to waive a portion of its management fee or reimburse expenses to limit expenses of the Portfolio (excluding taxes, brokerage expenses, dividend expenses on short securities and extraordinary expenses) to 1.15% and 0.90% of average daily net assets for Investment Class Shares and Institutional Class Shares, respectively. This agreement to limit expenses continue through at least April 30, 2017.
For the six months ended June 30, 2016, Wilshire waived advisory fees or reimbursed expenses as follows:
Portfolio | | Fees Waived/ Reimbursed | | | Fees Recouped | |
Small Company Growth Portfolio | | $ | 13,969 | | | | N/ | A |
Small Company Value Portfolio | | | 11,106 | | | | N/ | A |
The Board of Directors of the Company has approved Los Angeles Capital Management and Equity Research, Inc. (“L.A. Capital”), Victory Capital Management Inc. (“Victory”), Pzena Investment Management, LLC (“Pzena”), Barrow, Hanley, Mewhinney and Strauss, LLC (“BHMS”), Ranger Investment Management, LLC (“Ranger”), NWQ Investment Management Company, LP (“NWQ”), Cambiar Investors, LLC (“Cambiar”), Loomis, Sayles & Company, L.P. (“Loomis Sayles”), DoubleLine® Capital LP (“DoubleLine”), Guggenheim Partners Investment Management, LLC (“Guggenheim”) and WCM Investment Management (“WCM”) (collectively the “Sub-Advisers”) to provide sub-advisory services with respect to the Portfolios. L.A. Capital, Loomis Sayles and Victory each manage a portion of the Large Company Growth Portfolio. L.A. Capital, Pzena and BHMS each manage a portion of the Large Company Value Portfolio. L.A. Capital and Ranger each manage a portion of the Small Company Growth Portfolio. L.A. Capital and NWQ each manage a portion of the Small Company Value Portfolio. L.A. Capital is the sole sub-adviser for the Wilshire 5000 IndexSM Fund. L.A. Capital, Cambiar and WCM each manage a portion of the Wilshire International Equity Fund. DoubleLine® and Guggenheim each manage a portion of the Wilshire Income Opportunities Fund.
The Sub-Advisers are subject to Wilshire oversight. The fees of the Sub-Advisers are paid by Wilshire.
SEI Investments Global Funds Services (“SEI”) serves as the Company’s administrator and accounting agent pursuant to an administration agreement dated May 31, 2008, as amended. DST Systems, Inc. serves as the Company’s transfer agent and dividend disbursing agent. The Northern Trust Company (“NTC”) serves as the Company’s custodian for all Portfolios. SEI Investments Distribution Co. serves as the Company’s distributor.
103
Wilshire Mutual Funds, Inc. Notes to Financial Statements - (Continued) June 30, 2016 (Unaudited) |
|
Officers’ and Directors’ Expenses – Certain officers of the Company are affiliated with and receive remuneration from the Adviser. The Company does not pay any remuneration to its officers. The Company and the Wilshire Variable Insurance Trust together pay each independent director an annual retainer of $18,000, an annual additional Board chair retainer of $12,000, a Board in-person meeting fee of $2,000, a Board telephonic meeting fee of $1,000, an annual Committee Member retainer of $8,000 and a Committee telephonic meeting fee of $500.
4. Distribution Plan, Shareholder Services Plan and Fees Paid Indirectly.
The Directors of the Company have adopted shareholder services and/or distribution plans (the “Plans”) pursuant to Rule 12b-1 under the 1940 Act, with respect to the Investment Class Shares of each Portfolio and the Qualified Class Shares of the Wilshire 5000 IndexSM Fund. Under the Plans, each such Portfolio reimburses SEI Investments Distribution Co. (the “Distributor”), at an annual rate of up to 0.25% of the value of the average daily net assets attributable to the Investment Class Shares and Qualified Class Shares of each Portfolio for certain services provided by securities dealers or other financial intermediaries or for certain distribution expenses for the purpose of financing any activity intended to result in the sale of Investment Class Shares or Qualified Class Shares. For the period ended June 30, 2016, the distribution and service fee expenses incurred for the Investment Class of the Large Company Growth Portfolio, Large Company Value Portfolio, Small Company Growth Portfolio, Small Company Value Portfolio, Wilshire 5000 IndexSM Fund, Wilshire International Equity Fund and Wilshire Income Opportunities Fund was 0.12% of the respective average net assets of each Portfolio.
For the six months ended June 30, 2016, there were no distribution and service fee expenses incurred for Qualified Class Shares of the Wilshire 5000 IndexSM Fund.
The Directors of the Company have adopted a shareholder services and distribution plan pursuant to Rule 12b-1 with respect to the Horace Mann Class Shares of the Wilshire 5000 IndexSM Fund. Under such Plan, the Company reimburses the Distributor for its shareholder service and distribution payments at an annual rate of up to 0.35% of the value of the average daily net assets of the Wilshire 5000 IndexSM Fund attributable to the Horace Mann Class Shares. For the six months ended June 30, 2016, the shareholder services and distribution fees for the Horace Mann Class Shares were 0.17% of average net assets.
In addition, Investment Class Shares and Institutional Class Shares pay the expenses associated with certain shareholder servicing arrangements with third parties, provided that payment of such fees does not exceed in any year 0.20% and 0.15% for the Investment and Institutional Class Shares, respectively, of the average net assets of each class. For the six months ended June 30, 2016, the net shareholder service provider fees were as follows (as a percent of average net assets of each class):
Portfolio | Investment Class | Institutional Class |
Large Company Growth Portfolio | 0.08% | 0.02% |
Large Company Value Portfolio | 0.02% | 0.01% |
Small Company Growth Portfolio | 0.09% | 0.01% |
Small Company Value Portfolio | 0.09% | 0.01% |
Wilshire 5000 IndexSM Fund | 0.06% | 0.00% |
Wilshire International Equity Fund | 0.15% | 0.00% |
Wilshire Income Opportunities Fund | 0.02% | 0.02% |
104
Wilshire Mutual Funds, Inc. Notes to Financial Statements - (Continued) June 30, 2016 (Unaudited) |
|
The Directors of the Company have adopted a shareholder services plan with respect to the Qualified Class Shares of the Wilshire 5000 IndexSM Fund which authorizes payments by the Qualified Class Shares of up to 0.15% of the average daily net assets attributable to the Portfolio’s Qualified Class Shares for certain shareholder services provided by insurers or other financial intermediaries. For the six months ended June 30, 2016, there were no shareholder service provider fees for the Qualified Class Shares.
Fees paid indirectly – The Company has entered into a brokerage commission recapture program with the Distributor, pursuant to which a portion of the Portfolios’ commissions generated from transactions directed to the Distributor are used to reduce the Portfolios’ expenses. Under such program, the Distributor, as introducing broker, retains a portion of the Portfolios’ commissions.
Such commissions rebated to the Portfolios for the six months ended June 30, 2016 were as follows:
Large Company Growth Portfolio | | $ | 6,299 | |
Large Company Value Portfolio | | | 10,502 | |
Small Company Growth Portfolio | | | 475 | |
Small Company Value Portfolio | | | 3,471 | |
Wilshire 5000 IndexSM Fund | | | 203 | |
Wilshire International Equity Fund | | | — | |
Wilshire Income Opportunities Fund | | | — | |
For the six months ended June 30, 2016, the Distributor retained the following commissions:
Large Company Growth Portfolio | | $ | 2,279 | |
Large Company Value Portfolio | | | 4,978 | |
Small Company Growth Portfolio | | | 228 | |
Small Company Value Portfolio | | | 9,108 | |
Wilshire 5000 IndexSM Fund | | | 131 | |
Wilshire International Equity Fund | | | — | |
Wilshire Income Opportunities Fund | | | — | |
5. Securities Transactions.
For the six months ended June 30, 2016, aggregate cost of purchases and proceeds from sales of securities, other than affiliated investments, short-term investments, short sales and purchases to cover and U.S. Government securities, were as follows:
Portfolio | | Purchases | | | Sales | |
Large Company Growth Portfolio | | $ | 132,627,174 | | | $ | 95,018,152 | |
Large Company Value Portfolio | | | 307,499,790 | | | | 216,342,293 | |
Small Company Growth Portfolio | | | 25,153,213 | | | | 17,706,598 | |
Small Company Value Portfolio | | | 25,533,876 | | | | 15,136,300 | |
Wilshire 5000 IndexSM Fund | | | 1,743,834 | | | | 17,308,324 | |
Wilshire International Equity Fund | | | 198,131,597 | | | | 68,073,564 | |
Wilshire Income Opportunities Fund | | | 250,302,664 | | | | 9,312,674 | |
105
Wilshire Mutual Funds, Inc. Notes to Financial Statements - (Continued) June 30, 2016 (Unaudited) |
|
Purchases and sales of U.S. Government securities during the six months ended June 30, 2016 were:
Fund | | Purchases | | | Proceeds from Sales | |
Wilshire Income Opportunities Fund | | $ | 100,536,986 | | | $ | 36,082,205 | |
Purchases and sales of affiliated investments during the six months ended June 30, 2016, and value as of June 30, 2016 were:
Fund | | Value as of
March 30, 2016 | | | Purchases | | | Proceeds from Sales | | | Realized Gain | | | Change in Unrealized Appreciation (Depreciation) | | | Value as of June 30,
2016 | | | Income Distributions | |
Wilshire Income Opportunities Fund | | | | | | | | | | | | | | | | | | | | | |
Guggenheim Strategy Fund I | | $ | — | | | $ | 13,791,096 | | | $ | (9,200,000 | ) | | $ | 15,724 | | | $ | 7,444 | | | $ | 4,614,264 | | | $ | 26,245 | |
6. Securities Lending.
The Large Company Growth Portfolio, Large Company Value Portfolio, Small Company Growth Portfolio, Small Company Value Portfolio, Wilshire 5000 IndexSM Fund, Wilshire International Equity Fund and the Wilshire Income Opportunities Fund may seek additional income by lending their securities on a short-term basis to banks, brokers and dealers in return for cash collateral, which is invested in short-term securities. A Portfolio may return a portion of the interest earned to the borrower or a third party which is unaffiliated with the Company and acting as a “placing broker.” A Portfolio receives compensation for lending securities in the form of fees. A Portfolio also continues to receive dividends on the securities loaned. Security loans are secured at all times by collateral. It is the Company’s policy that the collateral be equal to at least 102% of the market value of the securities loaned (105% if the collateral and securities loaned are denominated in different currencies) plus accrued interest when the transaction is entered into, and that the collateral supporting loans be valued daily. However, due to market fluctuations during the day, the value of securities loaned on a particular day may, during the course of the day, exceed the value of collateral. On each business day, the amount of collateral is adjusted based on the prior day’s market fluctuations and the current day’s lending activity. Gain or loss in the market price of the securities loaned that may occur during the term of the loan are reflected in the value of the Portfolio. The risks from securities lending are that the borrower may not provide additional collateral when required or return the securities when due or when called for by the Portfolio. Lending securities entails a risk of loss to the Portfolio if and to the extent that the market value of securities loans were to increase and the borrower did not increase the collateral accordingly, and the borrower fails to return the securities. NTC, the Portfolios’ custodian, acts as the securities lending agent for the Portfolios. The value of the securities on loan and the value of the related collateral at June 30, 2016 are shown on the Statement of Assets and Liabilities. The Northern Trust Institutional Liquid Asset Portfolio was purchased with proceeds from collateral received from securities on loan. At June 30, 2016, $58,285,375, $18,048,948, $19,845,425, $28,897,925 and $52,038,555 of this cash equivalent represents the collateral received, net of any fees retained by the securities lending agent for securities on loan in the Large Company Growth Portfolio, Small Company Growth Portfolio, Small Company Value Portfolio, Wilshire 5000 IndexSM Fund, and the
106
Wilshire Mutual Funds, Inc. Notes to Financial Statements - (Continued) June 30, 2016 (Unaudited) |
|
Wilshire International Equity Fund, respectively. Securities on loan are also collateralized by various U.S. Treasury obligations. At June 30, 2016, $1,960,847, $39,400, $322,288, $787,024 and $4,518,602 represent the collateral received for securities on loan in the Large Company Growth Portfolio, Small Company Growth Portfolio, Small Company Value Portfolio, Wilshire 5000 IndexSM Fund and the Wilshire International Equity Fund, respectively. The Large Company Value Portfolio and Income Opportunities Fund did not utilize securities lending at June 30, 2016.
7. Significant Shareholder Activity.
On June 30, 2016, the Portfolios had the following concentrations of shareholders holding 10% or more of the outstanding shares of the Portfolios. These represent omnibus shareholder accounts comprised of many individual shareholders.
Portfolio | |
Large Company Growth Portfolio (4 omnibus shareholders) | 69% |
Large Company Value Portfolio (4 omnibus shareholder) | 79% |
Small Company Growth Portfolio (4 omnibus shareholders) | 71% |
Small Company Value Portfolio (4 omnibus shareholders) | 72% |
Wilshire 5000 IndexSM Fund (3 omnibus shareholders) | 60% |
Wilshire International Equity Fund (2 omnibus shareholders) | 69% |
Wilshire Income Opportunities Fund (3 omnibus shareholders) | 78% |
8. Tax Information.
No provision for federal income taxes is required because each Portfolio has qualified and intends to continue to qualify, as a regulated investment company under Subchapter M of the Internal Revenue Code of 1986, as amended, and distributes to shareholders all of its taxable income and gains. Federal income tax regulations differ from accounting principles generally accepted in the United States of America; therefore, distributions determined in accordance with tax regulations may differ in amount or character from net investment income and realized gains for financial reporting purposes. Financial reporting records are adjusted for permanent book/tax differences to reflect tax character. Financial records are not adjusted for temporary differences.
The Portfolios evaluate tax positions taken or expected to be taken in the course of preparing the Portfolios’ tax returns to determine whether it is “more-likely than-not” (i.e., greater than 50 percent) that each tax position will be sustained upon examination by a taxing authority based on the technical merits of the position. Tax positions not deemed to meet the more-likely-than-not threshold are recorded as a tax benefit or expense in the current year. The Portfolios did not record any tax provision in the current period. However, management’s conclusions regarding tax positions taken may be subject to review and adjustment at a later date based on factors including, but not limited to, examination by tax authorities (i.e., the last 3 tax year ends, as applicable), on-going analysis of and changes to tax laws, regulations and interpretations thereof.
107
Wilshire Mutual Funds, Inc. Notes to Financial Statements - (Continued) June 30, 2016 (Unaudited) |
|
The federal tax cost, unrealized appreciation and depreciation at June 30, 2016 for each Portfolio are as follows:
Portfolio | | Tax Cost | | | Aggregate
Gross
Unrealized Appreciation | | | Aggregate
Gross
Unrealized Depreciation | | | Net Unrealized Appreciation | |
Large Company Growth Portfolio | | $ | 274,324,563 | | | $ | 62,122,582 | | | $ | (2,102,837 | ) | | $ | 60,019,745 | |
Large Company Value Portfolio | | | 191,798,860 | | | | 17,109,806 | | | | (4,428,117 | ) | | | 12,681,689 | |
Small Company Growth Portfolio | | | 49,613,216 | | | | 7,598,608 | | | | (945,892 | ) | | | 6,652,716 | |
Small Company Value Portfolio | | | 56,333,817 | | | | 6,136,483 | | | | (1,933,707 | ) | | | 4,202,776 | |
Wilshire 5000 IndexSM Fund | | | 116,769,881 | | | | 125,654,837 | | | | (4,281,297 | ) | | | 121,373,540 | |
Wilshire International Equity Fund | | | 362,075,203 | | | | 24,392,246 | | | | (13,486,300 | ) | | | 10,905,946 | |
Wilshire Income Opportunities Fund | | | 364,737,314 | | | | 5,581,070 | | | | (5,126,001 | ) | | | 455,069 | |
The differences between book and tax-basis unrealized appreciation (depreciation) are attributable primarily to the tax deferral of losses on wash sales, investment in passive foreign investment companies, investments in Master Limited Partnerships and investment in Grantor Trusts.
Under the Regulated Investment Company Modernization Act of 2010 (“RIC Modernization”), the Portfolios are permitted to carry forward capital losses incurred in taxable years beginning after December 22, 2010 for an unlimited period. However, any losses incurred during those future taxable years will be required to be utilized prior to the losses incurred in pre-enactment taxable years. As a result of this ordering rule, pre-enactment capital loss carryforwards may be more likely to expire unused. Additionally, post-enactment capital losses that are carried forward will retain their character as either short-term or long-term capital losses rather than being considered all short-term as under previous law.
The Portfolios intend to retain realized gains to the extent of available capital loss carryforwards. At December 31, 2015, the following Portfolios had available for federal income tax purposes unused capital losses as follows:
| | | Expiring December 31 | |
Portfolio | | 2017 | | | 2018 | |
Wilshire 5000 IndexSM Fund | | $ | 21,728,203 | | | $ | 2,464 | |
Losses carried forward under these new provisions are as follows:
Portfolio | | Short-Term Loss | | | Long-Term Loss | | | Total | |
Wilshire International Equity Fund | | $ | 15,338,079 | | | $ | 1,414,850 | | | $ | 16,752,929 | |
During the year ended December 31, 2015, the Wilshire 5000 IndexSM Fund utilized capital loss carryforwards of $12,161,775, to offset capital gains.
108
Wilshire Mutual Funds, Inc. Notes to Financial Statements - (Continued) June 30, 2016 (Unaudited) |
|
The tax character of distributions declared during the years ended December 31, 2015 and 2014 were as follows:
Portfolio | | 2015 Ordinary Income | | | 2015
Capital
Gains | | | 2015
Return of Capital | | | 2014 Ordinary Income | | | 2014
Capital
Gains | | | 2014
Return of Capital | |
Large Company Growth Portfolio | | $ | 73,052 | | | $ | 23,416,653 | | | $ | — | | | $ | 10,600,458 | | | $ | 21,571,407 | | | $ | — | |
Large Company Value Portfolio | | | 1,572,836 | | | | 6,386,245 | | | | — | | | | 6,224,189 | | | | 7,351,245 | | | | — | |
Small Company Growth Portfolio | | | — | | | | 1,487,042 | | | | — | | | | 747,668 | | | | 1,635,144 | | | | — | |
Small Company Value Portfolio | | | 456,140 | | | | 1,181,754 | | | | — | | | | 538,712 | | | | 2,805,892 | | | | — | |
Wilshire 5000 IndexSM Fund | | | 3,154,520 | | | | — | | | | — | | | | 3,450,744 | | | | — | | | | — | |
Wilshire International Equity Fund | | | 1,756,414 | | | | — | | | | — | | | | 1,062,512 | | | | — | | | | 3,771 | |
The Wilshire Income Opportunities Fund had not commenced operations at December 31, 2015.
At December 31, 2015, the components of distributable earnings (accumulated losses) on a tax basis were as follows:
| | | Large Company Growth Portfolio | | | Large Company Value Portfolio | | | Small Company Growth Portfolio | | | Small Company Value Portfolio | | | Wilshire 5000 IndexSM Fund | | | Wilshire International Equity Fund | |
Undistributed ordinary income | | $ | — | | | $ | — | | | $ | — | | | $ | 34,826 | | | $ | 559,575 | | | $ | 91,938 | |
Undistributed long-term capital gain | | | 1,257,103 | | | | 1,334,528 | | | | 26,034 | | | | 807,953 | | | | — | | | | — | |
Capital loss carryforwards | | | — | | | | — | | | | — | | | | — | | | | (21,730,667 | ) | | | (16,752,929 | ) |
Post October losses | | | — | | | | — | | | | — | | | | — | | | | — | | | | (399,186 | ) |
Unrealized appreciation (depreciation) | | | 60,016,824 | | | | 10,563,267 | | | | 4,786,210 | | | | 2,577,015 | | | | 117,853,098 | | | | (299,313 | ) |
Other temporary differences | | | (5 | ) | | | (10 | ) | | | (2 | ) | | | (2 | ) | | | 19 | | | | (7 | ) |
Total distributable earnings/ (accumulated losses) | | $ | 61,273,922 | | | $ | 11,897,785 | | | $ | 4,812,242 | | | $ | 3,419,792 | | | $ | 96,682,025 | | | $ | (17,359,497 | ) |
The Wilshire Income Opportunities Fund had not commenced operations at December 31, 2015.
9. In-Kind Transfers.
During the six months ended June 30, 2016, the Portfolios issued shares of common stock through an affiliated in-kind transfer of investment securities and cash. The securities were transferred at their current value on the date of the transaction.
Receiving Portfolio | Contributing Portfolio | Date of
Transfer | | Value of Investment Securities | | | Cash | | | Total
Assets | | | Shares
Issued | |
Wilshire Income Opportunities Fund | Wilshire Variable Insurance Trust Global Allocation Fund | 3/30/2016 | | $ | 156,418,546 | | | $ | (13,659,576 | ) | | $ | 142,758,970 | | | | 14,275,907 | |
109
Wilshire Mutual Funds, Inc. Notes to Financial Statements - (Continued) June 30, 2016 (Unaudited) |
|
10. Indemnifications.
In the normal course of business, the Company, on behalf of the Portfolios, enters into contracts that provide general indemnifications. The Portfolios’ maximum exposure under these arrangements is dependent on claims that may be made against the Portfolios in the future and, therefore, cannot be estimated; however, based on experience, the risk of material loss from such claims is considered remote.
11. Risks.
Asset-Backed Securities Risk – Investors in asset-backed securities, including mortgage-backed securities and structured finance investments, generally receive payments that are part interest and part return of principal. These payments may vary based on the rate at which the underlying borrowers pay off their loans or other future expected receivables of assets or cash flows. Some asset-backed securities, including mortgage-backed securities, may have structures that make their reaction to interest rates and other factors difficult to predict, making them subject to liquidity risk.
Collateralized debt obligation (“CDO”) risk – A CDO is an asset-backed security whose underlying collateral is typically a portfolio of bonds, bank loans, other structured finance securities and/or synthetic instruments. Where the underlying collateral is a portfolio of bonds, a CDO is referred to as a collateralized bond obligation (“CBO”). Where the underlying collateral is a portfolio of bank loans, a CDO is referred to as a collateralized loan obligation (“CLO”). Investors in CDOs bear the credit risk of the underlying collateral. Multiple tranches of securities are issued by the CDO, offering investors various maturity and credit risk characteristics. Tranches are categorized as senior, mezzanine, and subordinated/equity, according to their degree of risk. If there are defaults or the CDO’s collateral otherwise underperforms, scheduled payments to senior tranches take precedence over those of mezzanine tranches, and scheduled payments to mezzanine tranches take precedence over those to subordinated/equity tranches. CDOs are subject to the same risk of prepayment described with respect to certain mortgage-related and asset-backed securities, and are subject to credit risk, interest rate risk and default risk. The market value of CDOs may be affected by changes in the market’s perception of the creditworthiness of the servicing agent for the pool or the originator.
Forward contracts risk – There may be imperfect correlation between the price of a forward contract and the underlying security, index or currency which will increase the volatility of the Wilshire Income Opportunities Fund. The Portfolio bears the risk of loss of the amount expected to be received under a forward contract in the event of the default or bankruptcy of a counterparty. If such a default occurs, the Portfolio will have contractual remedies pursuant to the forward contract, but such remedies may be subject to bankruptcy and insolvency laws which could affect the Portfolio’s rights as a creditor. Forward currency transactions include risks associated with fluctuations in foreign currency.
Interest rate risk – For debt securities, interest rate risk is the possibility that the market price will fall because of changing interest rates. In general, debt securities’ market prices rise or fall inversely to changes in interest rates. If interest rates rise, bond market prices generally fall; if interest rates fall, bond market prices generally rise. In addition, for a given change in interest rates, the market price of longer-maturity bonds fluctuates more (gaining
110
Wilshire Mutual Funds, Inc. Notes to Financial Statements - (Continued) June 30, 2016 (Unaudited) |
|
or losing more in value) than shorter- maturity bonds. There may be less governmental intervention in influencing interest rates in the near future. If so, it could cause an increase in interest rates, which would have a negative impact on the market prices of fixed income securities and could negatively affect a Portfolio’s NAV.
Credit risk – A Portfolio’s debt instruments are subject to credit risk, which is the risk that an issuer will be unable, or will be perceived to be unable, to repay its obligations at maturity. Funds that invest primarily in high quality securities generally are subject to less credit risk than funds that invest in lower quality securities. Certain securities are backed by credit enhancements from various financial institutions and financial guarantee assurance agencies. These credit enhancements reinforce the credit quality of the individual securities; however, if any of the financial institutions or financial guarantee assurance agencies’ credit quality should deteriorate, it could cause the individual security’s credit quality to change. Additionally, if a Portfolio concentrates its credit enhancements in any one financial institution, the risk of credit quality deterioration increases. The value of asset-backed securities may be affected by the credit risk of the servicing agent for the pool, the originator of the loans or receivables, or the financial institution(s) providing the credit support. In addition to credit risk, asset-backed securities and other securities with early redemption features are subject to pre-payment risk. During periods of declining interest rates, prepayment of loans underlying asset-backed securities can be expected to accelerate or an issuer may retire an outstanding bond early to reduce interest costs. A Portfolio’s ability to maintain positions in such securities will be affected by reductions in the principal amount of such securities resulting from prepayments, and its ability to reinvest the returns of principal at comparable yields is subject to generally prevailing interest rates at that time.
Counterparty credit risk – Counterparty credit risk is the risk that a counterparty to a financial instrument will fail on a commitment that it has entered into with a Portfolio. A Portfolio’s sub-adviser seeks to minimize counterparty credit risk by monitoring the creditworthiness of each counterparty on an ongoing basis.
Foreign security risk – The Wilshire International Equity Fund and Wilshire Income Opportunities Fund invest in securities of foreign issuers in various countries. These investments may involve certain considerations and risks not typically associated with investments in the United States, as a result of, among other factors, the possibility of future political and economic developments and the level of governmental supervision and regulation of securities markets in the respective countries. The market values of the Portfolios’ investments will change in response to interest rate changes and other factors. During periods of falling interest rates, the values of fixed income securities generally rise. Conversely, during periods of rising interest rates, the values of such securities generally decline. Changes by recognized rating agencies in the ratings of any fixed income security and in the ability of an issuer to make payments of interest and principal may also affect the value of these investments. Also, the ability of the issuers of debt securities held by the Portfolios to meet their obligations may be affected by economic and political developments in a specific country, industry or region.
Investments in Loans Risk – Investments in loans involve special types of risks, including credit risk, interest rate risk, counterparty risk and prepayment risk. Loans may offer a fixed or floating interest rate. Loans are often generally below investment grade and may be unrated. Loans may be difficult to value and some can be subject to liquidity risk.
A more complete description of risks is included in each Portfolio’s prospectus and SAI.
111
Wilshire Mutual Funds, Inc. Notes to Financial Statements - (Continued) June 30, 2016 (Unaudited) |
|
12. Contingencies.
The Wilshire 5000 IndexSM Fund was named as a defendant and a putative member of a proposed defendant class of shareholders in a lawsuit filed on December 7, 2010, in the U.S. Bankruptcy Court for the District of Delaware and on March 6, 2012, in the District Court for the Southern District of New York, in connection with Tribune Company’s Chapter 11 bankruptcy proceeding. The 2010 lawsuit was brought by the official Committee of Unsecured Creditors of the Tribune Company and the 2012 lawsuit was brought by Deutsche Bank, as trustee for senior noteholders of Tribune Company. Both lawsuits relate to a leveraged buyout transaction by which Tribune Company converted to a privately-held company in 2007 less than a year prior to Tribune Company’s bankruptcy filing. The putative defendant class is comprised of beneficial owners of shares of Tribune Company who meet certain jurisdictional requirements and received proceeds of the leveraged buyout. The plaintiffs seek to recover those proceeds, together with interest and attorneys’ fees and expenses, as fraudulent transfers under the Bankruptcy Act or various state laws, respectively. On September 2013, the District Court dismissed the 2012 lawsuit and in March 2016 the Second Circuit Court of Appeals affirmed this decision. The 2010 lawsuit continues in the District Court. The Adviser does not expect the Portfolio to be materially impacted by the lawsuits.
13. Subsequent Event Evaluation.
The Portfolios have evaluated the need for additional disclosures and/or adjustments resulting from subsequent events through the date the financial statements were issued. Based on this evaluation, no additional disclosures and/or adjustments were required to the financial statements.
112
Wilshire Mutual Funds, Inc. Additional Fund Information (Unaudited) |
|
Information on Proxy Voting
The Securities and Exchange Commission (“SEC”) has adopted the requirement that all funds file their complete proxy voting records with the SEC on an annual basis on Form N-PX. Such filing, for the 12-month period ended June 30, must be made no later than August 31 of each year.
A description of policies and procedures that the Portfolios use to determine how to vote proxies relating to portfolio securities, along with each Portfolio’s proxy voting record relating to portfolio securities held during most recent 12-month period ended June 30 is available at no charge, upon request by calling 1-888-200-6796, by e-mailing us at http://advisor.wilshire.com or on the SEC’s website at http://www.sec.gov.
Information on Form N-Q
The Company files its complete schedule of portfolio holdings with the SEC for the first and third quarters of each fiscal year on Form N-Q within sixty days after the end of period. The Company’s Forms N-Q are available on the SEC’s website at http://www.sec.gov, and may be reviewed and copied at the SEC’s Public Reference Room in Washington, DC. Information on the operation of the Public Reference Room may be obtained by calling 1-202-551-8090.
Householding Policy
In order to reduce printing and mailing expenses, only one copy of each prospectus, annual and semi-annual report will be sent to all related accounts at a common address, unless you have indicated otherwise on your Account Application. Shareholders may revoke their consent to householding at any time by calling 1-888-200-6796. Upon receipt of a shareholder’s revocation, the Company will begin mailing individual copies of the above-referenced documents to the shareholder’s attention within 30 days.
113
Wilshire Mutual Funds, Inc. Board Approval of Advisory and Subadvisory Agreements (Unaudited) |
|
During the six months ended June 30, 2016, the Board of Directors (the “Board”) of Wilshire Mutual Funds, Inc. (the “Company”) approved the Company’s advisory agreement (the “Advisory Agreement”) with Wilshire Associates Incorporated (“Wilshire” or the “Adviser”) on behalf of the Wilshire Income Opportunities Fund (the “Income Fund”) and the subadvisory agreements between Wilshire and each of DoubleLine Capital LP (“DoubleLine”) and Guggenheim Partners Investment Management, LLC (“Guggenheim”) with respect to the Income Fund. The Board also approved a new subadvisory agreement between Wilshire and Barrow, Hanley, Mewhinney & Strauss LLC (“BHMS”) with respect to the Large Company Value Portfolio (the “Large Value Fund”). In the following text, DoubleLine, Guggenheim and BHMS are each referred to as a “Subadviser” and collectively as “Subadvisers,” the subadvisory agreements between Wilshire and each Subadviser are referred to as “Subadvisory Agreements” and the Income Fund and Large Value Fund are each referred to as a “Fund” and collectively as “Funds.”
The information in this summary outlines the Board’s considerations associated with its approval of the Advisory Agreement and the Subadvisory Agreements In connection with its deliberations regarding the approval of these relationships, the Board considered such information and factors as it believed to be relevant. As described below, the Board considered the nature, extent and quality of the services to be performed by Wilshire and the Subadvisers under the advisory arrangements; with respect to Wilshire, comparative fees and expense ratios; the profits to be realized by Wilshire and the Subadvisers; the extent to which Wilshire and the Subadvisers realize economies of scale; and whether any fall-out benefits would be realized by Wilshire and the Subadvisers. In considering these matters, the Board was advised with respect to relevant legal standards by independent legal counsel. In addition, the Directors who are not “interested persons” of the Company as defined in the Investment Company Act of 1940 (the “Independent Directors”) discussed the approval of the Advisory Agreement with management and in private sessions with independent legal counsel at which no representatives of Wilshire were present and discussed the approval of the Subadvisory Agreements with management and in private sessions with counsel at which no representatives of the Subadvisers were present.
As required by the Investment Company Act of 1940, each approval was confirmed by a vote of the Independent Directors. In deciding to approve the Advisory Agreement and the Subadvisory Agreements, the Board did not identify any single factor as controlling and this summary does not describe all of the matters considered. However, the Board concluded that each of the various factors referred to below favored such approval.
Information Requested and Received
The Board, including all the Independent Directors, considered approval of the Advisory and Subadvisory Agreements with respect to the Income Fund pursuant to a process that concluded at the Board’s February 22-23, 2016 meeting. The Board considered the approval of the Subadvisory Agreement with respect to the Large Value Fund at the Board’s May 16-17, 2016 meeting. The Adviser sent memoranda to the Subadvisers requesting information regarding the Subadvisory Agreements and the Adviser provided information regarding the Advisory and Subadvisory Agreements, as applicable, in advance of meetings of the Independent Directors held prior to the Board meetings on February 22-23, 2016 and May 16-17, 2016, respectively.
With respect to the Income Fund, the Directors noted that, at the Board’s November 17-18, 2015 meeting, the Board considered the annual renewal of the Advisory Agreement with respect to the other series of the Company and took the information provided by Wilshire in connection therewith into consideration with respect to its review of the Advisory Agreement with respect to the Income Fund.
With respect to the Income Fund, the Directors reviewed information from the Adviser describing: (i) the nature, extent and quality of services to be provided; (ii) the costs of services to be provided and estimated profits to be realized by the Adviser; (iii) the extent to which economies of scale may be realized; (iv) any economies of scale that may be realized by the Adviser and any sharing of such for the benefit of Fund shareholders; (v) comparisons of services rendered and
114
Wilshire Mutual Funds, Inc. Board Approval of Advisory and Subadvisory Agreements (Unaudited) - (continued) |
|
amounts paid by other registered investment companies as provided by Wilshire based upon data gathered from the Morningstar Direct database (“Morningstar”), and (vi) benefits to be realized by the Adviser from its relationship with the Fund.
The Directors received information from the Adviser regarding the factors underlying its recommendations to approve the Subadvisory Agreements. The Directors also received information from each Subadviser as to the Fund it would manage describing: (i) the nature, extent and quality of services to be provided; (ii) the financial condition of the Subadviser; (iii) the extent to which economies of scale may be realized as the Fund grows; (iv) whether fee levels reflect any possible economies of scale for the benefit of Fund shareholders; (v) comparisons of services rendered and amounts paid by other registered investment companies and any comparable advisory clients; and (vi) benefits to be realized by the Subadviser from its relationship with the Fund. The Independent Directors also received a memorandum from independent legal counsel describing their duties in connection with contract approvals, and they were assisted in their review by such counsel.
As a part of its evaluations, the Board considered the assessment of performance made by the Investment Committee (which is comprised solely of Independent Directors), which met on February 22, 2016 and May 16, 2016, respectively, to review data on DoubleLine’s and Guggenheim’s performance for managing other fixed income investments products and on BHMS’ performance for managing investment products similar to the Large Value Fund. Based upon its evaluation of all materials provided, the Board concluded that it was in the best interests of the Income Fund to approve the Advisory Agreement and each Subadvisory Agreement and that it was in the best interests of the Large Value Fund to approve the Subadvisory Agreement.
Nature, Extent and Quality of Services – Wilshire (Income Fund)
With respect to the nature, extent and quality of services to be provided by the Adviser, the Board reviewed the functions currently performed by the Adviser with respect to the other series of the Company, noting that the Adviser would engage and oversee subadvisers to manage the assets of the Fund. The Board considered the experience and skills of the senior management leading Company operations, the experience and skills of the personnel performing the functions under the Advisory Agreement and the resources made available to such personnel. The Board determined that the current personnel had the requisite skill sets. The Board also considered the compliance program established by the Adviser and the level of compliance maintained for the Company, noting that no issues had been reported to the Board. The Board reviewed the processes used by the Adviser to select, monitor and replace subadvisers. The Board concluded that the Adviser was successful in negotiating favorable subadvisory agreements on behalf of the Fund and that the Adviser had a robust system in place for selecting, monitoring and terminating subadvisers, which system appeared to be reasonable. The Board also reviewed the Adviser’s financial condition, and considered the financial support to be provided by the Adviser to the Fund pursuant to an expense limitation agreement. Based upon all relevant factors, the Board concluded that the nature, quality and extent of the services to be provided by the Adviser to the Fund support approval of the contract.
Advisory Fees (Income Fund)
The Board reviewed the Fund’s proposed advisory fee and estimated total expense ratio and reviewed information comparing them to those of a peer group of funds. The Board concluded the proposed advisory fee was in a competitive range with a subset of the Fund’s expected peer group as selected by the Adviser. As to estimated total expenses, the Board noted that total expenses will be influenced by the small size of the complex. The Board also noted that the Adviser has agreed to waive advisory fees and reimburse expenses for the Fund pursuant to an expense limitation agreement. The Board noted that the Adviser does not advise other registered investment companies that are similar to the Fund. The Board concluded that the advisory fee for the Fund was reasonable.
115
Wilshire Mutual Funds, Inc. Board Approval of Advisory and Subadvisory Agreements (Unaudited) - (continued) |
|
Profitability to Wilshire and Economies of Scale (Income Fund)
With respect to the profitability of the Advisory Agreement, the Board noted the start-up status of the Fund. In addition, the Board considered the extent to which economies of scale may be realized and whether fee levels reasonably reflect economies of scale for the benefit of shareholders. The Board reviewed the Fund’s expected asset size, the Fund’s estimated expense ratio, the expense limitation agreement and whether the investment process would produce economies of scale. The Board concluded that the Fund’s advisory fee reasonably reflects any economies of scale.
Fall-Out Benefits – Wilshire (Income Fund)
The Board considered other benefits expected to be derived by the Adviser from its relationship with the Fund. The Board determined that the advisory fee was reasonable in light of any expected fall-out benefits.
Nature, Extent and Quality of Services – Subadvisers
As to each Subadvisory Agreement, the Board considered the nature, extent and quality of services to be provided. The Board considered the reputation, qualifications and background of each Subadviser, investment approach of the Subadviser, the experience and skills of investment personnel to be responsible for the day-to-day portfolio management of the Fund, and the resources made available to such personnel. In addition, the Board considered the analysis provided by the Adviser, which concluded that each Subadviser would provide reasonable services, and that the Adviser recommended that each Subadvisory Agreement be approved.
The Board noted that DoubleLine does not currently manage investment products using the same investment strategy that will be used for the Income Fund and that Guggenheim does not currently manage investment products with the same allocations to certain securities as are expected for the Income Fund.
The Board reviewed information comparing BHMS’ gross investment performance for managing investment products similar to the Large Value Fund to the Russell 1000 Value Index. The Board noted that BHMS outperformed the Russell 1000 Value Index for the one-, three-, five- and seven-year periods ended March 31, 2016.
Subadvisory Fees
The Board considered the proposed subadvisory fees. The Board evaluated the competitiveness of the subadvisory fees based upon data supplied by each Subadviser about the fees charged to its other clients with comparable investment policies and services. The Board noted that DoubleLine reported that it believes that the proposed fee to be charged the Adviser is in line with the fees charged to its other subadvised clients. The Board noted that Guggenheim reported that it charged higher fees to the Adviser for the Income Fund than were charged to certain of Guggenheim’s other clients, however, Guggenheim explained that higher potential allocations to certain types of more complex securities for the Income Fund justified the higher fee. BHMS represented that it charges all clients with comparable investment policies and services according to a standard fee schedule, but that it has negotiated fees with clients based on their use of multiple investment strategies. The Board also considered that the subadvisory fee rates were negotiated at arm’s length between the Adviser and each Subadviser, that the Adviser compensates the Subadviser from its fees, and that the aggregate advisory fee had been deemed reasonable by the Board.
Based upon all of the above, the Board determined that the subadvisory fees were reasonable.
116
Wilshire Mutual Funds, Inc. Board Approval of Advisory and Subadvisory Agreements (Unaudited) - (continued) |
|
Profitability to the Subadvisers
The Board noted that the Adviser will compensate each Subadviser from its own advisory fees and that the fees were negotiated at arm’s length between the Adviser and each Subadviser. In addition, the Board noted that the revenues to the Subadvisers would be limited due to the start-up status of the Income Fund and the size of the Large Value Fund, as applicable. The Board took these factors into account in concluding that the subadvisory fees were reasonable.
Economies of Scale – Subadvisers
The Board considered whether there may be economies of scale with respect to the subadvisory services provided to each Fund and whether the subadvisory fees reflect such economies of scale through breakpoints in fees. The Board also considered whether the estimated effective subadvisory fee rate for each Fund under the Subadvisory Agreement is reasonable in relation to the expected asset size of such Fund. The Board concluded that each fee schedule reasonably reflects any economies of scale.
Fall-Out Benefits – Subadvisers
The Board also considered Guggenheim’s response that it did not anticipate material incidental benefits from managing the Income Fund and DoubleLine’s response that it anticipates certain indirect benefits from managing the Income Fund.
The Board also considered the character and amount of other incidental benefits to be received by BHMS. The Board considered BHMS’ soft dollar practices. The Board concluded that, taking into account the benefits arising from these practices, the fees charged under the Subadvisory Agreement with respect to the Large Value Fund were reasonable.
Conclusion
Based upon all of the information considered and the conclusions reached, the Board determined that the terms of the Advisory Agreement and the Subadvisory Agreements are fair and reasonable and that the approval of the Advisory Agreement and each Subadvisory Agreement is in the best interests of the Income Fund.
Based upon all of the information considered and the conclusions reached, the Board determined that the terms of the Subadvisory Agreement are fair and reasonable and that the approval of the Subadvisory Agreement is in the best interests of the Large Value Fund.
117

Wilshire Mutual Funds
Wilshire Associates Incorporated
1299 Ocean Avenue
Santa Monica, CA 90401
1-888-200-6796
http://advisor.wilshire.com
WIL-SA-004-0400
Not applicable.
| Item 3. | Audit Committee Financial Expert. |
Not applicable.
| Item 4. | Principal Accountant Fees and Services. |
Not applicable.
| Item 5. | Audit Committee of Listed Registrants. |
Not applicable.
| Item 6. | Schedule of Investments. |
| (a) | The Schedules of Investments in securities of unaffiliated issuers as of the close of the reporting period for the the Large Company Growth Portfolio, the Large Company Value Portfolio, the Small Company Growth Portfolio, the Small Company Value Portfolio, the Wilshire 5000 IndexSM Fund, and the Wilshire International Equity Fund are listed below. |
Wilshire Mutual Funds, Inc. Large Company Growth Portfolio Schedule of Investments | June 30, 2016 (unaudited) |
| Shares | | | | Value | |
| | |
COMMON STOCK — 98.5%†† | | | |
Consumer Discretionary — 17.0% | | | |
| | 17,539 | | Amazon.com, Inc.† | | $ | 12,551,259 | |
| | 17,890 | | Aramark(a) | | | 597,884 | |
| | 436 | | AutoZone, Inc.†(a) | | | 346,114 | |
| | 7,700 | | Bed Bath & Beyond, Inc.(a) | | | 332,794 | |
| | 30 | | Brunswick Corp. | | | 1,359 | |
| | 413 | | Charter Communications, Inc., Class A† | | | 94,428 | |
| | 4,000 | | Chipotle Mexican Grill, Inc., Class A†(a) | | | 1,611,040 | |
| | 1,350 | | Choice Hotels International, Inc.(a) | | | 64,287 | |
| | 14,230 | | Coach, Inc.(a) | | | 579,730 | |
| | 15,606 | | Comcast Corp., Class A | | | 1,017,355 | |
| | 1,391 | | Darden Restaurants, Inc.(a) | | | 88,106 | |
| | 2,905 | | DISH Network Corp., Class A† | | | 152,222 | |
| | 17,355 | | Gentex Corp.(a) | | | 268,135 | |
| | 2,629 | | Genuine Parts Co.(a) | | | 266,186 | |
| | 7,210 | | Home Depot, Inc. (The) | | | 920,645 | |
| | 950 | | Leggett & Platt, Inc. | | | 48,554 | |
| | 7,025 | | Liberty Interactive Corp., Class A† | | | 178,224 | |
| | 4,333 | | Lowe's Cos., Inc. | | | 343,044 | |
| | 3,620 | | Macy's, Inc. | | | 121,668 | |
| | 737 | | Madison Square Garden Co.† | | | 127,140 | |
| | 22,610 | | Mattel, Inc. | | | 707,467 | |
| | 11,424 | | McDonald's Corp. | | | 1,374,764 | |
| | 160 | | Mohawk Industries, Inc.† | | | 30,362 | |
| | 2,705 | | Newell Brands, Inc. | | | 131,382 | |
| | 45,350 | | NIKE, Inc., Class B | | | 2,503,320 | |
| | 417 | | NVR, Inc.† | | | 742,402 | |
| | 6,221 | | Omnicom Group, Inc.(a) | | | 506,949 | |
| | 11,475 | | O'Reilly Automotive, Inc.†(a) | | | 3,110,873 | |
| | 1,625 | | Priceline Group, Inc.†(a) | | | 2,028,667 | |
| | 6,065 | | Ralph Lauren Corp., Class A(a) | | | 543,545 | |
| | 6,863 | | Service Corp. International | | | 185,576 | |
| | 4,000 | | ServiceMaster Global Holdings, Inc.†(a) | | | 159,200 | |
| | 4,450 | | Six Flags Entertainment Corp.(a) | | | 257,877 | |
| | 53,515 | | Starbucks Corp. | | | 3,056,777 | |
| | 9,275 | | Starz† | | | 277,508 | |
| | 6,770 | | TJX Cos., Inc. | | | 522,847 | |
| | 31,875 | | Tractor Supply Co. | | | 2,906,362 | |
| | 2,240 | | Tupperware Brands Corp.(a) | | | 126,067 | |
| | 17,200 | | Ulta Salon Cosmetics & Fragrance, Inc.†(a) | | | 4,190,608 | |
| | 6,374 | | Walt Disney Co. (The) | | | 623,505 | |
| | 3,795 | | Wyndham Worldwide Corp.(a) | | | 270,318 | |
| | 36,717 | | Yum! Brands, Inc. | | | 3,044,574 | |
| | | | | | | 47,011,124 | |
Consumer Staples — 13.9% | | | | |
| | 6,732 | | Altria Group, Inc. | | | 464,239 | |
| | 3,278 | | Campbell Soup Co. | | | 218,085 | |
| | 6,175 | | Church & Dwight Co., Inc. | | | 635,346 | |
| | 7,700 | | Clorox Co. (The) | | | 1,065,603 | |
| | 130,031 | | Coca-Cola Co. (The) | | | 5,894,305 | |
| | 9,308 | | Coca-Cola European Partners PLC | | | 332,202 | |
| | 9,175 | | Colgate-Palmolive Co. | | | 671,610 | |
| | 524 | | ConAgra Foods, Inc. | | | 25,052 | |
| | 18,600 | | Constellation Brands, Inc., Class A | | | 3,076,440 | |
| | 15,355 | | Costco Wholesale Corp.(a) | | | 2,411,349 | |
| | 254,834 | | Danone SA ADR(a) | | | 3,610,998 | |
| | 1,395 | | Dr. Pepper Snapple Group, Inc.(a) | | | 134,799 | |
| | 12,415 | | General Mills, Inc. | | | 885,438 | |
| | 1,285 | | Hershey Co. (The)(a) | | | 145,835 | |
| | 11,297 | | Kellogg Co. | | | 922,400 | |
| | 6,330 | | Kimberly-Clark Corp. | | | 870,248 | |
| Shares | | | | Value | |
Consumer Staples — (continued) | | | |
| | 765 | | Mead Johnson Nutrition Co., Class A | | $ | 69,424 | |
| | 50,132 | | Monster Beverage Corp.†(a) | | | 8,056,714 | |
| | 14,153 | | PepsiCo, Inc. | | | 1,499,369 | |
| | 13,449 | | Philip Morris International, Inc. | | | 1,368,032 | |
| | 42,432 | | Procter & Gamble Co. (The) | | | 3,592,718 | |
| | 34,780 | | Rite Aid Corp.† | | | 260,502 | |
| | 39,941 | | SABMiller PLC ADR(a) | | | 2,338,146 | |
| | | | | | | 38,548,854 | |
Energy — 1.3% | | | | |
| | 2,182 | | Apache Corp. | | | 121,472 | |
| | 2,845 | | Cabot Oil & Gas Corp. | | | 73,230 | |
| | 3,065 | | EOG Resources, Inc. | | | 255,682 | |
| | 10,155 | | FMC Technologies, Inc.† | | | 270,834 | |
| | 5,601 | | HollyFrontier Corp.(a) | | | 133,136 | |
| | 2,760 | | Memorial Resource Development Corp.† | | | 43,829 | |
| | 34,613 | | Schlumberger, Ltd. | | | 2,737,196 | |
| | | | | | | 3,635,379 | |
Financials — 4.4% | | | | |
| | 14,940 | | American Express Co. | | | 907,755 | |
| | 6,728 | | Aon PLC | | | 734,899 | |
| | 15,126 | | Arthur J. Gallagher & Co. | | | 719,998 | |
| | 3,210 | | Brown & Brown, Inc.(a) | | | 120,279 | |
| | 10,468 | | CBOE Holdings, Inc.(a) | | | 697,378 | |
| | 64,400 | | Charles Schwab Corp. (The)(a) | | | 1,629,964 | |
| | 2,252 | | Crown Castle International Corp. | | | 228,420 | |
| | 2,940 | | Equity LifeStyle Properties, Inc.(b) | | | 235,347 | |
| | 4,445 | | Erie Indemnity Co., Class A(a) | | | 441,566 | |
| | 11,704 | | FactSet Research Systems, Inc.(a) | | | 1,889,260 | |
| | 2,910 | | Federal Realty Investment Trust (b) | | | 481,751 | |
| | 1,040 | | Gaming and Leisure Properties, Inc.(b) | | | 35,859 | |
| | 4,703 | | Greenhill & Co., Inc.(a) | | | 75,718 | |
| | 930 | | Iron Mountain, Inc.(a) (b) | | | 37,042 | |
| | 16,224 | | Lamar Advertising Co., Class A(a) (b) | | | 1,075,651 | |
| | 14,115 | | Leucadia National Corp.(a) | | | 244,613 | |
| | 16,755 | | Marsh & McLennan Cos., Inc. | | | 1,147,047 | |
| | 4,085 | | Post Properties, Inc.(b) | | | 249,389 | |
| | 1,097 | | Public Storage(b) | | | 280,382 | |
| | 5,400 | | Regency Centers Corp. | | | 452,142 | |
| | 131 | | S&P Global, Inc. | | | 14,051 | |
| | 1,893 | | Simon Property Group, Inc.(b) | | | 410,592 | |
| | 720 | | Taubman Centers, Inc.(a) (b) | | | 53,424 | |
| | | | | | | 12,162,527 | |
Health Care — 16.0% | | | | |
| | 5,732 | | Abbott Laboratories | | | 225,325 | |
| | 9,490 | | AbbVie, Inc.(a) | | | 587,526 | |
| | 21,075 | | Alexion Pharmaceuticals, Inc.† | | | 2,460,717 | |
| | 4,511 | | AmerisourceBergen Corp., Class A | | | 357,812 | |
| | 20,707 | | Amgen, Inc. | | | 3,150,570 | |
| | 17,553 | | Baxter International, Inc.(a) | | | 793,747 | |
| | 1,623 | | Becton Dickinson and Co. | | | 275,244 | |
| | 53,049 | | Bristol-Myers Squibb Co. | | | 3,901,754 | |
| | 4,800 | | Bruker Corp. | | | 109,152 | |
| | 3,942 | | C.R. Bard, Inc. | | | 927,001 | |
| | 4,598 | | Cardinal Health, Inc. | | | 358,690 | |
| | 35,158 | | Celgene Corp.†(a) | | | 3,467,633 | |
| | 46,875 | | Centene Corp.† | | | 3,345,469 | |
| | 56,602 | | Cerner Corp.† | | | 3,316,877 | |
| | 2,430 | | Cigna Corp. | | | 311,016 | |
| | 584 | | DaVita HealthCare Partners, Inc.† | | | 45,155 | |
| | 26,525 | | Edwards Lifesciences Corp.† | | | 2,645,338 | |
| | 5,865 | | Eli Lilly & Co. | | | 461,869 | |
| | 7,055 | | Endo International PLC†(a) | | | 109,987 | |
| | 10,444 | | Express Scripts Holding Co.† | | | 791,655 | |
Wilshire Mutual Funds, Inc. Large Company Growth Portfolio Schedule of Investments | June 30, 2016 (unaudited) |
| Shares | | | | Value | |
Health Care — (continued) | | | |
| | 54 | | HCA Holdings, Inc.† | | $ | 4,159 | |
| | 13,978 | | Hologic, Inc.† | | | 483,639 | |
| | 21,550 | | IDEXX Laboratories, Inc.†(a) | | | 2,001,133 | |
| | 354 | | Intuitive Surgical, Inc.† | | | 234,139 | |
| | 15,040 | | Ionis Pharmaceuticals, Inc.†(a) | | | 350,282 | |
| | 9,877 | | Johnson & Johnson | | | 1,198,080 | |
| | 532 | | McKesson Corp. | | | 99,298 | |
| | 1,663 | | MEDNAX, Inc.†(a) | | | 120,451 | |
| | 40,999 | | Merck & Co., Inc. | | | 2,361,952 | |
| | 594 | | Mettler-Toledo International, Inc.† | | | 216,763 | |
| | 27,884 | | Novartis AG ADR(a) | | | 2,300,709 | |
| | 58,363 | | Novo Nordisk ADR(a) | | | 3,138,762 | |
| | 2,669 | | PerkinElmer, Inc. | | | 139,909 | |
| | 279 | | Perrigo Co. PLC(a) | | | 25,297 | |
| | 8,045 | | Premier, Inc., Class A†(a) | | | 263,071 | |
| | - | | Shire PLC ADR | | | 15 | |
| | 4,195 | | UnitedHealth Group, Inc. | | | 592,334 | |
| | 450 | | Universal Health Services, Inc., Class B | | | 60,345 | |
| | 29,439 | | Varian Medical Systems, Inc.†(a) | | | 2,420,769 | |
| | 2,835 | | VCA, Inc.† | | | 191,674 | |
| | 1,805 | | Veeva Systems, Inc., Class A†(a) | | | 61,587 | |
| | 2,555 | | Vertex Pharmaceuticals, Inc.†(a) | | | 219,781 | |
| | | | | | | 44,126,686 | |
Industrials — 6.9% | | | | |
| | 4,852 | | 3M Co. | | | 849,682 | |
| | 10,350 | | Acuity Brands, Inc.(a) | | | 2,566,386 | |
| | 1,475 | | Allegion PLC | | | 102,409 | |
| | 3,965 | | AO Smith Corp. | | | 349,356 | |
| | 1,926 | | Boeing Co. (The) | | | 250,130 | |
| | 650 | | BWX Technologies, Inc., Class W | | | 23,251 | |
| | 21,025 | | Canadian Pacific Railway, Ltd. | | | 2,707,810 | |
| | 3,230 | | Caterpillar, Inc.(a) | | | 244,866 | |
| | 100 | | Cummins, Inc. | | | 11,244 | |
| | 840 | | Danaher Corp. | | | 84,840 | |
| | 275 | | Deere & Co.(a) | | | 22,286 | |
| | 2,750 | | Emerson Electric Co. | | | 143,440 | |
| | 635 | | Equifax, Inc. | | | 81,534 | |
| | 63,101 | | Expeditors International of Washington, Inc. | | | 3,094,473 | |
| | 655 | | Flowserve Corp.(a) | | | 29,587 | |
| | 11,400 | | Hertz Global Holdings, Inc.† | | | 126,198 | |
| | 6,392 | | Honeywell International, Inc. | | | 743,517 | |
| | 1,625 | | KAR Auction Services, Inc. | | | 67,827 | |
| | 4,295 | | Landstar System, Inc.(a) | | | 294,894 | |
| | 3,093 | | Lockheed Martin Corp. | | | 767,590 | |
| | 1,705 | | MSC Industrial Direct Co., Inc., Class A(a) | | | 120,305 | |
| | 1,400 | | Nielsen Holdings PLC(a) | | | 72,758 | |
| | 1,173 | | Northrop Grumman Corp. | | | 260,734 | |
| | 16,458 | | Rollins, Inc.(a) | | | 481,726 | |
| | 910 | | Snap-on, Inc. | | | 143,616 | |
| | 2,690 | | Stericycle, Inc.†(a) | | | 280,083 | |
| | 3,905 | | Toro Co. (The) | | | 344,421 | |
| | 38,165 | | United Parcel Service, Inc., Class B | | | 4,111,134 | |
| | 950 | | Verisk Analytics, Inc., Class A† | | | 77,026 | |
| | 8,300 | | Waste Management, Inc. | | | 550,041 | |
| | | | | | | 19,003,164 | |
Information Technology — 35.3% | | | | |
| | 4,174 | | Accenture PLC, Class A | | | 472,872 | |
| | 29,325 | | Adobe Systems, Inc.† | | | 2,809,042 | |
| | 54,586 | | Alibaba Group Holding, Ltd. ADR†(a) | | | 4,341,224 | |
| | 11,099 | | Alphabet, Inc., Class C† | | | 7,681,618 | |
| | 5,562 | | Alphabet, Inc., Class A† | | | 3,913,034 | |
| Shares | | | | Value | |
Information Technology — (continued) | | | |
| | 7,175 | | Analog Devices, Inc. | | $ | 406,392 | |
| | 430 | | ANSYS, Inc.† | | | 39,023 | |
| | 57,032 | | Apple, Inc. | | | 5,452,259 | |
| | 81,800 | | Applied Materials, Inc. | | | 1,960,746 | |
| | 55,973 | | ARM Holdings PLC ADR | | | 2,547,331 | |
| | 2,175 | | ARRIS International PLC†(a) | | | 45,588 | |
| | 53,275 | | Autodesk, Inc.†(a) | | | 2,884,309 | |
| | 13,915 | | Automatic Data Processing, Inc. | | | 1,278,371 | |
| | 12,090 | | Booz Allen Hamilton Holding Corp., Class A | | | 358,348 | |
| | 1,162 | | CDK Global, Inc.(a) | | | 64,479 | |
| | 173,171 | | Cisco Systems, Inc. | | | 4,968,276 | |
| | 2,969 | | Citrix Systems, Inc.† | | | 237,787 | |
| | 47,250 | | Cognizant Technology Solutions Corp., Class A† | | | 2,704,590 | |
| | 4,143 | | CommScope Holding Co., Inc.† | | | 128,557 | |
| | 5,558 | | Cree, Inc.†(a) | | | 135,838 | |
| | 4,570 | | CSRA, Inc.(a) | | | 107,075 | |
| | 1,585 | | DST Systems, Inc. | | | 184,541 | |
| | 106,838 | | Facebook, Inc., Class A† | | | 12,209,447 | |
| | 2,592 | | Fidelity National Information Services, Inc. | | | 190,979 | |
| | 645 | | Fiserv, Inc.† | | | 70,131 | |
| | 1,035 | | Intel Corp.(a) | | | 33,948 | |
| | 13,165 | | International Business Machines Corp.(a) | | | 1,998,184 | |
| | 7,115 | | Intuit, Inc. | | | 794,105 | |
| | 6,778 | | Jack Henry & Associates, Inc. | | | 591,516 | |
| | 2,455 | | LinkedIn Corp., Class A† | | | 464,609 | |
| | 4,252 | | MasterCard, Inc., Class A | | | 374,431 | |
| | 950 | | Maxim Integrated Products, Inc. | | | 33,906 | |
| | 77,923 | | Microsoft Corp. | | | 3,987,320 | |
| | 7,241 | | Motorola Solutions, Inc. | | | 477,689 | |
| | 4,460 | | NetSuite, Inc.†(a) | | | 324,688 | |
| | 87,469 | | Nuance Communications, Inc.† | | | 1,367,140 | |
| | 28,600 | | NXP Semiconductors NV† | | | 2,240,524 | |
| | 126,975 | | Oracle Corp. | | | 5,197,087 | |
| | 14,875 | | Palo Alto Networks, Inc.†(a) | | | 1,824,270 | |
| | 4,865 | | Paychex, Inc. | | | 289,467 | |
| | 4,631 | | PTC, Inc.† | | | 174,033 | |
| | 89,388 | | QUALCOMM, Inc. | | | 4,788,515 | |
| | 13,900 | | Rackspace Hosting, Inc.†(a) | | | 289,954 | |
| | 270 | | Red Hat, Inc.† | | | 19,602 | |
| | 96,785 | | Sabre Corp. | | | 2,592,870 | |
| | 37,725 | | salesforce.com, Inc.† | | | 2,995,742 | |
| | 1,440 | | Splunk, Inc.†(a) | | | 78,019 | |
| | 2,935 | | Symantec Corp. | | | 60,285 | |
| | 9,864 | | Tableau Software, Inc., Class A† | | | 482,547 | |
| | 5,655 | | Teradata Corp.†(a) | | | 141,771 | |
| | 4,780 | | Texas Instruments, Inc. | | | 299,467 | |
| | 14,206 | | Trimble Navigation, Ltd.† | | | 346,058 | |
| | 590 | | Twitter, Inc.†(a) | | | 9,977 | |
| | 8,790 | | Vantiv, Inc., Class A† | | | 497,514 | |
| | 2,265 | | VeriFone Systems, Inc.†(a) | | | 41,993 | |
| | 113,321 | | Visa, Inc., Class A(a) | | | 8,405,019 | |
| | 29,333 | | Western Union Co. (The)(a) | | | 562,607 | |
| | 100 | | Workday, Inc., Class A† | | | 7,467 | |
| | 580 | | Xilinx, Inc.(a) | | | 26,755 | |
| | 16,462 | | Yelp, Inc., Class A†(a) | | | 499,786 | |
| | | | | | | 97,510,722 | |
Materials — 3.2% | | | | |
| | 840 | | AptarGroup, Inc.(a) | | | 66,469 | |
| | 3,585 | | Ashland, Inc. | | | 411,451 | |
| | 4,270 | | Avery Dennison Corp. | | | 319,182 | |
| | 780 | | Axalta Coating Systems, Ltd.† | | | 20,693 | |
Wilshire Mutual Funds, Inc. Large Company Growth Portfolio Schedule of Investments | June 30, 2016 (unaudited) |
| Shares | | | | Value | |
Materials — (continued) | | | |
| | 502 | | Ball Corp.(a) | | $ | 36,290 | |
| | 100 | | Bemis Co., Inc. | | | 5,149 | |
| | 1,085 | | Celanese Corp., Class A | | | 71,013 | |
| | 1,642 | | Compass Minerals International, Inc.(a) | | | 121,820 | |
| | 4,809 | | Crown Holdings, Inc.† | | | 243,672 | |
| | 2,840 | | Eastman Chemical Co. | | | 192,836 | |
| | 4,365 | | FMC Corp.(a) | | | 202,143 | |
| | 2,970 | | GCP Applied Technologies, Inc.†(a) | | | 77,339 | |
| | 590 | | Huntsman Corp. | | | 7,936 | |
| | 6,600 | | International Paper Co. | | | 279,708 | |
| | 6,935 | | LyondellBasell Industries NV, Class A | | | 516,103 | |
| | 10,821 | | Monsanto Co. | | | 1,119,000 | |
| | 1,545 | | Owens-Illinois, Inc.†(a) | | | 27,825 | |
| | 2,155 | | PPG Industries, Inc. | | | 224,443 | |
| | 3,970 | | Praxair, Inc. | | | 446,188 | |
| | 1,780 | | Sealed Air Corp. | | | 81,827 | |
| | 13,556 | | Sherwin-Williams Co. (The) | | | 3,980,991 | |
| | 3,645 | | WR Grace & Co. | | | 266,850 | |
| | | | | | | 8,718,928 | |
Telecommunication Services — 0.5% | | | | |
| | 5,034 | | AT&T, Inc. | | | 217,519 | |
| | 19,907 | | Verizon Communications, Inc. | | | 1,111,607 | |
| | | | | | | 1,329,126 | |
| Total Common Stock | | | | |
| (Cost $212,026,765) | | | 272,046,510 | |
| | |
SHORT-TERM INVESTMENTS (c) — 22.5% | |
| | 4,012,423 | | Northern Trust Institutional Government Select Portfolio, Institutional Class 0.240% | | | 4,012,423 | |
| | 58,285,375 | | Northern Trust Institutional Liquid Asset Portfolio, Institutional Class, 0.520%(d) | | | 58,285,375 | |
| | | | | | | | |
| Total Short-Term Investments | | | | |
| (Cost $62,297,798) | | | 62,297,798 | |
Total Investments — 121.0% | | | | |
| (Cost $274,324,563) | | | 334,344,308 | |
Other Assets & Liabilities, Net — (21.0)% | | | (58,079,584 | ) |
NET ASSETS — 100.0% | | $ | 276,264,724 | |
| †† | More narrow industries are utilized for compliance purposes, whereas broad sectors are utilized for reporting purposes. |
| † | Non-income producing security. |
| (a) | This security or a partial position of this security is on loan at June 30, 2016. The total market value of securities on loan at June 30, 2016 was $59,217,936 (Note 6). |
| (b) | Real Estate Investment Trust. |
| (c) | Rate shown is the 7-day effective yield as of June 30, 2016. |
| (d) | This security was purchased with cash collateral held from securities on loan. The total value of such securities as of June 30, 2016 was $58,285,375. Securities on loan are also collateralized by various U.S. Treasury obligations in the amount of $1,960,847 (Note 6). |
ADR — American Depositary Receipt Ltd. — Limited PLC — Public Limited Company |
| |
Amounts designated as “—” are either $0, or have been rounded to $0
As of June 30, 2016, all of the Portfolio’s investments were considered Level 1. For the six months ended June 30, 2016, there have been no transfers between Level 1 and Level 2 assets and liabilities. For the six months ended June 30, 2016, there have been no transfers between Level 2 and Level 3 assets and liabilities. Please see Note 2 in Notes to Financial Statements for further information regarding fair value measurements.
Wilshire Mutual Funds, Inc. Large Company Value Portfolio Schedule of Investments | June 30, 2016 (unaudited) |
| Shares | | | | Value | |
| | |
COMMON STOCK — 98.9%†† | | | |
Consumer Discretionary — 6.5% | | | |
| | 4,110 | | Aramark | | $ | 137,356 | |
| | 2,850 | | Choice Hotels International, Inc. | | | 135,717 | |
| | 3,515 | | Coach, Inc. | | | 143,201 | |
| | 112,525 | | Ford Motor Co. | | | 1,414,439 | |
| | 38,400 | | Gap, Inc. (The) | | | 814,848 | |
| | 9,222 | | General Motors Co. | | | 260,983 | |
| | 25,883 | | Gentex Corp. | | | 399,892 | |
| | 743 | | Genuine Parts Co. | | | 75,229 | |
| | 30,575 | | Interpublic Group of Cos., Inc. (The) | | | 706,282 | |
| | 515 | | John Wiley & Sons, Inc., Class A | | | 26,873 | |
| | 16,339 | | Johnson Controls, Inc. | | | 723,164 | |
| | 8,600 | | Kohl's Corp. | | | 326,112 | |
| | 30,300 | | Lennar Corp., Class A | | | 1,396,830 | |
| | 543 | | Liberty Media Group, Class C† | | | 10,301 | |
| | 3,035 | | Macy's, Inc. | | | 102,006 | |
| | 4,895 | | Mattel, Inc. | | | 153,165 | |
| | 89,450 | | News Corp., Class A | | | 1,015,258 | |
| | 17,600 | | Omnicom Group, Inc. | | | 1,434,224 | |
| | 625 | | PVH Corp. | | | 58,894 | |
| | 4,530 | | Ralph Lauren Corp., Class A | | | 405,978 | |
| | 115,830 | | Staples, Inc. | | | 998,455 | |
| | 1,360 | | Starz† | | | 40,691 | |
| | 24,274 | | Target Corp. | | | 1,694,811 | |
| | 1,405 | | TEGNA, Inc. | | | 32,554 | |
| | 2,062 | | Thomson Reuters Corp. | | | 83,346 | |
| | 4,800 | | Whirlpool Corp. | | | 799,872 | |
| | | | | | | 13,390,481 | |
Consumer Staples — 6.9% | | | | |
| | 32,300 | | Altria Group, Inc. | | | 2,227,408 | |
| | 5,645 | | Avon Products, Inc. | | | 21,338 | |
| | 3,272 | | Clorox Co. (The) | | | 452,812 | |
| | 7,915 | | Colgate-Palmolive Co. | | | 579,378 | |
| | 495 | | ConAgra Foods, Inc. | | | 23,666 | |
| | 6,825 | | CVS Health Corp. | | | 653,425 | |
| | 640 | | Edgewell Personal Care Co. | | | 54,023 | |
| | 15,136 | | Kellogg Co. | | | 1,235,854 | |
| | 916 | | Kimberly-Clark Corp. | | | 125,932 | |
| | 26,096 | | Philip Morris International, Inc. | | | 2,654,485 | |
| | 20,327 | | Procter & Gamble Co. (The) | | | 1,721,087 | |
| | 57,275 | | Wal-Mart Stores, Inc. | | | 4,182,221 | |
| | 6,950 | | Whole Foods Market, Inc. | | | 222,539 | |
| | | | | | | 14,154,168 | |
Energy — 13.3% | | | | |
| | 2,635 | | Anadarko Petroleum Corp. | | | 140,314 | |
| | 15,175 | | Apache Corp. | | | 844,792 | |
| | 7,100 | | Baker Hughes, Inc. | | | 320,423 | |
| | 90,378 | | BP PLC ADR | | | 3,209,323 | |
| | 15 | | California Resources Corp. | | | 181 | |
| | 48,175 | | Cenovus Energy, Inc. | | | 665,778 | |
| | 14,944 | | Chevron Corp. | | | 1,566,579 | |
| | 9,801 | | Cobalt International Energy, Inc.† | | | 13,133 | |
| | 47,095 | | ConocoPhillips | | | 2,053,342 | |
| | 4,925 | | Devon Energy Corp. | | | 178,531 | |
| | 10,909 | | Ensco PLC, Class A | | | 105,926 | |
| | 1,560 | | EOG Resources, Inc. | | | 130,135 | |
| | 55,927 | | Exxon Mobil Corp. | | | 5,242,597 | |
| | 18,208 | | FMC Technologies, Inc.† | | | 485,607 | |
| | 6,753 | | Gulfport Energy Corp.† | | | 211,099 | |
| | 16,150 | | Halliburton Co. | | | 731,434 | |
| | 2,840 | | Hess Corp. | | | 170,684 | |
| | 14,070 | | HollyFrontier Corp. | | | 334,444 | |
| | 4,800 | | Kinder Morgan, Inc. | | | 89,856 | |
| Shares | | | | Value | |
Energy — (continued) | | | |
| | 14,585 | | Marathon Oil Corp. | | $ | 218,921 | |
| | 6,035 | | Marathon Petroleum Corp. | | | 229,089 | |
| | 19,780 | | Murphy Oil Corp. | | | 628,015 | |
| | 2,576 | | Nabors Industries, Ltd. | | | 25,889 | |
| | 7,810 | | Noble Energy, Inc. | | | 280,145 | |
| | 42,135 | | Occidental Petroleum Corp. | | | 3,183,721 | |
| | 5,688 | | Oceaneering International, Inc. | | | 169,844 | |
| | 3,240 | | PBF Energy, Inc., Class A | | | 77,047 | |
| | 22,089 | | Phillips 66 | | | 1,752,541 | |
| | 66,151 | | Royal Dutch Shell PLC ADR, Class A | | | 3,652,840 | |
| | 6,600 | | Schlumberger, Ltd. | | | 521,928 | |
| | | | | | | 27,234,158 | |
Financials — 28.4% | | | | |
| | 2,430 | | Aflac, Inc. | | | 175,349 | |
| | 13,630 | | Allstate Corp. (The) | | | 953,418 | |
| | 1,290 | | American Campus Communities, Inc.(a) | | | 68,202 | |
| | 5,795 | | American Capital Agency Corp.(a) | | | 114,857 | |
| | 30,000 | | American Express Co. | | | 1,822,800 | |
| | 5,231 | | American Financial Group, Inc. | | | 386,728 | |
| | 36,973 | | American International Group, Inc. | | | 1,955,502 | |
| | 860 | | American National Insurance Co. | | | 97,309 | |
| | 8,500 | | Ameriprise Financial, Inc. | | | 763,725 | |
| | 54,290 | | Annaly Capital Management, Inc.(a) | | | 600,990 | |
| | 5,690 | | Arthur J. Gallagher & Co. | | | 270,844 | |
| | 15,020 | | Aspen Insurance Holdings, Ltd. | | | 696,628 | |
| | 19,700 | | Axis Capital Holdings, Ltd. | | | 1,083,500 | |
| | 358,873 | | Bank of America Corp. | | | 4,762,245 | |
| | 1,180 | | Bank of Hawaii Corp. | | | 81,184 | |
| | 4,469 | | Berkshire Hathaway, Inc., Class B† | | | 647,066 | |
| | 479 | | BlackRock, Inc., Class A | | | 164,072 | |
| | 15,845 | | Brown & Brown, Inc. | | | 593,712 | |
| | 1,100 | | Camden Property Trust(a) | | | 97,262 | |
| | 35,169 | | Chimera Investment Corp. | | | 552,153 | |
| | 891 | | Chubb, Ltd. | | | 116,463 | |
| | 49,837 | | Citigroup, Inc. | | | 2,112,590 | |
| | 30,900 | | Citizens Financial Group, Inc. | | | 617,382 | |
| | 2,100 | | CNA Financial Corp. | | | 65,982 | |
| | 31,275 | | Comerica, Inc. | | | 1,286,341 | |
| | 4,121 | | Commerce Bancshares, Inc. | | | 197,396 | |
| | 17,760 | | DDR Corp.(a) | | | 322,166 | |
| | 3,625 | | Duke Realty Corp.(a) | | | 96,643 | |
| | 725 | | Equity Commonwealth† (a) | | | 21,119 | |
| | 370 | | Erie Indemnity Co., Class A | | | 36,756 | |
| | 2,090 | | Everest Re Group, Ltd. | | | 381,780 | |
| | 37,775 | | Fifth Third Bancorp | | | 664,462 | |
| | 1,855 | | First Horizon National Corp. | | | 25,562 | |
| | 1,475 | | FNF Group | | | 55,312 | |
| | 38,980 | | Franklin Resources, Inc. | | | 1,300,763 | |
| | 411 | | Fulton Financial Corp. | | | 5,548 | |
| | 8,320 | | Gaming and Leisure Properties, Inc.(a) | | | 286,874 | |
| | 72,320 | | Genworth Financial, Inc., Class A† | | | 186,586 | |
| | 9,300 | | Goldman Sachs Group, Inc. (The) | | | 1,381,794 | |
| | 2,137 | | Hanover Insurance Group, Inc. (The) | | | 180,833 | |
| | 13,500 | | Invesco, Ltd. | | | 344,790 | |
| | 80,897 | | JPMorgan Chase & Co. | | | 5,026,940 | |
| | 56,475 | | KeyCorp | | | 624,049 | |
| | 7,770 | | Kimco Realty Corp.(a) | | | 243,823 | |
| | 1,820 | | Legg Mason, Inc. | | | 53,672 | |
| | 23,485 | | Leucadia National Corp. | | | 406,995 | |
| | 9,056 | | Liberty Property Trust(a) | | | 359,704 | |
| | 57,930 | | Loews Corp. | | | 2,380,344 | |
| | 511 | | Mercury General Corp. | | | 27,165 | |
| | 33,825 | | MetLife, Inc. | | | 1,347,250 | |
| | 48,107 | | MFA Financial, Inc.(a) | | | 349,738 | |
| | 56,375 | | Morgan Stanley | | | 1,464,622 | |
| | 26,188 | | Old Republic International Corp. | | | 505,167 | |
Wilshire Mutual Funds, Inc. Large Company Value Portfolio Schedule of Investments | June 30, 2016 (unaudited) |
| Shares | | | | Value | |
Financials — (continued) | | | |
| | 1,500 | | OneMain Holdings, Inc., Class A† | | $ | 34,230 | |
| | 180 | | PacWest Bancorp | | | 7,160 | |
| | 15,572 | | People's United Financial, Inc. | | | 228,285 | |
| | 18,099 | | PNC Financial Services Group, Inc. | | | 1,473,077 | |
| | 535 | | Post Properties, Inc.(a) | | | 32,662 | |
| | 475 | | Principal Financial Group, Inc. | | | 19,527 | |
| | 6,963 | | ProAssurance Corp. | | | 372,869 | |
| | 7,125 | | Progressive Corp. (The) | | | 238,687 | |
| | 1,280 | | Prologis, Inc. | | | 62,771 | |
| | 16,445 | | Realogy Holdings Corp.† | | | 477,234 | |
| | 3,325 | | Regency Centers Corp. | | | 278,402 | |
| | 109,325 | | Regions Financial Corp. | | | 930,356 | |
| | 5,520 | | RenaissanceRe Holdings, Ltd. | | | 648,269 | |
| | 3,655 | | SLM Corp.† | | | 22,588 | |
| | 440 | | Sovran Self Storage, Inc.(a) | | | 46,165 | |
| | 1,310 | | Spirit Realty Capital, Inc.(a) | | | 16,729 | |
| | 14,225 | | Starwood Property Trust, Inc.(a) | | | 294,742 | |
| | 59,210 | | State Street Corp. | | | 3,192,603 | |
| | 11,830 | | Synovus Financial Corp. | | | 342,952 | |
| | 16,755 | | TCF Financial Corp. | | | 211,951 | |
| | 2,827 | | Travelers Cos., Inc. (The) | | | 336,526 | |
| | 5,218 | | U.S. Bancorp | | | 210,442 | |
| | 88,375 | | UBS Group AG | | | 1,145,340 | |
| | 3,215 | | Validus Holdings, Ltd. | | | 156,217 | |
| | 10,930 | | VEREIT, Inc.(a) | | | 110,830 | |
| | 56,828 | | Voya Financial, Inc. | | | 1,407,061 | |
| | 18,005 | | Waddell & Reed Financial, Inc., Class A | | | 310,046 | |
| | 4,609 | | Weingarten Realty Investors(a) | | | 188,139 | |
| | 98,388 | | Wells Fargo & Co. | | | 4,656,704 | |
| | 2,354 | | Weyerhaeuser Co., | | | 70,079 | |
| | 2,843 | | Willis Towers Watson PLC | | | 353,413 | |
| | 1,025 | | WP Carey, Inc.(a) | | | 71,156 | |
| | 53,950 | | XL Group PLC, Class A | | | 1,797,074 | |
| | | | | | | 58,108,443 | |
Health Care — 11.7% | | | | |
| | 33,448 | | Abbott Laboratories | | | 1,314,841 | |
| | 3,205 | | Agilent Technologies, Inc. | | | 142,174 | |
| | 29,480 | | Baxter International, Inc. | | | 1,333,086 | |
| | 533 | | Brookdale Senior Living, Inc., Class A† | | | 8,230 | |
| | 2,793 | | Cardinal Health, Inc. | | | 217,882 | |
| | 5,500 | | Cigna Corp. | | | 703,945 | |
| | 13,410 | | Community Health Systems, Inc.† | | | 161,590 | |
| | 1,235 | | DaVita HealthCare Partners, Inc.† | | | 95,490 | |
| | 4,825 | | Endo International PLC† | | | 75,222 | |
| | 4,377 | | Express Scripts Holding Co.† | | | 331,777 | |
| | 1,225 | | Hologic, Inc.† | | | 42,385 | |
| | 54,200 | | Johnson & Johnson | | | 6,574,460 | |
| | 100 | | Laboratory Corp. of America Holdings† | | | 13,027 | |
| | 325 | | Mallinckrodt PLC† | | | 19,753 | |
| | 25,420 | | Medtronic PLC | | | 2,205,693 | |
| | 99,157 | | Merck & Co., Inc. | | | 5,712,435 | |
| | 1,035 | | Patterson Cos., Inc. | | | 49,566 | |
| | 137,902 | | Pfizer, Inc. | | | 4,855,529 | |
| | 1,191 | | Quorum Health Corp.† | | | 12,755 | |
| | 975 | | VCA, Inc.† | | | 65,920 | |
| | | | | | | 23,935,760 | |
Industrials — 9.0% | | | | |
| | 5,620 | | Allison Transmission Holdings, Inc. | | | 158,653 | |
| | 9,835 | | Caterpillar, Inc. | | | 745,591 | |
| | 285 | | Colfax Corp.† | | | 7,541 | |
| | 2,472 | | Danaher Corp. | | | 249,672 | |
| | 1,535 | | Deere & Co. | | | 124,396 | |
| | 23,225 | | Dover Corp. | | | 1,609,957 | |
| | 490 | | Flowserve Corp. | | | 22,133 | |
| | 3,102 | | General Dynamics Corp. | | | 431,922 | |
| Shares | | | | Value | |
Industrials — (continued) | | | |
| | 40,291 | | General Electric Co. | | $ | 1,268,361 | |
| | 11,200 | | Honeywell International, Inc. | | | 1,302,784 | |
| | 504 | | Ingersoll-Rand PLC | | | 32,095 | |
| | 1,722 | | KBR, Inc. | | | 22,799 | |
| | 5,296 | | Kennametal, Inc. | | | 117,095 | |
| | 4,768 | | L-3 Communications Holdings, Inc., Class 3 | | | 699,418 | |
| | 300 | | Lincoln Electric Holdings, Inc. | | | 17,724 | |
| | 10,725 | | Masco Corp. | | | 331,831 | |
| | 6,167 | | MSC Industrial Direct Co., Inc., Class A | | | 435,144 | |
| | 12,900 | | Norfolk Southern Corp. | | | 1,098,177 | |
| | 15,600 | | Parker-Hannifin Corp. | | | 1,685,580 | |
| | 9,617 | | Raytheon Co. | | | 1,307,431 | |
| | 5,895 | | Republic Services, Inc., Class A | | | 302,473 | |
| | 341 | | Roper Technologies, Inc. | | | 58,161 | |
| | 36,100 | | Southwest Airlines Co. | | | 1,415,481 | |
| | 28,801 | | Stanley Black & Decker, Inc. | | | 3,203,247 | |
| | 2,685 | | Triumph Group, Inc. | | | 95,318 | |
| | 12,895 | | United Technologies Corp. | | | 1,322,382 | |
| | 4,278 | | Waste Management, Inc. | | | 283,503 | |
| | | | | | | 18,348,869 | |
Information Technology — 11.5% | | | | |
| | 775 | | ANSYS, Inc.† | | | 70,331 | |
| | 8,895 | | ARRIS International PLC† | | | 186,439 | |
| | 1,647 | | Booz Allen Hamilton Holding Corp., Class A | | | 48,817 | |
| | 18,346 | | Brocade Communications Systems, Inc. | | | 168,416 | |
| | 1,459 | | CA, Inc. | | | 47,899 | |
| | 71,786 | | Cisco Systems, Inc. | | | 2,059,540 | |
| | 2,569 | | Corning, Inc. | | | 52,613 | |
| | 2,079 | | CSRA, Inc. | | | 48,711 | |
| | 634 | | Diebold, Inc. | | | 15,742 | |
| | 889 | | DST Systems, Inc. | | | 103,506 | |
| | 1,575 | | Fidelity National Information Services, Inc. | | | 116,046 | |
| | 368 | | Harris Corp. | | | 30,706 | |
| | 76,725 | | Hewlett Packard Enterprise Co. | | | 1,401,766 | |
| | 90,401 | | HP, Inc. | | | 1,134,533 | |
| | 86,102 | | Intel Corp. | | | 2,824,146 | |
| | 18,449 | | International Business Machines Corp. | | | 2,800,189 | |
| | 7,109 | | Juniper Networks, Inc. | | | 159,882 | |
| | 2,390 | | Leidos Holdings, Inc. | | | 114,410 | |
| | 217 | | Liberty Braves Group, Class C† | | | 3,181 | |
| | 2,175 | | Liberty SiriusXM Group, Class C† | | | 67,142 | |
| | 1,280 | | Marvell Technology Group, Ltd. | | | 12,198 | |
| | 20,873 | | Microsoft Corp. | | | 1,068,071 | |
| | 1,263 | | Motorola Solutions, Inc. | | | 83,320 | |
| | 3,080 | | NetApp, Inc. | | | 75,737 | |
| | 41,641 | | Nuance Communications, Inc.† | | | 650,849 | |
| | 12,913 | | ON Semiconductor Corp.† | | | 113,893 | |
| | 86,590 | | Oracle Corp. | | | 3,544,129 | |
| | 58,431 | | QUALCOMM, Inc. | | | 3,130,149 | |
| | 56,575 | | Seagate Technology PLC | | | 1,378,167 | |
| | 29,461 | | Symantec Corp. | | | 605,129 | |
| | 12,825 | | TE Connectivity, Ltd. | | | 732,436 | |
| | 23,450 | | Teradyne, Inc. | | | 461,730 | |
| | 6,954 | | Trimble Navigation, Ltd.† | | | 169,399 | |
| | 4 | | Vishay Intertechnology, Inc. | | | 50 | |
| | | | | | | 23,479,272 | |
Materials — 3.4% | | | | |
| | 705 | | AptarGroup, Inc. | | | 55,787 | |
| | 5,692 | | Ashland, Inc. | | | 653,271 | |
| | 6,434 | | Avery Dennison Corp. | | | 480,941 | |
| | 1,336 | | Bemis Co., Inc. | | | 68,791 | |
| | 2,014 | | Celanese Corp., Class A | | | 131,816 | |
Wilshire Mutual Funds, Inc. Large Company Value Portfolio Schedule of Investments | June 30, 2016 (unaudited) |
| Shares | | | | Value | |
Materials — (continued) | | | |
| | 71,200 | | CRH PLC ADR | | $ | 2,106,096 | |
| | 5,688 | | Crown Holdings, Inc.† | | | 288,211 | |
| | 40 | | Domtar Corp. | | | 1,400 | |
| | 4,045 | | Eastman Chemical Co. | | | 274,656 | |
| | 4,655 | | FMC Corp. | | | 215,573 | |
| | 10 | | GCP Applied Technologies, Inc.† | | | 260 | |
| | 6,500 | | Huntsman Corp. | | | 87,425 | |
| | 27,120 | | International Paper Co. | | | 1,149,346 | |
| | 8,845 | | Mosaic Co. (The) | | | 231,562 | |
| | 3,400 | | Praxair, Inc. | | | 382,126 | |
| | 100 | | Reliance Steel & Aluminum Co. | | | 7,690 | |
| | 23,800 | | Rio Tinto PLC ADR | | | 744,940 | |
| | 10 | | WR Grace & Co. | | | 732 | |
| | | | | | | 6,880,623 | |
Telecommunication Services — 3.7% | | | | |
| | 109,466 | | AT&T, Inc. | | | 4,730,026 | |
| | 11,503 | | CenturyLink, Inc. | | | 333,702 | |
| | 7,060 | | Telephone & Data Systems, Inc. | | | 209,400 | |
| | 600 | | United States Cellular Corp.† | | | 23,562 | |
| | 40,700 | | Verizon Communications, Inc. | | | 2,272,688 | |
| | | | | | | 7,569,378 | |
Utilities — 4.5% | | | | |
| | 655 | | AES Corp. (The) | | | 8,174 | |
| | 10,226 | | Ameren Corp. | | | 547,909 | |
| | 5,207 | | American Electric Power Co., Inc. | | | 364,959 | |
| | 6,665 | | Aqua America, Inc. | | | 237,674 | |
| | 2,918 | | Atmos Energy Corp. | | | 237,292 | |
| | 13,603 | | CenterPoint Energy, Inc. | | | 326,472 | |
| | 3,635 | | Dominion Resources, Inc. | | | 283,276 | |
| | 1,167 | | DTE Energy Co. | | | 115,673 | |
| | 2,684 | | Duke Energy Corp. | | | 230,260 | |
| | 16,530 | | Edison International | | | 1,283,885 | |
| | 43,743 | | Entergy Corp. | | | 3,558,493 | |
| | 1,430 | | Eversource Energy | | | 85,657 | |
| | 80 | | Exelon Corp. | | | 2,909 | |
| | 22,505 | | FirstEnergy Corp. | | | 785,649 | |
| | 839 | | NextEra Energy, Inc. | | | 109,406 | |
| | 2,859 | | PG&E Corp. | | | 182,747 | |
| | 230 | | Pinnacle West Capital Corp. | | | 18,644 | |
| | 100 | | PPL Corp. | | | 3,775 | |
| | 5,352 | | Questar Corp. | | | 135,780 | |
| | 12,020 | | Southern Co. (The) | | | 644,633 | |
| | 525 | | UGI Corp. | | | 23,756 | |
| | 1,420 | | Vectren Corp. | | | 74,791 | |
| | 1,135 | | WEC Energy Group, Inc. | | | 74,116 | |
| | | | | | | 9,335,930 | |
| Total Common Stock | | | | |
| (Cost $189,756,582) | | | 202,437,082 | |
| | |
SHORT-TERM INVESTMENT (b) — 1.0% | |
| | 2,042,278 | | Northern Trust Institutional Government Select Portfolio, Institutional Class, 0.240% | | | 2,042,278 | |
| | | | | | | | |
| Total Short-Term Investment | | | | |
| (Cost $2,042,278) | | | 2,042,278 | |
Number of Rights | | | | Value | |
RIGHTS — 0.0% | |
United States — 0.0% | |
| | 1,118 | | Safeway – PDC † ‡‡ | | $ | 54 | |
| | 1,118 | | Safeway CVR - Casa Ley † ‡‡ | | | 1,135 | |
Total Rights (Cost $–) | | | 1,189 | |
Total Investments — 99.9% | | | | |
| (Cost $191,798,860) | | | 204,480,549 | |
Other Assets & Liabilities, Net — 0.1% | | | 291,530 | |
NET ASSETS — 100.0% | | $ | 204,772,079 | |
| †† | More narrow industries are utilized for compliance purposes, whereas broad sectors are utilized for reporting purposes. |
| † | Non-income producing security. |
| ‡‡ | Expiration date is unavailable. |
| (a) | Real Estate Investment Trust. |
| (b) | Rate shown is the 7-day effective yield as of June 30, 2016. |
ADR — American Depositary Receipt
CVR— Contingent Value Rights
Ltd. — Limited
PDC— Property Development Center
PLC— Public Limited Company
The following is a summary of the level of inputs used as of June 30, 2016 in valuing the Fund’s investments carried at value: |
| Investments in Securities | | Level 1 | | | Level 2 | | | Level 3‡ | | | Total | |
| Common Stock | | $ | 202,437,082 | | | $ | — | | | $ | — | | | $ | 202,437,082 | |
| Short-Term Investment | | | 2,042,278 | | | | — | | | | — | | | | 2,042,278 | |
| Rights | | | — | | | | — | | | | 1,189 | | | | 1,189 | |
| Total Investments in Securities | | $ | 204,479,360 | | | $ | — | | | $ | 1,189 | | | $ | 204,480,549 | |
| ‡ | A reconciliation of Level 3 investments, including certain disclosures related to significant inputs used in valuing Level 3 investments is only presented when the Fund has over 1% of Level 3 investments at the beginning and/or end of the period in relation to net assets. |
For the six months ended June 30, 2016, there have been no transfers between Level 1 and Level 2 assets and liabilities. For the six months ended June 30, 2016, there have been no transfers between Level 2 and Level 3 assets and liabilities.
Amounts designated as “—” are either $0, or have been rounded to $0
Please see Note 2 in Notes to Financial Statements for further information regarding fair value measurements.
Wilshire Mutual Funds, Inc. Small Company Growth Portfolio Schedule of Investments | June 30, 2016 (unaudited) |
| Shares | | | | Value | |
| | |
COMMON STOCK — 97.3% | | | |
Consumer Discretionary — 14.7% | | | |
| | 100 | | 1-800-Flowers.com, Inc., Class A†(a) | | $ | 902 | |
| | 5,260 | | American Eagle Outfitters, Inc.(a) | | | 83,792 | |
| | 1,655 | | Ascena Retail Group, Inc.†(a) | | | 11,568 | |
| | 70 | | Big 5 Sporting Goods Corp.(a) | | | 649 | |
| | 2,325 | | BJ's Restaurants, Inc.†(a) | | | 101,905 | |
| | 685 | | Bloomin' Brands, Inc.(a) | | | 12,241 | |
| | 95 | | Blue Nile, Inc.(a) | | | 2,601 | |
| | 2,715 | | Bob Evans Farms, Inc.(a) | | | 103,034 | |
| | 1,315 | | Bright Horizons Family Solutions, Inc.†(a) | | | 87,198 | |
| | 515 | | Capella Education Co. | | | 27,109 | |
| | 1,161 | | Cheesecake Factory, Inc. (The)(a) | | | 55,891 | |
| | 14,000 | | Chico's FAS, Inc. | | | 149,940 | |
| | 310 | | ClubCorp Holdings, Inc. | | | 4,030 | |
| | 305 | | Columbia Sportswear Co.(a) | | | 17,550 | |
| | 49 | | Cracker Barrel Old Country Store, Inc.(a) | | | 8,402 | |
| | 560 | | Culp, Inc.(a) | | | 15,473 | |
| | 630 | | Dana Holding Corp. | | | 6,653 | |
| | 1,505 | | Dave & Buster's Entertainment, Inc.†(a) | | | 70,419 | |
| | 6,975 | | Denny's Corp.† | | | 74,842 | |
| | 6,280 | | Dorman Products, Inc.† | | | 359,216 | |
| | 5,270 | | Drew Industries, Inc. | | | 447,107 | |
| | 1,165 | | Entravision Communications Corp., Class A(a) | | | 7,829 | |
| | 185 | | Fiesta Restaurant Group, Inc.†(a) | | | 4,035 | |
| | 5,060 | | Francesca's Holdings Corp.†(a) | | | 55,913 | |
| | 1,330 | | Gentherm, Inc.† | | | 45,552 | |
| | 13,207 | | G-III Apparel Group, Ltd.†(a) | | | 603,824 | |
| | 949 | | Grand Canyon Education, Inc.†(a) | | | 37,884 | |
| | 2,065 | | HSN, Inc.(a) | | | 101,041 | |
| | 455 | | Installed Building Products, Inc.†(a) | | | 16,512 | |
| | 1,425 | | Jack in the Box, Inc. | | | 122,436 | |
| | 1,910 | | La-Z-Boy, Inc., Class Z | | | 53,136 | |
| | 1,335 | | Liberty Tax, Inc.(a) | | | 17,782 | |
| | 1,500 | | Malibu Boats, Inc., Class A†(a) | | | 18,120 | |
| | 240 | | Marriott Vacations Worldwide Corp.(a) | | | 16,438 | |
| | 545 | | MDC Holdings, Inc.(a) | | | 13,265 | |
| | 5 | | Monarch Casino & Resort, Inc.† | | | 110 | |
| | 7,430 | | Monro Muffler Brake, Inc.(a) | | | 472,251 | |
| | 12,329 | | Motorcar Parts of America, Inc.†(a) | | | 335,102 | |
| | 2,890 | | New York Times Co. (The), Class A(a) | | | 34,969 | |
| | 105 | | Office Depot, Inc.†(a) | | | 347 | |
| | 100 | | Oxford Industries, Inc.(a) | | | 5,662 | |
| | 891 | | Papa John's International, Inc.(a) | | | 60,588 | |
| | 8,300 | | Pier 1 Imports, Inc.(a) | | | 42,662 | |
| | 1,290 | | Pinnacle Entertainment, Inc.† | | | 14,293 | |
| | 795 | | Pool Corp. | | | 74,754 | |
| | 8,718 | | Popeyes Louisiana Kitchen, Inc.†(a) | | | 476,351 | |
| | 259 | | Red Robin Gourmet Burgers, Inc.†(a) | | | 12,284 | |
| | 4,240 | | SeaWorld Entertainment, Inc.(a) | | | 60,759 | |
| | 18,530 | | Sonic Corp.(a) | | | 501,236 | |
| | 16,450 | | Steven Madden, Ltd.†(a) | | | 562,261 | |
| | 60 | | Strayer Education, Inc.†(a) | | | 2,948 | |
| | 110 | | Sturm Ruger & Co., Inc.(a) | | | 7,041 | |
| | 2,645 | | Tailored Brands, Inc.(a) | | | 33,486 | |
| | 400 | | Texas Roadhouse, Inc., Class A(a) | | | 18,240 | |
| | 520 | | Vail Resorts, Inc. | | | 71,880 | |
| | 465 | | Winmark Corp. | | | 46,347 | |
| | | | | | | 5,587,860 | |
Consumer Staples — 6.5% | | | | |
| | 9,330 | | B&G Foods, Inc., Class A(a) | | | 449,706 | |
| | 7,510 | | Calavo Growers, Inc.(a) | | | 503,170 | |
| | 242 | | Coca-Cola Bottling Co. Consolidated(a) | | | 35,688 | |
| Shares | | | | Value | |
Consumer Staples — (continued) | | | |
| | 1,975 | | Dean Foods Co.(a) | | $ | 35,728 | |
| | 1,445 | | Farmer Brothers Co.†(a) | | | 46,327 | |
| | 9,725 | | Inter Parfums, Inc.(a) | | | 277,843 | |
| | 3,670 | | J&J Snack Foods Corp.(a) | | | 437,721 | |
| | 1,312 | | Lancaster Colony Corp. | | | 167,424 | |
| | 10 | | Lifeway Foods, Inc.† | | | 97 | |
| | 2,680 | | Medifast, Inc.(a) | | | 89,164 | |
| | 140 | | Orchids Paper Products Co. | | | 4,980 | |
| | 70 | | PriceSmart, Inc.(a) | | | 6,550 | |
| | 20 | | Primo Water Corp.† | | | 236 | |
| | 135 | | Revlon, Inc., Class A†(a) | | | 4,344 | |
| | 3,410 | | TreeHouse Foods, Inc.†(a) | | | 350,036 | |
| | 465 | | Vector Group, Ltd.(a) | | | 10,425 | |
| | 565 | | WD-40 Co.(a) | | | 66,359 | |
| | | | | | | 2,485,798 | |
Energy — 3.0% | | | | |
| | 40 | | Adams Resources & Energy, Inc. | | | 1,540 | |
| | 20,093 | | Callon Petroleum Co.†(a) | | | 225,644 | |
| | 4,100 | | Delek US Holdings, Inc.(a) | | | 54,161 | |
| | 10,690 | | Matador Resources Co.†(a) | | | 211,662 | |
| | 14,345 | | Memorial Resource Development Corp.† | | | 227,799 | |
| | 11,370 | | Oasis Petroleum, Inc.†(a) | | | 106,196 | |
| | 1,335 | | Parsley Energy, Inc., Class A†(a) | | | 36,125 | |
| | 3,740 | | PDC Energy, Inc.†(a) | | | 215,462 | |
| | 1,735 | | RigNet, Inc.† | | | 23,231 | |
| | 475 | | SemGroup Corp., Class A | | | 15,466 | |
| | 1,840 | | Synergy Resources Corp.†(a) | | | 12,254 | |
| | | | | | | 1,129,540 | |
Financials — 10.5% | | | | |
| | 410 | | Acadia Realty Trust(b) | | | 14,563 | |
| | 1,775 | | Ambac Financial Group, Inc.† | | | 29,217 | |
| | 615 | | American Assets Trust, Inc.(a) (b) | | | 26,101 | |
| | 80 | | Associated Capital Group, Inc. | | | 2,294 | |
| | 9,450 | | BancorpSouth, Inc.(a) | | | 214,420 | |
| | 3,540 | | Bank of the Ozarks, Inc.(a) | | | 132,821 | |
| | 730 | | CareTrust, Inc.(b) | | | 10,059 | |
| | 240 | | Cohen & Steers, Inc.(a) | | | 9,706 | |
| | 455 | | CoreSite Realty Corp.(a) (b) | | | 40,354 | |
| | 233 | | Credit Acceptance Corp.†(a) | | | 43,124 | |
| | 150 | | Eagle Bancorp, Inc.†(a) | | | 7,216 | |
| | 1,060 | | EastGroup Properties, Inc.(a) (b) | | | 73,055 | |
| | 400 | | Education Realty Trust, Inc.(b) | | | 18,456 | |
| | 845 | | eHealth, Inc.† | | | 11,847 | |
| | 545 | | Equity One, Inc.(b) | | | 17,538 | |
| | 250 | | Essent Group, Ltd.†(a) | | | 5,452 | |
| | 80 | | GAMCO Investors, Inc., Class A | | | 2,622 | |
| | 971 | | Gaming and Leisure Properties, Inc.(b) | | | 33,480 | |
| | 4,050 | | Greenhill & Co., Inc.(a) | | | 65,205 | |
| | 85 | | Hallmark Financial Services, Inc.†(a) | | | 985 | |
| | 1,286 | | Home BancShares, Inc.(a) | | | 25,450 | |
| | 1,395 | | KCG Holdings, Inc., Class A† | | | 18,554 | |
| | 8,360 | | LegacyTexas Financial Group, Inc.(a) | | | 224,968 | |
| | 1,005 | | LTC Properties, Inc.(a) (b) | | | 51,989 | |
| | 435 | | Marcus & Millichap, Inc.†(a) | | | 11,053 | |
| | 2,435 | | MarketAxess Holdings, Inc. | | | 354,049 | |
| | 2,900 | | Meridian Bancorp, Inc.(a) | | | 42,862 | |
| | 1,215 | | National Health Investors, Inc.(a) (b) | | | 91,234 | |
| | 628 | | PacWest Bancorp(a) | | | 24,982 | |
| | 70 | | Physicians Realty Trust(b) | | | 1,471 | |
| | 11,560 | | Pinnacle Financial Partners, Inc.(a) | | | 564,706 | |
| | 15,690 | | PrivateBancorp, Inc., Class A | | | 690,831 | |
| | 830 | | PS Business Parks, Inc.(b) | | | 88,046 | |
| | 1,010 | | QTS Realty Trust, Inc., Class A(a) (b) | | | 56,540 | |
| | 630 | | Retail Opportunity Investments Corp.(b) | | | 13,652 | |
Wilshire Mutual Funds, Inc. Small Company Growth Portfolio Schedule of Investments | June 30, 2016 (unaudited) |
| Shares | | | | Value | |
Financials — (continued) | | | |
| | 3,170 | | RLJ Lodging Trust(a) (b) | | $ | 67,997 | |
| | 7,040 | | South State Corp. | | | 479,072 | |
| | 675 | | Sovran Self Storage, Inc.(b) | | | 70,821 | |
| | 150 | | Sun Communities, Inc.(b) | | | 11,496 | |
| | 4,269 | | Texas Capital Bancshares, Inc.†(a) | | | 199,618 | |
| | 795 | | Universal Health Realty Income Trust(a) (b) | | | 45,458 | |
| | 315 | | Urban Edge Properties(a) (b) | | | 9,406 | |
| | 80 | | Virtus Investment Partners, Inc.(a) | | | 5,694 | |
| | 2,290 | | Washington Real Estate Investment Trust(b) | | | 72,043 | |
| | 1,895 | | WisdomTree Investments, Inc.(a) | | | 18,552 | |
| | | | | | | 3,999,059 | |
Health Care — 23.8% | | | | |
| | 10 | | Abaxis, Inc.(a) | | | 472 | |
| | 525 | | ABIOMED, Inc.† | | | 57,377 | |
| | 340 | | Acadia Healthcare Co., Inc.†(a) | | | 18,836 | |
| | 15,601 | | Aceto Corp.(a) | | | 341,506 | |
| | 1,535 | | Achillion Pharmaceuticals, Inc.† | | | 11,973 | |
| | 2,470 | | Acorda Therapeutics, Inc.†(a) | | | 62,997 | |
| | 45 | | Addus HomeCare Corp.† | | | 784 | |
| | 435 | | Adeptus Health, Inc., Class A†(a) | | | 22,472 | |
| | 435 | | Aerie Pharmaceuticals, Inc.†(a) | | | 7,656 | |
| | 1,150 | | Agenus, Inc.† | | | 4,657 | |
| | 350 | | Air Methods Corp.†(a) | | | 12,541 | |
| | 375 | | Amedisys, Inc.†(a) | | | 18,930 | |
| | 300 | | Amicus Therapeutics, Inc.†(a) | | | 1,638 | |
| | 865 | | AMN Healthcare Services, Inc.†(a) | | | 34,574 | |
| | 780 | | Amphastar Pharmaceuticals, Inc.† | | | 12,574 | |
| | 760 | | Anika Therapeutics, Inc.†(a) | | | 40,774 | |
| | 5,850 | | ARIAD Pharmaceuticals, Inc.†(a) | | | 43,231 | |
| | 13,930 | | Array BioPharma, Inc.†(a) | | | 49,591 | |
| | 742 | | AxoGen, Inc.† | | | 5,105 | |
| | 1,155 | | BioCryst Pharmaceuticals, Inc.†(a) | | | 3,280 | |
| | 475 | | BioSpecifics Technologies Corp.†(a) | | | 18,971 | |
| | 140 | | Bluebird Bio, Inc.†(a) | | | 6,061 | |
| | 13,654 | | Cambrex Corp.†(a) | | | 706,321 | |
| | 6,135 | | Cantel Medical Corp.(a) | | | 421,659 | |
| | 100 | | Catalent, Inc.†(a) | | | 2,299 | |
| | 3,968 | | Cepheid, Inc.†(a) | | | 122,016 | |
| | 800 | | Chemed Corp.(a) | | | 109,048 | |
| | 4,445 | | Chimerix, Inc.†(a) | | | 17,469 | |
| | 2,025 | | Clovis Oncology, Inc.†(a) | | | 27,783 | |
| | 429 | | CorVel Corp.† | | | 18,524 | |
| | 740 | | Cross Country Healthcare, Inc.† | | | 10,301 | |
| | 1,165 | | Cytokinetics, Inc.†(a) | | | 11,056 | |
| | 890 | | Dynavax Technologies Corp.†(a) | | | 12,976 | |
| | 5,470 | | Eagle Pharmaceuticals, Inc.†(a) | | | 212,181 | |
| | 580 | | Endologix, Inc.†(a) | | | 7,227 | |
| | 959 | | FibroGen, Inc.†(a) | | | 15,737 | |
| | 310 | | Five Prime Therapeutics, Inc.† | | | 12,818 | |
| | 30 | | Genomic Health, Inc.† | | | 777 | |
| | 4,790 | | Globus Medical, Inc., Class A†(a) | | | 114,146 | |
| | 765 | | Haemonetics Corp.† | | | 22,177 | |
| | 2,605 | | HealthEquity, Inc.†(a) | | | 79,153 | |
| | 3,579 | | HealthSouth Corp.(a) | | | 138,937 | |
| | 645 | | HealthStream, Inc.†(a) | | | 17,106 | |
| | 2,035 | | HeartWare International, Inc.†(a) | | | 117,521 | |
| | 3,280 | | HMS Holdings Corp.† | | | 57,761 | |
| | 5,010 | | ICON PLC† | | | 350,750 | |
| | 9,605 | | ImmunoGen, Inc.†(a) | | | 29,583 | |
| | 1,290 | | Impax Laboratories, Inc.†(a) | | | 37,178 | |
| | 340 | | Imprivata, Inc.† | | | 4,760 | |
| | 763 | | INC Research Holdings, Inc., Class A†(a) | | | 29,093 | |
| Shares | | | | Value | |
Health Care — (continued) | | | |
| | 3,450 | | Infinity Pharmaceuticals, Inc.†(a) | | $ | 4,589 | |
| | 1,090 | | Inogen, Inc.†(a) | | | 54,620 | |
| | 3,430 | | Insmed, Inc.†(a) | | | 33,820 | |
| | 4,262 | | Insulet Corp.†(a) | | | 128,883 | |
| | 485 | | Integra LifeSciences Holdings Corp.†(a) | | | 38,693 | |
| | 1,310 | | Intersect ENT, Inc.†(a) | | | 16,938 | |
| | 50 | | Intra-Cellular Therapies, Inc., Class A†(a) | | | 1,941 | |
| | 3,385 | | Ironwood Pharmaceuticals, Inc., Class A†(a) | | | 44,259 | |
| | 820 | | Landauer, Inc.(a) | | | 33,751 | |
| | 710 | | MacroGenics, Inc.†(a) | | | 19,163 | |
| | 120 | | Magellan Health, Inc.† | | | 7,892 | |
| | 3,105 | | Masimo Corp.† | | | 163,059 | |
| | 40 | | Medicines Co. (The)†(a) | | | 1,345 | |
| | 11,205 | | Medidata Solutions, Inc.†(a) | | | 525,178 | |
| | 5,265 | | Meridian Bioscience, Inc.(a) | | | 102,668 | |
| | 2,955 | | Momenta Pharmaceuticals, Inc.† | | | 31,914 | |
| | 180 | | Myriad Genetics, Inc.†(a) | | | 5,508 | |
| | 2,120 | | NanoString Technologies, Inc.†(a) | | | 26,712 | |
| | 1,569 | | Natus Medical, Inc.†(a) | | | 59,308 | |
| | 5,115 | | Nektar Therapeutics†(a) | | | 72,786 | |
| | 8,005 | | Neogen Corp.†(a) | | | 450,281 | |
| | 885 | | NuVasive, Inc.†(a) | | | 52,852 | |
| | 95 | | NxStage Medical, Inc.†(a) | | | 2,060 | |
| | 361 | | Omnicell, Inc.†(a) | | | 12,357 | |
| | 1,050 | | Ophthotech Corp.†(a) | | | 53,582 | |
| | 100 | | OraSure Technologies, Inc.† | | | 591 | |
| | 727 | | Pacira Pharmaceuticals, Inc.†(a) | | | 24,522 | |
| | 1,129 | | PAREXEL International Corp.†(a) | | | 70,992 | |
| | 3,015 | | Phibro Animal Health Corp., Class A | | | 56,260 | |
| | 2,125 | | Portola Pharmaceuticals, Inc., Class A†(a) | | | 50,150 | |
| | 13,235 | | PRA Health Sciences, Inc.†(a) | | | 552,694 | |
| | 13,894 | | Prestige Brands Holdings, Inc.† | | | 769,727 | |
| | 6,640 | | Providence Service Corp. (The)†(a) | | | 298,003 | |
| | 1,010 | | Puma Biotechnology, Inc.†(a) | | | 30,088 | |
| | 3,190 | | Quality Systems, Inc.(a) | | | 37,993 | |
| | 310 | | Radius Health, Inc.†(a) | | | 11,393 | |
| | 13,050 | | Repligen Corp.†(a) | | | 357,048 | |
| | 630 | | Sage Therapeutics, Inc.†(a) | | | 18,982 | |
| | 1,445 | | Sagent Pharmaceuticals, Inc.†(a) | | | 21,646 | |
| | 1,043 | | SciClone Pharmaceuticals, Inc.†(a) | | | 13,622 | |
| | 86 | | SeaSpine Holdings Corp.† | | | 901 | |
| | 2,300 | | Sucampo Pharmaceuticals, Inc., Class A†(a) | | | 25,231 | |
| | 33,065 | | Supernus Pharmaceuticals, Inc.†(a) | | | 673,534 | |
| | 455 | | SurModics, Inc.†(a) | | | 10,683 | |
| | 3,830 | | Tandem Diabetes Care, Inc.†(a) | | | 28,878 | |
| | 750 | | TESARO, Inc.†(a) | | | 63,038 | |
| | 705 | | Tetraphase Pharmaceuticals, Inc.†(a) | | | 3,031 | |
| | 1,650 | | U.S. Physical Therapy, Inc.(a) | | | 99,347 | |
| | 340 | | Ultragenyx Pharmaceutical, Inc.†(a) | | | 16,629 | |
| | 6,222 | | Vascular Solutions, Inc.†(a) | | | 259,209 | |
| | 5,145 | | Vocera Communications, Inc.† | | | 66,113 | |
| | 978 | | West Pharmaceutical Services, Inc. | | | 74,211 | |
| | 127 | | Wright Medical Group NV† | | | 2,206 | |
| | 15 | | Xencor, Inc.†(a) | | | 285 | |
| | 1,035 | | Zogenix, Inc.†(a) | | | 8,332 | |
| | | | | | | 9,071,855 | |
Industrials — 11.9% | | | | |
| | 10,650 | | Advanced Drainage Systems, Inc.(a) | | | 291,490 | |
| | 1,945 | | Advisory Board Co. (The)†(a) | | | 68,833 | |
| | 100 | | Allegiant Travel Co., Class A(a) | | | 15,150 | |
| | 135 | | Altra Industrial Motion Corp.(a) | | | 3,642 | |
| | 90 | | American Woodmark Corp.†(a) | | | 5,974 | |
Wilshire Mutual Funds, Inc. Small Company Growth Portfolio Schedule of Investments | June 30, 2016 (unaudited) |
| Shares | | | | Value | |
Industrials — (continued) | | | |
| | 2,300 | | Applied Industrial Technologies, Inc.(a) | | $ | 103,822 | |
| | 2,685 | | ARC Document Solutions, Inc.† | | | 10,445 | |
| | 790 | | Beacon Roofing Supply, Inc.† | | | 35,921 | |
| | 4,980 | | Brady Corp., Class A | | | 152,189 | |
| | 2,025 | | Brink's Co. (The) | | | 57,692 | |
| | 40 | | Casella Waste Systems, Inc., Class A†(a) | | | 314 | |
| | 5,837 | | CEB, Inc. | | | 360,026 | |
| | 2,330 | | Comfort Systems USA, Inc. | | | 75,888 | |
| | 125 | | Continental Building Products, Inc.† | | | 2,779 | |
| | 745 | | Deluxe Corp.(a) | | | 49,446 | |
| | 1,270 | | Douglas Dynamics, Inc.(a) | | | 32,677 | |
| | 1,065 | | DXP Enterprises, Inc.†(a) | | | 15,901 | |
| | 225 | | Dycom Industries, Inc.†(a) | | | 20,196 | |
| | 673 | | Exponent, Inc.(a) | | | 39,310 | |
| | 180 | | G&K Services, Inc., Class A | | | 13,783 | |
| | 100 | | Generac Holdings, Inc.†(a) | | | 3,496 | |
| | 4,040 | | General Cable Corp.(a) | | | 51,348 | |
| | 567 | | Gorman-Rupp Co. (The)(a) | | | 15,541 | |
| | 10,595 | | Harsco Corp.(a) | | | 70,351 | |
| | 1,895 | | Healthcare Services Group, Inc.(a) | | | 78,415 | |
| | 751 | | HEICO Corp.(a) | | | 50,174 | |
| | 990 | | Herman Miller, Inc.(a) | | | 29,591 | |
| | 1,155 | | Hillenbrand, Inc.(a) | | | 34,696 | |
| | 1,875 | | HNI Corp.(a) | | | 87,169 | |
| | 140 | | Hyster-Yale Materials Handling, Inc. | | | 8,329 | |
| | 470 | | Insperity, Inc.(a) | | | 36,298 | |
| | 1,515 | | Interface, Inc., Class A | | | 23,104 | |
| | 784 | | John Bean Technologies Corp. | | | 47,997 | |
| | 295 | | Kimball International, Inc., Class B | | | 3,357 | |
| | 13,407 | | Knight Transportation, Inc.(a) | | | 356,358 | |
| | 17,365 | | Knoll, Inc. | | | 421,622 | |
| | 2,610 | | Korn/Ferry International(a) | | | 54,027 | |
| | 595 | | Lydall, Inc.† | | | 22,943 | |
| | 45 | | Matson, Inc. | | | 1,453 | |
| | 180 | | Matthews International Corp., Class A | | | 10,015 | |
| | 128 | | Mueller Industries, Inc. | | | 4,081 | |
| | 115 | | Multi-Color Corp.(a) | | | 7,291 | |
| | 1,340 | | On Assignment, Inc.† | | | 49,513 | |
| | 740 | | PGT, Inc.†(a) | | | 7,622 | |
| | 2,045 | | Ply Gem Holdings, Inc.† | | | 29,796 | |
| | 30 | | Quad | | | 699 | |
| | 2,505 | | Raven Industries, Inc.(a) | | | 47,445 | |
| | 7,820 | | Saia, Inc.†(a) | | | 196,595 | |
| | 1,200 | | Simpson Manufacturing Co., Inc. | | | 47,964 | |
| | 130 | | SP Plus Corp.† | | | 2,935 | |
| | 405 | | Standex International Corp.(a) | | | 33,465 | |
| | 575 | | Steelcase, Inc., Class A | | | 7,803 | |
| | 395 | | Teledyne Technologies, Inc.†(a) | | | 39,125 | |
| | 1,532 | | Tennant Co.(a) | | | 82,529 | |
| | 8,735 | | Trex Co., Inc.†(a) | | | 392,376 | |
| | 13,515 | | WageWorks, Inc.† | | | 808,332 | |
| | 70 | | Watsco, Inc.(a) | | | 9,848 | |
| | | | | | | 4,529,181 | |
Information Technology — 22.5% | | | | |
| | 2,962 | | ACI Worldwide, Inc.†(a) | | | 57,789 | |
| | 450 | | ADTRAN, Inc. | | | 8,392 | |
| | 1,315 | | American Software, Inc., Class A(a) | | | 13,781 | |
| | 3,500 | | Aspen Technology, Inc.†(a) | | | 140,840 | |
| | 195 | | AVG Technologies NV† | | | 3,703 | |
| | 710 | | Badger Meter, Inc. | | | 51,851 | |
| | 2,920 | | Barracuda Networks, Inc.† | | | 44,209 | |
| | 330 | | Belden, Inc. | | | 19,922 | |
| | 880 | | Blackbaud, Inc.(a) | | | 59,752 | |
| | 785 | | Blackhawk Network Holdings, Inc., Class A†(a) | | | 26,290 | |
| Shares | | | | Value | |
Information Technology — (continued) | | | |
| | 7,359 | | BroadSoft, Inc.†(a) | | $ | 301,940 | |
| | 2,283 | | CalAmp Corp.†(a) | | | 33,811 | |
| | 20,330 | | Callidus Software, Inc.† | | | 406,193 | |
| | 2,085 | | Carbonite, Inc.†(a) | | | 20,287 | |
| | 1,636 | | Cardtronics, Inc.†(a) | | | 65,129 | |
| | 768 | | Cass Information Systems, Inc.(a) | | | 39,706 | |
| | 1,944 | | Cavium, Inc.†(a) | | | 75,038 | |
| | 8,218 | | CEVA, Inc.† | | | 223,283 | |
| | 2,785 | | ChannelAdvisor Corp.† | | | 40,355 | |
| | 3,510 | | Ciena Corp.†(a) | | | 65,812 | |
| | 765 | | Cimpress NV† | | | 70,747 | |
| | 1,655 | | CommVault Systems, Inc.† | | | 71,479 | |
| | 3,464 | | comScore, Inc.†(a) | | | 82,720 | |
| | 3,847 | | Cornerstone OnDemand, Inc.†(a) | | | 146,417 | |
| | 855 | | Cray, Inc.†(a) | | | 25,582 | |
| | 515 | | Diodes, Inc.†(a) | | | 9,677 | |
| | 140 | | DTS, Inc.†(a) | | | 3,703 | |
| | 12,010 | | EarthLink Holdings Corp.(a) | | | 76,864 | |
| | 7,986 | | Ellie Mae, Inc.†(a) | | | 731,917 | |
| | 2,720 | | EnerNOC, Inc.†(a) | | | 17,191 | |
| | 40 | | Envestnet, Inc.†(a) | | | 1,332 | |
| | 470 | | EPAM Systems, Inc.† | | | 30,226 | |
| | 955 | | Euronet Worldwide, Inc.†(a) | | | 66,076 | |
| | 2,105 | | EVERTEC, Inc.(a) | | | 32,712 | |
| | 220 | | ExlService Holdings, Inc.† | | | 11,530 | |
| | 585 | | Fair Isaac Corp. | | | 66,111 | |
| | 6,300 | | Five9, Inc.† | | | 74,970 | |
| | 700 | | Fleetmatics Group PLC† | | | 30,331 | |
| | 1,740 | | Gigamon, Inc.†(a) | | | 65,059 | |
| | 1,220 | | Guidewire Software, Inc.† | | | 75,347 | |
| | 429 | | Hackett Group, Inc. (The) | | | 5,950 | |
| | 890 | | HubSpot, Inc.†(a) | | | 38,644 | |
| | 984 | | Immersion Corp.†(a) | | | 7,222 | |
| | 2,200 | | Imperva, Inc.†(a) | | | 94,622 | |
| | 2,310 | | Infinera Corp.†(a) | | | 26,057 | |
| | 1,660 | | Infoblox, Inc.†(a) | | | 31,142 | |
| | 3,050 | | Integrated Device Technology, Inc.†(a) | | | 61,397 | |
| | 614 | | InterDigital, Inc.(a) | | | 34,188 | |
| | 6,105 | | Ixia† | | | 59,951 | |
| | 1,198 | | j2 Global, Inc.(a) | | | 75,678 | |
| | 715 | | Littelfuse, Inc. | | | 84,506 | |
| | 7,150 | | LogMeIn, Inc.†(a) | | | 453,524 | |
| | 960 | | Lumentum Holdings, Inc.† | | | 23,232 | |
| | 3,588 | | Luxoft Holding, Inc., Class A†(a) | | | 186,648 | |
| | 100 | | MACOM Technology Solutions Holdings, Inc.†(a) | | | 3,298 | |
| | 14,548 | | MAXIMUS, Inc.(a) | | | 805,523 | |
| | 196 | | MaxLinear, Inc., Class A† | | | 3,524 | |
| | 955 | | Methode Electronics, Inc. | | | 32,689 | |
| | 473 | | Microsemi Corp.†(a) | | | 15,458 | |
| | 1,983 | | Model N, Inc.†(a) | | | 26,473 | |
| | 470 | | Monolithic Power Systems, Inc.(a) | | | 32,110 | |
| | 825 | | MTS Systems Corp.(a) | | | 36,168 | |
| | 2,260 | | New Relic, Inc.† | | | 66,399 | |
| | 815 | | NVE Corp.(a) | | | 47,800 | |
| | 1,810 | | Paycom Software, Inc.†(a) | | | 78,210 | |
| | 70 | | PDF Solutions, Inc.†(a) | | | 979 | |
| | 12,610 | | Pegasystems, Inc. | | | 339,839 | |
| | 3,885 | | Plantronics, Inc. | | | 170,940 | |
| | 944 | | Plexus Corp.†(a) | | | 40,781 | |
| | 90 | | Power Integrations, Inc.(a) | | | 4,506 | |
| | 547 | | Proofpoint, Inc.†(a) | | | 34,510 | |
| | 1,345 | | PROS Holdings, Inc.†(a) | | | 23,443 | |
| | 2,170 | | Q2 Holdings, Inc.†(a) | | | 60,803 | |
Wilshire Mutual Funds, Inc. Small Company Growth Portfolio Schedule of Investments | June 30, 2016 (unaudited) |
| Shares | | | | Value | |
Information Technology — (continued) | | | |
| | 145 | | QAD, Inc., Class A | | $ | 2,794 | |
| | 530 | | Qlik Technologies, Inc.†(a) | | | 15,677 | |
| | 11,355 | | Qualys, Inc.†(a) | | | 338,493 | |
| | 3,474 | | Rambus, Inc.†(a) | | | 41,966 | |
| | 3,100 | | RealPage, Inc.† | | | 69,223 | |
| | 35 | | Reis, Inc. | | | 871 | |
| | 4,950 | | RingCentral, Inc., Class A†(a) | | | 97,614 | |
| | 1,015 | | Rubicon Project, Inc.† | | | 13,855 | |
| | 1,195 | | Science Applications International Corp.(a) | | | 69,728 | |
| | 2,600 | | Semtech Corp.† | | | 62,036 | |
| | 4,269 | | ShoreTel, Inc.†(a) | | | 28,560 | |
| | 1,055 | | Silicon Graphics International Corp.†(a) | | | 5,307 | |
| | 9,005 | | Silicon Laboratories, Inc.† | | | 438,904 | |
| | 510 | | Silver Spring Networks, Inc.†(a) | | | 6,196 | |
| | 610 | | Sonus Networks, Inc.† | | | 5,301 | |
| | 6,260 | | SPS Commerce, Inc.†(a) | | | 379,356 | |
| | 1,485 | | Stamps.com, Inc.†(a) | | | 129,819 | |
| | 399 | | Synaptics, Inc.†(a) | | | 21,446 | |
| | 295 | | Synchronoss Technologies, Inc.†(a) | | | 9,399 | |
| | 703 | | Syntel, Inc.†(a) | | | 31,818 | |
| | 755 | | Take-Two Interactive Software, Inc.†(a) | | | 28,630 | |
| | 1,323 | | TeleTech Holdings, Inc. | | | 35,893 | |
| | 1,515 | | Tessera Technologies, Inc.(a) | | | 46,420 | |
| | 1,300 | | TiVo, Inc.†(a) | | | 12,870 | |
| | 100 | | Unisys Corp.†(a) | | | 728 | |
| | 410 | | Virtusa Corp.†(a) | | | 11,841 | |
| | 1,565 | | Web.com Group, Inc.†(a) | | | 28,452 | |
| | 760 | | WebMD Health Corp., Class A†(a) | | | 44,164 | |
| | 529 | | WEX, Inc.†(a) | | | 46,906 | |
| | 5,654 | | XO Group, Inc.†(a) | | | 98,549 | |
| | 1,095 | | Zendesk, Inc.†(a) | | | 28,886 | |
| | 10,013 | | Zix Corp.† | | | 37,549 | |
| | | | | | | 8,583,539 | |
Materials — 2.9% | | | | |
| | 1,305 | | American Vanguard Corp.(a) | | | 19,718 | |
| | 2,955 | | Boise Cascade Co.†(a) | | | 67,817 | |
| | 825 | | Calgon Carbon Corp. | | | 10,849 | |
| | 1,170 | | Century Aluminum Co.†(a) | | | 7,406 | |
| | 2,500 | | Chemtura Corp.† | | | 65,950 | |
| | 4,915 | | Coeur Mining, Inc.† | | | 52,394 | |
| | 645 | | Deltic Timber Corp.(a) | | | 43,299 | |
| | 7,705 | | Ferroglobe PLC | | | 66,340 | |
| | 2,170 | | Graphic Packaging Holding Co.(a) | | | 27,212 | |
| | 885 | | HB Fuller Co. | | | 38,931 | |
| | 4,305 | | Headwaters, Inc.†(a) | | | 77,232 | |
| | 350 | | Kaiser Aluminum Corp.(a) | | | 31,643 | |
| | 1,989 | | KapStone Paper and Packaging Corp. | | | 25,877 | |
| | 1,385 | | Koppers Holdings, Inc.† | | | 42,561 | |
| | 6,885 | | Louisiana-Pacific Corp.†(a) | | | 119,455 | |
| | 7,855 | | Myers Industries, Inc. | | | 113,112 | |
| | 919 | | Neenah Paper, Inc. | | | 66,508 | |
| | 340 | | PolyOne Corp. | | | 11,982 | |
| | 2,070 | | Schweitzer-Mauduit International, Inc. | | | 73,030 | |
| | 1,045 | | SunCoke Energy, Inc. | | | 6,082 | |
| | 450 | | US Concrete, Inc.†(a) | | | 27,409 | |
| | 2,395 | | Worthington Industries, Inc. | | | 101,309 | |
| | | | | | | 1,096,116 | |
Telecommunication Services — 1.4% | | | | |
| | 845 | | 8x8, Inc.† | | | 12,346 | |
| | 13,405 | | Cogent Communications Holdings, Inc.(a) | | | 537,004 | |
| | | | | | | 549,350 | |
Shares/ Number of Rights | | | | Value | |
Utilities — 0.1% | | | |
| | 640 | | American States Water Co.(a) | | $ | 28,045 | |
| | 540 | | MGE Energy, Inc. | | | 30,518 | |
| | | | | | | 58,563 | |
| Total Common Stock | | | | |
| (Cost $30,438,505) | | | 37,090,861 | |
| | |
SHORT-TERM INVESTMENTS (c) — 50.3% | |
| | 1,125,763 | | Northern Trust Institutional Government Select Portfolio, Institutional Class, 0.240% | | | 1,125,763 | |
| | 18,048,948 | | Northern Trust Institutional Liquid Asset Portfolio, Institutional Class, 0.520% (d) | | | 18,048,948 | |
| | | | | | | | |
| Total Short-Term Investments | | | | |
| (Cost $19,174,711) | | | 19,174,711 | |
RIGHTS — 0.0% | |
United States — 0.0% | |
| | 860 | | Dyax CVR, Expires 12/31/19 † | | | — | |
| | 180 | | Trius CVR † ‡‡ | | | 360 | |
| | | | | | | | |
Total Rights (Cost $–) | | | 360 | |
Total Investments — 147.6% | | | | |
| (Cost $49,613,216) | | | 56,265,932 | |
Other Assets & Liabilities, Net — (47.6)% | | | (18,152,044 | ) |
NET ASSETS — 100.0% | | $ | 38,113,888 | |
| † | Non-income producing security. |
| ‡‡ | Expiration date is unavailable. |
| (a) | This security or a partial position of this security is on loan at June 30, 2016. The total market value of securities on loan at June 30, 2016 was $17,949,709 (Note 6). |
| (b) | Real Estate Investment Trust. |
| (c) | Rate shown is the 7-day effective yield as of June 30, 2016. |
| (d) | This security was purchased with cash collateral held from securities on loan. The total value of such securities as of June 30, 2016 was $18,048,948. Securities on loan are also collateralized by various U.S. Treasury obligations in the amount of $39,400 (Note 6). |
CVR — Contingent Value Rights
Ltd. — Limited
PLC — Public Limited Company
The following is a summary of the inputs used as of June 30, 2016 in valuing the Fund’s investments carried at value: | |
| | |
| Investments in Securities | | Level 1 | | | Level 2 | | | Level 3‡ | | | Total | |
| Common Stock | | $ | 37,090,861 | | | $ | — | | | $ | — | | | $ | 37,090,861 | |
| Short-Term Investments | | | 19,174,711 | | | | — | | | | — | | | | 19,174,711 | |
| Rights | | | — | | | | — | | | | 360 | | | | 360 | |
| Total Investments in Securities | | $ | 56,265,572 | | | $ | — | | | $ | 360 | | | $ | 56,265,932 | |
| ‡ | A reconciliation of Level 3 investments, including certain disclosures related to significant inputs used in valuing Level 3 investments is only presented when the Fund has over 1% of Level 3 investments at the beginning and/or end of the period in relation to net assets. |
For the six months ended June 30, 2016, there have been no transfers between Level 1 and Level 2 assets and liabilities. For the six months ended June 30, 2016, there have been no transfers between Level 2 and Level 3 assets and liabilities.
Amounts designated as “—” are either $0, or have been rounded to $0.
Please see Note 2 in Notes to Financial Statements for further information regarding fair value measurements.
Wilshire Mutual Funds, Inc. Small Company Value Portfolio Schedule of Investments | June 30, 2016 (unaudited) |
| Shares | | | | Value | |
| | |
COMMON STOCK — 98.4%†† | | | |
Consumer Discretionary — 9.6% | | | |
| | 8,055 | | Abercrombie & Fitch Co., Class A(a) | | $ | 143,460 | |
| | 200 | | AMC Entertainment Holdings, Inc., Class A(a) | | | 5,522 | |
| | 5,060 | | American Eagle Outfitters, Inc.(a) | | | 80,606 | |
| | 1,195 | | American Public Education, Inc.† | | | 33,579 | |
| | 25 | | Arctic Cat, Inc. | | | 425 | |
| | 3,864 | | Ascena Retail Group, Inc.†(a) | | | 27,009 | |
| | 230 | | BJ's Restaurants, Inc.†(a) | | | 10,081 | |
| | 1,825 | | Bob Evans Farms, Inc.(a) | | | 69,259 | |
| | 2,025 | | Dana Holding Corp. | | | 21,384 | |
| | 6,985 | | Denny's Corp.†(a) | | | 74,949 | |
| | 130 | | DineEquity, Inc. | | | 11,021 | |
| | 2,160 | | Ethan Allen Interiors, Inc.(a) | | | 71,366 | |
| | 614 | | Flexsteel Industries, Inc. | | | 24,327 | |
| | 30,190 | | Fred's, Inc., Class A(a) | | | 486,361 | |
| | 1,725 | | Guess, Inc.(a) | | | 25,961 | |
| | 21,031 | | Hooker Furniture Corp.(a) | | | 451,956 | |
| | 340 | | Jack in the Box, Inc. | | | 29,213 | |
| | 2,430 | | La-Z-Boy, Inc., Class Z | | | 67,602 | |
| | 175 | | Marcus Corp. | | | 3,692 | |
| | 1,139 | | Marriott Vacations Worldwide Corp.(a) | | | 78,010 | |
| | 2,055 | | MDC Holdings, Inc.(a) | | | 50,019 | |
| | 120 | | Meredith Corp. | | | 6,229 | |
| | 1,495 | | Modine Manufacturing Co.† | | | 13,156 | |
| | 5,995 | | National CineMedia, Inc.(a) | | | 92,803 | |
| | 6,770 | | New York Times Co. (The), Class A(a) | | | 81,917 | |
| | 1,200 | | Pier 1 Imports, Inc.(a) | | | 6,168 | |
| | 951 | | Reading International, Inc., Class A†(a) | | | 11,878 | |
| | 219 | | Red Robin Gourmet Burgers, Inc.†(a) | | | 10,387 | |
| | 2,880 | | Rent-A-Center, Inc., Class A(a) | | | 35,366 | |
| | 355 | | Ruby Tuesday, Inc.†(a) | | | 1,282 | |
| | 9,965 | | Select Comfort Corp.†(a) | | | 213,052 | |
| | 6,720 | | Stage Stores, Inc.(a) | | | 32,794 | |
| | 39,900 | | Stoneridge, Inc.†(a) | | | 596,106 | |
| | 935 | | Strayer Education, Inc.†(a) | | | 45,937 | |
| | 4,220 | | Tailored Brands, Inc.(a) | | | 53,425 | |
| | 30,255 | | Taylor Morrison Home Corp., Class A† | | | 448,984 | |
| | 43,680 | | TRI Pointe Group, Inc.†(a) | | | 516,298 | |
| | | | | | | 3,931,584 | |
Consumer Staples — 7.8% | | | | |
| | 14,960 | | Aryzta AG ADR | | | 276,461 | |
| | 6,120 | | Avon Products, Inc. | | | 23,133 | |
| | 21,785 | | Britvic PLC ADR | | | 346,896 | |
| | 595 | | Dean Foods Co.(a) | | | 10,763 | |
| | 26,345 | | Elizabeth Arden, Inc.† | | | 362,507 | |
| | 109 | | Ingles Markets, Inc., Class A(a) | | | 4,066 | |
| | 12,328 | | Inter Parfums, Inc.(a) | | | 352,211 | |
| | 9,085 | | John B. Sanfilippo & Son, Inc.(a) | | | 387,294 | |
| | 775 | | Lancaster Colony Corp. | | | 98,898 | |
| | 44,305 | | Landec Corp.†(a) | | | 476,722 | |
| | 925 | | Nutraceutical International Corp.†(a) | | | 21,414 | |
| | 290 | | Seneca Foods Corp., Class A†(a) | | | 10,501 | |
| | 1,405 | | Snyder's-Lance, Inc. | | | 47,615 | |
| | 7,405 | | TreeHouse Foods, Inc.†(a) | | | 760,123 | |
| | | | | | | 3,178,604 | |
Energy — 2.4% | | | | |
| | 8,180 | | Alon USA Energy, Inc.(a) | | | 53,006 | |
| | 13,035 | | Archrock, Inc.(a) | | | 122,790 | |
| | 4,393 | | Bristow Group, Inc.(a) | | | 50,124 | |
| | 19,810 | | Cobalt International Energy, Inc.†(a) | | | 26,545 | |
| Shares | | | | Value | |
Energy — (continued) | | | | |
| | 5,180 | | Contango Oil & Gas Co.† | | $ | 63,403 | |
| | 8,175 | | Delek US Holdings, Inc.(a) | | | 107,992 | |
| | 4,510 | | Dorian LPG, Ltd.†(a) | | | 31,796 | |
| | 625 | | Era Group, Inc.† | | | 5,875 | |
| | 485 | | Exterran Corp.†(a) | | | 6,232 | |
| | 4,005 | | Newpark Resources, Inc.†(a) | | | 23,189 | |
| | 6,630 | | Oasis Petroleum, Inc.†(a) | | | 61,924 | |
| | 780 | | Oil States International, Inc.†(a) | | | 25,647 | |
| | 1,410 | | Panhandle Oil and Gas, Inc., Class A | | | 23,505 | |
| | 3,875 | | Parsley Energy, Inc., Class A†(a) | | | 104,858 | |
| | 505 | | PDC Energy, Inc.† | | | 29,093 | |
| | 1,965 | | RSP Permian, Inc.†(a) | | | 68,559 | |
| | 7,600 | | Scorpio Tankers, Inc.(a) | | | 31,920 | |
| | 990 | | SemGroup Corp., Class A | | | 32,234 | |
| | 13,920 | | Synergy Resources Corp.†(a) | | | 92,707 | |
| | 1,265 | | Unit Corp.†(a) | | | 19,683 | |
| | | | | | | 981,082 | |
Financials — 32.9% | | | | |
| | 2,160 | | Acadia Realty Trust(b) | | | 76,723 | |
| | 1,955 | | Alexander & Baldwin, Inc. | | | 70,654 | |
| | 8,200 | | Ambac Financial Group, Inc.† | | | 134,972 | |
| | 4,693 | | American Equity Investment Life Holding Co.(a) | | | 66,875 | |
| | 10,535 | | Ameris Bancorp(a) | | | 312,889 | |
| | 499 | | Amerisafe, Inc. | | | 30,549 | |
| | 16,010 | | Anworth Mortgage Asset Corp.(a) (b) | | | 75,247 | |
| | 8,545 | | Apollo Commercial Real Estate Finance, Inc.(a) (b) | | | 137,318 | |
| | 9,195 | | Ares Commercial Real Estate Corp.(a) (b) | | | 113,007 | |
| | 863 | | Argo Group International Holdings, Ltd.(a) | | | 44,790 | |
| | 549 | | Arrow Financial Corp.(a) | | | 16,629 | |
| | 6,080 | | Ashford Hospitality Prime, Inc.(b) | | | 85,971 | |
| | 1,740 | | Ashford Hospitality Trust, Inc.(b) | | | 9,344 | |
| | 3,470 | | Astoria Financial Corp.(a) | | | 53,195 | |
| | 410 | | Banco Latinoamericano de Comercio Exterior SA, Class E(a) | | | 10,865 | |
| | 3,911 | | Bancorp, Inc.†(a) | | | 23,544 | |
| | 4,355 | | BancorpSouth, Inc.(a) | | | 98,815 | |
| | 3,022 | | Bank Mutual Corp.(a) | | | 23,209 | |
| | 390 | | Bank of the Ozarks, Inc.(a) | | | 14,633 | |
| | 2,133 | | BankFinancial Corp.(a) | | | 25,575 | |
| | 70 | | Banner Corp.(a) | | | 2,978 | |
| | 1,230 | | Beneficial Bancorp, Inc.†(a) | | | 15,646 | |
| | 5,405 | | Berkshire Hills Bancorp, Inc.(a) | | | 145,503 | |
| | 11,589 | | Boston Private Financial Holdings, Inc. | | | 136,518 | |
| | 48,455 | | Brandywine Realty Trust(b) | | | 814,044 | |
| | 1,670 | | Calamos Asset Management, Inc., Class A(a) | | | 12,208 | |
| | 15,405 | | Capital Bank Financial Corp., Class A(a) | | | 443,664 | |
| | 10,815 | | Capitol Federal Financial, Inc.(a) | | | 150,869 | |
| | 10,070 | | Capstead Mortgage Corp.(a) (b) | | | 97,679 | |
| | 400 | | Cathay General Bancorp(a) | | | 11,280 | |
| | 1,640 | | CBL & Associates Properties, Inc.(a) (b) | | | 15,268 | |
| | 11,903 | | Cedar Realty Trust, Inc.(a) (b) | | | 88,439 | |
| | 2,420 | | CenterState Banks, Inc.(a) | | | 38,115 | |
| | 1,200 | | Central Pacific Financial Corp. | | | 28,320 | |
| | 519 | | Chemical Financial Corp.(a) | | | 19,354 | |
| | 1,050 | | Chesapeake Lodging Trust(a) (b) | | | 24,412 | |
| | 495 | | Citizens & Northern Corp. | | | 10,009 | |
| | 569 | | City Holding Co.(a) | | | 25,872 | |
| | 6,315 | | Clifton Bancorp, Inc.(a) | | | 95,167 | |
| | 4,895 | | Colony Capital, Inc., Class A(a) (b) | | | 75,138 | |
| | 2,360 | | Community Bank System, Inc.(a) | | | 96,972 | |
Wilshire Mutual Funds, Inc. Small Company Value Portfolio Schedule of Investments | June 30, 2016 (unaudited) |
| Shares | | | | Value | |
Financials — (continued) | | | | |
| | 8,580 | | Cousins Properties, Inc.(a) (b) | | $ | 89,232 | |
| | 1,090 | | CU Bancorp† | | | 24,776 | |
| | 3,870 | | CYS Investments, Inc.(b) | | | 32,392 | |
| | 1,807 | | DCT Industrial Trust, Inc.(a) (b) | | | 86,808 | |
| | 695 | | DiamondRock Hospitality Co.(a) (b) | | | 6,276 | |
| | 925 | | Dime Community Bancshares, Inc. | | | 15,734 | |
| | 542 | | Dynex Capital, Inc.(a) (b) | | | 3,761 | |
| | 1,693 | | Eagle Bancorp, Inc.† | | | 81,450 | |
| | 565 | | EastGroup Properties, Inc.(a) (b) | | | 38,940 | |
| | 1,330 | | Education Realty Trust, Inc.(b) | | | 61,366 | |
| | 619 | | Employers Holdings, Inc. | | | 17,963 | |
| | 1,419 | | Enterprise Financial Services Corp.(a) | | | 39,576 | |
| | 3,171 | | Equity One, Inc.(b) | | | 102,043 | |
| | 7,159 | | Ezcorp, Inc., Class A†(a) | | | 54,122 | |
| | 2,657 | | FBL Financial Group, Inc., Class A(a) | | | 161,200 | |
| | 327 | | Federated National Holding Co.(a) | | | 6,226 | |
| | 3,020 | | FelCor Lodging Trust, Inc.(b) | | | 18,815 | |
| | 6,018 | | First Busey Corp.(a) | | | 128,725 | |
| | 277 | | First Citizens BancShares, Inc., Class A(a) | | | 71,718 | |
| | 7,308 | | First Commonwealth Financial Corp.(a) | | | 67,234 | |
| | 95 | | First Connecticut Bancorp, Inc. | | | 1,573 | |
| | 2,730 | | First Financial Bancorp(a) | | | 53,098 | |
| | 433 | | First Industrial Realty Trust, Inc.(a) (b) | | | 12,046 | |
| | 3,515 | | First Midwest Bancorp, Inc.(a) | | | 61,723 | |
| | 1,090 | | Flushing Financial Corp.(a) | | | 21,669 | |
| | 6,578 | | FNB Corp.(a) | | | 82,488 | |
| | 38,875 | | Forestar Group, Inc.†(a) | | | 462,224 | |
| | 2,188 | | Fox Chase Bancorp, Inc.(a) | | | 44,504 | |
| | 43 | | German American Bancorp, Inc. | | | 1,375 | |
| | 125 | | Getty Realty Corp.(a) (b) | | | 2,681 | |
| | 2,464 | | Glacier Bancorp, Inc.(a) | | | 65,493 | |
| | 1,508 | | Global Indemnity PLC, Class A†(a) | | | 41,515 | |
| | 2,910 | | Gramercy Property Trust(a) (b) | | | 26,830 | |
| | 7,720 | | Greenhill & Co., Inc.(a) | | | 124,292 | |
| | 3,365 | | Hallmark Financial Services, Inc.† | | | 39,000 | |
| | 2,723 | | Hanmi Financial Corp.(a) | | | 63,963 | |
| | 1,740 | | Hatteras Financial Corp.(b) | | | 28,536 | |
| | 6,009 | | Healthcare Realty Trust, Inc.(a) (b) | | | 210,255 | |
| | 18,160 | | Heritage Financial Corp.(a) | | | 319,253 | |
| | 965 | | Hersha Hospitality Trust, Class A(a) (b) | | | 16,550 | |
| | 2,990 | | Home BancShares, Inc.(a) | | | 59,172 | |
| | 9,985 | | HomeStreet, Inc.†(a) | | | 198,901 | |
| | 610 | | HomeTrust Bancshares, Inc.†(a) | | | 11,285 | |
| | 1,100 | | Horace Mann Educators Corp. | | | 37,169 | |
| | 1,745 | | Independent Bank Corp.(a) | | | 25,320 | |
| | 828 | | Infinity Property & Casualty Corp.(a) | | | 66,787 | |
| | 615 | | Invesco Mortgage Capital, Inc.(b) | | | 8,419 | |
| | 21,515 | | Investors Bancorp, Inc.(a) | | | 238,386 | |
| | 935 | | KCG Holdings, Inc., Class A† | | | 12,436 | |
| | 1,775 | | Kennedy-Wilson Holdings, Inc.(a) | | | 33,654 | |
| | 605 | | Kite Realty Group Trust(b) | | | 16,958 | |
| | 9,660 | | LaSalle Hotel Properties(a) (b) | | | 227,783 | |
| | 10,255 | | Lexington Realty Trust (b) | | | 103,678 | |
| | 2,741 | | LTC Properties, Inc.(a) (b) | | | 141,792 | |
| | 5,950 | | MB Financial, Inc. | | | 215,866 | |
| | 1,224 | | Mercantile Bank Corp.(a) | | | 29,205 | |
| | 10,680 | | Meridian Bancorp, Inc. | | | 157,850 | |
| | 18,018 | | MGIC Investment Corp.† | | | 107,207 | |
| | 395 | | National Health Investors, Inc.(a) (b) | | | 29,661 | |
| | 371 | | National Western Life Group, Inc., Class A(a) | | | 72,445 | |
| | 1,049 | | Navigators Group, Inc. (The) | | | 96,477 | |
| | 1,641 | | NBT Bancorp, Inc.(a) | | | 46,982 | |
| | 7,515 | | New Residential Investment Corp.(a) (b) | | | 104,008 | |
| Shares | | | | Value | |
Financials — (continued) | | | | |
| | 6,265 | | Northfield Bancorp, Inc.(a) | | $ | 92,910 | |
| | 455 | | Northwest Bancshares, Inc.(a) | | | 6,748 | |
| | 2,860 | | OFG Bancorp | | | 23,738 | |
| | 1,071 | | Oritani Financial Corp.(a) | | | 17,125 | |
| | 807 | | Pacific Continental Corp.(a) | | | 12,678 | |
| | 12,269 | | PacWest Bancorp(a) | | | 488,061 | |
| | 7,800 | | PennyMac Mortgage Investment Trust(a) (b) | | | 126,594 | |
| | 3,545 | | PHH Corp.†(a) | | | 47,220 | |
| | 1,499 | | Pinnacle Financial Partners, Inc.(a) | | | 73,226 | |
| | 589 | | Piper Jaffray Cos.†(a) | | | 22,205 | |
| | 875 | | Potlatch Corp.(b) | | | 29,838 | |
| | 11,045 | | PrivateBancorp, Inc., Class A | | | 486,311 | |
| | 1,720 | | Prosperity Bancshares, Inc.(a) | | | 87,703 | |
| | 230 | | Provident Financial Holdings, Inc. | | | 4,209 | |
| | 419 | | Provident Financial Services, Inc. | | | 8,229 | |
| | 805 | | PS Business Parks, Inc.(b) | | | 85,394 | |
| | 6,635 | | Radian Group, Inc. | | | 69,137 | |
| | 38,265 | | Ramco-Gershenson Properties Trust(a) (b) | | | 750,377 | |
| | 2,690 | | RE, Class A(a) | | | 108,299 | |
| | 8,195 | | Redwood Trust, Inc.(a) (b) | | | 113,173 | |
| | 585 | | Renasant Corp.(a) | | | 18,913 | |
| | 1,812 | | Republic Bancorp, Inc., Class A(a) | | | 50,066 | |
| | 1,332 | | RLI Corp.(a) | | | 91,615 | |
| | 3,779 | | RLJ Lodging Trust(a) (b) | | | 81,060 | |
| | 52 | | RMR Group, Inc. | | | 1,610 | |
| | 1,248 | | S&T Bancorp, Inc.(a) | | | 30,514 | |
| | 75 | | Sabra Health Care, Inc.(b) | | | 1,548 | |
| | 4,015 | | Select Income(a) (b) | | | 104,350 | |
| | 1,520 | | Selective Insurance Group, Inc. | | | 58,079 | |
| | 105 | | Sierra Bancorp(a) | | | 1,752 | |
| | 1,274 | | Simmons First National Corp., Class A(a) | | | 58,840 | |
| | 1,292 | | Southwest Bancorp, Inc.(a) | | | 21,874 | |
| | 935 | | Sovran Self Storage, Inc.(b) | | | 98,100 | |
| | 1,315 | | State Auto Financial Corp.(a) | | | 28,812 | |
| | 1,610 | | Sterling Bancorp(a) | | | 25,277 | |
| | 40 | | Stonegate Bank(a) | | | 1,291 | |
| | 3,475 | | STORE Capital Corp.(b) | | | 102,339 | |
| | 235 | | Summit Hotel Properties, Inc.(b) | | | 3,111 | |
| | 1,320 | | Sun Communities, Inc.(b) | | | 101,165 | |
| | 3,120 | | Sunstone Hotel Investors, Inc.(a) (b) | | | 37,658 | |
| | 3,305 | | Territorial Bancorp, Inc.(a) | | | 87,483 | |
| | 1,225 | | Texas Capital Bancshares, Inc.†(a) | | | 57,281 | |
| | 2,410 | | TriState Capital Holdings, Inc.†(a) | | | 33,089 | |
| | 5,090 | | Umpqua Holdings Corp.(a) | | | 78,742 | |
| | 2,175 | | United Financial Bancorp, Inc.(a) | | | 28,232 | |
| | 1,186 | | United Fire Group, Inc.(a) | | | 50,322 | |
| | 1,505 | | Univest Corp of Pennsylvania(a) | | | 31,635 | |
| | 140 | | Virtus Investment Partners, Inc.(a) | | | 9,965 | |
| | 460 | | Waddell & Reed Financial, Inc., Class A(a) | | | 7,921 | |
| | 4,500 | | Washington Federal, Inc.(a) | | | 109,170 | |
| | 745 | | Washington Real Estate Investment Trust(a) (b) | | | 23,438 | |
| | 170 | | Waterstone Financial, Inc.(a) | | | 2,606 | |
| | 2,804 | | Webster Financial Corp.(a) | | | 95,196 | |
| | 17,155 | | Western Alliance Bancorp† | | | 560,111 | |
| | 3,525 | | Wilshire Bancorp, Inc.(a) | | | 36,730 | |
| | 1,070 | | Wintrust Financial Corp. | | | 54,570 | |
| | | | | | | 13,438,765 | |
Health Care — 5.0% | | | | |
| | 715 | | Acorda Therapeutics, Inc.†(a) | | | 18,236 | |
| | 140 | | Almost Family, Inc.†(a) | | | 5,966 | |
| | 390 | | AMAG Pharmaceuticals, Inc.†(a) | | | 9,329 | |
Wilshire Mutual Funds, Inc. Small Company Value Portfolio Schedule of Investments | June 30, 2016 (unaudited) |
| Shares | | | | Value | |
Health Care — (continued) | | | | |
| | 555 | | Amphastar Pharmaceuticals, Inc.† | | $ | 8,946 | |
| | 7,830 | | Analogic Corp.(a) | | | 622,015 | |
| | 7,515 | | Array BioPharma, Inc.†(a) | | | 26,753 | |
| | 10 | | AtriCure, Inc.†(a) | | | 142 | |
| | 9,620 | | Chimerix, Inc.†(a) | | | 37,807 | |
| | 5,680 | | Community Health Systems, Inc.†(a) | | | 68,444 | |
| | 1,329 | | CONMED Corp.(a) | | | 63,433 | |
| | 2,015 | | Haemonetics Corp.† | | | 58,415 | |
| | 945 | | HealthEquity, Inc.†(a) | | | 28,714 | |
| | 1,546 | | HealthSouth Corp.(a) | | | 60,016 | |
| | 2,100 | | Healthways, Inc.†(a) | | | 24,255 | |
| | 495 | | ICU Medical, Inc.† | | | 55,811 | |
| | 11,490 | | ImmunoGen, Inc.†(a) | | | 35,389 | |
| | 9,130 | | Infinity Pharmaceuticals, Inc.†(a) | | | 12,143 | |
| | 3,570 | | Insmed, Inc.†(a) | | | 35,200 | |
| | 5,570 | | Invacare Corp.(a) | | | 67,564 | |
| | 4,460 | | Kindred Healthcare, Inc.(a) | | | 50,353 | |
| | 1,316 | | Magellan Health, Inc.† | | | 86,553 | |
| | 690 | | Medicines Co. (The)†(a) | | | 23,205 | |
| | 7,150 | | Meridian Bioscience, Inc.(a) | | | 139,425 | |
| | 910 | | Merit Medical Systems, Inc.†(a) | | | 18,045 | |
| | 799 | | National HealthCare Corp.(a) | | | 51,727 | |
| | 405 | | OraSure Technologies, Inc.†(a) | | | 2,394 | |
| | 945 | | Orthofix International NV† | | | 40,068 | |
| | 910 | | Owens & Minor, Inc.(a) | | | 34,016 | |
| | 188 | | PharMerica Corp.†(a) | | | 4,636 | |
| | 20 | | Portola Pharmaceuticals, Inc., Class A† | | | 472 | |
| | 1,520 | | Puma Biotechnology, Inc.†(a) | | | 45,281 | |
| | 1,880 | | Quality Systems, Inc.(a) | | | 22,391 | |
| | 880 | | Revance Therapeutics, Inc.†(a) | | | 11,968 | |
| | 690 | | Sage Therapeutics, Inc.†(a) | | | 20,790 | |
| | 11,220 | | Sagent Pharmaceuticals, Inc.†(a) | | | 168,076 | |
| | 5,535 | | Vocera Communications, Inc.† | | | 71,124 | |
| | 490 | | Wright Medical Group NV†(a) | | | 8,511 | |
| | | | | | | 2,037,613 | |
Industrials — 10.2% | | | | |
| | 1,852 | | AAR Corp. | | | 43,226 | |
| | 210 | | Actuant Corp., Class A(a) | | | 4,748 | |
| | 695 | | Aerovironment, Inc.†(a) | | | 19,321 | |
| | 7,255 | | Albany International Corp., Class A(a) | | | 289,692 | |
| | 730 | | American Science & Engineering, Inc.(a) | | | 27,309 | |
| | 3,230 | | Applied Industrial Technologies, Inc. | | | 145,802 | |
| | 2,690 | | ARC Document Solutions, Inc.† | | | 10,464 | |
| | 1,585 | | Beacon Roofing Supply, Inc.† | | | 72,070 | |
| | 6,570 | | Brady Corp., Class A | | | 200,779 | |
| | 68 | | Briggs & Stratton Corp.(a) | | | 1,440 | |
| | 2,185 | | CAI International, Inc.†(a) | | | 16,388 | |
| | 3,284 | | Casella Waste Systems, Inc., Class A†(a) | | | 25,780 | |
| | 1,500 | | CEB, Inc. | | | 92,520 | |
| | 4,185 | | Chart Industries, Inc.†(a) | | | 100,984 | |
| | 2,558 | | Comfort Systems USA, Inc. | | | 83,314 | |
| | 1,280 | | Cubic Corp.(a) | | | 51,405 | |
| | 1,555 | | Deluxe Corp. | | | 103,205 | |
| | 3,315 | | DigitalGlobe, Inc.†(a) | | | 70,908 | |
| | 2,245 | | Douglas Dynamics, Inc.(a) | | | 57,764 | |
| | 2,305 | | DXP Enterprises, Inc.†(a) | | | 34,414 | |
| | 797 | | EMCOR Group, Inc. | | | 39,260 | |
| | 9,355 | | EnerSys, Inc. | | | 556,342 | |
| | 4,990 | | Ennis, Inc. | | | 95,708 | |
| | 710 | | Essendant, Inc. | | | 21,698 | |
| | 1,496 | | Esterline Technologies Corp.† | | | 92,812 | |
| | 2,140 | | Federal Signal Corp.(a) | | | 27,563 | |
| | 6,660 | | General Cable Corp.(a) | | | 84,649 | |
| Shares | | | | Value | |
Industrials — (continued) | | | | |
| | 12,030 | | GP Strategies Corp.†(a) | | $ | 260,931 | |
| | 2,655 | | Graham Corp.(a) | | | 48,905 | |
| | 650 | | Harsco Corp. | | | 4,316 | |
| | 307 | | HEICO Corp.(a) | | | 20,511 | |
| | 300 | | HNI Corp.(a) | | | 13,947 | |
| | 1,079 | | Hyster-Yale Materials Handling, Inc. | | | 64,190 | |
| | 240 | | Kaman Corp.(a) | | | 10,205 | |
| | 6,660 | | Kennametal, Inc.(a) | | | 147,253 | |
| | 1,465 | | Kimball International, Inc., Class B | | | 16,672 | |
| | 1,875 | | Knoll, Inc. | | | 45,525 | |
| | 11,115 | | Marten Transport, Ltd.(a) | | | 220,077 | |
| | 854 | | Miller Industries, Inc. | | | 17,584 | |
| | 200 | | Mobile Mini, Inc.(a) | | | 6,928 | |
| | 1,063 | | Moog, Inc., Class A† | | | 57,317 | |
| | 1,945 | | MRC Global, Inc.† | | | 27,638 | |
| | 3,955 | | Navigant Consulting, Inc.†(a) | | | 63,873 | |
| | 3,689 | | Orbital ATK, Inc.(a) | | | 314,081 | |
| | 600 | | Quad | | | 13,974 | |
| | 4,815 | | Raven Industries, Inc.(a) | | | 91,196 | |
| | 1,250 | | Roadrunner Transportation Systems, Inc.† | | | 9,325 | |
| | 2,565 | | Simpson Manufacturing Co., Inc. | | | 102,523 | |
| | 2,640 | | TAL International Group, Inc. | | | 35,402 | |
| | 865 | | Teledyne Technologies, Inc.†(a) | | | 85,678 | |
| | 1,222 | | Tennant Co.(a) | | | 65,829 | |
| | 1,060 | | Triumph Group, Inc.(a) | | | 37,630 | |
| | 1,425 | | Wabash National Corp.†(a) | | | 18,097 | |
| | | | | | | 4,169,172 | |
Information Technology — 15.2% | | | | |
| | 30 | | Actua Corporation†(a) | | | 271 | |
| | 2,005 | | ADTRAN, Inc. | | | 37,393 | |
| | 290 | | Anixter International, Inc.† | | | 15,451 | |
| | 8,915 | | AVX Corp.(a) | | | 121,066 | |
| | 9,265 | | Bankrate, Inc.†(a) | | | 69,302 | |
| | 1,750 | | Black Box Corp.(a) | | | 22,890 | |
| | 3,505 | | Brooks Automation, Inc.(a) | | | 39,326 | |
| | 533 | | CACI International, Inc., Class A† | | | 48,189 | |
| | 300 | | Cardtronics, Inc.†(a) | | | 11,943 | |
| | 930 | | ChannelAdvisor Corp.† | | | 13,476 | |
| | 9,775 | | Coherent, Inc.†(a) | | | 897,149 | |
| | 3,420 | | Cohu, Inc. | | | 37,107 | |
| | 7,674 | | Comtech Telecommunications Corp.(a) | | | 98,534 | |
| | 1,928 | | CTS Corp.(a) | | | 34,550 | |
| | 5,331 | | Digi International, Inc.† | | | 57,202 | |
| | 2,550 | | EarthLink Holdings Corp.(a) | | | 16,320 | |
| | 7,280 | | EnerNOC, Inc.†(a) | | | 46,010 | |
| | 38,315 | | Entegris, Inc.† | | | 554,418 | |
| | 3,075 | | Euronet Worldwide, Inc.†(a) | | | 212,759 | |
| | 280 | | Fairchild Semiconductor International, Inc., Class A† | | | 5,558 | |
| | 3,075 | | Finisar Corp.†(a) | | | 53,843 | |
| | 110 | | FormFactor, Inc.†(a) | | | 989 | |
| | 1,800 | | Immersion Corp.†(a) | | | 13,212 | |
| | 2,912 | | Insight Enterprises, Inc.†(a) | | | 75,712 | |
| | 21,190 | | Integrated Device Technology, Inc.†(a) | | | 426,555 | |
| | 1,375 | | InterDigital, Inc.(a) | | | 76,560 | |
| | 5,010 | | Intersil Corp., Class A | | | 67,835 | |
| | 3,740 | | Ixia† | | | 36,727 | |
| | 290 | | IXYS Corp.(a) | | | 2,973 | |
| | 9,415 | | Kimball Electronics, Inc.†(a) | | | 117,217 | |
| | 122,900 | | Lattice Semiconductor Corp.†(a) | | | 657,515 | |
| | 9,723 | | Liquidity Services, Inc.† | | | 76,228 | |
| | 1,010 | | ManTech International Corp., Class A(a) | | | 38,198 | |
| | 710 | | Mentor Graphics Corp.(a) | | | 15,095 | |
Wilshire Mutual Funds, Inc. Small Company Value Portfolio Schedule of Investments | June 30, 2016 (unaudited) |
| Shares | | | | Value | |
Information Technology — (continued) | | | | |
| | 5 | | Mercury Systems, Inc.† | | $ | 124 | |
| | 112,195 | | Mitel Networks Corp.†(a) | | | 705,707 | |
| | 2,790 | | MKS Instruments, Inc. | | | 120,137 | |
| | 869 | | NETGEAR, Inc.† | | | 41,312 | |
| | 43,240 | | Novanta, Inc.†(a) | | | 655,086 | |
| | 60 | | NVE Corp.(a) | | | 3,519 | |
| | 4,399 | | Photronics, Inc.†(a) | | | 39,195 | |
| | 1,095 | | Plexus Corp.†(a) | | | 47,304 | |
| | 1,610 | | Polycom, Inc.† | | | 18,112 | |
| | 3,385 | | Progress Software Corp.†(a) | | | 92,952 | |
| | 1,835 | | QLogic Corp.† | | | 27,048 | |
| | 285 | | Reis, Inc. | | | 7,097 | |
| | 905 | | Rogers Corp.† | | | 55,295 | |
| | 4,405 | | Rovi Corp.†(a) | | | 68,894 | |
| | 3,340 | | Rubicon Project, Inc.† | | | 45,591 | |
| | 436 | | ScanSource, Inc.†(a) | | | 16,180 | |
| | 154 | | Semtech Corp.† | | | 3,675 | |
| | 4,530 | | ShoreTel, Inc.†(a) | | | 30,306 | |
| | 3,020 | | Silicon Graphics International Corp.† | | | 15,190 | |
| | 891 | | Silicon Laboratories, Inc.† | | | 43,427 | |
| | 3,340 | | Sonus Networks, Inc.† | | | 29,025 | |
| | 4,900 | | Telenav, Inc.†(a) | | | 24,990 | |
| | 3,360 | | Tessera Technologies, Inc.(a) | | | 102,950 | |
| | 615 | | Vishay Intertechnology, Inc.(a) | | | 7,620 | |
| | | | | | | 6,198,309 | |
Materials — 8.8% | | | | |
| | 1,315 | | A Schulman, Inc. | | | 32,112 | |
| | 6,395 | | American Vanguard Corp.(a) | | | 96,629 | |
| | 17,940 | | Boise Cascade Co.†(a) | | | 411,723 | |
| | 6,295 | | Calgon Carbon Corp. | | | 82,779 | |
| | 337 | | Carpenter Technology Corp.(a) | | | 11,097 | |
| | 6,370 | | Century Aluminum Co.†(a) | | | 40,322 | |
| | 2,915 | | Deltic Timber Corp.(a) | | | 195,684 | |
| | 5,585 | | Ferroglobe PLC | | | 48,087 | |
| | 5,583 | | FutureFuel Corp. | | | 60,743 | |
| | 4,292 | | Greif, Inc., Class A(a) | | | 159,963 | |
| | 1,725 | | Innophos Holdings, Inc. | | | 72,812 | |
| | 2,155 | | Innospec, Inc.(a) | | | 99,109 | |
| | 185 | | KMG Chemicals, Inc. | | | 4,808 | |
| | 1,675 | | Kronos Worldwide, Inc.(a) | | | 8,794 | |
| | 19,495 | | Louisiana-Pacific Corp.†(a) | | | 338,238 | |
| | 3,050 | | LSB Industries, Inc.†(a) | | | 36,844 | |
| | 16,820 | | Materion Corp.(a) | | | 416,463 | |
| | 6,219 | | Neenah Paper, Inc.(a) | | | 450,069 | |
| | 1,700 | | Olin Corp. | | | 42,228 | |
| | 10,260 | | PH Glatfelter Co.(a) | | | 200,686 | |
| | 4,785 | | Schnitzer Steel Industries, Inc., Class A(a) | | | 84,216 | |
| | 7,100 | | Schweitzer-Mauduit International, Inc. | | | 250,488 | |
| | 1,129 | | Sensient Technologies Corp.(a) | | | 80,204 | |
| | 10,310 | | Stillwater Mining Co.†(a) | | | 122,277 | |
| | 4,290 | | SunCoke Energy, Inc. | | | 24,968 | |
| | 6,720 | | TimkenSteel Corp.(a) | | | 64,646 | |
| | 2,105 | | Tredegar Corp. | | | 33,932 | |
| | 11,515 | | Tronox, Ltd., Class A(a) | | | 50,781 | |
| | 1,525 | | Worthington Industries, Inc. | | | 64,508 | |
| | | | | | | 3,585,210 | |
Telecommunication Services — 0.2% | | | | |
| | 18,200 | | Cincinnati Bell, Inc.†(a) | | | 83,174 | |
| | | | | | | | |
Utilities — 6.3% | | | | |
| | 1,890 | | ALLETE, Inc. | | | 122,151 | |
| | 2,304 | | American States Water Co. | | | 100,961 | |
| Shares | | | | Value | |
Utilities — (continued) | | | | |
| | 4,325 | | Artesian Resources Corp., Class A(a) | | $ | 146,704 | |
| | 345 | | Avista Corp. | | | 15,456 | |
| | 1,545 | | Black Hills Corp.(a) | | | 97,397 | |
| | 225 | | Connecticut Water Service, Inc.(a) | | | 12,645 | |
| | 1,264 | | El Paso Electric Co.(a) | | | 59,749 | |
| | 1,964 | | IDACORP, Inc. | | | 159,771 | |
| | 683 | | MGE Energy, Inc.(a) | | | 38,600 | |
| | 2,850 | | New Jersey Resources Corp.(a) | | | 109,868 | |
| | 765 | | Northwest Natural Gas Co.(a) | | | 49,587 | |
| | 1,105 | | NorthWestern Corp.(a) | | | 69,692 | |
| | 929 | | ONE Gas, Inc.(a) | | | 61,862 | |
| | 280 | | Otter Tail Corp.(a) | | | 9,377 | |
| | 13,699 | | PNM Resources, Inc. | | | 485,493 | |
| | 2,793 | | Portland General Electric Co. | | | 123,227 | |
| | 898 | | SJW Corp.(a) | | | 35,363 | |
| | 620 | | South Jersey Industries, Inc.(a) | | | 19,605 | |
| | 1,109 | | Southwest Gas Corp. | | | 87,289 | |
| | 8,480 | | Spire, Inc.(a) | | | 600,723 | |
| | 1,704 | | WGL Holdings, Inc.(a) | | | 120,626 | |
| | 1,560 | | York Water Co.(a) | | | 49,983 | |
| | | | | | | 2,576,129 | |
| Total Common Stock | | | | |
| (Cost $35,976,866) | | | 40,179,642 | |
| | |
SHORT-TERM INVESTMENTS (c) — 49.8% | |
| | 511,526 | | Northern Trust Institutional Government Select Portfolio, Institutional Class, 0.240% | | | 511,526 | |
| | 19,845,425 | | Northern Trust Institutional Liquid Asset Portfolio, Institutional Class, 0.520%(d) | | | 19,845,425 | |
| | | | | | | | |
| Total Short-Term Investments | | | | |
| (Cost $20,356,951) | | | 20,356,951 | |
Total Investments — 148.2% | | | | |
| (Cost $56,333,817) | | | 60,536,593 | |
Other Assets & Liabilities, Net — (48.2)% | | | (19,700,293 | ) |
NET ASSETS — 100.0% | | $ | 40,836,300 | |
| †† | More narrow industries are utilized for compliance purposes, whereas broad sectors are utilized for reporting purposes. |
| † | Non-income producing security. |
| (a) | This security or a partial position of this security is on loan at June 30, 2016. The total market value of securities on loan at June 30, 2016 was $19,951,795 (Note 6). |
| (b) | Real Estate Investment Trust. |
| (c) | Rate shown is the 7-day effective yield as of June 30, 2016. |
| (d) | This security was purchased with cash collateral held from securities on loan. The total value of such securities as of June 30, 2016 was $19,845,425. Securities on loan are also collateralized by various U.S. Treasury obligations in the amount of $322,288 (Note 6). |
ADR — American Depositary Receipt
Ltd. — Limited
PLC— Public Limited Company
As of June 30, 2016, all of the Portfolio’s investments were considered Level 1. For the six months ended June 30, 2016, there have been no transfers between Level 1 and Level 2 assets and liabilities. For the six months ended June 30, 2016, there have been no transfers between Level 2 and Level 3 assets and liabilities.
Please see Note 2 in Notes to Financial Statements for further information regarding fair value measurements.
Wilshire Mutual Funds, Inc. Wilshire 5000 IndexSM Fund Schedule of Investments | June 30, 2016 (unaudited) |
| Shares | | | | Value | |
| | |
COMMON STOCK — 99.2% | | | |
Consumer Discretionary — 12.7% | | | |
| | 300 | | 1-800-Flowers.com, Inc., Class A† | | $ | 2,706 | |
| | 90 | | A H Belo Corp., Class A | | | 450 | |
| | 975 | | Aaron's, Inc. | | | 21,343 | |
| | 900 | | Abercrombie & Fitch Co., Class A | | | 16,029 | |
| | 700 | | Advance Auto Parts, Inc. | | | 113,141 | |
| | 4,279 | | Amazon.com, Inc.† | | | 3,062,138 | |
| | 356 | | AMC Networks, Inc., Class A† | | | 21,510 | |
| | 550 | | American Axle & Manufacturing Holdings, Inc.† | | | 7,964 | |
| | 1,725 | | American Eagle Outfitters, Inc.(a) | | | 27,479 | |
| | 300 | | American Public Education, Inc.† | | | 8,430 | |
| | 1,350 | | Apollo Education Group, Inc., Class A† | | | 12,312 | |
| | 450 | | Aramark | | | 15,039 | |
| | 272 | | Asbury Automotive Group, Inc.† | | | 14,345 | |
| | 1,789 | | Ascena Retail Group, Inc.†(a) | | | 12,505 | |
| | 200 | | Ascent Capital Group, Inc., Class A† | | | 3,078 | |
| | 811 | | Autoliv, Inc. | | | 87,142 | |
| | 850 | | AutoNation, Inc.†(a) | | | 39,933 | |
| | 206 | | AutoZone, Inc.† | | | 163,531 | |
| | 347 | | Barnes & Noble Education, Inc.† | | | 3,522 | |
| | 550 | | Barnes & Noble, Inc. | | | 6,242 | |
| | 200 | | Beazer Homes USA, Inc.†(a) | | | 1,550 | |
| | 1,550 | | Bed Bath & Beyond, Inc. | | | 66,991 | |
| | 2,450 | | Best Buy Co., Inc. | | | 74,970 | |
| | 200 | | Big 5 Sporting Goods Corp.(a) | | | 1,854 | |
| | 500 | | Big Lots, Inc. | | | 25,055 | |
| | 40 | | Biglari Holdings, Inc.†(a) | | | 16,134 | |
| | 300 | | BJ's Restaurants, Inc.† | | | 13,149 | |
| | 250 | | Blue Nile, Inc. | | | 6,845 | |
| | 300 | | Bob Evans Farms, Inc. | | | 11,385 | |
| | 2,360 | | BorgWarner, Inc. | | | 69,667 | |
| | 725 | | Boyd Gaming Corp.†(a) | | | 13,340 | |
| | 1,000 | | Bravo Brio Restaurant Group, Inc.† | | | 8,190 | |
| | 500 | | Bridgepoint Education, Inc.†(a) | | | 3,620 | |
| | 300 | | Bright Horizons Family Solutions, Inc.† | | | 19,893 | |
| | 475 | | Brinker International, Inc.(a) | | | 21,627 | |
| | 850 | | Brunswick Corp. | | | 38,522 | |
| | 350 | | Buckle, Inc. (The)(a) | | | 9,097 | |
| | 166 | | Buffalo Wild Wings, Inc.†(a) | | | 23,066 | |
| | 300 | | Burlington Stores, Inc.† | | | 20,013 | |
| | 500 | | Cabela's, Inc.† | | | 25,030 | |
| | 834 | | CalAtlantic Group, Inc. | | | 30,616 | |
| | 425 | | Caleres, Inc. | | | 10,289 | |
| | 500 | | Callaway Golf Co. | | | 5,105 | |
| | 500 | | Career Education Corp.†(a) | | | 2,975 | |
| | 1,780 | | CarMax, Inc.†(a) | | | 87,273 | |
| | 300 | | Carmike Cinemas, Inc.† | | | 9,036 | |
| | 3,850 | | Carnival Corp. | | | 170,170 | |
| | 550 | | Carter's, Inc. | | | 58,558 | |
| | 300 | | Cato Corp. (The), Class A(a) | | | 11,316 | |
| | 3,908 | | CBS Corp., Class B(a) | | | 212,752 | |
| | 2,082 | | Charter Communications, Inc., Class A† | | | 476,131 | |
| | 300 | | Cheesecake Factory, Inc. (The) | | | 14,442 | |
| | 1,300 | | Chico's FAS, Inc. | | | 13,923 | |
| | 300 | | Children's Place Retail Stores, Inc. (The)(a) | | | 24,054 | |
| | 237 | | Chipotle Mexican Grill, Inc., Class A†(a) | | | 95,454 | |
| | 450 | | Choice Hotels International, Inc.(a) | | | 21,429 | |
| | 167 | | Churchill Downs, Inc.(a) | | | 21,102 | |
| | 1,125 | | Cinemark Holdings, Inc. | | | 41,017 | |
| | 50 | | Citi Trends, Inc. | | | 777 | |
| | 1,000 | | Clear Channel Outdoor Holdings, Inc., Class A(a) | | | 6,220 | |
| Shares | | | | Value | |
Consumer Discretionary — (continued) | | | |
| | 2,850 | | Coach, Inc.(a) | | $ | 116,109 | |
| | 110 | | Collectors Universe, Inc. | | | 2,173 | |
| | 400 | | Columbia Sportswear Co. | | | 23,016 | |
| | 23,796 | | Comcast Corp., Class A | | | 1,551,261 | |
| | 500 | | Conn's, Inc.†(a) | | | 3,760 | |
| | 425 | | Cooper Tire & Rubber Co. | | | 12,673 | |
| | 506 | | Core-Mark Holding Co., Inc. | | | 23,711 | |
| | 191 | | Cracker Barrel Old Country Store, Inc.(a) | | | 32,751 | |
| | 1,200 | | Crocs, Inc.†(a) | | | 13,536 | |
| | 50 | | CSS Industries, Inc.(a) | | | 1,340 | |
| | 679 | | CST Brands, Inc. | | | 29,251 | |
| | 2,025 | | Dana Holding Corp. | | | 21,384 | |
| | 975 | | Darden Restaurants, Inc. | | | 61,756 | |
| | 325 | | Deckers Outdoor Corp.†(a) | | | 18,694 | |
| | 200 | | Demand Media, Inc.† | | | 1,034 | |
| | 775 | | DeVry Education Group, Inc.(a) | | | 13,826 | |
| | 902 | | Dick's Sporting Goods, Inc.(a) | | | 40,644 | |
| | 347 | | Dillard's, Inc., Class A(a) | | | 21,028 | |
| | 1,298 | | Discovery Communications, Inc., Class C† | | | 30,957 | |
| | 1,523 | | Discovery Communications, Inc., Class A†(a) | | | 38,425 | |
| | 2,100 | | DISH Network Corp., Class A† | | | 110,040 | |
| | 600 | | Dollar General Corp. | | | 56,400 | |
| | 2,448 | | Dollar Tree, Inc.† | | | 230,700 | |
| | 279 | | Domino's Pizza, Inc.(a) | | | 36,655 | |
| | 300 | | Dorman Products, Inc.†(a) | | | 17,160 | |
| | 2,948 | | DR Horton, Inc. | | | 92,803 | |
| | 475 | | DreamWorks Animation SKG, Inc., Class A† | | | 19,413 | |
| | 300 | | Drew Industries, Inc. | | | 25,452 | |
| | 1,150 | | DSW, Inc., Class A(a) | | | 24,357 | |
| | 528 | | Eldorado Resorts, Inc.†(a) | | | 8,023 | |
| | 20 | | Empire Resorts, Inc.†(a) | | | 316 | |
| | 250 | | Entercom Communications Corp., Class A | | | 3,392 | |
| | 100 | | Entravision Communications Corp., Class A | | | 672 | |
| | 526 | | EW Scripps Co. (The), Class A†(a) | | | 8,332 | |
| | 857 | | Expedia, Inc. | | | 91,099 | |
| | 1,000 | | Express, Inc.† | | | 14,510 | |
| | 200 | | Famous Dave's of America, Inc.†(a) | | | 1,006 | |
| | 1,500 | | Federal-Mogul Holdings Corp.†(a) | | | 12,465 | |
| | 300 | | Fiesta Restaurant Group, Inc.†(a) | | | 6,543 | |
| | 1,400 | | Foot Locker, Inc.(a) | | | 76,804 | |
| | 40,460 | | Ford Motor Co.(a) | | | 508,582 | |
| | 400 | | Fossil Group, Inc.†(a) | | | 11,412 | |
| | 700 | | Fred's, Inc., Class A(a) | | | 11,277 | |
| | 600 | | Gaiam, Inc., Class A† | | | 4,644 | |
| | 1,025 | | GameStop Corp., Class A(a) | | | 27,245 | |
| | 1,050 | | Gannett Co., Inc. | | | 14,501 | |
| | 3,175 | | Gap, Inc. (The)(a) | | | 67,374 | |
| | 14,700 | | General Motors Co. | | | 416,010 | |
| | 300 | | Genesco, Inc.†(a) | | | 19,293 | |
| | 2,895 | | Gentex Corp.(a) | | | 44,728 | |
| | 375 | | Gentherm, Inc.† | | | 12,844 | |
| | 1,461 | | Genuine Parts Co.(a) | | | 147,927 | |
| | 275 | | G-III Apparel Group, Ltd.† | | | 12,573 | |
| | 100 | | Golden Entertainment, Inc. | | | 1,169 | |
| | 2,825 | | Goodyear Tire & Rubber Co. (The) | | | 72,489 | |
| | 300 | | GoPro, Inc., Class A†(a) | | | 3,243 | |
| | 500 | | Grand Canyon Education, Inc.† | | | 19,960 | |
| | 1,000 | | Gray Television, Inc.† | | | 10,850 | |
| | 45 | | Green Brick Partners, Inc.†(a) | | | 327 | |
| | 223 | | Group 1 Automotive, Inc.(a) | | | 11,007 | |
| | 400 | | Guess, Inc.(a) | | | 6,020 | |
Wilshire Mutual Funds, Inc. Wilshire 5000 IndexSM Fund Schedule of Investments | June 30, 2016 (unaudited) |
| Shares | | | | Value | |
Consumer Discretionary — (continued) | | | |
| | 2,110 | | H&R Block, Inc. | | $ | 48,530 | |
| | 3,820 | | Hanesbrands, Inc. | | | 95,996 | |
| | 1,875 | | Harley-Davidson, Inc.(a) | | | 84,938 | |
| | 561 | | Harman International Industries, Inc. | | | 40,291 | |
| | 900 | | Hasbro, Inc. | | | 75,591 | |
| | 219 | | Helen of Troy, Ltd.†(a) | | | 22,522 | |
| | 200 | | Hibbett Sports, Inc.†(a) | | | 6,958 | |
| | 1,425 | | Hilton Worldwide Holdings, Inc. | | | 32,105 | |
| | 12,084 | | Home Depot, Inc. (The) | | | 1,543,006 | |
| | 200 | | Hooker Furniture Corp. | | | 4,298 | |
| | 418 | | HSN, Inc.(a) | | | 20,453 | |
| | 300 | | Hyatt Hotels Corp., Class A†(a) | | | 14,742 | |
| | 450 | | Iconix Brand Group, Inc.†(a) | | | 3,042 | |
| | 237 | | International Speedway Corp., Class A | | | 7,928 | |
| | 4,272 | | Interpublic Group of Cos., Inc. (The) | | | 98,683 | |
| | 1,491 | | Interval Leisure Group, Inc. | | | 23,707 | |
| | 300 | | iRobot Corp.† | | | 10,524 | |
| | 3,442 | | J.C. Penney Co., Inc.†(a) | | | 30,565 | |
| | 350 | | Jack in the Box, Inc. | | | 30,072 | |
| | 500 | | John Wiley & Sons, Inc., Class A | | | 26,090 | |
| | 6,425 | | Johnson Controls, Inc. | | | 284,370 | |
| | 300 | | K12, Inc.† | | | 3,747 | |
| | 1,275 | | Kate Spade & Co.† | | | 26,278 | |
| | 800 | | KB Home(a) | | | 12,168 | |
| | 1,800 | | Kohl's Corp.(a) | | | 68,256 | |
| | 675 | | Krispy Kreme Doughnuts, Inc.†(a) | | | 14,148 | |
| | 2,140 | | L Brands, Inc. | | | 143,658 | |
| | 278 | | Lands' End, Inc.†(a) | | | 4,565 | |
| | 4,427 | | Las Vegas Sands Corp.(a) | | | 192,530 | |
| | 425 | | La-Z-Boy, Inc., Class Z | | | 11,824 | |
| | 818 | | Lear Corp. | | | 83,240 | |
| | 1,210 | | Leggett & Platt, Inc. | | | 61,843 | |
| | 1,550 | | Lennar Corp., Class A(a) | | | 71,455 | |
| | 250 | | Libbey, Inc. | | | 3,973 | |
| | 900 | | Liberty Broadband Corp., Class A† | | | 53,460 | |
| | 638 | | Liberty Broadband Corp., Class C†(a) | | | 38,280 | |
| | 3,425 | | Liberty Interactive Corp., Class A† | | | 86,892 | |
| | 900 | | Liberty Media Group, Class A† | | | 17,226 | |
| | 638 | | Liberty Media Group, Class C† | | | 12,103 | |
| | 790 | | Liberty TripAdvisor Holdings, Inc., Class A† | | | 17,285 | |
| | 1,253 | | Liberty Ventures, Ser A† | | | 46,449 | |
| | 700 | | Lifetime Brands, Inc. | | | 10,213 | |
| | 1,250 | | Lions Gate Entertainment Corp.(a) | | | 25,288 | |
| | 234 | | Lithia Motors, Inc., Class A | | | 16,630 | |
| | 912 | | Live Nation Entertainment, Inc.† | | | 21,432 | |
| | 2,800 | | LKQ Corp.† | | | 88,760 | |
| | 300 | | Loral Space & Communications, Inc.†(a) | | | 10,581 | |
| | 9,032 | | Lowe's Cos., Inc. | | | 715,063 | |
| | 241 | | Lumber Liquidators Holdings, Inc.†(a) | | | 3,716 | |
| | 3,298 | | Macy's, Inc. | | | 110,846 | |
| | 193 | | Madison Square Garden Co.† | | | 33,294 | |
| | 100 | | Marcus Corp. | | | 2,110 | |
| | 700 | | Marine Products Corp.(a) | | | 5,922 | |
| | 1,977 | | Marriott International, Inc., Class A(a) | | | 131,391 | |
| | 278 | | Marriott Vacations Worldwide Corp.(a) | | | 19,040 | |
| | 3,355 | | Mattel, Inc.(a) | | | 104,978 | |
| | 300 | | Mattress Firm Holding Corp.†(a) | | | 10,065 | |
| | 8,947 | | McDonald's Corp. | | | 1,076,682 | |
| | 571 | | MDC Holdings, Inc.(a) | | | 13,898 | |
| | 794 | | Media General, Inc.† | | | 13,649 | |
| | 500 | | Meritage Homes Corp.†(a) | | | 18,770 | |
| | 4,425 | | MGM Resorts International† | | | 100,138 | |
| | 632 | | Mohawk Industries, Inc.† | | | 119,928 | |
| | 1,600 | | Monarch Casino & Resort, Inc.†(a) | | | 35,152 | |
| | 325 | | Monro Muffler Brake, Inc.(a) | | | 20,657 | |
| Shares | | | | Value | |
Consumer Discretionary — (continued) | | | |
| | 300 | | Motorcar Parts of America, Inc.† | | $ | 8,154 | |
| | 300 | | Movado Group, Inc.(a) | | | 6,504 | |
| | 581 | | MSG Networks, Inc.† | | | 8,913 | |
| | 518 | | Murphy USA, Inc.† | | | 38,415 | |
| | 200 | | NACCO Industries, Inc., Class A(a) | | | 11,200 | |
| | 500 | | National CineMedia, Inc.(a) | | | 7,740 | |
| | 50 | | Nautilus, Inc.† | | | 892 | |
| | 4,018 | | Netflix, Inc.† | | | 367,567 | |
| | 301 | | New Media Investment Group, Inc.(a) | | | 5,439 | |
| | 1,050 | | New York Times Co. (The), Class A(a) | | | 12,705 | |
| | 4,690 | | Newell Brands, Inc. | | | 227,793 | |
| | 2,853 | | News Corp., Class A | | | 32,382 | |
| | 300 | | Nexstar Broadcasting Group, Inc., Class A(a) | | | 14,274 | |
| | 12,924 | | NIKE, Inc., Class B | | | 713,405 | |
| | 1,300 | | Nordstrom, Inc.(a) | | | 49,465 | |
| | 325 | | Norwegian Cruise Line Holdings, Ltd.†(a) | | | 12,948 | |
| | 40 | | NVR, Inc.† | | | 71,214 | |
| | 2,467 | | Omnicom Group, Inc.(a) | | | 201,036 | |
| | 1,042 | | O'Reilly Automotive, Inc.†(a) | | | 282,486 | |
| | 650 | | Orleans Homebuilders, Inc.† | | | — | |
| | 200 | | Outerwall, Inc.(a) | | | 8,400 | |
| | 300 | | Overstock.com, Inc.† | | | 4,833 | |
| | 50 | | Oxford Industries, Inc. | | | 2,831 | |
| | 200 | | Panera Bread Co., Class A†(a) | | | 42,388 | |
| | 300 | | Papa John's International, Inc.(a) | | | 20,400 | |
| | 700 | | Penske Automotive Group, Inc.(a) | | | 22,022 | |
| | 100 | | Perry Ellis International, Inc.†(a) | | | 2,012 | |
| | 800 | | Pinnacle Entertainment, Inc.† | | | 8,864 | |
| | 540 | | Polaris Industries, Inc.(a) | | | 44,150 | |
| | 450 | | Pool Corp. | | | 42,313 | |
| | 100 | | Popeyes Louisiana Kitchen, Inc.† | | | 5,464 | |
| | 525 | | Priceline Group, Inc.† | | | 655,415 | |
| | 2,865 | | PulteGroup, Inc.(a) | | | 55,839 | |
| | 782 | | PVH Corp. | | | 73,688 | |
| | 580 | | Ralph Lauren Corp., Class A(a) | | | 51,980 | |
| | 1,500 | | RCI Hospitality Holdings, Inc. | | | 15,285 | |
| | 925 | | Regal Entertainment Group, Class A(a) | | | 20,387 | |
| | 200 | | Regis Corp.†(a) | | | 2,490 | |
| | 4,603 | | Restaurant Brands International, Inc.(a) | | | 191,485 | |
| | 116 | | Restoration Hardware Holdings, Inc.†(a) | | | 3,327 | |
| | 100 | | Rocky Brands, Inc. | | | 1,142 | |
| | 3,850 | | Ross Stores, Inc. | | | 218,257 | |
| | 1,643 | | Royal Caribbean Cruises, Ltd.(a) | | | 110,327 | |
| | 500 | | Ruby Tuesday, Inc.†(a) | | | 1,805 | |
| | 100 | | Salem Media Group, Inc., Class A(a) | | | 722 | |
| | 700 | | Sally Beauty Holdings, Inc.† | | | 20,587 | |
| | 325 | | Scholastic Corp.(a) | | | 12,873 | |
| | 1,500 | | Scientific Games Corp., Class A†(a) | | | 13,785 | |
| | 926 | | Scripps Networks Interactive, Inc., Class A(a) | | | 57,662 | |
| | 625 | | Sears Holdings Corp.†(a) | | | 8,506 | |
| | 325 | | SeaWorld Entertainment, Inc.(a) | | | 4,657 | |
| | 188 | | Select Comfort Corp.†(a) | | | 4,019 | |
| | 223 | | Sequential Brands Group, Inc.†(a) | | | 1,779 | |
| | 2,000 | | Service Corp. International | | | 54,080 | |
| | 475 | | ServiceMaster Global Holdings, Inc.† | | | 18,905 | |
| | 600 | | Shoe Carnival, Inc.(a) | | | 15,036 | |
| | 400 | | Shutterfly, Inc.†(a) | | | 18,644 | |
| | 793 | | Signet Jewelers, Ltd.(a) | | | 65,351 | |
| | 900 | | Sinclair Broadcast Group, Inc., Class A | | | 26,874 | |
| | 22,650 | | Sirius XM Holdings, Inc.†(a) | | | 89,468 | |
| | 600 | | Six Flags Entertainment Corp. | | | 34,770 | |
| | 1,050 | | Skechers U.S.A., Inc., Class A†(a) | | | 31,206 | |
| | 475 | | Smith & Wesson Holding Corp.†(a) | | | 12,911 | |
| | 300 | | Sonic Automotive, Inc., Class A(a) | | | 5,133 | |
Wilshire Mutual Funds, Inc. Wilshire 5000 IndexSM Fund Schedule of Investments | June 30, 2016 (unaudited) |
| Shares | | | | Value | |
Consumer Discretionary — (continued) | | | |
| | 800 | | Sonic Corp.(a) | | $ | 21,640 | |
| | 903 | | Sotheby's(a) | | | 24,742 | |
| | 75 | | Spartan Motors, Inc. | | | 470 | |
| | 400 | | Speedway Motorsports, Inc.(a) | | | 7,100 | |
| | 552 | | Stage Stores, Inc.(a) | | | 2,694 | |
| | 300 | | Standard Motor Products, Inc. | | | 11,934 | |
| | 5,675 | | Staples, Inc.(a) | | | 48,919 | |
| | 14,273 | | Starbucks Corp. | | | 815,274 | |
| | 1,738 | | Starwood Hotels & Resorts Worldwide, Inc. | | | 128,525 | |
| | 1,177 | | Starz† | | | 35,216 | |
| | 600 | | Steven Madden, Ltd.† | | | 20,508 | |
| | 150 | | Superior Industries International, Inc. | | | 4,017 | |
| | 600 | | Systemax, Inc.†(a) | | | 5,118 | |
| | 475 | | Tailored Brands, Inc.(a) | | | 6,014 | |
| | 6,207 | | Target Corp. | | | 433,373 | |
| | 2,100 | | TEGNA, Inc.(a) | | | 48,657 | |
| | 416 | | Tempur Sealy International, Inc.†(a) | | | 23,013 | |
| | 450 | | Tenneco, Inc.† | | | 20,975 | |
| | 625 | | Tesla Motors, Inc.†(a) | | | 132,675 | |
| | 475 | | Texas Roadhouse, Inc., Class A(a) | | | 21,660 | |
| | 3,600 | | Thomson Reuters Corp.(a) | | | 145,512 | |
| | 500 | | Thor Industries, Inc.(a) | | | 32,370 | |
| | 1,035 | | Tiffany & Co.(a) | | | 62,762 | |
| | 8,197 | | Time Warner, Inc. | | | 602,807 | |
| | 1,304 | | Time, Inc. | | | 21,464 | |
| | 6,350 | | TJX Cos., Inc. | | | 490,411 | |
| | 1,500 | | Toll Brothers, Inc.† | | | 40,365 | |
| | 325 | | TopBuild Corp.† | | | 11,765 | |
| | 1,437 | | Tractor Supply Co. | | | 131,026 | |
| | 200 | | Trans World Entertainment Corp.† | | | 750 | |
| | 1,900 | | TRI Pointe Group, Inc.†(a) | | | 22,458 | |
| | 934 | | TripAdvisor, Inc.†(a) | | | 60,056 | |
| | 200 | | Tuesday Morning Corp.†(a) | | | 1,404 | |
| | 300 | | Tupperware Brands Corp.(a) | | | 16,884 | |
| | 9,988 | | Twenty-First Century Fox, Inc., Class A | | | 270,175 | |
| | 697 | | Ulta Salon Cosmetics & Fragrance, Inc.† | | | 169,817 | |
| | 1,600 | | Under Armour, Inc., Class A†(a) | | | 64,208 | |
| | 1,611 | | Under Armour, Inc., Class C†(a) | | | 58,653 | |
| | 200 | | Universal Electronics, Inc.† | | | 14,456 | |
| | 800 | | Urban Outfitters, Inc.† | | | 22,000 | |
| | 138 | | Vail Resorts, Inc. | | | 19,076 | |
| | 2,675 | | VF Corp. | | | 164,486 | |
| | 3,207 | | Viacom, Inc., Class B(a) | | | 132,994 | |
| | 400 | | Vista Outdoor, Inc.† | | | 19,092 | |
| | 400 | | Visteon Corp. | | | 26,324 | |
| | 300 | | Vitamin Shoppe, Inc.†(a) | | | 9,171 | |
| | 15,550 | | Walt Disney Co. (The) | | | 1,521,101 | |
| | 296 | | Weight Watchers International, Inc.†(a) | | | 3,442 | |
| | 2,500 | | Wendy's Co. (The) | | | 24,050 | |
| | 729 | | Whirlpool Corp.(a) | | | 121,481 | |
| | 500 | | Williams-Sonoma, Inc.(a) | | | 26,065 | |
| | 500 | | Winnebago Industries, Inc.(a) | | | 11,460 | |
| | 1,175 | | Wolverine World Wide, Inc. | | | 23,876 | |
| | 600 | | World Wrestling Entertainment, Inc., Class A(a) | | | 11,046 | |
| | 876 | | Wyndham Worldwide Corp.(a) | | | 62,397 | |
| | 904 | | Wynn Resorts, Ltd.(a) | | | 81,939 | |
| | 4,212 | | Yum! Brands, Inc. | | | 349,259 | |
| | 300 | | Zumiez, Inc.†(a) | | | 4,293 | |
| | | | | | | 26,758,439 | |
Consumer Staples — 9.8% | | | | |
| | 200 | | Alico, Inc. | | | 6,050 | |
| | 19,575 | | Altria Group, Inc. | | | 1,349,892 | |
| | 375 | | Andersons, Inc. (The) | | | 13,327 | |
| | 5,661 | | Archer-Daniels-Midland Co. | | | 242,800 | |
| Shares | | | | Value | |
Consumer Staples — (continued) | | | |
| | 100 | | Armstrong Flooring, Inc.† | | $ | 1,695 | |
| | 4,725 | | Avon Products, Inc. | | | 17,860 | |
| | 550 | | B&G Foods, Inc., Class A(a) | | | 26,510 | |
| | 100 | | Boston Beer Co., Inc. (The), Class A†(a) | | | 17,103 | |
| | 1,228 | | Brown-Forman Corp., Class B(a) | | | 122,505 | |
| | 1,350 | | Bunge, Ltd. | | | 79,853 | |
| | 300 | | Calavo Growers, Inc.(a) | | | 20,100 | |
| | 318 | | Cal-Maine Foods, Inc.(a) | | | 14,094 | |
| | 1,975 | | Campbell Soup Co. | | | 131,397 | |
| | 400 | | Casey's General Stores, Inc. | | | 52,604 | |
| | 1,300 | | Church & Dwight Co., Inc. | | | 133,757 | |
| | 1,174 | | Clorox Co. (The) | | | 162,470 | |
| | 40,315 | | Coca-Cola Co. (The) | | | 1,827,479 | |
| | 2,095 | | Coca-Cola European Partners PLC | | | 74,771 | |
| | 8,811 | | Colgate-Palmolive Co. | | | 644,965 | |
| | 4,473 | | ConAgra Foods, Inc. | | | 213,854 | |
| | 1,772 | | Constellation Brands, Inc., Class A | | | 293,089 | |
| | 4,480 | | Costco Wholesale Corp. | | | 703,539 | |
| | 725 | | Coty, Inc., Class A(a) | | | 18,843 | |
| | 10,947 | | CVS Health Corp. | | | 1,048,066 | |
| | 1,067 | | Dean Foods Co.(a) | | | 19,302 | |
| | 1,786 | | Dr. Pepper Snapple Group, Inc. | | | 172,581 | |
| | 592 | | Edgewell Personal Care Co. | | | 49,971 | |
| | 592 | | Energizer Holdings, Inc. | | | 30,482 | |
| | 2,001 | | Estee Lauder Cos., Inc. (The), Class A | | | 182,131 | |
| | 2,230 | | Flowers Foods, Inc.(a) | | | 41,812 | |
| | 100 | | Fresh Del Monte Produce, Inc.(a) | | | 5,443 | |
| | 5,850 | | General Mills, Inc. | | | 417,222 | |
| | 900 | | Hain Celestial Group, Inc. (The)†(a) | | | 44,775 | |
| | 650 | | Herbalife, Ltd.†(a) | | | 38,045 | |
| | 1,643 | | Hershey Co. (The)(a) | | | 186,464 | |
| | 2,800 | | Hormel Foods Corp.(a) | | | 102,480 | |
| | 2,500 | | HRG Group, Inc.† | | | 34,325 | |
| | 150 | | Ingles Markets, Inc., Class A(a) | | | 5,595 | |
| | 655 | | Ingredion, Inc. | | | 84,764 | |
| | 300 | | Inter Parfums, Inc. | | | 8,571 | |
| | 170 | | J&J Snack Foods Corp. | | | 20,276 | |
| | 1,154 | | JM Smucker Co. (The) | | | 175,881 | |
| | 2,875 | | Kellogg Co. | | | 234,744 | |
| | 3,519 | | Kimberly-Clark Corp. | | | 483,792 | |
| | 6,257 | | Kraft Heinz Co.(a) | | | 553,619 | |
| | 9,400 | | Kroger Co. (The) | | | 345,826 | |
| | 212 | | Lancaster Colony Corp. | | | 27,053 | |
| | 1,075 | | Manitowoc Foodservice, Inc.†(a) | | | 18,942 | |
| | 70 | | Mannatech, Inc.† | | | 1,417 | |
| | 1,027 | | McCormick & Co., Inc. | | | 109,550 | |
| | 1,676 | | Mead Johnson Nutrition Co., Class A | | | 152,097 | |
| | 200 | | MGP Ingredients, Inc.(a) | | | 7,646 | |
| | 1,500 | | Molson Coors Brewing Co., Class B | | | 151,695 | |
| | 15,671 | | Mondelez International, Inc., Class A | | | 713,187 | |
| | 1,282 | | Monster Beverage Corp.† | | | 206,030 | |
| | 700 | | Nu Skin Enterprises, Inc., Class A(a) | | | 32,333 | |
| | 100 | | Nuvectra Corp.†(a) | | | 740 | |
| | 14,726 | | PepsiCo, Inc. | | | 1,560,072 | |
| | 14,088 | | Philip Morris International, Inc. | | | 1,433,031 | |
| | 650 | | Pilgrim's Pride Corp.(a) | | | 16,562 | |
| | 375 | | Pinnacle Foods, Inc. | | | 17,359 | |
| | 650 | | Post Holdings, Inc.†(a) | | | 53,748 | |
| | 215 | | PriceSmart, Inc.(a) | | | 20,118 | |
| | 27,422 | | Procter & Gamble Co. (The) | | | 2,321,821 | |
| | 9,075 | | Reynolds American, Inc. | | | 489,415 | |
| | 10,550 | | Rite Aid Corp.† | | | 79,019 | |
| | 70 | | Rocky Mountain Chocolate Factory, Inc. | | | 710 | |
| | 243 | | Sanderson Farms, Inc. | | | 21,054 | |
| | 710 | | Snyder's-Lance, Inc.(a) | | | 24,062 | |
| | 400 | | SpartanNash Co. | | | 12,232 | |
Wilshire Mutual Funds, Inc. Wilshire 5000 IndexSM Fund Schedule of Investments | June 30, 2016 (unaudited) |
| Shares | | | | Value | |
Consumer Staples — (continued) | | | |
| | 300 | | Sprouts Farmers Market, Inc.†(a) | | $ | 6,870 | |
| | 2,050 | | SUPERVALU, Inc.† | | | 9,676 | |
| | 6,000 | | Sysco Corp. | | | 304,440 | |
| | 327 | | Tootsie Roll Industries, Inc.(a) | | | 12,599 | |
| | 501 | | TreeHouse Foods, Inc.† | | | 51,428 | |
| | 2,405 | | Tyson Foods, Inc., Class A | | | 160,630 | |
| | 450 | | United Natural Foods, Inc.† | | | 21,060 | |
| | 300 | | Universal Corp.(a) | | | 17,322 | |
| | 59 | | USANA Health Sciences, Inc.†(a) | | | 6,574 | |
| | 1,274 | | Vector Group, Ltd.(a) | | | 28,563 | |
| | 9,803 | | Walgreens Boots Alliance, Inc. | | | 816,296 | |
| | 16,404 | | Wal-Mart Stores, Inc. | | | 1,197,820 | |
| | 145 | | WD-40 Co.(a) | | | 17,030 | |
| | 1,121 | | WhiteWave Foods Co., Class A† | | | 52,620 | |
| | 3,100 | | Whole Foods Market, Inc.(a) | | | 99,262 | |
| | | | | | | 20,726,807 | |
Energy — 6.8% | | | | |
| | 250 | | Alon USA Energy, Inc. | | | 1,620 | |
| | 5,164 | | Anadarko Petroleum Corp. | | | 274,983 | |
| | 800 | | Antero Resources Corp.† | | | 20,784 | |
| | 4,038 | | Apache Corp. | | | 224,795 | |
| | 812 | | Archrock, Inc. | | | 7,649 | |
| | 600 | | Atwood Oceanics, Inc. | | | 7,512 | |
| | 4,245 | | Baker Hughes, Inc. | | | 191,577 | |
| | 400 | | Bill Barrett Corp.† | | | 2,556 | |
| | 300 | | BP Prudhoe Bay Royalty Trust | | | 5,544 | |
| | 200 | | Bristow Group, Inc.(a) | | | 2,282 | |
| | 3,700 | | Cabot Oil & Gas Corp. | | | 95,238 | |
| | 473 | | California Resources Corp.(a) | | | 5,766 | |
| | 1,500 | | Callon Petroleum Co.† | | | 16,845 | |
| | 150 | | CARBO Ceramics, Inc.(a) | | | 1,965 | |
| | 400 | | Carrizo Oil & Gas, Inc.†(a) | | | 14,340 | |
| | 2,400 | | Cheniere Energy, Inc.† | | | 90,120 | |
| | 6,875 | | Chesapeake Energy Corp.(a) | | | 29,425 | |
| | 19,392 | | Chevron Corp. | | | 2,032,863 | |
| | 886 | | Cimarex Energy Co. | | | 105,718 | |
| | 113 | | Clayton Williams Energy, Inc.†(a) | | | 3,103 | |
| | 3,590 | | Columbia Pipeline Group, Inc. | | | 91,509 | |
| | 1,122 | | Concho Resources, Inc.†(a) | | | 133,821 | |
| | 11,917 | | ConocoPhillips | | | 519,581 | |
| | 2,600 | | Consol Energy, Inc.(a) | | | 41,834 | |
| | 830 | | Continental Resources, Inc.†(a) | | | 37,574 | |
| | 200 | | Cross Timbers Royalty Trust | | | 3,626 | |
| | 78 | | Dawson Geophysical Co.†(a) | | | 636 | |
| | 175 | | Delek US Holdings, Inc. | | | 2,312 | |
| | 3,779 | | Denbury Resources, Inc.(a) | | | 13,567 | |
| | 4,416 | | Devon Energy Corp. | | | 160,080 | |
| | 850 | | Diamond Offshore Drilling, Inc. | | | 20,681 | |
| | 650 | | Diamondback Energy, Inc.†(a) | | | 59,286 | |
| | 445 | | Dril-Quip, Inc.†(a) | | | 26,001 | |
| | 822 | | Enbridge Energy Management LLC† | | | 18,914 | |
| | 790 | | Energen Corp.(a) | | | 38,086 | |
| | 1,550 | | EnLink Midstream LLC(a) | | | 24,660 | |
| | 5,063 | | EOG Resources, Inc. | | | 422,355 | |
| | 1,560 | | EQT Corp. | | | 120,791 | |
| | 300 | | Era Group, Inc.† | | | 2,820 | |
| | 406 | | Exterran Corp.†(a) | | | 5,217 | |
| | 42,764 | | Exxon Mobil Corp. | | | 4,008,697 | |
| | 1,606 | | FMC Technologies, Inc.† | | | 42,832 | |
| | 300 | | Forum Energy Technologies, Inc.†(a) | | | 5,193 | |
| | 226 | | Geospace Technologies Corp.†(a) | | | 3,700 | |
| | 300 | | Green Plains, Inc. | | | 5,916 | |
| | 381 | | Gulf Island Fabrication, Inc. | | | 2,644 | |
| | 900 | | Gulfport Energy Corp.† | | | 28,134 | |
| | 8,181 | | Halliburton Co. | | | 370,517 | |
| | 1,000 | | Helix Energy Solutions Group, Inc.†(a) | | | 6,760 | |
| Shares | | | | Value | |
Energy — (continued) | | | |
| | 850 | | Helmerich & Payne, Inc.(a) | | $ | 57,061 | |
| | 2,949 | | Hess Corp.(a) | | | 177,235 | |
| | 1,758 | | HollyFrontier Corp.(a) | | | 41,788 | |
| | 500 | | Hornbeck Offshore Services, Inc.†(a) | | | 4,170 | |
| | 12,560 | | Kinder Morgan, Inc. | | | 235,123 | |
| | 1,500 | | Laredo Petroleum, Inc.† | | | 15,720 | |
| | 7,272 | | Marathon Oil Corp. | | | 109,153 | |
| | 5,581 | | Marathon Petroleum Corp. | | | 211,855 | |
| | 375 | | Matador Resources Co.†(a) | | | 7,425 | |
| | 450 | | Matrix Service Co.† | | | 7,421 | |
| | 2,875 | | McDermott International, Inc.†(a) | | | 14,202 | |
| | 550 | | Memorial Resource Development Corp.† | | | 8,734 | |
| | 1,575 | | Murphy Oil Corp.(a) | | | 50,006 | |
| | 3,100 | | Nabors Industries, Ltd. | | | 31,155 | |
| | 3,736 | | National Oilwell Varco, Inc.(a) | | | 125,716 | |
| | 1,525 | | Newfield Exploration Co.† | | | 67,374 | |
| | 875 | | Newpark Resources, Inc.†(a) | | | 5,066 | |
| | 3,137 | | Noble Energy, Inc. | | | 112,524 | |
| | 1,000 | | Northern Oil and Gas, Inc.† | | | 4,620 | |
| | 7,866 | | Occidental Petroleum Corp. | | | 594,355 | |
| | 800 | | Oceaneering International, Inc. | | | 23,888 | |
| | 500 | | Oil States International, Inc.† | | | 16,440 | |
| | 2,050 | | ONEOK, Inc. | | | 97,272 | |
| | 1 | | Pacific Ethanol, Inc.†(a) | | | 5 | |
| | 650 | | Parsley Energy, Inc., Class A† | | | 17,589 | |
| | 1,950 | | Patterson-UTI Energy, Inc.(a) | | | 41,574 | |
| | 975 | | PBF Energy, Inc., Class A(a) | | | 23,185 | |
| | 375 | | PDC Energy, Inc.†(a) | | | 21,604 | |
| | 4,793 | | Phillips 66 | | | 380,277 | |
| | 675 | | Pioneer Energy Services Corp.†(a) | | | 3,105 | |
| | 1,484 | | Pioneer Natural Resources Co.(a) | | | 224,396 | |
| | 2,200 | | QEP Resources, Inc. | | | 38,786 | |
| | 1,158 | | Range Resources Corp.(a) | | | 49,956 | |
| | 109 | | Renewable Energy Group, Inc.†(a) | | | 962 | |
| | 675 | | Rice Energy, Inc.†(a) | | | 14,877 | |
| | 1,600 | | Rowan PLC, Class A(a) | | | 28,256 | |
| | 1,012 | | RPC, Inc.(a) | | | 15,716 | |
| | 600 | | RSP Permian, Inc.†(a) | | | 20,934 | |
| | 325 | | Sanchez Energy Corp.†(a) | | | 2,294 | |
| | 14,384 | | Schlumberger, Ltd. | | | 1,137,487 | |
| | 450 | | SemGroup Corp., Class A | | | 14,652 | |
| | 1,000 | | Ship Finance International, Ltd.(a) | | | 14,740 | |
| | 750 | | SM Energy Co.(a) | | | 20,250 | |
| | 3,325 | | Southwestern Energy Co.†(a) | | | 41,829 | |
| | 6,666 | | Spectra Energy Corp.(a) | | | 244,176 | |
| | 1,706 | | Superior Energy Services, Inc.(a) | | | 31,407 | |
| | 1,175 | | Synergy Resources Corp.†(a) | | | 7,826 | |
| | 230 | | Targa Resources Corp. | | | 9,692 | |
| | 775 | | Teekay Corp.(a) | | | 5,526 | |
| | 1,116 | | Tesoro Corp. | | | 83,611 | |
| | 850 | | TETRA Technologies, Inc.† | | | 5,415 | |
| | 1,600 | | Trico Marine Services, Inc.† | | | — | |
| | 500 | | Unit Corp.†(a) | | | 7,780 | |
| | 4,764 | | Valero Energy Corp. | | | 242,964 | |
| | 725 | | Western Refining, Inc.(a) | | | 14,957 | |
| | 300 | | Westmoreland Coal Co.†(a) | | | 2,856 | |
| | 1,922 | | Whiting Petroleum Corp.†(a) | | | 17,798 | |
| | 7,725 | | Williams Cos., Inc. (The) | | | 167,092 | |
| | 475 | | World Fuel Services Corp. | | | 22,558 | |
| | 1,925 | | WPX Energy, Inc.† | | | 17,922 | |
| | | | | | | 14,364,786 | |
Financials — 17.7% | | | | |
| | 676 | | Acadia Realty Trust(b) | | | 24,012 | |
| | 578 | | Affiliated Managers Group, Inc.† | | | 81,365 | |
| | 4,100 | | Aflac, Inc. | | | 295,856 | |
| | 450 | | Alexander & Baldwin, Inc. | | | 16,263 | |
Wilshire Mutual Funds, Inc. Wilshire 5000 IndexSM Fund Schedule of Investments | June 30, 2016 (unaudited) |
| Shares | | | | Value | |
Financials — (continued) | | | |
| | 859 | | Alexandria Real Estate Equities, Inc.(b) | | $ | 88,924 | |
| | 127 | | Alleghany Corp.† | | | 69,797 | |
| | 3,825 | | Allstate Corp. (The) | | | 267,559 | |
| | 33 | | Altisource Residential Corp., Class B(a) (b) | | | 303 | |
| | 425 | | American Assets Trust, Inc.(b) | | | 18,037 | |
| | 1,282 | | American Campus Communities, Inc.(b) | | | 67,779 | |
| | 3,525 | | American Capital Agency Corp.(b) | | | 69,865 | |
| | 575 | | American Capital Mortgage Investment Corp.(b) | | | 9,079 | |
| | 2,600 | | American Capital, Ltd.† | | | 41,158 | |
| | 1,100 | | American Equity Investment Life Holding Co. | | | 15,675 | |
| | 8,983 | | American Express Co. | | | 545,807 | |
| | 700 | | American Financial Group, Inc. | | | 51,751 | |
| | 1,700 | | American Homes 4 Rent, Class A(b) | | | 34,816 | |
| | 4,450 | | American International Group, Inc. | | | 235,360 | |
| | 300 | | American National Insurance Co. | | | 33,945 | |
| | 4,365 | | American Tower Corp., Class A | | | 495,908 | |
| | 1,573 | | Ameriprise Financial, Inc. | | | 141,334 | |
| | 300 | | Ameris Bancorp | | | 8,910 | |
| | 300 | | Amerisafe, Inc. | | | 18,366 | |
| | 664 | | AmTrust Financial Services, Inc. | | | 16,268 | |
| | 9,325 | | Annaly Capital Management, Inc.(b) | | | 103,228 | |
| | 1,500 | | Anworth Mortgage Asset Corp.(b) | | | 7,050 | |
| | 1,781 | | Apartment Investment & Management Co., Class A(b) | | | 78,649 | |
| | 600 | | Apollo Commercial Real Estate Finance, Inc.(a) (b) | | | 9,642 | |
| | 2,675 | | Apollo Investment Corp. | | | 14,819 | |
| | 200 | | Arbor Realty Trust, Inc.(b) | | | 1,438 | |
| | 800 | | Arch Capital Group, Ltd.† | | | 57,600 | |
| | 3,675 | | Ares Capital Corp.(a) | | | 52,185 | |
| | 363 | | Argo Group International Holdings, Ltd. | | | 18,840 | |
| | 4 | | Arlington Asset Investment Corp., Class A | | | 52 | |
| | 1,550 | | Arthur J. Gallagher & Co. | | | 73,780 | |
| | 300 | | Artisan Partners Asset Management, Inc., Class A(a) | | | 8,304 | |
| | 130 | | Ashford Hospitality Prime, Inc.(b) | | | 1,838 | |
| | 544 | | Ashford Hospitality Trust, Inc.(b) | | | 2,921 | |
| | 6 | | Ashford, Inc.† | | | 300 | |
| | 650 | | Aspen Insurance Holdings, Ltd. | | | 30,147 | |
| | 1,200 | | Associated Banc-Corp | | | 20,580 | |
| | 600 | | Assurant, Inc. | | | 51,786 | |
| | 1,650 | | Assured Guaranty, Ltd. | | | 41,861 | |
| | 700 | | Astoria Financial Corp. | | | 10,731 | |
| | 600 | | AV Homes, Inc.†(a) | | | 7,332 | |
| | 1,508 | | AvalonBay Communities, Inc. | | | 272,028 | |
| | 775 | | Axis Capital Holdings, Ltd. | | | 42,625 | |
| | 50 | | Bancorp, Inc.†(a) | | | 301 | |
| | 1,150 | | BancorpSouth, Inc. | | | 26,093 | |
| | 106,323 | | Bank of America Corp. | | | 1,410,906 | |
| | 450 | | Bank of Hawaii Corp. | | | 30,960 | |
| | 11,338 | | Bank of New York Mellon Corp. (The) | | | 440,481 | |
| | 765 | | Bank of the Ozarks, Inc. | | | 28,703 | |
| | 700 | | BankFinancial Corp.(a) | | | 8,393 | |
| | 375 | | BankUnited, Inc. | | | 11,520 | |
| | 300 | | Banner Corp. | | | 12,762 | |
| | 8,040 | | BB&T Corp. | | | 286,304 | |
| | 600 | | BBCN Bancorp, Inc. | | | 8,952 | |
| | 4 | | BBX Capital Corp., Class A†(a) | | | 62 | |
| | 549 | | Beneficial Bancorp, Inc.†(a) | | | 6,983 | |
| | 20,295 | | Berkshire Hathaway, Inc., Class B† | | | 2,938,513 | |
| | 2,300 | | BGC Partners, Inc., Class A | | | 20,033 | |
| | 1,283 | | BlackRock, Inc., Class A(a) | | | 439,466 | |
| | 900 | | Blackstone Mortgage Trust, Inc., Class A(b) | | | 24,903 | |
| Shares | | | | Value | |
Financials — (continued) | | | |
| | 400 | | BNC Bancorp(a) | | $ | 9,084 | |
| | 672 | | BofI Holding, Inc.†(a) | | | 11,901 | |
| | 1,000 | | Boston Private Financial Holdings, Inc. | | | 11,780 | |
| | 1,657 | | Boston Properties, Inc.(b) | | | 218,558 | |
| | 1,988 | | Brandywine Realty Trust(b) | | | 33,398 | |
| | 1,075 | | Brixmor Property Group, Inc.(b) | | | 28,444 | |
| | 3,075 | | Brookfield Property Partners | | | 69,064 | |
| | 1,500 | | Brookline Bancorp, Inc. | | | 16,545 | |
| | 1,300 | | Brown & Brown, Inc.(a) | | | 48,711 | |
| | 100 | | Camden National Corp. | | | 4,200 | |
| | 825 | | Camden Property Trust(a) (b) | | | 72,946 | |
| | 30 | | Capital Bank Financial Corp., Class A(a) | | | 864 | |
| | 350 | | Capital City Bank Group, Inc. | | | 4,872 | |
| | 4,985 | | Capital One Financial Corp. | | | 316,597 | |
| | 1,000 | | Capitol Federal Financial, Inc.(a) | | | 13,950 | |
| | 1,700 | | Capstead Mortgage Corp.(a) (b) | | | 16,490 | |
| | 100 | | Cardinal Financial Corp. | | | 2,194 | |
| | 978 | | Care Capital Properties, Inc.(b) | | | 25,633 | |
| | 403 | | CareTrust, Inc.(b) | | | 5,553 | |
| | 325 | | Cash America International, Inc. | | | 13,851 | |
| | 763 | | Cathay General Bancorp(a) | | | 21,517 | |
| | 1,205 | | CBL & Associates Properties, Inc.(a) (b) | | | 11,219 | |
| | 100 | | CBOE Holdings, Inc. | | | 6,662 | |
| | 3,425 | | CBRE Group, Inc., Class A† | | | 90,694 | |
| | 650 | | Cedar Realty Trust, Inc.(a) (b) | | | 4,829 | |
| | 12,139 | | Charles Schwab Corp. (The) | | | 307,238 | |
| | 498 | | Charter Financial Corp.(a) | | | 6,614 | |
| | 425 | | Chatham Lodging Trust(b) | | | 9,341 | |
| | 500 | | Chemical Financial Corp.(a) | | | 18,645 | |
| | 625 | | Chesapeake Lodging Trust(b) | | | 14,531 | |
| | 2,380 | | Chimera Investment Corp.(a) | | | 37,366 | |
| | 1,487 | | Chubb, Ltd. | | | 194,366 | |
| | 23 | | CIFC Corp. | | | 163 | |
| | 1,294 | | Cincinnati Financial Corp.(a) | | | 96,908 | |
| | 1,650 | | CIT Group, Inc. | | | 52,651 | |
| | 30,365 | | Citigroup, Inc. | | | 1,287,172 | |
| | 2,575 | | Citizens Financial Group, Inc. | | | 51,448 | |
| | 3,172 | | CME Group, Inc., Class A | | | 308,953 | |
| | 300 | | CNA Financial Corp. | | | 9,426 | |
| | 1,625 | | CNO Financial Group, Inc. | | | 28,372 | |
| | 750 | | CoBiz Financial, Inc. | | | 8,775 | |
| | 350 | | Cohen & Steers, Inc.(a) | | | 14,154 | |
| | 1,250 | | Colony Capital, Inc., Class A(a) (b) | | | 19,187 | |
| | 415 | | Colony Starwood Homes(a) (b) | | | 12,624 | |
| | 276 | | Columbia Banking System, Inc. | | | 7,745 | |
| | 1,625 | | Columbia Property Trust, Inc.(b) | | | 34,775 | |
| | 1,383 | | Comerica, Inc. | | | 56,883 | |
| | 981 | | Commerce Bancshares, Inc.(a) | | | 46,990 | |
| | 1,578 | | Communications Sales & Leasing, Inc.(a) (b) | | | 45,604 | |
| | 500 | | Community Bank System, Inc.(a) | | | 20,545 | |
| | 110 | | Community Trust Bancorp, Inc. | | | 3,813 | |
| | 300 | | CoreSite Realty Corp.(a) (b) | | | 26,607 | |
| | 850 | | Corporate Office Properties Trust | | | 25,134 | |
| | 799 | | Corrections Corp. of America(a) (b) | | | 27,981 | |
| | 2,613 | | Cousins Properties, Inc.(b) | | | 27,175 | |
| | 200 | | Crawford & Co., Class B | | | 1,698 | |
| | 112 | | Credit Acceptance Corp.†(a) | | | 20,729 | |
| | 2,941 | | Crown Castle International Corp. | | | 298,306 | |
| | 1,737 | | CubeSmart(b) | | | 53,639 | |
| | 432 | | Cullen/Frost Bankers, Inc.(a) | | | 27,531 | |
| | 1,000 | | CVB Financial Corp. | | | 16,390 | |
| | 725 | | CyrusOne, Inc.(b) | | | 40,353 | |
| | 1,575 | | CYS Investments, Inc.(a) (b) | | | 13,183 | |
| | 887 | | DCT Industrial Trust, Inc.(a) (b) | | | 42,611 | |
| | 3,845 | | DDR Corp.(b) | | | 69,748 | |
| | 2,502 | | DiamondRock Hospitality Co.(a) (b) | | | 22,593 | |
Wilshire Mutual Funds, Inc. Wilshire 5000 IndexSM Fund Schedule of Investments | June 30, 2016 (unaudited) |
| Shares | | | | Value | |
Financials — (continued) | | | |
| | 1,450 | | Digital Realty Trust, Inc.(a) (b) | | $ | 158,035 | |
| | 4,175 | | Discover Financial Services | | | 223,738 | |
| | 1,100 | | Donegal Group, Inc., Class A | | | 18,139 | |
| | 1,725 | | Douglas Emmett, Inc.(b) | | | 61,272 | |
| | 3,626 | | Duke Realty Corp.(b) | | | 96,669 | |
| | 700 | | DuPont Fabros Technology, Inc.(b) | | | 33,278 | |
| | 2,728 | | E*Trade Financial Corp.† | | | 64,081 | |
| | 300 | | Eagle Bancorp, Inc.† | | | 14,433 | |
| | 1,425 | | East West Bancorp, Inc. | | | 48,706 | |
| | 375 | | EastGroup Properties, Inc.(b) | | | 25,845 | |
| | 1,325 | | Eaton Vance Corp.(a) | | | 46,825 | |
| | 633 | | Education Realty Trust, Inc.(b) | | | 29,207 | |
| | 175 | | eHealth, Inc.† | | | 2,453 | |
| | 425 | | Ellington Financial LLC | | | 7,280 | |
| | 1,100 | | Empire State Realty Trust, Inc., Class A(b) | | | 20,889 | |
| | 375 | | Employers Holdings, Inc. | | | 10,882 | |
| | 200 | | Encore Capital Group, Inc.†(a) | | | 4,706 | |
| | 588 | | Endurance Specialty Holdings, Ltd. | | | 39,490 | |
| | 297 | | Enova International, Inc.† | | | 2,186 | |
| | 120 | | Enstar Group, Ltd.†(a) | | | 19,439 | |
| | 50 | | Enterprise Financial Services Corp. | | | 1,394 | |
| | 600 | | EPR Properties(b) | | | 48,408 | |
| | 530 | | Equinix, Inc.(b) | | | 205,497 | |
| | 1,293 | | Equity Commonwealth† (b) | | | 37,665 | |
| | 1,000 | | Equity LifeStyle Properties, Inc.(b) | | | 80,050 | |
| | 825 | | Equity One, Inc.(b) | | | 26,548 | |
| | 4,054 | | Equity Residential(b) | | | 279,240 | |
| | 300 | | Erie Indemnity Co., Class A | | | 29,802 | |
| | 719 | | Essex Property Trust, Inc.(b) | | | 163,997 | |
| | 350 | | Evercore Partners, Inc., Class A | | | 15,466 | |
| | 336 | | Everest Re Group, Ltd. | | | 61,377 | |
| | 1,500 | | Extra Space Storage, Inc.(b) | | | 138,810 | |
| | 1,000 | | Ezcorp, Inc., Class A†(a) | | | 7,560 | |
| | 350 | | FactSet Research Systems, Inc. | | | 56,497 | |
| | 790 | | Federal Realty Investment Trust(b) | | | 130,784 | |
| | 1,200 | | Federated Investors, Inc., Class B | | | 34,536 | |
| | 200 | | Federated National Holding Co. | | | 3,808 | |
| | 1,475 | | FelCor Lodging Trust, Inc.(b) | | | 9,189 | |
| | 1,750 | | Fifth Street Finance Corp.(a) | | | 8,487 | |
| | 8,076 | | Fifth Third Bancorp | | | 142,057 | |
| | 525 | | Financial Engines, Inc.(a) | | | 13,582 | |
| | 1,200 | | Financial Institutions, Inc. | | | 31,284 | |
| | 827 | | First American Financial Corp. | | | 33,262 | |
| | 300 | | First Bancorp(a) | | | 5,274 | |
| | 2,516 | | First BanCorp† | | | 9,989 | |
| | 200 | | First Cash Financial Services, Inc.(a) | | | 10,266 | |
| | 50 | | First Citizens BancShares, Inc., Class A | | | 12,945 | |
| | 800 | | First Commonwealth Financial Corp.(a) | | | 7,360 | |
| | 425 | | First Community Bancshares, Inc.(a) | | | 9,537 | |
| | 575 | | First Financial Bancorp | | | 11,184 | |
| | 600 | | First Financial Bankshares, Inc.(a) | | | 19,674 | |
| | 100 | | First Financial Corp.(a) | | | 3,662 | |
| | 2,433 | | First Horizon National Corp. | | | 33,527 | |
| | 1,375 | | First Industrial Realty Trust, Inc.(b) | | | 38,252 | |
| | 425 | | First Merchants Corp. | | | 10,595 | |
| | 800 | | First Midwest Bancorp, Inc. | | | 14,048 | |
| | 3,424 | | First Niagara Financial Group, Inc. | | | 33,350 | |
| | 800 | | First Potomac Realty Trust(b) | | | 7,360 | |
| | 150 | | First Republic Bank | | | 10,498 | |
| | 1,582 | | FirstMerit Corp. | | | 32,067 | |
| | 1,650 | | FNB Corp. | | | 20,691 | |
| | 3,184 | | FNF Group(a) | | | 119,400 | |
| | 2,100 | | Forest City Realty Trust, Inc., Class A | | | 46,851 | |
| | 444 | | Four Corners Property Trust, Inc.(a) (b) | | | 9,142 | |
| | 4,146 | | Franklin Resources, Inc.(a) | | | 138,352 | |
| | 950 | | Franklin Street Properties Corp.(b) | | | 11,657 | |
| Shares | | | | Value | |
Financials — (continued) | | | |
| | 2,700 | | FS Investment Corp.(a) | | $ | 24,435 | |
| | 1,850 | | Fulton Financial Corp.(a) | | | 24,975 | |
| | 1,817 | | Gaming and Leisure Properties, Inc.(b) | | | 62,650 | |
| | 4,415 | | General Growth Properties, Inc.(b) | | | 131,655 | |
| | 402 | | Getty Realty Corp.(a) (b) | | | 8,623 | |
| | 900 | | Glacier Bancorp, Inc. | | | 23,922 | |
| | 4,166 | | Goldman Sachs Group, Inc. (The) | | | 618,984 | |
| | 475 | | Golub Capital BDC, Inc. | | | 8,583 | |
| | 550 | | Government Properties Income Trust(a) (b) | | | 12,683 | |
| | 4,263 | | Gramercy Property Trust(a) (b) | | | 39,305 | |
| | 550 | | Green Dot Corp., Class A† | | | 12,645 | |
| | 300 | | Greenhill & Co., Inc.(a) | | | 4,830 | |
| | 200 | | Guaranty Bancorp | | | 3,340 | |
| | 100 | | Hallmark Financial Services, Inc.† | | | 1,159 | |
| | 800 | | Hancock Holding Co.(a) | | | 20,888 | |
| | 69 | | Hanmi Financial Corp. | | | 1,621 | |
| | 400 | | Hanover Insurance Group, Inc. (The) | | | 33,848 | |
| | 3,900 | | Hartford Financial Services Group, Inc. | | | 173,082 | |
| | 1,000 | | Hatteras Financial Corp.(b) | | | 16,400 | |
| | 5,150 | | HCP, Inc.(b) | | | 182,207 | |
| | 1,175 | | Healthcare Realty Trust, Inc.(a) (b) | | | 41,113 | |
| | 1,025 | | Healthcare Trust of America, Inc., Class A(b) | | | 33,149 | |
| | 775 | | Hercules Capital, Inc. | | | 9,625 | |
| | 50 | | Heritage Commerce Corp. | | | 527 | |
| | 550 | | Hersha Hospitality Trust, Class A(a) (b) | | | 9,433 | |
| | 375 | | HFF, Inc., Class A | | | 10,830 | |
| | 1,100 | | Highwoods Properties, Inc.(b) | | | 58,080 | |
| | 850 | | Hilltop Holdings, Inc.†(a) | | | 17,841 | |
| | 1,250 | | Home BancShares, Inc.(a) | | | 24,738 | |
| | 375 | | Horace Mann Educators Corp. | | | 12,671 | |
| | 1,850 | | Hospitality Properties Trust(a) (b) | | | 53,280 | |
| | 8,574 | | Host Hotels & Resorts, Inc.(a) (b) | | | 138,985 | |
| | 421 | | Howard Hughes Corp. (The)† | | | 48,129 | |
| | 700 | | Hudson Pacific Properties, Inc.(b) | | | 20,426 | |
| | 7,701 | | Huntington Bancshares, Inc. | | | 68,847 | |
| | 375 | | IBERIABANK Corp.(a) | | | 22,399 | |
| | 85 | | Impac Mortgage Holdings, Inc.†(a) | | | 1,333 | |
| | 300 | | Independent Bank Corp. | | | 13,710 | |
| | 500 | | Interactive Brokers Group, Inc., Class A(a) | | | 17,700 | |
| | 1,117 | | Intercontinental Exchange, Inc. | | | 285,907 | |
| | 700 | | International Bancshares Corp.(a) | | | 18,263 | |
| | 500 | | International. FCStone, Inc.†(a) | | | 13,645 | |
| | 1,000 | | Invesco Mortgage Capital, Inc.(b) | | | 13,690 | |
| | 4,625 | | Invesco, Ltd. | | | 118,123 | |
| | 1,000 | | Investment Technology Group, Inc.(a) | | | 16,720 | |
| | 1,325 | | Investors Bancorp, Inc.(a) | | | 14,681 | |
| | 1,800 | | Investors Real Estate Trust(a) (b) | | | 11,646 | |
| | 1,672 | | Iron Mountain, Inc.(a) (b) | | | 66,596 | |
| | 2,475 | | Janus Capital Group, Inc.(a) | | | 34,452 | |
| | 400 | | Jones Lang LaSalle, Inc. | | | 38,980 | |
| | 37,784 | | JPMorgan Chase & Co. | | | 2,347,898 | |
| | 828 | | Kearny Financial Corp. | | | 10,416 | |
| | 650 | | Kemper Corp.(a) | | | 20,137 | |
| | 925 | | Kennedy-Wilson Holdings, Inc.(a) | | | 17,538 | |
| | 7,873 | | KeyCorp | | | 86,997 | |
| | 1,000 | | Kilroy Realty Corp.(b) | | | 66,290 | |
| | 4,650 | | Kimco Realty Corp.(b) | | | 145,917 | |
| | 1,125 | | Kite Realty Group Trust(b) | | | 31,534 | |
| | 700 | | Lamar Advertising Co., Class A(b) | | | 46,410 | |
| | 1,000 | | LaSalle Hotel Properties(a) (b) | | | 23,580 | |
| | 375 | | LegacyTexas Financial Group, Inc. | | | 10,091 | |
| | 1,200 | | Legg Mason, Inc. | | | 35,388 | |
| | 90 | | LendingTree, Inc.†(a) | | | 7,950 | |
| | 3,507 | | Leucadia National Corp. | | | 60,776 | |
Wilshire Mutual Funds, Inc. Wilshire 5000 IndexSM Fund Schedule of Investments | June 30, 2016 (unaudited) |
| Shares | | | | Value | |
Financials — (continued) | | | |
| | 1,875 | | Lexington Realty Trust(b) | | $ | 18,956 | |
| | 1,525 | | Liberty Property Trust(b) | | | 60,573 | |
| | 2,400 | | Lincoln National Corp. | | | 93,048 | |
| | 3,525 | | Loews Corp. | | | 144,842 | |
| | 200 | | LPL Financial Holdings, Inc.(a) | | | 4,506 | |
| | 350 | | LTC Properties, Inc.(b) | | | 18,106 | |
| | 1,172 | | M&T Bank Corp.(a) | | | 138,566 | |
| | 1,538 | | Macerich Co. (The)(b) | | | 131,330 | |
| | 1,025 | | Mack-Cali Realty Corp.(a) (b) | | | 27,675 | |
| | 675 | | Maiden Holdings, Ltd.(a) | | | 8,262 | |
| | 475 | | Main Street Capital Corp.(a) | | | 15,604 | |
| | 138 | | Markel Corp.† | | | 131,484 | |
| | 350 | | MarketAxess Holdings, Inc. | | | 50,890 | |
| | 5,470 | | Marsh & McLennan Cos., Inc. | | | 374,476 | |
| | 865 | | MB Financial, Inc. | | | 31,382 | |
| | 1,900 | | MBIA, Inc.†(a) | | | 12,977 | |
| | 1,500 | | Medical Properties Trust, Inc.(b) | | | 22,815 | |
| | 300 | | Mercury General Corp.(a) | | | 15,948 | |
| | 9,596 | | MetLife, Inc. | | | 382,209 | |
| | 4,000 | | MFA Financial, Inc.(a) (b) | | | 29,080 | |
| | 1,500 | | MGIC Investment Corp.† | | | 8,925 | |
| | 914 | | Mid-America Apartment Communities, Inc.(b) | | | 97,250 | |
| | 2,300 | | Monogram Residential Trust, Inc.(b) | | | 23,483 | |
| | 1,784 | | Moody's Corp.(a) | | | 167,179 | |
| | 16,725 | | Morgan Stanley | | | 434,516 | |
| | 207 | | Morningstar, Inc. | | | 16,928 | |
| | 997 | | MSCI, Inc., Class A | | | 76,889 | |
| | 1,025 | | NASDAQ OMX Group, Inc. (The) | | | 66,287 | |
| | 525 | | National General Holdings Corp. | | | 11,245 | |
| | 325 | | National Health Investors, Inc.(a) (b) | | | 24,404 | |
| | 400 | | National Interstate Corp.(a) | | | 12,100 | |
| | 1,200 | | National Retail Properties, Inc.(b) | | | 62,064 | |
| | 3,100 | | Navient Corp. | | | 37,045 | |
| | 500 | | NBT Bancorp, Inc.(a) | | | 14,315 | |
| | 325 | | Nelnet, Inc., Class A | | | 11,294 | |
| | 650 | | New Mountain Finance Corp.(a) | | | 8,385 | |
| | 1,400 | | New Residential Investment Corp.(b) | | | 19,376 | |
| | 695 | | New Senior Investment Group, Inc.(b) | | | 7,423 | |
| | 5,087 | | New York Community Bancorp, Inc.(a) | | | 76,254 | |
| | 2,000 | | New York, Inc.(b) | | | 18,500 | |
| | 695 | | Newcastle Investment Corp.(a) (b) | | | 3,190 | |
| | 2,350 | | Northern Trust Corp. | | | 155,711 | |
| | 2,153 | | NorthStar Asset Management Group, Inc. | | | 21,982 | |
| | 542 | | NorthStar Realty Europe Corp.(b) | | | 5,014 | |
| | 1,626 | | NorthStar Realty Finance Corp.(a) (b) | | | 18,585 | |
| | 875 | | Northwest Bancshares, Inc.(a) | | | 12,976 | |
| | 1,100 | | Oaktree Capital Group LLC, Class A | | | 49,236 | |
| | 432 | | OFG Bancorp | | | 3,586 | |
| | 1,500 | | Old National Bancorp(a) | | | 18,795 | |
| | 2,161 | | Old Republic International Corp. | | | 41,686 | |
| | 400 | | Old Second Bancorp, Inc. | | | 2,732 | |
| | 1,725 | | Omega Healthcare Investors, Inc.(a) (b) | | | 58,564 | |
| | 600 | | OneBeacon Insurance Group, Ltd., Class A(a) | | | 8,280 | |
| | 600 | | OneMain Holdings, Inc., Class A†(a) | | | 13,692 | |
| | 400 | | Oritani Financial Corp. | | | 6,396 | |
| | 336 | | Outfront Media, Inc.(a) (b) | | | 8,121 | |
| | 1,267 | | PacWest Bancorp | | | 50,401 | |
| | 1,800 | | Paramount Group, Inc.(a) (b) | | | 28,692 | |
| | 187 | | Park National Corp.(a) | | | 17,163 | |
| | 1,100 | | Parkway Properties, Inc.(b) | | | 18,403 | |
| | 1,000 | | Pebblebrook Hotel Trust(a) (b) | | | 26,250 | |
| | 775 | | Pennsylvania Real Estate Investment Trust(a) (b) | | | 16,624 | |
| | 775 | | PennyMac Mortgage Investment Trust(b) | | | 12,578 | |
| | 2,997 | | People's United Financial, Inc.(a) | | | 43,936 | |
| Shares | | | | Value | |
Financials — (continued) | | | |
| | 573 | | PHH Corp.† | | $ | 7,632 | |
| | 900 | | Physicians Realty Trust(b) | | | 18,909 | |
| | 2,100 | | Piedmont Office Realty Trust, Inc., Class A(b) | | | 45,234 | |
| | 350 | | Pinnacle Financial Partners, Inc.(a) | | | 17,098 | |
| | 300 | | Piper Jaffray Cos.† | | | 11,310 | |
| | 5,160 | | PNC Financial Services Group, Inc. | | | 419,972 | |
| | 1,157 | | Popular, Inc. | | | 33,900 | |
| | 600 | | Post Properties, Inc.(b) | | | 36,630 | |
| | 400 | | Potlatch Corp.(b) | | | 13,640 | |
| | 600 | | PRA Group, Inc.†(a) | | | 14,484 | |
| | 200 | | Preferred Bank | | | 5,775 | |
| | 300 | | Primerica, Inc.(a) | | | 17,172 | |
| | 2,550 | | Principal Financial Group, Inc. | | | 104,831 | |
| | 697 | | PrivateBancorp, Inc., Class A | | | 30,689 | |
| | 530 | | ProAssurance Corp. | | | 28,382 | |
| | 5,450 | | Progressive Corp. (The) | | | 182,575 | |
| | 5,660 | | Prologis, Inc. | | | 277,566 | |
| | 3,375 | | Prospect Capital Corp.(a) | | | 26,393 | |
| | 500 | | Prosperity Bancshares, Inc.(a) | | | 25,495 | |
| | 600 | | Provident Financial Services, Inc. | | | 11,784 | |
| | 4,563 | | Prudential Financial, Inc. | | | 325,524 | |
| | 300 | | PS Business Parks, Inc.(b) | | | 31,824 | |
| | 1,655 | | Public Storage(b) | | | 423,001 | |
| | 2,077 | | Pzena Investment Management, Inc., Class A(a) | | | 15,806 | |
| | 300 | | QTS Realty Trust, Class A(b) | | | 16,794 | |
| | 2,145 | | Radian Group, Inc. | | | 22,351 | |
| | 1,000 | | Ramco-Gershenson Properties Trust(b) | | | 19,610 | |
| | 1,225 | | Raymond James Financial, Inc. | | | 60,393 | |
| | 1,501 | | Rayonier, Inc.(b) | | | 39,386 | |
| | 2,000 | | Realty Income Corp.(a) (b) | | | 138,720 | |
| | 1,200 | | Redwood Trust, Inc.(b) | | | 16,572 | |
| | 1,025 | | Regency Centers Corp. | | | 85,823 | |
| | 12,231 | | Regions Financial Corp. | | | 104,086 | |
| | 687 | | Reinsurance Group of America, Inc., Class A | | | 66,632 | |
| | 400 | | RenaissanceRe Holdings, Ltd. | | | 46,976 | |
| | 400 | | Renasant Corp. | | | 12,932 | |
| | 315 | | Republic Bancorp, Inc., Class A | | | 8,703 | |
| | 250 | | Resource America, Inc., Class A(a) | | | 2,430 | |
| | 50 | | Resource Capital Corp.(a) (b) | | | 643 | |
| | 725 | | Retail Opportunity Investments Corp.(b) | | | 15,711 | |
| | 725 | | Retail Properties of America, Inc., Class A(b) | | | 12,253 | |
| | 425 | | RLI Corp.(a) | | | 29,232 | |
| | 1,500 | | RLJ Lodging Trust(b) | | | 32,175 | |
| | 71 | | RMR Group, Inc. | | | 2,199 | |
| | 174 | | Rouse Properties, Inc.(a) (b) | | | 3,176 | |
| | 525 | | Ryman Hospitality Properties, Inc.(b) | | | 26,591 | |
| | 2,531 | | S&P Global, Inc. | | | 271,475 | |
| | 350 | | S&T Bancorp, Inc.(a) | | | 8,558 | |
| | 675 | | Sabra Health Care, Inc.(b) | | | 13,929 | |
| | 200 | | Saul Centers, Inc.(b) | | | 12,342 | |
| | 150 | | Seacoast Banking Corp of Florida†(a) | | | 2,436 | |
| | 1,300 | | SEI Investments Co.(a) | | | 62,543 | |
| | 350 | | Select Income(a) (b) | | | 9,097 | |
| | 600 | | Selective Insurance Group, Inc. | | | 22,926 | |
| | 2,750 | | Senior Housing Properties Trust(b) | | | 57,283 | |
| | 300 | | Seritage Growth Properties(a) (b) | | | 14,952 | |
| | 494 | | Signature Bank† | | | 61,710 | |
| | 152 | | Silver Bay Realty Trust Corp.(b) | | | 2,589 | |
| | 200 | | Simmons First National Corp., Class A(a) | | | 9,237 | |
| | 3,493 | | Simon Property Group, Inc.(b) | | | 757,632 | |
| | 1,157 | | SL Green Realty Corp.(a) (b) | | | 123,186 | |
| | 4,300 | | SLM Corp.† | | | 26,574 | |
| | 500 | | Solar Capital, Ltd. | | | 9,525 | |
Wilshire Mutual Funds, Inc. Wilshire 5000 IndexSM Fund Schedule of Investments | June 30, 2016 (unaudited) |
| Shares | | | | Value | |
Financials — (continued) | | | |
| | 300 | | South State Corp. | | $ | 20,415 | |
| | 331 | | Southside Bancshares, Inc. | | | 10,227 | |
| | 50 | | Southwest Bancorp, Inc. | | | 847 | |
| | 450 | | Sovran Self Storage, Inc.(b) | | | 47,214 | |
| | 4,000 | | Spirit Realty Capital, Inc.(a) (b) | | | 51,080 | |
| | 500 | | St. Joe Co. (The)†(a) | | | 8,860 | |
| | 450 | | STAG Industrial, Inc.(a) (b) | | | 10,715 | |
| | 2,550 | | Starwood Property Trust, Inc.(a) (b) | | | 52,836 | |
| | 400 | | State Auto Financial Corp. | | | 8,764 | |
| | 4,040 | | State Street Corp. | | | 217,837 | |
| | 1,113 | | Sterling Bancorp | | | 17,474 | |
| | 300 | | Stewart Information Services Corp. | | | 12,423 | |
| | 640 | | Stifel Financial Corp.† | | | 20,128 | |
| | 675 | | STORE Capital Corp.(b) | | | 19,879 | |
| | 50 | | Suffolk Bancorp(a) | | | 1,566 | |
| | 975 | | Summit Hotel Properties, Inc.(b) | | | 12,909 | |
| | 164 | | Sun Bancorp, Inc.†(a) | | | 3,388 | |
| | 500 | | Sun Communities, Inc.(b) | | | 38,320 | |
| | 2,415 | | Sunstone Hotel Investors, Inc.(a) (b) | | | 29,149 | |
| | 4,480 | | SunTrust Banks, Inc. | | | 184,038 | |
| | 501 | | SVB Financial Group† | | | 47,675 | |
| | 8,675 | | Synchrony Financial† | | | 219,304 | |
| | 1,547 | | Synovus Financial Corp. | | | 44,848 | |
| | 2,528 | | T Rowe Price Group, Inc.(a) | | | 184,468 | |
| | 1,300 | | Tanger Factory Outlet Centers, Inc.(a) (b) | | | 52,234 | |
| | 500 | | Taubman Centers, Inc.(a) (b) | | | 37,100 | |
| | 1,500 | | TCF Financial Corp. | | | 18,975 | |
| | 3,153 | | TD Ameritrade Holding Corp. | | | 89,782 | |
| | 50 | | Tejon Ranch Co.† | | | 1,182 | |
| | 575 | | Terreno Realty Corp.(b) | | | 14,875 | |
| | 384 | | Texas Capital Bancshares, Inc.† | | | 17,956 | |
| | 1,250 | | TFS Financial Corp. | | | 21,525 | |
| | 1,250 | | Torchmark Corp. | | | 77,275 | |
| | 103 | | Towne Bank(a) | | | 2,230 | |
| | 3,073 | | Travelers Cos., Inc. (The) | | | 365,810 | |
| | 350 | | Triangle Capital Corp.(a) | | | 6,783 | |
| | 409 | | TriCo Bancshares | | | 11,288 | |
| | 1,208 | | TrustCo Bank Corp. NY(a) | | | 7,743 | |
| | 1,000 | | Trustmark Corp.(a) | | | 24,850 | |
| | 4,125 | | Two Harbors Investment Corp.(b) | | | 35,310 | |
| | 17,984 | | U.S. Bancorp | | | 725,295 | |
| | 2,853 | | UDR, Inc.(a) (b) | | | 105,333 | |
| | 400 | | UMB Financial Corp.(a) | | | 21,284 | |
| | 2,275 | | Umpqua Holdings Corp.(a) | | | 35,194 | |
| | 575 | | Union Bankshares Corp.(a) | | | 14,208 | |
| | 832 | | United Bankshares, Inc.(a) | | | 31,208 | |
| | 474 | | United Community Banks, Inc. | | | 8,669 | |
| | 317 | | United Community Financial Corp.(a) | | | 1,927 | |
| | 542 | | United Financial Bancorp, Inc. | | | 7,035 | |
| | 300 | | United Fire Group, Inc. | | | 12,729 | |
| | 393 | | United Security Bancshares† | | | 2,523 | |
| | 200 | | Universal Health Realty Income Trust(a) (b) | | | 11,436 | |
| | 2,432 | | Unum Group | | | 77,313 | |
| | 1,286 | | Urban Edge Properties(a) (b) | | | 38,400 | |
| | 500 | | Urstadt Biddle Properties, Inc., Class A(b) | | | 12,390 | |
| | 783 | | Validus Holdings, Ltd. | | | 38,046 | |
| | 2,225 | | Valley National Bancorp | | | 20,292 | |
| | 200 | | Value Line, Inc.(a) | | | 3,270 | |
| | 3,615 | | Ventas, Inc.(a) (b) | | | 263,244 | |
| | 8,775 | | VEREIT, Inc.(b) | | | 88,979 | |
| | 48 | | Virtus Investment Partners, Inc.(a) | | | 3,417 | |
| | 2,072 | | Vornado Realty Trust(b) | | | 207,449 | |
| | 1,875 | | Voya Financial, Inc. | | | 46,425 | |
| | 687 | | W.R. Berkley Corp. | | | 41,165 | |
| | 1,125 | | Waddell & Reed Financial, Inc., Class A | | | 19,373 | |
| | 733 | | Washington Federal, Inc. | | | 17,783 | |
| Shares | | | | Value | |
Financials — (continued) | | | |
| | 750 | | Washington Real Estate Investment Trust(b) | | $ | 23,595 | |
| | 400 | | Washington Trust Bancorp, Inc.(a) | | | 15,168 | |
| | 1,100 | | Webster Financial Corp.(a) | | | 37,345 | |
| | 1,350 | | Weingarten Realty Investors(b) | | | 55,107 | |
| | 47,267 | | Wells Fargo & Co. | | | 2,237,147 | |
| | 3,962 | | Welltower, Inc.(b) | | | 301,786 | |
| | 350 | | WesBanco, Inc. | | | 10,868 | |
| | 383 | | Westamerica Bancorporation(a) | | | 18,867 | |
| | 1,150 | | Western Alliance Bancorp† | | | 37,548 | |
| | 200 | | Westfield Financial, Inc. | | | 1,540 | |
| | 7,977 | | Weyerhaeuser Co. | | | 237,475 | |
| | 80 | | White Mountains Insurance Group, Ltd. | | | 67,360 | |
| | 500 | | Willis Towers Watson PLC | | | 62,155 | |
| | 700 | | Wilshire Bancorp, Inc. | | | 7,294 | |
| | 425 | | Wintrust Financial Corp. | | | 21,675 | |
| | 750 | | WisdomTree Investments, Inc.(a) | | | 7,343 | |
| | 100 | | World Acceptance Corp.† | | | 4,560 | |
| | 2,292 | | WP Glimcher, Inc.(b) | | | 25,647 | |
| | 2,280 | | Zions Bancorporation | | | 57,296 | |
| | | | | | | 37,411,178 | |
Health Care — 13.2% | | | | |
| | 15,625 | | Abbott Laboratories | | | 614,219 | |
| | 15,600 | | AbbVie, Inc.(a) | | | 965,796 | |
| | 350 | | ABIOMED, Inc.† | | | 38,251 | |
| | 475 | | Acadia Healthcare Co., Inc.†(a) | | | 26,315 | |
| | 625 | | ACADIA Pharmaceuticals, Inc.† | | | 20,287 | |
| | 375 | | Acorda Therapeutics, Inc.†(a) | | | 9,564 | |
| | 3,600 | | Aetna, Inc.(a) | | | 439,668 | |
| | 3,046 | | Agilent Technologies, Inc. | | | 135,121 | |
| | 300 | | Agios Pharmaceuticals, Inc.†(a) | | | 12,569 | |
| | 300 | | Air Methods Corp.† | | | 10,749 | |
| | 900 | | Akorn, Inc.† | | | 25,636 | |
| | 700 | | Albany Molecular Research, Inc.† | | | 9,408 | |
| | 300 | | Alder Biopharmaceuticals, Inc.† | | | 7,491 | |
| | 850 | | Alere, Inc.† | | | 35,428 | |
| | 1,828 | | Alexion Pharmaceuticals, Inc.† | | | 213,437 | |
| | 750 | | Align Technology, Inc.† | | | 60,412 | |
| | 1,300 | | Alkermes PLC† | | | 56,186 | |
| | 3,782 | | Allergan PLC† | | | 873,982 | |
| | 140 | | Alliance HealthCare Services, Inc.† | | | 874 | |
| | 1,825 | | Allscripts Healthcare Solutions, Inc.†(a) | | | 23,178 | |
| | 713 | | Alnylam Pharmaceuticals, Inc.†(a) | | | 39,564 | |
| | 100 | | AMAG Pharmaceuticals, Inc.†(a) | | | 2,392 | |
| | 201 | | Amedisys, Inc.† | | | 10,146 | |
| | 1,905 | | AmerisourceBergen Corp., Class A | | | 151,105 | |
| | 6,787 | | Amgen, Inc. | | | 1,032,642 | |
| | 1,225 | | Amicus Therapeutics, Inc.†(a) | | | 6,689 | |
| | 250 | | AMN Healthcare Services, Inc.† | | | 9,992 | |
| | 375 | | Amsurg Corp., Class A† | | | 29,077 | |
| | 130 | | Analogic Corp. | | | 10,327 | |
| | 500 | | Anika Therapeutics, Inc.† | | | 26,825 | |
| | 2,736 | | Anthem, Inc. | | | 359,346 | |
| | 1,775 | | ARIAD Pharmaceuticals, Inc.† | | | 13,117 | |
| | 600 | | Arrowhead Pharmaceuticals, Inc.†(a) | | | 3,192 | |
| | 321 | | athenahealth, Inc.†(a) | | | 44,301 | |
| | 5,538 | | Baxter International, Inc. | | | 250,428 | |
| | 2,155 | | Becton Dickinson and Co. | | | 365,466 | |
| | 1,839 | | Biogen, Inc.† | | | 444,707 | |
| | 1,075 | | BioMarin Pharmaceutical, Inc.† | | | 83,635 | |
| | 199 | | Bio-Rad Laboratories, Inc., Class A† | | | 28,461 | |
| | 332 | | Bio-Techne Corp. | | | 37,440 | |
| | 286 | | Bluebird Bio, Inc.†(a) | | | 12,381 | |
| | 11,239 | | Boston Scientific Corp.† | | | 262,655 | |
| | 17,175 | | Bristol-Myers Squibb Co. | | | 1,263,221 | |
Wilshire Mutual Funds, Inc. Wilshire 5000 IndexSM Fund Schedule of Investments | June 30, 2016 (unaudited) |
| Shares | | | | Value | |
Health Care — (continued) | | | |
| | 2,194 | | Brookdale Senior Living, Inc., Class A† | | $ | 33,875 | |
| | 1,500 | | Bruker Corp. | | | 34,110 | |
| | 725 | | C.R. Bard, Inc. | | | 170,491 | |
| | 350 | | Cambrex Corp.† | | | 18,105 | |
| | 300 | | Cantel Medical Corp. | | | 20,619 | |
| | 100 | | Capital Senior Living Corp.† | | | 1,767 | |
| | 3,513 | | Cardinal Health, Inc. | | | 274,049 | |
| | 325 | | Cardiovascular Systems, Inc.†(a) | | | 5,972 | |
| | 550 | | Catalent, Inc.†(a) | | | 12,644 | |
| | 8,143 | | Celgene Corp.† | | | 803,144 | |
| | 927 | | Celldex Therapeutics, Inc.†(a) | | | 4,070 | |
| | 1,333 | | Centene Corp.† | | | 95,136 | |
| | 500 | | Cepheid, Inc.† | | | 15,375 | |
| | 2,850 | | Cerner Corp.† | | | 167,010 | |
| | 500 | | Charles River Laboratories International, Inc.† | | | 41,220 | |
| | 136 | | Chemed Corp.(a) | | | 18,538 | |
| | 300 | | Chimerix, Inc.†(a) | | | 1,179 | |
| | 2,663 | | Cigna Corp. | | | 340,837 | |
| | 300 | | Clovis Oncology, Inc.†(a) | | | 4,116 | |
| | 832 | | Community Health Systems, Inc.†(a) | | | 10,026 | |
| | 100 | | Computer Programs & Systems, Inc.(a) | | | 3,992 | |
| | 300 | | CONMED Corp. | | | 14,319 | |
| | 400 | | Cooper Cos., Inc. (The) | | | 68,628 | |
| | 91 | | Cynosure, Inc., Class A† | | | 4,427 | |
| | 1,808 | | DaVita HealthCare Partners, Inc.† | | | 139,795 | |
| | 2,427 | | Dentsply Sirona, Inc. | | | 150,571 | |
| | 675 | | Depomed, Inc.†(a) | | | 13,243 | |
| | 820 | | DexCom, Inc.†(a) | | | 65,051 | |
| | 425 | | Dynavax Technologies Corp.†(a) | | | 6,197 | |
| | 1,800 | | Edwards Lifesciences Corp.† | | | 179,514 | |
| | 9,561 | | Eli Lilly & Co. | | | 752,929 | |
| | 293 | | Emergent BioSolutions, Inc.† | | | 8,239 | |
| | 922 | | Endo International PLC†(a) | | | 14,374 | |
| | 700 | | Endologix, Inc.†(a) | | | 8,722 | |
| | 600 | | Ensign Group, Inc. (The)(a) | | | 12,606 | |
| | 600 | | Envision Healthcare Holdings, Inc.† | | | 15,222 | |
| | 775 | | Exact Sciences Corp.†(a) | | | 9,494 | |
| | 800 | | Exelixis, Inc.†(a) | | | 6,248 | |
| | 6,337 | | Express Scripts Holding Co.† | | | 480,345 | |
| | 500 | | Genomic Health, Inc.† | | | 12,948 | |
| | 13,013 | | Gilead Sciences, Inc. | | | 1,085,544 | |
| | 300 | | Greatbatch, Inc.† | | | 9,279 | |
| | 550 | | Haemonetics Corp.† | | | 15,944 | |
| | 1,700 | | Halozyme Therapeutics, Inc.†(a) | | | 14,671 | |
| | 597 | | Halyard Health, Inc.†(a) | | | 19,414 | |
| | 350 | | Hanger, Inc.†(a) | | | 2,600 | |
| | 500 | | HCA Holdings, Inc.† | | | 38,505 | |
| | 1,100 | | HealthSouth Corp.(a) | | | 42,702 | |
| | 170 | | HeartWare International, Inc.†(a) | | | 9,818 | |
| | 672 | | Henry Schein, Inc.†(a) | | | 118,810 | |
| | 600 | | Hill-Rom Holdings, Inc. | | | 30,270 | |
| | 925 | | HMS Holdings Corp.† | | | 16,289 | |
| | 2,077 | | Hologic, Inc.† | | | 71,864 | |
| | 1,125 | | Horizon Pharma PLC†(a) | | | 18,529 | |
| | 1,355 | | Humana, Inc.(a) | | | 243,737 | |
| | 200 | | ICU Medical, Inc.† | | | 22,550 | |
| | 818 | | IDEXX Laboratories, Inc.† | | | 75,959 | |
| | 1,162 | | Illumina, Inc.†(a) | | | 163,121 | |
| | 650 | | Impax Laboratories, Inc.†(a) | | | 18,733 | |
| | 825 | | IMS Health Holdings, Inc.†(a) | | | 20,922 | |
| | 1,700 | | Incyte Corp.†(a) | | | 135,966 | |
| | 1,000 | | Innoviva, Inc.(a) | | | 10,530 | |
| | 475 | | Insulet Corp.†(a) | | | 14,364 | |
| | 300 | | Integra LifeSciences Holdings Corp.†(a) | | | 23,934 | |
| Shares | | | | Value | |
Health Care — (continued) | | | |
| | 137 | | Intercept Pharmaceuticals, Inc.†(a) | | $ | 19,547 | |
| | 400 | | Intrexon Corp.†(a) | | | 9,844 | |
| | 365 | | Intuitive Surgical, Inc.† | | | 241,415 | |
| | 700 | | Ionis Pharmaceuticals, Inc.†(a) | | | 16,303 | |
| | 1,000 | | Ironwood Pharmaceuticals, Inc., Class A†(a) | | | 13,075 | |
| | 28,036 | | Johnson & Johnson | | | 3,400,767 | |
| | 975 | | Keryx Biopharmaceuticals, Inc.†(a) | | | 6,455 | |
| | 587 | | Kindred Healthcare, Inc.(a) | | | 6,627 | |
| | 300 | | Kite Pharma, Inc.†(a) | | | 15,000 | |
| | 1,049 | | Laboratory Corp. of America Holdings† | | | 136,653 | |
| | 300 | | Lannett Co., Inc.†(a) | | | 7,137 | |
| | 600 | | LHC Group, Inc.† | | | 25,968 | |
| | 265 | | LifePoint Health, Inc.† | | | 17,323 | |
| | 164 | | Ligand Pharmaceuticals, Inc., Class B†(a) | | | 19,560 | |
| | 300 | | LivaNova PLC† | | | 15,069 | |
| | 100 | | Magellan Health, Inc.† | | | 6,577 | |
| | 300 | | Masimo Corp.† | | | 15,755 | |
| | 2,258 | | McKesson Corp. | | | 421,456 | |
| | 650 | | Medicines Co. (The)†(a) | | | 21,860 | |
| | 425 | | Medidata Solutions, Inc.† | | | 19,920 | |
| | 1,394 | | Medivation, Inc.†(a) | | | 84,058 | |
| | 900 | | MEDNAX, Inc.† | | | 65,187 | |
| | 27,705 | | Merck & Co., Inc. | | | 1,596,085 | |
| | 375 | | Meridian Bioscience, Inc.(a) | | | 7,313 | |
| | 200 | | Mettler-Toledo International, Inc.† | | | 72,984 | |
| | 600 | | MGC Diagnostics Corp.†(a) | | | 3,912 | |
| | 300 | | Molina Healthcare, Inc.† | | | 14,970 | |
| | 200 | | Momenta Pharmaceuticals, Inc.† | | | 2,160 | |
| | 3,675 | | Mylan NV†(a) | | | 158,907 | |
| | 450 | | Myriad Genetics, Inc.† | | | 13,770 | |
| | 375 | | Natus Medical, Inc.† | | | 14,175 | |
| | 950 | | Nektar Therapeutics†(a) | | | 13,519 | |
| | 350 | | Neogen Corp.†(a) | | | 19,688 | |
| | 800 | | Neurocrine Biosciences, Inc.†(a) | | | 36,360 | |
| | 300 | | NewLink Genetics Corp.†(a) | | | 3,378 | |
| | 2,150 | | Novavax, Inc.†(a) | | | 15,631 | |
| | 400 | | NuVasive, Inc.†(a) | | | 23,888 | |
| | 1,000 | | NxStage Medical, Inc.†(a) | | | 21,680 | |
| | 375 | | Omnicell, Inc.† | | | 12,836 | |
| | 300 | | Ophthotech Corp.†(a) | | | 15,309 | |
| | 3,000 | | OPKO Health, Inc.†(a) | | | 28,020 | |
| | 300 | | Orthofix International NV† | | | 12,720 | |
| | 575 | | Owens & Minor, Inc.(a) | | | 21,494 | |
| | 375 | | Pacira Pharmaceuticals, Inc.†(a) | | | 12,649 | |
| | 6 | | Paratek Pharmaceuticals, Inc.†(a) | | | 83 | |
| | 600 | | PAREXEL International Corp.† | | | 37,728 | |
| | 950 | | Patterson Cos., Inc.(a) | | | 45,496 | |
| | 1,092 | | PerkinElmer, Inc. | | | 57,243 | |
| | 62,487 | | Pfizer, Inc. | | | 2,200,167 | |
| | 381 | | PharMerica Corp.† | | | 9,395 | |
| | 300 | | Portola Pharmaceuticals, Inc., Class A† | | | 7,080 | |
| | 300 | | PRA Health Sciences, Inc.†(a) | | | 12,528 | |
| | 350 | | Premier, Inc., Class A†(a) | | | 11,445 | |
| | 350 | | Prestige Brands Holdings, Inc.† | | | 19,390 | |
| | 800 | | Progenics Pharmaceuticals, Inc.†(a) | | | 3,376 | |
| | 200 | | Providence Service Corp. (The)† | | | 8,976 | |
| | 254 | | Puma Biotechnology, Inc.†(a) | | | 7,567 | |
| | 575 | | Quality Systems, Inc.(a) | | | 6,848 | |
| | 1,475 | | Quest Diagnostics, Inc. | | | 120,080 | |
| | 300 | | Quidel Corp.† | | | 5,358 | |
| | 750 | | Quintiles Transnational Holdings, Inc.†(a) | | | 48,990 | |
| | 208 | | Quorum Health Corp.† | | | 2,228 | |
| | 675 | | Raptor Pharmaceutical Corp.†(a) | | | 3,625 | |
| | 697 | | Regeneron Pharmaceuticals, Inc.† | | | 243,413 | |
Wilshire Mutual Funds, Inc. Wilshire 5000 IndexSM Fund Schedule of Investments | June 30, 2016 (unaudited) |
| Shares | | | | Value | |
Health Care — (continued) | | | |
| | 1,100 | | ResMed, Inc.(a) | | $ | 69,553 | |
| | 418 | | RTI Surgical, Inc.†(a) | | | 1,501 | |
| | 600 | | Sagent Pharmaceuticals, Inc.†(a) | | | 8,988 | |
| | 300 | | Sangamo BioSciences, Inc.†(a) | | | 1,737 | |
| | 400 | | Sarepta Therapeutics, Inc.†(a) | | | 7,628 | |
| | 100 | | SeaSpine Holdings Corp.† | | | 1,048 | |
| | 925 | | Seattle Genetics, Inc.† | | | 37,379 | |
| | 1,250 | | Select Medical Holdings Corp.†(a) | | | 13,588 | |
| | 921 | | Shire PLC ADR(a) | | | 169,494 | |
| | 600 | | Simulations Plus, Inc.(a) | | | 4,536 | |
| | 475 | | Spectranetics Corp.†(a) | | | 8,887 | |
| | 2,625 | | St. Jude Medical, Inc. | | | 204,750 | |
| | 350 | | STERIS PLC | | | 24,063 | |
| | 3,310 | | Stryker Corp. | | | 396,637 | |
| | 50 | | Symmetry Surgical, Inc.† | | | 657 | |
| | 675 | | Team Health Holdings, Inc.†(a) | | | 27,452 | |
| | 400 | | Teleflex, Inc. | | | 70,924 | |
| | 1,231 | | Tenet Healthcare Corp.†(a) | | | 34,025 | |
| | 300 | | Tetraphase Pharmaceuticals, Inc.†(a) | | | 1,290 | |
| | 1,275 | | TherapeuticsMD, Inc.†(a) | | | 10,838 | |
| | 4,056 | | Thermo Fisher Scientific, Inc. | | | 599,315 | |
| | 207 | | Ultragenyx Pharmaceutical, Inc.†(a) | | | 10,124 | |
| | 400 | | United Therapeutics Corp.†(a) | | | 42,368 | |
| | 9,269 | | UnitedHealth Group, Inc. | | | 1,308,783 | |
| | 500 | | Universal American Corp. | | | 3,790 | |
| | 940 | | Universal Health Services, Inc., Class B | | | 126,054 | |
| | 952 | | Varian Medical Systems, Inc.†(a) | | | 78,283 | |
| | 300 | | Vascular Solutions, Inc.† | | | 12,498 | |
| | 825 | | VCA, Inc.† | | | 55,778 | |
| | 425 | | Veeva Systems, Inc., Class A†(a) | | | 14,501 | |
| | 2,114 | | Vertex Pharmaceuticals, Inc.† | | | 181,846 | |
| | 800 | | Waters Corp.† | | | 112,520 | |
| | 450 | | WellCare Health Plans, Inc.† | | | 48,276 | |
| | 650 | | West Pharmaceutical Services, Inc. | | | 49,322 | |
| | 773 | | Wright Medical Group NV† | | | 13,427 | |
| | 1,660 | | Zimmer Biomet Holdings, Inc. | | | 199,831 | |
| | 64 | | ZIOPHARM Oncology, Inc.†(a) | | | 351 | |
| | 950 | | Zoetis, Inc., Class A(a) | | | 45,087 | |
| | | | | | | 27,884,031 | |
Industrials — 10.5% | | | | |
| | 6,136 | | 3M Co. | | | 1,074,536 | |
| | 525 | | AAON, Inc. | | | 14,443 | |
| | 500 | | ABM Industries, Inc. | | | 18,240 | |
| | 300 | | Acacia Research Corp. | | | 1,320 | |
| | 300 | | Acme United Corp. | | | 5,490 | |
| | 590 | | Actuant Corp., Class A(a) | | | 13,340 | |
| | 375 | | Acuity Brands, Inc.(a) | | | 92,985 | |
| | 400 | | Advisory Board Co. (The)†(a) | | | 14,156 | |
| | 1,427 | | AECOM† | | | 45,336 | |
| | 500 | | Aerojet Rocketdyne Holdings, Inc.† | | | 9,140 | |
| | 700 | | AGCO Corp. | | | 32,991 | |
| | 1,000 | | Air Lease Corp., Class A(a) | | | 26,780 | |
| | 500 | | Aircastle, Ltd.(a) | | | 9,780 | |
| | 1,134 | | Alaska Air Group, Inc. | | | 66,101 | |
| | 400 | | Albany International Corp., Class A | | | 15,972 | |
| | 153 | | Allegiant Travel Co., Class A | | | 23,180 | |
| | 300 | | Altra Industrial Motion Corp. | | | 8,094 | |
| | 100 | | AMERCO | | | 37,455 | |
| | 6,211 | | American Airlines Group, Inc. | | | 175,833 | |
| | 300 | | American Railcar Industries, Inc. | | | 11,841 | |
| | 130 | | American Woodmark Corp.† | | | 8,629 | |
| | 2,212 | | AMETEK, Inc. | | | 102,261 | |
| | 3,275 | | AMR Corp., Escrow†(e) | | | — | |
| | 652 | | AO Smith Corp. | | | 57,448 | |
| | 200 | | Apogee Enterprises, Inc. | | | 9,270 | |
| Shares | | | | Value | |
Industrials — (continued) | | | |
| | 375 | | Applied Industrial Technologies, Inc. | | $ | 16,927 | |
| | 300 | | ArcBest Corp. | | | 4,875 | |
| | 200 | | Armstrong World Industries, Inc.†(a) | | | 7,830 | |
| | 200 | | Astec Industries, Inc. | | | 11,230 | |
| | 300 | | Astronics Corp.† | | | 9,978 | |
| | 45 | | Astronics Corp., Class B† | | | 1,490 | |
| | 300 | | Atlas Air Worldwide Holdings, Inc.† | | | 12,426 | |
| | 1,192 | | Avis Budget Group, Inc.† | | | 38,418 | |
| | 225 | | AZZ, Inc. | | | 13,496 | |
| | 834 | | B/E Aerospace, Inc. | | | 38,510 | |
| | 718 | | Babcock & Wilcox Enterprises, Inc.† | | | 10,547 | |
| | 600 | | Barnes Group, Inc. | | | 19,872 | |
| | 500 | | Beacon Roofing Supply, Inc.† | | | 22,735 | |
| | 6,074 | | Boeing Co. (The) | | | 788,830 | |
| | 445 | | Brady Corp., Class A | | | 13,599 | |
| | 450 | | Briggs & Stratton Corp. | | | 9,531 | |
| | 450 | | Brink's Co. (The) | | | 12,820 | |
| | 450 | | Builders FirstSource, Inc.† | | | 5,063 | |
| | 912 | | BWX Technologies, Inc., Class W | | | 32,622 | |
| | 423 | | Carlisle Cos., Inc. | | | 44,703 | |
| | 100 | | Casella Waste Systems, Inc., Class A† | | | 785 | |
| | 6,136 | | Caterpillar, Inc.(a) | | | 465,170 | |
| | 1,300 | | CBIZ, Inc.† | | | 13,533 | |
| | 400 | | CDI Corp.(a) | | | 2,440 | |
| | 300 | | CEB, Inc. | | | 18,504 | |
| | 400 | | CECO Environmental Corp.(a) | | | 3,496 | |
| | 300 | | Celadon Group, Inc.(a) | | | 2,451 | |
| | 1,200 | | CH Robinson Worldwide, Inc. | | | 89,100 | |
| | 1,032 | | Cintas Corp. | | | 101,270 | |
| | 184 | | CIRCOR International, Inc.(a) | | | 10,486 | |
| | 400 | | CLARCOR, Inc. | | | 24,332 | |
| | 400 | | Clean Harbors, Inc.†(a) | | | 20,844 | |
| | 925 | | Colfax Corp.† | | | 24,475 | |
| | 400 | | Columbus McKinnon Corp. | | | 5,660 | |
| | 300 | | Comfort Systems USA, Inc. | | | 9,771 | |
| | 300 | | Commercial Vehicle Group, Inc.† | | | 1,560 | |
| | 1,000 | | Copart, Inc.† | | | 49,010 | |
| | 1,750 | | Covanta Holding Corp. | | | 28,787 | |
| | 100 | | Covenant Transportation Group, Inc., Class A† | | | 1,807 | |
| | 325 | | Crane Co. | | | 18,434 | |
| | 9,400 | | CSX Corp. | | | 245,152 | |
| | 300 | | Cubic Corp.(a) | | | 12,048 | |
| | 1,604 | | Cummins, Inc. | | | 180,354 | |
| | 300 | | Curtiss-Wright Corp. | | | 25,275 | |
| | 6,270 | | Danaher Corp. | | | 633,270 | |
| | 2,660 | | Deere & Co.(a) | | | 215,566 | |
| | 8,100 | | Delta Air Lines, Inc. | | | 295,083 | |
| | 500 | | Deluxe Corp. | | | 33,185 | |
| | 750 | | DigitalGlobe, Inc.† | | | 16,042 | |
| | 925 | | Donaldson Co., Inc. | | | 31,783 | |
| | 1,418 | | Dover Corp. | | | 98,296 | |
| | 313 | | Dun & Bradstreet Corp. | | | 38,136 | |
| | 100 | | DXP Enterprises, Inc.†(a) | | | 1,493 | |
| | 350 | | Dycom Industries, Inc.†(a) | | | 31,416 | |
| | 400 | | Dynamic Materials Corp. | | | 4,300 | |
| | 4,671 | | Eaton Corp. PLC | | | 278,999 | |
| | 500 | | EMCOR Group, Inc. | | | 24,630 | |
| | 6,653 | | Emerson Electric Co. | | | 347,020 | |
| | 700 | | Empire Resources, Inc. | | | 2,513 | |
| | 200 | | Encore Wire Corp. | | | 7,456 | |
| | 500 | | Energy Recovery, Inc.†(a) | | | 4,445 | |
| | 375 | | EnerSys, Inc. | | | 22,301 | |
| | 179 | | Engility Holdings, Inc.† | | | 3,780 | |
| | 50 | | Ennis, Inc. | | | 959 | |
| | 178 | | EnPro Industries, Inc. | | | 7,901 | |
Wilshire Mutual Funds, Inc. Wilshire 5000 IndexSM Fund Schedule of Investments | June 30, 2016 (unaudited) |
| Shares | | | | Value | |
Industrials — (continued) | | | |
| | 1,183 | | Equifax, Inc. | | $ | 151,897 | |
| | 200 | | ESCO Technologies, Inc. | | | 7,988 | |
| | 290 | | Esterline Technologies Corp.† | | | 17,992 | |
| | 1,550 | | Expeditors International of Washington, Inc. | | | 76,012 | |
| | 270 | | Exponent, Inc. | | | 15,771 | |
| | 2,600 | | Fastenal Co.(a) | | | 115,414 | |
| | 1,000 | | Federal Signal Corp.(a) | | | 12,880 | |
| | 2,438 | | FedEx Corp. | | | 370,040 | |
| | 1,115 | | Flowserve Corp.(a) | | | 50,365 | |
| | 1,386 | | Fluor Corp. | | | 68,302 | |
| | 1,300 | | Fortune Brands Home & Security, Inc.(a) | | | 75,361 | |
| | 300 | | Forward Air Corp. | | | 13,359 | |
| | 600 | | Franklin Electric Co., Inc. | | | 19,830 | |
| | 500 | | FreightCar America, Inc. | | | 7,025 | |
| | 600 | | FTI Consulting, Inc.† | | | 24,408 | |
| | 300 | | G&K Services, Inc., Class A | | | 22,971 | |
| | 325 | | GATX Corp.(a) | | | 14,290 | |
| | 625 | | General Cable Corp.(a) | | | 7,944 | |
| | 2,345 | | General Dynamics Corp. | | | 326,518 | |
| | 95,746 | | General Electric Co. | | | 3,014,084 | |
| | 585 | | Genessee & Wyoming, Inc., Class A†(a) | | | 34,486 | |
| | 507 | | Gorman-Rupp Co. (The)(a) | | | 13,897 | |
| | 362 | | Graco, Inc.(a) | | | 28,594 | |
| | 400 | | Granite Construction, Inc. | | | 18,220 | |
| | 1,500 | | Great Lakes Dredge & Dock Corp.†(a) | | | 6,540 | |
| | 550 | | Greenbrier Cos., Inc.(a) | | | 16,021 | |
| | 350 | | Griffon Corp.(a) | | | 5,901 | |
| | 325 | | H&E Equipment Services, Inc. | | | 6,185 | |
| | 850 | | Hardinge, Inc. | | | 8,551 | |
| | 625 | | Hawaiian Holdings, Inc.† | | | 23,725 | |
| | 625 | | HD Supply Holdings, Inc.† | | | 21,763 | |
| | 675 | | Healthcare Services Group, Inc.(a) | | | 27,931 | |
| | 625 | | Heartland Express, Inc.(a) | | | 10,869 | |
| | 350 | | HEICO Corp., Class A | | | 18,777 | |
| | 200 | | Heidrick & Struggles International, Inc. | | | 3,376 | |
| | 600 | | Herman Miller, Inc. | | | 17,934 | |
| | 2,150 | | Hertz Global Holdings, Inc.†(a) | | | 23,800 | |
| | 1,050 | | Hexcel Corp. | | | 43,722 | |
| | 300 | | Hill International, Inc.†(a) | | | 1,221 | |
| | 625 | | Hillenbrand, Inc. | | | 18,775 | |
| | 400 | | HNI Corp. | | | 18,596 | |
| | 8,099 | | Honeywell International, Inc. | | | 942,076 | |
| | 350 | | Hub Group, Inc., Class A† | | | 13,430 | |
| | 338 | | Hubbell, Inc., Class B | | | 35,649 | |
| | 419 | | Huntington Ingalls Industries, Inc. | | | 70,405 | |
| | 400 | | Hurco Cos., Inc. | | | 11,132 | |
| | 200 | | Huron Consulting Group, Inc.† | | | 12,084 | |
| | 118 | | Hyster-Yale Materials Handling, Inc. | | | 7,020 | |
| | 675 | | IDEX Corp. | | | 55,417 | |
| | 500 | | IES Holdings, Inc.† | | | 6,210 | |
| | 694 | | IHS, Inc., Class A† | | | 80,233 | |
| | 3,201 | | Illinois Tool Works, Inc.(a) | | | 333,416 | |
| | 500 | | InnerWorkings, Inc.† | | | 4,135 | |
| | 36 | | Insperity, Inc. | | | 2,780 | |
| | 500 | | Interface, Inc., Class A | | | 7,625 | |
| | 1,100 | | ITT, Inc. | | | 35,178 | |
| | 1,250 | | Jacobs Engineering Group, Inc.†(a) | | | 62,262 | |
| | 852 | | JB Hunt Transport Services, Inc. | | | 68,952 | |
| | 1,750 | | JetBlue Airways Corp.†(a) | | | 28,980 | |
| | 251 | | John Bean Technologies Corp. | | | 15,366 | |
| | 875 | | Joy Global, Inc.(a) | | | 18,497 | |
| | 200 | | Kadant, Inc. | | | 10,302 | |
| | 300 | | Kaman Corp.(a) | | | 12,756 | |
| | 1,152 | | Kansas City Southern | | | 103,784 | |
| | 400 | | KAR Auction Services, Inc. | | | 16,696 | |
| | 1,550 | | KBR, Inc. | | | 20,522 | |
| Shares | | | | Value | |
Industrials — (continued) | | | |
| | 400 | | Kelly Services, Inc., Class A | | $ | 7,588 | |
| | 800 | | Kennametal, Inc. | | | 17,688 | |
| | 150 | | Kforce, Inc.(a) | | | 2,533 | |
| | 700 | | Kimball International, Inc., Class B | | | 7,966 | |
| | 600 | | Kirby Corp.†(a) | | | 37,434 | |
| | 617 | | KLX, Inc.†(a) | | | 19,127 | |
| | 650 | | Knight Transportation, Inc. | | | 17,277 | |
| | 500 | | Knoll, Inc. | | | 12,140 | |
| | 525 | | Korn/Ferry International | | | 10,867 | |
| | 10 | | Kratos Defense & Security Solutions, Inc.†(a) | | | 41 | |
| | 775 | | L-3 Communications Holdings, Inc., Class 3 | | | 113,685 | |
| | 300 | | Landstar System, Inc.(a) | | | 20,598 | |
| | 600 | | Layne Christensen Co.†(a) | | | 4,860 | |
| | 357 | | Lennox International, Inc. | | | 50,908 | |
| | 600 | | Lincoln Electric Holdings, Inc.(a) | | | 35,448 | |
| | 200 | | Lindsay Corp.(a) | | | 13,572 | |
| | 100 | | LMI Aerospace, Inc.†(a) | | | 804 | |
| | 2,851 | | Lockheed Martin Corp. | | | 707,533 | |
| | 700 | | LSI Industries, Inc. | | | 7,749 | |
| | 1,075 | | Manitowoc Co., Inc. (The) | | | 5,859 | |
| | 702 | | ManpowerGroup, Inc. | | | 45,167 | |
| | 150 | | Marten Transport, Ltd.(a) | | | 2,970 | |
| | 3,325 | | Masco Corp. | | | 102,876 | |
| | 1,000 | | MasTec, Inc.†(a) | | | 22,320 | |
| | 325 | | Matson, Inc. | | | 10,494 | |
| | 400 | | Matthews International Corp., Class A(a) | | | 22,256 | |
| | 300 | | McGrath RentCorp | | | 9,177 | |
| | 1,550 | | Meritor, Inc.†(a) | | | 11,160 | |
| | 300 | | MFRI, Inc.† | | | 2,238 | |
| | 628 | | Middleby Corp.† | | | 72,377 | |
| | 406 | | Mobile Mini, Inc.(a) | | | 14,064 | |
| | 300 | | Moog, Inc., Class A† | | | 16,176 | |
| | 350 | | MSA Safety, Inc. | | | 18,385 | |
| | 508 | | MSC Industrial Direct Co., Inc., Class A | | | 35,844 | |
| | 600 | | Mueller Industries, Inc. | | | 19,128 | |
| | 1,600 | | Mueller Water Products, Inc., Class A | | | 18,272 | |
| | 400 | | Navigant Consulting, Inc.† | | | 6,460 | |
| | 1,000 | | Navistar International Corp.† | | | 11,690 | |
| | 500 | | NCI Building Systems, Inc.† | | | 7,995 | |
| | 418 | | Nordson Corp.(a) | | | 34,949 | |
| | 2,835 | | Norfolk Southern Corp. | | | 241,344 | |
| | 300 | | Nortek, Inc.†(a) | | | 17,793 | |
| | 1,837 | | Northrop Grumman Corp. | | | 408,328 | |
| | 1,299 | | NOW, Inc.†(a) | | | 23,564 | |
| | 600 | | Old Dominion Freight Line, Inc.† | | | 36,186 | |
| | 550 | | On Assignment, Inc.† | | | 20,323 | |
| | 608 | | Orbital ATK, Inc. | | | 51,765 | |
| | 350 | | Oshkosh Corp.(a) | | | 16,699 | |
| | 1,100 | | Owens Corning | | | 56,672 | |
| | 3,180 | | PACCAR, Inc. | | | 164,947 | |
| | 1,213 | | Parker-Hannifin Corp. | | | 131,065 | |
| | 300 | | Patrick Industries, Inc.†(a) | | | 18,087 | |
| | 1,825 | | Pentair PLC(a) | | | 106,379 | |
| | 2,125 | | Pitney Bowes, Inc. | | | 37,825 | |
| | 475 | | Primoris Services Corp.(a) | | | 8,992 | |
| | 1,000 | | Quanex Building Products Corp.(a) | | | 18,590 | |
| | 1,950 | | Quanta Services, Inc.† | | | 45,084 | |
| | 600 | | Raven Industries, Inc. | | | 11,364 | |
| | 3,055 | | Raytheon Co. | | | 415,327 | |
| | 300 | | RBC Bearings, Inc.† | | | 21,750 | |
| | 400 | | Regal Beloit Corp. | | | 22,020 | |
| | 2,518 | | Republic Services, Inc., Class A | | | 129,199 | |
| | 200 | | Resources Connection, Inc. | | | 2,956 | |
| | 325 | | Rexnord Corp.† | | | 6,380 | |
Wilshire Mutual Funds, Inc. Wilshire 5000 IndexSM Fund Schedule of Investments | June 30, 2016 (unaudited) |
| Shares | | | | Value | |
Industrials — (continued) | | | |
| | 350 | | Roadrunner Transportation Systems, Inc.† | | $ | 2,611 | |
| | 1,300 | | Robert Half International, Inc. | | | 49,608 | |
| | 1,384 | | Rockwell Automation, Inc.(a) | | | 158,911 | |
| | 1,125 | | Rockwell Collins, Inc. | | | 95,783 | |
| | 1,575 | | Rollins, Inc.(a) | | | 46,100 | |
| | 922 | | Roper Technologies, Inc. | | | 157,256 | |
| | 1,000 | | RPX Corp.† | | | 9,170 | |
| | 1,850 | | RR Donnelley & Sons Co.(a) | | | 31,302 | |
| | 375 | | Rush Enterprises, Inc., Class A†(a) | | | 8,081 | |
| | 534 | | Ryder System, Inc.(a) | | | 32,649 | |
| | 225 | | Saia, Inc.† | | | 5,656 | |
| | 400 | | Simpson Manufacturing Co., Inc. | | | 15,988 | |
| | 620 | | Snap-on, Inc. | | | 97,848 | |
| | 300 | | SolarCity Corp.† | | | 7,179 | |
| | 5,249 | | Southwest Airlines Co. | | | 205,813 | |
| | 1,475 | | Spirit AeroSystems Holdings, Inc., Class A† | | | 63,425 | |
| | 300 | | Spirit Airlines, Inc.†(a) | | | 13,461 | |
| | 312 | | SPX Corp. | | | 4,633 | |
| | 312 | | SPX FLOW, Inc.† | | | 8,134 | |
| | 50 | | Standex International Corp. | | | 4,132 | |
| | 1,469 | | Stanley Black & Decker, Inc. | | | 163,382 | |
| | 875 | | Steelcase, Inc., Class A | | | 11,874 | |
| | 916 | | Stericycle, Inc.†(a) | | | 95,374 | |
| | 300 | | Sun Hydraulics Corp.(a) | | | 8,907 | |
| | 1,000 | | Swift Transportation Co., Class A†(a) | | | 15,410 | |
| | 500 | | TAL International Group, Inc. | | | 6,705 | |
| | 650 | | TASER International, Inc.† | | | 16,172 | |
| | 564 | | Team, Inc.†(a) | | | 14,004 | |
| | 333 | | Teledyne Technologies, Inc.† | | | 32,984 | |
| | 300 | | Tennant Co.(a) | | | 16,161 | |
| | 1,300 | | Terex Corp. | | | 26,403 | |
| | 743 | | Tetra Tech, Inc. | | | 22,844 | |
| | 700 | | Textainer Group Holdings, Ltd.(a) | | | 7,798 | |
| | 2,975 | | Textron, Inc. | | | 108,766 | |
| | 675 | | Timken Co. | | | 20,696 | |
| | 312 | | Titan International, Inc.(a) | | | 1,934 | |
| | 600 | | Toro Co. (The) | | | 52,920 | |
| | 500 | | TransDigm Group, Inc.†(a) | | | 131,845 | |
| | 100 | | TRC Cos., Inc.†(a) | | | 632 | |
| | 225 | | Trex Co., Inc.†(a) | | | 10,107 | |
| | 1,550 | | Trinity Industries, Inc.(a) | | | 28,784 | |
| | 556 | | Triumph Group, Inc.(a) | | | 19,738 | |
| | 800 | | TrueBlue, Inc.†(a) | | | 15,136 | |
| | 500 | | Tutor Perini Corp.†(a) | | | 11,775 | |
| | 400 | | Twin Disc, Inc.(a) | | | 4,296 | |
| | 200 | | Ultralife Corp.† | | | 1,002 | |
| | 200 | | UniFirst Corp. | | | 23,144 | |
| | 8,161 | | Union Pacific Corp. | | | 712,047 | |
| | 3,330 | | United Continental Holdings, Inc.† | | | 136,663 | |
| | 5,514 | | United Parcel Service, Inc., Class B | | | 593,968 | |
| | 777 | | United Rentals, Inc.†(a) | | | 52,137 | |
| | 8,713 | | United Technologies Corp. | | | 893,518 | |
| | 300 | | Universal Forest Products, Inc. | | | 27,807 | |
| | 200 | | US Ecology, Inc.(a) | | | 9,190 | |
| | 1,075 | | USG Corp.†(a) | | | 28,982 | |
| | 259 | | Valmont Industries, Inc.(a) | | | 35,035 | |
| | 122 | | Vectrus, Inc.†(a) | | | 3,476 | |
| | 1,400 | | Verisk Analytics, Inc., Class A† | | | 113,512 | |
| | 97 | | Veritiv Corp.†(a) | | | 3,645 | |
| | 400 | | Viad Corp. | | | 12,400 | |
| | 300 | | Vicor Corp.†(a) | | | 3,021 | |
| | 300 | | Virgin America, Inc.† | | | 16,863 | |
| | 750 | | Volt Information Sciences, Inc.†(a) | | | 4,433 | |
| | 50 | | Wabash National Corp.† | | | 635 | |
| | 562 | | WABCO Holdings, Inc.† | | | 51,462 | |
| Shares | | | | Value | |
Industrials — (continued) | | | |
| | 859 | | Wabtec Corp.(a) | | $ | 60,328 | |
| | 1,137 | | Waste Connections, Inc. | | | 81,921 | |
| | 4,050 | | Waste Management, Inc. | | | 268,394 | |
| | 214 | | Watsco, Inc. | | | 30,108 | |
| | 300 | | Watts Water Technologies, Inc., Class A | | | 17,478 | |
| | 250 | | Werner Enterprises, Inc.(a) | | | 5,743 | |
| | 300 | | WESCO International, Inc.†(a) | | | 15,447 | |
| | 425 | | West Corp. | | | 8,356 | |
| | 500 | | Woodward, Inc. | | | 28,820 | |
| | 575 | | WW Grainger, Inc.(a) | | | 130,669 | |
| | 655 | | XPO Logistics, Inc.†(a) | | | 17,200 | |
| | 1,600 | | Xylem, Inc. | | | 71,440 | |
| | | | | | | 22,111,228 | |
Information Technology — 18.7% | | | | |
| | 1,423 | | 3D Systems Corp.†(a) | | | 19,481 | |
| | 1,185 | | ACI Worldwide, Inc.† | | | 23,119 | |
| | 5,288 | | Activision Blizzard, Inc. | | | 209,563 | |
| | 100 | | Actua Corp.† | | | 903 | |
| | 800 | | Acxiom Corp.† | | | 17,592 | |
| | 4,422 | | Adobe Systems, Inc.† | | | 423,583 | |
| | 700 | | Advanced Energy Industries, Inc.† | | | 26,572 | |
| | 6,750 | | Advanced Micro Devices, Inc.† | | | 34,695 | |
| | 500 | | Agilysys, Inc.†(a) | | | 5,235 | |
| | 1,759 | | Akamai Technologies, Inc.† | | | 98,381 | |
| | 508 | | Alliance Data Systems Corp.† | | | 99,527 | |
| | 5,840 | | Alphabet, Inc., Class C† | | | 4,041,864 | |
| | 1,050 | | Amkor Technology, Inc.† | | | 6,037 | |
| | 2,250 | | Amphenol Corp., Class A | | | 128,993 | |
| | 32 | | Amtech Systems, Inc.† | | | 191 | |
| | 2,750 | | Analog Devices, Inc. | | | 155,760 | |
| | 278 | | Anixter International, Inc.† | | | 14,812 | |
| | 763 | | ANSYS, Inc.† | | | 69,242 | |
| | 56,428 | | Apple, Inc. | | | 5,394,517 | |
| | 11,608 | | Applied Materials, Inc. | | | 278,244 | |
| | 1,500 | | Applied Micro Circuits Corp.†(a) | | | 9,630 | |
| | 1,529 | | ARRIS International PLC† | | | 32,048 | |
| | 800 | | Arrow Electronics, Inc.† | | | 49,520 | |
| | 625 | | Aspen Technology, Inc.† | | | 25,150 | |
| | 2,050 | | Autodesk, Inc.† | | | 110,987 | |
| | 4,661 | | Automatic Data Processing, Inc. | | | 428,206 | |
| | 1,200 | | Avnet, Inc. | | | 48,612 | |
| | 1,000 | | AVX Corp. | | | 13,580 | |
| | 200 | | Badger Meter, Inc. | | | 14,606 | |
| | 300 | | Bel Fuse, Inc., Class B | | | 5,334 | |
| | 400 | | Belden, Inc. | | | 24,148 | |
| | 475 | | Benchmark Electronics, Inc.† | | | 10,046 | |
| | 298 | | Black Box Corp. | | | 3,898 | |
| | 300 | | Black Knight Financial Services, Inc., Class A†(a) | | | 11,280 | |
| | 300 | | Blackbaud, Inc. | | | 20,370 | |
| | 250 | | Blucora, Inc.† | | | 2,590 | |
| | 1,000 | | Booz Allen Hamilton Holding Corp., Class A | | | 29,640 | |
| | 375 | | Bottomline Technologies de, Inc.†(a) | | | 8,074 | |
| | 128 | | Broadcom, Ltd. | | | 19,891 | |
| | 1,175 | | Broadridge Financial Solutions, Inc. | | | 76,610 | |
| | 300 | | BroadSoft, Inc.† | | | 12,309 | |
| | 4,475 | | Brocade Communications Systems, Inc. | | | 41,080 | |
| | 106 | | Brooks Automation, Inc. | | | 1,189 | |
| | 3,197 | | CA, Inc. | | | 104,958 | |
| | 100 | | Cabot Microelectronics Corp. | | | 4,234 | |
| | 199 | | CACI International, Inc., Class A† | | | 17,992 | |
| | 3,177 | | Cadence Design Systems, Inc.† | | | 77,201 | |
| | 400 | | CalAmp Corp.† | | | 5,924 | |
| | 175 | | Calix, Inc.† | | | 1,209 | |
Wilshire Mutual Funds, Inc. Wilshire 5000 IndexSM Fund Schedule of Investments | June 30, 2016 (unaudited) |
| Shares | | | | Value | |
Information Technology — (continued) | | | |
| | 200 | | Callidus Software, Inc.† | | $ | 3,996 | |
| | 475 | | Cardtronics, Inc.†(a) | | | 18,910 | |
| | 500 | | Cavium, Inc.†(a) | | | 19,300 | |
| | 300 | | CDW Corp.(a) | | | 12,024 | |
| | 997 | | Ciena Corp.† | | | 18,694 | |
| | 400 | | Cirrus Logic, Inc.† | | | 15,516 | |
| | 51,823 | | Cisco Systems, Inc. | | | 1,486,802 | |
| | 1,575 | | Citrix Systems, Inc.† | | | 126,142 | |
| | 1,000 | | Cognex Corp. | | | 43,100 | |
| | 5,948 | | Cognizant Technology Solutions Corp., Class A† | | | 340,464 | |
| | 100 | | Coherent, Inc.† | | | 9,178 | |
| | 1,150 | | CommScope Holding Co., Inc.†(a) | | | 35,685 | |
| | 375 | | CommVault Systems, Inc.† | | | 16,196 | |
| | 1,255 | | Computer Sciences Corp. | | | 62,311 | |
| | 400 | | comScore, Inc.† | | | 9,552 | |
| | 100 | | Comtech Telecommunications Corp. | | | 1,284 | |
| | 825 | | Convergys Corp.(a) | | | 20,625 | |
| | 1,152 | | CoreLogic, Inc.† | | | 44,329 | |
| | 500 | | Cornerstone OnDemand, Inc.†(a) | | | 19,030 | |
| | 11,594 | | Corning, Inc. | | | 237,445 | |
| | 325 | | CoStar Group, Inc.† | | | 71,065 | |
| | 425 | | Cray, Inc.† | | | 12,716 | |
| | 625 | | Cree, Inc.†(a) | | | 15,275 | |
| | 378 | | CSG Systems International, Inc.(a) | | | 15,237 | |
| | 1,255 | | CSRA, Inc. | | | 29,405 | |
| | 100 | | CTS Corp. | | | 1,792 | |
| | 1,625 | | Cypress Semiconductor Corp.(a) | | | 17,144 | |
| | 800 | | Daktronics, Inc. | | | 5,000 | |
| | 600 | | Datalink Corp.† | | | 4,500 | |
| | 300 | | Demandware, Inc.† | | | 22,470 | |
| | 388 | | DHI Group, Inc.† | | | 2,417 | |
| | 650 | | Diebold, Inc. | | | 16,139 | |
| | 51 | | Digital Ally, Inc.† | | | 198 | |
| | 300 | | Diodes, Inc.† | | | 5,637 | |
| | 300 | | Dolby Laboratories, Inc., Class A | | | 14,355 | |
| | 284 | | DST Systems, Inc. | | | 33,066 | |
| | 1,421 | | EarthLink Holdings Corp. | | | 9,094 | |
| | 11,775 | | eBay, Inc.† | | | 275,653 | |
| | 331 | | Ebix, Inc.(a) | | | 15,855 | |
| | 400 | | EchoStar Corp., Class A† | | | 15,880 | |
| | 100 | | Electro Scientific Industries, Inc.† | | | 584 | |
| | 2,850 | | Electronic Arts, Inc.† | | | 215,916 | |
| | 404 | | Electronics For Imaging, Inc.† | | | 17,388 | |
| | 350 | | Ellie Mae, Inc.† | | | 32,077 | |
| | 20,054 | | EMC Corp. | | | 544,867 | |
| | 125 | | EMCORE Corp.†(a) | | | 743 | |
| | 300 | | EnerNOC, Inc.†(a) | | | 1,896 | |
| | 1,836 | | Entegris, Inc.† | | | 26,567 | |
| | 375 | | Envestnet, Inc.†(a) | | | 12,491 | |
| | 600 | | EPAM Systems, Inc.† | | | 38,586 | |
| | 1,500 | | Epiq Systems, Inc. | | | 21,900 | |
| | 450 | | Euronet Worldwide, Inc.† | | | 31,135 | |
| | 500 | | Exar Corp.† | | | 4,025 | |
| | 300 | | ExlService Holdings, Inc.† | | | 15,723 | |
| | 768 | | F5 Networks, Inc.† | | | 87,429 | |
| | 22,067 | | Facebook, Inc., Class A† | | | 2,521,817 | |
| | 246 | | Fair Isaac Corp. | | | 27,800 | |
| | 1,250 | | Fairchild Semiconductor International, Inc., Class A† | | | 24,812 | |
| | 200 | | FARO Technologies, Inc.† | | | 6,766 | |
| | 406 | | FEI Co. | | | 43,393 | |
| | 3,135 | | Fidelity National Information Services, Inc. | | | 230,987 | |
| | 775 | | Finisar Corp.† | | | 13,570 | |
| | 600 | | FireEye, Inc.†(a) | | | 9,882 | |
| Shares | | | | Value | |
Information Technology — (continued) | | | |
| | 1,825 | | First Data Corp., Class A† | | $ | 20,203 | |
| | 700 | | First Solar, Inc.†(a) | | | 33,936 | |
| | 2,222 | | Fiserv, Inc.† | | | 241,598 | |
| | 425 | | Fitbit, Inc., Class A†(a) | | | 5,194 | |
| | 450 | | FleetCor Technologies, Inc.† | | | 64,408 | |
| | 1,500 | | FLIR Systems, Inc. | | | 46,425 | |
| | 481 | | FormFactor, Inc.† | | | 4,321 | |
| | 255 | | Forrester Research, Inc. | | | 9,399 | |
| | 1,675 | | Fortinet, Inc.† | | | 52,913 | |
| | 800 | | Gartner, Inc.† | | | 77,928 | |
| | 1,600 | | Genpact, Ltd.† | | | 42,944 | |
| | 1,350 | | Global Payments, Inc.(a) | | | 96,363 | |
| | 200 | | Guidance Software, Inc.†(a) | | | 1,238 | |
| | 300 | | Guidewire Software, Inc.† | | | 18,528 | |
| | 1,260 | | Harris Corp.(a) | | | 105,134 | |
| | 18,127 | | Hewlett Packard Enterprise Co. | | | 331,180 | |
| | 18,102 | | HP, Inc. | | | 227,180 | |
| | 1,100 | | Hutchinson Technology, Inc.†(a) | | | 3,729 | |
| | 900 | | IAC | | | 50,670 | |
| | 100 | | ID Systems, Inc.†(a) | | | 481 | |
| | 1,000 | | II-VI, Inc.†(a) | | | 18,760 | |
| | 600 | | Infinera Corp.†(a) | | | 6,768 | |
| | 1,600 | | Ingram Micro, Inc., Class A | | | 55,648 | |
| | 500 | | Insight Enterprises, Inc.† | | | 13,000 | |
| | 1,560 | | Integrated Device Technology, Inc.† | | | 31,403 | |
| | 48,643 | | Intel Corp.(a) | | | 1,595,490 | |
| | 350 | | Interactive Intelligence Group, Inc.†(a) | | | 14,346 | |
| | 350 | | InterDigital, Inc. | | | 19,488 | |
| | 8,947 | | International Business Machines Corp. | | | 1,357,976 | |
| | 850 | | Intersil Corp., Class A | | | 11,509 | |
| | 2,191 | | Intuit, Inc. | | | 244,538 | |
| | 381 | | IPG Photonics Corp.†(a) | | | 30,480 | |
| | 200 | | Itron, Inc.† | | | 8,620 | |
| | 1,200 | | Ixia† | | | 11,784 | |
| | 800 | | IXYS Corp.(a) | | | 8,200 | |
| | 325 | | j2 Global, Inc.(a) | | | 20,530 | |
| | 1,550 | | Jabil Circuit, Inc. | | | 28,629 | |
| | 722 | | Jack Henry & Associates, Inc. | | | 63,009 | |
| | 3,915 | | Juniper Networks, Inc. | | | 88,048 | |
| | 600 | | Key Tronic Corp.†(a) | | | 4,518 | |
| | 2,023 | | Keysight Technologies, Inc.† | | | 58,849 | |
| | 525 | | Kimball Electronics, Inc.† | | | 6,536 | |
| | 800 | | KLA-Tencor Corp. | | | 58,600 | |
| | 983 | | Knowles Corp.†(a) | | | 13,447 | |
| | 400 | | Kulicke & Soffa Industries, Inc.† | | | 4,868 | |
| | 1,487 | | Lam Research Corp.(a) | | | 124,997 | |
| | 200 | | Lattice Semiconductor Corp.†(a) | | | 1,070 | |
| | 681 | | Leidos Holdings, Inc.(a) | | | 32,599 | |
| | 550 | | Lexmark International, Inc., Class A | | | 20,763 | |
| | 360 | | Liberty Braves Group, Class A†(a) | | | 5,414 | |
| | 255 | | Liberty Braves Group, Class C†(a) | | | 3,738 | |
| | 3,602 | | Liberty SiriusXM Group, Class A† | | | 112,959 | |
| | 2,554 | | Liberty SiriusXM Group, Class C† | | | 78,842 | |
| | 2,100 | | Linear Technology Corp. | | | 97,713 | |
| | 1,180 | | LinkedIn Corp., Class A† | | | 223,315 | |
| | 218 | | Littelfuse, Inc. | | | 25,765 | |
| | 300 | | LogMeIn, Inc.† | | | 19,029 | |
| | 640 | | Lumentum Holdings, Inc.† | | | 15,488 | |
| | 650 | | Manhattan Associates, Inc.† | | | 41,684 | |
| | 300 | | ManTech International Corp., Class A | | | 11,346 | |
| | 4,125 | | Marvell Technology Group, Ltd. | | | 39,311 | |
| | 10,094 | | MasterCard, Inc., Class A | | | 888,878 | |
| | 2,575 | | Maxim Integrated Products, Inc. | | | 91,902 | |
| | 425 | | MAXIMUS, Inc. | | | 23,532 | |
| | 600 | | Medallion Financial Corp.(a) | | | 4,428 | |
| | 1,200 | | Mentor Graphics Corp. | | | 25,512 | |
Wilshire Mutual Funds, Inc. Wilshire 5000 IndexSM Fund Schedule of Investments | June 30, 2016 (unaudited) |
| Shares | | | | Value | |
Information Technology — (continued) | | | |
| | 100 | | Mercury Systems, Inc.† | | $ | 2,486 | |
| | 400 | | Methode Electronics, Inc. | | | 13,692 | |
| | 2,161 | | Microchip Technology, Inc.(a) | | | 109,692 | |
| | 10,002 | | Micron Technology, Inc.† | | | 137,628 | |
| | 650 | | Microsemi Corp.† | | | 21,242 | |
| | 81,437 | | Microsoft Corp. | | | 4,167,131 | |
| | 100 | | MicroStrategy, Inc., Class A† | | | 17,502 | |
| | 600 | | MKS Instruments, Inc. | | | 25,836 | |
| | 662 | | MoneyGram International, Inc.† | | | 4,535 | |
| | 200 | | Monolithic Power Systems, Inc.(a) | | | 13,664 | |
| | 350 | | Monotype Imaging Holdings, Inc. | | | 8,621 | |
| | 1,510 | | Motorola Solutions, Inc. | | | 99,615 | |
| | 328 | | Multi-Fineline Electronix, Inc.†(a) | | | 7,610 | |
| | 200 | | Nanometrics, Inc.† | | | 4,158 | |
| | 900 | | Napco Security Technologies, Inc.† | | | 5,724 | |
| | 1,312 | | National Instruments Corp. | | | 35,949 | |
| | 1,300 | | NCR Corp.† | | | 36,101 | |
| | 2,400 | | NetApp, Inc. | | | 59,016 | |
| | 350 | | NETGEAR, Inc.† | | | 16,639 | |
| | 400 | | NetScout Systems, Inc.†(a) | | | 8,900 | |
| | 600 | | NetSuite, Inc.†(a) | | | 43,680 | |
| | 750 | | NeuStar, Inc., Class A†(a) | | | 17,632 | |
| | 1,000 | | NIC, Inc. | | | 21,940 | |
| | 3,650 | | Nuance Communications, Inc.† | | | 57,050 | |
| | 100 | | NVE Corp.(a) | | | 5,865 | |
| | 4,175 | | NVIDIA Corp.(a) | | | 196,267 | |
| | 299 | | NXP Semiconductors NV† | | | 23,424 | |
| | 21 | | Oclaro, Inc.†(a) | | | 102 | |
| | 4,630 | | ON Semiconductor Corp.† | | | 40,837 | |
| | 33,205 | | Oracle Corp. | | | 1,359,081 | |
| | 200 | | OSI Systems, Inc.† | | | 11,626 | |
| | 100 | | Palo Alto Networks, Inc.†(a) | | | 12,264 | |
| | 425 | | Pandora Media, Inc.†(a) | | | 5,291 | |
| | 100 | | PAR Technology Corp.†(a) | | | 479 | |
| | 600 | | Park Electrochemical Corp.(a) | | | 8,718 | |
| | 3,225 | | Paychex, Inc. | | | 191,887 | |
| | 300 | | Paycom Software, Inc.†(a) | | | 12,963 | |
| | 300 | | Paylocity Holding Corp.†(a) | | | 12,960 | |
| | 11,925 | | PayPal Holdings, Inc.† | | | 435,382 | |
| | 400 | | PCM, Inc.† | | | 4,456 | |
| | 600 | | Pegasystems, Inc. | | | 16,170 | |
| | 8 | | PFSweb, Inc.†(a) | | | 76 | |
| | 300 | | Plantronics, Inc. | | | 13,200 | |
| | 300 | | Plexus Corp.† | | | 12,960 | |
| | 1,500 | | Polycom, Inc.† | | | 16,875 | |
| | 300 | | Power Integrations, Inc. | | | 15,021 | |
| | 220 | | PRGX Global, Inc.† | | | 1,148 | |
| | 500 | | Progress Software Corp.† | | | 13,730 | |
| | 300 | | PROS Holdings, Inc.† | | | 5,229 | |
| | 1,240 | | PTC, Inc.† | | | 46,599 | |
| | 40 | | QAD, Inc., Class B | | | 692 | |
| | 1,000 | | Qlik Technologies, Inc.† | | | 29,580 | |
| | 600 | | QLogic Corp.† | | | 8,844 | |
| | 15,180 | | QUALCOMM, Inc. | | | 813,193 | |
| | 300 | | Qualys, Inc.†(a) | | | 8,943 | |
| | 1,275 | | Rackspace Hosting, Inc.†(a) | | | 26,597 | |
| | 1,000 | | Rambus, Inc.†(a) | | | 12,080 | |
| | 681 | | RealNetworks, Inc.†(a) | | | 2,935 | |
| | 625 | | RealPage, Inc.† | | | 13,956 | |
| | 1,540 | | Red Hat, Inc.† | | | 111,804 | |
| | 200 | | Rightside Group, Ltd.† | | | 2,128 | |
| | 300 | | Rogers Corp.† | | | 18,330 | |
| | 300 | | Rosetta Stone, Inc.† | | | 2,325 | |
| | 1,020 | | Rovi Corp.†(a) | | | 15,953 | |
| | 340 | | Rudolph Technologies, Inc.† | | | 5,280 | |
| Shares | | | | Value | |
Information Technology — (continued) | | | |
| | 625 | | Sabre Corp. | | $ | 16,744 | |
| | 5,600 | | salesforce.com, Inc.† | | | 444,696 | |
| | 633 | | Sanmina Corp.† | | | 16,971 | |
| | 300 | | ScanSource, Inc.† | | | 11,133 | |
| | 560 | | Science Applications International Corp. | | | 32,676 | |
| | 600 | | Semtech Corp.† | | | 14,316 | |
| | 300 | | ServiceNow, Inc.†(a) | | | 19,920 | |
| | 300 | | ShoreTel, Inc.† | | | 2,007 | |
| | 122 | | Shutterstock, Inc.†(a) | | | 5,588 | |
| | 200 | | Silicon Laboratories, Inc.† | | | 9,748 | |
| | 1,907 | | Skyworks Solutions, Inc.(a) | | | 120,675 | |
| | 193 | | Splunk, Inc.†(a) | | | 10,457 | |
| | 300 | | SPS Commerce, Inc.† | | | 18,180 | |
| | 800 | | SS&C Technologies Holdings, Inc.(a) | | | 22,464 | |
| | 129 | | Stamps.com, Inc.†(a) | | | 11,277 | |
| | 1,300 | | SunPower Corp., Class A†(a) | | | 20,137 | |
| | 375 | | Super Micro Computer, Inc.†(a) | | | 9,319 | |
| | 102 | | SYKES Enterprises, Inc.† | | | 2,954 | |
| | 7,383 | | Symantec Corp. | | | 151,647 | |
| | 333 | | Synaptics, Inc.†(a) | | | 17,899 | |
| | 325 | | Synchronoss Technologies, Inc.† | | | 10,355 | |
| | 300 | | SYNNEX Corp.(a) | | | 28,446 | |
| | 1,417 | | Synopsys, Inc.† | | | 76,631 | |
| | 300 | | Syntel, Inc.†(a) | | | 13,578 | |
| | 1,025 | | Take-Two Interactive Software, Inc.†(a) | | | 38,868 | |
| | 325 | | Tech Data Corp.†(a) | | | 23,351 | |
| | 800 | | TechTarget, Inc.† | | | 6,480 | |
| | 1,325 | | Teradata Corp.†(a) | | | 33,218 | |
| | 1,800 | | Teradyne, Inc. | | | 35,442 | |
| | 100 | | TESSCO Technologies, Inc. | | | 1,389 | |
| | 400 | | Tessera Technologies, Inc. | | | 12,256 | |
| | 8,010 | | Texas Instruments, Inc. | | | 501,827 | |
| | 800 | | TiVo, Inc.† | | | 7,920 | |
| | 1,637 | | Total System Services, Inc. | | | 86,941 | |
| | 100 | | Travelzoo, Inc.†(a) | | | 802 | |
| | 1,959 | | Trimble Navigation, Ltd.† | | | 47,721 | |
| | 1,238 | | TTM Technologies, Inc.† | | | 9,322 | |
| | 1,100 | | Twitter, Inc.†(a) | | | 18,601 | |
| | 292 | | Tyler Technologies, Inc.†(a) | | | 48,679 | |
| | 265 | | Ultimate Software Group, Inc.† | | | 55,727 | |
| | 427 | | Unisys Corp.†(a) | | | 3,109 | |
| | 114 | | United Online, Inc.† | | | 1,254 | |
| | 400 | | Universal Display Corp.†(a) | | | 27,120 | |
| | 825 | | Vantiv, Inc., Class A† | | | 46,695 | |
| | 450 | | VASCO Data Security International, Inc.† | | | 7,376 | |
| | 400 | | Veeco Instruments, Inc.† | | | 6,624 | |
| | 1,665 | | VeriFone Systems, Inc.† | | | 30,869 | |
| | 375 | | Verint Systems, Inc.†(a) | | | 12,424 | |
| | 916 | | VeriSign, Inc.† | | | 79,197 | |
| | 350 | | ViaSat, Inc.†(a) | | | 24,990 | |
| | 3,203 | | Viavi Solutions, Inc.† | | | 21,236 | |
| | 475 | | VirnetX Holding Corp.†(a) | | | 1,900 | |
| | 400 | | Virtusa Corp.† | | | 11,552 | |
| | 16,166 | | Visa, Inc., Class A(a) | | | 1,199,032 | |
| | 1,806 | | Vishay Intertechnology, Inc.(a) | | | 22,376 | |
| | 129 | | Vishay Precision Group, Inc.† | | | 1,731 | |
| | 845 | | VMware, Inc., Class A†(a) | | | 48,351 | |
| | 500 | | Web.com Group, Inc.† | | | 9,090 | |
| | 458 | | WebMD Health Corp., Class A†(a) | | | 26,614 | |
| | 2,820 | | Western Digital Corp. | | | 133,273 | |
| | 4,254 | | Western Union Co. (The)(a) | | | 81,592 | |
| | 459 | | WEX, Inc.† | | | 40,700 | |
| | 195 | | Workday, Inc., Class A†(a) | | | 14,561 | |
| | 9,270 | | Xerox Corp. | | | 87,972 | |
| | 2,400 | | Xilinx, Inc. | | | 110,712 | |
Wilshire Mutual Funds, Inc. Wilshire 5000 IndexSM Fund Schedule of Investments | June 30, 2016 (unaudited) |
| Shares | | | | Value | |
Information Technology — (continued) | | | |
| | 800 | | XO Group, Inc.† | | $ | 13,944 | |
| | 300 | | Xura, Inc.† | | | 7,329 | |
| | 9,325 | | Yahoo!, Inc.†(a) | | | 350,247 | |
| | 241 | | Yelp, Inc., Class A†(a) | | | 7,317 | |
| | 525 | | Zebra Technologies Corp., Class A†(a) | | | 26,303 | |
| | 5 | | Zedge, Inc., Class B† | | | 23 | |
| | 524 | | Zillow Group, Inc., Class A†(a) | | | 19,205 | |
| | 1,048 | | Zillow Group, Inc., Class C†(a) | | | 38,021 | |
| | | | | | | 39,409,957 | |
Materials — 3.2% | | | | |
| | 381 | | A Schulman, Inc. | | | 9,304 | |
| | 2,035 | | Air Products & Chemicals, Inc. | | | 289,051 | |
| | 1,875 | | AK Steel Holding Corp.† | | | 8,737 | |
| | 1,032 | | Albemarle Corp. | | | 81,848 | |
| | 13,272 | | Alcoa, Inc. | | | 123,031 | |
| | 1,350 | | Allegheny Technologies, Inc.(a) | | | 17,212 | |
| | 400 | | American Vanguard Corp. | | | 6,044 | |
| | 550 | | AptarGroup, Inc. | | | 43,521 | |
| | 596 | | Ashland, Inc. | | | 68,403 | |
| | 700 | | Avery Dennison Corp. | | | 52,325 | |
| | 675 | | Axalta Coating Systems, Ltd.† | | | 17,908 | |
| | 575 | | Axiall Corp. | | | 18,751 | |
| | 348 | | Balchem Corp. | | | 20,758 | |
| | 1,200 | | Ball Corp. | | | 86,748 | |
| | 850 | | Bemis Co., Inc. | | | 43,766 | |
| | 350 | | Berry Plastics Group, Inc.† | | | 13,597 | |
| | 700 | | Cabot Corp. | | | 31,962 | |
| | 500 | | Calgon Carbon Corp. | | | 6,575 | |
| | 500 | | Carpenter Technology Corp.(a) | | | 16,465 | |
| | 1,400 | | Celanese Corp., Class A | | | 91,630 | |
| | 600 | | Century Aluminum Co.†(a) | | | 3,798 | |
| | 2,220 | | CF Industries Holdings, Inc.(a) | | | 53,502 | |
| | 1,939 | | Chemours Co. | | | 15,977 | |
| | 850 | | Chemtura Corp.† | | | 22,423 | |
| | 300 | | Clearwater Paper Corp.† | | | 19,611 | |
| | 1,400 | | Cliffs Natural Resources, Inc.†(a) | | | 7,938 | |
| | 37 | | Codexis, Inc.† | | | 149 | |
| | 1,110 | | Coeur Mining, Inc.† | | | 11,833 | |
| | 1,300 | | Commercial Metals Co.(a) | | | 21,970 | |
| | 400 | | Compass Minerals International, Inc.(a) | | | 29,676 | |
| | 1,800 | | Core Molding Technologies, Inc.† | | | 24,570 | |
| | 1,200 | | Crown Holdings, Inc.† | | | 60,804 | |
| | 100 | | Deltic Timber Corp.(a) | | | 6,713 | |
| | 11,636 | | Dow Chemical Co. (The) | | | 578,426 | |
| | 534 | | Eagle Materials, Inc.(a) | | | 41,198 | |
| | 1,415 | | Eastman Chemical Co. | | | 96,078 | |
| | 2,862 | | Ecolab, Inc. | | | 339,433 | |
| | 8,296 | | EI du Pont de Nemours & Co. | | | 537,581 | |
| | 1,000 | | Ferro Corp.† | | | 13,380 | |
| | 500 | | Ferroglobe PLC | | | 4,305 | |
| | 550 | | Flotek Industries, Inc.†(a) | | | 7,260 | |
| | 1,175 | | FMC Corp. | | | 54,414 | |
| | 11,144 | | Freeport-McMoRan, Inc.(a) | | | 124,144 | |
| | 727 | | GCP Applied Technologies, Inc.†(a) | | | 18,931 | |
| | 1,325 | | Graphic Packaging Holding Co. | | | 16,616 | |
| | 300 | | Greif, Inc., Class A(a) | | | 11,181 | |
| | 450 | | HB Fuller Co. | | | 19,795 | |
| | 750 | | Headwaters, Inc.† | | | 13,455 | |
| | 1,575 | | Huntsman Corp. | | | 21,184 | |
| | 393 | | Ingevity Corp.† | | | 13,378 | |
| | 300 | | Innophos Holdings, Inc. | | | 12,663 | |
| | 300 | | Innospec, Inc. | | | 13,797 | |
| | 767 | | International Flavors & Fragrances, Inc.(a) | | | 96,696 | |
| | 4,217 | | International Paper Co. | | | 178,716 | |
| | 138 | | Kaiser Aluminum Corp. | | | 12,477 | |
| | 950 | | KapStone Paper and Packaging Corp. | | | 12,360 | |
| Shares | | | | Value | |
Materials — (continued) | | | |
| | 300 | | Koppers Holdings, Inc.† | | $ | 9,219 | |
| | 1,275 | | Louisiana-Pacific Corp.† | | | 22,121 | |
| | 300 | | LSB Industries, Inc.†(a) | | | 3,624 | |
| | 645 | | Martin Marietta Materials, Inc.(a) | | | 123,840 | |
| | 300 | | Materion Corp. | | | 7,428 | |
| | 350 | | Minerals Technologies, Inc. | | | 19,880 | |
| | 4,245 | | Monsanto Co. | | | 438,975 | |
| | 3,275 | | Mosaic Co. (The)(a) | | | 85,740 | |
| | 200 | | Myers Industries, Inc. | | | 2,880 | |
| | 100 | | NewMarket Corp.(a) | | | 41,438 | |
| | 5,100 | | Newmont Mining Corp. | | | 199,512 | |
| | 2,695 | | Nucor Corp. | | | 133,160 | |
| | 1,595 | | Olin Corp.(a) | | | 39,620 | |
| | 1,875 | | Owens-Illinois, Inc.†(a) | | | 33,769 | |
| | 975 | | Packaging Corp. of America | | | 65,257 | |
| | 1,000 | | PH Glatfelter Co. | | | 19,560 | |
| | 783 | | PolyOne Corp. | | | 27,593 | |
| | 2,641 | | PPG Industries, Inc. | | | 275,060 | |
| | 2,683 | | Praxair, Inc. | | | 301,542 | |
| | 500 | | Rayonier Advanced Materials, Inc.(a) | | | 6,795 | |
| | 700 | | Reliance Steel & Aluminum Co. | | | 53,830 | |
| | 600 | | Royal Gold, Inc.(a) | | | 43,212 | |
| | 1,400 | | RPM International, Inc. | | | 69,930 | |
| | 300 | | Schweitzer-Mauduit International, Inc. | | | 10,584 | |
| | 400 | | Scotts Miracle-Gro Co. (The), Class A | | | 27,964 | |
| | 1,975 | | Sealed Air Corp. | | | 90,791 | |
| | 500 | | Sensient Technologies Corp. | | | 35,520 | |
| | 772 | | Sherwin-Williams Co. (The) | | | 226,713 | |
| | 375 | | Silgan Holdings, Inc. | | | 19,298 | |
| | 1,075 | | Sonoco Products Co.(a) | | | 53,385 | |
| | 1,322 | | Southern Copper Corp.(a) | | | 35,668 | |
| | 2,800 | | Steel Dynamics, Inc. | | | 68,600 | |
| | 300 | | Stepan Co. | | | 17,859 | |
| | 1,600 | | Stillwater Mining Co.†(a) | | | 18,976 | |
| | 558 | | Summit Materials, Inc., Class A†(a) | | | 11,417 | |
| | 564 | | SunCoke Energy, Inc. | | | 3,282 | |
| | 400 | | TimkenSteel Corp.(a) | | | 3,848 | |
| | 671 | | Tredegar Corp. | | | 10,817 | |
| | 500 | | UFP Technologies, Inc.† | | | 11,270 | |
| | 50 | | United States Lime & Minerals, Inc.(a) | | | 2,949 | |
| | 1,050 | | United States Steel Corp.(a) | | | 17,703 | |
| | 657 | | Valspar Corp. | | | 70,976 | |
| | 1,244 | | Vulcan Materials Co. | | | 149,728 | |
| | 502 | | Westlake Chemical Corp. | | | 21,546 | |
| | 2,359 | | WestRock Co. | | | 91,694 | |
| | 525 | | Worthington Industries, Inc. | | | 22,208 | |
| | 727 | | WR Grace & Co. | | | 53,224 | |
| | | | | | | 6,664,073 | |
Telecommunication Services — 2.9% | | | | |
| | 1,000 | | 8x8, Inc.† | | | 14,610 | |
| | 63,350 | | AT&T, Inc. | | | 2,737,354 | |
| | 5,010 | | CenturyLink, Inc.(a) | | | 145,340 | |
| | 500 | | Cogent Communications Holdings, Inc.(a) | | | 20,030 | |
| | 501 | | Consolidated Communications Holdings, Inc.(a) | | | 13,647 | |
| | 12,211 | | Frontier Communications Corp.(a) | | | 60,322 | |
| | 600 | | General Communication, Inc., Class A†(a) | | | 9,480 | |
| | 16 | | IDT Corp., Class B | | | 227 | |
| | 500 | | Inteliquent, Inc. | | | 9,945 | |
| | 2,211 | | Level 3 Communications, Inc.† | | | 113,845 | |
| | 1,276 | | SBA Communications Corp., Class A† | | | 137,732 | |
| | 600 | | Shenandoah Telecommunications Co.(a) | | | 23,436 | |
| | 400 | | Spok Holdings, Inc. | | | 7,666 | |
| | 8,897 | | Sprint Corp.†(a) | | | 40,303 | |
| | 8 | | Straight Path Communications, Inc.†(a) | | | 221 | |
| | 1,050 | | Telephone & Data Systems, Inc. | | | 31,143 | |
Wilshire Mutual Funds, Inc. Wilshire 5000 IndexSM Fund Schedule of Investments | June 30, 2016 (unaudited) |
| Shares | | | | Value | |
Telecommunication Services — (continued) | | | |
| | 7,900 | | T-Mobile US, Inc.†(a) | | $ | 341,833 | |
| | 300 | | United States Cellular Corp.† | | | 11,781 | |
| | 41,963 | | Verizon Communications, Inc. | | | 2,343,214 | |
| | 731 | | Windstream Holdings, Inc.(a) | | | 6,776 | |
| | | | | | | 6,068,905 | |
Utilities — 3.7% | | | | |
| | 6,335 | | AES Corp. (The) | | | 79,061 | |
| | 1,119 | | AGL Resources, Inc. | | | 73,821 | |
| | 425 | | ALLETE, Inc. | | | 27,468 | |
| | 2,200 | | Alliant Energy Corp. | | | 87,340 | |
| | 2,500 | | Ameren Corp. | | | 133,950 | |
| | 5,205 | | American Electric Power Co., Inc. | | | 364,818 | |
| | 400 | | American States Water Co. | | | 17,528 | |
| | 1,900 | | American Water Works Co., Inc. | | | 160,569 | |
| | 1,751 | | Aqua America, Inc. | | | 62,441 | |
| | 1,100 | | Atmos Energy Corp. | | | 89,452 | |
| | 550 | | Avangrid, Inc.(a) | | | 25,333 | |
| | 550 | | Avista Corp. | | | 24,640 | |
| | 300 | | Black Hills Corp. | | | 18,912 | |
| | 525 | | California Water Service Group(a) | | | 18,338 | |
| | 4,000 | | Calpine Corp.†(a) | | | 59,000 | |
| | 3,600 | | CenterPoint Energy, Inc. | | | 86,400 | |
| | 300 | | Chesapeake Utilities Corp. | | | 19,854 | |
| | 2,450 | | CMS Energy Corp. | | | 112,357 | |
| | 2,850 | | Consolidated Edison, Inc.(a) | | | 229,254 | |
| | 5,615 | | Dominion Resources, Inc.(a) | | | 437,577 | |
| | 1,675 | | DTE Energy Co. | | | 166,026 | |
| | 7,089 | | Duke Energy Corp. | | | 608,165 | |
| | 11 | | Dynegy, Inc., Class A†(a) | | | 190 | |
| | 3,150 | | Edison International | | | 244,660 | |
| | 400 | | El Paso Electric Co. | | | 18,908 | |
| | 475 | | Empire District Electric Co. | | | 16,136 | |
| | 1,650 | | Entergy Corp. | | | 134,227 | |
| | 2,867 | | Eversource Energy | | | 171,733 | |
| | 8,341 | | Exelon Corp. | | | 303,279 | |
| | 3,680 | | FirstEnergy Corp. | | | 128,469 | |
| | 16 | | Genie Energy, Ltd., Class B(a) | | | 108 | |
| | 1,405 | | Great Plains Energy, Inc.(a) | | | 42,712 | |
| | 1,100 | | Hawaiian Electric Industries, Inc.† | | | 36,069 | |
| | 500 | | IDACORP, Inc. | | | 40,675 | |
| | 1,500 | | ITC Holdings Corp. | | | 70,230 | |
| | 1,925 | | MDU Resources Group, Inc.(a) | | | 46,200 | |
| | 450 | | MGE Energy, Inc.(a) | | | 25,432 | |
| | 650 | | National Fuel Gas Co.(a) | | | 36,972 | |
| | 800 | | New Jersey Resources Corp.(a) | | | 30,840 | |
| | 4,707 | | NextEra Energy, Inc. | | | 613,793 | |
| | 3,315 | | NiSource, Inc. | | | 87,914 | |
| | 300 | | Northwest Natural Gas Co.(a) | | | 19,446 | |
| | 400 | | NorthWestern Corp. | | | 25,228 | |
| | 2,977 | | NRG Energy, Inc. | | | 44,625 | |
| | 300 | | NRG Yield, Inc., Class A(a) | | | 4,566 | |
| | 300 | | NRG Yield, Inc., Class C(a) | | | 4,677 | |
| | 1,800 | | OGE Energy Corp.(a) | | | 58,950 | |
| | 587 | | ONE Gas, Inc. | | | 39,088 | |
| | 175 | | Ormat Technologies, Inc. | | | 7,658 | |
| | 350 | | Otter Tail Corp.(a) | | | 11,722 | |
| | 4,600 | | PG&E Corp. | | | 294,032 | |
| | 700 | | Piedmont Natural Gas Co., Inc. | | | 42,084 | |
| | 1,000 | | Pinnacle West Capital Corp. | | | 81,060 | |
| | 700 | | PNM Resources, Inc. | | | 24,808 | |
| | 800 | | Portland General Electric Co. | | | 35,296 | |
| | 7,000 | | PPL Corp. | | | 264,250 | |
| | 4,950 | | Public Service Enterprise Group, Inc. | | | 230,719 | |
| | 1,300 | | Questar Corp. | | | 32,981 | |
| | 1,079 | | SCANA Corp.(a) | | | 81,637 | |
| | 2,293 | | Sempra Energy(a) | | | 261,448 | |
Shares/ Number of Warrants/ Number of Rights | | | | Value | |
Utilities — (continued) | | | |
| | 650 | | South Jersey Industries, Inc.(a) | | $ | 20,553 | |
| | 9,400 | | Southern Co. (The) | | | 504,122 | |
| | 475 | | Southwest Gas Corp. | | | 37,387 | |
| | 350 | | Spire, Inc. | | | 24,794 | |
| | 939 | | Talen Energy Corp.†(a) | | | 12,723 | |
| | 1,700 | | TECO Energy, Inc. | | | 46,988 | |
| | 1,600 | | UGI Corp. | | | 72,400 | |
| | 808 | | Vectren Corp. | | | 42,557 | |
| | 2,989 | | WEC Energy Group, Inc. | | | 195,182 | |
| | 1,175 | | Westar Energy, Inc., Class A | | | 65,906 | |
| | 350 | | WGL Holdings, Inc.(a) | | | 24,777 | |
| | 4,850 | | Xcel Energy, Inc. | | | 217,183 | |
| | | | | | | 7,779,698 | |
| Total Common Stock | | | | |
| (Cost $87,811,551) | | | 209,179,102 | |
| | |
SHORT-TERM INVESTMENTS (c) — 13.7% | |
| | 60,405 | | Northern Trust Institutional Government Select Portfolio, Institutional Class, 0.240% | | | 60,405 | |
| | 28,897,925 | | Northern Trust Institutional Liquid Asset Portfolio, Institutional Class, 0.520%(d) | | | 28,897,925 | |
| | | | | | | | |
| Total Short-Term Investments | | | | |
| (Cost $28,958,330) | | | 28,958,330 | |
| | |
WARRANTS † — 0.0% | |
| | 9 | | Asterias Biotherapeutics, Inc., Expires 10/05/16 | | | 2 | |
| | | | | | | | |
Total Warrants(Cost $–) | | | 2 | |
RIGHTS † (e) — 0.0% | |
United States — 0.0% | |
| | 1,200 | | Dyax CVR, Expires 12/31/19 | | | — | |
| | 1,500 | | Leap Wireless‡‡ | | | 3,780 | |
| | 2,075 | | Safeway - PDC‡‡ | | | 101 | |
| | 2,075 | | Safeway CVR - Casa Ley‡‡ | | | 2,106 | |
| | | | | | | | |
Total Rights (Cost $–) | | | 5,987 | |
Total Investments — 112.9% | | | | |
| (Cost $116,769,881) | | | 238,143,421 | |
Other Assets & Liabilities, Net — (12.9)% | | | (27,235,926 | ) |
NET ASSETS — 100.0% | | $ | 210,907,495 | |
| † | Non-income producing security. |
| ‡‡ | Expiration date is unavailable. |
| (a) | This security or a partial position of this security is on loan at June 30, 2016. The total market value of securities on loan at June 30, 2016 was $29,344,249 (Note 6). |
| (b) | Real Estate Investment Trust. |
| (c) | Rate shown is the 7-day effective yield as of June 30, 2016. |
| (d) | This security was purchased with cash collateral held from securities on loan. The total value of such securities as of June 30, 2016 was $28,897,925. Securities on loan are also collateralized by various U.S. Treasury obligations in the amount of $787,024 (Note 6). |
| (e) | Securities fair valued using methods determined in good faith by the Pricing Committee. The total market value of such securities as of June 30, 2016 was $5,987 and represented 0.0% of Net Assets. |
BDC— Business Development Company |
CVR— Contingent Value Rights |
LLC— Limited Liability Company |
Ltd. — Limited |
NY— New York |
PDC— Property Development Center |
PLC— Public Limited Company |
| |
The following is a summary of the level of inputs used as of June 30, 2016 in valuing the Fund’s investments carried at value: | |
| | |
| Investments in Securities | | Level 1 | | | Level 2 | | | Level 3‡ | | | Total | |
| Common Stock | | $ | 209,179,102 | | | $ | — | | | $ | — | | | $ | 209,179,102 | |
| Short-Term Investments | | | 28,958,330 | | | | — | | | | — | | | | 28,958,330 | |
| Warrant | | | — | | | | 2 | | | | — | | | | 2 | |
| Rights | | | — | | | | — | | | | 5,987 | | | | 5,987 | |
| Total Investments in Securities | | $ | 238,137,432 | | | $ | 2 | | | $ | 5,987 | | | $ | 238,143,421 | |
| ‡ | A reconciliation of Level 3 investments, including certain disclosures related to significant inputs used in valuing Level 3 investments is only presented when the Fund has over 1% of Level 3 investments at the beginning and/or end of the period in relation to net assets. |
For the six months ended June 30, 2016, there have been no transfers between Level 1 and Level 2 assets and liabilities. For the six months ended June 30, 2016, there have been no transfers between Level 2 and Level 3 assets and liabilities.
Amounts designated as “—” are either $0, or have been rounded to $0
Please see Note 2 in Notes to Financial Statements for further information regarding fair value measurements.
laz
Wilshire Mutual Funds, Inc. Wilshire International Equity Fund Schedule of Investments | June 30, 2016 (unaudited) |
| | Shares | | | | Value | |
| | COMMON STOCK — 95.5% | | | |
| | Australia — 3.9% | | | |
| | 183,550 | | Alumina, Ltd.(a) | | $ | 180,425 | |
| | 1,463 | | APA Group | | | 10,176 | |
| | 1,407 | | ASX, Ltd. | | | 48,444 | |
| | 92,021 | | Aurizon Holdings, Ltd. | | | 333,879 | |
| | 21,520 | | Bendigo & Adelaide Bank, Ltd.(a) | | | 155,815 | |
| | 42,624 | | Boral, Ltd. | | | 200,113 | |
| | 12,194 | | Caltex Australia, Ltd. | | | 293,997 | |
| | 692 | | CIMIC Group, Ltd. | | | 18,682 | |
| | 48,210 | | Coca-Cola Amatil, Ltd. | | | 297,601 | |
| | 6,571 | | Cochlear, Ltd. | | | 599,535 | |
| | 30,586 | | Computershare, Ltd. | | | 211,500 | |
| | 63,713 | | CSL, Ltd. | | | 5,373,089 | |
| | 27,732 | | Dexus Property Group(b) | | | 188,180 | |
| | 43,360 | | DUET Group | | | 81,326 | |
| | 110,537 | | Fortescue Metals Group, Ltd. | | | 295,802 | |
| | 183,238 | | GPT Group(b) | | | 745,166 | |
| | 18,210 | | Harvey Norman Holdings, Ltd.(a) | | | 63,363 | |
| | 86,055 | | Medibank Pvt, Ltd. | | | 190,832 | |
| | 7,811 | | Newcrest Mining, Ltd.† | | | 135,379 | |
| | 58,435 | | Oil Search, Ltd. | | | 295,072 | |
| | 25,630 | | Platinum Asset Management, Ltd. | | | 111,313 | |
| | 4,007 | | Ramsay Health Care, Ltd. | | | 216,561 | |
| | 5,836 | | REA Group, Ltd. | | | 261,907 | |
| | 180,802 | | Scentre Group(b) | | | 669,684 | |
| | 26,637 | | SEEK, Ltd.(a) | | | 305,784 | |
| | 30,210 | | South32, Ltd. | | | 35,430 | |
| | 91,516 | | Stockland(b) | | | 324,471 | |
| | 12,074 | | Sydney Airport | | | 63,046 | |
| | 71,947 | | Tatts Group, Ltd. | | | 207,045 | |
| | 13,326 | | TPG Telecom, Ltd. | | | 119,493 | |
| | 18,369 | | Treasury Wine Estates, Ltd. | | | 127,644 | |
| | 52,052 | | Westfield Corp.(b) | | | 418,118 | |
| | 6,785 | | Woodside Petroleum, Ltd. | | | 137,582 | |
| | | | | | | 12,716,454 | |
| | Austria — 0.0% | | | | |
| | 639 | | ANDRITZ AG | | | 30,300 | |
| | 2,587 | | Erste Group Bank AG | | | 58,901 | |
| | | | | | | 89,201 | |
| | Belgium — 0.5% | | | | |
| | 5,395 | | Ageas | | | 187,527 | |
| | 7,141 | | Colruyt SA | | | 395,170 | |
| | 5,419 | | Delhaize Group | | | 572,435 | |
| | 3,616 | | KBC Group NV | | | 177,839 | |
| | 1,337 | | Telenet Group Holding NV† | | | 61,136 | |
| | 3,942 | | UCB SA | | | 295,996 | |
| | | | | | | 1,690,103 | |
| | Bermuda — 0.6% | | | | |
| | 62,791 | | Lazard, Ltd., Class A(e) | | | 1,869,916 | |
| | | | | | | | |
| | Brazil — 0.3% | | | | |
| | 23,300 | | Ambev SA | | | 138,177 | |
| | 23,400 | | BM&F Bovespa SA | | | 129,810 | |
| | 9,500 | | Cia de Saneamento Basico do Estado de Sao Paulo | | | 85,202 | |
| | 6,600 | | Petroleo Brasileiro SA† | | | 23,505 | |
| | 6,000 | | Porto Seguro SA | | | 49,534 | |
| | 15,300 | | Qualicorp SA | | | 89,019 | |
| | 18,200 | | Sul America SA | | | 88,442 | |
| | 9,900 | | Transmissora Alianca de Energia Eletrica SA | | | 59,666 | |
| | 58,300 | | Vale SA | | | 294,014 | |
| | | | | | | 957,369 | |
| | Shares | | | | Value | |
| | Canada — 4.7% | | | |
| | 9,700 | | AltaGas, Ltd. | | $ | 235,752 | |
| | 2,600 | | Atco, Ltd., Class I | | | 91,205 | |
| | 9,000 | | Bank of Montreal(a) | | | 570,881 | |
| | 12,300 | | Bank of Nova Scotia | | | 602,742 | |
| | 3,300 | | BCE, Inc. | | | 156,169 | |
| | 3,000 | | BlackBerry, Ltd.† | | | 20,132 | |
| | 20,100 | | CAE, Inc. | | | 242,859 | |
| | 4,400 | | Canadian Imperial Bank of Commerce | | | 330,490 | |
| | 32,698 | | Canadian Pacific Railway, Ltd. | | | 4,211,175 | |
| | 1,060 | | Canadian Pacific Railway, Ltd.* | | | 136,468 | |
| | 4,100 | | Canadian Utilities, Ltd., Class A | | | 118,784 | |
| | 7,000 | | Cenovus Energy, Inc. | | | 96,823 | |
| | 14,000 | | CI Financial Corp. | | | 292,039 | |
| | 7,335 | | Constellation Software, Inc. | | | 2,838,789 | |
| | 11,900 | | Crescent Point Energy Corp. | | | 187,994 | |
| | 1,200 | | First Capital Realty, Inc. | | | 20,583 | |
| | 5,800 | | Fortis, Inc., Class Common Subscription Receipt(a) | | | 196,049 | |
| | 600 | | Goldcorp, Inc. | | | 11,480 | |
| | 15,200 | | H&R Real Estate Investment Trust(b) | | | 264,834 | |
| | 8,534 | | Husky Energy, Inc. | | | 104,169 | |
| | 10,500 | | IGM Financial, Inc. | | | 285,835 | |
| | 5,700 | | Imperial Oil, Ltd. | | | 180,360 | |
| | 1,400 | | Industrial Alliance Insurance & Financial Services, Inc. | | | 44,007 | |
| | 2,600 | | Intact Financial Corp., Class Common Subscription Receipt | | | 185,730 | |
| | 5,000 | | Inter Pipeline, Ltd. | | | 106,041 | |
| | 8,400 | | Metro, Inc., Class A | | | 292,646 | |
| | 49,400 | | Potash Corp. of Saskatchewan(a) | | | 802,972 | |
| | 16,200 | | PrairieSky Royalty, Ltd., Class Common Subscription Receipt | | | 307,461 | |
| | 16,400 | | RioCan Real Estate Investment Trust, Class Trust Unit(b) | | | 372,315 | |
| | 2,500 | | Rogers Communications, Inc., Class B | | | 101,204 | |
| | 8,400 | | Royal Bank of Canada | | | 496,348 | |
| | 800 | | Seven Generations Energy, Ltd.†(a) | | | 15,270 | |
| | 17,000 | | Shaw Communications, Inc., Class B | | | 326,328 | |
| | 2,000 | | SNC-Lavalin Group, Inc. | | | 83,997 | |
| | 21,100 | | Suncor Energy, Inc. | | | 585,335 | |
| | 1,800 | | Tourmaline Oil Corp.† | | | 47,384 | |
| | 3,800 | | TransCanada Corp., Class Common Subscription Receipt | | | 171,948 | |
| | | | | | | 15,134,598 | |
| | China — 3.3% | | | | |
| | 212,000 | | Air China, Ltd., Class H | | | 145,748 | |
| | 150,000 | | Beijing Capital International Airport Co., Ltd., Class H | | | 163,367 | |
| | 506,000 | | Belle International Holdings, Ltd. | | | 297,813 | |
| | 309,000 | | China Coal Energy Co., Ltd., Class H | | | 161,899 | |
| | 19,000 | | China Communications Construction Co., Ltd., Class H | | | 20,598 | |
| | 164,000 | | China Communications Services Corp., Ltd., Class H | | | 85,954 | |
| | 19,500 | | China Conch Venture Holdings, Ltd.(a) | | | 38,776 | |
| | 18,000 | | China Construction Bank Corp., Class H | | | 11,999 | |
| | 334,000 | | China National Building Material Co., Ltd., Class H | | | 146,891 | |
| | 26,500 | | China Railway Construction Corp., Ltd., Class H | | | 33,384 | |
| | 28,000 | | China Southern Airlines Co., Ltd., Class H | | | 15,841 | |
| | 82,068 | | Ctrip.com International, Ltd. ADR†(a) | | | 3,381,202 | |
| | 190,000 | | Geely Automobile Holdings, Ltd.(a) | | | 103,634 | |
| | 85,200 | | Guangzhou R&F Properties Co., Ltd. | | | 108,009 | |
Wilshire Mutual Funds, Inc. Wilshire International Equity Fund Schedule of Investments | June 30, 2016 (unaudited) |
| Shares | | | | Value | |
China — (continued) | | | |
| | 452,000 | | Huaneng Renewables Corp., Ltd., Class H | | $ | 151,282 | |
| | 79,000 | | Longfor Properties Co., Ltd. | | | 103,071 | |
| | 100 | | NetEase, Inc. ADR | | | 19,322 | |
| | 500 | | New Oriental Education & Technology Group, Inc. ADR(a) | | | 20,940 | |
| | 520,000 | | People's Insurance Co. Group of China, Ltd., Class H | | | 200,191 | |
| | 36,000 | | PICC Property & Casualty Co., Ltd., Class H | | | 56,759 | |
| | 92,000 | | Shandong Weigao Group Medical Polymer Co., Ltd., Class H | | | 52,718 | |
| | 309,000 | | Shui On Land, Ltd.(a) | | | 78,552 | |
| | 235,500 | | SOHO China, Ltd.(a) | | | 113,697 | |
| | 201,955 | | Tencent Holdings, Ltd. | | | 4,632,782 | |
| | 18,000 | | Tingyi Cayman Islands Holding Corp.(a) | | | 17,092 | |
| | 45,000 | | Want Want China Holdings, Ltd.(a) | | | 31,857 | |
| | 105,000 | | Weichai Power Co., Ltd., Class H(a) | | | 108,111 | |
| | 200,000 | | Yanzhou Coal Mining Co., Ltd., Class H | | | 130,305 | |
| | 78,000 | | Zhejiang Expressway Co., Ltd., Class H | | | 73,790 | |
| | | | | | | 10,505,584 | |
Denmark — 6.2% | | | | |
| | 28,766 | | Carlsberg A, Class B | | | 2,744,506 | |
| | 52,872 | | Chr Hansen Holding A | | | 3,472,385 | |
| | 49,199 | | Coloplast A, Class B | | | 3,682,772 | |
| | 88,471 | | Novo Nordisk ADR(a) | | | 4,757,970 | |
| | 19,649 | | Novo Nordisk A, Class B | | | 1,058,156 | |
| | 79,342 | | Novozymes A, Class B | | | 3,810,073 | |
| | 45,938 | | TDC A | | | 225,118 | |
| | 758 | | Vestas Wind Systems A/S | | | 51,521 | |
| | 12,625 | | William Demant Holding A† | | | 245,756 | |
| | | | | | | 20,048,257 | |
Finland — 0.4% | | | | |
| | 1,549 | | Fortum OYJ(a) | | | 24,887 | |
| | 8,524 | | Nokian Renkaat OYJ | | | 305,518 | |
| | 2,062 | | Sampo Oyj, Class A | | | 84,328 | |
| | 16,021 | | Stora Enso OYJ, Class R | | | 128,843 | |
| | 39,106 | | UPM-Kymmene OYJ | | | 718,410 | |
| | | | | | | 1,261,986 | |
France — 8.1% | | | | |
| | 8,538 | | Airbus Group SE | | | 489,400 | |
| | 2,310 | | Alstom SA | | | 53,335 | |
| | 35,443 | | Atos SE | | | 2,922,251 | |
| | 10,433 | | AXA SA | | | 206,289 | |
| | 7,981 | | Bureau Veritas SA(a) | | | 167,562 | |
| | 180 | | Casino Guichard Perrachon SA | | | 9,992 | |
| | 1,733 | | Christian Dior SE | | | 277,614 | |
| | 928 | | Cie Generale des Etablissements Michelin, Class B | | | 87,456 | |
| | 26,652 | | Essilor International SA | | | 3,502,863 | |
| | 7,530 | | Eutelsat Communications SA | | | 142,130 | |
| | 2,404 | | Gecina SA(b) | | | 325,619 | |
| | 7,266 | | Hermes International | | | 2,708,618 | |
| | 310 | | Iliad SA | | | 62,578 | |
| | 1,373 | | Lagardere SCA | | | 29,866 | |
| | 18,235 | | LVMH Moet Hennessy Louis Vuitton SE | | | 2,748,660 | |
| | 136,005 | | Orange SA | | | 2,211,520 | |
| | 433 | | Remy Cointreau SA | | | 37,273 | |
| | 1,031 | | Renault SA | | | 77,838 | |
| | 6,461 | | Safran SA | | | 435,097 | |
| | 5,758 | | SCOR SE | | | 170,236 | |
| | 48,419 | | Societe Generale | | | 1,514,839 | |
| | 1,820 | | Sodexo SA | | | 194,976 | |
| | 10,511 | | Technip SA | | | 568,910 | |
| | 46,475 | | TOTAL SA ADR(a) | | | 2,235,447 | |
| Shares | | | | Value | |
France — (continued) | | | |
| | 10,292 | | Unibail-Rodamco SE(b) | | $ | 2,662,491 | |
| | 2,640 | | Veolia Environnement SA | | | 57,010 | |
| | 772 | | Vinci SA | | | 54,478 | |
| | 115,315 | | Vivendi SA(a) | | | 2,157,405 | |
| | | | | | | 26,111,753 | |
Germany — 5.6% | | | | |
| | 17,792 | | adidas AG | | | 2,554,039 | |
| | 5,009 | | Allianz SE | | | 714,574 | |
| | 1,384 | | BASF SE | | | 106,124 | |
| | 4,854 | | Bayer AG | | | 487,513 | |
| | 4,157 | | Brenntag AG | | | 201,374 | |
| | 589 | | Continental AG | | | 111,455 | |
| | 16,154 | | Deutsche Bank AG | | | 223,299 | |
| | 14,517 | | Deutsche Lufthansa AG(a) | | | 170,685 | |
| | 82,830 | | Deutsche Post AG | | | 2,333,539 | |
| | 271,345 | | E.ON SE | | | 2,739,190 | |
| | 16,192 | | Evonik Industries AG | | | 482,662 | |
| | 25,650 | | Fresenius Medical Care AG & Co. KGAA | | | 2,234,290 | |
| | 2,360 | | Hannover Rueck SE | | | 247,276 | |
| | 4,323 | | HUGO BOSS AG(a) | | | 245,773 | |
| | 164,247 | | Infineon Technologies AG | | | 2,377,717 | |
| | 14,376 | | K+S AG(a) | | | 294,310 | |
| | 616 | | LANXESS AG | | | 27,026 | |
| | 964 | | Linde AG | | | 134,321 | |
| | 4,140 | | Muenchener Rueckversicherungs-Gesellschaft AG in Muenchen | | | 694,261 | |
| | 9,855 | | OSRAM Licht AG | | | 512,037 | |
| | 47,081 | | RWE AG | | | 749,778 | |
| | 4,119 | | SAP SE | | | 309,359 | |
| | 931 | | Siemens AG | | | 95,541 | |
| | 2,328 | | United Internet AG | | | 96,773 | |
| | | | | | | 18,142,916 | |
Greece — 0.0% | | | | |
| | 3,632 | | FF Group | | | 67,979 | |
| | | | | | | | |
Hong Kong — 2.5% | | | | |
| | 13,500 | | Beijing Enterprises Holdings, Ltd. | | | 76,534 | |
| | 200,000 | | Brilliance China Automotive Holdings, Ltd.(a) | | | 206,495 | |
| | 20,000 | | Cheung Kong Infrastructure Holdings, Ltd. | | | 172,441 | |
| | 78,000 | | China Everbright, Ltd. | | | 151,345 | |
| | 32,000 | | China Merchants Holdings International Co., Ltd. | | | 85,664 | |
| | 40,235 | | China Mobile, Ltd. ADR(a) | | | 2,329,606 | |
| | 120,000 | | China Resources Land, Ltd. | | | 282,774 | |
| | 172,900 | | CK Hutchison Holdings, Ltd. | | | 1,901,980 | |
| | 188,000 | | First Pacific Co., Ltd. | | | 136,487 | |
| | 11,000 | | Galaxy Entertainment Group, Ltd. | | | 32,912 | |
| | 256,000 | | Guangdong Investment, Ltd. | | | 390,805 | |
| | 34,100 | | Hang Seng Bank, Ltd. | | | 584,911 | |
| | 1,400 | | Hong Kong Exchanges and Clearing, Ltd. | | | 34,112 | |
| | 76,700 | | Hongkong Land Holdings, Ltd. | | | 469,425 | |
| | 56,000 | | Hysan Development Co., Ltd.(a) | | | 249,733 | |
| | 374,000 | | Kunlun Energy Co., Ltd.(a) | | | 311,236 | |
| | 178,000 | | Nine Dragons Paper Holdings, Ltd. | | | 136,471 | |
| | 496,400 | | Noble Group, Ltd.(a) | | | 75,170 | |
| | 7,000 | | Power Assets Holdings, Ltd. | | | 64,362 | |
| | 10,000 | | Shanghai Industrial Holdings, Ltd. | | | 22,734 | |
| | 48,000 | | Sino Land Co., Ltd. | | | 79,031 | |
| | 41,800 | | Swire Properties, Ltd. | | | 111,372 | |
| | | | | | | 7,905,600 | |
Wilshire Mutual Funds, Inc. Wilshire International Equity Fund Schedule of Investments | June 30, 2016 (unaudited) |
| Shares | | | | Value | |
India — 1.1% | | | |
| | 54,816 | | HDFC Bank, Ltd. ADR(a) | | $ | 3,637,042 | |
| | | | | | | | |
Indonesia — 0.1% | | | | |
| | 89,600 | | Bank Danamon Indonesia | | | 24,075 | |
| | 3,200 | | Bank Mandiri | | | 2,316 | |
| | 59,300 | | Bank Negara Indonesia Persero | | | 23,500 | |
| | 134,100 | | Charoen Pokphand Indonesia | | | 38,387 | |
| | 767,300 | | Global Mediacom | | | 57,454 | |
| | 161,000 | | Media Nusantara Citra | | | 27,010 | |
| | 320,500 | | Semen Indonesia Persero | | | 228,286 | |
| | | | | | | 401,028 | |
Ireland — 3.6% | | | | |
| | 19,924 | | Accenture PLC, Class A(a) | | | 2,257,190 | |
| | 63,850 | | AerCap Holdings NV†(a) | | | 2,144,722 | |
| | 210,318 | | Experian PLC | | | 3,990,187 | |
| | 47,913 | | ICON PLC† | | | 3,354,389 | |
| | | | | | | 11,746,488 | |
Israel — 0.1% | | | | |
| | 24,750 | | Bezeq The Israeli Telecommunication Corp., Ltd. | | | 49,028 | |
| | 4,359 | | Nice, Ltd. | | | 277,376 | |
| | | | | | | 326,404 | |
Italy — 1.2% | | | | |
| | 1,438,880 | | Intesa Sanpaolo SpA | | | 2,740,663 | |
| | 10,492 | | Prysmian SpA | | | 230,292 | |
| | 705,347 | | Saipem SpA(a) | | | 282,020 | |
| | 57,768 | | Snam SpA | | | 345,363 | |
| | 59,389 | | Terna Rete Elettrica Nazionale SpA | | | 330,507 | |
| | | | | | | 3,928,845 | |
Japan — 10.8% | | | | |
| | 2,600 | | ABC-Mart, Inc. | | | 174,491 | |
| | 19,300 | | Acom Co., Ltd.† | | | 93,500 | |
| | 11,200 | | AEON Financial Service Co., Ltd. | | | 242,513 | |
| | 1,100 | | Alps Electric Co., Ltd. | | | 20,898 | |
| | 25,200 | | Amada Holdings Co., Ltd. | | | 255,834 | |
| | 7,300 | | Benesse Holdings, Inc. | | | 171,373 | |
| | 6,000 | | Bridgestone Corp. | | | 192,822 | |
| | 3,900 | | Calbee, Inc. | | | 163,160 | |
| | 33,500 | | Canon, Inc. | | | 956,432 | |
| | 16,200 | | Credit Saison Co., Ltd. | | | 272,135 | |
| | 1,100 | | CYBERDYNE, Inc.†(a) | | | 24,795 | |
| | 8,000 | | Daiichi Sankyo Co., Ltd. | | | 194,361 | |
| | 2,600 | | Dentsu, Inc. | | | 121,877 | |
| | 1,000 | | Eisai Co., Ltd. | | | 55,836 | |
| | 430 | | Hirose Electric Co., Ltd. | | | 52,875 | |
| | 12,000 | | Hitachi Construction Machinery Co., Ltd. | | | 175,152 | |
| | 12,500 | | Hokuriku Electric Power Co. | | | 154,889 | |
| | 2,600 | | Hulic Co., Ltd. | | | 27,398 | |
| | 111,000 | | IHI Corp. | | | 299,200 | |
| | 10,700 | | Iida Group Holdings Co., Ltd. | | | 219,126 | |
| | 5,000 | | JGC Corp. | | | 71,578 | |
| | 19,000 | | JX Holdings, Inc. | | | 74,163 | |
| | 6,000 | | Kamigumi Co., Ltd. | | | 55,457 | |
| | 22,700 | | Kansai Electric Power Co., Inc. (The)† | | | 221,081 | |
| | 5,830 | | Keyence Corp. | | | 3,977,976 | |
| | 1,100 | | Kirin Holdings Co., Ltd. | | | 18,553 | |
| | 38,000 | | Kobe Steel, Ltd. | | | 31,231 | |
| | 3,500 | | Kose Corp. | | | 296,589 | |
| | 7,000 | | Kurita Water Industries, Ltd. | | | 156,042 | |
| | 15,400 | | Kyushu Electric Power Co., Inc. | | | 154,453 | |
| | 29,100 | | LIXIL Group Corp. | | | 477,876 | |
| | 148,900 | | Mazda Motor Corp. | | | 1,970,436 | |
| | 7,500 | | McDonald's Holdings Co. Japan, Ltd. | | | 203,721 | |
| Shares | | | | Value | |
Japan — (continued) | | | |
| | 200 | | MEIJI Holdings Co., Ltd. | | $ | 20,551 | |
| | 6,500 | | Miraca Holdings, Inc. | | | 281,893 | |
| | 123,000 | | Mitsubishi Estate Co., Ltd. | | | 2,256,164 | |
| | 44,000 | | Mitsubishi Gas Chemical Co., Inc. | | | 229,544 | |
| | 5,800 | | Mitsubishi Tanabe Pharma Corp. | | | 104,795 | |
| | 14,400 | | Mitsubishi UFJ Lease & Finance Co., Ltd. | | | 55,333 | |
| | 8,000 | | Mitsui OSK Lines, Ltd. | | | 17,012 | |
| | 90,100 | | Mizuho Financial Group, Inc. | | | 129,659 | |
| | 4,800 | | MS&AD Insurance Group Holdings, Inc. | | | 124,369 | |
| | 19,200 | | Murata Manufacturing Co., Ltd. | | | 2,152,601 | |
| | 6,100 | | Nabtesco Corp. | | | 145,547 | |
| | 32,000 | | NEC Corp. | | | 74,556 | |
| | 15,100 | | NHK Spring Co., Ltd. | | | 122,550 | |
| | 41,000 | | Nippon Electric Glass Co., Ltd. | | | 171,154 | |
| | 3,400 | | Nissin Foods Holdings Co., Ltd. | | | 185,677 | |
| | 2,970 | | Nomura Research Institute, Ltd. | | | 108,926 | |
| | 2,800 | | NTT DOCOMO, Inc. | | | 75,512 | |
| | 26,000 | | Oji Holdings Corp. | | | 99,814 | |
| | 3,900 | | Ono Pharmaceutical Co., Ltd. | | | 169,888 | |
| | 54,400 | | Otsuka Holdings Co., Ltd. | | | 2,506,909 | |
| | 3,600 | | Park24 Co., Ltd. | | | 123,712 | |
| | 100 | | Pola Orbis Holdings, Inc. | | | 9,411 | |
| | 28,700 | | Resona Holdings, Inc. | | | 104,896 | |
| | 2,700 | | Sankyo Co., Ltd. | | | 101,231 | |
| | 21,700 | | SBI Holdings, Inc. | | | 216,091 | |
| | 28,200 | | Secom Co., Ltd. | | | 2,084,905 | |
| | 18,200 | | Sega Sammy Holdings, Inc. | | | 196,016 | |
| | 139,900 | | Seiko Epson Corp. | | | 2,242,824 | |
| | 4,000 | | Shikoku Electric Power Co., Inc. | | | 47,382 | |
| | 3,600 | | Shiseido Co., Ltd. | | | 93,808 | |
| | 20,900 | | Showa Shell Sekiyu | | | 195,074 | |
| | 700 | | SoftBank Group Corp. | | | 39,586 | |
| | 400 | | Sohgo Security Services Co., Ltd. | | | 19,774 | |
| | 2,000 | | Sompo Japan Nipponkoa Holdings, Inc. | | | 53,224 | |
| | 65,500 | | Sumitomo Corp. | | | 660,234 | |
| | 2,000 | | Sumitomo Metal Mining Co., Ltd. | | | 20,345 | |
| | 8,800 | | Sumitomo Rubber Industries, Ltd. | | | 117,813 | |
| | 46,400 | | Suntory Beverage & Food, Ltd. | | | 2,099,652 | |
| | 4,700 | | Suzuken Co., Ltd. | | | 147,938 | |
| | 42,175 | | Sysmex Corp. | | | 2,904,106 | |
| | 26,000 | | Taiheiyo Cement Corp. | | | 61,583 | |
| | 14,900 | | Taiyo Nippon Sanso Corp.(a) | | | 136,946 | |
| | 22,200 | | Takeda Pharmaceutical Co., Ltd. | | | 957,446 | |
| | 5,100 | | Toho Co., Ltd. | | | 141,226 | |
| | 5,100 | | Tokyo Tatemono Co., Ltd. | | | 61,160 | |
| | 313,000 | | Toshiba Corp. | | | 852,613 | |
| | 400 | | Toyo Suisan Kaisha, Ltd. | | | 16,226 | |
| | 1,200 | | Toyoda Gosei Co., Ltd. | | | 21,371 | |
| | 2,000 | | Trend Micro, Inc. | | | 71,528 | |
| | 6,500 | | Unicharm Corp. | | | 146,039 | |
| | 5,500 | | Yamaha Corp. | | | 148,244 | |
| | 8,500 | | Yamaha Motor Co., Ltd. | | | 129,665 | |
| | 5,400 | | Yokohama Rubber Co., Ltd. | | | 67,727 | |
| | | | | | | 34,900,073 | |
Jersey — 0.1% | | | | |
| | 1,663 | | Randgold Resources, Ltd. | | | 186,619 | |
| | | | | | | | |
Macao — 0.0% | | | | |
| | 40,800 | | MGM China Holdings, Ltd.(a) | | | 53,273 | |
| | | | | | | | |
Malaysia — 0.2% | | | | |
| | 135,300 | | AirAsia BHD | | | 87,602 | |
| | 6,000 | | British American Tobacco Malaysia BHD | | | 78,471 | |
| | 38,400 | | CIMB Group Holdings BHD | | | 41,768 | |
Wilshire Mutual Funds, Inc. Wilshire International Equity Fund Schedule of Investments | June 30, 2016 (unaudited) |
| Shares | | | | Value | |
Malaysia — (continued) | | | |
| | 138,000 | | Felda Global Ventures Holdings BHD | | $ | 51,880 | |
| | 65,300 | | Public Bank BHD | | | 314,645 | |
| | | | | | | 574,366 | |
Mexico — 1.2% | | | | |
| | 74,500 | | Alfa SAB de CV, Class A | | | 128,075 | |
| | 41,600 | | Arca Continental SAB de CV | | | 298,554 | |
| | 107,352 | | Cemex SAB de CV† | | | 66,410 | |
| | 154,000 | | Fibra Uno Administracion SA de CV (b) | | | 328,089 | |
| | 37,600 | | Grupo Comercial Chedraui SA de CV | | | 93,740 | |
| | 6,700 | | Industrias Penoles SAB de CV | | | 159,960 | |
| | 140,700 | | Kimberly-Clark de Mexico SAB de CV, Class A | | | 332,384 | |
| | 57,500 | | Mexichem SAB de CV | | | 121,211 | |
| | 90,300 | | OHL Mexico SAB de CV† | | | 110,637 | |
| | 12,470 | | Promotora y Operadora de Infraestructura SAB de CV | | | 153,480 | |
| | 836,145 | | Wal-Mart de Mexico SAB de CV | | | 2,011,408 | |
| | | | | | | 3,803,948 | |
Netherlands — 6.4% | | | | |
| | 408,117 | | Aegon NV | | | 1,617,099 | |
| | 4,507 | | Akzo Nobel NV | | | 279,980 | |
| | 4,804 | | Boskalis Westminster | | | 163,926 | |
| | 33,325 | | Core Laboratories NV(a) | | | 4,128,634 | |
| | 37,545 | | Gemalto NV | | | 2,274,634 | |
| | 1,266 | | Heineken NV | | | 116,120 | |
| | 5,155 | | Koninklijke Ahold NV | | | 113,836 | |
| | 43,948 | | Koninklijke DSM NV | | | 2,535,390 | |
| | 622,972 | | Koninklijke KPN NV | | | 2,220,555 | |
| | 92,760 | | Koninklijke Philips NV | | | 2,303,823 | |
| | 6,792 | | Koninklijke Vopak NV | | | 338,104 | |
| | 10,407 | | NN Group NV | | | 286,490 | |
| | 9,335 | | OCI NV†(a) | | | 126,460 | |
| | 3,212 | | Randstad Holding NV | | | 128,451 | |
| | 5,030 | | Royal Dutch Shell PLC, Class A | | | 138,150 | |
| | 70,235 | | Royal Dutch Shell PLC ADR, Class A(a) | | | 3,878,377 | |
| | | | | | | 20,650,029 | |
New Zealand — 0.1% | | | | |
| | 26,095 | | Fletcher Building, Ltd. | | | 160,512 | |
| | 14,618 | | Meridian Energy, Ltd. | | | 27,588 | |
| | 7,623 | | Ryman Healthcare, Ltd. | | | 50,881 | |
| | | | | | | 238,981 | |
Norway — 0.3% | | | | |
| | 1,501 | | DnB NOR ASA | | | 17,967 | |
| | 3,679 | | Marine Harvest ASA | | | 62,055 | |
| | 2,266 | | Norsk Hydro ASA | | | 8,295 | |
| | 35,047 | | Orkla ASA | | | 311,692 | |
| | 9,105 | | Telenor ASA | | | 150,715 | |
| | 8,560 | | Yara International ASA | | | 271,924 | |
| | | | | | | 822,648 | |
Peru — 0.0% | | | | |
| | 9,100 | | Cia de Minas Buenaventura SAA ADR†(a) | | | 108,745 | |
| | | | | | | | |
Philippines — 0.0% | | | | |
| | 213,900 | | Alliance Global Group, Inc. | | | 67,481 | |
| | | | | | | | |
Portugal — 0.1% | | | | |
| | 12,420 | | Jeronimo Martins SGPS SA | | | 195,886 | |
| | | | | | | | |
Russia — 1.0% | | | | |
| | 38,700 | | Alrosa PAO | | | 41,946 | |
| Shares | | | | Value | |
Russia — (continued) | | | |
| | 1,858 | | MegaFon PJSC GDR | | $ | 19,403 | |
| | 10,360 | | Rostelecom PJSC | | | 14,928 | |
| | 10,440,000 | | RusHydro PJSC | | | 100,558 | |
| | 19,560 | | Sistema GDR | | | 147,450 | |
| | 127,636 | | Yandex NV, Class A†(a) | | | 2,788,847 | |
| | | | | | | 3,113,132 | |
Singapore — 0.9% | | | | |
| | 87,600 | | CapitaLand Commercial Trust(b) | | | 96,349 | |
| | 200,910 | | DBS Group Holdings, Ltd. | | | 2,368,914 | |
| | 4,500 | | Sembcorp Industries, Ltd. | | | 9,529 | |
| | 84,300 | | Sembcorp Marine, Ltd. | | | 98,096 | |
| | 5,400 | | Singapore Exchange, Ltd. | | | 30,760 | |
| | 20,000 | | StarHub, Ltd. | | | 56,434 | |
| | 176,700 | | Suntec Real Estate Investment Trust(b) | | | 233,487 | |
| | | | | | | 2,893,569 | |
South Africa — 0.8% | | | | |
| | 15,482 | | Exxaro Resources, Ltd. | | | 71,329 | |
| | 14,582 | | Gold Fields, Ltd. | | | 70,791 | |
| | 17,845 | | Hyprop Investments, Ltd.(b) | | | 157,099 | |
| | 73,293 | | Life Healthcare Group Holdings, Ltd. | | | 180,325 | |
| | 1,131 | | Mondi PLC | | | 21,175 | |
| | 12,386 | | Sasol, Ltd. | | | 335,088 | |
| | 124,946 | | Shoprite Holdings, Ltd. | | | 1,415,128 | |
| | 16,939 | | SPAR Group, Ltd. | | | 232,591 | |
| | 3,795 | | Steinhoff International Holdings NV | | | 21,771 | |
| | | | | | | 2,505,297 | |
South Korea — 1.8% | | | | |
| | 24,829 | | BNK Financial Group, Inc. | | | 174,978 | |
| | 692 | | Coway Co., Ltd. | | | 63,009 | |
| | 19,378 | | DGB Financial Group, Inc. | | | 146,737 | |
| | 5,413 | | Doosan Heavy Industries & Construction Co., Ltd. | | | 100,473 | |
| | 5,573 | | GS Holdings Corp. | | | 231,437 | |
| | 17,826 | | Hana Financial Group, Inc. | | | 362,418 | |
| | 3,323 | | Hankook Tire Co., Ltd. | | | 147,841 | |
| | 1,609 | | Hanwha Chemical Corp. | | | 33,619 | |
| | 4,820 | | Hanwha Corp. | | | 149,739 | |
| | 1,208 | | Hyundai Department Store Co., Ltd. | | | 135,901 | |
| | 2,458 | | Hyundai Engineering & Construction Co., Ltd. | | | 71,913 | |
| | 523 | | Hyundai Heavy Industries Co., Ltd. | | | 48,421 | |
| | 6,930 | | Hyundai Marine & Fire Insurance Co., Ltd. | | | 176,712 | |
| | 4,636 | | Hyundai Steel Co. | | | 186,538 | |
| | 1,978 | | Industrial Bank of Korea | | | 19,273 | |
| | 7,577 | | Kangwon Land, Inc. | | | 274,932 | |
| | 571 | | Korea Electric Power Corp. | | | 29,973 | |
| | 2,507 | | Korea Gas Corp. | | | 87,162 | |
| | 3,946 | | Korean Air Lines Co., Ltd.† | | | 89,257 | |
| | 1,089 | | KT Corp. | | | 28,126 | |
| | 2,512 | | KT&G Corp. | | | 297,509 | |
| | 1,628 | | LG Display Co., Ltd. | | | 37,694 | |
| | 1,916 | | LG Electronics, Inc. | | | 90,237 | |
| | 299 | | LG Innotek Co., Ltd. | | | 20,618 | |
| | 1,543 | | Lotte Chemical Corp. | | | 384,033 | |
| | 100 | | NAVER Corp. | | | 61,952 | |
| | 374 | | OCI Co., Ltd. | | | 29,648 | |
| | 899 | | Samsung Electronics Co., Ltd. | | | 1,119,571 | |
| | 6,453 | | Samsung Heavy Industries Co., Ltd. | | | 51,943 | |
| | 8,051 | | Shinhan Financial Group Co., Ltd. | | | 264,628 | |
| | 4,466 | | SK Hynix, Inc. | | | 127,089 | |
| | 2,253 | | SK Innovation Co., Ltd. | | | 277,602 | |
| | 3,405 | | S-Oil Corp. | | | 225,646 | |
Wilshire Mutual Funds, Inc. Wilshire International Equity Fund Schedule of Investments | June 30, 2016 (unaudited) |
| Shares | | | | Value | |
South Korea — (continued) | | | |
| | 39,148 | | Woori Bank | | $ | 325,491 | |
| | | | | | | 5,872,120 | |
Spain — 2.0% | | | | |
| | 28,358 | | Abertis Infraestructuras SA | | | 419,065 | |
| | 11,114 | | Amadeus IT Holding SA, Class A | | | 489,671 | |
| | 305,570 | | Banco Bilbao Vizcaya Argentaria SA ADR(a) | | | 1,753,972 | |
| | 10,469 | | Distribuidora Internacional de Alimentacion SA(a) | | | 61,107 | |
| | 22,166 | | Enagas SA | | | 677,180 | |
| | 1,727 | | Endesa SA | | | 34,653 | |
| | 1,858 | | Grifols SA | | | 42,207 | |
| | 111,341 | | Iberdrola SA | | | 759,523 | |
| | 52,225 | | Industria de Diseno Textil SA | | | 1,754,452 | |
| | 92,881 | | Mapfre SA | | | 203,983 | |
| | 2,236 | | Red Electrica Corp. SA | | | 199,796 | |
| | 15,080 | | Zardoya Otis SA | | | 142,406 | |
| | | | | | | 6,538,015 | |
Sweden — 0.6% | | | | |
| | 14,872 | | Alfa Laval AB(a) | | | 234,395 | |
| | 3,742 | | Boliden AB | | | 73,134 | |
| | 11,681 | | Electrolux AB, Class B | | | 318,481 | |
| | 41,447 | | Husqvarna AB, Class B | | | 308,634 | |
| | 7,375 | | Kinnevik AB | | | 176,297 | |
| | 4,085 | | Skandinaviska Enskilda Banken AB, Class A | | | 35,685 | |
| | 6,218 | | Svenska Handelsbanken AB, Class A | | | 75,490 | |
| | 15,020 | | Swedbank AB, Class A | | | 315,466 | |
| | 8,969 | | Swedish Match AB | | | 313,001 | |
| | 29,311 | | Telefonaktiebolaget LM Ericsson, Class B | | | 225,183 | |
| | | | | | | 2,075,766 | |
Switzerland — 7.0% | | | | |
| | 1,120 | | Actelion, Ltd. | | | 188,605 | |
| | 548 | | Adecco Group AG | | | 27,640 | |
| | 3,320 | | Aryzta AG | | | 122,694 | |
| | 10 | | Chocoladefabriken Lindt & Spruengli AG | | | 59,641 | |
| | 4,775 | | Credit Suisse Group AG | | | 50,865 | |
| | 71 | | Givaudan SA | | | 142,960 | |
| | 46,427 | | Julius Baer Group, Ltd. | | | 1,868,609 | |
| | 78,871 | | Nestle SA | | | 6,110,794 | |
| | 30,270 | | Novartis AG ADR(a) | | | 2,497,578 | |
| | 16,820 | | Novartis AG | | | 1,388,298 | |
| | 778 | | Partners Group Holding AG | | | 333,424 | |
| | 15,756 | | Roche Holding AG | | | 4,157,691 | |
| | 1,615 | | SGS SA | | | 3,699,563 | |
| | 17 | | Sika AG | | | 71,282 | |
| | 726 | | Sonova Holding AG | | | 96,359 | |
| | 12,415 | | STMicroelectronics NV | | | 72,484 | |
| | 545 | | Swiss Life Holding AG | | | 125,948 | |
| | 6,716 | | Swiss Prime Site AG | | | 607,991 | |
| | 7,784 | | Swiss Re, Ltd. | | | 679,858 | |
| | 395 | | Swisscom AG(a) | | | 196,238 | |
| | | | | | | 22,498,522 | |
Taiwan — 3.2% | | | | |
| | 20,000 | | Acer, Inc.† | | | 9,448 | |
| | 6,000 | | Asustek Computer, Inc. | | | 49,661 | |
| | 933,000 | | AU Optronics Corp. | | | 322,993 | |
| | 15,000 | | Casetek Holdings, Ltd. | | | 52,888 | |
| | 196,000 | | Cheng Shin Rubber Industry Co., Ltd. | | | 413,252 | |
| | 38,190 | | Chicony Electronics Co., Ltd. | | | 86,428 | |
| | 257,000 | | China Airlines, Ltd.† | | | 77,352 | |
| | 201,000 | | Chunghwa Telecom Co., Ltd. | | | 726,950 | |
| Shares | | | | Value | |
Taiwan — (continued) | | | |
| | 64,000 | | Far EasTone Telecommunications Co., Ltd. | | $ | 154,970 | |
| | 12,000 | | Formosa Petrochemical Corp. | | | 32,718 | |
| | 8,000 | | Formosa Plastics Corp. | | | 19,401 | |
| | 15,150 | | Foxconn Technology Co., Ltd. | | | 35,787 | |
| | 10,900 | | Hon Hai Precision Industry Co., Ltd. | | | 28,082 | |
| | 71,000 | | HTC Corp. | | | 229,851 | |
| | 771,000 | | Innolux Corp. | | | 260,510 | |
| | 114,000 | | Lite-On Technology Corp. | | | 157,011 | |
| | 25,000 | | MediaTek, Inc. | | | 191,039 | |
| | 78,000 | | Nanya Technology Corp. | | | 96,009 | |
| | 5,000 | | Phison Electronics Corp. | | | 43,338 | |
| | 62,000 | | Ruentex Development Co., Ltd. | | | 72,522 | |
| | 30,000 | | Simplo Technology Co., Ltd. | | | 105,586 | |
| | 19,800 | | Standard Foods Corp. | | | 48,726 | |
| | 147,000 | | Synnex Technology International Corp. | | | 159,486 | |
| | 538,000 | | Taishin Financial Holding Co., Ltd. | | | 208,001 | |
| | 426,849 | | Taiwan Business Bank† | | | 108,696 | |
| | 70,350 | | Taiwan Cooperative Financial Holding Co., Ltd. | | | 31,093 | |
| | 83,000 | | Taiwan Fertilizer Co., Ltd. | | | 110,807 | |
| | 226,629 | | Taiwan Semiconductor Manufacturing Co., Ltd. ADR(a) | | | 5,944,479 | |
| | 15,000 | | Transcend Information, Inc. | | | 45,617 | |
| | 213,000 | | United Microelectronics Corp. | | | 83,535 | |
| | 262,000 | | Wistron Corp. | | | 183,278 | |
| | 51,000 | | WPG Holdings, Ltd. | | | 59,563 | |
| | 34,000 | | Yulon Motor Co., Ltd. | | | 29,022 | |
| | | | | | | 10,178,099 | |
Thailand — 0.1% | | | | |
| | 13,800 | | BEC World PCL NVDR | | | 8,980 | |
| | 40,800 | | Indorama Ventures PCL NVDR | | | 33,857 | |
| | 351,800 | | Krung Thai Bank PCL NVDR | | | 163,871 | |
| | 7,400 | | Siam Commercial Bank PCL NVDR | | | 29,419 | |
| | 1,418,400 | | TMB Bank PCL NVDR | | | 87,543 | |
| | | | | | | 323,670 | |
Turkey — 0.1% | | | | |
| | 14,667 | | Emlak Konut Gayrimenkul Yatirim Ortakligi AS(b) | | | 14,608 | |
| | 72,389 | | Turkiye Halk Bankasi AS | | | 215,439 | |
| | 26,989 | | Turkiye Vakiflar Bankasi TAO, Class D | | | 42,384 | |
| | | | | | | 272,431 | |
United Kingdom — 12.2% | | | | |
| | 5,163 | | 3i Group PLC | | | 37,882 | |
| | 10,377 | | Aberdeen Asset Management PLC | | | 38,933 | |
| | 21,573 | | Admiral Group PLC | | | 586,574 | |
| | 76,154 | | ARM Holdings PLC ADR(a) | | | 3,465,768 | |
| | 11,748 | | ARM Holdings PLC | | | 178,450 | |
| | 66,260 | | AstraZeneca PLC | | | 3,961,276 | |
| | 44,566 | | BAE Systems PLC | | | 311,989 | |
| | 3,641 | | Barratt Developments PLC | | | 19,786 | |
| | 8,132 | | British American Tobacco PLC | | | 527,193 | |
| | 118,653 | | BT Group PLC, Class A | | | 652,191 | |
| | 1,766 | | Burberry Group PLC | | | 27,471 | |
| | 3,273 | | Capita Group PLC (The) | | | 42,175 | |
| | 81,282 | | Centrica PLC | | | 245,797 | |
| | 131,872 | | Cobham PLC | | | 277,834 | |
| | 197,023 | | Compass Group PLC | | | 3,748,459 | |
| | 10,052 | | Croda International PLC | | | 421,969 | |
| | 18,610 | | Diageo PLC | | | 519,885 | |
| | 8,431 | | Direct Line Insurance Group PLC | | | 38,978 | |
| | 12,412 | | easyJet PLC | | | 180,367 | |
| | 121,529 | | G4S PLC | | | 297,791 | |
| | 13,565 | | GlaxoSmithKline PLC | | | 291,310 | |
Wilshire Mutual Funds, Inc. Wilshire International Equity Fund Schedule of Investments | June 30, 2016 (unaudited) |
| Shares | | | | Value | |
United Kingdom — (continued) | | | |
| | 71,189 | | HSBC Holdings PLC ADR(a) | | $ | 2,228,927 | |
| | 16,932 | | HSBC Holdings PLC | | | 104,904 | |
| | 33,947 | | ICAP PLC | | | 191,011 | |
| | 16,570 | | ITV PLC | | | 39,730 | |
| | 233 | | Johnson Matthey PLC | | | 8,739 | |
| | 63,850 | | Markit, Ltd.†(a) | | | 2,081,510 | |
| | 235,783 | | National Grid PLC | | | 3,467,284 | |
| | 1,999 | | Next PLC | | | 132,086 | |
| | 6,775 | | Persimmon PLC | | | 131,379 | |
| | 9,643 | | Prudential PLC | | | 163,632 | |
| | 66,553 | | Reckitt Benckiser Group PLC | | | 6,673,413 | |
| | 10,480 | | Rexam PLC(a) | | | 91,458 | |
| | 1,129 | | Rolls-Royce Holdings PLC | | | 10,776 | |
| | 173,460 | | Sky PLC | | | 1,971,113 | |
| | 67,785 | | Smith & Nephew PLC ADR(a) | | | 2,326,381 | |
| | 14,089 | | Smith & Nephew PLC | | | 239,249 | |
| | 904 | | Standard Life PLC | | | 3,567 | |
| | 81,194 | | Tesco PLC | | | 190,693 | |
| | 4,540 | | Travis Perkins PLC | | | 89,574 | |
| | 363,601 | | William Hill PLC | | | 1,252,448 | |
| | 97,811 | | WPP PLC | | | 2,038,529 | |
| | | | | | | 39,308,481 | |
United States — 4.4% | | | | |
| | 41,642 | | Chubb, Ltd.(a) | | | 5,443,026 | |
| | 29,755 | | Schlumberger, Ltd. | | | 2,353,025 | |
| | 14,784 | | Shire PLC | | | 913,693 | |
| | 239,725 | | Telefonaktiebolaget LM Ericsson ADR(a) | | | 1,841,088 | |
| | 4,100 | | Thomson Reuters Corp. | | | 165,879 | |
| | 110,055 | | Vodafone Group PLC ADR(a) | | | 3,399,599 | |
| | | | | | | 14,116,310 | |
| Total Common Stock | | | | |
| (Cost $296,969,201) | | | 307,838,984 | |
| | |
SHORT-TERM INVESTMENTS (c) — 19.6% | |
| | 11,013,207 | | Northern Trust Institutional Government Select Portfolio, Institutional Class, 0.240% | | | 11,013,207 | |
| | 52,038,555 | | Northern Trust Institutional Liquid Asset Portfolio, Institutional Class, 0.520% (d) | | | 52,038,555 | |
| | | | | | | | |
| Total Short-Term Investments | | | | |
| (Cost $63,051,762) | | | 63,051,762 | |
| | |
EXCHANGE TRADED FUNDS (a) — 0.3% | |
| | 33,018 | | iShares MSCI India ETF | | | 921,863 | |
| | 5,173 | | Vanguard FTSE All-World ex-US ETF | | | 221,663 | |
| | | | | | | | |
Total Exchange Traded Fund | | | | |
| (Cost $1,238,009) | | | 1,143,526 | |
| | |
PREFERRED STOCK — 0.3% | | | | |
Brazil — 0.3% | | | | |
| | 10,900 | | Cia Brasileira de Distribuicao, Class Preference | | | 158,089 | |
| | 81,300 | | Cia Energetica de Minas Gerais | | | 182,984 | |
| | 8,600 | | Cia Energetica de Sao Paulo, Class Preference | | | 31,591 | |
| | 78,300 | | Gerdau SA | | | 143,569 | |
| | 67,400 | | Petroleo Brasileiro SA† | | | 196,810 | |
Shares/Number of Rights | | | | Value | |
Brazil — (continued) | | | |
| | 49,700 | | Vale SA | | $ | 200,669 | |
| | | | | | | | |
| Total Preferred Stock | | | | |
| (Cost $791,932) | | | 913,712 | |
RIGHTS — 0.0% | |
Hong Kong — 0.0% | |
| | 496,400 | | Noble Group, Ltd. † ‡‡ | | | 33,165 | |
| | | | | | | | |
| Total Rights (Cost $24,299) | | | 33,165 | |
Total Investments — 115.7% | | | | |
| (Cost $362,075,203) | | | 372,981,149 | |
Other Assets & Liabilities, Net — (15.7)% | | | (50,487,941 | ) |
NET ASSETS — 100.0% | | $ | 322,493,208 | |
| * | Security Traded on the Toronto Stock Exchange. |
| † | Non-income producing security. |
| ‡‡ | Expiration date is unavailable. |
| (a) | This security or a partial position of this security is on loan at June 30, 2016. The total market value of securities on loan at June 30, 2016 was $56,013,973 (Note 6). |
| (b) | Real Estate Investment Trust. |
| (c) | Rate shown is the 7-day effective yield as of June 30, 2016. |
| (d) | This security was purchased with cash collateral held from securities on loan. The total value of such securities as of June 30, 2016 was $52,038,555. Securities on loan are also collateralized by various U.S. Treasury obligations in the amount of $4,518,602 (Note 6). |
| (e) | Security considered Master Limited Partnership. At June 30, 2016, this security amounted to $1,869,916 or 0.6% of Net Assets. |
| ADR — American Depositary Receipt |
| ETF — Exchange Traded Fund |
FTSE — Financial Times Stock Exchange GDR — Global Depositary Receipt Ltd. — Limited MSCI — Morgan Stanley Capital International NVDR — Non-Voting Depositary Receipt |
| PLC — Public Limited Company |
Wilshire Mutual Funds, Inc. Wilshire International Equity Fund Schedule of Investments | June 30, 2016 (unaudited) |
The following is a list of the levels of inputs used as of June 30, 2016 valuing the Fund’s investments carried at value:
| Investments in Securities | | Level 1 | | | Level 2 | | | Level 3 | | | Total | |
| Common Stock | | | | | | | | | | | | |
| Australia | | $ | — | | | $ | 12,716,454 | * | | $ | — | | | $ | 12,716,454 | |
| Austria | | | — | | | | 89,201 | * | | | — | | | | 89,201 | |
| Belgium | | | — | | | | 1,690,103 | * | | | — | | | | 1,690,103 | |
| Bermuda | | | 1,869,916 | | | | — | | | | — | | | | 1,869,916 | |
| Brazil | | | — | | | | 957,369 | * | | | — | | | | 957,369 | |
| Canada | | | 15,134,598 | | | | — | | | | — | | | | 15,134,598 | |
| China | | | 3,421,464 | | | | 7,084,120 | * | | | — | | | | 10,505,584 | |
| Denmark | | | 4,757,970 | | | | 15,290,287 | * | | | — | | | | 20,048,257 | |
| Finland | | | — | | | | 1,261,986 | * | | | — | | | | 1,261,986 | |
| France | | | 2,235,447 | | | | 23,876,306 | * | | | — | | | | 26,111,753 | |
| Germany | | | 201,374 | | | | 17,941,542 | * | | | — | | | | 18,142,916 | |
| Greece | | | — | | | | 67,979 | * | | | — | | | | 67,979 | |
| Hong Kong | | | 2,329,606 | | | | 5,575,994 | * | | | — | | | | 7,905,600 | |
| India | | | 3,637,042 | | | | — | | | | — | | | | 3,637,042 | |
| Indonesia | | | — | | | | 401,028 | * | | | — | | | | 401,028 | |
| Ireland | | | 7,756,301 | | | | 3,990,187 | * | | | — | | | | 11,746,488 | |
| Israel | | | — | | | | 326,404 | * | | | — | | | | 326,404 | |
| Italy | | | — | | | | 3,928,845 | * | | | — | | | | 3,928,845 | |
| Japan | | | — | | | | 34,900,073 | * | | | — | | | | 34,900,073 | |
| Jersey | | | — | | | | 186,619 | * | | | — | | | | 186,619 | |
| Macao | | | — | | | | 53,273 | * | | | — | | | | 53,273 | |
| Malaysia | | | — | | | | 574,366 | * | | | — | | | | 574,366 | |
| Mexico | | | — | | | | 3,803,948 | * | | | — | | | | 3,803,948 | |
| Netherlands | | | 8,007,011 | | | | 12,643,018 | * | | | — | | | | 20,650,029 | |
| New Zealand | | | — | | | | 238,981 | * | | | — | | | | 238,981 | |
| Norway | | | — | | | | 822,648 | * | | | — | | | | 822,648 | |
| Peru | | | 108,745 | | | | — | | | | — | | | | 108,745 | |
| Philippines | | | — | | | | 67,481 | * | | | — | | | | 67,481 | |
| Portugal | | | — | | | | 195,886 | * | | | — | | | | 195,886 | |
| Russia | | | 2,946,279 | | | | 166,853 | * | | | — | | | | 3,113,132 | |
| Singapore | | | — | | | | 2,893,569 | * | | | — | | | | 2,893,569 | |
| South Africa | | | — | | | | 2,505,297 | * | | | — | | | | 2,505,297 | |
| South Korea | | | — | | | | 5,872,120 | * | | | — | | | | 5,872,120 | |
| Spain | | | 1,753,972 | | | | 4,784,043 | * | | | — | | | | 6,538,015 | |
| Sweden | | | — | | | | 2,075,766 | * | | | — | | | | 2,075,766 | |
| Switzerland | | | 2,497,578 | | | | 20,000,944 | * | | | — | | | | 22,498,522 | |
| Taiwan | | | 5,944,479 | | | | 4,233,620 | * | | | — | | | | 10,178,099 | |
| Thailand | | | 8,980 | | | | 314,690 | * | | | — | | | | 323,670 | |
| Turkey | | | — | | | | 272,431 | * | | | — | | | | 272,431 | |
| United Kingdom | | | 10,102,586 | | | | 29,205,895 | * | | | — | | | | 39,308,481 | |
| United States | | | 13,202,617 | | | | 913,693 | * | | | — | | | | 14,116,310 | |
| Total Common Stock | | | 85,915,965 | | | | 221,923,019 | | | | — | | | | 307,838,984 | |
| | | | | | | | | | | | | | | | | |
| Short-Term Investments | | | 63,051,762 | | | | — | | | | — | | | | 63,051,762 | |
| Exchange Traded Funds | | | 1,143,526 | | | | — | | | | — | | | | 1,143,526 | |
| Preferred Stock | | | — | | | | 913,712 | * | | | — | | | | 913,712 | |
| Rights | | | — | | | | 33,165 | | | | — | | | | 33,165 | |
| Total Investments in Securities | | $ | 150,111,253 | | | $ | 222,869,896 | | | $ | — | | | $ | 372,981,149 | |
| * | For the six months ended June 30, 2016, the transfers out of Level 1 and into Level 2 were $53,718,729 and the transfers out of Level 2 into Level 1 were $20,957,961. The transfers into Level 2 were due to securities trading primarily outside the United States, the value of which were adjusted as a result of local trading through the application of a third-party vendor (Note 2). |
For the six months ended June 30, 2016, there were transfers between Level 2 and Level 3 assets and liabilities due to changes in the availability of observable inputs used to determine fair value. All transfers, if any, are recognized by the Fund at the end of each period.
Amounts designated as “—“ are either $0 or have been rounded to $0.
| Item 7. | Disclosure of Proxy Voting Policies and Procedures for Closed-End Management Investment Companies. |
Not applicable.
| Item 8. | Portfolio Managers of Closed-End Management Investment Companies. |
Not applicable.
| Item 9. | Purchases of Equity Securities by Closed-End Management Investment Company and Affiliated Purchasers. |
Not applicable.
| Item 10. | Submission of Matters to a Vote of Security Holders. |
There have been no changes to the procedures by which shareholders may recommend nominees to the Registrant’s Board of Trustees since the Registrant last disclosed such procedures in the definitive prospectus/proxy statement on Form N-14 filed with the SEC on December 3, 2008.
| Item 11. | Controls and Procedures. |
| | |
| | (a) | The Registrant's principal executive and principal financial officers, or persons performing similar functions, have concluded that the Registrant's disclosure controls and procedures (as defined in Rule 30a-3(c) under the Investment Company Act of 1940 (the "1940 Act")) are effective as of a date within 90 days of the filing date of this report, based on the evaluation of these controls and procedures required by Rule 30a-3(b) under the 1940 Act and Rules 13a-15(b) or 15d-15(b) under the Securities Exchange Act of 1934 . |
| | | |
| | (b) | There were no changes in the Registrant's internal control over financial reporting (as defined in Rule 30a-3(d) under the 1940 Act) that occurred during the Registrant's second fiscal quarter of the period covered by this report that has materially affected, or is reasonably likely to materially affect, the Registrant's internal control over financial reporting. |
| Item 12. | Exhibits. |
| | |
| | (a)(1) | Not applicable. |
| | | |
| | (a)(2) | Certifications pursuant to Rule 30a-2(a) under the 1940 Act and Section 302 of the Sarbanes-Oxley Act of 2002 are attached hereto. |
| | | |
| | (a)(3) | Not applicable. |
| | | |
| | (b) | Certifications pursuant to Rule 30a-2(b) under the 1940 Act and Section 906 of the Sarbanes-Oxley Act of 2002 are attached hereto. |
SIGNATURES
Pursuant to the requirements of the Securities Exchange Act of 1934 and the Investment Company Act of 1940, the Registrant has duly caused this report to be signed on its behalf by the undersigned, thereunto duly authorized.
| (Registrant) | Wilshire Mutual Funds, Inc. | |
| By (Signature and Title)* | /s/ Jason A. Schwarz | |
| | Jason A. Schwarz, President | |
| (principal executive officer) | | |
| | | |
| Date: September 2, 2016 | | |
Pursuant to the requirements of the Securities Exchange Act of 1934 and the Investment Company Act of 1940, this report has been signed below by the following persons on behalf of the Registrant and in the capacities and on the dates indicated.| By (Signature and Title)* | /s/ Jason A. Schwarz | |
| | Jason A. Schwarz, President | |
| | (principal executive officer) | |
| | | |
| Date: September 2, 2016 | | |
| By (Signature and Title)* | /s/ Michael Wauters | |
| | Michael Wauters, Treasurer | |
| | (principal financial officer) | |
| | | |
| Date: September 2, 2016 | | |
| * | Print the name and title of each signing officer under his or her signature. |