| OMB APPROVAL |
OMB Number: 3235-0570 Expires: July 31, 2022 Estimated average burden hours per response: 20.6 |
UNITED STATES
SECURITIES AND EXCHANGE COMMISSION
Washington, D.C. 20549
FORM N-CSR
CERTIFIED SHAREHOLDER REPORT OF REGISTERED
MANAGEMENT INVESTMENT COMPANIES
| Investment Company Act file number | 811-07076 | |
| Wilshire Mutual Funds, Inc. |
| (Exact name of registrant as specified in charter) |
| 1299 Ocean Avenue, Suite 700 Santa Monica, CA | 90401-1085 |
| (Address of principal executive offices) | (Zip code) |
Jason A. Schwarz
| Wilshire Associates Incorporated, 1299 Ocean Avenue, Suite 700, Santa Monica, CA 90401-1085 |
| (Name and address of agent for service) |
| Registrant's telephone number, including area code: | (310) 451-3051 | |
| Date of fiscal year end: | December 31 | |
| | | |
| Date of reporting period: | June 30, 2019 | |
Form N-CSR is to be used by management investment companies to file reports with the Commission not later than 10 days after the transmission to stockholders of any report that is required to be transmitted to stockholders under Rule 30e-1 under the Investment Company Act of 1940 (17 CFR 270.30e-1). The Commission may use the information provided on Form N-CSR in its regulatory, disclosure review, inspection, and policymaking roles.
A registrant is required to disclose the information specified by Form N-CSR, and the Commission will make this information public. A registrant is not required to respond to the collection of information contained in Form N-CSR unless the Form displays a currently valid Office of Management and Budget ("OMB") control number. Please direct comments concerning the accuracy of the information collection burden estimate and any suggestions for reducing the burden to the Secretary, Securities and Exchange Commission, 450 Fifth Street, NW, Washington, DC 20549-0609. The OMB has reviewed this collection of information under the clearance requirements of 44 U.S.C. § 3507.
| Item 1. | Reports to Stockholders. |

Wilshire Mutual Funds, Inc. |
SEMI-ANNUAL REPORT (Unaudited) Large Company Growth Portfolio Large Company Value Portfolio Small Company Growth Portfolio Small Company Value Portfolio Wilshire 5000 Indexsm Fund Wilshire International Equity Fund Wilshire Income Opportunities Fund |
June 30, 2019 http://advisor.wilshire.com |
Beginning on January 1, 2021, as permitted by regulations adopted by the U.S. Securities and Exchange Commission, paper copies of the Portfolios’ shareholder reports like this one will no longer be sent by mail, unless you specifically request paper copies of the reports from the Portfolios or from your financial intermediary, such as a broker-dealer or bank. Instead, the reports will be made available on a website, and you will be notified by mail each time a report is posted and provided with a website link to access the report.
If you have already elected to receive shareholder reports electronically, you will not be affected by this change and you need not take any action. You may elect to receive shareholder reports and other communications from the Portfolios electronically by contacting the Portfolios at (866) 591-1568 or, if you own these shares through a financial intermediary, by contacting your financial intermediary.
You may elect to receive all future reports in paper free of charge. You can inform the Portfolios that you wish to continue receiving paper copies of your shareholder reports by contacting the Portfolios at (866) 591-1568. If you own shares through a financial intermediary, you may contact your financial intermediary or follow instructions included with this document to elect to continue to receive paper copies of your shareholder reports. Your election to receive reports in paper will apply to all funds held with the fund complex or at your financial intermediary.
Wilshire Mutual Funds, Inc. Table of Contents | 
|
| | |
Letter to Shareholders | 1 |
Commentary: | |
Large Company Growth Portfolio | 3 |
Large Company Value Portfolio | 6 |
Small Company Growth Portfolio | 9 |
Small Company Value Portfolio | 12 |
Wilshire 5000 IndexSM Fund | 15 |
Wilshire International Equity Fund | 18 |
Wilshire Income Opportunities Fund | 22 |
Disclosure of Fund Expenses | 25 |
Schedule of Investments/Condensed Schedules of Investments: | |
Large Company Growth Portfolio | 28 |
Large Company Value Portfolio | 30 |
Small Company Growth Portfolio | 32 |
Small Company Value Portfolio | 34 |
Wilshire 5000 IndexSM Fund | 36 |
Wilshire International Equity Fund | 38 |
Wilshire Income Opportunities Fund | 42 |
Statements of Assets and Liabilities | 55 |
Statements of Operations | 57 |
Statements of Changes in Net Assets | 59 |
Financial Highlights: | |
Large Company Growth Portfolio | 63 |
Large Company Value Portfolio | 65 |
Small Company Growth Portfolio | 67 |
Small Company Value Portfolio | 69 |
Wilshire 5000 IndexSM Fund | 71 |
Wilshire International Equity Fund | 73 |
Wilshire Income Opportunities Fund | 77 |
Notes to Financial Statements | 79 |
Additional Fund Information | 106 |
Board Approval of Subadvisory Agreement | 107 |
This report is for the general information of the shareholders of Large Company Growth Portfolio, Large Company Value Portfolio, Small Company Growth Portfolio, Small Company Value Portfolio, Wilshire 5000 IndexSM Fund, Wilshire International Equity Fund and Wilshire Income Opportunities Fund. Its use in connection with any offering of a Portfolio’s shares is authorized only if accompanied or preceded by the Portfolio’s current prospectus.
Wilshire Mutual Funds, Inc. are distributed by Ultimus Fund Distributors, LLC.
Wilshire Mutual Funds, Inc. Letter to Shareholders (Unaudited) | 
|
Dear Wilshire Mutual Fund Shareholder:
We are pleased to present this semi-annual report to all shareholders of the Wilshire Mutual Funds. This report covers the period from January 1, 2019 to June 30, 2019, for all share classes of the Large Company Growth Portfolio, Large Company Value Portfolio, Small Company Growth Portfolio, Small Company Value Portfolio, Wilshire 5000 Index Fund, Wilshire International Equity Fund, and Wilshire Income Opportunities Fund.
Market Environment
U.S. Equity
The U.S. stock market, represented by the Wilshire 5000 Total Market IndexSM, was up 18.66% for the first half of the year. This marks the strongest first half-year for U.S. equities in 24 years. Markets have been volatile this year as trade concerns and a possible global economic slowdown continue to sway investor sentiment, while the Q4 2018 selloff created attractive valuations and buying opportunities that propelled markets early in the year. Equity prices are also responding to the actions and statements of the Federal Reserve, which has softened its monetary policy stance over the past few months. Investors are expecting one or more Federal Funds rate cuts and the markets have begun to react strongly to perceived changes in the likelihood and magnitude of future rate cuts.
Non-U.S. Equity
Equity markets outside of the U.S. continue to enjoy a strong 2019, although they are generally underperforming the U.S. equity market. The MSCI All Country World ex-U.S. Index and MSCI Emerging Markets Index returned 13.60% and 10.58%, respectively. Indicators out of Europe are still gloomy as recent data show that the manufacturing sector in Germany has weakened, which could also mean problems for countries with close industrial ties. Manufacturing in Britain has worsened as well, as businesses continue to struggle with the effects of Brexit. These negative headlines were offset by continued corporate earnings growth and expectations that European corporate earnings growth will outpace U.S. corporate earnings growth over the coming twelve months. News out of Japan is also troubling as consumption and capital spending shows little or no growth. Trade negotiations between the U.S. and China, the world’s two largest economies, continue with both countries maintaining firm stances going into the G20. There was some good news following the conference as the two countries agreed to not impose new trade sanctions and, rather, continue negotiations.
Fixed Income
The U.S. Treasury yield curve fell across all maturities during the quarter ended June 30, 2019, with the biggest decreases occurring in the 1- to 10-year portion of the yield curve. The bellwether 10-year Treasury yield ended the quarter at 2.00%, down 41 basis points from March. The Federal Open Market Committee left its overnight rate unchanged during the quarter, at a range of 2.25% to 2.50%. The committee softened some of its messaging to indicate that it is willing to ease should conditions deteriorate. The commitee current forecast, however, is for no rate changes this year and a minor downward adjustment in 2020. Credit spreads tightened modestly within both the investment grade and high yield markets, and the Bloomberg Barclays Long Government/Credit Index and the Bloomberg Barclays US Corporate High Yield Index returned 13.46% and 9.94%, respectively. Emerging market debt benefited from dovish central bank announcements (both in the U.S. and from the ECB), and in the case of local currency issues, currency tailwinds.
Fund Performance Review
The Large Company Growth Portfolio Institutional Class returned 20.71%, underperforming the Russell 1000 Growth Index by 0.78 %. The Large Company Value Portfolio Institutional Class returned 14.29%, underperforming the Russell 1000 Value Index by 1.95%. The Small Company Growth Portfolio Institutional Class returned 20.72%, outperforming the Russell 2000 Growth Index by 0.36%. The Small Company Value Portfolio Institutional Class returned 14.41%,
1
Wilshire Mutual Funds, Inc. Letter to Shareholders (Unaudited) - (Continued) | 
|
outperforming the Russell 2000 Value Index by 0.94%. The Wilshire 5000 Index Fund Institutional Class returned 18.03%, underperforming the Wilshire 5000 Total Market Index by 0.63%. The Wilshire International Equity Fund Institutional Class returned 14.15%, outperforming the MSCI All Country World ex-USA Investable Market Index by 0.82%. The Wilshire Income Opportunities Fund Institutional Share Class returned 7.60%, outperforming the Bloomberg Barclays U.S. Universal Index by 1.06%. While some of the Funds underperformed during the six month period, we are confident that each fund is well positioned for future growth.
As always, we sincerely appreciate your continued support and confidence in Wilshire Associates.
Sincerely,

Jason Schwarz
President, Wilshire Mutual Funds
2
Large Company Growth Portfolio Commentary (Unaudited) | 
|
INVESTMENT CLASS SHARES
Average Annual Total Returns*
Six Months Ended 6/30/19** | 20.52% |
One Year Ended 6/30/19 | 9.84% |
Five Years Ended 6/30/19 | 11.63% |
Ten Years Ended 6/30/19 | 14.14% |
INSTITUTIONAL CLASS SHARES
Average Annual Total Returns
Six Months Ended 6/30/19** | 20.71% |
One Year Ended 6/30/19 | 10.18% |
Five Years Ended 6/30/19 | 11.99% |
Ten Years Ended 6/30/19 | 14.51% |
RUSSELL 1000® GROWTH INDEX(1)
Average Annual Total Returns
Six Months Ended 6/30/19** | 21.49% |
One Year Ended 6/30/19 | 11.56% |
Five Years Ended 6/30/19 | 13.39% |
Ten Years Ended 6/30/19 | 16.28% |
The performance data quoted represents past performance and does not guarantee future results. Current performance may be lower or higher. Performance data current to the most recent month end may be obtained at http://advisor.wilshire.com. The investment return and principal value of an investment will fluctuate so that shares, when redeemed, may be worth more or less than their original cost. The table above does not reflect the deduction of taxes that a shareholder would pay on Portfolio distributions or the redemption of Portfolio shares.
* | During the ten years ended June 30, 2019, certain fees and expenses were reduced or reimbursed. Without fee reductions and expense reimbursements (excluding fees paid indirectly), historical total returns would have been lower. For the six months ended June 30, 2019, the investment adviser reimbursed expenses in the annualized amount of 0.03% for Investment Class Shares. |
** | Not annualized. |
(1) | The Russell 1000® Growth Index is an unmanaged index that measures the performance of the largest 1,000 U.S. companies with higher price-to-book ratios and higher forecasted growth values. Index performance is presented for general comparative purposes. Unlike a mutual fund, the performance of an index assumes no transaction costs, management fees or other expenses. An individual cannot directly invest in any index. |
3
Large Company Growth Portfolio Commentary (Unaudited) - (Continued) | 
|
The Wilshire 5000 Total Market IndexSM returned 18.66% for the first half of the year. Global equities reached new highs, albeit with a heightened degree of market volatility. The dovish tone of global central banks has boosted the rally in equities, resulting in a significant decline in global government bond yields. U.S. growth continues to outpace major foreign developed economies, as Gross Domestic Product (“GDP”) in the first half of the year outperformed expectations due to strength in Personal Consumption Expenditures. However, the recent decline in Gross Private Domestic Investment has weighed on GDP growth, which may be an indicator of declining businesses sentiment and lack of willingness to spend due to uncertainty regarding the business cycle and trade.
Sector returns for the Wilshire 5000 Total Market Index were all positive for the first half of 2019. Information Technology (+27.55%), Industrials (+21.92%) and Consumer Discretionary (+19.90%) were the best performing sectors while Health Care (9.99%) and Energy (+11.94%) were the laggards. Large capitalization stocks outperformed small capitalization stocks with the Wilshire U.S. Large-Cap IndexSM returning 18.74% versus 17.85% for the Wilshire U.S. Small-Cap IndexSM. Year to date, Growth has outperformed Value.
Although U.S. real estate securities underperformed broader equities during the quarter ended June 30, 2019, they are still experiencing a surge for the year. Global real estate securities are up double-digits for the year as well. Commodity results were negative for the quarter as crude oil fell -2.8% to $58.47 per barrel. Natural gas prices were down -13.3%, ending the quarter at $2.31 per million BTUs. MLPs were modestly positive for the quarter (+0.12%) but are up significantly for the year. Gold prices finished at approximately $1,414 per troy ounce, up +9.3% from last quarter.
The Wilshire Large Company Growth Portfolio - Institutional Class returned 20.71% in the first six months of 2019, underperforming the Russell 1000 Growth Index return of 21.49% by 0.78%. Sector allocations to Health Care and Information Technology as well as stock selection within Industrials were detractive to performance. Stock selection within Health Care was the primary driver to relative performance.
Despite the Portfolio’s underperformance, we believe the Portfolio is well-positioned going into the second half of 2019 as the market deals with ongoing macroeconomic and geopolitical issues.
4
Large Company Growth Portfolio Commentary (Unaudited) - (Continued) | 
|
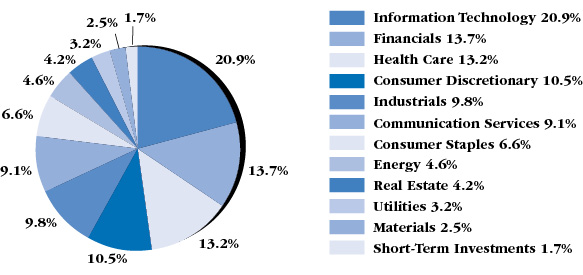
PORTFOLIO SECTOR WEIGHTING†
(As of June 30, 2019)

† | Based on percent of the Portfolio’s total investments in securities at value. Includes investments held as collateral for securities on loan (see Note 7 in Notes to Financial Statements). |
5
Large Company Value Portfolio Commentary (Unaudited) | 
|
INVESTMENT CLASS SHARES
Average Annual Total Returns
Six Months Ended 6/30/19* | 14.11% |
One Year Ended 6/30/19 | 2.84% |
Five Years Ended 6/30/19 | 5.51% |
Ten Years Ended 6/30/19 | 11.77% |
INSTITUTIONAL CLASS SHARES
Average Annual Total Returns
Six Months Ended 6/30/19* | 14.29% |
One Year Ended 6/30/19 | 3.15% |
Five Years Ended 6/30/19 | 5.76% |
Ten Years Ended 6/30/19 | 12.03% |
RUSSELL 1000® VALUE INDEX(1)
Average Annual Total Returns
Six Months Ended 6/30/19* | 16.24% |
One Year Ended 6/30/19 | 8.46% |
Five Years Ended 6/30/19 | 7.46% |
Ten Years Ended 6/30/19 | 13.19% |
The performance data quoted represents past performance and does not guarantee future results. Current performance may be lower or higher. Performance data current to the most recent month end may be obtained at http://advisor.wilshire.com. The investment return and principal value of an investment will fluctuate so that shares, when redeemed, may be worth more or less than their original cost. The table above does not reflect the deduction of taxes that a shareholder would pay on Portfolio distributions or the redemption of Portfolio shares.
* | Not annualized. |
(1) | The Russell 1000® Value Index is an unmanaged index that measures the performance of the largest 1,000 U.S. companies with lower price-to-book ratios and lower forecasted growth values. Index performance is presented for general comparative purposes. Unlike a mutual fund, the performance of an index assumes no transaction costs, management fees or other expenses. An individual cannot directly invest in any index. |
6
Large Company Value Portfolio Commentary (Unaudited) - (Continued) | 
|
The Wilshire 5000 Total Market IndexSM returned 18.66% for the first half of the year global equities reached new highs, albeit with a heightened degree of market volatility. The dovish tone of global central banks has boosted the rally in equities, resulting in a significant decline in global government bond yields. U.S. growth continues to outpace major foreign developed economies, as Gross Domestic Product (“GDP”) in the first half of the year outperformed expectations due to strength in Personal Consumption Expenditures. However, the recent decline in Gross Private Domestic Investment has weighed on GDP growth, which may be an indicator of declining businesses sentiment and lack of willingness to spend due to uncertainty regarding the business cycle and trade.
Sector returns for the Wilshire 5000 Total Market Index were all positive for the first half of 2019. Information Technology (+27.55%), Industrials (+21.92%) and Consumer Discretionary (+19.90%) were the best performing sectors while Health Care (9.99%) and Energy (+11.94%) were the laggards. Large capitalization stocks outperformed small capitalization stocks with the Wilshire U.S. Large-Cap IndexSM returning 18.74% versus 17.85% for the Wilshire U.S. Small-Cap IndexSM. Year to date, Growth has outperformed Value.
Although U.S. real estate securities underperformed broader equities during the quarter ended June 30, 2019, they are still experiencing a surge for the year. Global real estate securities are up double-digits for the year as well. Commodity results were negative for the quarter as crude oil fell -2.8% to $58.47 per barrel. Natural gas prices were down -13.3%, ending the quarter at $2.31 per million BTUs. MLPs were modestly positive for the quarter (+0.12%) but are up significantly for the year. Gold prices finished at approximately $1,414 per troy ounce, up +9.3% from last quarter.
The Wilshire Large Company Value Portfolio - Institutional Class returned 14.29% in 2019, underperforming the Russell 1000 Value Index return of 16.24% by 1.95%. Weak stock selection within Health Care and Energy weighted on performance. Conversely, the Portfolio benefited from strong stock selection within Industrials and sector allocation to Industrials.
Despite the Portfolio’s underperformance versus its benchmark, we believe the Portfolio is well-positioned going into the second half of 2019 as the market deals with ongoing macroeconomic and geopolitical uncertainties.
7
Large Company Value Portfolio Commentary (Unaudited) - (Continued) | 
|
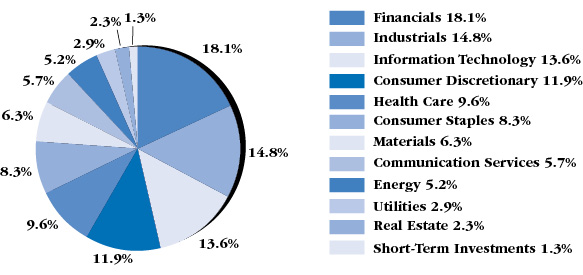
PORTFOLIO SECTOR WEIGHTING†
(As of June 30, 2019)

† | Based on percent of the Portfolio’s total investments in securities at value. Includes investments held as collateral for securities on loan (see Note 7 in Notes to Financial Statements). |
8
Small Company Growth Portfolio Commentary (Unaudited) | 
|
INVESTMENT CLASS SHARES
Average Annual Total Returns*
Six Months Ended 6/30/19** | 20.54% |
One Year Ended 6/30/19 | 2.13% |
Five Years Ended 6/30/19 | 9.77% |
Ten Years Ended 6/30/19 | 14.99% |
INSTITUTIONAL CLASS SHARES
Average Annual Total Returns*
Six Months Ended 6/30/19** | 20.72% |
One Year Ended 6/30/19 | 2.41% |
Five Years Ended 6/30/19 | 10.07% |
Ten Years Ended 6/30/19 | 15.29% |
RUSSELL 2000® GROWTH INDEX(1)
Average Annual Total Returns
Six Months Ended 6/30/19** | 20.36% |
One Year Ended 6/30/19 | (0.49%) |
Five Years Ended 6/30/19 | 8.63% |
Ten Years Ended 6/30/19 | 14.41% |
The performance data quoted represents past performance and does not guarantee future results. Current performance may be lower or higher. Performance data current to the most recent month end may be obtained at http://advisor.wilshire.com. The investment return and principal value of an investment will fluctuate so that shares, when redeemed, may be worth more or less than their original cost. The table above does not reflect the deduction of taxes that a shareholder would pay on Portfolio distributions or the redemption of Portfolio shares.
* | During the ten years ended June 30, 2019, certain fees and expenses were reduced or reimbursed. Without fee reductions and expense reimbursements (excluding fees paid indirectly), historical total returns would have been lower. For the six months ended June 30, 2019, the investment adviser reduced its fees or reimbursed expenses in the annualized amount of 0.21% and 0.19% of average net assets for Investment Class Shares and Institutional Class Shares, respectively. |
** | Not annualized. |
(1) | The Russell 2000® Growth Index is an unmanaged index that measures the performance of the 2,000 smallest U.S. companies with higher price-to-book ratios and higher forecasted growth values. Index performance is presented for general comparative purposes. Unlike a mutual fund, the performance of an index assumes no transaction costs, management fees or other expenses. An individual cannot directly invest in any index. |
9
Small Company Growth Portfolio Commentary (Unaudited) - (Continued) | 
|
The Wilshire 5000 Total Market IndexSM returned 18.66% for the first half of the year. Global equities reached new highs, albeit with a heightened degree of market volatility. The dovish tone of global central banks has boosted the rally in equities, resulting in a significant decline in global government bond yields. U.S. growth continues to outpace major foreign developed economies, as Gross Domestic Product (“GDP”) in the first half of the year outperformed expectations due to strength in Personal Consumption Expenditures. However, the recent decline in Gross Private Domestic Investment has weighed on GDP growth, which may be an indicator of declining businesses sentiment and lack of willingness to spend due to uncertainty regarding the business cycle and trade.
Sector returns for the Wilshire 5000 Total Market Index were all positive for the first half of 2019. Information Technology (+27.55%), Industrials (+21.92%) and Consumer Discretionary (+19.90%) were the best performing sectors while Health Care (9.99%) and Energy (+11.94%) were the laggards. Large capitalization stocks outperformed small capitalization stocks with the Wilshire U.S. Large-Cap IndexSM returning 18.74% versus 17.85% for the Wilshire U.S. Small-Cap IndexSM. Year to date, Growth has outperformed Value.
Although U.S. real estate securities underperformed broader equities during the quarter ended June 30, 2019, they are still experiencing a surge for the year. Global real estate securities are up double-digits for the year as well. Commodity results were negative for the quarter as crude oil fell -2.8% to $58.47 per barrel. Natural gas prices were down -13.3%, ending the quarter at $2.31 per million BTUs. MLPs were modestly positive for the quarter (+0.12%) but are up significantly for the year. Gold prices finished at approximately $1,414 per troy ounce, up +9.3% from last quarter.
The Wilshire Small Company Growth Portfolio - Institutional Class returned 20.72% in 2019, outperforming the Russell 2000 Growth Index return of 20.36% by 0.36%. Stock selection within Health Care and Information Technology, and sector allocation to Consumer Staples were detractive. Conversely, the Portfolio benefited from sector allocation in Information Technology, as well as from strong stock selection within Financials and Consumer Discretionary.
We are pleased with the Portfolio’s outperformance for the first half of 2019 and believe that the Portfolio is well-positioned going into the second half of 2019 as the market deals with ongoing macroeconomic and geopolitical issues.
10
Small Company Growth Portfolio Commentary (Unaudited) - (Continued) | 
|
PORTFOLIO SECTOR WEIGHTING†
(As of June 30, 2019)

† | Based on percent of the Portfolio’s total investments in securities at value. Includes investments held as collateral for securities on loan (see Note 7 in Notes to Financial Statements). |
11
Small Company Value Portfolio Commentary (Unaudited) | 
|
INVESTMENT CLASS SHARES
Average Annual Total Returns*
Six Months Ended 6/30/19** | 14.29% |
One Year Ended 6/30/19 | (8.88%) |
Five Years Ended 6/30/19 | 5.00% |
Ten Years Ended 6/30/19 | 12.71% |
INSTITUTIONAL CLASS SHARES
Average Annual Total Returns*
Six Months Ended 6/30/19** | 14.41% |
One Year Ended 6/30/19 | (8.68%) |
Five Years Ended 6/30/19 | 5.28% |
Ten Years Ended 6/30/19 | 13.02% |
RUSSELL 2000® VALUE INDEX(1)
Average Annual Total Returns
Six Months Ended 6/30/19** | 13.47% |
One Year Ended 6/30/19 | (6.24%) |
Five Years Ended 6/30/19 | 5.39% |
Ten Years Ended 6/30/19 | 12.40% |
The performance data quoted represents past performance and does not guarantee future results. Current performance may be lower or higher. Performance data current to the most recent month end may be obtained at http://advisor.wilshire.com. The investment return and principal value of an investment will fluctuate so that shares, when redeemed, may be worth more or less than their original cost. The table above does not reflect the deduction of taxes that a shareholder would pay on Portfolio distributions or the redemption of Portfolio shares.
* | During the ten years ended June 30, 2019, certain fees and expenses were reduced or reimbursed. Without fee reductions and expense reimbursements (excluding fees paid indirectly), historical total returns would have been lower. For the six months ended June 30, 2019, the investment adviser reduced its fees or reimbursed expenses in the annualized amount of 0.25% and 0.21% of average net assets for Investment Class Shares and Institutional Class Shares, respectively. |
** | Not annualized. |
(1) | The Russell 2000® Value Index is an unmanaged index that measures the performance of the 2,000 smallest U.S. companies with lower price-to-book ratios and lower forecasted growth values. Index performance is presented for general comparative purposes. Unlike a mutual fund, the performance of an index assumes no transaction costs, management fees or other expenses. An individual cannot directly invest in any index. |
12
Small Company Value Portfolio Commentary (Unaudited) - (Continued) | 
|
The Wilshire 5000 Total Market IndexSM returned 18.66% for the first half of the year. Global equities reached new highs, albeit with a heightened degree of market volatility. The dovish tone of global central banks has boosted the rally in equities, resulting in a significant decline in global government bond yields. U.S. growth continues to outpace major foreign developed economies, as Gross Domestic Product (“GDP”) in the first half of the year outperformed expectations due to strength in Personal Consumption Expenditures. However, the recent decline in Gross Private Domestic Investment has weighed on GDP growth, which may be an indicator of declining businesses sentiment and lack of willingness to spend due to uncertainty regarding the business cycle and trade.
Sector returns for the Wilshire 5000 Total Market Index were all positive for the first half of 2019. Information Technology (+27.55%), Industrials (+21.92%) and Consumer Discretionary (+19.90%) were the best performing sectors while Health Care (9.99%) and Energy (+11.94%) were the laggards. Large capitalization stocks outperformed small capitalization stocks with the Wilshire U.S. Large-Cap IndexSM returning 18.74% versus 17.85% for the Wilshire U.S. Small-Cap IndexSM. Year to date, Growth has outperformed Value.
Although U.S. real estate securities underperformed broader equities during the quarter ended June 30, 2019, they are still experiencing a surge for the year. Global real estate securities are up double-digits for the year as well. Commodity results were negative for the quarter as crude oil fell -2.8% to $58.47 per barrel. Natural gas prices were down -13.3%, ending the quarter at $2.31 per million BTUs. MLPs were modestly positive for the quarter (+0.12%) but are up significantly for the year. Gold prices finished at approximately $1,414 per troy ounce, up +9.3% from last quarter.
The Wilshire Small Company Value Portfolio - Institutional Class returned 14.41% in 2019, outperforming the Russell 2000 Value Index return of 13.47% by 0.94%. The Fund benefited from stock selection within Industrials and Financials as well as overweight to Industrials. However, performance was weighed down by weak stock selection within Energy and Health Care.
We are pleased with the Portfolio’s outperformance for the first half of 2019 and believe that the Portfolio is well-positioned going into the second half of 2019 as the market deals with ongoing macroeconomic and geopolitical issues.
13
Small Company Value Portfolio Commentary (Unaudited) - (Continued) | 
|
PORTFOLIO SECTOR WEIGHTING†
(As of June 30, 2019)

† | Based on percent of the Portfolio’s total investments in securities at value. Includes investments held as collateral for securities on loan (see Note 7 in Notes to Financial Statements). |
14
Wilshire 5000 Indexsm Fund Commentary (Unaudited) | 
|
INVESTMENT CLASS SHARES
Average Annual Total Returns
Six Months Ended 6/30/19* | 17.87% |
One Year Ended 6/30/19 | 8.35% |
Five Years Ended 6/30/19 | 9.60% |
Ten Years Ended 6/30/19 | 13.97% |
INSTITUTIONAL CLASS SHARES
Average Annual Total Returns
Six Months Ended 6/30/19* | 18.03% |
One Year Ended 6/30/19 | 8.72% |
Five Years Ended 6/30/19 | 9.90% |
Ten Years Ended 6/30/19 | 14.25% |
WILSHIRE 5000 INDEXSM(1)
Average Annual Total Returns
Six Months Ended 6/30/19* | 18.66% |
One Year Ended 6/30/19 | 9.09% |
Five Years Ended 6/30/19 | 10.33% |
Ten Years Ended 6/30/19 | 14.66% |
The performance data quoted represents past performance and does not guarantee future results. Current performance may be lower or higher. Performance data current to the most recent month end may be obtained at http://advisor.wilshire.com. The investment return and principal value of an investment will fluctuate so that shares, when redeemed, may be worth more or less than their original cost. The table above does not reflect the deduction of taxes that a shareholder would pay on Fund distributions or the redemption of Fund shares.
* | Not annualized. |
(1) | The Wilshire 5000 IndexSM is an unmanaged index that measures the performance of all U.S. headquartered equity securities with readily available price data. Index performance is presented for general comparative purposes. Unlike a mutual fund, the performance of an index assumes no transaction costs, management fees or other expenses. An individual cannot directly invest in any index. |
15
Wilshire 5000 Indexsm Fund Commentary (Unaudited) - (Continued) | 
|
The Wilshire 5000 Total Market IndexSM returned 18.66% for the first half of the year. Global equities reached new highs, albeit with a heightened degree of market volatility. The dovish tone of global central banks has boosted the rally in equities, resulting in a significant decline in global government bond yields. U.S. growth continues to outpace major foreign developed economies, as Gross Domestic Product (“GDP”) in the first half of the year outperformed expectations due to strength in Personal Consumption Expenditures. However, the recent decline in Gross Private Domestic Investment has weighed on GDP growth, which may be an indicator of declining businesses sentiment and lack of willingness to spend due to uncertainty regarding the business cycle and trade.
Outside of the United States, equities also performed well. The MSCI All Country World ex-U.S. Index returned 13.60% for the year-to-date period through June 30. Despite signs of stability, the U.K. and Europe both face cyclical and structural risks to economic growth, due to geopolitical uncertainty and the challenges associated with implementing a unified monetary policy across misaligned economies, respectively. In particular, the European Central Bank has acknowledged this issue and has communicated the willingness to be very supportive of growth through monetary stimulus. The MSCI Emerging Markets Index returned 10.59% during the period as trade war and lower earnings expectations weighed on export-driven economies.
Sector returns for the Wilshire 5000 Total Market Index were all positive for the first half of 2019. Information Technology (+27.55%), Industrials (+21.92%) and Consumer Discretionary (+19.90%) were the best performing sectors while Health Care (9.99%) and Energy (+11.94%) were the laggards. Large capitalization stocks outperformed small capitalization stocks with the Wilshire U.S. Large-Cap IndexSM returning 18.74% versus 17.85% for the Wilshire U.S. Small-Cap IndexSM. Year to date, Growth has outperformed Value.
Although U.S. real estate securities underperformed broader equities during the quarter ended June 30, 2019, they are still experiencing a surge for the year. Global real estate securities are up double-digits for the year as well. Commodity results were negative for the quarter as crude oil fell -2.8% to $58.47 per barrel. Natural gas prices were down -13.3%, ending the quarter at $2.31 per million BTUs. MLPs were modestly positive for the quarter (+0.12%) but are up significantly for the year. Gold prices finished at approximately $1,414 per troy ounce, up +9.3% from last quarter.
The Wilshire 5000 Index Fund - Institutional Class returned 18.03% in 2019, underperforming the Wilshire 5000 Index return of 18.66% by 0.63%. Relative underperformance is attributable to Fund expenses and is well within the historical range.
16
Wilshire 5000 Indexsm Fund Commentary (Unaudited) - (Continued) | 
|
PORTFOLIO SECTOR WEIGHTING†
(As of June 30, 2019)
† | Based on percent of the Portfolio’s total investments in securities at value. Includes investments held as collateral for securities on loan (see Note 7 in Notes to Financial Statements). |
17
Wilshire International Equity Fund Commentary (Unaudited) | 
|
INVESTMENT CLASS SHARES
Average Annual Total Returns*
Six Months Ended 6/30/19** | 14.06% |
One Year Ended 6/30/19 | 1.90% |
Five Years Ended 6/30/19 | 2.72% |
Ten Years Ended 6/30/19 | 7.62% |
INSTITUTIONAL CLASS SHARES
Average Annual Total Returns*
Six Months Ended 6/30/19** | 14.15% |
One Year Ended 6/30/19 | 2.23% |
Five Years Ended 6/30/19 | 2.98% |
Ten Years Ended 6/30/19 | 7.87% |
MSCI ALL COUNTRY WORLD EX-USA INVESTABLE MARKET INDEX(1)
Average Annual Total Returns
Six Months Ended 6/30/19** | 13.33% |
One Year Ended 6/30/19 | 0.26% |
Five Years Ended 6/30/19 | 2.25% |
Ten Years Ended 6/30/19 | 6.78% |
MSCI ALL COUNTRY WORLD EX-U.S. INDEX(1)
Average Annual Total Returns
Six Months Ended 6/30/19** | 13.60% |
One Year Ended 6/30/19 | 1.29% |
Five Years Ended 6/30/19 | 2.16% |
Ten Years Ended 6/30/19 | 6.54% |
On April 2, 2013, the Wilshire International Equity Fund’s investment strategy was changed. Consequently, prior period performance may have been different if the new investment strategy had been in effect during these periods.
18
Wilshire International Equity Fund Commentary (Unaudited) - (Continued) | 
|
* | During the ten years ended June 30, 2019, certain fees and expenses were reduced or reimbursed. Without fee reductions and expense reimbursements, historical total returns would have been lower. For the six months ended June 30, 2019, the investment adviser reimbursed expenses in the annualized amount of 0.10% for Investment Class Shares. |
** | Not annualized. |
(1) | Effective June 28, 2019, the Wilshire International Equity Fund’s (the “Fund”) primary benchmark index was changed from MSCI All Country World Ex-U.S. Index (“MSCI ACWI ex-US”) to the MSCI All Country World Ex-USA Investable Market Index (the “MSCI ACWI ex-US IMI”) because the investment adviser has determined that the MSCI ACWI ex-US IMI more closely aligns with the investment strategies of the Fund. The MSCI ACWI ex-US IMI captures large, mid and small cap representation across 22 of 23 Developed Markets countries (excluding the United States) and 26 Emerging Markets countries, covering approximately 99% of the global equity investment opportunity set outside the United States. The MSCI ACWI ex-US is an unmanaged capitalization-weighted measure of stock markets of developed and emerging markets, with the exception of U.S.-based companies. Unlike a mutual fund, the performance of an index assumes no transaction costs, management fees or other expenses. An individual cannot invest directly in an index. Index performance is presented for general comparative purposes. |
19
Wilshire International Equity Fund Commentary (Unaudited) - (Continued) | 
|
Outside of the United States, equities performed well. The MSCI All Country World ex-U.S. Index returned 13.60% for the year-to-date period through June 30. Despite signs of stability, the U.K. and Europe both face cyclical and structural risks to economic growth, due to geopolitical uncertainty and the challenges associated with implementing a unified monetary policy across misaligned economies, respectively. In particular, the European Central Bank has acknowledged this issue and has communicated the willingness to be very supportive of growth through monetary stimulus. The MSCI Emerging Markets Index returned 10.59% during the period as trade war and lower earnings expectations weighed on export-driven economies.
The Wilshire International Equity Fund - Institutional Class returned 14.15% in 2019, outperforming the MSCI All Country World ex-USA Investable Market Index return of 13.33% by 0.82%. Performance was weighed down by weak stock selection in Energy and Utilities as well as sector allocation regional selection in Canada. Conversely, strong stock selection within Consumer Discretionary, Industrials and Information Technology were contributive to returns. Additionally, an overweight to Information Technology aided relative performance.
We are pleased with the Fund’s relative outperformance for 2019 and believe that the Fund is well-positioned going into the second half of 2019 as the market deals with ongoing macroeconomic and geopolitical issues.
20
Wilshire International Equity Fund Commentary (Unaudited) - (Continued) | 
|
PORTFOLIO SECTOR WEIGHTING†
(As of June 30, 2019)
† | Based on percent of the Portfolio’s total investments in securities at value. Includes investments held as collateral for securities on loan (see Note 7 in Notes to Financial Statements). |
21
Wilshire Income Opportunities Fund Commentary (Unaudited) | 
|
INVESTMENT CLASS SHARES
Average Annual Total Returns*
Six Months Ended 6/30/19** | 7.42% |
One Year Ended 6/30/19 | 6.83% |
Inception (03/30/16) through 6/30/19 | 4.98% |
INSTITUTIONAL CLASS SHARES
Average Annual Total Returns
Six Months Ended 6/30/19** | 7.60% |
One Year Ended 6/30/19 | 7.14% |
Inception (03/30/16) through 6/30/19 | 5.15% |
Bloomberg Barclays U.S. Universal Index(1)
Average Annual Total Returns
Six Months Ended 6/30/19** | 6.54% |
One Year Ended 6/30/19 | 8.07% |
Inception (03/30/16) through 6/30/19 | 3.48% |
* | During certain periods since inception, certain fees and expenses were reduced or reimbursed. Without fee reductions and expense reimbursements, historical returns would have been lower. For the six months ended June 30, 2019, the investment adviser reimbursed expenses in the annualized amount of 0.08% for Investment Class Shares. |
** | Not annualized. |
(1) | The Bloomberg Barclays U.S. Universal Index represents the union of the U.S. Aggregate Index, U.S. Corporate High Yield Index, Investment Grade 144A Index, Eurodollar Index, U.S. Emerging Markets Index, and the non-ERISA eligible portion of the CMBS Index. The index covers USD-denominated, taxable bonds that are rated either investment grade or high-yield. Some U.S. Universal Index constituents may be eligible for one or more of its contributing subcomponents that are not mutually exclusive. The Bloomberg Barclays U.S. Universal Index includes Treasury securities, Government agency bonds, mortgage-backed bonds, corporate bonds, and a small amount of foreign bonds traded in U.S. |
22
Wilshire Income Opportunities Fund Commentary (Unaudited) - (Continued) | 
|
The Bloomberg Barclays US Aggregate Bond Index returned 6.11% for the first six months of the year as the U.S. Treasury yield curve fell across all maturities, particularly at the front-end of the curve. Credit spread tightened modestly in both investment grade and high yield markets with the Bloomberg Barclays Long Government/Credit Index and the Bloomberg Barclays US Corporate High Yield Index returned 13.46% and 9.94%, respectively. Globally, the trend of declining inflation across developed markets since mid-2018 has persisted into 2019. At the same time, inflation in emerging markets is well below historic levels, albeit higher than developed markets. This trend has fueled a dovish change in sentiment and central bank rhetoric on a global basis, including but not limited to the European Central Bank, Bank of Korea, Bank of Japan, and the U.S. Federal Reserve, all of which are communicating plans for monetary stimulus.
The Wilshire Income Opportunities Fund - Institutional Class returned 7.60% for the first six months of the year, outperforming the Bloomberg Barclays U.S. Universal Index return of 6.54% by 1.06%. Exposures to emerging market debt, investment grade and high yield issues were positive contributors to performance. Allocations to bank loans weighed on relative performance.
We are pleased with the Fund’s relative outperformance for 2019 and believe that the Fund is well-positioned going into the second half of 2019 as the market deals with ongoing macroeconomic and geopolitical issues.
23
Wilshire Income Opportunities Fund Commentary (Unaudited) - (Continued) | 
|
PORTFOLIO SECTOR WEIGHTING†
(As of June 30, 2019)

† | Based on percent of the Fund’s total investments in securities at value. |
24
Wilshire Mutual Funds, Inc. Disclosure of Fund Expenses (Unaudited) | 
|
All mutual funds have operating expenses. As a shareholder of a Portfolio, you incur ongoing costs, which include costs for investment advisory, administrative services, distribution and/or shareholder services and shareholder reports (like this one), among others. Operating expenses, which are deducted from a fund’s gross income, directly reduce the investment return of the Portfolio. A Portfolio’s expenses are expressed as a percentage of its average net assets. This figure is known as the expense ratio. The following examples are intended to help you understand the ongoing fees (in dollars) of investing in the Portfolios and to compare these costs with those of other mutual funds. The examples are based on an investment of $1,000 made at the beginning of the period and held for the entire period from January 1, 2019 to June 30, 2019.
The table on the next page illustrates the Portfolios’ costs in two ways:
Actual Fund Return: This section helps you to estimate the actual expenses, after any applicable fee reductions, that you paid over the period. The “Ending Account Value” shown is derived from each Portfolio’s actual return for the period. The “Expense Ratio” column shows the period’s annualized expense ratio and the “Expenses Paid During Period” column shows the dollar amount that would have been paid by an investor who started with $1,000 in the Portfolios at the beginning of the period.
You may use the information here, together with your account value, to estimate the expenses that you paid over the period. To do so, simply divide your account value by $1,000 (for example, an $8,600 account value divided by $1,000 = 8.6), then multiply the result by the number given for the Portfolio in the first line under the heading entitled “Expenses Paid During Period.”
Hypothetical 5% Return: This section is intended to help you compare the Portfolios’ costs with those of other mutual funds. The “Ending Account Value” shown is derived from hypothetical account values and hypothetical expenses based on the Portfolio’s actual expense ratio and assumed rate of return. It assumes that each Portfolio had an annual return of 5% before expenses, but that the expense ratio is unchanged. In this case, because the return used is not each Portfolio’s actual return, the results do not apply to your investment. This example is useful in making comparisons to other mutual funds because the U.S. Securities and Exchange Commission (“SEC”) requires all mutual funds to calculate expenses based on an assumed 5% annual return. You can assess the Portfolios’ ongoing costs by comparing this hypothetical example with the hypothetical examples that appear in shareholder reports of other funds.
Please note that the expenses shown in the table are meant to highlight and help you compare your ongoing costs only and do not reflect any transactional costs such as sales charges (loads), redemption fees, or exchange fees. Wilshire Mutual Funds, Inc. has no such charges, but these may be present in other funds to which you compare this data. Therefore, the hypothetical portions of the table are useful in comparing ongoing costs only, and will not help you determine the relative total costs of owning different funds.
25
Wilshire Mutual Funds, Inc. Disclosure of Fund Expenses (Unaudited) - (Continued) | 
|
| | Beginning
Account
Value
01/01/2019 | Ending
Account
Value
06/30/2019 | Net
Expense
Ratio(1) | Expenses
Paid During Period
01/01/19-06/30/19(2) |
Large Company Growth Portfolio |
Based on Actual Fund Return | | | | |
Investment Class | $ 1,000.00 | $ 1,205.20 | 1.30% | $ 7.11 |
Institutional Class | $ 1,000.00 | $ 1,207.10 | 1.00% | $ 5.47 |
Based on Hypothetical 5% Return | | | | |
Investment Class | $ 1,000.00 | $ 1,018.35 | 1.30% | $ 6.51 |
Institutional Class | $ 1,000.00 | $ 1,019.84 | 1.00% | $ 5.01 |
Large Company Value Portfolio |
Based on Actual Fund Return | | | | |
Investment Class | $ 1,000.00 | $ 1,141.10 | 1.26% | $ 6.69 |
Institutional Class | $ 1,000.00 | $ 1,142.90 | 0.99% | $ 5.26 |
Based on Hypothetical 5% Return | | | | |
Investment Class | $ 1,000.00 | $ 1,018.55 | 1.26% | $ 6.31 |
Institutional Class | $ 1,000.00 | $ 1,019.89 | 0.99% | $ 4.96 |
Small Company Growth Portfolio |
Based on Actual Fund Return | | | | |
Investment Class | $ 1,000.00 | $ 1,205.40 | 1.33% | $ 7.27 |
Institutional Class | $ 1,000.00 | $ 1,207.20 | 1.08% | $ 5.91 |
Based on Hypothetical 5% Return | | | | |
Investment Class | $ 1,000.00 | $ 1,018.20 | 1.33% | $ 6.66 |
Institutional Class | $ 1,000.00 | $ 1,019.44 | 1.08% | $ 5.41 |
Small Company Value Portfolio |
Based on Actual Fund Return | | | | |
Investment Class | $ 1,000.00 | $ 1,142.90 | 1.34% | $ 7.12 |
Institutional Class | $ 1,000.00 | $ 1,144.10 | 1.09% | $ 5.79 |
Based on Hypothetical 5% Return | | | | |
Investment Class | $ 1,000.00 | $ 1,018.15 | 1.34% | $ 6.71 |
Institutional Class | $ 1,000.00 | $ 1,019.39 | 1.09% | $ 5.46 |
26
Wilshire Mutual Funds, Inc. Disclosure of Fund Expenses (Unaudited) - (Continued) | 
|
| | Beginning
Account
Value
01/01/2019 | Ending
Account
Value
06/30/2019 | Net
Expense
Ratio(1) | Expenses
Paid During Period
01/01/19-06/30/19(2) |
Wilshire 5000 IndexSM Fund |
Based on Actual Fund Return | | | | |
Investment Class | $ 1,000.00 | $ 1,178.70 | 0.61% | $ 3.30 |
Institutional Class | $ 1,000.00 | $ 1,180.30 | 0.33% | $ 1.78 |
Based on Hypothetical 5% Return | | | | |
Investment Class | $ 1,000.00 | $ 1,021.77 | 0.61% | $ 3.06 |
Institutional Class | $ 1,000.00 | $ 1,023.16 | 0.33% | $ 1.66 |
Wilshire International Equity Fund |
Based on Actual Fund Return | | | | |
Investment Class | $ 1,000.00 | $ 1,140.60 | 1.52% | $ 8.07 |
Institutional Class | $ 1,000.00 | $ 1,141.50 | 1.27% | $ 6.74 |
Based on Hypothetical 5% Return | | | | |
Investment Class | $ 1,000.00 | $ 1,017.26 | 1.52% | $ 7.60 |
Institutional Class | $ 1,000.00 | $ 1,018.50 | 1.27% | $ 6.36 |
Wilshire Income Opportunities Fund |
Based on Actual Fund Return | | | | |
Investment Class | $ 1,000.00 | $ 1,074.20 | 1.19% | $ 6.12 |
Institutional Class | $ 1,000.00 | $ 1,076.00 | 0.92% | $ 4.74 |
Based on Hypothetical 5% Return | | | | |
Investment Class | $ 1,000.00 | $ 1,018.89 | 1.19% | $ 5.96 |
Institutional Class | $ 1,000.00 | $ 1,020.23 | 0.92% | $ 4.61 |
(1) | Annualized, based on the Portfolio’s most recent fiscal half-year expenses. |
(2) | Expenses are equal to the Portfolio’s annualized net expense ratio multiplied by the average account value over the period, multiplied by 181/365 (to reflect the one-half year period. |
27
Wilshire Mutual Funds, Inc. Large Company Growth Portfolio Condensed Schedule of Investments | June 30, 2019
(Unaudited) | 
|
| | | Shares | | | Value | |
COMMON STOCKS — 99.3%(a) |
Communication Services — 11.4% |
Alphabet, Inc. - Class A(b) | | | 3,119 | | | $ | 3,377,253 | |
Alphabet, Inc. - Class C(b) | | | 6,204 | | | | 6,705,966 | |
Facebook, Inc. - Class A(b) | | | 56,594 | | | | 10,922,642 | |
Netflix, Inc.(b) | | | 8,004 | | | | 2,940,029 | |
Other Securities(c) (d) | | | | | | | 441,686 | |
| | | | | | | | 24,387,576 | |
Consumer Discretionary — 18.6% | | | | | | | | |
Alibaba Group Holding Ltd. - ADR(b) | | | 40,153 | | | | 6,803,926 | |
Amazon.com, Inc.(b) | | | 7,217 | | | | 13,666,327 | |
Burlington Stores, Inc.(b) | | | 11,636 | | | | 1,979,865 | |
lululemon athletica, inc.(b) | | | 13,908 | | | | 2,506,361 | |
Starbucks Corp. | | | 37,062 | | | | 3,106,908 | |
Ulta Beauty, Inc.(b) | | | 7,752 | | | | 2,689,091 | |
Yum China Holdings, Inc. | | | 33,685 | | | | 1,556,247 | |
Yum! Brands, Inc. | | | 16,002 | | | | 1,770,941 | |
Other Securities(c) (d) | | | | | | | 5,563,600 | |
| | | | | | | | 39,643,266 | |
Consumer Staples — 6.4% | | | | | | | | |
Coca-Cola Co. (The) | | | 50,007 | | | | 2,546,356 | |
Colgate-Palmolive Co. | | | 22,495 | | | | 1,612,217 | |
Danone S.A. - ADR(d) | | | 127,086 | | | | 2,151,566 | |
Monster Beverage Corp.(b) | | | 53,528 | | | | 3,416,693 | |
Procter & Gamble Co. (The) | | | 20,660 | | | | 2,265,368 | |
Other Securities(c) | | | | | | | 1,671,394 | |
| | | | | | | | 13,663,594 | |
Energy — 0.5% | | | | | | | | |
Other Securities(c) | | | | | | | 1,136,723 | |
| | | | | | | | | |
Financials — 4.6% | | | | | | | | |
CME Group, Inc. | | | 8,590 | | | | 1,667,406 | |
FactSet Research Systems, Inc. | | | 5,202 | | | | 1,490,686 | |
SEI Investments Co. | | | 29,124 | | | | 1,633,857 | |
Other Securities(c) | | | | | | | 5,058,975 | |
| | | | | | | | 9,850,924 | |
Health Care — 17.1% | | | | | | | | |
ABIOMED, Inc.(b) | | | 7,002 | | | | 1,823,951 | |
Alexion Pharmaceuticals, Inc.(b) | | | 21,260 | | | | 2,784,634 | |
Align Technology, Inc.(b) | | | 8,373 | | | | 2,291,689 | |
Cerner Corp. | | | 27,854 | | | | 2,041,698 | |
Edwards Lifesciences Corp.(b) | | | 9,800 | | | | 1,810,452 | |
Illumina, Inc.(b) | | | 6,818 | | | | 2,510,047 | |
Novo Nordisk A/S - ADR | | | 40,082 | | | | 2,045,785 | |
Regeneron Pharmaceuticals, Inc.(b) | | | 6,104 | | | | 1,910,552 | |
UnitedHealth Group, Inc. | | | 13,397 | | | | 3,269,002 | |
Varian Medical Systems, Inc.(b) | | | 10,822 | | | | 1,473,199 | |
Veeva Systems, Inc. - Class A(b) | | | 13,955 | | | | 2,262,245 | |
Zoetis, Inc. | | | 27,920 | | | | 3,168,642 | |
Other Securities(c) (d) | | | | | | | 9,016,746 | |
| | | | | | | | 36,408,642 | |
Industrials — 6.9% | | | | | | | | |
CoStar Group, Inc.(b) | | | 2,968 | | | | 1,644,450 | |
Deere & Co. | | | 12,065 | | | | 1,999,292 | |
Expeditors International of Washington, Inc. | | | 28,081 | | | | 2,130,225 | |
Union Pacific Corp. | | | 12,994 | | | | 2,197,415 | |
Other Securities(c) (d) | | | | | | | 6,702,745 | |
| | | | | | | | 14,674,127 | |
Information Technology — 33.0% | | | | | | | | |
Apple, Inc. | | | 22,292 | | | | 4,412,033 | |
Autodesk, Inc.(b) | | | 21,093 | | | | 3,436,050 | |
Cisco Systems, Inc. | | | 49,417 | | | | 2,704,593 | |
EPAM Systems, Inc.(b) | | | 10,380 | | | | 1,796,777 | |
Keysight Technologies, Inc.(b) | | | 17,355 | | | | 1,558,652 | |
Microsoft Corp. | | | 54,643 | | | | 7,319,976 | |
NVIDIA Corp. | | | 26,166 | | | | 4,297,243 | |
Oracle Corp. | | | 80,359 | | | | 4,578,052 | |
PayPal Holdings, Inc.(b) | | | 32,147 | | | | 3,679,545 | |
PTC, Inc.(b) | | | 18,119 | | | | 1,626,361 | |
QUALCOMM, Inc. | | | 33,300 | | | | 2,533,131 | |
salesforce.com, inc.(b) | | | 20,640 | | | | 3,131,707 | |
ServiceNow, Inc.(b) | | | 12,760 | | | | 3,503,513 | |
Visa, Inc. - Class A(d) | | | 66,713 | | | | 11,578,040 | |
Workday, Inc. - Class A(b) | | | 10,655 | | | | 2,190,455 | |
Other Securities(c) (d) | | | | | | | 12,091,511 | |
| | | | | | | | 70,437,639 | |
Materials — 0.1% | | | | | | | | |
Other Securities(c) (d) | | | | | | | 214,005 | |
| | | | | | | | | |
Real Estate — 0.7% | | | | | | | | |
Other Securities(c) (d) | | | | | | | 1,510,699 | |
| | | | | | | | | |
Total Common Stocks(Cost $126,444,241) | | | | | | $ | 211,927,195 | |
See Notes to Financial Statements.
28
Wilshire Mutual Funds, Inc. Large Company Growth Portfolio Condensed Schedule of Investments - (Continued) | June 30, 2019
(Unaudited) | 
|
| | | Shares | | | Value | |
MONEY MARKET FUNDS — 1.1% |
Northern Trust Institutional Government Select Portfolio - Institutional Class, 2.24%(e) | | | 1,758,447 | | | $ | 1,758,447 | |
Northern Trust Institutional Liquid Asset Portfolio - Institutional Class, 2.36%(e) (f) | | | 565,233 | | | | 565,233 | |
Total Money Market Funds(Cost $2,323,680) | | | | | | $ | 2,323,680 | |
| | | | | | | | | |
Total Investments at Value — 100.4%(Cost $128,767,921) | | $ | 214,250,875 | |
| | | | | | | | | |
Liabilities in Excess of Other Assets — (0.4%) | | | (775,680 | ) |
| | | | | | | | | |
Net Assets — 100.0% | | | | | | $ | 213,475,195 | |
The Condensed Schedule of Investments does not reflect the complete portfolio holdings. It includes the Portfolio’s 50 largest holdings and each investment of any issue that exceeds 1% of the Portfolio’s net assets. “Other Securities” represent all issues not required to be disclosed under the rules adopted by the U.S. Securities and Exchange commission (“SEC”). The complete schedule of portfolio holdings is available (i) without charge, upon request, by calling (866) 591-1568; (ii) on the SEC’s website at www.sec.gov; and (iii) on our website at http://advisor.wilshire.com.
ADR — American Depositary Receipt.
(a) | More narrow industries are utilized for compliance purposes, whereas broad sectors are utilized for reporting purposes. |
(b) | Non-income producing security. |
(c) | Represents issuers not identified as a top 50 holding in terms of market value and issues or issuers not exceeding 1% of net assets individually or in the aggregate, respectively, as of June 30, 2019. |
(d) | This security or a partial position of this security is on loan at June 30, 2019. The total market value of securities on loan at June 30, 2019 was $14,049,802 (Note 7). |
(e) | The rate shown is the 7-day effective yield as of June 30, 2019. |
(f) | This security was purchased with cash collateral held from securities on loan. The total value of such securities as of June 30, 2019 was $565,233. Securities on loan are also collateralized by various U.S. Treasury obligations in the amount of $13,619,670 (Note 7). |
See Notes to Financial Statements.
29
Wilshire Mutual Funds, Inc. Large Company Value Portfolio Condensed Schedule of Investments | June 30, 2019
(Unaudited) | 
|
| | | Shares | | | Value | |
COMMON STOCKS — 98.5%(a) |
Communication Services — 5.5% |
AT&T, Inc. | | | 103,172 | | | $ | 3,457,293 | |
Comcast Corp. - Class A | | | 53,924 | | | | 2,279,907 | |
Verizon Communications, Inc. | | | 32,974 | | | | 1,883,805 | |
Other Securities(b) | | | | | | | 2,969,278 | |
| | | | | | | | 10,590,283 | |
Consumer Discretionary — 9.5% | | | | | | | | |
Ford Motor Co. | | | 229,062 | | | | 2,343,304 | |
Lear Corp. | | | 15,454 | | | | 2,152,278 | |
Lowe’s Cos., Inc. | | | 15,119 | | | | 1,525,658 | |
Mohawk Industries, Inc.(c) | | | 10,078 | | | | 1,486,203 | |
Target Corp. | | | 27,573 | | | | 2,388,098 | |
Other Securities(b) (d) | | | | | | | 8,262,580 | |
| | | | | | | | 18,158,121 | |
Consumer Staples — 4.0% | | | | | | | | |
Philip Morris International, Inc. | | | 22,963 | | | | 1,803,284 | |
Walmart, Inc. | | | 17,751 | | | | 1,961,308 | |
Other Securities(b) | | | | | | | 3,862,285 | |
| | | | | | | | 7,626,877 | |
Energy — 10.1% | | | | | | | | |
BP plc - ADR | | | 45,459 | | | | 1,895,640 | |
EOG Resources, Inc. | | | 19,852 | | | | 1,849,412 | |
Exxon Mobil Corp. | | | 33,157 | | | | 2,540,821 | |
Halliburton Co. | | | 76,373 | | | | 1,736,722 | |
National Oilwell Varco, Inc. | | | 81,943 | | | | 1,821,594 | |
Phillips 66 | | | 20,692 | | | | 1,935,530 | |
Royal Dutch Shell plc - Class A - ADR | | | 22,295 | | | | 1,450,736 | |
Schlumberger Ltd. | | | 42,142 | | | | 1,674,723 | |
Other Securities(b) (d) | | | | | | | 4,308,277 | |
| | | | | | | | 19,213,455 | |
Financials — 27.0% | | | | | | | | |
American International Group, Inc. | | | 46,735 | | | | 2,490,040 | |
AXA Equitable Holdings, Inc. | | | 78,734 | | | | 1,645,540 | |
Bank of America Corp. | | | 173,460 | | | | 5,030,339 | |
Capital One Financial Corp. | | | 26,591 | | | | 2,412,867 | |
Chubb Ltd. | | | 13,668 | | | | 2,013,159 | |
Citigroup, Inc. | | | 41,006 | | | | 2,871,650 | |
JPMorgan Chase & Co. | | | 39,010 | | | | 4,361,318 | |
MetLife, Inc. | | | 40,355 | | | | 2,004,433 | |
Morgan Stanley | | | 43,345 | | | | 1,898,944 | |
Northern Trust Corp. | | | 17,291 | | | | 1,556,190 | |
U.S. Bancorp | | | 39,411 | | | | 2,065,136 | |
Wells Fargo & Co. | | | 98,337 | | | | 4,653,306 | |
Other Securities(b) (d) | | | | | | | 18,493,943 | |
| | | | | | | | 51,496,865 | |
Health Care — 11.4% | | | | | | | | |
CVS Health Corp. | | | 37,221 | | | | 2,028,173 | |
Johnson & Johnson | | | 19,141 | | | | 2,665,958 | |
McKesson Corp. | | | 11,395 | | | | 1,531,374 | |
Medtronic plc | | | 19,461 | | | | 1,895,306 | |
Merck & Co., Inc. | | | 23,959 | | | | 2,008,962 | |
Pfizer, Inc. | | | 45,640 | | | | 1,977,125 | |
Other Securities(b) | | | | | | | 9,602,155 | |
| | | | | | | | 21,709,053 | |
Industrials — 10.7% | | | | | | | | |
General Electric Co. | | | 463,629 | | | | 4,868,105 | |
Stanley Black & Decker, Inc. | | | 18,689 | | | | 2,702,617 | |
United Technologies Corp. | | | 12,301 | | | | 1,601,590 | |
Westinghouse Air Brake Technologies Corp.(d) | | | 23,227 | | | | 1,666,771 | |
Other Securities(b) | | | | | | | 9,539,085 | |
| | | | | | | | 20,378,168 | |
Information Technology — 8.4% | | | | | | | | |
Cognizant Technology Solutions Corp. - Class A | | | 25,602 | | | | 1,622,910 | |
Hewlett Packard Enterprise Co. | | | 114,735 | | | | 1,715,288 | |
International Business Machines Corp. | | | 10,964 | | | | 1,511,936 | |
Oracle Corp. | | | 71,045 | | | | 4,047,434 | |
QUALCOMM, Inc. | | | 21,671 | | | | 1,648,512 | |
Other Securities(b) (d) | | | | | | | 5,507,012 | |
| | | | | | | | 16,053,092 | |
Materials — 2.7% | | | | | | | | |
Linde plc | | | 11,926 | | | | 2,394,740 | |
Other Securities(b) (d) | | | | | | | 2,792,622 | |
| | | | | | | | 5,187,362 | |
Real Estate — 2.8% | | | | | | | | |
HCP, Inc.(d) | | | 61,673 | | | | 1,972,302 | |
Other Securities(b) (d) | | | | | | | 3,443,151 | |
| | | | | | | | 5,415,453 | |
Utilities — 6.4% | | | | | | | | |
Dominion Energy, Inc. | | | 32,772 | | | | 2,533,931 | |
Edison International | | | 23,541 | | | | 1,586,899 | |
Entergy Corp. | | | 28,448 | | | | 2,928,152 | |
Exelon Corp. | | | 45,735 | | | | 2,192,536 | |
See Notes to Financial Statements.
30
Wilshire Mutual Funds, Inc. Large Company Value Portfolio Condensed Schedule of Investments - (Continued) | June 30, 2019
(Unaudited) | 
|
| | | Shares | | | Value | |
COMMON STOCKS — 98.5%(a) (Continued) |
Utilities — 6.4% (Continued) | | | | | | | | |
Other Securities(b) | | | | | | $ | 2,882,304 | |
| | | | | | | | 12,123,822 | |
Total Common Stocks(Cost $167,855,211) | | | | | | $ | 187,952,551 | |
| | | | | | | | | |
MONEY MARKET FUNDS — 1.4% | | | | |
Northern Trust Institutional Government Select Portfolio - Institutional Class, 2.24%(e) | | | 2,508,295 | | | $ | 2,508,295 | |
Northern Trust Institutional Liquid Asset Portfolio - Institutional Class, 2.36%(e) (f) | | | 117,111 | | | | 117,111 | |
Total Money Market Funds(Cost $2,625,406) | | | | | | $ | 2,625,406 | |
| | | | | | | | | |
Total Investments at Value — 99.9%(Cost $170,480,617) | | $ | 190,577,957 | |
| | | | | | | | | |
Other Assets in Excess of Liabilities — 0.1% | | | 207,900 | |
| | | | | | | | | |
Net Assets — 100.0% | | | | | | $ | 190,785,857 | |
The Condensed Schedule of Investments does not reflect the complete portfolio holdings. It includes the Portfolio’s 50 largest holdings and each investment of any issue that exceeds 1% of the Portfolio’s net assets. “Other Securities” represent all issues not required to be disclosed under the rules adopted by the U.S. Securities and Exchange commission (“SEC”). The complete schedule of portfolio holdings is available (i) without charge, upon request, by calling (866) 591-1568; (ii) on the SEC’s website at www.sec.gov; and (iii) on our website at http://advisor.wilshire.com.
ADR — American Depositary Receipt.
(a) | More narrow industries are utilized for compliance purposes, whereas broad sectors are utilized for reporting purposes. |
(b) | Represents issuers not identified as a top 50 holding in terms of market value and issues or issuers not exceeding 1% of net assets individually or in the aggregate, respectively, as of June 30, 2019. |
(c) | Non-income producing security. |
(d) | This security or a partial position of this security is on loan at June 30, 2019. The total market value of securities on loan at June 30, 2019 was $5,634,669 (Note 7). |
(e) | The rate shown is the 7-day effective yield as of June 30, 2019. |
(f) | This security was purchased with cash collateral held from securities on loan. The total value of such securities as of June 30, 2019 was $117,111. Securities on loan are also collateralized by various U.S. Treasury obligations in the amount of $5,567,232 (Note 7). |
See Notes to Financial Statements.
31
Wilshire Mutual Funds, Inc. Small Company Growth Portfolio Condensed Schedule of Investments | June 30, 2019
(Unaudited) | 
|
| | | Shares | | | Value | |
COMMON STOCKS — 97.1%(a) |
Communication Services — 1.5% |
Cogent Communications Holdings, Inc. | | | 7,680 | | | $ | 455,884 | |
Other Securities(b) | | | | | | | 490,727 | |
| | | | | | | | 946,611 | |
Consumer Discretionary — 10.0% | | | | | | | | |
Chegg, Inc.(c) | | | 13,931 | | | | 537,598 | |
Oxford Industries, Inc.(d) | | | 6,514 | | | | 493,761 | |
Skyline Champion Corp.(c) | | | 37,410 | | | | 1,024,285 | |
Steven Madden Ltd. | | | 20,632 | | | | 700,456 | |
TopBuild Corp.(c) | | | 10,114 | | | | 837,035 | |
Other Securities(b) (d) | | | | | | | 2,709,915 | |
| | | | | | | | 6,303,050 | |
Consumer Staples — 5.7% | | | | | | | | |
Calavo Growers, Inc.(d) | | | 7,690 | | | | 743,931 | |
Inter Parfums, Inc. | | | 18,650 | | | | 1,240,039 | |
J & J Snack Foods Corp. | | | 7,433 | | | | 1,196,340 | |
Other Securities(b) (d) | | | | | | | 408,279 | |
| | | | | | | | 3,588,589 | |
Energy — 1.3% | | | | | | | | |
Select Energy Services, Inc. - Class A(c) | | | 64,480 | | | | 748,613 | |
Other Securities(b) | | | | | | | 80,548 | |
| | | | | | | | 829,161 | |
Financials — 7.4% | | | | | | | | |
Banc of California, Inc. | | | 25,385 | | | | 354,628 | |
CenterState Bank Corp. | | | 29,165 | | | | 671,670 | |
Goosehead Insurance, Inc. - Class A(d) | | | 17,647 | | | | 843,526 | |
LegacyTexas Financial Group, Inc. | | | 7,104 | | | | 289,204 | |
LendingTree, Inc.(c) (d) | | | 1,610 | | | | 676,249 | |
Other Securities(b) (d) | | | | | | | 1,793,046 | |
| | | | | | | | 4,628,323 | |
Health Care — 26.7% | | | | | | | | |
BioTelemetry, Inc.(c) (d) | | | 11,373 | | | | 547,609 | |
Cambrex Corp.(c) | | | 12,785 | | | | 598,466 | |
Enanta Pharmaceuticals, Inc.(c) | | | 3,240 | | | | 273,391 | |
Heska Corp.(c) | | | 4,815 | | | | 410,094 | |
HMS Holdings Corp.(c) | | | 9,674 | | | | 313,341 | |
Integer Holdings Corp.(c) | | | 9,200 | | | | 772,065 | |
LeMaitre Vascular, Inc. | | | 13,735 | | | | 384,305 | |
Medidata Solutions, Inc.(c) | | | 6,385 | | | | 577,906 | |
Medpace Holdings, Inc.(c) | | | 12,626 | | | | 825,993 | |
Mesa Laboratories, Inc. | | | 4,260 | | | | 1,040,889 | |
Neogen Corp.(c) | | | 12,256 | | | | 761,220 | |
NeoGenomics, Inc.(c) | | | 35,010 | | | | 768,119 | |
PRA Health Sciences, Inc.(c) | | | 15,750 | | | | 1,561,613 | |
Repligen Corp.(c) (d) | | | 15,840 | | | | 1,361,448 | |
Supernus Pharmaceuticals, Inc.(c) | | | 14,433 | | | | 477,587 | |
Tabula Rasa HealthCare, Inc. (c) (d) | | | 16,430 | | | | 820,349 | |
Tactile Systems Technology, Inc. (c)(d) | | | 11,832 | | | | 673,477 | |
Other Securities(b) (d) | | | | | | | 4,612,850 | |
| | | | | | | | 16,780,722 | |
Industrials — 15.1% | | | | | | | | |
Axon Enterprise, Inc.(c) (d) | | | 16,290 | | | | 1,045,980 | |
Kratos Defense & Security Solutions, Inc.(c) | | | 24,390 | | | | 558,287 | |
Marten Transport Ltd.(d) | | | 20,700 | | | | 375,705 | |
Mercury Systems, Inc.(c) | | | 9,040 | | | | 635,963 | |
Saia, Inc.(c) | | | 10,091 | | | | 652,585 | |
SiteOne Landscape Supply, Inc. (c)(d) | | | 14,074 | | | | 975,329 | |
Other Securities(b) (d) | | | | | | | 5,240,807 | |
| | | | | | | | 9,484,656 | |
Information Technology — 25.8% | | | | | | | | |
AppFolio, Inc. - Class A(c) (d) | | | 4,537 | | | | 463,999 | |
Box, Inc. - Class A(c) | | | 47,949 | | | | 844,382 | |
Cabot Microelectronics Corp. | | | 5,465 | | | | 601,587 | |
EVO Payments, Inc. - Class A(c) | | | 36,937 | | | | 1,164,624 | |
MAXIMUS, Inc. | | | 17,138 | | | | 1,243,190 | |
Mimecast Ltd.(c) | | | 24,475 | | | | 1,143,227 | |
Pegasystems, Inc. | | | 24,635 | | | | 1,754,258 | |
Qualys, Inc.(c) (d) | | | 14,000 | | | | 1,219,120 | |
Silicon Laboratories, Inc.(c) | | | 7,090 | | | | 733,105 | |
WNS Holdings Ltd. - ADR(c) | | | 29,119 | | | | 1,723,844 | |
Workiva, Inc.(c) | | | 14,234 | | | | 826,853 | |
Other Securities(b) (d) | | | | | | | 4,509,543 | |
| | | | | | | | 16,227,732 | |
Materials — 2.0% | | | | | | | | |
Ferroglobe Representation & Warranty Insurance Trust(c) (e) (f) | | | 840 | | | | 0 | |
Quaker Chemical Corp.(d) | | | 3,675 | | | | 745,584 | |
Other Securities(b) | | | | | | | 493,393 | |
| | | | | | | | 1,238,977 | |
See Notes to Financial Statements.
32
Wilshire Mutual Funds, Inc. Small Company Growth Portfolio Condensed Schedule of Investments - (Continued) | June 30, 2019
(Unaudited) | 
|
| | | Shares | | | Value | |
COMMON STOCKS — 97.1%(a) (Continued) |
Real Estate — 1.2% | | | | | | | | |
Other Securities(b) (d) | | | | | | $ | 767,903 | |
| | | | | | | | | |
Utilities — 0.4% | | | | | | | | |
Other Securities(b) (d) | | | | | | | 258,046 | |
| | | | | | | | | |
Total Common Stocks(Cost $47,346,515) | | | | | | $ | 61,053,770 | |
| | | | | | | | | |
MONEY MARKET FUNDS — 4.7% | | | | |
Northern Trust Institutional Government Select Portfolio - Institutional Class, 2.24%(g) | | | 1,822,932 | | | $ | 1,822,932 | |
Northern Trust Institutional Liquid Asset Portfolio - Institutional Class, 2.36%(g) (h) | | | 1,119,629 | | | | 1,119,629 | |
Total Money Market Funds(Cost $2,942,561) | | | | | | $ | 2,942,561 | |
| | | | | | | | | |
Total Investments at Value — 101.8%(Cost $50,289,076) | | $ | 63,996,331 | |
| | | | | | | | | |
Liabilities in Excess of Other Assets — (1.8%) | | | (1,142,713 | ) |
| | | | | | | | | |
Net Assets — 100.0% | | | | | | $ | 62,853,618 | |
The Condensed Schedule of Investments does not reflect the complete portfolio holdings. It includes the Portfolio’s 50 largest holdings, each investment of any issue that exceeds 1% of the Portfolio’s net assets, and any illiquid investments or investments classified as Level 3. “Other Securities” represent all issues not required to be disclosed under the rules adopted by the U.S. Securities and Exchange commission (“SEC”). The complete schedule of portfolio holdings is available (i) without charge, upon request, by calling (866) 591-1568; (ii) on the SEC’s website at www.sec.gov; and (iii) on our website at http://advisor.wilshire.com.
ADR — American Depositary Receipt.
(a) | More narrow industries are utilized for compliance purposes, whereas broad sectors are utilized for reporting purposes. |
(b) | Represents issuers not identified as a top 50 holding in terms of market value, issues or issuers not exceeding 1% of net assets individually or in the aggregate, respectively, or any issuers not classified as illiquid or Level 3 investments, as of June 30, 2019. |
(c) | Non-income producing security. |
(d) | This security or a partial position of this security is on loan at June 30, 2019. The total market value of securities on loan at June 30, 2019 was $12,008,905 (Note 7). |
(e) | Level 3 security. Security has been valued at fair value in accordance with procedures adopted by and under the general supervision of the Board of Directors. The total value of such securities is $0 as of June 30, 2019, representing 0.0% of net assets (Note 2). |
(f) | Illiquid security. The total value of such securities is $0 as of June 30, 2019, representing 0.0% of net assets. |
(g) | The rate shown is the 7-day effective yield as of June 30, 2019. |
(h) | This security was purchased with cash collateral held from securities on loan. The total value of such securities as of June 30, 2019 was $1,119,629. Securities on loan are also collateralized by various U.S. Treasury obligations in the amount of $11,090,664 (Note 7). |
See Notes to Financial Statements.
33
Wilshire Mutual Funds, Inc. Small Company Value Portfolio Condensed Schedule of Investments | June 30, 2019
(Unaudited) | 
|
| | | Shares | | | Value | |
COMMON STOCKS — 96.5%(a) |
Communication Services — 1.1% |
Other Securities(b) (d) | | | | | | $ | 662,500 | |
| | | | | | | | | |
Consumer Discretionary — 7.2% | | | | | | | | |
Hooker Furniture Corp. | | | 28,777 | | | | 593,381 | |
Stoneridge, Inc.(c) | | | 14,113 | | | | 445,265 | |
Taylor Morrison Home Corp. - Class A(c) | | | 38,015 | | | | 796,793 | |
Other Securities(b) (d) | | | | | | | 2,391,327 | |
| | | | | | | | 4,226,766 | |
Consumer Staples — 1.8% | | | | | | | | |
Landec Corp.(c) | | | 65,795 | | | | 616,499 | |
Other Securities(b) (d) | | | | | | | 405,080 | |
| | | | | | | | 1,021,579 | |
Energy — 7.0% | | | | | | | | |
Centennial Resource Development, Inc. - Class A (c) (d) | | | 82,405 | | | | 625,454 | |
Equitrans Midstream Corp.(d) | | | 41,440 | | | | 816,782 | |
PDC Energy, Inc.(c) | | | 13,520 | | | | 487,531 | |
WPX Energy, Inc.(c) | | | 43,725 | | | | 503,275 | |
Other Securities(b) (d) | | | | | | | 1,650,089 | |
| | | | | | | | 4,083,131 | |
Financials — 28.0% | | | | | | | | |
Ameris Bancorp(d) | | | 32,096 | | | | 1,257,841 | |
Bank of N.T. Butterfield & Son Ltd. (The) | | | 25,076 | | | | 851,580 | |
Cadence Bancorp. | | | 15,230 | | | | 316,784 | |
CVB Financial Corp. | | | 14,860 | | | | 312,506 | |
Essent Group Ltd.(c) | | | 8,120 | | | | 381,559 | |
First Horizon National Corp.(d) | | | 45,337 | | | | 676,881 | |
HomeStreet, Inc.(c) | | | 20,655 | | | | 612,213 | |
PacWest Bancorp(d) | | | 15,065 | | | | 584,974 | |
Radian Group, Inc. | | | 12,746 | | | | 291,246 | |
RenaissanceRe Holdings Ltd. | | | 6,255 | | | | 1,113,452 | |
Texas Capital Bancshares, Inc.(c) | | | 9,275 | | | | 569,207 | |
Western Alliance Bancorp.(c) | | | 25,592 | | | | 1,144,473 | |
Other Securities(b) (d) | | | | | | | 8,317,131 | |
| | | | | | | | 16,429,847 | |
Health Care — 2.3% | | | | | | | | |
LivaNova plc(c) | | | 6,925 | | | | 498,322 | |
Other Securities(b) (d) | | | | | | | 865,531 | |
| | | | | | | | 1,363,853 | |
Industrials — 19.3% | | | | | | | | |
Alamo Group, Inc. | | | 6,055 | | | | 605,075 | |
Albany International Corp. - Class A | | | 4,035 | | | | 334,542 | |
Apogee Enterprises, Inc. | | | 11,410 | | | | 495,650 | |
Astronics Corp.(c) | | | 11,480 | | | | 461,726 | |
Barnes Group, Inc. | | | 7,515 | | | | 423,395 | |
BMC Stock Holdings, Inc.(c) | | | 33,180 | | | | 703,416 | |
EnerSys | | | 10,177 | | | | 697,124 | |
Federal Signal Corp. | | | 16,803 | | | | 449,480 | |
GP Strategies Corp.(c) | | | 20,375 | | | | 307,256 | |
HNI Corp. | | | 12,265 | | | | 433,935 | |
Knight-Swift Transportation Holdings, Inc.(d) | | | 22,679 | | | | 744,778 | |
Quanta Services, Inc. | | | 24,160 | | | | 922,671 | |
Other Securities(b) (d) | | | | | | | 4,723,591 | |
| | | | | | | | 11,302,639 | |
Information Technology — 12.2% | | | | | | | | |
Coherent, Inc.(c) | | | 4,389 | | | | 598,528 | |
Entegris, Inc.(d) | | | 14,814 | | | | 552,858 | |
Mellanox Technologies Ltd.(c) | | | 9,000 | | | | 996,030 | |
Methode Electronics, Inc. | | | 18,550 | | | | 529,974 | |
Rambus, Inc.(c) | | | 43,820 | | | | 527,593 | |
Verint Systems, Inc.(c) | | | 4,925 | | | | 264,866 | |
Other Securities(b) (d) | | | | | | | 3,713,517 | |
| | | | | | | | 7,183,366 | |
Materials — 5.5% | | | | | | | | |
Boise Cascade Co. | | | 9,945 | | | | 279,554 | |
Kaiser Aluminum Corp. | | | 5,932 | | | | 579,023 | |
Materion Corp. | | | 5,853 | | | | 396,892 | |
Neenah, Inc. | | | 7,525 | | | | 508,314 | |
P.H. Glatfelter Co.(d) | | | 46,525 | | | | 785,342 | |
Other Securities(b) (d) | | | | | | | 661,969 | |
| | | | | | | | 3,211,094 | |
Real Estate — 9.4% | | | | | | | | |
Brandywine Realty Trust | | | 49,329 | | | | 706,391 | |
First Industrial Realty Trust, Inc. | | | 7,080 | | | | 260,119 | |
PotlatchDeltic Corp. | | | 9,534 | | | | 371,635 | |
RLJ Lodging Trust(d) | | | 16,590 | | | | 294,307 | |
RPT Realty(d) | | | 86,685 | | | | 1,049,754 | |
STAG Industrial, Inc. | | | 10,307 | | | | 311,684 | |
Other Securities(b) (d) | | | | | | | 2,544,515 | |
| | | | | | | | 5,538,405 | |
See Notes to Financial Statements.
34
Wilshire Mutual Funds, Inc. Small Company Value Portfolio Condensed Schedule of Investments - (Continued) | June 30, 2019
(Unaudited) | 
|
| | | Shares | | | Value | |
COMMON STOCKS — 96.5%(a) (Continued) |
Utilities — 2.7% | | | | | | | | |
ONE Gas, Inc. | | | 3,592 | | | $ | 324,357 | |
Other Securities(b) (d) | | | | | | | 1,269,573 | |
| | | | | | | | 1,593,930 | |
Total Common Stocks(Cost $54,395,186) | | | | | | $ | 56,617,110 | |
| | | | | | | | | |
MONEY MARKET FUNDS — 4.3% | | | | |
Northern Trust Institutional Government Select Portfolio - Institutional Class, 2.24%(e) | | | 2,384,068 | | | $ | 2,384,068 | |
Northern Trust Institutional Liquid Asset Portfolio - Institutional Class, 2.36%(e) (f) | | | 138,067 | | | | 138,067 | |
Total Money Market Funds(Cost $2,522,135) | | | | | | $ | 2,522,135 | |
| | | | | | | | | |
Total Investments at Value — 100.8%(Cost $56,917,321) | | $ | 59,139,245 | |
| | | | | | | | | |
Liabilities in Excess of Other Assets — (0.8%) | | | (441,230 | ) |
| | | | | | | | | |
Net Assets — 100.0% | | | | | | $ | 58,698,015 | |
The Condensed Schedule of Investments does not reflect the complete portfolio holdings. It includes the Portfolio’s 50 largest holdings and each investment of any issue that exceeds 1% of the Portfolio’s net assets. “Other Securities” represent all issues not required to be disclosed under the rules adopted by the U.S. Securities and Exchange commission (“SEC”). The complete schedule of portfolio holdings is available (i) without charge, upon request, by calling (866) 591-1568; (ii) on the SEC’s website at www.sec.gov; and (iii) on our website at http://advisor.wilshire.com.
(a) | More narrow industries are utilized for compliance purposes, whereas broad sectors are utilized for reporting purposes. |
(b) | Represents issuers not identified as a top 50 holding in terms of market value and issues or issuers not exceeding 1% of net assets individually or in the aggregate, respectively, as of June 30, 2019. |
(c) | Non-income producing security. |
(d) | This security or a partial position of this security is on loan at June 30, 2019. The total market value of securities on loan at June 30, 2019 was $7,797,418 (Note 7). |
(e) | The rate shown is the 7-day effective yield as of June 30, 2019. |
(f) | This security was purchased with cash collateral held from securities on loan. The total value of such securities as of June 30, 2019 was $138,067. Securities on loan are also collateralized by various U.S. Treasury obligations in the amount of $7,753,094 (Note 7). |
See Notes to Financial Statements.
35
Wilshire Mutual Funds, Inc. Wilshire 5000 Indexsm Fund Condensed Schedule of Investments | June 30, 2019
(Unaudited) | 
|
| | | Shares | | | Value | |
COMMON STOCKS — 98.3%(a) |
Communication Services — 9.1% |
Actua Corp.(b) (c) (d) | | | 100 | | | $ | 63 | |
Alphabet, Inc. - Class C(b) | | | 4,133 | | | | 4,467,400 | |
AT&T, Inc. | | | 48,128 | | | | 1,612,769 | |
Comcast Corp. - Class A | | | 27,208 | | | | 1,150,354 | |
Facebook, Inc. - Class A(b) | | | 15,539 | | | | 2,999,027 | |
Netflix, Inc.(b) | | | 2,752 | | | | 1,010,865 | |
Verizon Communications, Inc. | | | 26,423 | | | | 1,509,546 | |
Walt Disney Co. (The) | | | 10,226 | | | | 1,427,959 | |
Other Securities(e) (f) | | | | | | | 3,260,199 | |
| | | | | | | | 17,438,182 | |
Consumer Discretionary — 10.5% | | | | | | | | |
Amazon.com, Inc.(b) | | | 2,898 | | | | 5,487,739 | |
Home Depot, Inc. (The) | | | 7,344 | | | | 1,527,331 | |
McDonald’s Corp. | | | 5,138 | | | | 1,066,956 | |
NIKE, Inc. - Class B | | | 9,049 | | | | 759,663 | |
Starbucks Corp. | | | 9,473 | | | | 794,121 | |
Other Securities(e) (f) | | | | | | | 10,462,259 | |
| | | | | | | | 20,098,069 | |
Consumer Staples — 6.6% | | | | | | | | |
Coca-Cola Co. (The) | | | 25,840 | | | | 1,315,774 | |
Costco Wholesale Corp. | | | 2,971 | | | | 785,116 | |
PepsiCo, Inc. | | | 9,119 | | | | 1,195,774 | |
Philip Morris International, Inc. | | | 10,726 | | | | 842,312 | |
Procter & Gamble Co. (The) | | | 16,340 | | | | 1,791,680 | |
Walmart, Inc. | | | 9,309 | | | | 1,028,552 | |
Other Securities(e) (f) | | | | | | | 5,691,183 | |
| | | | | | | | 12,650,391 | |
Energy — 4.6% | | | | | | | | |
Chevron Corp. | | | 12,863 | | | | 1,600,671 | |
Exxon Mobil Corp. | | | 27,928 | | | | 2,140,122 | |
Other Securities(e) (f) | | | | | | | 5,062,947 | |
| | | | | | | | 8,803,740 | |
Financials — 13.7% | | | | | | | | |
Bank of America Corp. | | | 63,858 | | | | 1,851,881 | |
Berkshire Hathaway, Inc. - Class B (b) | | | 14,686 | | | | 3,130,614 | |
Citigroup, Inc. | | | 16,485 | | | | 1,154,444 | |
JPMorgan Chase & Co. | | | 21,642 | | | | 2,419,575 | |
Wells Fargo & Co. | | | 29,157 | | | | 1,379,708 | |
Other Securities(e) (f) | | | | | | | 16,358,536 | |
| | | | | | | | 26,294,758 | |
Health Care — 13.2% | | | | | | | | |
Abbott Laboratories | | | 12,635 | | | | 1,062,603 | |
AbbVie, Inc. | | | 9,790 | | | | 711,928 | |
Amgen, Inc. | | | 3,950 | | | | 727,905 | |
Eli Lilly & Co. | | | 6,272 | | | | 694,874 | |
Johnson & Johnson | | | 17,485 | | | | 2,435,310 | |
Merck & Co., Inc. | | | 17,765 | | | | 1,489,594 | |
Pfizer, Inc. | | | 38,422 | | | | 1,664,440 | |
Thermo Fisher Scientific, Inc. | | | 2,831 | | | | 831,408 | |
UnitedHealth Group, Inc. | | | 6,246 | | | | 1,524,085 | |
Other Securities(e) (f) | | | | | | | 14,182,304 | |
| | | | | | | | 25,324,451 | |
Industrials — 9.8% | | | | | | | | |
Boeing Co. (The) | | | 3,988 | | | | 1,451,673 | |
Honeywell International, Inc. | | | 4,552 | | | | 794,734 | |
Union Pacific Corp. | | | 4,857 | | | | 821,366 | |
United Technologies Corp. | | | 5,348 | | | | 696,310 | |
Other Securities(e) (f) | | | | | | | 15,052,656 | |
| | | | | | | | 18,816,739 | |
Information Technology — 20.9% | | | | | | | | |
Adobe, Inc.(b) | | | 3,131 | | | | 922,548 | |
Apple, Inc. | | | 32,343 | | | | 6,401,326 | |
Broadcom, Inc. | | | 2,530 | | | | 728,285 | |
Cisco Systems, Inc. | | | 29,388 | | | | 1,608,405 | |
Intel Corp. | | | 29,498 | | | | 1,412,068 | |
International Business Machines Corp. | | | 6,425 | | | | 886,008 | |
Mastercard, Inc. - Class A | | | 6,525 | | | | 1,726,057 | |
Microsoft Corp. | | | 51,102 | | | | 6,845,623 | |
Oracle Corp. | | | 19,130 | | | | 1,089,835 | |
PayPal Holdings, Inc.(b) | | | 7,725 | | | | 884,204 | |
Texas Instruments, Inc. | | | 6,205 | | | | 712,085 | |
Visa, Inc. - Class A(f) | | | 11,316 | | | | 1,963,891 | |
Other Securities(e) (f) | | | | | | | 14,944,091 | |
| | | | | | | | 40,124,426 | |
Materials — 2.5% | | | | | | | | |
Ferroglobe Representation Warranty & Insurance Trust (b)(c) (d) | | | 500 | | | | 0 | |
Other Securities(e) (f) | | | | | | | 4,794,191 | |
| | | | | | | | 4,794,191 | |
| | | | | | | | | |
See Notes to Financial Statements.
36
Wilshire Mutual Funds, Inc. Wilshire 5000 Indexsm Fund Condensed Schedule of Investments - (Continued) | June 30, 2019
(Unaudited) | 
|
| | | Shares | | | Value | |
COMMON STOCKS — 98.3%(a) (Continued) |
Real Estate — 4.2% | | | | | | | | |
New York REIT Liquidating, LLC (b) (c)(d) (f) | | | 130 | | | $ | 1,715 | |
Other Securities(e) (f) | | | | | | | 7,991,014 | |
| | | | | | | | 7,992,729 | |
Utilities — 3.2% | | | | | | | | |
Other Securities(e) (f) | | | | | | | 6,199,927 | |
| | | | | | | | | |
Total Common Stocks(Cost $55,368,066) | | | | | | $ | 188,537,603 | |
| | | | | | | | | |
RIGHTS — 0.0%(g) | | | | | | | | |
AMR Corp., Escrow(b) (c) (d) | | | 3,275 | | | $ | 426 | |
Galectin Therapeutics, Inc. (b) (c)(d) | | | 3,690 | | | | 0 | |
Hertz Global Holdings, Inc. (b) (c) (d)(f) | | | 430 | | | | 838 | |
Media General, Inc. - CVR (b) (c) (d)(f) | | | 794 | | | | 0 | |
Schulman A, Inc.(b) (c) (d) | | | 81 | | | | 0 | |
Total Rights
(Cost $2,185) | | | | | | $ | 1,264 | |
| | | | | | | | | |
MONEY MARKET FUNDS — 1.6% | | | | |
Northern Trust Institutional Government Select Portfolio - Institutional Class, 2.24%(h) | | | 2,444,764 | | | $ | 2,444,764 | |
Northern Trust Institutional Liquid Asset Portfolio - Institutional Class, 2.36%(h) (i) | | | 738,590 | | | | 738,590 | |
Total Money Market Funds(Cost $3,183,354) | | | | | | $ | 3,183,354 | |
| | | | | | | | | |
Total Investments at Value — 99.9%(Cost $58,553,605) | | $ | 191,722,221 | |
| | | | | | | | | |
Other Assets in Excess of Liabilities — 0.1% | | | 135,233 | |
| | | | | | | | | |
Net Assets — 100.0% | | | | | | $ | 191,857,454 | |
The Condensed Schedule of Investments does not reflect the complete portfolio holdings. It includes the Portfolio’s 50 largest holdings, each investment of any issue that exceeds 1% of the Portfolio’s net assets, and any illiquid investments or investments classified as Level 3. “Other Securities” represent all issues not required to be disclosed under the rules adopted by the U.S. Securities and Exchange commission (“SEC”). The complete schedule of portfolio holdings is available (i) without charge, upon request, by calling (866) 591-1568; (ii) on the SEC’s website at www.sec.gov; and (iii) on our website at http://advisor.wilshire.com.
CVR — Contingent Value Right.
(a) | More narrow industries are utilized for compliance purposes, whereas broad sectors are utilized for reporting purposes. |
(b) | Non-income producing security. |
(c) | Level 3 security. Security has been valued at fair value in accordance with procedures adopted by and under the general supervision of the Board of Directors. The total value of such securities is $3,042 as of June 30, 2019, representing 0.0% (g) of net assets (Note 2). |
(d) | Illiquid security. The total value of such securities is $3,042 as of June 30, 2019, representing 0.0% (g) of net assets. |
(e) | Represents issuers not identified as a top 50 holding in terms of market value, issues or issuers not exceeding 1% of net assets individually or in the aggregate, respectively, or any issuers not classified as illiquid or Level 3 investments, as of June 30, 2019. |
(f) | This security or a partial position of this security is on loan at June 30, 2019. The total market value of securities on loan at June 30, 2019 was $11,889,763 (Note 7). |
(g) | Percentage rounds to less than 0.1%. |
(h) | The rate shown is the 7-day effective yield as of June 30, 2019. |
(i) | This security was purchased with cash collateral held from securities on loan. The total value of such securities as of June 30, 2019 was $738,590. Securities on loan are also collateralized by various U.S. Treasury obligations in the amount of $11,296,734 (Note 7). |
See Notes to Financial Statements.
37
Wilshire Mutual Funds, Inc. Wilshire International Equity Fund Condensed Schedule of Investments | June 30, 2019
(Unaudited) | 
|
| | | Shares | | | Value | |
COMMON STOCKS — 97.8% |
Argentina — 0.0%(a) |
Other Securities(b) (c) | | | | | | $ | 33,258 | |
| | | | | | | | | |
Australia — 3.3% | | | | | | | | |
CSL Ltd.(d) | | | 34,128 | | | | 5,167,794 | |
Other Securities(b) (c) (d) | | | | | | | 7,438,840 | |
| | | | | | | | 12,606,634 | |
Austria — 0.3% | | | | | | | | |
Other Securities(b) (d) | | | | | | | 985,552 | |
| | | | | | | | | |
Belgium — 0.6% | | | | | | | | |
Other Securities(b) (d) | | | | | | | 2,438,558 | |
| | | | | | | | | |
Bermuda — 0.4% | | | | | | | | |
Other Securities(b) (c) (d) | | | | | | | 1,404,563 | |
| | | | | | | | | |
Brazil — 1.0% | | | | | | | | |
Other Securities(b) | | | | | | | 3,698,709 | |
| | | | | | | | | |
Canada — 6.0% | | | | | | | | |
Canadian Pacific Railway Ltd. | | | 20,273 | | | | 4,769,021 | |
Shopify, Inc. - Class A(c) (e) | | | 18,322 | | | | 5,499,349 | |
Other Securities(b) (c) | | | | | | | 12,910,437 | |
| | | | | | | | 23,178,807 | |
Cayman Islands — 2.8% | | | | | | | | |
Tencent Holdings Ltd.(d) | | | 114,005 | | | | 5,157,639 | |
Other Securities(b) (c) (d) | | | | | | | 5,461,612 | |
| | | | | | | | 10,619,251 | |
Chile — 0.1% | | | | | | | | |
Other Securities(b) | | | | | | | 332,180 | |
| | | | | | | | | |
China — 0.7% | | | | | | | | |
Other Securities(b) (c) (d) | | | | | | | 2,841,427 | |
| | | | | | | | | |
Cyprus — 0.0%(a) | | | | | | | | |
Other Securities(b) (d) | | | | | | | 80,109 | |
| | | | | | | | | |
Czech Republic — 0.4% | | | | | | | | |
Other Securities(b) (d) | | | | | | | 1,535,749 | |
| | | | | | | | | |
Denmark — 3.2% | | | | | | | | |
A.P. Moller-Maerska A/S - Series B(c) (d) | | | 2,466 | | | | 3,068,594 | |
Chr. Hansen Holding A/S(d) | | | 30,761 | | | | 2,894,869 | |
DSV A/S(d) | | | 29,869 | | | | 2,941,304 | |
Other Securities(b) (c) (d) | | | | | | | 3,280,939 | |
| | | | | | | | 12,185,706 | |
Finland — 0.4% | | | | | | | | |
Other Securities(b) (c) (d) | | | | | | | 1,536,897 | |
| | | | | | | | | |
France — 9.2% | | | | | | | | |
EssilorLuxottica S.A.(d) | | | 18,816 | | | | 2,453,511 | |
LVMH Moet Hennessy Louis Vuitton SE(d) | | | 13,602 | | | | 5,782,755 | |
Pernod Ricard S.A.(d) | | | 18,274 | | | | 3,365,756 | |
Publicis Groupe S.A.(d) | | | 42,319 | | | | 2,233,709 | |
Rexel S.A.(d) | | | 278,831 | | | | 3,539,145 | |
Schneider Electric SE(d) | | | 32,150 | | | | 2,909,124 | |
Ubisoft Entertainment S.A.(d) (e) | | | 29,261 | | | | 2,288,540 | |
Other Securities(b) (c) (d) | | | | | | | 12,616,750 | |
| | | | | | | | 35,189,290 | |
Germany — 3.2% | | | | | | | | |
adidas AG(d) | | | 14,148 | | | | 4,377,118 | |
Volkswagon AG(d) | | | 16,862 | | | | 2,892,378 | |
Other Securities(b) (d) | | | | | | | 5,154,934 | |
| | | | | | | | 12,424,430 | |
Greece — 0.0%(a) | | | | | | | | |
FF Group(e) (f) (g) | | | 2,880 | | | | 0 | |
Other Securities(b) | | | | | | | 69,218 | |
| | | | | | | | 69,218 | |
Guernsey — 0.0%(a) | | | | | | | | |
Other Securities(b) (d) | | | | | | | 204,358 | |
| | | | | | | | | |
Hong Kong — 4.1% | | | | | | | | |
AIA Group Ltd.(d) | | | 453,465 | | | | 4,897,038 | |
China Resources Power Holdings Co. Ltd.(d) | | | 2,100,504 | | | | 3,063,958 | |
Lenovo Group Ltd.(d) | | | 2,961,000 | | | | 2,292,708 | |
Other Securities(b) (c) (d) | | | | | | | 5,266,034 | |
| | | | | | | | 15,519,738 | |
Hungary — 0.0%(a) | | | | | | | | |
Other Securities(b) (d) | | | | | | | 138,447 | |
| | | | | | | | | |
India — 1.4% | | | | | | | | |
HDFC Bank Ltd. - ADR | | | 33,986 | | | | 4,419,539 | |
Other Securities(b) (d) | | | | | | | 870,991 | |
| | | | | | | | 5,290,530 | |
Indonesia — 0.2% | | | | | | | | |
Other Securities(b) (d) | | | | | | | 667,921 | |
See Notes to Financial Statements.
38
Wilshire Mutual Funds, Inc. Wilshire International Equity Fund Condensed Schedule of Investments - (Continued) | June 30, 2019
(Unaudited) | 
|
| | | Shares | | | Value | |
COMMON STOCKS — 97.8% (Continued) |
Ireland — 2.1% | | | | | | | | |
Accenture plc - Class A | | | 25,392 | | | $ | 4,691,679 | |
Other Securities(b) (d) | | | | | | | 3,193,760 | |
| | | | | | | | 7,885,439 | |
Isle of Man — 0.0%(a) | | | | | | | | |
Other Securities(b) (d) | | | | | | | 144,573 | |
| | | | | | | | | |
Israel — 0.3% | | | | | | | | |
Other Securities(b) (c) (d) | | | | | | | 990,190 | |
| | | | | | | | | |
Italy — 1.7% | | | | | | | | |
Enel SpA(d) | | | 323,417 | | | | 2,256,153 | |
Other Securities(b) (c) (d) | | | | | | | 4,374,914 | |
| | | | | | | | 6,631,067 | |
Japan — 13.1% | | | | | | | | |
Fujitsu Ltd.(d) | | | 35,800 | | | | 2,502,046 | |
Hitachi Metals Ltd.(d) | | | 273,400 | | | | 3,100,411 | |
Honda Motor Co.(d) | | | 113,600 | | | | 2,937,694 | |
Inpex Corp.(d) | | | 379,800 | | | | 3,442,411 | |
Keyence Corp.(d) | | | 8,990 | | | | 5,544,592 | |
Sumitomo Mitsui Financial Group, Inc.(d) | | | 71,400 | | | | 2,530,939 | |
Other Securities(b) (d) | | | | | | | 30,074,360 | |
| | | | | | | | 50,132,453 | |
Jersey — 1.9% | | | | | | | | |
Experian plc(d) | | | 194,253 | | | | 5,883,709 | |
Other Securities(b) (d) | | | | | | | 1,449,023 | |
| | | | | | | | 7,332,732 | |
Korea (Republic of) — 2.6% | | | | | | | | |
Other Securities(b) (d) | | | | | | | 10,162,279 | |
| | | | | | | | | |
Luxembourg — 0.0%(a) | | | | | | | | |
Other Securities(b) (d) | | | | | | | 136,818 | |
| | | | | | | | | |
Malaysia — 0.2% | | | | | | | | |
Other Securities(b) (d) | | | | | | | 905,089 | |
| | | | | | | | | |
Mauritius — 0.0%(a) | | | | | | | | |
Other Securities(b) (d) | | | | | | | 40,298 | |
| | | | | | | | | |
Mexico — 0.9% | | | | | | | | |
Wal-Mart de Mexico S.A.B. de C.V. | | | 946,231 | | | | 2,582,938 | |
Other Securities(b) | | | | | | | 725,644 | |
| | | | | | | | 3,308,582 | |
Netherlands — 3.1% | | | | | | | | |
ASML Holding N.V. - ADR(c) | | | 10,964 | | | | 2,279,744 | |
Other Securities(b) (d) | | | | | | | 9,495,565 | |
| | | | | | | | 11,775,309 | |
New Zealand — 0.1% | | | | | | | | |
Other Securities(b) (d) | | | | | | | 221,156 | |
| | | | | | | | | |
Norway — 0.3% | | | | | | | | |
Other Securities(b) (d) | | | | | | | 1,079,214 | |
| | | | | | | | | |
Philippines — 0.2% | | | | | | | | |
Other Securities(b) (d) | | | | | | | 639,475 | |
| | | | | | | | | |
Poland — 0.1% | | | | | | | | |
Other Securities(b) (d) | | | | | | | 372,706 | |
| | | | | | | | | |
Portugal — 0.1% | | | | | | | | |
Other Securities(b) (d) | | | | | | | 443,736 | |
| | | | | | | | | |
Russia — 1.0% | | | | | | | | |
Other Securities(b) (d) | | | | | | | 3,809,283 | |
| | | | | | | | | |
Singapore — 1.2% | | | | | | | | |
Other Securities(b) (c) (d) | | | | | | | 4,643,327 | |
| | | | | | | | | |
South Africa — 0.5% | | | | | | | | |
Other Securities(b) (c) (d) | | | | | | | 1,886,446 | |
| | | | | | | | | |
Spain — 2.0% | | | | | | | | |
Amadeus IT Group S.A.(d) | | | 45,165 | | | | 3,579,245 | |
Other Securities(b) (d) | | | | | | | 4,208,628 | |
| | | | | | | | 7,787,873 | |
Sweden — 2.4% | | | | | | | | |
Atlas Copco AB - Class A(d) | | | 85,831 | | | | 2,750,709 | |
Other Securities(b) (c) (d) | | | | | | | 6,300,606 | |
| | | | | | | | 9,051,315 | |
Switzerland — 8.3% | | | | | | | | |
Alcon, Inc.(e) | | | 61,054 | | | | 3,770,101 | |
Chubb Ltd. | | | 25,821 | | | | 3,803,175 | |
Geberit AG(d) | | | 6,197 | | | | 2,896,672 | |
Nestlé S.A.(d) | | | 55,690 | | | | 5,765,214 | |
Roche Holdings AG(d) | | | 15,310 | | | | 4,305,031 | |
Sika AG(d) | | | 15,355 | | | | 2,623,316 | |
Other Securities(b) (d) | | | | | | | 8,673,009 | |
| | | | | | | | 31,836,518 | |
See Notes to Financial Statements.
39
Wilshire Mutual Funds, Inc. Wilshire International Equity Fund Condensed Schedule of Investments - (Continued) | June 30, 2019
(Unaudited) | 
|
| | | Shares | | | Value | |
COMMON STOCKS — 97.8% (Continued) |
Taiwan — 4.2% | | | | | | | | |
Hon Hai Precision Industry Co. Ltd.(d) | | | 925,400 | | | $ | 2,314,496 | |
Taiwan Semiconductor Manufacturing Co. Ltd.(d) | | | 330,000 | | | | 2,530,198 | |
Taiwan Semiconductor Manufacturing Co. Ltd. - ADR | | | 85,909 | | | | 3,365,055 | |
Other Securities(b) (d) | | | | | | | 7,926,923 | |
| | | | | | | | 16,136,672 | |
Thailand — 0.2% | | | | | | | | |
Other Securities(b) (d) | | | | | | | 848,033 | |
| | | | | | | | | |
Turkey — 0.4% | | | | | | | | |
Other Securities(b) (d) | | | | | | | 1,415,943 | |
| | | | | | | | | |
United Arab Emirates — 0.0%(a) | | | | | | | | |
Other Securities(b) (d) | | | | | | | 82,620 | |
| | | | | | | | | |
United Kingdom — 11.3% | | | | | | | | |
Compass Group plc(d) | | | 174,253 | | | | 4,177,062 | |
HSBC Holdings plc(d) | | | 298,530 | | | | 2,491,556 | |
John Wood Group plc(d) | | | 515,317 | | | | 2,967,116 | |
TechnipFMC plc | | | 98,456 | | | | 2,553,949 | |
Tesco plc(d) | | | 933,867 | | | | 2,691,975 | |
Travis Perkins plc(d) | | | 191,510 | | | | 3,097,342 | |
Vodafone Group plc(d) | | | 1,375,105 | | | | 2,253,835 | |
Other Securities(b) (d) | | | | | | | 23,150,315 | |
| | | | | | | | 43,383,150 | |
United States — 2.3% | | | | | | | | |
Mettler-Toledo International, Inc.(e) | | | 5,454 | | | | 4,581,360 | |
ResMed, Inc. | | | 28,898 | | | | 3,526,423 | |
Other Securities(b) (c) (d) | | | | | | | 525,533 | |
| | | | | | | | 8,633,316 | |
Total Common Stocks(Cost $338,445,899) | | | | | | $ | 374,696,944 | |
| | | | | | | | | |
| | | Shares | | | Value | |
PREFERRED STOCKS — 0.3% | | | | | | | | |
Brazil — 0.2% | | | | | | | | |
Other Securities(b) | | | | | | $ | 472,437 | |
| | | | | | | | | |
Colombia — 0.0%(a) | | | | | | | | |
Other Securities(b) | | | | | | | 102,729 | |
| | | | | | | | | |
Germany — 0.1% | | | | | | | | |
Other Securities(b) (d) | | | | | | | 439,078 | |
| | | | | | | | | |
Korea (Republic of) — 0.0%(a) | | | | | | | | |
CJ Corp.(e) (f) (g) | | | 15 | | | | 485 | |
| | | | | | | | | |
Total Preferred Stocks(Cost $928,108) | | | | | | $ | 1,014,729 | |
| | | | | | | | | |
RIGHTS — 0.0%(a) | | | | | | | | |
Chile — 0.0% | | | | | | | | |
Enel Americas S.A.(e) (f) (g) | | | 316,791 | | | $ | 0 | |
| | | | | | | | | |
Spain — 0.0%(a) | | | | | | | | |
Repsol S.A.(e) (f) (g) | | | 36,486 | | | | 20,238 | |
| | | | | | | | | |
Taiwan — 0.0%(a) | | | | | | | | |
China Life Insurance Co. Ltd. (e) (f)(g) | | | 26,008 | | | | 3,568 | |
| | | | | | | | | |
Total Rights
(Cost $24,623) | | | | | | $ | 23,806 | |
| | | | | | | | | |
See Notes to Financial Statements.
40
Wilshire Mutual Funds, Inc. Wilshire International Equity Fund Condensed Schedule of Investments - (Continued) | June 30, 2019
(Unaudited) | 
|
| | | Shares | | | Value | |
MONEY MARKET FUNDS — 1.3% | | | | |
Northern Trust Institutional Government Select Portfolio - Institutional Class, 2.24%(h) | | | 4,216,898 | | | $ | 4,216,898 | |
Northern Trust Institutional Liquid Asset Portfolio - Institutional Class, 2.36%(h) (i) | | | 913,808 | | | | 913,808 | |
Total Money Market Funds(Cost $5,130,706) | | $ | 5,130,706 | |
| | | | | | | | | |
Total Investments at Value — 99.4%(Cost $344,529,336) | | $ | 380,866,185 | |
| | | | | | | | | |
Other Assets in Excess of Liabilities — 0.6% | | | 2,171,568 | |
| | | | | | | | | |
Net Assets — 100.0% | | | | | | $ | 383,037,753 | |
The Condensed Schedule of Investments does not reflect the complete portfolio holdings. It includes the Fund’s 50 largest holdings, each investment of any issuer that exceeds 1% of the Fund’s net assets, and any illiquid investments or investments classified as Level 3. “Other Securities” represent all issues not required to be disclosed under the rules adopted by the U.S. Securities and Exchange Commission (“SEC”). The complete schedule of portfolio holdings is available (i) without charge, upon request, by calling (866) 591-1568; (ii) on the SEC’s website at www.sec.gov; and (iii) on our website at http://advisor.wilshire.com.
(a) | Percentage rounds to less than 0.1%. |
(b) | Represents issuers not identified as a top 50 holding in terms of market value, issues or issuers not exceeding 1% of net assets individually or in the aggregate, respectively, or any issuers not classified as illiquid or Level 3 investments, as of June 30, 2019. |
(c) | This security or a partial position of this security is on loan at June 30, 2019. The total market value of securities on loan at June 30, 2019 was $9,009,901 (Note 7). |
(d) | Level 2 security (Note 2). |
(e) | Non-income producing security. |
(f) | Illiquid security. The total value of such securities is $24,291 as of June 30, 2019, representing 0.0% (a) of net assets. |
(g) | Level 3 security. Security has been valued at fair value in accordance with procedures adopted by and under the general supervision of the Board of Directors. The total value of such securities is $24,291 as of June 30, 2019, representing 0.0% (a) of net assets (Note 2). |
(h) | The rate shown is the 7-day effective yield as of June 30, 2019. |
(i) | This security was purchased with cash collateral held from securities on loan. The total value of such securities as of June 30, 2018 was $913,808. Securities on loan are also collateralized by various U.S. Treasury obligations in the amount of $8,406,826 (Note 7). |
ADR — American Depositary Receipt.
See Notes to Financial Statements.
41
Wilshire Mutual Funds, Inc. Wilshire Income Opportunities Fund Schedule of Investments | June 30, 2019
(Unaudited) | 
|
| | | Par Value | | | Value | |
U.S. TREASURY OBLIGATIONS — 11.2% |
U.S. Treasury Bills — 1.0% |
2.406%, due 09/05/19(a) | | $ | 1,880,000 | | | $ | 1,872,762 | |
2.385%, due 11/07/19(a) | | | 1,300,000 | | | | 1,290,404 | |
| | | | | | | | 3,163,166 | |
U.S. Treasury Bonds — 2.6% | | | | | | | | |
4.375%, due 02/15/38 | | | 880,000 | | | | 1,162,425 | |
2.750%, due 11/15/42(b) | | | 1,195,000 | | | | 1,251,389 | |
3.125%, due 02/15/43 | | | 1,850,000 | | | | 2,061,305 | |
3.000%, due 02/15/49(b) | | | 2,280,300 | | | | 2,500,848 | |
Other Securities(b) (c) | | | | | | | 1,299,600 | |
| | | | | | | | 8,275,567 | |
U.S. Treasury Notes — 7.2% | | | | | | | | |
1.750%, due 06/15/22 | | | 1,338,000 | | | | 1,339,464 | |
1.750%, due 06/30/24 | | | 3,836,000 | | | | 3,833,003 | |
3.000%, due 09/30/25 | | | 1,000,000 | | | | 1,067,656 | |
2.250%, due 08/15/27 | | | 960,000 | | | | 982,500 | |
2.375%, due 05/15/29(b) | | | 2,000,000 | | | | 2,065,625 | |
Other Securities(b) (c) | | | | | | | 13,425,238 | |
| | | | | | | | 22,713,486 | |
U.S. Treasury Inflation-Protected Notes — 0.4% |
Other Securities(c) | | | | | | | 1,350,997 | |
| | | | | | | | | |
Total U.S. Treasury Obligations(Cost $34,171,752) | | $ | 35,503,216 | |
| | | | | | | | | |
AGENCY MORTGAGE-BACKED OBLIGATIONS — 8.3% |
Federal Home Loan Mortgage Corp. — 2.3% | | | | |
Series 4249, Class CS, 4.300%, due 09/15/43 | | $ | 1,263,587 | | | $ | 1,209,533 | |
Series 4355, Class ZX, 4.000%, due 05/15/44 | | | 4,273,488 | | | | 4,701,251 | |
Other Securities(c) (d) | | | | | | | 1,241,476 | |
| | | | | | | | 7,152,260 | |
Federal Home Loan Mortgage Corp. Interest-Only Strips — 0.3% |
Other Securities(c) (d) | | | | | | | 1,014,083 | |
| | | | | | | | | |
Federal National Mortgage Association — 2.9% |
Series 2016-75, Class ZP, 3.000%, due 10/25/46 | | | 1,382,552 | | | | 1,318,782 | |
Series TBA, 3.500%, due 02/25/48 | | | 1,700,000 | | | | 1,738,051 | |
Series TBA, 4.000%, due 05/25/48 | | | 1,350,000 | | | | 1,395,272 | |
Other Securities(b) (c) (d) | | | | | | | 4,799,145 | |
| | | | | | | | 9,251,250 | |
Federal National Mortgage Association Interest-Only Strips — 1.6% |
Series 2009-78, Class XS, 4.336% (1MO LIBOR + 674), due 10/25/39(d) | | | 6,229,155 | | | | 1,341,248 | |
Other Securities(c) (d) | | | | | | | 3,782,713 | |
| | | | | | | | 5,123,961 | |
Government National Mortgage Association — 0.6% |
Series TBA, 3.000%, due 04/20/47 | | | 1,650,000 | | | | 1,683,709 | |
| | | | | | | | | |
Government National Mortgage Association Interest-Only Strips — 0.6% |
Other Securities(c) (d) | | | | | | | 1,883,824 | |
| | | | | | | | | |
Total Agency Mortgage-Backed Obligations
(Cost $24,892,962) | | $ | 26,109,087 | |
| | | | | | | | | |
NON-AGENCY MORTGAGE-BACKED OBLIGATIONS — 18.6% |
BCAPB, LLC Trust, Series 2007-AB1, Class A-5, 4.916%, due 03/25/37(d) | | $ | 4,008,599 | | | $ | 2,581,634 | |
BX Trust, Series 2018-MCSF, Class F, 144A, 5.086%, due 04/15/35(d) (e) | | | 140,000 | | | | 140,701 | |
BX Trust, Series 2018-GW, Class G, 144A, 5.360% (1MO LIBOR + 292), due 05/15/35 (d)(e) | | | 83,000 | | | | 83,570 | |
Castlelake Aircraft Securitization, Series 2019-1A, Class C, 144A, 6.899%, due 04/15/39(d) | | | 976,071 | | | | 972,883 | |
CIM Trust, Series 2016-2, Class B2, 144A, 8.273%, due 02/01/56(d) | | | 1,000,000 | | | | 1,009,094 | |
CIM Trust, Series 2016-3, Class B2, 144A, 7.312%, due 02/27/56(d) | | | 1,000,000 | | | | 1,005,849 | |
See Notes to Financial Statements.
42
Wilshire Mutual Funds, Inc. Wilshire Income Opportunities Fund Schedule of Investments - (continued) | June 30, 2019
(Unaudited) | 
|
| | | Par Value | | | Value | |
NON-AGENCY MORTGAGE-BACKED OBLIGATIONS — 18.6% (Continued) |
CIM Trust, Series 2016-1, Class B2, 144A, 7.453%, due 07/26/55(d) | | $ | 1,000,000 | | | $ | 1,010,803 | |
CLNS Trust, Series 2017-IKPR, Class F, 144A, 6.953% (1MO LIBOR + 450), due 06/11/32 (d)(e) | | | 84,000 | | | | 84,630 | |
Commercial Mortgage Trust, Series 2016-GCT, Class F, 144A, 3.461%, due 08/10/29 (d) (e) | | | 150,000 | | | | 146,972 | |
Countrywide Asset Backed Securities, Inc., Series 2006-6, Class 1-A-1, 2.574% (1MO LIBOR + 175), due 09/25/36 (d) | | | 1,397,517 | | | | 1,366,702 | |
Countrywide Home Loan Mortgage Trust, Series 2007-HY5, Class 3-A-1, 3.795%, due 09/25/37(d) | | | 1,656,991 | | | | 1,605,317 | |
Credit Suisse Commercial Mortgage Trust, Series 2017-LSTK, Class E, 144A, 3.331%, due 04/05/33(d) (e) | | | 170,000 | | | | 168,565 | |
DBGS Mortgage Trust, Series 2018-5BP, Class F, 144A, 4.890% (1MO LIBOR + 245), due 06/15/33(d) (e) | | | 140,000 | | | | 139,716 | |
Dryden Senior Loan Fund, Series 2018-60A, Class C, 144A, 4.647% (3MO LIBOR + 205), due 07/15/31(d) | | | 1,000,000 | | | | 979,986 | |
FREMF Mortgage Trust, Series 2014-K503, Class D, 144A, 0.000%, due 10/25/47(d) (e) | | | 1,064,300 | | | | 1,049,084 | |
Goldman Sachs Mortgage Securities Trust, Series 2018-RIVR, Class F, 144A, 4.540% (1MO LIBOR + 210), due 07/15/35(d) | | | 1,000,000 | | | | 988,302 | |
GSAA Home Equity Trust, Series 2005-6, Class M-1, 2.860% (1MO LIBOR + 43), due 06/25/35(d) | | | 1,300,000 | | | | 1,255,671 | |
Home Partners of America Trust, Series 2018-1, Class E, 144A, 4.282% (1MO LIBOR + 185), due 07/17/37(d) | | | 1,000,000 | | | | 999,997 | |
IMT Trust, Series 2017-APTS, Class FFL, 144A, 5.290% (1MO LIBOR + 285), due 06/15/34(d) (e) | | | 56,000 | | | | 55,737 | |
JPMorgan Chase Commercial Mortgage Securities Trust, Series 2018-LAQ, Class E, 144A, 5.440% (1MO LIBOR + 300), due 06/15/32(d) (e) | | | 26,502 | | | | 26,717 | |
JPMorgan Chase Commercial Mortgage Trust, Series 2011-C5, Class D, 5.375%, due 08/15/46(d) (e) | | | 268,000 | | | | 271,929 | |
JPMorgan Chase Commercial Mortgage Trust, Series 2018-WPT, Class FFX, 144A, 5.542%, due 07/05/23(d) | | | 1,500,000 | | | | 1,541,499 | |
JPMorgan Chase Commercial Mortgage Trust, Series 2018-BCON, Class E, 3.756%, due 01/05/31(d) (e) | | | 300,000 | | | | 303,386 | |
Madison Avenue Trust, Series 2013-650M, Class E, 4.034%, due 10/12/32(d) (e) | | | 268,000 | | | | 265,811 | |
Morgan Stanley BofA Mortgage Loan Trust, Series 2014-C17, Class C, 4.465%, due 08/15/47(d) | | | 1,117,000 | | | | 1,144,007 | |
Morgan Stanley BofA Mortgage Loan Trust, Series 2015-C20, Class D, 144A, 3.071%, due 02/15/48(d) (e) | | | 42,000 | | | | 39,045 | |
Morgan Stanley BofA Mortgage Loan Trust, Series 2015-C22, Class C, 4.378%, due 04/15/48(d) | | | 1,000,000 | | | | 1,034,006 | |
Morgan Stanley Capital I Trust, Series 2018-SUN, Class G, 144A, 5.490% (1MO LIBOR + 305), due 07/15/35(d) (e) | | | 40,000 | | | | 40,251 | |
See Notes to Financial Statements.
43
Wilshire Mutual Funds, Inc. Wilshire Income Opportunities Fund Schedule of Investments - (continued) | June 30, 2019
(Unaudited) | 
|
| | | Par Value | | | Value | |
NON-AGENCY MORTGAGE-BACKED OBLIGATIONS — 18.6% (Continued) |
Morgan Stanley Capital I Trust, Series 2006-NC1, Class M-1, 2.810% (1MO LIBOR + 380), due 12/25/35 (d) | | $ | 1,000,000 | | | $ | 973,377 | |
MSCG Trust, Series 2018-SELF, Class F, 144A, 5.490% (1MO LIBOR + 305), due 10/15/28 (d) (e) | | | 199,000 | | | | 199,251 | |
PFP Ltd., Series 2017-4, Class D, 144A, 6.073% (1MO LIBOR + 360), due 07/14/35 (d) | | | 1,000,000 | | | | 999,795 | |
PR Mortgage Loan Trust, Series 2014-1, Class APT, 144A, 5.911%, due 10/25/49 (d) (e) | | | 1,865,055 | | | | 1,855,548 | |
Slide, Series 2018-FUN, Class F, 144A, 5.440% (1MO LIBOR + 300), due 06/15/31(d) | | | 1,224,832 | | | | 1,234,795 | |
Wells Fargo Commercial Mortgage Trust, Series 2015-LC5, Class D, 144A, 4.761%, due 10/15/45(d) (e) | | | 385,000 | | | | 397,457 | |
Other Securities(c) (d) | | | | | | | 32,878,299 | |
Total Non-Agency Mortgage-Backed Obligations
(Cost $57,954,737) | | $ | 58,850,386 | |
| | | | | | | | | |
NON-AGENCY MORTGAGE-BACKED OBLIGATION INTEREST-ONLY STRIPS — 2.9% |
FREMF Mortgage Trust, Series 2014-K503, Class X2A, 144A, 0.100%, due 10/25/47(d) (e) | | $ | 263,070 | | | $ | 51 | |
FREMF Mortgage Trust, Series 2014-K503, Class X2B, 144A, 0.100%, due 10/25/47(d) (e) | | | 2,554,200 | | | | 1,265 | |
L Street Securities, Series 2017-PM1, Class XIO, 144A, 0.000%, due 11/25/47(d) | | | 818,978,210 | | | | 1,167,208 | |
Other Securities(c) (d) | | | | | | | 8,113,767 | |
Total Non-Agency Mortgage-Backed Obligation Interest-Only Strips (Cost $8,795,932) | | $ | 9,282,291 | |
| |
ASSET-BACKED SECURITIES — 2.3% |
Helios Issuer, LLC, Series 2017-1A, Class A, 144A, 4.940%, due 09/20/49(d) | | $ | 1,081,513 | | | $ | 1,149,543 | |
Wingstop Funding, LLC, Series 2018-1, Class A2, 144A, 4.970%, due 12/05/48(d) | | | 997,500 | | | | 1,042,217 | |
Other Securities(c) (d) | | | | | | | 5,184,686 | |
Total Asset-Backed Securities
(Cost $7,148,604) | | | | | | $ | 7,376,446 | |
| | | | | | | | | |
COLLATERALIZED LOAN OBLIGATIONS — 3.3% |
Annisa CLO Ltd., Series 2016-2A, Class CR, 144A, 4.592% (3MO LIBOR + 200), due 07/20/31(d) | | $ | 1,000,000 | | | $ | 977,746 | |
Babson CLO Ltd., Series 2012-II, Class SUB, 144A, 0.000%, due 05/15/23(e) | | | 1,000,000 | | | | 34,632 | |
Other Securities(c) (d) | | | | | | | 9,298,316 | |
Total Collateralized Loan Obligations(Cost $11,179,022) | | $ | 10,310,694 | |
| | | | | | | | | |
INVESTMENT-GRADE CORPORATE OBLIGATIONS — 6.9% |
Communication Services — 0.6% | | | | |
Other Securities(b) (c) | | | | | | $ | 1,966,371 | |
| | | | | | | | | |
Consumer Discretionary — 0.4% | | | | |
Other Securities(c)(d) | | | | | | | 1,129,263 | |
| | | | | | | | | |
Consumer Staples — 0.4% | | | | | | | | |
Other Securities(c)(d) | | | | | | | 1,166,040 | |
| | | | | | | | | |
Energy — 1.4% | | | | | | | | |
Other Securities(b) (c) | | | | | | | 4,476,991 | |
| | | | | | | | | |
Financials — 1.9% | | | | | | | | |
Other Securities(b) (c) (d) | | | | | | | 6,114,667 | |
| | | | | | | | | |
See Notes to Financial Statements.
44
Wilshire Mutual Funds, Inc. Wilshire Income Opportunities Fund Schedule of Investments - (continued) | June 30, 2019
(Unaudited) | 
|
| | | Par Value | | | Value | |
INVESTMENT-GRADE CORPORATE OBLIGATIONS — 6.9% (Continued) |
Health Care — 0.6% | | | | | | | | |
Other Securities(b) (c) (d) | | | | | | $ | 1,905,347 | |
| | | | | | | | | |
Industrials — 0.3% | | | | | | | | |
Other Securities(b) (c) | | | | | | | 825,782 | |
| | | | | | | | | |
Information Technology — 0.7% |
Other Securities(c) | | | | | | | 2,314,588 | |
| | | | | | | | | |
Materials — 0.2% | | | | | | | | |
Other Securities(c) | | | | | | | 568,629 | |
| | | | | | | | | |
Real Estate — 0.2% | | | | | | | | |
Other Securities(c) | | | | | | | 553,902 | |
| | | | | | | | | |
Utilities — 0.2% | | | | | | | | |
Other Securities(b) (c) | | | | | | | 735,304 | |
| | | | | | | | | |
Total Investment-Grade Corporate Obligations
(Cost $20,716,039) | | $ | 21,756,884 | |
| | | | | | | | | |
HIGH YIELD CORPORATE OBLIGATIONS — 11.2% |
Communication Services — 1.5% | | | | |
Other Securities(b) (c) | | | | | | $ | 4,792,748 | |
| | | | | | | | | |
Consumer Discretionary — 1.6% | | | | |
Cengage Learning, Inc., 144A, 9.500%, due 06/15/24(e) | | $ | 55,000 | | | | 52,594 | |
PetSmart, Inc., 144A, 7.125%, due 03/15/23(e) | | | 30,000 | | | | 28,125 | |
Other Securities(b) (c) | | | | | | | 4,914,184 | |
| | | | | | | | 4,994,903 | |
Consumer Staples — 0.7% | | | | | | | | |
Other Securities(b) (c) | | | | | | | 2,273,344 | |
| | | | | | | | | |
Energy — 2.3% | | | | | | | | |
Other Securities(b) (c) | | | | | | | 7,145,123 | |
| | | | | | | | | |
Financials — 1.4% | | | | | | | | |
Other Securities(b) (c) (d) | | | | | | | 4,588,589 | |
| | | | | | | | | |
Health Care — 0.6% | | | | | | | | |
Other Securities(b) (c) | | | | | | | 1,948,192 | |
| | | | | | | | | |
Industrials — 0.8% | | | | | | | | |
Other Securities(b) (c) | | | | | | | 2,621,078 | |
| | | | | |
Information Technology — 0.8% | | | | |
Other Securities(b) (c) | | | | | | | 2,395,663 | |
| | | | | | | | | |
Materials — 1.0% | | | | | | | | |
Other Securities(b) (c) | | | | | | | 3,165,777 | |
| | | | | | | | | |
Real Estate — 0.1% | | | | | | | | |
Other Securities(c) | | | | | | | 374,405 | |
| | | | | | | | | |
Utilities — 0.4% | | | | | | | | |
Other Securities(b) (c) | | | | | | | 1,182,014 | |
| | | | | | | | | |
Total High Yield Corporate Obligations(Cost $34,476,166) | | $ | 35,481,836 | |
| | | | | | | | | |
FOREIGN BONDS — 23.5% | | | | | | | | |
Argentina — 0.9% | | | | | | | | |
Other Securities(b) (c) | | | | | | $ | 2,968,754 | |
| | | | | | | | | |
Australia — 0.4% | | | | | | | | |
Other Securities(c) | | | | | | | 1,372,368 | |
| | | | | | | | | |
Austria — 0.2% | | | | | | | | |
Other Securities(c) | | | | | | | 686,154 | |
| | | | | | | | | |
Bermuda — 0.5% | | | | | | | | |
Digicel Group Ltd., 144A, 9.125%, due 04/01/24(e) | | $ | 602,566 | | | | 126,539 | |
Other Securities(c) | | | | | | | 1,280,194 | |
| | | | | | | | 1,406,733 | |
Brazil — 1.3% | | | | | | | | |
Brazil Notas do Tesouro Nacional, 10.000%, due 01/01/23 | | | 4,560 | | | | 1,364,612 | |
Other Securities(b) (c) | | | | | | | 2,782,847 | |
| | | | | | | | 4,147,459 | |
See Notes to Financial Statements.
45
Wilshire Mutual Funds, Inc. Wilshire Income Opportunities Fund Schedule of Investments - (continued) | June 30, 2019
(Unaudited) | 
|
| | | Par Value | | | Value | |
FOREIGN BONDS — 23.5% (Continued) | | | | |
Canada — 2.4% | | | | | | | | |
Canadian Government, 2.250%, due 03/01/24 | | | 1,311,000 | | | $ | 1,039,555 | |
Other Securities(b) (c) | | | | | | | 6,461,914 | |
| | | | | | | | 7,501,469 | |
Cayman Islands — 0.9% | | | | | | | | |
Other Securities(c) | | | | | | | 2,774,684 | |
| | | | | | | | | |
Chile — 1.0% | | | | | | | | |
Other Securities(b) (c) | | | | | | | 3,074,647 | |
| | | | | | | | | |
Colombia — 0.8% | | | | | | | | |
Other Securities(c) | | | | | | | 2,581,709 | |
| | | | | | | | | |
Costa Rica — 0.1% | | | | | | | | |
Other Securities(c) | | | | | | | 211,750 | |
| | | | | | | | | |
Curacao — 0.1% | | | | | | | | |
Other Securities(b) (c) | | | | | | | 211,750 | |
| | | | | | | | | |
Dominican Republic — 0.1% | | | | | | | | |
Other Securities(b) (c) | | | | | | | 465,493 | |
| | | | | | | | | |
Finland — 0.1% | | | | | | | | |
Other Securities(c) | | | | | | | 234,494 | |
| | | | | | | | | |
Germany — 0.3% | | | | | | | | |
Other Securities(c) | | | | | | | 1,069,124 | |
| | | | | | | | | |
Hungary — 0.3% | | | | | | | | |
Other Securities(c) | | | | | | | 858,210 | |
| | | | | | | | | |
India — 0.5% | | | | | | | | |
Other Securities(c) | | | | | | | 1,733,853 | |
| | | | | | | | | |
Indonesia — 1.2% | | | | | | | | |
Other Securities(c) | | | | | | | 3,701,602 | |
| | | | | | | | | |
Ireland — 0.7% | | | | | | | | |
Other Securities(b) (c) | | | | | | | 2,300,371 | |
| | | | | | | | | |
Israel — 0.3% | | | | | | | | |
Other Securities(c) | | | | | | | 864,243 | |
| | | | | | | | | |
Japan — 0.4% | | | | | | | | |
Other Securities(c) (d) | | | | | | | 1,304,091 | |
| | | | | | | | | |
Liberia — 0.0%(f) | | | | | | | | |
Other Securities(c) | | | | | | | 65,081 | |
| | | | | | | | | |
Luxembourg — 1.4% | | | | | | | | |
Other Securities(b) (c) | | | | | | | 4,556,129 | |
| | | | | | | | | |
Malaysia — 0.4% | | | | | | | | |
Other Securities(c) | | | | | | | 1,279,801 | |
| | | | | | | | | |
Mauritius — 0.1% | | | | | | | | |
Other Securities(c) | | | | | | | 403,304 | |
| | | | | | | | | |
Mexico — 1.7% | | | | | | | | |
Other Securities(b) (c) (d) | | | | | | | 5,509,895 | |
| | | | | | | | | |
Mongolia — 0.1% | | | | | | | | |
Other Securities(b) (c) | | | | | | | 418,370 | |
| | | | | | | | | |
Netherlands — 1.6% | | | | | | | | |
Petrobras Global Finance B.V., 5.750%, due 02/01/29 | | $ | 1,015,000 | | | | 1,056,869 | |
Other Securities(b) (c) | | | | | | | 4,129,952 | |
| | | | | | | | 5,186,821 | |
New Zealand — 0.3% | | | | | | | | |
Other Securities(c) | | | | | | | 996,307 | |
| | | | | | | | | |
Norway — 0.6% | | | | | | | | |
Norwegian Government Bond, 144A, 3.750%, due 05/25/21 | | | 7,980,000 | | | | 978,911 | |
Other Securities(c) (d) | | | | | | | 827,951 | |
| | | | | | | | 1,806,862 | |
Panama — 0.4% | | | | | | | | |
Other Securities(b) (c) | | | | | | | 1,228,193 | |
| | | | | | | | | |
Paraguay — 0.1% | | | | | | | | |
Other Securities(c) | | | | | | | 206,187 | |
| | | | | | | | | |
Peru — 0.1% | | | | | | | | |
Other Securities(b) (c) | | | | | | | 429,534 | |
| | | | | | | | | |
Philippines — 0.9% | | | | | | | | |
Other Securities(c) (d) | | | | | | | 2,697,019 | |
| | | | | | | | | |
See Notes to Financial Statements.
46
Wilshire Mutual Funds, Inc. Wilshire Income Opportunities Fund Schedule of Investments - (continued) | June 30, 2019
(Unaudited) | 
|
| | | Par Value | | | Value | |
FOREIGN BONDS — 23.5% (Continued) |
Portugal — 0.3% | | | | | | | | |
Other Securities(c) | | | | | | $ | 946,254 | |
| | | | | | | | | |
Puerto Rico — 0.1% | | | | | | | | |
Other Securities(c) | | | | | | | 302,743 | |
| | | | | | | | | |
Qatar — 0.1% | | | | | | | | |
Other Securities(c) | | | | | | | 443,605 | |
| | | | | | | | | |
Saudi Arabia — 0.2% | | | | | | | | |
Other Securities(c) | | | | | | | 605,084 | |
| | | | | | | | | |
Singapore — 1.4% | | | | | | | | |
Other Securities(b) (c) | | | | | | | 4,393,741 | |
| | | | | | | | | |
Spain — 0.2% | | | | | | | | |
Other Securities(c) | | | | | | | 548,750 | |
| | | | | | | | | |
Sweden — 0.2% | | | | | | | | |
Other Securities(c) | | | | | | | 512,414 | |
| | | | | | | | | |
Thailand — 0.1% | | | | | | | | |
Other Securities(c) | | | | | | | 202,250 | |
| | | | | | | | | |
United Kingdom — 0.4% | | | | | | | | |
Other Securities(c) | | | | | | | 1,291,157 | |
| | | | | | | | | |
Virgin Islands British — 0.3% | | | | | | | | |
Other Securities(c) | | | | | | | 775,142 | |
| | | | | | | | | |
Total Foreign Bonds(Cost $72,301,652) | | | | | | $ | 74,273,601 | |
| | | | | | | | | |
LOAN PARTICIPATIONS — 4.8% | | | | |
Allied Universal Holdco, LLC, 4.700% (3MO LIBOR + 425), due 06/26/26(c) (e) | | $ | 10,811 | | | $ | 10,811 | |
Capital Automotive, L.P., 8.483% (3MO LIBOR + 600), due 03/21/25(d) (e) | | | 37,957 | | | | 37,981 | |
CPA Global, 5.833% (3MO LIBOR + 325), due 10/04/24 (d) (e) | | | 306,560 | | | | 299,969 | |
Radiology Partners, Inc., 7.342% (3MO LIBOR + 425), due 07/09/25(d) (e) | | | 149,624 | | | | 149,531 | |
RentPath, LLC, 7.240% (3MO LIBOR + 475), due 12/17/21 (d)(e) | | | 214,968 | | | | 123,222 | |
Tribune Media Co., 5.499% (3MO LIBOR + 300), due 12/27/20(d) (e) | | | 42,521 | | | | 42,424 | |
Other Securities(c) (d) | | | | | | | 14,461,070 | |
Total Loan Participations(Cost $15,365,260) | | | | | | $ | 15,125,008 | |
| | | | | | | | | |
| | | Shares | | | | | |
COMMON STOCKS — 0.2% | | | | | | | | |
Financials — 0.2% | | | | | | | | |
Other Securities(c) | | | | | | $ | 500,154 | |
| | | | | | | | | |
Industrials — 0.0%(f) | | | | | | | | |
Other Securities(c) | | | | | | | 25,016 | |
| | | | | | | | | |
Total Common Stocks(Cost $570,128) | | | | | | $ | 525,170 | |
| | | | | | | | | |
PREFERRED STOCKS — 0.9% | | | | | | | | |
U.S. Bancorp, 5.500%(e) | | | 6,900 | | | $ | 178,986 | |
Other Securities(c) | | | | | | | 2,569,171 | |
Total Preferred Stocks(Cost $2,716,605) | | | | | | $ | 2,748,157 | |
| | | | | | | | | |
PURCHASED OPTIONS — 0.0%(f) | | | | |
Other Securities(c)
(Cost $40,999) | | | | | | $ | 38,440 | |
| | | | | | | | | |
PURCHASED SWAPTION CONTRACTS — 0.00%(f) |
Other Securities(c)
(Cost $28,500) | | | | | | $ | 48,259 | |
See Notes to Financial Statements.
47
Wilshire Mutual Funds, Inc. Wilshire Income Opportunities Fund Schedule of Investments - (continued) | June 30, 2019
(Unaudited) | 
|
| | | Shares | | | Value | |
AFFILIATED REGISTERED INVESTMENT COMPANIES — 5.8% |
Voya Emerging Markets Hard Currency Debt Fund - Class P | | | 342,061 | | | $ | 3,345,353 | |
Voya Floating Rate Fund - Class P | | | 1,377,092 | | | | 13,164,995 | |
Voya High Yield Bond Fund - Class P | | | 215,924 | | | | 1,720,916 | |
Total Affiliated Registered Investment Companies
(Cost $18,277,918) | | | | | | $ | 18,231,264 | |
| | | | | | | | | |
MONEY MARKET FUNDS — 10.2% | | | | |
Northern Trust Institutional Government Select Portfolio - Institutional Class, 2.24%(g) | | | 12,347,287 | | | $ | 12,347,287 | |
Northern Trust Institutional Liquid Asset Portfolio - Institutional Class, 2.36%(g) (h) | | | 20,030,015 | | | | 20,030,015 | |
Total Money Market Funds(Cost $32,377,302) | | | | | | $ | 32,377,302 | |
| | | | | | | | | |
Total Investments at Value — 110.1%(Cost $340,985,078) | | $ | 348,038,041 | |
| | | | | | | | | |
Liabilities in Excess of Other Assets — (10.1%) | | | (31,867,915 | ) |
| | | | | | | | | |
Net Assets — 100.0% | | | | | | $ | 316,170,126 | |
The Condensed Schedule of Investments does not reflect the complete portfolio holdings. It includes the Portfolio’s 50 largest holdings, each investment of any issue that exceeds 1% of the Portfolio’s net assets, and any illiquid investments. “Other Securities” represent all issues not required to be disclosed under the rules adopted by the U.S. Securities and Exchange commission (“SEC”). The complete schedule of portfolio holdings is available (i) without charge, upon request, by calling (866) 591-1568; (ii) on the SEC’s website at www.sec.gov; and (iii) on our website at http://advisor.wilshire.com.
CLO — Collateralized Loan Obligation.
LIBOR — London Interbank Offered Rate.
144A — Security was purchased in a transaction exempt from registration in compliance with Rule 144A of the Securities Act of 1933. This security may be resold in transactions exempt from registration, normally to qualified institutional buyers. Management has determined that these securities are liquid. The total value of such securities is $94,667,274 as of June 30, 2019, representing 29.9% of net assets.
(a) | Rate shown is the annualized yield at time of purchase, not a coupon rate. |
(b) | This security or a partial position of this security is on loan at June 30, 2019. The total market value of securities on loan at June 30, 2019 was $22,129,883 (Note 7). |
(c) | Represents issuers not identified as a top 50 holding in terms of market value, issues or issuers not exceeding 1% of net assets individually or in the aggregate, respectively, or any illiquid investments as of June 30, 2019. |
(d) | Variable rate security. Interest rate resets periodically. The rate shown is the effective interest rate as of June 30, 2019. For securities based on a published reference rate and spread, the reference rate and spread (in basis points) are indicated parenthetically. Certain variable rate securities are not based on a published reference rate and spread but are determined by the issuer or agent and are based on current market conditions. These securities, therefore, do not indicate a reference rate and spread. |
(e) | Illiquid security. The total value of such securities is $6,354,500 as of June 30, 2019, representing 2.0% of net assets. |
(f) | Percentage rounds to less than 0.1%. |
(g) | The rate shown is the 7-day effective yield as of June 30, 2019. |
(h) | This security was purchased with cash collateral held from securities on loan. The total value of such securities as of June 30, 2019 was $20,030,015. Securities on loan are also collateralized by various U.S. Treasury obligations in the amount of $2,541,618 (Note 7). |
LIBOR rates as of June 30, 2019:
1MO LIBOR 2.39800%
3MO LIBOR 2.31988%
See Notes to Financial Statements.
48
Wilshire Mutual Funds, Inc. Wilshire Income Opportunities Fund Schedule of Futures Contracts | June 30, 2019
(Unaudited) | 
|
FUTURES CONTRACTS | | Contracts | | | Expiration
Date | | | Notional
Value | | | Value/
Unrealized
Appreciation | |
TREASURY FUTURES | | | | | | | | | | | | | | | | |
2-Year U.S. Treasury Note Future | | | 53 | | | | 09/30/2019 | | | $ | 11,402,867 | | | $ | 64,279 | |
5-Year U.S. Treasury Note Future | | | 246 | | | | 09/30/2019 | | | | 29,060,672 | | | | 439,470 | |
10-Year U.S. Treasury Note Future | | | 25 | | | | 09/19/2019 | | | | 3,198,438 | | | | 65,787 | |
U.S. Treasury Long Bond Future | | | 12 | | | | 09/19/2019 | | | | 1,867,125 | | | | 63,003 | |
Total Futures Contracts | | | | | | | | | | $ | 45,529,102 | | | $ | 632,539 | |
The average monthly notional amount of futures contracts during the six months ended June 30, 2019 was $45,056,139.
Wilshire Mutual Funds, Inc. Wilshire Income Opportunities Fund Schedule of Futures Contracts Sold Short | June 30, 2019
(Unaudited) | 
|
FUTURES CONTRACTS SOLD SHORT | | Contracts | | | Expiration
Date | | | Notional
Value | | | Value/
Unrealized
Depreciation | |
TREASURY FUTURES | | | | | | | | | | | | | | | | |
5-Year U.S. Treasury Note Future | | | 3 | | | | 09/30/2019 | | | $ | 354,398 | | | $ | (521 | ) |
CME Ultra Long-Term U.S. Treasury Bond Future | | | 18 | | | | 09/19/2019 | | | | 3,196,125 | | | | (66,538 | ) |
U.S. Treasury Long Bond Future | | | 15 | | | | 09/19/2019 | | | | 2,333,906 | | | | (4,124 | ) |
Ultra 10-Year U.S. Treasury Note Future | | | 5 | | | | 09/19/2019 | | | | 690,469 | | | | (1,330 | ) |
| | | | | | | | | | | | | | | | | |
Total Futures Contracts Sold Short | | | | | | | | | | $ | 6,574,898 | | | $ | (72,513 | ) |
The average monthly notional amount of futures contracts sold short during the six months ended June 30, 2019 was $4,569,639.
See Notes to Financial Statements.
49
Wilshire Mutual Funds, Inc. Wilshire Income Opportunities Fund Schedule of Forward Foreign Currency Contracts | June 30, 2019
(Unaudited) | 
|
| | | | | | | | | | | | | | | | | | | | | | | Asset
Derivatives | | | Liability
Derivatives | |
Counterparty | | Settlement
Date | | | Fund
Receiving | | | U.S. $ Value at
June 30,
2019 | | | Fund
Delivering | | | U.S. $ Value at
June 30,
2019 | | | Unrealized
Appreciation | | | Unrealized
Depreciation | |
Australia and New Zealand Banking Group Ltd. | | | 9/18/2019 | | | | USD | | | | 1,926,622 | | | | AUD | | | | 1,933,538 | | | $ | — | | | $ | (6,916 | ) |
Australia and New Zealand Banking Group Ltd. | | | 9/18/2019 | | | | USD | | | | 971,919 | | | | NZD | | | | 985,593 | | | | — | | | | (13,674 | ) |
Barclays Capital, Inc. | | | 7/26/2019 | | | | NOK | | | | 3,070,705 | | | | USD | | | | 3,061,885 | | | | 8,820 | | | | — | |
Barclays Capital, Inc. | | | 7/26/2019 | | | | SEK | | | | 527,588 | | | | USD | | | | 528,000 | | | | — | | | | (412 | ) |
BNP Paribas | | | 7/26/2019 | | | | EUR | | | | 184,591 | | | | USD | | | | 185,084 | | | | — | | | | (493 | ) |
BNP Paribas | | | 7/26/2019 | | | | USD | | | | 6,004 | | | | CAD | | | | 6,047 | | | | — | | | | (43 | ) |
BNP Paribas | | | 7/26/2019 | | | | USD | | | | 145,000 | | | | EUR | | | | 145,022 | | | | — | | | | (22 | ) |
Brown Brothers Harriman & Co. | | | 7/26/2019 | | | | AUD | | | | 888,784 | | | | USD | | | | 874,549 | | | | 14,234 | | | | — | |
Brown Brothers Harriman & Co. | | | 7/26/2019 | | | | EUR | | | | 390,091 | | | | USD | | | | 390,000 | | | | 91 | | | | — | |
Brown Brothers Harriman & Co. | | | 7/26/2019 | | | | GBP | | | | 953,504 | | | | USD | | | | 951,000 | | | | 2,504 | | | | — | |
Brown Brothers Harriman & Co. | | | 7/26/2019 | | | | SEK | | | | 111,517 | | | | USD | | | | 110,251 | | | | 1,266 | | | | — | |
Brown Brothers Harriman & Co. | | | 7/26/2019 | | | | USD | | | | 62,855 | | | | EUR | | | | 63,106 | | | | — | | | | (251 | ) |
Brown Brothers Harriman & Co. | | | 7/26/2019 | | | | USD | | | | 496,000 | | | | EUR | | | | 495,691 | | | | 309 | | | | — | |
Brown Brothers Harriman & Co. | | | 7/26/2019 | | | | USD | | | | 871,000 | | | | EUR | | | | 870,612 | | | | 388 | | | | — | |
Brown Brothers Harriman & Co. | | | 7/26/2019 | | | | USD | | | | 645,000 | | | | GBP | | | | 643,710 | | | | 1,290 | | | | — | |
Brown Brothers Harriman & Co. | | | 7/26/2019 | | | | USD | | | | 963,006 | | | | GBP | | | | 965,652 | | | | — | | | | (2,646 | ) |
Brown Brothers Harriman & Co. | | | 7/26/2019 | | | | USD | | | | 384,000 | | | | GBP | | | | 382,691 | | | | 1,309 | | | | — | |
Brown Brothers Harriman & Co. | | | 7/26/2019 | | | | USD | | | | 131,000 | | | | GBP | | | | 131,012 | | | | — | | | | (12 | ) |
Brown Brothers Harriman & Co. | | | 7/26/2019 | | | | USD | | | | 184,563 | | | | NOK | | | | 183,538 | | | | 1,025 | | | | — | |
Brown Brothers Harriman & Co. | | | 7/26/2019 | | | | USD | | | | 250,000 | | | | NOK | | | | 248,539 | | | | 1,461 | | | | — | |
Brown Brothers Harriman & Co. | | | 7/26/2019 | | | | USD | | | | 904,332 | | | | NZD | | | | 926,047 | | | | — | | | | (21,716 | ) |
Brown Brothers Harriman & Co. | | | 7/26/2019 | | | | USD | | | | 528,000 | | | | NZD | | | | 528,100 | | | | — | | | | (100 | ) |
CIBC, Toronto | | | 9/18/2019 | | | | CAD | | | | 603,466 | | | | USD | | | | 590,000 | | | | 13,466 | | | | — | |
CIBC, Toronto | | | 9/18/2019 | | | | CAD | | | | 600,847 | | | | USD | | | | 590,000 | | | | 10,847 | | | | — | |
CIBC, Toronto | | | 9/18/2019 | | | | USD | | | | 2,478,134 | | | | CAD | | | | 2,534,296 | | | | — | | | | (56,163 | ) |
See Notes to Financial Statements.
50
Wilshire Mutual Funds, Inc. Wilshire Income Opportunities Fund Schedule of Forward Foreign Currency Contracts
(Continued) | June 30, 2019
(Unaudited) | 
|
| | | | | | | | | | | | | | | | | | | | | | | Asset
Derivatives | | | Liability
Derivatives | |
Counterparty | | Settlement
Date | | | Fund
Receiving | | | U.S. $ Value at
June 30,
2019 | | | Fund
Delivering | | | U.S. $ Value at
June 30,
2019 | | | Unrealized
Appreciation | | | Unrealized
Depreciation | |
Citigroup | | | 7/1/2019 | | | | EUR | | | | 112,750 | | | | USD | | | | 111,330 | | | $ | 1,420 | | | $ | — | |
Citigroup | | | 7/26/2019 | | | | NZD | | | | 880,313 | | | | USD | | | | 876,000 | | | | 4,313 | | | | — | |
Citigroup | | | 7/26/2019 | | | | USD | | | | 761,000 | | | | NOK | | | | 759,708 | | | | 1,292 | | | | — | |
Citigroup | | | 7/26/2019 | | | | USD | | | | 1,500,000 | | | | JPY | | | | 1,500,645 | | | | — | | | | (645 | ) |
Citigroup | | | 9/18/2019 | | | | CAD | | | | 213,149 | | | | NOK | | | | 212,806 | | | | 343 | | | | — | |
Citigroup | | | 9/18/2019 | | | | CAD | | | | 225,575 | | | | NOK | | | | 224,568 | | | | 1,007 | | | | — | |
Citigroup | | | 9/18/2019 | | | | EUR | | | | 82,462 | | | | USD | | | | 81,431 | | | | 1,031 | | | | — | |
Citigroup | | | 9/18/2019 | | | | MXP | | | | 168,447 | | | | USD | | | | 164,020 | | | | 4,427 | | | | — | |
Citigroup | | | 9/18/2019 | | | | MXP | | | | 42,497 | | | | USD | | | | 41,005 | | | | 1,492 | | | | — | |
Citigroup | | | 9/18/2019 | | | | NOK | | | | 225,868 | | | | CAD | | | | 225,575 | | | | 293 | | | | — | |
Citigroup | | | 9/18/2019 | | | | USD | | | | 962,844 | | | | BRL | | | | 972,707 | | | | — | | | | (9,863 | ) |
Citigroup | | | 9/18/2019 | | | | USD | | | | 662,888 | | | | EUR | | | | 669,412 | | | | — | | | | (6,524 | ) |
Citigroup | | | 9/18/2019 | | | | USD | | | | 7,367,070 | | | | EUR | | | | 7,414,254 | | | | — | | | | (47,185 | ) |
Citigroup | | | 9/18/2019 | | | | USD | | | | 112,022 | | | | EUR | | | | 113,459 | | | | — | | | | (1,437 | ) |
Citigroup | | | 9/18/2019 | | | | USD | | | | 615,075 | | | | MXP | | | | 618,079 | | | | — | | | | (3,004 | ) |
Goldman Sachs Bank, USA | | | 7/26/2019 | | | | CHF | | | | 478,794 | | | | USD | | | | 481,000 | | | | — | | | | (2,206 | ) |
Goldman Sachs Bank, USA | | | 7/26/2019 | | | | CHF | | | | 132,140 | | | | USD | | | | 132,000 | | | | 140 | | | | — | |
Goldman Sachs Bank, USA | | | 7/26/2019 | | | | EUR | | | | 3,008,924 | | | | USD | | | | 3,017,000 | | | | — | | | | (8,076 | ) |
Goldman Sachs Bank, USA | | | 7/26/2019 | | | | USD | | | | 1,349,000 | | | | CHF | | | | 1,348,914 | | | | 86 | | | | — | |
Goldman Sachs Bank, USA | | | 7/26/2019 | | | | USD | | | | 2,909,000 | | | | EUR | | | | 2,909,626 | | | | — | | | | (626 | ) |
Goldman Sachs Bank, USA | | | 9/18/2019 | | | | MXP | | | | 840,754 | | | | USD | | | | 818,566 | | | | 22,188 | | | | — | |
Goldman Sachs Bank, USA | | | 9/18/2019 | | | | MXP | | | | 205,697 | | | | USD | | | | 204,548 | | | | 1,149 | | | | — | |
Goldman Sachs Bank, USA | | | 9/18/2019 | | | | USD | | | | 470,000 | | | | JPY | | | | 471,996 | | | | — | | | | (1,996 | ) |
Goldman Sachs Bank, USA | | | 9/18/2019 | | | | USD | | | | 204,641 | | | | MXP | | | | 205,176 | | | | — | | | | (535 | ) |
Goldman Sachs Bank, USA | | | 9/18/2019 | | | | USD | | | | 204,641 | | | | MXP | | | | 206,081 | | | | — | | | | (1,440 | ) |
HSBC Bank, USA | | | 7/26/2019 | | | | NZD | | | | 535,536 | | | | USD | | | | 530,000 | | | | 5,536 | | | | — | |
HSBC Bank, USA | | | 9/18/2019 | | | | CAD | | | | 443,503 | | | | NOK | | | | 438,361 | | | | 5,142 | | | | — | |
HSBC Bank, USA | | | 9/18/2019 | | | | JPY | | | | 472,098 | | | | USD | | | | 470,000 | | | | 2,098 | | | | — | |
HSBC Bank, USA | | | 9/18/2019 | | | | USD | | | | 150,502 | | | | GBP | | | | 150,537 | | | | — | | | | (35 | ) |
HSBC Bank, USA | | | 9/18/2019 | | | | USD | | | | 1,186,667 | | | | JPY | | | | 1,189,094 | | | | — | | | | (2,427 | ) |
JPMChase, New York | | | 7/26/2019 | | | | NZD | | | | 175,621 | | | | USD | | | | 173,000 | | | | 2,621 | | | | — | |
JPMChase, New York | | | 7/26/2019 | | | | USD | | | | 354,839 | | | | JPY | | | | 353,547 | | | | 1,292 | | | | — | |
JPMChase, New York | | | 9/18/2019 | | | | CAD | | | | 222,033 | | | | NOK | | | | 221,220 | | | | 813 | | | | — | |
JPMChase, New York | | | 9/18/2019 | | | | EUR | | | | 334,706 | | | | CAD | | | | 336,896 | | | | — | | | | (2,190 | ) |
JPMChase, New York | | | 9/18/2019 | | | | NOK | | | | 210,436 | | | | CAD | | | | 210,236 | | | | 200 | | | | — | |
JPMChase, New York | | | 9/18/2019 | | | | USD | | | | 590,000 | | | | CAD | | | | 600,953 | | | | — | | | | (10,953 | ) |
JPMChase, New York | | | 9/18/2019 | | | | USD | | | | 590,000 | | | | CAD | | | | 599,266 | | | | — | | | | (9,266 | ) |
JPMChase, New York | | | 9/18/2019 | | | | USD | | | | 1,785,791 | | | | SGD | | | | 1,802,258 | | | | — | | | | (16,467 | ) |
Morgan Stanley Capital | | | 7/26/2019 | | | | CAD | | | | 4,659,739 | | | | USD | | | | 4,619,613 | | | | 40,126 | | | | — | |
Morgan Stanley Capital | | | 7/26/2019 | | | | CHF | | | | 127,756 | | | | USD | | | | 128,000 | | | | — | | | | (244 | ) |
Morgan Stanley Capital | | | 7/26/2019 | | | | USD | | | | 587,000 | | | | AUD | | | | 588,579 | | | | — | | | | (1,579 | ) |
See Notes to Financial Statements.
51
Wilshire Mutual Funds, Inc. Wilshire Income Opportunities Fund Schedule of Forward Foreign Currency Contracts
(Continued) | June 30, 2019
(Unaudited) | 
|
| | | | | | | | | | | | | | | | | | | | | | | Asset
Derivatives | | | Liability
Derivatives | |
Counterparty | | Settlement
Date | | | Fund
Receiving | | | U.S. $ Value at
June 30,
2019 | | | Fund
Delivering | | | U.S. $ Value at
June 30,
2019 | | | Unrealized
Appreciation | | | Unrealized
Depreciation | |
Morgan Stanley Capital | | | 7/26/2019 | | | | USD | | | | 2,007,000 | | | | CAD | | | | 2,006,631 | | | $ | 369 | | | $ | — | |
Morgan Stanley Capital | | | 7/26/2019 | | | | USD | | | | 137,000 | | | | GBP | | | | 136,986 | | | | 14 | | | | — | |
Morgan Stanley Capital | | | 7/26/2019 | | | | USD | | | | 131,000 | | | | NZD | | | | 131,356 | | | | — | | | | (356 | ) |
Morgan Stanley Capital | | | 9/18/2019 | | | | CAD | | | | 426,298 | | | | NOK | | | | 425,670 | | | | 628 | | | | — | |
Morgan Stanley Capital | | | 9/18/2019 | | | | CAD | | | | 225,575 | | | | NOK | | | | 224,963 | | | | 612 | | | | — | |
Morgan Stanley Capital | | | 9/18/2019 | | | | CAD | | | | 210,236 | | | | NOK | | | | 209,787 | | | | 449 | | | | — | |
Morgan Stanley Capital | | | 9/18/2019 | | | | EUR | | | | 83,081 | | | | USD | | | | 82,932 | | | | 149 | | | | — | |
Morgan Stanley Capital | | | 9/18/2019 | | | | EUR | | | | 669,412 | | | | USD | | | | 667,443 | | | | 1,969 | | | | — | |
Morgan Stanley Capital | | | 9/18/2019 | | | | NOK | | | | 225,836 | | | | CAD | | | | 225,575 | | | | 261 | | | | — | |
Morgan Stanley Capital | | | 9/18/2019 | | | | NOK | | | | 44,376 | | | | CAD | | | | 44,350 | | | | 26 | | | | — | |
Morgan Stanley Capital | | | 9/18/2019 | | | | USD | | | | 928,786 | | | | JPY | | | | 930,631 | | | | — | | | | (1,845 | ) |
Royal Bank of Canada, Toronto | | | 9/18/2019 | | | | USD | | | | 273,207 | | | | CAD | | | | 279,208 | | | | — | | | | (6,001 | ) |
Royal Bank of Canada, Toronto | | | 9/18/2019 | | | | USD | | | | 1,780,000 | | | | CAD | | | | 1,793,923 | | | | — | | | | (13,923 | ) |
Standard Chartered Securities N.A. | | | 9/18/2019 | | | | JPY | | | | 883,857 | | | | USD | | | | 890,000 | | | | — | | | | (6,143 | ) |
Standard Chartered Securities N.A. | | | 9/18/2019 | | | | JPY | | | | 888,441 | | | | USD | | | | 890,000 | | | | — | | | | (1,559 | ) |
State Street Bank, Boston | | | 7/26/2019 | | | | AUD | | | | 115,044 | | | | USD | | | | 115,000 | | | | 44 | | | | — | |
State Street Bank, Boston | | | 7/26/2019 | | | | CHF | | | | 656,102 | | | | USD | | | | 656,000 | | | | 102 | | | | — | |
State Street Bank, Boston | | | 7/26/2019 | | | | CHF | | | | 581,953 | | | | USD | | | | 583,119 | | | | — | | | | (1,166 | ) |
State Street Bank, Boston | | | 7/26/2019 | | | | NZD | | | | 235,764 | | | | USD | | | | 231,000 | | | | 4,764 | | | | — | |
State Street Bank, Boston | | | 7/26/2019 | | | | USD | | | | 937,000 | | | | CHF | | | | 941,264 | | | | — | | | | (4,264 | ) |
State Street Bank, Boston | | | 7/26/2019 | | | | USD | | | | 636,853 | | | | GBP | | | | 634,425 | | | | 2,428 | | | | — | |
State Street Bank, Boston | | | 9/18/2019 | | | | USD | | | | 593,333 | | | | JPY | | | | 594,649 | | | | — | | | | (1,316 | ) |
State Street Bank, Boston | | | 9/18/2019 | | | | USD | | | | 409,283 | | | | MXP | | | | 412,961 | | | | — | | | | (3,678 | ) |
State Street Bank, Boston | | | 9/18/2019 | | | | USD | | | | 205,025 | | | | MXP | | | | 209,005 | | | | — | | | | (3,980 | ) |
State Street Bank, Boston | | | 9/18/2019 | | | | USD | | | | 205,025 | | | | MXP | | | | 205,307 | | | | — | | | | (282 | ) |
State Street Bank, Boston | | | 9/18/2019 | | | | USD | | | | 205,025 | | | | MXP | | | | 205,560 | | | | — | | | | (535 | ) |
UBS AG, Stamford | | | 9/18/2019 | | | | EUR | | | | 334,706 | | | | CAD | | | | 336,930 | | | | — | | | | (2,224 | ) |
UBS AG, Stamford | | | 9/18/2019 | | | | NOK | | | | 849,032 | | | | CAD | | | | 852,595 | | | | — | | | | (3,563 | ) |
UBS AG, Stamford | | | 9/18/2019 | | | | NOK | | | | 450,508 | | | | CAD | | | | 451,149 | | | | — | | | | (641 | ) |
UBS AG, Stamford | | | 9/18/2019 | | | | USD | | | | 1,744,924 | | | | NOK | | | | 1,780,261 | | | | — | | | | (35,338 | ) |
| | | | | | | | | | | | | | | | | | | | | | | | | | | | | |
Total | | | | | | | | | | | | | | | | | | | | | | $ | 165,834 | | | $ | (315,960 | ) |
See Notes to Financial Statements.
52
Wilshire Mutual Funds, Inc. Wilshire Income Opportunities Fund Schedule of Forward Foreign Currency Contracts
(Continued) | June 30, 2019
(Unaudited) | 
|
AUD - Australian Dollar | EUR - Euro | NOK - Norway Krona |
BRL - Brazilian Real | GBP - British Pound Sterling | NZD - New Zealand Dollar |
CAD - Canadian Dollar | JPY - Japanese Yen | SEK - Swedish Krona |
CHF - Swiss Franc | MXP - Mexican Peso | SGD - Singapore Dollar |
For the period ended June 30, 2019, the average volume of activity of forward foreign currency contracts was as follows:
Average Monthly Notional Amount Purchased | | $ | 86,712,536 | |
Average Monthly Notional Amount Sold | | $ | 110,729,386 | |
Wilshire Mutual Funds, Inc. Wilshire Income Opportunities Fund Schedule Of Purchased Options | June 30, 2019
(Unaudited) | 
|
PURCHASED OPTIONS | | Contracts | | | Notional
Amount | | | Value | | | Unrealized
Appreciation
(Depreciation) | |
Currency Call Options | | | | | | | | | | | | | | | | |
Chinese Yuan, 07/11/19 at 7.00(a) | | | 2,010,000 | | | $ | 2,010,000 | | | $ | 1,672 | | | $ | (4,428 | ) |
Mexican Peso, 12/20/19 at 20.825(a) | | | 1,230,000 | | | | 1,230,000 | | | | 16,984 | | | | 2,052 | |
Mexican Peso, 02/20/20 at 21.25(a) | | | 1,170,000 | | | | 1,170,000 | | | | 19,784 | | | | (183 | ) |
| | | | | | | | | | | | | | | | | |
Total Purchased Options (Cost $40,999) | | | | | | $ | 4,410,000 | | | $ | 38,440 | | | $ | (2,559 | ) |
(a) | Illiquid security. The total value of such securities is $38,440 as of June 30, 2019, representing 0.0% of net assets. |
See Notes to Financial Statements.
53
Wilshire Mutual Funds, Inc. Wilshire Income Opportunities Fund Schedule Of Interest Rate Swaptions Purchased | June 30, 2019
(Unaudited) | 
|
Counterparty | Description | | Exercise
Rate | | | Expiration
Date | | | Notional
Amount | | | Value | | | Unrealized
Appreciation
(Depreciation) | |
Calls | | | | | | | | | | | | | | | | | | | | | |
Bank of America, N.A. | Interest Rate, 3MO LIBOR | | | 0.000 | % | | | 02/25/20 | | | $ | 6,176,000 | | | $ | 1,112 | | | $ | 1,112 | |
Bank of America, N.A. | Interest Rate, 3MO LIBOR | | | 5.270 | % | | | 02/26/20 | | | | 5,187,000 | | | | (37 | ) | | | (37 | ) |
Bank of America, N.A. | Interest Rate, 3MO LIBOR | | | 5.295 | % | | | 03/02/20 | | | | 4,947,000 | | | | (1,341 | ) | | | (1,341 | ) |
Barclays Capital | Interest Rate, 3MO LIBOR | | | 5.020 | % | | | 03/14/20 | | | | 2,737,000 | | | | 6,643 | | | | 6,643 | |
JPMChase Bank | Interest Rate, 3MO LIBOR | | | 5.078 | % | | | 03/19/20 | | | | 3,212,000 | | | | 5,974 | | | | 5,974 | |
Morgan Stanley Capital | Interest Rate, 3MO LIBOR | | | 4.955 | % | | | 05/01/30 | | | | 1,826,000 | | | | 5,772 | | | | 5,772 | |
Morgan Stanley Capital | Interest Rate, 3MO LIBOR | | | 5.003 | % | | | 05/20/30 | | | | 609,000 | | | | 1,636 | | | | 1,636 | |
| | | | | | | | | | | | | | | | | 19,759 | | | | 19,759 | |
Puts | | | | | | | | | | | | | | | | | | | | | |
Morgan Stanley Capital | Interest Rate, 3MO LIBOR | | | 2.200 | % | | | 08/07/19 | | | | 150,000,000 | | | | 28,500 | | | | — | |
| | | | | | | | | | | | | | | | | | | | | | |
Total Interest Rate Swaptions Purchased | | | | | | | | | | | | | | | $ | 48,259 | | | $ | 19,759 | |
LIBOR — London Interbank Offered Rate.
See Notes to Financial Statements.
54
Wilshire Mutual Funds, Inc. Statements of Assets and Liabilities June 30, 2019 (Unaudited) | 
|
| | | LARGE
COMPANY
GROWTH
PORTFOLIO | | | LARGE
COMPANY
VALUE
PORTFOLIO | | | SMALL
COMPANY
GROWTH
PORTFOLIO | | | SMALL
COMPANY
VALUE
PORTFOLIO | | | WILSHIRE
5000
INDEXSM
FUND | | | WILSHIRE
INTERNATIONAL
EQUITY
FUND | | | WILSHIRE
INCOME
OPPORTUNITIES
FUND | |
ASSETS: | | | | | | | | | | | | | | | | | | | | | | | | | | | | |
Investments in unaffiliated securities, at value*(Note 2) | | $ | 214,250,875 | | | $ | 190,577,957 | | | $ | 63,996,331 | | | $ | 59,139,245 | | | $ | 191,722,221 | | | $ | 380,866,185 | | | $ | 329,806,777 | |
Investments in affiliated securities, at value (Note 5) | | | — | | | | — | | | | — | | | | — | | | | — | | | | — | | | | 18,231,264 | |
Foreign currency, at value | | | — | | | | — | | | | — | | | | — | | | | — | | | | 399,533 | | | | 233,502 | |
Margin deposits for futures contracts | | | — | | | | — | | | | — | | | | — | | | | — | | | | — | | | | 438,092 | |
Receivable for capital shares sold | | | 25,955 | | | | 20,823 | | | | 5,871 | | | | 8,205 | | | | 839,513 | | | | 76,749 | | | | 28,316 | |
Receivable for investment securities sold | | | 426,802 | | | | 337,711 | | | | 32,317 | | | | 96,118 | | | | — | | | | 1,511,712 | | | | 6,210,746 | |
Unrealized appreciation on foreign forward currency contracts (Note 6) | | | — | | | | — | | | | — | | | | — | | | | — | | | | — | | | | 165,834 | |
Net variation margin receivable on futures contracts | | | — | | | | — | | | | — | | | | — | | | | — | | | | — | | | | 38,834 | |
Dividends and interest receivable | | | 83,192 | | | | 229,048 | | | | 26,709 | | | | 86,654 | | | | 172,665 | | | | 1,044,512 | | | | 2,736,438 | |
Foreign withholding tax reclaims receivable | | | 7,659 | | | | 4,012 | | | | — | | | | — | | | | — | | | | 1,226,082 | | | | — | |
Other assets | | | 37,095 | | | | 33,402 | | | | 27,700 | | | | 28,060 | | | | 29,088 | | | | 45,614 | | | | 41,182 | |
Total Assets | | | 214,831,578 | | | | 191,202,953 | | | | 64,088,928 | | | | 59,358,282 | | | | 192,763,487 | | | | 385,170,387 | | | | 357,930,985 | |
LIABILITIES: | | | | | | | | | | | | | | | | | | | | | | | | | | | | |
Payable upon return of securities loaned (Note 7) | | | 565,233 | | | | 117,111 | | | | 1,119,629 | | | | 138,067 | | | | 738,590 | | | | 913,808 | | | | 20,030,015 | |
Distributions payable | | | — | | | | — | | | | — | | | | — | | | | — | | | | — | | | | 43,576 | |
Payable for capital shares redeemed | | | 503,362 | | | | 58,668 | | | | 15,177 | | | | 16,268 | | | | — | | | | 126,583 | | | | 2,265,246 | |
Payable for investment securities purchased | | | 63,058 | | | | 67,136 | | | | 22,840 | | | | 443,866 | | | | 19,124 | | | | 686,028 | | | | 18,655,666 | |
Net unrealized depreciation on currency contracts | | | — | | | | — | | | | — | | | | — | | | | — | | | | 103 | | | | — | |
Net variation margin payable on swaption and foreign forward currency contracts | | | — | | | | — | | | | — | | | | — | | | | — | | | | — | | | | 180,000 | |
Unrealized depreciation on foreign forward currency contracts (Note 6) | | | — | | | | — | | | | — | | | | — | | | | — | | | | — | | | | 315,960 | |
Investment advisory fees payable (Note 3) | | | 128,812 | | | | 115,007 | | | | 32,877 | | | | 30,487 | | | | 15,431 | | | | 305,765 | | | | 155,256 | |
Distribution fees payable (Note 4) | | | 19,779 | | | | 259 | | | | 11,325 | | | | 130 | | | | 68,938 | | | | — | | | | — | |
Shareholder service fees payable (Note 4) | | | 28,218 | | | | 15,712 | | | | 7,550 | | | | 7,370 | | | | 16,970 | | | | 24,072 | | | | 28,376 | |
Administration fees payable | | | 7,100 | | | | 6,300 | | | | 2,100 | | | | 1,900 | | | | 6,300 | | | | 12,600 | | | | 10,800 | |
Accrued expenses and other payables | | | 40,821 | | | | 36,903 | | | | 23,812 | | | | 22,179 | | | | 40,680 | | | | 63,675 | | | | 75,964 | |
Total Liabilities | | | 1,356,383 | | | | 417,096 | | | | 1,235,310 | | | | 660,267 | | | | 906,033 | | | | 2,132,634 | | | | 41,760,859 | |
NET ASSETS | | $ | 213,475,195 | | | $ | 190,785,857 | | | $ | 62,853,618 | | | $ | 58,698,015 | | | $ | 191,857,454 | | | $ | 383,037,753 | | | $ | 316,170,126 | |
*Includes value of securities on loan | | $ | 14,049,802 | | | $ | 5,634,669 | | | $ | 12,008,905 | | | $ | 7,797,418 | | | $ | 11,889,763 | | | $ | 9,009,901 | | | $ | 22,129,883 | |
See Notes to Financial Statements.
55
Wilshire Mutual Funds, Inc. Statements of Assets and Liabilities - (Continued) June 30, 2019 (Unaudited) | 
|
| | | LARGE
COMPANY
GROWTH
PORTFOLIO | | | LARGE
COMPANY
VALUE
PORTFOLIO | | | SMALL
COMPANY
GROWTH
PORTFOLIO | | | SMALL
COMPANY
VALUE
PORTFOLIO | | | WILSHIRE
5000
INDEXSM
FUND | | | WILSHIRE
INTERNATIONAL
EQUITY
FUND | | | WILSHIRE
INCOME
OPPORTUNITIES
FUND | |
NET ASSETS CONSIST OF: | | | | | | | | | | | | | | | | | | | | | | | | | | | | |
Paid-in capital | | $ | 116,126,375 | | | $ | 166,675,799 | | | $ | 50,177,626 | | | $ | 57,285,007 | | | $ | 54,333,440 | | | $ | 347,332,792 | | | $ | 309,708,936 | |
Accumulated earnings | | | 97,348,820 | | | | 24,110,058 | | | | 12,675,992 | | | | 1,413,008 | | | | 137,524,014 | | | | 35,704,961 | | | | 6,461,190 | |
| | | | | | | | | | | | | | | | | | | | | | | | | | | | | |
NET ASSETS | | $ | 213,475,195 | | | $ | 190,785,857 | | | $ | 62,853,618 | | | $ | 58,698,015 | | | $ | 191,857,454 | | | $ | 383,037,753 | | | $ | 316,170,126 | |
| | | | | | | | | | | | | | | | | | | | | | | | | | | | | |
NET ASSET VALUE PER SHARE: | | | | | | | | | | | | | | | | | | | | | | | | | | | | |
INVESTMENT CLASS | | | | | | | | | | | | | | | | | | | | | | | | | | | | |
Net assets applicable to Investment Class | | $ | 64,344,580 | | | $ | 5,673,785 | | | $ | 9,907,370 | | | $ | 5,044,374 | | | $ | 154,121,055 | | | $ | 2,961,971 | | | $ | 1,750,922 | |
Investment Class shares of beneficial interest outstanding (50,000,000 shares authorized, per class, per Portfolio, par value $.001 per share)† | | | 1,601,982 | | | | 288,769 | | | | 378,587 | | | | 243,511 | | | | 7,036,203 | | | | 278,651 | | | | 167,965 | |
Net asset value, offering and redemption price per share(a) | | $ | 40.17 | | | $ | 19.65 | | | $ | 26.17 | | | $ | 20.72 | | | $ | 21.90 | | | $ | 10.63 | | | $ | 10.42 | |
| | | | | | | | | | | | | | | | | | | | | | | | | | | | | |
INSTITUTIONAL CLASS | | | | | | | | | | | | | | | | | | | | | | | | | | | | |
Net assets applicable to Institutional Class | | $ | 149,130,615 | | | $ | 185,112,072 | | | $ | 52,946,248 | | | $ | 53,653,641 | | | $ | 37,736,399 | | | $ | 380,075,782 | | | $ | 314,419,204 | |
Institutional Class shares of beneficial interest outstanding (50,000,000 shares authorized, per class, per Portfolio, par value $.001 per share)† | | | 3,393,550 | | | | 9,523,585 | | | | 1,850,782 | | | | 2,531,227 | | | | 1,720,850 | | | | 36,234,070 | | | | 30,305,975 | |
Net asset value, offering and redemption price per share(a) | | $ | 43.95 | | | $ | 19.44 | | | $ | 28.61 | | | $ | 21.20 | | | $ | 21.93 | | | $ | 10.49 | | | $ | 10.37 | |
| | | | | | | | | | | | | | | | | | | | | | | | | | | | | |
Investments in unaffiliated securities, at cost (Note 2) | | $ | 128,767,921 | | | $ | 170,480,617 | | | $ | 50,289,076 | | | $ | 56,917,321 | | | $ | 58,553,605 | | | $ | 344,529,336 | | | $ | 322,707,160 | |
Investments in affiliated securities, at cost (Note 5) | | $ | — | | | $ | — | | | $ | — | | | $ | — | | | $ | — | | | $ | — | | | $ | 18,277,918 | |
Cash collateral for securities on loan, at cost | | $ | 565,233 | | | $ | 117,111 | | | $ | 1,119,629 | | | $ | 138,067 | | | $ | 738,590 | | | $ | 913,808 | | | $ | 20,030,015 | |
Foreign currency, at cost | | $ | — | | | $ | — | | | $ | — | | | $ | — | | | $ | — | | | $ | 400,212 | | | $ | 229,826 | |
† | For Wilshire International Equity Fund, (40,000,000 shares authorized, per class, par value $.001 per share). |
(a) | For Wilshire International Equity Fund, a redemption fee may apply to redemptions of shares held for sixty days or less, subject to certain exceptions (Note 2). |
See Notes to Financial Statements.
56
Wilshire Mutual Funds, Inc. Statements of Operations For the Six Months Ended June 30, 2019 (Unaudited) | 
|
| | | LARGE
COMPANY
GROWTH
PORTFOLIO | | | LARGE
COMPANY
VALUE
PORTFOLIO | | | SMALL
COMPANY
GROWTH
PORTFOLIO | | | SMALL
COMPANY
VALUE
PORTFOLIO | | | WILSHIRE
5000
INDEXSM
FUND | | | WILSHIRE
INTERNATIONAL
EQUITY
FUND | | | WILSHIRE
INCOME
OPPORTUNITIES
FUND | |
INVESTMENT INCOME: | | | | | | | | | | | | | | | | | | | | | | | | | | | | |
Dividends | | $ | 1,033,085 | | | $ | 2,886,067 | | | $ | 190,049 | | | $ | 528,493 | | | $ | 1,936,619 | | | $ | 6,344,931 | | | $ | 197,168 | |
Interest | | | — | | | | — | | | | — | | | | — | | | | — | | | | — | | | | 6,683,915 | |
Income from securities lending (Note 7) | | | 35,583 | | | | 5,327 | | | | 14,165 | | | | 5,897 | | | | 18,994 | | | | 13,442 | | | | — | |
Income distributions from affiliated investments (Note 5) | | | — | | | | — | | | | — | | | | — | | | | — | | | | — | | | | 525,035 | |
Foreign taxes withheld | | | (23,429 | ) | | | (24,732 | ) | | | — | | | | — | | | | (7 | ) | | | (678,560 | ) | | | (14,404 | ) |
Total income | | | 1,045,239 | | | | 2,866,662 | | | | 204,214 | | | | 534,390 | | | | 1,955,606 | | | | 5,679,813 | | | | 7,391,714 | |
| | | | | | | | | | | | | | | | | | | | | | | | | | | | | |
EXPENSES: | | | | | | | | | | | | | | | | | | | | | | | | | | | | |
Investment advisory fee (Note 3) | | | 798,707 | | | | 710,528 | | | | 255,433 | | | | 245,251 | | | | 91,481 | | | | 1,859,407 | | | | 929,842 | |
Shareholder Service fees (Note 4) | | | | | | | | | | | | | | | | | | | | | | | | | | | | |
Investment Class | | | 39,594 | | | | 1,861 | | | | 4,198 | | | | 2,789 | | | | 45,654 | | | | 2,107 | | | | 1,338 | |
Institutional Class | | | 42,371 | | | | 43,963 | | | | 18,021 | | | | 18,927 | | | | 4,728 | | | | 68,471 | | | | 84,490 | |
Distribution (12b-1) fees (Note 4) | | | | | | | | | | | | | | | | | | | | | | | | | | | | |
Investment Class | | | 78,089 | | | | 6,903 | | | | 11,917 | | | | 6,379 | | | | 184,236 | | | | 3,698 | | | | 2,252 | |
Administration and accounting fees (Note 3) | | | 43,660 | | | | 38,800 | | | | 12,429 | | | | 11,830 | | | | 37,536 | | | | 76,359 | | | | 63,752 | |
Transfer agent fees (Note 3) | | | 36,769 | | | | 24,059 | | | | 25,702 | | | | 24,559 | | | | 25,293 | | | | 46,945 | | | | 21,661 | |
Registration and filing fees | | | 24,703 | | | | 26,058 | | | | 23,610 | | | | 23,807 | | | | 26,357 | | | | 30,540 | | | | 31,093 | |
Custodian fees (Note 3) | | | 25,821 | | | | 22,920 | | | | 7,166 | | | | 6,633 | | | | 21,305 | | | | 55,694 | | | | 36,885 | |
Pricing costs | | | 3,301 | | | | 3,020 | | | | 4,581 | | | | 4,038 | | | | 16,026 | | | | 41,667 | | | | 94,075 | |
Professional fees | | | 20,938 | | | | 19,687 | | | | 13,134 | | | | 12,991 | | | | 19,464 | | | | 30,472 | | | | 40,772 | |
Directors’ fees and expenses (Note 3) | | | 20,093 | | | | 17,803 | | | | 5,659 | | | | 5,432 | | | | 17,165 | | | | 34,944 | | | | 30,844 | |
Postage and supplies | | | 12,323 | | | | 8,994 | | | | 9,326 | | | | 9,258 | | | | 4,038 | | | | 8,952 | | | | 8,001 | |
Printing expense | | | 5,896 | | | | 5,381 | | | | 1,947 | | | | 1,912 | | | | 4,954 | | | | 10,396 | | | | 9,990 | |
Insurance expense | | | 4,694 | | | | 4,203 | | | | 1,207 | | | | 1,178 | | | | 3,636 | | | | 8,209 | | | | 6,519 | |
Interest expense (Note 2) | | | 4,750 | | | | 4,406 | | | | 564 | | | | 516 | | | | 78 | | | | 17,661 | | | | 1,617 | |
Other | | | 9,908 | | | | 9,249 | | | | 6,492 | | | | 7,888 | | | | 9,141 | | | | 65,623 | | | | 70,843 | |
Total expenses | | | 1,171,617 | | | | 947,835 | | | | 401,386 | | | | 383,388 | | | | 511,092 | | | | 2,361,145 | | | | 1,433,974 | |
Previous investment advisory fee reductions and expense reimbursements recouped by the Investment Adviser (Note 3) | | | — | | | | — | | | | — | | | | — | | | | — | | | | 9,593 | | | | — | |
Fees reduced and/or expenses reimbursed by Investment Adviser (Note 3) | | | (6,801 | ) | | | — | | | | (58,344 | ) | | | (59,109 | ) | | | — | | | | (1,444 | ) | | | (696 | ) |
Fees paid indirectly (Note 4) | | | (1,370 | ) | | | (978 | ) | | | (7,057 | ) | | | (4,580 | ) | | | — | | | | (4,209 | ) | | | — | |
Net expenses | | | 1,163,446 | | | | 946,857 | | | | 335,985 | | | | 319,699 | | | | 511,092 | | | | 2,365,085 | | | | 1,433,278 | |
| | | | | | | | | | | | | | | | | | | | | | | | | | | | | |
Net investment income (loss) | | | (118,207 | ) | | | 1,919,805 | | | | (131,771 | ) | | | 214,691 | | | | 1,444,514 | | | | 3,314,728 | | | | 5,958,436 | |
See Notes to Financial Statements.
57
Wilshire Mutual Funds, Inc. Statements of Operations - (Continued) For the Six Months Ended June 30, 2019 (Unaudited) | 
|
| | | LARGE
COMPANY
GROWTH
PORTFOLIO | | | LARGE
COMPANY
VALUE
PORTFOLIO | | | SMALL
COMPANY
GROWTH
PORTFOLIO | | | SMALL
COMPANY
VALUE
PORTFOLIO | | | WILSHIRE
5000
INDEXSM
FUND | | | WILSHIRE
INTERNATIONAL
EQUITY
FUND | | | WILSHIRE
INCOME
OPPORTUNITIES
FUND | |
NET REALIZED AND UNREALIZED GAINS (LOSSES) ON INVESTMENTS AND FOREIGN CURRENCY TRANSACTIONS (NOTES 2 and 5): | | | | | | | | | | | | | | | | | | | | | | | | | | | | |
Net realized gains (losses) from: | | | | | | | | | | | | | | | | | | | | | | | | | | | | |
Sale of unaffiliated investments | | $ | 10,396,586 | | | $ | 2,565,963 | | | $ | (34,909 | ) | | $ | (301,324 | ) | | $ | 3,265,850 | | | $ | (8,301 | ) | | $ | (579,341 | ) |
Sale of affiliated investment company shares | | | — | | | | — | | | | — | | | | — | | | | — | | | | — | | | | (105,300 | ) |
Futures contracts | | | — | | | | — | | | | — | | | | — | | | | — | | | | — | | | | 295,367 | |
Swaption contracts | | | — | | | | — | | | | — | | | | — | | | | — | | | | — | | | | (398,112 | ) |
Option contracts | | | — | | | | — | | | | — | | | | — | | | | — | | | | — | | | | 9,938 | |
Swap contracts | | | — | | | | — | | | | — | | | | — | | | | — | | | | — | | | | (570,302 | ) |
Foreign currency transactions | | | — | | | | 519 | | | | — | | | | — | | | | — | | | | 8,386 | | | | 710,172 | |
Net change in unrealized appreciation (depreciation) on: | | | | | | | | | | | | | | | | | | | | | | | | | | | | |
Unaffiliated investments | | | 30,168,921 | | | | 21,395,601 | | | | 11,126,644 | | | | 7,531,988 | | | | 24,884,678 | | | | 47,798,225 | | | | 15,738,507 | |
Investments in affiliated investment company shares | | | — | | | | — | | | | — | | | | — | | | | — | | | | — | | | | 690,012 | |
Futures contracts | | | — | | | | — | | | | — | | | | — | | | | — | | | | — | | | | 463,212 | |
Swaption contracts | | | — | | | | — | | | | — | | | | — | | | | — | | | | — | | | | 19,760 | |
Option contracts | | | — | | | | — | | | | — | | | | — | | | | — | | | | — | | | | (2,559 | ) |
Swap contracts | | | — | | | | — | | | | — | | | | — | | | | — | | | | — | | | | 880,052 | |
Foreign currency transactions and translation of other assets and liabilities denominated in foreign currencies | | | — | | | | — | | | | — | | | | — | | | | — | | | | 18,012 | | | | 7,633 | |
Net realized and unrealized gains on investments and foreign currency transactions | | | 40,565,507 | | | | 23,962,083 | | | | 11,091,735 | | | | 7,230,664 | | | | 28,150,528 | | | | 47,816,321 | | | | 17,159,039 | |
| | | | | | | | | | | | | | | | | | | | | | | | | | | | | |
NET INCREASE IN NET ASSETS RESULTING FROM OPERATIONS | | $ | 40,447,300 | | | $ | 25,881,888 | | | $ | 10,959,964 | | | $ | 7,445,355 | | | $ | 29,595,042 | | | $ | 51,131,049 | | | $ | 23,117,475 | |
See Notes to Financial Statements.
58
Wilshire Mutual Funds, Inc. Statements of Changes in Net Assets | 
|
| | | LARGE COMPANY
GROWTH PORTFOLIO | | | LARGE COMPANY
VALUE PORTFOLIO | |
| | | Six Months Ended
June 30, 2019
(Unaudited) | | | Year Ended
December 31,
2018 | | | Six Months Ended
June 30, 2019
(Unaudited) | | | Year Ended
December 31,
2018 | |
OPERATIONS: | | | | | | | | | | | | | | | | |
Net investment income (loss) | | $ | (118,207 | ) | | $ | (601,788 | ) | | $ | 1,919,805 | | | $ | 3,740,941 | |
Net realized gains on investments and foreign currency transactions | | | 10,396,586 | | | | 25,974,339 | | | | 2,566,482 | | | | 9,938,112 | |
Net change in unrealized appreciation (depreciation) on investments | | | 30,168,921 | | | | (28,195,505 | ) | | | 21,395,601 | | | | (38,506,539 | ) |
Net increase (decrease) in net assets resulting from operations | | | 40,447,300 | | | | (2,822,954 | ) | | | 25,881,888 | | | | (24,827,486 | ) |
| | | | | | | | | | | | | | | | | |
DISTRIBUTIONS TO SHAREHOLDERS (Notes 2 and 10) | | | | | | | | | | | | | | | | |
Investment Class shares | | | — | | | | (8,482,489 | ) | | | — | | | | (424,524 | ) |
Institutional Class shares | | | — | | | | (20,828,265 | ) | | | — | | | | (15,990,332 | ) |
Total distributions to shareholders | | | — | | | | (29,310,754 | ) | | | — | | | | (16,414,856 | ) |
| | | | | | | | | | | | | | | | | |
CAPITAL STOCK TRANSACTIONS (DOLLARS) (Note 8): | | | | | | | | | | | | | | | | |
Investment Class shares: | | | | | | | | | | | | | | | | |
Shares sold | | | 252,344 | | | | 2,252,835 | | | | 184,793 | | | | 620,461 | |
Shares issued as reinvestment of distributions | | | — | | | | 8,313,397 | | | | — | | | | 412,505 | |
Shares redeemed | | | (4,055,651 | ) | | | (8,669,710 | ) | | | (365,049 | ) | | | (1,323,295 | ) |
Net increase (decrease) in net assets from Investment Class share transactions | | | (3,803,307 | ) | | | 1,896,522 | | | | (180,256 | ) | | | (290,329 | ) |
| | | | | | | | | | | | | | | | | |
Institutional Class shares: | | | | | | | | | | | | | | | | |
Shares sold | | | 5,030,946 | | | | 74,083,600 | | | | 6,445,368 | | | | 134,075,440 | |
Shares issued as reinvestment of distributions | | | — | | | | 16,422,748 | | | | — | | | | 12,737,140 | |
Shares redeemed | | | (32,899,498 | ) | | | (90,407,735 | ) | | | (29,050,904 | ) | | | (76,059,960 | ) |
Net increase (decrease) in net assets from Institutional Class share transactions | | | (27,868,552 | ) | | | 98,613 | | | | (22,605,536 | ) | | | 70,752,620 | |
| | | | | | | | | | | | | | | | | |
Net increase (decrease) in net assets | | | 8,775,441 | | | | (30,138,573 | ) | | | 3,096,096 | | | | 29,219,949 | |
| | | | | | | | | | | | | | | | | |
NET ASSETS: | | | | | | | | | | | | | | | | |
Beginning of period | | | 204,699,754 | | | | 234,838,327 | | | | 187,689,761 | | | | 158,469,812 | |
End of period | | $ | 213,475,195 | | | $ | 204,699,754 | | | $ | 190,785,857 | | | $ | 187,689,761 | |
See Notes to Financial Statements.
59
Wilshire Mutual Funds, Inc. Statements of Changes in Net Assets - (Continued) | 
|
| | | SMALL COMPANY
GROWTH PORTFOLIO | | | SMALL COMPANY
VALUE PORTFOLIO | |
| | | Six Months Ended
June 30, 2019
(Unaudited) | | | Year Ended
December 31,
2018 | | | Six Months Ended
June 30, 2019
(Unaudited) | | | Year Ended
December 31,
2018 | |
OPERATIONS: | | | | | | | | | | | | | | | | |
Net investment income (loss) | | $ | (131,771 | ) | | $ | (240,048 | ) | | $ | 214,691 | | | $ | 272,242 | |
Net realized gains (losses) on investments | | | (34,909 | ) | | | 1,672,145 | | | | (301,324 | ) | | | 1,531,328 | |
Net change in unrealized appreciation (depreciation) on investments | | | 11,126,644 | | | | (7,310,302 | ) | | | 7,531,988 | | | | (13,059,180 | ) |
Net increase (decrease) in net assets resulting from operations | | | 10,959,964 | | | | (5,878,205 | ) | | | 7,445,355 | | | | (11,255,610 | ) |
| | | | | | | | | | | | | | | | | |
DISTRIBUTIONS TO SHAREHOLDERS (Notes 2 and 10) | | | | | | | | | | | | | | | | |
Investment Class shares | | | — | | | | (522,031 | ) | | | — | | | | (291,975 | ) |
Institutional Class shares | | | — | | | | (2,569,642 | ) | | | — | | | | (2,927,272 | ) |
Total distributions to shareholders | | | — | | | | (3,091,673 | ) | | | — | | | | (3,219,247 | ) |
| | | | | | | | | | | | | | | | | |
CAPITAL STOCK TRANSACTIONS (DOLLARS) (Note 8): | | | | | | | | | | | | | | | | |
Investment Class shares: | | | | | | | | | | | | | | | | |
Shares sold | | | 997,373 | | | | 1,798,054 | | | | 394,665 | | | | 748,289 | |
Shares issued as reinvestment of distributions | | | — | | | | 484,890 | | | | — | | | | 283,145 | |
Shares redeemed | | | (967,097 | ) | | | (4,319,410 | ) | | | (814,813 | ) | | | (1,293,114 | ) |
Net increase (decrease) in net assets from Investment Class share transactions | | | 30,276 | | | | (2,036,466 | ) | | | (420,148 | ) | | | (261,680 | ) |
| | | | | | | | | | | | | | | | | |
Institutional Class shares: | | | | | | | | | | | | | | | | |
Shares sold | | | 4,233,367 | | | | 27,211,535 | | | | 4,781,863 | | | | 34,701,944 | |
Shares issued as reinvestment of distributions | | | — | | | | 2,113,320 | | | | — | | | | 2,450,563 | |
Shares redeemed | | | (5,134,907 | ) | | | (13,538,044 | ) | | | (4,849,182 | ) | | | (10,900,194 | ) |
Net increase (decrease) in net assets from Institutional Class share transactions | | | (901,540 | ) | | | 15,786,811 | | | | (67,319 | ) | | | 26,252,313 | |
| | | | | | | | | | | | | | | | | |
Net increase in net assets | | | 10,088,700 | | | | 4,780,467 | | | | 6,957,888 | | | | 11,515,776 | |
| | | | | | | | | | | | | | | | | |
NET ASSETS: | | | | | | | | | | | | | | | | |
Beginning of period | | | 52,764,918 | | | | 47,984,451 | | | | 51,740,127 | | | | 40,224,351 | |
End of period | | $ | 62,853,618 | | | $ | 52,764,918 | | | $ | 58,698,015 | | | $ | 51,740,127 | |
See Notes to Financial Statements.
60
Wilshire Mutual Funds, Inc. Statements of Changes in Net Assets - (Continued) | 
|
| | | WILSHIRE 5000
INDEXSM FUND | | | WILSHIRE INTERNATIONAL
EQUITY FUND | |
| | | Six Months Ended
June 30, 2019
(Unaudited) | | | Year Ended
December 31,
2018 | | | Six Months Ended
June 30, 2019
(Unaudited) | | | Year Ended
December 31,
2018 | |
OPERATIONS: | | | | | | | | | | | | | | | | |
Net investment income | | $ | 1,444,514 | | | $ | 2,764,503 | | | $ | 3,314,728 | | | $ | 5,271,940 | |
Net realized gains on investments and foreign currency transactions | | | 3,265,850 | | | | 6,686,319 | | | | 84 | | | | 16,191,912 | |
Net change in unrealized appreciation (depreciation) on investments and foreign currency transactions and translation of other assets and liabilities denominated in foreign currencies | | | 24,884,678 | | | | (18,868,145 | ) | | | 47,816,237 | | | | (77,244,693 | ) |
Net increase (decrease) in net assets resulting from operations | | | 29,595,042 | | | | (9,417,323 | ) | | | 51,131,049 | | | | (55,780,841 | ) |
| | | | | | | | | | | | | | | | | |
DISTRIBUTIONS TO SHAREHOLDERS (Notes 2 and 10) | | | | | | | | | | | | | | | | |
Investment Class shares | | | — | | | | (7,653,094 | ) | | | — | | | | (131,992 | ) |
Institutional Class shares | | | — | | | | (1,953,310 | ) | | | — | | | | (19,598,049 | ) |
Total distributions to shareholders | | | — | | | | (9,606,404 | ) | | | — | | | | (19,730,041 | ) |
| | | | | | | | | | | | | | | | | |
CAPITAL STOCK TRANSACTIONS (DOLLARS) (Note 8): | | | | | | | | | | | | | | | | |
Investment Class shares: | | | | | | | | | | | | | | | | |
Shares sold | | | 4,964,444 | | | | 15,029,035 | | | | 333,984 | | | | 1,204,559 | |
Shares issued as reinvestment of distributions | | | — | | | | 7,336,674 | | | | — | | | | 125,874 | |
Redemption fees (Note 2) | | | — | | | | — | | | | 12 | | | | 160 | |
Shares redeemed | | | (8,872,001 | ) | | | (22,235,511 | ) | | | (544,583 | ) | | | (2,195,013 | ) |
Net increase (decrease) in net assets from Investment Class share transactions | | | (3,907,557 | ) | | | 130,198 | | | | (210,587 | ) | | | (864,420 | ) |
| | | | | | | | | | | | | | | | | |
Institutional Class shares: | | | | | | | | | | | | | | | | |
Shares sold | | | 1,035,062 | | | | 2,772,314 | | | | 24,506,308 | | | | 193,084,996 | |
Shares issued as reinvestment of distributions | | | — | | | | 1,508,386 | | | | — | | | | 15,327,740 | |
Redemption fees (Note 2) | | | — | | | | — | | | | 450 | | | | 2,476 | |
Shares redeemed | | | (1,172,158 | ) | | | (3,487,814 | ) | | | (78,861,014 | ) | | | (100,880,391 | ) |
Net increase (decrease) in net assets from Institutional Class share transactions | | | (137,096 | ) | | | 792,886 | | | | (54,354,256 | ) | | | 107,534,821 | |
| | | | | | | | | | | | | | | | | |
Net increase (decrease) in net assets | | | 25,550,389 | | | | (18,100,643 | ) | | | (3,433,794 | ) | | | 31,159,519 | |
| | | | | | | | | | | | | | | | | |
NET ASSETS: | | | | | | | | | | | | | | | | |
Beginning of period | | | 166,307,065 | | | | 184,407,708 | | | | 386,471,547 | | | | 355,312,028 | |
End of period | | $ | 191,857,454 | | | $ | 166,307,065 | | | $ | 383,037,753 | | | $ | 386,471,547 | |
See Notes to Financial Statements.
61
Wilshire Mutual Funds, Inc. Statements of Changes in Net Assets - (Continued) | 
|
| | | WILSHIRE INCOME
OPPORTUNITIES FUND | |
| | | Six Months Ended
June 30, 2019
(Unaudited) | | | Year Ended
December 31,
2018 | |
OPERATIONS: | | | | | | | | |
Net investment income | | $ | 5,958,436 | | | $ | 11,096,338 | |
Net realized losses from sale of unaffiliated investments, sale of affiliated investment company shares, futures contracts, swaption contracts, swap contracts and foreign currency transactions | | | (637,578 | ) | | | (1,718,164 | ) |
Long-term capital gain distributions from regulated investment companies | | | — | | | | 35 | |
Net change in unrealized appreciation (depreciation) on unaffiliated investments, investments in affiliated investment company shares, futures contracts, swaption contracts, swap contracts and foreign currency transactions and translation of other assets and liabilities denominated in foreign currencies | | | 17,796,617 | | | | (10,976,703 | ) |
Net increase (decrease) in net assets resulting from operations | | | 23,117,475 | | | | (1,598,494 | ) |
| | | | | | | | | |
DISTRIBUTIONS TO SHAREHOLDERS (Notes 2 and 10) | | | | | | | | |
Investment Class shares | | | (31,912 | ) | | | (55,546 | ) |
Institutional Class shares | | | (6,207,218 | ) | | | (10,726,134 | ) |
Total distributions to shareholders | | | (6,239,130 | ) | | | (10,781,680 | ) |
| | | | | | | | | |
CAPITAL STOCK TRANSACTIONS (DOLLARS) (Note 8): | | | | | | | | |
Investment Class shares: | | | | | | | | |
Shares sold | | | 244,702 | | | | 890,690 | |
Shares issued as reinvestment of distributions | | | 30,626 | | | | 51,573 | |
Shares redeemed | | | (486,002 | ) | | | (5,398,236 | ) |
Net decrease in net assets from Investment Class share transactions | | | (210,674 | ) | | | (4,455,973 | ) |
| | | | | | | | | |
Institutional Class shares: | | | | | | | | |
Shares sold | | | 20,437,754 | | | | 87,947,585 | |
Shares issued as reinvestment of distributions | | | 6,164,929 | | | | 10,662,683 | |
Shares redeemed | | | (41,165,305 | ) | | | (84,345,512 | ) |
Net increase (decrease) in net assets from Institutional Class share transactions | | | (14,562,622 | ) | | | 14,264,756 | |
| | | | | | | | | |
Net increase (decrease) in net assets | | | 2,105,049 | | | | (2,571,391 | ) |
| | | | | | | | | |
NET ASSETS: | | | | | | | | |
Beginning of period | | | 314,065,077 | | | | 316,636,468 | |
End of period | | $ | 316,170,126 | | | $ | 314,065,077 | |
See Notes to Financial Statements.
62
Wilshire Mutual Funds, Inc. Large Company Growth Portfolio Financial Highlights | 
|
For a Fund Share Outstanding Throughout Each Period. |
| | | Investment Class Shares | |
| | | Six Months
Ended
06/30/2019
(Unaudited) | | | Year
Ended
12/31/2018 | | | Year
Ended
12/31/2017 | | | Year
Ended
12/31/2016 | | | Year
Ended
12/31/2015 | | | Year
Ended
12/31/2014 | |
Net asset value, beginning of period | | $ | 33.33 | | | $ | 39.53 | | | $ | 33.93 | | | $ | 36.82 | | | $ | 38.66 | | | $ | 41.60 | |
| | | | | | | | | | | | | | | | | | | | | | | | | |
Income (loss) from investment operations: | | | | | | | | | | | | | | | | | | | | | | | | |
Net investment income (loss)(a) | | | (0.06 | ) | | | (0.20 | ) | | | (0.08 | ) | | | 0.04 | | | | (0.14 | ) | | | (0.26 | ) |
Net realized and unrealized gains (losses) on investments | | | 6.90 | | | | (0.35 | ) | | | 9.24 | | | | 1.26 | | | | 2.53 | | | | 3.61 | |
Total from investment operations | | | 6.84 | | | | (0.55 | ) | | | 9.16 | | | | 1.30 | | | | 2.39 | | | | 3.35 | |
| | | | | | | | | | | | | | | | | | | | | | | | | |
Less distributions: | | | | | | | | | | | | | | | | | | | | | | | | |
From net investment income | | | — | | | | — | | | | — | | | | (0.01 | ) | | | — | | | | — | |
From realized capital gains | | | — | | | | (5.65 | ) | | | (3.56 | ) | | | (4.18 | ) | | | (4.23 | ) | | | (6.29 | ) |
Total distributions | | | — | | | | (5.65 | ) | | | (3.56 | ) | | | (4.19 | ) | | | (4.23 | ) | | | (6.29 | ) |
| | | | | | | | | | | | | | | | | | | | | | | | | |
Net asset value, end of period | | $ | 40.17 | | | $ | 33.33 | | | $ | 39.53 | | | $ | 33.93 | | | $ | 36.82 | | | $ | 38.66 | |
| | | | | | | | | | | | | | | | | | | | | | | | | |
Total return(b) | | | 20.52 | %(c) | | | (1.90 | %) | | | 26.93 | % | | | 3.33 | % | | | 6.18 | % | | | 7.97 | % |
| | | | | | | | | | | | | | | | | | | | | | | | | |
Ratios to average net assets/supplemental data: | | | | | | | | | | | | | | | | | | | | | | | | |
Net assets, end of period (in 000’s) | | $ | 64,345 | | | $ | 56,671 | | | $ | 64,130 | | | $ | 62,634 | | | $ | 107,381 | | | $ | 103,733 | |
Operating expenses(d) | | | 1.30 | %(e)(f) | | | 1.31 | % | | | 1.30 | % | | | 1.32 | % | | | 1.33 | % | | | 1.38 | % |
Net investment income (loss) | | | (0.32 | %)(e) | | | (0.48 | %) | | | (0.21 | %) | | | 0.10 | % | | | (0.34 | %) | | | (0.61 | %) |
Portfolio turnover rate | | | 25 | %(c) | | | 69 | % | | | 51 | % | | | 75 | % | | | 104 | % | | | 62 | % |
(a) | The selected per share data was calculated using the average shares outstanding method for the period. |
(b) | Total return is a measure of the change in value of an investment in the Portfolio over the period covered. The returns shown do not reflect the deduction of taxes a shareholder would pay on Portfolio distributions, if any, or the redemption of Portfolio shares. |
(c) | Not annualized. |
(d) | The ratio of operating expenses to average net assets includes the effect of fees paid indirectly. If this expense offset was excluded, the ratio would have been 1.30%(e), 1.31%, 1.30%, 1.32%, 1.34% and 1.38% for the periods ended June 30, 2019, December 31, 2018, 2017, 2016, 2015 and 2014, respectively (Note 4). |
(e) | Annualized. |
(f) | The ratio of operating expenses for the six months ended June 30, 2019 includes expense reimbursements by the investment adviser. If these expense reimbursements were excluded, the ratio would have been 1.33%(e) for the six months ended June 30, 2019 (Note 3). |
See Notes to Financial Statements.
63
Wilshire Mutual Funds, Inc. Large Company Growth Portfolio Financial Highlights - (Continued) | 
|
For a Fund Share Outstanding Throughout Each Period. |
| | | Institutional Class Shares | |
| | | Six Months
Ended
06/30/2019
(Unaudited) | | | Year
Ended
12/31/2018 | | | Year
Ended
12/31/2017 | | | Year
Ended
12/31/2016 | | | Year
Ended
12/31/2015 | | | Year
Ended
12/31/2014 | |
Net asset value, beginning of period | | $ | 36.41 | | | $ | 42.53 | | | $ | 36.19 | | | $ | 39.04 | | | $ | 40.62 | | | $ | 43.28 | |
| | | | | | | | | | | | | | | | | | | | | | | | | |
Income (loss) from investment operations: | | | | | | | | | | | | | | | | | | | | | | | | |
Net investment income (loss)(a) | | | (0.01 | ) | | | (0.07 | ) | | | 0.05 | | | | 0.15 | | | | (0.01 | ) | | | (0.13 | ) |
Net realized and unrealized gains (losses) on investments | | | 7.55 | | | | (0.40 | ) | | | 9.87 | | | | 1.34 | | | | 2.66 | | | | 3.76 | |
Total from investment operations | | | 7.54 | | | | (0.47 | ) | | | 9.92 | | | | 1.49 | | | | 2.65 | | | | 3.63 | |
| | | | | | | | | | | | | | | | | | | | | | | | | |
Less distributions: | | | | | | | | | | | | | | | | | | | | | | | | |
From net investment income | | | — | | | | — | | | | (0.02 | ) | | | (0.16 | ) | | | — | | | | (0.00 | )(b) |
From realized capital gains | | | — | | | | (5.65 | ) | | | (3.56 | ) | | | (4.18 | ) | | | (4.23 | ) | | | (6.29 | ) |
Total distributions | | | — | | | | (5.65 | ) | | | (3.58 | ) | | | (4.34 | ) | | | (4.23 | ) | | | (6.29 | ) |
| | | | | | | | | | | | | | | | | | | | | | | | | |
Net asset value, end of period | | $ | 43.95 | | | $ | 36.41 | | | $ | 42.53 | | | $ | 36.19 | | | $ | 39.04 | | | $ | 40.62 | |
| | | | | | | | | | | | | | | | | | | | | | | | | |
Total return(c) | | | 20.71 | %(d) | | | (1.58 | %) | | | 27.35 | % | | | 3.61 | % | | | 6.52 | % | | | 8.32 | % |
| | | | | | | | | | | | | | | | | | | | | | | | | |
Ratios to average net assets/supplemental data: | | | | | | | | | | | | | | | | | | | | | | | | |
Net assets, end of period (in 000’s) | | $ | 149,131 | | | $ | 148,029 | | | $ | 170,708 | | | $ | 152,167 | | | $ | 122,219 | | | $ | 134,534 | |
Operating expenses(e) | | | 1.00 | %(f) | | | 0.98 | % | | | 0.98 | % | | | 1.04 | % | | | 1.01 | % | | | 1.06 | % |
Net investment income (loss) | | | (0.03 | %)(f) | | | (0.16 | %) | | | 0.11 | % | | | 0.37 | % | | | (0.02 | %) | | | (0.29 | %) |
Portfolio turnover rate | | | 25 | %(d) | | | 69 | % | | | 51 | % | | | 75 | % | | | 104 | % | | | 62 | % |
(a) | The selected per share data was calculated using the average shares outstanding method for the period. |
(b) | Amount rounds to less than $0.01 per share. |
(c) | Total return is a measure of the change in value of an investment in the Portfolio over the period covered. The returns shown do not reflect the deduction of taxes a shareholder would pay on Portfolio distributions, if any, or the redemption of Portfolio shares. |
(d) | Not annualized. |
(e) | The ratio of operating expenses before fee reductions and expense reimbursements includes the effect of fees paid indirectly. If this expense offset was excluded, the ratio would have been 1.00%(f), 0.99%, 0.98%, 1.04%, 1.02% and 1.06% for the periods ended June 30, 2019, December 31, 2018, 2017, 2016, 2015 and 2014, respectively (Notes 3 and 4). |
(f) | Annualized. |
See Notes to Financial Statements.
64
Wilshire Mutual Funds, Inc. Large Company Value Portfolio Financial Highlights | 
|
For a Fund Share Outstanding Throughout Each Period. |
| | | Investment Class Shares | |
| | | Six Months
Ended
06/30/2019
(Unaudited) | | | Year
Ended
12/31/2018 | | | Year
Ended
12/31/2017 | | | Year
Ended
12/31/2016 | | | Year
Ended
12/31/2015 | | | Year
Ended
12/31/2014 | |
Net asset value, beginning of period | | $ | 17.22 | | | $ | 21.18 | | | $ | 20.40 | | | $ | 18.62 | | | $ | 21.19 | | | $ | 21.44 | |
| | | | | | | | | | | | | | | | | | | | | | | | | |
Income (loss) from investment operations: | | | | | | | | | | | | | | | | | | | | | | | | |
Net investment income(a) | | | 0.17 | | | | 0.29 | | | | 0.30 | | | | 0.37 | | | | 0.20 | | | | 0.18 | |
Net realized and unrealized gains (losses) on investments and foreign currency transactions | | | 2.26 | | | | (2.73 | ) | | | 2.67 | | | | 2.56 | | | | (1.33 | ) | | | 2.14 | |
Total from investment operations | | | 2.43 | | | | (2.44 | ) | | | 2.97 | | | | 2.93 | | | | (1.13 | ) | | | 2.32 | |
| | | | | | | | | | | | | | | | | | | | | | | | | |
Less distributions: | | | | | | | | | | | | | | | | | | | | | | | | |
From net investment income | | | — | | | | (0.29 | ) | | | (0.30 | ) | | | (0.14 | ) | | | (0.19 | ) | | | (0.23 | ) |
From realized capital gains | | | — | | | | (1.23 | ) | | | (1.89 | ) | | | (1.01 | ) | | | (1.25 | ) | | | (2.34 | ) |
Total distributions | | | — | | | | (1.52 | ) | | | (2.19 | ) | | | (1.15 | ) | | | (1.44 | ) | | | (2.57 | ) |
| | | | | | | | | | | | | | | | | | | | | | | | | |
Net asset value, end of period | | $ | 19.65 | | | $ | 17.22 | | | $ | 21.18 | | | $ | 20.40 | | | $ | 18.62 | | | $ | 21.19 | |
| | | | | | | | | | | | | | | | | | | | | | | | | |
Total return(b) | | | 14.11 | %(c) | | | (11.71 | %) | | | 14.64 | % | | | 15.73 | % | | | (5.33 | %) | | | 10.77 | % |
| | | | | | | | | | | | | | | | | | | | | | | | | |
Ratios to average net assets/supplemental data: | | | | | | | | | | | | | | | | | | | | | | | | |
Net assets, end of period (in 000’s) | | $ | 5,674 | | | $ | 5,137 | | | $ | 6,547 | | | $ | 10,112 | | | $ | 52,864 | | | $ | 61,566 | |
Operating expenses after fee reductions and expense reimbursements and fees
paid indirectly | | | 1.26 | %(d) | | | 1.24 | % | | | 1.26 | % | | | 1.26 | % | | | 1.27 | % | | | 1.29 | % |
Operating expenses before fee reductions and expense reimbursements and fees paid indirectly(e) | | | 1.26 | %(d) | | | 1.24 | % | | | 1.26 | % | | | 1.27 | % | | | 1.29 | % | | | 1.30 | % |
Net investment income | | | 1.78 | %(d) | | | 1.40 | % | | | 1.38 | % | | | 1.87 | % | | | 0.96 | % | | | 0.80 | % |
Portfolio turnover rate | | | 28 | %(c) | | | 65 | % | | | 39 | % | | | 174 | % | | | 55 | % | | | 57 | % |
(a) | The selected per share data was calculated using the average shares outstanding method for the period. |
(b) | Total return is a measure of the change in value of an investment in the Portfolio over the period covered. The returns shown do not reflect the deduction of taxes a shareholder would pay on Portfolio distributions, if any, or the redemption of Portfolio shares. |
(c) | Not annualized. |
(d) | Annualized. |
(e) | The ratio of operating expenses before fee reductions and expense reimbursements includes the effect of fees paid indirectly. If this expense offset was excluded, the ratio would have been 1.26%(d), 1.24%, 1.26%, 1.26%, 1.27% and 1.29% for the periods ended June 30, 2019, December 31, 2018, 2017, 2016, 2015 and 2014, respectively (Notes 3 and 4). |
See Notes to Financial Statements.
65
Wilshire Mutual Funds, Inc. Large Company Value Portfolio Financial Highlights - (Continued) | 
|
For a Fund Share Outstanding Throughout Each Period. |
| | | Institutional Class Shares | |
| | | Six Months
Ended
06/30/2019
(Unaudited) | | | Year
Ended
12/31/2018 | | | Year
Ended
12/31/2017 | | | Year
Ended
12/31/2016 | | | Year
Ended
12/31/2015 | | | Year
Ended
12/31/2014 | |
Net asset value, beginning of period | | $ | 17.01 | | | $ | 20.95 | | | $ | 20.20 | | | $ | 18.67 | | | $ | 21.24 | | | $ | 21.48 | |
| | | | | | | | | | | | | | | | | | | | | | | | | |
Income (loss) from investment operations: | | | | | | | | | | | | | | | | | | | | | | | | |
Net investment income(a) | | | 0.19 | | | | 0.35 | | | | 0.36 | | | | 0.40 | | | | 0.26 | | | | 0.24 | |
Net realized and unrealized gains (losses) on investments and foreign currency transactions | | | 2.24 | | | | (2.71 | ) | | | 2.65 | | | | 2.55 | | | | (1.33 | ) | | | 2.14 | |
Total from investment operations | | | 2.43 | | | | (2.36 | ) | | | 3.01 | | | | 2.95 | | | | (1.07 | ) | | | 2.38 | |
| | | | | | | | | | | | | | | | | | | | | | | | | |
Less distributions: | | | | | | | | | | | | | | | | | | | | | | | | |
From net investment income | | | — | | | | (0.35 | ) | | | (0.37 | ) | | | (0.41 | ) | | | (0.25 | ) | | | (0.28 | ) |
From realized capital gains | | | — | | | | (1.23 | ) | | | (1.89 | ) | | | (1.01 | ) | | | (1.25 | ) | | | (2.34 | ) |
Total distributions | | | — | | | | (1.58 | ) | | | (2.26 | ) | | | (1.42 | ) | | | (1.50 | ) | | | (2.62 | ) |
| | | | | | | | | | | | | | | | | | | | | | | | | |
Net asset value, end of period | | $ | 19.44 | | | $ | 17.01 | | | $ | 20.95 | | | $ | 20.20 | | | $ | 18.67 | | | $ | 21.24 | |
| | | | | | | | | | | | | | | | | | | | | | | | | |
Total return(b) | | | 14.29 | %(c) | | | (11.47 | %) | | | 14.99 | % | | | 15.78 | % | | | (5.07 | %) | | | 11.05 | % |
| | | | | | | | | | | | | | | | | | | | | | | | | |
Ratios to average net assets/supplemental data: | | | | | | | | | | | | | | | | | | | | | | | | |
Net assets, end of period (in 000’s) | | $ | 185,112 | | | $ | 182,553 | | | $ | 151,923 | | | $ | 175,497 | | | $ | 53,343 | | | $ | 63,499 | |
Operating expenses after fee reductions and expense reimbursements and fees
paid indirectly | | | 0.99 | %(d) | | | 0.97 | % | | | 0.98 | % | | | 1.04 | % | | | 1.01 | % | | | 1.00 | % |
Operating expenses before fee reductions and expense reimbursements and fees paid indirectly(e) | | | 0.99 | %(d) | | | 0.97 | % | | | 0.98 | % | | | 1.05 | % | | | 1.02 | % | | | 1.01 | % |
Net investment income | | | 2.03 | %(d) | | | 1.70 | % | | | 1.67 | % | | | 2.09 | % | | | 1.23 | % | | | 1.09 | % |
Portfolio turnover rate | | | 28 | %(c) | | | 65 | % | | | 39 | % | | | 174 | % | | | 55 | % | | | 57 | % |
(a) | The selected per share data was calculated using the average shares outstanding method for the period. |
(b) | Total return is a measure of the change in value of an investment in the Portfolio over the period covered. The returns shown do not reflect the deduction of taxes a shareholder would pay on Portfolio distributions, if any, or the redemption of Portfolio shares. |
(c) | Not annualized. |
(d) | Annualized. |
(e) | The ratio of operating expenses before fee reductions and expense reimbursements includes the effect of fees paid indirectly. If this expense offset was excluded, the ratio would have been 0.99%(d), 0.97%, 0.98%, 1.04%, 1.01% and 1.00% for the periods ended June 30, 2019, December 31, 2018, 2017, 2016, 2015 and 2014, respectively (Notes 3 and 4). |
See Notes to Financial Statements.
66
Wilshire Mutual Funds, Inc. Small Company Growth Portfolio Financial Highlights | 
|
For a Fund Share Outstanding Throughout Each Period. |
| | | Investment Class Shares | |
| | | Six Months
Ended
06/30/2019
(Unaudited) | | | Year
Ended
12/31/2018 | | | Year
Ended
12/31/2017 | | | Year
Ended
12/31/2016 | | | Year
Ended
12/31/2015 | | | Year
Ended
12/31/2014 | |
Net asset value, beginning of period | | $ | 21.71 | | | $ | 25.05 | | | $ | 24.41 | | | $ | 22.64 | | | $ | 23.44 | | | $ | 24.95 | |
| | | | | | | | | | | | | | | | | | | | | | | | | |
Income (loss) from investment operations: | | | | | | | | | | | | | | | | | | | | | | | | |
Net investment loss(a) | | | (0.08 | ) | | | (0.17 | ) | | | (0.19 | ) | | | (0.15 | ) | | | (0.15 | ) | | | (0.25 | ) |
Net realized and unrealized gains (losses) on investments | | | 4.54 | | | | (1.75 | ) | | | 3.51 | | | | 4.80 | | | | 0.70 | | | | 1.09 | |
Total from investment operations | | | 4.46 | | | | (1.92 | ) | | | 3.32 | | | | 4.65 | | | | 0.55 | | | | 0.84 | |
| | | | | | | | | | | | | | | | | | | | | | | | | |
Less distributions: | | | | | | | | | | | | | | | | | | | | | | | | |
From realized capital gains | | | — | | | | (1.42 | ) | | | (2.68 | ) | | | (2.88 | ) | | | (1.35 | ) | | | (2.35 | ) |
| | | | | | | | | | | | | | | | | | | | | | | | | |
Net asset value, end of period | | $ | 26.17 | | | $ | 21.71 | | | $ | 25.05 | | | $ | 24.41 | | | $ | 22.64 | | | $ | 23.44 | |
| | | | | | | | | | | | | | | | | | | | | | | | | |
Total return(b) | | | 20.54 | %(c) | | | (7.87 | %) | | | 13.66 | % | | | 20.44 | % | | | 2.29 | % | | | 3.44 | % |
| | | | | | | | | | | | | | | | | | | | | | | | | |
Ratios to average net assets/supplemental data: | | | | | | | | | | | | | | | | | | | | | | | | |
Net assets, end of period (in 000’s) | | $ | 9,907 | | | $ | 8,162 | | | $ | 11,386 | | | $ | 8,633 | | | $ | 12,642 | | | $ | 11,398 | |
Operating expenses after fee reductions and expense reimbursements and fees
paid indirectly | | | 1.33 | %(d) | | | 1.35 | % | | | 1.48 | % | | | 1.51 | % | | | 1.46 | % | | | 1.50 | % |
Operating expenses before fee reductions and expense reimbursements and fees paid indirectly(e) | | | 1.54 | %(d) | | | 1.54 | % | | | 1.64 | % | | | 1.60 | % | | | 1.64 | % | | | 1.55 | % |
Net investment loss | | | (0.64 | %)(d) | | | (0.65 | %) | | | (0.75 | %) | | | (0.57 | %) | | | (0.59 | %) | | | (1.00 | %) |
Portfolio turnover rate | | | 41 | %(c) | | | 92 | % | | | 110 | % | | | 114 | % | | | 63 | % | | | 77 | % |
(a) | The selected per share data was calculated using the average shares outstanding method for the period. |
(b) | Total return is a measure of the change in value of an investment in the Portfolio over the period covered. The returns shown do not reflect the deduction of taxes a shareholder would pay on Portfolio distributions, if any, or the redemption of Portfolio shares. |
(c) | Not annualized. |
(d) | Annualized. |
(e) | The ratio of operating expenses before fee reductions and expense reimbursements includes the effect of fees paid indirectly. If this expense offset was excluded, the ratio would have been 1.56%(d), 1.54%, 1.60%, 1.64% and 1.56% for the periods ended June 30, 2019, December 31, 2018, 2016, 2015 and 2014, respectively (Notes 3 and 4). |
See Notes to Financial Statements.
67
Wilshire Mutual Funds, Inc. Small Company Growth Portfolio Financial Highlights - (Continued) | 
|
For a Fund Share Outstanding Throughout Each Period. |
| | | Institutional Class Shares | |
| | | Six Months
Ended
06/30/2019
(Unaudited) | | | Year
Ended
12/31/2018 | | | Year
Ended
12/31/2017 | | | Year
Ended
12/31/2016 | | | Year
Ended
12/31/2015 | | | Year
Ended
12/31/2014 | |
Net asset value, beginning of period | | $ | 23.70 | | | $ | 27.14 | | | $ | 26.18 | | | $ | 24.04 | | | $ | 24.75 | | | $ | 26.14 | |
| | | | | | | | | | | | | | | | | | | | | | | | | |
Income (loss) from investment operations: | | | | | | | | | | | | | | | | | | | | | | | | |
Net investment loss(a) | | | (0.05 | ) | | | (0.11 | ) | | | (0.14 | ) | | | (0.08 | ) | | | (0.07 | ) | | | (0.18 | ) |
Net realized and unrealized gains (losses) on investments | | | 4.96 | | | | (1.91 | ) | | | 3.78 | | | | 5.10 | | | | 0.71 | | | | 1.14 | |
Total from investment operations | | | 4.91 | | | | (2.02 | ) | | | 3.64 | | | | 5.02 | | | | 0.64 | | | | 0.96 | |
| | | | | | | | | | | | | | | | | | | | | | | | | |
Less distributions: | | | | | | | | | | | | | | | | | | | | | | | | |
From realized capital gains | | | — | | | | (1.42 | ) | | | (2.68 | ) | | | (2.88 | ) | | | (1.35 | ) | | | (2.35 | ) |
| | | | | | | | | | | | | | | | | | | | | | | | | |
Net asset value, end of period | | $ | 28.61 | | | $ | 23.70 | | | $ | 27.14 | | | $ | 26.18 | | | $ | 24.04 | | | $ | 24.75 | |
| | | | | | | | | | | | | | | | | | | | | | | | | |
Total return(b) | | | 20.72 | %(c) | | | (7.63 | %) | | | 13.96 | % | | | 20.79 | % | | | 2.53 | % | | | 3.75 | % |
| | | | | | | | | | | | | | | | | | | | | | | | | |
Ratios to average net assets/supplemental data: | | | | | | | | | | | | | | | | | | | | | | | | |
Net assets, end of period (in 000’s) | | $ | 52,946 | | | $ | 44,603 | | | $ | 36,599 | | | $ | 28,454 | | | $ | 14,414 | | | $ | 15,483 | |
Operating expenses after fee reductions and expense reimbursements and fees
paid indirectly | | | 1.08 | %(d) | | | 1.10 | % | | | 1.23 | % | | | 1.27 | % | | | 1.19 | % | | | 1.20 | % |
Operating expenses before fee reductions and expense reimbursements and fees paid indirectly(e) | | | 1.27 | %(d) | | | 1.27 | % | | | 1.34 | % | | | 1.33 | % | | | 1.36 | % | | | 1.24 | % |
Net investment loss | | | (0.40 | %)(d) | | | (0.37 | %) | | | (0.47 | %) | | | (0.32 | %) | | | (0.28 | %) | | | (0.70 | %) |
Portfolio turnover rate | | | 41 | %(c) | | | 92 | % | | | 110 | % | | | 114 | % | | | 63 | % | | | 77 | % |
(a) | The selected per share data was calculated using the average shares outstanding method for the period. |
(b) | Total return is a measure of the change in value of an investment in the Portfolio over the period covered. The returns shown do not reflect the deduction of taxes a shareholder would pay on Portfolio distributions, if any, or the redemption of Portfolio shares. |
(c) | Not annualized. |
(d) | Annualized. |
(e) | The ratio of operating expenses before fee reductions and expense reimbursements includes the effect of fees paid indirectly. If this expense offset was excluded, the ratio would have been 1.29%(d), 1.27%, 1.33%, 1.37% and 1.29% for the periods ended June 30, 2019, December 31, 2018, 2016, 2015 and 2014, respectively (Notes 3 and 4). |
See Notes to Financial Statements.
68
Wilshire Mutual Funds, Inc. Small Company Value Portfolio Financial Highlights | 
|
For a Fund Share Outstanding Throughout Each Period. |
| | | Investment Class Shares | |
| | | Six Months
Ended
06/30/2019
(Unaudited) | | | Year
Ended
12/31/2018 | | | Year
Ended
12/31/2017 | | | Year
Ended
12/31/2016 | | | Year
Ended
12/31/2015 | | | Year
Ended
12/31/2014 | |
Net asset value, beginning of period | | $ | 18.13 | | | $ | 22.99 | | | $ | 23.75 | | | $ | 20.74 | | | $ | 22.86 | | | $ | 24.33 | |
| | | | | | | | | | | | | | | | | | | | | | | | | |
Income (loss) from investment operations: | | | | | | | | | | | | | | | | | | | | | | | | |
Net investment income (loss)(a) | | | 0.06 | | | | 0.05 | | | | (0.05 | ) | | | 0.10 | | | | 0.01 | | | | (0.08 | ) |
Net realized and unrealized gains (losses) on investments | | | 2.53 | | | | (3.77 | ) | | | 2.09 | | | | 4.99 | | | | (0.89 | ) | | | 1.53 | |
Total from investment operations | | | 2.59 | | | | (3.72 | ) | | | 2.04 | | | | 5.09 | | | | (0.88 | ) | | | 1.45 | |
| | | | | | | | | | | | | | | | | | | | | | | | | |
Less distributions: | | | | | | | | | | | | | | | | | | | | | | | | |
From net investment income | | | — | | | | (0.05 | ) | | | — | | | | (0.09 | ) | | | (0.00 | )(b) | | | — | |
From capital gains | | | — | | | | (1.09 | ) | | | (2.80 | ) | | | (1.99 | ) | | | (1.24 | ) | | | (2.92 | ) |
Total distributions | | | — | | | | (1.14 | ) | | | (2.80 | ) | | | (2.08 | ) | | | (1.24 | ) | | | (2.92 | ) |
| | | | | | | | | | | | | | | | | | | | | | | | | |
Net asset value, end of period | | $ | 20.72 | | | $ | 18.13 | | | $ | 22.99 | | | $ | 23.75 | | | $ | 20.74 | | | $ | 22.86 | |
| | | | | | | | | | | | | | | | | | | | | | | | | |
Total return(c) | | | 14.29 | %(d) | | | (16.35 | %) | | | 8.65 | % | | | 24.86 | % | | | (3.83 | %) | | | 6.17 | % |
| | | | | | | | | | | | | | | | | | | | | | | | | |
Ratios to average net assets/supplemental data: | | | | | | | | | | | | | | | | | | | | | | | | |
Net assets, end of period (in 000’s) | | $ | 5,044 | | | $ | 4,792 | | | $ | 6,305 | | | $ | 9,097 | | | $ | 14,287 | | | $ | 14,120 | |
Operating expenses after fee reductions and expense reimbursements and fees
paid indirectly | | | 1.34 | %(e) | | | 1.35 | % | | | 1.45 | % | | | 1.51 | % | | | 1.49 | % | | | 1.49 | % |
Operating expenses before fee reductions and expense reimbursements and fees paid indirectly(f) | | | 1.59 | %(e) | | | 1.57 | % | | | 1.69 | % | | | 1.60 | % | | | 1.67 | % | | | 1.56 | % |
Net investment income (loss) | | | 0.55 | %(e) | | | 0.21 | % | | | (0.25 | %) | | | 0.48 | % | | | 0.06 | % | | | (0.35 | %) |
Portfolio turnover rate | | | 36 | %(d) | | | 74 | % | | | 88 | % | | | 99 | % | | | 49 | % | | | 53 | % |
(a) | The selected per share data was calculated using the average shares outstanding method for the period. |
(b) | Amount rounds to less than $0.01 per share. |
(c) | Total return is a measure of the change in value of an investment in the Portfolio over the period covered. The returns shown do not reflect the deduction of taxes a shareholder would pay on Portfolio distributions, if any, or the redemption of Portfolio shares. |
(d) | Not annualized. |
(e) | Annualized. |
(f) | The ratio of operating expenses before fee reductions and expense reimbursements includes the effect of fees paid indirectly. If this expense offset was excluded, the ratio would have been 1.61%(e), 1.58%, 1.71%, 1.61%, 1.67% and 1.57% for the periods ended June 30, 2019, December 31, 2018, 2017, 2016, 2015 and 2014, respectively (Notes 3 and 4). |
See Notes to Financial Statements.
69
Wilshire Mutual Funds, Inc. Small Company Value Portfolio Financial Highlights - (Continued) | 
|
For a Fund Share Outstanding Throughout Each Period. |
| | | Institutional Class Shares | |
| | | Six Months
Ended
06/30/2019
(Unaudited) | | | Year
Ended
12/31/2018 | | | Year
Ended
12/31/2017 | | | Year
Ended
12/31/2016 | | | Year
Ended
12/31/2015 | | | Year
Ended
12/31/2014 | |
Net asset value, beginning of period | | $ | 18.53 | | | $ | 23.49 | | | $ | 24.14 | | | $ | 21.08 | | | $ | 23.21 | | | $ | 24.59 | |
| | | | | | | | | | | | | | | | | | | | | | | | | |
Income (loss) from investment operations: | | | | | | | | | | | | | | | | | | | | | | | | |
Net investment income (loss)(a) | | | 0.08 | | | | 0.11 | | | | 0.01 | | | | 0.16 | | | | 0.08 | | | | (0.02 | ) |
Net realized and unrealized gains (losses) on investments | | | 2.59 | | | | (3.88 | ) | | | 2.14 | | | | 5.08 | | | | (0.90 | ) | | | 1.56 | |
Total from investment operations | | | 2.67 | | | | (3.77 | ) | | | 2.15 | | | | 5.24 | | | | (0.82 | ) | | | 1.54 | |
| | | | | | | | | | | | | | | | | | | | | | | | | |
Less distributions: | | | | | | | | | | | | | | | | | | | | | | | | |
From net investment income | | | — | | | | (0.10 | ) | | | — | | | | (0.19 | ) | | | (0.07 | ) | | | — | |
From realized capital gains | | | — | | | | (1.09 | ) | | | (2.80 | ) | | | (1.99 | ) | | | (1.24 | ) | | | (2.92 | ) |
Total distributions | | | — | | | | (1.19 | ) | | | (2.80 | ) | | | (2.18 | ) | | | (1.31 | ) | | | (2.92 | ) |
| | | | | | | | | | | | | | | | | | | | | | | | | |
Net asset value, end of period | | $ | 21.20 | | | $ | 18.53 | | | $ | 23.49 | | | $ | 24.14 | | | $ | 21.08 | | | $ | 23.21 | |
| | | | | | | | | | | | | | | | | | | | | | | | | |
Total return(b) | | | 14.41 | %(c) | | | (16.17 | %) | | | 8.97 | % | | | 25.16 | % | | | (3.52 | %) | | | 6.47 | % |
| | | | | | | | | | | | | | | | | | | | | | | | | |
Ratios to average net assets/supplemental data: | | | | | | | | | | | | | | | | | | | | | | | | |
Net assets, end of period (in 000’s) | | $ | 53,654 | | | $ | 46,948 | | | $ | 33,919 | | | $ | 31,698 | | | $ | 13,727 | | | $ | 15,655 | |
Operating expenses after fee reductions and expense reimbursements and fees
paid indirectly | | | 1.09 | %(d) | | | 1.10 | % | | | 1.19 | % | | | 1.27 | % | | | 1.18 | % | | | 1.17 | % |
Operating expenses before fee reductions and expense reimbursements and fees paid indirectly(e) | | | 1.30 | %(d) | | | 1.26 | % | | | 1.37 | % | | | 1.33 | % | | | 1.36 | % | | | 1.23 | % |
Net investment income (loss) | | | 0.76 | %(d) | | | 0.53 | % | | | 0.07 | % | | | 0.73 | % | | | 0.36 | % | | | (0.07 | %) |
Portfolio turnover rate | | | 36 | %(c) | | | 74 | % | | | 88 | % | | | 99 | % | | | 49 | % | | | 53 | % |
(a) | The selected per share data was calculated using the average shares outstanding method for the period. |
(b) | Total return is a measure of the change in value of an investment in the Portfolio over the period covered. The returns shown do not reflect the deduction of taxes a shareholder would pay on Portfolio distributions, if any, or the redemption of Portfolio shares. |
(c) | Not annualized. |
(d) | Annualized. |
(e) | The ratio of operating expenses before fee reductions and expense reimbursements includes the effect of fees paid indirectly. If this expense offset was excluded, the ratio would have been 1.32%(d), 1.27%, 1.39%, 1.34%, 1.37% and 1.25% for the periods ended June 30, 2019, December 31, 2018, 2017, 2016, 2015 and 2014, respectively (Notes 3 and 4). |
See Notes to Financial Statements.
70
Wilshire Mutual Funds, Inc. Wilshire 5000 Indexsm Fund Financial Highlights | 
|
For a Fund Share Outstanding Throughout Each Period. |
| | | Investment Class Shares | |
| | | Six Months
Ended
06/30/2019
(Unaudited) | | | Year
Ended
12/31/2018 | | | Year
Ended
12/31/2017 | | | Year
Ended
12/31/2016 | | | Year
Ended
12/31/2015 | | | Year
Ended
12/31/2014 | |
Net asset value, beginning of period | | $ | 18.58 | | | $ | 20.83 | | | $ | 18.86 | | | $ | 17.78 | | | $ | 18.01 | | | $ | 16.22 | |
| | | | | | | | | | | | | | | | | | | | | | | | | |
Income (loss) from investment operations: | | | | | | | | | | | | | | | | | | | | | | | | |
Net investment income(a) | | | 0.16 | | | | 0.31 | | | | 0.29 | | | | 0.27 | | | | 0.24 | | | | 0.23 | |
Net realized and unrealized gains (losses) on investments | | | 3.16 | | | | (1.45 | ) | | | 3.52 | | | | 1.96 | | | | (0.22 | ) | | | 1.78 | |
Total from investment operations | | | 3.32 | | | | (1.14 | ) | | | 3.81 | | | | 2.23 | | | | 0.02 | | | | 2.01 | |
| | | | | | | | | | | | | | | | | | | | | | | | | |
Less distributions: | | | | | | | | | | | | | | | | | | | | | | | | |
From net investment income | | | — | | | | (0.30 | ) | | | (0.27 | ) | | | (0.39 | ) | | | (0.25 | ) | | | (0.22 | ) |
From realized capital gains | | | — | | | | (0.81 | ) | | | (1.57 | ) | | | (0.76 | ) | | | — | | | | — | |
Total distributions | | | — | | | | (1.11 | ) | | | (1.84 | ) | | | (1.15 | ) | | | (0.25 | ) | | | (0.22 | ) |
| | | | | | | | | | | | | | | | | | | | | | | | | |
Net asset value, end of period | | $ | 21.90 | | | $ | 18.58 | | | $ | 20.83 | | | $ | 18.86 | | | $ | 17.78 | | | $ | 18.01 | |
| | | | | | | | | | | | | | | | | | | | | | | | | |
Total return(b) | | | 17.87 | %(c) | | | (5.60 | %) | | | 20.20 | % | | | 12.51 | % | | | 0.08 | % | | | 12.38 | % |
| | | | | | | | | | | | | | | | | | | | | | | | | |
Ratios to average net assets/supplemental data: | | | | | | | | | | | | | | | | | | | | | | | | |
Net assets, end of period (in 000’s) | | $ | 154,121 | | | $ | 134,197 | | | $ | 149,342 | | | $ | 132,669 | | | $ | 159,709 | | | $ | 204,465 | |
Operating expenses | | | 0.61 | %(d) | | | 0.60 | % | | | 0.62 | % | | | 0.67 | %(e) | | | 0.64 | %(e) | | | 0.65 | % |
Net investment income | | | 1.52 | %(d) | | | 1.42 | % | | | 1.39 | % | | | 1.49 | % | | | 1.35 | % | | | 1.32 | % |
Portfolio turnover rate | | | 1 | %(c) | | | 1 | % | | | 3 | % | | | 5 | % | | | 6 | % | | | 3 | % |
(a) | The selected per share data was calculated using the average shares outstanding method for the period. |
(b) | Total return is a measure of the change in value of an investment in the Portfolio over the period covered. The returns shown do not reflect the deduction of taxes a shareholder would pay on Portfolio distributions, if any, or the redemption of Portfolio shares. |
(c) | Not annualized. |
(d) | Annualized. |
(e) | The ratio of operating expenses includes the effect of fees paid indirectly. If this expense offset was excluded, the ratio would have been 0.67% and 0.64% for the years ended December 31, 2016 and 2015, respectively (Notes 3 and 4). |
See Notes to Financial Statements.
71
Wilshire Mutual Funds, Inc. Wilshire 5000 Indexsm Fund Financial Highlights - (Continued) | 
|
For a Fund Share Outstanding Throughout Each Period. |
| | | Institutional Class Shares | |
| | | Six Months
Ended
06/30/2019
(Unaudited) | | | Year
Ended
12/31/2018 | | | Year
Ended
12/31/2017 | | | Year
Ended
12/31/2016 | | | Year
Ended
12/31/2015 | | | Year
Ended
12/31/2014 | |
Net asset value, beginning of period | | $ | 18.58 | | | $ | 20.83 | | | $ | 18.85 | | | $ | 17.78 | | | $ | 18.00 | | | $ | 16.21 | |
| | | | | | | | | | | | | | | | | | | | | | | | | |
Income (loss) from investment operations: | | | | | | | | | | | | | | | | | | | | | | | | |
Net investment income(a) | | | 0.19 | | | | 0.37 | | | | 0.35 | | | | 0.33 | | | | 0.29 | | | | 0.26 | |
Net realized and unrealized gains (losses) on investments | | | 3.16 | | | | (1.46 | ) | | | 3.53 | | | | 1.95 | | | | (0.22 | ) | | | 1.79 | |
Total from investment operations | | | 3.35 | | | | (1.09 | ) | | | 3.88 | | | | 2.28 | | | | 0.07 | | | | 2.05 | |
| | | | | | | | | | | | | | | | | | | | | | | | | |
Less distributions: | | | | | | | | | | | | | | | | | | | | | | | | |
From net investment income | | | — | | | | (0.35 | ) | | | (0.33 | ) | | | (0.45 | ) | | | (0.29 | ) | | | (0.26 | ) |
From realized capital gains | | | — | | | | (0.81 | ) | | | (1.57 | ) | | | (0.76 | ) | | | — | | | | — | |
Total distributions | | | — | | | | (1.16 | ) | | | (1.90 | ) | | | (1.21 | ) | | | (0.29 | ) | | | (0.26 | ) |
| | | | | | | | | | | | | | | | | | | | | | | | | |
Net asset value, end of period | | $ | 21.93 | | | $ | 18.58 | | | $ | 20.83 | | | $ | 18.85 | | | $ | 17.78 | | | $ | 18.00 | |
| | | | | | | | | | | | | | | | | | | | | | | | | |
Total return(b) | | | 18.03 | %(c) | | | (5.32 | %) | | | 20.57 | % | | | 12.81 | % | | | 0.36 | % | | | 12.60 | % |
| | | | | | | | | | | | | | | | | | | | | | | | | |
Ratios to average net assets/supplemental data: | | | | | | | | | | | | | | | | | | | | | | | | |
Net assets, end of period (in 000’s) | | $ | 37,736 | | | $ | 32,110 | | | $ | 35,066 | | | $ | 40,860 | | | $ | 59,065 | | | $ | 67,500 | |
Operating expenses | | | 0.33 | %(d) | | | 0.33 | % | | | 0.33 | % | | | 0.36 | %(e) | | | 0.41 | %(e) | | | 0.44 | % |
Net investment income | | | 1.81 | %(d) | | | 1.70 | % | | | 1.67 | % | | | 1.80 | % | | | 1.59 | % | | | 1.53 | % |
Portfolio turnover rate | | | 1 | %(c) | | | 1 | % | | | 3 | % | | | 5 | % | | | 6 | % | | | 3 | % |
(a) | The selected per share data was calculated using the average shares outstanding method for the period. |
(b) | Total return is a measure of the change in value of an investment in the Portfolio over the period covered. The returns shown do not reflect the deduction of taxes a shareholder would pay on Portfolio distributions, if any, or the redemption of Portfolio shares. |
(c) | Not annualized. |
(d) | Annualized. |
(e) | The ratio of operating expenses includes the effect of fees paid indirectly. If this expense offset was excluded, the ratio would have been 0.36% and 0.41% for the years ended December 31, 2016 and 2015, respectively (Notes 3 and 4). |
See Notes to Financial Statements.
72
Wilshire Mutual Funds, Inc. Wilshire International Equity Fund Financial Highlights | 
|
For a Fund Share Outstanding Throughout Each Period. |
| | | Investment Class Shares | |
| | | Six Months
Ended
06/30/2019
(Unaudited) | | | Year
Ended
12/31/2018 | | | Year
Ended
12/31/2017 | | | Year
Ended
12/31/2016 | | | Year
Ended
12/31/2015 | | | Year
Ended
12/31/2014 | |
Net asset value, beginning of period | | $ | 9.32 | | | $ | 11.19 | | | $ | 8.92 | | | $ | 8.90 | | | $ | 9.06 | | | $ | 9.70 | |
| | | | | | | | | | | | | | | | | | | | | | | | | |
Income (loss) from investment operations: | | | | | | | | | | | | | | | | | | | | | | | | |
Net investment income(a) | | | 0.08 | | | | 0.10 | | | | 0.08 | | | | 0.10 | | | | 0.09 | | | | 0.09 | |
Net realized and unrealized gains (losses) on investments and foreign currency transactions | | | 1.23 | | | | (1.51 | ) | | | 2.20 | | | | 0.07 | | | | (0.23 | ) | | | (0.71 | ) |
Total from investment operations | | | 1.31 | | | | (1.41 | ) | | | 2.28 | | | | 0.17 | | | | (0.14 | ) | | | (0.62 | ) |
| | | | | | | | | | | | | | | | | | | | | | | | | |
Less distributions: | | | | | | | | | | | | | | | | | | | | | | | | |
From net investment income | | | — | | | | (0.04 | ) | | | (0.01 | ) | | | (0.15 | ) | | | (0.02 | ) | | | (0.02 | ) |
From realized capital gains | | | — | | | | (0.42 | ) | | | — | | | | — | | | | — | | | | — | |
Total distributions | | | — | | | | (0.46 | ) | | | (0.01 | ) | | | (0.15 | ) | | | (0.02 | ) | | | (0.02 | ) |
| | | | | | | | | | | | | | | | | | | | | | | | | |
Redemption fees (Note 2) | | | 0.00 | (b) | | | 0.00 | (b) | | | 0.00 | (b) | | | 0.00 | (b) | | | 0.00 | (b) | | | — | |
| | | | | | | | | | | | | | | | | | | | | | | | | |
Net asset value, end of period | | $ | 10.63 | | | $ | 9.32 | | | $ | 11.19 | | | $ | 8.92 | | | $ | 8.90 | | | $ | 9.06 | |
| | | | | | | | | | | | | | | | | | | | | | | | | |
Total return(c) | | | 14.06 | %(d) | | | (12.66 | %) | | | 25.54 | % | | | 1.88 | % | | | (1.55 | %) | | | (6.38 | %) |
| | | | | | | | | | | | | | | | | | | | | | | | | |
See Notes to Financial Statements.
73
Wilshire Mutual Funds, Inc. Wilshire International Equity Fund Financial Highlights - (Continued) | 
|
For a Fund Share Outstanding Throughout Each Period. |
| | | Investment Class Shares | |
| | | Six Months
Ended
06/30/2019
(Unaudited) | | | Year
Ended
12/31/2018 | | | Year
Ended
12/31/2017 | | | Year
Ended
12/31/2016 | | | Year
Ended
12/31/2015 | | | Year
Ended
12/31/2014 | |
Ratios to average net assets/supplemental data: | | | | | | | | | | | | | | | | | | | | | | | | |
Net assets, end of period (in 000’s) | | $ | 2,962 | | | $ | 2,789 | | | $ | 4,176 | | | $ | 11,290 | | | $ | 3,438 | | | $ | 11,371 | |
Operating expenses after fee reductions and expense reimbursements and fees
paid indirectly | | | 1.52 | %(e)(f) | | | 1.51 | %(f) | | | 1.51 | %(f) | | | 1.52 | % | | | 1.50 | % | | | 1.50 | % |
Operating expenses before fee reductions and expense reimbursements and fees
paid indirectly | | | 1.62 | %(e)(g) | | | 1.59 | % | | | 1.55 | % | | | 1.65 | % | | | 1.75 | % | | | 1.71 | %(g) |
Net investment income | | | 1.62 | %(e) | | | 1.02 | % | | | 0.87 | % | | | 1.19 | % | | | 0.99 | % | | | 0.97 | % |
Portfolio turnover rate | | | 33 | %(d) | | | 96 | % | | | 62 | % | | | 79 | % | | | 84 | % | | | 176 | % |
(a) | The selected per share data was calculated using the average shares outstanding method for the period. |
(b) | Amount rounds to less than $0.01 per share. |
(c) | Total return is a measure of the change in value of an investment in the Portfolio over the period covered. The returns shown do not reflect the deduction of taxes a shareholder would pay on Portfolio distributions, if any, or the redemption of Portfolio shares. |
(d) | Not annualized. |
(e) | Annualized. |
(f) | The operating expense ratio includes the expenses related to foreign currency exchange contracts. Had these expenses been excluded, the expense ratio (after fee reductions and fees paid indirectly) would have been 1.50%(e), 1.50% and 1.50% for the periods ended June 30, 2019, December 31, 2018 and 2017, respectively. |
(g) | The ratio of operating expenses before fee reductions and expense reimbursements includes the effect of fees paid indirectly. If this expense offset was excluded, the ratio would have been 1.62%(e) and 1.71% for the periods ended June 30, 2019 and December 31, 2014, respectively (Notes 3 and 4). |
See Notes to Financial Statements.
74
Wilshire Mutual Funds, Inc. Wilshire International Equity Fund Financial Highlights - (Continued) | 
|
For a Fund Share Outstanding Throughout Each Period. |
| | | Institutional Class Shares | |
| | | Six Months
Ended
06/30/2019
(Unaudited) | | | Year
Ended
12/31/2018 | | | Year
Ended
12/31/2017 | | | Year
Ended
12/31/2016 | | | Year
Ended
12/31/2015 | | | Year
Ended
12/31/2014 | |
Net asset value, beginning of period | | $ | 9.19 | | | $ | 11.04 | | | $ | 8.81 | | | $ | 8.78 | | | $ | 8.99 | | | $ | 9.64 | |
| | | | | | | | | | | | | | | | | | | | | | | | | |
Income (loss) from investment operations: | | | | | | | | | | | | | | | | | | | | | | | | |
Net investment income(a) | | | 0.09 | | | | 0.13 | | | | 0.10 | | | | 0.12 | | | | 0.09 | | | | 0.09 | |
Net realized and unrealized gains (losses) on investments and foreign currency transactions | | | 1.21 | | | | (1.49 | ) | | | 2.18 | | | | 0.07 | | | | (0.21 | ) | | | (0.68 | ) |
Total from investment operations | | | 1.30 | | | | (1.36 | ) | | | 2.28 | | | | 0.19 | | | | (0.12 | ) | | | (0.59 | ) |
| | | | | | | | | | | | | | | | | | | | | | | | | |
Less distributions: | | | | | | | | | | | | | | | | | | | | | | | | |
From net investment income | | | — | | | | (0.07 | ) | | | (0.05 | ) | | | (0.16 | ) | | | (0.09 | ) | | | (0.06 | ) |
From realized capital gains | | | — | | | | (0.42 | ) | | | — | | | | — | | | | — | | | | — | |
Total distributions | | | — | | | | (0.49 | ) | | | (0.05 | ) | | | (0.16 | ) | | | (0.09 | ) | | | (0.06 | ) |
| | | | | | | | | | | | | | | | | | | | | | | | | |
Redemption fees (Note 2) | | | 0.00 | (b) | | | 0.00 | (b) | | | 0.00 | (b) | | | 0.00 | (b) | | | 0.00 | (b) | | | — | |
| | | | | | | | | | | | | | | | | | | | | | | | | |
Net asset value, end of period | | $ | 10.49 | | | $ | 9.19 | | | $ | 11.04 | | | $ | 8.81 | | | $ | 8.78 | | | $ | 8.99 | |
| | | | | | | | | | | | | | | | | | | | | | | | | |
Total return(c) | | | 14.15 | %(d) | | | (12.39 | %) | | | 25.92 | % | | | 2.16 | % | | | (1.37 | %) | | | (6.16 | %) |
| | | | | | | | | | | | | | | | | | | | | | | | | |
See Notes to Financial Statements.
75
Wilshire Mutual Funds, Inc. Wilshire International Equity Fund Financial Highlights - (Continued) | 
|
For a Fund Share Outstanding Throughout Each Period. |
| | | Institutional Class Shares | |
| | | Six Months
Ended
06/30/2019
(Unaudited) | | | Year
Ended
12/31/2018 | | | Year
Ended
12/31/2017 | | | Year
Ended
12/31/2016 | | | Year
Ended
12/31/2015 | | | Year
Ended
12/31/2014 | |
Ratios to average net assets/supplemental data: | | | | | | | | | | | | | | | | | | | | | | | | |
Net assets, end of period (in 000’s) | | $ | 380,076 | | | $ | 383,682 | | | $ | 351,136 | | | $ | 258,311 | | | $ | 176,937 | | | $ | 165,048 | |
Operating expenses after fee reductions and expense reimbursements and fees
paid indirectly | | | 1.27 | %(e)(f)(g) | | | 1.27 | %(f) | | | 1.26 | %(g) | | | 1.27 | % | | | 1.25 | % | | | 1.25 | % |
Operating expenses before fee reductions and expense reimbursements and fees
paid indirectly | | | 1.27 | %(e)(h) | | | 1.25 | % | | | 1.26 | % | | | 1.32 | % | | | 1.29 | % | | | 1.31 | %(h) |
Net investment income | | | 1.78 | %(e) | | | 1.28 | % | | | 1.02 | % | | | 1.44 | % | | | 1.00 | % | | | 0.96 | % |
Portfolio turnover rate | | | 33 | %(d) | | | 96 | % | | | 62 | % | | | 79 | % | | | 84 | % | | | 176 | % |
(a) | The selected per share data was calculated using the average shares outstanding method for the period. |
(b) | Amount rounds to less than $0.01 per share. |
(c) | Total return is a measure of the change in value of an investment in the Portfolio over the period covered. The returns shown do not reflect the deduction of taxes a shareholder would pay on Portfolio distributions, if any, or the redemption of Portfolio shares. |
(d) | Not annualized. |
(e) | Annualized. |
(f) | The ratio of operating expenses after fee reductions and expense reimbursements includes previous investment advisory fee reductions and expense reimbursements recouped by the Investment Adviser. If this expense offset was excluded, the ratio would have been 1.26%(e)and 1.25% for the periods ended June 30, 2019 and December 31, 2018, respectively (Note 3). |
(g) | The operating expense ratio includes the expenses related to foreign currency exchange contracts. Had these expenses been excluded, the expense ratio (after fee reductions and fees paid indirectly) would have been 1.25%(e) and 1.25% for the periods ended June 30, 2019 and December 31, 2017, respectively. |
(h) | The ratio of operating expenses before fee reductions and expense reimbursements includes the effect of fees paid indirectly. If this expense offset was excluded, the ratio would have been 1.27%(e) and 1.31% for the periods ended June 30, 2019 and December 31, 2014, respectively (Notes 3 and 4). |
See Notes to Financial Statements.
76
Wilshire Mutual Funds, Inc. Wilshire Income Opportunities Fund Financial Highlights | 
|
For a Fund Share Outstanding Throughout Each Period. |
| | | Investment Class Shares | |
| | | Six Months
Ended
06/30/2019
(Unaudited) | | | Year
Ended
12/31/2018 | | | Year
Ended
12/31/2017 | | | Period
Ended
12/31/2016* | |
Net asset value, beginning of period | | $ | 9.88 | | | $ | 10.25 | | | $ | 10.14 | | | $ | 10.00 | |
| | | | | | | | | | | | | | | | | |
Income (loss) from investment operations: | | | | | | | | | | | | | | | | |
Net investment income(a) | | | 0.18 | | | | 0.32 | | | | 0.35 | | | | 0.21 | |
Net realized and unrealized gains (losses) on investments and foreign currency transactions | | | 0.55 | | | | (0.39 | ) | | | 0.22 | | | | 0.18 | |
Total from investment operations | | | 0.73 | | | | (0.07 | ) | | | 0.57 | | | | 0.39 | |
| | | | | | | | | | | | | | | | | |
Less distributions: | | | | | | | | | | | | | | | | |
From net investment income | | | (0.19 | ) | | | (0.30 | ) | | | (0.42 | ) | | | (0.18 | ) |
From realized capital gains | | | — | | | | — | | | | (0.04 | ) | | | (0.07 | ) |
Total distributions | | | (0.19 | ) | | | (0.30 | ) | | | (0.46 | ) | | | (0.25 | ) |
| | | | | | | | | | | | | | | | | |
Net asset value, end of period | | $ | 10.42 | | | $ | 9.88 | | | $ | 10.25 | | | $ | 10.14 | |
| | | | | | | | | | | | | | | | | |
Total return(b) | | | 7.42 | %(c) | | | (0.65 | %) | | | 5.60 | % | | | 3.92 | %(c) |
| | | | | | | | | | | | | | | | | |
Ratios to average net assets/supplemental data: | | | | | | | | | | | | | | | | |
Net assets, end of period (in 000’s) | | $ | 1,751 | | | $ | 1,864 | | | $ | 6,409 | | | $ | 1,102 | |
Operating expenses after expense reimbursements(d) | | | 1.19 | %(e)(f) | | | 1.16 | %(e) | | | 1.17 | %(g) | | | 1.15 | %(f) |
Operating expense before expense reimbursements(d) | | | 1.27 | %(f) | | | 1.20 | % | | | 1.23 | % | | | 1.26 | %(f) |
Net investment income | | | 4.01 | %(f) | | | 3.02 | % | | | 3.28 | % | | | 2.83 | %(f) |
Portfolio turnover rate | | | 50 | %(c) | | | 177 | % | | | 88 | % | | | 74 | %(c) |
* | Commenced operations on March 30, 2016. |
(a) | The selected per share data was calculated using the average shares outstanding method for the period. |
(b) | Total return is a measure of the change in value of an investment in the Portfolio over the period covered. The returns shown do not reflect the deduction of taxes a shareholder would pay on Portfolio distributions, if any, or the redemption of Portfolio shares. |
(c) | Not annualized. |
(d) | Ratio does not include expenses from underlying funds. |
(e) | The ratio of operating expense after expense reimbursements includes interest expense and transactions costs related to foreign currency contracts. If these expenses had been excluded, the ratio would have been 1.15%(f) and 1.15% for the periods ended June 30, 2019 and December 31, 2018, respectively. |
(f) | Annualized. |
(g) | Includes interest incurred from reverse repurchase agreements of 0.02% during the year ended December 31, 2017. |
See Notes to Financial Statements.
77
Wilshire Mutual Funds, Inc. Wilshire Income Opportunities Fund Financial Highlights - (Continued) | 
|
For a Fund Share Outstanding Throughout Each Period. |
| | | Institutional Class Shares | |
| | | Six Months
Ended
06/30/2019
(Unaudited) | | | Year
Ended
12/31/2018 | | | Year
Ended
12/31/2017 | | | Period
Ended
12/31/2016* | |
Net asset value, beginning of period | | $ | 9.83 | | | $ | 10.22 | | | $ | 10.10 | | | $ | 10.00 | |
| | | | | | | | | | | | | | | | | |
Income (loss) from investment operations: | | | | | | | | | | | | | | | | |
Net investment income(a) | | | 0.20 | | | | 0.35 | | | | 0.37 | | | | 0.25 | |
Net realized and unrealized gains (losses) on investments and foreign currency transactions | | | 0.55 | | | | (0.40 | ) | | | 0.22 | | | | 0.13 | |
Total from investment operations | | | 0.75 | | | | (0.05 | ) | | | 0.59 | | | | 0.38 | |
| | | | | | | | | | | | | | | | | |
Less distributions: | | | | | | | | | | | | | | | | |
From net investment income | | | (0.21 | ) | | | (0.34 | ) | | | (0.43 | ) | | | (0.21 | ) |
From realized capital gains | | | — | | | | — | | | | (0.04 | ) | | | (0.07 | ) |
Total distributions | | | (0.21 | ) | | | (0.34 | ) | | | (0.47 | ) | | | (0.28 | ) |
| | | | | | | | | | | | | | | | | |
Net asset value, end of period | | $ | 10.37 | | | $ | 9.83 | | | $ | 10.22 | | | $ | 10.10 | |
| | | | | | | | | | | | | | | | | |
Total return(b) | | | 7.60 | %(c) | | | (0.43 | %) | | | 5.84 | % | | | 3.82 | %(c) |
| | | | | | | | | | | | | | | | | |
Ratios to average net assets/supplemental data: | | | | | | | | | | | | | | | | |
Net assets, end of period (in 000’s) | | $ | 314,419 | | | $ | 312,201 | | | $ | 310,227 | | | $ | 396,797 | |
Operating expenses(d) | | | 0.92 | %(e) | | | 0.90 | % | | | 0.92 | %(f) | | | 0.86 | %(e) |
Net investment income | | | 4.31 | %(e) | | | 3.48 | % | | | 3.49 | % | | | 3.11 | %(e) |
Portfolio turnover rate | | | 50 | %(c) | | | 177 | % | | | 88 | % | | | 74 | %(c) |
* | Commenced operations on March 30, 2016. |
(a) | The selected per share data was calculated using the average shares outstanding method for the period. |
(b) | Total return is a measure of the change in value of an investment in the Portfolio over the period covered. The returns shown do not reflect the deduction of taxes a shareholder would pay on Portfolio distributions, if any, or the redemption of Portfolio shares. |
(c) | Not annualized. |
(d) | Ratio does not include expenses from underlying funds. |
(e) | Annualized. |
(f) | Includes interest incurred from reverse repurchase agreements of 0.02% during the year ended December 31, 2017. |
See Notes to Financial Statements.
78
Wilshire Mutual Funds, Inc. Notes to Financial Statements June 30, 2019 (Unaudited) | 
|
1. Organization.
Wilshire Mutual Funds, Inc. (the “Company”) is registered under the Investment Company Act of 1940, as amended (the “1940 Act”), as an open-end diversified investment company, which was incorporated under Maryland law on July 30, 1992. The Company operates as a series company and presently offers seven series: Large Company Growth Portfolio, Large Company Value Portfolio, Small Company Growth Portfolio, Small Company Value Portfolio, Wilshire 5000 IndexSM Fund, Wilshire International Equity Fund and Wilshire Income Opportunities Fund (each a “Portfolio” and collectively the “Portfolios”). The Company accounts separately for the assets, liabilities and operations of each Portfolio.
The investment objective of Large Company Growth Portfolio is to provide investment results of a portfolio of publicly traded common stocks of companies in the applicable sub-category of the Wilshire 5000 IndexSM. The applicable sub-category of the Wilshire 5000 IndexSM is the large cap growth sub-category.
The investment objective of Large Company Value Portfolio is to provide investment results of a portfolio of publicly traded common stocks of companies in the applicable sub-category of the Wilshire 5000 IndexSM. The applicable sub-category of the Wilshire 5000 IndexSM is the large cap value sub-category.
The investment objective of Small Company Growth Portfolio is to provide investment results of a portfolio of publicly traded common stocks of companies in the applicable sub-category of the Wilshire 5000 IndexSM. The applicable sub-category of the Wilshire 5000 IndexSM is the small-cap growth sub-category.
The investment objective of Small Company Value Portfolio is to provide investment results of a portfolio of publicly traded common stocks of companies in the applicable sub-category of the Wilshire 5000 IndexSM. The applicable sub-category of the Wilshire 5000 IndexSM is the small-cap value sub-category.
The investment objective of Wilshire 5000 IndexSM Fund is to replicate as closely as possible the performance of the Wilshire 5000 IndexSM before the deduction of the Portfolio’s expenses.
The investment objective of Wilshire International Equity Fund is capital appreciation.
The primary investment objective of Wilshire Income Opportunities Fund is to maximize current income. Long-term capital appreciation is a secondary objective.
Each of the Portfolios currently offers Investment and Institutional Class shares, each of which has equal rights as to voting privileges except that the Investment Class has exclusive voting rights for its service and distribution plan. Investment income, realized and unrealized capital gains and losses and the common expenses of each Portfolio are allocated on a pro-rata basis to each class based on the relative net assets of each class to the total net assets of such Portfolio. Each class of shares differs with respect to its service and distribution expenses.
79
Wilshire Mutual Funds, Inc. Notes to Financial Statements - (Continued) June 30, 2019 (Unaudited) | 
|
2. Significant Accounting Policies.
The following is a summary of significant accounting policies consistently followed by the Portfolios in the preparation of their financial statements. These policies are in conformity with accounting principles generally accepted in the United States of America (“U.S. GAAP”). The Portfolios follow accounting and reporting guidance under Financial Accounting Standards Board (“FASB”) Accounting Standards Codification Topic 946, “Financial Services – Investment Companies.”
Use of estimates– The preparation of financial statements in accordance with U.S. GAAP requires management to make estimates and assumptions that affect the reported amounts of assets and liabilities and disclosure of contingent assets and liabilities at the date of the financial statements and the reported amounts of revenues and expenses during the reporting period. Actual results could differ from those estimates and those differences could be material.
New Accounting Pronouncement– In March 2017, FASB issued Accounting Standards Update No. 2017-08 (“ASU 2017-08”), “Receivables – Nonrefundable Fees and Other Costs (Subtopic 310-20): Premium Amortization on Purchased Callable Debt Securities.” ASU 2017-08 shortens the amortized period for callable debt securities, held at a premium, to be amortized to the earliest call date. ASU 2017-08 does not require an accounting change for securities held at a discount, which continue to accrete to maturity. ASU 2017-08 is effective for fiscal years and interim periods within those fiscal years beginning after December 15, 2018. The Portfolios have adopted ASU 2017-08 with these financial statements.
Security valuation– Securities listed or traded on U.S. exchanges, including options, futures, swaptions and swap contracts, are valued at the last sales price on the exchange where they are principally traded. In the absence of a current quotation, a security is valued at the mean between the last bid and asked prices on that exchange. Securities quoted on the National Association of Securities Dealers Automatic Quotation (NASDAQ) System, for which there have been sales, are valued at the NASDAQ official closing price. If there are no such sales, a security is valued at the mean between the last bid and asked prices. Securities traded over-the-counter (other than on NASDAQ) are valued at the last current sale price; and if there are no such sales, a security is valued at the mean between the last bid and asked prices. Debt securities are typically valued at an evaluated bid price by a third-party pricing agent employing methodologies that utilize actual market transactions, broker-supplied valuations, or other inputs designed to identify the market value for such securities. Third-party pricing agents often utilize proprietary models that are subjective and require the use of judgment and the application of various assumptions including, but not limited to, interest rates, prepayment speeds, and default rate assumptions. Debt securities that have a remaining maturity of 60 days or less are valued at prices supplied by the Portfolios’ pricing agent for such securities, if available. Otherwise such securities are valued at amortized cost if the Pricing Committee concludes it approximates fair value. Equity securities primarily traded on a foreign exchange are typically valued daily at a price as provided by an independent pricing service, which is an estimate of the fair value price. Foreign currency contracts, including forward contracts, are valued at the applicable translation rates as supplied by the third-party pricing vendor. In the event market quotations are not readily available, such securities are valued at fair value according to procedures adopted by the Board of Directors (the “Board”) or as determined in good faith by the Pricing Committee, whose members include at least two representatives of Wilshire Associates Incorporated (the “Adviser”), one of whom is an officer of the Company, or by the Company’s Valuation Committee. Fair value is
80
Wilshire Mutual Funds, Inc. Notes to Financial Statements - (Continued) June 30, 2019 (Unaudited) | 
|
defined as the amount the owner of a security might reasonably expect to receive upon a current sale. Securities whose value does not reflect fair value because a significant valuation event has occurred may be valued at fair value by the Pricing Committee or the Valuation Committee in accordance with the Company’s valuation procedures. Significant events may include, but are not limited to, the following: significant fluctuations in domestic markets, foreign markets or foreign currencies; occurrences not directly tied to the securities markets such as natural disasters, armed conflicts or significant governmental actions; and major announcements affecting a single issuer or an entire market or market sector. The value of fair valued securities may be different from the last sale price (or the mean between the last bid and asked prices), and there is no guarantee that a fair valued security will be sold at the price at which a Portfolio is carrying the security.
Wilshire International Equity Fund uses ICE Data Services (“ICE”) as a third-party pricing agent. ICE provides a daily fair value for foreign securities in Wilshire International Equity Fund based on certain factors and methodologies (involving, generally, tracking valuation correlations between the U.S. market and each non-U.S. security) applied by ICE. These factors are used to value Wilshire International Equity Fund’s securities without holding a Pricing Committee meeting. In the event that the Adviser believes that the fair values provided by ICE are not reliable, the Adviser contacts the Company’s administrator and may request that a meeting of the Pricing Committee be held.
In accordance with the authoritative guidance on fair value measurements and disclosures under U.S. GAAP, the Portfolios disclose the fair value of their investments in a hierarchy that prioritizes the inputs to valuation techniques used to measure the fair value. The objective of a fair value measurement is to determine the price that would be received to sell an asset or paid to transfer a liability in an orderly transaction between market participants at the measurement date (an exit price). Accordingly, the fair value hierarchy gives the highest priority to quoted prices (unadjusted) in active markets for identical assets or liabilities (Level 1) and the lowest priority to unobservable inputs (Level 3). The guidance establishes three levels of the fair value hierarchy as follows:
| | ● | Level 1 – Unadjusted quoted prices in active markets for identical, unrestricted assets or liabilities that the Portfolios have the ability to access at the measurement date; |
| | ● | Level 2 – Other significant observable inputs (including quoted prices for similar securities, interest rates, prepayment speeds, credit risk, referenced indices, quoted prices in inactive markets, adjusted quoted prices in active markets, etc.); and |
| | ● | Level 3 – Prices, inputs or exotic modeling techniques which are both significant to the fair value measurement and unobservable (supported by little or no market activity). |
The inputs or methodology used for valuing securities are not necessarily an indication of the risks associated with investing in those securities. During the six months ended June 30, 2019, there have been no significant changes to the Portfolios’ fair value methodologies.
81
Wilshire Mutual Funds, Inc. Notes to Financial Statements - (Continued) June 30, 2019 (Unaudited) | 
|
The following is a summary of the inputs used to value the Portfolios’ investments as of June 30, 2019:
Large Company Growth Portfolio | | Level 1 | | | Level 2 | | | Level 3 | | | Total | |
Common Stocks | | $ | 211,927,195 | | | $ | — | | | $ | — | | | $ | 211,927,195 | |
Money Market Funds | | | 2,323,680 | | | | — | | | | — | | | | 2,323,680 | |
Total | | $ | 214,250,875 | | | $ | — | | | $ | — | | | $ | 214,250,875 | |
Large Company Value Portfolio | | Level 1 | | | Level 2 | | | Level 3 | | | Total | |
Common Stocks | | $ | 187,952,551 | | | $ | — | | | $ | — | | | $ | 187,952,551 | |
Money Market Funds | | | 2,625,406 | | | | — | | | | — | | | | 2,625,406 | |
Total | | $ | 190,577,957 | | | $ | — | | | $ | — | | | $ | 190,577,957 | |
Small Company Growth Portfolio | | Level 1 | | | Level 2 | | | Level 3 | | | Total | |
Common Stocks | | $ | 61,053,770 | | | $ | — | | | $ | 0 | * | | $ | 61,053,770 | |
Money Market Funds | | | 2,942,561 | | | | — | | | | — | | | | 2,942,561 | |
Total | | $ | 63,996,331 | | | $ | — | | | $ | 0 | | | $ | 63,996,331 | |
Small Company Value Portfolio | | Level 1 | | | Level 2 | | | Level 3 | | | Total | |
Common Stocks | | $ | 56,617,110 | | | $ | — | | | $ | — | | | $ | 56,617,110 | |
Money Market Funds | | | 2,522,135 | | | | — | | | | — | | | | 2,522,135 | |
Total | | $ | 59,139,245 | | | $ | — | | | $ | — | | | $ | 59,139,245 | |
Wilshire 5000 IndexSM Fund | | Level 1 | | | Level 2 | | | Level 3 | | | Total | |
Common Stocks | | $ | 188,535,825 | | | $ | — | | | $ | 1,778 | * | | $ | 188,537,603 | |
Rights | | | — | | | | — | | | | 1,264 | * | | | 1,264 | |
Money Market Funds | | | 3,183,354 | | | | — | | | | — | | | | 3,183,354 | |
Total | | $ | 191,719,179 | | | $ | — | | | $ | 3,042 | | | $ | 191,722,221 | |
Wilshire International Equity Fund | | Level 1 | | | Level 2 | | | Level 3 | | | Total | |
Common Stocks | | $ | 75,533,319 | | | $ | 299,163,625 | | | $ | 0 | * | | $ | 374,696,944 | |
Preferred Stocks | | | 575,166 | | | | 439,078 | | | | 485 | | | | 1,014,729 | |
Rights | | | — | | | | — | | | | 23,806 | * | | | 23,806 | |
Money Market Funds | | | 5,130,706 | | | | — | | | | — | | | | 5,130,706 | |
Total | | $ | 81,239,191 | | | $ | 299,602,703 | | | $ | 24,291 | | | $ | 380,866,185 | |
* | Includes securities that have been fair valued at $0. |
82
Wilshire Mutual Funds, Inc. Notes to Financial Statements - (Continued) June 30, 2019 (Unaudited) | 
|
Wilshire Income Opportunities Fund | | Level 1 | | | Level 2 | | | Level 3 | | | Total | |
Investments in Securities | | | | | | | | | | | | | | | | |
U.S. Treasury Obligations | | $ | — | | | $ | 35,503,216 | | | $ | — | | | $ | 35,503,216 | |
Agency Mortgage-Backed Obligations | | | — | | | | 26,109,087 | | | | — | | | | 26,109,087 | |
Non-Agency Mortgage-Backed Obligations | | | — | | | | 58,850,386 | | | | — | | | | 58,850,386 | |
Non-Agency Mortgage-Backed Obligations Interest-Only Strips | | | — | | | | 9,282,291 | | | | — | | | | 9,282,291 | |
Asset-Backed Securities | | | — | | | | 7,376,446 | | | | — | | | | 7,376,446 | |
Collateralized Loan Obligations | | | — | | | | 10,310,694 | | | | — | | | | 10,310,694 | |
Investment-Grade Corporate Obligations | | | — | | | | 21,756,884 | | | | — | | | | 21,756,884 | |
High Yield Corporate Obligations | | | — | | | | 35,481,836 | | | | — | | | | 35,481,836 | |
Foreign Bonds | | | — | | | | 74,273,601 | | | | — | | | | 74,273,601 | |
Loan Participations | | | — | | | | 15,125,008 | | | | — | | | | 15,125,008 | |
Common Stocks | | | 525,170 | | | | — | | | | — | | | | 525,170 | |
Preferred Stocks | | | 2,748,157 | | | | — | | | | — | | | | 2,748,157 | |
Purchased Options | | | 38,440 | | | | — | | | | — | | | | 38,440 | |
Purchased Swaption Contracts | | | 48,259 | | | | — | | | | — | | | | 48,259 | |
Affiliated Registered Investment Companies | | | 18,231,264 | | | | — | | | | — | | | | 18,231,264 | |
Money Market Funds | | | 32,377,302 | | | | — | | | | — | | | | 32,377,302 | |
Total | | $ | 53,968,592 | | | $ | 294,069,449 | | | $ | — | | | $ | 348,038,041 | |
Other Financial Instruments** | | | | | | | | | | | | | | | | |
Futures Contracts | | $ | 632,539 | | | $ | — | | | $ | — | | | $ | 632,539 | |
Futures Contracts - Sold Short | | $ | (72,513 | ) | | $ | — | | | $ | — | | | $ | (72,513 | ) |
Forward Foreign Currency Contracts | | $ | (150,126 | ) | | $ | — | | | $ | — | | | $ | (150,126 | ) |
** | Other financial instruments are derivative financial instruments not reflected in the Schedules of Investments, such as futures contracts, forward foreign currency contracts and swaption contracts. These contracts are valued at the unrealized appreciation (depreciation) on the instrument. |
Refer to the Portfolios’ Condensed Schedules of Investments for a listing of the securities by industry or sector type. Large Company Growth Portfolio, Large Company Value Portfolio, Small Company Value Portfolio and Wilshire Income Opportunities Fund did not hold any assets or liabilities that were measured at fair value on a recurring basis using significant unobservable inputs (Level 3) as of June 30, 2019. Small Company Growth Portfolio held common stocks that were measured at fair value on a recurring basis using significant unobservable inputs (Level 3) totaling $0. Wilshire 5000 IndexSM Fund held common stocks and rights that were measured at fair value on a recurring basis using significant unobservable inputs (Level 3) totaling $1,778 and $1,264, respectively. Wilshire International Equity Fund held common stocks, preferred stocks and rights that were measured at fair value on a recurring basis using significant unobservable inputs (Level 3) totaling $0, $485 and $23,806, respectively. A reconciliation of Level 3 investments, including certain disclosures related to significant inputs used in valuing Level 3 investments, is only presented when a Portfolio has over 1% of Level 3 investments.
83
Wilshire Mutual Funds, Inc. Notes to Financial Statements - (Continued) June 30, 2019 (Unaudited) | 
|
Option Transactions – Wilshire Income Opportunities Fund may purchase and write call and put options on securities, securities indices, swaps (“swaptions”) and foreign currencies, provided such options are traded on a national securities exchange or an over-the-counter market. When the Portfolio writes a covered call or put option, an amount equal to the premium received is included as a liability in the Portfolio’s statement of assets and liabilities. The amount of the liability is subsequently marked-to-market to reflect the current value of the option. If an option expires on its stipulated expiration date or if the Portfolio enters into a closing purchase transaction, a gain or loss is realized. If a written call option is exercised, a gain or loss is realized for the sale of the underlying security and the proceeds from the sale are increased by the premium originally received. If a written put option is exercised, the cost of the security acquired is decreased by the premium originally received. As a writer of an option, the Portfolio has no control over whether the underlying securities are subsequently sold (call) or purchased (put). As a result, the Portfolio bears the market risk of an unfavorable change in the price of the security or index underlying the written option. When the Portfolio purchases a call or put option, an amount equal to the premium paid is included as an investment in the Portfolio’s statement of assets and liabilities and is subsequently marked-to-market to reflect the current value of the option. If an option expires on the stipulated expiration date or if the Portfolio enters into a closing sale transaction, a gain or loss is realized. If the Portfolio exercises a call, the cost of the security acquired is increased by the premium paid for the call. If the Portfolio exercises a put option, a gain or loss is realized from the sale of the underlying security, and the proceeds from such sale are decreased by the premium originally paid. Written and purchased options are non-income producing securities. The option techniques utilized are generally to hedge against changes in interest rates, foreign currency exchange rates or securities prices in order to establish more definitely the effective return on securities or currencies held or intended to be acquired by the Portfolio, to reduce the volatility of the currency exposure associated with an investment in non-U.S. securities, or as an efficient means of adjusting exposure to the bond, equity and currency markets.
The average monthly notional value of option contracts purchased for Wilshire Income Opportunities Fund during the six months ended June 30, 2019 was $1,123,333. There were no option contracts written by Wilshire Income Opportunities Fund during the six months ended June 30, 2019.
The average monthly notional value of swaption contracts purchased and written for Wilshire Income Opportunities during the six months ended June 30, 2019 was $44,725,000 and $4,800,000, respectively.
Interest Rate Swaps– Wilshire Income Opportunities Fund is subject to interest rate risk exposure in the normal course of pursuing its investment objectives. The value of fixed-rate bonds held by the Portfolio may decrease if interest rates rise. In order to reduce such risks, the Portfolio may enter into interest rate swaps. Interest rate swaps involve the exchange of commitments to pay and receive a fixed or floating rate of interest based on a notional principal amount. The risks of interest rate swaps include changes in market conditions that will affect their value or cash flows and the possible inability of the counterparty to fulfill its obligations under the agreement. The Portfolio’s maximum risk of loss from counterparty credit risk is the discounted net value of the cash flows to be received from the counterparty over the swap’s remaining life. Upon entering into a swap contract, the Portfolio is required to satisfy an initial margin requirement by delivering cash to the counterparty. Net periodic interest payments to be received or paid are accrued and settled daily and are recorded as interest income on the Statements of Operations. Interest rate swaps are marked-to-market daily and the change is recorded as an
84
Wilshire Mutual Funds, Inc. Notes to Financial Statements - (Continued) June 30, 2019 (Unaudited) | 
|
unrealized gain (loss) on swap contracts on the Statements of Operations. The average monthly notional value of interest rate swaps for Wilshire Income Opportunities Fund during the six months ended June 30, 2019 was $6,568,333. Wilshire Income Opportunities Fund held no interest rate swap contracts as of June 30, 2019.
Investment transactions and investment income – Investment transactions are recorded on a trade-date basis. Realized gains and losses from investment transactions are recorded on the identified cost basis. Dividend income is recognized on the ex-dividend date and interest income is accrued as earned. Discounts and premiums on fixed income securities purchased are accreted or amortized using the effective interest method. Gains and losses on paydowns of mortgage-backed securities are reflected in interest income on the Statements of Operations. Distributions received on investments that represent a return of capital or capital gain are reclassed as a reduction of cost of investments and/or as a realized gain. Withholding taxes on foreign dividends have been provided for in accordance with the Company’s understanding of the applicable country’s tax rules and rates. Settlement on bank loan transactions may be in excess of seven business days.
Borrowing costs – From time to time, the Portfolios may have an overdrawn cash balance at the custodian due to redemptions or market movements. When this occurs, the Portfolios will incur borrowing costs charged by the custodian. These borrowing costs are shown as interest expense on the Statements of Operations.
Foreign taxes – The Portfolios may be subject to foreign taxes related to foreign income received (a portion of which may be reclaimable), capital gains on the sale of securities and certain foreign currency transactions. All foreign taxes are recorded in accordance with the applicable regulations and rates that exist in the foreign jurisdictions in which the Portfolios invest.
Mortgage, asset-backed and collateralized loan securities – Wilshire Income Opportunities Fund may invest in mortgage, asset-backed and collateralized loan securities, including collateralized loan obligations (“CLOs”), which represent shares in a pool of mortgages or other debt. These securities are generally pass-through securities, which means that principal and interest payments on the underlying securities (less servicing fees) are passed through to owners on a pro rata basis. These securities involve prepayment risk, which is the risk that the underlying mortgages or other debt may be refinanced or paid off before they mature, particularly during periods of declining interest rates. In that case, proceeds from the securities may have to be reinvested at a lower interest rate. This could lower the Portfolio’s return and result in losses to the Portfolio if some securities were acquired at a premium. Potential market gains on a security subject to prepayment risk may be more limited than potential market gains on a comparable security that is not subject to prepayment risk. The Portfolio may also invest in collateralized mortgage obligations (“CMOs”). In a CMO, a series of bonds or certificates is issued in multiple classes, which have varying levels of risks.
Investments in CLOs may be subject to certain tax provisions that could result in the Portfolio incurring tax or recognizing income prior to receiving cash distributions related to such income. CLOs that fail to comply with certain U.S. tax disclosure requirements may be subject to withholding requirements that could adversely affect cash flows and investment results. Any unrealized losses the Portfolio experiences with respect to its CLO investments may be an indication of future realized losses.
85
Wilshire Mutual Funds, Inc. Notes to Financial Statements - (Continued) June 30, 2019 (Unaudited) | 
|
Stripped Mortgage-Backed Securities (“SMBS”) – Wilshire Income Opportunities Fund may invest in SMBS. SMBS are derivative multi-class mortgage-backed securities which are usually structured with two classes that receive different proportions of the interest and principal distributions on a pool of mortgage assets. An SMBS will have one class that will receive all of the interest (the interest-only or “IO” class), while the other class will receive the entire principal (the principal-only or “PO” class). IOs are more volatile and sensitive to the rate of prepayments than other types of mortgage-backed securities, and their value can fall dramatically in response to rapid or unexpected changes in the mortgage, interest rate or economic environment. Payments received for IOs are included in interest income on the Statements of Operations. Because no principal will be received at the maturity of an IO, adjustments are made to the cost of the security on a monthly basis until maturity. These adjustments are included in interest income on the Statements of Operations. Additionally, any prepayment penalties received for an IO are included in interest income on the Statements of Operations.
Loan participations and assignments – Wilshire Income Opportunities Fund may invest in direct debt instruments which are interests in amounts owed to lenders and lending syndicates by corporate, governmental, or other borrowers. The Portfolio’s investments in loans may be in the form of participations in loans or assignments of all or a portion of loans from third parties. A loan is often administered by a bank or other financial institution (the “lender”) that acts as agent for all holders. The agent administers the terms of the loan, as specified in the loan agreement. The Portfolio may invest in multiple series or tranches of a loan, which may have varying terms and carry different associated risks. The Portfolio will generally purchase assignments of these loans, in which case it will typically become a lender for purposes of the relevant loan agreement with direct contractual rights against the borrower, including the right to receive payments of principal and interest. When purchasing participation interests in a loan, the Portfolio generally has no right to enforce compliance with the terms of the loan agreement with the borrower. As a result, the Portfolio may be subject to the credit risk of both the borrower and the lender that is selling the loan agreement. The Portfolio may enter into unfunded loan commitments, which are contractual obligations for future funding. Unfunded loan commitments represent a future obligation in full, even though a percentage of the notional loan accounts may not be utilized by the borrower. When investing in a loan participation, the Portfolio has the right to receive payments of principal, interest and any fees to which it is entitled only from the lender selling the loan agreement and only upon receipt of payments by the lender from the borrower. In certain circumstances, the Portfolio may receive a penalty fee upon the prepayment of a floating rate loan by a borrower. Fees earned are recorded as a component of interest income on the Statements of Operations.
Foreign currency transactions – The books and records of the Portfolios are maintained in U.S. dollars. Foreign currency transactions are translated into U.S. dollars on the following basis:
| | ● | fair value of investment securities, other assets and liabilities at the daily rates of exchange and |
| | ● | purchases and sales of investment securities, dividend and interest income and certain expenses at the rates of exchange prevailing on the respective dates of such transactions. |
The portion of the results of operations caused by changes in foreign exchange rates on investments are not isolated from those caused by changes in market prices of securities held. Such fluctuations are included with the net realized and unrealized gains or losses on investments. Net realized and unrealized gains (losses) from foreign currency related transactions include gains and losses between trade and settlement dates on investment
86
Wilshire Mutual Funds, Inc. Notes to Financial Statements - (Continued) June 30, 2019 (Unaudited) | 
|
transactions, gains and losses arising from the sales of foreign currency and gains and losses between the ex-dividend and payment dates on dividends, interest and foreign withholding taxes. The effect of changes in foreign exchange rates on realized and unrealized gains or losses is reflected as a component of such gains or losses.
Forward Foreign Currency Contracts – Wilshire Income Opportunities Fund may enter into forward foreign currency contracts as hedges against either specific transactions, Portfolio positions or anticipated Portfolio positions. The Portfolio may also engage in currency transactions to enhance the Portfolio’s returns. All commitments are marked-to-market daily at the applicable foreign exchange rate, and any resulting unrealized gains or losses are recorded. The Portfolio realizes gains and losses at the time forward foreign currency contracts are closed. Unrealized gains or losses on outstanding positions in forward foreign currency contracts held at the close of the period are recognized as ordinary income or loss for federal income tax purposes. Finally, the risk exists that losses could exceed amounts disclosed on the Statements of Assets and Liabilities.
Over-the-Counter (“OTC”) Derivative Contracts – To reduce counterparty risk for OTC transactions, Wilshire Income Opportunities Fund has entered into master netting arrangements, established within the International Swap Dealers Association, Inc. (“ISDA”) master agreements, which allow the Portfolio to make (or to have an entitlement to receive) a single net payment in the event of default (close-out netting) for outstanding payables and receivables for certain OTC positions for each individual counterparty. In addition, the Portfolio may require that certain counterparties post cash and/or securities in collateral accounts to cover their net payment obligations for those derivative contracts subject to ISDA master agreements. If the counterparty fails to perform under these contracts and agreements, the cash and/or securities will be made available to the Portfolio. For financial reporting purposes, the Portfolio does not offset derivative assets and derivative liabilities that are subject to netting arrangements in the Statement of Assets and Liabilities. Bankruptcy or insolvency laws of a particular jurisdiction may impose restrictions on or prohibitions against the right of offset in bankruptcy, insolvency or other events.
Collateral terms are contract-specific for OTC derivatives. For derivatives traded under an ISDA master agreement or other similar agreement, the collateral requirements are typically calculated by netting the mark-to-market amount of each transaction under such agreement and comparing that amount to the value of any collateral currently pledged by the Portfolio or the counterparty.
For financial reporting purposes, cash collateral that has been pledged to cover obligations of the Portfolio, if any, is reported separately as Margin Deposits for Futures Contracts on the Statements of Assets and Liabilities. Non-cash collateral pledged by the Portfolio, if any, is noted in the Schedule of Investments. Generally, the amount of collateral due from or to a party must exceed a minimum transfer amount before a transfer has to be made. To the extent amounts due to the Portfolio from its counterparties are not fully collateralized, contractually or otherwise, the Portfolio bears the risk of loss from counterparty nonperformance.
87
Wilshire Mutual Funds, Inc. Notes to Financial Statements - (Continued) June 30, 2019 (Unaudited) | 
|
The following table presents, by derivative type, Wilshire Income Opportunities Fund’s OTC financial derivative instruments net of the related collateral pledged by counterparty at June 30, 2019:
| | | Derivative Assets | | | Derivative Liabilities | | | | | | | | | | | | | |
Counterparty | | Futures(a) | | | Forward
Currency
Contracts | | | Swaptions(a) | | | Total | | | Futures(a) | | | Forward
Currency
Contracts | | | Swaptions(a) | | | Total | | | Net
Derivative
Asset
(Liabilities) | | | Collateral
(Received)
Pledged | | | Net
Amount | |
Australia and New Zealand Banking Group Ltd. | | $ | — | | | $ | — | | | $ | — | | | $ | — | | | $ | — | | | $ | (20,590 | ) | | $ | — | | | $ | (20,590 | ) | | $ | (20,590 | ) | | $ | — | | | $ | (20,590 | ) |
Bank of America, N.A. | | | — | | | | — | | | | 1,112 | | | | 1,112 | | | | — | | | | — | | | | (1,378 | ) | | | (1,378 | ) | | | (266 | ) | | | — | | | | (266 | ) |
Barclays Capital, Inc. | | | — | | | | 8,820 | | | | 6,643 | | | | 15,463 | | | | — | | | | (412 | ) | | | — | | | | (412 | ) | | | 15,051 | | | | — | | | | 15,051 | |
BNP Paribas | | | — | | | | — | | | | — | | | | — | | | | — | | | | (558 | ) | | | — | | | | (558 | ) | | | (558 | ) | | | — | | | | (558 | ) |
Brown Brothers & Harriman & Co. | | | — | | | | 23,877 | | | | — | | | | 23,877 | | | | — | | | | (24,725 | ) | | | — | | | | (24,725 | ) | | | (848 | ) | | | — | | | | (848 | ) |
CIBC, Toronto | | | — | | | | 24,313 | | | | — | | | | 24,313 | | | | — | | | | (56,163 | ) | | | — | | | | (56,163 | ) | | | (31,850 | ) | | | — | | | | (31,850 | ) |
Citibank, New York | | | — | | | | 15,618 | | | | — | | | | 15,618 | | | | — | | | | (68,658 | ) | | | — | | | | (68,658 | ) | | | (53,040 | ) | | | — | | | | (53,040 | ) |
Goldman Sachs & Co. | | | 537 | | | | 23,563 | | | | — | | | | 24,100 | | | | (5,182 | ) | | | (14,879 | ) | | | — | | | | (20,061 | ) | | | 4,039 | | | | — | | | | 4,039 | |
HSBC Bank, USA | | | — | | | | 12,776 | | | | — | | | | 12,776 | | | | — | | | | (2,462 | ) | | | — | | | | (2,462 | ) | | | 10,314 | | | | — | | �� | | 10,314 | |
JPMChase, New York | | | — | | | | 4,926 | | | | 5,974 | | | | 10,900 | | | | — | | | | (38,876 | ) | | | — | | | | (38,876 | ) | | | (27,976 | ) | | | — | | | | (27,976 | ) |
Morgan Stanley Capital | | | 633,798 | | | | 44,603 | | | | 7,408 | | | | 685,809 | | | | (69,127 | ) | | | (4,024 | ) | | | — | | | | (73,151 | ) | | | 612,658 | | | | — | | | | 612,658 | |
Royal Bank of Canada, Toronto | | | — | | | | — | | | | — | | | | — | | | | — | | | | (19,924 | ) | | | — | | | | (19,924 | ) | | | (19,924 | ) | | | — | | | | (19,924 | ) |
Standard Chartered Securities N.A. | | | — | | | | — | | | | — | | | | — | | | | — | | | | (7,702 | ) | | | — | | | | (7,702 | ) | | | (7,702 | ) | | | — | | | | (7,702 | ) |
State Street Bank, Boston | | | — | | | | 7,338 | | | | — | | | | 7,338 | | | | — | | | | (15,221 | ) | | | — | | | | (15,221 | ) | | | (7,883 | ) | | | — | | | | (7,883 | ) |
UBS AG, Stamford | | | — | | | | — | | | | — | | | | — | | | | — | | | | (41,766 | ) | | | — | | | | (41,766 | ) | | | (41,766 | ) | | | — | | | | (41,766 | ) |
Total | | $ | 634,335 | | | $ | 165,834 | | | $ | 21,137 | | | $ | 821,306 | | | $ | (74,309 | ) | | $ | (315,960 | ) | | $ | (1,378 | ) | | $ | (391,647 | ) | | $ | 429,659 | | | $ | — | | | $ | 429,659 | |
(a) | Includes cumulative appreciation (depreciation) as reported in the Schedules of Investments. Only current day’s variation margin is reported within the Statements of Assets and Liabilities. |
Expense policy– Distribution and shareholder service fees directly attributable to a Class of shares are charged to that class’ operating expenses. Expenses of a Portfolio other than distribution and service fees are prorated among the classes to which the expense relates based on the relative net assets of each class of shares. Expenses directly attributable to a Portfolio are charged to that Portfolio. Expenses not directly attributable to a Portfolio are allocated proportionately among all Portfolios daily in relation to the net assets of each Portfolio or another reasonable basis.
Expenses that are attributable to both the Company and the Wilshire Variable Insurance Trust (an affiliated investment company) are allocated across the Company and the Wilshire Variable Insurance Trust based upon relative net assets or another reasonable basis. Expenses and fees, including the advisory fees, are accrued daily and taken into account for the purpose of determining the net asset value (“NAV”) of each Class of each Portfolio’s shares.
88
Wilshire Mutual Funds, Inc. Notes to Financial Statements - (Continued) June 30, 2019 (Unaudited) | 
|
Investments in REITs– With respect to each Portfolio, dividend income is recorded based on the income included in distributions received from its REIT investments using published REIT reclassifications including some management estimates when actual amounts are not available. Distributions received in excess of these estimated amounts are recorded as a reduction of the cost of investments or reclassified to capital gains. The actual amounts of income, return of capital, and capital gains are only determined by each REIT after its fiscal year end, and may differ from the estimated amounts.
Master Limited Partnerships (“MLPs”)– Each Portfolio may invest in MLPs, which are limited partnerships or limited liability companies whose partnership units or limited liability interests are listed and traded on a U.S. securities exchange. MLPs are treated as publicly traded partnerships for federal income tax purposes. To qualify to be treated as a partnership for tax purposes, an MLP must receive at least 90% of its income from qualifying sources as set forth in Section 7704(d) of the Internal Revenue Code of 1986, as amended (the “Code”). These qualifying sources include activities such as the exploration, development, mining, production, processing, refining, transportation, storage and marketing of mineral or natural resources. MLPs generally have two classes of owners, the general partner and limited partners. MLPs that are formed as limited liability companies generally have two analogous classes of owners, the managing member and the members. For purposes of this section, references to general partners also apply to managing members and references to limited partners also apply to members. The general partner is typically owned by a major energy company, an investment fund, the direct management of the MLP, or is an entity owned by one or more of such parties. The general partner may be structured as a private or publicly traded corporation or other entity. The general partner typically controls the operations and management of the MLP through an equity interest in the MLP of as much as 2% plus, in many cases, ownership of common units and subordinated units. Limited partners own the remainder of the MLP through ownership of common units and have a limited role in the MLP’s operations and management.
Distributions to shareholders– Distributions to shareholders are recorded on the ex-dividend date. Distributions from net investment income, if any, are declared and paid at least once a year. Beginning in June, 2019, Wilshire Income Opportunities Fund declares and pays any distributions from net investment income on a quarterly basis. The Portfolios’ net realized capital gains, unless offset by any available capital loss carryforward, are distributed to shareholders at least once a year. Additional distributions of net investment income and net realized capital gains may be made at the discretion of the Board in order to avoid the application of a 4% non-deductible Federal excise tax.
Redemption fees – Wilshire International Equity Fund charges a redemption fee of 1% on redemption of its shares held for sixty days or less, subject to certain exceptions. During the periods ended June 30, 2019 and December 31, 2018, Wilshire International Equity Fund collected $462 and $2,636, respectively, in redemption fees.
3. Investment Adviser and Other Service Providers.
Pursuant to the Advisory Agreement between the Company and the Adviser, the Adviser charges annual fees of 0.75% of average daily net assets for the first $1 billion and 0.65% thereafter for each of Large Company Growth Portfolio and Large Company Value Portfolio; 0.85% of average daily net assets for the first $1 billion and 0.75% thereafter for each of Small Company Growth Portfolio and Small Company Value Portfolio; 0.10% of the average
89
Wilshire Mutual Funds, Inc. Notes to Financial Statements - (Continued) June 30, 2019 (Unaudited) | 
|
daily net assets for the first $1 billion and 0.07% thereafter for Wilshire 5000 IndexSM Fund; 1.00% of the average daily net assets for the first $1 billion and 0.90% thereafter for Wilshire International Equity Fund; and 0.60% of average daily net assets for Wilshire Income Opportunities Fund.
The Adviser has entered into expense limitation agreements with Large Company Growth Portfolio and Large Company Value Portfolio requiring the Adviser to reduce its management fees or reimburse expenses to limit expenses of such Portfolios (excluding taxes, brokerage expenses, dividend expenses on short securities, and extraordinary expenses) to 1.30% and 1.05% of average daily net assets for Investment Class Shares and Institutional Class Shares, respectively. The Adviser has entered into expense limitation agreements with Small Company Growth Portfolio and Small Company Value Portfolio requiring the Adviser to reduce its management fees or reimburse expenses to limit expenses of such Portfolios (excluding taxes, brokerage expenses, dividend expenses on short securities, and extraordinary expenses) to 1.35% and 1.10% of average daily net assets for Investment Class Shares and Institutional Class Shares, respectively. The Adviser has also entered into an expense limitation agreement with Wilshire International Equity Fund requiring the Adviser to reduce its management fees or reimburse expenses to limit expenses of such Portfolio (excluding taxes, brokerage expenses, dividend expenses on short securities, and extraordinary expenses) to 1.50% and 1.25% of average daily net assets for Investment Class Shares and Institutional Class Shares, respectively. The Adviser has also entered into an expense limitation agreement with Wilshire Income Opportunities Fund requiring the Adviser to reduce its management fees or reimburse expenses to limit expenses of such Portfolio (excluding taxes, brokerage expenses, dividend expenses on short securities, acquired fund fees and expenses and extraordinary expenses) to 1.15% and 0.90% of average daily net assets for Investment Class Shares and Institutional Class Shares, respectively. These agreements to limit expenses continue through at least April 30, 2020. The Adviser may recoup the amount of any fee reductions or expense reimbursements within three years after the day on which it reduced its fees or reimbursed expenses if the recoupment does not cause a Portfolio’s expenses to exceed the expense limitation that was in place at the time of the fee reduction or expense reimbursement.
During the six months ended June 30, 2019, the Adviser reduced fees, reimbursed expenses or recouped fees as follows:
Portfolio | | Fees Reductions/
Reimbursements | | | Fees Recouped | |
Large Company Growth Portfolio | | $ | 6,801 | | | | N/A | |
Small Company Growth Portfolio | | | 58,344 | | | | N/A | |
Small Company Value Portfolio | | | 59,109 | | | | N/A | |
International Equity Fund | | | 1,444 | | | $ | 9,593 | |
Wilshire Income Opportunities Fund | | | 696 | | | | N/A | |
90
Wilshire Mutual Funds, Inc. Notes to Financial Statements - (Continued) June 30, 2019 (Unaudited) | 
|
As of June 30, 2019, the amounts of fee reductions and expense reimbursements subject to recovery by the Adviser from Large Company Growth Portfolio, Small Company Growth Portfolio, Small Company Value Portfolio, Wilshire International Equity Fund and Wilshire Income Opportunities Fund are $6,801, $230,357, $225,693, $114,630 and $5,372, respectively. The portions of these amounts that the Adviser may recover expire no later than the following dates:
Portfolio | | December 31,
2019 | | | December 31,
2020 | | | December 31,
2021 | | | June 30, 2022 | |
Large Company Growth Portfolio | | $ | — | | | $ | — | | | $ | — | | | $ | 6,801 | |
Small Company Growth Portfolio | | | 13,680 | | | | 53,561 | | | | 104,772 | | | | 58,344 | |
Small Company Value Portfolio | | | 14,437 | | | | 55,407 | | | | 96,740 | | | | 59,109 | |
Wilshire International Equity Fund | | | 107,990 | | | | 2,177 | | | | 3,019 | | | | 1,444 | |
Wilshire Income Opportunities Fund | | | 723 | | | | 3,021 | | | | 932 | | | | 696 | |
The Board has approved Los Angeles Capital Management and Equity Research, Inc. (“L.A. Capital”), Victory Capital Management Inc., through its investment franchise NewBridge Asset Management (“NewBridge”), Pzena Investment Management, LLC (“Pzena”), Barrow, Hanley, Mewhinney and Strauss, LLC (“BHMS”), Ranger Investment Management, LLC (“Ranger”), NWQ Investment Management Company, LP (“NWQ”), Loomis, Sayles & Company, L.P. (“Loomis Sayles”), DoubleLine®Capital LP (“DoubleLine”), WCM Investment Management, LLC (“WCM”), Voya Investment Management Co. LLC (“Voya”), Manulife Asset Management (US) LLC (“Manulife”) and Lazard Asset Management LLC (“Lazard”) (collectively the “Sub-Advisers”) to provide sub-advisory services for the Portfolios. L.A. Capital, Loomis Sayles and NewBridge each manage a portion of Large Company Growth Portfolio. L.A. Capital, Pzena and BHMS each manage a portion of Large Company Value Portfolio. L.A. Capital and Ranger each manage a portion of Small Company Growth Portfolio. L.A. Capital and NWQ each manage a portion of Small Company Value Portfolio. L.A. Capital is the sole sub-adviser for Wilshire 5000 IndexSM Fund. L.A. Capital, Pzena, Lazard and WCM each manage a portion of Wilshire International Equity Fund. DoubleLine, Voya and Manulife each manage a portion of Wilshire Income Opportunities Fund.
The Sub-Advisers are subject to the Adviser’s oversight. The fees of the Sub-Advisers are paid by the Adviser.
The Portfolios are permitted to purchase and sell securities from or to certain affiliates under specific conditions outlined in the Rule 17a-7 procedures adopted by the Board. The procedures are designed to ensure that any purchase or sale of securities by a Portfolio from or to another mutual fund or separate account that is or could be considered an affiliate by virtue of having a common investment adviser (or affiliated investment advisers), common trustees and/or common officers complies with Rule 17a-7 under the 1940 Act. During the six months ended June 30, 2019, there were no such transactions by the Portfolios.
DST Systems, Inc. serves as the Company’s transfer agent and dividend disbursing agent. The Northern Trust Company (“NTC”) serves as the Company’s custodian. Ultimus Fund Solutions, LLC (the “Administrator”) serves as the Company’s administrator and accounting agent and Ultimus Fund Distributors, LLC, an affiliate of the Administrator, serves as the Company’s principal underwriter.
91
Wilshire Mutual Funds, Inc. Notes to Financial Statements - (Continued) June 30, 2019 (Unaudited) | 
|
Officers’ and Directors’ Expenses– Certain officers of the Company are affiliated with and receive remuneration from the Adviser or the Administrator. The Company does not pay any remuneration to its officers. The Company and the Wilshire Variable Insurance Trust together pay each director who is not an interested person of the Company (“Independent Director”) an annual retainer of $48,000, an annual additional retainer for each Committee chair of $12,000 and an annual additional retainer to the Board chair of $12,000. In addition, each Independent Director is compensated for Board and Committee meeting attendance in accordance with the following schedule: an in-person Board meeting fee of $3,000 for Independent Directors and $4,000 for the Board chair; a telephonic Board meeting fee of $1,500 for Independent Directors and $2,000 for the Board chair; and a telephonic Committee meeting fee of $500.
4. Distribution Plan, Shareholder Services Plan and Fees Paid Indirectly.
The Board has adopted a shareholder services and distribution plan (the “Plan”), pursuant to Rule 12b-1 under the 1940 Act, on behalf of the Investment Class Shares of each Portfolio. Under the Plan, each Portfolio may pay up to 0.25% of the value of the average daily net assets attributable to the Investment Class Shares for certain services provided by financial intermediaries or for certain distribution expenses for the purpose of financing any activity intended to result in the sale of Investment Class Shares. During the six months ended June 30, 2019, the distribution and service fee expenses incurred by the Investment Class of the Portfolios was 0.25% of the respective average net assets of the Investment Class of each Portfolio.
In addition, Investment Class Shares and Institutional Class Shares pay the expenses associated with certain shareholder servicing arrangements with third parties, provided that payment of such fees does not exceed in any year 0.20% and 0.15% of the average daily net assets of Investment Class Shares and Institutional Class Shares, respectively. For the six months ended June 30, 2019, the shareholder service provider fees were as follows (as a percent of average net assets of each class):
Portfolio | Investment Class | Institutional Class |
Large Company Growth Portfolio | 0.127% | 0.056% |
Large Company Value Portfolio | 0.067% | 0.048% |
Small Company Growth Portfolio | 0.088% | 0.071% |
Small Company Value Portfolio | 0.109% | 0.072% |
Wilshire 5000 IndexSM Fund | 0.062% | 0.027% |
Wilshire International Equity Fund | 0.142% | 0.037% |
Wilshire Income Opportunities Fund | 0.149% | 0.055% |
92
Wilshire Mutual Funds, Inc. Notes to Financial Statements - (Continued) June 30, 2019 (Unaudited) | 
|
Fees paid indirectly – The Company has a brokerage commission recapture program with Cowen and Company, LLC (“Cowen”), pursuant to which a portion of the Portfolios’ commissions generated from transactions directed to Cowen are used to reduce the Portfolios’ expenses. Under such program, Cowen, as introducing broker, retains a portion of the Portfolios’ commissions.
Such commissions rebated to the Portfolios during the six months ended June 30, 2019 were as follows:
Large Company Growth Portfolio | | $ | 1,370 | |
Large Company Value Portfolio | | | 978 | |
Small Company Growth Portfolio | | | 7,057 | |
Small Company Value Portfolio | | | 4,580 | |
Wilshire 5000 IndexSM Fund | | | — | |
Wilshire International Equity Fund | | | 4,209 | |
Wilshire Income Opportunities Fund | | | — | |
For the six months ended June 30, 2019, Cowen retained the following commissions:
Large Company Growth Portfolio | | $ | 132 | |
Large Company Value Portfolio | | | 448 | |
Small Company Growth Portfolio | | | 1,050 | |
Small Company Value Portfolio | | | 1,501 | |
Wilshire 5000 IndexSM Fund | | | — | |
Wilshire International Equity Fund | | | 729 | |
Wilshire Income Opportunities Fund | | | — | |
5. Investment Transactions.
During the six months ended June 30, 2019, aggregate cost of purchases and proceeds from sales and maturities of investments, other than affiliated investments, short-term investments, short sales and purchases to cover short sales, and U.S. Government securities, were as follows:
Portfolio | | Purchases | | | Sales and
Maturities | |
Large Company Growth Portfolio | | $ | 52,935,694 | | | $ | 79,872,864 | |
Large Company Value Portfolio | | | 51,730,818 | | | | 71,022,829 | |
Small Company Growth Portfolio | | | 23,904,505 | | | | 25,651,285 | |
Small Company Value Portfolio | | | 20,137,052 | | | | 21,045,175 | |
Wilshire 5000 IndexSM Fund | | | 2,623,513 | | | | 6,023,868 | |
Wilshire International Equity Fund | | | 123,108,934 | | | | 173,158,429 | |
Wilshire Income Opportunities Fund | | | 84,054,186 | | | | 102,939,176 | |
93
Wilshire Mutual Funds, Inc. Notes to Financial Statements - (Continued) June 30, 2019 (Unaudited) | 
|
Purchases and sales and maturities of long-term U.S. Government securities during the six months ended June 30, 2019 were:
Portfolio | | Purchases | | | Sales and
Maturities | |
Wilshire Income Opportunities Fund | | $ | 61,682,960 | | | $ | 48,854,585 | |
Due to Voya managing a portion of Wilshire Income Opportunities Fund during the six months ended June 30, 2019, certain securities held by such Portfolio are considered affiliated investments. Purchases and sales of shares of affiliated registered investment companies by Wilshire Income Opportunities Fund during the six months ended June 30, 2019 and the value of such investments as of June 30, 2019 were as follows:
Affiliated Investment | | Value as of
December 31,
2018 | | | Purchases | | | Proceeds
from Sales | | | Realized
Losses | | | Change in
Unrealized
Appreciation
(Depreciation) | | | Value as of
June 30,
2019 | | | Income
Distributions | | | Capital Gain
Distributions | |
Voya Emerging Markets Hard Currency Debt Fund - Class P | | $ | 3,001,354 | | | $ | 80,298 | | | $ | — | | | $ | — | | | $ | 263,701 | | | $ | 3,345,353 | | | $ | 82,755 | | | $ | — | |
Voya Floating Rate Fund - Class P | | | 12,807,636 | | | | 3,879,442 | | | | (3,724,500 | ) | | | (105,300 | ) | | | 307,717 | | | | 13,164,995 | | | | 389,486 | | | | — | |
Voya High Yield Bond Fund - Class P | | | 1,550,927 | | | | 51,395 | | | | — | | | | — | | | | 118,594 | | | | 1,720,916 | | | | 52,794 | | | | — | |
| | | $ | 17,359,917 | | | $ | 4,011,135 | | | $ | (3,724,500 | ) | | $ | (105,300 | ) | | $ | 690,012 | | | $ | 18,231,264 | | | $ | 525,035 | | | $ | — | |
94
Wilshire Mutual Funds, Inc. Notes to Financial Statements - (Continued) June 30, 2019 (Unaudited) | 
|
6. Derivative Transactions.
Large Company Growth Portfolio, Large Company Value Portfolio, Small Company Growth Portfolio, Small Company Value Portfolio, Wilshire 5000 IndexSM Fund and Wilshire International Equity Fund did not hold any derivative instruments as of or during the six months ended June 30, 2019.
At June 30, 2019, Wilshire Income Opportunities Fund is invested in derivative contracts, which are reflected in the Statements of Assets and Liabilities, as follows:
| | | Derivative Assets | Derivative Liabilities |
Risk | Derivative Type | Statements of Assets
and Liabilities Location | | Fair Value
Amount | | Statements of Assets
and Liabilities Location | | Fair Value
Amount | |
Interest Rate | Futures contracts* | Net variation margin receivable | | $ | 632,539 | | Net variation margin payable | | $ | (72,513 | ) |
Credit | Swaption contracts | Investments in unaffiliated securities, at value | | | 49,636 | | Investments in unaffiliated securities, at value | | | (1,377 | ) |
Currency | Forward foreign currency exchange contracts | Unrealized appreciation on foreign forward currency contracts | | | 165,834 | | Unrealized depreciation on foreign forward currency contracts | | | (315,960 | ) |
Total | | | | $ | 848,009 | | | | $ | (389,850 | ) |
* | Includes cumulative appreciation (depreciation) as reported on the Schedules of Futures Contracts. Only current days variation margin in reported within the Statements of Assets and Liabilities. |
For the six months ended June 30, 2019, the effect of derivative contracts in Wilshire Income Opportunities Fund’s Statements of Operations was as follows:
| | | | Statements of Operations | |
Risk | Derivative Type | | Net Realized
Gain (Loss) | | | Net Change in
Unrealized
Gain (Loss) | |
Interest Rate | Futures contracts | | $ | 295,367 | | | $ | 463,212 | |
Credit Default | Swaption contracts | | | (398,112 | ) | | | 19,760 | |
Currency | Options contracts | | | 9,938 | | | | (2,559 | ) |
Credit Default | Swap contracts | | | (570,302 | ) | | | 880,052 | |
Currency | Forward foreign currency exchange contracts(a) | | | 851,053 | | | | (357,031 | ) |
Total | | | $ | 187,944 | | | $ | (1,003,434 | ) |
(a) | Forward foreign currency exchange contracts are included in Foreign Currency Transactions in the Statements of Operations. |
95
Wilshire Mutual Funds, Inc. Notes to Financial Statements - (Continued) June 30, 2019 (Unaudited) | 
|
7. Securities Lending.
Each Portfolio may seek additional income by lending its securities on a short-term basis to banks, brokers and dealers in return for cash collateral, which is invested in short-term securities. A Portfolio may return a portion of the interest earned to the borrower or a third party that is unaffiliated with the Company and acting as a “placing broker.” A Portfolio receives compensation for lending securities in the form of fees. A Portfolio also continues to receive dividends on the securities loaned. Security loans are secured at all times by collateral. It is the Company’s policy that the collateral be equal to at least 102% of the market value of the securities loaned (105% if the securities loaned are denominated in different currencies) plus accrued interest when the transaction is entered into, and that the collateral supporting the loans be valued daily. However, due to market fluctuations during the day, the value of securities loaned on a particular day may, during the course of the day, exceed the value of collateral. On each business day, the amount of collateral is adjusted based on the prior day’s market fluctuations and the current day’s lending activity. Gain or loss in the market price of the securities loaned that may occur during the term of the loan are reflected in the value of the Portfolio. The risks from securities lending are that the borrower may not provide additional collateral when required or return the securities when due or when called for by the Portfolio. Lending securities entails a risk of loss to the Portfolio if and to the extent that the market value of securities loans were to increase, the borrower did not increase the collateral accordingly, and the borrower fails to return the securities. NTC, the Portfolios’ custodian, acts as the securities lending agent for the Portfolios. The value of the securities on loan and the cash collateral at June 30, 2019 are shown on the Statements of Assets and Liabilities. Shares of the Northern Trust Institutional Liquid Asset Portfolio were purchased with proceeds from cash collateral received from securities on loan. Securities on loan are also collateralized by various U.S. Treasury obligations. The Portfolios do not have effective control of the non-cash collateral and therefore it is not disclosed in the Portfolios’ Schedules of Investments.
The following table is a summary of the Portfolios’ securities lending transactions accounted for as secured borrowings with cash collateral of overnight and continuous maturities and non-cash collateral, which are subject to offset as of June 30, 2019:
| | | | | | | Collateral Received | |
Portfolio | | Value of
Securities on Loan | | | Value of Cash
Collateral Received | | | Value of Non-Cash
Collateral Received* | | | Net Amount | |
Large Company Growth Portfolio | | $ | 14,049,802 | | | $ | 565,233 | | | $ | 13,484,569 | | | $ | — | |
Large Company Value Portfolio | | | 5,634,669 | | | | 117,111 | | | | 5,517,558 | | | | — | |
Small Company Growth Portfolio | | | 12,008,905 | | | | 1,119,629 | | | | 10,889,276 | | | | — | |
Small Company Value Portfolio | | | 7,797,418 | | | | 138,067 | | | | 7,659,351 | | | | — | |
Wilshire 5000 IndexSM Fund | | | 11,889,763 | | | | 738,590 | | | | 11,151,173 | | | | — | |
Wilshire International Equity Fund | | | 9,009,901 | | | | 913,808 | | | | 8,096,093 | | | | — | |
Wilshire Income Opportunities Fund | | | 22,129,883 | | | | 20,030,015 | | | | 2,099,868 | | | | — | |
* | The amount of collateral reflected in the table above does not include any over collateralization received by the Portolios. |
96
Wilshire Mutual Funds, Inc. Notes to Financial Statements - (Continued) June 30, 2019 (Unaudited) | 
|
The value of loaned securities and related collateral outstanding at June 30, 2019 are shown in the Portfolios’ Schedules of Investments. The value of the collateral held may be temporarily less than that required under the lending contract. As of June 30, 2019, the cash collateral was invested in shares of Northern Trust Institutional Liquid Asset Portfolio and the non-cash collateral consisted of U.S. Treasury Bills, Notes, Bonds and U.S. Treasury Inflation Index Bonds (collectively, “U.S. Government Securities”) with the following maturities:
| | | Overnight and
Continuous | | | <30 Days | | | Between 30
and 90 Days | | | >90 Days | | | Total | |
Large Company Growth Portfolio | | | | | | | | | | | | | | | | | | | | |
Money Market Funds | | $ | 565,233 | | | $ | — | | | $ | — | | | $ | — | | | $ | 565,233 | |
U.S. Government Securities | | | — | | | | — | | | | 177,446 | | | | 13,442,224 | | | | 13,619,670 | |
Total | | $ | 565,233 | | | $ | — | | | $ | 177,446 | | | $ | 13,442,224 | | | $ | 14,184,903 | |
| | | | | | | | | | | | | | | | | | | | | |
Large Company Value Portfolio | | | | | | | | | | | | | | | | | | | | |
Money Market Funds | | $ | 117,111 | | | $ | — | | | $ | — | | | $ | — | | | $ | 117,111 | |
U.S. Government Securities | | | — | | | | — | | | | 199,316 | | | | 5,367,916 | | | | 5,567,232 | |
Total | | $ | 117,111 | | | $ | — | | | $ | 199,316 | | | $ | 5,367,916 | | | $ | 5,684,343 | |
| | | | | | | | | | | | | | | | | | | | | |
Small Company Growth Portfolio | | | | | | | | | | | | | | | | | | | | |
Money Market Funds | | $ | 1,119,629 | | | $ | — | | | $ | — | | | $ | — | | | $ | 1,119,629 | |
U.S. Government Securities | | | — | | | | — | | | | 233,480 | | | | 10,857,184 | | | | 11,090,664 | |
Total | | $ | 1,119,629 | | | $ | — | | | $ | 233,480 | | | $ | 10,857,184 | | | $ | 12,210,293 | |
| | | | | | | | | | | | | | | | | | | | | |
Small Company Value Portfolio | | | | | | | | | | | | | | | | | | | | |
Money Market Funds | | $ | 138,067 | | | $ | — | | | $ | — | | | $ | — | | | $ | 138,067 | |
U.S. Government Securities | | | — | | | | — | | | | 94,036 | | | | 7,659,058 | | | | 7,753,094 | |
Total | | $ | 138,067 | | | $ | — | | | $ | 94,036 | | | $ | 7,659,058 | | | $ | 7,891,161 | |
| | | | | | | | | | | | | | | | | | | | | |
Wilshire 5000 IndexSM Fund | | | | | | | | | | | | | | | | | | | | |
Money Market Funds | | $ | 738,590 | | | $ | — | | | $ | — | | | $ | — | | | $ | 738,590 | |
U.S. Government Securities | | | — | | | | — | | | | 188,187 | | | | 11,108,547 | | | | 11,296,734 | |
Total | | $ | 738,590 | | | $ | — | | | $ | 188,187 | | | $ | 11,108,547 | | | $ | 12,035,324 | |
| | | | | | | | | | | | | | | | | | | | | |
Wilshire International Equity Fund | | | | | | | | | | | | | | | | | | | | |
Money Market Funds | | $ | 913,808 | | | $ | — | | | $ | — | | | $ | — | | | $ | 913,808 | |
U.S. Government Securities | | | — | | | | — | | | | 16,058 | | | | 8,390,768 | | | | 8,406,826 | |
Total | | $ | 913,808 | | | $ | — | | | $ | 16,058 | | | $ | 8,390,768 | | | $ | 9,320,634 | |
| | | | | | | | | | | | | | | | | | | | | |
Wilshire Income Opportunities Fund | | | | | | | | | | | | | | | | | | | | |
Money Market Funds | | $ | 20,030,015 | | | $ | — | | | $ | — | | | $ | — | | | $ | 20,030,015 | |
U.S. Government Securities | | | — | | | | — | | | | — | | | | 2,541,618 | | | | 2,541,618 | |
Total | | $ | 20,030,015 | | | $ | — | | | $ | — | | | $ | 2,541,618 | | | $ | 22,571,633 | |
97
Wilshire Mutual Funds, Inc. Notes to Financial Statements - (Continued) June 30, 2019 (Unaudited) | 
|
8. Capital Share Transactions.
Transactions in shares of the Portfolios are summarized below:
| | | LARGE COMPANY
GROWTH PORTFOLIO | | | LARGE COMPANY
VALUE PORTFOLIO | | | SMALL COMPANY
GROWTH PORTFOLIO | | | SMALL COMPANY
VALUE PORTFOLIO | |
| | | Six Months
Ended
June 30,
2019 | | | Year Ended
December 31,
2018 | | | Six Months
Ended
June 30,
2019 | | | Year Ended
December 31,
2018 | | | Six Months
Ended
June 30,
2019 | | | Year Ended
December 31,
2018 | | | Six Months
Ended
June 30,
2019 | | | Year Ended
December 31,
2018 | |
CAPITAL SHARE TRANSACTIONS: | | | | | | | | | | | | | | | | | | | | | | | | | | | | | | | | |
Investment Class shares: | | | | | | | | | | | | | | | | | | | | | | | | | | | | | | | | |
Shares sold | | | 6,598 | | | | 53,223 | | | | 9,740 | | | | 29,422 | | | | 41,853 | | | | 67,784 | | | | 19,540 | | | | 32,714 | |
Shares issued as reinvestment of distributions | | | — | | | | 240,411 | | | | — | | | | 23,016 | | | | — | | | | 21,579 | | | | — | | | | 15,059 | |
Shares redeemed | | | (105,147 | ) | | | (215,382 | ) | | | (19,363 | ) | | | (63,077 | ) | | | (39,255 | ) | | | (167,868 | ) | | | (40,348 | ) | | | (57,676 | ) |
Net increase (decrease) in Investment Class shares outstanding | | | (98,549 | ) | | | 78,252 | | | | (9,623 | ) | | | (10,639 | ) | | | 2,598 | | | | (78,505 | ) | | | (20,808 | ) | | | (9,903 | ) |
Shares outstanding at beginning of period | | | 1,700,531 | | | | 1,622,279 | | | | 298,392 | | | | 309,031 | | | | 375,989 | | | | 454,494 | | | | 264.319 | | | | 274,222 | |
Shares outstanding at end of period | | | 1,601,982 | | | | 1,700,531 | | | | 288,769 | | | | 298,392 | | | | 378,587 | | | | 375,989 | | | | 243,511 | | | | 264,319 | |
| | | | | | | | | | | | | | | | | | | | | | | | | | | | | | | | | |
Institutional Class shares: | | | | | | | | | | | | | | | | | | | | | | | | | | | | | | | | |
Shares sold | | | 121,331 | | | | 1,659,401 | | | | 342,659 | | | | 6,469,168 | | | | 156,725 | | | | 933,681 | | | | 231,011 | | | | 1,441,980 | |
Shares issued as reinvestment of distributions | | | — | | | | 434,809 | | | | — | | | | 718,766 | | | | — | | | | 86,153 | | | | — | | | | 127,502 | |
Shares redeemed | | | (793,613 | ) | | | (2,042,180 | ) | | | (1,552,795 | ) | | | (3,704,924 | ) | | | (187,818 | ) | | | (486,281 | ) | | | (232,879 | ) | | | (480,681 | ) |
Net increase (decrease) in Institutional Class shares outstanding | | | (672,282 | ) | | | 52,030 | | | | (1,210,136 | ) | | | 3,483,010 | | | | (31,093 | ) | | | 533,553 | | | | (1,868 | ) | | | 1,088,801 | |
Shares outstanding at beginning of period | | | 4,065,832 | | | | 4,013,802 | | | | 10,733,721 | | | | 7,250,711 | | | | 1,881,875 | | | | 1,348,322 | | | | 2.533.095 | | | | 1,444,294 | |
Shares outstanding at end of period | | | 3,393,550 | | | | 4,065,832 | | | | 9,523,585 | | | | 10,733,721 | | | | 1,850,782 | | | | 1,881,875 | | | | 2,531,227 | | | | 2,533,095 | |
98
Wilshire Mutual Funds, Inc. Notes to Financial Statements - (Continued) June 30, 2019 (Unaudited) | 
|
| | | WILSHIRE 5000
INDEXSM FUND | | | WILSHIRE INTERNATIONAL
EQUITY FUND | | | WILSHIRE INCOME
OPPORTUNITIES FUND | |
| | | Six Months
Ended
June 30,
2019 | | | Year Ended
December 31,
2018 | | | Six Months
Ended
June 30,
2019 | | | Year Ended
December 31,
2018 | | | Six Months
Ended
June 30,
2019 | | | Year Ended
December 31,
2018 | |
CAPITAL SHARE TRANSACTIONS: | | | | | | | | | | | | | | | | | | | | | | | | |
Investment Class shares: | | | | | | | | | | | | | | | | | | | | | | | | |
Shares sold | | | 238,320 | | | | 716,562 | | | | 33,165 | | | | 109,186 | | | | 24,006 | | | | 86,963 | |
Shares issued as reinvestment of distributions | | | — | | | | 381,135 | | | | — | | | | 13,328 | | | | 2,939 | | | | 5,241 | |
Shares redeemed | | | (423,169 | ) | | | (1,047,065 | ) | | | (53,752 | ) | | | (196,470 | ) | | | (47,676 | ) | | | (528,689 | ) |
Net increase (decrease) in Investment Class shares outstanding | | | (184,849 | ) | | | 50,632 | | | | (20,587 | ) | | | (73,956 | ) | | | (20,731 | ) | | | (436,485 | ) |
Shares outstanding at beginning of period | | | 7,221,052 | | | | 7,170,420 | | | | 299,238 | | | | 373,194 | | | | 188,696 | | | | 625,181 | |
Shares outstanding at end of period | | | 7,036,203 | | | | 7,221,052 | | | | 278,651 | | | | 299,238 | | | | 167,965 | | | | 188,696 | |
| | | | | | | | | | | | | | | | | | | | | | | | | |
Institutional Class shares: | | | | | | | | | | | | | | | | | | | | | | | | |
Shares sold | | | 49,875 | | | | 130,658 | | | | 2,396,678 | | | | 17,699,282 | | | | 1,986,597 | | | | 8,602,933 | |
Shares issued as reinvestment of distributions | | | — | | | | 77,552 | | | | — | | | | 1,645,158 | | | | 594,497 | | | | 1,089,140 | |
Shares redeemed | | | (57,361 | ) | | | (163,444 | ) | | | (7,923,986 | ) | | | (9,383,097 | ) | | | (4,033,987 | ) | | | (8,273,742 | ) |
Net increase (decrease) in Institutional Class shares outstanding | | | (7,486 | ) | | | 44,766 | | | | (5,527,308 | ) | | | 9,961,343 | | | | (1,452,893 | ) | | | 1,418,331 | |
Shares outstanding at beginning of period | | | 1,728,336 | | | | 1,683,570 | | | | 41,761,378 | | | | 31,800,035 | | | | 31,758,868 | | | | 30,340,537 | |
Shares outstanding at end of period | | | 1,720,850 | | | | 1,728,336 | | | | 36,234,070 | | | | 41,761,378 | | | | 30,305,975 | | | | 31,758,868 | |
9. Significant Shareholders.
On June 30, 2019, the Portfolios had the following concentrations of shareholders holding 10% or more of the outstanding shares of the Portfolios. These represent omnibus shareholder accounts comprised of many individual shareholders.
Portfolio | |
Large Company Growth Portfolio (3 omnibus shareholders) | 63% |
Large Company Value Portfolio (3 omnibus shareholder) | 69% |
Small Company Growth Portfolio (4 omnibus shareholders) | 69% |
Small Company Value Portfolio (4 omnibus shareholders) | 76% |
Wilshire 5000 IndexSM Fund (3 omnibus shareholders) | 56% |
Wilshire International Equity Fund (3 omnibus shareholders) | 74% |
Wilshire Income Opportunities Fund (3 omnibus shareholders) | 76% |
99
Wilshire Mutual Funds, Inc. Notes to Financial Statements - (Continued) June 30, 2019 (Unaudited) | 
|
As of June 30, 2019, an affiliated investment company, also advised by the Adviser, owned the following amounts of the outstanding shares of the Portfolios:
Portfolio | |
Large Company Growth Portfolio | 23% |
Large Company Value Portfolio | 35% |
Small Company Growth Portfolio | 25% |
Small Company Value Portfolio | 26% |
Wilshire 5000 IndexSM Fund | 0% |
Wilshire International Equity Fund | 46% |
Wilshire Income Opportunities Fund | 41% |
10. Tax Information.
No provision for federal income taxes is required because each Portfolio has qualified and intends to continue to qualify as a regulated investment company under Subchapter M of the Code and distributes to shareholders all of its taxable income and net realized gains. Federal income tax regulations differ from U.S. GAAP; therefore, distributions determined in accordance with tax regulations may differ in amount or character from net investment income and realized gains for financial reporting purposes. Financial reporting records are adjusted for permanent book/tax differences to reflect tax character. Financial records are not adjusted for temporary differences.
The Portfolios evaluate tax positions taken or expected to be taken in the course of preparing the Portfolios’ tax returns to determine whether it is “more-likely than-not” (i.e., greater than 50 percent) that each tax position will be sustained upon examination by a taxing authority based on the technical merits of the position. Tax positions not deemed to meet the more-likely-than-not threshold are recorded as a tax benefit or expense in the current year. The Portfolios did not record any tax provision in the current period. However, management’s conclusions regarding tax positions taken may be subject to review and adjustment at a later date based on factors including, but not limited to, examination by tax authorities of returns filed in the last 3 years and on-going analysis of and changes to tax laws, regulations and interpretations thereof. The Portfolios identify their major tax jurisdiction as U.S. Federal.
100
Wilshire Mutual Funds, Inc. Notes to Financial Statements - (Continued) June 30, 2019 (Unaudited) | 
|
The federal tax cost of portfolio securities and unrealized appreciation and depreciation at June 30, 2019 for each Portfolio are as follows:
Portfolio | | Large
Company
Growth
Portfolio | | | Large
Company
Value
Portfolio | | | Small
Company
Growth
Portfolio | | | Small
Company
Value
Portfolio | | | Wilshire
5000
IndexSM
Fund | | | Wilshire
International
Equity
Fund | | | Wilshire
Income
Opportunities
Fund | |
Tax cost of portfolio investments | | $ | 130,347,018 | | | $ | 172,614,727 | | | $ | 50,169,111 | | | $ | 57,167,748 | | | $ | 60,040,473 | | | $ | 345,229,435 | | | $ | 341,118,657 | |
Gross unrealized appreciation | | $ | 85,780,932 | | | $ | 28,601,192 | | | $ | 15,298,108 | | | $ | 7,049,571 | | | $ | 135,113,141 | | | $ | 56,729,374 | | | $ | 11,487,680 | |
Gross unrealized depreciation | | | (1,877,075 | ) | | | (10,637,962 | ) | | | (1,940,888 | ) | | | (5,078,074 | ) | | | (3,431,393 | ) | | | (21,092,624 | ) | | | (4,616,555 | ) |
Net unrealized appreciation | | $ | 83,903,857 | | | $ | 17,963,230 | | | $ | 13,357,220 | | | $ | 1,971,497 | | | $ | 131,681,748 | | | $ | 35,636,750 | | | $ | 6,871,125 | |
The differences between book and tax-basis unrealized appreciation (depreciation) are attributable primarily to the tax deferral of losses on wash sales and investment in passive foreign investment companies.
The tax character of distributions declared during the periods ended June 30, 2019 and December 31, 2018 was as follows:
Portfolio | | 2019
Ordinary
Income | | | 2019
Long-Term
Capital Gains | | | 2018
Ordinary
Income | | | 2018
Long-Term
Capital Gains | |
Large Company Growth Portfolio | | $ | — | | | $ | — | | | $ | 2,240,277 | | | $ | 27,070,477 | |
Large Company Value Portfolio | | | — | | | | — | | | | 4,328,602 | | | | 12,086,254 | |
Small Company Growth Portfolio | | | — | | | | — | | | | 281,539 | | | | 2,810,134 | |
Small Company Value Portfolio | | | — | | | | — | | | | 905,824 | | | | 2,313,423 | |
Wilshire 5000 IndexSM Fund | | | — | | | | — | | | | 2,704,449 | | | | 6,901,955 | |
Wilshire International Equity Fund | | | — | | | | — | | | | 6,145,911 | | | | 13,584,130 | |
Wilshire Income Opportunities Fund | | | 6,239,130 | | | | — | | | | 10,781,680 | | | | — | |
101
Wilshire Mutual Funds, Inc. Notes to Financial Statements - (Continued) June 30, 2019 (Unaudited) | 
|
As of December 31, 2018, the components of accumulated earnings (deficit) on a tax basis were as follows:
Portfolio | | Large
Company
Growth
Portfolio | | | Large
Company
Value
Portfolio | | | Small
Company
Growth
Portfolio | | | Small
Company
Value
Portfolio | | | Wilshire
5000
IndexSM
Fund | | | Wilshire
International
Equity
Fund | | | Wilshire
Income
Opportunities
Fund | |
Undistributed ordinary income | | $ | — | | | $ | — | | | $ | — | | | $ | — | | | $ | 15,824 | | | $ | 275,153 | | | $ | — | |
Undistributed long-term capital gain | | | 4,002,652 | | | | 2,241,355 | | | | — | | | | — | | | | 1,084,994 | | | | — | | | | — | |
Accumulated capital and other losses | | | (443,652 | ) | | | (496,919 | ) | | | (558,626 | ) | | | (552,460 | ) | | | (1,095 | ) | | | (3,150,961 | ) | | | (1,417,361 | ) |
Unrealized appreciation (depreciation) | | | 53,342,520 | | | | (3,516,266 | ) | | | 2,274,654 | | | | (5,479,887 | ) | | | 106,829,249 | | | | (12,550,280 | ) | | | (8,999,794 | ) |
Accumulated earnings (deficit) | | $ | 56,901,520 | | | $ | (1,771,830 | ) | | $ | 1,716,028 | | | $ | (6,032,347 | ) | | $ | 107,928,972 | | | $ | (15,426,088 | ) | | $ | (10,417,155 | ) |
As of December 31, 2018, Wilshire Income Opportunities Fund had the following capital loss carryforwards (“CLCFs”) for federal income tax purposes which do not expire:
Portfolio | | Short-Term Loss | | | Long-Term Loss | | | Total | |
Wilshire Income Opportunities Fund | | $ | 801,759 | | | $ | 73,743 | | | $ | 875,502 | |
These CLCFs may be utilized in the current and futures years to offset net realized capital gains, if any, prior to distributing such gains to shareholders.
11. Indemnifications.
In the normal course of business, the Company, on behalf of the Portfolios, enters into contracts that provide general indemnifications. The Portfolios’ maximum exposure under these arrangements is dependent on claims that may be made against the Portfolios in the future and, therefore, cannot be estimated; however, based on experience, the risk of material loss from such claims is considered remote.
12. Certain Investment Risks.
Asset-backed securities (“ABS”) risk – Investors in ABS, including mortgage-backed securities (“MBS”) and structured finance investments, generally receive payments that are part interest and part return of principal. These payments may vary based on the rate at which the underlying borrowers pay off their loans or other future expected receivables of assets or cash flows. Some ABS, including MBS, may have structures that make their reaction to interest rates and other factors difficult to predict, making them subject to liquidity risk.
Collateralized debt obligation (“CDO”) risk – A CDO is an ABS whose underlying collateral is typically a portfolio of bonds, bank loans, other structured finance securities and/or synthetic instruments. Investors in CDOs bear the credit risk of the underlying collateral. Multiple tranches of securities are issued by the CDO,
102
Wilshire Mutual Funds, Inc. Notes to Financial Statements - (Continued) June 30, 2019 (Unaudited) | 
|
offering investors various maturity and credit risk characteristics. Tranches are categorized as senior, mezzanine, and subordinated/equity, according to their degree of risk. If there are defaults or the CDO’s collateral otherwise underperforms, scheduled payments to senior tranches take precedence over those of mezzanine tranches, and scheduled payments to mezzanine tranches take precedence over those to subordinated/equity tranches. CDOs are subject to the same risk of prepayment described for certain mortgage-related and ABS, and are subject to credit risk, interest rate risk and default risk. The market value of CDOs may be affected by changes in the market’s perception of the creditworthiness of the servicing agent for the pool or the originator.
Forward contracts risk – There may be an imperfect correlation between the price of a forward contract and the underlying security, index or currency which will increase the volatility of Wilshire Income Opportunities Fund’s NAV. The Portfolio bears the risk of loss of the amount expected to be received under a forward contract in the event of the default or bankruptcy of a counterparty. If such a default occurs, the Portfolio will have contractual remedies pursuant to the forward contract, but such remedies may be subject to bankruptcy and insolvency laws that could affect the Portfolio’s rights as a creditor. Forward currency transactions include risks associated with fluctuations in foreign currency.
Interest rate risk – For debt securities, interest rate risk is the possibility that the market price will fall because of changing interest rates. In general, debt securities’ market prices rise or fall inversely to changes in interest rates. If interest rates rise, bond market prices generally fall; if interest rates fall, bond market prices generally rise. In addition, for a given change in interest rates, the market price of longer-maturity bonds fluctuates more (gaining or losing more in value) than shorter-maturity bonds. There may be less governmental intervention in influencing interest rates in the near future. If so, it could cause an increase in interest rates, which would have a negative impact on the market prices of fixed income securities and could negatively affect a Portfolio’s NAV.
Credit risk – A Portfolio’s debt instruments are subject to credit risk, which is the risk that an issuer will be unable, or will be perceived to be unable, to repay its obligations at maturity. Funds that invest primarily in high quality securities generally are subject to less credit risk than funds that invest in lower quality securities. Certain securities are backed by credit enhancements from various financial institutions and financial guarantee assurance agencies. These credit enhancements reinforce the credit quality of the individual securities; however, if any of the financial institutions or financial guarantee assurance agencies’ credit quality should deteriorate, it could cause the individual security’s credit quality to change. Additionally, if a Portfolio concentrates its credit enhancements in any one financial institution, the risk of credit quality deterioration increases. The value of ABS may be affected by the credit risk of the servicing agent for the pool, the originator of the loans or receivables, or the financial institution(s) providing the credit support. In addition to credit risk, ABS and other securities with early redemption features are subject to pre-payment risk. During periods of declining interest rates, prepayment of loans underlying ABS can be expected to accelerate or an issuer may retire an outstanding bond early to reduce interest costs. A Portfolio’s ability to maintain positions in such securities will be affected by reductions in the principal amount of such securities resulting from prepayments, and its ability to reinvest the returns of principal at comparable yields is subject to generally prevailing interest rates at that time.
Counterparty credit risk – Counterparty credit risk is the risk that a counterparty to a financial instrument will fail on a commitment that it has entered into with a Portfolio. A Portfolio’s Sub-Adviser seeks to minimize counterparty credit risk by monitoring the creditworthiness of each counterparty on an ongoing basis.
103
Wilshire Mutual Funds, Inc. Notes to Financial Statements - (Continued) June 30, 2019 (Unaudited) | 
|
Foreign security risk– Wilshire International Equity Fund and Wilshire Income Opportunities Fund invest in securities of foreign issuers in various countries. These investments may involve certain considerations and risks not typically associated with investments in the United States as a result of, among other factors, the possibility of future political and economic developments and the level of governmental supervision and regulation of securities markets in foreign countries. The market values of the Portfolios’ investments will change in response to interest rate changes and other factors. During periods of falling interest rates, the values of fixed income securities generally rise. Conversely, during periods of rising interest rates, the values of such securities generally decline.
Changes by recognized rating agencies in the ratings of any fixed income security and in the ability of an issuer to make payments of interest and principal may also affect the value of these investments. Also, the ability of the issuers of debt securities held by the Portfolios to meet their obligations may be affected by economic and political developments in a specific country, industry or region.
Investments in Loans Risk – Investments in loans involve special types of risks, including credit risk, interest rate risk, counterparty risk and prepayment risk. Loans may offer a fixed or floating interest rate. Loans are often generally below investment grade and may be unrated. Loans may be difficult to value and some can be subject to liquidity risk.
Sector Risk – If a Portfolio has significant investments in the securities of issuers in industries within a particular sector, any development affecting that sector will have a greater impact on the value of the net assets of the Portfolio than would be the case if the Portfolio did not have significant investments in that sector. In addition, this may increase the risk of loss of an investment in the Portfolio and increase the volatility of the Portfolio’s NAV per share. From time to time, circumstances may affect a particular sector and the companies within such sector. For instance, economic or market factors, regulation or deregulation, or other developments may negatively impact all companies in a particular sector and therefore the value of a Portfolio’s holdings would be adversely affected. As of June 30, 2019, Large Company Growth Portfolio had 33.0% of the value of its net assets invested in stocks within the Information Technology sector; Large Company Value Portfolio had 27.0% of the value of its net assets invested in stocks within the Financials sector; Small Company Growth Portfolio had 26.7% and 25.8% of the value of its net assets invested in stocks within the Health Care and Information Technology sectors, respectively; and Small Company Value Portfolio had 28.0% of the value of its net assets invested in stocks within the Financials sector.
A more complete description of risks is included in each Portfolio’s prospectus and Statement of Additional Information.
13. Contingencies.
Wilshire 5000 IndexSM Fund was named as a defendant and a putative member of a proposed defendant class of shareholders in a lawsuit filed on December 7, 2010 in the U.S. Bankruptcy Court for the District of Delaware and on March 6, 2012 in the District Court for the Southern District of New York, in connection with Tribune Company’s Chapter 11 bankruptcy proceeding. The 2010 lawsuit was brought by the official Committee of Unsecured Creditors of the Tribune Company and the 2012 lawsuit was brought by Deutsche Bank, as trustee for senior noteholders of Tribune Company. Both lawsuits relate to a leveraged buyout transaction by which Tribune Company converted to a privately-held company in 2007 less than a year prior to Tribune Company’s bankruptcy filing. The putative
104
Wilshire Mutual Funds, Inc. Notes to Financial Statements - (Continued) June 30, 2019 (Unaudited) | 
|
defendant class is comprised of beneficial owners of shares of Tribune Company who meet certain jurisdictional requirements and received proceeds of the leveraged buyout. The plaintiffs seek to recover those proceeds, together with interest and attorneys’ fees and expenses, as fraudulent transfers under the Bankruptcy Act or various state laws. In 2013, the Complaint in the 2012 lawsuit was dismissed and the Second Circuit Court of Appeals recently affirmed the dismissal and the plaintiffs filed a petition for review by the Supreme Court. In April, 2018, the Supreme Court deferred consideration of the petition to allow the Second Circuit to consider whether it would be appropriate to vacate the judgment in light of a 2018 Supreme Court decision in another case. In May, 2018, the Second Circuit recalled its judgment mandate in anticipation of further panel review. The case remains pending before the Second Circuit. The District Court of New York has stayed the 2010 lawsuit pending a further decision by the Second Circuit in the 2012 lawsuit. The Adviser does not expect the Portfolio to be materially impacted by the lawsuits.
14. Subsequent Event Evaluation.
The Portfolios have evaluated the need for additional disclosures and/or adjustments resulting from subsequent events through the date these financial statements were issued. Based on this evaluation, no additional disclosures and/or adjustments were required to these financial statements except as follows:
Effective July 24, 2019, NWQ Investment Management Company, LLC (“NWQ”) no longer serves as a subadviser to the Small Company Value Portfolio.
105
Wilshire Mutual Funds, Inc. Additional Fund Information (Unaudited) | 
|
Information on Proxy Voting
A description of policies and procedures that the Portfolios use to determine how to vote proxies relating to portfolio securities, along with each Portfolio’s proxy voting record relating to portfolio securities held during most recent 12-month period ended June 30, is available at no charge, upon request by calling (866) 591-1568, by e-mailing us at http://advisor.wilshire.com or on the SEC’s website at www.sec.gov.
Information on Form N-PORT
The Company files its complete schedule of portfolio holdings with the SEC as of the end of the first and third quarters of each fiscal year on Form N-PORT. The Company’s Forms N-PORT are available on the SEC’s website at www.sec.gov.
Householding Policy
In order to reduce printing and mailing expenses, only one copy of each prospectus, annual and semi-annual report will be sent to all related accounts at a common address, unless you have indicated otherwise on your Account Application. Shareholders may revoke their consent to householding at any time by calling (866) 591-1568. Upon receipt of a shareholder’s revocation, the Company will begin mailing individual copies of the above-referenced documents to the shareholder’s attention within 30 days.
On May 20, 2019, the Board of Directors (the “Board” and each individually, a “Director”) of Wilshire Mutual Funds, Inc. (the “Company”) approved a subadvisory agreement between Wilshire Associates Incorporated (“Wilshire” or the “Adviser”) and Lazard Asset Management LLC (the “Subadviser”) pursuant to which the Subadviser serves as a new subadviser to the Wilshire International Equity Fund (the “Fund”) effective June 28, 2019 (the “Subadvisory Agreement”).
106
Wilshire Mutual Funds, Inc. Board Approval of Subadvisory Agreement (Unaudited) | 
|
On May 20, 2019, the Board of Directors (the “Board” and each individually, a “Director”) of Wilshire Mutual Funds, Inc. (the “Company”) approved a subadvisory agreement between Wilshire Associates Incorporated (“Wilshire” or the “Adviser”) and Lazard Asset Management LLC (the “Subadviser”) pursuant to which the Subadviser serves as a new subadviser to the Wilshire International Equity Fund (the “Fund”) effective June 28, 2019 (the “Subadvisory Agreement”).
At the meeting on May 20, 2019, in connection with the review of Wilshire’s proposed subadvisory agreement with the Subadviser, the Board evaluated information provided by Wilshire and the Subadviser in accordance with Section 15(c) of the Investment Company Act of 1940, as amended (the “1940 Act”).
The information that follows outlines the Board’s considerations associated with its approval of the Subadvisory Agreement. In connection with its deliberations regarding the approval of this relationship, the Board considered such information and factors as it believed to be relevant. As described below, the Board considered the nature, extent and quality of the services to be performed by the Subadviser under the proposed subadvisory arrangement; comparative fees as provided by the Subadviser; the profits to be realized by the Subadviser; the extent to which the Subadviser would realize economies of scale as the Fund grows; and whether any fall-out benefits would be realized by the Subadviser. In considering these matters, the Board was advised with respect to relevant legal standards by independent legal counsel. In addition, the Directors who are not “interested persons” of the Company as defined in the 1940 Act (the “Independent Directors”) discussed the approval of the Subadvisory Agreement with management and in private sessions with independent legal counsel at which no representatives of the Subadviser were present.
As required by the 1940 Act, the approval was confirmed by a separate vote of the Independent Directors. In deciding to approve the Subadvisory Agreement, the Board did not identify any single factor as controlling and this summary does not describe all of the matters considered. However, the Board concluded that each of the various factors referred to below favored such approval.
Information Received
The Board, including all the Independent Directors, considered the approval of the Subadvisory Agreement at the Board’s May 20, 2019 meeting. The Directors received information from the Adviser regarding the factors underlying its recommendations to approve the Subadvisory Agreement. The Directors also received information from the Subadviser describing: (i) the nature, extent and quality of services to be provided; (ii) the financial condition of the Subadviser; (iii) the extent to which economies of scale may be realized as the Fund grows; (iv) whether fee levels reflect any possible economies of scale for the benefit of the Fund’s shareholders; (v) comparisons of services rendered and amounts paid by any comparable advisory clients; and (vi) benefits to be realized by the Subadviser from its relationship with the Fund. The Independent Directors were assisted in their review by independent legal counsel.
As part of its evaluation, the Board considered the assessment of performance made by the Investment Committee (which is composed solely of Independent Directors), which also met on May 20, 2019 to review data on the Subadviser’s performance for managing investment products similar to the Fund. Based upon its evaluation of all materials provided, the Board concluded that it was in the best interests of the Fund to approve the Subadvisory Agreement.
107
Wilshire Mutual Funds, Inc. Board Approval of Subadvisory Agreement (Unaudited) - (continued) | 
|
Nature, Extent and Quality of Services
The Board considered the nature, extent and quality of services to be provided under the Subadvisory Agreement. The Board considered the reputation, qualifications and background of the Subadviser, investment approach of the Subadviser, the experience and skills of investment personnel to be responsible for the day-to-day management of the Fund, and the resources made available to such personnel. In addition, the Board considered the analysis provided by the Adviser, which concluded that the Subadviser would provide reasonable services and recommended that the Subadvisory Agreement be approved.
The Board reviewed information comparing the Subadviser’s annualized gross investment performance for managing investment products with an investment strategy similar to the one to be employed by the Subadviser for the Fund to the MSCI ACWI ex-US Investable Market Index (the Fund’s benchmark index effective June 28, 2019) and the MSCI ACWI ex-US Small Cap Index (the index most comparable to the investment strategy to be employed by the Subadviser for the Fund) for the one- and three-year periods ended March 31, 2019. The Board noted that the Subadviser underperformed both indexes for the one-year period ended March 31, 2019 and outperformed both indexes for the three-year period ended March 31, 2019.
Subadvisory Fees
The Board considered the Subadviser’s proposed subadvisory fee. The Board evaluated the competitiveness of the subadvisory fee based upon data supplied by the Subadviser about the fees charged to other clients. The Board also considered that the subadvisory fee rate was negotiated at arm’s length between the Adviser and the Subadviser, that the Adviser compensates the Subadviser from its fees and that the aggregate advisory fee had been deemed reasonable by the Board.
With respect to the Subadviser’s reported fees for “Other Clients” with comparable investment policies and services, the Board determined that the subadvisory fee to be charged to the Adviser were competitive.
Based upon all of the above, the Board determined that the subadvisory fee was reasonable.
Profitability to the Subadviser
The Board noted that the Adviser compensates the Subadviser from its own advisory fees and that the fee was negotiated at arm’s length between the Adviser and the Subadviser. In addition, the Board noted that the revenues to the Subadviser would be limited due to the current size of the Fund. The Board took these factors into consideration in concluding that the subadvisory fee was reasonable.
Economies of Scale
The Board considered whether there may be economies of scale with respect to the subadvisory services to be provided to the Fund and whether the subadvisory fee reflects such economies of scale through breakpoints in fees. The Board also considered whether the effective subadvisory fee rate under the Subadvisory Agreement is reasonable in relation to the asset size of the Fund. The Board concluded that the flat fee schedule for the Subadviser reflects an appropriate recognition of any economies of scale.
108
Wilshire Mutual Funds, Inc. Board Approval of Subadvisory Agreement (Unaudited) - (continued) | 
|
Fall-Out Benefits
The Board also considered the character and amount of other incidental benefits to be received by the Subadviser. The Board considered the Subadviser’s soft dollar practices. The Board concluded that, taking into account any such other benefits, the subadvisory fee to be charged under the Subadvisory Agreement was reasonable.
Conclusion
Based upon all of the information considered and the conclusions reached, the Board determined that the terms of the Subadvisory Agreement are fair and reasonable and that the approval of the Subadvisory Agreement is in the best interests of the Fund.
109

Wilshire Mutual Funds
Wilshire Associates Incorporated
1299 Ocean Avenue
Santa Monica, CA 90401
1-888-200-6796
http://advisor.wilshire.com
Not Applicable.
| Item 3. | Audit Committee Financial Expert. |
Not Applicable.
| Item 4. | Principal Accountant Fees and Services. |
Not Applicable.
| Item 5. | Audit Committee of Listed Registrants. |
Not applicable
| Item 6. | Schedule of Investments. |
| (a) | The Schedules of Investment in securities of unaffiliated issuers as of the close of the reporting period for the Large Company Growth Portfolio, the Large Company Value Portfolio, the Small Company Growth Portfolio, the Small Company Value Portfolio, the Wilshire 5000 IndexSM Fund, the Wilshire International Equity Fund and the Wilshire Income Opportunities Fund are listed below. |
| WILSHIRE LARGE COMPANY GROWTH PORTFOLIO | |
| SCHEDULE OF INVESTMENTS | |
| June 30, 2019 (Unaudited) | |
| COMMON STOCKS - 99.3% | | Shares | | | Value | |
| Communication Services - 11.4% | | | | | | | | |
| Alphabet, Inc. - Class A(a) | | | 3,119 | | | $ | 3,377,253 | |
| Alphabet, Inc. - Class C(a) | | | 6,204 | | | | 6,705,966 | |
| Facebook, Inc. - Class A(a) | | | 56,594 | | | | 10,922,642 | |
| Live Nation Entertainment, Inc.(a) | | | 200 | | | | 13,250 | |
| Netflix, Inc.(a) | | | 8,004 | | | | 2,940,029 | |
| New York Times Co. (The) - Class A(b) | | | 1,280 | | | | 41,754 | |
| Sinclair Broadcast Group, Inc. - Class A | | | 3,100 | | | | 166,253 | |
| TripAdvisor, Inc.(a) | | | 570 | | | | 26,385 | |
| Twitter, Inc.(a) | | | 5,560 | | | | 194,044 | |
| | | | | | | | 24,387,576 | |
| Consumer Discretionary - 18.6% | | | | | | | | |
| Alibaba Group Holding Ltd. - ADR(a) | | | 40,153 | | | | 6,803,926 | |
| Amazon.com, Inc.(a) | | | 7,217 | | | | 13,666,327 | |
| AutoZone, Inc.(a) | | | 480 | | | | 527,746 | |
| Booking Holdings, Inc.(a) | | | 330 | | | | 618,654 | |
| Burlington Stores, Inc.(a) | | | 11,636 | | | | 1,979,865 | |
| Carter's, Inc.(b) | | | 578 | | | | 56,378 | |
| Chipotle Mexican Grill, Inc.(a) | | | 10 | | | | 7,329 | |
| Choice Hotels International, Inc. | | | 970 | | | | 84,400 | |
| Columbia Sportswear Co. | | | 700 | | | | 70,112 | |
| Domino's Pizza, Inc. | | | 697 | | | | 193,961 | |
| Dunkin' Brands Group, Inc. | | | 410 | | | | 32,661 | |
| Etsy, Inc.(a) | | | 1,950 | | | | 119,671 | |
| Five Below, Inc.(a) | | | 280 | | | | 33,606 | |
| Grand Canyon Education, Inc.(a) | | | 170 | | | | 19,893 | |
| H&R Block, Inc.(b) | | | 2,600 | | | | 76,180 | |
| Hilton Worldwide Holdings, Inc. | | | 2,910 | | | | 284,423 | |
| Home Depot, Inc. (The) | | | 6,416 | | | | 1,334,336 | |
| Las Vegas Sands Corp. | | | 1,740 | | | | 102,817 | |
| Lowe's Cos., Inc. | | | 1,330 | | | | 134,210 | |
| lululemon athletica, inc.(a) | | | 13,908 | | | | 2,506,361 | |
| McDonald's Corp. | | | 1,370 | | | | 284,494 | |
| NIKE, Inc. - Class B | | | 7,380 | | | | 619,551 | |
| O'Reilly Automotive, Inc.(a) | | | 466 | | | | 172,103 | |
| Planet Fitness, Inc. - Class A(a) | | | 1,960 | | | | 141,982 | |
| WILSHIRE LARGE COMPANY GROWTH PORTFOLIO | |
| SCHEDULE OF INVESTMENTS (Continued) | |
| COMMON STOCKS - 99.3% (Continued) | | Shares | | | Value | |
| Consumer Discretionary - 18.6% (Continued) | | | | | | | | |
| Pool Corp. | | | 1,061 | | | $ | 202,651 | |
| Roku, Inc.(a) (b) | | | 1,240 | | | | 112,319 | |
| Ross Stores, Inc. | | | 500 | | | | 49,560 | |
| Skechers U.S.A., Inc. - Class A(a) | | | 1,120 | | | | 35,269 | |
| Starbucks Corp. | | | 37,062 | | | | 3,106,908 | |
| TJX Cos., Inc. (The) | | | 4,100 | | | | 216,808 | |
| Ulta Beauty, Inc.(a) | | | 7,752 | | | | 2,689,091 | |
| Wyndham Destinations, Inc. | | | 740 | | | | 32,486 | |
| Yum China Holdings, Inc. | | | 33,685 | | | | 1,556,247 | |
| Yum! Brands, Inc. | | | 16,002 | | | | 1,770,941 | |
| | | | | | | | 39,643,266 | |
| Consumer Staples - 6.4% | | | | | | | | |
| Brown-Forman Corp. - Class B | | | 370 | | | | 20,509 | |
| Church & Dwight Co., Inc. | | | 60 | | | | 4,384 | |
| Coca-Cola Co. (The) | | | 50,007 | | | | 2,546,356 | |
| Colgate-Palmolive Co. | | | 22,495 | | | | 1,612,217 | |
| Costco Wholesale Corp. | | | 2,240 | | | | 591,942 | |
| Danone S.A. - ADR(b) | | | 127,086 | | | | 2,151,566 | |
| Estée Lauder Cos., Inc. (The) - Class A | | | 1,030 | | | | 188,603 | |
| Herbalife Nutrition Ltd.(a) | | | 2,480 | | | | 106,045 | |
| Monster Beverage Corp.(a) | | | 53,528 | | | | 3,416,693 | |
| Nu Skin Enterprises, Inc. - Class A | | | 4,250 | | | | 209,610 | |
| PepsiCo, Inc. | | | 4,090 | | | | 536,322 | |
| Procter & Gamble Co. (The) | | | 20,660 | | | | 2,265,368 | |
| Sprouts Farmers Market, Inc.(a) | | | 740 | | | | 13,979 | |
| | | | | | | | 13,663,594 | |
| Energy - 0.5% | | | | | | | | |
| Schlumberger Ltd. | | | 28,604 | | | | 1,136,723 | |
| | | | | | | | | |
| Financials - 4.6% | | | | | | | | |
| American Express Co. | | | 7,591 | | | | 937,033 | |
| Aon plc | | | 140 | | | | 27,017 | |
| Charles Schwab Corp. (The) | | | 27,770 | | | | 1,116,076 | |
| CME Group, Inc. | | | 8,590 | | | | 1,667,406 | |
| Eaton Vance Corp. | | | 4,580 | | | | 197,535 | |
| Evercore, Inc. - Class A | | | 3,440 | | | | 304,681 | |
| WILSHIRE LARGE COMPANY GROWTH PORTFOLIO | |
| SCHEDULE OF INVESTMENTS (Continued) | |
| COMMON STOCKS - 99.3% (Continued) | | Shares | | | Value | |
| Financials - 4.6% (Continued) | | | | | | | | |
| FactSet Research Systems, Inc. | | | 5,202 | | | $ | 1,490,686 | |
| Kemper Corp. | | | 3,030 | | | | 261,459 | |
| LPL Financial Holdings, Inc. | | | 5,790 | | | | 472,290 | |
| Moody's Corp. | | | 1,620 | | | | 316,402 | |
| MSCI, Inc. | | | 1,280 | | | | 305,651 | |
| OneMain Holdings, Inc. | | | 810 | | | | 27,386 | |
| Progressive Corp. (The) | | | 1,240 | | | | 99,113 | |
| S&P Global, Inc. | | | 2,700 | | | | 615,033 | |
| SEI Investments Co. | | | 29,124 | | | | 1,633,857 | |
| Synovus Financial Corp. | | | 420 | | | | 14,700 | |
| T. Rowe Price Group, Inc. | | | 320 | | | | 35,107 | |
| TD Ameritrade Holding Corp. | | | 670 | | | | 33,446 | |
| Western Alliance Bancorp.(a) | | | 6,620 | | | | 296,046 | |
| | | | | | | | 9,850,924 | |
| Health Care - 17.1% | | | | | | | | |
| AbbVie, Inc. | | | 3,142 | | | | 228,486 | |
| ABIOMED, Inc.(a) | | | 7,002 | | | | 1,823,951 | |
| Agilent Technologies, Inc. | | | 1,220 | | | | 91,097 | |
| Alcon, Inc.(a) (b) | | | 2,735 | | | | 169,707 | |
| Alexion Pharmaceuticals, Inc.(a) | | | 21,260 | | | | 2,784,634 | |
| Align Technology, Inc.(a) | | | 8,373 | | | | 2,291,689 | |
| Amgen, Inc. | | | 6,443 | | | | 1,187,316 | |
| Boston Scientific Corp.(a) | | | 11,030 | | | | 474,069 | |
| Bruker Corp. | | | 4,940 | | | | 246,753 | |
| Canopy Growth Corp.(a) (b) | | | 19,788 | | | | 797,654 | |
| Cerner Corp. | | | 27,854 | | | | 2,041,698 | |
| Charles River Laboratories International, Inc.(a) | | | 340 | | | | 48,246 | |
| Chemed Corp. | | | 530 | | | | 191,245 | |
| DexCom, Inc.(a) | | | 480 | | | | 71,923 | |
| Edwards Lifesciences Corp.(a) | | | 9,800 | | | | 1,810,452 | |
| Eli Lilly & Co. | | | 1,815 | | | | 201,084 | |
| IDEXX Laboratories, Inc.(a) | | | 1,190 | | | | 327,643 | |
| Illumina, Inc.(a) | | | 6,818 | | | | 2,510,047 | |
| Intuitive Surgical, Inc.(a) | | | 1,010 | | | | 529,796 | |
| Johnson & Johnson | | | 1,380 | | | | 192,206 | |
| Masimo Corp.(a) | | | 605 | | | | 90,036 | |
| WILSHIRE LARGE COMPANY GROWTH PORTFOLIO | |
| SCHEDULE OF INVESTMENTS (Continued) | |
| COMMON STOCKS - 99.3% (Continued) | | Shares | | | Value | |
| Health Care - 17.1% (Continued) | | | | | | | | |
| Merck & Co., Inc. | | | 16,060 | | | $ | 1,346,631 | |
| Mettler-Toledo International, Inc.(a) | | | 310 | | | | 260,400 | |
| Neurocrine Biosciences, Inc.(a) | | | 150 | | | | 12,665 | |
| Novartis AG - ADR | | | 13,691 | | | | 1,250,125 | |
| Novo Nordisk A/S - ADR | | | 40,082 | | | | 2,045,785 | |
| Regeneron Pharmaceuticals, Inc.(a) | | | 6,104 | | | | 1,910,552 | |
| ResMed, Inc. | | | 3,109 | | | | 379,391 | |
| Stryker Corp. | | | 870 | | | | 178,855 | |
| Thermo Fisher Scientific, Inc. | | | 1,110 | | | | 325,985 | |
| UnitedHealth Group, Inc. | | | 13,397 | | | | 3,269,002 | |
| Varian Medical Systems, Inc.(a) | | | 10,822 | | | | 1,473,199 | |
| Veeva Systems, Inc. - Class A(a) | | | 13,955 | | | | 2,262,245 | |
| Vertex Pharmaceuticals, Inc.(a) | | | 1,060 | | | | 194,383 | |
| Waters Corp.(a) | | | 870 | | | | 187,259 | |
| West Pharmaceutical Services, Inc. | | | 270 | | | | 33,791 | |
| Zoetis, Inc. | | | 27,920 | | | | 3,168,642 | |
| | | | | | | | 36,408,642 | |
| Industrials - 6.9% | | | | | | | | |
| 3M Co. | | | 795 | | | | 137,805 | |
| A.O. Smith Corp. | | | 3,160 | | | | 149,026 | |
| AMETEK, Inc. | | | 1,194 | | | | 108,463 | |
| Armstrong World Industries, Inc. | | | 2,951 | | | | 286,837 | |
| Boeing Co. (The) | | | 2,060 | | | | 749,861 | |
| CoStar Group, Inc.(a) | | | 2,968 | | | | 1,644,450 | |
| Curtiss-Wright Corp. | | | 6,040 | | | | 767,864 | |
| Deere & Co. | | | 12,065 | | | | 1,999,292 | |
| Emerson Electric Co. | | | 3,650 | | | | 243,528 | |
| Expeditors International of Washington, Inc. | | | 28,081 | | | | 2,130,225 | |
| Gardner Denver Holdings, Inc.(a) | | | 3,990 | | | | 138,054 | |
| Graco, Inc. | | | 1,360 | | | | 68,245 | |
| Harris Corp. | | | 650 | | | | 122,935 | |
| HD Supply Holdings, Inc.(a) | | | 3,690 | | | | 148,633 | |
| HEICO Corp. | | | 2,360 | | | | 315,792 | |
| Hexcel Corp. | | | 6,810 | | | | 550,793 | |
| Honeywell International, Inc. | | | 2,860 | | | | 499,327 | |
| IDEX Corp. | | | 2,710 | | | | 466,499 | |
| WILSHIRE LARGE COMPANY GROWTH PORTFOLIO | |
| SCHEDULE OF INVESTMENTS (Continued) | |
| COMMON STOCKS - 99.3% (Continued) | | Shares | | | Value | |
| Industrials - 6.9% (Continued) | | | | | | | | |
| Illinois Tool Works, Inc. | | | 3,100 | | | $ | 467,511 | |
| Landstar System, Inc. | | | 1,850 | | | | 199,782 | |
| Lennox International, Inc.(b) | | | 100 | | | | 27,500 | |
| Lincoln Electric Holdings, Inc. | | | 3,390 | | | | 279,065 | |
| MSC Industrial Direct Co., Inc. - Class A | | | 2,470 | | | | 183,422 | |
| Quanta Services, Inc. | | | 4,460 | | | | 170,327 | |
| Rockwell Automation, Inc. | | | 210 | | | | 34,404 | |
| Rollins, Inc. | | | 465 | | | | 16,680 | |
| Roper Technologies, Inc. | | | 760 | | | | 278,358 | |
| TransUnion | | | 100 | | | | 7,351 | |
| Union Pacific Corp. | | | 12,994 | | | | 2,197,415 | |
| Waste Management, Inc. | | | 1,600 | | | | 184,592 | |
| Watsco, Inc.(b) | | | 100 | | | | 16,353 | |
| Woodward, Inc. | | | 740 | | | | 83,738 | |
| | | | | | | | 14,674,127 | |
| Information Technology - 33.0% | | | | | | | | |
| Accenture plc - Class A | | | 2,274 | | | | 420,167 | |
| Adobe, Inc.(a) | | | 3,130 | | | | 922,255 | |
| Akamai Technologies, Inc.(a) | | | 2,110 | | | | 169,095 | |
| Amphenol Corp. - Class A | | | 1,760 | | | | 168,854 | |
| Analog Devices, Inc. | | | 1,788 | | | | 201,812 | |
| ANSYS, Inc.(a) | | | 850 | | | | 174,097 | |
| Apple, Inc. | | | 22,292 | | | | 4,412,033 | |
| Applied Materials, Inc. | | | 4,780 | | | | 214,670 | |
| Arista Networks, Inc.(a) | | | 910 | | | | 236,254 | |
| Atlassian Corp. plc - Class A(a) | | | 410 | | | | 53,644 | |
| Autodesk, Inc.(a) | | | 21,093 | | | | 3,436,050 | |
| Automatic Data Processing, Inc. | | | 4,671 | | | | 772,256 | |
| Black Knight, Inc.(a) | | | 6,390 | | | | 384,359 | |
| Broadcom, Inc. | | | 600 | | | | 172,716 | |
| Broadridge Financial Solutions, Inc. | | | 450 | | | | 57,456 | |
| Cadence Design Systems, Inc.(a) | | | 7,230 | | | | 511,956 | |
| CDW Corp. | | | 700 | | | | 77,700 | |
| Cisco Systems, Inc. | | | 49,417 | | | | 2,704,593 | |
| Citrix Systems, Inc. | | | 3,569 | | | | 350,262 | |
| Cognex Corp. | | | 2,150 | | | | 103,157 | |
| WILSHIRE LARGE COMPANY GROWTH PORTFOLIO | |
| SCHEDULE OF INVESTMENTS (Continued) | |
| COMMON STOCKS - 99.3% (Continued) | | Shares | | | Value | |
| Information Technology - 33.0% (Continued) | | | | | | | | |
| Cypress Semiconductor Corp. | | | 1,980 | | | $ | 44,035 | |
| Dell Technologies, Inc. - Class C(a) | | | 630 | | | | 32,004 | |
| EPAM Systems, Inc.(a) | | | 10,380 | | | | 1,796,777 | |
| Fair Isaac Corp.(a) | | | 330 | | | | 103,627 | |
| Fidelity National Information Services, Inc. | | | 1,139 | | | | 139,733 | |
| Fiserv, Inc.(a) (b) | | | 1,070 | | | | 97,541 | |
| FleetCor Technologies, Inc.(a) | | | 910 | | | | 255,574 | |
| FLIR Systems, Inc. | | | 2,390 | | | | 129,299 | |
| Fortinet, Inc.(a) | | | 1,430 | | | | 109,867 | |
| Gartner, Inc.(a) | | | 1,270 | | | | 204,394 | |
| Global Payments, Inc. | | | 730 | | | | 116,895 | |
| GoDaddy, Inc. - Class A(a) | | | 470 | | | | 32,971 | |
| Intuit, Inc. | | | 1,990 | | | | 520,047 | |
| Jack Henry & Associates, Inc. | | | 1,518 | | | | 203,291 | |
| Keysight Technologies, Inc.(a) | | | 17,355 | | | | 1,558,652 | |
| KLA-Tencor Corp. | | | 40 | | | | 4,728 | |
| Lam Research Corp. | | | 1,170 | | | | 219,773 | |
| LogMeIn, Inc. | | | 1,240 | | | | 91,363 | |
| Mastercard, Inc. - Class A | | | 5,377 | | | | 1,422,378 | |
| Maxim Integrated Products, Inc. | | | 3,170 | | | | 189,629 | |
| Microsoft Corp. | | | 54,643 | | | | 7,319,976 | |
| Monolithic Power Systems, Inc. | | | 430 | | | | 58,385 | |
| National Instruments Corp. | | | 3,350 | | | | 140,667 | |
| NVIDIA Corp. | | | 26,166 | | | | 4,297,243 | |
| ON Semiconductor Corp.(a) | | | 530 | | | | 10,711 | |
| Oracle Corp. | | | 80,359 | | | | 4,578,052 | |
| Palo Alto Networks, Inc.(a) | | | 1,090 | | | | 222,098 | |
| Paycom Software, Inc.(a) (b) | | | 360 | | | | 81,619 | |
| PayPal Holdings, Inc.(a) | | | 32,147 | | | | 3,679,545 | |
| Proofpoint, Inc.(a) | | | 660 | | | | 79,365 | |
| PTC, Inc.(a) | | | 18,119 | | | | 1,626,361 | |
| QUALCOMM, Inc. | | | 33,300 | | | | 2,533,131 | |
| Red Hat, Inc.(a) | | | 770 | | | | 144,575 | |
| RingCentral, Inc. - Class A(a) | | | 480 | | | | 55,162 | |
| salesforce.com, inc.(a) | | | 20,640 | | | | 3,131,707 | |
| ServiceNow, Inc.(a) | | | 12,760 | | | | 3,503,513 | |
| WILSHIRE LARGE COMPANY GROWTH PORTFOLIO | |
| SCHEDULE OF INVESTMENTS (Continued) | |
| COMMON STOCKS - 99.3% (Continued) | | Shares | | | Value | |
| Information Technology - 33.0% (Continued) | | | | | | | | |
| Splunk, Inc.(a) | | | 348 | | | $ | 43,761 | |
| Square, Inc. - Class A(a) (b) | | | 950 | | | | 68,904 | |
| Teradata Corp.(a) (b) | | | 1,560 | | | | 55,926 | |
| Teradyne, Inc. | | | 1,550 | | | | 74,261 | |
| Texas Instruments, Inc. | | | 6,345 | | | | 728,152 | |
| Total System Services, Inc. | | | 1,960 | | | | 251,409 | |
| Trade Desk, Inc. (The) - Class A(a) (b) | | | 1,290 | | | | 293,836 | |
| Tyler Technologies, Inc.(a) | | | 850 | | | | 183,617 | |
| Universal Display Corp.(b) | | | 350 | | | | 65,821 | |
| VeriSign, Inc.(a) | | | 780 | | | | 163,145 | |
| Visa, Inc. - Class A(b) | | | 66,713 | | | | 11,578,040 | |
| VMware, Inc. - Class A | | | 620 | | | | 103,670 | |
| Workday, Inc. - Class A(a) | | | 10,655 | | | | 2,190,455 | |
| Xilinx, Inc. | | | 870 | | | | 102,590 | |
| Zscaler, Inc.(a) (b) | | | 3,340 | | | | 255,978 | |
| | | | | | | | 70,437,639 | |
| Materials - 0.1% | | | | | | | | |
| Sherwin-Williams Co. (The) | | | 110 | | | | 50,412 | |
| Southern Copper Corp.(b) | | | 1,860 | | | | 72,261 | |
| W.R. Grace & Co. | | | 1,200 | | | | 91,332 | |
| | | | | | | | 214,005 | |
| Real Estate - 0.7% | | | | | | | | |
| American Tower Corp. | | | 3,440 | | | | 703,309 | |
| Equinix, Inc. | | | 30 | | | | 15,129 | |
| Equity LifeStyle Properties, Inc. | | | 210 | | | | 25,481 | |
| Hudson Pacific Properties, Inc. | | | 5,860 | | | | 194,962 | |
| Life Storage, Inc. | | | 1,630 | | | | 154,980 | |
| SBA Communications Corp.(a) | | | 980 | | | | 220,343 | |
| Simon Property Group, Inc. | | | 430 | | | | 68,697 | |
| Taubman Centers, Inc. | | | 3,130 | | | | 127,798 | |
| | | | | | | | 1,510,699 | |
| | | | | | | | | |
| Total Common Stocks(Cost $126,444,241) | | | | | | $ | 211,927,195 | |
| WILSHIRE LARGE COMPANY GROWTH PORTFOLIO | |
| SCHEDULE OF INVESTMENTS (Continued) | |
| MONEY MARKET FUNDS - 1.1% | | Shares | | | Value | |
| Northern Trust Institutional Government Select Portfolio - Institutional Class, 2.24%(c) | | | 1,758,447 | | | $ | 1,758,447 | |
| Northern Trust Institutional Liquid Asset Portfolio - Institutional Class, 2.36%(c) (d) | | | 565,233 | | | | 565,233 | |
| Total Money Market Funds(Cost $2,323,680) | | | | | | $ | 2,323,680 | |
| | | | | | | | | |
| Total Investments at Value - 100.4%(Cost $128,767,921) | | | | | | $ | 214,250,875 | |
| | | | | | | | | |
| Liabilities in Excess of Other Assets - (0.4%) | | | | | | | (775,680 | ) |
| | | | | | | | | |
| Net Assets - 100.0% | | | | | | $ | 213,475,195 | |
| (a) | Non-income producing security. |
| (b) | This security or a partial position of this security is on loan at June 30, 2019. The total market value of securities on loan at June 30, 2019 was $14,049,802. |
| (c) | The rate shown is the 7-day effective yield as of June 30, 2019. |
| (d) | This security was purchased with cash collateral held from securities on loan. The total value of such securities as of June 30, 2019 was $565,233. Securities on loan are also collateralized by various U.S. Treasury obligations in the amount of $13,619,670. |
| ADR - | American Depositary Receipt. |
| WILSHIRE LARGE COMPANY VALUE PORTFOLIO | |
| SCHEDULE OF INVESTMENTS | |
| June 30, 2019 (Unaudited) | |
| COMMON STOCKS - 98.5% | | Shares | | | Value | |
| Communication Services - 5.5% | | | | | | | | |
| AT&T, Inc. | | | 103,172 | | | $ | 3,457,293 | |
| CenturyLink, Inc. | | | 7,230 | | | | 85,025 | |
| Cinemark Holdings, Inc. | | | 4,346 | | | | 156,891 | |
| Comcast Corp. - Class A | | | 53,924 | | | | 2,279,907 | |
| Discovery, Inc. - Series C(a) | | | 990 | | | | 28,166 | |
| Interpublic Group of Cos., Inc. (The) | | | 62,516 | | | | 1,412,236 | |
| John Wiley & Sons, Inc. - Class A | | | 515 | | | | 23,618 | |
| New York Times Co. (The) - Class A | | | 4,860 | | | | 158,533 | |
| News Corp. - Class B | | | 620 | | | | 8,655 | |
| Omnicom Group, Inc. | | | 9,300 | | | | 762,135 | |
| Sinclair Broadcast Group, Inc. - Class A | | | 3,270 | | | | 175,370 | |
| Telephone & Data Systems, Inc. | | | 2,540 | | | | 77,216 | |
| Tribune Media Co. - Class A | | | 860 | | | | 39,749 | |
| Verizon Communications, Inc. | | | 32,974 | | | | 1,883,805 | |
| Zynga, Inc. - Class A(a) | | | 6,800 | | | | 41,684 | |
| | | | | | | | 10,590,283 | |
| Consumer Discretionary - 9.5% | | | | | | | | |
| Advance Auto Parts, Inc. | | | 40 | | | | 6,166 | |
| Aptiv plc | | | 1,130 | | | | 91,338 | |
| AutoZone, Inc.(a) | | | 270 | | | | 296,857 | |
| Best Buy Co., Inc. | | | 1,010 | | | | 70,427 | |
| Choice Hotels International, Inc. | | | 1,602 | | | | 139,390 | |
| Columbia Sportswear Co. | | | 990 | | | | 99,158 | |
| eBay, Inc. | | | 5,910 | | | | 233,445 | |
| Ford Motor Co. | | | 229,062 | | | | 2,343,304 | |
| Garmin Ltd. | | | 3,620 | | | | 288,876 | |
| Gildan Activewear, Inc. | | | 18,108 | | | | 700,417 | |
| H&R Block, Inc.(b) | | | 8,095 | | | | 237,184 | |
| Home Depot, Inc. (The) | | | 820 | | | | 170,535 | |
| L Brands, Inc. | | | 2,160 | | | | 56,376 | |
| Las Vegas Sands Corp. | | | 3,250 | | | | 192,043 | |
| Lear Corp. | | | 15,454 | | | | 2,152,278 | |
| Lowe's Cos., Inc. | | | 15,119 | | | | 1,525,658 | |
| McDonald's Corp. | | | 3,880 | | | | 805,720 | |
| Mohawk Industries, Inc.(a) | | | 10,078 | | | | 1,486,203 | |
| WILSHIRE LARGE COMPANY VALUE PORTFOLIO | |
| SCHEDULE OF INVESTMENTS (Continued) | |
| COMMON STOCKS - 98.5% (Continued) | | Shares | | | Value | |
| Consumer Discretionary - 9.5% (Continued) | | | | | | | | |
| Newell Brands, Inc. | | | 83,912 | | | $ | 1,293,923 | |
| PVH Corp. | | | 11,030 | | | | 1,043,880 | |
| Roku, Inc.(a) (b) | | | 290 | | | | 26,268 | |
| Skechers U.S.A., Inc. - Class A(a) | | | 5,280 | | | | 166,267 | |
| Target Corp. | | | 27,573 | | | | 2,388,098 | |
| Tiffany & Co.(b) | | | 1,370 | | | | 128,287 | |
| Whirlpool Corp. | | | 5,933 | | | | 844,622 | |
| Williams-Sonoma, Inc.(b) | | | 1,710 | | | | 111,150 | |
| Yum China Holdings, Inc. | | | 16,822 | | | | 777,176 | |
| Yum! Brands, Inc. | | | 4,365 | | | | 483,075 | |
| | | | | | | | 18,158,121 | |
| Consumer Staples - 4.0% | | | | | | | | |
| Church & Dwight Co., Inc. | | | 290 | | | | 21,187 | |
| Coca-Cola Co. (The) | | | 6,703 | | | | 341,317 | |
| Colgate-Palmolive Co. | | | 5,745 | | | | 411,744 | |
| Flowers Foods, Inc. | | | 5,940 | | | | 138,224 | |
| Herbalife Nutrition Ltd.(a) | | | 4,300 | | | | 183,868 | |
| Kellogg Co. | | | 12,014 | | | | 643,590 | |
| Kimberly-Clark Corp. | | | 710 | | | | 94,629 | |
| Lamb Weston Holdings, Inc. | | | 1,580 | | | | 100,109 | |
| Mondelēz International, Inc. - Class A | | | 7,830 | | | | 422,037 | |
| Nu Skin Enterprises, Inc. - Class A | | | 5,640 | | | | 278,165 | |
| Philip Morris International, Inc. | | | 22,963 | | | | 1,803,284 | |
| Pilgrim's Pride Corp.(a) | | | 2,660 | | | | 67,537 | |
| Procter & Gamble Co. (The) | | | 10,578 | | | | 1,159,878 | |
| Walmart, Inc. | | | 17,751 | | | | 1,961,308 | |
| | | | | | | | 7,626,877 | |
| Energy - 10.1% | | | | | | | | |
| Apergy Corp.(a) | | | 1,210 | | | | 40,583 | |
| Baker Hughes, a GE Co. | | | 25,075 | | | | 617,597 | |
| BP plc - ADR | | | 45,459 | | | | 1,895,640 | |
| Cenovus Energy, Inc.(b) | | | 84,013 | | | | 740,995 | |
| Chevron Corp. | | | 7,089 | | | | 882,155 | |
| ConocoPhillips | | | 9,140 | | | | 557,540 | |
| Continental Resources, Inc.(a) | | | 1,880 | | | | 79,129 | |
| EOG Resources, Inc. | | | 19,852 | | | | 1,849,412 | |
| WILSHIRE LARGE COMPANY VALUE PORTFOLIO | |
| SCHEDULE OF INVESTMENTS (Continued) | |
| COMMON STOCKS - 98.5% (Continued) | | Shares | | | Value | |
| Energy - 10.1% (Continued) | | | | | | | | |
| Equitrans Midstream Corp. | | | 590 | | | $ | 11,629 | |
| Exxon Mobil Corp. | | | 33,157 | | | | 2,540,821 | |
| Halliburton Co. | | | 76,373 | | | | 1,736,722 | |
| HollyFrontier Corp. | | | 560 | | | | 25,917 | |
| Marathon Oil Corp. | | | 720 | | | | 10,231 | |
| National Oilwell Varco, Inc. | | | 81,943 | | | | 1,821,594 | |
| Occidental Petroleum Corp. | | | 1,500 | | | | 75,420 | |
| ONEOK, Inc. | | | 2,195 | | | | 151,038 | |
| Phillips 66 | | | 20,692 | | | | 1,935,530 | |
| Pioneer Natural Resources Co. | | | 876 | | | | 134,781 | |
| Royal Dutch Shell plc - Class A - ADR | | | 22,295 | | | | 1,450,736 | |
| Schlumberger Ltd. | | | 42,142 | | | | 1,674,723 | |
| Valero Energy Corp. | | | 11,462 | | | | 981,262 | |
| | | | | | | | 19,213,455 | |
| Financials - 27.0% | | | | | | | | |
| Affiliated Managers Group, Inc. | | | 1,140 | | | | 105,040 | |
| Ally Financial, Inc. | | | 520 | | | | 16,115 | |
| American Express Co. | | | 10,150 | | | | 1,252,916 | |
| American International Group, Inc. | | | 46,735 | | | | 2,490,040 | |
| American National Insurance Co. | | | 985 | | | | 114,723 | |
| Arthur J. Gallagher & Co. | | | 3,360 | | | | 294,302 | |
| Assured Guaranty Ltd.(b) | | | 4,220 | | | | 177,578 | |
| AXA Equitable Holdings, Inc. | | | 78,734 | | | | 1,645,540 | |
| Axis Capital Holdings Ltd. | | | 11,941 | | | | 712,281 | |
| Bank of America Corp. | | | 173,460 | | | | 5,030,339 | |
| Bank of Hawaii Corp. | | | 1,305 | | | | 108,198 | |
| Bank of New York Mellon Corp. (The) | | | 660 | | | | 29,139 | |
| BankUnited, Inc. | | | 1,990 | | | | 67,143 | |
| Berkshire Hathaway, Inc. - Class B(a) | | | 5,396 | | | | 1,150,265 | |
| BGC Partners, Inc. - Class A | | | 1,540 | | | | 8,054 | |
| BlackRock, Inc. | | | 688 | | | | 322,878 | |
| Brighthouse Financial, Inc.(a) | | | 2,860 | | | | 104,933 | |
| Brown & Brown, Inc. | | | 3,710 | | | | 124,285 | |
| Capital One Financial Corp. | | | 26,591 | | | | 2,412,867 | |
| Cboe Global Markets, Inc. | | | 680 | | | | 70,468 | |
| Chubb Ltd. | | | 13,668 | | | | 2,013,159 | |
| WILSHIRE LARGE COMPANY VALUE PORTFOLIO | |
| SCHEDULE OF INVESTMENTS (Continued) | |
| COMMON STOCKS - 98.5% (Continued) | | Shares | | | Value | |
| Financials - 27.0% (Continued) | | | | | | | | |
| Cincinnati Financial Corp. | | | 680 | | | $ | 70,496 | |
| CIT Group, Inc. | | | 700 | | | | 36,778 | |
| Citigroup, Inc. | | | 41,006 | | | | 2,871,650 | |
| Erie Indemnity Co. - Class A(b) | | | 20 | | | | 5,086 | |
| Evercore, Inc. - Class A | | | 680 | | | | 60,228 | |
| Fidelity National Financial, Inc. | | | 1,890 | | | | 76,167 | |
| Fifth Third Bancorp | | | 30,552 | | | | 852,401 | |
| First American Financial Corp. | | | 2,315 | | | | 124,316 | |
| First Hawaiian, Inc. | | | 7,100 | | | | 183,677 | |
| First Horizon National Corp. | | | 1,280 | | | | 19,110 | |
| FNB Corp. | | | 14,370 | | | | 169,135 | |
| Franklin Resources, Inc.(b) | | | 100 | | | | 3,480 | |
| Fulton Financial Corp. | | | 286 | | | | 4,682 | |
| Genworth Financial, Inc. - Class A(a) | | | 420 | | | | 1,558 | |
| Goldman Sachs Group, Inc. (The) | | | 5,590 | | | | 1,143,714 | |
| Hanover Insurance Group, Inc. (The) | | | 4,000 | | | | 513,200 | |
| Interactive Brokers Group, Inc. - Class A | | | 1,990 | | | | 107,858 | |
| Intercontinental Exchange, Inc. | | | 5,125 | | | | 440,443 | |
| Invesco Ltd. | | | 15,118 | | | | 309,314 | |
| Jefferies Financial Group, Inc. | | | 5,590 | | | | 107,496 | |
| JPMorgan Chase & Co. | | | 39,010 | | | | 4,361,318 | |
| Kemper Corp. | | | 11,080 | | | | 956,093 | |
| KeyCorp | | | 44,483 | | | | 789,573 | |
| KKR & Co., Inc. - Class A | | | 31,305 | | | | 791,077 | |
| Legg Mason, Inc. | | | 2,760 | | | | 105,653 | |
| Mercury General Corp. | | | 486 | | | | 30,375 | |
| MetLife, Inc. | | | 40,355 | | | | 2,004,433 | |
| MFA Financial, Inc. | | | 45,890 | | | | 329,490 | |
| MGIC Investment Corp.(a) | | | 45,630 | | | | 599,578 | |
| Morgan Stanley | | | 43,345 | | | | 1,898,944 | |
| Nasdaq, Inc. | | | 220 | | | | 21,157 | |
| Navient Corp. | | | 100 | | | | 1,365 | |
| New Residential Investment Corp. | | | 11,150 | | | | 171,599 | |
| Northern Trust Corp. | | | 17,291 | | | | 1,556,190 | |
| OneMain Holdings, Inc. | | | 3,770 | | | | 127,464 | |
| PacWest Bancorp(b) | | | 100 | | | | 3,883 | |
| WILSHIRE LARGE COMPANY VALUE PORTFOLIO | |
| SCHEDULE OF INVESTMENTS (Continued) | |
| COMMON STOCKS - 98.5% (Continued) | | Shares | | | Value | |
| Financials - 27.0% (Continued) | | | | | | | | |
| Popular, Inc. | | | 8,220 | | | $ | 445,853 | |
| Primerica, Inc. | | | 650 | | | | 77,968 | |
| Progressive Corp. (The) | | | 590 | | | | 47,159 | |
| SLM Corp. | | | 2,410 | | | | 23,425 | |
| State Street Corp. | | | 21,545 | | | | 1,207,813 | |
| Sterling Bancorp | | | 10,720 | | | | 228,122 | |
| Synchrony Financial | | | 5,810 | | | | 201,433 | |
| Synovus Financial Corp. | | | 4,725 | | | | 165,375 | |
| T. Rowe Price Group, Inc. | | | 1,725 | | | | 189,250 | |
| U.S. Bancorp | | | 39,411 | | | | 2,065,136 | |
| UBS Group AG(a) (b) | | | 28,654 | | | | 339,550 | |
| Umpqua Holdings Corp. | | | 20,420 | | | | 338,768 | |
| Voya Financial, Inc. | | | 26,156 | | | | 1,446,427 | |
| Webster Financial Corp. | | | 5,940 | | | | 283,754 | |
| Wells Fargo & Co. | | | 98,337 | | | | 4,653,306 | |
| Western Alliance Bancorp.(a) | | | 12,095 | | | | 540,888 | |
| Wintrust Financial Corp. | | | 1,960 | | | | 143,394 | |
| | | | | | | | 51,496,865 | |
| Health Care - 11.4% | | | | | | | | |
| Abbott Laboratories | | | 8,910 | | | | 749,331 | |
| Agilent Technologies, Inc. | | | 3,190 | | | | 238,197 | |
| Allergan plc | | | 1,050 | | | | 175,802 | |
| Amgen, Inc. | | | 7,669 | | | | 1,413,243 | |
| Anthem, Inc. | | | 378 | | | | 106,675 | |
| Baxter International, Inc. | | | 4,420 | | | | 361,998 | |
| Becton, Dickinson and Co. | | | 490 | | | | 123,485 | |
| Bio-Rad Laboratories, Inc. - Class A(a) | | | 200 | | | | 62,518 | |
| Boston Scientific Corp.(a) | | | 5,610 | | | | 241,118 | |
| Bristol-Myers Squibb Co. | | | 460 | | | | 20,861 | |
| Bruker Corp. | | | 5,090 | | | | 254,246 | |
| Cardinal Health, Inc. | | | 16,074 | | | | 757,085 | |
| Cerner Corp. | | | 4,080 | | | | 299,064 | |
| Charles River Laboratories International, Inc.(a) | | | 590 | | | | 83,721 | |
| Cigna Corp. | | | 3,894 | | | | 613,500 | |
| Cooper Cos., Inc. (The) | | | 390 | | | | 131,387 | |
| CVS Health Corp. | | | 37,221 | | | | 2,028,173 | |
| WILSHIRE LARGE COMPANY VALUE PORTFOLIO | |
| SCHEDULE OF INVESTMENTS (Continued) | |
| COMMON STOCKS - 98.5% (Continued) | | Shares | | | Value | |
| Health Care - 11.4% (Continued) | | | | | | | | |
| Danaher Corp. | | | 3,395 | | | $ | 485,213 | |
| DENTSPLY SIRONA, Inc. | | | 30 | | | | 1,751 | |
| Elanco Animal Health, Inc.(a) | | | 20 | | | | 676 | |
| Eli Lilly & Co. | | | 210 | | | | 23,266 | |
| Integra LifeSciences Holdings Corp.(a) | | | 590 | | | | 32,952 | |
| IQVIA Holdings, Inc.(a) | | | 380 | | | | 61,142 | |
| Johnson & Johnson | | | 19,141 | | | | 2,665,958 | |
| McKesson Corp. | | | 11,395 | | | | 1,531,374 | |
| Medtronic plc | | | 19,461 | | | | 1,895,306 | |
| Merck & Co., Inc. | | | 23,959 | | | | 2,008,962 | |
| Mylan N.V.(a) | | | 58,659 | | | | 1,116,867 | |
| PerkinElmer, Inc. | | | 70 | | | | 6,744 | |
| Pfizer, Inc. | | | 45,640 | | | | 1,977,125 | |
| Teleflex, Inc. | | | 270 | | | | 89,411 | |
| Thermo Fisher Scientific, Inc. | | | 2,619 | | | | 769,148 | |
| UnitedHealth Group, Inc. | | | 5,220 | | | | 1,273,732 | |
| Waters Corp.(a) | | | 460 | | | | 99,010 | |
| West Pharmaceutical Services, Inc. | | | 80 | | | | 10,012 | |
| | | | | | | | 21,709,053 | |
| Industrials - 10.7% | | | | | | | | |
| 3M Co. | | | 1,360 | | | | 235,742 | |
| AMETEK, Inc. | | | 4,475 | | | | 406,509 | |
| Copa Holdings, S.A. - Class A | | | 960 | | | | 93,667 | |
| Crane Co. | | | 2,210 | | | | 184,402 | |
| Curtiss-Wright Corp. | | | 7,400 | | | | 940,762 | |
| Dover Corp. | | | 3,825 | | | | 383,265 | |
| Emerson Electric Co. | | | 1,710 | | | | 114,091 | |
| General Dynamics Corp. | | | 5,523 | | | | 1,004,192 | |
| General Electric Co. | | | 463,629 | | | | 4,868,105 | |
| HD Supply Holdings, Inc.(a) | | | 600 | | | | 24,168 | |
| Hexcel Corp. | | | 6,650 | | | | 537,852 | |
| Honeywell International, Inc. | | | 3,770 | | | | 658,204 | |
| IDEX Corp. | | | 540 | | | | 92,956 | |
| IHS Markit Ltd.(a) | | | 110 | | | | 7,009 | |
| ITT, Inc. | | | 1,130 | | | | 73,992 | |
| Johnson Controls International plc | | | 32,081 | | | | 1,325,266 | |
| WILSHIRE LARGE COMPANY VALUE PORTFOLIO | |
| SCHEDULE OF INVESTMENTS (Continued) | |
| COMMON STOCKS - 98.5% (Continued) | | Shares | | | Value | |
| Industrials - 10.7% (Continued) | | | | | | | | |
| MSC Industrial Direct Co., Inc. - Class A | | | 1,550 | | | $ | 115,103 | |
| nVent Electric plc | | | 5,100 | | | | 126,429 | |
| Oshkosh Corp. | | | 460 | | | | 38,405 | |
| Parker-Hannifin Corp. | | | 4,183 | | | | 711,152 | |
| Quanta Services, Inc. | | | 5,000 | | | | 190,950 | |
| Raytheon Co. | | | 872 | | | | 151,623 | |
| Republic Services, Inc. | | | 2,195 | | | | 190,175 | |
| Roper Technologies, Inc. | | | 1,249 | | | | 457,459 | |
| Schneider National, Inc. - Class B | | | 7,050 | | | | 128,592 | |
| Southwest Airlines Co. | | | 11,639 | | | | 591,029 | |
| Stanley Black & Decker, Inc. | | | 18,689 | | | | 2,702,617 | |
| Terex Corp. | | | 610 | | | | 19,154 | |
| Timken Co. (The) | | | 420 | | | | 21,563 | |
| Union Pacific Corp. | | | 20 | | | | 3,382 | |
| United Technologies Corp. | | | 12,301 | | | | 1,601,590 | |
| Waste Management, Inc. | | | 2,625 | | | | 302,846 | |
| Watsco, Inc. | | | 210 | | | | 34,341 | |
| Westinghouse Air Brake Technologies Corp.(b) | | | 23,227 | | | | 1,666,771 | |
| Woodward, Inc. | | | 3,120 | | | | 353,059 | |
| Xylem, Inc. | | | 260 | | | | 21,746 | |
| | | | | | | | 20,378,168 | |
| Information Technology - 8.4% | | | | | | | | |
| Akamai Technologies, Inc.(a) | | | 600 | | | | 48,084 | |
| Analog Devices, Inc. | | | 2,950 | | | | 332,967 | |
| Apple, Inc. | | | 104 | | | | 20,584 | |
| Autodesk, Inc.(a) | | | 550 | | | | 89,595 | |
| Broadcom, Inc. | | | 160 | | | | 46,058 | |
| CACI International, Inc. - Class A(a) | | | 100 | | | | 20,459 | |
| Ciena Corp.(a) | | | 2,620 | | | | 107,761 | |
| Cisco Systems, Inc. | | | 15,142 | | | | 828,721 | |
| Cognizant Technology Solutions Corp. - Class A | | | 25,602 | | | | 1,622,910 | |
| CommScope Holding Co., Inc.(a) | | | 1,920 | | | | 30,202 | |
| Cypress Semiconductor Corp. | | | 4,620 | | | | 102,749 | |
| Dell Technologies, Inc. - Class C(a) | | | 1,780 | | | | 90,424 | |
| Dolby Laboratories, Inc. - Class A | | | 3,670 | | | | 237,082 | |
| Fidelity National Information Services, Inc. | | | 4,050 | | | | 496,854 | |
| WILSHIRE LARGE COMPANY VALUE PORTFOLIO | |
| SCHEDULE OF INVESTMENTS (Continued) | |
| COMMON STOCKS - 98.5% (Continued) | | Shares | | | Value | |
| Information Technology - 8.4% (Continued) | | | | | | | | |
| FLIR Systems, Inc. | | | 1,570 | | | $ | 84,937 | |
| Hewlett Packard Enterprise Co. | | | 114,735 | | | | 1,715,288 | |
| Intel Corp. | | | 9,597 | | | | 459,408 | |
| International Business Machines Corp. | | | 10,964 | | | | 1,511,936 | |
| Jabil, Inc. | | | 8,810 | | | | 278,397 | |
| Juniper Networks, Inc. | | | 25,935 | | | | 690,649 | |
| Keysight Technologies, Inc.(a) | | | 730 | | | | 65,561 | |
| LogMeIn, Inc. | | | 1,100 | | | | 81,048 | |
| Micron Technology, Inc.(a) | | | 1,370 | | | | 52,868 | |
| Microsoft Corp. | | | 5,494 | | | | 735,976 | |
| Motorola Solutions, Inc. | | | 300 | | | | 50,019 | |
| National Instruments Corp. | | | 1,560 | | | | 65,504 | |
| Nuance Communications, Inc.(a) | | | 4,430 | | | | 70,747 | |
| Oracle Corp. | | | 71,045 | | | | 4,047,434 | |
| Qorvo, Inc.(a) | | | 570 | | | | 37,968 | |
| QUALCOMM, Inc. | | | 21,671 | | | | 1,648,512 | |
| Skyworks Solutions, Inc. | | | 540 | | | | 41,726 | |
| Symantec Corp. | | | 2,440 | | | | 53,094 | |
| Synopsys, Inc.(a) | | | 540 | | | | 69,493 | |
| Teradata Corp.(a) (b) | | | 1,860 | | | | 66,681 | |
| Teradyne, Inc. | | | 3,160 | | | | 151,396 | |
| | | | | | | | 16,053,092 | |
| Materials - 2.7% | | | | | | | | |
| Air Products & Chemicals, Inc. | | | 470 | | | | 106,394 | |
| Amcor plc(a) | | | 6,355 | | | | 73,014 | |
| Axalta Coating Systems Ltd.(a) | | | 1,910 | | | | 56,861 | |
| Cabot Corp. | | | 1,800 | | | | 85,878 | |
| Corteva, Inc.(a) | | | 16,603 | | | | 490,951 | |
| Domtar Corp. | | | 770 | | | | 34,288 | |
| Dow, Inc. | | | 640 | | | | 31,558 | |
| DuPont de Nemours, Inc. | | | 16,603 | | | | 1,246,387 | |
| Eagle Materials, Inc.(b) | | | 100 | | | | 9,270 | |
| Ecolab, Inc. | | | 420 | | | | 82,925 | |
| Freeport-McMoRan, Inc. | | | 1,330 | | | | 15,441 | |
| Huntsman Corp. | | | 1,008 | | | | 20,604 | |
| Linde plc | | | 11,926 | | | | 2,394,740 | |
| WILSHIRE LARGE COMPANY VALUE PORTFOLIO | |
| SCHEDULE OF INVESTMENTS (Continued) | |
| COMMON STOCKS - 98.5% (Continued) | | Shares | | | Value | |
| Materials - 2.7% (Continued) | | | | | | | | |
| Olin Corp.(b) | | | 5,390 | | | $ | 118,095 | |
| Scotts Miracle-Gro Co. (The)(b) | | | 220 | | | | 21,670 | |
| Sonoco Products Co. | | | 3,098 | | | | 202,424 | |
| Valvoline, Inc. | | | 10,080 | | | | 196,862 | |
| | | | | | | | 5,187,362 | |
| Real Estate - 2.8% | | | | | | | | |
| Apple Hospitality REIT, Inc. | | | 10,890 | | | | 172,715 | |
| AvalonBay Communities, Inc. | | | 780 | | | | 158,480 | |
| Boston Properties, Inc. | | | 754 | | | | 97,266 | |
| Brandywine Realty Trust | | | 13,926 | | | | 199,420 | |
| Brookfield Property REIT, Inc. - Class A(b) | | | 60 | | | | 1,133 | |
| Camden Property Trust | | | 330 | | | | 34,449 | |
| Corporate Office Properties Trust | | | 1,090 | | | | 28,743 | |
| Crown Castle International Corp. | | | 1,070 | | | | 139,475 | |
| CubeSmart | | | 2,740 | | | | 91,626 | |
| Duke Realty Corp. | | | 13,500 | | | | 426,735 | |
| EPR Properties | | | 440 | | | | 32,820 | |
| Equity Commonwealth | | | 880 | �� | | | 28,618 | |
| Equity Residential | | | 1,870 | | | | 141,970 | |
| Essex Property Trust, Inc. | | | 290 | | | | 84,660 | |
| Extra Space Storage, Inc. | | | 310 | | | | 32,891 | |
| Federal Realty Investment Trust | | | 220 | | | | 28,327 | |
| HCP, Inc.(b) | | | 61,673 | | | | 1,972,302 | |
| Healthcare Trust of America, Inc. - Class A | | | 4,100 | | | | 112,463 | |
| Highwoods Properties, Inc. | | | 5,630 | | | | 232,519 | |
| Hospitality Properties Trust | | | 1,330 | | | | 33,250 | |
| Host Hotels & Resorts, Inc. | | | 4,500 | | | | 81,990 | |
| Hudson Pacific Properties, Inc. | | | 1,310 | | | | 43,584 | |
| Newmark Group, Inc. - Class A(b) | | | 714 | | | | 6,412 | |
| Outfront Media, Inc. | | | 10,460 | | | | 269,763 | |
| Prologis, Inc. | | | 5,360 | | | | 429,336 | |
| Retail Properties of America, Inc. - Class A | | | 4,860 | | | | 57,154 | |
| Senior Housing Properties Trust | | | 440 | | | | 3,639 | |
| Simon Property Group, Inc. | | | 1,130 | | | | 180,529 | |
| UDR, Inc. | | | 2,140 | | | | 96,065 | |
| Vornado Realty Trust | | | 1,880 | | | | 120,508 | |
| WILSHIRE LARGE COMPANY VALUE PORTFOLIO | |
| SCHEDULE OF INVESTMENTS (Continued) | |
| COMMON STOCKS - 98.5% (Continued) | | Shares | | | Value | |
| Real Estate - 2.8% (Continued) | | | | | | | | |
| Weingarten Realty Investors | | | 2,794 | | | $ | 76,611 | |
| | | | | | | | 5,415,453 | |
| Utilities - 6.4% | | | | | | | | |
| Aqua America, Inc. | | | 3,225 | | | | 133,418 | |
| Avangrid, Inc. | | | 15,169 | | | | 766,035 | |
| CenterPoint Energy, Inc. | | | 213 | | | | 6,098 | |
| Dominion Energy, Inc. | | | 32,772 | | | | 2,533,931 | |
| DTE Energy Co. | | | 367 | | | | 46,932 | |
| Duke Energy Corp. | | | 1,212 | | | | 106,947 | |
| Edison International | | | 23,541 | | | | 1,586,899 | |
| Entergy Corp. | | | 28,448 | | | | 2,928,152 | |
| Exelon Corp. | | | 45,735 | | | | 2,192,536 | |
| Hawaiian Electric Industries, Inc. | | | 170 | | | | 7,404 | |
| IDACORP, Inc. | | | 2,160 | | | | 216,929 | |
| MDU Resources Group, Inc. | | | 21,370 | | | | 551,346 | |
| National Fuel Gas Co. | | | 3,245 | | | | 171,174 | |
| NextEra Energy, Inc. | | | 1,720 | | | | 352,359 | |
| NRG Energy, Inc. | | | 9,750 | | | | 342,420 | |
| Southern Co. (The) | | | 1,680 | | | | 92,870 | |
| WEC Energy Group, Inc. | | | 1,060 | | | | 88,372 | |
| | | | | | | | 12,123,822 | |
| | | | | | | | | |
| Total Common Stocks(Cost $167,855,211) | | | | | | $ | 187,952,551 | |
| MONEY MARKET FUNDS - 1.4% | | Shares | | | Value | |
| Northern Trust Institutional Government Select Portfolio - Institutional Class, 2.24%(c) | | | 2,508,295 | | | $ | 2,508,295 | |
| WILSHIRE LARGE COMPANY VALUE PORTFOLIO | |
| SCHEDULE OF INVESTMENTS (Continued) | |
| MONEY MARKET FUNDS - 1.4% (Continued) | | Shares | | | Value | |
| Northern Trust Institutional Liquid Asset Portfolio - Institutional Class, 2.36%(c) (d) | | | 117,111 | | | $ | 117,111 | |
| Total Money Market Funds(Cost $2,625,406) | | | | | | $ | 2,625,406 | |
| | | | | | | | | |
| Total Investments at Value - 99.9%(Cost $170,480,617) | | | | | | $ | 190,577,957 | |
| | | | | | | | | |
| Other Assets in Excess of Liabilities - 0.1% | | | | | | | 207,900 | |
| | | | | | | | | |
| Net Assets - 100.0% | | | | | | $ | 190,785,857 | |
| (a) | Non-income producing security. |
| (b) | This security or a partial position of this security is on loan at June 30, 2019. The total market value of securities on loan at June 30, 2019 was $5,634,669. |
| (c) | The rate shown is the 7-day effective yield as of June 30, 2019. |
| (d) | This security was purchased with cash collateral held from securities on loan. The total value of such securities as of June 30, 2019 was $117,111. Securities on loan are also collateralized by various U.S. Treasury obligations in the amount of $5,567,232. |
| ADR - | American Depositary Receipt. |
| WILSHIRE SMALL COMPANY GROWTH PORTFOLIO | |
| SCHEDULE OF INVESTMENTS | |
| June 30, 2019 (Unaudited) | |
| COMMON STOCKS - 97.1% | | Shares | | | Value | |
| Communication Services - 1.5% | | | | | | | | |
| Boingo Wireless, Inc.(a) | | | 760 | | | $ | 13,657 | |
| CarGurus, Inc.(a) | | | 2,070 | | | | 74,748 | |
| Cogent Communications Holdings, Inc. | | | 7,680 | | | | 455,884 | |
| Entravision Communications Corp. - Class A | | | 1,195 | | | | 3,728 | |
| Glu Mobile, Inc.(a) | | | 1,090 | | | | 7,826 | |
| IMAX Corp.(a) | | | 1,340 | | | | 27,068 | |
| National CineMedia, Inc. | | | 3,300 | | | | 21,648 | |
| New York Times Co. (The) - Class A | | | 210 | | | | 6,850 | |
| Ooma, Inc.(a) | | | 370 | | | | 3,878 | |
| Shenandoah Telecommunications Co. | | | 1,122 | | | | 43,220 | |
| Sinclair Broadcast Group, Inc. - Class A | | | 1,010 | | | | 54,166 | |
| TechTarget, Inc.(a) | | | 3,960 | | | | 84,151 | |
| Vonage Holdings Corp.(a) | | | 6,665 | | | | 75,514 | |
| Yelp, Inc.(a) | | | 2,173 | | | | 74,273 | |
| | | | | | | | 946,611 | |
| Consumer Discretionary - 10.0% | | | | | | | | |
| American Eagle Outfitters, Inc. | | | 6,130 | | | | 103,597 | |
| BJ's Restaurants, Inc.(b) | | | 655 | | | | 28,781 | |
| Bloomin' Brands, Inc. | | | 2,690 | | | | 50,868 | |
| Boot Barn Holdings, Inc.(a) | | | 900 | | | | 32,076 | |
| Boyd Gaming Corp. | | | 1,730 | | | | 46,606 | |
| Career Education Corp.(a) | | | 4,330 | | | | 82,573 | |
| Cavco Industries, Inc.(a) | | | 275 | | | | 43,324 | |
| Chegg, Inc.(a) | | | 13,931 | | | | 537,598 | |
| Churchill Downs, Inc.(b) | | | 150 | | | | 17,261 | |
| Core-Mark Holding Co., Inc. | | | 1,935 | | | | 76,858 | |
| Cracker Barrel Old Country Store, Inc.(b) | | | 360 | | | | 61,463 | |
| Crocs, Inc.(a) | | | 3,505 | | | | 69,224 | |
| Deckers Outdoor Corp.(a) | | | 965 | | | | 169,811 | |
| Denny's Corp.(a) | | | 220 | | | | 4,517 | |
| Dine Brands Global, Inc.(b) | | | 30 | | | | 2,864 | |
| Eldorado Resorts, Inc.(a) (b) | | | 760 | | | | 35,013 | |
| Etsy, Inc.(a) | | | 1,705 | | | | 104,636 | |
| Five Below, Inc.(a) | | | 838 | | | | 100,577 | |
| Fox Factory Holding Corp.(a) | | | 825 | | | | 68,071 | |
| WILSHIRE SMALL COMPANY GROWTH PORTFOLIO | |
| SCHEDULE OF INVESTMENTS (Continued) | |
| COMMON STOCKS - 97.1% (Continued) | | Shares | | | Value | |
| Consumer Discretionary - 10.0% (Continued) | | | | | | | | |
| Grand Canyon Education, Inc.(a) | | | 259 | | | $ | 30,308 | |
| Groupon, Inc.(a) (b) | | | 2,540 | | | | 9,093 | |
| Hudson Ltd. - Class A(a) | | | 210 | | | | 2,896 | |
| Installed Building Products, Inc.(a) | | | 1,720 | | | | 101,858 | |
| Jack in the Box, Inc. | | | 905 | | | | 73,658 | |
| KB Home | | | 130 | | | | 3,345 | |
| La-Z-Boy, Inc. | | | 2,055 | | | | 63,006 | |
| LGI Homes, Inc.(a) (b) | | | 100 | | | | 7,143 | |
| Malibu Boats, Inc. - Class A(a) | | | 4,583 | | | | 178,050 | |
| MasterCraft Boat Holdings, Inc.(a) | | | 1,885 | | | | 36,927 | |
| Monro, Inc. | | | 630 | | | | 53,739 | |
| Murphy USA, Inc.(a) | | �� | 110 | | | | 9,243 | |
| National Vision Holdings, Inc.(a) | | | 260 | | | | 7,990 | |
| Ollie's Bargain Outlet Holdings, Inc.(a) | | | 1,230 | | | | 107,145 | |
| Oxford Industries, Inc.(b) | | | 6,514 | | | | 493,761 | |
| Planet Fitness, Inc. - Class A(a) | | | 1,445 | | | | 104,676 | |
| RCI Hospitality Holdings, Inc. | | | 570 | | | | 9,981 | |
| Rent-A-Center, Inc.(a) | | | 1,780 | | | | 47,401 | |
| RH(a) (b) | | | 10 | | | | 1,156 | |
| Ruth's Hospitality Group, Inc. | | | 4,175 | | | | 94,814 | |
| Scientific Games Corp.(a) (b) | | | 1,210 | | | | 23,982 | |
| SeaWorld Entertainment, Inc.(a) | | | 4,055 | | | | 125,704 | |
| Shutterstock, Inc. | | | 850 | | | | 33,312 | |
| Skyline Champion Corp.(a) | | | 37,410 | | | | 1,024,285 | |
| Sleep Number Corp.(a) | | | 1,079 | | | | 43,581 | |
| Sotheby's(a) (b) | | | 440 | | | | 25,577 | |
| Steven Madden Ltd. | | | 20,632 | | | | 700,456 | |
| Strategic Education, Inc. | | | 660 | | | | 117,480 | |
| Texas Roadhouse, Inc.(b) | | | 2,240 | | | | 120,221 | |
| TopBuild Corp.(a) | | | 10,114 | | | | 837,035 | |
| Weight Watchers International, Inc.(a) | | | 110 | | | | 2,101 | |
| Wingstop, Inc. | | | 975 | | | | 92,381 | |
| Winmark Corp. | | | 455 | | | | 78,783 | |
| Winnebago Industries, Inc.(b) | | | 40 | | | | 1,546 | |
| Zumiez, Inc.(a) | | | 180 | | | | 4,698 | |
| | | | | | | | 6,303,050 | |
| WILSHIRE SMALL COMPANY GROWTH PORTFOLIO | |
| SCHEDULE OF INVESTMENTS (Continued) | |
| COMMON STOCKS - 97.1% (Continued) | | Shares | | | Value | |
| Consumer Staples - 5.7% | | | | | | | | |
| BJ's Wholesale Club Holdings, Inc.(a) | | | 1,180 | | | $ | 31,152 | |
| Calavo Growers, Inc.(b) | | | 7,690 | | | | 743,931 | |
| Inter Parfums, Inc. | | | 18,650 | | | | 1,240,039 | |
| J & J Snack Foods Corp. | | | 7,433 | | | | 1,196,340 | |
| LifeVantage Corp.(a) | | | 3,790 | | | | 49,194 | |
| Medifast, Inc.(b) | | | 655 | | | | 84,037 | |
| Performance Food Group Co.(a) | | | 2,730 | | | | 109,282 | |
| Sanderson Farms, Inc.(b) | | | 410 | | | | 55,990 | |
| USANA Health Sciences, Inc.(a) | | | 580 | | | | 46,069 | |
| Vector Group Ltd. | | | 3,339 | | | | 32,555 | |
| | | | | | | | 3,588,589 | |
| Energy - 1.3% | | | | | | | | |
| CVR Energy, Inc. | | | 290 | | | | 14,497 | |
| Delek US Holdings, Inc. | | | 450 | | | | 18,234 | |
| ProPetro Holding Corp.(a) | | | 2,310 | | | | 47,817 | |
| Select Energy Services, Inc. - Class A(a) | | | 64,480 | | | | 748,613 | |
| | | | | | | | 829,161 | |
| Financials - 7.4% | | | | | | | | |
| Artisan Partners Asset Management, Inc. - Class A | | | 3,080 | | | | 84,762 | |
| Axos Financial, Inc.(a) (b) | | | 1,240 | | | | 33,790 | |
| Banc of California, Inc. | | | 25,385 | | | | 354,628 | |
| Blucora, Inc.(a) | | | 2,490 | | | | 75,621 | |
| BrightSphere Investment Group plc | | | 7,450 | | | | 85,005 | |
| Cadence Bancorp. | | | 5,830 | | | | 121,264 | |
| CenterState Bank Corp. | | | 29,165 | | | | 671,670 | |
| Enova International, Inc.(a) | | | 2,970 | | | | 68,458 | |
| Essent Group Ltd.(a) | | | 4,180 | | | | 196,418 | |
| Evercore, Inc. - Class A | | | 680 | | | | 60,228 | |
| Federated Investors, Inc. - Class B | | | 1,950 | | | | 63,375 | |
| First Financial Bankshares, Inc. | | | 700 | | | | 21,553 | |
| FirstCash, Inc. | | | 600 | | | | 60,012 | |
| Glacier Bancorp, Inc. | | | 1,060 | | | | 42,983 | |
| Goosehead Insurance, Inc. - Class A(b) | | | 17,647 | | | | 843,526 | |
| Hallmark Financial Services, Inc.(a) | | | 100 | | | | 1,423 | |
| Hamilton Lane, Inc. - Class A | | | 1,340 | | | | 76,460 | |
| Kemper Corp. | | | 1,350 | | | | 116,492 | |
| WILSHIRE SMALL COMPANY GROWTH PORTFOLIO | |
| SCHEDULE OF INVESTMENTS (Continued) | |
| COMMON STOCKS - 97.1% (Continued) | | Shares | | | Value | |
| Financials - 7.4% (Continued) | | | | | | | | |
| Kinsale Capital Group, Inc. | | | 410 | | | $ | 37,507 | |
| Lakeland Financial Corp.(b) | | | 1,180 | | | | 55,259 | |
| LegacyTexas Financial Group, Inc. | | | 7,104 | | | | 289,204 | |
| LendingTree, Inc.(a) (b) | | | 1,610 | | | | 676,249 | |
| Meta Financial Group, Inc. | | | 1,880 | | | | 52,734 | |
| Moelis & Co. - Class A | | | 2,930 | | | | 102,403 | |
| NMI Holdings, Inc. - Class A(a) | | | 2,460 | | | | 69,839 | |
| Piper Jaffray Cos. | | | 140 | | | | 10,398 | |
| Primerica, Inc.(b) | | | 800 | | | | 95,960 | |
| Pzena Investment Management, Inc. - Class A | | | 1,795 | | | | 15,419 | |
| Regional Management Corp.(a) | | | 335 | | | | 8,834 | |
| RLI Corp. | | | 1,240 | | | | 106,280 | |
| Silvercrest Asset Management Group, Inc. - Class A | | | 441 | | | | 6,187 | |
| Stock Yards Bancorp, Inc. | | | 1,880 | | | | 67,962 | |
| United Community Banks, Inc. | | | 660 | | | | 18,850 | |
| Washington Trust Bancorp, Inc. | | | 720 | | | | 37,570 | |
| | | | | | | | 4,628,323 | |
| Health Care - 26.7% | | | | | | | | |
| ACADIA Pharmaceuticals, Inc.(a) (b) | | | 1,020 | | | | 27,265 | |
| Acceleron Pharma, Inc.(a) | | | 860 | | | | 35,329 | |
| Addus HomeCare Corp.(a) | | | 870 | | | | 65,207 | |
| Aerie Pharmaceuticals, Inc.(a) (b) | | | 900 | | | | 26,595 | |
| Aimmune Therapeutics, Inc.(a) (b) | | | 465 | | | | 9,681 | |
| Amedisys, Inc.(a) | | | 1,105 | | | | 134,157 | |
| Amicus Therapeutics, Inc.(a) | | | 6,620 | | | | 82,618 | |
| AMN Healthcare Services, Inc.(a) | | | 720 | | | | 39,060 | |
| AnaptysBio, Inc.(a) (b) | | | 785 | | | | 44,290 | |
| ArQule, Inc.(a) | | | 2,790 | | | | 30,718 | |
| Array BioPharma, Inc.(a) | | | 5,745 | | | | 266,166 | |
| Arrowhead Pharmaceuticals, Inc.(a) (b) | | | 1,510 | | | | 40,015 | |
| Assembly Biosciences, Inc.(a) | | | 240 | | | | 3,238 | |
| Atara Biotherapeutics, Inc.(a) | | | 300 | | | | 6,033 | |
| Audentes Therapeutics, Inc.(a) | | | 240 | | | | 9,086 | |
| BioDelivery Sciences International, Inc.(a) | | | 22,440 | | | | 104,346 | |
| Biohaven Pharmaceutical Holding Co. Ltd.(a) | | | 170 | | | | 7,444 | |
| BioSpecifics Technologies Corp.(a) | | | 90 | | | | 5,374 | |
| WILSHIRE SMALL COMPANY GROWTH PORTFOLIO | |
| SCHEDULE OF INVESTMENTS (Continued) | |
| COMMON STOCKS - 97.1% (Continued) | | Shares | | | Value | |
| Health Care - 26.7% (Continued) | | | | | | | | |
| BioTelemetry, Inc.(a) (b) | | | 11,373 | | | $ | 547,609 | |
| Blueprint Medicines Corp.(a) | | | 1,273 | | | | 120,082 | |
| Cambrex Corp.(a) | | | 12,785 | | | | 598,466 | |
| CareDx, Inc.(a) | | | 100 | | | | 3,599 | |
| Catalyst Pharmaceutical, Inc.(a) (b) | | | 6,470 | | | | 24,845 | |
| Chemed Corp. | | | 334 | | | | 120,520 | |
| ChemoCentryx, Inc.(a) | | | 1,655 | | | | 15,392 | |
| Clovis Oncology, Inc.(a) (b) | | | 280 | | | | 4,164 | |
| Codexis, Inc.(a) (b) | | | 100 | | | | 1,843 | |
| CONMED Corp. | | | 1,530 | | | | 130,922 | |
| CorVel Corp.(a) | | | 604 | | | | 52,554 | |
| Cyclerion Therapeutics, Inc.(a) | | | 403 | | | | 4,614 | |
| Dicerna Pharmaceuticals, Inc.(a) | | | 700 | | | | 11,025 | |
| Eagle Pharmaceuticals, Inc.(a) (b) | | | 930 | | | | 51,782 | |
| Editas Medicine, Inc.(a) (b) | | | 610 | | | | 15,091 | |
| Eiger BioPharmaceuticals, Inc.(a) | | | 380 | | | | 4,028 | |
| Emergent BioSolutions, Inc.(a) | | | 1,190 | | | | 57,489 | |
| Enanta Pharmaceuticals, Inc.(a) | | | 3,240 | | | | 273,391 | |
| Ensign Group, Inc. (The) | | | 540 | | | | 30,737 | |
| Esperion Therapeutics, Inc.(a) (b) | | | 1,660 | | | | 77,223 | |
| Fate Therapeutics, Inc.(a) (b) | | | 480 | | | | 9,744 | |
| Fluidigm Corp.(a) | | | 310 | | | | 3,819 | |
| G1 Therapeutics, Inc.(a) (b) | | | 280 | | | | 8,585 | |
| Genomic Health, Inc.(a) | | | 1,885 | | | | 109,650 | |
| Glaukos Corp.(a) | | | 240 | | | | 18,096 | |
| Global Blood Therapeutics, Inc.(a) (b) | | | 990 | | | | 52,074 | |
| Globus Medical, Inc. - Class A(a) | | | 3,980 | | | | 168,354 | |
| Haemonetics Corp.(a) | | | 2,015 | | | | 242,485 | |
| Halozyme Therapeutics, Inc.(a) | | | 11,275 | | | | 193,705 | |
| Hanger, Inc.(a) | | | 2,737 | | | | 52,414 | |
| HealthEquity, Inc.(a) | | | 1,690 | | | | 110,526 | |
| HealthStream, Inc.(a) | | | 500 | | | | 12,930 | |
| Heska Corp.(a) | | | 4,815 | | | | 410,094 | |
| HMS Holdings Corp.(a) | | | 9,674 | | | | 313,341 | |
| Horizon Therapeutics plc(a) | | | 3,940 | | | | 94,796 | |
| ImmunoGen, Inc.(a) | | | 2,275 | | | | 4,937 | |
| WILSHIRE SMALL COMPANY GROWTH PORTFOLIO | |
| SCHEDULE OF INVESTMENTS (Continued) | |
| COMMON STOCKS - 97.1% (Continued) | | Shares | | | Value | |
| Health Care - 26.7% (Continued) | | | | | | | | |
| Immunomedics, Inc.(a) (b) | | | 3,130 | | | $ | 43,413 | |
| Inogen, Inc.(a) (b) | | | 75 | | | | 5,007 | |
| Insmed, Inc.(a) (b) | | | 1,655 | | | | 42,368 | |
| Inspire Medical Systems, Inc.(a) | | | 250 | | | | 15,163 | |
| Integer Holdings Corp.(a) | | | 9,200 | | | | 772,065 | |
| Intercept Pharmaceuticals, Inc.(a) (b) | | | 190 | | | | 15,118 | |
| IntriCon Corp.(a) (b) | | | 150 | | | | 3,504 | |
| Invitae Corp.(a) | | | 260 | | | | 6,110 | |
| Iovance Biotherapeutics, Inc.(a) (b) | | | 3,070 | | | | 75,276 | |
| iRhythm Technologies, Inc.(a) (b) | | | 640 | | | | 50,611 | |
| Ironwood Pharmaceuticals, Inc.(a) (b) | | | 5,022 | | | | 54,941 | |
| Kura Oncology, Inc.(a) | | | 510 | | | | 10,042 | |
| LeMaitre Vascular, Inc. | | | 13,735 | | | | 384,305 | |
| Ligand Pharmaceuticals, Inc.(a) (b) | | | 580 | | | | 66,207 | |
| LivaNova plc(a) | | | 1,190 | | | | 85,632 | |
| Madrigal Pharmaceuticals, Inc.(a) (b) | | | 120 | | | | 12,577 | |
| Medidata Solutions, Inc.(a) | | | 6,385 | | | | 577,906 | |
| Medpace Holdings, Inc.(a) | | | 12,626 | | | | 825,993 | |
| Merit Medical Systems, Inc.(a) | | | 900 | | | | 53,604 | |
| Mesa Laboratories, Inc. | | | 4,260 | | | | 1,040,889 | |
| Mirati Therapeutics, Inc.(a) (b) | | | 120 | | | | 12,360 | |
| Momenta Pharmaceuticals, Inc.(a) | | | 160 | | | | 1,992 | |
| MyoKardia, Inc.(a) (b) | | | 1,190 | | | | 59,667 | |
| Myriad Genetics, Inc.(a) | | | 2,230 | | | | 61,949 | |
| NanoString Technologies, Inc.(a) | | | 2,280 | | | | 69,198 | |
| Natera, Inc.(a) | | | 521 | | | | 14,369 | |
| Neogen Corp.(a) | | | 12,256 | | | | 761,220 | |
| NeoGenomics, Inc.(a) | | | 35,010 | | | | 768,119 | |
| NextGen Healthcare, Inc.(a) | | | 1,210 | | | | 24,079 | |
| NovoCure Ltd.(a) | | | 1,287 | | | | 81,377 | |
| NuVasive, Inc.(a) | | | 820 | | | | 48,003 | |
| Omnicell, Inc.(a) | | | 2,130 | | | | 183,244 | |
| Orthofix Medical, Inc.(a) | | | 660 | | | | 34,901 | |
| Pacira BioSciences, Inc.(a) | | | 1,150 | | | | 50,014 | |
| Phibro Animal Health Corp. - Class A | | | 30 | | | | 953 | |
| Pieris Pharmaceuticals, Inc.(a) | | | 2,060 | | | | 9,682 | |
| WILSHIRE SMALL COMPANY GROWTH PORTFOLIO | |
| SCHEDULE OF INVESTMENTS (Continued) | |
| COMMON STOCKS - 97.1% (Continued) | | Shares | | | Value | |
| Health Care - 26.7% (Continued) | | | | | | | | |
| Portola Pharmaceuticals, Inc.(a) (b) | | | 1,230 | | | $ | 33,370 | |
| PRA Health Sciences, Inc.(a) | | | 15,750 | | | | 1,561,613 | |
| Providence Service Corp. (The)(a) | | | 590 | | | | 33,831 | |
| PTC Therapeutics, Inc.(a) | | | 290 | | | | 13,050 | |
| Quidel Corp.(a) | | | 750 | | | | 44,490 | |
| R1 RCM, Inc.(a) | | | 410 | | | | 5,158 | |
| RadNet, Inc.(a) | | | 30 | | | | 414 | |
| REGENXBIO, Inc.(a) (b) | | | 1,318 | | | | 67,706 | |
| Repligen Corp.(a) (b) | | | 15,840 | | | | 1,361,448 | |
| Rigel Pharmaceuticals, Inc.(a) | | | 11,320 | | | | 29,545 | |
| Spectrum Pharmaceuticals, Inc.(a) | | | 1,940 | | | | 16,703 | |
| STAAR Surgical Co.(a) | | | 2,220 | | | | 65,224 | |
| Stemline Therapeutics, Inc.(a) (b) | | | 1,080 | | | | 16,546 | |
| Supernus Pharmaceuticals, Inc.(a) | | | 14,433 | | | | 477,587 | |
| Surmodics, Inc.(a) | | | 920 | | | | 39,716 | |
| Syros Pharmaceuticals, Inc.(a) | | | 3,470 | | | | 32,132 | |
| Tabula Rasa HealthCare, Inc.(a) (b) | | | 16,430 | | | | 820,349 | |
| Tactile Systems Technology, Inc.(a) (b) | | | 11,832 | | | | 673,477 | |
| Tandem Diabetes Care, Inc.(a) | | | 170 | | | | 10,968 | |
| Teladoc Health, Inc.(a) (b) | | | 450 | | | | 29,885 | |
| Tenet Healthcare Corp.(a) (b) | | | 310 | | | | 6,405 | |
| Tivity Health, Inc.(a) (b) | | | 720 | | | | 11,837 | |
| U.S. Physical Therapy, Inc. | | | 440 | | | | 53,931 | |
| Ultragenyx Pharmaceutical, Inc.(a) (b) | | | 405 | | | | 25,718 | |
| Vanda Pharmaceuticals, Inc.(a) | | | 2,055 | | | | 28,955 | |
| Veracyte, Inc.(a) | | | 780 | | | | 22,238 | |
| Voyager Therapeutics, Inc.(a) (b) | | | 860 | | | | 23,409 | |
| Xencor, Inc.(a) | | | 1,603 | | | | 65,611 | |
| | | | | | | | 16,780,722 | |
| Industrials - 15.1% | | | | | | | | |
| Advanced Drainage Systems, Inc. | | | 2,060 | | | | 67,547 | |
| Aerojet Rocketdyne Holdings, Inc.(a) | | | 5,120 | | | | 229,222 | |
| AeroVironment, Inc.(a) (b) | | | 1,750 | | | | 99,348 | |
| Albany International Corp. - Class A | | | 1,600 | | | | 132,656 | |
| Allegiant Travel Co.(b) | | | 90 | | | | 12,915 | |
| Allied Motion Technologies, Inc. | | | 550 | | | | 20,845 | |
| WILSHIRE SMALL COMPANY GROWTH PORTFOLIO | |
| SCHEDULE OF INVESTMENTS (Continued) | |
| COMMON STOCKS - 97.1% (Continued) | | Shares | | | Value | |
| Industrials - 15.1% (Continued) | | | | | | | | |
| Altra Industrial Motion Corp. | | | 570 | | | $ | 20,452 | |
| Applied Industrial Technologies, Inc. | | | 1,170 | | | | 71,990 | |
| ASGN, Inc.(a) | | | 1,950 | | | | 118,170 | |
| Astronics Corp.(a) | | | 480 | | | | 19,306 | |
| Atkore International Group, Inc.(a) | | | 1,764 | | | | 45,635 | |
| Avis Budget Group, Inc.(a) | | | 1,180 | | | | 41,489 | |
| Axon Enterprise, Inc.(a) (b) | | | 16,290 | | | | 1,045,980 | |
| AZZ, Inc. | | | 850 | | | | 39,117 | |
| Barnes Group, Inc. | | | 3,020 | | | | 170,146 | |
| Barrett Business Services, Inc. | | | 985 | | | | 81,361 | |
| Blue Bird Corp.(a) | | | 110 | | | | 2,166 | |
| Brady Corp. - Class A | | | 1,155 | | | | 56,965 | |
| Brink's Co. (The) | | | 1,510 | | | | 122,581 | |
| Casella Waste Systems, Inc. - Class A(a) | | | 960 | | | | 38,045 | |
| Chart Industries, Inc.(a) | | | 1,020 | | | | 78,418 | |
| Cimpress N.V.(a) (b) | | | 860 | | | | 78,165 | |
| Comfort Systems USA, Inc. | | | 3,860 | | | | 196,821 | |
| Continental Building Products, Inc.(a) | | | 3,600 | | | | 95,652 | |
| CRA International, Inc. | | | 520 | | | | 19,932 | |
| CSW Industrials, Inc. | | | 680 | | | | 46,342 | |
| Deluxe Corp. | | | 1,160 | | | | 47,166 | |
| Douglas Dynamics, Inc. | | | 500 | | | | 19,895 | |
| DXP Enterprises, Inc.(a) | | | 90 | | | | 3,410 | |
| EMCOR Group, Inc. | | | 1,050 | | | | 92,505 | |
| Evoqua Water Technologies Corp.(a) | | | 3,220 | | | | 45,853 | |
| Exponent, Inc. | | | 2,566 | | | | 150,214 | |
| Federal Signal Corp. | | | 3,990 | | | | 106,733 | |
| Forward Air Corp. | | | 1,345 | | | | 79,557 | |
| Foundation Building Materials, Inc.(a) | | | 2,050 | | | | 36,449 | |
| Franklin Electric Co., Inc. | | | 2,350 | | | | 111,625 | |
| Generac Holdings, Inc.(a) | | | 2,285 | | | | 158,602 | |
| Gorman-Rupp Co. (The) | | | 507 | | | | 16,645 | |
| Great Lakes Dredge & Dock Corp.(a) | | | 690 | | | | 7,618 | |
| H&E Equipment Services, Inc.(b) | | | 390 | | | | 11,345 | |
| Harsco Corp.(a) | | | 3,796 | | | | 104,162 | |
| Heidrick & Struggles International, Inc. | | | 950 | | | | 28,472 | |
| WILSHIRE SMALL COMPANY GROWTH PORTFOLIO | |
| SCHEDULE OF INVESTMENTS (Continued) | |
| COMMON STOCKS - 97.1% (Continued) | | Shares | | | Value | |
| Industrials - 15.1% (Continued) | | | | | | | | |
| Heritage-Crystal Clean, Inc.(a) | | | 365 | | | $ | 9,603 | |
| Herman Miller, Inc. | | | 2,235 | | | | 99,905 | |
| Hillenbrand, Inc. | | | 4,310 | | | | 170,546 | |
| Insperity, Inc. | | | 2,002 | | | | 244,523 | |
| JELD-WEN Holding, Inc.(a) | | | 2,485 | | | | 52,757 | |
| John Bean Technologies Corp. | | | 1,510 | | | | 182,905 | |
| Kadant, Inc.(b) | | | 238 | | | | 21,613 | |
| Kforce, Inc. | | | 380 | | | | 13,334 | |
| Kimball International, Inc. - Class B | | | 2,075 | | | | 36,167 | |
| Korn Ferry | | | 3,010 | | | | 120,611 | |
| Kratos Defense & Security Solutions, Inc.(a) | | | 24,390 | | | | 558,287 | |
| Marten Transport Ltd.(b) | | | 20,700 | | | | 375,705 | |
| Masonite International Corp.(a) | | | 260 | | | | 13,697 | |
| MasTec, Inc.(a) | | | 810 | | | | 41,739 | |
| McGrath RentCorp | | | 110 | | | | 6,837 | |
| Mercury Systems, Inc.(a) | | | 9,040 | | | | 635,963 | |
| Meritor, Inc.(a) | | | 3,760 | | | | 91,180 | |
| Mobile Mini, Inc. | | | 100 | | | | 3,043 | |
| MSA Safety, Inc. | | | 730 | | | | 76,935 | |
| Mueller Industries, Inc. | | | 2,348 | | | | 68,726 | |
| MYR Group, Inc.(a) | | | 331 | | | | 12,363 | |
| Navistar International Corp.(a) | | | 130 | | | | 4,479 | |
| PGT Innovations, Inc.(a) | | | 70 | | | | 1,170 | |
| Proto Labs, Inc.(a) | | | 550 | | | | 63,811 | |
| Raven Industries, Inc. | | | 3,750 | | | | 134,550 | |
| Rexnord Corp.(a) | | | 1,870 | | | | 56,511 | |
| Saia, Inc.(a) | | | 10,091 | | | | 652,585 | |
| Simpson Manufacturing Co., Inc. | | | 1,330 | | | | 88,392 | |
| SiteOne Landscape Supply, Inc.(a) (b) | | | 14,074 | | | | 975,329 | |
| Tennant Co. | | | 570 | | | | 34,884 | |
| Tetra Tech, Inc. | | | 2,670 | | | | 209,728 | |
| Trex Co., Inc.(a) (b) | | | 2,290 | | | | 164,193 | |
| TriNet Group, Inc.(a) | | | 1,080 | | | | 73,224 | |
| Universal Forest Products, Inc. | | | 820 | | | | 31,209 | |
| Vectrus, Inc.(a) | | | 705 | | | | 28,595 | |
| Vicor Corp.(a) (b) | | | 1,320 | | | | 40,986 | |
| WILSHIRE SMALL COMPANY GROWTH PORTFOLIO | |
| SCHEDULE OF INVESTMENTS (Continued) | |
| COMMON STOCKS - 97.1% (Continued) | | Shares | | | Value | |
| Industrials - 15.1% (Continued) | | | | | | | | |
| Watts Water Technologies, Inc. - Class A | | | 60 | | | $ | 5,591 | |
| Woodward, Inc. | | | 985 | | | | 111,463 | |
| | | | | | | | 9,484,656 | |
| Information Technology - 25.8% | | | | | | | | |
| Acacia Communications, Inc.(a) | | | 4,160 | | | | 196,185 | |
| ACI Worldwide, Inc.(a) | | | 1,300 | | | | 44,642 | |
| Aerohive Networks, Inc.(a) | | | 90 | | | | 399 | |
| Alarm.com Holdings, Inc.(a) | | | 460 | | | | 24,610 | |
| Altair Engineering, Inc. - Class A(a) | | | 2,230 | | | | 90,070 | |
| Alteryx, Inc. - Class A(a) (b) | | | 460 | | | | 50,195 | |
| Anaplan, Inc.(a) (b) | | | 400 | | | | 20,188 | |
| AppFolio, Inc. - Class A(a) (b) | | | 4,537 | | | | 463,999 | |
| Avalara, Inc.(a) | | | 880 | | | | 63,536 | |
| Badger Meter, Inc. | | | 1,080 | | | | 64,465 | |
| Blackbaud, Inc.(b) | | | 890 | | | | 74,315 | |
| BlackLine, Inc.(a) | | | 820 | | | | 43,878 | |
| Bottomline Technologies (de), Inc.(a) | | | 240 | | | | 10,618 | |
| Box, Inc. - Class A(a) | | | 47,949 | | | | 844,382 | |
| Brooks Automation, Inc. | | | 710 | | | | 27,513 | |
| Cabot Microelectronics Corp. | | | 5,465 | | | | 601,587 | |
| Carbon Black, Inc.(a) (b) | | | 1,340 | | | | 22,405 | |
| Cardtronics plc - Class A(a) | | | 1,690 | | | | 46,171 | |
| Cass Information Systems, Inc. | | | 733 | | | | 35,536 | |
| Cision Ltd.(a) | | | 490 | | | | 5,748 | |
| Cloudera, Inc.(a) (b) | | | 7,149 | | | | 37,604 | |
| CommVault Systems, Inc.(a) | | | 617 | | | | 30,616 | |
| Control4 Corp.(a) | | | 760 | | | | 18,050 | |
| Cornerstone OnDemand, Inc.(a) | | | 2,208 | | | | 127,909 | |
| Coupa Software, Inc.(a) | | | 570 | | | | 72,168 | |
| CSG Systems International, Inc. | | | 1,510 | | | | 73,733 | |
| Diodes, Inc.(a) | | | 3,180 | | | | 115,657 | |
| Endava plc(a) | | | 3,490 | | | | 140,438 | |
| Envestnet, Inc.(a) | | | 1,755 | | | | 119,989 | |
| ePlus, Inc.(a) | | | 15 | | | | 1,034 | |
| EVERTEC, Inc. | | | 1,295 | | | | 42,347 | |
| EVO Payments, Inc. - Class A(a) | | | 36,937 | | | | 1,164,624 | |
| WILSHIRE SMALL COMPANY GROWTH PORTFOLIO | |
| SCHEDULE OF INVESTMENTS (Continued) | |
| COMMON STOCKS - 97.1% (Continued) | | Shares | | | Value | |
| Information Technology - 25.8% (Continued) | | | | | | | | |
| ExlService Holdings, Inc.(a) | | | 773 | | | $ | 51,118 | |
| Fair Isaac Corp.(a) | | | 379 | | | | 119,014 | |
| Five9, Inc.(a) | | | 2,300 | | | | 117,967 | |
| ForeScout Technologies, Inc.(a) | | | 860 | | | | 29,120 | |
| HubSpot, Inc.(a) (b) | | | 670 | | | | 114,248 | |
| II-VI, Inc.(a) (b) | | | 2,220 | | | | 81,163 | |
| Inphi Corp.(a) | | | 1,040 | | | | 52,104 | |
| Insight Enterprises, Inc.(a) | | | 200 | | | | 11,640 | |
| Itron, Inc.(a) | | | 120 | | | | 7,508 | |
| j2 Global, Inc. | | | 3,030 | | | | 269,337 | |
| Lattice Semiconductor Corp.(a) | | | 3,500 | | | | 51,065 | |
| LivePerson, Inc.(a) | | | 540 | | | | 15,142 | |
| MAXIMUS, Inc. | | | 17,138 | | | | 1,243,190 | |
| Mimecast Ltd.(a) | | | 24,475 | | | | 1,143,227 | |
| Nanometrics, Inc.(a) | | | 1,235 | | | | 42,867 | |
| New Relic, Inc.(a) | | | 225 | | | | 19,465 | |
| NIC, Inc. | | | 5 | | | | 80 | |
| Novanta, Inc.(a) | | | 430 | | | | 40,549 | |
| NVE Corp. | | | 1,037 | | | | 72,206 | |
| OSI Systems, Inc.(a) | | | 430 | | | | 48,431 | |
| Park Electrochemical Corp. | | | 1,930 | | | | 32,212 | |
| Paylocity Holding Corp.(a) | | | 750 | | | | 70,365 | |
| Pegasystems, Inc. | | | 24,635 | | | | 1,754,258 | |
| Perficient, Inc.(a) | | | 2,730 | | | | 93,694 | |
| Perspecta, Inc. | | | 20 | | | | 468 | |
| Progress Software Corp. | | | 4,460 | | | | 194,545 | |
| Proofpoint, Inc.(a) | | | 45 | | | | 5,411 | |
| PROS Holdings, Inc.(a) | | | 1,230 | | | | 77,810 | |
| QAD, Inc. - Class A | | | 180 | | | | 7,238 | |
| Qualys, Inc.(a) (b) | | | 14,000 | | | | 1,219,120 | |
| Rapid7, Inc.(a) | | | 865 | | | | 50,032 | |
| Rogers Corp.(a) | | | 535 | | | | 92,331 | |
| Sanmina Corp.(a) | | | 2,440 | | | | 73,883 | |
| Science Applications International Corp. | | | 1,760 | | | | 152,346 | |
| Semtech Corp.(a) | | | 1,820 | | | | 87,451 | |
| Silicon Laboratories, Inc.(a) | | | 7,090 | | | | 733,105 | |
| WILSHIRE SMALL COMPANY GROWTH PORTFOLIO | |
| SCHEDULE OF INVESTMENTS (Continued) | |
| COMMON STOCKS - 97.1% (Continued) | | Shares | | | Value | |
| Information Technology - 25.8% (Continued) | | | | | | | | |
| SPS Commerce, Inc.(a) | | | 2,485 | | | $ | 253,992 | |
| Telaria, Inc.(a) | | | 710 | | | | 5,339 | |
| Tenable Holdings, Inc.(a) (b) | | | 340 | | | | 9,704 | |
| Trade Desk, Inc. (The) - Class A(a) (b) | | | 230 | | | | 52,389 | |
| TTEC Holdings, Inc. | | | 693 | | | | 32,287 | |
| Unisys Corp.(a) | | | 180 | | | | 1,750 | |
| Upland Software, Inc.(a) | | | 310 | | | | 14,114 | |
| Varonis Systems, Inc.(a) (b) | | | 810 | | | | 50,171 | |
| Verint Systems, Inc.(a) | | | 3,290 | | | | 176,936 | |
| Viavi Solutions, Inc.(a) | | | 1,690 | | | | 22,460 | |
| Virtusa Corp.(a) | | | 680 | | | | 30,212 | |
| Vishay Precision Group, Inc.(a) | | | 50 | | | | 2,032 | |
| WNS Holdings Ltd. - ADR(a) | | | 29,119 | | | | 1,723,844 | |
| Workiva, Inc.(a) | | | 14,234 | | | | 826,853 | |
| Yext, Inc.(a) | | | 2,990 | | | | 60,069 | |
| Zscaler, Inc.(a) (b) | | | 1,530 | | | | 117,259 | |
| | | | | | | | 16,227,732 | |
| Materials - 2.0% | | | | | | | | |
| Balchem Corp. | | | 533 | | | | 53,284 | |
| Boise Cascade Co. | | | 1,970 | | | | 55,377 | |
| Ferro Corp.(a) | | | 330 | | | | 5,214 | |
| Ferroglobe Representation & Warranty Insurance Trust(a) (c) (d) | | | 840 | | | | 0 | |
| Greif, Inc. - Class A | | | 1,010 | | | | 32,876 | |
| Ingevity Corp.(a) | | | 665 | | | | 69,938 | |
| Kraton Corp.(a) | | | 330 | | | | 10,253 | |
| Kronos Worldwide, Inc. | | | 2,240 | | | | 34,317 | |
| Materion Corp. | | | 1,684 | | | | 114,192 | |
| Myers Industries, Inc. | | | 2,965 | | | | 57,135 | |
| Neenah, Inc. | | | 79 | | | | 5,336 | |
| PolyOne Corp. | | | 1,190 | | | | 37,354 | |
| Quaker Chemical Corp.(b) | | | 3,675 | | | | 745,584 | |
| Worthington Industries, Inc. | | | 450 | | | | 18,117 | |
| | | | | | | | 1,238,977 | |
| Real Estate - 1.2% | | | | | | | | |
| Americold Realty Trust(b) | | | 2,740 | | | | 88,831 | |
| WILSHIRE SMALL COMPANY GROWTH PORTFOLIO | |
| SCHEDULE OF INVESTMENTS (Continued) | |
| COMMON STOCKS - 97.1% (Continued) | | Shares | | | Value | |
| Real Estate - 1.2% (Continued) | | | | | | | | |
| Cushman & Wakefield plc(a) | | | 1,350 | | | $ | 24,138 | |
| EastGroup Properties, Inc. | | | 1,353 | | | | 156,921 | |
| First Industrial Realty Trust, Inc. | | | 2,250 | | | | 82,665 | |
| Monmouth Real Estate Investment Corp. | | | 230 | | | | 3,117 | |
| National Health Investors, Inc. | | | 280 | | | | 21,848 | |
| Newmark Group, Inc. - Class A(b) | | | 3,080 | | | | 27,658 | |
| NexPoint Residential Trust, Inc. | | | 360 | | | | 14,904 | |
| PS Business Parks, Inc. | | | 470 | | | | 79,209 | |
| RMR Group, Inc. (The) - Class A | | | 360 | | | | 16,913 | |
| Ryman Hospitality Properties, Inc. | | | 2,990 | | | | 242,459 | |
| Tanger Factory Outlet Centers, Inc.(b) | | | 570 | | | | 9,240 | |
| | | | | | | | 767,903 | |
| Utilities - 0.4% | | | | | | | | |
| American States Water Co. | | | 800 | | | | 60,192 | |
| Genie Energy Ltd. - Class B(b) | | | 2,710 | | | | 28,862 | |
| Otter Tail Corp. | | | 3,200 | | | | 168,992 | |
| | | | | | | | 258,046 | |
| | | | | | | | | |
| Total Common Stocks(Cost $47,346,515) | | | | | | $ | 61,053,770 | |
| WILSHIRE SMALL COMPANY GROWTH PORTFOLIO | |
| SCHEDULE OF INVESTMENTS (Continued) | |
| MONEY MARKET FUNDS - 4.7% | | Shares | | | Value | |
| Northern Trust Institutional Government Select Portfolio - Institutional Class, 2.24%(e) | | | 1,822,932 | | | $ | 1,822,932 | |
| Northern Trust Institutional Liquid Asset Portfolio - Institutional Class, 2.36%(e) (f) | | | 1,119,629 | | | | 1,119,629 | |
| Total Money Market Funds(Cost $2,942,561) | | | | | | $ | 2,942,561 | |
| | | | | | | | | |
| Total Investments at Value - 101.8%(Cost $50,289,076) | | | | | | $ | 63,996,331 | |
| | | | | | | | | |
| Liabilities in Excess of Other Assets - (1.8%) | | | | | | | (1,142,713 | ) |
| | | | | | | | | |
| Net Assets - 100.0% | | | | | | $ | 62,853,618 | |
| (a) | Non-income producing security. |
| (b) | This security or a partial position of this security is on loan at June 30, 2019. The total market value of securities on loan at June 30, 2019 was $12,008,905. |
| (c) | Level 3 security. Security has been valued at fair value in accordance with procedures adopted by and under the general supervision of the Board of Directors. The total value of such securities is $0 as of June 30, 2019, representing 0.0% of net assets. |
| (d) | Illiquid security. The total value of such securities is $0 as of June 30, 2019, representing 0.0% of net assets. |
| (e) | The rate shown is the 7-day effective yield as of June 30, 2019. |
| (f) | This security was purchased with cash collateral held from securities on loan. The total value of such securities as of June 30, 2019 was $1,119,629. Securities on loan are also collateralized by various U.S. Treasury obligations in the amount of $11,090,664. |
| ADR - | American Depositary Receipt. |
| |
| WILSHIRE SMALL COMPANY VALUE PORTFOLIO | |
| SCHEDULE OF INVESTMENTS | |
| June 30, 2019 (Unaudited) | |
| COMMON STOCKS - 96.5% | | Shares | | | Value | |
| Communication Services - 1.1% | | | | | | | | |
| Entravision Communications Corp. - Class A | | | 10,770 | | | $ | 33,602 | |
| IDT Corp. - Class B(a) | | | 3,300 | | | | 31,251 | |
| Liberty Latin America Ltd. - Class A(a) | | | 2,050 | | | | 35,322 | |
| Liberty Latin America Ltd. - Class C(a) | | | 1,210 | | | | 20,800 | |
| Marcus Corp. (The) | | | 3,110 | | | | 102,506 | |
| MSG Networks, Inc. - Class A(a) | | | 6,030 | | | | 125,062 | |
| National CineMedia, Inc.(b) | | | 29,360 | | | | 192,601 | |
| New Media Investment Group, Inc.(b) | | | 10,045 | | | | 94,825 | |
| Saga Communications, Inc. - Class A | | | 161 | | | | 5,030 | |
| Sinclair Broadcast Group, Inc. - Class A | | | 340 | | | | 18,234 | |
| WideOpenWest, Inc.(a) (b) | | | 450 | | | | 3,267 | |
| | | | | | | | 662,500 | |
| Consumer Discretionary - 7.2% | | | | | | | | |
| Aaron's, Inc. | | | 2,480 | | | | 152,296 | |
| Adtalem Global Education, Inc.(a) | | | 3,920 | | | | 176,596 | |
| American Axle & Manufacturing Holdings, Inc.(a) | | | 370 | | | | 4,721 | |
| American Eagle Outfitters, Inc. | | | 7,842 | | | | 132,529 | |
| American Outdoor Brands Corp.(a) (b) | | | 3,410 | | | | 30,724 | |
| American Public Education, Inc.(a) | | | 1,464 | | | | 43,305 | |
| Bassett Furniture Industries, Inc. | | | 2,330 | | | | 35,533 | |
| Boyd Gaming Corp.(b) | | | 580 | | | | 15,625 | |
| Callaway Golf Co.(b) | | | 3,130 | | | | 53,711 | |
| Chico's FAS, Inc.(b) | | | 534 | | | | 1,800 | |
| Citi Trends, Inc. | | | 2,000 | | | | 29,240 | |
| Columbia Sportswear Co. | | | 575 | | | | 57,592 | |
| Conn's, Inc.(a) (b) | | | 550 | | | | 9,801 | |
| Core-Mark Holding Co., Inc. | | | 3,260 | | | | 129,487 | |
| Dana, Inc. | | | 270 | | | | 5,384 | |
| Designer Brands, Inc. - Class A | | | 3,428 | | | | 65,715 | |
| Dine Brands Global, Inc.(b) | | | 80 | | | | 7,638 | |
| Ethan Allen Interiors, Inc. | | | 2,810 | | | | 59,179 | |
| Flexsteel Industries, Inc. | | | 879 | | | | 14,996 | |
| Fossil Group, Inc.(a) (b) | | | 3,090 | | | | 35,535 | |
| G-III Apparel Group Ltd.(a) (b) | | | 460 | | | | 13,533 | |
| Guess?, Inc.(b) | | | 630 | | | | 10,174 | |
| WILSHIRE SMALL COMPANY VALUE PORTFOLIO | |
| SCHEDULE OF INVESTMENTS (Continued) | |
| COMMON STOCKS - 96.5% (Continued) | | Shares | | | Value | |
| Consumer Discretionary - 7.2% (Continued) | | | | | | | | |
| Helen of Troy Ltd.(a) (b) | | | 275 | | | $ | 35,912 | |
| Hibbett Sports, Inc.(a) | | | 390 | | | | 7,098 | |
| Hooker Furniture Corp. | | | 28,777 | | | | 593,381 | |
| Jack in the Box, Inc. | | | 1,795 | | | | 146,095 | |
| K12, Inc.(a) | | | 1,216 | | | | 36,979 | |
| KB Home | | | 2,550 | | | | 65,612 | |
| La-Z-Boy, Inc. | | | 3,387 | | | | 103,846 | |
| Leaf Group Ltd.(a) | | | 1,490 | | | | 11,041 | |
| Meritage Homes Corp.(a) (b) | | | 420 | | | | 21,563 | |
| Movado Group, Inc.(b) | | | 2,371 | | | | 64,018 | |
| Murphy USA, Inc.(a) | | | 800 | | | | 67,224 | |
| Office Depot, Inc.(b) | | | 9,815 | | | | 20,219 | |
| Penn National Gaming, Inc.(a) (b) | | | 1,430 | | | | 27,542 | |
| Rent-A-Center, Inc.(a) | | | 4,850 | | | | 129,156 | |
| Rocky Brands, Inc. | | | 180 | | | | 4,910 | |
| Sonic Automotive, Inc. - Class A | | | 100 | | | | 2,335 | |
| Standard Motor Products, Inc. | | | 1,031 | | | | 46,746 | |
| Stoneridge, Inc.(a) | | | 14,113 | | | | 445,265 | |
| Strategic Education, Inc. | | | 362 | | | | 64,436 | |
| Taylor Morrison Home Corp. - Class A(a) | | | 38,015 | | | | 796,793 | |
| Tilly's, Inc. - Class A | | | 2,497 | | | | 19,052 | |
| TRI Pointe Group, Inc.(a) (b) | | | 21,121 | | | | 252,818 | |
| Universal Electronics, Inc.(a) | | | 400 | | | | 16,408 | |
| Vera Bradley, Inc.(a) (b) | | | 3,170 | | | | 38,040 | |
| Weight Watchers International, Inc.(a) | | | 2,642 | | | | 50,462 | |
| Wingstop, Inc. | | | 400 | | | | 37,900 | |
| Zumiez, Inc.(a) | | | 1,410 | | | | 36,801 | |
| | | | | | | | 4,226,766 | |
| Consumer Staples - 1.8% | | | | | | | | |
| BJ's Wholesale Club Holdings, Inc.(a) | | | 2,210 | | | | 58,344 | |
| Edgewell Personal Care Co.(a) | | | 250 | | | | 6,737 | |
| Inter Parfums, Inc. | | | 50 | | | | 3,325 | |
| Landec Corp.(a) | | | 65,795 | | | | 616,499 | |
| Natural Grocers by Vitamin Cottage, Inc.(a) | | | 4,900 | | | | 49,245 | |
| Sanderson Farms, Inc.(b) | | | 840 | | | | 114,710 | |
| Universal Corp. | | | 540 | | | | 32,816 | |
| WILSHIRE SMALL COMPANY VALUE PORTFOLIO | |
| SCHEDULE OF INVESTMENTS (Continued) | |
| | |
| COMMON STOCKS - 96.5% (Continued) | | Shares | | | Value | |
| Consumer Staples - 1.8% (Continued) | | | | | | | | |
| Vector Group Ltd. | | | 14,349 | | | $ | 139,903 | |
| | | | | | | | 1,021,579 | |
| Energy - 7.0% | | | | | | | | |
| Archrock, Inc. | | | 15,413 | | | | 163,377 | |
| C&J Energy Services, Inc.(a) | | | 570 | | | | 6,715 | |
| California Resources Corp.(a) (b) | | | 2,390 | | | | 47,035 | |
| Carrizo Oil & Gas, Inc.(a) (b) | | | 3,910 | | | | 39,178 | |
| Centennial Resource Development, Inc. - Class A(a) (b) | | | 82,405 | | | | 625,454 | |
| CONSOL Energy, Inc.(a) (b) | | | 1,970 | | | | 52,422 | |
| CVR Energy, Inc. | | | 1,580 | | | | 78,984 | |
| Delek US Holdings, Inc.(b) | | | 3,140 | | | | 127,233 | |
| Denbury Resources, Inc.(a) (b) | | | 4,170 | | | | 5,171 | |
| Dril-Quip, Inc.(a) (b) | | | 740 | | | | 35,520 | |
| Equitrans Midstream Corp.(b) | | | 41,440 | | | | 816,782 | |
| Forum Energy Technologies, Inc.(a) (b) | | | 14,220 | | | | 48,632 | |
| FTS International, Inc.(a) (b) | | | 4,050 | | | | 22,599 | |
| Golar LNG Ltd.(b) | | | 690 | | | | 12,751 | |
| Hallador Energy Co. | | | 3,810 | | | | 21,450 | |
| Helix Energy Solutions Group, Inc.(a) | | | 930 | | | | 8,026 | |
| Laredo Petroleum, Inc.(a) (b) | | | 37,290 | | | | 108,141 | |
| McDermott International, Inc.(a) (b) | | | 1,230 | | | | 11,882 | |
| Midstates Petroleum Co., Inc.(a) | | | 5,964 | | | | 35,128 | |
| Nabors Industries Ltd.(b) | | | 10,680 | | | | 30,972 | |
| NACCO Industries, Inc. - Class A | | | 1,450 | | | | 75,313 | |
| Natural Gas Services Group, Inc.(a) | | | 1,090 | | | | 17,985 | |
| Oasis Petroleum, Inc.(a) (b) | | | 3,823 | | | | 21,715 | |
| Oceaneering International, Inc.(a) | | | 1,180 | | | | 24,060 | |
| Oil States International, Inc.(a) (b) | | | 1,850 | | | | 33,855 | |
| Overseas Shipholding Group, Inc. - Class A(a) | | | 26,392 | | | | 49,617 | |
| Panhandle Oil and Gas, Inc. - Class A(b) | | | 4,020 | | | | 52,421 | |
| PDC Energy, Inc.(a) | | | 13,520 | | | | 487,531 | |
| Peabody Energy Corp. | | | 2,228 | | | | 53,695 | |
| Ring Energy, Inc.(a) | | | 20,380 | | | | 66,235 | |
| SandRidge Energy, Inc.(a) | | | 3,225 | | | | 22,317 | |
| SEACOR Holdings, Inc.(a) (b) | | | 1,850 | | | | 87,894 | |
| SRC Energy, Inc.(a) | | | 12,820 | | | | 63,587 | |
| WILSHIRE SMALL COMPANY VALUE PORTFOLIO | |
| SCHEDULE OF INVESTMENTS (Continued) | |
| COMMON STOCKS - 96.5% (Continued) | | Shares | | | Value | |
| Energy - 7.0% (Continued) | | | | | | | | |
| Talos Energy, Inc.(a) | | | 1,250 | | | $ | 30,063 | |
| Transocean Ltd.(a) (b) | | | 241 | | | | 1,545 | |
| Unit Corp.(a) (b) | | | 360 | | | | 3,200 | |
| W&T Offshore, Inc.(a) | | | 9,460 | | | | 46,922 | |
| Whiting Petroleum Corp.(a) (b) | | | 4,980 | | | | 93,026 | |
| World Fuel Services Corp. | | | 1,430 | | | | 51,423 | |
| WPX Energy, Inc.(a) | | | 43,725 | | | | 503,275 | |
| | | | | | | | 4,083,131 | |
| Financials - 28.0% | | | | | | | | |
| Ameris Bancorp(b) | | | 32,096 | | | | 1,257,841 | |
| AMERISAFE, Inc. | | | 1,010 | | | | 64,408 | |
| Argo Group International Holdings Ltd. | | | 394 | | | | 29,176 | |
| Arrow Financial Corp. | | | 569 | | | | 19,761 | |
| Artisan Partners Asset Management, Inc. - Class A | | | 3,900 | | | | 107,328 | |
| Associated Banc-Corp. | | | 1,148 | | | | 24,269 | |
| Bancorp, Inc. (The)(a) | | | 2,810 | | | | 25,065 | |
| Bank of N.T. Butterfield & Son Ltd. (The) | | | 25,076 | | | | 851,580 | |
| BankUnited, Inc. | | | 4,060 | | | | 136,984 | |
| Banner Corp. | | | 1,310 | | | | 70,937 | |
| Berkshire Hills Bancorp, Inc. | | | 864 | | | | 27,121 | |
| Blackstone Mortgage Trust, Inc. - Class A(b) | | | 1,780 | | | | 63,332 | |
| Blucora, Inc.(a) | | | 2,350 | | | | 71,370 | |
| Boston Private Financial Holdings, Inc. | | | 7,200 | | | | 86,904 | |
| BrightSphere Investment Group plc | | | 7,490 | | | | 85,461 | |
| Brookline Bancorp, Inc. | | | 15,958 | | | | 245,434 | |
| Cadence Bancorp. | | | 15,230 | | | | 316,784 | |
| Capitol Federal Financial, Inc. | | | 7,414 | | | | 102,091 | |
| Carolina Financial Corp. | | | 1,220 | | | | 42,810 | |
| Cathay General Bancorp | | | 6,441 | | | | 231,296 | |
| CenterState Bank Corp. | | | 4,855 | | | | 111,811 | |
| Central Pacific Financial Corp. | | | 329 | | | | 9,857 | |
| Chemical Financial Corp. | | | 4,075 | | | | 167,523 | |
| City Holding Co. | | | 824 | | | | 62,838 | |
| CNO Financial Group, Inc. | | | 5,378 | | | | 89,705 | |
| Columbia Banking System, Inc. | | | 1,920 | | | | 69,466 | |
| Community Bank System, Inc.(b) | | | 1,960 | | | | 129,046 | |
| WILSHIRE SMALL COMPANY VALUE PORTFOLIO | |
| SCHEDULE OF INVESTMENTS (Continued) | |
| COMMON STOCKS - 96.5% (Continued) | | Shares | | | Value | |
| Financials - 28.0% (Continued) | | | | | | | | |
| CVB Financial Corp. | | | 14,860 | | | $ | 312,506 | |
| Dime Community Bancshares, Inc. | | | 1,364 | | | | 25,902 | |
| Donegal Group, Inc. - Class A | | | 2,480 | | | | 37,870 | |
| Eagle Bancorp, Inc. | | | 738 | | | | 39,948 | |
| Employers Holdings, Inc. | | | 290 | | | | 12,258 | |
| Enova International, Inc.(a) | | | 2,680 | | | | 61,774 | |
| Enterprise Financial Services Corp. | | | 1,732 | | | | 72,051 | |
| Essent Group Ltd.(a) | | | 8,120 | | | | 381,559 | |
| FBL Financial Group, Inc. - Class A | | | 1,212 | | | | 77,326 | |
| Federated Investors, Inc. - Class B | | | 3,400 | | | | 110,500 | |
| First BanCorp. | | | 2,050 | | | | 22,632 | |
| First Citizens BancShares, Inc. - Class A | | | 331 | | | | 149,039 | |
| First Commonwealth Financial Corp. | | | 160 | | | | 2,155 | |
| First Defiance Financial Corp. | | | 1,386 | | | | 39,598 | |
| First Financial Corp. | | | 1,011 | | | | 40,602 | |
| First Horizon National Corp.(b) | | | 45,337 | | | | 676,881 | |
| First Merchants Corp. | | | 3,740 | | | | 141,746 | |
| First Midwest Bancorp, Inc. | | | 2,650 | | | | 54,246 | |
| Fulton Financial Corp. | | | 7,930 | | | | 129,814 | |
| Genworth Financial, Inc. - Class A(a) (b) | | | 30,810 | | | | 114,305 | |
| Glacier Bancorp, Inc. | | | 2,457 | | | | 99,631 | |
| Global Indemnity Ltd. | | | 1,839 | | | | 56,935 | |
| Great Western Bancorp, Inc. | | | 5,820 | | | | 207,890 | |
| Hallmark Financial Services, Inc.(a) | | | 6,086 | | | | 86,604 | |
| Hancock Whitney Corp. | | | 2,586 | | | | 103,595 | |
| Heritage Commerce Corp. | | | 1,580 | | | | 19,355 | |
| Home BancShares, Inc. | | | 6,460 | | | | 124,420 | |
| HomeStreet, Inc.(a) | | | 20,655 | | | | 612,213 | |
| Hope Bancorp, Inc. | | | 7,910 | | | | 109,000 | |
| Horace Mann Educators Corp. | | | 5,490 | | | | 221,191 | |
| IBERIABANK Corp. | | | 2,140 | | | | 162,319 | |
| Independent Bank Corp. | | | 1,618 | | | | 35,256 | |
| International Bancshares Corp. | | | 1,400 | | | | 52,794 | |
| Invesco Mortgage Capital, Inc.(b) | | | 2,000 | | | | 32,240 | |
| Investors Bancorp, Inc. | | | 9,910 | | | | 110,497 | |
| Kemper Corp. | | | 1,670 | | | | 144,104 | |
| WILSHIRE SMALL COMPANY VALUE PORTFOLIO | |
| SCHEDULE OF INVESTMENTS (Continued) | |
| COMMON STOCKS - 96.5% (Continued) | | Shares | | | Value | |
| Financials - 28.0% (Continued) | | | | | | | | |
| LegacyTexas Financial Group, Inc. | | | 3,225 | | | $ | 131,290 | |
| Mercantile Bank Corp. | | | 1,498 | | | | 48,805 | |
| Meridian Bancorp, Inc. | | | 9,425 | | | | 168,613 | |
| Meta Financial Group, Inc.(b) | | | 420 | | | | 11,781 | |
| MGIC Investment Corp.(a) | | | 10,895 | | | | 143,160 | |
| MutualFirst Financial, Inc. | | | 840 | | | | 28,594 | |
| National Bank Holdings Corp. - Class A | | | 1,915 | | | | 69,515 | |
| National General Holdings Corp. | | | 4,090 | | | | 93,825 | |
| National Western Life Group, Inc. - Class A | | | 595 | | | | 152,915 | |
| NBT Bancorp, Inc. | | | 2,028 | | | | 76,070 | |
| NMI Holdings, Inc. - Class A(a) | | | 5,029 | | | | 142,773 | |
| Northfield Bancorp, Inc. | | | 1,832 | | | | 28,598 | |
| Northrim BanCorp, Inc. | | | 1,360 | | | | 48,498 | |
| Northwest Bancshares, Inc. | | | 3,270 | | | | 57,585 | |
| On Deck Capital, Inc.(a) | | | 3,610 | | | | 14,982 | |
| OP Bancorp | | | 2,961 | | | | 32,097 | |
| Oritani Financial Corp. | | | 1,150 | | | | 20,401 | |
| Orrstown Financial Services, Inc.(b) | | | 430 | | | | 9,456 | |
| PacWest Bancorp(b) | | | 15,065 | | | | 584,974 | |
| PennyMac Mortgage Investment Trust | | | 2,250 | | | | 49,118 | |
| Provident Financial Services, Inc. | | | 2,550 | | | | 61,838 | |
| Pzena Investment Management, Inc. - Class A | | | 7,016 | | | | 60,268 | |
| Radian Group, Inc. | | | 12,746 | | | | 291,246 | |
| RenaissanceRe Holdings Ltd. | | | 6,255 | | | | 1,113,452 | |
| Renasant Corp. | | | 5,990 | | | | 215,281 | |
| Republic Bancorp, Inc. - Class A | | | 2,233 | | | | 111,092 | |
| RLI Corp. | | | 800 | | | | 68,568 | |
| S&T Bancorp, Inc.(b) | | | 1,687 | | | | 63,229 | |
| Selective Insurance Group, Inc. | | | 1,240 | | | | 92,864 | |
| Stifel Financial Corp. | | | 1,900 | | | | 112,213 | |
| Stock Yards Bancorp, Inc. | | | 3,470 | | | | 125,441 | |
| Texas Capital Bancshares, Inc.(a) | | | 9,275 | | | | 569,207 | |
| Third Point Reinsurance Ltd.(a) (b) | | | 8,133 | | | | 83,933 | |
| TowneBank | | | 3,160 | | | | 86,205 | |
| TPG RE Finance Trust, Inc. | | | 570 | | | | 10,995 | |
| TrustCo Bank Corp.(b) | | | 8,390 | | | | 66,449 | |
| WILSHIRE SMALL COMPANY VALUE PORTFOLIO | |
| SCHEDULE OF INVESTMENTS (Continued) | |
| COMMON STOCKS - 96.5% (Continued) | | Shares | | | Value | |
| Financials - 28.0% (Continued) | | | | | | | | |
| Trustmark Corp. | | | 2,960 | | | $ | 98,420 | |
| UMB Financial Corp. | | | 100 | | | | 6,582 | |
| Umpqua Holdings Corp. | | | 1,130 | | | | 18,747 | |
| United Bankshares, Inc.(b) | | | 6,290 | | | | 233,296 | |
| United Community Banks, Inc. | | | 5,200 | | | | 148,512 | |
| Univest Financial Corp. | | | 1,200 | | | | 31,512 | |
| Veritex Holdings, Inc.(b) | | | 2,580 | | | | 66,951 | |
| Waddell & Reed Financial, Inc. - Class A(b) | | | 1,680 | | | | 28,006 | |
| Walker & Dunlop, Inc.(b) | | | 860 | | | | 45,761 | |
| Washington Federal, Inc. | | | 4,810 | | | | 168,013 | |
| Washington Trust Bancorp, Inc. | | | 610 | | | | 31,830 | |
| WesBanco, Inc. | | | 1,520 | | | | 58,596 | |
| Western Alliance Bancorp.(a) | | | 25,592 | | | | 1,144,473 | |
| Wintrust Financial Corp. | | | 683 | | | | 49,968 | |
| WSFS Financial Corp. | | | 1,765 | | | | 72,895 | |
| | | | | | | | 16,429,847 | |
| Health Care - 2.3% | | | | | | | | |
| Anika Therapeutics, Inc.(a) (b) | | | 100 | | | | 4,062 | |
| Avanos Medical, Inc.(a) (b) | | | 323 | | | | 14,086 | |
| CONMED Corp. | | | 1,680 | | | | 143,758 | |
| Evolent Health, Inc. - Class A(a) (b) | | | 1,240 | | | | 9,858 | |
| Haemonetics Corp.(a) | | | 679 | | | | 81,711 | |
| Hanger, Inc.(a) | | | 3,238 | | | | 62,008 | |
| HMS Holdings Corp.(a) | | | 4,450 | | | | 144,136 | |
| Integer Holdings Corp.(a) (b) | | | 1,585 | | | | 133,013 | |
| LivaNova plc(a) | | | 6,925 | | | | 498,322 | |
| Mallinckrodt plc(a) (b) | | | 3,920 | | | | 35,986 | |
| Myriad Genetics, Inc.(a) | | | 740 | | | | 20,557 | |
| National HealthCare Corp. | | | 1,103 | | | | 89,508 | |
| Orthofix Medical, Inc.(a) | | | 400 | | | | 21,152 | |
| Spectrum Pharmaceuticals, Inc.(a) | | | 500 | | | | 4,305 | |
| Tivity Health, Inc.(a) | | | 5,500 | | | | 90,420 | |
| Triple-S Management Corp. - Class B(a) | | | 460 | | | | 10,971 | |
| | | | | | | | 1,363,853 | |
| Industrials - 19.3% | | | | | | | | |
| AAR Corp. | | | 690 | | | | 25,385 | |
| WILSHIRE SMALL COMPANY VALUE PORTFOLIO | |
| SCHEDULE OF INVESTMENTS (Continued) | |
| COMMON STOCKS - 96.5% (Continued) | | Shares | | | Value | |
| Industrials - 19.3% (Continued) | | | | | | | | |
| Aerojet Rocketdyne Holdings, Inc.(a) | | | 1,920 | | | $ | 85,958 | |
| AeroVironment, Inc.(a) | | | 495 | | | | 28,101 | |
| Alamo Group, Inc. | | | 6,055 | | | | 605,075 | |
| Albany International Corp. - Class A | | | 4,035 | | | | 334,542 | |
| Altra Industrial Motion Corp. | | | 3,730 | | | | 133,832 | |
| Apogee Enterprises, Inc. | | | 11,410 | | | | 495,650 | |
| Applied Industrial Technologies, Inc. | | | 1,165 | | | | 71,682 | |
| ArcBest Corp. | | | 1,390 | | | | 39,073 | |
| Astronics Corp.(a) | | | 11,480 | | | | 461,726 | |
| AZZ, Inc. | | | 3,280 | | | | 150,946 | |
| Barnes Group, Inc. | | | 7,515 | | | | 423,395 | |
| Blue Bird Corp.(a) | | | 4,440 | | | | 87,424 | |
| BMC Stock Holdings, Inc.(a) | | | 33,180 | | | | 703,416 | |
| Brady Corp. - Class A | | | 1,731 | | | | 85,373 | |
| CBIZ, Inc.(a) | | | 1,690 | | | | 33,107 | |
| Columbus McKinnon Corp. | | | 750 | | | | 31,478 | |
| Comfort Systems USA, Inc. | | | 2,503 | | | | 127,628 | |
| CSW Industrials, Inc. | | | 2,193 | | | | 149,453 | |
| Curtiss-Wright Corp. | | | 830 | | | | 105,518 | |
| Ducommun, Inc.(a) | | | 840 | | | | 37,859 | |
| DXP Enterprises, Inc.(a) | | | 1,350 | | | | 51,152 | |
| Echo Global Logistics, Inc.(a) | | | 1,310 | | | | 27,340 | |
| EMCOR Group, Inc. | | | 2,642 | | | | 232,760 | |
| Encore Wire Corp. | | | 890 | | | | 52,136 | |
| EnerSys | | | 10,177 | | | | 697,124 | |
| Exponent, Inc. | | | 1,136 | | | | 66,501 | |
| Federal Signal Corp. | | | 16,803 | | | | 449,480 | |
| Foundation Building Materials, Inc.(a) | | | 5,530 | | | | 98,323 | |
| Franklin Electric Co., Inc. | | | 3,050 | | | | 144,875 | |
| FTI Consulting, Inc.(a) | | | 1,735 | | | | 145,462 | |
| Gencor Industries, Inc.(a) | | | 1,314 | | | | 17,082 | |
| Gibraltar Industries, Inc.(a) | | | 100 | | | | 4,036 | |
| GP Strategies Corp.(a) | | | 20,375 | | | | 307,256 | |
| Graham Corp. | | | 2,354 | | | | 47,574 | |
| H&E Equipment Services, Inc.(b) | | | 1,020 | | | | 29,672 | |
| Heidrick & Struggles International, Inc. | | | 7,589 | | | | 227,442 | |
| WILSHIRE SMALL COMPANY VALUE PORTFOLIO | |
| SCHEDULE OF INVESTMENTS (Continued) | |
| COMMON STOCKS - 96.5% (Continued) | | Shares | | | Value | |
| Industrials - 19.3% (Continued) | | | | | | | | |
| Heritage-Crystal Clean, Inc.(a) | | | 2,530 | | | $ | 66,564 | |
| Herman Miller, Inc. | | | 2,320 | | | | 103,704 | |
| HNI Corp. | | | 12,265 | | | | 433,935 | |
| Huron Consulting Group, Inc.(a) | | | 490 | | | | 24,686 | |
| ICF International, Inc. | | | 1,310 | | | | 95,368 | |
| Kennametal, Inc. | | | 3,646 | | | | 134,866 | |
| Kimball International, Inc. - Class B | | | 2,268 | | | | 39,531 | |
| Knight-Swift Transportation Holdings, Inc.(b) | | | 22,679 | | | | 744,778 | |
| L.B. Foster Co. - Class A(a) | | | 290 | | | | 7,929 | |
| Manitowoc Co., Inc. (The)(a) (b) | | | 1,030 | | | | 18,334 | |
| Mercury Systems, Inc.(a) | | | 1,510 | | | | 106,229 | |
| Milacron Holdings Corp.(a) | | | 4,150 | | | | 57,270 | |
| Moog, Inc. - Class A | | | 682 | | | | 63,842 | |
| Mueller Water Products, Inc. - Series A | | | 3,700 | | | | 36,334 | |
| Navistar International Corp.(a) | | | 2,150 | | | | 74,068 | |
| NOW, Inc.(a) | | | 5,250 | | | | 77,490 | |
| nVent Electric plc | | | 5,895 | | | | 146,137 | |
| Quanta Services, Inc. | | | 24,160 | | | | 922,671 | |
| Rexnord Corp.(a) | | | 6,930 | | | | 209,425 | |
| Rush Enterprises, Inc. - Class A | | | 1,110 | | | | 40,537 | |
| SkyWest, Inc. | | | 2,395 | | | | 145,305 | |
| SP Plus Corp.(a) | | | 1,505 | | | | 48,055 | |
| SPX Corp.(a) | | | 1,170 | | | | 38,633 | |
| SPX FLOW, Inc.(a) | | | 4,136 | | | | 173,133 | |
| Tetra Tech, Inc.(b) | | | 1,930 | | | | 151,602 | |
| TriMas Corp.(a) (b) | | | 5,520 | | | | 170,954 | |
| TrueBlue, Inc.(a) (b) | | | 626 | | | | 13,810 | |
| Universal Forest Products, Inc. | | | 3,480 | | | | 132,449 | |
| Vectrus, Inc.(a) | | | 940 | | | | 38,126 | |
| Vicor Corp.(a) (b) | | | 640 | | | | 19,872 | |
| Wabash National Corp. | | | 3,740 | | | | 60,850 | |
| Watts Water Technologies, Inc. - Class A | | | 980 | | | | 91,316 | |
| | | | | | | | 11,302,639 | |
| Information Technology - 12.2% | | | | | | | | |
| Acacia Communications, Inc.(a) | | | 1,480 | | | | 69,797 | |
| ACI Worldwide, Inc.(a) | | | 970 | | | | 33,310 | |
| WILSHIRE SMALL COMPANY VALUE PORTFOLIO | |
| SCHEDULE OF INVESTMENTS (Continued) | |
| COMMON STOCKS - 96.5% (Continued) | | Shares | | | Value | |
| Information Technology - 12.2% (Continued) | | | | | | | | |
| ADTRAN, Inc. | | | 1,816 | | | $ | 27,694 | |
| American Software, Inc. - Class A | | | 1,250 | | | | 16,438 | |
| Anixter International, Inc.(a) | | | 1,900 | | | | 113,449 | |
| Avalara, Inc.(a) | | | 619 | | | | 44,692 | |
| AVX Corp.(b) | | | 830 | | | | 13,778 | |
| Belden, Inc.(b) | | | 1,130 | | | | 67,314 | |
| Cabot Microelectronics Corp. | | | 724 | | | | 79,698 | |
| CACI International, Inc. - Class A(a) | | | 571 | | | | 116,821 | |
| Cardtronics plc - Class A(a) | | | 830 | | | | 22,676 | |
| Ciena Corp.(a) (b) | | | 1,070 | | | | 44,009 | |
| Cirrus Logic, Inc.(a) | | | 1,771 | | | | 77,393 | |
| Coherent, Inc.(a) | | | 4,389 | | | | 598,528 | |
| Comtech Telecommunications Corp. | | | 3,550 | | | | 99,790 | |
| Control4 Corp.(a) | | | 365 | | | | 8,669 | |
| CSG Systems International, Inc. | | | 770 | | | | 37,599 | |
| CTS Corp. | | | 5,610 | | | | 154,724 | |
| Diodes, Inc.(a) | | | 5,555 | | | | 202,035 | |
| Entegris, Inc.(b) | | | 14,814 | | | | 552,858 | |
| Euronet Worldwide, Inc.(a) | | | 1,380 | | | | 232,170 | |
| Fabrinet(a) | | | 2,580 | | | | 128,149 | |
| FormFactor, Inc.(a) | | | 150 | | | | 2,351 | |
| Insight Enterprises, Inc.(a) | | | 450 | | | | 26,190 | |
| InterDigital, Inc. | | | 630 | | | | 40,572 | |
| KEMET Corp. | | | 926 | | | | 17,418 | |
| Kimball Electronics, Inc.(a) | | | 9,445 | | | | 153,387 | |
| Knowles Corp.(a) | | | 5,840 | | | | 106,930 | |
| Mellanox Technologies Ltd.(a) | | | 9,000 | | | | 996,030 | |
| Methode Electronics, Inc. | | | 18,550 | | | | 529,974 | |
| Monotype Imaging Holdings, Inc. | | | 3,150 | | | | 53,046 | |
| Nanometrics, Inc.(a) | | | 1,593 | | | | 55,293 | |
| NVE Corp. | | | 1,288 | | | | 89,683 | |
| OSI Systems, Inc.(a) | | | 1,140 | | | | 128,398 | |
| Park Electrochemical Corp. | | | 4,230 | | | | 70,599 | |
| Perficient, Inc.(a) | | | 4,340 | | | | 148,949 | |
| Perspecta, Inc. | | | 7,410 | | | | 173,468 | |
| Plexus Corp.(a) (b) | | | 355 | | | | 20,721 | |
| WILSHIRE SMALL COMPANY VALUE PORTFOLIO | |
| SCHEDULE OF INVESTMENTS (Continued) | |
| COMMON STOCKS - 96.5% (Continued) | | Shares | | | Value | |
| Information Technology - 12.2% (Continued) | | | | | | | | |
| Presidio, Inc. | | | 7,960 | | | $ | 108,813 | |
| Progress Software Corp. | | | 3,333 | | | | 145,385 | |
| Rambus, Inc.(a) | | | 43,820 | | | | 527,593 | |
| Rogers Corp.(a) (b) | | | 719 | | | | 124,085 | |
| Sanmina Corp.(a) | | | 5,094 | | | | 154,246 | |
| Science Applications International Corp.(b) | | | 1,700 | | | | 147,152 | |
| Semtech Corp.(a) | | | 940 | | | | 45,167 | |
| SYNNEX Corp. | | | 930 | | | | 91,512 | |
| Tech Data Corp.(a) | | | 950 | | | | 99,370 | |
| Tenable Holdings, Inc.(a) (b) | | | 740 | | | | 21,120 | |
| Unisys Corp.(a) | | | 2,430 | | | | 23,620 | |
| Verint Systems, Inc.(a) | | | 4,925 | | | | 264,866 | |
| Viavi Solutions, Inc.(a) | | | 2,930 | | | | 38,940 | |
| Vishay Intertechnology, Inc. | | | 807 | | | | 13,332 | |
| Vishay Precision Group, Inc.(a) | | | 580 | | | | 23,565 | |
| | | | | | | | 7,183,366 | |
| Materials - 5.5% | | | | | | | | |
| Boise Cascade Co. | | | 9,945 | | | | 279,554 | |
| Cleveland-Cliffs, Inc.(b) | | | 1,890 | | | | 20,166 | |
| Commercial Metals Co.(b) | | | 1,490 | | | | 26,597 | |
| FutureFuel Corp. | | | 1,929 | | | | 22,550 | |
| Greif, Inc. - Class A | | | 1,785 | | | | 58,101 | |
| Innophos Holdings, Inc. | | | 1,293 | | | | 37,639 | |
| Innospec, Inc. | | | 100 | | | | 9,124 | |
| Intrepid Potash, Inc.(a) | | | 750 | | | | 2,520 | |
| Kaiser Aluminum Corp. | | | 5,932 | | | | 579,023 | |
| Kronos Worldwide, Inc. | | | 1,680 | | | | 25,738 | |
| Louisiana-Pacific Corp. | | | 2,917 | | | | 76,484 | |
| Materion Corp. | | | 5,853 | | | | 396,892 | |
| Neenah, Inc. | | | 7,525 | | | | 508,314 | |
| P.H. Glatfelter Co.(b) | | | 46,525 | | | | 785,342 | |
| PolyOne Corp. | | | 2,410 | | | | 75,650 | |
| Ryerson Holding Corp.(a) | | | 1,730 | | | | 14,411 | |
| Schnitzer Steel Industries, Inc. - Class A | | | 265 | | | | 6,935 | |
| Sensient Technologies Corp. | | | 542 | | | | 39,826 | |
| SunCoke Energy, Inc.(a) | | | 1,980 | | | | 17,582 | |
| WILSHIRE SMALL COMPANY VALUE PORTFOLIO | |
| SCHEDULE OF INVESTMENTS (Continued) | |
| COMMON STOCKS - 96.5% (Continued) | | Shares | | | Value | |
| Materials - 5.5% (Continued) | | | | | | | | |
| Tredegar Corp. | | | 2,550 | | | $ | 42,381 | |
| Tronox Holdings plc - Class A(b) | | | 2,890 | | | | 36,934 | |
| UFP Technologies, Inc.(a) | | | 1,391 | | | | 57,880 | |
| Warrior Met Coal, Inc. | | | 3,270 | | | | 85,412 | |
| Worthington Industries, Inc. | | | 150 | | | | 6,039 | |
| | | | | | | | 3,211,094 | |
| Real Estate - 9.4% | | | | | | | | |
| Armada Hoffler Properties, Inc. | | | 620 | | | | 10,261 | |
| Brandywine Realty Trust | | | 49,329 | | | | 706,391 | |
| CareTrust REIT, Inc. | | | 3,220 | | | | 76,572 | |
| CatchMark Timber Trust, Inc. - Class A | | | 2,472 | | | | 25,832 | |
| Chatham Lodging Trust | | | 2,560 | | | | 48,307 | |
| Chesapeake Lodging Trust | | | 4,630 | | | | 131,585 | |
| CoreCivic, Inc. | | | 8,410 | | | | 174,592 | |
| Cousins Properties, Inc. | | | 3,838 | | | | 138,802 | |
| Cushman & Wakefield plc(a) | | | 100 | | | | 1,788 | |
| DiamondRock Hospitality Co. | | | 10,010 | | | | 103,503 | |
| First Industrial Realty Trust, Inc. | | | 7,080 | | | | 260,119 | |
| Gladstone Commercial Corp. | | | 1,130 | | | | 23,979 | |
| Healthcare Realty Trust, Inc. | | | 4,160 | | | | 130,291 | |
| Lexington Realty Trust | | | 4,570 | | | | 43,004 | |
| Monmouth Real Estate Investment Corp. | | | 8,040 | | | | 108,942 | |
| National Health Investors, Inc. | | | 821 | | | | 64,063 | |
| Office Properties Income Trust(b) | | | 2,970 | | | | 78,022 | |
| Pebblebrook Hotel Trust | | | 6,780 | | | | 191,060 | |
| Piedmont Office Realty Trust, Inc. - Class A | | | 8,050 | | | | 160,437 | |
| PotlatchDeltic Corp. | | | 9,534 | | | | 371,635 | |
| PS Business Parks, Inc. | | | 344 | | | | 57,974 | |
| RE/MAX Holdings, Inc. - Class A | | | 3,677 | | | | 113,105 | |
| Retail Opportunity Investments Corp. | | | 2,520 | | | | 43,168 | |
| Rexford Industrial Realty, Inc. | | | 6,320 | | | | 255,138 | |
| RLJ Lodging Trust(b) | | | 16,590 | | | | 294,307 | |
| RPT Realty(b) | | | 86,685 | | | | 1,049,754 | |
| STAG Industrial, Inc. | | | 10,307 | | | | 311,684 | |
| Summit Hotel Properties, Inc. | | | 7,040 | | | | 80,749 | |
| Sunstone Hotel Investors, Inc.(b) | | | 11,450 | | | | 156,980 | |
| WILSHIRE SMALL COMPANY VALUE PORTFOLIO | |
| SCHEDULE OF INVESTMENTS (Continued) | |
| COMMON STOCKS - 96.5% (Continued) | | Shares | | | Value | |
| Real Estate - 9.4% (Continued) | | | | | | | | |
| Terreno Realty Corp. | | | 1,170 | | | $ | 57,377 | |
| Urban Edge Properties | | | 340 | | | | 5,892 | |
| Washington Real Estate Investment Trust | | | 3,930 | | | | 105,049 | |
| Xenia Hotels & Resorts, Inc.(b) | | | 7,580 | | | | 158,043 | |
| | | | | | | | 5,538,405 | |
| Utilities - 2.7% | | | | | | | | |
| ALLETE, Inc. | | | 1,870 | | | | 155,604 | |
| American States Water Co. | | | 1,432 | | | | 107,744 | |
| Artesian Resources Corp. - Class A | | | 4,199 | | | | 156,076 | |
| Avista Corp. | | | 1,410 | | | | 62,886 | |
| Black Hills Corp.(b) | | | 540 | | | | 42,212 | |
| El Paso Electric Co. | | | 1,480 | | | | 96,792 | |
| IDACORP, Inc. | | | 1,398 | | | | 140,402 | |
| MGE Energy, Inc. | | | 1,081 | | | | 78,999 | |
| New Jersey Resources Corp.(b) | | | 740 | | | | 36,830 | |
| ONE Gas, Inc. | | | 3,592 | | | | 324,357 | |
| Otter Tail Corp. | | | 1,935 | | | | 102,187 | |
| PNM Resources, Inc. | | | 1,590 | | | | 80,947 | |
| Portland General Electric Co. | | | 2,185 | | | | 118,361 | |
| SJW Group | | | 400 | | | | 24,308 | |
| York Water Co. (The) | | | 1,854 | | | | 66,225 | |
| | | | | | | | 1,593,930 | |
| | | | | | | | | |
| Total Common Stocks(Cost $54,395,186) | | | | | | $ | 56,617,110 | |
| MONEY MARKET FUNDS - 4.3% | | Shares | | | Value | |
| Northern Trust Institutional Government Select Portfolio - Institutional Class, 2.24%(c) | | | 2,384,068 | | | $ | 2,384,068 | |
| WILSHIRE SMALL COMPANY VALUE PORTFOLIO | |
| SCHEDULE OF INVESTMENTS (Continued) | |
| MONEY MARKET FUNDS - 4.3% (Continued) | | Shares | | | Value | |
| Northern Trust Institutional Liquid Asset Portfolio - Institutional Class, 2.36%(c) (d) | | | 138,067 | | | $ | 138,067 | |
| Total Money Market Funds(Cost $2,522,135) | | | | | | $ | 2,522,135 | |
| | | | | | | | | |
| Total Investments at Value - 100.8%(Cost $56,917,321) | | | | | | $ | 59,139,245 | |
| | | | | | | | | |
| Liabilities in Excess of Other Assets - (0.8%) | | | | | | | (441,230 | ) |
| | | | | | | | | |
| Net Assets - 100.0% | | | | | | $ | 58,698,015 | |
| (a) | Non-income producing security. |
| (b) | This security or a partial position of this security is on loan at June 30, 2019. The total market value of securities on loan at June 30, 2019 was $7,797,418. |
| (c) | The rate shown is the 7-day effective yield as of June 30, 2019. |
| (d) | This security was purchased with cash collateral held from securities on loan. The total value of such securities as of June 30, 2019 was $138,067. Securities on loan are also collateralized by various U.S. Treasury obligations in the amount of $7,753,094. |
| WILSHIRE 5000 INDEX FUND | |
| SCHEDULE OF INVESTMENTS | |
| June 30, 2019 (Unaudited) | |
| COMMON STOCKS - 98.3% | | Shares | | | Value | |
| Communication Services - 9.1% | | | | | | | | |
| A.H. Belo Corp. - Class A | | | 90 | | | $ | 332 | |
| Activision Blizzard, Inc. | | | 4,613 | | | | 217,734 | |
| Actua Corp.(a) (b) (c) | | | 100 | | | | 63 | |
| Alphabet, Inc. - Class C(a) | | | 4,133 | | | | 4,467,400 | |
| AMC Entertainment Holdings, Inc. - Class A(d) | | | 107 | | | | 998 | |
| AMC Networks, Inc. - Class A(a) (d) | | | 356 | | | | 19,398 | |
| AT&T, Inc. | | | 48,128 | | | | 1,612,769 | |
| Boingo Wireless, Inc.(a) | | | 750 | | | | 13,478 | |
| Cars.com, Inc.(a) (d) | | | 575 | | | | 11,339 | |
| CBS Corp. - Class B | | | 2,353 | | | | 117,415 | |
| CenturyLink, Inc. | | | 6,072 | | | | 71,407 | |
| Charter Communications, Inc. - Class A(a) | | | 1,328 | | | | 524,799 | |
| Cinemark Holdings, Inc. | | | 775 | | | | 27,978 | |
| Clear Channel Outdoor Holdings(a) (d) | | | 1,000 | | | | 4,720 | |
| Cogent Communications Holdings, Inc. | | | 200 | | | | 11,872 | |
| Comcast Corp. - Class A | | | 27,208 | | | | 1,150,354 | |
| comScore, Inc.(a) (d) | | | 400 | | | | 2,064 | |
| Consolidated Communications Holdings, Inc.(d) | | | 501 | | | | 2,470 | |
| Discovery, Inc. - Series A(a) (d) | | | 798 | | | | 24,499 | |
| DISH Network Corp. - Class A(a) | | | 1,375 | | | | 52,814 | |
| E.W. Scripps Co. (The) - Class A | | | 526 | | | | 8,043 | |
| Electronic Arts, Inc.(a) | | | 1,940 | | | | 196,444 | |
| Entercom Communications Corp. - Class A(d) | | | 250 | | | | 1,450 | |
| Facebook, Inc. - Class A(a) | | | 15,539 | | | | 2,999,027 | |
| Fox Corp. - Class A | | | 2,196 | | | | 80,461 | |
| Gannett Co., Inc.(d) | | | 1,050 | | | | 8,568 | |
| GCI Liberty, Inc. - Class A(a) | | | 681 | | | | 41,854 | |
| Gray Television, Inc.(a) | | | 500 | | | | 8,195 | |
| IAC/InterActiveCorp(a) | | | 450 | | | | 97,889 | |
| IDT Corp. - Class B(a) | | | 2,496 | | | | 23,637 | |
| Interpublic Group of Cos., Inc. (The) | | | 2,422 | | | | 54,713 | |
| Iridium Communications, Inc.(a) (d) | | | 910 | | | | 21,167 | |
| John Wiley & Sons, Inc. - Class A | | | 200 | | | | 9,172 | |
| Liberty Broadband Corp. - Series A(a) | | | 1,381 | | | | 142,022 | |
| Liberty Media Corp. - Liberty Braves - Series A(a) (d) | | | 360 | | | | 10,008 | |
| WILSHIRE 5000 INDEX FUND | |
| SCHEDULE OF INVESTMENTS (Continued) | |
| COMMON STOCKS - 98.3% (Continued) | | Shares | | | Value | |
| Communication Services - 9.1% (Continued) | | | | | | | | |
| Liberty Media Corp. - Liberty Formula One - Series A(a) (d) | | | 600 | | | $ | 21,516 | |
| Liberty Media Corp. - Liberty SiriusXM - Series A(a) | | | 2,252 | | | | 85,148 | |
| Liberty TripAdvisor Holdings, Inc. - Series A(a) | | | 790 | | | | 9,796 | |
| Lions Gate Entertainment Corp. - Class B | | | 1,033 | | | | 11,993 | |
| Live Nation Entertainment, Inc.(a) | | | 1,137 | | | | 75,326 | |
| Loral Space & Communications, Inc.(a) | | | 300 | | | | 10,353 | |
| Madison Square Garden Co. (The) - Class A(a) | | | 93 | | | | 26,034 | |
| Marcus Corp. (The) | | | 100 | | | | 3,296 | |
| Match Group, Inc.(d) | | | 1,015 | | | | 68,279 | |
| Meredith Corp.(d) | | | 300 | | | | 16,518 | |
| MSG Networks, Inc. - Class A(a) (d) | | | 581 | | | | 12,050 | |
| National CineMedia, Inc.(d) | | | 500 | | | | 3,280 | |
| Netflix, Inc.(a) | | | 2,752 | | | | 1,010,865 | |
| New Media Investment Group, Inc.(d) | | | 301 | | | | 2,841 | |
| New York Times Co. (The) - Class A(d) | | | 1,050 | | | | 34,251 | |
| News Corp. - Class A | | | 2,853 | | | | 38,487 | |
| Nexstar Media Group, Inc. - Class A(d) | | | 399 | | | | 40,299 | |
| Omnicom Group, Inc.(d) | | | 844 | | | | 69,166 | |
| Rosetta Stone, Inc.(a) | | | 300 | | | | 6,864 | |
| Scholastic Corp. | | | 325 | | | | 10,803 | |
| Shenandoah Telecommunications Co. | | | 300 | | | | 11,556 | |
| Sinclair Broadcast Group, Inc. - Class A | | | 425 | | | | 22,793 | |
| Sirius XM Holdings, Inc.(d) | | | 14,709 | | | | 82,076 | |
| Spok Holdings, Inc. | | | 400 | | | | 6,016 | |
| Sprint Corp.(a) (d) | | | 5,547 | | | | 36,444 | |
| Take-Two Interactive Software, Inc.(a) | | | 625 | | | | 70,956 | |
| TechTarget, Inc.(a) | | | 800 | | | | 17,000 | |
| TEGNA, Inc.(d) | | | 1,725 | | | | 26,134 | |
| Telephone & Data Systems, Inc. | | | 700 | | | | 21,280 | |
| T-Mobile US, Inc.(a) | | | 2,125 | | | | 157,547 | |
| Travelzoo(a) (d) | | | 100 | | | | 1,544 | |
| TripAdvisor, Inc.(a) | | | 634 | | | | 29,348 | |
| Twitter, Inc.(a) | | | 5,300 | | | | 184,970 | |
| United States Cellular Corp.(a) (d) | | | 300 | | | | 13,401 | |
| Verizon Communications, Inc. | | | 26,423 | | | | 1,509,546 | |
| Viacom, Inc. - Class B | | | 2,082 | | | | 62,189 | |
| WILSHIRE 5000 INDEX FUND | |
| SCHEDULE OF INVESTMENTS (Continued) | |
| COMMON STOCKS - 98.3% (Continued) | | Shares | | | Value | |
| Communication Services - 9.1% (Continued) | | | | | | | | |
| Vonage Holdings Corp.(a) | | | 1,425 | | | $ | 16,145 | |
| Walt Disney Co. (The) | | | 10,226 | | | | 1,427,959 | |
| World Wrestling Entertainment, Inc. - Class A(d) | | | 600 | | | | 43,326 | |
| Yelp, Inc.(a) | | | 566 | | | | 19,346 | |
| Zayo Group Holdings, Inc.(a) | | | 1,525 | | | | 50,188 | |
| Zillow Group, Inc. - Class C(a) (d) | | | 748 | | | | 34,700 | |
| | | | | | | | 17,438,182 | |
| Consumer Discretionary - 10.5% | | | | | | | | |
| 1-800-FLOWERS.COM, Inc. - Class A(a) | | | 300 | | | | 5,664 | |
| Aaron's, Inc. | | | 400 | | | | 24,564 | |
| Abercrombie & Fitch Co. - Class A(d) | | | 425 | | | | 6,817 | |
| Adtalem Global Education, Inc.(a) | | | 400 | | | | 18,020 | |
| Advance Auto Parts, Inc. | | | 491 | | | | 75,683 | |
| Amazon.com, Inc.(a) | | | 2,898 | | | | 5,487,739 | |
| American Axle & Manufacturing Holdings, Inc.(a) (d) | | | 550 | | | | 7,018 | |
| American Eagle Outfitters, Inc. | | | 1,225 | | | | 20,703 | |
| American Outdoor Brands Corp.(a) (d) | | | 475 | | | | 4,280 | |
| American Public Education, Inc.(a) | | | 300 | | | | 8,874 | |
| Aramark | | | 1,675 | | | | 60,401 | |
| Autoliv, Inc.(d) | | | 648 | | | | 45,691 | |
| AutoNation, Inc.(a) | | | 525 | | | | 22,019 | |
| AutoZone, Inc.(a) | | | 186 | | | | 204,501 | |
| Barnes & Noble Education, Inc.(a) (d) | | | 347 | | | | 1,166 | |
| Barnes & Noble, Inc.(d) | | | 550 | | | | 3,680 | |
| Beazer Homes USA, Inc.(a) | | | 200 | | | | 1,922 | |
| Bed Bath & Beyond, Inc.(d) | | | 1,125 | | | | 13,073 | |
| Best Buy Co., Inc. | | | 1,625 | | | | 113,311 | |
| Big Lots, Inc. | | | 200 | | | | 5,722 | |
| Booking Holdings, Inc.(a) | | | 278 | | | | 521,169 | |
| BorgWarner, Inc. | | | 1,310 | | | | 54,994 | |
| Boyd Gaming Corp.(d) | | | 725 | | | | 19,532 | |
| Bright Horizons Family Solutions, Inc.(a) | | | 300 | | | | 45,261 | |
| Brinker International, Inc.(d) | | | 175 | | | | 6,886 | |
| Brunswick Corp. | | | 550 | | | | 25,240 | |
| Buckle, Inc. (The)(d) | | | 350 | | | | 6,059 | |
| Burlington Stores, Inc.(a) | | | 548 | | | | 93,242 | |
| WILSHIRE 5000 INDEX FUND | |
| SCHEDULE OF INVESTMENTS (Continued) | |
| COMMON STOCKS - 98.3% (Continued) | | Shares | | | Value | |
| Consumer Discretionary - 10.5% (Continued) | | | | | | | | |
| Caleres, Inc.(d) | | | 425 | | | $ | 8,466 | |
| Callaway Golf Co.(d) | | | 500 | | | | 8,580 | |
| Career Education Corp.(a) | | | 500 | | | | 9,535 | |
| CarMax, Inc.(a) | | | 930 | | | | 80,752 | |
| Carnival Corp. | | | 2,825 | | | | 131,504 | |
| Carter's, Inc. | | | 382 | | | | 37,260 | |
| Cato Corp. (The) - Class A | | | 300 | | | | 3,696 | |
| Cavco Industries, Inc.(a) | | | 100 | | | | 15,754 | |
| Cheesecake Factory, Inc. (The)(d) | | | 300 | | | | 13,116 | |
| Children's Place, Inc. (The)(d) | | | 132 | | | | 12,590 | |
| Chipotle Mexican Grill, Inc.(a) | | | 157 | | | | 115,062 | |
| Choice Hotels International, Inc. | | | 450 | | | | 39,155 | |
| Churchill Downs, Inc.(d) | | | 201 | | | | 23,129 | |
| Citi Trends, Inc. | | | 50 | | | | 731 | |
| Collectors Universe, Inc. | | | 110 | | | | 2,347 | |
| Columbia Sportswear Co. | | | 100 | | | | 10,016 | |
| Conn's, Inc.(a) (d) | | | 500 | | | | 8,910 | |
| Cooper Tire & Rubber Co. | | | 425 | | | | 13,409 | |
| Core-Mark Holding Co., Inc. | | | 206 | | | | 8,182 | |
| Cracker Barrel Old Country Store, Inc.(d) | | | 191 | | | | 32,609 | |
| Crocs, Inc.(a) | | | 1,200 | | | | 23,700 | |
| CSS Industries, Inc. | | | 50 | | | | 244 | |
| D.R. Horton, Inc. | | | 2,073 | | | | 89,409 | |
| Dana, Inc. | | | 900 | | | | 17,946 | |
| Darden Restaurants, Inc. | | | 823 | | | | 100,184 | |
| Dave & Buster's Entertainment, Inc.(d) | | | 300 | | | | 12,141 | |
| Deckers Outdoor Corp.(a) | | | 25 | | | | 4,399 | |
| Designer Brands, Inc. - Class A(d) | | | 550 | | | | 10,544 | |
| Dick's Sporting Goods, Inc.(d) | | | 527 | | | | 18,250 | |
| Dillard's, Inc. - Class A(d) | | | 347 | | | | 21,611 | |
| Dollar General Corp. | | | 1,696 | | | | 229,231 | |
| Dollar Tree, Inc.(a) | | | 1,546 | | | | 166,025 | |
| Domino's Pizza, Inc. | | | 279 | | | | 77,640 | |
| Dorman Products, Inc.(a) (d) | | | 200 | | | | 17,428 | |
| Dunkin' Brands Group, Inc. | | | 600 | | | | 47,796 | |
| eBay, Inc. | | | 6,565 | | | | 259,318 | |
| WILSHIRE 5000 INDEX FUND | |
| SCHEDULE OF INVESTMENTS (Continued) | |
| COMMON STOCKS - 98.3% (Continued) | | Shares | | | Value | |
| Consumer Discretionary - 10.5% (Continued) | | | | | | | | |
| Empire Resorts, Inc.(a) (d) | | | 20 | | | $ | 192 | |
| Etsy, Inc.(a) | | | 740 | | | | 45,414 | |
| Expedia Group, Inc. | | | 757 | | | | 100,704 | |
| Express, Inc.(a) (d) | | | 1,000 | | | | 2,730 | |
| Fiesta Restaurant Group, Inc.(a) | | | 300 | | | | 3,942 | |
| Five Below, Inc.(a) | | | 200 | | | | 24,004 | |
| Foot Locker, Inc. | | | 1,025 | | | | 42,968 | |
| Ford Motor Co. | | | 25,100 | | | | 256,773 | |
| Fossil Group, Inc.(a) (d) | | | 400 | | | | 4,600 | |
| frontdoor, inc.(a) | | | 487 | | | | 21,209 | |
| Gaia, Inc.(a) (d) | | | 600 | | | | 4,548 | |
| GameStop Corp. - Class A(d) | | | 550 | | | | 3,009 | |
| Gap, Inc. (The) | | | 1,550 | | | | 27,854 | |
| General Motors Co. | | | 8,990 | | | | 346,384 | |
| Gentex Corp. | | | 2,195 | | | | 54,019 | |
| Gentherm, Inc.(a) (d) | | | 75 | | | | 3,137 | |
| Genuine Parts Co. | | | 1,007 | | | | 104,305 | |
| G-III Apparel Group Ltd.(a) (d) | | | 275 | | | | 8,091 | |
| Golden Entertainment, Inc.(a) (d) | | | 100 | | | | 1,400 | |
| Goodyear Tire & Rubber Co. (The) | | | 1,825 | | | | 27,923 | |
| GoPro, Inc. - Class A(a) (d) | | | 300 | | | | 1,638 | |
| Grand Canyon Education, Inc.(a) | | | 200 | | | | 23,404 | |
| Green Brick Partners, Inc.(a) | | | 45 | | | | 374 | |
| Group 1 Automotive, Inc. | | | 223 | | | | 18,261 | |
| GrubHub, Inc.(a) (d) | | | 550 | | | | 42,895 | |
| Guess?, Inc.(d) | | | 400 | | | | 6,460 | |
| H&R Block, Inc.(d) | | | 1,310 | | | | 38,383 | |
| Hanesbrands, Inc.(d) | | | 2,695 | | | | 46,408 | |
| Harley-Davidson, Inc.(d) | | | 1,150 | | | | 41,205 | |
| Hasbro, Inc. | | | 700 | | | | 73,975 | |
| Helen of Troy Ltd.(a) (d) | | | 119 | | | | 15,540 | |
| Hibbett Sports, Inc.(a) | | | 200 | | | | 3,640 | |
| Hilton Grand Vacations, Inc.(a) (d) | | | 105 | | | | 3,341 | |
| Hilton Worldwide Holdings, Inc. | | | 850 | | | | 83,079 | |
| Home Depot, Inc. (The) | | | 7,344 | | | | 1,527,331 | |
| Hooker Furniture Corp.(d) | | | 200 | | | | 4,124 | |
| WILSHIRE 5000 INDEX FUND | |
| SCHEDULE OF INVESTMENTS (Continued) | |
| COMMON STOCKS - 98.3% (Continued) | | Shares | | | Value | |
| Consumer Discretionary - 10.5% (Continued) | | | | | | | | |
| Hyatt Hotels Corp. - Class A | | | 300 | | | $ | 22,839 | |
| IAA, Inc.(a) | | | 975 | | | | 37,811 | |
| International Speedway Corp. - Class A | | | 237 | | | | 10,639 | |
| iRobot Corp.(a) (d) | | | 167 | | | | 15,304 | |
| Jack in the Box, Inc. | | | 236 | | | | 19,208 | |
| K12, Inc.(a) | | | 300 | | | | 9,123 | |
| KB Home | | | 375 | | | | 9,649 | |
| Kohl's Corp. | | | 1,075 | | | | 51,116 | |
| Kontoor Brands, Inc.(a) | | | 339 | | | | 9,499 | |
| L Brands, Inc. | | | 1,484 | | | | 38,732 | |
| Lands' End, Inc.(a) (d) | | | 278 | | | | 3,397 | |
| Las Vegas Sands Corp. | | | 2,727 | | | | 161,138 | |
| La-Z-Boy, Inc. | | | 425 | | | | 13,031 | |
| LCI Industries(d) | | | 154 | | | | 13,860 | |
| Leaf Group Ltd.(a) | | | 200 | | | | 1,482 | |
| Lear Corp. | | | 500 | | | | 69,634 | |
| Leggett & Platt, Inc. | | | 910 | | | | 34,917 | |
| Lennar Corp. - Class A | | | 1,250 | | | | 60,575 | |
| Liberty Expedia Holdings, Inc. - Series A(a) | | | 381 | | | | 18,208 | |
| Lithia Motors, Inc. - Class A(d) | | | 134 | | | | 15,917 | |
| LKQ Corp.(a) | | | 2,100 | | | | 55,881 | |
| Lowe's Cos., Inc. | | | 5,556 | | | | 560,655 | |
| Lumber Liquidators Holdings, Inc.(a) (d) | | | 241 | | | | 2,784 | |
| M.D.C. Holdings, Inc.(d) | | | 330 | | | | 10,817 | |
| Macy's, Inc. | | | 2,223 | | | | 47,706 | |
| Marine Products Corp.(d) | | | 700 | | | | 10,808 | |
| Marriott International, Inc. - Class A | | | 2,349 | | | | 329,541 | |
| Marriott Vacations Worldwide Corp. | | | 244 | | | | 23,522 | |
| Mattel, Inc.(a) (d) | | | 2,255 | | | | 25,279 | |
| McDonald's Corp. | | | 5,138 | | | | 1,066,956 | |
| Meritage Homes Corp.(a) (d) | | | 200 | | | | 10,268 | |
| MGM Resorts International | | | 3,300 | | | | 94,281 | |
| Mohawk Industries, Inc.(a) | | | 392 | | | | 57,808 | |
| Monro, Inc. | | | 325 | | | | 27,723 | |
| Motorcar Parts of America, Inc.(a) (d) | | | 300 | | | | 6,423 | |
| Movado Group, Inc.(d) | | | 300 | | | | 8,100 | |
| WILSHIRE 5000 INDEX FUND | |
| SCHEDULE OF INVESTMENTS (Continued) | |
| COMMON STOCKS - 98.3% (Continued) | | Shares | | | Value | |
| Consumer Discretionary - 10.5% (Continued) | | | | | | | | |
| Murphy USA, Inc.(a) (d) | | | 296 | | | $ | 24,873 | |
| Nautilus, Inc.(a) | | | 50 | | | | 111 | |
| Newell Brands, Inc.(d) | | | 3,415 | | | | 52,659 | |
| NIKE, Inc. - Class B | | | 9,049 | | | | 759,663 | |
| Nordstrom, Inc.(d) | | | 1,000 | | | | 31,860 | |
| Norwegian Cruise Line Holdings Ltd.(a) | | | 325 | | | | 17,430 | |
| NVR, Inc.(a) | | | 40 | | | | 134,811 | |
| O'Reilly Automotive, Inc.(a) | | | 620 | | | | 228,978 | |
| Overstock.com, Inc.(a) (d) | | | 300 | | | | 4,080 | |
| Oxford Industries, Inc.(d) | | | 50 | | | | 3,790 | |
| Papa John's International, Inc.(d) | | | 173 | | | | 7,737 | |
| Penn National Gaming, Inc.(a) (d) | | | 178 | | | | 3,428 | |
| Penske Automotive Group, Inc.(d) | | | 350 | | | | 16,555 | |
| Polaris Industries, Inc. | | | 340 | | | | 31,018 | |
| Pool Corp. | | | 313 | | | | 59,783 | |
| PulteGroup, Inc. | | | 1,915 | | | | 60,552 | |
| PVH Corp. | | | 543 | | | | 51,390 | |
| Qurate Retail, Inc.(a) | | | 2,919 | | | | 36,166 | |
| Ralph Lauren Corp. | | | 406 | | | | 46,118 | |
| RCI Hospitality Holdings, Inc. | | | 300 | | | | 5,253 | |
| Regis Corp.(a) | | | 200 | | | | 3,320 | |
| RH(a) (d) | | | 116 | | | | 13,410 | |
| Rocky Brands, Inc. | | | 100 | | | | 2,728 | |
| Roku, Inc.(a) (d) | | | 290 | | | | 26,268 | |
| Ross Stores, Inc. | | | 2,575 | | | | 255,233 | |
| Royal Caribbean Cruises Ltd. | | | 1,087 | | | | 131,755 | |
| Sally Beauty Holdings, Inc.(a) (d) | | | 700 | | | | 9,338 | |
| SeaWorld Entertainment, Inc.(a) | | | 685 | | | | 21,235 | |
| Service Corp. International | | | 1,250 | | | | 58,474 | |
| ServiceMaster Global Holdings, Inc.(a) | | | 975 | | | | 50,788 | |
| Shoe Carnival, Inc.(d) | | | 600 | | | | 16,560 | |
| Shutterfly, Inc.(a) | | | 100 | | | | 5,055 | |
| Shutterstock, Inc. | | | 122 | | | | 4,781 | |
| Signet Jewelers Ltd.(d) | | | 620 | | | | 11,086 | |
| Six Flags Entertainment Corp.(d) | | | 600 | | | | 29,808 | |
| Skechers U.S.A., Inc. - Class A(a) | | | 750 | | | | 23,618 | |
| WILSHIRE 5000 INDEX FUND | |
| SCHEDULE OF INVESTMENTS (Continued) | |
| COMMON STOCKS - 98.3% (Continued) | | Shares | | | Value | |
| Consumer Discretionary - 10.5% (Continued) | | | | | | | | |
| Sleep Number Corp.(a) | | | 188 | | | $ | 7,593 | |
| Sonic Automotive, Inc. - Class A | | | 300 | | | | 7,005 | |
| Sotheby's(a) (d) | | | 428 | | | | 24,880 | |
| Speedway Motorsports, Inc. | | | 400 | | | | 7,420 | |
| Stamps.com, Inc.(a) (d) | | | 129 | | | | 5,840 | |
| Starbucks Corp. | | | 9,473 | | | | 794,121 | |
| Steven Madden Ltd.(d) | | | 450 | | | | 15,278 | |
| Strategic Education, Inc. | | | 87 | | | | 15,486 | |
| Superior Industries International, Inc. | | | 150 | | | | 519 | |
| Tailored Brands, Inc.(d) | | | 475 | | | | 2,741 | |
| Tapestry, Inc. | | | 1,900 | | | | 60,287 | |
| Target Corp. | | | 3,681 | | | | 318,812 | |
| Tempur Sealy International, Inc.(a) (d) | | | 298 | | | | 21,864 | |
| Tenneco, Inc. - Class A(d) | | | 450 | | | | 4,991 | |
| Tesla, Inc.(a) (d) | | | 643 | | | | 143,685 | |
| Texas Roadhouse, Inc.(d) | | | 475 | | | | 25,493 | |
| Thor Industries, Inc.(d) | | | 381 | | | | 22,269 | |
| Tiffany & Co.(d) | | | 735 | | | | 68,825 | |
| TJX Cos., Inc. (The) | | | 8,566 | | | | 452,969 | |
| Toll Brothers, Inc. | | | 1,050 | | | | 38,451 | |
| TopBuild Corp.(a) (d) | | | 325 | | | | 26,897 | |
| Tractor Supply Co. | | | 1,061 | | | | 115,437 | |
| TRI Pointe Group, Inc.(a) | | | 1,100 | | | | 13,167 | |
| Tupperware Brands Corp. | | | 300 | | | | 5,709 | |
| Ulta Beauty, Inc.(a) | | | 369 | | | | 128,002 | |
| Under Armour, Inc. - Class A(a) (d) | | | 2,425 | | | | 61,473 | |
| Universal Electronics, Inc.(a) | | | 200 | | | | 8,204 | |
| Urban Outfitters, Inc.(a) | | | 800 | | | | 18,200 | |
| Vail Resorts, Inc. | | | 190 | | | | 42,404 | |
| Veoneer, Inc.(a) (d) | | | 648 | | | | 11,217 | |
| VF Corp. | | | 2,375 | | | | 207,455 | |
| Vista Outdoor, Inc.(a) | | | 400 | | | | 3,552 | |
| Visteon Corp.(a) (d) | | | 261 | | | | 15,289 | |
| Vitamin Shoppe, Inc.(a) (d) | | | 300 | | | | 1,182 | |
| Wayfair, Inc. - Class A(a) (d) | | | 300 | | | | 43,800 | |
| Weight Watchers International, Inc.(a) | | | 296 | | | | 5,654 | |
| WILSHIRE 5000 INDEX FUND | |
| SCHEDULE OF INVESTMENTS (Continued) | |
| COMMON STOCKS - 98.3% (Continued) | | Shares | | | Value | |
| Consumer Discretionary - 10.5% (Continued) | | | | | | | | |
| Wendy's Co. (The) | | | 1,925 | | | $ | 37,692 | |
| Whirlpool Corp. | | | 504 | | | | 71,749 | |
| Williams-Sonoma, Inc.(d) | | | 500 | | | | 32,500 | |
| Winnebago Industries, Inc.(d) | | | 175 | | | | 6,764 | |
| Wolverine World Wide, Inc. | | | 725 | | | | 19,967 | |
| Wyndham Destinations, Inc. | | | 620 | | | | 27,218 | |
| Wyndham Hotels & Resorts, Inc. | | | 620 | | | | 34,559 | |
| Wynn Resorts Ltd. | | | 621 | | | | 76,998 | |
| Yum! Brands, Inc. | | | 2,289 | | | | 253,324 | |
| Zovio, Inc.(a) (d) | | | 500 | | | | 1,790 | |
| Zumiez, Inc.(a) | | | 300 | | | | 7,830 | |
| | | | | | | | 20,098,069 | |
| Consumer Staples - 6.6% | | | | | | | | |
| Alico, Inc. | | | 200 | | | | 6,068 | |
| Altria Group, Inc. | | | 11,691 | | | | 553,569 | |
| Andersons, Inc. (The) | | | 75 | | �� | | 2,043 | |
| Archer-Daniels-Midland Co. | | | 3,686 | | | | 150,388 | |
| B&G Foods, Inc.(d) | | | 250 | | | | 5,200 | |
| Boston Beer Co., Inc. (The) - Class A(a) | | | 100 | | | | 37,776 | |
| Brown-Forman Corp. - Class B | | | 1,505 | | | | 83,422 | |
| Bunge Ltd. | | | 1,050 | | | | 58,496 | |
| Cal-Maine Foods, Inc.(d) | | | 18 | | | | 751 | |
| Campbell Soup Co.(d) | | | 1,350 | | | | 54,095 | |
| Casey's General Stores, Inc. | | | 287 | | | | 44,769 | |
| Church & Dwight Co., Inc. | | | 1,606 | | | | 117,334 | |
| Clorox Co. (The) | | | 850 | | | | 130,144 | |
| Coca-Cola Co. (The) | | | 25,840 | | | | 1,315,774 | |
| Colgate-Palmolive Co. | | | 5,631 | | | | 403,574 | |
| Conagra Brands, Inc. | | | 3,741 | | | | 99,211 | |
| Constellation Brands, Inc. - Class A | | | 1,196 | | | | 235,540 | |
| Costco Wholesale Corp. | | | 2,971 | | | | 785,116 | |
| Coty, Inc. - Class A(d) | | | 2,800 | | | | 37,520 | |
| Darling Ingredients, Inc.(a) (d) | | | 975 | | | | 19,393 | |
| e.l.f. Beauty, Inc.(a) | | | 300 | | | | 4,230 | |
| Edgewell Personal Care Co.(a) | | | 446 | | | | 12,020 | |
| Energizer Holdings, Inc.(d) | | | 592 | | | | 22,875 | |
| WILSHIRE 5000 INDEX FUND | |
| SCHEDULE OF INVESTMENTS (Continued) | |
| COMMON STOCKS - 98.3% (Continued) | | Shares | | | Value | |
| Consumer Staples - 6.6% (Continued) | | | | | | | | |
| Estée Lauder Cos., Inc. (The) - Class A | | | 1,451 | | | $ | 265,692 | |
| Flowers Foods, Inc. | | | 1,580 | | | | 36,767 | |
| Fresh Del Monte Produce, Inc. | | | 100 | | | | 2,695 | |
| General Mills, Inc. | | | 3,975 | | | | 208,766 | |
| Hain Celestial Group, Inc. (The)(a) (d) | | | 600 | | | | 13,140 | |
| Herbalife Nutrition Ltd.(a) | | | 1,300 | | | | 55,588 | |
| Hershey Co. (The) | | | 929 | | | | 124,514 | |
| Hormel Foods Corp.(d) | | | 1,875 | | | | 76,013 | |
| Ingles Markets, Inc. - Class A(d) | | | 150 | | | | 4,670 | |
| Ingredion, Inc. | | | 271 | | | | 22,355 | |
| Inter Parfums, Inc. | | | 300 | | | | 19,947 | |
| J & J Snack Foods Corp. | | | 70 | | | | 11,267 | |
| J.M. Smucker Co. (The) | | | 852 | | | | 98,142 | |
| Kellogg Co. | | | 1,903 | | | | 101,944 | |
| Keurig Dr Pepper, Inc.(d) | | | 1,258 | | | | 36,356 | |
| Kimberly-Clark Corp. | | | 2,431 | | | | 324,004 | |
| Kraft Heinz Co. (The) | | | 4,215 | | | | 130,833 | |
| Kroger Co. (The) | | | 5,485 | | | | 119,079 | |
| Lamb Weston Holdings, Inc. | | | 1,157 | | | | 73,308 | |
| Lancaster Colony Corp. | | | 112 | | | | 16,643 | |
| Mannatech, Inc. | | | 70 | | | | 1,189 | |
| McCormick & Co., Inc. | | | 677 | | | | 104,942 | |
| Medifast, Inc.(d) | | | 140 | | | | 17,962 | |
| MGP Ingredients, Inc.(d) | | | 200 | | | | 13,262 | |
| Molson Coors Brewing Co. - Class B | | | 1,163 | | | | 65,128 | |
| Mondelez International, Inc. - Class A | | | 10,801 | | | | 582,173 | |
| Monster Beverage Corp.(a) | | | 2,696 | | | | 172,086 | |
| Nu Skin Enterprises, Inc. - Class A | | | 325 | | | | 16,029 | |
| PepsiCo, Inc. | | | 9,119 | | | | 1,195,774 | |
| Philip Morris International, Inc. | | | 10,726 | | | | 842,312 | |
| Pilgrim's Pride Corp.(a) | | | 650 | | | | 16,504 | |
| Post Holdings, Inc.(a) | | | 438 | | | | 45,539 | |
| PriceSmart, Inc. | | | 115 | | | | 5,879 | |
| Procter & Gamble Co. (The) | | | 16,340 | | | | 1,791,680 | |
| Sanderson Farms, Inc.(d) | | | 143 | | | | 19,528 | |
| SpartanNash Co. | | | 400 | | | | 4,668 | |
| WILSHIRE 5000 INDEX FUND | |
| SCHEDULE OF INVESTMENTS (Continued) | |
| COMMON STOCKS - 98.3% (Continued) | | Shares | | | Value | |
| Consumer Staples - 6.6% (Continued) | | | | | | | | |
| Spectrum Brands Holdings, Inc.(d) | | | 217 | | | $ | 11,668 | |
| Sprouts Farmers Market, Inc.(a) | | | 300 | | | | 5,667 | |
| Sysco Corp. | | | 3,410 | | | | 241,155 | |
| Tootsie Roll Industries, Inc.(d) | | | 27 | | | | 997 | |
| TreeHouse Foods, Inc.(a) (d) | | | 385 | | | | 20,829 | |
| Tyson Foods, Inc. - Class A | | | 1,911 | | | | 154,293 | |
| United Natural Foods, Inc.(a) (d) | | | 150 | | | | 1,346 | |
| US Foods Holding Corp.(a) | | | 475 | | | | 16,986 | |
| USANA Health Sciences, Inc.(a) | | | 118 | | | | 9,373 | |
| Vector Group Ltd. | | | 894 | | | | 8,717 | |
| Walgreens Boots Alliance, Inc. | | | 5,999 | | | | 327,965 | |
| Walmart, Inc. | | | 9,309 | | | | 1,028,552 | |
| WD-40 Co.(d) | | | 45 | | | | 7,157 | |
| | | | | | | | 12,650,391 | |
| Energy - 4.6% | | | | | | | | |
| Anadarko Petroleum Corp. | | | 3,889 | | | | 274,408 | |
| Antero Resources Corp.(a) (d) | | | 800 | | | | 4,424 | |
| Apache Corp. | | | 2,913 | | | | 84,390 | |
| Apergy Corp.(a) | | | 565 | | | | 18,950 | |
| Arch Coal, Inc. - Class A(d) | | | 163 | | | | 15,356 | |
| Archrock, Inc. | | | 812 | | | | 8,607 | |
| Baker Hughes, a GE Co. | | | 2,795 | | | | 68,841 | |
| BP Prudhoe Bay Royalty Trust | | | 300 | | | | 4,641 | |
| Cabot Oil & Gas Corp. | | | 3,325 | | | | 76,342 | |
| California Resources Corp.(a) (d) | | | 472 | | | | 9,289 | |
| Callon Petroleum Co.(a) (d) | | | 1,500 | | | | 9,885 | |
| Carrizo Oil & Gas, Inc.(a) (d) | | | 400 | | | | 4,008 | |
| Cheniere Energy, Inc.(a) | | | 1,625 | | | | 111,231 | |
| Chevron Corp. | | | 12,863 | | | | 1,600,671 | |
| Cimarex Energy Co. | | | 596 | | | | 35,361 | |
| CNX Resources Corp.(a) | | | 1,650 | | | | 12,062 | |
| Concho Resources, Inc. | | | 1,020 | | | | 105,244 | |
| ConocoPhillips | | | 8,132 | | | | 496,051 | |
| CONSOL Energy, Inc.(a) (d) | | | 206 | | | | 5,482 | |
| Continental Resources, Inc.(a) | | | 830 | | | | 34,935 | |
| Cross Timbers Royalty Trust | | | 200 | | | | 2,530 | |
| WILSHIRE 5000 INDEX FUND | |
| SCHEDULE OF INVESTMENTS (Continued) | |
| COMMON STOCKS - 98.3% (Continued) | | Shares | | | Value | |
| Energy - 4.6% (Continued) | | | | | | | | |
| Delek US Holdings, Inc.(d) | | | 301 | | | $ | 12,197 | |
| Devon Energy Corp. | | | 3,766 | | | | 107,406 | |
| Diamond Offshore Drilling, Inc.(a) (d) | | | 850 | | | | 7,540 | |
| Diamondback Energy, Inc. | | | 850 | | | | 92,625 | |
| DMC Global, Inc.(d) | | | 400 | | | | 25,340 | |
| Dril-Quip, Inc.(a) (d) | | | 145 | | | | 6,960 | |
| EOG Resources, Inc. | | | 3,898 | | | | 363,138 | |
| EQT Corp. | | | 1,339 | | | | 21,170 | |
| Equitrans Midstream Corp.(d) | | | 1,071 | | | | 21,109 | |
| Era Group, Inc.(a) | | | 300 | | | | 2,502 | |
| Exterran Corp.(a) | | | 406 | | | | 5,773 | |
| Exxon Mobil Corp. | | | 27,928 | | | | 2,140,122 | |
| Forum Energy Technologies, Inc.(a) (d) | | | 300 | | | | 1,026 | |
| Geospace Technologies Corp.(a) (d) | | | 226 | | | | 3,415 | |
| Green Plains, Inc. | | | 300 | | | | 3,234 | |
| Gulf Island Fabrication, Inc.(a) (d) | | | 381 | | | | 2,705 | |
| Gulfport Energy Corp.(a) | | | 900 | | | | 4,419 | |
| Halliburton Co. | | | 5,931 | | | | 134,871 | |
| Helix Energy Solutions Group, Inc.(a) | | | 1,000 | | | | 8,630 | |
| Helmerich & Payne, Inc.(d) | | | 550 | | | | 27,841 | |
| Hess Corp.(d) | | | 2,024 | | | | 128,666 | |
| HollyFrontier Corp. | | | 1,158 | | | | 53,592 | |
| Kinder Morgan, Inc. | | | 13,180 | | | | 275,198 | |
| KLX Energy Services Holdings, Inc.(a) (d) | | | 126 | | | | 2,574 | |
| Marathon Oil Corp. | | | 5,647 | | | | 80,244 | |
| Marathon Petroleum Corp. | | | 3,531 | | | | 197,312 | |
| Matador Resources Co.(a) (d) | | | 375 | | | | 7,455 | |
| Matrix Service Co.(a) | | | 450 | | | | 9,117 | |
| McDermott International, Inc.(a) (d) | | | 525 | | | | 5,072 | |
| Murphy Oil Corp.(d) | | | 1,025 | | | | 25,266 | |
| National Oilwell Varco, Inc. | | | 2,661 | | | | 59,154 | |
| Newpark Resources, Inc.(a) (d) | | | 875 | | | | 6,493 | |
| Noble Energy, Inc. | | | 2,476 | | | | 55,462 | |
| Oasis Petroleum, Inc.(a) (d) | | | 1,375 | | | | 7,810 | |
| Occidental Petroleum Corp. | | | 5,440 | | | | 273,523 | |
| Oceaneering International, Inc.(a) | | | 500 | | | | 10,195 | |
| WILSHIRE 5000 INDEX FUND | |
| SCHEDULE OF INVESTMENTS (Continued) | |
| COMMON STOCKS - 98.3% (Continued) | | Shares | | | Value | |
| Energy - 4.6% (Continued) | | | | | | | | |
| Oil States International, Inc.(a) (d) | | | 200 | | | $ | 3,660 | |
| ONEOK, Inc. | | | 1,365 | | | | 93,926 | |
| Parsley Energy, Inc. - Class A(a) (d) | | | 1,425 | | | | 27,089 | |
| Patterson-UTI Energy, Inc. | | | 1,100 | | | | 12,661 | |
| PBF Energy, Inc. - Class A | | | 625 | | | | 19,563 | |
| PDC Energy, Inc.(a) (d) | | | 375 | | | | 13,523 | |
| Phillips 66 | | | 3,213 | | | | 300,544 | |
| Pioneer Natural Resources Co. | | | 1,221 | | | | 187,863 | |
| QEP Resources, Inc.(a) | | | 1,750 | | | | 12,653 | |
| Range Resources Corp.(d) | | | 1,339 | | | | 9,346 | |
| Renewable Energy Group, Inc.(a) (d) | | | 114 | | | | 1,808 | |
| RPC, Inc.(d) | | | 587 | | | | 4,232 | |
| Schlumberger Ltd. | | | 9,396 | | | | 373,397 | |
| SemGroup Corp. - Class A(d) | | | 450 | | | | 5,400 | |
| Ship Finance International Ltd.(d) | | | 575 | | | | 7,193 | |
| SM Energy Co. | | | 450 | | | | 5,634 | |
| Southwestern Energy Co.(a) (d) | | | 3,325 | | | | 10,507 | |
| SRC Energy, Inc.(a) (d) | | | 1,175 | | | | 5,828 | |
| Superior Energy Services, Inc.(a) | | | 1,131 | | | | 1,470 | |
| Targa Resources Corp. | | | 1,255 | | | | 49,271 | |
| Teekay Corp.(d) | | | 775 | | | | 2,666 | |
| Unit Corp.(a) (d) | | | 500 | | | | 4,445 | |
| Valero Energy Corp. | | | 3,214 | | | | 275,151 | |
| Whiting Petroleum Corp.(a) (d) | | | 480 | | | | 8,966 | |
| Williams Cos., Inc. (The) | | | 5,250 | | | | 147,210 | |
| World Fuel Services Corp. | | | 475 | | | | 17,081 | |
| WPX Energy, Inc.(a) | | | 2,675 | | | | 30,789 | |
| | | | | | | | 8,803,740 | |
| Financials - 13.7% | | | | | | | | |
| Affiliated Managers Group, Inc. | | | 428 | | | | 39,436 | |
| Aflac, Inc. | | | 3,970 | | | | 217,596 | |
| AGNC Investment Corp. | | | 2,175 | | | | 36,583 | |
| Alleghany Corp.(a) | | | 127 | | | | 86,501 | |
| Allstate Corp. (The) | | | 1,615 | | | | 164,229 | |
| Ally Financial, Inc. | | | 3,625 | | | | 112,339 | |
| American Equity Investment Life Holding Co. | | | 625 | | | | 16,975 | |
| WILSHIRE 5000 INDEX FUND | |
| SCHEDULE OF INVESTMENTS (Continued) | |
| COMMON STOCKS - 98.3% (Continued) | | Shares | | | Value | |
| Financials - 13.7% (Continued) | | | | | | | | |
| American Express Co. | | | 4,313 | | | $ | 532,396 | |
| American Financial Group, Inc. | | | 446 | | | | 45,702 | |
| American International Group, Inc. | | | 6,150 | | | | 327,671 | |
| American National Insurance Co. | | | 181 | | | | 21,081 | |
| Ameriprise Financial, Inc. | | | 1,035 | | | | 150,241 | |
| Ameris Bancorp | | | 300 | | | | 11,757 | |
| Annaly Capital Management, Inc. | | | 6,939 | | | | 63,352 | |
| Anworth Mortgage Asset Corp. | | | 1,500 | | | | 5,685 | |
| Apollo Commercial Real Estate Finance, Inc.(d) | | | 600 | | | | 11,034 | |
| Apollo Investment Corp.(d) | | | 575 | | | | 9,085 | |
| Arbor Realty Trust, Inc.(d) | | | 201 | | | | 2,436 | |
| Arch Capital Group Ltd.(a) | | | 1,857 | | | | 68,858 | |
| Ares Capital Corp. | | | 3,355 | | | | 60,189 | |
| Argo Group International Holdings Ltd. | | | 72 | | | | 5,332 | |
| Arlington Asset Investment Corp. - Class A(d) | | | 4 | | | | 28 | |
| Arthur J. Gallagher & Co. | | | 1,225 | | | | 107,298 | |
| Artisan Partners Asset Management, Inc. - Class A | | | 300 | | | | 8,256 | |
| Ashford, Inc.(a) | | | 6 | | | | 191 | |
| Associated Banc-Corp. | | | 900 | | | | 19,026 | |
| Assurant, Inc. | | | 337 | | | | 35,850 | |
| Assured Guaranty Ltd.(d) | | | 775 | | | | 32,612 | |
| Atlantic Union Bancshares Corp. | | | 275 | | | | 9,716 | |
| Axis Capital Holdings Ltd. | | | 475 | | | | 28,334 | |
| Axos Financial, Inc.(a) (d) | | | 372 | | | | 10,137 | |
| Bancorp, Inc. (The)(a) | | | 50 | | | | 446 | |
| BancorpSouth Bank(d) | | | 675 | | | | 19,602 | |
| Bank of America Corp. | | | 63,858 | | | | 1,851,881 | |
| Bank of Hawaii Corp.(d) | | | 303 | | | | 25,122 | |
| Bank of New York Mellon Corp. (The) | | | 7,163 | | | | 316,246 | |
| Bank OZK(d) | | | 765 | | | | 23,019 | |
| BankFinancial Corp. | | | 700 | | | | 9,793 | |
| BankUnited, Inc. | | | 825 | | | | 27,836 | |
| Banner Corp. | | | 300 | | | | 16,245 | |
| Barings BDC, Inc.(d) | | | 350 | | | | 3,444 | |
| BB&T Corp. | | | 5,840 | | | | 286,918 | |
| Berkley (W.R.) Corp. | | | 1,030 | | | | 67,908 | |
| WILSHIRE 5000 INDEX FUND | |
| SCHEDULE OF INVESTMENTS (Continued) | |
| COMMON STOCKS - 98.3% (Continued) | | Shares | | | Value | |
| Financials - 13.7% (Continued) | | | | | | | | |
| Berkshire Hathaway, Inc. - Class B(a) | | | 14,686 | | | $ | 3,130,614 | |
| Berkshire Hills Bancorp, Inc. | | | 300 | | | | 9,417 | |
| BGC Partners, Inc. - Class A | | | 1,650 | | | | 8,630 | |
| BlackRock, Inc. | | | 862 | | | | 404,536 | |
| Blackstone Mortgage Trust, Inc. - Class A(d) | | | 600 | | | | 21,348 | |
| Blucora, Inc.(a) | | | 250 | | | | 7,593 | |
| BOK Financial Corp. | | | 296 | | | | 22,342 | |
| Boston Private Financial Holdings, Inc. | | | 500 | | | | 6,035 | |
| Bridge Bancorp, Inc. | | | 300 | | | | 8,838 | |
| Brighthouse Financial, Inc.(a) | | | 608 | | | | 22,308 | |
| Brookline Bancorp, Inc. | | | 500 | | | | 7,690 | |
| Brown & Brown, Inc. | | | 1,800 | | | | 60,300 | |
| Camden National Corp. | | | 150 | | | | 6,881 | |
| Capital City Bank Group, Inc. | | | 350 | | | | 8,698 | |
| Capital One Financial Corp. | | | 3,012 | | | | 273,309 | |
| Capitol Federal Financial, Inc. | | | 1,000 | | | | 13,770 | |
| Capstead Mortgage Corp.(d) | | | 700 | | | | 5,845 | |
| Cathay General Bancorp | | | 463 | | | | 16,626 | |
| Cboe Global Markets, Inc. | | | 590 | | | | 61,142 | |
| CenterState Bank Corp. | | | 367 | | | | 8,452 | |
| Central Pacific Financial Corp. | | | 300 | | | | 8,988 | |
| Charles Schwab Corp. (The) | | | 8,189 | | | | 329,115 | |
| Chemical Financial Corp. | | | 500 | | | | 20,555 | |
| Chimera Investment Corp.(d) | | | 1,455 | | | | 27,456 | |
| Cincinnati Financial Corp. | | | 1,135 | | | | 117,665 | |
| CIT Group, Inc. | | | 1,350 | | | | 70,929 | |
| Citigroup, Inc. | | | 16,485 | | | | 1,154,444 | |
| Citizens Financial Group, Inc. | | | 3,375 | | | | 119,340 | |
| CME Group, Inc. | | | 2,138 | | | | 415,006 | |
| CNA Financial Corp. | | | 300 | | | | 14,121 | |
| CNO Financial Group, Inc. | | | 1,100 | | | | 18,348 | |
| Cohen & Steers, Inc. | | | 50 | | | | 2,572 | |
| Columbia Banking System, Inc. | | | 276 | | | | 9,986 | |
| Comerica, Inc. | | | 1,083 | | | | 78,669 | |
| Commerce Bancshares, Inc. | | | 758 | | | | 45,222 | |
| Community Bank System, Inc.(d) | | | 200 | | | | 13,168 | |
| WILSHIRE 5000 INDEX FUND | |
| SCHEDULE OF INVESTMENTS (Continued) | |
| COMMON STOCKS - 98.3% (Continued) | | Shares | | | Value | |
| Financials - 13.7% (Continued) | | | | | | | | |
| Community Trust Bancorp, Inc. | | | 110 | | | $ | 4,652 | |
| Crawford & Co. - Class B | | | 200 | | | | 1,862 | |
| Credit Acceptance Corp.(a) | | | 112 | | | | 54,189 | |
| Cullen/Frost Bankers, Inc.(d) | | | 332 | | | | 31,095 | |
| CVB Financial Corp. | | | 600 | | | | 12,618 | |
| Discover Financial Services | | | 2,775 | | | | 215,312 | |
| Donnelley Financial Solutions, Inc.(a) | | | 159 | | | | 2,121 | |
| E*TRADE Financial Corp. | | | 2,078 | | | | 92,679 | |
| Eagle Bancorp, Inc. | | | 300 | | | | 16,239 | |
| East West Bancorp, Inc. | | | 1,025 | | | | 47,939 | |
| Eaton Vance Corp. | | | 850 | | | | 36,661 | |
| eHealth, Inc.(a) (d) | | | 175 | | | | 15,068 | |
| Employers Holdings, Inc. | | | 75 | | | | 3,170 | |
| Encore Capital Group, Inc.(a) (d) | | | 200 | | | | 6,774 | |
| Enova International, Inc.(a) | | | 297 | | | | 6,846 | |
| Enstar Group Ltd.(a) (d) | | | 120 | | | | 20,914 | |
| Enterprise Financial Services Corp. | | | 50 | | | | 2,080 | |
| Erie Indemnity Co. - Class A(d) | | | 174 | | | | 44,245 | |
| Evercore, Inc. - Class A | | | 350 | | | | 31,000 | |
| Everest Re Group Ltd. | | | 226 | | | | 55,863 | |
| Exantas Capital Corp. | | | 50 | | | | 566 | |
| EZCORP, Inc. - Class A(a) (d) | | | 1,000 | | | | 9,470 | |
| F.N.B. Corp. | | | 2,460 | | | | 28,954 | |
| FactSet Research Systems, Inc. | | | 250 | | | | 71,640 | |
| FBL Financial Group, Inc. - Class A | | | 300 | | | | 19,140 | |
| Federated Investors, Inc. - Class B(d) | | | 700 | | | | 22,750 | |
| FedNat Holding Co. | | | 200 | | | | 2,854 | |
| Fidelity National Financial, Inc. | | | 1,909 | | | | 76,933 | |
| Fifth Third Bancorp | | | 6,059 | | | | 169,046 | |
| Financial Institutions, Inc. | | | 200 | | | | 5,830 | |
| First American Financial Corp. | | | 527 | | | | 28,300 | �� |
| First Bancorp | | | 300 | | | | 10,926 | |
| First BanCorp. | | | 1,366 | | | | 15,081 | |
| First Busey Corp. | | | 325 | | | | 8,583 | |
| First Citizens BancShares, Inc. - Class A | | | 50 | | | | 22,514 | |
| First Commonwealth Financial Corp. | | | 800 | | | | 10,776 | |
| WILSHIRE 5000 INDEX FUND | |
| SCHEDULE OF INVESTMENTS (Continued) | |
| COMMON STOCKS - 98.3% (Continued) | | Shares | | | Value | |
| Financials - 13.7% (Continued) | | | | | | | | |
| First Community Bancshares, Inc. | | | 425 | | | $ | 14,348 | |
| First Financial Bancorp(d) | | | 991 | | | | 24,002 | |
| First Financial Bankshares, Inc. | | | 600 | | | | 18,474 | |
| First Financial Corp. | | | 100 | | | | 4,016 | |
| First Hawaiian, Inc. | | | 300 | | | | 7,761 | |
| First Horizon National Corp.(d) | | | 1,617 | | | | 24,142 | |
| First Interstate BancSystem, Inc. - Class A | | | 300 | | | | 11,883 | |
| First Merchants Corp.(d) | | | 425 | | | | 16,108 | |
| First Midwest Bancorp, Inc. | | | 800 | | | | 16,376 | |
| First Republic Bank | | | 1,013 | | | | 98,919 | |
| FirstCash, Inc. | | | 221 | | | | 22,104 | |
| Franklin Resources, Inc.(d) | | | 2,621 | | | | 91,211 | |
| FS KKR Capital Corp. | | | 1,925 | | | | 11,473 | |
| Fulton Financial Corp. | | | 1,250 | | | | 20,463 | |
| Glacier Bancorp, Inc. | | | 550 | | | | 22,303 | |
| Goldman Sachs Group, Inc. (The) | | | 2,705 | | | | 553,442 | |
| Golub Capital BDC, Inc. | | | 475 | | | | 8,455 | |
| Granite Point Mortgage Trust, Inc.(d) | | | 229 | | | | 4,395 | |
| Great Western Bancorp, Inc. | | | 300 | | | | 10,716 | |
| Green Dot Corp. - Class A(a) | | | 250 | | | | 12,225 | |
| Greenhill & Co., Inc.(d) | | | 300 | | | | 4,077 | |
| Hallmark Financial Services, Inc.(a) | | | 100 | | | | 1,423 | |
| Hancock Whitney Corp. | | | 500 | | | | 20,030 | |
| Hanmi Financial Corp. | | | 369 | | | | 8,218 | |
| Hanover Insurance Group, Inc. (The) | | | 300 | | | | 38,490 | |
| Hartford Financial Services Group, Inc. (The) | | | 2,375 | | | | 132,335 | |
| Heartland Financial USA, Inc. | | | 300 | | | | 13,419 | |
| Hercules Capital, Inc.(d) | | | 775 | | | | 9,936 | |
| Heritage Commerce Corp. | | | 50 | | | | 613 | |
| Hilltop Holdings, Inc. | | | 550 | | | | 11,699 | |
| Home BancShares, Inc. | | | 950 | | | | 18,297 | |
| HomeStreet, Inc.(a) | | | 300 | | | | 8,892 | |
| Hope Bancorp, Inc. | | | 1,092 | | | | 15,048 | |
| Horace Mann Educators Corp. | | | 375 | | | | 15,109 | |
| Huntington Bancshares, Inc. | | | 7,172 | | | | 99,117 | |
| IBERIABANK Corp. | | | 375 | | | | 28,444 | |
| WILSHIRE 5000 INDEX FUND | |
| SCHEDULE OF INVESTMENTS (Continued) | |
| COMMON STOCKS - 98.3% (Continued) | | Shares | | | Value | |
| Financials - 13.7% (Continued) | | | | | | | | |
| Independent Bank Corp.(d) | | | 300 | | | $ | 22,845 | |
| Independent Bank Group, Inc. | | | 90 | | | | 4,946 | |
| Interactive Brokers Group, Inc. - Class A | | | 500 | | | | 27,100 | |
| Intercontinental Exchange, Inc. | | | 4,000 | | | | 343,759 | |
| International Bancshares Corp. | | | 400 | | | | 15,084 | |
| INTL FCStone, Inc.(a) | | | 500 | | | | 19,795 | |
| Invesco Ltd. | | | 2,975 | | | | 60,869 | |
| Invesco Mortgage Capital, Inc.(d) | | | 625 | | | | 10,075 | |
| Investors Bancorp, Inc. | | | 1,325 | | | | 14,774 | |
| Jefferies Financial Group, Inc. | | | 2,432 | | | | 46,767 | |
| JPMorgan Chase & Co. | | | 21,642 | | | | 2,419,575 | |
| Kearny Financial Corp. | | | 828 | | | | 11,004 | |
| Kemper Corp. | | | 300 | | | | 25,887 | |
| KeyCorp | | | 7,726 | | | | 137,137 | |
| Lakeland Financial Corp.(d) | | | 300 | | | | 14,049 | |
| LegacyTexas Financial Group, Inc. | | | 375 | | | | 15,266 | |
| Legg Mason, Inc. | | | 750 | | | | 28,710 | |
| LendingTree, Inc.(a) (d) | | | 90 | | | | 37,802 | |
| Lincoln National Corp. | | | 1,600 | | | | 103,120 | |
| Loews Corp. | | | 1,955 | | | | 106,880 | |
| LPL Financial Holdings, Inc. | | | 200 | | | | 16,314 | |
| M&T Bank Corp. | | | 967 | | | | 164,458 | |
| Main Street Capital Corp.(d) | | | 475 | | | | 19,532 | |
| Markel Corp.(a) | | | 138 | | | | 150,365 | |
| MarketAxess Holdings, Inc. | | | 250 | | | | 80,355 | |
| Marsh & McLennan Cos., Inc. | | | 3,129 | | | | 312,117 | |
| MBIA, Inc.(a) (d) | | | 925 | | | | 8,612 | |
| Mercury General Corp. | | | 300 | | | | 18,750 | |
| Meta Financial Group, Inc.(d) | | | 300 | | | | 8,415 | |
| MetLife, Inc. | | | 5,796 | | | | 287,886 | |
| MFA Financial, Inc. | | | 2,250 | | | | 16,155 | |
| MGIC Investment Corp.(a) | | | 1,500 | | | | 19,710 | |
| Moody's Corp. | | | 1,218 | | | | 237,888 | |
| Morgan Stanley | | | 8,770 | | | | 384,213 | |
| Morningstar, Inc. | | | 207 | | | | 29,940 | |
| MSCI, Inc. | | | 519 | | | | 123,932 | |
| WILSHIRE 5000 INDEX FUND | |
| SCHEDULE OF INVESTMENTS (Continued) | |
| COMMON STOCKS - 98.3% (Continued) | | Shares | | | Value | |
| Financials - 13.7% (Continued) | | | | | | | | |
| Nasdaq, Inc. | | | 725 | | | $ | 69,723 | |
| National General Holdings Corp. | | | 525 | | | | 12,044 | |
| Navient Corp. | | | 2,050 | | | | 27,983 | |
| NBT Bancorp, Inc. | | | 200 | | | | 7,502 | |
| Nelnet, Inc. - Class A | | | 25 | | | | 1,481 | |
| New Mountain Finance Corp.(d) | | | 650 | | | | 9,081 | |
| New Residential Investment Corp. | | | 1,400 | | | | 21,546 | |
| New York Community Bancorp, Inc.(d) | | | 3,062 | | | | 30,559 | |
| Northern Trust Corp. | | | 1,738 | | | | 156,420 | |
| Northwest Bancshares, Inc. | | | 875 | | | | 15,409 | |
| Oaktree Special Lending Corp. | | | 1,750 | | | | 9,485 | |
| OceanFirst Financial Corp. | | | 100 | | | | 2,485 | |
| OFG Bancorp | | | 432 | | | | 10,269 | |
| Old National Bancorp | | | 950 | | | | 15,761 | |
| Old Republic International Corp. | | | 1,661 | | | | 37,173 | |
| Old Second Bancorp, Inc. | | | 400 | | | | 5,108 | |
| OneMain Holdings, Inc. | | | 300 | | | | 10,143 | |
| Oritani Financial Corp.(d) | | | 400 | | | | 7,096 | |
| Pacific Premier Bancorp, Inc. | | | 300 | | | | 9,264 | |
| PacWest Bancorp(d) | | | 817 | | | | 31,724 | |
| Park National Corp.(d) | | | 87 | | | | 8,647 | |
| PennyMac Mortgage Investment Trust | | | 450 | | | | 9,824 | |
| People's United Financial, Inc. | | | 1,983 | | | | 33,275 | |
| Pinnacle Financial Partners, Inc. | | | 559 | | | | 32,131 | |
| PNC Financial Services Group, Inc. (The) | | | 3,334 | | | | 457,691 | |
| Popular, Inc. | | | 782 | | | | 42,416 | |
| PRA Group, Inc.(a) | | | 300 | | | | 8,442 | |
| Preferred Bank(d) | | | 200 | | | | 9,450 | |
| Primerica, Inc.(d) | | | 300 | | | | 35,985 | |
| Principal Financial Group, Inc. | | | 1,100 | | | | 63,712 | |
| ProAssurance Corp. | | | 230 | | | | 8,305 | |
| Progressive Corp. (The) | | | 3,875 | | | | 309,728 | |
| Prospect Capital Corp.(d) | | | 2,650 | | | | 17,305 | |
| Prosperity Bancshares, Inc.(d) | | | 500 | | | | 33,025 | |
| Provident Financial Services, Inc. | | | 600 | | | | 14,550 | |
| Prudential Financial, Inc. | | | 2,801 | | | | 282,901 | |
| WILSHIRE 5000 INDEX FUND | |
| SCHEDULE OF INVESTMENTS (Continued) | |
| COMMON STOCKS - 98.3% (Continued) | | Shares | | | Value | |
| Financials - 13.7% (Continued) | | | | | | | | |
| Pzena Investment Management, Inc. - Class A | | | 2,077 | | | $ | 17,841 | |
| Radian Group, Inc. | | | 1,445 | | | | 33,017 | |
| Raymond James Financial, Inc. | | | 925 | | | | 78,209 | |
| Redwood Trust, Inc.(d) | | | 450 | | | | 7,439 | |
| Regions Financial Corp. | | | 8,081 | | | | 120,730 | |
| Reinsurance Group of America, Inc. | | | 454 | | | | 70,838 | |
| RenaissanceRe Holdings Ltd. | | | 290 | | | | 51,623 | |
| Renasant Corp. | | | 400 | | | | 14,376 | |
| Republic Bancorp, Inc. - Class A | | | 315 | | | | 15,671 | |
| RLI Corp. | | | 425 | | | | 36,427 | |
| S&P Global, Inc. | | | 1,782 | | | | 405,921 | |
| S&T Bancorp, Inc.(d) | | | 350 | | | | 13,118 | |
| Sandy Spring Bancorp, Inc. | | | 300 | | | | 10,464 | |
| Seacoast Banking Corp. of Florida(a) | | | 150 | | | | 3,816 | |
| SEI Investments Co. | | | 975 | | | | 54,698 | |
| Selective Insurance Group, Inc. | | | 300 | | | | 22,467 | |
| ServisFirst Bancshares, Inc.(d) | | | 400 | | | | 13,704 | |
| Signature Bank | | | 387 | | | | 46,765 | |
| Simmons First National Corp. - Class A | | | 438 | | | | 10,188 | |
| SLM Corp. | | | 2,500 | | | | 24,300 | |
| Solar Capital Ltd. | | | 500 | | | | 10,265 | |
| South State Corp. | | | 180 | | | | 13,261 | |
| Southside Bancshares, Inc. | | | 340 | | | | 11,009 | |
| Starwood Property Trust, Inc. | | | 1,825 | | | | 41,463 | |
| State Auto Financial Corp.(d) | | | 400 | | | | 14,000 | |
| State Street Corp. | | | 2,476 | | | | 138,805 | |
| Sterling Bancorp | | | 1,725 | | | | 36,708 | |
| Stewart Information Services Corp. | | | 300 | | | | 12,147 | |
| Stifel Financial Corp. | | | 340 | | | | 20,080 | |
| Stock Yards Bancorp, Inc. | | | 300 | | | | 10,845 | |
| SunTrust Banks, Inc. | | | 3,030 | | | | 190,435 | |
| SVB Financial Group(a) | | | 367 | | | | 82,425 | |
| Synchrony Financial | | | 5,775 | | | | 200,219 | |
| Synovus Financial Corp. | | | 947 | | | | 33,145 | |
| T. Rowe Price Group, Inc. | | | 1,890 | | | | 207,352 | |
| TCF Financial Corp. | | | 975 | | | | 20,270 | |
| WILSHIRE 5000 INDEX FUND | |
| SCHEDULE OF INVESTMENTS (Continued) | |
| COMMON STOCKS - 98.3% (Continued) | | Shares | | | Value | |
| Financials - 13.7% (Continued) | | | | | | | | |
| TD Ameritrade Holding Corp. | | | 2,053 | | | $ | 102,486 | |
| Texas Capital Bancshares, Inc.(a) | | | 384 | | | | 23,566 | |
| TFS Financial Corp. | | | 525 | | | | 9,487 | |
| Tompkins Financial Corp.(d) | | | 105 | | | | 8,568 | |
| Torchmark Corp. | | | 566 | | | | 50,634 | |
| TowneBank | | | 553 | | | | 15,086 | |
| Travelers Cos., Inc. (The) | | | 1,672 | | | | 249,997 | |
| TriCo Bancshares | | | 109 | | | | 4,120 | |
| TrustCo Bank Corp.(d) | | | 1,208 | | | | 9,567 | |
| Trustmark Corp. | | | 425 | | | | 14,131 | |
| Two Harbors Investment Corp.(d) | | | 1,949 | | | | 24,694 | |
| U.S. Bancorp | | | 10,204 | | | | 534,689 | |
| UMB Financial Corp. | | | 243 | | | | 15,994 | |
| Umpqua Holdings Corp. | | | 1,500 | | | | 24,885 | |
| United Bankshares, Inc.(d) | | | 553 | | | | 20,511 | |
| United Community Banks, Inc. | | | 474 | | | | 13,537 | |
| United Community Financial Corp. | | | 317 | | | | 3,034 | |
| United Financial Bancorp, Inc. | | | 542 | | | | 7,686 | |
| United Fire Group, Inc. | | | 300 | | | | 14,538 | |
| United Security Bancshares | | | 406 | | | | 4,624 | |
| Unum Group | | | 1,407 | | | | 47,205 | |
| Valley National Bancorp(d) | | | 1,750 | | | | 18,865 | |
| Value Line, Inc.(d) | | | 200 | | | | 5,502 | |
| Virtus Investment Partners, Inc.(d) | | | 48 | | | | 5,155 | |
| Voya Financial, Inc. | | | 1,275 | | | | 70,508 | |
| Waddell & Reed Financial, Inc. - Class A(d) | | | 525 | | | | 8,752 | |
| Washington Federal, Inc. | | | 433 | | | | 15,125 | |
| Washington Trust Bancorp, Inc. | | | 100 | | | | 5,218 | |
| Webster Financial Corp. | | | 675 | | | | 32,245 | |
| Wells Fargo & Co. | | | 29,157 | | | | 1,379,708 | |
| WesBanco, Inc. | | | 350 | | | | 13,493 | |
| Westamerica Bancorp. | | | 83 | | | | 5,114 | |
| Western Alliance Bancorp.(a) | | | 850 | | | | 38,012 | |
| Western New England Bancorp, Inc. | | | 200 | | | | 1,868 | |
| Wintrust Financial Corp. | | | 425 | | | | 31,093 | |
| WisdomTree Investments, Inc. | | | 750 | | | | 4,628 | |
| WILSHIRE 5000 INDEX FUND | |
| SCHEDULE OF INVESTMENTS (Continued) | |
| COMMON STOCKS - 98.3% (Continued) | | Shares | | | Value | |
| Financials - 13.7% (Continued) | | | | | | | | |
| World Acceptance Corp.(a) (d) | | | 100 | | | $ | 16,411 | |
| WSFS Financial Corp. | | | 465 | | | | 19,205 | |
| Zions Bancorp. | | | 1,480 | | | | 68,050 | |
| | | | | | | | 26,294,758 | |
| Health Care - 13.2% | | | | | | | | |
| Abbott Laboratories | | | 12,635 | | | | 1,062,603 | |
| AbbVie, Inc. | | | 9,790 | | | | 711,928 | |
| ABIOMED, Inc.(a) | | | 250 | | | | 65,123 | |
| Acadia Healthcare Co., Inc.(a) (d) | | | 475 | | | | 16,601 | |
| ACADIA Pharmaceuticals, Inc.(a) (d) | | | 1,155 | | | | 30,873 | |
| Acorda Therapeutics, Inc.(a) | | | 375 | | | | 2,876 | |
| Addus HomeCare Corp.(a) | | | 290 | | | | 21,736 | |
| Aerie Pharmaceuticals, Inc.(a) (d) | | | 350 | | | | 10,343 | |
| Agilent Technologies, Inc. | | | 2,196 | | | | 163,975 | |
| Agios Pharmaceuticals, Inc.(a) (d) | | | 300 | | | | 14,964 | |
| Alder Biopharmaceuticals, Inc.(a) (d) | | | 300 | | | | 3,531 | |
| Aldeyra Therapeutics, Inc.(a) | | | 1,990 | | | | 11,940 | |
| Alexion Pharmaceuticals, Inc.(a) | | | 1,349 | | | | 176,692 | |
| Align Technology, Inc.(a) | | | 454 | | | | 124,260 | |
| Alkermes plc(a) | | | 1,000 | | | | 22,540 | |
| Allergan plc | | | 2,419 | | | | 405,013 | |
| Allscripts Healthcare Solutions, Inc.(a) (d) | | | 1,225 | | | | 14,247 | |
| Alnylam Pharmaceuticals, Inc.(a) | | | 413 | | | | 29,967 | |
| AMAG Pharmaceuticals, Inc.(a) (d) | | | 100 | | | | 999 | |
| Amedisys, Inc.(a) | | | 201 | | | | 24,403 | |
| AmerisourceBergen Corp. | | | 1,144 | | | | 97,537 | |
| Amgen, Inc. | | | 3,950 | | | | 727,905 | |
| Amicus Therapeutics, Inc.(a) (d) | | | 1,225 | | | | 15,288 | |
| AMN Healthcare Services, Inc.(a) (d) | | | 250 | | | | 13,563 | |
| Amneal Pharmaceuticals, Inc.(a) | | | 650 | | | | 4,661 | |
| Anika Therapeutics, Inc.(a) (d) | | | 100 | | | | 4,062 | |
| Anixa Biosciences, Inc.(a) (d) | | | 3,590 | | | | 13,032 | |
| Anthem, Inc. | | | 1,960 | | | | 553,132 | |
| Apyx Medical Corp.(a) | | | 2,030 | | | | 13,642 | |
| Array BioPharma, Inc.(a) | | | 1,175 | | | | 54,438 | |
| Assembly Biosciences, Inc.(a) | | | 800 | | | | 10,792 | |
| WILSHIRE 5000 INDEX FUND | |
| SCHEDULE OF INVESTMENTS (Continued) | |
| COMMON STOCKS - 98.3% (Continued) | | Shares | | | Value | |
| Health Care - 13.2% (Continued) | | | | | | | | |
| Assertio Therapeutics, Inc.(a) | | | 675 | | | $ | 2,329 | |
| Avanos Medical, Inc.(a) (d) | | | 297 | | | | 12,952 | |
| Avrobio, Inc.(a) (d) | | | 1,360 | | | | 22,114 | |
| Axogen, Inc.(a) | | | 550 | | | | 10,890 | |
| Baxter International, Inc. | | | 3,963 | | | | 324,570 | |
| Becton, Dickinson and Co. | | | 1,824 | | | | 459,666 | |
| Biogen, Inc.(a) | | | 1,313 | | | | 307,071 | |
| BioMarin Pharmaceutical, Inc.(a) | | | 978 | | | | 83,766 | |
| Bio-Rad Laboratories, Inc. - Class A(a) | | | 99 | | | | 30,946 | |
| Bio-Techne Corp. | | | 232 | | | | 48,370 | |
| Bluebird Bio, Inc.(a) (d) | | | 168 | | | | 21,370 | |
| Blueprint Medicines Corp.(a) (d) | | | 130 | | | | 12,263 | |
| Boston Scientific Corp.(a) | | | 7,964 | | | | 342,293 | |
| Bristol-Myers Squibb Co. | | | 10,775 | | | | 488,646 | |
| Brookdale Senior Living, Inc.(a) | | | 1,294 | | | | 9,330 | |
| Bruker Corp. | | | 725 | | | | 36,214 | |
| Cambrex Corp.(a) (d) | | | 350 | | | | 16,384 | |
| Cantel Medical Corp.(d) | | | 200 | | | | 16,128 | |
| Capital Senior Living Corp.(a) (d) | | | 100 | | | | 503 | |
| Cardinal Health, Inc. | | | 2,048 | | | | 96,461 | |
| Cardiovascular Systems, Inc.(a) | | | 325 | | | | 13,952 | |
| CareDx, Inc.(a) | | | 790 | | | | 28,432 | |
| Catalent, Inc.(a) | | | 550 | | | | 29,816 | |
| Catalyst Biosciences, Inc.(a) (d) | | | 2,050 | | | | 15,109 | |
| Celgene Corp.(a) | | | 5,216 | | | | 482,167 | |
| Centene Corp.(a) | | | 2,666 | | | | 139,805 | |
| Cerner Corp. | | | 2,200 | | | | 161,259 | |
| Champions Oncology, Inc.(a) (d) | | | 1,410 | | | | 11,040 | |
| Charles River Laboratories International, Inc.(a) | | | 346 | | | | 49,097 | |
| Chemed Corp. | | | 136 | | | | 49,074 | |
| Cigna Corp. | | | 2,747 | | | | 432,790 | |
| Clovis Oncology, Inc.(a) (d) | | | 300 | | | | 4,461 | |
| Codexis, Inc.(a) (d) | | | 1,187 | | | | 21,876 | |
| Coherus Biosciences, Inc.(a) (d) | | | 590 | | | | 13,039 | |
| Computer Programs & Systems, Inc. | | | 100 | | | | 2,779 | |
| CONMED Corp. | | | 300 | | | | 25,671 | |
| WILSHIRE 5000 INDEX FUND | |
| SCHEDULE OF INVESTMENTS (Continued) | |
| COMMON STOCKS - 98.3% (Continued) | | Shares | | | Value | |
| Health Care - 13.2% (Continued) | | | | | | | | |
| Cooper Cos., Inc. (The) | | | 300 | | | $ | 101,067 | |
| Corvus Pharmaceuticals, Inc.(a) | | | 4,500 | | | | 16,830 | |
| Covetrus, Inc.(a) (d) | | | 356 | | | | 8,708 | |
| CVS Health Corp. | | | 8,658 | | | | 471,774 | |
| Cyclerion Therapeutics, Inc.(a) | | | 100 | | | | 1,145 | |
| Danaher Corp. | | | 4,019 | | | | 574,394 | |
| DaVita, Inc.(a) | | | 1,033 | | | | 58,117 | |
| DENTSPLY SIRONA, Inc. | | �� | 1,552 | | | | 90,575 | |
| Dermira, Inc.(a) (d) | | | 300 | | | | 2,868 | |
| DexCom, Inc.(a) | | | 428 | | | | 64,132 | |
| Dynavax Technologies Corp.(a) (d) | | | 425 | | | | 1,696 | |
| Edwards Lifesciences Corp.(a) | | | 1,473 | | | | 272,122 | |
| Elanco Animal Health, Inc.(a) | | | 300 | | | | 10,140 | |
| Eli Lilly & Co. | | | 6,272 | | | | 694,874 | |
| Emergent BioSolutions, Inc.(a) | | | 293 | | | | 14,155 | |
| Encompass Health Corp. | | | 650 | | | | 41,184 | |
| Endo International plc(a) (d) | | | 922 | | | | 3,799 | |
| Ensign Group, Inc. (The)(d) | | | 300 | | | | 17,076 | |
| Evolent Health, Inc. - Class A(a) (d) | | | 1,020 | | | | 8,109 | |
| Exact Sciences Corp.(a) | | | 775 | | | | 91,481 | |
| Exelixis, Inc.(a) | | | 1,875 | | | | 40,069 | |
| Fate Therapeutics, Inc.(a) (d) | | | 1,270 | | | | 25,781 | |
| FibroGen, Inc.(a) (d) | | | 280 | | | | 12,650 | |
| G1 Therapeutics, Inc.(a) (d) | | | 830 | | | | 25,448 | |
| Galectin Therapeutics, Inc.(a) (d) | | | 3,690 | | | | 15,314 | |
| Genomic Health, Inc.(a) | | | 200 | | | | 11,634 | |
| Gilead Sciences, Inc. | | | 8,547 | | | | 577,434 | |
| Glaukos Corp.(a) | | | 280 | | | | 21,112 | |
| Global Blood Therapeutics, Inc.(a) (d) | | | 370 | | | | 19,462 | |
| Haemonetics Corp.(a) | | | 250 | | | | 30,085 | |
| Halozyme Therapeutics, Inc.(a) | | | 750 | | | | 12,885 | |
| Hanger, Inc.(a) | | | 350 | | | | 6,703 | |
| Harrow Health, Inc.(a) (d) | | | 2,920 | | | | 25,404 | |
| HCA Healthcare, Inc. | | | 2,203 | | | | 297,780 | |
| Henry Schein, Inc.(a) | | | 890 | | | | 62,211 | |
| Hill-Rom Holdings, Inc. | | | 300 | | | | 31,386 | |
| WILSHIRE 5000 INDEX FUND | |
| SCHEDULE OF INVESTMENTS (Continued) | |
| COMMON STOCKS - 98.3% (Continued) | | Shares | | | Value | |
| Health Care - 13.2% (Continued) | | | | | | | | |
| HMS Holdings Corp.(a) | | | 525 | | | $ | 17,005 | |
| Hologic, Inc.(a) | | | 1,777 | | | | 85,332 | |
| Horizon Therapeutics plc(a) | | | 1,125 | | | | 27,068 | |
| Humana, Inc. | | | 848 | | | | 224,974 | |
| ICU Medical, Inc.(a) | | | 100 | | | | 25,191 | |
| IDEXX Laboratories, Inc.(a) | | | 599 | | | | 164,923 | |
| Illumina, Inc.(a) | | | 752 | | | | 276,849 | |
| Immunomedics, Inc.(a) (d) | | | 1,410 | | | | 19,557 | |
| Incyte Corp.(a) | | | 1,343 | | | | 114,101 | |
| Innoviva, Inc.(a) | | | 1,000 | | | | 14,560 | |
| Insulet Corp.(a) (d) | | | 175 | | | | 20,892 | |
| Integer Holdings Corp.(a) (d) | | | 300 | | | | 25,176 | |
| Integra LifeSciences Holdings Corp.(a) | | | 378 | | | | 21,111 | |
| Intercept Pharmaceuticals, Inc.(a) (d) | | | 137 | | | | 10,901 | |
| Intrexon Corp.(a) (d) | | | 400 | | | | 3,064 | |
| IntriCon Corp.(a) (d) | | | 370 | | | | 8,643 | |
| Intuitive Surgical, Inc.(a) | | | 515 | | | | 270,143 | |
| Invitae Corp.(a) (d) | | | 750 | | | | 17,625 | |
| Ionis Pharmaceuticals, Inc.(a) | | | 700 | | | | 44,989 | |
| IQVIA Holdings, Inc.(a) | | | 1,031 | | | | 165,888 | |
| Ironwood Pharmaceuticals, Inc.(a) (d) | | | 1,000 | | | | 10,940 | |
| Johnson & Johnson | | | 17,485 | | | | 2,435,310 | |
| Kindred Biosciences, Inc.(a) | | | 1,780 | | | | 14,827 | |
| Laboratory Corp. of America Holdings(a) | | | 670 | | | | 115,843 | |
| Lannett Co., Inc.(a) (d) | | | 300 | | | | 1,818 | |
| LHC Group, Inc.(a) | | | 100 | | | | 11,958 | |
| Ligand Pharmaceuticals, Inc.(a) (d) | | | 164 | | | | 18,721 | |
| Madrigal Pharmaceuticals, Inc.(a) (d) | | | 60 | | | | 6,289 | |
| Magellan Health, Inc.(a) | | | 100 | | | | 7,423 | |
| Marker Therapeutics, Inc.(a) (d) | | | 2,160 | | | | 17,107 | |
| Masimo Corp.(a) | | | 300 | | | | 44,646 | |
| McKesson Corp. | | | 1,428 | | | | 191,909 | |
| Medicines Co. (The)(a) (d) | | | 350 | | | | 12,765 | |
| Medidata Solutions, Inc.(a) (d) | | | 125 | | | | 11,314 | |
| MEDNAX, Inc.(a) | | | 600 | | | | 15,138 | |
| Merck & Co., Inc. | | | 17,765 | | | | 1,489,594 | |
| WILSHIRE 5000 INDEX FUND | |
| SCHEDULE OF INVESTMENTS (Continued) | |
| COMMON STOCKS - 98.3% (Continued) | | Shares | | | Value | |
| Health Care - 13.2% (Continued) | | | | | | | | |
| Meridian Bioscience, Inc. | | | 375 | | | $ | 4,455 | |
| Mettler-Toledo International, Inc.(a) | | | 200 | | | | 168,000 | |
| Molina Healthcare, Inc.(a) | | | 300 | | | | 42,942 | |
| Momenta Pharmaceuticals, Inc.(a) | | | 200 | | | | 2,490 | |
| MTBC, Inc.(a) (d) | | | 3,710 | | | | 18,736 | |
| MyoKardia, Inc.(a) (d) | | | 420 | | | | 21,059 | |
| Myriad Genetics, Inc.(a) | | | 450 | | | | 12,501 | |
| Natera, Inc.(a) | | | 550 | | | | 15,169 | |
| Natus Medical, Inc.(a) | | | 75 | | | | 1,927 | |
| Nektar Therapeutics(a) (d) | | | 650 | | | | 23,127 | |
| Neogen Corp.(a) | | | 466 | | | | 28,943 | |
| Neurocrine Biosciences, Inc.(a) | | | 500 | | | | 42,215 | |
| Nevro Corp.(a) (d) | | | 162 | | | | 10,502 | |
| NextGen Healthcare, Inc.(a) (d) | | | 575 | | | | 11,443 | |
| NuVasive, Inc.(a) | | | 290 | | | | 16,977 | |
| Nuvectra Corp.(a) | | | 1,340 | | | | 4,489 | |
| Omnicell, Inc.(a) | | | 375 | | | | 32,261 | |
| OncoCyte Corp.(a) (d) | | | 2,200 | | | | 5,478 | |
| Pacira BioSciences, Inc.(a) | | | 75 | | | | 3,262 | |
| Paratek Pharmaceuticals, Inc.(a) (d) | | | 6 | | | | 24 | |
| Patterson Cos., Inc.(d) | | | 575 | | | | 13,168 | |
| Penumbra, Inc.(a) (d) | | | 196 | | | | 31,360 | |
| PerkinElmer, Inc.(d) | | | 492 | | | | 47,399 | |
| Pfizer, Inc. | | | 38,422 | | | | 1,664,440 | |
| Portola Pharmaceuticals, Inc.(a) (d) | | | 300 | | | | 8,139 | |
| PRA Health Sciences, Inc.(a) (d) | | | 300 | | | | 29,745 | |
| Premier, Inc. - Class A(a) | | | 350 | | | | 13,689 | |
| Prestige Consumer Healthcare, Inc.(a) | | | 350 | | | | 11,088 | |
| Pro-Dex, Inc.(a) (d) | | | 1,220 | | | | 15,836 | |
| Progenics Pharmaceuticals, Inc.(a) (d) | | | 800 | | | | 4,936 | |
| Providence Service Corp. (The)(a) | | | 200 | | | | 11,468 | |
| PTC Therapeutics, Inc.(a) | | | 470 | | | | 21,150 | |
| Puma Biotechnology, Inc.(a) (d) | | | 254 | | | | 3,228 | |
| Quest Diagnostics, Inc. | | | 877 | | | | 89,287 | |
| Quidel Corp.(a) | | | 300 | | | | 17,796 | |
| R1 RCM, Inc.(a) | | | 2,200 | | | | 27,676 | |
| WILSHIRE 5000 INDEX FUND | |
| SCHEDULE OF INVESTMENTS (Continued) | |
| COMMON STOCKS - 98.3% (Continued) | | Shares | | | Value | |
| Health Care - 13.2% (Continued) | | | | | | | | |
| Ra Pharmaceuticals, Inc.(a) | | | 510 | | | $ | 15,336 | |
| Regeneron Pharmaceuticals, Inc.(a) | | | 469 | | | | 146,797 | |
| REGENXBIO, Inc.(a) (d) | | | 410 | | | | 21,062 | |
| Repligen Corp.(a) (d) | | | 300 | | | | 25,785 | |
| ResMed, Inc. | | | 800 | | | | 97,624 | |
| Sage Therapeutics, Inc.(a) (d) | | | 300 | | | | 54,927 | |
| Sarepta Therapeutics, Inc.(a) (d) | | | 400 | | | | 60,780 | |
| SeaSpine Holdings Corp.(a) | | | 1,280 | | | | 16,960 | |
| Seattle Genetics, Inc.(a) (d) | | | 625 | | | | 43,256 | |
| Select Medical Holdings Corp.(a) | | | 725 | | | | 11,506 | |
| Sientra, Inc.(a) (d) | | | 1,590 | | | | 9,794 | |
| Simulations Plus, Inc. | | | 600 | | | | 17,136 | |
| STAAR Surgical Co.(a) | | | 460 | | | | 13,515 | |
| Stryker Corp. | | | 1,986 | | | | 408,282 | |
| Syneos Health, Inc.(a) (d) | | | 300 | | | | 15,327 | |
| Syros Pharmaceuticals, Inc.(a) (d) | | | 3,100 | | | | 28,706 | |
| Teladoc Health, Inc.(a) (d) | | | 350 | | | | 23,244 | |
| Teleflex, Inc. | | | 200 | | | | 66,230 | |
| Tenet Healthcare Corp.(a) (d) | | | 631 | | | | 13,036 | |
| TherapeuticsMD, Inc.(a) (d) | | | 1,275 | | | | 3,315 | |
| Thermo Fisher Scientific, Inc. | | | 2,831 | | | | 831,408 | |
| Tivity Health, Inc.(a) | | | 64 | | | | 1,052 | |
| Ultragenyx Pharmaceutical, Inc.(a) (d) | | | 207 | | | | 13,145 | |
| United Therapeutics Corp.(a) | | | 288 | | | | 22,481 | |
| UnitedHealth Group, Inc. | | | 6,246 | | | | 1,524,085 | |
| Universal Health Services, Inc. - Class B | | | 562 | | | | 73,279 | |
| Varex Imaging Corp.(a) | | | 282 | | | | 8,643 | |
| Varian Medical Systems, Inc.(a) | | | 607 | | | | 82,631 | |
| Veeva Systems, Inc. - Class A(a) | | | 725 | | | | 117,529 | |
| Vericel Corp.(a) (d) | | | 1,410 | | | | 26,635 | |
| Vertex Pharmaceuticals, Inc.(a) | | | 1,349 | | | | 247,380 | |
| Waters Corp.(a) | | | 544 | | | | 117,091 | |
| WellCare Health Plans, Inc.(a) (d) | | | 329 | | | | 93,788 | |
| West Pharmaceutical Services, Inc. | | | 505 | | | | 63,201 | |
| Zimmer Biomet Holdings, Inc. | | | 1,472 | | | | 173,313 | |
| Zoetis, Inc. | | | 3,275 | | | | 371,680 | |
| WILSHIRE 5000 INDEX FUND | |
| SCHEDULE OF INVESTMENTS (Continued) | |
| COMMON STOCKS - 98.3% (Continued) | | Shares | | | Value | |
| Health Care - 13.2% (Continued) | | | | | | | | |
| Zogenix, Inc.(a) (d) | | | 410 | | | $ | 19,590 | |
| | | | | | | | 25,324,451 | |
| Industrials - 9.8% | | | | | | | | |
| 3M Co. | | | 3,826 | | | | 663,199 | |
| A.O. Smith Corp. | | | 1,040 | | | | 49,046 | |
| AAON, Inc.(d) | | | 225 | | | | 11,291 | |
| AAR Corp. | | | 300 | | | | 11,037 | |
| ABM Industries, Inc. | | | 500 | | | | 20,000 | |
| ACCO Brands Corp. | | | 825 | | | | 6,493 | |
| Acme United Corp.(d) | | | 300 | | | | 6,774 | |
| Actuant Corp. - Class A(d) | | | 290 | | | | 7,195 | |
| Acuity Brands, Inc. | | | 275 | | | | 37,925 | |
| AECOM(a) | | | 977 | | | | 36,979 | |
| Aerojet Rocketdyne Holdings, Inc.(a) | | | 500 | | | | 22,385 | |
| AGCO Corp. | | | 400 | | | | 31,028 | |
| Air Lease Corp.(d) | | | 600 | | | | 24,804 | |
| Aircastle Ltd. | | | 500 | | | | 10,630 | |
| Alaska Air Group, Inc. | | | 834 | | | | 53,301 | |
| Albany International Corp. - Class A | | | 100 | | | | 8,291 | |
| Allegiant Travel Co.(d) | | | 53 | | | | 7,606 | |
| Allison Transmission Holdings, Inc. | | | 1,125 | | | | 52,144 | |
| Altra Industrial Motion Corp. | | | 300 | | | | 10,764 | |
| AMERCO | | | 70 | | | | 26,499 | |
| American Airlines Group, Inc. | | | 2,303 | | | | 75,101 | |
| American Woodmark Corp.(a) | | | 130 | | | | 11,001 | |
| AMETEK, Inc. | | | 1,337 | | | | 121,453 | |
| Apogee Enterprises, Inc. | | | 200 | | | | 8,688 | |
| Applied Industrial Technologies, Inc. | | | 375 | | | | 23,074 | |
| ArcBest Corp. | | | 300 | | | | 8,433 | |
| Arconic, Inc. | | | 3,140 | | | | 81,075 | |
| Arcosa, Inc. | | | 350 | | | | 13,171 | |
| Armstrong Flooring, Inc.(a) | | | 100 | | | | 985 | |
| Armstrong World Industries, Inc. | | | 200 | | | | 19,440 | |
| ASGN, Inc.(a) | | | 250 | | | | 15,150 | |
| Astec Industries, Inc. | | | 200 | | | | 6,512 | |
| Astronics Corp.(a) | | | 300 | | | | 12,066 | |
| WILSHIRE 5000 INDEX FUND | |
| SCHEDULE OF INVESTMENTS (Continued) | |
| COMMON STOCKS - 98.3% (Continued) | | Shares | | | Value | |
| Industrials - 9.8% (Continued) | | | | | | | | |
| Astronics Corp. - Class B(a) | | | 155 | | | $ | 6,223 | |
| Avis Budget Group, Inc.(a) | | | 392 | | | | 13,783 | |
| Axon Enterprise, Inc.(a) (d) | | | 325 | | | | 20,868 | |
| AZZ, Inc. | | | 225 | | | | 10,355 | |
| Barnes Group, Inc. | | | 300 | | | | 16,902 | |
| Beacon Roofing Supply, Inc.(a) | | | 500 | | | | 18,360 | |
| BMC Stock Holdings, Inc.(a) | | | 475 | | | | 10,070 | |
| Boeing Co. (The) | | | 3,988 | | | | 1,451,673 | |
| Brady Corp. - Class A | | | 145 | | | | 7,151 | |
| Briggs & Stratton Corp.(d) | | | 150 | | | | 1,536 | |
| BrightView Holdings, Inc.(a) (d) | | | 830 | | | | 15,529 | |
| Brink's Co. (The) | | | 150 | | | | 12,177 | |
| Builders FirstSource, Inc.(a) | | | 450 | | | | 7,587 | |
| BWX Technologies, Inc. | | | 612 | | | | 31,885 | |
| C.H. Robinson Worldwide, Inc. | | | 360 | | | | 30,366 | |
| Carlisle Cos., Inc. | | | 423 | | | | 59,393 | |
| Casella Waste Systems, Inc. - Class A(a) | | | 100 | | | | 3,963 | |
| Caterpillar, Inc. | | | 3,781 | | | | 515,311 | |
| CBIZ, Inc.(a) | | | 300 | | | | 5,877 | |
| CECO Environmental Corp.(a) | | | 2,970 | | | | 28,482 | |
| Chart Industries, Inc.(a) | | | 300 | | | | 23,064 | |
| Cintas Corp. | | | 701 | | | | 166,340 | |
| CIRCOR International, Inc.(a) | | | 184 | | | | 8,464 | |
| Clean Harbors, Inc.(a) | | | 400 | | | | 28,440 | |
| Colfax Corp.(a) | | | 625 | | | | 17,519 | |
| Columbus McKinnon Corp. | | | 400 | | | | 16,788 | |
| Comfort Systems USA, Inc. | | | 300 | | | | 15,297 | |
| Commercial Vehicle Group, Inc.(a) | | | 300 | | | | 2,406 | |
| Copart, Inc.(a) | | | 1,400 | | | | 104,636 | |
| Cornerstone Building Brands, Inc.(a) | | | 500 | | | | 2,915 | |
| CoStar Group, Inc.(a) | | | 225 | | | | 124,663 | |
| Covanta Holding Corp.(d) | | | 850 | | | | 15,224 | |
| Covenant Transportation Group, Inc. - Class A(a) | | | 100 | | | | 1,471 | |
| Crane Co. | | | 325 | | | | 27,118 | |
| CSX Corp. | | | 5,905 | | | | 456,869 | |
| Cubic Corp.(d) | | | 300 | | | | 19,344 | |
| WILSHIRE 5000 INDEX FUND | |
| SCHEDULE OF INVESTMENTS (Continued) | |
| COMMON STOCKS - 98.3% (Continued) | | Shares | | | Value | |
| Industrials - 9.8% (Continued) | | | | | | | | |
| Cummins, Inc. | | | 887 | | | $ | 151,979 | |
| Curtiss-Wright Corp. | | | 300 | | | | 38,139 | |
| Deere & Co. | | | 1,971 | | | | 326,613 | |
| Delta Air Lines, Inc. | | | 3,900 | | | | 221,324 | |
| Deluxe Corp. | | | 200 | | | | 8,132 | |
| Donaldson Co., Inc.(d) | | | 925 | | | | 47,046 | |
| Dover Corp. | | | 1,131 | | | | 113,326 | |
| DXP Enterprises, Inc.(a) (d) | | | 100 | | | | 3,789 | |
| Dycom Industries, Inc.(a) | | | 211 | | | | 12,422 | |
| Eaton Corp. plc | | | 3,061 | | | | 254,920 | |
| EMCOR Group, Inc. | | | 500 | | | | 44,050 | |
| Emerson Electric Co. | | | 4,248 | | | | 283,426 | |
| Encore Wire Corp. | | | 200 | | | | 11,716 | |
| Energy Recovery, Inc.(a) (d) | | | 500 | | | | 5,210 | |
| EnerSys(d) | | | 375 | | | | 25,688 | |
| Ennis, Inc. | | | 50 | | | | 1,026 | |
| EnPro Industries, Inc. | | | 178 | | | | 11,364 | |
| Equifax, Inc. | | | 795 | | | | 107,515 | |
| ESCO Technologies, Inc.(d) | | | 200 | | | | 16,524 | |
| Expeditors International of Washington, Inc. | | | 1,250 | | | | 94,825 | |
| Exponent, Inc. | | | 540 | | | | 31,612 | |
| Fastenal Co. | | | 4,250 | | | | 138,509 | |
| Federal Signal Corp. | | | 475 | | | | 12,706 | |
| FedEx Corp. | | | 1,567 | | | | 257,286 | |
| Flowserve Corp. | | | 815 | | | | 42,942 | |
| Fluor Corp. | | | 1,086 | | | | 36,587 | |
| Forrester Research, Inc. | | | 255 | | | | 11,993 | |
| Fortive Corp. | | | 1,835 | | | | 149,589 | |
| Fortune Brands Home & Security, Inc. | | | 1,000 | | | | 57,130 | |
| Forward Air Corp. | | | 300 | | | | 17,745 | |
| Franklin Electric Co., Inc. | | | 275 | | | | 13,063 | |
| FreightCar America, Inc.(a) | | | 500 | | | | 2,935 | |
| FTI Consulting, Inc.(a) | | | 250 | | | | 20,960 | |
| GATX Corp.(d) | | | 325 | | | | 25,769 | |
| General Dynamics Corp. | | | 1,390 | | | | 252,730 | |
| General Electric Co. | | | 57,876 | | | | 607,698 | |
| WILSHIRE 5000 INDEX FUND | |
| SCHEDULE OF INVESTMENTS (Continued) | |
| COMMON STOCKS - 98.3% (Continued) | | Shares | | | Value | |
| Industrials - 9.8% (Continued) | | | | | | | | |
| Genesee & Wyoming, Inc. - Class A(a) | | | 285 | | | $ | 28,500 | |
| Gibraltar Industries, Inc.(a) | | | 300 | | | | 12,108 | |
| Gorman-Rupp Co. (The) | | | 182 | | | | 5,975 | |
| Graco, Inc. | | | 1,086 | | | | 54,495 | |
| Granite Construction, Inc.(d) | | | 562 | | | | 27,077 | |
| Great Lakes Dredge & Dock Corp.(a) | | | 1,500 | | | | 16,560 | |
| Greenbrier Cos., Inc. (The)(d) | | | 200 | | | | 6,080 | |
| Griffon Corp.(d) | | | 350 | | | | 5,922 | |
| H&E Equipment Services, Inc.(d) | | | 325 | | | | 9,454 | |
| Harris Corp. | | | 892 | | | | 168,704 | |
| Hawaiian Holdings, Inc.(d) | | | 325 | | | | 8,915 | |
| HD Supply Holdings, Inc.(a) | | | 1,130 | | | | 45,516 | |
| Healthcare Services Group, Inc.(d) | | | 375 | | | | 11,370 | |
| Heartland Express, Inc. | | | 325 | | | | 5,873 | |
| HEICO Corp. - Class A | | | 682 | | | | 70,498 | |
| Heidrick & Struggles International, Inc. | | | 200 | | | | 5,994 | |
| Herc Holdings, Inc.(a) | | | 143 | | | | 6,554 | |
| Heritage-Crystal Clean, Inc.(a) | | | 370 | | | | 9,735 | |
| Herman Miller, Inc. | | | 300 | | | | 13,410 | |
| Hertz Global Holdings, Inc.(a) (d) | | | 430 | | | | 6,863 | |
| Hexcel Corp. | | | 750 | | | | 60,660 | |
| Hillenbrand, Inc. | | | 325 | | | | 12,860 | |
| HNI Corp. | | | 100 | | | | 3,538 | |
| Honeywell International, Inc. | | | 4,552 | | | | 794,734 | |
| Hub Group, Inc. - Class A(a) | | | 50 | | | | 2,099 | |
| Hubbell, Inc.(d) | | | 338 | | | | 44,075 | |
| Huntington Ingalls Industries, Inc. | | | 319 | | | | 71,692 | |
| Hurco Cos., Inc. | | | 400 | | | | 14,224 | |
| Huron Consulting Group, Inc.(a) | | | 200 | | | | 10,076 | |
| Hyster-Yale Materials Handling, Inc.(d) | | | 118 | | | | 6,521 | |
| IDEX Corp. | | | 437 | | | | 75,225 | |
| IES Holdings, Inc.(a) | | | 500 | | | | 9,425 | |
| Illinois Tool Works, Inc. | | | 1,814 | | | | 273,568 | |
| Insperity, Inc. | | | 292 | | | | 35,665 | |
| Insteel Industries, Inc. | | | 300 | | | | 6,246 | |
| Interface, Inc. | | | 500 | | | | 7,665 | |
| WILSHIRE 5000 INDEX FUND | |
| SCHEDULE OF INVESTMENTS (Continued) | |
| COMMON STOCKS - 98.3% (Continued) | | Shares | | | Value | |
| Industrials - 9.8% (Continued) | | | | | | | | |
| ITT, Inc. | | | 600 | | | $ | 39,288 | |
| J.B. Hunt Transport Services, Inc. | | | 570 | | | | 52,104 | |
| Jacobs Engineering Group, Inc. | | | 850 | | | | 71,731 | |
| JetBlue Airways Corp.(a) | | | 1,750 | | | | 32,358 | |
| John Bean Technologies Corp.(d) | | | 151 | | | | 18,291 | |
| Johnson Controls International plc | | | 3,610 | | | | 149,129 | |
| Kaman Corp. | | | 300 | | | | 19,107 | |
| Kansas City Southern | | | 759 | | | | 92,461 | |
| KAR Auction Services, Inc. | | | 975 | | | | 24,375 | |
| Kelly Services, Inc. - Class A | | | 400 | | | | 10,476 | |
| Kennametal, Inc.(d) | | | 475 | | | | 17,570 | |
| Kforce, Inc. | | | 150 | | | | 5,264 | |
| Kimball International, Inc. - Class B | | | 700 | | | | 12,201 | |
| Kirby Corp.(a) | | | 300 | | | | 23,700 | |
| Knight-Swift Transportation Holdings, Inc.(d) | | | 638 | | | | 20,952 | |
| Knoll, Inc. | | | 500 | | | | 11,490 | |
| Korn Ferry | | | 225 | | | | 9,016 | |
| Kratos Defense & Security Solutions, Inc.(a) (d) | | | 10 | | | | 229 | |
| L3 Technologies, Inc. | | | 512 | | | | 125,527 | |
| Landstar System, Inc. | | | 300 | | | | 32,397 | |
| Lennox International, Inc.(d) | | | 257 | | | | 70,675 | |
| Lincoln Electric Holdings, Inc. | | | 332 | | | | 27,330 | |
| Lockheed Martin Corp. | | | 1,584 | | | | 575,847 | |
| LSC Communications, Inc. | | | 159 | | | | 584 | |
| Manitowoc Co., Inc. (The)(a) (d) | | | 268 | | | | 4,770 | |
| ManpowerGroup, Inc. | | | 413 | | | | 39,896 | |
| Marten Transport Ltd.(d) | | | 250 | | | | 4,538 | |
| Masco Corp. | | | 2,050 | | | | 80,442 | |
| MasTec, Inc.(a) (d) | | | 500 | | | | 25,765 | |
| Matson, Inc.(d) | | | 325 | | | | 12,626 | |
| Matthews International Corp. - Class A | | | 100 | | | | 3,485 | |
| McGrath RentCorp | | | 300 | | | | 18,645 | |
| Mercury Systems, Inc.(a) | | | 400 | | | | 28,140 | |
| Meritor, Inc.(a) | | | 550 | | | | 13,338 | |
| Middleby Corp. (The)(a) | | | 468 | | | | 63,508 | |
| Mobile Mini, Inc. | | | 406 | | | | 12,355 | |
| WILSHIRE 5000 INDEX FUND | |
| SCHEDULE OF INVESTMENTS (Continued) | |
| COMMON STOCKS - 98.3% (Continued) | | Shares | | | Value | |
| Industrials - 9.8% (Continued) | | | | | | | | |
| Moog, Inc. - Class A | | | 300 | | | $ | 28,083 | |
| MSA Safety, Inc. | | | 228 | | | | 24,029 | |
| MSC Industrial Direct Co., Inc. - Class A | | | 245 | | | | 18,194 | |
| Mueller Industries, Inc. | | | 300 | | | | 8,781 | |
| Mueller Water Products, Inc. - Series A | | | 1,600 | | | | 15,712 | |
| Navigant Consulting, Inc.(d) | | | 400 | | | | 9,276 | |
| Navistar International Corp.(a) (d) | | | 625 | | | | 21,531 | |
| Nordson Corp. | | | 318 | | | | 44,937 | |
| Norfolk Southern Corp. | | | 2,084 | | | | 415,403 | |
| Northrop Grumman Corp. | | | 1,017 | | | | 328,603 | |
| NOW, Inc.(a) | | | 649 | | | | 9,579 | |
| nVent Electric plc | | | 1,425 | | | | 35,326 | |
| Old Dominion Freight Line, Inc. | | | 500 | | | | 74,630 | |
| Oshkosh Corp. | | | 350 | | | | 29,222 | |
| Owens Corning | | | 800 | | | | 46,560 | |
| PACCAR, Inc. | | | 1,515 | | | | 108,565 | |
| Parker-Hannifin Corp. | | | 877 | | | | 149,099 | |
| Perma-Pipe International Holdings, Inc.(a) | | | 300 | | | | 2,730 | |
| Pitney Bowes, Inc.(d) | | | 1,375 | | | | 5,885 | |
| Primoris Services Corp. | | | 475 | | | | 9,942 | |
| Quanex Building Products Corp. | | | 1,000 | | | | 18,890 | |
| Quanta Services, Inc. | | | 1,050 | | | | 40,100 | |
| R.R. Donnelley & Sons Co.(d) | | | 425 | | | | 837 | |
| Raven Industries, Inc. | | | 275 | | | | 9,867 | |
| Raytheon Co. | | | 1,951 | | | | 339,240 | |
| RBC Bearings, Inc.(a) | | | 165 | | | | 27,524 | |
| Red Violet, Inc.(a) (d) | | | 1,490 | | | | 18,476 | |
| Regal Beloit Corp. | | | 100 | | | | 8,171 | |
| Republic Services, Inc. | | | 1,233 | | | | 106,827 | |
| Resideo Technologies, Inc.(a) | | | 758 | | | | 16,615 | |
| Resources Connection, Inc.(d) | | | 200 | | | | 3,202 | |
| Rexnord Corp.(a) | | | 325 | | | | 9,822 | |
| Robert Half International, Inc. | | | 1,000 | | | | 57,010 | |
| Rockwell Automation, Inc. | | | 970 | | | | 158,915 | |
| Rollins, Inc. | | | 1,350 | | | | 48,425 | |
| Roper Technologies, Inc. | | | 634 | | | | 232,209 | |
| WILSHIRE 5000 INDEX FUND | |
| SCHEDULE OF INVESTMENTS (Continued) | |
| COMMON STOCKS - 98.3% (Continued) | | Shares | | | Value | |
| Industrials - 9.8% (Continued) | | | | | | | | |
| Rush Enterprises, Inc. - Class A | | | 75 | | | $ | 2,739 | |
| Ryder System, Inc. | | | 405 | | | | 23,612 | |
| Saia, Inc.(a) (d) | | | 225 | | | | 14,551 | |
| Simpson Manufacturing Co., Inc. | | | 100 | | | | 6,646 | |
| SkyWest, Inc. | | | 375 | | | | 22,751 | |
| Snap-on, Inc. | | | 362 | | | | 59,962 | |
| Southwest Airlines Co. | | | 3,214 | | | | 163,206 | |
| Spartan Motors, Inc. | | | 75 | | | | 822 | |
| Spirit AeroSystems Holdings, Inc. - Class A | | | 700 | | | | 56,959 | |
| Spirit Airlines, Inc.(a) (d) | | | 475 | | | | 22,672 | |
| SPX Corp.(a) | | | 312 | | | | 10,302 | |
| SPX FLOW, Inc.(a) | | | 312 | | | | 13,060 | |
| Standex International Corp. | | | 50 | | | | 3,657 | |
| Stanley Black & Decker, Inc. | | | 1,020 | | | | 147,502 | |
| Steelcase, Inc. - Class A | | | 875 | | | | 14,963 | |
| Stericycle, Inc.(a) | | | 575 | | | | 27,456 | |
| Systemax, Inc. | | | 600 | | | | 13,296 | |
| Team, Inc.(a) (d) | | | 1,114 | | | | 17,066 | |
| Teledyne Technologies, Inc.(a) | | | 211 | | | | 57,787 | |
| Terex Corp. | | | 825 | | | | 25,905 | |
| Tetra Tech, Inc. | | | 418 | | | | 32,834 | |
| Textainer Group Holdings Ltd.(a) (d) | | | 700 | | | | 7,056 | |
| Textron, Inc. | | | 1,375 | | | | 72,930 | |
| Timken Co. (The) | | | 375 | | | | 19,253 | |
| Titan International, Inc. | | | 312 | | | | 1,526 | |
| Toro Co. (The) | | | 528 | | | | 35,323 | |
| TransDigm Group, Inc.(a) | | | 298 | | | | 144,172 | |
| TransUnion | | | 650 | | | | 47,782 | |
| Trex Co., Inc.(a) (d) | | | 450 | | | | 32,265 | |
| TriNet Group, Inc.(a) | | | 200 | | | | 13,560 | |
| Trinity Industries, Inc. | | | 1,050 | | | | 21,788 | |
| Triumph Group, Inc. | | | 256 | | | | 5,862 | |
| TrueBlue, Inc.(a) (d) | | | 300 | | | | 6,618 | |
| Tutor Perini Corp.(a) | | | 200 | | | | 2,774 | |
| Twin Disc, Inc.(a) (d) | | | 400 | | | | 6,040 | |
| Ultralife Corp.(a) | | | 200 | | | | 1,590 | |
| WILSHIRE 5000 INDEX FUND | |
| SCHEDULE OF INVESTMENTS (Continued) | |
| COMMON STOCKS - 98.3% (Continued) | | Shares | | | Value | |
| Industrials - 9.8% (Continued) | | | | | | | | |
| UniFirst Corp. | | | 86 | | | $ | 16,217 | |
| Union Pacific Corp. | | | 4,857 | | | | 821,366 | |
| United Airlines Holdings, Inc.(a) | | | 1,581 | | | | 138,417 | |
| United Parcel Service, Inc. - Class B | | | 4,100 | | | | 423,406 | |
| United Rentals, Inc.(a) | | | 542 | | | | 71,885 | |
| United Technologies Corp. | | | 5,348 | | | | 696,310 | |
| Univar, Inc.(a) (d) | | | 575 | | | | 12,673 | |
| Universal Forest Products, Inc. | | | 399 | | | | 15,186 | |
| Upwork, Inc.(a) (d) | | | 1,040 | | | | 16,723 | |
| US Ecology, Inc.(d) | | | 200 | | | | 11,908 | |
| Valmont Industries, Inc. | | | 159 | | | | 20,163 | |
| Vectrus, Inc.(a) | | | 122 | | | | 4,948 | |
| Verisk Analytics, Inc. | | | 1,124 | | | | 164,620 | |
| Veritiv Corp.(a) (d) | | | 97 | | | | 1,884 | |
| Viad Corp. | | | 100 | | | | 6,624 | |
| Vicor Corp.(a) (d) | | | 300 | | | | 9,315 | |
| W.W. Grainger, Inc. | | | 423 | | | | 113,461 | |
| Wabash National Corp. | | | 50 | | | | 814 | |
| WABCO Holdings, Inc.(a) | | | 303 | | | | 40,178 | |
| WageWorks, Inc.(a) | | | 300 | | | | 15,237 | |
| Waste Management, Inc. | | | 2,145 | | | | 247,468 | |
| Watsco, Inc.(d) | | | 214 | | | | 34,995 | |
| Watts Water Technologies, Inc. - Class A | | | 300 | | | | 27,954 | |
| Welbilt, Inc.(a) | | | 1,075 | | | | 17,953 | |
| Werner Enterprises, Inc.(d) | | | 250 | | | | 7,770 | |
| WESCO International, Inc.(a) | | | 300 | | | | 15,195 | |
| Westinghouse Air Brake Technologies Corp.(d) | | | 869 | | | | 62,359 | |
| Willdan Group, Inc.(a) (d) | | | 340 | | | | 12,665 | |
| Woodward, Inc. | | | 500 | | | | 56,580 | |
| XPO Logistics, Inc.(a) (d) | | | 655 | | | | 37,866 | |
| Xylem, Inc. | | | 1,300 | | | | 108,732 | |
| | | | | | | | 18,816,739 | |
| Information Technology - 20.9% | | | | | | | | |
| 2U, Inc.(a) (d) | | | 325 | | | | 12,233 | |
| 3D Systems Corp.(a) (d) | | | 848 | | | | 7,717 | |
| 8x8, Inc.(a) | | | 1,000 | | | | 24,100 | |
| WILSHIRE 5000 INDEX FUND | |
| SCHEDULE OF INVESTMENTS (Continued) | |
| COMMON STOCKS - 98.3% (Continued) | | Shares | | | Value | |
| Information Technology - 20.9% (Continued) | | | | | | | | |
| ACI Worldwide, Inc.(a) | | | 560 | | | $ | 19,230 | |
| Adobe, Inc.(a) | | | 3,131 | | | | 922,548 | |
| Advanced Energy Industries, Inc.(a) | | | 300 | | | | 16,881 | |
| Advanced Micro Devices, Inc.(a) (d) | | | 5,945 | | | | 180,550 | |
| Agilysys, Inc.(a) | | | 500 | | | | 10,735 | |
| Akamai Technologies, Inc.(a) | | | 984 | | | | 78,858 | |
| Alliance Data Systems Corp. | | | 408 | | | | 57,173 | |
| Ambarella, Inc.(a) | | | 300 | | | | 13,239 | |
| Amber Road, Inc.(a) | | | 2,060 | | | | 26,904 | |
| Amkor Technology, Inc.(a) | | | 1,050 | | | | 7,833 | |
| Amphenol Corp. - Class A | | | 1,600 | | | | 153,504 | |
| Amtech Systems, Inc.(a) (d) | | | 4,002 | | | | 22,011 | |
| Analog Devices, Inc. | | | 2,429 | | | | 274,161 | |
| Anixter International, Inc.(a) | | | 167 | | | | 9,972 | |
| ANSYS, Inc.(a) | | | 500 | | | | 102,410 | |
| Apple, Inc. | | | 32,343 | | | | 6,401,326 | |
| Applied Materials, Inc. | | | 7,148 | | | | 321,017 | |
| Arista Networks, Inc.(a) | | | 320 | | | | 83,078 | |
| Arlo Technologies, Inc.(a) (d) | | | 99 | | | | 397 | |
| Arrow Electronics, Inc.(a) | | | 500 | | | | 35,635 | |
| Aspen Technology, Inc.(a) | | | 325 | | | | 40,391 | |
| Autodesk, Inc.(a) | | | 1,475 | | | | 240,278 | |
| Automatic Data Processing, Inc. | | | 3,274 | | | | 541,290 | |
| Avnet, Inc. | | | 900 | | | | 40,743 | |
| AVX Corp.(d) | | | 375 | | | | 6,225 | |
| AXT, Inc.(a) (d) | | | 4,230 | | | | 16,751 | |
| Badger Meter, Inc. | | | 300 | | | | 17,907 | |
| Bel Fuse, Inc. - Class B | | | 300 | | | | 5,151 | |
| Belden, Inc.(d) | | | 100 | | | | 5,957 | |
| Benchmark Electronics, Inc. | | | 475 | | | | 11,932 | |
| Black Knight, Inc.(a) | | | 585 | | | | 35,188 | |
| Blackbaud, Inc.(d) | | | 200 | | | | 16,700 | |
| Booz Allen Hamilton Holding Corp. | | | 1,000 | | | | 66,210 | |
| Bottomline Technologies (de), Inc.(a) | | | 375 | | | | 16,590 | |
| Broadcom, Inc. | | | 2,530 | | | | 728,285 | |
| Broadridge Financial Solutions, Inc. | | | 775 | | | | 98,952 | |
| WILSHIRE 5000 INDEX FUND | |
| SCHEDULE OF INVESTMENTS (Continued) | |
| COMMON STOCKS - 98.3% (Continued) | | Shares | | | Value | |
| Information Technology - 20.9% (Continued) | | | | | | | | |
| Brooks Automation, Inc.(d) | | | 106 | | | $ | 4,108 | |
| Cabot Microelectronics Corp. | | | 100 | | | | 11,008 | |
| CACI International, Inc. - Class A(a) | | | 99 | | | | 20,254 | |
| Cadence Design Systems, Inc.(a) | | | 1,902 | | | | 134,681 | |
| CalAmp Corp.(a) (d) | | | 400 | | | | 4,672 | |
| Calix, Inc.(a) | | | 175 | | | | 1,148 | |
| Carbon Black, Inc.(a) (d) | | | 1,150 | | | | 19,228 | |
| Carbonite, Inc.(a) | | | 630 | | | | 16,405 | |
| Cardtronics plc - Class A(a) | | | 175 | | | | 4,781 | |
| CDW Corp. | | | 1,025 | | | | 113,775 | |
| Ciena Corp.(a) (d) | | | 997 | | | | 41,007 | |
| Cirrus Logic, Inc.(a) | | | 400 | | | | 17,480 | |
| Cisco Systems, Inc. | | | 29,388 | | | | 1,608,405 | |
| Citrix Systems, Inc. | | | 1,118 | | | | 109,721 | |
| Cognex Corp. | | | 1,150 | | | | 55,177 | |
| Cognizant Technology Solutions Corp. - Class A | | | 4,298 | | | | 272,450 | |
| Coherent, Inc.(a) | | | 200 | | | | 27,274 | |
| CommScope Holding Co., Inc.(a) | | | 1,150 | | | | 18,090 | |
| CommVault Systems, Inc.(a) | | | 375 | | | | 18,608 | |
| Comtech Telecommunications Corp. | | | 100 | | | | 2,811 | |
| Conduent, Inc.(a) | | | 1,399 | | | | 13,416 | |
| CoreLogic, Inc.(a) | | | 677 | | | | 28,319 | |
| Cornerstone OnDemand, Inc.(a) | | | 500 | | | | 28,965 | |
| Corning, Inc. | | | 6,669 | | | | 221,610 | |
| Coupa Software, Inc.(a) | | | 290 | | | | 36,717 | |
| Cray, Inc.(a) | | | 425 | | | | 14,799 | |
| Cree, Inc.(a) (d) | | | 625 | | | | 35,113 | |
| CSG Systems International, Inc. | | | 78 | | | | 3,809 | |
| CTS Corp. | | | 100 | | | | 2,758 | |
| CyberOptics Corp.(a) (d) | | | 840 | | | | 13,633 | |
| Cypress Semiconductor Corp. | | | 1,625 | | | | 36,140 | |
| Daktronics, Inc. | | | 800 | | | | 4,936 | |
| Diebold Nixdorf, Inc.(a) | | | 650 | | | | 5,954 | |
| Diodes, Inc.(a) | | | 300 | | | | 10,911 | |
| Dolby Laboratories, Inc. - Class A | | | 300 | | | | 19,380 | |
| DXC Technology Co. | | | 1,978 | | | | 109,087 | |
| WILSHIRE 5000 INDEX FUND | |
| SCHEDULE OF INVESTMENTS (Continued) | |
| COMMON STOCKS - 98.3% (Continued) | | Shares | | | Value | |
| Information Technology - 20.9% (Continued) | | | | | | | | |
| Ebix, Inc.(d) | | | 31 | | | $ | 1,557 | |
| EchoStar Corp. - Class A(a) | | | 400 | | | | 17,728 | |
| eGain Corp.(a) | | | 2,700 | | | | 21,978 | |
| Electronics For Imaging, Inc.(a) | | | 404 | | | | 14,912 | |
| EMCORE Corp.(a) | | | 125 | | | | 411 | |
| Entegris, Inc.(d) | | | 1,011 | | | | 37,731 | |
| Envestnet, Inc.(a) | | | 375 | | | | 25,639 | |
| EPAM Systems, Inc.(a) | | | 300 | | | | 51,930 | |
| Euronet Worldwide, Inc.(a) | | | 349 | | | | 58,716 | |
| Everspin Technologies, Inc.(a) (d) | | | 2,680 | | | | 17,474 | |
| ExlService Holdings, Inc.(a) | | | 300 | | | | 19,839 | |
| F5 Networks, Inc.(a) | | | 433 | | | | 63,058 | |
| Fair Isaac Corp.(a) | | | 146 | | | | 45,847 | |
| FARO Technologies, Inc.(a) (d) | | | 200 | | | | 10,516 | |
| Fidelity National Information Services, Inc. | | | 2,344 | | | | 287,562 | |
| Finisar Corp.(a) (d) | | | 775 | | | | 17,724 | |
| FireEye, Inc.(a) | | | 600 | | | | 8,886 | |
| First Data Corp. - Class A(a) | | | 1,825 | | | | 49,403 | |
| First Solar, Inc.(a) (d) | | | 400 | | | | 26,272 | |
| Fiserv, Inc.(a) (d) | | | 2,396 | | | | 218,419 | |
| Fitbit, Inc. - Class A(a) (d) | | | 425 | | | | 1,870 | |
| Five9, Inc.(a) | | | 570 | | | | 29,235 | |
| FleetCor Technologies, Inc.(a) | | | 628 | | | | 176,374 | |
| FLIR Systems, Inc. | | | 1,025 | | | | 55,453 | |
| ForeScout Technologies, Inc.(a) | | | 590 | | | | 19,977 | |
| FormFactor, Inc.(a) | | | 480 | | | | 7,522 | |
| Fortinet, Inc.(a) | | | 1,075 | | | | 82,592 | |
| Gartner, Inc.(a) | | | 581 | | | | 93,506 | |
| Genpact Ltd. | | | 1,125 | | | | 42,851 | |
| Global Payments, Inc. | | | 950 | | | | 152,124 | |
| Guidewire Software, Inc.(a) (d) | | | 300 | | | | 30,414 | |
| Hewlett Packard Enterprise Co. | | | 11,547 | | | | 172,628 | |
| HP, Inc. | | | 10,922 | | | | 227,067 | |
| HubSpot, Inc.(a) (d) | | | 300 | | | | 51,156 | |
| I.D. Systems, Inc.(a) | | | 100 | | | | 588 | |
| II-VI, Inc.(a) (d) | | | 375 | | | | 13,710 | |
| WILSHIRE 5000 INDEX FUND | |
| SCHEDULE OF INVESTMENTS (Continued) | |
| COMMON STOCKS - 98.3% (Continued) | | Shares | | | Value | |
| Information Technology - 20.9% (Continued) | | | | | | | | |
| Infinera Corp.(a) (d) | | | 600 | | | $ | 1,746 | |
| Inphi Corp.(a) (d) | | | 300 | | | | 15,030 | |
| Insight Enterprises, Inc.(a) (d) | | | 200 | | | | 11,640 | |
| Instructure, Inc.(a) | | | 470 | | | | 19,975 | |
| Intel Corp. | | | 29,498 | | | | 1,412,068 | |
| Intelligent Systems Corp.(a) (d) | | | 840 | | | | 24,184 | |
| InterDigital, Inc. | | | 246 | | | | 15,842 | |
| International Business Machines Corp. | | | 6,425 | | | | 886,008 | |
| inTEST Corp.(a) | | | 2,450 | | | | 11,785 | |
| Intuit, Inc. | | | 1,589 | | | | 415,253 | |
| IPG Photonics Corp.(a) | | | 281 | | | | 43,344 | |
| Itron, Inc.(a) | | | 200 | | | | 12,514 | |
| j2 Global, Inc. | | | 325 | | | | 28,889 | |
| Jabil, Inc. | | | 1,025 | | | | 32,390 | |
| Jack Henry & Associates, Inc. | | | 486 | | | | 65,085 | |
| Juniper Networks, Inc. | | | 2,190 | | | | 58,320 | |
| KBR, Inc. | | | 925 | | | | 23,070 | |
| Key Tronic Corp.(a) | | | 600 | | | | 2,988 | |
| Keysight Technologies, Inc.(a) | | | 1,298 | | | | 116,573 | |
| Kimball Electronics, Inc.(a) | | | 525 | | | | 8,526 | |
| KLA-Tencor Corp. | | | 956 | | | | 112,999 | |
| Knowles Corp.(a) | | | 458 | | | | 8,386 | |
| Kulicke & Soffa Industries, Inc. | | | 400 | | | | 9,020 | |
| Lam Research Corp. | | | 1,116 | | | | 209,629 | |
| Lattice Semiconductor Corp.(a) | | | 200 | | | | 2,918 | |
| Leidos Holdings, Inc. | | | 931 | | | | 74,340 | |
| Littelfuse, Inc. | | | 118 | | | | 20,875 | |
| LivePerson, Inc.(a) | | | 770 | | | | 21,591 | |
| LiveRamp Holdings, Inc.(a) | | | 475 | | | | 23,028 | |
| LogMeIn, Inc. | | | 356 | | | | 26,230 | |
| Lumentum Holdings, Inc.(a) (d) | | | 424 | | | | 22,646 | |
| MACOM Technology Solutions Holdings, Inc.(a) (d) | | | 463 | | | | 7,005 | |
| Manhattan Associates, Inc.(a) | | | 350 | | | | 24,266 | |
| Marin Software, Inc.(a) | | | 2,840 | | | | 6,986 | |
| Marvell Technology Group Ltd.(d) | | | 4,389 | | | | 104,765 | |
| Mastercard, Inc. - Class A | | | 6,525 | | | | 1,726,057 | |
| WILSHIRE 5000 INDEX FUND | |
| SCHEDULE OF INVESTMENTS (Continued) | |
| COMMON STOCKS - 98.3% (Continued) | | Shares | | | Value | |
| Information Technology - 20.9% (Continued) | | | | | | | | |
| Maxim Integrated Products, Inc. | | | 1,775 | | | $ | 106,181 | |
| MAXIMUS, Inc. | | | 425 | | | | 30,830 | |
| MaxLinear, Inc.(a) | | | 475 | | | | 11,134 | |
| Methode Electronics, Inc. | | | 100 | | | | 2,857 | |
| Microchip Technology, Inc.(d) | | | 1,574 | | | | 136,466 | |
| Micron Technology, Inc.(a) | | | 7,002 | | | | 270,207 | |
| Microsoft Corp. | | | 51,102 | | | | 6,845,623 | |
| MicroStrategy, Inc. - Class A(a) | | | 100 | | | | 14,331 | |
| Mitek Systems, Inc.(a) | | | 2,920 | | | | 29,025 | |
| MKS Instruments, Inc. | | | 300 | | | | 23,367 | |
| MobileIron, Inc.(a) | | | 3,650 | | | | 22,630 | |
| Monolithic Power Systems, Inc. | | | 200 | | | | 27,156 | |
| Monotype Imaging Holdings, Inc. | | | 350 | | | | 5,894 | |
| Motorola Solutions, Inc. | | | 1,132 | | | | 188,738 | |
| Nanometrics, Inc.(a) | | | 200 | | | | 6,942 | |
| Napco Security Technologies, Inc.(a) (d) | | | 900 | | | | 26,712 | |
| National Instruments Corp. | | | 812 | | | | 34,096 | |
| NCR Corp.(a) | | | 925 | | | | 28,768 | |
| Net Element, Inc.(a) (d) | | | 2,980 | | | | 13,619 | |
| NetApp, Inc. | | | 1,775 | | | | 109,518 | |
| NETGEAR, Inc.(a) (d) | | | 50 | | | | 1,265 | |
| NetScout Systems, Inc.(a) | | | 700 | | | | 17,773 | |
| NetSol Technologies, Inc.(a) (d) | | | 2,580 | | | | 14,422 | |
| New Relic, Inc.(a) | | | 230 | | | | 19,897 | |
| NIC, Inc. | | | 375 | | | | 6,015 | |
| Nuance Communications, Inc.(a) (d) | | | 2,175 | | | | 34,735 | |
| Nutanix, Inc. - Class A(a) | | | 470 | | | | 12,192 | |
| NVE Corp. | | | 100 | | | | 6,963 | |
| NVIDIA Corp. | | | 3,787 | | | | 621,939 | |
| ON Semiconductor Corp.(a) | | | 2,730 | | | | 55,173 | |
| OneSpan, Inc.(a) (d) | | | 450 | | | | 6,377 | |
| Oracle Corp. | | | 19,130 | | | | 1,089,835 | |
| OSI Systems, Inc.(a) (d) | | | 100 | | | | 11,263 | |
| Palo Alto Networks, Inc.(a) | | | 719 | | | | 146,503 | |
| PAR Technology Corp.(a) (d) | | | 100 | | | | 2,820 | |
| Park Electrochemical Corp. | | | 600 | | | | 10,014 | |
| WILSHIRE 5000 INDEX FUND | |
| SCHEDULE OF INVESTMENTS (Continued) | |
| COMMON STOCKS - 98.3% (Continued) | | Shares | | | Value | |
| Information Technology - 20.9% (Continued) | | | | | | | | |
| Paychex, Inc. | | | 2,150 | | | $ | 176,924 | |
| Paycom Software, Inc.(a) | | | 300 | | | | 68,016 | |
| Paylocity Holding Corp.(a) | | | 300 | | | | 28,146 | |
| PayPal Holdings, Inc.(a) | | | 7,725 | | | | 884,204 | |
| PCM, Inc.(a) | | | 400 | | | | 14,016 | |
| Pegasystems, Inc. | | | 300 | | | | 21,363 | |
| Perspecta, Inc. | | | 989 | | | | 23,153 | |
| PFSweb, Inc.(a) | | | 8 | | | | 32 | |
| Plantronics, Inc. | | | 300 | | | | 11,112 | |
| Plexus Corp.(a) (d) | | | 300 | | | | 17,511 | |
| Power Integrations, Inc. | | | 300 | | | | 24,054 | |
| PRGX Global, Inc.(a) | | | 2,150 | | | | 14,448 | |
| Progress Software Corp. | | | 200 | | | | 8,724 | |
| Proofpoint, Inc.(a) | | | 316 | | | | 37,999 | |
| PROS Holdings, Inc.(a) (d) | | | 300 | | | | 18,978 | |
| PTC, Inc.(a) | | | 865 | | | | 77,642 | |
| QUALCOMM, Inc. | | | 9,065 | | | | 689,575 | |
| Qualys, Inc.(a) (d) | | | 300 | | | | 26,124 | |
| Rambus, Inc.(a) | | | 500 | | | | 6,020 | |
| Rapid7, Inc.(a) | | | 540 | | | | 31,234 | |
| RealPage, Inc.(a) | | | 325 | | | | 19,126 | |
| Red Hat, Inc.(a) | | | 978 | | | | 183,629 | |
| RF Industries Ltd.(d) | | | 2,570 | | | | 21,691 | |
| RingCentral, Inc. - Class A(a) | | | 260 | | | | 29,879 | |
| Rubicon Project, Inc. (The)(a) | | | 4,060 | | | | 25,822 | |
| Rudolph Technologies, Inc.(a) (d) | | | 340 | | | | 9,394 | |
| Sabre Corp. | | | 1,400 | | | | 31,080 | |
| SailPoint Technology Holdings, Inc.(a) (d) | | | 630 | | | | 12,625 | |
| salesforce.com, Inc.(a) | | | 4,289 | | | | 650,770 | |
| Sanmina Corp.(a) | | | 333 | | | | 10,083 | |
| Science Applications International Corp.(d) | | | 340 | | | | 29,430 | |
| Semtech Corp.(a) | | | 300 | | | | 14,415 | |
| ServiceNow, Inc.(a) | | | 1,203 | | | | 330,308 | |
| SharpSpring, Inc.(a) (d) | | | 1,870 | | | | 24,291 | |
| Silicon Laboratories, Inc.(a) | | | 200 | | | | 20,680 | |
| Skyworks Solutions, Inc. | | | 1,099 | | | | 84,920 | |
| WILSHIRE 5000 INDEX FUND | |
| SCHEDULE OF INVESTMENTS (Continued) | |
| COMMON STOCKS - 98.3% (Continued) | | Shares | | | Value | |
| Information Technology - 20.9% (Continued) | | | | | | | | |
| Snap, Inc. - Class A(a) (d) | | | 3,880 | | | $ | 55,484 | |
| Splunk, Inc.(a) | | | 918 | | | | 115,439 | |
| Square, Inc. - Class A(a) (d) | | | 1,090 | | | | 79,058 | |
| SS&C Technologies Holdings, Inc.(d) | | | 1,325 | | | | 76,333 | |
| SunPower Corp.(a) (d) | | | 1,300 | | | | 13,897 | |
| Super Micro Computer, Inc.(a) (d) | | | 375 | | | | 7,256 | |
| Sykes Enterprises, Inc.(a) | | | 102 | | | | 2,801 | |
| Symantec Corp. | | | 3,483 | | | | 75,790 | |
| Synaptics, Inc.(a) (d) | | | 333 | | | | 9,704 | |
| Synchronoss Technologies, Inc.(a) (d) | | | 325 | | | | 2,571 | |
| SYNNEX Corp. | | | 229 | | | | 22,534 | |
| Synopsys, Inc.(a) | | | 1,117 | | | | 143,747 | |
| Tech Data Corp.(a) | | | 211 | | | | 22,071 | |
| Teradata Corp.(a) (d) | | | 1,025 | | | | 36,746 | |
| Teradyne, Inc. | | | 1,075 | | | | 51,503 | |
| TESSCO Technologies, Inc.(d) | | | 100 | | | | 1,786 | |
| Texas Instruments, Inc. | | | 6,205 | | | | 712,085 | |
| TiVo Corp. | | | 878 | | | | 6,471 | |
| Total System Services, Inc. | | | 1,337 | | | | 171,497 | |
| Trade Desk, Inc. (The) - Class A(a) (d) | | | 140 | | | | 31,889 | |
| Trimble, Inc.(a) | | | 1,334 | | | | 60,177 | |
| TTM Technologies, Inc.(a) | | | 488 | | | | 4,978 | |
| Twilio, Inc. - Class A(a) (d) | | | 260 | | | | 35,451 | |
| Tyler Technologies, Inc.(a) | | | 192 | | | | 41,476 | |
| Unisys Corp.(a) | | | 427 | | | | 4,150 | |
| Universal Display Corp.(d) | | | 270 | | | | 50,776 | |
| Upland Software, Inc.(a) (d) | | | 580 | | | | 26,407 | |
| USA Technologies, Inc.(a) (d) | | | 2,980 | | | | 22,141 | |
| Varonis Systems, Inc.(a) (d) | | | 310 | | | | 19,201 | |
| Veeco Instruments, Inc.(a) (d) | | | 400 | | | | 4,888 | |
| Verint Systems, Inc.(a) | | | 375 | | | | 20,168 | |
| VeriSign, Inc.(a) | | | 516 | | | | 107,927 | |
| Versum Materials, Inc. | | | 821 | | | | 42,347 | |
| ViaSat, Inc.(a) | | | 350 | | | | 28,287 | |
| Viavi Solutions, Inc.(a) | | | 1,328 | | | | 17,649 | |
| Virtusa Corp.(a) | | | 400 | | | | 17,772 | |
| WILSHIRE 5000 INDEX FUND | |
| SCHEDULE OF INVESTMENTS (Continued) | |
| COMMON STOCKS - 98.3% (Continued) | | Shares | | | Value | |
| Information Technology - 20.9% (Continued) | | | | | | | | |
| Visa, Inc. - Class A(d) | | | 11,316 | | | $ | 1,963,891 | |
| Vishay Intertechnology, Inc. | | | 806 | | | | 13,315 | |
| Vishay Precision Group, Inc.(a) | | | 129 | | | | 5,241 | |
| VMware, Inc. - Class A | | | 594 | | | | 99,323 | |
| Western Digital Corp.(d) | | | 2,020 | | | | 96,051 | |
| Western Union Co. (The) | | | 2,454 | | | | 48,810 | |
| WEX, Inc.(a) | | | 214 | | | | 44,533 | |
| Workday, Inc. - Class A(a) | | | 195 | | | | 40,088 | |
| Workiva, Inc.(a) | | | 440 | | | | 25,560 | |
| Worldpay, Inc. - Class A(a) | | | 525 | | | | 64,339 | |
| Xerox Corp. | | | 1,748 | | | | 61,897 | |
| Xilinx, Inc. | | | 1,575 | | | | 185,724 | |
| Xperi Corp. | | | 400 | | | | 8,236 | |
| Yext, Inc.(a) | | | 1,150 | | | | 23,104 | |
| Zebra Technologies Corp. - Class A(a) | | | 225 | | | | 47,135 | |
| Zendesk, Inc.(a) | | | 550 | | | | 48,967 | |
| Zix Corp.(a) | | | 2,390 | | | | 21,725 | |
| | | | | | | | 40,124,426 | |
| Materials - 2.5% | | | | | | | | |
| AdvanSix, Inc.(a) | | | 250 | | | | 6,108 | |
| Air Products & Chemicals, Inc. | | | 1,460 | | | | 330,500 | |
| Albemarle Corp.(d) | | | 745 | | | | 52,455 | |
| Alcoa Corp.(a) | | | 1,163 | | | | 27,226 | |
| Allegheny Technologies, Inc.(a) (d) | | | 775 | | | | 19,530 | |
| Amcor plc(a) | | | 2,805 | | | | 32,229 | |
| American Vanguard Corp. | | | 400 | | | | 6,164 | |
| AptarGroup, Inc. | | | 286 | | | | 35,561 | |
| Ashland Global Holdings, Inc. | | | 467 | | | | 37,346 | |
| Avery Dennison Corp. | | | 590 | | | | 68,251 | |
| Axalta Coating Systems Ltd.(a) | | | 675 | | | | 20,095 | |
| Balchem Corp. | | | 201 | | | | 20,094 | |
| Ball Corp. | | | 1,960 | | | | 137,181 | |
| Berry Global Group, Inc.(a) | | | 900 | | | | 47,331 | |
| Cabot Corp. | | | 400 | | | | 19,084 | |
| Carpenter Technology Corp. | | | 200 | | | | 9,596 | |
| Celanese Corp. | | | 945 | | | | 101,871 | |
| WILSHIRE 5000 INDEX FUND | |
| SCHEDULE OF INVESTMENTS (Continued) | |
| COMMON STOCKS - 98.3% (Continued) | | Shares | | | Value | |
| Materials - 2.5% (Continued) | | | | | | | | |
| Century Aluminum Co.(a) (d) | | | 600 | | | $ | 4,146 | |
| CF Industries Holdings, Inc. | | | 1,670 | | | | 78,006 | |
| Chemours Co. (The) | | | 1,289 | | | | 30,936 | |
| Clearwater Paper Corp.(a) (d) | | | 720 | | | | 13,313 | |
| Cleveland-Cliffs, Inc.(d) | | | 1,400 | | | | 14,938 | |
| Coeur Mining, Inc.(a) (d) | | | 1,110 | | | | 4,817 | |
| Commercial Metals Co.(d) | | | 775 | | | | 13,834 | |
| Compass Minerals International, Inc. | | | 100 | | | | 5,495 | |
| Core Molding Technologies, Inc.(a) | | | 200 | | | | 1,494 | |
| Corteva, Inc.(a) | | | 4,773 | | | | 141,138 | |
| Crown Holdings, Inc.(a) | | | 900 | | | | 54,990 | |
| Dow, Inc. | | | 4,773 | | | | 235,357 | |
| DuPont de Nemours, Inc. | | | 4,773 | | | | 358,308 | |
| Eagle Materials, Inc. | | | 333 | | | | 30,869 | |
| Eastman Chemical Co. | | | 990 | | | | 77,052 | |
| Ecolab, Inc. | | | 1,764 | | | | 348,284 | |
| Ferro Corp.(a) | | | 575 | | | | 9,085 | |
| Ferroglobe Representation & Warranty Insurance Trust(a) (b) (c) | | | 500 | | | | 0 | |
| Flotek Industries, Inc.(a) (d) | | | 3,760 | | | | 12,446 | |
| FMC Corp. | | | 875 | | | | 72,581 | |
| Freeport-McMoRan, Inc. | | | 8,769 | | | | 101,808 | |
| GCP Applied Technologies, Inc.(a) | | | 427 | | | | 9,667 | |
| Graphic Packaging Holding Co. | | | 1,325 | | | | 18,524 | |
| Greif, Inc. - Class A | | | 300 | | | | 9,765 | |
| H.B. Fuller Co. | | | 150 | | | | 6,960 | |
| Huntsman Corp. | | | 1,575 | | | | 32,193 | |
| Ingevity Corp.(a) | | | 393 | | | | 41,332 | |
| International Flavors & Fragrances, Inc.(d) | | | 471 | | | | 68,337 | |
| International Paper Co. | | | 2,867 | | | | 124,198 | |
| Kaiser Aluminum Corp. | | | 138 | | | | 13,470 | |
| Kraton Corp.(a) | | | 300 | | | | 9,321 | |
| Livent Corp.(a) (d) | | | 818 | | | | 5,661 | |
| Louisiana-Pacific Corp. | | | 825 | | | | 21,631 | |
| LSB Industries, Inc.(a) (d) | | | 3,160 | | | | 12,324 | |
| Martin Marietta Materials, Inc. | | | 444 | | | | 102,169 | |
| WILSHIRE 5000 INDEX FUND | |
| SCHEDULE OF INVESTMENTS (Continued) | |
| COMMON STOCKS - 98.3% (Continued) | | Shares | | | Value | |
| Materials - 2.5% (Continued) | | | | | | | | |
| Minerals Technologies, Inc. | | | 250 | | | $ | 13,378 | |
| Mosaic Co. (The) | | | 2,625 | | | | 65,704 | |
| Myers Industries, Inc. | | | 200 | | | | 3,854 | |
| Neenah, Inc. | | | 120 | | | | 8,106 | |
| Newmont Mining Corp. | | | 3,650 | | | | 140,415 | |
| Nucor Corp. | | | 2,045 | | | | 112,679 | |
| Olin Corp.(d) | | | 1,020 | | | | 22,348 | |
| Owens-Illinois, Inc. | | | 1,300 | | | | 22,451 | |
| P.H. Glatfelter Co.(d) | | | 325 | | | | 5,486 | |
| Packaging Corp. of America | | | 575 | | | | 54,809 | |
| PolyOne Corp. | | | 483 | | | | 15,161 | |
| PPG Industries, Inc. | | | 1,799 | | | | 209,961 | |
| Quaker Chemical Corp.(d) | | | 100 | | | | 20,288 | |
| Rayonier Advanced Materials, Inc.(d) | | | 500 | | | | 3,245 | |
| Reliance Steel & Aluminum Co. | | | 549 | | | | 51,946 | |
| Royal Gold, Inc.(d) | | | 491 | | | | 50,323 | |
| RPM International, Inc.(d) | | | 1,000 | | | | 61,110 | |
| Schweitzer-Mauduit International, Inc. | | | 300 | | | | 9,954 | |
| Scotts Miracle-Gro Co. (The)(d) | | | 296 | | | | 29,156 | |
| Sealed Air Corp. | | | 1,250 | | | | 53,475 | |
| Sensient Technologies Corp.(d) | | | 335 | | | | 24,616 | |
| Sherwin-Williams Co. (The) | | | 583 | | | | 267,183 | |
| Silgan Holdings, Inc. | | | 150 | | | | 4,590 | |
| Sonoco Products Co. | | | 725 | | | | 47,372 | |
| Southern Copper Corp.(d) | | | 747 | | | | 29,021 | |
| Steel Dynamics, Inc. | | | 1,550 | | | | 46,810 | |
| Stepan Co.(d) | | | 148 | | | | 13,603 | |
| Summit Materials, Inc. - Class A(a) (d) | | | 571 | | | | 10,992 | |
| SunCoke Energy, Inc.(a) | | | 564 | | | | 5,008 | |
| TimkenSteel Corp.(a) | | | 400 | | | | 3,252 | |
| Tredegar Corp. | | | 671 | | | | 11,152 | |
| Trinseo S.A. | | | 300 | | | | 12,702 | |
| UFP Technologies, Inc.(a) | | | 500 | | | | 20,805 | |
| United States Lime & Minerals, Inc. | | | 50 | | | | 4,000 | |
| United States Steel Corp.(d) | | | 1,350 | | | | 20,669 | |
| Valvoline, Inc. | | | 1,282 | | | | 25,037 | |
| WILSHIRE 5000 INDEX FUND | |
| SCHEDULE OF INVESTMENTS (Continued) | |
| COMMON STOCKS - 98.3% (Continued) | | Shares | | | Value | |
| Materials - 2.5% (Continued) | | | | | | | | |
| Verso Corp. - Class A(a) | | | 500 | | | $ | 9,525 | |
| Vulcan Materials Co. | | | 855 | | | | 117,400 | |
| W.R. Grace & Co. | | | 427 | | | | 32,499 | |
| Westlake Chemical Corp.(d) | | | 202 | | | | 14,031 | |
| WestRock Co. | | | 1,534 | | | | 55,945 | |
| Worthington Industries, Inc. | | | 225 | | | | 9,059 | |
| | | | | | | | 4,794,191 | |
| Real Estate - 4.2% | | | | | | | | |
| Acadia Realty Trust(d) | | | 676 | | | | 18,502 | |
| Agree Realty Corp.(d) | | | 300 | | | | 19,215 | |
| Alexander & Baldwin, Inc. | | | 213 | | | | 4,920 | |
| Alexandria Real Estate Equities, Inc.(d) | | | 601 | | | | 84,795 | |
| American Assets Trust, Inc. | | | 425 | | | | 20,026 | |
| American Campus Communities, Inc. | | | 982 | | | | 45,329 | |
| American Homes 4 Rent - Class A | | | 1,700 | | | | 41,327 | |
| American Tower Corp. | | | 2,896 | | | | 592,086 | |
| Apartment Investment & Management Co. - Class A | | | 1,381 | | | | 69,216 | |
| Apple Hospitality REIT, Inc. | | | 1,975 | | | | 31,324 | |
| Ashford Hospitality Trust, Inc. | | | 544 | | | | 1,616 | |
| AvalonBay Communities, Inc. | | | 1,099 | | | | 223,295 | |
| Boston Properties, Inc. | | | 1,243 | | | | 160,347 | |
| Braemar Hotels & Resorts, Inc. | | | 130 | | | | 1,287 | |
| Brandywine Realty Trust | | | 1,413 | | | | 20,234 | |
| Brixmor Property Group, Inc. | | | 2,275 | | | | 40,677 | |
| Camden Property Trust | | | 725 | | | | 75,683 | |
| CareTrust REIT, Inc. | | | 403 | | | | 9,583 | |
| CBRE Group, Inc. - Class A(a) | | | 2,425 | | | | 124,402 | |
| Chatham Lodging Trust | | | 425 | | | | 8,020 | |
| Chesapeake Lodging Trust | | | 625 | | | | 17,763 | |
| Colony Capital, Inc. | | | 3,575 | | | | 17,875 | |
| Columbia Property Trust, Inc. | | | 1,075 | | | | 22,296 | |
| CoreCivic, Inc. | | | 799 | | | | 16,587 | |
| CoreSite Realty Corp. | | | 300 | | | | 34,551 | |
| Corporate Office Properties Trust | | | 850 | | | | 22,415 | |
| Cousins Properties, Inc.(d) | | | 839 | | | | 30,347 | |
| Crown Castle International Corp. | | | 2,435 | | | | 317,401 | |
| WILSHIRE 5000 INDEX FUND | |
| SCHEDULE OF INVESTMENTS (Continued) | |
| COMMON STOCKS - 98.3% (Continued) | | Shares | | | Value | |
| Real Estate - 4.2% (Continued) | | | | | | | | |
| CubeSmart | | | 1,412 | | | $ | 47,217 | |
| CyrusOne, Inc.(d) | | | 725 | | | | 41,847 | |
| DiamondRock Hospitality Co. | | | 1,727 | | | | 17,857 | |
| Digital Realty Trust, Inc.(d) | | | 1,631 | | | | 192,115 | |
| Douglas Emmett, Inc. | | | 1,300 | | | | 51,792 | |
| Duke Realty Corp. | | | 2,726 | | | | 86,169 | |
| EastGroup Properties, Inc. | | | 262 | | | | 30,387 | |
| Empire State Realty Trust, Inc. - Class A | | | 775 | | | | 11,478 | |
| EPR Properties | | | 422 | | | | 31,477 | |
| Equinix, Inc. | | | 530 | | | | 267,274 | |
| Equity Commonwealth | | | 993 | | | | 32,292 | |
| Equity LifeStyle Properties, Inc. | | | 739 | | | | 89,670 | |
| Equity Residential | | | 2,904 | | | | 220,472 | |
| Essex Property Trust, Inc. | | | 472 | | | | 137,791 | |
| Extra Space Storage, Inc. | | | 989 | | | | 104,933 | |
| Federal Realty Investment Trust | | | 520 | | | | 66,955 | |
| First Industrial Realty Trust, Inc. | | | 1,025 | | | | 37,659 | |
| Four Corners Property Trust, Inc. | | | 444 | | | | 12,135 | |
| Franklin Street Properties Corp. | | | 950 | | | | 7,011 | |
| Front Yard Residential Corp. | | | 33 | | | | 403 | |
| Gaming and Leisure Properties, Inc. | | | 1,217 | | | | 47,439 | |
| Getty Realty Corp. | | | 402 | | | | 12,366 | |
| Global Medical REIT, Inc. | | | 1,810 | | | | 19,005 | |
| HCP, Inc.(d) | | | 3,775 | | | | 120,725 | |
| Healthcare Realty Trust, Inc. | | | 875 | | | | 27,405 | |
| Healthcare Trust of America, Inc. - Class A | | | 1,025 | | | | 28,116 | |
| Hersha Hospitality Trust | | | 550 | | | | 9,097 | |
| HFF, Inc. - Class A(d) | | | 75 | | | | 3,411 | |
| Highwoods Properties, Inc. | | | 800 | | | | 33,040 | |
| Hospitality Properties Trust | | | 1,325 | | | | 33,125 | |
| Host Hotels & Resorts, Inc. | | | 5,974 | | | | 108,846 | |
| Howard Hughes Corp. (The)(a) | | | 321 | | | | 39,753 | |
| Hudson Pacific Properties, Inc. | | | 1,225 | | | | 40,756 | |
| Industrial Logistics Properties Trust(d) | | | 175 | | | | 3,644 | |
| Investors Real Estate Trust | | | 180 | | | | 10,561 | |
| Invitation Homes, Inc. | | | 871 | | | | 23,282 | |
| WILSHIRE 5000 INDEX FUND | |
| SCHEDULE OF INVESTMENTS (Continued) | |
| COMMON STOCKS - 98.3% (Continued) | | Shares | | | Value | |
| Real Estate - 4.2% (Continued) | | | | | | | | |
| Iron Mountain, Inc.(d) | | | 1,372 | | | $ | 42,944 | |
| JBG SMITH Properties | | | 764 | | | | 30,056 | |
| Jones Lang LaSalle, Inc. | | | 284 | | | | 39,955 | |
| Kennedy-Wilson Holdings, Inc. | | | 925 | | | | 19,027 | |
| Kilroy Realty Corp.(d) | | | 700 | | | | 51,667 | |
| Kimco Realty Corp.(d) | | | 3,350 | | | | 61,908 | |
| Kite Realty Group Trust | | | 725 | | | | 10,969 | |
| Lamar Advertising Co. - Class A | | | 400 | | | | 32,284 | |
| Lexington Realty Trust | | | 1,125 | | | | 10,586 | |
| Liberty Property Trust | | | 1,225 | | | | 61,299 | |
| Life Storage, Inc. | | | 350 | | | | 33,278 | |
| LTC Properties, Inc. | | | 50 | | | | 2,283 | |
| Macerich Co. (The)(d) | | | 803 | | | | 26,892 | |
| Mack-Cali Realty Corp. | | | 725 | | | | 16,885 | |
| Medical Properties Trust, Inc. | | | 1,500 | | | | 26,160 | |
| Mid-America Apartment Communities, Inc. | | | 859 | | | | 101,156 | |
| National Health Investors, Inc. | | | 325 | | | | 25,360 | |
| National Retail Properties, Inc. | | | 900 | | | | 47,709 | |
| New Senior Investment Group, Inc.(d) | | | 695 | | | | 4,670 | |
| New York REIT Liquidating, LLC(a) (b) (c) (d) | | | 130 | | | | 1,715 | |
| Newmark Group, Inc. - Class A(d) | | | 765 | | | | 6,870 | |
| NorthStar Realty Europe Corp.(d) | | | 542 | | | | 8,905 | |
| Office Properties Income Trust(d) | | | 228 | | | | 5,990 | |
| Omega Healthcare Investors, Inc.(d) | | | 1,749 | | | | 64,276 | |
| Outfront Media, Inc. | | | 336 | | | | 8,665 | |
| Paramount Group, Inc. | | | 1,800 | | | | 25,218 | |
| Park Hotels & Resorts, Inc. | | | 227 | | | | 6,256 | |
| Pebblebrook Hotel Trust(d) | | | 1,188 | | | | 33,478 | |
| Pennsylvania Real Estate Investment Trust(d) | | | 775 | | | | 5,038 | |
| Physicians Realty Trust | | | 900 | | | | 15,696 | |
| Piedmont Office Realty Trust, Inc. - Class A | | | 1,275 | | | | 25,411 | |
| Plymouth Industrial REIT, Inc.(d) | | | 1,130 | | | | 21,402 | |
| PotlatchDeltic Corp. | | | 298 | | | | 11,616 | |
| Prologis, Inc. | | | 4,883 | | | | 391,127 | |
| PS Business Parks, Inc. | | | 200 | | | | 33,706 | |
| Public Storage | | | 1,249 | | | | 297,473 | |
| WILSHIRE 5000 INDEX FUND | |
| SCHEDULE OF INVESTMENTS (Continued) | |
| COMMON STOCKS - 98.3% (Continued) | | Shares | | | Value | |
| Real Estate - 4.2% (Continued) | | | | | | | | |
| Rafael Holdings, Inc. - Class B(a) (d) | | | 1,018 | | | $ | 29,268 | |
| Rayonier, Inc. | | | 826 | | | | 25,028 | |
| Realty Income Corp. | | | 1,700 | | | | 117,249 | |
| Regency Centers Corp. | | | 1,182 | | | | 78,887 | |
| Retail Opportunity Investments Corp. | | | 725 | | | | 12,419 | |
| Retail Properties of America, Inc. - Class A | | | 2,075 | | | | 24,402 | |
| Retail Value, Inc. | | | 144 | | | | 5,011 | |
| RLJ Lodging Trust(d) | | | 1,633 | | | | 28,969 | |
| RMR Group, Inc. (The) - Class A | | | 71 | | | | 3,336 | |
| RPT Realty(d) | | | 1,000 | | | | 12,110 | |
| Ryman Hospitality Properties, Inc.(d) | | | 525 | | | | 42,572 | |
| Sabra Health Care REIT, Inc.(d) | | | 1,436 | | | | 28,275 | |
| SBA Communications Corp.(a) | | | 920 | | | | 206,853 | |
| Senior Housing Properties Trust | | | 2,075 | | | | 17,160 | |
| Simon Property Group, Inc. | | | 2,553 | | | | 407,866 | |
| SITE Centers Corp. | | | 1,410 | | | | 18,668 | |
| SL Green Realty Corp. | | | 776 | | | | 62,367 | |
| Spirit MTA REIT | | | 300 | | | | 2,502 | |
| Spirit Realty Capital, Inc.(d) | | | 600 | | | | 25,596 | |
| St. Joe Co. (The)(a) (d) | | | 500 | | | | 8,640 | |
| STAG Industrial, Inc. | | | 450 | | | | 13,608 | |
| STORE Capital Corp. | | | 675 | | | | 22,403 | |
| Summit Hotel Properties, Inc. | | | 975 | | | | 11,183 | |
| Sun Communities, Inc. | | | 500 | | | | 64,095 | |
| Sunstone Hotel Investors, Inc.(d) | | | 1,840 | | | | 25,226 | |
| Tanger Factory Outlet Centers, Inc.(d) | | | 775 | | | | 12,563 | |
| Taubman Centers, Inc. | | | 500 | | | | 20,415 | |
| Tejon Ranch Co.(a) | | | 50 | | | | 830 | |
| Terreno Realty Corp. | | | 275 | | | | 13,486 | |
| UDR, Inc. | | | 2,028 | | | | 91,037 | |
| Uniti Group, Inc.(d) | | | 1,228 | | | | 11,666 | |
| Universal Health Realty Income Trust | | | 200 | | | | 16,986 | |
| Urban Edge Properties | | | 811 | | | | 14,055 | |
| Urstadt Biddle Properties, Inc. - Class A | | | 500 | | | | 10,500 | |
| Ventas, Inc. | | | 2,665 | | | | 182,153 | |
| VEREIT, Inc. | | | 6,175 | | | | 55,637 | |
| WILSHIRE 5000 INDEX FUND | |
| SCHEDULE OF INVESTMENTS (Continued) | |
| COMMON STOCKS - 98.3% (Continued) | | Shares | | | Value | |
| Real Estate - 4.2% (Continued) | | | | | | | | |
| Vornado Realty Trust | | | 1,528 | | | $ | 97,945 | |
| Washington Prime Group, Inc.(d) | | | 1,617 | | | | 6,177 | |
| Washington Real Estate Investment Trust(d) | | | 450 | | | | 12,029 | |
| Weingarten Realty Investors | | | 1,050 | | | | 28,791 | |
| Welltower, Inc. | | | 2,820 | | | | 229,915 | |
| Weyerhaeuser Co. | | | 5,677 | | | | 149,532 | |
| Xenia Hotels & Resorts, Inc.(d) | | | 900 | | | | 18,765 | |
| | | | | | | | 7,992,729 | |
| Utilities - 3.2% | | | | | | | | |
| AES Corp. | | | 4,360 | | | | 73,074 | |
| ALLETE, Inc. | | | 425 | | | | 35,364 | |
| Alliant Energy Corp. | | | 1,375 | | | | 67,485 | |
| Ameren Corp. | | | 1,625 | | | | 122,054 | |
| American Electric Power Co., Inc. | | | 3,355 | | | | 295,274 | |
| American States Water Co. | | | 100 | | | | 7,524 | |
| American Water Works Co., Inc. | | | 1,190 | | | | 138,039 | |
| Aqua America, Inc. | | | 1,326 | | | | 54,857 | |
| Atmos Energy Corp. | | | 760 | | | | 80,225 | |
| Avangrid, Inc. | | | 550 | | | | 27,775 | |
| Avista Corp. | | | 250 | | | | 11,150 | |
| Black Hills Corp. | | | 430 | | | | 33,613 | |
| California Water Service Group(d) | | | 415 | | | | 21,011 | |
| CenterPoint Energy, Inc. | | | 2,900 | | | | 83,027 | |
| CMS Energy Corp. | | | 1,800 | | | | 104,238 | |
| Consolidated Edison, Inc. | | | 2,169 | | | | 190,178 | |
| Dominion Energy, Inc. | | | 4,617 | | | | 356,987 | |
| DTE Energy Co. | | | 1,023 | | | | 130,821 | |
| Duke Energy Corp. | | | 4,412 | | | | 389,315 | |
| Edison International | | | 2,291 | | | | 154,436 | |
| El Paso Electric Co. | | | 100 | | | | 6,540 | |
| Entergy Corp. | | | 1,150 | | | | 118,370 | |
| Evergy, Inc. | | | 1,715 | | | | 103,157 | |
| Eversource Energy | | | 2,092 | | | | 158,490 | |
| Exelon Corp. | | | 4,631 | | | | 222,010 | |
| FirstEnergy Corp.(d) | | | 3,030 | | | | 129,714 | |
| Genie Energy Ltd. - Class B(d) | | | 7,016 | | | | 74,720 | |
| WILSHIRE 5000 INDEX FUND | |
| SCHEDULE OF INVESTMENTS (Continued) | |
| COMMON STOCKS - 98.3% (Continued) | | Shares | | | Value | |
| Utilities - 3.2% (Continued) | | | | | | | | |
| Hawaiian Electric Industries, Inc. | | | 800 | | | $ | 34,840 | |
| IDACORP, Inc. | | | 313 | | | | 31,435 | |
| MDU Resources Group, Inc. | | | 1,075 | | | | 27,735 | |
| MGE Energy, Inc.(d) | | | 150 | | | | 10,962 | |
| Middlesex Water Co.(d) | | | 780 | | | | 46,215 | |
| National Fuel Gas Co.(d) | | | 650 | | | | 34,288 | |
| New Jersey Resources Corp.(d) | | | 500 | | | | 24,885 | |
| NextEra Energy, Inc. | | | 3,223 | | | | 660,265 | |
| NiSource, Inc. | | | 2,140 | | | | 61,632 | |
| Northwest Natural Holding Co. | | | 300 | | | | 20,850 | |
| NorthWestern Corp. | | | 400 | | | | 28,860 | |
| NRG Energy, Inc. | | | 2,772 | | | | 97,353 | |
| OGE Energy Corp. | | | 1,175 | | | | 50,008 | |
| ONE Gas, Inc. | | | 287 | | | | 25,916 | |
| Ormat Technologies, Inc. | | | 175 | | | | 11,093 | |
| Otter Tail Corp. | | | 350 | | | | 18,484 | |
| PG&E Corp.(a) | | | 3,350 | | | | 76,782 | |
| Pinnacle West Capital Corp. | | | 716 | | | | 67,368 | |
| PNM Resources, Inc. | | | 400 | | | | 20,364 | |
| Portland General Electric Co. | | | 500 | | | | 27,085 | |
| PPL Corp.(d) | | | 4,700 | | | | 145,747 | |
| Public Service Enterprise Group, Inc. | | | 3,600 | | | | 211,752 | |
| Sempra Energy | | | 1,737 | | | | 238,733 | |
| SJW Group | | | 180 | | | | 10,939 | |
| South Jersey Industries, Inc. | | | 1,090 | | | | 36,766 | |
| Southern Co. (The) | | | 6,540 | | | | 361,531 | |
| Southwest Gas Holdings, Inc. | | | 325 | | | | 29,127 | |
| Spire, Inc. | | | 350 | | | | 29,372 | |
| TerraForm Power, Inc. - Class A | | | 2,090 | | | | 29,887 | |
| UGI Corp. | | | 1,805 | | | | 96,404 | |
| Vistra Energy Corp.(d) | | | 2,177 | | | | 49,287 | |
| WEC Energy Group, Inc. | | | 2,039 | | | | 169,991 | |
| Xcel Energy, Inc. | | | 3,600 | | | | 214,164 | |
| WILSHIRE 5000 INDEX FUND | |
| SCHEDULE OF INVESTMENTS (Continued) | |
| COMMON STOCKS - 98.3% (Continued) | | Shares | | | Value | |
| Utilities - 3.2% (Continued) | | | | | | | | |
| York Water Co. (The) | | | 290 | | | $ | 10,359 | |
| | | | | | | | 6,199,927 | |
| | | | | | | | | |
| Total Common Stocks(Cost $55,368,066) | | | | | | $ | 188,537,603 | |
| RIGHTS - 0.0%(e) | | Shares | | | Value | |
| AMR Corp., Escrow(a) (b) (c) | | | 3,275 | | | $ | 426 | |
| Galectin Therapeutics, Inc.(a) (b) (c) | | | 3,690 | | | | 0 | |
| Hertz Global Holdings, Inc.(a) (b) (c) (d) | | | 430 | | | | 838 | |
| Media General, Inc. - CVR(a) (b) (c) (d) | | | 794 | | | | 0 | |
| Schulman A, Inc.(a) (b) (c) | | | 81 | | | | 0 | |
| Total Rights(Cost $2,185) | | | | | | $ | 1,264 | |
| WILSHIRE 5000 INDEX FUND | |
| SCHEDULE OF INVESTMENTS (Continued) | |
| MONEY MARKET FUNDS - 1.6% | | Shares | | | Value | |
| Northern Trust Institutional Government Select Portfolio - Institutional Class, 2.24%(f) | | | 2,444,764 | | | $ | 2,444,764 | |
| Northern Trust Institutional Liquid Asset Portfolio - Institutional Class, 2.36%(f) (g) | | | 738,590 | | | | 738,590 | |
| Total Money Market Funds(Cost $3,183,354) | | | | | | $ | 3,183,354 | |
| | | | | | | | | |
| Total Investments at Value - 99.9%(Cost $58,553,605) | | | | | | $ | 191,722,221 | |
| | | | | | | | | |
| Other Assets in Excess of Liabilities - 0.1% | | | | | | | 135,233 | |
| | | | | | | | | |
| Net Assets - 100.0% | | | | | | $ | 191,857,454 | |
| (a) | Non-income producing security. |
| (b) | Illiquid security. The total value of such securities is $3,042 as of June 30, 2019, representing 0.0%(e)of net assets. |
| (c) | Level 3 security. Security has been valued at fair value in accordance with procedures adopted by and under the general supervision of the Board of Directors. The total value of such securities was $3,042 as of June 30, 2019, representing 0.0%(e) of net assets. |
| (d) | This security or a partial position of this security is on loan at June 30, 2019. The total market value of securities on loan at June 30, 2019 was $11,889,763. |
| (e) | Percentage rounds to less than 0.1%. |
| (f) | The rate shown is the 7-day effective yield as of June 30, 2019. |
| (g) | This security was purchased with cash collateral held from securities on loan. The total value of such securities as of June 30, 2019 was $738,590. Securities on loan are also collateralized by various U.S. Treasury obligations in the amount of $11,296,734. |
| CVR - | Contingent Value Right. |
| WILSHIRE INTERNATIONAL EQUITY FUND |
| SCHEDULE OF INVESTMENTS |
| June 30, 2019 (Unaudited) |
| COMMON STOCKS - 97.8% | | Shares | | | Value | |
| Argentina - 0.0% (a) |
| Transportadora de Gas del Sur S.A. - B Shares(b) | | | 2,300 | | | $ | 33,258 | |
| | | | | | | | | |
| Australia - 3.3% |
| AGL Energy Ltd.(c) | | | 6,398 | | | | 89,978 | |
| Alumina Ltd.(c) | | | 135,008 | | | | 221,608 | |
| Appen Ltd.(c) | | | 5,086 | | | | 100,471 | |
| Aristocrat Leisure Ltd.(c) | | | 5,169 | | | | 111,734 | |
| ASX Ltd.(c) | | | 4,258 | | | | 246,696 | |
| Aurizon Holdings Ltd.(c) | | | 25,236 | | | | 95,800 | |
| Beach Energy Ltd.(c) | | | 53,541 | | | | 75,301 | |
| BHP Billiton Ltd.(c) | | | 39,417 | | | | 1,145,795 | |
| BlueScope Steel Ltd.(c) | | | 4,292 | | | | 36,495 | |
| Brickworks Ltd.(c) | | | 18,058 | | | | 206,722 | |
| Charter Hall Education Trust(c) | | | 25,187 | | | | 64,408 | |
| Charter Hall Group(c) | | | 31,266 | | | | 238,088 | |
| Charter Hall Long Wale REIT(c) | | | 11,070 | | | | 38,951 | |
| CIMIC Group Ltd.(b) (c) | | | 7,529 | | | | 236,753 | |
| Cochlear Ltd.(c) | | | 2,386 | | | | 347,392 | |
| Computershare Ltd.(c) | | | 14,370 | | | | 163,886 | |
| CSL Ltd.(c) | | | 34,128 | | | | 5,167,794 | |
| EML Payments Ltd.(c) (d) | | | 16,752 | | | | 34,882 | |
| Goodman Group(c) | | | 31,874 | | | | 336,901 | |
| IDP Education Ltd.(c) | | | 4,233 | | | | 52,634 | |
| Iluka Resources Ltd.(c) | | | 41,318 | | | | 313,712 | |
| Independence Group NL(c) | | | 13,536 | | | | 45,038 | |
| Inghams Group Ltd.(c) | | | 59,831 | | | | 168,908 | |
| Insurance Australia Group Ltd.(c) | | | 44,153 | | | | 256,351 | |
| IRESS Ltd.(c) | | | 14,982 | | | | 146,775 | |
| JB Hi-Fi Ltd.(c) | | | 10,381 | | | | 188,552 | |
| Jupiter Mines Ltd.(c) | | | 240,988 | | | | 58,494 | |
| Lovisa Holdings Ltd.(c) | | | 4,459 | | | | 35,652 | |
| Macquarie Group Ltd.(c) | | | 5,616 | | | | 495,365 | |
| Medibank Private Ltd.(c) | | | 85,832 | | | | 210,607 | |
| Metcash Ltd.(c) | | | 38,017 | | | | 68,760 | |
| Mineral Resources Ltd.(c) | | | 3,846 | | | | 40,613 | |
| WILSHIRE INTERNATIONAL EQUITY FUND |
| SCHEDULE OF INVESTMENTS (Continued) |
| COMMON STOCKS - 97.8% (Continued) | | Shares | | | Value | |
| Australia - 3.3% (Continued) |
| National Storage REIT(c) | | | 121,971 | | | $ | 149,982 | |
| Nearmap Ltd.(c) (d) | | | 12,500 | | | | 33,343 | |
| Newcrest Mining Ltd.(c) | | | 9,836 | | | | 220,978 | |
| Platinum Asset Management Ltd.(c) | | | 44,729 | | | | 152,610 | |
| Rhipe Ltd.(c) | | | 21,399 | | | | 43,044 | |
| Rio Tinto Ltd.(c) | | | 2,653 | | | | 194,267 | |
| Sandfire Resources NL(c) | | | 7,377 | | | | 34,785 | |
| Saracen Mineral Holdings Ltd.(c) (d) | | | 28,167 | | | | 72,919 | |
| Service Stream Ltd.(c) | | | 60,276 | | | | 119,046 | |
| Silver Lake Resources Ltd.(c) (d) | | | 45,560 | | | | 40,341 | |
| South32 Ltd.(c) | | | 10,223 | | | | 22,916 | |
| Super Retail Group Ltd.(c) | | | 15,767 | | | | 91,261 | |
| Telstra Corp. Ltd.(c) | | | 82,559 | | | | 223,248 | |
| Wesfarmers Ltd.(c) | | | 5,197 | | | | 132,109 | |
| Whitehaven Coal Ltd.(c) | | | 13,454 | | | | 34,669 | |
| | | | | | | | 12,606,634 | |
| Austria - 0.3% |
| ams AG(c) | | | 1,723 | | | | 67,460 | |
| BAWAG Group AG(c) | | | 4,179 | | | | 175,045 | |
| EVN AG(c) | | | 2,273 | | | | 34,331 | |
| Porr AG(c) | | | 2,081 | | | | 45,897 | |
| Raiffeisen Bank International AG(c) | | | 9,307 | | | | 218,542 | |
| S IMMO AG(c) | | | 5,593 | | | | 121,065 | |
| Telekom Austria AG | | | 18,402 | | | | 138,946 | |
| Wienerberger AG(c) | | | 7,467 | | | | 184,266 | |
| | | | | | | | 985,552 | |
| Belgium - 0.6% |
| Aedifica S.A.(c) | | | 2,139 | | | | 204,212 | |
| Anheuser-Busch InBev S.A./N.V.(c) | | | 7,355 | | | | 650,869 | |
| Befimmo S.A.(c) | | | 1,557 | | | | 89,544 | |
| Fagron(c) | | | 1,756 | | | | 35,710 | |
| Intervest Offices & Warehouses N.V.(c) | | | 1,828 | | | | 51,368 | |
| KBC Group N.V.(c) | | | 19,773 | | | | 1,297,654 | |
| Montea C.V.A.(c) | | | 1,274 | | | | 109,201 | |
| | | | | | | | 2,438,558 | |
| WILSHIRE INTERNATIONAL EQUITY FUND |
| SCHEDULE OF INVESTMENTS (Continued) |
| COMMON STOCKS - 97.8% (Continued) | | Shares | | | Value | |
| Bermuda - 0.4% |
| Alibaba Health Information Technology Ltd.(b) (c) (d) | | | 4,000 | | | $ | 3,834 | |
| China Gas Holdings Ltd.(b) (c) (d) | | | 50,200 | | | | 186,548 | |
| China Water Affairs Group Ltd.(c) (d) | | | 152,000 | | | | 149,669 | |
| Chow Sang Sang Holdings International Ltd.(c) | | | 34,000 | | | | 50,140 | |
| CK Infrastructure Holdings Ltd.(c) | | | 15,000 | | | | 122,257 | |
| Cosan Ltd. - Class A(d) | | | 3,600 | | | | 48,096 | |
| Fly Leasing Ltd.(d) | | | 8,300 | | | | 144,503 | |
| Frontline Ltd.(c) (d) | | | 4,236 | | | | 34,399 | |
| Gemdale Properties & Investment Corp. Ltd.(c) | | | 946,000 | | | | 112,688 | |
| Hongkong Land Holdings Ltd.(c) | | | 40,900 | | | | 263,631 | |
| Hopson Development Holdings Ltd.(c) | | | 92,000 | | | | 99,525 | |
| K Wah International Holdings Ltd.(c) | | | 79,000 | | | | 46,120 | |
| Kerry Properties Ltd.(c) | | | 15,000 | | | | 63,009 | |
| Luye Pharma Group Ltd.(b) (c) | | | 110,500 | | | | 80,144 | |
| | | | | | | | 1,404,563 | |
| Brazil - 1.0% |
| Ambev S.A. | | | 112,400 | | | | 523,417 | |
| Azul S.A.(d) | | | 5,500 | | | | 61,767 | |
| B3 SA - Brasil Bolsa Balcao | | | 12,000 | | | | 117,293 | |
| Banco do Brasil S.A. | | | 1,400 | | | | 19,609 | |
| Banco do Estado do Rio Grande | | | 19,200 | | | | 119,812 | |
| Banco Santander Brasil S.A. | | | 14,500 | | | | 173,150 | |
| BB Seguridade Participacoes S.A. | | | 47,000 | | | | 398,439 | |
| Cia de Saneamento Basico do Estado de Sao Paulo | | | 22,400 | | | | 274,428 | |
| Cia Hering | | | 4,800 | | | | 37,504 | |
| Cosan Logistica S.A.(d) | | | 15,600 | | | | 71,914 | |
| EDP - Energias do Brasil S.A. | | | 10,300 | | | | 51,130 | |
| Embraer S.A. | | | 8,200 | | | | 41,389 | |
| ENEVA S.A.(d) | | | 17,600 | | | | 110,470 | |
| Estacio Participacoes S.A. | | | 10,600 | | | | 80,833 | |
| Instituto Hermes Pardini S.A. | | | 7,000 | | | | 35,095 | |
| Itau Unibanco Holding S.A. | | | 33,800 | | | | 318,757 | |
| JBS S.A. | | | 14,400 | | | | 78,983 | |
| JSL S.A. | | | 20,600 | | | | 77,366 | |
| Kroton Educacional S.A. | | | 15,700 | | | | 44,897 | |
| Localiza Rent a Car S.A. | | | 2,600 | | | | 27,553 | |
| WILSHIRE INTERNATIONAL EQUITY FUND |
| SCHEDULE OF INVESTMENTS (Continued) |
| COMMON STOCKS - 97.8% (Continued) | | Shares | | | Value | |
| Brazil - 1.0% (Continued) |
| Porto Seguro S.A. | | | 1,200 | | | $ | 16,252 | |
| Qualicorp Consultoria e Corretora de Seguros S.A. | | | 21,500 | | | | 129,741 | |
| Rumo S.A.(d) | | | 4,200 | | | | 22,752 | |
| Ser Educacional S.A. | | | 5,700 | | | | 37,247 | |
| Sul America S.A. | | | 13,000 | | | | 127,170 | |
| TIM Participacoes S.A. | | | 82,200 | | | | 246,840 | |
| Vale S.A. | | | 33,296 | | | | 449,283 | |
| WEG S.A. | | | 1,000 | | | | 5,618 | |
| | | | | | | | 3,698,709 | |
| Canada - 6.0% |
| Aecon Group, Inc. | | | 8,200 | | | | 120,026 | |
| Aimia, Inc.(d) | | | 12,600 | | | | 36,751 | |
| Alimentation Couche-Tard, Inc. - Class B | | | 2,700 | | | | 169,895 | |
| AltaGas Canada, Inc. | | | 2,000 | | | | 36,544 | |
| Badger Daylighting Ltd. | | | 2,100 | | | | 76,613 | |
| Bank of Montreal | | | 2,300 | | | | 173,720 | |
| Brookfield Asset Management, Inc. - Class A | | | 5,000 | | | | 239,182 | |
| BRP, Inc. | | | 3,400 | | | | 121,496 | |
| CAE, Inc. | | | 3,200 | | | | 86,031 | |
| Canadian National Railway Co. | | | 3,900 | | | | 360,915 | |
| Canadian Natural Resources Ltd. | | | 11,500 | | | | 310,051 | |
| Canadian Pacific Railway Ltd. | | | 20,273 | | | | 4,769,021 | |
| Canadian Solar, Inc.(b) (d) | | | 3,600 | | | | 78,588 | |
| Cascades, Inc. | | | 14,700 | | | | 118,303 | |
| CCL Industries, Inc. - Class B | | | 1,200 | | | | 58,842 | |
| Centerra Gold, Inc.(d) | | | 9,100 | | | | 64,063 | |
| Chartwell Retirement Residences | | | 18,600 | | | | 215,161 | |
| CI Financial Corp. | | | 22,900 | | | | 373,137 | |
| Cineplex Inc. | | | 13,400 | | | | 235,224 | |
| Computer Modelling Group Ltd. | | | 10,300 | | | | 57,254 | |
| Constellation Software, Inc. | | | 400 | | | | 376,965 | |
| Crescent Point Energy Corp. | | | 11,500 | | | | 38,021 | |
| Detour Gold Corp.(d) | | | 3,300 | | | | 41,626 | |
| Dollarama, Inc. | | | 63,140 | | | | 2,221,063 | |
| Dream Industrial Real Estate Investment Trust | | | 32,400 | | | | 291,921 | |
| Element Fleet Management Corp. | | | 4,800 | | | | 35,038 | |
| WILSHIRE INTERNATIONAL EQUITY FUND |
| SCHEDULE OF INVESTMENTS (Continued) |
| COMMON STOCKS - 97.8% (Continued) | | Shares | | | Value | |
| Canada - 6.0% (Continued) |
| Enerflex Ltd. | | | 6,600 | | | $ | 85,923 | |
| Enghouse Systems Ltd.(d) | | | 4,700 | | | | 124,276 | |
| Equitable Group, Inc. | | | 2,200 | | | | 121,937 | |
| ERO Copper Corp.(d) | | | 2,700 | | | | 45,726 | |
| Fiera Capital Corp. | | | 5,000 | | | | 43,064 | |
| FirstService Corp. | | | 1,200 | | | | 115,449 | |
| Franco-Nevada Corp. | | | 5,100 | | | | 432,831 | |
| Home Capital Group, Inc.(d) | | | 3,200 | | | | 47,377 | |
| iA Financial Corp., Inc. | | | 3,300 | | | | 134,402 | |
| IGM Financial, Inc. | | | 2,600 | | | | 74,228 | |
| Kirkland Lake Gold Ltd. | | | 6,000 | | | | 258,477 | |
| Labrador Iron Ore Royalty Corp. | | | 4,000 | | | | 106,958 | |
| Largo Resources Ltd.(d) | | | 23,600 | | | | 32,616 | |
| Manulife Financial Corp. | | | 21,200 | | | | 385,257 | |
| NFI Group, Inc. | | | 11,800 | | | | 332,465 | |
| North American Construction Group Ltd. | | | 5,700 | | | | 61,410 | |
| Northland Power, Inc. | | | 13,900 | | | | 270,641 | |
| Open Text Corp. | | | 3,800 | | | | 156,797 | |
| Parex Resources, Inc.(d) | | | 14,900 | | | | 239,029 | |
| Park Lawn Corp. | | | 1,500 | | | | 32,951 | |
| PrairieSky Royalty Ltd. | | | 16,500 | | | | 231,814 | |
| Precision Drilling Corp.(d) | | | 43,100 | | | | 80,956 | |
| Restaurant Brands International, Inc. | | | 500 | | | | 34,768 | |
| Rogers Communications, Inc. - Class B | | | 2,100 | | | | 112,402 | |
| Royal Bank of Canada | | | 8,400 | | | | 667,488 | |
| Shopify, Inc. - Class A(d) | | | 400 | | | | 120,208 | |
| Shopify, Inc. - Class A(b) (d) | | | 18,322 | | | | 5,499,349 | |
| SmartCentres Real Estate Investment Trust | | | 17,600 | | | | 446,293 | |
| Summit Industrial Income REIT | | | 36,600 | | | | 359,944 | |
| Suncor Energy, Inc. | | | 8,100 | | | | 252,648 | |
| Surge Energy, Inc. | | | 38,700 | | | | 37,823 | |
| Tamarack Valley Energy Ltd.(d) | | | 26,400 | | | | 42,130 | |
| Teck Resources Ltd. - Class B | | | 7,700 | | | | 177,674 | |
| TFI International, Inc. | | | 5,400 | | | | 163,401 | |
| Thomson Reuters Corp. | | | 6,200 | | | | 399,930 | |
| TMX Group Ltd. | | | 8,300 | | | | 577,344 | |
| WILSHIRE INTERNATIONAL EQUITY FUND |
| SCHEDULE OF INVESTMENTS (Continued) |
| COMMON STOCKS - 97.8% (Continued) | | Shares | | | Value | |
| Canada - 6.0% (Continued) |
| Toronto-Dominion Bank (The) | | | 200 | | | $ | 11,685 | |
| Tricon Capital Group, Inc. | | | 10,200 | | | | 77,882 | |
| Viemed Healthcare, Inc.(d) | | | 4,700 | | | | 32,047 | |
| Whitecap Resources, Inc. | | | 14,100 | | | | 45,756 | |
| | | | | | | | 23,178,807 | |
| Cayman Islands - 2.8% |
| Alibaba Group Holding Ltd. - ADR(d) | | | 1,800 | | | | 305,010 | |
| Apex International Co. Ltd.(c) (d) | | | 21,000 | | | | 37,135 | |
| Autohome, Inc. - ADR(b) (d) | | | 800 | | | | 68,496 | |
| Baidu, Inc. - ADR(d) | | | 6,274 | | | | 736,317 | |
| C&D International Investment Group Ltd.(c) (d) | | | 41,000 | | | | 51,331 | |
| China Medical System Holdings Ltd.(c) | | | 179,000 | | | | 164,384 | |
| China Overseas Property Holdings Ltd.(c) | | | 60,000 | | | | 31,282 | |
| China Tian Lun Gas Holdings Ltd.(c) | | | 118,000 | | | | 135,382 | |
| CK Asset Holdings Ltd.(c) | | | 72,000 | | | | 564,066 | |
| CK Hutchison Holdings Ltd.(c) | | | 41,000 | | | | 404,423 | |
| Comba Telecom Systems Holdings Ltd.(c) | | | 232,000 | | | | 51,790 | |
| Country Garden Holdings Co. Ltd.(b) (c) | | | 63,000 | | | | 95,778 | |
| Country Garden Services Holdings Co. Ltd.(c) | | | 71,000 | | | | 164,062 | |
| Dongyue Group Ltd.(c) | | | 127,000 | | | | 78,110 | |
| Greenland Hong Kong Holdings Ltd.(c) (d) | | | 92,000 | | | | 36,648 | |
| Hengan International Group Co. Ltd.(b) (c) | | | 17,000 | | | | 125,178 | |
| JD.com, Inc. - ADR(d) | | | 16,000 | | | | 484,640 | |
| Kaisa Group Holdings Ltd.(c) | | | 103,000 | | | | 50,886 | |
| Kingdee International Software Group Co. Ltd.(b) (c) | | | 36,000 | | | | 38,999 | |
| Logan Property Holdings Co. Ltd.(c) | | | 16,000 | | | | 25,873 | |
| Momo, Inc. - ADR | | | 5,600 | | | | 200,480 | |
| NetEase, Inc. - ADR | | | 1,300 | | | | 332,501 | |
| New Oriental Education & Technology Group, Inc. - ADR(d) | | | 3,500 | | | | 338,030 | |
| Nexteer Automotive Group Ltd.(c) | | | 22,000 | | | | 27,395 | |
| Qudian, Inc. - ADR(b) (d) | | | 4,500 | | | | 33,750 | |
| Sands China Ltd.(c) | | | 16,800 | | | | 80,257 | |
| SSY Group Ltd. | | | 184,000 | | | | 166,298 | |
| TAL Education Group - ADR(d) | | | 6,200 | | | | 236,220 | |
| Tencent Holdings Ltd.(c) | | | 114,005 | | | | 5,157,639 | |
| WILSHIRE INTERNATIONAL EQUITY FUND |
| SCHEDULE OF INVESTMENTS (Continued) |
| COMMON STOCKS - 97.8% (Continued) | | Shares | | | Value | |
| Cayman Islands - 2.8% (Continued) |
| Tiangong International Co. Ltd.(c) | | | 180,000 | | | $ | 56,868 | |
| Tingyi (Cayman Islands) Holding Corp.(c) | | | 164,000 | | | | 273,984 | |
| TOPBI International Holdings Ltd.(c) (d) | | | 24,000 | | | | 66,039 | |
| | | | | | | | 10,619,251 | |
| Chile - 0.1% |
| AES Gener S.A. | | | 349,911 | | | | 96,183 | |
| Enel Americas S.A. | | | 863,852 | | | | 152,358 | |
| Inversiones Aguas Metropolitanas S.A. | | | 53,976 | | | | 83,639 | |
| | | | | | | | 332,180 | |
| China - 0.7% |
| Air China Ltd. - H Shares(c) | | | 26,000 | | | | 26,144 | |
| Asia Cement China Holdings Corp.(c) | | | 60,500 | | | | 97,005 | |
| China Construction Bank Corp. - H Shares(c) | | | 536,000 | | | | 462,045 | |
| China Life Insurance Co. Ltd. - H Shares(c) | | | 273,000 | | | | 674,780 | |
| China Merchants Bank Co. Ltd. - H Shares(c) | | | 6,000 | | | | 29,775 | |
| China Pacific Insurance Co. Ltd. - H Shares(c) | | | 25,000 | | | | 97,783 | |
| China Shenhua Energy Co. Ltd. - H Shares(c) | | | 51,500 | | | | 107,873 | |
| Fantasia Holdings Group Co. Ltd.(c) | | | 450,000 | | | | 82,286 | |
| Hisense Home Appliances Group Co. Ltd. - H Shares(c) (d) | | | 44,000 | | | | 53,503 | |
| Industrial & Commercial Bank of China Ltd. - H Shares(c) | | | 548,000 | | | | 400,006 | |
| PetroChina Co. Ltd. - H Shares(c) | | | 270,000 | | | | 148,878 | |
| PICC Property & Casualty Co. Ltd. - H Shares(c) | | | 4,000 | | | | 4,316 | |
| Ping an Insurance Group Co. of China Ltd. - H Shares(c) | | | 14,000 | | | | 168,352 | |
| Poly Property Group Co. Ltd.(c) | | | 97,000 | | | | 35,548 | |
| PPDAI Group, Inc. - ADR(b) | | | 9,400 | | | | 40,890 | |
| Shanghai Haohai Biological Technology Co. Ltd. - H Shares(c) | | | 8,100 | | | | 44,151 | |
| Shenzhen Expressway Co. Ltd. - H Shares(c) | | | 118,000 | | | | 141,851 | |
| Shougang Fushan Resources Group Ltd.(c) | | | 252,000 | | | | 54,874 | |
| Sihuan Pharmaceutical Holdings Group Ltd.(c) | | | 214,000 | | | | 48,303 | |
| West China Cement Ltd.(c) | | | 260,000 | | | | 39,965 | |
| YiChang HEC ChangJiang Pharmaceutical Co. Ltd. - H Shares(c) | | | 16,600 | | | | 83,099 | |
| | | | | | | | 2,841,427 | |
| WILSHIRE INTERNATIONAL EQUITY FUND |
| SCHEDULE OF INVESTMENTS (Continued) |
| COMMON STOCKS - 97.8% (Continued) | | Shares | | | Value | |
| Cyprus - 0.0% (a) |
| TCS Group Holding plc(c) | | | 4,086 | | | $ | 80,109 | |
| | | | | | | | | |
| Czech Republic - 0.4% |
| CEZ A/S(c) | | | 63,451 | | | | 1,533,398 | |
| Komercní banka a.s.(c) | | | 59 | | | | 2,351 | |
| | | | | | | | 1,535,749 | |
| Denmark - 3.2% |
| A.P. Moller-Maerska A/S - Series B(b) (c) | | | 2,466 | | | | 3,068,594 | |
| Carlsberg A/S - Series B(c) | | | 447 | | | | 59,317 | |
| Chr. Hansen Holding A/S(c) | | | 30,761 | | | | 2,894,869 | |
| Danske Bank A/S(c) | | | 77,627 | | | | 1,229,911 | |
| DSV A/S(c) | | | 29,869 | | | | 2,941,304 | |
| Genmab A/S(c) (d) | | | 275 | | | | 50,613 | |
| ISS A/S(c) | | | 1,223 | | | | 36,976 | |
| Novo Nordisk A/S - Class B(c) | | | 25,412 | | | | 1,298,019 | |
| Pandora A/S(c) | | | 1,307 | | | | 46,504 | |
| Per Aarsleff Holdings A/S(c) | | | 2,254 | | | | 80,456 | |
| Royal Unibrew A/S(c) | | | 661 | | | | 48,325 | |
| SimCorp A/S(c) | | | 3,633 | | | | 351,694 | |
| Topdanmark A/S(c) | | | 616 | | | | 34,766 | |
| Vestas Wind Systems A/S(c) | | | 512 | | | | 44,358 | |
| | | | | | | | 12,185,706 | |
| Finland - 0.4% |
| Fortum OYJ(c) | | | 2,628 | | | | 58,085 | |
| Huhtamaki OYJ(c) | | | 2,767 | | | | 113,802 | |
| Kemira OYJ(c) | | | 12,591 | | | | 185,361 | |
| Neste OYJ(c) | | | 8,315 | | | | 282,699 | |
| Rovio Entertainment OYJ(c) | | | 7,386 | | | | 59,981 | |
| Sampo OYJ - A Shares(c) | | | 10,727 | | | | 506,378 | |
| UPM-Kymmene OYJ(c) | | | 7,712 | | | | 205,201 | |
| Valmet OYJ(b) (c) | | | 5,026 | | | | 125,390 | |
| | | | | | | | 1,536,897 | |
| France - 9.2% |
| Air France-KLM(c) (d) | | | 13,849 | | | | 133,067 | |
| Amundi S.A.(c) | | | 24,570 | | | | 1,715,531 | |
| Bouygues S.A.(c) | | | 17,110 | | | | 633,657 | |
| WILSHIRE INTERNATIONAL EQUITY FUND |
| SCHEDULE OF INVESTMENTS (Continued) |
| COMMON STOCKS - 97.8% (Continued) | | Shares | | | Value | |
| France - 9.2% (Continued) |
| Bureau Veritas S.A.(c) | | | 16,824 | | | $ | 415,278 | |
| Capgemini SE(c) | | | 871 | | | | 108,298 | |
| Coface S.A.(c) | | | 8,175 | | | | 82,459 | |
| Danone S.A.(c) | | | 2,903 | | | | 245,812 | |
| Dassault Aviation S.A.(c) | | | 188 | | | | 270,302 | |
| Dassault Systemes S.A.(c) | | | 2,444 | | | | 389,844 | |
| Eiffage S.A.(c) | | | 406 | | | | 40,126 | |
| Elis S.A.(c) | | | 13,602 | | | | 246,612 | |
| Engie S.A.(c) | | | 9,896 | | | | 150,063 | |
| Eramet(c) | | | 675 | | | | 44,928 | |
| EssilorLuxottica S.A.(c) | | | 18,816 | | | | 2,453,511 | |
| EssilorLuxottica S.A.(c) | | | 12,710 | | | | 1,656,448 | |
| Eutelsat Communications S.A.(c) | | | 4,506 | | | | 84,157 | |
| Faurecia S.A.(c) | | | 3,301 | | | | 153,112 | |
| Fnac Darty S.A.(c) (d) | | | 477 | | | | 35,433 | |
| Gaztransport Et Technigaz S.A.(c) | | | 1,326 | | | | 133,018 | |
| Hermes International S.A.(c) | | | 1,138 | | | | 820,411 | |
| Ingenico Group S.A.(c) | | | 2,693 | | | | 238,342 | |
| Ipsen S.A.(c) | | | 859 | | | | 117,168 | |
| Kering S.A.(c) | | | 444 | | | | 262,068 | |
| Lagardere S.C.A.(c) | | | 14,244 | | | | 371,110 | |
| Legrand S.A.(c) | | | 1,615 | | | | 118,075 | |
| L'Oréal(c) | | | 3,304 | | | | 939,452 | |
| LVMH Moet Hennessy Louis Vuitton SE(c) | | | 13,602 | | | | 5,782,755 | |
| Mersen S.A.(c) (d) | | | 2,822 | | | | 108,263 | |
| Neopost S.A.(c) | | | 1,620 | | | | 34,660 | |
| Pernod Ricard S.A.(c) | | | 18,274 | | | | 3,365,756 | |
| Publicis Groupe S.A.(c) | | | 42,319 | | | | 2,233,709 | |
| Rexel S.A.(c) | | | 278,831 | | | | 3,539,145 | |
| Rubis S.C.A.(c) | | | 641 | | | | 36,092 | |
| Safran S.A.(c) | | | 690 | | | | 100,945 | |
| Sanofi S.A.(c) | | | 9,641 | | | | 833,226 | |
| Schneider Electric SE(c) | | | 32,150 | | | | 2,909,124 | |
| SCOR SE(c) | | | 15,348 | | | | 672,861 | |
| SOITEC(c) (d) | | | 965 | | | | 105,574 | |
| Total S.A.(c) | | | 16,809 | | | | 942,913 | |
| WILSHIRE INTERNATIONAL EQUITY FUND |
| SCHEDULE OF INVESTMENTS (Continued) |
| COMMON STOCKS - 97.8% (Continued) | | Shares | | | Value | |
| France - 9.2% (Continued) |
| Ubisoft Entertainment S.A.(c) (d) | | | 29,261 | | | $ | 2,288,540 | |
| Unione di Banche Italiane SpA(b) (c) | | | 46,275 | | | | 126,346 | |
| Vinci S.A.(c) | | | 770 | | | | 78,639 | |
| Wendel S.A.(c) | | | 1,265 | | | | 172,460 | |
| | | | | | | | 35,189,290 | |
| Germany - 3.2% |
| adidas AG(c) | | | 14,148 | | | | 4,377,118 | |
| ADVA Optical Networking SE(c) (d) | | | 4,649 | | | | 34,022 | |
| AIXTRON SE(d) | | | 3,939 | | | | 37,598 | |
| Allianz SE(c) | | | 3,490 | | | | 841,733 | |
| Amadeus Fire AG(c) | | | 581 | | | | 79,104 | |
| BASF SE(c) | | | 2,287 | | | | 166,383 | |
| Bauer AG(c) | | | 2,298 | | | | 63,356 | |
| CompuGroup Medical SE(c) | | | 2,269 | | | | 183,254 | |
| Corestate Capital Holding S.A.(c) | | | 3,380 | | | | 115,584 | |
| Dermapharm Holding SE(c) | | | 1,418 | | | | 48,923 | |
| Deutsche EuroShop AG(c) | | | 3,423 | | | | 94,603 | |
| Deutsche Pfandbriefbank AG(c) | | | 7,519 | | | | 90,541 | |
| Deutz AG(c) | | | 9,445 | | | | 91,889 | |
| Eckert & Ziegler Strahlen- und Medizintechnik AG(c) | | | 874 | | | | 102,943 | |
| Encavis AG(c) | | | 7,191 | | | | 56,044 | |
| Evotec SE(c) (d) | | | 4,341 | | | | 121,542 | |
| Freenet AG(c) | | | 4,499 | | | | 90,011 | |
| Fresenius SE & Co. KGaA(c) | | | 178 | | | | 9,666 | |
| Gerresheimer AG(c) | | | 4,340 | | | | 319,893 | |
| Hannover Rueck SE(c) | | | 2,127 | | | | 343,934 | |
| Isra Vision AG(c) | | | 425 | | | | 18,938 | |
| KION Group AG(c) | | | 3,365 | | | | 212,813 | |
| Merck KGaA(c) | | | 1,233 | | | | 128,793 | |
| MTU Aero Engines AG(c) | | | 137 | | | | 32,677 | |
| Rheinmetall AG(c) | | | 2,152 | | | | 263,760 | |
| Salzgitter AG(c) | | | 3,349 | | | | 95,973 | |
| SAP SE(c) | | | 4,967 | | | | 680,958 | |
| Siemens AG(c) | | | 4,706 | | | | 560,294 | |
| Stoeer SE & Co. KGaA(c) | | | 1,038 | | | | 77,984 | |
| Symrise AG(c) | | | 277 | | | | 26,673 | |
| WILSHIRE INTERNATIONAL EQUITY FUND |
| SCHEDULE OF INVESTMENTS (Continued) |
| COMMON STOCKS - 97.8% (Continued) | | Shares | | | Value | |
| Germany - 3.2% (Continued) |
| Volkswagon AG(c) | | | 16,862 | | | $ | 2,892,378 | |
| Wirecard AG(c) | | | 168 | | | | 28,362 | |
| Wuestenrot & Wuerttembergische AG(c) | | | 2,299 | | | | 49,463 | |
| XING SE(c) | | | 204 | | | | 87,223 | |
| | | | | | | | 12,424,430 | |
| Greece - 0.0% (a) |
| FF Group(d) (e) (f) | | | 2,880 | | | | 0 | |
| Motor Oil Hellas Corinth Refineries S.A(c) | | | 1,788 | | | | 45,763 | |
| OPAP S.A.(c) | | | 2,091 | | | | 23,455 | |
| | | | | | | | 69,218 | |
| Guernsey - 0.0% (a) |
| Picton Property Income Ltd. (The)(c) | | | 48,519 | | | | 60,421 | |
| Regional REIT Ltd.(c) | | | 54,950 | | | | 75,460 | |
| Standard Life Investment Property Income Trust Ltd.(c) | | | 57,243 | | | | 68,477 | |
| | | | | | | | 204,358 | |
| Hong Kong - 4.1% |
| AIA Group Ltd.(c) | | | 453,465 | | | | 4,897,038 | |
| Beijing Enterprises Water Group Ltd.(c) | | | 2,000 | | | | 1,189 | |
| BOC Hong Kong Holdings Ltd.(c) | | | 80,000 | | | | 314,979 | |
| Champion REIT(c) | | | 306,000 | | | | 254,978 | |
| China Merchants Holdings Ltd.(c) | | | 42,000 | | | | 71,472 | |
| China Mobile Ltd.(c) | | | 95,500 | | | | 869,420 | |
| China Overseas Grand Oceans Group Ltd.(c) | | | 83,000 | | | | 36,554 | |
| China Resources Power Holdings Co. Ltd.(c) | | | 2,100,504 | | | | 3,063,958 | |
| China Taiping Insurance Holdings Co. Ltd.(c) (d) | | | 59,800 | | | | 160,192 | |
| China Unicom Hong Kong Ltd.(c) | | | 152,000 | | | | 166,201 | |
| CITIC Ltd.(c) | | | 9,000 | | | | 12,954 | |
| CITIC Securities Co. Ltd.(c) (d) | | | 10,500 | | | | 21,900 | |
| CNOOC Ltd.(c) | | | 141,000 | | | | 240,518 | |
| Dah Sing Financial Holdings Ltd.(c) | | | 23,600 | | | | 110,277 | |
| Fosun International Ltd.(c) | | | 230,500 | | | | 306,897 | |
| Hang Lung Group Ltd.(c) | | | 58,000 | | | | 160,991 | |
| Hang Lung Properties Ltd.(c) | | | 17,000 | | | | 40,444 | |
| Hang Seng Bank Ltd.(c) | | | 23,100 | | | | 574,983 | |
| Henderson Land Development Co. Ltd.(c) | | | 85,800 | | | | 473,055 | |
| HKT Trust and HKT Ltd.(c) | | | 78,000 | | | | 123,821 | |
| WILSHIRE INTERNATIONAL EQUITY FUND |
| SCHEDULE OF INVESTMENTS (Continued) |
| COMMON STOCKS - 97.8% (Continued) | | Shares | | | Value | |
| Hong Kong - 4.1% (Continued) |
| Hong Kong Exchanges & Clearing Ltd.(c) | | | 23,200 | | | $ | 819,909 | |
| Kingsoft Corp. Ltd.(b) (c) | | | 11,000 | | | | 23,826 | |
| Lenovo Group Ltd.(c) | | | 2,961,000 | | | | 2,292,708 | |
| MTR Corp. Ltd.(c) | | | 5,000 | | | | 33,680 | |
| Power Assets Holdings Ltd.(c) | | | 11,000 | | | | 79,136 | |
| Sany Heavy Equipment International Holdings Co. Ltd.(c) | | | 194,000 | | | | 70,119 | |
| Shanghai Industrial Holdings Ltd.(c) | | | 26,000 | | | | 56,376 | |
| Shui On Land Ltd.(c) | | | 827,500 | | | | 191,999 | |
| Wheelock & Co. Ltd.(c) | | | 1,000 | | | | 7,181 | |
| Wynn Macau Ltd.(c) | | | 19,200 | | | | 42,983 | |
| | | | | | | | 15,519,738 | |
| Hungary - 0.0% (a) |
| Magyar Telekom Telecommunications plc(c) | | | 45,164 | | | | 66,965 | |
| OTP Bank plc(c) | | | 1,795 | | | | 71,482 | |
| | | | | | | | 138,447 | |
| India - 1.4% |
| Ashok Leyland Ltd.(c) | | | 20,919 | | | | 26,458 | |
| Bharti Infratel Ltd.(c) | | | 898 | | | | 3,478 | |
| Container Corp. of India Ltd.(c) | | | 11,478 | | | | 94,856 | |
| Graphite India Ltd.(c) | | | 11,340 | | | | 55,055 | |
| HDFC Bank Ltd. - ADR | | | 33,986 | | | | 4,419,539 | |
| Just Dial Ltd.(c) (d) | | | 3,342 | | | | 36,877 | |
| NCC Ltd.(c) (d) | | | 29,132 | | | | 41,174 | |
| Power Finance Corp.(c) (d) | | | 103,759 | | | | 201,942 | |
| REC Ltd.(c) | | | 78,710 | | | | 188,027 | |
| SpiceJet Ltd.(c) (d) | | | 22,619 | | | | 41,006 | |
| Steel Authority of India Ltd.(c) (d) | | | 94,261 | | | | 69,371 | |
| Sterlite Technologies Ltd.(c) (d) | | | 13,611 | | | | 34,653 | |
| Union Bank of India(c) (d) | | | 61,959 | | | | 72,818 | |
| Zee Entertainment Enterprises Ltd.(c) | | | 1,073 | | | | 5,276 | |
| | | | | | | | 5,290,530 | |
| Indonesia - 0.2% |
| Hanjaya Mandala Sampoerna Tbk PT(c) | | | 831,700 | | | | 185,150 | |
| Surya Citra Media Tbk PT(c) | | | 323,800 | | | | 36,934 | |
| United Tractors Tbk PT(c) | | | 204,500 | | | | 408,071 | |
| WILSHIRE INTERNATIONAL EQUITY FUND |
| SCHEDULE OF INVESTMENTS (Continued) |
| COMMON STOCKS - 97.8% (Continued) | | Shares | | | Value | |
| Indonesia - 0.2% (Continued) |
| Wijaya Karya Persero Tbk PT(c) | | | 219,600 | | | $ | 37,766 | |
| | | | | | | | 667,921 | |
| Ireland - 2.1% |
| Accenture plc - Class A | | | 25,392 | | | | 4,691,679 | |
| C&C Group plc(c) | | | 36,389 | | | | 161,672 | |
| DCC plc(c) | | | 1,307 | | | | 116,597 | |
| Grafton Group plc(c) | | | 10,140 | | | | 103,686 | |
| ICON plc(d) | | | 13,026 | | | | 2,005,613 | |
| Irish Residential Properties REIT plc(c) | | | 25,430 | | | | 48,766 | |
| UDG Healthcare plc(c) | | | 18,757 | | | | 190,276 | |
| Willis Towers Watson plc | | | 2,961 | | | | 567,150 | |
| | | | | | | | 7,885,439 | |
| Isle of Man - 0.0% (a) |
| GVC Holdings plc(c) | | | 17,441 | | | | 144,573 | |
| | | | | | | | | |
| Israel - 0.3% |
| Check Point Software Technologies Ltd.(b) (d) | | | 2,826 | | | | 326,713 | |
| Delek Group Ltd.(c) | | | 207 | | | | 35,606 | |
| Matrix IT Ltd.(c) | | | 6,550 | | | | 94,336 | |
| Nice Ltd.(c) (d) | | | 938 | | | | 128,405 | |
| Paz Oil Co. Ltd.(c) | | | 1,133 | | | | 159,568 | |
| Shikun & Binui Ltd.(c) | | | 39,232 | | | | 114,496 | |
| Teva Pharmaceutical Industries Ltd. - ADR(b) (d) | | | 14,200 | | | | 131,066 | |
| | | | | | | | 990,190 | |
| Italy - 1.7% |
| A2A SpA(c) | | | 56,542 | | | | 98,156 | |
| Ascopiave SpA(c) | | | 10,769 | | | | 46,233 | |
| Atlantia SpA(c) | | | 2,208 | | | | 57,579 | |
| Banca Farmafactoring SpA(c) | | | 26,344 | | | | 146,841 | |
| Banca Generali SpA(b) (c) | | | 7,240 | | | | 208,480 | |
| Banca Mediolanum SpA(c) | | | 22,764 | | | | 167,684 | |
| Banca Popolare di Sondrio Societa cooperativa(c) | | | 39,076 | | | | 86,691 | |
| Banco BPM SpA(c) | | | 17,800 | | | | 36,255 | |
| Enel SpA(c) | | | 323,417 | | | | 2,256,153 | |
| Eni SpA(c) | | | 49,107 | | | | 816,546 | |
| Eurotech SpA(c) (d) | | | 17,054 | | | | 94,259 | |
| WILSHIRE INTERNATIONAL EQUITY FUND |
| SCHEDULE OF INVESTMENTS (Continued) |
| COMMON STOCKS - 97.8% (Continued) | | Shares | | | Value | |
| Italy - 1.7% (Continued) |
| Immobiliare Grande Distibuzione SIIQ SpA(c) | | | 9,530 | | | $ | 62,830 | |
| Intesa Sanpaolo SpA(c) | | | 61,474 | | | | 131,608 | |
| Maire Tecnimont SpA(c) | | | 21,236 | | | | 68,854 | |
| Mediobanca Banca di Credito Finanziario SpA(c) | | | 18,786 | | | | 193,724 | |
| Moncler SpA(c) | | | 5,609 | | | | 240,418 | |
| Piaggio & C SpA(c) | | | 42,623 | | | | 125,080 | |
| SAES Getters SpA(c) | | | 2,221 | | | | 51,839 | |
| Saipem SpA(b) (c) (d) | | | 15,851 | | | | 79,105 | |
| Snam SpA(c) | | | 71,256 | | | | 354,498 | |
| Telecom Italia SpA/Milano(c) (d) | | | 149,313 | | | | 81,521 | |
| Terna Rete Elettrica Nazionale SpA(c) | | | 25,159 | | | | 160,309 | |
| Tinexta SpA(c) | | | 8,206 | | | | 122,604 | |
| Unicredit SpA(c) | | | 71,230 | | | | 876,788 | |
| Unieuro SpA(c) | | | 4,186 | | | | 67,012 | |
| | | | | | | | 6,631,067 | |
| Japan - 13.1% |
| 77 Bank Ltd. (The)(c) (d) | | | 11,400 | | | | 168,073 | |
| A&D Co. Ltd.(c) (d) | | | 5,000 | | | | 36,781 | |
| ADEKA Corp.(c) (d) | | | 17,300 | | | | 256,305 | |
| AEON REIT Investment Corp.(c) (d) | | | 189 | | | | 242,014 | |
| Akatsuki, Inc.(c) (d) | | | 600 | | | | 32,468 | |
| AOI TYO Holdings, Inc.(c) | | | 6,500 | | | | 41,525 | |
| Aoyama Trading Co. Ltd.(c) (d) | | | 2,200 | | | | 43,193 | |
| Asahi Group Holdings Ltd.(c) | | | 600 | | | | 27,012 | |
| Astellas Pharma, Inc.(c) | | | 31,900 | | | | 454,621 | |
| Avex, Inc.(c) (d) | | | 7,600 | | | | 96,582 | |
| Bridgestone Corp.(c) | | | 2,400 | | | | 94,682 | |
| Bunka Shutter Co. Ltd.(c) (d) | | | 13,000 | | | | 98,703 | |
| CAC Holdings Corp.(c) | | | 10,300 | | | | 143,721 | |
| Capcom Co. Ltd.(c) (d) | | | 1,900 | | | | 38,249 | |
| Central Japan Railway Co.(c) | | | 1,400 | | | | 280,724 | |
| Citizen Watch Co. Ltd.(c) (d) | | | 7,500 | | | | 38,594 | |
| Cosmo Energy Holdings Co. Ltd.(c) (d) | | | 2,700 | | | | 61,194 | |
| Credit Saison Co. Ltd.(c) | | | 14,300 | | | | 167,836 | |
| Daido Metal Co. Ltd.(c) (d) | | | 14,600 | | | | 89,897 | |
| Daiho Corp.(c) (d) | | | 2,700 | | | | 67,763 | |
| WILSHIRE INTERNATIONAL EQUITY FUND |
| SCHEDULE OF INVESTMENTS (Continued) |
| COMMON STOCKS - 97.8% (Continued) | | Shares | | | Value | |
| Japan - 13.1% (Continued) |
| Dai-ichi Life Holdings, Inc.(c) | | | 38,200 | | | $ | 577,983 | |
| Daikin Industries Ltd.(c) | | | 3,100 | | | | 405,930 | |
| Daiwa Office Investment Corp.(c) (d) | | | 42 | | | | 301,340 | |
| DCM Holdings Co. Ltd.(c) (d) | | | 10,000 | | | | 98,390 | |
| Denki Kogyo Co. Ltd.(c) (d) | | | 3,400 | | | | 100,494 | |
| Denso Corp.(c) | | | 1,000 | | | | 42,168 | |
| Digital Garage, Inc.(c) | | | 1,900 | | | | 60,370 | |
| DMG Mori Co. Ltd.(c) | | | 5,200 | | | | 83,773 | |
| East Japan Railway Co.(c) | | | 2,900 | | | | 271,580 | |
| Eisai Co. Ltd.(c) | | | 5,200 | | | | 294,730 | |
| FANUC Corp.(c) | | | 1,500 | | | | 278,732 | |
| Fast Retailing Co. Ltd.(c) | | | 500 | | | | 302,664 | |
| Feed One Co. Ltd.(c) (d) | | | 25,800 | | | | 44,672 | |
| FJ Next Co. Ltd.(c) (d) | | | 6,800 | | | | 65,744 | |
| Fudo Tetra Corp.(c) | | | 6,300 | | | | 76,596 | |
| Fuji Electric Co. Ltd.(c) | | | 400 | | | | 13,863 | |
| Fujita Kanko, Inc.(c) (d) | | | 2,100 | | | | 52,712 | |
| Fujitsu Ltd.(c) | | | 35,800 | | | | 2,502,046 | |
| Fukuoka Financial Group, Inc. | | | 22,300 | | | | 406,865 | |
| Furuno Electric Co. Ltd.(c) (d) | | | 3,900 | | | | 36,705 | |
| Future Corp.(c) | | | 3,600 | | | | 71,181 | |
| Hamamatsu Photonics K.K.(c) | | | 1,700 | | | | 66,417 | |
| Hazama Ando Corp.(c) | | | 5,700 | | | | 38,157 | |
| HIS Co. Ltd.(c) | | | 12,300 | | | | 306,629 | |
| Hitachi Metals Ltd.(c) | | | 273,400 | | | | 3,100,411 | |
| Hokkaido Electric Power Co., Inc.(c) (d) | | | 29,500 | | | | 165,462 | |
| Hokuetsu Corp.(c) (d) | | | 30,500 | | | | 164,884 | |
| Hokuhoku Financial Group, Inc.(c) | | | 3,300 | | | | 34,387 | |
| Hokuriku Electric Power Co.(c) | | | 5,000 | | | | 36,305 | |
| Hokuto Corp.(c) | | | 5,300 | | | | 89,465 | |
| Honda Motor Co.(c) | | | 113,600 | | | | 2,937,694 | |
| House Foods Group, Inc.(c) (d) | | | 1,100 | | | | 41,351 | |
| Hoya Corp.(c) | | | 500 | | | | 38,429 | |
| Hulic Co. Ltd.(c) | | | 12,200 | | | | 98,223 | |
| Iida Group Holdings Co. Ltd.(c) | | | 72,600 | | | | 1,175,437 | |
| Iino Kaiun Kaisha Ltd.(c) (d) | | | 18,900 | | | | 63,129 | |
| WILSHIRE INTERNATIONAL EQUITY FUND |
| SCHEDULE OF INVESTMENTS (Continued) |
| COMMON STOCKS - 97.8% (Continued) | | Shares | | | Value | |
| Japan - 13.1% (Continued) |
| i-mobile Co. Ltd.(c) (d) | | | 4,600 | | | $ | 33,567 | |
| Inpex Corp.(c) | | | 379,800 | | | | 3,442,411 | |
| Internet Initiative Japan, Inc.(c) (d) | | | 6,500 | | | | 122,218 | |
| Ishihara Sangyo Kaisha Ltd.(c) (d) | | | 8,200 | | | | 96,256 | |
| Isuzu Motors Ltd.(c) | | | 91,200 | | | | 1,041,651 | |
| Jaccs Co. Ltd.(c) (d) | | | 5,500 | | | | 109,725 | |
| Japan Hotel REIT Investment Corp.(c) | | | 42 | | | | 33,840 | |
| Japan Petroleum Exploration Co. Ltd.(c) | | | 4,200 | | | | 97,677 | |
| Japan Securities Finance Co. Ltd.(c) (d) | | | 23,600 | | | | 120,590 | |
| Japan Tobacco, Inc.(c) | | | 1,500 | | | | 33,067 | |
| Juroku Bank Ltd. (The)(c) (d) | | | 4,100 | | | | 83,657 | |
| JVCKenwood Corp.(c) (d) | | | 18,900 | | | | 44,021 | |
| Kaga Electronics Co. Ltd.(c) (d) | | | 2,400 | | | | 34,753 | |
| Kandenko Co. Ltd.(c) (d) | | | 21,900 | | | | 183,367 | |
| Kao Corp.(c) | | | 1,900 | | | | 144,985 | |
| Kato Works Co. Ltd.(c) | | | 4,100 | | | | 76,625 | |
| Keihin Corp.(c) (d) | | | 3,700 | | | | 53,093 | |
| Kewpie Corp.(c) (d) | | | 3,500 | | | | 77,371 | |
| Keyence Corp.(c) | | | 8,990 | | | | 5,544,592 | |
| Kintetsu World Express, Inc.(c) | | | 4,600 | | | | 60,179 | |
| Kirin Holdings Co. Ltd.(c) | | | 12,900 | | | | 278,557 | |
| Kobayashi Pharmaceutical Co. Ltd.(c) | | | 100 | | | | 7,175 | |
| Kobe Steel Ltd.(c) | | | 17,600 | | | | 115,526 | |
| Koito Manufacturing Co. Ltd.(c) | | | 6,900 | | | | 369,281 | |
| Kojima Co. Ltd.(c) (d) | | | 30,900 | | | | 136,629 | |
| Kokuyo Co. Ltd.(c) | | | 6,500 | | | | 91,185 | |
| KOMEDA Holdings Co. Ltd.(c) (d) | | | 1,900 | | | | 35,859 | |
| Kose Corp.(c) | | | 500 | | | | 84,395 | |
| Kuboto Corp.(c) | | | 11,700 | | | | 195,475 | |
| Kumiai Chemical Industry Co. Ltd.(c) (d) | | | 7,000 | | | | 50,742 | |
| Kurita Water Industries Ltd.(c) | | | 6,600 | | | | 164,446 | |
| Kyocera Corp.(c) | | | 200 | | | | 13,105 | |
| Kyokuyo Co. Ltd.(c) (d) | | | 1,900 | | | | 50,629 | |
| KYORIN Holdings, Inc.(c) (d) | | | 6,000 | | | | 106,394 | |
| Life Corp.(c) (d) | | | 4,400 | | | | 88,631 | |
| Maeda Corp.(c) (d) | | | 8,500 | | | | 68,267 | |
| WILSHIRE INTERNATIONAL EQUITY FUND |
| SCHEDULE OF INVESTMENTS (Continued) |
| COMMON STOCKS - 97.8% (Continued) | | Shares | | | Value | |
| Japan - 13.1% (Continued) |
| Mamezou Holdings Co. Ltd.(c) (d) | | | 2,900 | | | $ | 34,272 | |
| Mandom Corp.(c) | | | 2,700 | | | | 65,474 | |
| Marubeni Corp.(c) | | | 5,400 | | | | 35,846 | |
| Maruha Nichiro Corp.(c) (d) | | | 4,800 | | | | 141,059 | |
| Maxell Holdings Ltd.(c) | | | 3,100 | | | | 42,521 | |
| MCUBS MidCity Investment Corp.(c) | | | 49 | | | | 46,110 | |
| Mebuki Financial Group, Inc.(c) | | | 38,400 | | | | 100,349 | |
| Mirai Corp.(c) (d) | | | 525 | | | | 254,263 | |
| Mitsubishi Corp.(c) | | | 11,100 | | | | 293,335 | |
| Mitsui & Co. Ltd.(c) | | | 84,400 | | | | 1,377,716 | |
| Mitsui Mining and Smelting Co. Ltd.(c) (d) | | | 1,700 | | | | 40,866 | |
| Mitsui Sugar Co. Ltd.(c) (d) | | | 1,500 | | | | 31,039 | |
| Mitsui-Soko Holdings Co. Ltd.(c) (d) | | | 5,500 | | | | 79,354 | |
| Miyaji Engineering Group, Inc.(c) (d) | | | 3,200 | | | | 51,963 | |
| Mizuho Financial Group, Inc.(c) | | | 2,800 | | | | 4,072 | |
| Mizuno Corp.(c) (d) | | | 2,200 | | | | 49,883 | |
| Moriroku Holdings Co. Ltd.(c) (d) | | | 1,900 | | | | 43,841 | |
| MS&AD Insurance Group Holdings, Inc.(c) | | | 22,400 | | | | 712,049 | |
| Murata Manufacturing Co. Ltd.(c) | | | 2,100 | | | | 94,548 | |
| Nagase & Co. Ltd.(c) (d) | | | 9,300 | | | | 139,813 | |
| Nanto Bank Ltd. (The)(c) (d) | | | 5,500 | | | | 119,546 | |
| Nexon Co. Ltd.(c) | | | 1,200 | | | | 17,532 | |
| NichiiGakkan Co. Ltd.(c) (d) | | | 2,700 | | | | 39,441 | |
| Nichi-iko Pharmaceutical Co. Ltd.(c) | | | 3,800 | | | | 41,632 | |
| Nidec Corp.(c) | | | 1,200 | | | | 164,810 | |
| Nihon Chouzai Co. Ltd.(c) (d) | | | 2,600 | | | | 80,506 | |
| Nikkiso Co. Ltd.(c) | | | 7,100 | | | | 94,876 | |
| Nikkon Holdings Co. Ltd.(c) | | | 4,200 | | | | 96,574 | |
| Nintendo Co. Ltd.(c) | | | 900 | | | | 330,225 | |
| Nippon Antenna Co. Ltd.(c) (d) | | | 4,200 | | | | 40,083 | |
| Nippon Carbon Co. Ltd.(c) | | | 2,100 | | | | 80,949 | |
| Nippon Electric Glass Co. Ltd.(c) | | | 4,800 | | | | 122,003 | |
| Nippon Sheet Glass Co. Ltd.(c) (d) | | | 20,400 | | | | 139,279 | |
| Nippon Television Holdings, Inc.(c) (d) | | | 6,700 | | | | 99,412 | |
| Nippon Thompson Co. Ltd.(c) (d) | | | 19,700 | | | | 89,160 | |
| Nishimatsu Construction Co. Ltd.(c) (d) | | | 6,000 | | | | 115,938 | |
| WILSHIRE INTERNATIONAL EQUITY FUND |
| SCHEDULE OF INVESTMENTS (Continued) |
| COMMON STOCKS - 97.8% (Continued) | | Shares | | | Value | |
| Japan - 13.1% (Continued) |
| Nishi-Nippon Financial Holdings, Inc.(c) | | | 23,400 | | | $ | 168,751 | |
| Nishio Rent All Co. Ltd.(c) | | | 1,700 | | | | 48,137 | |
| Nissan Chemical Corp.(c) | | | 1,500 | | | | 67,770 | |
| Nissin Kogyo Co. Ltd.(c) | | | 7,900 | | | | 108,890 | |
| Nisso Corp.(c) (d) | | | 2,600 | | | | 35,946 | |
| Nittetsu Mining Co. Ltd.(c) (d) | | | 1,100 | | | | 47,689 | |
| Nomura Research Institute Ltd.(c) | | | 9,201 | | | | 147,970 | |
| North Pacific Bank Ltd.(c) | | | 15,000 | | | | 35,729 | |
| NS United Kaiun Kaisha Ltd.(c) (d) | | | 3,400 | | | | 70,112 | |
| NSD Co. Ltd.(c) (d) | | | 1,200 | | | | 34,744 | |
| NTT DoCoMo, Inc.(c) | | | 14,600 | | | | 340,662 | |
| Obic Co. Ltd.(c) | | | 400 | | | | 45,460 | |
| One REIT, Inc.(c) (d) | | | 83 | | | | 221,541 | |
| Ono Pharmaceutical Co. Ltd.(c) | | | 4,000 | | | | 71,922 | |
| Oriental Land Co. Ltd.(c) | | | 700 | | | | 86,845 | |
| Otsuka Corp.(c) | | | 9,400 | | | | 379,092 | |
| P.C.A. Corp.(c) (d) | | | 1,300 | | | | 43,491 | |
| Persol Holdings Co. Ltd.(c) | | | 5,200 | | | | 122,601 | |
| Recruit Holdings Co. Ltd.(c) | | | 11,300 | | | | 378,364 | |
| Resona Holdings, Inc.(c) | | | 210,000 | | | | 876,074 | |
| Roland DG Corp.(c) | | | 2,500 | | | | 56,101 | |
| S Foods, Inc.(c) | | | 2,400 | | | | 81,596 | |
| SAMTY Co. Ltd.(c) | | | 9,800 | | | | 149,338 | |
| Sanken Electric Co. Ltd.(c) (d) | | | 3,100 | | | | 64,813 | |
| Sanki Engineering Co. Ltd.(c) (d) | | | 7,700 | | | | 89,375 | |
| Sankyo Co. Ltd.(c) | | | 5,600 | | | | 203,054 | |
| Scala, Inc.(c) | | | 4,000 | | | | 33,696 | |
| SEC Carbon Ltd.(c) (d) | | | 300 | | | | 27,530 | |
| Secom Co. Ltd.(c) | | | 700 | | | | 60,322 | |
| Seikagaku Corp.(c) (d) | | | 3,300 | | | | 37,948 | |
| Sekisui House Reit, Inc.(c) | | | 550 | | | | 411,541 | |
| Sekisui Plastics Co. Ltd.(c) (d) | | | 7,300 | | | | 50,909 | |
| Shimano, Inc.(c) | | | 4,600 | | | | 685,479 | |
| Shin Nippon Biomedical Laboratories Ltd.(c) (d) | | | 14,700 | | | | 95,525 | |
| Shin-Etsu Chemical Co. Ltd.(c) | | | 6,000 | | | | 561,397 | |
| Shionogi & Co. Ltd.(c) | | | 9,000 | | | | 520,070 | |
| WILSHIRE INTERNATIONAL EQUITY FUND |
| SCHEDULE OF INVESTMENTS (Continued) |
| COMMON STOCKS - 97.8% (Continued) | | Shares | | | Value | |
| Japan - 13.1% (Continued) |
| SK-Electronics Co. Ltd.(c) (d) | | | 1,800 | | | $ | 35,132 | |
| SKY Perfect JSAT Holdings, Inc.(c) | | | 22,900 | | | | 89,397 | |
| SMC Corp.(c) | | | 800 | | | | 299,914 | |
| SoftBank Corp.(c) | | | 12,600 | | | | 606,911 | |
| Sohgo Security Services Co. Ltd.(c) | | | 800 | | | | 36,979 | |
| Sojitz Corp.(c) (d) | | | 33,200 | | | | 106,849 | |
| Sony Corp.(c) | | | 4,800 | | | | 252,252 | |
| Sumitomo Corp.(c) | | | 28,600 | | | | 434,399 | |
| Sumitomo Densetsu Co. Ltd.(c) (d) | | | 3,300 | | | | 52,501 | |
| Sumitomo Mitsui Financial Group, Inc.(c) | | | 71,400 | | | | 2,530,939 | |
| Sumitomo Mitsui Trust Holdings, Inc.(c) | | | 600 | | | | 21,800 | |
| Sumitomo Warehouse Co. Ltd. (The)(c) (d) | | | 4,600 | | | | 58,830 | |
| Sundrug Co. Ltd.(c) | | | 500 | | | | 13,561 | |
| Suzuki Motor Corp.(c) | | | 5,900 | | | | 277,585 | |
| SWCC Showa Holdings Co. Ltd.(c) (d) | | | 6,900 | | | | 52,749 | |
| T&D Holdings, Inc.(c) | | | 1,600 | | | | 17,414 | |
| Tadano Ltd.(c) (d) | | | 4,900 | | | | 51,325 | |
| Taiyo Yuden Co. Ltd.(c) | | | 4,100 | | | | 76,963 | |
| Takara Standard Co. Ltd.(c) (d) | | | 4,300 | | | | 68,229 | |
| Takashimaya Co. Ltd.(c) (d) | | | 14,900 | | | | 163,528 | |
| Takeei Corp.(c) (d) | | | 7,700 | | | | 64,884 | |
| Tama Home Co. Ltd.(c) | | | 14,700 | | | | 146,764 | |
| Terumo Corp.(c) | | | 1,400 | | | | 41,825 | |
| THK Co. Ltd.(c) | | | 1,500 | | | | 36,082 | |
| TIS, Inc.(c) (d) | | | 2,600 | | | | 132,876 | |
| Toa Corp.(c) (d) | | | 14,900 | | | | 225,368 | |
| Toho Holdings Co. Ltd.(c) | | | 10,800 | | | | 242,346 | |
| Tokyo Electron Ltd.(c) | | | 900 | | | | 126,506 | |
| Tokyotokeiba Co. Ltd. | | | 1,100 | | | | 33,823 | |
| TOMONY Holdings, Inc.(c) (d) | | | 25,100 | | | | 84,477 | |
| Toppan Forms Co. Ltd.(c) | | | 10,000 | | | | 78,796 | |
| Torii Pharmaceutical Co. Ltd.(c) | | | 3,100 | | | | 74,751 | |
| Towa Pharmaceutical Co. Ltd.(c) | | | 1,700 | | | | 43,274 | |
| Toyota Motor Corp.(c) | | | 800 | | | | 49,653 | |
| Transaction Co. Ltd.(c) (d) | | | 6,600 | | | | 55,974 | |
| Trend Micro, Inc.(c) | | | 1,600 | | | | 71,499 | |
| WILSHIRE INTERNATIONAL EQUITY FUND |
| SCHEDULE OF INVESTMENTS (Continued) |
| COMMON STOCKS - 97.8% (Continued) | | Shares | | | Value | |
| Japan - 13.1% (Continued) |
| Ube Industries Ltd.(c) (d) | | | 9,700 | | | $ | 201,817 | |
| Unicharm Corp.(c) | | | 800 | | | | 24,120 | |
| UNITED, Inc.(c) | | | 2,600 | | | | 35,856 | |
| Unitika Ltd.(c) (d) | | | 10,800 | | | | 38,844 | |
| USS Co. Ltd.(c) | | | 6,400 | | | | 126,438 | |
| UT Group Co. Ltd.(c) | | | 1,600 | | | | 39,147 | |
| V Technology Co. Ltd.(c) (d) | | | 1,100 | | | | 50,572 | |
| Valor Holdings Co. Ltd.(c) (d) | | | 4,300 | | | | 89,497 | |
| Vital KSK Holdings, Inc.(c) (d) | | | 7,400 | | | | 70,202 | |
| Wakita & Co. Ltd.(c) (d) | | | 5,200 | | | | 50,429 | |
| Will Group, Inc.(c) (d) | | | 8,600 | | | | 71,583 | |
| World Co. Ltd.(c) (d) | | | 7,800 | | | | 149,324 | |
| World Holdings Co. Ltd.(c) (d) | | | 2,500 | | | | 39,125 | |
| Yahoo Japan Corp.(c) | | | 19,000 | | | | 55,892 | |
| Yakult Honsha Co. Ltd.(c) | | | 400 | | | | 23,609 | |
| Yamaha Corp.(c) | | | 1,000 | | | | 47,600 | |
| Yamato Holdings Co. Ltd.(c) | | | 7,700 | | | | 156,960 | |
| Yokohama Reito Co. Ltd.(c) (d) | | | 12,900 | | | | 119,664 | |
| | | | | | | | 50,132,453 | |
| Jersey - 1.9% |
| boohoo Group plc(c) (d) | | | 27,421 | | | | 73,686 | |
| Experian plc(c) | | | 194,253 | | | | 5,883,709 | |
| Genel Energy plc(c) | | | 26,342 | | | | 64,803 | |
| Glencore plc(c) | | | 3,824 | | | | 13,234 | |
| Man Group plc(c) | | | 19,052 | | | | 37,669 | |
| WPP plc(c) | | | 100,001 | | | | 1,259,631 | |
| | | | | | | | 7,332,732 | |
| Korea (Republic of) - 2.6% |
| Ace Technologies Corp.(c) | | | 3,551 | | | | 32,909 | |
| Asia Paper Manufacturing Co. Ltd.(c) | | | 2,585 | | | | 86,169 | |
| Autech Corp.(c) | | | 3,346 | | | | 36,251 | |
| Chongkundang Holdings Corp.(c) | | | 613 | | | | 59,941 | |
| Classys, Inc.(c) | | | 4,559 | | | | 48,180 | |
| Daewoong Co. Ltd.(c) | | | 2,503 | | | | 36,971 | |
| Dawonsys Co. Ltd.(c) | | | 4,663 | | | | 56,985 | |
| Deutsch Motors, Inc.(c) (d) | | | 9,896 | | | | 95,494 | |
| WILSHIRE INTERNATIONAL EQUITY FUND |
| SCHEDULE OF INVESTMENTS (Continued) |
| COMMON STOCKS - 97.8% (Continued) | | Shares | | | Value | |
| Korea (Republic of) - 2.6% (Continued) |
| DGB Financial Group, Inc.(c) | | | 12,836 | | | $ | 90,480 | |
| DIO Corp(c) (d) | | | 1,094 | | | | 38,517 | |
| Doosan Bobcat, Inc.(c) | | | 3,612 | | | | 113,672 | |
| ENF Technology Co. Ltd.(c) | | | 2,000 | | | | 35,951 | |
| Hana Financial Group, Inc.(c) | | | 50,558 | | | | 1,635,488 | |
| Handok, Inc.(c) | | | 2,531 | | | | 53,382 | |
| Handsome Co. Ltd.(c) | | | 1,061 | | | | 33,924 | |
| Hankook Technology Group Co. Ltd.(c) | | | 4,679 | | | | 69,364 | |
| Hansol Chemical Co. Ltd.(c) | | | 1,423 | | | | 97,797 | |
| HDC Hyundai Development Co. Engineering & Construction(c) | | | 2,290 | | | | 86,247 | |
| Hyosung Advanced Materials Corp.(c) (d) | | | 795 | | | | 82,262 | |
| Hyundai Mobis Co. Ltd.(c) | | | 206 | | | | 41,946 | |
| Hyundai Motor Co. Ltd.(c) | | | 19,076 | | | | 1,305,250 | |
| INTOPS Co. Ltd.(c) | | | 2,237 | | | | 32,540 | |
| IS Dongseo Co. Ltd.(c) | | | 2,786 | | | | 93,150 | |
| KIWOOM Securities Co. Ltd.(c) | | | 1,636 | | | | 115,695 | |
| Koentec Co. Ltd.(c) | | | 11,932 | | | | 121,354 | |
| Korea Autoglass Corp.(c) | | | 2,031 | | | | 37,753 | |
| Korea Electric Terminal Co. Ltd.(c) | | | 1,641 | | | | 95,374 | |
| Korea Zinc Co. Ltd.(c) | | | 204 | | | | 83,975 | |
| KT&G Corp.(c) | | | 1,735 | | | | 147,766 | |
| LOTTE Fine Chemical Co. Ltd.(c) | | | 787 | | | | 35,972 | |
| Mcnex Co. Ltd.(c) | | | 1,546 | | | | 38,553 | |
| ME2ON Co. Ltd.(c) (d) | | | 5,985 | | | | 34,274 | |
| MegaStudyEdu Co. Ltd.(c) | | | 1,097 | | | | 33,030 | |
| Neowiz(c) (d) | | | 2,956 | | | | 37,312 | |
| NEPES Corp.(c) | | | 1,334 | | | | 37,099 | |
| Nexen Tire Corp.(c) | | | 4,843 | | | | 40,835 | |
| NICE Information Service Co. Ltd.(c) | | | 5,313 | | | | 77,939 | |
| Osstem Implant Co. Ltd.(c) (d) | | | 1,889 | | | | 122,522 | |
| Partron Co. Ltd.(c) | | | 6,890 | | | | 105,857 | |
| Pearl Abyss Corp.(c) (d) | | | 89 | | | | 16,357 | |
| POSCO(c) | | | 8,123 | | | | 1,721,008 | |
| Power Logics Co. Ltd.(c) (d) | | | 3,017 | | | | 34,277 | |
| RFHIC Corp.(c) | | | 2,168 | | | | 54,585 | |
| WILSHIRE INTERNATIONAL EQUITY FUND |
| SCHEDULE OF INVESTMENTS (Continued) |
| COMMON STOCKS - 97.8% (Continued) | | Shares | | | Value | |
| Korea (Republic of) - 2.6% (Continued) |
| Samsung Electronics Co. Ltd.(c) | | | 21,991 | | | $ | 893,724 | |
| Samsung SDS Co. Ltd.(c) | | | 498 | | | | 92,650 | |
| Sebang Global Batter Co. Ltd.(c) | | | 1,596 | | | | 58,951 | |
| Seojin System Co. Ltd.(c) | | | 3,202 | | | | 71,359 | |
| SFA Semicon Co. Ltd.(c) (d) | | | 12,860 | | | | 36,337 | |
| Shinhan Financial Group Co. Ltd.(c) | | | 34,750 | | | | 1,348,918 | |
| SK Hynix, Inc.(c) | | | 4,068 | | | | 244,208 | |
| Suprema, Inc.(c) (d) | | | 1,193 | | | | 37,578 | |
| Taekwang Industrial Co. Ltd.(c) | | | 72 | | | | 82,160 | |
| WiSoL Co. Ltd.(c) | | | 2,563 | | | | 41,987 | |
| | | | | | | | 10,162,279 | |
| Luxembourg - 0.0% (a) |
| Befesa S.A.(c) | | | 1,202 | | | | 47,870 | |
| Solutions 30 SE(c) (d) | | | 8,885 | | | | 88,948 | |
| | | | | | | | 136,818 | |
| Malaysia - 0.2% |
| Bermaz Auto Berhad(c) | | | 163,700 | | | | 105,318 | |
| Carlsberg Brewery Malaysia Berhad(c) | | | 12,600 | | | | 78,178 | |
| Genting Malaysia Berhad(c) | | | 613,400 | | | | 481,089 | |
| Maylasia Airports Holdings Berhad(c) | | | 17,000 | | | | 35,110 | |
| MMC Corp. Berhad(c) | | | 167,400 | | | | 46,138 | |
| Sunway Berhad(c) | | | 87,200 | | | | 35,451 | |
| Syarikat Takaful Malaysia Keluarga Berhad(c) | | | 43,600 | | | | 72,295 | |
| YNH Property Berhad(c) | | | 88,000 | | | | 51,510 | |
| | | | | | | | 905,089 | |
| Mauritius - 0.0% (a) |
| Golden Agri-Resources Ltd.(c) | | | 187,700 | | | | 40,298 | |
| | | | | | | | | |
| Mexico - 0.9% |
| America Movil S.A.B. de C.V. | | | 170,500 | | | | 124,283 | |
| Controladora Vuela Compania de Aviacion S.A.B. de - Class A(d) | | | 36,300 | | | | 34,139 | |
| Gentera S.A.B. de C.V. | | | 43,700 | | | | 37,843 | |
| Grupo Aeroportuario del Centro Norte S.A.B. de C.V. | | | 16,700 | | | | 102,057 | |
| Grupo Aeroportuario del Sureste S.A.B. de C.V. - Class B | | | 1,535 | | | | 24,912 | |
| Grupo Financiero Inbursa S.A.B. de C.V. | | | 159,600 | | | | 230,928 | |
| WILSHIRE INTERNATIONAL EQUITY FUND |
| SCHEDULE OF INVESTMENTS (Continued) |
| COMMON STOCKS - 97.8% (Continued) | | Shares | | | Value | |
| Mexico - 0.9% (Continued) |
| Promotora y Operadora de Infraestructura S.A.B. de C.V. | | | 8,345 | | | $ | 83,083 | |
| Qualitas Controladora S.A.B. de C.V. | | | 31,500 | | | | 88,399 | |
| Wal-Mart de Mexico S.A.B. de C.V. | | | 946,231 | | | | 2,582,938 | |
| | | | | | | | 3,308,582 | |
| Netherlands - 3.1% |
| Airbus SE(c) | | | 1,496 | | | | 211,724 | |
| Argenx SE - ADR(d) | | | 200 | | | | 28,316 | |
| ASML Holding N.V. - ADR(b) | | | 10,964 | | | | 2,279,744 | |
| ASML Holding N.V.(c) | | | 7,306 | | | | 1,520,357 | |
| ASR Nederland N.V.(c) | | | 3,262 | | | | 132,544 | |
| Basic-Fit N.V.(c) (d) | | | 1,761 | | | | 61,980 | |
| CNH Industrial N.V.(c) | | | 1,452 | | | | 14,917 | |
| Constellium SE(d) | | | 3,700 | | | | 37,148 | |
| Exor N.V.(c) | | | 177 | | | | 12,401 | |
| Ferrari N.V.(c) | | | 2,115 | | | | 342,937 | |
| Fiat Chrysler Automobiles N.V.(c) | | | 13,321 | | | | 184,881 | |
| Flow Traders(c) | | | 1,973 | | | | 57,585 | |
| Heineken N.V.(c) | | | 898 | | | | 100,088 | |
| ING Groep N.V.(c) | | | 185,788 | | | | 2,152,194 | |
| Intertrust N.V.(c) | | | 6,185 | | | | 127,578 | |
| Koninklijke Ahold Delhaize N.V.(c) | | | 19,181 | | | | 430,622 | |
| Koninklijke DSM N.V.(c) | | | 622 | | | | 76,748 | |
| Koninklijke KPN N.V.(c) | | | 175,580 | | | | 539,189 | |
| Koninklijke Philips N.V.(c) | | | 12,841 | | | | 558,294 | |
| Koninklijke VolkerWessels N.V.(c) | | | 7,425 | | | | 149,290 | |
| Mylan N.V.(d) | | | 94,137 | | | | 1,792,368 | |
| Qaigen N.V.(c) (d) | | | 4,733 | | | | 192,601 | |
| Randstad Holding N.V.(c) | | | 588 | | | | 32,272 | |
| RHI Magnesita N.V.(c) | | | 4,176 | | | | 256,318 | |
| Signify N.V.(c) | | | 1,163 | | | | 34,316 | |
| Unilever N.V.(c) | | | 7,388 | | | | 448,897 | |
| | | | | | | | 11,775,309 | |
| New Zealand - 0.1% |
| a2 Milk Co. Ltd.(c) (d) | | | 456 | | | | 4,507 | |
| Fisher & Paykel Healthcare Corp. Ltd.(c) | | | 11,662 | | | | 121,310 | |
| WILSHIRE INTERNATIONAL EQUITY FUND |
| SCHEDULE OF INVESTMENTS (Continued) |
| COMMON STOCKS - 97.8% (Continued) | | Shares | | | Value | |
| New Zealand - 0.1% (Continued) |
| Infratil Ltd.(c) | | | 30,507 | | | $ | 95,339 | |
| | | | | | | | 221,156 | |
| Norway - 0.3% |
| DNB ASA(c) | | | 637 | | | | 11,869 | |
| DNO ASA(c) | | | 19,226 | | | | 34,996 | |
| Elkem ASA(c) | | | 26,430 | | | | 74,606 | |
| Equinor ASA(c) | | | 4,607 | | | | 91,385 | |
| Europris ASA(c) | | | 19,452 | | | | 60,352 | |
| Grieg Seafood ASA(c) | | | 3,425 | | | | 47,553 | |
| Kongsberg Gruppen ASA(c) | | | 8,072 | | | | 112,823 | |
| Orkla ASA(c) | | | 35,078 | | | | 311,294 | |
| Salmar ASA(c) | | | 2,537 | | | | 110,436 | |
| Telenor ASA(c) | | | 10,539 | | | | 223,900 | |
| | | | | | | | 1,079,214 | |
| Philippines - 0.2% |
| Aboitiz Power Corp.(c) | | | 105,600 | | | | 71,719 | |
| Ayala Land, Inc.(c) | | | 253,700 | | | | 251,620 | |
| First Gen Corp.(c) | | | 157,600 | | | | 82,438 | |
| Manila Electric Co.(c) | | | 20,230 | | | | 152,841 | |
| PLDT, Inc.(c) | | | 1,010 | | | | 25,330 | |
| Robinsons Land Corp.(c) | | | 94,600 | | | | 48,648 | |
| SM Prime Holdings, Inc.(c) | | | 9,500 | | | | 6,879 | |
| | | | | | | | 639,475 | |
| Poland - 0.1% |
| Enea S.A.(c) | | | 24,535 | | | | 61,372 | |
| LPP S.A.(c) | | | 15 | | | | 30,717 | |
| PLAY Communications S.A.(c) | | | 7,226 | | | | 62,652 | |
| Powszechna Kasa Oszczednosci Bank Polski S.A.(c) | | | 15,390 | | | | 176,645 | |
| Tauron Polska Energia S.A.(c) | | | 89,929 | | | | 41,320 | |
| | | | | | | | 372,706 | |
| Portugal - 0.1% |
| Banco Comercial Portugues, S.A.(c) | | | 292,049 | | | | 90,304 | |
| Galp Energia SGPS S.A.(c) | | | 1,662 | | | | 25,561 | |
| Jeronimo Martins SGPS S.A.(c) | | | 5,972 | | | | 96,267 | |
| NOS SGPS S.A.(c) | | | 6,977 | | | | 45,870 | |
| REN - Redes Energeticas Nacionais SGPS S.A.(c) | | | 48,162 | | | | 132,017 | |
| WILSHIRE INTERNATIONAL EQUITY FUND |
| SCHEDULE OF INVESTMENTS (Continued) |
| COMMON STOCKS - 97.8% (Continued) | | Shares | | | Value | |
| Portugal - 0.1% (Continued) |
| Sonae SGPS S.A.(c) | | | 55,619 | | | $ | 53,717 | |
| | | | | | | | 443,736 | |
| Russia - 1.0% |
| Inter RAO UES PJSC | | | 3,290,000 | | | | 236,233 | |
| MMC Norilsk Nickel PJSC | | | 3,435 | | | | 779,199 | |
| MMC Norilsk Nickel PJSC - ADR(c) | | | 30,450 | | | | 691,999 | |
| Mobile TeleSystems PJSC - ADR | | | 14,400 | | | | 134,064 | |
| Rosneft Oil Co. PJSC - GDR(c) | | | 175,678 | | | | 1,152,714 | |
| Severstal PJSC | | | 18,810 | | | | 318,376 | |
| Tatneft PJSC | | | 40,430 | | | | 496,698 | |
| | | | | | | | 3,809,283 | |
| Singapore - 1.2% |
| Ascendas Hospitality Trust(c) | | | 61,000 | | | | 44,192 | |
| Ascendas Real Estate Investment Trust(c) | | | 7,500 | | | | 17,306 | |
| DBS Group Holdings Ltd.(c) | | | 78,500 | | | | 1,507,979 | |
| Keppel Infrastructure Trust(c) | | | 460,300 | | | | 171,868 | |
| Manulife U.S. Real Estate Investment Trust(c) | | | 78,500 | | | | 67,922 | |
| Mapletree North Asia Commercial Trust(c) | | | 50,300 | | | | 54,274 | |
| Singapore Exchange Ltd.(c) | | | 46,800 | | | | 274,177 | |
| SPH REIT(c) | | | 64,000 | | | | 50,599 | |
| Venture Corp. Ltd.(c) | | | 8,800 | | | | 106,248 | |
| Wilmar International Ltd.(b) (c) | | | 781,700 | | | | 2,139,844 | |
| Yangzijiang Shipbuildings Holdings Ltd.(c) | | | 184,400 | | | | 208,918 | |
| | | | | | | | 4,643,327 | |
| South Africa - 0.5% |
| African Rainbow Minerals Ltd.(c) | | | 9,428 | | | | 122,393 | |
| Clicks Group Ltd.(c) | | | 2,277 | | | | 33,174 | |
| DataTec Ltd.(c) | | | 20,742 | | | | 51,186 | |
| Harmony Gold Mining Co. Ltd. - ADR(d) | | | 38,200 | | | | 86,714 | |
| Impala Platinum Holdings Ltd.(c) (d) | | | 7,308 | | | | 36,211 | |
| Kumba Iron Ore Ltd.(c) | | | 1,614 | | | | 57,212 | |
| Liberty Holdings Ltd.(c) | | | 23,290 | | | | 174,490 | |
| MMI Holdings Ltd.(c) | | | 186,682 | | | | 251,109 | |
| Mr. Price Group Ltd.(c) | | | 1,248 | | | | 17,573 | |
| MTN Group Ltd.(b) (c) | | | 48,270 | | | | 364,963 | |
| Remgro Ltd.(c) | | | 612 | | | | 8,165 | |
| WILSHIRE INTERNATIONAL EQUITY FUND |
| SCHEDULE OF INVESTMENTS (Continued) |
| COMMON STOCKS - 97.8% (Continued) | | Shares | | | Value | |
| South Africa - 0.5% (Continued) |
| Resilient REIT Ltd.(c) | | | 14,063 | | | $ | 61,983 | |
| Sibanye Gold Ltd.(c) | | | 93,642 | | | | 110,273 | |
| Standard Bank Group Ltd.(c) | | | 8,542 | | | | 119,315 | |
| Super Group Ltd.(c) (d) | | | 34,508 | | | | 80,633 | |
| Telkom SA SOC Ltd.(c) | | | 5,123 | | | | 33,500 | |
| Tsogo Sun Holdings Ltd. | | | 47,598 | | | | 51,461 | |
| Vodacom Group Ltd.(c) | | | 10,452 | | | | 88,800 | |
| Woolworths Holdings Ltd.(c) | | | 39,626 | | | | 137,291 | |
| | | | | | | | 1,886,446 | |
| Spain - 2.0% |
| Amadeus IT Group S.A.(c) | | | 45,165 | | | | 3,579,245 | |
| Atresmedia Corporacion de Medios de Comunicacion(c) | | | 6,928 | | | | 34,045 | |
| Banco Bilbao Vizcaya Argentaria S.A.(c) | | | 92,022 | | | | 513,287 | |
| Bankia S.A.(c) | | | 488,604 | | | | 1,154,121 | |
| Bankinter S.A.(c) | | | 23,178 | | | | 159,772 | |
| CIE Automotive, S.A.(c) (d) | | | 7,843 | | | | 226,996 | |
| Endesa S.A.(c) | | | 1,556 | | | | 40,023 | |
| Faes Farma, S.A.(c) | | | 27,064 | | | | 127,533 | |
| Gestamp Automocion S.A.(c) (d) | | | 16,723 | | | | 98,942 | |
| Grupo Catalana Occidente S.A.(c) | | | 2,328 | | | | 86,144 | |
| Grupo Empresarial San Jose S.A.(c) (d) | | | 5,561 | | | | 49,431 | |
| Iberdrola S.A.(c) | | | 29,930 | | | | 297,998 | |
| Indra Sistemas S.A.(c) (d) | | | 13,120 | | | | 132,743 | |
| Industria de Diseno Textil S.A.(c) | | | 11,546 | | | | 347,400 | |
| Masmovil Ibercom S.A.(c) (d) | | | 1,800 | | | | 40,153 | |
| Red Electrica Corp. S.A.(c) | | | 5,497 | | | | 114,496 | |
| Repsol S.A.(c) | | | 32,434 | | | | 508,999 | |
| Siemens Gamesa Renewable Energy S.A.(c) | | | 7,165 | | | | 119,093 | |
| Talgo S.A.(c) (d) | | | 19,867 | | | | 123,873 | |
| Tecnicas Reunidas S.A.(c) | | | 1,308 | | | | 33,579 | |
| | | | | | | | 7,787,873 | |
| Sweden - 2.4% |
| AF POYRY AB(c) | | | 10,854 | | | | 245,831 | |
| Alfa Laval AB(c) | | | 7,959 | | | | 173,937 | |
| Assa Abloy AB - Class B(c) | | | 535 | | | | 12,072 | |
| Atlas Copco AB - Class A(c) | | | 85,831 | | | | 2,750,709 | |
| WILSHIRE INTERNATIONAL EQUITY FUND |
| SCHEDULE OF INVESTMENTS (Continued) |
| COMMON STOCKS - 97.8% (Continued) | | Shares | | | Value | |
| Sweden - 2.4% (Continued) |
| Axfood AB(b) (c) | | | 18,558 | | | $ | 367,478 | |
| Betsson AB(c) | | | 6,531 | | | | 40,000 | |
| Biotage AB(c) | | | 4,552 | | | | 53,449 | |
| Elekta AB(c) (d) | | | 15,210 | | | | 221,120 | |
| Epiroc AB - Class A(c) | | | 1,588 | | | | 16,547 | |
| Evolution Gaming Group AB(c) | | | 6,186 | | | | 122,511 | |
| Fastighets AB Balder - B Shares(c) (d) | | | 4,856 | | | | 162,768 | |
| Fortnox AB | | | 4,952 | | | | 74,769 | |
| Hemfosa Fastigheter AB(c) (d) | | | 13,110 | | | | 123,992 | |
| Hennes & Mauritz AB (H&M) - Class B(b) (c) | | | 683 | | | | 12,135 | |
| Hexagon AB - B Shares(c) | | | 7,143 | | | | 397,206 | |
| Hoist Finance AB(c) | | | 7,324 | | | | 35,792 | |
| Industrivarden AB - C Shares(c) | | | 2,785 | | | | 61,801 | |
| Indutrade AB(c) | | | 4,553 | | | | 145,589 | |
| Instalco AB(c) | | | 4,939 | | | | 46,461 | |
| Intrum AB(c) | | | 4,479 | | | | 115,143 | |
| Investor AB - B Shares(c) | | | 13,073 | | | | 628,713 | |
| KNOW IT AB(c) | | | 2,184 | | | | 50,382 | |
| Lifco AB - B Shares(c) | | | 4,002 | | | | 222,145 | |
| Lindab International AB(c) | | | 14,387 | | | | 165,551 | |
| Loomis AB(c) | | | 2,830 | | | | 97,297 | |
| Lundin Petroleum AB(c) | | | 2,107 | | | | 65,652 | |
| Maha Energy AB(c) (d) | | | 12,369 | | | | 37,178 | |
| MIPS AB(c) | | | 1,739 | | | | 34,698 | |
| Nordic Enterntainment Group - Class B | | | 5,548 | | | | 130,253 | |
| Nyfosa AB(c) (d) | | | 30,316 | | | | 190,313 | |
| Orexo AB(c) (d) | | | 5,668 | | | | 43,754 | |
| Sandvik AB(c) | | | 33,457 | | | | 614,852 | |
| SSAB AB - B Shares(c) | | | 11,412 | | | | 34,818 | |
| Swedish Match AB(c) | | | 12,277 | | | | 519,088 | |
| Tele2 AB - B Shares(c) | | | 6,754 | | | | 98,651 | |
| Telefonaktiebolaget LM Ericsson - B Shares(c) | | | 57,770 | | | | 548,377 | |
| Tethys Oil AB(c) (d) | | | 11,282 | | | | 90,976 | |
| Vitrolife AB(c) | | | 4,235 | | | | 82,628 | |
| Volvo AB - B Shares(c) | | | 11,015 | | | | 175,037 | |
| WILSHIRE INTERNATIONAL EQUITY FUND |
| SCHEDULE OF INVESTMENTS (Continued) |
| COMMON STOCKS - 97.8% (Continued) | | Shares | | | Value | |
| Sweden - 2.4% (Continued) |
| Wihlborgs Fastigheter AB(c) | | | 2,870 | | | $ | 41,642 | |
| | | | | | | | 9,051,315 | |
| Switzerland - 8.3% |
| ABB Ltd.(c) | | | 34,067 | | | | 682,988 | |
| Adecco Group AG(c) | | | 1,501 | | | | 90,207 | |
| Alcon, Inc.(d) | | | 61,054 | | | | 3,770,101 | |
| Barry Callebaut AG(c) | | | 73 | | | | 146,516 | |
| Chubb Ltd. | | | 25,821 | | | | 3,803,175 | |
| Coca-Cola HBC AG(c) (d) | | | 1,531 | | | | 57,832 | |
| Credit Suisse Group AG(c) | | | 157,464 | | | | 1,884,734 | |
| Emmi AG(c) | | | 303 | | | | 283,499 | |
| EMS-Chemie Holding AG(c) | | | 619 | | | | 401,827 | |
| Forbo Holding AG - Registered Shares(c) | | | 44 | | | | 77,701 | |
| Geberit AG(c) | | | 6,197 | | | | 2,896,672 | |
| Interroll Holding AG(c) | | | 60 | | | | 150,923 | |
| Landis+Gyr Group AG(c) | | | 547 | | | | 43,634 | |
| LEM Holding S.A.(c) (d) | | | 35 | | | | 49,197 | |
| Nestlé S.A.(c) | | | 55,690 | | | | 5,765,214 | |
| Novartis AG(c) | | | 10,556 | | | | 963,686 | |
| Partners Group Holding AG(c) | | | 1,491 | | | | 1,172,564 | |
| Roche Holdings AG(c) | | | 15,310 | | | | 4,305,031 | |
| Schindler Holding AG(c) | | | 77 | | | | 17,163 | |
| SGS S.A.(c) | | | 104 | | | | 265,084 | |
| SIG Combibloc Group AG(c) | | | 9,110 | | | | 104,920 | |
| Sika AG(c) | | | 15,355 | | | | 2,623,316 | |
| Sulzer AG(c) | | | 532 | | | | 58,235 | |
| Sunrise Communications Group AG(c) | | | 1,667 | | | | 124,507 | |
| Swatch Group AG (The) - Bearer Shares(c) | | | 349 | | | | 100,046 | |
| Swatch Group AG (The) - Registered Shares(c) | | | 431 | | | | 23,357 | |
| Temenos AG(c) | | | 1,024 | | | | 183,353 | |
| UBS Group AG - Registered Shares(c) | | | 143,481 | | | | 1,705,324 | |
| Vifor Pharma AG(c) | | | 593 | | | | 85,712 | |
| | | | | | | | 31,836,518 | |
| Taiwan - 4.2% |
| Asia Vital Components Co. Ltd.(c) (d) | | | 47,000 | | | | 58,596 | |
| Bioteque Corp.(c) (d) | | | 15,000 | | | | 58,602 | |
| WILSHIRE INTERNATIONAL EQUITY FUND |
| SCHEDULE OF INVESTMENTS (Continued) |
| COMMON STOCKS - 97.8% (Continued) | | Shares | | | Value | |
| Taiwan - 4.2% (Continued) |
| Catcher Technology Co. Ltd.(c) | | | 209,000 | | | $ | 1,505,259 | |
| Cathay Financial Holding Co. Ltd.(c) | | | 37,000 | | | | 51,375 | |
| Chang Wah Electromaterials, Inc.(c) (d) | | | 6,000 | | | | 30,841 | |
| China Development Financial Holdings Corp.(c) | | | 765,000 | | | | 234,086 | |
| China Life Insurance Co. Ltd.(c) | | | 256,976 | | | | 206,184 | |
| China Metal Products(c) (d) | | | 68,000 | | | | 79,003 | |
| Chong Hong Construction Co. Ltd.(c) (d) | | | 41,000 | | | | 118,213 | |
| Chunghwa Telecom Co. Ltd.(c) | | | 6,000 | | | | 21,878 | |
| Compal Electronics, Inc.(c) | | | 882,000 | | | | 579,970 | |
| Egis Technology, Inc.(c) (d) | | | 5,000 | | | | 39,260 | |
| Eva Airways Corp.(c) | | | 140,000 | | | | 67,484 | |
| Farglory Land Development Co. Ltd.(c) (d) | | | 55,000 | | | | 73,266 | |
| First Financial Holding Co. Ltd.(c) | | | 149,540 | | | | 110,113 | |
| Formosa Petrochemical Corp.(c) | | | 97,000 | | | | 347,254 | |
| Giant Manufacturing Co. Ltd.(c) | | | 4,000 | | | | 31,444 | |
| Global Mixed Mode Technology, Inc.(c) (d) | | | 36,000 | | | | 107,582 | |
| Hon Hai Precision Industry Co. Ltd.(c) | | | 925,400 | | | | 2,314,496 | |
| International Games System Co. Ltd.(c) (d) | | | 8,000 | | | | 77,402 | |
| Jentech Precision Industrial Co. Ltd.(c) (d) | | | 9,000 | | | | 34,306 | |
| Johnson Health Tech Co. Ltd.(c) (d) | | | 35,000 | | | | 77,710 | |
| King Yuan Electronics Co. Ltd.(c) (d) | | | 275,000 | | | | 238,579 | |
| King's Town Bank Co. Ltd.(c) | | | 76,000 | | | | 82,958 | |
| Lanner Electronics, Inc.(c) (d) | | | 45,000 | | | | 105,299 | |
| Li Cheng Enterprise Co. Ltd.(c) (d) | | | 16,000 | | | | 35,171 | |
| Longwell Co.(c) (d) | | | 23,000 | | | | 37,608 | |
| Lotus Pharmaceutical Co. Ltd.(c) (d) | | | 10,041 | | | | 36,121 | |
| MediaTek, Inc.(c) | | | 32,000 | | | | 324,921 | |
| Mirle Automation Corp.(c) (d) | | | 93,000 | | | | 143,989 | |
| MOSA Industrial Corp.(c) (d) | | | 39,000 | | | | 67,324 | |
| Nantex Industry Co. Ltd.(c) (d) | | | 61,000 | | | | 70,963 | |
| Nanya Technology Corp.(c) | | | 112,000 | | | | 233,426 | |
| Nien Made Enterprise Co. Ltd.(c) | | | 7,000 | | | | 52,841 | |
| Novatek Microelectronics Corp.(c) (d) | | | 52,000 | | | | 290,884 | |
| Pan-International Industrial Corp.(c) (d) | | | 84,000 | | | | 64,269 | |
| Pegavision Corp.(c) (d) | | | 7,170 | | | | 50,982 | |
| Power Wind Health Industry, Inc.(c) (d) | | | 7,000 | | | | 59,133 | |
| WILSHIRE INTERNATIONAL EQUITY FUND |
| SCHEDULE OF INVESTMENTS (Continued) |
| COMMON STOCKS - 97.8% (Continued) | | Shares | | | Value | |
| Taiwan - 4.2% (Continued) |
| Radiant Opto-Electronics Corp.(c) | | | 13,000 | | | $ | 43,796 | |
| Realtek Semiconductor Corp.(c) | | | 43,000 | | | | 317,489 | |
| Rexon Industrial Corp. Ltd.(c) | | | 18,000 | | | | 49,235 | |
| Ruentex Development Co. Ltd.(c) | | | 44,000 | | | | 63,121 | |
| Ruentex Industries Ltd.(c) | | | 40,000 | | | | 97,677 | |
| SCI Pharmtech, Inc.(c) (d) | | | 99,000 | | | | 311,814 | |
| Shinkong Synthetic Fibers Corp.(c) (d) | | | 159,000 | | | | 71,478 | |
| Sino-American Silicon Products, Inc.(c) (d) | | | 26,000 | | | | 68,652 | |
| Standard Foods Corp.(c) | | | 73,000 | | | | 143,065 | |
| Taiwan Business Bank(c) | | | 227,880 | | | | 100,535 | |
| Taiwan Cement Corp.(c) | | | 12,100 | | | | 17,981 | |
| Taiwan Semiconductor Manufacturing Co. Ltd.(c) | | | 330,000 | | | | 2,530,198 | |
| Taiwan Semiconductor Manufacturing Co. Ltd. - ADR | | | 85,909 | | | | 3,365,055 | |
| TCI Co. Ltd.(c) (d) | | | 8,000 | | | | 110,209 | |
| TSC Auto ID Technology Co. Ltd.(c) (d) | | | 8,000 | | | | 72,354 | |
| Unimicron Technology Corp.(c) (d) | | | 35,000 | | | | 39,941 | |
| Uni-President Enterprises Corp.(c) | | | 67,000 | | | | 178,907 | |
| United Integrated Services Co. Ltd.(c) (d) | | | 36,000 | | | | 176,915 | |
| United Microelectronics Corp.(c) | | | 51,000 | | | | 23,035 | |
| Vanguard International Semiconductor Corp.(c) | | | 112,000 | | | | 236,423 | |
| | | | | | | | 16,136,672 | |
| Thailand - 0.2% |
| Airports of Thailand pcl - NVDR(c) | | | 120,800 | | | | 289,489 | |
| GFPT pcl - NVDR(c) | | | 163,600 | | | | 90,166 | |
| Kasikornbank pcl - NVDR(c) | | | 28,800 | | | | 176,544 | |
| Major Cineplex Group pcl - NVDR | | | 154,000 | | | | 59,221 | |
| Supalai pcl - NVDR(c) | | | 257,800 | | | | 197,467 | |
| Vinythai pcl - NVDR(c) | | | 44,900 | | | | 35,146 | |
| | | | | | | | 848,033 | |
| Turkey - 0.4% |
| Akbank T.A.S.(c) | | | 813,814 | | | | 963,212 | |
| Koza Altin Isletmeleri A.S.(c) (d) | | | 5,405 | | | | 49,283 | |
| Koza Anadolu Metal Madencilik Isletmeleri A.S.(c) (d) | | | 26,802 | | | | 32,734 | |
| Mavi Giyim Sanayi Ve Ticaret AS - B Shares(c) (d) | | | 9,404 | | | | 65,229 | |
| Soda Sanayii AS(c) | | | 162,914 | | | | 178,965 | |
| WILSHIRE INTERNATIONAL EQUITY FUND |
| SCHEDULE OF INVESTMENTS (Continued) |
| COMMON STOCKS - 97.8% (Continued) | | Shares | | | Value | |
| Turkey - 0.4% (Continued) |
| Tekfen Holding AS(c) | | | 28,259 | | | $ | 126,520 | |
| | | | | | | | 1,415,943 | |
| United Arab Emirates - 0.0% (a) |
| DP World Ltd.(c) | | | 5,197 | | | | 82,620 | |
| | | | | | | | | |
| United Kingdom - 11.3% |
| Admiral Group plc(c) | | | 7,163 | | | | 200,854 | |
| Aggreko plc(c) | | | 22,500 | | | | 225,883 | |
| Anglo Pacific Group plc(c) (d) | | | 13,100 | | | | 34,335 | |
| AstraZeneca plc(c) | | | 1,886 | | | | 154,180 | |
| Avast plc(c) | | | 30,737 | | | | 117,271 | |
| Aviva plc(c) | | | 298,253 | | | | 1,579,680 | |
| Barclays plc(c) | | | 798,777 | | | | 1,519,281 | |
| Barratt Developments plc(c) | | | 14,985 | | | | 109,043 | |
| BHP Billiton plc(c) | | | 20,333 | | | | 519,992 | |
| Bovis Homes Group plc(c) | | | 9,083 | | | | 119,410 | |
| BP plc(c) | | | 49,587 | | | | 345,453 | |
| British American Tobacco plc(c) | | | 36,571 | | | | 1,276,883 | |
| Britvic plc(c) | | | 36,898 | | | | 416,294 | |
| Bunzl plc(c) | | | 4,292 | | | | 113,246 | |
| Burberry Group plc(c) | | | 1,761 | | | | 41,739 | |
| Card Factory plc(c) | | | 17,905 | | | | 40,079 | |
| Charter Court Financial Services Group plc(c) | | | 21,095 | | | | 79,225 | |
| Cineworld Group plc(c) | | | 33,090 | | | | 106,456 | |
| Clinigen Group plc(c) | | | 6,200 | | | | 79,431 | |
| Coats Group plc(c) | | | 82,910 | | | | 86,322 | |
| Coca-Cola European Partners plc | | | 9,100 | | | | 514,150 | |
| Compass Group plc(c) | | | 174,253 | | | | 4,177,062 | |
| Countryside Properties plc(c) | | | 19,155 | | | | 72,651 | |
| Cranswick plc(c) (d) | | | 5,536 | | | | 181,677 | |
| Crest Nicholson Holdings plc(c) (d) | | | 30,697 | | | | 139,461 | |
| Croda International plc(c) | | | 5,527 | | | | 359,504 | |
| Dart Group plc(c) | | | 8,701 | | | | 92,264 | |
| Diageo plc(c) | | | 23,690 | | | | 1,019,601 | |
| Dialog Semiconductor plc(c) (d) | | | 1,864 | | | | 75,009 | |
| Diversified Gas & Oil plc(c) | | | 49,767 | | | | 70,167 | |
| WILSHIRE INTERNATIONAL EQUITY FUND |
| SCHEDULE OF INVESTMENTS (Continued) |
| COMMON STOCKS - 97.8% (Continued) | | Shares | | | Value | |
| United Kingdom - 11.3% (Continued) |
| Dunelm Group plc(c) | | | 26,791 | | | $ | 313,185 | |
| easyJet plc(c) | | | 5,962 | | | | 72,183 | |
| Endava plc(d) | | | 1,000 | | | | 40,240 | |
| Ferrexpo plc(c) | | | 12,145 | | | | 42,924 | |
| FirstGroup plc(c) (d) | | | 68,721 | | | | 85,350 | |
| Forterra plc(c) | | | 18,022 | | | | 67,770 | |
| Games Workshop Group plc(c) | | | 3,465 | | | | 218,333 | |
| GlaxoSmithKline plc(c) | | | 27,291 | | | | 547,032 | |
| Go-Ahead Group plc (The)(c) | | | 6,762 | | | | 169,661 | |
| Grainger plc(c) | | | 21,064 | | | | 65,669 | |
| Greggs plc(c) | | | 13,029 | | | | 379,742 | |
| Hikma Pharmaceuticals plc(c) | | | 2,757 | | | | 60,335 | |
| HSBC Holdings plc(c) | | | 298,530 | | | | 2,491,556 | |
| Informa plc(c) | | | 2,401 | | | | 25,462 | |
| InterContinental Hotels Group plc(c) | | | 4,119 | | | | 270,900 | |
| Intermediate Capital Group plc(c) | | | 21,829 | | | | 382,886 | |
| Investec plc(c) (d) | | | 19,363 | | | | 125,869 | |
| J Sainsbury plc(c) | | | 386,343 | | | | 960,040 | |
| John Laing Group plc(c) | | | 40,155 | | | | 200,701 | |
| John Wood Group plc(c) | | | 515,317 | | | | 2,967,116 | |
| KAZ Minerals plc(c) | | | 13,806 | | | | 106,048 | |
| Legal & General Group plc(c) | | | 16,163 | | | | 55,373 | |
| Lloyds Banking Group plc(c) | | | 134,124 | | | | 96,311 | |
| Marshalls plc(c) | | | 9,492 | | | | 82,160 | |
| Marston's plc(c) | | | 126,878 | | | | 188,171 | |
| Mediclinic International plc(c) | | | 14,204 | | | | 54,992 | |
| Mitchells & Butlers plc(c) | | | 27,361 | | | | 99,578 | |
| Mondi plc(c) | | | 86 | | | | 1,957 | |
| Morgan Advanced Materials plc(c) | | | 14,220 | | | | 50,225 | |
| National Express Group plc(c) | | | 20,232 | | | | 103,161 | |
| NewRiver REIT plc(c) | | | 37,541 | | | | 85,174 | |
| Next plc(c) | | | 2,251 | | | | 157,627 | |
| OneSavings Bank plc(c) | | | 17,800 | | | | 82,017 | |
| P2P Global Investments plc(c) | | | 4,771 | | | | 51,134 | |
| Persimmon plc(c) | | | 1,569 | | | | 39,860 | |
| Playtech plc(c) | | | 8,291 | | | | 44,962 | |
| WILSHIRE INTERNATIONAL EQUITY FUND |
| SCHEDULE OF INVESTMENTS (Continued) |
| COMMON STOCKS - 97.8% (Continued) | | Shares | | | Value | |
| United Kingdom - 11.3% (Continued) |
| Polypipe Group plc(c) | | | 17,735 | | | $ | 99,608 | |
| Prudential plc(c) | | | 9,618 | | | | 209,966 | |
| PZ Cussons plc(c) | | | 22,810 | | | | 62,005 | |
| Reckitt Benckiser Group plc(c) | | | 8,603 | | | | 679,232 | |
| Redrow plc(c) | | | 16,330 | | | | 113,083 | |
| RELX plc(c) | | | 4,605 | | | | 111,689 | |
| Royal Bank of Scotland Group plc(c) | | | 731,003 | | | | 2,038,804 | |
| Royal Dutch Shell plc - A Shares(c) | | | 52,369 | | | | 1,705,362 | |
| Senior plc(c) | | | 12,091 | | | | 33,134 | |
| Softcat plc(c) | | | 6,400 | | | | 79,032 | |
| Sophos Group plc(c) (d) | | | 17,636 | | | | 88,531 | |
| SSP Group plc(c) | | | 5,321 | | | | 46,374 | |
| Standard Chartered plc(c) | | | 212,783 | | | | 1,930,296 | |
| Synthomer plc(c) | | | 13,152 | | | | 62,384 | |
| Tate & Lyle plc(c) | | | 26,082 | | | | 244,500 | |
| TechnipFMC plc | | | 98,456 | | | | 2,553,949 | |
| Telford Homes plc(c) | | | 8,890 | | | | 35,292 | |
| Tesco plc(c) | | | 933,867 | | | | 2,691,975 | |
| Travis Perkins plc(c) | | | 191,510 | | | | 3,097,342 | |
| Unilever plc(c) | | | 911 | | | | 56,549 | |
| Vodafone Group plc(c) | | | 1,375,105 | | | | 2,253,835 | |
| WH Smith plc(c) | | | 16,936 | | | | 424,215 | |
| William Hill plc(c) | | | 57,899 | | | | 113,686 | |
| | | | | | | | 43,383,150 | |
| United States - 2.3% |
| Coronado Global Resources, Inc.(c) | | | 37,947 | | | | 96,995 | |
| Mettler-Toledo International, Inc.(d) | | | 5,454 | | | | 4,581,360 | |
| ResMed, Inc. | | | 28,898 | | | | 3,526,423 | |
| Southern Copper Corp.(b) | | | 4,958 | | | | 192,618 | |
| WNS Holdings Ltd. - ADR(d) | | | 1,800 | | | | 106,560 | |
| Yum China Holdings, Inc. | | | 2,800 | | | | 129,360 | |
| | | | | | | | 8,633,316 | |
| | | | | | | | | |
| Total Common Stocks(Cost $338,445,899) | | | | | | $ | 374,696,944 | |
| WILSHIRE INTERNATIONAL EQUITY FUND |
| SCHEDULE OF INVESTMENTS (Continued) |
| PREFERRED STOCKS - 0.3% | | Shares | | | Value | |
| Brazil - 0.2% |
| Banco Bradesco S.A. | | | 11,124 | | | $ | 109,600 | |
| Braskem S.A. - Series A(d) | | | 1,600 | | | | 14,656 | |
| Cia Paranaense de Energia | | | 4,500 | | | | 57,264 | |
| Telefonica Brasil S.A. | | | 22,300 | | | | 290,917 | |
| | | | | | | | 472,437 | |
| Colombia - 0.0% (a) |
| Grupo Aval Acciones y Valores S.A. | | | 256,839 | | | | 102,729 | |
| | | | | | | | | |
| Germany - 0.1% |
| FUCHS PETROLUB SE(c) | | | 844 | | | | 33,137 | |
| Porsche Automobil Holding SE(c) | | | 3,180 | | | | 206,021 | |
| Schaeffler AG(c) | | | 19,770 | | | | 146,860 | |
| Volkswagon AG(c) | | | 315 | | | | 53,060 | |
| | | | | | | | 439,078 | |
| Korea (Republic of) - 0.0% (a) |
| CJ Corp.(d) (e) (f) | | | 15 | | | | 485 | |
| | | | | | | | | |
| Total Preferred Stocks(Cost $928,108) | | | | | | $ | 1,014,729 | |
| RIGHTS - 0.0%(a) | | Shares | | | Value | |
| Chile - 0.0% |
| Enel Americas S.A.(d) (e) (f) | | | 316,791 | | | $ | 0 | |
| | | | | | | | | |
| Spain - 0.0% (a) |
| Repsol S.A.(d) (e) (f) | | | 36,486 | | | | 20,238 | |
| | | | | | | | | |
| Taiwan - 0.0% (a) |
| China Life Insurance Co. Ltd.(d) (e) (f) | | | 26,008 | | | | 3,568 | |
| | | | | | | | | |
| Total Rights(Cost $24,623) | | | | | | $ | 23,806 | |
| WILSHIRE INTERNATIONAL EQUITY FUND |
| SCHEDULE OF INVESTMENTS (Continued) |
| MONEY MARKET FUNDS - 1.3% | | Shares | | | Value | |
| Northern Trust Institutional Government Select Portfolio - Institutional Class, 2.24%(g) | | | 4,216,898 | | | $ | 4,216,898 | |
| Northern Trust Institutional Liquid Asset Portfolio - Institutional Class, 2.36%(g) (h) | | | 913,808 | | | | 913,808 | |
| Total Money Market Funds(Cost $5,130,706) | | | | | | $ | 5,130,706 | |
| | | | | | | | | |
| Total Investments at Value - 99.4%(Cost $344,529,336) | | | | | | $ | 380,866,185 | |
| | | | | | | | | |
| Other Assets in Excess of Liabilities - 0.6% | | | | | | | 2,171,568 | |
| | | | | | | | | |
| Net Assets - 100.0% | | | | | | $ | 383,037,753 | |
|
| (a) | Percentage rounds to less than 0.1%. |
| (b) | This security or a partial position of this security is on loan at June 30, 2019. The total market value of securities on loan at June 30, 2019 was $9,009,901. |
| (c) | Level 2 security (Note 2). |
| (d) | Non-income producing security. |
| (e) | Level 3 security. Security has been valued at fair value in accordance with procedures adopted by and under the general supervision of the Board of Directors. The total value of such securities is $24,291 as of June 30, 2019, representing 0.0%(a) of net assets. |
| (f) | Illiquid security. The total value of such securities is $24,291 as of June 30, 2019, representing 0.0%(a) of net assets. |
| (g) | The rate shown is the 7-day effective yield as of June 30, 2019. |
| (h) | This security was purchased with cash collateral held from securities on loan. The total value of such securities as of June 30, 2018 was $913,808. Securities on loan are also collateralized by various U.S. Treasury obligations in the amount of $8,406,826. |
| ADR - | American Depositary Receipt. |
| NVDR - | Non-voting Depositary Receipt. |
| GDR- | Global Depositary Receipt. |
| WILSHIRE INCOME OPPORTUNITIES FUND | |
| SCHEDULE OF INVESTMENTS | |
| June 30, 2019 (Unaudited) | |
| U.S. TREASURY OBLIGATIONS - 11.2% | | Par Value | | | Value | |
| U.S. Treasury Bills - 1.0% | | | | | | | | |
| 2.406%, due 09/05/19(a) | | $ | 1,880,000 | | | $ | 1,872,762 | |
| 2.385%, due 11/07/19(a) | | | 1,300,000 | | | | 1,290,404 | |
| | | | | | | | 3,163,166 | |
| U.S. Treasury Bonds - 2.6% | | | | | | | | |
| 4.375%, due 02/15/38 | | | 880,000 | | | | 1,162,425 | |
| 3.500%, due 02/15/39 | | | 40,000 | | | | 47,514 | |
| 2.750%, due 11/15/42(b) | | | 1,195,000 | | | | 1,251,389 | |
| 3.125%, due 02/15/43 | | | 1,850,000 | | | | 2,061,305 | |
| 3.625%, due 08/15/43(b) | | | 470,000 | | | | 566,791 | |
| 3.750%, due 11/15/43(b) | | | 430,000 | | | | 528,967 | |
| 2.750%, due 11/15/47(b) | | | 150,000 | | | | 156,328 | |
| 3.000%, due 02/15/49(b) | | | 2,280,300 | | | | 2,500,848 | |
| | | | | | | | 8,275,567 | |
| U.S. Treasury Notes - 7.2% | | | | | | | | |
| 2.125%, due 05/31/21(b) | | | 77,000 | | | | 77,505 | |
| 2.500%, due 02/15/22 | | | 530,000 | | | | 540,269 | |
| 1.750%, due 06/15/22 | | | 1,338,000 | | | | 1,339,464 | |
| 2.625%, due 02/28/23 | | | 730,000 | | | | 752,813 | |
| 2.500%, due 03/31/23 | | | 870,000 | | | | 893,925 | |
| 2.750%, due 04/30/23 | | | 850,000 | | | | 881,477 | |
| 1.625%, due 05/31/23 | | | 700,000 | | | | 696,938 | |
| 2.500%, due 01/31/24(b) | | | 460,000 | | | | 474,950 | |
| 2.375%, due 02/29/24 | | | 920,000 | | | | 945,587 | |
| 2.000%, due 05/31/24(b) | | | 737,000 | | | | 745,406 | |
| 1.750%, due 06/30/24 | | | 3,836,000 | | | | 3,833,003 | |
| 1.875%, due 08/31/24 | | | 900,000 | | | | 903,937 | |
| 2.125%, due 09/30/24(b) | | | 900,000 | | | | 914,766 | |
| 2.250%, due 10/31/24 | | | 890,000 | | | | 910,303 | |
| 3.000%, due 09/30/25 | | | 1,000,000 | | | | 1,067,656 | |
| 2.375%, due 04/30/26(b) | | | 460,000 | | | | 474,734 | |
| 2.125%, due 05/31/26 | | | 480,000 | | | | 487,650 | |
| 2.000%, due 11/15/26 | | | 570,000 | | | | 574,008 | |
| 2.375%, due 05/15/27 | | | 860,000 | | | | 888,622 | |
| 2.250%, due 08/15/27 | | | 960,000 | | | | 982,500 | |
| 2.250%, due 11/15/27 | | | 870,000 | | | | 890,119 | |
| WILSHIRE INCOME OPPORTUNITIES FUND | |
| SCHEDULE OF INVESTMENTS (Continued) | |
| U.S. TREASURY OBLIGATIONS - 11.2% (Continued) | | Par Value | | | Value | |
| U.S. Treasury Notes - 7.2% (Continued) | | | | | | | | |
| 2.750%, due 02/15/28 | | $ | 840,000 | | | $ | 892,631 | |
| 2.625%, due 02/15/29 | | | 455,000 | | | | 479,598 | |
| 2.375%, due 05/15/29(b) | | | 2,000,000 | | | | 2,065,625 | |
| | | | | | | | 22,713,486 | |
| U.S. Treasury Inflation-Protected Notes - 0.4% | | | | | | | | |
| 0.875%, due 01/15/29 | | | 435,186 | | | | 458,237 | |
| 1.000%, due 02/15/46 | | | 852,023 | | | | 892,760 | |
| | | | | | | | 1,350,997 | |
| | | | | | | | | |
| Total U.S. Treasury Obligations(Cost $34,171,752) | | | | | | $ | 35,503,216 | |
| AGENCY MORTGAGE-BACKED OBLIGATIONS - 8.3% | | Par Value | | | Value | |
| Federal Home Loan Mortgage Corp. - 2.3% | | | | | | | | |
| Series 2014-DN3, Class M3, 6.404% (1MO LIBOR + 400), due 08/25/24(c) | | $ | 184,376 | | | $ | 196,565 | |
| Series 2017-DNA2, Class M1, 3.604% (1MO LIBOR + 120), due 10/25/29(c) | | | 185,719 | | | | 186,511 | |
| Series 2017-DNA3, Class M1, 3.154% (1MO LIBOR + 75), due 03/25/30(c) | | | 613,031 | | | | 613,700 | |
| Series 2989, Class SG, 17.190% (1MO LIBOR + 3395), due 08/15/34(c) | | | 105,699 | | | | 244,700 | |
| Series 4249, Class CS, 4.300%, due 09/15/43 | | | 1,263,587 | | | | 1,209,533 | |
| Series 4355, Class ZX, 4.000%, due 05/15/44 | | | 4,273,488 | | | | 4,701,251 | |
| | | | | | | | 7,152,260 | |
| Federal Home Loan Mortgage Corp. Interest-Only Strips - 0.3% | | | | | | | | |
| Series K-722, Class X1, 1.307%, due 03/01/23(c) | | | 2,157,243 | | | | 84,246 | |
| Series 2980, Class SC, 4.306% (1MO LIBOR + 670), due 05/15/35(c) | | | 690,264 | | | | 86,968 | |
| Series 3359, Class SC, 3.280% (1MO LIBOR + 572), due 08/15/37(c) | | | 1,274,087 | | | | 175,712 | |
| Series 4077, Class TS, 3.606% (1MO LIBOR + 600), due 05/15/41(c) | | | 1,212,298 | | | | 193,981 | |
| Series 3966, Class SA, 3.506% (1MO LIBOR + 590), due 12/15/41(c) | | | 1,702,985 | | | | 267,086 | |
| WILSHIRE INCOME OPPORTUNITIES FUND | |
| SCHEDULE OF INVESTMENTS (Continued) | |
| AGENCY MORTGAGE-BACKED OBLIGATIONS - 8.3% (Continued) | | Par Value | | | Value | |
| Federal Home Loan Mortgage Corp. Interest-Only Strips - 0.3% (Continued) | | | | | | | | |
| Series 4089, Class SH, 3.606% (1MO LIBOR + 600), due 08/15/42(c) | | $ | 1,281,833 | | | $ | 206,090 | |
| | | | | | | | 1,014,083 | |
| Federal National Mortgage Association - 2.9% | | | | | | | | |
| Series 2015-C02, Class 1M2, 6.404% (1MO LIBOR + 400), due 05/25/25(c) | | | 553,948 | | | | 588,965 | |
| Series 2015-C04, Class 2M2, 7.980% (1MO LIBOR + 555), due 04/25/28(c) | | | 201,612 | | | | 218,952 | |
| Series 2016-C04, Class 1M2, 6.680% (1MO LIBOR + 425), due 01/25/29(b)(c) | | | 200,000 | | | | 214,538 | |
| Series 2016-C06, Class 1M1, 3.704% (1MO LIBOR + 130), due 04/25/29(c) | | | 229,153 | | | | 229,943 | |
| Series 2017-C03, Class 1M1, 3.354% (1MO LIBOR + 95), due 10/25/29(c) | | | 337,696 | | | | 338,704 | |
| Series 2017-C05, Class 1M1, 2.954% (1MO LIBOR + 55), due 01/25/30(c) | | | 21,779 | | | | 21,809 | |
| Series 2017-C07, Class 2M2, 4.904% (1MO LIBOR + 250), due 05/25/30(c) | | | 500,000 | | | | 508,452 | |
| Series 2018-C01, Class 1M2, 4.654% (1MO LIBOR + 225), due 07/25/30(c) | | | 200,000 | | | | 201,556 | |
| Series 2018-C03, Class 1M1, 3.084% (1MO LIBOR + 68), due 10/25/30(c) | | | 360,495 | | | | 360,716 | |
| Series 2018-C04, Class 2M2, 4.980% (1MO LIBOR + 255), due 12/25/30(c) | | | 500,000 | | | | 508,466 | |
| Series 2018-C06, Class 1M2, 4.404%, due 03/25/31(c) | | | 500,000 | | | | 500,085 | |
| Series TBA, 3.000%, due 02/05/34 | | | 325,000 | | | | 331,287 | |
| Series 2019-R04, Class 2M2, 144A, 0.000% (1MO LIBOR + 210), due 06/25/39(c) | | | 190,000 | | | | 190,499 | |
| Series 2016-75, Class ZP, 3.000%, due 10/25/46 | | | 1,382,552 | | | | 1,318,782 | |
| Series TBA, 3.500%, due 02/25/48 | | | 1,700,000 | | | | 1,738,051 | |
| Series TBA, 4.000%, due 05/25/48 | | | 1,350,000 | | | | 1,395,272 | |
| Series TBA, 4.500%, due 07/25/48 | | | 560,000 | | | | 585,173 | |
| | | | | | | | 9,251,250 | |
| WILSHIRE INCOME OPPORTUNITIES FUND | |
| SCHEDULE OF INVESTMENTS (Continued) | |
| AGENCY MORTGAGE-BACKED OBLIGATIONS - 8.3% (Continued) | | Par Value | | | Value | |
| Federal National Mortgage Association Interest-Only Strips - 1.6% | | | | | | | | |
| Series 2014-63, Class BI, 3.500%, due 06/25/33 | | $ | 5,631,349 | | | $ | 411,623 | |
| Series 3311, Class IA, 4.016% (1MO LIBOR + 641), due 05/15/37(c) | | | 2,473,274 | | | | 459,833 | |
| Series 2007-50, Class SX, 4.046% (1MO LIBOR + 645), due 06/25/37(c) | | | 4,289,403 | | | | 794,704 | |
| Series 2009-78, Class XS, 4.336% (1MO LIBOR + 674), due 10/25/39(c) | | | 6,229,155 | | | | 1,341,248 | |
| Series 2011-124, Class NS, 4.096% (1MO LIBOR + 650), due 12/25/41(c) | | | 1,387,930 | | | | 265,806 | |
| Series 2012-20, Class SA, 4.046% (1MO LIBOR + 645), due 03/25/42(c) | | | 1,395,586 | | | | 244,524 | |
| Series 2012-76, Class SC, 3.596% (1MO LIBOR + 600), due 07/25/42(c) | | | 643,255 | | | | 108,039 | |
| Series 2014-28, Class SD, 3.646% (1MO LIBOR + 650), due 05/25/44(c) | | | 4,499,868 | | | | 845,936 | |
| Series 2017-53, Class IE, 4.000%, due 07/25/47 | | | 1,354,757 | | | | 171,761 | |
| Series 2008-22, Class SB, 3.756% (1MO LIBOR + 616), due 04/25/48(c) | | | 2,521,932 | | | | 480,487 | |
| | | | | | | | 5,123,961 | |
| Government National Mortgage Association - 0.6% | | | | | | | | |
| Series TBA, 3.000%, due 04/20/47 | | | 1,650,000 | | | | 1,683,709 | |
| | | | | | | | | |
| Government National Mortgage Association Interest-Only Strips - 0.6% | | | | | | | | |
| Series 2010-133, Class SD, 3.632% (1MO LIBOR + 607), due 10/16/40(c) | | | 5,366,160 | | | | 736,217 | |
| Series 2014-102, Class SY, 3.267%, due 02/20/44(c) | | | 5,485,795 | | | | 711,668 | |
| Series 2018-83, Class HI, 5.000%, due 01/20/48 | | | 2,850,486 | | | | 435,939 | |
| | | | | | | | 1,883,824 | |
| | | | | | | | | |
| Total Agency Mortgage-Backed Obligations(Cost $24,892,962) | | | | | | $ | 26,109,087 | |
| WILSHIRE INCOME OPPORTUNITIES FUND | |
| SCHEDULE OF INVESTMENTS (Continued) | |
| NON-AGENCY MORTGAGE-BACKED OBLIGATIONS - 18.6% | | Par Value | | | Value | |
| Ajax Mortgage Loan Trust, Series 2018-A, Class A, 144A, 3.850%, due 04/25/58 | | $ | 726,297 | | | $ | 739,890 | |
| Ajax Mortgage Loan Trust, Series 2018-C, Class A, 4.360%, due 09/25/65(c) | | | 749,601 | | | | 758,336 | |
| American Express Credit Account, Series 2019-1, Class A, 2.870%, due 10/15/24(c) | | | 145,000 | | | | 148,242 | |
| Americold, LLC Trust, Series 2010-ART, Class C, 144A, 6.811%, due 01/14/29 | | | 50,000 | | | | 53,340 | |
| Applebees/IHOP Funding, LLC, Series 2019-1A, Class A2I, 144A, 4.194%, due 06/07/49(c) | | | 150,000 | | | | 151,579 | |
| Applebees/IHOP Funding, LLC, Series 2019-1A, Class A2II, 144A, 4.723%, due 06/07/49(c) | | | 100,000 | | | | 101,355 | |
| Arroyo Mortgage Trust, Series 2019-1, Class A1, 144A, 3.805%, due 01/25/49(c) | | | 225,142 | | | | 229,335 | |
| Arroyo Mortgage Trust, Series 2019-2, Class A1, 144A, 3.347%, due 04/25/49(c) | | | 327,771 | | | | 331,351 | |
| Atrium Hotel Portfolio Trust, Series 2017-ATRM, Class E, 144A, 5.490%, due 11/15/19(c) | | | 94,000 | | | | 94,708 | |
| Atrium Hotel Portfolio Trust, Series 2018-ATRM, Class E, 144A, 5.840% (1MO LIBOR + 340), due 06/15/35(c) | | | 140,000 | | | | 140,697 | |
| Bank of America Credit Card Trust, Series 2017-A1, Class A1, 1.950%, due 08/15/22 | | | 300,000 | | | | 299,348 | |
| Barclays Commercial Mortgage Securities Trust, Series 2018-CBM, Class D, 144A, 4.831% (1MO LIBOR + 2.391), due 07/15/37(c) | | | 400,000 | | | | 401,022 | |
| Barclays Commercial Mortgage Securities, LLC, Series 2014-BX0, Class E, 144A, 6.190% (1MO LIBOR + 375), due 08/15/27(c) | | | 236,000 | | | | 236,063 | |
| BCAPB, LLC Trust, Series 2007-AB1, Class A-5, 4.916%, due 03/25/37(c) | | | 4,008,599 | | | | 2,581,634 | |
| Bear Stearns Adjustable Rate Mortgage Trust, Series 2004-10, Class I-M-1, 4.485%, due 01/25/35(c) | | | 436,487 | | | | 441,867 | |
| Bear Stearns Commercial Mortgage Trust, Series 2007-T26, Class AJ, 5.464%, due 01/12/45(c) | | | 150,000 | | | | 134,017 | |
| Benchmark Mortgage Trust, Series 2018-B4, Class D, 144A, 2.813%, due 07/15/51(c) | | | 500,000 | | | | 443,124 | |
| WILSHIRE INCOME OPPORTUNITIES FUND | |
| SCHEDULE OF INVESTMENTS (Continued) | |
| NON-AGENCY MORTGAGE-BACKED OBLIGATIONS - 18.6% (Continued) | | Par Value | | | Value | |
| BHMS Mortgage Trust, Series 2018-ATLS, Class C, 144A, 4.340% (1MO LIBOR + 190), due 07/15/35(c) | | $ | 251,000 | | | $ | 251,073 | |
| BHMS Mortgage Trust, Series 2018-ATLS, Class D, 144A, 4.690% (1MO LIBOR + 225), due 07/15/35(c) | | | 100,000 | | | | 99,972 | |
| BX Trust, Series 2019-IMC, Class D, 144A, 4.400% (1MO LIBOR + 190), due 04/15/34(c) | | | 184,000 | | | | 184,575 | |
| BX Trust, Series 2018-MCSF, Class E, 144A, 4.589% (1MO LIBOR + 215), due 04/15/35(c) | | | 126,000 | | | | 126,473 | |
| BX Trust, Series 2018-MCSF, Class F, 144A, 5.086%, due 04/15/35(c) (d) | | | 140,000 | | | | 140,701 | |
| BX Trust, Series 2018-GW, Class G, 144A, 5.360% (1MO LIBOR + 292), due 05/15/35(c) (d) | | | 83,000 | | | | 83,570 | |
| BX Trust, Series 2018-BIOA, Class E, 144A, 4.391% (1MO LIBOR + 195.1), due 03/15/37(c) | | | 343,000 | | | | 343,642 | |
| Capital One Multi-Asset Execution Trust, Series 2017-A4, Class A4, 1.990%, due 07/17/23 | | | 185,000 | | | | 184,642 | |
| Castlelake Aircraft Securitization, Series 2019-1A, Class C, 144A, 6.899%, due 04/15/39(c) | | | 976,071 | | | | 972,883 | |
| CFCRE Commercial Mortgage Trust, Series 2011-C1, Class E, 144A, 6.272%, due 04/15/44(c) | | | 156,795 | | | | 141,217 | |
| CFCRE Commercial Mortgage Trust, Series 2016-C4, Class C, 4.878%, due 05/10/58 | | | 120,000 | | | | 128,843 | |
| CGGS Commercial Mortgage Trust, Series 2018-WSS, Class D, 144A, 4.740% (1MO LIBOR + 230), due 02/15/20(c) | | | 142,000 | | | | 142,269 | |
| Chase Mortgage Finance Corp., Series 2019-ATR1, Class A3, 144A, 4.000%, due 04/25/49(c) | | | 93,694 | | | | 95,570 | |
| CIM Trust, Series 2018-INV1, Class A10, 144A, 4.000%, due 08/25/48 | | | 500,000 | | | | 533,187 | |
| CIM Trust, Series 2019-INV2, Class A3, 144A, 4.000%, due 05/25/49(c) | | | 195,651 | | | | 202,181 | |
| CIM Trust, Series 2016-1, Class B2, 144A, 7.453%, due 07/26/55(c) | | | 1,000,000 | | | | 1,010,803 | |
| CIM Trust, Series 2016-2, Class B2, 144A, 8.273%, due 02/01/56(c) | | | 1,000,000 | | | | 1,009,094 | |
| CIM Trust, Series 2016-3, Class B2, 144A, 7.312%, due 02/27/56(c) | | | 1,000,000 | | | | 1,005,849 | |
| WILSHIRE INCOME OPPORTUNITIES FUND | |
| SCHEDULE OF INVESTMENTS (Continued) | |
| NON-AGENCY MORTGAGE-BACKED OBLIGATIONS - 18.6% (Continued) | | Par Value | | | Value | |
| Citigroup Commercial Mortgage Trust, Series 2013-GC17, Class D, 144A, 5.262%, due 11/10/46(c) | | $ | 100,000 | | | $ | 102,042 | |
| Citigroup Commercial Mortgage Trust, Series 2016-P4, Class D, 144A, 4.132%, due 07/10/49(c) | | | 500,000 | | | | 471,414 | |
| Citigroup Commercial Mortgage Trust, Series 2018-C6, Class D, 144A, 5.066%, due 11/10/51 | | | 380,000 | | | | 397,638 | |
| CLNS Trust, Series 2017-IKPR, Class D, 144A, 4.503% (1MO LIBOR + 205), due 06/11/32(c) | | | 84,000 | | | | 84,158 | |
| CLNS Trust, Series 2017-IKPR, Class E, 144A, 5.953% (1MO LIBOR + 350), due 06/11/32(c) | | | 84,000 | | | | 84,420 | |
| CLNS Trust, Series 2017-IKPR, Class F, 144A, 6.953% (1MO LIBOR + 450), due 06/11/32(c) (d) | | | 84,000 | | | | 84,630 | |
| Commercial Mortgage Trust, Series 2016-GCT, Class F, 144A, 3.461%, due 08/10/29(c) (d) | | | 150,000 | | | | 146,972 | |
| Countrywide Alternative Loan Trust, Series 2006-HY11, Class A1, 2.524% (1MO LIBOR + 12), due 06/25/36(c) | | | 489,942 | | | | 436,979 | |
| Countrywide Alternative Loan Trust, Series 2007-16CB, Class 5-A-4, 6.250%, due 08/25/37(c) | | | 686,446 | | | | 548,634 | |
| Countrywide Alternative Loan Trust, Series 2007-OA4, Class A1, 2.574% (1MO LIBOR + 17), due 05/25/47(c) | | | 483,303 | | | | 442,118 | |
| Countrywide Asset Backed Securities, Inc., Series 2006-6, Class 1-A-1, 2.574% (1MO LIBOR + 175), due 09/25/36(c) | | | 1,397,517 | | | | 1,366,702 | |
| Countrywide Home Loan Mortgage Trust, Series 2007-HY5, Class 3-A-1, 3.795%, due 09/25/37(c) | | | 1,656,991 | | | | 1,605,317 | |
| Credit Suisse Commercial Mortgage Trust, Series 2017-CHOP, Class E, 144A, 5.740% (1MO LIBOR + 330), due 07/15/32(c) | | | 169,000 | | | | 169,688 | |
| Credit Suisse Commercial Mortgage Trust, Series 2017-LSTK, Class E, 144A, 3.331%, due 04/05/33(c) (d) | | | 170,000 | | | | 168,565 | |
| Credit Suisse Commercial Mortgage Trust, Series 2018-TOP, Class F, 5.190%, due 08/15/35(c) | | | 200,000 | | | | 200,504 | |
| Credit Suisse Mortgage Trust, Series 2019-ICE4, Class D, 144A, 4.063% (1MO LIBOR + 160), due 05/15/36(c) | | | 165,000 | | | | 165,515 | |
| Credit Suisse Mortgage Trust, Series 2019-ICE4, Class E, 144A, 4.613% (1MO LIBOR + 215), due 05/15/36(c) | | | 189,000 | | | | 189,656 | |
| WILSHIRE INCOME OPPORTUNITIES FUND | |
| SCHEDULE OF INVESTMENTS (Continued) | |
| NON-AGENCY MORTGAGE-BACKED OBLIGATIONS - 18.6% (Continued) | | Par Value | | | Value | |
| CSAIL Commercial Mortgage Trust, Series 2016-C6, Class D, 144A, 4.909%, due 01/15/49(c) | | $ | 580,000 | | | $ | 560,214 | |
| DB Master Finance, LLC, Series 2019-1A, Class A2I, 144A, 3.787%, due 05/20/49(c) | | | 170,000 | | | | 176,758 | |
| DB Master Finance, LLC, Series 2019-1A, Class A2II, 144A, 4.021%, due 05/20/49(c) | | | 90,000 | | | | 92,830 | |
| DBGS Mortgage Trust, Series 2018-5BP, Class F, 144A, 4.890% (1MO LIBOR + 245), due 06/15/33(c) (d) | | | 140,000 | | | | 139,716 | |
| DBGS Mortgage Trust, Series 2018-BIOD, Class B, 144A, 3.328% (1MO LIBOR + 89), due 05/15/35(c) | | | 232,035 | | | | 231,598 | |
| DBUBS Mortgage Trust, Series 2017-BRBK, Class E, 144A, 3.648%, due 10/10/34(c) | | | 220,000 | | | | 220,791 | |
| DBUBS Mortgage Trust, Series 2011-LC1A, Class F, 144A, 5.885%, due 11/10/46(c) | | | 230,000 | | | | 235,262 | |
| Deephaven Residential Mortgage Trust, Series 2018-3A, Class M1, 144A, 4.357%, due 08/25/58(c) | | | 500,000 | | | | 526,029 | |
| Discover Card Execution Note Trust, Series 2019-A1, Class A1, 3.040%, due 07/15/24(c) | | | 235,000 | | | | 240,873 | |
| Domino's Pizza Master Issuer, LLC, Series 2017-1A, Class A2I, 144A, 3.830% (3MO LIBOR + 125), due 07/25/47(c) | | | 230,888 | | | | 230,703 | |
| Dryden Senior Loan Fund, Series 2018-60A, Class C, 144A, 4.647% (3MO LIBOR + 205), due 07/15/31(c) | | | 1,000,000 | | | | 979,986 | |
| Dryden Senior Loan Fund, Series 2015-40A, Class CR, 144A, 4.618%, due 08/15/31(c) | | | 500,000 | | | | 492,946 | |
| First Franklin Mortgage Trust, Series 2004-FF10, Class M-1, 3.679% (1MO LIBOR + 127.50), due 07/25/34(c) | | | 422,564 | | | | 417,605 | |
| Flagstar Mortgage Trust, Series 2016-6RR, Class B1, 144A, 5.058%, due 10/25/48(c) | | | 494,026 | | | | 538,169 | |
| Focus Brands Funding, LLC, Series 2017-1A, Class A2II, 144A, 5.093%, due 04/30/47(c) | | | 176,400 | | | | 183,847 | |
| FREMF Mortgage Trust, Series 2014-K503, Class D, 144A, 0.000%, due 10/25/47(c) (d) | | | 1,064,300 | | | | 1,049,084 | |
| GMAC Commercial Mortgage Securities, Series 2004-C3, Class D, 5.044%, due 12/10/41(c) | | | 96,000 | | | | 95,815 | |
| GMAC Commercial Mortgage Securities, Series 2004-C3, Class E, 144A, 5.142%, due 12/10/41(c) | | | 160,000 | | | | 160,655 | |
| WILSHIRE INCOME OPPORTUNITIES FUND | |
| SCHEDULE OF INVESTMENTS (Continued) | |
| NON-AGENCY MORTGAGE-BACKED OBLIGATIONS - 18.6% (Continued) | | Par Value | | | Value | |
| GoldenTree Loan Management, L.P., Series 2017-2A, Class D, 144A, 5.241% (3MO LIBOR + 265), due 11/28/30(c) | | $ | 500,000 | | | $ | 477,492 | |
| Goldman Sachs Mortgage Securities Trust, Series 2018-TWR, Class A, 144A, 3.340%, due 07/15/31(c) | | | 215,000 | | | | 214,828 | |
| Goldman Sachs Mortgage Securities Trust, Series 2018-LUAU, Class E, 144A, 4.944% (1MO LIBOR + 255), due 11/15/32(c) | | | 150,000 | | | | 150,095 | |
| Goldman Sachs Mortgage Securities Trust, Series 2018-RIVR, Class F, 144A, 4.540% (1MO LIBOR + 210), due 07/15/35(c) | | | 1,000,000 | | | | 988,302 | |
| Goldman Sachs Mortgage Securities Trust, Series 2018-RIVR, Class G, 144A, 5.040% (1MO LIBOR + 260), due 07/15/35(c) | | | 500,000 | | | | 493,206 | |
| GPT 2018-GPP Mortgage Trust, Series 2018-GPP, Class E, 144A, 4.910% (1MO LIBOR + 247), due 06/15/35(c) | | | 500,000 | | | | 495,040 | |
| GS Mortgage Securities Trust, Series 2016-GS4, Class D, 144A, 3.233%, due 11/10/49 | | | 370,000 | | | | 332,124 | |
| GS Mortgage Security Trust, Series 2019-SOHO, Class E, 144A, 4.325% (1MO LIBOR + 187), due 06/15/36(c) | | | 188,000 | | | | 187,591 | |
| GSAA Home Equity Trust, Series 2005-6, Class M-1, 2.860% (1MO LIBOR + 43), due 06/25/35(c) | | | 1,300,000 | | | | 1,255,671 | |
| GSAA Home Equity Trust, Series 2006-4, Class 4A3, 4.198%, due 03/25/36(c) | | | 672,105 | | | | 528,515 | |
| GSAA Home Equity Trust, Series 2007-7, Class A4, 2.700%, due 07/25/37(c) | | | 540,523 | | | | 513,173 | |
| Home Partners of America Trust, Series 2018-1, Class D, 144A, 3.882% (1MO LIBOR + 145), due 07/17/37(c) | | | 135,000 | | | | 133,720 | |
| Home Partners of America Trust, Series 2018-1, Class E, 144A, 4.282% (1MO LIBOR + 185), due 07/17/37(c) | | | 1,000,000 | | | | 999,997 | |
| Hospitality Mortgage Trust, Series 2019-HIT, Class F, 144A, 5.650% (1MO LIBOR + 315), due 11/15/26(c) | | | 189,000 | | | | 189,769 | |
| IMT Trust, Series 2017-APTS, Class EFL, 144A, 4.590% (1MO LIBOR + 215), due 06/15/34(c) | | | 182,000 | | | | 182,308 | |
| IMT Trust, Series 2017-APTS, Class FFL, 144A, 5.290% (1MO LIBOR + 285), due 06/15/34(c) (d) | | | 56,000 | | | | 55,737 | |
| WILSHIRE INCOME OPPORTUNITIES FUND | |
| SCHEDULE OF INVESTMENTS (Continued) | |
| NON-AGENCY MORTGAGE-BACKED OBLIGATIONS - 18.6% (Continued) | | Par Value | | | Value | |
| Jack in the Box Funding, LLC, Series 2019-1A, Class A2II, 144A, 0.000%, due 08/25/49(c) | | $ | 115,000 | | | $ | 115,000 | |
| JPMBB Commercial Mortgage Securities Trust, Series 2015-C29, Class C, 4.169%, due 05/15/48(c) | | | 400,000 | | | | 411,197 | |
| JPMorgan Chase Commercial Mortgage Securities Trust, Series 2018-LAQ, Class C, 144A, 4.040% (1MO LIBOR + 160), due 06/15/32(c) | | | 210,052 | | | | 211,108 | |
| JPMorgan Chase Commercial Mortgage Securities Trust, Series 2018-LAQ, Class D, 144A, 4.540% (1MO LIBOR + 210), due 06/15/32(c) | | | 83,432 | | | | 84,005 | |
| JPMorgan Chase Commercial Mortgage Securities Trust, Series 2018-LAQ, Class E, 144A, 5.440% (1MO LIBOR + 300), due 06/15/32(c) (d) | | | 26,502 | | | | 26,717 | |
| JPMorgan Chase Commercial Mortgage Securities Trust, Series 2019-MFP, Class E, 144A, 0.000% (1MO LIBOR + 216), due 07/15/36(c) | | | 125,000 | | | | 125,000 | |
| JPMorgan Chase Commercial Mortgage Trust, Series 2018-PHH, Class C, 144A, 3.800%, due 06/15/23(c) | | | 45,000 | | | | 45,052 | |
| JPMorgan Chase Commercial Mortgage Trust, Series 2018-WPT, Class EFX, 144A, 5.542%, due 07/05/23(c) | | | 141,000 | | | | 149,601 | |
| JPMorgan Chase Commercial Mortgage Trust, Series 2018-WPT, Class FFX, 144A, 5.542%, due 07/05/23(c) | | | 1,500,000 | | | | 1,541,499 | |
| JPMorgan Chase Commercial Mortgage Trust, Series 2018-BCON, Class E, 3.756%, due 01/05/31(c) (d) | | | 300,000 | | | | 303,386 | |
| JPMorgan Chase Commercial Mortgage Trust, Series 2015-MAR7, Class D, 144A, 5.227%, due 06/05/32(c) | | | 113,000 | | | | 115,489 | |
| JPMorgan Chase Commercial Mortgage Trust, Series 2004-CIBC10, Class D, 5.097%, due 01/12/37 | | | 189,000 | | | | 190,311 | |
| JPMorgan Chase Commercial Mortgage Trust, Series 2011-C5, Class D, 5.375%, due 08/15/46(c) (d) | | | 268,000 | | | | 271,929 | |
| JPMorgan Chase Commercial Mortgage Trust, Series 2018-6, Class B2, 144A, 4.004%, due 12/25/48(c) | | | 391,200 | | | | 410,016 | |
| JPMorgan Chase Commercial Mortgage Trust, Series 2007-LDPX, Class A-M, 5.464%, due 01/15/49(c) | | | 6,212 | | | | 6,221 | |
| JPMorgan Chase Commercial Mortgage Trust, Series 2018-8, Class B1, 144A, 4.230%, due 01/25/49(c) | | | 492,436 | | | | 531,137 | |
| WILSHIRE INCOME OPPORTUNITIES FUND | |
| SCHEDULE OF INVESTMENTS (Continued) | |
| NON-AGENCY MORTGAGE-BACKED OBLIGATIONS - 18.6% (Continued) | | Par Value | | | Value | |
| LSTAR Commercial Mortgage Trust, Series 2016-4, Class C, 144A, 4.701%, due 03/10/49 | | $ | 274,000 | | | $ | 263,983 | |
| Madison Avenue Trust, Series 2013-650M, Class E, 4.034%, due 10/12/32(c) (d) | | | 268,000 | | | | 265,811 | |
| Marlette Funding Trust, Series 2019-3A, Class B, 144A, 0.000%, due 09/17/29(c) | | | 200,000 | | | | 199,981 | |
| Mill City Mortgage Trust, Series 2018-3, Class A1, 144A, 3.500%, due 08/25/58(c) | | | 329,167 | | | | 336,977 | |
| Monarch Beach Resort Trust, Series 2018-MBR, Class F, 4.990%, due 07/15/35(c) | | | 307,000 | | | | 308,157 | |
| Morgan Stanley BofA Mortgage Loan Trust, Series 2014-C17, Class C, 4.465%, due 08/15/47(c) | | | 1,117,000 | | | | 1,144,007 | |
| Morgan Stanley BofA Mortgage Loan Trust, Series 2015-C20, Class D, 144A, 3.071%, due 02/15/48(c) (d) | | | 42,000 | | | | 39,045 | |
| Morgan Stanley BofA Mortgage Loan Trust, Series 2015-C22, Class C, 4.378%, due 04/15/48(c) | | | 1,000,000 | | | | 1,034,006 | |
| Morgan Stanley Capital I Trust, Series 2017-JWDR, Class E, 144A, 5.444% (1MO LIBOR + 305), due 11/15/34(c) | | | 158,000 | | | | 159,186 | |
| Morgan Stanley Capital I Trust, Series 2018-SUN, Class D, 144A, 4.090% (1MO LIBOR + 165), due 07/15/35(c) | | | 40,000 | | | | 40,151 | |
| Morgan Stanley Capital I Trust, Series 2018-SUN, Class F, 144A, 4.990% (1MO LIBOR + 255), due 07/15/35(c) | | | 60,000 | | | | 60,526 | |
| Morgan Stanley Capital I Trust, Series 2018-SUN, Class G, 144A, 5.490% (1MO LIBOR + 305), due 07/15/35(c) (d) | | | 40,000 | | | | 40,251 | |
| Morgan Stanley Capital I Trust, Series 2006-NC1, Class M-1, 2.810% (1MO LIBOR + 380), due 12/25/35(c) | | | 1,000,000 | | | | 973,377 | |
| Morgan Stanley Capital I Trust, Series 2019-PLND, Class E, 144A, 4.650% (1MO LIBOR + 215), due 05/15/36(c) | | | 189,000 | | | | 189,103 | |
| MSCG Trust, Series 2018-SELF, Class F, 144A, 5.490% (1MO LIBOR + 305), due 10/15/28(c) (d) | | | 199,000 | | | | 199,251 | |
| MVW Owner Trust, Series 2018-1A, Class A, 144A, 3.450%, due 01/21/36(c) | | | 103,090 | | | | 106,339 | |
| Natixis Commercial Mortgage Securities, Series 2018-FL1, Class C, 144A, 4.673% (1MO LIBOR + 220), due 06/15/35(c) | | | 141,000 | | | | 139,722 | |
| WILSHIRE INCOME OPPORTUNITIES FUND | |
| SCHEDULE OF INVESTMENTS (Continued) | |
| NON-AGENCY MORTGAGE-BACKED OBLIGATIONS - 18.6% (Continued) | | Par Value | | | Value | |
| NextGear Floorplan Master Owner Trust, Series 2018-2A, Class A2, 144A, 3.690%, due 10/16/23(c) | | $ | 160,000 | | | $ | 164,351 | |
| OHA Loan Funding Ltd., Series 2013-1A, Class CR2, 4.661%, due 07/23/31(c) | | | 500,000 | | | | 493,628 | |
| PFP Ltd., Series 2017-4, Class D, 144A, 6.073% (1MO LIBOR + 360), due 07/14/35(c) | | | 1,000,000 | | | | 999,795 | |
| PR Mortgage Loan Trust, Series 2014-1, Class APT, 144A, 5.911%, due 10/25/49(c) (d) | | | 1,865,055 | | | | 1,855,548 | |
| Rait Trust, Series 2017-FL7, Class B, 144A, 4.040% (1MO LIBOR + 160), due 06/15/37(c) | | | 169,000 | | | | 169,000 | |
| Residential Accredited Loans, Inc., Series 2006-QS15, Class A-3, 6.500%, due 10/25/36 | | | 1,005,176 | | | | 967,573 | |
| Slide, Series 2018-FUN, Class F, 144A, 5.440% (1MO LIBOR + 300), due 06/15/31(c) | | | 1,224,832 | | | | 1,234,795 | |
| SoFi Consumer Loan Program Trust, Series 2018-1, Class C, 144A, 3.970%, due 02/25/27(c) | | | 250,000 | | | | 256,253 | |
| SoFi Consumer Loan Program Trust, Series 2018-2, Class C, 144A, 4.250%, due 04/26/27 | | | 215,000 | | | | 221,653 | |
| Structured Asset Securities Corp., Series 2006-BC3, Class A3, 2.564% (1MO LIBOR + 16), due 10/25/36(c) | | | 965,091 | | | | 842,367 | |
| Sunrun Calisto Issuer, LLC, Series 2019-1A, Class A, 3.980%, due 06/30/54(c) | | | 150,000 | | | | 150,000 | |
| Taco Bell Fund, LLC, Series 2016-1A, Class A23, 144A, 4.970%, due 05/25/46 | | | 424,340 | | | | 452,645 | |
| Textainer Marine Containers Ltd., Series 2018-1A, Class A, 4.110%, due 08/20/43 | | | 84,060 | | | | 84,936 | |
| Tharaldson Hotel Portfolio Trust, Series 2018-THL, Class E, 144A, 5.647% (3MO LIBOR + 318), due 11/11/34(c) | | | 113,411 | | | | 113,764 | |
| Towd Point Mortgage Trust, Series 2017-3, Class A1, 144A, 2.750%, due 07/01/57(c) | | | 182,658 | | | | 183,422 | |
| Towd Point Mortgage Trust, Series 2019-1, Class A, 144A, 3.750%, due 03/25/58(c) | | | 180,400 | | | | 187,570 | |
| Towd Point Mortgage Trust, Series 2018-4, Class A1, 3.000%, due 06/25/58(c) | | | 240,149 | | | | 242,663 | |
| UBS Commercial Mortgage Trust, Series 2018-C8, Class C, 4.704%, due 02/15/51(c) | | | 95,000 | | | | 100,904 | |
| WILSHIRE INCOME OPPORTUNITIES FUND | |
| SCHEDULE OF INVESTMENTS (Continued) | |
| NON-AGENCY MORTGAGE-BACKED OBLIGATIONS - 18.6% (Continued) | | Par Value | | | Value | |
| UBS-Citigroup Commercial Mortgage Trust, Series 2011-C1, Class D, 144A, 6.051%, due 01/10/45(c) | | $ | 142,000 | | | $ | 149,239 | |
| Velocity Commercial Capital Loan Trust, Series 2016-1, Class A-FX, 144A, 3.534%, due 04/25/46 | | | 49,800 | | | | 49,700 | |
| Verizon Owner Trust, Series 2017-1A, Class A, 144A, 2.060%, due 09/20/21 | | | 159,087 | | | | 158,899 | |
| Verus Securitization Trust, Series 2018-1, Class B1, 144A, 3.801%, due 01/25/58(c) | | | 500,000 | | | | 512,324 | |
| Verus Securitization Trust, Series 2018-2, Class B1, 144A, 4.426%, due 06/01/58(c) | | | 900,000 | | | | 944,414 | |
| Verus Securitization Trust, Series 2018-3, Class M1, 144A, 4.595%, due 10/25/58(c) | | | 300,000 | | | | 310,633 | |
| WAMU Mortgage Pass-Through Certificates, Series 2007-HY3, Class 1A1, 3.570%, due 03/25/37(c) | | | 637,998 | | | | 554,091 | |
| Wells Fargo Commercial Mortgage Trust, Series 2015-LC5, Class D, 144A, 4.761%, due 10/15/45(c) (d) | | | 385,000 | | | | 397,457 | |
| Wells Fargo Commercial Mortgage Trust, Series 2016-C34, Class C, 5.030%, due 06/15/49 | | | 141,000 | | | | 152,209 | |
| Wells Fargo Commercial Mortgage Trust, Series 2019-C49, Class D, 144A, 3.000%, due 03/15/52(c) | | | 1,090,000 | | | | 933,502 | |
| Wells Fargo Mortgage Backed Securities Trust, Series 2019-2, Class A1, 144A, 4.000%, due 04/25/49(c) | | | 474,012 | | | | 484,474 | |
| Wells Fargo Mortgage Backed Securities Trust, Series 2006-8, Class A18, 6.000%, due 07/25/36(c) | | | 332,560 | | | | 321,697 | |
| WF-RBS Commercial Mortgage Trust, Series 2013-C12, Class E, 144A, 3.500%, due 03/15/48 | | | 900,000 | | | | 745,486 | |
| Total Non-Agency Mortgage-Backed Obligations(Cost $57,954,737) | | | | | | $ | 58,850,386 | |
| NON-AGENCY MORTGAGE-BACKED OBLIGATION INTEREST-ONLY STRIPS - 2.9% | | Par Value | | | Value | |
| Bank, Series 2019-BN17, Class XA, 1.038%, due 04/15/52(c) | | $ | 3,429,978 | | | $ | 288,769 | |
| Barclays Commercial Mortgage Securities, LLC, Series 2017-C1, Class X-A, 1.508%, due 02/01/27(c) | | | 1,955,647 | | | | 172,870 | |
| WILSHIRE INCOME OPPORTUNITIES FUND | |
| SCHEDULE OF INVESTMENTS (Continued) | |
| NON-AGENCY MORTGAGE-BACKED OBLIGATION INTEREST-ONLY STRIPS - 2.9% (Continued) | | Par Value | | | Value | |
| Benchmark Mortgage Trust, Series 2018-B4, Class XA, 0.542%, due 07/15/51(c) | | $ | 6,916,365 | | | $ | 255,460 | |
| Benchmark Mortgage Trust, Series 2018-B4, Class X-D, 144A, 1.750%, due 07/15/51(c) | | | 7,000,000 | | | | 919,875 | |
| Benchmark Mortgage Trust, Series 2019-B10, Class XB, 0.900%, due 03/15/62(c) | | | 2,820,000 | | | | 222,066 | |
| Benchmark Mortgage Trust, Series 2019-B10, Class XA, 1.233%, due 03/15/62(c) | | | 3,548,735 | | | | 333,900 | |
| CD Commercial Mortgage Trust, Series 2016-CD1, Class X-A, 1.419%, due 08/10/26(c) | | | 1,955,692 | | | | 148,930 | |
| CD Commercial Mortgage Trust, Series 2017-CD4, Class X-A, 1.316%, due 05/01/50(c) | | | 1,742,778 | | | | 131,832 | |
| CFCRE Commercial Mortgage Trust, Series 2017-C8, Class X-A, 1.655%, due 06/15/50(c) | | | 1,410,801 | | | | 130,231 | |
| CFCRE Commercial Mortgage Trust, Series 2016-C4, Class X-A, 1.722%, due 05/10/58(c) | | | 766,261 | | | | 68,444 | |
| Citigroup Commercial Mortgage Trust, Series 2016-P4, Class X-A, 1.989%, due 08/10/26(c) | | | 937,368 | | | | 95,588 | |
| Citigroup Commercial Mortgage Trust, Series 2016-C1, Class X-A, 1.899%, due 05/10/49(c) | | | 813,601 | | | | 83,943 | |
| Citigroup Commercial Mortgage Trust, Series 2017-P8, Class XA, 1.066%, due 09/15/50(c) | | | 1,011,582 | | | | 62,354 | |
| Commercial Mortgage Trust, Series 2012-LC4, Class X-A, 144A, 2.106%, due 12/10/44(c) | | | 13,234,291 | | | | 575,017 | |
| Commercial Mortgage Trust, Series 2015-CR26, Class D, 3.632%, due 07/10/45(c) | | | 52,000 | | | | 48,196 | |
| Commercial Mortgage Trust, Series 2013-CCRE12, Class X-A, 1.166%, due 10/01/46(c) | | | 3,376,005 | | | | 142,665 | |
| Commercial Mortgage Trust, Series 2015-LC21, Class X-A, 0.769%, due 07/10/48(c) | | | 1,820,302 | | | | 57,045 | |
| Commercial Mortgage Trust, Series 2016-CR28, Class D, 3.896%, due 02/10/49(c) | | | 30,000 | | | | 30,190 | |
| CSAIL Commercial Mortgage Trust, Series 2016-C6, Class X-A, 1.789%, due 01/15/49(c) | | | 973,840 | | | | 82,373 | |
| CSAIL Commercial Mortgage Trust, Series 2017-CX10, Class X-A, 0.725%, due 11/15/50(c) | | | 5,580,528 | | | | 268,063 | |
| WILSHIRE INCOME OPPORTUNITIES FUND | |
| SCHEDULE OF INVESTMENTS (Continued) | |
| NON-AGENCY MORTGAGE-BACKED OBLIGATION INTEREST-ONLY STRIPS - 2.9% (Continued) | | Par Value | | | Value | |
| CSAIL Commercial Mortgage Trust, Series 2018-CX12, Class X-A, 144A, 0.781%, due 08/15/51(c) | | $ | 4,781,583 | | | $ | 215,460 | |
| FREMF Mortgage Trust, Series 2014-K503, Class X2A, 144A, 0.100%, due 10/25/47(c) (d) | | | 263,070 | | | | 51 | |
| FREMF Mortgage Trust, Series 2014-K503, Class X2B, 144A, 0.100%, due 10/25/47(c) (d) | | | 2,554,200 | | | | 1,265 | |
| Goldman Sachs Mortgage Securities Trust, Series 2013-GC10, Class X-A, 1.514%, due 01/10/23(c) | | | 2,053,410 | | | | 93,766 | |
| Goldman Sachs Mortgage Securities Trust, Series 2011-GC3, Class X, 144A, 0.817%, due 03/10/44(c) | | | 15,487,184 | | | | 152,761 | |
| Goldman Sachs Mortgage Securities Trust, Series 2016-GS2, Class X-A, 1.657%, due 05/10/49(c) | | | 1,031,187 | | | | 83,041 | |
| JPMBB Commercial Mortgage Securities Trust, Series 2014-C19, Class X-A, 1.144%, due 04/15/47(c) | | | 18,497,546 | | | | 447,864 | |
| JPMBB Commercial Mortgage Securities Trust, Series 2016-C2, Class X-A, 1.682%, due 06/01/49(c) | | | 1,236,976 | | | | 89,721 | |
| L Street Securities, Series 2017-PM1, Class XIO, 144A, 0.000%, due 11/25/47(c) | | | 818,978,210 | | | | 1,167,208 | |
| LSTAR Commercial Mortgage Trust, Series 2016-4, Class X-A, 144A, 1.882%, due 03/01/49(c) | | | 1,468,467 | | | | 94,739 | |
| LSTAR Commercial Mortgage Trust, Series 2017-5, Class X, 144A, 1.109%, due 03/10/50(c) | | | 2,634,913 | | | | 110,097 | |
| Morgan Stanley BofA Mortgage Loan Trust, Series 2013-C13, Class X-A, 1.166%, due 11/15/46(c) | | | 5,354,943 | | | | 192,079 | |
| Morgan Stanley BofA Mortgage Loan Trust, Series 2014-C19, Class X-A, 1.089%, due 12/01/47(c) | | | 3,378,882 | | | | 110,128 | |
| Morgan Stanley Capital I Trust, Series 2016-UB12, Class X-A, 0.792%, due 12/15/49(c) | | | 3,178,112 | | | | 130,977 | |
| Morgan Stanley Capital I Trust, Series 2017-BNK8, Class X-E, 144A, 1.274%, due 11/15/50(c) | | | 7,050,000 | | | | 647,520 | |
| Morgan Stanley Capital I Trust, Series 2018-BN11, Class X-A, 0.497%, due 03/15/61(c) | | | 11,733,446 | | | | 433,347 | |
| Societe Generale Commercial Mortgage Securities Trust, Series 2016-C5, Class X-A, 1.992%, due 10/01/48(c) | | | 1,162,400 | | | | 111,720 | |
| UBS Commercial Mortgage Trust, Series 2018-C8, Class X-A, 0.887%, due 02/15/51(c) | | | 1,379,389 | | | | 83,183 | |
| WILSHIRE INCOME OPPORTUNITIES FUND | |
| SCHEDULE OF INVESTMENTS (Continued) | |
| NON-AGENCY MORTGAGE-BACKED OBLIGATION INTEREST-ONLY STRIPS - 2.9% (Continued) | | Par Value | | | Value | |
| Wells Fargo Commercial Mortgage Trust, Series 2017-C42, Class X-E, 144A, 1.300%, due 12/15/50(c) | | $ | 5,000,000 | | | $ | 444,714 | |
| Wells Fargo Commercial Mortgage Trust, Series 2018-C45, Class X-A, 0.996%, due 06/15/51(c) | | | 5,448,909 | | | | 339,969 | |
| Wells Fargo Commercial Mortgage Trust, Series 2018-C46, Class X-A, 0.948%, due 08/15/51(c) | | | 3,529,823 | | | | 214,870 | |
| Total Non-Agency Mortgage-Backed Obligation Interest-Only Strips(Cost $8,795,932) | | | | | | $ | 9,282,291 | |
| ASSET-BACKED SECURITIES - 2.3% | | Par Value | | | Value | |
| American Express Credit Account Master Trust, Series 2017-6, Class A, 2.040%, due 05/15/23 | | $ | 350,000 | | | $ | 349,870 | |
| Arroyo Mortgage Trust, Series 2018-1, Class A1, 144A, 3.763%, due 04/25/48 | | | 156,132 | | | | 160,137 | |
| Citibank Credit Card Issuance, Series 2017-A3, Class A3, 1.920%, due 04/07/22 | | | 125,000 | | | | 124,732 | |
| Coinstar Funding, LLC, Series 2017-1A, Class A2, 144A, 5.216%, due 04/25/47 | | | 269,500 | | | | 278,996 | |
| CommonBond Student Loan Term, Series 2018-BGS, Class C, 144A, 4.120%, due 09/25/45(c) | | | 100,000 | | | | 101,586 | |
| DB Master Finance, LLC, Series 2017-1A, Class A2I, 144A, 3.629%, due 11/20/47 | | | 197,000 | | | | 201,373 | |
| Discover Card Execution Note Trust, Series 2016-A4, Class A4, 1.390%, due 03/15/22 | | | 225,000 | | | | 224,497 | |
| Domino's Pizza Master Issuer, LLC, Series 2017-1A, Class A2II, 144A, 3.082%, due 07/25/47 | | | 196,500 | | | | 196,797 | |
| Earnest Student Loan Program, LLC, Series 2016-C, Class B, 144A, 4.460%, due 01/26/37 | | | 326,085 | | | | 340,865 | |
| Ford Credit Auto Owner Trust, Series 2016-C, Class A3, 1.220%, due 03/15/21 | | | 84,903 | | | | 84,544 | |
| Helios Issuer, LLC, Series 2017-1A, Class A, 144A, 4.940%, due 09/20/49(c) | | | 1,081,513 | | | | 1,149,543 | |
| Mosaic Solar Loans, LLC, Series 2018-1A, Class A, 144A, 4.010%, due 06/22/43 | | | 384,725 | | | | 393,471 | |
| WILSHIRE INCOME OPPORTUNITIES FUND | |
| SCHEDULE OF INVESTMENTS (Continued) | |
| ASSET-BACKED SECURITIES - 2.3% (Continued) | | Par Value | | | Value | |
| Mosaic Solar Loans, LLC, Series 2018-2GS, Class B, 144A, 4.740%, due 02/20/44(c) | | $ | 450,000 | | | $ | 454,285 | |
| Mosaic Solar Loans, LLC, Series 2018-2GS, Class A, 4.200%, due 02/22/44 | | | 412,807 | | | | 423,589 | |
| OSCAR US Funding Trust, Series 2018-2A, Class A4, 144A, 3.630%, due 09/10/25(c) | | | 150,000 | | | | 147,334 | |
| Santander Drive Auto Receivable, Series 2018-1, Class E, 144A, 4.370%, due 05/15/25(c) | | | 750,000 | | | | 763,480 | |
| SoFi Consumer Loan Program Trust, Series 2018-3, Class C, 144A, 4.670%, due 08/25/27 | | | 150,000 | | | | 156,480 | |
| SoFi Consumer Loan Program Trust, Series 2018-4, Class D, 144A, 4.760%, due 11/26/27 | | | 500,000 | | | | 516,740 | |
| Structured Agency Credit Risk Debt Notes, Series 15-DNA1, Class M2, 4.254%, due 10/25/27(c) | | | 163,934 | | | | 165,319 | |
| Wendy's Funding LLC, Series 2019-1A, Class A2I, 144A, 3.783%, due 06/15/49 | | | 100,000 | | | | 100,591 | |
| Wingstop Funding, LLC, Series 2018-1, Class A2, 144A, 4.970%, due 12/05/48(c) | | | 997,500 | | | | 1,042,217 | |
| Total Asset-Backed Securities(Cost $7,148,604) | | | | | | $ | 7,376,446 | |
| COLLATERALIZED LOAN OBLIGATIONS - 3.3% | | Par Value | | | Value | |
| Annisa CLO Ltd., Series 2016-2A, Class CR, 144A, 4.592% (3MO LIBOR + 200), due 07/20/31(c) | | $ | 1,000,000 | | | $ | 977,746 | |
| Apidos CLO, Series 2016-24A, Class CR, 144A, 5.641% (3MO LIBOR + 305), due 10/20/30(c) | | | 500,000 | | | | 488,369 | |
| Ares CLO Ltd., Series 2018-49A, Class C, 144A, 4.542%, due 07/22/30(c) | | | 1,000,000 | | | | 970,203 | |
| Atrium CDO Corp., Series 2013-9R, Class D-R, 144A, 6.121% (3MO LIBOR + 360), due 05/28/30(c) | | | 500,000 | | | | 500,181 | |
| Avery Point CLO Ltd., Series 2015-6A, Class AR, 144A, 3.615% (3MO LIBOR + 105), due 08/05/27(c) | | | 500,000 | | | | 499,706 | |
| Babson CLO Ltd., Series 2012-II, Class SUB, 144A, 0.000%, due 05/15/23(d) | | | 1,000,000 | | | | 34,632 | |
| BlueMountain CLO Ltd., Series 2016-2A, Class C, 144A, 6.620% (3MO LIBOR + 410), due 08/20/28(c) | | | 500,000 | | | | 500,162 | |
| WILSHIRE INCOME OPPORTUNITIES FUND | |
| SCHEDULE OF INVESTMENTS (Continued) | |
| COLLATERALIZED LOAN OBLIGATIONS - 3.3% (Continued) | | Par Value | | | Value | |
| BlueMountain CLO Ltd., Series 2012-2A, Class DR, 144A, 5.420% (3MO LIBOR + 290), due 11/20/28(c) | | $ | 350,000 | | | $ | 344,025 | |
| Canyon Capital CLO Ltd., Series 2014-1A, Class CR, 144A, 5.333%, due 01/30/31(c) | | | 250,000 | | | | 233,770 | |
| Carlyle Global Market Strategies CLO, Series 2015-3A, Class CR, 144A, 5.432% (3MO LIBOR + 285), due 07/28/28(c) | | | 500,000 | | | | 498,753 | |
| CIFC Funding CLO Ltd., Series 2015-5A, Class CR, 144A, 5.530% (3MO LIBOR + 295), due 10/25/27(c) | | | 345,000 | | | | 344,136 | |
| Dryden Senior Loan Fund, Series 2014-33A, Class DR2, 144A, 6.447% (3MO LIBOR + 385), due 04/15/29(c) | | | 500,000 | | | | 499,705 | |
| Galaxy CLO Ltd., Series 2018-29A, Class D, 4.918% (3MO LIBOR + 240), due 11/15/26(c) | | | 250,000 | | | | 244,769 | |
| Galaxy CLO Ltd., Series 2016-22A, Class DR, 144A, 5.701% (3MO LIBOR + 310), due 07/16/28(c) | | | 250,000 | | | | 244,082 | |
| LCM CLO Ltd. Partnership, Series 20A, Class DR, 144A, 5.392% (3MO LIBOR + 280), due 10/20/27(c) | | | 250,000 | | | | 246,673 | |
| LCM CLO Ltd. Partnership, Series 22A, Class CR, 144A, 5.392% (3MO LIBOR + 280), due 10/20/28(c) | | | 350,000 | | | | 339,444 | |
| Newark BSL CLO 1 Ltd., Series 2016-1A, Class C, 144A, 6.582% (3MO LIBOR + 400), due 12/21/29(c) | | | 500,000 | | | | 500,487 | |
| Palmer Square Loan Funding CLO Ltd., Series 2018-3A, Class C, 144A, 4.818% (3MO LIBOR + 230), due 08/15/26(c) | | | 1,000,000 | | | | 970,746 | |
| Symphony CLO XIV Ltd., Series 2014-14A, Class D-2, 144A, 6.397% (3MO LIBOR + 360), due 07/14/26(c) | | | 500,000 | | | | 500,079 | |
| TPG Real Estate Finance, Series 2018-FL2, Class D, 144A, 5.094% (1MO LIBOR + 270), due 11/15/37(c) | | | 125,000 | | | | 126,033 | |
| Voya CLO Ltd., Series 2016-2A, Class C, 144A, 6.842% (3MO LIBOR + 425), due 07/19/28(c) | | | 500,000 | | | | 500,100 | |
| Westcott Park CLO Ltd., Series 2016-1A, CLASS DR, 144A, 0.000% (3MO LIBOR + 325), due 07/20/28(c) | | | 500,000 | | | | 497,379 | |
| Wind River CLO I Ltd., Series 2012-1A, Class D-R, 144A, 6.697% (3MO LIBOR + 410), due 01/15/26(c) | | | 250,000 | | | | 249,514 | |
| Total Collateralized Loan Obligations(Cost $11,179,022) | | | | | | $ | 10,310,694 | |
| WILSHIRE INCOME OPPORTUNITIES FUND | |
| SCHEDULE OF INVESTMENTS (Continued) | |
| INVESTMENT-GRADE CORPORATE OBLIGATIONS - 6.9% | | Par Value | | | Value | |
| Communication Services - 0.6% | | | | | | | | |
| AT&T, Inc., 5.250%, due 03/01/37 | | $ | 115,000 | | | $ | 128,951 | |
| AT&T, Inc., 5.150%, due 02/15/50 | | | 260,000 | | | | 286,320 | |
| Charter Communications Operating, LLC, 4.908%, due 07/23/25 | | | 120,000 | | | | 130,234 | |
| Charter Communications Operating, LLC, 5.050%, due 03/30/29 | | | 312,000 | | | | 343,514 | |
| Comcast Corp., 3.700%, due 04/15/24 | | | 180,000 | | | | 190,988 | |
| Comcast Corp., 4.700%, due 10/15/48 | | | 240,000 | | | | 278,927 | |
| Interpublic Group of Cos., Inc. (The), 4.650%, due 10/01/28 | | | 55,000 | | | | 60,015 | |
| Interpublic Group of Cos., Inc. (The), 5.400%, due 10/01/48 | | | 65,000 | | | | 72,230 | |
| Verizon Communications, Inc., 4.272%, due 01/15/36(b) | | | 85,000 | | | | 91,686 | |
| Verizon Communications, Inc., 4.522%, due 09/15/48 | | | 260,000 | | | | 290,718 | |
| Viacom, Inc., 4.375%, due 03/15/43 | | | 95,000 | | | | 92,788 | |
| | | | | | | | 1,966,371 | |
| Consumer Discretionary - 0.4% | | | | | | | | |
| Allied Universal Holdco, LLC, 144A, 6.625%, due 07/15/26 | | | 60,000 | | | | 60,975 | |
| Expedia, Inc., 5.000%, due 02/15/26 | | | 235,000 | | | | 255,228 | |
| Expedia, Inc., 3.800%, due 02/15/28 | | | 240,000 | | | | 243,587 | |
| Ford Motor Co., 7.450%, due 07/16/31 | | | 55,000 | | | | 64,901 | |
| General Motors Financial Co., Inc., 3.588% (3MO LIBOR + 99), due 01/05/23(c) | | | 150,000 | | | | 147,464 | |
| General Motors Financial Co., Inc., 3.950%, due 04/13/24 | | | 40,000 | | | | 40,801 | |
| Hasbro, Inc., 3.500%, due 09/15/27 | | | 70,000 | | | | 70,874 | |
| Home Depot, Inc. (The), 3.900%, due 06/15/47 | | | 65,000 | | | | 70,241 | |
| Molson Coors Brewing Co., 1.250%, due 07/15/24 | | | 150,000 | | | | 175,192 | |
| | | | | | | | 1,129,263 | |
| Consumer Staples - 0.4% | | | | | | | | |
| Anheuser-Busch Cos., LLC/Anheuser-Busch InBev Worldwide, Inc., 144A, 4.900%, due 02/01/46 | | | 60,000 | | | | 66,265 | |
| Anheuser-Busch InBev Worldwide, Inc., 4.600%, due 04/15/48 | | | 265,000 | | | | 281,535 | |
| BAT Capital Corp., 144A, 3.398% (3MO LIBOR + 100), due 08/15/22(c) | | | 20,000 | | | | 20,023 | |
| BAT Capital Corp., 144A, 4.540%, due 08/15/47 | | | 270,000 | | | | 249,447 | |
| Dollar Tree, Inc., 4.000%, due 05/15/25 | | | 120,000 | | | | 124,610 | |
| Kraft Heinz Food Co., 3.000%, due 06/01/26 | | | 295,000 | | | | 286,770 | |
| WILSHIRE INCOME OPPORTUNITIES FUND | |
| SCHEDULE OF INVESTMENTS (Continued) | |
| INVESTMENT-GRADE CORPORATE OBLIGATIONS - 6.9% (Continued) | | Par Value | | | Value | |
| Consumer Staples - 0.4% (Continued) | | | | | | | | |
| Smithfield Foods, Inc., 144A, 4.250%, due 02/01/27 | | $ | 135,000 | | | $ | 137,390 | |
| | | | | | | | 1,166,040 | |
| Energy - 1.4% | | | | | | | | |
| Andeavor, 5.125%, due 12/15/26 | | | 150,000 | | | | 167,472 | |
| Concho Resources, Inc., 4.300%, due 08/15/28 | | | 680,000 | | | | 732,700 | |
| Continental Resources, Inc., 4.375%, due 01/15/28(b) | | | 465,000 | | | | 489,645 | |
| Enbridge, Inc., 4.250%, due 12/01/26(b) | | | 385,000 | | | | 417,120 | |
| Energy Transfer Operating, L.P., 6.000%, due 06/15/48 | | | 240,000 | | | | 273,092 | |
| Energy Transfer Partners, L.P., 4.750%, due 01/15/26 | | | 60,000 | | | | 64,040 | |
| Enterprise Products Operating, 3.900%, due 02/15/24 | | | 420,000 | | | | 444,977 | |
| EQT Midstream Partners, L.P., 4.750%, due 07/15/23 | | | 55,000 | | | | 56,924 | |
| Kinder Morgan Energy Partners, 6.950%, due 01/15/38 | | | 50,000 | | | | 63,855 | |
| Kinder Morgan, Inc., 5.200%, due 03/01/48 | | | 250,000 | | | | 282,169 | |
| Marathon Oil Corp., 4.400%, due 07/15/27 | | | 415,000 | | | | 439,564 | |
| Marathon Petroleum Corp., 5.125%, due 12/15/26 | | | 60,000 | | | | 65,823 | |
| Murphy Oil Corp., 5.750%, due 08/15/25 | | | 25,000 | | | | 25,888 | |
| NGPL Pipeco, LLC, 144A, 4.875%, due 08/15/27 | | | 50,000 | | | | 53,125 | |
| Noble Energy, Inc., 3.850%, due 01/15/28(b) | | | 111,000 | | | | 113,294 | |
| Sabine Pass Liquefaction, LLC, 5.000%, due 03/15/27 | | | 60,000 | | | | 65,700 | |
| Schlumberger Holding Corp., 144A, 3.900%, due 05/17/28 | | | 145,000 | | | | 150,538 | |
| Williams Cos., Inc. (The), 3.600%, due 03/15/22 | | | 235,000 | | | | 240,948 | |
| Williams Cos., Inc. (The), 4.550%, due 06/24/24 | | | 307,000 | | | | 330,117 | |
| | | | | | | | 4,476,991 | |
| Financials - 1.9% | | | | | | | | |
| Air Lease Corp., 3.250%, due 03/01/25(b) | | | 130,000 | | | | 130,493 | |
| American International Group, Inc., 4.750%, due 04/01/48 | | | 260,000 | | | | 285,985 | |
| AXA Equitable Holdings, Inc., 3.900%, due 04/20/23 | | | 180,000 | | | | 187,333 | |
| Bank of America Corp., 3.458%, due 03/15/25 | | | 110,000 | | | | 113,963 | |
| Capital One Financial Corp., 3.303% (3MO LIBOR + 72), due 01/30/23(b)(c) | | | 195,000 | | | | 194,303 | |
| Citigroup, Inc., 3.138% (BBSW + 155), due 05/04/21(c) | | | 245,000 | | | | 174,539 | |
| Citigroup, Inc., 3.625% (3MO LIBOR + 110), due 05/17/24(c) | | | 115,000 | | | | 115,918 | |
| Citigroup, Inc., 4.750%, due 05/18/46 | | | 220,000 | | | | 247,221 | |
| Crown Castle International Corp., 3.650%, due 09/01/27 | | | 65,000 | | | | 66,302 | |
| Crown Castle International Corp., 4.300%, due 02/15/29 | | | 165,000 | | | | 178,171 | |
| WILSHIRE INCOME OPPORTUNITIES FUND | |
| SCHEDULE OF INVESTMENTS (Continued) | |
| INVESTMENT-GRADE CORPORATE OBLIGATIONS - 6.9% (Continued) | | Par Value | | | Value | |
| Financials - 1.9% (Continued) | | | | | | | | |
| Discover Financial Services, 4.100%, due 02/09/27 | | $ | 125,000 | | | $ | 129,823 | |
| First Maryland Capital II, 3.429% (3MO LIBOR + 85), due 02/01/27(c) | | | 250,000 | | | | 226,443 | |
| Fiserv, Inc., 3.500%, due 07/01/29 | | | 325,000 | | | | 332,772 | |
| Goldman Sachs Group, Inc. (The), 3.274% (3MO LIBOR + 75), due 02/23/23(c) | | | 170,000 | | | | 169,456 | |
| Goldman Sachs Group, Inc. (The), 1.375%, due 05/15/24 | | | 150,000 | | | | 176,691 | |
| JPMorgan Chase & Co., 3.625%, due 12/01/27 | | | 135,000 | | | | 139,030 | |
| JPMorgan Chase & Co., 3.509%, due 01/23/29(c) | | | 225,000 | | | | 233,291 | |
| JPMorgan Chase &Co., 3.702%, due 05/06/30 | | | 65,000 | | | | 68,294 | |
| Liberty Mutual Group, Inc., 144A, 6.500%, due 05/01/42 | | | 50,000 | | | | 65,938 | |
| Morgan Stanley, 3.737%, due 04/24/24 | | | 120,000 | | | | 125,049 | |
| MPT Operating Partnership, L.P., 5.250%, due 08/01/26 | | | 55,000 | | | | 57,475 | |
| MPT Operating Partnership, L.P., 5.000%, due 10/15/27 | | | 50,000 | | | | 51,500 | |
| PNC Financial Services Group, Inc., 3.500%, due 01/23/24 | | | 95,000 | | | | 99,592 | |
| Prudential Financial, Inc., 3.905%, due 12/07/47 | | | 45,000 | | | | 46,631 | |
| Public Storage, 3.385%, due 05/01/29 | | | 60,000 | | | | 62,749 | |
| Santander Holdings USA, Inc., 3.400%, due 01/18/23 | | | 120,000 | | | | 121,616 | |
| Synchrony Financial, 3.950%, due 12/01/27 | | | 65,000 | | | | 64,699 | |
| U.S. Bancorp, 3.375%, due 02/05/24 | | | 99,000 | | | | 103,464 | |
| U.S. Bancorp, 3.600%, due 09/11/24 | | | 55,000 | | | | 57,757 | |
| U.S. Bancorp, 3.150%, due 04/27/27 | | | 170,000 | | | | 176,260 | |
| U.S. Bancorp, Series I, 5.125% (3MO LIBOR + 348.60), due 12/31/49(b)(c) | | | 225,000 | | | | 229,500 | |
| U.S. Bank National Association, 3.000%, due 02/04/21 | | | 280,000 | | | | 283,338 | |
| USB Capital IX, 3.617% (3MO LIBOR + 150), due 12/31/49(c) | | | 405,000 | | | | 332,100 | |
| Wachovia Capital Trust II, 5.570%, due 03/29/49(c) | | | 430,000 | | | | 430,537 | |
| Wells Fargo & Co., 2.880%, due 07/27/21(c) | | | 200,000 | | | | 142,095 | |
| Wells Fargo & Co., 3.250%, due 04/27/22 | | | 200,000 | | | | 145,851 | |
| Wells Fargo & Co., 4.750%, due 12/07/46 | | | 250,000 | | | | 284,390 | |
| Willis North America, Inc., 4.500%, due 09/15/28 | | | 60,000 | | | | 64,098 | |
| | | | | | | | 6,114,667 | |
| Health Care - 0.6% | | | | | | | | |
| Becton, Dickinson and Co., 4.669%, due 06/06/47 | | | 250,000 | | | | 279,581 | |
| WILSHIRE INCOME OPPORTUNITIES FUND | |
| SCHEDULE OF INVESTMENTS (Continued) | |
| INVESTMENT-GRADE CORPORATE OBLIGATIONS - 6.9% (Continued) | | Par Value | | | Value | |
| Health Care - 0.6% (Continued) | | | | | | | | |
| Celgene Corp., 4.550%, due 02/20/48 | | $ | 270,000 | | | $ | 306,267 | |
| Cigna Corp., 144A, 3.487% (3MO LIBOR + 89), due 07/15/23(c) | | | 95,000 | | | | 94,593 | |
| Cigna Corp., 144A, 4.900%, due 12/15/48(b) | | | 340,000 | | | | 369,146 | |
| CVS Health Corp., 5.050%, due 03/25/48 | | | 240,000 | | | | 254,016 | |
| HCA, Inc., 5.000%, due 03/15/24 | | | 170,000 | | | | 184,875 | |
| Thermo Fisher Scientific, 0.750%, due 09/12/24 | | | 100,000 | | | | 116,230 | |
| UnitedHealth Group, Inc., 2.375%, due 10/15/22(b) | | | 300,000 | | | | 300,639 | |
| | | | | | | | 1,905,347 | |
| Industrials - 0.3% | | | | | | | | |
| CSX Corp., 3.800%, due 11/01/46(b) | | | 70,000 | | | | 70,549 | |
| FedEx Corp., 4.950%, due 10/17/48(b) | | | 245,000 | | | | 266,260 | |
| General Electric Co., 5.875%, due 01/14/38 | | | 60,000 | | | | 67,898 | |
| John Deere Capital Corp., 3.450%, due 01/10/24 | | | 80,000 | | | | 83,843 | |
| John Deere Capital Corp., 2.600%, due 03/07/24 | | | 75,000 | | | | 75,706 | |
| Lockheed Martin Corp., 4.700%, due 05/15/46 | | | 105,000 | | | | 126,670 | |
| Penske Truck Leasing Co., L.P., 144A, 4.200%, due 04/01/27 | | | 60,000 | | | | 62,254 | |
| Reynolds American, Inc., 4.000%, due 06/12/22(b) | | | 70,000 | | | | 72,602 | |
| | | | | | | | 825,782 | |
| Information Technology - 0.7% | | | | | | | | |
| Apple, Inc., 0.875%, due 05/24/25 | | | 115,000 | | | | 137,310 | |
| Arrow Electronics, Inc., 3.875%, due 01/12/28 | | | 25,000 | | | | 24,729 | |
| Banff Merger Sub, Inc., 144A, 9.750%, due 09/01/26 | | | 245,000 | | | | 212,538 | |
| Broadcom, Inc., 144A, 4.750%, due 04/15/29 | | | 241,000 | | | | 246,071 | |
| Dell International LLC, 144A, 8.100%, due 07/15/36 | | | 46,000 | | | | 56,420 | |
| Dell, Inc., 144A, 8.350%, due 07/15/46 | | | 617,000 | | | | 777,838 | |
| Microchip Technology, Inc., 4.333%, due 06/01/23 | | | 215,000 | | | | 223,806 | |
| Micron Technology, Inc., 5.327%, due 02/06/29 | | | 325,000 | | | | 344,500 | |
| Microsoft Corp., 2.400%, due 08/08/26 | | | 290,000 | | | | 291,376 | |
| | | | | | | | 2,314,588 | |
| Materials - 0.2% | | | | | | | | |
| International Paper Co., 4.350%, due 08/15/48 | | | 280,000 | | | | 272,898 | |
| Mosaic Co. (The), 4.050%, due 11/15/27 | | | 115,000 | | | | 118,557 | |
| Owens Corning, 4.400%, due 01/30/48 | | | 70,000 | | | | 59,273 | |
| Standard Industries, Inc., 144A, 5.000%, due 02/15/27 | | | 50,000 | | | | 50,375 | |
| WILSHIRE INCOME OPPORTUNITIES FUND | |
| SCHEDULE OF INVESTMENTS (Continued) | |
| INVESTMENT-GRADE CORPORATE OBLIGATIONS - 6.9% (Continued) | | Par Value | | | Value | |
| Materials - 0.2% (Continued) | | | | | | | | |
| WestRock Co., 3.750%, due 03/15/25 | | $ | 65,000 | | | $ | 67,526 | |
| | | | | | | | 568,629 | |
| Real Estate - 0.2% | | | | | | | | |
| American Tower Corp., 2.250%, due 01/15/22 | | | 240,000 | | | | 238,764 | |
| American Tower Corp., 1.950%, due 05/22/26 | | | 100,000 | | | | 121,308 | |
| American Tower Corp., 3.950%, due 03/15/29 | | | 60,000 | | | | 62,499 | |
| Welltower, Inc., 3.950%, due 09/01/23 | | | 125,000 | | | | 131,331 | |
| | | | | | | | 553,902 | |
| Utilities - 0.2% | | | | | | | | |
| Dominion Energy, Inc., 0.000%, due(b) | | | 4,100 | | | | 424,596 | |
| Vistra Operations Co., LLC, 144A, 3.550%, due 07/15/24 | | | 230,000 | | | | 231,150 | |
| Williams Partners, L.P., 4.300%, due 03/04/24 | | | 75,000 | | | | 79,558 | |
| | | | | | | | 735,304 | |
| | | | | | | | | |
| Total Investment-Grade Corporate Obligations(Cost $20,716,039) | | | | | | $ | 21,756,884 | |
| HIGH YIELD CORPORATE OBLIGATIONS - 11.2% | | Par Value | | | Value | |
| Communication Services - 1.5% | | | | | | | | |
| AMC Networks, Inc., 4.750%, due 08/01/25 | | $ | 50,000 | | | $ | 50,750 | |
| Block Communications, Inc., 6.875%, due 02/15/25 | | | 50,000 | | | | 52,125 | |
| Cablevision Systems Corp., 5.875%, due 09/15/22 | | | 60,000 | | | | 63,375 | |
| CBS Radio, Inc., 144A, 7.250%, due 11/01/24 | | | 25,000 | | | | 26,312 | |
| CCO Holdings, LLC, 144A, 5.750%, due 02/15/26 | | | 195,000 | | | | 204,750 | |
| CCO Holdings, LLC, 144A, 5.125%, due 05/01/27 | | | 350,000 | | | | 362,250 | |
| CCO Holdings, LLC, 144A, 5.000%, due 02/01/28 | | | 210,000 | | | | 214,462 | |
| CenturyLink, Inc., 5.800%, due 03/15/22 | | | 25,000 | | | | 26,125 | |
| Clear Channel Worldwide Holdings, Inc., 144A, CV, 9.250%, due 02/15/24 | | | 20,000 | | | | 21,700 | |
| Comcel Trust, 6.875%, due 02/06/24 | | | 200,000 | | | | 206,750 | |
| CSC Holdings, LLC, 5.250%, due 06/01/24 | | | 95,000 | | | | 98,681 | |
| CSC Holdings, LLC, 144A, 5.500%, due 04/15/27 | | | 200,000 | | | | 209,750 | |
| Cumulus Media New Holding, Inc., 144A, 6.750%, due 07/01/26 | | | 25,000 | | | | 24,937 | |
| WILSHIRE INCOME OPPORTUNITIES FUND | |
| SCHEDULE OF INVESTMENTS (Continued) | |
| HIGH YIELD CORPORATE OBLIGATIONS - 11.2% (Continued) | | Par Value | | | Value | |
| Communication Services - 1.5% (Continued) | | | | | | | | |
| DISH DBS Corp., 5.000%, due 03/15/23 | | $ | 50,000 | | | $ | 48,125 | |
| DISH Network Corp., CV, 3.375%, due 08/15/26 | | | 250,000 | | | | 242,890 | |
| Embarq Corp., 7.995%, due 06/01/36 | | | 50,000 | | | | 48,312 | |
| Frontier Communications Corp., 6.875%, due 01/15/25 | | | 10,000 | | | | 5,600 | |
| Frontier Communications Corp., 11.000%, due 09/15/25(b) | | | 10,000 | | | | 6,212 | |
| Frontier Communications Corp., 144A, 8.000%, due 04/01/27 | | | 45,000 | | | | 46,800 | |
| GCI Liberty, Inc., 144A, 1.750%, due 09/30/46 | | | 270,000 | | | | 314,126 | |
| Gray Escrow, Inc., 144A, 7.000%, due 05/15/27(b) | | | 125,000 | | | | 135,625 | |
| GTT Communications, Inc., 144A, 7.875%, due 12/31/24(b) | | | 70,000 | | | | 57,137 | |
| HC2 Holdings, Inc., 144A, 11.500%, due 12/01/21 | | | 130,000 | | | | 114,238 | |
| Hughes Satellite Systems Corp., 6.625%, due 08/01/26(b) | | | 25,000 | | | | 26,281 | |
| iHeartCommunications, Inc., 6.375%, due 05/01/26 | | | 15,000 | | | | 15,919 | |
| iHeartCommunications, Inc., 8.375%, due 05/01/27 | | | 10,000 | | | | 10,475 | |
| InterActiveCorp, 0.875%, due 06/15/26 | | | 250,000 | | | | 250,458 | |
| Level 3 Financing, Inc., 5.375%, due 01/15/24 | | | 95,000 | | | | 97,019 | |
| Level 3 Financing, Inc., 5.250%, due 03/15/26 | | | 45,000 | | | | 46,575 | |
| MGIC Investment Corp., 5.750%, due 08/15/23 | | | 135,000 | | | | 146,475 | |
| Netflix, Inc., 5.875%, due 11/15/28(b) | | | 50,000 | | | | 55,125 | |
| Netflix, Inc., 144A, 5.375%, due 11/15/29 | | | 210,000 | | | | 223,125 | |
| Nexstar Escrow Corp., 144A, 5.625%, due 08/01/24(b) | | | 50,000 | | | | 51,750 | |
| Sinclair Television Group, Inc., 144A, 5.125%, due 02/15/27 | | | 50,000 | | | | 49,063 | |
| Sirius XM Radio, Inc., 144A, 4.625%, due 05/15/23(b) | | | 200,000 | | | | 202,750 | |
| Sirius XM Radio, Inc., 144A, 4.625%, due 07/15/24 | | | 15,000 | | | | 15,338 | |
| Sirius XM Radio, Inc., 144A, 6.000%, due 07/15/24 | | | 25,000 | | | | 25,775 | |
| Sirius XM Radio, Inc., 144A, 5.375%, due 07/15/26 | | | 225,000 | | | | 232,875 | |
| Sirius XM Radio, Inc., 144A, 5.000%, due 08/01/27 | | | 125,000 | | | | 127,031 | |
| Sirius XM Radio, Inc., 144A, 5.500%, due 07/01/29 | | | 30,000 | | | | 30,750 | |
| Sprint Capital Corp., 6.875%, due 11/15/28 | | | 65,000 | | | | 67,356 | |
| Sprint Corp., 7.125%, due 06/15/24 | | | 60,000 | | | | 63,450 | |
| Sprint Corp., 7.625%, due 03/01/26(b) | | | 25,000 | | | | 26,625 | |
| T-Mobile USA, Inc., 6.000%, due 04/15/24 | | | 20,000 | | | | 20,850 | |
| T-Mobile USA, Inc., 6.375%, due 03/01/25 | | | 20,000 | | | | 20,725 | |
| T-Mobile USA, Inc., 5.125%, due 04/15/25 | | | 23,000 | | | | 23,920 | |
| T-Mobile USA, Inc., 6.500%, due 01/15/26 | | | 240,000 | | | | 258,000 | |
| WILSHIRE INCOME OPPORTUNITIES FUND | |
| SCHEDULE OF INVESTMENTS (Continued) | |
| HIGH YIELD CORPORATE OBLIGATIONS - 11.2% (Continued) | | Par Value | | | Value | |
| Communication Services - 1.5% (Continued) | | | | | | | | |
| T-Mobile USA, Inc., 4.500%, due 02/01/26 | | $ | 95,000 | | | $ | 97,256 | |
| T-Mobile USA, Inc., 5.375%, due 04/15/27 | | | 25,000 | | | | 26,750 | |
| | | | | | | | 4,792,748 | |
| Consumer Discretionary - 1.6% | | | | | | | | |
| Allied Universal Holdco, LLC, 144A, 9.750%, due 07/15/27 | | | 15,000 | | | | 14,925 | |
| Amazon.com, Inc., 3.150%, due 08/22/27 | | | 205,000 | | | | 215,380 | |
| AMC Entertainment Holdings, Inc., 5.875%, due 11/15/26(b) | | | 50,000 | | | | 45,000 | |
| Aramark Services, Inc., 5.125%, due 01/15/24 | | | 200,000 | | | | 205,500 | |
| Aramark Services, Inc., 144A, 5.000%, due 04/01/25 | | | 270,000 | | | | 274,725 | |
| Asbury Automotive Group, 6.000%, due 12/15/24 | | | 50,000 | | | | 51,875 | |
| Ashton Woods USA, 144A, 6.750%, due 08/01/25 | | | 25,000 | | | | 23,750 | |
| AV Homes, Inc., 6.625%, due 05/15/22 | | | 25,000 | | | | 25,812 | |
| Beacon Escrow Corp., 144A, 4.875%, due 11/01/25 | | | 100,000 | | | | 99,000 | |
| BMC East, LLC, 144A, 5.500%, due 10/01/24 | | | 25,000 | | | | 25,344 | |
| Builders FirstSource, Inc., 144A, 5.625%, due 09/01/24 | | | 65,000 | | | | 66,787 | |
| Builders FirstSource, Inc., 144A, 6.750%, due 06/01/27 | | | 25,000 | | | | 26,375 | |
| Caesars Report Collection, LLC, 144A, 5.250%, due 10/15/25 | | | 100,000 | | | | 100,000 | |
| Carvana Co., 144A, 8.875%, due 10/01/23 | | | 25,000 | | | | 25,062 | |
| CCM Merger, Inc., 144A, 6.000%, due 03/15/22 | | | 50,000 | | | | 51,187 | |
| Cedar Fair, L.P., 5.375%, due 06/01/24 | | | 50,000 | | | | 51,375 | |
| Cedar Fair, L.P., 144A, 5.250%, due 07/15/29 | | | 40,000 | | | | 40,800 | |
| Cengage Learning, Inc., 144A, 9.500%, due 06/15/24(d) | | | 55,000 | | | | 52,594 | |
| Century Communities, Inc., 5.875%, due 07/15/25 | | | 50,000 | | | | 50,250 | |
| Cimpress N.V., 144A, 7.000%, due 06/15/26 | | | 150,000 | | | | 152,250 | |
| CSC Holdings, LLC, 144A, 5.375%, due 02/01/28 | | | 200,000 | | | | 207,750 | |
| Dana Holding Corp., 5.500%, due 12/15/24 | | | 50,000 | | | | 51,000 | |
| Ecolab, Inc., 1.000%, due 01/15/24 | | | 150,000 | | | | 177,151 | |
| Eldorado Resorts, Inc., 6.000%, due 04/01/25 | | | 45,000 | | | | 47,306 | |
| Golden Entertainment, Inc., 144A, 7.625%, due 04/15/26 | | | 35,000 | | | | 35,875 | |
| Golden Nugget, Inc., 144A, 6.750%, due 10/15/24(b) | | | 125,000 | | | | 128,750 | |
| Graham Holdings Co., 144A, 5.750%, due 06/01/26 | | | 140,000 | | | | 148,050 | |
| Hertz Corp., 7.375%, due 01/15/21 | | | 50,000 | | | | 50,188 | |
| Hilton Domestic Operating Co., Inc., 4.250%, due 09/01/24(b) | | | 125,000 | | | | 126,875 | |
| WILSHIRE INCOME OPPORTUNITIES FUND | |
| SCHEDULE OF INVESTMENTS (Continued) | |
| HIGH YIELD CORPORATE OBLIGATIONS - 11.2% (Continued) | | Par Value | | | Value | |
| Consumer Discretionary - 1.6% (Continued) | | | | | | | | |
| IAA Spinco, Inc., 144A, 5.500%, due 06/15/27 | | $ | 25,000 | | | $ | 26,000 | |
| KFC Holding Co., 144A, 4.750%, due 06/01/27 | | | 125,000 | | | | 128,125 | |
| L Brands, Inc., 6.750%, due 07/01/36 | | | 25,000 | | | | 21,750 | |
| Lennar Corp., 5.375%, due 10/01/22 | | | 25,000 | | | | 26,531 | |
| Lennar Corp., 5.250%, due 06/01/26 | | | 25,000 | | | | 26,469 | |
| Live Nation Entertainment, Inc., 144A, 5.375%, due 06/15/22 | | | 25,000 | | | | 25,375 | |
| LTF Merger Sub, Inc., 144A, 8.500%, due 06/15/23 | | | 45,000 | | | | 46,013 | |
| M/I Homes, Inc., 5.625%, due 08/01/25 | | | 50,000 | | | | 50,375 | |
| McGraw-Hill Global Education Holdings, LLC, 7.875%, due 05/15/24 | | | 245,000 | | | | 225,400 | |
| Men's Wearhouse, Inc. (The), 7.000%, due 07/01/22(b) | | | 40,000 | | | | 38,800 | |
| Meritage Homes Corp., 6.000%, due 06/01/25 | | | 25,000 | | | | 26,875 | |
| MGM Resorts International, 6.000%, due 03/15/23 | | | 25,000 | | | | 27,188 | |
| MGM Resorts International, 5.750%, due 06/15/25 | | | 25,000 | | | | 27,125 | |
| Michaels Stores, Inc., 144A, 8.000%, due 07/15/27 | | | 25,000 | | | | 24,875 | |
| Penn National Gaming, Inc., 144A, 5.625%, due 01/15/27 | | | 25,000 | | | | 24,750 | |
| PetSmart, Inc., 144A, 7.125%, due 03/15/23(d) | | | 30,000 | | | | 28,125 | |
| PetSmart, Inc., 144A, 5.875%, due 06/01/25(b) | | | 65,000 | | | | 63,050 | |
| PGT Escrow Issuer, Inc., 144A, 6.750%, due 08/01/26 | | | 50,000 | | | | 52,938 | |
| Scientific Games International, Inc., 144A, 5.000%, due 10/15/25(b) | | | 50,000 | | | | 50,438 | |
| Six Flags Entertainment Corp., 144A, 5.500%, due 04/15/27 | | | 50,000 | | | | 51,500 | |
| Sonic Automotive, Inc., 6.125%, due 03/15/27 | | | 25,000 | | | | 24,563 | |
| Staples, Inc., 144A, 7.500%, due 04/15/26 | | | 90,000 | | | | 88,875 | |
| Station Casinos, LLC, 144A, 5.000%, due 10/01/25 | | | 50,000 | | | | 50,063 | |
| Tempur Sealy International, Inc., 5.500%, due 06/15/26 | | | 119,000 | | | | 123,463 | |
| United Continental Holdings, Inc., 4.875%, due 01/15/25 | | | 25,000 | | | | 25,575 | |
| Viacom, Inc., 6.250%, due 02/28/57 | | | 325,000 | | | | 337,069 | |
| William Carter, 144A, 5.625%, due 03/15/27(b) | | | 25,000 | | | | 26,188 | |
| WMG Acquisition Corp., 144A, 5.500%, due 04/15/26 | | | 320,000 | | | | 329,600 | |
| Wolverine World Wide, Inc., 144A, 5.000%, due 09/01/26 | | | 25,000 | | | | 24,750 | |
| Yum! Brands, Inc., 144A, 5.000%, due 06/01/24 | | | 110,000 | | | | 113,713 | |
| Yum! Brands, Inc., 144A, 5.250%, due 06/01/26(b) | | | 275,000 | | | | 288,406 | |
| | | | | | | | 4,994,903 | |
| WILSHIRE INCOME OPPORTUNITIES FUND | |
| SCHEDULE OF INVESTMENTS (Continued) | |
| HIGH YIELD CORPORATE OBLIGATIONS - 11.2% (Continued) | | Par Value | | | Value | |
| Consumer Staples - 0.7% | | | | | | | | |
| Albertsons Cos., LLC, 6.625%, due 06/15/24 | | $ | 50,000 | | | $ | 51,750 | |
| Albertsons Cos., LLC, 144A, 7.500%, due 03/15/26 | | | 65,000 | | | | 69,387 | |
| Altria Group, Inc., 5.950%, due 02/14/49 | | | 60,000 | | | | 67,874 | |
| B&G Foods, Inc., 5.250%, due 04/01/25 | | | 70,000 | | | | 70,700 | |
| Central Garden & Pet Co., 5.125%, due 02/01/28 | | | 25,000 | | | | 24,500 | |
| Cott Holdings, Inc., 144A, 5.500%, due 04/01/25 | | | 85,000 | | | | 86,594 | |
| JBS USA LUX/JBS USA Finance, Inc., 144A, 6.750%, due 02/15/28(b) | | | 104,000 | | | | 112,970 | |
| JBS USA, LLC, 144A, 5.750%, due 06/15/25 | | | 5,000 | | | | 5,200 | |
| NBM U.S. Holdings, Inc., 144A, 7.000%, due 05/14/26(b) | | | 500,000 | | | | 525,625 | |
| Pilgrim's Pride Corp., 144A, 5.750%, due 03/15/25 | | | 25,000 | | | | 25,375 | |
| Pilgrim's Pride Corp., 144A, 5.875%, due 09/30/27(b) | | | 95,000 | | | | 98,325 | |
| Post Holdings, Inc., 144A, 5.500%, due 03/01/25 | | | 70,000 | | | | 72,450 | |
| Post Holdings, Inc., 144A, 5.000%, due 08/15/26 | | | 330,000 | | | | 334,950 | |
| Post Holdings, Inc., 144A, 5.750%, due 03/01/27 | | | 445,000 | | | | 458,906 | |
| Post Holdings, Inc., 144A, 5.625%, due 01/15/28(b) | | | 190,000 | | | | 194,988 | |
| Post Holdings, Inc., 144A, 5.500%, due 12/15/29 | | | 25,000 | | | | 25,062 | |
| Simmons Foods, Inc., 144A, 5.750%, due 11/01/24 | | | 25,000 | | | | 22,750 | |
| Spectrum Brands, Inc., 5.750%, due 07/15/25 | | | 25,000 | | | | 25,938 | |
| | | | | | | | 2,273,344 | |
| Energy - 2.3% | | | | | | | | |
| Antero Midstream Partners, L.P., 144A, 5.750%, due 03/01/27 | | | 125,000 | | | | 125,000 | |
| Antero Resources Corp., 5.000%, due 03/01/25(b) | | | 55,000 | | | | 50,875 | |
| Archrock Partners, L.P., 144A, 6.875%, due 04/01/27 | | | 25,000 | | | | 26,125 | |
| Calfrac Holdings, L.P., 144A, 8.500%, due 06/15/26 | | | 50,000 | | | | 34,875 | |
| Cheniere Corpus Christi Holdings, LLC, 5.125%, due 06/30/27 | | | 60,000 | | | | 65,175 | |
| Cheniere Energy Partners, L.P., 144A, 5.250%, due 10/01/25 | | | 45,000 | | | | 46,519 | |
| Cheniere Energy Partners, L.P., 144A, 5.625%, due 10/01/26 | | | 85,000 | | | | 89,462 | |
| Chesapeake Energy Corp., 7.000%, due 10/01/24(b) | | | 325,000 | | | | 290,875 | |
| Chesapeake Energy Corp., 8.000%, due 01/15/25(b) | | | 25,000 | | | | 23,062 | |
| Chesapeake Energy Corp., 144A, 8.000%, due 03/15/26 | | | 280,000 | | | | 254,100 | |
| WILSHIRE INCOME OPPORTUNITIES FUND | |
| SCHEDULE OF INVESTMENTS (Continued) | |
| HIGH YIELD CORPORATE OBLIGATIONS - 11.2% (Continued) | | Par Value | | | Value | |
| Energy - 2.3% (Continued) | | | | | | | | |
| Chesapeake Energy Corp., 5.500%, due 09/15/26 | | $ | 251,000 | | | $ | 200,936 | |
| Chesapeake Energy Corp., 8.000%, due 06/15/27(b) | | | 460,000 | | | | 402,500 | |
| Crestwood Midstream Partners, L.P., CV, 6.250%, due 04/01/23 | | | 25,000 | | | | 25,500 | |
| DCP Midstream Operating, L.P., 3.875%, due 03/15/23(b) | | | 20,000 | | | | 20,225 | |
| DCP Midstream Operating, L.P., 5.375%, due 07/15/25 | | | 400,000 | | | | 421,000 | |
| DCP Midstream Operating, L.P., 5.125%, due 05/15/29 | | | 200,000 | | | | 205,500 | |
| Delek Logistics Partners, L.P., CV, 6.750%, due 05/15/25 | | | 75,000 | | | | 74,437 | |
| Diamondback Energy, Inc., 144A, 4.750%, due 11/01/24 | | | 145,000 | | | | 148,988 | |
| Diamondback Energy, Inc., 5.375%, due 05/31/25(b) | | | 490,000 | | | | 515,112 | |
| Eclipse Resources Corp., 8.875%, due 07/15/23 | | | 25,000 | | | | 21,312 | |
| Endeavor Energy Resources, L.P., 144A, 5.750%, due 01/30/28 | | | 25,000 | | | | 26,406 | |
| EnLink Midstream, LLC, 5.375%, due 06/01/29 | | | 25,000 | | | | 25,609 | |
| Enviva Partners, L.P., 8.500%, due 11/02/21 | | | 25,000 | | | | 25,937 | |
| FTS International, Inc., 6.250%, due 05/01/22 | | | 90,000 | | | | 83,700 | |
| Gulfport Energy Corp., 6.375%, due 05/15/25 | | | 55,000 | | | | 42,144 | |
| Gulfport Energy Corp., 6.375%, due 01/15/26 | | | 25,000 | | | | 18,937 | |
| Hess Infrastructure Partners, L.P., 144A, 5.625%, due 02/15/26 | | | 25,000 | | | | 25,750 | |
| Hilcorp Energy I, L.P., 144A, 6.250%, due 11/01/28 | | | 65,000 | | | | 65,406 | |
| Hill-Rom Holdings, Inc., 144A, 5.750%, due 09/01/23(b) | | | 50,000 | | | | 51,625 | |
| Lonestar Resources America, Inc., 144A, 11.250%, due 01/01/23 | | | 50,000 | | | | 47,250 | |
| Magnolia Oil and Gas Operating, 144A, 6.000%, due 08/01/26 | | | 75,000 | | | | 76,500 | |
| MPLX, L.P., 4.000%, due 03/15/28 | | | 430,000 | | | | 444,789 | |
| Murphy Oil Corp., 6.875%, due 08/15/24 | | | 219,000 | | | | 229,612 | |
| Murphy Oil USA, Inc., 5.625%, due 05/01/27 | | | 25,000 | | | | 26,000 | |
| Murray Energy Corp., 144A, 11.250%, due 04/15/21 | | | 50,000 | | | | 16,063 | |
| Oasis Petroleum, Inc., 6.875%, due 03/15/22 | | | 35,000 | | | | 34,913 | |
| Oasis Petroleum, Inc., CV, 2.625%, due 09/15/23 | | | 190,000 | | | | 173,549 | |
| Parsley Energy, LLC, 144A, 5.375%, due 01/15/25 | | | 350,000 | | | | 358,750 | |
| Parsley Energy, LLC, 144A, 5.625%, due 10/15/27(b) | | | 390,000 | | | | 405,600 | |
| PBF Holding Co., LLC, 7.250%, due 06/15/25 | | | 365,000 | | | | 381,425 | |
| WILSHIRE INCOME OPPORTUNITIES FUND | |
| SCHEDULE OF INVESTMENTS (Continued) | |
| HIGH YIELD CORPORATE OBLIGATIONS - 11.2% (Continued) | | Par Value | | | Value | |
| Energy - 2.3% (Continued) | | | | | | | | |
| PBF Logistics, L.P., 6.875%, due 05/15/23(b) | | $ | 25,000 | | | $ | 25,781 | |
| Peabody Securities Finance Corp., 144A, 6.000%, due 03/31/22(b) | | | 130,000 | | | | 132,925 | |
| QEP Resources, Inc., 5.625%, due 03/01/26 | | | 30,000 | | | | 28,200 | |
| SM Energy Co., CV, 1.500%, due 07/01/21 | | | 150,000 | | | | 137,499 | |
| SM Energy Co., 6.625%, due 01/15/27 | | | 375,000 | | | | 345,938 | |
| Sunoco, L.P., 144A, 6.000%, due 04/15/27(b) | | | 35,000 | | | | 36,750 | |
| Sunoco, L.P. / Sunoco Finance Corp., 144A, 5.500%, due 02/15/26 | | | 25,000 | | | | 26,031 | |
| Tallgrass Energy Partners, L.P., 144A, 5.500%, due 01/15/28 | | | 25,000 | | | | 25,281 | |
| Targa Resources Partners, L.P., 5.875%, due 04/15/26 | | | 190,000 | | | | 201,400 | |
| Targa Resources Partners, L.P., 144A, 6.500%, due 07/15/27(b) | | | 5,000 | | | | 5,450 | |
| Targa Resources Partners, L.P., 144A, 6.875%, due 01/15/29 | | | 20,000 | | | | 22,150 | |
| USA Compression Partners, L.P., 144A, 6.875%, due 09/01/27(b) | | | 95,000 | | | | 99,750 | |
| Vistra Operations Co., LLC, 144A, 5.000%, due 07/31/27 | | | 60,000 | | | | 62,175 | |
| WPX Energy, Inc., 5.750%, due 06/01/26 | | | 380,000 | | | | 394,250 | |
| | | | | | | | 7,145,123 | |
| Financials - 1.4% | | | | | | | | |
| Alexandria Real Estate Equities, Inc., 4.000%, due 01/15/24 | | | 120,000 | | | | 126,929 | |
| Alexandria Real Estate Equities, Inc., 4.850%, due 04/15/49 | | | 25,000 | | | | 28,417 | |
| Alliant Holdings Intermediate, LLC, 144A, 8.250%, due 08/01/23 | | | 60,000 | | | | 61,350 | |
| Ally Financial, Inc., 5.750%, due 11/20/25 | | | 50,000 | | | | 55,375 | |
| American Express Co., 3.400%, due 02/22/24 | | | 125,000 | | | | 130,109 | |
| Athene Global Funding, 144A, 3.000%, due 07/01/22 | | | 120,000 | | | | 121,300 | |
| Bank of America Corp., 3.419%, due 12/20/28 | | | 381,000 | | | | 392,047 | |
| Bank of America Corp., 3.974%, due 02/07/30(b) | | | 60,000 | | | | 64,125 | |
| Berkshire Hathaway Finance Corp., 2.375%, due 06/19/39 | | | 120,000 | | | | 154,975 | |
| CFX Escrow Corp., 144A, 6.000%, due 02/15/24 | | | 20,000 | | | | 21,175 | |
| CFX Escrow Corp., 144A, 6.375%, due 02/15/26 | | | 60,000 | | | | 64,275 | |
| CIT Group, Inc., 5.250%, due 03/07/25(b) | | | 25,000 | | | | 27,406 | |
| WILSHIRE INCOME OPPORTUNITIES FUND | |
| SCHEDULE OF INVESTMENTS (Continued) | |
| HIGH YIELD CORPORATE OBLIGATIONS - 11.2% (Continued) | | Par Value | | | Value | |
| Financials - 1.4% (Continued) | | | | | | | | |
| Citigroup, Inc., 0.164% (3MO EURIBOR + 50), due 03/21/23(c) | | $ | 170,000 | | | $ | 193,534 | |
| Eagle Holding Co. II, LLC, 144A, 7.625%, due 05/15/22 | | | 25,000 | | | | 25,312 | |
| Eagle Holding Co. II, LLC, 144A, 7.750%, due 05/15/22(b) | | | 40,000 | | | | 40,500 | |
| ESH Hospitality, Inc., 144A, 5.250%, due 05/01/25(b) | | | 295,000 | | | | 302,006 | |
| Fidelity National Information Service, Inc., 1.500%, due 05/21/27 | | | 100,000 | | | | 118,756 | |
| Fiserv, Inc., 1.125%, due 07/01/27 | | | 100,000 | | | | 115,296 | |
| Goldman Sachs Group, Inc. (The), 3.625%, due 02/20/24 | | | 125,000 | | | | 130,225 | |
| Hub International Ltd., 144A, 7.000%, due 05/01/26 | | | 35,000 | | | | 35,481 | |
| Icahn Enterprises, L.P., 6.375%, due 12/15/25(b) | | | 35,000 | | | | 35,656 | |
| Icahn Enterprises, L.P., 144A, 6.250%, due 05/15/26 | | | 85,000 | | | | 85,850 | |
| Lions Gate Capital Holdings, LLC, 144A, 6.375%, due 02/01/24 | | | 345,000 | | | | 362,681 | |
| Lions Gate Capital Holdings, LLC, 144A, 5.875%, due 11/01/24 | | | 103,000 | | | | 105,833 | |
| MGM Growth Properties Operating Partnership, L.P./MGP Finance Co. Issuer, Inc., 5.625%, due 05/01/24(b) | | | 50,000 | | | | 53,875 | |
| Nationstar Mortgage Holdings, Inc., 144A, 8.125%, due 07/15/23 | | | 45,000 | | | | 45,788 | |
| NFP Corp., 144A, 6.875%, due 07/15/25 | | | 80,000 | | | | 79,000 | |
| Quicken Loans, Inc., 144A, 5.250%, due 01/15/28(b) | | | 50,000 | | | | 49,704 | |
| Realogy Group, LLC, 144A, 5.250%, due 12/01/21(b) | | | 25,000 | | | | 24,219 | |
| Springleaf Finance Corp., 7.125%, due 03/15/26 | | | 50,000 | | | | 54,500 | |
| Springleaf Finance Corp., 6.625%, due 01/15/28(b) | | | 40,000 | | | | 42,000 | |
| SunTrust Banks, Inc., 5.050%, due 12/31/49 | | | 225,000 | | | | 221,625 | |
| Synovus Financial Corp., 5.750% (3MO LIBOR + 418.20), due 12/15/25(c) | | | 300,000 | | | | 305,322 | |
| Tempo Acquisition, LLC, 144A, 6.750%, due 06/01/25 | | | 80,000 | | | | 82,400 | |
| U.S. Bancorp, 0.850%, due 06/07/24 | | | 100,000 | | | | 117,391 | |
| U.S. Bank National Association, 2.650%, due 05/23/22 | | | 705,000 | | | | 714,152 | |
| | | | | | | | 4,588,589 | |
| Health Care - 0.6% | | | | | | | | |
| AbbVie, Inc., 4.700%, due 05/14/45 | | | 65,000 | | | | 66,131 | |
| WILSHIRE INCOME OPPORTUNITIES FUND | |
| SCHEDULE OF INVESTMENTS (Continued) | |
| HIGH YIELD CORPORATE OBLIGATIONS - 11.2% (Continued) | | Par Value | | | Value | |
| Health Care - 0.6% (Continued) | | | | | | | | |
| AbbVie, Inc., 4.875%, due 11/14/48 | | $ | 260,000 | | | $ | 271,849 | |
| Anthem, Inc., 2.750%, due 10/15/42 | | | 47,000 | | | | 182,916 | |
| Bausch Health Cos., Inc., 144A, 7.000%, due 03/15/24(b) | | | 15,000 | | | | 15,900 | |
| Catalent Pharma Solutions, Inc., 144A, 5.000%, due 07/15/27(b) | | | 15,000 | | | | 15,262 | |
| Centene Corp., 4.750%, due 01/15/25 | | | 55,000 | | | | 56,650 | |
| Centene Corp., 144A, 5.375%, due 06/01/26 | | | 85,000 | | | | 89,250 | |
| DaVita, Inc., 5.125%, due 07/15/24 | | | 35,000 | | | | 35,000 | |
| HCA, Inc., 6.250%, due 02/15/21 | | | 250,000 | | | | 261,875 | |
| HCA, Inc., 7.500%, due 02/15/22(b) | | | 58,000 | | | | 63,945 | |
| HCA, Inc., 5.375%, due 02/01/25 | | | 365,000 | | | | 393,744 | |
| HCA, Inc., 5.375%, due 09/01/26 | | | 115,000 | | | | 123,912 | |
| Molina Healthcare, Inc., 5.375%, due 11/15/22(b) | | | 25,000 | | | | 26,063 | |
| MPH Acquisition Holdings, LLC, 144A, 7.125%, due 06/01/24 | | | 90,000 | | | | 84,375 | |
| Par Pharmaceutical, Inc., 144A, 7.500%, due 04/01/27 | | | 30,000 | | | | 29,475 | |
| Polaris Intermediate Corp., 144A, 8.500%, due 12/01/22 | | | 25,000 | | | | 22,063 | |
| UnitedHealth Group, Inc., 4.125%, due 06/15/29 | | | 65,000 | | | | 66,819 | |
| Vizient, Inc., 144A, 6.250%, due 05/15/27(b) | | | 10,000 | | | | 10,563 | |
| WellCare Health Plans, Inc., 144A, 5.375%, due 08/15/26(b) | | | 90,000 | | | | 95,400 | |
| West Street Merger Sub, Inc., 144A, 6.375%, due 09/01/25 | | | 40,000 | | | | 37,000 | |
| | | | | | | | 1,948,192 | |
| Industrials - 0.8% | | | | | | | | |
| Advanced Disposal Services, Inc., 144A, 5.625%, due 11/15/24 | | | 50,000 | | | | 52,250 | |
| AECOM, 5.875%, due 10/15/24 | | | 275,000 | | | | 297,344 | |
| AECOM, 5.125%, due 03/15/27 | | | 520,000 | | | | 540,150 | |
| Allison Transmission, Inc., 144A, 5.875%, due 06/01/29 | | | 15,000 | | | | 15,769 | |
| Amsted Industries, 144A, 5.625%, due 07/01/27 | | | 15,000 | | | | 15,600 | |
| Avantor, Inc., 144A, 9.000%, due 10/01/25 | | | 40,000 | | | | 44,500 | |
| Clean Harbors, Inc., 144A, 4.875%, due 07/15/27 | | | 40,000 | | | | 40,600 | |
| Crown Americas Capital Corp. IV, 4.500%, due 01/15/23 | | | 270,000 | | | | 279,788 | |
| Crown Cork & Seal Co., Inc., 7.375%, due 12/15/26 | | | 175,000 | | | | 203,875 | |
| Delta Airlines, Inc., 3.625%, due 03/15/22 | | | 115,000 | | | | 116,928 | |
| Flex Acquisition Co., Inc., 144A, 6.875%, due 01/15/25(b) | | | 35,000 | | | | 31,762 | |
| WILSHIRE INCOME OPPORTUNITIES FUND | |
| SCHEDULE OF INVESTMENTS (Continued) | |
| HIGH YIELD CORPORATE OBLIGATIONS - 11.2% (Continued) | | Par Value | | | Value | |
| Industrials - 0.8% (Continued) | | | | | | | | |
| FXI Holdings, Inc., 7.875%, due 11/01/24 | | $ | 35,000 | | | $ | 32,637 | |
| H&E Equipment Services, Inc., 5.625%, due 09/01/25 | | | 50,000 | | | | 51,375 | |
| Indigo Natural Resources, LLC, 144A, 6.875%, due 02/15/26(b) | | | 105,000 | | | | 93,975 | |
| Itron, Inc., 144A, 5.000%, due 01/15/26 | | | 50,000 | | | | 51,000 | |
| Navistar International Corp., 144A, 6.625%, due 11/01/25 | | | 50,000 | | | | 52,375 | |
| Novelis Corp., 144A, 5.875%, due 09/30/26(b) | | | 50,000 | | | | 50,625 | |
| Resideo Funding, Inc., 144A, 6.125%, due 11/01/26 | | | 50,000 | | | | 51,825 | |
| Stevens Holding Co., Inc., 144A, 6.125%, due 10/01/26 | | | 25,000 | | | | 26,313 | |
| Tenet Healthcare Corp., 6.750%, due 06/15/23(b) | | | 25,000 | | | | 25,125 | |
| TransDigm, Inc., 6.500%, due 05/15/25(b) | | | 25,000 | | | | 25,281 | |
| TransDigm, Inc., 144A, 6.250%, due 03/15/26 | | | 15,000 | | | | 15,675 | |
| TransDigm, Inc., 6.375%, due 06/15/26(b) | | | 15,000 | | | | 15,187 | |
| United Rentals North America, Inc., 4.625%, due 10/15/25 | | | 75,000 | | | | 76,219 | |
| United Rentals North America, Inc., 6.500%, due 12/15/26 | | | 35,000 | | | | 37,887 | |
| United Rentals North America, Inc., 5.500%, due 05/15/27 | | | 275,000 | | | | 289,094 | |
| United Rentals North America, Inc., 5.250%, due 01/15/30(b) | | | 60,000 | | | | 61,575 | |
| Zekelman Industries, Inc., 144A, 9.875%, due 06/15/23 | | | 25,000 | | | | 26,344 | |
| | | | | | | | 2,621,078 | |
| Information Technology - 0.8% | | | | | | | | |
| Ascend Learning, LLC, 144A, 6.875%, due 08/01/25 | | | 25,000 | | | | 25,437 | |
| CDK Global, Inc., 144A, 5.250%, due 05/15/29 | | | 20,000 | | | | 20,600 | |
| CDW, LLC, 5.000%, due 09/01/25 | | | 35,000 | | | | 36,444 | |
| Change Healthcare Holdings, LLC, 144A, 5.750%, due 03/01/25(b) | | | 50,000 | | | | 50,750 | |
| CommScope Finance, LLC, 144A, 5.500%, due 03/01/24 | | | 75,000 | | | | 76,969 | |
| CommScope Technologies, LLC, 144A, 6.000%, due 06/15/25(b) | | | 25,000 | | | | 23,375 | |
| Dell International, LLC, 144A, 7.125%, due 06/15/24(b) | | | 25,000 | | | | 26,375 | |
| Dell International, LLC, 144A, 5.300%, due 10/01/29(b) | | | 380,000 | | | | 399,199 | |
| Donnelley Financial Solutions, Inc., 8.250%, due 10/15/24 | | | 25,000 | | | | 25,812 | |
| First Data Corp., 144A, 5.750%, due 01/15/24 | | | 60,000 | | | | 61,725 | |
| GCI, LLC, 144A, 6.625%, due 06/15/24 | | | 290,000 | | | | 303,413 | |
| WILSHIRE INCOME OPPORTUNITIES FUND | |
| SCHEDULE OF INVESTMENTS (Continued) | |
| HIGH YIELD CORPORATE OBLIGATIONS - 11.2% (Continued) | | Par Value | | | Value | |
| Information Technology - 0.8% (Continued) | | | | | | | | |
| GOGO Intermediate Holdings, LLC, 144A, 9.875%, due 05/01/24 | | $ | 55,000 | | | $ | 56,581 | |
| Greeneden U.S. Holdings II, LLC, 144A, 10.000%, due 11/30/24 | | | 60,000 | | | | 65,100 | |
| IBM Corp., 2.750%, due 12/21/20 | | | 96,000 | | | | 124,701 | |
| Informatica, LLC, 144A, 7.125%, due 07/15/23 | | | 80,000 | | | | 81,400 | |
| KLA-Tencor Corp., 4.100%, due 03/15/29 | | | 250,000 | | | | 263,926 | |
| MSCI, Inc., 144A, 5.750%, due 08/15/25 | | | 25,000 | | | | 26,250 | |
| Plantronics, Inc., 5.500%, due 05/31/23(b) | | | 50,000 | | | | 49,813 | |
| Quintiles Transnational Corp., 144A, 4.875%, due 05/15/23 | | | 120,000 | | | | 123,150 | |
| Refinitiv U.S. Holdings, Inc., 144A, 6.250%, due 05/15/26(b) | | | 80,000 | | | | 82,400 | |
| Refinitiv U.S. Holdings, Inc., 144A, 8.250%, due 11/15/26(b) | | | 235,000 | | | | 242,050 | |
| RP Crown Parent, LLC, 144A, 7.375%, due 10/15/24 | | | 25,000 | | | | 26,000 | |
| SS&C Technologies, Inc., 144A, 5.500%, due 09/30/27(b) | | | 25,000 | | | | 25,938 | |
| Star Merger Sub, Inc., 144A, 6.875%, due 08/15/26(b) | | | 50,000 | | | | 52,812 | |
| Verscend Holding Corp., 144A, 9.750%, due 08/15/26 | | | 92,000 | | | | 95,680 | |
| Viasat, Inc., 144A, 5.625%, due 04/15/27 | | | 5,000 | | | | 5,200 | |
| ViaSat, Inc., 144A, 5.625%, due 09/15/25 | | | 25,000 | | | | 24,563 | |
| | | | | | | | 2,395,663 | |
| Materials - 1.0% | | | | | | | | |
| Aruba Investments, Inc., 144A, 8.750%, due 02/15/23 | | | 25,000 | | | | 25,000 | |
| Ball Corp., 4.375%, due 12/15/20(b) | | | 125,000 | | | | 127,344 | |
| Ball Corp., 4.000%, due 11/15/23(b) | | | 360,000 | | | | 373,050 | |
| Ball Corp., 5.250%, due 07/01/25 | | | 355,000 | | | | 383,400 | |
| Ball Corp., 4.875%, due 03/15/26(b) | | | 285,000 | | | | 302,100 | |
| Berry Global Escrow Corp., 144A, 5.625%, due 07/15/27(b) | | | 25,000 | | | | 25,969 | |
| BWAY Holding Co., 144A, 7.250%, due 04/15/25(b) | | | 25,000 | | | | 24,125 | |
| Chemours Co. (The), 5.375%, due 05/15/27(b) | | | 40,000 | | | | 38,100 | |
| Cleveland-Cliffs, Inc., 5.750%, due 03/01/25 | | | 50,000 | | | | 49,687 | |
| Cornerstone Chemical Co., 144A, 6.750%, due 08/15/24 | | | 45,000 | | | | 42,187 | |
| Freeport-McMoRan, Inc., 4.550%, due 11/14/24(b) | | | 25,000 | | | | 25,531 | |
| Freeport-McMoRan, Inc., 5.400%, due 11/14/34 | | | 400,000 | | | | 381,000 | |
| Freeport-McMoRan, Inc., 5.450%, due 03/15/43 | | | 400,000 | | | | 367,000 | |
| Koppers, Inc., 144A, 6.000%, due 02/15/25 | | | 50,000 | | | | 46,938 | |
| Olin Corp., 5.125%, due 09/15/27(b) | | | 50,000 | | | | 51,250 | |
| WILSHIRE INCOME OPPORTUNITIES FUND | |
| SCHEDULE OF INVESTMENTS (Continued) | |
| HIGH YIELD CORPORATE OBLIGATIONS - 11.2% (Continued) | | Par Value | | | Value | |
| Materials - 1.0% (Continued) | | | | | | | | |
| Owens-Brockway Glass Container, Inc., 144A, 5.875%, due 08/15/23 | | $ | 50,000 | | | $ | 53,688 | |
| Rayonier A.M. Product, Inc., 144A, 5.500%, due 06/01/24(b) | | | 60,000 | | | | 51,300 | |
| Reynolds Group Issuer, Inc., 144A, 5.125%, due 07/15/23(b) | | | 25,000 | | | | 25,438 | |
| Schweitzer Mauduit International, 144A, 6.875%, due 10/01/26 | | | 50,000 | | | | 51,185 | |
| Sealed Air Corp., 144A, 6.500%, due 12/01/20 | | | 200,000 | | | | 207,500 | |
| Sealed Air Corp., 144A, 5.125%, due 12/01/24 | | | 355,000 | | | | 372,750 | |
| Sealed Air Corp., 144A, 5.500%, due 09/15/25 | | | 44,000 | | | | 46,860 | |
| Summit Materials, LLC, 144A, 5.125%, due 06/01/25 | | | 50,000 | | | | 50,125 | |
| SunCoke Energy Partners, L.P., 144A, 7.500%, due 06/15/25 | | | 20,000 | | | | 19,500 | |
| Tronox, Inc., 144A, 6.500%, due 04/15/26 | | | 25,000 | | | | 24,750 | |
| | | | | | | | 3,165,777 | |
| Real Estate - 0.1% | | | | | | | | |
| Brookfield Property REIT, Inc., 144A, 5.750%, due 05/15/26 | | | 134,000 | | | | 138,080 | |
| SBA Communications Corp., 4.875%, due 09/01/24 | | | 230,000 | | | | 236,325 | |
| | | | | | | | 374,405 | |
| Utilities - 0.4% | | | | | | | | |
| Brooklyn Union Gas Co. (The), 144A, 4.487%, due 03/04/49(b) | | | 55,000 | | | | 61,741 | |
| Calpine Corp., 144A, 5.250%, due 06/01/26 | | | 65,000 | | | | 66,137 | |
| NGL Energy Partners, L.P., 144A, 7.500%, due 04/15/26 | | | 30,000 | | | | 31,200 | |
| NRG Energy, Inc., 6.625%, due 01/15/27(b) | | | 375,000 | | | | 407,344 | |
| NRG Energy, Inc., 5.750%, due 01/15/28 | | | 65,000 | | | | 70,038 | |
| NRG Energy, Inc., 144A, 5.250%, due 06/15/29(b) | | | 50,000 | | | | 53,375 | |
| NRG Energy, Inc., 144A, 2.750%, due 06/01/48(b) | | | 200,000 | | | | 211,910 | |
| Vistra Operations Co., LLC, 144A, 5.500%, due 09/01/26(b) | | | 120,000 | | | | 126,750 | |
| Vistra Operations Co., LLC, 144A, 5.625%, due 02/15/27(b) | | | 145,000 | | | | 153,519 | |
| | | | | | | | 1,182,014 | |
| | | | | | | | | |
| Total High Yield Corporate Obligations(Cost $34,476,166) | | | | | | $ | 35,481,836 | |
| WILSHIRE INCOME OPPORTUNITIES FUND | |
| SCHEDULE OF INVESTMENTS (Continued) | |
| FOREIGN BONDS - 23.5% | | Par Value | | | Value | |
| Argentina - 0.9% | | | | | | | | |
| Argentine Republic Government International Bond, 6.875%, due 01/26/27 | | $ | 700,000 | | | $ | 554,750 | |
| Argentine Republic Government International Bond, 5.875%, due 01/11/28 | | | 200,000 | | | | 150,750 | |
| Banco Macro S.A., 6.750%, due 11/04/26 | | | 550,000 | | | | 472,379 | |
| Pampa Energie S.A., 7.500%, due 01/24/27 | | | 600,000 | | | | 553,500 | |
| Provincia de Buenos Aires, 7.875%, due 06/15/27 | | | 700,000 | | | | 513,625 | |
| YPF S.A., 8.500%, due 07/28/25(b) | | | 500,000 | | | | 496,875 | |
| YPF S.A., 6.950%, due 07/21/27 | | | 250,000 | | | | 226,875 | |
| | | | | | | | 2,968,754 | |
| Australia - 0.4% | | | | | | | | |
| Asian Development Bank, 5.000%, due 03/09/22 | | | 110,000 | | | | 84,712 | |
| Commonwealth Bank of Australia, 144A, 3.900%, due 07/12/47 | | | 45,000 | | | | 48,493 | |
| Inter-American Development Bank, 6.500%, due 08/20/19 | | | 290,000 | | | | 205,010 | |
| International Bank for Reconstruction & Development, 2.500%, due 03/12/20 | | | 280,000 | | | | 198,235 | |
| International Bank for Reconstruction & Development, 2.800%, due 01/13/21 | | | 125,000 | | | | 89,771 | |
| International Finance Corp., 2.800%, due 08/15/22 | | | 310,000 | | | | 227,312 | |
| Queensland Treasury Corp., 6.250%, due 02/21/20 | | | 175,000 | | | | 126,833 | |
| Queensland Treasury Corp., 5.500%, due 06/21/21 | | | 515,000 | | | | 392,002 | |
| | | | | | | | 1,372,368 | |
| Austria - 0.2% | | | | | | | | |
| Austria (Republic of), 0.500%, due 02/20/29 | | | 230,000 | | | | 275,404 | |
| ESAL GmbH, 6.250%, due 02/05/23 | | | 200,000 | | | | 204,000 | |
| JBS Investments GmbH, 7.250%, due 04/03/24 | | | 200,000 | | | | 206,750 | |
| | | | | | | | 686,154 | |
| Bermuda - 0.5% | | | | | | | | |
| Digicel Group Ltd., 144A, 9.125%, due 04/01/24(d) | | | 602,566 | | | | 126,539 | |
| Geopark Ltd., 6.500%, due 09/21/24 | | | 600,000 | | | | 613,500 | |
| IHS Markit Ltd., 4.750%, due 08/01/28 | | | 135,000 | | | | 147,319 | |
| Inkia Energy Ltd., 5.875%, due 11/09/27 | | | 400,000 | | | | 408,000 | |
| Viking Cruises Ltd., 144A, 5.875%, due 09/15/27 | | | 110,000 | | | | 111,375 | |
| | | | | | | | 1,406,733 | |
| WILSHIRE INCOME OPPORTUNITIES FUND | |
| SCHEDULE OF INVESTMENTS (Continued) | |
| FOREIGN BONDS - 23.5% (Continued) | | Par Value | | | Value | |
| Brazil - 1.3% | | | | | | | | |
| Banco BTG Pactual S.A., 144A, 7.750%, due 02/15/29 | | $ | 600,000 | | | $ | 624,455 | |
| Banco de Brasil S.A., 6.250%, due 12/31/49 | | | 700,000 | | | | 662,375 | |
| Brazil Notas do Tesouro Nacional, 10.000%, due 01/01/21 | | | 1,865 | | | | 536,267 | |
| Brazil Notas do Tesouro Nacional, 10.000%, due 01/01/23 | | | 4,560 | | | | 1,364,612 | |
| Federative Republic of Brazil, 4.500%, due 05/30/29(b) | | | 335,000 | | | | 343,790 | |
| Itau Unibanco Holding S.A., 6.500%, due 12/31/49(b) | | | 600,000 | | | | 615,960 | |
| | | | | | | | 4,147,459 | |
| Canada - 2.4% | | | | | | | | |
| ATS Automation Tooling Systems, Inc., 144A, 6.500%, due 06/15/23 | | | 50,000 | | | | 51,625 | |
| Bank of Montreal, 3.803%, due 12/15/32 | | | 65,000 | | | | 65,837 | |
| Bank of Nova Scotia (The), 3.400%, due 02/11/24(b) | | | 125,000 | | | | 129,997 | |
| Bausch Health Cos., Inc., 144A, 5.500%, due 11/01/25 | | | 25,000 | | | | 26,000 | |
| Bausch Health Cos., Inc., 144A, 8.500%, due 01/31/27(b) | | | 25,000 | | | | 27,438 | |
| Bausch Health Cos., Inc., 144A, 5.750%, due 08/15/27(b) | | | 40,000 | | | | 41,900 | |
| Bausch Health Cos., Inc., 144A, 7.000%, due 01/15/28(b) | | | 40,000 | | | | 41,450 | |
| Bausch Health Cos., Inc., 144A, 7.250%, due 05/30/29 | | | 40,000 | | | | 41,500 | |
| BC ULC/New Red Finance, Inc., 144A, 4.625%, due 01/15/22 | | | 300,000 | | | | 300,750 | |
| BC ULC/New Red Finance, Inc., 144A, 4.250%, due 05/15/24(b) | | | 325,000 | | | | 328,656 | |
| BC ULC/New Red Finance, Inc., 144A, 5.000%, due 10/15/25 | | | 492,000 | | | | 495,690 | |
| Bombardier, Inc., 144A, 8.750%, due 12/01/21 | | | 25,000 | | | | 27,187 | |
| Bombardier, Inc., 6.000%, due 10/15/22(b) | | | 40,000 | | | | 40,100 | |
| Canacol Energy Ltd., 144A, 7.250%, due 05/03/25 | | | 200,000 | | | | 207,250 | |
| Canacol Energy Ltd., 7.250%, due 05/03/25 | | | 400,000 | | | | 414,500 | |
| Canada Housing Trust No. 1, 2.350%, due 06/15/23 | | | 305,000 | | | | 238,696 | |
| Canadian Government, 1.250%, due 11/01/19 | | | 570,000 | | | | 434,680 | |
| Canadian Government, 0.750%, due 09/01/20 | | | 920,000 | | | | 695,414 | |
| Canadian Government, 2.250%, due 03/01/24 | | | 1,311,000 | | | | 1,039,555 | |
| Cascades, Inc., 5.500%, due 07/15/22 | | | 25,000 | | | | 25,094 | |
| Cenovus Energy, Inc., 5.250%, due 06/15/37 | | | 250,000 | | | | 260,000 | |
| Cenovus Energy, Inc., 5.400%, due 06/15/47 | | | 60,000 | | | | 64,800 | |
| Emera, Inc., 6.750%, due 06/15/76 | | | 604,000 | | | | 647,790 | |
| Enbridge, Inc., 6.000%, due 01/15/77 | | | 240,000 | | | | 240,600 | |
| WILSHIRE INCOME OPPORTUNITIES FUND | |
| SCHEDULE OF INVESTMENTS (Continued) | |
| FOREIGN BONDS - 23.5% (Continued) | | Par Value | | | Value | |
| Canada - 2.4% (Continued) | | | | | | | | |
| GFL Environmental, Inc., 144A, 8.500%, due 05/01/27 | | $ | 45,000 | | | $ | 48,375 | |
| GW Honos Security Corp., 144A, 8.750%, due 05/15/25 | | | 70,000 | | | | 69,212 | |
| Masonite International Corp., 144A, 5.625%, due 03/15/23 | | | 90,000 | | | | 92,700 | |
| MDC Partners, Inc., 144A, 6.500%, due 05/01/24 | | | 25,000 | | | | 23,000 | |
| Norbord, Inc., 144A, 5.750%, due 07/15/27 | | | 25,000 | | | | 25,156 | |
| Nutrien Ltd., 4.200%, due 04/01/29(b) | | | 55,000 | | | | 59,348 | |
| Open Text Corp., 144A, 5.875%, due 06/01/26 | | | 50,000 | | | | 53,000 | |
| Parkland Fuel Corp., 144A, 5.875%, due 07/15/27 | | | 45,000 | | | | 45,718 | |
| Province of British Columbia, 144A, 6.600%, due 01/09/20 | | | 9,200,000 | | | | 132,948 | |
| Province of Ontario, 3.500%, due 06/02/24 | | | 440,000 | | | | 361,986 | |
| Stoneway Capital Corp., 10.000%, due 03/01/27 | | | 462,753 | | | | 435,566 | |
| Teck Resources Ltd., 5.200%, due 03/01/42 | | | 25,000 | | | | 25,313 | |
| Telesat Canada, LLC, 144A, 8.875%, due 11/15/24 | | | 85,000 | | | | 92,013 | |
| Tervita Escrow Corp., 144A, 7.625%, due 12/01/21 | | | 100,000 | | | | 101,625 | |
| Vermilion Energy, Inc., 144A, 5.625%, due 03/15/25 | | | 50,000 | | | | 49,000 | |
| | | | | | | | 7,501,469 | |
| Cayman Islands - 0.9% | | | | | | | | |
| Avolon Holdings Funding Ltd., 144A, 5.125%, due 10/01/23 | | | 25,000 | | | | 26,488 | |
| Avolon Holdings Funding Ltd., 144A, 5.250%, due 05/15/24 | | | 95,000 | | | | 101,294 | |
| Avolon Holdings Funding Ltd., 144A, 3.950%, due 07/01/24 | | | 60,000 | | | | 61,396 | |
| CNS Islands XII Corp., 7.000%, due 12/31/49 | | | 300,000 | | | | 268,500 | |
| Cosan Overseas Ltd., 8.250%, due 11/29/49 | | | 200,000 | | | | 206,000 | |
| Energuate Trust, 5.875%, due 05/03/27 | | | 200,000 | | | | 203,750 | |
| Gran Tierra Energy International Holdings Ltd., 6.250%, due 02/15/25 | | | 400,000 | | | | 373,500 | |
| Guanay Finance Ltd., 6.000%, due 12/15/20 | | | 332,726 | | | | 336,885 | |
| Industrial Senior Trust, 5.500%, due 11/01/22 | | | 100,000 | | | | 101,767 | |
| Intelsat Connect Finance S.A., 144A, 9.500%, due 02/15/23 | | | 25,000 | | | | 22,062 | |
| Latam Finance Ltd., 6.875%, due 04/11/24 | | | 200,000 | | | | 207,500 | |
| Latam Finance Ltd., 144A, 7.000%, due 03/01/26 | | | 200,000 | | | | 208,750 | |
| SPARC EM SPC Panama Metroline 2 SP, 144A, 0.000%, due 12/05/22 | | | 170,833 | | | | 161,650 | |
| SPARC EM SPC Panama Metroline 2 SP, 0.000%, due 12/05/22 | | | 170,833 | | | | 161,650 | |
| Tecnoglass, Inc., 8.200%, due 01/31/22 | | | 200,000 | | | | 211,500 | |
| Transocean Guardian Ltd., 144A, 5.875%, due 01/15/24 | | | 14,175 | | | | 14,405 | |
| WILSHIRE INCOME OPPORTUNITIES FUND | |
| SCHEDULE OF INVESTMENTS (Continued) | |
| FOREIGN BONDS - 23.5% (Continued) | | Par Value | | | Value | |
| Cayman Islands - 0.9% (Continued) | | | | | | | | |
| Transocean Poseidon Ltd., 144A, 6.875%, due 02/01/27 | | $ | 75,000 | | | $ | 79,125 | |
| Transocean, Inc., 144A, 7.250%, due 11/01/25 | | | 30,000 | | | | 28,462 | |
| | | | | | | | 2,774,684 | |
| Chile - 1.0% | | | | | | | | |
| AES Gener S.A., 5.000%, due 07/14/25 | | | 200,000 | | | | 206,500 | |
| AES Gener S.A., 144A, 7.125%, due 03/26/79 | | | 400,000 | | | | 427,030 | |
| Celulosa Arauco y Constitucion, 144A, 5.500%, due 04/30/49(b) | | | 200,000 | | | | 211,000 | |
| Colbun S.A., 3.950%, due 10/11/27 | | | 200,000 | | | | 202,856 | |
| Empresa Electrica Angamos S.A., 4.875%, due 05/25/29 | | | 173,900 | | | | 180,246 | |
| Empresa Electrica Guacolda S.A., 4.560%, due 04/30/25 | | | 400,000 | | | | 374,308 | |
| Engie Energia Chile S.A., 4.500%, due 01/29/25 | | | 200,000 | | | | 210,076 | |
| Entel Chila S.A., 4.750%, due 08/01/26(b) | | | 600,000 | | | | 630,000 | |
| GNL Quintero S.A., 4.634%, due 07/31/29 | | | 200,000 | | | | 210,831 | |
| Inversiones CMPC S.A., 4.750%, due 09/15/24(b) | | | 200,000 | | | | 212,050 | |
| Sociedad Quimica y Minera de Chile, 4.375%, due 01/28/25 | | | 200,000 | | | | 209,750 | |
| | | | | | | | 3,074,647 | |
| Colombia - 0.8% | | | | | | | | |
| Bancolombia S.A., 4.875%, due 10/18/27 | | | 200,000 | | | | 204,151 | |
| Colombia Telecomunicaciones S.A., 8.500%, due 09/30/66 | | | 200,000 | | | | 207,500 | |
| Columbian TES, 7.000%, due 05/04/22 | | | 1,855,000,000 | | | | 608,806 | |
| Fideicomiso P.A. Pacifico Tres, 8.250%, due 01/15/35 | | | 200,000 | | | | 216,668 | |
| Republic of Colombia, 10.000%, due 07/24/24 | | | 1,187,000,000 | | | | 443,232 | |
| Republic of Columbia, 7.000%, due 09/11/19 | | | 604,700,000 | | | | 189,221 | |
| Republic of Columbia, 11.000%, due 07/24/20 | | | 565,100,000 | | | | 188,131 | |
| Republic of Columbia, 4.500%, due 01/28/26 | | | 275,000 | | | | 297,000 | |
| Republic of Columbia, 5.200%, due 05/15/49 | | | 200,000 | | | | 227,000 | |
| | | | | | | | 2,581,709 | |
| Costa Rica - 0.1% | | | | | | | | |
| Costa Rica Government International Bond, 9.995%, due 08/01/20 | | | 200,000 | | | | 211,750 | |
| | | | | | | | | |
| Curacao - 0.1% | | | | | | | | |
| Sura Asset Management S.A., 4.875%, due 04/17/24(b) | | | 200,000 | | | | 211,750 | |
| WILSHIRE INCOME OPPORTUNITIES FUND | |
| SCHEDULE OF INVESTMENTS (Continued) | |
| FOREIGN BONDS - 23.5% (Continued) | | Par Value | | | Value | |
| Dominican Republic - 0.1% | | | | | | | | |
| Banco de Reservas de la Republica Dominicana, 7.000%, due 02/01/23 | | $ | 300,000 | | | $ | 308,813 | |
| Dominican Republic, 144A, 6.400%, due 06/05/49(b) | | | 150,000 | | | | 156,680 | |
| | | | | | | | 465,493 | |
| Finland - 0.1% | | | | | | | | |
| Finland (Republic of), 0.500%, due 09/15/28 | | | 195,000 | | | | 234,494 | |
| | | | | | | | | |
| Germany - 0.3% | | | | | | | | |
| KFW Development Bank, 6.000%, due 08/20/20 | | | 240,000 | | | | 177,447 | |
| KFW Development Bank, 0.375%, due 03/15/23 | | | 150,000 | | | | 176,258 | |
| KFW Development Bank, 2.125%, due 08/15/23 | | | 260,000 | | | | 327,986 | |
| KFW Development Bank, 0.000%, due 09/15/23 | | | 80,000 | | | | 92,841 | |
| Kreditanstalt Fuer Weideraufbau, 2.625%, due 02/28/24 | | | 285,000 | | | | 294,592 | |
| | | | | | | | 1,069,124 | |
| Hungary - 0.3% | | | | | | | | |
| Hungary Government International Bond, 6.250%, due 01/29/20 | | | 380,000 | | | | 388,048 | |
| Hungary Government International Bond, 6.375%, due 03/29/21 | | | 440,000 | | | | 470,162 | |
| | | | | | | | 858,210 | |
| India - 0.5% | | | | | | | | |
| Adani Green Energy UP Ltd., 144A, 6.250%, due 12/10/24 | | | 200,000 | | | | 204,500 | |
| Bharti Airtel Ltd., 5.125%, due 03/11/23 | | | 200,000 | | | | 210,000 | |
| Bharti Airtel Ltd., 4.375%, due 06/10/25 | | | 700,000 | | | | 706,125 | |
| Indian Oil Corp. Ltd., 5.750%, due 08/01/23 | | | 300,000 | | | | 328,518 | |
| NTPC Ltd., 7.250%, due 05/03/22 | | | 20,000,000 | | | | 284,710 | |
| | | | | | | | 1,733,853 | |
| Indonesia - 1.2% | | | | | | | | |
| Indonesia Government International Bond, 144A, 2.625%, due 06/14/23 | | | 150,000 | | | | 184,520 | |
| Indonesia Government International Bond, 144A, 2.150%, due 07/18/24 | | | 150,000 | | | | 181,429 | |
| Indonesia Treasury Bond, 8.250%, due 07/15/21 | | | 585,000,000 | | | | 42,589 | |
| Indonesia Treasury Bond, 7.000%, due 05/15/22 | | | 608,000,000 | | | | 43,192 | |
| Indonesia Treasury Bond, 5.625%, due 05/15/23 | | | 395,000,000 | | | | 26,853 | |
| Indonesia Treasury Bond, 8.375%, due 03/15/24 | | | 2,879,000,000 | | | | 215,548 | |
| WILSHIRE INCOME OPPORTUNITIES FUND | |
| SCHEDULE OF INVESTMENTS (Continued) | |
| FOREIGN BONDS - 23.5% (Continued) | | Par Value | | | Value | |
| Indonesia - 1.2% (Continued) | | | | | | | | |
| Indonesia Treasury Bond, 8.375%, due 09/15/26 | | $ | 1,606,000,000 | | | $ | 120,456 | |
| Indonesia Treasury Bond, 7.000%, due 05/15/27 | | | 4,699,000,000 | | | | 327,460 | |
| Indonesia Treasury Bond, 6.125%, due 05/15/28 | | | 4,089,000,000 | | | | 266,569 | |
| Indonesia Treasury Bond, 9.000%, due 03/15/29 | | | 1,457,000,000 | | | | 113,674 | |
| Indonesia Treasury Bond, 8.750%, due 05/15/31 | | | 3,000,000,000 | | | | 229,725 | |
| Indonesia Treasury Bond, 6.625%, due 05/15/33 | | | 419,000,000 | | | | 26,636 | |
| Indonesia Treasury Bond, 7.500%, due 05/15/38 | | | 1,447,000,000 | | | | 98,983 | |
| International Bank for Reconstruction & Development, 7.450%, due 08/20/21 | | | 2,760,000,000 | | | | 198,188 | |
| Jasa Marga (Persero), 144A, 7.500%, due 12/11/20 | | | 1,500,000,000 | | | | 102,874 | |
| Pelabuhan Indonesia II PT, 144A, 4.250%, due 05/05/25 | | | 200,000 | | | | 207,250 | |
| Pertamina Persero PT, 144A, 4.300%, due 05/20/23 | | | 200,000 | | | | 209,500 | |
| Perusahaan Listrik Negara PT, 144A, 4.125%, due 05/15/27 | | | 250,000 | | | | 254,688 | |
| Perusahaan Penerbit SBSN, 144A, 4.150%, due 03/29/27 | | | 400,000 | | | | 418,750 | |
| Republic of Indonesia, 3.750%, due 03/01/23 | | | 400,000 | | | | 411,500 | |
| Republic of Indonesia, 8.250%, due 05/15/29 | | | 283,000,000 | | | | 21,218 | |
| | | | | | | | 3,701,602 | |
| Ireland - 0.7% | | | | | | | | |
| Bank of Ireland Group plc, 144A, 4.500%, due 11/25/23 | | | 200,000 | | | | 208,524 | |
| C&W Senior Financing Designated Activity Co., 6.875%, due 09/15/27(b) | | | 800,000 | | | | 824,000 | |
| Ireland Government Bond, 3.900%, due 03/20/23 | | | 400,000 | | | | 529,406 | |
| Ireland Government Bond, 3.400%, due 03/18/24 | | | 550,000 | | | | 738,441 | |
| | | | | | | | 2,300,371 | |
| Israel - 0.3% | | | | | | | | |
| Delek & Avner Tamar Bond Ltd., 144A, 5.082%, due 12/30/23 | | | 100,000 | | | | 103,235 | |
| Delek & Avner Tamar Bond Ltd., 144A, 5.412%, due 12/30/25 | | | 100,000 | | | | 103,758 | |
| Israel Electric Corp. Ltd., 144A, 6.875%, due 06/21/23 | | | 200,000 | | | | 226,750 | |
| Israel Electric Corp. Ltd., 144A, 5.000%, due 11/12/24 | | | 400,000 | | | | 430,500 | |
| | | | | | | | 864,243 | |
| Japan - 0.4% | | | | | | | | |
| Japan, 0.100%, due 12/20/23 | | | 99,800,000 | | | | 940,542 | |
| Mitsubishi UFJ Financial Group, Inc., 3.260% (3MO LIBOR + 74), due 03/02/23(c) | | | 125,000 | | | | 124,692 | |
| WILSHIRE INCOME OPPORTUNITIES FUND | |
| SCHEDULE OF INVESTMENTS (Continued) | |
| FOREIGN BONDS - 23.5% (Continued) | | Par Value | | | Value | |
| Japan - 0.4% (Continued) | | | | | | | | |
| Sony Corp., 0.000%, due 09/30/22 | | $ | 20,000,000 | | | $ | 238,857 | |
| | | | | | | | 1,304,091 | |
| Liberia - 0.0%(e) | | | | | | | | |
| Royal Caribbean Cruises Ltd., 3.700%, due 03/15/28 | | | 65,000 | | | | 65,081 | |
| | | | | | | | | |
| Luxembourg - 1.4% | | | | | | | | |
| Adecoagro S.A., 6.000%, due 09/21/27 | | | 150,000 | | | | 142,313 | |
| Allergan Funding SCS, 1.250%, due 06/01/24 | | | 100,000 | | | | 116,616 | |
| Allergan Funding SCS, 2.625%, due 11/15/28 | | | 100,000 | | | | 125,067 | |
| Becton Dickinson Euro Finance S.a.r.l, 1.208%, due 06/04/26 | | | 145,000 | | | | 167,978 | |
| CSN Resources S.A., 7.625%, due 02/13/23(b) | | | 200,000 | | | | 211,750 | |
| CSN Resources S.A., 144A, 7.625%, due 04/17/26 | | | 200,000 | | | | 212,000 | |
| European Financial Stability Facility, 0.500%, due 01/20/23 | | | 150,000 | | | | 176,589 | |
| European Financial Stability Facility, 1.875%, due 05/23/23 | | | 185,000 | | | | 229,710 | |
| European Financial Stability Facility, 0.125%, due 10/17/23 | | | 280,000 | | | | 326,158 | |
| Gilex Holding S.ar.l, 144A, 8.500%, due 05/02/23 | | | 150,000 | | | | 158,625 | |
| Gilex Holding S.ar.l., 8.500%, due 05/02/23 | | | 150,000 | | | | 158,625 | |
| Intelsat Jackson Holdings S.A., 144A, 8.500%, due 10/15/24 | | | 25,000 | | | | 24,750 | |
| JSL Europe S.A., 7.750%, due 07/26/24 | | | 200,000 | | | | 202,750 | |
| Millicom International Cellular S.A., 144A, 6.625%, due 10/15/26 | | | 200,000 | | | | 217,500 | |
| Millicom International Cellular S.A., 5.125%, due 01/15/28(b) | | | 400,000 | | | | 403,500 | |
| Minerva Luxembourg S.A., 6.500%, due 09/20/26 | | | 600,000 | | | | 620,232 | |
| Minerva Luxembourg S.A., 5.875%, due 01/19/28 | | | 200,000 | | | | 200,000 | |
| Nexa Resources S.A., 5.375%, due 05/04/27(b) | | | 200,000 | | | | 209,326 | |
| Swiss Insured Brazil Power Finance, 144A, 9.850%, due 07/16/32 | | | 2,000,000 | | | | 557,350 | |
| Telecom Italia Captial S.A., 6.375%, due 11/15/33 | | | 25,000 | | | | 25,781 | |
| Waste Management, Inc., 4.000%, due 07/15/39 | | | 65,000 | | | | 69,509 | |
| | | | | | | | 4,556,129 | |
| Malaysia - 0.4% | | | | | | | | |
| Malaysia Government Bond, 4.160%, due 07/15/21 | | | 1,045,000 | | | | 257,023 | |
| Malaysia Government Bond, 3.620%, due 11/30/21 | | | 400,000 | | | | 97,415 | |
| Malaysia Government Bond, 4.059%, due 09/30/24 | | | 1,375,000 | | | | 341,450 | |
| WILSHIRE INCOME OPPORTUNITIES FUND | |
| SCHEDULE OF INVESTMENTS (Continued) | |
| FOREIGN BONDS - 23.5% (Continued) | | Par Value | | | Value | |
| Malaysia - 0.4% (Continued) | | | | | | | | |
| Malaysia Government Bond, 3.882%, due 03/14/25 | | $ | 430,000 | | | $ | 105,804 | |
| Malaysia Government Bond, 3.899%, due 11/16/27 | | | 600,000 | | | | 147,258 | |
| Malaysia Government Bond, 3.733%, due 06/15/28 | | | 400,000 | | | | 97,201 | |
| Malaysia Government Bond, 3.844%, due 04/15/33 | | | 980,000 | | | | 233,650 | |
| | | | | | | | 1,279,801 | |
| Mauritius - 0.1% | | | | | | | | |
| UPL Corp. Ltd., 3.250%, due 10/13/21 | | | 200,000 | | | | 200,504 | |
| UPL Corp. Ltd., 4.500%, due 03/08/28 | | | 200,000 | | | | 202,800 | |
| | | | | | | | 403,304 | |
| Mexico - 1.7% | | | | | | | | |
| Banco Mercantil del Norte S.A., 6.875%, due 12/31/49 | | | 400,000 | | | | 406,556 | |
| Banco Mercantil del Norte S.A., 7.625%, due 10/06/66 | | | 400,000 | | | | 409,293 | |
| Banco Santander S.A., 144A, 5.950%, due 10/01/28 | | | 200,000 | | | | 212,000 | |
| BBVA Bancomer S.A., 5.125%, due 01/18/33(c) | | | 1,000,000 | | | | 954,840 | |
| Cometa Energia, S.A. de C.V., 6.375%, due 04/24/35 | | | 780,000 | | | | 803,501 | |
| Controladora Mabe S.A. de C.V., 5.600%, due 10/23/28(b) | | | 200,000 | | | | 209,000 | |
| Credito Real S.A.B. de C.V., 9.125%, due 11/29/62 | | | 200,000 | | | | 202,250 | |
| Creito Real S.A.B. de C.V., 144A, 9.500%, due 02/07/26 | | | 200,000 | | | | 220,500 | |
| Grupo Bimbo S.A.B. de C.V., 5.950%, due 12/31/49 | | | 200,000 | | | | 210,064 | |
| Grupo Idesa S.A. de C.V., 7.875%, due 12/18/20 | | | 300,000 | | | | 222,750 | |
| Mexichem S.A.B. de C.V., 5.875%, due 09/17/44 | | | 200,000 | | | | 206,750 | |
| Mexico Generadora de Energia S.A. de R.L., 5.500%, due 12/06/32 | | | 504,313 | | | | 542,224 | |
| Petroleos Mexicanos, 6.500%, due 06/02/41 | | | 200,000 | | | | 177,167 | |
| Unifin Financiera S.A.B. de C.V., 8.875%, due 12/31/22 | | | 800,000 | | | | 733,000 | |
| | | | | | | | 5,509,895 | |
| Mongolia - 0.1% | | | | | | | | |
| European Investment Bank, 1.500%, due 05/12/22 | | | 1,920,000 | | | | 225,139 | |
| JBS USA Finance, Inc., 144A, 6.500%, due 04/15/29(b) | | | 45,000 | | | | 48,881 | |
| JBS USA LUX S.A., 144A, 5.875%, due 07/15/24(b) | | | 10,000 | | | | 10,287 | |
| NXP BV/NXP Funding, LLC/NXP USA, Inc., 144A, 3.875%, due 06/18/26 | | | 65,000 | | | | 66,463 | |
| Panther Finance Cos., Inc., 144A, 6.250%, due 05/15/26(b) | | | 65,000 | | | | 67,600 | |
| | | | | | | | 418,370 | |
| Netherlands - 1.6% | | | | | | | | |
| AES Andres Dominicana Ltd., 144A, 7.950%, due 05/11/26 | | | 500,000 | | | | 541,250 | |
| WILSHIRE INCOME OPPORTUNITIES FUND | |
| SCHEDULE OF INVESTMENTS (Continued) | |
| FOREIGN BONDS - 23.5% (Continued) | | Par Value | | | Value | |
| Netherlands - 1.6% (Continued) | | | | | | | | |
| Bank Nederlandse Gemeenten N.V., 0.250%, due 02/22/23 | | $ | 150,000 | | | $ | 174,891 | |
| Bank Nederlandse Gemeenten N.V., 0.250%, due 06/07/24 | | | 200,000 | | | | 234,121 | |
| BMW Finance, 1.000%, due 11/14/24 | | | 75,000 | | | | 88,473 | |
| CIMPOR Financial Operations B.V., 5.750%, due 07/17/24 | | | 200,000 | | | | 175,000 | |
| Greenko Dutch B.V., 144A, 5.250%, due 07/24/24 | | | 200,000 | | | | 197,000 | |
| Marfrig Holdings Europe B.V., 144A, 7.000%, due 03/15/24 | | | 200,000 | | | | 207,930 | |
| Minejesa Capital B.V., 4.625%, due 08/10/30 | | | 400,000 | | | | 404,644 | |
| Minejesa Capital B.V., 5.625%, due 08/10/37 | | | 200,000 | | | | 209,882 | |
| NXP Funding, LLC, 144A, 4.625%, due 06/01/23(b) | | | 270,000 | | | | 284,513 | |
| Petrobras Global Finance, 7.375%, due 01/27/27 | | | 235,000 | | | | 269,956 | |
| Petrobras Global Finance B.V., 8.750%, due 05/23/26 | | | 105,000 | | | | 129,413 | |
| Petrobras Global Finance B.V., 5.750%, due 02/01/29 | | | 1,015,000 | | | | 1,056,869 | |
| Petrobras Global Finance B.V., 6.900%, due 03/19/49 | | | 195,000 | | | | 206,653 | |
| Syngenta Finance N.V., 5.676%, due 04/24/48 | | | 600,000 | | | | 593,226 | |
| VTR Finance B.V., 6.875%, due 01/15/24 | | | 400,000 | | | | 413,000 | |
| | | | | | | | 5,186,821 | |
| New Zealand - 0.3% | | | | | | | | |
| International Bank for Reconstruction & Development, 3.500%, due 01/22/21 | | | 295,000 | | | | 203,911 | |
| International Bank for Reconstruction & Development, 4.625%, due 10/06/21 | | | 515,000 | | | | 369,013 | |
| International Bank for Reconstruction & Development, 3.375%, due 01/25/22 | | | 370,000 | | | | 259,314 | |
| Nordic Investment Bank, 4.125%, due 03/19/20 | | | 240,000 | | | | 164,069 | |
| | | | | | | | 996,307 | |
| Norway - 0.6% | | | | | | | | |
| Aker BP ASA, 144A, 4.750%, due 06/15/24 | | | 155,000 | | | | 159,069 | |
| Nordea Eiendomskreditt AS, 1.820% (3MO NIBOR + 30), due 06/21/23(c) | | | 1,000,000 | | | | 117,571 | |
| Nordea Eiendomskreditt AS, 1.860% (3MO NIBOR + 34), due 06/19/24(c) | | | 1,000,000 | | | | 117,419 | |
| Norwegian Government Bond, 144A, 3.750%, due 05/25/21 | | | 7,980,000 | | | | 978,911 | |
| Norwegian Government Bond, 144A, 2.000%, due 05/24/23 | | | 3,600,000 | | | | 433,892 | |
| | | | | | | | 1,806,862 | |
| WILSHIRE INCOME OPPORTUNITIES FUND | |
| SCHEDULE OF INVESTMENTS (Continued) | |
| FOREIGN BONDS - 23.5% (Continued) | | Par Value | | | Value | |
| Panama - 0.4% | | | | | | | | |
| Aeropuerto Internacional de Tocumen S.A., 5.625%, due 05/18/36 | | $ | 200,000 | | | $ | 223,246 | |
| Banco General S.A., 4.125%, due 08/07/27 | | | 200,000 | | | | 203,134 | |
| Empresa de Transmision, 144A, 5.125%, due 05/02/49 | | | 400,000 | | | | 436,500 | |
| Global Bank Corp., 144A, 5.250%, due 04/16/29(b) | | | 350,000 | | | | 365,313 | |
| | | | | | | | 1,228,193 | |
| Paraguay - 0.1% | | | | | | | | |
| Telfon Celular del Paraguay S.A., 144A, 5.875%, due 04/15/27 | | | 200,000 | | | | 206,187 | |
| | | | | | | | | |
| Peru - 0.1% | | | | | | | | |
| Orazul Energy Egenor S. en C. por A., 5.625%, due 04/28/27(b) | | | 200,000 | | | | 202,098 | |
| Petroleos del Peru S.A., 144A, 5.625%, due 06/19/47 | | | 200,000 | | | | 227,436 | |
| | | | | | | | 429,534 | |
| Philippines - 0.9% | | | | | | | | |
| BDO Unibank, Inc., 2.950%, due 03/06/23 | | | 300,000 | | | | 300,375 | |
| Philippine Government Bond, 3.500%, due 03/20/21 | | | 6,900,000 | | | | 131,392 | |
| Philippine Government Bond, 6.500%, due 04/28/21 | | | 8,830,000 | | | | 176,811 | |
| Philippine Government Bond, 3.500%, due 04/21/23 | | | 10,820,000 | | | | 200,259 | |
| Philippine Government Bond, 8.000%, due 07/19/31 | | | 15,000,000 | | | | 366,872 | |
| Philippine Government International Bond, 4.950%, due 01/15/21 | | | 10,000,000 | | | | 194,962 | |
| Philippine Government International Bond, 6.250%, due 01/14/36 | | | 15,000,000 | | | | 329,637 | |
| Republic of the Philippines, 3.875%, due 11/22/19 | | | 5,640,000 | | | | 109,572 | |
| Republic of the Philippines, 3.375%, due 01/12/20 | | | 1,960,000 | | | | 37,932 | |
| Republic of the Philippines, 4.250%, due 04/11/20 | | | 3,225,000 | | | | 62,573 | |
| Republic of the Philippines, 3.375%, due 08/20/20 | | | 1,390,000 | | | | 26,644 | |
| Republic of the Philippines, 5.500% (3MO LIBOR + 350), due 03/08/23(c) | | | 4,250,000 | | | | 84,342 | |
| Republic of the Philippines, 6.250%, due 03/12/24 | | | 7,090,000 | | | | 145,568 | |
| Republic of the Philippines, 0.875%, due 05/17/27 | | | 285,000 | | | | 328,074 | |
| Union Bank of Philippines, Series EMTN, 3.369%, due 11/29/22 | | | 200,000 | | | | 202,006 | |
| | | | | | | | 2,697,019 | |
| WILSHIRE INCOME OPPORTUNITIES FUND | |
| SCHEDULE OF INVESTMENTS (Continued) | |
| FOREIGN BONDS - 23.5% (Continued) | | Par Value | | | Value | |
| Portugal - 0.3% | | | | | | | | |
| Portugal Government International Bond, 144A, 5.125%, due 10/15/24 | | $ | 425,000 | | | $ | 474,938 | |
| Portugal Obrigacoes do Tesouro OT, 144A, 3.850%, due 04/15/21 | | | 385,000 | | | | 471,316 | |
| | | | | | | | 946,254 | |
| Puerto Rico - 0.1% | | | | | | | | |
| Popular, Inc., 6.125%, due 09/14/23 | | | 290,000 | | | | 302,743 | |
| | | | | | | | | |
| Qatar - 0.1% | | | | | | | | |
| Qatar (State of), 144A, 4.000%, due 03/14/29 | | | 200,000 | | | | 215,550 | |
| Qatar (State of), 144A, 4.817%, due 03/14/49 | | | 200,000 | | | | 228,055 | |
| | | | | | | | 443,605 | |
| Saudi Arabia - 0.2% | | | | | | | | |
| Saudi Arabian Oil Co., 144A, 3.500%, due 04/16/29 | | | 200,000 | | | | 202,364 | |
| Saudi Arabian Oil Co., 144A, 4.250%, due 04/16/39 | | | 200,000 | | | | 201,730 | |
| Saudi Arabian Oil Co., 144A, 4.375%, due 04/16/49 | | | 200,000 | | | | 200,990 | |
| | | | | | | | 605,084 | |
| Singapore - 1.4% | | | | | | | | |
| BOC Aviation Ltd., 144A, 2.750%, due 09/18/22 | | | 200,000 | | | | 199,215 | |
| BPRL International Singapore, 4.375%, due 01/18/27 | | | 500,000 | | | | 521,125 | |
| DBS Group Holdings Ltd., 3.600%, due 03/07/67 | | | 500,000 | | | | 498,125 | |
| Indika Energy Capital III Ltd., 144A, 5.875%, due 11/09/24 | | | 200,000 | | | | 196,000 | |
| LLPL Capital Pte. Ltd., 144A, 6.875%, due 02/04/39 | | | 300,000 | | | | 341,625 | |
| Medco Oak Tree PTE Ltd., 144A, 7.375%, due 05/14/26 | | | 220,000 | | | | 220,550 | |
| ONGC Videsh Vankorneft, 3.750%, due 07/27/26(b) | | | 500,000 | | | | 503,790 | |
| Singapore Government Bond, 3.250%, due 09/01/20 | | | 1,190,000 | | | | 895,809 | |
| Singapore Government Bond, 1.750%, due 04/01/22 | | | 450,000 | | | | 333,210 | |
| United Overseas Bank Ltd., 3.875%, due 12/31/49 | | | 700,000 | | | | 684,292 | |
| | | | | | | | 4,393,741 | |
| Spain - 0.2% | | | | | | | | |
| AI Candelaria Spain SLU, 144A, 7.500%, due 12/15/28 | | | 250,000 | | | | 274,375 | |
| AI Candelaria Spain SLU, 7.500%, due 12/15/28 | | | 250,000 | | | | 274,375 | |
| | | | | | | | 548,750 | |
| WILSHIRE INCOME OPPORTUNITIES FUND | |
| SCHEDULE OF INVESTMENTS (Continued) | |
| FOREIGN BONDS - 23.5% (Continued) | | Par Value | | | Value | |
| Sweden - 0.2% | | | | | | | | |
| Sweden Government International Bond, 144A, 0.125%, due 04/24/23 | | $ | 440,000 | | | $ | 512,414 | |
| | | | | | | | | |
| Thailand - 0.1% | | | | | | | | |
| PTTEP Treasury Center Co. Ltd., 4.600%, due 12/31/49 | | | 200,000 | | | | 202,250 | |
| | | | | | | | | |
| United Kingdom - 0.4% | | | | | | | | |
| Genting Overseas Holding Ltd., 4.250%, due 01/24/27 | | | 700,000 | | | | 720,657 | |
| Vedanta Resources Finance II plc, 144A, 9.250%, due 04/23/26 | | | 200,000 | | | | 202,500 | |
| Vedanta Resources plc, 6.125%, due 08/09/24 | | | 400,000 | | | | 368,000 | |
| | | | | | | | 1,291,157 | |
| Virgin Islands British - 0.3% | | | | | | | | |
| Radiant Access Ltd., 4.600%, due 12/31/49 | | | 200,000 | | | | 193,875 | |
| Star Energy Geothermal Wayang Windu Ltd., 6.750%, due 04/24/33 | | | 574,800 | | | | 581,267 | |
| | | | | | | | 775,142 | |
| | | | | | | | | |
| Total Foreign Bonds(Cost $72,301,652) | | | | | | $ | 74,273,601 | |
| LOAN PARTICIPATIONS - 4.8% | | Par Value | | | Value | |
| Acrisure, LLC, 6.879% (3MO LIBOR + 425), due 11/22/23(c) | | $ | 348,159 | | | $ | 346,056 | |
| Albertson's LLC, 5.402% (3MO LIBOR + 300), due 11/17/25(c) | | | 74,875 | | | | 74,435 | |
| Aleris International, Inc., 7.152% (3MO LIBOR + 475), due 02/08/23(c) | | | 183,613 | | | | 183,669 | |
| AlixPartners, LLP, 5.152% (3MO LIBOR + 300), due 03/17/21(c) | | | 299,624 | | | | 298,749 | |
| Allied Universal Holdco, LLC, 4.700% (3MO LIBOR + 425), due 06/26/26(c) | | | 109,189 | | | | 108,097 | |
| Allied Universal Holdco, LLC, 4.700% (3MO LIBOR + 425), due 06/26/26(c)(d) | | | 10,811 | | | | 10,811 | |
| Almonde, Inc., 5.886% (3MO LIBOR + 350), due 04/26/24(c) | | | 299,487 | | | | 291,626 | |
| American Tire Distributors, Inc., 9.981% (3MO LIBOR + 425), due 09/01/21(c) | | | 228,429 | | | | 213,581 | |
| WILSHIRE INCOME OPPORTUNITIES FUND | |
| SCHEDULE OF INVESTMENTS (Continued) | |
| LOAN PARTICIPATIONS - 4.8% (Continued) | | Par Value | | | Value | |
| American Tire Distributors, Inc., 8.522% due 09/01/23(c) | | $ | 35,210 | | | $ | 34,858 | |
| Applied Systems, Inc., 5.483% (3MO LIBOR + 325), due 09/13/24(c) | | | 61,126 | | | | 60,484 | |
| AssuredPartners, Inc., 5.902% (3MO LIBOR + 350), due 10/22/24(c) | | | 291,680 | | | | 288,451 | |
| AthenaHealth, Inc., 7.045% (3MO LIBOR+ 425), due 02/09/26(c) | | | 125,000 | | | | 124,584 | |
| Auris LuxCo., 6.233% (3MO LIBOR + 375), due 07/24/25(c) | | | 180,000 | | | | 180,045 | |
| Bausch Health Cos., Inc., 5.162% (3MO LIBOR + 275), due 11/14/25(c) | | | 128,250 | | | | 127,352 | |
| BCP Renaissance Parent, LLC, 6.083% (3MO LIBOR + 450), due 12/31/20(c) | | | 128,751 | | | | 128,315 | |
| Berry Global, Inc., 0.000% (3MO LIBOR + 250), due 05/15/26(c) | | | 160,000 | | | | 158,800 | |
| Beta Sub, LLC, 4.700% (3MO LIBOR + 425), due 05/22/26(c) | | | 105,000 | | | | 104,475 | |
| BJ's Wholesale Club, Inc., 5.411% (3MO LIBOR + 375), due 01/27/24(c) | | | 109,449 | | | | 109,460 | |
| Blackhawk Network Holdings, Inc., 5.402% (3MO LIBOR + 300), due 06/16/25(c) | | | 60,209 | | | | 59,694 | |
| Blackstone CQP Holdco, L.P., 4.700% (3MO LIBOR + 350), due 06/07/24(c) | | | 120,000 | | | | 120,120 | |
| Calpine Corp., 5.080% (3MO LIBOR + 275), due 04/05/26(c) | | | 300,000 | | | | 299,457 | |
| Canyon Valor Cos., Inc., 5.080% (3MO LIBOR + 425), due 06/16/23(c) | | | 220,674 | | | | 219,129 | |
| Capital Automotive, L.P., 8.483% (3MO LIBOR + 600), due 03/21/25(c) (d) | | | 37,957 | | | | 37,981 | |
| Catalent Pharma Solutions, Inc., 4.652% (3MO LIBOR + 225), due 05/18/26(c) | | | 150,000 | | | | 149,876 | |
| Cengage Learning, Inc., 6.680% (3MO LIBOR + 425), due 06/07/23(c) | | | 111,033 | | | | 106,262 | |
| CenturyLink, Inc., 5.152% (3MO LIBOR + 275), due 02/29/24(c) | | | 306,125 | | | | 298,643 | |
| Change Healthcare Holdings, LLC, 5.152% (3MO LIBOR + 275), due 03/01/24(c) | | | 299,447 | | | | 296,594 | |
| CHG Healthcare Services, Inc., 5.402% (3MO LIBOR + 300), due 06/07/23(c) | | | 64,439 | | | | 63,991 | |
| WILSHIRE INCOME OPPORTUNITIES FUND | |
| SCHEDULE OF INVESTMENTS (Continued) | |
| LOAN PARTICIPATIONS - 4.8% (Continued) | | Par Value | | | Value | |
| Colorado Buyer, Inc., 5.420% (3MO LIBOR + 300), due 03/15/24(c) | | $ | 302,987 | | | $ | 280,833 | |
| CommScope, Inc., 5.733% (3MO LIBOR+ 325), due 02/26/26(c) | | | 155,000 | | | | 154,419 | |
| CPA Global, 5.833% (3MO LIBOR + 325), due 10/04/24(c) (d) | | | 306,560 | | | | 299,969 | |
| CSC Holdings, LLC, 5.440% (3MO LIBOR+ 300), due 04/15/27(c) | | | 155,000 | | | | 155,078 | |
| Cvent, Inc., 6.152% (3MO LIBOR + 375), due 11/29/23(c) | | | 303,614 | | | | 299,819 | |
| Edelman Financial Center, LLC (The), 5.644% (3MO LIBOR + 325), due 12/31/21(c) | | | 74,812 | | | | 74,532 | |
| EG America, LLC, 6.601% (3MO LIBOR + 400), due 02/07/25(c) | | | 215,327 | | | | 211,425 | |
| EG Group Ltd., 6.330% (3MO LIBOR + 400), due 01/31/25(c) | | | 84,150 | | | | 82,625 | |
| Envision Healthcare Corp., 6.152% (3MO LIBOR + 375), due 12/31/21(c) | | | 44,817 | | | | 38,629 | |
| Equian, LLC, 5.652% (3MO LIBOR + 325), due 05/20/24(c) | | | 211,304 | | | | 210,987 | |
| Equinox Holdings, Inc., 5.402% (3MO LIBOR + 300), due 03/08/24(c) | | | 264,329 | | | | 263,557 | |
| EW Scripps Co. (The), 4.700% (3MO LIBOR + 275), due 04/03/26(c) | | | 90,000 | | | | 89,737 | |
| Filtration Group Corp., 5.438% (3MO LIBOR + 300), due 03/27/25(c) | | | 277,350 | | | | 276,359 | |
| Financial & Risk US Holdings, Inc., 6.152% (3MO LIBOR + 375), due 09/18/25(c) | | | 299,250 | | | | 290,006 | |
| Forest City, 6.402% (3MO LIBOR + 400), due 10/24/25(c) | | | 119,700 | | | | 119,999 | |
| Gentiva Health Services, Inc., 6.250% (3MO LIBOR + 375), due 06/23/25(c) | | | 297,047 | | | | 296,863 | |
| Greeneden U.S. Holdings II, LLC, 5.652% (3MO LIBOR + 350), due 12/01/23(c) | | | 297,299 | | | | 293,583 | |
| Grocery Outlet, 6.135% due 12/31/21(c) | | | 104,869 | | | | 104,738 | |
| Hyland Software Inc, 5.652% (3MO LIBOR + 350), due 07/01/24(c) | | | 301,963 | | | | 299,792 | |
| Informatica, LLC, 5.652% (3MO LIBOR + 325), due 08/05/22(c) | | | 386,238 | | | | 386,319 | |
| Intelsat Jackson Holdings S.A., 6.154% (3MO LIBOR + 375), due 11/30/23(c) | | | 180,000 | | | | 177,946 | |
| WILSHIRE INCOME OPPORTUNITIES FUND | |
| SCHEDULE OF INVESTMENTS (Continued) | |
| LOAN PARTICIPATIONS - 4.8% (Continued) | | Par Value | | | Value | |
| Intrawest Resorts Holdings, Inc., 5.483% (3MO LIBOR + 325), due 12/31/20(c) | | $ | 298,365 | | | $ | 296,873 | |
| IRB Holding Corp., 5.644% (3MO LIBOR + 325), due 01/17/25(c) | | | 60,016 | | | | 59,201 | |
| JBS U.S.A. LUX S.A., 4.700% (3MO LIBOR + 250), due 04/24/26(c) | | | 149,875 | | | | 149,437 | |
| Kronos, Inc., 5.579% (3MO LIBOR + 350), due 11/01/23(c) | | | 59,875 | | | | 59,733 | |
| Life Time Fitness, Inc., 5.272% (3MO LIBOR + 300), due 06/10/22(c) | | | 59,827 | | | | 59,553 | |
| Lower Cadence Holdings, LLC, 6.404% (3MO LIBOR + 400), due 05/09/26(c) | | | 190,000 | | | | 188,892 | |
| Messer Industries, LLC, 5.101% (3MO LIBOR + 250), due 10/01/25(c) | | | 125,000 | | | | 123,243 | |
| Milacron, LLC, 4.983% (3MO LIBOR + 250), due 09/28/23(c) | | | 232,408 | | | | 226,016 | |
| MPH Acquisition Holdings, LLC, 5.351% (3MO LIBOR + 300), due 06/07/23(c) | | | 58,134 | | | | 55,400 | |
| Nexstar Broadcasting, Inc., 4.700% (3MO LIBOR + 275), due 06/19/26(c) | | | 115,000 | | | | 114,631 | |
| Panther BF Aggregator 2, L.P., 5.902% (3MO LIBOR + 350), due 03/18/26(c) | | | 150,904 | | | | 149,348 | |
| Pisces Midco, Inc., 6.353% (3MO LIBOR + 375), due 03/29/25(c) | | | 243,772 | | | | 236,839 | |
| Plantronics, Inc., 4.983% (3MO LIBOR + 250), due 12/31/21(c) | | | 206,790 | | | | 204,809 | |
| Project Alpha Intermediate Holding, Inc., 6.370% (3MO LIBOR + 350), due 04/04/21(c) | | | 231,819 | | | | 226,314 | |
| Radiology Partners, Inc., 7.342% (3MO LIBOR + 425), due 07/09/25(c) (d) | | | 149,624 | | | | 149,531 | |
| RentPath, LLC, 7.240% (3MO LIBOR + 475), due 12/17/21(c) (d) | | | 214,968 | | | | 123,222 | |
| Science Applications International Corp., 4.152% due 11/05/25(c) | | | 124,375 | | | | 123,481 | |
| Scientific Games International, Inc., 5.152% (3MO LIBOR + 275), due 08/14/24(c) | | | 60,018 | | | | 59,093 | |
| Securus Technologies Holdings, Inc., 6.938% (3MO LIBOR + 450), due 06/15/24(c) | | | 187,796 | | | | 173,867 | |
| WILSHIRE INCOME OPPORTUNITIES FUND | |
| SCHEDULE OF INVESTMENTS (Continued) | |
| LOAN PARTICIPATIONS - 4.8% (Continued) | | Par Value | | | Value | |
| Select Medical Corp., 4.930% (3MO LIBOR + 350), due 02/13/24(c) | | $ | 307,370 | | | $ | 305,449 | |
| SolarWinds, Inc., 5.152% (3MO LIBOR + 300), due 03/07/24(c) | | | 211,916 | | | | 210,737 | |
| Solera, LLC, 5.152% (3MO LIBOR + 375), due 03/03/23(c) | | | 391,572 | | | | 389,207 | |
| Sophia, L.P., 5.580% (3MO LIBOR + 325), due 09/30/22(c) | | | 299,538 | | | | 297,978 | |
| Spade Facilities II, LLC, 6.152% (3MO LIBOR + 375), due 11/14/25(c) | | | 145,925 | | | | 145,530 | |
| Starfruit Finco B.V., 5.717% due 09/19/25(c) | | | 304,073 | | | | 299,068 | |
| TKC Holdings, Inc., 6.160% (3MO LIBOR + 425), due 02/01/23(c) | | | 295,384 | | | | 288,862 | |
| TransDigm, Inc., 4.830% (3MO LIBOR + 250), due 06/09/23(c) | | | 272,514 | | | | 267,497 | |
| TransDigm, Inc., 4.939% (3MO LIBOR + 250), due 05/14/25(c) | | | 23,993 | | | | 23,464 | |
| Traverse Midstream Partners, LLC, 6.590% (3MO LIBOR + 400), due 09/11/21(c) | | | 75,738 | | | | 74,764 | |
| Tribune Media Co., 5.499% (3MO LIBOR + 300), due 12/27/20(c) (d) | | | 42,521 | | | | 42,424 | |
| UFC Holdings LLC, 4.700% (3MO LIBOR + 325), due 04/30/26(c) | | | 80,000 | | | | 79,889 | |
| US Silica Co., 6.500% (3MO LIBOR + 400), due 12/31/21(c) | | | 311 | | | | 0 | |
| VeriFone Systems, Inc., 6.520% (3MO LIBOR + 400), due 08/08/25(c) | | | 66,493 | | | | 64,365 | |
| Verscend TLB, 6.983% (3MO LIBOR + 450), due 08/08/25(c) | | | 258,700 | | | | 258,312 | |
| VF Holding Corp., 5.748% (3MO LIBOR + 325), due 06/04/25(c) | | | 258,448 | | | | 248,001 | |
| Virgin Media Bristol, LLC, 4.700% (3MO LIBOR + 250), due 01/15/26(c) | | | 300,000 | | | | 298,701 | |
| Web.com Group, Inc., 6.161% due 09/17/25(c) | | | 150,728 | | | | 148,467 | |
| Total Loan Participations(Cost $15,365,260) | | | | | | $ | 15,125,008 | |
| COMMON STOCKS - 0.2% | | Shares | | | Value | |
| Financials - 0.2% | | | | | | | | |
| JPMorgan Chase & Co. | | | 2,350 | | | $ | 262,730 | |
| WILSHIRE INCOME OPPORTUNITIES FUND | |
| SCHEDULE OF INVESTMENTS (Continued) | |
| COMMON STOCKS - 0.2% (Continued) | | Shares | | | Value | |
| Financials - 0.2% (Continued) | | | | | | | | |
| U.S. Bancorp | | | 4,531 | | | $ | 237,424 | |
| | | | | | | | 500,154 | |
| Industrials - 0.0%(e) | | | | | | | | |
| HC2 Holdings, Inc.(f) | | | 10,600 | | | | 25,016 | |
| | | | | | | | | |
| Total Common Stocks(Cost $570,128) | | | | | | $ | 525,170 | |
| PREFERRED STOCKS - 0.9% | | Shares | | | Value | |
| American Electric Power Co., Inc., 6.125%(b) | | | 6,650 | | | $ | 355,841 | |
| Becton Dickinson and Co. - Series A, 6.125% | | | 6,600 | | | | 409,200 | |
| Crown Castle International Corp. - Series A, 6.875%(b) | | | 200 | | | | 239,155 | |
| First Republic Bank - Series H, 5.125% | | | 3,375 | | | | 82,991 | |
| Fortive Corp. - Series A, 5.000%(b) | | | 460 | | | | 471,459 | |
| NextEra Energy, Inc., 6.123%(b) | | | 5,650 | | | | 369,397 | |
| South Jersey Industries, Inc., 7.250%(b) | | | 2,800 | | | | 148,680 | |
| U.S. Bancorp - Series A, 3.500%(b) | | | 375 | | | | 300,750 | |
| U.S. Bancorp, 5.500%(d) | | | 6,900 | | | | 178,986 | |
| Wells Fargo & Co. - Series Q, 5.850%(b) | | | 7,300 | | | | 191,698 | |
| Total Preferred Stocks(Cost $2,716,605) | | | | | | $ | 2,748,157 | |
| PURCHASED OPTIONS - 0.0%(e) | | Contracts | | | Notional Amount | | | Value | |
| | | | | | | | | | |
| Currency Call Options - 0.0%(e) | | | | | | | | | | | |
| Chinese Yuan, 07/11/19 at 7.00(d) | | 2,010,000 | | | $ | 2,010,000 | | | $ | 1,672 | |
| Mexican Peso, 12/20/19 at 20.825(d) | | 1,230,000 | | | | 1,230,000 | | | | 16,984 | |
| Mexican Peso, 02/20/20 at 21.25(d) | | 1,170,000 | | | | 1,170,000 | | | | 19,784 | |
| Total Purchased Options (Cost $40,999) | | | | | $ | 4,410,000 | | | $ | 38,440 | |
| PURCHASED SWAPTION CONTRACTS - 0.0%(e) | | | | | | | | | | |
| | | | | | | | | | | | | |
Counterparty | | Description | | Exercise Rate | | Expiration Date | | Notional Amount | | | Value | |
| Calls | | | | | | | | | | | | |
| Bank of America, N.A. | | Interest Rate, 3MO LIBOR | | 0.000% | | 02/25/20 | | $ | 6,176,000 | | | $ | 1,112 | |
| Bank of America, N.A. | | Interest Rate, 3MO LIBOR | | 5.270% | | 02/26/20 | | | 5,187,000 | | | | (37 | ) |
| Bank of America, N.A. | | Interest Rate, 3MO LIBOR | | 5.295% | | 03/02/20 | | | 4,947,000 | | | | (1,341 | ) |
| Barclays Capital | | Interest Rate, 3MO LIBOR | | 5.020% | | 03/14/20 | | | 2,737,000 | | | | 6,643 | |
| JPMChase Bank | | Interest Rate, 3MO LIBOR | | 5.078% | | 03/19/20 | | | 3,212,000 | | | | 5,974 | |
| Morgan Stanley Capital | | Interest Rate, 3MO LIBOR | | 4.955% | | 05/01/30 | | | 1,826,000 | | | | 5,772 | |
| Morgan Stanley Capital | | Interest Rate, 3MO LIBOR | | 5.003% | | 05/20/30 | | | 609,000 | | | | 1,636 | |
| | | | | | | | | | 24,694,000 | | | | 19,759 | |
| Puts | | | | | | | | | | | | | | |
| Morgan Stanley Capital | | Interest Rate, 3MO LIBOR | | 2.200% | | 08/07/19 | | | 150,000,000 | | | | 28,500 | |
| | | | | | | | | | | | | | | |
| Total Purchased Swaption Contracts (Cost $28,500) | | | | | | $ | 174,694,000 | | | $ | 48,259 | |
| AFFILIATED REGISTERED INVESTMENT COMPANIES - 5.8% | | Shares | | | Value | |
| Voya Emerging Markets Hard Currency Debt Fund - Class P | | | 342,061 | | | $ | 3,345,353 | |
| Voya Floating Rate Fund - Class P | | | 1,377,092 | | | | 13,164,995 | |
| Voya High Yield Bond Fund - Class P | | | 215,924 | | | | 1,720,916 | |
| Total Affiliated Registered Investment Companies(Cost $18,277,918) | | | | | | $ | 18,231,264 | |
| WILSHIRE INCOME OPPORTUNITIES FUND | |
| SCHEDULE OF INVESTMENTS (Continued) | |
| MONEY MARKET FUNDS - 10.2% | | Shares | | | Value | |
| Northern Trust Institutional Government Select Portfolio - Institutional Class, 2.24%(g) | | | 12,347,287 | | | $ | 12,347,287 | |
| Northern Trust Institutional Liquid Asset Portfolio - Institutional Class, 2.36%(g) (h) | | | 20,030,015 | | | | 20,030,015 | |
| Total Money Market Funds (Cost $32,377,302) | | | | | | $ | 32,377,302 | |
| | | | | | | | | |
| Total Investments at Value - 110.1% (Cost $340,985,078) | | | | | | $ | 348,038,041 | |
| | | | | | | | | |
| Liabilities in Excess of Other Assets - (10.1%) | | | | | | | (31,867,915 | ) |
| | | | | | | | | |
| Net Assets - 100.0% | | | | | | $ | 316,170,126 | |
| (a) | Rate shown is the annualized yield at time of purchase, not a coupon rate. |
| (b) | This security or a partial position of this security is on loan at June 30, 2019. The total market value of securities on loan at June 30, 2019 was $22,129,883. |
| (c) | Variable rate security. Interest rate resets periodically. The rate shown is the effective interest rate as of June 30, 2019. For securities based on a published reference rate and spread, the reference rate and spread (in basis points) are indicated parenthetically. Certain variable rate securities are not based on a published reference rate and spread but are determined by the issuer or agent and are based on current market conditions. These securities, therefore, do not indicate a reference rate and spread. |
| (d) | Illiquid security. The total value of such securities is $6,354,500 as of June 30, 2019, representing 2.0% of net assets. |
| (e) | Percentage rounds to less than 0.1%. |
| (f) | Non-income producing security. |
| (g) | The rate shown is the 7-day effective yield as of June 30, 2019. |
| (h) | This security was purchased with cash collateral held from securities on loan. The total value of such securities as of June 30, 2019 was $20,030,015. Securities on loan are also collateralized by various U.S. Treasury obligations in the amount of $2,541,618. |
| BBSW - | Australian Bank Bill Swap Rate. |
| CDO - | Collateralized Debt Obligation. |
| CLO - | Collateralized Loan Obligation. |
| CV - | Convertible Security. |
| EURIBOR - | Euro Interbank Offered Rate. |
| LIBOR - | London Interbank Offered Rate. |
| NIBOR - | Norwegian Interbank Offered Rate. |
| 144A - | Security was purchased in a transaction exempt from registration in compliance with Rule 144A of the Securities Act of 1933. This security may be resold in transactions exempt from registration, normally to qualified institutional buyers. The total value of such securities is $94,667,274 as of June 30, 2019, representing 29.9% of net assets. |
| LIBOR rates as of June 30, 2019: |
| 1MO LIBOR 2.39800% |
| 3MO LIBOR 2.31988% |
| Item 7. | Disclosure of Proxy Voting Policies and Procedures for Closed-End Management Investment Companies. |
Not applicable
| Item 8. | Portfolio Managers of Closed-End Management Investment Companies. |
Not applicable
| Item 9. | Purchases of Equity Securities by Closed-End Management Investment Company and Affiliated Purchasers. |
Not applicable
| Item 10. | Submission of Matters to a Vote of Security Holders. |
There have been no changes to the procedures by which shareholders may recommend nominees to the Registrant’s Board of Directors since the Registrant last disclosed such procedures in the definitive proxy statement filed with the SEC on March 29, 2011.
| Item 11. | Controls and Procedures. |
(a) Based on their evaluation of the registrant’s disclosure controls and procedures (as defined in Rule 30a-3(c) under the Investment Company Act of 1940) as of a date within 90 days of the filing date of this report, the registrant’s principal executive officer and principal financial officer have concluded that such disclosure controls and procedures are reasonably designed and are operating effectively to ensure that material information relating to the registrant, including its consolidated subsidiaries, is made known to them by others within those entities, particularly during the period in which this report is being prepared, and that the information required in filings on Form N-CSR is recorded, processed, summarized, and reported on a timely basis.
(b) There were no changes in the registrant’s internal control over financial reporting (as defined in Rule 30a-3(d) under the Investment Company Act of 1940) that occurred during the second fiscal quarter of the period covered by this report that have materially affected, or are reasonably likely to materially affect, the registrant’s internal control over financial reporting.
Item 12. Disclosure of Securities Lending Activities for Closed-End Management Investment Companies.
Not applicable
File the exhibits listed below as part of this Form. Letter or number the exhibits in the sequence indicated.
(a)(1) Any code of ethics, or amendment thereto, that is the subject of the disclosure required by Item 2, to the extent that the registrant intends to satisfy the Item 2 requirements through filing of an exhibit: Not applicable.
(a)(2) A separate certification for each principal executive officer and principal financial officer of the registrant as required by Rule 30a-2(a) under the Act (17 CFR 270.30a-2(a)): Attached hereto
(a)(3) Any written solicitation to purchase securities under Rule 23c-1 under the Act (17 CFR 270.23c-1) sent or given during the period covered by the report by or on behalf of the registrant to 10 or more persons: Not applicable
(a)(4) Change in the registrant’s independent public accountants. Not applicable
(b) Certifications required by Rule 30a-2(b) under the Act (17 CFR 270.30a-2(b)): Attached hereto
| Exhibit 99.CERT | Certifications required by Rule 30a-2(a) under the Act |
| | |
| Exhibit 99.906CERT | Certifications required by Rule 30a-2(b) under the Act |
SIGNATURES
Pursuant to the requirements of the Securities Exchange Act of 1934 and the Investment Company Act of 1940, the registrant has duly caused this report to be signed on its behalf by the undersigned, thereunto duly authorized.
| (Registrant) | Wilshire Mutual Funds, Inc. | | |
| | | | |
| By (Signature and Title)* | /s/ Jason A. Schwarz | |
| | | Jason A. Schwarz, President and Principal Executive Officer | |
| | | | |
| Date | September 3, 2019 | | |
| | | | |
| Pursuant to the requirements of the Securities Exchange Act of 1934 and the Investment Company Act of 1940, this report has been signed below by the following persons on behalf of the registrant and in the capacities and on the dates indicated. |
| | | | |
| By (Signature and Title)* | /s/ Jason A. Schwarz | |
| | | Jason A. Schwarz, President and Principal Executive Officer | |
| | | | |
| Date | September 3, 2019 | | |
| | | | |
| By (Signature and Title)* | /s/ Michael Wauters | |
| | | Michael Wauters, Treasurer, Principal Financial Officer and Principal Accounting Officer | |
| | | | |
| Date | September 3, 2019 | | |
| * | Print the name and title of each signing officer under his or her signature. |