| OMB APPROVAL |
OMB Number: 3235-0570 Expires: August 31, 2020 Estimated average burden hours per response: 20.6 |
UNITED STATES
SECURITIES AND EXCHANGE COMMISSION
Washington, D.C. 20549
FORM N-CSR
CERTIFIED SHAREHOLDER REPORT OF REGISTERED
MANAGEMENT INVESTMENT COMPANIES
| Investment Company Act file number | 811-07076 | |
| Wilshire Mutual Funds, Inc. |
| (Exact name of registrant as specified in charter) |
| 1299 Ocean Avenue, Suite 700 Santa Monica, CA | 90401-1085 |
| (Address of principal executive offices) | (Zip code) |
Jason A. Schwarz
| Wilshire Associates Incorporated, 1299 Ocean Avenue, Suite 700, Santa Monica, CA 90401-1085 |
| (Name and address of agent for service) |
| Registrant's telephone number, including area code: | (866) 591-1568 | |
| Date of fiscal year end: | December 31 | |
| | | |
| Date of reporting period: | June 30, 2018 | |
Form N-CSR is to be used by management investment companies to file reports with the Commission not later than 10 days after the transmission to stockholders of any report that is required to be transmitted to stockholders under Rule 30e-1 under the Investment Company Act of 1940 (17 CFR 270.30e-1). The Commission may use the information provided on Form N-CSR in its regulatory, disclosure review, inspection, and policymaking roles.
A registrant is required to disclose the information specified by Form N-CSR, and the Commission will make this information public. A registrant is not required to respond to the collection of information contained in Form N-CSR unless the Form displays a currently valid Office of Management and Budget ("OMB") control number. Please direct comments concerning the accuracy of the information collection burden estimate and any suggestions for reducing the burden to the Secretary, Securities and Exchange Commission, 450 Fifth Street, NW, Washington, DC 20549-0609. The OMB has reviewed this collection of information under the clearance requirements of 44 U.S.C. § 3507.
| Item 1. | Reports to Stockholders. |
Wilshire Mutual Funds, Inc. |

SEMI-ANNUAL REPORT (Unaudited) Large Company Growth Portfolio Large Company Value Portfolio Small Company Growth Portfolio Small Company Value Portfolio Wilshire 5000 Indexsm Fund Wilshire International Equity Fund Wilshire Income Opportunities Fund |
June 30, 2018 http://advisor.wilshire.com |
Wilshire Mutual Funds, Inc. Table of Contents | 
|
Letter to Shareholders | 1 |
Commentary: | |
Large Company Growth Portfolio | 4 |
Large Company Value Portfolio | 7 |
Small Company Growth Portfolio | 10 |
Small Company Value Portfolio | 13 |
Wilshire 5000 IndexSM Fund | 16 |
Wilshire International Equity Fund | 19 |
Wilshire Income Opportunities Fund | 22 |
Disclosure of Fund Expenses | 25 |
Schedule of Investments/Condensed Schedules of Investments: | |
Large Company Growth Portfolio | 28 |
Large Company Value Portfolio | 30 |
Small Company Growth Portfolio | 32 |
Small Company Value Portfolio | 34 |
Wilshire 5000 IndexSM Fund | 36 |
Wilshire International Equity Fund | 38 |
Wilshire Income Opportunities Fund | 42 |
Statements of Assets and Liabilities | 67 |
Statements of Operations | 70 |
Statements of Changes in Net Assets | 72 |
Financial Highlights: | |
Large Company Growth Portfolio | 77 |
Large Company Value Portfolio | 79 |
Small Company Growth Portfolio | 81 |
Small Company Value Portfolio | 83 |
Wilshire 5000 IndexSM Fund | 85 |
Wilshire International Equity Fund | 87 |
Wilshire Income Opportunities Fund | 91 |
Notes to Financial Statements | 93 |
Additional Fund Information | 118 |
Board Approval of Subadvisory Agreements | 119 |
This report is for the general information of the shareholders of Large Company Growth Portfolio, Large Company Value Portfolio, Small Company Growth Portfolio, Small Company Value Portfolio, Wilshire 5000 IndexSM Fund, Wilshire International Equity Fund and Wilshire Income Opportunities Fund. Its use in connection with any offering of a Portfolio’s shares is authorized only if accompanied or preceded by the Portfolio’s current prospectus.
Wilshire Mutual Funds, Inc. are distributed by Ultimus Fund Distributors, LLC.
Wilshire Mutual Funds, Inc. Letter to Shareholders (Unaudited) |
|
Dear Wilshire Mutual Fund Shareholder:
We are pleased to present this semi-annual report to all shareholders of the Wilshire Mutual Funds. This report covers the period from January 1, 2018 to June 30, 2018, for all share classes of the Large Company Growth Fund, Large Company Value Fund, Small Company Growth Fund, Small Company Value Fund, Wilshire 5000 Index Fund, Wilshire International Equity Fund, and Wilshire Income Opportunities Fund.
MARKET ENVIRONMENT
U.S. Equity Market
The U.S. stock market, represented by the Wilshire 5000 Total Market IndexSM, was up 3.04% for the first half of the year. During the first six months of the year, growth-oriented stocks outpaced value securities across all market capitalizations. Within the small cap space, growth stocks have generally outpaced value stocks except for the most recent quarter where value led growth. Sector performance was mixed with six of the eleven major sectors producing gains. Information Technology and Consumer Discretionary were the top performers, returning, +11.34% and +10.22%, respectively. Consumer Staples (-7.72%) and Telecommunication Services (-7.78%) were the largest laggards. Concerns over trade and tariffs continued to drive markets this spring, as did increased anti-euro sentiment in Italy.
International Equity Market
Equity markets outside of the U.S. produced mixed results, with the MSCI All Country World ex USA Index down -3.77% for the year-to-date period ended June 30. As global growth slowed and the Federal Reserve adopted a more aggressive stance on interest rates, the U.S. dollar was up approximately 5% versus a basket of international currencies. Equity price volatility affected global markets, as tensions seemed to escalate between the U.S. and its major trading partners. The broad developed markets index represented by the MSCI EAFE Index, however, returned 3.47% in local currency. Additionally, the MSCI Japan Index returned -3.66% through June 30. Emerging markets struggled during the second quarter as U.S. trade war fears weighed on export-driven economies, erasing all of the earlier gains from the first quarter. The MSCI Emerging Markets Index produced -6.66% over the same time period.
Bond Market
Bonds overall did not fare well during the first six months of 2018 as concerns around inflation, a global trade war, continued geopolitical risk, and slower than expected economic growth weighed on sentiment. The Bloomberg Barclays US Aggregate Bond Index returned -1.62% for the period. While the Federal Reserve raised the federal funds rate in both March and June meetings, rates on longer-term bonds remain low, and the U.S. Treasury yield curve flattened in the second quarter. U.S. Treasuries hit a peak of 3.11% in mid-May but fell to 2.85% by the end of the second quarter. Credit spreads for investment grade bonds widened to 116 bps over U.S. Treasuries at the end of the period. The Bloomberg Barclays U.S. High Yield Index returned 0.16% for the first half of the year as credit spreads remained within a tight range.
1
Wilshire Mutual Funds, Inc. Letter to Shareholders (Unaudited) - (Continued) |
|
Fund Performance Review
The Large Company Growth Portfolio Institutional Class returned 7.83%, outperforming the Russell 1000 Growth Index by 58 bps. The Large Company Value Portfolio Institutional Class returned -1.91%, underperforming the Russell 1000 Value Index by 0.22%. The Small Company Growth Portfolio Institutional Class returned 8.88%, underperforming the Russell 2000 Growth Index by 0.82%. The Small Company Value Portfolio Institutional Class returned 5.02%, underperforming the Russell 2000 Value Index by 0.42%. The Wilshire 5000 Index Fund Institutional Class returned 2.78%, underperforming the Wilshire 5000 Total Market Index by 0.26%. The Wilshire International Equity Fund Institutional Class returned -2.17%, outperforming the MSCI All Country World ex USA Index by 1.60%. The Wilshire Income Opportunities Fund Institutional Share Class returned 0.00% outperforming the Bloomberg Barclays US Universal Index by 1.67%. While some of the Funds struggled during this period, we are confident that each Fund is well positioned for future growth.
As always, we sincerely appreciate your continued support and confidence in Wilshire Associates.
Sincerely,

Jason Schwarz
President, Wilshire Mutual Funds
2
Wilshire Mutual Funds, Inc. Letter to Shareholders (Unaudited) - (Continued) |
|
The performance data quoted represents past performance and does not guarantee future results. Current performance may be lower or higher. The investment return and principal value of an investment will fluctuate so that shares, when redeemed, may be worth more or less than their original cost. Returns assume reinvestment of all distributions.
Index returns are for illustrative purposes only and do not represent actual Fund performance. Index performance returns do not reflect any management fees, transactions costs or expenses. Indexes are unmanaged and one cannot invest directly in an index. Past performance does not guarantee future results.
Bonds and bond funds are subject to interest rate risk and will decline in value as interest rates rise.
In addition to the normal risks associated with investing, international investments may involve risk of capital loss from unfavorable fluctuation in currency values, from differences in generally accepted accounting principles or from social, economic or political instability in other nations. Investments in smaller companies typically exhibit higher volatility.
Investing involves risk including loss of principal. This report identifies each Portfolio’s investments on June 30, 2018. These holdings are subject to change. Not all investments in each Portfolio performed the same, nor is there any guarantee that these investments will perform as well in the future. Market forecasts provided in this report may not occur.
The MSCI EAFE Index is an equity index which captures large and mid-cap representation across developed markets countries around the world, excluding the U.S. and Canada.
MSCI Emerging Markets Index is a free float-adjusted market capitalization index that is designed to measure equity market performance of emerging markets.
The Wilshire 5000 Total Market IndexSM is widely accepted as the definitive benchmark for the U.S. equity market, and measures performance of all U.S. equity securities with readily available price data.
3
Large Company Growth Portfolio Commentary (Unaudited) |
|
INVESTMENT CLASS SHARES
Average Annual Total Returns
Six Months Ended 6/30/18* | 7.64% |
One Year Ended 6/30/18 | 19.30% |
Five Years Ended 6/30/18 | 14.13% |
Ten Years Ended 6/30/18 | 9.45% |
INSTITUTIONAL CLASS SHARES
Average Annual Total Returns
Six Months Ended 6/30/18* | 7.83% |
One Year Ended 6/30/18 | 19.70% |
Five Years Ended 6/30/18 | 14.49% |
Ten Years Ended 6/30/18 | 9.80% |
RUSSELL 1000® GROWTH INDEX(1)
Average Annual Total Returns
Six Months Ended 6/30/18* | 7.25% |
One Year Ended 6/30/18 | 22.51% |
Five Years Ended 6/30/18 | 16.36% |
Ten Years Ended 6/30/18 | 11.83% |
The performance data quoted represents past performance and does not guarantee future results. Current performance may be lower or higher. Performance data current to the most recent month end may be obtained at http://advisor.wilshire.com. The investment return and principal value of an investment will fluctuate so that shares, when redeemed, may be worth more or less than their original cost. The tables above do not reflect the deduction of taxes that a shareholder would pay on Portfolio distributions or the redemption of Portfolio shares.
* | Not annualized. |
(1) | The Russell 1000® Growth Index is an unmanaged index that measures the performance of the largest 1,000 U.S. companies with higher price-to-book ratios and higher forecasted growth values. Index performance is presented for general comparative purposes. Unlike a mutual fund, the performance of an index assumes no transaction costs, management fees or other expenses. An individual cannot directly invest in any index. |
4
Large Company Growth Portfolio Commentary (Unaudited) - (Continued) |
|
The Wilshire 5000 Total Market IndexSM returned 3.04% for the first half of the year as concerns around inflation, global trade war, continued geopolitical risk, and slower than expected economic growth weighed on investors’ minds. Inflation fears and valuation concerns caused the CBOE Volatility Index to spike to 37.32 in February before falling to 16.09 at the end of June. Ironically, it was mostly good news on the economic front that caused much of the volatility. Strong jobs reports and wage growth during the first quarter prompted concerns that higher inflation might spur the Federal Reserve to accelerate increases in its short-term rate. Following a global sell-off during early February, the U.S. equity market recovered in the second quarter of 2018. This marks the second longest U.S. bull market since World War II. Volatility continued to be a theme during the second quarter, as U.S. tariffs on Chinese goods and Beijing’s intent to respond “in kind” have increased fears of a trade war; however, these levels are in line with long term historical figures.
Personal income, consumer spending, and the consumer price index have all increased over the year through June 2018, albeit at a slower pace compared to the previous year. Together, with a slight decrease in trade deficits, strong consumer and business spending contributed to growth.
Domestically, job growth has been solid in 2018, with unemployment decreasing to 4.0% in June. Reflecting an improved outlook for growth, the Federal Open Market Committee raised the federal funds rate again in June to between 1.75% and 2.00% and signaled plans to raise rates two more times this year. This was the seventh rate hike since late 2015. On the equity front, year to date, growth-oriented securities have outperformed value-oriented stocks, and small capitalization stocks outperformed their large capitalization counterparts.
Sector performance for the Wilshire 5000 Total Market Index was mostly positive with six of the eleven major sectors producing gains. Increased consumer spending and tax cut benefits propelled performance of the Consumer Discretionary and Information Technology sectors, which returned 11.34% and 10.22%, respectively. The Energy sector was up 7.49% as Brent crude prices increased 4.4% in the first quarter and another 17.2% in the second quarter. Conversely, Consumer Staples (-7.72%) and Telecommunication Services (-7.78%) were the worst performing sectors as interest rate sensitivity remained a concern. Going forward, continued threats of a trade war could prove to be a headwind to equities overall.
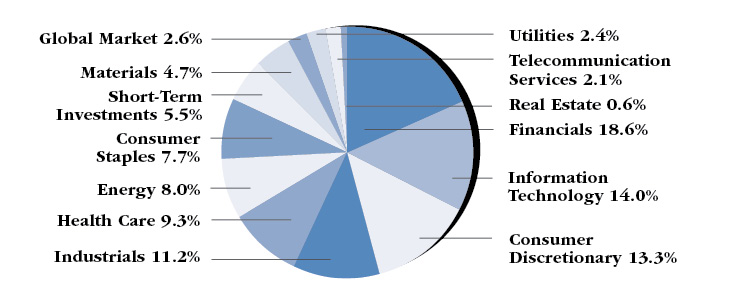
The Wilshire Large Company Growth Portfolio Institutional Class returned 7.83% for the first six months of 2018, outperforming the Russell 1000 Growth Index return of 7.25%. Weak stock selection in both Financials and Consumer Discretionary, as well as overweight allocation to the Financials sector was detractive from performance. Strong selection in Health Care and Industrials, as well as an overweight to the Information Technology sector contributed to performance.
We are pleased with the Fund’s performance for the year-to-date period and believe that the Fund is well positioned going into the second half of 2018 as the market deals with ongoing macroeconomic and geopolitical uncertainties.
5
Large Company Growth Portfolio Commentary (Unaudited) - (Continued) |
|
PORTFOLIO SECTOR WEIGHTING†
(As of June 30, 2018)
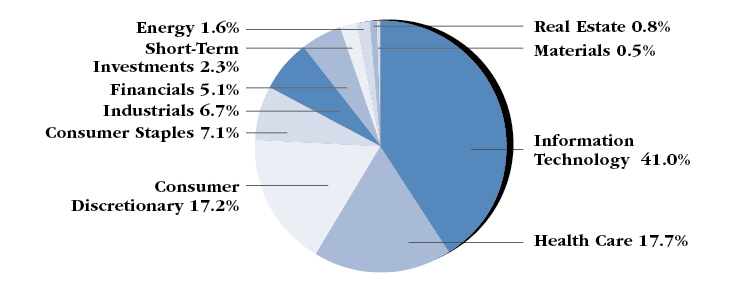
† | Based on percent of the Portfolio’s total investments in securities at value. Includes investments held as collateral for securities on loan (see Note 7 in Notes to Financial Statements). |
6
Large Company Value Portfolio Commentary (Unaudited) |
|
INVESTMENT CLASS SHARES
Average Annual Total Returns
Six Months Ended 6/30/18* | (2.03%) |
One Year Ended 6/30/18 | 7.32% |
Five Years Ended 6/30/18 | 9.45% |
Ten Years Ended 6/30/18 | 7.56% |
INSTITUTIONAL CLASS SHARES
Average Annual Total Returns
Six Months Ended 6/30/18* | (1.91%) |
One Year Ended 6/30/18 | 7.57% |
Five Years Ended 6/30/18 | 9.70% |
Ten Years Ended 6/30/18 | 7.80% |
RUSSELL 1000® VALUE INDEX(1)
Average Annual Total Returns
Six Months Ended 6/30/18* | (1.69%) |
One Year Ended 6/30/18 | 6.77% |
Five Years Ended 6/30/18 | 10.34% |
Ten Years Ended 6/30/18 | 8.49% |
The performance data quoted represents past performance and does not guarantee future results. Current performance may be lower or higher. Performance data current to the most recent month end may be obtained at http://advisor.wilshire.com. The investment return and principal value of an investment will fluctuate so that shares, when redeemed, may be worth more or less than their original cost. The tables above do not reflect the deduction of taxes that a shareholder would pay on Portfolio distributions or the redemption of Portfolio shares.
* | Not annualized. |
(1) | The Russell 1000® Value Index is an unmanaged index that measures the performance of the largest 1,000 U.S. companies with lower price-to-book ratios and lower forecasted growth values. Index performance is presented for general comparative purposes. Unlike a mutual fund, the performance of an index assumes no transaction costs, management fees or other expenses. An individual cannot directly invest in any index. |
7
Large Company Value Portfolio Commentary (Unaudited) - (Continued) |
|
The Wilshire 5000 Total Market IndexSM returned 3.04% for the first half of the year as concerns around inflation, global trade war, continued geopolitical risk, and slower than expected economic growth weighed on investors’ minds. Inflation fears and valuation concerns caused the CBOE Volatility Index to spike to 37.32 in February before falling to 16.09 at the end of June. Ironically, it was mostly good news on the economic front that caused much of the volatility. Strong jobs reports and wage growth during the first quarter prompted concerns that higher inflation might spur the Federal Reserve to accelerate increases in its short-term rate. Following a global sell-off during early February, the U.S. equity market recovered in the second quarter of 2018. This marks the second longest U.S. bull market since World War II. Volatility continued to be a theme during the second quarter, as U.S. tariffs on Chinese goods and Beijing’s intent to respond “in kind” have increased fears of a trade war; however, these levels are in line with long term historical figures.
Personal income, consumer spending, and the consumer price index have all increased over the year through June 2018, albeit at a slower pace compared to the previous year. Together, with a slight decrease in trade deficits, strong consumer and business spending contributed to growth.
Domestically, job growth has been solid in 2018, with unemployment decreasing to 4.0% in June. Reflecting an improved outlook for growth, the Federal Open Market Committee raised the federal funds rate again in June to between 1.75% and 2.00% and signaled plans to raise rates two more times this year. This was the seventh rate hike since late 2015. On the equity front, year to date, growth-oriented securities have outperformed value-oriented stocks, and small capitalization stocks outperformed their large capitalization counterparts.
Sector performance for the Wilshire 5000 Total Market Index was mostly positive with six of the eleven major sectors producing gains. Increased consumer spending and tax cut benefits propelled performance of the Consumer Discretionary and Information Technology sectors, which returned 11.34% and 10.22%, respectively. The Energy sector was up 7.49% as Brent crude prices increased 4.4% in first quarter and another 17.2% in the second quarter. Conversely, Consumer Staples (-7.72%) and Telecommunication Services (-7.78%) were the worst performing sectors as interest rate sensitivity remained a concern. Going forward, continued threats of a trade war could prove to be a headwind to equities overall.
The Wilshire Large Company Value Portfolio Institutional Class returned -1.91% for the first six months of 2018, underperforming the Russell 1000 Value Index return of -1.69%. Fund performance benefited modestly from stock selection in Financials and from an overweight to Energy, but was weighed down by weak stock selection in Consumer Discretionary and Health Care, as well as an underweight allocation to Real Estate.
Despite the Fund’s underperformance for the year-to-date period, we believe that the Fund is well positioned going into the second half of 2018 as the market deals with ongoing macroeconomic and geopolitical uncertainties.
8
Large Company Value Portfolio Commentary (Unaudited) - (Continued) |
|
PORTFOLIO SECTOR WEIGHTING†
(As of June 30, 2018)
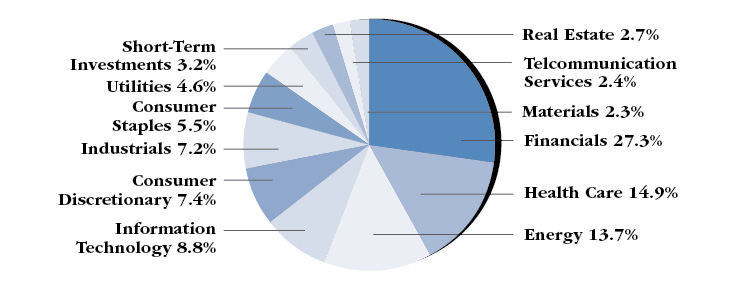
† | Based on percent of the Portfolio’s total investments in securities at value. Includes investments held as collateral for securities on loan (see Note 7 in Notes to Financial Statements). |
9
Small Company Growth Portfolio Commentary (Unaudited) |
|
INVESTMENT CLASS SHARES
Average Annual Total Returns*
Six Months Ended 6/30/18** | 8.74% |
One Year Ended 6/30/18 | 17.35% |
Five Years Ended 6/30/18 | 13.55% |
Ten Years Ended 6/30/18 | 10.60% |
INSTITUTIONAL CLASS SHARES
Average Annual Total Returns*
Six Months Ended 6/30/18** | 8.88% |
One Year Ended 6/30/18 | 17.65% |
Five Years Ended 6/30/18 | 13.87% |
Ten Years Ended 6/30/18 | 10.89% |
RUSSELL 2000® GROWTH INDEX(1)
Average Annual Total Returns
Six Months Ended 6/30/18** | 9.70% |
One Year Ended 6/30/18 | 21.86% |
Five Years Ended 6/30/18 | 13.65% |
Ten Years Ended 6/30/18 | 11.24% |
The performance data quoted represents past performance and does not guarantee future results. Current performance may be lower or higher. Performance data current to the most recent month end may be obtained at http://advisor.wilshire.com. The investment return and principal value of an investment will fluctuate so that shares, when redeemed, may be worth more or less than their original cost. The tables above do not reflect the deduction of taxes that a shareholder would pay on Portfolio distributions or the redemption of Portfolio shares.
* | During the ten years ended June 30, 2018, certain fees and expenses were reduced or reimbursed. Without fee reductions and expense reimbursements (excluding fees paid indirectly), historical total returns would have been lower. For the six months ended June 30, 2018, the investment adviser reduced its fees or reimbursed expenses in the annualized amount of 0.24% and 0.19% of average net assets for Investment Class Shares and Institutional Class Shares, respectively. |
** | Not annualized. |
(1) | The Russell 2000® Growth Index is an unmanaged index that measures the performance of the 2,000 smallest U.S. companies with higher price-to-book ratios and higher forecasted growth values. Index performance is presented for general comparative purposes. Unlike a mutual fund, the performance of an index assumes no transaction costs, management fees or other expenses. An individual cannot directly invest in any index. |
10
Small Company Growth Portfolio Commentary (Unaudited) - (Continued) |
|
The Wilshire 5000 Total Market IndexSM returned 3.04% for the first half of the year as concerns around inflation, global trade war, continued geopolitical risk, and slower than expected economic growth weighed on investors’ minds. Inflation fears and valuation concerns caused the CBOE Volatility Index to spike to 37.32 in February before falling to 16.09 at the end of June. Ironically, it was mostly good news on the economic front that caused much of the volatility. Strong jobs reports and wage growth during the first quarter prompted concerns that higher inflation might spur the Federal Reserve to accelerate increases in its short-term rate. Following a global sell-off during early February, the U.S. equity market recovered in the second quarter of 2018. This marks the second longest U.S. bull market since World War II. Volatility increased and continued to be a theme during the second quarter, as U.S. tariffs on Chinese goods and Beijing’s intent to respond “in kind” have increased fears of a trade war; however, these levels are in line with long term historical figures.
Personal income, consumer spending, and the consumer price index have all increased over the year through June 2018, albeit at a slower pace compared to the previous year. Together, with a slight decrease in trade deficits, strong consumer and business spending contributed to growth.
Domestically, job growth has been solid in 2018, with unemployment decreasing to 4.0% in June. Reflecting an improved outlook for growth, the Federal Open Market Committee raised the federal funds rate again in June to between 1.75% and 2.00% and signaled plans to raise rates two more times this year. This was the seventh rate hike since late 2015. On the equity front, year to date, growth-oriented securities have outperformed value-oriented stocks, and small capitalization stocks outperformed their large capitalization counterparts.
Sector performance for the Wilshire 5000 Total Market Index was mostly positive with eight of the eleven major sectors producing gains. Increased consumer spending and tax cut benefits propelled performance of the Consumer Discretionary and Information Technology sectors, which returned 11.34% and 10.22%, respectively. The Energy sector was up 7.49% as Brent crude prices increased 4.4% in first quarter and another 17.2% in the second quarter. Conversely, Consumer Staples (-7.72%) and Telecommunication Services (-7.78%) were the worst performing sectors as interest rate sensitivity remained a concern. Going forward, continued threats of a trade war could prove to be a headwind to equities overall.
The Wilshire Small Company Growth Portfolio Institutional Class returned 8.88% for the first six months of 2018, underperforming the Russell 2000 Growth Index return of 9.70%. Fund performance benefited from strong stock selection in Health Care and Financials, as well as an underweight to the Consumer Staples sector, but was weighed down by weak stock selection in Consumer Staples, Information Technology and Health Care, as well as an underweight allocation to the Consumer Discretionary sector.
Despite the Fund’s underperformance versus its benchmark, we believe the Fund is well positioned going into the second half of 2018 as the market deals with ongoing macroeconomic and geopolitical uncertainties.
11
Small Company Growth Portfolio Commentary (Unaudited) - (Continued) |
|
PORTFOLIO SECTOR WEIGHTING†
(As of June 30, 2018)
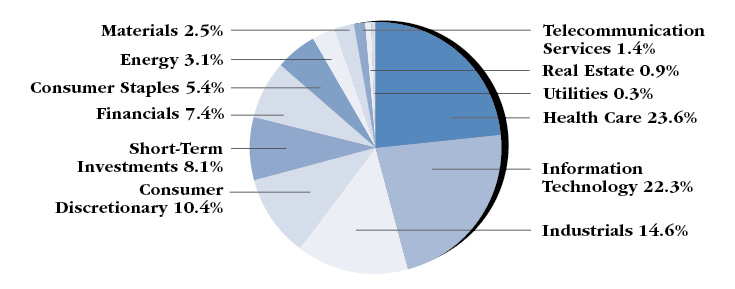
† | Based on percent of the Portfolio’s total investments in securities at value. Includes investments held as collateral for securities on loan (see Note 7 in Notes to Financial Statements). |
12
Small Company Value Portfolio Commentary (Unaudited) |
|
INVESTMENT CLASS SHARES
Average Annual Total Returns*
Six Months Ended 6/30/18** | 4.92% |
One Year Ended 6/30/18 | 14.91% |
Five Years Ended 6/30/18 | 12.05% |
Ten Years Ended 6/30/18 | 9.92% |
INSTITUTIONAL CLASS SHARES
Average Annual Total Returns*
Six Months Ended 6/30/18** | 5.02% |
One Year Ended 6/30/18 | 15.21% |
Five Years Ended 6/30/18 | 12.36% |
Ten Years Ended 6/30/18 | 10.25% |
RUSSELL 2000® VALUE INDEX(1)
Average Annual Total Returns
Six Months Ended 6/30/18** | 5.44% |
One Year Ended 6/30/18 | 13.10% |
Five Years Ended 6/30/18 | 11.18% |
Ten Years Ended 6/30/18 | 9.88% |
The performance data quoted represents past performance and does not guarantee future results. Current performance may be lower or higher. Performance data current to the most recent month end may be obtained at http://advisor.wilshire.com. The investment return and principal value of an investment will fluctuate so that shares, when redeemed, may be worth more or less than their original cost. The tables above do not reflect the deduction of taxes that a shareholder would pay on Portfolio distributions or the redemption of Portfolio shares.
* | During the ten years ended June 30, 2018, certain fees and expenses were reduced or reimbursed. Without fee reductions and expense reimbursements (excluding fees paid indirectly), historical total returns would have been lower. For the six months ended June 30, 2018, the investment adviser reduced its fees or reimbursed expenses in the annualized amount of 0.26% and 0.20% of average net assets for Investment Class Shares and Institutional Class Shares, respectively. |
** | Not annualized. |
(1) | The Russell 2000® Value Index is an unmanaged index that measures the performance of the 2,000 smallest U.S. companies with lower price-to-book ratios and lower forecasted growth values. Index performance is presented for general comparative purposes. Unlike a mutual fund, the performance of an index assumes no transaction costs, management fees or other expenses. An individual cannot directly invest in any index. |
13
Small Company Value Portfolio Commentary (Unaudited) - (Continued) |
|
The Wilshire 5000 Total Market IndexSM returned 3.04% for the first half of the year as concerns around inflation, global trade war, continued geopolitical risk, and slower than expected economic growth weighed on investors’ minds. Inflation fears and valuation concerns caused the CBOE Volatility Index to spike to 37.32 in February before falling to 16.09 at the end of June. Ironically, it was mostly good news on the economic front that caused much of the volatility. Strong jobs reports and wage growth during the first quarter prompted concerns that higher inflation might spur the Federal Reserve to accelerate increases in its short-term rate. Following a global sell-off during early February, the U.S. equity market recovered in the second quarter of 2018. This marks the second longest U.S. bull market since World War II. Volatility continued to be a theme during the second quarter, as U.S. tariffs on Chinese goods and Beijing’s intent to respond “in kind” have increased fears of a trade war; however, these levels are in line with long term historical figures.
Personal income, consumer spending, and the consumer price index have all increased over the year through June 2018, albeit at a slower pace compared to the previous year. Together, with a slight decrease in trade deficits, strong consumer and business spending contributed to growth.
Domestically, job growth has been solid in 2018, with unemployment decreasing to 4.0% in June. Reflecting an improved outlook for growth, the Federal Open Market Committee raised the federal funds rate again in June to between 1.75% and 2.00% and signaled plans to raise rates two more times this year. This was the seventh rate hike since late 2015. On the equity front, year to date, growth-oriented securities have outperformed value-oriented stocks, and small capitalization stocks outperformed their large capitalization counterparts.
Sector performance for the Wilshire 5000 Total Market Index was mostly positive with six of the eleven major sectors producing gains. Increased consumer spending and tax cut benefits propelled performance of the Consumer Discretionary and Information Technology sectors, which returned 11.34% and 10.22%, respectively. The Energy sector was up 7.49% as Brent crude prices increased 4.4% in first quarter and another 17.2% in the second quarter. Conversely, Consumer Staples (-7.72%) and Telecommunication Services (-7.78%) were the worst performing sectors as interest rate sensitivity remained a concern. Going forward, continued threats of a trade war could prove to be a headwind to equities overall.
The Wilshire Small Company Value Portfolio Institutional Class returned 5.02% for the first six months of 2018, underperforming the Russell 2000 Value Index return of 5.44%. The Fund benefited from strong stock selection in Energy and Information Technology as well as overweight in Energy. Performance was impacted by weak stock selection in Financials, Information Technology and Health Care as well as an underweight allocation to Real Estate.
Despite the Fund’s underperformance versus its benchmark, we believe the Fund is well positioned going into the second half of 2018 as the market deals with ongoing macroeconomic and geopolitical uncertainties.
14
Small Company Value Portfolio Commentary (Unaudited) - (Continued) |
|
PORTFOLIO SECTOR WEIGHTING†
(As of June 30, 2018)
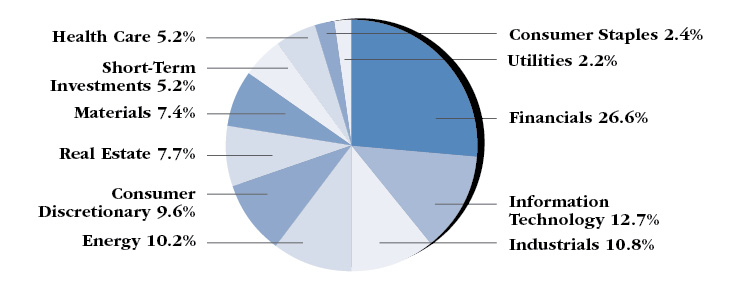
† | Based on percent of the Portfolio’s total investments in securities at value. Includes investments held as collateral for securities on loan (see Note 7 in Notes to Financial Statements). |
15
Wilshire 5000 Indexsm Fund Commentary (Unaudited) |
|
INVESTMENT CLASS SHARES
Average Annual Total Returns
Six Months Ended 6/30/18* | 2.69% |
One Year Ended 6/30/18 | 13.95% |
Five Years Ended 6/30/18 | 12.68% |
Ten Years Ended 6/30/18 | 9.60% |
INSTITUTIONAL CLASS SHARES
Average Annual Total Returns
Six Months Ended 6/30/18* | 2.78% |
One Year Ended 6/30/18 | 14.18% |
Five Years Ended 6/30/18 | 12.95% |
Ten Years Ended 6/30/18 | 9.84% |
WILSHIRE 5000 INDEXSM(1)
Average Annual Total Returns
Six Months Ended 6/30/18* | 3.04% |
One Year Ended 6/30/18 | 14.66% |
Five Years Ended 6/30/18 | 13.36% |
Ten Years Ended 6/30/18 | 10.23% |
The performance data quoted represents past performance and does not guarantee future results. Current performance may be lower or higher. Performance data current to the most recent month end may be obtained at http://advisor.wilshire.com. The investment return and principal value of an investment will fluctuate so that shares, when redeemed, may be worth more or less than their original cost. The tables above do not reflect the deduction of taxes that a shareholder would pay on Fund distributions or the redemption of Fund shares.
* | Not annualized. |
(1) | The Wilshire 5000 IndexSM is an unmanaged index that measures the performance of all U.S. headquartered equity securities with readily available price data. Index performance is presented for general comparative purposes. Unlike a mutual fund, the performance of an index assumes no transaction costs, management fees or other expenses. An individual cannot directly invest in any index. |
16
Wilshire 5000 Indexsm Fund Commentary (Unaudited) - (Continued) |
|
The Wilshire 5000 Total Market IndexSM returned 3.04% for the first half of the year as concerns around inflation, global trade war, continued geopolitical risk, and slower than expected economic growth weighed on investors’ minds. Inflation fears and valuation concerns caused the CBOE Volatility Index to spike to 37.32 in February before falling to 16.09 at the end of June. Ironically, it was mostly good news on the economic front that caused much of the volatility. Strong jobs reports and wage growth during the first quarter prompted concerns that higher inflation might spur the Federal Reserve to accelerate increases in its short-term rate. Following a global sell-off during early February, the U.S. equity market recovered in the second quarter of 2018. This marks the second longest U.S. bull market since World War II. Volatility continued to be a theme during the second quarter, as U.S. tariffs on Chinese goods and Beijing’s intent to respond “in kind” have increased fears of a trade war; however, these levels are in line with long term historical figures.
Personal income, consumer spending, and the consumer price index have all increased over the year through June 2018, albeit at a slower pace compared to the previous year. Together, with a slight decrease in trade deficits, strong consumer and business spending contributed to growth.
Domestically, job growth has been solid in 2018, with unemployment decreasing to 4.0% in June. Reflecting an improved outlook for growth, the Federal Open Market Committee raised the federal funds rate again in June to between 1.75% and 2.00% and signaled plans to raise rates two more times this year. This was the seventh rate hike since late 2015. On the equity front, year to date, growth-oriented securities have outperformed value-oriented stocks, and small capitalization stocks outperformed their large capitalization counterparts.
Sector performance for the Wilshire 5000 Total Market Index was mostly positive with six of the eleven major sectors producing gains. Increased consumer spending and tax cut benefits propelled performance of the Consumer Discretionary and Information Technology sectors, which returned 11.34% and 10.22%, respectively. The Energy sector was up 7.49% as Brent crude prices increased 4.4% in first quarter and another 17.2% in the second quarter. Conversely, Consumer Staples (-7.72%) and Telecommunication Services (-7.78%) were the worst performing sectors as interest rate sensitivity remained a concern. Going forward, continued threats of a trade war could prove to be a headwind to equities overall.
The Wilshire 5000 Index Fund Institutional Class returned 2.78% for the first six months of 2018, underperforming the Wilshire 5000 Total Market Index return of 3.04%. Underperformance is attributable to both Fund expenses and the optimization approach utilized by Los Angeles Capital, the Fund’s sub-advisor, and is well within its historical range.
Despite the Fund’s performance for the year-to-date period, we believe the Fund is well positioned going into the second half of 2018 as the market deals with ongoing macroeconomic and geopolitical uncertainties.
17
Wilshire 5000 Indexsm Fund Commentary (Unaudited) - (Continued) |
|
PORTFOLIO SECTOR WEIGHTING†
(As of June 30, 2018)

† | Based on percent of the Fund’s total investments in securities at value. Includes investments held as collateral for securities on loan (see Note 7 in Notes to Financial Statements). |
18
Wilshire International Equity Fund Commentary (Unaudited) |
|
INVESTMENT CLASS SHARES
Average Annual Total Returns*
Six Months Ended 6/30/18** | (2.23%) |
One Year Ended 6/30/18 | 7.75% |
Five Years Ended 6/30/18 | 5.62% |
Ten Years Ended 6/30/18 | 3.40% |
INSTITUTIONAL CLASS SHARES
Average Annual Total Returns*
Six Months Ended 6/30/18** | (2.17%) |
One Year Ended 6/30/18 | 7.98% |
Five Years Ended 6/30/18 | 5.85% |
Ten Years Ended 6/30/18 | 3.66% |
MSCI ALL COUNTRY WORLD INDEX EX USA(1)
Average Annual Total Returns
Six Months Ended 6/30/18** | (3.77%) |
One Year Ended 6/30/18 | 7.28% |
Five Years Ended 6/30/18 | 5.99% |
Ten Years Ended 6/30/18 | 2.54% |
On April 2, 2013, the Wilshire International Equity Fund’s investment strategy was changed. Consequently, prior period performance may have been different if the new investment strategy had been in effect during these periods.
The performance data quoted represents past performance and does not guarantee future results. Current performance may be lower or higher. Performance data current to the most recent month end may be obtained at http://advisor.wilshire.com. The investment return and principal value of an investment will fluctuate so that shares, when redeemed, may be worth more or less than their original cost. The tables above do not reflect the deduction of taxes that a shareholder would pay on Fund distributions or the redemption of Fund shares.
* | During the ten years ended June 30, 2018, certain fees and expenses were reduced or reimbursed. Without fee reductions and expense reimbursements, historical total returns would have been lower. For the six months ended June 30, 2018, the investment adviser reduced its fees or reimbursed expenses in the annualized amount of 0.09% of average net assets for Investment Class Shares. |
** | Not annualized. |
(1) | The MSCI All Country World ex USA Index is an unmanaged capitalization-weighted measure of stock markets of developed and emerging markets, with the exception of U.S.-based companies. Unlike a mutual fund, the performance of an index assumes no transaction costs, management fees or other expenses. An individual cannot invest directly in an index. Index performance is presented for general comparative purposes. |
19
Wilshire International Equity Fund Commentary (Unaudited) - (Continued) |
|
Outside of the United States, equities have not fared well, with the MSCI All Country World ex USA Index returning -3.77% for the year-to-date period through June 30. As global growth slowed and the Federal Reserve adopted a more aggressive stance on interest rates, the U.S. dollar reversed its previous trend and ended the period up approximately 5% versus a basket of international currencies, which heavily impacted U.S.-based investors.
Eurozone economic data was mixed during the second quarter as the unemployment rate fell to 8.4%. Equity price volatility affected global markets as tensions seemed to escalate between the U.S. and its major trading partners. It has yet to be seen, however, how much of the threatened tariffs and retaliation will actually be implemented. Already having been rattled by the Greek financial crisis and Brexit in recent years, the European Union faces a fresh challenge with political developments in Italy. The broad developed markets index, however, was in positive territory for the second quarter in local currency terms. Emerging markets struggled during the second quarter as trade war concerns weighed on export-driven economies, erasing all of the earlier gain in the first quarter. Latin America was hit especially hard, with the MSCI EM Latin America Index declining -17.75% for the quarter. The broader MSCI Emerging Markets Index has returned -6.66% for the year-to-date period through June 30.
Growth outperformed Value overseas as well, with the MSCI EAFE Growth Index returning 0.11% versus -2.64% for the MSCI EAFE Value Index. The MSCI Pacific ex Japan Index (+1.77%) outperformed the MSCI Europe Index (-1.27%). After a strong first quarter, Japan faltered during the second quarter as Japanese manufacturers’ confidence fell and a weakening yen contributed to a decrease of -2.84% for the MSCI Japan Index.
Sector performance for the MSCI All Country World ex USA Index was mostly negative for the quarter. Energy (+5.70%) was the top performing sector, boosted by a rebound in the price of Brent crude from 2017 lows. Conversely, Telecommunication Services (-9.59%) was the worst performing sector as interest rate sensitivity remained a concern.
The Wilshire International Equity Fund Institutional Class returned -2.17% for the first six months of 2018, outperforming the MSCI All Country World ex USA Index return of -3.77%. Fund performance benefited from strong stock selection in Financials and an underweight to the Telecommunication Services sector. Weak stock selection in Consumer Staples and an overweight allocation to the Information Technology sector detracted from returns. Regionally, the Fund benefited from strong stock selection in Australia and Japan and an overweight allocation to France overall. Weak stock selection in Brazil weighed on relative performance.
We are pleased with the Fund’s performance for the year-to-date period through June 30 and believe the Fund is well positioned going into the second half of 2018 as the market deals with ongoing macroeconomic and geopolitical uncertainties.
20
Wilshire International Equity Fund Commentary (Unaudited) - (Continued) |
|
PORTFOLIO SECTOR WEIGHTING†
(As of June 30, 2018)
† | Based on percent of the Fund’s total investments in securities at value. Includes investments held as collateral for securities on loan (see Note 7 in Notes to Financial Statements). |
21
Wilshire Income Opportunities Fund Commentary (Unaudited) |
|
INVESTMENT CLASS SHARES
Average Annual Total Returns*
Six Months Ended 6/30/18** | (0.10%) |
One Year Ended 6/30/18 | 1.88% |
Inception (03/30/16) through 6/30/18 | 4.17% |
INSTITUTIONAL CLASS SHARES
Average Annual Total Returns
Six Months Ended 6/30/18** | 0.00% |
One Year Ended 6/30/18 | 2.01% |
Inception (03/30/16) through 6/30/18 | 4.28% |
Bloomberg Barclays US Universal Index(1)
Average Annual Total Returns
Six Months Ended 6/30/18** | (1.67%) |
One Year Ended 6/30/18 | (0.27%) |
Inception (03/30/16) through 6/30/18 | 1.51% |
The performance data quoted represents past performance and does not guarantee future results. Current performance may be lower or higher. Performance data current to the most recent month end may be obtained at http://advisor.wilshire.com. The investment return and principal value of an investment will fluctuate so that shares, when redeemed, may be worth more or less than their original cost. The tables above do not reflect the deduction of taxes that a shareholder would pay on Fund distributions or the redemption of Fund shares.
* | During certain periods since inception, certain fees and expenses were reduced or reimbursed. Without fee reductions and expense reimbursements, historical returns would have been lower. For the six months ended June 30, 2018, the investment adviser reduced its fees or reimbursed expenses in the annualized amount of 0.02% of average net assets for Investment Class Shares. |
** | Not annualized. |
(1) | The Bloomberg Barclays US Universal Index represents the union of the US Aggregate Index, US Corporate High Yield Index, Investment Grade 144A Index, Eurodollar Index, US Emerging Markets Index, and the non-ERISA eligible portion of the CMBS Index. The index covers USD-denominated, taxable bonds that are rated either investment grade or high-yield. Some US Universal Index constituents may be eligible for one or more of its contributing subcomponents that are not mutually exclusive. The Bloomberg Barclays US Universal Index includes Treasury securities, Government agency bonds, mortgage-backed bonds, corporate bonds, and a small amount of foreign bonds traded in U.S. |
22
Wilshire Income Opportunities Fund Commentary (Unaudited) - (Continued) |
|
The Bloomberg Barclays US Aggregate Bond Index returned -1.62% for the first six months of the year, as credit spread continue to widen. The ICE Bank of America/Merrill Lynch US High Yield Index gained 1.00% as spreads remained within a tight range. Reflecting an improved outlook for growth, the Federal Open Market Committee raised the fed funds rate again in June to between 1.75% and 2.00% and signaled plans to raise rates two more times this year. This was the seventh rate hike since late 2015. The yield curve flattened during the period as the long end of the curve did not keep pace with the rising yields on the short end of the curve. While the short end of the curve is directly influenced by the federal funds rate, the long end is driven by market outlook. Continued economic growth without upward movement in long rates could be an indication that market participants are expecting an economic slowdown.
Globally, continued rhetoric around a trade war, as well as fresh challenges with political developments in Italy, weighed on performance. Demand for risk assets has decreased as central banks roll back stimulus. The Citi World Government Bond Index ended the first six months of the year down -0.94%. Emerging market bonds were heavily impacted by the geopolitical uncertainty.
The Wilshire Income Opportunities Fund Institutional Class returned flat at 0.00% for the period, outperforming the Bloomberg Barclays US Universal Index return of -1.67%. MBS, U.S. Treasuries, high yield, bank loans, CMBS and CLO boosted performance while investment grade and emerging market debt detracted from performance.
We are pleased with the Fund’s outperformance for the year-to-date period through June 30 and believe the Fund is well positioned going into the second half of 2018 as the market deals with ongoing macroeconomic and geopolitical uncertainties.
23
Wilshire Income Opportunities Fund Commentary (Unaudited) - (Continued) |
|
PORTFOLIO SECTOR WEIGHTING†
(As of June 30, 2018)
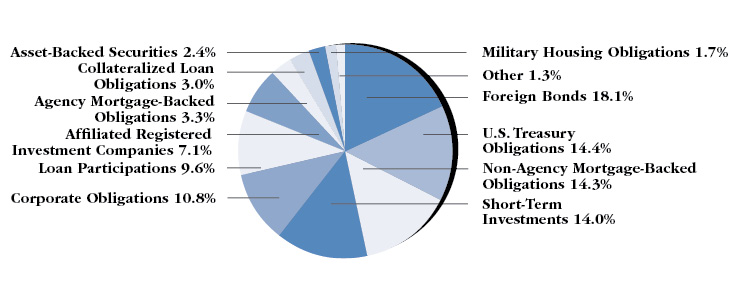
† | Based on percent of the Fund’s total investments in securities at value. |
24
Wilshire Mutual Funds, Inc. Disclosure of Fund Expenses (Unaudited) |
|
All mutual funds have operating expenses. As a shareholder of a Portfolio, you incur ongoing costs, which include costs for investment advisory, administrative services, distribution and/or shareholder services and shareholder reports (like this one), among others. Operating expenses, which are deducted from a fund’s gross income, directly reduce the investment return of the Portfolio. A Portfolio’s expenses are expressed as a percentage of its average net assets. This figure is known as the expense ratio. The following examples are intended to help you understand the ongoing fees (in dollars) of investing in the Portfolios and to compare these costs with those of other mutual funds. The examples are based on an investment of $1,000 made at the beginning of the period and held for the entire period from January 1, 2018 to June 30, 2018.
The table on the next page illustrates the Portfolios’ costs in two ways:
Actual Fund Return: This section helps you to estimate the actual expenses, after any applicable fee reductions, that you paid over the period. The “Ending Account Value” shown is derived from each Portfolio’s actual return for the period. The “Expense Ratio” column shows the period’s annualized expense ratio and the “Expenses Paid During Period” column shows the dollar amount that would have been paid by an investor who started with $1,000 in the Portfolios at the beginning of the period.
You may use the information here, together with your account value, to estimate the expenses that you paid over the period. To do so, simply divide your account value by $1,000 (for example, an $8,600 account value divided by $1,000 = 8.6), then multiply the result by the number given for the Portfolio in the first line under the heading entitled “Expenses Paid During Period.”
Hypothetical 5% Return: This section is intended to help you compare the Portfolios’ costs with those of other mutual funds. The “Ending Account Value” shown is derived from hypothetical account values and hypothetical expenses based on the Portfolio’s actual expense ratio and assumed rate of return. It assumes that each Portfolio had an annual return of 5% before expenses, but that the expense ratio is unchanged. In this case, because the return used is not each Portfolio’s actual return, the results do not apply to your investment. This example is useful in making comparisons to other mutual funds because the Securities and Exchange Commission (“SEC”) requires all mutual funds to calculate expenses based on an assumed 5% annual return. You can assess the Portfolios’ ongoing costs by comparing this hypothetical example with the hypothetical examples that appear in shareholder reports of other funds.
Please note that the expenses shown in the table are meant to highlight and help you compare your ongoing costs only and do not reflect any transactional costs such as sales charges (loads), redemption fees, or exchange fees. Wilshire Mutual Funds, Inc. has no such charges, but these may be present in other funds to which you compare this data. Therefore, the hypothetical portions of the table are useful in comparing ongoing costs only, and will not help you determine the relative total costs of owning different funds.
25
Wilshire Mutual Funds, Inc. Disclosure of Fund Expenses (Unaudited) - (Continued) |
|
| | Beginning
Account
Value
01/01/2018 | Ending
Account
Value
06/30/2018 | Net
Expense
Ratio(1) | Expenses Paid
During Period
01/01/18-06/30/18(2) |
Large Company Growth Portfolio |
Based on Actual Fund Return | | | | |
Investment Class | $ 1,000.00 | $ 1,076.40 | 1.31% | $ 6.74 |
Institutional Class | $ 1,000.00 | $ 1,078.30 | 0.97% | $ 5.00 |
Based on Hypothetical 5% Return | | | | |
Investment Class | $ 1,000.00 | $ 1,018.30 | 1.31% | $ 6.56 |
Institutional Class | $ 1,000.00 | $ 1,019.98 | 0.97% | $ 4.86 |
Large Company Value Portfolio |
Based on Actual Fund Return | | | | |
Investment Class | $ 1,000.00 | $ 979.70 | 1.22% | $ 5.99 |
Institutional Class | $ 1,000.00 | $ 980.90 | 0.95% | $ 4.67 |
Based on Hypothetical 5% Return | | | | |
Investment Class | $ 1,000.00 | $ 1,018.74 | 1.22% | $ 6.11 |
Institutional Class | $ 1,000.00 | $ 1,020.08 | 0.95% | $ 4.76 |
Small Company Growth Portfolio |
Based on Actual Fund Return | | | | |
Investment Class | $ 1,000.00 | $ 1,087.40 | 1.33% | $ 6.88 |
Institutional Class | $ 1,000.00 | $ 1,088.80 | 1.08% | $ 5.59 |
Based on Hypothetical 5% Return | | | | |
Investment Class | $ 1,000.00 | $ 1,018.20 | 1.33% | $ 6.66 |
Institutional Class | $ 1,000.00 | $ 1,019.44 | 1.08% | $ 5.41 |
Small Company Value Portfolio |
Based on Actual Fund Return | | | | |
Investment Class | $ 1,000.00 | $ 1,049.20 | 1.32% | $ 6.71 |
Institutional Class | $ 1,000.00 | $ 1,050.20 | 1.07% | $ 5.44 |
Based on Hypothetical 5% Return | | | | |
Investment Class | $ 1,000.00 | $ 1,018.25 | 1.32% | $ 6.61 |
Institutional Class | $ 1,000.00 | $ 1,019.49 | 1.07% | $ 5.36 |
26
Wilshire Mutual Funds, Inc. Disclosure of Fund Expenses (Unaudited) - (Continued) |
|
| | Beginning
Account
Value
01/01/2018 | Ending
Account
Value
06/30/2018 | Net
Expense
Ratio(1) | Expenses Paid
During Period
01/01/18-06/30/18(2) |
Wilshire 5000 IndexSM Fund |
Based on Actual Fund Return | | | | |
Investment Class | $ 1,000.00 | $ 1,026.90 | 0.57% | $ 2.86 |
Institutional Class | $ 1,000.00 | $ 1,027.80 | 0.33% | $ 1.66 |
Based on Hypothetical 5% Return | | | | |
Investment Class | $ 1,000.00 | $ 1,021.97 | 0.57% | $ 2.86 |
Institutional Class | $ 1,000.00 | $ 1,023.16 | 0.33% | $ 1.66 |
Wilshire International Equity Fund |
Based on Actual Fund Return | | | | |
Investment Class | $ 1,000.00 | $ 977.70 | 1.51% | $ 7.40 |
Institutional Class | $ 1,000.00 | $ 978.30 | 1.26% | $ 6.18 |
Based on Hypothetical 5% Return | | | | |
Investment Class | $ 1,000.00 | $ 1,017.31 | 1.51% | $ 7.55 |
Institutional Class | $ 1,000.00 | $ 1,018.55 | 1.26% | $ 6.31 |
Wilshire Income Opportunities Fund |
Based on Actual Fund Return | | | | |
Investment Class | $ 1,000.00 | $ 999.00 | 1.15% | $ 5.70 |
Institutional Class | $ 1,000.00 | $ 1,000.00 | 0.88% | $ 4.36 |
Based on Hypothetical 5% Return | | | | |
Investment Class | $ 1,000.00 | $ 1,019.09 | 1.15% | $ 5.76 |
Institutional Class | $ 1,000.00 | $ 1,020.43 | 0.88% | $ 4.41 |
(1) | Annualized, based on the Portfolio’s most recent fiscal half-year expenses. |
(2) | Expenses are equal to the Portfolio’s annualized net expense ratio multiplied by the average account value over the period, multiplied by 181/365 (to reflect the one-half year period). |
27
Wilshire Mutual Funds, Inc. Large Company Growth Portfolio Condensed Schedule of Investments | June 30, 2018
(Unaudited) |
|
| | | Shares | | | Value | |
COMMON STOCKS — 93.8% (a) |
Consumer Discretionary — 16.5% |
Amazon.com, Inc. (b) | | | 10,295 | | | $ | 17,499,440 | |
Booking Holdings, Inc. (b) | | | 1,895 | | | | 3,841,336 | |
Burlington Stores, Inc. (b) | | | 18,897 | | | | 2,844,565 | |
Floor & Decor Holdings, Inc. - Class A (b) (c) | | | 47,675 | | | | 2,351,808 | |
Starbucks Corp. | | | 48,188 | | | | 2,353,984 | |
Ulta Beauty, Inc. (b) | | | 10,870 | | | | 2,537,710 | |
Yum! Brands, Inc. | | | 20,620 | | | | 1,612,896 | |
Other Securities (c) (d) | | | | | | | 10,843,357 | |
| | | | | | | | 43,885,096 | |
Consumer Staples — 6.8% | | | | | | | | |
Coca-Cola Co. (The) | | | 53,845 | | | | 2,361,642 | |
Colgate-Palmolive Co. | | | 28,328 | | | | 1,835,938 | |
Danone S.A. - ADR (c) | | | 175,459 | | | | 2,558,192 | |
Monster Beverage Corp. (b) | | | 123,624 | | | | 7,083,654 | |
Procter & Gamble Co. (The) | | | 29,313 | | | | 2,288,173 | |
Other Securities (c) (d) | | | | | | | 2,143,278 | |
| | | | | | | | 18,270,877 | |
Energy — 1.5% | | | | | | | | |
Schlumberger Ltd. | | | 39,521 | | | | 2,649,093 | |
Other Securities (c) (d) | | | | | | | 1,349,265 | |
| | | | | | | | 3,998,358 | |
Financials — 4.9% | | | | | | | | |
Charles Schwab Corp. (The) | | | 36,300 | | | | 1,854,930 | |
First Republic Bank | | | 18,325 | | | | 1,773,677 | |
MarketAxess Holdings, Inc. | | | 10,550 | | | | 2,087,423 | |
SEI Investments Co. | | | 40,303 | | | | 2,519,743 | |
Other Securities (c) (d) | | | | | | | 4,728,589 | |
| | | | | | | | 12,964,362 | |
Health Care — 17.0% | | | | | | | | |
ABIOMED, Inc. (b) | | | 5,784 | | | | 2,365,945 | |
Alexion Pharmaceuticals, Inc. (b) | | | 23,967 | | | | 2,975,503 | |
Align Technology, Inc. (b) | | | 8,401 | | | | 2,874,318 | |
Amgen, Inc. | | | 8,932 | | | | 1,648,758 | |
Cerner Corp. (b) | | | 36,883 | | | | 2,205,235 | |
Edwards Lifesciences Corp. (b) | | | 18,935 | | | | 2,756,368 | |
Illumina, Inc. (b) | | | 7,654 | | | | 2,137,686 | |
Novo Nordisk A/S - ADR | | | 55,339 | | | | 2,552,235 | |
Regeneron Pharmaceuticals, Inc. (b) | | | 8,521 | | | | 2,939,660 | |
UnitedHealth Group, Inc. | | | 24,043 | | | | 5,898,709 | |
Zoetis, Inc. | | | 42,663 | | | | 3,634,461 | |
Other Securities (c) (d) | | | | | | | 13,301,254 | |
| | | | | | | | 45,290,132 | |
Industrials — 6.4% | | | | | | | | |
CSX Corp. | | | 42,800 | | | | 2,729,784 | |
Deere & Co. | | | 16,732 | | | | 2,339,133 | |
Expeditors International of Washington, Inc. | | | 44,612 | | | | 3,261,137 | |
XPO Logistics, Inc. (b) | | | 21,256 | | | | 2,129,426 | |
Other Securities (c) (d) | | | | | | | 6,644,920 | |
| | | | | | | | 17,104,400 | |
Information Technology — 39.4% | | | | | | | | |
Activision Blizzard, Inc. | | | 39,670 | | | | 3,027,614 | |
Adobe Systems, Inc. (b) | | | 14,035 | | | | 3,421,873 | |
Alibaba Group Holding Ltd. - ADR (b) (c) | | | 42,250 | | | | 7,838,643 | |
Alphabet, Inc. - Class A (b) | | | 3,846 | | | | 4,342,865 | |
Alphabet, Inc. - Class C (b) | | | 7,953 | | | | 8,872,764 | |
Apple, Inc. | | | 23,522 | | | | 4,354,158 | |
Arista Networks, Inc. (b) | | | 8,523 | | | | 2,194,587 | |
Autodesk, Inc. (b) | | | 28,511 | | | | 3,737,507 | |
Cisco Systems, Inc. | | | 53,548 | | | | 2,304,170 | |
Facebook, Inc. - Class A (b) | | | 66,681 | | | | 12,957,451 | |
Microsoft Corp. | | | 71,451 | | | | 7,045,783 | |
NVIDIA Corp. | | | 14,321 | | | | 3,392,646 | |
Oracle Corp. | | | 92,522 | | | | 4,076,519 | |
PayPal Holdings, Inc. (b) | | | 40,115 | | | | 3,340,376 | |
QUALCOMM, Inc. | | | 43,879 | | | | 2,462,489 | |
Red Hat, Inc. (b) | | | 17,870 | | | | 2,401,192 | |
salesforce.com, Inc. (b) | | | 25,715 | | | | 3,507,526 | |
ServiceNow, Inc. (b) | | | 15,636 | | | | 2,696,741 | |
Visa, Inc. - Class A (c) | | | 80,742 | | | | 10,694,278 | |
Other Securities (c) (d) | | | | | | | 12,246,514 | |
| | | | | | | | 104,915,696 | |
Materials — 0.5% | | | | | | | | |
Other Securities (c) (d) | | | | | | | 1,336,680 | |
| | | | | | | | | |
Real Estate — 0.8% | | | | | | | | |
Other Securities (c) (d) | | | | | | | 2,159,026 | |
| | | | | | | | | |
Total Common Stocks (Cost $168,097,077) | | | | | | $ | 249,924,627 | |
See Notes to Financial Statements.
28
Wilshire Mutual Funds, Inc. Large Company Growth Portfolio Condensed Schedule of Investments - (Continued) | June 30, 2018
(Unaudited) |
|
| | | Shares | | | Value | |
MONEY MARKET FUNDS — 2.2% |
Northern Trust Institutional Government Select Portfolio - Institutional Class, 1.73% (e) | | | 5,818,517 | | | $ | 5,818,517 | |
Northern Trust Institutional Liquid Asset Portfolio - Institutional Class, 1.98% (e) (f) | | | 147,988 | | | | 147,988 | |
Total Money Market Funds (Cost $5,966,505) | | | | | | $ | 5,966,505 | |
| | | | | | | | | |
Total Investments at Value — 96.0% (Cost $174,063,582) | | $ | 255,891,132 | |
| | | | | | | | | |
Other Assets in Excess of Liabilities — 4.0% | | | 10,594,214 | |
| | | | | | | | | |
Net Assets — 100.0% | | | | | | $ | 266,485,346 | |
The Condensed Schedule of Investments does not reflect the complete portfolio holdings. It includes the Portfolio’s 50 largest holdings and each investment of any issue that exceeds 1% of the Portfolio’s net assets. “Other Securities” represent all issues not required to be disclosed under the rules adopted by the U.S. Securities and Exchange Commission (“SEC”). The complete schedule of portfolio holdings is available (i) without charge, upon request, by calling (800)607-2200; (ii) on the SEC’s website at http://www.sec.gov; and (iii) on our website at http://advisor.wilshire.com.
ADR — American Depositary Receipt.
(a) | More narrow industries are utilized for compliance purposes, whereas broad sectors are utilized for reporting purposes. |
(b) | Non-income producing security. |
(c) | This security or a partial position of this security is on loan at June 30, 2018. The total market value of securities on loan at June 30, 2018 was $24,520,199 (Note 7). |
(d) | Represents issuers not identified as a top 50 holding in terms of market value and issues or issuers not exceeding 1% of net assets individually or in the aggregate, respectively, as of June 30, 2018. |
(e) | The rate shown is the 7-day effective yield as of June 30, 2018. |
(f) | This security was purchased with cash collateral held from securities on loan. The total value of such securities as of June 30, 2018 was $147,988. Securities on loan are also collateralized by various U.S. Treasury obligations in the amount of $25,044,009 (Note 7). |
See Notes to Financial Statements.
29
Wilshire Mutual Funds, Inc. Large Company Value Portfolio Condensed Schedule of Investments | June 30, 2018
(Unaudited) |
|
| | | Shares | | | Value | |
COMMON STOCKS — 91.8% (a) |
Consumer Discretionary — 7.0% |
Ford Motor Co. | | | 278,077 | | | $ | 3,078,312 | |
Interpublic Group of Cos., Inc. (The) (b) | | | 78,158 | | | | 1,832,023 | |
Newell Brands, Inc. | | | 67,418 | | | | 1,738,710 | |
Omnicom Group, Inc. | | | 24,236 | | | | 1,848,479 | |
Other Securities (b) (c) | | | | | | | 9,197,233 | |
| | | | | | | | 17,694,757 | |
Consumer Staples — 5.3% | | | | | | | | |
Altria Group, Inc. | | | 37,183 | | | | 2,111,623 | |
Philip Morris International, Inc. | | | 29,622 | | | | 2,391,679 | |
Walmart, Inc. | | | 56,980 | | | | 4,880,336 | |
Other Securities (b) (c) | | | | | | | 3,835,767 | |
| | | | | | | | 13,219,405 | |
Energy — 13.0% | | | | | | | | |
BP plc - ADR | | | 82,248 | | | | 3,755,444 | |
Chevron Corp. | | | 29,294 | | | | 3,703,640 | |
ConocoPhillips | | | 28,730 | | | | 2,000,183 | |
Exxon Mobil Corp. | | | 42,536 | | | | 3,519,003 | |
Occidental Petroleum Corp. | | | 32,540 | | | | 2,722,947 | |
Phillips 66 | | | 20,077 | | | | 2,254,848 | |
Royal Dutch Shell plc - Class A - ADR | | | 53,532 | | | | 3,706,020 | |
Other Securities (b) (c) | | | | | | | 10,951,446 | |
| | | | | | | | 32,613,531 | |
Financials — 25.9% | | | | | | | | |
American Express Co. | | | 28,507 | | | | 2,793,686 | |
American International Group, Inc. | | | 48,752 | | | | 2,584,832 | |
Bank of America Corp. | | | 199,954 | | | | 5,636,703 | |
Capital One Financial Corp. | | | 30,536 | | | | 2,806,258 | |
Citigroup, Inc. | | | 46,063 | | | | 3,082,536 | |
Goldman Sachs Group, Inc. (The) | | | 8,807 | | | | 1,942,560 | |
JPMorgan Chase & Co. | | | 60,991 | | | | 6,355,262 | |
MetLife, Inc. | | | 48,233 | | | | 2,102,959 | |
Morgan Stanley | | | 39,076 | | | | 1,852,202 | |
State Street Corp. | | | 33,029 | | | | 3,074,670 | |
U.S. Bancorp | | | 53,348 | | | | 2,668,467 | |
Wells Fargo & Co. | | | 119,932 | | | | 6,649,031 | |
XL Group Ltd. | | | 32,616 | | | | 1,824,865 | |
Other Securities (b) (c) | | | | | | | 21,942,911 | |
| | | | | | | | 65,316,942 | |
Health Care — 14.1% | | | | | | | | |
Amgen, Inc. | | | 13,625 | | | | 2,515,039 | |
Cardinal Health, Inc. | | | 35,797 | | | | 1,747,968 | |
CVS Health Corp. | | | 54,228 | | | | 3,489,573 | |
Express Scripts Holding Co. (d) | | | 26,554 | | | | 2,050,234 | |
Johnson & Johnson | | | 30,645 | | | | 3,718,464 | |
Merck & Co., Inc. | | | 77,080 | | | | 4,678,755 | |
Mylan N.V. (d) | | | 71,704 | | | | 2,591,383 | |
Pfizer, Inc. | | | 158,552 | | | | 5,752,266 | |
Other Securities (b) (c) | | | | | | | 9,039,107 | |
| | | | | | | | 35,582,789 | |
Industrials — 6.8% | | | | | | | | |
Dover Corp. (b) | | | 23,971 | | | | 1,754,677 | |
General Electric Co. | | | 227,860 | | | | 3,101,175 | |
Johnson Controls International plc | | | 52,771 | | | | 1,765,190 | |
Stanley Black & Decker, Inc. | | | 13,996 | | | | 1,858,809 | |
United Technologies Corp. | | | 15,935 | | | | 1,992,353 | |
Other Securities (b) (c) | | | | | | | 6,647,747 | |
| | | | | | | | 17,119,951 | |
Information Technology — 8.3% | | | | | | | | |
Cisco Systems, Inc. | | | 47,526 | | | | 2,045,044 | |
Cognizant Technology Solutions Corp. - Class A | | | 21,733 | | | | 1,716,691 | |
Hewlett Packard Enterprise Co. | | | 129,143 | | | | 1,886,779 | |
Oracle Corp. | | | 116,667 | | | | 5,140,347 | |
Other Securities (b) (c) | | | | | | | 10,202,336 | |
| | | | | | | | 20,991,197 | |
Materials — 2.2% | | | | | | | | |
DowDuPont, Inc. | | | 40,338 | | | | 2,659,081 | |
Other Securities (b) (c) | | | | | | | 2,913,206 | |
| | | | | | | | 5,572,287 | |
Real Estate — 2.6% | | | | | | | | |
Other Securities (b) (c) | | | | | | | 6,445,276 | |
| | | | | | | | | |
Telecommunication Services — 2.3% |
AT&T, Inc. | | | 89,643 | | | | 2,878,437 | |
Verizon Communications, Inc. | | | 47,845 | | | | 2,407,082 | |
Other Securities (c) | | | | | | | 485,053 | |
| | | | | | | | 5,770,572 | |
Utilities — 4.3% | | | | | | | | |
Edison International | | | 36,629 | | | | 2,317,517 | |
Entergy Corp. | | | 36,444 | | | | 2,944,310 | |
Exelon Corp. | | | 41,529 | | | | 1,769,135 | |
Other Securities (b) (c) | | | | | | | 3,883,082 | |
| | | | | | | | 10,914,044 | |
Total Common Stocks (Cost $205,425,923) | | | | | | $ | 231,240,751 | |
See Notes to Financial Statements.
30
Wilshire Mutual Funds, Inc. Large Company Value Portfolio Condensed Schedule of Investments - (Continued) | June 30, 2018
(Unaudited) |
|
| | | Shares | | | Value | |
MONEY MARKET FUNDS — 3.0% |
Northern Trust Institutional Government Select Portfolio - Institutional Class, 1.73% (e) | | | 5,068,858 | | | $ | 5,068,858 | |
Northern Trust Institutional Liquid Asset Portfolio - Institutional Class, 1.98% (e) (f) | | | 2,552,002 | | | | 2,552,002 | |
Total Money Market Funds (Cost $7,620,860) | | | | | | $ | 7,620,860 | |
| | | | | | | | | |
Total Investments at Value — 94.8% (Cost $213,046,783) | | $ | 238,861,611 | |
| | | | | | | | | |
Other Assets in Excess of Liabilities — 5.2% | | | 12,963,751 | |
| | | | | | | | | |
Net Assets — 100.0% | | | | | | $ | 251,825,362 | |
The Condensed Schedule of Investments does not reflect the complete portfolio holdings. It includes the Portfolio’s 50 largest holdings and each investment of any issue that exceeds 1% of the Portfolio’s net assets. “Other Securities” represent all issues not required to be disclosed under the rules adopted by the U.S. Securities and Exchange Commission (“SEC”). The complete schedule of portfolio holdings is available (i) without charge, upon request, by calling (800)607-2200; (ii) on the SEC’s website at http://www.sec.gov; and (iii) on our website at http://advisor.wilshire.com.
ADR — American Depositary Receipt.
(a) | More narrow industries are utilized for compliance purposes, whereas broad sectors are utilized for reporting purposes. |
(b) | This security or a partial position of this security is on loan at June 30, 2018. The total market value of securities on loan at June 30, 2018 was $11,631,429 (Note 7). |
(c) | Represents issuers not identified as a top 50 holding in terms of market value and issues or issuers not exceeding 1% of net assets individually or in the aggregate, respectively, as of June 30, 2018. |
(d) | Non-income producing security. |
(e) | The rate shown is the 7-day effective yield as of June 30, 2018. |
(f) | This security was purchased with cash collateral held from securities on loan. The total value of such securities as of June 30, 2018 was $2,552,002. Securities on loan are also collateralized by various U.S. Treasury obligations in the amount of $9,301,730 (Note 7). |
See Notes to Financial Statements.
31
Wilshire Mutual Funds, Inc. Small Company Growth Portfolio Condensed Schedule of Investments | June 30, 2018
(Unaudited) |
|
| | | Shares | | | Value | |
COMMON STOCKS — 90.2% (a) |
Consumer Discretionary — 10.3% |
Malibu Boats, Inc. - Class A (b) | | | 16,113 | | | $ | 675,779 | |
Sonic Corp. (c) | | | 17,127 | | | | 589,510 | |
Steven Madden Ltd. | | | 26,063 | | | | 1,383,945 | |
TopBuild Corp. (b) | | | 7,250 | | | | 567,965 | |
Other Securities (c) (d) | | | | | | | 2,810,834 | |
| | | | | | | | 6,028,033 | |
Consumer Staples — 5.3% | | | | | | | | |
Calavo Growers, Inc. (c) | | | 9,556 | | | | 918,810 | |
e.l.f. Beauty, Inc. (b) (c) | | | 25,713 | | | | 391,866 | |
Inter Parfums, Inc. | | | 16,965 | | | | 907,627 | |
J & J Snack Foods Corp. (c) | | | 3,607 | | | | 549,959 | |
Other Securities (c) (d) | | | | | | | 355,453 | |
| | | | | | | | 3,123,715 | |
Energy — 3.0% | | | | | | | | |
Callon Petroleum Co. (b) (c) | | | 23,337 | | | | 250,639 | |
Extraction Oil & Gas, Inc. (b) (c) | | | 33,625 | | | | 493,951 | |
WildHorse Resource Development Corp. (b) (c) | | | 23,916 | | | | 606,509 | |
Other Securities (c) (d) | | | | | | | 421,112 | |
| | | | | | | | 1,772,211 | |
Financials — 7.2% | | | | | | | | |
Banc of California, Inc. (c) | | | 53,812 | | | | 1,052,024 | |
CenterState Bank Corp. | | | 20,099 | | | | 599,352 | |
Green Dot Corp. - Class A (b) | | | 3,185 | | | | 233,747 | |
LegacyTexas Financial Group, Inc. | | | 16,623 | | | | 648,629 | |
South State Corp. | | | 2,889 | | | | 249,176 | |
Veritex Holdings, Inc. (b) | | | 15,718 | | | | 488,358 | |
Other Securities (c) (d) | | | | | | | 973,930 | |
| | | | | | | | 4,245,216 | |
Health Care — 23.2% | | | | | | | | |
BioTelemetry, Inc. (b) (c) | | | 9,657 | | | | 434,565 | |
Cambrex Corp. (b) (c) | | | 17,951 | | | | 938,837 | |
Cantel Medical Corp. | | | 7,695 | | | | 756,879 | |
Cotiviti Holdings, Inc. (b) | | | 12,888 | | | | 568,747 | |
Inogen, Inc. (b) | | | 1,355 | | | | 252,477 | |
LeMaitre Vascular, Inc. (c) | | | 14,041 | | | | 470,093 | |
Medidata Solutions, Inc. (b) (c) | | | 8,905 | | | | 717,388 | |
Neogen Corp. (b) | | | 6,043 | | | | 484,588 | |
PRA Health Sciences, Inc. (b) | | | 10,944 | | | | 1,021,732 | |
Repligen Corp. (b) (c) | | | 20,456 | | | | 962,249 | |
Supernus Pharmaceuticals, Inc. (b) (c) | | | 12,367 | | | | 740,164 | |
Tabula Rasa HealthCare, Inc. (b) (c) | | | 10,325 | | | | 659,045 | |
Other Securities (c) (d) | | | | | | | 5,583,136 | |
| | | | | | | | 13,589,900 | |
Industrials — 14.3% | | | | | | | | |
Insteel Industries, Inc. | | | 19,196 | | | | 641,145 | |
Knoll, Inc. | | | 38,211 | | | | 795,170 | |
Marten Transport Ltd. | | | 23,134 | | | | 542,492 | |
Mercury Systems, Inc. (b) (c) | | | 13,673 | | | | 520,394 | |
Saia, Inc. (b) | | | 13,449 | | | | 1,087,351 | |
SiteOne Landscape Supply, Inc. (b) (c) | | | 12,927 | | | | 1,085,480 | |
WageWorks, Inc. (b) | | | 10,959 | | | | 547,950 | |
Other Securities (c) (d) | | | | | | | 3,191,770 | |
| | | | | | | | 8,411,752 | |
Information Technology — 21.9% | | | | | | | | |
Box, Inc. - Class A (b) (c) | | | 28,843 | | | | 720,786 | |
Cabot Microelectronics Corp. | | | 5,797 | | | | 623,524 | |
CEVA, Inc. (b) | | | 9,391 | | | | 283,608 | |
Ellie Mae, Inc. (b) | | | 3,205 | | | | 332,807 | |
Integrated Device Technology, Inc. (b) | | | 14,376 | | | | 458,307 | |
MAXIMUS, Inc. | | | 10,037 | | | | 623,398 | |
MaxLinear, Inc. (b) | | | 16,914 | | | | 263,689 | |
MINDBODY, Inc. - Class A (b) (c) | | | 26,103 | | | | 1,007,575 | |
Pegasystems, Inc. (c) | | | 25,461 | | | | 1,395,263 | |
Qualys, Inc. (b) | | | 12,255 | | | | 1,033,097 | |
Silicon Laboratories, Inc. (b) | | | 4,362 | | | | 434,455 | |
WNS Holdings Ltd. - ADR (b) | | | 18,244 | | | | 951,971 | |
Other Securities (c) (d) | | | | | | | 4,730,316 | |
| | | | | | | | 12,858,796 | |
Materials — 2.5% | | | | | | | | |
Quaker Chemical Corp. | | | 4,014 | | | | 621,647 | |
Other Securities (d) | | | | | | | 849,489 | |
| | | | | | | | 1,471,136 | |
Real Estate — 0.9% | | | | | | | | |
Other Securities (c) (d) | | | | | | | 528,386 | |
| | | | | | | | | |
Telecommunication Services — 1.3% |
Cogent Communications Holdings, Inc. (c) | | | 13,428 | | | | 717,055 | |
Other Securities (d) | | | | | | | 69,076 | |
| | | | | | | | 786,131 | |
See Notes to Financial Statements.
32
Wilshire Mutual Funds, Inc. Small Company Growth Portfolio Condensed Schedule of Investments - (Continued) | June 30, 2018
(Unaudited) |
|
| | | Shares | | | Value | |
COMMON STOCKS — 90.2% (a) (Continued) |
Utilities — 0.3% | | | | | | | | |
Other Securities (d) | | | | | | $ | 177,886 | |
| | | | | | | | | |
Total Common Stocks (Cost $40,533,857) | | | | | | $ | 52,993,162 | |
| | | | | | | | | |
RIGHTS — 0.0% | | | | | | | | |
Dyax Corp. (b) (c) (e) (Cost $0) | | | 860 | | | $ | 0 | |
| | | | | | | | | |
MONEY MARKET FUNDS — 8.0% |
Northern Trust Institutional Government Select Portfolio - Institutional Class, 1.73% (f) | | | 2,090,903 | | | $ | 2,090,903 | |
Northern Trust Institutional Liquid Asset Portfolio - Institutional Class, 1.98% (f) (g) | | | 2,584,771 | | | | 2,584,771 | |
Total Money Market Funds (Cost $4,675,674) | | | | | | $ | 4,675,674 | |
| | | | | | | | | |
Total Investments at Value — 98.2% (Cost $45,209,531) | | $ | 57,668,836 | |
| | | | | | | | | |
Other Assets in Excess of Liabilities — 1.8% | | | 1,056,394 | |
| | | | | | | | | |
Net Assets — 100.0% | | | | | | $ | 58,725,230 | |
The Condensed Schedule of Investments does not reflect the complete portfolio holdings. It includes the Portfolio’s 50 largest holdings and each investment of any issue that exceeds 1% of the Portfolio’s net assets. “Other Securities” represent all issues not required to be disclosed under the rules adopted by the U.S. Securities and Exchange Commission (“SEC”). The complete schedule of portfolio holdings is available (i) without charge, upon request, by calling (800)607-2200; (ii) on the SEC’s website at http://www.sec.gov; and (iii) on our website at http://advisor.wilshire.com.
ADR — American Depositary Receipt.
(a) | More narrow industries are utilized for compliance purposes, whereas broad sectors are utilized for reporting purposes. |
(b) | Non-income producing security. |
(c) | This security or a partial position of this security is on loan at June 30, 2018. The total market value of securities on loan at June 30, 2018 was $17,043,667 (Note 7). |
(d) | Represents issuers not identified as a top 50 holding in terms of market value and issues or issuers not exceeding 1% of net assets individually or in the aggregate, respectively, as of June 30, 2018. |
(e) | Level 3 security. Security has been valued at fair value in accordance with procedures adopted by and under the general supervision of the Board of Directors. The total value of such securities is $0 as of June 30, 2018, representing 0.0% of net assets (Note 2). |
(f) | The rate shown is the 7-day effective yield as of June 30, 2018. |
(g) | This security was purchased with cash collateral held from securities on loan. The total value of such securities as of June 30, 2018 was $2,584,771. Securities on loan are also collateralized by various U.S. Treasury obligations in the amount of $14,900,923 (Note 7). |
See Notes to Financial Statements.
33
Wilshire Mutual Funds, Inc. Small Company Value Portfolio Condensed Schedule of Investments | June 30, 2018
(Unaudited) |
|
| | | Shares | | | Value | |
COMMON STOCKS — 88.9% (a) |
Consumer Discretionary — 9.0% |
Hooker Furniture Corp. | | | 19,842 | | | $ | 930,591 | |
Stoneridge, Inc. (b) | | | 11,333 | | | | 398,242 | |
Taylor Morrison Home Corp. - Class A (b) | | | 32,690 | | | | 679,298 | |
TRI Pointe Group, Inc. (b) (c) | | | 44,776 | | | | 732,535 | |
Other Securities (c) (d) | | | | | | | 2,441,925 | |
| | | | | | | | 5,182,591 | |
Consumer Staples — 2.3% | | | | | | | | |
Landec Corp. (b) | | | 48,650 | | | | 724,884 | |
Other Securities (c) (d) | | | | | | | 597,003 | |
| | | | | | | | 1,321,887 | |
Energy — 9.5% | | | | | | | | |
Carrizo Oil & Gas, Inc. (b) (c) | | | 41,670 | | | | 1,160,509 | |
McDermott International, Inc. (b) (c) | | | 36,016 | | | | 707,713 | |
PDC Energy, Inc. (b) | | | 21,731 | | | | 1,313,638 | |
SRC Energy, Inc. (b) | | | 70,907 | | | | 781,395 | |
Other Securities (c) (d) | | | | | | | 1,545,267 | |
| | | | | | | | 5,508,522 | |
Financials — 24.9% | | | | | | | | |
Ameris Bancorp (c) | | | 10,830 | | | | 577,781 | |
Aspen Insurance Holdings Ltd. | | | 19,125 | | | | 778,387 | |
Bank of N.T. Butterfield & Son Ltd. (The) | | | 19,910 | | | | 910,285 | |
Banner Corp. | | | 4,704 | | | | 282,852 | |
Eagle Bancorp, Inc. (b) | | | 4,788 | | | | 293,504 | |
First Horizon National Corp. (c) | | | 15,797 | | | | 281,818 | |
Hilltop Holdings, Inc. | | | 16,540 | | | | 365,038 | |
HomeStreet, Inc. (b) (c) | | | 26,120 | | | | 703,934 | |
Hope Bancorp, Inc. | | | 20,990 | | | | 374,252 | |
MGIC Investment Corp. (b) | | | 26,235 | | | | 281,239 | |
PacWest Bancorp | | | 9,655 | | | | 477,150 | |
ProAssurance Corp. | | | 7,970 | | | | 282,536 | |
Radian Group, Inc. | | | 19,686 | | | | 319,307 | |
Texas Capital Bancshares, Inc. (b) | | | 4,125 | | | | 377,438 | |
Western Alliance Bancorp (b) | | | 17,165 | | | | 971,711 | |
Other Securities (c) (d) | | | | | | | 7,105,333 | |
| | | | | | | | 14,382,565 | |
Health Care — 4.9% | | | | | | | | |
Globus Medical, Inc. - Class A (b) | | | 6,785 | | | | 342,371 | |
LivaNova plc (b) | | | 5,535 | | | | 552,505 | |
Other Securities (c) (d) | | | | | | | 1,916,403 | |
| | | | | | | | 2,811,279 | |
Industrials — 10.1% | | | | | | | | |
Albany International Corp. - Class A | | | 9,830 | | | | 591,274 | |
Apogee Enterprises, Inc. (c) | | | 9,510 | | | | 458,097 | |
Astronics Corp. (b) (c) | | | 8,995 | | | | 323,549 | |
BMC Stock Holdings, Inc. (b) | | | 26,260 | | | | 547,520 | |
EnerSys | | | 8,427 | | | | 628,991 | |
GP Strategies Corp. (b) | | | 16,340 | | | | 287,583 | |
Other Securities (c) (d) | | | | | | | 3,012,396 | |
| | | | | | | | 5,849,410 | |
Information Technology — 11.9% | | | | | | | | |
Coherent, Inc. (b) (c) | | | 3,699 | | | | 578,599 | |
Entegris, Inc. | | | 16,080 | | | | 545,112 | |
Euronet Worldwide, Inc. (b) (c) | | | 3,435 | | | | 287,750 | |
Integrated Device Technology, Inc. (b) | | | 15,645 | | | | 498,763 | |
Lattice Semiconductor Corp. (b) | | | 55,875 | | | | 366,540 | |
Mellanox Technologies Ltd. (b) | | | 8,020 | | | | 676,085 | |
Methode Electronics, Inc. (c) | | | 9,965 | | | | 401,590 | |
Mitel Networks Corp. (b) | | | 71,750 | | | | 787,098 | |
Other Securities (c) (d) | | | | | | | 2,728,639 | |
| | | | | | | | 6,870,176 | |
Materials — 6.9% | | | | | | | | |
Bemis Co., Inc. | | | 12,959 | | | | 547,000 | |
Boise Cascade Co. | | | 8,675 | | | | 387,773 | |
Kaiser Aluminum Corp. (c) | | | 6,152 | | | | 640,484 | |
Louisiana-Pacific Corp. | | | 16,357 | | | | 445,238 | |
P.H. Glatfelter Co. | | | 35,340 | | | | 692,310 | |
Other Securities (c) (d) | | | | | | | 1,275,883 | |
| | | | | | | | 3,988,688 | |
Real Estate — 7.3% | | | | | | | | |
Alexander & Baldwin, Inc. (c) | | | 13,180 | | | | 309,729 | |
Brandywine Realty Trust | | | 21,853 | | | | 368,878 | |
CatchMark Timber Trust, Inc. - Class A | | | 23,182 | | | | 295,107 | |
PotlatchDeltic Corp. | | | 5,974 | | | | 303,778 | |
Ramco-Gershenson Properties Trust (c) | | | 44,370 | | | | 586,127 | |
Other Securities (c) (d) | | | | | | | 2,328,849 | |
| | | | | | | | 4,192,468 | |
Utilities — 2.1% | | | | | | | | |
Other Securities (c) (d) | | | | | | | 1,186,421 | |
| | | | | | | | | |
Total Common Stocks (Cost $43,165,595) | | | | | | $ | 51,294,007 | |
See Notes to Financial Statements.
34
Wilshire Mutual Funds, Inc. Small Company Value Portfolio Condensed Schedule of Investments - (Continued) | June 30, 2018
(Unaudited) |
|
| | | Shares | | | Value | |
MONEY MARKET FUNDS — 4.9% |
Northern Trust Institutional Government Select Portfolio - Institutional Class, 1.73% (e) | | | 2,088,414 | | | $ | 2,088,414 | |
Northern Trust Institutional Liquid Asset Portfolio - Institutional Class, 1.98% (e) (f) | | | 727,806 | | | | 727,806 | |
Total Money Market Funds (Cost $2,816,220) | | | | | | $ | 2,816,220 | |
| | | | | | | | | |
Total Investments at Value — 93.8% (Cost $45,981,815) | | $ | 54,110,227 | |
| | | | | | | | | |
Other Assets in Excess of Liabilities — 6.2% | | | 3,583,029 | |
| | | | | | | | | |
Net Assets — 100.0% | | | | | | $ | 57,693,256 | |
The Condensed Schedule of Investments does not reflect the complete portfolio holdings. It includes the Portfolio’s 50 largest holdings and each investment of any issue that exceeds 1% of the Portfolio���s net assets. “Other Securities” represent all issues not required to be disclosed under the rules adopted by the U.S. Securities and Exchange Commission (“SEC”). The complete schedule of portfolio holdings is available (i) without charge, upon request, by calling (800)607-2200; (ii) on the SEC’s website at http://www.sec.gov; and (iii) on our website at http://advisor.wilshire.com.
(a) | More narrow industries are utilized for compliance purposes, whereas broad sectors are utilized for reporting purposes. |
(b) | Non-income producing security. |
(c) | This security or a partial position of this security is on loan at June 30, 2018. The total market value of securities on loan at June 30, 2018 was $10,886,090 (Note 7). |
(d) | Represents issuers not identified as a top 50 holding in terms of market value and issues or issuers not exceeding 1% of net assets individually or in the aggregate, respectively, as of June 30, 2018. |
(e) | The rate shown is the 7-day effective yield as of June 30, 2018. |
(f) | This security was purchased with cash collateral held from securities on loan. The total value of such securities as of June 30, 2018 was $727,806. Securities on loan are also collateralized by various U.S. Treasury obligations in the amount of $10,438,924 (Note 7). |
See Notes to Financial Statements.
35
Wilshire Mutual Funds, Inc. Wilshire 5000 Indexsm Fund Condensed Schedule of Investments | June 30, 2018
(Unaudited) |
|
| | | Shares | | | Value | |
COMMON STOCKS — 99.1% (a) |
Consumer Discretionary — 13.1% |
Amazon.com, Inc. (b) | | | 2,908 | | | $ | 4,943,019 | |
Comcast Corp. - Class A | | | 29,648 | | | | 972,750 | |
Home Depot, Inc. (The) | | | 8,054 | | | | 1,571,334 | |
McDonald's Corp. | | | 6,068 | | | | 950,794 | |
Netflix, Inc. (b) | | | 2,752 | | | | 1,077,216 | |
NIKE, Inc. - Class B | | | 9,749 | | | | 776,800 | |
Walt Disney Co. (The) | | | 10,918 | | | | 1,144,315 | |
Other Securities (c) (d) | | | | | | | 13,104,402 | |
| | | | | | | | 24,540,630 | |
Consumer Staples — 6.5% | | | | | | | | |
Coca-Cola Co. (The) | | | 27,490 | | | | 1,205,712 | |
Costco Wholesale Corp. | | | 3,201 | | | | 668,945 | |
PepsiCo, Inc. | | | 9,699 | | | | 1,055,930 | |
Philip Morris International, Inc. | | | 10,726 | | | | 866,017 | |
Procter & Gamble Co. (The) | | | 17,430 | | | | 1,360,585 | |
Walmart, Inc. | | | 10,939 | | | | 936,924 | |
Other Securities (c) (d) | | | | | | | 6,063,603 | |
| | | | | | | | 12,157,716 | |
Energy — 6.0% | | | | | | | | |
Chevron Corp. | | | 13,833 | | | | 1,748,905 | |
Exxon Mobil Corp. | | | 30,298 | | | | 2,506,553 | |
Other Securities (c) (d) | | | | | | | 7,043,995 | |
| | | | | | | | 11,299,453 | |
Financials — 14.7% | | | | | | | | |
Bank of America Corp. | | | 72,498 | | | | 2,043,718 | |
Berkshire Hathaway, Inc. - Class B (b) | | | 15,706 | | | | 2,931,524 | |
Citigroup, Inc. | | | 20,065 | | | | 1,342,749 | |
JPMorgan Chase & Co. | | | 24,732 | | | | 2,577,073 | |
Wells Fargo & Co. | | | 32,147 | | | | 1,782,229 | |
Other Securities (c) (d) | | | | | | | 16,921,953 | |
| | | | | | | | 27,599,246 | |
Health Care — 12.7% | | | | | | | | |
Abbott Laboratories | | | 12,635 | | | | 770,608 | |
AbbVie, Inc. | | | 10,100 | | | | 935,764 | |
Amgen, Inc. | | | 4,500 | | | | 830,654 | |
Bristol-Myers Squibb Co. | | | 12,225 | | | | 676,532 | |
Johnson & Johnson | | | 19,625 | | | | 2,381,297 | |
Merck & Co., Inc. | | | 20,155 | | | | 1,223,409 | |
Pfizer, Inc. | | | 43,962 | | | | 1,594,941 | |
UnitedHealth Group, Inc. | | | 6,576 | | | | 1,613,356 | |
Other Securities (c) (d) | | | | | | | 13,674,820 | |
| | | | | | | | 23,701,381 | |
Industrials — 10.2% | | | | | | | | |
3M Co. | | | 4,256 | | | | 837,240 | |
Boeing Co. (The) | | | 4,038 | | | | 1,354,788 | |
General Electric Co. | | | 60,816 | | | | 827,706 | |
Honeywell International, Inc. | | | 5,622 | | | | 809,849 | |
Union Pacific Corp. | | | 5,627 | | | | 797,232 | |
United Technologies Corp. | | | 5,952 | | | | 744,178 | |
Other Securities (c) (d) | | | | | | | 13,730,023 | |
| | | | | | | | 19,101,016 | |
Information Technology — 24.2% | | | | | | | | |
Adobe Systems, Inc. (b) | | | 3,131 | | | | 763,368 | |
Alphabet, Inc. - Class C (b) | | | 4,183 | | | | 4,666,763 | |
Apple, Inc. | | | 37,983 | | | | 7,031,032 | |
Cisco Systems, Inc. | | | 36,598 | | | | 1,574,811 | |
Facebook, Inc. - Class A (b) | | | 16,349 | | | | 3,176,937 | |
Intel Corp. | | | 34,918 | | | | 1,735,773 | |
International Business Machines Corp. | | | 6,425 | | | | 897,572 | |
Mastercard, Inc. - Class A | | | 6,945 | | | | 1,364,830 | |
Microsoft Corp. | | | 56,162 | | | | 5,538,134 | |
NVIDIA Corp. | | | 3,547 | | | | 840,283 | |
Oracle Corp. | | | 23,530 | | | | 1,036,731 | |
Texas Instruments, Inc. | | | 6,205 | | | | 684,100 | |
Visa, Inc. - Class A (d) | | | 11,316 | | | | 1,498,803 | |
Other Securities (c) (d) | | | | | | | 14,556,039 | |
| | | | | | | | 45,365,176 | |
Materials — 2.9% | | | | | | | | |
DowDuPont, Inc. | | | 15,951 | | | | 1,051,489 | |
Other Securities (c) (d) | | | | | | | 4,368,596 | |
| | | | | | | | 5,420,085 | |
Real Estate — 4.0% | | | | | | | | |
Other Securities (c) (d) | | | | | | | 7,564,895 | |
| | | | | | | | | |
Telecommunication Services — 1.9% | | | | |
AT&T, Inc. | | | 52,488 | | | | 1,685,397 | |
Verizon Communications, Inc. | | | 28,673 | | | | 1,442,539 | |
Other Securities (c) (d) | | | | | | | 427,474 | |
| | | | | | | | 3,555,410 | |
Utilities — 2.9% | | | | | | | | |
Other Securities (c) (d) | | | | | | | 5,327,619 | |
| | | | | | | | | |
Total Common Stocks (Cost $55,998,520) | | | | | | $ | 185,632,627 | |
| | | | | | | | | |
See Notes to Financial Statements.
36
Wilshire Mutual Funds, Inc. Wilshire 5000 Indexsm Fund Condensed Schedule of Investments - (Continued) | June 30, 2018
(Unaudited) |
|
| | | Shares | | | Value | |
PREFERRED STOCKS — 0.0% (e) | | | | | | | | |
Other Securities (c) (Cost $484) | | | | | | $ | 845 | |
| | | | | | | | | |
RIGHTS — 0.0% (e) | | | | | | | | |
AMR Corp., Escrow (b) (f) | | | 3,275 | | | $ | 5,044 | |
Dyax Corp. (b) (d) (f) | | | 1,200 | | | | 0 | |
Media General, Inc. - CVR (b) (d) (f) | | | 794 | | | | 0 | |
Total Rights (Cost $0) | | | | | | $ | 5,044 | |
| | | | | | | | | |
MONEY MARKET FUNDS — 1.8% | | | | |
Northern Trust Institutional Government Select Portfolio - Institutional Class, 1.73% (g) | | | 1,602,106 | | | $ | 1,602,106 | |
Northern Trust Institutional Liquid Asset Portfolio - Institutional Class, 1.98% (g) (h) | | | 1,716,714 | | | | 1,716,714 | |
Total Money Market Funds (Cost $3,318,820) | | | | | | $ | 3,318,820 | |
| | | | | | | | | |
Total Investments at Value — 100.9% (Cost $59,317,824) | | $ | 188,957,336 | |
| | | | | | | | | |
Liabilities in Excess of Other Assets — (0.9%) | | | (1,611,591 | ) |
| | | | | | | | | |
Net Assets — 100.0% | | | | | | $ | 187,345,745 | |
The Condensed Schedule of Investments does not reflect the complete portfolio holdings. It includes the Portfolio’s 50 largest holdings and each investment of any issue that exceeds 1% of the Portfolio’s net assets. “Other Securities” represent all issues not required to be disclosed under the rules adopted by the U.S. Securities and Exchange Commission (“SEC”). The complete schedule of portfolio holdings is available (i) without charge, upon request, by calling (800)607-2200; (ii) on the SEC’s website at http://www.sec.gov; and (iii) on our website at http://advisor.wilshire.com.
CVR — Contingent Value Right.
(a) | More narrow industries are utilized for compliance purposes, whereas broad sectors are utilized for reporting purposes. |
(b) | Non-income producing security. |
(c) | Represents issuers not identified as a top 50 holding in terms of market value and issues or issuers not exceeding 1% of net assets individually or in the aggregate, respectively, as of June 30, 2018. |
(d) | This security or a partial position of this security is on loan at June 30, 2018. The total market value of securities on loan at June 30, 2018 was $12,236,966 (Note 7). |
(e) | Percentage rounds to less than 0.1%. |
(f) | Level 3 security. Security has been valued at fair value in accordance with procedures adopted by and under the general supervision of the Board of Directors. The total value of such securities is $5,044 as of June 30, 2018, representing 0.0% (e) of net assets (Note 2). |
(g) | The rate shown is the 7-day effective yield as of June 30, 2018. |
(h) | This security was purchased with cash collateral held from securities on loan. The total value of such securities as of June 30, 2018 was $1,716,714. Securities on loan are also collateralized by various U.S. Treasury obligations in the amount of $10,850,995 (Note 7). |
See Notes to Financial Statements.
37
Wilshire Mutual Funds, Inc. Wilshire International Equity Fund Condensed Schedule of Investments | June 30, 2018
(Unaudited) |
|
| | | Shares | | | Value | |
COMMON STOCKS — 85.9% |
Australia — 3.1% |
CSL Ltd. (a) | | | 41,950 | | | $ | 5,972,002 | |
Other Securities (a) (b) | | | | | | | 7,394,470 | |
| | | | | | | | 13,366,472 | |
Austria — 0.1% | | | | | | | | |
Other Securities (a) (b) | | | | | | | 418,145 | |
| | | | | | | | | |
Belgium — 0.6% | | | | | | | | |
Other Securities (a) (b) | | | | | | | 2,456,641 | |
| | | | | | | | | |
Bermuda — 0.2% | | | | | | | | |
Other Securities (a) (b) | | | | | | | 869,764 | |
| | | | | | | | | |
Brazil — 0.7% | | | | | | | | |
Other Securities (b) | | | | | | | 3,246,519 | |
| | | | | | | | | |
Canada — 4.2% | | | | | | | | |
Canadian Pacific Railway Ltd. | | | 24,332 | | | | 4,453,244 | |
Dollarama, Inc. | | | 70,189 | | | | 2,720,789 | |
Shopify, Inc. - Class A (c) (d) | | | 27,789 | | | | 4,054,137 | |
Other Securities (b) | | | | | | | 6,778,010 | |
| | | | | | | | 18,006,180 | |
Cayman Islands — 2.5% | | | | | | | | |
Tencent Holdings Ltd. (a) | | | 124,755 | | | | 6,264,591 | |
Other Securities (a) (b) (d) | | | | | | | 4,399,893 | |
| | | | | | | | 10,664,484 | |
Chile — 0.2% | | | | | | | | |
Other Securities (b) | | | | | | | 717,380 | |
| | | | | | | | | |
China — 0.7% | | | | | | | | |
Other Securities (a) (b) | | | | | | | 3,052,892 | |
| | | | | | | | | |
Colombia — 0.0% (e) | | | | | | | | |
Other Securities (b) | | | | | | | 85,472 | |
| | | | | | | | | |
Czech Republic — 0.3% | | | | | | | | |
Other Securities (b) | | | | | | | 1,435,265 | |
| | | | | | | | | |
Denmark — 2.1% | | | | | | | | |
Chr. Hansen Holding A/S (a) | | | 38,651 | | | | 3,557,899 | |
Other Securities (a) (b) | | | | | | | 5,614,264 | |
| | | | | | | | 9,172,163 | |
Finland — 0.4% | | | | | | | | |
Other Securities (a) (b) (d) | | | | | | | 1,783,350 | |
| | | | | | | | | |
France — 7.3% | | | | | | | | |
Essilor International Cie Generale d'Optique S.A. (a) | | | 21,042 | | | | 2,966,534 | |
LVMH Moet Hennessy Louis Vuitton SE (a) | | | 16,167 | | | | 5,367,193 | |
Pernod Ricard S.A. (a) | | | 22,013 | | | | 3,592,254 | |
Publicis Groupe S.A. (a) | | | 42,825 | | | | 2,938,452 | |
Rexel S.A. (d) | | | 250,412 | | | | 3,600,915 | |
Schneider Electric SE (a) | | | 45,249 | | | | 3,762,822 | |
Total S.A. (a) | | | 50,584 | | | | 3,071,433 | |
Other Securities (a) (b) | | | | | | | 6,291,780 | |
| | | | | | | | 31,591,383 | |
Germany — 3.5% | | | | | | | | |
adidas AG (a) | | | 22,594 | | | | 4,918,606 | |
Volkswagon AG (a) | | | 25,606 | | | | 4,209,009 | |
Other Securities (a) (b) | | | | | | | 6,143,036 | |
| | | | | | | | 15,270,651 | |
Greece — 0.0% (e) | | | | | | | | |
Other Securities (a) (b) | | | | | | | 16,405 | |
| | | | | | | | | |
Hong Kong — 4.2% | | | | | | | | |
AIA Group Ltd. (a) | | | 501,200 | | | | 4,366,136 | |
China Mobile Ltd. (a) | | | 462,000 | | | | 4,099,281 | |
China Resources Power Holdings Co. Ltd. | | | 1,666,000 | | | | 2,934,639 | |
Lenovo Group Ltd. (c) | | | 5,632,000 | | | | 3,050,866 | |
Other Securities (a) (b) | | | | | | | 3,663,034 | |
| | | | | | | | 18,113,956 | |
India — 1.1% | | | | | | | | |
HDFC Bank Ltd. - ADR | | | 40,650 | | | | 4,269,064 | |
Other Securities (a) (b) | | | | | | | 398,721 | |
| | | | | | | | 4,667,785 | |
Indonesia — 0.2% | | | | | | | | |
Other Securities (a) (b) | | | | | | | 741,790 | |
| | | | | | | | | |
Ireland — 2.8% | | | | | | | | |
Accenture plc - Class A | | | 30,474 | | | | 4,985,242 | |
ICON plc (c) | | | 24,522 | | | | 3,249,901 | |
Other Securities (b) (d) | | | | | | | 3,848,259 | |
| | | | | | | | 12,083,402 | |
Israel — 0.1% | | | | | | | | |
Other Securities (b) (d) | | | | | | | 276,044 | |
| | | | | | | | | |
See Notes to Financial Statements.
38
Wilshire Mutual Funds, Inc. Wilshire International Equity Fund Condensed Schedule of Investments - (Continued) | June 30, 2018
(Unaudited) |
|
| | | Shares | | | Value | |
COMMON STOCKS — 85.9% (Continued) |
Italy — 2.7% | | | | | | | | |
Eni SpA (a) | | | 216,471 | | | $ | 4,013,253 | |
Other Securities (a) (b) (d) | | | | | | | 7,657,075 | |
| | | | | | | | 11,670,328 | |
Japan — 12.2% | | | | | | | | |
FANUC Corp. (a) | | | 14,700 | | | | 2,913,846 | |
Fujitsu Ltd. (a) | | | 725,000 | | | | 4,387,548 | |
Honda Motor Co. (a) | | | 124,200 | | | | 3,641,830 | |
INPEX Corp. (a) | | | 299,200 | | | | 3,107,596 | |
Keyence Corp. (a) | | | 9,760 | | | | 5,505,030 | |
Sumitomo Mitsui Financial Group, Inc. (a) | | | 71,100 | | | | 2,773,451 | |
Sysmex Corp. (a) | | | 31,255 | | | | 2,912,306 | |
Other Securities (a) (b) (d) | | | | | | | 27,215,340 | |
| | | | | | | | 52,456,947 | |
Jersey — 1.7% | | | | | | | | |
Experian plc (a) | | | 230,042 | | | | 5,675,189 | |
Other Securities (a) (b) | | | | | | | 1,683,530 | |
| | | | | | | | 7,358,719 | |
Korea (Republic of) — 1.9% | | | | | | | | |
Other Securities (a) (b) | | | | | | | 8,102,366 | |
| | | | | | | | | |
Luxembourg — 0.2% | | | | | | | | |
Other Securities (a) (b) | | | | | | | 768,483 | |
| | | | | | | | | |
Malaysia — 0.2% | | | | | | | | |
Other Securities (a) (b) | | | | | | | 971,835 | |
| | | | | | | | | |
Mexico — 0.7% | | | | | | | | |
Wal-Mart de Mexico S.A.B. de C.V. | | | 1,131,775 | | | | 2,986,466 | |
Other Securities (b) | | | | | | | 6,066 | |
| | | | | | | | 2,992,532 | |
Netherlands — 3.5% | | | | | | | | |
Core Laboratories N.V. (d) | | | 24,799 | | | | 3,129,882 | |
Ferrari N.V. (a) | | | 23,044 | | | | 3,114,515 | |
Mylan N.V. (c) | | | 98,613 | | | | 3,563,873 | |
Other Securities (a) (b) | | | | | | | 5,266,116 | |
| | | | | | | | 15,074,386 | |
New Zealand — 0.1% | | | | | | | | |
Other Securities (a) (b) | | | | | | | 300,373 | |
| | | | | | | | | |
Norway — 0.3% | | | | | | | | |
Other Securities (a) (b) | | | | | | | 1,133,844 | |
| | | | | | | | | |
Peru — 0.0% (e) | | | | | | | | |
Other Securities (b) | | | | | | | 19,982 | |
| | | | | | | | | |
Philippines — 0.1% | | | | | | | | |
Other Securities (a) (b) | | | | | | | 324,336 | |
| | | | | | | | | |
Poland — 0.1% | | | | | | | | |
Other Securities (a) (b) | | | | | | | 251,279 | |
| | | | | | | | | |
Portugal — 0.0% (e) | | | | | | | | |
Other Securities (a) (b) | | | | | | | 196,005 | |
| | | | | | | | | |
Russia — 1.1% | | | | | | | | |
Other Securities (b) | | | | | | | 4,688,762 | |
| | | | | | | | | |
Singapore — 1.1% | | | | | | | | |
Other Securities (a) (b) | | | | | | | 4,608,062 | |
| | | | | | | | | |
South Africa — 0.2% | | | | | | | | |
Other Securities (a) (b) | | | | | | | 680,921 | |
| | | | | | | | | |
Spain — 2.4% | | | | | | | | |
Amadeus IT Group S.A. (a) | | | 47,167 | | | | 3,708,472 | |
Other Securities (a) (b) | | | | | | | 6,778,552 | |
| | | | | | | | 10,487,024 | |
Sweden — 2.5% | | | | | | | | |
Telefonaktiebolaget LM Ericsson - B Shares (a) | | | 390,597 | | | | 3,009,407 | |
Other Securities (a) (b) | | | | | | | 7,752,909 | |
| | | | | | | | 10,762,316 | |
Switzerland — 6.7% | | | | | | | | |
Chubb Ltd. | | | 31,021 | | | | 3,940,287 | |
Nestlé S.A. (a) | | | 53,789 | | | | 4,168,441 | |
Roche Holdings AG (a) | | | 21,751 | | | | 4,825,344 | |
Sika AG (a) | | | 19,605 | | | | 2,708,651 | |
Other Securities (a) (b) | | | | | | | 13,439,683 | |
| | | | | | | | 29,082,406 | |
Taiwan — 2.3% | | | | | | | | |
Taiwan Semiconductor Manufacturing Co. Ltd. - ADR | | | 102,880 | | | | 3,761,292 | |
Other Securities (a) (b) | | | | | | | 6,323,594 | |
| | | | | | | | 10,084,886 | |
Thailand — 0.0% (e) | | | | | | | | |
Other Securities (a) (b) | | | | | | | 189,304 | |
See Notes to Financial Statements.
39
Wilshire Mutual Funds, Inc. Wilshire International Equity Fund Condensed Schedule of Investments - (Continued) | June 30, 2018
(Unaudited) |
|
| | | Shares | | | Value | |
COMMON STOCKS — 85.9% (Continued) |
Turkey — 0.5% | | | | | | | | |
Other Securities (a) (b) | | | | | | $ | 2,053,867 | |
| | | | | | | | | |
United Arab Emirates — 0.0% (e) | | | | | | | | |
Other Securities (a) (b) | | | | | | | 124,257 | |
| | | | | | | | | |
United Kingdom — 10.1% | | | | | | | | |
Compass Group plc (a) | | | 207,358 | | | | 4,420,255 | |
Royal Dutch Shell plc - Class A (a) | | | 76,226 | | | | 2,988,778 | |
Standard Chartered plc (a) | | | 324,798 | | | | 2,950,467 | |
Tesco plc (a) | | | 889,363 | | | | 3,009,442 | |
Travis Perkins plc | | | 200,614 | | | | 3,766,460 | |
Vodafone Group plc (a) | | | 1,216,024 | | | | 2,945,756 | |
Other Securities (a) (b) | | | | | | | 23,329,208 | |
| | | | | | | | 43,410,366 | |
United States — 1.0% | | | | | | | | |
Other Securities (b) (d) | | | | | | | 4,215,879 | |
| | | | | | | | | |
Total Common Stocks (Cost $336,758,687) | | | | | | $ | 370,045,608 | |
| | | | | | | | | |
PREFERRED STOCKS — 0.4% | | | | | | | | |
Brazil — 0.1% | | | | | | | | |
Other Securities (b) | | | | | | $ | 351,601 | |
| | | | | | | | | |
Germany — 0.3% | | | | | | | | |
Other Securities (a) (b) | | | | | | | 1,259,189 | |
| | | | | | | | | |
Korea (Republic of) — 0.0% (e) | | | | | | | | |
Other Securities (a) (b) | | | | | | | 184,094 | |
| | | | | | | | | |
Total Preferred Stocks (Cost $2,066,490) | | | | | | $ | 1,794,884 | |
| | | | | | | | | |
RIGHTS — 0.0% | | | | | | | | |
Switzerland — 0.0% | | | | | | | | |
Sika AG (c) (f) | | | 1,830 | | | $ | 0 | |
| | | | | | | | | |
Taiwan — 0.0% | | | | | | | | |
Cathay Financial Holding Co. (c) (f) | | | 1,830 | | | | 0 | |
| | | | | | | | | |
Total Rights (Cost $0) | | | | | | $ | 0 | |
| | | | | | | | | |
EXCHANGE-TRADED FUNDS — 2.5% |
Korea (Republic of) — 1.4% | | | | | | | | |
iShares MSCI South Korea Capped ETF (d) | | | 88,787 | | | $ | 6,011,768 | |
| | | | | | | | | |
Taiwan — 1.1% | | | | | | | | |
iShares MSCI Taiwan ETF | | | 125,790 | | | | 4,528,440 | |
| | | | | | | | | |
Total Exchange-Traded Funds (Cost $10,484,806) | | | | | | $ | 10,540,208 | |
| | | | | | | | | |
MONEY MARKET FUNDS — 6.8% |
Northern Trust Institutional Government Select Portfolio - Institutional Class, 1.73% (g) | | | 25,384,764 | | | $ | 25,384,764 | |
Northern Trust Institutional Liquid Asset Portfolio - Institutional Class, 1.98% (g) (h) | | | 3,907,774 | | | | 3,907,774 | |
Total Money Market Funds (Cost $29,292,538) | | | | | | $ | 29,292,538 | |
| | | | | | | | | |
Total Investments at Value — 95.6% (Cost $378,602,521) | | $ | 411,673,238 | |
| | | | | | | | | |
Other Assets in Excess of Liabilities — 4.4% | | | 19,169,091 | |
| | | | | | | | | |
Net Assets — 100.0% | | | | | | $ | 430,842,329 | |
The Condensed Schedule of Investments does not reflect the complete portfolio holdings. It includes the Fund’s 50 largest holdings and each investment of any issuer that exceeds 1% of the Fund’s net assets. “Other Securities” represent all issues not required to be disclosed under the rules adopted by the U.S. Securities and Exchange Commission (“SEC”). The complete schedule of portfolio holdings is available (i) without charge, upon request, by calling (800)607-2200; (ii) on the SEC’s website at http://www.sec.gov; and (iii) on our website at http://advisor.wilshire.com.
ADR — American Depositary Receipt.
See Notes to Financial Statements.
40
Wilshire Mutual Funds, Inc. Wilshire International Equity Fund Condensed Schedule of Investments - (Continued) | June 30, 2018
(Unaudited) |
|
(a) | Level 2 security (Note 2). |
(b) | Represents issuers not identified as a top 50 holding in terms of market value and issues or issuers not exceeding 1% of net assets individually or in the aggregate, respectively, as of June 30, 2018. |
(c) | Non-income producing security. |
(d) | This security or a partial position of this security is on loan at June 30, 2018. The total market value of securities on loan at June 30, 2018 was $18,631,012 (Note 7). |
(e) | Percentage rounds to less than 0.1%. |
(f) | Level 3 security. Security has been valued at fair value in accordance with procedures adopted by and under the general supervision of the Board of Directors. The total value of such securities is $0 as of June 30, 2018, representing 0.0% of net assets (Note 2). |
(g) | The rate shown is the 7-day effective yield as of June 30, 2018. |
(h) | This security was purchased with cash collateral held from securities on loan. The total value of such securities as of June 30, 2018 was $3,907,774. Securities on loan are also collateralized by various U.S. Treasury obligations in the amount of $15,224,045 (Note 7). |
See Notes to Financial Statements.
41
Wilshire Mutual Funds, Inc. Wilshire Income Opportunities Fund Schedule of Investments | June 30, 2018
(Unaudited) |
|
| | | Par Value | | | Value | |
U.S. TREASURY OBLIGATIONS — 14.9% |
U.S. Treasury Bills — 0.3% |
1.857%, due 09/06/18 (a) | | $ | 620,000 | | | $ | 617,863 | |
2.095%, due 12/06/18 (a) | | | 440,000 | | | | 436,105 | |
| | | | | | | | 1,053,968 | |
U.S. Treasury Bonds — 7.9% | | | | | | | | |
2.625%, due 06/30/23 | | | 19,760,000 | | | | 19,658,112 | |
2.750%, due 11/15/42 | | | 1,110,000 | | | | 1,065,600 | |
3.625%, due 08/15/43 | | | 1,330,000 | | | | 1,479,833 | |
3.375%, due 05/15/44 | | | 610,000 | | | | 652,700 | |
2.875%, due 08/15/45 | | | 1,080,000 | | | | 1,057,050 | |
2.875%, due 11/15/46 | | | 1,110,000 | | | | 1,085,545 | |
3.000%, due 02/15/47 | | | 880,000 | | | | 882,063 | |
2.750%, due 11/15/47 | | | 730,000 | | | | 695,781 | |
| | | | | | | | 26,576,684 | |
U.S. Treasury Notes — 5.9% | | | | | | | | |
1.500%, due 10/31/19 | | | 1,900,000 | | | | 1,876,547 | |
1.750%, due 11/30/19 | | | 1,920,000 | | | | 1,900,799 | |
2.125%, due 08/31/20 | | | 1,420,000 | | | | 1,407,131 | |
2.000%, due 09/30/20 | | | 1,540,000 | | | | 1,520,750 | |
1.750%, due 10/31/20 | | | 1,400,000 | | | | 1,373,750 | |
1.625%, due 11/30/20 | | | 1,260,000 | | | | 1,231,650 | |
2.000%, due 05/31/21 | | | 1,530,000 | | | | 1,503,225 | |
1.125%, due 06/30/21 | | | 1,590,000 | | | | 1,521,183 | |
1.875%, due 08/31/24 | | | 1,580,000 | | | | 1,498,284 | |
2.125%, due 09/30/24 | | | 1,580,000 | | | | 1,518,775 | |
2.250%, due 10/31/24 | | | 1,570,000 | | | | 1,519,466 | |
2.250%, due 08/15/27 | | | 1,590,000 | | | | 1,512,488 | |
2.250%, due 11/15/27 | | | 1,580,000 | | | | 1,501,000 | |
| | | | | | | | 19,885,048 | |
U.S. Treasury Inflation-Protected Notes — 0.8% |
0.125%, due 04/15/22 | | | 1,915,967 | | | | 1,876,750 | |
0.375%, due 07/15/27 | | | 645,183 | | | | 627,642 | |
| | | | | | | | 2,504,392 | |
Total U.S. Treasury Obligations (Cost $50,209,051) | | | | | | $ | 50,020,092 | |
| | | | | | | | | |
AGENCY MORTGAGE-BACKED OBLIGATIONS — 3.4% |
Federal Home Loan Mortgage Corp. — 2.1% |
Series 2017-DNA3, Class M1, 2.841% (1MO LIBOR + 75), due 03/25/30 (b) | | $ | 451,814 | | | $ | 452,731 | |
Series 4249, Class CS, 4.300%, due 09/15/43 | | | 1,288,943 | | | | 1,120,667 | |
Series 4355, Class ZX, 4.000%, due 05/15/44 | | | 5,279,394 | | | | 5,415,675 | |
| | | | | | | | 6,989,073 | |
Federal Home Loan Mortgage Corp. Interest-Only Strips — 0.2% |
Series K-722, Class X1, 1.310%, due 03/01/23 (b) | | | 2,254,481 | | | | 109,761 | |
Series 4077, Class TS, 3.927% (1MO LIBOR + 600), due 05/15/41 (b) | | | 1,457,067 | | | | 181,019 | |
Series 3966, Class SA, 3.827% (1MO LIBOR + 590), due 12/15/41 (b) | | | 1,992,684 | | | | 240,723 | |
Series 4089, Class SH, 3.927% (1MO LIBOR + 600), due 08/15/42 (b) | | | 1,577,633 | | | | 197,101 | |
| | | | | | | | 728,604 | |
Federal National Mortgage Association — 0.7% |
Series 2017-C03, Class 1M1, 3.041% (1MO LIBOR + 95), due 10/25/29 (b) | | | 453,256 | | | | 455,408 | |
Series 2018-C04, Class 2M2, 4.652% (1MO LIBOR + 255), due 12/25/30 (b) | | | 500,000 | | | | 500,226 | |
Series 2016-75, Class ZP, 3.000%, due 10/25/46 | | | 1,437,710 | | | | 1,327,729 | |
| | | | | | | | 2,283,363 | |
Federal National Mortgage Association Interest-Only Strips — 0.4% |
Series 2011-124, Class NS, 4.540% (1MO LIBOR + 650), due 12/25/41 (b) | | | 1,664,869 | | | | 251,491 | |
Series 2012-20, Class SA, 4.359% (1MO LIBOR + 645), due 03/25/42 (b) | | | 1,600,155 | | | | 224,941 | |
Series 2012-76, Class SC, 3.909% (1MO LIBOR + 600), due 07/25/42 (b) | | | 769,694 | | | | 96,239 | |
Series 2014-28, Class SD, 3.959% (1MO LIBOR + 650), due 05/25/44 (b) | | | 5,239,250 | | | | 763,093 | |
| | | | | | | | 1,335,764 | |
Total Agency Mortgage-Backed Obligations (Cost $12,394,576) | | $ | 11,336,804 | |
| | | | | | | | | |
NON-AGENCY MORTGAGE-BACKED OBLIGATIONS — 12.3% |
A10, LLC, Series 2016-1, Class A-1, 2.420%, due 03/15/35 | | | 18,818 | | | $ | 18,749 | |
American Express Credit Account Master Trust, Series 2017-6, Class A, 2.040%, due 05/15/23 | | | 450,000 | | | | 440,692 | |
Americold, LLC Trust, Series 2010-ART, Class C, 6.811%, due 01/14/29 | | | 50,000 | | | | 53,157 | |
Arbor Realty Commercial Real Estate, Series 2016-FL1, Class B, 5.023% (1MO LIBOR + 295), due 09/15/26 (b) | | | 302,000 | | | | 304,212 | |
See Notes to Financial Statements.
42
Wilshire Mutual Funds, Inc. Wilshire Income Opportunities Fund Schedule of Investments - (continued) | June 30, 2018
(Unaudited) |
|
| | | Par Value | | | Value | |
NON-AGENCY MORTGAGE-BACKED OBLIGATIONS — 12.3% (Continued) |
Atrium Hotel Portfolio Trust, Series 2017-ATRM, Class E, 144A, 4.969%, due 11/15/19 (b) | | $ | 94,000 | | | $ | 93,935 | |
Atrium Hotel Portfolio Trust, Series 2018-ATRM, Class E, 144A, 5.362% (1MO LIBOR +340), due 06/15/35 (b) | | | 140,000 | | | | 140,003 | |
Barclays Commercial Mortgage Securities, Series 2014-BX0, Class E, 5.823% (1MO LIBOR + 375), due 08/15/27 (b) | | | 236,000 | | | | 237,039 | |
BCAPB, LLC Trust, Series 2007-AB1, Class A-5, 4.960%, due 03/25/37 (b) | | | 4,291,341 | | | | 2,838,432 | |
Bear Stearns Adjustable Rate Mortgage Trust, Series 2004-10, Class I-M-1, 3.739%, due 01/25/35 (b) | | | 561,483 | | | | 530,667 | |
Benchmark Mortgage Trust, Series 2018-B4, Class D, 2.960%, due 07/15/51 (b) | | | 500,000 | | | | 406,147 | |
BX Trust, Series 2018-MCSF, Class F, 144A, 4.565%, due 04/15/35 (b) | | | 140,000 | | | | 138,953 | |
BX Trust, Series 2018-GW, Class G, 144A, 4.820% (1MO LIBOR + 292), due 05/15/35 (b) | | | 139,000 | | | | 139,171 | |
BX Trust, Series 2018-BIOA, Class E, 144A, 4.02% (1MO LIBOR + 195.1), due 03/15/37 (b) | | | 143,000 | | | | 142,289 | |
CFCRE Commercial Mortgage Trust, Series 2016-C4, Class C, 4.878%, due 05/10/58 | | | 120,000 | | | | 121,517 | |
CGGS Commercial Mortgage Trust, Series 2018-WSS, Class D, 144A, 4.219% (1MO LIBOR + 230), due 02/15/20 (b) | | | 142,000 | | | | 142,994 | |
CIM Trust, Series 2016-1, Class B2, 7.954%, due 07/26/55 (b) | | | 1,000,000 | | | | 872,640 | |
CIM Trust, Series 2016-2, Class B2, 7.847%, due 02/01/56 (b) | | | 1,000,000 | | | | 965,702 | |
CIM Trust, Series 2016-3, Class B2, 12.174%, due 02/27/56 | | | 1,000,000 | | | | 955,155 | |
Citigroup Commercial Mortgage Trust, Series 2013-GC17, Class D, 5.258%, due 11/10/46 (b) | | | 100,000 | | | | 95,031 | |
Citigroup Commercial Mortgage Trust, Series 2016-P4, Class D, 4.133%, due 07/10/49 (b) | | | 500,000 | | | | 432,872 | |
Citigroup Commercial Mortgage Trust, Series 2008-C7, Class A-M, 6.133%, due 12/10/49 (b) | | | 99,262 | | | | 99,087 | |
Citi-Mortgage Alternative Loan Trust, Series 2006-A1, Class IA-6, 6.000%, due 04/25/36 | | | 2,758,135 | | | | 2,721,899 | |
Citi-Mortgage Alternative Loan Trust, Series 2007-A5, Class IA-6, 6.000%, due 05/25/37 (b) | | | 2,954,430 | | | | 2,842,541 | |
CLNS Trust, Series 2017-IKPR, Class D, 3.979% (1MO LIBOR + 205), due 06/11/32 (b) | | | 84,000 | | | | 84,137 | |
CLNS Trust, Series 2017-IKPR, Class E, 5.429% (1MO LIBOR + 350), due 06/11/32 (b) | | | 84,000 | | | | 84,266 | |
CLNS Trust, Series 2017-IKPR, Class F, 6.429% (1MO LIBOR + 450), due 06/11/32 (b) | | | 84,000 | | | | 84,475 | |
Commercial Mortgage Trust, Series 2012-CCRE4, Class C, 4.442%, due 10/15/45 | | | 69,000 | | | | 62,535 | |
Countrywide Alternative Loan, Inc., Series 2007-16CB, Class 5-A-4, 6.250%, due 08/25/37 (b) | | | 753,544 | | | | 659,129 | |
Countrywide Asset Backed Securities, Inc., Series 2006-6, Class 1-A-1, 2.130% (1MO LIBOR + 175), due 09/25/36 (b) | | | 1,610,249 | | | | 1,586,903 | |
Countrywide Home Loan Mortgage Trust, Series 2007-HY5, Class 3-A-1, 3.412%, due 09/25/37 (b) | | | 2,117,387 | | | | 2,047,816 | |
Credit Suisse Commercial Mortgage Trust, Series 2017-CHOP, Class E, 5.219% (1MO LIBOR + 330), due 07/15/32 (b) | | | 169,000 | | | | 169,696 | |
Credit Suisse Commercial Mortgage Trust, Series 2017-LSTK, Class E, 3.331%, due 04/05/33 (b) | | | 170,000 | | | | 165,879 | |
Credit Suisse Commercial Mortgage Trust, Series 2016-PR1, Class A-1, 5.500%, due 07/25/56 (b) | | | 730,508 | | | | 721,356 | |
See Notes to Financial Statements.
43
Wilshire Mutual Funds, Inc. Wilshire Income Opportunities Fund Schedule of Investments - (continued) | June 30, 2018
(Unaudited) |
|
| | | Par Value | | | Value | |
NON-AGENCY MORTGAGE-BACKED OBLIGATIONS — 12.3% (Continued) |
DBGS Mortgage Trust, 4.350% (1MO LIBOR + 245), due 06/15/33 (b) | | $ | 140,000 | | | $ | 139,102 | |
DBUBS Mortgage Trust, Series 2011-LC1A, Class E, 144A, 5.884%, due 11/10/46 (b) | | | 150,000 | | | | 155,434 | |
Dominos Pizza Master Issuer, LLC, Series 2017-1A, Class A2I, 144A, 3.610% (3MO LIBOR + 125), due 07/25/47 (b) | | | 233,238 | | | | 234,067 | |
Drug Royalty III, L.P., Series 2016-1, Class NT, 3.979%, due 04/15/27 | | | 541,598 | | | | 537,982 | |
Dryden Senior Loan Fund, Series 2012-25A, Class CRR, 4.198% (3MO LIBOR +185), due 10/15/27 (b) | | | 1,000,000 | | | | 997,310 | |
Dryden Senior Loan Fund, Series 14-33A, Class DR, 144A, 6.698%, due 10/15/28 (b) | | | 500,000 | | | | 503,854 | |
First Franklin Mortgage Trust, Series 2004-FF10, Class M-1, 3.235% (1MO LIBOR + 127.50), due 07/25/34 (b) | | | 511,983 | | | | 517,113 | |
Focus Brands Funding, LLC, Series 2017-1A, Class A2II, 144A, 5.093%, due 04/30/47 (b) | | | 178,200 | | | | 182,411 | |
Fort CRE, LLC, Series 2016-1, Class B, 3.250%, due 05/21/36 | | | 153,465 | | | | 153,654 | |
GMAC Commercial Mortgage Securities, Series 2004-C3, Class D, 5.044%, due 12/10/41 (b) | | | 96,000 | | | | 95,001 | |
GMAC Commercial Mortgage Securities, Series 2004-C3, Class E, 5.142%, due 12/10/41 (b) | | | 160,000 | | | | 159,569 | |
GoldenTree Loan Management, L.P., Series 2017-2A, Class D, 144A, 4.224% (3MO LIBOR + 265), due 11/28/30 (b) | | | 500,000 | | | | 496,289 | |
Goldman Sachs Mortgage Securities Trust, Series 2013-GC13, Class D, 4.081%, due 07/10/46 (b) | | | 60,000 | | | | 55,016 | |
GSAA Home Equity Trust, Series 2005-6, Class M-1, 2.521% (1MO LIBOR + 43), due 06/25/35 (b) | | | 1,300,000 | | | | 1,270,948 | |
GSAA Home Equity Trust, Series 2007-7, Class A4, 2.361%, due 07/25/37 (b) | | | 689,039 | | | | 664,677 | |
IMT Trust, Series 2017-APTS, Class EFL, 4.069% (1MO LIBOR + 215), due 06/15/34 (b) | | | 56,000 | | | | 55,951 | |
IMT Trust, Series 2017-APTS, Class FFL, 4.769% (1MO LIBOR + 285), due 06/15/34 (b) | | | 56,000 | | | | 56,094 | |
JPMCC Commercial Mortgage Trust, Series 2016-ASH, Class B, 4.069% (1MO LIBOR + 215), due 10/15/34 (b) | | | 113,047 | | | | 113,090 | |
JPMCC Commercial Mortgage Trust, Series 2016-ASH, Class C, 4.669% (1MO LIBOR + 275), due 10/15/34 (b) | | | 63,896 | | | | 63,943 | |
JPMCC RE-REMIC Trust, Series 2014-FRR1, Class A-K707, 4.347%, due 01/27/47 | | | 181,000 | | | | 179,948 | |
JPMorgan Chase Commercial Mortgage, Series 2015-MAR7, Class D, 144A, 5.227%, due 06/05/32 (b) | | | 113,000 | | | | 112,782 | |
JPMorgan Chase Commercial Mortgage, Series 2017-MAUI, Class C, 144A, 3.178% (1MO LIBOR + 125), due 07/15/34 (b) | | | 43,000 | | | | 43,037 | |
JPMorgan Chase Commercial Mortgage, Series 2017-MAUI, Class D, 3.878% (1MO LIBOR + 195), due 07/15/34 (b) | | | 40,000 | | | | 40,108 | |
JPMorgan Chase Commercial Mortgage, Series 2017-MAUI, Class E, 144A, 4.878% (1MO LIBOR + 295), due 07/15/34 (b) | | | 36,000 | | | | 36,108 | |
JPMorgan Chase Commercial Mortgage, Series 2017-MAUI, Class F, 144A, 5.678% (1MO LIBOR + 375), due 07/15/34 (b) | | | 50,000 | | | | 50,151 | |
JPMorgan Chase Commercial Mortgage, Series 2015-JP1, Class F, 4.742%, due 01/15/49 (b) | | | 240,000 | | | | 177,072 | |
JPMorgan Chase Commercial Mortgage, Series 2007-LDPX, Class A-M, 5.464%, due 01/15/49 (b) | | | 13,973 | | | | 13,985 | |
JPMorgan Chase Commercial Mortgage Securities Trust, Series 2018-LAQ, Class C, 144A, 3.670% (1MO LIBOR +160), due 06/15/32 (b) | | | 214,000 | | | | 214,205 | |
See Notes to Financial Statements.
44
Wilshire Mutual Funds, Inc. Wilshire Income Opportunities Fund Schedule of Investments - (continued) | June 30, 2018
(Unaudited) |
|
| | | Par Value | | | Value | |
NON-AGENCY MORTGAGE-BACKED OBLIGATIONS — 12.3% (Continued) |
JPMorgan Chase Commercial Mortgage Securities Trust, Series 2018-LAQ, Class D, 144A, 4.171% (1MO LIBOR +210), due 06/15/32 (b) | | $ | 1,085,000 | | | $ | 1,086,363 | |
JPMorgan Chase Commercial Mortgage Securities Trust, Series 2018-LAQ, Class E, 144A, 5.071% (1MO LIBOR +300), due 06/15/32 (b) | | | 777,000 | | | | 778,206 | |
JPMorgan Commercial Mortgage Trust, Series 2004-CIBC10, Class D, 5.097%, due 01/12/37 | | | 189,000 | | | | 192,472 | |
JPMorgan Commercial Mortgage Trust, Series 2006-LDP9, Class A-MS, 5.337%, due 05/15/47 | | | 176,000 | | | | 175,502 | |
JPMorgan Commercial Mortgage Trust, Series 2018-6, Class B2, 144A, 4.013%, due 12/25/48 (b)(c) | | | 400,000 | | | | 388,525 | |
LSTAR Commercial Mortgage Trust, Series 2016-4, Class C, 4.701%, due 03/10/49 | | | 274,000 | | | | 246,835 | |
Merrill Lynch Mortgage Trust, Series 2007-C1, Class A-M, 5.775%, due 06/12/50 (b) | | | 19,355 | | | | 19,376 | |
Morgan Stanley BofA Mortgage Loan Trust, Series 2014-C17, Class C, 4.457%, due 08/15/47 (b) | | | 1,117,000 | | | | 1,091,750 | |
Morgan Stanley BofA Mortgage Loan Trust, Series 2015-C20, Class D, 3.071%, due 02/15/48 (b) | | | 232,000 | | | | 185,826 | |
Morgan Stanley BofA Mortgage Loan Trust, Series 2015-C22, Class C, 4.382%, due 04/15/48 (b) | | | 1,000,000 | | | | 974,015 | |
Morgan Stanley Capital I Trust, Series 2006-NC1, Class M-1, 2.340% (1MO LIBOR + 380), due 12/25/35 (b) | | | 1,000,000 | | | | 973,079 | |
Natixis Commercial Mortgage Securities, Series 2018-FL1, Class C, 4.273% (1MO LIBOR + 220), due 06/15/35 (b) | | | 141,000 | | | | 140,660 | |
PFP Ltd., Series 2017-4, Class D, 5.673% (1MO LIBOR + 360), due 07/14/35 (b) | | | 1,000,000 | | | | 1,008,727 | |
PR Mortgage Loan Trust, Series 2014-1, Class APT, 5.915%, due 10/25/49 (b) | | | 2,096,078 | | | | 2,063,560 | |
Rait Trust, Series 2017-FL7, Class B, 3.519% (1MO LIBOR + 160), due 06/15/37 (b) | | | 169,000 | | | | 169,131 | |
Residential Accredited Loans, Inc., Series 2006-QS15, Class A-3, 6.500%, due 10/25/36 | | | 1,182,196 | | | | 1,104,855 | |
Resource Capital Corp. Ltd., Series 2017-CRE5, Class B, 144A, 3.939% (1MO LIBOR + 200), due 07/15/34 (b) | | | 123,281 | | | | 123,370 | |
SoFi Consumer Loan Program, Series 2018-1, Class C, 144A, 3.970%, due 02/25/27 (b) | | | 250,000 | | | | 246,957 | |
Stanwich Mortgage Loan Trust, Series 2017-NPA1, Class A-1, 3.598%, due 03/16/22 (b) | | | 50,847 | | | | 50,858 | |
Structured Asset Securities Corp., Series 2006-BC3, Class A3, 2.251% (1MO LIBOR + 16), due 10/25/36 (b) | | | 1,124,045 | | | | 1,001,896 | |
Tharaldson Hotel Portfolio Trust, Series 2018-THL, Class E, 144A, 5.109% (3MO LIBOR + 318), due 11/11/34 (b) | | | 129,979 | | | | 130,398 | |
UBS Commercial Mortgage Trust, Series 2018-C8, Class C, 4.705%, due 02/15/51 (b) | | | 95,000 | | | | 93,051 | |
UBS-Citigroup Commercial Mortgage Trust, Series 2011-C1, Class D, 6.051%, due 01/10/45 (b) | | | 142,000 | | | | 147,731 | |
Velocity Commercial Capital Loan Trust, Series 2016-1, Class A-FX, 3.534%, due 04/25/46 | | | 247,373 | | | | 246,172 | |
Verizon Owner Trust, 144A, 2.060%, due 09/20/21 | | | 225,000 | | | | 222,504 | |
Wachovia Bank Commercial Mortgage Trust, Series 2006-C25, Class F, 5.191%, due 05/15/43 (b) | | | 89,275 | | | | 89,026 | |
Wachovia Bank Commercial Mortgage Trust, Series 2006-C26, Class A-M, 5.997%, due 06/15/45 (b) | | | 22,485 | | | | 22,533 | |
Waldorf Astoria Boca Raton Trust, Series 2016-BOCA, Class B, 3.969% (1MO LIBOR + 205), due 06/15/29 (b) | | | 148,000 | | | | 148,134 | |
See Notes to Financial Statements.
45
Wilshire Mutual Funds, Inc. Wilshire Income Opportunities Fund Schedule of Investments - (continued) | June 30, 2018
(Unaudited) |
|
| | | Par Value | | | Value | |
NON-AGENCY MORTGAGE-BACKED OBLIGATIONS — 12.3% (Continued) |
Waldorf Astoria Boca Raton Trust, Series 2016-BOCA, Class C, 4.419% (1MO LIBOR + 205), due 06/15/29 (b) | | $ | 125,000 | | | $ | 125,191 | |
Wells Fargo Commercial Mortgage Trust, Series 2016-C34, Class C, 5.030%, due 06/15/49 | | | 141,000 | | | | 143,566 | |
Total Non-Agency Mortgage-Backed Obligations (Cost $40,560,764) | | $ | 41,108,246 | |
| | | | | | | | | |
NON-AGENCY MORTGAGE-BACKED OBLIGATION INTEREST-ONLY STRIPS — 2.5% |
Barclays Commercial Mortgage Securities, Series 2017-C1, Class X-A, 1.519%, due 02/01/27 (b) | | | 1,969,177 | | | | 194,055 | |
Benchmark Mortgage Trust, Series 2018-B4, Class XD, 1.750%, due 07/15/51 (b) | | | 7,000,000 | | | | 958,436 | |
BofA Merrill Lynch Commercial Mortgage Trust, Series 2016-UBS10, Class X-A, 1.990%, due 06/15/49 (b) | | | 1,103,489 | | | | 110,631 | |
CD Commercial Mortgage Trust, Series 2016-CD1, Class X-A, 1.432%, due 08/10/26 (b) | | | 1,973,185 | | | | 169,509 | |
CD Commercial Mortgage Trust, Series 2017-CD4, Class X-A, 1.324%, due 05/01/50 (b) | | | 1,753,363 | | | | 147,632 | |
CFCRE Commercial Mortgage Trust, Series 2017-C8, Class X-A, 1.669%, due 06/15/50 (b) | | | 1,424,644 | | | | 147,324 | |
CFCRE Commercial Mortgage Trust, Series 2016-C4, Class X-A, 1.744%, due 05/10/58 (b) | | | 1,274,090 | | | | 129,371 | |
Citigroup Commercial Mortgage Trust, Series 2016-P4, Class X-A, 2.002%, due 08/10/26 (b) | | | 1,222,571 | | | | 141,388 | |
Citigroup Commercial Mortgage Trust, Series 2016-C1, Class X-A, 1.922%, due 05/10/49 (b) | | | 1,158,046 | | | | 133,050 | |
Commercial Mortgage Trust, Series 2012-LC4, Class XA, 2.382%, due 12/10/44 (b) | | | 14,958,097 | | | | 854,733 | |
Commercial Mortgage Trust, Series 2013-CCRE12, Class X-A, 1.269%, due 10/01/46 (b) | | | 3,831,179 | | | | 177,693 | |
Commercial Mortgage Trust, Series 2015-LC21, Class X-A, 0.837%, due 07/10/48 (b) | | | 1,884,842 | | | | 69,059 | |
CSAIL Commercial Mortgage Trust, Series 2016-C6, Class X-A, 1.805%, due 01/15/49 (b) | | | 984,539 | | | | 94,989 | |
CSAIL Commercial Mortgage Trust, Series 2017-CX10, Class XA, 0.867%, due 11/15/50 (b) | | | 5,599,996 | | | | 293,261 | |
Goldman Sachs Mortgage Securities Trust, Series 2013-GC10, Class X-A, 1.546%, due 01/10/23 (b) | | | 2,211,204 | | | | 122,444 | |
Goldman Sachs Mortgage Securities Trust, Series 2011-GC3, Class X, 0.821%, due 03/10/44 (b) | | | 15,803,625 | | | | 233,744 | |
Goldman Sachs Mortgage Securities Trust, Series 2016-GS2, Class X-A, 1.664%, due 05/10/49 (b) | | | 1,036,061 | | | | 95,355 | |
JPMBB Commercial Mortgage Securities Trust, Series 2014-C19, Class XA, 1.289%, due 04/15/47 (b) | | | 33,081,016 | | | | 712,939 | |
JPMCC Commercial Mortgage Trust, Series 2016-JP2, Class X-A, 1.852%, due 08/15/49 (b) | | | 1,919,414 | | | | 219,519 | |
JPMDB Commercial Mortgage Securities, Series 2016-C2, Class X-A, 1.697%, due 06/01/49 (b) | | | 1,247,690 | | | | 105,136 | |
LSTAR Commercial Mortgage Trust, Series 2016-4, Class X-A, 1.949%, due 03/01/49 (b) | | | 1,508,974 | | | | 106,704 | |
LSTAR Commercial Mortgage Trust, Series 2017-5, Class X, 1.232%, due 03/10/50 (b) | | | 2,648,661 | | | | 129,494 | |
Morgan Stanley BofA Mortgage Loan Trust, Series 2013-C13, Class XA, 1.237%, due 11/15/46 (b) | | | 6,016,419 | | | | 245,212 | |
Morgan Stanley BofA Mortgage Loan Trust, Series 2014-C19, Class X-A, 1.115%, due 12/01/47 (b) | | | 3,452,381 | | | | 147,098 | |
See Notes to Financial Statements.
46
Wilshire Mutual Funds, Inc. Wilshire Income Opportunities Fund Schedule of Investments - (continued) | June 30, 2018
(Unaudited) |
|
| | | Par Value | | | Value | |
NON-AGENCY MORTGAGE-BACKED OBLIGATION INTEREST-ONLY STRIPS — 2.5% (Continued) |
Morgan Stanley Capital I Trust, Series 2016-UB12, Class X-A, 0.815%, due 12/15/49 (b) | | $ | 3,222,727 | | | $ | 150,732 | |
Morgan Stanley Capital I, Inc., Series 2017-BNK8, Class XE, 1.411%, due 11/15/50 (b) | | | 7,050,000 | | | | 689,106 | |
Societe Generale Commercial Mortgage Securities Trust, Series 2016-C5, Class X-A, 2.011%, due 10/01/48 (b) | | | 1,175,950 | | | | 129,556 | |
UBS Commercial Mortgage Trust, Series 2018-C8, Class XA, 0.894%, due 02/15/51 (b) | | | 1,386,585 | | | | 91,395 | |
Wells Fargo Commercial Mortgage Trust, Series 2016-C35, Class X-A, 1.988%, due 07/15/48 (b) | | | 6,759,464 | | | | 787,575 | |
Wells Fargo Commercial Mortgage Trust, Series 2017-C42, Class XE, 1.300%, due 12/15/50 (b) | | | 5,000,000 | | | | 480,166 | |
Wells Fargo Commercial Mortgage Trust, Series 2018-C45, Class XA, 0.998%, due 06/15/51 (b)(c) | | | 5,467,142 | | | | 362,220 | |
Total Non-Agency Mortgage-Backed Obligation Interest-Only Strips (Cost $8,281,175) | | $ | 8,429,526 | |
| | | | | | | | | |
ASSET-BACKED SECURITIES — 2.5% |
American Express Credit Account Master Trust, Series 2017-3, Class A, 1.770%, due 11/15/22 | | $ | 225,000 | | | $ | 220,605 | |
Arcadia Receivables Credit Trust, Series 2017-1, Class A, 144A, 3.250%, due 06/15/23 | | | 96,626 | | | | 96,605 | |
Capital One Multi-Asset Execution Trust, Series 2016-A3, Class A3, 1.340%, due 04/15/22 | | | 175,000 | | | | 172,724 | |
Chase Issuance Trust, Series 2016-A2, Class A, 1.370%, due 06/15/21 | | | 225,000 | | | | 222,250 | |
Chase Issuance Trust, Series 2016-A5, Class A5, 1.270%, due 07/15/21 | | | 225,000 | | | | 224,016 | |
Coinstar Funding, LLC, Series 2017-1A, Class A2, 144A, 5.216%, due 04/25/47 | | | 272,250 | | | | 275,486 | |
DB Master Finance, LLC, Series 2015-1A-A2II, 144A, 3.980%, due 02/20/45 | | | 435,375 | | | | 436,503 | |
Discover Card Execution Note Trust, Series 2016-A4, Class A4, 1.390%, due 03/15/22 | | | 225,000 | | | | 221,291 | |
Earnest Student Loan Program, LLC, Series 2016-C, Class B, 4.460%, due 01/26/37 | | | 519,953 | | | | 520,736 | |
Ford Credit Auto Owner Trust, Series 2016-C, Class A3, 1.220%, due 03/15/21 | | | 225,000 | | | | 222,082 | |
Helios Issuer, LLC, Series 2017-1A, Class A, 4.940%, due 09/20/49 (b) | | | 1,140,951 | | | | 1,171,775 | |
Home Partners of America Trust, Series 2018-1, Class D, 144A, 3.384% (1MO LIBOR + 145), due 07/17/37 (b) | | | 135,000 | | | | 135,000 | |
Honda Auto Receivables Owner Trust, Series 2015-4, Class A3, 1.230%, due 09/23/19 | | | 193,232 | | | | 192,581 | |
Jimmy John's Funding, LLC, Series 2017-1A, Class A2I, 144A, 3.610%, due 07/30/47 (b) | | | 818,632 | | | | 812,051 | |
Kabbage Funding, LLC, Series 2017-1, Class A, 144A, 4.571%, due 03/15/22 | | | 1,000,000 | | | | 1,009,921 | |
Mosaic Solar Loans, LLC, Series 2018-2GS, Class B, 4.740%, due 02/20/44 (b) | | | 450,000 | | | | 449,845 | |
Nissan Auto Receivables Owner Trust, Series 2015-B, Class A4, 1.790%, due 01/17/22 | | | 230,000 | | | | 227,724 | |
Rise Ltd., Series 2014-1A, Class A, 4.750%, due 02/15/39 | | | 836,964 | | | | 830,252 | |
SoFi Consumer Loan Program Trust, Series 2018-2, C, 144A, 4.250%, due 04/26/27 | | | 215,000 | | | | 214,214 | |
Springfield Funding Trust, Series 2015-A, Class A, 3.160%, due 11/15/24 | | | 628,988 | | | | 628,285 | |
Wendys Funding, LLC, Series 2018-1A, Class A2I, 144A, 3.573%, due 03/15/48 | | | 199,000 | | | | 193,612 | |
Total Asset-Backed Securities (Cost $8,464,353) | | | | | | $ | 8,477,558 | |
See Notes to Financial Statements.
47
Wilshire Mutual Funds, Inc. Wilshire Income Opportunities Fund Schedule of Investments - (continued) | June 30, 2018
(Unaudited) |
|
| | | Par Value | | | Value | |
COLLATERALIZED LOAN OBLIGATIONS — 3.1% |
ALM Loan Funding, Series 2016-19A, Class B, 5.348% (3MO LIBOR + 300), due 07/15/28 (b) | | $ | 250,000 | | | $ | 252,075 | |
Annisa CLO Ltd., Series 2016-2A, Class B, 4.459% (3MO LIBOR + 210), due 07/20/28 (b) | | | 500,000 | | | | 500,160 | |
Annisa CLO Ltd., Series 2016-2A, Class CR, 144A, 4.348% (3MO LIBOR + 200), due 07/20/31 (b) | | | 1,000,000 | | | | 1,000,000 | |
Apidos CLO, Series 2016-24A, Class C, 6.309% (3MO LIBOR + 395), due 07/20/27 (b) | | | 500,000 | | | | 501,052 | |
Atrium CDO Corp., Series 2013-9R, Class D-R, 144A, 5.584% (3MO LIBOR + 360), due 05/28/30 (b) | | | 500,000 | | | | 503,068 | |
Babson CLO Ltd., Series 2012-II, Class SUB, 144A, 0.000%, due 05/15/23 | | | 1,000,000 | | | | 38,200 | |
BlueMountain CLO Ltd., Series 2016-2A, Class C, 5.985% (3MO LIBOR + 410), due 08/20/28 (b) | | | 500,000 | | | | 501,326 | |
Canyon Capital CLO Ltd., Series 2014-1A, Class CR, 144A, 5.109%, due 01/30/31 (b) | | | 250,000 | | | | 247,159 | |
Galaxy XXII CLO Ltd., Series 2016-22A, Class D, 6.798% (3MO LIBOR + 445), due 07/16/28 (b) | | | 500,000 | | | | 500,250 | |
Keuka Park CLO Ltd., Series 2013, 144A, 0.000%, due 10/21/24 | | | 1,250,000 | | | | 65,353 | |
Octagon Investment Partners XXI, Series 2014-1A, Class D, 8.955% (3MO LIBOR + 660), due 11/14/26 (b) | | | 250,000 | | | | 251,162 | |
Palmer Square CLO Ltd., Series 2018-3A, Class C, 144A, 4.635% (3MO LIBOR +230), due 08/15/26 (b) | | | 1,000,000 | | | | 990,003 | |
Palmer Square CLO Ltd., Series 2013-2A, Class CR, 5.953% (3MO LIBOR + 360), due 10/17/27 (b) | | | 700,000 | | | | 702,298 | |
Sound Point CLO Ltd., Series 2014-2A, Class CR, 144A, 4.629%, due 10/20/26 (b) | | | 1,000,000 | | | | 1,000,221 | |
Symphony CLO XIV Ltd., Series 2014-14A, Class D-2, 5.322% (3MO LIBOR + 360), due 07/14/26 (b) | | | 500,000 | | | | 500,116 | |
TCI-Cent CLO, Series 2016-1A, Class C, 6.366% (3MO LIBOR + 400), due 12/21/29 (b) | | | 500,000 | | | | 503,425 | |
TCI-Flatiron, Series 2016-1A, Class C, 5.403% (3MO LIBOR + 305), due 07/17/28 (b) | | | 250,000 | | | | 250,955 | |
Treman Park CLO Ltd., Series 2015-1A, Class COM, 7.100%, due 04/20/27 | | | 500,000 | | | | 428,564 | |
Venture CDO Ltd., Series 2016-23A, Class B, 4.655% (3MO LIBOR + 230), due 07/19/28 (b) | | | 500,000 | | | | 499,994 | |
Voya CLO Ltd., Series 2016-2A, Class C, 5.989% (3MO LIBOR + 425), due 07/19/28 (b) | | | 500,000 | | | | 500,277 | |
Westcott Park CLO, Series 2016-1A, Class D, 6.709% (3MO LIBOR + 435), due 07/20/28 (b) | | | 500,000 | | | | 504,806 | |
Wind River CLO I Ltd., Series 2012-1A, Class D-R, 6.448% (3MO LIBOR + 410), due 01/15/26 (b) | | | 250,000 | | | | 251,661 | |
Total Collateralized Loan Obligations (Cost $12,210,597) | | | | | | $ | 10,492,125 | |
| | | | | | | | | |
INVESTMENT-GRADE CORPORATE OBLIGATIONS — 6.4% |
Consumer Discretionary — 0.7% | | | | | | | | |
Amazon.com, Inc., 3.150%, due 08/22/27 | | | 230,000 | | | | 219,806 | |
Anheuser-Busch InBev Finance, Inc., 3.650%, due 02/01/26 | | | 285,000 | | | | 278,956 | |
Expedia, Inc., 5.000%, due 02/15/26 | | | 225,000 | | | | 229,463 | |
Expedia, Inc., 3.800%, due 02/15/28 | | | 250,000 | | | | 228,624 | |
Ford Motor Co., 7.450%, due 07/16/31 | | | 170,000 | | | | 199,571 | |
General Motors Co., 2.593% (3MO LIBOR + 80), due 08/07/20 (b) | | | 40,000 | | | | 40,173 | |
General Motors Financial Co., Inc., 3.311% (3MO LIBOR + 99), due 01/05/23 (b) | | | 90,000 | | | | 90,266 | |
GLP Capital, L.P. / GLP Financing II, Inc., 5.750%, due 06/01/28 | | | 45,000 | | | | 45,225 | |
Hasbro, Inc., 3.500%, due 09/15/27 | | | 75,000 | | | | 69,416 | |
Molson Coors Brewing Co., 1.250%, due 07/15/24 | | | 150,000 | | | | 174,315 | |
Omnicom Group, Inc., 3.600%, due 04/15/26 | | | 155,000 | | | | 148,212 | |
See Notes to Financial Statements.
48
Wilshire Mutual Funds, Inc. Wilshire Income Opportunities Fund Schedule of Investments - (continued) | June 30, 2018
(Unaudited) |
|
| | | Par Value | | | Value | |
INVESTMENT-GRADE CORPORATE OBLIGATIONS — 6.4% (Continued) |
Consumer Discretionary — 0.7% (Continued) |
Royal Caribbean Cruises Ltd., 3.700%, due 03/15/28 | | $ | 80,000 | | | $ | 74,000 | |
Vector Group Ltd., 2.500%, due 01/15/19 | | | 170,000 | | | | 228,395 | |
Viacom, Inc., 5.850%, due 09/01/43 | | | 90,000 | | | | 90,253 | |
Viacom, Inc., 6.250%, due 02/28/57 | | | 275,000 | | | | 261,937 | |
| | | | | | | | 2,378,612 | |
Consumer Staples — 0.4% | | | | | | | | |
Anheuser-Busch InBev S.A./N.V., 4.900%, due 02/01/46 | | | 65,000 | | | | 66,885 | |
BAT Capital Corp., 144A, 3.223% (3MO LIBOR + 100), due 08/15/22 (b) | | | 20,000 | | | | 20,078 | |
Constellation Brands, Inc., 4.250%, due 05/01/23 | | | 270,000 | | | | 275,506 | |
Dollar Tree, Inc., 4.000%, due 05/15/25 | | | 225,000 | | | | 219,856 | |
JBS USA LUX/JBS USA Finance, Inc., 144A, 6.750%, due 02/15/28 | | | 30,000 | | | | 28,275 | |
Kraft Heinz Co. (The), 2.000%, due 07/02/18 | | | 80,000 | | | | 79,999 | |
Kraft Heinz Co. (The), 2.800%, due 07/02/20 | | | 240,000 | | | | 238,092 | |
Kraft Heinz Co. (The), 144A, 4.875%, due 02/15/25 | | | 250,000 | | | | 255,000 | |
Smithfield Foods, Inc., 144A, 4.250%, due 02/01/27 | | | 160,000 | | | | 153,361 | |
| | | | | | | | 1,337,052 | |
Energy — 1.4% | | | | | | | | |
Andeavor, 4.750%, due 12/15/23 | | | 275,000 | | | | 285,313 | |
Andeavor, 5.125%, due 12/15/26 | | | 75,000 | | | | 78,375 | |
AXA Equitable Holdings, Inc., 144A, 3.900%, due 04/20/23 | | | 240,000 | | | | 237,992 | |
Canacol Energy Ltd., 144A, 7.250%, due 05/03/25 | | | 200,000 | | | | 194,000 | |
Canadian Natural Resources Ltd., 2.950%, due 01/15/23 | | | 160,000 | | | | 154,237 | |
Concho Resources, Inc., 4.375%, due 01/15/25 | | | 175,000 | | | | 175,438 | |
DCP Midstream Operating, L.P., 3.875%, due 03/15/23 | | | 15,000 | | | | 14,494 | |
Delek & Avner Tamar Bond Ltd., 5.082%, due 12/30/23 | | | 100,000 | | | | 100,000 | |
Delek & Avner Tamar Bond Ltd., 5.412%, due 12/30/25 | | | 100,000 | | | | 99,875 | |
Ecopetrol S.A., 7.625%, due 07/23/19 | | | 600,000 | | | | 626,249 | |
Enbridge, Inc., 4.250%, due 12/01/26 | | | 330,000 | | | | 328,224 | |
Energy Transfer Partners, L.P., 4.750%, due 01/15/26 | | | 75,000 | | | | 74,407 | |
Energy Transfer Partners, L.P., 4.200%, due 04/15/27 | | | 15,000 | | | | 14,189 | |
EQT Midstream Partners, L.P., 4.750%, due 07/15/23 | | | 160,000 | | | | 159,832 | |
Kinder Morgan Energy Partners, 6.950%, due 01/15/38 | | | 200,000 | | | | 227,718 | |
Murphy Oil Corp., 6.875%, due 08/15/24 | | | 250,000 | | | | 263,438 | |
Nabors Industries, Inc., 144A, 5.750%, due 02/01/25 | | | 40,000 | | | | 37,948 | |
Oasis Petroleum, Inc., CV, 2.625%, due 09/15/23 | | | 140,000 | | | | 181,705 | |
Occidental Petroleum Corp., 3.500%, due 06/15/25 | | | 315,000 | | | | 311,231 | |
Pioneer Natural Resources, 4.450%, due 01/15/26 | | | 260,000 | | | | 267,091 | |
Plains All American Pipeline, L.P., 4.650%, due 10/15/25 | | | 90,000 | | | | 89,629 | |
Sabine Pass Liquefaction, LLC, 5.000%, due 03/15/27 | | | 150,000 | | | | 153,000 | |
USA Compression Partners, L.P., 144A, 6.875%, due 04/01/26 | | | 35,000 | | | | 36,181 | |
Williams Cos., Inc. (The), 4.550%, due 06/24/24 | | | 235,000 | | | | 235,000 | |
Williams Partners, L.P., 3.750%, due 06/15/27 | | | 275,000 | | | | 259,617 | |
| | | | | | | | 4,605,183 | |
Financials — 1.4% | | | | | | | | |
Air Lease Corp., 3.250%, due 03/01/25 | | | 105,000 | | | | 96,902 | |
Ally Financial, Inc., 4.125%, due 03/30/20 | | | 125,000 | | | | 125,000 | |
Athene Global Funding, 144A, 3.000%, due 07/01/22 | | | 165,000 | | | | 159,659 | |
BAC Capital Trust XIII, 4.000%, due 12/31/49 | | | 250,000 | | | | 219,063 | |
BAC Capital Trust XIV, 4.000% (3MO LIBOR + 83), due 12/31/49 (b) | | | 265,000 | | | | 232,206 | |
Bank of Montreal, 3.803%, due 12/15/32 | | | 60,000 | | | | 55,598 | |
See Notes to Financial Statements.
49
Wilshire Mutual Funds, Inc. Wilshire Income Opportunities Fund Schedule of Investments - (continued) | June 30, 2018
(Unaudited) |
|
| | | Par Value | | | Value | |
INVESTMENT-GRADE CORPORATE OBLIGATIONS — 6.4% (Continued) |
Financials — 1.4% (Continued) |
Capital One Financial Corp., 3.079% (3MO LIBOR + 72), due 01/30/23 (b) | | $ | 80,000 | | | $ | 79,416 | |
Citigroup, Inc., 3.570% (BBSW + 155), due 05/04/21 (b) | | | 245,000 | | | | 183,916 | |
Citigroup, Inc., 3.421% (3MO LIBOR + 110), due 05/17/24 (b) | | | 155,000 | | | | 155,627 | |
Crown Castle International Corp., 3.650%, due 09/01/27 | | | 110,000 | | | | 102,282 | |
Discover Financial Services, 4.100%, due 02/09/27 | | | 160,000 | | | | 153,364 | |
Fifth Third Bancorp, 5.100%, due 12/31/49 (b) | | | 350,000 | | | | 344,712 | |
Goldman Sachs Group, Inc. (The), 3.080% (3MO LIBOR + 75), due 02/23/23 (b) | | | 270,000 | | | | 268,934 | |
Huntington Bancshares, 5.700%, due 10/15/25 | | | 140,000 | | | | 138,425 | |
Liberty Mutual Group, Inc., 144A, 6.500%, due 05/01/42 | | | 65,000 | | | | 79,226 | |
M&T Bank Corp., Series F, 5.125%, due 12/31/49 | | | 119,000 | | | | 118,524 | |
Morgan Stanley, 3.737%, due 04/24/24 | | | 160,000 | | | | 158,958 | |
Royal Bank of Scotland Group plc, 3.498%, due 05/15/23 | | | 200,000 | | | | 193,720 | |
Santander Holdings USA, Inc., 144A, 3.400%, due 01/18/23 | | | 160,000 | | | | 153,968 | |
SunTrust Banks, Inc., 5.050%, due 12/31/49 | | | 225,000 | | | | 220,500 | |
Synchrony Financial, 3.950%, due 12/01/27 | | | 205,000 | | | | 189,332 | |
Total System Services, Inc., 4.450%, due 06/01/28 | | | 225,000 | | | | 225,579 | |
U.S. Bancorp, 0.850%, due 06/07/24 | | | 100,000 | | | | 116,672 | |
USB Capital IX, 3.500% (3MO LIBOR + 150), due 12/31/49 (b) | | | 305,000 | | | | 274,499 | |
Wachovia Capital Trust III, 5.570%, due 03/29/49 (b) | | | 400,000 | | | | 393,999 | |
Wand Merger Corp., 144A, 8.125%, due 07/15/23 | | | 160,000 | | | | 162,000 | |
| | | | | | | | 4,602,081 | |
Health Care — 0.6% | | | | | | | | |
AbbVie, Inc., 1.375%, due 05/17/24 | | | 120,000 | | | | 142,103 | |
AbbVie, Inc., 4.700%, due 05/14/45 | | | 85,000 | | | | 84,089 | |
CVS Health Corp., 4.100%, due 03/25/25 | | | 375,000 | | | | 371,354 | |
CVS Health Corp., 4.300%, due 03/25/28 | | | 270,000 | | | | 266,045 | |
CVS Health Corp., 5.050%, due 03/25/48 | | | 75,000 | | | | 75,940 | |
HCA, Inc., 5.000%, due 03/15/24 | | | 270,000 | | | | 270,675 | |
HCA, Inc., 4.500%, due 02/15/27 | | | 225,000 | | | | 213,570 | |
Teva Pharmaceutical Finance Netherlands III B.V., 6.000%, due 04/15/24 | | | 315,000 | | | | 314,606 | |
Teva Pharmaceuticals Financial Co. B.V., 2.800%, due 07/21/23 | | | 180,000 | | | | 155,484 | |
Thermo Fisher Scientific, 0.750%, due 09/12/24 | | | 100,000 | | | | 114,889 | |
Zimmer Biomet Holdings, Inc., 2.700%, due 04/01/20 | | | 230,000 | | | | 227,734 | |
| | | | | | | | 2,236,489 | |
Industrials — 0.7% | | | | | | | | |
CSX Corp., 3.800%, due 11/01/46 | | | 90,000 | | | | 79,601 | |
Delta Airlines, Inc., 3.625%, due 03/15/22 | | | 160,000 | | | | 157,608 | |
Emera, Inc., 6.750%, due 06/15/76 | | | 350,000 | | | | 367,322 | |
General Electric Co., Series D, 5.000%, due 12/31/49 | | | 315,000 | | | | 310,669 | |
General Motors Financial Co., Inc., 3.950%, due 04/13/24 | | | 40,000 | | | | 39,037 | |
Lockheed Martin Corp., 4.700%, due 05/15/46 | | | 145,000 | | | | 152,399 | |
Mexico City Airport Trust, 144A, 5.500%, due 07/31/47 | | | 900,000 | | | | 801,265 | |
Penske Truck Leasing Co., L.P., 144A, 4.200%, due 04/01/27 | | | 155,000 | | | | 152,800 | |
Reynolds American, Inc., 4.000%, due 06/12/22 | | | 70,000 | | | | 70,449 | |
Tervita Escrow Corp., 144A, 7.625%, due 12/01/21 | | | 65,000 | | | | 66,138 | |
Trimble, Inc., 4.150%, due 06/15/23 | | | 135,000 | | | | 134,563 | |
| | | | | | | | 2,331,851 | |
Information Technology — 0.6% | | | | | | | | |
Apple, Inc., 3.450%, due 05/06/24 | | | 225,000 | | | | 224,978 | |
Apple, Inc., 3.200%, due 05/13/25 | | | 460,000 | | | | 450,082 | |
Arrow Electronics, Inc., 3.875%, due 01/12/28 | | | 160,000 | | | | 150,114 | |
See Notes to Financial Statements.
50
Wilshire Mutual Funds, Inc. Wilshire Income Opportunities Fund Schedule of Investments - (continued) | June 30, 2018
(Unaudited) |
|
| | | Par Value | | | Value | |
INVESTMENT-GRADE CORPORATE OBLIGATIONS — 6.4% (Continued) |
Information Technology — 0.6% (Continued) |
Broadcom Corp./Broadcom Cayman Finance Ltd., 3.500%, due 01/15/28 | | $ | 150,000 | | | $ | 136,866 | |
Citrix Systems, Inc., 4.500%, due 12/01/27 | | | 135,000 | | | | 130,781 | |
IBM Corp., 2.750%, due 12/21/20 | | | 200,000 | | | | 273,665 | |
Liberty Expedia Holdings, Inc., 1.000%, due 06/30/47 | | | 230,000 | | | | 227,772 | |
Microchip Technology, Inc., 144A, 4.333%, due 06/01/23 | | | 295,000 | | | | 295,639 | |
Novellus Systems, Inc., 2.625%, due 05/15/41 | | | 25,000 | | | | 129,976 | |
| | | | | | | | 2,019,873 | |
Materials — 0.2% | | | | | | | | |
Mosaic Co. (The), 4.050%, due 11/15/27 | | | 160,000 | | | | 152,460 | |
Owens Corning, 4.400%, due 01/30/48 | | | 85,000 | | | | 70,570 | |
Southern Copper Corp., 3.875%, due 04/23/25 | | | 325,000 | | | | 319,610 | |
WestRock Co., 144A, 3.750%, due 03/15/25 | | | 80,000 | | | | 78,294 | |
| | | | | | | | 620,934 | |
Telecommunication Services — 0.2% | | | | | | | | |
AT&T, Inc., 5.250%, due 03/01/37 | | | 230,000 | | | | 226,466 | |
Charter Communications, LLC, 4.908%, due 07/23/25 | | | 155,000 | | | | 156,482 | |
GCI Liberty, Inc., 1.750%, due 09/30/46 | | | 270,000 | | | | 278,289 | |
Motorola Solutions, Inc., 4.600%, due 02/23/28 | | | 90,000 | | | | 88,916 | |
| | | | | | | | 750,153 | |
Utilities — 0.2% | | | | | | | | |
Edison International, 4.125%, due 03/15/28 | | | 75,000 | | | | 73,809 | |
Emera US Finance, L.P., 3.550%, due 06/15/26 | | | 400,000 | | | | 376,455 | |
Southern Co. (The), 2.450%, due 09/01/18 | | | 146,000 | | | | 145,975 | |
| | | | | | | | 596,239 | |
Total Investment-Grade Corporate Obligations (Cost $21,735,481) | | $ | 21,478,467 | |
| | | | | | | | | |
HIGH YIELD CORPORATE OBLIGATIONS — 4.8% |
Consumer Discretionary — 0.9% | | | | | | | | |
American Axle & Manufacturing, Inc., 6.625%, due 10/15/22 | | $ | 125,000 | | | $ | 128,125 | |
Aramark Services, Inc., 144A, 5.000%, due 04/01/25 | | | 185,000 | | | | 184,075 | |
Beacon Escrow Corp., 144A, 4.875%, due 11/01/25 | | | 70,000 | | | | 64,400 | |
Boyd Gaming Corp., 144A, 6.000%, due 08/15/26 | | | 15,000 | | | | 14,831 | |
Builders FirstSource, Inc., 144A, 5.625%, due 09/01/24 | | | 65,000 | | | | 63,375 | |
CCO Holdings, LLC, 144A, 5.125%, due 05/01/27 | | | 200,000 | | | | 184,000 | |
Cengage Learning, Inc., 144A, 9.500%, due 06/15/24 | | | 60,000 | | | | 50,700 | |
Cequel Communications Holdings I, LLC, 144A, 7.500%, due 04/01/28 | | | 200,000 | | | | 202,250 | |
Cimpress N.V., 144A, 7.000%, due 06/15/26 | | | 150,000 | | | | 153,000 | |
CRC Escrow Issuer, LLC, 144A, 5.250%, due 10/15/25 | | | 70,000 | | | | 66,238 | |
DISH Network Corp., CV, 3.375%, due 08/15/26 | | | 90,000 | | | | 87,172 | |
Eldorado Resorts, Inc., 6.000%, due 04/01/25 | | | 65,000 | | | | 65,081 | |
Graham Holdings Co., 144A, 5.750%, due 06/01/26 | | | 140,000 | | | | 142,244 | |
LIN Television Corp., 5.875%, due 11/15/22 | | | 135,000 | | | | 137,531 | |
Meredith Corp., 144A, 6.875%, due 02/01/26 | | | 275,000 | | | | 270,874 | |
Newell Brands, Inc., 5.500%, due 04/01/46 | | | 75,000 | | | | 73,008 | |
PetSmart, Inc., 144A, 7.125%, due 03/15/23 | | | 40,000 | | | | 26,800 | |
PetSmart, Inc., 144A, 5.875%, due 06/01/25 | | | 40,000 | | | | 30,800 | |
Prime Securities Service Borrower, LLC, 144A, 9.250%, due 05/15/23 | | | 58,000 | | | | 61,915 | |
Radiate Holdco, LLC, 144A, 6.625%, due 02/15/25 | | | 200,000 | | | | 183,000 | |
Service Corp. International, 4.625%, due 12/15/27 | | | 275,000 | | | | 259,188 | |
See Notes to Financial Statements.
51
Wilshire Mutual Funds, Inc. Wilshire Income Opportunities Fund Schedule of Investments - (continued) | June 30, 2018
(Unaudited) |
|
| | | Par Value | | | Value | |
HIGH YIELD CORPORATE OBLIGATIONS — 4.8% (Continued) |
Consumer Discretionary — 0.9% (Continued) |
ServiceMaster Co., LLC, 144A, 5.125%, due 11/15/24 | | $ | 35,000 | | | $ | 33,950 | |
Tempur Sealy International, Inc., 5.500%, due 06/15/26 | | | 70,000 | | | | 67,550 | |
Viking Cruises Ltd., 144A, 5.875%, due 09/15/27 | | | 70,000 | | | | 66,325 | |
WMG Acquisition Corp., 144A, 5.500%, due 04/15/26 | | | 180,000 | | | | 177,750 | |
Yum! Brands, Inc., 144A, 5.250%, due 06/01/26 | | | 275,000 | | | | 270,875 | |
| | | | | | | | 3,065,057 | |
Consumer Staples — 0.4% | | | | | | | | |
AECOM, 5.875%, due 10/15/24 | | | 225,000 | | | | 232,874 | |
B&G Foods, Inc., 5.250%, due 04/01/25 | | | 65,000 | | | | 61,263 | |
Coty, Inc., 144A, 6.500%, due 04/15/26 | | | 30,000 | | | | 28,763 | |
Hearthside Food Solutions, LLC, 144A, 8.500%, due 06/01/26 | | | 15,000 | | | | 14,663 | |
Kronos Acquisition Holdings, Inc., 144A, 9.000%, due 08/15/23 | | | 70,000 | | | | 63,000 | |
Pilgrim's Pride Corp., 144A, 5.750%, due 03/15/25 | | | 70,000 | | | | 67,113 | |
Post Holdings, Inc., 144A, 5.500%, due 03/01/25 | | | 65,000 | | | | 63,619 | |
Post Holdings, Inc., 144A, 5.000%, due 08/15/26 | | | 275,000 | | | | 256,093 | |
Post Holdings, Inc., 144A, 5.750%, due 03/01/27 | | | 235,000 | | | | 227,950 | |
Yum! Brands, Inc., 144A, 5.000%, due 06/01/24 | | | 235,000 | | | | 232,062 | |
| | | | | | | | 1,247,400 | |
Energy — 0.9% | | | | | | | | |
Antero Midstream Partners, 5.375%, due 09/15/24 | | | 275,000 | | | | 275,687 | |
Antero Resources Corp., 5.625%, due 06/01/23 | | | 230,000 | | | | 233,162 | |
Antero Resources Corp., 5.000%, due 03/01/25 | | | 225,000 | | | | 224,156 | |
Baker Hughes, a GE Company, LLC, 4.080%, due 12/15/47 | | | 165,000 | | | | 147,029 | |
Cheniere Energy Partners, 144A, 5.250%, due 10/01/25 | | | 65,000 | | | | 63,294 | |
Diamondback Energy, Inc., 5.375%, due 05/31/25 | | | 225,000 | | | | 223,875 | |
Extraction Oil & Gas, Inc., 144A, 5.625%, due 02/01/26 | | | 30,000 | | | | 28,688 | |
FTS International, Inc., 6.250%, due 05/01/22 | | | 90,000 | | | | 90,450 | |
Gulfport Energy Corp., 6.375%, due 05/15/25 | | | 70,000 | | | | 68,075 | |
Newfield Exploration Co., 5.625%, due 07/01/24 | | | 300,000 | | | | 316,124 | |
Newfield Exploration Co., 5.375%, due 01/01/26 | | | 225,000 | | | | 230,062 | |
Parsley Energy, LLC, 144A, 6.250%, due 06/01/24 | | | 90,000 | | | | 93,600 | |
Parsley Energy, LLC, 144A, 5.375%, due 01/15/25 | | | 350,000 | | | | 347,374 | |
Parsley Energy, LLC, 144A, 5.625%, due 10/15/27 | | | 270,000 | | | | 267,974 | |
Peabody Securities Finance Corp., 144A, 6.000%, due 03/31/22 | | | 65,000 | | | | 66,138 | |
QEP Resources, Inc., 5.625%, due 03/01/26 | | | 35,000 | | | | 33,338 | |
Sanchez Energy Corp., 6.125%, due 01/15/23 | | | 45,000 | | | | 30,488 | |
Sunco L.P. / Sunoco Finance Corp., 144A, 5.500%, due 02/15/26 | | | 35,000 | | | | 33,163 | |
Targa Resources Partners, L.P., 144A, 5.875%, due 04/15/26 | | | 90,000 | | | | 90,450 | |
Transocean Guardian Ltd., 144A, 5.875%, due 01/15/24 | | | 15,000 | | | | 14,944 | |
Weatherford International Ltd., 9.875%, due 02/15/24 | | | 35,000 | | | | 35,263 | |
WPX Energy, Inc., 5.750%, due 06/01/26 | | | 65,000 | | | | 64,919 | |
| | | | | | | | 2,978,253 | |
Financials — 0.6% | | | | | | | | |
Alliant Holdings Intermediate, LLC, 144A, 8.250%, due 08/01/23 | | | 65,000 | | | | 66,788 | |
ASP AMC Merger Sub, Inc., 144A, 8.000%, due 05/15/25 | | | 35,000 | | | | 29,050 | |
CCO Holdings, LLC, 5.750%, due 02/15/26 | | | 35,000 | | | | 34,300 | |
Crown Castle International Corp., 3.800%, due 02/15/28 | | | 55,000 | | | | 51,460 | |
Equinix, Inc., 5.375%, due 05/15/27 | | | 400,000 | | | | 399,000 | |
See Notes to Financial Statements.
52
Wilshire Mutual Funds, Inc. Wilshire Income Opportunities Fund Schedule of Investments - (continued) | June 30, 2018
(Unaudited) |
|
| | | Par Value | | | Value | |
HIGH YIELD CORPORATE OBLIGATIONS — 4.8% (Continued) |
Financials — 0.6% (Continued) |
ESH Hospitality, Inc., 144A, 5.250%, due 05/01/25 | | $ | 295,000 | | | $ | 284,306 | |
First Data Corp., 5.000%, due 01/15/24 | | | 225,000 | | | | 223,031 | |
Freedom Mortgage Corp., 144A, 8.250%, due 04/15/25 | | | 200,000 | | | | 196,000 | |
Hexion, Inc., 144A, 10.375%, due 02/01/22 | | | 50,000 | | | | 49,000 | |
Lions Gate Capital Holdings, LLC, 144A, 5.875%, due 11/01/24 | | | 225,000 | | | | 227,813 | |
National Financial Partners Corp., 144A, 6.875%, due 07/15/25 | | | 65,000 | | | | 63,619 | |
Springleaf Finance Corp., 7.125%, due 03/15/26 | | | 20,000 | | | | 19,925 | |
Synovus Financial Corp., 5.750% (3MO LIBOR + 418.20), due 12/15/25 (b) | | | 400,000 | | | | 415,099 | |
| | | | | | | | 2,059,391 | |
Health Care — 0.2% | | | | | | | | |
Centene Corp., 4.750%, due 01/15/25 | | | 70,000 | | | | 69,650 | |
Centene Corp., 144A, 5.375%, due 06/01/26 | | | 5,000 | | | | 5,063 | |
HCA, Inc., 6.250%, due 02/15/21 | | | 250,000 | | | | 259,374 | |
MPT Operating Partnership, L.P., 5.250%, due 08/01/26 | | | 70,000 | | | | 68,425 | |
Polaris Intermediate Corp., 144A, 8.500%, due 12/01/22 | | | 15,000 | | | | 15,469 | |
Team Health Holdings, Inc., 6.375%, due 02/01/25 | | | 40,000 | | | | 34,400 | |
Universal Hospital Services, Inc., 7.625%, due 08/15/20 | | | 65,000 | | | | 64,838 | |
| | | | | | | | 517,219 | |
Industrials — 0.6% | | | | | | | | |
AECOM, 5.125%, due 03/15/27 | | | 425,000 | | | | 399,499 | |
Avantor, Inc., 144A, 9.000%, due 10/01/25 | | | 35,000 | | | | 35,263 | |
Ball Corp., 4.875%, due 03/15/26 | | | 185,000 | | | | 184,306 | |
Blueline Rental Corp., 9.250%, due 03/15/24 | | | 65,000 | | | | 69,144 | |
Crown Americas Capital Corporation IV, 4.500%, due 01/15/23 | | | 270,000 | | | | 265,275 | |
Crown Cork & Seal Company, Inc., 7.375%, due 12/15/26 | | | 175,000 | | | | 188,563 | |
Flex Acquisition Co., Inc., 6.875%, due 01/15/25 | | | 70,000 | | | | 67,550 | |
Indigo Natural Resources, LLC, 144A, 6.875%, due 02/15/26 | | | 140,000 | | | | 135,450 | |
Sealed Air Corp., 144A, 5.125%, due 12/01/24 | | | 185,000 | | | | 186,388 | |
Teekay Offshore Partners, L.P., 144A, 8.500%, due 07/15/23 | | | 50,000 | | | | 50,500 | |
TransDigm, Inc., 6.375%, due 06/15/26 | | | 45,000 | | | | 44,663 | |
United Rentals North America, Inc., 5.500%, due 05/15/27 | | | 275,000 | | | | 266,749 | |
| | | | | | | | 1,893,350 | |
Information Technology — 0.1% | | | | | | | | |
CommScope Technologies, LLC, 144A, 6.000%, due 06/15/25 | | | 65,000 | | | | 66,138 | |
Ensemble S Merger Sub, Inc., 144A, 9.000%, due 09/30/23 | | | 75,000 | | | | 78,750 | |
Greeneden U.S. Holdings II, LLC, 144A, 10.000%, due 11/30/24 | | | 60,000 | | | | 66,825 | |
Informatica, LLC, 144A, 7.125%, due 07/15/23 | | | 65,000 | | | | 65,650 | |
Rackspace Hosting, Inc., 144A, 8.625%, due 11/15/24 | | | 90,000 | | | | 90,562 | |
Riverbed Technology, Inc., 144A, 8.875%, due 03/01/23 | | | 35,000 | | | | 33,250 | |
Solera, LLC/Solera Finance, Inc., 144A, 10.500%, due 03/01/24 | | | 25,000 | | | | 27,688 | |
| | | | | | | | 428,863 | |
Materials — 0.2% | | | | | | | | |
Ball Corp., 4.000%, due 11/15/23 | | | 285,000 | | | | 277,975 | |
Ball Corp., 5.250%, due 07/01/25 | | | 300,000 | | | | 305,999 | |
Flex Acquisition Co., Inc., 144A, 7.875%, due 07/15/26 | | | 5,000 | | | | 4,963 | |
Hexion, Inc., 6.625%, due 04/15/20 | | | 15,000 | | | | 14,044 | |
SunCoke Energy Partners, L.P., 144A, 7.500%, due 06/15/25 | | | 65,000 | | | | 66,138 | |
| | | | | | | | 669,119 | |
Real Estate — 0.0% (d) | | | | | | | | |
CyrusOne, L.P., 5.000%, due 03/15/24 | | | 140,000 | | | | 140,000 | |
| | | | | | | | | |
Telecommunication Services — 0.7% | | | | | | | | |
Altice Financing S.A., 144A, 7.500%, due 05/15/26 | | | 200,000 | | | | 193,000 | |
CB Escrow Corp., 144A, 8.000%, due 10/15/25 | | | 15,000 | | | | 14,025 | |
See Notes to Financial Statements.
53
Wilshire Mutual Funds, Inc. Wilshire Income Opportunities Fund Schedule of Investments - (continued) | June 30, 2018
(Unaudited) |
|
| | | Par Value | | | Value | |
HIGH YIELD CORPORATE OBLIGATIONS — 4.8% (Continued) |
Telecommunication Services — 0.7% (Continued) |
CCO Holdings, LLC, 5.750%, due 01/15/24 | | $ | 225,000 | | | $ | 224,437 | |
CCO Holdings, LLC, 144A, 5.000%, due 02/01/28 | | | 35,000 | | | | 32,069 | |
Cincinnati Bell, Inc., 144A, 7.000%, due 07/15/24 | | | 50,000 | | | | 45,625 | |
CSC Holdings, LLC, 5.250%, due 06/01/24 | | | 35,000 | | | | 33,075 | |
CSC Holdings, LLC, 144A, 5.500%, due 04/15/27 | | | 200,000 | | | | 191,000 | |
Diamondback Energy, Inc., 144A, 5.375%, due 05/31/25 | | | 190,000 | | | | 189,050 | |
Dish DBS Corp., 7.750%, due 07/01/26 | | | 100,000 | | | | 87,375 | |
Frontier Communications Corp., 8.500%, due 04/15/20 | | | 20,000 | | | | 20,300 | |
GTT Communications, Inc., 144A, 7.875%, due 12/31/24 | | | 65,000 | | | | 64,513 | |
Intelsat Jackson Holdings S.A., 7.250%, due 10/15/20 | | | 35,000 | | | | 34,694 | |
Level 3 Financing, Inc., 5.375%, due 01/15/24 | | | 65,000 | | | | 63,700 | |
Match Group, Inc., 144A, 5.000%, due 12/15/27 | | | 70,000 | | | | 65,100 | |
MDC Partners, Inc., 144A, 6.500%, due 05/01/24 | | | 450,000 | | | | 390,374 | |
MGIC Investment Corp., 5.750%, due 08/15/23 | | | 135,000 | | | | 137,363 | |
SFR Group S.A., 144A, 7.375%, due 05/01/26 | | | 350,000 | | | | 341,687 | |
Sirius XM Radio, Inc., 144A, 5.000%, due 08/01/27 | | | 100,000 | | | | 93,250 | |
Sprint Capital Corp., 6.875%, due 11/15/28 | | | 15,000 | | | | 14,363 | |
Sprint Corp., 7.125%, due 06/15/24 | | | 35,000 | | | | 35,175 | |
Telesat Canada, LLC, 144A, 8.875%, due 11/15/24 | | | 60,000 | | | | 64,500 | |
Tribune Media Co., 5.875%, due 07/15/22 | | | 90,000 | | | | 90,338 | |
| | | | | | | | 2,425,013 | |
Utilities — 0.2% | | | | | | | | |
NextEra Energy Operating Partners, L.P., 144A, 4.250%, due 09/15/24 | | | 190,000 | | | | 182,875 | |
NextEra Energy Operating Partners, L.P., 144A, 4.500%, due 09/15/27 | | | 395,000 | | | | 369,325 | |
Southern Co. (The), 1.850%, due 07/01/19 | | | 95,000 | | | | 94,025 | |
| | | | | | | | 646,225 | |
Total High Yield Corporate Obligations (Cost $16,392,430) | | $ | 16,069,890 | |
| | | | | | | | | |
FOREIGN BONDS — 18.8% | | | | | | | | |
Argentina — 0.8% | | | | | | | | |
Argentine Republic Government International Bond, 6.875%, due 01/26/27 | | $ | 700,000 | | | $ | 628,250 | |
Argentine Republic Government International Bond, 5.875%, due 01/11/28 | | | 200,000 | | | | 163,000 | |
Banco Macro S.A., 6.750%, due 11/04/26 | | | 400,000 | | | | 377,288 | |
Pampa Energie S.A., 7.500%, due 01/24/27 | | | 600,000 | | | | 537,000 | |
Provincia de Buenos Aires, 7.875%, due 06/15/27 | | | 400,000 | | | | 351,000 | |
YPF S.A., 8.500%, due 07/28/25 | | | 350,000 | | | | 331,188 | |
YPF S.A., 6.950%, due 07/21/27 | | | 250,000 | | | | 213,750 | |
| | | | | | | | 2,601,476 | |
Australia — 0.4% | | | | | | | | |
Asian Development Bank, 5.000%, due 03/09/22 | | | 110,000 | | | | 88,580 | |
Australian Government Bond, 5.750%, due 07/15/22 | | | 110,000 | | | | 92,621 | |
Inter-American Development Bank, 6.500%, due 08/20/19 | | | 290,000 | | | | 224,932 | |
International Bank for Reconstruction & Development, 2.800%, due 01/13/21 | | | 125,000 | | | | 93,417 | |
International Finance Corp., 2.800%, due 08/15/22 | | | 310,000 | | | | 231,439 | |
New South Wales Treasury Corp., 6.000%, due 03/01/22 | | | 235,000 | | | | 196,531 | |
Queensland Treasury Corp., 6.000%, due 07/21/22 | | | 500,000 | | | | 420,587 | |
| | | | | | | | 1,348,107 | |
See Notes to Financial Statements.
54
Wilshire Mutual Funds, Inc. Wilshire Income Opportunities Fund Schedule of Investments - (continued) | June 30, 2018
(Unaudited) |
|
| | | Par Value | | | Value | |
FOREIGN BONDS — 18.8% (Continued) |
Austria — 0.2% | | | | | | | | |
ESAL GmbH, 6.250%, due 02/05/23 | | $ | 400,000 | | | $ | 373,500 | |
Republic of Austria Government Bond, 0.000%, due 07/15/23 | | | 230,000 | | | | 270,032 | |
| | | | | | | | 643,532 | |
Bermuda — 0.2% | | | | | | | | |
Digicel Group Ltd., 7.125%, due 04/01/22 | | | 600,000 | | | | 399,000 | |
Geopark Ltd., 6.500%, due 09/21/24 | | | 200,000 | | | | 192,750 | |
Inkia Energy Ltd., 5.875%, due 11/09/27 | | | 200,000 | | | | 186,500 | |
| | | | | | | | 778,250 | |
Brazil — 0.7% | | | | | | | | |
Banco BTG Pactual S.A., 5.500%, due 01/31/23 | | | 200,000 | | | | 186,144 | |
Banco de Brasil S.A., 6.250%, due 10/15/29 | | | 700,000 | | | | 544,250 | |
Brazil Notas do Tesouro Nacional, 10.000%, due 01/01/21 | | | 2,000 | | | | 523,394 | |
Brazil Notas do Tesouro Nacional, 10.000%, due 01/01/23 | | | 3,190 | | | | 803,575 | |
Itau Unibanco Holding S.A., 6.500%, due 03/19/23 | | | 400,000 | | | | 378,688 | |
| | | | | | | | 2,436,051 | |
Canada — 0.5% | | | | | | | | |
BC ULC/New Red Finance, Inc., 4.625%, due 01/15/22 | | | 300,000 | | | | 299,625 | |
BC ULC/New Red Finance, Inc., 144A, 5.000%, due 10/15/25 | | | 315,000 | | | | 297,675 | |
Canada Housing Trust No. 1, 1.250%, due 12/15/20 | | | 315,000 | | | | 234,819 | |
Canadian Government Bond, 1.250%, due 02/01/20 | | | 630,000 | | | | 474,828 | |
GFL Environmental, Inc., 144A, 7.000%, due 06/01/26 | | | 40,000 | | | | 38,100 | |
GW Honos Security Corp., 144A, 8.750%, due 05/15/25 | | | 65,000 | | | | 66,625 | |
Province of British Columbia, 144A, 6.600%, due 01/09/20 | | | 9,200,000 | | | | 134,579 | |
| | | | | | | | 1,546,251 | |
Cayman Islands — 0.8% | | | | | | | | |
CK Hutchison International 17 Ltd., 144A, 2.250%, due 09/29/20 | | | 200,000 | | | | 195,481 | |
CK Hutchison International 17 Ltd., 2.875%, due 04/05/22 | | | 200,000 | | | | 194,900 | |
Cosan Overseas Ltd., 8.250%, due 11/29/49 | | | 200,000 | | | | 197,750 | |
Gran Tierra Energy International Holdings Ltd., 6.250%, due 02/15/25 | | | 400,000 | | | | 373,000 | |
Guanay Finance Ltd., 6.000%, due 12/15/20 | | | 538,042 | | | | 542,077 | |
Industrial Senior Trust, 5.500%, due 11/01/22 | | | 100,000 | | | | 98,625 | |
Latam Finance Ltd., 6.875%, due 04/11/24 | | | 200,000 | | | | 197,500 | |
SPARC EM SPC Panama Metroline 2 SP, 1.843%, due 12/05/22 (a) | | | 700,000 | | | | 626,500 | |
SPARC EM SPC Panama Metroline 2 SP, 144A, 1.843%, due 12/05/22 | | | 400,000 | | | | 358,000 | |
| | | | | | | | 2,783,833 | |
Chile — 1.1% | | | | | | | | |
Banco de Credito e Inversiones, 4.000%, due 02/11/23 | | | 300,000 | | | | 297,674 | |
Banco del Estado de Chile, 4.125%, due 10/07/20 | | | 300,000 | | | | 303,375 | |
Banco del Estado de Chile, 3.875%, due 02/08/22 | | | 150,000 | | | | 149,250 | |
Embotelladora Andina S.A., 5.000%, due 10/01/23 | | | 600,000 | | | | 617,903 | |
Empresa Electrica Angamos S.A., 4.875%, due 05/25/29 | | | 191,300 | | | | 185,014 | |
Engie Energia Chile S.A., 5.625%, due 01/15/21 | | | 400,000 | | | | 413,340 | |
Inversiones CMPC S.A., CV, 4.500%, due 04/25/22 | | | 450,000 | | | | 451,600 | |
Itau CorpBanc, 3.875%, due 09/22/19 | | | 200,000 | | | | 200,186 | |
Republic of Chile, 3.125%, due 03/27/25 | | | 800,000 | | | | 773,402 | |
Republic of Chile, 3.125%, due 01/21/26 | | | 200,000 | | | | 191,750 | |
| | | | | | | | 3,583,494 | |
China — 0.1% | | | | | | | | |
CNOOC Finance 2011 Ltd., 4.250%, due 01/26/21 | | | 400,000 | | | | 407,424 | |
| | | | | | | | | |
Colombia — 0.4% | | | | | | | | |
Bancolombia S.A., 6.125%, due 07/26/20 | | | 100,000 | | | | 103,825 | |
Bancolombia S.A., 4.875%, due 10/18/27 | | | 200,000 | | | | 189,439 | |
See Notes to Financial Statements.
55
Wilshire Mutual Funds, Inc. Wilshire Income Opportunities Fund Schedule of Investments - (continued) | June 30, 2018
(Unaudited) |
|
| | | Par Value | | | Value | |
FOREIGN BONDS — 18.8% (Continued) |
Colombia — 0.4% (Continued) |
Columbian TES, 7.000%, due 05/04/22 | | $ | 755,000,000 | | | $ | 268,123 | |
Ecopetrol S.A., 5.875%, due 09/18/23 | | | 100,000 | | | | 106,125 | |
Republic of Columbia, 4.500%, due 01/28/26 | | | 275,000 | | | | 279,125 | |
Transportadora de Gas Internacional S.A., 5.700%, due 03/20/22 | | | 400,000 | | | | 398,940 | |
| | | | | | | | 1,345,577 | |
Costa Rica — 0.3% | | | | | | | | |
Banco de Costa Rica, 5.250%, due 08/12/18 | | | 200,000 | | | | 199,800 | |
Bharat Petroleum Corp. Ltd., 4.625%, due 10/25/22 | | | 500,000 | | | | 506,185 | |
Costa Rica Government International Bond, 9.995%, due 08/01/20 | | | 200,000 | | | | 218,900 | |
| | | | | | | | 924,885 | |
Denmark — 0.1% | | | | | | | | |
Realkredit Danmark A/S, 2.000%, due 04/01/19 | | | 1,450,000 | | | | 230,859 | |
| | | | | | | | | |
Dominican Republic — 0.1% | | | | | | | | |
Banco de Reservas de la Republica Dominicana, 7.000%, due 02/01/23 | | | 300,000 | | | | 302,291 | |
| | | | | | | | | |
Finland — 0.1% | | | | | | | | |
Finland Government Bond, 1.500%, due 04/15/23 | | | 220,000 | | | | 277,869 | |
| | | | | | | | | |
Germany — 0.3% | | | | | | | | |
KFW Development Bank, 3.750%, due 05/29/20 | | | 260,000 | | | | 180,578 | |
KFW Development Bank, 6.000%, due 08/20/20 | | | 210,000 | | | | 167,349 | |
KFW Development Bank, 2.125%, due 08/15/23 | | | 340,000 | | | | 439,872 | |
KFW Development Bank, 0.000%, due 09/15/23 | | | 80,000 | | | | 93,239 | |
| | | | | | | | 881,038 | |
India — 1.0% | | | | | | | | |
Adani Ports & Special Economic Zone, 3.500%, due 07/29/20 | | | 200,000 | | | | 197,236 | |
Asian Development Bank, 6.950%, due 01/16/20 | | | 12,500,000 | | | | 180,847 | |
Asian Development Bank, 6.450%, due 08/08/21 | | | 15,200,000 | | | | 216,271 | |
Bharti Airtel Ltd., 5.125%, due 03/11/23 | | | 200,000 | | | | 197,500 | |
Bharti Airtel Ltd., 4.375%, due 06/10/25 | | | 700,000 | | | | 646,625 | |
Export-Import Bank of India, 3.125%, due 07/20/21 | | | 400,000 | | | | 389,500 | |
Indian Oil Corp. Ltd., 5.625%, due 08/02/21 | | | 200,000 | | | | 208,722 | |
Indian Oil Corp. Ltd., 5.750%, due 08/01/23 | | | 600,000 | | | | 632,124 | |
Indonesia Treasury Bond, 7.500%, due 05/15/38 | | | 2,000,000,000 | | | | 130,946 | |
International Bank for Reconstruction & Development, 5.750%, due 10/28/19 | | | 12,500,000 | | | | 178,886 | |
International Finance Corp., 6.450%, due 10/30/18 | | | 18,150,000 | | | | 264,289 | |
| | | | | | | | 3,242,946 | |
Indonesia — 1.2% | | | | | | | | |
Indonesia Government Bond, 8.250%, due 07/15/21 | | | 4,105,000,000 | | | | 292,043 | |
Indonesia Government Bond, 8.375%, due 09/15/26 | | | 4,170,000,000 | | | | 296,229 | |
Indonesia Government International Bond, 144A, 2.625%, due 06/14/23 | | | 150,000 | | | | 181,944 | |
Indonesia Government International Bond, 144A, 2.150%, due 07/18/24 | | | 150,000 | | | | 176,289 | |
Indonesia Treasury Bond, 7.000%, due 05/15/22 | | | 4,700,000,000 | | | | 321,163 | |
Indonesia Treasury Bond, 5.625%, due 05/15/23 | | | 1,400,000,000 | | | | 90,190 | |
Indonesia Treasury Bond, 8.375%, due 03/15/24 | | | 4,175,000,000 | | | | 296,291 | |
Indonesia Treasury Bond, 7.000%, due 05/15/27 | | | 3,500,000,000 | | | | 228,615 | |
Indonesia Treasury Bond, 6.125%, due 05/15/28 | | | 6,400,000,000 | | | | 394,757 | |
Indonesia Treasury Bond, 9.000%, due 03/15/29 | | | 1,800,000,000 | | | | 133,609 | |
Indonesia Treasury Bond, 6.625%, due 05/15/33 | | | 2,905,000,000 | | | | 174,092 | |
Pelabuhan Indonesia II PT, 144A, 4.250%, due 05/05/25 | | | 200,000 | | | | 191,000 | |
See Notes to Financial Statements.
56
Wilshire Mutual Funds, Inc. Wilshire Income Opportunities Fund Schedule of Investments - (continued) | June 30, 2018
(Unaudited) |
|
| | | Par Value | | | Value | |
FOREIGN BONDS — 18.8% (Continued) |
Indonesia — 1.2% (Continued) |
Pertamina Persero PT, 144A, 4.300%, due 05/20/23 | | $ | 200,000 | | | $ | 197,750 | |
Perusahaan Listrik Negara PT, 144A, 4.125%, due 05/15/27 | | | 250,000 | | | | 230,000 | |
Perusahaan Penerbit SBSN, 4.150%, due 03/29/27 | | | 500,000 | | | | 481,875 | |
Perusahaan Penerbit SBSN, 144A, 4.150%, due 03/29/27 | | | 200,000 | | | | 192,750 | |
| | | | | | | | 3,878,597 | |
Ireland — 0.7% | | | | | | | | |
C&W Senior Financing Designated Activity Co., 6.875%, due 09/15/27 | | | 200,000 | | | | 192,000 | |
Ireland Government Bond, 3.900%, due 03/20/23 | | | 800,000 | | | | 1,109,856 | |
Ireland Government Bond, 3.400%, due 03/18/24 | | | 775,000 | | | | 1,073,905 | |
| | | | | | | | 2,375,761 | |
Israel — 0.4% | | | | | | | | |
Israel Electric Corp. Ltd., 5.000%, due 11/12/24 | | | 200,000 | | | | 205,300 | |
State of Israel, 4.000%, due 06/30/22 | | | 200,000 | | | | 204,873 | |
State of Israel, 3.150%, due 06/30/23 | | | 200,000 | | | | 197,245 | |
State of Israel, 2.875%, due 03/16/26 | | | 800,000 | | | | 757,301 | |
| | | | | | | | 1,364,719 | |
Japan — 0.1% | | | | | | | | |
Mitsubishi UFJ Financial Group, Inc., 3.061% (3MO LIBOR + 74), due 03/02/23 (b) | | | 240,000 | | | | 239,675 | |
Sony Corp., 0.000%, due 09/30/22 | | | 20,000,000 | | | | 232,927 | |
| | | | | | | | 472,602 | |
Luxembourg — 0.4% | | | | | | | | |
Allergan Funding SCS, 1.250%, due 06/01/24 | | | 100,000 | | | | 114,341 | |
European Financial Stability Facility, 1.875%, due 05/23/23 | | | 185,000 | | | | 235,352 | |
European Financial Stability Facility, 0.125%, due 10/17/23 | | | 280,000 | | | | 327,071 | |
Minerva Luxembourg S.A., 6.500%, due 09/20/26 | | | 200,000 | | | | 182,932 | |
Minerva Luxembourg S.A., 5.875%, due 01/19/28 | | | 200,000 | | | | 174,500 | |
Swiss Insured Brazil Power Finance, 144A, 9.850%, due 07/16/32 | | | 1,500,000 | | | | 357,312 | |
| | | | | | | | 1,391,508 | |
Malaysia — 0.9% | | | | | | | | |
Axiata SPV2 Berhad, 3.466%, due 11/19/20 | | | 900,000 | | | | 896,598 | |
Malayan Banking Berhad, 3.905%, due 10/29/26 | | | 200,000 | | | | 196,678 | |
Malaysia Government Bond, 4.160%, due 07/15/21 | | | 1,045,000 | | | | 262,331 | |
Malaysia Government Bond, 4.059%, due 09/30/24 | | | 1,900,000 | | | | 468,252 | |
Malaysia Government Bond, 3.882%, due 03/14/25 | | | 430,000 | | | | 105,441 | |
Malaysia Government Bond, 3.844%, due 04/15/33 | | | 980,000 | | | | 219,963 | |
Malaysia Sovereign Sukuk, 3.043%, due 04/22/25 | | | 400,000 | | | | 381,000 | |
Malaysia Sukuk Global, 3.179%, due 04/27/26 | | | 500,000 | | | | 474,375 | |
Petronas Capital Ltd., 3.500%, due 03/18/25 | | | 200,000 | | | | 193,460 | |
| | | | | | | | 3,198,098 | |
Mauritius — 0.1% | | | | | | | | |
UPL Corp. Ltd., 3.250%, due 10/13/21 | | | 200,000 | | | | 193,480 | |
| | | | | | | | | |
Mexico — 1.6% | | | | | | | | |
America Movil S.A.B. de C.V., 7.125%, due 12/09/24 | | | 3,000,000 | | | | 139,342 | |
Banco Mercantil del Norte S.A., 6.875%, due 01/06/25 | | | 200,000 | | | | 197,506 | |
Banco Santander Mexico, 5.950%, due 01/30/24 | | | 600,000 | | | | 601,500 | |
BBVA Bancomer S.A., 5.125%, due 01/18/33 | | | 400,000 | | | | 353,256 | |
Cemex S.A.B. de C.V., 144A, 6.125%, due 05/05/25 | | | 275,000 | | | | 278,094 | |
Grupo Idesa S.A. de C.V., 7.875%, due 12/18/20 | | | 630,000 | | | | 478,800 | |
Mexican Bonos, 8.500%, due 12/13/18 (b) | | | 34,800 | | | | 176,539 | |
Mexican Bonos, 6.500%, due 06/10/21 | | | 72,300 | | | | 353,647 | |
Mexican Bonos, 8.000%, due 12/07/23 | | | 55,000 | | | | 282,053 | |
Mexican Bonos, 10.000%, due 12/05/24 | | | 47,400 | | | | 267,947 | |
See Notes to Financial Statements.
57
Wilshire Mutual Funds, Inc. Wilshire Income Opportunities Fund Schedule of Investments - (continued) | June 30, 2018
(Unaudited) |
|
| | | Par Value | | | Value | |
FOREIGN BONDS — 18.8% (Continued) |
Mexico — 1.6% (Continued) |
Mexican Bonos Desarr, 7.750%, due 05/29/31 | | $ | 40,000 | | | $ | 204,308 | |
Mexico City Airport Trust, 144A, 3.875%, due 04/30/28 | | | 530,000 | | | | 475,473 | |
Mexico City Airport Trust, 144A, 5.500%, due 10/31/46 | | | 205,000 | | | | 181,732 | |
Mexico Government International Bond, 3.750%, due 01/11/28 | | | 400,000 | | | | 377,667 | |
Mexico Government International Bond, 4.600%, due 01/23/46 | | | 200,000 | | | | 183,395 | |
Petroleos Mexicanos, 4.625%, due 09/21/23 | | | 135,000 | | | | 133,100 | |
Petroleos Mexicanos, 144A, 7.190%, due 09/12/24 | | | 20,000 | | | | 89,212 | |
Petroleos Mexicanos S.A. de C.V., 144A, 5.350%, due 02/12/28 | | | 140,000 | | | | 131,691 | |
Trust F/1401, 144A, 5.250%, due 12/15/24 | | | 225,000 | | | | 220,219 | |
Unifin Financiera S.A.B. de C.V., 8.875%, due 01/29/25 | | | 200,000 | | | | 178,250 | |
| | | | | | | | 5,303,731 | |
Netherlands — 0.9% | | | | | | | | |
AES Andres Dominicana Ltd., 144A, 7.950%, due 05/11/26 | | | 500,000 | | | | 513,800 | |
Bank Nederlandse Gemeenten N.V., 0.250%, due 02/22/23 | | | 150,000 | | | | 177,459 | |
Bank Nederlandse Gemeenten N.V., 0.250%, due 06/07/24 | | | 115,000 | | | | 134,479 | |
Bayer Capital Corp. B.V., 144A, 5.625%, due 11/22/19 | | | 200,000 | | | | 249,197 | |
Darling Global Finance B.V., 144A, 3.625%, due 05/15/26 | | | 100,000 | | | | 116,809 | |
Greenko Dutch B.V., 144A, 5.250%, due 07/24/24 | | | 200,000 | | | | 181,750 | |
Marfrig Holdings Europe B.V., 144A, 8.000%, due 06/08/23 | | | 500,000 | | | | 506,250 | |
Marfrig Holdings Europe B.V., 144A, 7.000%, due 03/15/24 | | | 200,000 | | | | 191,897 | |
NXP Funding, LLC, 144A, 4.625%, due 06/01/23 | | | 270,000 | | | | 273,038 | |
Petrobras Global Finance B.V., 5.750%, due 02/01/29 | | | 700,000 | | | | 615,125 | |
Teva Pharmaceutical Finance Netherlands II B.V., 4.500%, due 03/01/25 | | | 145,000 | | | | 174,308 | |
| | | | | | | | 3,134,112 | |
New Zealand — 0.6% | | | | | | | | |
Asian Development Bank, 4.625%, due 03/06/19 | | | 330,000 | | | | 227,188 | |
International Bank for Reconstruction & Development, 3.500%, due 01/22/21 | | | 295,000 | | | | 205,261 | |
International Bank for Reconstruction & Development, 4.625%, due 10/06/21 | | | 380,000 | | | | 273,551 | |
International Finance Corp., 3.625%, due 05/20/20 | | | 330,000 | | | | 228,786 | |
New Zealand Government Bond, 3.000%, due 04/15/20 | | | 400,000 | | | | 276,512 | |
New Zealand Government Bond, 6.000%, due 05/15/21 | | | 365,000 | | | | 275,038 | |
New Zealand Government Bond, 5.500%, due 04/15/23 | | | 300,000 | | | | 234,230 | |
New Zealand Local Government Funding Agency Bond, 5.000%, due 03/15/19 | | | 385,000 | | | | 265,974 | |
| | | | | | | | 1,986,540 | |
Norway — 0.5% | | | | | | | | |
Norwegian Government Bond, 4.500%, due 05/22/19 | | | 3,900,000 | | | | 494,634 | |
Norwegian Government Bond, 3.750%, due 05/25/21 | | | 5,900,000 | | | | 778,644 | |
Norwegian Government Bond, 2.000%, due 05/24/23 | | | 2,400,000 | | | | 303,954 | |
| | | | | | | | 1,577,232 | |
Panama — 0.4% | | | | | | | | |
Ena Norte Trust, 4.950%, due 04/25/28 | | | 176,021 | | | | 176,682 | |
Global Bank Corp., 5.125%, due 10/30/19 | | | 400,000 | | | | 402,500 | |
Republic of Panama, 5.200%, due 01/30/20 | | | 500,000 | | | | 516,500 | |
Republic of Panama, 4.000%, due 09/22/24 | | | 400,000 | | | | 403,660 | |
| | | | | | | | 1,499,342 | |
See Notes to Financial Statements.
58
Wilshire Mutual Funds, Inc. Wilshire Income Opportunities Fund Schedule of Investments - (continued) | June 30, 2018
(Unaudited) |
|
| | | Par Value | | | Value | |
FOREIGN BONDS — 18.8% (Continued) |
Peru — 0.8% | | | | | | | | |
Banco Continental S.A., 5.500%, due 11/18/20 | | $ | 500,000 | | | $ | 517,425 | |
Banco de Credito del Peru of Panama, 5.375%, due 09/16/20 | | | 100,000 | | | | 103,330 | |
Banco Internacional del Peru S.A.A. of Panama, 5.750%, due 10/07/20 | | | 800,000 | | | | 835,167 | |
Fondo Mivivienda S.A., 3.500%, due 01/31/23 | | | 400,000 | | | | 385,604 | |
Hungary Government, 6.250%, due 01/29/20 | | | 365,000 | | | | 381,841 | |
Petroleos del Peru S.A., 144A, 5.625%, due 06/19/47 | | | 200,000 | | | | 194,614 | |
Transportadora de Gas del Peru S.A., 4.250%, due 04/30/28 | | | 300,000 | | | | 289,359 | |
| | | | | | | | 2,707,340 | |
Philippines — 1.0% | | | | | | | | |
BDO Unibank, Inc., 2.625%, due 10/24/21 | | | 200,000 | | | | 192,438 | |
BDO Unibank, Inc., 2.950%, due 03/06/23 | | | 600,000 | | | | 565,368 | |
Philippine Government Bond, 3.500%, due 03/20/21 | | | 10,500,000 | | | | 188,954 | |
Philippine Government Bond, 3.500%, due 04/21/23 | | | 13,000,000 | | | | 220,374 | |
Philippine Government Bond, 8.000%, due 07/19/31 | | | 15,000,000 | | | | 315,065 | |
Philippine Government International Bond, 4.200%, due 01/21/24 | | | 1,200,000 | | | | 1,221,001 | |
Philippine Government International Bond, 6.250%, due 01/14/36 | | | 15,000,000 | | | | 286,537 | |
Union Bank of Philippines, Series EMTN, 3.369%, due 11/29/22 | | | 400,000 | | | | 379,848 | |
| | | | | | | | 3,369,585 | |
Portugal — 0.2% | | | | | | | | |
Portugal Government International Bond, 144A, 5.125%, due 10/15/24 | | | 330,000 | | | | 342,679 | |
Portugal Obrigacoes do Tesouro OT, 3.850%, due 04/15/21 | | | 380,000 | | | | 490,716 | |
| | | | | | | | 833,395 | |
Singapore — 1.2% | | | | | | | | |
BPRL International Singapore, 4.375%, due 01/18/27 | | | 500,000 | | | | 474,440 | |
DBS Group Holdings Ltd., 3.600%, due 12/29/49 | | | 300,000 | | | | 287,250 | |
Indika Energy Capital III Ltd., 144A, 5.875%, due 11/09/24 | | | 200,000 | | | | 178,000 | |
ONGC Videsh Vankorneft, 3.750%, due 07/27/26 | | | 800,000 | | | | 743,775 | |
Singapore Government Bond, 3.250%, due 09/01/20 | | | 600,000 | | | | 452,342 | |
Singtel Group Treasury Pte. Ltd., 4.500%, due 09/08/21 | | | 400,000 | | | | 412,988 | |
Temasek Financial I Ltd., 2.375%, due 01/23/23 | | | 750,000 | | | | 717,250 | |
United Overseas Bank Ltd., 3.750%, due 09/19/24 | | | 500,000 | | | | 499,330 | |
United Overseas Bank Ltd., 3.500%, due 09/16/26 | | | 200,000 | | | | 196,212 | |
| | | | | | | | 3,961,587 | |
Sweden — 0.1% | | | | | | | | |
Sweden Government International Bond, 144A, 0.125%, due 04/24/23 | | | 340,000 | | | | 400,421 | |
| | | | | | | | | |
United Kingdom — 0.2% | | | | | | | | |
Genting Overseas Holding Ltd., 4.250%, due 01/24/27 | | | 700,000 | | | | 661,871 | |
Vedanta Resources plc, 6.125%, due 08/09/24 | | | 200,000 | | | | 176,500 | |
| | | | | | | | 838,371 | |
United States — 0.3% | | | | | | | | |
AMC Entertainment Holdings, Inc., 6.375%, due 11/15/24 | | | 205,000 | | | | 273,310 | |
Comcel Trust, 6.875%, due 02/06/24 | | | 200,000 | | | | 205,250 | |
Equinix, Inc., 2.875%, due 03/15/24 | | | 115,000 | | | | 131,632 | |
Goldman Sachs Group, Inc. (The), 1.375%, due 05/15/24 | | | 150,000 | | | | 177,271 | |
Reliance Holdings USA, 5.400%, due 02/14/22 | | | 250,000 | | | | 258,375 | |
| | | | | | | | 1,045,838 | |
Virgin Islands British — 0.1% | | | | | | | | |
Sinopec Group Overseas Development 2016, 2.750%, due 05/03/21 | | | 200,000 | | | | 195,474 | |
| | | | | | | | | |
Total Foreign Bonds (Cost $64,623,745) | | | | | | $ | 63,061,616 | |
| | | | | | | | | |
See Notes to Financial Statements.
59
Wilshire Mutual Funds, Inc. Wilshire Income Opportunities Fund Schedule of Investments - (continued) | June 30, 2018
(Unaudited) |
|
| | | Par Value | | | Value | |
LOAN PARTICIPATIONS — 10.0% |
Acrisure, LLC, 4.700% (3MO LIBOR + 375), due 06/07/23 (b) | | $ | 20,000 | | | $ | 19,825 | |
Acrisure, LLC, 6.609% (3MO LIBOR + 425), due 11/22/23 (b) | | | 454,277 | | | | 452,291 | |
AECOM, 4.091% (3MO LIBOR + 175), due 02/23/25 (b) | | | 225,000 | | | | 225,844 | |
Aleris International, Inc., 4.700% (3MO LIBOR + 475), due 02/08/23 (b) | | | 185,000 | | | | 183,207 | |
AlixPartners, LLP, 4.844% (3MO LIBOR + 300), due 03/17/21 (b) | | | 480,000 | | | | 479,159 | |
Almonde, Inc., 5.484% (3MO LIBOR + 350), due 04/26/24 (b) | | | 367,225 | | | | 360,391 | |
American Airlines, Inc., 4.354% (3MO LIBOR + 200), due 04/28/23 (b) | | | 180,000 | | | | 177,840 | |
American Axle & Manufacturing, Inc., 4.587% (3MO LIBOR + 225), due 04/06/24 (b) | | | 200,000 | | | | 199,500 | |
American Tire Distributors, 6.343% (3MO LIBOR + 425), due 09/01/21 (b) | | | 96,859 | | | | 62,625 | |
Applied Systems, Inc., 4.943% (3MO LIBOR + 325), due 09/13/24 (b) | | | 475,000 | | | | 475,147 | |
Aramark Services, Inc., 4.069% (3MO LIBOR + 175), due 03/28/24 (b) | | | 180,000 | | | | 179,775 | |
Ascend Learning, LLC, 5.348% (3MO LIBOR + 300), due 07/12/24 (b) | | | 95,000 | | | | 94,644 | |
AssuredPartners, Inc., 5.344% (3MO LIBOR + 325), due 10/22/24 (b) | | | 478,175 | | | | 475,488 | |
Asurion, LLC, 0.000% due 10/10/50 (b) | | | 435,000 | | | | 432,825 | |
Avaya, Inc., 6.323% (3MO LIBOR + 475), due 12/31/20 (b) | | | 586 | | | | 589 | |
BCP Renaissance Parent, LLC, 6.359% (3MO LIBOR + 450), due 12/31/20 (b) | | | 240,000 | | | | 239,362 | |
Berry Global, Inc., 4.342% (3MO LIBOR + 200), due 10/01/22 (b) | | | 135,000 | | | | 134,711 | |
Berry Global, Inc., 4.342% (3MO LIBOR + 200), due 01/19/24 (b) | | | 270,000 | | | | 269,325 | |
BJ's Wholesale Club, Inc., 5.530% (3MO LIBOR + 375), due 01/27/24 (b) | | | 383,481 | | | | 383,097 | |
BMC Software Finance, Inc., 4.700% (3MO LIBOR + 425), due 09/01/25 (b) | | | 480,000 | | | | 477,000 | |
Brookfield Retail Holdings, LLC, 4.855% (3MO LIBOR + 250), due 05/07/25 (b) | | | 275,000 | | | | 271,219 | |
Burger King, 4.581% (3MO LIBOR + 225), due 02/17/24 (b) | | | 350,000 | | | | 348,688 | |
BWAY Holding Co., 5.584% (3MO LIBOR + 325), due 04/03/24 (b) | | | 130,000 | | | | 129,208 | |
BWAY Holding Co., 5.587% (3MO LIBOR + 325), due 04/03/24 (b) | | | 482,872 | | | | 479,930 | |
Canyon Valor Cos., Inc., 5.584% (3MO LIBOR + 425), due 06/16/23 (b) | | | 227,582 | | | | 226,900 | |
Capital Automotive, L.P., 8.100% (3MO LIBOR + 600), due 03/21/25 (b) | | | 37,957 | | | | 38,116 | |
Capri Acquisitions BidCo Ltd., 5.609% (3MO LIBOR + 325), due 10/04/24 (b) | | | 473,813 | | | | 469,373 | |
CBS Radio, Inc., 4.838% (3MO LIBOR + 275), due 10/17/23 (b) | | | 223,875 | | | | 220,517 | |
Cengage Learning, Inc., 6.184% (3MO LIBOR + 425), due 06/07/23 (b) | | | 385,277 | | | | 353,010 | |
CenturyLink, Inc., 4.844% (3MO LIBOR + 275), due 02/29/24 (b) | | | 309,225 | | | | 302,654 | |
CenturyLink, Inc., 5.080% (3MO LIBOR + 275), due 01/31/25 (b) | | | 134,662 | | | | 131,800 | |
Ceva Intercompany B.V., 7.859% (3MO LIBOR + 550), due 03/19/21 (b) | | | 20,077 | | | | 20,002 | |
Ceva Logistics Canada ULC, 7.859% (3MO LIBOR + 550), due 03/19/21 (b) | | | 10,142 | | | | 10,104 | |
Ceva Logistics U.S. Holdings, Inc., 2.208% (3MO LIBOR + 550), due 03/19/21 (b) | | | 59,158 | | | | 58,936 | |
Ceva Logistics U.S. Holdings, Inc., 7.859% (3MO LIBOR + 550), due 03/19/21 (b) | | | 92,427 | | | | 92,080 | |
Change Healthcare Holdings, LLC, 4.844% (3MO LIBOR + 275), due 03/01/24 (b) | | | 470,000 | | | | 468,162 | |
Charter Communications Operating, LLC, 4.335% (3MO LIBOR + 200), due 04/30/25 (b) | | | 314,211 | | | | 313,522 | |
Cinemark USA, Inc., 4.089% (3MO LIBOR + 175), due 03/29/25 (b) | | | 90,000 | | | | 89,944 | |
Cogeco Communications, 4.714% (3MO LIBOR + 237.5), due 01/31/25 (b) | | | 315,000 | | | | 312,817 | |
Colorado Buyer, Inc., 4.380% (3MO LIBOR + 300), due 03/15/24 (b) | | | 480,000 | | | | 479,040 | |
CSM Bakery Supplies, 7.210% (3MO LIBOR + 400), due 07/03/20 (b) | | | 188,272 | | | | 182,036 | |
See Notes to Financial Statements.
60
Wilshire Mutual Funds, Inc. Wilshire Income Opportunities Fund Schedule of Investments - (continued) | June 30, 2018
(Unaudited) |
|
| | | Par Value | | | Value | |
LOAN PARTICIPATIONS — 10.0% (Continued) |
Cvent, Inc., 5.843% (3MO LIBOR + 375), due 11/29/23 (b) | | $ | 495,000 | | | $ | 493,762 | |
DAE Aviation Holdings, 6.119% (3MO LIBOR + 375), due 07/07/22 (b) | | | 90,000 | | | | 90,038 | |
Dell International, LLC, 4.359% (3MO LIBOR + 200), due 09/07/23 (b) | | | 225,000 | | | | 224,719 | |
Edelman Financial Center, LLC (The), 4.700% (3MO LIBOR + 325), due 12/31/21 (b) | | | 155,000 | | | | 154,710 | |
EG America, LLC, 6.140% (3MO LIBOR + 400), due 02/07/25 (b) | | | 280,000 | | | | 277,270 | |
EG Group Ltd., 6.337% (3MO LIBOR + 400), due 01/31/25 (b) | | | 85,000 | | | | 84,171 | |
Equian, LLC, 5.334% (3MO LIBOR + 325), due 05/20/24 (b) | | | 214,084 | | | | 213,192 | |
Exgen Renewables IV, LLC, 5.310% (3MO LIBOR + 300), due 12/31/20 (b) | | | 142,201 | | | | 142,557 | |
Federal Mogul Holdings Corp., 5.840% (3MO LIBOR + 375), due 04/15/21 (b) | | | 310,190 | | | | 310,245 | |
Filtration Group Corp., 5.093% (3MO LIBOR + 300), due 03/27/25 (b) | | | 260,000 | | | | 259,740 | |
First Data Corp., 4.335% (3MO LIBOR + 200), due 07/10/22 (b) | | | 270,000 | | | | 268,650 | |
Four Seasons Hotels Ltd., 4.336% (3MO LIBOR + 200), due 11/30/23 (b) | | | 315,000 | | | | 312,442 | |
Frontera Generation Holdings, LLC, 6.232% (3MO LIBOR + 450), due 12/31/21 (b) | | | 195,000 | | | | 194,610 | |
Gentiva Health Services, Inc., 4.700% (3MO LIBOR + 375), due 06/23/25 (b) | | | 252,308 | | | | 250,415 | |
Gentiva Health Services, Inc., 4.700% (3MO LIBOR + 375), due 06/23/25 (b) | | | 157,692 | | | | 156,510 | |
GrafTech Finance, Inc., 5.505% (3MO LIBOR + 350), due 01/31/25 (b) | | | 480,000 | | | | 476,702 | |
Greeneden U.S. Holdings II, LLC, 5.802% (3MO LIBOR + 350), due 12/01/23 (b) | | | 478,091 | | | | 477,493 | |
Grifols Worldwide Operations USA, Inc., 4.613% (3MO LIBOR + 225), due 01/31/25 (b) | | | 225,000 | | | | 225,563 | |
GTT Communications, Inc., 4.700% (3MO LIBOR + 275), due 04/25/25 (b) | | | 460,000 | | | | 452,755 | |
Hardware Holdings, LLC, 8.193% (3MO LIBOR + 650), due 03/30/20 (b)(e) | | | 521,625 | | | | 491,631 | |
Hayward Industries, Inc., 5.594% (3MO LIBOR + 350), due 12/31/20 (b) | | | 373,125 | | | | 373,360 | |
HB Fuller Co., 4.360% (3MO LIBOR + 200), due 10/20/24 (b) | | | 140,000 | | | | 138,775 | |
Hilton Worldwide Finance, LLC, 4.112% (3MO LIBOR + 175), due 10/25/23 (b) | | | 225,000 | | | | 224,906 | |
Informatica, LLC, 5.344% (3MO LIBOR + 325), due 08/05/22 (b) | | | 470,000 | | | | 470,254 | |
Intelsat Jackson Holdings S.A., 5.718% (3MO LIBOR + 375), due 11/30/23 (b) | | | 180,000 | | | | 179,408 | |
Intrawest Resorts Holdings, Inc., 5.093% (3MO LIBOR + 325), due 12/31/20 (b) | | | 474,213 | | | | 473,326 | |
Ion Trading Finance Ltd., 4.700% (3MO LIBOR + 400), due 11/21/24 (b) | | | 380,000 | | | | 376,200 | |
IRB Holding Corp., 5.255% (3MO LIBOR + 325), due 01/17/25 (b) | | | 364,419 | | | | 364,721 | |
Kronos Acquisition Holdings, Inc., 5.968% (3MO LIBOR + 450), due 08/26/22 (b) | | | 385,000 | | | | 382,016 | |
Kronos, Inc., 5.357% (3MO LIBOR + 350), due 11/01/23 (b) | | | 477,694 | | | | 476,414 | |
Life Time Fitness, Inc., 4.398% (3MO LIBOR + 300), due 06/10/22 (b) | | | 475,000 | | | | 473,100 | |
Meredith Corp., 5.363% (3MO LIBOR + 300), due 01/31/25 (b) | | | 135,000 | | | | 134,831 | |
Metro-Goldwyn-Mayer, Inc., 6.841% (3MO LIBOR + 450), due 06/29/26 (b) | | | 140,000 | | | | 138,600 | |
Microchip Technology, Inc., 4.307% (3MO LIBOR + 200), due 05/29/25 (b) | | | 135,000 | | | | 135,169 | |
Micron Technology, Inc., 4.108% (3MO LIBOR + 175), due 04/26/22 (b) | | | 90,000 | | | | 90,135 | |
Milacron, LLC, 4.480% (3MO LIBOR + 250), due 09/28/23 (b) | | | 475,000 | | | | 471,438 | |
Mitchell International, Inc., 5.344% (3MO LIBOR + 325), due 12/31/20 (b) | | | 33,582 | | | | 33,316 | |
Mitchell International, Inc., 5.151% (3MO LIBOR + 325), due 11/20/24 (b) | | | 416,418 | | | | 413,120 | |
See Notes to Financial Statements.
61
Wilshire Mutual Funds, Inc. Wilshire Income Opportunities Fund Schedule of Investments - (continued) | June 30, 2018
(Unaudited) |
|
| | | Par Value | | | Value | |
LOAN PARTICIPATIONS — 10.0% (Continued) |
MPH Acquisition Holdings, LLC, 5.052% (3MO LIBOR + 300), due 06/07/23 (b) | | $ | 480,000 | | | $ | 476,923 | |
Neiman Marcus Group Ltd., LLC, 5.591% (3MO LIBOR + 325), due 10/25/20 (b) | | | 250,000 | | | | 222,500 | |
Peak 10 Holding Corp., 5.802% (3MO LIBOR + 350), due 07/24/24 (b) | | | 308,450 | | | | 304,499 | |
Plantronics, Inc., 4.700% (3MO LIBOR + 250), due 12/31/21 (b) | | | 225,000 | | | | 224,298 | |
Playa Funding, LLC, 4.840% (3MO LIBOR + 325), due 04/05/24 (b) | | | 417,896 | | | | 412,325 | |
PowerTeam Services, LLC, 5.584% (3MO LIBOR + 325), due 03/06/25 (b) | | | 475,000 | | | | 468,768 | |
Project Alpha Intermediate Holding, Inc., 5.040% (3MO LIBOR + 350), due 04/04/21 (b) | | | 382,113 | | | | 379,724 | |
Quest of Software US Holdings, Inc., 4.700% (3MO LIBOR + 425), due 05/17/25 (b) | | | 240,000 | | | | 238,901 | |
RBS Global, Inc., 4.577% (3MO LIBOR + 225), due 08/21/24 (b) | | | 90,000 | | | | 89,832 | |
RentPath, LLC, 6.850% (3MO LIBOR + 475), due 12/17/21 (b) | | | 379,021 | | | | 343,961 | |
Revlon Consumer Products Co., 5.598% (3MO LIBOR + 350), due 09/07/23 (b) | | | 505,000 | | | | 388,850 | |
RP Crown Parent, LLC, 5.110% (3MO LIBOR + 275), due 10/12/23 (b) | | | 225,000 | | | | 223,031 | |
Sable International Finance Ltd., 5.619% (3MO LIBOR + 325), due 01/31/26 (b) | | | 225,000 | | | | 225,281 | |
SBA Senior Finance II, LLC, 4.337% (3MO LIBOR + 200), due 04/11/25 (b) | | | 270,000 | | | | 268,650 | |
Scientific Games International, Inc., 4.844% (3MO LIBOR + 275), due 08/14/24 (b) | | | 470,000 | | | | 466,475 | |
Securus Technologies Holdings, Inc., 6.594% (3MO LIBOR + 450), due 06/15/24 (b) | | | 486,825 | | | | 488,499 | |
Securus Technologies Holdings, Inc., 6.594% (3MO LIBOR + 450), due 11/01/24 (b) | | | 72,000 | | | | 72,248 | |
Select Medical Corp., 4.800% (3MO LIBOR + 350), due 02/13/24 (b) | | | 326,700 | | | | 325,883 | |
ServiceMaster Co., LLC, 4.853% (3MO LIBOR + 250), due 11/08/23 (b) | | | 270,000 | | | | 270,000 | |
Sinclair Television Group, 4.863% (3MO LIBOR + 250), due 01/31/25 (b) | | | 185,000 | | | | 184,192 | |
SIWF Holdings, Inc., 4.700% (3MO LIBOR + 400), due 12/31/21 (b) | | | 290,000 | | | | 291,088 | |
SolarWinds, Inc., 4.980% (3MO LIBOR + 300), due 03/07/24 (b) | | | 279,225 | | | | 278,798 | |
Solenis International, L.P., 4.700% (3MO LIBOR + 400), due 12/18/23 (b) | | | 250,000 | | | | 249,213 | |
Solera, LLC, 4.844% (3MO LIBOR + 375), due 03/03/23 (b) | | | 480,000 | | | | 477,240 | |
Solera, LLC, 4.700% (3MO LIBOR + 275), due 06/18/25 (b) | | | 310,000 | | | | 306,708 | |
Sophia, L.P., 4.943% (3MO LIBOR + 325), due 09/30/22 (b) | | | 480,000 | | | | 477,600 | |
Sprint Communications, 4.863% (3MO LIBOR + 250), due 02/02/24 (b) | | | 270,000 | | | | 269,325 | |
SS&C European Holdings S.A.R.L., 4.855% (3MO LIBOR + 250), due 04/16/25 (b) | | | 36,356 | | | | 36,336 | |
SS&C Technologies, Inc., 4.855% (3MO LIBOR + 250), due 04/16/25 (b) | | | 96,102 | | | | 96,049 | |
Team Health Holdings, Inc., 4.730% (3MO LIBOR + 275), due 01/12/24 (b) | | | 434,100 | | | | 416,736 | |
TKC Holdings, Inc., 5.850% (3MO LIBOR + 425), due 02/01/23 (b) | | | 391,050 | | | | 389,705 | |
TransDigm, Inc., 4.476% (3MO LIBOR + 250), due 06/09/23 (b) | | | 459,700 | | | | 456,482 | |
TransDigm, Inc., 4.700% (3MO LIBOR + 250), due 05/14/25 (b) | | | 24,235 | | | | 24,027 | |
Traverse Midstream Partners, LLC, 6.340% (3MO LIBOR + 400), due 09/11/21 (b) | | | 240,000 | | | | 239,700 | |
Tribune Media Co., 4.569% (3MO LIBOR + 300), due 12/27/20 (b) | | | 42,521 | | | | 42,415 | |
U.S.I., Inc. of New York, 5.321% (3MO LIBOR + 300), due 05/16/24 (b) | | | 175,000 | | | | 174,125 | |
Uber Technologies, Inc., 6.327% (3MO LIBOR + 400), due 03/22/25 (b) | | | 90,000 | | | | 90,187 | |
Ultra Resources, Inc., 5.085% (3MO LIBOR + 300), due 04/12/24 (b) | | | 120,000 | | | | 110,326 | |
See Notes to Financial Statements.
62
Wilshire Mutual Funds, Inc. Wilshire Income Opportunities Fund Schedule of Investments - (continued) | June 30, 2018
(Unaudited) |
|
| | | Par Value | | | Value | |
LOAN PARTICIPATIONS — 10.0% (Continued) |
US Silica Co., 6.125% (3MO LIBOR + 400), due 12/31/21 (b) | | $ | 290,000 | | | $ | 289,565 | |
VF Holding Corp., 4.700% (3MO LIBOR + 325), due 06/04/25 (b) | | | 485,000 | | | | 481,667 | |
Virgin Media Bristol, LLC, 4.855% (3MO LIBOR + 250), due 01/15/26 (b) | | | 175,000 | | | | 174,125 | |
West Corp., 6.339% (3MO LIBOR + 400), due 10/10/24 (b) | | | 135,000 | | | | 134,393 | |
Wyndham Hotels & Resorts, Inc., 4.071% (3MO LIBOR + 175), due 05/30/25 (b) | | | 90,000 | | | | 89,775 | |
Yak Access, LLC, 7.077% (3MO LIBOR + 500), due 10/31/50 (b) | | | 305,000 | | | | 295,850 | |
Zodiac, 8.000% (3MO LIBOR + 300), due 12/20/23 (b) | | | 229,421 | | | | 229,134 | |
Total Loan Participations (Cost $33,729,711) | | | | | | $ | 33,422,376 | |
| | | | | | | | | |
MILITARY HOUSING OBLIGATIONS — 1.8% |
Atlantic Marine Corps Communities Military Housing, 144A, 5.433% due 12/01/50 (f) | | $ | 702,168 | | | $ | 715,044 | |
Capmark Military Housing Trust, Series 2007-AETC, Class A-1, 5.746% due 02/10/52 (e) | | | 1,893,993 | | | | 1,826,149 | |
Capmark Military Housing Trust, Series 2007-ROBS, Class A, 6.059% due 10/10/52 (e) | | | 475,831 | | | | 486,734 | |
Fort Benning Family Communities, LLC, 144A, 5.810% due 01/15/51 (e)(f) | | | 1,050,000 | | | | 1,098,582 | |
GMAC Commercial Military Housing Trust, Series 2007-HCKM, Class A, 6.107% due 08/10/52 | | | 1,110,800 | | | | 1,171,292 | |
HP Communities, LLC, 5.630% due 09/15/34 (e) | | | 650,000 | | | | 714,796 | |
Total Military Housing Obligations (Cost $6,027,298) | | | | | | $ | 6,012,597 | |
| | | Shares | | | Value | |
COMMON STOCKS — 0.7% | | | | | | | | |
Financials — 0.7% | | | | | | | | |
Ameris Bancorp | | | 1,775 | | | $ | 94,696 | |
BankUnited, Inc. | | | 2,900 | | | | 118,465 | |
Capital One Financial Corp. | | | 1,850 | | | | 170,015 | |
Citigroup, Inc. | | | 3,500 | | | | 234,220 | |
Columbia Banking System, Inc. | | | 6,350 | | | | 259,715 | |
Comerica, Inc. | | | 2,500 | | | | 227,300 | |
Investors Bancorp, Inc. | | | 6,650 | | | | 85,054 | |
JPMorgan Chase & Co. | | | 3,300 | | | | 343,859 | |
Park National Corp. | | | 775 | | | | 86,351 | |
Prosperity Bancshares, Inc. | | | 3,250 | | | | 222,170 | |
U.S. Bancorp | | | 4,500 | | | | 225,090 | |
Washington Trust Bancorp, Inc. | | | 1,500 | | | | 87,150 | |
| | | | | | | | 2,154,085 | |
Industrials — 0.0% (d) | | | | | | | | |
HC2 Holdings, Inc. (g) | | | 10,600 | | | | 62,010 | |
| | | | | | | | | |
Total Common Stocks (Cost $2,255,741) | | | | | | $ | 2,216,095 | |
| | | | | | | | | |
PREFERRED STOCKS — 0.7% | | | | | | | | |
Becton Dickinson and Co. - Series A, 6.125% | | | 5,000 | | | $ | 309,250 | |
Crown Castle International Corp. - Series A, 6.875% | | | 200 | | | | 214,615 | |
Dominioin Energy, Inc. - Series A, 6.750% | | | 6,100 | | | | 281,881 | |
First Republic Bank - Series H, 5.125% | | | 5,725 | | | | 140,606 | |
Fortive Corp. - Series A, 5.000% | | | 125 | | | | 128,199 | |
Hess Corp. - Series A, 8.000% | | | 3,200 | | | | 241,376 | |
Kinder Morgan, Inc. - Series A, 9.750% | | | 9,000 | | | | 312,030 | |
NextEra Energy, Inc., 6.371% | | | 1,900 | | | | 140,847 | |
South Jersey Industries, Inc., 7.250% | | | 1,700 | | | | 94,044 | |
Stanley Black & Decker, Inc., 5.375% | | | 1,200 | | | | 125,736 | |
Synovus Financial Corp. - Series C, 7.875% | | | 9,000 | | | | 228,871 | |
Total Preferred Stocks (Cost $2,196,357) | | | | | | $ | 2,217,455 | |
See Notes to Financial Statements.
63
Wilshire Mutual Funds, Inc. Wilshire Income Opportunities Fund Schedule of Investments - (continued) | June 30, 2018
(Unaudited) |
|
| | | Shares | | | Value | |
AFFILIATED REGISTERED INVESTMENT COMPANIES — 7.4% |
Voya Emerging Markets Hard Currency Debt Fund | | | 326,266 | | | $ | 2,995,121 | |
Voya Floating Rate Fund | | | 1,426,792 | | | | 13,982,557 | |
Voya High Yield Bond Fund | | | 984,012 | | | | 7,714,652 | |
Total Affiliated Registered Investment Companies (Cost $24,781,078) | | $ | 24,692,330 | |
| | | | | | | | | |
MONEY MARKET FUNDS — 14.5% | | | | | | | | |
Northern Trust Institutional Government Select Portfolio - Institutional Class, 1.73% (h) (Cost $48,677,042) | | | 48,677,042 | | | $ | 48,677,042 | |
| | | | | | | | | |
Total Investments at Value — 103.8% (Cost $352,539,399) | | | | | | $ | 347,712,219 | |
| | | | | | | | | |
Liabilities in Excess of Other Assets — (3.8%) | | | (12,835,334 | ) |
| | | | | | | | | |
Net Assets — 100.0% | | | | | | $ | 334,876,885 | |
(a) | Zero coupon security. The rate reported on the Schedule of Investments is the effective yield at the time of purchase. |
(b) | Variable rate security. Interest rate resets periodically. The rate shown is the effective interest rate as of June 30, 2018. For securities based on a published reference rate and spread, the reference rate and spread (in basis points) are indicated parenthetically. Certain variable rate securities are not based on a published reference rate and spread but are determined by the issuer or agent and are based on current market conditions. These securities, therefore, do not indicate a reference rate and spread. |
(c) | Security has been valued at fair value in accordance with the procedures adopted by and under the general supervision of the Board of Directors. The total value of such securities is $750,745 as of June 30, 2018, representing 0.2% of net assets (Note 2). |
(d) | Percentage rounds to less than 0.1%. |
(e) | Illiquid security. The total value of such securities is $4,617,892 as of June 30, 2018, representing 1.4% of net assets. |
(f) | 144A securities that are restricted securities not registered under the Securities Act of 1933. The total value of such securities is $1,813,626 as of June 30, 2018, representing 0.5% of net assets. |
(g) | Non-income producing security. |
(h) | The rate shown is the 7-day effective yield as of June 30, 2018. |
BBSW — Australian Bank Bill Swap Rate
CV — Convertible Security.
CDO — Collateralized Debt Obligation.
CLO — Collateralized Loan Obligation.
Re-REMIC — Re-securitization of Real Estate Mortgage Investment Conduit.
LIBOR — London Interbank Offered Rate.
144A — Security was purchased in a transaction exempt from registration in compliance with Rule 144A of the Securities Act of 1933. This security may be resold in transactions exempt from registration, normally to qualified institutional buyers. The total value of such securities is $32,974,589 as of June 30, 2018, representing 9.8% of net assets.
LIBOR rates as of June 30, 2018: |
1MO LIBOR | 2.09213% |
3MO LIBOR | 2.33738% |
See Notes to Financial Statements.
64
Wilshire Mutual Funds, Inc. Wilshire Income Opportunities Fund Schedule of Futures Contracts Sold Short | June 30, 2018
(Unaudited) |
|
FUTURES CONTRACTS SOLD SHORT | | Contracts | | | Expiration
Date | | | Notional
Value | | | Value/
Unrealized
Appreciation
(Depreciation) | |
FOREIGN FUTURES | | | | | | | | | | | | | | | | |
Euro Long-Term Bond Future | | | 33 | | | | 09/06/2018 | | | $ | 6,260,135 | | | $ | (1,708 | ) |
| | | | | | | | | | | | | | | | | |
TREASURY FUTURES | | | | | | | | | | | | | | | | |
10-Year U.S. Treasury Note Future | | | 33 | | | | 09/19/2018 | | | | 3,965,156 | | | | 2,588 | |
5-Year U.S. Treasury Note Future | | | 42 | | | | 09/28/2018 | | | | 4,770,938 | | | | 2,180 | |
U.S. Treasury Long Bond Future | | | 10 | | | | 09/19/2018 | | | | 1,448,438 | | | | 2,475 | |
Total Treasury Futures | | | | | | | | | | | 10,184,532 | | | | 7,243 | |
| | | | | | | | | | | | | | | | | |
Total Futures Contracts Sold Short | | | | | | | | | | $ | 16,444,667 | | | $ | 5,535 | |
The average monthly notional value of future contracts sold short during the six months ended June 30, 2018 was $2,740,778.
See Notes to Financial Statements.
65
Wilshire Mutual Funds, Inc. Wilshire Income Opportunities Fund Schedule of Forward Foreign Currency Contracts | June 30, 2018
(Unaudited) |
|
Counterparty | | Settlement
Date | | | Currency to
Deliver | | | Currency to
Receive | | | Unrealized
Appreciation
(Depreciation) | |
Goldman, Sachs & Co. | | | 7/13/2018 | | USD | | | 1,145,000 | | JPY | | | 126,788,712 | | | $ | 1,019 | |
Goldman, Sachs & Co. | | | 7/13/2018 | | USD | | | 121,000 | | NZD | | | 178,762 | | | | 81 | |
Goldman, Sachs & Co. | | | 9/19/2018 | | JPY | | | 25,400,000 | | USD | | | 230,601 | | | | (108 | ) |
Goldman, Sachs & Co. | | | 9/19/2018 | | NZD | | | 1,370,000 | | USD | | | 938,661 | | | | 10,669 | |
| | | | | | | | | | | | | | | | | | | | | | | | 11,661 | |
| | | | | | | | | | | | | | | | | | | | | | | | | |
HSBC Securities, Inc. | | | 9/19/2018 | | AUD | | | 465,000 | | USD | | | 344,176 | | | | (69 | ) |
HSBC Securities, Inc. | | | 9/19/2018 | | DKK | | | 1,484,621 | | USD | | | 231,984 | | | | (2,176 | ) |
HSBC Securities, Inc. | | | 9/19/2018 | | MXP | | | 4,895,000 | | USD | | | 242,499 | | | | (856 | ) |
HSBC Securities, Inc. | | | 9/19/2018 | | NZD | | | 640,000 | | USD | | | 433,559 | | | | 44 | |
HSBC Securities, Inc. | | | 9/19/2018 | | USD | | | 347,290 | | AUD | | | 470,000 | | | | 657 | |
| | | | | | | | | | | | | | | | | | | | | | | | (2,400 | ) |
| | | | | | | | | | | | | | | | | | | | | | | | | |
Morgan Stanley & Co., LLC | | | 7/13/2018 | | AUD | | | 3,894,140 | | USD | | | 2,879,000 | | | | (3,296 | ) |
Morgan Stanley & Co., LLC | | | 7/13/2018 | | GBP | | | 337,930 | | USD | | | 446,000 | | | | (221 | ) |
Morgan Stanley & Co., LLC | | | 7/13/2018 | | NOK | | | 15,206,345 | | USD | | | 1,865,000 | | | | (2,771 | ) |
Morgan Stanley & Co., LLC | | | 7/13/2018 | | USD | | | 601,000 | | CAD | | | 790,648 | | | | 531 | |
Morgan Stanley & Co., LLC | | | 7/13/2018 | | USD | | | 2,055,000 | | EUR | | | 1,758,265 | | | | (378 | ) |
Morgan Stanley & Co., LLC | | | 7/13/2018 | | USD | | | 144,000 | | SEK | | | 1,288,307 | | | | (46 | ) |
| | | | | | | | | | | | | | | | | | | | | | | | (6,181 | ) |
| | | | | | | | | | | | | | | | | | | | | | | | | |
State Street Global Markets, LLC | | | 9/19/2018 | | AUD | | | 1,713,989 | | USD | | | 1,266,790 | | | | (2,096 | ) |
State Street Global Markets, LLC | | | 9/19/2018 | | GBP | | | 211,071 | | USD | | | 279,745 | | | | 172 | |
State Street Global Markets, LLC | | | 9/19/2018 | | GBP | | | 210,271 | | USD | | | 278,486 | | | | (27 | ) |
State Street Global Markets, LLC | | | 9/19/2018 | | NZD | | | 649,347 | | USD | | | 438,160 | | | | (1,687 | ) |
State Street Global Markets, LLC | | | 9/19/2018 | | SGD | | | 85,000 | | USD | | | 62,491 | | | | (1 | ) |
| | | | | | | | | | | | | | | | | | | | | | | | (3,639 | ) |
| | | | | | | | | | | | | | | | | | | | | | | | | |
UBS Securities, Inc. | | | 9/19/2018 | | MXP | | | 2,355,043 | | USD | | | 117,500 | | | | 419 | |
| | | | | | | | | | | | | | | | | | | | | | | | | |
Total | | | | | | | | | | | | | | | | | | | | | | $ | (140 | ) |
AUD - Australian Dollar | GBP - British Pound Sterling | NZD - New Zealand Dollar |
CAD - Canadian Dollar | JPY - Japanese Yen | SEK - Swedish Krona |
DKK - Danish Krone | MXP - Mexican Peso | SGD - Singapore Dollar |
EUR - Euro | NOK - Norway Krona | USD - U.S. Dollar |
For the six months ended June 30, 2018, the average volume of activity of forward foreign currency contracts was as follows:
Average Monthly Notional Amount Purchased | | $ | 735,548 | |
Average Monthly Notional Amount Sold | | $ | 1,675,775 | |
See Notes to Financial Statements.
66
Wilshire Mutual Funds, Inc. Statements of Assets and Liabilities June 30, 2018 (Unaudited) |
|
| | | LARGE
COMPANY
GROWTH
PORTFOLIO | | | LARGE
COMPANY
VALUE
PORTFOLIO | | | SMALL
COMPANY
GROWTH
PORTFOLIO | | | SMALL
COMPANY
VALUE
PORTFOLIO | | | WILSHIRE
5000
INDEXSM
FUND | | | WILSHIRE
INTERNATIONAL
EQUITY
FUND | | | WILSHIRE
INCOME
OPPORTUNITIES
FUND | |
ASSETS: | | | | | | | | | | | | | | | | | | | | | | | | | | | | |
Investments in unaffiliated securities, at value* (Note 2) | | $ | 255,891,132 | | | $ | 238,861,611 | | | $ | 57,668,836 | | | $ | 54,110,227 | | | $ | 188,957,336 | | | $ | 411,673,238 | | | $ | 323,019,889 | |
Investments in affiliated securities, at value (Note 5) | | | — | | | | — | | | | — | | | | — | | | | — | | | | — | | | | 24,692,330 | |
Cash | | | — | | | | — | | | | — | | | | — | | | | — | | | | 4,277 | | | | 39,996 | |
Cash pledged as collateral | | | — | | | | — | | | | — | | | | — | | | | — | | | | — | | | | 629,982 | |
Foreign currency, at value | | | — | | | | — | | | | — | | | | — | | | | — | | | | 2,815,518 | | | | 1,780,353 | |
Receivable for capital shares sold | | | 10,927,977 | | | | 16,127,842 | | | | 3,744,092 | | | | 4,321,108 | | | | 113,514 | | | | 21,714,727 | | | | 29,589,434 | |
Receivable for investment securities sold | | | 95,125 | | | | 396,661 | | | | 1,253,143 | | | | — | | | | — | | | | — | | | | 36,621,040 | |
Net unrealized appreciation on foreign forward currency contracts (Note 6) | | | — | | | | — | | | | — | | | | — | | | | — | | | | — | | | | 13,592 | |
Net variation margin receivable | | | — | | | | — | | | | — | | | | — | | | | — | | | | — | | | | 3,192 | |
Dividends and interest receivable | | | 81,993 | | | | 396,348 | | | | 22,318 | | | | 40,987 | | | | 166,194 | | | | 891,197 | | | | 2,118,600 | |
Dividend reclaim receivable | | | — | | | | — | | | | — | | | | — | | | | — | | | | 941,734 | | | | — | |
Other assets | | | 42,303 | | | | 33,999 | | | | 29,271 | | | | 28,748 | | | | 32,068 | | | | 50,751 | | | | 42,667 | |
Total Assets | | | 267,038,530 | | | | 255,816,461 | | | | 62,717,660 | | | | 58,501,070 | | | | 189,269,112 | | | | 438,091,442 | | | | 418,551,075 | |
| | | | | | | | | | | | | | | | | | | | | | | | | | | | | |
LIABILITIES: | | | | | | | | | | | | | | | | | | | | | | | | | | | | |
Payable upon return of securities loaned (Note 7) | | | 147,988 | | | | 2,552,002 | | | | 2,584,771 | | | | 727,806 | | | | 1,716,714 | | | | 3,907,774 | | | | — | |
Payable for investment securities purchased | | | 78,614 | | | | 1,166,568 | | | | 1,319,948 | | | | — | | | | — | | | | 2,800,416 | | | | 83,327,898 | |
Payable for capital shares redeemed | | | 89,531 | | | | 61,507 | | | | 15,229 | | | | 17,556 | | | | 90,628 | | | | 100,333 | | | | 82,971 | |
Net unrealized depreciation on foreign forward currency contracts (Note 6) | | | — | | | | — | | | | — | | | | — | | | | — | | | | — | | | | 13,732 | |
Investment advisory fees payable (Note 3) | | | 161,393 | | | | 147,693 | | | | 32,893 | | | | 32,567 | | | | 15,631 | | | | 332,873 | | | | 151,164 | |
Distribution fees payable (Note 4) | | | 12,570 | | | | 371 | | | | 9,763 | | | | — | | | | 43,184 | | | | — | | | | — | |
Shareholder Service fees payable (Note 4) | | | 13,210 | | | | 9,440 | | | | 2,660 | | | | 2,280 | | | | 8,900 | | | | 12,680 | | | | 15,210 | |
Administration fees payable | | | 8,600 | | | | 7,800 | | | | 1,800 | | | | 1,800 | | | | 6,200 | | | | 13,500 | | | | 10,000 | |
Accrued expenses and other payables | | | 41,278 | | | | 45,718 | | | | 25,366 | | | | 25,805 | | | | 42,110 | | | | 81,537 | | | | 73,215 | |
Total Liabilities | | | 553,184 | | | | 3,991,099 | | | | 3,992,430 | | | | 807,814 | | | | 1,923,367 | | | | 7,249,113 | | | | 83,674,190 | |
| | | | | | | | | | | | | | | | | | | | | | | | | | | | | |
NET ASSETS | | $ | 266,485,346 | | | $ | 251,825,362 | | | $ | 58,725,230 | | | $ | 57,693,256 | | | $ | 187,345,745 | | | $ | 430,842,329 | | | $ | 334,876,885 | |
| | | | | | | | | | | | | | | | | | | | | | | | | | | | | |
* Includes value of securities on loan | | $ | 24,520,199 | | | $ | 11,631,429 | | | $ | 17,043,667 | | | $ | 10,886,090 | | | $ | 12,236,966 | | | $ | 18,631,012 | | | $ | — | |
See Notes to Financial Statements.
67
Wilshire Mutual Funds, Inc. Statements of Assets and Liabilities - (Continued) June 30, 2018 (Unaudited) |
|
| | | LARGE
COMPANY
GROWTH
PORTFOLIO | | | LARGE
COMPANY
VALUE
PORTFOLIO | | | SMALL
COMPANY
GROWTH
PORTFOLIO | | | SMALL
COMPANY
VALUE
PORTFOLIO | | | WILSHIRE
5000
INDEXSM
FUND | | | WILSHIRE
INTERNATIONAL
EQUITY
FUND | | | WILSHIRE
INCOME
OPPORTUNITIES
FUND | |
NET ASSETS CONSIST OF: | | | | | | | | | | | | | | | | | | | | | | | | | | | | |
Paid-in capital | | $ | 160,496,506 | | | $ | 217,180,343 | | | $ | 44,209,863 | | | $ | 46,791,557 | | | $ | 55,492,014 | | | $ | 380,790,412 | | | $ | 333,145,662 | |
Accumulated net investment income (loss) | | | (336,527 | ) | | | 1,727,014 | | | | (139,574 | ) | | | 30,025 | | | | 1,517,072 | | | | 830,355 | | | | 4,429,721 | |
Accumulated net realized gains from investment transactions | | | 24,497,817 | | | | 7,103,177 | | | | 2,195,636 | | | | 2,743,262 | | | | 697,147 | | | | 16,153,550 | | | | 2,102,649 | |
Net unrealized appreciation (depreciation) on: | | | | | | | | | | | | | | | | | | | | | | | | | | | | |
Unaffiliated investments | | | 81,827,550 | | | | 25,814,828 | | | | 12,459,305 | | | | 8,128,412 | | | | 129,639,512 | | | | 33,070,717 | | | | (4,738,432 | ) |
Investments in affiliated funds | | | — | | | | — | | | | — | | | | — | | | | — | | | | — | | | | (88,748 | ) |
Futures contracts | | | — | | | | — | | | | — | | | | — | | | | — | | | | — | | | | 5,535 | |
Net unrealized appreciation (depreciation) on assets and liabilities denominated in foreign currencies | | | — | | | | — | | | | — | | | | — | | | | — | | | | (2,705 | ) | | | 20,498 | |
| | | | | | | | | | | | | | | | | | | | | | | | | | | | | |
NET ASSETS | | $ | 266,485,346 | | | $ | 251,825,362 | | | $ | 58,725,230 | | | $ | 57,693,256 | | | $ | 187,345,745 | | | $ | 430,842,329 | | | $ | 334,876,885 | |
| | | | | | | | | | | | | | | | | | | | | | | | | | | | | |
Investments in unaffiliated securities, at cost (Note 2) | | $ | 174,063,582 | | | $ | 213,046,783 | | | $ | 45,209,531 | | | $ | 45,981,815 | | | $ | 59,317,824 | | | $ | 378,602,521 | | | $ | 327,758,321 | |
Investments in affiliated securities, at cost (Note 5) | | | — | | | | — | | | | — | | | | — | | | | — | | | | — | | | | 24,781,078 | |
Cash collateral for securities on loan, at cost | | | 147,988 | | | | 2,552,002 | | | | 2,584,771 | | | | 727,806 | | | | 1,716,714 | | | | 3,907,774 | | | | — | |
Foreign currency, at cost | | | — | | | | — | | | | — | | | | — | | | | — | | | | 2,821,554 | | | | 1,781,779 | |
See Notes to Financial Statements.
68
Wilshire Mutual Funds, Inc. Statements of Assets and Liabilities - (Continued) June 30, 2018 (Unaudited) |
|
| | | LARGE
COMPANY
GROWTH
PORTFOLIO | | | LARGE
COMPANY
VALUE
PORTFOLIO | | | SMALL
COMPANY
GROWTH
PORTFOLIO | | | SMALL
COMPANY
VALUE
PORTFOLIO | | | WILSHIRE
5000
INDEXSM
FUND | | | WILSHIRE
INTERNATIONAL
EQUITY
FUND | | | WILSHIRE
INCOME
OPPORTUNITIES
FUND | |
NET ASSET VALUE PER SHARE: | | | | | | | | | | | | | | | | | | | | | | | | | | | | |
INVESTMENT CLASS | | | | | | | | | | | | | | | | | | | | | | | | | | | | |
Net assets applicable to Investment Class | | $ | 66,337,785 | | | $ | 5,765,123 | | | $ | 10,656,399 | | | $ | 6,269,285 | | | $ | 151,374,591 | | | $ | 2,951,684 | | | $ | 1,566,205 | |
Investment Class shares of beneficial interest outstanding | | | | | | | | | | | | | | | | | | | | | | | | | | | | |
(50,000,000 shares authorized, per class, per Portfolio, par value $.001 per share)† | | | 1,558,872 | | | | 277,872 | | | | 391,159 | | | | 259,878 | | | | 7,078,524 | | | | 269,921 | | | | 152,970 | |
| | | | | | | | | | | | | | | | | | | | | | | | | | | | | |
Net asset value, offering and redemption price per share (a) | | $ | 42.55 | | | $ | 20.75 | | | $ | 27.24 | | | $ | 24.12 | | | $ | 21.39 | | | $ | 10.94 | | | $ | 10.24 | |
| | | | | | | | | | | | | | | | | | | | | | | | | | | | | |
INSTITUTIONAL CLASS | | | | | | | | | | | | | | | | | | | | | | | | | | | | |
Net assets applicable to Institutional Class | | $ | 200,147,561 | | | $ | 246,060,239 | | | $ | 48,068,831 | | | $ | 51,423,971 | | | $ | 35,971,154 | | | $ | 427,890,645 | | | $ | 333,310,680 | |
Institutional Class shares of beneficial interest outstanding | | | | | | | | | | | | | | | | | | | | | | | | | | | | |
(50,000,000 shares authorized, per class, per Portfolio, par value $.001 per share)† | | | 4,364,441 | | | | 11,975,375 | | | | 1,626,516 | | | | 2,084,551 | | | | 1,680,046 | | | | 39,610,752 | | | | 32,608,482 | |
| | | | | | | | | | | | | | | | | | | | | | | | | | | | | |
Net asset value, offering and redemption price per share (a) | | $ | 45.86 | | | $ | 20.55 | | | $ | 29.55 | | | $ | 24.67 | | | $ | 21.41 | | | $ | 10.80 | | | $ | 10.22 | |
† | For Wilshire International Equity Fund, (40,000,000 shares authorized, per class, par value $.001 per share). |
(a) | For Wilshire International Equity Fund, a redemption fee may apply to redemptions of shares held for sixty days or less, subject to certain exceptions (Note 2). |
See Notes to Financial Statements.
69
Wilshire Mutual Funds, Inc. Statements of Operations For the Six Months Ended June 30, 2018 (Unaudited) |
|
| | | LARGE
COMPANY
GROWTH
PORTFOLIO | | | LARGE
COMPANY
VALUE
PORTFOLIO | | | SMALL
COMPANY
GROWTH
PORTFOLIO | | | SMALL
COMPANY
VALUE
PORTFOLIO | | | WILSHIRE
5000
INDEXSM
FUND | | | WILSHIRE
INTERNATIONAL
EQUITY
FUND | | | WILSHIRE
INCOME
OPPORTUNITIES
FUND | |
INVESTMENT INCOME: | | | | | | | | | | | | | | | | | | | | | | | | | | | | |
Dividends | | $ | 971,121 | | | $ | 2,761,985 | | | $ | 123,625 | | | $ | 286,745 | | | $ | 1,764,924 | | | $ | 7,261,087 | | | $ | 212,717 | |
Interest | | | — | | | | — | | | | — | | | | — | | | | — | | | | — | | | | 6,015,352 | |
Income from securities lending (Note 7) | | | 12,219 | | | | 6,413 | | | | 22,134 | | | | 7,632 | | | | 16,566 | | | | 29,507 | | | | — | |
Income distributions from affiliated investments (Note 5) | | | — | | | | — | | | | — | | | | — | | | | — | | | | — | | | | 93,407 | |
Foreign taxes withheld | | | (56,960 | ) | | | (25,613 | ) | | | — | | | | — | | | | (289 | ) | | | (803,499 | ) | | | — | |
Total income | | | 926,380 | | | | 2,742,785 | | | | 145,759 | | | | 294,377 | | | | 1,781,201 | | | | 6,487,095 | | | | 6,321,476 | |
| | | | | | | | | | | | | | | | | | | | | | | | | | | | | |
EXPENSES: | | | | | | | | | | | | | | | | | | | | | | | | | | | | |
Investment advisory fee (Note 3) | | | 887,154 | | | | 783,812 | | | | 214,243 | | | | 203,697 | | | | 92,843 | | | | 2,025,257 | (a) | | | 939,539 | |
Shareholder Service fees (Note 4) | | | | | | | | | | | | | | | | | | | | | | | | | | | | |
Investment Class | | | 42,897 | | | | 2,207 | | | | 4,876 | | | | 3,409 | | | | 52,200 | | | | 2,448 | | | | 1,688 | |
Institutional Class | | | 40,997 | | | | 51,641 | | | | 11,124 | | | | 10,118 | | | | 4,131 | | | | 77,052 | | | | 89,753 | |
Administration and accounting fees (Note 3) | | | 47,915 | | | | 42,257 | | | | 10,191 | | | | 9,693 | | | | 37,624 | | | | 80,472 | | | | 63,377 | |
Distribution (12b-1) fees (Note 4) | | | | | | | | | | | | | | | | | | | | | | | | | | | | |
Investment Class | | | 81,426 | | | | 7,717 | | | | 12,993 | | | | 7,727 | | | | 148,466 | | | | 4,473 | | | | 4,662 | |
Pricing costs | | | 4,034 | | | | 4,464 | | | | 5,518 | | | | 5,441 | | | | 21,407 | | | | 58,520 | | | | 135,037 | |
Custodian fees (Note 3) | | | 27,450 | | | | 22,584 | | | | 5,548 | | | | 4,921 | | | | 21,058 | | | | 46,816 | | | | 35,600 | |
Registration and filing fees | | | 21,608 | | | | 28,874 | | | | 20,586 | | | | 19,857 | | | | 20,250 | | | | 27,883 | | | | 21,637 | |
Transfer agent fees (Note 3) | | | 30,051 | | | | 14,631 | | | | 16,418 | | | | 15,487 | | | | 29,223 | | | | 42,127 | | | | 11,663 | |
Professional fees | | | 19,455 | | | | 17,947 | | | | 11,697 | | | | 11,542 | | | | 18,594 | | | | 28,414 | | | | 24,375 | |
Directors’ fees and expenses (Note 3) | | | 18,210 | | | | 15,837 | | | | 3,919 | | | | 3,666 | | | | 14,489 | | | | 30,988 | | | | 25,377 | |
Postage and supplies | | | 18,193 | | | | 13,852 | | | | 10,638 | | | | 10,496 | | | | 8,380 | | | | 17,668 | | | | 6,569 | |
Insurance expense | | | 6,681 | | | | 4,526 | | | | 1,363 | | | | 1,190 | | | | 5,281 | | | | 9,708 | | | | 9,202 | |
Printing expense | | | 6,119 | | | | 4,711 | | | | 1,760 | | | | 1,622 | | | | 5,033 | | | | 9,252 | | | | 8,656 | |
Interest expense (Note 2) | | | 4,702 | | | | 1,200 | | | | — | | | | 297 | | | | 86 | | | | 12,506 | | | | 1,700 | |
Other | | | 6,991 | | | | 7,281 | | | | 5,936 | | | | 6,219 | | | | 8,069 | | | | 42,931 | | | | 8,193 | |
Total expenses | | | 1,263,883 | | | | 1,023,541 | | | | 336,810 | | | | 315,382 | | | | 487,134 | | | | 2,516,515 | | | | 1,387,028 | |
Fees reduced and/or expenses reimbursed by Investment Adviser (Note 3) | | | — | | | | — | | | | (51,477 | ) | | | (48,363 | ) | | | — | | | | (1,600 | ) | | | (362 | ) |
Fees paid indirectly (Note 4) | | | (976 | ) | | | (7,151 | ) | | | — | | | | (1,511 | ) | | | — | | | | — | | | | — | |
Net expenses | | | 1,262,907 | | | | 1,016,390 | | | | 285,333 | | | | 265,508 | | | | 487,134 | | | | 2,514,915 | | | | 1,386,666 | |
| | | | | | | | | | | | | | | | | | | | | | | | | | | | | |
Net investment income (loss) | | | (336,527 | ) | | | 1,726,395 | | | | (139,574 | ) | | | 28,869 | | | | 1,294,067 | | | | 3,972,180 | | | | 4,934,810 | |
(a) | Includes $40,068 of prior years’ investment advisory fee reductions and expense reimbursement recouped by the Adviser (Note 3). |
See Notes to Financial Statements.
70
Wilshire Mutual Funds, Inc. Statements of Operations - (Continued) For the Six Months Ended June 30, 2018 (Unaudited) |
|
| | | LARGE
COMPANY
GROWTH
PORTFOLIO | | | LARGE
COMPANY
VALUE
PORTFOLIO | | | SMALL
COMPANY
GROWTH
PORTFOLIO | | | SMALL
COMPANY
VALUE
PORTFOLIO | | | WILSHIRE
5000
INDEXSM
FUND | | | WILSHIRE
INTERNATIONAL
EQUITY
FUND | | | WILSHIRE
INCOME
OPPORTUNITIES
FUND | |
NET REALIZED AND UNREALIZED GAINS (LOSSES) ON INVESTMENTS AND FOREIGN CURRENCY TRANSACTIONS (NOTES 2 and 5): | | | | | | | | | | | | | | | | | | | | | | | | | | | | |
Net realized gains (losses) from: | | | | | | | | | | | | | | | | | | | | | | | | | | | | |
Unaffiliated investments | | $ | 18,972,128 | | | $ | 4,840,944 | | | $ | 1,640,690 | | | $ | 2,051,025 | | | $ | 1,119,530 | | | $ | 23,013,550 | | | $ | (1,988,251 | ) |
Sale of affiliated investment company shares | | | — | | | | — | | | | — | | | | — | | | | — | | | | — | | | | (7,262 | ) |
Swap contracts | | | — | | | | — | | | | — | | | | — | | | | — | | | | — | | | | 2,307,142 | |
Foreign currency transactions | | | — | | | | 619 | | | | — | | | | — | | | | — | | | | (4,306,055 | ) | | | (619 | ) |
Net change in unrealized appreciation (depreciation) on: | | | | | | | | | | | | | | | | | | | | | | | | | | | | |
Unaffiliated investments | | | (1,681,988 | ) | | | (11,393,450 | ) | | | 2,568,392 | | | | 379,296 | | | | 2,487,429 | | | | (32,677,153 | ) | | | (4,923,071 | ) |
Investments in affiliated investment company shares | | | — | | | | — | | | | — | | | | — | | | | — | | | | — | | | | (86,258 | ) |
Futures contracts | | | — | | | | — | | | | — | | | | — | | | | — | | | | — | | | | 5,535 | |
Swap contracts | | | — | | | | — | | | | — | | | | — | | | | — | | | | — | | | | (437,340 | ) |
Forward foreign currency exchange contracts | | | — | | | | — | | | | — | | | | — | | | | — | | | | — | | | | (140 | ) |
Foreign currency transactions and translation of other assets and liabilities denominated in foreign currencies | | | — | | | | — | | | | — | | | | — | | | | — | | | | (35,399 | ) | | | 20,638 | |
Net realized and unrealized gains (losses) on investments and foreign currency transactions | | | 17,290,140 | | | | (6,551,887 | ) | | | 4,209,082 | | | | 2,430,321 | | | | 3,606,959 | | | | (14,005,057 | ) | | | (5,109,626 | ) |
| | | | | | | | | | | | | | | | | | | | | | | | | | | | | |
NET INCREASE (DECREASE) IN NET ASSETS RESULTING FROM OPERATIONS | | $ | 16,953,613 | | | $ | (4,825,492 | ) | | $ | 4,069,508 | | | $ | 2,459,190 | | | $ | 4,901,026 | | | $ | (10,032,877 | ) | | $ | (174,816 | ) |
See Notes to Financial Statements.
71
Wilshire Mutual Funds, Inc. Statements of Changes in Net Assets |
|
| | | LARGE COMPANY
GROWTH PORTFOLIO | | | LARGE COMPANY
VALUE PORTFOLIO | |
| | | Six Months Ended
June 30, 2018
(Unaudited) | | | Year Ended
December 31, 2017 | | | Six Months Ended
June 30, 2018
(Unaudited) | | | Year Ended
December 31, 2017 | |
OPERATIONS: | | | | | | | | | | | | | | | | |
Net investment income (loss) | | $ | (336,527 | ) | | $ | 62,370 | | | $ | 1,726,395 | | | $ | 2,767,177 | |
Net realized gains on investments | | | 18,972,128 | | | | 23,070,730 | | | | 4,841,563 | | | | 13,077,655 | |
Net change in unrealized appreciation (depreciation) on investments | | | (1,681,988 | ) | | | 32,528,372 | | | | (11,393,450 | ) | | | 6,970,898 | |
Net increase (decrease) in net assets resulting from operations | | | 16,953,613 | | | | 55,661,472 | | | | (4,825,492 | ) | | | 22,815,730 | |
| | | | | | | | | | | | | | | | | |
DISTRIBUTIONS TO SHAREHOLDERS FROM: | | | | | | | | | | | | | | | | |
Net investment income: | | | | | | | | | | | | | | | | |
Investment Class shares | | | — | | | | — | | | | — | | | | (92,892 | ) |
Institutional Class shares | | | — | | | | (83,014 | ) | | | — | | | | (2,679,991 | ) |
Net realized capital gains: | | | | | | | | | | | | | | | | |
Investment Class shares | | | — | | | | (5,345,348 | ) | | | — | | | | (529,991 | ) |
Institutional Class shares | | | — | | | | (13,199,444 | ) | | | — | | | | (12,564,148 | ) |
Total distributions to shareholders | | | — | | | | (18,627,806 | ) | | | — | | | | (15,867,022 | ) |
| | | | | | | | | | | | | | | | | |
CAPITAL STOCK TRANSACTIONS (DOLLARS) (Note 8): | | | | | | | | | | | | | | | | |
Investment Class shares: | | | | | | | | | | | | | | | | |
Shares sold | | | 1,729,691 | | | | 1,303,759 | | | | 337,212 | | | | 910,198 | |
Shares issued as reinvestment of distributions | | | — | | | | 5,238,090 | | | | — | | | | 607,100 | |
Shares redeemed | | | (4,306,870 | ) | | | (14,751,160 | ) | | | (994,393 | ) | | | (5,436,320 | ) |
Net decrease in net assets from Investment Class share transactions | | | (2,577,179 | ) | | | (8,209,311 | ) | | | (657,181 | ) | | | (3,919,022 | ) |
| | | | | | | | | | | | | | | | | |
Institutional Class shares: | | | | | | | | | | | | | | | | |
Shares sold | | | 60,791,331 | | | | 41,145,232 | | | | 118,345,538 | | | | 24,380,834 | |
Shares issued as reinvestment of distributions | | | — | | | | 12,550,610 | | | | — | | | | 15,150,692 | |
Shares redeemed | | | (43,520,746 | ) | | | (62,483,304 | ) | | | (19,507,315 | ) | | | (69,699,659 | ) |
Net increase (decrease) in net assets from Institutional Class share transactions | | | 17,270,585 | | | | (8,787,462 | ) | | | 98,838,223 | | | | (30,168,133 | ) |
| | | | | | | | | | | | | | | | | |
Net increase (decrease) in net assets | | | 31,647,019 | | | | 20,036,893 | | | | 93,355,550 | | | | (27,138,447 | ) |
| | | | | | | | | | | | | | | | | |
NET ASSETS: | | | | | | | | | | | | | | | | |
Beginning of period | | | 234,838,327 | | | | 214,801,434 | | | | 158,469,812 | | | | 185,608,259 | |
End of period | | $ | 266,485,346 | | | $ | 234,838,327 | | | $ | 251,825,362 | | | $ | 158,469,812 | |
| | | | | | | | | | | | | | | | | |
Accumulated net investment income (loss), end of period | | $ | (336,527 | ) | | $ | — | | | $ | 1,727,014 | | | $ | — | |
See Notes to Financial Statements.
72
Wilshire Mutual Funds, Inc. Statements of Changes in Net Assets - (Continued) |
|
| | | SMALL COMPANY
GROWTH PORTFOLIO | | | SMALL COMPANY
VALUE PORTFOLIO | |
| | | Six Months Ended
June 30, 2018
(Unaudited) | | | Year Ended
December 31, 2017 | | | Six Months Ended
June 30, 2018
(Unaudited) | | | Year Ended
December 31, 2017 | |
OPERATIONS: | | | | | | | | | | | | | | | | |
Net investment income (loss) | | $ | (139,574 | ) | | $ | (230,978 | ) | | $ | 28,869 | | | $ | 1,156 | |
Net realized gains on investments | | | 1,640,690 | | | | 4,094,232 | | | | 2,051,025 | | | | 3,862,700 | |
Net change in unrealized appreciation (depreciation) on investments | | | 2,568,392 | | | | 1,518,666 | | | | 379,296 | | | | (939,024 | ) |
Net increase in net assets resulting from operations | | | 4,069,508 | | | | 5,381,920 | | | | 2,459,190 | | | | 2,924,832 | |
| | | | | | | | | | | | | | | | | |
DISTRIBUTIONS TO SHAREHOLDERS FROM: | | | | | | | | | | | | | | | | |
Net realized capital gains: | | | | | | | | | | | | | | | | |
Investment Class shares | | | — | | | | (1,097,621 | ) | | | — | | | | (709,839 | ) |
Institutional Class shares | | | — | | | | (3,329,032 | ) | | | — | | | | (3,781,888 | ) |
Total distributions to shareholders | | | — | | | | (4,426,653 | ) | | | — | | | | (4,491,727 | ) |
| | | | | | | | | | | | | | | | | |
CAPITAL STOCK TRANSACTIONS (DOLLARS) (Note 8): | | | | | | | | | | | | | | | | |
Investment Class shares: | | | | | | | | | | | | | | | | |
Shares sold | | | 1,079,963 | | | | 14,638,488 | | | | 338,326 | | | | 1,117,553 | |
Shares issued as reinvestment of distributions | | | — | | | | 1,041,243 | | | | — | | | | 689,265 | |
Shares redeemed | | | (2,671,229 | ) | | | (13,152,021 | ) | | | (671,244 | ) | | | (4,390,773 | ) |
Net increase (decrease) in net assets from Investment Class share transactions | | | (1,591,266 | ) | | | 2,527,710 | | | | (332,918 | ) | | | (2,583,955 | ) |
| | | | | | | | | | | | | | | | | |
Institutional Class shares: | | | | | | | | | | | | | | | | |
Shares sold | | | 14,406,543 | | | | 18,566,543 | | | | 18,730,139 | | | | 15,355,723 | |
Shares issued as reinvestment of distributions | | | — | | | | 3,308,750 | | | | — | | | | 3,772,200 | |
Shares redeemed | | | (6,144,006 | ) | | | (14,460,998 | ) | | | (3,387,506 | ) | | | (15,548,502 | ) |
Net increase in net assets from Institutional Class share transactions | | | 8,262,537 | | | | 7,414,295 | | | | 15,342,633 | | | | 3,579,421 | |
| | | | | | | | | | | | | | | | | |
Net increase (decrease) in net assets | | | 10,740,779 | | | | 10,897,272 | | | | 17,468,905 | | | | (571,429 | ) |
| | | | | | | | | | | | | | | | | |
NET ASSETS: | | | | | | | | | | | | | | | | |
Beginning of period | | | 47,984,451 | | | | 37,087,179 | | | | 40,224,351 | | | | 40,795,780 | |
End of period | | $ | 58,725,230 | | | $ | 47,984,451 | | | $ | 57,693,256 | | | $ | 40,224,351 | |
| | | | | | | | | | | | | | | | | |
Accumulated net investment income (loss), end of period | | $ | (139,574 | ) | | $ | — | | | $ | 30,025 | | | $ | 1,156 | |
See Notes to Financial Statements.
73
Wilshire Mutual Funds, Inc. Statements of Changes in Net Assets - (Continued) |
|
| | | WILSHIRE 5000
INDEXSM FUND | | | WILSHIRE INTERNATIONAL
EQUITY FUND | |
| | | Six Months Ended
June 30, 2018
(Unaudited) | | | Year Ended
December 31, 2017 | | | Six Months Ended
June 30, 2018
(Unaudited) | | | Year Ended
December 31, 2017 | |
OPERATIONS: | | | | | | | | | | | | | | | | |
Net investment income | | $ | 1,294,067 | | | $ | 2,600,534 | | | $ | 3,972,180 | | | $ | 3,180,903 | |
Net realized gains on investments and foreign currency transactions | | | 1,119,530 | | | | 12,583,104 | | | | 18,707,495 | | | | 15,094,926 | |
Net change in unrealized appreciation (depreciation) on investments and foreign currency transactions and translation of other assets and liabilities denominated in foreign currencies | | | 2,487,429 | | | | 17,971,304 | | | | (32,712,552 | ) | | | 52,204,776 | |
Net increase (decrease) in net assets resulting from operations | | | 4,901,026 | | | | 33,154,942 | | | | (10,032,877 | ) | | | 70,480,605 | |
| | | | | | | | | | | | | | | | | |
DISTRIBUTIONS TO SHAREHOLDERS FROM: | | | | | | | | | | | | | | | | |
Net investment income: | | | | | | | | | | | | | | | | |
Investment Class shares | | | — | | | | (1,946,012 | ) | | | — | | | | (2,976 | ) |
Institutional Class shares | | | — | | | | (555,678 | ) | | | — | | | | (1,689,353 | ) |
Net realized capital gains: | | | | | | | | | | | | | | | | |
Investment Class shares | | | — | | | | (10,494,187 | ) | | | — | | | | — | |
Institutional Class shares | | | — | | | | (2,473,623 | ) | | | — | | | | — | |
Total distributions to shareholders | | | — | | | | (15,469,500 | ) | | | — | | | | (1,692,329 | ) |
See Notes to Financial Statements.
74
Wilshire Mutual Funds, Inc. Statements of Changes in Net Assets - (Continued) |
|
| | | WILSHIRE 5000
INDEXSM FUND | | | WILSHIRE INTERNATIONAL
EQUITY FUND | |
| | | Six Months Ended
June 30, 2018
(Unaudited) | | | Year Ended
December 31, 2017 | | | Six Months Ended
June 30, 2018
(Unaudited) | | | Year Ended
December 31, 2017 | |
CAPITAL STOCK TRANSACTIONS (DOLLARS) (Note 8): | | | | | | | | | | | | | | | | |
Investment Class shares: | | | | | | | | | | | | | | | | |
Shares sold | | $ | 8,436,409 | | | $ | 19,689,466 | | | $ | 535,489 | | | $ | 2,292,119 | |
Shares issued as reinvestment of distributions | | | — | | | | 11,943,752 | | | | — | | | | 2,853 | |
Redemption fees (Note 2) | | | — | | | | — | | | | 132 | | | | 10 | |
Shares redeemed | | | (10,334,530 | ) | | | (28,829,164 | ) | | | (1,706,645 | ) | | | (11,034,460 | ) |
Net increase (decrease) in net assets from Investment Class share transactions | | | (1,898,121 | ) | | | 2,804,054 | | | | (1,171,024 | ) | | | (8,739,478 | ) |
| | | | | | | | | | | | | | | | | |
Institutional Class shares: | | | | | | | | | | | | | | | | |
Shares sold | | | 2,040,426 | | | | 3,066,897 | | | | 144,030,727 | | | | 76,449,497 | |
Shares issued as reinvestment of distributions | | | — | | | | 2,507,629 | | | | — | | | | 1,646,137 | |
Redemption fees (Note 2) | | | — | | | | — | | | | 107 | | | | 635 | |
Shares redeemed | | | (2,105,294 | ) | | | (15,185,693 | ) | | | (57,296,632 | ) | | | (52,433,552 | ) |
Net increase (decrease) in net assets from Institutional Class share transactions | | | (64,868 | ) | | | (9,611,167 | ) | | | 86,734,202 | | | | 25,662,717 | |
| | | | | | | | | | | | | | | | | |
Net increase in net assets | | | 2,938,037 | | | | 10,878,329 | | | | 75,530,301 | | | | 85,711,515 | |
| | | | | | | | | | | | | | | | | |
NET ASSETS: | | | | | | | | | | | | | | | | |
Beginning of period | | | 184,407,708 | | | | 173,529,379 | | | | 355,312,028 | | | | 269,600,513 | |
End of period | | $ | 187,345,745 | | | $ | 184,407,708 | | | $ | 430,842,329 | | | $ | 355,312,028 | |
| | | | | | | | | | | | | | | | | |
Accumulated net investment income, end of period | | $ | 1,517,072 | | | $ | 223,005 | | | $ | 830,355 | | | $ | 1,164,230 | |
See Notes to Financial Statements.
75
Wilshire Mutual Funds, Inc. Statements of Changes in Net Assets - (Continued)
|
|
| | | WILSHIRE INCOME
OPPORTUNITIES FUND | |
| | | Six Months Ended
June 30, 2018
(Unaudited) | | | Year Ended
December 31, 2017 | |
OPERATIONS: | | | | | | | | |
Net investment income | | $ | 4,934,810 | | | $ | 12,972,402 | |
Net realized gains on unaffiliated investments, sale of affiliated investment company shares, written option contracts, swap contracts, forward currency contracts and foreign currency transactions | | | 311,010 | | | | 2,958,790 | |
Long-term capital gain distributions from affiliated funds | | | — | | | | 1,090 | |
Net change in unrealized appreciation (depreciation) on affiliated and unaffiliated investments, swap contracts and foreign currency transactions and translation of other assets and liabilities denominated in foreign currencies | | | (5,420,636 | ) | | | 5,169,869 | |
Net increase (decrease) in net assets resulting from operations | | | (174,816 | ) | | | 21,102,151 | |
| | | | | | | | | |
DISTRIBUTIONS TO SHAREHOLDERS FROM: | | | | | | | | |
Net investment income: | | | | | | | | |
Investment Class shares | | | — | | | | (252,971 | ) |
Institutional Class shares | | | — | | | | (12,802,854 | ) |
Net realized capital gains: | | | | | | | | |
Investment Class shares | | | — | | | | (23,429 | ) |
Institutional Class shares | | | — | | | | (1,122,003 | ) |
Total distributions to shareholders | | | — | | | | (14,201,257 | ) |
| | | | | | | | | |
CAPITAL STOCK TRANSACTIONS (DOLLARS) (Note 8): | | | | | | | | |
Investment Class shares: | | | | | | | | |
Shares sold | | | 381,551 | | | | 7,558,909 | |
Shares issued as reinvestment of distributions | | | — | | | | 270,908 | |
Shares redeemed | | | (5,202,769 | ) | | | (2,467,223 | ) |
Net increase (decrease) in net assets from Investment Class share transactions | | | (4,821,218 | ) | | | 5,362,594 | |
| | | | | | | | | |
Institutional Class shares: | | | | | | | | |
Shares sold | | | 58,211,186 | | | | 43,898,687 | |
Shares issued as reinvestment of distributions | | | — | | | | 13,781,761 | |
Shares redeemed | | | (34,974,735 | ) | | | (151,206,477 | ) |
Net increase (decrease) in net assets from Institutional Class share transactions | | | 23,236,451 | | | | (93,526,029 | ) |
| | | | | | | | | |
Net increase (decrease) in net assets | | | 18,240,417 | | | | (81,262,541 | ) |
| | | | | | | | | |
NET ASSETS: | | | | | | | | |
Beginning of period | | | 316,636,468 | | | | 397,899,009 | |
End of period | | $ | 334,876,885 | | | $ | 316,636,468 | |
| | | | | | | | | |
Accumulated (distributions in excess of) net investment income, end of period | | $ | 4,429,721 | | | $ | (393,090 | ) |
See Notes to Financial Statements.
76
Wilshire Mutual Funds, Inc. Large Company Growth Portfolio Financial Highlights |
|
For a Fund Share Outstanding Throughout Each Period. |
| | | Investment Class Shares | |
| | | Six Months
Ended
06/30/2018
(Unaudited) | | | Year
Ended
12/31/2017 | | | Year
Ended
12/31/2016 | | | Year
Ended
12/31/2015 | | | Year
Ended
12/31/2014 | | | Year
Ended
12/31/2013 | |
Net asset value, beginning of period | | $ | 39.53 | | | $ | 33.93 | | | $ | 36.82 | | | $ | 38.66 | | | $ | 41.60 | | | $ | 34.70 | |
| | | | | | | | | | | | | | | | | | | | | | | | | |
Income (loss) from investment operations: | | | | | | | | | | | | | | | | | | | | | | | | |
Net investment income (loss) (a) | | | (0.11 | ) | | | (0.08 | ) | | | 0.04 | | | | (0.14 | ) | | | (0.26 | ) | | | (0.02 | ) |
Net realized and unrealized gains on investments | | | 3.13 | | | | 9.24 | | | | 1.26 | | | | 2.53 | | | | 3.61 | | | | 10.38 | |
Total from investment operations | | | 3.02 | | | | 9.16 | | | | 1.30 | | | | 2.39 | | | | 3.35 | | | | 10.36 | |
| | | | | | | | | | | | | | | | | | | | | | | | | |
Less distributions: | | | | | | | | | | | | | | | | | | | | | | | | |
From net investment income | | | — | | | | — | | | | (0.01 | ) | | | — | | | | — | | | | — | |
From realized capital gains | | | — | | | | (3.56 | ) | | | (4.18 | ) | | | (4.23 | ) | | | (6.29 | ) | | | (3.46 | ) |
Total distributions | | | — | | | | (3.56 | ) | | | (4.19 | ) | | | (4.23 | ) | | | (6.29 | ) | | | (3.46 | ) |
| | | | | | | | | | | | | | | | | | | | | | | | | |
Net asset value, end of period | | $ | 42.55 | | | $ | 39.53 | | | $ | 33.93 | | | $ | 36.82 | | | $ | 38.66 | | | $ | 41.60 | |
| | | | | | | | | | | | | | | | | | | | | | | | | |
Total return (b) | | | 7.64 | %(c) | | | 26.93 | % | | | 3.33 | % | | | 6.18 | % | | | 7.97 | % | | | 30.22 | % |
| | | | | | | | | | | | | | | | | | | | | | | | | |
Ratios to average net assets/supplemental data: | | | | | | | | | | | | | | | | | | | | | | | | |
Net assets, end of period (in 000’s) | | $ | 66,338 | | | $ | 64,130 | | | $ | 62,634 | | | $ | 107,381 | | | $ | 103,733 | | | $ | 113,495 | |
Operating expenses (e) | | | 1.31 | %(d) | | | 1.30 | % | | | 1.32 | % | | | 1.33 | % | | | 1.38 | % | | | 1.36 | % |
Net investment income (loss) | | | (0.19 | %)(d) | | | (0.21 | %) | | | 0.10 | % | | | (0.34 | %) | | | (0.61 | %) | | | (0.05 | %) |
Portfolio turnover rate | | | 44 | %(c) | | | 51 | % | | | 75 | % | | | 104 | % | | | 62 | % | | | 136 | % |
(a) | The selected per share data was calculated using the average shares outstanding method for the period. |
(b) | Total return is a measure of the change in value of an investment in the Portfolio over the period covered. The returns shown do not reflect the deduction of taxes a shareholder would pay on Portfolio distributions, if any, or the redemption of Portfolio shares. |
(c) | Not annualized. |
(d) | Annualized. |
(e) | The ratio of operating expenses to average net assets excludes the effect of fees paid indirectly. If this expense offset was included, the ratio would have been 1.31%(d), 1.30%, 1.32%, 1.34%, 1.38% and 1.36% for the periods ended June 30, 2018, December 31, 2017, 2016, 2015, 2014 and 2013, respectively (Note 4). |
See Notes to Financial Statements.
77
Wilshire Mutual Funds, Inc. Large Company Growth Portfolio Financial Highlights - (Continued) |
|
For a Fund Share Outstanding Throughout Each Period. |
| | | Institutional Class Shares | |
| | | Six Months
Ended
06/30/2018
(Unaudited) | | | Year
Ended
12/31/2017 | | | Year
Ended
12/31/2016 | | | Year
Ended
12/31/2015 | | | Year
Ended
12/31/2014 | | | Year
Ended
12/31/2013 | |
Net asset value, beginning of period | | $ | 42.53 | | | $ | 36.19 | | | $ | 39.04 | | | $ | 40.62 | | | $ | 43.28 | | | $ | 35.94 | |
| | | | | | | | | | | | | | | | | | | | | | | | | |
Income (loss) from investment operations: | | | | | | | | | | | | | | | | | | | | | | | | |
Net investment income (loss) (a) | | | (0.04 | ) | | | 0.05 | | | | 0.15 | | | | (0.01 | ) | | | (0.13 | ) | | | 0.10 | |
Net realized and unrealized gains on investments | | | 3.37 | | | | 9.87 | | | | 1.34 | | | | 2.66 | | | | 3.76 | | | | 10.77 | |
Total from investment operations | | | 3.33 | | | | 9.92 | | | | 1.49 | | | | 2.65 | | | | 3.63 | | | | 10.87 | |
| | | | | | | | | | | | | | | | | | | | | | | | | |
Less distributions: | | | | | | | | | | | | | | | | | | | | | | | | |
From net investment income | | | — | | | | (0.02 | ) | | | (0.16 | ) | | | — | | | | (0.00 | )(b) | | | (0.07 | ) |
From realized capital gains | | | — | | | | (3.56 | ) | | | (4.18 | ) | | | (4.23 | ) | | | (6.29 | ) | | | (3.46 | ) |
Total distributions | | | — | | | | (3.58 | ) | | | (4.34 | ) | | | (4.23 | ) | | | (6.29 | ) | | | (3.53 | ) |
| | | | | | | | | | | | | | | | | | | | | | | | | |
Net asset value, end of period | | $ | 45.86 | | | $ | 42.53 | | | $ | 36.19 | | | $ | 39.04 | | | $ | 40.62 | | | $ | 43.28 | |
| | | | | | | | | | | | | | | | | | | | | | | | | |
Total return (c) | | | 7.83 | %(d) | | | 27.35 | % | | | 3.61 | % | | | 6.52 | % | | | 8.32 | % | | | 30.60 | % |
| | | | | | | | | | | | | | | | | | | | | | | | | |
Ratios to average net assets/supplemental data: | | | | | | | | | | | | | | | | | | | | | | | | |
Net assets, end of period (in 000’s) | | $ | 200,148 | | | $ | 170,708 | | | $ | 152,167 | | | $ | 122,219 | | | $ | 134,534 | | | $ | 243,622 | |
Operating expenses after fee reductions and expense reimbursements and fees paid indirectly | | | 0.97 | %(e) | | | 0.98 | % | | | 1.04 | % | | | 1.01 | % | | | 1.06 | % | | | 1.05 | % |
Operating expenses before fee reductions and expense reimbursements and fees paid indirectly (f) | | | 0.97 | %(e) | | | 0.98 | % | | | 1.04 | % | | | 1.01 | % | | | 1.06 | % | | | 1.06 | % |
Net investment income (loss) | | | (0.52 | %)(e) | | | 0.11 | % | | | 0.37 | % | | | (0.02 | %) | | | (0.29 | %) | | | 0.23 | % |
Portfolio turnover rate | | | 44 | %(d) | | | 51 | % | | | 75 | % | | | 104 | % | | | 62 | % | | | 136 | % |
(a) | The selected per share data was calculated using the average shares outstanding method for the period. |
(b) | Amount rounds to less than $0.01 per share. |
(c) | Total return is a measure of the change in value of an investment in the Portfolio over the period covered. The returns shown do not reflect the deduction of taxes a shareholder would pay on Portfolio distributions, if any, or the redemption of Portfolio shares. |
(d) | Not annualized. |
(e) | Annualized. |
(f) | The ratio of operating expenses before fee reductions and expense reimbursements excludes the effect of fees paid indirectly. If this expense offset was included, the ratio would have been 0.97%(e), 0.98%, 1.04%, 1.02%, 1.06% and 1.05% for periods ended June 30, 2018, December 31, 2017, 2016, 2015, 2014 and 2013, respectively (Notes 3 and 4). |
See Notes to Financial Statements.
78
Wilshire Mutual Funds, Inc. Large Company Value Portfolio Financial Highlights |
|
For a Fund Share Outstanding Throughout Each Period. |
| | | Investment Class Shares | |
| | | Six Months
Ended
06/30/2018
(Unaudited) | | | Year
Ended
12/31/2017 | | | Year
Ended
12/31/2016 | | | Year
Ended
12/31/2015 | | | Year
Ended
12/31/2014 | | | Year
Ended
12/31/2013 | |
Net asset value, beginning of period | | $ | 21.18 | | | $ | 20.40 | | | $ | 18.62 | | | $ | 21.19 | | | $ | 21.44 | | | $ | 15.86 | |
| | | | | | | | | | | | | | | | | | | | | | | | | |
Income (loss) from investment operations: | | | | | | | | | | | | | | | | | | | | | | | | |
Net investment income (a) | | | 0.14 | | | | 0.30 | | | | 0.37 | | | | 0.20 | | | | 0.18 | | | | 0.16 | |
Net realized and unrealized gains (losses) on investments | | | (0.57 | ) | | | 2.67 | | | | 2.56 | | | | (1.33 | ) | | | 2.14 | | | | 5.64 | |
Total from investment operations | | | (0.43 | ) | | | 2.97 | | | | 2.93 | | | | (1.13 | ) | | | 2.32 | | | | 5.80 | |
| | | | | | | | | | | | | | | | | | | | | | | | | |
Less distributions: | | | | | | | | | | | | | | | | | | | | | | | | |
From net investment income | | | — | | | | (0.30 | ) | | | (0.14 | ) | | | (0.19 | ) | | | (0.23 | ) | | | (0.14 | ) |
From realized capital gains | | | — | | | | (1.89 | ) | | | (1.01 | ) | | | (1.25 | ) | | | (2.34 | ) | | | (0.08 | ) |
Total distributions | | | — | | | | (2.19 | ) | | | (1.15 | ) | | | (1.44 | ) | | | (2.57 | ) | | | (0.22 | ) |
| | | | | | | | | | | | | | | | | | | | | | | | | |
Net asset value, end of period | | $ | 20.75 | | | $ | 21.18 | | | $ | 20.40 | | | $ | 18.62 | | | $ | 21.19 | | | $ | 21.44 | |
| | | | | | | | | | | | | | | | | | | | | | | | | |
Total return (b) | | | (2.03 | %)(c) | | | 14.64 | % | | | 15.73 | % | | | (5.33 | %) | | | 10.77 | % | | | 36.54 | % |
| | | | | | | | | | | | | | | | | | | | | | | | | |
Ratios to average net assets/supplemental data: | | | | | | | | | | | | | | | | | | | | | | | | |
Net assets, end of period (in 000’s) | | $ | 5,765 | | | $ | 6,547 | | | $ | 10,112 | | | $ | 52,864 | | | $ | 61,566 | | | $ | 61,800 | |
Operating expenses after fee reductions and expense reimbursements and fees
paid indirectly | | | 1.23 | %(d) | | | 1.26 | % | | | 1.26 | % | | | 1.27 | % | | | 1.29 | % | | | 1.24 | % |
Operating expenses before fee reductions and expense reimbursements and fees
paid indirectly (e) | | | 1.23 | %(d) | | | 1.26 | % | | | 1.27 | % | | | 1.29 | % | | | 1.30 | % | | | 1.25 | % |
Net investment income | | | 1.32 | %(d) | | | 1.38 | % | | | 1.87 | % | | | 0.96 | % | | | 0.80 | % | | | 0.87 | % |
Portfolio turnover rate | | | 24 | %(c) | | | 39 | % | | | 174 | % | | | 55 | % | | | 57 | % | | | 101 | % |
(a) | The selected per share data was calculated using the average shares outstanding method for the period. |
(b) | Total return is a measure of the change in value of an investment in the Portfolio over the period covered. The returns shown do not reflect the deduction of taxes a shareholder would pay on Portfolio distributions, if any, or the redemption of Portfolio shares. |
(c) | Not annualized. |
(d) | Annualized. |
(e) | The ratio of operating expenses before fee reductions and expense reimbursements excludes the effect of fees paid indirectly. If this expense offset was included, the ratio would have been 1.22%(d), 1.26%, 1.26%, 1.27%, 1.29% and 1.24% for the periods ended June 30, 2018, December 31, 2017, 2016, 2015, 2014 and 2013, respectively (Notes 3 and 4). |
See Notes to Financial Statements.
79
Wilshire Mutual Funds, Inc. Large Company Value Portfolio Financial Highlights - (Continued) |
|
For a Fund Share Outstanding Throughout Each Period. |
| | | Institutional Class Shares | |
| | | Six Months
Ended
06/30/2018
(Unaudited) | | | Year
Ended
12/31/2017 | | | Year
Ended
12/31/2016 | | | Year
Ended
12/31/2015 | | | Year
Ended
12/31/2014 | | | Year
Ended
12/31/2013 | |
Net asset value, beginning of period | | $ | 20.95 | | | $ | 20.20 | | | $ | 18.67 | | | $ | 21.24 | | | $ | 21.48 | | | $ | 15.89 | |
| | | | | | | | | | | | | | | | | | | | | | | | | |
Income (loss) from investment operations: | | | | | | | | | | | | | | | | | | | | | | | | |
Net investment income (a) | | | 0.17 | | | | 0.36 | | | | 0.40 | | | | 0.26 | | | | 0.24 | | | | 0.22 | |
Net realized and unrealized gains (losses) on investments | | | (0.57 | ) | | | 2.65 | | | | 2.55 | | | | (1.33 | ) | | | 2.14 | | | | 5.63 | |
Total from investment operations | | | (0.40 | ) | | | 3.01 | | | | 2.95 | | | | (1.07 | ) | | | 2.38 | | | | 5.85 | |
| | | | | | | | | | | | | | | | | | | | | | | | | |
Less distributions: | | | | | | | | | | | | | | | | | | | | | | | | |
From net investment income | | | — | | | | (0.37 | ) | | | (0.41 | ) | | | (0.25 | ) | | | (0.28 | ) | | | (0.18 | ) |
From realized capital gains | | | — | | | | (1.89 | ) | | | (1.01 | ) | | | (1.25 | ) | | | (2.34 | ) | | | (0.08 | ) |
Total distributions | | | — | | | | (2.26 | ) | | | (1.42 | ) | | | (1.50 | ) | | | (2.62 | ) | | | (0.26 | ) |
| | | | | | | | | | | | | | | | | | | | | | | | | |
Net asset value, end of period | | $ | 20.55 | | | $ | 20.95 | | | $ | 20.20 | | | $ | 18.67 | | | $ | 21.24 | | | $ | 21.48 | |
| | | | | | | | | | | | | | | | | | | | | | | | | |
Total return (b) | | | (1.91 | %)(c) | | | 14.99 | % | | | 15.78 | % | | | (5.07 | %) | | | 11.05 | % | | | 36.85 | % |
| | | | | | | | | | | | | | | | | | | | | | | | | |
Ratios to average net assets/supplemental data: | | | | | | | | | | | | | | | | | | | | | | | | |
Net assets, end of period (in 000’s) | | $ | 246,060 | | | $ | 151,923 | | | $ | 175,497 | | | $ | 53,343 | | | $ | 63,499 | | | $ | 111,550 | |
Operating expenses after fee reductions and expense reimbursements and fees paid indirectly | | | 0.96 | %(d) | | | 0.98 | % | | | 1.04 | % | | | 1.01 | % | | | 1.00 | % | | | 0.95 | % |
Operating expenses before fee reductions and expense reimbursements and fees paid indirectly (e) | | | 0.96 | %(d) | | | 0.98 | % | | | 1.05 | % | | | 1.02 | % | | | 1.01 | % | | | 0.97 | % |
Net investment income | | | 1.66 | %(d) | | | 1.67 | % | | | 2.09 | % | | | 1.23 | % | | | 1.09 | % | | | 1.13 | % |
Portfolio turnover rate | | | 24 | %(c) | | | 39 | % | | | 174 | % | | | 55 | % | | | 57 | % | | | 101 | % |
(a) | The selected per share data was calculated using the average shares outstanding method for the period. |
(b) | Total return is a measure of the change in value of an investment in the Portfolio over the period covered. The returns shown do not reflect the deduction of taxes a shareholder would pay on Portfolio distributions, if any, or the redemption of Portfolio shares. |
(c) | Not annualized. |
(d) | Annualized. |
(e) | The ratio of operating expenses before fee reductions and expense reimbursements excludes the effect of fees paid indirectly. If this expense offset was included, the ratio would have been 0.95%(d), 0.98%, 1.04%, 1.01%, 1.00% and 0.95% for the periods ended June 30, 2018, December 31, 2017, 2016, 2015, 2014 and 2013, respectively (Notes 3 and 4). |
See Notes to Financial Statements.
80
Wilshire Mutual Funds, Inc. Small Company Growth Portfolio Financial Highlights |
|
For a Fund Share Outstanding Throughout Each Period. |
| | | Investment Class Shares | |
| | | Six Months
Ended
06/30/2018
(Unaudited) | | | Year
Ended
12/31/2017 | | | Year
Ended
12/31/2016 | | | Year
Ended
12/31/2015 | | | Year
Ended
12/31/2014 | | | Year
Ended
12/31/2013 | |
Net asset value, beginning of period | | $ | 25.05 | | | $ | 24.41 | | | $ | 22.64 | | | $ | 23.44 | | | $ | 24.95 | | | $ | 18.06 | |
| | | | | | | | | | | | | | | | | | | | | | | | | |
Income (loss) from investment operations: | | | | | | | | | | | | | | | | | | | | | | | | |
Net investment loss (a) | | | (0.10 | ) | | | (0.19 | ) | | | (0.15 | ) | | | (0.15 | ) | | | (0.25 | ) | | | (0.16 | ) |
Net realized and unrealized gains on investments | | | 2.29 | | | | 3.51 | | | | 4.80 | | | | 0.70 | | | | 1.09 | | | | 7.59 | |
Total from investment operations | | | 2.19 | | | | 3.32 | | | | 4.65 | | | | 0.55 | | | | 0.84 | | | | 7.43 | |
| | | | | | | | | | | | | | | | | | | | | | | | | |
Less distributions: | | | | | | | | | | | | | | | | | | | | | | | | |
From realized capital gains | | | — | | | | (2.68 | ) | | | (2.88 | ) | | | (1.35 | ) | | | (2.35 | ) | | | (0.54 | ) |
| | | | | | | | | | | | | | | | | | | | | | | | | |
Net asset value, end of period | | $ | 27.24 | | | $ | 25.05 | | | $ | 24.41 | | | $ | 22.64 | | | $ | 23.44 | | | $ | 24.95 | |
| | | | | | | | | | | | | | | | | | | | | | | | | |
Total return (b) | | | 8.74 | %(c) | | | 13.66 | % | | | 20.44 | % | | | 2.29 | % | | | 3.44 | % | | | 41.25 | % |
| | | | | | | | | | | | | | | | | | | | | | | | | |
Ratios to average net assets/supplemental data: | | | | | | | | | | | | | | | | | | | | | | | | |
Net assets, end of period (in 000’s) | | $ | 10,656 | | | $ | 11,386 | | | $ | 8,633 | | | $ | 12,642 | | | $ | 11,398 | | | $ | 9,582 | |
Operating expenses after fee reductions and expense reimbursements and fees paid indirectly | | | 1.33 | %(d) | | | 1.48 | % | | | 1.51 | % | | | 1.46 | % | | | 1.50 | % | | | 1.47 | % |
Operating expenses before fee reductions and expense reimbursements and fees paid indirectly (e) | | | 1.57 | %(d) | | | 1.64 | % | | | 1.60 | % | | | 1.64 | % | | | 1.55 | % | | | 1.62 | % |
Net investment loss | | | (0.75 | %)(d) | | | (0.75 | %) | | | (0.57 | %) | | | (0.59 | %) | | | (1.00 | %) | | | (0.75 | %) |
Portfolio turnover rate | | | 46 | %(c) | | | 110 | % | | | 114 | % | | | 63 | % | | | 77 | % | | | 88 | % |
(a) | The selected per share data was calculated using the average shares outstanding method for the period. |
(b) | Total return is a measure of the change in value of an investment in the Portfolio over the period covered. The returns shown do not reflect the deduction of taxes a shareholder would pay on Portfolio distributions, if any, or the redemption of Portfolio shares. |
(c) | Not annualized. |
(d) | Annualized. |
(e) | The ratio of operating expenses before fee reductions and expense reimbursements excludes the effect of fees paid indirectly. If this expense offset was included, the ratio would have been 1.60%, 1.64%, 1.54% and 1.61% for the years ended December 31, 2016, 2015, 2014 and 2013, respectively (Notes 3 and 4). |
See Notes to Financial Statements.
81
Wilshire Mutual Funds, Inc. Small Company Growth Portfolio Financial Highlights - (Continued) |
|
For a Fund Share Outstanding Throughout Each Period. |
| | | Institutional Class Shares | |
| | | Six Months
Ended
06/30/2018
(Unaudited) | | | Year
Ended
12/31/2017 | | | Year
Ended
12/31/2016 | | | Year
Ended
12/31/2015 | | | Year
Ended
12/31/2014 | | | Year
Ended
12/31/2013 | |
Net asset value, beginning of period | | $ | 27.14 | | | $ | 26.18 | | | $ | 24.04 | | | $ | 24.75 | | | $ | 26.14 | | | $ | 18.89 | |
| | | | | | | | | | | | | | | | | | | | | | | | | |
Income (loss) from investment operations: | | | | | | | | | | | | | | | | | | | | | | | | |
Net investment loss (a) | | | (0.07 | ) | | | (0.14 | ) | | | (0.08 | ) | | | (0.07 | ) | | | (0.18 | ) | | | (0.15 | ) |
Net realized and unrealized gains on investments | | | 2.48 | | | | 3.78 | | | | 5.10 | | | | 0.71 | | | | 1.14 | | | | 7.99 | |
Total from investment operations | | | 2.41 | | | | 3.64 | | | | 5.02 | | | | 0.64 | | | | 0.96 | | | | 7.84 | |
| | | | | | | | | | | | | | | | | | | | | | | | | |
Less distributions: | | | | | | | | | | | | | | | | | | | | | | | | |
From net investment income | | | — | | | | — | | | | — | | | | — | | | | — | | | | (0.05 | ) |
From realized capital gains | | | — | | | | (2.68 | ) | | | (2.88 | ) | | | (1.35 | ) | | | (2.35 | ) | | | (0.54 | ) |
Total distributions | | | — | | | | (2.68 | ) | | | (2.88 | ) | | | (1.35 | ) | | | (2.35 | ) | | | (0.59 | ) |
| | | | | | | | | | | | | | | | | | | | | | | | | |
Net asset value, end of period | | $ | 29.55 | | | $ | 27.14 | | | $ | 26.18 | | | $ | 24.04 | | | $ | 24.75 | | | $ | 26.14 | |
| | | | | | | | | | | | | | | | | | | | | | | | | |
Total return (b) | | | 8.88 | %(c) | | | 13.96 | % | | | 20.79 | % | | | 2.53 | % | | | 3.75 | % | | | 41.58 | % |
| | | | | | | | | | | | | | | | | | | | | | | | | |
Ratios to average net assets/supplemental data: | | | | | | | | | | | | | | | | | | | | | | | | |
Net assets, end of period (in 000’s) | | $ | 48,069 | | | $ | 36,599 | | | $ | 28,454 | | | $ | 14,414 | | | $ | 15,483 | | | $ | 24,013 | |
Operating expenses after fee reductions and expense reimbursements and fees paid indirectly | | | 1.08 | %(d) | | | 1.23 | % | | | 1.27 | % | | | 1.19 | % | | | 1.20 | % | | | 1.19 | % |
Operating expenses before fee reductions and expense reimbursements and fees paid indirectly (e) | | | 1.27 | %(d) | | | 1.34 | % | | | 1.33 | % | | | 1.36 | % | | | 1.24 | % | | | 1.20 | % |
Net investment loss | | | (0.50 | %)(d) | | | (0.47 | %) | | | (0.32 | %) | | | (0.28 | %) | | | (0.70 | %) | | | (0.54 | %) |
Portfolio turnover rate | | | 46 | %(c) | | | 110 | % | | | 114 | % | | | 63 | % | | | 77 | % | | | 88 | % |
(a) | The selected per share data was calculated using the average shares outstanding method for the period. |
(b) | Total return is a measure of the change in value of an investment in the Portfolio over the period covered. The returns shown do not reflect the deduction of taxes a shareholder would pay on Portfolio distributions, if any, or the redemption of Portfolio shares. |
(c) | Not annualized. |
(d) | Annualized. |
(e) | The ratio of operating expenses before fee reductions and expense reimbursements excludes the effect of fees paid indirectly. If this expense offset was included, the ratio would have been 1.33%, 1.35%, 1.19% and 1.18% for the years ended December 31, 2016, 2015, 2014 and 2013, respectively (Notes 3 and 4). |
See Notes to Financial Statements.
82
Wilshire Mutual Funds, Inc. Small Company Value Portfolio Financial Highlights |
|
For a Fund Share Outstanding Throughout Each Period. |
| | | Investment Class Shares | |
| | | Six Months
Ended
06/30/2018
(Unaudited) | | | Year
Ended
12/31/2017 | | | Year
Ended
12/31/2016 | | | Year
Ended
12/31/2015 | | | Year
Ended
12/31/2014 | | | Year
Ended
12/31/2013 | |
Net asset value, beginning of period | | $ | 22.99 | | | $ | 23.75 | | | $ | 20.74 | | | $ | 22.86 | | | $ | 24.33 | | | $ | 17.40 | |
| | | | | | | | | | | | | | | | | | | | | | | | | |
Income (loss) from investment operations: | | | | | | | | | | | | | | | | | | | | | | | | |
Net investment income (loss) (a) | | | (0.01 | ) | | | (0.05 | ) | | | 0.10 | | | | 0.01 | | | | (0.08 | ) | | | (0.03 | ) |
Net realized and unrealized gains (losses) on investments | | | 1.14 | | | | 2.09 | | | | 4.99 | | | | (0.89 | ) | | | 1.53 | | | | 7.62 | |
Total from investment operations | | | 1.13 | | | | 2.04 | | | | 5.09 | | | | (0.88 | ) | | | 1.45 | | | | 7.59 | |
| | | | | | | | | | | | | | | | | | | | | | | | | |
Less distributions: | | | | | | | | | | | | | | | | | | | | | | | | |
From net investment income | | | — | | | | — | | | | (0.09 | ) | | | (0.00 | )(b) | | | — | | | | (0.00 | )(b) |
From capital gains | | | — | | | | (2.80 | ) | | | (1.99 | ) | | | (1.24 | ) | | | (2.92 | ) | | | (0.66 | ) |
Total distributions | | | — | | | | (2.80 | ) | | | (2.08 | ) | | | (1.24 | ) | | | (2.92 | ) | | | (0.66 | ) |
| | | | | | | | | | | | | | | | | | | | | | | | | |
Net asset value, end of period | | $ | 24.12 | | | $ | 22.99 | | | $ | 23.75 | | | $ | 20.74 | | | $ | 22.86 | | | $ | 24.33 | |
| | | | | | | | | | | | | | | | | | | | | | | | | |
Total return (c) | | | 4.92 | %(d) | | | 8.65 | % | | | 24.86 | % | | | (3.83 | %) | | | 6.17 | % | | | 43.79 | % |
| | | | | | | | | | | | | | | | | | | | | | | | | |
Ratios to average net assets/supplemental data: | | | | | | | | | | | | | | | | | | | | | | | | |
Net assets, end of period (in 000’s) | | $ | 6,269 | | | $ | 6,305 | | | $ | 9,097 | | | $ | 14,287 | | | $ | 14,120 | | | $ | 13,688 | |
Operating expenses after fee reductions and expense reimbursements and fees paid indirectly | | | 1.32 | %(e) | | | 1.45 | % | | | 1.51 | % | | | 1.49 | % | | | 1.49 | % | | | 1.49 | % |
Operating expenses before fee reductions and expense reimbursements and fees paid indirectly (f) | | | 1.58 | %(e) | | | 1.69 | % | | | 1.60 | % | | | 1.67 | % | | | 1.56 | % | | | 1.58 | % |
Net investment income (loss) | | | (0.10 | %)(e) | | | (0.25 | %) | | | 0.48 | % | | | 0.06 | % | | | (0.35 | %) | | | (0.13 | %) |
Portfolio turnover rate | | | 37 | %(d) | | | 88 | % | | | 99 | % | | | 49 | % | | | 53 | % | | | 60 | % |
(a) | The selected per share data was calculated using the average shares outstanding method for the period. |
(b) | Amount rounds to less than $0.01 per share. |
(c) | Total return is a measure of the change in value of an investment in the Portfolio over the period covered. The returns shown do not reflect the deduction of taxes a shareholder would pay on Portfolio distributions, if any, or the redemption of Portfolio shares. |
(d) | Not annualized. |
(e) | Annualized. |
(f) | The ratio of operating expenses before fee reductions and expense reimbursements excludes the effect of fees paid indirectly. If this expense offset was included, the ratio would have been 1.57%(e), 1.67%, 1.59%, 1.67%, 1.55% and 1.57% for the periods ended June 30, 2018, December 31, 2017, 2016, 2015, 2014 and 2013, respectively (Notes 3 and 4). |
See Notes to Financial Statements.
83
Wilshire Mutual Funds, Inc. Small Company Value Portfolio Financial Highlights - (Continued) |
|
For a Fund Share Outstanding Throughout Each Period. |
| | | Institutional Class Shares | |
| | | Six Months
Ended
06/30/2018
(Unaudited) | | | Year
Ended
12/31/2017 | | | Year
Ended
12/31/2016 | | | Year
Ended
12/31/2015 | | | Year
Ended
12/31/2014 | | | Year
Ended
12/31/2013 | |
Net asset value, beginning of period | | $ | 23.49 | | | $ | 24.14 | | | $ | 21.08 | | | $ | 23.21 | | | $ | 24.59 | | | $ | 17.58 | |
| | | | | | | | | | | | | | | | | | | | | | | | | |
Income (loss) from investment operations: | | | | | | | | | | | | | | | | | | | | | | | | |
Net investment income (loss) (a) | | | 0.02 | | | | 0.01 | | | | 0.16 | | | | 0.08 | | | | (0.02 | ) | | | 0.00 | (b) |
Net realized and unrealized gains (losses) on investments | | | 1.16 | | | | 2.14 | | | | 5.08 | | | | (0.90 | ) | | | 1.56 | | | | 7.74 | |
Total from investment operations | | | 1.18 | | | | 2.15 | | | | 5.24 | | | | (0.82 | ) | | | 1.54 | | | | 7.74 | |
| | | | | | | | | | | | | | | | | | | | | | | | | |
Less distributions: | | | | | | | | | | | | | | | | | | | | | | | | |
From net investment income | | | — | | | | — | | | | (0.19 | ) | | | (0.07 | ) | | | — | | | | (0.07 | ) |
From realized capital gains | | | — | | | | (2.80 | ) | | | (1.99 | ) | | | (1.24 | ) | | | (2.92 | ) | | | (0.66 | ) |
Total distributions | | | — | | | | (2.80 | ) | | | (2.18 | ) | | | (1.31 | ) | | | (2.92 | ) | | | (0.73 | ) |
| | | | | | | | | | | | | | | | | | | | | | | | | |
Net asset value, end of period | | $ | 24.67 | | | $ | 23.49 | | | $ | 24.14 | | | $ | 21.08 | | | $ | 23.21 | | | $ | 24.59 | |
| | | | | | | | | | | | | | | | | | | | | | | | | |
Total return (c) | | | 5.02 | %(d) | | | 8.97 | % | | | 25.16 | % | | | (3.52 | %) | | | 6.47 | % | | | 44.16 | % |
| | | | | | | | | | | | | | | | | | | | | | | | | |
Ratios to average net assets/supplemental data: | | | | | | | | | | | | | | | | | | | | | | | | |
Net assets, end of period (in 000’s) | | $ | 51,424 | | | $ | 33,919 | | | $ | 31,698 | | | $ | 13,727 | | | $ | 15,655 | | | $ | 24,934 | |
Operating expenses after fee reductions and expense reimbursements and fees paid indirectly | | | 1.07 | %(e) | | | 1.19 | % | | | 1.27 | % | | | 1.18 | % | | | 1.17 | % | | | 1.20 | % |
Operating expenses before fee reductions and expense reimbursements and fees paid indirectly (f) | | | 1.27 | %(e) | | | 1.37 | % | | | 1.33 | % | | | 1.36 | % | | | 1.23 | % | | | 1.19 | % |
Net investment income (loss) | | | 0.15 | %(e) | | | 0.07 | % | | | 0.73 | % | | | 0.36 | % | | | (0.07 | %) | | | (0.01 | %) |
Portfolio turnover rate | | | 37 | %(d) | | | 88 | % | | | 99 | % | | | 49 | % | | | 53 | % | | | 60 | % |
(a) | The selected per share data was calculated using the average shares outstanding method for the period. |
(b) | Amount rounds to less than $0.01 per share. |
(c) | Total return is a measure of the change in value of an investment in the Portfolio over the period covered. The returns shown do not reflect the deduction of taxes a shareholder would pay on Portfolio distributions, if any, or the redemption of Portfolio shares. |
(d) | Not annualized. |
(e) | Annualized. |
(f) | The ratio of operating expenses before fee reductions and expense reimbursements excludes the effect of fees paid indirectly. If this expense offset was included, the ratio would have been 1.26%(e), 1.35%, 1.32%, 1.35%, 1.21% and 1.18% for the periods ended June 30, 2018, December 31, 2017, 2016, 2015, 2014 and 2013, respectively (Notes 3 and 4). |
See Notes to Financial Statements.
84
Wilshire Mutual Funds, Inc. Wilshire 5000 Indexsm Fund Financial Highlights |
|
For a Fund Share Outstanding Throughout Each Period. |
| | | Investment Class Shares | |
| | | Six Months
Ended
06/30/2018
(Unaudited) | | | Year
Ended
12/31/2017 | | | Year
Ended
12/31/2016 | | | Year
Ended
12/31/2015 | | | Year
Ended
12/31/2014 | | | Year
Ended
12/31/2013 | |
Net asset value, beginning of period | | $ | 20.83 | | | $ | 18.86 | | | $ | 17.78 | | | $ | 18.01 | | | $ | 16.22 | | | $ | 12.43 | |
| | | | | | | | | | | | | | | | | | | | | | | | | |
Income (loss) from investment operations: | | | | | | | | | | | | | | | | | | | | | | | | |
Net investment income (a) | | | 0.14 | | | | 0.29 | | | | 0.27 | | | | 0.24 | | | | 0.23 | | | | 0.19 | |
Net realized and unrealized gains (losses) on investments | | | 0.42 | | | | 3.52 | | | | 1.96 | | | | (0.22 | ) | | | 1.78 | | | | 3.80 | |
Total from investment operations | | | 0.56 | | | | 3.81 | | | | 2.23 | | | | 0.02 | | | | 2.01 | | | | 3.99 | |
| | | | | | | | | | | | | | | | | | | | | | | | | |
Less distributions: | | | | | | | | | | | | | | | | | | | | | | | | |
From net investment income | | | — | | | | (0.27 | ) | | | (0.39 | ) | | | (0.25 | ) | | | (0.22 | ) | | | (0.20 | ) |
From realized capital gains | | | — | | | | (1.57 | ) | | | (0.76 | ) | | | — | | | | — | | | | — | |
Total distributions | | | — | | | | (1.84 | ) | | | (1.15 | ) | | | (0.25 | ) | | | (0.22 | ) | | | (0.20 | ) |
| | | | | | | | | | | | | | | | | | | | | | | | | |
Net asset value, end of period | | $ | 21.39 | | | $ | 20.83 | | | $ | 18.86 | | | $ | 17.78 | | | $ | 18.01 | | | $ | 16.22 | |
| | | | | | | | | | | | | | | | | | | | | | | | | |
Total return (b) | | | 2.69 | %(c) | | | 20.20 | % | | | 12.51 | % | | | 0.08 | % | | | 12.38 | % | | | 32.10 | % |
| | | | | | | | | | | | | | | | | | | | | | | | | |
Ratios to average net assets/supplemental data: | | | | | | | | | | | | | | | | | | | | | | | | |
Net assets, end of period (in 000’s) | | $ | 151,375 | | | $ | 149,342 | | | $ | 132,669 | | | $ | 159,709 | | | $ | 204,465 | | | $ | 139,354 | |
Operating expenses | | | 0.57 | %(d) | | | 0.62 | % | | | 0.67 | %(e) | | | 0.64 | %(e) | | | 0.65 | % | | | 0.68 | % |
Net investment income | | | 1.35 | %(d) | | | 1.39 | % | | | 1.49 | % | | | 1.35 | % | | | 1.32 | % | | | 1.33 | % |
Portfolio turnover rate | | | 1 | %(c) | | | 3 | % | | | 5 | % | | | 6 | % | | | 3 | % | | | 2 | % |
(a) | The selected per share data was calculated using the average shares outstanding method for the period. |
(b) | Total return is a measure of the change in value of an investment in the Portfolio over the period covered. The returns shown do not reflect the deduction of taxes a shareholder would pay on Portfolio distributions, if any, or the redemption of Portfolio shares. |
(c) | Not annualized. |
(d) | Annualized. |
(e) | The ratio of operating expenses excludes the effect of fees paid indirectly. If this expense offset was included, the ratio would have been 0.67% and 0.64% for the years ended December 31, 2016 and 2015, respectively (Notes 3 and 4). |
See Notes to Financial Statements.
85
Wilshire Mutual Funds, Inc. Wilshire 5000 Indexsm Fund Financial Highlights - (Continued) |
|
For a Fund Share Outstanding Throughout Each Period. |
| | | Institutional Class Shares | |
| | | Six Months
Ended
06/30/2018
(Unaudited) | | | Year
Ended
12/31/2017 | | | Year
Ended
12/31/2016 | | | Year
Ended
12/31/2015 | | | Year
Ended
12/31/2014 | | | Year
Ended
12/31/2013 | |
Net asset value, beginning of period | | $ | 20.83 | | | $ | 18.85 | | | $ | 17.78 | | | $ | 18.00 | | | $ | 16.21 | | | $ | 12.41 | |
| | | | | | | | | | | | | | | | | | | | | | | | | |
Income (loss) from investment operations: | | | | | | | | | | | | | | | | | | | | | | | | |
Net investment income (a) | | | 0.17 | | | | 0.35 | | | | 0.33 | | | | 0.29 | | | | 0.26 | | | | 0.22 | |
Net realized and unrealized gains (losses) on investments | | | 0.41 | | | | 3.53 | | | | 1.95 | | | | (0.22 | ) | | | 1.79 | | | | 3.81 | |
Total from investment operations | | | 0.58 | | | | 3.88 | | | | 2.28 | | | | 0.07 | | | | 2.05 | | | | 4.03 | |
| | | | | | | | | | | | | | | | | | | | | | | | | |
Less distributions: | | | | | | | | | | | | | | | | | | | | | | | | |
From net investment income | | | — | | | | (0.33 | ) | | | (0.45 | ) | | | (0.29 | ) | | | (0.26 | ) | | | (0.23 | ) |
From realized capital gains | | | — | | | | (1.57 | ) | | | (0.76 | ) | | | — | | | | — | | | | — | |
Total distributions | | | — | | | | (1.90 | ) | | | (1.21 | ) | | | (0.29 | ) | | | (0.26 | ) | | | (0.23 | ) |
| | | | | | | | | | | | | | | | | | | | | | | | | |
Net asset value, end of period | | $ | 21.41 | | | $ | 20.83 | | | $ | 18.85 | | | $ | 17.78 | | | $ | 18.00 | | | $ | 16.21 | |
| | | | | | | | | | | | | | | | | | | | | | | | | |
Total return (b) | | | 2.78 | %(c) | | | 20.57 | % | | | 12.81 | % | | | 0.36 | % | | | 12.60 | % | | | 32.48 | % |
| | | | | | | | | | | | | | | | | | | | | | | | | |
Ratios to average net assets/supplemental data: | | | | | | | | | | | | | | | | | | | | | | | | |
Net assets, end of period (in 000’s) | | $ | 35,971 | | | $ | 35,066 | | | $ | 40,860 | | | $ | 59,065 | | | $ | 67,500 | | | $ | 59,565 | |
Operating expenses | | | 0.33 | %(d) | | | 0.33 | % | | | 0.36 | %(e) | | | 0.41 | %(e) | | | 0.44 | % | | | 0.46 | % |
Net investment income | | | 1.59 | %(d) | | | 1.67 | % | | | 1.80 | % | | | 1.59 | % | | | 1.53 | % | | | 1.55 | % |
Portfolio turnover rate | | | 1 | %(c) | | | 3 | % | | | 5 | % | | | 6 | % | | | 3 | % | | | 2 | % |
(a) | The selected per share data was calculated using the average shares outstanding method for the period. |
(b) | Total return is a measure of the change in value of an investment in the Portfolio over the period covered. The returns shown do not reflect the deduction of taxes a shareholder would pay on Portfolio distributions, if any, or the redemption of Portfolio shares. |
(c) | Not annualized. |
(d) | Annualized. |
(e) | The ratio of operating expenses excludes the effect of fees paid indirectly. If this expense offset was included, the ratio would have been 0.36% and 0.41% for the years ended December 31, 2016 and 2015, respectively (Notes 3 and 4). |
See Notes to Financial Statements.
86
Wilshire Mutual Funds, Inc. Wilshire International Equity Fund Financial Highlights |
|
For a Fund Share Outstanding Throughout Each Period. |
| | | Investment Class Shares | |
| | | Six Months
Ended
06/30/2018
(Unaudited) | | | Year
Ended
12/31/2017 | | | Year
Ended
12/31/2016 | | | Year
Ended
12/31/2015 | | | Year
Ended
12/31/2014 | | | Year
Ended
12/31/2013 | |
Net asset value, beginning of period | | $ | 11.19 | | | $ | 8.92 | | | $ | 8.90 | | | $ | 9.06 | | | $ | 9.70 | | | $ | 8.34 | |
| | | | | | | | | | | | | | | | | | | | | | | | | |
Income (loss) from investment operations: | | | | | | | | | | | | | | | | | | | | | | | | |
Net investment income (a) | | | 0.09 | | | | 0.08 | | | | 0.10 | | | | 0.09 | | | | 0.09 | | | | 0.03 | |
Net realized and unrealized gains (losses) on investments and foreign currency transactions | | | (0.34 | ) | | | 2.20 | | | | 0.07 | | | | (0.23 | ) | | | (0.71 | ) | | | 1.54 | |
Total from investment operations | | | (0.25 | ) | | | 2.28 | | | | 0.17 | | | | (0.14 | ) | | | (0.62 | ) | | | 1.57 | |
| | | | | | | | | | | | | | | | | | | | | | | | | |
Less distributions: | | | | | | | | | | | | | | | | | | | | | | | | |
From net investment income | | | — | | | | (0.01 | ) | | | (0.15 | ) | | | (0.02 | ) | | | (0.02 | ) | | | (0.00 | )(b) |
From realized capital gains | | | — | | | | — | | | | — | | | | — | | | | — | | | | (0.21 | ) |
Total distributions | | | — | | | | (0.01 | ) | | | (0.15 | ) | | | (0.02 | ) | | | (0.02 | ) | | | (0.21 | ) |
| | | | | | | | | | | | | | | | | | | | | | | | | |
Redemption fees (Note 2) | | | 0.00 | (b) | | | 0.00 | (b) | | | 0.00 | (b) | | | 0.00 | (b) | | | — | | | | — | |
| | | | | | | | | | | | | | | | | | | | | | | | | |
Net asset value, end of period | | $ | 10.94 | | | $ | 11.19 | | | $ | 8.92 | | | $ | 8.90 | | | $ | 9.06 | | | $ | 9.70 | |
| | | | | | | | | | | | | | | | | | | | | | | | | |
Total return (c) | | | (2.23 | %)(d) | | | 25.54 | % | | | 1.88 | % | | | (1.55 | %) | | | (6.38 | %) | | | 18.95 | % |
| | | | | | | | | | | | | | | | | | | | | | | | | |
See Notes to Financial Statements.
87
Wilshire Mutual Funds, Inc. Wilshire International Equity Fund Financial Highlights - (Continued) |
|
For a Fund Share Outstanding Throughout Each Period. |
| | | Investment Class Shares | |
| | | Six Months
Ended
06/30/2018
(Unaudited) | | | Year
Ended
12/31/2017 | | | Year
Ended
12/31/2016 | | | Year
Ended
12/31/2015 | | | Year
Ended
12/31/2014 | | | Year
Ended
12/31/2013 | |
Ratios to average net assets/supplemental data: | | | | | | | | | | | | | | | | | | | | | | | | |
Net assets, end of period (in 000’s) | | $ | 2,952 | | | $ | 4,176 | | | $ | 11,290 | | | $ | 3,438 | | | $ | 11,371 | | | $ | 2,410 | |
Operating expenses including dividends and rebates on securities sold short and interest expense, after fee reductions and expense reimbursements and fees paid indirectly (e) | | | 1.51 | %(f) | | | 1.51 | %(g) | | | 1.52 | % | | | 1.50 | % | | | 1.50 | % | | | 1.85 | %(g) |
Operating expenses including dividends and rebates on securities sold short and interest expense, before fee reductions and expense reimbursements and fees paid indirectly (e) | | | 1.60 | %(f) | | | 1.55 | % | | | 1.65 | % | | | 1.75 | % | | | 1.71 | %(h) | | | 1.93 | %(h) |
Net investment income | | | 1.84 | %(f) | | | 0.87 | % | | | 1.19 | % | | | 0.99 | % | | | 0.97 | % | | | 0.38 | % |
Portfolio turnover rate | | | 154 | %(d) | | | 62 | % | | | 79 | % | | | 84 | % | | | 176 | % | | | 368 | % |
(a) | The selected per share data was calculated using the average shares outstanding method for the period. |
(b) | Amount rounds to less than $0.01 per share. |
(c) | Total return is a measure of the change in value of an investment in the Portfolio over the period covered. The returns shown do not reflect the deduction of taxes a shareholder would pay on Portfolio distributions, if any, or the redemption of Portfolio shares. |
(d) | Not annualized. |
(e) | Effective April 2, 2013, the Wilshire International Equity Fund no longer engages in short selling. |
(f) | Annualized. |
(g) | The operating expense ratios include the expenses related to foreign currency exchange contracts or investing in securities sold short. Had these expenses been excluded, the expense ratio (after fee reductions and fees paid indirectly) would have been 1.50% for years ended December 31, 2017 and 2013. |
(h) | The ratio of operating expenses including dividends and rebates on securities sold short and interest expense, before fee reductions and expense reimbursements excludes the effect of fees paid indirectly. If this expense offset was included, the ratio would have been 1.71% and 1.93% for the years ended December 31, 2014 and 2013, respectively (Notes 3 and 4). |
See Notes to Financial Statements.
88
Wilshire Mutual Funds, Inc. Wilshire International Equity Fund Financial Highlights - (Continued) |
|
For a Fund Share Outstanding Throughout Each Period. |
| | | Institutional Class Shares | |
| | | Six Months
Ended
06/30/2018
(Unaudited) | | | Year
Ended
12/31/2017 | | | Year
Ended
12/31/2016 | | | Year
Ended
12/31/2015 | | | Year
Ended
12/31/2014 | | | Year
Ended
12/31/2013 | |
Net asset value, beginning of period | | $ | 11.04 | | | $ | 8.81 | | | $ | 8.78 | | | $ | 8.99 | | | $ | 9.64 | | | $ | 8.38 | |
| | | | | | | | | | | | | | | | | | | | | | | | | |
Income (loss) from investment operations: | | | | | | | | | | | | | | | | | | | | | | | | |
Net investment income (a) | | | 0.11 | | | | 0.10 | | | | 0.12 | | | | 0.09 | | | | 0.09 | | | | 0.08 | |
Net realized and unrealized gains (losses) on investments and foreign currency transactions | | | (0.35 | ) | | | 2.18 | | | | 0.07 | | | | (0.21 | ) | | | (0.68 | ) | | | 1.51 | |
Total from investment operations | | | (0.24 | ) | | | 2.28 | | | | 0.19 | | | | (0.12 | ) | | | (0.59 | ) | | | 1.59 | |
| | | | | | | | | | | | | | | | | | | | | | | | | |
Less distributions: | | | | | | | | | | | | | | | | | | | | | | | | |
From net investment income | | | — | | | | (0.05 | ) | | | (0.16 | ) | | | (0.09 | ) | | | (0.06 | ) | | | (0.12 | ) |
From realized capital gains | | | — | | | | — | | | | — | | | | — | | | | — | | | | (0.21 | ) |
Total distributions | | | — | | | | (0.05 | ) | | | (0.16 | ) | | | (0.09 | ) | | | (0.06 | ) | | | (0.33 | ) |
| | | | | | | | | | | | | | | | | | | | | | | | | |
Redemption fees (Note 2) | | | 0.00 | (b) | | | 0.00 | (b) | | | 0.00 | (b) | | | 0.00 | (b) | | | — | | | | — | |
| | | | | | | | | | | | | | | | | | | | | | | | | |
Net asset value, end of period | | $ | 10.80 | | | $ | 11.04 | | | $ | 8.81 | | | $ | 8.78 | | | $ | 8.99 | | | $ | 9.64 | |
| | | | | | | | | | | | | | | | | | | | | | | | | |
Total return (c) | | | (2.17 | %)(d) | | | 25.92 | % | | | 2.16 | % | | | (1.37 | %) | | | (6.16 | %) | | | 19.10 | % |
See Notes to Financial Statements.
89
Wilshire Mutual Funds, Inc. Wilshire International Equity Fund Financial Highlights - (Continued) |
|
For a Fund Share Outstanding Throughout Each Period. |
| | | Institutional Class Shares | |
| | | Six Months
Ended
06/30/2018
(Unaudited) | | | Year
Ended
12/31/2017 | | | Year
Ended
12/31/2016 | | | Year
Ended
12/31/2015 | | | Year
Ended
12/31/2014 | | | Year
Ended
12/31/2013 | |
Ratios to average net assets/supplemental data: | | | | | | | | | | | | | | | | | | | | | | | | |
Net assets, end of period (in 000’s) | | $ | 427,891 | | | $ | 351,136 | | | $ | 258,311 | | | $ | 176,937 | | | $ | 165,048 | | | $ | 45,897 | |
Operating expenses including dividends and rebates on securities sold short and interest expense, after fee reductions and expense reimbursements and fees paid indirectly (e) | | | 1.26 | %(f) | | | 1.26 | %(g) | | | 1.27 | % | | | 1.25 | % | | | 1.25 | % | | | 1.61 | %(g) |
Operating expenses including dividends and rebates on securities sold short and interest expense, before fee reductions and expense reimbursements and fees paid indirectly (e) | | | 1.26 | %(f) | | | 1.26 | % | | | 1.32 | % | | | 1.29 | % | | | 1.31 | %(h) | | | 1.87 | %(h) |
Net investment income | | | 2.00 | %(f) | | | 1.02 | % | | | 1.44 | % | | | 1.00 | % | | | 0.96 | % | | | 0.88 | % |
Portfolio turnover rate | | | 154 | %(d) | | | 62 | % | | | 79 | % | | | 84 | % | | | 176 | % | | | 368 | % |
(a) | The selected per share data was calculated using the average shares outstanding method for the period. |
(b) | Amount rounds to less than $0.01 per share. |
(c) | Total return is a measure of the change in value of an investment in the Portfolio over the period covered. The returns shown do not reflect the deduction of taxes a shareholder would pay on Portfolio distributions, if any, or the redemption of Portfolio shares. |
(d) | Not annualized. |
(e) | Effective April 2, 2013, the Wilshire International Equity Fund no longer engages in short selling. |
(f) | Annualized. |
(g) | The operating expense ratios include the expenses related to foreign currency exchange contracts or investing in securities sold short. Had these expenses been excluded, the expense ratio (after fee reductions and fees paid indirectly) would have been 1.25% for the years ended December 31, 2017 and 2013. |
(h) | The ratio of operating expenses including dividends and rebates on securities sold short and interest expense, before fee reductions and expense reimbursements excludes the effect of fees paid indirectly. If this expense offset was included, the ratio would have been 1.31% and 1.87% for the years ended December 31, 2014 and 2013, respectively (Notes 3 and 4). |
See Notes to Financial Statements.
90
Wilshire Mutual Funds, Inc. Wilshire Income Opportunities Fund Financial Highlights |
|
For a Fund Share Outstanding Throughout Each Period. |
| | | Investment Class Shares | |
| | | Six Months
Ended
06/30/2018
(Unaudited) | | | Year
Ended
12/31/2017 | | | Period Ended
12/31/2016* | |
Net asset value, beginning of period | | $ | 10.25 | | | $ | 10.14 | | | $ | 10.00 | |
| | | | | | | | | | | | | |
Income (loss) from investment operations: | | | | | | | | | | | | |
Net investment income (a) | | | 0.15 | | | | 0.35 | | | | 0.21 | |
Net realized and unrealized gains (losses) on investments and foreign currency transactions | | | (0.16 | ) | | | 0.22 | | | | 0.18 | |
Total from investment operations | | | (0.01 | ) | | | 0.57 | | | | 0.39 | |
| | | | | | | | | | | | | |
Less distributions: | | | | | | | | | | | | |
From net investment income | | | — | | | | (0.42 | ) | | | (0.18 | ) |
From realized capital gains | | | — | | | | (0.04 | ) | | | (0.07 | ) |
Total distributions | | | — | | | | (0.46 | ) | | | (0.25 | ) |
| | | | | | | | | | | | | |
Net asset value, end of period | | $ | 10.24 | | | $ | 10.25 | | | $ | 10.14 | |
| | | | | | | | | | | | | |
Total return (b) | | | (0.10 | %)(c) | | | 5.60 | % | | | 3.92 | %(c) |
| | | | | | | | | | | | | |
Ratios to average net assets/supplemental data: | | | | | | | | | | | | |
Net assets, end of period (in 000’s) | | $ | 1,566 | | | $ | 6,409 | | | $ | 1,102 | |
Operating expenses after expense reimbursements (d) | | | 1.15 | %(e) | | | 1.17 | %(f) | | | 1.15 | %(e) |
Operating expense before expense reimbursements (d) | | | 1.17 | %(e) | | | 1.23 | % | | | 1.26 | %(e) |
Net investment income | | | 2.68 | %(e) | | | 3.28 | % | | | 2.83 | %(e) |
Portfolio turnover rate | | | 86 | %(c) | | | 88 | % | | | 74 | %(c) |
* | Commenced operations on March 30, 2016. |
(a) | The selected per share data was calculated using the average shares outstanding method for the period. |
(b) | Total return is a measure of the change in value of an investment in the Portfolio over the period covered. The returns shown do not reflect the deduction of taxes a shareholder would pay on Portfolio distributions, if any, or the redemption of Portfolio shares. |
(c) | Not annualized. |
(d) | Ratio does not include expenses from underlying funds. |
(e) | Annualized. |
(f) | Includes interest incurred from reverse repurchase agreements of 0.02% during the year ended December 31, 2017. |
See Notes to Financial Statements.
91
Wilshire Mutual Funds, Inc. Wilshire Income Opportunities Fund Financial Highlights - (Continued) |
|
For a Fund Share Outstanding Throughout Each Period. |
| | | Institutional Class Shares | |
| | | Six Months
Ended
06/30/2018
(Unaudited) | | | Year
Ended
12/31/2017 | | | Period Ended
12/31/2016* | |
Net asset value, beginning of period | | $ | 10.22 | | | $ | 10.10 | | | $ | 10.00 | |
| | | | | | | | | | | | | |
Income (loss) from investment operations: | | | | | | | | | | | | |
Net investment income (a) | | | 0.16 | | | | 0.37 | | | | 0.25 | |
Net realized and unrealized gains (losses) on investments and foreign currency transactions | | | (0.16 | ) | | | 0.22 | | | | 0.13 | |
Total from investment operations | | | (0.00 | ) | | | 0.59 | | | | 0.38 | |
| | | | | | | | | | | | | |
Less distributions: | | | | | | | | | | | | |
From net investment income | | | — | | | | (0.43 | ) | | | (0.21 | ) |
From realized capital gains | | | — | | | | (0.04 | ) | | | (0.07 | ) |
Total distributions | | | — | | | | (0.47 | ) | | | (0.28 | ) |
| | | | | | | | | | | | | |
Net asset value, end of period | | $ | 10.22 | | | $ | 10.22 | | | $ | 10.10 | |
| | | | | | | | | | | | | |
Total return (b) | | | 0.00 | % | | | 5.84 | % | | | 3.82 | %(c) |
| | | | | | | | | | | | | |
Ratios to average net assets/supplemental data: | | | | | | | | | | | | |
Net assets, end of period (in 000’s) | | $ | 333,311 | | | $ | 310,227 | | | $ | 396,797 | |
Operating expenses (d) | | | 0.88 | %(e) | | | 0.92 | %(f) | | | 0.86 | %(e) |
Net investment income | | | 3.01 | %(e) | | | 3.49 | % | | | 3.11 | %(e) |
Portfolio turnover rate | | | 86 | %(c) | | | 88 | % | | | 74 | %(c) |
* | Commenced operations on March 30, 2016. |
(a) | The selected per share data was calculated using the average shares outstanding method for the period. |
(b) | Total return is a measure of the change in value of an investment in the Portfolio over the period covered. The returns shown do not reflect the deduction of taxes a shareholder would pay on Portfolio distributions, if any, or the redemption of Portfolio shares. |
(c) | Not annualized. |
(d) | Ratio does not include expenses from underlying funds. |
(e) | Annualized. |
(f) | Includes interest incurred from reverse repurchase agreements of 0.02% during the year ended December 31, 2017. |
See Notes to Financial Statements.
92
Wilshire Mutual Funds, Inc. Notes to Financial Statements June 30, 2018 (Unaudited) |
|
1. Organization.
Wilshire Mutual Funds, Inc. (the “Company”) is registered under the Investment Company Act of 1940, as amended (the “1940 Act”), as an open-end diversified investment company, which was incorporated under Maryland law on July 30, 1992. The Company operates as a series company and presently offers seven series: Large Company Growth Portfolio, Large Company Value Portfolio, Small Company Growth Portfolio, Small Company Value Portfolio, Wilshire 5000 IndexSM Fund, Wilshire International Equity Fund and Wilshire Income Opportunities Fund (each a “Portfolio” and collectively the “Portfolios”). The Company accounts separately for the assets, liabilities and operations of each series.
The investment objective of Large Company Growth Portfolio is to provide investment results of a portfolio of publicly traded common stocks of companies in the applicable sub-category of the Wilshire 5000 IndexSM. The applicable sub-category of the Wilshire 5000 IndexSM is the large cap growth sub-category.
The investment objective of Large Company Value Portfolio is to provide investment results of a portfolio of publicly traded common stocks of companies in the applicable sub-category of the Wilshire 5000 IndexSM. The applicable sub-category of the Wilshire 5000 IndexSM is the large cap value sub-category.
The investment objective of Small Company Growth Portfolio is to provide investment results of a portfolio of publicly traded common stocks of companies in the applicable sub-category of the Wilshire 5000 IndexSM. The applicable sub-category of the Wilshire 5000 IndexSM is the small-cap growth sub-category.
The investment objective of Small Company Value Portfolio is to provide investment results of a portfolio of publicly traded common stocks of companies in the applicable sub-category of the Wilshire 5000 IndexSM. The applicable sub-category of the Wilshire 5000 IndexSM is the small-cap value sub-category.
The investment objective of Wilshire 5000 IndexSM Fund is to replicate as closely as possible the performance of the Wilshire 5000 IndexSM before the deduction of the Portfolio’s expenses.
The investment objective of Wilshire International Equity Fund is capital appreciation.
The primary investment objective of Wilshire Income Opportunities Fund is to maximize current income. Long-term capital appreciation is a secondary objective.
Each of the Portfolios currently offers Investment and Institutional Class shares, each of which has equal rights as to voting privileges except that the Investment Class has exclusive voting rights for its service and distribution plan. Investment income, realized and unrealized capital gains and losses and the common expenses of each Portfolio are allocated on a pro-rata basis to each class based on the relative net assets of each class to the total net assets of such Portfolio. Each class of shares differs with respect to its service and distribution expenses.
93
Wilshire Mutual Funds, Inc. Notes to Financial Statements - (Continued) June 30, 2018 (Unaudited) |
|
2. Significant Accounting Policies.
The following is a summary of significant accounting policies consistently followed by the Portfolios in the preparation of their financial statements. These policies are in conformity with accounting principles generally accepted in the United States of America (“U.S. GAAP”). The Portfolios follow accounting and reporting guidance under Financial Accounting Standards Board (“FASB”) Accounting Standards Codification Topic 946, “Financial Services – Investment Companies.”
Use of estimates – The preparation of financial statements in accordance with U.S. GAAP requires management to make estimates and assumptions that affect the reported amounts of assets and liabilities and disclosure of contingent assets and liabilities at the date of the financial statements and the reported amounts of revenues and expenses during the reporting period. Actual results could differ from those estimates and those differences could be material.
New Accounting Pronouncement – In March, 2017, FASB issued Accounting Standards Update No. 2017-08 – Receivables – Nonrefundable Fees and Other Costs (Subtopic 310-20): Premium Amortization on Purchased Callable Debt Securities (the “ASU”). The ASU shortens the amortized period for callable debt securities, held at a premium, to be amortized to the earliest call date. The ASU does not require an accounting change for securities held at a discount, which continue to be amortized to maturity. The ASU is effective for fiscal years and interim periods within those fiscal years beginning after December 15, 2018. Management is currently evaluating the impact, if any, of applying the ASU.
Security valuation – Securities listed or traded on U.S. exchanges, including options, futures and swap contracts, are valued at the last sales price on the exchange where they are principally traded. In the absence of a current quotation, a security is valued at the mean between the last bid and asked prices on that exchange. Securities quoted on the National Association of Securities Dealers Automatic Quotation (NASDAQ) System, for which there have been sales, are valued at the NASDAQ official closing price. If there are no such sales, a security is valued at the mean between the last bid and asked prices. Securities traded over-the-counter (other than on NASDAQ) are valued at the last current sale price; and if there are no such sales, a security is valued at the mean between the last bid and asked prices. Debt securities are typically valued at an evaluated bid price by a third-party pricing agent employing methodologies that utilize actual market transactions, broker-supplied valuations, or other inputs designed to identify the market value for such securities. Third-party pricing agents often utilize proprietary models that are subjective and require the use of judgment and the application of various assumptions including, but not limited to, interest rates, prepayment speeds, and default rate assumptions. Debt securities that have a remaining maturity of 60 days or less are valued at prices supplied by the Portfolios’ pricing agent for such securities, if available. Otherwise such securities are valued at amortized cost if the Pricing Committee concludes it approximates fair value. Equity securities primarily traded on a foreign exchange are typically valued daily at a price as provided by an independent pricing service, which is an estimate of the fair value price. Foreign currency contracts, including forward contracts, are valued at the applicable translation rates as supplied by the third-party pricing vendor. In the event market quotations are not readily available, such securities are valued at fair value according to procedures adopted by the Board of Directors (the “Board”) or as determined in good faith by the Pricing Committee, whose members include at least two representatives of Wilshire Associates Incorporated (the “Adviser”), one of whom is an officer of the Company, or by the Company’s Valuation Committee. Fair value is
94
Wilshire Mutual Funds, Inc. Notes to Financial Statements - (Continued) June 30, 2018 (Unaudited) |
|
defined as the amount the owner of a security might reasonably expect to receive upon a current sale. Securities whose value does not reflect fair value because a significant valuation event has occurred may be valued at fair value by the Pricing Committee or the Valuation Committee in accordance with the Company’s valuation procedures. Significant events may include, but are not limited to, the following: significant fluctuations in domestic markets, foreign markets or foreign currencies; occurrences not directly tied to the securities markets such as natural disasters, armed conflicts or significant governmental actions; and major announcements affecting a single issuer or an entire market or market sector. The value of fair valued securities may be different from the last sale price (or the mean between the last bid and asked prices), and there is no guarantee that a fair valued security will be sold at the price at which a Portfolio is carrying the security.
Wilshire International Equity Fund uses ICE Data Services (“ICE”) as a third-party pricing agent. ICE provides a daily fair value for foreign securities in Wilshire International Equity Fund based on certain factors and methodologies (involving, generally, tracking valuation correlations between the U.S. market and each non-U.S. security) applied by ICE. These factors are used to value Wilshire International Equity Fund’s securities without holding a Pricing Committee meeting. In the event that the Adviser believes that the fair values provided by ICE are not reliable, the Adviser contacts the Company’s administrator and may request that a meeting of the Pricing Committee be held.
In accordance with the authoritative guidance on fair value measurements and disclosures under U.S. GAAP, the Portfolios disclose the fair value of their investments in a hierarchy that prioritizes the inputs to valuation techniques used to measure the fair value. The objective of a fair value measurement is to determine the price that would be received to sell an asset or paid to transfer a liability in an orderly transaction between market participants at the measurement date (an exit price). Accordingly, the fair value hierarchy gives the highest priority to quoted prices (unadjusted) in active markets for identical assets or liabilities (Level 1) and the lowest priority to unobservable inputs (Level 3). The guidance establishes three levels of the fair value hierarchy as follows:
| | ● | Level 1 – Unadjusted quoted prices in active markets for identical, unrestricted assets or liabilities that the Portfolios have the ability to access at the measurement date; |
| | ● | Level 2 – Other significant observable inputs (including quoted prices for similar securities, interest rates, prepayment speeds, credit risk, referenced indices, quoted prices in inactive markets, adjusted quoted prices in active markets, etc.); and |
| | ● | Level 3 – Prices, inputs or exotic modeling techniques which are both significant to the fair value measurement and unobservable (supported by little or no market activity). |
The inputs or methodology used for valuing securities are not necessarily an indication of the risks associated with investing in those securities. During the six months ended June 30, 2018, there have been no significant changes to the Portfolios’ fair value methodologies.
95
Wilshire Mutual Funds, Inc. Notes to Financial Statements - (Continued) June 30, 2018 (Unaudited) |
|
The following is a summary of the inputs used to value the Portfolios’ investments as of June 30, 2018:
Large Company Growth Portfolio | | Level 1 | | | Level 2 | | | Level 3 | | | Total | |
Common Stocks | | $ | 249,924,627 | | | $ | — | | | $ | — | | | $ | 249,924,627 | |
Money Market Funds | | | 5,966,505 | | | | — | | | | — | | | | 5,966,505 | |
Total | | $ | 255,891,132 | | | $ | — | | | $ | — | | | $ | 255,891,132 | |
Large Company Value Portfolio | | Level 1 | | | Level 2 | | | Level 3 | | | Total | |
Common Stocks | | $ | 231,240,751 | | | $ | — | | | $ | — | | | $ | 231,240,751 | |
Money Market Funds | | | 7,620,860 | | | | — | | | | — | | | | 7,620,860 | |
Total | | $ | 238,861,611 | | | $ | — | | | $ | — | | | $ | 238,861,611 | |
Small Company Growth Portfolio | | Level 1 | | | Level 2 | | | Level 3 | | | Total | |
Common Stocks | | $ | 52,993,162 | | | $ | — | | | $ | — | | | $ | 52,993,162 | |
Rights | | | — | | | | — | | | | 0* | | | | 0 | |
Money Market Funds | | | 4,675,674 | | | | — | | | | — | | | | 4,675,674 | |
Total | | $ | 57,668,836 | | | $ | — | | | $ | 0 | | | $ | 57,668,836 | |
Small Company Value Portfolio | | Level 1 | | | Level 2 | | | Level 3 | | | Total | |
Common Stocks | | $ | 51,294,007 | | | $ | — | | | $ | — | | | $ | 51,294,007 | |
Money Market Funds | | | 2,816,220 | | | | — | | | | — | | | | 2,816,220 | |
Total | | $ | 54,110,227 | | | $ | — | | | $ | — | | | $ | 54,110,227 | |
Wilshire 5000 IndexSM Fund | | Level 1 | | | Level 2 | | | Level 3 | | | Total | |
Common Stocks | | $ | 185,632,627 | | | $ | — | | | $ | — | | | $ | 185,632,627 | |
Preferred Stocks | | | 845 | | | | — | | | | — | | | | 845 | |
Rights | | | — | | | | — | | | | 5,044* | | | | 5,044 | |
Money Market Funds | | | 3,318,820 | | | | — | | | | — | | | | 3,318,820 | |
Total | | $ | 188,952,292 | | | $ | — | | | $ | 5,044 | | | $ | 188,957,336 | |
Wilshire International Equity Fund | | Level 1 | | | Level 2 | | | Level 3 | | | Total | |
Common Stocks | | $ | 109,049,868 | | | $ | 260,995,740 | | | $ | — | | | $ | 370,045,608 | |
Preferred Stocks | | | 351,601 | | | | 1,443,283 | | | | — | | | | 1,794,884 | |
Rights | | | — | | | | — | | | | 0* | | | | 0 | |
Exchange-Traded Funds | | | 10,540,208 | | | | — | | | | — | | | | 10,540,208 | |
Money Market Funds | | | 29,292,538 | | | | — | | | | — | | | | 29,292,538 | |
Total | | $ | 149,234,215 | | | $ | 262,439,023 | | | $ | 0 | | | $ | 411,673,238 | |
* | Includes securities that have been fair valued at $0. |
96
Wilshire Mutual Funds, Inc. Notes to Financial Statements - (Continued) June 30, 2018 (Unaudited) |
|
Wilshire Income Opportunities Fund | | Level 1 | | | Level 2 | | | Level 3 | | | Total | |
Investments in Securities | | | | | | | | | | | | | | | | |
U.S. Treasury Obligations | | $ | — | | | $ | 50,020,092 | | | $ | — | | | $ | 50,020,092 | |
Agency Mortgage-Backed Obligations | | | — | | | | 11,336,804 | | | | — | | | | 11,336,804 | |
Non-Agency Mortgage-Backed Obligations | | | — | | | | 41,108,246 | | | | — | | | | 41,108,246 | |
Non-Agency Mortgage-Backed Obligation Interest-Only Strips | | | — | | | | 8,429,526 | | | | — | | | | 8,429,526 | |
Asset-Backed Securities | | | — | | | | 8,477,558 | | | | — | | | | 8,477,558 | |
Collateralized Loan Obligations | | | — | | | | 10,492,125 | | | | — | | | | 10,492,125 | |
Investment Grade Corporate Obligations | | | — | | | | 21,478,467 | | | | — | | | | 21,478,467 | |
High Yield Corporate Obligations | | | — | | | | 16,069,890 | | | | — | | | | 16,069,890 | |
Foreign Bonds | | | — | | | | 63,061,616 | | | | — | | | | 63,061,616 | |
Loan Participations | | | — | | | | 33,422,376 | | | | — | | | | 33,422,376 | |
Military Housing Obligations | | | — | | | | 6,012,597 | | | | — | | | | 6,012,597 | |
Common Stocks | | | 2,216,095 | | | | — | | | | — | | | | 2,216,095 | |
Preferred Stocks | | | — | | | | 2,217,455 | | | | — | | | | 2,217,455 | |
Affiliated Registered Investment Companies | | | 24,692,330 | | | | — | | | | — | | | | 24,692,330 | |
Money Market Funds | | | 48,677,042 | | | | — | | | | — | | | | 48,677,042 | |
Total | | $ | 75,585,467 | | | $ | 272,126,752 | | | $ | — | | | $ | 347,712,219 | |
Other Financial Instruments** | | | | | | | | | | | | | | | | |
Futures Contracts Sold Short | | $ | 5,535 | | | $ | — | | | $ | — | | | $ | 5,535 | |
Forward Foreign Currency Contracts | | $ | (140 | ) | | $ | — | | | $ | — | | | $ | (140 | ) |
** | Other financial instruments are derivative financial instruments not reflected in the Schedules of Investments, such as futures contracts. Futures contracts are valued at the unrealized appreciation (depreciation) on the instrument. |
Refer to the Portfolios’ Schedules of Investments for a listing of the securities by industry or sector type. It is the Portfolios’ policy to recognize transfers between Levels at the end of the reporting period. As of June 30, 2018, the Portfolios did not have any transfers between Levels. In addition, Large Company Growth Portfolio, Large Company Value Portfolio, Small Company Value Portfolio and Wilshire Income Opportunities Fund did not hold any assets or liabilities that were measured at fair value on a recurring basis using significant unobservable inputs (Level 3) as of June 30, 2018. Small Company Growth Portfolio, Wilshire 5000 IndexSM Fund and Wilshire International Equity Fund held rights that were measured at fair value on a recurring basis using significant unobservable inputs (Level 3) totaling $0, $5,044 and $0, respectively. A reconciliation of Level 3 investments, including certain disclosures related to significant inputs used in valuing Level 3 investments, is only presented when a Portfolio has over 1% of Level 3 investments at the beginning and/or end of the period in relation to net assets.
Option Transactions – Wilshire Income Opportunities Fund may purchase and write call and put options on securities, securities indices, swaps (“swaptions”) and foreign currencies, provided such options are traded on a national securities exchange or an over-the-counter market. When the Portfolio writes or purchases a covered call or put option, an amount equal to the premium received is included as a liability in the Portfolio’s statement of assets and liabilities. The amount of the liability is subsequently marked-to-market to reflect the current value of the option. If an option expires on its stipulated expiration date or if the Portfolio enters into a closing purchase
97
Wilshire Mutual Funds, Inc. Notes to Financial Statements - (Continued) June 30, 2018 (Unaudited) |
|
transaction, a gain or loss is realized. If a written call option is exercised, a gain or loss is realized for the sale of the underlying security and the proceeds from the sale are increased by the premium originally received. If a written put option is exercised, the cost of the security acquired is decreased by the premium originally received. As a writer of an option, the Portfolio has no control over whether the underlying securities are subsequently sold (call) or purchased (put). As a result, the Portfolio bears the market risk of an unfavorable change in the price of the security or index underlying the written option. When the Portfolio purchases a call or put option, an amount equal to the premium paid is included as an investment in the Portfolio’s statement of assets and liabilities, and is subsequently marked-to-market to reflect the current value of the option. If an option expires on the stipulated expiration date or if the Portfolio enters into a closing sale transaction, a gain or loss is realized. If the Portfolio exercises a call, the cost of the security acquired is increased by the premium paid for the call. If the Portfolio exercises a put option, a gain or loss is realized from the sale of the underlying security, and the proceeds from such sale are decreased by the premium originally paid. Written and purchased options are non-income producing securities. The option techniques utilized are generally to hedge against changes in interest rates, foreign currency exchange rates or securities prices in order to establish more definitely the effective return on securities or currencies held or intended to be acquired by the Portfolio, to reduce the volatility of the currency exposure associated with an investment in non-U.S. securities, or as an efficient means of adjusting exposure to the bond, equity and currency markets.
Transactions in options purchased by Wilshire Income Opportunities Fund during the six months ended June 30, 2018 were as follows:
| | | Option
Contracts | | | Option
Premiums | |
Options outstanding at beginning of period | | | — | | | $ | — | |
Options purchased | | | 1,028 | | | | 280,484 | |
Options sold | | | (1,028 | ) | | | (280,484 | ) |
Options outstanding at end of period | | | — | | | $ | — | |
There were no transactions in written option contracts by Wilshire Income Opportunities Fund during the six months ended June 30, 2018.
Interest Rate Swaps – Wilshire Income Opportunities Fund is subject to interest rate risk exposure in the normal course of pursuing its investment objectives. The value of fixed-rate bonds held by the Portfolio may decrease if interest rates rise. In order to reduce such risks, the Portfolio may enter into interest rate swaps.
Interest rate swaps involve the exchange of commitments to pay and receive a fixed or floating rate of interest based on a notional principal amount. The risks of interest rate swaps include changes in market conditions that will affect their value or cash flows and the possible inability of the counterparty to fulfill its obligations under the agreement. The Portfolio’s maximum risk of loss from counterparty credit risk is the discounted net value of the cash flows to be received from the counterparty over the swap’s remaining life. Upon entering into a swap contract, the Portfolio is required to satisfy an initial margin requirement by delivering cash to the counterparty. Net periodic interest payments to be received or paid are accrued and settled daily and are recorded as interest income on the Statements of Operations. Interest rate swaps are marked-to-market daily and the change is recorded as
98
Wilshire Mutual Funds, Inc. Notes to Financial Statements - (Continued) June 30, 2018 (Unaudited) |
|
an unrealized gain (loss) on swap contracts on the Statements of Operations. The average monthly notional value of interest rate swaps for Wilshire Income Opportunities Fund during the six months ended June 30, 2018 was $48,458,333. Wilshire Income Opportunities Fund held no interest rate swap contracts as of June 30, 2018.
Reverse Repurchase Agreements – Wilshire Income Opportunities Fund may enter into reverse repurchase agreements for investment purposes. A reverse repurchase agreement involves the sale of portfolio assets together with an agreement to repurchase the same assets later at a fixed price. At the time the Portfolio enters into a reverse repurchase agreement, it segregates cash, cash equivalents, or other liquid assets, including equity securities and debt securities, at least equal in value to the repurchase price. In the event the buyer of securities under a reverse repurchase agreement files for bankruptcy or becomes insolvent, the Portfolio’s use of the proceeds under the agreement may be restricted pending a determination by the other party, or its trustee or receiver, whether to enforce the obligation to repurchase the securities. Interest incurred from the sale of reverse repurchase agreements is listed as Interest Expense on the Statements of Operations. Wilshire Income Opportunities Fund entered into no reverse repurchase agreements during the six months ended June 30, 2018.
Securities traded on a “to-be-announced” basis – Wilshire Income Opportunities Fund occasionally trades securities on a “to-be-announced” (“TBA”) basis. In a TBA transaction, the Portfolio has committed to purchase securities for which all specific information is not yet known at the time of the trade, particularly the face amount in mortgage-backed securities transactions. Securities purchased on a TBA basis are not settled until they are delivered to the Portfolio, normally 15 to 45 days later. These transactions are subject to market fluctuations and their current value is determined in the same manner as for other portfolio securities. TBA securities, if any, are noted as such on the Portfolio’s Schedule of Investments.
Investment transactions and investment income – Investment transactions are recorded on a trade-date basis. Realized gains and losses from investment transactions are recorded on the identified cost basis. Dividend income is recognized on the ex-dividend date and interest income is accrued as earned. Discounts and premiums on fixed income securities purchased are accreted or amortized using the effective interest method. Gains and losses on paydowns of mortgage-backed securities are reflected in interest income on the Statements of Operations. Distributions received on investments that represent a return of capital or capital gain are reclassed as a reduction of cost of investments and/or as a realized gain. Withholding taxes on foreign dividends have been provided for in accordance with the Company’s understanding of the applicable country’s tax rules and rates.
Mortgage, asset-backed and collateralized loan securities – Wilshire Income Opportunities Fund may invest in mortgage, asset-backed and collateralized loan securities which represent shares in a pool of mortgages or other debt. These securities are generally pass-through securities, which means that principal and interest payments on the underlying securities (less servicing fees) are passed through to owners on a pro rata basis. These securities involve prepayment risk, which is the risk that the underlying mortgages or other debt may be refinanced or paid off before they mature, particularly during periods of declining interest rates. In that case, proceeds from the securities may have to be reinvested at a lower interest rate. This could lower the Portfolio’s return and result in losses to the Portfolio if some securities were acquired at a premium. Potential market gains on a security subject to prepayment risk may be more limited than potential market gains on a comparable security that is not subject to prepayment risk. The Portfolio may also invest in collateralized mortgage obligations (“CMOs”). In a CMO, a series of bonds or certificates is issued in multiple classes, which have varying levels of risks.
99
Wilshire Mutual Funds, Inc. Notes to Financial Statements - (Continued) June 30, 2018 (Unaudited) |
|
Stripped Mortgage-Backed Securities (“SMBS”) – Wilshire Income Opportunities Fund may invest in SMBS. SMBS are derivative multi-class mortgage-backed securities which are usually structured with two classes that receive different proportions of the interest and principal distributions on a pool of mortgage assets. An SMBS will have one class that will receive all of the interest (the interest-only or “IO” class), while the other class will receive the entire principal (the principal-only or “PO” class). IOs are more volatile and sensitive to the rate of prepayments than other types of mortgage-backed securities, and their value can fall dramatically in response to rapid or unexpected changes in the mortgage, interest rate or economic environment. Payments received for IOs are included in interest income on the Statements of Operations. Because no principal will be received at the maturity of an IO, adjustments are made to the cost of the security on a monthly basis until maturity. These adjustments are included in interest income on the Statements of Operations. Additionally, any prepayment penalties received for an IO are included in interest income on the Statements of Operations.
Loan participations and assignments – Wilshire Income Opportunities Fund may invest in direct debt instruments which are interests in amounts owed to lenders and lending syndicates by corporate, governmental, or other borrowers. The Portfolio’s investments in loans may be in the form of participations in loans or assignments of all or a portion of loans from third parties. A loan is often administered by a bank or other financial institution (the “lender”) that acts as agent for all holders. The agent administers the terms of the loan, as specified in the loan agreement. The Portfolio may invest in multiple series or tranches of a loan, which may have varying terms and carry different associated risks. The Portfolio will generally purchase assignments of these loans, in which case it will typically become a lender for purposes of the relevant loan agreement with direct contractual rights against the borrower, including the right to receive payments of principal and interest. When purchasing participation interests in a loan, the Portfolio generally has no right to enforce compliance with the terms of the loan agreement with the borrower. As a result, the Portfolio may be subject to the credit risk of both the borrower and the lender that is selling the loan agreement. The Portfolio may enter into unfunded loan commitments, which are contractual obligations for future funding. Unfunded loan commitments represent a future obligation in full, even though a percentage of the notional loan accounts may not be utilized by the borrower. When investing in a loan participation, the Portfolio has the right to receive payments of principal, interest and any fees to which it is entitled only from the lender selling the loan agreement and only upon receipt of payments by the lender from the borrower. In certain circumstances, the Portfolio may receive a penalty fee upon the prepayment of a floating rate loan by a borrower. Fees earned are recorded as a component of interest income on the Statements of Operations.
Foreign currency transactions – The books and records of the Portfolios are maintained in U.S. dollars. Foreign currency transactions are translated into U.S. dollars on the following basis:
| | ● | fair value of investment securities, other assets and liabilities at the daily rates of exchange and |
| | ● | purchases and sales of investment securities, dividend and interest income and certain expenses at the rates of exchange prevailing on the respective dates of such transactions. |
The portion of the results of operations caused by changes in foreign exchange rates on investments are not isolated from those caused by changes in market prices of securities held. Such fluctuations are included with the net realized and unrealized gains or losses on investments. Net realized and unrealized gains (losses) from foreign currency related transactions include gains and losses between trade and settlement dates on investment
100
Wilshire Mutual Funds, Inc. Notes to Financial Statements - (Continued) June 30, 2018 (Unaudited) |
|
transactions, gains and losses arising from the sales of foreign currency and gains and losses between the ex-dividend and payment dates on dividends, interest and foreign withholding taxes. The effect of changes in foreign exchange rates on realized and unrealized gains or losses is reflected as a component of such gains or losses.
Forward Foreign Currency Contracts – Wilshire Income Opportunities Fund may enter into forward foreign currency contracts as hedges against either specific transactions, Portfolio positions or anticipated Portfolio positions. The Portfolio may also engage in currency transactions to enhance the Portfolio’s returns. All commitments are marked-to-market daily at the applicable foreign exchange rate, and any resulting unrealized gains or losses are recorded. The Portfolio realizes gains and losses at the time forward foreign currency contracts are closed. Unrealized gains or losses on outstanding positions in forward foreign currency contracts held at the close of the period are recognized as ordinary income or loss for federal income tax purposes. Finally, the risk exists that losses could exceed amounts disclosed on the Statements of Assets and Liabilities.
Over-the-Counter (“OTC”) Derivative Contracts – To reduce counterparty risk for OTC transactions, Wilshire Income Opportunities Fund has entered into master netting arrangements, established within the International Swap Dealers Association, Inc. (“ISDA”) master agreements, which allow the Portfolio to make (or to have an entitlement to receive) a single net payment in the event of default (close-out netting) for outstanding payables and receivables for certain OTC positions for each individual counterparty. In addition, the Portfolio may require that certain counterparties post cash and/or securities in collateral accounts to cover their net payment obligations for those derivative contracts subject to ISDA master agreements. If the counterparty fails to perform under these contracts and agreements, the cash and/or securities will be made available to the Portfolio. For financial reporting purposes, the Portfolio does not offset derivative assets and derivative liabilities that are subject to netting arrangements in the Statement of Assets and Liabilities. Bankruptcy or insolvency laws of a particular jurisdiction may impose restrictions on or prohibitions against the right of offset in bankruptcy, insolvency or other events.
Collateral terms are contract-specific for OTC derivatives. For derivatives traded under an ISDA master agreement or other similar agreement, the collateral requirements are typically calculated by netting the mark-to-market amount of each transaction under such agreement and comparing that amount to the value of any collateral currently pledged by the Portfolio or the counterparty.
For financial reporting purposes, cash collateral that has been pledged to cover obligations of the Portfolio, if any, is reported separately as Cash Pledged as Collateral on the Statements of Assets and Liabilities. Non-cash collateral pledged by the Portfolio, if any, is noted in the Schedule of Investments. Generally, the amount of collateral due from or to a party must exceed a minimum transfer amount before a transfer has to be made. To the extent amounts due to the Portfolio from its counterparties are not fully collateralized, contractually or otherwise, the Portfolio bears the risk of loss from counterparty nonperformance.
101
Wilshire Mutual Funds, Inc. Notes to Financial Statements - (Continued) June 30, 2018 (Unaudited) |
|
The following table presents, by derivative type, Wilshire Income Opportunities Fund’s OTC financial derivative instruments net of the related collateral pledged by counterparty at June 30, 2018:
Counterparty | | Financial
Derivative
Assets | | | Financial
Derivative
Liabilities | | | Derivatives
Available
for Offset | | | Collateral
Pledged* | | | Net
Amount | |
Futures contracts** | | | | | | | | | | | | | | | | | | | | |
Goldman Sachs & Co. LLC | | $ | 7,243 | | | $ | (1,708 | ) | | $ | 5,535 | | | $ | (5,535 | ) | | $ | — | |
Total | | $ | 7,243 | | | $ | (1,708 | ) | | $ | 5,535 | | | $ | (5,535 | ) | | $ | — | |
* | Collateral pledged is limited to the net outstanding amount from an individual counterparty. The actual collateral amount pledged may exceed the amount and may fluctuate in value. |
** | Includes cumulative appreciation (depreciation) of futures contracts as reported in the Schedule of Futures Contracts Sold Short. Only current days variation margin is reported within the Statement of Assets and Liabilities. |
Expense policy – Distribution and shareholder service fees directly attributable to a Class of shares are charged to that class’ operating expenses. Expenses of a Portfolio other than distribution and service fees are prorated among the classes to which the expense relates based on the relative net assets of each class of shares. Expenses directly attributable to a Portfolio are charged to that Portfolio. Expenses not directly attributable to a Portfolio are allocated proportionately among all Portfolios daily in relation to the net assets of each Portfolio or another reasonable basis.
Expenses that are attributable to both the Company and the Wilshire Variable Insurance Trust (an affiliated investment company) are allocated across the Company and the Wilshire Variable Insurance Trust based upon relative net assets or another reasonable basis. Expenses and fees, including the advisory fees, are accrued daily and taken into account for the purpose of determining the net asset value (“NAV”) of each Class of each Portfolio’s shares.
Investments in REITs – With respect to each Portfolio, dividend income is recorded based on the income included in distributions received from its REIT investments using published REIT reclassifications including some management estimates when actual amounts are not available. Distributions received in excess of these estimated amounts are recorded as a reduction of the cost of investments or reclassified to capital gains. The actual amounts of income, return of capital, and capital gains are only determined by each REIT after its fiscal year end, and may differ from the estimated amounts.
Master Limited Partnerships (“MLPs”) – Each Portfolio may invest in MLPs, which are limited partnerships or limited liability companies whose partnership units or limited liability interests are listed and traded on a U.S. securities exchange. MLPs are treated as publicly traded partnerships for federal income tax purposes. To qualify to be treated as a partnership for tax purposes, an MLP must receive at least 90% of its income from qualifying sources as set forth in Section 7704(d) of the Internal Revenue Code of 1986, as amended (the “Code”). These qualifying sources include activities such as the exploration, development, mining, production, processing, refining, transportation, storage and marketing of mineral or natural resources. MLPs generally have two classes of owners, the general partner and limited partners. MLPs that are formed as limited liability companies generally have two analogous classes of owners, the managing member and the members. For purposes of this section, references to
102
Wilshire Mutual Funds, Inc. Notes to Financial Statements - (Continued) June 30, 2018 (Unaudited) |
|
general partners also apply to managing members and references to limited partners also apply to members. The general partner is typically owned by a major energy company, an investment fund, the direct management of the MLP, or is an entity owned by one or more of such parties. The general partner may be structured as a private or publicly traded corporation or other entity. The general partner typically controls the operations and management of the MLP through an equity interest in the MLP of as much as 2% plus, in many cases, ownership of common units and subordinated units. Limited partners own the remainder of the MLP through ownership of common units and have a limited role in the MLP’s operations and management.
Distributions to shareholders – Distributions to shareholders are recorded on the ex-dividend date. Distributions from net investment income, if any, are declared and paid annually. The Portfolios’ net realized capital gains, unless offset by any available capital loss carryforward, are distributed to shareholders annually. Additional distributions of net investment income and net realized capital gains may be made at the discretion of the Board in order to avoid the application of a 4% non-deductible Federal excise tax.
Redemption fees – Wilshire International Equity Fund charges a redemption fee of 1% on redemption of its shares held for sixty days or less, subject to certain exceptions. During the periods ended June 30, 2018 and December 31, 2017, Wilshire International Equity Fund collected $239 and $645, respectively, in redemption fees.
3. Investment Adviser and Other Service Providers.
Pursuant to the Advisory Agreement between the Company and the Adviser, the Adviser charges annual fees of 0.75% of average daily net assets for the first $1 billion and 0.65% thereafter for each of Large Company Growth Portfolio and Large Company Value Portfolio; 0.85% of average daily net assets for the first $1 billion and 0.75% thereafter for each of Small Company Growth Portfolio and Small Company Value Portfolio; 0.10% of the average daily net assets for the first $1 billion and 0.07% thereafter for Wilshire 5000 IndexSM Fund; 1.00% of the average daily net assets for the first $1 billion and 0.90% thereafter for Wilshire International Equity Fund; and 0.60% of average daily net assets for Wilshire Income Opportunities Fund.
The Adviser has entered into expense limitation agreements with Small Company Growth Portfolio and Small Company Value Portfolio requiring the Adviser to reduce its management fees or reimburse expenses to limit expenses of such Portfolios (excluding taxes, interest, brokerage expenses, dividend expenses on short securities, and extraordinary expenses) to 1.35% and 1.10% of average daily net assets for Investment Class Shares and Institutional Class Shares, respectively. The Adviser has also entered into an expense limitation agreement with Wilshire International Equity Fund requiring the Adviser to reduce its management fees or reimburse expenses to limit expenses of such Portfolio (excluding taxes, interest, brokerage expenses, dividend expenses on short securities, and extraordinary expenses) to 1.50% and 1.25% of average daily net assets for Investment Class Shares and Institutional Class Shares, respectively. The Adviser has also entered into an expense limitation agreement with Wilshire Income Opportunities Fund requiring the Adviser to reduce its management fees or reimburse expenses to limit expenses of such Portfolio (excluding taxes, interest, brokerage expenses, dividend expenses on short securities, acquired fund fees and expenses and extraordinary expenses) to 1.15% and 0.90% of average daily net assets for Investment Class Shares and Institutional Class Shares, respectively. These agreements to limit expenses continue through at least April 30, 2019. The Adviser may recoup the amount of any fee reductions or
103
Wilshire Mutual Funds, Inc. Notes to Financial Statements - (Continued) June 30, 2018 (Unaudited) |
|
expense reimbursements within three years after the year in which it reduced its fees or reimbursed expenses if the recoupment does not cause a Portfolio’s expenses to exceed the expense limitation that was in place at the time of the fee reduction or expense reimbursement.
During the six months ended June 30, 2018, the Adviser reduced fees, reimbursed expenses or recouped fees as follows:
Portfolio | | Fees Reductions/
Reimbursements | | | Fees Recouped | |
Small Company Growth Portfolio | | $ | 51,477 | | | | N/A | |
Small Company Value Portfolio | | | 48,363 | | | | N/A | |
International Equity Fund | | | 1,600 | | | $ | 40,068 | |
Wilshire Income Opportunities Fund | | | 362 | | | | N/A | |
As of June 30, 2018, the amounts of fee reductions and expense reimbursements subject to recovery by the Adviser from Small Company Growth Portfolio, Small Company Value Portfolio, Wilshire International Equity Fund and Wilshire Income Opportunities Fund are $169,331, $171,678, $190,319 and $4,106, respectively. The portions of these amounts that the Adviser may recover expire as of the following dates:
Portfolio | | December 31,
2018 | | | December 31,
2019 | | | December 31,
2020 | | | June 30,
2021 | |
Small Company Growth Portfolio | | $ | 38,044 | | | $ | 26,249 | | | $ | 53,561 | | | $ | 51,477 | |
Small Company Value Portfolio | | | 44,399 | | | | 23,509 | | | | 55,407 | | | | 48,363 | |
Wilshire International Equity Fund | | | 41,610 | | | | 144,932 | | | | 2,177 | | | | 1,600 | |
Wilshire Income Opportunities Fund | | | — | | | | 723 | | | | 3,021 | | | | 362 | |
The Board has approved Los Angeles Capital Management and Equity Research, Inc. (“L.A. Capital”), Victory Capital Management Inc. (“Victory”), Pzena Investment Management, LLC (“Pzena”), Barrow, Hanley, Mewhinney and Strauss, LLC (“BHMS”), Ranger Investment Management, LLC (“Ranger”), NWQ Investment Management Company, LP (“NWQ”), Loomis, Sayles & Company, L.P. (“Loomis Sayles”), DoubleLine® Capital LP (“DoubleLine”), Guggenheim Partners Investment Management, LLC (“Guggenheim”), WCM Investment Management (“WCM”), Voya Investment Management Co. LLC (“Voya”) and Manulife Asset Management (US) LLC (“Manulife”) (collectively the “Sub-Advisers”) to provide sub-advisory services for the Portfolios. L.A. Capital, Loomis Sayles and Victory each manage a portion of Large Company Growth Portfolio. L.A. Capital, Pzena and BHMS each manage a portion of Large Company Value Portfolio. L.A. Capital and Ranger each manage a portion of Small Company Growth Portfolio. L.A. Capital and NWQ each manage a portion of Small Company Value Portfolio. L.A. Capital is the sole sub-adviser for Wilshire 5000 IndexSM Fund. L.A. Capital, Pzena and WCM each manage a portion of Wilshire International Equity Fund. DoubleLine, Guggenheim, Voya and Manulife each manage a portion of Wilshire Income Opportunities Fund.
The Sub-Advisers are subject to the Adviser’s oversight. The fees of the Sub-Advisers are paid by the Adviser.
104
Wilshire Mutual Funds, Inc. Notes to Financial Statements - (Continued) June 30, 2018 (Unaudited) |
|
DST Systems, Inc. serves as the Company’s transfer agent and dividend disbursing agent. The Northern Trust Company (“NTC”) serves as the Company’s custodian. Ultimus Fund Solutions, LLC (the “Administrator”) serves as the Company’s administrator and accounting agent and Ultimus Fund Distributors, LLC, an affiliate of the Administrator, serves as the Company’s principal underwriter.
Officers’ and Directors’ Expenses – Certain officers of the Company are affiliated with and receive remuneration from the Adviser or the Administrator. The Company does not pay any remuneration to its officers. The Company and the Wilshire Variable Insurance Trust together pay each director who is not an interested person of the Company (“Independent Director”) an annual retainer of $48,000, an annual additional retainer for each Committee chair of $12,000 and an annual additional retainer to the Board chair of $12,000. In addition, each Independent Director is compensated for Board and Committee meeting attendance in accordance with the following schedule: an in-person Board meeting fee of $3,000 for Independent Directors and $4,000 for the Board chair; a telephonic Board meeting fee of $1,500 for Independent Directors and $2,000 for the Board chair; and a telephonic Committee meeting fee of $500.
4. Distribution Plan, Shareholder Services Plan and Fees Paid Indirectly.
The Board has adopted a shareholder services and distribution plan (the “Plan”), pursuant to Rule 12b-1 under the 1940 Act, on behalf of the Investment Class Shares of each Portfolio. Under the Plan, each Portfolio may pay up to 0.25% of the value of the average daily net assets attributable to the Investment Class Shares for certain services provided by financial intermediaries or for certain distribution expenses for the purpose of financing any activity intended to result in the sale of Investment Class Shares. During the six months ended June 30, 2018, the distribution and service fee expenses incurred by the Investment Class of Large Company Growth Portfolio, Large Company Value Portfolio, Small Company Growth Portfolio, Small Company Value Portfolio, Wilshire International Equity Fund and Wilshire Income Opportunities Fund was 0.25% of the respective average net assets of the Investment Class of each Portfolio. During the six months ended June 30, 2018, the distribution and service fee expenses incurred by the Investment Class of Wilshire 5000 IndexSM Fund was 0.20% of the average net assets of the Investment Class of the Portfolio.
In addition, Investment Class Shares and Institutional Class Shares pay the expenses associated with certain shareholder servicing arrangements with third parties, provided that payment of such fees does not exceed in any year 0.20% and 0.15% of the average daily net assets of Investment Class Shares and Institutional Class Shares, respectively. For the six months ended June 30, 2018, the shareholder service provider fees were as follows (as a percent of average net assets of each class):
Portfolio | Investment Class | Institutional Class |
Wilshire Large Company Growth Portfolio | 0.132% | 0.048% |
Wilshire Large Company Value Portfolio | 0.072% | 0.051% |
Wilshire Small Company Growth Portfolio | 0.094% | 0.056% |
Wilshire Small Company Value Portfolio | 0.110% | 0.048% |
Wilshire 5000 IndexSM Fund | 0.069% | 0.023% |
Wilshire International Equity Fund | 0.137% | 0.039% |
Wilshire Income Opportunities Fund | 0.091% | 0.058% |
105
Wilshire Mutual Funds, Inc. Notes to Financial Statements - (Continued) June 30, 2018 (Unaudited) |
|
Fees paid indirectly – The Company has a brokerage commission recapture program with SEI Investments Global Funds Services (“SEI”), pursuant to which a portion of the Portfolios’ commissions generated from transactions directed to SEI are used to reduce the Portfolios’ expenses. Under such program, SEI, as introducing broker, retains a portion of the Portfolios’ commissions.
Such commissions rebated to the Portfolios during the six months ended June 30, 2018 were as follows:
Wilshire Large Company Growth Portfolio | | $ | 976 | |
Wilshire Large Company Value Portfolio | | | 7,151 | |
Wilshire Small Company Growth Portfolio | | | — | |
Wilshire Small Company Value Portfolio | | | 1,511 | |
Wilshire 5000 IndexSM Fund | | | — | |
Wilshire International Equity Fund | | | — | |
Wilshire Income Opportunities Fund | | | — | |
For the six months ended June 30, 2018, SEI retained the following commissions:
Wilshire Large Company Growth Portfolio | | $ | 177 | |
Wilshire Large Company Value Portfolio | | | 2,604 | |
Wilshire Small Company Growth Portfolio | | | — | |
Wilshire Small Company Value Portfolio | | | 780 | |
Wilshire 5000 IndexSM Fund | | | — | |
Wilshire International Equity Fund | | | — | |
Wilshire Income Opportunities Fund | | | — | |
5. Investment Transactions.
During the six months ended June 30, 2018, aggregate cost of purchases and proceeds from sales and maturities of investments, other than affiliated investments, short-term investments, short sales and purchases to cover short sales, and U.S. Government securities, were as follows:
Portfolio | | Purchases | | | Sales and
Maturities | |
Wilshire Large Company Growth Portfolio | | $ | 103,982,967 | | | $ | 103,368,927 | |
Wilshire Large Company Value Portfolio | | | 131,447,502 | | | | 48,752,392 | |
Wilshire Small Company Growth Portfolio | | | 24,736,751 | | | | 22,661,110 | |
Wilshire Small Company Value Portfolio | | | 26,246,922 | | | | 16,812,181 | |
Wilshire 5000 IndexSM Fund | | | 286,778 | | | | 1,564,933 | |
Wilshire International Equity Fund | | | 624,965,264 | | | | 586,499,249 | |
Wilshire Income Opportunities Fund | | | 189,701,388 | | | | 198,713,509 | |
106
Wilshire Mutual Funds, Inc. Notes to Financial Statements - (Continued) June 30, 2018 (Unaudited) |
|
Purchases and sales and maturities of long-term U.S. Government securities during the six months ended June 30, 2018 were:
Portfolio | | Purchases | | | Sales and
Maturities | |
Wilshire Income Opportunities Fund | | $ | 71,362,037 | | | $ | 64,242,046 | |
Due to Guggenheim and Voya managing a portion of Wilshire Income Opportunities Fund, certain securities held by such Portfolio are considered affiliated investments. Purchases and sales of shares of affiliated registered investment companies by Wilshire Income Opportunities Fund during the six months ended June 30, 2018 and the value of such investments as of June 30, 2018 were as follows:
Affiliated Investment | | Value as of December 31, 2017 | | | Purchases | | | Proceeds
from Sales | | | Realized
Loss | | | Change in
Unrealized
Appreciation
(Depreciation) | | | Value as of
June 30,
2018 | | | Income
Distributions | | | Capital Gain
Distributions | |
Guggenheim Floating Rate Strategies Fund | | $ | 1,222,303 | | | $ | 24,599 | | | $ | (1,242,131 | ) | | $ | (2,430 | ) | | $ | (2,341 | ) | | $ | — | | | $ | 24,593 | | | $ | — | |
Guggenheim Strategy Fund I | | $ | 4,034,258 | | | $ | 45,100 | | | $ | (4,079,357 | ) | | $ | (4,832 | ) | | $ | 4,831 | | | $ | — | | | $ | 45,085 | | | $ | — | |
Voya Emerging Markets Hard Currency Debt Fund | | $ | — | | | $ | 3,002,708 | | | $ | — | | | $ | — | | | $ | (7,587 | ) | | $ | 2,995,121 | | | $ | 3,159 | | | $ | — | |
Voya Floating Rate Fund | | $ | — | | | $ | 14,011,070 | | | $ | — | | | $ | — | | | $ | (28,513 | ) | | $ | 13,982,557 | | | $ | 12,396 | | | $ | — | |
Voya High Yield Bond Fund | | $ | — | | | $ | 7,767,300 | | | $ | — | | | $ | — | | | $ | (52,648 | ) | | $ | 7,714,652 | | | $ | 8,174 | | | $ | — | |
6. Derivative Transactions.
Large Company Growth Portfolio, Large Company Value Portfolio, Small Company Growth Portfolio, Small Company Value Portfolio and Wilshire 5000 IndexSM Fund did not hold any derivative instruments as of or during the six months ended June 30, 2018.
107
Wilshire Mutual Funds, Inc. Notes to Financial Statements - (Continued) June 30, 2018 (Unaudited) |
|
At June 30, 2018, Wilshire International Equity Fund did not hold any derivative instruments. At June 30, 2018, Wilshire Income Opportunities Fund is invested in derivative contracts, which are reflected in the Statements of Assets and Liabilities, as follows:
| | | | | | Derivative Assets | | Derivative Liabilities |
| Risk | | | Derivative Type | | Statements of Assets
and Liabilities Location | | Fair Value
Amount | | | Statements of Assets
and Liabilities Location | | Fair Value
Amount | |
| | Currency | | | Foreign forward currency contracts | | Net unrealized appreciation on foreign forward currency contracts | | $ | 13,592 | | | Net unrealized depreciation on foreign forward currency contracts | | $ | (13,732 | ) |
| | Total | | | | | | | $ | 13,592 | | | | | $ | (13,732 | ) |
For the six months ended June 30, 2018, the effect of derivative contracts in Wilshire Income Opportunities Fund’s Statements of Operations was as follows:
| | | | Statements of Operations | |
Risk | Derivative Type | | Net Realized
Gains (Losses) | | | Net Change
in Unrealized
Appreciation
(Depreciation) | |
Equity | Purchased option contracts (a) | | $ | (225,136 | ) | | $ | — | |
Interest Rate | Swap contracts | | | 2,307,142 | | | | (437,340 | ) |
Currency | Forward foreign currency exchange contracts | | | — | | | | (140 | ) |
Total | | | $ | 2,082,006 | | | $ | (437,480 | ) |
(a) | The Statement of Operations location for “Purchased option contracts” is “Net realized and unrealized gains (losses) on unaffiliated investments.” |
7. Securities Lending.
Each Portfolio may seek additional income by lending its securities on a short-term basis to banks, brokers and dealers in return for cash collateral, which is invested in short-term securities. A Portfolio may return a portion of the interest earned to the borrower or a third party that is unaffiliated with the Company and acting as a “placing broker.” A Portfolio receives compensation for lending securities in the form of fees. A Portfolio also continues to receive dividends on the securities loaned. Security loans are secured at all times by collateral. It is the Company’s policy that the collateral be equal to at least 102% of the market value of the securities loaned (105% if the securities loaned are denominated in different currencies) plus accrued interest when the transaction is entered into, and that the collateral supporting the loans be valued daily. However, due to market fluctuations during the day, the value of securities loaned on a particular day may, during the. course of the day, exceed the value of collateral. On each business day, the amount of collateral is adjusted based on the prior day’s market fluctuations and the current day’s lending activity. Gain or loss in the market price of the securities loaned that may occur during the term of the loan
108
Wilshire Mutual Funds, Inc. Notes to Financial Statements - (Continued) June 30, 2018 (Unaudited) |
|
are reflected in the value of the Portfolio. The risks from securities lending are that the borrower may not provide additional collateral when required or return the securities when due or when called for by the Portfolio. Lending securities entails a risk of loss to the Portfolio if and to the extent that the market value of securities loans were to increase, the borrower did not increase the collateral accordingly, and the borrower fails to return the securities. NTC, the Portfolios’ custodian, acts as the securities lending agent for the Portfolios. The value of the securities on loan and the cash collateral at June 30, 2018 are shown on the Statements of Assets and Liabilities. Shares of the Northern Trust Institutional Liquid Asset Portfolio were purchased with proceeds from cash collateral received from securities on loan. Securities on loan are also collateralized by various U.S. Treasury obligations.
The following table is a summary of the Funds’ securities lending transactions accounted for as secured borrowings with cash collateral of overnight and continuous maturities and non-cash collateral greater than 90 days, which are subject to offset as of June 30, 2018:
| | | | | | | Collateral Received | |
Portfolio | | Value of
Securities on Loan | | | Value of Cash
Collateral Received | | | Value of Non-Cash
Collateral Received | | | Excess Amount Due
to Counterparty | |
Large Company Growth Portfolio | | $ | 24,520,199 | | | $ | 147,988 | | | $ | 25,044,009 | | | $ | 671,798 | |
Large Company Value Portfolio | | | 11,631,429 | | | | 2,552,002 | | | | 9,301,730 | | | | 222,303 | |
Small Company Growth Portfolio | | | 17,043,667 | | | | 2,584,771 | | | | 14,900,923 | | | | 442,027 | |
Small Company Value Portfolio | | | 10,886,090 | | | | 727,806 | | | | 10,438,924 | | | | 280,640 | |
Wilshire 5000 IndexSM Fund | | | 12,236,966 | | | | 1,716,714 | | | | 10,850,995 | | | | 330,743 | |
Wilshire International Equity Fund | | | 18,631,012 | | | | 3,907,774 | | | | 15,224,045 | | | | 500,807 | |
No non-cash collateral held by the Portfolios has a maturity of less than 90 days as of June 30, 2018.
Wilshire Income Opportunities Fund did not utilize securities lending during the six months ended June 30, 2018.
109
Wilshire Mutual Funds, Inc. Notes to Financial Statements - (Continued) June 30, 2018 (Unaudited) |
|
8. Capital Share Transactions.
Transactions in shares of the Portfolios are summarized below:
| | | LARGE COMPANY
GROWTH PORTFOLIO | | | LARGE COMPANY
VALUE PORTFOLIO | | | SMALL COMPANY
GROWTH PORTFOLIO | | | SMALL COMPANY
VALUE PORTFOLIO | |
| | | Six Months
Ended
June 30,
2018 | | | Year Ended
December 31, 2017 | | | Six Months
Ended
June 30,
2018 | | | Year Ended
December 31, 2017 | | | Six Months
Ended
June 30,
2018 | | | Year Ended
December 31, 2017 | | | Six Months
Ended
June 30,
2018 | | | Year Ended
December 31, 2017 | |
CAPITAL SHARE TRANSACTIONS: | | | | | | | | | | | | | | | | | | | | | | | | | | | | | | | | |
Investment Class shares: | | | | | | | | | | | | | | | | | | | | | | | | | | | | | | | | |
Shares sold | | | 40,573 | | | | 33,646 | | | | 16,011 | | | | 42,620 | | | | 41,270 | | | | 573,827 | | | | 14,439 | | | | 46,651 | |
Shares issued as reinvestment of distributions | | | — | | | | 131,643 | | | | — | | | | 28,470 | | | | — | | | | 41,834 | | | | — | | | | 30,112 | |
Shares redeemed | | | (103,980 | ) | | | (389,262 | ) | | | (47,170 | ) | | | (257,831 | ) | | | (104,605 | ) | | | (514,906 | ) | | | (28,783 | ) | | | (185,599 | ) |
Net increase (decrease) in Investment Class shares outstanding | | | (63,407 | ) | | | (223,973 | ) | | | (31,159 | ) | | | (186,741 | ) | | | (63,335 | ) | | | 100,755 | | | | (14,344 | ) | | | (108,836 | ) |
Shares outstanding at beginning of period | | | 1,622,279 | | | | 1,846,252 | | | | 309,031 | | | | 495,772 | | | | 454,494 | | | | 353,739 | | | | 274,222 | | | | 383,058 | |
Shares outstanding at end of period | | | 1,558,872 | | | | 1,622,279 | | | | 277,872 | | | | 309,031 | | | | 391,159 | | | | 454,494 | | | | 259,878 | | | | 274,222 | |
| | | | | | | | | | | | | | | | | | | | | | | | | | | | | | | | | |
Institutional Class shares: | | | | | | | | | | | | | | | | | | | | | | | | | | | | | | | | |
Shares sold | | | 1,346,736 | | | | 1,019,884 | | | | 5,664,961 | | | | 1,164,082 | | | | 502,889 | | | | 661,776 | | | | 782,275 | | | | 614,219 | |
Shares issued as reinvestment of distributions | | | — | | | | 293,035 | | | | — | | | | 716,652 | | | | — | | | | 122,682 | | | | — | | | | 161,412 | |
Shares redeemed | | | (996,097 | ) | | | (1,504,242 | ) | | | (940,297 | ) | | | (3,319,731 | ) | | | (224,695 | ) | | | (522,936 | ) | | | (142,018 | ) | | | (644,308 | ) |
Net increase (decrease) in Institutional Class shares outstanding | | | 350,639 | | | | (191,323 | ) | | | 4,724,664 | | | | (1,438,997 | ) | | | 278,194 | | | | 261,522 | | | | 640,257 | | | | 131,323 | |
Shares outstanding at beginning of period | | | 4,013,802 | | | | 4,205,125 | | | | 7,250,711 | | | | 8,689,708 | | | | 1,348,322 | | | | 1,086,800 | | | | 1,444,294 | | | | 1,312,971 | |
Shares outstanding at end of period | | | 4,364,441 | | | | 4,013,802 | | | | 11,975,375 | | | | 7,250,711 | | | | 1,626,516 | | | | 1,348,322 | | | | 2,084,551 | | | | 1,444,294 | |
110
Wilshire Mutual Funds, Inc. Notes to Financial Statements - (Continued) June 30, 2018 (Unaudited) |
|
| | | WILSHIRE 5000
INDEXSM FUND | | | WILSHIRE INTERNATIONAL
EQUITY FUND | | | WILSHIRE INCOME
OPPORTUNITIES FUND | |
| | | Six Months
Ended
June 30,
2018 | | | Year Ended
December 31, 2017 | | | Six Months
Ended
June 30,
2018 | | | Year Ended
December 31, 2017 | | | Six Months
Ended
June 30,
2018 | | | Year Ended
December 31, 2017 | |
CAPITAL SHARE TRANSACTIONS: | | | | | | | | | | | | | | | | | | | | | | | | |
Investment Class shares: | | | | | | | | | | | | | | | | | | | | | | | | |
Shares sold | | | 396,831 | | | | 984,802 | | | | 47,256 | | | | 226,707 | | | | 37,412 | | | | 724,183 | |
Shares issued as reinvestment of distributions | | | — | | | | 567,184 | | | | — | | | | 255 | | | | — | | | | 26,365 | |
Shares redeemed | | | (488,727 | ) | | | (1,415,579 | ) | | | (150,529 | ) | | | (1,119,765 | ) | | | (509,623 | ) | | | (234,014 | ) |
Net increase (decrease) in Investment Class
shares outstanding | | | (91,896 | ) | | | 136,407 | | | | (103,273 | ) | | | (892,803 | ) | | | (472,211 | ) | | | 516,534 | |
Shares outstanding at beginning of period | | | 7,170,420 | | | | 7,034,013 | | | | 373,194 | | | | 1,265,997 | | | | 625,181 | | | | 108,647 | |
Shares outstanding at end of period | | | 7,078,524 | | | | 7,170,420 | | | | 269,921 | | | | 373,194 | | | | 152,970 | | | | 625,181 | |
| | | | | | | | | | | | | | | | | | | | | | | | | |
Institutional Class shares: | | | | | | | | | | | | | | | | | | | | | | | | |
Shares sold | | | 95,719 | | | | 151,639 | | | | 12,940,004 | | | | 7,552,599 | | | | 5,701,097 | | | | 4,212,021 | |
Shares issued as reinvestment of distributions | | | — | | | | 118,693 | | | | — | | | | 149,107 | | | | — | | | | 1,343,981 | |
Shares redeemed | | | (99,243 | ) | | | (753,858 | ) | | | (5,129,287 | ) | | | (5,212,955 | ) | | | (3,433,152 | ) | | | (14,493,554 | ) |
Net increase (decrease) in Institutional Class
shares outstanding | | | (3,524 | ) | | | (483,526 | ) | | | 7,810,717 | | | | 2,488,751 | | | | 2,267,945 | | | | (8,937,552 | ) |
Shares outstanding at beginning of period | | | 1,683,570 | | | | 2,167,096 | | | | 31,800,035 | | | | 29,311,284 | | | | 30,340,537 | | | | 39,278,089 | |
Shares outstanding at end of period | | | 1,680,046 | | | | 1,683,570 | | | | 39,610,752 | | | | 31,800,035 | | | | 32,608,482 | | | | 30,340,537 | |
9. Significant Shareholders.
On June 30, 2018, the Portfolios had the following concentrations of shareholders holding 10% or more of the outstanding shares of the Portfolios. These represent omnibus shareholder accounts comprised of many individual shareholders.
Portfolio | |
Large Company Growth Portfolio (4 omnibus shareholders) | 66% |
Large Company Value Portfolio (3 omnibus shareholder) | 58% |
Small Company Growth Portfolio (4 omnibus shareholders) | 45% |
Small Company Value Portfolio (4 omnibus shareholders) | 52% |
Wilshire 5000 IndexSM Fund (3 omnibus shareholders) | 50% |
Wilshire International Equity Fund (3 omnibus shareholders) | 59% |
Wilshire Income Opportunities Fund (3 omnibus shareholders) | 69% |
111
Wilshire Mutual Funds, Inc. Notes to Financial Statements - (Continued) June 30, 2018 (Unaudited) |
|
As of June 30, 2018, certain affiliated investment companies, also advised by the Adviser, owned the following amounts of the outstanding shares of the Portfolios:
Portfolio | |
Large Company Growth Portfolio | 27% |
Large Company Value Portfolio | 47% |
Small Company Growth Portfolio | 20% |
Small Company Value Portfolio | 31% |
Wilshire 5000 IndexSM Fund | — |
Wilshire International Equity Fund | 59% |
Wilshire Income Opportunities Fund | 39% |
10. Tax Information.
No provision for federal income taxes is required because each Portfolio has qualified and intends to continue to qualify as a regulated investment company under Subchapter M of the Code and distributes to shareholders all of its taxable income and net realized gains. Federal income tax regulations differ from U.S. GAAP; therefore, distributions determined in accordance with tax regulations may differ in amount or character from net investment income and realized gains for financial reporting purposes. Financial reporting records are adjusted for permanent book/tax differences to reflect tax character. Financial records are not adjusted for temporary differences.
The Portfolios evaluate tax positions taken or expected to be taken in the course of preparing the Portfolios’ tax returns to determine whether it is “more-likely than-not” (i.e., greater than 50 percent) that each tax position will be sustained upon examination by a taxing authority based on the technical merits of the position. Tax positions not deemed to meet the more-likely-than-not threshold are recorded as a tax benefit or expense in the current year. The Portfolios did not record any tax provision in the current period. However, management’s conclusions regarding tax positions taken may be subject to review and adjustment at a later date based on factors including, but not limited to, examination by tax authorities of returns filed in the last 3 years and on-going analysis of and changes to tax laws, regulations and interpretations thereof. The Funds identify their major tax jurisdiction as U.S. Federal.
112
Wilshire Mutual Funds, Inc. Notes to Financial Statements - (Continued) June 30, 2018 (Unaudited) |
|
The federal tax cost of portfolio securities and unrealized appreciation and depreciation at June 30, 2018 for each Portfolio are as follows:
Portfolio | | Large
Company
Growth
Portfolio | | | Large
Company
Value
Portfolio | | | Small
Company
Growth
Portfolio | | | Small
Company
Value
Portfolio | | | Wilshire
5000
IndexSM
Fund | | | Wilshire
International
Equity
Fund | | | Wilshire
Income
Opportunities
Fund | |
Tax cost of portfolio investments | | $ | 175,250,952 | | | $ | 214,356,743 | | | $ | 45,508,853 | | | $ | 46,197,974 | | | $ | 60,903,862 | | | $ | 378,985,681 | | | $ | 352,589,077 | |
Gross unrealized appreciation | | $ | 83,902,243 | | | $ | 32,767,046 | | | $ | 13,477,508 | | | $ | 9,967,549 | | | $ | 130,737,776 | | | $ | 44,642,892 | | | $ | 2,133,714 | |
Gross unrealized depreciation | | | (3,262,063 | ) | | | (8,262,178 | ) | | | (1,317,525 | ) | | | (2,055,296 | ) | | | (2,684,302 | ) | | | (11,955,335 | ) | | | (7,010,572 | ) |
Net unrealized appreciation (depreciation) | | $ | 80,640,180 | | | $ | 24,504,868 | | | $ | 12,159,983 | | | $ | 7,912,253 | | | $ | 128,053,474 | | | $ | 32,687,557 | | | $ | (4,876,858 | ) |
The differences between book and tax-basis unrealized appreciation (depreciation) are attributable primarily to the tax deferral of losses on wash sales and investment in passive foreign investment companies.
The tax character of distributions declared during the year ended December 31, 2017 was as follows:
Portfolio | | 2017
Ordinary
Income | | | 2017
Long-Term
Capital Gains | |
Large Company Growth Portfolio | | $ | 2,084,944 | | | $ | 16,542,862 | |
Large Company Value Portfolio | | | 9,726,872 | | | | 6,140,150 | |
Small Company Growth Portfolio | | | 1,210,846 | | | | 3,215,807 | |
Small Company Value Portfolio | | | 1,049,935 | | | | 3,441,792 | |
Wilshire 5000 IndexSM Fund | | | 2,666,332 | | | | 12,803,168 | |
Wilshire International Equity Fund | | | 1,692,329 | | | | — | |
Wilshire Income Opportunities Fund | | | 13,133,583 | | | | 1,067,674 | |
There were no distributions paid to shareholders by any Portfolio during the six months ended June 30, 2018.
113
Wilshire Mutual Funds, Inc. Notes to Financial Statements - (Continued) June 30, 2018 (Unaudited) |
|
As of December 31, 2017, the components of accumulated earnings on a tax basis were as follows:
Portfolio | | Large
Company
Growth
Portfolio | | | Large
Company
Value
Portfolio | | | Small
Company
Growth
Portfolio | | | Small
Company
Value
Portfolio | | | Wilshire
5000
IndexSM
Fund | | | Wilshire
International
Equity
Fund | | | Wilshire
Income
Opportunities
Fund | |
Undistributed ordinary income | | $ | 1,305,001 | | | $ | 515,595 | | | $ | 281,540 | | | $ | 402,689 | | | $ | 18,783 | | | $ | 1,387,326 | | | $ | 208,542 | |
Undistributed long-term gains | | | 5,080,173 | | | | 2,498,592 | | | | 575,900 | | | | 654,988 | | | | 1,348,852 | | | | — | | | | 216,495 | |
Accumulated capital and other losses | | | — | | | | — | | | | — | | | | — | | | | — | | | | (6,118,433 | ) | | | — | |
Net unrealized appreciation | | | 82,650,053 | | | | 36,456,324 | | | | 9,588,419 | | | | 7,384,832 | | | | 125,585,071 | | | | 64,783,207 | | | | 1,481,002 | |
Net unrealized appreciation on foreign currency translation | | | — | | | | — | | | | — | | | | — | | | | — | | | | 32,694 | | | | — | |
Accumulated earnings | | $ | 89,035,227 | | | $ | 39,470,511 | | | $ | 10,445,859 | | | $ | 8,442,509 | | | $ | 126,952,706 | | | $ | 60,084,794 | | | $ | 1,906,039 | |
As of December 31, 2017, Wilshire International Equity Fund had short-term capital loss carryforwards (“CLCFs”) of $6,118,433 for federal income tax purposes, which do not expire. These CLCFs may be utilized in the current and future years to offset net realized capital gains, if any, prior to distributing such gains to shareholders.
For the six months ended June 30, 2018, the following reclassifications were made on the Statements of Assets and Liabilities as a result of permanent differences in the recognition of capital gains or losses under income tax regulations and GAAP:
Portfolio | | Large
Company
Growth
Portfolio | | | Large
Company
Value
Portfolio | | | Small
Company
Growth
Portfolio | | | Small
Company
Value
Portfolio | | | Wilshire
5000
IndexSM
Fund | | | Wilshire
International
Equity
Fund | | | Wilshire
Income
Opportunities
Fund | |
Accumulated net investment income (loss) | | $ | — | | | $ | 619 | | | $ | — | | | $ | — | | | $ | — | | | $ | (4,253,874 | ) | | $ | (111,999 | ) |
Accumulated net realized gains (losses) from investment transactions | | | — | | | | (619 | ) | | | — | | | | — | | | | — | | | | 4,253,874 | | | | 111,999 | |
Such reclassifications, the result of permanent differences between financial statement and income tax reporting requirements, had no effect on each Portfolio’s net assets or NAV per share.
11. Indemnifications.
In the normal course of business, the Company, on behalf of the Portfolios, enters into contracts that provide general indemnifications. The Portfolios’ maximum exposure under these arrangements is dependent on claims that may be made against the Portfolios in the future and, therefore, cannot be estimated; however, based on experience, the risk of material loss from such claims is considered remote.
114
Wilshire Mutual Funds, Inc. Notes to Financial Statements - (Continued) June 30, 2018 (Unaudited) |
|
12. Certain Investment Risks.
Asset-Backed Securities (“ABS”) Risk – Investors in ABS, including mortgage-backed securities (“MBS”) and structured finance investments, generally receive payments that are part interest and part return of principal. These payments may vary based on the rate at which the underlying borrowers pay off their loans or other future expected receivables of assets or cash flows. Some ABS, including MBS, may have structures that make their reaction to interest rates and other factors difficult to predict, making them subject to liquidity risk.
Collateralized debt obligation (“CDO”) risk – A CDO is an ABS whose underlying collateral is typically a portfolio of bonds, bank loans, other structured finance securities and/or synthetic instruments. Investors in CDOs bear the credit risk of the underlying collateral. Multiple tranches of securities are issued by the CDO, offering investors various maturity and credit risk characteristics. Tranches are categorized as senior, mezzanine, and subordinated/equity, according to their degree of risk. If there are defaults or the CDO’s collateral otherwise underperforms, scheduled payments to senior tranches take precedence over those of mezzanine tranches, and scheduled payments to mezzanine tranches take precedence over those to subordinated/equity tranches. CDOs are subject to the same risk of prepayment described for certain mortgage-related and ABS, and are subject to credit risk, interest rate risk and default risk. The market value of CDOs may be affected by changes in the market’s perception of the creditworthiness of the servicing agent for the pool or the originator.
Forward contracts risk – There may be an imperfect correlation between the price of a forward contract and the underlying security, index or currency which will increase the volatility of Wilshire Income Opportunities Fund’s NAV. The Portfolio bears the risk of loss of the amount expected to be received under a forward contract in the event of the default or bankruptcy of a counterparty. If such a default occurs, the Portfolio will have contractual remedies pursuant to the forward contract, but such remedies may be subject to bankruptcy and insolvency laws that could affect the Portfolio’s rights as a creditor. Forward currency transactions include risks associated with fluctuations in foreign currency.
Interest rate risk – For debt securities, interest rate risk is the possibility that the market price will fall because of changing interest rates. In general, debt securities’ market prices rise or fall inversely to changes in interest rates. If interest rates rise, bond market prices generally fall; if interest rates fall, bond market prices generally rise. In addition, for a given change in interest rates, the market price of longer-maturity bonds fluctuates more (gaining or losing more in value) than shorter-maturity bonds. There may be less governmental intervention in influencing interest rates in the near future. If so, it could cause an increase in interest rates, which would have a negative impact on the market prices of fixed income securities and could negatively affect a Portfolio’s NAV.
Credit risk – A Portfolio’s debt instruments are subject to credit risk, which is the risk that an issuer will be unable, or will be perceived to be unable, to repay its obligations at maturity. Funds that invest primarily in high quality securities generally are subject to less credit risk than funds that invest in lower quality securities. Certain securities are backed by credit enhancements from various financial institutions and financial guarantee assurance agencies. These credit enhancements reinforce the credit quality of the individual securities; however, if any of the financial institutions or financial guarantee assurance agencies’ credit quality should deteriorate, it could cause the individual security’s credit quality to change. Additionally, if a Portfolio concentrates its credit enhancements in any one financial institution, the risk of credit quality deterioration increases. The value of ABS may be affected
115
Wilshire Mutual Funds, Inc. Notes to Financial Statements - (Continued) June 30, 2018 (Unaudited) |
|
by the credit risk of the servicing agent for the pool, the originator of the loans or receivables, or the financial institution(s) providing the credit support. In addition to credit risk, ABS and other securities with early redemption features are subject to pre-payment risk. During periods of declining interest rates, prepayment of loans underlying ABS can be expected to accelerate or an issuer may retire an outstanding bond early to reduce interest costs. A Portfolio’s ability to maintain positions in such securities will be affected by reductions in the principal amount of such securities resulting from prepayments, and its ability to reinvest the returns of principal at comparable yields is subject to generally prevailing interest rates at that time.
Counterparty credit risk – Counterparty credit risk is the risk that a counterparty to a financial instrument will fail on a commitment that it has entered into with a Portfolio. A Portfolio’s sub-adviser seeks to minimize counterparty credit risk by monitoring the creditworthiness of each counterparty on an ongoing basis.
Foreign security risk – Wilshire International Equity Fund and Wilshire Income Opportunities Fund invest in securities of foreign issuers in various countries. These investments may involve certain considerations and risks not typically associated with investments in the United States as a result of, among other factors, the possibility of future political and economic developments and the level of governmental supervision and regulation of securities markets in foreign countries. The market values of the Portfolios’ investments will change in response to interest rate changes and other factors. During periods of falling interest rates, the values of fixed income securities generally rise. Conversely, during periods of rising interest rates, the values of such securities generally decline.
Changes by recognized rating agencies in the ratings of any fixed income security and in the ability of an issuer to make payments of interest and principal may also affect the value of these investments. Also, the ability of the issuers of debt securities held by the Portfolios to meet their obligations may be affected by economic and political developments in a specific country, industry or region.
Investments in Loans Risk – Investments in loans involve special types of risks, including credit risk, interest rate risk, counterparty risk and prepayment risk. Loans may offer a fixed or floating interest rate. Loans are often generally below investment grade and may be unrated. Loans may be difficult to value and some can be subject to liquidity risk.
Sector Risk – If a Portfolio has significant investments in the securities of issuers in industries within a particular sector, any development affecting that sector will have a greater impact on the value of the net assets of the Portfolio than would be the case if the Portfolio did not have significant investments in that sector. In addition, this may increase the risk of loss of an investment in the Portfolio and increase the volatility of the Portfolio’s NAV per share. From time to time, circumstances may affect a particular sector and the companies within such sector. For instance, economic or market factors, regulation or deregulation, or other developments may negatively impact all companies in a particular sector and therefore the value of a Portfolio’s holdings would be adversely affected. As of June 30, 2018, Large Company Growth Portfolio had 39.4% of the value of its net assets invested in stocks within the Information Technology sector; and Large Company Value Portfolio had 25.9% of the value of its net assets invested in stocks within the Financials sector.
A more complete description of risks is included in each Portfolio’s prospectus and Statement of Additional Information.
116
Wilshire Mutual Funds, Inc. Notes to Financial Statements - (Continued) June 30, 2018 (Unaudited) |
|
13. Contingencies.
Wilshire 5000 IndexSM Fund was named as a defendant and a putative member of a proposed defendant class of shareholders in a lawsuit filed on December 7, 2010 in the U.S. Bankruptcy Court for the District of Delaware and on March 6, 2012 in the District Court for the Southern District of New York, in connection with Tribune Company’s Chapter 11 bankruptcy proceeding. The 2010 lawsuit was brought by the official Committee of Unsecured Creditors of the Tribune Company and the 2012 lawsuit was brought by Deutsche Bank, as trustee for senior noteholders of Tribune Company. Both lawsuits relate to a leveraged buyout transaction by which Tribune Company converted to a privately-held company in 2007 less than a year prior to Tribune Company’s bankruptcy filing. The putative defendant class is comprised of beneficial owners of shares of Tribune Company who meet certain jurisdictional requirements and received proceeds of the leveraged buyout. The plaintiffs seek to recover those proceeds, together with interest and attorneys’ fees and expenses, as fraudulent transfers under the Bankruptcy Act or various state laws. On September 2013, the District Court dismissed the 2012 lawsuit and in March 2016 the Second Circuit Court of Appeals affirmed this decision. The 2010 lawsuit continues in the District Court. The Adviser does not expect the Portfolio to be materially impacted by the lawsuits.
14. Subsequent Event Evaluation.
The Portfolios have evaluated the need for additional disclosures and/or adjustments resulting from subsequent events through the date these financial statements were issued. Based on this evaluation, no additional disclosures and/or adjustments were required to these financial statements.
117
Wilshire Mutual Funds, Inc. Additional Fund Information (Unaudited) |
|
Information on Proxy Voting
A description of policies and procedures that the Portfolios use to determine how to vote proxies relating to portfolio securities, along with each Portfolio’s proxy voting record relating to portfolio securities held during most recent 12-month period ended June 30, is available at no charge, upon request by calling 1-888-200-6796, by e-mailing us at http://advisor.wilshire.com or on the SEC’s website at http://www.sec.gov.
Information on Form N-Q
The Company files its complete schedule of portfolio holdings with the SEC as of the end of the first and third quarters of each fiscal year on Form N-Q within sixty days after the end of period. The Company’s Forms N-Q are available on the SEC’s website at http://www.sec.gov, and may be reviewed and copied at the SEC’s Public Reference Room in Washington, DC. Information on the operation of the Public Reference Room may be obtained by calling 1-202-551-8090.
Householding Policy
In order to reduce printing and mailing expenses, only one copy of each prospectus, annual and semi-annual report will be sent to all related accounts at a common address, unless you have indicated otherwise on your Account Application. Shareholders may revoke their consent to householding at any time by calling 1-888-200-6796. Upon receipt of a shareholder’s revocation, the Company will begin mailing individual copies of the above-referenced documents to the shareholder’s attention within 30 days.
118
Wilshire Mutual Funds, Inc. Board Approval of Sub-Advisory Agreements (Unaudited) |
|
On May 15, 2018, the Board of Directors (the “Board” and each individually, a “Director”) of Wilshire Mutual Funds, Inc. (the “Company”) approved the following: (i) an amended subadvisory agreement between Wilshire Associates Incorporated (“Wilshire” or the “Adviser”) and Pzena Investment Management, LLC (“Pzena”) pursuant to which Pzena serves as a new subadviser to the Wilshire International Equity Fund (the “International Fund”) effective June 25, 2018 (the “Pzena Subadvisory Agreement”); (ii) a subadvisory agreement between Wilshire and Manulife Asset Management (US) LLC (“Manulife”) pursuant to which Manulife serves as a new subadviser to the Wilshire Income Opportunities Fund (the “Income Fund”) effective June 21, 2018 (the “Manulife Subadvisory Agreement”); and (iii) a subadvisory agreement between Wilshire and Voya Investment Management Co. LLC (“Voya”) pursuant to which Voya serves as a new subadviser to the Income Fund effective June 20, 2018 (the “Voya Subadvisory Agreement”).
At the meeting on May 15, 2018, in connection with the review of Wilshire’s proposed subadvisory agreements with each of Pzena, Manulife and Voya (each, a “Subadviser” and collectively, the “Subadvisers”), the Board evaluated information provided by Wilshire and each Subadviser in accordance with Section 15(c) of the Investment Company Act of 1940, as amended (the “1940 Act”).
The information that follows outlines the Board’s considerations associated with its approval of each of the Pzena Subadvisory Agreement, the Manulife Subadvisory Agreement and the Voya Subadvisory Agreement (collectively, the “Subadvisory Agreements”). (For purposes of the following discussion of the Board’s considerations, each of the Income Fund and the International Fund may be referred to as a “Fund.”) In connection with its deliberations regarding the approval of these relationships, the Board considered such information and factors as it believed to be relevant. As described below, the Board considered the nature, extent and quality of the services to be performed by the Subadvisers under the proposed subadvisory arrangements; comparative fees as provided by the Subadvisers; the profits to be realized by the Subadvisers; the extent to which the Subadvisers would realize economies of scale as a Fund grows; and whether any fall-out benefits would be realized by the Subadvisers. In considering these matters, the Board was advised with respect to relevant legal standards by independent legal counsel. In addition, the Directors who are not “interested persons” of the Company as defined in the 1940 Act (the “Independent Directors”) discussed the approval of the Subadvisory Agreements with management and in private sessions with independent legal counsel at which no representatives of the Subadvisers were present.
As required by the 1940 Act, each approval was confirmed by a separate vote of the Independent Directors. In deciding to approve the Subadvisory Agreements, the Board did not identify any single factor as controlling and this summary does not describe all of the matters considered. However, the Board concluded that each of the various factors referred to below favored such approval.
Information Received
The Board, including all the Independent Directors, considered the approval of the Subadvisory Agreements at the Board’s May 15, 2018 meeting. The Directors received information from the Adviser regarding the factors underlying its recommendations to approve each Subadvisory Agreement. The Directors also received information from each Subadviser as to the Fund it would manage describing: (i) the nature, extent and quality of services to be provided; (ii) the financial condition of the Subadviser; (iii) the extent to which economies of scale may be realized as the Fund grows; (iv) whether fee levels reflect any possible economies of scale for the benefit of the Fund’s
119
Wilshire Mutual Funds, Inc. Board Approval of Sub-Advisory Agreements (Unaudited) - (continued) |
|
shareholders; (v) comparisons of services rendered and amounts paid by other registered investment companies and any comparable advisory clients; and (vi) benefits to be realized by the Subadviser from its relationship with the Fund. The Independent Directors were assisted in their review by independent legal counsel.
As part of its evaluation, the Board considered the assessment of performance made by the Investment Committee (which is composed solely of Independent Directors), which also met on May 15, 2018 to review data on each Subadviser’s performance for managing investment products similar to the applicable Fund. Based upon its evaluation of all materials provided, the Board concluded that it was in the best interests of each of the Funds to approve each of the Subadvisory Agreements.
Nature, Extent and Quality of Services
The Board considered the nature, extent and quality of services to be provided under each Subadvisory Agreement. The Board considered the reputation, qualifications and background of the Subadviser, investment approach of the Subadviser, the experience and skills of investment personnel to be responsible for the day-to-day management of the applicable Fund, and the resources made available to such personnel. In addition, the Board considered the analysis provided by the Adviser, which concluded that each Subadviser would provide reasonable services and recommended that each Subadvisory Agreement be approved. With respect to Pzena, the Board considered its prior experience with Pzena for managing another fund of the Company.
The Board reviewed information comparing Manulife’s and Voya’s annualized gross investment performance for managing investment products similar to the Income Fund to the Bloomberg Barclays U.S. Universal Index (the “Universal Index”) for the one-, two-, three- and five-year periods ended March 31, 2018. The Board noted that Manulife and Voya outperformed the Universal Index for all periods reviewed.
The Board also reviewed information comparing Pzena’s annualized gross investment performance for managing investment products similar to the International Fund to the MSCI ACWI ex USA Index (the “MSCI ACWI Index”) for the one-, two- and three-year periods ended March 31, 2018. The Board noted that Pzena outperformed the MSCI ACWI Index for the two- and three-year periods.
Subadvisory Fees
The Board considered each Subadviser’s proposed subadvisory fee. The Board evaluated the competitiveness of the subadvisory fees based upon data supplied by each Subadviser about the fees charged to other clients. The Board also considered that the subadvisory fee rates were negotiated at arm’s length between the Adviser and each Subadviser, that the Adviser compensates the Subadviser from its fees and that the aggregate advisory fee had been deemed reasonable by the Board.
With respect to the Subadvisers’ reported fees for “Other Clients” with comparable investment policies and services, for the Subadviser where the fees charged to the Adviser were higher than that charged to Other Clients, the Board determined that the fees charged to the Adviser were competitive.
Based upon all of the above, the Board determined that the subadvisory fees were reasonable.
120
Wilshire Mutual Funds, Inc. Board Approval of Sub-Advisory Agreements (Unaudited) - (continued) |
|
Profitability to the Subadvisers
The Board noted that the Adviser compensates each Subadviser from its own advisory fees and that the fees were negotiated at arm’s length between the Adviser and each Subadviser. In addition, the Board noted that the revenues to the Subadviser would be limited due to the current size of the Funds. The Board took these factors into consideration in concluding that the subadvisory fees were reasonable.
Economies of Scale
The Board considered whether there may be economies of scale with respect to the subadvisory services to be provided to each Fund and whether the subadvisory fees reflect such economies of scale through breakpoints in fees. The Board also considered whether the effective subadvisory fee rate under each Subadvisory Agreement is reasonable in relation to the asset size of the applicable Fund. The Board concluded that the fee schedule for each Subadviser reflects an appropriate recognition of any economies of scale.
Fall-Out Benefits
The Board also considered the character and amount of other incidental benefits to be received by the Subadvisers. The Board considered Pzena’s soft dollar practices. The Board concluded that, taking into account any such other benefits, the fees to be charged under each Subadvisory Agreement were reasonable.
Conclusion
Based upon all of the information considered and the conclusions reached, the Board determined that the terms of each Subadvisory Agreement are fair and reasonable and that the approval of each Subadvisory Agreement is in the best interests of each of the Funds.
121

Wilshire Mutual Funds
Wilshire Associates Incorporated
1299 Ocean Avenue
Santa Monica, CA 90401
1-888-200-6796
http://advisor.wilshire.com
Not Applicable.
| Item 3. | Audit Committee Financial Expert. |
Not Applicable.
| Item 4. | Principal Accountant Fees and Services. |
Not Applicable.
| Item 5. | Audit Committee of Listed Registrants. |
Not applicable.
| Item 6. | Schedule of Investments. |
| (a) | The Schedules of Investment in securities of unaffiliated issuers as of the close of the reporting period for the Large Company Growth Portfolio, the Large Company Value Portfolio, the Small Company Growth Portfolio, the Small Company Value Portfolio, the Wilshire 5000 IndexSM Fund, the Wilshire International Equity Fund and the Wilshire Income Opportunities Fund are listed below. |
| Item 7. | Disclosure of Proxy Voting Policies and Procedures for Closed-End Management Investment Companies. |
Not applicable.
| Item 8. | Portfolio Managers of Closed-End Management Investment Companies. |
Not applicable.
| Item 9. | Purchases of Equity Securities by Closed-End Management Investment Company and Affiliated Purchasers. |
Not applicable.
| Item 10. | Submission of Matters to a Vote of Security Holders. |
There have been no changes to the procedures by which shareholders may recommend nominees to the Registrant’s Board of Directors since the Registrant last disclosed such procedures in the definitive proxy statement filed with the SEC on March 29, 2011.
| Item 11. | Controls and Procedures. |
(a) Based on their evaluation of the registrant’s disclosure controls and procedures (as defined in Rule 30a-3(c) under the Investment Company Act of 1940) as of a date within 90 days of the filing date of this report, the registrant’s principal executive officer and principal financial officer have concluded that such disclosure controls and procedures are reasonably designed and are operating effectively to ensure that material information relating to the registrant, including its consolidated subsidiaries, is made known to them by others within those entities, particularly during the period in which this report is being prepared, and that the information required in filings on Form N-CSR is recorded, processed, summarized, and reported on a timely basis.
(b) There were no changes in the registrant’s internal control over financial reporting (as defined in Rule 30a-3(d) under the Investment Company Act of 1940) that occurred during the second fiscal quarter of the period covered by this report that have materially affected, or are reasonably likely to materially affect, the registrant’s internal control over financial reporting.
| Item 12. | Disclosure of Securities Lending Activities for Closed-End Management Investment Companies. |
Not applicable.
File the exhibits listed below as part of this Form. Letter or number the exhibits in the sequence indicated.
(a)(1) Any code of ethics, or amendment thereto, that is the subject of the disclosure required by Item 2, to the extent that the registrant intends to satisfy the Item 2 requirements through filing of an exhibit: Not applicable
(a)(2) A separate certification for each principal executive officer and principal financial officer of the registrant as required by Rule 30a-2(a) under the Act (17 CFR 270.30a-2(a)): Attached hereto
(a)(3) Any written solicitation to purchase securities under Rule 23c-1 under the Act (17 CFR 270.23c-1) sent or given during the period covered by the report by or on behalf of the registrant to 10 or more persons: Not applicable
(a)(4) Change in the registrant’s independent public accountants: Not applicable.
(b) Certifications required by Rule 30a-2(b) under the Act (17 CFR 270.30a-2(b)): Attached hereto
| Exhibit 99.CERT | Certifications required by Rule 30a-2(a) under the Act |
| Exhibit 99.906CERT | Certifications required by Rule 30a-2(b) under the Act |
SIGNATURES
Pursuant to the requirements of the Securities Exchange Act of 1934 and the Investment Company Act of 1940, the registrant has duly caused this report to be signed on its behalf by the undersigned, thereunto duly authorized.
| (Registrant) | Wilshire Mutual Funds, Inc. | | |
| | | | |
| By (Signature and Title)* | /s/ Jason A. Schwarz | |
| | | Jason A. Schwarz, President and Principal Executive Officer | |
| | | | |
| Date | September 6, 2018 | | |
| | | | |
| Pursuant to the requirements of the Securities Exchange Act of 1934 and the Investment Company Act of 1940, this report has been signed below by the following persons on behalf of the registrant and in the capacities and on the dates indicated. |
| | | | |
| By (Signature and Title)* | /s/ Jason A. Schwarz | |
| | | Jason A. Schwarz, President and Principal Executive Officer | |
| | | | |
| Date | September 6, 2018 | | |
| | | | |
| By (Signature and Title)* | /s/ Michael Wauters | |
| | | Michael Wauters, Treasurer, Principal Financial Officer and Principal Accounting Officer | |
| | | | |
| Date | September 6, 2018 | | |
| * | Print the name and title of each signing officer under his or her signature. |