UNITED STATES
SECURITIES AND EXCHANGE COMMISSION
Washington, DC 20549
FORM 20-F
| ¨ | | REGISTRATION STATEMENT PURSUANT TO SECTION 12 (b) OR (g) OF THE SECURITIES EXCHANGE ACT OF 1934 |
or
| x | | ANNUAL REPORT PURSUANT TO SECTION 13 OR 15 (d) OF THE SECURITIES EXCHANGE ACT OF 1934 |
For the 12-month period ended June 30, 2002
or
| ¨ | | TRANSITION REPORT PURSUANT TO SECTION 13 OR 15 (d) OF THE SECURITIES EXCHANGE ACT OF 1934 |
For the transition period ended June 30, 2002
Commission file number # 0-20588
NEWMONT YANDAL OPERATIONS LIMITED (A.C.N. 007 066 766)
(Exact Name of Registrant as Specified in its Charter)
(Translation of Registrant’s Name Into English)
STATE OF VICTORIA, AUSTRALIA
(Jurisdiction of Incorporation or Organisation)
100 Hutt Street, Adelaide, South Australia, 5000, Australia
(Address of Principal Executive Offices)
Securities registered or to be registered pursuant to Section 12 (b) of the Act:
TITLE OF EACH CLASS
| | NAME OF EACH EXCHANGE-
ON WHICH REGISTERED
|
NONE | | NONE |
| |
|
Securities registered or to be registered pursuant to Section 12(g) of the Act:
None
Securities for which there is a reporting obligation pursuant to Section 15(d) of the Act:
None
Indicate the number of outstanding shares of each of the issuer’s classes of capital or common stock as of the close of the period covered by the annual report.
Fully Paid Ordinary Shares: | | |
at June 30, 2002 | | 308,960,662 |
Indicate by check mark whether the registrant: (1) has filed all reports required to be filed by Section 13 or 15 (d) of the Securities Exchange Act of 1934 during the preceding 12 months (or for such shorter period that the registrant was required to file such reports), and (2) has been subject to such filing requirements for the past 90 days.
Indicate by check mark which financial statement item the registrant has elected to follow.
(APPLICABLE ONLY TO ISSUERS INVOLVED IN BANKRUPTCY PROCEEDINGS DURING THE PAST FIVE YEARS.)
Indicate by check mark whether the registrant has filed all documents and reports required to be filed by Section 12,13 or 15 (d) of the Securities Exchange Act of 1934 subsequent to the distribution of securities under a plan confirmed by a court.
YES | | ¨ | | NO | | ¨ | | NOT APPLICABLE |
2
TABLE OF CONTENTS
3
4
Newmont Yandal Operations Limited
In this Annual Report on Form 20-F, references to Newmont Yandal Operations, NYOL or the Group are references to the Newmont Yandal Operations consolidated group of companies. Reference to Newmont Yandal Operations Limited or the Company is to the company “Newmont Yandal Operations Limited”.
Change of Name
On April 23, 2002, the Company changed its name from Normandy Yandal Operations Limited to Newmont Yandal Operations Limited. NYOL’s Annual Report for the eighteen months ended December 31, 2002 is expected to be published in May 2003.
Change of Financial Year
For the purpose of synchronising the Company’s financial year with that of its ultimate parent entity, Newmont Mining Corporation, NYOL has changed its financial year to a calendar basis. Under Australian Corporations Law, NYOL will prepare audited financial statements for the eighteen months ended December 31, 2002.
This Report as of and for the twelve months ended June 30, 2002 is being filed voluntarily by the Company.
Accounting principles
NYOL’s general purpose financial report for the twelve months ended June 30, 2002 has been prepared in accordance with applicable Australian Accounting Standards, Urgent Issues Group Consensus Views and the Australian Corporations Act 2001. These accounting principles are referred to within this annual report on Form 20-F as A-GAAP (Australian generally accepted accounting principles).
Currency
NYOL’s general purpose financial report is in Australian dollars (“A$”). In this annual report, unless otherwise specified or the context otherwise requires, all dollar amounts are expressed in A$. References made to US$ is the lawful currency of the United States.
5
Change in functional currency for US GAAP
NYOL first prepared a US GAAP reconciliation in connection with the issue of its US$300,000,000 8 7/8% Senior Notes due April 1998. At that time, the Group was an Australia public company with a predominantly Australian shareholder base, and used Australian dollars (“A$”) as the reporting currency for A-GAAP. Consequently, A$ was adopted as the functional currency for US GAAP.
On February 15, 2002, the Group’s parent entity, Newmont Australia Limited (formerly Normandy Mining Limited) was acquired by Newmont Mining Corporation (“Newmont”), a US public gold mining company with a majority of US shareholders. Newmont adopts the US dollars as the functional currency for each of its international subsidiaries.
With the Group’s sales price for gold moving in direct correlation with the US dollar gold price, and a combination of US dollars and A$ costs, necessitated a change in functional currency for the Group to the US dollars.
As the A$ is still used as the reporting currency for A GAAP, the reconciling adjustment to US GAAP reflects the impact of recording transactions denominated in A$ or other currencies in US dollars at the prevailing exchange rate at the time they occur.
6
Certain forward-looking statements
This annual report includes “forward-looking information” within the meaning of Section 27A of the Securities Act of 1933, as amended, and Section 21E of the Securities Exchange Act of 1934, as amended is intended to be covered by the safe harbor provided for under these sections. Certain statements contained in this annual report, including without limitation, those concerning the economic outlook for the gold mining industry; estimates of future costs and other liabilities, and estimates of future hedge liabilities expectations regarding gold prices, sales and production; the timing, scope and cost of drilling and other exploration activities, potential changes in NYOL’s gold production and reserves, and NYOL’s liquidity and capital resources, contain certain forward-looking statements regarding the Group’s operations.
NYOL believes that the expectations expressed in these forward looking statements are reasonable, however, no assurance can be given that such expectations will prove to be accurate or correct.
Accordingly, results could differ materially from those set out in the forward-looking statements. Factors that could cause actual results to differ materially include, among others, changes in gold prices, interest rates and exchange rates, unanticipated grade, geological, metallurgical processing or other problems, results of current exploration activities, results of pending and future feasibility studies, changes in project parameters as plans continue to be refined, availability of materials and equipment, the timing of receipt of governmental permits, force majeure events, the failure of plant, equipment or processes to operate in accordance with specifications or expectations, accidents, labour relations, delays in start-up dates, environmental costs and risks, the outcome of acquisition negotiations and general domestic and international economic and political conditions. Refer to item 3D “Risk factors” for a more in depth discussion of factors that could materially adversely affect the Group.
7
Part I
Item 1: Identity of directors, senior management and advisers
Not applicable.
Item 2: Offer statistics and expected timetable
Not applicable.
Item 3: Key information
| 3A. | | Selected financial data |
Exchange rates
The following table sets forth for the periods indicated, the average, high, low and period-end Noon Buying Rates in the City of New York for Australian dollars into United States dollars as certified for customs purposes by the Federal Reserve Bank of New York, rounded to two decimal places.
Twelve months ended: | | Average | | High | | Low | | Period end |
June 30, 1998 – A$1.00 = | | US$ | 0.68 | | US$ | 0.75 | | US$ | 0.59 | | US$ | 0.62 |
June 30, 1999 – A$1.00 = | | US$ | 0.63 | | US$ | 0.67 | | US$ | 0.56 | | US$ | 0.66 |
June 30, 2000 – A$1.00 = | | US$ | 0.62 | | US$ | 0.67 | | US$ | 0.57 | | US$ | 0.60 |
June 30, 2001 – A$1.00 = | | US$ | 0.54 | | US$ | 0.60 | | US$ | 0.48 | | US$ | 0.51 |
June 30, 2002 – A$1.00 = | | US$ | 0.52 | | US$ | 0.57 | | US$ | 0.48 | | US$ | 0.56 |
The high and low exchange rates for the previous six complete months, rounded to two decimal places are:
Months | | High | | Low |
October 2002 – A$1.00 = | | US$ | 0.56 | | US$ | 0.54 |
November 2002 – A$1.00 = | | US$ | 0.56 | | US$ | 0.55 |
December 2002 – A$1.00 = | | US$ | 0.56 | | US$ | 0.56 |
January 2003 – A$1.00 = | | US$ | 0.59 | | US$ | 0.58 |
February 2003 – A$1.00 = | | US$ | 0.61 | | US$ | 0.60 |
March 2003 – A$1.00 = | | US$ | 0.61 | | US$ | 0.59 |
The exchange rate for Australian dollars into United States dollars on April, 7, 2003, rounded to two decimal places, was A$1.00 equal US$0.59.
Gold Prices
The following table sets forth for the dates indicated, the average spot price for the twelve months ending on the following specified dates for gold as displayed on Bloomberg Financial Markets Commodities News.
| | | A$ per ounce
| | US$ per ounce
|
June 30, 1998 | | 477.73 | | 306.43 |
June 30, 1999 | | 456.50 | | 286.36 |
June 30, 2000 | | 447.63 | | 281.05 |
June 30, 2001 | | 501.83 | | 269.53 |
June 30, 2002 | | 550.67 | | 288.93 |
8
Selected Financial Data
The selected financial data set forth below has been derived from NYOL’s respective audited consolidated financial statements. NYOL’s audited consolidated financial statements as of June 30, 2002 and for each of the three years in the period ended June 30, 2002 are included elsewhere herein.
Such audited consolidated financial statements are prepared in accordance with A-GAAP, which differ in certain significant respects from accounting principles generally accepted in the United States of America (“US GAAP”). Note 37 of the audited consolidated financial statements provides a description of the material differences between A-GAAP and US GAAP as they affect NYOL and a reconciliation to US GAAP of the net profit/(loss) and total equity for the periods and as of the dates presented therein.
Subsequent to the issuance of the Group’s 2001 audited consolidated financial statements and the filing of its 2001 Annual Report on Form 20-F with the Securities and Exchange Commission (the “SEC”), management determined that certain errors had been made in the reconciliation to US GAAP (Note 37) in the prior year. As a result, the reconciliation to US GAAP as of June 30, 2001 and for the year ended June 30, 2001 and related narrative have been restated. Thus, for the year ended June 30, 2001, NYOL’s net loss in accordance with US GAAP was reduced from A$240.5 million to A$213.0 million and NYOL’s total deficit in accordance with US GAAP was reduced from A$290.8 million to A$263.2 million. Refer to Note 38 to the audited consolidated financial statements for a discussion and quantification of the restatements.
The following selected financial data should be read in conjunction with, and are qualified in their entirety by reference to, the audited consolidated financial statements, including the notes thereto. The selected financial data should also be read in conjunction with Item 5 – “Operating and financial review and prospects”.
| | | As Of and For the Year Ended June 30,
| |
| | | 2002 | | | 2001 | | | 2000 | | | 1999 | | | 1998(1) | |
| | | A$
| | | A$
| | | A$
| | | A$
| | | A$
| |
| | | (in thousands, except share data) | |
Statement of Financial Performance Data: | | | | | | | | | | | | | | | |
A-GAAP: | | | | | | | | | | | | | | | |
Sales revenue | | 404,226 | | | 416,481 | | | 395,805 | | | 440,160 | | | 376,061 | |
Cost of sales | | (390,985 | ) | | (376,227 | ) | | (308,935 | ) | | (326,032 | ) | | (194,163 | ) |
| | |
|
| |
|
| |
|
| |
|
| |
|
|
Gross profit | | 13,241 | | | 40,254 | | | 86,870 | | | 114,128 | | | 181,898 | |
Other expenses from ordinary activities, net (2) | | (494,820 | ) | | (139,537 | ) | | (407,432 | ) | | (84,542 | ) | | (115,481 | ) |
| | |
|
| |
|
| |
|
| |
|
| |
|
|
(Loss)/profit from ordinary activities | | (481,579 | ) | | (99,283 | ) | | (320,562 | ) | | 29,586 | | | 66,417 | |
Income tax benefit/(expense) relating to ordinary activities | | (6,539 | ) | | 23,141 | | | 66,763 | | | (17,165 | ) | | (28,681 | ) |
| | |
|
| |
|
| |
|
| |
|
| |
|
|
Net (loss)/profit | | (488,118 | ) | | (76,142 | ) | | (253,799 | ) | | 12,421 | | | 37,736 | |
| | |
|
| |
|
| |
|
| |
|
| |
|
|
(Loss)/profit per share: | | | | | | | | | | | | | | | |
– Basic (cents per share) (3) | | (158.0 | ) | | (24.6 | ) | | (82.1 | ) | | 4.0 | | | 13.3 | |
US GAAP:(4) | | | | | As Restated
| | | | | | | | | | |
Sales revenue | | 402,121 | | | 415,390 | | | 395,805 | | | 440,160 | | | N/A | |
Net (loss)/profit | | (439,737 | ) | | (212,973 | ) | | (219,049 | ) | | 19,176 | | | N/A | |
| | |
|
| |
|
| |
|
| |
|
| |
|
|
9
| | | As Of and For the Year Ended June 30,
|
| | | 2002 | | | 2001 | | | 2000 | | | 1999 | | 1998(1) |
| | | A$
| | | A$
| | | A$
| | | A$
| | A$
|
| | | (in thousands, except share data) |
Statement of Financial Position Data: | | | | | | | | | | | | | |
A-GAAP | | | | | | | | | | | | | |
Cash and cash equivalents | | 106,478 | | | 104,672 | | | 9,506 | | | 41,941 | | 27,183 |
Total assets | | 464,701 | | | 747,714 | | | 756,022 | | | 1,102,015 | | 1,094,449 |
Total interest bearing liabilities, including current maturities | | 533,652 | | | 511,270 | | | 476,510 | | | 509,558 | | 522,130 |
Total liabilities | | 864,214 | | | 659,109 | | | 591,275 | | | 675,210 | | 675,354 |
Net (liabilities) / assets | | (399,513 | ) | | 88,605 | | | 164,747 | | | 426,805 | | 419,095 |
Contributed equity | | — 358,533 | | | 358,533 | | | 358,533 | | | 358,533 | | 354,839 |
Retained earnings(deficit) | | (758,046 | ) | | (269,928 | ) | | (193,786 | ) | | 68,272 | | 64,256 |
| | |
|
| |
|
| |
|
| |
| |
|
US GAAP: (4) | | | | | As Restated
| | | | | | | | |
Total (deficit)/equity | | (559,901 | ) | | (263,321 | ) | | 148,411 | | | N/A | | N/A |
| | |
|
| |
|
| |
|
| |
| |
|
Other Data: | | | | | | | | | | | | | |
Dividends: | | | | | | | | | | | | | |
Dividends per ordinary share: | | | | | | | | | | | | | |
– Dividend (A$) | | — | | | — | | | 0.03 | | | 0.03 | | 0.06 |
– Dividend (US$) (5) | | — | | | — | | | 0.02 | | | 0.02 | | 0.03 |
| (1) | | Includes the results of Eagle Mining Limited from October 1, 1997 and the results of Wiluna Mines Limited from November 1, 1997. |
| (2) | | “Other expenses from ordinary activities, net” includes exploration and evaluation expenditure, administration expenses, borrowing costs, write downs and other income and expense items and derivative losses. |
| (3) | | The weighted average number of ordinary shares on issue used to calculate basic and diluted earnings per share was as follows: 2002 – 308,960,662, 2001 – 308,960,662, 2000 – 308,960,662, 1999 – 308,147,621, and 1998 – 282,657,701. |
| (4) | | For a description of the differences between A-GAAP and US GAAP as they relate to NYOL, see Note 37 to the audited consolidated financial statements of the Group included elsewhere herein. |
| (5) | | A convenience translation has been made to determine the US$ value of the dividends at an exchange rate of A$1.00 = US$0.51. |
| 3B. | | Capitalisation and indebtedness |
Not applicable.
| 3C. | | Reasons for the offer and use of proceeds |
Not applicable.
10
A substantial or extended rise in gold prices may adversely effect NYOL’s financial position
Gold prices are subject to volatile movements over short periods of time and are influenced by numerous factors beyond NYOL’s control. Movement in the market price of gold has an effect on the mark to mark value of financial instruments entered into by NYOL. NYOL entered into hedging transactions with a view to reducing the adverse effects of gold price fluctuations, however as at June 30, 2002 hedge positions exceed sales forecasts, resulting in recognition of the mark to market deficit of excess positions as a A$222.8 million liability on the Company’s audited consolidated financial statements.
In addition, gold interest rate swap arrangements include gold indexation structures with various hedge counter-parties. The effect of these gold indexation structures is that the Company is obliged to pay the counter-parties certain amounts of gold if the gold price is above A$540 per ounce at the end of March and September in the years 2003 through to 2008. The ounce liability under these indexation structures increases on a linear basis between the floor price of A$540, where the liability is zero ounces and a capped price of A$627, where the liability is 42,224 ounces for each semi annual period. Given these matters a substantial or extended rise in gold prices may adversely effect NYOL’s financial position. Refer to Item 11 “Quantitative and qualitative disclosures about market risk” and Note 28 “Financial Instruments” to the audited consolidated financial statements for a description of the Group’s hedging activities.
Exercise of rights to break under hedging contracts may result in cash settlements to hedge counter-parties in excess of funds available to the Group
A number of NYOL’s hedging positions are governed by agreements that confer to the relevant hedge counter-party a right to terminate prior to their agreed scheduled maturity dates. Such a termination would result in an immediate cash settlement of those contracts based on the market value on the date of termination. Exercise of rights to break may result in cash settlements to hedge counter-parties in excess of funds available to the Group. Refer to Item 5B “Liquidity and capital resources”, Item 11 “Quantitative and qualitative disclosures about market risk” and Note 28 “Financial Instruments” to the audited consolidated financial statements for a description of the Group’s hedging activities.
NYOL’s level of indebtedness may adversely affect its business
NYOL’s capital structure is highly leveraged. As at June 30, 2002 the consolidated financial statements reflect negative shareholders funds of A$399.5 million. Moreover, at June 30, 2002, in addition to A$222.8 million of liabilities in respect of the Company’s hedge positions included on the Company’s Statement of financial position, the mark to market value of NYOL’s effective hedges not recorded on the Statement of Financial Position totalled A$241.7 million. Its existing obligations and credit ratings (Moody’s Investors Service “Ba2” and Standard & Poor’s “B-”) and its high leverage may limit its ability to raise capital at commercially reasonable cost and terms in the future.
On March 3, 2003 Standard and Poor’s announced that it had lowered NYOL’s corporate credit rating and the rating on NYOL’s US$300,000,000 8 7/8% Senior Notes due April 2008 from BBB to BB- Standard and Poor’s also announced that it had revised its outlook on the Company from stable to negative. On April 1, 2003, Standard & Poor’s lowered it’s long-term rating on the Company from BB- to B- and affirmed its continued outlook on the Company. According to Standard & Poor’s: “An obligation rated ‘B’ is more vulnerable to nonpayment than obligations rated BB-, but the obligor currently has the capacity to meet its financial commitment on the obligation. Adverse business, financial, or economic conditions will likely impair the obligor’s capacity or willingness to meet its financial commitment on the obligation.” In addition, according to Standard & Poor’s, a minus or “-” shows relative standing within a ratings category and a negative outlook means that the current rating may be lowered. Standard & Poor’s indicated that its action was based on concern over the Company’s future liquidity position in June 2004 if hedge counter parties exercise their rights to break existing contracts. The Company’s US$300, 000,000 8 7/8% Senior Notes due April 2008 and hedge book obligations rankpari passu in liquidation and are nonrecourse to the Company’s ultimate parent entity, Newmont Mining Corporation.
On March 28, 2003, Moody’s Investor Services revised its review direction for the Company to a review for a possible downgrade. Moody’s indicated that the change to review for possible downgrade reflected
11
Moody’s concern that the Senior Notes will remain an unsupported legal obligation of the Company, dependent upon its financial strength and cash flow generating ability. Additionally, Moody’s indicated that it was concerned with the Company’s limited proven reserve position relative to its debt maturities and hedge book position. Further factors of concern identified by Moody’s included the degree of the Company’s leverage, the negative mark to market position of the hedge book and the early termination dates under various hedge contracts, giving counter parties the right to break.
Refer to Item 5B “Liquidity and capital resources” for further information.
NYOL’s exploration activities may not be successful
Exploration activities are highly speculative and often unproductive. Once gold mineralisation is discovered, it can take several years until the actual production of gold is possible. During this development period, the economic feasibility of production may change significantly. In addition, as part of the development period, substantial expenditures need to be made to establish confidence that the area under development contains probable gold reserves exploitable through mining. As a result, there can be no assurance that the Group’s exploration program will result in the expansion or replacement of current production with new reserves or operations. The discovery and production of additional reserves is an important factor in addressing the Company’s ability to meet its financial obligations.
Increased production costs could affect profitability
Changes in costs have a major impact on NYOL’s profitability. NYOL’s main costs are salaries and wages, energy, transport, materials, and amortisation of property, plant and equipment. In addition, industrial disruptions, work stoppages, refurbishments, installation of new plants, accidents or bad weather at the Group’s operations can result in production losses and delays in delivery of products, which may adversely affect profitability. Certain costs are also affected by government imposts and regulations. NYOL’s costs depend upon the efficient design and construction of mining and processing facilities and competent operation of those facilities. Changes in cost of mining and processing operations can occur as a result of unforeseen events or change in reserve estimates.
Estimates of reserves are uncertain
NYOL prepares its figures for gold reserves in conformity with the SEC Industry Guide 7; Description Of Property By Issuers Engaged Or To Be Engaged In Significant Mining Operations. However, such figures are estimates and there can be no assurance that the reserves will be recovered. Additionally, estimates may change substantially if new information subsequently becomes available. Fluctuations in the price of gold, a variation in production costs or different recovery rates may ultimately result in NYOL’s estimated reserves being restated. The Bronzewing and Wiluna gold operations are anticipated to process all currently known reserves by the end of 2003 or early 2004. In the absence of a new discovery that could promptly be put into production to sustain the operations, NYOL’s gold production commencing in calender year 2004 will be substantially reduced. Refer to Item 5D “Trend information” for further information.
Foreign exchange risk
In April 1998, Newmont Yandal Operations Limited issued US$300 million of ten year senior unsecured notes (“Notes”) pursuant to an Indenture entered into with The Bank of New York, as trustee for the noteholders (the “Indenture”). Of the total, US $183.6 million has been swapped into a gold commodity obligation. The Company has an exposure to the US$/A$ exchange rate on the remaining US $116.4 million of Notes. Adverse movements in the US$/A$ exchange rate will result in an increase in obligations of the Company. The impact of adverse exchange rate movements in a financial year will be recorded in the Statement of Financial Performance. Any adverse movement in the exchange rate over the ten-year life of the Notes will result in additional cash outflow on the Notes’ redemption. Assuming a constant USD gold price a fall in the AUD/USD exchange rate will have an adverse effect on hedge book obligations.
12
Regulatory and court action risk
The Group’s operations could be affected by government actions, such as controls on imports, exports and prices, variations in taxation laws (including royalties), government directions, guidelines and regulations particularly in relation to the environment and mine operations, and court decisions, particularly those that impact on land access and freedom to conduct mining operations. Refer to Item 4B “Business Overview – Description of material effects of government regulations on the Group’s business activities”. Any such government action or court decisions may require increased capital or operating expenditures or both.
Title to some of our properties may be challenged
Plainting against NYOL by other parties for statutory conditions non-compliance is becoming more of an issue, as it is for other exploration and mining companies in Western Australia. NYOL has approximately 15 Plaints to defend, none of which impacts on critical land holdings. There can be no assurance that NYOL can successfully defend against such claims. In addition certain mining titles are subject to native title claims, but such claims are not anticipated to impact existing titles. Refer to Item 4D “Property, plant, equipment – Exploration”.
13
Item 4: Information on the Company
| 4A. | | History and development of the Company |
NYOL is a gold producer, with three producing gold mines in the Yandal and Wiluna greenstone belts of Western Australia, producing 750,202 ounces of gold in the year ended June 30, 2002.
Newmont Yandal Operations Limited (ABN 30 007 066 766) was incorporated as Great Central Mines N.L. under the laws of Western Australia on February 12, 1985. At the Company’s request and following the conclusion of the ASIC litigation discussed below, its ordinary shares were removed from the official list of the Australian Stock Exchange (ASX) on February 28, 2003. In November 1996, the Company changed its name to Great Central Mines Limited. Following the 100% acquisition of the Company by Normandy Mining Limited, (Normandy) in April, 2000 the name was changed to Normandy Yandal Operations Limited. On April 23, 2002, the Company changed its name to Newmont Yandal Operations Limited, following the takeover of its parent entity, Normandy by Newmont Mining Corporation. Its principal registered and administration office is located at 100 Hutt Street, Adelaide, South Australia, Australia, 5000 (Telephone +61 8 8303 1700). The Company’s agent in the United States of America is: CT Corporation System, 111 Eighth Avenue, 13th Floor, New York, NY 10011, United States of America.
In late 1988, NYOL discovered the Plutonic gold deposit near Meekatharra in Western Australia, which is located approximately 120 kilometres from Jundee-Nimary. It subsequently sold this deposit to Pioneer Minerals Australia Limited in 1989. NYOL sold the Plutonic gold deposit because it did not at the time have sufficient cash resources to conduct the additional exploration to complete a bankable feasibility study.
The Group utilised part of the proceeds from the sale of the Plutonic gold deposit to acquire tenement interests at Nabberu which were located approximately 20 kilometres north-east of the Plutonic gold deposit. NYOL conducted gold, base metals and subsequently diamond exploration on the tenements at Nabberu until early 1994 when it decided to focus its exploration program solely on the Yandal region following the discovery of Bronzewing and Jundee-Nimary. As a result, NYOL entered into an agreement to sell its diamond interests to Astro Mining N.L. (“Astro”), formerly an affiliated company.
In 1989, NYOL acquired a tenement known as Great Lady, located approximately 50 kilometres northwest of Kalgoorlie in Western Australia and approximately 300 kilometres south of Bronzewing. Great Lady was located adjacent to the Lady Bountiful Extended gold operations of Centaur Mining & Exploration Limited (“Centaur”), formerly an affiliated company, and was developed in conjunction with that operation. Great Lady was a small, open pit mining operation managed by Centaur on behalf of NYOL. Production ceased in 1995 when reserves were depleted. In 1997, Great Lady was sold to Centaur for A$0.3 million (based on an independent valuation) as there was no ongoing production, no reserves and the Group wished to concentrate its focus on the Yandal region.
In late 1991, NYOL entered into a purchase agreement with Mr. Mark Creasy, an Australian prospector, to acquire tenements for the purpose of conducting exploration for gold in the Yandal region of Western Australia. Pursuant to the purchase agreement, the Group acquired a 51% interest in the tenements, which now contain the Jundee-Nimary Gold Operations and a 70% interest in a number of other tenements, some of which now contain the Bronzewing Gold Operations. NYOL paid Mr. Creasy A$3.2 million and issued 20,000 Newmont Yandal Operations Limited ordinary shares for these interests. NYOL discovered the Bronzewing deposit in 1993 and the Jundee-Nimary deposit in 1994. Subsequently, the Group entered into further agreements with Mr. Creasy to acquire the remaining 49% of the Jundee-Nimary tenements and 30% of the Bronzewing tenements it did not own at a cost of A$122 million plus the issuance of 1,000,000 Newmont Yandal Operations Limited ordinary shares to Mr. Creasy. NYOL funded the cash payment with part of the proceeds of private equity placements.
14
The Group acquired control of Eagle Mining Corporation Limited and Wiluna Mines Limited in October and November 1997, respectively. The acquisitions allowed NYOL to: consolidate exploration and mining rights covering approximately 80% of the mineral rich Yandal belt; increase NYOL’s contiguous tenements in this region; and gain important tenements in the neighbouring Wiluna and Millrose greenstone belts. These acquisitions were partly funded through equity issues to and loans from Normandy.
In April 1998, the Company issued US$300 million 8 7/8% Senior Notes due 2008 (the “Senior Notes”). The Senior Notes are guaranteed by the Company’s subsidiaries. Refer to Item 5B “Liquidity and capital resources – Liquidity”. In connection with the issue of Senior Notes, the Company entered into a gold interest rate swap arrangement to partially reduce the interest rate risk exposure associated with the Senior Notes. Of the total US$300 million, US$183.6 million was swapped into a gold commodity contract, of which half was fixed at 3.87% and half was floating and subject to an indexation component. The mark to market value of the principal component of the gold commodity obligation was negative A$53.9 million as at June 30, 2002 and negative A$53.4 million as at December 31, 2002. Refer to Item 11 “Quantitative and Qualitative disclosures about market risk -Gold price risk management activities” The mark to market value of the interest rate component of the gold commodity obligation and indexation arrangement was negative A$ 48.0 million as at June 30, 2002 and negative A$ 100.9 million as at December 31, 2002. Refer to item 11 “Quantitative and Qualitative disclosures about market risk – Interest rate risk management.
In September 1999, NYOL acquired the Mt McClure mine, infrastructure and surrounding tenement interests from the Receivers and Managers of Arimco Mining N.L., a non-associated company, for A$8.3 million. The Mt McClure Gold Mine is located approximately 10 kilometres from NYOL’s Bronzewing Mine and ore from Mt McClure was processed through the Bronzewing gold processing plant.
In January 1999, Yandal Gold, a company owned 100% by Yandal Gold Holdings Pty Ltd, which in turn was owned 50.1% by Edensor Nominees Pty Ltd (“Edensor”) and 49.9% by Normandy, announced a takeover bid of A$1.50 per ordinary share of Great Central Mines Limited. Compulsory acquisition procedures had commenced in April 1999 but had been discontinued whilst the legal proceedings referred to below were pending. In June 1999 Yandal Gold continued compulsory acquisition procedures in respect of those shareholders who had not accepted its takeover bid under the Australian Corporations Act. Following the conclusion of the compulsory acquisition procedures Yandal Gold had acquired 174,434,858 ordinary shares with the remaining shares being held by Edensor as to 38,796,340 ordinary shares, Normandy as to 85,912,369 ordinary shares and ANZ Nominees Limited as to 9,817,093 ordinary shares. In April 2000, Normandy acquired all of Edensor’s shares in the Company and in Yandal Gold Holdings, resulting in Normandy holding 100% of the Company.
In a Federal Court action brought by the Australian Securities and Investment Commission (“ASIC”) against Yandal Gold and others, the Federal Court found the defendants to have committed various breaches of the Corporation Law, now referred to as the Corporations Act 2001 and ordered payment by Edensor to ASIC of A$28.5 million for distribution to former Newmont Yandal Operations Limited shareholders. An appeal by Edensor to the Full Court of the Federal Court, to which Normandy became a party on the application of ASIC, was allowed on the basis that the Federal Court lacked jurisdiction to make the order. This decision was appealed to the High Court, which overturned the Full Federal Court decision. The High Court held that the Federal Court did have jurisdiction to hear and determine the matter and make orders under the Corporation Law now referred to as the Corporations Act 2001. The High Court sent the matter back to the Full Federal Court to determine Edensor’s appeal on the merits. In early 2002 the Full Federal Court affirmed the Federal Court decision and leave to appeal to the High Court was denied in September 2002. On January 6, 2003, NAL paid an amount of approximately of A$33.7 million to ASIC who distributed it to the former shareholders of NYOL, representing funds (with interest) that the Federal Court ordered certain respondents in the proceeding to pay for distribution to former NYOL shareholders. In addition to the payment order, the Federal Court also entered an order allowing former NYOL shareholders to reacquire their NYOL, (formerly GCM) shares upon returning the consideration paid by Yandal Gold Pty Ltd in the takeover. Newmont Australia Limited, a party to the proceedings, applied to the Federal Court to remove this portion of its order. Newmont Australia’s application was
15
granted by the Federal Court on February 18, 2003. Following that court decision and ASIC’s confirmation that it had no objection to the Company de-listing from the ASX, at the Company’s request, its ordinary shares were removed from the official list of the ASX on February 28, 2003.
NYOL’s capital expenditure for the last three years has been as follows:
| • | | Year ended June 30, 2002: A$46.4 million |
| • | | Year ended June 30, 2001: A$40.7 million |
| • | | Year ended June 30, 2000: A$65.4 million |
For the six months ended December 31, 2002, capital expenditures were A$19.9 million, including capital expenditures of A$6.3 million at the Bronzewing Gold Operations, A$9.5 million at the Jundee-Nimary Gold Operations and A$4.1 million at the Wiluna Gold Operations. For the year ended December 31, 2003, capital expenditure of A$36.7 million has been budgeted, including capital expenditures for 2003 of A$1.7 million at the Bronzewing Gold Operations, A$33.9 million at the Jundee-Nimary Gold Operations and A$1.1 million at the Wiluna Gold Operations.
Capital expenditures for the year ended June 30, 2002 and the six months ended December 31, 2002, and the budgeted capital expenditure for the year ended December 31, 2003 has been or is expected to be financed internally from funds within the Group and the cash generated from its operations.
16
Description of the nature of operations and principal activities
NYOL currently operates three producing gold mines within the Yandal and Wiluna greenstone belts, known as Bronzewing, Jundee-Nimary and Wiluna. Jundee-Nimary is the combination of the former Jundee-Nimary operations of Great Central Mines and the Nimary operations of Eagle Mining Corporation acquired in the financial year ended June 30, 1998. The operations are located immediately adjacent to each other at the northern end of the Yandal greenstone belt.
Sales revenue for the years ended June 30, 2002, 2001and 2000 were A$404.2 million, A$416.5 million and A$395.8 million, respectively. All sales revenue is derived from the sale of gold produced at the Group’s Western Australian operations.
NYOL has an extensive gold price hedging program which effectively fixed the realisable gold price for all sales. Following the acquisition of NYOL’s parent entity, Newmont Australia Limited (formerly Normandy Mining Limited) by Newmont Mining Corporation in February 2002, revised life of mine plans have been developed by management which revised the forecasts of the amount and timing of future production. As a result of adoption of the revised plans, certain derivative contracts held by the Group were considered excess to the requirement to hedge future production. Accordingly, unrealised losses on these contracts in the amount of A$222.8 million has been recorded as an expense, in the statement of financial performance during the period, as deferred foreign exchange losses on derivative contracts and as a liability in the statement of financial position.
Refer to Item 11: “Quantitative and qualitative disclosures about market risk” and Note 28 “Financial Instruments”.
On September 11, 2002, NYOL entered into an agreement to sell the Wiluna mine and surrounding exploration acreage to Agincourt Resources Limited, a company controlled by members of the Wiluna mine management group and an independent contractor. Completion of the sales transaction was originally anticipated to occur in October 2002 subject to receipt of necessary third party consents and approvals. As of the date of this report, the Company had not received all the necessary third party consents and approvals and, as a result, the agreement has expired without the sale having been completed. As of the date of this report, the agreement had not been extended nor had any new agreement been concluded.
The operation and assets of NYOL’s business are further described in Item 4D “Property, Plant and Equipment”.
Description of the sources and availability of gold reserves
Ore reserves referred to in this Annual Report are reported in accordance with the SEC Industry Guide 7; Description of Property By Issuers Engaged Or To Be Engaged In Significant Mining Operations.
Ore reserve estimates are stated in terms of tonnage, ore grade and either contained metal or recoverable metal. Contained metal represents the total amount of metal contained within the reserves. Recoverable metal represents that portion of the contained metal that can be extracted from the ore and recovered in the processing plant as a saleable product.
In this report all reserves estimates are reported as contained metal.
17
Ore reserves
The term “reserve” means that part of a mineral deposit which can be economically and legally extracted or produced at the time of the reserve determination.
The term “economically”, as used in the definition of reserve implies that profitable extraction or production has been established or analytically demonstrated, in a full feasibility study, to be viable and justifiable under reasonable investment and market assumptions.
The term “legally”, as used in the definition of reserve does not imply that all permits needed for mining and processing have been obtained or that other legal issues have been completely resolved. However, for a reserve to exist the Company must have a justifiable expectation, based on applicable laws and regulations, that issuance of permits or resolution of legal issues necessary for mining and processing at a particular deposit will be accomplished in the ordinary course and in a timeframe consistent with the Company’s current mine plans.
The term “proven reserves” means reserves for which (a) quantity is computed from dimensions revealed in outcrops, trenches, workings or drill holes; (b) grade and/or quality are computed from the result of detailed sampling and (c) the sites for inspection, sampling and measurements are spaced so closely and the geologic character is sufficiently defined that size, shape, depth and mineral content of reserves are well established.
The term “probable reserves” means reserves for which quantity and grade are computed from information similar to that used for proven reserves but the sites for sampling are farther apart or are otherwise less adequately spaced. The degree of assurance, although lower than that for proven reserves, is high enough to assume continuity between points of observation.
Proven and probable reserves were calculated using different cutoff grades depending on each deposit’s properties. The term “cut-off grade” means the lowest grade of mineralized rock that can be included in the reserves in a given deposit. Cut-off grades vary between deposits depending upon prevailing economic conditions, mineability of the deposit, amenability of the ore to gold extraction, and milling or leaching facilities available.
Ore reserve estimates in this Annual Report have been adjusted for dilution during the mining process. Reserves and grade figures are not adjusted for metallurgical recovery; they are contained grade and metal.
| | | RESERVES
|
| | | (at June 30, 2002)
|
| | | Proven
| | Probable
| | Total
| | Gold Tonnes
|
| | | (Mt) | | (g/t) | | (Mt) | | (g/t) | | (Mt) | | (g/t) | | |
Bronzewing | | 3.26 | | 3.5 | | 1.24 | | 5.30 | | 4.49 | | 4.0 | | 17.91 |
Jundee-Nimary | | 5.05 | | 2.5 | | 3.14 | | 6.20 | | 8.19 | | 3.9 | | 32.16 |
Wiluna | | 0.55 | | 4.3 | | 0.36 | | 8.15 | | 0.91 | | 5.8 | | 5.25 |
TOTAL | | 8.90 | | 3.0 | | 4.70 | | 6.10 | | 13.6 | | 4.1 | | 55.28 |
| | | RESERVES
|
| | | (at December 31, 2002)
|
| | | Proven
| | Probable
| | Total
| | Gold Tonnes
|
| | | (Mt) | | (g/t) | | (Mt) | | (g/t) | | (Mt) | | (g/t) | | |
Bronzewing | | 1.02 | | 4.37 | | 2.30 | | 2.70 | | 3.32 | | 3.21 | | 10.68 |
Jundee-Nimary | | 3.84 | | 1.78 | | 6.31 | | 6.83 | | 10.15 | | 4.92 | | 49.88 |
Wiluna | | 0.40 | | 4.27 | | 0.65 | | 5.42 | | 1.04 | | 4.98 | | 5.18 |
TOTAL | | 5.27 | | 2.47 | | 9.25 | | 5.71 | | 14.52 | | 4.53 | | 65.77 |
18
Information in this report relating to ore reserves, conforms to the reporting requirements of “ SEC Industry Guide 7, Description Of Property By Issuers Engaged Or To Be Engaged In Significant Mining Operations.” It is based on, and accurately reflects, information complied by M Hatcher, Chief Operations Geologist, Newmont Australia, a Member of the AusIMM. It is included in this report with his consent.
Description of the sources and availability of raw materials
NYOL’s gold processing plants use various supplies in the production of gold, with major items including cyanide, lime, steel balls, diesel oil and natural gas which are purchased from various sources. NYOL has long-term contracts with certain suppliers, which include suppliers of cyanide, natural gas and natural gas transportation. Diesel oil and natural gas, the primary energy sources for ore processing are in adequate supply.
In January 1998, NYOL entered into a six year take-or-pay natural gas supply agreement (with certain rights to extend for a further eight years) under which NYOL was obligated to pay for 80% of its agreed supply until December 31, 2001. Under the terms of the agreement, NYOL may source additional gas from alternative markets, unless the sellers can provide such additional gas on no less favourable terms.
On September 1, 1998, NYOL entered into a gas transportation agreement with Newmont Pipelines Pty. Ltd. (“NPPL”) effective as from that date. The agreement lasts until September 13, 2016, but may be terminated by either party on 60 days notice from May 1, 2003. The agreement allows NYOL to avail itself of part of the reserved capacity of NPPL in the GGT Pipeline. The agreement was subsequently novated to Southern Cross Pipelines (NPL) Pty Ltd effective from April 1, 1999.
Mining Contracts
The Group is currently party to a number of mining contracts that are detailed below.
With respect to the Bronzewing Gold Operations, NYOL has an agreement with Brandrill Ltd to perform all mining activities at Bronzewing and Mt McClure until January 2003. This agreement is extended on a monthly basis as required.
At the Jundee-Nimary Gold Operations, Byrnecut Pty Ltd (“Byrnecut”) provides the excavation of declines, underground production and other underground development services at Barton Deeps. A new two-year contract was awarded to Byrnecut in September 2001. A tender is currently out for the mining and haulage from several satellite pits, this contract is expected to run for no longer than 14 months.
At Wiluna Operations Barminco Pty Ltd provides underground development, hand held mining, production drilling, bogging and haulage services. The contract will continue until NYOL deems, in its’ reasonable opinion the continuation of mining of ore and waste is not viable for any reason. The contract for open pit mining services (including the provision of mining of ore and waste, drilling and blasting services) and rehabilitation at Wiluna, was awarded to Roche Mining (a division of Downer EDI Limited) for two years from March 2001. This contract was cancelled when open pit mining ceased in June 2002.
Under each of the mining contracts, the contract employees are covered by the mining contractors’ workers’ compensation liability policy and also is responsible for all other insurance matters. In each case NYOL pays mobilisation and demobilisation to the mining contractor and during the term of the contract, the mining contractor invoices NYOL at rates for the particular services defined in the respective mining contract. Furthermore, at each of its mine sites, NYOL has an experienced mining team on-site which is responsible for the mine planning, ore scheduling and pit design, grade control drilling, definition and marking of ore zones and reconciliation of ore produced and the supervision of the contract employees.
19
Competition
Because mines have limited lives based on proved and probable reserves, NYOL is continually seeking to replace and expand its reserves. The Group encounters competition from other mining companies in connection with the acquisition of properties producing or capable of producing gold and in the recruitment and retention of qualified labour. As a result of this competition, some of which is with companies having significantly greater financial resources, the Group may be unable to acquire attractive mining properties on terms it considers acceptable. In addition, there are a number of uncertainties inherent in any program relating to the location of economic reserves, the development of appropriate metallurgical processes, the receipt of necessary governmental approvals, licenses and permits, the construction of mining and processing facilities and the appropriate financing thereof.
Description of material effects of government regulations on the Group’s business activities
Newmont Yandal Operations Limited is subject to and complies with the following material governmental regulations:
Australian Corporations and Securities Legislation
Australian Corporations and Securities Legislation is the main body of law governing companies incorporated in Australia. The Legislation is administered and enforced by the Australian Securities and Investment Commission (ASIC), which is an Australian Government instrumentality.
The legislation covers matters such as:
| • | | Directors’ duties and responsibilities. |
| • | | Preparation of financial statements. |
| • | | Control of auditors who have to be registered and approved by ASIC. |
| • | | Issue and transfer of shares. |
| • | | Rights of minority interests. |
| • | | Amendments to capital structures. |
| • | | Preparation and filing of public documents such as returns relating to change in Directors, details of changes to capital and annual reports. |
| • | | Insolvency of a corporation. |
20
ASX Listing Rules
ASX Listing Rules are imposed on all listed companies.
The ASX Listing Rules cover such things as ASX prior approval of certain documentation to be forwarded to shareholders, immediate notification to the market of price sensitive and other relevant information and periodic financial reporting.
At the Company’s request, its ordinary shares were removed from the official list of the ASX on February 28, 2003. Refer to Item 4A “History and development of the Company”. Accordingly, the Company is no longer subject to the ASX Listing Rules.
Mining Law
In Australia, legislation regulating the exploration for and the production of minerals is enacted by the individual States and Territories. At common law there is a presumption that the owner of land owns everything on or below the surface of that land to an indefinite extent. However, this principle has virtually been abolished by statute in Australia so that, with limited exceptions, minerals are the property of the States or Territories of Australia. Under the relevant legislation, exploration and mining titles are available for grant and the grant is a prerequisite to the conduct of exploration or mining operations (as the case may be). There are a number of procedural steps, which must be followed before a title is granted, including the right to negotiate procedure under the Native Title Act.
The process of application for and the granting of rights to use land for exploration and mining is governed by State Legislation. The Group’s current mining operations are located in the State of Western Australia. Under the Mining Act 1978 (Western Australia) and Regulations, as amended (the “Mining Act”), there are several categories of exploration, mining and ancillary titles. The principal of these are as follows:
Prospecting License | A Prospecting License authorises the holder to enter the land to prospect for all minerals (except iron ore unless expressly authorised by the Minister of Mines). The maximum area of a Prospecting License is 200 hectares and the term is four years (if granted after July 1, 1994) with no right of renewal. The holder of a Prospecting License has a priority right during its term to apply for Mining Leases over the whole or part of the area of the Prospecting License. Pending determination of the application, the Prospecting License remains in force notwithstanding the expiry, in the interim, of its four-year term. |
Exploration License | The rights conferred by an Exploration License are materially the same as by a Prospecting License. The maximum area of an Exploration License is 70 graticular blocks. A graticular block is an area of one square kilometre. The term is five years with annual renewal permitted in exceptional circumstances. There is a requirement for progressive surrender during its term of parts of an Exploration License. The holder of an Exploration License has a priority right, during its term, to apply for Mining Leases over the whole or part of the area of the Exploration License. Pending determination of the application the Exploration License remains in force notwithstanding the expiration of its term. |
Retention License | A Retention License may be granted in respect of the whole or any part of the land formerly within a Prospecting License, Exploration License or Mining Lease. The purpose of a Retention Lease is to permit the holder to retain title to an identified but marginal mineralised deposit and the area of the Retention License varies with the area of such deposit. The term is five years with a right of renewal for up to a further five years. |
21
Mining Lease | A Mining Lease authorises the holder to mine for and dispose of any minerals on the land in respect of which the Mining Lease is granted. In contrast to other States in Australia, in Western Australia the holder of an Exploration or Prospecting licence need not establish indications of an economic mineralised deposit before applying for a Mining Lease. A Mining Lease may be applied for provided that the holder has expended a minimum level of investment. The lessee is entitled to use, occupy and enjoy the land for mining purposes and owns all minerals lawfully mined. The rights conferred are exclusive rights for mining purposes in relation to the land in respect of which the Mining Lease was granted. No other mining tenement (except a Miscellaneous License) may be granted over the land. The State of Western Australia may grant or refuse a Mining Lease at its discretion. However if the applicant is the holder of a valid Exploration or Prospecting Licence and the holder has complied with the conditions of the licence the Mining Lease application, generally, will be granted. The area of a Mining Lease may not exceed 10 square kilometres. The term of a Mining Lease is 21 years with a right of renewal for a further 21 years. Subsequent renewals are at the discretion of the Minister for Mines for terms of up to 21 years. |
General Purpose Lease | A General Purpose Lease is fundamentally a surface lease aimed at acquiring large areas of land for purposes incidental to mining without attracting requirements to commit to certain levels of mining or exploration expenditure which are a feature of Mining Leases or Exploration Licenses. It entitles the lessee to erect, place and operate machinery in connection with mining operations, to deposit or treat minerals or tailing obtained from the land and to use the land for any other specified purpose directly connected with mining operations. |
Miscellaneous License | A Miscellaneous License may be granted over any land, including any land the subject of an existing mining title, whether held by the applicant or by another person. A Miscellaneous License authorises the construction and operation of specified facilities in connection with a mining operation, which may include roads, tramways, aerial ropeways, water pipelines, powerlines, conveyor systems, tunnels, bridges or a license for any prescribed purpose. |
Pastoral Lease | Leasehold title in respect of areas up to 500,000 hectares granted by the Department of Land Administration in Western Australia over Crown land (being land vested in the State) for the purposes of grazing livestock. This grant is made by the Government pursuant to TheLand Act 1933 (WA) (the “Land Act”) and is subject to a number of terms relating to improvements (e.g., fences and dams), stocking levels and environmental requirements. The Lease has a fixed term and all Pastoral Leases have a common expiry date of June 30, 2015. The Pastoral Lease may be transferred by the lessee provided that the Minister of Lands gives his consent. A Pastoral Lease may exist over land, subject to a mining tenement. Provision is made in the Land Act and the Mining Act to control this interaction. |
The terms and conditions under which NYOL has title to its various mining Tenements oblige it to meet Tenement rentals and minimum levels of exploration expenditure as gazetted by the Western Australian Department of Minerals and Energy as well as Local Government rates and taxes.
22
Native Title
The legal framework concerning native title issues in Australia is as follows:
Common Law.In 1992, the High Court of Australia, inMabo v. State of Queensland, recognised that a form of native title existed on a small island in the Torres Strait. Subsequently in November 1998, the Federal Court held, inWard v Western Australia, that the Mirriuwung Gajerrong people held native title in respect of an area of Western Australia and the Northern Territory. This decision followed on from Mabo by confirming that native title can exist on the mainland of Australia. In its time, Mabo introduced a degree of uncertainty over the tenure to land in Australia because the High Court did not define exhaustively all of the circumstances in which native title might continue to exist.
Subsequent legislation (discussed below) and court decisions have provided further guidance in respect of native title. In the appeal of theWard v Western Australiacase to the High Court, the court determined that native title does not extend to minerals in Western Australia and that, while mining lease may not entirely extinguish native title, any native title right to control access to land that may have existed would not survive the grant of a mining lease because such a native title right would be inconsistent with the rights conferred by the mining lease.
The Native Title Act 1993 (the “Native Title Act”). The Australian Parliament enacted the Native Title Act in 1993. In enacting the Native Title Act, the Parliament recognised that native title rights needed to be supplemented. It achieved this by a package of related measures, the underlying principle of which is the recognition of native title and its protection from the effects of future acts, including the grant of various mining tenement types which at common law would lessen or extinguish it. To provide this protection the Native Title Act provided for, amongst other things, the validation of existing exploration and mining tenements where such tenements were granted before January 1, 1994. Where exploration and mining tenements were applied for after January 1, 1994, the Native Title Act established a procedure, known as the “right to negotiate” procedure, whereby Australian Aboriginal claimants to native title may participate in the process of deciding whether the tenement applications should be granted. Basically both Australian Aboriginals and non-Aboriginals could seek a ruling from the National Native Title Tribunal (“NNTT”) or the Federal Court of Australia for a determination as to whether native title exists on a specified piece of land and/or whether mining activities can be undertaken. Although native title may continue to exist over land subject to valid mining tenements, the rights and interests incidental to that native title have no effect to the extent they are inconsistent with such tenements. Upon the expiration of any such tenement, native title rights and interests may revive. Importantly, the Native Title Act provided certainty in relation to past acts confirming for instance, that the grant of a tenement prior to 1994 was not invalid due to the existence of native title.
The Native Title Amendment Act 1998 (the “Native Title Amendment Act”). The Native Title Amendment Act was proclaimed, and became operational, on September 30, 1998. The Native Title Amendment Act provides for the implementation of the strengthened claimant registration test (registration being a precondition for Aboriginal claimants to obtain the “right to negotiate”) as well as improvements to procedures related to mining tenement renewals, infrastructure projects and negotiation timeframes.
The Native Title Amendment Act also provided for the validation of tenements and other titles issued by State and Territory Governments without subjecting them to the “right to negotiate” provisions between January 1, 1994 and the“Wik” decision on December 24, 1996, as well as allowing States and Territories to establish their own right to negotiate regimes as an alternative to the right to negotiate provisions in the Native Title Act.
The Native Title Amendment Act sets out how the right to negotiate may not apply to some proposed developments, introducing instead a right to be consulted, which in some cases replaces the “right to negotiate”. Some types of proposed developments where the “right to negotiate” no longer applies include amongst others certain mineral exploration tenements, renewal of some mineral tenements, and the grant of mining infrastructure tenements. In these cases registered native title applicants or holders have a right to be consulted.
23
State/Territory legislation complementary to amended Commonwealth Native Title Act. Each State and Territory in Australia is now in the process of or has passed legislation complementary to the Native Title Amendment Act. The extent of the response in each state and territory to date has differed. Some states are establishing more comprehensive regimes (as provided for in section 43A of the Native Title Act), whilst others are relying upon the Commonwealth to continue administering native title through the NNTT.
The WA Government has enacted legislation (Native Title (State Provisions) Act 1999) establishing alternative provisions under section 43A of the Native Title Act. There has since been a change of government in WA and the new government has not yet proceeded with the implementation of this legislation.
All current and future tenement and title applications (including any change of status of any existing tenement from an Exploration License to a Mining Lease) will require processing through the provisions of the Native Title Act, as amended.
Impact on the Group’s Mining Tenements.NYOL believes that none of its gold mining operations or projects is jeopardised by any native title issues. NYOL’s gold mining tenements were either issued prior to January 1, 1994 (in which case they are either valid as not having been affected by the existence of native title or validated by Western Australian state legislation passed in conformity with the Native Title Act), granted pursuant to the “right to negotiate” procedures set down in the Native Title Act, or were validated by the Native Title Amendment Act and the Titles (Validation) and Native Title (Effect of Past Acts) Act 1995.
Applications for a range of further tenements have been lodged with the Western Australian Government, which is processing the tenements through the relevant native title provisions. Negotiations with the relevant native title claimants have been proceeding in accordance with the Native Title Act. Further tenements required for the purposes of the NYOL’s operations, and/or renewals of existing tenements, will be required to go through the relevant transitional and/or future act provisions of the Native Title Amendment Act. NYOL actively seeks negotiated outcomes with registered native title claimants. The negotiation process can lead to delays in the grant of new tenements and claimants actively seek some form of compensation in agreeing to the grant of a mining lease.
Eleven native title claims now affect the Group’s operations and surrounding areas. Five of these have been registered and six remain unregistered. The reduction over the past twelve months is due principally to the consolidation of claims. The registered native title claims are ‘WC99/24 Wiluna, WC95/01 Koara, WC95/042 Koara 6, WC99/10 Wutha and WC99/01 Wongatha’. The unregistered native title claims are ‘WC95/58 Sir Samuel, WC95/82 Sir Samuel 2, WC01/14 Ngalia Kutjungkatja, WC02/02 Ngalia Kutjungkatja 2, WC96/20 Mantjintjarra Ngalia and WC99/05 Koara (Registration set aside)’. Claims WC95/58 Sir Samuel and WC95/82 Sir Samuel 2 are currently being amended and are entering the registration process.
Australian Aboriginal Cultural Heritage Legislation
The Commonwealth of Australia and Western Australia have passed legislation governing the preservation of the heritage of Aboriginals.
The Commonwealth legislation provides for declarations of preservation to be made in relation to any region by the Commonwealth Minister for Aboriginal Affairs. Usually such a declaration would be made on the application by interested groups of Australian Aborigines seeking preservation of a place of particular significance to them. The terms of a declaration of preservation are for the Minister to decide, but may include prohibiting access to or disturbance of the region concerned, or allowing such access or disturbance on certain conditions. It is an offence to contravene such a declaration. The Western Australian legislation has particular application to the discovery and preservation of Australian Aboriginal sites, relics and artifacts, and provides for the state Minister to make declarations relating to the protection of Australian Aboriginal sites (for example by requiring the consent of the Aboriginal groups concerned) in certain circumstances. It also requires a mining company, which discovers any Aboriginal relics or artifacts to report the matter to the state government.
24
NYOL maintains a good working relationship with Aboriginal communities. Some Australian Aboriginal sites may be located in regions, which are likely to be affected by the Group’s mining. Applications to disturb in accordance with these agreements have been made by NYOL and granted in accordance with the relevant Aboriginal heritage legislation. If additional archaeological and anthropological evidence of an Aboriginal site is revealed at any stage, NYOL is required to report this evidence to the Aboriginal Affairs Department and to the native title claimants concerned under the terms of their agreements with NYOL. In addition, NYOL routinely conducts heritage surveys of mining tenements, in conjunction with Aboriginals, to determine if heritage sites might exist in areas where NYOL intends to conduct exploration and other activities.
Western Australia Gold Royalty
Since July 1, 1998, the Mining Act has imposed a royalty on gold. The royalty from July 1, 1998 to June 30, 2000 was 1.25% of the realised value of gold produced (calculated monthly based on the average gold spot prices in the relevant month). From July 1, 2000 the royalty has been 2.5%, however, in the period from July 1, 2000 to June 30, 2005 only, the royalty will be 1.25% if the average gold spot price for a quarter is less than A$450 per ounce. After 2005, the royalty rate will be fixed at 2.5%. The first 2,500 ounces produced during a financial year from gold bearing material produced or obtained from the same “gold royalty project” (being either a mining treatment plant or tenements from which anyone produces or obtains gold bearing material that is treated or processed at a common treatment facility or combination of treatment facilities, or as is approved as such by the Minister of the Director General of Mines) will be exempt from royalty payment.
Environmental Matters
NYOL complies with legislation in relation to the environment in the conduct of its affairs. This legislation covers such areas as pollution control, safety and rehabilitation. Failure to comply with applicable laws and regulations may result in orders being sought that may cause operations to cease or be curtailed or may require installation of additional equipment. Violators may be required to compensate those suffering loss or damage by reason of violations and may be fined if convicted of an offence under such legislation.
Legislation such as the Mining Act, the Land Act, theEnvironmental Protection Act 1986 (WA), the Soil and Land Conservation Act 1945 (WA), the Health Act 1911 (WA), the Water Boards Act 1904 (WA), the Rights in Water and Irrigation Act 1914 (WA), the Explosives and Dangerous Goods Act 1961 (WA), Conservation and Land Management Act 1984 (WA), Aboriginal Affairs Planning Authority Act 1972 (WA), Aboriginal Heritage Act 1972 (WA), Country Areas Water Supply Act 1947 (WA), Local Government Act 1960 (WA) andTown Planning and Development Act 1928 (WA), regulate or control noise, air and water pollution and soil erosion and protect State forests, timber reserves, Aboriginal reserves, Aboriginal sacred sites and national parks. These Acts, as amended, and the regulations made under them must be complied with, to the extent that they are applicable, in the conduct of various mining activities conducted by the Group. In particular, emissions from processing plants are controlled under theEnvironmental Protection Act 1986 (WA) and are monitored by local environmental officials.
The Western Australian government currently has a bill, theContaminated Sites Bill 2002, before Parliament dealing with the identification of contaminated sites. The objective of the Bill is to protect human health, the environment and environmental values by providing for the identification, recording, management and remediation of contaminated sites in Western Australia.
Water used in production and in dust abatement around mining sites in Western Australia is largely derived from ground water. Access to and use of the available ground water resource is regulated by the Mining Act and theRights in Water and Irrigation Act 1914 (WA). Licences are required to be obtained under the Mining Act to search for water and install and operate bore fields and associated pipelines.
Under applicable law and the terms of licenses under which NYOL operates, it is required to reclaim and rehabilitate land disturbed by its operations to certain environmentally acceptable conditions. NYOL’s
25
policy is to conduct reclamation concurrently with mining operations where feasible, although NYOL is currently behind schedule in reclaiming disturbed exploration areas.
The Group must complete the remainder of reclamation activities, which include the closure and dismantling of mining and processing facilities upon cessation of mining activities. In addition, NYOL is required under the Mining Act, to secure performance bonds in the form of bank guarantees to ensure its performance of the various environmental conditions imposed in the tenements it holds which relate to the conduct of mining operations.
NYOL has made, and expects to make in the future, expenditures to comply with such laws and licenses, but cannot predict the amount of such future expenditures. Estimated future reclamation costs are based principally on legal and regulatory requirements. At June 30, 2002, approximately A$55.7 million was accrued for reclamation costs relating to currently producing mines.
Australian Corporate Tax
Australian income tax is a tax imposed and payable to the Federal Government of Australia. Individual States of Australia currently do not impose income tax though they have the power to do so.
In Australia, the taxable income of a resident company is subject to corporate income tax at the rate of 36% for the 2000 tax year, 34% for the 2001 tax year and 30% for the 2002 and subsequent tax years. A company is resident in Australia if it is incorporated in Australia or, not being so incorporated, if it carries on business in Australia and has either its central management and control in Australia or its voting power controlled by Australian resident shareholders. The Company is resident in Australia for income tax purposes.
The taxable income of a company is calculated as the difference between the company’s assessable income and its allowable deductions. Assessable income includes income as it is traditionally understood including sales income, interest, hedging profits, rent and royalties as well as capital gains derived from the disposal of assets.
All losses or outgoings to the extent to which they are incurred in producing such assessable income or in carrying on of a business are allowable deductions except where they are capital or private in nature. Separate capital allowances are available in respect of capital expenditure including depreciation and amortisation of mine development costs. Exploration expenditure is deductible in the year that it is incurred.
Plant and equipment is depreciable with depreciation rates determined by reference to the plant’s effective life. Subject to certain limited exceptions, mine development expenditure that is not plant and equipment is amortised on a straight-line basis over ten years or life of mine, whichever is less. From July 1, 2001, mine development is required to be amortised over the life of mine.
Tax losses incurred in 1989-90 and later years are available to be carried forward indefinitely and set off against future taxable income, provided that the company satisfies certain continuity of ownership and same business tests. Carry-backs are not permitted.
From July 1, 2000, a goods and services tax (“GST”) of 10% applies on the supply of most goods; services and anything else consumed in Australia. GST is a transaction-based tax imposed on the supply of most goods and services at virtually all stages of production and distribution. Businesses generally charge GST in the price of goods, services and anything else they supply. To the extent that supplies are used in business activities, registered persons are then generally entitled to claim an input tax credit for GST paid on their purchases. All relevant subsidiaries in the Group are registered for GST purposes.
Since June 30, 2002 the Australian Government has enacted legislation that will allow 100 per cent commonly owned Australian resident company groups to form a single consolidated group for income tax purposes. The new rules apply, at the group’s election, on a date any time after June 30, 2002. The first two
26
tranches of legislation became substantively enacted on October 21, 2002 when the New Business Tax System (Consolidation, Value Shifting, Demergers and Other Measures) Bill 2002 was passed by the Senate.
The consequences of forming a tax-consolidated group are many. Formation of a consolidated group for tax purposes will require the tax basis of assets to be re-set pursuant to complex transition rules. Furthermore future utilisation of tax losses that transition to a consolidated group will become subject to loss factors that will limit in any one year the amount of transitional losses that can be offset against taxable income of the tax consolidated group.
The financial effect of the legislation has not been recognised in this financial report in accordance with the UIG 39 “Effect of Proposed Tax Consolidation on Deferred Tax Balances” as it cannot yet be reliably estimated. NYOL has not determined whether to adopt the legislation.
27
| 4C. | | Organisational Structure |
All Newmont Yandal Operations Limited controlled entities are 100% owned and are incorporated in Australia. The entities in the Group are listed below, indicating those with mine ownership rights:
Parent entity | | Mine ownership |
Newmont Yandal Operations Limited | | 100% Bronzewing mine, 100% Jundee mine |
|
Subsidiaries | | |
Clynton Court Pty Limited | | |
Great Central Holdings Pty Limited | | |
Eagle Mining Pty Limited | | 51% Nimary mine |
Hunter Resources Pty Limited | | 29% Nimary mine |
Quotidian No. 117 Pty Limited | | |
Matlock Mining Pty Limited | | |
Matlock Castellano Pty Limited | | |
Great Central Mines Pty Limited | | |
Australian Metals Corp. Pty Limited | | 20% Nimary mine |
Great Central Investments Pty Limited | | |
Newmont Wiluna Mines Pty Limited | | |
Newmont Wiluna Gold Pty Limited | | 100% Wiluna mine, 100% Mt McClure mine |
Newmont Wiluna Metals Pty Limited | | |
28
4D. Property, plant and equipment
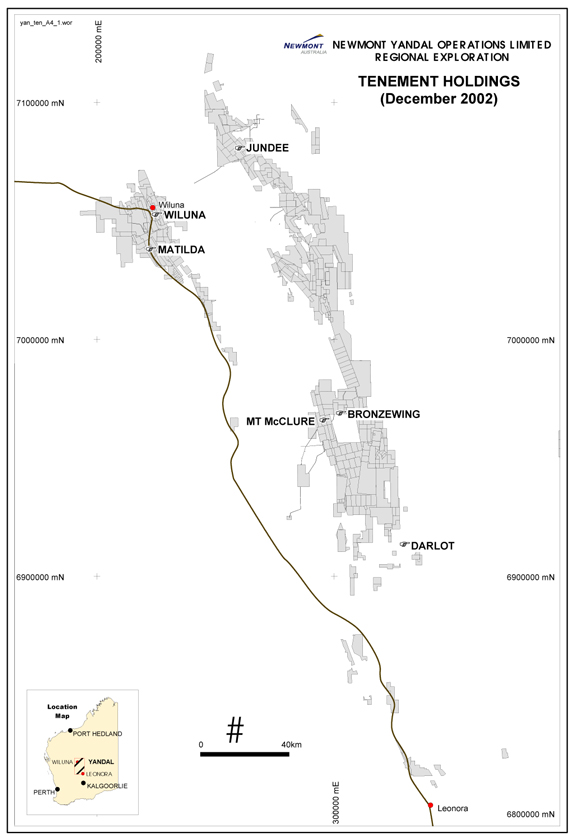
The Group’s main property consists of the plant and infrastructure at Bronzewing, Jundee-Nimary and Wiluna mines as well as its rights to explore and mine land in Western Australia as granted under the Mining Act. In addition, NYOL has a number of significant joint venture agreements under which it is able to obtain an interest in the rights to explore or mine land.
NYOL’s exploration activities encompass 3,150 square kilometres of exploration tenements located in the Yandal region. A map showing the location of NYOL’s land holdings is set out on the following page.
29
30
Operating Mines
Bronzewing
Background. NYOL’s Bronzewing Gold Operations are in the central Yandal greenstone belt and are located approximately 68 kilometres from Leinster township and 360 kilometres from Kalgoorlie in Western Australia. Access to Bronzewing is by air charter flight to its airstrip or by road. The Bronzewing gold deposits were discovered by NYOL in 1993 on tenements, which were subject to a purchase agreement with Mr. Mark Creasy. In May 1994, NYOL entered into a purchase agreement with Mr. Creasy to acquire the balance of his interest in the Bronzewing and Jundee-Nimary tenements for A$122 million and the issuance of 1,000,000 of Newmont Yandal Operations’ ordinary shares. The acquisition closed in 1995.
Mining. Open pit mining commenced in June 1994 in three pits known as Laterite, Central and Discovery. In February 1995 the development of underground mining commenced. Open pit mining operations concluded at the Laterite pit in February 1995 at a planned depth of 20 metres and at the Central pit at a planned depth of 130 metres. Open pit mining operations concluded at the Discovery pit in August 1996 at a planned depth of 235 metres. Since August 1996 all mining operations at Bronzewing have been conducted from underground. The adjacent dormant McClure property was acquired in September 1999 and integrated with the Bronzewing operation.
During the year ended June 30, 2002, pre-feasibility work was undertaken on Lotus Deeps orebody extensions and the Cockburn pit cutback and underground plan.
The mining operations are carried out by a combination of NYOL employees and contract miners. The mining contractor invoices NYOL at rates defined in the mining contract under which the contractor provides substantially all mining and associated equipment to conduct mining, including drilling and blasting where necessary. NYOL’s employees (rather than contract employees) carry out the stope drill and blast work. A separate contract exists for the haulage of the ore to the ore stockpiled prior to treatment. A full description of the contracts is set out in “Item 4B: Business Overview”.
During the year ended June 30, 2002, mine production totalled 1,703,434 tonnes of ore at an average grade of 4.70 grams of gold per tonne. The ore was sourced from Bronzewing and McClure (Lotus Deeps).
Processing. Bronzewing’s gold processing plant is a conventional carbon-in-pulp/carbon-in-leach gold treatment plant. Due to the course nature of the Bronzewing gold mineralisation, approximately 60% of the gold is extracted through the gravity portion of the processing plant thereby reducing costs and increasing recovery rates. Plant construction was completed in November 1994 for a total cost of A$36 million.
The plant was upgraded to a capacity of 2.0 million tonnes per annum during 1997/98 with construction of a new primary and secondary crushing circuit, the installation of new cyclones and the addition of a third Knelson concentrator. A thickener and INCO detoxification unit was also constructed during 1997/98. These additions reduce water consumption by 30-35 percent and eliminate cyanide in the water tailings dam, thereby lowering rehabilitation costs.
For the year ended June 30, 2002, total production was 8.46 tonnes of gold from 1,865,282 tonnes of ore at a headfeed grade of 4.69 grams of gold per tonne and plant recovery of 96.7%. For the year ended June 30, 2001, total production was 8.10 tonnes of gold from 1,801,126 tonnes of ore at a headfeed grade of 4.63 grams of gold per tonne and plant recovery of 97.22%.
Capital expenditure for the year ended June 30, 2002 was A$16 million. Capital expenditure was A$6.3 million for the six months ended December 31, 2002, and is budgeted to be A$1.7 million for the year ended December 31, 2003.
The total cost of Property, Plant and Equipment as at June 30, 2002 was A$351.2 million, (June 30, 2001: A$338.2 million)
31
At June 30, 2002 there were 193 persons employed at the Bronzewing Gold Operations.
The Bronzewing mine is expected to cease operations in late 2003 or early 2004, when NYOL’s reserves at Bronzewing are exhausted. If no additional reserves are discovered and no agreements for toll treating ore are entered into, the likelihood of which cannot be reasonably predicted, the Bronzewing processing plant could be dismantled and the site reclaimed.
Jundee-Nimary
Background. NYOL’s Jundee-Nimary Gold Operations are located in the northern part of the Yandal region and are the consolidation of two separate mines (Jundee-Nimary and Nimary) with contiguous boundaries which Newmont Yandal Operations and Eagle mined separately prior to the acquisition of Eagle by Newmont Yandal Operations. Jundee-Nimary is located approximately 45 kilometres north-east of Wiluna which is the nearest township. Access to Jundee-Nimary is by air charter flight to the Jundee-Nimary mine airstrip or by road from Wiluna township.
Like the Bronzewing mine, the deposit forming the Jundee-Nimary mine was discovered by NYOL on tenements acquired from Mr. Creasy in May 1994. By a separate agreement, NYOL paid Mr. Creasy a non-refundable deposit of A$1.0 million to acquire an option to obtain a 100% interest in Plover Bore, a tenement adjacent to the Jundee-Nimary mine site. A payment of A$40 million by NYOL on November 1, 2001 was required if NYOL wanted to purchase the tenement. That payment was not made, however, it is anticipated that Mr. Creasy will extend the November 1, 2001 date for payment to November 1, 2003, and that further extensions will be granted from year to year. NYOL also has an access deed with Mr. Creasy that gives it the right to construct and operate the Jundee-Nimary gold processing plant on this tenement.
Mining. NYOL and Eagle Mining Corporation commenced open pit mining at Jundee-Nimary and Nimary in late 1995. At that time Nimary and Jundee-Nimary merged along a common border and shared some common pits. Consolidation and integration of the Jundee-Nimary operation is now complete, resulting in an overall reduction in staffing levels and costs.
Underground mine production was mostly sourced from the Barton Deeps orebody, but there was increased production from Hughes and Nim 3 developments. Level 17S from Barton Deeps was extended to intercept the Westside ore shoots and development of this new mineralised system has commenced. Open pit production continued to decline until all open pits were exhausted in late 2002.
Contractors carry out all of the mining operations at Jundee-Nimary under the management of the Group’s senior operations staff. A full description of the contracts is set out in “Item 4B: Business Overview”.
During the year ended June 30, 2002, mine production totalled 3,185,244 tonnes of ore at an average grade of 3.91 grams of gold per tonne.
Processing. Ore is treated at one of two conventional carbon-in-pulp/carbon-in-leach gold processing plants. A number of improvements have been made to the processing operations since start-up in late November 1995 with the aim of improving recoveries. These include installation of two additional leach tanks and a regrind ball mill at Nimary, and installation of oxygen generation and Filblast air injection plants at both mills. Improvements to the Nimary mill during the year ended June 30, 2000 increased capacity to 1.2 million tonnes per annum. The plants now have a combined processing capacity of 3.0 million tonnes per annum, depending on the hardness of the ore being mined.
During the year ended June 30, 2002, treatment plant throughput declined, reflecting an increasing proportion of harder ore from the deepening open pits and underground. Ore was processed through the Nimary and Jundee plants.
For the year ended June 30, 2002, total production was 11.10 tonnes of gold from 2,158,757 tonnes of ore at a headfeed grade of 5.47 grams of gold per tonne and plant recovery of 93.96%. For the year ended June 30, 2001, total production was 12.79 tonnes of gold from 2,457,454 tonnes of ore at a headfeed grade of 5.51 grams of gold per tonne and plant recovery of 94.3%.
32
Capital expenditure for the year ended June 30, 2002 was A$24.2 million. Capital expenditure was A$9.5 million for the six months ended December 31, 2002, and is budgeted to be A$33.9 million for the year ended December 31, 2003.
The total cost of Property, Plant and Equipment as at June 30, 2002 was A$308.4 million, (June 30, 2001: A$284.2 million)
At June 30, 2002 there were 135 persons employed at the Jundee-Nimary Gold Operations.
Wiluna
Background. The Wiluna mine is located just south of the township of Wiluna and is approximately 45 kilometres south-west of the Jundee-Nimary operation. Access to the Wiluna mine is by air charter flight to the Wiluna mine airstrip or by road from Wiluna township. Mining has been intermittently carried in the Wiluna mine region for over 100 years.
Asarco Inc. (“Asarco”) commenced exploration activity in the Wiluna region in 1982. Construction of an oxide gold processing plant began in 1986 with the first gold production occurring in 1987. Oxide ores were mined from several open pits in the Wiluna and surrounding regions between 1987 and 1994. Commencing in 1993 several of the open pits were deepened to provide access to sulphide ores. Generally, the Wiluna primary sulphide ore is refractory and requires pre-treatment to release gold bound up in sulphide prior to processing in a traditional carbon-in-pulp or carbon-in-leach circuit. Asarco sold its interests in its Australian operations to Wiluna Mines Limited (“Wiluna Mines”) in 1994 and in the same year commenced underground sulphide mining operations. The Wiluna Gold Operations were integrated into NYOL’s operations from January 1, 1998, following the takeover of Wiluna Mines.
Mining. Mining at Wiluna is mainly underground and refractory, sulphide ore from the Bulletin, Woodley and Creek Shear deposits. The Golden Age underground, quartz vein hosted gold mineralisation is non-refractory and the East and West Lode Open pits also provided mill feed during the year. Stoping of the upper levels of the Woodley orebody commenced in 2001-2002. Studies to redevelop the East and West Lode underground resources advanced from conceptual to feasibility status but a decision on the future development of this resource was deferred.
Contractors carry out all of the mining operations at Wiluna under the management of the Group’s senior operations staff. A full description of the contracts is set out in “Item 4B: Business Overview”.
For the year ended June 30, 2002, mine production was 869,709 tonnes of ore at an average grade of 5.39 grams of gold per tonne.
Processing. With the exception of the Golden Age underground quartz vein hosted gold mineralisation, most of the ore produced by the Wiluna mine is now refractory sulphide ore. The sulphide ore must be treated prior to cyanide leaching to reduce the sulphide content using bacterial oxidation (otherwise known as the BIOX process). BIOX is a patented process technology owned by Goldfields of South Africa. Micro-organisms are used to oxidise certain gold-bearing sulphide ores in order to facilitate gold recovery. Following consideration of the available options and environmental waste concerns, Wiluna Mines chose the BIOX bacterial oxidation process because of the lower operating and capital costs involved. The Wiluna BIOX gold processing plant, completed in 1993, was originally designed to treat sulphide flotation concentrate and had a designed processing capacity of 420,000 tonnes per annum of ore. The initial BIOX gold processing plant consisted of six 450 cubic metre reactors, three primary reactors in parallel followed by three secondary reactors in series. An expansion in the BIOX gold processing plant was completed during 1996, resulting in an increased designed processing capacity of 600,000 tonnes per annum. The BIOX expansion project enabled the plant to treat higher grade sulphide ore produced from the underground mines and included an upgrade of the BIOX circuit’s cooling water and air reticulation systems. Following the BIOX process, the oxidised product is treated in a standard carbon-in-leach gold processing circuit similar to that used at Bronzewing and Jundee-Nimary mines. Currently the BIOX plant is running in excess of designed processing capacity of 600,000 tonnes per annum.
33
The commissioning of the gas fired power plant in 1997/98 and 1998/99 and ongoing research into improving metallurgical and throughput recoveries has led to an overall decrease in mining and processing costs and an increase in recoveries over recent years.
For the year ended June 30, 2002, total production was 3.68 tonnes of gold from 789,720 tonnes of ore at a headfeed grade of 5.66 grams of gold per tonne and plant recovery of 82.22%. For the year ended June 30, 2001, total production was 3.6 tonnes of gold from 808,275 tonnes of ore at a headfeed grade of 5.41 grams of gold per tonne and plant recovery of 82.44%.
On September 11, 2002, NYOL entered into an agreement to sell the Wiluna mine and surrounding exploration acreage to Agincourt Resources Limited, a company controlled by members of the Wiluna mine management group and an independent contractor. Completion of the sales transaction was originally anticipated to occur in October 2002 subject to receipt of necessary third party consents and approvals. As of the date of this report, the Company had not received all the necessary third party consents and approvals and, as a result, the agreement has expired without the sale having been completed. As of the date of this report, the agreement had not been extended nor had any new agreement been concluded.
Based on current mine plans production at the Wiluna operation is expected to cease by December 2003.
Capital expenditure for the year ended June 30,2002 was A$6.2 million. Capital expenditure was A$ 4.1 million for the six months ended December 31, 2002 and is budgeted to be A$1.1 million for the year ended June 30, 2003.
The total cost of Property, Plant and Equipment as at June 30, 2002 was A$193.2 million, (June 30,2001: A$189.0 million)
At June 30, 2002 there were 96 persons employed at the Wiluna Gold Operations.
34
Reserves
NYOL’s consolidated reserves included the proven and probable reserves at Bronzewing, Jundee-Nimary and Wiluna totaling 55.28 tonnes of gold, comprising 13.60 million tonnes of ore at an average grade of 4.10 grams of gold per tonne. During the year ended June 30, 2002, the Group produced 23.31 tonnes of gold depleting the reserve by 4.81 million tonnes of ore containing an average grade of 5.20 grams of gold per tonne, or 25.02 tonnes of gold (average recovery 93%).
Bronzewing:
| • | | The main changes in the June 2002 reserves were downgrades in the estimates at Lotus (- 0.81 tonnes) and Western zone (- 0.95 tonnes) at Bronzewing. |
| • | | Reserves as at June 30, 2002 are based on the June 2001 and December 2001 resource models, which used an inverse distance squared interpolation method. The high grade Wright and Herbison veins have been separately wireframed and estimated, to restrict smoothing of high grades. |
| • | | The interpolation boundary for blockmodelling at Central was 1.0 gram of gold per tonne, for Discovery 2.0 grams of gold per tonne and for Western Zone 3.0 grams of gold per tonne. |
| • | | Drill hole composite lengths were 5 metres in Central and Discovery Zones and block sizes 5 metres cubed. |
| • | | Reconciliation’s to date continue to support the June 2001 change to unfactored models. No factors were applied except for a 5% upgraded to one stope, which contained remnants of the Herbison vein. This affected less than 1% of the reserve. |
Jundee-Nimary:
Pits
For the Jundee-Nimary open pit Reserves, cutoff grade in oxide was 0.5 grams of gold per tonne, in transition 0.7 grams of gold per tonne, and in the primary zone 0.8 grams of gold per tonne.
Barton Deeps
In December 2000 a revised estimate (previously estimated June 1999) was made for Barton Deeps. Underground drilling during 1999 and 2000 had infilled much of the original 80 metre x 80 metre spaced surface drilling used for the June 1999 estimate to 20 metre x 20 metre in the main production zones. The December 2000 reserve estimate was an improvement on the June 1999 estimate because the:
| • | | greater drill density produced a more reliable estimate. eg the June 1999 – 80al lenze (2.55 tonnes ) model had 42 drill intercepts compared to 175 drill intercepts for the December 2000 estimate; |
| • | | more detailed geological information has allowed better 3D representation of post-mineralisation lamprophyres, which stope out the mineralised zone; |
| • | | previously there had been complicated sample and block cuts to grade. The new model has sample cuts based on sample population distribution; and |
| • | | the previous model had been factored 0.7 for tonnes and a grade of 1.6 grams of gold per tonne. Reconciliations during 2000 did not support these factors. |
Other Deeps Models
| • | | Other Deep mineralised structures (Hughes, Nim 3) have been modeled using similar parameters as Barton Deeps. |
| • | | Other Deeps reserves were reported above a 3.5 grams of gold per tonne cut off. |
Exploration underground drilling located the Westside lense in the hanging wall of Barton Deeps in 2000. This new, high grade, mineralised vein system was extensively drilled during 2001-2002 and this work has confirmed the initial exploration potential. (see later Jundee – Nimary in Mine Exploration)
35
Wiluna:
The change in the mineralised material estimate when compared with June 30, 2001 is a 33% (15.01 tonnes) reduction from 30.86 tonnes. This reduction was due predominantly to:
| • | | Mine depletion during 2001-2002 – production 3.75 tonnes of gold at 84% recovery. |
| • | | a revised contribution from the East West underground lode models following more stringent economic constraints placed on the material available for extraction, |
| • | | downgrading of the Galaxy prospect after further drill testing and geological review, |
| • | | redefinition of the modeling criteria applied in Woodley from mining experience in the upper section of the orebody. |
| • | | The continuing review of East Lode, West Lode and Calvert Lode underground project area accounted for a net decline in mineralised material of 3.27 tonnes from 17.40 tonnes to 14.13 tonnes. Calvert resources increased by 1.51 tonnes as a result of an extensional drilling program. |
| • | | Mine planning outcomes to date in the East /West Calvert Project are currently sub-economic due largely to an inadequate production rate and high capital costs. A planning review was conducted in August 2002. East/West Project area block models continue to be refined and upgraded with improvements in the geological interpretation and additional drilling information. |
| • | | The substantial decrease in the mineralised material at Woodley underground sulphide orebody to 2.13 tonnes follows a review of the geological constraints in the resource model from reserve drilling and development exposures. Woodley mineralisation is irregular and structurally complex and a more conservative approach has been taken to mineralised material estimates until drilling densities improve. |
| • | | East and West pit block models were reviewed and updated during the year. Mining has been completed in these pits and reserves reduced to zero. A minor quantity of the reserve of West Pit left below the final pit floor has been recategorised as mineralised material. |
| • | | Biox residue tailings in dams E and F are now classified as Probable Reserves. Contained metal is 0.82 tonnes. The tailings are currently being treated in the mill with metallurgical recoveries following anticipated trends. The remaining 70,000 tonnes at 9.0g/t Au of Biox Residue Tailings in Dam G is categorized as mineralised material. |
| • | | Golden Age mineralised material increased by 0.45 tonnes net of the 0.78 tonnes in crushed ore. The vein continues to prove difficult to drill test ahead of production development. Available information indicates the vein is maintaining grade and shallowing in dip with depth. Mining has reached 960RL. |
| • | | Mineralised material ounces contained in remnant sulphide sources in the Bulletin, Creek Shear and Happy Jack systems after exclusion of reserves have declined 1.01 tonnes to 1.79 tonnes . Crushed ore figures from mine production in these areas totaled 0.75 tonnes . |
| • | | Underground sulphide mineralised material is commonly geologically constrained with pronounced, structurally controlled grade boundaries. Where relevant, a 4g/t Au block cut-off has been applied. |
Wiluna Belt
The previously reported reserves of the regional Wiluna Belt are now included in the Wiluna Mine estimate.
36
Yandal Belt
These were reserves outside the main mining areas reported in June 2001. They comprised 8 small deposits plus Gourdis-Vause and Mt Joel. Gourdis-Vause now forms part of the Jundee Open Pit mineralised material.
A review has been made of the Mt. Joel prospect and it was concluded there was not continuity of the mineralised system at a gold grade that would sustain economic development.
The table below is a summary of the Group’s ore reserves at June 30, 2002:
37
Ore reserves as at June 30, 2002
| | | | | Proven
| | Probable
| | Total
|
Bronzewing | | | | | | | | |
Mine | | Mt | | 3.17 | | 1.10 | | 4.27 |
| | | G/t | | 3.5 | | 4.6 | | 3.8 |
| | | Tonnes Au | | 11.16 | | 5.07 | | 16.23 |
Mt McClure | | Mt | | | | 0.14 | | 0.14 |
| | | G/t | | | | 10.2 | | 10.2 |
| | | Tonnes Au | | | | 1.49 | | 1.49 |
Stockpiles | | Mt | | 0.09 | | | | 0.09 |
| | | G/t | | 2.0 | | | | 2.0 |
| | | Tonnes Au | | 0.19 | | | | 0.19 |
Total Bronzewing | | Mt | | 3.26 | | 1.24 | | 4.49 |
| | | G/t | | 3.5 | | 5.3 | | 4.0 |
| | | Tonnes Au | | 11.35 | | 6.56 | | 17.91 |
| | | | |
| |
| |
|
Jundee-Nimary | | | | | | | | |
Barton Deeps | | Mt | | 1.56 | | 1.43 | | 2.99 |
| | | G/t | | 5.7 | | 6.01 | | 5.9 |
| | | Tonnes Au | | 8.93 | | 8.61 | | 17.54 |
Other Deeps | | Mt | | | | 1.71 | | 1.71 |
| | | G/t | | | | 6.3 | | 6.3 |
| | | Tonnes Au | | | | 10.79 | | 10.79 |
Open pits | | Mt | | 0.05 | | | | 0.05 |
| | | G/t | | 1.7 | | | | 1.7 |
| | | Tonnes Au | | 0.09 | | | | 0.09 |
Stockpiles | | Mt | | 3.44 | | | | 3.44 |
| | | G/t | | 1.1 | | | | 1.1 |
| | | Tonnes Au | | 3.7 | | | | 3.7 |
Total Jundee-Nimary | | Mt | | 5.05 | | 3.14 | | 8.19 |
| | | G/t | | 2.5 | | 6.2 | | 3.9 |
| | | Tonnes Au | | 12.75 | | 19.41 | | 32.16 |
| | | | |
| |
| |
|
Wiluna | | | | | | | | |
Sulphides | | Mt | | 0.18 | | .26 | | .44 |
| | | G/t | | 8.42 | | 7.96 | | 8.15 |
| | | Tonnes Au | | 1.52 | | 2.08 | | 3.61 |
Stockpiles | | Mt | | .37 | | .09 | | .46 |
| | | G/t | | 2.25 | | 8.68 | | 3.56 |
| | | Tonnes Au | | 0.84 | | 0.81 | | 1.65 |
Total Wiluna | | Mt | | .55 | | .36 | | .91 |
| | | G/t | | 4.29 | | 8.15 | | 5.8 |
| | | Tonnes Au | | 2.36 | | 2.89 | | 5.26 |
| | | | |
| |
| |
|
Total | | Mt | | 8.9 | | 4.7 | | 13.6 |
| | | G/t | | 3.0 | | 6.1 | | 4.1 |
| | | Tonnes Au | | 26.43 | | 28.85 | | 55.28 |
| | | | |
| |
| |
|
Mt = million tonnes, G/t = grams per tonne, t = tonnes contained in gold.
38
It should be noted that contained ounces do not take into account recovery factors.
Figures do not in some instances exactly match tonnage, grade and ounce totals due to rounding.
Notes to accompany ore reserves table above
Most reserve estimates were made at a gold price of A$545 per ounce.
Bronzewing
The Bronzewing reserve declined as a result of mining depletion. The removal of the blanket 20% reconciliation factor on the grade in June 2001 was supported by the reconciliation between the revised reserve and production in the January-June 2002 period. The Bronzewing reserve estimates are based on designed stopes and development planned to economically extract the resource. The reserves are being continually evaluated in response to production information and new drilling data.
Jundee-Nimary
Barton Deeps/Other Deeps
The Barton Deeps Reserve has declined as a result of
| • | | increased data density (particularly to a depth of 400m from surface), which has refined ore zone shapes and better defined post mineral lamprophyre dykes, which stope out the ore zone. |
All underground reserves are reported above a block grade of 3.5 grams of gold per tonne.
The Other Deeps reserves include Hughes Deeps and Nim 3 Deeps.
Underground sill development, has commenced on the 17 South level into the Westside Deposit. Drilling on 40X40m centres closing down to 20x20m has started at Westside and a reserve estimate is expected in early 2003.
Open Pits
Surface reserves are reported within a A$545 pit shell above a cutoff of 0.5 grams of gold per tonne for oxide material, 0.7 grams of gold per tonne for transition and 0.8 grams of gold per tonne for sulphide or fresh ore. Mill recoveries of 96% for oxide, 92% for transition and 90% for fresh material were used to assess the viability of the mineralised material.
Wiluna
Reserves totaling 5.26 tonnes were compiled from multiple sources, five of which were underground and an array of stockpiles including for the first time the Biox Residue Dam. The underground Woodley deposit has the largest single source. reserve at 39% of total. Ore reserves have declined by 35% (2.79 tonnes) from the June 2001 figure to 5.26 tonnes net of depletion from mine production and resource model reviews. Mine production (excluding 860oz from low-grade stockpiles) totals, 4.61 tonnes with 56% from underground and 44% from the East/West pits. Recovery of the contained gold mined from the June 2001 ore reserve to the crusher is 100%. Recovery from the main underground sources Woodley and Golden Age is again significantly positive at 133%. The pits show negative recovery at 92% of reserves.
Underground Sulphide
Development of the lenses of the Woodley underground orebody confirmed the complex grade distribution and irregular geological controls. Reserve reconciliation of 0.87 tonnes depleted from reserves for 1.05 tonnes or 120% in the crusher. Block modeling methods continue to be refined. A minor 0.096 tonne ore remnant remains to be recovered from the Bulletin orebody. Extensions in Creek Shear on 6 and 7 levels delineated during the year add 0.46 tonnes to the reserves. Golden Age reserves have increased by 0.08 tonnes net of depletion by mine production. Mining has reached 23 Level and deeper drilling supports continuity of the vein at a shallowing dip to 37 Level at 891RL (610m below surface). Reserves are to 30 Level at 926 RL.A review of the underground orebodies has shown no material difference between reserves estimated at A$500 and A$575/oz.
Open Pit (Sulphide Reserves)
39
East and West pit reserves have been depleted by mining during 2001/02. Reserve recovery in the crusher from the open pits has been generally negative at 92% of ounces. Problems persisted with erratic grades, mining dilution and operational difficulties mining around old open stopes.
General Summary
| • | | Reserves are nominally estimated at A$545/ounce . The style of these mineralised systems mean they are relatively insensitive to gold price. |
| • | | Metallurgical recovery based on test work and plant performance has not been applied to Reserve estimates although they are used in establishing the viability of the estimates. Reserves reported are contained gold. |
| • | | Proved and probable reserves include dilution. |
| • | | Reserves for all mines include stockpiles. |
| • | | Analytical results have been verified by quality control and quality assurance procedures including screen fire assays, duplicates assays and assay of standards at various independent laboratories. |
| • | | Specific gravity is based on test work on core and mine operational experience. |
40
Reserves as at December 31, 2002
NYOL’s consolidated reserves include the proved and probable reserves at Bronzewing, Jundee – Nimary and Wiluna totalling 65.77 tonnes of gold; compromising 14.52 million tonnes of ore at an average grade of 4.53 grams of gold per tonne. During the six months from June 30, 2002 to December 31, 2002 the group produced 10.36 tonnes of gold depleting the reserve by 2.6 million tonnes of ore
Bronzewing
| | • | | During the period June 30, 2002 to December 31, 2002 a re-estimation of the Reserves was undertaken and resulted in a reduction in the total contained gold of 21.33 tonnes. The principal changes in estimation parameters, from those applied in June 2002 was the inclusion of more stringent economic criteria, foremost of which was the requirement for all reserves to be economically viable at a gold price of US$325 per ounce. |
| | • | | The application of these economic criteria, when combined with the results of ongoing underground diamond drilling, resulted in a number of proposed mining areas becoming economically unviable and these Reserves have been removed from the December 31, estimates. These mineralised areas were largely concentrated in the deeper portions of the Bronzewing mine and along the margins of previously completed stoping blocks, and contained a total of approximately 16.8 tonnes of gold. |
| | • | | Production during the period July to December 2002 further reduced the gold inventory attributable to Reserves by 4.53 tonnes of gold. |
| | • | | Within the McClure tenements application of revised economic criteria as described above resulted in Reserves totalling 2.4 tonnes of gold being removed from the estimates. These reductions were principally within the Lotus underground mine and in the Cockburn area. Production from these areas during the July to December 2002 period was a modest 0.14 tonnes of gold. |
Jundee – Nimary
Total contained gold for Reserves at December 31, 2002 reduced by 4.21 tonnes against estimates at June 30, 2002. Production during the period was 4.86 tonnes of gold. The principal change in the estimation methodology was the application of more stringent economic criteria foremost of which was the requirement for all Reserves to be economically viable at a gold price of US$325 per ounce.
Pits
For the Jundee – Nimary open pits the total contained gold within estimates of the Reserves as at December 31, 2002 increased by 1.63 tonnes over that at June 30, 2002. This has been due to the inclusion of new deposits at Gourdis, Vause and Area 7, which has more than compensated for the completion of open pit mining in July 2002 of the original Jundee pits.
Barton Deeps
Re-modelling of the Barton Deeps was completed and incorporated both improved geological understanding and the application of more stringent economic criteria. This has resulted in a reduction of 15.47 tonnes of gold against that estimated at the June 30, 2002. The new geological modelling highlighted that the lower levels of the Barton Deeps are more discontinuous with greater grade variation than that experienced in the upper levels. When more stringent economic criteria were applied to the new model substantial portions of the lower levels of the Barton Deeps were shown to be sub-economic.
Other Deeps
The gold inventory within the Other Deeps areas increased from 59.46 tonnes to 69.55 tonnes of contained gold during the period June 30, to December 31, 2002, a net increase of 10.09 tonnes. The increase has been due to the discovery and inclusion within the December 31, 2002 estimate of new deposits within the
41
Westside system. The total increase at Westside has been partially offset by reductions at other deposits within the Other Deeps due to the application of revised economic parameters and production from Hughes and NIM3.
Wiluna
The total inventory of contained gold in Ore Reserves at Wiluna as at December 31, 2002 was 34.77 tonnes of gold. This represents an increase of 3.92 tonnes after allowance for production in the period July to December 2002 (inclusive) of 1.78 tonnes. This increase has been principally due to;
| | • | | Inclusion of the Williamson, Regent, Adelaide, Lone Hand and Moonlight underground deposits. |
| | • | | Upward revision of estimates at Woodley as a result of positive results from drilling of the Woodley Deeps area. |
| | • | | The discovery of a high grade hanging wall reef adjacent to the Golden Age. |
| | • | | Inclusion for the first time, of the low grade stockpiles. |
These increases have been partially offset by depletion of the East and West Pits and downward revision of East Lode Underground, West Lode Underground, Calvert, Creek Shear and Bulletin due to more stringent economic criteria.
The table below is a summary of the Group’s ore reserves at December 31, 2002.
All ore reserve estimates have been undertaken at a gold price A$530 per ounce.
42
Ore Reserves as at December 31, 2002
| | | | | Proven
| | Probable
| | Total
|
Bronzewing | | | | | | | | |
Mine | | Mt | | 0.91 | | 2.30 | | 3.21 |
| | | g/t | | 4.55 | | 2.70 | | 3.25 |
| | | Tonnes Au | | 4.14 | | 6.20 | | 10.34 |
Mt McClure | | Mt | | 0.04 | | — | | 0.04 |
| | | g/t | | 5.20 | | — | | 5.20 |
| | | Tonnes Au | | 0.20 | | — | | 0.20 |
Stockpiles | | Mt | | 0.074 | | — | | 0.074 |
| | | g/t | | 1.82 | | — | | 1.82 |
| | | Tonnes Au | | 0.13 | | — | | 0.13 |
Total Bronzewing | | Mt | | 1.02 | | 2.30 | | 3.32 |
| | | g/t | | 4.37 | | 2.70 | | 3.21 |
| | | Tonnes Au | | 4.47 | | 6.20 | | 10.68 |
| | | | |
| |
| |
|
Jundee – Nimary | | | | | | | | |
Barton Deeps | | Mt | | 0.36 | | 1.33 | | 1.69 |
| | | g/t | | 8.10 | | 6.79 | | 7.07 |
| | | Tonnes Au | | 2.87 | | 8.99 | | 11.86 |
Other Deeps | | Mt | | 0.11 | | 3.76 | | 3.87 |
| | | g/t | | 7.43 | | 8.54 | | 8.30 |
| | | Tonnes Au | | 0.79 | | 32.11 | | 32.91 |
Open Pits | | Mt | | — | | 1.22 | | 1.22 |
| | | g/t | | — | | 1.61 | | 1.61 |
| | | Tonnes Au | | — | | 1.96 | | 1.96 |
Stockpiles | | Mt | | 3.38 | | — | | 3.38 |
| | | g/t | | 0.94 | | — | | 0.94 |
| | | Tonnes Au | | 3.17 | | — | | 3.17 |
Total Jundee – Nimary | | | | | | | | |
| | | Mt | | 3.84 | | 6.31 | | 10.15 |
| | | g/t | | 1.78 | | 6.83 | | 4.92 |
| | | Tonnes Au | | 6.83 | | 43.09 | | 49.88 |
| | | | |
| |
| |
|
Wiluna | | | | | | | | |
Sulphides | | Mt | | 0.13 | | 0.34 | | 0.47 |
| | | g/t | | 9.16 | | 7.39 | | 7.88 |
| | | Tonnes Au | | 1.18 | | 2.52 | | 3.70 |
Stockpiles | | Mt | | 0.27 | | 0.30 | | 0.57 |
| | | g/t | | 1.91 | | 3.22 | | 2.60 |
| | | Tonnes Au | | 0.51 | | 0.98 | | 1.48 |
Total Wiluna | | Mt | | 0.40 | | 0.65 | | 1.04 |
| | | g/t | | 4.27 | | 5.42 | | 4.98 |
| | | Tonnes Au | | 1.70 | | 3.48 | | 5.18 |
| | | | |
| |
| |
|
Total | | Mt | | 5.27 | | 9.25 | | 14.52 |
| | | g/t | | 2.47 | | 5.71 | | 4.53 |
| | | Tonnes Au | | 13.0 | | 52.78 | | 65.77 |
| | | | |
| |
| |
|
43
Mt = million tonnes of ore, g/t = grams of gold per tonne contained in ore, t = tonnes of contained gold. It should be noted that contained tonnes of gold do not take into account recovery factors. Figures do not in some instances exactly match tonnage, grade and gold totals due to rounding.
Notes to accompany Ore Reserves table above
Ore reserve estimates were made at a gold price assumption of A$530 per ounce.
Bronzewing
During the period June 30, 2002 to December 31, 2002 total contained gold within Ore Reserves at Bronzewing declined from 17.91 tonnes to 10.68 tonnes of gold, a net reduction of 7.23 tonnes. Of this decline 4.53 tonnes or 63% is directly attributable to production during the six month period. Other changes principally related to;
| | • | | Removal of some resource blocks within the Bronzewing mine (2.22 tonnes) due to improved geological modelling and refined economic criteria. |
| | • | | Reduction in underground reserve at Lotus (1.18 tonnes) as a result of more stringent economic constraints. |
| | • | | Re-evaluation of the expanded Central Pit (0.73 tonnes), which is not considered economic at US$300 per ounce gold. |
Jundee – Nimary
Significant changes in the gold inventory attributable to Ore Reserves at Jundee – Nimary occurred during the six month period from June 30, to December 31, 2002. Total contained gold in reserves increased by 17.72 tonnes from 32.16 tonnes on June 30, to 49.88 tonnes at December 31, 2002. This increase has been achieved after allowance for production during the period of 4.86 tonnes of gold. Principal changes include;
| | • | | The addition to the Open Pits reserve of 1.96 tonnes of gold from new deposits at Gourdis, Vause and Area 7. |
| | • | | An addition to reserves from the Westside deposit of 19.06 tonnes. Drilling to define further additions to this new ore position will be ongoing throughout 2003 – 2004. |
| | • | | A revised feasibility study into underground mining at the Invicta deposit. |
These additions to the Ore Reserves have been partially offset by re-modelling of the lower levels at the Barton Deeps, which highlighted the more discontinuous nature of this orebody at depth. This has resulted in a reduction in available reserves in this area.
Wiluna
Ore reserves at Wiluna have been generally maintained at constant levels after allowance for production of 1.78 tonnes during the period from June 30, 2002 to December 31, 2002. The very modest net reduction of 0.08 tonnes has been achieved after changes in reserves principally due to;
| • | | depletion of the intermediate stockpiles being partially offset by the inclusion of the low grade stockpiles (0.36 tonnes) into the reserves. |
| • | | Underground depletion due to production during the period has been more than matched by new additions to reserves based on additional data, in the Woodley Orebodies. |
44
Exploration
The Eastern Goldfields in Western Australia is one of the major gold producing regions in the world, currently accounting for approximately 8% of worldwide production NYOL believes the Yandal and Wiluna greenstone belts, located at the northern end of the Eastern Goldfields, to be among the most prospective regions for mineral exploration in Western Australia. At June 30, 2002 NYOL had reserves of 55.28 tonnes within the Yandal and Wiluna greenstone belts.
NYOL has discovered and developed two major gold deposits in the Yandal Belt: Bronzewing and Jundee. Recent research by the University of Western Australia has shown the Yandal Belt to be the northern extension of the Kalgoorlie Terrain. NYOL operates two other mines: Wiluna in the Wiluna Belt and McClure in the Yandal Belt. The Group has a total of 3,150 square kilometres secured under 387 granted tenements and 1,560 square kilometres held under 182 license applications. The total tenement area is reduced from previous years as NYOL has reviewed and prioritised targets and relinquished tenements over un-prospective or completely explored ground.
The Group has a commitment to the discovery of extensions and repetitions of known deposits. The potential was highlighted by the discovery of the new Westside ore position at Jundee.
District-scale exploration also has the potential to add value to existing operations because all exploration is conducted within 60km (trucking distance) of an existing NYOL mill.
NYOL has discovered 311 tonnes of gold (current deposits plus past production) in the Yandal greenstone belt since 1992. The primary goals of the current exploration program are:
| • | | Within Mine: to explore the extensions of known mineralised systems and to evaluate potential repetitions of those systems. |
| • | | Near Mine: Within the immediate mine environs look for repetitions or extensions either at depth, along strike or in parallel structures. |
| • | | District-scale: to grow production through the discovery of new Reserves that are within trucking distance of one of the Yandal mills, and discover new Reserves in excess of 100 tonnes of gold that can be developed as stand-alone mining operations; |
NYOL spent A$15.5 million on exploration in the year ended June 30, 2002, of which A$7.2 million was on mine sites. For the six months ended December 31, 2002 a total of A$6.7 million was budgeted for exploration, which included A$2.4 million for mine-site and near mine exploration and A$4.3 million for district-scale exploration. The company also recently moved to a calendar year budget. For the year ending December 31, 2003, a total of A$13.1 million has been budgeted for exploration, which includes A$4.1 million for mine-site and near mine exploration and A$9.0 million for district scale exploration. The Group’s exploration expenditures include all of the costs associated with exploration activities such as contract drilling, personnel, geochemical testing and tenement statutory fees.
NYOL’s focus is on gold, but it also holds tenements prospective for nickel and copper-lead-zinc-silver. Exploration partnerships are being considered with companies interested in pursuing this non-gold potential. NYOL is placing greater emphasis on exploration in the Yandal Belt as more land becomes accessible through the grant of exploration title in important target areas and the development of heritage protection protocols with a number of indigenous groups permitting on-ground access to granted exploration tenements. Exploration consists of a rigorous process of historical data analysis and evaluation, geophysical surveying and interpretation, geological mapping and surface sampling, and drilling. Improved data processing techniques and the refinement of geological models for the Yandal Belt continue to expose untested exploration opportunities. It is estimated that 65% of the Yandal Belt controlled by NYOL remains either under-explored or unexplored.
Plainting against NYOL by other parties for statutory conditions non-compliance is becoming more of an issue, as it is for all exploration and mining companies in Western Australia. NYOL has 15 Plaints to defend, none of which impacts on critical land holdings. It is anticipated that all tenements affected will be successfully retained by NYOL.
45
Opportunities to grow the Group’s portfolio of prospective and strategic landholdings are rigorously pursued. Land acquisition is pursued through pegging of vacant tenements over areas of prospective geology through the vigilant monitoring of tenement situations, and through commercial joint venture agreement with other companies or individuals.
Bronzewing
In Mine Exploration
With a declining reserve base an aggressive in mine and near mine exploration program was undertaken during 2001-2002 with the objective of extending mine life.
The in mine program involved drill testing immediate extensions to known mineralization. The Winged Keel, Avacado, Shoot 39 and Carrot targets at Bronzewing and Lotus North at McClure fall into this category.
The Bronzewing Deeps and Eastern Zone were conceptual targets with the potential for repetition of the Discovery or Central orebodies.
The Eastern Zone was a potential repetition of the Bronzewing system east of the Discovery Granodiorite and the Bronzewing Deeps target was a potential depth repetition of the mineralised systems.
The resource extension programs atWinged Keel (13.2m @ 14.4g/t Au; 7.8m @ 6.2 g/t Au; 5m @ 6.9g/t Au),Avacodo (10 Level, 30.6m @ 12.3 g/t Au from 72m and 8.2m @ 4.1 from 106.9m ; 8.4m @ 4.7 g/t Au from 26.0m; 3.9m. @ 13.2 g/t Au from 49.1m ; 4.2m @ 35.8 g/t Au from 8.2m) andShoot 39 (9.8m @ 8.8g/t, 6.5m @ 8.0g/t and 5.7m @ 6.4g/t) were successful, but only resulted in an incremental increase in the mineralised material. Most successful were extensions to the Winged Keel position, with the known lode now extended to the 17 and potentially 18 levels.
The programs to test theEastern Zone andDiscovery Deeps commenced in 2000 and the final holes were completed in July and August 2001.
BWRCD3179 intersected 1m @ 6.6g/t Au from 511m in the Eastern Zone,immediately east of the Discovery Granodiorite
BWRCD3181 drilled to further test the Discovery Deeps target intersected a 30m wide shear zone with 11m of quartz veining and intense biotite-carbonate alteration. An anomalous zone of 10m @ 0.7g/t Au (inc 2m @ 2.3g/t Au) was outlined.
These two deep diamond holes completed the Eastern Zone and Discovery Deeps programs. This work showed that although alteration zones and anomalous gold mineralisation extended beyond the Discovery and Central Deposits, no economically significant gold mineralisation was intersected.
McClure
At Lotus both surface RC and Diamond drilling was used to explore the northern extension of the Lotus mineralisation. Only one hole intersected economically significant mineralisation 3m (TW 1.5m) @ 70.0 g/t Au approximately 80m north of current resource limits.
For the year ended June 30, 2002, A$0.14 million was spent on in mine exploration at Bronzewing. For the six months ended December 31, 2002, A$0.03 million was spent on mine exploration at Bronzewing and for the year ending December 31, 2003, no mine exploration has been budgeted.
Near Mine Exploration
Sparrow Hawk, Parthfinder, Voyager and Old Sundowner are prospects associated with NNE trending structures from 2–6 kms NE of Bronzewing. Cockburn, Goldwing, Grand Union and Anomaly 45 are associated with the NNW trending McClure Trend
46
Sparrow Hawk
Several diamond holes were drilled to test this target and zones of anomalous gold mineralisation were intersected. eg, 8m @ 2.0 g/t Au from 36m; 3m @ 10.6 g/t Au from 109m; 8m @ 0.8gt/t Au from 99m; 4m @ 3.7 g/t Au from 108m; and 12m @ 0.5 g/t Au from 96m.
However, considering the lack of continuity of the mineralisation and the depth of the intersections no further work is planned.
AtPathfinder ((NDYBWRCD3182 4m @ 0.4 g/t Au from 208m) andVoyager (DYBWRCD 3185 12m @ 0.33 g/t au from 236m) diamond drilling intersected at best anomalous gold mineralisation.
Old Sundowner
Near mine drilling atSundowner North (10m @ 0.9g/t Au from 8m; 1m @ 4.4 g/t Au from 38m; 1m @ 4.0 g/t Au from 119m and 4m @ 4.9 g/t Au from 168m) and BWRCD3199 1m @ 1.4 g/t, 1.7m @ 2.2 g/t and 2.1m @ 1.6 g/t (all below 176m), produced broadly anomalous zones, but no economically significant mineralisation.
In summary the near mine programs on the NE prospects intersected the target structures and alteration, but the extent and quality of the gold mineralisation was not sufficient to warrant further work.
McClure Trend
Cockburn
As a prelude to evaluating the Cockburn resource, all old surface holes drilled by previous owners were gyroscopically surveyed. A revised geological and mineralisation interpretation was undertaken. Reverse circulation drilling was undertaken atGoldwing andAnomaly 45 without improving the prospectivity of the targets. At Grand Union follow up to a previous intersection of 4m @ 4.0g/t (MCRC28 from 264m) intersected 12m @ 2.8 g/t Au (MCRC44).
For the year ended June 30, 2002, A$2.89 million was spent on near mine exploration at Bronzewing. For the six months ended December 31, 2002, A$1.0 million was budgeted for near mine exploration at Bronzewing and for the year ending December 31, 2003, A$1.0 million has been budgeted, subject to favourable drilling results on near mine leases and/or at McClure.
Jundee-Nimary
In Mine Exploration
In mine exploration focused on the Westside mineralised system, discovered during 2000. Westside began the year as a promising narrow, high grade target close to the Barton Deeps underground development and by June 2002 had emerged as a probable new, future reserve. After initial surface holes it was possible to drill the Upper Panel of Westside (200-460m below surface) from Barton Deeps with a drill spacing of approximately 40x40m. This program was well advanced by June 2002 and added reserves at year ended December 31, 2002.
In addition to the Main and Hangingwall veins defined by surface drilling the more closely spaced underground holes showed the continuity of splays and linking structures between the major veins.
For logistical reasons it was not possible to drill the Lower Westside Panel (460- 700m) from underground. As of the date of this report, approximately 80 x80m spaced surface holes have tested the Lower Panel.
In the process of testing Westside the hangingwall Lyons Dolerite with shear hosted gold mineralisation similar to Westside was intersected. The Lyons target has emerged as having significant additional exploration potential for mineralisation similar to Westside.
47
Westside
Upper Panel
The table below contains a sample of the economically significant results from drill testing the Westside Upper Panel. The mineralisation is restricted to discrete structures with very little leakage into a halo around the structures.
Westside Upper Panel Surface and Underground Diamond Drill Results
Hole No
| | From
| | To
| | Width
| | Au
| | Comments
|
| | | m. | | m. | | m. | | g/t | | |
WSXP521 | | 128.8 228.0 | | 129.5 229.0 | | 0.7 1.0 | | 1,470 49.2 | | |
BDXP0500 | | 73.0 | | 74.0 | | 1.0 | | 63.2 | | Upper Panel Westside |
BDXP0501 | | 101.0 | | 105.0 | | 4.0 | | 16.8 | | Upper Panel Westside |
HDXPO488 | | 137.5 249.9 | | 141.2 251.0 | | 3.7 1.1 | | 32.7 110 | | |
HDXPO489 | | 149.6 219.6 227.8 277.4 | | 151.0 220.0 229.0 279.0 | | 1.4 0.4 1.2 1.6 | | 148 26.2 16.4 17.0 | | |
HDXPO490 | | 103.0 | | 104.0 | | 1.0 | | 50.9 | | |
BDXPO420 | | 294.0 | | 299.0 | | 5.0 | | 3,288 | | |
HDX04161 | | 58.1 | | 59.2 | | 1.1 | | 96.3 | | |
JRCD8859 | | 361.8 398.0 | | 362.45 399.0 | | 0.65 1.0 | | 96.2 21.1 | | Surface Hole |
BDXP0502 | | 71.0 120.0 165.9 183.0 222.4 | | 75.0 125.6 170.0 184.0 223.4 | | 4.0 5.6 4.1 1.0 0.9 | | 8.3 5.3 46.2 59.1
122.4 | | Upper Panel Westside Upper Panel Westside Upper Panel Westside Upper Panel Westside Upper Panel Westside |
N.B. all grades are uncut
These holes demonstrate the narrow width of the multiple vein system (eg BDXP0502) and the very high gold grades that are possible. The mineralised system has been outlined over a strikelength of approximately 400m. The gold mineralisation is often visible and associated with chlorite and biotite, quartz and carbonate veining within shear zones sometimes with breccia.
Lower Panel
The bulk of the Lower Panel (460-700m from surface) has been drilled from surface on approximately 80m centres . The table below contains a selection of drill results from the 2001-2002 program.
Westside Lower Panel Surface and Underground Diamond Drill results
Hole No
| | From
| | To
| | Width
| | Au
| | Comments
|
| | | m. | | m. | | m. | | g/t | | |
BDXP0497 | | 168.0 351.0 | | 170.0 353.9 | | 2.0 2.9 | | 5.6 6.1 | | Lyons Dolerite Lower Panel Westside |
JRCD9050 | | 664.0 | | 664.5 | | 0.5 | | 8,970 | | |
JRCD8926 | | 482.2 | | 484.2 | | 2.0 | | 8.6 | | Westside |
JRCD8951 | | 646.1 | | 647.8 | | 1.7 | | 115 | | Westside HW |
JRCD8952 | | 366.8 | | 367.5 | | 0.7 | | 18.7 | | Lyons Dolerite |
| | | 532.0 | | 535.2 | | 3.2 | | 9.1 | | Westside |
JRCD8953 | | 166.2 | | 166.6 | | 0.4 | | 122 | | Lyons Dolerite |
| | | 451.1 | | 451.8 | | 0.7 | | 40.7 | | Westside HW |
48
| | | 463.3 | | 463.7 | | 0.4 | | 49.8 | | Westside |
BDXP0419 | | 89.2 | | 90.9 | | 1.7 | | 20.8 | | Westside HW |
HDXP0493 | | 98.1 | | 98.7 | | 0.6 | | 119 | | Westside HW |
| | | 84.7 | | 85.2 | | 0.5 | | 767 | | Westside |
N.B. all grades are uncut
The Lower Panel is an immediate extension of the Upper Westside Panel. Gold grades, widths of structures and the host alteration are similar.
Lyons Dolerite
At Jundee there are three dolerites separated by narrow bands of sediments. The eastern most dolerite, the Barton Dolorite hosts the Barton and Barton Deeps orebodies, which will produce approximately 47 tonnes of gold.
In the hanging wall to the Barton’s Dolerite is the Hughes Dolerite, which hosts the Westside mineralisation. The third and most western dolerite is the Lyons Dolerite. Surface drilling, targeting Westside Lower Panel has intersected narrow zones of high grade gold mineralisation in the Lyons Dolerite. The table below summarizes some of the more economically significant drill results.
Lyons Dolerite Diamond Drill results
Hole No
| | From
| | To
| | Width
| | Au
| | Comments
|
| | | m. | | m. | | m. | | g/t | | |
BDXP0497 | | 168.0 351.0 | | 170.0 353.9 | | 2.0 2.9 | | 5.6 6.1 | | Lyons Dolerite Lower Panel Westside |
BDXP0494 | | 173.0 | | 177.0 | | 4.0 | | 5.0 | | Lyons Dolerite |
| | | 227.0 | | 227.4 | | 0.4 | | 34.2 | | Westside HW |
BXD0509 | | | | | | 1.8 | | 58.7 | | Lyons Dolerite |
JRCD 8925 | | | | | | 0.3 | | 2,910 | | Surface Hole – Lyons Dolerite |
JRCD8952 | | | | | | 0.7 | | 18.7 | | Surface Hole – Lyons dolerite |
It should be noted that all grades are uncut.
Exploration of the Lyons Dolerite hosted mineralised system is at an early stage, but results to date have been encouraging.
For the year ended June 30, 2002, A$2,4 million was spent on in mine exploration at Jundee-Nimary. For the six months ended December 31, 2002, A$0.8 million was budgeted for in mine exploration at Jundee-Nimary and for the year ending December 31, 2003, A$2.6 million has been budgeted.
Near Mine Exploration
Near mine exploration has targeted the Gateway Prospect mineralised system and a group of low grade potentially open pitable deposits located up to 50 kms south of Jundee. Minor work was done at Cork Bore north of Jundee.
Gateway
The Gateway prospect is located approximately 2 kms SW of Barton and has the Nexis structural orientation. Several surface diamond holes were drilled during the year with variable results.
JRCD8873 returned 3m @ 5.0 g/t Au from 542m, and JRCD8842 intersected a zone of visible gold mineralised dacite which assayed 57.4 g/t Au over 2.3m from 551m.
In March 2002 3.9m @ 6.0g/t Au, 100m downdip from the base of the current interpretation was intersected, but a second hole JRCD9017 intersected similar alteration, but no economically significant Au mineralisation.
49
Open Pits
South of Jundee, broad zones of low grade mineralisation,Winter (61m @ 0.81g/t Au from 8m.) andStrickland Prospects ( 48m @ 0.91 g/t Au from 20m.) were intersected, but the area does not appear to have reserve potential.
At Area 7 West,15 kms south of Jundee carbonate-chlorite-silica alteration and disseminated pyrite was intersected in dolerite. The interval returned 29m @ 1.2 g/t Au (inc 10m @ 2.3 g/tAu) from 297m.
AtCork Bore10 kms north of Jundee there was some encouragement from testing NS and NE trending limonitic quartz veining in Mg basalt and felsic porphyry. Initial result included 20m @ 1.1 g/t Au from 51m and follow up drilling continued to expand the zone eg JRC8881 8m @ 0.5 g/t Au from 44m; JRC8882 16m @ 0.23 g/t Au from 48m and 4m @ 0.8 g/t Au from 108m. However, there was no indication of the extent or grade of mineralisation necessary for economic exploitation.
For the year ended June 30, 2002, A$3.26 million was spent on near mine exploration at Jundee-Nimary. For the six months ended December 31, 2002, A$0.4 million was spent on near mine exploration at Jundee-Nimary and for the year ending December 31, 2003, A$0.4 million has been budgeted (not including expenditure on resource to reserve conversion).
Wiluna
In Mine Exploration
Exploration at Wiluna focused on immediate extensions to known mineralised systems to increase reserves in the short term and expand mine life. In Mine drilling was undertaken at Happy Jack, East and West Lodes and Calvert, Golden Age and Woodley.
AtHappy Jack drilling intersected a lens (7.63m @ 15.4g/t Au; 2.9m @ 16.6 g/t Au and 1m @ 9.1 g/t Au), 30m south of the old workings and 80m from the nearest development.
In theEast/West Lodes andCalvert reverse circulation and diamond drilling was undertaken to extend the East/West Lode open pit potential and to add to the underground resource potential associated with the old East and West Lode underground workings. At Calvert-West Lode WD545B intersected 16m @ 12.2 g/t Au from 520m and WD547 10.2m @ 4.7g/t Au from 585.3m. At East Lode Sth WR2690A intersected 8m @ 7.7 g/t Au, WR2681 9m @ 10.5 g/t Au from 241m and WR2682 4m @ 5.1 g/t Au from 251m. However, additional holes drilled down plunge failed to intersect economic grades and widths of gold mineralisation
GDH272 intersected 4.1m @ 24.8g/t Au from 433.7m and GDH273 intersected 0.61m at 11.3 g/t Au from 505.4m at Golden Age and these results should extend the reef 250m south and 150m below the current workings on the 21 Level.
AtWiluna Queen andMagazine south-east of East Lode reverse circulation drilling intersected relatively narrow zones of moderate grade gold mineralisation. (WR2652; 2.0m @ 4.1g/t Au from 222m: WR2671; 2.0m @ 3.6g/t Au from 260m; WR2672; 4.0m @ 6.2g/t Au from 106m;WR2672; 1.0m @ 3.2g/t from 218m)
AtWoodley results include WDH124 4.8m @ 16.0 g/t Au, WDH128 1.1m @ 33.6 g/t Au and WDH130 4.0m @ 6.1 g/t Au testing lens 80/200 below the 965RL.
WD496B was drilled to testWoodley Deeps downdip from the Woodley and Bulletin Sth mineralised zones. The hole intersected 4.7m @ 17.9 g/t Au from 934.3m in sheared dolerite and 14.7m @ 2.7 g/t in the interpreted Woodley position.
Other prospects tested with reverse circulation or diamond drilling in the near mine area includedSquib Nth,East Lode South,Lake Reef North,Lone Hand Fault,Moonlight/Adelaide (2m @ 3.0 g/t Au from 640m),Dolerite Zone (WD544A – 10.9m @ 4 g/t Au),Golden Bracelet (WR2689A 4m @ 0.35 g/t Au
50
from 199m and 1m @ 2.15 g/t Au from 181m),Quartz Scheelite, North Lode andStonehaven.
There was no expenditure on in mine exploration at Wiluna for the year ended June 30, 2002, the six months ended December 31, 2002, and none has been budgeted for the year ending December 31, 2003.
Near Mine Exploration
Outside the mine area, exploration was undertaken at Galaxy, 12 kms to the north and Williamson on Lake Way to the south.
Galaxy
Sixteen RC holes were drilled to test oxide pit potential at Galaxy. Results include WR2709 13m @ 3.3 g/t Au from 33m, WR2714 2m @ 11.6 g/t Au from 36m and WR2718 4m @ 11.4 g/t Au from 54m.
Williamson
A 43 hole Aircore programme was completed to depths of 33-119m over 500m strikelength at the Williamson Prospect on Lake Way. Eighteen holes reported intervals with grades exceeding 1 g/t Au and these are summarised in the table below. All holes were drilled at 60 degrees to the west.
| | | Co ordinates
| | Interval
| | | | |
Hole No
| | North
| | East
| | From
| | To
| | Width
| | Au
|
| | | m. | | m. | | m. | | m. | | m. | | g/t |
WA01716 | | 7035580 | | 233180 | | 9.0 16.0 | | 11.0 24.0 | | 2.0 8.0 | | 4.3 1.3 |
|
WA01717 | | | | 233195 | | 18.0 | | 31.0 | | 13.0 | | 3.3 |
|
WA01718 | | | | 233210 | | 21.0 33.0 42.0 | | 30.0 37.0 47.0 | | 9.0 4.0 5.0 | | 1.3 1.1 2.5 |
|
WA01720 | | 7035640 | | 233165 | | 5.0 | | 10.0 | | 5.0 | | 1.2 |
|
WA01721 | | | | 233179 | | 28.0 37.0 | | 30.0 41.0 | | 2.0 4.0 | | 4.7 2.7 |
|
WA01722 | | | | 233195 | | 15.0 36.0 | | 22.0 40.0 | | 7.0 4.0 | | 9.1 1.4 |
|
WA01723 | | | | 233210 | | 34.0 41.0 75.0 90.0 | | 36.0 71.0 77.0 92.0 | | 2.0 30.0 2.0 2.0 | | 4.4 7.3 3.3 3.9 |
|
WA01728 | | 7035670 | | 233205 | | 20.0 67.0 | | 24.0 70.0 | | 4.0 3.0 | | 2.7 3.2 |
|
WA01731 | | 7035740 | | 233176 | | 9.0 | | 12.0 | | 3.0 | | 3.9 |
|
WA01732 | | | | 233190 | | 26.0 | | 32.0 | | 6.0 | | 4.1 |
|
WA01733 | | | | 233205 | | 27.0 | | 43.0 | | 16.0 | | 4.6 |
|
WA01737 | | 7035820 | | 233210 | | 31.0 60.0 | | 53.0 70.0 | | 22.0 10.0 | | 2.8 5.6 |
|
WA01738 | | | | 233224 | | 88.0 | | 93.0 | | 5.0 | | 5.3 |
|
WA01742 | | 7036020 | | 233211 | | 81.0 | | 88.0 | | 7.0 | | 1.5 |
|
WA01745 | | 7036060 | | 233209 | | 54.0 | | 64.0 | | 10.0 | | 2.4 |
|
WA01747 | | 7035390 | | 233201 | | 38.0 | | 43.0 | | 5.0 | | 3.0 |
|
WA01748 | | | | 233222 | | 42.0 | | 52.0 | | 10.0 | | 4.7 |
|
WA01756 | | 7035550 | | 233209 | | 6.0 | | 39.0 | | 33.0 | | 3.4 |
For the year ended June 30, 2002, A$1.1 million was spent on near mine exploration at Wiluna. For the six months ended December 31, 2002, A$0.5 million was spent on near mine exploration at Wiluna and for the year ending December 31, 2003, no near mine exploration has been budgeted.
51
District-Scale Exploration
Newmont Yandal Operations Limited (NYOL) and wholly owned entities (principally Newmont Wiluna Gold Pty Ltd) hold 411km2
of granted exploration and mining tenure, and 187km2of tenure under application in the Wiluna Belt. Holding costs for all granted tenure amount to A$170,808 per annum in Rates and A$477,324 per annum in rent. The aggregate statutory expenditure commitment on granted tenure only is A$4.3 million. Despite statutory expenditure commitments having not been met on many tenements for a number of years, tenure is relatively secure because the Project Status granted by the Department of Industry and Resources (DoIR) permits the redistribution of aggregated mining and exploration costs across all tenements.
The Wiluna gold deposits were discovered in outcrop over 100 years ago in 1896. Areas of outcrop were easily prospected at low cost using loaming and dry blowing techniques, and more recently by systematic soil sampling and assaying using analytical techniques with detection limits that only in the early 1980’s surpassed the effectiveness of the gold pan.
The Wiluna ore bodies lie along north-trending faults in the Wiluna Mine Sequence. These structures are easily identifiable in the high-resolution aeromagnetic data. The same data also highlights similar structures within sections of the 80% of the Wiluna Mine Sequence concealed beneath transported cover. This transported cover masks the geochemical response of the buried mineralisation and consequently, these areas are not amenable to traditional surface prospecting techniques. These concealed conceptual targets have been systematically drilled and tested with 20,800 holes for 864,350 metres.
The last of the priority targets was tested in 2000 & 2001 with comprehensive drilling on Lake Way. The northern shore of the lake is located approximately 10km south of the Wiluna Mine and the drilling was permitted only with the development of new lake drilling technology. The Williamson gold system was discovered by this work, but gold grades in the discontinuous mineralisation were generally low. Potential remains for the discovery of small oxide deposits beneath Lake Way Structural sites and host rocks with characteristics similar to those that control other types or Archaean lode gold deposits in the Eastern Goldfields have also been tested in the Wiluna area. However, initial indications of gold anomalism and mineralisation failed to develop into tangible resource potential when followed up with systematic drill testing. The risk profile of future exploration, should it be undertaken, will increase substantially as lower order opportunities are targeted beneath increasingly thicker transported cover.
The Wiluna Belt is recognized more for its nickel rather than its gold endowment. Several nickel sulphide deposits, some in production (Agnew, Mt Keith and Cosmos), have been discovered in the southern half of the Wiluna Belt. No nickel sulphide deposits have been discovered within NYOL land holdings in the northern Wiluna Belt although favourable host rocks are present and a contemporary reassessment of historical nickel exploration could reveal untested nickel potential. A lateritic nickel deposit of approximately 100 million tonnes grading 1% nickel equivalent has been outlined on NYOL tenure, although this resource is relatively small by lateritic nickel deposit standards and is unlikely to be of economic value in the foreseeable future.
52
Yandal Belt
Bronzewing Area (South Yandal)
Exploration priority was given to targets that fell within a 30km radius of Bronzewing Mine because of the mine’s pending closure due to reserve depletion. Although all high priority district-scale targets, with the exception of the Katherine Well prospect, had been tested, lower priority targets which could have possibly represented incremental mill feed for Bronzewing were also assessed. In September 2002 the Bronzewing Mine geologists and Yandal Regional geologists formed a task force to systematically work through and audit all exploration that had been conducted within a 30km radius of Bronzewing Mine and identify the residual exploration opportunities that either remained untested or partially tested. As a results of this audit a further 10 lower priority district-scale targets were evaluated, but no significant mineralisation was discovered.
The Katherine Well prospect, located 30km southeast of Bronzewing Mine, was discovered in mid-2002 and was the last of the higher priority district-scale exploration targets to be tested near Bronzewing. Initial drilling of this new discovery, which is concealed beneath transported cover, intersected mineralisation assaying >1g/t Au over a strike of 1,200 metres in broad-spaced (400m) drill traversed. Better results include 4m @ 6.7g/t Au from 68m and 8m @ 2.0g/t Au from 60m.Subsequent follow-up drilling along lines 200 metres apart was unsuccessful in delineating coherent, ore-grade mineralisation and no further work is planned following the downgrading of the resource potential.
Other district-scale exploration that could have had a positive impact on Bronzewing was undertaken in the Newton project area—an area considered prospective because of the coincidence of favourable structure, lithologies and broad-scale alteration. As part of the follow-up of a conceptual targets in mid-2002, an outcropping, gold-bearing quartz vein that assay up to 1,470g/t Au in rock-chip samples was discovered 45km north of Bronzewing. Follow-up drilling of this mineralized vein returned a best result of 4m @ 2.3g/t Au. Since the drilling was conducted, intensive geological mapping has documented three principal vein arrays that are known to contain gold. Further drilling is planned in 2003.
Exploration beneath Lake Darlot located 50km southeast of Bronzewing Mine has been delayed due to aboriginal heritage issue. Although the tenure has been granted, three separate heritage surveys are required with three indigenous groups before drilling on the surface of the ephemeral salt lake can commence The project area is located 15km northwest of Barrick’s 2 million ounce Darlot gold mine. The principal controlling structure at the Darlot Gold Mine strikes north into NYOL’s ground and converges with a number of other region structures to form an interpreted zone of dilation and focus for mineralisation beneath Lake Darlot. It is anticipated that all three heritage surveys will be completed during the first half of 2003 and drilling on the lake will commence in the second half of 2003.
Jundee Area (North Yandal)
The northern section of the Yandal Belt, in particular the 200km2 Red Lake project area located 50km southeast of Jundee mine, holds some of the best remaining conceptual exploration potential in the Yandal Belt. Granting of tenure at Red Lake is expected in the first half of 2003 once a heritage protocol and land access agreement has been negotiated with the Wiluna Native Title Claimants and the Tjupan People (heritage survey scheduled for April 2003).
Exploration during 2002 focussed on the Tipperary Well prospect – a large (2 km2), gold anomalous (+0.2g/t Au), pervasive haematite-epidote alteration system located 60km south of Jundee. Exploration drilling was unsuccessful in delineating a focus for the metal-rich mineralizing fluids beyond a few, narrow, high-grade quartz veins which returned a best intercept of 1m @ 11g/t Au.
53
Item 5: Operating and Financial Review and Prospects
The following discussion uses financial data prepared in accordance with A-GAAP, which differ in certain significant respects from US GAAP. Refer to Note 37 to the audited consolidated financial statements for a description of the material differences between A-GAAP and US GAAP as they affect NYOL and a reconciliation to US GAAP of the net profit/(loss) and total equity for the periods and as of the dates presented therein. The reconciliation to US GAAP as of June 30, 2001 and for the year ended June 30, 2001 and the related narrative has been restated as management determined that certain errors had been made. As a result, for the year ended June 30, 2001, NYOL’s net loss in accordance with US GAAP was reduced from A$240.5 million to A$213.0 million and NYOL’s total deficit in accordance with US GAAP was reduced from A$290.7million to A$263.2 million. Refer to Note 38 to the audited consolidated financial statements for a discussion and quantification of the restatements.
Principal Differences Between A-GAAP and US-GAAP
NYOL’s consolidated financial statements are prepared in accordance with A-GAAP.
The net loss for the year ended June 30, 2002 under A-GAAP was A$488.1 million, compared to a loss of A$76.1 million for the year ended June 30, 2001 and A$253.8 million in 2000. Under US GAAP, NYOL would have reported a net loss of A$439.7 million for the year ended June 30, 2002, compared to a loss of A$212.9 million for the year ended June 30, 2001 and a loss of A$219.0 million for the year ended June 30, 2000.
The principal differences between A-GAAP and US GAAP that affect NYOL’s loss, as well as shareholder’s equity, relate to NYOL’s treatment of amortisation and depreciation, incurred exploration and evaluation, gold bullion, provision for mine completion costs, derivative financial instruments and hedging activities, borrowing costs, provision for redundancy and restructuring, asset revaluation, insurance claims, impairment of long lived assets, inventory, prepaid hedge fees, marketable securities, deferred taxes, functional currency.
See Note 37 to the consolidated financial statements included in Item 17 of this Form 20-F for a description of the principal differences between A-GAAP and US GAAP, and Note 36 for a description of the anticipated impact on the consolidated financial statements of the adoption of recently issued US GAAP accounting standards.
Critical Accounting Policies
NYOL’s significant accounting policies are more fully described in Note 1 to its audited consolidated financial statements, in respect of A-GAAP, with differences in accounting policies for US GAAP more fully described in Note 37 to the audited consolidated financial statements. Some of NYOL’s accounting policies require application of significant judgement by management in selecting the appropriate assumptions for calculating financial estimates. By their nature, these judgements are subject to an inherent degree of uncertainty and are based on NYOL’s historical experience, terms of existing contracts, and management’s view on trends in the mining industry and information from outside sources.
Management believes the most critical accounting policies, upon which NYOL’s financial status depends are those requiring estimates of proven and probable reserves, recoverable ounces therefrom, NYOL’s ability to renew mining leases upon which certain of those reserves are located, and/or assumptions of future gold prices. Such estimates and assumptions affect the value of inventories (which are stated at lower of cost or net realisable value), the potential impairment of long-lived assets and the ability to realise income tax benefits associated with deferred tax assets. These estimates and assumptions also affect NYOL’s profitability and cash flow. In addition, management estimates costs associated with reclamation of mining properties as well as remediation costs for inactive properties. On an ongoing basis, management evaluates its estimates and assumptions; however, actual amounts could differ from those based on such estimates and assumptions.
54
Recent Accounting Pronouncements
The Financial Accounting Standards Board has issued certain Statements of Financial Accounting Standards, which are not effective with respect to the 12-month periods presented in the combined financial statements.
SFAS No. 142 “Goodwill and Other Intangible Assets” which supersedes APB Opinion No. 17 was issued in June 2001 and is effective for the Group from January 1,2003. It addresses how goodwill and other intangible assets should be accounted for after they have been initially recognized in the financial statements. Amortization of goodwill ceases and is replaced by impairment tests. Identified intangibles need to be separately identified and recorded outside of goodwill, and amortised over their useful lives. As the Group does not have any goodwill or indefinite lived intangible assets, adoption of this standard will not have a significant impact on the Group’s financial position or results of operations.
SFAS No. 143 “Accounting for Asset Retirement Obligations” was issued in 2001. It will be effective for the Group from January 1, 2003. The statement requires an asset retirement obligation and a matching asset to be brought to account (calculated at a discounted present value) at the initial point the liability is incurred, generally when the mine is first commenced. The cost of the obligation is to be amortized over the life of a long-lived asset. Increases in the obligation as a result of the reduction of time are to be treated as interest. Upon adoption of this standard by NYOL the Group’s assets and liabilities will be increased by $5.2 million
In August 2001, the FASB issued SFAS No. 144, “Accounting for the Impairment or Disposal of Long-Lived Assets”. It will be effective for the Group from January 1, 2003. This statement supersedes SFAS No. 121 and the accounting and reporting provisions of APB Opinion No.30. This statement requires one accounting model to be used for long-lived assets to be held and used or disposed of by sale, whether previously held and used or newly acquired, and broadens the presentation of discontinued operations to include more disposal transactions. Upon adoption of this standard by the Group there will be no impact to the financial position and results from operations.
In April 2002, the FASB issued SFAS No. 145, “Rescission of FASB Statements No. 4, 44, and 64, Amendment of FASB Statement No.13, and Technical Corrections”. The standard rescinds FASB Statements No. 4 and 64 that deal with issues relating to the extinguishment of debt. The standard also rescinds FASB Statement No. 44 that deals with intangible assets of motor carriers. The standard modifies SFAS No.13, “Accounting for Leases”, so that certain capital lease modifications must be accounted for by lessees as sale-leaseback transactions. Additionally, the standard identifies amendments that should have been made to previously existing pronouncements and formally amends the appropriate pronouncements. SFAS No. 145 is effective for fiscal years beginning after May 15, 2002 with earlier adoption encouraged. The standard will be effective for the Group from July 1, 2002. Upon adoption of this standard by the Group there will be no impact to the financial position and results from operations.
In July 2002, the FASB issued SFAS No. 146, “Accounting for Costs Associated with Exit or Disposal Activities”. It will be effective for the Group from January 1, 2003. The statement requires that costs associated with exit or disposal activities must be recognized when they are incurred rather than at the date of a commitment to an exit or disposal plan. Such costs include lease termination costs and certain employee severance costs associated with a restructuring, discontinued operations or other exit or disposal activity. Upon adoption of this standard by the Group there will be no impact to the financial position and results from operations.
In November 2002, the FASB issued FASB Interpretation No. 45, “Guarantor’s Accounting and Disclosure Requirements for Guarantees, Including Indirect Guarantees of Indebtedness of Others”. It will be effective for the Group from January 1, 2003. This Interpretation elaborates on the disclosures to be made by a guarantor in its interim and annual financial statements about its obligations under certain guarantees that it has issued. It also clarifies that a guarantor is required to recognize, at the inception of a guarantee, a liability for the fair value of the obligation undertaken in issuing the guarantee. This Interpretation does not prescribe a specific approach for subsequently measuring the guarantor’s recognized liability over the term of the related guarantee. This Interpretation also incorporates, without change, the guidance in FASB
55
Interpretation No. 34, Disclosure of Indirect Guarantees of Indebtedness of Others, which is being superseded. Upon adoption of this standard by the Group there will be no impact to the financial position and results from operations.
In December 2002, the FASB issued SFAS 148 “Accounting for Stock based compensation “. This Statement amends FASB Statement No. 123, Accounting for Stock-Based Compensation, to provide alternative methods of transition for a voluntary change to the fair value based method of accounting for stock-based employee compensation. In addition, this Statement amends the disclosure requirements of Statement 123 to require prominent disclosures in both annual and interim financial statements about the method of accounting for stock-based employee compensation and the effect of the method used on reported results. The standard will be effective for the Group from January 1, 2003. The Group has no stock based compensation plans and therefore there will be no impact on the financial position and results from operations.
In January 2003, the FASB issued FASB Interpretation No. 46 “Consolidation of Variable Interest Entities” an interpretation of ARB No. 51. This interpretation of Accounting Research Bulletin No. 51 “Consolidated Financial Statements”,addresses consolidation by business enterprises of variable interest entities, which have one or both of the following characteristics:
| 1. | | The equity investment at risk is not sufficient to permit the entity to finance its activities without additional subordinated financial support from other parties, which is provided through other interests that will absorb some or all of the expected losses to the entity. |
| 2. | | The equity investors lack one or more of the following essential characteristics of a controlling financial interest: |
| | a) | | The direct or indirect ability to make decisions about the entity’s activities through voting rights or similar rights, |
| | b) | | The obligation to absorb the expected losses of the entity if they occur, which makes it possible for the entity to finance its activities, |
| | c) | | The right to receive the expected residual returns of the entity if they occur, which is the compensation for the risk of absorbing the expected losses. |
The objective of this Interpretation is not to restrict the use of variable interest entities but to improve financial reporting by enterprises involved with variable interest entities. The Company believes that if a business enterprise has a controlling financial interest in a variable interest entity, the assets, liabilities, and results of the activities of the variable interest entity should be included in consolidated financial statements with those of the business enterprise. The Interpretation applies immediately to variable interest entities after January 31, 2003, and to variable interest entities in which an enterprise obtains an interest after that date. It applies in the first fiscal year or interim period beginning after June 15, 2003, to variable interest entities in which an enterprise holds a variable interest that it acquired before February 1, 2003. The Company believes that the adoption of this interpretation will not have an impact on the financial statements of Newmont Yandal Operations.
The Australian Accounting Standards Board (“AASB”) has issued or revised certain Accounting Standards that are not effective for the fiscal periods reported upon in the combined financial statements.
AASB 1020, “Income Taxes” was issued in December 1999. It will be effective for Newmont Yandal Operations from January 1, 2005. Newmont Yandal Operations is currently assessing the impact of adopting this standard on its financial report.
AASB 1012 “Foreign Currency Translation” was revised in November 2000. It is effective for Newmont Yandal Operations from July 1, 2002. Adoption of this standard is not expected to have a significant impact on Newmont Yandal Operations’ financial position or results.
AASB 1028 “Employee Benefits” was revised in June 2001. It will be effective for Newmont Yandal Operations from July 1, 2002. Adoption of this standard is not expected to have a significant impact on Newmont Yandal Operations’ financial position or results.
56
AASB 1044 “Provisions, Contingent Liabilities and Contingent Assets” was issued in October 2001. It is effective for Newmont Yandal Operations from July 1, 2002. This standard was issued as a part of harmonization with International Accounting Standards. It largely codifies existing Australian practice, except that dividends must only be provided for when they are declared, determined or publicly recommended before balance date. A note disclosure will also be required for any contingent assets. Adoption of this standard is not expected to have a significant impact on Newmont Yandal Operations’ financial position or results.
57
Year Ended June 30, 2002 Compared to Year Ended June 30, 2001
Sales Revenue
Sales revenue decreased from A$416.5 million in the year ended June 30, 2001 to A$404.2 million in the year ended June 30, 2002. This decrease was primarily due to a decrease in gold sales from 785,607 ounces in the year ended June 30, 2001 to 749,412 ounces in the year ended June 30, 2002. The decrease in gold sales was driven by a decrease in gold production from 787,457 ounces in the year ended June 30, 2001 to 750,202 ounces in the year ended June 30, 2002. This decrease in sales revenue was partially offset by an increase in the average gold price received from A$530 per ounce in the year ended June 30, 2001 to A$539 per ounce in the year ended June 30, 2002.
Bronzewing’s gold production increased from 260,411 ounces in the year ended June 30, 2001 to 271,811 ounces in the year ended June 30, 2002. Jundee-Nimary’s gold production decreased from 411,140 ounces in the year ended June 30, 2001 to 355,403 ounces in the year ended June 30, 2002. Wiluna’s gold production increased from 115,906 ounces in the year ended June 30, 2001 to 122,988 in the year ended June 30, 2002.
Cost of Sales
Cost of sales increased from A$376.2 million in year ended June 30, 2001 to A$391.0 million in the year ended June 30, 2002. This increase was primarily due to higher average cash costs per ounce of gold produced, partially offset by lower depreciation charges in the year ended June 30, 2002. Average cash costs increased from A$295 per ounce in the year ended June 30, 2001 to A$349 per ounce in the year ended June 30, 2002 due mainly to increased maintenance costs at Bronzewing during the year ended June 30, 2002. The total cash costs per ounce is a measure intended to provide investor’s with information about the cash generating capacities of these mining operations. NYOL’s management uses this measure for the same purpose and for monitoring the performance of its mining operations. This information differs from measures of performance determined in accordance with A-GAAP and should not be considered in isolation or as a substitute for measures of performance determined in accordance with A-GAAP. This measure was developed in conjunction with gold mining companies associated with the Gold Institute, a non-profit industry group, in an effort to provide a level of comparability: however NYOL’s measures may not be comparable to similarly titled measures of other companies.
Production Cost Statement
Gold Institute Standard
For the Year Ended June 30, 2002
| | | A$’000
| |
Costs applicable to sales per financial statements | | 390,985 | |
Depreciation and amortisation | | (111,662 | ) |
Mine closure | | (7,494 | ) |
Prepayments written off | | (5,966 | ) |
Stores obsolescence | | (2,103 | ) |
Other | | (2,215 | ) |
| | |
|
|
Total cash costs for per ounce calculation | | 261,545 | |
| | |
|
|
58
Other revenue from ordinary activities
Other revenue from ordinary activities remained stable at A$5.1 million in the year ended June 30, 2001 compared to A$6.3 million in the year ended June 30, 2002.
Exploration and evaluation expenses
Exploration and evaluation expenditure of A$14.8 million for both June 30, 2002 and June 30, 2001 was expensed as incurred.
As part of recoverable amount estimates, previously capitalised exploration and evaluation of A$42.5 million was written off. Newmont Australia does not capitalise costs of regional exploration and evaluation attributable to areas not in production.
Administration expenses
Administration expenses decreased from A$9.1 million in the year ended June 30, 2001 to A$5.6 million in the year ended June 30, 2002, reflecting lower fees charged by Newmont Australia during the year ended June 30, 2002 in respect of the provision of management, technical and financial services to NYOL.
Borrowing costs
Interest expense remained stable at A$31.4 million in the year ended June 30, 2002 compared to A$30.8 million in the year ended June 30, 2002. Included in interest expense for the year ended June 30, 2002 was A$29.8 million pertaining to the Notes (2001: A$29.2 million).
Write off of non-current assets
Following the acquisition of NYOL’s parent entity, Newmont Australia Limited (formerly Normandy Mining Limited) by Newmont Mining Corporation in February 2002, revised life of mine plans have been developed by management which revised the forecasts of the amount and timing of future production. As a result of adoption of the revised plans, certain derivative contracts held by the Group were considered excess to the requirement to hedge future production. As a result of adoption of these plans, for the year ended June 30, 2002, net assets relating to the Jundee operation have been written down by A$54.2 million, the net assets relating to the Bronzewing operation have been written down by A$17.9 million and the net assets relating to the Wiluna operation have been written down by A$15.8 million. For the year ended June 30, 2001, non-current assets relating to the NYOL’s consolidated operations were written down by A$30.0 million.
Write off of prepaid mining costs
As a result of the revised life of mine plans as discussed above, prepaid mining costs relating to the Bronzewing, Jundee and Wiluna operations were written down by A$26.7 million, A$35.6 million and A$1.0 million respectively, for the year ended June 30, 2002. There was no write down of prepaid mining costs for the year ended June 30, 2001.
Other expenses from ordinary activities
Other expenses from ordinary activities decreased from A$59.9 million in the year ended June 30, 2001 to A$32.8 million in the year ended June 30, 2002. This is due to other expenses from ordinary activities for the year ended June 30, 2001, primarily comprising foreign exchange losses of A$45.9 million relating to the close out of unallocated exchange contracts and the revaluation of the US$300million Notes and an additional charge in the provision for mine site rehabilitation of A$14 million. However, for the year ended June 30, 2002, the foreign exchanges losses relating to the revaluation of the US$300 million Notes were A$23.9 million. Prepaid hedge fees of A$8.9 million were written off during the year ended June 30, 2002.
Derivative Losses
Derivative losses of A$222.8 million relating to the mark to market deficit of excess hedges being recognised during the year ended June 30, 2002, primarily as a result of hedge positions exceeding sales forecasts.
59
Provision for income tax
NYOL was not required to pay Australian income tax for the year ended June 30, 2002 or the year ended June 30, 2001 due to taxable losses. The income tax expense attributable to the operating loss for the year ended June 30, 2002 was A$6.5 million (2001: A$23.1 million, income tax benefit).
Net loss
As a result of the foregoing, NYOL had a net loss of A$488.1 million for the year ended June 30, 2002 compared to a net loss of A$76.1 million for the year ended June 30, 2001.
Impact of Gold hedging on operating results
749,412 ounces of gold were sold in the year ended June 30, 2002 at an average price of A$539 per ounce compared to the average spot price for that year of A$550 per ounce, resulting in a hedge loss of A$8.2 million.
785,607 ounces were sold in the year ended June 30, 2001 at an average price of A$530 per ounce compared to the average spot price for that year of A$502 per ounce, resulting in a hedge gain of A$22.0 million.
Assets
Current Receivables
Receivables decreased from A$26.3 million as at June 30, 2001 to A$10.5 million at June 30, 2002. This decrease was primarily due to the timing of gold sales at June 30, 2002.
Other Assets
Other assets decreased from A$67.4 million as at June 30, 2001 to A$11.6 million as at June 30, 2002. As discussed above this decrease was primarily due to prepaid mining costs being written off during the year ended June 30, 2002.
Exploration and evaluation expenditure
Capitalised exploration and evaluation expenditure decreased from A$42.5 million as at June 30, 2001 to nil for the year ended June 30,2002, as a result of all previously capitalised exploration interests being written off during the year ended June 30, 2002.
Property, plant and equipment
Property, plant and equipment decreased from A$449.5 million for the year ended June 30, 2001 to A$289.2 million for the year ended June 30, 2002 as a result of property, plant and equipment being written off during the year ended June 30, 2002.
Liabilities
Payables
Payables as at June 30, 2002 decreased from A$73.7 million as at June 30, 2001 to A$45.5 million as at June 30, 2002 primarily due to the timing of payments to contractors at the operations.
Provisions
Total provisions as at June 30, 2002 decreased from A$74.0 million as at June 30, 2001 to A$62.0 million as at June 30, 2002. Primarily due to previously capitalised foreign exchange losses, relating to unallocated foreign exchange contracts that were settled during the year ended June 30,2002.
60
Interest Bearing Liabilities
Interest bearing liabilities as at June 30, 2002 increased from A$511.2 million as at June 30, 2001 to A$533.6 million at June 30, 2002 primarily due the changes in the exchange rate between the AUD and the USD as the US$300 million Notes are denominated in US dollars.
Other
Other liabilities as at June 30, 2002 increased from nil as at June 30, 2001 to A$222.8 million as at June 30, 2002 due to a provision for the mark to market value of NYOL’s excess hedging being raised during the year ended June 30, 2002.
Accumulated losses
As a result of the foregoing, NYOL’s accumulated losses of A$758.0 million for the year ended June 30, 2002 compared to accumulated losses of A$269.9 million for the year ended June 30, 2001.
Year Ended June 30, 2001 Compared to Year Ended June 30, 2000
Sales Revenue
Sales revenue increased from A$395.8 million in the year ended June 30, 2000 to A$416.5 million in the year ended June 30, 2001. This increase was primarily due to an increase in gold sales from 732,411 ounces in the year ended June 30, 2000 to 785,607 ounces in the year ended June 30, 2001. The increase in gold sales was driven by an increase in gold production from 732,350 ounces in the year ended June 30, 2000 to 787,457 ounces in the year ended June 30, 2001. The increase in sales revenue was partially offset by a decrease in the average gold price received from A$540 per ounce in the year ended June 30, 2000 to A$530 per ounce in the year ended June 30, 2001.
Bronzewing’s gold production increased from 250,933 ounces in the year ended June 30, 2000 to 260,411 ounces in the year ended June 30, 2001. Jundee-Nimary’s gold production increased from 358,100 ounces in the year ended June 30, 2000 to 411,140 ounces in the year ended June 30, 2001. Wiluna’s gold production decreased from 123,317 ounces in the year ended June 30, 2000 to 115,906 in the year ended June 30, 2001.
Cost of Sales
Cost of sales increased from A$308.9 million in year ended June 30, 2000 to A$376.2 million in year ended June 30, 2001. This increase was primarily due to a higher depreciation and amortisation charge in the year ended June 30, 2001 due to an increase in depreciation rates to bring NYOL’s accounting policies in line with those of Normandy from April 2000.
Average cash costs per ounce of gold produced decreased from A$311 per ounce in the year ended June 30, 2000 to A$295 per ounce in the year ended June 30, 2001. This was primarily due to production difficulties at Bronzewing during the year ended June 30, 2000 resulting from reduced mill feed following the Discovery Shoot crown pillar failure in the first half of the year and a successful year at Jundee-Nimary in the year ended June 30, 2001.
Other revenue from ordinary activities
Other revenue from ordinary activities decreased from A$10.3 million in the year ended June 30, 2000 to A$5.1 million in the year ended June 30, 2001. The change resulted from the following: interest income decreased from A$2.8 million in the year ended June 30, 2000 to A$2.5 million in the year ended June 30, 2001, proceeds on sale of plant and equipment decreased from A$3.4 million in the year ended June 30, 2000 to A$1.0 million in the year ended June 30, 2001, proceeds on sale of investments increased to A$1.6 million in the year ended June 30, 2001 (2000: nil) and proceeds on sale of controlled entities were nil in the year ended June 30, 2001 compared to A$4.1 million in the year ended June 30, 2000.
61
Exploration and evaluation expenses
In accordance with A-GAAP, a review is performed biannually of exploration and evaluation expenditure carried forward. As a result of this review exploration and evaluation expenditure expensed in the year ended June 30, 2000 was A$13.4 million compared to A$14.8 million in the year ended June 30, 2001.
In the year ended June 30, 2000, previously capitalised exploration and evaluation of A$195.9 million was written off. This was done to align NYOL’s accounting policies with those of Normandy as a result of the acquisition by Normandy in April 2000. Normandy does not capitalise costs of regional exploration and evaluation attributable to areas not in production.
Administration expenses
Administration expenses decreased from A$11.3 million in the year ended June 30, 2000 to A$9.1 million in the year ended June 30, 2001, reflecting lower fees charged by Normandy during the year ended June 30, 2001 in respect of the provision of management, technical and financial services to NYOL. These services were previously provided by AWI Administration Services Pty Ltd up to April 2000, when Normandy completed acquisition of 100% of NYOL.
Borrowing costs
Interest expense decreased from A$33.3 million in the year ended June 30, 2000 to A$30.8 million in the year ended June 30, 2001. Included in interest expense for the year ended June 30, 2001 A$29.2 million pertaining to the Notes (2000: A$30.7 million).
Write off of non-current assets
As part of recoverable amount estimates, mine properties were written down by A$30.0 million, in the year ended June 30, 2001 compared to A$107.5 million in the year ended June 30, 2000.
The decrease can be explained primarily by the decision to align NYOL’s accounting policies with those of Normandy in the year ended June 30, 2000.
Other expenses from ordinary activities
Other expenses from ordinary activities increased from A$56.3 million in the year ended June 30, 2000 to A$59.9 million in the year ended June 30, 2001. For the year ended June 30, 2001, other expenses are primarily comprised of foreign exchange losses of A$45.9 million (2000: A$24.7 million) relating to the closeout of unallocated foreign exchange contracts and the revaluation of the US$300 million Notes and an additional increase in the provision for mine site rehabilitation of A$14.0 million (2000: A$22.7 million).
Provision for Income tax
NYOL was not required to pay Australian income tax for the year ended June 30, 2001 or the year ended June 30, 2000 due to taxable losses. The income tax benefit attributable to the operating loss for the year ended June 30, 2001 was A$23.1 million (2000: A$66.8 million).
Net loss
As a result of the foregoing, NYOL made a net loss of A$76.1 million for the year ended June 30, 2001 compared to a net loss of A$253.8 million for the year ended June 30, 2000.
Impact of Gold hedging on operating results
785,607 ounces were sold in the year ended June 30, 2001 at an average price of A$530 per ounce compared to the average spot price for the year of A$502 per ounce, resulting in a hedge gain of A$22.0 million.
732,411 ounces were sold in the year ended June 30, 2000 at an average price of A$540 per ounce compared to the average spot price for the year of A$448 per ounce resulting in a hedge gain of A$67.3 million.
62
| 5B. | | Liquidity and capital resources |
Year Ended June 30, 2002 Compared to Year Ended June 30, 2001
Operating activities
For the year ended June 30, 2002, net cash provided from operating activities was A$57.9 million (2001: A$134.5 million). The decrease was primarily driven by the decrease in gold production from 787,457 ounces in the year ended June 30, 2001 to 750,202 ounces in the year ended June 30, 2002, and the increased cash cost of production per ounce produced from A$295 in the year ended June 30, 2001 to A$349 per ounce in the year ended June 30, 2002. This was partially offset by an increase in the average gold price received from A$530 per ounce in the year ended June 30, 2001 to A$539 per ounce in the year ended June 30, 2002.
Investing activities
For the year ended June 30, 2002, the net cash outflow from investing activities was A$54.6 million (2001: A$38.1 million). The increase was primarily driven by there being no receipt of a refund of the security deposit on bank guarantees in the year ended June 30, 2002, which occurred in the year ended June 30, 2001, of A$15.9 million. Capital expenditure on property, plant and equipment remained stable in the year ended June 30, 2002 of A$41.1 million compared to A$40.7 million in the year ended June 30, 2001.
Financing activities
For the year ended June 30, 2002, the net cash outflow from financing activities was A$1.5 million (2001: A$1.2 million).
Liquidity
The Group’s cash and cash equivalents increased from A$104.7 million at June 30, 2001 to A$106.5 million at June 30, 2002.
In April 1998, Newmont Yandal Operations Limited issued US$300 million (A$456 million) in 8.875% ten year senior unsecured notes issue in the US Capital Markets (the “Notes”). This allowed the Group to re-finance a majority of its short-term debt into a long-term facility. Interest on the Notes is paid semi-annually in arrears. Certain financial instruments were entered into whereby the Company agreed to exchange US dollar fixed interest amounts payable with a gold interest rate exposure. Of the total A$300 million, US$183.6 million was swapped into a gold commodity contract, of which half was fixed at 3.87% and half was floating and subject to an indexation component. The mark to market value of the principle component of the gold commodity obligation was negative A$53.9 million as at June 30, 2002 and negative A$53.4 million as at December 31, 2002. Refer to Item 11 “Quantitative and Qualitative disclosures about market risk – Gold price risk management activities” The mark to market value of the interest rate component of the gold commodity obligation and indexation arrangement was negative A$48.0 million as at June 30, 2002 and negative A$100.9 million as at December 31, 2002. Refer to Item 11 “Quantitative and Qualitative disclosures about market risk – Interest rate risk management.
The Notes, amongst other things place requirements and/or limitations on:
| • | | indebtedness of the Group subject to an earnings before tax, depreciation and amortisation ratio; |
| • | | certain payments, including payments for investments in particular circumstances and dividend distribution; |
| • | | distributions from certain controlled entities; |
| • | | the sale of assets or sale and lease-back transactions in certain circumstances; |
| • | | transactions with affiliates; |
| • | | the sale of shares in certain controlled entities, and charges and liens that can be created over assets; |
| • | | Newmont Yandal Operations Limited maintaining 100% equity in certain of its controlled entities. |
63
As at June 30, 2002, the Group has certain obligations to perform A$16 million of exploration work and expend minimum amounts of money in order to maintain rights to tenure over mining and exploration tenements (2001: A$19.0 million). Other commitments included $1.0 million of finance lease obligations (2001: A$2.6 million).
Details of the financing of NYOL are as follows:
| | | Available at June 30,
| | Used at June 30,
| | Unused at June 30,
|
| | | 2002 | | 2001 | | 2002 | | 2001 | | 2002 | | 2001 |
| | | A$’000
| | A$’000
| | A$’000
| | A$’000
| | A$’000
| | A$’000
|
Unsecured US dollar notes | | 532,707 | | 508,719 | | 532,707 | | 508,719 | | — | | — |
Finance lease facility | | 945 | | 2,551 | | 945 | | 2,551 | | — | | — |
NYOL’s capital structure is highly leveraged. As at June 30,2002 the consolidated financial statements reflect negative shareholders funds of A$399.5 million. Moreover, at June 30, 2002, in addition to A$222.8 million of liabilities in respect of the Company’s hedge positions included on the Company’s balance sheet, off-balance sheet obligations in respect of effective hedge positions totalled A$241.7 million. Refer to Item 11 “Quantitative and qualitative disclosures about market risk”.
Management is aware of the need to ensure that the Company has sufficient funds to meet its financial obligations as and when they fall due. It continues to consider various means by which it can fund its financial obligations and exploration expenditures over the long term. Management considers that in all likelihood, the Company will require further significant funding, however it also considers that due to the Company’s highly leveraged capital structure and credit ratings (Moody’s Investors Service “Ba2” and Standard & Poor’s “B-”), the ability to raise funds from external sources at reasonable cost and terms, is severely limited. Current cash flow forecasts indicate that NYOL will have positive cash balances for at least the next 12 months.
Management also believes that there are a number of good conceptual exploration targets that have been identified around existing processing facilities, which together with other targets are expected to assist in meeting the company’s financial obligations.
On April 3, 2003, Newmont Mining Corporation agreed to advance up to US$10 million to enable the Group to pay certain ordinary course debts incurred on and after that date. Newmont Mining Corporation’s obligation to advance funds is subject to several conditions. No advance may be applied to meet any obligations or liabilities of any Group company to counter-parties to hedging contracts entered into by the Company, or to holders of the Notes issued by the Company or to any other persons whose debts or obligations were created prior to April 3, 2003.
Newmont Mining Corporation can terminate unilaterally the agreement on 30-days advance notice. As of the date of this report, no advance has been requested by the Group or made by Newmont Mining Corporation. Refer to Item 7B “Related party transactions”.
Credit Ratings
On March 3, 2003, Standard & Poor’s announced that it had lowered NYOL’s corporate credit rating and the rating on NYOL’s US$300,000,000 8 7/8% Senior Notes due April 2008 from BBB to BB-, Standard & Poor’s also announced that it had revised its outlook on the Company from stable to negative.
On April 1, 2003, Standard & Poor’s lowered it’s long-term rating on the Company from BB- to B- and affirmed its continued outlook on the Company. According to Standard & Poor’s: “An obligation rated ‘B’ I is more vulnerable to non payment than obligations rated BB-, but the obligor currently has the capacity to meet its financial commitment on the obligation. Adverse business, financial, or economic conditions will likely impair the obligor’s capacity or willingness to meet its financial commitment on the obligation.” In addition, according to Standard & Poor’s a minus or “-” shows relative standing within a ratings category and a negative outlook means that the current rating may be lowered. Standard & Poor’s indicated
64
that its action was based on concern over the Company’s future liquidity position in June 2004 if hedge counter parties exercise their rights to break existing contracts. The Company’s US$300, 000,000 8 7/8% Senior Notes due April 2008 and hedge book obligations rankpari passu in liquidation and are nonrecourse to the Company’s ultimate parent entity, Newmont Mining Corporation.
Moody’s Investor Services’ rating on the Senior Notes is Ba2. According to Moody’s bonds that are rated “Ba2” are judged to have speculative elements and their future cannot be considered well assured and the numerical modifier “2” indicates a mid-range ranking. On March 28, 2003, Moody’s revised its review direction for the Company to a review for possible downgrade. Moody’s indicated that the change to review for possible downgrade reflected Moody’s concern that the Senior Notes will remain an unsupported legal obligation of the Company, dependent upon its financial strength and cash flow generating ability. Additionally, Moody’s indicated that it was concerned with the Company’s limited proven reserve position relative to its debt maturities and hedge book position. Further factors of concern identified by Moody’s included the degree of the Company’s leverage, the negative mark to market position of the hedge book and the early termination dates under various hedge contracts, giving counter parties the right to break.
Off Balance Sheet Arrangements
Commodity forward sale contracts, foreign exchange contracts, options and swaps have been valued at the mark-to-market gain or loss, which would arise if the contract were terminated at balance date. Refer to Item 11 “Quantitative and qualitative disclosures about market risk” and Note 28 “Financial Instruments” to the audited consolidated financial statements for a description of the Group’s off balance sheet arrangements.
Contractual Obligations and Commercial Commitments
The following table discloses aggregate information about our contractual obligations as at June 30, 2002, and the periods in which payments are due:
| | | | | | | Payments Due by Period
|
Contractual Obligations, A$’000
| | Total
| | Less than 1 year
| | 1-2 years
| | 2-5 years
| | After 5 years
|
US dollar Senior Notes | | 532.7 | | — | | — | | 532.7 | | — |
|
Operating leases | | 3.4 | | 2.0 | | — | | 1.4 | | — |
|
Finance leases | | 1.0 | | 0.6 | | — | | 0.4 | | — |
|
Exploration and mineral leases | | 80.9 | | 16.0 | | — | | 64.9 | | — |
|
Purchase obligations regarding fixed assets | | 20.4 | | 20.4 | | — | | — | | — |
|
Commodity contracts | | 416.5 | | 38.4 | | — | | 158.1 | | 45.0 |
| | |
| |
| |
| |
| |
|
|
Total contractual cash obligations | | 1054.9 | | 77.4 | | — | | 757.5 | | 45.0 |
| | |
| |
| |
| |
| |
|
Guarantees
At June 30, 2002, NYOL had a bank indemnity guarantee facility under which bank guarantees totaling A$16.2 million (2001: A$16.0 million) to mining departments in respect of performance bonds were outstanding.
65
The Group had no other material contingent liabilities as at June 30, 2002.
Funding and treasury policies
For discussion on the funding and treasury policies of the Group, see “Item 11: Quantitative and qualitative disclosures about market risk – Gold price risk management activities”.
Year Ended June 30, 2001 Compared to Year Ended June 30, 2000
Operating activities
For the year ended June 30, 2001, net cash provided from operating activities was A$134.5 million (2000: A$119.5 million). The increase was primarily driven by the increase in gold production from 732,350 ounces in the year ended June 30, 2000 to 787,457 ounces in the year ended June 30, 2001, partially offset by a decrease in the average gold price received from A$540 per ounce in the year ended June 30, 2000 to A$530 per ounce in the year ended June 30, 2001.
Investing activities
For the year ended June 30, 2001, the net cash outflow from investing activities was A$38.1 million (2000: A$90.2 million). The decrease was due to reduced capital expenditure on property, plant and equipment in the year ended June 30, 2001 of A$40.7 million compared to A$65.4 million in the year ended June 30, 2000, reduced exploration expenditure in the year ended June 30, 2001 of A$15.9 million compared to A$28.2 million in the year ended June 30, 2000, and the refund of security deposits on bank guarantees of A$15.9 million in the year ended June 30, 2001. The decrease was partially offset by proceeds on the sale of controlled entities of A$4.1 million in the year ended June 30, 2000 (2001: nil).
Financing activities
For the year ended June 30, 2001, the net cash outflow from financing activities was A$1.2 million (2000: A$61.7 million). The reduction reflects borrowings repayments of A$51.9 million in the year ended June 30, 2000 compared to A$1.2 million in the year ended June 30, 2001 and no dividends being paid in the year ended June 30, 2001 compared to a dividend of A$9.3 million in the year ended June 30, 2000.
Liquidity
The Group’s cash and cash equivalents increased from A$9.5 million at June 30, 2000 to A$104.7 million at June 30, 2001.
In April 1998, Newmont Yandal Operations Limited issued Notes. Interest on the Notes is paid semi-annually in arrears. Certain financial instruments were entered into whereby Newmont Yandal Operations Limited has agreed to exchange US dollar fixed interest amounts payable with a gold interest rate exposure. Of the total, US$183.6 million has been swapped into a gold interest rate exposure, of which half is fixed at 3.87% and half is floating. The floating rate at June 30, 2001 was 2.07% (2000: 1.49%).
The Notes, amongst other things place requirements and/or limitations on:
| • | | indebtedness of the Group subject to an earnings before tax, depreciation and amortisation ratio; |
| • | | certain payments, including payments for investments in particular circumstances and dividend distribution; |
| • | | distribution from certain controlled entities; |
| • | | the sale of assets or sale and lease-back transactions in certain circumstances; |
| • | | transactions with affiliates; |
| • | | the sale of shares in certain controlled entities, and charges and liens that can be created over assets; |
| • | | Newmont Yandal Operations Limited maintaining 100% equity in certain of its controlled entities. |
As at June 30, 2001, the Group has certain obligations to perform A$51.9 million of exploration work and expend minimum amounts of money in order to maintain rights to tenure over mining and exploration
66
tenements (2000: A$129.3 million). Other commitments included $2.6 million of finance lease obligations (2000: A$3.8 million).
Details of the financing of NYOL are as follows:
| | | Available at June 30,
| | Used at June 30,
| | Unused at June 30,
|
| | | 2001 | | 2000 | | 2001 | | 2000 | | 2001 | | 2000 |
| | | A$’000
| | A$’000
| | A$’000
| | A$’000
| | A$’000
| | A$’000
|
Unsecured US dollar notes | | 508,719 | | 472,715 | | 508,719 | | 472,715 | | — | | — |
Revolving corporate facilities | | — | | 25,000 | | — | | — | | — | | 25,000 |
Finance lease facility | | 2,551 | | 3,795 | | 2,551 | | 3,795 | | — | | — |
The management of NYOL considers that the Group has sufficient working capital to meet its’ present requirements.
Funding and treasury policies
For discussion on the funding and treasury policies of the Group, see “Item 11: Quantitative and qualitative disclosures about market risk – Gold price risk management activities”.
| 5C. | | R&D, patents & licenses, etc. |
The focus of NYOL’s research and development activities is the continual improvement of mining techniques, metallurgical processes and engineering systems with the objectives of improving operational efficiency and promoting a safer working environment for all people at NYOL’s operations.
Project expenditures qualifying for Australian Research and Development tax concessions were:
Year ended June 30, 2000 | | A$2.7 million |
Year ended June 30, 2001 | | A$7.1 million |
Year ended June 30, 2002 | | A$13.8 million |
The above figures only apply to those expenditures on which the Group has applied for tax concessions. Additional research and development expenditure is incurred in our site operating costs due to the continuous improvement philosophy of NYOL.
Production
NYOL’s gold production over the last five years has been as follows:
| | | Year ended June 30,
|
| | | 2002
| | 2001
| | 2000
| | 1999
| | 1998
|
| | | (in ounces) |
Bronzewing (1) | | 271,811 | | 260,411 | | 250,933 | | 272,608 | | 272,524 |
Jundee-Nimary (2) | | 355,403 | | 411,140 | | 358,100 | | 371,041 | | 293,016 |
Wiluna (3)(4) | | 122,988 | | 115,906 | | 123,317 | | 139,534 | | 85,380 |
| | |
| |
| |
| |
| |
|
Total | | 750,202 | | 787,457 | | 732,350 | | 783,183 | | 650,920 |
| | |
| |
| |
| |
| |
|
| (1) | | Bronzewing commenced production in late November 1994. |
| (2) | | Jundee-Nimary commenced production in late December 1995. |
| (3) | | Includes production from the leaching treatment of low grade stockpiles at the Wiluna mine. |
| (4) | | This table provides production information between 1998 and 2002. NYOL acquired interests in the Nimary and Wiluna Gold Operations from October 1, 1997 and November 1, 1997 respectively. |
The Bronzewing and Wiluna gold operations are anticipated to process all currently known reserves by the end of 2003 or early 2004. In the absence of a new discovery that could promptly be put into production to
67
sustain the operations, NYOL’s gold production commencing in calender year 2004 will be substantially reduced.
For the six months ended December 31, 2002, NYOL recorded gold production of 338,533 ounces at a total cash cost of A$376 per ounce.
Sales
NYOL’s product sales over the last five years have been as follows:
Year ended June 30,
| | Sales revenue, A$ (in thousands)
|
1998 | | 376,061 |
1999 | | 440,160 |
2000 | | 395,805 |
2001 | | 416,481 |
2002 | | 404,226 |
For the six months ended December 31, 2002, NYOL recorded sales revenue of A$187.2 million reflecting 336,926 ounces of gold at an average realised price of A$526 per ounce.
Inventory
NYOL’s inventories over the last five years have been as follows:
As at June 30,
| | Inventories, A$ (in thousands)
|
1998 | | 55,634 |
1999 | | 58,232 |
2000 | | 19,459 |
2001 | | 28,117 |
2002 | | 28,683 |
Outlook
NYOL has a commitment to an extensive exploration program. The objective of this program is the identification of new low cost reserves.
68
Item 6: Directors, senior management and employees
| 6A. | | Directors and senior management |
Directors
The Company’s Board of Directors consists of five executive members.
Name
| | Age
| | | | | | | | Position held
| | Year first appointed
|
Britt B Banks | | 41 | | | | | | | | Executive Director | | 2002 |
John AS Dow | | 56 | | | | | | | | Executive Director | | 2002 |
David H Francisco | | 53 | | | | | | | | Executive Director | | 2002 |
Bruce D Hansen | | 45 | | | | | | | | Executive Director | | 2002 |
Kenneth G Williams | | 42 | | | | | | | | Executive Director | | 2000 |
Mr Britt D Banks
Mr Banks is a lawyer and a member of the Colorado State Bar. He was elected Vice President and General Counsel of Newmont Mining Corporation in May 2001. He joined Newmont Mining Corporation in 1993 after four years in general practice and a period serving as law clerk to the Hon.Oliver Seth, US Court of Appeals for the Tenth Circuit.
Mr John AS Dow
Mr Dow is a geologist with 24 years international experience with Newmont Mining Corporation. He was appointed Managing Director of Newmont Australia March 2002, having previously served as Executive Vice President and Group Executive for Latin America. Prior to that he served as Senior Vice President of Exploration with responsibility for Newmont Mining Corporation’s worldwide exploration program, after many years in senior roles directing Newmont Mining Corporation’s exploration activities in Southeast Asia and Australia.
Mr David H Francisco
Mr Francisco holds a bachelor’s degree in geological engineering. He was elected Executive Vice President Operations of Newmont Mining Corporation in July 1999 after having served as Senior Vice President International Operations since May 1997. He joined Newmont Mining Corporation in July 1995 after seven years with P.T. Freeport Indonesia where he ultimately served as Executive Vice President and General Manager.
Mr Bruce D Hansen
Mr Hansen is a mining engineer and holds a Masters’s degree in Business Administration. He was elected Senior Vice President and Chief Financial Officer of Newmont Mining Corporation in July 1999. He joined Newmont Mining Corporation as Vice President Project Development in May 1997, having previously served as Senior Vice President Corporate Development for Santa Fe Pacific Gold Corporation.
Mr Kenneth G Williams
B Ec (Hons), MApp. Fin, MAICD, CFTP
Mr Williams joined Normandy Mining Limited in January 1999 as Executive General Manager Treasury. He was appointed as Group Executive – Finance and Business Administration of Newmont Australia in 2002 after serving as Chief Financial Officer of the Normandy Mining Group since February 2001. His career includes 13 years experience in the Treasury department of several major public companies including Qantas Airways Limited and RGC Limited, and several years in the Commonwealth Treasury, Canberra. He is a Member of the Australian Institute of Company Directors and the Australian Finance and Treasury Association.
69
Group executives
The Group’s key executives are as follows:
Name
| | Age
| | Position
|
John AS Dow | | 56 | | Group Executive |
Hans Umlauff | | 51 | | Group Executive – Operations and Development |
Kenneth G Williams | | 42 | | Group Executive – Finance and Business Administration |
Mr John AS Dow
Mr Dow is a geologist with 24 years international experience with Newmont Mining Corporation. He was appointed Managing Director of Newmont Australian March 2002, having previously served as Executive Vice President and Group Executive for Latin America and is a member of the Group Executive. Prior to that he served as Senior Vice President of Exploration with responsibility for Newmont Mining Corporation’s worldwide exploration program, after many years in senior roles directing Newmont Mining Corporation’s exploration activities Southeast Asia and Australia.
Mr H Umlauff
Mr Umlauff, has been with Normandy Mining Limited, now Newmont Australia for two and a half years, and is a member of the Group Executive, which is responsible for developing and implementing the strategy to achieve Newmont Australia’s objectives. He is a Mechanical Engineer with more than 25 years experience in design, construction, maintenance, manufacturing, project management and operations in the steel, petroleum and minerals industries. He gained considerable international experience in his previous role as Vice President Project Management at BHP. He is a Director of Newmont NFM Limited, Otter Gold Mining Limited and Australian Magnesium Corporation (AMC).
Mr Kenneth G Williams
B Ec (Hons), MApp. Fin, MAICD, CFTP
Mr Williams joined Normandy Mining Limited in January 1999 as Executive General Manager Treasury. He was appointed as Group Executive – Finance and Business Administration of Newmont Australia in 2002 after serving as Chief Financial Officer of the Normandy Mining Group since February 2001. His career includes 13 years experience in the Treasury department of several major public companies including Qantas Airways Limited and RGC Limited, and several years in the Commonwealth Treasury, Canberra. He is a Member of the Australian Institute of Company Directors and the Australian Finance and Treasury Association.
70
No officers of Newmont Yandal Operations Limited receive any emoluments from the Company or its controlled entities. Executive Directors and Executive Officers of the Company receive emoluments from a controlled entity of Newmont Australia.
Pursuant to the Company’s Constitution, the Board of Directors staggers the terms of its members by retiring approximately one-third of the directors each year. Such directors are, however, eligible for reappointment at such time. The Company Constitution provides that the Board may appoint from time to time one or more of the Directors to be the Managing Director. The Constitution further provides that should such an appointment be made, it can be either for a fixed time (but not for life) or non-fixed term.
Committees
Newmont Yandal Operations Limited maintains a Board of Directors, and a Hedging Committee. The Hedging Committee is responsible for ensuring NYOL’s hedging activities are in accordance with the Company’s policy and advises the Board of the status of the hedge book.
As of June 30, 2002, the Group had 424 employees. Of these employees, 193 were employed at Bronzewing, 135 at Jundee-Nimary and 96 at Wiluna. A total of 10 employees are engaged in exploration of the Yandal region and a total of 8 employees are involved in administrative functions. NYOL believes that its relations with employees are good and has not experienced any industrial disputes or strikes at its gold operations. A majority of mining operations are conducted by third party contractors who have a number of employees; some of whom NYOL believes have union affiliations.
Employees at the mining operations together with the exploration group are employed on a fly in/out roster system from Perth with most contractors and staff working a two week on, one week off roster. NYOL’s staff are based in Western Australia and South Australia principally at the Group’s operational sites.
NYOL is committed to promoting and providing employees with a safe and healthy work environment. NYOL aims to exceed legislative requirements as a minimum standard through its programmes of instruction, employee participation, rigorous procedures and thorough incident investigation.
The Group provides employees with support structures and facilities, which encourage and promote a harmonious and comfortable environment during non-working hours. Mine sites are equipped with excellent accommodation, messing and recreational facilities. The primary focus is on a healthy lifestyle where a wide range of passive and active recreational options are available.
NYOL is intensifying its commitment to health and safety performance as an integral part of the business. The Group is focused on:
| • | | maintaining a system of safe work practices; |
| • | | maintaining a pro-active approach to control and management approach to control and management of hazards; |
| • | | developing and improving management and performance standards; and |
| • | | implementing a common reporting and safety management system to ensure timely capture, analysis and dissemination of information. |
71
Newmont Yandal Operations Limited is a wholly owned subsidiary of the Newmont Australia Limited group. The Directors of Newmont Yandal Operations Limited do not have any shareholdings in the company or any of its subsidiaries.
Item 7: Major Shareholders and Related Party Transactions
At June 30, 2002, Newmont Yandal Operations Limited had 308,960,662 ordinary shares on issue, all of which were held by the Newmont Australia Limited group, which is 100 per cent owned by Newmont Mining Corporation. All shares have the same voting rights.
The subsidiaries of Newmont Australia that hold shares in the Company are as follows:
Company
| | No. of shares held
| | Percentage held
|
Yandal Gold Holdings Pty Ltd | | 184,251,951 | | 59.63 |
Newmont Mining Holdings Pty Ltd | | 85,912,369 | | 27.81 |
Newmont Operations Pty Ltd | | 38,796,342 | | 12.56 |
All the major shareholders listed above are incorporated and have their principal office in Australia.
| 7B. | | Related Party Transactions |
During the year NYOL received management, technical and financial services from other companies in the Newmont Australia Group. The Newmont Australia Group employs a core of executives who specialise in the areas of exploration, mining, metallurgy, finance, corporate, environment, safety, and information technology. The objective is to provide individual member entities with access to these skills. The management fee incurred for this service for the year ended June 30, 2002 was A$4,021,000 (2001: A$7,991,000). The management fee incurred for this service for the six months ended December 31, 2002 was A$3,003,000.
Newmont Australia has established a shared services group and charges a fee to the various entities in the Newmont Australia Limited group for the use of the service. Under this arrangement Newmont Mining Services Pty Ltd arranges for the provision of shared services to on behalf of the various entities in the Newmont Australia Limited group and recovers the cost of the shared services from the respective entity. Effective July 1, 2001 NYOL group became part of this arrangement and the fee charged for this service was A$1,741,000, for the year ended June 30, 2002.
In October 2002, the day to day management of NYOL’s treasury operations (including the management of the derivative financial instruments) were transferred from Newmont Australia Limited to Newmont Mining Corporation in Denver. Newmont Australia Limited pays fees to Newmont Mining Corporation for the management services provided by Newmont Mining Corporation. This day to day management is subject to the supervision of the Company’s Board of Directors and Hedging Committee.
On February 4, 2003, NAL signed a Heads of Agreement with AuDAX Resources Ltd, for an option to form joint ventures over a portion of the Bronzewing South Exploration Licence. The parties have also discussed preliminary terms of a toll treatment agreement with NYOL in relation to the Bronzewing mine.
On April 3, 2003,Newmont Mining Corporation agreed to advance up to US$10 million for the sole purpose of enabling the Group to pay debts incurred by the Group on and after April 3, 2003 for services rendered, goods bought, or property hired, leased, used or occupied, in the ordinary course of the Group’s business and which, but for the agreement, the Group or any Group company would otherwise be unable to pay. Newmont Mining Corporation’s obligation to advance funds is subject to several conditions, including the condition that no default or event of default would result from the making of any such advance under any agreement to which any Group company is a party and that no advances made be applied or be available to meet any obligations or liabilities of any Group company to counter-parties to
72
hedging contracts entered into by the Company, or to holders of the Notes issued by the Company or to any other persons whose debts or obligations were created prior to April 3, 2003.
Newmont Mining Corporation can terminate unilaterally the agreement on 30-days advance notice. Newmont Mining Corporation agreed that any advances made by it to any Group company would be subordinated to other debts and financial obligations of the Group company taking the advance and would not be repayable by that Group company until 18 months from the date of the advance (the “repayment date”), unless the repayment date is extended prior to the repayment date by written agreement. If, however, any Group company becomes an“externally administered body corporate” as that phrase is defined in theCorporations Act2001, the advances will no longer be available and any amounts previously advanced by Newmont Mining Corporation to any Group company shall be immediately repayable. As of the date of this report, no advance has been requested by the Group or made by Newmont Mining Corporation.
On November 27, 2002, Newmont Mining Corporation entered into a guarantee agreement in favour of Australia and New Zealand Banking Group Limited (“ANZ”) guaranteeing the payment obligations of the Company under its A$16 million indemnity/guarantee facility dated January 5, 2001 with ANZ. The facility is used by the Group to provide bank guarantees to support various rehabilitation obligations. No fee was charged by Newmont Mining Corporation for the provision of this guarantee agreement. If Newmont Mining Corporation pays ANZ under the guarantee agreement, Newmont Mining Corporation would be subrogated to the right of ANZ against the Company with respect to such payment.
For other related party information see Note 31 to the audited consolidated financial statements.
| 7C. | | Interests of experts and council |
None.
Item 8: Financial Information
| 8A. | | Consolidated Statements and Other Financial Information |
See “Item 17: Financial statements”.
Legal proceedings
NYOL is from time to time involved in various legal proceedings relating to its business. NYOL does not believe that adverse decisions in any pending or threatened proceeding or that amounts which it may be required to pay by reason thereof will have a material adverse effect on its financial condition or results of operations.
During 2002, the proceedings brought by families of three contractor employees involved in a fatal accident that occurred on June 26, 2000 were settled. NYOL is seeking compensation from insurers for the amounts involved in this settlement.
NYOL is also presently defending plaints filed in relation to certain mining tenements.
Dividend policy
Holders of ordinary shares are entitled to receive such dividends as are declared by NYOL’s Directors (the “Directors”). In determining dividends, the Directors consider the earnings, capital requirements, cash flow requirements and financial condition of the Group, and any other relevant factors. The unsecured Notes amongst other things also place requirements and/or limitations on dividend distributions. The Directors consider these requirements when determining dividends.
For the year ended June 30, 2002, no dividends were declared or paid.
73
| • | | The Indenture governing the US$300 million 8 7/8% Senior Notes due 2008 issued by the Company provides that in certain circumstances the Company may be required to offer to repurchase those notes at 101% of the principal amount plus accrued and unpaid interest. The Company is not required to make this offer if a third party makes the offer and purchases all notes which are validly tendered and not withdrawn under that offer. |
| • | | The Company has been advised by its ultimate parent entity, Newmont Mining Corporation, that a subsidiary of Newmont Mining Corporation made an offer to repurchase the notes as if those circumstances had occurred and purchased notes in the principal amount of US$62.8 million, representing all notes which were validly tendered and not withdrawn under that offer. This ensures that whether or not the relevant circumstances have occurred the Company is not, and will not be, obliged to make an offer to repurchase the notes pursuant to the circumstances that gave rise to such subsidiary’s offer to purchase the notes. |
| • | | A master hedging agreement between the Company and Dresdner Bank AG contains a provision, which makes a change of control of the Company a termination event. Following the acquisition of NYOL’s parent, Normandy, by Newmont Mining Corporation, Dresdner Bank A.G. asserted that a termination event was triggered with respect to all hedging contracts entered into under the hedging master agreement between the company and Dresdner Bank AG. As a result of the change in control of more than 50% of the company’s issued share capital that occurred as a result of Newmont Mining Corporation’s acquisition of the shares of Normandy Mining Limited. As a result of negotiation with Dresdner Bank AG, settlement was deferred until August 2002 at which time a payment of A$28.5 million was made to closeout forward sales of 270,369 ounces of gold and sold call options for 48,000 ounces of gold. |
| • | | During the fourth quarter of 2002 and the first quarter of 2003 a hedge counter-party, Societe Generale exercised its option to terminate hedge contracts on the fifth anniversary of the respective dates of establishment of those contracts. Pursuant to these rights to terminate a 240,000 ounce bought convertible put position was closed out with a cash payment of A$19.3 million in December 2002. Societe Generale exercised an additional right to terminate 336,000 ounces of sold forwards and bought put options in January 2003, and these transactions were closed out in January 2003. Concurrently with the January 2003 close out, a further 48,000 ounces of bought call options were voluntarily closed out to reduce the net close out payment to A$5.9 million. |
| • | | On March 3, 2003, Standard & Poor’s announced that it had lowered NYOL’s corporate credit rating and the rating on NYOL’s US$300,000,000 8 7/8% Senior Notes due April 2008 from BBB- to BB- and on April 1, 2003 to B-. Standard & Poor’s also announced that it had revised its outlook on the Company from stable to negative. |
| • | | On April 3, 2003,Newmont Mining Corporation agreed to advance up to US$10 million to enable the Group to pay certain ordinary course debts incurred on and after that date. Newmont Mining Corporation’s obligation to advance funds is subject to several conditions. No advance may be applied to meet any obligations or liabilities of any Group company to counter-parties to hedging contracts entered into by the Company, or to holders of the Notes issued by the Company or to any other persons whose debts or obligations were created prior to April 3, 2003. Newmont Mining Corporation can terminate unilaterally the agreement on 30-days advance notice. As of the date of this report, no advance has been requested by the Group or made by Newmont Mining Corporation. Refer to Item 7B “Related party transactions”. |
74
Item 9: The Offer and Listing
| 9A. | | Offer and listing details |
Following Normandy’s 100% acquisition of the Company its shares were suspended from trading on the Australian Stock Exchange (ASX) in April 2000.
After receiving confirmation from ASIC that it had no objection to the Company de-listing from the ASX, its ordinary shares were removed from the official list of the ASX on February 28, 2003.
Not applicable.
The Company’s ordinary shares are not listed or traded on any exchange or other regulated market. At the Company’s request, its ordinary shares were removed from the official list of the Australian Stock Exchange (ASX) on February 28, 2003.
None.
None.
| 9F. | | Expenses of the issue |
None.
Item 10: Additional information
Not applicable.
10B. Memorandum and articles of association
Newmont Yandal Operations Limited’s corporate organisation and conductance is governed by its Constitution (the “Constitution”) as amended as of June 27, 2000. Set forth below is a summary of the principal terms of the Constitution.
Company Objects & Purposes
The Company is taken to be registered as a public company limited by shares under the Corporations Act 2001 and is registered with Australian Company Number 007 066 766.
The current Constitution was approved by shareholders at a General Meeting held on June 27, 2000. The Constitution does not specify the Company’s objects and purposes.
Directors’ Powers & Qualifications
| a. | | No director is permitted to vote as a director, or participate in any way in any resolution of the Board, on or in respect of any matter in which he has a material interest. |
| b. | | A director who has a material interest is counted in determining if a quorum is present at a Board meeting. The Constitution provides that compensation of non-executive directors may not in any 12 months starting at the end of a financial year of the Company, exceed in aggregate the amount fixed for them by ordinary resolution. As a wholly owned subsidiary of NAL, the Company presently has no non-executive directors. Executive directors do not receive compensation from the Company – see Item 6B. |
75
| c. | | The Constitution does not contain any limitations on borrowing powers exercisable by the directors. |
| d. | | The Constitution does not contain any age limit requirement on the retirement of directors. The Corporations Act prescribes age limit requirements. |
| e. | | A director does not need to own shares in the Company as a qualification for office. |
Rights & Restrictions Attaching to Each Class of Shares
| a. | | The Company has only one class of shares, the ordinary shares. The rights attaching to ordinary shares include the right to dividends in the event that the directors declare them. Directors may declare and authorise the distribution from the profits of the Company of a dividend to be distributed to the members according to their respective rights and interests, determine the property to constitute the dividend and fix the time for distribution. |
Dividends declared but unclaimed may be invested for the benefit of the Company until claimed or until required to be dealt with under any applicable law dealing with unclaimed money.
| b. | | The voting right attached to ordinary shares is the right to vote in person, by proxy, by attorney or by representative in general meeting. |
On a show of hands each member (regardless of the number of shares held) has one vote. On a poll each member may exercise one vote for each fully paid ordinary share held. In respect of partly paid shares, the member has a vote equivalent to the proportion which the amount paid up bears to the total issue price of the share.
| c. | | Dividends are only payable out of the profits of the Company. |
| d. | | In the event of a winding up, ordinary shares rank equally in the division of any surplus. |
| e. | | Shareholders cannot redeem ordinary shares. |
| f. | | The holders of fully paid ordinary shares have no further liability to the Company in respect of those shares. The holders of partly paid shares are liable to the Company once a call is made for the payment of the unpaid amount. |
| g. | | There is no provision in the Constitution which discriminates against an existing or prospective member as a result of that member owning a substantial number of shares unless such ownership leads to an offer under a “proportional takeover scheme��� (within the meaning given to that expression by Chapter 6 of the Corporations Act) or the directors exercise their discretion to refuse to register any transfer of shares or other marketable securities (i) on which stamp duty is payable but unpaid and (ii) in any circumstances permitted by the Australian Stock Exchange listing rules. |
| h. | | To vary or cancel the rights attached to ordinary shares, a special resolution must be passed at a separate meeting of the holders of ordinary shares, or by the consent in writing of the holders of 75 percent of the issued ordinary shares. |
General Meetings of the Company
The Board may convene a general meeting of the Company at any time. No member may convene a general meeting unless entitled to do so under the Corporations Act.
All members may attend general meetings in person, or be represented by the attendance of a representative, attorney or by proxy.
76
Limitations on the Right to Own Securities
The Company’s Constitution does not impose limitations on the right to own securities except those provisions relating to minimum holdings (known as unmarketable parcels).
The rights of non-resident or foreign shareholders to hold or exercise voting rights on the Company’s securities are subject to theForeign Acquisitions and Takeovers Act 1975. The Treasurer of the Australian Federal Government has the power to prohibit the acquisition of a controlling interest in any Australian company by a foreign person or foreign persons, if the Treasurer is of the opinion that the acquisition would be contrary to the national interest. For this purpose, a shareholding of 15 percent or more held by a single foreign person or 40 percent or more held by two or more foreign persons is deemed to constitute a controlling interest.
Section 50 of theTrade Practices Act 1974 prohibits an acquisition of shares that would have the effect, or be likely to have the effect, of substantially lessening competition in a substantial market for goods or services, unless the acquisition is authorised by the Australian Competition and Consumer Commission.
Disclosure of Share Ownership
The Constitution does not prescribe an ownership threshold above which shareholders must disclose their holding to the Company. However, Part 6C.1 of the Corporations Act, 2001 imposes disclosure requirements on persons who acquire or cease to hold a substantial holding (see Section 9 of the Corporations Act, 2001) in the Company. The disclosure must be given to the Company within the prescribed time.
Changes in Share Capital
The Company by resolution passed in general meeting may from time to time alter its share capital in one or more of the ways provided for, and in the manner prescribed by the Corporations Act.
Subject to the Constitution, the Company may reduce its share capital or buy back shares in accordance with the Corporations.
The Group has not entered into any material contracts outside the ordinary course of business.
Under existing Australian legislation, the Reserve Bank of Australia does not inhibit the import and export of funds, and no permission is required by the Group for the movement of funds in and out of Australia. However, payments to or from (or relating to) Iraq, its agencies or nationals, the government or a public authority of Libya, or certain Libyan undertakings, the authorities in the Federal Republic of Yugoslavia (Serbia and Montenegro) or their agencies, or the National Union for the Total Independence of Angola (also known as UNITA), its senior officials or the adult members of their immediate families, may not be made without specific approval of the Reserve Bank of Australia.
There are no limitations under the laws of Australia, on the right of non-residents to hold or vote ordinary shares in the Company, except for the Foreign Acquisitions and Takeovers Act (the “Act”) and Section 606 of the Corporations Act. The Act controls the rights of non-residents to hold 15 percent or more of the total voting powers as outstanding shares of an Australian company, but it does not affect the rights attaching to shares that are held or acquired in accordance with its provisions.
Under the Act, any acquisition or issue of shares (including the acquisition of an option to acquire shares) which would increase or alter beyond 15 percent in the case of a single foreign interest, or 40 percent in the case of more than one foreign interest, the level of foreign ownership in a corporation that carries on an
77
Australian business is subject to review and approval by the Treasurer of the Commonwealth of Australia. The Act permits the Treasurer to deny or refuse proposals where such proposals would be contrary to the Australian national interest.
Section 606 of the Corporations Act, provides that, subject to certain exceptions, a person must not acquire a relevant interest in shares in a company if as a result someone’s voting power in the company increases to more than 20 percent, or from a starting point that is above 20 percent and below 90 percent. Section 606 also prohibits a person acquiring a legal or equitable interest in shares if, because of the acquisition, another person acquires a relevant interest in shares and someone’s voting power increases to more than 20 percent, or from a starting point that is above 20 percent and below 90 percent. Section 608 of the Corporations Act provides that a person has a “relevant interest” in shares if that person holds the shares, or has power or control over the voting rights attaching to them or their disposal, whether directly or indirectly.
The foregoing summary does not purport to be complete and is qualified in its entirety by reference to the applicable legislation.
10E. Taxation
Since June 30, 2002 the Australian Government has enacted legislation that will allow 100 per cent commonly owned Australian resident company groups to form a single consolidated group for income tax purposes. The new rules apply, at the group’s election, on a date any time from July 1, 2001. The first two tranches of legislation became substantively enacted on October 21, 2002 when the New Business Tax System (Consolidation, Value Shifting, Demergers and Other Measures) Bill 2002 was passed by the Senate
The consequences of forming a tax consolidated group are many. Formation of a consolidated group for tax purposes will require the tax basis of assets to be re-set pursuant to complex transition rules. Furthermore future utilisation of tax losses that transition to a consolidated group will become subject to loss factors that will limit in any one year the amount of transitional losses that can be offset against taxable income of the tax consolidated group.
The Group has not made any final determination about whether to become a tax-consolidated group. The impact of becoming a tax-consolidated group cannot be accurately quantified until it is known when and if a tax-consolidated group will be formed. The Company is of the view, both in terms of the re-setting of the tax basis of underlying assets and in respect of the future rate of utilisation of tax losses, the existence of concessional transition rules should mean that there will be no material impact arising from the formation of a tax-consolidated group. There can be no assurance of this, however, because the financial effect of the legislation cannot be reliably estimated. The financial effect of the legislation has not been recognised in this report in accordance with UIG 39 “Effect of Proposed Tax Consolidation Legislation on Deferred Tax Balances”.
10F. Dividends and paying agents
Not applicable.
10G. Statement by experts
Not applicable.
10H. Documents on display
It is possible to read and copy documents referred to in the annual report on Form 20-F that have been filed with the SEC at the SEC’s public reference room located at 450 Fifth Street, NW, Washington DC 20549. Please call the SEC at 1-800-SEC-0330 for further information.
10I. Subsidiary information
Not applicable.
78
Item 11. Quantitative and qualitative disclosures about market risk
Objectives of derivative financial instruments
NYOL employs derivative financial instruments, including forward sales contracts, option contracts, swaps and forward rate agreements to manage risk emanating from actual exposures to commodity price risk and interest rate risk. Derivative instruments are entered into based on prevailing sales forecasts in order to manage commodity price risks. Following the acquisition of Great Central Mines by Normandy in 2000, the Company applied new criteria in line with Newmont’s standards to estimate its gold reserves and revised downward its estimates of reserves. As a result of these revisions to forecasts, hedge positions currently exceed forecast sales, resulting in recognition of a mark to market liability for the excess positions in the financial statements.
Total derivative positions have been disclosed in two tables, one for contracts qualifying as hedges and the other for excess hedging.
Gold price risk management activities
A number of products, including derivative instruments are used to manage gold price risks that arise out of the Group’s core business activities. Fixed and spot-deferred forward sales contracts and put options have been used by the Group to protect it from downward fluctuations in the gold price.
Under A-GAAP, derivative financial instruments used to hedge anticipated sales are not recognised in the financial statements on inception. The costs associated with entering hedge transactions in respect of commodity sales, together with gains or losses to the date of sale, are deferred and included in the measurement of the final sale price. In the event that during the term of the hedge, the hedge ceases to be effective, gains and losses on the hedge are no longer deferred, but recognised in the Statement of Financial Performance.
The following table sets out the maturity dates of existing contracts together with gold ounces hedged, weighted average gold price and the fair value of those contracts for the Group. The average price disclosed for put and convertible put options is the weighted average of the relevant put option strike values. The prices disclosed are gross contractual prices. The ultimate price realised on gold hedging is the gross contractual price less any associated future financing costs arising from gold borrowing commitments related to such contracts. The fair value disclosures reflect all components of the hedging including future gold borrowing commitments. To the extent that these contracts hedge specific commitments, any unrealised gains or losses on the contracts, together with the deferred costs of the contracts (June 30, 2002; A$17.2 million: June 30, 2001 A$22.1 million) will be recognised in the financial statements at the time the underlying transactions occurs.
79
As at June 30, 2002:
Excess Hedges
| |
Maturity
| | Forward sale of Gold
| | | Put and convertible options
| | | Gold swaps
| |
| | | Qty (‘000oz)
| | Avg Price (per oz)
| | Fair Value A$ (000)
| | | Qty (‘000oz)
| | Avg Price (per oz)
| | Fair Value A$ (000)
| | | Qty (‘000oz)
| | Avg Price (per oz)
| | Fair Value A$ (000)
| |
2002-2003 | | 21 | | 556 | | 626 | | | 167 | | 549 | | (5,253 | ) | | — | | — | | — | |
2003-2007 | | 329 | | 570 | | (31,108 | ) | | 433 | | 596 | | (34,920 | ) | | — | | — | | — | |
2007-Plus | | 145 | | 555 | | (18,162 | ) | | 718 | | 637 | | (78,500 | ) | | 600 | | 543 | | (53,932 | ) |
| | |
| |
| |
|
| |
| |
| |
|
| |
| |
| |
|
|
Total | | 495 | | 565 | | (48,644 | ) | | 1,318 | | 612 | | (118,673 | ) | | 600 | | 543 | | (53,932 | ) |
| | |
| |
| |
|
| |
| |
| |
|
| |
| |
| |
|
|
Ounces Hedged Against Future Production
|
Maturity
| | Forward sale of Gold
| | | Put and convertible options
| | | Gold swaps
|
| | | Qty (‘000oz)
| | Avg Price (per oz)
| | Fair Value A$ (000)
| | | Qty (‘000oz)
| | Avg Price (per oz)
| | Fair Value A$ (000)
| | | Qty Hedged (‘000oz)
| | Avg Price (per oz)
| | Fair Value A$ (000)
|
2002-2003 | | 552 | | 552 | | (27,658 | ) | | 0 | | 0 | | — | | | — | | — | | — |
2003-2007 | | 476 | | 547 | | (44,356 | ) | | 106 | | 618 | | (11,318 | ) | | — | | — | | — |
2007-Plus | | 36 | | 558 | | (4,877 | ) | | 729 | | 671 | | (107,024 | ) | | — | | — | | — |
| | |
| |
| |
|
| |
| |
| |
|
| |
| |
| |
|
Total | | 1,058 | | 550 | | (76,891 | ) | | 836 | | 665 | | (118,342 | ) | | — | | — | | — |
| | |
| |
| |
|
| |
| |
| |
|
| |
| |
| |
|
As at June 30, 2001:
Ounces Hedged Against Future Production |
Maturity
| | Forward sale of Gold
| | Put and convertible options
| | Gold swaps
| | Total
|
| | | Qty (‘000oz)
| | Avg Price (per oz)
| | Qty (‘000oz))
| | Avg Price (per oz)
| | Qty (‘000oz)
| | Avg Price (per oz)
| | Qty (‘000oz
| | Avg Price (per oz)
|
2001-2002 | | 109 | | 558 | | 619 | | 542 | | — | | — | | 728 | | 544 |
2002-2006 | | 1,029 | | 548 | | 627 | | 580 | | — | | — | | 1,656 | | 560 |
2006-Plus | | 321 | | 547 | | 1,752 | | 648 | | 600 | | 465 | | 2,673 | | 595 |
| | |
| |
| |
| |
| |
| |
| |
| |
|
Total | | 1,459 | | 549 | | 2,998 | | 612 | | 600 | | 465 | | 5,057 | | 576 |
| | |
| |
| |
| |
| |
| |
| |
| |
|
A number of hedging positions reported in the above tables are governed by agreements that confer to the relevant hedge counter-party a right to terminate the contracts prior to their agreed maturity dates. Such a termination would result in immediate cash settlement of those contracts based on the market value on the date of termination. The rights can only be exercised on specific future. In the year to June 30, 2002, no termination rights were exercised, however, in the subsequent period up to the end of January 2003, a
80
number of termination rights were exercised. Refer to Item 8B “Significant changes” for further details on the exercise of termination rights.
The table below summerises those contracts that are subject to the rights to terminate and the mark to market of those contracts.
As at June 30 2002
Potential Termination Date (1)
| | Ounces
| | Value A$Million
|
Dec 02 | | 240,000 | | (23.1) |
Jan 03 | | 336,000 | | (9.5) |
Jan-04 | | 780,000 | | 25.0 |
Jun 04 | | 133,335 | | (17.4) |
Apr 05 | | 840,000 | | (82.7) |
May 05 | | 195,000 | | (25.7) |
Jun 05 | | (30,000)(2) | | (20.7) |
Aug 05 | | 1,304,997 | | (158.2) |
| | |
| |
|
Total | | 3,799,332 | | (312.3) |
| | |
| |
|
| (1) | | Earliest possible termination date permitted under the contracts |
| (2) | | Net position of 270,000oz of bought put options and 300,000oz of sold put options. |
| (3) | | The above right to break table does not include outflows that may occur in interest rate risk contracts. Right to breaks in relation to interest rate risks are disclosed on page 83. |
The following tables reflect gold price risk management hedge positions and related rights to terminate at December 31, 2002.
Excess Hedges
| |
Maturity
| | Forward sale of Gold
| | | Put and convertible options
| | | Gold swaps
| |
| | | Qty (‘000oz)
| | Avg Price (per oz)
| | Fair Value A$ (000)
| | | Qty (‘000oz)
| | Avg Price (per oz)
| | Fair Value A$ (000)
| | | Qty (‘000oz)
| | Avg Price (per oz)
| | Fair Value A$ (000)
| |
2003 | | — | | — | | — | | | — | | — | | — | | | — | | — | | — | |
2004-2008 | | 266 | | 600 | | (36,910 | ) | | 203 | | 637 | | (29,753 | ) | | 600 | | 543 | | (53,415 | ) |
2008-Plus | | 22 | | 616 | | (3,476 | ) | | 219 | | 675 | | (36,943 | ) | | — | | — | | — | |
| | |
| |
| |
|
| |
| |
| |
|
| |
| |
| |
|
|
Total | | 288 | | 601 | | (40,385 | ) | | 421 | | 657 | | (66,696 | ) | | 600 | | 543 | | (53,415 | ) |
| | |
| |
| |
|
| |
| |
| |
|
| |
| |
| |
|
|
81
Ounces Hedged Against Future Production
|
Maturity
| | Forward sale of Gold
| | | Put and convertible options
| | | Gold swaps
|
| | | Qty (‘000oz)
| | Avg Price (per oz)
| | Fair Value A$ (000)
| | | Qty (‘000oz)
| | Avg Price (per oz)
| | Fair Value A$ (000)
| | | Qty Hedged (‘000oz)
| | Avg Price (per oz)
| | Fair Value A$ (000)
|
2003 | | 85 | | 552 | | (9,538 | ) | | 29 | | 507 | | (5,607 | ) | | — | | — | | — |
2004-2008 | | 891 | | 561 | | (115,459 | ) | | 402 | | 615 | | (24,461 | ) | | — | | — | | — |
2008-Plus | | 8 | | 616 | | (1,308 | ) | | 666 | | 668 | | (92,994 | ) | | — | | — | | — |
| | |
| |
| |
|
| |
| |
| |
|
| |
| |
| |
|
Total | | 985 | | 561 | | (126,304 | ) | | 1,096 | | 664 | | (123,062 | ) | | — | | — | | — |
| | |
| |
| |
|
| |
| |
| |
|
| |
| |
| |
|
The table below summerises those contracts that are subject to the rights to terminate and the mark to market of those contracts.
As at December 31 2002
Potential Termination Date (1)
| | Ounces
| | Value A$Million
|
Jan 03 | | 336,000 | | (9.0) |
Jan-04 | | 780,000 | | 20.9 |
Jun 04 | | 133,335 | | (18.4) |
Apr 05 | | 840,000 | | (85.4) |
May 05 | | 195,000 | | (27.9) |
Jun 05 | | (30,000)(2) | | (21.0) |
Aug 05 | | 1,304,997 | | (187.2) |
| | |
| |
|
Total | | 3,559,332 | | (328.0) |
| | |
| |
|
| (1) | | Earliest possible termination date permitted under the contracts |
| (2) | | Net position of 270,000oz of bought put options and 300,000oz of sold put options. |
| (3) | | The above right to break table does not include outflows that may occur in interest rate risk contracts. Right to breaks in relation to interest rate risks are disclosed on page 83. |
Interest rate risk management
The Company has entered into a gold interest rate swap arrangement to partially reduce the interest rate risk exposure associated with the US$300 million 8 7/8% Senior Notes due 2008. Of the total US$300 million, US$183.6 million was swapped into a gold commodity contract, of which half was fixed at 3.87% and half was floating and subject to an indexation component. The mark to market value of the interest rate component of the gold commodity obligation and indexation arrangement was negative A$48.4 million as at June 30, 2002 and negative A$100.9 million as at December 31, 2002.
The gold interest rate swap includes gold indexation arrangements with various hedge counter-parties. The effect of these gold indexation structures is that the Company is obliged to pay the counter-parties certain amounts of gold if the gold price is above A$540 per ounce at the end of March and September in the years 2003 through to 2008. The ounce liability under these indexation structures increases on a linear basis between the floor price of A$540, where the liability is zero ounces and a capped price of A$627, where the liability is 42,224 ounces for each semi annual period. The mark to market of the indexation arrangements
82
was negative A$138.8 million as at June 30, 2002 and negative A$187.4 million as at December 31, 2002. In addition, NYOL utilises forward rate agreements to manage its interest rate exposures arising from its gold hedging programs by locking in future floating gold interest rates.
A number of interest rate arrangements reported in this section are governed by agreements that confer to the relevant counter-party a right to terminate the arrangements prior to their agreed maturity dates. Such a termination would result in immediate cash settlement of those arrangements based on the market value on the date of termination. The rights can only be exercised on specific future dates the tables below summerise those contracts that are subject to the rights to terminate and the mark to market of the contracts at the relevant date.
As at June 30 2002
Potential Termination Date (1)
| | A$Million
|
Apr 05 | | 43.4 |
Oct 06 | | (14.0) |
| | |
|
Total | | (29.2) |
| | |
|
As at December 31 2002
Potential Termination Date (1)
| | A$Million
|
Apr 05 | | 30.5 |
Oct 06 | | (23.1) |
| | |
|
Total | | 7.4 |
| | |
|
| (1) | | Earliest possible termination date permitted under the contracts |
83
The Group’s exposure to interest rate risk at June 30, 2002 and June 30,2001 is set out below. All other financial assets and liabilities are non-interest bearing
| | | Weighted average interest rate %
| | Floating Interest Rate A$’000 A$’000
| | Fixed Interest Maturing in
| | Non Interest Bearing A$’000
| | Total A$’000
|
| | | | | < 1 Year A$’000
| | 1-5 Years A$’000
| | > 5 Years A$’000
| | |
| | | | | | | | |
as at June 30, 2002: | | | | | | | | | | | | | | |
|
Financial assets | | | | | | | | | | | | | | |
Cash assets | | 4.70 | | 97,226 | | — | | — | | — | | — | | 97,226 |
| | | | |
| |
| |
| |
| |
| |
|
| | | | | 97,226 | | — | | — | | — | | — | | 97,226 |
| | | | |
| |
| |
| |
| |
| |
|
Financial liabilities | | | | | | | | | | | | | | |
US dollar guaranteed notes | | 8.88 | | — | | — | | — | | 206,750 | | | | 206,750 |
Floating gold lease rate exposure | | 2.55 | | 162,979 | | — | | — | | 162,978 | | | | 325,957 |
Other borrowings | | 7.00 | | | | 513 | | 432 | | — | | — | | 945 |
| | | | |
| |
| |
| |
| |
| |
|
| | | | | 162,979 | | 513 | | 432 | | 369,728 | | — | | 533,652 |
| | | | |
| |
| |
| |
| |
| |
|
| | | Weighted average interest rate %
| | Floating Interest Rate A$’000 A$’000
| | Fixed Interest Maturing in
| | Non Interest Bearing A$’000
| | Total A$’000
|
| | | | | < 1 Year A$’000
| | 1-5 Years A$’000
| | > 5 Years A$’000
| | |
| | | | | | | | |
June 30, 2001: | | | | | | | | | | | | | | |
|
Financial assets | | | | | | | | | | | | | | |
Cash assets | | 4.94 | | 61,449 | | — | | — | | — | | — | | 61,449 |
Bank Bills | | 4.99 | | 35,616 | | — | | — | | — | | — | | 35,616 |
| | | | |
| |
| |
| |
| |
| |
|
| | | | | 97,065 | | — | | — | | — | | — | | 97,065 |
| | | | |
| |
| |
| |
| |
| |
|
Financial liabilities | | | | | | | | | | | | | | |
US dollar guaranteed notes | | 5.87 | | — | | — | | — | | 228,733 | | — | | 228,733 |
Floating gold lease rate exposure | | 2.55 | | 139,493 | | — | | — | | 139,493 | | | | 278,986 |
Other borrowings | | 7.00 | | — | | 1,587 | | 964 | | — | | — | | 2,551 |
| | | | |
| |
| |
| |
| |
| |
|
| | | | | — | | 1,587 | | 964 | | 508,719 | | — | | 510,270 |
| | | | |
| |
| |
| |
| |
| |
|
84
Credit risk Exposure
Credit risk represents the loss that would be recognised if counter parties failed to perform as contracted. NYOL’s only material exposure arises from gold hedging. The Group is exposed to loss in the event that counter parties fail to settle on contracts, which are favourable to NYOL. Unrealised gains on these contracts, net of master netting agreements, at June 30, 2002 are nil (2001: A$97.3 million). In order to mitigate these risks, the board has approved a list of counter parties; all rated A- or better by Standard & Poors.
Foreign exchange risk
Refer to “Foreign exchange risk – Interest bearing liabilities” under Item 3D – “Risk factors” for a discussion of foreign exchange risk.
Fair values of financial assets and liabilities
On-Balance Sheet
The carrying amounts of cash, bank bills, gold bullion receivables, prepayments, investments, payables, loans to related parties, interest bearing liabilities, employee entitlements and restoration provisions approximate their net fair value except for:
| | | June 30, 2002
| | June 30, 2002
| | June 30, 2001
| | June 30, 2001
|
| | | Carrying amount A$’000
| | Net Fair Value A$’000
| | Carrying amount A$’000
| | Net Fair Value A$’000
|
Financial Liability | | | | | | | | |
US Dollar Notes (Note 17) | | 532,707 | | 654,162 | | 508,719 | | 832,971 |
Off-Balance Sheet
Commodity forward sale contracts, foreign exchange contracts, options and swaps have been valued at the mark-to-market gain or loss, which would arise if the contract were terminated at June 30,2002.
The expected timing of recognition as revenue of the net fair value (mark to market) of off balance sheet financial instruments is as follows:
| | | As at June 30,
| |
| | | 2002 | | | 2001 | |
| | | A$’000
| | | A$’000
| |
Commodity contracts | | | | | | |
Not later than one year | | (27,658 | ) | | (5,616 | ) |
Later than one year but not later than five years | | (55,674 | ) | | (63,814 | ) |
Later than five years | | (158,331 | ) | | (288,059 | ) |
| | |
|
| |
|
|
| | | (241,663 | ) | | (357,489 | ) |
| | |
|
| |
|
|
Item 12: Description of securities other than equity securities
Not applicable.
85
PART II
Item 13: Defaults, dividend arrearages and delinquincies
None.
Item 14: Material modifications to the rights of security holders and use of proceeds.
None.
Item 15: Controls and Procedures
This annual report relates to the Company’s 12-month period ended June 30, 2002, which date is prior to the effective date of Rule 15d-15 under the Exchange Act. No evaluation of the effectiveness of the Company’s disclosure controls and procedures or internal controls has been undertaken by the Company’s Chief Executive Officer or Chief Financial Officer.
Item 16: Reserved
PART III
Item 17: Financial Statements
Reference is made to Item 19 for a list of all financial statements filed as part of this annual report.
Item 18: Financial Statements
Not applicable
Item 19: Exhibits
Consolidated Financial Statements of Newmont Yandal Operations Limited. As of June 30, 2002 and 2001and for each of the three years in the period ended June 30, 2002, are included as Exhibit 1.
Newmont Yandal Operations Limited Valuation and Qualifying Accounts for the years ended June 30, 2002, 2001 and 2000 are included as Exhibit 2.
86
Signatures
The registrant hereby certifies that it meets all of the requirements for filing on Form 20-F and that it has duly caused and authorised the undersigned to sign this annual report on its behalf.
Newmont Yandal Operations Limited
By:
/s/ Kenneth G. Williams
Kenneth G. Williams
Executive Director
Date: April 3, 2003
87
CERTIFICATION OF CHIEF EXECUTIVE OFFICER
(SECTION 302 CERTIFICATION OF THE SARBANES OXLEY ACT OF 2002)
I, John AS Dow, certify that:
| 1. | | I have reviewed this annual report on Form 20-F of Newmont Yandal Operations Limited; |
| 2. | | Based on my knowledge, this annual report does not contain any untrue statement of a material fact or omit to state a material fact necessary to make the statements made, in light of the circumstances under which such statements were made, not misleading with respect to the period covered by this annual report; |
| 3. | | Based on my knowledge, the financial statements, and other financial information included in this annual report, fairly present in all material respects the financial condition, results of operations and cash flows of the registrant as of, and for, the periods presented in this annual report; |
Date: April 3, 2003
/s/ John AS Dow
John AS Dow
Chief Executive Officer
88
CERTIFICATION OF CHIEF FINANCIAL OFFICER
(SECTION 302 CERTIFICATION OF THE SARBANES OXLEY ACT OF 2002)
I, Kenneth G Williams, certify that:
| 1. | | I have reviewed this annual report on Form 20-F of Newmont Yandal Operations Ltd. |
| 2. | | Based on my knowledge, this annual report does not contain any untrue statement of a material fact or omit to state a material fact necessary to make the statements made, in light of the circumstances under which such statements were made, not misleading with respect to the period covered by this annual report; |
| 3. | | Based on my knowledge, the financial statements, and other financial information included in this annual report, fairly present in all material respects the financial condition, results of operations and cash flows of the registrant as of, and for, the periods presented in this annual report; |
Date: April 3, 2003
/s/ Kenneth G. Williams
Kenneth G. Williams
Chief Financial Officer
89