UNITED STATES
SECURITIES AND EXCHANGE COMMISSION
Washington, D.C. 20549
FORM N-CSR
CERTIFIED SHAREHOLDER REPORT OF REGISTERED
MANAGEMENT INVESTMENT COMPANIES
| Investment Company Act file number | 811-07148 | |
| Schwartz Investment Trust |
| (Exact name of registrant as specified in charter) |
| 801 W. Ann Arbor Trail, Suite 244 Plymouth, Michigan | 48170 |
| (Address of principal executive offices) | (Zip code) |
George P. Schwartz
| Schwartz Investment Counsel, Inc. 801 W. Ann Arbor Trail, Plymouth, MI 48170 |
| (Name and address of agent for service) |
| Registrant's telephone number, including area code: | (734) 455-7777 | |
| Date of fiscal year end: | December 31 | |
| | | |
| Date of reporting period: | December 31, 2024 | |
Form N-CSR is to be used by management investment companies to file reports with the Commission not later than 10 days after the transmission to stockholders of any report that is required to be transmitted to stockholders under Rule 30e-1 under the Investment Company Act of 1940 (17 CFR 270.30e-1). The Commission may use the information provided on Form N-CSR in its regulatory, disclosure review, inspection, and policymaking roles.
A registrant is required to disclose the information specified by Form N-CSR, and the Commission will make this information public. A registrant is not required to respond to the collection of information contained in Form N-CSR unless the Form displays a currently valid Office of Management and Budget ("OMB") control number. Please direct comments concerning the accuracy of the information collection burden estimate and any suggestions for reducing the burden to the Secretary, Securities and Exchange Commission, 450 Fifth Street, NW, Washington, DC 20549-0609. The OMB has reviewed this collection of information under the clearance requirements of 44 U.S.C. § 3507.
Item 1. Reports to Stockholders.
(a)
Schwartz Value Focused Fund
Annual Shareholder Report - December 31, 2024
This annual shareholder report contains important information about Schwartz Value Focused Fund (the "Fund") for the period of January 1, 2024 to December 31, 2024. You can find additional information about the Fund at https://www.schwartzvaluefocusedfund.com/reports.html. You can also request this information by contacting us at (888) 726-0753.
What were the Fund’s costs for the last year?
(based on a hypothetical $10,000 investment)
| Fund Name | Costs of a $10,000 investment | Costs paid as a percentage of a $10,000 investment |
|---|
| Schwartz Value Focused Fund | $149 | 1.25% |
|---|
How did the Fund perform during the reporting period?
For the year ended December 31, 2024, the Fund had a total return of 38.71%. The Fund’s strong performance was driven primarily due to share price appreciation in Texas Pacific Land Corporation (+137%), LandBridge Company LLC (+64%), and Mastercard Incorporated (+23%). Texas Pacific Land and LandBridge Company, both significant holdings in the Fund, are royalty-based companies that are benefitting from their vast asset holdings of oil, natural gas, water, and land.
The largest relative detractors of performance for the year ended December 31, 2024 were Occidental Petroleum Corporation (-30%), Devon Energy Corporation (-28%), and Schlumberger Limited (-27%). These energy related companies posted lackluster results during 2024 due primarily to a decline in oil prices and lack of capital spending in the oil & natural gas sector. The share price decline of each company offered an attractive opportunity to increase our exposure.
At year end, the Fund had 25 holdings, across a broad array of industries, with an emphasis on royalty companies engaged in land and natural resource management, basic materials, and financial services. Texas Pacific Land Corporation remains the largest holding in the Fund at 27.3% of net assets.
How has the Fund performed over the last ten years?
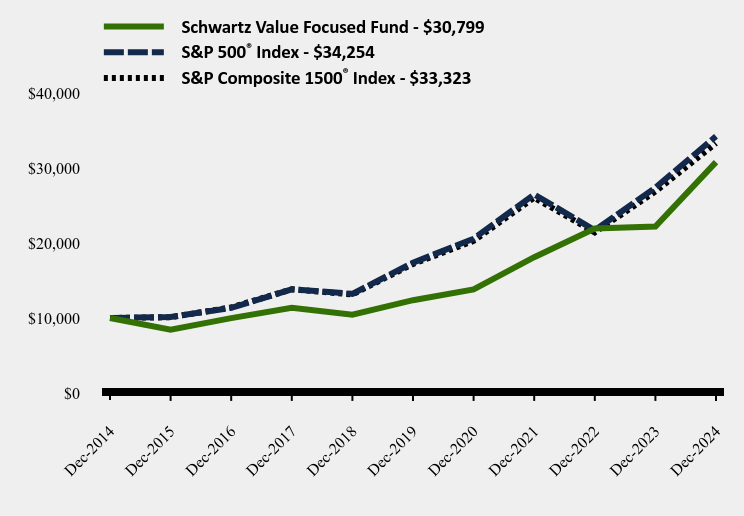
Total Return Based on $10,000 Investment
| Schwartz Value Focused Fund | S&P 500® Index | S&P Composite 1500® Index |
|---|
| Dec-2014 | $10,000 | $10,000 | $10,000 |
|---|
| Dec-2015 | $8,452 | $10,138 | $10,101 |
|---|
| Dec-2016 | $9,984 | $11,351 | $11,417 |
|---|
| Dec-2017 | $11,353 | $13,829 | $13,830 |
|---|
| Dec-2018 | $10,429 | $13,223 | $13,144 |
|---|
| Dec-2019 | $12,376 | $17,386 | $17,206 |
|---|
| Dec-2020 | $13,813 | $20,585 | $20,289 |
|---|
| Dec-2021 | $18,115 | $26,494 | $26,060 |
|---|
| Dec-2022 | $21,946 | $21,696 | $21,427 |
|---|
| Dec-2023 | $22,205 | $27,399 | $26,883 |
|---|
| Dec-2024 | $30,799 | $34,254 | $33,323 |
|---|
Average Annual Total Returns as of 12/31/2024
| 1 Year | 5 Years | 10 Years |
|---|
| Schwartz Value Focused Fund | 38.71% | 20.00% | 11.91% |
|---|
S&P 500® Index | 25.02% | 14.53% | 13.10% |
|---|
S&P Composite 1500® Index | 23.95% | 14.13% | 12.79% |
|---|
The Fund's past performance is not a good predictor of how the Fund will perform in the future. The graph and table do not reflect the deduction of taxes that a shareholder would pay on fund distributions or redemption of fund shares.
- Net Assets$52,562,088
- Number of Portfolio Holdings25
- Total Expense Ratio1.25%
- Advisory Fee (net of waivers & recoupments) $308,242
- Portfolio turnover (fiscal year)39%
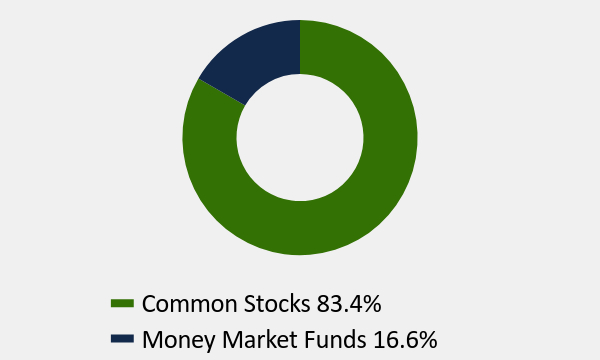
Asset Weighting (% of total investments)
| Value | Value |
|---|
| Common Stocks | 83.4% |
| Money Market Funds | 16.6% |
Timothy S. Schwartz, CFA
George P. Schwartz, CFA
Top 10 Holdings (% of net assets)
| Holding Name | % of Net Assets |
| Texas Pacific Land Corporation | 27.3% |
| Landbridge Company, LLC - Class A | 6.0% |
| St. Joe Company (The) | 4.5% |
| Mastercard, Inc. - Class A | 3.8% |
| CDW Corporation | 3.6% |
| Franco-Nevada Corporation | 3.4% |
| Occidental Petroleum Corporation | 3.4% |
| Genuine Parts Company | 3.3% |
| DigitalBridge Group, Inc. | 3.2% |
| Schlumberger Ltd. | 2.9% |
What did the Fund invest in?
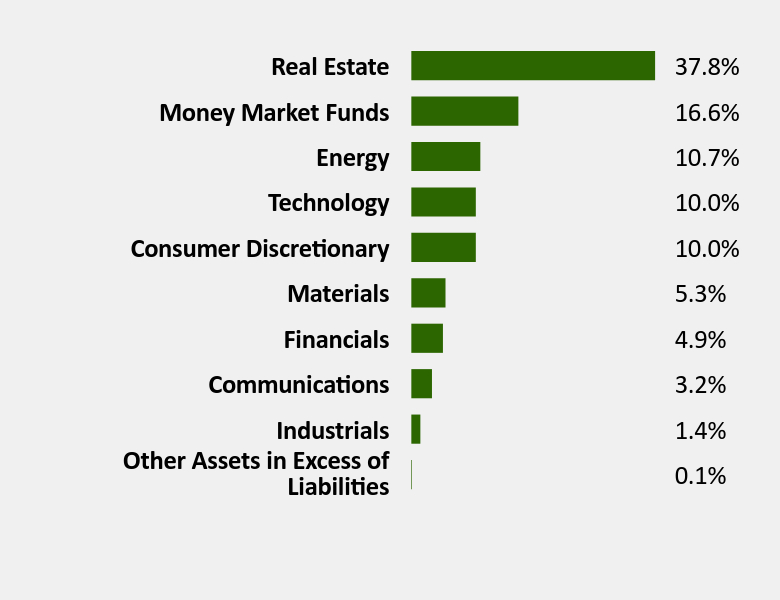
Sector Weighting (% of net assets)
| Value | Value |
|---|
| Other Assets in Excess of Liabilities | 0.1% |
| Industrials | 1.4% |
| Communications | 3.2% |
| Financials | 4.9% |
| Materials | 5.3% |
| Consumer Discretionary | 10.0% |
| Technology | 10.0% |
| Energy | 10.7% |
| Money Market Funds | 16.6% |
| Real Estate | 37.8% |
No material changes occurred during the year ended December 31, 2024.
Annual Shareholder Report - December 31, 2024
Where can I find additional information about the Fund?
Additional information is available on the Fund's website (https://www.schwartzvaluefocusedfund.com/reports.html), including its:
Prospectus
Financial information
Holdings
Proxy voting information
Annual Shareholder Report - December 31, 2024
This annual shareholder report contains important information about Ave Maria Value Fund (the "Fund") for the period of January 1, 2024 to December 31, 2024. You can find additional information about the Fund at https://avemariafunds.com/reports-forms/reports.html. You can also request this information by contacting us at (888) 726-9331.
What were the Fund’s costs for the last year?
(based on a hypothetical $10,000 investment)
| Fund Name | Costs of a $10,000 investment | Costs paid as a percentage of a $10,000 investment |
|---|
| Ave Maria Value Fund | $103 | 0.93% |
|---|
How did the Fund perform during the reporting period?
For the year ended December 31, 2024, the Fund had a total return of 21.52%. The Fund’s positive performance was driven primarily due to share price appreciation in Texas Pacific Land Corporation (+137%), LandBridge Company LLC (+72%), and Mirion Technologies, Inc. (+71%). Texas Pacific Land and LandBridge Company, both significant holdings in the Fund, are royalty-based companies that are benefitting from their vast asset holdings of oil, natural gas, water, and land.
The largest relative detractors of performance for the year ended December 31, 2024 were Schlumberger Limited (-27%), Occidental Petroleum Corporation (-21%), and CDW Corporation (-21%). Schlumberger and Occidental posted lackluster results during 2024 due primarily to a decline in oil prices and lack of capital spending in the oil & natural gas sector. CDW posted disappointing results due to tepid technology spending from their major customers. The share price decline of each of these companies offered an attractive opportunity to increase our exposure.
At year end, the Fund had 34 holdings, across a broad array of industries, with an emphasis on royalty companies engaged in land and natural resource management, industrials, and financial services. Texas Pacific Land Corporation remains the largest holding in the Fund at 16.5% of net assets.
How has the Fund performed over the last ten years?
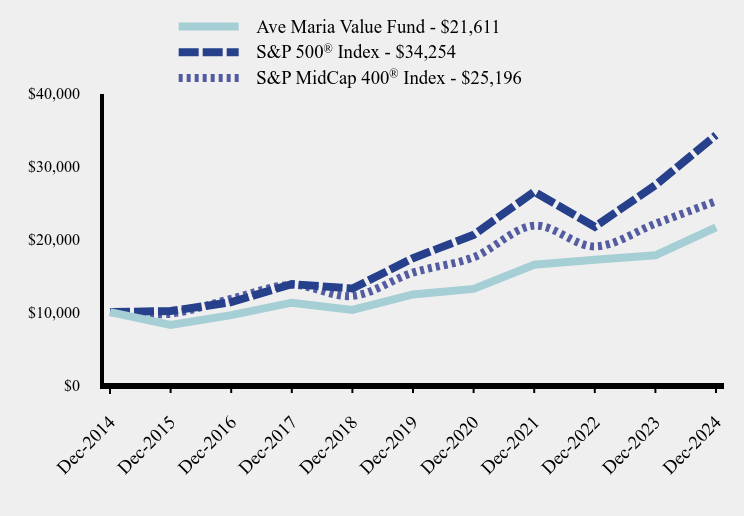
Total Return Based on $10,000 Investment
| Ave Maria Value Fund | S&P 500® Index | S&P MidCap 400® Index |
|---|
| Dec-2014 | $10,000 | $10,000 | $10,000 |
|---|
| Dec-2015 | $8,232 | $10,138 | $9,782 |
|---|
| Dec-2016 | $9,586 | $11,351 | $11,811 |
|---|
| Dec-2017 | $11,286 | $13,829 | $13,730 |
|---|
| Dec-2018 | $10,298 | $13,223 | $12,208 |
|---|
| Dec-2019 | $12,412 | $17,386 | $15,407 |
|---|
| Dec-2020 | $13,176 | $20,585 | $17,511 |
|---|
| Dec-2021 | $16,490 | $26,494 | $21,847 |
|---|
| Dec-2022 | $17,179 | $21,696 | $18,993 |
|---|
| Dec-2023 | $17,784 | $27,399 | $22,115 |
|---|
| Dec-2024 | $21,611 | $34,254 | $25,196 |
|---|
Average Annual Total Returns as of 12/31/2024
| 1 Year | 5 Years | 10 Years |
|---|
| Ave Maria Value Fund | 21.52% | 11.73% | 8.01% |
|---|
S&P 500® Index | 25.02% | 14.53% | 13.10% |
|---|
S&P MidCap 400® Index | 13.93% | 10.34% | 9.68% |
|---|
The Fund's past performance is not a good predictor of how the Fund will perform in the future. The graph and table do not reflect the deduction of taxes that a shareholder would pay on fund distributions or redemption of fund shares.
- Net Assets$446,204,797
- Number of Portfolio Holdings34
- Total Expense Ratio0.93%
- Advisory Fee $3,025,200
- Portfolio turnover (fiscal year)16%
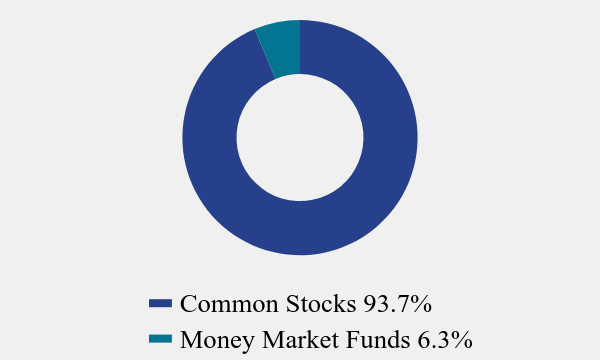
Asset Weighting (% of total investments)
| Value | Value |
|---|
| Common Stocks | 93.7% |
| Money Market Funds | 6.3% |
Timothy S. Schwartz, CFA
Ryan M. Kuyawa, CFA
Top 10 Holdings (% of net assets)
| Holding Name | % of Net Assets |
| Texas Pacific Land Corporation | 16.5% |
| Mirion Technologies, Inc. | 4.8% |
| Hingham Institution For Savings (The) | 4.6% |
| Landbridge Company, LLC - Class A | 4.4% |
| Brown & Brown, Inc. | 3.8% |
| Expand Energy Corporation | 3.2% |
| CDW Corporation | 3.2% |
| Permian Basin Royalty Trust | 3.1% |
| Wheaton Precious Metals Corporation | 2.8% |
| TD SYNNEX Corporation | 2.7% |
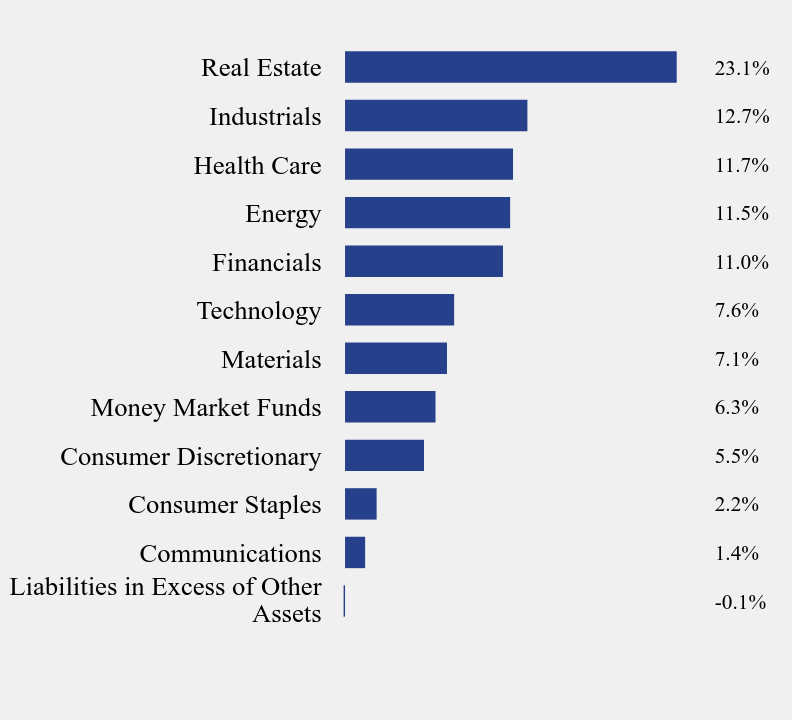
What did the Fund invest in?
Sector Weighting (% of net assets)
| Value | Value |
|---|
| Liabilities in Excess of Other Assets | -0.1% |
| Communications | 1.4% |
| Consumer Staples | 2.2% |
| Consumer Discretionary | 5.5% |
| Money Market Funds | 6.3% |
| Materials | 7.1% |
| Technology | 7.6% |
| Financials | 11.0% |
| Energy | 11.5% |
| Health Care | 11.7% |
| Industrials | 12.7% |
| Real Estate | 23.1% |
No material changes occurred during the year ended December 31, 2024.
Where can I find additional information about the Fund?
Additional information is available on the Fund's website (https://avemariafunds.com/reports-forms/reports.html), including its:
Prospectus
Financial information
Holdings
Proxy voting information
Ave Maria Value Fund (AVEMX)
Annual Shareholder Report - December 31, 2024
Annual Shareholder Report - December 31, 2024
This annual shareholder report contains important information about Ave Maria Growth Fund (the "Fund") for the period of January 1, 2024 to December 31, 2024. You can find additional information about the Fund at https://avemariafunds.com/reports-forms/reports.html. You can also request this information by contacting us at (888) 726-9331.
What were the Fund’s costs for the last year?
(based on a hypothetical $10,000 investment)
| Fund Name | Costs of a $10,000 investment | Costs paid as a percentage of a $10,000 investment |
|---|
| Ave Maria Growth Fund | $98 | 0.91% |
|---|
How did the Fund perform during the reporting period?
For the year ended December 31, 2024, the Fund had a total return of 14.91%, driven primarily by significant contributions from the Information Technology, Industrial, and Financial sectors. The Information Technology sector's performance was propelled by the semiconductor giant NVIDIA Corp., which returned an astounding 171% during the year, with additional support from Ciena Corp.'s impressive 79% gain. The Industrial holdings saw strength across the board with performance scattered around the sector’s 16% total return. Financials had a total return of 21%, its smaller relative weighting limited its overall impact on the Fund’s total performance.
The largest relative detractors of performance for the year were Health Care, Real Estate and Communication Services. The Health Care sector was down -14%, driven by weak performance from IQVIA Holdings Inc. and Chemed Corp. Real Estate had a single holding, SBA Communications Corp., which was down -18% over the year. The Communications Services sector, represented by a single holding, also underperformed the broader market, delivering a return of -3%.
The Fund’s goal is to purchase shares of exceptional companies at attractive prices with the expectations of earning favorable returns over the long run.
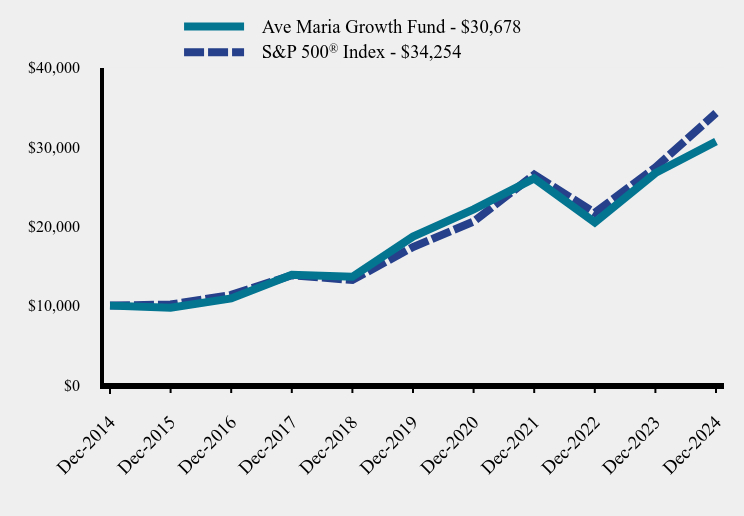
How has the Fund performed over the last ten years?
Total Return Based on $10,000 Investment
| Ave Maria Growth Fund | S&P 500® Index |
|---|
| Dec-2014 | $10,000 | $10,000 |
|---|
| Dec-2015 | $9,730 | $10,138 |
|---|
| Dec-2016 | $10,904 | $11,351 |
|---|
| Dec-2017 | $13,888 | $13,829 |
|---|
| Dec-2018 | $13,637 | $13,223 |
|---|
| Dec-2019 | $18,696 | $17,386 |
|---|
| Dec-2020 | $22,130 | $20,585 |
|---|
| Dec-2021 | $26,014 | $26,494 |
|---|
| Dec-2022 | $20,490 | $21,696 |
|---|
| Dec-2023 | $26,697 | $27,399 |
|---|
| Dec-2024 | $30,678 | $34,254 |
|---|
Average Annual Total Returns as of 12/31/2024
| 1 Year | 5 Years | 10 Years |
|---|
| Ave Maria Growth Fund | 14.91% | 10.41% | 11.86% |
|---|
S&P 500® Index | 25.02% | 14.53% | 13.10% |
|---|
The Fund's past performance is not a good predictor of how the Fund will perform in the future. The graph and table do not reflect the deduction of taxes that a shareholder would pay on fund distributions or redemption of fund shares.
- Net Assets$1,077,662,646
- Number of Portfolio Holdings33
- Total Expense Ratio0.91%
- Advisory Fee $7,860,874
- Portfolio turnover (fiscal year)17%
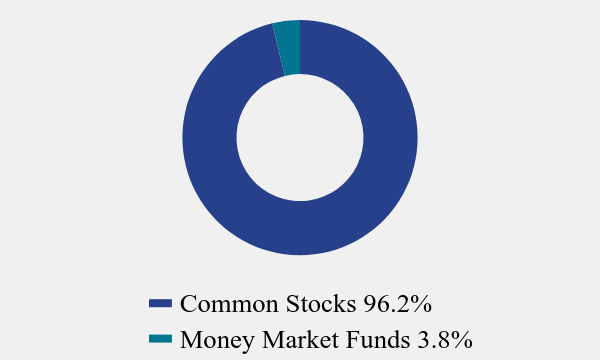
Asset Weighting (% of total investments)
| Value | Value |
|---|
| Common Stocks | 96.2% |
| Money Market Funds | 3.8% |
Adam P. Gaglio, CFA
Chadd M. Garcia, CFA
Top 10 Holdings (% of net assets)
| Holding Name | % of Net Assets |
| NVIDIA Corporation | 7.7% |
| Mastercard, Inc. - Class A | 6.9% |
| Copart, Inc. | 6.0% |
| API Group Corporation | 6.0% |
| O'Reilly Automotive, Inc. | 5.6% |
| HEICO Corporation - Class A | 4.8% |
| Taiwan Semiconductor Manufacturing Company Ltd. - ADR | 4.7% |
| Roper Technologies, Inc. | 4.7% |
| S&P Global, Inc. | 4.4% |
| Texas Instruments, Inc. | 4.2% |
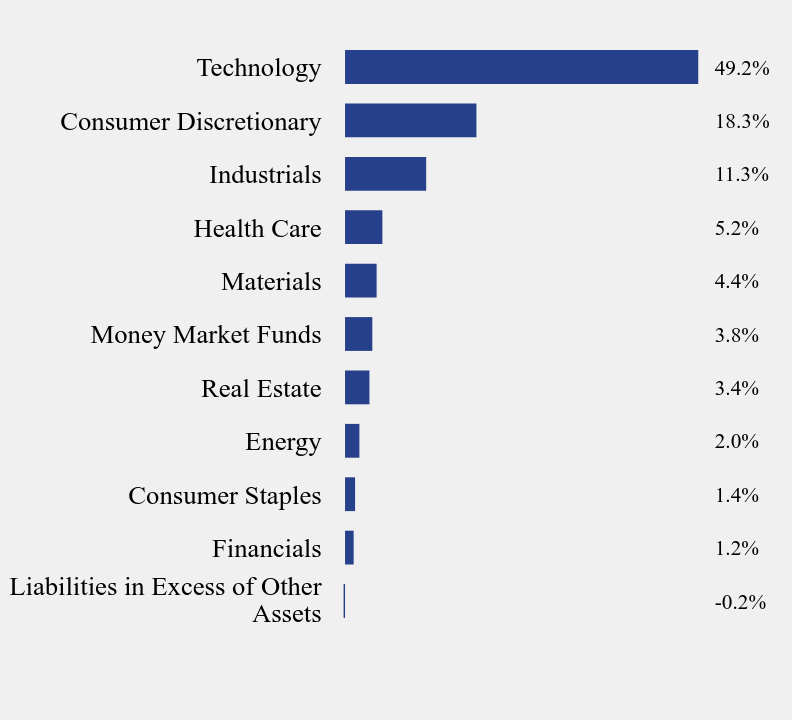
What did the Fund invest in?
Sector Weighting (% of net assets)
| Value | Value |
|---|
| Liabilities in Excess of Other Assets | -0.2% |
| Financials | 1.2% |
| Consumer Staples | 1.4% |
| Energy | 2.0% |
| Real Estate | 3.4% |
| Money Market Funds | 3.8% |
| Materials | 4.4% |
| Health Care | 5.2% |
| Industrials | 11.3% |
| Consumer Discretionary | 18.3% |
| Technology | 49.2% |
No material changes occurred during the year ended December 31, 2024.
Where can I find additional information about the Fund?
Additional information is available on the Fund's website (https://avemariafunds.com/reports-forms/reports.html), including its:
Prospectus
Financial information
Holdings
Proxy voting information
Ave Maria Growth Fund (AVEGX)
Annual Shareholder Report - December 31, 2024
Ave Maria Rising Dividend Fund
Annual Shareholder Report - December 31, 2024
This annual shareholder report contains important information about Ave Maria Rising Dividend Fund (the "Fund") for the period of January 1, 2024 to December 31, 2024. You can find additional information about the Fund at https://avemariafunds.com/reports-forms/reports.html. You can also request this information by contacting us at (888) 726-9331.
What were the Fund’s costs for the last year?
(based on a hypothetical $10,000 investment)
| Fund Name | Costs of a $10,000 investment | Costs paid as a percentage of a $10,000 investment |
|---|
| Ave Maria Rising Dividend Fund | $96 | 0.90% |
|---|
How did the Fund perform during the reporting period?
For the year ended December 31, 2024, the Fund had a total return of 14.42%, driven primarily by significant contributions from the Financial, Energy, and Industrial sectors. The Financial sector delivered a 22% return, driven by standout performance from Brown & Brown, Inc. and Brookfield Corp., which increased 44% each. The Energy sector surged 46% for the year, fueled by an outstanding 115% return from Texas Pacific Land Corp. Holdings in the Industrial sector delivered mixed results, contributing to a 10% return for the year.
The largest relative detractors of performance for the year were Real Estate, Health Care and Information Technology. Real Estate had a single holding, SBA Communications Corp., which was down -18% over the year. The Health Care sector declined by -4%, primarily due to the underperformance of Chemed Corp. Information Technology was up 3% for the year, however, the negative performance of three of the five holdings caused the sector to underperform.
The Fund’s investment strategy identifies companies with strong balance sheets that operate with competitive advantages and produce consistent, above-average cash flow and dividend growth, facilitating a rising stream of dividends. We strive to buy these companies when they are unpopular and undervalued.
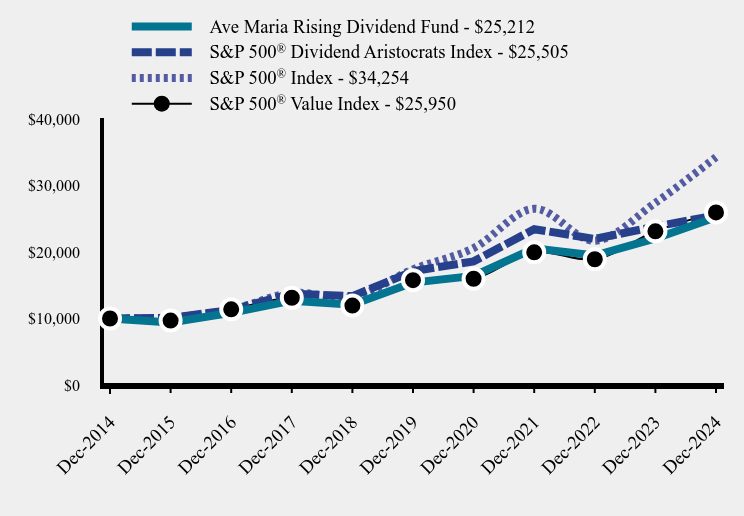
How has the Fund performed over the last ten years?
Total Return Based on $10,000 Investment
| Ave Maria Rising Dividend Fund | S&P 500® Dividend Aristocrats Index | S&P 500® Index | S&P 500® Value Index |
|---|
| Dec-2014 | $10,000 | $10,000 | $10,000 | $10,000 |
|---|
| Dec-2015 | $9,411 | $10,093 | $10,138 | $9,687 |
|---|
| Dec-2016 | $10,854 | $11,287 | $11,351 | $11,372 |
|---|
| Dec-2017 | $12,680 | $13,740 | $13,829 | $13,119 |
|---|
| Dec-2018 | $12,071 | $13,365 | $13,223 | $11,944 |
|---|
| Dec-2019 | $15,400 | $17,103 | $17,386 | $15,758 |
|---|
| Dec-2020 | $16,394 | $18,587 | $20,585 | $15,972 |
|---|
| Dec-2021 | $20,550 | $23,418 | $26,494 | $19,949 |
|---|
| Dec-2022 | $19,467 | $21,965 | $21,696 | $18,907 |
|---|
| Dec-2023 | $22,035 | $23,818 | $27,399 | $23,110 |
|---|
| Dec-2024 | $25,212 | $25,505 | $34,254 | $25,950 |
|---|
Average Annual Total Returns as of 12/31/2024
| 1 Year | 5 Years | 10 Years |
|---|
| Ave Maria Rising Dividend Fund | 14.42% | 10.36% | 9.69% |
|---|
S&P 500® Dividend Aristocrats Index | 7.08% | 8.32% | 9.82% |
|---|
S&P 500® Index | 25.02% | 14.53% | 13.10% |
|---|
S&P 500® Value Index | 12.29% | 10.49% | 10.01% |
|---|
The Fund's past performance is not a good predictor of how the Fund will perform in the future. The graph and table do not reflect the deduction of taxes that a shareholder would pay on fund distributions or redemption of fund shares.
- Net Assets$1,077,147,464
- Number of Portfolio Holdings37
- Total Expense Ratio0.90%
- Advisory Fee $7,944,740
- Portfolio turnover (fiscal year)8%
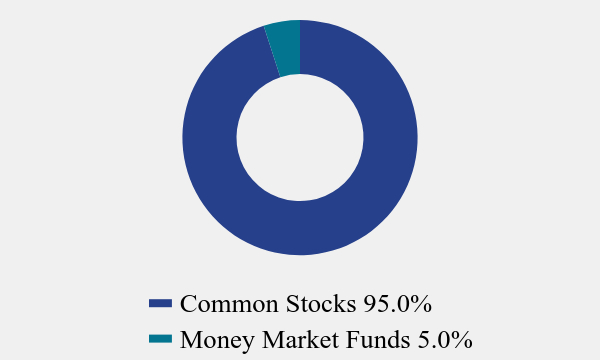
Asset Weighting (% of total investments)
| Value | Value |
|---|
| Common Stocks | 95.0% |
| Money Market Funds | 5.0% |
Brandon S. Scheitler
George P. Schwartz, CFA
Top 10 Holdings (% of net assets)
| Holding Name | % of Net Assets |
| Texas Pacific Land Corporation | 5.6% |
| Chubb Ltd. | 4.5% |
| Mastercard, Inc. - Class A | 4.2% |
| Accenture plc - Class A | 4.0% |
| Moody's Corporation | 3.5% |
| Diamondback Energy, Inc. | 3.5% |
| Texas Instruments, Inc. | 3.5% |
| Chemed Corporation | 3.4% |
| Brown & Brown, Inc. | 3.3% |
| Broadridge Financial Solutions, Inc. | 3.1% |
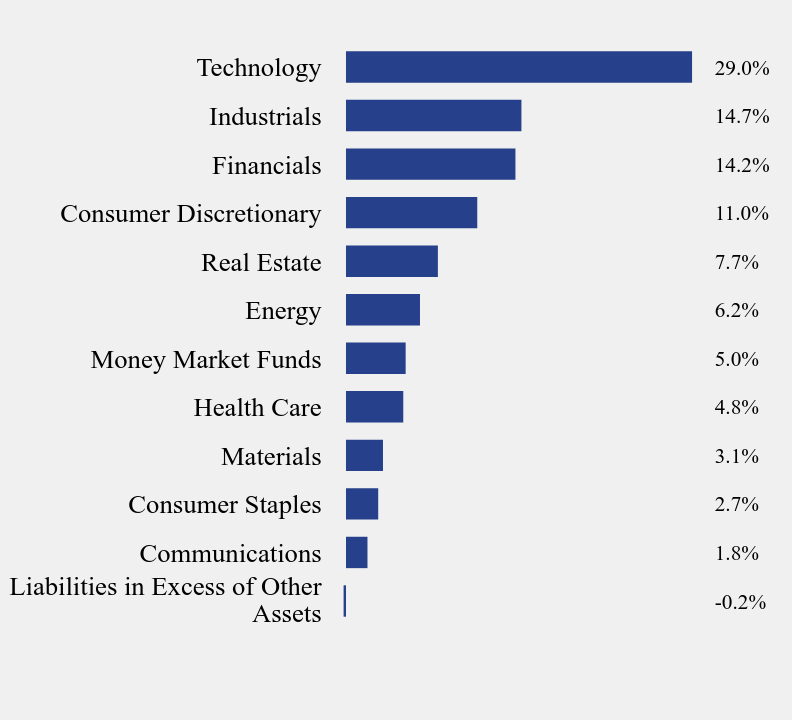
What did the Fund invest in?
Sector Weighting (% of net assets)
| Value | Value |
|---|
| Liabilities in Excess of Other Assets | -0.2% |
| Communications | 1.8% |
| Consumer Staples | 2.7% |
| Materials | 3.1% |
| Health Care | 4.8% |
| Money Market Funds | 5.0% |
| Energy | 6.2% |
| Real Estate | 7.7% |
| Consumer Discretionary | 11.0% |
| Financials | 14.2% |
| Industrials | 14.7% |
| Technology | 29.0% |
No material changes occurred during the year ended December 31, 2024.
Where can I find additional information about the Fund?
Additional information is available on the Fund's website (https://avemariafunds.com/reports-forms/reports.html), including its:
Prospectus
Financial information
Holdings
Proxy voting information
Ave Maria Rising Dividend Fund (AVEDX)
Annual Shareholder Report - December 31, 2024
Ave Maria World Equity Fund
Annual Shareholder Report - December 31, 2024
This annual shareholder report contains important information about Ave Maria World Equity Fund (the "Fund") for the period of January 1, 2024 to December 31, 2024. You can find additional information about the Fund at https://avemariafunds.com/reports-forms/reports.html. You can also request this information by contacting us at (888) 726-9331.
What were the Fund’s costs for the last year?
(based on a hypothetical $10,000 investment)
| Fund Name | Costs of a $10,000 investment | Costs paid as a percentage of a $10,000 investment |
|---|
| Ave Maria World Equity Fund | $105 | 1.03% |
|---|
How did the Fund perform during the reporting period?
For the year ended December 31, 2024, the Fund had a total return of 4.64%, driven primarily by significant contributions from the Information Technology, Industrial and Consumer Staples sectors. Information Technology delivered a 38% return for the year, driven by standout performances from Taiwan Semiconductor Manufacturing Co. and Karooooo Ltd, both achieving returns exceeding 90%. The Industrial sector gained 21% for the year, with long-time holding Eaton Corp. contributing to much of the sector’s performance. Consumer Staples rose 24% for the year, driven by nearly equal contributions from the Fund’s two holdings in the sector.
The largest relative detractors of performance for the year were Financial, Health Care and Consumer Discretionary. The Financial sector declined -14% for the year, reflecting weak performance for the sector’s larger holdings. Similarly, Health Care also fell -14%, with three out of four holdings contributing to the sector's overall downturn. Consumer Discretionary was down -1% due to the underperformance of several larger holdings within the sector.
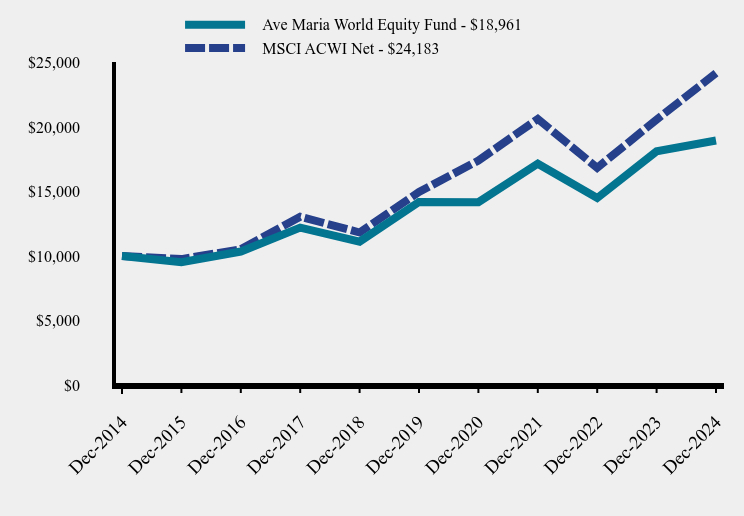
How has the Fund performed over the last ten years?
Total Return Based on $10,000 Investment
| Ave Maria World Equity Fund | MSCI ACWI Net |
|---|
| Dec-2014 | $10,000 | $10,000 |
|---|
| Dec-2015 | $9,522 | $9,763 |
|---|
| Dec-2016 | $10,352 | $10,531 |
|---|
| Dec-2017 | $12,203 | $13,056 |
|---|
| Dec-2018 | $11,121 | $11,826 |
|---|
| Dec-2019 | $14,197 | $14,972 |
|---|
| Dec-2020 | $14,175 | $17,406 |
|---|
| Dec-2021 | $17,160 | $20,633 |
|---|
| Dec-2022 | $14,501 | $16,843 |
|---|
| Dec-2023 | $18,120 | $20,583 |
|---|
| Dec-2024 | $18,961 | $24,183 |
|---|
Average Annual Total Returns as of 12/31/2024
| 1 Year | 5 Years | 10 Years |
|---|
| Ave Maria World Equity Fund | 4.64% | 5.96% | 6.61% |
|---|
| MSCI ACWI Net | 17.49% | 10.06% | 9.23% |
|---|
The Fund's past performance is not a good predictor of how the Fund will perform in the future. The graph and table do not reflect the deduction of taxes that a shareholder would pay on fund distributions or redemption of fund shares.
Anthony W. Gennaro Jr., CFA, CPA
Sean C. Gaffney, CFA
| Net Assets | $116,384,489 |
|---|
| Number of Portfolio Holdings | 49 |
|---|
| Total Expense Ratio | 1.03% |
|---|
| Advisory Fee | $839,339 |
|---|
| Portfolio turnover (fiscal year) | 13% |
|---|
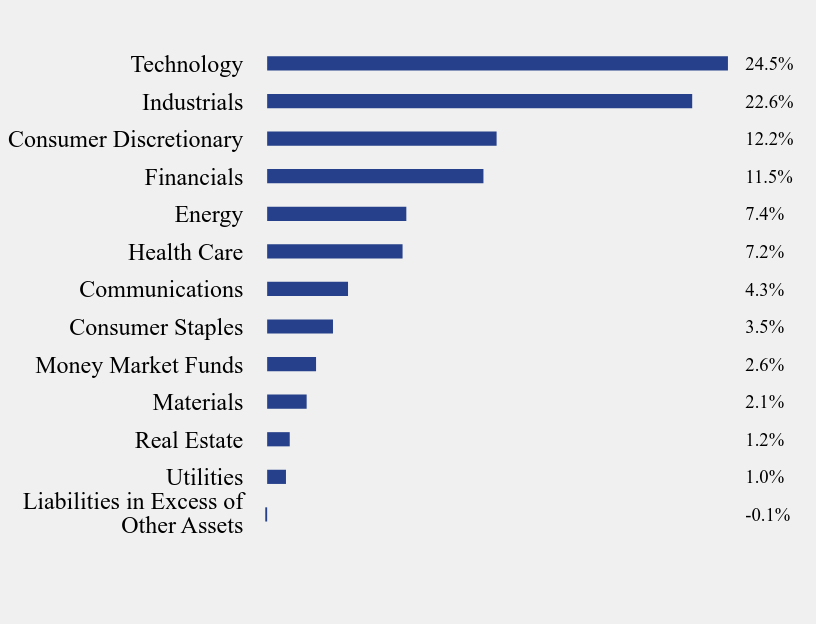
What did the Fund invest in?
Sector Weighting (% of net assets)
| Value | Value |
|---|
| Liabilities in Excess of Other Assets | -0.1% |
| Utilities | 1.0% |
| Real Estate | 1.2% |
| Materials | 2.1% |
| Money Market Funds | 2.6% |
| Consumer Staples | 3.5% |
| Communications | 4.3% |
| Health Care | 7.2% |
| Energy | 7.4% |
| Financials | 11.5% |
| Consumer Discretionary | 12.2% |
| Industrials | 22.6% |
| Technology | 24.5% |
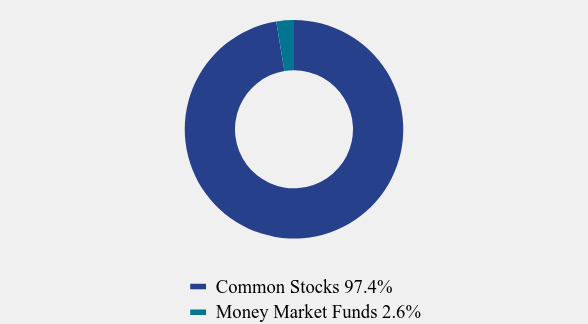
Asset Weighting (% of total investments)
| Value | Value |
|---|
| Common Stocks | 97.4% |
| Money Market Funds | 2.6% |
Top 10 Holdings (% of net assets)
| Holding Name | % of Net Assets |
| SAP SE | 5.2% |
| Mastercard, Inc. - Class A | 4.5% |
| Eaton Corporation plc | 4.5% |
| SharkNinja, Inc. | 4.2% |
| GFL Environmental, Inc. | 4.1% |
| Taiwan Semiconductor Manufacturing Company Ltd. - ADR | 3.6% |
| F&G Annuities & Life, Inc. | 3.4% |
| Accenture plc - Class A | 3.0% |
| HDFC Bank Ltd. - ADR | 2.8% |
| S&P Global, Inc. | 2.7% |
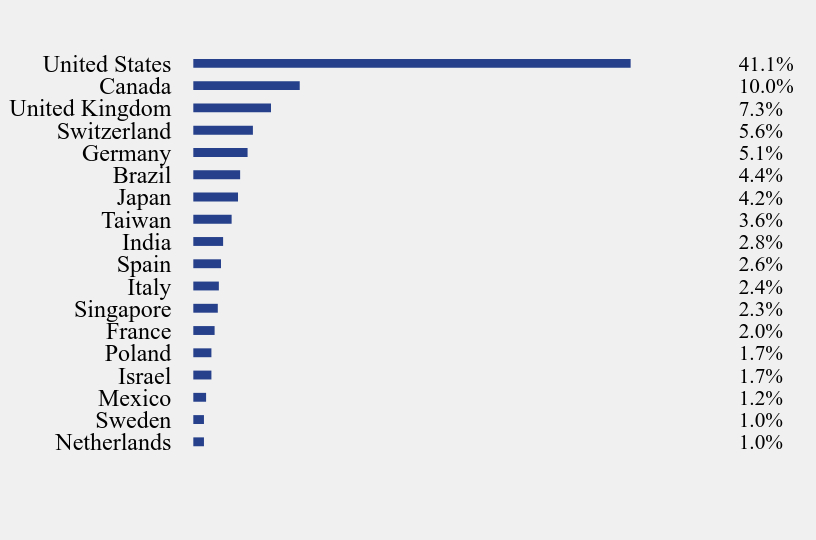
Country Weighting (% of net assets)
| Value | Value |
|---|
| Netherlands | 1.0% |
| Sweden | 1.0% |
| Mexico | 1.2% |
| Israel | 1.7% |
| Poland | 1.7% |
| France | 2.0% |
| Singapore | 2.3% |
| Italy | 2.4% |
| Spain | 2.6% |
| India | 2.8% |
| Taiwan | 3.6% |
| Japan | 4.2% |
| Brazil | 4.4% |
| Germany | 5.1% |
| Switzerland | 5.6% |
| United Kingdom | 7.3% |
| Canada | 10.0% |
| United States | 41.1% |
No material changes occurred during the year ended December 31, 2024.
Where can I find additional information about the Fund?
Additional information is available on the Fund's website (https://avemariafunds.com/reports-forms/reports.html), including its:
Prospectus
Financial information
Holdings
Proxy voting information
Ave Maria World Equity Fund (AVEWX)
Annual Shareholder Report - December 31, 2024
Annual Shareholder Report - December 31, 2024
This annual shareholder report contains important information about Ave Maria Focused Fund (the "Fund") for the period of January 1, 2024 to December 31, 2024. You can find additional information about the Fund at https://avemariafunds.com/reports-forms/reports.html. You can also request this information by contacting us at (888) 726-9331.
What were the Fund’s costs for the last year?
(based on a hypothetical $10,000 investment)
| Fund Name | Costs of a $10,000 investment | Costs paid as a percentage of a $10,000 investment |
|---|
| Ave Maria Focused Fund | $117 | 1.11% |
|---|
How did the Fund perform during the reporting period?
For the year ended December 31, 2024, the Fund had a total return of 11.52%, driven primarily by significant contributions from the Real Estate, Financial and Industrial sectors. The Real Estate sector soared an impressive 180% for the year, driven entirely by its sole holding, Landbridge Co. LLC. The Financial sector rose 13%, driven by strong performance from its three holdings. Meanwhile, the Industrials sector gained 10%, largely fueled by the outstanding performance of GFL Environmental Inc., which climbed nearly 30% for the year.
The largest relative detractors of performance for the year were Materials, Information Technology and Health Care. The Materials sector was down -15%, with two of the three holdings posting negative returns. The Information Technology sector was down -68% due to the only holding in the sector, Cirata PLC. In contrast, the Health Care sector edged up 4%, supported by its lone holding, Chemed, Corp.
The Fund will continue to be managed with a focus on companies that can grow their per-share economic earnings over a long period of time. The Fund privileges companies with durable and forecastable earnings, companies with an economic moat, and companies that generate high returns on invested capital.
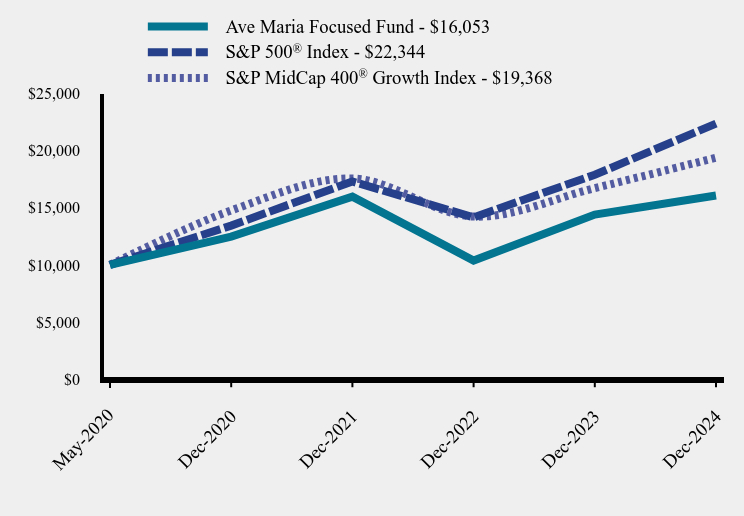
How has the Fund performed since inception?
Total Return Based on $10,000 Investment
| Ave Maria Focused Fund | S&P 500® Index | S&P MidCap 400® Growth Index |
|---|
| May-2020 | $10,000 | $10,000 | $10,000 |
|---|
| Dec-2020 | $12,471 | $13,428 | $14,756 |
|---|
| Dec-2021 | $15,958 | $17,282 | $17,546 |
|---|
| Dec-2022 | $10,376 | $14,152 | $14,219 |
|---|
| Dec-2023 | $14,395 | $17,873 | $16,706 |
|---|
| Dec-2024 | $16,053 | $22,344 | $19,368 |
|---|
Average Annual Total Returns as of 12/31/2024
| 1 Year | Since Inception (May 1, 2020) |
|---|
| Ave Maria Focused Fund | 11.52% | 10.67% |
|---|
S&P 500® Index | 25.02% | 18.79% |
|---|
S&P MidCap 400® Growth Index | 15.95% | 15.21% |
|---|
The Fund's past performance is not a good predictor of how the Fund will perform in the future. The graph and table do not reflect the deduction of taxes that a shareholder would pay on fund distributions or redemption of fund shares.
- Net Assets$57,489,704
- Number of Portfolio Holdings17
- Total Expense Ratio1.11%
- Advisory Fee $418,690
- Portfolio turnover (fiscal year)22%
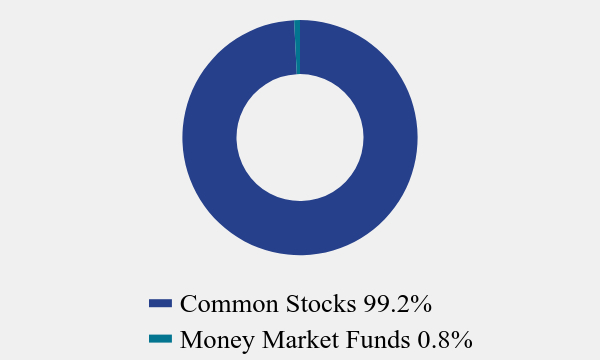
Asset Weighting (% of total investments)
| Value | Value |
|---|
| Common Stocks | 99.2% |
| Money Market Funds | 0.8% |
Chadd M. Garcia, CFA
Adam P. Gaglio, CFA
Top 10 Holdings (% of net assets)
| Holding Name | % of Net Assets |
| eDreams ODIGEO S.A. | 20.6% |
| API Group Corporation | 18.0% |
| DigitalBridge Group, Inc. | 8.7% |
| Brookfield Corporation | 8.5% |
| Brookfield Wealth Solutions Ltd. | 8.4% |
| GFL Environmental, Inc. | 8.0% |
| Apollo Global Management, Inc. | 6.4% |
| Secure Energy Services, Inc. | 6.2% |
| Landbridge Company, LLC - Class A | 6.1% |
| SigmaRoc plc | 4.2% |
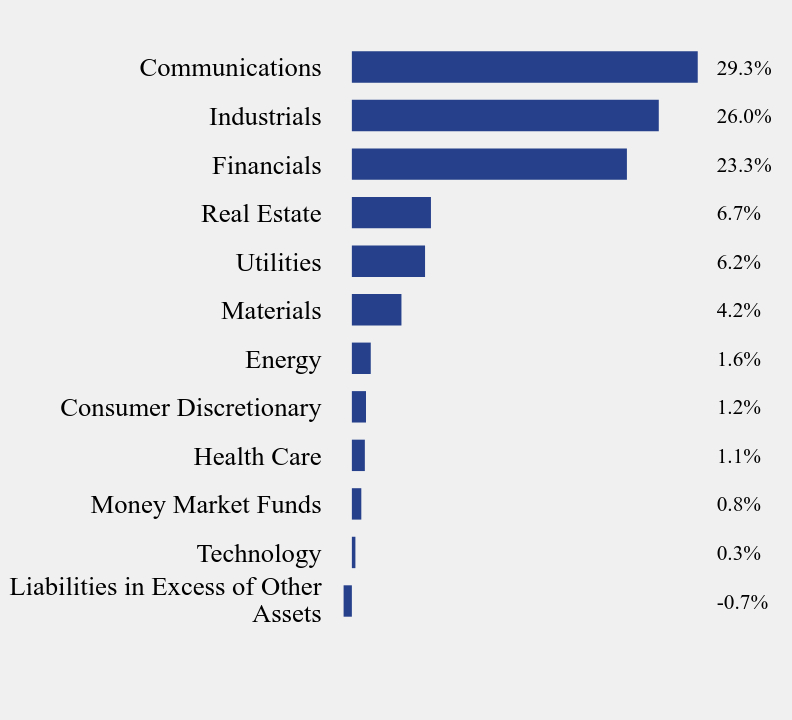
What did the Fund invest in?
Sector Weighting (% of net assets)
| Value | Value |
|---|
| Liabilities in Excess of Other Assets | -0.7% |
| Technology | 0.3% |
| Money Market Funds | 0.8% |
| Health Care | 1.1% |
| Consumer Discretionary | 1.2% |
| Energy | 1.6% |
| Materials | 4.2% |
| Utilities | 6.2% |
| Real Estate | 6.7% |
| Financials | 23.3% |
| Industrials | 26.0% |
| Communications | 29.3% |
No material changes occurred during the year ended December 31, 2024.
Where can I find additional information about the Fund?
Additional information is available on the Fund's website (https://avemariafunds.com/reports-forms/reports.html), including its:
Prospectus
Financial information
Holdings
Proxy voting information
Ave Maria Focused Fund (AVEAX)
Annual Shareholder Report - December 31, 2024
Annual Shareholder Report - December 31, 2024
This annual shareholder report contains important information about Ave Maria Bond Fund (the "Fund") for the period of January 1, 2024 to December 31, 2024. You can find additional information about the Fund at https://avemariafunds.com/reports-forms/reports.html. You can also request this information by contacting us at (888) 726-9931.
What were the Fund’s costs for the last year?
(based on a hypothetical $10,000 investment)
| Fund Name | Costs of a $10,000 investment | Costs paid as a percentage of a $10,000 investment |
|---|
| Ave Maria Bond Fund | $42 | 0.41% |
|---|
How did the Fund perform during the reporting period?
For the year ended December 31, 2024, the Fund had a total return of 5.71%. The Fund's exposure to dividend-paying common stocks and high quality, short-duration bonds contributed to its outperformance versus the benchmark during the year. Notable performers included Texas Pacific Land Corp., Truist Financial, Corp., and Coca-Cola Europacific Partners PLC, which increased by 115%, 24%, and 18%, respectively. Performance detractors include the common stocks of United Parcel Service, Inc., and Genuine Parts, Co., which declined by -15% and -13%, respectively. The Fund’s longer-duration bond holdings saw low single-digit declines as interest rates increased.
In a twist of fate, interest rates on longer-dated bonds have increased as the Federal Reserve reduced short-term rates by 1% during the latter half of the year. A stronger-than-expected economy, significant fiscal deficits by the Federal Government and lingering inflation present challenges to further lower short-term interest rates this year.
Corporate bond spreads have continued to narrow near historic lows. Investors should exercise caution when adding credit exposure at this time. This is particularly important for low credit quality bonds, where investors are not being adequately compensated for the additional credit risk.
The Bond Fund will continue to be managed in a conservative manner by keeping bond maturities in the short-to-intermediate range and the credit quality high. Additionally, high-quality, dividend-paying common stocks continue to offer an attractive combination of income and price appreciation potential.
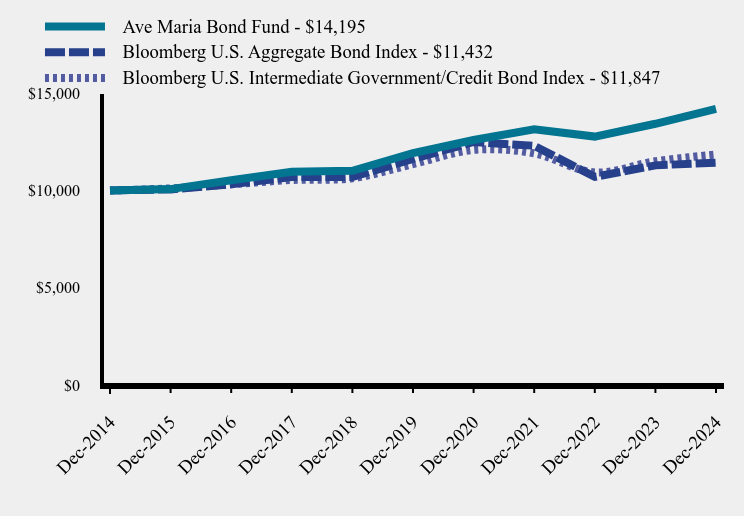
How has the Fund performed over the last ten years?
Total Return Based on $10,000 Investment
| Ave Maria Bond Fund | Bloomberg U.S. Aggregate Bond Index | Bloomberg U.S. Intermediate Government/Credit Bond Index |
|---|
| Dec-2014 | $10,000 | $10,000 | $10,000 |
|---|
| Dec-2015 | $10,070 | $10,055 | $10,107 |
|---|
| Dec-2016 | $10,528 | $10,321 | $10,317 |
|---|
| Dec-2017 | $10,966 | $10,687 | $10,538 |
|---|
| Dec-2018 | $11,011 | $10,688 | $10,630 |
|---|
| Dec-2019 | $11,925 | $11,620 | $11,353 |
|---|
| Dec-2020 | $12,592 | $12,492 | $12,084 |
|---|
| Dec-2021 | $13,144 | $12,299 | $11,910 |
|---|
| Dec-2022 | $12,770 | $10,699 | $10,929 |
|---|
| Dec-2023 | $13,428 | $11,291 | $11,502 |
|---|
| Dec-2024 | $14,195 | $11,432 | $11,847 |
|---|
Average Annual Total Returns as of 12/31/2024
| 1 Year | 5 Years | 10 Years |
|---|
| Ave Maria Bond Fund | 5.71% | 3.55% | 3.57% |
|---|
| Bloomberg U.S. Aggregate Bond Index | 1.25% | -0.33% | 1.35% |
|---|
| Bloomberg U.S. Intermediate Government/Credit Bond Index | 3.00% | 0.86% | 1.71% |
|---|
The Fund's past performance is not a good predictor of how the Fund will perform in the future. The graph and table do not reflect the deduction of taxes that a shareholder would pay on fund distributions or redemption of fund shares.
- Net Assets$676,516,344
- Number of Portfolio Holdings179
- Total Expense Ratio0.41%
- Advisory Fee $1,548,571
- Portfolio turnover (fiscal year)20%
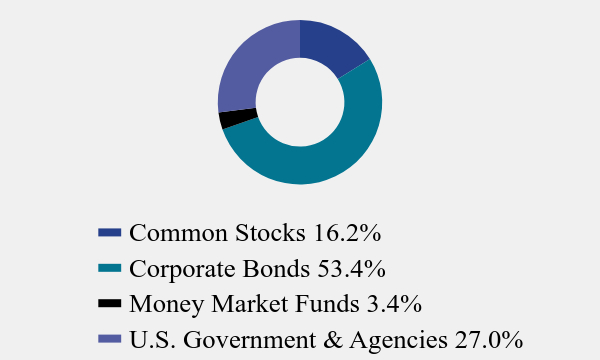
Asset Weighting (% of total investments)
| Value | Value |
|---|
| Common Stocks | 16.2% |
| Corporate Bonds | 53.4% |
| Money Market Funds | 3.4% |
| U.S. Government & Agencies | 27.0% |
Brandon S. Scheitler
George P. Schwartz, CFA
Top 10 Holdings (% of net assets)
| Holding Name | % of Net Assets |
| Coca-Cola Europacific Partners plc | 1.7% |
| Watsco, Inc. | 1.7% |
| Illinois Tool Works, Inc., 2.650%, due 11/15/26 | 1.5% |
| U.S. Treasury Notes, 4.625%, due 09/30/30 | 1.5% |
| U.S. Treasury Notes, 4.500%, due 11/15/25 | 1.5% |
| U.S. Treasury Notes, 1.375%, due 01/31/25 | 1.5% |
| U.S. Treasury Notes, 4.125%, due 09/30/27 | 1.5% |
| U.S. Treasury Notes, 4.500%, due 11/15/33 | 1.5% |
| U.S. Treasury Notes, 4.250%, due 06/30/29 | 1.5% |
| U.S. Treasury Notes, 2.875%, due 06/15/25 | 1.5% |
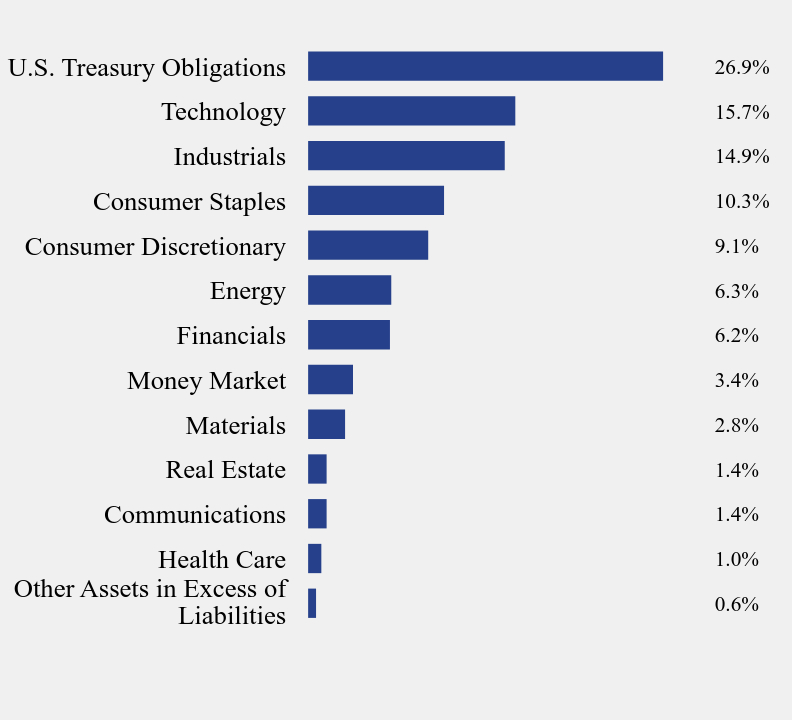
What did the Fund invest in?
Sector Weighting (% of net assets)
| Value | Value |
|---|
| Other Assets in Excess of Liabilities | 0.6% |
| Health Care | 1.0% |
| Communications | 1.4% |
| Real Estate | 1.4% |
| Materials | 2.8% |
| Money Market | 3.4% |
| Financials | 6.2% |
| Energy | 6.3% |
| Consumer Discretionary | 9.1% |
| Consumer Staples | 10.3% |
| Industrials | 14.9% |
| Technology | 15.7% |
| U.S. Treasury Obligations | 26.9% |
No material changes occurred during the year ended December 31, 2024.
Where can I find additional information about the Fund?
Additional information is available on the Fund's website (https://avemariafunds.com/reports-forms/reports.html), including its:
Prospectus
Financial information
Holdings
Proxy voting information
Ave Maria Bond Fund (AVEFX)
Annual Shareholder Report - December 31, 2024
Item 2. Code of Ethics.
As of the end of the period covered by this report, the registrant has adopted a code of ethics that applies to the registrant’s principal executive officer, principal financial officer, principal accounting officer or controller, or persons performing similar functions, regardless of whether these individuals are employed by the registrant or a third party. Pursuant to Item 13(a)(1), a copy of registrant’s code of ethics is filed as an exhibit to this Form N-CSR. During the period covered by this report, the code of ethics has not been amended, and the registrant has not granted any waivers, including implicit waivers, from the provisions of the code of ethics.
Item 3. Audit Committee Financial Expert.
The registrant’s board of trustees has determined that the registrant has an audit committee financial expert serving on its audit committee. The name of the audit committee financial expert is William A. Morrow. Mr. Morrow is “independent” for purposes of this Item.
Item 4. Principal Accountant Fees and Services.
| (a) | Audit Fees. The aggregate fees billed for professional services rendered by the principal accountant for the audit of the registrant’s annual financial statements or for services that are normally provided by the accountant in connection with statutory and regulatory filings or engagements were $191,600 and $191,600 with respect to the registrant’s fiscal years ended December 31, 2024 and 2023, respectively. |
| (b) | Audit-Related Fees. No fees were billed in either of the last two fiscal years for assurance and related services by the principal accountant that are reasonably related to the performance of the audit of the registrant’s financial statements and are not reported under paragraph (a) of this Item. |
| (c) | Tax Fees. The aggregate fees billed for professional services rendered by the principal accountant for tax compliance, tax advice, and tax planning were $26,300 and $25,300 with respect to the registrant’s fiscal years ended December 31, 2024 and 2023, respectively. The services comprising these fees are tax consulting and the preparation of the registrant’s federal income and excise tax returns. |
| (d) | All Other Fees. No fees were billed in either of the last two fiscal years for products and services provided by the principal accountant, other than the services reported in paragraphs (a) through (c) of this Item. |
| (e)(1) | The audit committee has not adopted pre-approval policies and procedures described in paragraph (c)(7) of Rule 2-01 of Regulation S-X. |
| (e)(2) | None of the services described in paragraph (b) through (d) of this Item were approved by the audit committee pursuant to paragraph (c)(7)(i)(C) of Rule 2-01 of Regulation S-X. |
| (f) | Less than 50% of hours expended on the principal accountant’s engagement to audit the registrant’s financial statements for the most recent fiscal year were attributed to work performed by persons other than the principal accountant’s full-time, permanent employees. |
| (g) | During the fiscal years ended December 31, 2024 and 2023, aggregate non- audit fees of $26,300 and $25,300, respectively, were billed by the registrant’s principal accountant for services rendered to the registrant. During the fiscal years ended December 31, 2024 and 2023, $16,500 and $16,050, respectively, were billed by the registrant’s principal accountant for services rendered to the registrant’s investment adviser (not including any sub-adviser whose role is primarily portfolio management and is subcontracted with or overseen by another investment adviser), and any entity controlling, controlled by, or under common control with the adviser that provides ongoing services to the registrant. |
| (h) | The registrant’s audit committee determined that the provision of non-audit services that were rendered to the registrant’s investment adviser (not including any sub-adviser whose role is primarily portfolio management and is subcontracted with or overseen by another investment adviser), and any entity controlling, controlled by, or under common control with the investment adviser that provides ongoing services to the registrant, that were not pre-approved pursuant to paragraph (c)(7)(ii) of Rule 2-01 of Regulation S-X is compatible with maintaining the principal accountant’s independence. |
Item 5. Audit Committee of Listed Registrants.
Not applicable
Item 6. Investments.
(a) The Registrant(s) schedule(s) of investments is included in the Financial Statements under Item 7 of this form.
(b) Not applicable
Item 7. Financial Statements and Financial Highlights for Open-End Management Investment Companies
(a) To be inserted
SCHWARTZ VALUE FOCUSED FUND
SCHEDULE OF INVESTMENTS
December 31, 2024
COMMON STOCKS — 83.3% | | Shares | | | Fair Value | |
Communications — 3.2% | | | | | | | | |
Telecommunications — 3.2% | | | | | | | | |
DigitalBridge Group, Inc. | | | 150,000 | | | $ | 1,692,000 | |
| | | | | | | | | |
Consumer Discretionary — 10.0% | | | | | | | | |
Home Construction — 2.1% | | | | | | | | |
Masco Corporation | | | 15,000 | | | | 1,088,550 | |
| | | | | | | | | |
Leisure Facilities & Services — 2.8% | | | | | | | | |
Madison Square Garden Sports Corporation * | | | 6,400 | | | | 1,444,352 | |
| | | | | | | | | |
Leisure Products — 1.8% | | | | | | | | |
YETI Holdings, Inc. * | | | 25,000 | | | | 962,750 | |
| | | | | | | | | |
Retail - Discretionary — 3.3% | | | | | | | | |
Genuine Parts Company | | | 15,000 | | | | 1,751,400 | |
| | | | | | | | | |
Energy — 10.7% | | | | | | | | |
Oil & Gas Producers — 7.8% | | | | | | | | |
Devon Energy Corporation | | | 20,000 | | | | 654,600 | |
Expand Energy Corporation | | | 12,300 | | | | 1,224,465 | |
Occidental Petroleum Corporation | | | 36,000 | | | | 1,778,760 | |
Permian Basin Royalty Trust | | | 38,735 | | | | 429,184 | |
| | | | | | | | 4,087,009 | |
Oil & Gas Services & Equipment — 2.9% | | | | | | | | |
Schlumberger Ltd. | | | 39,800 | | | | 1,525,932 | |
| | | | | | | | | |
Financials — 4.9% | | | | | | | | |
Institutional Financial Services — 2.3% | | | | | | | | |
Intercontinental Exchange, Inc. | | | 8,000 | | | | 1,192,080 | |
| | | | | | | | | |
Insurance — 2.6% | | | | | | | | |
Berkshire Hathaway, Inc. - Class A * | | | 2 | | | | 1,361,840 | |
| | | | | | | | | |
Industrials — 1.4% | | | | | | | | |
Electrical Equipment — 1.4% | | | | | | | | |
A.O. Smith Corporation | | | 10,600 | | | | 723,026 | |
| | | | | | | | | |
Materials — 5.3% | | | | | | | | |
Metals & Mining — 5.3% | | | | | | | | |
Franco-Nevada Corporation | | | 15,200 | | | | 1,787,368 | |
Pan American Silver Corporation | | | 50,500 | | | | 1,021,110 | |
| | | | | | | | 2,808,478 | |
1
SCHWARTZ VALUE FOCUSED FUND
SCHEDULE OF INVESTMENTS
(Continued)
COMMON STOCKS — 83.3% (Continued) | | Shares | | | Fair Value | |
Real Estate — 37.8% | | | | | | | | |
Multi-Asset Class Owners & Developers — 6.0% | | | | | | | | |
Landbridge Company, LLC - Class A | | | 48,659 | | | $ | 3,143,371 | |
| | | | | | | | | |
Real Estate Owners & Developers — 31.8% | | | | | | | | |
St. Joe Company (The) | | | 52,600 | | | | 2,363,318 | |
Texas Pacific Land Corporation | | | 13,000 | | | | 14,377,480 | |
| | | | | | | | 16,740,798 | |
Technology — 10.0% | | | | | | | | |
Technology Services — 10.0% | | | | | | | | |
CDW Corporation | | | 10,750 | | | | 1,870,930 | |
Mastercard, Inc. - Class A | | | 3,750 | | | | 1,974,638 | |
Moody’s Corporation | | | 3,000 | | | | 1,420,110 | |
| | | | | | | | 5,265,678 | |
| | | | | | | | | |
Total Common Stocks (Cost $24,259,654) | | | | | | $ | 43,787,264 | |
MONEY MARKET FUNDS — 16.6% | | Shares | | | Fair Value | |
Federated Hermes Government Obligations Tax-Managed Fund - Institutional Shares, 4.33% (a) | | | 2,279,072 | | | $ | 2,279,072 | |
Federated Hermes Treasury Obligations Fund - Institutional Shares, 4.34% (a) | | | 2,640,548 | | | | 2,640,548 | |
Federated Hermes U.S. Treasury Cash Reserves Fund - Institutional Shares, 4.32% (a) | | | 2,640,548 | | | | 2,640,548 | |
Invesco Treasury Portfolio - Institutional Class, 4.38% (a) | | | 1,139,345 | | | | 1,139,345 | |
Total Money Market Funds (Cost $8,699,513) | | | | | | $ | 8,699,513 | |
| | | | | | | | | |
Total Investments at Fair Value — 99.9% (Cost $32,959,167) | | | | | | $ | 52,486,777 | |
| | | | | | | | | |
Other Assets in Excess of Liabilities — 0.1% | | | | | | | 75,311 | |
| | | | | | | | | |
Net Assets — 100.0% | | | | | | $ | 52,562,088 | |
* | Non-income producing security. |
(a) | The rate shown is the 7-day effective yield as of December 31, 2024. |
See notes to financial statements. |
2
SCHWARTZ VALUE FOCUSED FUND
STATEMENT OF ASSETS AND LIABILITIES
December 31, 2024
ASSETS | | | | |
Investments, at fair value (cost of $32,959,167) (Note 1) | | $ | 52,486,777 | |
Receivable for capital shares sold | | | 201,815 | |
Dividends receivable | | | 61,999 | |
Other assets | | | 12,984 | |
TOTAL ASSETS | | | 52,763,575 | |
| | | | | |
LIABILITIES | | | | |
Payable for capital shares redeemed | | | 72,790 | |
Payable to Adviser (Note 2) | | | 112,220 | |
Payable to administrator (Note 2) | | | 4,622 | |
Other accrued expenses | | | 11,855 | |
TOTAL LIABILITIES | | | 201,487 | |
| | | | | |
NET ASSETS | | $ | 52,562,088 | |
| | | | | |
NET ASSETS CONSIST OF: | | | | |
Paid-in capital | | $ | 33,034,478 | |
Distributable earnings | | | 19,527,610 | |
NET ASSETS | | $ | 52,562,088 | |
| | | | | |
Shares of beneficial interest outstanding (unlimited number of shares authorized, no par value) | | | 996,812 | |
| | | | | |
Net asset value, offering price and redemption price per share (Note 1) | | $ | 52.73 | |
See notes to financial statements. |
3
SCHWARTZ VALUE FOCUSED FUND
STATEMENT OF OPERATIONS
For the Year Ended December 31, 2024
INVESTMENT INCOME | | | | |
Dividends | | $ | 697,078 | |
Foreign withholding taxes on dividends | | | (3,874 | ) |
TOTAL INVESTMENT INCOME | | | 693,204 | |
| | | | | |
EXPENSES | | | | |
Investment advisory fees (Note 2) | | | 285,796 | |
Administration, accounting and transfer agent fees (Note 2) | | | 41,781 | |
Registration and filing fees | | | 31,663 | |
Legal fees | | | 31,595 | |
Audit and tax services fees | | | 15,576 | |
Shareholder reporting expenses | | | 9,793 | |
Trustees’ fees and expenses (Note 2) | | | 7,703 | |
Custodian and bank service fees | | | 6,855 | |
Postage and supplies | | | 5,966 | |
Insurance expense | | | 2,231 | |
Compliance service fees (Note 2) | | | 1,693 | |
Other expenses | | | 13,622 | |
TOTAL EXPENSES | | | 454,274 | |
Less fee reductions by the Adviser (Note 2) | | | (16,460 | ) |
Previous investment advisory fee reductions recouped by the Adviser (Note 2) | | | 38,906 | |
NET EXPENSES | | | 476,720 | |
| | | | | |
NET INVESTMENT INCOME | | | 216,484 | |
| | | | | |
REALIZED AND UNREALIZED GAINS ON INVESTMENTS | | | | |
Net realized gains from investment transactions | | | 6,677,803 | |
Net change in unrealized appreciation (depreciation) on investments | | | 4,674,466 | |
NET REALIZED AND UNREALIZED GAINS ON INVESTMENTS | | | 11,352,269 | |
| | | | | |
NET INCREASE IN NET ASSETS RESULTING FROM OPERATIONS | | $ | 11,568,753 | |
See notes to financial statements. |
4
SCHWARTZ VALUE FOCUSED FUND
STATEMENTS OF CHANGES IN NET ASSETS
| | Year Ended
December 31,
2024 | | | Year Ended
December 31,
2023 | |
FROM OPERATIONS | | | | | | | | |
Net investment income | | $ | 216,484 | | | $ | 201,220 | |
Net realized gains from investment transactions | | | 6,677,803 | | | | 1,394,285 | |
Net change in unrealized appreciation (depreciation) on investments | | | 4,674,466 | | | | (2,658,521 | ) |
Net increase (decrease) in net assets resulting from operations | | | 11,568,753 | | | | (1,063,016 | ) |
| | | | | | | | | |
FROM DISTRIBUTIONS TO SHAREHOLDERS (Note 1) | | | (6,894,355 | ) | | | (1,374,652 | ) |
| | | | | | | | | |
FROM CAPITAL SHARE TRANSACTIONS | | | | | | | | |
Proceeds from shares sold | | | 17,460,142 | | | | 13,333,788 | |
Reinvestment of distributions to shareholders | | | 6,565,207 | | | | 1,288,235 | |
Payments for shares redeemed | | | (9,426,152 | ) | | | (30,668,436 | ) |
Net increase (decrease) in net assets from capital share transactions | | | 14,599,197 | | | | (16,046,413 | ) |
| | | | | | | | | |
TOTAL INCREASE (DECREASE) IN NET ASSETS | | | 19,273,595 | | | | (18,484,081 | ) |
| | | | | | | | | |
NET ASSETS | | | | | | | | |
Beginning of year | | | 33,288,493 | | | | 51,772,574 | |
End of year | | $ | 52,562,088 | | | $ | 33,288,493 | |
| | | | | | | | | |
SUMMARY OF CAPITAL SHARE ACTIVITY | | | | | | | | |
Shares sold | | | 296,845 | | | | 297,002 | |
Shares issued in reinvestment of distributions to shareholders | | | 124,695 | | | | 29,238 | |
Shares redeemed | | | (185,952 | ) | | | (714,086 | ) |
Net increase (decrease) in shares outstanding | | | 235,588 | | | | (387,846 | ) |
Shares outstanding, beginning of year | | | 761,224 | | | | 1,149,070 | |
Shares outstanding, end of year | | | 996,812 | | | | 761,224 | |
See notes to financial statements. |
5
SCHWARTZ VALUE FOCUSED FUND
FINANCIAL HIGHLIGHTS
Per Share Data for a Share Outstanding Throughout Each Year
| | Year
Ended
Dec. 31,
2024 | | | Year
Ended
Dec. 31,
2023 | | | Year
Ended
Dec. 31,
2022 | | | Year
Ended
Dec. 31,
2021 | | | Year
Ended
Dec. 31,
2020 | |
Net asset value at beginning of year | | $ | 43.73 | | | $ | 45.06 | | | $ | 37.52 | | | $ | 30.54 | | | $ | 28.03 | |
| | | | | | | | | | | | | | | | | | | | | |
Income from investment operations: | | | | | | | | | | | | | | | | | | | | |
Net investment income | | | 0.25 | | | | 0.27 | | | | 0.39 | | | | 0.12 | | | | 0.15 | |
Net realized and unrealized gains on investments | | | 16.67 | | | | 0.27 | (a) | | | 7.54 | | | | 9.39 | | | | 3.11 | |
Total from investment operations | | | 16.92 | | | | 0.54 | | | | 7.93 | | | | 9.51 | | | | 3.26 | |
| | | | | | | | | | | | | | | | | | | | | |
Less distributions from: | | | | | | | | | | | | | | | | | | | | |
Net investment income | | | (0.25 | ) | | | (0.27 | ) | | | (0.39 | ) | | | (0.12 | ) | | | (0.15 | ) |
Net realized gains on investments | | | (7.67 | ) | | | (1.60 | ) | | | — | | | | (2.41 | ) | | | (0.60 | ) |
Total distributions | | | (7.92 | ) | | | (1.87 | ) | | | (0.39 | ) | | | (2.53 | ) | | | (0.75 | ) |
| | | | | | | | | | | | | | | | | | | | | |
Net asset value at end of year | | $ | 52.73 | | | $ | 43.73 | | | $ | 45.06 | | | $ | 37.52 | | | $ | 30.54 | |
| | | | | | | | | | | | | | | | | | | | | |
Total return (b) | | | 38.71 | % | | | 1.18 | % | | | 21.15 | % | | | 31.14 | % | | | 11.62 | % |
| | | | | | | | | | | | | | | | | | | | | |
Ratios/Supplementary Data: | | | | | | | | | | | | | | | | | | | | |
Net assets at end of year (000’s) | | $ | 52,562 | | | $ | 33,288 | | | $ | 51,773 | | | $ | 23,561 | | | $ | 18,097 | |
| | | | | | | | | | | | | | | | | | | | | |
Ratio of total expenses to average net assets | | | 1.19 | %(c) | | | 1.17 | %(c) | | | 1.28 | % | | | 1.51 | % | | | 1.71 | % |
| | | | | | | | | | | | | | | | | | | | | |
Ratio of net expenses to average net assets (d) | | | 1.25 | % | | | 1.25 | % | | | 1.25 | % | | | 1.25 | % | | | 1.25 | % |
| | | | | | | | | | | | | | | | | | | | | |
Ratio of net investment income to average net assets (d) | | | 0.57 | % | | | 0.50 | % | | | 1.39 | % | | | 0.28 | % | | | 0.49 | % |
| | | | | | | | | | | | | | | | | | | | | |
Portfolio turnover rate | | | 39 | % | | | 24 | % | | | 14 | % | | | 18 | % | | | 45 | % |
(a) | Represents a balancing figure derived from other amounts in the financial highlights table that captures all other changes affecting net asset value per share. This per share amount does not correlate to the aggregate of the net realized and unrealized losses on the Statement of Operations for the same period. |
(b) | Total return is a measure of the change in value of an investment in the Fund over the period covered, which assumes any dividends or capital gains distributions are reinvested in shares of the Fund. Returns shown do not reflect the deduction of taxes a shareholder would pay on Fund distributions or the redemption of Fund shares. |
(c) | The ratios would have been 1.29% and 1.28%, respectively, if the amounts recouped by the Adviser were included for the years ended December 31, 2024 and 2023. |
(d) | Ratio was determined after advisory fee reductions and/or recoupments (Note 2). |
See notes to financial statements. |
6
SCHWARTZ VALUE FOCUSED FUND
NOTES TO FINANCIAL STATEMENTS
December 31, 2024
1. Organization and Significant Accounting Policies
Schwartz Value Focused Fund (the “Fund”) is a non-diversified series of Schwartz Investment Trust (the “Trust”), an open-end management investment company established as an Ohio business trust under a Declaration of Trust dated August 31, 1992. Other series of the Trust are not incorporated in this report. The Fund is registered under the Investment Company Act of 1940, as amended (the “1940 Act”).
The investment objective of the Fund is to seek long-term capital appreciation. See the Prospectus for information regarding the principal investment strategies of the Fund.
The Fund has adopted Financial Accounting Standards Board (“FASB”) Accounting Standards Update 2023-07, Segment Reporting (Topic 280) - Improvements to Reportable Segment Disclosures (“ASU 2023-07”). Adoption of the standard impacted financial statement disclosures only and did not affect the Fund’s financial position or the results of its operations. An operating segment is defined in Topic 280 as a component of a public entity that engages in business activities from which it may recognize revenues and incur expenses, has operating results that are regularly reviewed by the public entity’s chief operating decision maker (“CODM”) to make decisions about resources to be allocated to the segment and assess its performance, and has discrete financial information available. The CODM is the President and Chief Executive Officer of the Fund. The Fund operates as a single operating segment. The Fund’s income, expenses, assets, changes in net assets resulting from operations and performance are regularly monitored and assessed as a whole by the CODM responsible for oversight functions of the Fund, using the information presented in the financial statements and financial highlights.
Shares of the Fund are sold at net asset value (“NAV”). To calculate the NAV, the Fund’s assets are valued and totaled, liabilities are subtracted, and the balance is divided by the number of shares outstanding. The offering price and redemption price per share are equal to the NAV per share.
The Fund follows accounting and reporting guidance under FASB Accounting Standards Codification Topic 946, “Financial Services – Investment Companies.” The following is a summary of the Fund’s significant accounting policies used in the preparation of its financial statements. These policies are in conformity with accounting principles generally accepted in the United States of America (“GAAP”).
(a) Valuation of investments — Securities which are traded on stock exchanges, other than NASDAQ, are valued at the closing sales price as of the close of the regular session of trading on the New York Stock Exchange on the day the securities are being valued, or, if not traded on a particular day, at the closing bid price. Securities which are quoted by NASDAQ are valued at the NASDAQ Official Closing Price or, if an Official Closing Price is not available, at the most recently quoted bid price. Securities traded in the over-the-counter market are valued at the last reported sales price or, if there is no reported sale on the valuation date, at the most recently quoted bid price. Securities which are traded both in the over-the-counter market and on a stock exchange are valued according to the broadest and most representative market. Fixed income securities, if any, are generally valued using prices provided by an
7
SCHWARTZ VALUE FOCUSED FUND
NOTES TO FINANCIAL STATEMENTS
(Continued)
independent pricing service. The independent pricing service uses information with respect to transactions in bonds, quotations from bond dealers, market transactions in comparable securities and various relationships between securities in determining these prices. Investments representing shares of other open-end investment companies are valued at their NAV as reported by such companies. When using quoted prices and when the market for the securities are considered active, the securities will be classified as Level 1 within the fair value hierarchy (see below). Securities (and other assets) for which market quotations are not readily available are valued at their fair value as determined in good faith by Schwartz Investment Counsel, Inc. (the “Adviser”), as the valuation designee, in accordance with consistently applied procedures established by and under the general supervision of the Board of Trustees pursuant to Rule 2a-5 under the 1940 Act, and will be classified as Level 2 or 3 within the fair value hierarchy, depending on the inputs used. Fair value pricing may be used, for example, in situations where (i) a portfolio security is so thinly traded that there have been no transactions for that stock over an extended period of time; (ii) the exchange on which the portfolio security is principally traded closes early; or (iii) trading of the portfolio security is halted during the day and does not resume prior to the Fund’s NAV calculation. A portfolio security’s “fair value” price may differ from the price next available for that portfolio security using the Fund’s normal pricing procedures.
GAAP establishes a single authoritative definition of fair value, sets out a framework for measuring fair value and requires additional disclosures about fair value measurements.
Various inputs are used in determining the value of the Fund’s investments. These inputs are summarized in the three broad levels listed below:
● Level 1 – quoted prices in active markets for identical securities
● Level 2 – other significant observable inputs
● Level 3 – significant unobservable inputs
U.S. Government & Agencies securities held by the Fund, if any, are classified as Level 2 since the values for such securities are based on prices provided by an independent pricing service that utilizes various “other significant observable inputs” including bid and ask quotations, prices of similar securities and interest rates, among other factors.
The inputs or methodology used for valuing securities are not necessarily an indication of the risks associated with investing in those securities. The inputs used to measure fair value may fall into different levels of the fair value hierarchy. In such cases, for disclosure purposes, the level in the fair value hierarchy within which the fair value
8
SCHWARTZ VALUE FOCUSED FUND
NOTES TO FINANCIAL STATEMENTS
(Continued)
measurement falls in its entirety is determined based on the lowest level input that is significant to the fair value measurement.
The following is a summary of the Fund’s investments and the levels assigned to the investments, by security type, as of December 31, 2024:
| | Level 1 | | | Level 2 | | | Level 3 | | | Total | |
Common Stocks | | $ | 43,787,264 | | | $ | — | | | $ | — | | | $ | 43,787,264 | |
Money Market Funds | | | 8,699,513 | | | | — | | | | — | | | | 8,699,513 | |
Total | | $ | 52,486,777 | | | $ | — | | | $ | — | | | $ | 52,486,777 | |
Refer to the Fund’s Schedule of Investments for a listing of the securities by security type, sector and industry type. There were no Level 3 securities or derivative instruments held by or transferred in/out of the Fund as of or during the year ended December 31, 2024.
(b) Income taxes — The Fund has qualified and intends to continue to qualify as a regulated investment company under the Internal Revenue Code of 1986, as amended (the “Code”). Qualification generally will relieve the Fund of liability for federal income taxes to the extent 100% of its net investment income and net realized capital gains are distributed in accordance with the Code.
In order to avoid imposition of the excise tax applicable to regulated investment companies, it is also the Fund’s intention to declare as dividends in each calendar year at least 98% of its net investment income and 98.2% of its net realized capital gains plus undistributed amounts from prior years.
The following information is computed on a tax basis for each item as of December 31, 2024:
Federal income tax cost | | $ | 32,959,167 | |
Gross unrealized appreciation | | $ | 20,312,176 | |
Gross unrealized depreciation | | | (784,566 | ) |
Net unrealized appreciation | | | 19,527,610 | |
Distributable earnings | | $ | 19,527,610 | |
For the year ended December 31, 2024, the Fund reclassified $68 of over-distribution against paid-in capital on the Statement of Assets and Liabilities. Such reclassification, the result of permanent differences between the financial statement and income tax reporting requirements, has no effect on the Fund’s net assets or NAV per share.
The Fund recognizes the tax benefits or expenses of uncertain tax positions only when the position is “more-likely-than-not” to be sustained assuming examination by tax authorities. Management has reviewed the tax positions taken on federal income tax returns for all open tax years (generally, three years) and has concluded that no provision for unrecognized tax benefits or expenses is required in these financial statements.
9
SCHWARTZ VALUE FOCUSED FUND
NOTES TO FINANCIAL STATEMENTS
(Continued)
The Fund recognizes interest and penalties, if any, related to unrecognized tax benefits as income tax expense on the Statement of Operations. During the year ended December 31, 2024, the Fund did not incur any interest or penalties.
(c) Investment transactions and investment income — Investment transactions are accounted for on the trade date. Dividend income is recorded on the ex-dividend date. Non-cash dividends included in dividend income, if any, are recorded at the fair value of the securities received. Interest income is recognized on the accrual basis. Realized capital gains and losses on investment transactions are determined on the identified cost basis. Withholding taxes on foreign dividends have been recorded in accordance with the Fund’s understanding of the applicable country’s rules and tax rates.
(d) Dividends and distributions — Dividends from net investment income and distributions of net realized capital gains, if any, are declared and paid annually in December. Dividends and distributions to shareholders are recorded on the ex-dividend date. The tax character of distributions paid to shareholders during the years ended December 31, 2024 and 2023 was as follows:
Year Ended | | Ordinary Income | | | Long-Term
Capital Gains | | | Total
Distributions | |
December 31, 2024 | | $ | 221,878 | | | $ | 6,672,477 | | | $ | 6,894,355 | |
December 31, 2023 | | $ | 201,353 | | | $ | 1,173,299 | | | $ | 1,374,652 | |
(e) Estimates — The preparation of financial statements in conformity with GAAP requires management to make estimates and assumptions that affect the reported amounts of assets and liabilities and disclosure of contingent assets and liabilities as of the date of the financial statements and the reported amounts of revenues and expenses during the reporting period. Actual results could differ from those estimates.
(f) Common expenses — Common expenses of the Trust are allocated among the Fund and the other series of the Trust based on relative net assets of each series or the nature of the services performed and the relative applicability to each series.
(g) Regulatory update — Tailored Shareholder Reporting for Mutual Funds and Exchange-Traded Funds (“ETFs”) – Effective January 24, 2023, the Securities and Exchange Commission (the “SEC”) adopted rule and form amendments to require mutual funds and ETFs to transmit concise and visually engaging streamlined annual and semi-annual reports to shareholders that highlight key information. Other information, including financial statements, will no longer appear in a streamlined shareholder report but must be available online, delivered free of charge upon request, and filed on a semi-annual basis on Form N-CSR. The rule and form amendments have a compliance date of July 24, 2024. The Fund has implemented the rule and form requirements, as applicable, and is currently adhering to the requirements.
10
SCHWARTZ VALUE FOCUSED FUND
NOTES TO FINANCIAL STATEMENTS
(Continued)
2. Investment Advisory Agreement and Transactions with Related Parties
The Chairman and President of the Trust is also the Executive Chairman of the Adviser. Certain other officers of the Trust are officers of the Adviser, or of Ultimus Fund Solutions, LLC (“Ultimus”), the administrative, accounting and transfer agent for the Fund, or of Ultimus Fund Distributors, LLC (the “Distributor”), the Fund’s principal underwriter.
Pursuant to an Investment Advisory Agreement between the Trust and the Adviser, the Adviser is responsible for the management of the Fund and provides investment advice along with the necessary personnel, facilities, equipment and certain other services necessary to the operations of the Fund. The Adviser receives from the Fund a quarterly fee at the annual rate of 0.75% per annum of the Fund’s average daily net assets.
The Adviser has contractually agreed to reduce its advisory fees or reimburse a portion of the Fund’s expenses until at least May 1, 2025, so that the ordinary operating expenses of the Fund do not exceed 1.25% per annum of average daily net assets. Accordingly, during the year ended December 31, 2024, the Adviser reduced its investment advisory fees by $16,460.
Any fee reductions or expense reimbursements by the Adviser are subject to repayment by the Fund for a period of three years after such fees and expenses were incurred, provided repayment to the Adviser does not cause the ordinary operating expenses of the Fund to exceed 1.25% per annum of average daily net assets. During the year ended December 31, 2024, the Fund recouped $38,906 of prior years’ investment advisory fee reductions. As of December 31, 2024, the Adviser may seek recoupment of investment advisory fee reductions totaling $63,028 no later than the dates stated below:
December 31, 2025 | | $ | 36,210 | |
December 31, 2026 | | | 10,358 | |
December 31, 2027 | | | 16,460 | |
Total | | $ | 63,028 | |
The Chief Compliance Officer of the Trust (the “CCO”) is an employee of the Adviser. The Trust pays the Adviser a fee for providing CCO services, of which the Fund pays its proportionate share along with the other series of the Trust. In addition, the Trust reimburses the Adviser for out-of-pocket expenses incurred, if any, for providing these services.
Pursuant to a Mutual Fund Services Agreement between the Trust and Ultimus, Ultimus supplies regulatory and compliance services, calculates the daily NAV per share, maintains the financial books and records of the Fund, maintains the records of each shareholder’s account, and processes purchases and redemptions of the Fund’s shares. For these services Ultimus receives fees computed as a percentage of the average daily net assets of the Fund, subject to a minimum monthly fee.
Pursuant to a Distribution Agreement between the Trust and the Distributor, the Distributor serves as the Fund’s exclusive agent for the distribution of its shares. The Distributor is an affiliate of Ultimus.
11
SCHWARTZ VALUE FOCUSED FUND
NOTES TO FINANCIAL STATEMENTS
(Continued)
Trustees and officers affiliated with the Adviser or Ultimus are not compensated by the Trust for their services. Each Trustee who is not an affiliated person of the Adviser or Ultimus (“Independent Trustee”) receives from the Trust an annual retainer of $67,000 (except that such fee is $78,000 for the Lead Independent Trustee/Chairman of the Governance Committee and $73,500 for the Chairman of the Audit Committee), payable quarterly; a fee of $6,500 for attendance at each meeting of the Board of Trustees; plus reimbursement of travel and other expenses incurred in attending meetings. Trustee Emeritus, if any, receives one-half of both the annual retainer and fee for attendance at each meeting; plus reimbursement of travel and other expenses incurred in attending meetings. The Fund paid its proportionate share of the Independent Trustees’ fees and expenses along with the other series of the Trust.
Effective January 1, 2025, each Independent Trustee will receive from the Trust an annual retainer of $70,000 (except that such fee will be $82,000 for the Lead Independent Trustee/Chairman of the Governance Committee and $80,500 for the Chairman of the Audit Committee), payable quarterly; a fee of $7,000 for attendance at each meeting of the Board of Trustees; plus reimbursement of travel and other expenses incurred in attending meetings. The Fund will pay its proportionate share of the Independent Trustees’ fees and expenses along with the other series of the Trust.
3. Investment Transactions
During the year ended December 31, 2024, cost of purchases and proceeds from sales and maturities of investment securities, excluding short-term investments and U.S. government securities, amounted to $13,708,744 and $14,472,249, respectively.
4. Contingencies and Commitments
The Fund indemnifies the Trust’s officers and Trustees for certain liabilities that might arise from their performance of their duties to the Fund. Additionally, in the normal course of business, the Fund enters into contracts that contain a variety of representations and warranties and which provide general indemnifications. The Fund’s maximum exposure under these arrangements is unknown, as this would involve future claims that may be made against the Fund that have not yet occurred. However, based on experience, the Fund expects the risk of loss to be remote.
5. Sector Risk
If the Fund has significant investments in the securities of issuers in industries within a particular sector, any development affecting that sector will have a greater impact on the value of the net assets of the Fund than would be the case if the Fund did not have significant investments in that sector. In addition, this may increase the risk of loss of an investment in the Fund and increase the volatility of the Fund’s NAV per share. From time to time, circumstances may affect a particular sector and the companies within such sector. For instance, economic or market factors, regulation or deregulation, and technological or other developments may negatively impact all companies in a particular sector and therefore the value of the Fund’s portfolio will be adversely affected. As of December 31, 2024, the Fund had 37.8% of the value of its net assets invested in
12
SCHWARTZ VALUE FOCUSED FUND
NOTES TO FINANCIAL STATEMENTS
(Continued)
common stocks within the real estate sector. The Fund had 27.3% of the value of its net assets invested in Texas Pacific Land Corporation (“TPL”) within the real estate sector. The financial statements for TPL can be found at www.sec.gov.
6. Subsequent Events
The Fund is required to recognize in the financial statements the effects of all subsequent events that provide additional evidence about conditions that existed as of the date of the Statement of Assets and Liabilities. For non-recognized subsequent events that must be disclosed to keep the financial statements from being misleading, the Fund is required to disclose the nature of the event as well as an estimate of its financial effect, or a statement that such an estimate cannot be made. Management has evaluated subsequent events through the issuance of these financial statements and has noted no such events, except for the following:
Change in Control
The founder and principal of the Adviser plans to transfer all of his ownership interest in the Adviser to his family members (the “Transaction”). The closing of the Transaction (the “Closing”), anticipated to take place near the end of the second quarter of 2025, will result in a change in control of the Adviser. Consistent with the requirements of the 1940 Act, the Investment Advisory Agreement (the “Present Advisory Agreement”) between the Adviser and the Fund contains a provision that the Present Advisory Agreement will terminate automatically in the event of its “assignment” (as defined in the 1940 Act). As noted above, the Transaction will result in a change in control of the Adviser effective as of the Closing and will be deemed an assignment of the Present Advisory Agreement and result in the automatic termination of the Present Advisory Agreement.
At its in-person meeting on February 12, 2025, the Board of Trustees, including the Trustees who are not “interested persons” of the Fund or the Adviser within the meaning of the 1940 Act (the “Independent Trustees”), approved a new investment advisory agreement between the Adviser and the Fund (the “New Advisory Agreement”). The New Advisory Agreement needs to be approved by shareholders of the Fund at a special meeting of shareholders. Except for the effective and termination dates and the initial term, the terms and conditions of the New Advisory Agreement is substantially similar to the Present Advisory Agreement, including the rate of the investment advisory fee for the Fund. Upon approval of the New Advisory Agreement, the Adviser will enter into a new Expense Limitation Agreement for the Fund that is substantially the same as under the current Expense Limitation Agreement. The new Expense Limitation Agreement will continue for one year after the Closing.
Other than the change in the ownership structure of the Adviser, the operations of the Adviser will stay the same and the same personnel of the Adviser who currently provide investment advisory services to the Fund will continue to do so upon approval of the New Advisory Agreement.
13
SCHWARTZ VALUE FOCUSED FUND
NOTES TO FINANCIAL STATEMENTS
(Continued)
Fund Name Change and Investment Policy Change
Effective on or around April 28, 2025, the name of the Fund will change to the “Ave Maria Value Focused Fund” and the Fund will be managed using a morally responsible investment process that is designed to avoid investments in companies believed to offer products or services or engage in practices that are contrary to the core values and teachings of the Roman Catholic Church. The Fund will continue to apply its current investment strategy of investing at least 80% of its net assets, including the amount of any borrowings for investment purposes, in equity securities (the “80% Policy”), but that 80% Policy will include the requirement that at least 80% of the Fund’s net assets will be invested in the equity securities of companies that meet the Fund’s religious criteria. The revised 80% Policy is not expected to significantly alter the Fund’s portfolio composition or investment management process.
14
SCHWARTZ VALUE FOCUSED FUND
REPORT OF INDEPENDENT REGISTERED
PUBLIC ACCOUNTING FIRM
To the Shareholders and the Board of Trustees of Schwartz Investment Trust:
Opinion on the Financial Statements and Financial Highlights
We have audited the accompanying statement of assets and liabilities, including the schedule of investments, of the Schwartz Value Focused Fund, one of the series constituting the Schwartz Investment Trust (the “Fund”), as of December 31, 2024, the related statement of operations for the year then ended, the statements of changes in net assets for each of the two years in the period then ended, the financial highlights for each of the five years in the period then ended, and the related notes. In our opinion, the financial statements and financial highlights present fairly, in all material respects, the financial position of the Fund as of December 31, 2024, and the results of its operations for the year then ended, the changes in its net assets for each of the two years in the period then ended, and the financial highlights for each of the five years in the period then ended, in conformity with accounting principles generally accepted in the United States of America.
Basis for Opinion
These financial statements and financial highlights are the responsibility of the Fund’s management. Our responsibility is to express an opinion on the Fund’s financial statements and financial highlights based on our audits. We are a public accounting firm registered with the Public Company Accounting Oversight Board (United States) (PCAOB) and are required to be independent with respect to the Fund in accordance with the U.S. federal securities laws and the applicable rules and regulations of the Securities and Exchange Commission and the PCAOB.
We conducted our audits in accordance with the standards of the PCAOB. Those standards require that we plan and perform the audit to obtain reasonable assurance about whether the financial statements and financial highlights are free of material misstatement, whether due to error or fraud. The Fund is not required to have, nor were we engaged to perform, an audit of its internal control over financial reporting. As part of our audit, we are required to obtain an understanding of internal control over financial reporting but not for the purpose of expressing an opinion on the effectiveness of the Fund’s internal control over financial reporting. Accordingly, we express no such opinion.
Our audits included performing procedures to assess the risks of material misstatement of the financial statements and financial highlights, whether due to error or fraud, and performing procedures that respond to those risks. Such procedures included examining, on a test basis, evidence regarding the amounts and disclosures in the financial statements and financial highlights. Our audits also included evaluating the accounting principles used and significant estimates made by management, as well as evaluating the overall presentation of the financial statements and financial highlights. Our procedures included confirmation of securities owned as of December 31, 2024, by correspondence with the custodian and brokers; when replies were not received from brokers, we performed
15
SCHWARTZ VALUE FOCUSED FUND
REPORT OF INDEPENDENT REGISTERED
PUBLIC ACCOUNTING FIRM (Continued)
other auditing procedures. We believe that our audits provide a reasonable basis for our opinion.

Chicago, Illinois
February 21, 2025
We have served as the auditor of one or more Schwartz Investment Trust investment companies since 1993.
16
SCHWARTZ VALUE FOCUSED FUND
ADDITIONAL INFORMATION
(Unaudited)
Changes in Disagreements with Accountants
There were no changes in or disagreements with accountants during the period covered by this report.
Proxy Disclosures
Not applicable.
Renumeration Paid to Directors, Officers and Others
Refer to the financial statements included herein.
Statement Regarding Basis for Approval of Investment Advisory Agreement
Not applicable.
FEDERAL TAX INFORMATION (Unaudited)
For the year ended December 31, 2024, the Fund designated $6,672,431 as long-term capital gain distributions.
Qualified Dividend Income – The Fund designates 100% of its ordinary income dividends, or up to the maximum amount of such dividends allowable pursuant to the Internal Revenue Code, as qualified dividend income eligible for the reduced tax rate.
Dividends Received Deduction – Corporate shareholders are generally entitled to take the dividends received deduction on the portion of the Fund’s dividend distributions that qualifies under tax law. For the fiscal year ended December 31, 2024, 100% of ordinary income dividends qualified for the corporate dividends received deduction.
17
This page intentionally left blank.
AVE MARIA MUTUAL FUNDS
TABLE OF CONTENTS
| | |
Schedule of Investments | |
Ave Maria Value Fund | 1 |
Ave Maria Growth Fund | 4 |
Ave Maria Rising Dividend Fund | 7 |
Ave Maria World Equity Fund | 10 |
Summary of Common Stocks by Country | 14 |
Ave Maria Focused Fund | 15 |
Ave Maria Bond Fund | 17 |
Statements of Assets and Liabilities | 24 |
Statements of Operations | 26 |
Statements of Changes in Net Assets | |
Ave Maria Value Fund | 30 |
Ave Maria Growth Fund | 31 |
Ave Maria Rising Dividend Fund | 32 |
Ave Maria World Equity Fund | 33 |
Ave Maria Focused Fund | 34 |
Ave Maria Bond Fund | 35 |
Financial Highlights | |
Ave Maria Value Fund | 36 |
Ave Maria Growth Fund | 37 |
Ave Maria Rising Dividend Fund | 38 |
Ave Maria World Equity Fund | 39 |
Ave Maria Focused Fund | 40 |
Ave Maria Bond Fund | 41 |
Notes to Financial Statements | 42 |
Report of Independent Registered Public Accounting Firm | 56 |
Additional Information | 58 |
Federal Tax Information | 59 |
This report is for the information of the shareholders of the Ave Maria Mutual Funds. To obtain a copy of the prospectus, please visit our website at www.avemariafunds.com or call 1-888-726-9331 and a copy will be sent to you free of charge. Please read the prospectus carefully before you invest. The Ave Maria Mutual Funds are distributed by Ultimus Fund Distributors, LLC.
Past performance is not predictive of future performance. Investment results and principal value will fluctuate so that shares, when redeemed, may be worth more or less than their original cost. Current performance may be higher or lower than the performance data quoted. Performance data, current to the most recent month end, is available at the Ave Maria Mutual Funds’ website at www.avemariafunds.com or by calling 1-888-726-9331.
Ave Maria Value Fund
SCHEDULE OF INVESTMENTS
December 31, 2024
COMMON STOCKS — 93.8% | | Shares | | | Fair Value | |
Communications — 1.4% | | | | | | | | |
Internet Media & Services — 1.4% | | | | | | | | |
VeriSign, Inc. * | | | 30,200 | | | $ | 6,250,192 | |
| | | | | | | | | |
Consumer Discretionary — 5.5% | | | | | | | | |
Automotive — 0.7% | | | | | | | | |
XPEL, Inc. * | | | 82,000 | | | | 3,275,080 | |
| | | | | | | | | |
Leisure Products — 2.4% | | | | | | | | |
YETI Holdings, Inc. * | | | 275,000 | | | | 10,590,250 | |
| | | | | | | | | |
Retail - Discretionary — 2.4% | | | | | | | | |
Winmark Corporation | | | 26,600 | | | | 10,455,662 | |
| | | | | | | | | |
Consumer Staples — 2.2% | | | | | | | | |
Food — 2.2% | | | | | | | | |
Simply Good Foods Company (The) * | | | 256,500 | | | | 9,998,370 | |
| | | | | | | | | |
Energy — 11.5% | | | | | | | | |
Oil & Gas Producers — 9.0% | | | | | | | | |
Expand Energy Corporation | | | 145,500 | | | | 14,484,525 | |
Occidental Petroleum Corporation | | | 241,000 | | | | 11,907,810 | |
Permian Basin Royalty Trust | | | 1,246,474 | | | | 13,810,932 | |
| | | | | | | | 40,203,267 | |
Oil & Gas Services & Equipment — 2.5% | | | | | | | | |
Schlumberger Ltd. | | | 294,000 | | | | 11,271,960 | |
| | | | | | | | | |
Financials — 11.0% | | | | | | | | |
Banking — 4.6% | | | | | | | | |
Hingham Institution For Savings (The) | | | 81,087 | | | | 20,607,450 | |
| | | | | | | | | |
Institutional Financial Services — 2.6% | | | | | | | | |
Intercontinental Exchange, Inc. | | | 77,000 | | | | 11,473,770 | |
| | | | | | | | | |
Insurance — 3.8% | | | | | | | | |
Brown & Brown, Inc. | | | 167,150 | | | | 17,052,643 | |
| | | | | | | | | |
Health Care — 11.7% | | | | | | | | |
Health Care Facilities & Services — 2.2% | | | | | | | | |
Chemed Corporation | | | 18,300 | | | | 9,695,340 | |
1
AVE MARIA VALUE FUND
SCHEDULE OF INVESTMENTS
(Continued)
COMMON STOCKS — 93.8% (Continued) | | Shares | | | Fair Value | |
Health Care — 11.7% (Continued) | | | | | | | | |
Medical Equipment & Devices — 9.5% | | | | | | | | |
Alcon, Inc. | | | 110,000 | | | $ | 9,337,900 | |
Haemonetics Corporation * | | | 151,000 | | | | 11,790,080 | |
Mirion Technologies, Inc. * | | | 1,220,000 | | | | 21,289,000 | |
| | | | | | | | 42,416,980 | |
Industrials — 12.7% | | | | | | | | |
Aerospace & Defense — 1.7% | | | | | | | | |
HEICO Corporation - Class A | | | 40,000 | | | | 7,443,200 | |
| | | | | | | | | |
Electrical Equipment — 5.7% | | | | | | | | |
A.O. Smith Corporation | | | 113,000 | | | | 7,707,730 | |
Allegion plc | | | 76,000 | | | | 9,931,680 | |
Otis Worldwide Corporation | | | 85,000 | | | | 7,871,850 | |
| | | | | | | | 25,511,260 | |
Industrial Intermediate Products — 3.9% | | | | | | | | |
Armstrong World Industries, Inc. | | | 78,000 | | | | 11,023,740 | |
Distribution Solutions Group, Inc. * | | | 186,892 | | | | 6,429,085 | |
| | | | | | | | 17,452,825 | |
Industrial Support Services — 1.4% | | | | | | | | |
U-Haul Holding Company | | | 97,200 | | | | 6,225,660 | |
| | | | | | | | | |
Materials — 7.1% | | | | | | | | |
Chemicals — 1.6% | | | | | | | | |
Valvoline, Inc. * | | | 200,000 | | | | 7,236,000 | |
| | | | | | | | | |
Metals & Mining — 5.5% | | | | | | | | |
Franco-Nevada Corporation | | | 100,000 | | | | 11,759,000 | |
Wheaton Precious Metals Corporation | | | 225,000 | | | | 12,654,000 | |
| | | | | | | | 24,413,000 | |
Real Estate — 23.1% | | | | | | | | |
Multi-Asset Class Owners & Developers — 4.4% | | | | | | | | |
Landbridge Company, LLC - Class A | | | 305,295 | | | | 19,722,057 | |
| | | | | | | | | |
Real Estate Owners & Developers — 18.7% | | | | | | | | |
St. Joe Company (The) | | | 215,800 | | | | 9,695,894 | |
Texas Pacific Land Corporation | | | 66,500 | | | | 73,546,340 | |
| | | | | | | | 83,242,234 | |
2
AVE MARIA VALUE FUND
SCHEDULE OF INVESTMENTS
(Continued)
COMMON STOCKS — 93.8% (Continued) | | Shares | | | Fair Value | |
Technology — 7.6% | | | | | | | | |
Technology Services — 7.6% | | | | | | | | |
CDW Corporation | | | 81,250 | | | $ | 14,140,750 | |
Jack Henry & Associates, Inc. | | | 45,000 | | | | 7,888,500 | |
TD SYNNEX Corporation | | | 102,500 | | | | 12,021,200 | |
| | | | | | | | 34,050,450 | |
| | | | | | | | | |
Total Common Stocks (Cost $272,395,378) | | | | | | $ | 418,587,650 | |
MONEY MARKET FUNDS — 6.3% | | Shares | | | Fair Value | |
Federated Hermes Government Obligations Tax-Managed Fund - Institutional Shares, 4.33% (a) | | | 22,407,117 | | | $ | 22,407,117 | |
Federated Hermes Treasury Obligations Fund - Institutional Shares, 4.34% (a) | | | 5,604,860 | | | | 5,604,860 | |
Total Money Market Funds (Cost $28,011,977) | | | | | | $ | 28,011,977 | |
| | | | | | | | | |
Total Investments at Fair Value — 100.1% (Cost $300,407,355) | | | | | | $ | 446,599,627 | |
| | | | | | | | | |
Liabilities in Excess of Other Assets — (0.1%) | | | | | | | (394,830 | ) |
| | | | | | | | | |
Net Assets — 100.0% | | | | | | $ | 446,204,797 | |
* | Non-income producing security. |
(a) | The rate shown is the 7-day effective yield as of December 31, 2024. |
See notes to financial statements. |
3
Ave Maria Growth Fund
SCHEDULE OF INVESTMENTS
December 31, 2024
COMMON STOCKS — 96.4% | | Shares | | | Fair Value | |
Consumer Discretionary — 18.3% | | | | | | | | |
Automotive — 1.7% | | | | | | | | |
XPEL, Inc. * | | | 455,000 | | | $ | 18,172,700 | |
| | | | | | | | | |
Leisure Facilities & Services — 2.0% | | | | | | | | |
Atlanta Braves Holdings, Inc. - Series C * | | | 542,264 | | | | 20,747,021 | |
| | | | | | | | | |
Retail - Discretionary — 8.6% | | | | | | | | |
Lowe’s Companies, Inc. | | | 131,000 | | | | 32,330,800 | |
O’Reilly Automotive, Inc. * | | | 51,000 | | | | 60,475,800 | |
| | | | | | | | 92,806,600 | |
Wholesale - Discretionary — 6.0% | | | | | | | | |
Copart, Inc. * | | | 1,130,000 | | | | 64,850,700 | |
| | | | | | | | | |
Consumer Staples — 1.4% | | | | | | | | |
Food — 1.4% | | | | | | | | |
McCormick & Company, Inc. | | | 200,000 | | | | 15,248,000 | |
| | | | | | | | | |
Energy — 2.0% | | | | | | | | |
Oil & Gas Producers — 2.0% | | | | | | | | |
Expand Energy Corporation | | | 220,000 | | | | 21,901,000 | |
| | | | | | | | | |
Financials — 1.2% | | | | | | | | |
Asset Management — 1.2% | | | | | | | | |
Brookfield Asset Management Ltd. - Class A | | | 230,000 | | | | 12,463,700 | |
| | | | | | | | | |
Health Care — 5.2% | | | | | | | | |
Health Care Facilities & Services — 5.2% | | | | | | | | |
Chemed Corporation | | | 29,000 | | | | 15,364,200 | |
IQVIA Holdings, Inc. * | | | 207,000 | | | | 40,677,570 | |
| | | | | | | | 56,041,770 | |
Industrials — 11.3% | | | | | | | | |
Aerospace & Defense — 4.8% | | | | | | | | |
HEICO Corporation - Class A | | | 278,590 | | | | 51,840,027 | |
| | | | | | | | | |
Commercial Support Services — 6.0% | | | | | | | | |
API Group Corporation * | | | 1,795,000 | | | | 64,566,150 | |
| | | | | | | | | |
Industrial Support Services — 0.5% | | | | | | | | |
Watsco, Inc. | | | 12,000 | | | | 5,686,680 | |
| | | | | | | | | |
Materials — 4.4% | | | | | | | | |
Chemicals — 0.5% | | | | | | | | |
Valvoline, Inc. * | | | 150,000 | | | | 5,427,000 | |
4
AVE MARIA GROWTH FUND
SCHEDULE OF INVESTMENTS
(Continued)
COMMON STOCKS — 96.4% (Continued) | | Shares | | | Fair Value | |
Materials — 4.4% (Continued) | | | | | | | | |
Containers & Packaging — 3.9% | | | | | | | | |
AptarGroup, Inc. | | | 270,000 | | | $ | 42,417,000 | |
| | | | | | | | | |
Real Estate — 3.4% | | | | | | | | |
Real Estate Owners & Developers — 0.6% | | | | | | | | |
Texas Pacific Land Corporation | | | 6,000 | | | | 6,635,760 | |
| | | | | | | | | |
REITs — 2.8% | | | | | | | | |
SBA Communications Corporation - Class A | | | 149,000 | | | | 30,366,200 | |
| | | | | | | | | |
Technology — 49.2% | | | | | | | | |
Semiconductors — 20.5% | | | | | | | | |
Alphawave IP Group plc * | | | 2,800,000 | | | | 2,947,436 | |
NVIDIA Corporation | | | 620,000 | | | | 83,259,800 | |
Silicon Laboratories, Inc. * | | | 230,000 | | | | 28,570,600 | |
Silicon Motion Technology Corporation - ADR | | | 190,000 | | | | 10,269,500 | |
Taiwan Semiconductor Manufacturing Company Ltd. - ADR | | | 255,000 | | | | 50,359,950 | |
Texas Instruments, Inc. | | | 240,000 | | | | 45,002,400 | |
| | | | | | | | 220,409,686 | |
Software — 9.9% | | | | | | | | |
ANSYS, Inc. * | | | 80,000 | | | | 26,986,400 | |
BlackLine, Inc. * | | | 480,000 | | | | 29,164,800 | |
Roper Technologies, Inc. | | | 96,500 | | | | 50,165,525 | |
| | | | | | | | 106,316,725 | |
Technology Services — 18.8% | | | | | | | | |
Accenture plc - Class A - ADR | | | 119,000 | | | | 41,863,010 | |
Broadridge Financial Solutions, Inc. | | | 97,000 | | | | 21,930,730 | |
Mastercard, Inc. - Class A | | | 142,000 | | | | 74,772,940 | |
Moody’s Corporation | | | 35,000 | | | | 16,567,950 | |
S&P Global, Inc. | | | 96,000 | | | | 47,810,880 | |
| | | | | | | | 202,945,510 | |
| | | | | | | | | |
Total Common Stocks (Cost $566,409,676) | | | | | | $ | 1,038,842,229 | |
5
AVE MARIA GROWTH FUND
SCHEDULE OF INVESTMENTS
(Continued)
MONEY MARKET FUNDS — 3.8% | | Shares | | | Fair Value | |
Federated Hermes Government Obligations Tax-Managed Fund - Institutional Shares, 4.33% (a) | | | 41,341,596 | | | $ | 41,341,596 | |
Federated Hermes Treasury Obligations Fund - Institutional Shares, 4.34% (a) | | | 74,290 | | | | 74,290 | |
Total Money Market Funds (Cost $41,415,886) | | | | | | $ | 41,415,886 | |
| | | | | | | | | |
Total Investments at Fair Value — 100.2% (Cost $607,825,562) | | | | | | $ | 1,080,258,115 | |
| | | | | | | | | |
Liabilities in Excess of Other Assets — (0.2%) | | | | | | | (2,595,469 | ) |
| | | | | | | | | |
Net Assets — 100.0% | | | | | | $ | 1,077,662,646 | |
ADR - American Depositary Receipt. |
* | Non-income producing security. |
(a) | The rate shown is the 7-day effective yield as of December 31, 2024. |
See notes to financial statements. |
6
Ave Maria Rising Dividend Fund
SCHEDULE OF INVESTMENTS
December 31, 2024
COMMON STOCKS — 95.2% | | Shares | | | Fair Value | |
Communications — 1.8% | | | | | | | | |
Internet Media & Services — 1.8% | | | | | | | | |
Booking Holdings, Inc. | | | 4,000 | | | $ | 19,873,680 | |
| | | | | | | | | |
Consumer Discretionary — 11.0% | | | | | | | | |
Home & Office Products — 0.3% | | | | | | | | |
SharkNinja, Inc. * | | | 40,000 | | | | 3,894,400 | |
| | | | | | | | | |
Retail - Discretionary — 10.7% | | | | | | | | |
Genuine Parts Company | | | 250,000 | | | | 29,190,000 | |
Lowe’s Companies, Inc. | | | 135,000 | | | | 33,318,000 | |
TJX Companies, Inc. (The) | | | 260,000 | | | | 31,410,600 | |
Tractor Supply Company | | | 397,500 | | | | 21,091,350 | |
| | | | | | | | 115,009,950 | |
Consumer Staples — 2.7% | | | | | | | | |
Beverages — 2.7% | | | | | | | | |
Coca-Cola Europacific Partners plc | | | 375,000 | | | | 28,803,750 | |
| | | | | | | | | |
Energy — 6.2% | | | | | | | | |
Oil & Gas Producers — 6.2% | | | | | | | | |
Chevron Corporation | | | 200,000 | | | | 28,968,000 | |
Diamondback Energy, Inc. | | | 230,000 | | | | 37,680,900 | |
| | | | | | | | 66,648,900 | |
Financials — 14.2% | | | | | | | | |
Asset Management — 1.4% | | | | | | | | |
Brookfield Corporation | | | 250,000 | | | | 14,362,500 | |
| | | | | | | | | |
Banking — 2.4% | | | | | | | | |
Truist Financial Corporation | | | 600,000 | | | | 26,028,000 | |
| | | | | | | | | |
Insurance — 7.8% | | | | | | | | |
Brown & Brown, Inc. | | | 352,000 | | | | 35,911,040 | |
Chubb Ltd. | | | 175,000 | | | | 48,352,500 | |
| | | | | | | | 84,263,540 | |
Specialty Finance — 2.6% | | | | | | | | |
Fidelity National Financial, Inc. | | | 500,000 | | | | 28,070,000 | |
| | | | | | | | | |
Health Care — 4.8% | | | | | | | | |
Health Care Facilities & Services — 4.8% | | | | | | | | |
Chemed Corporation | | | 70,000 | | | | 37,086,000 | |
Quest Diagnostics, Inc. | | | 95,000 | | | | 14,331,700 | |
| | | | | | | | 51,417,700 | |
7
AVE MARIA RISING DIVIDEND FUND
SCHEDULE OF INVESTMENTS
(Continued)
COMMON STOCKS — 95.2% (Continued) | | Shares | | | Fair Value | |
Industrials — 14.7% | | | | | | | | |
Aerospace & Defense — 7.6% | | | | | | | | |
HEICO Corporation - Class A | | | 137,120 | | | $ | 25,515,290 | |
L3Harris Technologies, Inc. | | | 115,500 | | | | 24,287,340 | |
Lockheed Martin Corporation | | | 65,000 | | | | 31,586,100 | |
| | | | | | | | 81,388,730 | |
Commercial Support Services — 1.4% | | | | | | | | |
Rentokil Initial plc | | | 3,077,000 | | | | 15,360,036 | |
| | | | | | | | | |
Electrical Equipment — 1.6% | | | | | | | | |
A.O. Smith Corporation | | | 250,000 | | | | 17,052,500 | |
| | | | | | | | | |
Industrial Support Services — 4.1% | | | | | | | | |
Fastenal Company | | | 450,000 | | | | 32,359,500 | |
Watsco, Inc. | | | 25,000 | | | | 11,847,250 | |
| | | | | | | | 44,206,750 | |
Materials — 3.1% | | | | | | | | |
Construction Materials — 3.1% | | | | | | | | |
Carlisle Companies, Inc. | | | 90,000 | | | | 33,195,600 | |
| | | | | | | | | |
Real Estate — 7.7% | | | | | | | | |
Real Estate Owners & Developers — 5.6% | | | | | | | | |
Texas Pacific Land Corporation | | | 55,000 | | | | 60,827,800 | |
| | | | | | | | | |
REITs — 2.1% | | | | | | | | |
SBA Communications Corporation - Class A | | | 110,000 | | | | 22,418,000 | |
| | | | | | | | | |
Technology — 29.0% | | | | | | | | |
Semiconductors — 3.5% | | | | | | | | |
Texas Instruments, Inc. | | | 200,000 | | | | 37,502,000 | |
| | | | | | | | | |
Software — 4.1% | | | | | | | | |
ANSYS, Inc. * | | | 70,000 | | | | 23,613,100 | |
Roper Technologies, Inc. | | | 41,000 | | | | 21,313,850 | |
| | | | | | | | 44,926,950 | |
8
AVE MARIA RISING DIVIDEND FUND
SCHEDULE OF INVESTMENTS
(Continued)
COMMON STOCKS — 95.2% (Continued) | | Shares | | | Fair Value | |
Technology — 29.0% (Continued) | | | | | | | | |
Technology Services — 21.4% | | | | | | | | |
Accenture plc - Class A - ADR | | | 121,500 | | | $ | 42,742,485 | |
Broadridge Financial Solutions, Inc. | | | 150,000 | | | | 33,913,500 | |
CDW Corporation | | | 70,000 | | | | 12,182,800 | |
Jack Henry & Associates, Inc. | | | 165,000 | | | | 28,924,500 | |
Mastercard, Inc. - Class A | | | 85,000 | | | | 44,758,450 | |
Moody’s Corporation | | | 80,000 | | | | 37,869,600 | |
S&P Global, Inc. | | | 60,000 | | | | 29,881,800 | |
| | | | | | | | 230,273,135 | |
| | | | | | | | | |
Total Common Stocks (Cost $632,730,625) | | | | | | $ | 1,025,523,921 | |
MONEY MARKET FUNDS — 5.0% | | Shares | | | Fair Value | |
Federated Hermes Government Obligations Tax-Managed Fund - Institutional Shares, 4.33% (a) (Cost $53,419,593) | | | 53,419,593 | | | $ | 53,419,593 | |
| | | | | | | | | |
Total Investments at Fair Value — 100.2% (Cost $686,150,218) | | | | | | $ | 1,078,943,514 | |
| | | | | | | | | |
Liabilities in Excess of Other Assets — (0.2%) | | | | | | | (1,796,050 | ) |
| | | | | | | | | |
Net Assets — 100.0% | | | | | | $ | 1,077,147,464 | |
* | Non-income producing security. |
(a) | The rate shown is the 7-day effective yield as of December 31, 2024. |
See notes to financial statements. |
9
Ave Maria World Equity Fund
SCHEDULE OF INVESTMENTS
December 31, 2024
COMMON STOCKS — 97.5% | | Shares | | | Fair Value | |
Communications — 4.3% | | | | | | | | |
Entertainment Content — 1.7% | | | | | | | | |
Nintendo Company Ltd. | | | 34,700 | | | $ | 2,020,939 | |
| | | | | | | | | |
Internet Media & Services — 2.6% | | | | | | | | |
eDreams ODIGEO S.A. * | | | 329,450 | | | | 2,969,863 | |
| | | | | | | | | |
Consumer Discretionary — 12.2% | | | | | | | | |
Home & Office Products — 4.2% | | | | | | | | |
SharkNinja, Inc. * | | | 50,700 | | | | 4,936,152 | |
| | | | | | | | | |
Leisure Facilities & Services — 3.5% | | | | | | | | |
Alsea S.A.B. de C.V. | | | 685,920 | | | | 1,434,031 | |
Greggs plc | | | 47,400 | | | | 1,653,350 | |
Lucky Strike Entertainment Corporation - Class A | | | 94,400 | | | | 944,944 | |
| | | | | | | | 4,032,325 | |
Leisure Products — 1.0% | | | | | | | | |
MIPS AB | | | 27,800 | | | | 1,177,722 | |
| | | | | | | | | |
Retail - Discretionary — 3.5% | | | | | | | | |
Auto Partner S.A. | | | 421,719 | | | | 2,022,535 | |
B & M European Value Retail S.A. | | | 444,000 | | | | 2,035,895 | |
| | | | | | | | 4,058,430 | |
Consumer Staples — 3.5% | | | | | | | | |
Beverages — 2.0% | | | | | | | | |
Coca-Cola Europacific Partners plc | | | 30,300 | | | | 2,327,343 | |
| | | | | | | | | |
Food — 1.5% | | | | | | | | |
Simply Good Foods Company (The) * | | | 46,400 | | | | 1,808,672 | |
| | | | | | | | | |
Energy — 7.4% | | | | | | | | |
Oil & Gas Producers — 7.4% | | | | | | | | |
Canadian Natural Resources Ltd. | | | 79,800 | | | | 2,464,029 | |
ConocoPhillips | | | 18,800 | | | | 1,864,396 | |
Diamondback Energy, Inc. | | | 15,100 | | | | 2,473,833 | |
Exxon Mobil Corporation | | | 16,857 | | | | 1,813,307 | |
| | | | | | | | 8,615,565 | |
Financials — 11.5% | | | | | | | | |
Asset Management — 1.6% | | | | | | | | |
Partners Group Holding AG | | | 1,410 | | | | 1,915,869 | |
10
AVE MARIA WORLD EQUITY FUND
SCHEDULE OF INVESTMENTS
(Continued)
COMMON STOCKS — 97.5% | | Shares | | | Fair Value | |
Financials — 11.5% (Continued) | | | | | | | | |
Banking — 2.8% | | | | | | | | |
HDFC Bank Ltd. - ADR | | | 50,050 | | | $ | 3,196,193 | |
| | | | | | | | | |
Institutional Financial Services — 1.6% | | | | | | | | |
Nu Holdings Ltd. - Class A * | | | 174,500 | | | | 1,807,820 | |
| | | | | | | | | |
Insurance — 5.5% | | | | | | | | |
Chubb Ltd. | | | 8,750 | | | | 2,417,625 | |
F&G Annuities & Life, Inc. | | | 96,384 | | | | 3,994,153 | |
| | | | | | | | 6,411,778 | |
Health Care — 7.2% | | | | | | | | |
Health Care Facilities & Services — 1.0% | | | | | | | | |
IQVIA Holdings, Inc. * | | | 6,290 | | | | 1,236,048 | |
| | | | | | | | | |
Medical Equipment & Devices — 6.2% | | | | | | | | |
Alcon, Inc. | | | 25,500 | | | | 2,164,695 | |
Mirion Technologies, Inc. * | | | 129,300 | | | | 2,256,285 | |
Stevanato Group S.p.A. | | | 126,281 | | | | 2,751,663 | |
| | | | | | | | 7,172,643 | |
Industrials — 22.6% | | | | | | | | |
Aerospace & Defense — 1.1% | | | | | | | | |
Howmet Aerospace, Inc. | | | 11,500 | | | | 1,257,755 | |
| | | | | | | | | |
Commercial Services — 2.3% | | | | | | | | |
Karooooo Ltd. | | | 60,566 | | | | 2,734,555 | |
| | | | | | | | | |
Commercial Support Services — 6.9% | | | | | | | | |
Edenred SE | | | 70,500 | | | | 2,318,457 | |
Franchise Brands plc | | | 484,063 | | | | 963,617 | |
GFL Environmental, Inc. | | | 106,300 | | | | 4,734,602 | |
| | | | | | | | 8,016,676 | |
Diversified Industrials — 4.5% | | | | | | | | |
Eaton Corporation plc | | | 15,700 | | | | 5,210,359 | |
| | | | | | | | | |
Electrical Equipment — 4.7% | | | | | | | | |
Hammond Power Solutions, Inc. - Class A | | | 34,000 | | | | 3,029,103 | |
TE Connectivity plc | | | 17,550 | | | | 2,509,124 | |
| | | | | | | | 5,538,227 | |
Engineering & Construction — 1.4% | | | | | | | | |
Comfort Systems USA, Inc. | | | 3,800 | | | | 1,611,428 | |
11
AVE MARIA WORLD EQUITY FUND
SCHEDULE OF INVESTMENTS
(Continued)
COMMON STOCKS — 97.5% (Continued) | | Shares | | | Fair Value | |
Industrials — 22.6% (Continued) | | | | | | | | |
Machinery — 1.7% | | | | | | | | |
ITOCHU Corporation | | | 29,700 | | | $ | 1,460,442 | |
Nidec Corporation | | | 28,400 | | | | 510,098 | |
| | | | | | | | 1,970,540 | |
Materials — 2.1% | | | | | | | | |
Chemicals — 0.8% | | | | | | | | |
Shin-Etsu Chemical Company Ltd. | | | 28,400 | | | | 935,391 | |
| | | | | | | | | |
Construction Materials — 1.3% | | | | | | | | |
SigmaRoc plc * | | | 1,642,239 | | | | 1,480,383 | |
| | | | | | | | | |
Real Estate — 1.2% | | | | | | | | |
Real Estate Services — 1.2% | | | | | | | | |
FirstService Corporation | | | 7,500 | | | | 1,357,650 | |
| | | | | | | | | |
Technology — 24.5% | | | | | | | | |
IT Services — 1.9% | | | | | | | | |
StoneCo Ltd. - Class A * | | | 276,200 | | | | 2,201,314 | |
| | | | | | | | | |
Semiconductors — 5.5% | | | | | | | | |
ASML Holding N.V. | | | 1,700 | | | | 1,191,098 | |
Taiwan Semiconductor Manufacturing Company Ltd. - ADR | | | 21,000 | | | | 4,147,290 | |
Texas Instruments, Inc. | | | 5,700 | | | | 1,068,807 | |
| | | | | | | | 6,407,195 | |
Software — 6.9% | | | | | | | | |
SAP SE | | | 24,400 | | | | 6,003,581 | |
Sapiens International Corporation N.V. | | | 74,052 | | | | 1,989,777 | |
| | | | | | | | 7,993,358 | |
Technology Services — 10.2% | | | | | | | | |
Accenture plc - Class A - ADR | | | 9,900 | | | | 3,482,721 | |
Mastercard, Inc. - Class A | | | 10,000 | | | | 5,265,700 | |
S&P Global, Inc. | | | 6,400 | | | | 3,187,392 | |
| | | | | | | | 11,935,813 | |
Utilities — 1.0% | | | | | | | | |
Gas & Water Utilities — 1.0% | | | | | | | | |
Cia de Saneamento Basico do Estado de Sao Paulo - ADR | | | 81,000 | | | | 1,160,730 | |
| | | | | | | | | |
Total Common Stocks (Cost $79,655,136) | | | | | | $ | 113,498,736 | |
12
AVE MARIA WORLD EQUITY FUND
SCHEDULE OF INVESTMENTS
(Continued)
MONEY MARKET FUNDS — 2.6% | | Shares | | | Fair Value | |
Federated Hermes Government Obligations Tax-Managed Fund - Institutional Shares, 4.33% (a) (Cost $2,986,015) | | | 2,986,015 | | | $ | 2,986,015 | |
| | | | | | | | | |
Total Investments at Fair Value — 100.1% (Cost $82,641,151) | | | | | | $ | 116,484,751 | |
| | | | | | | | | |
Liabilities in Excess of Other Assets — (0.1%) | | | | | | | (100,262 | ) |
| | | | | | | | | |
Net Assets — 100.0% | | | | | | $ | 116,384,489 | |
ADR - American Depositary Receipt. |
* | Non-income producing security. |
(a) | The rate shown is the 7-day effective yield as of December 31, 2024. |
See notes to financial statements. |
13
AVE MARIA WORLD EQUITY FUND
Summary of Common Stocks by Country
December 31, 2024
Country | | Value | | | % of Net Assets | |
United States ** | | $ | 44,921,076 | | | | 38.6 | % |
Canada | | | 11,585,384 | | | | 10.0 | % |
United Kingdom | | | 8,460,588 | | | | 7.3 | % |
Switzerland | | | 6,498,189 | | | | 5.6 | % |
Germany | | | 6,003,581 | | | | 5.1 | % |
Brazil | | | 5,169,864 | | | | 4.4 | % |
Japan | | | 4,926,870 | | | | 4.2 | % |
Taiwan | | | 4,147,290 | | | | 3.6 | % |
India | | | 3,196,193 | | | | 2.8 | % |
Spain | | | 2,969,863 | | | | 2.6 | % |
Italy | | | 2,751,663 | | | | 2.4 | % |
Singapore | | | 2,734,555 | | | | 2.3 | % |
France | | | 2,318,457 | | | | 2.0 | % |
Poland | | | 2,022,535 | | | | 1.7 | % |
Israel | | | 1,989,777 | | | | 1.7 | % |
Mexico | | | 1,434,031 | | | | 1.2 | % |
Netherlands | | | 1,191,098 | | | | 1.0 | % |
Sweden | | | 1,177,722 | | | | 1.0 | % |
Total | | $ | 113,498,736 | | | | 97.5 | % |
** | Includes any company deemed to be a “non-U.S. company” as defined in the Fund’s Prospectus. According to the Fund’s Prospectus, a “non-U.S. company” is one that is headquartered outside of the United States or has 50% of its revenues or operations outside of the United States during its most recent fiscal year, at the time of purchase. |
See notes to financial statements. |
14
Ave Maria Focused Fund
SCHEDULE OF INVESTMENTS
December 31, 2024
COMMON STOCKS — 99.9% | | Shares | | | Fair Value | |
Communications — 29.3% | | | | | | | | |
Internet Media & Services — 20.6% | | | | | | | | |
eDreams ODIGEO S.A. * | | | 1,313,620 | | | $ | 11,841,772 | |
| | | | | | | | | |
Telecommunications — 8.7% | | | | | | | | |
DigitalBridge Group, Inc. | | | 441,341 | | | | 4,978,326 | |
| | | | | | | | | |
Consumer Discretionary — 1.2% | | | | | | | | |
Apparel & Textile Products — 1.2% | | | | | | | | |
Hermes International SCA | | | 284 | | | | 681,627 | |
| | | | | | | | | |
Energy — 1.6% | | | | | | | | |
Oil & Gas Producers — 1.6% | | | | | | | | |
Permian Basin Royalty Trust | | | 47,193 | | | | 522,898 | |
PrairieSky Royalty Ltd. | | | 20,474 | | | | 399,284 | |
| | | | | | | | 922,182 | |
Financials — 23.3% | | | | | | | | |
Asset Management — 23.3% | | | | | | | | |
Apollo Global Management, Inc. | | | 22,281 | | | | 3,679,930 | |
Brookfield Corporation | | | 84,720 | | | | 4,867,164 | |
Brookfield Wealth Solutions Ltd. * | | | 84,720 | | | | 4,866,317 | |
| | | | | | | | 13,413,411 | |
Health Care — 1.1% | | | | | | | | |
Health Care Facilities & Services — 1.1% | | | | | | | | |
Chemed Corporation | | | 1,173 | | | | 621,455 | |
| | | | | | | | | |
Industrials — 26.0% | | | | | | | | |
Commercial Support Services — 26.0% | | | | | | | | |
API Group Corporation * | | | 288,209 | | | | 10,366,878 | |
GFL Environmental, Inc. | | | 103,422 | | | | 4,606,416 | |
| | | | | | | | 14,973,294 | |
Materials — 4.2% | | | | | | | | |
Construction Materials — 4.2% | | | | | | | | |
SigmaRoc plc * | | | 2,704,477 | | | | 2,437,930 | |
| | | | | | | | | |
Real Estate — 6.7% | | | | | | | | |
Multi-Asset Class Owners & Developers — 6.1% | | | | | | | | |
Landbridge Company, LLC - Class A | | | 54,214 | | | | 3,502,224 | |
| | | | | | | | | |
Real Estate Owners & Developers — 0.6% | | | | | | | | |
Texas Pacific Land Corporation | | | 326 | | | | 360,543 | |
15
AVE MARIA FOCUSED FUND
SCHEDULE OF INVESTMENTS
(Continued)
COMMON STOCKS — 99.9% (Continued) | | Shares | | | Fair Value | |
Technology — 0.3% | | | | | | | | |
Software — 0.3% | | | | | | | | |
Cirata plc * | | | 617,700 | | | $ | 178,453 | |
| | | | | | | | | |
Utilities — 6.2% | | | | | | | | |
Gas & Water Utilities — 6.2% | | | | | | | | |
Secure Energy Services, Inc. | | | 314,511 | | | | 3,558,050 | |
| | | | | | | | | |
Total Common Stocks (Cost $42,121,651) | | | | | | $ | 57,469,267 | |
MONEY MARKET FUNDS — 0.8% | | Shares | | | Fair Value | |
Federated Hermes Government Obligations Tax-Managed Fund - Institutional Shares, 4.33% (a) (Cost $441,428) | | | 441,428 | | | $ | 441,428 | |
| | | | | | | | | |
Total Investments at Fair Value — 100.7% (Cost $42,563,079) | | | | | | $ | 57,910,695 | |
| | | | | | | | | |
Liabilities in Excess of Other Assets — (0.7%) | | | | | | | (420,991 | ) |
| | | | | | | | | |
Net Assets — 100.0% | | | | | | $ | 57,489,704 | |
* | Non-income producing security. |
(a) | The rate shown is the 7-day effective yield as of December 31, 2024. |
See notes to financial statements. |
16
Ave Maria Bond Fund
SCHEDULE OF INVESTMENTS
December 31, 2024
U.S. GOVERNMENT & AGENCIES — 26.9% | | Par Value | | | Fair Value | |
U.S. Treasury Inflation-Protected Notes — 6.6% (a) | | | | | | | | |
2.375%, due 01/15/25 | | $ | 5,023,740 | | | $ | 5,020,766 | |
0.625%, due 01/15/26 | | | 6,642,200 | | | | 6,550,437 | |
2.000%, due 01/15/26 | | | 4,771,110 | | | | 4,771,180 | |
0.125%, due 04/15/26 | | | 6,018,150 | | | | 5,873,392 | |
0.375%, due 01/15/27 | | | 5,096,247 | | | | 4,940,949 | |
0.375%, due 07/15/27 | | | 8,387,535 | | | | 8,093,632 | |
0.500%, due 01/15/28 | | | 6,398,400 | | | | 6,116,147 | |
0.750%, due 07/15/28 | | | 3,143,750 | | | | 3,019,312 | |
| | | | | | | | 44,385,815 | |
U.S. Treasury Notes — 20.3% | | | | | | | | |
1.375%, due 01/31/25 | | | 10,000,000 | | | | 9,976,453 | |
2.875%, due 06/15/25 | | | 10,000,000 | | | | 9,939,609 | |
4.500%, due 11/15/25 | | | 10,000,000 | | | | 10,018,516 | |
4.125%, due 09/30/27 | | | 10,000,000 | | | | 9,959,375 | |
4.000%, due 02/29/28 | | | 10,000,000 | | | | 9,907,813 | |
1.250%, due 09/30/28 | | | 10,000,000 | | | | 8,935,938 | |
3.250%, due 06/30/29 | | | 10,000,000 | | | | 9,541,016 | |
4.250%, due 06/30/29 | | | 10,000,000 | | | | 9,943,359 | |
4.000%, due 10/31/29 | | | 10,000,000 | | | | 9,830,469 | |
4.000%, due 02/28/30 | | | 10,000,000 | | | | 9,813,672 | |
3.750%, due 05/31/30 | | | 10,000,000 | | | | 9,677,734 | |
4.625%, due 09/30/30 | | | 10,000,000 | | | | 10,091,797 | |
4.125%, due 07/31/31 | | | 10,000,000 | | | | 9,800,000 | |
4.500%, due 11/15/33 | | | 10,000,000 | | | | 9,956,250 | |
| | | | | | | | 137,392,001 | |
Total U.S. Government & Agencies (Cost $186,102,766) | | | | | | $ | 181,777,816 | |
CORPORATE BONDS — 53.1% | | Par Value | | | Fair Value | |
Communications — 1.4% | | | | | | | | |
Electronic Arts, Inc., 4.800%, due 03/01/26 | | $ | 5,500,000 | | | $ | 5,501,020 | |
Electronic Arts, Inc., 1.850%, due 02/15/31 | | | 4,880,000 | | | | 4,053,217 | |
| | | | | | | | 9,554,237 | |
Consumer Discretionary — 7.8% | | | | | | | | |
Genuine Parts Company, 1.875%, due 11/01/30 | | | 2,429,000 | | | | 2,029,060 | |
Genuine Parts Company, 6.875%, due 11/01/33 | | | 900,000 | | | | 986,549 | |
Lowe’s Companies, Inc., 3.375%, due 09/15/25 | | | 1,500,000 | | | | 1,485,822 | |
Lowe’s Companies, Inc., 2.500%, due 04/15/26 | | | 3,000,000 | | | | 2,923,324 | |
Lowe’s Companies, Inc., 3.100%, due 05/03/27 | | | 9,050,000 | | | | 8,748,052 | |
Lowe’s Companies, Inc., 1.300%, due 04/15/28 | | | 400,000 | | | | 357,505 | |
Lowe’s Companies, Inc., 1.700%, due 10/15/30 | | | 925,000 | | | | 773,803 | |
Lowe’s Companies, Inc., 3.750%, due 04/01/32 | | | 4,000,000 | | | | 3,664,413 | |
17
AVE MARIA BOND FUND
SCHEDULE OF INVESTMENTS
(Continued)
CORPORATE BONDS — 53.1% (Continued) | | Par Value | | | Fair Value | |
Consumer Discretionary — 7.8% (Continued) | | | | | | | | |
O’Reilly Automotive, Inc., 3.900%, due 06/01/29 | | $ | 2,767,000 | | | $ | 2,652,435 | |
O’Reilly Automotive, Inc., 4.200%, due 04/01/30 | | | 400,000 | | | | 384,497 | |
O’Reilly Automotive, Inc., 4.700%, due 06/15/32 | | | 7,850,000 | | | | 7,596,199 | |
Ross Stores, Inc., 0.875%, due 04/15/26 | | | 5,255,000 | | | | 5,003,614 | |
Ross Stores, Inc., 4.700%, due 04/15/27 | | | 1,300,000 | | | | 1,281,789 | |
Ross Stores, Inc., 1.875%, due 04/15/31 | | | 615,000 | | | | 507,484 | |
TJX Companies, Inc. (The), 2.250%, due 09/15/26 | | | 3,226,000 | | | | 3,109,359 | |
TJX Companies, Inc. (The), 1.150%, due 05/15/28 | | | 3,276,000 | | | | 2,922,796 | |
TJX Companies, Inc. (The), 3.875%, due 04/15/30 | | | 2,902,000 | | | | 2,763,557 | |
TJX Companies, Inc. (The), 1.600%, due 05/15/31 | | | 5,263,000 | | | | 4,305,691 | |
Tractor Supply Company, 5.250%, due 05/15/33 | | | 1,400,000 | | | | 1,400,086 | |
| | | | | | | | 52,896,035 | |
Consumer Staples — 8.6% | | | | | | | | |
Coca-Cola Company (The), 1.450%, due 06/01/27 | | | 5,452,000 | | | | 5,089,463 | |
Coca-Cola Company (The), 2.125%, due 09/06/29 | | | 1,550,000 | | | | 1,388,923 | |
Coca-Cola Company (The), 2.000%, due 03/05/31 | | | 1,250,000 | | | | 1,065,687 | |
Coca-Cola Company (The), 2.250%, due 01/05/32 | | | 450,000 | | | | 383,361 | |
Colgate-Palmolive Company, 3.100%, due 08/15/27 | | | 5,000,000 | | | | 4,837,098 | |
Colgate-Palmolive Company, 3.250%, due 08/15/32 | | | 2,750,000 | | | | 2,472,144 | |
Colgate-Palmolive Company, 4.600%, due 03/01/33 | | | 2,720,000 | | | | 2,682,599 | |
Hershey Company (The), 0.900%, due 06/01/25 | | | 7,450,000 | | | | 7,332,059 | |
Hershey Company (The), 3.200%, due 08/21/25 | | | 645,000 | | | | 639,169 | |
Hershey Company (The), 2.300%, due 08/15/26 | | | 2,000,000 | | | | 1,933,427 | |
Hershey Company (The), 4.250%, due 05/04/28 | | | 1,350,000 | | | | 1,337,110 | |
Hershey Company (The), 2.450%, due 11/15/29 | | | 4,875,000 | | | | 4,395,637 | |
Hormel Foods Corporation, 1.700%, due 06/03/28 | | | 1,850,000 | | | | 1,676,365 | |
Hormel Foods Corporation, 1.800%, due 06/11/30 | | | 4,600,000 | | | | 3,927,761 | |
J.M. Smucker Company (The), 3.375%, due 12/15/27 | | | 3,750,000 | | | | 3,632,148 | |
J.M. Smucker Company (The), 2.125%, due 03/15/32 | | | 1,450,000 | | | | 1,177,432 | |
Kimberly-Clark Corporation, 2.650%, due 03/01/25 | | | 1,115,000 | | | | 1,110,928 | |
Kimberly-Clark Corporation, 2.750%, due 02/15/26 | | | 2,648,000 | | | | 2,597,243 | |
Kimberly-Clark Corporation, 1.050%, due 09/15/27 | | | 1,900,000 | | | | 1,735,641 | |
Kimberly-Clark Corporation, 3.950%, due 11/01/28 | | | 1,665,000 | | | | 1,627,173 | |
Kimberly-Clark Corporation, 3.200%, due 04/25/29 | | | 1,397,000 | | | | 1,318,014 | |
Kimberly-Clark Corporation, 3.100%, due 03/26/30 | | | 609,000 | | | | 562,988 | |
Kimberly-Clark Corporation, 2.000%, due 11/02/31 | | | 5,530,000 | | | | 4,665,769 | |
Kimberly-Clark Corporation, 4.500%, due 02/16/33 | | | 500,000 | | | | 487,089 | |
| | | | | | | | 58,075,228 | |
Energy — 2.8% | | | | | | | | |
Chevron Corporation, 8.000%, due 04/01/27 | | | 2,600,000 | | | | 2,803,175 | |
Chevron Corporation, 1.995%, due 05/11/27 | | | 1,500,000 | | | | 1,417,919 | |
Chevron Corporation, 1.018%, due 08/12/27 | | | 1,150,000 | | | | 1,052,263 | |
Chevron Corporation, 3.250%, due 10/15/29 | | | 7,685,000 | | | | 7,230,485 | |
18
AVE MARIA BOND FUND
SCHEDULE OF INVESTMENTS
(Continued)
CORPORATE BONDS — 53.1% (Continued) | | Par Value | | | Fair Value | |
Energy — 2.8% (Continued) | | | | | | | | |
Exxon Mobil Corporation, 2.709%, due 03/06/25 | | $ | 998,000 | | | $ | 994,827 | |
Exxon Mobil Corporation, 2.440%, due 08/16/29 | | | 546,000 | | | | 498,281 | |
Exxon Mobil Corporation, 2.610%, due 10/15/30 | | | 180,000 | | | | 160,392 | |
Pioneer Natural Resources, 1.125%, due 01/15/26 | | | 2,578,000 | | | | 2,488,624 | |
Pioneer Natural Resources, 7.200%, due 01/15/28 | | | 1,936,000 | | | | 2,066,675 | |
Pioneer Natural Resources, 1.900%, due 08/15/30 | | | 530,000 | | | | 451,518 | |
| | | | | | | | 19,164,159 | |
Financials — 3.4% | | | | | | | | |
Chubb INA Holdings, Inc., 3.150%, due 03/15/25 | | | 4,309,000 | | | | 4,294,774 | |
Chubb INA Holdings, Inc., 3.350%, due 05/03/26 | | | 650,000 | | | | 639,860 | |
Chubb INA Holdings, Inc., 1.375%, due 09/15/30 | | | 5,700,000 | | | | 4,734,509 | |
Chubb INA Holdings, Inc., 5.000%, due 03/15/34 | | | 6,600,000 | | | | 6,523,708 | |
PNC Financial Services Group, Inc. (The), 3.250%, due 06/01/25 | | | 1,528,000 | | | | 1,518,158 | |
PNC Financial Services Group, Inc. (The), 3.150%, due 05/19/27 | | | 400,000 | | | | 385,835 | |
PNC Financial Services Group, Inc. (The), 3.250%, due 01/22/28 | | | 4,380,000 | | | | 4,194,458 | |
Truist Financial Corporation, 2.250%, due 03/11/30 | | | 900,000 | | | | 772,755 | |
| | | | | | | | 23,064,057 | |
Health Care — 1.0% | | | | | | | | |
Stryker Corporation, 3.375%, due 11/01/25 | | | 1,026,000 | | | | 1,015,739 | |
Stryker Corporation, 3.500%, due 03/15/26 | | | 1,404,000 | | | | 1,385,215 | |
Stryker Corporation, 3.650%, due 03/07/28 | | | 500,000 | | | | 482,854 | |
Stryker Corporation, 4.850%, due 12/08/28 | | | 325,000 | | | | 325,906 | |
Stryker Corporation, 1.950%, due 06/15/30 | | | 3,595,000 | | | | 3,090,410 | |
Stryker Corporation, 4.625%, due 09/11/34 | | | 300,000 | | | | 286,430 | |
| | | | | | | | 6,586,554 | |
Industrials — 10.9% | | | | | | | | |
Amphenol Corporation, 4.350%, due 06/01/29 | | | 5,950,000 | | | | 5,828,863 | |
Amphenol Corporation, 2.200%, due 09/15/31 | | | 6,460,000 | | | | 5,413,995 | |
Cintas Corporation, 4.000%, due 05/01/32 | | | 1,874,000 | | | | 1,754,106 | |
Honeywell International, Inc., 1.100%, due 03/01/27 | | | 650,000 | | | | 604,826 | |
Honeywell International, Inc., 4.950%, due 02/15/28 | | | 870,000 | | | | 879,793 | |
Honeywell International, Inc., 2.700%, due 08/15/29 | | | 650,000 | | | | 595,670 | |
Honeywell International, Inc., 1.750%, due 09/01/31 | | | 600,000 | | | | 491,916 | |
Honeywell International, Inc., 4.950%, due 09/01/31 | | | 4,165,000 | | | | 4,167,343 | |
Honeywell International, Inc., 4.750%, due 02/01/32 | | | 5,000,000 | | | | 4,919,862 | |
Honeywell International, Inc., 5.000%, due 02/15/33 | | | 3,512,000 | | | | 3,493,922 | |
Honeywell International, Inc., 4.500%, due 01/15/34 | | | 1,930,000 | | | | 1,842,005 | |
Hubbell, Inc., 3.150%, due 08/15/27 | | | 5,632,000 | | | | 5,391,094 | |
Hubbell, Inc., 2.300%, due 03/15/31 | | | 1,270,000 | | | | 1,077,822 | |
Illinois Tool Works, Inc., 2.650%, due 11/15/26 | | | 10,601,000 | | | | 10,293,917 | |
19
AVE MARIA BOND FUND
SCHEDULE OF INVESTMENTS
(Continued)
CORPORATE BONDS — 53.1% (Continued) | | Par Value | | | Fair Value | |
Industrials — 10.9% (Continued) | | | | | | | | |
L3 Harris Technologies, Inc., 5.050%, due 06/01/29 | | $ | 1,500,000 | | | $ | 1,499,496 | |
L3 Harris Technologies, Inc., 1.800%, due 01/15/31 | | | 1,300,000 | | | | 1,070,552 | |
L3 Harris Technologies, Inc., 5.250%, due 06/01/31 | | | 800,000 | | | | 801,355 | |
L3 Harris Technologies, Inc., 5.400%, due 07/31/33 | | | 1,900,000 | | | | 1,895,957 | |
L3 Harris Technologies, Inc., 5.350%, due 06/01/34 | | | 800,000 | | | | 797,215 | |
Lockheed Martin Corporation, 3.550%, due 01/15/26 | | | 3,848,000 | | | | 3,810,927 | |
Lockheed Martin Corporation, 5.100%, due 11/15/27 | | | 3,057,000 | | | | 3,103,805 | |
Lockheed Martin Corporation, 4.450%, due 05/15/28 | | | 1,000,000 | | | | 992,753 | |
Lockheed Martin Corporation, 1.850%, due 06/15/30 | | | 1,000,000 | | | | 857,298 | |
Lockheed Martin Corporation, 5.250%, due 01/15/33 | | | 2,560,000 | | | | 2,587,283 | |
Lockheed Martin Corporation, 4.750%, due 02/15/34 | | | 650,000 | | | | 631,218 | |
PACCAR Financial Corporation, 1.800%, due 02/06/25 | | | 350,000 | | | | 349,026 | |
PACCAR Financial Corporation, 1.100%, due 05/11/26 | | | 835,000 | | | | 797,311 | |
PACCAR Financial Corporation, 2.000%, due 02/04/27 | | | 500,000 | | | | 475,186 | |
PACCAR Financial Corporation, 4.600%, due 01/10/28 | | | 1,050,000 | | | | 1,047,685 | |
United Parcel Service, Inc., 2.400%, due 11/15/26 | | | 1,869,000 | | | | 1,801,485 | |
United Parcel Service, Inc., 4.450%, due 04/01/30 | | | 740,000 | | | | 732,406 | |
United Parcel Service, Inc., 5.150%, due 05/22/34 | | | 3,650,000 | | | | 3,645,026 | |
| | | | | | | | 73,651,118 | |
Materials — 2.8% | | | | | | | | |
Carlisle Companies, Inc., 2.200%, due 03/01/32 | | | 6,050,000 | | | | 4,938,113 | |
Ecolab, Inc., 2.700%, due 11/01/26 | | | 6,438,000 | | | | 6,234,472 | |
Ecolab, Inc., 4.800%, due 03/24/30 | | | 1,745,000 | | | | 1,746,944 | |
Ecolab, Inc., 1.300%, due 01/30/31 | | | 2,705,000 | | | | 2,190,016 | |
Ecolab, Inc., 2.125%, due 02/01/32 | | | 3,028,000 | | | | 2,518,568 | |
RPM International, Inc., 3.750%, due 03/15/27 | | | 1,250,000 | | | | 1,221,843 | |
| | | | | | | | 18,849,956 | |
Technology — 14.4% | | | | | | | | |
Analog Devices, Inc., 2.100%, due 10/01/31 | | | 2,300,000 | | | | 1,927,837 | |
Analog Devices, Inc., 5.050%, due 04/01/34 | | | 4,230,000 | | | | 4,230,409 | |
Broadridge Financial Solutions, Inc., 3.400%, due 06/27/26 | | | 600,000 | | | | 588,499 | |
Broadridge Financial Solutions, Inc., 2.900%, due 12/01/29 | | | 6,800,000 | | | | 6,143,671 | |
Broadridge Financial Solutions, Inc., 2.600%, due 05/01/31 | | | 5,319,000 | | | | 4,554,507 | |
Cisco Systems, Inc., 3.500%, due 06/15/25 | | | 5,000,000 | | | | 4,978,872 | |
Cisco Systems, Inc., 2.950%, due 02/28/26 | | | 2,770,000 | | | | 2,722,817 | |
Cisco Systems, Inc., 2.500%, due 09/20/26 | | | 3,080,000 | | | | 2,985,172 | |
Mastercard, Inc., 2.000%, due 03/03/25 | | | 5,625,000 | | | | 5,600,278 | |
Mastercard, Inc., 2.950%, due 11/21/26 | | | 2,000,000 | | | | 1,944,827 | |
Mastercard, Inc., 3.300%, due 03/26/27 | | | 2,150,000 | | | | 2,096,510 | |
Mastercard, Inc., 3.500%, due 02/26/28 | | | 450,000 | | | | 435,897 | |
20
AVE MARIA BOND FUND
SCHEDULE OF INVESTMENTS
(Continued)
CORPORATE BONDS — 53.1% (Continued) | | Par Value | | | Fair Value | |
Technology — 14.4% (Continued) | | | | | | | | |
Mastercard, Inc., 3.350%, due 03/26/30 | | $ | 1,500,000 | | | $ | 1,401,544 | |
Mastercard, Inc., 2.000%, due 11/18/31 | | | 3,717,000 | | | | 3,088,187 | |
Mastercard, Inc., 4.850%, due 03/09/33 | | | 4,100,000 | | | | 4,065,277 | |
Mastercard, Inc., 4.875%, due 05/09/34 | | | 2,500,000 | | | | 2,461,905 | |
Moody’s Corporation, 3.250%, due 01/15/28 | | | 4,706,000 | | | | 4,509,041 | |
Moody’s Corporation, 4.250%, due 02/01/29 | | | 5,289,000 | | | | 5,175,666 | |
Moody’s Corporation, 4.250%, due 08/08/32 | | | 2,853,000 | | | | 2,707,679 | |
S&P Global, Inc., 2.950%, due 01/22/27 | | | 3,675,000 | | | | 3,556,991 | |
S&P Global, Inc., 2.450%, due 03/01/27 | | | 3,000,000 | | | | 2,867,381 | |
S&P Global, Inc., 4.750%, due 08/01/28 | | | 1,115,000 | | | | 1,116,513 | |
S&P Global, Inc., 4.250%, due 05/01/29 | | | 427,000 | | | | 417,611 | |
S&P Global, Inc., 2.500%, due 12/01/29 | | | 700,000 | | | | 628,683 | |
S&P Global, Inc., 1.250%, due 08/15/30 | | | 2,600,000 | | | | 2,151,989 | |
S&P Global, Inc., 2.900%, due 03/01/32 | | | 2,200,000 | | | | 1,920,704 | |
S&P Global, Inc., 5.250%, due 09/15/33 | | | 900,000 | | | | 909,482 | |
Texas Instruments, Inc., 1.375%, due 03/12/25 | | | 1,160,000 | | | | 1,152,778 | |
Texas Instruments, Inc., 1.750%, due 05/04/30 | | | 380,000 | | | | 325,347 | |
Texas Instruments, Inc., 1.900%, due 09/15/31 | | | 2,000,000 | | | | 1,675,983 | |
Texas Instruments, Inc., 3.650%, due 08/16/32 | | | 1,293,000 | | | | 1,186,198 | |
Texas Instruments, Inc., 4.900%, due 03/14/33 | | | 1,400,000 | | | | 1,390,587 | |
Texas Instruments, Inc., 4.850%, due 02/08/34 | | | 2,947,000 | | | | 2,899,086 | |
Visa, Inc., 3.150%, due 12/14/25 | | | 3,905,000 | | | | 3,859,767 | |
Visa, Inc., 1.900%, due 04/15/27 | | | 3,854,000 | | | | 3,643,517 | |
Visa, Inc., 2.750%, due 09/15/27 | | | 6,051,000 | | | | 5,790,248 | |
| | | | | | | | 97,111,460 | |
| | | | | | | | | |
Total Corporate Bonds (Cost $364,694,570) | | | | | | $ | 358,952,804 | |
COMMON STOCKS — 16.0% | | Shares | | | Fair Value | |
Consumer Discretionary — 1.3% | | | | | | | | |
Retail - Discretionary — 1.3% | | | | | | | | |
Genuine Parts Company | | | 77,000 | | | $ | 8,990,520 | |
| | | | | | | | | |
Consumer Staples — 1.7% | | | | | | | | |
Beverages — 1.7% | | | | | | | | |
Coca-Cola Europacific Partners plc | | | 150,000 | | | | 11,521,500 | |
21
AVE MARIA BOND FUND
SCHEDULE OF INVESTMENTS
(Continued)
COMMON STOCKS — 16.0% (Continued) | | Shares | | | Fair Value | |
Energy — 3.5% | | | | | | | | |
Oil & Gas Producers — 3.5% | | | | | | | | |
Chevron Corporation | | | 50,000 | | | $ | 7,242,000 | |
Diamondback Energy, Inc. | | | 45,200 | | | | 7,405,116 | |
Exxon Mobil Corporation | | | 80,000 | | | | 8,605,600 | |
| | | | | | | | 23,252,716 | |
Financials — 2.8% | | | | | | | | |
Banking — 1.4% | | | | | | | | |
Truist Financial Corporation | | | 225,000 | | | | 9,760,500 | |
| | | | | | | | | |
Specialty Finance — 1.4% | | | | | | | | |
Fidelity National Financial, Inc. | | | 165,000 | | | | 9,263,100 | |
| | | | | | | | | |
Industrials — 4.0% | | | | | | | | |
Aerospace & Defense — 1.2% | | | | | | | | |
Lockheed Martin Corporation | | | 17,000 | | | | 8,260,980 | |
| | | | | | | | | |
Industrial Support Services — 2.8% | | | | | | | | |
Fastenal Company | | | 106,000 | | | | 7,622,460 | |
Watsco, Inc. | | | 24,000 | | | | 11,373,360 | |
| | | | | | | | 18,995,820 | |
Real Estate — 1.4% | | | | | | | | |
Real Estate Owners & Developers — 1.0% | | | | | | | | |
Texas Pacific Land Corporation | | | 6,000 | | | | 6,635,760 | |
| | | | | | | | | |
REITs — 0.4% | | | | | | | | |
SBA Communications Corporation - Class A | | | 15,000 | | | | 3,057,000 | |
| | | | | | | | | |
Technology — 1.3% | | | | | | | | |
Semiconductors — 1.3% | | | | | | | | |
Texas Instruments, Inc. | | | 47,000 | | | | 8,812,970 | |
| | | | | | | | | |
Total Common Stocks (Cost $67,061,774) | | | | | | $ | 108,550,866 | |
22
AVE MARIA BOND FUND
SCHEDULE OF INVESTMENTS
(Continued)
MONEY MARKET FUNDS — 3.4% | | Shares | | | Fair Value | |
Federated Hermes Government Obligations Tax-Managed Fund - Institutional Shares, 4.33% (b) (Cost $23,030,272) | | | 23,030,272 | | | $ | 23,030,272 | |
| | | | | | | | | |
Total Investments at Fair Value — 99.4% (Cost $640,889,382) | | | | | | $ | 672,311,758 | |
| | | | | | | | | |
Other Assets in Excess of Liabilities — 0.6% | | | | | | | 4,204,586 | |
| | | | | | | | | |
Net Assets — 100.0% | | | | | | $ | 676,516,344 | |
(a) | Interest rate for this investment is the stated rate. Interest payments are determined based on the inflation adjusted principal. |
(b) | The rate shown is the 7-day effective yield as of December 31, 2024. |
| |
23
AVE MARIA MUTUAL FUNDS
Statements of Assets and Liabilities
December 31, 2024
| | Ave Maria
Value Fund | | | Ave Maria
Growth Fund | | | Ave Maria
Rising
Dividend Fund | |
ASSETS | | | | | | | | | | | | |
Investment securities: | | | | | | | | | | | | |
At cost | | $ | 300,407,355 | | | $ | 607,825,562 | | | $ | 686,150,218 | |
At fair value (Note 1) | | $ | 446,599,627 | | | $ | 1,080,258,115 | | | $ | 1,078,943,514 | |
Receivable for capital shares sold | | | 497,431 | | | | 579,810 | | | | 269,635 | |
Dividends receivable | | | 265,794 | | | | 473,332 | | | | 748,514 | |
Tax reclaims receivable | | | 5,817 | | | | 139,352 | | | | 98,249 | |
Other assets | | | 23,609 | | | | 48,773 | | | | 49,143 | |
TOTAL ASSETS | | | 447,392,278 | | | | 1,081,499,382 | | | | 1,080,109,055 | |
| | | | | | | | | | | | | |
LIABILITIES | | | | | | | | | | | | |
Payable for capital shares redeemed | | | 242,796 | | | | 1,568,999 | | | | 665,547 | |
Payable to Adviser (Note 2) | | | 878,392 | | | | 2,125,505 | | | | 2,157,854 | |
Payable to administrator (Note 2) | | | 40,140 | | | | 93,487 | | | | 93,461 | |
Other accrued expenses | | | 26,153 | | | | 48,745 | | | | 44,729 | |
TOTAL LIABILITIES | | | 1,187,481 | | | | 3,836,736 | | | | 2,961,591 | |
| | | | | | | | | | | | | |
NET ASSETS | | $ | 446,204,797 | | | $ | 1,077,662,646 | | | $ | 1,077,147,464 | |
| | | | | | | | | | | | | |
NET ASSETS CONSIST OF: | | | | | | | | | | | | |
Paid-in capital | | $ | 299,480,978 | | | $ | 605,230,093 | | | $ | 684,355,311 | |
Distributable earnings | | | 146,723,819 | | | | 472,432,553 | | | | 392,792,153 | |
NET ASSETS | | $ | 446,204,797 | | | $ | 1,077,662,646 | | | $ | 1,077,147,464 | |
Shares of beneficial interest outstanding (unlimited number of shares authorized, no par value) | | | 16,753,953 | | | | 22,735,932 | | | | 47,362,560 | |
Net asset value, offering price and redemption price per share (Note 1) | | $ | 26.63 | | | $ | 47.40 | | | $ | 22.74 | |
See notes to financial statements. |
24
AVE MARIA MUTUAL FUNDS
STATEMENTS OF ASSETS AND LIABILITIES
December 31, 2024 (Continued)
| | Ave Maria
World
Equity Fund | | | Ave Maria
Focused Fund | | | Ave Maria
Bond Fund | |
ASSETS | | | | | | | | | | | | |
Investment securities: | | | | | | | | | | | | |
At cost | | $ | 82,641,151 | | | $ | 42,563,079 | | | $ | 640,889,382 | |
At fair value (Note 1) | | $ | 116,484,751 | | | $ | 57,910,695 | | | $ | 672,311,758 | |
Cash | | | — | | | | 6,778 | | | | — | |
Receivable for capital shares sold | | | 76,438 | | | | 33,120 | | | | 908,307 | |
Dividends and interest receivable | | | 54,953 | | | | 28,023 | | | | 4,358,991 | |
Tax reclaims receivable | | | 48,805 | | | | 1,181 | | | | — | |
Other assets | | | 11,307 | | | | 7,667 | | | | 36,870 | |
TOTAL ASSETS | | | 116,676,254 | | | | 57,987,464 | | | | 677,615,926 | |
| | | | | | | | | | | | | |
LIABILITIES | | | | | | | | | | | | |
Payable for capital shares redeemed | | | 37,218 | | | | 36,651 | | | | 558,297 | |
Payable for investment securities purchased | | | — | | | | 337,287 | | | | — | |
Payable to Adviser (Note 2) | | | 226,470 | | | | 106,814 | | | | 441,726 | |
Payable to administrator (Note 2) | | | 10,126 | | | | 4,939 | | | | 51,258 | |
Other accrued expenses | | | 17,951 | | | | 12,069 | | | | 48,301 | |
TOTAL LIABILITIES | | | 291,765 | | | | 497,760 | | | | 1,099,582 | |
| | | | | | | | | | | | | |
NET ASSETS | | $ | 116,384,489 | | | $ | 57,489,704 | | | $ | 676,516,344 | |
| | | | | | | | | | | | | |
NET ASSETS CONSIST OF: | | | | | | | | | | | | |
Paid-in capital | | $ | 82,541,781 | | | $ | 42,260,893 | | | $ | 645,093,968 | |
Distributable earnings | | | 33,842,708 | | | | 15,228,811 | | | | 31,422,376 | |
NET ASSETS | | $ | 116,384,489 | | | $ | 57,489,704 | | | $ | 676,516,344 | |
Shares of beneficial interest outstanding (unlimited number of shares authorized, no par value) | | | 5,823,983 | | | | 3,757,168 | | | | 56,047,237 | |
Net asset value, offering price and redemption price per share (Note 1) | | $ | 19.98 | | | $ | 15.30 | | | $ | 12.07 | |
See notes to financial statements. |
25
AVE MARIA MUTUAL FUNDS
Statements of Operations
For the Year Ended December 31, 2024
| | Ave Maria
Value Fund | | | Ave Maria
Growth Fund | | | Ave Maria
Rising
Dividend Fund | |
INVESTMENT INCOME | | | | | | | | | | | | |
Dividends | | $ | 5,737,573 | | | $ | 8,636,710 | | | $ | 19,951,679 | |
Tax reclaims received | | | 5,817 | | | | 139,352 | | | | 100,732 | |
Foreign withholding taxes on dividends | | | (52,702 | ) | | | (156,422 | ) | | | (18,600 | ) |
TOTAL INVESTMENT INCOME | | | 5,690,688 | | | | 8,619,640 | | | | 20,033,811 | |
| | | | | | | | | | | | | |
EXPENSES | | | | | | | | | | | | |
Investment advisory fees (Note 2) | | | 3,025,200 | | | | 7,860,874 | | | | 7,944,740 | |
Administration, accounting and transfer agent fees (Note 2) | | | 405,928 | | | | 1,038,388 | | | | 1,047,172 | |
Trustees’ fees and expenses (Note 2) | | | 62,157 | | | | 162,096 | | | | 162,805 | |
Registration and filing fees | | | 41,868 | | | | 49,494 | | | | 41,866 | |
Postage and supplies | | | 40,811 | | | | 76,382 | | | | 69,667 | |
Audit and tax services fees | | | 33,926 | | | | 64,391 | | | | 65,072 | |
Custodian and bank service fees | | | 23,840 | | | | 65,876 | | | | 68,905 | |
Legal fees | | | 31,595 | | | | 31,595 | | | | 31,595 | |
Compliance service fees (Note 2) | | | 15,618 | | | | 39,383 | | | | 39,101 | |
Insurance expense | | | 11,775 | | | | 24,397 | | | | 25,827 | |
Advisory board fees and expenses (Note 2) | | | 8,902 | | | | 23,610 | | | | 23,897 | |
Shareholder reporting expenses | | | 12,341 | | | | 16,315 | | | | 14,855 | |
Borrowing costs (Note 4) | | | 276 | | | | — | | | | — | |
Other expenses | | | 26,738 | | | | 47,988 | | | | 50,738 | |
TOTAL EXPENSES | | | 3,740,975 | | | | 9,500,789 | | | | 9,586,240 | |
| | | | | | | | | | | | | |
NET INVESTMENT INCOME (LOSS) | | | 1,949,713 | | | | (881,149 | ) | | | 10,447,571 | |
See notes to financial statements.
26
AVE MARIA MUTUAL FUNDS
STATEMENTS OF OPERATIONS
For the Year Ended December 31, 2024 (Continued)
| | Ave Maria
Value Fund | | | Ave Maria
Growth Fund | | | Ave Maria
Rising
Dividend Fund | |
REALIZED AND UNREALIZED GAINS (LOSSES) ON INVESTMENTS AND FOREIGN CURRENCIES | | | | | | | | | | | | |
Net realized gains from investment transactions | | $ | 34,977,325 | | | $ | 86,896,670 | | | $ | 55,649,262 | |
Net realized losses from foreign currency transactions (Note 1) | | | — | | | | (8,984 | ) | | | (1,611 | ) |
Long-term capital gain distributions from regulated investment companies | | | 17 | | | | 29 | | | | 41 | |
Net change in unrealized appreciation (depreciation) on investments | | | 40,822,245 | | | | 57,627,337 | | | | 73,095,806 | |
Net change in unrealized appreciation (depreciation) on foreign currency translation | | | — | | | | — | | | | (1,143 | ) |
NET REALIZED AND UNREALIZED GAINS ON INVESTMENTS AND FOREIGN CURRENCIES | | | 75,799,587 | | | | 144,515,052 | | | | 128,742,355 | |
| | | | | | | | | | | | | |
NET INCREASE IN NET ASSETS RESULTING FROM OPERATIONS | | $ | 77,749,300 | | | $ | 143,633,903 | | | $ | 139,189,926 | |
See notes to financial statements.
27
AVE MARIA MUTUAL FUNDS
STATEMENTS OF OPERATIONS
For the Year Ended December 31, 2024 (Continued)
| | Ave Maria
World
Equity Fund | | | Ave Maria
Focused Fund | | | Ave Maria
Bond Fund | |
INVESTMENT INCOME | | | | | | | | | | | | |
Dividends | | $ | 1,675,337 | | | $ | 326,983 | | | $ | 5,151,982 | |
Tax reclaims received | | | 94,894 | | | | 1,180 | | | | — | |
Foreign withholding taxes on dividends | | | (150,101 | ) | | | (19,468 | ) | | | — | |
Interest | | | — | | | | — | | | | 15,823,589 | |
TOTAL INVESTMENT INCOME | | | 1,620,130 | | | | 308,695 | | | | 20,975,571 | |
| | | | | | | | | | | | | |
EXPENSES | | | | | | | | | | | | |
Investment advisory fees (Note 2) | | | 839,339 | | | | 418,690 | | | | 1,548,571 | |
Administration, accounting and transfer agent fees (Note 2) | | | 113,726 | | | | 57,559 | | | | 543,170 | |
Trustees’ fees and expenses (Note 2) | | | 19,276 | | | | 11,287 | | | | 94,282 | |
Registration and filing fees | | | 30,782 | | | | 34,738 | | | | 61,455 | |
Postage and supplies | | | 14,299 | | | | 8,975 | | | | 39,164 | |
Audit and tax services fees | | | 18,833 | | | | 16,104 | | | | 44,749 | |
Custodian and bank service fees | | | 24,168 | | | | 13,642 | | | | 36,319 | |
Legal fees | | | 31,595 | | | | 31,595 | | | | 31,595 | |
Compliance service fees (Note 2) | | | 4,161 | | | | 2,029 | | | | 23,982 | |
Insurance expense | | | 4,267 | | | | 2,590 | | | | 16,019 | |
Advisory board fees and expenses (Note 2) | | | 2,500 | | | | 1,301 | | | | 13,790 | |
Shareholder reporting expenses | | | 6,368 | | | | 5,323 | | | | 9,448 | |
Borrowing costs (Note 4) | | | — | | | | 943 | | | | — | |
Other expenses | | | 38,606 | | | | 15,901 | | | | 70,962 | |
TOTAL EXPENSES | | | 1,147,920 | | | | 620,677 | | | | 2,533,506 | |
| | | | | | | | | | | | | |
NET INVESTMENT INCOME (LOSS) | | | 472,210 | | | | (311,982 | ) | | | 18,442,065 | |
See notes to financial statements.
28
AVE MARIA MUTUAL FUNDS
STATEMENTS OF OPERATIONS
For the Year Ended December 31, 2024 (Continued)
| | Ave Maria
World
Equity Fund | | | Ave Maria
Focused Fund | | | Ave Maria
Bond Fund | |
REALIZED AND UNREALIZED GAINS (LOSSES) ON INVESTMENTS AND FOREIGN CURRENCIES | | | | | | | | | | | | |
Net realized gains from investment transactions | | $ | 603,813 | | | $ | 375,548 | | | $ | 6,697,526 | |
Net realized losses from foreign currency transactions (Note 1) | | | (15,867 | ) | | | (5,271 | ) | | | — | |
Long-term capital gain distributions from regulated investment companies | | | 2 | | | | — | | | | 18 | |
Net change in unrealized appreciation (depreciation) on investments | | | 3,759,629 | | | | 5,685,469 | | | | 8,478,602 | |
Net change in unrealized appreciation (depreciation) on foreign currency translation | | | (1,633 | ) | | | — | | | | — | |
NET REALIZED AND UNREALIZED GAINS ON INVESTMENTS AND FOREIGN CURRENCIES | | | 4,345,944 | | | | 6,055,746 | | | | 15,176,146 | |
| | | | | | | | | | | | | |
NET INCREASE IN NET ASSETS RESULTING FROM OPERATIONS | | $ | 4,818,154 | | | $ | 5,743,764 | | | $ | 33,618,211 | |
See notes to financial statements.
29
Ave Maria Value Fund
STATEMENTS OF CHANGES IN NET ASSETS
| | Year
Ended
December 31,
2024 | | | Year
Ended
December 31,
2023 | |
FROM OPERATIONS | | | | | | | | |
Net investment income | | $ | 1,949,713 | | | $ | 2,803,533 | |
Net realized gains from investment transactions | | | 34,977,325 | | | | 14,178,694 | |
Long-term capital gain distributions from regulated investment companies | | | 17 | | | | — | |
Net change in unrealized appreciation (depreciation) on investments | | | 40,822,245 | | | | (4,241,594 | ) |
Net increase in net assets resulting from operations | | | 77,749,300 | | | | 12,740,633 | |
| | | | | | | | | |
FROM DISTRIBUTIONS TO SHAREHOLDERS (Note 1) | | | (36,308,430 | ) | | | (15,807,519 | ) |
| | | | | | | | | |
FROM CAPITAL SHARE TRANSACTIONS | | | | | | | | |
Proceeds from shares sold | | | 47,800,494 | | | | 53,304,355 | |
Reinvestment of distributions to shareholders | | | 34,632,053 | | | | 15,039,012 | |
Payments for shares redeemed | | | (49,398,813 | ) | | | (64,618,144 | ) |
Net increase in net assets from capital share transactions | | | 33,033,734 | | | | 3,725,223 | |
| | | | | | | | | |
TOTAL INCREASE IN NET ASSETS | | | 74,474,604 | | | | 658,337 | |
| | | | | | | | | |
NET ASSETS | | | | | | | | |
Beginning of year | | | 371,730,193 | | | | 371,071,856 | |
End of year | | $ | 446,204,797 | | | $ | 371,730,193 | |
| | | | | | | | | |
SUMMARY OF CAPITAL SHARE ACTIVITY | | | | | | | | |
Shares sold | | | 1,766,218 | | | | 2,240,336 | |
Shares issued in reinvestment of distributions to shareholders | | | 1,302,931 | | | | 626,104 | |
Shares redeemed | | | (1,900,005 | ) | | | (2,708,196 | ) |
Net increase in shares outstanding | | | 1,169,144 | | | | 158,244 | |
Shares outstanding, beginning of year | | | 15,584,809 | | | | 15,426,565 | |
Shares outstanding, end of year | | | 16,753,953 | | | | 15,584,809 | |
See notes to financial statements. |
30
Ave Maria Growth Fund
Statements of Changes in Net Assets
| | Year
Ended
December 31,
2024 | | | Year
Ended
December 31,
2023 | |
FROM OPERATIONS | | | | | | | | |
Net investment income (loss) | | $ | (881,149 | ) | | $ | 889,460 | |
Net realized gains from investment transactions | | | 86,896,670 | | | | 24,127,870 | |
Net realized losses from foreign currency transactions (Note 1) | | | (8,984 | ) | | | (2,779 | ) |
Long-term capital gain distributions from regulated investment companies | | | 29 | | | | — | |
Net change in unrealized appreciation (depreciation) on investments | | | 57,627,337 | | | | 204,916,596 | |
Net increase in net assets resulting from operations | | | 143,633,903 | | | | 229,931,147 | |
| | | | | | | | | |
FROM DISTRIBUTIONS TO SHAREHOLDERS (Note 1) | | | (84,582,661 | ) | | | (24,778,392 | ) |
| | | | | | | | | |
FROM CAPITAL SHARE TRANSACTIONS | | | | | | | | |
Proceeds from shares sold | | | 116,989,334 | | | | 110,984,356 | |
Reinvestment of distributions to shareholders | | | 79,894,899 | | | | 23,468,797 | |
Payments for shares redeemed | | | (159,273,877 | ) | | | (123,498,000 | ) |
Net increase in net assets from capital share transactions | | | 37,610,356 | | | | 10,955,153 | |
| | | | | | | | | |
TOTAL INCREASE IN NET ASSETS | | | 96,661,598 | | | | 216,107,908 | |
| | | | | | | | | |
NET ASSETS | | | | | | | | |
Beginning of year | | | 981,001,048 | | | | 764,893,140 | |
End of year | | $ | 1,077,662,646 | | | $ | 981,001,048 | |
| | | | | | | | | |
SUMMARY OF CAPITAL SHARE ACTIVITY | | | | | | | | |
Shares sold | | | 2,417,689 | | | | 2,766,004 | |
Shares issued in reinvestment of distributions to shareholders | | | 1,680,581 | | | | 522,574 | |
Shares redeemed | | | (3,303,117 | ) | | | (3,078,110 | ) |
Net increase in shares outstanding | | | 795,153 | | | | 210,468 | |
Shares outstanding, beginning of year | | | 21,940,779 | | | | 21,730,311 | |
Shares outstanding, end of year | | | 22,735,932 | | | | 21,940,779 | |
See notes to financial statements. |
31
Ave Maria Rising Dividend Fund
Statements of Changes in Net Assets
| | Year
Ended
December 31,
2024 | | | Year
Ended
December 31,
2023 | |
FROM OPERATIONS | | | | | | | | |
Net investment income | | $ | 10,447,571 | | | $ | 11,051,644 | |
Net realized gains from investment transactions | | | 55,649,262 | | | | 16,527,715 | |
Net realized losses from foreign currency transactions (Note 1) | | | (1,611 | ) | | | (30,319 | ) |
Long-term capital gain distributions from regulated investment companies | | | 41 | | | | — | |
Net change in unrealized appreciation (depreciation) on investments | | | 73,095,806 | | | | 89,107,582 | |
Net change in unrealized appreciation (depreciation) on foreign currency translation | | | (1,143 | ) | | | — | |
Net increase in net assets resulting from operations | | | 139,189,926 | | | | 116,656,622 | |
| | | | | | | | | |
FROM DISTRIBUTIONS TO SHAREHOLDERS (Note 1) | | | (66,105,105 | ) | | | (27,561,785 | ) |
| | | | | | | | | |
FROM CAPITAL SHARE TRANSACTIONS | | | | | | | | |
Proceeds from shares sold | | | 126,984,652 | | | | 156,576,245 | |
Reinvestment of distributions to shareholders | | | 59,848,577 | | | | 24,630,034 | |
Payments for shares redeemed | | | (186,344,150 | ) | | | (157,687,816 | ) |
Net increase in net assets from capital share transactions | | | 489,079 | | | | 23,518,463 | |
| | | | | | | | | |
TOTAL INCREASE IN NET ASSETS | | | 73,573,900 | | | | 112,613,300 | |
| | | | | | | | | |
NET ASSETS | | | | | | | | |
Beginning of year | | | 1,003,573,564 | | | | 890,960,264 | |
End of year | | $ | 1,077,147,464 | | | $ | 1,003,573,564 | |
| | | | | | | | | |
SUMMARY OF CAPITAL SHARE ACTIVITY | | | | | | | | |
Shares sold | | | 5,468,274 | | | | 7,857,239 | |
Shares issued in reinvestment of distributions to shareholders | | | 2,629,899 | | | | 1,186,538 | |
Shares redeemed | | | (8,155,030 | ) | | | (7,960,602 | ) |
Net increase (decrease) in shares outstanding | | | (56,857 | ) | | | 1,083,175 | |
Shares outstanding, beginning of year | | | 47,419,417 | | | | 46,336,242 | |
Shares outstanding, end of year | | | 47,362,560 | | | | 47,419,417 | |
See notes to financial statements. |
32
Ave Maria World Equity Fund
Statements of Changes in Net Assets
| | Year
Ended
December 31,
2024 | | | Year
Ended
December 31,
2023 | |
FROM OPERATIONS | | | | | | | | |
Net investment income | | $ | 472,210 | | | $ | 801,158 | |
Net realized gains from investment transactions | | | 603,813 | | | | 3,715,011 | |
Net realized losses from foreign currency transactions (Note 1) | | | (15,867 | ) | | | (14,356 | ) |
Long-term capital gain distributions from regulated investment companies | | | 2 | | | | — | |
Net change in unrealized appreciation (depreciation) on investments | | | 3,759,629 | | | | 15,403,936 | |
Net change in unrealized appreciation (depreciation) on foreign currency translation | | | (1,633 | ) | | | 609 | |
Net increase in net assets resulting from operations | | | 4,818,154 | | | | 19,906,358 | |
| | | | | | | | | |
FROM DISTRIBUTIONS TO SHAREHOLDERS (Note 1) | | | (1,059,672 | ) | | | (3,748,510 | ) |
| | | | | | | | | |
FROM CAPITAL SHARE TRANSACTIONS | | | | | | | | |
Proceeds from shares sold | | | 22,785,960 | | | | 21,101,870 | |
Reinvestment of distributions to shareholders | | | 1,002,883 | | | | 3,553,383 | |
Payments for shares redeemed | | | (12,766,029 | ) | | | (14,064,515 | ) |
Net increase in net assets from capital share transactions | | | 11,022,814 | | | | 10,590,738 | |
| | | | | | | | | |
TOTAL INCREASE IN NET ASSETS | | | 14,781,296 | | | | 26,748,586 | |
| | | | | | | | | |
NET ASSETS | | | | | | | | |
Beginning of year | | | 101,603,193 | | | | 74,854,607 | |
End of year | | $ | 116,384,489 | | | $ | 101,603,193 | |
| | | | | | | | | |
SUMMARY OF CAPITAL SHARE ACTIVITY | | | | | | | | |
Shares sold | | | 1,133,692 | | | | 1,205,330 | |
Shares issued in reinvestment of distributions to shareholders | | | 50,295 | | | | 184,209 | |
Shares redeemed | | | (631,439 | ) | | | (792,696 | ) |
Net increase in shares outstanding | | | 552,548 | | | | 596,843 | |
Shares outstanding, beginning of year | | | 5,271,435 | | | | 4,674,592 | |
Shares outstanding, end of year | | | 5,823,983 | | | | 5,271,435 | |
See notes to financial statements. |
33
Ave Maria Focused Fund
StatementS of Changes in Net Assets
| | Year
Ended
December 31,
2024 | | | Year
Ended
December 31,
2023 | |
FROM OPERATIONS | | | | | | | | |
Net investment loss | | $ | (311,982 | ) | | $ | (388,127 | ) |
Net realized gains from investment transactions | | | 375,548 | | | | 176,586 | |
Net realized losses from foreign currency transactions (Note 1) | | | (5,271 | ) | | | (9,640 | ) |
Net change in unrealized appreciation (depreciation) on investments | | | 5,685,469 | | | | 17,904,712 | |
Net increase in net assets resulting from operations | | | 5,743,764 | | | | 17,683,531 | |
| | | | | | | | | |
FROM CAPITAL SHARE TRANSACTIONS | | | | | | | | |
Proceeds from shares sold | | | 9,579,833 | | | | 11,184,614 | |
Payments for shares redeemed | | | (18,194,122 | ) | | | (16,679,976 | ) |
Net decrease in net assets from capital share transactions | | | (8,614,289 | ) | | | (5,495,362 | ) |
| | | | | | | | | |
TOTAL INCREASE (DECREASE) IN NET ASSETS | | | (2,870,525 | ) | | | 12,188,169 | |
| | | | | | | | | |
NET ASSETS | | | | | | | | |
Beginning of year | | | 60,360,229 | | | | 48,172,060 | |
End of year | | $ | 57,489,704 | | | $ | 60,360,229 | |
| | | | | | | | | |
SUMMARY OF CAPITAL SHARE ACTIVITY | | | | | | | | |
Shares sold | | | 706,555 | | | | 946,645 | |
Shares redeemed | | | (1,350,332 | ) | | | (1,418,788 | ) |
Net decrease in shares outstanding | | | (643,777 | ) | | | (472,143 | ) |
Shares outstanding, beginning of year | | | 4,400,945 | | | | 4,873,088 | |
Shares outstanding, end of year | | | 3,757,168 | | | | 4,400,945 | |
See notes to financial statements. |
34
Ave Maria Bond Fund
Statements of Changes in Net Assets
| | Year
Ended
December 31,
2024 | | | Year
Ended
December 31,
2023 | |
FROM OPERATIONS | | | | | | | | |
Net investment income | | $ | 18,442,065 | | | $ | 13,562,340 | |
Net realized gains (losses) from investment transactions | | | 6,697,526 | | | | (6,667,630 | ) |
Long-term capital gain distributions from regulated investment companies | | | 18 | | | | — | |
Net change in unrealized appreciation (depreciation) on investments | | | 8,478,602 | | | | 20,156,806 | |
Net increase in net assets resulting from operations | | | 33,618,211 | | | | 27,051,516 | |
| | | | | | | | | |
FROM DISTRIBUTIONS TO SHAREHOLDERS (Note 1) | | | (18,484,015 | ) | | | (13,568,375 | ) |
| | | | | | | | | |
FROM CAPITAL SHARE TRANSACTIONS | | | | | | | | |
Proceeds from shares sold | | | 183,260,049 | | | | 141,351,638 | |
Reinvestment of distributions to shareholders | | | 17,003,046 | | | | 12,222,892 | |
Payments for shares redeemed | | | (96,248,781 | ) | | | (122,275,083 | ) |
Net increase in net assets from capital share transactions | | | 104,014,314 | | | | 31,299,447 | |
| | | | | | | | | |
TOTAL INCREASE IN NET ASSETS | | | 119,148,510 | | | | 44,782,588 | |
| | | | | | | | | |
NET ASSETS | | | | | | | | |
Beginning of year | | | 557,367,834 | | | | 512,585,246 | |
End of year | | $ | 676,516,344 | | | $ | 557,367,834 | |
| | | | | | | | | |
SUMMARY OF CAPITAL SHARE ACTIVITY | | | | | | | | |
Shares sold | | | 15,235,400 | | | | 12,292,051 | |
Shares issued in reinvestment of distributions to shareholders | | | 1,413,718 | | | | 1,064,420 | |
Shares redeemed | | | (8,006,398 | ) | | | (10,647,278 | ) |
Net increase in shares outstanding | | | 8,642,720 | | | | 2,709,193 | |
Shares outstanding, beginning of year | | | 47,404,517 | | | | 44,695,324 | |
Shares outstanding, end of year | | | 56,047,237 | | | | 47,404,517 | |
See notes to financial statements. |
35
Ave Maria Value Fund
FINANCIAL HIGHLIGHTS
Per Share Data for a Share Outstanding Throughout Each Year
| | Year
Ended
December 31,
2024 | | | Year
Ended
December 31,
2023 | | | Year
Ended
December 31,
2022 | | | Year
Ended
December 31,
2021 | | | Year
Ended
December 31,
2020 | |
Net asset value at beginning of year | | $ | 23.85 | | | $ | 24.05 | | | $ | 23.35 | | | $ | 20.17 | | | $ | 19.68 | |
| | | | | | | | | | | | | | | | | | | | | |
Income from investment operations: | | | | | | | | | | | | | | | | | | | | |
Net investment income | | | 0.12 | | | | 0.19 | | | | 0.28 | | | | 0.06 | | | | 0.09 | |
Net realized and unrealized gains on investments | | | 5.01 | | | | 0.67 | | | | 0.70 | | | | 5.00 | | | | 1.12 | |
Total from investment operations | | | 5.13 | | | | 0.86 | | | | 0.98 | | | | 5.06 | | | | 1.21 | |
| | | | | | | | | | | | | | | | | | | | | |
Less distributions from: | | | | | | | | | | | | | | | | | | | | |
Net investment income | | | (0.09 | ) | | | (0.20 | ) | | | (0.28 | ) | | | (0.06 | ) | | | (0.09 | ) |
Net realized gains on investments | | | (2.26 | ) | | | (0.86 | ) | | | — | | | | (1.82 | ) | | | (0.63 | ) |
Total distributions | | | (2.35 | ) | | | (1.06 | ) | | | (0.28 | ) | | | (1.88 | ) | | | (0.72 | ) |
| | | | | | | | | | | | | | | | | | | | | |
Net asset value at end of year | | $ | 26.63 | | | $ | 23.85 | | | $ | 24.05 | | | $ | 23.35 | | | $ | 20.17 | |
| | | | | | | | | | | | | | | | | | | | | |
Total return (a) | | | 21.52 | % | | | 3.52 | % | | | 4.18 | % | | | 25.15 | % | | | 6.16 | % |
| | | | | | | | | | | | | | | | | | | | | |
Ratios/Supplementary Data: | | | | | | | | | | | | | | | | | | | | |
Net assets at end of year (000’s) | | $ | 446,205 | | | $ | 371,730 | | | $ | 371,072 | | | $ | 327,853 | | | $ | 251,247 | |
| | | | | | | | | | | | | | | | | | | | | |
Ratio of total expenses to average net assets | | | 0.93 | % | | | 0.93 | % | | | 0.93 | % | | | 0.96 | % | | | 1.05 | % |
| | | | | | | | | | | | | | | | | | | | | |
Ratio of net investment income to average net assets | | | 0.48 | % | | | 0.77 | % | | | 1.27 | % | | | 0.27 | % | | | 0.52 | % |
| | | | | | | | | | | | | | | | | | | | | |
Portfolio turnover rate | | | 16 | % | | | 31 | % | | | 33 | % | | | 20 | % | | | 68 | % |
(a) | Total return is a measure of the change in value of an investment in the Fund over the period covered, which assumes any dividends or capital gains distributions are reinvested in shares of the Fund. The returns shown do not reflect the deduction of taxes a shareholder would pay on Fund distributions or the redemption of Fund shares. |
See notes to financial statements. |
36
Ave Maria Growth Fund
Financial Highlights
Per Share Data for a Share Outstanding Throughout Each Year
| | Year
Ended
December 31,
2024 | | | Year
Ended
December 31,
2023 | | | Year
Ended
December 31,
2022 | | | Year
Ended
December 31,
2021 | | | Year
Ended
December 31,
2020 | |
Net asset value at beginning of year | | $ | 44.71 | | | $ | 35.20 | | | $ | 44.82 | | | $ | 42.72 | | | $ | 38.00 | |
| | | | | | | | | | | | | | | | | | | | | |
Income (loss) from investment operations: | | | | | | | | | | | | | | | | | | | | |
Net investment income (loss) | | | (0.04 | ) | | | 0.04 | | | | 0.10 | | | | (0.05 | ) | | | (0.06 | ) |
Net realized and unrealized gains (losses) on investments and foreign currencies | | | 6.72 | | | | 10.63 | | | | (9.62 | ) | | | 7.55 | | | | 7.03 | |
Total from investment operations | | | 6.68 | | | | 10.67 | | | | (9.52 | ) | | | 7.50 | | | | 6.97 | |
| | | | | | | | | | | | | | | | | | | | | |
Less distributions from: | | | | | | | | | | | | | | | | | | | | |
Net investment income | | | (0.00 | )(a) | | | (0.04 | ) | | | (0.10 | ) | | | — | | | | — | |
Net realized gains on investments | | | (3.99 | ) | | | (1.12 | ) | | | — | | | | (5.40 | ) | | | (2.25 | ) |
Total distributions | | | (3.99 | ) | | | (1.16 | ) | | | (0.10 | ) | | | (5.40 | ) | | | (2.25 | ) |
| | | | | | | | | | | | | | | | | | | | | |
Net asset value at end of year | | $ | 47.40 | | | $ | 44.71 | | | $ | 35.20 | | | $ | 44.82 | | | $ | 42.72 | |
| | | | | | | | | | | | | | | | | | | | | |
Total return (b) | | | 14.91 | % | | | 30.29 | % | | | (21.23 | %) | | | 17.55 | % | | | 18.37 | % |
| | | | | | | | | | | | | | | | | | | | | |
Ratios/Supplementary Data: | | | | | | | | | | | | | | | | | | | | |
Net assets at end of year (000,000’s) | | $ | 1,078 | | | $ | 981 | | | $ | 765 | | | $ | 1,066 | | | $ | 949 | |
| | | | | | | | | | | | | | | | | | | | | |
Ratio of total expenses to average net assets | | | 0.91 | % | | | 0.91 | % | | | 0.91 | % | | | 0.90 | % | | | 0.91 | % |
| | | | | | | | | | | | | | | | | | | | | |
Ratio of net investment income (loss) to average net assets | | | (0.08 | %) | | | 0.10 | % | | | 0.27 | % | | | (0.13 | %) | | | (0.16 | %) |
| | | | | | | | | | | | | | | | | | | | | |
Portfolio turnover rate | | | 17 | % | | | 27 | % | | | 25 | % | | | 25 | % | | | 26 | % |
(a) | Amount rounds to less than $0.01 per share. |
(b) | Total return is a measure of the change in value of an investment in the Fund over the period covered, which assumes any dividends or capital gains distributions are reinvested in shares of the Fund. The returns shown do not reflect the deduction of taxes a shareholder would pay on Fund distributions or the redemption of Fund shares. |
See notes to financial statements. |
37
Ave Maria Rising Dividend Fund
Financial Highlights
Per Share Data for a Share Outstanding Throughout Each Year
| | Year
Ended
December 31,
2024 | | | Year
Ended
December 31,
2023 | | | Year
Ended
December 31,
2022 | | | Year
Ended
December 31,
2021 | | | Year
Ended
December 31,
2020 | |
Net asset value at beginning of year | | $ | 21.16 | | | $ | 19.23 | | | $ | 21.92 | | | $ | 19.34 | | | $ | 18.68 | |
| | | | | | | | | | | | | | | | | | | | | |
Income (loss) from investment operations: | | | | | | | | | | | | | | | | | | | | |
Net investment income | | | 0.23 | | | | 0.24 | | | | 0.30 | | | | 0.20 | | | | 0.21 | |
Net realized and unrealized gains (losses) on investments and foreign currencies | | | 2.81 | | | | 2.28 | | | | (1.46 | ) | | | 4.69 | | | | 0.95 | |
Total from investment operations | | | 3.04 | | | | 2.52 | | | | (1.16 | ) | | | 4.89 | | | | 1.16 | |
| | | | | | | | | | | | | | | | | | | | | |
Less distributions from: | | | | | | | | | | | | | | | | | | | | |
Net investment income | | | (0.23 | ) | | | (0.24 | ) | | | (0.30 | ) | | | (0.20 | ) | | | (0.21 | ) |
Net realized gains on investments | | | (1.23 | ) | | | (0.35 | ) | | | (1.23 | ) | | | (2.11 | ) | | | (0.29 | ) |
Total distributions | | | (1.46 | ) | | | (0.59 | ) | | | (1.53 | ) | | | (2.31 | ) | | | (0.50 | ) |
| | | | | | | | | | | | | | | | | | | | | |
Net asset value at end of year | | $ | 22.74 | | | $ | 21.16 | | | $ | 19.23 | | | $ | 21.92 | | | $ | 19.34 | |
| | | | | | | | | | | | | | | | | | | | | |
Total return (a) | | | 14.42 | % | | | 13.19 | % | | | (5.27 | %) | | | 25.35 | % | | | 6.45 | % |
| | | | | | | | | | | | | | | | | | | | | |
Ratios/Supplementary Data: | | | | | | | | | | | | | | | | | | | | |
Net assets at end of year (000,000’s) | | $ | 1,077 | | | $ | 1,004 | | | $ | 891 | | | $ | 964 | | | $ | 858 | |
| | | | | | | | | | | | | | | | | | | | | |
Ratio of total expenses to average net assets | | | 0.90 | % | | | 0.91 | % | | | 0.91 | % | | | 0.90 | % | | | 0.92 | % |
| | | | | | | | | | | | | | | | | | | | | |
Ratio of net investment income to average net assets | | | 0.99 | % | | | 1.19 | % | | | 1.47 | % | | | 0.90 | % | | | 1.21 | % |
| | | | | | | | | | | | | | | | | | | | | |
Portfolio turnover rate | | | 8 | % | | | 19 | % | | | 15 | % | | | 21 | % | | | 38 | % |
(a) | Total return is a measure of the change in value of an investment in the Fund over the period covered, which assumes any dividends or capital gains distributions are reinvested in shares of the Fund. The returns shown do not reflect the deduction of taxes a shareholder would pay on Fund distributions or the redemption of Fund shares. |
See notes to financial statements. |
38
Ave Maria World Equity Fund
Financial Highlights
Per Share Data for a Share Outstanding Throughout Each Year
| | Year
Ended
December 31,
2024 | | | Year
Ended
December 31,
2023 | | | Year
Ended
December 31,
2022 | | | Year
Ended
December 31,
2021 | | | Year
Ended
December 31,
2020 | |
Net asset value at beginning of year | | $ | 19.27 | | | $ | 16.01 | | | $ | 19.17 | | | $ | 15.89 | | | $ | 15.99 | |
| | | | | | | | | | | | | | | | | | | | | |
Income (loss) from investment operations: | | | | | | | | | | | | | | | | | | | | |
Net investment income | | | 0.08 | | | | 0.15 | | | | 0.19 | | | | 0.07 | | | | 0.08 | |
Net realized and unrealized gains (losses) on investments and foreign currencies | | | 0.81 | | | | 3.84 | | | | (3.16 | ) | | | 3.28 | | | | (0.10 | ) |
Total from investment operations | | | 0.89 | | | | 3.99 | | | | (2.97 | ) | | | 3.35 | | | | (0.02 | ) |
| | | | | | | | | | | | | | | | | | | | | |
Less distributions from: | | | | | | | | | | | | | | | | | | | | |
Net investment income | | | (0.08 | ) | | | (0.15 | ) | | | (0.19 | ) | | | (0.07 | ) | | | (0.08 | ) |
Net realized gains on investments | | | (0.10 | ) | | | (0.58 | ) | | | — | | | | — | | | | — | |
Total distributions | | | (0.18 | ) | | | (0.73 | ) | | | (0.19 | ) | | | (0.07 | ) | | | (0.08 | ) |
| | | | | | | | | | | | | | | | | | | | | |
Net asset value at end of year | | $ | 19.98 | | | $ | 19.27 | | | $ | 16.01 | | | $ | 19.17 | | | $ | 15.89 | |
| | | | | | | | | | | | | | | | | | | | | |
Total return (a) | | | 4.64 | % | | | 24.96 | % | | | (15.50 | %) | | | 21.06 | % | | | (0.15 | %) |
| | | | | | | | | | | | | | | | | | | | | |
Ratios/Supplementary Data: | | | | | | | | | | | | | | | | | | | | |
Net assets at end of year (000’s) | | $ | 116,384 | | | $ | 101,603 | | | $ | 74,855 | | | $ | 92,908 | | | $ | 69,231 | |
| | | | | | | | | | | | | | | | | | | | | |
Ratio of total expenses to average net assets | | | 1.03 | % | | | 1.05 | % | | | 1.12 | % | | | 1.22 | % | | | 1.26 | % |
| | | | | | | | | | | | | | | | | | | | | |
Ratio of net expenses to average net assets | | | 1.03 | % | | | 1.05 | % | | | 1.18 | %(b) | | | 1.25 | %(b) | | | 1.25 | %(b) |
| | | | | | | | | | | | | | | | | | | | | |
Ratio of net investment income to average net assets | | | 0.42 | % | | | 0.88 | % | | | 1.12 | %(b) | | | 0.40 | %(b) | | | 0.51 | %(b) |
| | | | | | | | | | | | | | | | | | | | | |
Portfolio turnover rate | | | 13 | % | | | 29 | % | | | 23 | % | | | 16 | % | | | 43 | % |
(a) | Total return is a measure of the change in value of an investment in the Fund over the period covered, which assumes any dividends or capital gains distributions are reinvested in shares of the Fund. The returns shown do not reflect the deduction of taxes a shareholder would pay on Fund distributions or the redemption of Fund shares. |
(b) | Ratio was determined after advisory fee reductions and/or recoupments (Note 2). |
See notes to financial statements. |
39
Ave Maria Focused Fund
Financial Highlights
Per Share Data for a Share Outstanding Throughout Each Period
| | Year
Ended
December 31,
2024 | | | Year
Ended
December 31,
2023 | | | Year
Ended
December 31,
2022 | | | Year
Ended
December 31,
2021 | | | Period
Ended
December 31,
2020(a) | |
Net asset value at beginning of period | | $ | 13.72 | | | $ | 9.89 | | | $ | 15.21 | | | $ | 12.43 | | | $ | 10.00 | |
| | | | | | | | | | | | | | | | | | | | | |
Income (loss) from investment operations: | | | | | | | | | | | | | | | | | | | | |
Net investment loss | | | (0.09 | ) | | | (0.09 | ) | | | (0.08 | ) | | | (0.10 | ) | | | (0.03 | ) |
Net realized and unrealized gains (losses) on investments and foreign currencies | | | 1.67 | | | | 3.92 | | | | (5.24 | ) | | | 3.57 | | | | 2.50 | |
Total from investment operations | | | 1.58 | | | | 3.83 | | | | (5.32 | ) | | | 3.47 | | | | 2.47 | |
| | | | | | | | | | | | | | | | | | | | | |
Less distributions from: | | | | | | | | | | | | | | | | | | | | |
Net realized gains on investments | | | — | | | | — | | | | — | | | | (0.69 | ) | | | (0.04 | ) |
| | | | | | | | | | | | | | | | | | | | | |
Net asset value at end of period | | $ | 15.30 | | | $ | 13.72 | | | $ | 9.89 | | | $ | 15.21 | | | $ | 12.43 | |
| | | | | | | | | | | | | | | | | | | | | |
Total return (b) | | | 11.52 | % | | | 38.73 | % | | | (34.98 | %) | | | 27.96 | % | | | 24.71 | %(c) |
| | | | | | | | | | | | | | | | | | | | | |
Ratios/Supplementary Data: | | | | | | | | | | | | | | | | | | | | |
Net assets at end of period (000’s) | | $ | 57,490 | | | $ | 60,360 | | | $ | 48,172 | | | $ | 63,476 | | | $ | 34,316 | |
| | | | | | | | | | | | | | | | | | | | | |
Ratio of total expenses to average net assets | | | 1.11 | % | | | 1.09 | % | | | 1.14 | % | | | 1.21 | % | | | 1.29 | %(d) |
| | | | | | | | | | | | | | | | | | | | | |
Ratio of net expenses to average net assets | | | 1.11 | % | | | 1.09 | % | | | 1.14 | % | | | 1.23 | %(e) | | | 1.25 | %(d)(e) |
| | | | | | | | | | | | | | | | | | | | | |
Ratio of net investment loss to average net assets | | | (0.56 | %) | | | (0.72 | %) | | | (0.76 | %) | | | (0.82 | %)(e) | | | (0.54 | %)(d)(e) |
| | | | | | | | | | | | | | | | | | | | | |
Portfolio turnover rate | | | 22 | % | | | 29 | % | | | 69 | % | | | 27 | % | | | 16 | %(c) |
(a) | Represents the period from the commencement of operations (May 1, 2020) through December 31, 2020. |
(b) | Total return is a measure of the change in value of an investment in the Fund over the period covered, which assumes any dividends or capital gains distributions are reinvested in shares of the Fund. The returns shown do not reflect the deduction of taxes a shareholder would pay on Fund distributions or the redemption of Fund shares. |
(c) | Not annualized. |
(d) | Annualized. |
(e) | Ratio was determined after advisory fee reductions and/or recoupments (Note 2). |
See notes to financial statements. |
40
Ave Maria Bond Fund
Financial Highlights
Per Share Data for a Share Outstanding Throughout Each Year
| | Year
Ended
December 31,
2024 | | | Year
Ended
December 31,
2023 | | | Year
Ended
December 31,
2022 | | | Year
Ended
December 31,
2021 | | | Year
Ended
December 31,
2020 | |
Net asset value at beginning of year | | $ | 11.76 | | | $ | 11.47 | | | $ | 12.23 | | | $ | 11.99 | | | $ | 11.64 | |
| | | | | | | | | | | | | | | | | | | | | |
Income (loss) from investment operations: | | | | | | | | | | | | | | | | | | | | |
Net investment income | | | 0.35 | | | | 0.29 | | | | 0.26 | | | | 0.20 | | | | 0.22 | |
Net realized and unrealized gains (losses) on investments | | | 0.31 | | | | 0.29 | | | | (0.61 | ) | | | 0.33 | | | | 0.42 | |
Total from investment operations | | | 0.66 | | | | 0.58 | | | | (0.35 | ) | | | 0.53 | | | | 0.64 | |
| | | | | | | | | | | | | | | | | | | | | |
Less distributions from: | | | | | | | | | | | | | | | | | | | | |
Net investment income | | | (0.35 | ) | | | (0.29 | ) | | | (0.26 | ) | | | (0.20 | ) | | | (0.22 | ) |
Net realized gains on investments | | | (0.00 | )(a) | | | — | | | | (0.15 | ) | | | (0.09 | ) | | | (0.07 | ) |
Total distributions | | | (0.35 | ) | | | (0.29 | ) | | | (0.41 | ) | | | (0.29 | ) | | | (0.29 | ) |
| | | | | | | | | | | | | | | | | | | | | |
Net asset value at end of year | | $ | 12.07 | | | $ | 11.76 | | | $ | 11.47 | | | $ | 12.23 | | | $ | 11.99 | |
| | | | | | | | | | | | | | | | | | | | | |
Total return (b) | | | 5.71 | % | | | 5.16 | % | | | (2.85 | %) | | | 4.38 | % | | | 5.60 | % |
| | | | | | | | | | | | | | | | | | | | | |
Ratios/Supplementary Data: | | | | | | | | | | | | | | | | | | | | |
Net assets at end of year (000’s) | | $ | 676,516 | | | $ | 557,368 | | | $ | 512,585 | | | $ | 502,768 | | | $ | 420,876 | |
| | | | | | | | | | | | | | | | | | | | | |
Ratio of total expenses to average net assets | | | 0.41 | % | | | 0.41 | % | | | 0.41 | % | | | 0.43 | % | | | 0.47 | % |
| | | | | | | | | | | | | | | | | | | | | |
Ratio of net investment income to average net assets | | | 2.98 | % | | | 2.55 | % | | | 2.21 | % | | | 1.66 | % | | | 1.87 | % |
| | | | | | | | | | | | | | | | | | | | | |
Portfolio turnover rate | | | 20 | % | | | 16 | % | | | 21 | % | | | 25 | % | | | 47 | % |
(a) | Amount rounds to less than $0.01 per share. |
(b) | Total return is a measure of the change in value of an investment in the Fund over the period covered, which assumes any dividends or capital gains distributions are reinvested in shares of the Fund. The returns shown do not reflect the deduction of taxes a shareholder would pay on Fund distributions or the redemption of Fund shares. |
See notes to financial statements. |
41
AVE MARIA MUTUAL FUNDS
Notes to Financial Statements
December 31, 2024
1. Organization and Significant Accounting Policies
The Ave Maria Value Fund, the Ave Maria Growth Fund, the Ave Maria Rising Dividend Fund, the Ave Maria World Equity Fund, the Ave Maria Focused Fund and the Ave Maria Bond Fund (individually, a “Fund” and collectively, the “Funds”) are each a diversified series, except for the Ave Maria Focused Fund, which is a non-diversified series, of the Schwartz Investment Trust (the “Trust”), an open-end management investment company registered under the Investment Company Act of 1940, as amended (the “1940 Act”), and established as an Ohio business trust under a Declaration of Trust dated August 31, 1992.
The investment objective of the Ave Maria Value Fund is to seek long-term capital appreciation from equity investments in companies that do not violate core values and teachings of the Roman Catholic Church.
The investment objective of the Ave Maria Growth Fund is to seek long-term capital appreciation, using the growth style, from equity investments in companies that do not violate core values and teachings of the Roman Catholic Church.
The investment objective of the Ave Maria Rising Dividend Fund is to provide increasing dividend income over time, long-term growth of capital, and a reasonable level of current income from investments in dividend-paying common stocks of companies that do not violate core values and teachings of the Roman Catholic Church.
The investment objective of the Ave Maria World Equity Fund is to seek long-term capital appreciation from equity investments in U.S. and non-U.S. companies that do not violate core values and teachings of the Roman Catholic Church.
The investment objective of the Ave Maria Focused Fund is to seek long-term capital appreciation from equity investments in companies that do not violate core values and teachings of the Roman Catholic Church.
The investment objective of the Ave Maria Bond Fund is to seek preservation of principal with a reasonable level of current income in corporate debt and equity securities that do not violate core values and teachings of the Roman Catholic Church.
See the Funds’ Prospectus for information regarding the principal investment strategies of each Fund.
The Funds have adopted Financial Accounting Standards Board (“FASB”) Accounting Standards Update 2023-07, Segment Reporting (Topic 280) - Improvements to Reportable Segment Disclosures (“ASU 2023-07”). Adoption of the standard impacted financial statement disclosures only and did not affect each Fund’s financial position or the results of its operations. An operating segment is defined in Topic 280 as a component of a public entity that engages in business activities from which it may recognize revenues and incur expenses, has operating results that are regularly reviewed
42
AVE MARIA MUTUAL FUNDS
NOTES TO FINANCIAL STATEMENTS
December 31, 2024 (Continued)
by the public entity’s chief operating decision maker (“CODM”) to make decisions about resources to be allocated to the segment and assess its performance, and has discrete financial information available. The CODM is the President and Chief Executive Officer of the Funds. Each Fund operates as a single operating segment. Each Fund’s income, expenses, assets, changes in net assets resulting from operations and performance are regularly monitored and assessed as a whole by the CODM responsible for oversight functions of each Fund, using the information presented in the financial statements and financial highlights.
Shares of each Fund are sold at net asset value (“NAV”). To calculate the NAV, a Fund’s assets are valued and totaled, liabilities are subtracted, and the balance is divided by the number of shares outstanding. The offering price and redemption price per share are equal to the NAV per share for each Fund.
The Funds follow accounting and reporting guidance under FASB Accounting Standards Codification Topic 946, “Financial Services – Investment Companies.” The following is a summary of significant accounting policies followed by the Funds. These policies are in conformity with accounting principles generally accepted in the United States of America (“GAAP”).
(a) Valuation of investments – Securities which are traded on stock exchanges are valued at the closing sales price as of the close of the regular session of trading on the New York Stock Exchange on the day the securities are being valued, or, if not traded on a particular day, at the closing bid price. Securities which are quoted by NASDAQ are valued at the NASDAQ Official Closing Price or, if an Official Closing Price is not available, at the most recently quoted bid price. Securities traded in the over-the-counter market are valued at the last reported sales price or, if there is no reported sale on the valuation date, at the most recently quoted bid price. Securities which are traded both in the over-the-counter market and on a stock exchange are valued according to the broadest and most representative market. Securities traded on foreign exchanges are typically fair valued by an independent pricing service and translated from the local currency into U.S. dollars using currency exchange rates supplied by an independent pricing service. Fixed income securities are generally valued using prices provided by an independent pricing service. The independent pricing service uses information with respect to transactions in bonds, quotations from bond dealers, market transactions in comparable securities and various relationships between securities in determining these prices. Investments in shares of other open-end investment companies are valued at their NAV as reported by such companies. When using quoted prices and when the market for the securities are considered active, the securities will be classified as Level 1 within the fair value hierarchy (see below). Securities for which market quotations are not readily available are valued at their fair value as determined in good faith by Schwartz Investment Counsel, Inc. (the “Adviser”), as the valuation designee, in accordance with consistently applied
43
AVE MARIA MUTUAL FUNDS
NOTES TO FINANCIAL STATEMENTS
December 31, 2024 (Continued)
procedures established by and under the general supervision of the Board of Trustees pursuant to Rule 2a-5 under the 1940 Act, and will be classified as Level 2 or 3 within the fair value hierarchy, depending on the inputs used. Fair value pricing may be used, for example, in situations where (i) a security is so thinly traded that there have been no transactions for that stock over an extended period of time; (ii) the exchange on which the security is principally traded closes early; or (iii) trading of the security is halted during the day and does not resume prior to a Fund’s NAV calculation. A security’s “fair value” price may differ from the price next available for that security using the Funds’ normal pricing procedures.
GAAP establishes a single authoritative definition of fair value, sets out a framework for measuring fair value and requires additional disclosures about fair value measurements.
Various inputs are used in determining the value of each Fund’s investments. These inputs are summarized in the three broad levels listed below:
| | ● | Level 1 – quoted prices in active markets for identical securities |
| | ● | Level 2 – other significant observable inputs |
| | ● | Level 3 – significant unobservable inputs |
The Funds’ foreign equity securities actively traded in foreign markets may be classified as Level 2 despite the availability of closing prices because such securities are typically fair valued by an independent pricing service. The Board of Trustees has authorized the Funds to retain an independent pricing service to determine the fair value of its foreign securities because the value of such securities may be materially affected by events occurring before the Funds’ pricing time but after the close of the primary markets or exchanges on which such foreign securities are traded. These intervening events might be country-specific (e.g., natural disaster, economic or political developments, interest rate change); issuer specific (e.g., earnings report or merger announcement); or U.S. market-specific (such as a significant movement in the U.S. market that is deemed to affect the value of foreign securities). The pricing service uses an automated system that incorporates a model based on multiple parameters, including a security’s local closing price, relevant general and sector indices, currency fluctuations, trading in depositary receipts and futures, if applicable, and/or research valuations by its staff, in determining what it believes is the fair value of the securities.
U.S. Government & Agencies and Corporate Bonds held by the Funds, if any, are classified as Level 2 since the values for such securities are based on prices provided by an independent pricing service that utilizes various “other significant observable inputs” including bid and ask quotations, prices of similar securities and interest rates, among other factors.
44
AVE MARIA MUTUAL FUNDS
NOTES TO FINANCIAL STATEMENTS
December 31, 2024 (Continued)
The inputs or methodology used for valuing securities are not necessarily an indication of the risks associated with investing in those securities. The inputs used to measure fair value may fall into different levels of the fair value hierarchy. In such cases, for disclosure purposes, the level in the fair value hierarchy within which the fair value measurement falls in its entirety is determined based on the lowest level input that is significant to the fair value measurement.
The following is a summary of the Funds’ investments and the levels assigned to the investments, by security type, as of December 31, 2024:
Ave Maria Value Fund | | Level 1 | | | Level 2 | | | Level 3 | | | Total | |
Common Stocks | | $ | 418,587,650 | | | $ | — | | | $ | — | | | $ | 418,587,650 | |
Money Market Funds | | | 28,011,977 | | | | — | | | | — | | | | 28,011,977 | |
Total | | $ | 446,599,627 | | | $ | — | | | $ | — | | | $ | 446,599,627 | |
Ave Maria Growth Fund | | Level 1 | | | Level 2 | | | Level 3 | | | Total | |
Common Stocks | | $ | 1,035,894,793 | | | $ | 2,947,436 | | | $ | — | | | $ | 1,038,842,229 | |
Money Market Funds | | | 41,415,886 | | | | — | | | | — | | | | 41,415,886 | |
Total | | $ | 1,077,310,679 | | | $ | 2,947,436 | | | $ | — | | | $ | 1,080,258,115 | |
Ave Maria Rising Dividend Fund | | Level 1 | | | Level 2 | | | Level 3 | | | Total | |
Common Stocks | | $ | 1,010,163,885 | | | $ | 15,360,036 | | | $ | — | | | $ | 1,025,523,921 | |
Money Market Funds | | | 53,419,593 | | | | — | | | | — | | | | 53,419,593 | |
Total | | $ | 1,063,583,478 | | | $ | 15,360,036 | | | $ | — | | | $ | 1,078,943,514 | |
Ave Maria World Equity Fund | | Level 1 | | | Level 2 | | | Level 3 | | | Total | |
Common Stocks | | $ | 93,929,244 | | | $ | 19,569,492 | | | $ | — | | | $ | 113,498,736 | |
Money Market Funds | | | 2,986,015 | | | | — | | | | — | | | | 2,986,015 | |
Total | | $ | 96,915,259 | | | $ | 19,569,492 | | | $ | — | | | $ | 116,484,751 | |
Ave Maria Focused Fund | | Level 1 | | | Level 2 | | | Level 3 | | | Total | |
Common Stocks | | $ | 56,787,640 | | | $ | 681,627 | | | $ | — | | | $ | 57,469,267 | |
Money Market Funds | | | 441,428 | | | | — | | | | — | | | | 441,428 | |
Total | | $ | 57,229,068 | | | $ | 681,627 | | | $ | — | | | $ | 57,910,695 | |
45
AVE MARIA MUTUAL FUNDS
NOTES TO FINANCIAL STATEMENTS
December 31, 2024 (Continued)
Ave Maria Bond Fund | | Level 1 | | | Level 2 | | | Level 3 | | | Total | |
U.S. Government & Agencies | | $ | — | | | $ | 181,777,816 | | | $ | — | | | $ | 181,777,816 | |
Corporate Bonds | | | — | | | | 358,952,804 | | | | — | | | | 358,952,804 | |
Common Stocks | | | 108,550,866 | | | | — | | | | — | | | | 108,550,866 | |
Money Market Funds | | | 23,030,272 | | | | — | | | | — | | | | 23,030,272 | |
Total | | $ | 131,581,138 | | | $ | 540,730,620 | | | $ | — | | | $ | 672,311,758 | |
Refer to each Fund’s Schedule of Investments for a listing of the securities by security type and sector or industry type. There were no Level 3 securities or derivative instruments held by or transferred in/out of the Funds as of or during the year ended December 31, 2024.
(b) Income taxes – Each Fund has qualified and intends to continue to qualify as a regulated investment company under the Internal Revenue Code of 1986, as amended (the “Code”). Qualification generally will relieve each Fund of liability for federal income taxes to the extent 100% of its net investment income and net realized capital gains are distributed in accordance with the Code.
In order to avoid imposition of the excise tax applicable to regulated investment companies, it is also each Fund’s intention to declare as dividends in each calendar year at least 98% of its net investment income and 98.2% of its net realized capital gains plus undistributed amounts from prior years.
The following information is computed on a tax basis for each item as of December 31, 2024:
| | Ave Maria
Value
Fund | | | Ave Maria
Growth
Fund | | | Ave Maria
Rising
Dividend
Fund | |
Federal income tax cost | | $ | 299,875,808 | | | $ | 607,825,562 | | | $ | 686,150,218 | |
Gross unrealized appreciation | | $ | 161,069,828 | | | $ | 496,757,190 | | | $ | 397,855,584 | |
Gross unrealized depreciation | | | (14,346,009 | ) | | | (24,324,637 | ) | | | (5,062,288 | ) |
Net unrealized appreciation | | | 146,723,819 | | | | 472,432,553 | | | | 392,793,296 | |
Net unrealized depreciation on foreign currency translation | | | — | | | | — | | | | (1,143 | ) |
Distributable earnings | | $ | 146,723,819 | | | $ | 472,432,553 | | | $ | 392,792,153 | |
46
AVE MARIA MUTUAL FUNDS
NOTES TO FINANCIAL STATEMENTS
December 31, 2024 (Continued)
| | Ave Maria
World
Equity Fund | | | Ave Maria
Focused
Fund | | | Ave Maria
Bond
Fund | |
Federal income tax cost | | $ | 82,641,151 | | | $ | 42,681,884 | | | $ | 640,889,382 | |
Gross unrealized appreciation | | $ | 39,547,651 | | | $ | 20,439,511 | | | $ | 43,301,773 | |
Gross unrealized depreciation | | | (5,704,051 | ) | | | (5,210,700 | ) | | | (11,879,397 | ) |
Net unrealized appreciation | | | 33,843,600 | | | | 15,228,811 | | | | 31,422,376 | |
Net unrealized depreciation on foreign currency translation | | | (892 | ) | | | — | | | | — | |
Distributable earnings | | $ | 33,842,708 | | | $ | 15,228,811 | | | $ | 31,422,376 | |
The difference between the federal income tax cost of investments and the financial statement cost of portfolio investments for the Ave Maria Value Fund and the Ave Maria Focused Fund is due to certain timing differences in the recognition of capital gains and losses under income tax regulations and GAAP. These “book/tax” differences are temporary in nature and are due to the tax deferral of losses on wash sales and adjustments to basis for grantor trusts. There is no difference between the federal income tax cost and the financial statement cost of portfolio investments for the Ave Maria Growth Fund, the Ave Maria Rising Dividend Fund, the Ave Maria World Equity Fund and the Ave Maria Bond Fund as of December 31, 2024.
During the year ended December 31, 2024, the following capital loss carryforwards (“CLCFs”) were utilized against current year gains:
| | Ave Maria
Value Fund | | | Ave Maria
Growth
Fund | | | Ave Maria
Rising
Dividend
Fund | |
Short-term - utilized | | $ | — | | | $ | — | | | $ | — | |
Long-term - utilized | | | — | | | | — | | | | — | |
| | | $ | — | | | $ | — | | | $ | — | |
| | Ave Maria
World
Equity Fund | | | Ave Maria
Focused
Fund | | | Ave Maria
Bond
Fund | |
Short-term - utilized | | $ | — | | | $ | — | | | $ | 88,473 | |
Long-term - utilized | | | — | | | | 31,934 | | | | 6,579,157 | |
| | | $ | — | | | $ | 31,934 | | | $ | 6,667,630 | |
As of December 31, 2024, all CLCFs were utilized and none are left to carry over to future years.
47
AVE MARIA MUTUAL FUNDS
NOTES TO FINANCIAL STATEMENTS
December 31, 2024 (Continued)
For the year ended December 31, 2024, the following reclassifications were made as a result of permanent differences between the financial statements and income tax reporting requirements due to reclassifications of the character of distributions and net investment loss:
| | Increase
Distributable
Earnings | | | Decrease
Paid-in
Capital | |
Ave Maria Value Fund | | $ | 30,881 | | | $ | (30,881 | ) |
Ave Maria Growth Fund | | | 3,811 | | | | (3,811 | ) |
Ave Maria Rising Dividend Fund | | | 9,842 | | | | (9,842 | ) |
Ave Maria World Equity Fund | | | 440 | | | | (440 | ) |
Ave Maria Focused Fund | | | 31,759 | | | | (31,759 | ) |
Ave Maria Bond Fund | | | 12,036 | | | | (12,036 | ) |
These reclassifications have no effect on each Fund’s net assets or NAV per share.
The Funds recognize the tax benefits or expenses of uncertain tax positions only when the position is “more-likely-than-not” to be sustained assuming examination by tax authorities. Management has reviewed the tax positions taken on federal income tax returns for all open tax years (generally, three years) and has concluded that no provision for unrecognized tax benefits or expenses is required in these financial statements.
The Funds recognize interest and penalties, if any, related to unrecognized tax benefits as income tax expense on the Statements of Operations. During the year ended December 31, 2024, the Funds did not incur any interest or penalties.
(c) Investment transactions and investment income – Investment transactions are accounted for on the trade date. Dividend income is recorded on the ex-dividend date. Non-cash dividends included in dividend income, if any, are recorded at the fair value of the securities received. Interest income is recognized on the accrual basis and includes amortization of premiums and accretion of discounts using the effective yield method. Cost of investments includes amortization of premiums and accretion of discounts. Realized gains and losses on investments sold are determined on a specific identification basis. Withholding taxes on foreign dividends have been recorded in accordance with the Funds’ understanding of the applicable country’s rules and tax rates.
(d) Dividends and distributions – Dividends from net investment income, if any, are declared and paid annually in December for the Ave Maria Value Fund, the Ave Maria Growth Fund, the Ave Maria World Equity Fund and the Ave Maria Focused Fund. Dividends from net investment income, if any, are declared and paid quarterly
48
AVE MARIA MUTUAL FUNDS
NOTES TO FINANCIAL STATEMENTS
December 31, 2024 (Continued)
for the Ave Maria Rising Dividend Fund and are declared and paid monthly for the Ave Maria Bond Fund. Each Fund expects to distribute any net realized capital gains annually. Dividends and distributions to shareholders are recorded on the ex-dividend date. The tax character of distributions paid to shareholders during the years ended December 31, 2024 and 2023 was as follows:
Year Ended | | Ordinary
Income | | | Long-Term
Capital Gains | | | Total
Distributions | |
Ave Maria Value Fund: | | | | | | | | | | | | |
December 31, 2024 | | $ | 1,330,477 | | | $ | 34,977,953 | | | $ | 36,308,430 | |
December 31, 2023 | | $ | 2,924,099 | | | $ | 12,883,420 | | | $ | 15,807,519 | |
Ave Maria Growth Fund: | | | | | | | | | | | | |
December 31, 2024 | | $ | 22,458,533 | | | $ | 62,124,128 | | | $ | 84,582,661 | |
December 31, 2023 | | $ | 2,876,427 | | | $ | 21,901,965 | | | $ | 24,778,392 | |
Ave Maria Rising Dividend Fund: | | | | | | | | | | | | |
December 31, 2024 | | $ | 10,464,369 | | | $ | 55,640,736 | | | $ | 66,105,105 | |
December 31, 2023 | | $ | 11,877,069 | | | $ | 15,684,716 | | | $ | 27,561,785 | |
Ave Maria World Equity Fund: | | | | | | | | | | | | |
December 31, 2024 | | $ | 456,783 | | | $ | 602,889 | | | $ | 1,059,672 | |
December 31, 2023 | | $ | 787,472 | | | $ | 2,961,038 | | | $ | 3,748,510 | |
Ave Maria Focused Fund: | | | | | | | | | | | | |
December 31, 2024 | | $ | — | | | $ | — | | | $ | — | |
December 31, 2023 | | $ | — | | | $ | — | | | $ | — | |
Ave Maria Bond Fund: | | | | | | | | | | | | |
December 31, 2024 | | $ | 18,484,015 | | | $ | — | | | $ | 18,484,015 | |
December 31, 2023 | | $ | 13,568,375 | | | $ | — | | | $ | 13,568,375 | |
(e) Estimates – The preparation of financial statements in conformity with GAAP requires management to make estimates and assumptions that affect the reported amounts of assets and liabilities and disclosure of contingent assets and liabilities as of the date of the financial statements and the reported amounts of revenues and expenses during the reporting period. Actual results could differ from those estimates.
(f) Common expenses – Common expenses of the Trust are allocated among the series of the Trust based on relative net assets of each series or the nature of the services performed and the relative applicability to each series.
49
AVE MARIA MUTUAL FUNDS
NOTES TO FINANCIAL STATEMENTS
December 31, 2024 (Continued)
(g) Foreign currency translation – Securities and other assets and liabilities denominated in or expected to settle in foreign currencies are translated into U.S. dollars based on exchange rates on the following basis:
| | (i) | The fair values of investment securities and other assets and liabilities are translated as of the close of the NYSE each day. |
| | (ii) | Purchases and sales of investment securities and income and expenses are translated at the rate of exchange prevailing as of 4:00 p.m. Eastern Time on the respective date of such transactions. |
| | (iii) | The Funds do not isolate that portion of the results of operations caused by changes in foreign exchange rates on investments from those caused by changes in market prices of securities held. Such fluctuations are included with the net realized and unrealized gains or losses on investments. |
Reported net realized foreign exchange gains or losses arise from 1) purchase and sales of foreign currencies, 2) currency gains or losses realized between the trade and settlement dates on securities transactions and 3) the difference between the amounts of dividends and foreign withholding taxes recorded on the Funds’ books and the U.S. dollar equivalent of the amounts actually received or paid. Reported net unrealized foreign exchange gains and losses arise from changes in the value of assets and liabilities that result from changes in exchange rates.
The Funds may be subject to foreign taxes related to foreign income received, capital gains on the sale of securities and certain foreign currency transactions (a portion of which may be reclaimable). All foreign taxes are recorded in accordance with the applicable regulations and rates that exist in the foreign jurisdictions in which the Funds invest.
(h) Regulatory update – Tailored Shareholder Reports for Mutual Funds and Exchange-Traded Funds (“ETFs”) – Effective January 24, 2023, the Securities and Exchange Commission (the “SEC”) adopted rule and form amendments to require mutual funds and ETFs to transmit concise and visually engaging streamlined annual and semi-annual reports to shareholders that highlight key information. Other information, including financial statements, will no longer appear in a streamlined shareholder report but must be available online, delivered free of charge upon request, and filed on a semi-annual basis on Form N-CSR. The rule and form amendments have a compliance date of July 24, 2024. The Funds have implemented the rule and form requirements, as applicable, and are currently adhering to the requirements.
50
AVE MARIA MUTUAL FUNDS
NOTES TO FINANCIAL STATEMENTS
December 31, 2024 (Continued)
2. Investment Advisory Agreements and Transactions with Related Parties
The Chairman and President of the Trust is also the Executive Chairman of the Adviser. Certain other officers of the Trust are officers of the Adviser, or of Ultimus Fund Solutions, LLC (“Ultimus”), the administrative, accounting and transfer agent for the Funds, or of Ultimus Fund Distributors, LLC (the “Distributor”), the Funds’ principal underwriter.
Pursuant to Investment Advisory Agreements between the Trust and the Adviser, the Adviser is responsible for the management of each Fund and provides investment advice along with the necessary personnel, facilities, equipment and certain other services necessary to the operations of the Funds. The Adviser receives fees based on a percentage of the average daily net assets of each Fund, which are accrued daily and paid quarterly, at the annual rates as stated below:
Ave Maria Value Fund | | | 0.75 | % |
Ave Maria Growth Fund | | | 0.75 | % |
Ave Maria Rising Dividend Fund | | | 0.75 | % |
Ave Maria World Equity Fund | | | 0.75 | % |
Ave Maria Focused Fund | | | 0.75 | % |
Ave Maria Bond Fund | | | 0.25 | % |
The Adviser has contractually agreed to reduce its advisory fees or reimburse a portion of operating expenses until at least May 1, 2025 so that the ordinary operating expenses of each of the Ave Maria Value Fund, the Ave Maria Growth Fund, the Ave Maria Rising Dividend Fund, the Ave Maria World Equity Fund and the Ave Maria Focused Fund do not exceed 1.25% per annum of average daily net assets; and so that the ordinary operating expenses of the Ave Maria Bond Fund do not exceed 0.60% per annum of average daily net assets. The Adviser did not reduce its investment advisory fees for any of the Funds during the year ended December 31, 2024.
Any investment advisory fee reductions or expense reimbursements by the Adviser are subject to repayment by the Funds for a period of three years after such fees and expenses were incurred, provided the Funds are able to effect such repayment and remain in compliance with any undertaking by the Adviser to limit expenses of the Funds. As of December 31, 2024, no advisory fee reductions are available for recoupment.
The Chief Compliance Officer of the Trust (the “CCO”) is an employee of the Adviser. The Trust pays the Adviser a fee for providing CCO services, of which each Fund pays its proportionate share along with the other series of the Trust. In addition, the Trust reimburses the Adviser for out-of-pocket expenses incurred, if any, for providing these services.
51
AVE MARIA MUTUAL FUNDS
NOTES TO FINANCIAL STATEMENTS
December 31, 2024 (Continued)
Pursuant to a Mutual Fund Services Agreement between the Trust and Ultimus, Ultimus supplies regulatory and compliance services, calculates the daily NAV per share of each Fund, maintains the financial books and records of the Funds, maintains the records of each shareholder’s account, and processes purchases and redemptions of each Fund’s shares. For the performance of these services, Ultimus receives fees from each Fund computed as a percentage of such Fund’s average daily net assets, subject to a minimum monthly fee.
Pursuant to a Distribution Agreement between the Trust and the Distributor, the Distributor serves as each Fund’s exclusive agent for the distribution of its shares. The Distributor is an affiliate of Ultimus.
Trustees and officers affiliated with the Adviser or Ultimus are not compensated by the Trust for their services. Each Trustee who is not an affiliated person of the Adviser or Ultimus (“Independent Trustee”) receives from the Trust an annual retainer of $67,000 (except that such fee was $78,000 for the Lead Independent Trustee/Chairman of the Governance Committee and $73,500 for the Chairman of the Audit Committee), payable quarterly; a fee of $6,500 for attendance at each meeting of the Board of Trustees; plus reimbursement of travel and other expenses incurred in attending meetings. Trustee Emeritus, if any, receives one-half of both the annual retainer and fee for attendance at each meeting; plus reimbursement of travel and other expenses incurred in attending meetings. Each Fund pays its proportionate share of the Independent Trustees’ fees and expenses along with the other series of the Trust.
Effective January 1, 2025, each Independent Trustee will receive from the Trust an annual retainer of $70,000 (except that such fee will be $82,000 for the Lead Independent Trustee/Chairman of the Governance Committee and $80,500 for the Chairman of the Audit Committee), payable quarterly; a fee of $7,000 for attendance at each meeting of the Board of Trustees; plus reimbursement of travel and other expenses incurred in attending meetings. Each Fund will pay its proportionate share of the Independent Trustees’ fees and expenses along with the other series of the Trust.
Each member of the Catholic Advisory Board (“CAB”), including Emeritus members, receives an annual retainer of $6,000 (except that such fee is $16,000 for the CAB chairman), payable quarterly; a fee of $4,000 for attendance at each meeting of the CAB; plus reimbursement of travel and other expenses incurred in attending meetings. Each Fund pays its proportionate share of CAB members’ fees and expenses.
52
AVE MARIA MUTUAL FUNDS
NOTES TO FINANCIAL STATEMENTS
December 31, 2024 (Continued)
3. Investment Transactions
During the year ended December 31, 2024, cost of purchases and proceeds from sales and maturities of investment securities, excluding short-term investments and U.S. government securities, were as follows:
| | Ave Maria
Value Fund | | | Ave Maria
Growth Fund | | | Ave Maria
Rising
Dividend
Fund | |
Purchases of investment securities | | $ | 64,843,768 | | | $ | 174,516,146 | | | $ | 83,234,943 | |
Proceeds from sales of investment securities | | $ | 86,321,099 | | | $ | 228,036,372 | | | $ | 175,463,414 | |
| | Ave Maria
World
Equity Fund | | | Ave Maria
Focused
Fund | | | Ave Maria
Bond Fund | |
Purchases of investment securities | | $ | 23,538,210 | | | $ | 12,192,264 | | | $ | 119,646,554 | |
Proceeds from sales and maturities of investment securities | | $ | 14,683,253 | | | $ | 21,030,913 | | | $ | 77,774,294 | |
During the year ended December 31, 2024, cost of purchases and proceeds from sales and maturities of long-term U.S. government securities for the Ave Maria Bond Fund were $100,732,830 and $39,230,066, respectively.
4. Borrowing Costs
From time to time, the Funds may have an overdrawn cash balance at the custodian due to redemptions or market movements. When this occurs, the Funds will incur borrowing costs charged by the custodian. Accordingly, during the year ended December 31, 2024, the Ave Maria Value Fund and the Ave Maria Focused Fund incurred $276 and $943, respectively, of borrowing costs charged by the custodian.
5. Contingencies and Commitments
The Funds indemnify the Trust’s officers and Trustees for certain liabilities that might arise from their performance of their duties to the Funds. Additionally, in the normal course of business, the Funds enter into contracts that contain a variety of representations and warranties and which provide general indemnifications. The Funds’ maximum exposure under these arrangements is unknown, as this would involve future claims that may be made against the Funds that have not yet occurred. However, based on experience, the Funds expect the risk of loss to be remote.
53
AVE MARIA MUTUAL FUNDS
NOTES TO FINANCIAL STATEMENTS
December 31, 2024 (Continued)
6. Sector Risk
If a Fund has significant investments in the securities of issuers in industries within a particular sector, any development affecting that sector will have a greater impact on the value of the net assets of the Fund than would be the case if the Fund did not have significant investments in that sector. In addition, this may increase the risk of loss of an investment in the Fund and increase the volatility of the Fund’s NAV per share. From time to time, circumstances may affect a particular sector and the companies within such sector. For instance, economic or market factors, regulation or deregulation, and technological or other developments may negatively impact all companies in a particular sector and therefore the value of a Fund’s portfolio will be adversely affected. As of December 31, 2024, the Ave Maria Growth Fund and the Ave Maria Rising Dividend Fund had 49.2% and 29.0%, respectively, of the value of their net assets invested in common stocks within the technology sector and the Ave Maria Focused Fund had 29.3% of the value of its net assets invested in common stocks within the communications sector and 26.0% of the value of its net assets invested in common stocks within the industrials sector.
7. Subsequent Events
The Funds are required to recognize in the financial statements the effects of all subsequent events that provide additional evidence about conditions that existed as of the date of the Statements of Assets and Liabilities. For non-recognized subsequent events that must be disclosed to keep the financial statements from being misleading, the Funds are required to disclose the nature of the event as well as an estimate of its financial effect, or a statement that such an estimate cannot be made. Management has evaluated subsequent events through the issuance of these financial statements and has noted no such events, except for the following:
Change in Control
The founder and principal of the Adviser plans to transfer all of his ownership interest in the Adviser to his family members (the “Transaction”). The closing of the Transaction (the “Closing”), anticipated to take place near the end of the second quarter of 2025, will result in a change in control of the Adviser. Consistent with the requirements of the 1940 Act, the Investment Advisory Agreements (the “Present Advisory Agreements”) between the Adviser and the Funds each contain a provision that each Present Advisory Agreement will terminate automatically in the event of its “assignment” (as defined in the 1940 Act). As noted above, the Transaction will result in a change in control of the Adviser effective as of the Closing and will be deemed an assignment of the Present Advisory Agreements and result in the automatic termination of the Present Advisory Agreements.
54
AVE MARIA MUTUAL FUNDS
NOTES TO FINANCIAL STATEMENTS
December 31, 2024 (Continued)
At its in-person meeting on February 12, 2025, the Board of Trustees, including the Trustees who are not “interested persons” of the Funds or the Adviser within the meaning of the 1940 Act (the “Independent Trustees”), approved new investment advisory agreements between the Adviser and each of the Funds (together, the “New Advisory Agreements”). The New Advisory Agreements need to be approved by shareholders of the Funds at a special meeting of shareholders. Except for the effective and termination dates and the initial term, the terms and conditions of the New Advisory Agreements are substantially similar to the Present Advisory Agreements, including the rate of the investment advisory fee for the Funds. Upon approval of the New Advisory Agreements, the Adviser will enter into a new Expense Limitation Agreement for each Fund that is substantially the same as under the current Expense Limitation Agreement. The new Expense Limitation Agreements will continue for one year after the Closing.
Other than the change in the ownership structure of the Adviser, the operations of the Adviser will stay the same and the same personnel of the Adviser who currently provide investment advisory services to the Funds will continue to do so upon approval of the New Advisory Agreements.
Fund Name Change
Effective on or around April 28, 2025, the name of the Ave Maria Focused Fund will be changed to the “Ave Maria Growth Focused Fund.” This change is being made in order to differentiate the Ave Maria Focused Fund from the Schwartz Value Focused Fund (to be renamed the Ave Maria Value Focused Fund) another series of the Trust. The Fund’s name change will not result in any material change to the investment strategies and investment processes that the Adviser currently uses to manage the Fund, as the Fund will continue to seek long-term capital appreciation by investing in equity securities that the Adviser believes have high earnings growth potential.
55
AVE MARIA MUTUAL FUNDS
Report of Independent Registered
Public Accounting Firm
To the Shareholders and the Board of Trustees of Schwartz Investment Trust:
Opinion on the Financial Statements and Financial Highlights
We have audited the accompanying statements of assets and liabilities of Schwartz Investment Trust, comprising the Ave Maria Value Fund, Ave Maria Growth Fund, Ave Maria Rising Dividend Fund, Ave Maria World Equity Fund, Ave Maria Focused Fund, and Ave Maria Bond Fund (the “Funds”), including the schedules of investments, as of December 31, 2024, the related statements of operations, the statements of changes in net assets, and the financial highlights for each of the periods listed in the table below, and the related notes. In our opinion, the financial statements and financial highlights present fairly, in all material respects, the financial position of each of the Funds constituting the Schwartz Investment Trust as of December 31, 2024, and the results of their operations, the changes in their net assets, and the financial highlights for each of the periods listed in the table below, in conformity with accounting principles generally accepted in the United States of America.
Individual Funds Comprising the
Schwartz Investment Trust | Statement of
Operations | Statements of
Changes in
Net Assets | Financial
Highlights |
Ave Maria Value Fund Ave Maria Growth Fund Ave Maria Rising Dividend Fund Ave Maria World Equity Fund Ave Maria Bond Fund | For the year ended December 31, 2024 | For the years ended December 31, 2024 and December 31, 2023 | For the years ended December 31, 2024, December 31, 2023, December 31, 2022, December 31, 2021 and December 31 2020 |
Ave Maria Focused Fund | For the year ended December 31, 2024 | For the years ended December 31, 2024 and December 31, 2023 | For the years ended December 31, 2024, December 31, 2023, December 31, 2022, December 31, 2021, and For the period from May 1, 2020 (commencement of operations) through December 31, 2020 |
Basis for Opinion
These financial statements and financial highlights are the responsibility of the Funds’ management. Our responsibility is to express an opinion on the Funds’ financial statements and financial highlights based on our audits. We are a public accounting firm registered with the Public Company Accounting Oversight Board (United States)
56
AVE MARIA MUTUAL FUNDS
REPORT OF INDEPENDENT REGISTERED
PUBLIC ACCOUNTING FIRM (Continued)
(PCAOB) and are required to be independent with respect to the Funds in accordance with the U.S. federal securities laws and the applicable rules and regulations of the Securities and Exchange Commission and the PCAOB.
We conducted our audits in accordance with the standards of the PCAOB. Those standards require that we plan and perform the audit to obtain reasonable assurance about whether the financial statements and financial highlights are free of material misstatement, whether due to error or fraud. The Funds are not required to have, nor were we engaged to perform, an audit of their internal control over financial reporting. As part of our audits, we are required to obtain an understanding of internal control over financial reporting but not for the purpose of expressing an opinion on the effectiveness of the Funds’ internal control over financial reporting. Accordingly, we express no such opinion.
Our audits included performing procedures to assess the risks of material misstatement of the financial statements and financial highlights, whether due to error or fraud, and performing procedures that respond to those risks. Such procedures included examining, on a test basis, evidence regarding the amounts and disclosures in the financial statements and financial highlights. Our audits also included evaluating the accounting principles used and significant estimates made by management, as well as evaluating the overall presentation of the financial statements and financial highlights. Our procedures included confirmation of securities owned as of December 31, 2024, by correspondence with the custodian and brokers; when replies were not received from brokers, we performed other auditing procedures. We believe that our audits provide a reasonable basis for our opinion.

Chicago, Illinois
February 21, 2025
We have served as the auditor of one or more Schwartz Investment Trust investment companies since 1993.
57
AVE MARIA MUTUAL FUNDS
Additional Information
(Unaudited)
Changes in Disagreements with Accountants
There were no changes in or disagreements with accountants during the period covered by this report.
Proxy Disclosures
Not applicable.
Renumeration Paid to Directors, Officers and Others
Refer to the financial statements included herein.
Statement Regarding Basis for Approval of Investment Advisory Agreement
Not applicable.
58
AVE MARIA MUTUAL FUNDS
Federal Tax Information
(Unaudited)
Capital Gain Distribution – For the year ended December 31, 2024, the following Funds designated long-term capital gain distributions:
Ave Maria Value Fund | | $ | 34,977,227 | |
Ave Maria Growth Fund | | | 62,122,177 | |
Ave Maria Rising Dividend Fund | | | 55,639,776 | |
Ave Maria World Equity Fund | | | 602,890 | |
Qualified Dividend Income – The Funds have designated the following of their ordinary income dividends, or up to the maximum amount of such dividends allowable pursuant to the Internal Revenue Code, as qualified dividend income eligible for the reduced tax rate:
Ave Maria Value Fund | | | 100.00 | % |
Ave Maria Growth Fund | | | 28.64 | % |
Ave Maria Rising Dividend Fund | | | 100.00 | % |
Ave Maria World Equity Fund | | | 100.00 | % |
Ave Maria Bond Fund | | | 19.69 | % |
Dividends Received Deduction – For corporate shareholders, the following percentages of ordinary dividends paid during the year ended December 31, 2024 qualify for the corporate dividends received deduction:
Ave Maria Value Fund | | | 100.00 | % |
Ave Maria Growth Fund | | | 23.64 | % |
Ave Maria Rising Dividend Fund | | | 100.00 | % |
Ave Maria World Equity Fund | | | 92.37 | % |
Ave Maria Bond Fund | | | 17.84 | % |
Foreign Source Income and Expense – The following Funds intend to elect to pass through to shareholders the income tax credit for taxes paid to foreign countries. The pass-through of the foreign tax credit will only affect those persons who are shareholders on the dividend record date. These shareholders will receive more detailed information with their 2024 Form 1099-DIV. The per share amounts designated were:
| | Foreign
Source
Income | | | Foreign Tax
Expense | |
Ave Maria World Equity Fund | | $ | 0.2092 | | | $ | 0.0036 | |
59
This page intentionally left blank.
This page intentionally left blank.
This page intentionally left blank.
This page intentionally left blank.
(b) Included in (a)
Item 8. Changes in and Disagreements with Accountants for Open-End Management Investment Companies.
Not applicable
Item 9. Proxy Disclosures for Open-End Management Investment Companies.
Not applicable
Item 10. Remuneration Paid to Directors, Officers, and Others of Open-End Management Investment Companies.
Included under Item 7
Item 11. Statement Regarding Basis for Approval of Investment Advisory Contract.
Not applicable
Item 12. Disclosure of Proxy Voting Policies and Procedures for Closed-End Management Investment Companies.
Not applicable
Item 13. Portfolio Managers of Closed-End Management Investment Companies.
Not applicable
Item 14. Purchases of Equity Securities by Closed-End Management Investment Company and Affiliated Purchasers.
Not applicable
Item 15. Submission of Matters to a Vote of Security Holders.
The registrant’s Nominating and Governance Committee shall review shareholder recommendations to fill vacancies on the registrant’s board of trustees if such recommendations are submitted in writing, addressed to the Committee at the registrant’s offices and meet any minimum qualifications adopted by the Committee. The Committee may adopt, by resolution, a policy regarding its procedures for considering candidates for the board of trustees, including any recommended by shareholders.
Item 16. Controls and Procedures.
(a) Based on their evaluation of the registrant’s disclosure controls and procedures (as defined in Rule 30a-3(c) under the Investment Company Act of 1940) as of a date within 90 days of the filing date of this report, the registrant’s principal executive officer and principal financial officer have concluded that such disclosure controls and procedures are reasonably designed and are operating effectively to ensure that material information relating to the registrant, including its consolidated subsidiaries, is made known to them by others within those entities, particularly during the period in which this report is being prepared, and that the information required in filings on Form N-CSR is recorded, processed, summarized, and reported on a timely basis.
(b) There were no changes in the registrant’s internal control over financial reporting (as defined in Rule 30a-3(d) under the Investment Company Act of 1940) that occurred during the period covered by this report that have materially affected, or are reasonably likely to materially affect, the registrant’s internal control over financial reporting.
Item 17. Disclosure of Securities Lending Activities for Closed-End Management Investment Companies.
Not applicable
Item 18. Recovery of Erroneously Awarded Compensation.
(a) Not applicable
(b) Not applicable
Item 19. Exhibits.
File the exhibits listed below as part of this Form. Letter or number the exhibits in the sequence indicated.
(a)(1) Any code of ethics, or amendment thereto, that is the subject of the disclosure required by Item 2, to the extent that the registrant intends to satisfy the Item 2 requirements through filing of an exhibit: Attached hereto
(a)(2) A separate certification for each principal executive officer and principal financial officer of the registrant as required by Rule 30a-2(a) under the Act (17 CFR 270.30a-2(a)): Attached hereto
(1) Not applicable
(2) Change in the registrant’s independent public accountant: Not applicable
(b) Certifications required by Rule 30a-2(b) under the Act (17 CFR 270.30a-2(b)): Attached hereto
SIGNATURES
Pursuant to the requirements of the Securities Exchange Act of 1934 and the Investment Company Act of 1940, the registrant has duly caused this report to be signed on its behalf by the undersigned, thereunto duly authorized.
| (Registrant) | Schwartz Investment Trust | | |
| | | | |
| By (Signature and Title)* | /s/ George P. Schwartz | |
| | | George P. Schwartz, President and Principal Executive Officer |
| | | | |
| Date | February 28, 2025 | | |
| | | | |
| Pursuant to the requirements of the Securities Exchange Act of 1934 and the Investment Company Act of 1940, this report has been signed below by the following persons on behalf of the registrant and in the capacities and on the dates indicated. |
| | | | |
| By (Signature and Title)* | /s/ George P. Schwartz | |
| | | George P. Schwartz, President and Principal Executive Officer |
| | | | |
| Date | February 28, 2025 | | |
| | | | |
| By (Signature and Title)* | /s/ Timothy S. Schwartz | |
| | | Timothy S. Schwartz, Treasurer and Principal Financial Officer |
| | | | |
| Date | February 28, 2025 | | |
| * | Print the name and title of each signing officer under his or her signature. |