UNITED STATES
SECURITIES AND EXCHANGE COMMISSION
Washington, D.C. 20549
FORM N-CSR
CERTIFIED SHAREHOLDER REPORT OF REGISTERED
MANAGEMENT INVESTMENT COMPANIES
| Investment Company Act file number | 811-07148 | |
| Schwartz Investment Trust |
| (Exact name of registrant as specified in charter) |
| 801 W. Ann Arbor Trail, Suite 244 Plymouth, Michigan | 48170 |
| (Address of principal executive offices) | (Zip code) |
George P. Schwartz
| Schwartz Investment Counsel, Inc. 801 W. Ann Arbor Trail, Plymouth, MI 48170 |
| (Name and address of agent for service) |
| Registrant's telephone number, including area code: | (734) 455-7777 | |
| Date of fiscal year end: | December 31 | |
| | | |
| Date of reporting period: | December 31, 2022 | |
Form N-CSR is to be used by management investment companies to file reports with the Commission not later than 10 days after the transmission to stockholders of any report that is required to be transmitted to stockholders under Rule 30e-1 under the Investment Company Act of 1940 (17 CFR 270.30e-1). The Commission may use the information provided on Form N-CSR in its regulatory, disclosure review, inspection, and policymaking roles.
A registrant is required to disclose the information specified by Form N-CSR, and the Commission will make this information public. A registrant is not required to respond to the collection of information contained in Form N-CSR unless the Form displays a currently valid Office of Management and Budget ("OMB") control number. Please direct comments concerning the accuracy of the information collection burden estimate and any suggestions for reducing the burden to the Secretary, Securities and Exchange Commission, 450 Fifth Street, NW, Washington, DC 20549-0609. The OMB has reviewed this collection of information under the clearance requirements of 44 U.S.C. § 3507.
| Item 1. | Reports to Stockholders. |

Schwartz Value Focused Fund
Shareholder Services c/o Ultimus Fund Solutions, LLC P.O. Box 46707 Cincinnati, OH 45246 (888) 726-0753 | | Investment Adviser Schwartz Investment Counsel, Inc.
801 W. Ann Arbor Trail Suite 244 Plymouth, MI 48170 |
Dear Fellow Shareholders:
2022 was a good year for the Schwartz Value Focused Fund (“the Fund”) with a total return of 21.15%, compared to -17.77% for the benchmark S&P 1500 Index, and -14.02% for the Morningstar Mid-Cap Blend category average. For the year, the Fund ranked #1 out of 370 equity mutual funds in the Morningstar Mid-Cap Blend category. This performance has been recognized by the investment community, as the Fund was highlighted in The Wall Street Journal’s January 9, 2023 edition, in the article titled “The Best Stock-Fund Managers of 2022.” As stated in the article, the Fund’s 2022 performance ranked #3 out of 1,410 U.S. equity funds, as tracked by Morningstar, an independent rating service.
The Fund’s outperformance in 2022 was driven primarily by the Fund’s energy sector investments. In particular, the share prices of Chevron Corporation (oil & natural gas integrated), Devon Energy (oil & natural gas exploration and production), Pioneer Natural Resources Company (oil & natural gas exploration and production), Schlumberger Limited (oil & natural gas equipment and services), and Texas Pacific Land Corporation (real estate and royalties) all rose substantially in 2022. We believe the worldwide demand for energy, including oil and natural gas, will continue to grow for many years. With rising demand, coupled with constrained supply (due to a myriad of factors), we believe energy prices may escalate in 2023 and beyond. As such, we remain optimistic that the Fund’s energy sector companies will continue to grow revenues, earnings, cash flows, and dividends.
The Fund’s five best performing securities in 2022 were:
Company | Industry | 2022 Return |
Schlumberger Limited | Oil/Gas Equipment & Services | 91.98% |
Texas Pacific Land Corporation | Real Estate/Royalties | 91.28% |
Devon Energy Corporation | Oil/Gas Exploration & Production | 67.21% |
Chevron Corporation | Integrated Oil/Gas | 56.94% |
Pioneer Natural Resources Co. | Oil/Gas Exploration & Production | 44.11% |
The Fund’s five worst performing securities in 2022 were:
Company | Industry | 2022 Return |
Purple Innovation, Inc. | Consumer Products | -44.22% |
Garmin Ltd. | Technology Products | -30.38% |
Moody’s Corporation | Debt Rating Services | -28.04% |
Vontier Corporation | Technology Mobility | -27.49% |
CME Group Inc. | Financial Exchanges | -20.48% |
1
Due to its strong performance in 2021 and 2022, the Fund’s longer-term performance measures have markedly improved. For the 3-year and 5-year periods ending December 31, 2022, the Fund placed in the 1st percentile in Morningstar’s Mid-Cap Blend category. The Fund’s 1, 3, 5, and 10-year performance figures for periods ending December 31, 2022 are as follows:
| | Average Annual Total Return
For the Periods Ending 12/31/22 |
| | 1 year | 3 years | 5 years | 10 years |
Schwartz Value Focused Fund | 21.15% | 21.04% | 14.09% | 10.06% |
S&P 1500 Index | -17.77% | 7.59% | 9.15% | 12.40% |
Value-oriented investment managers were vindicated in 2022. It was a year in which many investors got sucked into the vortex of a speculative stock market mania driven by tech stocks that got ridiculously overpriced, even though many were unprofitable enterprises. These “story stocks” were hailed as industry disruptors, and no share price was too high. The carnage here was brutal.
Recent performance of 10 former high-flying technology stocks:
Company | Performance
Since 2021 Peak
through
2022 Year End |
Carvana Co. | -99% |
Peloton Interactive, Inc. | -95% |
Coinbase Global, Inc. | -92% |
Teladoc Health, Inc. | -92% |
Leamonade, Inc. | -91% |
Robinhood Markets, Inc. | -91% |
Snap Inc. | -90% |
Zoom Video Communications, Inc. | -88% |
Docusign, Inc. | -83% |
Spotify Technology S.A. | -80% |
Individual and institutional investors alike in these issues probably learned again the truism that real investing is not a game, and success is not assured. One cannot ignore valuations and expect to achieve successful results. Fundamentals matter.
In managing the Schwartz Value Focused Fund, we will continue to pursue a risk-averse, value-focused investment approach that utilizes fundamental security analysis to identify securities available at a discount to intrinsic value. We believe this approach provides the best opportunities to achieve above-average investment results.
2
The year-end distribution of $0.394 per share consisted solely of investment income, as there were no realized short or long-term capital gains. The net asset value of the Fund ended the year at $45.06 per share.
Thank you for being a shareholder in the Schwartz Value Focused Fund.

| 
|
Timothy S. Schwartz, CFA | George P. Schwartz, CFA |
Lead Portfolio Manager | Co-Portfolio Manager |
Past performance is no guarantee of future results. Rank in Category is the fund’s total return percentile rank relative to all funds that have the same Morningstar Category. The highest (or most favorable) percentile rank is 1 and the lowest (or least favorable) percentile rank is 100. The top-performing fund in a category will always receive a rank of 1.
3
SCHWARTZ VALUE FOCUSED FUND
PERFORMANCE
(Unaudited)
Comparison of the Change in Value of a $10,000 Investment
in Schwartz Value Focused Fund and the S&P 1500 Index
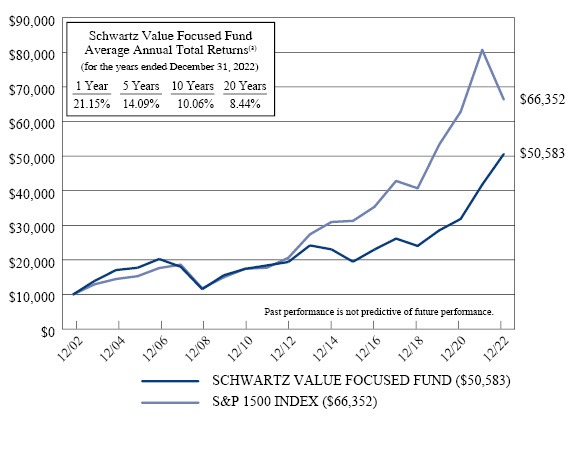
(a) | The returns shown do not reflect the deduction of taxes a shareholder would pay on Fund distributions or the redemption of Fund shares. |
Expense Ratio
information as of: | Year Ended 12-31-21
(as disclosed in May 1, 2022
prospectus) | Year Ended 12-31-22 |
Gross | 1.32%* | 1.28% |
Net | 1.26%* | 1.25% |
* | Includes Acquired Fund Fees and Expenses and had been adjusted to reflect a reduction in the annual management fees of 0.20% effective May 1, 2022 (Note 2). |
4
SCHWARTZ VALUE FOCUSED FUND
ANNUAL TOTAL RATES OF RETURN
COMPARISON WITH MAJOR INDICES (Unaudited)
| SCHWARTZ
VALUE
FOCUSED
FUND(a) | S&P 1500
INDEX(b) | VALUE
LINE
COMPOSITE(c) |
1984 | 11.1% | N/A | -8.4% |
1985 | 21.7% | N/A | 20.7% |
1986 | 16.4% | N/A | 5.0% |
1987 | -0.6% | N/A | -10.6% |
1988 | 23.1% | N/A | 15.4% |
1989 | 8.3% | N/A | 11.2% |
1990 | -5.3% | N/A | -24.3% |
1991 | 32.0% | N/A | 27.2% |
1992 | 22.7% | N/A | 7.0% |
1993 | 20.5% | N/A | 10.7% |
1994 | -6.8% | N/A | -6.0% |
1995 | 16.9% | 36.5% | 19.3% |
1996 | 18.3% | 22.4% | 13.4% |
1997 | 28.0% | 32.9% | 21.1% |
1998 | -10.4% | 26.4% | -3.8% |
1999 | -2.5% | 20.3% | -1.4% |
2000 | 9.3% | -7.0% | -8.7% |
2001 | 28.1% | -10.6% | -6.1% |
2002 | -14.9% | -21.3% | -28.6% |
2003 | 39.3% | 29.6% | 37.4% |
2004 | 22.6% | 11.8% | 11.5% |
2005 | 3.8% | 5.7% | 2.0% |
2006 | 14.3% | 15.3% | 11.0% |
2007 | -11.1% | 5.5% | -3.8% |
2008 | -35.9% | -36.7% | -48.7% |
2009 | 34.8% | 27.2% | 36.8% |
2010 | 12.0% | 16.4% | 20.5% |
2011 | 5.6% | 1.7% | -11.4% |
2012 | 5.4% | 16.2% | 9.5% |
2013 | 24.7% | 32.8% | 35.5% |
2014 | -4.7% | 13.1% | 2.7% |
2015 | -15.5% | 1.0% | -11.2% |
2016 | 18.1% | 13.0% | 13.5% |
2017 | 13.7% | 21.1% | 11.1% |
2018 | -8.1% | -5.0% | -16.0% |
2019 | 18.7% | 30.9% | 16.9% |
2020 | 11.6% | 17.9% | 1.2% |
2021 | 31.1% | 28.5% | 18.1% |
2022 | 21.2% | -17.8% | -20.2% |
(a) | Schwartz Value Focused Fund’s performance combines the performance of the Fund since its commencement of operations as a registered investment company on July 20, 1993, and the performance of RCM Partners Limited Partnership for periods prior thereto. |
(b) | Inception date of the S&P 1500 Index is December 30, 1994. |
(c) | Excluding dividends. |
5
SCHWARTZ VALUE FOCUSED FUND
AVERAGE ANNUAL TOTAL RETURNS
As of December 31, 2022 (Unaudited)
| SCHWARTZ
VALUE
FOCUSED
FUND(a) | S&P 1500
INDEX(b) | VALUE
LINE
COMPOSITE(c) |
3 Years | 21.0% | 7.6% | -1.0% |
5 Years | 14.1% | 9.2% | -0.9% |
10 Years | 10.1% | 12.4% | 3.8% |
20 Years | 8.4% | 9.9% | 3.6% |
39 Years | 9.4% | N/A | 2.6% |
(a) | Schwartz Value Focused Fund’s performance combines the performance of the Fund since its commencement of operations as a registered investment company on July 20, 1993, and the performance of RCM Partners Limited Partnership for periods prior thereto. |
(b) | Inception date of the S&P 1500 Index is December 30, 1994. |
(c) | Excluding dividends. |
6
SCHWARTZ VALUE FOCUSED FUND
TEN LARGEST HOLDINGS
December 31, 2022 (Unaudited)
| | Shares | | | Security Description | | Fair
Value | | | % of
Net Assets | |
| | | 5,500 | | | Texas Pacific Land Corporation | | $ | 12,893,265 | | | | 24.9% | |
| | | 24,400 | | | Intercontinental Exchange, Inc. | | | 2,503,196 | | | | 4.8% | |
| | | 9,000 | | | RH | | | 2,404,710 | | | | 4.7% | |
| | | 17,390 | | | Franco-Nevada Corporation | | | 2,373,387 | | | | 4.6% | |
| | | 12,169 | | | Chevron Corporation | | | 2,184,214 | | | | 4.2% | |
| | | 12,400 | | | CME Group, Inc. | | | 2,085,184 | | | | 4.0% | |
| | | 47,600 | | | St. Joe Company (The) | | | 1,839,740 | | | | 3.6% | |
| | | 84,900 | | | Vontier Corporation | | | 1,641,117 | | | | 3.2% | |
| | | 29,800 | | | Schlumberger Ltd. | | | 1,593,108 | | | | 3.1% | |
| | | 6,000 | | | Pioneer Natural Resources Company | | | 1,370,340 | | | | 2.6% | |
ASSET ALLOCATION (Unaudited)
| % of
Net Assets |
COMMON STOCKS | |
Sector | |
Consumer Discretionary | 14.2% |
Energy | 12.3% |
Financials | 11.9% |
Health Care | 0.1% |
Industrials | 5.4% |
Materials | 9.2% |
Real Estate | 28.5% |
Technology | 2.3% |
Money Market Funds, Other Assets in Excess of Liabilities | 16.1% |
| | 100.0% |
7
SCHWARTZ VALUE FOCUSED FUND
SCHEDULE OF INVESTMENTS
December 31, 2022
COMMON STOCKS — 83.9% | | Shares | | | Fair Value | |
Consumer Discretionary — 14.2% | | | | | | | | |
Automotive — 1.5% | | | | | | | | |
Gentex Corporation | | | 28,800 | | | $ | 785,376 | |
| | | | | | | | | |
Home & Office Products — 1.6% | | | | | | | | |
Purple Innovation, Inc. * | | | 175,000 | | | | 838,250 | |
| | | | | | | | | |
Home Construction — 2.5% | | | | | | | | |
Masco Corporation | | | 27,900 | | | | 1,302,093 | |
| | | | | | | | | |
Leisure Facilities & Services — 2.3% | | | | | | | | |
Madison Square Garden Sports Corporation | | | 6,400 | | | | 1,173,312 | |
| | | | | | | | | |
Leisure Products — 1.6% | | | | | | | | |
YETI Holdings, Inc. * | | | 20,000 | | | | 826,200 | |
| | | | | | | | | |
Retail - Discretionary — 4.7% | | | | | | | | |
RH * | | | 9,000 | | | | 2,404,710 | |
| | | | | | | | | |
Energy — 12.3% | | | | | | | | |
Oil & Gas Producers — 9.2% | | | | | | | | |
Chevron Corporation | | | 12,169 | | | | 2,184,214 | |
Devon Energy Corporation | | | 20,000 | | | | 1,230,200 | |
Pioneer Natural Resources Company | | | 6,000 | | | | 1,370,340 | |
| | | | | | | | 4,784,754 | |
Oil & Gas Services & Equipment — 3.1% | | | | | | | | |
Schlumberger Ltd. | | | 29,800 | | | | 1,593,108 | |
| | | | | | | | | |
Financials — 11.9% | | | | | | | | |
Institutional Financial Services — 8.8% | | | | | | | | |
CME Group, Inc. | | | 12,400 | | | | 2,085,184 | |
Intercontinental Exchange, Inc. | | | 24,400 | | | | 2,503,196 | |
| | | | | | | | 4,588,380 | |
Insurance — 3.1% | | | | | | | | |
Berkshire Hathaway, Inc. - Class A * | | | 2 | | | | 937,422 | |
Markel Corporation * | | | 500 | | | | 658,745 | |
| | | | | | | | 1,596,167 | |
Health Care — 0.1% | | | | | | | | |
Biotech & Pharma — 0.1% | | | | | | | | |
Avid Bioservices, Inc. * | | | 5,000 | | | | 68,850 | |
8
SCHWARTZ VALUE FOCUSED FUND
SCHEDULE OF INVESTMENTS
(Continued)
COMMON STOCKS — 83.9% (Continued) | | Shares | | | Fair Value | |
Industrials — 5.4% | | | | | | | | |
Electrical Equipment — 4.3% | | | | | | | | |
A.O. Smith Corporation | | | 10,600 | | | $ | 606,744 | |
Vontier Corporation | | | 84,900 | | | | 1,641,117 | |
| | | | | | | | 2,247,861 | |
Industrial Support Services — 1.1% | | | | | | | | |
U-Haul Holding Company | | | 1,000 | | | | 60,190 | |
U-Haul Holding Company - Series N | | | 9,000 | | | | 494,820 | |
| | | | | | | | 555,010 | |
Materials — 9.2% | | | | | | | | |
Chemicals — 1.6% | | | | | | | | |
Valvoline, Inc. | | | 25,000 | | | | 816,250 | |
| | | | | | | | | |
Containers & Packaging — 0.4% | | | | | | | | |
Ardagh Metal Packaging S.A. | | | 50,000 | | | | 240,500 | |
| | | | | | | | | |
Metals & Mining — 7.2% | | | | | | | | |
Barrick Gold Corporation | | | 35,300 | | | | 606,454 | |
Franco-Nevada Corporation | | | 17,390 | | | | 2,373,387 | |
Pan American Silver Corporation | | | 45,500 | | | | 743,470 | |
| | | | | | | | 3,723,311 | |
Real Estate — 28.5% | | | | | | | | |
Real Estate Owners & Developers — 28.5% | | | | | | | | |
St. Joe Company (The) | | | 47,600 | | | | 1,839,740 | |
Texas Pacific Land Corporation | | | 5,500 | | | | 12,893,265 | |
| | | | | | | | 14,733,005 | |
Technology — 2.3% | | | | | | | | |
Technology Hardware — 0.5% | | | | | | | | |
Garmin Ltd. | | | 2,500 | | | | 230,725 | |
| | | | | | | | | |
Technology Services — 1.8% | | | | | | | | |
Mastercard, Inc. - Class A | | | 1,500 | | | | 521,595 | |
Moody’s Corporation | | | 1,500 | | | | 417,930 | |
| | | | | | | | 939,525 | |
| | | | | | | | | |
Total Common Stocks (Cost $25,935,722) | | | | | | $ | 43,447,387 | |
9
SCHWARTZ VALUE FOCUSED FUND
SCHEDULE OF INVESTMENTS
(Continued)
MONEY MARKET FUNDS — 16.0% | | Shares | | | Fair Value | |
Federated Hermes Government Obligations Tax-Managed Fund - Institutional Shares, 3.97% (a) | | | 2,480,746 | | | $ | 2,480,746 | |
Federated Hermes Treasury Obligations Fund - Institutional Shares, 4.15% (a) | | | 2,480,746 | | | | 2,480,746 | |
Federated Hermes U.S. Treasury Cash Reserves Fund - Institutional Shares, 3.85% (a) | | | 2,442,705 | | | | 2,442,705 | |
Invesco Short-Term Investments Trust (The) - Treasury Portfolio - Institutional Class, 4.19% (a) | | | 899,682 | | | | 899,682 | |
Total Money Market Funds (Cost $8,303,879) | | | | | | $ | 8,303,879 | |
| | | | | | | | | |
Total Investments at Fair Value — 99.9% (Cost $34,239,601) | | | | | | $ | 51,751,266 | |
| | | | | | | | | |
Other Assets in Excess of Liabilities — 0.1% | | | | | | | 21,308 | |
| | | | | | | | | |
Net Assets — 100.0% | | | | | | $ | 51,772,574 | |
* | Non-income producing security. |
(a) | The rate shown is the 7-day effective yield as of December 31, 2022. |
See notes to financial statements. |
10
SCHWARTZ VALUE FOCUSED FUND
STATEMENT OF ASSETS AND LIABILITIES
December 31, 2022
ASSETS | | | | |
Investments, at fair value (cost of $34,239,601) (Note 1) | | $ | 51,751,266 | |
Cash | | | 1,825 | |
Receivable for capital shares sold | | | 46,677 | |
Dividends receivable | | | 89,689 | |
Other assets | | | 14,317 | |
TOTAL ASSETS | | | 51,903,774 | |
| | | | | |
LIABILITIES | | | | |
Payable for capital shares redeemed | | | 10,672 | |
Payable to Adviser (Note 2) | | | 102,568 | |
Payable to administrator (Note 2) | | | 4,386 | |
Other accrued expenses | | | 13,574 | |
TOTAL LIABILITIES | | | 131,200 | |
| | | | | |
NET ASSETS | | $ | 51,772,574 | |
| | | | | |
NET ASSETS CONSIST OF: | | | | |
Paid-in capital | | $ | 34,481,786 | |
Distributable earnings | | | 17,290,788 | |
NET ASSETS | | $ | 51,772,574 | |
| | | | | |
Shares of beneficial interest outstanding (unlimited number of shares authorized, no par value) | | | 1,149,070 | |
| | | | | |
Net asset value, offering price and redemption price per share (Note 1) | | $ | 45.06 | |
See notes to financial statements. |
11
SCHWARTZ VALUE FOCUSED FUND
STATEMENT OF OPERATIONS
For the Year Ended December 31, 2022
INVESTMENT INCOME | | | | |
Dividends | | $ | 856,873 | |
Foreign withholding taxes on dividends | | | (7,117 | ) |
TOTAL INVESTMENT INCOME | | | 849,756 | |
| | | | | |
EXPENSES | | | | |
Investment advisory fees (Note 2) | | | 256,610 | |
Administration, accounting and transfer agent fees (Note 2) | | | 38,565 | |
Legal fees | | | 29,174 | |
Registration and filing fees | | | 27,299 | |
Audit and tax services fees | | | 16,047 | |
Shareholder reporting expenses | | | 8,667 | |
Custodian and bank service fees | | | 7,760 | |
Trustees’ fees and expenses (Note 2) | | | 5,134 | |
Postage and supplies | | | 3,909 | |
Insurance expense | | | 3,665 | |
Compliance service fees and expenses (Note 2) | | | 1,726 | |
Other expenses | | | 13,549 | |
TOTAL EXPENSES | | | 412,105 | |
Less fee reductions by the Adviser (Note 2) | | | (36,210 | ) |
Previous investment advisory fee reductions recouped by the Adviser (Note 2) | | | 25,276 | |
NET EXPENSES | | | 401,171 | |
| | | | | |
NET INVESTMENT INCOME | | | 448,585 | |
| | | | | |
REALIZED AND UNREALIZED GAINS (LOSSES) ON INVESTMENTS | | | | |
Net realized losses from investment transactions | | | (221,016 | ) |
Net change in unrealized appreciation (depreciation) on investments | | | 6,358,455 | |
NET REALIZED AND UNREALIZED GAINS ON INVESTMENTS | | | 6,137,439 | |
| | | | | |
NET INCREASE IN NET ASSETS RESULTING FROM OPERATIONS | | $ | 6,586,024 | |
See notes to financial statements. |
12
SCHWARTZ VALUE FOCUSED FUND
STATEMENTS OF CHANGES IN NET ASSETS
| | Year Ended
December 31,
2022 | | | Year Ended
December 31,
2021 | |
FROM OPERATIONS | | | | | | | | |
Net investment income | | $ | 448,585 | | | $ | 68,100 | |
Net realized gains (losses) from investment transactions | | | (221,016 | ) | | | 1,420,261 | |
Net change in unrealized appreciation (depreciation) on investments | | | 6,358,455 | | | | 3,917,570 | |
Net increase in net assets resulting from operations | | | 6,586,024 | | | | 5,405,931 | |
| | | | | | | | | |
FROM DISTRIBUTIONS TO SHAREHOLDERS (Note 1) | | | (448,446 | ) | | | (1,488,406 | ) |
| | | | | | | | | |
FROM CAPITAL SHARE TRANSACTIONS | | | | | | | | |
Proceeds from shares sold | | | 26,360,198 | | | | 6,691,800 | |
Reinvestment of distributions to shareholders | | | 401,888 | | | | 1,430,459 | |
Payments for shares redeemed | | | (4,688,357 | ) | | | (6,575,752 | ) |
Net increase in net assets from capital share transactions | | | 22,073,729 | | | | 1,546,507 | |
| | | | | | | | | |
TOTAL INCREASE IN NET ASSETS | | | 28,211,307 | | | | 5,464,032 | |
| | | | | | | | | |
NET ASSETS | | | | | | | | |
Beginning of year | | | 23,561,267 | | | | 18,097,235 | |
End of year | | $ | 51,772,574 | | | $ | 23,561,267 | |
| | | | | | | | | |
SUMMARY OF CAPITAL SHARE ACTIVITY | | | | | | | | |
Shares sold | | | 621,397 | | | | 161,720 | |
Shares issued in reinvestment of distributions to shareholders | | | 8,925 | | | | 38,257 | |
Shares redeemed | | | (109,141 | ) | | | (164,577 | ) |
Net increase in shares outstanding | | | 521,181 | | | | 35,400 | |
Shares outstanding, beginning of year | | | 627,889 | | | | 592,489 | |
Shares outstanding, end of year | | | 1,149,070 | | | | 627,889 | |
See notes to financial statements. |
13
SCHWARTZ VALUE FOCUSED FUND
FINANCIAL HIGHLIGHTS
Per Share Data for a Share Outstanding Throughout Each Year
| | Year
Ended
Dec. 31,
2022 | | | Year
Ended
Dec. 31,
2021 | | | Year
Ended
Dec. 31,
2020 | | | Year
Ended
Dec. 31,
2019 | | | Year
Ended
Dec. 31,
2018 | |
Net asset value at beginning of year | | $ | 37.52 | | | $ | 30.54 | | | $ | 28.03 | | | $ | 23.62 | | | $ | 26.44 | |
| | | | | | | | | | | | | | | | | | | | | |
Income (loss) from investment operations: | | | | | | | | | | | | | | | | | | | | |
Net investment income (loss) | | | 0.39 | | | | 0.12 | | | | 0.15 | | | | (0.03 | ) | | | (0.08 | ) |
Net realized and unrealized gains (losses) on investments | | | 7.54 | | | | 9.39 | | | | 3.11 | | | | 4.44 | | | | (2.08 | ) |
Total from investment operations | | | 7.93 | | | | 9.51 | | | | 3.26 | | | | 4.41 | | | | (2.16 | ) |
| | | | | | | | | | | | | | | | | | | | | |
Less distributions from: | | | | | | | | | | | | | | | | | | | | |
Net investment income | | | (0.39 | ) | | | (0.12 | ) | | | (0.15 | ) | | | — | | | | — | |
Net realized gains on investments | | | — | | | | (2.41 | ) | | | (0.60 | ) | | | — | | | | (0.66 | ) |
Total distributions | | | (0.39 | ) | | | (2.53 | ) | | | (0.75 | ) | | | — | | | | (0.66 | ) |
| | | | | | | | | | | | | | | | | | | | | |
Net asset value at end of year | | $ | 45.06 | | | $ | 37.52 | | | $ | 30.54 | | | $ | 28.03 | | | $ | 23.62 | |
| | | | | | | | | | | | | | | | | | | | | |
Total return (a) | | | 21.15 | % | | | 31.14 | % | | | 11.62 | % | | | 18.67 | % | | | (8.14 | %) |
| | | | | | | | | | | | | | | | | | | | | |
Ratios/Supplementary Data: | | | | | | | | | | | | | | | | | | | | |
Net assets at end of year (000’s) | | $ | 51,773 | | | $ | 23,561 | | | $ | 18,097 | | | $ | 22,461 | | | $ | 19,428 | |
| | | | | | | | | | | | | | | | | | | | | |
Ratio of total expenses to average net assets | | | 1.28 | % | | | 1.51 | % | | | 1.71 | % | | | 1.61 | % | | | 1.67 | % |
| | | | | | | | | | | | | | | | | | | | | |
Ratio of net expenses to average net assets (b) | | | 1.25 | % | | | 1.25 | % | | | 1.25 | % | | | 1.25 | % | | | 1.25 | % |
| | | | | | | | | | | | | | | | | | | | | |
Ratio of net investment income (loss) to average net assets (b) | | | 1.39 | % | | | 0.28 | % | | | 0.49 | % | | | (0.13 | %) | | | (0.31 | %) |
| | | | | | | | | | | | | | | | | | | | | |
Portfolio turnover rate | | | 14 | % | | | 18 | % | | | 45 | % | | | 28 | % | | | 34 | % |
(a) | Total return is a measure of the change in value of an investment in the Fund over the period covered, which assumes any dividends or capital gains distributions are reinvested in shares of the Fund. Returns shown do not reflect the deduction of taxes a shareholder would pay on Fund distributions or the redemption of Fund shares. |
(b) | Ratio was determined after advisory fee reductions and/or recoupments (Note 2). |
See notes to financial statements. |
14
SCHWARTZ VALUE FOCUSED FUND
NOTES TO FINANCIAL STATEMENTS
December 31, 2022
1. Organization and Significant Accounting Policies
Schwartz Value Focused Fund (the “Fund”) is a non-diversified series of Schwartz Investment Trust (the “Trust”), an open-end management investment company established as an Ohio business trust under a Declaration of Trust dated August 31, 1992. Other series of the Trust are not incorporated in this report. The Fund is registered under the Investment Company Act of 1940, as amended (the “1940 Act”).
The investment objective of the Fund is to seek long-term capital appreciation. See the Prospectus for information regarding the principal investment strategies of the Fund.
Shares of the Fund are sold at net asset value (“NAV”). To calculate the NAV, the Fund’s assets are valued and totaled, liabilities are subtracted, and the balance is divided by the number of shares outstanding. The offering price and redemption price per share are equal to the NAV per share.
The Fund follows accounting and reporting guidance under Financial Accounting Standards Board Accounting Standards Codification Topic 946, “Financial Services – Investment Companies.” The following is a summary of the Fund’s significant accounting policies used in the preparation of its financial statements. These policies are in conformity with accounting principles generally accepted in the United States of America (“GAAP”).
(a) Valuation of investments — Securities which are traded on stock exchanges, other than NASDAQ, are valued at the closing sales price as of the close of the regular session of trading on the New York Stock Exchange on the day the securities are being valued, or, if not traded on a particular day, at the closing bid price. Securities which are quoted by NASDAQ are valued at the NASDAQ Official Closing Price or, if an Official Closing Price is not available, at the most recently quoted bid price. Securities traded in the over-the-counter market are valued at the last reported sales price or, if there is no reported sale on the valuation date, at the most recently quoted bid price. Securities which are traded both in the over-the-counter market and on a stock exchange are valued according to the broadest and most representative market. Fixed income securities, if any, are generally valued using prices provided by an independent pricing service. The independent pricing service uses information with respect to transactions in bonds, quotations from bond dealers, market transactions in comparable securities and various relationships between securities in determining these prices. Investments representing shares of other open-end investment companies are valued at their NAV as reported by such companies. When using quoted prices and when the market for the securities are considered active, the securities will be classified as Level 1 within the fair value hierarchy (see below). Securities (and other assets) for which market quotations are not readily available are valued at their fair value as determined in good faith in accordance with consistently applied procedures established by and under the general supervision of the Board of Trustees, and will be classified as Level 2 or 3 within the fair value hierarchy, depending on the inputs used. Fair value pricing may be used, for example, in situations where (i) a portfolio security is so thinly traded that there have been no transactions for that stock over an extended period of time; (ii) the exchange on which the portfolio security
15
SCHWARTZ VALUE FOCUSED FUND
NOTES TO FINANCIAL STATEMENTS
(Continued)
is principally traded closes early; or (iii) trading of the portfolio security is halted during the day and does not resume prior to the Fund’s NAV calculation. A portfolio security’s “fair value” price may differ from the price next available for that portfolio security using the Fund’s normal pricing procedures.
GAAP establishes a single authoritative definition of fair value, sets out a framework for measuring fair value and requires additional disclosures about fair value measurements.
Various inputs are used in determining the value of the Fund’s investments. These inputs are summarized in the three broad levels listed below:
● Level 1 – quoted prices in active markets for identical securities
● Level 2 – other significant observable inputs
● Level 3 – significant unobservable inputs
U.S. Government & Agencies securities held by the Fund, if any, are classified as Level 2 since the values for such securities are based on prices provided by an independent pricing service that utilizes various “other significant observable inputs” including bid and ask quotations, prices of similar securities and interest rates, among other factors.
The inputs or methodology used for valuing securities are not necessarily an indication of the risks associated with investing in those securities. The inputs used to measure fair value may fall into different levels of the fair value hierarchy. In such cases, for disclosure purposes, the level in the fair value hierarchy within which the fair value measurement falls in its entirety is determined based on the lowest level input that is significant to the fair value measurement.
The following is a summary of the Fund’s investments and the levels assigned to the investments, by security type, as of December 31, 2022:
| | Level 1 | | | Level 2 | | | Level 3 | | | Total | |
Common Stocks | | $ | 43,447,387 | | | $ | — | | | $ | — | | | $ | 43,447,387 | |
Money Market Funds | | | 8,303,879 | | | | — | | | | — | | | | 8,303,879 | |
Total | | $ | 51,751,266 | | | $ | — | | | $ | — | | | $ | 51,751,266 | |
Refer to the Fund’s Schedule of Investments for a listing of the securities by security type, sector and industry type. There were no Level 3 securities or derivative instruments held by or transferred in/out of the Fund as of or during the year ended December 31, 2022.
(b) Income taxes — The Fund has qualified and intends to continue to qualify as a regulated investment company under the Internal Revenue Code of 1986, as amended (the “Code”). Qualification generally will relieve the Fund of liability for federal income taxes to the extent 100% of its net investment income and net realized capital gains are distributed in accordance with the Code.
16
SCHWARTZ VALUE FOCUSED FUND
NOTES TO FINANCIAL STATEMENTS
(Continued)
In order to avoid imposition of the excise tax applicable to regulated investment companies, it is also the Fund’s intention to declare as dividends in each calendar year at least 98% of its net investment income and 98.2% of its net realized capital gains plus undistributed amounts from prior years.
The following information is computed on a tax basis for each item as of December 31, 2022:
Federal income tax cost | | $ | 34,239,601 | |
Gross unrealized appreciation | | $ | 18,274,240 | |
Gross unrealized depreciation | | | (762,575 | ) |
Net unrealized appreciation | | | 17,511,665 | |
Undistributed ordinary income | | | 139 | |
Accumulated capital and other losses | | | (221,016 | ) |
Distributable earnings | | $ | 17,290,788 | |
As of December 31, 2022, the Fund had a short-term capital loss carryforward of $221,016 for federal income tax purposes, which may be carried forward indefinitely. This capital loss carryforward is available to offset net realized gains in future years, thereby reducing future taxable gain distributions.
The Fund recognizes the tax benefits or expenses of uncertain tax positions only when the position is “more-likely-than-not” to be sustained assuming examination by tax authorities. Management has reviewed the tax positions taken on federal income tax returns for all open tax years (generally, three years) and has concluded that no provision for unrecognized tax benefits or expenses is required in these financial statements.
(c) Investment transactions and investment income — Investment transactions are accounted for on the trade date. Dividend income is recorded on the ex-dividend date. Non-cash dividends included in dividend income, if any, are recorded at the fair value of the securities received. Interest income is recognized on the accrual basis. Realized capital gains and losses on investment transactions are determined on the identified cost basis. Withholding taxes on foreign dividends have been recorded in accordance with the Fund’s understanding of the applicable country’s rules and tax rates.
(d) Dividends and distributions — Dividends from net investment income and distributions of net realized capital gains, if any, are declared and paid annually in December. Dividends and distributions to shareholders are recorded on the ex-
17
SCHWARTZ VALUE FOCUSED FUND
NOTES TO FINANCIAL STATEMENTS
(Continued)
dividend date. The tax character of distributions paid to shareholders during the years ended December 31, 2022 and 2021 was as follows:
Year Ended | | Ordinary Income | | | Long-Term
Capital Gains | | | Total
Distributions* | |
December 31, 2022 | | $ | 448,446 | | | $ | — | | | $ | 448,446 | |
December 31, 2021 | | $ | 68,386 | | | $ | 1,419,975 | | | $ | 1,488,361 | |
| | * | Total Distributions may not tie to the amounts listed on the Statements of Changes in Net Assets due to reclassifications of the character of the distributions as a result of permanent differences between the financial statements and income tax reporting. |
(e) Estimates — The preparation of financial statements in conformity with GAAP requires management to make estimates and assumptions that affect the reported amounts of assets and liabilities and disclosure of contingent assets and liabilities as of the date of the financial statements and the reported amounts of revenues and expenses during the reporting period. Actual results could differ from those estimates.
(f) Common expenses — Common expenses of the Trust are allocated among the Fund and the other series of the Trust based on relative net assets of each series or the nature of the services performed and the relative applicability to each series.
2. Investment Advisory Agreement and Transactions with Related Parties
The Chairman and President of the Trust is also the Chairman and Chief Executive Officer of Schwartz Investment Counsel, Inc. (the “Adviser”). Certain other officers of the Trust are officers of the Adviser, or of Ultimus Fund Solutions, LLC (“Ultimus”), the administrative, accounting and transfer agent for the Fund, or of Ultimus Fund Distributors, LLC (the “Distributor”), the Fund’s principal underwriter.
Pursuant to an Investment Advisory Agreement between the Trust and the Adviser, the Adviser is responsible for the management of the Fund and provides investment advice along with the necessary personnel, facilities, equipment and certain other services necessary to the operations of the Fund. Effective May 1, 2022, the Adviser receives from the Fund a quarterly fee at the annual rate of 0.75% per annum of the Fund’s average daily net assets. Prior to May 1, 2022, the Adviser received from the Fund a quarterly fee at the annual rate of 0.95% per annum of the Fund’s average daily net assets.
The Adviser has contractually agreed to reduce its advisory fees or reimburse a portion of the Fund’s expenses until at least May 1, 2023, so that the ordinary operating expenses of the Fund do not exceed 1.25% per annum of average daily net assets. Accordingly, during the year ended December 31, 2022, the Adviser reduced its investment advisory fees by $36,210.
Any fee reductions or expense reimbursements by the Adviser are subject to repayment by the Fund for a period of three years after such fees and expenses were incurred, provided repayment to the Adviser does not cause the ordinary operating expenses of the Fund to exceed 1.25% per annum of average daily net assets. During the year ended December 31, 2022, the Fund recouped $25,276 of prior years’ investment advisory fee
18
SCHWARTZ VALUE FOCUSED FUND
NOTES TO FINANCIAL STATEMENTS
(Continued)
reductions. As of December 31, 2022, the Adviser may seek recoupment of investment advisory fee reductions totaling $180,194 no later than the dates stated below:
December 31, 2023 | | $ | 79,720 | |
December 31, 2024 | | | 64,264 | |
December 31, 2025 | | | 36,210 | |
Total | | $ | 180,194 | |
The Chief Compliance Officer of the Trust (the “CCO”) is an employee of the Adviser. The Trust pays the Adviser a fee for providing CCO services, of which the Fund pays its proportionate share along with the other series of the Trust. In addition, the Trust reimburses the Adviser for out-of-pocket expenses incurred, if any, for providing these services.
Pursuant to a Mutual Fund Services Agreement between the Trust and Ultimus, Ultimus supplies regulatory and compliance services, calculates the daily NAV per share, maintains the financial books and records of the Fund, maintains the records of each shareholder’s account, and processes purchases and redemptions of the Fund’s shares. For these services Ultimus receives fees computed as a percentage of the average daily net assets of the Fund, subject to a minimum monthly fee.
Pursuant to a Distribution Agreement between the Trust and the Distributor, the Distributor serves as the Fund’s exclusive agent for the distribution of its shares. The Distributor is an affiliate of Ultimus.
Trustees and officers affiliated with the Adviser or Ultimus are not compensated by the Trust for their services. Each Trustee who is not an affiliated person of the Adviser or Ultimus (“Independent Trustee”) receives from the Trust an annual retainer of $63,000 (except that such fee is $76,500 for the Lead Independent Trustee/Chairman of the Governance Committee and $71,500 for the Chairman of the Audit Committee), payable quarterly; a fee of $6,000 for attendance at each meeting of the Board of Trustees; plus reimbursement of travel and other expenses incurred in attending meetings. Trustee Emeritus, if any, receives one-half of both the annual retainer and fee for attendance at each meeting; plus reimbursement of travel and other expenses incurred in attending meetings. The Fund paid its proportionate share of the Independent Trustees’ fees and expenses along with the other series of the Trust.
3. Investment Transactions
During the year ended December 31, 2022, cost of purchases and proceeds from sales and maturities of investment securities, excluding short-term investments and U.S. government securities, amounted to $17,977,693 and $4,052,957, respectively.
4. Contingencies and Commitments
The Fund indemnifies the Trust’s officers and Trustees for certain liabilities that might arise from their performance of their duties to the Fund. Additionally, in the normal course of business, the Fund enters into contracts that contain a variety of representations and warranties and which provide general indemnifications. The Fund’s maximum
19
SCHWARTZ VALUE FOCUSED FUND
NOTES TO FINANCIAL STATEMENTS
(Continued)
exposure under these arrangements is unknown, as this would involve future claims that may be made against the Fund that have not yet occurred. However, based on experience, the Fund expects the risk of loss to be remote.
5. Sector Risk
If the Fund has significant investments in the securities of issuers in industries within a particular sector, any development affecting that sector will have a greater impact on the value of the net assets of the Fund than would be the case if the Fund did not have significant investments in that sector. In addition, this may increase the risk of loss of an investment in the Fund and increase the volatility of the Fund’s NAV per share. From time to time, circumstances may affect a particular sector and the companies within such sector. For instance, economic or market factors, regulation or deregulation, and technological or other developments may negatively impact all companies in a particular sector and therefore the value of the Fund’s portfolio will be adversely affected. As of December 31, 2022, the Fund had 28.5% of the value of its net assets invested in common stocks within the real estate sector. The Fund had 24.9% of the value of its net assets invested in Texas Pacific Land Corporation (“TPL”) within the real estate sector. The financial statements for TPL can be found at www.sec.gov.
6. Subsequent Events
The Fund is required to recognize in the financial statements the effects of all subsequent events that provide additional evidence about conditions that existed as of the date of the Statement of Assets and Liabilities. For non-recognized subsequent events that must be disclosed to keep the financial statements from being misleading, the Fund is required to disclose the nature of the event as well as an estimate of its financial effect, or a statement that such an estimate cannot be made. Management has evaluated subsequent events through the issuance of these financial statements and has noted no such events.
20
SCHWARTZ VALUE FOCUSED FUND
REPORT OF INDEPENDENT REGISTERED
PUBLIC ACCOUNTING FIRM
To the Shareholders and the Board of Trustees of Schwartz Investment Trust:
Opinion on the Financial Statements and Financial Highlights
We have audited the accompanying statement of assets and liabilities, including the schedule of investments, of the Schwartz Value Focused Fund, one of the series constituting the Schwartz Investment Trust (the “Fund”), as of December 31, 2022, the related statement of operations for the year then ended, the statements of changes in net assets for each of the two years in the period then ended, the financial highlights for each of the five years in the period then ended, and the related notes. In our opinion, the financial statements and financial highlights present fairly, in all material respects, the financial position of the Fund as of December 31, 2022, and the results of its operations for the year then ended, the changes in its net assets for each of the two years in the period then ended, and the financial highlights for each of the five years in the period then ended, in conformity with accounting principles generally accepted in the United States of America.
Basis for Opinion
These financial statements and financial highlights are the responsibility of the Fund’s management. Our responsibility is to express an opinion on the Fund’s financial statements and financial highlights based on our audits. We are a public accounting firm registered with the Public Company Accounting Oversight Board (United States) (PCAOB) and are required to be independent with respect to the Funds in accordance with the U.S. federal securities laws and the applicable rules and regulations of the Securities and Exchange Commission and the PCAOB.
We conducted our audits in accordance with the standards of the PCAOB. Those standards require that we plan and perform the audit to obtain reasonable assurance about whether the financial statements and financial highlights are free of material misstatement, whether due to error or fraud. The Fund is not required to have, nor were we engaged to perform, an audit of internal control over financial reporting. As part of our audits we are required to obtain an understanding of internal control over financial reporting but not for the purpose of expressing an opinion on the effectiveness of the Fund’s internal control over financial reporting. Accordingly, we express no such opinion.
Our audits included performing procedures to assess the risks of material misstatement of the financial statements and financial highlights, whether due to error or fraud, and performing procedures that respond to those risks. Such procedures included examining, on a test basis, evidence regarding the amounts and disclosures in the financial statements and financial highlights. Our audits also included evaluating the accounting principles used and significant estimates made by management, as well as evaluating the overall presentation of the financial statements and financial highlights. Our procedures included confirmation of securities owned as of December 31, 2022, by correspondence with the custodian and brokers; when replies were not received from brokers, we performed
21
SCHWARTZ VALUE FOCUSED FUND
REPORT OF INDEPENDENT REGISTERED
PUBLIC ACCOUNTING FIRM (Continued)
other auditing procedures. We believe that our audits provide a reasonable basis for our opinion.
Chicago, Illinois
February 22, 2023
We have served as the auditor of one or more Schwartz Investment Trust investment companies since 1993.
22
SCHWARTZ VALUE FOCUSED FUND
BOARD OF TRUSTEES AND EXECUTIVE OFFICERS
(Unaudited)
Overall responsibility for management of the Trust rests with the Board of Trustees. The Trustees serve during the lifetime of the Trust and until its termination, or until death, resignation, retirement or removal. The Trustees, in turn, elect the officers of the Trust to actively supervise its day-to-day operations. The officers have been elected for an annual term. The following are the Trustees and executive officers of the Trust:
Trustee/Officer | Address | Year of
Birth | Position Held
with the Trust | Length of
Time Served |
Interested Trustee: |
* | George P. Schwartz, CFA | 801 W. Ann Arbor Trail,
Plymouth, MI | 1944 | Chairman of the Board/President/Trustee | Since 1992 |
Independent Trustees: |
| | Donald J. Dawson, Jr. | 801 W. Ann Arbor Trail,
Plymouth, MI | 1947 | Trustee | Since 1993 |
| | John J. McHale, Jr. | 801 W. Ann Arbor Trail,
Plymouth, MI | 1949 | Trustee | Since 2014 |
| | Edward J. Miller | 801 W. Ann Arbor Trail,
Plymouth, MI | 1946 | Trustee | Since 2017 |
| | William A. Morrow | 801 W. Ann Arbor Trail,
Plymouth, MI | 1947 | Trustee | Since 2018 |
Executive Officers: |
* | Robert C. Schwartz | 801 W. Ann Arbor Trail,
Plymouth, MI | 1976 | Vice President and Secretary | Since 2013 |
* | Timothy S. Schwartz, CFA | 5060 Annunciation Circle,
Ave Maria, FL | 1971 | Treasurer | Since 2000 |
* | Cathy M. Stoner, CPA, IACCP | 801 W. Ann Arbor Trail,
Plymouth, MI | 1970 | Chief Compliance Officer | Since 2010 |
* | George P. Schwartz, Robert C. Schwartz, Timothy S. Schwartz and Cathy M. Stoner, as affiliated persons of Schwartz Investment Counsel, Inc., the Funds’ investment adviser, are “interested persons” of the Trust within the meaning of Section 2(a)(19) of the 1940 Act. George P. Schwartz is the father of Robert C. Schwartz and Timothy S. Schwartz. |
23
SCHWARTZ VALUE FOCUSED FUND
BOARD OF TRUSTEES AND EXECUTIVE OFFICERS
(Unaudited) (Continued)
Each Trustee oversees seven series of the Trust: the Ave Maria Value Fund, the Ave Maria Growth Fund, the Ave Maria Rising Dividend Fund, the Ave Maria World Equity Fund, the Ave Maria Focused Fund, the Ave Maria Bond Fund and the Fund. The principal occupations of the Trustees and executive officers of the Trust during the past five years and public directorships held by the Trustees are set forth below:
George P. Schwartz, CFA is Chairman and Chief Executive Officer of Schwartz Investment Counsel, Inc. and the co-portfolio manager of the Fund.
Donald J. Dawson, Jr. retired in March 2015. Prior to retirement, he was Chairman of Payroll 1, Inc. (a payroll processing company).
John J. McHale, Jr. is a consultant to the Commissioner of Major League Baseball. From 2015 until 2020, he was the Special Assistant to Commissioner of Major League Baseball.
Edward J. Miller retired in 2019. Prior to his retirement, he was Vice Chairman and Director of Detroit Investment Fund from 2001 until 2019 and Invest Detroit Foundation (financiers for redevelopment of Detroit, Michigan) from 2010 until 2019.
William A. Morrow retired in 2017. Prior to his retirement, he was Senior Executive Vice President of Crain Communications, Inc. (business media) from 1985 until 2017.
Robert C. Schwartz is Executive Vice President and Secretary of Schwartz Investment Counsel, Inc.
Timothy S. Schwartz, CFA is President of Schwartz Investment Counsel, Inc. and the lead portfolio manager of the Fund.
Cathy M. Stoner, CPA, IACCP is Vice President, Chief Financial Officer, Chief Compliance Officer, and Treasurer of Schwartz Investment Counsel, Inc.
Additional information regarding the Trustees and executive officers is available in the Statement of Additional Information (“SAI”). To obtain a free copy of the SAI, please call (888) 726-0753.
24
SCHWARTZ VALUE FOCUSED FUND
ABOUT YOUR FUND’S EXPENSES
(Unaudited)
We believe it is important for you to understand the impact of costs on your investment. As a shareholder of the Fund, you incur ongoing costs, including management fees and other Fund expenses. The following examples are intended to help you understand your ongoing costs (in dollars) of investing in the Fund and to compare these costs with the ongoing costs of investing in other mutual funds.
A mutual fund’s ongoing costs are expressed as a percentage of its average net assets. This figure is known as the expense ratio. The ongoing costs reflected in the table below are based on an investment of $1,000 made at the beginning of the most recent semi-annual period (July 1, 2022) and held until the end of the period (December 31, 2022).
The table below illustrates the Fund’s ongoing costs in two ways:
Actual fund return – This section helps you to estimate the actual expenses that you paid over the period. The “Ending Account Value” shown is derived from the Fund’s actual return, and the third column shows the dollar amount of operating expenses that would have been paid by an investor who started with $1,000 in the Fund. You may use the information here, together with the amount you invested, to estimate the expenses that you paid over the period.
To do so, simply divide your account value by $1,000 (for example, an $8,600 account value divided by $1,000 = 8.6), then multiply the result by the number given for the Fund under the heading “Expenses Paid During Period.”
Hypothetical 5% return – This section is intended to help you compare the Fund’s ongoing costs with those of other mutual funds. It assumes that the Fund had an annual return of 5% before expenses during the period shown, but that the expense ratio is unchanged. In this case, because the return used is not the Fund’s actual return, the result does not apply to your investment. The example is useful in making comparisons because the U.S. Securities and Exchange Commission (the “SEC”) requires all mutual funds to calculate expenses based on a 5% return. You can assess the Fund’s ongoing costs by comparing this hypothetical example with the hypothetical examples that appear in shareholder reports of other funds.
Note that expenses shown in the table are meant to highlight and help you compare ongoing costs only. The Fund does not charge sales loads or redemption fees.
The calculations assume no shares were bought or sold during the period. Your actual costs may have been higher or lower, depending on the amount of your investment and the timing of any purchases or redemptions.
25
SCHWARTZ VALUE FOCUSED FUND
ABOUT YOUR FUND’S EXPENSES
(Unaudited) (Continued)
More information about the Fund’s expenses, including historical annual expense ratios, can be found in this report. For additional information on operating expenses and other shareholder costs, please refer to the Fund’s Prospectus.
| Beginning
Account Value
July 1, 2022 | Ending
Account Value
December 31, 2022 | Expenses Paid
During Period* |
Based on Actual Fund Return | $1,000.00 | $1,207.60 | $6.96 |
Based on Hypothetical 5% Return (before expenses) | $1,000.00 | $1,018.90 | $6.36 |
* | Expenses are equal to the Fund’s annualized net expense ratio of 1.25% for the period, multiplied by the average account value over the period, multiplied by 184/365 (to reflect the one-half year period). |
26
SCHWARTZ VALUE FOCUSED FUND
OTHER INFORMATION
(Unaudited)
A description of the policies and procedures the Fund uses to determine how to vote proxies relating to portfolio securities is available without charge upon request by calling toll-free (888) 726-0753, or on the SEC’s website at www.sec.gov. Information regarding how the Fund voted proxies relating to portfolio securities during the most recent 12-month period ended June 30 is also available without charge upon request by calling toll-free (888) 726-0753, or on the SEC’s website at www.sec.gov.
The Trust files a complete listing of portfolio holdings for the Fund with the SEC as of the end of the first and third quarters of each fiscal year as an exhibit on Form N-PORT. The filings are available free of charge, upon request, by calling (888) 726-0753. Furthermore, you may obtain a copy of the filings on the SEC’s website at www.sec.gov.
FEDERAL TAX INFORMATION (Unaudited)
Qualified Dividend Income – The Fund designates 100% of its ordinary income dividends, or up to the maximum amount of such dividends allowable pursuant to the Internal Revenue Code, as qualified dividend income eligible for the reduced tax rate of 15%.
Dividends Received Deduction – Corporate shareholders are generally entitled to take the dividends received deduction on the portion of the Fund’s dividend distributions that qualifies under tax law. For the fiscal year ended December 31, 2022, 100% of ordinary income dividends qualified for the corporate dividends received deduction.
27
SCHWARTZ VALUE FOCUSED FUND
LIQUIDITY RISK
(Unaudited)
The Fund has adopted and implemented a written liquidity risk management program as required by Rule 22e-4 (the “Liquidity Rule”) under the Investment Company Act of 1940. The program is reasonably designed to assess, manage, and periodically review the Fund’s liquidity risk, taking into consideration, among other factors, the Fund’s investment strategy and the liquidity of its portfolio investments during normal and reasonably foreseeable stressed conditions; its short and long-term cash flow projections; and its cash holdings and access to other funding sources. The Board of Trustees approved the appointment of a Liquidity Risk Management Program Administrator (the “Liquidity Administrator”), which includes representatives from Schwartz Investment Counsel, Inc., the Fund’s investment adviser. The Liquidity Administrator is responsible for the administration of the program and its policies and procedures and for reporting to the Board on an annual basis regarding the program’s operation, adequacy and effectiveness, as well as any material changes to the program. The Liquidity Administrator assessed the Fund’s liquidity risk profile and the adequacy and effectiveness of the liquidity risk management program’s operations during the period from June 1, 2021 through June 30, 2022 (the “Review Period”) in order to prepare a written report for the Board of Trustees (the “Report”) for consideration at its meeting held on August 5, 2022. During the Review Period, the Fund did not experience unusual stress or disruption to its operations from any purchase and redemption activity. Also, during the Review Period the Fund held adequate levels of cash and highly liquid investments to meet shareholder redemption activities in accordance with applicable requirements. The Report concluded that (i) the Fund’s liquidity risk management program is reasonably designed to prevent violations of the Liquidity Rule and (ii) the Fund’s liquidity risk management program has been effectively implemented during the Review Period.
28
Shareholder Accounts c/o Ultimus Fund Solutions, LLC P.O. Box 46707 Cincinnati, OH 45246 (888) 726-9331 | 
| Corporate Offices 801 W. Ann Arbor Trail Suite 244 Plymouth, MI 48170 (734) 455-7777 Fax (734) 455-7720 |
To the owners of:
Ave Maria Value Fund (AVEMX)
Ave Maria Growth Fund (AVEGX)
Ave Maria Rising Dividend Fund (AVEDX)
Ave Maria World Equity Fund (AVEWX)
Ave Maria Focused Fund (AVEAX)
Ave Maria Bond Fund (AVEFX)
Ave Maria Money Market Account
2022 was a year that scared many investors. It was the first year in several decades that both stocks and bonds declined as measured by popular indices. One anxiety producer among many was the fear of recession. The jury is still out as to whether the current economic slowdown will be officially called a recession or not. In this environment, retail and institutional investors alike seem paralyzed, holding on to their cash reserves “until things are clearer”. I wonder where they think stock prices will be when things are clearer.
Successful investors have learned not to try outguessing the market. They don’t overanalyze and burden themselves by fretting over the unknowable and instead stay long-term oriented. That’s the only thing that matters for serious investors. Indeed, long-term is the essence of investing – deferral of gratification or consumption now with the hope of gaining greater purchasing power later. Currently, it’s possible that the stock market is pricing in the widespread negative sentiments.
Also, it’s worth noting that there has been a significant shift in investor thinking to a healthy focus on fundamentals. This, as opposed to mania for meme stocks, overhyped information technology companies, and the infatuation with quarterly results. The crash of inflated stock prices has shocked the get-rich-quick artists, as well as investors with unrealistic expectations for infinite growth. Value is back after a long period of investor infatuation with hypergrowth stocks selling at unrealistic prices. It’s a new world. Actually, it’s a return to the old world of disciplined balance sheet and cash flow analysis used to calculate intrinsic value.
While short-term thinkers, traders, and speculators were weeping and gnashing their teeth in 2022, as the enclosed pages show, three of the Ave Maria Mutual Funds beat their benchmarks for performance, in one case quite handily.
Sincerely,

George P. Schwartz, CFA
Chairman & CEO
December 31, 2022
AVE MARIA MUTUAL FUNDS
TABLE OF CONTENTS
| | |
Ave Maria Value Fund | |
Portfolio Manager Commentary | 1 |
Performance | 4 |
Annual Total Rates of Return Comparison with Major Indices | 5 |
Ten Largest Equity Holdings | 6 |
Asset Allocation | 6 |
Schedule of Investments | 7 |
Ave Maria Growth Fund | |
Portfolio Manager Commentary | 10 |
Performance | 12 |
Annual Total Rates of Return Comparison with Major Indices | 13 |
Ten Largest Equity Holdings | 14 |
Asset Allocation | 14 |
Schedule of Investments | 15 |
Ave Maria Rising Dividend Fund | |
Portfolio Manager Commentary | 18 |
Performance | 19 |
Annual Total Rates of Return Comparison with Major Indices | 20 |
Ten Largest Equity Holdings | 21 |
Asset Allocation | 21 |
Schedule of Investments | 22 |
Ave Maria World Equity Fund | |
Portfolio Manager Commentary | 25 |
Performance | 28 |
Annual Total Rates of Return Comparison with Major Indices | 29 |
Ten Largest Equity Holdings | 30 |
Asset Allocation | 30 |
Schedule of Investments | 31 |
Summary of Common Stocks by Country | 35 |
Ave Maria Focused Fund | |
Portfolio Manager Commentary | 36 |
Performance | 39 |
Annual Total Rates of Return Comparison with Major Indices | 40 |
Ten Largest Equity Holdings | 41 |
Asset Allocation | 41 |
Schedule of Investments | 42 |
Ave Maria Bond Fund | |
Portfolio Manager Commentary | 44 |
Performance | 45 |
Annual Total Rates of Return Comparison with Major Indices | 46 |
Ten Largest Holdings | 47 |
Asset Allocation | 47 |
Schedule of Investments | 48 |
AVE MARIA MUTUAL FUNDS
TABLE OF CONTENTS
(Continued)
Statements of Assets and Liabilities | 54 |
Statements of Operations | 56 |
Statements of Changes in Net Assets | |
Ave Maria Value Fund | 58 |
Ave Maria Growth Fund | 59 |
Ave Maria Rising Dividend Fund | 60 |
Ave Maria World Equity Fund | 61 |
Ave Maria Focused Fund | 62 |
Ave Maria Bond Fund | 63 |
Financial Highlights | |
Ave Maria Value Fund | 64 |
Ave Maria Growth Fund | 65 |
Ave Maria Rising Dividend Fund | 66 |
Ave Maria World Equity Fund | 67 |
Ave Maria Focused Fund | 68 |
Ave Maria Bond Fund | 69 |
Notes to Financial Statements | 70 |
Report of Independent Registered Public Accounting Firm | 82 |
Board of Trustees and Executive Officers | 84 |
Catholic Advisory Board | 86 |
About Your Funds’ Expenses | 88 |
Federal Tax Information | 90 |
Other Information | 91 |
Liquidity Risk | 92 |
This report is for the information of the shareholders of the Ave Maria Mutual Funds. To obtain a copy of the prospectus, please visit our website at www.avemariafunds.com or call 1-888-726-9331 and a copy will be sent to you free of charge. Please read the prospectus carefully before you invest. The Ave Maria Mutual Funds are distributed by Ultimus Fund Distributors, LLC.
Past performance is not predictive of future performance. Investment results and principal value will fluctuate so that shares, when redeemed, may be worth more or less than their original cost. Current performance may be higher or lower than the performance data quoted. Performance data, current to the most recent month end, is available at the Ave Maria Mutual Funds website at www.avemariafunds.com or by calling 1-888-726-9331.
This page intentionally left blank.
Ave Maria Value Fund
Portfolio Manager Commentary
(Unaudited)
Dear Fellow Shareholders:
2022 was a relatively good year for the Ave Maria Value Fund (the “Fund”) with a total return of 4.18%, compared to -13.06% for the benchmark S&P MidCap 400 Index, and -14.02% for the Morningstar Mid-Cap Blend category average. For the year, the Fund ranked in the 1st percentile out of 370 equity mutual funds in the Morningstar Mid-Cap Blend category. This performance has been recognized by the investment community, as the Fund was mentioned in The Wall Street Journal’s January 9, 2023 edition, in the article titled “The Best Stock-Fund Managers of 2022.” As stated in the article, the Fund’s 2022 performance ranked #11 out of 1,410 U.S. stocks funds, as tracked by Morningstar, an independent rating service. Likewise, in the same edition of The Wall Street Journal, in the “Category Kings in 9 realms” section, the Fund was ranked #1 out of 390 Midcap Growth equity mutual funds for 2022 performance, as tracked by Lipper, an independent rating service.
The Fund’s outperformance in 2022 was driven primarily by the Fund’s energy sector investments. In particular, the share prices of Chevron Corporation (oil & natural gas integrated), Pioneer Natural Resources Company (oil & natural gas exploration and production), Schlumberger Limited (oil & natural gas equipment and services), and Texas Pacific Land Corporation (real estate and royalties) all rose substantially in 2022. We believe the worldwide demand for energy, including oil and natural gas, will continue to grow for many years. With rising demand, coupled with constrained supply (due to a myriad of factors), we believe energy prices may escalate in 2023 and beyond. As such, we remain optimistic that the Fund’s energy sector companies will continue to grow revenues, earnings, cash flows, and dividends.
The Fund’s five best performing securities in 2022 were:
Company | Industry | 2022 Return |
Texas Pacific Land Corporation | Real Estate/Royalties | 91.28% |
Schlumberger Limited | Oil/Gas Equipment & Services | 83.51% |
Chevron Corporation | Integrated Oil/Gas | 56.94% |
Bowlero Corporation | Bowling Centers | 53.97% |
Haemonetics Corporation | Medical Instruments & Supplies | 49.92% |
1
AVE MARIA VALUE FUND
PORTFOLIO MANAGER COMMENTARY
(Unaudited) (Continued)
The Fund’s five worst performing securities in 2022 were:
Company | Industry | 2022 Return |
Purple Innovation, Inc. | Consumer Products | -41.43% |
Vontier Corporation | Technology Mobility | -32.85% |
Intercontinental Exchange, Inc. | Financial Exchanges | -32.25% |
YETI Holdings, Inc. | Consumer Products | -32.15% |
A.O. Smith Corporation | Specialty Machinery | -27.05% |
Due to the recent, strong relative outperformance, the Fund’s longer-term performance measures have markedly improved. For the 3-year and 5-year periods ending December 31, 2022, the Fund placed in the top 3rd percentile and top 9th percentile, respectively, in Morningstar’s Mid-Cap Blend category. The Fund’s 1, 3, 5, and 10-year performance figures for periods ending December 31, 2022 are as follows:
| | Average Annual Total Return
For the Periods Ending 12/31/22 |
| | 1 year | 3 years | 5 years | 10 years |
Ave Maria Value Fund | 4.18% | 11.44% | 8.77% | 8.35% |
S&P MidCap 400 Index | -13.06% | 7.23% | 6.71% | 10.78% |
Value-oriented investment managers were vindicated in 2022. It was a year in which many investors got sucked into the vortex of a speculative stock market mania driven by tech stocks that got ridiculously overpriced, even though many were unprofitable enterprises. These “story stocks” were hailed as industry disruptors, and no share price was too high. The carnage here was brutal.
Recent performance of 10 former high-flying technology stocks:
Company | Performance Since 2021
Peak through 2022 Year End |
Carvana Co. | -99% |
Peloton Interactive, Inc. | -95% |
Coinbase Global, Inc. | -92% |
Teladoc Health, Inc. | -92% |
Leamonade, Inc. | -91% |
Robinhood Markets, Inc. | -91% |
Snap Inc. | -90% |
Zoom Video Communications, Inc. | -88% |
Docusign, Inc. | -83% |
Spotify Technology S.A. | -80% |
2
AVE MARIA VALUE FUND
PORTFOLIO MANAGER COMMENTARY
(Unaudited) (Continued)
Individual and institutional investors alike in these issues probably learned again the truism that real investing is not a game, and success is not assured. One cannot ignore valuations and expect to achieve successful results. Fundamentals matter.
In managing the Ave Maria Value Fund, we will continue to pursue a risk-averse, value-focused investment approach that utilizes fundamental security analysis to identify securities available at a discount to intrinsic value. We believe this approach provides the best opportunities to achieve above-average investment results.
The year-end distribution of $0.2764 per share consisted solely of investment income, as there were no realized short or long-term capital gains. The net asset value of the Fund ended the year at $24.05 per share.
Thank you for being a shareholder in the Ave Maria Value Fund.

| 
|
Timothy S. Schwartz, CFA | Ryan M. Kuyawa, CFA |
Lead Portfolio Manager | Co-Portfolio Manager |
Past performance is no guarantee of future results. Rank in Category is the fund’s total return percentile rank relative to all funds that have the same Morningstar Category. The highest (or most favorable) percentile rank is 1 and the lowest (or least favorable) percentile rank is 100. The top-performing fund in a category will always receive a rank of 1.
3
AVE MARIA VALUE FUND Performance (Unaudited) |
Comparison of the Change in Value of a $10,000 Investment
in the Ave Maria Value Fund and the S&P MidCap 400 Index

(a) | The returns shown do not reflect the deduction of taxes a shareholder would pay on Fund distributions or the redemption of Fund shares. |
Expense ratio as of 12-31-21 (as disclosed in May 1, 2022 prospectus) | 0.97%* |
Expense ratio for the year ended 12-31-22 | 0.93% |
* | Includes Acquired Fund Fees and Expenses. |
Past performance is not predictive of future performance. Investment results and principal value will fluctuate so that shares, when redeemed, may be worth more or less than their original cost. Current performance may be higher or lower than the performance data quoted. Performance data, current to the most recent month end, is available at the Ave Maria Mutual Funds website at www.avemariafunds.com or by calling 1-888-726-9331.
4
AVE MARIA VALUE FUND Annual Total Rates of Return
Comparison with Major Indices (Unaudited) |
| AVE MARIA
VALUE FUND | S&P MidCap 400
INDEX | S&P 500
INDEX |
2001(a) | 5.3% | -0.5% | -8.5% |
2002 | -9.8% | -14.5% | -22.1% |
2003 | 35.6% | 35.6% | 28.7% |
2004 | 20.1% | 16.5% | 10.9% |
2005 | 5.8% | 12.6% | 4.9% |
2006 | 14.2% | 10.3% | 15.8% |
2007 | -4.0% | 8.0% | 5.5% |
2008 | -36.8% | -36.2% | -37.0% |
2009 | 37.6% | 37.4% | 26.5% |
2010 | 20.5% | 26.7% | 15.1% |
2011 | -1.3% | -1.7% | 2.1% |
2012 | 13.3% | 17.9% | 16.0% |
2013 | 26.2% | 33.5% | 32.4% |
2014 | 2.9% | 9.8% | 13.7% |
2015 | -17.7% | -2.2% | 1.4% |
2016 | 16.4% | 20.7% | 12.0% |
2017 | 17.7% | 16.2% | 21.8% |
2018 | -8.8% | -11.1% | -4.4% |
2019 | 20.5% | 26.2% | 31.5% |
2020 | 6.2% | 13.7% | 18.4% |
2021 | 25.2% | 24.8% | 28.7% |
2022 | 4.2% | -13.1% | -18.1% |
AVERAGE ANNUAL TOTAL RETURNS
As of December 31, 2022 (Unaudited)
| AVE MARIA
VALUE FUND | S&P MidCap
400
INDEX | S&P 500
INDEX |
3 Years | 11.4% | 7.2% | 7.7% |
5 Years | 8.8% | 6.7% | 9.4% |
10 Years | 8.4% | 10.8% | 12.6% |
20 Years | 8.3% | 10.7% | 9.8% |
Since Inception (b) | 7.4% | 9.0% | 7.3% |
(a) | Represents the period from the commencement of operations (May 1, 2001) through December 31, 2001. |
(b) | Represents the period from the commencement of operations (May 1, 2001) through December 31, 2022. |
5
AVE MARIA VALUE FUND
Ten Largest Equity Holdings
December 31, 2022 (Unaudited)
| | Shares | | | Company | | Fair Value | | | % of Net Assets | |
| | | 25,500 | | | Texas Pacific Land Corporation | | $ | 59,777,865 | | | | 16.1 | % |
| | | 90,000 | | | Pioneer Natural Resources Company | | | 20,555,100 | | | | 5.5 | % |
| | | 100,180 | | | Chevron Corporation | | | 17,981,308 | | | | 4.9 | % |
| | | 323,900 | | | Schlumberger Ltd. | | | 17,315,694 | | | | 4.7 | % |
| | | 184,000 | | | Haemonetics Corporation | | | 14,471,600 | | | | 3.9 | % |
| | | 104,000 | | | Franco-Nevada Corporation | | | 14,193,920 | | | | 3.8 | % |
| | | 150,000 | | | Chesapeake Energy Corporation | | | 14,155,500 | | | | 3.8 | % |
| | | 330,000 | | | Valvoline, Inc. | | | 10,774,500 | | | | 2.9 | % |
| | | 100,000 | | | Intercontinental Exchange, Inc. | | | 10,259,000 | | | | 2.8 | % |
| | | 506,402 | | | Vontier Corporation | | | 9,788,751 | | | | 2.6 | % |
Asset Allocation (Unaudited)
| | % of Net Assets | |
COMMON STOCKS | | | | |
Sector | | | | |
Communications | | | 1.3 | % |
Consumer Discretionary | | | 9.6 | % |
Consumer Staples | | | 0.8 | % |
Energy | | | 20.6 | % |
Financials | | | 10.6 | % |
Health Care | | | 10.9 | % |
Industrials | | | 10.2 | % |
Materials | | | 7.9 | % |
Real Estate | | | 17.2 | % |
Technology | | | 3.8 | % |
| | | | | |
MONEY MARKET FUNDS, OTHER ASSETS IN EXCESS OF LIABILITIES | | | 7.1 | % |
| | | | 100.0 | % |
6
AVE MARIA VALUE FUND
Schedule of Investments
December 31, 2022
COMMON STOCKS — 92.9% | | Shares | | | Fair Value | |
Communications — 1.3% | | | | | | | | |
Publishing & Broadcasting — 1.3% | | | | | | | | |
Liberty Media Corporation - Liberty Formula One - Series C * | | | 80,000 | | | $ | 4,782,400 | |
| | | | | | | | | |
Consumer Discretionary — 9.6% | | | | | | | | |
Automotive — 1.3% | | | | | | | | |
Gentex Corporation | | | 170,000 | | | | 4,635,900 | |
| | | | | | | | | |
Home & Office Products — 1.8% | | | | | | | | |
Purple Innovation, Inc. * | | | 1,409,490 | | | | 6,751,457 | |
| | | | | | | | | |
Leisure Facilities & Services — 2.5% | | | | | | | | |
Bowlero Corporation * | | | 489,574 | | | | 6,599,457 | |
Madison Square Garden Sports Corporation | | | 15,000 | | | | 2,749,950 | |
| | | | | | | | 9,349,407 | |
Leisure Products — 1.5% | | | | | | | | |
YETI Holdings, Inc. * | | | 132,500 | | | | 5,473,575 | |
| | | | | | | | | |
Retail - Discretionary — 2.5% | | | | | | | | |
RH * | | | 14,000 | | | | 3,740,660 | |
Winmark Corporation | | | 23,700 | | | | 5,589,171 | |
| | | | | | | | 9,329,831 | |
Consumer Staples — 0.8% | | | | | | | | |
Beverages — 0.8% | | | | | | | | |
Remy Cointreau S.A. - ADR | | | 175,550 | | | | 2,946,835 | |
| | | | | | | | | |
Energy — 20.6% | | | | | | | | |
Oil & Gas Producers — 14.2% | | | | | | | | |
Chesapeake Energy Corporation | | | 150,000 | | | | 14,155,500 | |
Chevron Corporation | | | 100,180 | | | | 17,981,308 | |
Pioneer Natural Resources Company | | | 90,000 | | | | 20,555,100 | |
| | | | | | | | 52,691,908 | |
Oil & Gas Services & Equipment — 6.4% | | | | | | | | |
Core Laboratories N.V. | | | 318,000 | | | | 6,445,860 | |
Schlumberger Ltd. | | | 323,900 | | | | 17,315,694 | |
| | | | | | | | 23,761,554 | |
Financials — 10.6% | | | | | | | | |
Banking — 2.5% | | | | | | | | |
Hingham Institution for Savings (The) | | | 34,000 | | | | 9,382,640 | |
| | | | | | | | | |
Institutional Financial Services — 4.6% | | | | | | | | |
CME Group, Inc. | | | 40,000 | | | | 6,726,400 | |
Intercontinental Exchange, Inc. | | | 100,000 | | | | 10,259,000 | |
| | | | | | | | 16,985,400 | |
7
AVE MARIA VALUE FUND
SCHEDULE OF INVESTMENTS
(Continued)
COMMON STOCKS — 92.9% (Continued) | | Shares | | | Fair Value | |
Financials — 10.6% (Continued) | | | | | | | | |
Insurance — 3.5% | | | | | | | | |
Brown & Brown, Inc. | | | 117,450 | | | $ | 6,691,126 | |
Markel Corporation * | | | 4,850 | | | | 6,389,827 | |
| | | | | | | | 13,080,953 | |
Health Care — 10.9% | | | | | | | | |
Biotech & Pharma — 2.5% | | | | | | | | |
Mirion Technologies, Inc. * | | | 1,390,000 | | | | 9,187,900 | |
| | | | | | | | | |
Health Care Facilities & Services — 2.5% | | | | | | | | |
Chemed Corporation | | | 18,300 | | | | 9,340,869 | |
| | | | | | | | | |
Medical Equipment & Devices — 5.9% | | | | | | | | |
Alcon, Inc. | | | 110,000 | | | | 7,540,500 | |
Haemonetics Corporation * | | | 184,000 | | | | 14,471,600 | |
| | | | | | | | 22,012,100 | |
Industrials — 10.2% | | | | | | | | |
Aerospace & Defense — 1.3% | | | | | | | | |
HEICO Corporation - Class A | | | 40,000 | | | | 4,794,000 | |
| | | | | | | | | |
Electrical Equipment — 7.3% | | | | | | | | |
A.O. Smith Corporation | | | 113,000 | | | | 6,468,120 | |
Allegion plc | | | 37,500 | | | | 3,947,250 | |
Otis Worldwide Corporation | | | 85,000 | | | | 6,656,350 | |
Vontier Corporation | | | 506,402 | | | | 9,788,751 | |
| | | | | | | | 26,860,471 | |
Industrial Support Services — 1.6% | | | | | | | | |
U-Haul Holding Company | | | 10,800 | | | | 650,052 | |
U-Haul Holding Company - Series N | | | 97,200 | | | | 5,344,056 | |
| | | | | | | | 5,994,108 | |
Materials — 7.9% | | | | | | | | |
Chemicals — 2.9% | | | | | | | | |
Valvoline, Inc. | | | 330,000 | | | | 10,774,500 | |
| | | | | | | | | |
Metals & Mining — 5.0% | | | | | | | | |
Barrick Gold Corporation | | | 175,000 | | | | 3,006,500 | |
Franco-Nevada Corporation | | | 104,000 | | | | 14,193,920 | |
Newmont Corporation | | | 30,000 | | | | 1,416,000 | |
| | | | | | | | 18,616,420 | |
Real Estate — 17.2% | | | | | | | | |
Real Estate Owners & Developers — 17.2% | | | | | | | | |
St. Joe Company (The) | | | 103,000 | | | | 3,980,950 | |
Texas Pacific Land Corporation | | | 25,500 | | | | 59,777,865 | |
| | | | | | | | 63,758,815 | |
8
AVE MARIA VALUE FUND
SCHEDULE OF INVESTMENTS
(Continued)
COMMON STOCKS — 92.9% (Continued) | | Shares | | | Fair Value | |
Technology — 3.8% | | | | | | | | |
Technology Services — 3.8% | | | | | | | | |
CDW Corporation | | | 37,350 | | | $ | 6,669,963 | |
Jack Henry & Associates, Inc. | | | 43,050 | | | | 7,557,858 | |
| | | | | | | | 14,227,821 | |
| | | | | | | | | |
Total Common Stocks (Cost $235,127,243) | | | | | | $ | 344,738,864 | |
MONEY MARKET FUNDS — 7.1% | | Shares | | | Fair Value | |
Federated Hermes Government Obligations Tax-Managed Fund - Institutional Shares, 3.97% (a) | | | 17,818,000 | | | $ | 17,818,000 | |
Federated Hermes Treasury Obligations Fund - Institutional Shares, 4.15% (a) | | | 8,429,255 | | | | 8,429,255 | |
Total Money Market Funds (Cost $26,247,255) | | | | | | $ | 26,247,255 | |
| | | | | | | | | |
Total Investments at Fair Value — 100.0% (Cost $261,374,498) | | | | | | $ | 370,986,119 | |
| | | | | | | | | |
Other Assets in Excess of Liabilities — 0.0% (b) | | | | | | | 85,737 | |
| | | | | | | | | |
Net Assets — 100.0% | | | | | | $ | 371,071,856 | |
ADR - American Depositary Receipt. |
* | Non-income producing security. |
(a) | The rate shown is the 7-day effective yield as of December 31, 2022. |
(b) | Percentage rounds to less than 0.1%. |
See notes to financial statements. |
9
Ave Maria Growth Fund
Portfolio Manager Commentary
(Unaudited)
Dear Fellow Shareholders:
For the year ended December 31, 2022, the Ave Maria Growth Fund (the “Fund”) had a total return of -21.23% compared with the benchmark S&P 500 Index total return of -18.11%. Long-term performance measures are summarized below.
| | For Period Ending December 31, 2022: |
Fund or Index Name | Three-year
Annualized | Five-year
Annualized | Ten-year
Annualized |
Ave Maria Growth Fund, net of fees | 3.10% | 8.09% | 11.22% |
S&P 500 Index | 7.66% | 9.42% | 12.56% |
Morningstar Large Growth Category Average | 4.91% | 8.38% | 12.02% |
In 2022, top contributors to return included O’Reilly Automotive, Texas Pacific Land Corp., Valvoline, Change Healthcare, and HEICO. Top detractors from return included Purple Innovation, Microsoft, Ardagh Metal Packaging, Adobe, and Brookfield Asset Management.
After less than five months in the Fund, our position in Avalara was converted to cash during the fourth quarter. Avalara was purchased by private equity for an attractive premium to the Fund’s average purchase price. No other positions in the Fund were completely liquidated during the fourth quarter, while SiTime Corporation was the only new addition to the Fund.
| | ● | SiTime is a semiconductor company focused specifically on silicon-based devices for the electronic measurement of time. Timing devices are responsible for synchronizing circuits and are a ubiquitous component of modern electronic devices. The industry has been dominated by quartz-based products for the last 70 years, but SiTime now offers a disruptive silicon alternative that is capable of precision performance in some of the most demanding environments. We expect silicon-based timing devices to rapidly take market share from legacy quartz devices due to cost advantages, greater programmability, and higher reliability. SiTime is perfectly positioned to benefit from this new technology with approximately 90% market share of silicon-based timers. |
Our goal remains to purchase shares of exceptional companies at attractive prices with the expectation of earning favorable returns over the long run.
10
AVE MARIA GROWTH FUND
PORTFOLIO MANAGER COMMENTARY
(Unaudited) (Continued)
We appreciate your investment in the Ave Maria Growth Fund.
With best regards,

| 
|
Adam P. Gaglio, CFA | Chadd M. Garcia, CFA |
Lead Portfolio Manager | Co-Portfolio Manager |
11
AVE MARIA GROWTH FUND Performance (Unaudited) |
Comparison of the Change in Value of a $10,000 Investment
in the Ave Maria Growth Fund and the S&P 500 Index
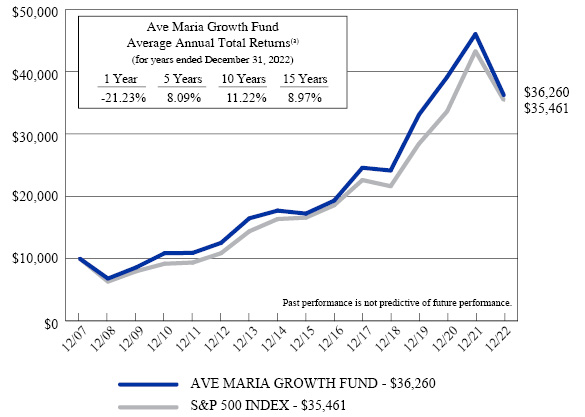
(a) | The returns shown do not reflect the deduction of taxes a shareholder would pay on Fund distributions or the redemption of Fund shares. |
Expense ratio as of 12-31-21 (as disclosed in May 1, 2022 prospectus) | 0.90%* |
Expense ratio for the year ended 12-31-22 | 0.91% |
* | Includes Acquired Fund Fees and Expenses. |
Past performance is not predictive of future performance. Investment results and principal value will fluctuate so that shares, when redeemed, may be worth more or less than their original cost. Current performance may be higher or lower than the performance data quoted. Performance data, current to the most recent month end, is available at the Ave Maria Mutual Funds website at www.avemariafunds.com or by calling 1-888-726-9331.
12
AVE MARIA GROWTH FUND Annual Total Rates of Return
Comparison with Major Indices (Unaudited) |
| AVE MARIA GROWTH FUND | S&P 500 INDEX |
2003 (a) | 23.4% | 22.8% |
2004 | 21.5% | 10.9% |
2005 | 0.3% | 4.9% |
2006 | 15.8% | 15.8% |
2007 | 11.6% | 5.5% |
2008 | -32.1% | -37.0% |
2009 | 26.4% | 26.5% |
2010 | 26.5% | 15.1% |
2011 | 0.5% | 2.1% |
2012 | 14.7% | 16.0% |
2013 | 31.5% | 32.4% |
2014 | 7.5% | 13.7% |
2015 | -2.7% | 1.4% |
2016 | 12.1% | 12.0% |
2017 | 27.4% | 21.8% |
2018 | -1.8% | -4.4% |
2019 | 37.1% | 31.5% |
2020 | 18.4% | 18.4% |
2021 | 17.6% | 28.7% |
2022 | -21.2% | -18.1% |
AVERAGE ANNUAL TOTAL RETURNS
As of December 31, 2022 (Unaudited)
| AVE MARIA GROWTH FUND | S&P 500 INDEX |
3 Years | 3.1% | 7.7% |
5 Years | 8.1% | 9.4% |
10 Years | 11.2% | 12.6% |
15 Years | 9.0% | 8.8% |
Since Inception (b) | 10.4% | 9.7% |
(a) | Represents the period from the commencement of operations (May 1, 2003) through December 31, 2003. |
(b) | Represents the period from the commencement of operations (May 1, 2003) through December 31, 2022. |
13
AVE MARIA GROWTH FUND
Ten Largest Equity Holdings
December 31, 2022 (Unaudited)
| | Shares | | | Company | | Fair Value | | | % of Net Assets | |
| | | 850,000 | | | Copart, Inc. | | $ | 51,756,500 | | | | 6.8 | % |
| | | 142,000 | | | Mastercard, Inc. - Class A | | | 49,377,660 | | | | 6.5 | % |
| | | 275,000 | | | Texas Instruments, Inc. | | | 45,435,500 | | | | 5.9 | % |
| | | 180,000 | | | Microsoft Corporation | | | 43,167,600 | | | | 5.6 | % |
| | | 51,000 | | | O’Reilly Automotive, Inc. | | | 43,045,530 | | | | 5.6 | % |
| | | 299,377 | | | HEICO Corporation - Class A | | | 35,880,333 | | | | 4.7 | % |
| | | 325,000 | | | AptarGroup, Inc. | | | 35,743,500 | | | | 4.7 | % |
| | | 1,795,000 | | | API Group Corporation | | | 33,763,950 | | | | 4.4 | % |
| | | 96,000 | | | S&P Global, Inc. | | | 32,154,240 | | | | 4.2 | % |
| | | 145,000 | | | IQVIA Holdings, Inc. | | | 29,709,050 | | | | 3.9 | % |
Asset Allocation (Unaudited)
| | % of Net Assets | |
COMMON STOCKS | | | | |
Sector | | | | |
Consumer Discretionary | | | 16.6 | % |
Energy | | | 2.7 | % |
Financials | | | 7.8 | % |
Health Care | | | 5.2 | % |
Industrials | | | 9.1 | % |
Materials | | | 10.1 | % |
Real Estate | | | 7.8 | % |
Technology | | | 36.7 | % |
| | | | | |
MONEY MARKET FUNDS, LIABILITIES IN EXCESS OF OTHER ASSETS | | | 4.0 | % |
| | | | 100.0 | % |
14
AVE MARIA GROWTH FUND
Schedule of Investments
December 31, 2022
COMMON STOCKS — 96.0% | | Shares | | | Fair Value | |
Consumer Discretionary — 16.6% | | | | | | | | |
Retail - Discretionary — 9.8% | | | | | | | | |
Lowe’s Companies, Inc. | | | 122,000 | | | $ | 24,307,280 | |
O’Reilly Automotive, Inc. * | | | 51,000 | | | | 43,045,530 | |
RH * | | | 30,000 | | | | 8,015,700 | |
| | | | | | | | 75,368,510 | |
Wholesale - Discretionary — 6.8% | | | | | | | | |
Copart, Inc. * | | | 850,000 | | | | 51,756,500 | |
| | | | | | | | | |
Energy — 2.7% | | | | | | | | |
Oil & Gas Producers — 2.7% | | | | | | | | |
Chesapeake Energy Corporation | | | 220,000 | | | | 20,761,400 | |
| | | | | | | | | |
Financials — 7.8% | | | | | | | | |
Asset Management — 3.6% | | | | | | | | |
Brookfield Asset Management Ltd. - Class A * | | | 179,353 | | | | 5,142,050 | |
Brookfield Corporation | | | 712,500 | | | | 22,415,250 | |
Brookfield Reinsurance Ltd. * | | | 4,913 | | | | 153,728 | |
| | | | | | | | 27,711,028 | |
Diversified Financial Services — 4.2% | | | | | | | | |
S&P Global, Inc. | | | 96,000 | | | | 32,154,240 | |
| | | | | | | | | |
Health Care — 5.2% | | | | | | | | |
Health Care Facilities & Services — 5.2% | | | | | | | | |
Chemed Corporation | | | 20,000 | | | | 10,208,600 | |
IQVIA Holdings, Inc. * | | | 145,000 | | | | 29,709,050 | |
| | | | | | | | 39,917,650 | |
Industrials — 9.1% | | | | | | | | |
Aerospace & Defense — 4.7% | | | | | | | | |
HEICO Corporation - Class A | | | 299,377 | | | | 35,880,333 | |
| | | | | | | | | |
Electrical Equipment — 4.4% | | | | | | | | |
API Group Corporation * | | | 1,795,000 | | | | 33,763,950 | |
| | | | | | | | | |
Materials — 10.1% | | | | | | | | |
Chemicals — 3.0% | | | | | | | | |
Valvoline, Inc. | | | 700,000 | | | | 22,855,000 | |
| | | | | | | | | |
Containers & Packaging — 7.1% | | | | | | | | |
AptarGroup, Inc. | | | 325,000 | | | | 35,743,500 | |
Ardagh Metal Packaging S.A. | | | 3,772,376 | | | | 18,145,129 | |
| | | | | | | | 53,888,629 | |
15
AVE MARIA GROWTH FUND
SCHEDULE OF INVESTMENTS
(Continued)
COMMON STOCKS — 96.0% (Continued) | | Shares | | | Fair Value | |
Real Estate — 7.8% | | | | | | | | |
Real Estate Owners & Developers — 1.5% | | | | | | | | |
Texas Pacific Land Corporation | | | 5,000 | | | $ | 11,721,150 | |
| | | | | | | | | |
REITs — 6.3% | | | | | | | | |
Equinix, Inc. | | | 40,500 | | | | 26,528,715 | |
SBA Communications Corporation - Class A | | | 76,000 | | | | 21,303,560 | |
| | | | | | | | 47,832,275 | |
Technology — 36.7% | | | | | | | | |
Semiconductors — 12.0% | | | | | | | | |
Advanced Micro Devices, Inc. * | | | 340,000 | | | | 22,021,800 | |
NVIDIA Corporation | | | 125,000 | | | | 18,267,500 | |
SiTime Corporation * | | | 60,000 | | | | 6,097,200 | |
Texas Instruments, Inc. | | | 275,000 | | | | 45,435,500 | |
| | | | | | | | 91,822,000 | |
Software — 12.5% | | | | | | | | |
ANSYS, Inc. * | | | 54,000 | | | | 13,045,860 | |
Microsoft Corporation | | | 180,000 | | | | 43,167,600 | |
Roper Technologies, Inc. | | | 68,000 | | | | 29,382,120 | |
Software AG - ADR | | | 1,638,504 | | | | 10,044,030 | |
| | | | | | | | 95,639,610 | |
Technology Services — 12.2% | | | | | | | | |
Accenture plc - Class A | | | 91,000 | | | | 24,282,440 | |
Broadridge Financial Solutions, Inc. | | | 72,000 | | | | 9,657,360 | |
Mastercard, Inc. - Class A | | | 142,000 | | | | 49,377,660 | |
Moody’s Corporation | | | 35,000 | | | | 9,751,700 | |
| | | | | | | | 93,069,160 | |
| | | | | | | | | |
Total Common Stocks (Cost $524,252,815) | | | | | | $ | 734,141,435 | |
16
AVE MARIA GROWTH FUND
SCHEDULE OF INVESTMENTS
(Continued)
MONEY MARKET FUNDS — 4.2% | | Shares | | | Fair Value | |
Federated Hermes Government Obligations Tax-Managed Fund - Institutional Shares, 3.97% (a) (Cost $32,350,168) | | | 32,350,168 | | | $ | 32,350,168 | |
| | | | | | | | | |
Total Investments at Fair Value — 100.2% (Cost $556,602,983) | | | | | | $ | 766,491,603 | |
| | | | | | | | | |
Liabilities in Excess of Other Assets — (0.2%) | | | | | | | (1,598,463 | ) |
| | | | | | | | | |
Net Assets — 100.0% | | | | | | $ | 764,893,140 | |
ADR - American Depositary Receipt. |
* | Non-income producing security. |
(a) | The rate shown is the 7-day effective yield as of December 31, 2022. |
See notes to financial statements. |
17
Ave Maria Rising Dividend Fund
Portfolio Manager Commentary
(Unaudited)
Dear Fellow Shareholders:
The Ave Maria Rising Dividend Fund (the “Fund”) finished the year ended December 31, 2022with a return of -5.27%, compared to -5.22% for the benchmark, the S&P 500 Value Index.
For the year, the Fund’s strongest contributors were from the Energy, Consumer Staples, and Industrials sectors. Also, Texas Pacific Land Corporation (royalty income – oil and gas) was up over 91%, posting the strongest performance. Consumer Staples finished the year up 2.4%, driven by Coca-Cola Europacifc Partners plc (carbonated soft drinks). The Industrials sector was up 2.4%, with strong returns posted by Lockheed Martin Corporation (defense), up 65%, and newcomer to the portfolio, A.O. Smith Corporation (commercial & residential building equipment), up 16%.
The weakest performers were the Technology, Real Estate, and Health Care sectors. Technology was down nearly -22% collectively, with only one company, Jack Henry & Associates, Inc. (financial transaction processor), posting a positive total return for the year. Real Estate was -21%, due to weakness in our holding in Equinix, Inc. (data center REIT). Health Care posted a -11% return, with Medtronic, plc (medical devices), dragging down overall performance, due to its -23% total return.
In the fourth quarter, the Fund added three new positions, A.O. Smith Corporation (commercial & residential equipment), Fastenal Company (industrial equipment & supply wholesaler), and S&P Global, Inc. (credit agency). These companies all have strong balance sheets, operate with competitive advantages, and consistently produce above-average cash flow and dividend growth. We purchased shares of each of these companies when they were undervalued in our opinion.
We appreciate your investment in the Ave Maria Rising Dividend Fund.

| 
|
Brandon S. Scheitler | George P. Schwartz, CFA |
Co-Portfolio Manager | Co-Portfolio Manager |
18
AVE MARIA RISING DIVIDEND FUND Performance (Unaudited) |
Comparison of the Change in Value of a $10,000 Investment
in the Ave Maria Rising Dividend Fund
and the S&P 500 Value Index
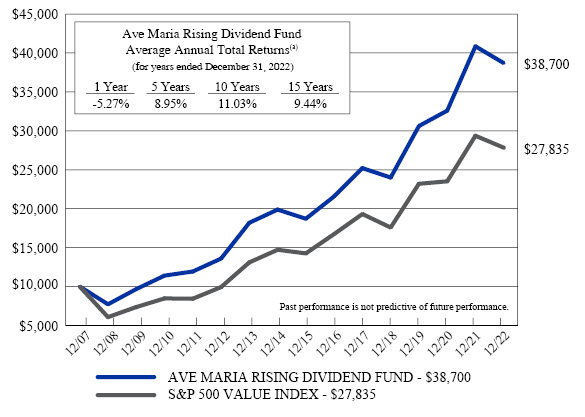
(a) | The returns shown do not reflect the deduction of taxes a shareholder would pay on Fund distributions or the redemption of Fund shares. |
Expense ratio as of 12-31-21 (as disclosed in May 1, 2022 prospectus) | 0.90%* |
Expense ratio for the year ended 12-31-22 | 0.91% |
* | Includes Acquired Fund Fees and Expenses. |
Past performance is not predictive of future performance. Investment results and principal value will fluctuate so that shares, when redeemed, may be worth more or less than their original cost. Current performance may be higher or lower than the performance data quoted. Performance data, current to the most recent month end, is available at the Ave Maria Mutual Funds website at www.avemariafunds.com or by calling 1-888-726-9331.
19
AVE MARIA RISING DIVIDEND FUND Annual Total Rates of Return
Comparison with Major Indices (Unaudited) |
| AVE MARIA
RISING DIVIDEND FUND | S&P 500
VALUE INDEX | S&P 500 INDEX |
2005 (a) | 6.7% | 11.3% | 8.8% |
2006 | 17.9% | 20.8% | 15.8% |
2007 | -0.6% | 2.0% | 5.5% |
2008 | -22.8% | -39.2% | -37.0% |
2009 | 25.3% | 21.2% | 26.5% |
2010 | 17.9% | 15.1% | 15.1% |
2011 | 4.6% | -0.5% | 2.1% |
2012 | 13.9% | 17.7% | 16.0% |
2013 | 33.9% | 32.0% | 32.4% |
2014 | 9.3% | 12.4% | 13.7% |
2015 | -5.9% | -3.1% | 1.4% |
2016 | 15.3% | 17.4% | 12.0% |
2017 | 16.8% | 15.4% | 21.8% |
2018 | -4.8% | -9.0% | -4.4% |
2019 | 27.6% | 31.9% | 31.5% |
2020 | 6.5% | 1.4% | 18.4% |
2021 | 25.4% | 24.9% | 28.7% |
2022 | -5.3% | -5.2% | -18.1% |
AVERAGE ANNUAL TOTAL RETURNS
As of December 31, 2022 (Unaudited)
| AVE MARIA
RISING DIVIDEND FUND | S&P 500
VALUE INDEX | S&P 500 INDEX |
3 Years | 8.1% | 6.3% | 7.7% |
5 Years | 9.0% | 7.6% | 9.4% |
10 Years | 11.0% | 10.9% | 12.6% |
15 Years | 9.4% | 7.1% | 8.8% |
Since Inception (b) | 9.3% | 7.9% | 9.2% |
(a) | Represents the period from the commencement of operations (May 2, 2005) through December 31, 2005. |
(b) | Represents the period from the commencement of operations (May 2, 2005) through December 31, 2022. |
20
AVE MARIA RISING DIVIDEND FUND
Ten Largest Equity Holdings
December 31, 2022 (Unaudited)
| | Shares | | | Company | | Fair Value | | | % of Net Assets | |
| | | 24,000 | | | Texas Pacific Land Corporation | | $ | 56,261,520 | | | | 6.3 | % |
| | | 190,000 | | | Chubb Ltd. | | | 41,914,000 | | | | 4.7 | % |
| | | 170,000 | | | Pioneer Natural Resources Company | | | 38,826,300 | | | | 4.4 | % |
| | | 200,000 | | | Chevron Corporation | | | 35,898,000 | | | | 4.0 | % |
| | | 70,000 | | | Chemed Corporation | | | 35,730,100 | | | | 4.0 | % |
| | | 215,000 | | | Texas Instruments, Inc. | | | 35,522,300 | | | | 4.0 | % |
| | | 62,500 | | | Lockheed Martin Corporation | | | 30,405,625 | | | | 3.4 | % |
| | | 85,000 | | | Mastercard, Inc. - Class A | | | 29,557,050 | | | | 3.3 | % |
| | | 140,000 | | | Lowe’s Companies, Inc. | | | 27,893,600 | | | | 3.1 | % |
| | | 205,000 | | | Broadridge Financial Solutions, Inc. | | | 27,496,650 | | | | 3.1 | % |
Asset Allocation (Unaudited)
| | % of Net Assets | |
COMMON STOCKS | | | | |
Sector | | | | |
Communications | | | 0.9 | % |
Consumer Discretionary | | | 16.3 | % |
Consumer Staples | | | 1.8 | % |
Energy | | | 8.4 | % |
Financials | | | 15.4 | % |
Health Care | | | 8.5 | % |
Industrials | | | 10.2 | % |
Real Estate | | | 9.1 | % |
Technology | | | 27.7 | % |
| | | | | |
MONEY MARKET FUNDS, LIABILITIES IN EXCESS OF OTHER ASSETS | | | 1.7 | % |
| | | | 100.0 | % |
21
AVE MARIA RISING DIVIDEND FUND
Schedule of Investments
December 31, 2022
COMMON STOCKS — 98.3% | | Shares | | | Fair Value | |
Communications — 0.9% | | | | | | | | |
Internet Media & Services — 0.9% | | | | | | | | |
Booking Holdings, Inc. * | | | 4,000 | | | $ | 8,061,120 | |
| | | | | | | | | |
Consumer Discretionary — 16.3% | | | | | | | | |
Leisure Products — 2.9% | | | | | | | | |
Polaris, Inc. | | | 140,000 | | | | 14,140,000 | |
Thor Industries, Inc. | | | 150,000 | | | | 11,323,500 | |
| | | | | | | | 25,463,500 | |
Retail - Discretionary — 13.4% | | | | | | | | |
Genuine Parts Company | | | 150,000 | | | | 26,026,500 | |
Lowe’s Companies, Inc. | | | 140,000 | | | | 27,893,600 | |
RH * | | | 90,000 | | | | 24,047,100 | |
TJX Companies, Inc. (The) | | | 300,000 | | | | 23,880,000 | |
Tractor Supply Company | | | 79,500 | | | | 17,885,115 | |
| | | | | | | | 119,732,315 | |
Consumer Staples — 1.8% | | | | | | | | |
Beverages — 1.8% | | | | | | | | |
Coca-Cola European Partners plc | | | 300,000 | | | | 16,596,000 | |
| | | | | | | | | |
Energy — 8.4% | | | | | | | | |
Oil & Gas Producers — 8.4% | | | | | | | | |
Chevron Corporation | | | 200,000 | | | | 35,898,000 | |
Pioneer Natural Resources Company | | | 170,000 | | | | 38,826,300 | |
| | | | | | | | 74,724,300 | |
Financials — 15.4% | | | | | | | | |
Asset Management — 1.7% | | | | | | | | |
Brookfield Asset Management Ltd. - Class A * | | | 100,000 | | | | 2,867,000 | |
Brookfield Corporation | | | 400,000 | | | | 12,584,000 | |
| | | | | | | | 15,451,000 | |
Banking — 3.5% | | | | | | | | |
First Horizon Corporation | | | 250,000 | | | | 6,125,000 | |
Truist Financial Corporation | | | 575,000 | | | | 24,742,250 | |
| | | | | | | | 30,867,250 | |
Diversified Financial Services — 1.1% | | | | | | | | |
S&P Global, Inc. | | | 29,000 | | | | 9,713,260 | |
| | | | | | | | | |
Insurance — 6.3% | | | | | | | | |
Brown & Brown, Inc. | | | 230,000 | | | | 13,103,100 | |
Chubb Ltd. | | | 190,000 | | | | 41,914,000 | |
F&G Annuities & Life, Inc. * | | | 45,560 | | | | 911,656 | |
| | | | | | | | 55,928,756 | |
Specialty Finance — 2.8% | | | | | | | | |
Fidelity National Financial, Inc. | | | 670,000 | | | | 25,205,400 | |
22
AVE MARIA RISING DIVIDEND FUND
SCHEDULE OF INVESTMENTS
(Continued)
COMMON STOCKS — 98.3% (Continued) | | Shares | | | Fair Value | |
Health Care — 8.5% | | | | | | | | |
Health Care Facilities & Services — 5.6% | | | | | | | | |
Chemed Corporation | | | 70,000 | | | $ | 35,730,100 | |
Quest Diagnostics, Inc. | | | 95,000 | | | | 14,861,800 | |
| | | | | | | | 50,591,900 | |
Medical Equipment & Devices — 2.9% | | | | | | | | |
Medtronic plc | | | 330,000 | | | | 25,647,600 | |
| | | | | | | | | |
Industrials — 10.2% | | | | | | | | |
Aerospace & Defense — 5.3% | | | | | | | | |
HEICO Corporation - Class A | | | 137,120 | | | | 16,433,832 | |
Lockheed Martin Corporation | | | 62,500 | | | | 30,405,625 | |
| | | | | | | | 46,839,457 | |
Commercial Support Services — 0.8% | | | | | | | | |
Rentokil Initial plc | | | 1,185,500 | | | | 7,282,944 | |
| | | | | | | | | |
Electrical Equipment — 1.2% | | | | | | | | |
A.O. Smith Corporation | | | 180,000 | | | | 10,303,200 | |
| | | | | | | | | |
Industrial Support Services — 1.0% | | | | | | | | |
Fastenal Company | | | 195,000 | | | | 9,227,400 | |
| | | | | | | | | |
Transportation & Logistics — 1.9% | | | | | | | | |
United Parcel Service, Inc. - Class B | | | 100,000 | | | | 17,384,000 | |
| | | | | | | | | |
Real Estate — 9.1% | | | | | | | | |
Real Estate Owners & Developers — 6.3% | | | | | | | | |
Texas Pacific Land Corporation | | | 24,000 | | | | 56,261,520 | |
| | | | | | | | | |
REITs — 2.8% | | | | | | | | |
Equinix, Inc. | | | 37,400 | | | | 24,498,122 | |
| | | | | | | | | |
Technology — 27.7% | | | | | | | | |
Semiconductors — 4.0% | | | | | | | | |
Texas Instruments, Inc. | | | 215,000 | | | | 35,522,300 | |
| | | | | | | | | |
Software — 9.2% | | | | | | | | |
ANSYS, Inc. * | | | 56,000 | | | | 13,529,040 | |
Microsoft Corporation | | | 110,000 | | | | 26,380,200 | |
Roper Technologies, Inc. | | | 25,000 | | | | 10,802,250 | |
SAP SE | | | 90,000 | | | | 9,294,517 | |
SS&C Technologies Holdings, Inc. | | | 425,000 | | | | 22,125,500 | |
| | | | | | | | 82,131,507 | |
23
AVE MARIA RISING DIVIDEND FUND
SCHEDULE OF INVESTMENTS
(Continued)
COMMON STOCKS — 98.3% (Continued) | | Shares | | | Fair Value | |
Technology — 27.7% (Continued) | | | | | | | | |
Technology Services — 14.5% | | | | | | | | |
Accenture plc - Class A | | | 93,000 | | | $ | 24,816,120 | |
Broadridge Financial Solutions, Inc. | | | 205,000 | | | | 27,496,650 | |
Jack Henry & Associates, Inc. | | | 125,000 | | | | 21,945,000 | |
Mastercard, Inc. - Class A | | | 85,000 | | | | 29,557,050 | |
Moody’s Corporation | | | 90,000 | | | | 25,075,800 | |
| | | | | | | | 128,890,620 | |
| | | | | | | | | |
Total Common Stocks (Cost $645,733,563) | | | | | | $ | 876,323,471 | |
MONEY MARKET FUNDS — 1.7% | | Shares | | | Fair Value | |
Federated Hermes Government Obligations Tax-Managed Fund - Institutional Shares, 3.97% (a) (Cost $14,942,042) | | | 14,942,042 | | | $ | 14,942,042 | |
| | | | | | | | | |
Total Investments at Fair Value — 100.0% (Cost $660,675,605) | | | | | | $ | 891,265,513 | |
| | | | | | | | | |
Liabilities in Excess of Other Assets - (0.0%) (b) | | | | | | | (305,249 | ) |
| | | | | | | | | |
Net Assets — 100.0% | | | | | | $ | 890,960,264 | |
* | Non-income producing security. |
(a) | The rate shown is the 7-day effective yield as of December 31, 2022. |
(b) | Percentage rounds to less than 0.1%. |
See notes to financial statements. |
24
Ave Maria World Equity Fund
Portfolio Manager Commentary
(Unaudited)
Dear Fellow Shareholders:
The Ave Maria World Equity Fund (the “Fund”) had a total return of -15.50% for the year ended December 31, 2022, compared to the total return of -18.37% for the MSCI ACWI Index.
Large global markets performed poorly in 2022, which led to negative total returns in U.S. dollar terms across the board.
Europe (S&P Europe 350) | -14.06% |
Japan (Topix 150) | -15.10% |
United States (S&P 500) | -18.11% |
Emerging Market (MSCI Emerging Market Index) | -19.94% |
China (S&P China 500) | -24.41% |
The Fund outperformed the MSCI ACWI Index in the fourth quarter and in calendar year 2022 by 2.73% and 2.87%, respectively
Top contributors to performance during the fourth quarter of 2022
Coca-Cola Europacific Partners PLC | 32.76% |
AXA SA | 27.96% |
Chubb Limited | 21.76% |
Top contributors to performance during calendar year 2022
Chevron Corporation | 58.48% |
Pioneer Natural Resources | 38.87% |
First Horizon Corporation | 33.09% |
Coca-Cola Europacific Partners PLC is the largest global Coca-Cola bottler by revenue. The management team has a track record of creating value for shareholders by consolidating and improving the operations of smaller bottlers. The company has been applying the same playbook to Coca-Cola Amatil, an Australian bottler with operations in six countries.
AXA SA is a global provider of insurance products and asset management services. The company has been reducing its exposure to volatile natural catastrophe reinsurance and low-margin traditional general account savings in favor of more predictable and profitable P&C, life, and health insurance products.
25
AVE MARIA WORLD EQUITY FUND
PORTFOLIO MANAGER COMMENTARY
(Unaudited) (Continued)
Chubb Limited is the world’s largest publicly traded P&C insurance company and a leading commercial lines insurer in the U.S. with operations in 54 countries and territories. Chubb is regarded as one of the most skilled property and casualty underwriters globally with an average P&C combined ratio of 92.5% between 2017 and 2021.
Bottom contributors to performance during the fourth quarter of 2022
Mirion Technologies, Inc. | -11.51% |
Nidec Corporation | -7.78% |
Teleperformance SE | -5.77% |
Bottom contributors to performance during calendar year 2022
eDreams ODIGEO S.A. | -61.81% |
Nidec Corporation | -55.55% |
Accenture plc | -34.75% |
Mirion Technologies is the global leader in ionizing radiation measurement and detection technologies serving the nuclear, medical, and civil defense industries. The medical division benefits from an aging population that drives demand for radiation hardware, therapies, and materials; while the nuclear division may benefit from a renewed interest in nuclear power.
Nidec Corporation focuses on creating next-generation drive technologies for everything that spins and moves with a substantial portion of revenue derived from the sale of brushless DC motors. Brushless DC motors are used in many applications across the industrial, automotive, and electronic industries. The market has been transitioning to brushless DC motors because of their increased reliability, longer life, reduced noise, and energy savings, which we expect to continue. Recently, margins have come under pressure due to the ongoing challenges of acquiring semiconductors and other electronic components coupled with the soaring costs of raw materials.
Teleperformance is the worldwide leader in the outsourced customer experience market serving customers in 265 languages and dialects in over 170 markets. The company has a track record of solid organic revenue growth and in employing technologies to drive agent productivity.
26
AVE MARIA WORLD EQUITY FUND
PORTFOLIO MANAGER COMMENTARY
(Unaudited) (Continued)
During the fourth quarter, the Fund eliminated its positions in Adobe Inc. (Technology) and Medtronic plc (Health Care), while initiating new positions in Auto Partner SA (Consumer Discretionary), Canadian Natural Resources Limited (Energy), and F&G Annuities & Life, Inc. (Financials).
Thank you for being a shareholder in the Ave Maria World Equity Fund.

| 
|
Anthony W. Gennaro Jr., CFA, CPA | Sean C. Gaffney, CFA |
Lead Portfolio Manager | Co-Portfolio Manager |
27
AVE MARIA WORLD EQUITY FUND Performance (Unaudited) |
Comparison of the Change in Value of a $10,000 Investment
in the Ave Maria World Equity Fund and the MSCI ACWI Index
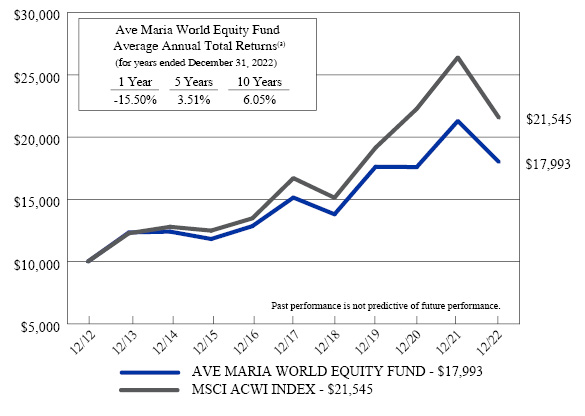
(a) | The returns shown do not reflect the deduction of taxes a shareholder would pay on Fund distributions or the redemption of Fund shares. |
Expense Ratio
information as of: | Year Ended 12-31-21
(as disclosed in May 1, 2022 prospectus) | Year Ended
12-31-22 |
Gross | 0.99%* | 1.12% |
Net | 1.02%* | 1.18% |
* | Includes Acquired Fund Fees and Expenses and had been adjusted to reflect a reduction in the annual management fees of 0.20% effective May 1, 2022 (Note 2). |
Past performance is not predictive of future performance. Investment results and principal value will fluctuate so that shares, when redeemed, may be worth more or less than their original cost. Current performance may be higher or lower than the performance data quoted. Performance data, current to the most recent month end, is available at the Ave Maria Mutual Funds website at www.avemariafunds.com or by calling 1-888-726-9331.
28
AVE MARIA WORLD EQUITY FUND Annual Total Rates of Return
Comparison with Major Indices (Unaudited) |
| AVE MARIA
WORLD EQUITY
FUND | MSCI
ACWI
INDEX |
2010 (a) | 12.4% | 9.1% |
2011 | -9.6% | -7.3% |
2012 | 13.8% | 16.1% |
2013 | 23.5% | 22.8% |
2014 | 0.5% | 4.2% |
2015 | -4.8% | -2.4% |
2016 | 8.7% | 7.9% |
2017 | 17.9% | 24.0% |
2018 | -8.9% | -9.4% |
2019 | 27.7% | 26.6% |
2020 | -0.2% | 16.3% |
2021 | 21.1% | 18.5% |
2022 | -15.5% | -18.4% |
AVERAGE ANNUAL TOTAL RETURNS
As of December 31, 2022 (Unaudited)
| AVE MARIA
WORLD EQUITY
FUND | MSCI
ACWI
INDEX |
3 Years | 0.7% | 4.0% |
5 Years | 3.5% | 5.2% |
10 Years | 6.1% | 8.0% |
Since Inception (b) | 6.0% | 7.6% |
(a) | Represents the period from the commencement of operations (April 30, 2010) through December 31, 2010. |
(b) | Represents the period from the commencement of operations (April 30, 2010) through December 31, 2022. |
29
AVE MARIA WORLD EQUITY FUND
Ten Largest Equity Holdings
December 31, 2022 (Unaudited)
| | Shares | | | Company | | Fair Value | | | % of Net Assets | |
| | | 16,400 | | | Microsoft Corporation | | $ | 3,933,048 | | | | 5.3 | % |
| | | 10,000 | | | Mastercard, Inc. - Class A | | | 3,477,300 | | | | 4.7 | % |
| | | 14,610 | | | Pioneer Natural Resources Company | | | 3,336,778 | | | | 4.5 | % |
| | | 59,000 | | | Coca-Cola European Partners plc | | | 3,263,880 | | | | 4.4 | % |
| | | 14,200 | | | Chubb Ltd. | | | 3,132,520 | | | | 4.2 | % |
| | | 10,500 | | | Accenture plc - Class A | | | 2,801,820 | | | | 3.7 | % |
| | | 25,000 | | | SAP SE | | | 2,581,810 | | | | 3.4 | % |
| | | 12,450 | | | Lowe’s Companies, Inc. | | | 2,480,538 | | | | 3.4 | % |
| | | 42,200 | | | Edenred | | | 2,297,457 | | | | 3.1 | % |
| | | 6,800 | | | S&P Global, Inc. | | | 2,277,592 | | | | 3.0 | % |
Asset Allocation (Unaudited)
| | % of Net Assets | |
COMMON STOCKS | | | | |
Sector | | | | |
Communications | | | 3.3 | % |
Consumer Discretionary | | | 4.8 | % |
Consumer Staples | | | 5.0 | % |
Energy | | | 9.1 | % |
Financials | | | 19.3 | % |
Health Care | | | 8.0 | % |
Industrials | | | 23.9 | % |
Real Estate | | | 2.2 | % |
Technology | | | 23.4 | % |
| | | | | |
MONEY MARKET FUNDS, LIABILITIES IN EXCESS OF OTHER ASSETS | | | 1.0 | % |
| | | | 100.0 | % |
30
AVE MARIA WORLD EQUITY FUND
Schedule of Investments
December 31, 2022
COMMON STOCKS — 99.0% | | Shares | | | Fair Value | |
Communications — 3.3% | | | | | | | | |
Entertainment Content — 2.0% | | | | | | | | |
Electronic Arts, Inc. | | | 12,000 | | | $ | 1,466,160 | |
| | | | | | | | | |
Internet Media & Services — 1.3% | | | | | | | | |
eDreams ODIGEO S.A. * | | | 240,300 | | | | 1,014,721 | |
| | | | | | | | | |
Consumer Discretionary — 4.8% | | | | | | | | |
Leisure Products — 1.3% | | | | | | | | |
MIPS AB | | | 24,200 | | | | 1,000,451 | |
| | | | | | | | | |
Retail - Discretionary — 3.4% | | | | | | | | |
Lowe’s Companies, Inc. | | | 12,450 | | | | 2,480,538 | |
| | | | | | | | | |
Specialty Retail — 0.1% | | | | | | | | |
Auto Partner S.A. | | | 22,009 | | | | 67,466 | |
| | | | | | | | | |
Consumer Staples — 5.0% | | | | | | | | |
Beverages — 4.4% | | | | | | | | |
Coca-Cola European Partners plc | | | 59,000 | | | | 3,263,880 | |
| | | | | | | | | |
Food — 0.6% | | | | | | | | |
Mondelez International, Inc. - Class A | | | 6,600 | | | | 439,890 | |
| | | | | | | | | |
Energy — 9.1% | | | | | | | | |
Oil & Gas Producers — 9.1% | | | | | | | | |
Canadian Natural Resources Ltd. | | | 16,100 | | | | 894,094 | |
Chevron Corporation | | | 10,350 | | | | 1,857,722 | |
Pioneer Natural Resources Company | | | 14,610 | | | | 3,336,778 | |
Rubis SCA | | | 27,750 | | | | 730,941 | |
| | | | | | | | 6,819,535 | |
Financials — 19.3% | | | | | | | | |
Asset Management — 1.5% | | | | | | | | |
Partners Group Holding AG | | | 1,270 | | | | 1,124,637 | |
| | | | | | | | | |
Banking — 4.1% | | | | | | | | |
HDFC Bank Ltd. - ADR | | | 29,250 | | | | 2,000,993 | |
Truist Financial Corporation | | | 24,500 | | | | 1,054,235 | |
| | | | | | | | 3,055,228 | |
Diversified Financial Services — 3.0% | | | | | | | | |
S&P Global, Inc. | | | 6,800 | | | | 2,277,592 | |
31
AVE MARIA WORLD EQUITY FUND
SCHEDULE OF INVESTMENTS
(Continued)
COMMON STOCKS — 99.0% (Continued) | | Shares | | | Fair Value | |
Financials — 19.3% (Continued) | | | | | | | | |
Insurance — 7.2% | | | | | | | | |
AXA S.A. - ADR | | | 58,600 | | | $ | 1,633,182 | |
Chubb Ltd. | | | 14,200 | | | | 3,132,520 | |
F&G Annuities & Life, Inc. * | | | 32,484 | | | | 650,005 | |
| | | | | | | | 5,415,707 | |
Specialty Finance — 3.5% | | | | | | | | |
Fidelity National Financial, Inc. | | | 22,950 | | | | 863,379 | |
International Money Express, Inc. * | | | 71,500 | | | | 1,742,455 | |
| | | | | | | | 2,605,834 | |
Health Care — 8.0% | | | | | | | | |
Biotech & Pharma — 0.9% | | | | | | | | |
Mirion Technologies, Inc. * | | | 100,000 | | | | 661,000 | |
| | | | | | | | | |
Health Care Facilities & Services — 2.1% | | | | | | | | |
IQVIA Holdings, Inc. * | | | 7,615 | | | | 1,560,237 | |
| | | | | | | | | |
Medical Equipment & Devices — 5.0% | | | | | | | | |
Alcon, Inc. | | | 25,500 | | | | 1,748,025 | |
Stevanato Group S.p.A. | | | 112,481 | | | | 2,021,284 | |
| | | | | | | | 3,769,309 | |
Industrials — 23.9% | | | | | | | | |
Aerospace & Defense — 2.4% | | | | | | | | |
Lockheed Martin Corporation | | | 3,750 | | | | 1,824,337 | |
| | | | | | | | | |
Commercial Services — 3.2% | | | | | | | | |
Karooooo Ltd. | | | 36,808 | | | | 873,454 | |
Teleperformance S.A. - ADR | | | 12,911 | | | | 1,538,475 | |
| | | | | | | | 2,411,929 | |
Commercial Support Services — 5.2% | | | | | | | | |
Edenred | | | 42,200 | | | | 2,297,457 | |
GFL Environmental, Inc. | | | 53,000 | | | | 1,549,190 | |
| | | | | | | | 3,846,647 | |
Diversified Industrials — 2.9% | | | | | | | | |
Eaton Corporation plc | | | 14,000 | | | | 2,197,300 | |
| | | | | | | | | |
Electrical Equipment — 3.6% | | | | | | | | |
Otis Worldwide Corporation | | | 12,000 | | | | 939,720 | |
TE Connectivity Ltd. | | | 15,350 | | | | 1,762,180 | |
| | | | | | | | 2,701,900 | |
Machinery — 2.9% | | | | | | | | |
ITOCHU Corporation | | | 28,000 | | | | 878,297 | |
Nidec Corporation | | | 25,285 | | | | 1,300,936 | |
| | | | | | | | 2,179,233 | |
32
AVE MARIA WORLD EQUITY FUND
SCHEDULE OF INVESTMENTS
(Continued)
COMMON STOCKS — 99.0% (Continued) | | Shares | | | Fair Value | |
Industrials — 23.9% (Continued) | | | | | | | | |
Transportation & Logistics — 3.7% | | | | | | | | |
Canadian National Railway Company | | | 10,000 | | | $ | 1,188,800 | |
Grupo Aeroportuario del Pacifico S.A.B. de C.V. - Series B | | | 109,400 | | | | 1,568,503 | |
| | | | | | | | 2,757,303 | |
Real Estate — 2.2% | | | | | | | | |
Real Estate Services — 1.2% | | | | | | | | |
FirstService Corporation | | | 7,500 | | | | 919,125 | |
| | | | | | | | | |
REITs — 1.0% | | | | | | | | |
Equinix, Inc. | | | 1,075 | | | | 704,157 | |
| | | | | | | | | |
Technology — 23.4% | | | | | | | | |
IT Services — 0.9% | | | | | | | | |
StoneCo Ltd. - Class A * | | | 74,600 | | | | 704,224 | |
| | | | | | | | | |
Semiconductors — 4.0% | | | | | | | | |
Taiwan Semiconductor Manufacturing Company Ltd. - ADR | | | 21,000 | | | | 1,564,290 | |
Texas Instruments, Inc. | | | 8,500 | | | | 1,404,370 | |
| | | | | | | | 2,968,660 | |
Software — 9.3% | | | | | | | | |
Microsoft Corporation | | | 16,400 | | | | 3,933,048 | |
SAP SE | | | 25,000 | | | | 2,581,810 | |
Sapiens International Corporation N.V. | | | 25,652 | | | | 474,049 | |
| | | | | | | | 6,988,907 | |
Technology Hardware — 0.8% | | | | | | | | |
Murata Manufacturing Company Ltd. | | | 11,640 | | | | 573,937 | |
| | | | | | | | | |
Technology Services — 8.4% | | | | | | | | |
Accenture plc - Class A | | | 10,500 | | | | 2,801,820 | |
Mastercard, Inc. - Class A | | | 10,000 | | | | 3,477,300 | |
| | | | | | | | 6,279,120 | |
| | | | | | | | | |
Total Common Stocks (Cost $59,398,929) | | | | | | $ | 74,078,964 | |
33
AVE MARIA WORLD EQUITY FUND
SCHEDULE OF INVESTMENTS
(Continued)
MONEY MARKET FUNDS — 1.2% | | Shares | | | Fair Value | |
Federated Hermes Government Obligations Tax-Managed Fund - Institutional Shares, 3.97% (a) (Cost $936,026) | | | 936,026 | | | $ | 936,026 | |
| | | | | | | | | |
Total Investments at Fair Value — 100.2% (Cost $60,334,955) | | | | | | $ | 75,014,990 | |
| | | | | | | | | |
Liabilities in Excess of Other Assets — (0.2%) | | | | | | | (160,383 | ) |
| | | | | | | | | |
Net Assets — 100.0% | | | | | | $ | 74,854,607 | |
ADR - American Depositary Receipt. |
* | Non-income producing security. |
(a) | The rate shown is the 7-day effective yield as of December 31, 2022. |
See notes to financial statements. |
34
AVE MARIA WORLD EQUITY FUND
Summary of Common Stocks by Country
December 31, 2022 (Unaudited)
Country | | Fair Value | | | % of Net Assets | |
United States ** | | $ | 37,434,223 | | | | 50.0 | % |
France | | | 6,200,055 | | | | 8.3 | % |
Switzerland | | | 6,005,182 | | | | 8.0 | % |
Canada | | | 4,551,209 | | | | 6.1 | % |
United Kingdom | | | 3,263,880 | | | | 4.4 | % |
Japan | | | 2,753,170 | | | | 3.7 | % |
Germany | | | 2,581,810 | | | | 3.5 | % |
Italy | | | 2,021,284 | | | | 2.7 | % |
India | | | 2,000,993 | | | | 2.7 | % |
Mexico | | | 1,568,503 | | | | 2.1 | % |
Taiwan | | | 1,564,290 | | | | 2.1 | % |
Spain | | | 1,014,721 | | | | 1.3 | % |
Sweden | | | 1,000,451 | | | | 1.3 | % |
Singapore | | | 873,454 | | | | 1.2 | % |
Brazil | | | 704,224 | | | | 0.9 | % |
Israel | | | 474,049 | | | | 0.6 | % |
Poland | | | 67,466 | | | | 0.1 | % |
Total | | $ | 74,078,964 | | | | 99.0 | % |
** | Includes any company deemed to be a “non-U.S. company” as defined in the Fund’s Prospectus. According to the Fund’s Prospectus, a “non-U.S. company” is one that is headquartered outside the United States or has at least 50% of its revenues or operations outside of the United States during its most recent fiscal year, at the time of purchase. |
See notes to financial statements. |
35
Ave Maria Focused Fund
Portfolio Manager Commentary
(Unaudited)
Dear Fellow Shareholders:
For the year ended December 31, 2022, the Ave Maria Focused Fund (the “Fund”) had a total return of -34.98% compared with the benchmark S&P MidCap 400 Growth Index of -18.96% and the S&P 500 Index of -18.11%.
| | 2022 Investment Performance |
| Q4 22 | 1 Year | Since
Inception |
Ave Maria Focused Fund | 12.39% | -34.98% | 1.39% |
S&P 500 Index | 7.56% | -18.11% | 13.90% |
S&P MidCap 400 Growth Index | 8.74% | -18.96% | 14.10% |
This was the Fund’s first negative calendar year return since inception in May 2020. When the Fund was launched, these guiding principles were disclosed: Our goal is to compound shareholder capital at a rate in excess of the Fund’s benchmarks. To do so, we invest in companies with 1) durable, forecastable, and growing earnings, 2) a strong competitive advantage resulting in an economic moat, 3) high incremental returns on invested capital, and 4) ethical management teams skilled in both operations and capital allocation. After suffering a down year, we continue to adhere to these guiding principles and believe that, over time, this strategy will serve shareholders well.
The chart below provides the revenue growth rates for each of the top ten holdings of the Fund at year-end. Collectively, the top ten holdings made up 76% of the Fund. Fundamentally, the companies have performed well. Our conclusion is that the weakness in the stock prices during 2022 was driven
36
AVE MARIA FOCUSED FUND
PORTFOLIO MANAGER COMMENTARY
(Unaudited) (Continued)
by multiple contractions, and rising interest rates, as opposed to weakness in their business fundamentals. Assuming the companies continue to perform well operationally, we believe investors will take notice, and sentiment will change.
Company | Percent of Fund | 2022 Revenue
Growth |
GFL Environmental | 11.9% | 33.6% |
eDreams ODIGEO | 11.5% | 69.3% |
APi Group | 11.3% | 71.7% |
DigitalBridge | 10.0% | 50.7% |
Brookfield Corporation (1) | 8.3% | NA |
Permian Basin Royalty Trust | 4.8% | 364.1% |
Green Plains | 4.8% | 35.8% |
Orion Engineered Carbons | 4.7% | 35.9% |
Valvoline (2) | 4.6% | 19.2% |
Radius Global Infrastructure | 4.6% | 32.0% |
(1) | Brookfield Corporation includes both Brookfield Corporation and Brookfield Reinsurance Ltd. but excludes Brookfield Asset Management, which was spun out of both Brookfield Corporation and Brookfield Reinsurance in December. |
(2) | Includes only the continued operations of Valvoline, the instant oil change business, and excludes the global lubricants business, which is in the process of being sold to Aramco. |
Potential catalysts could also help change investor sentiments.
GFL Environmental: GFL is in the process of selling some non-core assets which will allow the company to reduce debt. Also, the company’s renewable natural gas (“RNG”) business could start to generate free cash flow in the second half of 2023.
eDreams: eDreams has materially grown its Prime subscription business. As new Prime members pass their first anniversaries, cash flow should increase materially as the company’s earnings and margins are likely to accelerate as well.
DigitalBridge: DigitalBridge is transforming its business from a REIT that invests from its own balance sheet into a manager of alternative asset funds. Most of the heavy lifting with the transformation is complete. However, due to its on-balance sheet investments, DigitalBridge’s GAAP financials do not look like the financials of its asset manager peer group. Over the next couple of quarters, as DigitalBridge continues to sell its balance sheet investments, the GAAP financials will be simplified.
37
AVE MARIA FOCUSED FUND
PORTFOLIO MANAGER COMMENTARY
(Unaudited) (Continued)
Valvoline: Valvoline is expected to complete its sale of its lubricants business to Aramco in the first half of 2023, with proceeds used to repurchase shares.
Portfolio Changes:
We added 3 new companies to the portfolio in the fourth quarter of 2022.
| | 1) | Orion Engineered Carbons is a specialty chemical business exposed to secularly growing end markets. It is at the tail end of a massive capital expenditure cycle. The company has ample cash to repurchase shares. |
| | 2) | Permian Basin Royalty Trust is a trust that receives royalty payments for mineral rights that it owns in Texas. The most important of its assets are in the Permian Basin. We view the company as a mini-Texas Pacific Land Corporation, another portfolio holding. |
| | 3) | Rice Acquisition Corp. II (“RONI”) is a special-purpose acquisition vehicle, with a lot of upside potential because of the Rice family involvement. |
Saint Josemaria Escriva said, “Let your perseverance not be a blind consequence of the first impulse, the work of inertia; let it be a reflective perseverance”. We wholeheartedly agree with the sentiment. We continue to look for strong operating performance from the holdings of the Fund and remain confident that the market will recognize those developments.
Thank you for investing in the Ave Maria Focused Fund.
With best regards,

| 
|
Chadd M. Garcia, CFA | Adam P. Gaglio, CFA |
Lead Portfolio Manager | Co-Portfolio Manager |
38
AVE MARIA FOCUSED FUND Performance (Unaudited) |
Comparison of the Change in Value of a $10,000 Investment
in the Ave Maria Focused Fund and the S&P MidCap 400 Growth Index

(a) | The return shown does not reflect the deduction of taxes a shareholder would pay on Fund distributions or the redemption of Fund shares. |
(b) | Represents the period from the commencement of operations (May 1, 2020) through December 31, 2022. |
Expense ratio as of 12-31-21 (as disclosed in May 1, 2022 prospectus) | 1.12%* |
Expense ratio for the year ended 12-31-22 | 1.14% |
* | Includes Acquired Fund Fees and Expenses and had been adjusted to reflect a reduction in the annual management fees of 0.10% effective May 1, 2022 (Note 2). |
Past performance is not predictive of future performance. Investment results and principal value will fluctuate so that shares, when redeemed, may be worth more or less than their original cost. Current performance may be higher or lower than the performance data quoted. Performance data, current to the most recent month end, is available at the Ave Maria Mutual Funds website at www.avemariafunds.com or by calling 1-888-726-9331.
39
AVE MARIA FOCUSED FUND Annual Total Rates of Return
Comparison with Major Indices (Unaudited) |
| AVE MARIA
FOCUSED FUND | S&P MIDCAP 400
GROWTH INDEX |
2020 (a) | 24.7% | 47.6% |
2021 | 28.0% | 18.9% |
2022 | -35.0% | -19.0% |
AVERAGE ANNUAL TOTAL RETURNS
As of December 31, 2022 (Unaudited)
| AVE MARIA
FOCUSED FUND | S&P MIDCAP 400
GROWTH INDEX |
Since Inception (b) | 1.4% | 14.1% |
(a) | Represents the period from the commencement of operations (May 1, 2020) through December 31, 2020. |
(b) | Represents the period from the commencement of operations (May 1, 2020) through December 31, 2022. |
40
AVE MARIA FOCUSED FUND
Ten Largest Equity Holdings
December 31, 2022 (Unaudited)
| | Shares | | | Company | | Fair Value | | | % of Net Assets | |
| | | 205,295 | | | Brookfield Asset Management* | | $ | 6,233,867 | | | | 12.9 | % |
| | | 196,896 | | | GFL Environmental, Inc. | | | 5,755,270 | | | | 11.9 | % |
| | | 1,313,620 | | | eDreams ODIEGO S.A. | | | 5,547,059 | | | | 11.5 | % |
| | | 288,209 | | | API Group Corporation | | | 5,421,211 | | | | 11.3 | % |
| | | 441,341 | | | DigitalBridge Group, Inc. | | | 4,828,270 | | | | 10.0 | % |
| | | 91,893 | | | Permian Basin Royalty Trust | | | 2,315,704 | | | | 4.8 | % |
| | | 74,896 | | | Green Plains, Inc. | | | 2,284,328 | | | | 4.8 | % |
| | | 126,157 | | | Orion Engineered Carbons S.A. | | | 2,246,856 | | | | 4.7 | % |
| | | 68,397 | | | Valvoline, Inc. | | | 2,233,162 | | | | 4.6 | % |
| | | 187,926 | | | Radius Global Infrastructure, Inc. - Class A | | | 2,221,286 | | | | 4.6 | % |
* | Combination of Brookfield Asset Management Ltd. - Class A, Brookfield Corporation & Brookfield Reinsurance Ltd. |
Asset Allocation (Unaudited)
| | % of Net Assets | |
COMMON STOCKS | | | | |
Sector | | | | |
Communications | | | 21.5 | % |
Energy | | | 9.6 | % |
Financials | | | 16.0 | % |
Health Care | | | 4.1 | % |
Industrials | | | 25.0 | % |
Materials | | | 9.3 | % |
Real Estate | | | 5.6 | % |
Technology | | | 7.5 | % |
| | | | | |
MONEY MARKET FUNDS, OTHER ASSETS IN EXCESS OF LIABILITIES | | | 1.4 | % |
| | | | 100.0 | % |
41
AVE MARIA FOCUSED FUND
Schedule of Investments
December 31, 2022
COMMON STOCKS — 98.6% | | Shares | | | Fair Value | |
Communications — 21.5% | | | | | | | | |
Internet Media & Services — 11.5% | | | | | | | | |
eDreams ODIGEO S.A. * | | | 1,313,620 | | | $ | 5,547,059 | |
| | | | | | | | | |
Telecommunications — 10.0% | | | | | | | | |
DigitalBridge Group, Inc. | | | 441,341 | | | | 4,828,270 | |
| | | | | | | | | |
Energy — 9.6% | | | | | | | | |
Oil & Gas Producers — 4.8% | | | | | | | | |
Permian Basin Royalty Trust | | | 91,893 | | | | 2,315,704 | |
| | | | | | | | | |
Renewable Energy — 4.8% | | | | | | | | |
Green Plains, Inc. * | | | 74,896 | | | | 2,284,328 | |
| | | | | | | | | |
Financials — 16.0% | | | | | | | | |
Asset Management — 16.0% | | | | | | | | |
Brookfield Asset Management Ltd. - Class A * | | | 76,471 | | | | 2,192,424 | |
Brookfield Corporation | | | 61,999 | | | | 1,950,489 | |
Brookfield Reinsurance Ltd. * | | | 66,825 | | | | 2,090,954 | |
Rice Acquisition Corp. II - Class A * | | | 145,596 | | | | 1,480,711 | |
| | | | | | | | 7,714,578 | |
Health Care — 4.1% | | | | | | | | |
Health Care Facilities & Services — 4.1% | | | | | | | | |
Chemed Corporation | | | 3,846 | | | | 1,963,114 | |
| | | | | | | | | |
Industrials — 25.0% | | | | | | | | |
Aerospace & Defense — 1.8% | | | | | | | | |
AMMO, Inc. * | | | 503,000 | | | | 870,190 | |
| | | | | | | | | |
Commercial Support Services — 11.9% | | | | | | | | |
GFL Environmental, Inc. | | | 196,896 | | | | 5,755,270 | |
| | | | | | | | | |
Electrical Equipment — 11.3% | | | | | | | | |
API Group Corporation * | | | 288,209 | | | | 5,421,211 | |
| | | | | | | | | |
Materials — 9.3% | | | | | | | | |
Chemicals — 9.3% | | | | | | | | |
Orion Engineered Carbons S.A. | | | 126,157 | | | | 2,246,856 | |
Valvoline, Inc. | | | 68,397 | | | | 2,233,162 | |
| | | | | | | | 4,480,018 | |
Real Estate — 5.6% | | | | | | | | |
Real Estate Owners & Developers — 5.6% | | | | | | | | |
Radius Global Infrastructure, Inc. - Class A * | | | 187,926 | | | | 2,221,286 | |
42
AVE MARIA FOCUSED FUND
SCHEDULE OF INVESTMENTS
(Continued)
COMMON STOCKS — 98.6% (Continued) | | Shares | | | Fair Value | |
Real Estate — 5.6% (Continued) | | | | | | | | |
Real Estate Owners & Developers — 5.6% (Continued) | | | | | | | | |
Texas Pacific Land Corporation | | | 210 | | | $ | 492,288 | |
| | | | | | | | 2,713,574 | |
Technology — 7.5% | | | | | | | | |
Software — 6.5% | | | | | | | | |
Microsoft Corporation | | | 7,196 | | | | 1,725,745 | |
Tyler Technologies, Inc. * | | | 4,377 | | | | 1,411,188 | |
| | | | | | | | 3,136,933 | |
Technology Hardware — 1.0% | | | | | | | | |
NextDC Ltd. * | | | 76,723 | | | | 473,380 | |
| | | | | | | | | |
Total Common Stocks (Cost $55,746,194) | | | | | | $ | 47,503,629 | |
MONEY MARKET FUNDS — 0.9% | | Shares | | | Fair Value | |
Federated Hermes Government Obligations Tax-Managed Fund - Institutional Shares, 3.97% (a) (Cost $412,069) | | | 412,069 | | | $ | 412,069 | |
| | | | | | | | | |
Total Investments at Fair Value — 99.5% (Cost $56,158,263) | | | | | | $ | 47,915,698 | |
| | | | | | | | | |
Other Assets in Excess of Liabilities — 0.5% | | | | | | | 256,362 | |
| | | | | | | | | |
Net Assets — 100.0% | | | | | | $ | 48,172,060 | |
* | Non-income producing security. |
(a) | The rate shown is the 7-day effective yield as of December 31, 2022. |
See notes to financial statements. |
43
Ave Maria Bond Fund
Portfolio Manager Commentary
(Unaudited)
Dear Fellow Shareholders:
For the year ended December 31, 2022, the Ave Maria Bond Fund (the “Fund”) returned -2.9% compared to -8.2% for the benchmark, the Bloomberg Intermediate U.S. Government/Credit Index. The Fund’s shorter duration profile, along with the positive performance from the dividend-paying common stocks in the portfolio, accounted for the favorable relative outperformance compared to the benchmark.
Interest rates across the yield curve quickly increased as the Federal Reserve (the Fed) was forced into action due to high inflation. Short-term interest rates were increased from near zero to 4.5% by year-end, and Quantitative Tightening (Q.T.) was implemented to further restrict economic activity. Further interest rate increases are forecasted and will likely continue until inflation subsides.
Top contributors to the Fund’s performance were the common stocks of Texas Pacific Land Corporation (royalty income – oil and gas), Chevron Corporation (integrated oils), and Lockheed Martin Corporation (defense). The Fund’s weakest performing assets were the common stocks of VF Corporation (apparel), Medtronic plc (medical devices), and Truist Financial Corporation (bank).
Interest rates and corporate credit spreads increased substantially over the past year. Therefore, the Fund has been modestly increasing duration and credit risk to capitalize on this opportunity. Even with the adjustment, the Fund remains conservatively positioned. Dividend-paying common stocks continue to offer an attractive combination of income and price appreciation potential.
We appreciate your investment in the Ave Maria Bond Fund.

| 
|
Brandon S. Scheitler | George P. Schwartz, CFA |
Lead Portfolio Manager | Co-Portfolio Manager |
44
AVE MARIA BOND FUND Performance (Unaudited) |
Comparison of the Change in Value of a $10,000 Investment
in the Ave Maria Bond Fund and the Bloomberg
U.S. Intermediate Government/Credit Index
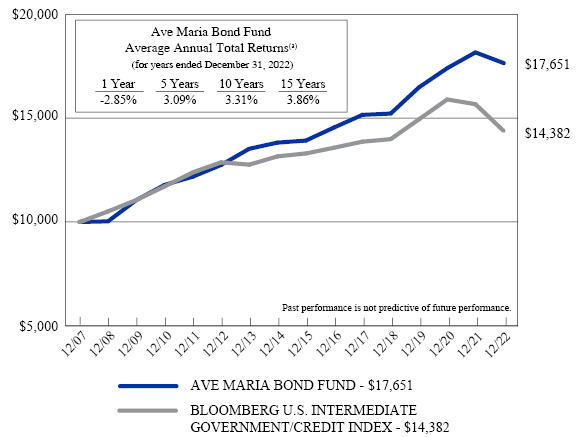
(a) | The returns shown do not reflect the deduction of taxes a shareholder would pay on Fund distributions or the redemption of Fund shares. |
Expense ratio as of 12-31-21 (as disclosed in May 1, 2022 prospectus) | 0.44%* |
Expense ratio for the year ended 12-31-22 | 0.41% |
* | Includes Acquired Fund Fees and Expenses. |
Past performance is not predictive of future performance. Investment results and principal value will fluctuate so that shares, when redeemed, may be worth more or less than their original cost. Current performance may be higher or lower than the performance data quoted. Performance data, current to the most recent month end, is available at the Ave Maria Mutual Funds website at www.avemariafunds.com or by calling 1-888-726-9331.
45
AVE MARIA BOND FUND Annual Total Rates of Return
Comparison with Major Indices (Unaudited) |
| AVE MARIA BOND FUND | BLOOMBERG
U.S. INTERMEDIATE
GOVERNMENT/
CREDIT INDEX |
2003 (a) | 2.4% | 1.9% |
2004 | 5.1% | 3.0% |
2005 | 1.4% | 1.6% |
2006 | 6.0% | 4.1% |
2007 | 4.8% | 7.4% |
2008 | 0.3% | 5.1% |
2009 | 10.2% | 5.2% |
2010 | 6.7% | 5.9% |
2011 | 3.3% | 5.8% |
2012 | 4.6% | 3.9% |
2013 | 6.1% | -0.9% |
2014 | 2.2% | 3.1% |
2015 | 0.7% | 1.1% |
2016 | 4.5% | 2.1% |
2017 | 4.2% | 2.1% |
2018 | 0.4% | 0.9% |
2019 | 8.3% | 6.8% |
2020 | 5.6% | 6.4% |
2021 | 4.4% | -1.4% |
2022 | -2.9% | -8.2% |
AVERAGE ANNUAL TOTAL RETURNS
As of December 31, 2022 (Unaudited)
| AVE MARIA BOND FUND | BLOOMBERG
U.S. INTERMEDIATE
GOVERNMENT/
CREDIT INDEX |
3 Years | 2.3% | -1.3% |
5 Years | 3.1% | 0.7% |
10 Years | 3.3% | 1.1% |
15 Years | 3.9% | 2.5% |
Since Inception (b) | 3.9% | 2.8% |
(a) | Represents the period from the commencement of operations (May 1, 2003) through December 31, 2003. |
(b) | Represents the period from the commencement of operations (May 1, 2003) through December 31, 2022. |
46
AVE MARIA BOND FUND
Ten Largest Holdings*
December 31, 2022 (Unaudited)
| | Par Value/
Shares | | | Holding | | Fair Value | | | % of Net Assets | |
| | | 25,000 | | | Lockheed Martin Corporation | | $ | 12,162,250 | | | | 2.4 | % |
| | $ | 11,814,600 | | | U.S. Treasury Inflation-Protected Notes, 0.500%, due 04/15/24 | | | 11,494,083 | | | | 2.2 | % |
| | | 100,000 | | | Exxon Mobil Corporation | | | 11,030,000 | | | | 2.2 | % |
| | $ | 10,000,000 | | | U.S. Treasury Notes, 4.500%, due 11/15/25 | | | 10,068,750 | | | | 2.0 | % |
| | $ | 10,601,000 | | | Illinois Tool Works, Inc., 2.650%, due 11/15/26 | | | 9,858,339 | | | | 1.9 | % |
| | $ | 10,000,000 | | | U.S. Treasury Notes, 2.875%, due 11/30/23 | | | 9,836,719 | | | | 1.9 | % |
| | $ | 10,000,000 | | | U.S. Treasury Notes, 2.875%, due 06/15/25 | | | 9,672,656 | | | | 1.9 | % |
| | | 4,100 | | | Texas Pacific Land Corporation | | | 9,611,343 | | | | 1.9 | % |
| | $ | 10,000,000 | | | U.S. Treasury Notes, 3.250%, due 06/30/29 | | | 9,591,406 | | | | 1.9 | % |
| | $ | 10,000,000 | | | U.S. Treasury Notes, 2.125%, due 11/30/24 | | | 9,577,734 | | | | 1.9 | % |
* | Excludes cash equivalents. |
Asset Allocation (Unaudited)
| | % of Net Assets | |
U.S. GOVERNMENT & AGENCIES | | | 24.5 | % |
| | | | | |
CORPORATE BONDS | | | | |
Sector | | | | |
Communications | | | 1.1 | % |
Consumer Discretionary | | | 6.7 | % |
Consumer Staples | | | 10.4 | % |
Energy | | | 4.1 | % |
Financials | | | 3.1 | % |
Health Care | | | 1.8 | % |
Industrials | | | 6.1 | % |
Materials | | | 2.3 | % |
Technology | | | 15.8 | % |
| | | | | |
COMMON STOCKS | | | | |
Sector | | | | |
Consumer Discretionary | | | 1.3 | % |
Consumer Staples | | | 1.6 | % |
Energy | | | 3.9 | % |
Financials | | | 3.2 | % |
Health Care | | | 1.0 | % |
Industrials | | | 5.4 | % |
Real Estate | | | 1.9 | % |
Technology | | | 1.2 | % |
| | | | | |
MONEY MARKET FUNDS, OTHER ASSETS IN EXCESS OF LIABILITIES | | | 4.6 | % |
| | | | 100.0 | % |
47
AVE MARIA BOND FUND
Schedule of Investments
December 31, 2022
U.S. GOVERNMENT & AGENCIES — 24.5% | | Par Value | | | Fair Value | |
U.S. Treasury Inflation-Protected Notes — 11.5% (a) | | | | | | | | |
0.625%, due 04/15/23 | | $ | 6,477,894 | | | $ | 6,411,723 | |
0.500%, due 04/15/24 | | | 11,814,600 | | | | 11,494,083 | |
2.375%, due 01/15/25 | | | 4,742,370 | | | | 4,749,224 | |
0.625%, due 01/15/26 | | | 6,270,200 | | | | 6,023,801 | |
2.000%, due 01/15/26 | | | 4,503,900 | | | | 4,502,009 | |
0.125%, due 04/15/26 | | | 5,681,100 | | | | 5,345,708 | |
0.375%, due 01/15/27 | | | 4,810,806 | | | | 4,541,013 | |
0.375%, due 07/15/27 | | | 7,917,715 | | | | 7,469,792 | |
0.500%, due 01/15/28 | | | 6,040,000 | | | | 5,685,858 | |
0.750%, due 07/15/28 | | | 2,967,675 | | | | 2,830,014 | |
| | | | | | | | 59,053,225 | |
U.S. Treasury Notes — 13.0% | | | | | | | | |
2.875%, due 11/30/23 | | | 10,000,000 | | | | 9,836,719 | |
2.125%, due 11/30/24 | | | 10,000,000 | | | | 9,577,734 | |
1.375%, due 01/31/25 | | | 10,000,000 | | | | 9,403,516 | |
2.875%, due 06/15/25 | | | 10,000,000 | | | | 9,672,656 | |
4.500%, due 11/15/25 | | | 10,000,000 | | | | 10,068,750 | |
3.250%, due 06/30/29 | | | 10,000,000 | | | | 9,591,406 | |
1.500%, due 02/15/30 | | | 10,000,000 | | | | 8,544,531 | |
| | | | | | | | 66,695,312 | |
Total U.S. Government & Agencies (Cost $133,000,091) | | | | | | $ | 125,748,537 | |
CORPORATE BONDS — 51.4% | | Par Value | | | Fair Value | |
Communications — 1.1% | | | | | | | | |
Electronic Arts, Inc., 4.800%, due 03/01/26 | | $ | 5,500,000 | | | $ | 5,487,634 | |
| | | | | | | | | |
Consumer Discretionary — 6.7% | | | | | | | | |
Genuine Parts Company, 1.875%, due 11/01/30 | | | 775,000 | | | | 598,615 | |
Lowe’s Companies, Inc., 3.125%, due 09/15/24 | | | 800,000 | | | | 774,464 | |
Lowe’s Companies, Inc., 3.375%, due 09/15/25 | | | 1,500,000 | | | | 1,442,029 | |
Lowe’s Companies, Inc., 2.500%, due 04/15/26 | | | 3,000,000 | | | | 2,799,361 | |
Lowe’s Companies, Inc., 3.100%, due 05/03/27 | | | 9,050,000 | | | | 8,440,793 | |
Lowe’s Companies, Inc., 1.300%, due 04/15/28 | | | 400,000 | | | | 332,948 | |
Lowe’s Companies, Inc., 1.700%, due 10/15/30 | | | 925,000 | | | | 725,544 | |
Ross Stores, Inc., 3.375%, due 09/15/24 | | | 3,000,000 | | | | 2,912,054 | |
Ross Stores, Inc., 0.875%, due 04/15/26 | | | 5,255,000 | | | | 4,617,412 | |
Ross Stores, Inc., 4.700%, due 04/15/27 | | | 1,300,000 | | | | 1,280,781 | |
TJX Companies, Inc. (The), 2.500%, due 05/15/23 | | | 2,000,000 | | | | 1,982,144 | |
TJX Companies, Inc. (The), 2.250%, due 09/15/26 | | | 4,226,000 | | | | 3,870,230 | |
TJX Companies, Inc. (The), 1.150%, due 05/15/28 | | | 2,000,000 | | | | 1,672,398 | |
TJX Companies, Inc. (The), 3.875%, due 04/15/30 | | | 1,312,000 | | | | 1,224,705 | |
48
AVE MARIA BOND FUND
SCHEDULE OF INVESTMENTS
(Continued)
CORPORATE BONDS — 51.4% (Continued) | | Par Value | | | Fair Value | |
Consumer Discretionary — 6.7% (Continued) | | | | | | | | |
VF Corporation, 2.400%, due 04/23/25 | | $ | 650,000 | | | $ | 609,928 | |
VF Corporation, 2.800%, due 04/23/27 | | | 1,200,000 | | | | 1,088,957 | |
| | | | | | | | 34,372,363 | |
Consumer Staples — 10.4% | | | | | | | | |
Coca-Cola Company (The), 1.450%, due 06/01/27 | | | 7,952,000 | | | | 7,031,762 | |
Coca-Cola Company (The), 1.000%, due 03/15/28 | | | 1,000,000 | | | | 837,366 | |
Coca-Cola Company (The), 2.125%, due 09/06/29 | | | 1,550,000 | | | | 1,328,972 | |
Colgate-Palmolive Company, 1.950%, due 02/01/23 | | | 2,663,000 | | | | 2,657,501 | |
Colgate-Palmolive Company, 3.250%, due 03/15/24 | | | 795,000 | | | | 781,988 | |
Colgate-Palmolive Company, 3.100%, due 08/15/27 | | | 5,000,000 | | | | 4,739,257 | |
Hershey Company (The), 2.625%, due 05/01/23 | | | 4,536,000 | | | | 4,500,082 | |
Hershey Company (The), 3.375%, due 05/15/23 | | | 500,000 | | | | 497,439 | |
Hershey Company (The), 2.050%, due 11/15/24 | | | 3,200,000 | | | | 3,043,831 | |
Hershey Company (The), 0.900%, due 06/01/25 | | | 7,450,000 | | | | 6,804,826 | |
Hershey Company (The), 3.200%, due 08/21/25 | | | 645,000 | | | | 621,743 | |
Hershey Company (The), 2.300%, due 08/15/26 | | | 2,000,000 | | | | 1,840,131 | |
Hormel Foods Corporation, 1.700%, due 06/03/28 | | | 895,000 | | | | 774,137 | |
Hormel Foods Corporation, 1.800%, due 06/11/30 | | | 5,863,000 | | | | 4,778,815 | |
JM Smucker Company (The), 3.375%, due 12/15/27 | | | 3,750,000 | | | | 3,474,222 | |
Kimberly-Clark Corporation, 2.400%, due 06/01/23 | | | 440,000 | | | | 435,576 | |
Kimberly-Clark Corporation, 2.650%, due 03/01/25 | | | 1,115,000 | | | | 1,065,583 | |
Kimberly-Clark Corporation, 2.750%, due 02/15/26 | | | 1,343,000 | | | | 1,266,801 | |
Kimberly-Clark Corporation, 1.050%, due 09/15/27 | | | 5,047,000 | | | | 4,310,287 | |
McCormick & Company, Inc., 3.500%, due 09/01/23 | | | 2,500,000 | | | | 2,473,385 | |
| | | | | | | | 53,263,704 | |
Energy — 4.1% | | | | | | | | |
Chevron Corporation, 2.895%, due 03/03/24 | | | 1,824,000 | | | | 1,783,337 | |
Chevron Corporation, 3.900%, due 11/15/24 | | | 550,000 | | | | 540,890 | |
Chevron Corporation, 2.954%, due 05/16/26 | | | 1,450,000 | | | | 1,377,455 | |
Chevron Corporation, 8.000%, due 04/01/27 | | | 2,600,000 | | | | 2,931,733 | |
Chevron Corporation, 1.995%, due 05/11/27 | | | 5,840,000 | | | | 5,252,870 | |
Chevron Corporation, 1.018%, due 08/12/27 | | | 1,150,000 | | | | 988,110 | |
Exxon Mobil Corporation, 3.176%, due 03/15/24 | | | 1,634,000 | | | | 1,602,055 | |
Exxon Mobil Corporation, 2.019%, due 08/16/24 | | | 2,650,000 | | | | 2,535,824 | |
Exxon Mobil Corporation, 2.709%, due 03/06/25 | | | 998,000 | | | | 954,938 | |
Pioneer Natural Resources, 1.125%, due 01/15/26 | | | 2,578,000 | | | | 2,300,282 | |
Pioneer Natural Resources, 1.900%, due 08/15/30 | | | 1,330,000 | | | | 1,044,944 | |
| | | | | | | | 21,312,438 | |
Financials — 3.1% | | | | | | | | |
Chubb INA Holdings, Inc., 3.150%, due 03/15/25 | | | 4,309,000 | | | | 4,163,764 | |
Chubb INA Holdings, Inc., 3.350%, due 05/03/26 | | | 500,000 | | | | 478,797 | |
PNC Financial Services Group, Inc. (The), 3.250%, due 06/01/25 | | | 1,528,000 | | | | 1,475,175 | |
49
AVE MARIA BOND FUND
SCHEDULE OF INVESTMENTS
(Continued)
CORPORATE BONDS — 51.4% (Continued) | | Par Value | | | Fair Value | |
Financials — 3.1% (Continued) | | | | | | | | |
PNC Financial Services Group, Inc. (The), 3.150%, due 05/19/27 | | $ | 400,000 | | | $ | 374,142 | |
PNC Financial Services Group, Inc. (The), 3.250%, due 01/22/28 | | | 4,380,000 | | | | 4,091,857 | |
S&P Global, Inc., 2.950%, due 01/22/27 | | | 3,675,000 | | | | 3,442,718 | |
Truist Financial Corporation, 2.250%, due 03/11/30 | | | 900,000 | | | | 729,734 | |
U.S. Bancorp, 3.375%, due 02/05/24 | | | 1,000,000 | | | | 982,425 | |
| | | | | | | | 15,738,612 | |
Health Care — 1.8% | | | | | | | | |
Stryker Corporation, 3.375%, due 05/15/24 | | | 5,500,000 | | | | 5,372,962 | |
Stryker Corporation, 3.375%, due 11/01/25 | | | 1,026,000 | | | | 990,462 | |
Stryker Corporation, 3.500%, due 03/15/26 | | | 2,904,000 | | | | 2,790,363 | |
| | | | | | | | 9,153,787 | |
Industrials — 6.1% | | | | | | | | |
3M Company, 2.250%, due 03/15/23 | | | 3,000,000 | | | | 2,983,374 | |
Hubbell, Inc., 3.150%, due 08/15/27 | | | 4,180,000 | | | | 3,805,721 | |
Illinois Tool Works, Inc., 3.500%, due 03/01/24 | | | 2,450,000 | | | | 2,412,505 | |
Illinois Tool Works, Inc., 2.650%, due 11/15/26 | | | 10,601,000 | | | | 9,858,339 | |
Lockheed Martin Corporation, 3.550%, due 01/15/26 | | | 3,848,000 | | | | 3,741,624 | |
PACCAR Financial Corporation, 1.800%, due 02/06/25 | | | 350,000 | | | | 329,559 | |
PACCAR Financial Corporation, 1.100%, due 05/11/26 | | | 835,000 | | | | 744,912 | |
PACCAR Financial Corporation, 2.000%, due 02/04/27 | | | 500,000 | | | | 451,895 | |
United Parcel Service, Inc., 2.200%, due 09/01/24 | | | 3,410,000 | | | | 3,265,531 | |
United Parcel Service, Inc., 2.800%, due 11/15/24 | | | 1,000,000 | | | | 964,175 | |
United Parcel Service, Inc., 2.400%, due 11/15/26 | | | 2,869,000 | | | | 2,665,420 | |
| | | | | | | | 31,223,055 | |
Materials — 2.3% | | | | | | | | |
Ecolab, Inc., 2.700%, due 11/01/26 | | | 6,438,000 | | | | 5,983,034 | |
Ecolab, Inc., 3.250%, due 12/01/27 | | | 3,676,000 | | | | 3,426,263 | |
Ecolab, Inc., 1.300%, due 01/30/31 | | | 1,450,000 | | | | 1,107,306 | |
RPM International, Inc., 3.750%, due 03/15/27 | | | 1,250,000 | | | | 1,165,356 | |
| | | | | | | | 11,681,959 | |
Technology — 15.8% | | | | | | | | |
Broadridge Financial Solutions, Inc., 3.400%, due 06/27/26 | | | 500,000 | | | | 468,991 | |
Broadridge Financial Solutions, Inc., 2.900%, due 12/01/29 | | | 6,500,000 | | | | 5,519,943 | |
Cisco Systems, Inc., 2.600%, due 02/28/23 | | | 2,475,000 | | | | 2,467,197 | |
Cisco Systems, Inc., 3.625%, due 03/04/24 | | | 3,500,000 | | | | 3,444,292 | |
Cisco Systems, Inc., 3.500%, due 06/15/25 | | | 5,000,000 | | | | 4,862,746 | |
Cisco Systems, Inc., 2.950%, due 02/28/26 | | | 1,000,000 | | | | 954,532 | |
Cisco Systems, Inc., 2.500%, due 09/20/26 | | | 3,080,000 | | | | 2,871,361 | |
Mastercard, Inc., 3.375%, due 04/01/24 | | | 3,855,000 | | | | 3,785,470 | |
50
AVE MARIA BOND FUND
SCHEDULE OF INVESTMENTS
(Continued)
CORPORATE BONDS — 51.4% (Continued) | | Par Value | | | Fair Value | |
Technology — 15.8% (Continued) | | | | | | | | |
Mastercard, Inc., 2.000%, due 03/03/25 | | $ | 5,625,000 | | | $ | 5,316,837 | |
Mastercard, Inc., 2.950%, due 11/21/26 | | | 2,000,000 | | | | 1,887,778 | |
Mastercard, Inc., 3.300%, due 03/26/27 | | | 5,199,000 | | | | 4,959,858 | |
Mastercard, Inc., 3.500%, due 02/26/28 | | | 450,000 | | | | 427,932 | |
Microsoft Corporation, 2.400%, due 08/08/26 | | | 5,750,000 | | | | 5,364,153 | |
Microsoft Corporation, 3.300%, due 02/06/27 | | | 5,320,000 | | | | 5,132,410 | |
Moody’s Corporation, 4.875%, due 02/15/24 | | | 1,500,000 | | | | 1,495,619 | |
Moody’s Corporation, 3.250%, due 01/15/28 | | | 5,550,000 | | | | 5,133,263 | |
Moody’s Corporation, 4.250%, due 02/01/29 | | | 5,000,000 | | | | 4,794,258 | |
Texas Instruments, Inc., 2.250%, due 05/01/23 | | | 2,500,000 | | | | 2,480,594 | |
Texas Instruments, Inc., 1.375%, due 03/12/25 | | | 1,160,000 | | | | 1,083,862 | |
Texas Instruments, Inc., 2.900%, due 11/03/27 | | | 740,000 | | | | 689,783 | |
Texas Instruments, Inc., 2.250%, due 09/04/29 | | | 1,112,000 | | | | 963,885 | |
Texas Instruments, Inc., 1.750%, due 05/04/30 | | | 4,880,000 | | | | 4,026,546 | |
Visa, Inc., 3.150%, due 12/14/25 | | | 3,905,000 | | | | 3,765,158 | |
Visa, Inc., 1.900%, due 04/15/27 | | | 3,854,000 | | | | 3,476,517 | |
Visa, Inc., 2.750%, due 09/15/27 | | | 6,051,000 | | | | 5,605,706 | |
| | | | | | | | 80,978,691 | |
| | | | | | | | | |
Total Corporate Bonds (Cost $284,010,706) | | | | | | $ | 263,212,243 | |
COMMON STOCKS — 19.5% | | Shares | | | Fair Value | |
Consumer Discretionary — 1.3% | | | | | | | | |
Retail — Discretionary — 1.3% | | | | | | | | |
Genuine Parts Company | | | 40,000 | | | $ | 6,940,400 | |
| | | | | | | | | |
Consumer Staples — 1.6% | | | | | | | | |
Beverages — 1.6% | | | | | | | | |
Coca-Cola European Partners plc | | | 150,000 | | | | 8,298,000 | |
| | | | | | | | | |
Energy — 3.9% | | | | | | | | |
Oil & Gas Producers — 3.9% | | | | | | | | |
Chevron Corporation | | | 50,000 | | | | 8,974,500 | |
Exxon Mobil Corporation | | | 100,000 | | | | 11,030,000 | |
| | | | | | | | 20,004,500 | |
Financials — 3.2% | | | | | | | | |
Banking — 1.8% | | | | | | | | |
First Horizon Corporation | | | 85,500 | | | | 2,094,750 | |
Truist Financial Corporation | | | 169,000 | | | | 7,272,070 | |
| | | | | | | | 9,366,820 | |
51
AVE MARIA BOND FUND
SCHEDULE OF INVESTMENTS
(Continued)
COMMON STOCKS — 19.5% (Continued) | | Shares | | | Fair Value | |
Financials — 3.2% (Continued) | | | | | | | | |
Insurance — 0.1% | | | | | | | | |
F&G Annuities & Life, Inc. * | | | 12,240 | | | $ | 244,922 | |
| | | | | | | | | |
Specialty Finance — 1.3% | | | | | | | | |
Fidelity National Financial, Inc. | | | 180,000 | | | | 6,771,600 | |
| | | | | | | | | |
Health Care — 1.0% | | | | | | | | |
Medical Equipment & Devices — 1.0% | | | | | | | | |
Medtronic plc | | | 64,000 | | | | 4,974,080 | |
| | | | | | | | | |
Industrials — 5.4% | | | | | | | | |
Aerospace & Defense — 2.4% | | | | | | | | |
Lockheed Martin Corporation | | | 25,000 | | | | 12,162,250 | |
| | | | | | | | | |
Industrial Support Services — 2.1% | | | | | | | | |
Fastenal Company | | | 106,000 | | | | 5,015,920 | |
Watsco, Inc. | | | 24,000 | | | | 5,985,600 | |
| | | | | | | | 11,001,520 | |
Transportation & Logistics — 0.9% | | | | | | | | |
United Parcel Service, Inc. - Class B | | | 25,000 | | | | 4,346,000 | |
| | | | | | | | | |
Real Estate — 1.9% | | | | | | | | |
Real Estate Owners & Developers — 1.9% | | | | | | | | |
Texas Pacific Land Corporation | | | 4,100 | | | | 9,611,343 | |
| | | | | | | | | |
Technology — 1.2% | | | | | | | | |
Semiconductors — 1.2% | | | | | | | | |
Texas Instruments, Inc. | | | 37,000 | | | | 6,113,140 | |
| | | | | | | | | |
Total Common Stocks (Cost $68,997,590) | | | | | | $ | 99,834,575 | |
52
AVE MARIA BOND FUND
SCHEDULE OF INVESTMENTS
(Continued)
MONEY MARKET FUNDS — 4.1% | | Shares | | | Fair Value | |
Federated Hermes Government Obligations Tax-Managed Fund - Institutional Shares, 3.97% (b) (Cost $21,098,416) | | | 21,098,416 | | | $ | 21,098,416 | |
| | | | | | | | | |
Total Investments at Fair Value — 99.5% (Cost $507,106,803) | | | | | | $ | 509,893,771 | |
| | | | | | | | | |
Other Assets in Excess of Liabilities — 0.5% | | | | | | | 2,691,475 | |
| | | | | | | | | |
Net Assets — 100.0% | | | | | | $ | 512,585,246 | |
* | Non-income producing security. |
(a) | Interest rate for this investment is the stated rate. Interest payments are determined based on the inflation adjusted principal. |
(b) | The rate shown is the 7-day effective yield as of December 31, 2022. |
See notes to financial statements. |
53
AVE MARIA MUTUAL FUNDS
Statements of Assets and Liabilities
December 31, 2022
| | Ave Maria
Value Fund | | | Ave Maria
Growth Fund | | | Ave Maria
Rising
Dividend Fund | |
ASSETS | | | | | | | | | | | | |
Investment securities: | | | | | | | | | | | | |
At cost | | $ | 261,374,498 | | | $ | 556,602,983 | | | $ | 660,675,605 | |
At fair value (Note 1) | | $ | 370,986,119 | | | $ | 766,491,603 | | | $ | 891,265,513 | |
Cash | | | 15,375 | | | | 85,475 | | | | 47,600 | |
Receivable for capital shares sold | | | 466,762 | | | | 338,790 | | | | 772,123 | |
Dividends receivable | | | 371,914 | | | | 147,177 | | | | 843,924 | |
Other assets | | | 22,567 | | | | 37,572 | | | | 41,622 | |
TOTAL ASSETS | | | 371,862,737 | | | | 767,100,617 | | | | 892,970,782 | |
| | | | | | | | | | | | | |
LIABILITIES | | | | | | | | | | | | |
Payable for capital shares redeemed | | | 68,002 | | | | 669,289 | | | | 199,981 | |
Payable to Adviser (Note 2) | | | 668,653 | | | | 1,437,404 | | | | 1,691,184 | |
Payable to administrator (Note 2) | | | 31,817 | | | | 67,401 | | | | 78,427 | |
Other accrued expenses | | | 22,409 | | | | 33,383 | | | | 40,926 | |
TOTAL LIABILITIES | | | 790,881 | | | | 2,207,477 | | | | 2,010,518 | |
| | | | | | | | | | | | | |
NET ASSETS | | $ | 371,071,856 | | | $ | 764,893,140 | | | $ | 890,960,264 | |
| | | | | | | | | | | | | |
NET ASSETS CONSIST OF: | | | | | | | | | | | | |
Paid-in capital | | $ | 262,756,275 | | | $ | 556,668,396 | | | $ | 660,370,356 | |
Distributable earnings | | | 108,315,581 | | | | 208,224,744 | | | | 230,589,908 | |
NET ASSETS | | $ | 371,071,856 | | | $ | 764,893,140 | | | $ | 890,960,264 | |
Shares of beneficial interest outstanding (unlimited number of shares authorized, no par value) | | | 15,426,565 | | | | 21,730,311 | | | | 46,336,242 | |
Net asset value, offering price and redemption price per share (Note 1) | | $ | 24.05 | | | $ | 35.20 | | | $ | 19.23 | |
See notes to financial statements. |
54
AVE MARIA MUTUAL FUNDS
STATEMENTS OF ASSETS AND LIABILITIES
December 31, 2022 (Continued)
| | Ave Maria
World
Equity Fund | | | Ave Maria
Focused Fund | | | Ave Maria
Bond Fund | |
ASSETS | | | | | | | | | | | | |
Investment securities: | | | | | | | | | | | | |
At cost | | $ | 60,334,955 | | | $ | 56,158,263 | | | $ | 507,106,803 | |
At fair value (Note 1) | | $ | 75,014,990 | | | $ | 47,915,698 | | | $ | 509,893,771 | |
Cash | | | 9,150 | | | | 14,278 | | | | 162,500 | |
Receivable for capital shares sold | | | 5,481 | | | | 9,371 | | | | 681,242 | |
Receivable for investment securities sold | | | — | | | | 319,873 | | | | — | |
Dividends and interest receivable | | | 33,728 | | | | 13,735 | | | | 2,509,598 | |
Tax reclaims receivable | | | 1,585 | | | | — | | | | — | |
Other assets | | | 9,890 | | | | 7,072 | | | | 29,613 | |
TOTAL ASSETS | | | 75,074,824 | | | | 48,280,027 | | | | 513,276,724 | |
| | | | | | | | | | | | | |
LIABILITIES | | | | | | | | | | | | |
Payable for capital shares redeemed | | | 58,241 | | | | 315 | | | | 300,443 | |
Payable to Adviser (Note 2) | | | 139,604 | | | | 89,238 | | | | 321,721 | |
Payable to administrator (Note 2) | | | 6,477 | | | | 4,178 | | | | 38,851 | |
Other accrued expenses | | | 15,895 | | | | 14,236 | | | | 30,463 | |
TOTAL LIABILITIES | | | 220,217 | | | | 107,967 | | | | 691,478 | |
| | | | | | | | | | | | | |
NET ASSETS | | $ | 74,854,607 | | | $ | 48,172,060 | | | $ | 512,585,246 | |
| | | | | | | | | | | | | |
NET ASSETS CONSIST OF: | | | | | | | | | | | | |
Paid-in capital | | $ | 60,928,669 | | | $ | 56,768,269 | | | $ | 509,798,278 | |
Distributable earnings ( accumulated deficit) | | | 13,925,938 | | | | (8,596,209 | ) | | | 2,786,968 | |
NET ASSETS | | $ | 74,854,607 | | | $ | 48,172,060 | | | $ | 512,585,246 | |
Shares of beneficial interest outstanding (unlimited number of shares authorized, no par value) | | | 4,674,592 | | | | 4,873,088 | | | | 44,695,324 | |
Net asset value, offering price and redemption price per share (Note 1) | | $ | 16.01 | | | $ | 9.89 | | | $ | 11.47 | |
See notes to financial statements. |
55
AVE MARIA MUTUAL FUNDS
Statements of Operations
For the Year Ended December 31, 2022
| | Ave Maria
Value Fund | | | Ave Maria
Growth Fund | | | Ave Maria
Rising
Dividend Fund | |
INVESTMENT INCOME | | | | | | | | | | | | |
Dividends | | $ | 7,393,799 | | | $ | 10,391,860 | | | $ | 21,637,842 | |
Foreign withholding taxes on dividends | | | (71,323 | ) | | | (487,336 | ) | | | (163,948 | ) |
TOTAL INVESTMENT INCOME | | | 7,322,476 | | | | 9,904,524 | | | | 21,473,894 | |
| | | | | | | | | | | | | |
EXPENSES | | | | | | | | | | | | |
Investment advisory fees (Note 2) | | | 2,493,108 | | | | 6,270,163 | | | | 6,769,713 | |
Administration, accounting and transfer agent fees (Note 2) | | | 332,640 | | | | 836,157 | | | | 903,219 | |
Trustees’ fees and expenses (Note 2) | | | 51,144 | | | | 135,742 | | | | 140,690 | |
Registration and filing fees | | | 38,426 | | | | 48,339 | | | | 48,455 | |
Postage and supplies | | | 39,680 | | | | 81,491 | | | | 71,290 | |
Audit and tax services fees | | | 29,356 | | | | 48,891 | | | | 53,368 | |
Custodian and bank service fees | | | 21,430 | | | | 48,301 | | | | 60,776 | |
Legal fees | | | 29,174 | | | | 29,174 | | | | 29,174 | |
Compliance service fees and expenses (Note 2) | | | 14,035 | | | | 31,349 | | | | 35,777 | |
Advisory board fees and expenses (Note 2) | | | 9,513 | | | | 26,142 | | | | 26,619 | |
Insurance expense | | | 13,174 | | | | 16,867 | | | | 20,647 | |
Shareholder reporting expenses | | | 12,257 | | | | 21,054 | | | | 18,871 | |
Other expenses | | | 24,739 | | | | 49,375 | | | | 48,868 | |
TOTAL EXPENSES | | | 3,108,676 | | | | 7,643,045 | | | | 8,227,467 | |
| | | | | | | | | | | | | |
NET INVESTMENT INCOME | | | 4,213,800 | | | | 2,261,479 | | | | 13,246,427 | |
| | | | | | | | | | | | | |
REALIZED AND UNREALIZED GAINS (LOSSES) ON INVESTMENTS AND FOREIGN CURRENCIES | | | | | | | | | | | | |
Net realized gains (losses) from investment transactions | | | (1,296,040 | ) | | | (1,505,002 | ) | | | 53,527,576 | |
Net realized losses from foreign currency transactions (Note 1) | | | — | | | | — | | | | (18,274 | ) |
Net change in unrealized appreciation (depreciation) on investments | | | 10,890,764 | | | | (225,784,063 | ) | | | (118,444,746 | ) |
NET REALIZED AND UNREALIZED GAINS (LOSSES) ON INVESTMENTS AND FOREIGN CURRENCIES | | | 9,594,724 | | | | (227,289,065 | ) | | | (64,935,444 | ) |
| | | | | | | | | | | | | |
NET INCREASE (DECREASE) IN NET ASSETS RESULTING FROM OPERATIONS | | $ | 13,808,524 | | | $ | (225,027,586 | ) | | $ | (51,689,017 | ) |
See notes to financial statements. |
56
AVE MARIA MUTUAL FUNDS
STATEMENTS OF OPERATIONS
For the Year Ended December 31, 2022 (Continued)
| | Ave Maria
World
Equity Fund | | | Ave Maria
Focused Fund | | | Ave Maria
Bond Fund | |
INVESTMENT INCOME | | | | | | | | | | | | |
Dividends | | $ | 1,956,390 | | | $ | 205,741 | | | $ | 3,618,984 | |
Foreign withholding taxes on dividends | | | (126,845 | ) | | | (6,674 | ) | | | — | |
Interest | | | — | | | | — | | | | 9,582,642 | |
TOTAL INVESTMENT INCOME | | | 1,829,545 | | | | 199,067 | | | | 13,201,626 | |
| | | | | | | | | | | | | |
EXPENSES | | | | | | | | | | | | |
Investment advisory fees (Note 2) | | | 656,864 | | | | 402,732 | | | | 1,257,489 | |
Administration, accounting and transfer agent fees (Note 2) | | | 79,856 | | | | 51,270 | | | | 452,313 | |
Trustees’ fees and expenses (Note 2) | | | 13,494 | | | | 8,995 | | | | 79,698 | |
Registration and filing fees | | | 33,982 | | | | 31,001 | | | | 54,316 | |
Postage and supplies | | | 12,640 | | | | 6,612 | | | | 33,036 | |
Audit and tax services fees | | | 17,553 | | | | 16,334 | | | | 37,544 | |
Custodian and bank service fees | | | 17,124 | | | | 14,506 | | | | 30,242 | |
Legal fees | | | 29,174 | | | | 29,174 | | | | 29,174 | |
Compliance service fees and expenses (Note 2) | | | 3,009 | | | | 1,955 | | | | 19,900 | |
Advisory board fees and expenses (Note 2) | | | 2,419 | | | | 1,574 | | | | 14,948 | |
Insurance expense | | | 5,950 | | | | 2,848 | | | | 14,526 | |
Shareholder reporting expenses | | | 5,568 | | | | 3,890 | | | | 10,068 | |
Other expenses | | | 19,871 | | | | 14,937 | | | | 47,478 | |
TOTAL EXPENSES | | | 897,504 | | | | 585,828 | | | | 2,080,732 | |
Previous investment advisory fee reductions recouped by the Adviser (Note 2) | | | 40,177 | | | | — | | | | — | |
NET EXPENSES | | | 937,681 | | | | 585,828 | | | | 2,080,732 | |
| | | | | | | | | | | | | |
NET INVESTMENT INCOME (LOSS) | | | 891,864 | | | | (386,761 | ) | | | 11,120,894 | |
| | | | | | | | | | | | | |
REALIZED AND UNREALIZED GAINS (LOSSES) ON INVESTMENTS AND FOREIGN CURRENCIES | | | | | | | | | | | | |
Net realized gains (losses) from investment transactions | | | 423,180 | | | | (344,538 | ) | | | 6,717,570 | |
Net realized losses from foreign currency transactions (Note 1) | | | (12,377 | ) | | | (4,515 | ) | | | — | |
Net change in unrealized appreciation (depreciation) on investments | | | (16,116,660 | ) | | | (22,847,047 | ) | | | (33,106,182 | ) |
Net change in unrealized appreciation (depreciation) on foreign currency translation | | | 155 | | | | — | | | | — | |
NET REALIZED AND UNREALIZED LOSSES ON INVESTMENTS AND FOREIGN CURRENCIES | | | (15,705,702 | ) | | | (23,196,100 | ) | | | (26,388,612 | ) |
| | | | | | | | | | | | | |
NET DECREASE IN NET ASSETS RESULTING FROM OPERATIONS | | | $(14,813,838 | ) | | | $(23,582,861 | ) | | | $(15,267,718 | ) |
See notes to financial statements. |
57
Ave Maria Value Fund
STATEMENTS OF CHANGES IN NET ASSETS
| | Year
Ended
December 31,
2022 | | | Year
Ended
December 31,
2021 | |
FROM OPERATIONS | | | | | | | | |
Net investment income | | $ | 4,213,800 | | | $ | 806,006 | |
Net realized gains (losses) from investment transactions | | | (1,296,040 | ) | | | 23,775,668 | |
Net change in unrealized appreciation (depreciation) on investments | | | 10,890,764 | | | | 38,344,817 | |
Net increase in net assets resulting from operations | | | 13,808,524 | | | | 62,926,491 | |
| | | | | | | | | |
FROM DISTRIBUTIONS TO SHAREHOLDERS (Note 1) | | | (4,214,033 | ) | | | (24,583,788 | ) |
| | | | | | | | | |
FROM CAPITAL SHARE TRANSACTIONS | | | | | | | | |
Proceeds from shares sold | | | 73,112,565 | | | | 54,244,398 | |
Reinvestment of distributions to shareholders | | | 3,981,832 | | | | 23,535,894 | |
Payments for shares redeemed | | | (43,470,023 | ) | | | (39,517,457 | ) |
Net increase in net assets from capital share transactions | | | 33,624,374 | | | | 38,262,835 | |
| | | | | | | | | |
TOTAL INCREASE IN NET ASSETS | | | 43,218,865 | | | | 76,605,538 | |
| | | | | | | | | |
NET ASSETS | | | | | | | | |
Beginning of year | | | 327,852,991 | | | | 251,247,453 | |
End of year | | $ | 371,071,856 | | | $ | 327,852,991 | |
| | | | | | | | | |
SUMMARY OF CAPITAL SHARE ACTIVITY | | | | | | | | |
Shares sold | | | 3,143,320 | | | | 2,253,604 | |
Shares issued in reinvestment of distributions to shareholders | | | 165,565 | | | | 1,012,296 | |
Shares redeemed | | | (1,923,440 | ) | | | (1,679,840 | ) |
Net increase in shares outstanding | | | 1,385,445 | | | | 1,586,060 | |
Shares outstanding, beginning of year | | | 14,041,120 | | | | 12,455,060 | |
Shares outstanding, end of year | | | 15,426,565 | | | | 14,041,120 | |
See notes to financial statements. |
58
Ave Maria Growth Fund
Statements of Changes in Net Assets
| | Year
Ended
December 31,
2022 | | | Year
Ended
December 31,
2021 | |
FROM OPERATIONS | | | | | | | | |
Net investment income (loss) | | $ | 2,261,479 | | | $ | (1,291,040 | ) |
Net realized gains (losses) from investment transactions | | | (1,505,002 | ) | | | 116,613,780 | |
Net change in unrealized appreciation (depreciation) on investments | | | (225,784,063 | ) | | | 44,578,192 | |
Net increase (decrease) in net assets resulting from operations | | | (225,027,586 | ) | | | 159,900,932 | |
| | | | | | | | | |
FROM DISTRIBUTIONS TO SHAREHOLDERS (Note 1) | | | (2,263,570 | ) | | | (115,484,450 | ) |
| | | | | | | | | |
FROM CAPITAL SHARE TRANSACTIONS | | | | | | | | |
Proceeds from shares sold | | | 103,810,510 | | | | 171,537,812 | |
Reinvestment of distributions to shareholders | | | 2,125,194 | | | | 109,358,524 | |
Payments for shares redeemed | | | (180,067,270 | ) | | | (207,744,366 | ) |
Net increase (decrease) in net assets from capital share transactions | | | (74,131,566 | ) | | | 73,151,970 | |
| | | | | | | | | |
TOTAL INCREASE (DECREASE) IN NET ASSETS | | | (301,422,722 | ) | | | 117,568,452 | |
| | | | | | | | | |
NET ASSETS | | | | | | | | |
Beginning of year | | | 1,066,315,862 | | | | 948,747,410 | |
End of year | | $ | 764,893,140 | | | $ | 1,066,315,862 | |
| | | | | | | | | |
SUMMARY OF CAPITAL SHARE ACTIVITY | | | | | | | | |
Shares sold | | | 2,765,803 | | | | 3,631,484 | |
Shares issued in reinvestment of distributions to shareholders | | | 60,064 | | | | 2,438,861 | |
Shares redeemed | | | (4,888,374 | ) | | | (4,488,041 | ) |
Net increase (decrease) in shares outstanding | | | (2,062,507 | ) | | | 1,582,304 | |
Shares outstanding, beginning of year | | | 23,792,818 | | | | 22,210,514 | |
Shares outstanding, end of year | | | 21,730,311 | | | | 23,792,818 | |
See notes to financial statements. |
59
Ave Maria Rising Dividend Fund
Statements of Changes in Net Assets
| | Year
Ended
December 31,
2022 | | | Year
Ended
December 31,
2021 | |
FROM OPERATIONS | | | | | | | | |
Net investment income | | $ | 13,246,427 | | | $ | 8,372,463 | |
Net realized gains from investment transactions | | | 53,527,576 | | | | 85,250,805 | |
Net realized gains (losses) from foreign currency transactions (Note 1) | | | (18,274 | ) | | | 14,111 | |
Net change in unrealized appreciation (depreciation) on investments | | | (118,444,746 | ) | | | 112,600,350 | |
Net increase (decrease) in net assets resulting from operations | | | (51,689,017 | ) | | | 206,237,729 | |
| | | | | | | | | |
FROM DISTRIBUTIONS TO SHAREHOLDERS (Note 1) | | | (66,771,369 | ) | | | (93,627,002 | ) |
| | | | | | | | | |
FROM CAPITAL SHARE TRANSACTIONS | | | | | | | | |
Proceeds from shares sold | | | 139,063,164 | | | | 136,128,629 | |
Reinvestment of distributions to shareholders | | | 59,788,156 | | | | 84,010,186 | |
Payments for shares redeemed | | | (153,572,866 | ) | | | (226,134,530 | ) |
Net increase (decrease) in net assets from capital share transactions | | | 45,278,454 | | | | (5,995,715 | ) |
| | | | | | | | | |
TOTAL INCREASE (DECREASE) IN NET ASSETS | | | (73,181,932 | ) | | | 106,615,012 | |
| | | | | | | | | |
NET ASSETS | | | | | | | | |
Beginning of year | | | 964,142,196 | | | | 857,527,184 | |
End of year | | $ | 890,960,264 | | | $ | 964,142,196 | |
| | | | | | | | | |
SUMMARY OF CAPITAL SHARE ACTIVITY | | | | | | | | |
Shares sold | | | 6,798,986 | | | | 6,197,924 | |
Shares issued in reinvestment of distributions to shareholders | | | 3,095,035 | | | | 3,834,822 | |
Shares redeemed | | | (7,542,251 | ) | | | (10,391,053 | ) |
Net increase (decrease) in shares outstanding | | | 2,351,770 | | | | (358,307 | ) |
Shares outstanding, beginning of year | | | 43,984,472 | | | | 44,342,779 | |
Shares outstanding, end of year | | | 46,336,242 | | | | 43,984,472 | |
See notes to financial statements. |
60
Ave Maria World Equity Fund
Statements of Changes in Net Assets
| | Year
Ended
December 31,
2022 | | | Year
Ended
December 31,
2021 | |
FROM OPERATIONS | | | | | | | | |
Net investment income | | $ | 891,864 | | | $ | 319,816 | |
Net realized gains from investment transactions | | | 423,180 | | | | 2,211,616 | |
Net realized losses from foreign currency transactions (Note 1) | | | (12,377 | ) | | | (1,869 | ) |
Net change in unrealized appreciation (depreciation) on investments | | | (16,116,660 | ) | | | 12,433,990 | |
Net change in unrealized appreciation (depreciation) on foreign currency translation | | | 155 | | | | (23 | ) |
Net increase (decrease) in net assets resulting from operations | | | (14,813,838 | ) | | | 14,963,530 | |
| | | | | | | | | |
FROM DISTRIBUTIONS TO SHAREHOLDERS (Note 1) | | | (880,100 | ) | | | (318,409 | ) |
| | | | | | | | | |
FROM CAPITAL SHARE TRANSACTIONS | | | | | | | | |
Proceeds from shares sold | | | 11,028,683 | | | | 21,926,581 | |
Reinvestment of distributions to shareholders | | | 822,387 | | | | 294,907 | |
Payments for shares redeemed | | | (14,210,321 | ) | | | (13,189,467 | ) |
Net increase (decrease) in net assets from capital share transactions | | | (2,359,251 | ) | | | 9,032,021 | |
| | | | | | | | | |
TOTAL INCREASE (DECREASE) IN NET ASSETS | | | (18,053,189 | ) | | | 23,677,142 | |
| | | | | | | | | |
NET ASSETS | | | | | | | | |
Beginning of year | | | 92,907,796 | | | | 69,230,654 | |
End of year | | $ | 74,854,607 | | | $ | 92,907,796 | |
| | | | | | | | | |
SUMMARY OF CAPITAL SHARE ACTIVITY | | | | | | | | |
Shares sold | | | 645,881 | | | | 1,229,440 | |
Shares issued in reinvestment of distributions to shareholders | | | 51,080 | | | | 15,400 | |
Shares redeemed | | | (869,293 | ) | | | (754,670 | ) |
Net increase (decrease) in shares outstanding | | | (172,332 | ) | | | 490,170 | |
Shares outstanding, beginning of year | | | 4,846,924 | | | | 4,356,754 | |
Shares outstanding, end of year | | | 4,674,592 | | | | 4,846,924 | |
See notes to financial statements. |
61
Ave Maria Focused Fund
StatementS of Changes in Net Assets
| | Year
Ended
December 31,
2022 | | | Year
Ended
December 31,
2021 | |
FROM OPERATIONS | | | | | | | | |
Net investment loss | | $ | (386,761 | ) | | $ | (400,468 | ) |
Net realized gains (losses) from investment transactions | | | (344,538 | ) | | | 3,218,225 | |
Net realized losses from foreign currency transactions (Note 1) | | | (4,515 | ) | | | (24,235 | ) |
Net change in unrealized appreciation (depreciation) on investments | | | (22,847,047 | ) | | | 9,158,451 | |
Net increase (decrease) in net assets resulting from operations | | | (23,582,861 | ) | | | 11,951,973 | |
| | | | | | | | | |
FROM DISTRIBUTIONS TO SHAREHOLDERS (Note 1) | | | — | | | | (2,771,641 | ) |
| | | | | | | | | |
FROM CAPITAL SHARE TRANSACTIONS | | | | | | | | |
Proceeds from shares sold | | | 14,714,046 | | | | 22,081,280 | |
Reinvestment of distributions to shareholders | | | — | | | | 2,717,423 | |
Payments for shares redeemed | | | (6,435,125 | ) | | | (4,819,301 | ) |
Net increase in net assets from capital share transactions | | | 8,278,921 | | | | 19,979,402 | |
| | | | | | | | | |
TOTAL INCREASE (DECREASE) IN NET ASSETS | | | (15,303,940 | ) | | | 29,159,734 | |
| | | | | | | | | |
NET ASSETS | | | | | | | | |
Beginning of year | | | 63,476,000 | | | | 34,316,266 | |
End of year | | $ | 48,172,060 | | | $ | 63,476,000 | |
| | | | | | | | | |
SUMMARY OF CAPITAL SHARE ACTIVITY | | | | | | | | |
Shares sold | | | 1,277,757 | | | | 1,585,440 | |
Shares issued in reinvestment of distributions to shareholders | | | — | | | | 179,131 | |
Shares redeemed | | | (576,620 | ) | | | (353,210 | ) |
Net increase in shares outstanding | | | 701,137 | | | | 1,411,361 | |
Shares outstanding, beginning of year | | | 4,171,951 | | | | 2,760,590 | |
Shares outstanding, end of year | | | 4,873,088 | | | | 4,171,951 | |
See notes to financial statements. |
62
Ave Maria Bond Fund
Statements of Changes in Net Assets
| | Year
Ended
December 31,
2022 | | | Year
Ended
December 31,
2021 | |
FROM OPERATIONS | | | | | | | | |
Net investment income | | $ | 11,120,894 | | | $ | 7,625,144 | |
Net realized gains from investment transactions | | | 6,717,570 | | | | 3,569,186 | |
Net change in unrealized appreciation (depreciation) on investments | | | (33,106,182 | ) | | | 7,105,083 | |
Net increase (decrease) in net assets resulting from operations | | | (15,267,718 | ) | | | 18,299,413 | |
| | | | | | | | | |
FROM DISTRIBUTIONS TO SHAREHOLDERS (Note 1) | | | (17,840,405 | ) | | | (10,958,224 | ) |
| | | | | | | | | |
FROM CAPITAL SHARE TRANSACTIONS | | | | | | | | |
Proceeds from shares sold | | | 148,825,719 | | | | 165,249,090 | |
Reinvestment of distributions to shareholders | | | 16,108,784 | | | | 9,927,737 | |
Payments for shares redeemed | | | (122,008,893 | ) | | | (100,626,525 | ) |
Net increase in net assets from capital share transactions | | | 42,925,610 | | | | 74,550,302 | |
| | | | | | | | | |
TOTAL INCREASE IN NET ASSETS | | | 9,817,487 | | | | 81,891,491 | |
| | | | | | | | | |
NET ASSETS | | | | | | | | |
Beginning of year | | | 502,767,759 | | | | 420,876,268 | |
End of year | | $ | 512,585,246 | | | $ | 502,767,759 | |
| | | | | | | | | |
SUMMARY OF CAPITAL SHARE ACTIVITY | | | | | | | | |
Shares sold | | | 12,666,959 | | | | 13,393,881 | |
Shares issued in reinvestment of distributions to shareholders | | | 1,386,991 | | | | 807,671 | |
Shares redeemed | | | (10,457,452 | ) | | | (8,192,081 | ) |
Net increase in shares outstanding | | | 3,596,498 | | | | 6,009,471 | |
Shares outstanding, beginning of year | | | 41,098,826 | | | | 35,089,355 | |
Shares outstanding, end of year | | | 44,695,324 | | | | 41,098,826 | |
See notes to financial statements. |
63
Ave Maria Value Fund
FINANCIAL HIGHLIGHTS
Per Share Data for a Share Outstanding Throughout Each Year
| | Year
Ended
December 31,
2022 | | | Year
Ended
December 31,
2021 | | | Year
Ended
December 31,
2020 | | | Year
Ended
December 31,
2019 | | | Year
Ended
December 31,
2018 | |
Net asset value at beginning of year | | $ | 23.35 | | | $ | 20.17 | | | $ | 19.68 | | | $ | 17.19 | | | $ | 20.88 | |
| | | | | | | | | | | | | | | | | | | | | |
Income (loss) from investment operations: | | | | | | | | | | | | | | | | | | | | |
Net investment income (loss) | | | 0.28 | | | | 0.06 | | | | 0.09 | | | | 0.01 | | | | (0.03 | ) |
Net realized and unrealized gains (losses) on investments | | | 0.70 | | | | 5.00 | | | | 1.12 | | | | 3.52 | | | | (1.81 | ) |
Total from investment operations | | | 0.98 | | | | 5.06 | | | | 1.21 | | | | 3.53 | | | | (1.84 | ) |
| | | | | | | | | | | | | | | | | | | | | |
Less distributions from: | | | | | | | | | | | | | | | | | | | | |
Net investment income | | | (0.28 | ) | | | (0.06 | ) | | | (0.09 | ) | | | (0.01 | ) | | | — | |
Net realized gains on investments | | | — | | | | (1.82 | ) | | | (0.63 | ) | | | (1.03 | ) | | | (1.85 | ) |
Total distributions | | | (0.28 | ) | | | (1.88 | ) | | | (0.72 | ) | | | (1.04 | ) | | | (1.85 | ) |
| | | | | | | | | | | | | | | | | | | | | |
Net asset value at end of year | | $ | 24.05 | | | $ | 23.35 | | | $ | 20.17 | | | $ | 19.68 | | | $ | 17.19 | |
| | | | | | | | | | | | | | | | | | | | | |
Total return (a) | | | 4.18 | % | | | 25.15 | % | | | 6.16 | % | | | 20.52 | % | | | (8.75 | %) |
| | | | | | | | | | | | | | | | | | | | | |
Ratios/Supplementary Data: | | | | | | | | | | | | | | | | | | | | |
Net assets at end of year (000’s) | | $ | 371,072 | | | $ | 327,853 | | | $ | 251,247 | | | $ | 247,743 | | | $ | 211,481 | |
| | | | | | | | | | | | | | | | | | | | | |
Ratio of total expenses to average net assets | | | 0.93 | % | | | 0.96 | % | | | 1.05 | % | | | 1.11 | % | | | 1.18 | % |
| | | | | | | | | | | | | | | | | | | | | |
Ratio of net investment income (loss) to average net assets | | | 1.27 | % | | | 0.27 | % | | | 0.52 | % | | | 0.04 | % | | | (0.13 | %) |
| | | | | | | | | | | | | | | | | | | | | |
Portfolio turnover rate | | | 33 | % | | | 20 | % | | | 68 | % | | | 40 | % | | | 43 | % |
(a) | Total return is a measure of the change in value of an investment in the Fund over the period covered, which assumes any dividends or capital gains distributions are reinvested in shares of the Fund. The returns shown do not reflect the deduction of taxes a shareholder would pay on Fund distributions or the redemption of Fund shares. |
See notes to financial statements. |
64
Ave Maria Growth Fund
Financial Highlights
Per Share Data for a Share Outstanding Throughout Each Year
| | Year
Ended
December 31,
2022 | | | Year
Ended
December 31,
2021 | | | Year
Ended
December 31,
2020 | | | Year
Ended
December 31,
2019 | | | Year
Ended
December 31,
2018 | |
Net asset value at beginning of year | | $ | 44.82 | | | $ | 42.72 | | | $ | 38.00 | | | $ | 28.19 | | | $ | 30.80 | |
| | | | | | | | | | | | | | | | | | | | | |
Income (loss) from investment operations: | | | | | | | | | | | | | | | | | | | | |
Net investment income (loss) | | | 0.10 | | | | (0.05 | ) | | | (0.06 | ) | | | 0.00 | (a) | | | 0.06 | |
Net realized and unrealized gains (losses) on investments | | | (9.62 | ) | | | 7.55 | | | | 7.03 | | | | 10.45 | | | | (0.63 | ) |
Total from investment operations | | | (9.52 | ) | | | 7.50 | | | | 6.97 | | | | 10.45 | | | | (0.57 | ) |
| | | | | | | | | | | | | | | | | | | | | |
Less distributions from: | | | | | | | | | | | | | | | | | | | | |
Net investment income | | | (0.10 | ) | | | — | | | | — | | | | (0.00 | )(a) | | | (0.06 | ) |
Net realized gains on investments | | | — | | | | (5.40 | ) | | | (2.25 | ) | | | (0.64 | ) | | | (1.98 | ) |
Total distributions | | | (0.10 | ) | | | (5.40 | ) | | | (2.25 | ) | | | (0.64 | ) | | | (2.04 | ) |
| | | | | | | | | | | | | | | | | | | | | |
Net asset value at end of year | | $ | 35.20 | | | $ | 44.82 | | | $ | 42.72 | | | $ | 38.00 | | | $ | 28.19 | |
| | | | | | | | | | | | | | | | | | | | | |
Total return (b) | | | (21.23 | %) | | | 17.55 | % | | | 18.37 | % | | | 37.09 | % | | | (1.80 | %) |
| | | | | | | | | | | | | | | | | | | | | |
Ratios/Supplementary Data: | | | | | | | | | | | | | | | | | | | | |
Net assets at end of year (000’s) | | $ | 764,893 | | | $ | 1,066,316 | | | $ | 948,747 | | | $ | 854,764 | | | $ | 577,806 | |
| | | | | | | | | | | | | | | | | | | | | |
Ratio of total expenses to average net assets | | | 0.91 | % | | | 0.90 | % | | | 0.91 | % | | | 0.94 | % | | | 0.95 | % |
| | | | | | | | | | | | | | | | | | | | | |
Ratio of net investment income (loss) to average net assets | | | 0.27 | % | | | (0.13 | %) | | | (0.16 | %) | | | 0.00 | %(c) | | | 0.19 | % |
| | | | | | | | | | | | | | | | | | | | | |
Portfolio turnover rate | | | 25 | % | | | 25 | % | | | 26 | % | | | 15 | % | | | 33 | % |
(a) | Amount rounds to less than $0.01 per share. |
(b) | Total return is a measure of the change in value of an investment in the Fund over the period covered, which assumes any dividends or capital gains distributions are reinvested in shares of the Fund. The returns shown do not reflect the deduction of taxes a shareholder would pay on Fund distributions or the redemption of Fund shares. |
(c) | Percentage rounds to less than 0.01%. |
See notes to financial statements. |
65
Ave Maria Rising Dividend Fund
Financial Highlights
Per Share Data for a Share Outstanding Throughout Each Year
| | Year
Ended
December 31,
2022 | | | Year
Ended
December 31,
2021 | | | Year
Ended
December 31,
2020 | | | Year
Ended
December 31,
2019 | | | Year
Ended
December 31,
2018 | |
Net asset value at beginning of year | | $ | 21.92 | | | $ | 19.34 | | | $ | 18.68 | | | $ | 15.83 | | | $ | 18.44 | |
| | | | | | | | | | | | | | | | | | | | | |
Income (loss) from investment operations: | | | | | | | | | | | | | | | | | | | | |
Net investment income | | | 0.30 | | | | 0.20 | | | | 0.21 | | | | 0.23 | | | | 0.24 | |
Net realized and unrealized gains (losses) on investments and foreign currencies | | | (1.46 | ) | | | 4.69 | | | | 0.95 | | | | 4.12 | | | | (1.13 | ) |
Total from investment operations | | | (1.16 | ) | | | 4.89 | | | | 1.16 | | | | 4.35 | | | | (0.89 | ) |
| | | | | | | | | | | | | | | | | | | | | |
Less distributions from: | | | | | | | | | | | | | | | | | | | | |
Net investment income | | | (0.30 | ) | | | (0.20 | ) | | | (0.21 | ) | | | (0.23 | ) | | | (0.25 | ) |
Net realized gains on investments | | | (1.23 | ) | | | (2.11 | ) | | | (0.29 | ) | | | (1.27 | ) | | | (1.47 | ) |
Total distributions | | | (1.53 | ) | | | (2.31 | ) | | | (0.50 | ) | | | (1.50 | ) | | | (1.72 | ) |
| | | | | | | | | | | | | | | | | | | | | |
Net asset value at end of year | | $ | 19.23 | | | $ | 21.92 | | | $ | 19.34 | | | $ | 18.68 | | | $ | 15.83 | |
| | | | | | | | | | | | | | | | | | | | | |
Total return (a) | | | (5.27 | %) | | | 25.35 | % | | | 6.45 | % | | | 27.58 | % | | | (4.80 | %) |
| | | | | | | | | | | | | | | | | | | | | |
Ratios/Supplementary Data: | | | | | | | | | | | | | | | | | | | | |
Net assets at end of year (000’s) | | $ | 890,960 | | | $ | 964,142 | | | $ | 857,527 | | | $ | 953,085 | | | $ | 780,811 | |
| | | | | | | | | | | | | | | | | | | | | |
Ratio of total expenses to average net assets | | | 0.91 | % | | | 0.90 | % | | | 0.92 | % | | | 0.93 | % | | | 0.93 | % |
| | | | | | | | | | | | | | | | | | | | | |
Ratio of net investment income to average net assets | | | 1.47 | % | | | 0.90 | % | | | 1.21 | % | | | 1.23 | % | | | 1.25 | % |
| | | | | | | | | | | | | | | | | | | | | |
Portfolio turnover rate | | | 15 | % | | | 21 | % | | | 38 | % | | | 30 | % | | | 31 | % |
(a) | Total return is a measure of the change in value of an investment in the Fund over the period covered, which assumes any dividends or capital gains distributions are reinvested in shares of the Fund. The returns shown do not reflect the deduction of taxes a shareholder would pay on Fund distributions or the redemption of Fund shares. |
See notes to financial statements. |
66
Ave Maria World Equity Fund
Financial Highlights
Per Share Data for a Share Outstanding Throughout Each Year
| | Year
Ended
December 31,
2022 | | | Year
Ended
December 31,
2021 | | | Year
Ended
December 31,
2020 | | | Year
Ended
December 31,
2019 | | | Year
Ended
December 31,
2018 | |
Net asset value at beginning of year | | $ | 19.17 | | | $ | 15.89 | | | $ | 15.99 | | | $ | 13.10 | | | $ | 15.08 | |
| | | | | | | | | | | | | | | | | | | | | |
Income (loss) from investment operations: | | | | | | | | | | | | | | | | | | | | |
Net investment income | | | 0.19 | | | | 0.07 | | | | 0.08 | | | | 0.11 | | | | 0.15 | |
Net realized and unrealized gains (losses) on investments and foreign currencies | | | (3.16 | ) | | | 3.28 | | | | (0.10 | ) | | | 3.51 | | | | (1.49 | ) |
Total from investment operations | | | (2.97 | ) | | | 3.35 | | | | (0.02 | ) | | | 3.62 | | | | (1.34 | ) |
| | | | | | | | | | | | | | | | | | | | | |
Less distributions from: | | | | | | | | | | | | | | | | | | | | |
Net investment income | | | (0.19 | ) | | | (0.07 | ) | | | (0.08 | ) | | | (0.11 | ) | | | (0.15 | ) |
Net realized gains on investments | | | — | | | | — | | | | — | | | | (0.62 | ) | | | (0.49 | ) |
Total distributions | | | (0.19 | ) | | | (0.07 | ) | | | (0.08 | ) | | | (0.73 | ) | | | (0.64 | ) |
| | | | | | | | | | | | | | | | | | | | | |
Net asset value at end of year | | $ | 16.01 | | | $ | 19.17 | | | $ | 15.89 | | | $ | 15.99 | | | $ | 13.10 | |
| | | | | | | | | | | | | | | | | | | | | |
Total return (a) | | | (15.50 | %) | | | 21.06 | % | | | (0.15 | %) | | | 27.66 | % | | | (8.87 | %) |
| | | | | | | | | | | | | | | | | | | | | |
Ratios/Supplementary Data: | | | | | | | | | | | | | | | | | | | | |
Net assets at end of year (000’s) | | $ | 74,855 | | | $ | 92,908 | | | $ | 69,231 | | | $ | 73,902 | | | $ | 57,044 | |
| | | | | | | | | | | | | | | | | | | | | |
Ratio of total expenses to average net assets | | | 1.12 | % | | | 1.22 | % | | | 1.26 | % | | | 1.29 | % | | | 1.34 | % |
| | | | | | | | | | | | | | | | | | | | | |
Ratio of net expenses to average net assets (b) | | | 1.18 | % | | | 1.25 | % | | | 1.25 | % | | | 1.25 | % | | | 1.25 | % |
| | | | | | | | | | | | | | | | | | | | | |
Ratio of net investment income to average net assets (b) | | | 1.12 | % | | | 0.40 | % | | | 0.51 | % | | | 0.77 | % | | | 0.98 | % |
| | | | | | | | | | | | | | | | | | | | | |
Portfolio turnover rate | | | 23 | % | | | 16 | % | | | 43 | % | | | 37 | % | | | 33 | % |
(a) | Total return is a measure of the change in value of an investment in the Fund over the period covered, which assumes any dividends or capital gains distributions are reinvested in shares of the Fund. The returns shown do not reflect the deduction of taxes a shareholder would pay on Fund distributions or the redemption of Fund shares. |
(b) | Ratio was determined after advisory fee reductions and/or recoupments (Note 2). |
See notes to financial statements. |
67
Ave Maria Focused Fund
Financial Highlights
Per Share Data for a Share Outstanding Throughout Each Period
| | Year Ended
December 31,
2022 | | | Year Ended
December 31,
2021 | | | Period Ended
December 31,
2020(a) | |
Net asset value at beginning of period | | $ | 15.21 | | | $ | 12.43 | | | $ | 10.00 | |
| | | | | | | | | | | | | |
Income (loss) from investment operations: | | | | | | | | | | | | |
Net investment loss | | | (0.08 | ) | | | (0.10 | ) | | | (0.03 | ) |
Net realized and unrealized gains (losses) on investments and foreign currencies | | | (5.24 | ) | | | 3.57 | | | | 2.50 | |
Total from investment operations | | | (5.32 | ) | | | 3.47 | | | | 2.47 | |
| | | | | | | | | | | | | |
Less distributions from: | | | | | | | | | | | | |
Net realized gains on investments | | | — | | | | (0.69 | ) | | | (0.04 | ) |
| | | | | | | | | | | | | |
Net asset value at end of period | | $ | 9.89 | | | $ | 15.21 | | | $ | 12.43 | |
| | | | | | | | | | | | | |
Total return (b) | | | (34.98 | %) | | | 27.96 | % | | | 24.71 | %(c) |
| | | | | | | | | | | | | |
Ratios/Supplementary Data: | | | | | | | | | | | | |
Net assets at end of period (000’s) | | $ | 48,172 | | | $ | 63,476 | | | $ | 34,316 | |
| | | | | | | | | | | | | |
Ratio of total expenses to average net assets | | | 1.14 | % | | | 1.21 | % | | | 1.29 | %(d) |
| | | | | | | | | | | | | |
Ratio of net expenses to average net assets | | | 1.14 | % | | | 1.23 | %(e) | | | 1.25 | %(d)(e) |
| | | | | | | | | | | | | |
Ratio of net investment loss to average net assets | | | (0.76 | %) | | | (0.82 | %)(e) | | | (0.54 | %)(d)(e) |
| | | | | | | | | | | | | |
Portfolio turnover rate | | | 69 | % | | | 27 | % | | | 16 | %(c) |
(a) | Represents the period from the commencement of operations (May 1, 2020) through December 31, 2020. |
(b) | Total return is a measure of the change in value of an investment in the Fund over the period covered, which assumes any dividends or capital gains distributions are reinvested in shares of the Fund. The returns shown do not reflect the deduction of taxes a shareholder would pay on Fund distributions or the redemption of Fund shares. |
(c) | Not annualized. |
(d) | Annualized. |
(e) | Ratio was determined after advisory fee reductions and/or recoupments (Note 2). |
See notes to financial statements. |
68
Ave Maria Bond Fund
Financial Highlights
Per Share Data for a Share Outstanding Throughout Each Year
| | Year
Ended
December 31,
2022 | | | Year
Ended
December 31,
2021 | | | Year
Ended
December 31,
2020 | | | Year
Ended
December 31,
2019 | | | Year
Ended
December 31,
2018 | |
Net asset value at beginning of year | | $ | 12.23 | | | $ | 11.99 | | | $ | 11.64 | | | $ | 11.11 | | | $ | 11.42 | |
| | | | | | | | | | | | | | | | | | | | | |
Income (loss) from investment operations: | | | | | | | | | | | | | | | | | | | | |
Net investment income | | | 0.26 | | | | 0.20 | | | | 0.22 | | | | 0.22 | | | | 0.19 | |
Net realized and unrealized gains (losses) on investments | | | (0.61 | ) | | | 0.33 | | | | 0.42 | | | | 0.70 | | | | (0.14 | ) |
Total from investment operations | | | (0.35 | ) | | | 0.53 | | | | 0.64 | | | | 0.92 | | | | 0.05 | |
| | | | | | | | | | | | | | | | | | | | | |
Less distributions from: | | | | | | | | | | | | | | | | | | | | |
Net investment income | | | (0.26 | ) | | | (0.20 | ) | | | (0.22 | ) | | | (0.22 | ) | | | (0.19 | ) |
Net realized gains on investments | | | (0.15 | ) | | | (0.09 | ) | | | (0.07 | ) | | | (0.17 | ) | | | (0.17 | ) |
Total distributions | | | (0.41 | ) | | | (0.29 | ) | | | (0.29 | ) | | | (0.39 | ) | | | (0.36 | ) |
| | | | | | | | | | | | | | | | | | | | | |
Net asset value at end of year | | $ | 11.47 | | | $ | 12.23 | | | $ | 11.99 | | | $ | 11.64 | | | $ | 11.11 | |
| | | | | | | | | | | | | | | | | | | | | |
Total return (a) | | | (2.85 | %) | | | 4.38 | % | | | 5.60 | % | | | 8.30 | % | | | 0.41 | % |
| | | | | | | | | | | | | | | | | | | | | |
Ratios/Supplementary Data: | | | | | | | | | | | | | | | | | | | | |
Net assets at end of year (000’s) | | $ | 512,585 | | | $ | 502,768 | | | $ | 420,876 | | | $ | 394,850 | | | $ | 323,716 | |
| | | | | | | | | | | | | | | | | | | | | |
Ratio of total expenses to average net assets | | | 0.41 | % | | | 0.43 | % | | | 0.47 | % | | | 0.49 | % | | | 0.50 | % |
| | | | | | | | | | | | | | | | | | | | | |
Ratio of net investment income to average net assets | | | 2.21 | % | | | 1.66 | % | | | 1.87 | % | | | 1.91 | % | | | 1.68 | % |
| | | | | | | | | | | | | | | | | | | | | |
Portfolio turnover rate | | | 21 | % | | | 25 | % | | | 47 | % | | | 31 | % | | | 26 | % |
(a) | Total return is a measure of the change in value of an investment in the Fund over the period covered, which assumes any dividends or capital gains distributions are reinvested in shares of the Fund. The returns shown do not reflect the deduction of taxes a shareholder would pay on Fund distributions or the redemption of Fund shares. |
See notes to financial statements. |
69
AVE MARIA MUTUAL FUNDS
Notes to Financial Statements
December 31, 2022
1. Organization and Significant Accounting Policies
The Ave Maria Value Fund, the Ave Maria Growth Fund, the Ave Maria Rising Dividend Fund, the Ave Maria World Equity Fund, the Ave Maria Focused Fund and the Ave Maria Bond Fund (individually, a “Fund” and collectively, the “Funds”) are each a diversified series, except for the Ave Maria Focused Fund, which is a non-diversified series, of the Schwartz Investment Trust (the “Trust”), an open-end management investment company registered under the Investment Company Act of 1940, as amended (the “1940 Act”), and established as an Ohio business trust under a Declaration of Trust dated August 31, 1992.
The investment objective of the Ave Maria Value Fund is to seek long-term capital appreciation from equity investments in companies that do not violate core values and teachings of the Roman Catholic Church.
The investment objective of the Ave Maria Growth Fund is to seek long-term capital appreciation, using the growth style, from equity investments in companies that do not violate core values and teachings of the Roman Catholic Church.
The investment objective of the Ave Maria Rising Dividend Fund is to provide increasing dividend income over time, long-term growth of capital, and a reasonable level of current income from investments in dividend-paying common stocks of companies that do not violate core values and teachings of the Roman Catholic Church.
The investment objective of the Ave Maria World Equity Fund is to seek long-term capital appreciation from equity investments in U.S. and non-U.S. companies that do not violate core values and teachings of the Roman Catholic Church.
The investment objective of the Ave Maria Focused Fund is to seek long-term capital appreciation from equity investments in companies that do not violate core values and teachings of the Roman Catholic Church.
The investment objective of the Ave Maria Bond Fund is to seek preservation of principal with a reasonable level of current income in corporate debt and equity securities that do not violate core values and teachings of the Roman Catholic Church.
See the Funds’ Prospectus for information regarding the principal investment strategies of each Fund.
Shares of each Fund are sold at net asset value (“NAV”). To calculate the NAV, a Fund’s assets are valued and totaled, liabilities are subtracted, and the balance is divided by the number of shares outstanding. The offering price and redemption price per share are equal to the NAV per share for each Fund.
70
AVE MARIA MUTUAL FUNDS
NOTES TO FINANCIAL STATEMENTS
(Continued)
The Funds follow accounting and reporting guidance under Financial Accounting Standards Board Accounting Standards Codification Topic 946, “Financial Services – Investment Companies.” The following is a summary of significant accounting policies followed by the Funds. These policies are in conformity with accounting principles generally accepted in the United States of America (“GAAP”).
(a) Valuation of investments – Securities which are traded on stock exchanges are valued at the closing sales price as of the close of the regular session of trading on the New York Stock Exchange on the day the securities are being valued, or, if not traded on a particular day, at the closing bid price. Securities which are quoted by NASDAQ are valued at the NASDAQ Official Closing Price or, if an Official Closing Price is not available, at the most recently quoted bid price. Securities traded in the over-the-counter market are valued at the last reported sales price or, if there is no reported sale on the valuation date, at the most recently quoted bid price. Securities which are traded both in the over-the-counter market and on a stock exchange are valued according to the broadest and most representative market. Securities traded on foreign exchanges are typically fair valued by an independent pricing service and translated from the local currency into U.S. dollars using currency exchange rates supplied by an independent pricing service. Fixed income securities are generally valued using prices provided by an independent pricing service. The independent pricing service uses information with respect to transactions in bonds, quotations from bond dealers, market transactions in comparable securities and various relationships between securities in determining these prices. Investments in shares of other open-end investment companies are valued at their NAV as reported by such companies. When using quoted prices and when the market for the securities are considered active, the securities will be classified as Level 1 within the fair value hierarchy (see below). Securities for which market quotations are not readily available are valued at their fair value as determined in good faith in accordance with consistently applied procedures established by and under the general supervision of the Board of Trustees, and will be classified as Level 2 or 3 within the fair value hierarchy, depending on the inputs used. Fair value pricing may be used, for example, in situations where (i) a security is so thinly traded that there have been no transactions for that stock over an extended period of time; (ii) the exchange on which the security is principally traded closes early; or (iii) trading of the security is halted during the day and does not resume prior to a Fund’s NAV calculation. A security’s “fair value” price may differ from the price next available for that security using the Funds’ normal pricing procedures.
GAAP establishes a single authoritative definition of fair value, sets out a framework for measuring fair value and requires additional disclosures about fair value measurements.
71
AVE MARIA MUTUAL FUNDS
NOTES TO FINANCIAL STATEMENTS
(Continued)
Various inputs are used in determining the value of each Fund’s investments. These inputs are summarized in the three broad levels listed below:
| | ● | Level 1 – quoted prices in active markets for identical securities |
| | ● | Level 2 – other significant observable inputs |
| | ● | Level 3 – significant unobservable inputs |
The Funds’ foreign equity securities actively traded in foreign markets may be classified as Level 2 despite the availability of closing prices because such securities are typically fair valued by an independent pricing service. The Board of Trustees has authorized the Funds to retain an independent pricing service to determine the fair value of its foreign securities because the value of such securities may be materially affected by events occurring before the Funds’ pricing time but after the close of the primary markets or exchanges on which such foreign securities are traded. These intervening events might be country-specific (e.g., natural disaster, economic or political developments, interest rate change); issuer specific (e.g., earnings report or merger announcement); or U.S. market-specific (such as a significant movement in the U.S. market that is deemed to affect the value of foreign securities). The pricing service uses an automated system that incorporates a model based on multiple parameters, including a security’s local closing price, relevant general and sector indices, currency fluctuations, trading in depositary receipts and futures, if applicable, and/or research valuations by its staff, in determining what it believes is the fair value of the securities.
U.S. Government & Agencies and Corporate Bonds held by the Funds, if any, are classified as Level 2 since the values for such securities are based on prices provided by an independent pricing service that utilizes various “other significant observable inputs” including bid and ask quotations, prices of similar securities and interest rates, among other factors.
The inputs or methodology used for valuing securities are not necessarily an indication of the risks associated with investing in those securities. The inputs used to measure fair value may fall into different levels of the fair value hierarchy. In such cases, for disclosure purposes, the level in the fair value hierarchy within which the fair value measurement falls in its entirety is determined based on the lowest level input that is significant to the fair value measurement.
72
AVE MARIA MUTUAL FUNDS
NOTES TO FINANCIAL STATEMENTS
(Continued)
The following is a summary of the Funds’ investments and the levels assigned to the investments, by security type, as of December 31, 2022:
Ave Maria Value Fund | | Level 1 | | | Level 2 | | | Level 3 | | | Total | |
Common Stocks | | $ | 344,738,864 | | | $ | — | | | $ | — | | | $ | 344,738,864 | |
Money Market Funds | | | 26,247,255 | | | | — | | | | — | | | | 26,247,255 | |
Total | | $ | 370,986,119 | | | $ | — | | | $ | — | | | $ | 370,986,119 | |
Ave Maria Growth Fund | | Level 1 | | | Level 2 | | | Level 3 | | | Total | |
Common Stocks | | $ | 734,141,435 | | | $ | — | | | $ | — | | | $ | 734,141,435 | |
Money Market Funds | | | 32,350,168 | | | | — | | | | — | | | | 32,350,168 | |
Total | | $ | 766,491,603 | | | $ | — | | | $ | — | | | $ | 766,491,603 | |
Ave Maria Rising Dividend Fund | | Level 1 | | | Level 2 | | | Level 3 | | | Total | |
Common Stocks | | $ | 859,746,010 | | | $ | 16,577,461 | | | $ | — | | | $ | 876,323,471 | |
Money Market Funds | | | 14,942,042 | | | | — | | | | — | | | | 14,942,042 | |
Total | | $ | 874,688,052 | | | $ | 16,577,461 | | | $ | — | | | $ | 891,265,513 | |
Ave Maria World Equity Fund | | Level 1 | | | Level 2 | | | Level 3 | | | Total | |
Common Stocks | | $ | 62,575,777 | | | $ | 11,503,187 | | | $ | — | | | $ | 74,078,964 | |
Money Market Funds | | | 936,026 | | | | — | | | | — | | | | 936,026 | |
Total | | $ | 63,511,803 | | | $ | 11,503,187 | | | $ | — | | | $ | 75,014,990 | |
Ave Maria Focused Fund | | Level 1 | | | Level 2 | | | Level 3 | | | Total | |
Common Stocks | | $ | 41,483,190 | | | $ | 6,020,439 | | | $ | — | | | $ | 47,503,629 | |
Money Market Funds | | | 412,069 | | | | — | | | | — | | | | 412,069 | |
Total | | $ | 41,895,259 | | | $ | 6,020,439 | | | $ | — | | | $ | 47,915,698 | |
Ave Maria Bond Fund | | Level 1 | | | Level 2 | | | Level 3 | | | Total | |
U.S. Government & Agencies | | $ | — | | | $ | 125,748,537 | | | $ | — | | | $ | 125,748,537 | |
Corporate Bonds | | | — | | | | 263,212,243 | | | | — | | | | 263,212,243 | |
Common Stocks | | | 99,834,575 | | | | — | | | | — | | | | 99,834,575 | |
Money Market Funds | | | 21,098,416 | | | | — | | | | — | | | | 21,098,416 | |
Total | | $ | 120,932,991 | | | $ | 388,960,780 | | | $ | — | | | $ | 509,893,771 | |
73
AVE MARIA MUTUAL FUNDS
NOTES TO FINANCIAL STATEMENTS
(Continued)
Refer to each Fund’s Schedule of Investments for a listing of the securities by security type and sector or industry type. There were no Level 3 securities or derivative instruments held by or transferred in/out of the Funds as of or during the year ended December 31, 2022.
(b) Income taxes – Each Fund has qualified and intends to continue to qualify as a regulated investment company under the Internal Revenue Code of 1986, as amended (the “Code”). Qualification generally will relieve each Fund of liability for federal income taxes to the extent 100% of its net investment income and net realized capital gains are distributed in accordance with the Code.
In order to avoid imposition of the excise tax applicable to regulated investment companies, it is also each Fund’s intention to declare as dividends in each calendar year at least 98% of its net investment income and 98.2% of its net realized capital gains plus undistributed amounts from prior years.
The following information is computed on a tax basis for each item as of December 31, 2022:
| | Ave Maria
Value Fund | | | Ave Maria
Growth
Fund | | | Ave Maria
Rising
Dividend
Fund | |
Federal income tax cost | | $ | 261,374,498 | | | $ | 558,046,576 | | | $ | 660,675,605 | |
Gross unrealized appreciation | | $ | 120,220,389 | | | $ | 258,843,662 | | | $ | 260,437,471 | |
Gross unrealized depreciation | | | (10,608,768 | ) | | | (50,398,635 | ) | | | (29,847,563 | ) |
Net unrealized appreciation | | | 109,611,621 | | | | 208,445,027 | | | | 230,589,908 | |
Accumulated capital and other losses | | | (1,296,040 | ) | | | (220,283 | ) | | | — | |
Distributable earnings | | $ | 108,315,581 | | | $ | 208,224,744 | | | $ | 230,589,908 | |
| | Ave Maria
World
Equity Fund | | | Ave Maria
Focused
Fund | | | Ave Maria
Bond
Fund | |
Federal income tax cost | | $ | 60,334,955 | | | $ | 56,364,162 | | | $ | 507,106,803 | |
Gross unrealized appreciation | | $ | 19,723,390 | | | $ | 2,520,302 | | | $ | 34,246,640 | |
Gross unrealized depreciation | | | (5,043,355 | ) | | | (10,968,766 | ) | | | (31,459,672 | ) |
Net unrealized appreciation (depreciation) | | | 14,680,035 | | | | (8,448,464 | ) | | | 2,786,968 | |
Net unrealized appreciation on foreign currency translation | | | 132 | | | | — | | | | — | |
Accumulated capital and other losses | | | (754,229 | ) | | | (147,745 | ) | | | — | |
Distributable earnings (accumulated deficit) | | $ | 13,925,938 | | | $ | (8,596,209 | ) | | $ | 2,786,968 | |
74
AVE MARIA MUTUAL FUNDS
NOTES TO FINANCIAL STATEMENTS
(Continued)
The difference between the federal income tax cost of investments and the financial statement cost of portfolio investments for the Ave Maria Growth Fund and the Ave Maria Focused Fund is due to certain timing differences in the recognition of capital gains and losses under income tax regulations and GAAP. These “book/tax” differences are temporary in nature and are due to the tax deferral of losses on wash sales. There is no difference between the federal income tax cost and the financial statement cost of portfolio investments for the Ave Maria Value Fund, the Ave Maria Rising Dividend Fund, the Ave Maria World Equity Fund and the Ave Maria Bond Fund as of December 31, 2022.
During the year ended December 31, 2022, the Ave Maria World Equity Fund utilized $423,180 of short-term capital loss carryforwards (“CLCFs”) against current year gains.
As of December 31, 2022, the following CLCFs are available for federal income tax purposes, which may be carried forward indefinitely. These CLCFs are available to offset net realized gains in future years, thereby reducing future taxable gains distributions.
| | Ave Maria
Value Fund | | | Ave Maria
Growth
Fund | | | Ave Maria
Rising
Dividend
Fund | |
No expiration - short-term | | $ | 1,296,040 | | | $ | 220,283 | | | $ | — | |
No expiration - long-term | | | — | | | | — | | | | — | |
| | | $ | 1,296,040 | | | $ | 220,283 | | | $ | — | |
| | Ave Maria
World
Equity Fund | | | Ave Maria
Focused
Fund | | | Ave Maria
Bond
Fund | |
No expiration - short-term | | $ | 754,229 | | | $ | 147,745 | | | $ | — | |
No expiration - long-term | | | — | | | | — | | | | — | |
| | | $ | 754,229 | | | $ | 147,745 | | | $ | — | |
75
AVE MARIA MUTUAL FUNDS
NOTES TO FINANCIAL STATEMENTS
(Continued)
For the year ended December 31, 2022, the following reclassifications were made as a result of permanent differences between the financial statements and income tax reporting requirements:
| | Increase
Distributable
Earnings
(Accumulated
Deficit) | | | Decrease
Paid-in
Capital | |
Ave Maria Value Fund | | $ | 233 | | | $ | (233 | ) |
Ave Maria Growth Fund | | | 2,091 | | | | (2,091 | ) |
Ave Maria Rising Dividend Fund | | | 5,263 | | | | (5,263 | ) |
Ave Maria World Equity Fund | | | 613 | | | | (613 | ) |
Ave Maria Focused Fund | | | 391,276 | | | | (391,276 | ) |
Ave Maria Bond Fund | | | 1,941 | | | | (1,941 | ) |
The Funds recognize the tax benefits or expenses of uncertain tax positions only when the position is “more-likely-than-not” to be sustained assuming examination by tax authorities. Management has reviewed the tax positions taken on federal income tax returns for all open tax years (generally, three years) and has concluded that no provision for unrecognized tax benefits or expenses is required in these financial statements.
(c) Investment transactions and investment income – Investment transactions are accounted for on the trade date. Dividend income is recorded on the ex-dividend date. Non-cash dividends included in dividend income, if any, are recorded at the fair value of the securities received. Interest income is recognized on the accrual basis and includes amortization of premiums and accretion of discounts using the effective yield method. Cost of investments includes amortization of premiums and accretion of discounts. Realized gains and losses on investments sold are determined on a specific identification basis. Withholding taxes on foreign dividends have been recorded in accordance with the Funds’ understanding of the applicable country’s rules and tax rates.
(d) Dividends and distributions – Dividends from net investment income, if any, are declared and paid annually in December for the Ave Maria Value Fund, the Ave Maria Growth Fund, the Ave Maria World Equity Fund and the Ave Maria Focused Fund. Dividends from net investment income, if any, are declared and paid quarterly for the Ave Maria Rising Dividend Fund and are declared and paid monthly for the Ave Maria Bond Fund. Each Fund expects to distribute any net realized capital gains
76
AVE MARIA MUTUAL FUNDS
NOTES TO FINANCIAL STATEMENTS
(Continued)
annually. Dividends and distributions to shareholders are recorded on the ex-dividend date. The tax character of distributions paid to shareholders during the years ended December 31, 2022 and 2021 was as follows:
Year Ended | | Ordinary
Income | | | Long-Term
Capital Gains | | | Total
Distributions* | |
Ave Maria Value Fund: | | | | | | | | | | | | |
December 31, 2022 | | $ | 4,214,033 | | | $ | — | | | $ | 4,214,033 | |
December 31, 2021 | | $ | 2,384,142 | | | $ | 22,197,532 | | | $ | 24,581,674 | |
Ave Maria Growth Fund: | | | | | | | | | | | | |
December 31, 2022 | | $ | 2,263,570 | | | $ | — | | | $ | 2,263,570 | |
December 31, 2021 | | $ | 10,716,636 | | | $ | 104,764,978 | | | $ | 115,481,614 | |
Ave Maria Rising Dividend Fund: | | | | | | | | | | | | |
December 31, 2022 | | $ | 13,240,593 | | | $ | 53,530,776 | | | $ | 66,771,369 | |
December 31, 2021 | | $ | 17,038,866 | | | $ | 76,588,136 | | | $ | 93,627,002 | |
Ave Maria World Equity Fund: | | | | | | | | | | | | |
December 31, 2022 | | $ | 880,100 | | | $ | — | | | $ | 880,100 | |
December 31, 2021 | | $ | 317,947 | | | $ | — | | | $ | 317,947 | |
Ave Maria Focused Fund: | | | | | | | | | | | | |
December 31, 2022 | | $ | — | | | $ | — | | | $ | — | |
December 31, 2021 | | $ | 266,572 | | | $ | 2,502,952 | | | $ | 2,769,524 | |
Ave Maria Bond Fund: | | | | | | | | | | | | |
December 31, 2022 | | $ | 11,120,999 | | | $ | 6,719,406 | | | $ | 17,840,405 | |
December 31, 2021 | | $ | 9,543,572 | | | $ | 1,414,652 | | | $ | 10,958,224 | |
* | Total Distributions may not tie to the amounts listed on the Statements of Changes in Net Assets due to reclassifications of the character of the distributions as a result of permanent differences between the financial statements and income tax reporting. |
(e) Estimates – The preparation of financial statements in conformity with GAAP requires management to make estimates and assumptions that affect the reported amounts of assets and liabilities and disclosure of contingent assets and liabilities as of the date of the financial statements and the reported amounts of revenues and expenses during the reporting period. Actual results could differ from those estimates.
(f) Common expenses – Common expenses of the Trust are allocated among the series of the Trust based on relative net assets of each series or the nature of the services performed and the relative applicability to each series.
77
AVE MARIA MUTUAL FUNDS
NOTES TO FINANCIAL STATEMENTS
(Continued)
(g) Foreign currency translation – Securities and other assets and liabilities denominated in or expected to settle in foreign currencies are translated into U.S. dollars based on exchange rates on the following basis:
| | (i) | The fair values of investment securities and other assets and liabilities are translated as of the close of the NYSE each day. |
| | (ii) | Purchases and sales of investment securities and income and expenses are translated at the rate of exchange prevailing as of 4:00 p.m. Eastern Time on the respective date of such transactions. |
| | (iii) | The Funds do not isolate that portion of the results of operations caused by changes in foreign exchange rates on investments from those caused by changes in market prices of securities held. Such fluctuations are included with the net realized and unrealized gains or losses on investments. |
Reported net realized foreign exchange gains or losses arise from 1) purchase and sales of foreign currencies, 2) currency gains or losses realized between the trade and settlement dates on securities transactions and 3) the difference between the amounts of dividends and foreign withholding taxes recorded on the Funds’ books and the U.S. dollar equivalent of the amounts actually received or paid. Reported net unrealized foreign exchange gains and losses arise from changes in the value of assets and liabilities that result from changes in exchange rates.
The Funds may be subject to foreign taxes related to foreign income received, capital gains on the sale of securities and certain foreign currency transactions (a portion of which may be reclaimable). All foreign taxes are recorded in accordance with the applicable regulations and rates that exist in the foreign jurisdictions in which the Funds invest.
2. Investment Advisory Agreements and Transactions with Related Parties
The Chairman and President of the Trust is also the Chairman and Chief Executive Officer of Schwartz Investment Counsel, Inc. (the “Adviser”). Certain other officers of the Trust are officers of the Adviser, or of Ultimus Fund Solutions, LLC (“Ultimus”), the administrative, accounting and transfer agent for the Funds, or of Ultimus Fund Distributors, LLC (the “Distributor”), the Funds’ principal underwriter.
Pursuant to Investment Advisory Agreements between the Trust and the Adviser, the Adviser is responsible for the management of each Fund and provides investment advice along with the necessary personnel, facilities, equipment and certain other services
78
AVE MARIA MUTUAL FUNDS
NOTES TO FINANCIAL STATEMENTS
(Continued)
necessary to the operations of the Funds. The Adviser receives fees based on a percentage of the average daily net assets of each Fund, which are accrued daily and paid quarterly, at the annual rates as stated below:
Ave Maria Value Fund | | | 0.75 | % |
Ave Maria Growth Fund | | | 0.75 | % |
Ave Maria Rising Dividend Fund | | | 0.75 | % |
Ave Maria World Equity Fund * | | | 0.75 | % |
Ave Maria Focused Fund * | | | 0.75 | % |
Ave Maria Bond Fund | | | 0.25 | % |
* | Effective May 1, 2022, the Adviser reduced its fees from 0.95% to 0.75% for the Ave Maria World Equity Fund and from 0.85% to 0.75% for the Ave Maria Focused Fund. |
The Adviser has contractually agreed to reduce its advisory fees or reimburse a portion of operating expenses until at least May 1, 2023 so that the ordinary operating expenses of each of the Ave Maria Value Fund, the Ave Maria Growth Fund, the Ave Maria Rising Dividend Fund, the Ave Maria World Equity Fund and the Ave Maria Focused Fund do not exceed 1.25% per annum of average daily net assets; and so that the ordinary operating expenses of the Ave Maria Bond Fund do not exceed 0.60% per annum of average daily net assets. The Adviser did not reduce its investment advisory fees for any of the Funds during the year ended December 31, 2022.
Any investment advisory fee reductions or expense reimbursements by the Adviser are subject to repayment by the Funds for a period of three years after such fees and expenses were incurred, provided the Funds are able to effect such repayment and remain in compliance with any undertaking by the Adviser to limit expenses of the Funds. During the year ended December 31, 2022, the Ave Maria World Equity Fund recouped $40,177 of prior years’ investment advisory fee reductions. As of December 31, 2022, no additional advisory fee reductions are available for recoupment.
The Chief Compliance Officer of the Trust (the “CCO”) is an employee of the Adviser. The Trust pays the Adviser a fee for providing CCO services, of which each Fund pays its proportionate share along with the other series of the Trust. In addition, the Trust reimburses the Adviser for out-of-pocket expenses incurred, if any, for providing these services.
Pursuant to a Mutual Fund Services Agreement between the Trust and Ultimus, Ultimus supplies regulatory and compliance services, calculates the daily NAV per share of each Fund, maintains the financial books and records of the Funds, maintains the records of each shareholder’s account, and processes purchases and redemptions of each Fund’s shares. For the performance of these services, Ultimus receives fees from each Fund computed as a percentage of such Fund’s average daily net assets, subject to a minimum monthly fee.
79
AVE MARIA MUTUAL FUNDS
NOTES TO FINANCIAL STATEMENTS
(Continued)
Pursuant to a Distribution Agreement between the Trust and the Distributor, the Distributor serves as each Fund’s exclusive agent for the distribution of its shares. The Distributor is an affiliate of Ultimus.
Trustees and officers affiliated with the Adviser or Ultimus are not compensated by the Trust for their services. Each Trustee who is not an affiliated person of the Adviser or Ultimus (“Independent Trustee”) receives from the Trust an annual retainer of $63,000 (except that such fee was $76,500 for the Lead Independent Trustee/Chairman of the Governance Committee and $71,500 for the Chairman of the Audit Committee), payable quarterly; a fee of $6,000 for attendance at each meeting of the Board of Trustees; plus reimbursement of travel and other expenses incurred in attending meetings. Trustee Emeritus, if any, receives one-half of both the annual retainer and fee for attendance at each meeting; plus reimbursement of travel and other expenses incurred in attending meetings. Each Fund pays its proportionate share of the Independent Trustees’ fees and expenses along with the other series of the Trust.
Each member of the Catholic Advisory Board (“CAB”), including Emeritus members, receives an annual retainer of $4,000 (except that such fee is $14,000 for the CAB chairman), payable quarterly; a fee of $3,000 for attendance at each meeting of the CAB; plus reimbursement of travel and other expenses incurred in attending meetings. Each Fund pays its proportionate share of CAB members’ fees and expenses.
3. Investment Transactions
During the year ended December 31, 2022, cost of purchases and proceeds from sales and maturities of investment securities, excluding short-term investments and U.S. government securities, were as follows:
| | Ave Maria
Value Fund | | | Ave Maria
Growth Fund | | | Ave Maria
Rising
Dividend
Fund | |
Purchases of investment securities | | $ | 122,091,966 | | | $ | 207,777,745 | | | $ | 134,204,734 | |
Proceeds from sales of investment securities | | $ | 102,908,627 | | | $ | 300,673,376 | | | $ | 157,048,443 | |
| | Ave Maria
World
Equity Fund | | | Ave Maria
Focused
Fund | | | Ave Maria
Bond Fund | |
Purchases of investment securities | | $ | 18,287,593 | | | $ | 42,965,864 | | | $ | 103,158,626 | |
Proceeds from sales and maturities of investment securities | | $ | 20,222,355 | | | $ | 35,599,351 | | | $ | 65,445,244 | |
80
AVE MARIA MUTUAL FUNDS
NOTES TO FINANCIAL STATEMENTS
(Continued)
During the year ended December 31, 2022, cost of purchases and proceeds from sales and maturities of long-term U.S. government securities for the Ave Maria Bond Fund were $52,044,218 and $35,064,170, respectively.
4. Contingencies and Commitments
The Funds indemnify the Trust’s officers and Trustees for certain liabilities that might arise from their performance of their duties to the Funds. Additionally, in the normal course of business, the Funds enter into contracts that contain a variety of representations and warranties and which provide general indemnifications. The Funds’ maximum exposure under these arrangements is unknown, as this would involve future claims that may be made against the Funds that have not yet occurred. However, based on experience, the Funds expect the risk of loss to be remote.
5. Sector Risk
If a Fund has significant investments in the securities of issuers in industries within a particular sector, any development affecting that sector will have a greater impact on the value of the net assets of the Fund than would be the case if the Fund did not have significant investments in that sector. In addition, this may increase the risk of loss of an investment in the Fund and increase the volatility of the Fund’s NAV per share. From time to time, circumstances may affect a particular sector and the companies within such sector. For instance, economic or market factors, regulation or deregulation, and technological or other developments may negatively impact all companies in a particular sector and therefore the value of a Fund’s portfolio will be adversely affected. As of December 31, 2022, the Ave Maria Growth Fund and the Ave Maria Rising Dividend Fund had 36.7% and 27.7%, respectively, of the value of their net assets invested in stocks within the technology sector and the Ave Maria Focused Fund had 25.0% of the value of its net assets invested in stocks within the industrials sector.
6. Subsequent Events
The Funds are required to recognize in the financial statements the effects of all subsequent events that provide additional evidence about conditions that existed as of the date of the Statements of Assets and Liabilities. For non-recognized subsequent events that must be disclosed to keep the financial statements from being misleading, the Funds are required to disclose the nature of the event as well as an estimate of its financial effect, or a statement that such an estimate cannot be made. Management has evaluated subsequent events through the issuance of these financial statements and has noted no such events.
81
AVE MARIA MUTUAL FUNDS
Report of Independent Registered
Public Accounting Firm
To the Shareholders and the Board of Trustees of Schwartz Investment Trust:
Opinion on the Financial Statements and Financial Highlights
We have audited the accompanying statements of assets and liabilities of Schwartz Investment Trust (the “Funds”) comprising the Ave Maria Value Fund, Ave Maria Growth Fund, Ave Maria Rising Dividend Fund, Ave Maria World Equity Fund, Ave Maria Focused Fund, and Ave Maria Bond Fund, including the schedules of investments, as of December 31, 2022, the related statements of operations, the statements of changes in net assets, and the financial highlights for each of the periods listed in the table below, and the related notes. In our opinion, the financial statements and financial highlights present fairly, in all material respects, the financial position of each of the series constituting the Schwartz Investment Trust as of December 31, 2022, and the results of their operations, the changes in their net assets, and the financial highlights for each of the periods listed in the table below, in conformity with accounting principles generally accepted in the United States of America.
Individual Series Comprising the
Schwartz Investment Trust | Statement of
Operations | Statements of
Changes in
Net Assets | Financial
Highlights |
Ave Maria Value Fund Ave Maria Growth Fund Ave Maria Rising Dividend Fund Ave Maria World Equity Fund Ave Maria Bond Fund | For the year ended December 31, 2022 | For the years ended December 31, 2022 and 2021 | For the years ended December 31, 2022, December 31, 2021, December 31, 2020, December 31, 2019 and December 31, 2018 |
Ave Maria Focused Fund | For the year ended December 31, 2022 | For the years ended December 31, 2022 and 2021 | For the years ended December 31, 2022, December 31, 2021 and For the period from May 1, 2020 (commencement of operations) through December 31, 2020 |
Basis for Opinion
These financial statements and financial highlights are the responsibility of the Funds’ management. Our responsibility is to express an opinion on the Funds’ financial statements and financial highlights based on our audits. We are a public accounting firm registered with the Public Company Accounting Oversight Board (United States)
82
AVE MARIA MUTUAL FUNDS
REPORT OF INDEPENDENT REGISTERED
PUBLIC ACCOUNTING FIRM (Continued)
(PCAOB) and are required to be independent with respect to the Funds in accordance with the U.S. federal securities laws and the applicable rules and regulations of the Securities and Exchange Commission and the PCAOB.
We conducted our audits in accordance with the standards of the PCAOB. Those standards require that we plan and perform the audit to obtain reasonable assurance about whether the financial statements and financial highlights are free of material misstatement, whether due to error or fraud. The Funds are not required to have, nor were we engaged to perform, an audit of internal control over financial reporting. As part of our audits we are required to obtain an understanding of internal control over financial reporting but not for the purpose of expressing an opinion on the effectiveness of the Funds’ internal control over financial reporting. Accordingly, we express no such opinion.
Our audits included performing procedures to assess the risks of material misstatement of the financial statements and financial highlights, whether due to error or fraud, and performing procedures that respond to those risks. Such procedures included examining, on a test basis, evidence regarding the amounts and disclosures in the financial statements and financial highlights. Our audits also included evaluating the accounting principles used and significant estimates made by management, as well as evaluating the overall presentation of the financial statements and financial highlights. Our procedures included confirmation of securities owned as of December 31, 2022, by correspondence with the custodian and brokers; when replies were not received from brokers, we performed other auditing procedures. We believe that our audits provide a reasonable basis for our opinion.
Chicago, Illinois
February 22, 2023
We have served as the auditor of one or more Schwartz Investment Trust investment companies since 1993.
83
AVE MARIA MUTUAL FUNDS
Board of Trustees and Executive Officers
(Unaudited)
Overall responsibility for management of the Trust rests with the Board of Trustees. The Trustees serve during the lifetime of the Trust and until its termination, or until death, resignation, retirement or removal. The Trustees, in turn, elect the officers of the Trust to actively supervise its day-to-day operations. The officers have been elected for an annual term. The following are the Trustees and executive officers of the Trust:
Trustee/Officer | Address | Year of
Birth | Position Held
with the Trust | Length of
Time Served |
Interested Trustee: | | | | |
* | George P. Schwartz, CFA | 801 W. Ann Arbor Trail, Plymouth, MI | 1944 | Chairman of the Board/President/Trustee | Since 1992 |
Independent Trustees: | | | | |
| | Donald J. Dawson, Jr. | 801 W. Ann Arbor Trail, Plymouth, MI | 1947 | Trustee | Since 1993 |
| | John J. McHale, Jr. | 801 W. Ann Arbor Trail, Plymouth, MI | 1949 | Trustee | Since 2014 |
| | Edward J. Miller | 801 W. Ann Arbor Trail, Plymouth, MI | 1946 | Trustee | Since 2017 |
| | William A. Morrow | 801 W. Ann Arbor Trail Plymouth, MI | 1947 | Trustee | Since 2018 |
Executive Officers: | | | | |
* | Robert C. Schwartz | 801 W. Ann Arbor Trail, Plymouth, MI | 1976 | Vice President and Secretary | Since 2013 |
* | Timothy S. Schwartz, CFA | 5060 Annunciation Circle, Ave Maria, FL | 1971 | Treasurer | Since 2000 |
* | Cathy M. Stoner, CPA, IACCP | 801 W. Ann Arbor Trail, Plymouth, MI | 1970 | Chief Compliance Officer | Since 2010 |
* | George P. Schwartz, Robert C. Schwartz, Timothy S. Schwartz and Cathy M. Stoner, as affiliated persons of Schwartz Investment Counsel, Inc., the Funds’ investment adviser, are “interested persons” of the Trust within the meaning of Section 2(a)(19) of the 1940 Act. George P. Schwartz is the father of Robert C. Schwartz and Timothy S. Schwartz. |
Each Trustee oversees seven series of the Trust: the Ave Maria Value Fund, the Ave Maria Growth Fund, the Ave Maria Rising Dividend Fund, the Ave Maria World Equity Fund, the Ave Maria Focused Fund, the Ave Maria Bond Fund and the Schwartz Value
84
AVE MARIA MUTUAL FUNDS
BOARD OF TRUSTEES AND EXECUTIVE OFFICERS
(Unaudited) (Continued)
Focused Fund. The principal occupations of the Trustees and executive officers of the Trust during the past five years and public directorships held by the Trustees are set forth below:
George P. Schwartz, CFA is Chairman and Chief Executive Officer of Schwartz Investment Counsel, Inc. and the co-portfolio manager of the Ave Maria Rising Dividend Fund and the Ave Maria Bond Fund.
Donald J. Dawson, Jr. retired in March 2015. Prior to retirement, he was Chairman of Payroll 1, Inc. (a payroll processing company).
John J. McHale, Jr. is a consultant to the Commissioner of Major League Baseball. From 2015 until 2020, he was the Special Assistant to Commissioner of Major League Baseball.
Edward J. Miller retired in 2019. Prior to his retirement, he was Vice Chairman and Director of Detroit Investment Fund from 2001 until 2019 and Invest Detroit Foundation (financiers for redevelopment of Detroit, Michigan) from 2010 until 2019.
William A. Morrow retired in 2017. Prior to his retirement, he was Senior Executive Vice President of Crain Communications, Inc. (business media) from 1985 until 2017.
Robert C. Schwartz is Executive Vice President and Secretary of Schwartz Investment Counsel, Inc.
Timothy S. Schwartz, CFA is President of Schwartz Investment Counsel, Inc. and the lead portfolio manager of the Ave Maria Value Fund.
Cathy M. Stoner, CPA, IACCP is Vice President, Chief Financial Officer, Chief Compliance Officer, and Treasurer of Schwartz Investment Counsel, Inc.
Additional information regarding the Trustees and executive officers of the Trust may be found in the Funds’ Statement of Additional Information and is available without charge upon request by calling (888) 726-9931.
85
AVE MARIA MUTUAL FUNDS
Catholic Advisory Board
(Unaudited)
The Catholic Advisory Board reviews the companies selected by the Adviser to ensure that the companies operate in a way that is consistent with teachings and core values of the Roman Catholic Church. The Catholic Advisory Board evaluates companies using publicly available information, information from the Adviser, and information from shareholders and other sources in making its recommendations. The following are the members of the Catholic Advisory Board:
Member | Address | Year of
Birth | Length of
Time Served |
Raymond Arroyo | 801 W. Ann Arbor Trail, Plymouth, MI | 1970 | Since 2022 |
Dr. Scott Hahn, PhD | 801 W. Ann Arbor Trail, Plymouth, MI | 1957 | Since 2018 |
Lou Holtz, Emeritus | 801 W. Ann Arbor Trail, Plymouth, MI | 1937 | Since 2007 |
Lawrence Kudlow | 801 W. Ann Arbor Trail, Plymouth, MI | 1947 | Since 2005 |
Thomas S. Monaghan | 801 W. Ann Arbor Trail, Plymouth, MI | 1937 | Since 2001 |
Melissa Moschella, PhD | 801 W. Ann Arbor Trail, Plymouth, MI | 1979 | Since 2017 |
Fr. John Riccardo, STL, Emeritus | 801 W. Ann Arbor Trail, Plymouth, MI | 1965 | Since 2011 |
Paul R. Roney | 801 W. Ann Arbor Trail, Plymouth, MI | 1957 | Since 2001 |
Raymond Arroyo is an award-winning journalist, producer and bestselling author. He is a Fox News Contributor and Editorial Adviser to “The Ingraham Angle” and a co-host of Fox Nation’s “Laura and Raymond” with Laura Ingraham. He is the founding News Director, Managing Editor and Lead Anchor of the Eternal World Television Network (EWTN) news and host of “EWTN News” and “The World Over Live.”
Dr. Scott Hahn, PhD is a bestselling author and theology professor at Franciscan University since 1990 and holds the Fr. Michael Scanlan Chair of Biblical Theology and the New Evangelization. He is Founder and President of the St. Paul Center for Biblical Theology and Editor-in-Chief of Emmaus Road Publishing.
Lou Holtz is the former football coach at University of Notre Dame among others, ESPN college football analyst, author and motivational speaker.
Lawrence Kudlow is Host of “Kudlow” on Fox Business Network and a Fox news contributor. He was the Assistant to the President and Director of the National Economic Council for the Trump Administration from April 2018 until January 2021. Prior to that, Mr. Kudlow was CNBC’s Senior Contributor and host of CNBC’s primetime “The Kudlow Report” and a syndicated radio show host. During President Reagan’s first term, Mr. Kudlow was the associate director for economics and planning, Office of Management and Budget. He is the CEO/founder of Kudlow & Co., LLC, an economic research and consulting firm.
86
AVE MARIA MUTUAL FUNDS
CATHOLIC ADVISORY BOARD
(Unaudited) (Continued)
Thomas S. Monaghan is Chairman of the Ave Maria Foundation (a non-profit foundation supporting Roman Catholic organizations) and Chancellor of Ave Maria University. Prior to December 1998, he was Chairman and Chief Executive Officer of Domino’s Pizza, Inc.
Melissa Moschella, PhD is an Associate Professor, School of Philosophy, The Catholic University of America since August 2020. From July 2017 until July 2020, she was an -Assistant Professor of Medical Ethics at Columbia University and from August 2013 until June 2017, she was Assistant Professor of Philosophy at The Catholic University of America. She has published articles about moral and political philosophy and ethics in a number of academic publications. She is also a lecturer and recipient of a number of academic honors and fellowships.
Fr. John Riccardo, STL is a priest of the Archdiocese of Detroit and Executive Director of ACTS XXIX, an organization committed to helping parishes create a road map for evangelization and discipleship.
Paul R. Roney is Executive Director of the Ave Maria Foundation and President of Domino’s Farms Corporation. Prior to December 1998, he was Treasurer of Domino’s Pizza, Inc.
Additional information regarding the Funds’ Catholic Advisory Board members may be found in the Funds’ Statement of Additional Information and is available without charge upon request by calling (888) 726-9331.
87
AVE MARIA MUTUAL FUNDS
About Your Funds’ Expenses
(Unaudited)
We believe it is important for you to understand the impact of costs on your investment. As a shareholder of the Funds, you incur ongoing costs, including management fees and other Fund expenses. The following examples are intended to help you understand your ongoing costs (in dollars) of investing in the Funds and to compare these costs with the ongoing costs of investing in other mutual funds.
A mutual fund’s ongoing costs are expressed as a percentage of its average net assets. This figure is known as the expense ratio. The ongoing costs reflected in the table below is based on an investment of $1,000 made at the beginning of the most recent semi-annual period (July 1, 2022) and held until the end of the period (December 31, 2022).
The table that follows illustrates each Fund’s ongoing costs in two ways:
Actual fund return – This section helps you to estimate the actual expenses that you paid over the period. The “Ending Account Value” shown is derived from each Fund’s actual return, and the fourth column shows the dollar amount of operating expenses that would have been paid by an investor who started with $1,000 in the Funds. You may use the information here, together with the amount you invested, to estimate the expenses that you paid over the period.
To do so, simply divide your account value by $1,000 (for example, an $8,600 account value divided by $1,000 = 8.6), then multiply the result by the number given for the Funds under the heading “Expenses Paid During Period.”
Hypothetical 5% return – This section is intended to help you compare each Fund’s ongoing costs with those of other mutual funds. It assumes that each Fund had an annual return of 5% before expenses during the period shown, but that the expense ratio is unchanged. In this case, because the return used is not the Funds’ actual returns, the results do not apply to your investment. The example is useful in making comparisons because the U.S Securities and Exchange Commission (the “SEC”) requires all mutual funds to calculate expenses based on a 5% return. You can assess each Fund’s ongoing costs by comparing this hypothetical example with the hypothetical examples that appear in shareholder reports of other funds.
Note that expenses shown in the table are meant to highlight and help you compare ongoing costs only. The Funds do not charge sales loads or redemption fees.
The calculations assume no shares were bought or sold during the period. Your actual costs may have been higher or lower, depending on the amount of your investment and the timing of any purchases or redemptions.
88
AVE MARIA MUTUAL FUNDS
ABOUT YOUR FUNDS’ EXPENSES
(Unaudited) (Continued)
More information about the Funds’ expenses, including historical annual expense ratios, can be found in this report. For additional information on operating expenses and other shareholder costs, please refer to the Funds’ Prospectus.
| Beginning
Account Value
July 1, 2022 | Ending
Account Value
December 31,
2022 | Net
Expense
Ratio(a) | Expenses
Paid During
Period(b) |
Ave Maria Value Fund |
Based on Actual Fund Return | $1,000.00 | $ 1,152.40 | 0.93% | $5.05 |
Based on Hypothetical 5% Return (before expenses) | $1,000.00 | $ 1,020.52 | 0.93% | $4.74 |
| | | | | |
Ave Maria Growth Fund | | | | |
Based on Actual Fund Return | $1,000.00 | $ 1,044.80 | 0.91% | $4.69 |
Based on Hypothetical 5% Return (before expenses) | $1,000.00 | $ 1,020.62 | 0.91% | $4.63 |
| | | | | |
Ave Maria Rising Dividend Fund | | | |
Based on Actual Fund Return | $1,000.00 | $ 1,085.20 | 0.91% | $4.78 |
Based on Hypothetical 5% Return (before expenses) | $1,000.00 | $ 1,020.62 | 0.91% | $4.63 |
| | | | | |
Ave Maria World Equity Fund | | | |
Based on Actual Fund Return | $1,000.00 | $ 1,050.50 | 1.09% | $5.63 |
Based on Hypothetical 5% Return (before expenses) | $1,000.00 | $ 1,019.71 | 1.09% | $5.55 |
| | | | | |
Ave Maria Focused Fund | | | | |
Based on Actual Fund Return | $1,000.00 | $ 976.30 | 1.09% | $5.43 |
Based on Hypothetical 5% Return (before expenses) | $1,000.00 | $ 1,019.71 | 1.09% | $5.55 |
| | | | | |
Ave Maria Bond Fund | | | | |
Based on Actual Fund Return | $1,000.00 | $ 1,020.70 | 0.41% | $2.09 |
Based on Hypothetical 5% Return (before expenses) | $1,000.00 | $ 1,023.14 | 0.41% | $2.09 |
(a) | Annualized, based on each Fund’s most recent one-half year expenses. |
(b) | Expenses are equal to each Fund’s annualized net expense ratio multiplied by the average account value over the period, multiplied by 184/365 (to reflect the one-half year period) for Actual Fund Return and Hypothetical 5% Return information, respectively. |
89
AVE MARIA MUTUAL FUNDS
Federal Tax Information
(Unaudited)
Capital Gain Distribution – For the year ended December 31, 2022, the following Funds designated long-term capital gain distributions:
Ave Maria Rising Dividend Fund | | $ | 53,527,576 | |
Ave Maria Bond Fund | | | 6,717,570 | |
Qualified Dividend Income – The Funds have designated the following of their ordinary income dividends, or up to the maximum amount of such dividends allowable pursuant to the Internal Revenue Code, as qualified dividend income eligible for the reduced tax rate:
Ave Maria Value Fund | | | 100.00 | % |
Ave Maria Growth Fund | | | 100.00 | % |
Ave Maria Rising Dividend Fund | | | 100.00 | % |
Ave Maria World Equity Fund | | | 100.00 | % |
Ave Maria Bond Fund | | | 26.71 | % |
Dividends Received Deduction – For corporate shareholders, the following percentages of ordinary dividends paid during the year ended December 31, 2022 qualify for the corporate dividends received deduction:
Ave Maria Value Fund | | | 100.00 | % |
Ave Maria Growth Fund | | | 100.00 | % |
Ave Maria Rising Dividend Fund | | | 99.99 | % |
Ave Maria World Equity Fund | | | 100.00 | % |
Ave Maria Bond Fund | | | 22.43 | % |
Foreign Source Income and Expense – The following Funds intend to elect to pass through to shareholders the income tax credit for taxes paid to foreign countries. The pass-through of the foreign tax credit will only affect those persons who are shareholders on the dividend record date. These shareholders will receive more detailed information with their 2022 Form 1099-DIV. The per share amounts designated were:
| | Foreign Source
Income | | | Foreign Tax
Expense | |
Ave Maria World Equity Fund | | $ | 0.2100 | | | $ | 0.0157 | |
90
AVE MARIA MUTUAL FUNDS
Other Information
(Unaudited)
A description of the policies and procedures the Funds use to determine how to vote proxies relating to portfolio securities is available without charge upon request by calling toll-free (888) 726-9331, or on the SEC’s website at www.sec.gov. Information regarding how the Funds voted proxies relating to portfolio securities during the most recent 12-month period ended June 30 is also available without charge upon request by calling toll-free (888) 726-9331, or on the SEC’s website at www.sec.gov.
The Trust files a complete listing of portfolio holdings for each of the Funds with the SEC as of the end of the first and third quarters of each fiscal year as an exhibit on Form N-PORT. The filings are available free of charge, upon request, by calling (888) 726-9331. Furthermore, you may obtain a copy of the filings on the SEC’s website at www.sec.gov.
91
AVE MARIA MUTUAL FUNDS
Liquidity Risk
(Unaudited)
The Funds have adopted and implemented a written liquidity risk management program as required by Rule 22e-4 (the “Liquidity Rule”) under the Investment Company Act of 1940. The program is reasonably designed to assess, manage, and periodically review each Fund’s liquidity risk, taking into consideration, among other factors, each Fund’s investment strategies and the liquidity of its portfolio investments during normal and reasonably foreseeable stressed conditions; its short and long-term cash flow projections; and its cash holdings and access to other funding sources. The Board of Trustees approved the appointment of a Liquidity Risk Management Program Administrator (the “Liquidity Administrator”), which includes representatives from Schwartz Investment Counsel, Inc., the Funds’ investment adviser. The Liquidity Administrator is responsible for the administration of the program and its policies and procedures and for reporting to the Board on an annual basis regarding the program’s operation, adequacy and effectiveness, as well as any material changes to the program. The Liquidity Administrator assessed each Fund’s liquidity risk profile and the adequacy and effectiveness of the liquidity risk management program’s operations during the period from June 1, 2021 through June 30, 2022 (the “Review Period”) in order to prepare a written report for the Board of Trustees (the “Report”) for consideration at its meeting held on August 5, 2022. During the Review Period, none of the Funds experienced unusual stress or disruption to its operations from any purchase and redemption activity. Also, during the Review Period the Funds held adequate levels of cash and highly liquid investments to meet shareholder redemption activities in accordance with applicable requirements. The Report concluded that (i) the Funds’ liquidity risk management program is reasonably designed to prevent violations of the Liquidity Rule and (ii) the Funds’ liquidity risk management program has been effectively implemented during the Review Period.
92
As of the end of the period covered by this report, the registrant has adopted a code of ethics that applies to the registrant’s principal executive officer, principal financial officer, principal accounting officer or controller, or persons performing similar functions, regardless of whether these individuals are employed by the registrant or a third party. Pursuant to Item 13(a)(1), a copy of registrant’s code of ethics is filed as an exhibit to this Form N-CSR. During the period covered by this report, the code of ethics has not been amended, and the registrant has not granted any waivers, including implicit waivers, from the provisions of the code of ethics.
| Item 3. | Audit Committee Financial Expert. |
The registrant’s board of trustees has determined that the registrant has an audit committee financial expert serving on its audit committee. The name of the audit committee financial expert is William A. Morrow. Mr. Morrow is “independent” for purposes of this Item.
| Item 4. | Principal Accountant Fees and Services. |
| (a) | Audit Fees. The aggregate fees billed for professional services rendered by the principal accountant for the audit of the registrant’s annual financial statements or for services that are normally provided by the accountant in connection with statutory and regulatory filings or engagements were $186,000 and $174,000 with respect to the registrant’s fiscal years ended December 31, 2022 and 2021, respectively. |
| (b) | Audit-Related Fees. No fees were billed in either of the last two fiscal years for assurance and related services by the principal accountant that are reasonably related to the performance of the audit of the registrant’s financial statements and are not reported under paragraph (a) of this Item. |
| (c) | Tax Fees. The aggregate fees billed for professional services rendered by the principal accountant for tax compliance, tax advice, and tax planning were $24,500 and $22,600 with respect to the registrant’s fiscal years ended December 31, 2022 and 2021, respectively. The services comprising these fees are tax consulting and the preparation of the registrant’s federal income and excise tax returns. |
| (d) | All Other Fees. No fees were billed in either of the last two fiscal years for products and services provided by the principal accountant, other than the services reported in paragraphs (a) through (c) of this Item. |
| (e)(1) | The audit committee has not adopted pre-approval policies and procedures described in paragraph (c)(7) of Rule 2-01 of Regulation S-X. |
| (e)(2) | None of the services described in paragraph (b) through (d) of this Item were approved by the audit committee pursuant to paragraph (c)(7)(i)(C) of Rule 2-01 of Regulation S-X. |
| (f) | Less than 50% of hours expended on the principal accountant’s engagement to audit the registrant’s financial statements for the most recent fiscal year were attributed to work performed by persons other than the principal accountant’s full-time, permanent employees. |
| (g) | During the fiscal years ended December 31, 2022 and 2021, aggregate non-audit fees of $24,500 and $22,600, respectively, were billed by the registrant’s principal accountant for services rendered to the registrant. During the fiscal years ended December 31, 2022 and 2021, $16,050 and $15,000, respectively, were billed by the registrant’s principal accountant for services rendered to the registrant’s investment adviser (not including any sub-adviser whose role is primarily portfolio management and is subcontracted with or overseen by another investment adviser), and any entity controlling, controlled by, or under common control with the adviser that provides ongoing services to the registrant. |
| (h) | The registrant’s audit committee determined that the provision of non-audit services that were rendered to the registrant’s investment adviser (not including any sub-adviser whose role is primarily portfolio management and is subcontracted with or overseen by another investment adviser), and any entity controlling, controlled by, or under common control with the investment adviser that provides ongoing services to the registrant, that were not pre-approved pursuant to paragraph (c)(7)(ii) of Rule 2-01 of Regulation S-X is compatible with maintaining the principal accountant’s independence. |
| Item 5. | Audit Committee of Listed Registrants. |
Not applicable
| Item 6. | Schedule of Investments. |
| (a) | Not applicable [schedule filed with Item 1] |
| Item 7. | Disclosure of Proxy Voting Policies and Procedures for Closed-End Management Investment Companies. |
Not applicable
| Item 8. | Portfolio Managers of Closed-End Management Investment Companies. |
Not applicable
| Item 9. | Purchases of Equity Securities by Closed-End Management Investment Company and Affiliated Purchasers. |
Not applicable
| Item 10. | Submission of Matters to a Vote of Security Holders. |
The registrant’s Nominating and Governance Committee shall review shareholder recommendations to fill vacancies on the registrant’s board of trustees if such recommendations are submitted in writing, addressed to the Committee at the registrant’s offices and meet any minimum qualifications adopted by the Committee. The Committee may adopt, by resolution, a policy regarding its procedures for considering candidates for the board of trustees, including any recommended by shareholders.
| Item 11. | Controls and Procedures. |
(a) Based on their evaluation of the registrant’s disclosure controls and procedures (as defined in Rule 30a-3(c) under the Investment Company Act of 1940) as of a date within 90 days of the filing date of this report, the registrant’s principal executive officer and principal financial officer have concluded that such disclosure controls and procedures are reasonably designed and are operating effectively to ensure that material information relating to the registrant, including its consolidated subsidiaries, is made known to them by others within those entities, particularly during the period in which this report is being prepared, and that the information required in filings on Form N-CSR is recorded, processed, summarized, and reported on a timely basis.
(b) There were no changes in the registrant’s internal control over financial reporting (as defined in Rule 30a-3(d) under the Investment Company Act of 1940) that occurred during the period covered by this report that have materially affected, or are reasonably likely to materially affect, the registrant’s internal control over financial reporting.
| Item 12. | Disclosure of Securities Lending Activities for Closed-End Management Investment Companies. |
Not applicable
File the exhibits listed below as part of this Form. Letter or number the exhibits in the sequence indicated.
(a)(1) Any code of ethics, or amendment thereto, that is the subject of the disclosure required by Item 2, to the extent that the registrant intends to satisfy the Item 2 requirements through filing of an exhibit: Attached hereto
(a)(2) A separate certification for each principal executive officer and principal financial officer of the registrant as required by Rule 30a-2(a) under the Act (17 CFR 270.30a-2(a)): Attached hereto
(1) Not applicable
(2) Change in the registrant’s independent public accountants: Not applicable
(b) Certifications required by Rule 30a-2(b) under the Act (17 CFR 270.30a-2(b)): Attached hereto
SIGNATURES
Pursuant to the requirements of the Securities Exchange Act of 1934 and the Investment Company Act of 1940, the registrant has duly caused this report to be signed on its behalf by the undersigned, thereunto duly authorized.
| (Registrant) | Schwartz Investment Trust | | |
| | | | |
| By (Signature and Title)* | /s/ George P. Schwartz | |
| | | George P. Schwartz, President and Principal Executive Officer | |
| | | | |
| Date | March 1, 2023 | | |
| | | | |
| Pursuant to the requirements of the Securities Exchange Act of 1934 and the Investment Company Act of 1940, this report has been signed below by the following persons on behalf of the registrant and in the capacities and on the dates indicated. |
| | | | |
| By (Signature and Title)* | /s/ George P. Schwartz | |
| | | George P. Schwartz, President and Principal Executive Officer | |
| | | | |
| Date | March 1, 2023 | | |
| | | | |
| By (Signature and Title)* | /s/ Timothy S. Schwartz | |
| | | Timothy S. Schwartz, Treasurer, Principal Financial Officer and Principal Accounting Officer | |
| | | | |
| Date | March 1, 2023 | | |
| * | Print the name and title of each signing officer under his or her signature. |