| OMB APPROVAL |
OMB Number: 3235-0570 Expires: August 31, 2020 Estimated average burden hours per response: 20.6 |
UNITED STATES
SECURITIES AND EXCHANGE COMMISSION
Washington, D.C. 20549
FORM N-CSR
CERTIFIED SHAREHOLDER REPORT OF REGISTERED
MANAGEMENT INVESTMENT COMPANIES
| Investment Company Act file number | 811-07148 | |
| Schwartz Investment Trust |
| (Exact name of registrant as specified in charter) |
| 801 W. Ann Arbor Trail, Suite 244 Plymouth, Michigan | 48170 |
| (Address of principal executive offices) | (Zip code) |
George P. Schwartz
| Schwartz Investment Counsel, Inc. 801 W. Ann Arbor Trail, Plymouth, MI 48170 |
| (Name and address of agent for service) |
| Registrant's telephone number, including area code: | (734) 455-7777 | |
| Date of fiscal year end: | December 31 | |
| | | |
| Date of reporting period: | December 31, 2019 | |
Form N-CSR is to be used by management investment companies to file reports with the Commission not later than 10 days after the transmission to stockholders of any report that is required to be transmitted to stockholders under Rule 30e-1 under the Investment Company Act of 1940 (17 CFR 270.30e-1). The Commission may use the information provided on Form N-CSR in its regulatory, disclosure review, inspection, and policymaking roles.
A registrant is required to disclose the information specified by Form N-CSR, and the Commission will make this information public. A registrant is not required to respond to the collection of information contained in Form N-CSR unless the Form displays a currently valid Office of Management and Budget ("OMB") control number. Please direct comments concerning the accuracy of the information collection burden estimate and any suggestions for reducing the burden to the Secretary, Securities and Exchange Commission, 450 Fifth Street, NW, Washington, DC 20549-0609. The OMB has reviewed this collection of information under the clearance requirements of 44 U.S.C. § 3507.
| Item 1. | Reports to Stockholders. |
Beginning on January 1, 2021, as permitted by regulations adopted by the U.S. Securities and Exchange Commission, paper copies of the Fund’s shareholder reports like this one will no longer be sent by mail, unless you specifically request paper copies of the reports from the Fund or from your financial intermediary, such as a broker-dealer or bank. Instead, the reports will be made available on a website, and you will be notified by mail each time a report is posted and provided with a website link to access the report.
If you already elected to receive shareholder reports electronically, you will not be affected by this change and you need not take any action. You may elect to receive shareholder reports and other communications from the Fund electronically by contacting the Fund at 1-888-726-0753 or, if you own these shares through a financial intermediary, by contacting your financial intermediary.
You may elect to receive all future reports in paper free of charge. You can inform the Fund that you wish to continue receiving paper copies of your shareholder reports by contacting the Fund at 1-888-726-0753. If you own shares through a financial intermediary, you may contact your financial intermediary or follow instructions included with this document to elect to continue to receive paper copies of your shareholder reports. Your election to receive reports in paper will apply to all Funds held with the Fund complex or at your financial intermediary.
Schwartz Value Focused Fund
Shareholder Services c/o Ultimus Fund Solutions, LLC P.O. Box 46707 Cincinnati, OH 45246 (888) 726-0753 | | Investment Adviser Schwartz Investment Counsel, Inc.
801 W. Ann Arbor Trail Suite 244 Plymouth, MI 48170 |
Dear Fellow Shareholders,
The bull market resumed in 2019. Somewhat paradoxically, it was a great year for almost all asset classes, as domestic stocks, foreign stocks, Treasuries, corporate bonds, real estate, and precious metals all recorded strong gains. It was a particularly good year for U.S. equity investors, with the major stock market indices posting their biggest gains since 2013. Nearly everything worked, as small-caps, mid-caps, and especially large-caps all rose in tandem. For the year ended December 31, 2019, the Schwartz Value Focused Fund (“the Fund”) posted a total return of 18.67%, compared to 30.90% for the benchmark S&P 1500 Index.
The multi-year cycle of large-cap stocks outperforming small-caps continued last year. In the S&P 1500, returns were highly stratified by market capitalization - the larger the market cap, the greater the price appreciation, as shown in the table below:
Index | Market Cap | 2019 Total Return |
S&P 500 Index | Large-caps | 31.49% |
S&P 400 Index | Mid-caps | 26.20% |
S&P 600 Index | Small-caps | 22.78% |
Likewise, growth mutual funds continued their outperformance over value funds. According to Morningstar, the best performing fund category was large-cap growth, with the average fund up 31.91%. In contrast, the worst performing category was small-cap value with the average fund up 21.53%. In the S&P 500, the best performing sectors were the growth-oriented technology (+50.3%), communication services (+32.7%), and financials (+32.1%). Meanwhile, traditional value-oriented sectors lagged: energy (+11.8%), health care (+20.8%), and materials (+24.6%). In this environment, the Fund’s small-cap exposure, along with its risk averse approach, hurt our relative performance. As you know, the Fund is non-diversified, holds several concentrated positions, and thus does not resemble a broadly diversified index like the S&P 500.
The Fund’s largest holding remains Texas Pacific Land Trust (TPL or “the Trust”), which represents 19.1% of Fund assets. TPL’s share price appreciated substantially during 2019 with a 45.73% return. During Q3 of last year, the Trust formed a special committee to explore the possibility of converting the Trust to a corporate structure. We believe such a conversion is likely to occur in 2020 and would benefit TPL shareholders in numerous ways. We continue to believe the intrinsic value of TPL far exceeds its current share price. The Fund’s five best performing stocks in 2019 were:
Company | Industry | 2019 Performance |
Avid Bioservices, Inc. | Biopharmaceuticals | 87.07% |
Garmin Ltd. | Scientific & Technical Instruments | 71.55% |
Moody’s Corporation | Business & Financial Services | 71.35% |
Pan American Silver Corporation | Metals & Mining | 63.59% |
Mastercard, Inc. | Credit Services | 59.18% |
1
The Fund’s worst performing security last year was Qurate Retail, Inc., a leading TV, video, and e-commerce retailer. As we noted in last year’s semi-annual report, we had reduced the position size due to the company’s lackluster operational performance, owing to the challenging retail environment and the decline in traditional TV viewing. In Q3 of last year, we determined that our thesis was going to take longer to play out than we had expected, and we subsequently sold the remaining position, in favor of more attractive investment opportunities. The Fund’s five worst performing stocks in 2019 were:
Company | Industry | 2019 Performance |
Qurate Retail, Inc. | TV & Internet Retail | -52.66% |
Gildan Activewear, Inc. | Apparel & Textiles | -11.22% |
Apache Corporation | Oil & Gas Exploration/Production | -9.56% |
Pioneer Natural Resources Co. | Oil & Gas Exploration/Production | -7.78% |
American Airlines Group, Inc. | Airlines | -1.17% |
During the second half of 2019, the Fund also liquidated shares of: Cognizant Technology Solutions Corp. and Gildan Activewear (due to deteriorating fundamentals), and Corteva, Inc. and DuPont de Nemours, Inc. (due to concerns regarding potential litigation). Cash was redeployed into our best existing positions, which we believe have outstanding appreciation potential. Their businesses are continuing to produce excellent operational results, which will likely be reflected in their shares prices.
Due to the continuing popularity of passive investing, with billions of new money flowing into ETFs and Index Funds, the mega-cap stocks (Apple, Microsoft, Facebook, Amazon, Alphabet, etc.) continue to drive the S&P higher. During this passive investing craze, traditional measures of valuation have lost their relevance, as ETFs and Index Funds must purchase these same mega-cap stocks when the new money comes in, regardless of price. Many investors don’t realize that the outperformance of growth stocks over value stocks represents a departure from the long-term norm. As famed economist Herb Stein said, “If something cannot go on forever, it will stop.” At some point, very high-quality, value stocks of businesses that are prospering, will regain favor with investors, and the Fund will likely be a beneficiary. It’s overdue. Now more than ever, we remain confident in our approach and steadfast in our belief in the merits of value investing to generate favorable long-term results and minimize risk. It’s important to be aware of risk.
No capital gains distribution was made at year-end and the net asset value of the Fund finished the year at $28.03 per share.
Thank you for being a shareholder in the Schwartz Value Focused Fund.

| 
|
Timothy S. Schwartz, CFA | George P. Schwartz, CFA |
Lead Portfolio Manager | Co-Portfolio Manager |
2
SCHWARTZ VALUE FOCUSED FUND
PERFORMANCE
(Unaudited)
Comparison of the Change in Value of a $10,000 Investment
in Schwartz Value Focused Fund and the S&P 1500 Index

(a) | The returns shown do not reflect the deduction of taxes a shareholder would pay on Fund distributions or the redemption of Fund shares. |
Expense Ratio
Information as of: | Year Ended 12-31-18
(as disclosed in May 1, 2019
prospectus) | Year Ended 12-31-19 |
Gross | 1.68%* | 1.61% |
Net | 1.26%* | 1.25% |
* | Includes Acquired Fund Fees and Expenses. |
3
SCHWARTZ VALUE FOCUSED FUND
ANNUAL TOTAL RATES OF RETURN
COMPARISON WITH MAJOR INDICES (Unaudited)
| SCHWARTZ
VALUE
FOCUSED
FUND(a) | S&P 1500
INDEX(b) | VALUE
LINE
COMPOSITE(c) |
1984 | 11.1% | N/A | -8.4% |
1985 | 21.7% | N/A | 20.7% |
1986 | 16.4% | N/A | 5.0% |
1987 | -0.6% | N/A | -10.6% |
1988 | 23.1% | N/A | 15.4% |
1989 | 8.3% | N/A | 11.2% |
1990 | -5.3% | N/A | -24.3% |
1991 | 32.0% | N/A | 27.2% |
1992 | 22.7% | N/A | 7.0% |
1993 | 20.5% | N/A | 10.7% |
1994 | -6.8% | N/A | -6.0% |
1995 | 16.9% | 36.5% | 19.3% |
1996 | 18.3% | 22.4% | 13.4% |
1997 | 28.0% | 32.9% | 21.1% |
1998 | -10.4% | 26.4% | -3.8% |
1999 | -2.5% | 20.3% | -1.4% |
2000 | 9.3% | -7.0% | -8.7% |
2001 | 28.1% | -10.6% | -6.1% |
2002 | -14.9% | -21.3% | -28.6% |
2003 | 39.3% | 29.6% | 37.4% |
2004 | 22.6% | 11.8% | 11.5% |
2005 | 3.8% | 5.7% | 2.0% |
2006 | 14.3% | 15.3% | 11.0% |
2007 | -11.1% | 5.5% | -3.8% |
2008 | -35.9% | -36.7% | -48.7% |
2009 | 34.8% | 27.2% | 36.8% |
2010 | 12.0% | 16.4% | 20.5% |
2011 | 5.6% | 1.7% | -11.4% |
2012 | 5.4% | 16.2% | 9.5% |
2013 | 24.7% | 32.8% | 35.5% |
2014 | -4.7% | 13.1% | 2.7% |
2015 | -15.5% | 1.0% | -11.2% |
2016 | 18.1% | 13.0% | 13.5% |
2017 | 13.7% | 21.1% | 11.1% |
2018 | -8.1% | -5.0% | -16.0% |
2019 | 18.7% | 30.9% | 16.9% |
(a) | Schwartz Value Focused Fund’s performance combines the performance of the Fund since its commencement of operations as a registered investment company on July 20, 1993, and the performance of RCM Partners Limited Partnership for periods prior thereto. |
(b) | Inception date of the S&P 1500 Index is December 30, 1994. |
(c) | Excluding dividends. |
4
SCHWARTZ VALUE FOCUSED FUND
AVERAGE ANNUAL TOTAL RETURNS
As of December 31, 2019 (Unaudited)
| SCHWARTZ
VALUE
FOCUSED
FUND(a) | S&P 1500
INDEX(b) | VALUE
LINE
COMPOSITE(c) |
3 Years | 7.4% | 14.7% | 2.9% |
5 Years | 4.4% | 11.5% | 1.9% |
10 Years | 6.2% | 13.5% | 6.0% |
20 Years | 6.3% | 6.4% | 1.3% |
36 Years | 8.5% | N/A | 2.9% |
(a) | Schwartz Value Focused Fund’s performance combines the performance of the Fund since its commencement of operations as a registered investment company on July 20, 1993, and the performance of RCM Partners Limited Partnership for periods prior thereto. |
(b) | Inception date of the S&P 1500 Index is December 30, 1994. |
(c) | Excluding dividends. |
5
SCHWARTZ VALUE FOCUSED FUND
TEN LARGEST EQUITY HOLDINGS
December 31, 2019 (Unaudited)
| | Shares | | | Security Description | | Market
Value | | | % of
Net Assets | |
| | | 5,500 | | | Texas Pacific Land Trust | | $ | 4,296,710 | | | | 19.1% | |
| | | 40,000 | | | Delta Air Lines, Inc. | | | 2,339,200 | | | | 10.4% | |
| | | 80,000 | | | Barrick Gold Corporation | | | 1,487,200 | | | | 6.6% | |
| | | 80,000 | | | Rosetta Stone, Inc. | | | 1,451,200 | | | | 6.5% | |
| | | 4,000 | | | Madison Square Garden Company (The) - Class A | | | 1,176,760 | | | | 5.2% | |
| | | 3 | | | Berkshire Hathaway, Inc. - Class A | | | 1,018,770 | | | | 4.5% | |
| | | 35,000 | | | Pan American Silver Corporation | | | 829,150 | | | | 3.7% | |
| | | 2,000 | | | AMERCO | | | 751,640 | | | | 3.4% | |
| | | 3,000 | | | Moody’s Corporation | | | 712,230 | �� | | | 3.2% | |
| | | 30,000 | | | Valvoline, Inc. | | | 642,300 | | | | 2.9% | |
ASSET ALLOCATION (Unaudited)
Sector | % of
Net Assets |
Communication Services | 13.3% |
Consumer Discretionary | 4.9% |
Consumer Staples | 3.1% |
Energy | 5.2% |
Financials | 7.7% |
Health Care | 2.1% |
Industrials | 17.9% |
Information Technology | 2.7% |
Materials | 13.2% |
Real Estate | 19.1% |
Money Market Funds, Liabilities in Excess of Other Assets | 10.8% |
| | 100.0% |
6
SCHWARTZ VALUE FOCUSED FUND
SCHEDULE OF INVESTMENTS
December 31, 2019
COMMON STOCKS — 89.2% | | Shares | | | Market Value | |
Communication Services — 13.3% | | | | | | | | |
Entertainment — 13.3% | | | | | | | | |
Liberty Media Corporation - Liberty Formula One - Series C * | | | 8,000 | | | $ | 367,720 | |
Madison Square Garden Company (The) - Class A * | | | 4,000 | | | | 1,176,760 | |
Rosetta Stone, Inc. * | | | 80,000 | | | | 1,451,200 | |
| | | | | | | | 2,995,680 | |
Consumer Discretionary — 4.9% | | | | | | | | |
Household Durables — 2.2% | | | | | | | | |
Garmin Ltd. | | | 5,000 | | | | 487,800 | |
| | | | | | | | | |
Specialty Retail — 2.7% | | | | | | | | |
TJX Companies, Inc. (The) | | | 10,000 | | | | 610,600 | |
| | | | | | | | | |
Consumer Staples — 3.1% | | | | | | | | |
Beverages — 1.2% | | | | | | | | |
Brown-Forman Corporation - Class B | | | 4,000 | | | | 270,400 | |
| | | | | | | | | |
Food & Staples Retailing — 1.9% | | | | | | | | |
Kroger Company (The) | | | 15,000 | | | | 434,850 | |
| | | | | | | | | |
Energy — 5.2% | | | | | | | | |
Oil, Gas & Consumable Fuels — 5.2% | | | | | | | | |
Apache Corporation | | | 5,000 | | | | 127,950 | |
Devon Energy Corporation | | | 9,000 | | | | 233,730 | |
Noble Energy, Inc. | | | 20,000 | | | | 496,800 | |
Pioneer Natural Resources Company | | | 2,000 | | | | 302,740 | |
| | | | | | | | 1,161,220 | |
Financials — 7.7% | | | | | | | | |
Capital Markets — 3.2% | | | | | | | | |
Moody’s Corporation | | | 3,000 | | | | 712,230 | |
| | | | | | | | | |
Diversified Financial Services — 4.5% | | | | | | | | |
Berkshire Hathaway, Inc. - Class A * | | | 3 | | | | 1,018,770 | |
| | | | | | | | | |
Health Care — 2.1% | | | | | | | | |
Biotechnology — 2.1% | | | | | | | | |
Avid Bioservices, Inc. * | | | 60,000 | | | | 460,200 | |
7
SCHWARTZ VALUE FOCUSED FUND
SCHEDULE OF INVESTMENTS
(Continued)
COMMON STOCKS — 89.2% (Continued) | | Shares | | | Market Value | |
Industrials — 17.9% | | | | | | | | |
Airlines — 12.3% | | | | | | | | |
American Airlines Group, Inc. | | | 15,000 | | | $ | 430,200 | |
Delta Air Lines, Inc. | | | 40,000 | | | | 2,339,200 | |
| | | | | | | | 2,769,400 | |
Electrical Equipment — 2.2% | | | | | | | | |
AMETEK, Inc. | | | 5,000 | | | | 498,700 | |
| | | | | �� | | | | |
Road & Rail — 3.4% | | | | | | | | |
AMERCO | | | 2,000 | | | | 751,640 | |
| | | | | | | | | |
Information Technology — 2.7% | | | | | | | | |
IT Services — 2.7% | | | | | | | | |
Mastercard, Inc. - Class A | | | 2,000 | | | | 597,180 | |
| | | | | | | | | |
Materials — 13.2% | | | | | | | | |
Chemicals — 2.9% | | | | | | | | |
Valvoline, Inc. | | | 30,000 | | | | 642,300 | |
| | | | | | | | | |
Metals & Mining — 10.3% | | | | | | | | |
Barrick Gold Corporation | | | 80,000 | | | | 1,487,200 | |
Pan American Silver Corporation | | | 35,000 | | | | 829,150 | |
| | | | | | | | 2,316,350 | |
Real Estate — 19.1% | | | | | | | | |
Real Estate Management & Development — 19.1% | | | | | | | | |
Texas Pacific Land Trust | | | 5,500 | | | | 4,296,710 | |
| | | | | | | | | |
Total Common Stocks (Cost $12,821,185) | | | | | | $ | 20,024,030 | |
8
SCHWARTZ VALUE FOCUSED FUND
SCHEDULE OF INVESTMENTS
(Continued)
MONEY MARKET FUNDS — 11.0% | | Shares | | | Market Value | |
Federated Government Obligations Tax-Managed Fund - Institutional Shares, 1.46% (a) | | | 1,017,182 | | | $ | 1,017,182 | |
Federated Treasury Obligations Fund - Institutional Shares, 1.51% (a) | | | 1,017,182 | | | | 1,017,182 | |
Federated U.S. Treasury Cash Reserves Fund - Institutional Shares, 1.46% (a) | | | 439,850 | | | | 439,850 | |
Total Money Market Funds (Cost $2,474,214) | | | | | | $ | 2,474,214 | |
| | | | | | | | | |
Total Investments at Market Value — 100.2% (Cost $15,295,399) | | | | | | $ | 22,498,244 | |
| | | | | | | | | |
Liabilities in Excess of Other Assets — (0.2%) | | | | | | | (36,914 | ) |
| | | | | | | | | |
Net Assets — 100.0% | | | | | | $ | 22,461,330 | |
* | Non-income producing security. |
(a) | The rate shown is the 7-day effective yield as of December 31, 2019. |
See notes to financial statements. |
9
SCHWARTZ VALUE FOCUSED FUND
STATEMENT OF ASSETS AND LIABILITIES
December 31, 2019
ASSETS | | | | |
Investments, at market value (cost of $15,295,399) (Note 1) | | $ | 22,498,244 | |
Cash | | | 2,850 | |
Dividends receivable | | | 5,677 | |
Other assets | | | 7,679 | |
TOTAL ASSETS | | | 22,514,450 | |
| | | | | |
LIABILITIES | | | | |
Payable to Adviser (Note 2) | | | 35,601 | |
Payable to administrator (Note 2) | | | 3,000 | |
Other accrued expenses | | | 14,519 | |
TOTAL LIABILITIES | | | 53,120 | |
| | | | | |
NET ASSETS | | $ | 22,461,330 | |
| | | | | |
NET ASSETS CONSIST OF: | | | | |
Paid-in capital | | $ | 15,976,623 | |
Accumulated earnings | | | 6,484,707 | |
NET ASSETS | | $ | 22,461,330 | |
| | | | | |
Shares of beneficial interest outstanding (unlimited number of shares authorized, no par value) | | | 801,292 | |
| | | | | |
Net asset value, offering price and redemption price per share (Note 1) | | $ | 28.03 | |
See notes to financial statements. |
10
SCHWARTZ VALUE FOCUSED FUND
STATEMENT OF OPERATIONS
For the Year Ended December 31, 2019
INVESTMENT INCOME | | | | |
Dividends (Net of foreign tax of $3,200) | | $ | 239,406 | |
| | | | | |
EXPENSES | | | | |
Investment advisory fees (Note 2) | | | 202,347 | |
Administration, accounting and transfer agent fees (Note 2) | | | 36,000 | |
Legal fees | | | 22,597 | |
Registration and filing fees | | | 22,580 | |
Audit and tax services fees | | | 16,469 | |
Postage and supplies | | | 7,034 | |
Printing of shareholder reports | | | 6,488 | |
Custodian and bank service fees | | | 5,408 | |
Insurance expense | | | 4,845 | |
Trustees’ fees and expenses (Note 2) | | | 4,554 | |
Compliance service fees and expenses (Note 2) | | | 871 | |
Pricing fees | | | 813 | |
Other expenses | | | 12,327 | |
TOTAL EXPENSES | | | 342,333 | |
Less fee reductions by the Adviser (Note 2) | | | (76,087 | ) |
NET EXPENSES | | | 266,246 | |
| | | | | |
NET INVESTMENT LOSS | | | (26,840 | ) |
| | | | | |
REALIZED AND UNREALIZED GAINS (LOSSES) ON INVESTMENTS | | | | |
Net realized losses from investment transactions | | | (718,138 | ) |
Net change in unrealized appreciation (depreciation) on investments | | | 4,350,603 | |
NET REALIZED AND UNREALIZED GAINS ON INVESTMENTS | | | 3,632,465 | |
| | | | | |
NET INCREASE IN NET ASSETS RESULTING FROM OPERATIONS | | $ | 3,605,625 | |
See notes to financial statements. |
11
SCHWARTZ VALUE FOCUSED FUND
STATEMENTS OF CHANGES IN NET ASSETS
| | Year Ended
December 31,
2019 | | | Year Ended
December 31,
2018 | |
FROM OPERATIONS | | | | | | | | |
Net investment loss | | $ | (26,840 | ) | | $ | (69,312 | ) |
Net realized gains (losses) from investment transactions | | | (718,138 | ) | | | 598,304 | |
Net change in unrealized appreciation (depreciation) on investments | | | 4,350,603 | | | | (2,199,588 | ) |
Net increase (decrease) in net assets resulting from operations | | | 3,605,625 | | | | (1,670,596 | ) |
| | | | | | | | | |
FROM DISTRIBUTIONS TO SHAREHOLDERS (Note 1) | | | — | | | | (529,689 | ) |
| | | | | | | | | |
FROM CAPITAL SHARE TRANSACTIONS | | | | | | | | |
Proceeds from shares sold | | | 224,244 | | | | 344,904 | |
Reinvestment of distributions to shareholders | | | — | | | | 514,383 | |
Payments for shares redeemed | | | (796,351 | ) | | | (1,822,743 | ) |
Net decrease in net assets from capital share transactions | | | (572,107 | ) | | | (963,456 | ) |
| | | | | | | | | |
TOTAL INCREASE (DECREASE) IN NET ASSETS | | | 3,033,518 | | | | (3,163,741 | ) |
| | | | | | | | | |
NET ASSETS | | | | | | | | |
Beginning of year | | | 19,427,812 | | | | 22,591,553 | |
End of year | | $ | 22,461,330 | | | $ | 19,427,812 | |
| | | | | | | | | |
SUMMARY OF CAPITAL SHARE ACTIVITY | | | | | | | | |
Shares sold | | | 8,920 | | | | 12,630 | |
Shares issued in reinvestment of distributions to shareholders | | | — | | | | 21,926 | |
Shares redeemed | | | (30,285 | ) | | | (66,475 | ) |
Net decrease in shares outstanding | | | (21,365 | ) | | | (31,919 | ) |
Shares outstanding, beginning of year | | | 822,657 | | | | 854,576 | |
Shares outstanding, end of year | | | 801,292 | | | | 822,657 | |
See notes to financial statements. |
12
SCHWARTZ VALUE FOCUSED FUND
FINANCIAL HIGHLIGHTS
Per Share Data for a Share Outstanding Throughout Each Year
| | Year
Ended
Dec. 31,
2019 | | | Year
Ended
Dec. 31,
2018 | | | Year
Ended
Dec. 31,
2017 | | | Year
Ended
Dec. 31,
2016 | | | Year
Ended
Dec. 31,
2015 | |
Net asset value at beginning of year | | $ | 23.62 | | | $ | 26.44 | | | $ | 25.02 | | | $ | 21.18 | | | $ | 25.06 | |
| | | | | | | | | | | | | | | | | | | | | |
Income (loss) from investment operations: | | | | | | | | | | | | | | | | | | | | |
Net investment loss | | | (0.03 | ) | | | (0.08 | ) | | | (0.13 | ) | | | (0.08 | ) | | | (0.11 | ) |
Net realized and unrealized gains (losses) on investments | | | 4.44 | | | | (2.08 | ) | | | 3.57 | | | | 3.92 | | | | (3.77 | ) |
Total from investment operations | | | 4.41 | | | | (2.16 | ) | | | 3.44 | | | | 3.84 | | | | (3.88 | ) |
| | | | | | | | | | | | | | | | | | | | | |
Less distributions: | | | | | | | | | | | | | | | | | | | | |
From net realized gains on investments | | | — | | | | (0.66 | ) | | | (2.02 | ) | | | — | | | | — | |
| | | | | | | | | | | | | | | | | | | | | |
Net asset value at end of year | | $ | 28.03 | | | $ | 23.62 | | | $ | 26.44 | | | $ | 25.02 | | | $ | 21.18 | |
| | | | | | | | | | | | | | | | | | | | | |
Total return (a) | | | 18.7 | % | | | (8.1 | %) | | | 13.7 | % | | | 18.1 | % | | | (15.5 | %) |
| | | | | | | | | | | | | | | | | | | | | |
Ratios/Supplementary Data: | | | | | | | | | | | | | | | | | | | | |
Net assets at end of year (000’s) | | $ | 22,461 | | | $ | 19,428 | | | $ | 22,592 | | | $ | 21,012 | | | $ | 18,772 | |
| | | | | | | | | | | | | | | | | | | | | |
Ratio of total expenses to average net assets | | | 1.61 | % | | | 1.67 | % | | | 1.79 | % | | | 1.80 | % | | | 1.59 | % |
| | | | | | | | | | | | | | | | | | | | | |
Ratio of net expenses to average net assets (b) | | | 1.25 | % | | | 1.25 | % | | | 1.25 | % | | | 1.25 | % | | | 1.35 | % |
| | | | | | | | | | | | | | | | | | | | | |
Ratio of net investment loss to average net assets (b) | | | (0.13 | %) | | | (0.31 | %) | | | (0.52 | %) | | | (0.35 | %) | | | (0.40 | %) |
| | | | | | | | | | | | | | | | | | | | | |
Portfolio turnover rate | | | 28 | % | | | 34 | % | | | 48 | % | | | 48 | % | | | 104 | % |
(a) | Total return is a measure of the change in value of an investment in the Fund over the period covered, which assumes any dividends or capital gains distributions are reinvested in shares of the Fund. Returns shown do not reflect the deduction of taxes a shareholder would pay on Fund distributions or the redemption of Fund shares. |
(b) | Ratio was determined after advisory fee reductions (Note 2). |
See notes to financial statements. |
13
SCHWARTZ VALUE FOCUSED FUND
NOTES TO FINANCIAL STATEMENTS
December 31, 2019
1. Significant Accounting Policies
Schwartz Value Focused Fund (the “Fund”) is a series of Schwartz Investment Trust (the “Trust”), an open-end, non-diversified management investment company established as an Ohio business trust under a Declaration of Trust dated August 31, 1992. Other series of the Trust are not incorporated in this report. The Fund is registered under the Investment Company Act of 1940, as amended (the “1940 Act”).
The investment objective of the Fund is to seek long-term capital appreciation. See the Prospectus for information regarding the principal investment strategies of the Fund.
Shares of the Fund are sold at net asset value (“NAV”). To calculate the NAV, the Fund’s assets are valued and totaled, liabilities are subtracted, and the balance is divided by the number of shares outstanding. The offering price and redemption price per share are equal to the NAV per share.
The Fund follows accounting and reporting guidance under Financial Accounting Standards Board Accounting Standards Codification Topic 946, “Financial Services – Investment Companies.” The following is a summary of the Fund’s significant accounting policies used in the preparation of its financial statements. These policies are in conformity with accounting principles generally accepted in the United States of America (“GAAP”).
(a) Valuation of investments — Securities which are traded on stock exchanges, other than NASDAQ, are valued at the closing sales price as of the close of the regular session of trading on the New York Stock Exchange on the day the securities are being valued, or, if not traded on a particular day, at the closing bid price. Securities which are quoted by NASDAQ are valued at the NASDAQ Official Closing Price or, if an Official Closing Price is not available, at the most recently quoted bid price. Securities traded in the over-the-counter market are valued at the last reported sales price or, if there is no reported sale on the valuation date, at the most recently quoted bid price. Securities which are traded both in the over-the-counter market and on a stock exchange are valued according to the broadest and most representative market. Investments representing shares of other open-end investment companies are valued at their NAV as reported by such companies. When using quoted prices and when the market for the securities are considered active, the securities will be classified as Level 1 within the fair value hierarchy (see below). Securities (and other assets) for which market quotations are not readily available are valued at their fair value as determined in good faith in accordance with consistently applied procedures established by and under the general supervision of the Board of Trustees, and will be classified as Level 2 or 3 within the fair value hierarchy, depending on the inputs used. Fair value pricing may be used, for example, in situations where (i) a portfolio security is so thinly traded that there have been no transactions for that stock over an extended period of time; (ii) the exchange on which the portfolio security is principally traded closes early; or (iii) trading of the portfolio security is halted during the day and does not resume prior to the Fund’s NAV calculation. A portfolio security’s “fair value” price may differ from the price next available for that portfolio security using the Fund’s normal pricing procedures.
14
SCHWARTZ VALUE FOCUSED FUND
NOTES TO FINANCIAL STATEMENTS
(Continued)
GAAP establishes a single authoritative definition of fair value, sets out a framework for measuring fair value and requires additional disclosures about fair value measurements.
Various inputs are used in determining the value of the Fund’s investments. These inputs are summarized in the three broad levels listed below:
● Level 1 – quoted prices in active markets for identical securities
● Level 2 – other significant observable inputs
● Level 3 – significant unobservable inputs
The inputs or methodology used for valuing securities are not necessarily an indication of the risks associated with investing in those securities. The inputs used to measure fair value may fall into different levels of the fair value hierarchy. In such cases, for disclosure purposes, the level in the fair value hierarchy within which the fair value measurement falls in its entirety is determined based on the lowest level input that is significant to the fair value measurement.
The following is a summary of the inputs used to value the Fund’s investments, by security type, as of December 31, 2019:
| | Level 1 | | | Level 2 | | | Level 3 | | | Total | |
Common Stocks | | $ | 20,024,030 | | | $ | — | | | $ | — | | | $ | 20,024,030 | |
Money Market Funds | | | 2,474,214 | | | | — | | | | — | | | | 2,474,214 | |
Total | | $ | 22,498,244 | | | $ | — | | | $ | — | | | $ | 22,498,244 | |
Refer to the Fund’s Schedule of Investments for a listing of the common stocks by sector and industry type. There were no Level 3 securities or derivative instruments held by the Fund as of or during the year ended December 31, 2019.
(b) Income taxes — The Fund has qualified and intends to continue to qualify as a regulated investment company under the Internal Revenue Code of 1986, as amended (the “Code”). Qualification generally will relieve the Fund of liability for federal income taxes to the extent 100% of its net investment income and net realized capital gains are distributed in accordance with the Code.
In order to avoid imposition of the excise tax applicable to regulated investment companies, it is also the Fund’s intention to declare as dividends in each calendar year at least 98% of its net investment income and 98.2% of its net realized capital gains plus undistributed amounts from prior years.
15
SCHWARTZ VALUE FOCUSED FUND
NOTES TO FINANCIAL STATEMENTS
(Continued)
The following information is computed on a tax basis for each item as of December 31, 2019:
Federal income tax cost | | $ | 15,295,399 | |
Gross unrealized appreciation | | $ | 7,264,468 | |
Gross unrealized depreciation | | | (61,623 | ) |
Net unrealized appreciation | | | 7,202,845 | |
Accumulated capital and other losses | | | (718,138 | ) |
Accumulated earnings | | $ | 6,484,707 | |
As of December 31, 2019, the Fund had a short-term capital loss carryforward of $309,531 and a long-term capital loss carryforward of $408,607 for federal income tax purposes, which may be carried forward indefinitely. These capital loss carryforwards are available to offset net realized capital gains in future years, thereby reducing future taxable gains distributions.
During the year ended December 31, 2019, the Fund reclassified $26,840 of accumulated earnings against paid-in capital on the Statement of Assets and Liabilities. Such reclassification, the result of permanent differences between the financial statement and income tax reporting requirements, has no effect on the Fund’s net assets or NAV per share.
The Fund recognizes the tax benefits or expenses of uncertain tax positions only when the position is “more-likely-than-not” to be sustained assuming examination by tax authorities. Management has reviewed the tax positions taken on federal income tax returns for all open tax years (generally, three years) and has concluded that no provision for unrecognized tax benefits or expenses is required in these financial statements.
(c) Investment transactions and investment income — Investment transactions are accounted for on the trade date. Dividend income is recorded on the ex-dividend date. Non-cash dividends included in dividend income, if any, are recorded at the fair market value of the securities received. Interest income is recognized on the accrual basis. Realized capital gains and losses on investment transactions are determined on the identified cost basis. Withholding taxes on foreign dividends have been recorded in accordance with the Fund’s understanding of the applicable country’s rules and tax rates.
(d) Dividends and distributions — Dividends from net investment income and distributions of net realized capital gains, if any, are declared and paid annually in December. Dividends and distributions to shareholders are recorded on the ex-dividend date. The tax character of the distributions paid to shareholders during the years ended December 31, 2019 and 2018 was as follows:
Year Ended | | Ordinary
Income | | | Long-Term
Capital Gains | | | Total
Distributions | |
December 31, 2019 | | $ | — | | | $ | — | | | $ | — | |
December 31, 2018 | | $ | 261,488 | | | $ | 268,201 | | | $ | 529,689 | |
16
SCHWARTZ VALUE FOCUSED FUND
NOTES TO FINANCIAL STATEMENTS
(Continued)
(e) Estimates — The preparation of financial statements in conformity with GAAP requires management to make estimates and assumptions that affect the reported amounts of assets and liabilities and disclosure of contingent assets and liabilities as of the date of the financial statements and the reported amounts of revenues and expenses during the reporting period. Actual results could differ from those estimates.
(f) Common expenses — Common expenses of the Trust are allocated among the Fund and the other series of the Trust based on relative net assets of each series or the nature of the services performed and the relative applicability to each series.
2. Investment Advisory Agreement and Transactions with Related Parties
The Chairman and President of the Trust is also the Chairman and Chief Executive Officer of Schwartz Investment Counsel, Inc. (the “Adviser”). Certain other officers of the Trust are officers of the Adviser, or of Ultimus Fund Solutions, LLC (“Ultimus”), the administrative, accounting and transfer agent for the Fund, or of Ultimus Fund Distributors, LLC (the “Distributor”), the Fund’s principal underwriter.
Pursuant to an Investment Advisory Agreement between the Trust and the Adviser, the Adviser is responsible for the management of the Fund and provides investment advice along with the necessary personnel, facilities, equipment and certain other services necessary to the operations of the Fund. The Adviser receives from the Fund a quarterly fee at the annual rate of 0.95% per annum of the Fund’s average daily net assets.
The Adviser has contractually agreed to reduce its advisory fees or reimburse a portion of the Fund’s expenses until at least May 1, 2020 so that the ordinary operating expenses of the Fund do not exceed 1.25% per annum of average daily net assets. Accordingly, during the year ended December 31, 2019, the Adviser reduced its investment advisory fees by $76,087.
Any fee reductions or expense reimbursements by the Adviser are subject to repayment by the Fund for a period of three years after such fees and expenses were incurred, provided repayment to the Adviser does not cause the ordinary operating expenses of the Fund to exceed 1.25% per annum of average daily net assets. As of December 31, 2019, the Adviser may seek recoupment of investment advisory fee reductions totaling $286,002 no later than the dates stated below:
December 31, 2020 | | $ | 115,484 | |
December 31, 2021 | | | 94,431 | |
December 31, 2022 | | | 76,087 | |
Total | | $ | 286,002 | |
The Chief Compliance Officer of the Trust (the “CCO”) is an employee of the Adviser. The Trust pays the Adviser a fee for providing CCO services, of which the Fund pays its proportionate share along with the other series of the Trust. In addition, the Trust reimburses the Adviser for out-of-pocket expenses incurred, if any, for providing these services.
17
SCHWARTZ VALUE FOCUSED FUND
NOTES TO FINANCIAL STATEMENTS
(Continued)
Pursuant to a Mutual Fund Services Agreement between the Trust and Ultimus, Ultimus supplies regulatory and compliance services, calculates the daily NAV per share, maintains the financial books and records of the Fund, maintains the records of each shareholder’s account, and processes purchases and redemptions of the Fund’s shares. For these services Ultimus receives fees computed as a percentage of the average daily net assets of the Fund, subject to a minimum monthly fee.
Pursuant to a Distribution Agreement between the Trust and the Distributor, the Distributor serves as the Fund’s exclusive agent for the distribution of its shares. The Distributor is an affiliate of Ultimus.
Trustees and officers affiliated with the Adviser or Ultimus are not compensated by the Trust for their services. Each Trustee who is not an affiliated person of the Adviser or Ultimus (“Independent Trustee”) received from the Trust an annual retainer of $46,000 (except that such fee is $56,000 for the Lead Independent Trustee/Chairman of the Governance Committee and $50,000 for the Chairman of the Audit Committee), payable quarterly; a fee of $6,000 for attendance at each meeting of the Board of Trustees; plus reimbursement of travel and other expenses incurred in attending meetings. Trustee Emeritus receive one-half of both the annual retainer and fee for attendance at each meeting; plus reimbursement of travel and other expenses incurred in attending meetings. Effective January 1, 2020, each Independent Trustee will receive from the Trust an annual retainer of $53,000 (except that such fee will be $64,500 for the Lead Independent Trustee/Chairman of the Governance Committee and $59,500 for the Chairman of the Audit Committee), payable quarterly; a fee of $6,000 for attendance at each meeting of the Board of Trustees; plus reimbursement of travel and other expenses incurred in attending meetings. Trustee Emeritus will receive one-half of both the annual retainer and fee for attendance at each meeting; plus reimbursement of travel and other expenses incurred in attending meetings. The Fund pays its proportionate share of the Independent Trustees’ fees and expenses along with the other series of the Trust.
3. Investment Transactions
During the year ended December 31, 2019, cost of purchases and proceeds from sales and maturities of investment securities, excluding short-term investments and U.S. government securities, amounted to $5,330,655 and $5,703,192, respectively.
4. Contingencies and Commitments
The Fund indemnifies the Trust’s officers and Trustees for certain liabilities that might arise from their performance of their duties to the Fund. Additionally, in the normal course of business, the Fund enters into contracts that contain a variety of representations and warranties and which provide general indemnifications. The Fund’s maximum exposure under these arrangements is unknown, as this would involve future claims that may be made against the Fund that have not yet occurred. However, based on experience, the Fund expects the risk of loss to be remote.
18
SCHWARTZ VALUE FOCUSED FUND
NOTES TO FINANCIAL STATEMENTS
(Continued)
5. Subsequent Events
The Fund is required to recognize in the financial statements the effects of all subsequent events that provide additional evidence about conditions that existed as of the date of the Statement of Assets and Liabilities. For non-recognized subsequent events that must be disclosed to keep the financial statements from being misleading, the Fund is required to disclose the nature of the event as well as an estimate of its financial effect, or a statement that such an estimate cannot be made. Management has evaluated subsequent events through the issuance of these financial statements and has noted no such events.
19
SCHWARTZ VALUE FOCUSED FUND
REPORT OF INDEPENDENT REGISTERED
PUBLIC ACCOUNTING FIRM
To the Shareholders and the Board of Trustees of Schwartz Investment Trust
Opinion on the Financial Statements and Financial Highlights
We have audited the accompanying statement of assets and liabilities, including the schedule of investments, of the Schwartz Value Focused Fund, one of the portfolios constituting the Schwartz Investment Trust (the “Fund”), as of December 31, 2019, the related statement of operations for the year then ended, the statement of changes in net assets for each of the two years in the period then ended, the financial highlights for each of the five years in the period then ended, and the related notes. In our opinion, the financial statements and financial highlights present fairly, in all material respects, the financial position of the Fund as of December 31, 2019, and the results of its operations for the year then ended, the changes in its net assets for each of the two years in the period then ended, and the financial highlights for each of the five years in the period then ended, in conformity with accounting principles generally accepted in the United States of America.
Basis for Opinion
These financial statements and financial highlights are the responsibility of the Fund’s management. Our responsibility is to express an opinion on the Fund’s financial statements and financial highlights based on our audits. We are a public accounting firm registered with the Public Company Accounting Oversight Board (United States) (PCAOB) and are required to be independent with respect to the Funds in accordance with the U.S. federal securities laws and the applicable rules and regulations of the Securities and Exchange Commission and the PCAOB.
We conducted our audits in accordance with the standards of the PCAOB. Those standards require that we plan and perform the audit to obtain reasonable assurance about whether the financial statements and financial highlights are free of material misstatement, whether due to error or fraud. The Fund is not required to have, nor were we engaged to perform, an audit of internal control over financial reporting. As part of our audits we are required to obtain an understanding of internal control over financial reporting but not for the purpose of expressing an opinion on the effectiveness of the Fund’s internal control over financial reporting. Accordingly, we express no such opinion.
Our audits included performing procedures to assess the risks of material misstatement of the financial statements and financial highlights, whether due to error or fraud, and performing procedures that respond to those risks. Such procedures included examining, on a test basis, evidence regarding the amounts and disclosures in the financial statements and financial highlights. Our audits also included evaluating the accounting principles used and significant estimates made by management, as well as evaluating the overall presentation of the financial statements and financial highlights. Our procedures included confirmation of securities owned as of December 31, 2019, by correspondence with the
20
SCHWARTZ VALUE FOCUSED FUND
REPORT OF INDEPENDENT REGISTERED
PUBLIC ACCOUNTING FIRM (Continued)
custodian and brokers. We believe that our audits provide a reasonable basis for our opinion.

Chicago, Illinois
February 18, 2020
We have served as the auditor of one or more Schwartz Investment Trust investment companies since 1993.
21
SCHWARTZ VALUE FOCUSED FUND
BOARD OF TRUSTEES AND EXECUTIVE OFFICERS
(Unaudited)
Overall responsibility for management of the Trust rests with the Board of Trustees. The Trustees serve during the lifetime of the Trust and until its termination, or until death, resignation, retirement or removal. The Trustees, in turn, elect the officers of the Trust to actively supervise its day-to-day operations. The officers have been elected for an annual term. The following are the Trustees and executive officers of the Trust:
Trustee/Officer | Address | Year of
Birth | Position Held
with the Trust | Length of
Time Served |
Interested Trustees: |
* | George P. Schwartz, CFA | 801 W. Ann Arbor Trail
Plymouth, MI | 1944 | Chairman of the Board/President/ Trustee | Since 1992 |
Independent Trustees: |
| | Louis C. Bosco, Jr. | 801 W. Ann Arbor Trail
Plymouth, MI | 1936 | Trustee Emeritus | Since 2008 |
| | Donald J. Dawson, Jr. | 801 W. Ann Arbor Trail
Plymouth, MI | 1947 | Trustee | Since 1993 |
| | Joseph M. Grace | 801 W. Ann Arbor Trail
Plymouth, MI | 1936 | Trustee Emeritus | Since 2007 |
| | John J. McHale, Jr. | 801 W. Ann Arbor Trail
Plymouth, MI | 1949 | Trustee | Since 2014 |
| | Edward J. Miller | 801 W. Ann Arbor Trail
Plymouth, MI | 1946 | Trustee | Since 2017 |
| | William A. Morrow | 801 W. Ann Arbor Trail
Plymouth, MI | 1947 | Trustee | Since 2018 |
Executive Officers: |
* | Robert C. Schwartz, CFP | 801 W. Ann Arbor Trail
Plymouth, MI | 1976 | Vice President and Secretary | Since 2013 |
* | Timothy S. Schwartz, CFA | 5060 Annunciation Circle
Ave Maria, FL | 1971 | Treasurer | Since 2000 |
* | Cathy M. Stoner, CPA, IACCP | 801 W. Ann Arbor Trail
Plymouth, MI | 1970 | Chief Compliance Officer | Since 2010 |
* | George P. Schwartz, Robert C. Schwartz, Timothy S. Schwartz and Cathy M. Stoner, as affiliated persons of Schwartz Investment Counsel, Inc., the Fund’s investment adviser, are “interested persons” of the Trust within the meaning of Section 2(a)(19) of the 1940 Act. George P. Schwartz is the father of Robert C. Schwartz and Timothy S. Schwartz. |
22
SCHWARTZ VALUE FOCUSED FUND
BOARD OF TRUSTEES AND EXECUTIVE OFFICERS
(Unaudited) (Continued)
Each Trustee oversees six portfolios of the Trust: the Ave Maria Value Fund, the Ave Maria Growth Fund, the Ave Maria Rising Dividend Fund, the Ave Maria World Equity Fund, the Ave Maria Bond Fund and the Fund. The principal occupations of the Trustees and executive officers of the Trust during the past five years and public directorships held by the Trustees are set forth below:
George P. Schwartz, CFA is Chairman and Chief Executive Officer of Schwartz Investment Counsel, Inc. and is the co-portfolio manager of the Fund.
Louis C. Bosco, Jr. retired in April 2012. Prior to his retirement, he was a partner in Bosco Development Company (a real estate firm).
Donald J. Dawson, Jr. retired in March 2015. Prior to retirement, he was Chairman of Payroll 1, Inc. (a payroll processing company) from 1986 – 2015.
Joseph M. Grace retired in 1996. Prior to his retirement, he was Senior Vice President of National Bank of Detroit (renamed JPMorgan Chase & Company).
John J. McHale, Jr. is Special Assistant to Commissioner of Major League Baseball since 2015. He was Executive Vice President of Major League Baseball from 2000 – 2015.
Edward J. Miller is Vice Chairman and Director of Detroit Investment Fund since 2001 and Invest Detroit Foundation since 2010 (financiers for redevelopment of Detroit, Michigan).
William A. Morrow retired in 2017. Prior to his retirement, he was Senior Executive Vice President of Crain Communications, Inc. (business media) from 1985 – 2017.
Robert C. Schwartz, CFP is Senior Vice President and Secretary of Schwartz Investment Counsel, Inc.
Timothy S. Schwartz, CFA is President of Schwartz Investment Counsel, Inc. and is the lead portfolio manager of the Fund.
Cathy M. Stoner, CPA, IACCP is Vice President, Chief Financial Officer, Chief Compliance Officer and Treasurer of Schwartz Investment Counsel, Inc.
Additional information about members of the Board of Trustees and executive officers is available in the Statement of Additional Information (“SAI”). To obtain a free copy of the SAI, please call (888) 726-0753.
23
SCHWARTZ VALUE FOCUSED FUND
ABOUT YOUR FUND’S EXPENSES
(Unaudited)
We believe it is important for you to understand the impact of costs on your investment. As a shareholder of the Fund, you incur ongoing costs, including management fees and other Fund expenses. The following examples are intended to help you understand your ongoing costs (in dollars) of investing in the Fund and to compare these costs with the ongoing costs of investing in other mutual funds.
A mutual fund’s ongoing costs are expressed as a percentage of its average net assets. This figure is known as the expense ratio. The ongoing costs reflected in the table below are based on an investment of $1,000 made at the beginning of the most recent semi-annual period (July 1, 2019) and held until the end of the period (December 31, 2019).
The table below illustrates the Fund’s ongoing costs in two ways:
Actual fund return – This section helps you to estimate the actual expenses that you paid over the period. The “Ending Account Value” shown is derived from the Fund’s actual return, and the third column shows the dollar amount of operating expenses that would have been paid by an investor who started with $1,000 in the Fund. You may use the information here, together with the amount you invested, to estimate the expenses that you paid over the period.
To do so, simply divide your account value by $1,000 (for example, an $8,600 account value divided by $1,000 = 8.6), then multiply the result by the number given for the Fund under the heading “Expenses Paid During Period.”
Hypothetical 5% return – This section is intended to help you compare the Fund’s ongoing costs with those of other mutual funds. It assumes that the Fund had an annual return of 5% before expenses during the period shown, but that the expense ratio is unchanged. In this case, because the return used is not the Fund’s actual return, the result does not apply to your investment. The example is useful in making comparisons because the U.S. Securities and Exchange Commission (the “SEC”) requires all mutual funds to calculate expenses based on a 5% return. You can assess the Fund’s ongoing costs by comparing this hypothetical example with the hypothetical examples that appear in shareholder reports of other funds.
Note that expenses shown in the table are meant to highlight and help you compare ongoing costs only. The Fund does not charge sales loads or redemption fees.
The calculations assume no shares were bought or sold during the period. Your actual costs may have been higher or lower, depending on the amount of your investment and the timing of any purchases or redemptions.
More information about the Fund’s expenses, including historical annual expense ratios, can be found in this report. For additional information on operating expenses and other shareholder costs, please refer to the Fund’s Prospectus.
24
SCHWARTZ VALUE FOCUSED FUND
ABOUT YOUR FUND’S EXPENSES
(Unaudited) (Continued)
| Beginning
Account Value
July 1, 2019 | Ending
Account Value
December 31, 2019 | Expenses Paid
During Period* |
Based on Actual Fund Return | $1,000.00 | $1,147.50 | $6.45 |
Based on Hypothetical 5% Return (before expenses) | $1,000.00 | $1,018.90 | $6.36 |
* | Expenses are equal to the Fund’s annualized net expense ratio of 1.25% for the period, multiplied by the average account value over the period, multiplied by 184/365 (to reflect the one-half year period). |
25
SCHWARTZ VALUE FOCUSED FUND
OTHER INFORMATION
(Unaudited)
A description of the policies and procedures the Fund uses to determine how to vote proxies relating to portfolio securities is available without charge upon request by calling toll-free (888) 726-0753, or on the SEC’s website at www.sec.gov. Information regarding how the Fund voted proxies relating to portfolio securities during the most recent 12-month period ended June 30 is also available without charge upon request by calling toll-free (888) 726-0753, or on the SEC’s website at www.sec.gov.
The Trust files a complete listing of portfolio holdings for the Fund with the SEC as of the end of the first and third quarters of each fiscal year on Form N-PORT. The filings are available free of charge, upon request, by calling (888) 726-0753. Furthermore, you may obtain a copy of the filings on the SEC’s website at www.sec.gov.
26
This page intentionally left blank.
This page intentionally left blank.
This page intentionally left blank.
Beginning on January 1, 2021, as permitted by regulations adopted by the U.S. Securities and Exchange Commission, paper copies of the Funds’ shareholder reports like this one will no longer be sent by mail, unless you specifically request paper copies of the reports from the Funds or from your financial intermediary, such as a broker-dealer or bank. Instead, the reports will be made available on a website, and you will be notified by mail each time a report is posted and provided with a website link to access the report.
If you already elected to receive shareholder reports electronically, you will not be affected by this change and you need not take any action. You may elect to receive shareholder reports and other communications from the Funds electronically by contacting the Funds at 1-888-726-9331 or, if you own these shares through a financial intermediary, by contacting your financial intermediary.
You may elect to receive all future reports in paper free of charge. You can inform the Funds that you wish to continue receiving paper copies of your shareholder reports by contacting the Funds at 1-888-726-9331. If you own shares through a financial intermediary, you may contact your financial intermediary or follow instructions included with this document to elect to continue to receive paper copies of your shareholder reports. Your election to receive reports in paper will apply to all Funds held with the Fund complex or at your financial intermediary.
Shareholder Accounts c/o Ultimus Fund Solutions, LLC P.O. Box 46707 Cincinnati, OH 45246 (888) 726-9331 | 
| Corporate Offices 801 W. Ann Arbor Trail Suite 244 Plymouth, MI 48170 (734) 455-7777 Fax (734) 455-7720 |
Dear Fellow Shareholders of:
Ave Maria Value Fund (AVEMX)
Ave Maria Growth Fund (AVEGX)
Ave Maria Rising Dividend Fund (AVEDX)
Ave Maria World Equity Fund (AVEWX)
Ave Maria Bond Fund (AVEFX)
Ave Maria Money Market Account
The current economic expansion has been the longest in postwar history, with no recession on the horizon. Several stock market averages soared over 25% last year, and we see no reason to believe the bull market is over. As you know, speculating on how equities will perform in the short run is a fool’s errand. The long run is the only thing that matters, and that direction is clearly up. The economic and market data we study lead us to believe holders of the Ave Maria Mutual Funds will continue to be well rewarded.
As always, your ongoing support is appreciated. Our team is working diligently on your behalf. The trust you have placed in us reinforces our effort to make prudent investment decisions, in a morally responsible way, of course.
Hopefully you’ll have a holy, healthy and happy 2020.
Sincerely,

George P. Schwartz, CFA
Chairman & CEO
January 1, 2020
AVE MARIA MUTUAL FUNDS
TABLE OF CONTENTS
| | |
Ave Maria Value Fund | |
Portfolio Manager Commentary | 2 |
Performance | 5 |
Annual Total Rates of Return Comparison with Major Indices | 6 |
Ten Largest Equity Holdings | 7 |
Asset Allocation | 7 |
Schedule of Investments | 8 |
Ave Maria Growth Fund | |
Portfolio Manager Commentary | 11 |
Performance | 13 |
Annual Total Rates of Return Comparison with Major Indices | 14 |
Ten Largest Equity Holdings | 15 |
Asset Allocation | 15 |
Schedule of Investments | 16 |
Ave Maria Rising Dividend Fund | |
Portfolio Manager Commentary | 19 |
Performance | 21 |
Annual Total Rates of Return Comparison with Major Indices | 22 |
Ten Largest Equity Holdings | 23 |
Asset Allocation | 23 |
Schedule of Investments | 24 |
Ave Maria World Equity Fund | |
Portfolio Manager Commentary | 27 |
Performance | 29 |
Annual Total Rates of Return Comparison with Major Indices | 30 |
Ten Largest Equity Holdings | 31 |
Asset Allocation | 31 |
Schedule of Investments | 32 |
Summary of Common Stocks by Country | 35 |
Ave Maria Bond Fund | |
Portfolio Manager Commentary | 36 |
Performance | 37 |
Annual Total Rates of Return Comparison with Major Indices | 38 |
Ten Largest Holdings | 39 |
Asset Allocation | 39 |
Schedule of Investments | 40 |
AVE MARIA MUTUAL FUNDS
TABLE OF CONTENTS
(Continued)
Statements of Assets and Liabilities | 46 |
Statements of Operations | 48 |
Statements of Changes in Net Assets | |
Ave Maria Value Fund | 50 |
Ave Maria Growth Fund | 51 |
Ave Maria Rising Dividend Fund | 52 |
Ave Maria World Equity Fund | 53 |
Ave Maria Bond Fund | 54 |
Financial Highlights | |
Ave Maria Value Fund | 55 |
Ave Maria Growth Fund | 56 |
Ave Maria Rising Dividend Fund | 57 |
Ave Maria World Equity Fund | 58 |
Ave Maria Bond Fund | 59 |
Notes to Financial Statements | 60 |
Report of Independent Registered Public Accounting Firm | 70 |
Board of Trustees and Executive Officers | 72 |
Catholic Advisory Board | 74 |
About Your Funds’ Expenses | 76 |
Federal Tax Information | 78 |
Other Information | 78 |
This report is for the information of the shareholders of the Ave Maria Mutual Funds. To obtain a copy of the prospectus, please visit our website at www.avemariafunds.com or call 1-888-726-9331 and a copy will be sent to you free of charge. Please read the prospectus carefully before you invest. The Ave Maria Mutual Funds are distributed by Ultimus Fund Distributors, LLC.
Past performance is not predictive of future performance. Investment results and principal value will fluctuate so that shares, when redeemed, may be worth more or less than their original cost. Current performance may be higher or lower than the performance data quoted. Performance data, current to the most recent month end, is available at the Ave Maria Mutual Funds website at www.avemariafunds.com or by calling 1-888-726-9331.
Ave Maria Value Fund
Portfolio Manager Commentary
(Unaudited)
Dear Fellow Shareholders,
The bull market resumed in 2019. Somewhat paradoxically, it was a great year for almost all asset classes, as domestic stocks, foreign stocks, Treasuries, corporate bonds, real estate, and precious metals all recorded strong gains. It was a particularly good year for U.S. equity investors, with the major stock market indices posting their biggest gains since 2013. Nearly everything worked, as small-caps, mid-caps, and especially large-caps all rose in tandem. For the year ended December 31, 2019, the Ave Maria Value Fund (“the Fund”) posted a total return of 20.52%, compared to 26.20% for the benchmark S&P MidCap 400 Index.
The multi-year cycle of large-cap stocks outperforming small-caps continued last year. In the S&P 1500, returns were highly stratified by market capitalization - the larger the market cap, the greater the price appreciation, as shown in the table below:
Index | Market Cap | 2019 Total
Return |
S&P 500 Index | Large-caps | 31.49% |
S&P 400 Index | Mid-caps | 26.20% |
S&P 600 Index | Small-caps | 22.78% |
Likewise, growth mutual funds continued their outperformance over value funds. According to Morningstar, the best performing fund category was large-cap growth, with the average fund up 31.91%. In contrast, the worst performing category was small-cap value with the average fund up 21.53%. In the S&P 500, the best performing sectors were the growth-oriented technology (+50.3%), communication services (+32.7%), and financials (+32.1%). Meanwhile, traditional value-oriented sectors lagged: energy (+11.8%) and materials (+24.6%). In this environment, the Fund’s small-cap exposure and its value-oriented approach, hurt relative performance.
The Fund’s largest holding remains Texas Pacific Land Trust (TPL or “the Trust”), which represents 8.0% of Fund assets. TPL’s share price appreciated substantially during 2019 with a 45.73% return. During Q3 of last year, the Trust formed a special committee to explore the possibility of converting the Trust to a corporate structure. We believe such a conversion is likely to occur
2
AVE MARIA VALUE FUND
PORTFOLIO MANAGER COMMENTARY
(Unaudited) (Continued)
in 2020 and would benefit TPL shareholders in numerous ways. We continue to believe the intrinsic value of TPL far exceeds its current share price. The Fund’s five best performing stocks in 2019 were:
Company | Industry | 2019
Performance |
Avid Bioservices, Inc. | Biopharmaceuticals | +87.07% |
Frontdoor, Inc. | Business Services | +68.59% |
Spectrum Brands Holdings, Inc. | Consumer Products | +57.76% |
InterXion Holding N.V. | IT Services | +57.67% |
AMETEK, Inc. | Industrial Machinery | +54.87% |
The Fund’s worst performing security last year was Qurate Retail, Inc., a leading TV, video, and e-commerce retailer. As we noted in last year’s semi-annual report, we had reduced the position size due to the company’s lackluster operational performance, owing to the challenging retail environment and the decline in traditional TV viewing. In Q3 of last year, we determined that our thesis was going to take longer to play out than we had expected, and we subsequently sold the remaining position, in favor of more attractive investment opportunities. The Fund’s five worst performing stocks in 2019 were:
Company | Industry | 2019
Performance |
Qurate Retail, Inc. | TV & Internet Retail | -52.85% |
Element Solutions, Inc. | Specialty Chemicals | -24.66% |
Interactive Brokers Group, Inc. | Brokerage Services | -17.23% |
Gildan Activewear, Inc. | Apparel & Textiles | -11.22% |
American Airlines Group, Inc. | Airlines | - 7.14% |
During the second half of 2019, the Fund also liquidated shares of Gildan Activewear and Element Solutions, Inc. (due to deteriorating fundamentals), along with Corteva, Inc. and DuPont de Nemours, Inc. (due to a weakening earnings outlook and concerns regarding potential litigation). The following companies were also sold as their share prices reached our estimate of intrinsic value: Avnet, Inc., Garmin Ltd., IAA, Inc., and Kar Auction Services, Inc. Four new holdings to the portfolio were: eDreams ODIGEO – an online travel and ecommerce company; Allison Transmission Holdings – the world’s largest manufacturer of fully automatic transmissions for commercial vehicles; Brookfield Property REIT – a global owner, operator, and developer of commercial real estate properties; and Hexcel Corporation – a leading supplier
3
AVE MARIA VALUE FUND
PORTFOLIO MANAGER COMMENTARY
(Unaudited) (Continued)
to the aerospace & defense industry. Additionally, we redeployed capital into our most attractive existing positions, which we believe have outstanding appreciation potential.
Due to the continuing popularity of passive investing, with billions of new money flowing into ETFs and Index Funds, the mega-cap stocks (Apple, Microsoft, Facebook, Amazon, Alphabet, etc.) continue to drive the S&P higher. During this passive investing craze, traditional measures of valuation have lost their relevance, as ETFs and Index Funds must purchase these same mega-cap stocks when the new money comes in, regardless of price. Many investors don’t realize that the outperformance of growth stocks over value stocks represents a departure from the long-term norm. As famed economist Herb Stein said, “If something cannot go on forever, it will stop.” At some point, very high-quality, value stocks of businesses that are prospering, will regain favor with investors, and the Fund will likely be a beneficiary. It’s overdue. Now, more than ever, we remain confident in our approach and steadfast in our belief in the merits of value investing to generate favorable long-term results and minimize risk.
The year-end distribution of $1.0362 per share consisted of $1.0278 of long-term capital gains and $0.0084 per share of investment income. The net asset value of the Fund ended the year at $19.68 per share.
Thank you for being a shareholder in the Ave Maria Value Fund.

| 
|
Timothy S. Schwartz, CFA | Joseph W. Skornicka, CFA |
Lead Portfolio Manager | Co-Portfolio Manager |
4
AVE MARIA VALUE FUND Performance (Unaudited) |
Comparison of the Change in Value of a $10,000 Investment
in the Ave Maria Value Fund and the S&P 400 Index
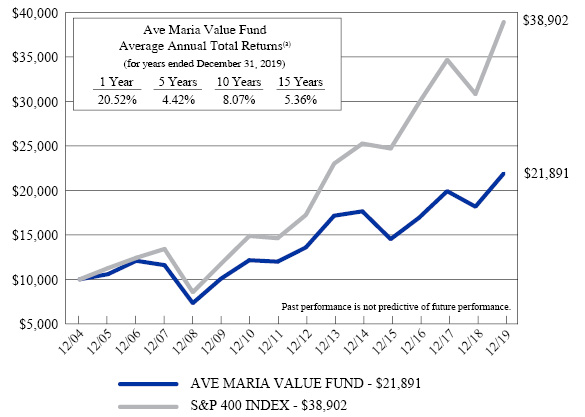
(a) | The returns shown do not reflect the deduction of taxes a shareholder would pay on Fund distributions or the redemption of Fund shares. |
Expense ratio as of 12-31-18 (as disclosed in May 1, 2019 prospectus) | 1.10%* |
Expense ratio for the year ended 12-31-19 | 1.11% |
* | Includes Acquired Fund Fees and Expenses. |
Past performance is not predictive of future performance. Investment results and principal value will fluctuate so that shares, when redeemed, may be worth more or less than their original cost. Current performance may be higher or lower than the performance data quoted. Performance data, current to the most recent month end, is available at the Ave Maria Mutual Funds website at www.avemariafunds.com or by calling 1-888-726-9331.
5
AVE MARIA VALUE FUND Annual Total Rates of Return
Comparison with Major Indices (Unaudited) |
| AVE MARIA
VALUE FUND | S&P 400
INDEX | S&P 500
INDEX |
2001(a) | 5.3% | -0.5% | -8.5% |
2002 | -9.8% | -14.5% | -22.1% |
2003 | 35.6% | 35.6% | 28.7% |
2004 | 20.1% | 16.5% | 10.9% |
2005 | 5.8% | 12.6% | 4.9% |
2006 | 14.2% | 10.3% | 15.8% |
2007 | -4.0% | 8.0% | 5.5% |
2008 | -36.8% | -36.2% | -37.0% |
2009 | 37.6% | 37.4% | 26.5% |
2010 | 20.5% | 26.7% | 15.1% |
2011 | -1.3% | -1.7% | 2.1% |
2012 | 13.3% | 17.9% | 16.0% |
2013 | 26.2% | 33.5% | 32.4% |
2014 | 2.9% | 9.8% | 13.7% |
2015 | -17.7% | -2.2% | 1.4% |
2016 | 16.4% | 20.7% | 12.0% |
2017 | 17.7% | 16.2% | 21.8% |
2018 | -8.8% | -11.1% | -4.4% |
2019 | 20.5% | 26.2% | 31.5% |
AVERAGE ANNUAL TOTAL RETURNS
As of December 31, 2019 (Unaudited)
| AVE MARIA
VALUE FUND | S&P 400
INDEX | S&P 500
INDEX |
3 Years | 9.0% | 9.3% | 15.3% |
5 Years | 4.4% | 9.0% | 11.7% |
10 Years | 8.1% | 12.7% | 13.6% |
15 Years | 5.4% | 9.5% | 9.0% |
Since Inception (b) | 6.8% | 9.3% | 7.3% |
(a) | Represents the period from the commencement of operations (May 1, 2001) through December 31, 2001. |
(b) | Represents the period from the commencement of operations (May 1, 2001) through December 31, 2019. |
6
AVE MARIA VALUE FUND
Ten Largest Equity Holdings
December 31, 2019 (Unaudited)
| | Shares | | | Company | | Market Value | | | % of Net Assets | |
| | | 25,500 | | | Texas Pacific Land Trust | | $ | 19,921,110 | | | | 8.0 | % |
| | | 145,000 | | | HEICO Corporation - Class A | | | 12,981,850 | | | | 5.2 | % |
| | | 215,000 | | | Delta Air Lines, Inc. | | | 12,573,200 | | | | 5.1 | % |
| | | 617,309 | | | Rosetta Stone, Inc. | | | 11,197,985 | | | | 4.5 | % |
| | | 440,000 | | | Valvoline, Inc. | | | 9,420,400 | | | | 3.8 | % |
| | | 25,000 | | | AMERCO | | | 9,395,500 | | | | 3.8 | % |
| | | 300,000 | | | American Airlines Group, Inc. | | | 8,604,000 | | | | 3.5 | % |
| | | 10,536 | | | Alleghany Corporation | | | 8,424,270 | | | | 3.4 | % |
| | | 100,000 | | | InterXion Holding N.V. | | | 8,381,000 | | | | 3.4 | % |
| | | 175,000 | | | Liberty Media Corporation - Liberty Formula One - Series C | | | 8,043,875 | | | | 3.2 | % |
Asset Allocation (Unaudited)
Sector | | % of Net Assets | |
Communication Services | | | 9.5 | % |
Consumer Discretionary | | | 5.2 | % |
Consumer Staples | | | 3.1 | % |
Energy | | | 2.0 | % |
Financials | | | 11.3 | % |
Health Care | | | 4.0 | % |
Industrials | | | 28.8 | % |
Information Technology | | | 4.1 | % |
Materials | | | 5.0 | % |
Real Estate | | | 12.0 | % |
Money Market Funds, Liabilities in Excess of Other Assets | | | 15.0 | % |
| | | | 100.0 | % |
7
AVE MARIA VALUE FUND
Schedule of Investments
December 31, 2019
| COMMON STOCKS — 85.0% | | Shares | | | Market Value | |
| Communication Services — 9.5% | | | | | | |
| Entertainment — 9.5% | | | | | | |
Liberty Media Corporation - Liberty Formula One - Series C * | | | 175,000 | | | $ | 8,043,875 | |
Madison Square Garden Company (The) - Class A * | | | 15,000 | | | | 4,412,850 | |
Rosetta Stone, Inc. * | | | 617,309 | | | | 11,197,985 | |
| | | | | | | | 23,654,710 | |
| Consumer Discretionary — 5.2% | | | | | | | | |
| Diversified Consumer Services — 4.2% | | | | | | | | |
frontdoor, inc. * | | | 150,000 | | | | 7,113,000 | |
| Graham Holdings Company - Class B | | | 5,000 | | | | 3,194,950 | |
| | | | | | | | 10,307,950 | |
| Internet & Direct Marketing Retail — 1.0% | | | | | | | | |
eDreams ODIEGO S.A. - ADR * | | | 52,115 | | | | 2,497,909 | |
| | | | | | | | | |
| Consumer Staples — 3.1% | | | | | | | | |
| Beverages — 0.5% | | | | | | | | |
| Brown-Forman Corporation - Class B | | | 20,000 | | | | 1,352,000 | |
| | | | | | | | | |
| Household Products — 2.6% | | | | | | | | |
| Spectrum Brands Holdings, Inc. | | | 100,000 | | | | 6,429,000 | |
| | | | | | | | | |
| Energy — 2.0% | | | | | | | | |
| Oil, Gas & Consumable Fuels — 2.0% | | | | | | | | |
| Noble Energy, Inc. | | | 200,000 | | | | 4,968,000 | |
| | | | | | | | | |
| Financials — 11.3% | | | | | | | | |
| Banks — 1.7% | | | | | | | | |
| First Horizon National Corporation | | | 250,000 | | | | 4,140,000 | |
| | | | | | | | | |
| Capital Markets — 2.2% | | | | | | | | |
| Interactive Brokers Group, Inc. - Class A | | | 20,000 | | | | 932,400 | |
| KKR & Company, Inc. - Class A | | | 150,000 | | | | 4,375,500 | |
| | | | | | | | 5,307,900 | |
| Consumer Finance — 1.0% | | | | | | | | |
| Discover Financial Services | | | 30,000 | | | | 2,544,600 | |
| | | | | | | | | |
| Insurance — 6.4% | | | | | | | | |
Alleghany Corporation * | | | 10,536 | | | | 8,424,270 | |
Athene Holding Ltd. - Class A * | | | 160,000 | | | | 7,524,800 | |
| | | | | | | | 15,949,070 | |
8
AVE MARIA VALUE FUND
SCHEDULE OF INVESTMENTS
(Continued)
| COMMON STOCKS — 85.0% (Continued) | | Shares | | | Market Value | |
| Health Care — 4.0% | | | | | | | | |
| Biotechnology — 1.0% | | | | | | | | |
Avid Bioservices, Inc. * | | | 300,000 | | | $ | 2,301,000 | |
| | | | | | | | | |
| Health Care Equipment & Supplies — 3.0% | | | | | | | | |
| Zimmer Biomet Holdings, Inc. | | | 50,000 | | | | 7,484,000 | |
| | | | | | | | | |
| Industrials — 28.8% | | | | | | | | |
| Aerospace & Defense — 6.7% | | | | | | | | |
| HEICO Corporation - Class A | | | 145,000 | | | | 12,981,850 | |
| Hexcel Corporation | | | 50,000 | | | | 3,665,500 | |
| | | | | | | | 16,647,350 | |
| Airlines — 8.6% | | | | | | | | |
| American Airlines Group, Inc. | | | 300,000 | | | | 8,604,000 | |
| Delta Air Lines, Inc. | | | 215,000 | | | | 12,573,200 | |
| | | | | | | | 21,177,200 | |
| Building Products — 2.9% | | | | | | | | |
| A.O. Smith Corporation | | | 150,000 | | | | 7,146,000 | |
| | | | | | | | | |
| Electrical Equipment — 2.0% | | | | | | | | |
| AMETEK, Inc. | | | 50,000 | | | | 4,987,000 | |
| | | | | | | | | |
| Industrial Conglomerates — 2.1% | | | | | | | | |
| Roper Technologies, Inc. | | | 15,000 | | | | 5,313,450 | |
| | | | | | | | | |
| Machinery — 0.5% | | | | | | | | |
| Allison Transmission Holdings, Inc. | | | 25,000 | | | | 1,208,000 | |
| | | | | | | | | |
| Road & Rail — 3.8% | | | | | | | | |
| AMERCO | | | 25,000 | | | | 9,395,500 | |
| | | | | | | | | |
| Trading Companies & Distributors — 2.2% | | | | | | | | |
| Watsco, Inc. | | | 30,000 | | | | 5,404,500 | |
| | | | | | | | | |
| Information Technology — 4.1% | | | | | | | | |
| Electronic Equipment, Instruments & Components — 0.7% | | | | | | | | |
Arrow Electronics, Inc. * | | | 20,000 | | | | 1,694,800 | |
| | | | | | | | | |
| IT Services — 3.4% | | | | | | | | |
InterXion Holding N.V. * | | | 100,000 | | | | 8,381,000 | |
9
AVE MARIA VALUE FUND
SCHEDULE OF INVESTMENTS
(Continued)
| COMMON STOCKS — 85.0% (Continued) | | Shares | | | Market Value | |
| Materials — 5.0% | | | | | | | | |
| Chemicals — 5.0% | | | | | | | | |
Axalta Coating Systems Ltd. * | | | 100,000 | | | $ | 3,040,000 | |
| Valvoline, Inc. | | | 440,000 | | | | 9,420,400 | |
| | | | | | | | 12,460,400 | |
| Real Estate — 12.0% | | | | | | | | |
| Equity Real Estate Investment Trusts (REITs) — 4.0% | | | | | | | | |
| Brookfield Property REIT, Inc. - Class A | | | 150,000 | | | | 2,766,750 | |
| Lamar Advertising Company - Class A | | | 80,000 | | | | 7,140,800 | |
| | | | | | | | 9,907,550 | |
| Real Estate Management & Development — 8.0% | | | | | | | | |
| Texas Pacific Land Trust | | | 25,500 | | | | 19,921,110 | |
| | | | | | | | | |
Total Common Stocks (Cost $155,015,037) | | | | | | $ | 210,579,999 | |
| MONEY MARKET FUNDS — 15.2% | | Shares | | | Market Value | |
Federated Government Obligations Tax-Managed Fund - Institutional Shares, 1.46% (a) | | | 11,927,622 | | | $ | 11,927,622 | |
Federated Treasury Obligations Fund - Institutional Shares, 1.51% (a) | | | 11,858,008 | | | | 11,858,008 | |
Federated U.S. Treasury Cash Reserves Fund - Institutional Shares, 1.46% (a) | | | 11,858,008 | | | | 11,858,008 | |
Invesco Short-Term Investments Trust (The) - Treasury Portfolio - Institutional Class, 1.49% (a) | | | 2,031,748 | | | | 2,031,748 | |
Total Money Market Funds (Cost $37,675,386) | | | | | | $ | 37,675,386 | |
| | | | | | | | | |
Total Investments at Market Value — 100.2% (Cost $192,690,423) | | | | | | $ | 248,255,385 | |
| | | | | | | | | |
| Liabilities in Excess of Other Assets — (0.2%) | | | | | | | (511,981 | ) |
| | | | | | | | | |
| Net Assets — 100.0% | | | | | | $ | 247,743,404 | |
ADR - American Depositary Receipt. |
* | Non-income producing security. |
(a) | The rate shown is the 7-day effective yield as of December 31, 2019. |
See accompanying notes to financial statements. |
10
Ave Maria Growth Fund
Portfolio Manager Commentary
(Unaudited)
Dear Fellow Shareholders,
For the year ended December 31, 2019, the Ave Maria Growth Fund (the “Fund”) had a total return of 37.09% compared with the benchmark S&P 500 Index total return of 31.49%. In 2019, the Morningstar Large Growth Category Average total return was 31.89%. For the year ended December 31, 2019, the Fund outperformed 87% of the Morningstar Large Growth Category Average out of 1,348 funds. Long-term performance measures are summarized below.
Fund or Index Name | Three-year
Annualized | Five-year
Annualized | Ten-year
Annualized |
Ave Maria Growth Fund, net of fees | 19.69% | 13.33% | 14.44% |
S&P 500 Index | 15.27% | 11.70% | 13.56% |
Morningstar Large Growth Category Average | 18.08% | 12.08% | 13.39% |
In 2019, top contributors to return included Copart, Mastercard, HEICO, ANSYS, and SBA Communications. Top detractors from return included Brown-Forman, Cognizant Technology Solutions, AutoNation, FedEx, and Kontoor Brands.
Our position in FedEx was completely liquidated during the fourth quarter due to our concerns over the company’s ability to continue to earn high returns on its invested capital.
IQVIA Holdings and Frontdoor, Inc. were new additions to the Fund during the quarter. IQVIA is a contract research organization providing clinical trial management, data services, and software to the biopharma industry. Through the use of its proprietary data assets, IQVIA is able to offer its services more efficiently than competitors while lowering costs for customers. Frontdoor offers home warranties to millions of households across the country. The company’s extensive national network of service providers makes frontdoor uniquely qualified to launch pre-priced on-demand home services, available through its CanduHome.com website.
We also added to existing positions in Brookfield Asset Management, Electronic Arts, Roper Technologies, and Rosetta Stone while we reduced existing positions in Charles Schwab, Copart, and Moody’s during the fourth quarter.
11
AVE MARIA GROWTH FUND
PORTFOLIO MANAGER COMMENTARY
(Unaudited) (Continued)
Our goal remains to purchase shares of exceptional companies at attractive prices with the expectation of earning favorable returns over the long run.
We appreciate your participation in the Ave Maria Growth Fund.
With best regards,

| 
|
Adam P. Gaglio, CFA | Chadd M. Garcia, CFA |
Lead Portfolio Manager | Co-Portfolio Manager |
Morningstar Percentile Rankings is the Fund’s total-return percentile rank relative to all funds that have the same Morningstar Category. The highest (or most favorable) percentile rank is 1 and the lowest (or least favorable) percentile rank is 100. The top-performing fund in a category will always receive a rank of 1. Percentile rankings for other periods are as follows: 1 year (13th out of 1,348 funds) 3 years (36th out of 1,210 funds), 5 years (34th out of 1,078 funds) and 10 years (27th out of 805 funds).
12
AVE MARIA GROWTH FUND Performance (Unaudited) |
Comparison of the Change in Value of a $10,000 Investment
in the Ave Maria Growth Fund and the S&P 500 Index

(a) | The returns shown do not reflect the deduction of taxes a shareholder would pay on Fund distributions or the redemption of Fund shares. |
Expense ratio as of 12-31-18 (as disclosed in May 1, 2019 prospectus) | 0.97%* |
Expense ratio for the year ended 12-31-19 | 0.94% |
* | Includes Acquired Fund Fees and Expenses. |
Past performance is not predictive of future performance. Investment results and principal value will fluctuate so that shares, when redeemed, may be worth more or less than their original cost. Current performance may be higher or lower than the performance data quoted. Performance data, current to the most recent month end, is available at the Ave Maria Mutual Funds website at www.avemariafunds.com or by calling 1-888-726-9331.
13
AVE MARIA GROWTH FUND Annual Total Rates of Return
Comparison with Major Indices (Unaudited) |
| AVE MARIA GROWTH FUND | S&P 500 INDEX |
2003 (a) | 23.4% | 22.8% |
2004 | 21.5% | 10.9% |
2005 | 0.3% | 4.9% |
2006 | 15.8% | 15.8% |
2007 | 11.6% | 5.5% |
2008 | -32.1% | -37.0% |
2009 | 26.4% | 26.5% |
2010 | 26.5% | 15.1% |
2011 | 0.5% | 2.1% |
2012 | 14.7% | 16.0% |
2013 | 31.5% | 32.4% |
2014 | 7.5% | 13.7% |
2015 | -2.7% | 1.4% |
2016 | 12.1% | 12.0% |
2017 | 27.4% | 21.8% |
2018 | -1.8% | -4.4% |
2019 | 37.1% | 31.5% |
AVERAGE ANNUAL TOTAL RETURNS
As of December 31, 2019 (Unaudited)
| AVE MARIA GROWTH FUND | S&P 500 INDEX |
3 Years | 19.7% | 15.3% |
5 Years | 13.3% | 11.7% |
10 Years | 14.4% | 13.6% |
15 Years | 10.2% | 9.0% |
Since Inception (b) | 11.8% | 10.1% |
(a) | Represents the period from the commencement of operations (May 1, 2003) through December 31, 2003. |
(b) | Represents the period from the commencement of operations (May 1, 2003) through December 31, 2019. |
14
AVE MARIA GROWTH FUND
Ten Largest Equity Holdings
December 31, 2019 (Unaudited)
| | Shares | | | Company | | Market Value | | | % of Net Assets | |
| | | 490,000 | | | Copart, Inc. | | $ | 44,560,600 | | | | 5.2 | % |
| | | 142,000 | | | Mastercard, Inc. - Class A | | | 42,399,780 | | | | 5.0 | % |
| | | 153,000 | | | ANSYS, Inc. | | | 39,383,730 | | | | 4.6 | % |
| | | 675,000 | | | Brookfield Asset Management, Inc. - Class A | | | 39,015,000 | | | | 4.6 | % |
| | | 198,000 | | | Visa, Inc. - Class A | | | 37,204,200 | | | | 4.4 | % |
| | | 150,000 | | | SBA Communications Corporation | | | 36,148,500 | | | | 4.2 | % |
| | | 116,000 | | | S&P Global, Inc. | | | 31,673,800 | | | | 3.7 | % |
| | | 235,000 | | | Texas Instruments, Inc. | | | 30,148,150 | | | | 3.6 | % |
| | | 141,000 | | | Accenture plc - Class A | | | 29,690,370 | | | | 3.5 | % |
| | | 150,000 | | | Ecolab, Inc. | | | 28,948,500 | | | | 3.4 | % |
Asset Allocation (Unaudited)
Sector | | % of Net Assets | |
Communication Services | | | 3.5 | % |
Consumer Discretionary | | | 13.6 | % |
Financials | | | 13.7 | % |
Health Care | | | 8.4 | % |
Industrials | | | 25.3 | % |
Information Technology | | | 24.3 | % |
Materials | | | 3.4 | % |
Real Estate | | | 4.7 | % |
Money Market Funds, Liabilities in Excess of Other Assets | | | 3.1 | % |
| | | | 100.0 | % |
15
AVE MARIA GROWTH FUND
Schedule of Investments
December 31, 2019
| COMMON STOCKS — 96.9% | | Shares | | | Market Value | |
| Communication Services — 3.5% | | | | | | |
| Entertainment — 3.5% | | | | | | |
Electronic Arts, Inc. * | | | 110,000 | | | $ | 11,826,100 | |
Liberty Media Corporation - Liberty Braves - Series A * | | | 32,000 | | | | 948,800 | |
Liberty Media Corporation - Liberty Braves - Series C * | | | 78,000 | | | | 2,304,120 | |
Madison Square Garden Company (The) - Class A * | | | 35,000 | | | | 10,296,650 | |
Rosetta Stone, Inc. * | | | 270,000 | | | | 4,897,800 | |
| | | | | | | | 30,273,470 | |
| Consumer Discretionary — 13.6% | | | | | | | | |
| Diversified Consumer Services — 3.1% | | | | | | | | |
frontdoor, inc. * | | | 552,000 | | | | 26,175,840 | |
| | | | | | | | | |
| Internet & Direct Marketing Retail — 2.4% | | | | | | | | |
Booking Holdings, Inc. * | | | 10,150 | | | | 20,845,359 | |
| | | | | | | | | |
| Specialty Retail — 6.2% | | | | | | | | |
| Lowe’s Companies, Inc. | | | 215,000 | | | | 25,748,400 | |
O’Reilly Automotive, Inc. * | | | 63,000 | | | | 27,610,380 | |
| | | | | | | | 53,358,780 | |
| Textiles, Apparel & Luxury Goods — 1.9% | | | | | | | | |
| VF Corporation | | | 160,000 | | | | 15,945,600 | |
| | | | | | | | | |
| Financials — 13.7% | | | | | | | | |
| Capital Markets — 13.1% | | | | | | | | |
| Brookfield Asset Management, Inc. - Class A | | | 675,000 | | | | 39,015,000 | |
| Charles Schwab Corporation (The) | | | 400,000 | | | | 19,024,000 | |
| Moody’s Corporation | | | 95,000 | | | | 22,553,950 | |
| S&P Global, Inc. | | | 116,000 | | | | 31,673,800 | |
| | | | | | | | 112,266,750 | |
| Insurance — 0.6% | | | | | | | | |
Markel Corporation * | | | 4,500 | | | | 5,144,265 | |
| | | | | | | | | |
| Health Care — 8.4% | | | | | | | | |
| Health Care Equipment & Supplies — 5.6% | | | | | | | | |
| Medtronic plc | | | 233,000 | | | | 26,433,850 | |
| Zimmer Biomet Holdings, Inc. | | | 145,000 | | | | 21,703,600 | |
| | | | | | | | 48,137,450 | |
| Life Sciences Tools & Services — 2.8% | | | | | | | | |
IQVIA Holdings, Inc. * | | | 155,000 | | | | 23,949,050 | |
16
AVE MARIA GROWTH FUND
SCHEDULE OF INVESTMENTS
(Continued)
| COMMON STOCKS — 96.9% (Continued) | | Shares | | | Market Value | |
| Industrials — 25.3% | | | | | | | | |
| Aerospace & Defense — 5.1% | | | | | | | | |
| HEICO Corporation - Class A | | | 280,000 | | | $ | 25,068,400 | |
| Hexcel Corporation | | | 255,000 | | | | 18,694,050 | |
| | | | | | | | 43,762,450 | |
| Air Freight & Logistics — 1.0% | | | | | | | | |
| Expeditors International of Washington, Inc. | | | 110,000 | | | | 8,582,200 | |
| | | | | | | | | |
| Commercial Services & Supplies — 5.2% | | | | | | | | |
Copart, Inc. * | | | 490,000 | | | | 44,560,600 | |
| | | | | | | | | |
| Electrical Equipment — 5.4% | | | | | | | | |
| AMETEK, Inc. | | | 172,000 | | | | 17,155,280 | |
| Rockwell Automation, Inc. | | | 140,000 | | | | 28,373,800 | |
| | | | | | | | 45,529,080 | |
| Industrial Conglomerates — 3.3% | | | | | | | | |
| Roper Technologies, Inc. | | | 80,000 | | | | 28,338,400 | |
| | | | | | | | | |
| Machinery — 5.3% | | | | | | | | |
| Fortive Corporation | | | 235,000 | | | | 17,951,650 | |
| Graco, Inc. | | | 526,000 | | | | 27,352,000 | |
| | | | | | | | 45,303,650 | |
| Information Technology — 24.3% | | | | | | | | |
| IT Services — 16.1% | | | | | | | | |
| Accenture plc - Class A | | | 141,000 | | | | 29,690,370 | |
| Broadridge Financial Solutions, Inc. | | | 230,000 | | | | 28,414,200 | |
| Mastercard, Inc. - Class A | | | 142,000 | | | | 42,399,780 | |
| Visa, Inc. - Class A | | | 198,000 | | | | 37,204,200 | |
| | | | | | | | 137,708,550 | |
| Semiconductors & Semiconductor Equipment — 3.6% | | | | | | | | |
| Texas Instruments, Inc. | | | 235,000 | | | | 30,148,150 | |
| | | | | | | | | |
| Software — 4.6% | | | | | | | | |
ANSYS, Inc. * | | | 153,000 | | | | 39,383,730 | |
| | | | | | | | | |
| Materials — 3.4% | | | | | | | | |
| Chemicals — 3.4% | | | | | | | | |
| Ecolab, Inc. | | | 150,000 | | | | 28,948,500 | |
| | | | | | | | | |
| Real Estate — 4.7% | | | | | | | | |
| Equity Real Estate Investment Trusts (REITs) — 4.2% | | | | | | | | |
| SBA Communications Corporation | | | 150,000 | | | | 36,148,500 | |
17
AVE MARIA GROWTH FUND
SCHEDULE OF INVESTMENTS
(Continued)
| COMMON STOCKS — 96.9% (Continued) | | Shares | | | Market Value | |
| Real Estate — 4.7% (Continued) | | | | | | | | |
| Real Estate Management & Development — 0.5% | | | | | | | | |
| Texas Pacific Land Trust | | | 5,000 | | | $ | 3,906,100 | |
| | | | | | | | | |
Total Common Stocks (Cost $539,877,150) | | | | | | $ | 828,416,474 | |
| MONEY MARKET FUNDS — 3.1% | | Shares | | | Market Value | |
Federated Government Obligations Tax-Managed Fund - Institutional Shares, 1.46% (a) (Cost $26,498,248) | | | 26,498,248 | | | $ | 26,498,248 | |
| | | | | | | | | |
Total Investments at Market Value — 100.0% (Cost $566,375,398) | | | | | | $ | 854,914,722 | |
| | | | | | | | | |
Liabilities in Excess of Other Assets — (0.0%) (b) | | | | | | | (150,827 | ) |
| | | | | | | | | |
| Net Assets — 100.0% | | | | | | $ | 854,763,895 | |
* | Non-income producing security. |
(a) | The rate shown is the 7-day effective yield as of December 31, 2019. |
(b) | Percentage rounds to less than 0.1%. |
See accompanying notes to financial statements. |
18
Ave Maria Rising Dividend Fund
Portfolio Manager Commentary
(Unaudited)
Dear Fellow Shareholders,
The Ave Maria Rising Dividend (the “Fund”) delivered a total return of 27.58% for the year ended December 31, 2019. This compared to the total return on the S&P 500 of 31.49%. The Fund trailed the S&P for the year primarily due to its relative weakness in the 4th quarter, due to its lower contribution from the two strongest sectors of the S&P, technology and health care.
For the year, the Fund benefitted from its holdings in financials and health care. Within financials, the positive performance was broad based, with seven of the Fund’s issues delivering a total return of greater than 20%. Moody’s Corporation led the way – up 70%. Moody’s benefited from the Fed’s decision to lower short term interest rates during the year, as the bond issuance outlook improved from prior expectations. Other financials that helped boost performance were PNC Financial Services, Inc. and Discover Financial Services. In health care, Zimmer Biomet Holdings, Inc. and Medtronic plc were both up solidly for the year. Zimmer Biomet’s turnaround continues under new CEO Bryan Hanson, who has almost completely turned over the management team (75%) since he arrived at the beginning of 2018. New products in its knee replacement business are starting to drive above-market growth for the company. The consumer staples segment was also a positive for the Fund as the shares of Mondelēz International, Inc. advanced nicely.
Detracting from performance of the Fund on a relative basis were the Fund’s technology and industrial sector holdings. In technology, an underweighted position vs. the S&P 500 hurt relative returns. Lower returns also hindered performance as the average total return of the Fund’s technology holdings was up just short of 30% for the year, while the sector’s holdings in the S&P 500 were up around 50%. We don’t own some of the “high flyers” in technology due to valuation or our moral screens, but we do own a number of wonderful businesses that are performing well, including Texas Instruments, Inc., Visa, Inc., TE Connectivity Ltd. and Cisco Systems, Inc. While our overall industrial performance lagged, sector holdings included the shares of nine companies that were up over 20%.
Four positions were eliminated since the semi-annual report on June 30, 2019: Cognizant Technology Solutions Corporation, FedEx Corporation, Norfolk Southern Corporation, and U.S. Bancorp. We would characterize the first two sales as based on fundamental concerns, and the later two as valuation based. We added new positions in First Horizon National Corporation (bank holding company), Fidelity National Financial, Inc. (title insurance) , International Flavors and Fragrances, Inc. (specialty chemicals), and Kellogg Company (food), all of which passed our moral screens.
19
AVE MARIA RISING DIVIDEND FUND
PORTFOLIO MANAGER COMMENTARY
(Unaudited) (Continued)
The current U.S. economic expansion is now the longest in postwar history, and not surprisingly the S&P 500 has now risen almost 500% on a total return basis since its low point on March 9th, 2009. We see no recession on the horizon, unlike a lot of talking heads on TV. The Fund is comprised of shares of companies with strong balance sheets, a high level of profitability and a history of raising dividends, which we expect to continue. Thank you for being a shareholder.
Respectfully,

| 
|
Joseph W. Skornicka, CFA | George P. Schwartz, CFA |
Lead-Portfolio Manager | Co-Portfolio Manager |
20
AVE MARIA RISING DIVIDEND FUND Performance (Unaudited) |
Comparison of the Change in Value of a $10,000 Investment
in the Ave Maria Rising Dividend Fund and the S&P 500 Index

(a) | The returns shown do not reflect the deduction of taxes a shareholder would pay on Fund distributions or the redemption of Fund shares. |
Expense ratio as of 12-31-18 (as disclosed in May 1, 2019 prospectus) | 0.94%* |
Expense ratio for the year ended 12-31-19 | 0.93% |
* | Includes Acquired Fund Fees and Expenses. |
Past performance is not predictive of future performance. Investment results and principal value will fluctuate so that shares, when redeemed, may be worth more or less than their original cost. Current performance may be higher or lower than the performance data quoted. Performance data, current to the most recent month end, is available at the Ave Maria Mutual Funds website at www.avemariafunds.com or by calling 1-888-726-9331.
21
AVE MARIA RISING DIVIDEND FUND Annual Total Rates of Return
Comparison with Major Indices (Unaudited) |
| AVE MARIA
RISING DIVIDEND FUND | S&P 500 INDEX |
2005 (a) | 6.7% | 8.8% |
2006 | 17.9% | 15.8% |
2007 | -0.6% | 5.5% |
2008 | -22.8% | -37.0% |
2009 | 25.3% | 26.5% |
2010 | 17.9% | 15.1% |
2011 | 4.6% | 2.1% |
2012 | 13.9% | 16.0% |
2013 | 33.9% | 32.4% |
2014 | 9.3% | 13.7% |
2015 | -5.9% | 1.4% |
2016 | 15.3% | 12.0% |
2017 | 16.8% | 21.8% |
2018 | -4.8% | -4.4% |
2019 | 27.6% | 31.5% |
AVERAGE ANNUAL TOTAL RETURNS
As of December 31, 2019 (Unaudited)
| AVE MARIA
RISING DIVIDEND FUND | S&P 500 INDEX |
3 Years | 12.4% | 15.3% |
5 Years | 9.0% | 11.7% |
10 Years | 12.2% | 13.6% |
Since Inception (b) | 9.6% | 9.5% |
(a) | Represents the period from the commencement of operations (May 2, 2005) through December 31, 2005. |
(b) | Represents the period from the commencement of operations (May 2, 2005) through December 31, 2019. |
22
AVE MARIA RISING DIVIDEND FUND
Ten Largest Equity Holdings
December 31, 2019 (Unaudited)
| | Shares | | | Company | | Market Value | | | % of Net Assets | |
| | | 270,000 | | | Zimmer Biomet Holdings, Inc. | | $ | 40,413,600 | | | | 4.2 | % |
| | | 350,000 | | | Medtronic plc | | | 39,707,500 | | | | 4.2 | % |
| | | 325,000 | | | Lowe’s Companies, Inc. | | | 38,922,000 | | | | 4.1 | % |
| | | 265,000 | | | Texas Instruments, Inc. | | | 33,996,850 | | | | 3.6 | % |
| | | 600,000 | | | Mondelēz International, Inc. - Class A | | | 33,048,000 | | | | 3.5 | % |
| | | 550,000 | | | Royal Dutch Shell plc - Class B - ADR | | | 32,983,500 | | | | 3.5 | % |
| | | 175,000 | | | Visa, Inc. - Class A | | | 32,882,500 | | | | 3.5 | % |
| | | 440,000 | | | Hexcel Corporation | | | 32,256,400 | | | | 3.4 | % |
| | | 15,000 | | | Booking Holdings, Inc. | | | 30,805,950 | | | | 3.2 | % |
| | | 435,000 | | | Kellogg Company | | | 30,084,600 | | | | 3.1 | % |
Asset Allocation (Unaudited)
Sector | | % of Net Assets | |
Consumer Discretionary | | | 13.1 | % |
Consumer Staples | | | 6.6 | % |
Energy | | | 3.5 | % |
Financials | | | 20.2 | % |
Health Care | | | 8.4 | % |
Industrials | | | 24.7 | % |
Information Technology | | | 15.0 | % |
Materials | | | 4.7 | % |
Money Market Funds, Liabilities in Excess of Other Assets | | | 3.8 | % |
| | | | 100.0 | % |
23
AVE MARIA RISING DIVIDEND FUND
Schedule of Investments
December 31, 2019
| COMMON STOCKS — 96.2% | | Shares | | | Market Value | |
| Consumer Discretionary — 13.1% | | | | | | | | |
| Internet & Direct Marketing Retail — 3.2% | | | | | | | | |
Booking Holdings, Inc. * | | | 15,000 | | | $ | 30,805,950 | |
| | | | | | | | | |
| Specialty Retail — 8.3% | | | | | | | | |
| Lowe’s Companies, Inc. | | | 325,000 | | | | 38,922,000 | |
| TJX Companies, Inc. (The) | | | 300,000 | | | | 18,318,000 | |
| Tractor Supply Company | | | 235,000 | | | | 21,958,400 | |
| | | | | | | | 79,198,400 | |
| Textiles, Apparel & Luxury Goods — 1.6% | | | | | | | | |
| VF Corporation | | | 150,000 | | | | 14,949,000 | |
| | | | | | | | | |
| Consumer Staples — 6.6% | | | | | | | | |
| Food Products — 6.6% | | | | | | | | |
| Kellogg Company | | | 435,000 | | | | 30,084,600 | |
| Mondelēz International, Inc. - Class A | | | 600,000 | | | | 33,048,000 | |
| | | | | | | | 63,132,600 | |
| Energy — 3.5% | | | | | | | | |
| Oil, Gas & Consumable Fuels — 3.5% | | | | | | | | |
| Royal Dutch Shell plc - Class B - ADR | | | 550,000 | | | | 32,983,500 | |
| | | | | | | | | |
| Financials — 20.2% | | | | | | | | |
| Banks — 7.6% | | | | | | | | |
| First Horizon National Corporation | | | 1,050,000 | | | | 17,388,000 | |
| PNC Financial Services Group, Inc. (The) | | | 170,000 | | | | 27,137,100 | |
| Truist Financial Corporation | | | 500,000 | | | | 28,160,000 | |
| | | | | | | | 72,685,100 | |
| Capital Markets — 5.8% | | | | | | | | |
| BlackRock, Inc. | | | 44,000 | | | | 22,118,800 | |
| Brookfield Asset Management, Inc. - Class A | | | 300,000 | | | | 17,340,000 | |
| Moody’s Corporation | | | 65,000 | | | | 15,431,650 | |
| | | | | | | | 54,890,450 | |
| Consumer Finance — 2.2% | | | | | | | | |
| Discover Financial Services | | | 250,000 | | | | 21,205,000 | |
| | | | | | | | | |
| Insurance — 4.6% | | | | | | | | |
| Chubb Ltd. | | | 180,000 | | | | 28,018,800 | |
| Fidelity National Financial, Inc. | | | 340,000 | | | | 15,419,000 | |
| | | | | | | | 43,437,800 | |
| Health Care — 8.4% | | | | | | | | |
| Health Care Equipment & Supplies — 8.4% | | | | | | | | |
| Medtronic plc | | | 350,000 | | | | 39,707,500 | |
| Zimmer Biomet Holdings, Inc. | | | 270,000 | | | | 40,413,600 | |
| | | | | | | | 80,121,100 | |
24
AVE MARIA RISING DIVIDEND FUND
SCHEDULE OF INVESTMENTS
(Continued)
| COMMON STOCKS — 96.2% (Continued) | | Shares | | | Market Value | |
| Industrials — 24.7% | | | | | | | | |
| Aerospace & Defense — 3.4% | | | | | | | | |
| Hexcel Corporation | | | 440,000 | | | $ | 32,256,400 | |
| | | | | | | | | |
| Air Freight & Logistics — 2.1% | | | | | | | | |
| United Parcel Service, Inc. - Class B | | | 175,000 | | | | 20,485,500 | |
| | | | | | | | | |
| Airlines — 1.7% | | | | | | | | |
| Delta Air Lines, Inc. | | | 270,000 | | | | 15,789,600 | |
| | | | | | | | | |
| Building Products — 2.4% | | | | | | | | |
| A.O. Smith Corporation | | | 475,000 | | | | 22,629,000 | |
| | | | | | | | | |
| Commercial Services & Supplies — 2.5% | | | | | | | | |
| Genuine Parts Company | | | 220,000 | | | | 23,370,600 | |
| | | | | | | | | |
| Electrical Equipment — 2.8% | | | | | | | | |
| Eaton Corporation plc | | | 285,000 | | | | 26,995,200 | |
| | | | | | | | | |
| Industrial Conglomerates — 0.9% | | | | | | | | |
| Roper Technologies, Inc. | | | 25,000 | | | | 8,855,750 | |
| | | | | | | | | |
| Machinery — 3.7% | | | | | | | | |
| Graco, Inc. | | | 290,000 | | | | 15,080,000 | |
| Illinois Tool Works, Inc. | | | 115,000 | | | | 20,657,450 | |
| | | | | | | | 35,737,450 | |
| Trading Companies & Distributors — 5.2% | | | | | | | | |
| Fastenal Company | | | 725,000 | | | | 26,788,750 | |
| Watsco, Inc. | | | 125,000 | | | | 22,518,750 | |
| | | | | | | | 49,307,500 | |
| Information Technology — 15.0% | | | | | | | | |
| Communications Equipment — 2.5% | | | | | | | | |
| Cisco Systems, Inc. | | | 500,000 | | | | 23,980,000 | |
| | | | | | | | | |
| Electronic Equipment, Instruments & Components — 2.8% | | | | | | | | |
| TE Connectivity Ltd. | | | 275,000 | | | | 26,356,000 | |
| | | | | | | | | |
| IT Services — 6.1% | | | | | | | | |
| Broadridge Financial Solutions, Inc. | | | 205,000 | | | | 25,325,700 | |
| Visa, Inc. - Class A | | | 175,000 | | | | 32,882,500 | |
| | | | | | | | 58,208,200 | |
25
AVE MARIA RISING DIVIDEND FUND
SCHEDULE OF INVESTMENTS
(Continued)
| COMMON STOCKS — 96.2% (Continued) | | Shares | | | Market Value | |
| Information Technology — 15.0% (Continued) | | | | | | |
| Semiconductors & Semiconductor Equipment — 3.6% | | | | | | | | |
| Texas Instruments, Inc. | | | 265,000 | | | $ | 33,996,850 | |
| | | | | | | | | |
| Materials — 4.7% | | | | | | | | |
| Chemicals — 4.7% | | | | | | | | |
| International Flavors & Fragrances, Inc. | | | 125,000 | | | | 16,127,500 | |
| RPM International, Inc. | | | 375,000 | | | | 28,785,000 | |
| | | | | | | | 44,912,500 | |
| | | | | | | | | |
Total Common Stocks (Cost $692,190,610) | | | | | | $ | 916,289,450 | |
| MONEY MARKET FUNDS — 3.9% | | Shares | | | Market Value | |
Federated Government Obligations Tax-Managed Fund - Institutional Shares, 1.46% (a) | | | 37,355,071 | | | $ | 37,355,071 | |
Invesco Short-Term Investments Trust (The) - Treasury Portfolio - Institutional Class, 1.49% (a) | | | 126,500 | | | | 126,500 | |
Total Money Market Funds (Cost $37,481,571) | | | | | | $ | 37,481,571 | |
| | | | | | | | | |
Total Investments at Market Value — 100.1% (Cost $729,672,181) | | | | | | $ | 953,771,021 | |
| | | | | | | | | |
| Liabilities in Excess of Other Assets — (0.1%) | | | | | | | (686,029 | ) |
| | | | | | | | | |
| Net Assets — 100.0% | | | | | | $ | 953,084,992 | |
ADR - Amerian Depositary Receipt. |
* | Non-income producing security. |
(a) | The rate shown is the 7-day effective yield as of December 31, 2019. |
See accompanying notes to financial statements. |
26
Ave Maria World Equity Fund
Portfolio Manager Commentary
(Unaudited)
Dear Fellow Shareholders,
The Ave Maria World Equity Fund (the “Fund”) delivered a total return of 27.66% for the year ended December 31, 2019. Global equity indices were also up strongly for the year, with the S&P Global 1200 Index up 28.23% and the MSCI World Index up 27.67%.
The U.S. equity market outperformed the other large global developed markets for the year, with the S&P 500 delivering a total return of around 31%, the S&P Europe 350 up almost 25%, and the S&P Topix 150 (Japan) up around 18%. Emerging markets also performed well, with the S&P Emerging BMI delivering just short of a 20% total return. Note: all returns in US dollars. The year ended with a strong global equity market rally in the fourth quarter, (S&P 1200 up 8.9% and MSCI World up 8.6%), helped by the U.S. and China appearing to move closer to a truce on the trade front, and the major global central banks all being in easing mode.
For the year, the Fund’s performance was positively impacted by its financials and health care holdings. The strong performance in financials was broad-based as six holdings delivered total returns of over 30%, with Citigroup, Inc. and Brookfield Asset Management, Inc. leading the way. Of note, Brookfield closed on its acquisition of Oaktree Partners during the second half of the year, which attractively broadens its product offering. Insurance related companies, AXA S.A. of France, and Willis Towers Watson of the U.K., were also important contributors for financials. In health care, Zimmer Biomet Holdings, Inc. and Koninklijke Philips N.V. were both strong outperformers. Zimmer Biomet continues to make impressive strides in its turnaround under the new CEO, Bryan Hanson. Driven by an acceleration in its Diagnosis & Treatment division, Philips saw solid organic top-line growth during the year.
The Fund’s performance was negatively impacted by its holdings in the materials and consumer discretionary sectors. Within materials, both Dow, Inc. and DuPont De Nemours, Inc. posted negative performance during the period. We decided to exit both stocks due to steeply declining earnings estimates because of tough industry conditions. In the consumer discretionary sector, Japan based Bridgestone Corp. was also a disappointing stock. We decided to sell the shares because operating performance was lackluster, and we felt the shares were fairly valued. We ultimately put the proceeds into Michelin, a tire manufacturing competitor headquartered in France, as they were doing a better job controlling expenses and driving better operating earnings growth.
27
AVE MARIA WORLD EQUITY FUND
PORTFOLIO MANAGER COMMENTARY
(Unaudited) (Continued)
Five new positions, all of which comply with our moral screens, have been added to the Fund since the semiannual report, dated June 30, 2019: Airbus SE (aerospace), Fidelity National Financial, Inc. (title insurance), International Flavors & Fragrances, Inc. (specialty chemical), Michelin (tire manufacturer), and Toyota Motor Corporation (automobile manufacturer). Four issuers were eliminated: Bridgestone Corp., Dow, Inc., Dupont De Nemours, Inc., and Siemens AG. All were sold in favor of what we believe to be more attractive investment opportunities.
As of December 31, 2019, the Fund’s geographic weightings based on the headquarters domicile of each company versus the S&P Global 1200 Index were approximately:
| | Ave Maria World
Equity Fund | S&P Global
1200 Index |
Americas | 58.6% | 65.1% |
Europe Developed | 22.9% | 15.1% |
United Kingdom | 11.8% | 5.6% |
Japan | 0.9% | 7.3% |
Asia / Australia | 1.7% | 6.9% |
Cash Equivalents | 4.1% | — |
Looking forward, we will continue with our focus on owning high quality, larger capitalization, globally oriented companies, at attractive valuations. Thank you for your continued interest in the Ave Maria World Equity Fund.
Best Regards,

| 
|
Joseph W. Skornicka, CFA | Robert C. Schwartz, CFP |
Lead-Portfolio Manager | Co-Portfolio Manager |
28
AVE MARIA WORLD EQUITY FUND Performance (Unaudited) |
Comparison of the Change in Value of a $10,000 Investment
in the Ave Maria World Equity Fund and the S&P 1200 Global Index
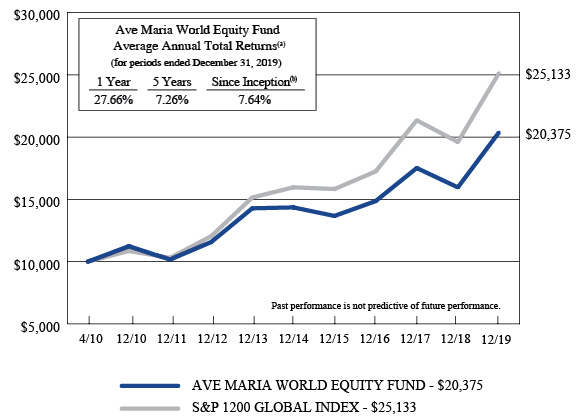
(a) | The returns shown do not reflect the deduction of taxes a shareholder would pay on Fund distributions or the redemption of Fund shares. |
(b) | Represents the period from the commencement of operations (April 30, 2010) through December 31, 2019. |
Expense Ratio
information as of: | Year Ended 12-31-18
(as disclosed in May 1, 2019 prospectus) | Year Ended
12-31-19 |
Gross | 1.35%* | 1.29% |
Net | 1.26%* | 1.25% |
* | Includes Acquired Fund Fees and Expenses. |
Past performance is not predictive of future performance. Investment results and principal value will fluctuate so that shares, when redeemed, may be worth more or less than their original cost. Current performance may be higher or lower than the performance data quoted. Performance data, current to the most recent month end, is available at the Ave Maria Mutual Funds website at www.avemariafunds.com or by calling 1-888-726-9331.
29
AVE MARIA WORLD EQUITY FUND Annual Total Rates of Return
Comparison with Major Indices (Unaudited) |
| AVE MARIA
WORLD EQUITY
FUND | S&P 1200
GLOBAL INDEX | MSCI WORLD
INDEX |
2010 (a) | 12.4% | 8.5% | 8.2% |
2011 | -9.6% | -5.1% | -5.5% |
2012 | 13.8% | 16.8% | 15.8% |
2013 | 23.5% | 25.8% | 26.7% |
2014 | 0.5% | 5.4% | 4.9% |
2015 | -4.8% | -0.9% | -0.9% |
2016 | 8.7% | 8.9% | 7.5% |
2017 | 17.9% | 23.8% | 22.4% |
2018 | -8.9% | -8.2% | -8.7% |
2019 | 27.7% | 28.2% | 27.7% |
AVERAGE ANNUAL TOTAL RETURNS
As of December 31, 2019 (Unaudited)
| AVE MARIA
WORLD EQUITY
FUND | S&P 1200
GLOBAL INDEX | MSCI WORLD
INDEX |
3 Years | 11.1% | 13.4% | 12.6% |
5 Years | 7.3% | 9.5% | 8.7% |
Since Inception (b) | 7.6% | 10.0% | 9.4% |
(a) | Represents the period from the commencement of operations (April 30, 2010) through December 31, 2010. |
(b) | Represents the period from the commencement of operations (April 30, 2010) through December 31, 2019. |
30
AVE MARIA WORLD EQUITY FUND
Ten Largest Equity Holdings
December 31, 2019 (Unaudited)
| | Shares | | | Company | | Market Value | | | % of Net Assets | |
| | | 22,000 | | | IQVIA Holdings, Inc. | | $ | 3,399,220 | | | | 4.6 | % |
| | | 120,000 | | | AXA S.A. - ADR | | | 3,377,400 | | | | 4.6 | % |
| | | 16,000 | | | Willis Towers Watson plc | | | 3,231,040 | | | | 4.4 | % |
| | | 190,000 | | | Danone S.A. - ADR | | | 3,133,100 | | | | 4.2 | % |
| | | 49,500 | | | Royal Dutch Shell plc - Class B - ADR | | | 2,968,515 | | | | 4.0 | % |
| | | 80,000 | | | Airbus SE - ADR | | | 2,940,000 | | | | 4.0 | % |
| | | 19,500 | | | Zimmer Biomet Holdings, Inc. | | | 2,918,760 | | | | 3.9 | % |
| | | 24,619 | | | Medtronic plc | | | 2,793,026 | | | | 3.8 | % |
| | | 9,000 | | | Mastercard, Inc. - Class A | | | 2,687,310 | | | | 3.6 | % |
| | | 54,064 | | | Koninklijke Philips N.V. | | | 2,638,323 | | | | 3.6 | % |
Asset Allocation (Unaudited)
Sector | | % of Net Assets | |
Communication Services | | | 1.9 | % |
Consumer Discretionary | | | 7.2 | % |
Consumer Staples | | | 10.7 | % |
Energy | | | 8.0 | % |
Financials | | | 20.0 | % |
Health Care | | | 15.9 | % |
Industrials | | | 13.1 | % |
Information Technology | | | 14.5 | % |
Materials | | | 3.2 | % |
Real Estate | | | 1.4 | % |
Money Market Funds, Liabilities in Excess of Other Assets | | | 4.1 | % |
| | | | 100.0 | % |
31
AVE MARIA WORLD EQUITY FUND
Schedule of Investments
December 31, 2019
| COMMON STOCKS — 95.9% | | Shares | | | Market Value | |
| Communication Services — 1.9% | | | | | | |
| Entertainment — 1.9% | | | | | | |
Electronic Arts, Inc. * | | | 13,000 | | | $ | 1,397,630 | |
| | | | | | | | | |
| Consumer Discretionary — 7.2% | | | | | | | | |
| Auto Components — 2.5% | | | | | | | | |
| Cie Générale des Établissements Michelin - ADR | | | 75,000 | | | | 1,833,375 | |
| | | | | | | | | |
| Automobiles — 0.9% | | | | | | | | |
| Toyota Motor Corporation - ADR | | | 5,000 | | | | 702,700 | |
| | | | | | | | | |
| Internet & Direct Marketing Retail — 1.7% | | | | | | | | |
Booking Holdings, Inc. * | | | 600 | | | | 1,232,238 | |
| | | | | | | | | |
| Specialty Retail — 2.1% | | | | | | | | |
| Lowe’s Companies, Inc. | | | 13,000 | | | | 1,556,880 | |
| | | | | | | | | |
| Consumer Staples — 10.7% | | | | | | | | |
| Beverages — 4.2% | | | | | | | | |
| Coca-Cola European Partners plc | | | 49,000 | | | | 2,493,120 | |
| Heineken N.V. - ADR | | | 12,000 | | | | 641,160 | |
| | | | | | | | 3,134,280 | |
| Food Products — 6.5% | | | | | | | | |
| Danone S.A. - ADR | | | 190,000 | | | | 3,133,100 | |
| Mondelēz International, Inc. - Class A | | | 30,000 | | | | 1,652,400 | |
| | | | | | | | 4,785,500 | |
| Energy — 8.0% | | | | | | | | |
| Oil, Gas & Consumable Fuels — 8.0% | | | | | | | | |
| Exxon Mobil Corporation | | | 19,000 | | | | 1,325,820 | |
| Pioneer Natural Resources Company | | | 10,500 | | | | 1,589,385 | |
| Royal Dutch Shell plc - Class B - ADR | | | 49,500 | | | | 2,968,515 | |
| | | | | | | | 5,883,720 | |
| Financials — 20.0% | | | | | | | | |
| Banks — 3.9% | | | | | | | | |
| Citigroup, Inc. | | | 14,000 | | | | 1,118,460 | |
| First Horizon National Corporation | | | 108,000 | | | | 1,788,480 | |
| | | | | | | | 2,906,940 | |
| Capital Markets — 2.4% | | | | | | | | |
| Brookfield Asset Management, Inc. - Class A | | | 30,000 | | | | 1,734,000 | |
| | | | | | | | | |
| Consumer Finance — 1.4% | | | | | | | | |
| Discover Financial Services | | | 12,500 | | | | 1,060,250 | |
32
AVE MARIA WORLD EQUITY FUND
SCHEDULE OF INVESTMENTS
(Continued)
| COMMON STOCKS — 95.9% (Continued) | | Shares | | | Market Value | |
| Financials — 20.0% (Continued) | | | | | | | | |
| Insurance — 12.3% | | | | | | | | |
| AXA S.A. - ADR | | | 120,000 | | | $ | 3,377,400 | |
| Chubb Ltd. | | | 10,000 | | | | 1,556,600 | |
| Fidelity National Financial, Inc. | | | 20,000 | | | | 907,000 | |
| Willis Towers Watson plc | | | 16,000 | | | | 3,231,040 | |
| | | | | | | | 9,072,040 | |
| Health Care — 15.9% | | | | | | | | |
| Health Care Equipment & Supplies — 11.3% | | | | | | | | |
| Koninklijke Philips N.V. | | | 54,064 | | | | 2,638,323 | |
| Medtronic plc | | | 24,619 | | | | 2,793,026 | |
| Zimmer Biomet Holdings, Inc. | | | 19,500 | | | | 2,918,760 | |
| | | | | | | | 8,350,109 | |
| Life Sciences Tools & Services — 4.6% | | | | | | | | |
IQVIA Holdings, Inc. * | | | 22,000 | | | | 3,399,220 | |
| | | | | | | | | |
| Industrials — 13.1% | | | | | | | | |
| Aerospace & Defense — 6.5% | | | | | | | | |
| Airbus SE - ADR | | | 80,000 | | | | 2,940,000 | |
| Hexcel Corporation | | | 25,000 | | | | 1,832,750 | |
| | | | | | | | 4,772,750 | |
| Airlines — 3.3% | | | | | | | | |
| Delta Air Lines, Inc. | | | 41,500 | | | | 2,426,920 | |
| | | | | | | | | |
| Electrical Equipment — 2.1% | | | | | | | | |
| Eaton Corporation plc | | | 16,500 | | | | 1,562,880 | |
| | | | | | | | | |
| Road & Rail — 1.2% | | | | | | | | |
| Canadian National Railway Company | | | 10,000 | | | | 904,500 | |
| | | | | | | | | |
| Information Technology — 14.5% | | | | | | | | |
| Communications Equipment — 2.6% | | | | | | | | |
| Cisco Systems, Inc. | | | 40,000 | | | | 1,918,400 | |
| | | | | | | | | |
| Electronic Equipment, Instruments & Components — 2.3% | | | | | | | | |
| TE Connectivity Ltd. | | | 18,000 | | | | 1,725,120 | |
| | | | | | | | | |
| IT Services — 6.1% | | | | | | | | |
| Accenture plc - Class A | | | 5,000 | | | | 1,052,850 | |
InterXion Holding N.V. * | | | 9,500 | | | | 796,195 | |
| Mastercard, Inc. - Class A | | | 9,000 | | | | 2,687,310 | |
| | | | | | | | 4,536,355 | |
33
AVE MARIA WORLD EQUITY FUND
SCHEDULE OF INVESTMENTS
(Continued)
| COMMON STOCKS — 95.9% (Continued) | | Shares | | | Market Value | |
| Information Technology — 14.5% (Continued) | | | | | | | | |
| Semiconductors & Semiconductor Equipment — 3.5% | | | | | | | | |
| Taiwan Semiconductor Manufacturing Company Ltd. - ADR | | | 22,000 | | | $ | 1,278,200 | |
| Texas Instruments, Inc. | | | 10,000 | | | | 1,282,900 | |
| | | | | | | | 2,561,100 | |
| Materials — 3.2% | | | | | | | | |
| Chemicals — 3.2% | | | | | | | | |
| Corteva, Inc. | | | 40,166 | | | | 1,187,307 | |
| International Flavors & Fragrances, Inc. | | | 9,000 | | | | 1,161,180 | |
| | | | | | | | 2,348,487 | |
| Real Estate — 1.4% | | | | | | | | |
| Equity Real Estate Investment Trusts (REITs) — 1.4% | | | | | | | | |
| Equinix, Inc. | | | 1,800 | | | | 1,050,660 | |
| | | | | | | | | |
Total Common Stocks (Cost $55,052,624) | | | | | | $ | 70,856,054 | |
| MONEY MARKET FUNDS — 4.2% | | Shares | | | Market Value | |
Federated Government Obligations Tax-Managed Fund - Institutional Shares, 1.46% (a) (Cost $3,090,432) | | | 3,090,432 | | | $ | 3,090,432 | |
| | | | | | | | | |
Total Investments at Market Value — 100.1% (Cost $58,143,056) | | | | | | $ | 73,946,486 | |
| | | | | | | | | |
| Liabilities in Excess of Other Assets — (0.1%) | | | | | | | (44,111 | ) |
| | | | | | | | | |
| Net Assets — 100.0% | | | | | | $ | 73,902,375 | |
ADR - American Depositary Receipt. |
* | Non-income producing security. |
(a) | The rate shown is the 7-day effective yield as of December 31, 2019. |
See accompanying notes to financial statements. |
34
AVE MARIA WORLD EQUITY FUND
Summary of Common Stocks by Country
December 31, 2019 (Unaudited)
Country | | Value | | | % of Net Assets | |
United States * | | $ | 40,627,826 | | | | 55.0 | % |
United Kingdom | | | 8,692,675 | | | | 11.8 | % |
France | | | 8,343,875 | | | | 11.3 | % |
Netherlands | | | 7,015,678 | | | | 9.5 | % |
Canada | | | 2,638,500 | | | | 3.6 | % |
Switzerland | | | 1,556,600 | | | | 2.1 | % |
Taiwan | | | 1,278,200 | | | | 1.7 | % |
Japan | | | 702,700 | | | | 0.9 | % |
Total | | $ | 70,856,054 | | | | 95.9 | % |
* | Includes companies deemed to be a “non-U.S. company” as defined in the Fund’s prospectus, if a company has at least 50% of its revenues or operations outside of the United States. |
See accompanying notes to financial statements. |
35
Ave Maria Bond Fund
Portfolio Manager Commentary
(Unaudited)
Dear Fellow Shareholders,
The Ave Maria Bond Fund (“the Fund”) finished its 17th consecutive year of positive performance. For the year ended December 31, 2019, the Fund had a total return of 8.3% vs. 6.8% for the Bloomberg Barclays Intermediate U.S. Government/Credit Index.
The overall economy looks strong, as unemployment is at 50-year lows and inflation is under the Federal Reserve’s (the Fed) 2% target. Forward looking, economic indicators continue to read solid, and the Fed stands ready with easy monetary policy should the economy falter.
The 10-year U.S. Treasury Note started the year yielding 2.7% and finished at 1.9%. The decrease in yield gave investors in Treasuries their best year since 2014. Corporate credit spreads tightened in 2019, as money flowed into bond funds and pushed yields lower. At this point, attention to quality is vital, because investors are not being compensated to take on undue risk. In the Fund, we diligently look for companies with fortress balance sheets and defendable business models.
In reviewing the performance of the Fund, the top contributors to return were the common stocks of Texas Instruments, Inc. (semiconductor devices), Illinois Tool Works, Inc. (industrial machinery), and PNC Financial Services Group, Inc. (bank). The top detractors of return included the common stocks of 3M Company (specialty chemicals), Kontoor Brands, Inc. (apparel), and a Kimberly-Clark Corporation (household products) bond that was purchased late in the year.
With interest rates low by historical standards, the Fund continues to be managed in a conservative manner, with the average bond maturity short and credit quality high. Dividend-paying common stocks continue to offer an attractive combination of current income and potential price appreciation.
We appreciate your investment in the Ave Maria Bond Fund.

| 
|
Brandon S. Scheitler | George P. Schwartz, CFA |
Lead Portfolio Manager | Co-Portfolio Manager |
36
AVE MARIA BOND FUND Performance (Unaudited) |
Comparison of the Change in Value of a $10,000 Investment
in the Ave Maria Bond Fund and the Bloomberg Barclays
U.S. Intermediate Government/Credit Index

(a) | The returns shown do not reflect the deduction of taxes a shareholder would pay on Fund distributions or the redemption of Fund shares. |
Expense ratio as of 12-31-18 (as disclosed in May 1, 2019 prospectus) | 0.50%* |
Expense ratio for the year ended 12-31-19 | 0.49% |
* | Includes Acquired Fund Fees and Expenses. |
Past performance is not predictive of future performance. Investment results and principal value will fluctuate so that shares, when redeemed, may be worth more or less than their original cost. Current performance may be higher or lower than the performance data quoted. Performance data, current to the most recent month end, is available at the Ave Maria Mutual Funds website at www.avemariafunds.com or by calling 1-888-726-9331.
37
AVE MARIA BOND FUND Annual Total Rates of Return
Comparison with Major Indices (Unaudited) |
| AVE MARIA BOND FUND | BLOOMBERG BARCLAYS
U.S. INTERMEDIATE
GOVERNMENT/CREDIT INDEX |
2003 (a) | 2.4% | 1.9% |
2004 | 5.1% | 3.0% |
2005 | 1.4% | 1.6% |
2006 | 6.0% | 4.1% |
2007 | 4.8% | 7.4% |
2008 | 0.3% | 5.1% |
2009 | 10.2% | 5.2% |
2010 | 6.7% | 5.9% |
2011 | 3.3% | 5.8% |
2012 | 4.6% | 3.9% |
2013 | 6.1% | -0.9% |
2014 | 2.2% | 3.1% |
2015 | 0.7% | 1.1% |
2016 | 4.5% | 2.1% |
2017 | 4.2% | 2.1% |
2018 | 0.4% | 0.9% |
2019 | 8.3% | 6.8% |
AVERAGE ANNUAL TOTAL RETURNS
As of December 31, 2019 (Unaudited)
| AVE MARIA BOND FUND | BLOOMBERG BARCLAYS
U.S. INTERMEDIATE
GOVERNMENT/CREDIT INDEX |
3 Years | 4.2% | 3.2% |
5 Years | 3.6% | 2.6% |
10 Years | 4.1% | 3.1% |
15 Years | 4.2% | 3.6% |
Since Inception (b) | 4.2% | 3.5% |
(a) | Represents the period from the commencement of operations (May 1, 2003) through December 31, 2003. |
(b) | Represents the period from the commencement of operations (May 1, 2003) through December 31, 2019. |
38
AVE MARIA BOND FUND
Ten Largest Holdings*
December 31, 2019 (Unaudited)
| | Par Value/
Shares | | | Holding | | Market Value | | | % of Net Assets | |
| | $ | 10,000,000 | | | U.S. Treasury Notes, 2.750%, due 05/31/23 | | $ | 10,368,750 | | | | 2.6 | % |
| | $ | 10,000,000 | | | U.S. Treasury Notes, 1.250%, due 02/29/20 | | | 9,993,372 | | | | 2.5 | % |
| | $ | 10,000,000 | | | U.S. Treasury Notes, 1.375%, due 01/31/21 | | | 9,972,266 | | | | 2.5 | % |
| | $ | 8,000,000 | | | U.S. Treasury Notes, 2.750%, due 09/30/20 | | | 8,064,375 | | | | 2.0 | % |
| | | 48,500 | | | Texas Instruments, Inc. | | | 6,222,065 | | | | 1.6 | % |
| | | 103,000 | | | Royal Dutch Shell plc - Class B - ADR | | | 6,176,910 | | | | 1.6 | % |
| | | 11,500 | | | BlackRock, Inc. | | | 5,781,050 | | | | 1.5 | % |
| | | 31,700 | | | Watsco, Inc. | | | 5,710,755 | | | | 1.4 | % |
| | $ | 5,000,000 | | | Electronic Arts, Inc., 4.800%, due 03/01/26 | | | 5,619,655 | | | | 1.4 | % |
| | | 80,000 | | | Kellogg Company | | | 5,532,800 | | | | 1.4 | % |
* | Excludes cash equivalents. |
Asset Allocation (Unaudited)
| | % of Net Assets | |
U.S. TREASURY OBLIGATIONS | | | 34.5 | % |
| | | | | |
CORPORATE BONDS | | | | |
Sector | | | | |
Communication Services | | | 2.5 | % |
Consumer Discretionary | | | 4.3 | % |
Consumer Staples | | | 9.9 | % |
Energy | | | 1.6 | % |
Financials | | | 4.0 | % |
Health Care | | | 1.9 | % |
Industrials | | | 6.7 | % |
Information Technology | | | 6.4 | % |
Materials | | | 3.3 | % |
| | | | | |
COMMON STOCKS | | | | |
Sector | | | | |
Consumer Discretionary | | | 0.5 | % |
Consumer Staples | | | 2.9 | % |
Energy | | | 2.8 | % |
Financials | | | 5.9 | % |
Health Care | | | 0.6 | % |
Industrials | | | 5.4 | % |
Information Technology | | | 1.6 | % |
| | | | | |
MONEY MARKET FUNDS, OTHER ASSETS IN EXCESS OF LIABILITIES | | | 5.2 | % |
| | | | 100.0 | % |
39
AVE MARIA BOND FUND
Schedule of Investments
December 31, 2019
| U.S. TREASURY OBLIGATIONS — 34.5% | | Par Value | | | Market Value | |
| U.S. Treasury Bonds — 1.3% | | | | | | | | |
| 8.125%, due 05/15/21 | | $ | 2,000,000 | | | $ | 2,176,719 | |
| 8.000%, due 11/15/21 | | | 2,500,000 | | | | 2,791,797 | |
| | | | | | | | 4,968,516 | |
U.S. Treasury Inflation-Protected Notes — 0.6% (a) | | | | | | | | |
| 1.125%, due 01/15/21 | | | 2,352,680 | | | | 2,374,468 | |
| | | | | | | | | |
| U.S. Treasury Notes — 32.6% | | | | | | | | |
| 1.250%, due 01/31/20 | | | 3,000,000 | | | | 2,999,035 | |
| 1.375%, due 02/15/20 | | | 2,000,000 | | | | 1,999,299 | |
| 1.250%, due 02/29/20 | | | 10,000,000 | | | | 9,993,372 | |
| 2.250%, due 02/29/20 | | | 5,000,000 | | | | 5,004,587 | |
| 1.625%, due 03/15/20 | | | 3,000,000 | | | | 2,999,766 | |
| 1.500%, due 04/15/20 | | | 3,000,000 | | | | 2,999,180 | |
| 3.500%, due 05/15/20 | | | 3,000,000 | | | | 3,020,039 | |
| 1.625%, due 06/30/20 | | | 3,000,000 | | | | 3,000,000 | |
| 2.000%, due 07/31/20 | | | 5,000,000 | | | | 5,010,351 | |
| 2.625%, due 07/31/20 | | | 5,000,000 | | | | 5,028,320 | |
| 2.625%, due 08/15/20 | | | 3,000,000 | | | | 3,018,047 | |
| 2.000%, due 09/30/20 | | | 3,000,000 | | | | 3,007,734 | |
| 2.750%, due 09/30/20 | | | 8,000,000 | | | | 8,064,375 | |
| 1.375%, due 10/31/20 | | | 3,000,000 | | | | 2,993,086 | |
| 2.625%, due 11/15/20 | | | 3,000,000 | | | | 3,025,195 | |
| 2.375%, due 12/31/20 | | | 2,000,000 | | | | 2,014,141 | |
| 1.375%, due 01/31/21 | | | 10,000,000 | | | | 9,972,266 | |
| 2.000%, due 02/28/21 | | | 3,000,000 | | | | 3,012,305 | |
| 2.250%, due 03/31/21 | | | 4,000,000 | | | | 4,030,469 | |
| 2.375%, due 04/15/21 | | | 5,000,000 | | | | 5,048,242 | |
| 1.375%, due 04/30/21 | | | 3,000,000 | | | | 2,990,859 | |
| 2.125%, due 08/15/21 | | | 4,000,000 | | | | 4,033,437 | |
| 2.125%, due 09/30/21 | | | 3,000,000 | | | | 3,026,836 | |
| 2.000%, due 10/31/21 | | | 2,000,000 | | | | 2,014,922 | |
| 1.500%, due 01/31/22 | | | 3,000,000 | | | | 2,995,547 | |
| 1.875%, due 02/28/22 | | | 5,000,000 | | | | 5,030,664 | |
| 1.750%, due 03/31/22 | | | 2,000,000 | | | | 2,007,500 | |
| 1.750%, due 04/30/22 | | | 5,000,000 | | | | 5,018,750 | |
| 1.750%, due 05/31/22 | | | 5,000,000 | | | | 5,019,531 | |
| 2.750%, due 05/31/23 | | | 10,000,000 | | | | 10,368,750 | |
| | | | | | | | 128,746,605 | |
| | | | | | | | | |
Total U.S. Treasury Obligations (Cost $135,705,067) | | | | | | $ | 136,089,589 | |
40
AVE MARIA BOND FUND
SCHEDULE OF INVESTMENTS
(Continued)
| CORPORATE BONDS — 40.6% | | Par Value | | | Market Value | |
| Communication Services — 2.5% | | | | | | | | |
| Electronic Arts, Inc., 3.700%, due 03/01/21 | | $ | 4,000,000 | | | $ | 4,074,822 | |
| Electronic Arts, Inc., 4.800%, due 03/01/26 | | | 5,000,000 | | | | 5,619,655 | |
| | | | | | | | 9,694,477 | |
| Consumer Discretionary — 4.3% | | | | | | | | |
| Lowe’s Companies, Inc., 3.800%, due 11/15/21 | | | 1,000,000 | | | | 1,030,065 | |
| Lowe’s Companies, Inc., 3.120%, due 04/15/22 | | | 3,000,000 | | | | 3,073,212 | |
| Ross Stores, Inc., 3.375%, due 09/15/24 | | | 3,000,000 | | | | 3,133,340 | |
| TJX Companies, Inc. (The), 2.750%, due 06/15/21 | | | 2,305,000 | | | | 2,333,376 | |
| TJX Companies, Inc. (The), 2.250%, due 09/15/26 | | | 3,426,000 | | | | 3,442,835 | |
| VF Corporation, 3.500%, due 09/01/21 | | | 3,775,000 | | | | 3,854,768 | |
| | | | | | | | 16,867,596 | |
| Consumer Staples — 9.9% | | | | | | | | |
| Coca-Cola Company (The), 3.150%, due 11/15/20 | | | 3,000,000 | | | | 3,035,559 | |
| Coca-Cola Company (The), 3.300%, due 09/01/21 | | | 2,000,000 | | | | 2,049,568 | |
| Coca-Cola Company (The), 2.875%, due 10/27/25 | | | 2,800,000 | | | | 2,919,726 | |
| Colgate-Palmolive Company, 2.450%, due 11/15/21 | | | 3,000,000 | | | | 3,040,150 | |
| Colgate-Palmolive Company, 1.950%, due 02/01/23 | | | 2,263,000 | | | | 2,273,110 | |
| Colgate-Palmolive Company, 3.250%, due 03/15/24 | | | 795,000 | | | | 839,710 | |
| Dr Pepper Snapple Group, Inc., 3.200%, due 11/15/21 | | | 2,000,000 | | | | 2,032,187 | |
| Hershey Company (The), 2.900%, due 05/15/20 | | | 1,000,000 | | | | 1,003,360 | |
| Hershey Company (The), 2.625%, due 05/01/23 | | | 4,536,000 | | | | 4,619,384 | |
| Hershey Company (The), 2.050%, due 11/15/24 | | | 950,000 | | | | 952,310 | |
| Hormel Foods Corporation, 4.125%, due 04/15/21 | | | 3,814,000 | | | | 3,901,240 | |
| J.M. Smucker Company (The), 3.500%, due 10/15/21 | | | 2,000,000 | | | | 2,051,622 | |
| Kimberly-Clark Corporation, 2.400%, due 03/01/22 | | | 3,811,000 | | | | 3,852,943 | |
| Kimberly-Clark Corporation, 2.650%, due 03/01/25 | | | 1,115,000 | | | | 1,143,013 | |
| Kimberly-Clark Corporation, 2.750%, due 02/15/26 | | | 343,000 | | | | 353,311 | |
| McCormick & Company, Inc., 3.900%, due 07/15/21 | | | 2,500,000 | | | | 2,559,722 | |
| McCormick & Company, Inc., 3.500%, due 09/01/23 | | | 2,500,000 | | | | 2,599,818 | |
| | | | | | | | 39,226,733 | |
| Energy — 1.6% | | | | | | | | |
| Exxon Mobil Corporation, 2.397%, due 03/06/22 | | | 2,000,000 | | | | 2,021,797 | |
| Exxon Mobil Corporation, 3.176%, due 03/15/24 | | | 1,634,000 | | | | 1,712,034 | |
| Exxon Mobil Corporation, 2.019%, due 08/16/24 | | | 2,650,000 | | | | 2,659,595 | |
| | | | | | | | 6,393,426 | |
| Financials — 4.0% | | | | | | | | |
| BlackRock, Inc., 3.500%, due 03/18/24 | | | 2,000,000 | | | | 2,127,856 | |
| BlackRock, Inc., 3.200%, due 03/15/27 | | | 1,000,000 | | | | 1,057,325 | |
| Chubb INA Holdings, Inc., 3.150%, due 03/15/25 | | | 3,809,000 | | | | 4,008,774 | |
| Moody’s Corporation, 4.500%, due 09/01/22 | | | 1,000,000 | | | | 1,057,467 | |
41
AVE MARIA BOND FUND
SCHEDULE OF INVESTMENTS
(Continued)
| CORPORATE BONDS — 40.6% (Continued) | | Par Value | | | Market Value | |
| Financials — 4.0% (Continued) | | | | | | | | |
| Moody’s Corporation, 2.625%, due 01/15/23 | | $ | 3,319,000 | | | $ | 3,369,298 | |
| Moody’s Corporation, 4.875%, due 02/15/24 | | | 1,500,000 | | | | 1,649,611 | |
| Moody’s Corporation, 3.250%, due 01/15/28 | | | 700,000 | | | | 734,458 | |
| PNC Financial Services Group, Inc. (The), 3.250%, due 06/01/25 | | | 1,528,000 | | | | 1,603,709 | |
| | | | | | | | 15,608,498 | |
| Health Care — 1.9% | | | | | | | | |
| Stryker Corporation, 4.375%, due 01/15/20 | | | 1,000,000 | | | | 1,000,754 | |
| Stryker Corporation, 3.375%, due 05/15/24 | | | 5,000,000 | | | | 5,253,983 | |
| Zimmer Biomet Holdings, Inc., 3.550%, due 04/01/25 | | | 1,025,000 | | | | 1,080,974 | |
| | | | | | | | 7,335,711 | |
| Industrials — 6.7% | | | | | | | | |
| 3M Company, 2.000%, due 06/26/22 | | | 1,073,000 | | | | 1,077,190 | |
| 3M Company, 2.250%, due 03/15/23 | | | 3,000,000 | | | | 3,025,306 | |
| Emerson Electric Company, 4.250%, due 11/15/20 | | | 2,109,000 | | | | 2,150,610 | |
| Illinois Tool Works, Inc., 3.500%, due 03/01/24 | | | 2,450,000 | | | | 2,598,559 | |
| Illinois Tool Works, Inc., 2.650%, due 11/15/26 | | | 4,090,000 | | | | 4,200,332 | |
| PACCAR Financial Corporation, 1.650%, due 08/11/21 | | | 3,750,000 | | | | 3,739,804 | |
| Snap-on, Inc., 6.125%, due 09/01/21 | | | 2,000,000 | | | | 2,136,239 | |
| United Parcel Service, Inc., 2.350%, due 05/16/22 | | | 2,990,000 | | | | 3,023,489 | |
| United Parcel Service, Inc., 2.200%, due 09/01/24 | | | 3,410,000 | | | | 3,429,487 | |
| United Parcel Service, Inc., 2.400%, due 11/15/26 | | | 1,000,000 | | | | 1,011,014 | |
| | | | | | | | 26,392,030 | |
| Information Technology — 6.4% | | | | | | | | |
| Cisco Systems, Inc., 4.450%, due 01/15/20 | | | 606,000 | | | | 606,521 | |
| Cisco Systems, Inc., 2.200%, due 02/28/21 | | | 3,250,000 | | | | 3,269,023 | |
| Cisco Systems, Inc., 2.600%, due 02/28/23 | | | 2,475,000 | | | | 2,530,646 | |
| Cisco Systems, Inc., 2.500%, due 09/20/26 | | | 3,080,000 | | | | 3,140,286 | |
| Mastercard, Inc., 3.375%, due 04/01/24 | | | 2,300,000 | | | | 2,440,775 | |
| Mastercard, Inc., 2.000%, due 03/03/25 | | | 2,375,000 | | | | 2,369,121 | |
| Mastercard, Inc., 2.950%, due 11/21/26 | | | 500,000 | | | | 520,217 | |
| Texas Instruments, Inc., 1.750%, due 05/01/20 | | | 1,825,000 | | | | 1,823,928 | |
| Texas Instruments, Inc., 2.250%, due 05/01/23 | | | 2,500,000 | | | | 2,531,323 | |
| Visa, Inc., 2.150%, due 09/15/22 | | | 3,000,000 | | | | 3,034,148 | |
| Visa, Inc., 3.150%, due 12/14/25 | | | 3,005,000 | | | | 3,177,079 | |
| | | | | | | | 25,443,067 | |
| Materials — 3.3% | | | | | | | | |
| Ecolab, Inc., 4.350%, due 12/08/21 | | | 4,292,000 | | | | 4,494,534 | |
| Ecolab, Inc., 3.250%, due 01/14/23 | | | 5,000,000 | | | | 5,159,844 | |
| Ecolab, Inc., 2.700%, due 11/01/26 | | | 1,000,000 | | | | 1,027,477 | |
42
AVE MARIA BOND FUND
SCHEDULE OF INVESTMENTS
(Continued)
| CORPORATE BONDS — 40.6% (Continued) | | Par Value | | | Market Value | |
| Materials — 3.3% (Continued) | | | | | | | | |
| Praxair, Inc., 2.250%, due 09/24/20 | | $ | 2,000,000 | | | $ | 2,008,400 | |
| Praxair, Inc., 4.050%, due 03/15/21 | | | 500,000 | | | | 513,471 | |
| | | | | | | | 13,203,726 | |
| | | | | | | | | |
Total Corporate Bonds (Cost $158,082,819) | | | | | | $ | 160,165,264 | |
| COMMON STOCKS — 19.7% | | Shares | | | Market Value | |
| Consumer Discretionary — 0.5% | | | | | | | | |
| Textiles, Apparel & Luxury Goods — 0.5% | | | | | | | | |
| VF Corporation | | | 20,000 | | | $ | 1,993,200 | |
| | | | | | | | | |
| Consumer Staples — 2.9% | | | | | | | | |
| Beverages — 1.5% | | | | | | | | |
| Coca-Cola European Partners plc | | | 60,000 | | | | 3,052,800 | |
| Diageo plc - ADR | | | 17,500 | | | | 2,947,350 | |
| | | | | | | | 6,000,150 | |
| Food Products — 1.4% | | | | | | | | |
| Kellogg Company | | | 80,000 | | | | 5,532,800 | |
| | | | | | | | | |
| Energy — 2.8% | | | | | | | | |
| Oil, Gas & Consumable Fuels — 2.8% | | | | | | | | |
| Exxon Mobil Corporation | | | 73,000 | | | | 5,093,940 | |
| Royal Dutch Shell plc - Class B - ADR | | | 103,000 | | | | 6,176,910 | |
| | | | | | | | 11,270,850 | |
| Financials — 5.9% | | | | | | | | |
| Banks — 2.3% | | | | | | | | |
| First Horizon National Corporation | | | 225,000 | | | | 3,726,000 | |
| PNC Financial Services Group, Inc. (The) | | | 33,000 | | | | 5,267,790 | |
| | | | | | | | 8,993,790 | |
| Capital Markets — 1.5% | | | | | | | | |
| BlackRock, Inc. | | | 11,500 | | | | 5,781,050 | |
| | | | | | | | | |
| Diversified Financial Services — 0.5% | | | | | | | | |
| Western Union Company (The) | | | 80,000 | | | | 2,142,400 | |
| | | | | | | | | |
| Insurance — 1.6% | | | | | | | | |
| Chubb Ltd. | | | 15,000 | | | | 2,334,900 | |
| Fidelity National Financial, Inc. | | | 90,000 | | | | 4,081,500 | |
| | | | | | | | 6,416,400 | |
| Health Care — 0.6% | | | | | | | | |
| Health Care Equipment & Supplies — 0.6% | | | | | | | | |
| Medtronic plc | | | 20,000 | | | | 2,269,000 | |
43
AVE MARIA BOND FUND
SCHEDULE OF INVESTMENTS
(Continued)
| COMMON STOCKS — 19.7% (Continued) | | Shares | | | Market Value | |
| Industrials — 5.4% | | | | | | | | |
| Air Freight & Logistics — 1.1% | | | | | | | | |
| United Parcel Service, Inc. - Class B | | | 35,500 | | | $ | 4,155,630 | |
| | | | | | | | | |
| Commercial Services & Supplies — 0.9% | | | | | | | | |
| Genuine Parts Company | | | 34,300 | | | | 3,643,689 | |
| | | | | | | | | |
| Machinery — 0.9% | | | | | | | | |
| Illinois Tool Works, Inc. | | | 20,000 | | | | 3,592,600 | |
| | | | | | | | | |
| Trading Companies & Distributors — 2.5% | | | | | | | | |
| Fastenal Company | | | 115,000 | | | | 4,249,250 | |
| Watsco, Inc. | | | 31,700 | | | | 5,710,755 | |
| | | | | | | | 9,960,005 | |
| Information Technology — 1.6% | | | | | | | | |
| Semiconductors & Semiconductor Equipment — 1.6% | | | | | | | | |
| Texas Instruments, Inc. | | | 48,500 | | | | 6,222,065 | |
| | | | | | | | | |
Total Common Stocks (Cost $62,727,297) | | | | | | $ | 77,973,629 | |
| MONEY MARKET FUNDS — 4.9% | | Shares | | | Market Value | |
Federated Government Obligations Tax-Managed Fund - Institutional Shares, 1.46% (b) | | | 18,757,392 | | | $ | 18,757,392 | |
Federated Treasury Obligations Fund - Institutional Shares, 1.51% (b) | | | 717,805 | | | | 717,805 | |
Total Money Market Funds (Cost $19,475,197) | | | | | | $ | 19,475,197 | |
| | | | | | | | | |
Total Investments at Market Value — 99.7% (Cost $375,990,380) | | | | | | $ | 393,703,679 | |
| | | | | | | | | |
| Other Assets in Excess of Liabilities — 0.3% | | | | | | | 1,146,503 | |
| | | | | | | | | |
| Net Assets — 100.0% | | | | | | $ | 394,850,182 | |
ADR - American Depositary Receipt. |
(a) | Interest rate for this investment is the stated rate. Interest payments are determined based on the inflation adjusted principal. |
(b) | The rate shown is the 7-day effective yield as of December 31, 2019. |
See accompanying notes to financial statements. |
44
This page intentionally left blank.
AVE MARIA MUTUAL FUNDS
Statements of Assets and Liabilities
December 31, 2019
| | Ave Maria
Value Fund | | | Ave Maria
Growth Fund | | | Ave Maria
Rising
Dividend Fund | |
ASSETS | | | | | | | | | | | | |
Investment securities: | | | | | | | | | | | | |
At cost | | $ | 192,690,423 | | | $ | 566,375,398 | | | $ | 729,672,181 | |
At market value (Note 1) | | $ | 248,255,385 | | | $ | 854,914,722 | | | $ | 953,771,021 | |
Cash | | | — | | | | 91,800 | | | | 40,800 | |
Receivable for capital shares sold | | | 65,414 | | | | 1,449,994 | | | | 636,506 | |
Dividends receivable | | | 110,523 | | | | 394,785 | | | | 1,251,704 | |
Other assets | | | 15,580 | | | | 23,707 | | | | 21,535 | |
TOTAL ASSETS | | | 248,446,902 | | | | 856,875,008 | | | | 955,721,566 | |
| | | | | | | | | | | | | |
LIABILITIES | | | | | | | | | | | | |
Payable for capital shares redeemed | | | 124,689 | | | | 418,703 | | | | 698,263 | |
Payable to Adviser (Note 2) | | | 524,232 | | | | 1,550,892 | | | | 1,784,070 | |
Payable to administrator (Note 2) | | | 25,859 | | | | 81,675 | | | | 91,008 | |
Other accrued expenses | | | 28,718 | | | | 59,843 | | | | 63,233 | |
TOTAL LIABILITIES | | | 703,498 | | | | 2,111,113 | | | | 2,636,574 | |
| | | | | | | | | | | | | |
NET ASSETS | | $ | 247,743,404 | | | $ | 854,763,895 | | | $ | 953,084,992 | |
| | | | | | | | | | | | | |
NET ASSETS CONSIST OF: | | | | | | | | | | | | |
Paid-in capital | | $ | 192,178,442 | | | $ | 566,224,571 | | | $ | 728,986,152 | |
Accumulated earnings | | | 55,564,962 | | | | 288,539,324 | | | | 224,098,840 | |
NET ASSETS | | $ | 247,743,404 | | | $ | 854,763,895 | | | $ | 953,084,992 | |
Shares of beneficial interest outstanding (unlimited number of shares authorized, no par value) | | | 12,587,668 | | | | 22,494,038 | | | | 51,028,171 | |
Net asset value, offering price and redemption price per share (Note 1) | | $ | 19.68 | | | $ | 38.00 | | | $ | 18.68 | |
See accompanying notes to financial statements. |
46
AVE MARIA MUTUAL FUNDS
STATEMENTS OF ASSETS AND LIABILITIES
December 31, 2019 (Continued)
| | Ave Maria
World
Equity Fund | | | Ave Maria
Bond Fund | |
ASSETS | | | | | | | | |
Investment securities: | | | | | | | | |
At cost | | $ | 58,143,056 | | | $ | 375,990,380 | |
At market value (Note 1) | | $ | 73,946,486 | | | $ | 393,703,679 | |
Cash | | | 4,080 | | | | — | |
Receivable for capital shares sold | | | 55,130 | | | | 307,469 | |
Dividends and interest receivable | | | 82,490 | | | | 2,087,469 | |
Other assets | | | 11,311 | | | | 19,713 | |
TOTAL ASSETS | | | 74,099,497 | | | | 396,118,330 | |
| | | | | | | | | |
LIABILITIES | | | | | | | | |
Payable for capital shares redeemed | | | 1,358 | | | | 143,865 | |
Payable for securities purchased | | | — | | | | 744,664 | |
Payable to Adviser (Note 2) | | | 169,561 | | | | 301,524 | |
Payable to administrator (Note 2) | | | 7,696 | | | | 32,616 | |
Other accrued expenses | | | 18,507 | | | | 45,479 | |
TOTAL LIABILITIES | | | 197,122 | | | | 1,268,148 | |
| | | | | | | | | |
NET ASSETS | | $ | 73,902,375 | | | $ | 394,850,182 | |
| | | | | | | | | |
NET ASSETS CONSIST OF: | | | | | | | | |
Paid-in capital | | $ | 58,128,955 | | | $ | 377,136,883 | |
Accumulated earnings | | | 15,773,420 | | | | 17,713,299 | |
NET ASSETS | | $ | 73,902,375 | | | $ | 394,850,182 | |
Shares of beneficial interest outstanding (unlimited number of shares authorized, no par value) | | | 4,622,443 | | | | 33,928,458 | |
Net asset value, offering price and redemption price per share (Note 1) | | $ | 15.99 | | | $ | 11.64 | |
See accompanying notes to financial statements. |
47
AVE MARIA MUTUAL FUNDS
Statements of Operations
For the Year Ended December 31, 2019
| | Ave Maria
Value Fund | | | Ave Maria
Growth Fund | | | Ave Maria
Rising
Dividend Fund | |
INVESTMENT INCOME | | | | | | | | | | | | |
Dividends | | $ | 2,784,051 | | | $ | 7,020,203 | | | $ | 19,208,760 | |
Foreign withholding taxes on dividends | | | (12,060 | ) | | | (60,480 | ) | | | (18,890 | ) |
TOTAL INVESTMENT INCOME | | | 2,771,991 | | | | 6,959,723 | | | | 19,189,870 | |
| | | | | | | | | | | | | |
EXPENSES | | | | | | | | | | | | |
Investment advisory fees (Note 2) | | | 2,130,257 | | | | 5,532,990 | | | | 6,654,691 | |
Administration, accounting and transfer agent fees (Note 2) | | | 301,831 | | | | 862,853 | | | | 1,011,985 | |
Trustees’ fees and expenses (Note 2) | | | 46,234 | | | | 135,263 | | | | 167,862 | |
Registration and filing fees | | | 37,232 | | | | 82,813 | | | | 58,634 | |
Postage and supplies | | | 34,255 | | | | 69,352 | | | | 74,933 | |
Audit and tax services fees | | | 25,992 | | | | 48,906 | | | | 54,204 | |
Custodian and bank service fees | | | 14,894 | | | | 42,666 | | | | 52,043 | |
Legal fees | | | 22,597 | | | | 22,597 | | | | 22,597 | |
Compliance service fees and expenses (Note 2) | | | 9,781 | | | | 32,405 | | | | 37,297 | |
Advisory board fees and expenses (Note 2) | | | 8,437 | | | | 24,677 | | | | 30,402 | |
Insurance expense | | | 14,457 | | | | 17,494 | | | | 19,380 | |
Printing of shareholder reports | | | 9,577 | | | | 15,991 | | | | 16,237 | |
Other expenses | | | 21,707 | | | | 36,105 | | | | 47,346 | |
TOTAL EXPENSES | | | 2,677,251 | | | | 6,924,112 | | | | 8,247,611 | |
| | | | | | | | | | | | | |
NET INVESTMENT INCOME | | | 94,740 | | | | 35,611 | | | | 10,942,259 | |
| | | | | | | | | | | | | |
REALIZED AND UNREALIZED GAINS ON INVESTMENTS | | | | | | | | | | | | |
Net realized gains from investment transactions | | | 12,330,238 | | | | 14,295,605 | | | | 61,112,499 | |
Net change in unrealized appreciation (depreciation) on investments | | | 30,654,966 | | | | 206,413,769 | | | | 138,759,926 | |
NET REALIZED AND UNREALIZED GAINS ON INVESTMENTS | | | 42,985,204 | | | | 220,709,374 | | | | 199,872,425 | |
| | | | | | | | | | | | | |
NET INCREASE IN NET ASSETS RESULTING FROM OPERATIONS | | $ | 43,079,944 | | | $ | 220,744,985 | | | $ | 210,814,684 | |
See accompanying notes to financial statements. |
48
AVE MARIA MUTUAL FUNDS
STATEMENTS OF OPERATIONS
For the Year Ended December 31, 2019 (Continued)
| | Ave Maria
World
Equity Fund | | | Ave Maria
Bond Fund | |
INVESTMENT INCOME | | | | | | | | |
Dividends | | $ | 1,429,174 | | | $ | 2,308,339 | |
Foreign withholding taxes on dividends | | | (102,604 | ) | | | (425 | ) |
Interest | | | — | | | | 6,249,142 | |
TOTAL INVESTMENT INCOME | | | 1,326,570 | | | | 8,557,056 | |
| | | | | | | | | |
EXPENSES | | | | | | | | |
Investment advisory fees (Note 2) | | | 624,825 | | | | 1,069,271 | |
Administration, accounting and transfer agent fees (Note 2) | | | 82,204 | | | | 356,400 | |
Trustees’ fees and expenses (Note 2) | | | 12,792 | | | | 68,114 | |
Registration and filing fees | | | 34,536 | | | | 60,300 | |
Postage and supplies | | | 15,141 | | | | 29,786 | |
Audit and tax services fees | | | 18,485 | | | | 30,638 | |
Custodian and bank service fees | | | 5,464 | | | | 21,769 | |
Legal fees | | | 22,597 | | | | 22,597 | |
Compliance service fees and expenses (Note 2) | | | 2,847 | | | | 15,196 | |
Advisory board fees and expenses (Note 2) | | | 2,367 | | | | 12,297 | |
Insurance expense | | | 7,752 | | | | 14,535 | |
Printing of shareholder reports | | | 3,428 | | | | 6,474 | |
Other expenses | | | 14,697 | | | | 40,136 | |
TOTAL EXPENSES | | | 847,135 | | | | 1,747,513 | |
Less fee reductions by the Adviser (Note 2) | | | (24,996 | ) | | | — | |
NET EXPENSES | | | 822,139 | | | | 1,747,513 | |
| | | | | | | | | |
NET INVESTMENT INCOME | | | 504,431 | | | | 6,809,543 | |
| | | | | | | | | |
REALIZED AND UNREALIZED GAINS ON INVESTMENTS | | | | | | | | |
Net realized gains from investment transactions | | | 2,708,192 | | | | 5,566,998 | |
Net change in unrealized appreciation (depreciation) on investments | | | 12,253,945 | | | | 15,701,342 | |
NET REALIZED AND UNREALIZED GAINS ON INVESTMENTS | | | 14,962,137 | | | | 21,268,340 | |
| | | | | | | | | |
NET INCREASE IN NET ASSETS RESULTING FROM OPERATIONS | | $ | 15,466,568 | | | $ | 28,077,883 | |
See accompanying notes to financial statements. |
49
Ave Maria Value Fund
STATEMENTS OF CHANGES IN NET ASSETS
| | Year
Ended
December 31,
2019 | | | Year
Ended
December 31,
2018 | |
FROM OPERATIONS | | | | | | | | |
Net investment income (loss) | | $ | 94,740 | | | $ | (329,012 | ) |
Net realized gains from investment transactions | | | 12,330,238 | | | | 20,716,534 | |
Net change in unrealized appreciation (depreciation) on investments | | | 30,654,966 | | | | (40,061,357 | ) |
Net increase (decrease) in net assets resulting from operations | | | 43,079,944 | | | | (19,673,835 | ) |
| | | | | | | | | |
FROM DISTRIBUTIONS TO SHAREHOLDERS (Note 1) | | | (12,431,593 | ) | | | (20,668,673 | ) |
| | | | | | | | | |
FROM CAPITAL SHARE TRANSACTIONS | | | | | | | | |
Proceeds from shares sold | | | 21,172,839 | | | | 21,921,785 | |
Reinvestment of distributions to shareholders | | | 11,853,432 | | | | 19,678,112 | |
Payments for shares redeemed | | | (27,412,297 | ) | | | (39,667,885 | ) |
Net increase in net assets from capital share transactions | | | 5,613,974 | | | | 1,932,012 | |
| | | | | | | | | |
TOTAL INCREASE (DECREASE) IN NET ASSETS | | | 36,262,325 | | | | (38,410,496 | ) |
| | | | | | | | | |
NET ASSETS | | | | | | | | |
Beginning of year | | | 211,481,079 | | | | 249,891,575 | |
End of year | | $ | 247,743,404 | | | $ | 211,481,079 | |
| | | | | | | | | |
SUMMARY OF CAPITAL SHARE ACTIVITY | | | | | | | | |
Shares sold | | | 1,068,769 | | | | 1,021,784 | |
Shares issued in reinvestment of distributions to shareholders | | | 603,228 | | | | 1,153,437 | |
Shares redeemed | | | (1,385,794 | ) | | | (1,841,844 | ) |
Net increase in shares outstanding | | | 286,203 | | | | 333,377 | |
Shares outstanding, beginning of year | | | 12,301,465 | | | | 11,968,088 | |
Shares outstanding, end of year | | | 12,587,668 | | | | 12,301,465 | |
See accompanying notes to financial statements. |
50
Ave Maria Growth Fund
Statements of Changes in Net Assets
| | Year
Ended
December 31,
2019 | | | Year
Ended
December 31,
2018 | |
FROM OPERATIONS | | | | | | | | |
Net investment income | | $ | 35,611 | | | $ | 1,077,558 | |
Net realized gains from investment transactions | | | 14,295,605 | | | | 37,942,682 | |
Net change in unrealized appreciation (depreciation) on investments | | | 206,413,769 | | | | (57,912,533 | ) |
Net increase (decrease) in net assets resulting from operations | | | 220,744,985 | | | | (18,892,293 | ) |
| | | | | | | | | |
FROM DISTRIBUTIONS TO SHAREHOLDERS (Note 1) | | | (14,275,838 | ) | | | (39,024,521 | ) |
| | | | | | | | | |
FROM CAPITAL SHARE TRANSACTIONS | | | | | | | | |
Proceeds from shares sold | | | 180,023,858 | | | | 215,576,499 | |
Reinvestment of distributions to shareholders | | | 13,554,971 | | | | 37,004,032 | |
Payments for shares redeemed | | | (123,090,103 | ) | | | (99,372,827 | ) |
Net increase in net assets from capital share transactions | | | 70,488,726 | | | | 153,207,704 | |
| | | | | | | | | |
TOTAL INCREASE IN NET ASSETS | | | 276,957,873 | | | | 95,290,890 | |
| | | | | | | | | |
NET ASSETS | | | | | | | | |
Beginning of year | | | 577,806,022 | | | | 482,515,132 | |
End of year | | $ | 854,763,895 | | | $ | 577,806,022 | |
| | | | | | | | | |
SUMMARY OF CAPITAL SHARE ACTIVITY | | | | | | | | |
Shares sold | | | 5,179,690 | | | | 6,578,219 | |
Shares issued in reinvestment of distributions to shareholders | | | 357,271 | | | | 1,325,381 | |
Shares redeemed | | | (3,538,946 | ) | | | (3,076,127 | ) |
Net increase in shares outstanding | | | 1,998,015 | | | | 4,827,473 | |
Shares outstanding, beginning of year | | | 20,496,023 | | | | 15,668,550 | |
Shares outstanding, end of year | | | 22,494,038 | | | | 20,496,023 | |
See accompanying notes to financial statements. |
51
Ave Maria Rising Dividend Fund
Statements of Changes in Net Assets
| | Year
Ended
December 31,
2019 | | | Year
Ended
December 31,
2018 | |
FROM OPERATIONS | | | | | | | | |
Net investment income | | $ | 10,942,259 | | | $ | 11,609,500 | |
Net realized gains from investment transactions | | | 61,112,499 | | | | 66,980,880 | |
Net change in unrealized appreciation (depreciation) on investments | | | 138,759,926 | | | | (111,930,102 | ) |
Net increase (decrease) in net assets resulting from operations | | | 210,814,684 | | | | (33,339,722 | ) |
| | | | | | | | | |
FROM DISTRIBUTIONS TO SHAREHOLDERS (Note 1) | | | (72,019,270 | ) | | | (78,794,322 | ) |
| | | | | | | | | |
FROM CAPITAL SHARE TRANSACTIONS | | | | | | | | |
Proceeds from shares sold | | | 132,949,834 | | | | 160,319,825 | |
Reinvestment of distributions to shareholders | | | 64,860,750 | | | | 70,598,101 | |
Payments for shares redeemed | | | (164,331,511 | ) | | | (308,081,911 | ) |
Net increase (decrease) in net assets from capital share transactions | | | 33,479,073 | | | | (77,163,985 | ) |
| | | | | | | | | |
TOTAL INCREASE (DECREASE) IN NET ASSETS | | | 172,274,487 | | | | (189,298,029 | ) |
| | | | | | | | | |
NET ASSETS | | | | | | | | |
Beginning of year | | | 780,810,505 | | | | 970,108,534 | |
End of year | | $ | 953,084,992 | | | $ | 780,810,505 | |
| | | | | | | | | |
SUMMARY OF CAPITAL SHARE ACTIVITY | | | | | | | | |
Shares sold | | | 7,269,107 | | | | 8,557,151 | |
Shares issued in reinvestment of distributions to shareholders | | | 3,481,659 | | | | 4,423,195 | |
Shares redeemed | | | (9,043,867 | ) | | | (16,282,058 | ) |
Net increase (decrease) in shares outstanding | | | 1,706,899 | | | | (3,301,712 | ) |
Shares outstanding, beginning of year | | | 49,321,272 | | | | 52,622,984 | |
Shares outstanding, end of year | | | 51,028,171 | | | | 49,321,272 | |
See accompanying notes to financial statements. |
52
Ave Maria World Equity Fund
Statements of Changes in Net Assets
| | Year
Ended
December 31,
2019 | | | Year
Ended
December 31,
2018 | |
FROM OPERATIONS | | | | | | | | |
Net investment income | | $ | 504,431 | | | $ | 618,502 | |
Net realized gains from security investment transactions | | | 2,708,192 | | | | 2,053,537 | |
Net change in unrealized appreciation (depreciation) on investments | | | 12,253,945 | | | | (8,256,416 | ) |
Net increase (decrease) in net assets resulting from operations | | | 15,466,568 | | | | (5,584,377 | ) |
| | | | | | | | | |
FROM DISTRIBUTIONS TO SHAREHOLDERS (Note 1) | | | (3,243,084 | ) | | | (2,675,175 | ) |
| | | | | | | | | |
FROM CAPITAL SHARE TRANSACTIONS | | | | | | | | |
Proceeds from shares sold | | | 13,022,485 | | | | 13,143,742 | |
Reinvestment of distributions to shareholders | | | 2,983,300 | | | | 2,424,612 | |
Payments for shares redeemed | | | (11,370,792 | ) | | | (12,435,290 | ) |
Net increase in net assets from capital share transactions | | | 4,634,993 | | | | 3,133,064 | |
| | | | | | | | | |
TOTAL INCREASE (DECREASE) IN NET ASSETS | | | 16,858,477 | | | | (5,126,488 | ) |
| | | | | | | | | |
NET ASSETS | | | | | | | | |
Beginning of year | | | 57,043,898 | | | | 62,170,386 | |
End of year | | $ | 73,902,375 | | | $ | 57,043,898 | |
| | | | | | | | | |
SUMMARY OF CAPITAL SHARE ACTIVITY | | | | | | | | |
Shares sold | | | 843,278 | | | | 879,267 | |
Shares issued in reinvestment of distributions to shareholders | | | 187,273 | | | | 186,222 | |
Shares redeemed | | | (764,079 | ) | �� | | (833,472 | ) |
Net increase in shares outstanding | | | 266,472 | | | | 232,017 | |
Shares outstanding, beginning of year | | | 4,355,971 | | | | 4,123,954 | |
Shares outstanding, end of year | | | 4,622,443 | | | | 4,355,971 | |
See accompanying notes to financial statements. |
53
Ave Maria Bond Fund
Statements of Changes in Net Assets
| | Year
Ended
December 31,
2019 | | | Year
Ended
December 31,
2018 | |
FROM OPERATIONS | | | | | | | | |
Net investment income | | $ | 6,809,543 | | | $ | 5,327,810 | |
Net realized gains from investment transactions | | | 5,566,998 | | | | 4,791,342 | |
Net change in unrealized appreciation (depreciation) on investments | | | 15,701,342 | | | | (8,720,320 | ) |
Net increase in net assets resulting from operations | | | 28,077,883 | | | | 1,398,832 | |
| | | | | | | | | |
FROM DISTRIBUTIONS TO SHAREHOLDERS (Note 1) | | | (12,384,326 | ) | | | (10,116,647 | ) |
| | | | | | | | | |
FROM CAPITAL SHARE TRANSACTIONS | | | | | | | | |
Proceeds from shares sold | | | 114,713,938 | | | | 101,683,387 | |
Reinvestment of distributions to shareholders | | | 11,201,957 | | | | 9,080,604 | |
Payments for shares redeemed | | | (70,474,950 | ) | | | (85,564,883 | ) |
Net increase in net assets from capital share transactions | | | 55,440,945 | | | | 25,199,108 | |
| | | | | | | | | |
TOTAL INCREASE IN NET ASSETS | | | 71,134,502 | | | | 16,481,293 | |
| | | | | | | | | |
NET ASSETS | | | | | | | | |
Beginning of year | | | 323,715,680 | | | | 307,234,387 | |
End of year | | $ | 394,850,182 | | | $ | 323,715,680 | |
| | | | | | | | | |
SUMMARY OF CAPITAL SHARE ACTIVITY | | | | | | | | |
Shares sold | | | 9,946,278 | | | | 8,953,434 | |
Shares issued in reinvestment of distributions to shareholders | | | 966,855 | | | | 809,829 | |
Shares redeemed | | | (6,129,550 | ) | | | (7,525,406 | ) |
Net increase in shares outstanding | | | 4,783,583 | | | | 2,237,857 | |
Shares outstanding, beginning of year | | | 29,144,875 | | | | 26,907,018 | |
Shares outstanding, end of year | | | 33,928,458 | | | | 29,144,875 | |
See accompanying notes to financial statements. |
54
Ave Maria Value Fund
FINANCIAL HIGHLIGHTS
Per Share Data for a Share Outstanding Throughout Each Year
| | Year
Ended
December 31,
2019 | | | Year
Ended
December 31,
2018 | | | Year
Ended
December 31,
2017 | | | Year
Ended
December 31,
2016 | | | Year
Ended
December 31,
2015 | |
Net asset value at beginning of year | | $ | 17.19 | | | $ | 20.88 | | | $ | 19.12 | | | $ | 16.42 | | | $ | 19.97 | |
| | | | | | | | | | | | | | | | | | | | | |
Income (loss) from investment operations: | | | | | | | | | | | | | | | | | | | | |
Net investment income (loss) | | | 0.01 | | | | (0.03 | ) | | | (0.06 | ) | | | (0.03 | ) | | | 0.01 | |
Net realized and unrealized gains (losses) on investments | | | 3.52 | | | | (1.81 | ) | | | 3.46 | | | | 2.73 | | | | (3.54 | ) |
Total from investment operations | | | 3.53 | | | | (1.84 | ) | | | 3.40 | | | | 2.70 | | | | (3.53 | ) |
| | | | | | | | | | | | | | | | | | | | | |
Less distributions: | | | | | | | | | | | | | | | | | | | | |
From net investment income | | | (0.01 | ) | | | — | | | | — | | | | — | | | | (0.01 | ) |
From net realized gains on investments | | | (1.03 | ) | | | (1.85 | ) | | | (1.64 | ) | | | — | | | | (0.01 | ) |
Total distributions | | | (1.04 | ) | | | (1.85 | ) | | | (1.64 | ) | | | — | | | | (0.02 | ) |
| | | | | | | | | | | | | | | | | | | | | |
Net asset value at end of year | | $ | 19.68 | | | $ | 17.19 | | | $ | 20.88 | | | $ | 19.12 | | | $ | 16.42 | |
| | | | | | | | | | | | | | | | | | | | | |
Total return (a) | | | 20.5 | % | | | (8.8 | %) | | | 17.7 | % | | | 16.4 | % | | | (17.7 | %) |
| | | | | | | | | | | | | | | | | | | | | |
Ratios/Supplementary Data: | | | | | | | | | | | | | | | | | | | | |
Net assets at end of year (000’s) | | $ | 247,743 | | | $ | 211,481 | | | $ | 249,892 | | | $ | 224,593 | | | $ | 211,879 | |
| | | | | | | | | | | | | | | | | | | | | |
Ratio of total expenses to average net assets | | | 1.11 | % | | | 1.18 | % | | | 1.19 | % | | | 1.20 | % | | | 1.18 | % |
| | | | | | | | | | | | | | | | | | | | | |
Ratio of net investment income (loss) to average net assets | | | 0.04 | % | | | (0.13 | %) | | | (0.32 | %) | | | (0.15 | %) | | | 0.06 | % |
| | | | | | | | | | | | | | | | | | | | | |
Portfolio turnover rate | | | 40 | % | | | 43 | % | | | 40 | % | | | 47 | % | | | 63 | % |
(a) | Total return is a measure of the change in value of an investment in the Fund over the period covered, which assumes any dividends or capital gains distributions are reinvested in shares of the Fund. The returns shown do not reflect the deduction of taxes a shareholder would pay on Fund distributions or the redemption of Fund shares. |
See accompanying notes to financial statements. |
55
Ave Maria Growth Fund
Financial Highlights
Per Share Data for a Share Outstanding Throughout Each Year
| | Year
Ended
December 31,
2019 | | | Year
Ended
December 31,
2018 | | | Year
Ended
December 31,
2017 | | | Year
Ended
December 31,
2016 | | | Year
Ended
December 31,
2015 | |
Net asset value at beginning of year | | $ | 28.19 | | | $ | 30.80 | | | $ | 26.44 | | | $ | 25.02 | | | $ | 28.24 | |
| | | | | | | | | | | | | | | | | | | | | |
Income (loss) from investment operations: | | | | | | | | | | | | | | | | | | | | |
Net investment income | | | 0.00 | (a) | | | 0.06 | | | | 0.03 | | | | 0.02 | | | | 0.07 | |
Net realized and unrealized gains (losses) on investments | | | 10.45 | | | | (0.63 | ) | | | 7.22 | | | | 3.01 | | | | (0.81 | ) |
Total from investment operations | | | 10.45 | | | | (0.57 | ) | | | 7.25 | | | | 3.03 | | | | (0.74 | ) |
| | | | | | | | | | | | | | | | | | | | | |
Less distributions: | | | | | | | | | | | | | | | | | | | | |
From net investment income | | | (0.00 | )(a) | | | (0.06 | ) | | | (0.03 | ) | | | (0.02 | ) | | | (0.07 | ) |
From net realized gains on investments | | | (0.64 | ) | | | (1.98 | ) | | | (2.86 | ) | | | (1.59 | ) | | | (2.41 | ) |
Total distributions | | | (0.64 | ) | | | (2.04 | ) | | | (2.89 | ) | | �� | (1.61 | ) | | | (2.48 | ) |
| | | | | | | | | | | | | | | | | | | | | |
Net asset value at end of year | | $ | 38.00 | | | $ | 28.19 | | | $ | 30.80 | | | $ | 26.44 | | | $ | 25.02 | |
| | | | | | | | | | | | | | | | | | | | | |
Total return (b) | | | 37.1 | % | | | (1.8 | %) | | | 27.4 | % | | | 12.1 | % | | | (2.7 | %) |
| | | | | | | | | | | | | | | | | | | | | |
Ratios/Supplementary Data: | | | | | | | | | | | | | | | | | | | | |
Net assets at end of year (000’s) | | $ | 854,764 | | | $ | 577,806 | | | $ | 482,515 | | | $ | 351,085 | | | $ | 300,119 | |
| | | | | | | | | | | | | | | | | | | | | |
Ratio of total expenses to average net assets | | | 0.94 | % | | | 0.95 | % | | | 1.08 | % | | | 1.17 | % | | | 1.17 | % |
| | | | | | | | | | | | | | | | | | | | | |
Ratio of net investment income to average net assets | | | 0.00 | %(c) | | | 0.19 | % | | | 0.10 | % | | | 0.09 | % | | | 0.24 | % |
| | | | | | | | | | | | | | | | | | | | | |
Portfolio turnover rate | | | 15 | % | | | 33 | % | | | 26 | % | | | 29 | % | | | 32 | % |
(a) | Amount rounds to less than $0.01 per share. |
(b) | Total return is a measure of the change in value of an investment in the Fund over the period covered, which assumes any dividends or capital gains distributions are reinvested in shares of the Fund. The returns shown do not reflect the deduction of taxes a shareholder would pay on Fund distributions or the redemption of Fund shares. |
(c) | Percentage rounds to less than 0.01%. |
See accompanying notes to financial statements. |
56
Ave Maria Rising Dividend Fund
Financial Highlights
Per Share Data for a Share Outstanding Throughout Each Year
| | Year
Ended
December 31,
2019 | | | Year
Ended
December 31,
2018 | | | Year
Ended
December 31,
2017 | | | Year
Ended
December 31,
2016 | | | Year
Ended
December 31,
2015 | |
Net asset value at beginning of year | | $ | 15.83 | | | $ | 18.44 | | | $ | 16.79 | | | $ | 15.58 | | | $ | 17.72 | |
| | | | | | | | | | | | | | | | | | | | | |
Income (loss) from investment operations: | | | | | | | | | | | | | | | | | | | | |
Net investment income | | | 0.23 | | | | 0.24 | | | | 0.20 | | | | 0.27 | | | | 0.24 | |
Net realized and unrealized gains (losses) on investments | | | 4.12 | | | | (1.13 | ) | | | 2.62 | | | | 2.11 | | | | (1.27 | ) |
Total from investment operations | | | 4.35 | | | | (0.89 | ) | | | 2.82 | | | | 2.38 | | | | (1.03 | ) |
| | | | | | | | | | | | | | | | | | | | | |
Less distributions: | | | | | | | | | | | | | | | | | | | | |
From net investment income | | | (0.23 | ) | | | (0.25 | ) | | | (0.20 | ) | | | (0.28 | ) | | | (0.23 | ) |
From net realized gains on investments | | | (1.27 | ) | | | (1.47 | ) | | | (0.97 | ) | | | (0.89 | ) | | | (0.88 | ) |
Total distributions | | | (1.50 | ) | | | (1.72 | ) | | | (1.17 | ) | | | (1.17 | ) | | | (1.11 | ) |
| | | | | | | | | | | | | | | | | | | | | |
Net asset value at end of year | | $ | 18.68 | | | $ | 15.83 | | | $ | 18.44 | | | $ | 16.79 | | | $ | 15.58 | |
| | | | | | | | | | | | | | | | | | | | | |
Total return (a) | | | 27.6 | % | | | (4.8 | %) | | | 16.8 | % | | | 15.3 | % | | | (5.9 | %) |
| | | | | | | | | | | | | | | | | | | | | |
Ratios/Supplementary Data: | | | | | | | | | | | | | | | | | | | | |
Net assets at end of year (000’s) | | $ | 953,085 | | | $ | 780,811 | | | $ | 970,109 | | | $ | 828,649 | | | $ | 750,890 | |
| | | | | | | | | | | | | | | | | | | | | |
Ratio of total expenses to average net assets | | | 0.93 | % | | | 0.93 | % | | | 0.92 | % | | | 0.92 | % | | | 0.92 | % |
| | | | | | | | | | | | | | | | | | | | | |
Ratio of net investment income to average net assets | | | 1.23 | % | | | 1.25 | % | | | 1.12 | % | | | 1.61 | % | | | 1.38 | % |
| | | | | | | | | | | | | | | | | | | | | |
Portfolio turnover rate | | | 30 | % | | | 31 | % | | | 26 | % | | | 24 | % | | | 35 | % |
(a) | Total return is a measure of the change in value of an investment in the Fund over the period covered, which assumes any dividends or capital gains distributions are reinvested in shares of the Fund. The returns shown do not reflect the deduction of taxes a shareholder would pay on Fund distributions or the redemption of Fund shares. |
See accompanying notes to financial statements. |
57
Ave Maria World Equity Fund
Financial Highlights
Per Share Data for a Share Outstanding Throughout Each Year
| | Year
Ended
December 31,
2019 | | | Year
Ended
December 31,
2018 | | | Year
Ended
December 31,
2017 | | | Year
Ended
December 31,
2016 | | | Year
Ended
December 31,
2015 | |
Net asset value at beginning of year | | $ | 13.10 | | | $ | 15.08 | | | $ | 13.18 | | | $ | 12.36 | | | $ | 13.22 | |
| | | | | | | | | | | | | | | | | | | | | |
Income (loss) from investment operations: | | | | | | | | | | | | | | | | | | | | |
Net investment income | | | 0.11 | | | | 0.15 | | | | 0.07 | | | | 0.06 | | | | 0.07 | |
Net realized and unrealized gains (losses) on investments | | | 3.51 | | | | (1.49 | ) | | | 2.29 | | | | 1.01 | | | | (0.70 | ) |
Total from investment operations | | | 3.62 | | | | (1.34 | ) | | | 2.36 | | | | 1.07 | | | | (0.63 | ) |
| | | | | | | | | | | | | | | | | | | | | |
Less distributions: | | | | | | | | | | | | | | | | | | | | |
From net investment income | | | (0.11 | ) | | | (0.15 | ) | | | (0.07 | ) | | | (0.06 | ) | | | (0.07 | ) |
From net realized gains on investments | | | (0.62 | ) | | | (0.49 | ) | | | (0.39 | ) | | | (0.19 | ) | | | (0.16 | ) |
Total distributions | | | (0.73 | ) | | | (0.64 | ) | | | (0.46 | ) | | | (0.25 | ) | | | (0.23 | ) |
| | | | | | | | | | | | | | | | | | | | | |
Net asset value at end of year | | $ | 15.99 | | | $ | 13.10 | | | $ | 15.08 | | | $ | 13.18 | | | $ | 12.36 | |
| | | | | | | | | | | | | | | | | | | | | |
Total return (a) | | | 27.7 | % | | | (8.9 | %) | | | 17.9 | % | | | 8.7 | % | | | (4.8 | %) |
| | | | | | | | | | | | | | | | | | | | | |
Ratios/Supplementary Data: | | | | | | | | | | | | | | | | | | | | |
Net assets at end of year (000’s) | | $ | 73,902 | | | $ | 57,044 | | | $ | 62,170 | | | $ | 46,030 | | | $ | 41,199 | |
| | | | | | | | | | | | | | | | | | | | | |
Ratio of total expenses to average net assets | | | 1.29 | % | | | 1.34 | % | | | 1.41 | % | | | 1.45 | % | | | 1.50 | % |
| | | | | | | | | | | | | | | | | | | | | |
Ratio of net expenses to average net assets (b) | | | 1.25 | % | | | 1.25 | % | | | 1.25 | % | | | 1.33 | % | | | 1.50 | % |
| | | | | | | | | | | | | | | | | | | | | |
Ratio of net investment income to average net assets (b) | | | 0.77 | % | | | 0.98 | % | | | 0.50 | % | | | 0.50 | % | | | 0.51 | % |
| | | | | | | | | | | | | | | | | | | | | |
Portfolio turnover rate | | | 37 | % | | | 33 | % | | | 29 | % | | | 42 | % | | | 35 | % |
(a) | Total return is a measure of the change in value of an investment in the Fund over the period covered, which assumes any dividends or capital gains distributions are reinvested in shares of the Fund. The returns shown do not reflect the deduction of taxes a shareholder would pay on Fund distributions or the redemption of Fund shares. |
(b) | Ratio was determined after advisory fee reductions (Note 2). |
See accompanying notes to financial statements. |
58
Ave Maria Bond Fund
Financial Highlights
Per Share Data for a Share Outstanding Throughout Each Year
| | Year
Ended
December 31,
2019 | | | Year
Ended
December 31,
2018 | | | Year
Ended
December 31,
2017 | | | Year
Ended
December 31,
2016 | | | Year
Ended
December 31,
2015 | |
Net asset value at beginning of year | | $ | 11.11 | | | $ | 11.42 | | | $ | 11.19 | | | $ | 11.02 | | | $ | 11.15 | |
| | | | | | | | | | | | | | | | | | | | | |
Income (loss) from investment operations: | | | | | | | | | | | | | | | | | | | | |
Net investment income | | | 0.22 | | | | 0.19 | | | | 0.17 | | | | 0.15 | | | | 0.14 | |
Net realized and unrealized gains (losses) on investments | | | 0.70 | | | | (0.14 | ) | | | 0.30 | | | | 0.35 | | | | (0.06 | ) |
Total from investment operations | | | 0.92 | | | | 0.05 | | | | 0.47 | | | | 0.50 | | | | 0.08 | |
| | | | | | | | | | | | | | | | | | | | | |
Less distributions: | | | | | | | | | | | | | | | | | | | | |
From net investment income | | | (0.22 | ) | | | (0.19 | ) | | | (0.17 | ) | | | (0.15 | ) | | | (0.14 | ) |
From net realized gains on investments | | | (0.17 | ) | | | (0.17 | ) | | | (0.07 | ) | | | (0.18 | ) | | | (0.07 | ) |
Total distributions | | | (0.39 | ) | | | (0.36 | ) | | | (0.24 | ) | | | (0.33 | ) | | | (0.21 | ) |
| | | | | | | | | | | | | | | | | | | | | |
Net asset value at end of year | | $ | 11.64 | | | $ | 11.11 | | | $ | 11.42 | | | $ | 11.19 | | | $ | 11.02 | |
| | | | | | | | | | | | | | | | | | | | | |
Total return (a) | | | 8.3 | % | | | 0.4 | % | | | 4.2 | % | | | 4.5 | % | | | 0.7 | % |
| | | | | | | | | | | | | | | | | | | | | |
Ratios/Supplementary Data: | | | | | | | | | | | | | | | | | | | | |
Net assets at end of year (000’s) | | $ | 394,850 | | | $ | 323,716 | | | $ | 307,234 | | | $ | 248,971 | | | $ | 223,842 | |
| | | | | | | | | | | | | | | | | | | | | |
Ratio of total expenses to average net assets | | | 0.49 | % | | | 0.50 | % | | | 0.50 | % | | | 0.50 | % | | | 0.51 | % |
| | | | | | | | | | | | | | | | | | | | | |
Ratio of net investment income to average net assets | | | 1.91 | % | | | 1.68 | % | | | 1.47 | % | | | 1.34 | % | | | 1.30 | % |
| | | | | | | | | | | | | | | | | | | | | |
Portfolio turnover rate | | | 31 | % | | | 26 | % | | | 19 | % | | | 21 | % | | | 25 | % |
(a) | Total return is a measure of the change in value of an investment in the Fund over the period covered, which assumes any dividends or capital gains distributions are reinvested in shares of the Fund. The returns shown do not reflect the deduction of taxes a shareholder would pay on Fund distributions or the redemption of Fund shares. |
See accompanying notes to financial statements. |
59
AVE MARIA MUTUAL FUNDS
Notes to Financial Statements
December 31, 2019
1. Organization and Significant Accounting Policies
The Ave Maria Value Fund, the Ave Maria Growth Fund, the Ave Maria Rising Dividend Fund, the Ave Maria World Equity Fund and the Ave Maria Bond Fund (individually, a “Fund” and collectively, the “Funds”) are each a diversified series of the Schwartz Investment Trust (the “Trust”), an open-end management investment company registered under the Investment Company Act of 1940, as amended (the “1940 Act”), and established as an Ohio business trust under a Declaration of Trust dated August 31, 1992.
The investment objective of the Ave Maria Value Fund is to seek long-term capital appreciation from equity investments in companies that do not violate core values and teachings of the Roman Catholic Church. The investment objective of the Ave Maria Growth Fund is to seek long-term capital appreciation, using the growth style, from equity investments in companies that do not violate core values and teachings of the Roman Catholic Church. The investment objective of the Ave Maria Rising Dividend Fund is to provide increasing dividend income over time, long-term growth of capital, and a reasonable level of current income from investments in dividend-paying common stocks of companies that do not violate core values and teachings of the Roman Catholic Church. The investment objective of the Ave Maria World Equity Fund is to seek long-term capital appreciation from equity investments in U.S. and non-U.S. companies that do not violate core values and teachings of the Roman Catholic Church. The investment objective of the Ave Maria Bond Fund is to seek preservation of principal with a reasonable level of current income in corporate debt and equity securities that do not violate core values and teachings of the Roman Catholic Church. See the Funds’ Prospectus for information regarding the investment strategies of each Fund.
Shares of each Fund are sold at net asset value (“NAV”). To calculate the NAV, a Fund’s assets are valued and totaled, liabilities are subtracted, and the balance is divided by the number of shares outstanding. The offering price and redemption price per share are equal to the NAV per share for each Fund.
The Funds follow accounting and reporting guidance under Financial Accounting Standards Board (“FASB”) Accounting Standards Codification Topic 946, “Financial Services – Investment Companies.” The following is a summary of significant accounting policies followed by the Funds. These policies are in conformity with accounting principles generally accepted in the United States of America (“GAAP”).
New accounting pronouncement – In March 2017, FASB issued Accounting Standards Update No. 2017-08 (“ASU 2017-08”), “Receivables – Nonrefundable Fees and Other Costs (Subtopic 310-20): Premium Amortization on Purchased Callable Debt Securities.” ASU 2017-08 shortens the amortization period for certain callable debt securities, held at a premium, to be amortized to the earliest call date. ASU 2017-08 does not require an accounting change for securities held at a discount, which continue to accrete to
60
AVE MARIA MUTUAL FUNDS
NOTES TO FINANCIAL STATEMENTS
(Continued)
maturity. ASU 2017-08 is effective for fiscal years and interim periods within those fiscal years beginning after December 15, 2018. The Funds are complying with ASU 2017-08 and the impact is not deemed to be material to the Funds.
(a) Valuation of investments – Securities which are traded on stock exchanges are valued at the closing sales price as of the close of the regular session of trading on the New York Stock Exchange on the day the securities are being valued, or, if not traded on a particular day, at the closing bid price. Securities which are quoted by NASDAQ are valued at the NASDAQ Official Closing Price or, if an Official Closing Price is not available, at the most recently quoted bid price. Securities traded in the over-the-counter market are valued at the last reported sales price or, if there is no reported sale on the valuation date, at the most recently quoted bid price. Securities which are traded both in the over-the-counter market and on a stock exchange are valued according to the broadest and most representative market. Fixed income securities are generally valued using prices provided by an independent pricing service. The independent pricing service uses information with respect to transactions in bonds, quotations from bond dealers, market transactions in comparable securities and various relationships between securities in determining these prices. Investments in shares of other open-end investment companies are valued at their NAV as reported by such companies. When using quoted prices and when the market for the securities are considered active, the securities will be classified as Level 1 within the fair value hierarchy (see below). Securities for which market quotations are not readily available are valued at their fair value as determined in good faith in accordance with consistently applied procedures established by and under the general supervision of the Board of Trustees, and will be classified as Level 2 or 3 within the fair value hierarchy, depending on the inputs used. Fair value pricing may be used, for example, in situations where (i) a security is so thinly traded that there have been no transactions for that stock over an extended period of time; (ii) the exchange on which the security is principally traded closes early; or (iii) trading of the security is halted during the day and does not resume prior to a Fund’s NAV calculation. A security’s “fair value” price may differ from the price next available for that security using the Funds’ normal pricing procedures.
GAAP establishes a single authoritative definition of fair value, sets out a framework for measuring fair value and requires additional disclosures about fair value measurements.
Various inputs are used in determining the value of each Fund’s investments. These inputs are summarized in the three broad levels listed below:
| | ● | Level 1 – quoted prices in active markets for identical securities |
| | ● | Level 2 – other significant observable inputs |
| | ● | Level 3 – significant unobservable inputs |
61
AVE MARIA MUTUAL FUNDS
NOTES TO FINANCIAL STATEMENTS
(Continued)
U.S. Treasury Obligations and Corporate Bonds held by the Ave Maria Bond Fund are classified as Level 2 since the values for such securities are based on prices provided by an independent pricing service that utilizes various “other significant observable inputs” including bid and ask quotations, prices of similar securities and interest rates, among other factors.
The inputs or methodology used for valuing securities are not necessarily an indication of the risks associated with investing in those securities. The inputs used to measure fair value may fall into different levels of the fair value hierarchy. In such cases, for disclosure purposes, the level in the fair value hierarchy within which the fair value measurement falls in its entirety is determined based on the lowest level input that is significant to the fair value measurement.
The following is a summary of the inputs used to value the Funds’ investments, by security type, as of December 31, 2019:
Ave Maria Value Fund | | Level 1 | | | Level 2 | | | Level 3 | | | Total | |
Common Stocks | | $ | 210,579,999 | | | $ | — | | | $ | — | | | $ | 210,579,999 | |
Money Market Funds | | | 37,675,386 | | | | — | | | | — | | | | 37,675,386 | |
Total | | $ | 248,255,385 | | | $ | — | | | $ | — | | | $ | 248,255,385 | |
Ave Maria Growth Fund | | Level 1 | | | Level 2 | | | Level 3 | | | Total | |
Common Stocks | | $ | 828,416,474 | | | $ | — | | | $ | — | | | $ | 828,416,474 | |
Money Market Funds | | | 26,498,248 | | | | — | | | | — | | | | 26,498,248 | |
Total | | $ | 854,914,722 | | | $ | — | | | $ | — | | | $ | 854,914,722 | |
Ave Maria Rising Dividend Fund | | Level 1 | | | Level 2 | | | Level 3 | | | Total | |
Common Stocks | | $ | 916,289,450 | | | $ | — | | | $ | — | | | $ | 916,289,450 | |
Money Market Funds | | | 37,481,571 | | | | — | | | | — | | | | 37,481,571 | |
Total | | $ | 953,771,021 | | | $ | — | | | $ | — | | | $ | 953,771,021 | |
Ave Maria World Equity Fund | | Level 1 | | | Level 2 | | | Level 3 | | | Total | |
Common Stocks | | $ | 70,856,054 | | | $ | — | | | $ | — | | | $ | 70,856,054 | |
Money Market Funds | | | 3,090,432 | | | | — | | | | — | | | | 3,090,432 | |
Total | | $ | 73,946,486 | | | $ | — | | | $ | — | | | $ | 73,946,486 | |
62
AVE MARIA MUTUAL FUNDS
NOTES TO FINANCIAL STATEMENTS
(Continued)
Ave Maria Bond Fund | | Level 1 | | | Level 2 | | | Level 3 | | | Total | |
U.S. Treasury Obligations | | $ | — | | | $ | 136,089,589 | | | $ | — | | | $ | 136,089,589 | |
Corporate Bonds | | | — | | | | 160,165,264 | | | | — | | | | 160,165,264 | |
Common Stocks | | | 77,973,629 | | | | — | | | | — | | | | 77,973,629 | |
Money Market Funds | | | 19,475,197 | | | | — | | | | — | | | | 19,475,197 | |
Total | | $ | 97,448,826 | | | $ | 296,254,853 | | | $ | — | | | $ | 393,703,679 | |
Refer to each Fund’s Schedule of Investments for a listing of the securities by security type and sector or industry type. There were no Level 3 securities or derivative instruments held by the Funds as of or during the year ended December 31, 2019.
(b) Income taxes – Each Fund has qualified and intends to continue to qualify as a regulated investment company under the Internal Revenue Code of 1986, as amended (the “Code”). Qualification generally will relieve each Fund of liability for federal income taxes to the extent 100% of its net investment income and net realized capital gains are distributed in accordance with the Code.
In order to avoid imposition of the excise tax applicable to regulated investment companies, it is also each Fund’s intention to declare as dividends in each calendar year at least 98% of its net investment income and 98.2% of its net realized capital gains plus undistributed amounts from prior years.
The following information is computed on a tax basis for each item as of December 31, 2019:
| | Ave Maria
Value Fund | | | Ave Maria
Growth
Fund | | | Ave Maria
Rising
Dividend Fund | | | Ave Maria
World
Equity Fund | | | Ave Maria
Bond Fund | |
Federal income tax cost | | $ | 192,690,423 | | | $ | 566,375,398 | | | $ | 729,672,181 | | | $ | 58,173,066 | | | $ | 375,990,380 | |
Gross unrealized appreciation | | $ | 57,813,884 | | | $ | 290,190,417 | | | $ | 228,889,350 | | | $ | 16,208,695 | | | $ | 18,484,428 | |
Gross unrealized depreciation | | | (2,248,922 | ) | | | (1,651,093 | ) | | | (4,790,510 | ) | | | (435,275 | ) | | | (771,129 | ) |
Net unrealized appreciation | | | 55,564,962 | | | | 288,539,324 | | | | 224,098,840 | | | | 15,773,420 | | | | 17,713,299 | |
Accumulated earnings | | $ | 55,564,962 | | | $ | 288,539,324 | | | $ | 224,098,840 | | | $ | 15,773,420 | | | $ | 17,713,299 | |
The difference between the federal income tax cost of portfolio investments and the financial statement cost of portfolio investments for the Ave Maria World Equity Fund is due to certain timing differences in the recognition of capital gains and losses under income tax regulations and GAAP. These “book/tax” differences are temporary in nature and are due to the tax deferral of losses on wash sales. There is no difference between the federal income tax cost and the financial statement cost of
63
AVE MARIA MUTUAL FUNDS
NOTES TO FINANCIAL STATEMENTS
(Continued)
portfolio investments for the Ave Maria Value Fund, the Ave Maria Growth Fund, the Ave Maria Rising Dividend Fund and the Ave Maria Bond Fund as of December 31, 2019.
During the year ended December 31, 2019, the following reclassifications were made as a result of permanent differences between the financial statements and income tax reporting requirements:
| | Increase
Accumulated
Earnings | | | Decrease
in Paid-in
Capital | |
Ave Maria Value Fund | | $ | 6,615 | | | $ | (6,615 | ) |
Ave Maria Growth Fund | | | 2,814 | | | | (2,814 | ) |
Ave Maria Rising Dividend Fund | | | 5,058 | | | | (5,058 | ) |
Ave Maria World Equity Fund | | | 451 | | | | (451 | ) |
Ave Maria Bond Fund | | | 5,280 | | | | (5,280 | ) |
The Funds recognize the tax benefits or expenses of uncertain tax positions only when the position is “more-likely-than-not” to be sustained assuming examination by tax authorities. Management has reviewed the tax positions taken on federal income tax returns for all open tax years (generally, three years) and has concluded that no provision for unrecognized tax benefits or expenses is required in these financial statements.
(c) Investment transactions and investment income – Investment transactions are accounted for on the trade date. Dividend income is recorded on the ex-dividend date. Non-cash dividends included in dividend income, if any, are recorded at the fair market value of the securities received. Interest income is recognized on the accrual basis and includes amortization of premiums and accretion of discounts using the effective yield method. Cost of investments includes amortization of premiums and accretion of discounts. Realized gains and losses on investments sold are determined on a specific identification basis. Withholding taxes on foreign dividends have been recorded in accordance with the Funds’ understanding of the applicable country’s rules and tax rates.
(d) Dividends and distributions – Dividends from net investment income, if any, are declared and paid annually in December for the Ave Maria Value Fund, the Ave Maria Growth Fund and the Ave Maria World Equity Fund. Dividends from net investment income, if any, are declared and paid quarterly for the Ave Maria Rising Dividend Fund and are declared and paid monthly for the Ave Maria Bond Fund. Each Fund expects to distribute any net realized capital gains annually. Dividends
64
AVE MARIA MUTUAL FUNDS
NOTES TO FINANCIAL STATEMENTS
(Continued)
and distributions to shareholders are recorded on the ex-dividend date. The tax character of distributions paid to shareholders during the years ended December 31, 2019 and 2018 was as follows:
Year Ended | | Ordinary
Income | | | Long-Term
Capital Gains | | | Total
Distributions | |
Ave Maria Value Fund: | | | | | | | | | | | | |
December 31, 2019 | | $ | 94,740 | | | $ | 12,330,238 | | | $ | 12,424,978 | |
December 31, 2018 | | $ | — | | | $ | 20,668,673 | | | $ | 20,668,673 | |
Ave Maria Growth Fund: | | | | | | | | | | | | |
December 31, 2019 | | $ | 35,611 | | | $ | 14,237,413 | | | $ | 14,273,024 | |
December 31, 2018 | | $ | 1,081,565 | | | $ | 37,942,956 | | | $ | 39,024,521 | |
Ave Maria Rising Dividend Fund: | | | | | | | | | | | | |
December 31, 2019 | | $ | 10,942,259 | | | $ | 61,071,953 | | | $ | 72,014,212 | |
December 31, 2018 | | $ | 13,973,053 | | | $ | 64,821,269 | | | $ | 78,794,322 | |
Ave Maria World Equity Fund: | | | | | | | | | | | | |
December 31, 2019 | | $ | 504,431 | | | $ | 2,738,202 | | | $ | 3,242,633 | |
December 31, 2018 | | $ | 621,539 | | | $ | 2,053,636 | | | $ | 2,675,175 | |
Ave Maria Bond Fund | | | | | | | | | | | | |
December 31, 2019 | | $ | 7,148,408 | | | $ | 5,230,638 | | | $ | 12,379,046 | |
December 31, 2018 | | $ | 5,325,147 | | | $ | 4,791,500 | | | $ | 10,116,647 | |
(e) Estimates – The preparation of financial statements in conformity with GAAP requires management to make estimates and assumptions that affect the reported amounts of assets and liabilities and disclosure of contingent assets and liabilities as of the date of the financial statements and the reported amounts of revenues and expenses during the reporting period. Actual results could differ from those estimates.
(f) Common expenses – Common expenses of the Trust are allocated among the series of the Trust based on relative net assets of each series or the nature of the services performed and the relative applicability to each series.
2. Investment Advisory Agreements and Transactions with Related Parties
The Chairman and President of the Trust is also the Chairman and Chief Executive Officer of Schwartz Investment Counsel, Inc. (the “Adviser”). Certain other officers of the Trust are officers of the Adviser, or of Ultimus Fund Solutions, LLC (“Ultimus”), the administrative, accounting and transfer agent for the Funds, or of Ultimus Fund Distributors, LLC (the “Distributor”), the Funds’ principal underwriter.
65
AVE MARIA MUTUAL FUNDS
NOTES TO FINANCIAL STATEMENTS
(Continued)
Pursuant to Investment Advisory Agreements between the Trust and the Adviser, the Adviser is responsible for the management of each Fund and provides investment advice along with the necessary personnel, facilities, equipment and certain other services necessary to the operations of the Funds. Effective May 1, 2019, the Adviser receives from the Ave Maria Value Fund a fee, which is accrued daily and paid quarterly, at the annual rate of 0.85% of its average daily net assets. Prior to May 1, 2019, the Adviser received from the Ave Maria Value Fund a fee, which was accrued daily and paid quarterly, at the annual rate of 0.95% of its average daily net assets. The Adviser receives from each of the Ave Maria Growth Fund and the Ave Maria Rising Dividend Fund a fee, which is accrued daily and paid quarterly, at the annual rate of 0.75% of its average daily net assets. The Adviser receives from the Ave Maria World Equity Fund a fee, which is accrued daily and paid quarterly, at the annual rate of 0.95% of its average daily net assets. The Adviser receives from the Ave Maria Bond Fund a fee, which is accrued daily and paid quarterly, at the annual rate of 0.30% of its average daily net assets.
The Adviser has contractually agreed to reduce its advisory fees or reimburse a portion of operating expenses until at least May 1, 2020 so that the ordinary operating expenses of each of the Ave Maria Value Fund, the Ave Maria Growth Fund, the Ave Maria Rising Dividend Fund and the Ave Maria World Equity Fund do not exceed 1.25% per annum of average daily net assets; and so that the ordinary operating expenses of the Ave Maria Bond Fund do not exceed 0.60% per annum of average daily net assets. Accordingly, during the year ended December 31, 2019, the Adviser reduced its investment advisory fees by $24,996 with respect to the Ave Maria World Equity Fund.
Any investment advisory fee reductions or expense reimbursements by the Adviser are subject to repayment by the Funds for a period of three years after such fees and expenses were incurred, provided the Funds are able to effect such repayment and remain in compliance with any undertaking by the Adviser to limit expenses of the Funds. As of December 31, 2019, the Adviser may seek recoupment of investment advisory fee reductions from the Ave Maria World Equity Fund totaling $167,233 no later than the dates as stated below:
Ave Maria World Equity | | | | |
December 31, 2020 | | $ | 84,176 | |
December 31, 2021 | | | 58,061 | |
December 31, 2022 | | | 24,996 | |
Total | | $ | 167,233 | |
66
AVE MARIA MUTUAL FUNDS
NOTES TO FINANCIAL STATEMENTS
(Continued)
The Chief Compliance Officer of the Trust (the “CCO”) is an employee of the Adviser. The Trust pays the Adviser a fee for providing CCO services, of which each Fund pays its proportionate share along with the other series of the Trust. In addition, the Trust reimburses the Adviser for out-of-pocket expenses incurred, if any, for providing these services.
Pursuant to a Mutual Fund Services Agreement between the Trust and Ultimus, Ultimus supplies regulatory and compliance services, calculates the daily NAV per share of each Fund, maintains the financial books and records of the Funds, maintains the records of each shareholder’s account, and processes purchases and redemptions of each Fund’s shares. For the performance of these services, Ultimus receives fees from each Fund computed as a percentage of such Fund’s average daily net assets, subject to a minimum monthly fee.
Pursuant to a Distribution Agreement between the Trust and the Distributor, the Distributor serves as each Fund’s exclusive agent for the distribution of its shares. The Distributor is an affiliate of Ultimus.
Trustees and officers affiliated with the Adviser or Ultimus are not compensated by the Trust for their services. Each Trustee who is not an affiliated person of the Adviser or Ultimus (“Independent Trustee”) received from the Trust an annual retainer of $46,000 (except that such fee is $56,000 for the Lead Independent Trustee/Chairman of the Governance Committee and $50,000 for the Chairman of the Audit Committee), payable quarterly; a fee of $6,000 for attendance at each meeting of the Board of Trustees; plus reimbursement of travel and other expenses incurred in attending meetings. Trustee Emeritus receive one-half of both the annual retainer and fee for attendance at each meeting; plus reimbursement of travel and other expenses incurred in attending meetings. Effective January 1, 2020, each Independent Trustee will receive from the Trust an annual retainer of $53,000 (except that such fee will be $64,500 for the Lead Independent Trustee/Chairman of the Governance Committee and $59,500 for the Chairman of the Audit Committee), payable quarterly; a fee of $6,000 for attendance at each meeting of the Board of Trustees; plus reimbursement of travel and other expenses incurred in attending meetings. Trustee Emeritus will receive one-half of both the annual retainer and fee for attendance at each meeting; plus reimbursement of travel and other expenses incurred in attending meetings. Each Fund pays its proportionate share of the Independent Trustees’ fees and expenses along with the other series of the Trust.
Each member of the Catholic Advisory Board (“CAB”), including Emeritus members, except Lawrence Kudlow, receives an annual retainer of $4,000 (except that such fee is $14,000 for the CAB chairman), payable quarterly; a fee of $3,000 for attendance at each meeting of the CAB; plus reimbursement of travel and other expenses incurred in attending meetings. Each Fund pays its proportionate share of CAB members’ fees and expenses.
67
AVE MARIA MUTUAL FUNDS
NOTES TO FINANCIAL STATEMENTS
(Continued)
3. Investment Transactions
During the year ended December 31, 2019, cost of purchases and proceeds from sales and maturities of investment securities, excluding short-term investments and U.S. government securities, were as follows:
| | Ave Maria
Value Fund | | | Ave Maria
Growth
Fund | | | Ave Maria
Rising
Dividend Fund | | | Ave Maria
World Equity
Fund | | | Ave Maria
Bond Fund | |
Purchases of investment securities | | $ | 82,627,064 | | | $ | 143,982,665 | | | $ | 257,968,286 | | | $ | 24,631,371 | | | $ | 94,708,963 | |
Proceeds from sales and maturities of investment securities | | $ | 95,683,116 | | | $ | 106,913,403 | | | $ | 293,417,092 | | | $ | 23,269,874 | | | $ | 50,537,256 | |
4. Contingencies and Commitments
The Funds indemnify the Trust’s officers and Trustees for certain liabilities that might arise from their performance of their duties to the Funds. Additionally, in the normal course of business, the Funds enter into contracts that contain a variety of representations and warranties and which provide general indemnifications. The Funds’ maximum exposure under these arrangements is unknown, as this would involve future claims that may be made against the Funds that have not yet occurred. However, based on experience, the Funds expect the risk of loss to be remote.
5. Sector Risk
If a Fund has significant investments in the securities of issuers in industries within a particular sector, any development affecting that sector will have a greater impact on the value of the net assets of the Fund than would be the case if the Fund did not have significant investments in that sector. In addition, this may increase the risk of loss of an investment in the Fund and increase the volatility of the Fund’s NAV per share. From time to time, circumstances may affect a particular sector and the companies within such sector. For instance, economic or market factors, regulation or deregulation, and technological or other developments may negatively impact all companies in a particular sector and therefore the value of a Fund’s portfolio will be adversely affected. As of December 31, 2019, the Ave Maria Value Fund and the Ave Maria Growth Fund had 28.8% and 25.3%, respectively, of the value of their net assets invested in stocks within the industrials sector.
68
AVE MARIA MUTUAL FUNDS
NOTES TO FINANCIAL STATEMENTS
(Continued)
6. Subsequent Events
The Funds are required to recognize in the financial statements the effects of all subsequent events that provide additional evidence about conditions that existed as of the date of the Statements of Assets and Liabilities. For non-recognized subsequent events that must be disclosed to keep the financial statements from being misleading, the Funds are required to disclose the nature of the event as well as an estimate of its financial effect, or a statement that such an estimate cannot be made. Management has evaluated subsequent events through the issuance of these financial statements and has noted no such events.
69
AVE MARIA MUTUAL FUNDS
Report of Independent Registered
Public Accounting Firm
To the Shareholders and the Board of Trustees of Schwartz Investment Trust
Opinion on the Financial Statements and Financial Highlights
We have audited the accompanying statements of assets and liabilities of Schwartz Investment Trust (the “Funds”) comprising the Ave Maria Value Fund, Ave Maria Growth Fund, Ave Maria Rising Dividend Fund, Ave Maria World Equity Fund, and Ave Maria Bond Fund, including the schedules of investments, as of December 31, 2019, the related statements of operations for the year then ended, the statements of changes in net assets for each of the two years in the period then ended, the financial highlights for each of the five years in the period then ended, and the related notes. In our opinion, the financial statements and financial highlights present fairly, in all material respects, the financial position of each of the portfolios constituting the Schwartz Investment Trust as of December 31, 2019, and the results of their operations for the year then ended, the changes in their net assets for each of the two years in the period then ended, and the financial highlights for each of the five years in the period then ended, in conformity with accounting principles generally accepted in the United States of America.
Basis for Opinion
These financial statements and financial highlights are the responsibility of the Funds’ management. Our responsibility is to express an opinion on the Funds’ financial statements and financial highlights based on our audits. We are a public accounting firm registered with the Public Company Accounting Oversight Board (United States) (PCAOB) and are required to be independent with respect to the Funds in accordance with the U.S. federal securities laws and the applicable rules and regulations of the Securities and Exchange Commission and the PCAOB.
We conducted our audits in accordance with the standards of the PCAOB. Those standards require that we plan and perform the audit to obtain reasonable assurance about whether the financial statements and financial highlights are free of material misstatement, whether due to error or fraud. The Funds are not required to have, nor were we engaged to perform, an audit of internal control over financial reporting. As part of our audits we are required to obtain an understanding of internal control over financial reporting but not for the purpose of expressing an opinion on the effectiveness of the Funds’ internal control over financial reporting. Accordingly, we express no such opinion.
Our audits included performing procedures to assess the risks of material misstatement of the financial statements and financial highlights, whether due to error or fraud, and performing procedures that respond to those risks. Such procedures included examining, on a test basis, evidence regarding the amounts and disclosures in the financial statements and financial highlights. Our audits also included evaluating the accounting principles used and significant estimates made by management, as well as evaluating the overall
70
AVE MARIA MUTUAL FUNDS
REPORT OF INDEPENDENT REGISTERED
PUBLIC ACCOUNTING FIRM (Continued)
presentation of the financial statements and financial highlights. Our procedures included confirmation of securities owned as of December 31, 2019, by correspondence with the custodian and brokers; when replies were not received from brokers, we performed other auditing procedures. We believe that our audits provide a reasonable basis for our opinion.

Chicago, Illinois
February 18, 2020
We have served as the auditor of one or more Schwartz Investment Trust investment companies since 1993.
71
AVE MARIA MUTUAL FUNDS
Board of Trustees and Executive Officers
(Unaudited)
Overall responsibility for management of the Trust rests with the Board of Trustees. The Trustees serve during the lifetime of the Trust and until its termination, or until death, resignation, retirement or removal. The Trustees, in turn, elect the officers of the Trust to actively supervise its day-to-day operations. The officers have been elected for an annual term. The following are the Trustees and executive officers of the Trust:
Trustee/Officer | Address | Year of
Birth | Position Held
with the Trust | Length of
Time Served |
Interested Trustees: | | | | |
* | George P. Schwartz, CFA | 801 W. Ann Arbor Trail,
Plymouth, MI | 1944 | Chairman of the Board/President/Trustee | Since 1992 |
Independent Trustees: | | | | |
| | Louis C. Bosco, Jr. | 801 W. Ann Arbor Trail,
Plymouth, MI | 1936 | Trustee Emeritus | Since 2008 |
| | Donald J. Dawson, Jr. | 801 W. Ann Arbor Trail,
Plymouth, MI | 1947 | Trustee | Since 1993 |
| | Joseph M. Grace | 801 W. Ann Arbor Trail,
Plymouth, MI | 1936 | Trustee Emeritus | Since 2007 |
| | John J. McHale, Jr. | 801 W. Ann Arbor Trail,
Plymouth, MI | 1949 | Trustee | Since 2014 |
| | Edward J. Miller | 801 W. Ann Arbor Trail,
Plymouth, MI | 1946 | Trustee | Since 2017 |
| | William A. Morrow | 801 W. Ann Arbor Trail
Plymouth, MI | 1947 | Trustee | Since 2018 |
Executive Officers: | | | | |
* | Robert C. Schwartz, CFP | 801 W. Ann Arbor Trail,
Plymouth, MI | 1976 | Vice President and Secretary | Since 2013 |
* | Timothy S. Schwartz, CFA | 5060 Annunciation Circle,
Ave Maria, FL | 1971 | Treasurer | Since 2000 |
* | Cathy M. Stoner, CPA, IACCP | 801 W. Ann Arbor Trail,
Plymouth, MI | 1970 | Chief Compliance Officer | Since 2010 |
* | George P. Schwartz, Robert C. Schwartz, Timothy S. Schwartz and Cathy M. Stoner, as affiliated persons of Schwartz Investment Counsel, Inc., the Funds’ investment adviser, are “interested persons” of the Trust within the meaning of Section 2(a)(19) of the 1940 Act. George P. Schwartz is the father of Robert C. Schwartz and Timothy S. Schwartz. |
72
AVE MARIA MUTUAL FUNDS
BOARD OF TRUSTEES AND EXECUTIVE OFFICERS
(Unaudited) (Continued)
Each Trustee oversees six portfolios of the Trust: the Ave Maria Value Fund, the Ave Maria Growth Fund, the Ave Maria Rising Dividend Fund, the Ave Maria World Equity Fund, the Ave Maria Bond Fund and the Schwartz Value Focused Fund. The principal occupations of the Trustees and executive officers of the Trust during the past five years and public directorships held by the Trustees are set forth below:
George P. Schwartz, CFA is Chairman and Chief Executive Officer of Schwartz Investment Counsel, Inc. and the co-portfolio manager of the Ave Maria Rising Dividend Fund.
Louis C. Bosco, Jr. retired in April 2012. Prior to his retirement, he was a partner in Bosco Development Company (a real estate firm).
Donald J. Dawson, Jr. retired in March 2015. Prior to retirement, he was Chairman of Payroll 1, Inc. (a payroll processing company) from 1986 – 2015.
Joseph M. Grace retired in 1996. Prior to his retirement, he was Senior Vice President of National Bank of Detroit (renamed JPMorgan Chase & Company).
John J. McHale, Jr. is Special Assistant to Commissioner of Major League Baseball since 2015. He was Executive Vice President of Major League Baseball from 2000 – 2015.
Edward J. Miller is Vice Chairman and Director of Detroit Investment Fund since 2001 and Invest Detroit Foundation since 2010 (financiers for redevelopment of Detroit, Michigan).
William A. Morrow retired in 2017. Prior to his retirement, he was Senior Executive Vice President of Crain Communications, Inc. (business media) from 1985 – 2017.
Robert C. Schwartz, CFP is Senior Vice President and Secretary of Schwartz Investment Counsel, Inc. and is the co-portfolio manager of the Ave Maria World Equity Fund.
Timothy S. Schwartz, CFA is President of Schwartz Investment Counsel, Inc. and the lead portfolio manager of the Ave Maria Value Fund.
Cathy M. Stoner, CPA, IACCP is Vice President, Chief Financial Officer, Chief Compliance Officer, and Treasurer of Schwartz Investment Counsel, Inc.
Additional information regarding the Trustees and executive officers of the Trust may be found in the Funds’ Statement of Additional Information and is available without charge upon request by calling (888) 726-9931.
73
AVE MARIA MUTUAL FUNDS
Catholic Advisory Board
(Unaudited)
The Catholic Advisory Board reviews the companies selected by the Adviser to ensure that the companies operate in a way that is consistent with teachings and core values of the Roman Catholic Church. The Catholic Advisory Board evaluates companies using publicly available information, information from the Adviser, and information from shareholders and other sources in making its recommendations. The following are the members of the Catholic Advisory Board:
Member | Address | Year of
Birth | Length of
Time Served |
Robert P. George | 801 W. Ann Arbor Trail, Plymouth, MI | 1955 | Since 2016 |
Dr. Scott Hahn, PhD | 801 W. Ann Arbor Trail, Plymouth, MI | 1957 | Since 2018 |
Lou Holtz | 801 W. Ann Arbor Trail, Plymouth, MI | 1937 | Since 2007 |
Lawrence Kudlow | 801 W. Ann Arbor Trail, Plymouth, MI | 1947 | Since 2005 |
Thomas S. Monaghan | 801 W. Ann Arbor Trail, Plymouth, MI | 1937 | Since 2001 |
Melissa Moschella, PhD | 801 W. Ann Arbor Trail, Plymouth, MI | 1979 | Since 2017 |
Gloria Purvis | 801 W. Ann Arbor Trail, Plymouth, MI | 1969 | Since 2017 |
Fr. John Riccardo, STL | 801 W. Ann Arbor Trail, Plymouth, MI | 1965 | Since 2011 |
Paul R. Roney | 801 W. Ann Arbor Trail, Plymouth, MI | 1957 | Since 2001 |
Lila Rose | 801 W. Ann Arbor Trail, Plymouth, MI | 1988 | Since 2019 |
Robert P. George is a legal scholar, political philosopher, and public intellectual who serves as the McCormick Professor of Jurisprudence at Princeton University.
Dr. Scott Hahn, PhD is a bestselling author and theology professor at Franciscan University since 1990 and holds the Fr. Michael Scanlan Chair of Biblical Theology and the New Evangelization. He is Founder and President of the St. Paul Center for Biblical Theology and Editor-in-Chief of Emmaus Road Publishing.
Lou Holtz is the former football coach at University of Notre Dame among others, ESPN college football analyst, author and motivational speaker.
Lawrence Kudlow is the Assistant to the President for Economic Policy and Director of the National Economic Council. He is also Chief Executive Officer and founder of Kudlow & Co., LLC (an economic research and consulting firm). He was formerly CNBC’s Senior Contributor and radio host of the nationally-syndicated “Larry Kudlow Show.”
Thomas S. Monaghan is Chairman of the Ave Maria Foundation (a non-profit foundation supporting Roman Catholic organizations) and Chancellor of Ave Maria University. Prior to December 1998, he was Chairman and Chief Executive Officer of Domino’s Pizza, Inc.
74
AVE MARIA MUTUAL FUNDS
CATHOLIC ADVISORY BOARD
(Unaudited) (Continued)
Melissa Moschella, PhD is Assistant Professor of Medical Ethics at Columbia University. From August 2013 until June 2017, she was Assistant Professor of Philosophy at The Catholic University of America. She has published articles about moral and political philosophy and ethics in a number of academic publications. She is also a lecturer and recipient of a number of academic honors and fellowships.
Gloria Purvis is creator and host of Eternal World Television Network (EWTN) series “Authentically Free at Last” and host of “Morning Glory” on EWTN Global Catholic Radio.
Fr. John Riccardo, STL is a priest of the Archdiocese of Detroit and Executive Director of ACTS XXIX, an organization committed to helping parishes create a road map for evangelization and discipleship.
Paul R. Roney is Executive Director of the Ave Maria Foundation and President of Domino’s Farms Corporation. Prior to December 1998, he was Treasurer of Domino’s Pizza, Inc.
Lila Rose is Founder and President of “Live Action,” a media and news nonprofit dedicated to ending abortion and inspiring a culture that respects all human life. She is the host of “The Lila Rose Show” podcast and has made numerous media appearances on many major news outlets.
Additional information regarding the Funds’ Catholic Advisory Board members may be found in the Funds’ Statement of Additional Information and is available without charge upon request by calling (888) 726-9331.
75
AVE MARIA MUTUAL FUNDS
About Your Funds’ Expenses
(Unaudited)
We believe it is important for you to understand the impact of costs on your investment. As a shareholder of the Funds, you incur ongoing costs, including management fees and other Fund expenses. The following examples are intended to help you understand your ongoing costs (in dollars) of investing in the Funds and to compare these costs with the ongoing costs of investing in other mutual funds.
A mutual fund’s ongoing costs are expressed as a percentage of its average net assets. This figure is known as the expense ratio. The ongoing costs reflected in the tables below are based on an investment of $1,000 made at the beginning of the most recent semi-annual period (July 1, 2019) and held until the end of the period (December 31, 2019).
The tables that follow illustrate each Fund’s ongoing costs in two ways:
Actual fund return – This section helps you to estimate the actual expenses that you paid over the period. The “Ending Account Value” shown is derived from each Fund’s actual return, and the fourth column shows the dollar amount of operating expenses that would have been paid by an investor who started with $1,000 in the Funds. You may use the information here, together with the amount you invested, to estimate the expenses that you paid over the period.
To do so, simply divide your account value by $1,000 (for example, an $8,600 account value divided by $1,000 = 8.6), then multiply the result by the number given for the Funds under the heading “Expenses Paid During Period.”
Hypothetical 5% return – This section is intended to help you compare each Fund’s ongoing costs with those of other mutual funds. It assumes that each Fund had an annual return of 5% before expenses during the period shown, but that the expense ratio is unchanged. In this case, because the return used is not the Funds’ actual returns, the results do not apply to your investment. The example is useful in making comparisons because the U.S Securities and Exchange Commission (the “SEC”) requires all mutual funds to calculate expenses based on a 5% return. You can assess each Fund’s ongoing costs by comparing this hypothetical example with the hypothetical examples that appear in shareholder reports of other funds.
Note that expenses shown in the table are meant to highlight and help you compare ongoing costs only. The Funds do not charge sales loads or redemption fees.
The calculations assume no shares were bought or sold during the period. Your actual costs may have been higher or lower, depending on the amount of your investment and the timing of any purchases or redemptions.
76
AVE MARIA MUTUAL FUNDS
ABOUT YOUR FUNDS’ EXPENSES
(Unaudited) (Continued)
More information about the Funds’ expenses, including historical annual expense ratios, can be found in this report. For additional information on operating expenses and other shareholder costs, please refer to the Funds’ Prospectus.
| Beginning
Account Value
July 1, 2019 | Ending
Account Value
December 31, 2019 | Net
Expense
Ratio(a) | Expenses
Paid During
Period(b) |
Ave Maria Value Fund |
Based on Actual Fund Return | $1,000.00 | $1,014.10 | 1.07% | $5.43 |
Based on Hypothetical 5% Return (before expenses) | $1,000.00 | $1,019.81 | 1.07% | $5.45 |
| | | | | |
Ave Maria Growth Fund | | | | |
Based on Actual Fund Return | $1,000.00 | $1,098.20 | 0.93% | $4.92 |
Based on Hypothetical 5% Return (before expenses) | $1,000.00 | $1,020.52 | 0.93% | $4.74 |
| | | | | |
Ave Maria Rising Dividend Fund | | | |
Based on Actual Fund Return | $1,000.00 | $1,085.60 | 0.92% | $4.84 |
Based on Hypothetical 5% Return (before expenses) | $1,000.00 | $1,020.57 | 0.92% | $4.69 |
| | | | | |
Ave Maria World Equity Fund | | | |
Based on Actual Fund Return | $1,000.00 | $1,062.50 | 1.25% | $6.50 |
Based on Hypothetical 5% Return (before expenses) | $1,000.00 | $1,018.90 | 1.25% | $6.36 |
| | | | | |
Ave Maria Bond Fund | | | | |
Based on Actual Fund Return | $1,000.00 | $1,029.60 | 0.48% | $2.46 |
Based on Hypothetical 5% Return (before expenses) | $1,000.00 | $1,022.79 | 0.48% | $2.45 |
(a) | Annualized, based on each Fund’s most recent one-half year expenses. |
(b) | Expenses are equal to each Fund’s annualized net expense ratio multiplied by the average account value over the period, multiplied by 184/365 (to reflect the one-half year period). |
77
AVE MARIA MUTUAL FUNDS
Federal Tax Information
(Unaudited)
For the fiscal year ended December 31, 2019, the Ave Maria Value Fund, the Ave Maria Growth Fund, the Ave Maria Rising Dividend Fund, the Ave Maria World Equity Fund and the Ave Maria Bond Fund designated $12,330,816, $14,238,253, $61,076,176, $2,738,348 and $5,233,278, respectively, as long-term capital gain distributions.
Qualified Dividend Income – The Ave Maria Value Fund, the Ave Maria Growth Fund, the Ave Maria Rising Dividend Fund, the Ave Maria World Equity Fund and the Ave Maria Bond Fund designates 100%, 100%, 100%, 100%, 100% and 28.89%, respectively, of their ordinary income dividends, or up to the maximum amount of such dividends allowable pursuant to the Internal Revenue Code, as qualified dividend income eligible for the reduced tax rate of 15%.
Dividends Received Deduction – Corporate shareholders are generally entitled to take the dividends received deduction on the portion of the Fund’s dividend distributions that qualifies under tax law. For the fiscal year ended December 31, 2019, the percentage of ordinary income dividends qualified for the corporate dividends receivable deduction for the Ave Maria Value Fund, the Ave Maria Growth Fund, the Ave Maria Rising Dividend Fund, the Ave Maria World Equity Fund and the Ave Maria Bond Fund was 100%, 100%, 100%, 97.35% and 21.60%, respectively.
AVE MARIA MUTUAL FUNDS
Other Information
(Unaudited)
A description of the policies and procedures the Funds use to determine how to vote proxies relating to portfolio securities is available without charge upon request by calling toll-free (888) 726-9331, or on the SEC’s website at www.sec.gov. Information regarding how the Funds voted proxies relating to portfolio securities during the most recent 12-month period ended June 30 is also available without charge upon request by calling toll-free (888) 726-9331, or on the SEC’s website at www.sec.gov.
The Trust files a complete listing of portfolio holdings for each of the Funds with the SEC as of the end of the first and third quarters of each fiscal year on Form N-PORT. The filings are available free of charge, upon request, by calling (888) 726-9331. Furthermore, you may obtain a copy of the filings on the SEC’s website at www.sec.gov.
78
As of the end of the period covered by this report, the registrant has adopted a code of ethics that applies to the registrant’s principal executive officer, principal financial officer, principal accounting officer or controller, or persons performing similar functions, regardless of whether these individuals are employed by the registrant or a third party. Pursuant to Item 13(a)(1), a copy of registrant’s code of ethics is filed as an exhibit to this Form N-CSR. During the period covered by this report, the code of ethics has not been amended, and the registrant has not granted any waivers, including implicit waivers, from the provisions of the code of ethics.
| Item 3. | Audit Committee Financial Expert. |
The registrant’s board of trustees has determined that the registrant has an audit committee financial expert serving on its audit committee. The name of the audit committee financial expert is William A. Morrow. Mr. Morrow is “independent” for purposes of this Item.
| Item 4. | Principal Accountant Fees and Services. |
| (a) | Audit Fees. The aggregate fees billed for professional services rendered by the principal accountant for the audit of the registrant’s annual financial statements or for services that are normally provided by the accountant in connection with statutory and regulatory filings or engagements were $148,500 and $144,000 with respect to the registrant’s fiscal years ended December 31, 2019 and 2018, respectively. |
| (b) | Audit-Related Fees. No fees were billed in either of the last two fiscal years for assurance and related services by the principal accountant that are reasonably related to the performance of the audit of the registrant’s financial statements and are not reported under paragraph (a) of this Item. |
| (c) | Tax Fees. The aggregate fees billed for professional services rendered by the principal accountant for tax compliance, tax advice, and tax planning were $19,000 and $18,350 with respect to the registrant’s fiscal years ended December 31, 2019 and 2018, respectively. The services comprising these fees are tax consulting and the preparation of the registrant’s federal income and excise tax returns. |
| (d) | All Other Fees. No fees were billed in either of the last two fiscal years for products and services provided by the principal accountant, other than the services reported in paragraphs (a) through (c) of this Item. |
| (e)(1) | The audit committee has not adopted pre-approval policies and procedures described in paragraph (c)(7) of Rule 2-01 of Regulation S-X. |
| (e)(2) | None of the services described in paragraph (b) through (d) of this Item were approved by the audit committee pursuant to paragraph (c)(7)(i)(C) of Rule 2-01 of Regulation S-X. |
| (f) | Less than 50% of hours expended on the principal accountant’s engagement to audit the registrant’s financial statements for the most recent fiscal year were attributed to work performed by persons other than the principal accountant’s full-time, permanent employees. |
| (g) | During the fiscal years ended December 31, 2019 and 2018, aggregate non-audit fees of $19,000 and $18,350, respectively, were billed by the registrant’s principal accountant for services rendered to the registrant. During the fiscal years ended December 31, 2019 and 2018, $15,000 and $14,000, respectively, were billed by the registrant’s principal accountant for services rendered to the registrant’s investment adviser (not including any sub-adviser whose role is primarily portfolio management and is subcontracted with or overseen by another investment adviser), and any entity controlling, controlled by, or under common control with the adviser that provides ongoing services to the registrant. |
| (h) | The registrant’s audit committee determined that the provision of non-audit services that were rendered to the registrant’s investment adviser (not including any sub-adviser whose role is primarily portfolio management and is subcontracted with or overseen by another investment adviser), and any entity controlling, controlled by, or under common control with the investment adviser that provides ongoing services to the registrant, that were not pre-approved pursuant to paragraph (c)(7)(ii) of Rule 2-01 of Regulation S-X is compatible with maintaining the principal accountant’s independence. |
| Item 5. | Audit Committee of Listed Registrants. |
Not applicable
| Item 6. | Schedule of Investments. |
| (a) | Not applicable [schedule filed with Item 1] |
| Item 7. | Disclosure of Proxy Voting Policies and Procedures for Closed-End Management Investment Companies. |
Not applicable
| Item 8. | Portfolio Managers of Closed-End Management Investment Companies. |
Not applicable
| Item 9. | Purchases of Equity Securities by Closed-End Management Investment Company and Affiliated Purchasers. |
Not applicable
| Item 10. | Submission of Matters to a Vote of Security Holders. |
The registrant’s Nominating and Governance Committee shall review shareholder recommendations to fill vacancies on the registrant’s board of trustees if such recommendations are submitted in writing, addressed to the Committee at the registrant’s offices and meet any minimum qualifications adopted by the Committee. The Committee may adopt, by resolution, a policy regarding its procedures for considering candidates for the board of trustees, including any recommended by shareholders.
| Item 11. | Controls and Procedures. |
(a) Based on their evaluation of the registrant’s disclosure controls and procedures (as defined in Rule 30a-3(c) under the Investment Company Act of 1940) as of a date within 90 days of the filing date of this report, the registrant’s principal executive officer and principal financial officer have concluded that such disclosure controls and procedures are reasonably designed and are operating effectively to ensure that material information relating to the registrant, including its consolidated subsidiaries, is made known to them by others within those entities, particularly during the period in which this report is being prepared, and that the information required in filings on Form N-CSR is recorded, processed, summarized, and reported on a timely basis.
(b) There were no changes in the registrant’s internal control over financial reporting (as defined in Rule 30a-3(d) under the Investment Company Act of 1940) that occurred during the second fiscal quarter of the period covered by this report that have materially affected, or are reasonably likely to materially affect, the registrant’s internal control over financial reporting.
| Item 12. | Disclosure of Securities Lending Activities for Closed-End Management Investment Companies. |
Not applicable
File the exhibits listed below as part of this Form. Letter or number the exhibits in the sequence indicated.
(a)(1) Any code of ethics, or amendment thereto, that is the subject of the disclosure required by Item 2, to the extent that the registrant intends to satisfy the Item 2 requirements through filing of an exhibit: Attached hereto
(a)(2) A separate certification for each principal executive officer and principal financial officer of the registrant as required by Rule 30a-2(a) under the Act (17 CFR 270.30a-2(a)): Attached hereto
(a)(3) Any written solicitation to purchase securities under Rule 23c-1 under the Act (17 CFR 270.23c-1) sent or given during the period covered by the report by or on behalf of the registrant to 10 or more persons: Not applicable
(a)(4) Change in the registrant’s independent public accountants: Not applicable
(b) Certifications required by Rule 30a-2(b) under the Act (17 CFR 270.30a-2(b)): Attached hereto
| Exhibit 99.CODE ETH | Code of Ethics |
| | |
| Exhibit 99.CERT | Certifications required by Rule 30a-2(a) under the Act |
| | |
| Exhibit 99.906CERT | Certifications required by Rule 30a-2(b) under the Act |
SIGNATURES
Pursuant to the requirements of the Securities Exchange Act of 1934 and the Investment Company Act of 1940, the registrant has duly caused this report to be signed on its behalf by the undersigned, thereunto duly authorized.
| (Registrant) | Schwartz Investment Trust | | |
| | | | |
| By (Signature and Title)* | /s/ George P. Schwartz | |
| | | George P. Schwartz, President and Principal Executive Officer |
| | | | |
| Date | February 25, 2020 | | |
| | | | |
| Pursuant to the requirements of the Securities Exchange Act of 1934 and the Investment Company Act of 1940, this report has been signed below by the following persons on behalf of the registrant and in the capacities and on the dates indicated. |
| | | | |
| By (Signature and Title)* | /s/ George P. Schwartz | |
| | | George P. Schwartz, President and Principal Executive Officer |
| | | | |
| Date | February 25, 2020 | | |
| | | | |
| By (Signature and Title)* | /s/ Timothy S. Schwartz | |
| | | Timothy S. Schwartz, Treasurer, Principal Financial Officer and Principal Accounting Officer |
| | | | |
| Date | February 25, 2020 | | |
| * | Print the name and title of each signing officer under his or her signature. |