| OMB APPROVAL |
OMB Number: 3235-0570 Expires: August 31, 2020 Estimated average burden hours per response: 20.6 |
UNITED STATES
SECURITIES AND EXCHANGE COMMISSION
Washington, D.C. 20549
FORM N-CSR
CERTIFIED SHAREHOLDER REPORT OF REGISTERED
MANAGEMENT INVESTMENT COMPANIES
| Investment Company Act file number | 811-07148 | |
| Schwartz Investment Trust |
| (Exact name of registrant as specified in charter) |
| 801 W. Ann Arbor Trail, Suite 244 Plymouth, Michigan | 48170 |
| (Address of principal executive offices) | (Zip code) |
George P. Schwartz
| Schwartz Investment Counsel, Inc. 801 W. Ann Arbor Trail, Plymouth, MI 48170 |
| (Name and address of agent for service) |
| Registrant's telephone number, including area code: | (734) 455-7777 | |
| Date of fiscal year end: | December 31 | |
| | | |
| Date of reporting period: | December 31, 2017 | |
Form N-CSR is to be used by management investment companies to file reports with the Commission not later than 10 days after the transmission to stockholders of any report that is required to be transmitted to stockholders under Rule 30e-1 under the Investment Company Act of 1940 (17 CFR 270.30e-1). The Commission may use the information provided on Form N-CSR in its regulatory, disclosure review, inspection, and policymaking roles.
A registrant is required to disclose the information specified by Form N-CSR, and the Commission will make this information public. A registrant is not required to respond to the collection of information contained in Form N-CSR unless the Form displays a currently valid Office of Management and Budget ("OMB") control number. Please direct comments concerning the accuracy of the information collection burden estimate and any suggestions for reducing the burden to the Secretary, Securities and Exchange Commission, 450 Fifth Street, NW, Washington, DC 20549-0609. The OMB has reviewed this collection of information under the clearance requirements of 44 U.S.C. § 3507.
| Item 1. | Reports to Stockholders. |

Schwartz Value Focused Fund
Shareholder Services c/o Ultimus Fund Solutions, LLC P.O. Box 46707 Cincinnati, OH 45246 (888) 726-0753 | | Investment Adviser Schwartz Investment Counsel, Inc.
801 W. Ann Arbor Trail Suite 244 Plymouth, MI 48170 |
Dear Fellow Shareholders,
Schwartz Value Focused Fund (the “Fund”) was up 13.71% for the year ended December 31, 2017, compared to 21.13% for the benchmark S&P 1500 Index. Unlike 2016, when the Fund outperformed its benchmark by a wide margin, the investment climate in 2017 was tilted heavily in the favor of large-cap companies and growth stocks, as compared to small-caps and value stocks. Among U.S. equity mutual funds tracked by Morningstar, the top performing fund category was large-cap growth, up 27.64%. In contrast, the worst performing fund category was small-cap value, up only 8.56%. Further, in the S&P 500, the best performing sectors were growth-oriented technology, materials, and consumer discretionary. The value-oriented sectors such as consumer staples and energy were laggards. In this environment, our risk-averse, value-oriented holdings hurt our relative performance. The Fund did own several stocks that showed strong price appreciation during the year. The Fund’s five best performing stocks in 2017 were:
Company | Industry | 2017
Performance |
Interactive Brokers Group, Inc. | Investment Brokerage | +76.59% |
Moody’s Corporation | Business & Financial Services | +60.37% |
Brown-Forman Corporation | Consumer Goods | +51.39% |
Texas Pacific Land Trust | Oil/Gas Royalties/Real Estate | +50.64% |
AMETEK, Inc. | Diversified Machinery | +50.30% |
After a strong year of performance in 2016, the Fund’s energy related holdings performed poorly in 2017. Since peaking in January last year, oil and natural gas prices steadily declined throughout the year, due to several factors including increased U.S. shale production, tepid global demand, and moderate weather.
The Fund’s five worst performing stocks in 2017 were:
Company | Industry | 2017
Performance |
Apache Corporation | Oil/Gas Exploration & Production | -32.80% |
Schlumberger Limited | Oil/Gas Equipment and Services | -24.53% |
Noble Energy, Inc. | Oil/Gas Exploration & Production | -23.06% |
Avnet, Inc. | Technology Distributors | -20.42% |
Unico American Corporation | Specialty P&C Insurance | -20.30% |
1
During the second half of 2017 the Fund liquidated its position in Schlumberger Limited due to deteriorating fundamentals, realizing a small loss on the investment. Ubiquiti Networks, Inc. (communications equipment), was also liquidated based upon a reassessment of the company’s corporate governance practices, which we viewed as inadequate. We owned the stock for a few months and realized a 15% gain on the sale. New positions were established in three companies that meet our value investing criteria:
| | ● | American Airlines Group, Inc. (AAL) – is the world’s largest airline based on fleet size and destinations served. The U.S. airline industry has undergone positive fundamental and structural changes during the past decade, owing primarily to industry consolidation. Today, the four largest airlines have about 80% market share in the U.S., whereas 10 years ago it was 50%. This consolidation has resulted in numerous benefits to the airlines such as more rational pricing, increased ancillary revenue, flights with fewer empty seats and generally improved profitability. In our view, American Airlines has the best management in the industry and has produced strong profits and cash flow growth over the past several years. |
| | ● | The Kroger Company (KR) – Founded In 1883, Kroger is one of the oldest and largest grocery store operators in the U.S. with annual sales of $120 billion. The company has strong brand recognition, a loyal customer base, a dominant share in the markets they serve, and top-notch management with a demonstrated track record of creating shareholder value. Kroger’s share price came under pressure last fall, due to competitive concerns surrounding Amazon’s acquisition of Whole Foods. We viewed the sell-off as unwarranted and eagerly bought the depressed shares at 10x earnings. Subsequently, the company reported better than expected results with market-share gains, stable margins, and growth in its digital segment. Since our initial purchase a few months ago the stock is up 40%. |
| | ● | The Madison Square Garden Company (MSG) – owns and operates sports teams, entertainment productions, and various venues. Major holdings include the New York Knicks (NBA), the New York Rangers (NHL), Madison Square Garden arena in NYC, The Forum arena in L.A., and the Rockettes. With a cash-rich balance sheet sporting $1 billion in net cash, and a market cap of only $5 billion, we believe the shares are trading at a significant discount to our sum-of-the-parts valuation, based upon its diverse portfolio of its iconic and irreplaceable assets. |
The S&P 500 Index was up 21.83% in 2017, which was the 9th consecutive year of positive returns for that index, marking one of the longest running bull markets in history. While some commentators are writing the obituary for this bull, we remain generally optimistic. With an improving job market, moderate inflation, accommodative monetary policies globally, along with the recently enacted tax rate cuts, financial conditions appear conducive to robust economic growth, which should lead to rising corporate profits and higher stock prices over the long term. 2018 could be another good year for U.S. equity returns. According to the Wall Street Journal Market Data Group, when the S&P 500 total return exceeds 19% for the year, 68% of the time it rises again the following year. No guarantees!
As always, we believe our low-risk, value-oriented investment approach is a good way to achieve superior long-term investment returns. Despite stock market indices trading at or near all-time highs, the Fund owns many high-quality companies selling well below our estimate of intrinsic value. As such, we believe the Fund is well-positioned entering 2018.
2
The year-end distribution of $2.02 per share consisted solely of long-term capital gains. The net asset value of the Fund ended the year at $26.44 per share.
Thank you for being a shareholder in the Schwartz Value Focused Fund.

| 
|
Timothy S. Schwartz, CFA | George P. Schwartz, CFA |
Lead Portfolio Manager | Co-Portfolio Manager |
3
SCHWARTZ VALUE FOCUSED FUND
PERFORMANCE
(Unaudited)
Comparison of the Change in Value of a $10,000 Investment
in Schwartz Value Focused Fund and the S&P 1500 Index
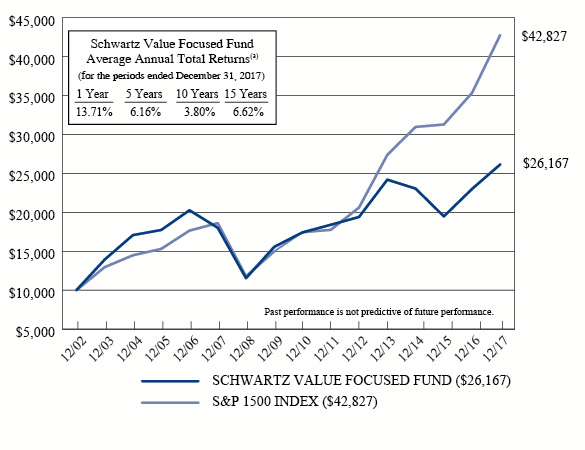
(a) | The returns shown do not reflect the deduction of taxes a shareholder would pay on Fund distributions or the redemption of Fund shares. |
Expense Ratio
Information as of: | Year Ended 12-31-16
(as disclosed in May 1, 2017 prospectus) | Year Ended 12-31-17 |
Gross | 1.82%* | 1.79% |
Net | 1.27%* | 1.25% |
* | Includes Acquired Fund Fees and Expenses. |
This report is for the information of shareholders, but it may also be used as sales literature when preceded or accompanied by a current prospectus, which gives details about charges, expenses, investment objectives and operating policies of the Fund. The Fund is distributed by Ultimus Fund Distributors, LLC.
4
SCHWARTZ VALUE FOCUSED FUND
ANNUAL TOTAL RATES OF RETURN
COMPARISON WITH MAJOR INDICES (Unaudited)
| SCHWARTZ
VALUE
FOCUSED
FUND(a) | S&P 1500
INDEX(b) | VALUE
LINE
COMPOSITE(c) |
1984 | 11.1% | N/A | -8.4% |
1985 | 21.7% | N/A | 20.7% |
1986 | 16.4% | N/A | 5.0% |
1987 | -0.6% | N/A | -10.6% |
1988 | 23.1% | N/A | 15.4% |
1989 | 8.3% | N/A | 11.2% |
1990 | -5.3% | N/A | -24.3% |
1991 | 32.0% | N/A | 27.2% |
1992 | 22.7% | N/A | 7.0% |
1993 | 20.5% | N/A | 10.7% |
1994 | -6.8% | N/A | -6.0% |
1995 | 16.9% | 36.5% | 19.3% |
1996 | 18.3% | 22.4% | 13.4% |
1997 | 28.0% | 32.9% | 21.1% |
1998 | -10.4% | 26.4% | -3.8% |
1999 | -2.5% | 20.3% | -1.4% |
2000 | 9.3% | -7.0% | -8.7% |
2001 | 28.1% | -10.6% | -6.1% |
2002 | -14.9% | -21.3% | -28.6% |
2003 | 39.3% | 29.6% | 37.4% |
2004 | 22.6% | 11.8% | 11.5% |
2005 | 3.8% | 5.7% | 2.0% |
2006 | 14.3% | 15.3% | 11.0% |
2007 | -11.1% | 5.5% | -3.8% |
2008 | -35.9% | -36.7% | -48.7% |
2009 | 34.8% | 27.2% | 36.8% |
2010 | 12.0% | 16.4% | 20.5% |
2011 | 5.6% | 1.7% | -11.4% |
2012 | 5.4% | 16.2% | 9.5% |
2013 | 24.7% | 32.8% | 35.5% |
2014 | -4.7% | 13.1% | 2.7% |
2015 | -15.5% | 1.0% | -11.2% |
2016 | 18.1% | 13.0% | 13.5% |
2017 | 13.7% | 21.1% | 11.1% |
(a) | Schwartz Value Focused Fund’s performance combines the performance of the Fund since its commencement of operations as a registered investment company on July 20, 1993, and the performance of RCM Partners Limited Partnership for periods prior thereto. |
(b) | Inception date of the S&P 1500 Index is December 30, 1994. |
(c) | Excluding dividends. |
5
SCHWARTZ VALUE FOCUSED FUND
AVERAGE ANNUAL TOTAL RETURNS
As of December 31, 2017 (Unaudited)
| SCHWARTZ
VALUE
FOCUSED
FUND(a) | S&P 1500
INDEX(b) | VALUE
LINE
COMPOSITE(c) |
3 Years | 4.3% | 11.4% | 3.8% |
5 Years | 6.2% | 15.7% | 9.3% |
10 Years | 3.8% | 8.7% | 2.5% |
15 Years | 6.6% | 10.2% | 5.2% |
34 Years | 8.8% | N/A | 3.2% |
(a) | Schwartz Value Focused Fund’s performance combines the performance of the Fund since its commencement of operations as a registered investment company on July 20, 1993, and the performance of RCM Partners Limited Partnership for periods prior thereto. |
(b) | Inception date of the S&P 1500 Index is December 30, 1994. |
(c) | Excluding dividends. |
6
SCHWARTZ VALUE FOCUSED FUND
TEN LARGEST EQUITY HOLDINGS
December 31, 2017 (Unaudited)
| Shares | | | Security Description | | Market
Value | | | % of
Net Assets | |
| | 4,500 | | | Texas Pacific Land Trust | | $ | 2,009,835 | | | | 8.9 | % |
| | 70,000 | | | Liberty Interactive Corporation QVC Group - Series A | | | 1,709,400 | | | | 7.6 | % |
| | 15,000 | | | Brown-Forman Corporation - Class B | | | 1,030,050 | | | | 4.6 | % |
| | 37,500 | | | Kroger Company (The) | | | 1,029,375 | | | | 4.5 | % |
| | 40,000 | | | ARRIS International plc | | | 1,027,600 | | | | 4.5 | % |
| | 30,000 | | | Axalta Coating Systems Ltd. | | | 970,800 | | | | 4.3 | % |
| | 3 | | | Berkshire Hathaway, Inc. - Class A | | | 892,800 | | | | 3.9 | % |
| | 96,467 | | | Unico American Corporation | | | 819,970 | | | | 3.6 | % |
| | 15,000 | | | American Airlines Group, Inc. | | | 780,450 | | | | 3.5 | % |
| | 60,000 | | | Goldcorp, Inc. | | | 766,200 | | | | 3.4 | % |
ASSET ALLOCATION (Unaudited)
Sector | % of
Net Assets |
Consumer Discretionary | 21.2% |
Consumer Staples | 9.1% |
Energy | 15.2% |
Financials | 13.3% |
Industrials | 8.4% |
Information Technology | 16.0% |
Materials | 11.4% |
Money Market Funds, Liabilities in Excess of Other Assets | 5.4% |
| | 100.0% |
7
SCHWARTZ VALUE FOCUSED FUND
SCHEDULE OF INVESTMENTS
December 31, 2017
| COMMON STOCKS — 94.6% | | Shares | | | Market Value | |
| Consumer Discretionary — 21.2% | | | | | | |
| Diversified Consumer Services — 2.4% | | | | | | |
| Graham Holdings Company - Class B | | | 500 | | | $ | 279,175 | |
| ServiceMaster Global Holdings, Inc. * | | | 5,000 | | | | 256,350 | |
| | | | | | | | 535,525 | |
| Household Durables — 2.6% | | | | | | | | |
| Garmin Ltd. | | | 10,000 | | | | 595,700 | |
| | | | | | | | | |
| Internet & Direct Marketing Retail — 7.6% | | | | | | | | |
| Liberty Interactive Corporation QVC Group - Series A * | | | 70,000 | | | | 1,709,400 | |
| | | | | | | | | |
| Media — 3.6% | | | | | | | | |
| Liberty Global plc - Series C * | | | 15,000 | | | | 507,600 | |
| Madison Square Garden Company (The) - Class A * | | | 1,500 | | | | 316,275 | |
| | | | | | | | 823,875 | |
| Specialty Retail — 5.0% | | | | | | | | |
| TJX Companies, Inc. (The) | | | 5,000 | | | | 382,300 | |
| Tractor Supply Company | | | 10,000 | | | | 747,500 | |
| | | | | | | | 1,129,800 | |
| Consumer Staples — 9.1% | | | | | | | | |
| Beverages — 4.6% | | | | | | | | |
| Brown-Forman Corporation - Class B | | | 15,000 | | | | 1,030,050 | |
| | | | | | | | | |
| Food & Staples Retailing — 4.5% | | | | | | | | |
| Kroger Company (The) | | | 37,500 | | | | 1,029,375 | |
| | | | | | | | | |
| Energy — 15.2% | | | | | | | | |
| Oil, Gas & Consumable Fuels — 15.2% | | | | | | | | |
| Apache Corporation | | | 6,000 | | | | 253,320 | |
| Devon Energy Corporation | | | 14,000 | | | | 579,600 | |
| Noble Energy, Inc. | | | 20,000 | | | | 582,800 | |
| Texas Pacific Land Trust | | | 4,500 | | | | 2,009,835 | |
| | | | | | | | 3,425,555 | |
| Financials — 13.3% | | | | | | | | |
| Capital Markets — 5.8% | | | | | | | | |
| Interactive Brokers Group, Inc. - Class A | | | 12,000 | | | | 710,520 | |
| Moody's Corporation | | | 4,000 | | | | 590,440 | |
| | | | | | | | 1,300,960 | |
8
SCHWARTZ VALUE FOCUSED FUND
SCHEDULE OF INVESTMENTS
(Continued)
| COMMON STOCKS — 94.6% (Continued) | | Shares | | | Market Value | |
| Financials — 13.3% (Continued) | | | | | | |
| Diversified Financial Services — 3.9% | | | | | | |
| Berkshire Hathaway, Inc. - Class A * | | | 3 | | | $ | 892,800 | |
| | | | | | | | | |
| Insurance — 3.6% | | | | | | | | |
Unico American Corporation * (a) | | | 96,467 | | | | 819,970 | |
| | | | | | | | | |
| Industrials — 8.4% | | | | | | | | |
| Airlines — 3.5% | | | | | | | | |
| American Airlines Group, Inc. | | | 15,000 | | | | 780,450 | |
| | | | | | | | | |
| Electrical Equipment — 1.6% | | | | | | | | |
| AMETEK, Inc. | | | 5,000 | | | | 362,350 | |
| | | | | | | | | |
| Road & Rail — 3.3% | | | | | | | | |
| AMERCO | | | 2,000 | | | | 755,820 | |
| | | | | | | | | |
| Information Technology — 16.0% | | | | | | | | |
| Communications Equipment — 4.5% | | | | | | | | |
| ARRIS International plc * | | | 40,000 | | | | 1,027,600 | |
| | | | | | | | | |
| Electronic Equipment, Instruments & Components — 4.3% | | | | | | | | |
| Arrow Electronics, Inc. * | | | 7,000 | | | | 562,870 | |
| Avnet, Inc. | | | 10,000 | | | | 396,200 | |
| | | | | | | | 959,070 | |
| IT Services — 5.5% | | | | | | | | |
| Cognizant Technology Solutions Corporation - Class A | | | 10,000 | | | | 710,200 | |
| MasterCard, Inc. - Class A | | | 3,500 | | | | 529,760 | |
| | | | | | | | 1,239,960 | |
| Semiconductors & Semiconductor Equipment — 1.7% | | | | | | | | |
| QUALCOMM Incorporated | | | 6,000 | | | | 384,120 | |
| | | | | | | | | |
| Materials — 11.4% | | | | | | | | |
| Chemicals — 4.3% | | | | | | | | |
| Axalta Coating Systems Ltd. * | | | 30,000 | | | | 970,800 | |
9
SCHWARTZ VALUE FOCUSED FUND
SCHEDULE OF INVESTMENTS
(Continued)
| COMMON STOCKS — 94.6% (Continued) | | Shares | | | Market Value | |
| Materials — 11.4% (Continued) | | | | | | |
| Metals & Mining — 7.1% | | | | | | |
| Barrick Gold Corporation | | | 20,000 | | | $ | 289,400 | |
| Goldcorp, Inc. | | | 60,000 | | | | 766,200 | |
| Pan American Silver Corporation | | | 35,000 | | | | 544,600 | |
| | | | | | | | 1,600,200 | |
| | | | | | | | | |
Total Common Stocks (Cost $16,321,550) | | | | | | $ | 21,373,380 | |
| MONEY MARKET FUNDS — 6.3% | | Shares | | | Market Value | |
Federated Government Obligations Tax-Managed Fund - Institutional Shares, 1.05% (b) | | | 1,069,905 | | | $ | 1,069,905 | |
Federated Treasury Obligations Fund - Institutional Shares, 1.13% (b) | | | 341,760 | | | | 341,760 | |
Total Money Market Funds (Cost $1,411,665) | | | | | | $ | 1,411,665 | |
| | | | | | | | | |
Total Investments at Market Value — 100.9% (Cost $17,733,215) | | | | | | $ | 22,785,045 | |
| | | | | | | | | |
Liabilities in Excess of Other Assets — (0.9%) | | | | | | | (193,492 | ) |
| | | | | | | | | |
Net Assets — 100.0% | | | | | | $ | 22,591,553 | |
* | Non-income producing security. |
(a) | Security value has been determined in good faith pursuant to procedures adopted by the Board of Trustees. The total value of such securities was $819,970 at December 31, 2017, representing 3.6% of net assets (Note 1). |
(b) | The rate shown is the 7-day effective yield as of December 31, 2017. |
See notes to financial statements. |
10
SCHWARTZ VALUE FOCUSED FUND
STATEMENT OF ASSETS AND LIABILITIES
December 31, 2017
| ASSETS | | | |
| Investments, at market value (cost of $17,733,215) (Note 1) | | $ | 22,785,045 | |
| Dividends receivable | | | 5,401 | |
| Other assets | | | 7,336 | |
| TOTAL ASSETS | | | 22,797,782 | |
| | | | | |
| LIABILITIES | | | | |
| Payable for investment securities purchased | | | 81,302 | |
| Payable for capital shares redeemed | | | 84,306 | |
| Payable to Adviser (Note 2) | | | 25,114 | |
| Payable to administrator (Note 2) | | | 3,000 | |
| Other accrued expenses | | | 12,507 | |
| TOTAL LIABILITIES | | | 206,229 | |
| | | | | |
NET ASSETS | | $ | 22,591,553 | |
| | | | | |
| NET ASSETS CONSIST OF: | | | | |
| Paid-in capital | | $ | 17,539,723 | |
| Net unrealized appreciation on investments | | | 5,051,830 | |
| NET ASSETS | | $ | 22,591,553 | |
| | | | | |
| Shares of beneficial interest outstanding (unlimited number of shares authorized, no par value) | | | 854,576 | |
| | | | | |
| Net asset value, offering price and redemption price per share (Note 1) | | $ | 26.44 | |
See notes to financial statements. |
11
SCHWARTZ VALUE FOCUSED FUND
STATEMENT OF OPERATIONS
For the Year Ended December 31, 2017
| INVESTMENT INCOME | | | |
| Dividends (Net of foreign tax of $1,665) | | $ | 156,264 | |
| | | | | |
| EXPENSES | | | | |
| Investment advisory fees (Note 2) | | | 203,886 | |
| Trustees’ fees and expenses (Note 2) | | | 60,555 | |
| Legal and audit fees | | | 38,556 | |
| Administration, accounting and transfer agent fees (Note 2) | | | 36,000 | |
| Registration and filing fees | | | 14,540 | |
| Postage and supplies | | | 7,545 | |
| Custodian and bank service fees | | | 5,982 | |
| Printing of shareholder reports | | | 5,308 | |
| Insurance expense | | | 1,277 | |
| Compliance service fees and expenses (Note 2) | | | 1,077 | |
| Other expenses | | | 9,029 | |
| TOTAL EXPENSES | | | 383,755 | |
| Less fee reductions by the Adviser (Note 2) | | | (115,484 | ) |
| NET EXPENSES | | | 268,271 | |
| | | | | |
| NET INVESTMENT LOSS | | | (112,007 | ) |
| | | | | |
| REALIZED AND UNREALIZED GAINS ON INVESTMENTS | | | | |
| Net realized gains from investment transactions | | | 2,239,114 | |
| Net change in unrealized appreciation (depreciation) on investments | | | 669,495 | |
| NET REALIZED AND UNREALIZED GAINS ON INVESTMENTS | | | 2,908,609 | |
| | | | | |
| NET INCREASE IN NET ASSETS RESULTING FROM OPERATIONS | | $ | 2,796,602 | |
See notes to financial statements. |
12
SCHWARTZ VALUE FOCUSED FUND
STATEMENTS OF CHANGES IN NET ASSETS
| | | Year Ended December 31, 2017 | | | Year Ended December 31, 2016 | |
| FROM OPERATIONS | | | | | | |
| Net investment loss | | $ | (112,007 | ) | | $ | (67,763 | ) |
| Net realized gains from investment transactions | | | 2,239,114 | | | | 29,217 | |
| Net change in unrealized appreciation (depreciation) on investments | | | 669,495 | | | | 3,288,843 | |
| Net increase in net assets resulting from operations | | | 2,796,602 | | | | 3,250,297 | |
| | | | | | | | | |
| FROM DISTRIBUTIONS TO SHAREHOLDERS (Note 1) | | | | | | | | |
| From net realized gains on investments | | | (1,619,709 | ) | | | — | |
| | | | | | | | | |
| FROM CAPITAL SHARE TRANSACTIONS | | | | | | | | |
| Proceeds from shares sold | | | 328,864 | | | | 1,533,951 | |
| Reinvestment of distributions to shareholders | | | 1,557,160 | | | | — | |
| Payments for shares redeemed | | | (1,483,218 | ) | | | (2,544,502 | ) |
| Net increase (decrease) in net assets from capital share transactions | | | 402,806 | | | | (1,010,551 | ) |
| | | | | | | | | |
| TOTAL INCREASE IN NET ASSETS | | | 1,579,699 | | | | 2,239,746 | |
| | | | | | | | | |
| NET ASSETS | | | | | | | | |
| Beginning of year | | | 21,011,854 | | | | 18,772,108 | |
| End of year | | $ | 22,591,553 | | | $ | 21,011,854 | |
| | | | | | | | | |
| ACCUMULATED NET INVESTMENT LOSS | | $ | — | | | $ | — | |
| | | | | | | | | |
| SUMMARY OF CAPITAL SHARE ACTIVITY | | | | | | | | |
| Shares sold | | | 12,584 | | | | 65,097 | |
| Shares issued in reinvestment of distributions to shareholders | | | 58,584 | | | | — | |
| Shares redeemed | | | (56,357 | ) | | | (111,549 | ) |
| Net increase (decrease) in shares outstanding | | | 14,811 | | | | (46,452 | ) |
| Shares outstanding, beginning of year | | | 839,765 | | | | 886,217 | |
| Shares outstanding, end of year | | | 854,576 | | | | 839,765 | |
See notes to financial statements. |
13
SCHWARTZ VALUE FOCUSED FUND
FINANCIAL HIGHLIGHTS
Per Share Data for a Share Outstanding Throughout Each Year
| | | Year
Ended
Dec. 31,
2017 | | | Year
Ended
Dec. 31,
2016 | | | Year
Ended
Dec. 31,
2015 | | | Year
Ended
Dec. 31,
2014 | | | Year
Ended
Dec. 31,
2013 | |
| Net asset value at beginning of year | | $ | 25.02 | | | $ | 21.18 | | | $ | 25.06 | | | $ | 28.54 | | | $ | 23.31 | |
| | | | | | | | | | | | | | | | | | | | | |
| Income (loss) from investment operations: | | | | | | | | | | | | | | | | | | | | |
| Net investment loss | | | (0.13 | ) | | | (0.08 | ) | | | (0.11 | ) | | | (0.08 | ) | | | (0.04 | ) |
| Net realized and unrealized gains (losses) on investments | | | 3.57 | | | | 3.92 | | | | (3.77 | ) | | | (1.26 | ) | | | 5.80 | |
| Total from investment operations | | | 3.44 | | | | 3.84 | | | | (3.88 | ) | | | (1.34 | ) | | | 5.76 | |
| | | | | | | | | | | | | | | | | | | | | |
| Less distributions: | | | | | | | | | | | | | | | | | | | | |
| From net realized gains on investments | | | (2.02 | ) | | | — | | | | — | | | | (2.14 | ) | | | (0.53 | ) |
| | | | | | | | | | | | | | | | | | | | | |
| Net asset value at end of year | | $ | 26.44 | | | $ | 25.02 | | | $ | 21.18 | | | $ | 25.06 | | | $ | 28.54 | |
| | | | | | | | | | | | | | | | | | | | | |
Total return (a) | | | 13.7 | % | | | 18.1 | % | | | (15.5 | %) | | | (4.7 | %) | | | 24.7 | % |
| | | | | | | | | | | | | | | | | | | | | |
| Ratios/Supplementary Data: | | | | | | | | | | | | | | | | | | | | |
| Net assets at end of year (000’s) | | $ | 22,592 | | | $ | 21,012 | | | $ | 18,772 | | | $ | 28,129 | | | $ | 32,030 | |
| | | | | | | | | | | | | | | | | | | | | |
| Ratio of total expenses to average net assets | | | 1.79 | % | | | 1.80 | % | | | 1.59 | % | | | 1.46 | % | | | 1.45 | % |
| | | | | | | | | | | | | | | | | | | | | |
| Ratio of net expenses to average net assets | | | 1.25 | %(b) | | | 1.25 | %(b) | | | 1.35 | %(b) | | | 1.46 | % | | | 1.45 | % |
| | | | | | | | | | | | | | | | | | | | | |
| Ratio of net investment loss to average net assets | | | (0.52 | %)(b) | | | (0.35 | %)(b) | | | (0.40 | %)(b) | | | (0.28 | %) | | | (0.13 | %) |
| | | | | | | | | | | | | | | | | | | | | |
| Portfolio turnover rate | | | 48 | % | | | 48 | % | | | 104 | % | | | 72 | % | | | 57 | % |
(a) | Total return is a measure of the change in value of an investment in the Fund over the period covered, which assumes any dividends or capital gains distributions are reinvested in shares of the Fund. Returns shown do not reflect the deduction of taxes a shareholder would pay on Fund distributions or the redemption of Fund shares. |
(b) | Ratio was determined after advisory fee reductions (Note 2). |
See notes to financial statements. |
14
SCHWARTZ VALUE FOCUSED FUND
NOTES TO FINANCIAL STATEMENTS
December 31, 2017
1. Significant Accounting Policies
Schwartz Value Focused Fund (the “Fund”) is a series of Schwartz Investment Trust (the “Trust”), an open-end, non-diversified management investment company established as an Ohio business trust under a Declaration of Trust dated August 31, 1992. Other series of the Trust are not incorporated in this report. The Fund is registered under the Investment Company Act of 1940, as amended (the “1940 Act”), and commenced operations on July 20, 1993.
The investment objective of the Fund is to seek long-term capital appreciation. See the Prospectus for information regarding the principal investment strategies of the Fund.
Shares of the Fund are sold at net asset value (“NAV”). To calculate the NAV, the Fund’s assets are valued and totaled, liabilities are subtracted, and the balance is divided by the number of shares outstanding. The offering price and redemption price per share are equal to the NAV per share.
The Fund follows accounting and reporting guidance under Financial Accounting Standards Board Accounting Standards Codification Topic 946, “Financial Services – Investment Companies.” The following is a summary of the Fund’s significant accounting policies used in the preparation of its financial statements. These policies are in conformity with accounting principles generally accepted in the United States of America (“GAAP”).
(a) Valuation of investments — Securities which are traded on stock exchanges, other than NASDAQ, are valued at the closing sales price as of the close of the regular session of trading on the New York Stock Exchange on the day the securities are being valued, or, if not traded on a particular day, at the closing bid price. Securities which are quoted by NASDAQ are valued at the NASDAQ Official Closing Price or, if an Official Closing Price is not available, at the most recently quoted bid price. Securities traded in the over-the-counter market are valued at the last reported sales price or, if there is no reported sale on the valuation date, at the most recently quoted bid price. Securities which are traded both in the over-the-counter market and on a stock exchange are valued according to the broadest and most representative market. Investments representing shares of other open-end investment companies are valued at their NAV as reported by such companies. When using quoted prices and when the market for the securities are considered active, the securities will be classified as Level 1 within the fair value hierarchy (see below). Securities (and other assets) for which market quotations are not readily available are valued at their fair value as determined in good faith in accordance with consistently applied procedures established by and under the general supervision of the Board of Trustees, and will be classified as Level 2 or 3 within the fair value hierarchy, depending on the inputs used. Fair value pricing may be used, for example, in situations where (i) a portfolio security is so thinly traded that there have been no transactions for that stock over an extended period of time; (ii) the exchange on which the portfolio security is principally traded closes early; or (iii) trading of the portfolio security is halted during the day and does not resume prior to the Fund’s NAV calculation. A portfolio
15
SCHWARTZ VALUE FOCUSED FUND
NOTES TO FINANCIAL STATEMENTS
(Continued)
security’s “fair value” price may differ from the price next available for that portfolio security using the Fund’s normal pricing procedures.
GAAP establishes a single authoritative definition of fair value, sets out a framework for measuring fair value and requires additional disclosures about fair value measurements.
Various inputs are used in determining the value of the Fund’s investments. These inputs are summarized in the three broad levels listed below:
| | ● | Level 1 – quoted prices in active markets for identical securities |
| | ● | Level 2 – other significant observable inputs |
| | ● | Level 3 – significant unobservable inputs |
The inputs or methodology used for valuing securities are not necessarily an indication of the risks associated with investing in those securities. The inputs used to measure fair value may fall into different levels of the fair value hierarchy. In such cases, for disclosure purposes, the level in the fair value hierarchy within which the fair value measurement falls in its entirety is determined based on the lowest level input that is significant to the fair value measurement.
The following is a summary of the inputs used to value the Fund’s investments, by security type, as of December 31, 2017:
| | | Level 1 | | | Level 2 | | | Level 3 | | | Total | |
| Common Stocks | | $ | 20,553,410 | | | $ | 819,970 | | | $ | — | | | $ | 21,373,380 | |
| Money Market Funds | | | 1,411,665 | | | | — | | | | — | | | | 1,411,665 | |
| Total | | $ | 21,965,075 | | | $ | 819,970 | | | $ | — | | | $ | 22,785,045 | |
Refer to the Fund’s Schedule of Investments for a listing of the securities by industry type. There were no Level 3 securities or derivative instruments held by the Fund as of December 31, 2017. It is the Fund’s policy to recognize transfers into or out of any Level at the end of the reporting period. Transfers that occurred between Level 1 and 2 on December 31, 2017 due to fair value procedures was as follows:
| | | Transfers
from Level 1
to Level 2 | |
| Common Stocks | | $ | 819,970 | |
(b) Income taxes — The Fund has qualified and intends to continue to qualify as a regulated investment company under the Internal Revenue Code of 1986, as amended (the “Code”). Qualification generally will relieve the Fund of liability for federal income taxes to the extent 100% of its net investment income and net realized capital gains are distributed in accordance with the Code.
16
SCHWARTZ VALUE FOCUSED FUND
NOTES TO FINANCIAL STATEMENTS
(Continued)
In order to avoid imposition of the excise tax applicable to regulated investment companies, it is also the Fund’s intention to declare as dividends in each calendar year at least 98% of its net investment income and 98.2% of its net realized capital gains plus undistributed amounts from prior years.
The following information is computed on a tax basis for each item as of December 31, 2017:
| Federal income tax cost | | $ | 17,733,215 | |
| Gross unrealized appreciation | | $ | 5,347,641 | |
| Gross unrealized depreciation | | | (295,811 | ) |
| Net unrealized appreciation | | | 5,051,830 | |
| Accumulated earnings | | $ | 5,051,830 | |
During the year ended December 31, 2017, the Fund utilized $509,257 of short-term capital loss carryforwards to offset current year gains.
During the year ended December 31, 2017, the Fund reclassified $110,148 and $1,859 of net investment loss against net realized gains and paid-in capital, respectively, on the Statement of Assets and Liabilities. Such reclassifications, the result of permanent differences between the financial statement and income tax reporting requirements, have no effect on the Fund’s net assets or NAV per share.
The Fund recognizes the tax benefits or expenses of uncertain tax positions only when the position is “more-likely-than-not” to be sustained assuming examination by tax authorities. Management has reviewed the tax positions taken on federal income tax returns for all open tax years (tax years ended December 31, 2014 through December 31, 2017) and has concluded that no provision for unrecognized tax benefits or expenses is required in these financial statements.
(c) Investment transactions and investment income — Investment transactions are accounted for on the trade date. Dividend income is recorded on the ex-dividend date. Interest income is recognized on the accrual basis. Realized capital gains and losses on security transactions are determined on the identified cost basis. Withholding taxes on foreign dividends have been recorded in accordance with the Fund’s understanding of the applicable country’s rules and tax rates.
(d) Dividends and distributions — Dividends from net investment income and distributions of net realized capital gains, if any, are declared and paid annually in December. Dividends and distributions to shareholders are recorded on the ex-dividend date. There were no distributions paid to shareholders during the year ended December 31, 2016. The tax character of the distributions paid to shareholders during the year ended December 31, 2017 was long-term capital gains.
(e) Estimates — The preparation of financial statements in conformity with GAAP requires management to make estimates and assumptions that affect the reported amounts of assets and liabilities and disclosure of contingent assets and liabilities as of the date of the financial statements and the reported amounts of revenues and expenses during the reporting period. Actual results could differ from those estimates.
17
SCHWARTZ VALUE FOCUSED FUND
NOTES TO FINANCIAL STATEMENTS
(Continued)
(f) Common expenses — Common expenses of the Trust are allocated among the Fund and the other series of the Trust based on relative net assets of each series or the nature of the services performed and the relative applicability to each series.
2. Investment Advisory Agreement and Transactions with Related Parties
The Chairman and President of the Trust is also the Chairman and Chief Executive Officer of Schwartz Investment Counsel, Inc. (the “Adviser”). Certain other officers of the Trust are officers of the Adviser, or of Ultimus Fund Solutions, LLC (“Ultimus”), the administrative, accounting and transfer agent for the Fund, or of Ultimus Fund Distributors, LLC (the “Distributor”), the Fund’s principal underwriter.
Pursuant to an Investment Advisory Agreement between the Trust and the Adviser, the Adviser is responsible for the management of the Fund and provides investment advice along with the necessary personnel, facilities, equipment and certain other services necessary to the operations of the Fund. The Adviser receives from the Fund a quarterly fee at the annual rate of 0.95% per annum of the Fund’s average daily net assets.
The Adviser has contractually agreed to reduce its advisory fees or reimburse a portion of the Fund’s expenses until at least May 1, 2018 so that the ordinary operating expenses of the Fund do not exceed 1.25% per annum of average daily net assets. Accordingly, during the year ended December 31, 2017, the Adviser reduced its investment advisory fees by $115,484.
Any fee reductions or expense reimbursements by the Adviser are subject to repayment by the Fund for a period of three years after such fees and expenses were incurred, provided repayment to the Adviser does not cause the ordinary operating expenses of the Fund to exceed 1.25% per annum of average daily net assets. As of December 31, 2017, the Advisor may seek recoupment of investment advisory fee reductions totaling $278,968 no later than the dates stated below:
December 31, 2018 | December 31, 2019 | December 31, 2020 | Total |
$ 56,616 | $ 106,868 | $ 115,484 | $ 278,968 |
The Chief Compliance Officer of the Trust (the “CCO”) is an employee of the Adviser. The Trust pays the Adviser a fee for providing CCO services, of which the Fund pays its proportionate share along with the other series of the Trust. In addition, the Trust reimburses the Adviser for out-of-pocket expenses incurred, if any, for providing these services.
Pursuant to a Mutual Fund Services Agreement between the Trust and Ultimus, Ultimus supplies regulatory and compliance services, calculates the daily NAV per share, maintains the financial books and records of the Fund, maintains the records of each shareholder’s account, and processes purchases and redemptions of the Fund’s shares. For these services Ultimus receives fees computed as a percentage of the average daily net assets of the Fund, subject to a minimum monthly fee.
18
SCHWARTZ VALUE FOCUSED FUND
NOTES TO FINANCIAL STATEMENTS
(Continued)
Pursuant to a Distribution Agreement between the Trust and the Distributor, the Distributor serves as the Fund’s exclusive agent for the distribution of its shares. The Distributor is an affiliate of Ultimus.
Trustees and officers affiliated with the Adviser or Ultimus are not compensated by the Trust for their services. Each Trustee who is not an affiliated person of the Adviser or Ultimus (“Independent Trustee”) received from the Trust an annual retainer of $40,000 (except that such fee was $50,000 for the Lead Independent Trustee/Chairman of the Governance Committee and $44,000 for the Chairman of the Audit Committee), payable quarterly; a fee of $6,000 for attendance at each meeting of the Board of Trustees; plus reimbursement of travel and other expenses incurred in attending meetings. Effective January 1, 2018, each Independent Trustee will receive from the Trust an annual retainer of $46,000 (except that such fee is $56,000 for the Lead Independent Trustee/Chairman of the Governance Committee and $50,000 for the Chairman of the Audit Committee), payable quarterly; a fee of $6,000 for attendance at each meeting of the Board of Trustees; plus reimbursement of travel and other expenses incurred in attending meetings. The Fund pays its proportionate share of the Independent Trustees’ fees and expenses along with the other series of the Trust.
3. Investment Transactions
During the year ended December 31, 2017, cost of purchases and proceeds from sales and maturities of investment securities, excluding short-term investments and U.S. government securities, amounted to $9,619,180 and $10,351,971, respectively.
4. Contingencies and Commitments
The Fund indemnifies the Trust’s officers and Trustees for certain liabilities that might arise from their performance of their duties to the Fund. Additionally, in the normal course of business, the Fund enters into contracts that contain a variety of representations and warranties and which provide general indemnifications. The Fund’s maximum exposure under these arrangements is unknown, as this would involve future claims that may be made against the Fund that have not yet occurred. However, based on experience, the Fund expects the risk of loss to be remote.
5. Subsequent Events
The Fund is required to recognize in the financial statements the effects of all subsequent events that provide additional evidence about conditions that existed as of the date of the Statement of Assets and Liabilities. For non-recognized subsequent events that must be disclosed to keep the financial statements from being misleading, the Fund is required to disclose the nature of the event as well as an estimate of its financial effect, or a statement that such an estimate cannot be made. Management has evaluated subsequent events through the issuance of these financial statements and has noted no such events.
19
SCHWARTZ VALUE FOCUSED FUND
REPORT OF INDEPENDENT REGISTERED
PUBLIC ACCOUNTING FIRM
To the Shareholders and the Board of Trustees of Schwartz Investment Trust
Opinion on the Financial Statements and Financial Highlights
We have audited the accompanying statement of assets and liabilities, including the schedule of investments, of the Schwartz Value Focused Fund, one of the portfolios constituting the Schwartz Investment Trust (the “Fund”), as of December 31, 2017, the related statement of operations for the year then ended, the statement of changes in net assets for each of the two years in the period then ended, the financial highlights for each of the five years in the period then ended, and the related notes. In our opinion, the financial statements and financial highlights present fairly, in all material respects, the financial position of the Fund as of December 31, 2017, and the results of its operation for the year then ended, the changes in its net assets for each of the two years in the period then ended, and the financial highlights for each of the five years in the period then ended, in conformity with accounting principles generally accepted in the United States of America.
Basis for Opinion
These financial statements and financial highlights are the responsibility of the Fund’s management. Our responsibility is to express an opinion on the Fund’s financial statements and financial highlights based on our audits. We are a public accounting firm registered with the Public Company Accounting Oversight Board (United States) (PCAOB) and are required to be independent with respect to the Funds in accordance with the U.S. federal securities laws and the applicable rules and regulations of the Securities and Exchange Commission and the PCAOB.
We conducted our audits in accordance with the standards of the PCAOB. Those standards require that we plan and perform the audits to obtain reasonable assurance about whether the financial statements and financial highlights are free of material misstatement, whether due to error or fraud. The Funds is not required to have, nor were we engaged to perform, an audit of internal control over financial reporting. As part of our audits we are required to obtain an understanding of internal control over financial reporting but not for the purpose of expressing an opinion on the effectiveness of the Fund’s internal control over financial reporting. Accordingly, we express no such opinion.
Our audits included performing procedures to assess the risks of material misstatement of the financial statements and financial highlights, whether due to error or fraud, and performing procedures that respond to those risks. Such procedures included examining, on a test basis, evidence regarding the amounts and disclosures in the financial statements and financial highlights. Our audits also included evaluating the accounting principles used and significant estimates made by management, as well as evaluating the overall presentation of the financial statements and financial highlights. Our procedures included confirmation of securities owned as of December 31, 2017, by correspondence with the custodian and brokers; when replies were not received from brokers, we performed
20
SCHWARTZ VALUE FOCUSED FUND
REPORT OF INDEPENDENT REGISTERED
PUBLIC ACCOUNTING FIRM (Continued)
other auditing procedures. We believe that our audits provide a reasonable basis for our opinion.

Chicago, Illinois
February 16, 2018
We have served as the auditor of one or more Schwartz Investment Trust investment companies since 1993.
21
SCHWARTZ VALUE FOCUSED FUND
BOARD OF TRUSTEES AND EXECUTIVE OFFICERS
(Unaudited)
Overall responsibility for management of the Trust rests with the Board of Trustees. The Trustees serve during the lifetime of the Trust and until its termination, or until death, resignation, retirement or removal. The Trustees, in turn, elect the officers of the Trust to actively supervise its day-to-day operations. The officers have been elected for an annual term. The following are the Trustees and executive officers of the Trust:
Trustee/Officer | Address | Year of
Birth | Position Held
with the Trust | Length of
Time Served |
Interested Trustees: |
* | George P. Schwartz, CFA | 801 W. Ann Arbor Trail
Plymouth, MI | 1944 | Chairman of the Board/President/ Trustee | Since 1992 |
Independent Trustees: |
| | Louis C. Bosco, Jr. | 801 W. Ann Arbor Trail
Plymouth, MI | 1936 | Trustee | Since 2008 |
| | Donald J. Dawson, Jr. | 801 W. Ann Arbor Trail
Plymouth, MI | 1947 | Trustee | Since 1993 |
| | Joseph M. Grace | 801 W. Ann Arbor Trail
Plymouth, MI | 1936 | Trustee | Since 2007 |
| | John J. McHale, Jr. | 801 W. Ann Arbor Trail
Plymouth, MI | 1949 | Trustee | Since 2014 |
| | Edward J. Miller | 801 W. Ann Arbor Trail
Plymouth, MI | 1946 | Trustee | Since 2017 |
Executive Officers: |
* | Richard L. Platte, Jr., CFA | 801 W. Ann Arbor Trail
Plymouth, MI | 1951 | Vice President and Secretary | Since 1993 |
* | Robert C. Schwartz, CFP | 801 W. Ann Arbor Trail
Plymouth, MI | 1976 | Vice President | Since 2013 |
* | Timothy S. Schwartz, CFA | 5060 Annunciation Circle
Ave Maria, FL | 1971 | Treasurer | Since 2000 |
* | Cathy M. Stoner, CPA, IACCP | 801 W. Ann Arbor Trail
Plymouth, MI | 1970 | Chief Compliance Officer | Since 2010 |
* | George P. Schwartz, Richard L. Platte, Jr., Robert C. Schwartz, Timothy S. Schwartz and Cathy M. Stoner, as affiliated persons of Schwartz Investment Counsel, Inc., the Fund’s investment adviser, are “interested persons” of the Trust within the meaning of Section 2(a)(19) of the 1940 Act. George P. Schwartz is the father of Robert C. Schwartz and Timothy S. Schwartz. |
22
SCHWARTZ VALUE FOCUSED FUND
BOARD OF TRUSTEES AND EXECUTIVE OFFICERS
(Unaudited) (Continued)
Each Trustee oversees six portfolios of the Trust: the Ave Maria Value Fund, the Ave Maria Growth Fund, the Ave Maria Rising Dividend Fund, the Ave Maria World Equity Fund, the Ave Maria Bond Fund and the Schwartz Value Focused Fund. The principal occupations of the Trustees and executive officers of the Trust during the past five years and public directorships held by the Trustees are set forth below:
George P. Schwartz, CFA is Chairman and Chief Executive Officer of Schwartz Investment Counsel, Inc. and is the co-portfolio manager of the Fund.
Louis C. Bosco, Jr. retired in April 2012. Prior to his retirement, he was a partner in Bosco Development Company (a real estate firm).
Donald J. Dawson, Jr. retired in March 2015. Prior to retirement, he was Chairman of Payroll 1, Inc. (a payroll processing company) from 1986 – 2015.
Joseph M. Grace is retired Senior Vice President of National Bank of Detroit (renamed JPMorgan Chase & Company).
John J. McHale, Jr. is Special Assistant to Commissioner of Major League Baseball since 2015. He was Executive Vice President of Major League Baseball from 2000 – 2015.
Edward J. Miller is Vice Chairman and Director of Detroit Investment Fund since 2001 and Invest Detroit Foundation since 2010 (financiers for redevelopment of Detroit, Michigan).
Richard L. Platte, Jr., CFA is President and Chief Investment Officer of Schwartz Investment Counsel, Inc.
Robert C. Schwartz, CFP is Senior Vice President and Secretary of Schwartz Investment Counsel, Inc.
Timothy S. Schwartz, CFA is Executive Vice President and Chief Financial Officer of Schwartz Investment Counsel, Inc. and is the lead portfolio manager of the Fund.
Cathy M. Stoner, CPA, IACCP is Vice President, Chief Compliance Officer and Treasurer of Schwartz Investment Counsel, Inc.
Additional information about members of the Board of Trustees and executive officers is available in the Statement of Additional Information (“SAI”). To obtain a free copy of the SAI, please call (888) 726-0753.
23
SCHWARTZ VALUE FOCUSED FUND
ABOUT YOUR FUND’S EXPENSES
(Unaudited)
We believe it is important for you to understand the impact of costs on your investment. As a shareholder of the Fund, you incur ongoing costs, including management fees and other Fund expenses. The following examples are intended to help you understand your ongoing costs (in dollars) of investing in the Fund and to compare these costs with the ongoing costs of investing in other mutual funds.
A mutual fund’s ongoing costs are expressed as a percentage of its average net assets. This figure is known as the expense ratio. The ongoing costs reflected in the table below are based on an investment of $1,000 made at the beginning of the most recent semi-annual period (July 1, 2017) and held until the end of the period (December 31, 2017).
The table below illustrates the Fund’s ongoing costs in two ways:
Actual fund return – This section helps you to estimate the actual expenses that you paid over the period. The “Ending Account Value” shown is derived from the Fund’s actual return, and the third column shows the dollar amount of operating expenses that would have been paid by an investor who started with $1,000 in the Fund. You may use the information here, together with the amount you invested, to estimate the expenses that you paid over the period.
To do so, simply divide your account value by $1,000 (for example, an $8,600 account value divided by $1,000 = 8.6), then multiply the result by the number given for the Fund under the heading “Expenses Paid During Period.”
Hypothetical 5% return – This section is intended to help you compare the Fund’s ongoing costs with those of other mutual funds. It assumes that the Fund had an annual return of 5% before expenses during the period shown, but that the expense ratio is unchanged. In this case, because the return used is not the Fund’s actual return, the result does not apply to your investment. The example is useful in making comparisons because the U.S. Securities and Exchange Commission (the “SEC”) requires all mutual funds to calculate expenses based on a 5% return. You can assess the Fund’s ongoing costs by comparing this hypothetical example with the hypothetical examples that appear in shareholder reports of other funds.
Note that expenses shown in the table are meant to highlight and help you compare ongoing costs only. The Fund does not charge sales loads or redemption fees.
The calculations assume no shares were bought or sold during the period. Your actual costs may have been higher or lower, depending on the amount of your investment and the timing of any purchases or redemptions.
More information about the Fund’s expenses, including historical annual expense ratios, can be found in this report. For additional information on operating expenses and other shareholder costs, please refer to the Fund’s Prospectus.
| Beginning
Account Value
July 1, 2017 | Ending
Account Value
December 31, 2017 | Expenses Paid
During Period* |
Based on Actual Fund Return | $1,000.00 | $1,119.20 | $6.68 |
Based on Hypothetical 5% Return (before expenses) | $1,000.00 | $1,018.90 | $6.36 |
* | Expenses are equal to the Fund’s annualized net expense ratio of 1.25% for the period, multiplied by the average account value over the period, multiplied by 184/365 (to reflect the one-half year period). |
24
SCHWARTZ VALUE FOCUSED FUND
FEDERAL TAX INFORMATION
(Unaudited)
For the fiscal year ended December 31, 2017, the Fund designated $1,619,709 as long-term capital gain distributions.
OTHER INFORMATION
(Unaudited)
A description of the policies and procedures the Fund uses to determine how to vote proxies relating to portfolio securities is available without charge upon request by calling toll-free (888) 726-0753, or on the SEC’s website at http://www.sec.gov. Information regarding how the Fund voted proxies relating to portfolio securities during the most recent 12-month period ended June 30 is also available without charge upon request by calling toll-free (888) 726-0753, or on the SEC’s website at http://www.sec.gov.
The Trust files a complete listing of portfolio holdings for the Fund with the SEC as of the end of the first and third quarters of each fiscal year on Form N-Q. The filings are available free of charge, upon request, by calling (888) 726-0753. Furthermore, you may obtain a copy of the filings on the SEC’s website at http://www.sec.gov. The Trust’s Forms N-Q may also be reviewed and copied at the SEC’s Public Reference Room in Washington, DC, and information on the operation of the Public Reference Room may be obtained by calling (800) SEC-0330.
25
This page intentionally left blank.
This page intentionally left blank.
This page intentionally left blank.


Shareholder Services c/o Ultimus Fund Solutions, LLC P.O. Box 46707 Cincinnati, OH 45246 (888) 726-9331 | 
| Corporate Offices 801 W. Ann Arbor Trail Suite 244 Plymouth, MI 48170 (734) 455-7777 Fax (734) 455-7720 |
Dear Fellow Shareholders of:
Ave Maria Value Fund (AVEMX)
Ave Maria Growth Fund (AVEGX)
Ave Maria Rising Dividend Fund (AVEDX)
Ave Maria World Equity Fund (AVEWX)
Ave Maria Bond Fund (AVEFX)
Ave Maria Money Market Account
2017 — What a year (what a country)!
For many years, I have preached to anyone who would listen — “count your blessings.” 2017 was certainly a year of blessings for investors. Regarding 2018 and beyond, there is a lot of wisdom in the advice, “don’t try to outguess the near-term swings in the stock market.” I am optimistic on our country, economy and stock market. The long term is all that should really matter to serious investors.
Many factors point to the prospect of robust economic growth. For the first time in years, fiscal and monetary policy are leaning in the same direction. Monetary policy remains highly accommodative, while fiscal policy has stopped acting as a drag. Since the change of administration in Washington, the crusade against business has ended. Runaway regulation has been brought under control, and the tax code has been changed to make American corporations more competitive in global markets and encourage them to invest in America again. This is significantly positive for corporate profits and equity investors. As Catholic Advisory Board member, Larry Kudlow, is famous for saying, “corporate profits are the mother’s milk of stock prices.”
As you’ll see in the individual portfolio managers’ letters, each of our pro-life, pro-family mutual funds had notably positive years in 2017. With assets now exceeding $2 billion, owned by 100,000 plus shareholders, the Ave Maria Mutual Funds are the largest family of Catholic mutual funds in the country. It is indeed a privilege to offer Catholics and other like-minded investors these opportunities to invest in a manner consistent with our faith.
Thanks for your participation.
Sincerely,

George P. Schwartz, CFA
Chairman & CEO
January 31, 2018
AVE MARIA MUTUAL FUNDS
TABLE OF CONTENTS
Ave Maria Value Fund: | |
Portfolio Manager Commentary | 2 |
Performance | 5 |
Annual Total Rates of Return Comparison with Major Indices | 6 |
Ten Largest Equity Holdings | 7 |
Asset Allocation | 7 |
Schedule of Investments | 8 |
| | |
Ave Maria Growth Fund: | |
Portfolio Manager Commentary | 12 |
Performance | 14 |
Annual Total Rates of Return Comparison with Major Indices | 15 |
Ten Largest Equity Holdings | 16 |
Asset Allocation | 16 |
Schedule of Investments | 17 |
| | |
Ave Maria Rising Dividend Fund: | |
Portfolio Manager Commentary | 20 |
Performance | 22 |
Annual Total Rates of Return Comparison with Major Indices | 23 |
Ten Largest Equity Holdings | 24 |
Asset Allocation | 24 |
Schedule of Investments | 25 |
| | |
Ave Maria World Equity Fund: | |
Portfolio Manager Commentary | 28 |
Performance | 30 |
Annual Total Rates of Return Comparison with Major Indices | 31 |
Ten Largest Equity Holdings | 32 |
Asset Allocation | 32 |
Schedule of Investments | 33 |
Summary of Common Stocks by Country | 36 |
| | |
Ave Maria Bond Fund: | |
Portfolio Manager Commentary | 37 |
Performance | 39 |
Annual Total Rates of Return Comparison with Major Indices | 40 |
Ten Largest Holdings | 41 |
Asset Allocation | 41 |
Schedule of Investments | 42 |
AVE MARIA MUTUAL FUNDS
TABLE OF CONTENTS
(Continued)
Statements of Assets and Liabilities | 47 |
| | |
Statements of Operations | 49 |
| | |
Statements of Changes in Net Assets: | |
Ave Maria Value Fund | 51 |
Ave Maria Growth Fund | 52 |
Ave Maria Rising Dividend Fund | 53 |
Ave Maria World Equity Fund | 54 |
Ave Maria Bond Fund | 55 |
| | |
Financial Highlights: | |
Ave Maria Value Fund | 56 |
Ave Maria Growth Fund | 57 |
Ave Maria Rising Dividend Fund | 58 |
Ave Maria World Equity Fund | 59 |
Ave Maria Bond Fund | 60 |
| | |
Notes to Financial Statements | 61 |
| | |
Report of Independent Registered Public Accounting Firm | 72 |
| | |
Board of Trustees and Executive Officers | 74 |
| | |
Catholic Advisory Board | 76 |
| | |
About Your Funds’ Expenses | 78 |
| | |
Federal Tax Information | 80 |
| | |
Other Information | 80 |
This report is for the information of the shareholders of the Ave Maria Mutual Funds. To obtain a copy of the prospectus, please visit our website at www.avemariafunds.com or call 1-888-726-9331 and a copy will be sent to you free of charge. Please read the prospectus carefully before you invest. The Ave Maria Mutual Funds are distributed by Ultimus Fund Distributors, LLC.
Past performance is not predictive of future performance. Investment results and principal value will fluctuate so that shares, when redeemed, may be worth more or less than their original cost. Current performance may be higher or lower than the performance data quoted. Performance data, current to the most recent month end, is available at the Ave Maria Mutual Funds website at www.avemariafunds.com or by calling 1-888-726-9331.
AVE MARIA VALUE FUND
PORTFOLIO MANAGER COMMENTARY
(Unaudited)
Dear Fellow Shareholders,
2017 was another good year for the Ave Maria Value Fund (the “Fund”) with a total return of 17.73%, compared to 16.24% for the S&P 400 MidCap Index. The Fund’s outperformance can be attributed to broad gains across the portfolio with 16 stocks, from a variety of industries, each gaining more than 30% for the year. The investment climate in 2017 was tilted heavily in favor of large-cap companies and growth stocks, as compared to small-caps and value stocks. Among U.S. equity mutual funds tracked by Morningstar, the top performing fund category was large-cap growth, up 27.64%. In contrast, the worst performing fund category was small-cap value, up only 8.56%. In the S&P 500, the best performing sectors were growth-oriented ones such as technology, materials, and consumer discretionary. The value-oriented sectors such as consumer staples, utilities, and energy were laggards. The five stocks which contributed the most to the Fund’s positive performance were:
Company | Industry | 2017
Performance |
Interactive Brokers Group, Inc. | Investment Brokerage | +72.53% |
InterXion Holding N.V. | Internet Software & Services | +68.04% |
Moody’s Corporation | Business & Financial Services | +60.07% |
Texas Pacific Land Trust | Oil/Gas Royalties/Real Estate | +50.35% |
HEICO Corporation | Aerospace Products | +45.70% |
After a strong year of performance in 2016, the Fund’s energy related holdings performed poorly in 2017. Since peaking in January last year, oil and natural gas prices steadily declined throughout the year, due to in part to increased U.S. shale production, tepid global demand, and moderate weather. The five stocks which detracted the most from the Fund’s 2017’s performance were:
Company | Industry | 2017
Performance |
Range Resources, Inc. | Oil/Gas Exploration & Production | -31.62% |
Unico American Corporation | Specialty P&C Insurance | -22.22% |
Noble Energy, Inc. | Oil/Gas Exploration & Production | -21.05% |
Avnet, Inc. | Technology Distributors | -21.91% |
ARRIS International plc | Communications Equipment | -13.98% |
2
AVE MARIA VALUE FUND
PORTFOLIO MANAGER COMMENTARY
(Unaudited) (Continued)
During the second half of 2017, the Fund sold several stocks that reached our estimate of intrinsic value: Donaldson Company, Inc. (diversified machinery), Varian Medical Systems, Inc. (medical appliances & equipment), The Western Union Company (money transfer services), and PNC Financial Services Group – warrants (regional banking). Ubiquiti Networks, Inc. (communications equipment), was also liquidated based upon our reassessment of the company’s corporate governance practices, which we viewed as inadequate. New positions were established in two companies that meet our value investing criteria:
| | ● | American Airlines Group, Inc. (AAL) – is the world’s largest airline based on fleet size and destinations served. The U.S. airline industry has undergone positive fundamental and structural changes during the past decade, owing primarily to industry consolidation. Today, the four largest airlines have about 80% market share in the U.S., whereas 10 years ago it was 50%. This consolidation has resulted in numerous benefits to the airlines such as more rational pricing, increased ancillary revenue, flights with fewer empty seats and generally improved profitability. In our view, American Airlines has the best management in the industry and has produced strong profits and cash flow growth over the past several years. |
| | ● | Madison Square Garden Company (MSG) – owns and operates sports teams, entertainment productions, and various venues. Major holdings include the New York Knicks (NBA), the New York Rangers (NHL), Madison Square Garden arena in New York City, the Forum arena in Los Angeles, and the Rockettes. With a cash-rich balance sheet sporting $1 billion in net cash, and a market cap of only $5 billion, we believe the shares are trading at a significant discount to our sum-of-the-parts valuation, based upon its diverse portfolio of iconic and irreplaceable assets. |
The S&P 500 Index was up 21.83% in 2017, which was the 9th consecutive year of positive returns for that index, marking one of the longest running bull markets in history. While some commentators are writing the obituary for this bull, we remain generally optimistic. With an improving job market, moderate inflation, accommodative monetary policies globally, along with the recently enacted tax rate cuts, financial conditions appear conducive to robust economic growth, which should lead to rising corporate profits and higher stock prices over the long term. We believe 2018 could be another good year for U.S. equity returns. According to the Wall Street Journal Market Data Group, when the S&P 500 total return exceeds 19% for the year, 68% of the time it rises again the following year. No guarantees!
3
AVE MARIA VALUE FUND
PORTFOLIO MANAGER COMMENTARY
(Unaudited) (Continued)
As always, we believe our low-risk, value-oriented investment approach is a good way to achieve superior long-term investment returns. Despite stock market indices trading at or near all-time highs, the Fund owns many high-quality companies selling well below our estimate of intrinsic value. As such, we believe the Fund is well-positioned.
The year-end distribution of $1.64 per share consisted of long-term capital gains of $1.62 per share and short-term capital gains of $0.02 per share. The net asset value of the Fund ended the year at $20.88 per share.
Thank you for being a shareholder in the Ave Maria Value Fund.

| 
|
Timothy S. Schwartz, CFA | Joseph W. Skornicka, CFA |
Lead Portfolio Manager | Co-Portfolio Manager |

|
Chadd M. Garcia |
Co-Portfolio Manager |
4
AVE MARIA VALUE FUND
PERFORMANCE
(Unaudited) |
Comparison of the Change in Value of a $10,000 Investment
in the Ave Maria Value Fund and the S&P 400 Index
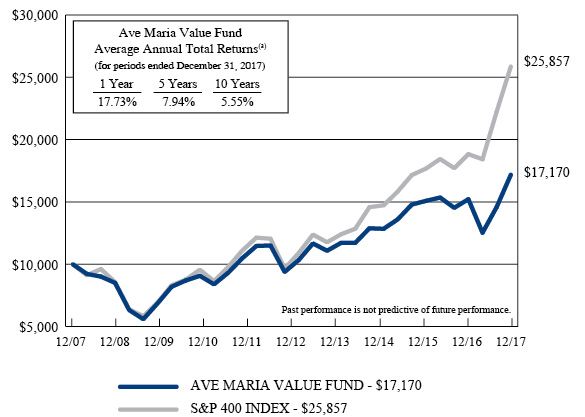
(a) | The returns shown do not reflect the deduction of taxes a shareholder would pay on Fund distributions or the redemption of Fund shares. |
Expense ratio as of 12-31-16 (as disclosed in May 1, 2017 prospectus) | 1.21%* |
Expense ratio for the year ended 12-31-17 | 1.19% |
* | Includes Acquired Fund Fees and Expenses. |
Past performance is not predictive of future performance. Investment results and principal value will fluctuate so that shares, when redeemed, may be worth more or less than their original cost. Current performance may be higher or lower than the performance data quoted. Performance data, current to the most recent month end, is available at the Ave Maria Mutual Funds website at www.avemariafunds.com or by calling 1-888-726-9331.
5
AVE MARIA VALUE FUND
ANNUAL TOTAL RATES OF RETURN
COMPARISON WITH MAJOR INDICES (Unaudited) |
| AVE MARIA
VALUE FUND | S&P 400
INDEX | S&P 500
INDEX |
2001 (a) | 5.3% | -0.5% | -8.5% |
2002 | -9.8% | -14.5% | -22.1% |
2003 | 35.6% | 35.6% | 28.7% |
2004 | 20.1% | 16.5% | 10.9% |
2005 | 5.8% | 12.6% | 4.9% |
2006 | 14.2% | 10.3% | 15.8% |
2007 | -4.0% | 8.0% | 5.5% |
2008 | -36.8% | -36.2% | -37.0% |
2009 | 37.6% | 37.4% | 26.5% |
2010 | 20.5% | 26.7% | 15.1% |
2011 | -1.3% | -1.7% | 2.1% |
2012 | 13.3% | 17.9% | 16.0% |
2013 | 26.2% | 33.5% | 32.4% |
2014 | 2.9% | 9.8% | 13.7% |
2015 | -17.7% | -2.2% | 1.4% |
2016 | 16.4% | 20.7% | 12.0% |
2017 | 17.7% | 16.2% | 21.8% |
AVERAGE ANNUAL TOTAL RETURNS
As of December 31, 2017 (Unaudited)
| AVE MARIA
VALUE FUND | S&P 400
INDEX | S&P 500
INDEX |
3 Years | 4.1% | 11.1% | 11.4% |
5 Years | 7.9% | 15.0% | 15.8% |
10 Years | 5.6% | 10.0% | 8.5% |
Since Inception (b) | 7.0% | 9.7% | 6.7% |
(a) | Represents the period from the commencement of operations (May 1, 2001) through December 31, 2001. |
(b) | Represents the period from the commencement of operations (May 1, 2001) through December 31, 2017. |
6
AVE MARIA VALUE FUND
TEN LARGEST EQUITY HOLDINGS
December 31, 2017 (Unaudited)
| Shares | | | Company | | Market Value | | | % of Net Assets | |
| | 25,500 | | | Texas Pacific Land Trust | | $ | 11,389,065 | | | | 4.6 | % |
| | 125,000 | | | HEICO Corporation - Class A | | | 9,881,250 | | | | 4.0 | % |
| | 400,000 | | | Liberty Interactive Corporation QVC Group - Series A | | | 9,768,000 | | | | 3.9 | % |
| | 150,000 | | | InterXion Holding N.V. | | | 8,839,500 | | | | 3.5 | % |
| | 165,000 | | | American Airlines Group, Inc. | | | 8,584,950 | | | | 3.4 | % |
| | 105,000 | | | Arrow Electronics, Inc. | | | 8,443,050 | | | | 3.4 | % |
| | 50,000 | | | Laboratory Corporation of America Holdings | | | 7,975,500 | | | | 3.2 | % |
| | 65,000 | | | Zimmer Biomet Holdings, Inc. | | | 7,843,550 | | | | 3.1 | % |
| | 100,000 | | | Discover Financial Services | | | 7,692,000 | | | | 3.1 | % |
| | 100,000 | | | Tractor Supply Company | | | 7,475,000 | | | | 3.0 | % |
ASSET ALLOCATION (Unaudited)
Sector | % of Net Assets |
Consumer Discretionary | 18.8% |
Consumer Staples | 5.1% |
Energy | 9.7% |
Financials | 15.1% |
Health Care | 7.9% |
Industrials | 17.6% |
Information Technology | 13.8% |
Materials | 2.6% |
Real Estate | 0.9% |
Money Market Funds, Liabilities in Excess of Other Assets | 8.5% |
| | 100.0% |
7
AVE MARIA VALUE FUND
SCHEDULE OF INVESTMENTS
December 31, 2017
| COMMON STOCKS — 91.5% | | Shares | | | Market Value | |
| Consumer Discretionary — 18.8% | | | | | | |
| Diversified Consumer Services — 3.4% | | | | | | |
| Graham Holdings Company - Class B | | | 5,000 | | | $ | 2,791,750 | |
| ServiceMaster Global Holdings, Inc. * | | | 110,000 | | | | 5,639,700 | |
| | | | | | | | 8,431,450 | |
| Household Durables — 2.4% | | | | | | | | |
| Garmin Ltd. | | | 100,000 | | | | 5,957,000 | |
| | | | | | | | | |
| Internet & Direct Marketing Retail — 3.9% | | | | | | | | |
| Liberty Interactive Corporation QVC Group - Series A * | | | 400,000 | | | | 9,768,000 | |
| | | | | | | | | |
| Media — 0.8% | | | | | | | | |
| Madison Square Garden Company (The) - Class A * | | | 10,000 | | | | 2,108,500 | |
| | | | | | | | | |
| Specialty Retail — 4.0% | | | | | | | | |
| AutoNation, Inc. * | | | 50,000 | | | | 2,566,500 | |
| Tractor Supply Company | | | 100,000 | | | | 7,475,000 | |
| | | | | | | | 10,041,500 | |
| Textiles, Apparel & Luxury Goods — 4.3% | | | | | | | | |
| Gildan Activewear, Inc. | | | 100,000 | | | | 3,230,000 | |
| VF Corporation | | | 100,000 | | | | 7,400,000 | |
| | | | | | | | 10,630,000 | |
| Consumer Staples — 5.1% | | | | | | | | |
| Beverages — 5.1% | | | | | | | | |
| Brown-Forman Corporation - Class B | | | 100,000 | | | | 6,867,000 | |
| Coca-Cola European Partners plc | | | 150,000 | | | | 5,977,500 | |
| | | | | | | | 12,844,500 | |
| Energy — 9.7% | | | | | | | | |
| Oil, Gas & Consumable Fuels — 9.7% | | | | | | | | |
| Noble Energy, Inc. | | | 200,000 | | | | 5,828,000 | |
| Pioneer Natural Resources Company | | | 40,000 | | | | 6,914,000 | |
| Texas Pacific Land Trust | | | 25,500 | | | | 11,389,065 | |
| | | | | | | | 24,131,065 | |
| Financials — 15.1% | | | | | | | | |
| Banks — 1.5% | | | | | | | | |
| Fifth Third Bancorp | | | 125,000 | | | | 3,792,500 | |
| | | | | | | | | |
| Capital Markets — 7.0% | | | | | | | | |
| Federated Investors, Inc. - Class B | | | 100,000 | | | | 3,608,000 | |
| Interactive Brokers Group, Inc. - Class A | | | 110,000 | | | | 6,513,100 | |
| Moody's Corporation | | | 50,000 | | | | 7,380,500 | |
| | | | | | | | 17,501,600 | |
8
AVE MARIA VALUE FUND
SCHEDULE OF INVESTMENTS
(Continued)
| COMMON STOCKS — 91.5% (Continued) | | Shares | | | Market Value | |
| Financials — 15.1% (Continued) | | | | | | |
| Consumer Finance — 3.1% | | | | | | |
| Discover Financial Services | | | 100,000 | | | $ | 7,692,000 | |
| | | | | | | | | |
| Insurance — 3.5% | | | | | | | | |
| Alleghany Corporation * | | | 10,536 | | | | 6,280,404 | |
Unico American Corporation * # (a) | | | 280,000 | | | | 2,380,000 | |
| | | | | | | | 8,660,404 | |
| Health Care — 7.9% | | | | | | | | |
| Health Care Equipment & Supplies — 3.1% | | | | | | | | |
| Zimmer Biomet Holdings, Inc. | | | 65,000 | | | | 7,843,550 | |
| | | | | | | | | |
| Health Care Providers & Services — 3.2% | | | | | | | | |
| Laboratory Corporation of America Holdings * | | | 50,000 | | | | 7,975,500 | |
| | | | | | | | | |
| Life Sciences Tools & Services — 1.6% | | | | | | | | |
| Waters Corporation * | | | 20,000 | | | | 3,863,800 | |
| | | | | | | | | |
| Industrials — 17.6% | | | | | | | | |
| Aerospace & Defense — 5.9% | | | | | | | | |
| HEICO Corporation - Class A | | | 125,000 | | | | 9,881,250 | |
| Hexcel Corporation | | | 80,000 | | | | 4,948,000 | |
| | | | | | | | 14,829,250 | |
| Airlines — 3.4% | | | | | | | | |
| American Airlines Group, Inc. | | | 165,000 | | | | 8,584,950 | |
| | | | | | | | | |
| Electrical Equipment — 2.4% | | | | | | | | |
| AMETEK, Inc. | | | 70,000 | | | | 5,072,900 | |
| Eaton Corporation plc | | | 10,000 | | | | 790,100 | |
| | | | | | | | 5,863,000 | |
| Machinery — 3.6% | | | | | | | | |
| Colfax Corporation * | | | 75,000 | | | | 2,971,500 | |
| Graco, Inc. | | | 135,000 | | | | 6,104,700 | |
| | | | | | | | 9,076,200 | |
| Road & Rail — 2.3% | | | | | | | | |
| AMERCO | | | 15,000 | | | | 5,668,650 | |
| | | | | | | | | |
| Information Technology — 13.8% | | | | | | | | |
| Communications Equipment — 2.3% | | | | | | | | |
| ARRIS International plc * | | | 230,000 | | | | 5,908,700 | |
9
AVE MARIA VALUE FUND
SCHEDULE OF INVESTMENTS
(Continued)
| COMMON STOCKS — 91.5% (Continued) | | Shares | | | Market Value | |
| Information Technology — 13.8% (Continued) | | | | | | |
| Electronic Equipment, Instruments & Components — 4.5% | | | | | | |
| Arrow Electronics, Inc. * | | | 105,000 | | | $ | 8,443,050 | |
| Avnet, Inc. | | | 70,000 | | | | 2,773,400 | |
| | | | | | | | 11,216,450 | |
| IT Services — 5.2% | | | | | | | | |
| Cognizant Technology Solutions Corporation - Class A | | | 60,000 | | | | 4,261,200 | |
| InterXion Holding N.V. * | | | 150,000 | | | | 8,839,500 | |
| | | | | | | | 13,100,700 | |
| Software — 1.2% | | | | | | | | |
| ANSYS, Inc. * | | | 20,000 | | | | 2,951,800 | |
| | | | | | | | | |
| Technology Hardware, Storage & Peripherals — 0.6% | | | | | | | | |
| Hewlett Packard Enterprise Company | | | 100,000 | | | | 1,436,000 | |
| | | | | | | | | |
| Materials — 2.6% | | | | | | | | |
| Chemicals — 2.6% | | | | | | | | |
| Axalta Coating Systems Ltd. * | | | 200,000 | | | | 6,472,000 | |
| | | | | | | | | |
| Real Estate — 0.9% | | | | | | | | |
| Equity Real Estate Investment Trusts (REITs) — 0.9% | | | | | | | | |
| Equinix, Inc. | | | 4,948 | | | | 2,242,533 | |
| | | | | | | | | |
Total Common Stocks (Cost $163,620,249) | | | | | | $ | 228,591,602 | |
10
AVE MARIA VALUE FUND
SCHEDULE OF INVESTMENTS
(Continued)
| MONEY MARKET FUNDS — 9.0% | | Shares | | | Market Value | |
Federated Government Obligations Tax-Managed Fund - Institutional Shares, 1.05% (b) | | | 11,771,765 | | | $ | 11,771,765 | |
Federated Treasury Obligations Fund - Institutional Shares, 1.13% (b) | | | 10,811,643 | | | | 10,811,643 | |
Total Money Market Funds (Cost $22,583,408) | | | | | | $ | 22,583,408 | |
| | | | | | | | | |
Total Investments at Market Value — 100.5% (Cost $186,203,657) | | | | | | $ | 251,175,010 | |
| | | | | | | | | |
| Liabilities in Excess of Other Assets — (0.5%) | | | | | | | (1,283,435 | ) |
| | | | | | | | | |
| Net Assets — 100.0% | | | | | | $ | 249,891,575 | |
* | Non-income producing security. |
# | The Fund owns 5% or more of the company’s outstanding voting shares thereby making the company an affiliated company as that term is defined in the Investment Company Act of 1940 (Note 5). |
(a) | Security value has been determined in good faith pursuant to procedures adopted by the Board of Trustees. The total value of such securities was $2,380,000 at December 31, 2017, representing 1.0% of net assets (Note 1). |
(b) | The rate shown is the 7-day effective yield as of December 31, 2017. |
See accompanying notes to financial statements. |
11
AVE MARIA GROWTH FUND
PORTFOLIO MANAGER COMMENTARY
(Unaudited)
Dear Fellow Shareholders,
For 2017, the Ave Maria Growth Fund (the “Fund”) had a total return of 27.36% compared with the benchmark S&P 500 Index total return of 21.83%. In 2017, the Morningstar mid-cap growth peer group average total return was 23.97%. For a combination of moral and valuation reasons, it’s worth noting the Fund did not own any of the “FAANG” stocks, which is the acronym for Facebook, Amazon, Apple, Netflix, and Alphabet’s Google. On average, the FAANG stocks were up 50% in 2017. The FAANGs, excluding Netflix which isn’t part of the S&P 500 Index, accounted for 10% of the S&P 500 market capitalization weighting and accounted for 17% of its 21.83% return.
The Fund’s growth-at-a-reasonable-price (GARP) investment style continues to produce consistently favorable results. As of December 31, 2017, the Fund’s 10-year average annual return was 9.41% compared with the S&P 500 Index average annual return of 8.50%. The Fund seeks to invest in companies with sustainable competitive advantages, above-average growth prospects, and high returns on equity. From our perspective, it’s important for the high returns on equity to be derived from high margins and asset turnover rather than high financial leverage. The aggregate return on equity of the Fund’s holdings as of year-end was 20.7% compared with 13.0% for the S&P 500 Index.
A notable addition to the Fund during the second half of 2017 was O’Reilly Automotive, which is now a top 10 holding in the Fund. Our team has been following O’Reilly for a couple of years. When O’Reilly’s stock price declined from $280 at the beginning of 2017 to under $175 in July, we aggressively bought shares, believing the Amazon threat to be exaggerated and recent industry weakness to be temporary. We view O’Reilly as the best operator among the automotive aftermarket retailers, with a good portion of sales to professional mechanics that place an average of 6-8 orders per day for same day delivery. Plus, most of O’Reilly’s revenue is from driving-related parts, which is less vulnerable to the e-commerce threat than discretionary and maintenance items. Time is money for professional mechanics, and do-it-yourselfers don’t want to risk ordering the wrong part online when they need the vehicle running as soon as possible. These factors lessen the e-commerce threat.
12
AVE MARIA GROWTH FUND
PORTFOLIO MANAGER COMMENTARY
(Unaudited) (Continued)
Our goal remains to purchase shares of exceptional companies at attractive prices to produce favorable returns over the long run. Our team continues to spend considerable time searching for companies that fit our quality and price requirements. We appreciate your participation in the Ave Maria Growth Fund.
With best regards,

| 
|
Brian D. Milligan, CFA | Richard L. Platte, Jr., CFA |
Lead Portfolio Manager | Co-Portfolio Manager |
13
AVE MARIA GROWTH FUND
PERFORMANCE
(Unaudited) |
Comparison of the Change in Value of a $10,000 Investment
in the Ave Maria Growth Fund and the S&P 500 Index
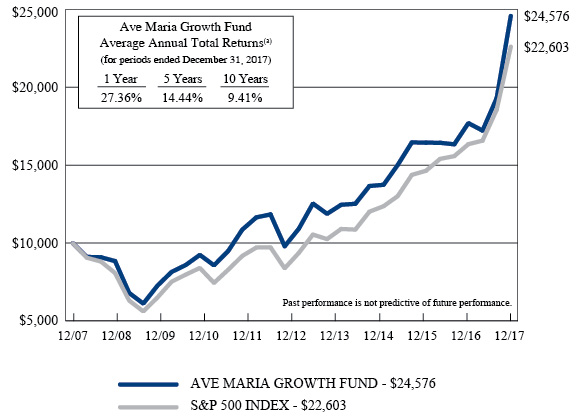
(a) | The returns shown do not reflect the deduction of taxes a shareholder would pay on Fund distributions or the redemption of Fund shares. |
Expense ratio as of 12-31-16 (as disclosed in May 1, 2017 prospectus) | 1.07%* |
Expense ratio for the year ended 12-31-17 | 1.08% |
* | Includes Acquired Fund Fees and Expenses. |
Past performance is not predictive of future performance. Investment results and principal value will fluctuate so that shares, when redeemed, may be worth more or less than their original cost. Current performance may be higher or lower than the performance data quoted. Performance data, current to the most recent month end, is available at the Ave Maria Mutual Funds website at www.avemariafunds.com or by calling 1-888-726-9331.
14
AVE MARIA GROWTH FUND
ANNUAL TOTAL RATES OF RETURN
COMPARISON WITH MAJOR INDICES (Unaudited) |
| AVE MARIA GROWTH FUND | S&P 500 INDEX |
2003 (a) | 23.4% | 22.8% |
2004 | 21.5% | 10.9% |
2005 | 0.3% | 4.9% |
2006 | 15.8% | 15.8% |
2007 | 11.6% | 5.5% |
2008 | -32.1% | -37.0% |
2009 | 26.4% | 26.5% |
2010 | 26.5% | 15.1% |
2011 | 0.5% | 2.1% |
2012 | 14.7% | 16.0% |
2013 | 31.5% | 32.4% |
2014 | 7.5% | 13.7% |
2015 | -2.7% | 1.4% |
2016 | 12.1% | 12.0% |
2017 | 27.4% | 21.8% |
AVERAGE ANNUAL TOTAL RETURNS
As of December 31, 2017 (Unaudited)
| AVE MARIA GROWTH FUND | S&P 500 INDEX |
3 Years | 11.6% | 11.4% |
5 Years | 14.4% | 15.8% |
10 Years | 9.4% | 8.5% |
Since Inception (b) | 11.3% | 9.8% |
(a) | Represents the period from the commencement of operations (May 1, 2003) through December 31, 2003. |
(b) | Represents the period from the commencement of operations (May 1, 2003) through December 31, 2017. |
15
AVE MARIA GROWTH FUND
TEN LARGEST EQUITY HOLDINGS
December 31, 2017 (Unaudited)
| Shares | | | Company | | Market Value | | | % of Net Assets | |
| | 185,000 | | | Lowe's Companies, Inc. | | $ | 17,193,900 | | | | 3.6 | % |
| | 110,000 | | | MasterCard, Inc. - Class A | | | 16,649,600 | | | | 3.5 | % |
| | 385,000 | | | Copart, Inc. | | | 16,628,150 | | | | 3.4 | % |
| | 111,000 | | | Moody's Corporation | | | 16,384,710 | | | | 3.4 | % |
| | 100,000 | | | Accenture plc - Class A | | | 15,309,000 | | | | 3.2 | % |
| | 62,000 | | | O'Reilly Automotive, Inc. | | | 14,913,480 | | | | 3.1 | % |
| | 130,000 | | | Visa, Inc. - Class A | | | 14,822,600 | | | | 3.1 | % |
| | 225,000 | | | Hexcel Corporation | | | 13,916,250 | | | | 2.9 | % |
| | 110,000 | | | Zimmer Biomet Holdings, Inc. | | | 13,273,700 | | | | 2.8 | % |
| | 66,000 | | | Rockwell Automation, Inc. | | | 12,959,100 | | | | 2.7 | % |
ASSET ALLOCATION (Unaudited)
Sector | % of Net Assets |
Consumer Discretionary | 19.9% |
Consumer Staples | 1.8% |
Energy | 1.0% |
Financials | 4.5% |
Health Care | 14.1% |
Industrials | 27.7% |
Information Technology | 15.8% |
Materials | 3.5% |
Real Estate | 0.9% |
Money Market Funds, Liabilities in Excess of Other Assets | 10.8% |
| | 100.0% |
16
AVE MARIA GROWTH FUND
SCHEDULE OF INVESTMENTS
December 31, 2017
| COMMON STOCKS — 89.2% | | Shares | | | Market Value | |
| Consumer Discretionary — 19.9% | | | | | | |
| Internet & Direct Marketing Retail — 2.5% | | | | | | |
| Priceline Group, Inc. (The) * | | | 7,000 | | | $ | 12,164,180 | |
| | | | | | | | | |
| Media — 1.6% | | | | | | | | |
| Omnicom Group, Inc. | | | 105,000 | | | | 7,647,150 | |
| | | | | | | | | |
| Specialty Retail — 13.3% | | | | | | | | |
| AutoNation, Inc. * | | | 150,000 | | | | 7,699,500 | |
| Lowe's Companies, Inc. | | | 185,000 | | | | 17,193,900 | |
| O'Reilly Automotive, Inc. * | | | 62,000 | | | | 14,913,480 | |
| Ross Stores, Inc. | | | 94,000 | | | | 7,543,500 | |
| TJX Companies, Inc. (The) | | | 105,000 | | | | 8,028,300 | |
| Tractor Supply Company | | | 120,000 | | | | 8,970,000 | |
| | | | | | | | 64,348,680 | |
| Textiles, Apparel & Luxury Goods — 2.5% | | | | | | | | |
| VF Corporation | | | 160,000 | | | | 11,840,000 | |
| | | | | | | | | |
| Consumer Staples — 1.8% | | | | | | | | |
| Beverages — 1.8% | | | | | | | | |
| Brown-Forman Corporation - Class B | | | 125,000 | | | | 8,583,750 | |
| | | | | | | | | |
| Energy — 1.0% | | | | | | | | |
| Energy Equipment & Services — 0.5% | | | | | | | | |
| Schlumberger Limited | | | 40,000 | | | | 2,695,600 | |
| | | | | | | | | |
| Oil, Gas & Consumable Fuels — 0.5% | | | | | | | | |
| Texas Pacific Land Trust | | | 5,000 | | | | 2,233,150 | |
| | | | | | | | | |
| Financials — 4.5% | | | | | | | | |
| Capital Markets — 4.5% | | | | | | | | |
| Charles Schwab Corporation (The) | | | 100,000 | | | | 5,137,000 | |
| Moody's Corporation | | | 111,000 | | | | 16,384,710 | |
| | | | | | | | 21,521,710 | |
| Health Care — 14.1% | | | | | | | | |
| Biotechnology — 2.3% | | | | | | | | |
| Amgen, Inc. | | | 64,000 | | | | 11,129,600 | |
| | | | | | | | | |
| Health Care Equipment & Supplies — 6.6% | | | | | | | | |
| Medtronic plc | | | 145,000 | | | | 11,708,750 | |
| Varian Medical Systems, Inc. * | | | 63,000 | | | | 7,002,450 | |
| Zimmer Biomet Holdings, Inc. | | | 110,000 | | | | 13,273,700 | |
| | | | | | | | 31,984,900 | |
17
AVE MARIA GROWTH FUND
SCHEDULE OF INVESTMENTS
(Continued)
| COMMON STOCKS — 89.2% (Continued) | | Shares | | | Market Value | |
| Health Care — 14.1% (Continued) | | | | | | |
| Health Care Providers & Services — 2.6% | | | | | | |
| Laboratory Corporation of America Holdings * | | | 78,000 | | | $ | 12,441,780 | |
| | | | | | | | | |
| Health Care Technology — 2.6% | | | | | | | | |
| Cerner Corporation * | | | 183,000 | | | | 12,332,370 | |
| | | | | | | | | |
| Industrials — 27.7% | | | | | | | | |
| Aerospace & Defense — 2.9% | | | | | | | | |
| Hexcel Corporation | | | 225,000 | | | | 13,916,250 | |
| | | | | | | | | |
| Air Freight & Logistics — 3.8% | | | | | | | | |
| Expeditors International of Washington, Inc. | | | 110,000 | | | | 7,115,900 | |
| United Parcel Service, Inc. - Class B | | | 95,000 | | | | 11,319,250 | |
| | | | | | | | 18,435,150 | |
| Commercial Services & Supplies — 3.9% | | | | | | | | |
| Copart, Inc. * | | | 385,000 | | | | 16,628,150 | |
| Rollins, Inc. | | | 50,000 | | | | 2,326,500 | |
| | | | | | | | 18,954,650 | |
| Electrical Equipment — 5.3% | | | | | | | | |
| AMETEK, Inc. | | | 172,000 | | | | 12,464,840 | |
| Rockwell Automation, Inc. | | | 66,000 | | | | 12,959,100 | |
| | | | | | | | 25,423,940 | |
| Industrial Conglomerates — 1.6% | | | | | | | | |
| Roper Technologies, Inc. | | | 30,000 | | | | 7,770,000 | |
| | | | | | | | | |
| Machinery — 8.0% | | | | | | | | |
| Colfax Corporation * | | | 270,000 | | | | 10,697,400 | |
| Donaldson Company, Inc. | | | 190,000 | | | | 9,300,500 | |
| Fortive Corporation | | | 95,000 | | | | 6,873,250 | |
| Graco, Inc. | | | 264,000 | | | | 11,938,080 | |
| | | | | | | | 38,809,230 | |
| Trading Companies & Distributors — 2.2% | | | | | | | | |
| MSC Industrial Direct Company, Inc. - Class A | | | 110,000 | | | | 10,632,600 | |
| | | | | | | | | |
| Information Technology — 15.8% | | | | | | | | |
| IT Services — 13.1% | | | | | | | | |
| Accenture plc - Class A | | | 100,000 | | | | 15,309,000 | |
| Broadridge Financial Solutions, Inc. | | | 40,000 | | | | 3,623,200 | |
| Cognizant Technology Solutions Corporation - Class A | | | 180,000 | | | | 12,783,600 | |
| MasterCard, Inc. - Class A | | | 110,000 | | | | 16,649,600 | |
| Visa, Inc. - Class A | | | 130,000 | | | | 14,822,600 | |
| | | | | | | | 63,188,000 | |
18
AVE MARIA GROWTH FUND
SCHEDULE OF INVESTMENTS
(Continued)
| COMMON STOCKS — 89.2% (Continued) | | Shares | | | Market Value | |
| Information Technology — 15.8% (Continued) | | | | | | |
| Semiconductors & Semiconductor Equipment — 0.8% | | | | | | |
| Texas Instruments, Inc. | | | 37,000 | | | $ | 3,864,280 | |
| | | | | | | | | |
| Software — 1.9% | | | | | | | | |
| ANSYS, Inc. * | | | 61,000 | | | | 9,002,990 | |
| | | | | | | | | |
| Materials — 3.5% | | | | | | | | |
| Chemicals — 3.5% | | | | | | | | |
| Ecolab, Inc. | | | 45,000 | | | | 6,038,100 | |
| Praxair, Inc. | | | 69,000 | | | | 10,672,920 | |
| | | | | | | | 16,711,020 | |
| Real Estate — 0.9% | | | | | | | | |
| Equity Real Estate Investment Trust (REITs) — 0.9% | | | | | | | | |
| Equinix, Inc. | | | 10,000 | | | | 4,532,200 | |
| | | | | | | | | |
Total Common Stocks (Cost $290,125,092) | | | | | | $ | 430,163,180 | |
| MONEY MARKET FUNDS — 10.9% | | Shares | | | Market Value | |
Federated Government Obligations Tax-Managed Fund - Institutional Shares, 1.05% (a) | | | 22,968,538 | | | $ | 22,968,538 | |
Federated Treasury Obligations Fund - Institutional Shares, 1.13% (a) | | | 22,928,538 | | | | 22,928,538 | |
Federated U.S. Treasury Cash Reserves Fund - Institutional Shares, 1.05% (a) | | | 6,839,541 | | | | 6,839,541 | |
Total Money Market Funds (Cost $52,736,617) | | | | | | $ | 52,736,617 | |
| | | | | | | | | |
Total Investments at Market Value — 100.1% (Cost $342,861,709) | | | | | | $ | 482,899,797 | |
| | | | | | | | | |
| Liabilities in Excess of Other Assets — (0.1%) | | | | | | | (384,665 | ) |
| | | | | | | | | |
| Net Assets — 100.0% | | | | | | $ | 482,515,132 | |
* | Non-income producing security. |
(a) | The rate shown is the 7-day effective yield as of December 31, 2017. |
See accompanying notes to financial statements. |
19
AVE MARIA RISING DIVIDEND FUND
PORTFOLIO MANAGER COMMENTARY
(Unaudited)
Dear Fellow Shareholders,
For the year ended December 31, 2017, the Ave Maria Rising Dividend Fund (the “Fund”) had a total return of 16.82% vs. 21.83% for the S&P 500. The stock market favored companies that were expected to grow rapidly. Our companies continued to do well, with the majority continuing to grow their earnings and raise their dividends. Most of the stocks contributed positively to returns, with the greatest contributions coming from Moody’s Corp. (credit ratings, analytical services); VF Corp. (apparel); and Diageo plc (beverages). The biggest detractors to overall performance came from W.W. Grainger (distributor); Schlumberger, Ltd. (energy services); and Omnicom (advertising & marketing). In the case of W.W. Grainger, after careful review, we concluded that it was more susceptible to the threat posed by Amazon than previously thought, so we exited the position. We subsequently purchased another distributor, MSC Industrial Direct Co., that was considered less vulnerable to that threat. In the case of Omnicom, we concluded that fears of Alphabet/Google and Facebook had unduly depressed the stock price, and the Fund continued to hold the stock. As a company providing energy services, Schlumberger’s performance and stock price is greatly influenced by energy prices. It therefore seemed likely that the price of Schlumberger’s stock would improve with higher energy prices. As of this writing, that scenario seems to be unfolding.
Much of 2017 seemed to be taken up with the press trying to assess what damage Amazon would inflict on various business models. When Amazon bought Whole Foods during the year, suddenly nothing was considered beyond the threat. Closer examination revealed that not all business models were equally exposed to the threat. Not every product lends itself to being sold over the internet. Some of our retail holdings rely upon the customer experience (TJX Companies), while others deal in bulky items that don’t lend themselves to easy shipping (Tractor Supply Company, Lowe’s Companies). Other retailers, such as Williams Sonoma, have already made the adjustment to the internet with a meaningful component of their sales through that medium. A similar review of the distributors reveals distinctions based upon what was being distributed and the services associated with those items. W.W. Grainger, as stated above, was at least somewhat vulnerable to having its moat eroded by Amazon, while MSC Industrial’s more specialized industrial products required more customer touch and afforded MSC a more durable moat. Our overall conclusion, the threat that Amazon, and other similar distribution models, poses to certain business models is real, but there are limits to what even Amazon can do. (Amazon, incidentally, fails to pass our moral screens.)
20
AVE MARIA RISING DIVIDEND FUND
PORTFOLIO MANAGER COMMENTARY
(Unaudited) (Continued)
Fundamentally, we are encouraged by the outlook for economic and corporate earnings growth. However, in an environment where more and more money is being invested in a non-discerning manner, i.e. index funds, and the greatest fear seems to be one of missing out, we are focusing increasingly on risk and valuations.
We appreciate your participation in the Ave Maria Rising Dividend Fund.
Sincerely,

|
|
Richard L. Platte, Jr., CFA | George P. Schwartz, CFA |
Lead Portfolio Manager | Co-Portfolio Manager |
21
AVE MARIA RISING DIVIDEND FUND
PERFORMANCE
(Unaudited) |
Comparison of the Change in Value of a $10,000 Investment
in the Ave Maria Rising Dividend Fund and the S&P 500 Index
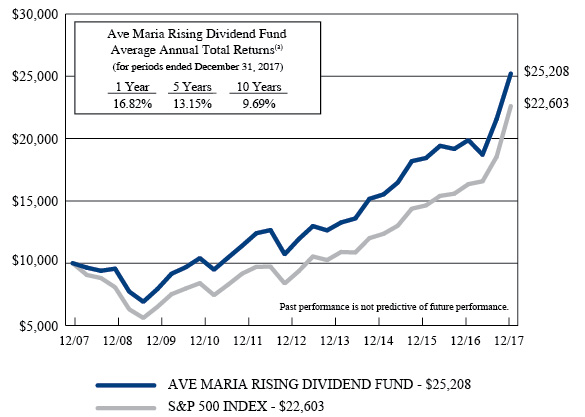
(a) | The returns shown do not reflect the deduction of taxes a shareholder would pay on Fund distributions or the redemption of Fund shares. |
Expense ratio as of 12-31-16 (as disclosed in May 1, 2017 prospectus) | 0.93%* |
Expense ratio for the year ended 12-31-17 | 0.92% |
* | Includes Acquired Fund Fees and Expenses. |
Past performance is not predictive of future performance. Investment results and principal value will fluctuate so that shares, when redeemed, may be worth more or less than their original cost. Current performance may be higher or lower than the performance data quoted. Performance data, current to the most recent month end, is available at the Ave Maria Mutual Funds website at www.avemariafunds.com or by calling 1-888-726-9331.
22
AVE MARIA RISING DIVIDEND FUND
ANNUAL TOTAL RATES OF RETURN
COMPARISON WITH MAJOR INDICES (Unaudited) |
| AVE MARIA
RISING DIVIDEND FUND | S&P 500 INDEX |
2005 (a) | 6.7% | 8.8% |
2006 | 17.9% | 15.8% |
2007 | -0.6% | 5.5% |
2008 | -22.8% | -37.0% |
2009 | 25.3% | 26.5% |
2010 | 17.9% | 15.1% |
2011 | 4.6% | 2.1% |
2012 | 13.9% | 16.0% |
2013 | 33.9% | 32.4% |
2014 | 9.3% | 13.7% |
2015 | -5.9% | 1.4% |
2016 | 15.3% | 12.0% |
2017 | 16.8% | 21.8% |
AVERAGE ANNUAL TOTAL RETURNS
As of December 31, 2017 (Unaudited)
| AVE MARIA
RISING DIVIDEND FUND | S&P 500 INDEX |
3 Years | 8.2% | 11.4% |
5 Years | 13.2% | 15.8% |
10 Years | 9.7% | 8.5% |
Since Inception (b) | 9.5% | 9.1% |
(a) | Represents the period from the commencement of operations (May 2, 2005) through December 31, 2005. |
(b) | Represents the period from the commencement of operations (May 2, 2005) through December 31, 2017. |
23
AVE MARIA RISING DIVIDEND FUND
TEN LARGEST EQUITY HOLDINGS
December 31, 2017 (Unaudited)
| Shares | | | Company | | Market Value | | | % of Net Assets | |
| | 240,000 | | | Moody's Corporation | | $ | 35,426,400 | | | | 3.7 | % |
| | 230,000 | | | Diageo plc - ADR | | | 33,586,900 | | | | 3.5 | % |
| | 360,000 | | | Lowe's Companies, Inc. | | | 33,458,400 | | | | 3.4 | % |
| | 450,000 | | | VF Corporation | | | 33,300,000 | | | | 3.4 | % |
| | 275,000 | | | United Parcel Service, Inc. - Class B | | | 32,766,250 | | | | 3.4 | % |
| | 425,000 | | | Tractor Supply Company | | | 31,768,750 | | | | 3.3 | % |
| | 800,000 | | | Cisco Systems, Inc. | | | 30,640,000 | | | | 3.1 | % |
| | 250,000 | | | Zimmer Biomet Holdings, Inc. | | | 30,167,500 | | | | 3.1 | % |
| | 190,000 | | | Praxair, Inc. | | | 29,389,200 | | | | 3.0 | % |
| | 360,000 | | | Medtronic plc | | | 29,070,000 | | | | 3.0 | % |
ASSET ALLOCATION (Unaudited)
Sector | % of Net Assets |
Consumer Discretionary | 17.9% |
Consumer Staples | 7.8% |
Energy | 4.9% |
Financials | 18.1% |
Health Care | 8.9% |
Industrials | 21.2% |
Information Technology | 8.8% |
Materials | 5.5% |
Money Market Funds, Other Assets in Excess of Liabilities | 6.9% |
| | 100.0% |
24
AVE MARIA RISING DIVIDEND FUND
SCHEDULE OF INVESTMENTS
December 31, 2017
| COMMON STOCKS — 93.1% | | Shares | | | Market Value | |
| Consumer Discretionary — 17.9% | | | | | | |
| Internet & Direct Marketing Retail — 0.5% | | | | | | |
| Priceline Group, Inc. (The) * | | | 3,000 | | | $ | 5,213,220 | |
| | | | | | | | | |
| Leisure Products — 0.8% | | | | | | | | |
| Polaris Industries, Inc. | | | 60,000 | | | | 7,439,400 | |
| | | | | | | | | |
| Media — 2.2% | | | | | | | | |
| Omnicom Group, Inc. | | | 300,000 | | | | 21,849,000 | |
| | | | | | | | | |
| Specialty Retail — 11.0% | | | | | | | | |
| Lowe's Companies, Inc. | | | 360,000 | | | | 33,458,400 | |
| TJX Companies, Inc. (The) | | | 375,000 | | | | 28,672,500 | |
| Tractor Supply Company | | | 425,000 | | | | 31,768,750 | |
| Williams-Sonoma, Inc. | | | 240,000 | | | | 12,408,000 | |
| | | | | | | | 106,307,650 | |
| Textiles, Apparel & Luxury Goods — 3.4% | | | | | | | | |
| VF Corporation | | | 450,000 | | | | 33,300,000 | |
| | | | | | | | | |
| Consumer Staples — 7.8% | | | | | | | | |
| Beverages — 5.6% | | | | | | | | |
| Brown-Forman Corporation - Class B | | | 300,000 | | | | 20,601,000 | |
| Diageo plc - ADR | | | 230,000 | | | | 33,586,900 | |
| | | | | | | | 54,187,900 | |
| Food Products — 2.2% | | | | | | | | |
| Mondelēz International, Inc. - Class A | | | 500,000 | | | | 21,400,000 | |
| | | | | | | | | |
| Energy — 4.9% | | | | | | | | |
| Energy Equipment & Services — 2.8% | | | | | | | | |
| Schlumberger Limited | | | 400,000 | | | | 26,956,000 | |
| | | | | | | | | |
| Oil, Gas & Consumable Fuels — 2.1% | | | | | | | | |
| Exxon Mobil Corporation | | | 240,000 | | | | 20,073,600 | |
| | | | | | | | | |
| Financials — 18.1% | | | | | | | | |
| Banks — 8.3% | | | | | | | | |
| BB&T Corporation | | | 425,000 | | | | 21,131,000 | |
| Fifth Third Bancorp | | | 650,000 | | | | 19,721,000 | |
| PNC Financial Services Group, Inc. (The) | | | 125,000 | | | | 18,036,250 | |
| U.S. Bancorp | | | 400,000 | | | | 21,432,000 | |
| | | | | | | | 80,320,250 | |
25
AVE MARIA RISING DIVIDEND FUND
SCHEDULE OF INVESTMENTS
(Continued)
| COMMON STOCKS — 93.1% (Continued) | | Shares | | | Market Value | |
| Financials — 18.1% (Continued) | | | | | | |
| Capital Markets — 6.0% | | | | | | |
| Bank of New York Mellon Corporation (The) | | | 425,000 | | | $ | 22,890,500 | |
| Moody's Corporation | | | 240,000 | | | | 35,426,400 | |
| | | | | | | | 58,316,900 | |
| Consumer Finance — 1.6% | | | | | | | | |
| Discover Financial Services | | | 200,000 | | | | 15,384,000 | |
| | | | | | | | | |
| Insurance — 2.2% | | | | | | | | |
| Chubb Limited | | | 150,000 | | | | 21,919,500 | |
| | | | | | | | | |
| Health Care — 8.9% | | | | | | | | |
| Biotechnology — 2.8% | | | | | | | | |
| Amgen, Inc. | | | 155,000 | | | | 26,954,500 | |
| | | | | | | | | |
| Health Care Equipment & Supplies — 6.1% | | | | | | | | |
| Medtronic plc | | | 360,000 | | | | 29,070,000 | |
| Zimmer Biomet Holdings, Inc. | | | 250,000 | | | | 30,167,500 | |
| | | | | | | | 59,237,500 | |
| Industrials — 21.2% | | | | | | | | |
| Aerospace & Defense — 2.6% | | | | | | | | |
| Hexcel Corporation | | | 410,000 | | | | 25,358,500 | |
| | | | | | | | | |
| Air Freight & Logistics — 3.4% | | | | | | | | |
| United Parcel Service, Inc. - Class B | | | 275,000 | | | | 32,766,250 | |
| | | | | | | | | |
| Building Products — 2.6% | | | | | | | | |
| Johnson Controls International plc | | | 660,000 | | | | 25,152,600 | |
| | | | | | | | | |
| Electrical Equipment — 0.6% | | | | | | | | |
| Eaton Corporation plc | | | 75,000 | | | | 5,925,750 | |
| | | | | | | | | |
| Industrial Conglomerates — 2.8% | | | | | | | | |
| 3M Company | | | 115,000 | | | | 27,067,550 | |
| | | | | | | | | |
| Machinery — 5.5% | | | | | | | | |
| Donaldson Company, Inc. | | | 350,000 | | | | 17,132,500 | |
| Graco, Inc. | | | 345,000 | | | | 15,600,900 | |
| Illinois Tool Works, Inc. | | | 125,000 | | | | 20,856,250 | |
| | | | | | | | 53,589,650 | |
| Road & Rail — 1.0% | | | | | | | | |
| Norfolk Southern Corporation | | | 65,000 | | | | 9,418,500 | |
26
AVE MARIA RISING DIVIDEND FUND
SCHEDULE OF INVESTMENTS
(Continued)
| COMMON STOCKS — 93.1% (Continued) | | Shares | | | Market Value | |
| Industrials — 21.2% (Continued) | | | | | | |
| Trading Companies & Distributors — 2.7% | | | | | | |
| MSC Industrial Direct Company, Inc. - Class A | | | 275,000 | | | $ | 26,581,500 | |
| | | | | | | | | |
| Information Technology — 8.8% | | | | | | | | |
| Communications Equipment — 3.1% | | | | | | | | |
| Cisco Systems, Inc. | | | 800,000 | | | | 30,640,000 | |
| | | | | | | | | |
| IT Services — 4.3% | | | | | | | | |
| Broadridge Financial Solutions, Inc. | | | 175,000 | | | | 15,851,500 | |
| Cognizant Technology Solutions Corporation - Class A | | | 360,000 | | | | 25,567,200 | |
| | | | | | | | 41,418,700 | |
| Semiconductors & Semiconductor Equipment — 1.4% | | | | | | | | |
| Microchip Technology, Inc. | | | 150,000 | | | | 13,182,000 | |
| | | | | | | | | |
| Materials — 5.5% | | | | | | | | |
| Chemicals — 5.5% | | | | | | | | |
| Praxair, Inc. | | | 190,000 | | | | 29,389,200 | |
| RPM International, Inc. | | | 450,000 | | | | 23,589,000 | |
| | | | | | | | 52,978,200 | |
| | | | | | | | | |
Total Common Stocks (Cost $705,669,604) | | | | | | $ | 902,938,620 | |
| |
| MONEY MARKET FUNDS — 6.9% | | Shares | | | Market Value | |
Federated Government Obligations Tax-Managed Fund - Institutional Shares, 1.05% (a) | | | 46,807,196 | | | $ | 46,807,196 | |
Federated Treasury Obligations Fund - Institutional Shares, 1.13% (a) | | | 20,350,247 | | | | 20,350,247 | |
Total Money Market Funds (Cost $67,157,443) | | | | | | $ | 67,157,443 | |
| | | | | | | | | |
Total Investments at Market Value — 100.0% (Cost $772,827,047) | | | | | | $ | 970,096,063 | |
| | | | | | | | | |
Other Assets in Excess of Liabilities — 0.0% (b) | | | | | | | 12,471 | |
| | | | | | | | | |
| Net Assets — 100.0% | | | | | | $ | 970,108,534 | |
ADR - American Depositary Receipt. |
* | Non-income producing security. |
(a) | The rate shown is the 7-day effective yield as of December 31, 2017. |
(b) | Percentage rounds to less than 0.1%. |
See accompanying notes to financial statements. |
27
AVE MARIA WORLD EQUITY FUND
PORTFOLIO MANAGER COMMENTARY
(Unaudited)
Dear Fellow Shareholders,
The Ave Maria World Equity Fund (the “Fund”) posted a total return of 17.88% for the twelve months ended December 31, 2017, while the S&P Global 1200 Index rose 23.84% for the same period.
We entered 2017 hopeful about the potential for tax reform and a more favorable regulatory environment for business. By the end of the year our patience was rewarded. Normalcy also seems to be returning to interest rates. During 2017 the Federal Reserve raised short-term interest rates in the U.S. three separate times and is forecasting three more hikes in 2018 and 2019. Central banks in Europe and Japan have continued their very loose monetary policies, however. The fiscal & monetary policy actions combined, along with accelerating global earnings growth, helped fuel significant gains in global equity markets. The developed equity markets showed very balanced performance, with the U.S., Europe and Japan each up over 20% (all performance cited in U.S. dollar terms). Emerging equity markets performance was even stronger, increasing north of 35%!
From a sector standpoint, the S&P Global 1200 Index delivered broad double-digit gains, led by the technology sector, followed by materials, industrials, financials and consumer discretionary. For the Fund, performance was positively impacted by the consumer staples, technology and real estate sectors. In consumer staples, two international beverage holdings were up over 40% for the year, Diageo plc and Heineken N.V. The Fund’s technology stocks were led by strong performance from Interxion Holdings (IT services), and Taiwan Semiconductor (semiconductors), both up over 40%. Three other technology holdings were up over 30% for the year.
The Fund’s performance was negatively impacted by its health care, consumer discretionary and energy holdings. Within healthcare, Shire plc was the primary cause of underperformance. Shire had a disappointing 2017, as earnings estimates came down due to an accelerated launch of a generic competitor for one of its key drugs, and concern about the potential for disruption of the company’s hemophilia franchise. Shares of WPP plc were also down double digits, as traditional advertisers were pressured, which helped weigh down consumer discretionary performance. The energy sector for the Fund lagged due primarily to oil & gas equipment and services stocks, Schlumberger Limited and Halliburton Company.
Five new positions, all of which comply with our moral screens, have been added to the Fund since June 30, 2017: Cisco Systems, Inc. (communications equipment), Panasonic Corporation (consumer electronics), Priceline Group, Inc.
28
AVE MARIA WORLD EQUITY FUND
PORTFOLIO MANAGER COMMENTARY
(Unaudited) (Continued)
(internet and direct marketing retail), Tencent Holdings LTD (internet software and services), and Texas Instruments, Inc. (semiconductors). Four positions were eliminated: AMETEK, Inc. (electrical components and equipment), Haliburton Company (oil services) and Nestle S.A. (packaged foods) due to more attractive investment opportunities and Level 3 Communications Inc. (telecommunications) as it was acquired.
As of December 31, 2017, the Fund’s geographic weightings versus the S&P Global 1200 Index were approximately:
| | Ave Maria World
Equity Fund | S&P Global
1200 Index |
Americas | 58.0% | 61.6% |
Europe Developed | 14.3% | 16.5% |
United Kingdom | 14.4% | 6.5% |
Japan | 3.3% | 8.0% |
Asia Developed | 0.0% | 2.4% |
Asia Emerging | 3.8% | 2.5% |
Australasia | 0.0% | 2.5% |
Cash Equivalents | 6.2% | — |
We continue to be optimistic as we execute on our strategy of finding high quality, large capitalization, globally oriented, attractively valued companies. Thank you for your continued interest in the Ave Maria World Equity Fund.

| 
|
Joseph W. Skornicka | Robert C. Schwartz |
Lead-Portfolio Manager | Co-Portfolio Manager |
29
AVE MARIA WORLD EQUITY FUND
PERFORMANCE
(Unaudited) |
Comparison of the Change in Value of a $10,000 Investment
in the Ave Maria World Equity Fund and the S&P 1200 Global Index
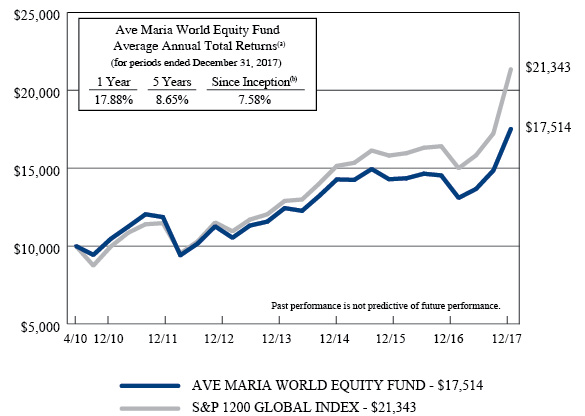
(a) | The returns shown do not reflect the deduction of taxes a shareholder would pay on Fund distributions or the redemption of Fund shares. |
(b) | Represents the period from the commencement of operations (April 30, 2010) through December 31, 2017. |
Expense Ratio
information as of: | Year Ended 12-31-16
(as disclosed in May 1, 2017 prospectus) | Year Ended
12-31-17 |
Gross | 1.46%* | 1.41% |
Net | 1.26%* | 1.25% |
* | Includes Acquired Fund Fees and Expenses. |
Past performance is not predictive of future performance. Investment results and principal value will fluctuate so that shares, when redeemed, may be worth more or less than their original cost. Current performance may be higher or lower than the performance data quoted. Performance data, current to the most recent month end, is available at the Ave Maria Mutual Funds website at www.avemariafunds.com or by calling 1-888-726-9331.
30
AVE MARIA WORLD EQUITY FUND
ANNUAL TOTAL RATES OF RETURN
COMPARISON WITH MAJOR INDICES (Unaudited) |
| AVE MARIA
WORLD EQUITY FUND | S&P 1200
GLOBAL INDEX |
2010 (a) | 12.4% | 8.5% |
2011 | -9.6% | -5.1% |
2012 | 13.8% | 16.8% |
2013 | 23.5% | 25.8% |
2014 | 0.5% | 5.4% |
2015 | -4.8% | -0.9% |
2016 | 8.7% | 8.9% |
2017 | 17.9% | 23.8% |
AVERAGE ANNUAL TOTAL RETURNS
As of December 31, 2017 (Unaudited)
| AVE MARIA
WORLD EQUITY FUND | S&P 1200
GLOBAL INDEX |
3 Years | 6.9% | 10.2% |
5 Years | 8.7% | 12.1% |
Since Inception (b) | 7.6% | 10.4% |
(a) | Represents the period from the commencement of operations (April 30, 2010) through December 31, 2010. |
(b) | Represents the period from the commencement of operations (April 30, 2010) through December 31, 2017. |
31
AVE MARIA WORLD EQUITY FUND
TEN LARGEST EQUITY HOLDINGS
December 31, 2017 (Unaudited)
| Shares | | | Company | | Market Value | | | % of Net Assets | |
| | 28,500 | | | Lowe's Companies, Inc. | | $ | 2,648,790 | | | | 4.3 | % |
| | 82,000 | | | AXA S.A. - ADR | | | 2,432,530 | | | | 3.9 | % |
| | 24,000 | | | TE Connectivity Ltd. | | | 2,280,960 | | | | 3.7 | % |
| | 27,500 | | | Eaton Corporation plc | | | 2,172,775 | | | | 3.5 | % |
| | 18,000 | | | Zimmer Biomet Holdings, Inc. | | | 2,172,060 | | | | 3.5 | % |
| | 26,619 | | | Medtronic plc | | | 2,149,484 | | | | 3.5 | % |
| | 28,000 | | | Citigroup, Inc. | | | 2,083,480 | | | | 3.3 | % |
| | 30,500 | | | Royal Dutch Shell plc - Class B - ADR | | | 2,082,845 | | | | 3.3 | % |
| | 14,000 | | | Diageo plc - ADR | | | 2,044,420 | | | | 3.3 | % |
| | 13,000 | | | Shire plc - ADR | | | 2,016,560 | | | | 3.2 | % |
ASSET ALLOCATION (Unaudited)
Sector | % of Net Assets |
Consumer Discretionary | 10.1% |
Consumer Staples | 10.8% |
Energy | 8.6% |
Financials | 17.2% |
Health Care | 12.6% |
Industrials | 12.4% |
Information Technology | 19.3% |
Materials | 1.4% |
Real Estate | 1.4% |
Money Market Funds, Liabilities in Excess of Other Assets | 6.2% |
| | 100.0% |
32
AVE MARIA WORLD EQUITY FUND
SCHEDULE OF INVESTMENTS
December 31, 2017
| COMMON STOCKS — 93.8% | | Shares | | | Market Value | |
| Consumer Discretionary — 10.1% | | | | | | |
| Auto Components — 2.3% | | | | | | |
| Bridgestone Corporation - ADR | | | 61,000 | | | $ | 1,417,640 | |
| | | | | | | | | |
| Household Durables — 1.0% | | | | | | | | |
| Panasonic Corporation - ADR * | | | 41,500 | | | | 610,465 | |
| | | | | | | | | |
| Internet & Direct Marketing Retail — 1.1% | | | | | | | | |
| Priceline Group, Inc. (The) * | | | 400 | | | | 695,096 | |
| | | | | | | | | |
| Media — 1.4% | | | | | | | | |
| WPP plc - ADR | | | 10,000 | | | | 905,600 | |
| | | | | | | | | |
| Specialty Retail — 4.3% | | | | | | | | |
| Lowe's Companies, Inc. | | | 28,500 | | | | 2,648,790 | |
| | | | | | | | | |
| Consumer Staples — 10.8% | | | | | | | | |
| Beverages — 8.1% | | | | | | | | |
| Coca-Cola European Partners plc | | | 48,500 | | | | 1,932,725 | |
| Diageo plc - ADR | | | 14,000 | | | | 2,044,420 | |
| Heineken N.V. - ADR | | | 20,000 | | | | 1,042,400 | |
| | | | | | | | 5,019,545 | |
| Food Products — 2.7% | | | | | | | | |
| Mondelēz International, Inc. - Class A | | | 39,500 | | | | 1,690,600 | |
| | | | | | | | | |
| Energy — 8.6% | | | | | | | | |
| Energy Equipment & Services — 1.5% | | | | | | | | |
| Schlumberger Limited | | | 13,700 | | | | 923,243 | |
| | | | | | | | | |
| Oil, Gas & Consumable Fuels — 7.1% | | | | | | | | |
| Exxon Mobil Corporation | | | 18,000 | | | | 1,505,520 | |
| Pioneer Natural Resources Company | | | 4,700 | | | | 812,395 | |
| Royal Dutch Shell plc - Class B - ADR | | | 30,500 | | | | 2,082,845 | |
| | | | | | | | 4,400,760 | |
| Financials — 17.2% | | | | | | | | |
| Banks — 3.3% | | | | | | | | |
| Citigroup, Inc. | | | 28,000 | | | | 2,083,480 | |
| | | | | | | | | |
| Capital Markets — 4.8% | | | | | | | | |
| Bank of New York Mellon Corporation (The) | | | 31,000 | | | | 1,669,660 | |
| Brookfield Asset Management, Inc. - Class A | | | 30,000 | | | | 1,306,200 | |
| | | | | | | | 2,975,860 | |
33
AVE MARIA WORLD EQUITY FUND
SCHEDULE OF INVESTMENTS
(Continued)
| COMMON STOCKS — 93.8% (Continued) | | Shares | | | Market Value | |
| Financials — 17.2% (Continued) | | | | | | |
| Consumer Finance — 3.2% | | | | | | |
| Discover Financial Services | | | 25,500 | | | $ | 1,961,460 | |
| | | | | | | | | |
| Insurance — 5.9% | | | | | | | | |
| AXA S.A. - ADR | | | 82,000 | | | | 2,432,530 | |
| Chubb Limited | | | 8,500 | | | | 1,242,105 | |
| | | | | | | | 3,674,635 | |
| Health Care — 12.6% | | | | | | | | |
| Biotechnology — 3.2% | | | | | | | | |
| Shire plc - ADR | | | 13,000 | | | | 2,016,560 | |
| | | | | | | | | |
| Health Care Equipment & Supplies — 9.4% | | | | | | | | |
| Koninklijke Philips N.V. | | | 40,064 | | | | 1,514,419 | |
| Medtronic plc | | | 26,619 | | | | 2,149,484 | |
| Zimmer Biomet Holdings, Inc. | | | 18,000 | | | | 2,172,060 | |
| | | | | | | | 5,835,963 | |
| Industrials — 12.4% | | | | | | | | |
| Aerospace & Defense — 2.1% | | | | | | | | |
| Hexcel Corporation | | | 21,500 | | | | 1,329,775 | |
| | | | | | | | | |
| Building Products — 1.9% | | | | | | | | |
| Johnson Controls International plc | | | 31,000 | | | | 1,181,410 | |
| | | | | | | | | |
| Electrical Equipment — 3.5% | | | | | | | | |
| Eaton Corporation plc | | | 27,500 | | | | 2,172,775 | |
| | | | | | | | | |
| Industrial Conglomerates — 2.5% | | | | | | | | |
| Siemens AG - ADR | | | 22,500 | | | | 1,558,575 | |
| | | | | | | | | |
| Road & Rail — 2.4% | | | | | | | | |
| Canadian National Railway Company | | | 18,000 | | | | 1,485,000 | |
| | | | | | | | | |
| Information Technology — 19.3% | | | | | | | | |
| Communications Equipment — 2.1% | | | | | | | | |
| Cisco Systems, Inc. | | | 35,000 | | | | 1,340,500 | |
| | | | | | | | | |
| Electronic Equipment, Instruments & Components — 3.7% | | | | | | | | |
| TE Connectivity Ltd. | | | 24,000 | | | | 2,280,960 | |
| | | | | | | | | |
| Internet Software & Services — 1.1% | | | | | | | | |
| Tencent Holdings Ltd. - ADR | | | 13,000 | | | | 674,960 | |
34
AVE MARIA WORLD EQUITY FUND
SCHEDULE OF INVESTMENTS
(Continued)
| COMMON STOCKS — 93.8% (Continued) | | Shares | | | Market Value | |
| Information Technology — 19.3% (Continued) | | | | | | |
| IT Services — 7.6% | | | | | | |
| Accenture plc - Class A | | | 12,500 | | | $ | 1,913,625 | |
| InterXion Holding N.V. * | | | 19,000 | | | | 1,119,670 | |
| MasterCard, Inc. - Class A | | | 11,000 | | | | 1,664,960 | |
| | | | | | | | 4,698,255 | |
| Semiconductors & Semiconductor Equipment — 4.8% | | | | | | | | |
| Taiwan Semiconductor Manufacturing Company Ltd. - ADR | | | 42,500 | | | | 1,685,125 | |
| Texas Instruments, Inc. | | | 12,500 | | | | 1,305,500 | |
| | | | | | | | 2,990,625 | |
| Materials — 1.4% | | | | | | | | |
| Chemicals — 1.4% | | | | | | | | |
| Axalta Coating Systems Ltd. * | | | 26,000 | | | | 841,360 | |
| | | | | | | | | |
| Real Estate — 1.4% | | | | | | | | |
| Equity Real Estate Investment Trusts (REITs) — 1.4% | | | | | | | | |
| Equinix, Inc. | | | 2,000 | | | | 906,440 | |
| | | | | | | | | |
Total Common Stocks (Cost $46,514,431) | | | | | | $ | 58,320,332 | |
| MONEY MARKET FUNDS — 6.4% | | Shares | | | Market Value | |
Federated Government Obligations Tax-Managed Fund - Institutional Shares, 1.05% (a) | | | 2,888,488 | | | $ | 2,888,488 | |
Federated Treasury Obligations Fund - Institutional Shares, 1.13% (a) | | | 1,114,942 | | | | 1,114,942 | |
Total Money Market Funds (Cost $4,003,430) | | | | | | $ | 4,003,430 | |
| | | | | | | | | |
Total Investments at Market Value — 100.2% (Cost $50,517,861) | | | | | | $ | 62,323,762 | |
| | | | | | | | | |
| Liabilities in Excess of Other Assets — (0.2%) | | | | | | | (153,376 | ) |
| | | | | | | | | |
| Net Assets — 100.0% | | | | | | $ | 62,170,386 | |
ADR - American Depositary Receipt. |
* | Non-income producing security. |
(a) | The rate shown is the 7-day effective yield as of December 31, 2017. |
See accompanying notes to financial statements. |
35
AVE MARIA WORLD EQUITY FUND
SUMMARY OF COMMON STOCKS BY COUNTRY
December 31, 2017 (Unaudited)
| Country | | Value | | | % of Net Assets | |
| United States * | | $ | 33,249,093 | | | | 53.5 | % |
| United Kingdom | | | 8,982,150 | | | | 14.4 | % |
| Netherlands | | | 3,676,489 | | | | 5.9 | % |
| Canada | | | 2,791,200 | | | | 4.5 | % |
| France | | | 2,432,530 | | | | 3.9 | % |
| Japan | | | 2,028,105 | | | | 3.3 | % |
| Taiwan | | | 1,685,125 | | | | 2.7 | % |
| Germany | | | 1,558,575 | | | | 2.5 | % |
| Switzerland | | | 1,242,105 | | | | 2.0 | % |
| China | | | 674,960 | | | | 1.1 | % |
| Total | | $ | 58,320,332 | | | | 93.8 | % |
* | Includes companies deemed to be a “non-U.S. company” as defined in the Fund’s prospectus, if a company has at least 50% of its revenues or operations outside of the United States. |
See accompanying notes to financial statements. |
36
AVE MARIA BOND FUND
PORTFOLIO MANAGER COMMENTARY
(Unaudited)
Dear Fellow Shareholders,
For the year ended December 31, 2017, the Ave Maria Bond Fund (“the Fund”) had a total return of 4.16% vs. 2.14% for the Bloomberg Barclays Intermediate U.S. Government/Credit Index. The ten-year U.S. Treasury started the year yielding 2.43% and was range-bound for most of the year, between 2.2% and 2.6%. Even though the economic outlook improved in 2017, the ten-year bond ended 2017 yielding 2.41%.
The yield curve gained attention in 2017, as short rates were pushed higher by the Federal Reserve (“the Fed”) and long rates decreased modestly. Typically, a flattening of the yield curve would normally be an early indicator of an impending recession. Not likely this time. While the short end of the yield curve is influenced by the Fed through the management of the Fed Funds rate, the long end of the yield curve is generally considered an indication of investor expectations about future growth and inflation. But, with the European Central Bank and the Bank of Japan still pursuing aggressive monetary policy, 2.4% yield on the ten-year U.S. Treasury looks attractive to foreign buyers, and this action has been distorting the long end of the U.S. yield curve.
Economic growth accelerated in 2017, as Real GDP grew 3.2% in the third quarter and about the same in the fourth quarter. Unemployment fell to 4.1%. Inflation, excluding food and energy, was at 1.7% at last reading. The Fed followed through with its projections in 2017, as it raised the Fed Funds rate 0.25% on three occasions. Additionally, in October the Fed started to scale back its balance sheet that was grossly expanded over the last ten years.
Corporate credit spreads tightened to Treasuries during 2017. Improvement in earnings, and now lower corporate tax rates, have been tailwinds for corporate bond prices. With spreads not seen this tight since before the financial crisis, investors are being poorly compensated for assuming additional credit risk, and thusly, we have been increasing our exposure to Treasuries.
In reviewing the performance of the Fund, the three top-performing assets were the common stocks of VF Corporation (apparel), Texas Instruments, Inc. (semiconductor devices), and Diageo plc (beverages). The Fund’s weakest-performing assets were the common stocks of Omnicom Group, Inc. (advertising & marketing), Williams-Sonoma, Inc. (home products stores), and Exxon Mobil Corporation (integrated oils).
The Fund continues to be managed in a conservative manner, and has had no down years since the inception of the Fund in 2003. With interest rates and corporate credit spreads low by historical standards, we continue to keep the average bond maturity short and credit quality high. Carefully selected
37
AVE MARIA BOND FUND
PORTFOLIO MANAGER COMMENTARY
(Unaudited) (Continued)
dividend-paying common stocks once again contributed positively to the Fund’s performance in 2017, and we believe they offer an attractive combination of income and potential capital appreciation.
We appreciate your investment in the Ave Maria Bond Fund.

| 
|
Brandon S. Scheitler | Richard L. Platte, Jr., CFA |
Lead Portfolio Manager | Co-Portfolio Manager |
38
AVE MARIA BOND FUND
PERFORMANCE
(Unaudited) |
Comparison of the Change in Value of a $10,000 Investment
in the Ave Maria Bond Fund and the Bloomberg Barclays
U.S. Intermediate Government/Credit Index
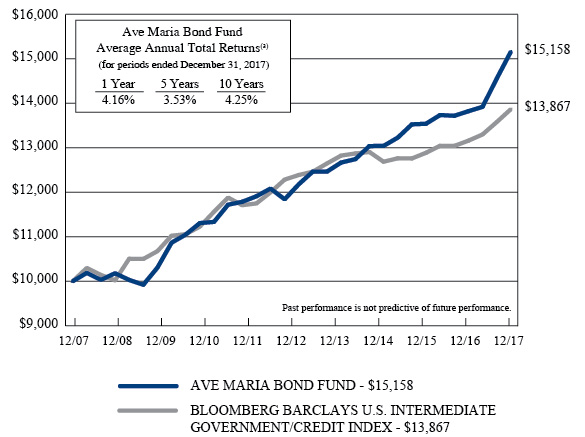
(a) | The returns shown do not reflect the deduction of taxes a shareholder would pay on Fund distributions or the redemption of Fund shares. |
Expense ratio as of 12-31-16 (as disclosed in May 1, 2017 prospectus) | 0.51%* |
Expense ratio for the year ended 12-31-17 | 0.50% |
* | Includes Acquired Fund Fees and Expenses. |
Past performance is not predictive of future performance. Investment results and principal value will fluctuate so that shares, when redeemed, may be worth more or less than their original cost. Current performance may be higher or lower than the performance data quoted. Performance data, current to the most recent month end, is available at the Ave Maria Mutual Funds website at www.avemariafunds.com or by calling 1-888-726-9331.
39
AVE MARIA BOND FUND
ANNUAL TOTAL RATES OF RETURN
COMPARISON WITH MAJOR INDICES (Unaudited) |
| AVE MARIA BOND FUND | BLOOMBERG BARCLAYS
U.S. INTERMEDIATE
GOVERNMENT/CREDIT INDEX |
2003 (a) | 2.4% | 1.9% |
2004 | 5.1% | 3.0% |
2005 | 1.4% | 1.6% |
2006 | 6.0% | 4.1% |
2007 | 4.8% | 7.4% |
2008 | 0.3% | 5.1% |
2009 | 10.2% | 5.2% |
2010 | 6.7% | 5.9% |
2011 | 3.3% | 5.8% |
2012 | 4.6% | 3.9% |
2013 | 6.1% | -0.9% |
2014 | 2.2% | 3.1% |
2015 | 0.7% | 1.1% |
2016 | 4.5% | 2.1% |
2017 | 4.2% | 2.1% |
AVERAGE ANNUAL TOTAL RETURNS
As of December 31, 2017 (Unaudited)
| AVE MARIA BOND FUND | BLOOMBERG BARCLAYS
U.S. INTERMEDIATE
GOVERNMENT/CREDIT INDEX |
3 Years | 3.1% | 1.8% |
5 Years | 3.5% | 1.5% |
10 Years | 4.3% | 3.3% |
Since Inception (b) | 4.2% | 3.5% |
(a) | Represents the period from the commencement of operations (May 1, 2003) through December 31, 2003. |
(b) | Represents the period from the commencement of operations (May 1, 2003) through December 31, 2017. |
40
AVE MARIA BOND FUND
TEN LARGEST HOLDINGS*
December 31, 2017 (Unaudited)
| Par Value/Shares | | | Holding | | Market Value | | | % of Net Assets | |
| $ | 5,000,000 | | | U.S. Treasury Notes, 3.875%, due 05/15/18 | | $ | 5,044,727 | | | | 1.6 | % |
| $ | 5,000,000 | | | U.S. Treasury Notes, 3.500%, due 02/15/18 | | | 5,013,028 | | | | 1.6 | % |
| $ | 5,000,000 | | | U.S. Treasury Notes, 2.000%, due 07/31/20 | | | 5,008,203 | | | | 1.6 | % |
| $ | 5,000,000 | | | U.S. Treasury Notes, 1.875%, due 02/28/22 | | | 4,945,898 | | | | 1.6 | % |
| $ | 5,000,000 | | | U.S. Treasury Notes, 1.750%, due 04/30/22 | | | 4,913,867 | | | | 1.6 | % |
| $ | 5,000,000 | | | U.S. Treasury Notes, 1.750%, due 05/31/22 | | | 4,912,891 | | | | 1.6 | % |
| | 60,000 | | | Royal Dutch Shell plc - Class B - ADR | | | 4,097,400 | | | | 1.3 | % |
| $ | 4,000,000 | | | U.S. Treasury Notes, 2.250%, due 03/31/21 | | | 4,026,406 | | | | 1.3 | % |
| $ | 4,000,000 | | | U.S. Treasury Notes, 2.125%, due 08/15/21 | | | 4,005,781 | | | | 1.3 | % |
| $ | 4,000,000 | | | U.S. Treasury Notes, 2.000%, due 10/31/21 | | | 3,982,812 | | | | 1.3 | % |
* | Excludes cash equivalents. |
ASSET ALLOCATION (Unaudited)
| % of Net Assets |
U.S. TREASURY OBLIGATIONS | |
U.S. Treasuries | 53.7% |
| | |
CORPORATE BONDS | |
Sector | |
Consumer Discretionary | 4.4% |
Consumer Staples | 10.0% |
Energy | 2.2% |
Financials | 0.7% |
Health Care | 1.9% |
Industrials | 5.4% |
Information Technology | 2.3% |
Materials | 0.8% |
Utilities | 0.8% |
| | |
COMMON STOCKS | |
Sector | |
Consumer Discretionary | 1.9% |
Consumer Staples | 1.2% |
Energy | 2.4% |
Financials | 2.1% |
Health Care | 0.9% |
Industrials | 3.2% |
Information Technology | 2.2% |
Materials | 1.2% |
| | |
Money Market Funds, Other Assets in Excess of Liabilities | 2.7% |
| | 100.0% |
41
AVE MARIA BOND FUND
SCHEDULE OF INVESTMENTS
December 31, 2017
| U.S. TREASURY OBLIGATIONS — 53.7% | | Par Value | | | Market Value | |
| U.S. Treasury Bonds — 1.8% | | | | | | |
| 8.125%, due 05/15/21 | | $ | 2,000,000 | | | $ | 2,393,359 | |
| 8.000%, due 11/15/21 | | | 2,500,000 | | | | 3,045,801 | |
| | | | | | | | 5,439,160 | |
U.S. Treasury Inflation-Protected Notes (a) — 1.4% | | | | | | | | |
| 0.125%, due 04/15/18 | | | 2,134,180 | | | | 2,131,651 | |
| 1.125%, due 01/15/21 | | | 2,255,220 | | | | 2,322,524 | |
| | | | | | | | 4,454,175 | |
| U.S. Treasury Notes — 50.5% | | | | | | | | |
| 0.875%, due 01/15/18 | | | 3,000,000 | | | | 2,999,629 | |
| 3.500%, due 02/15/18 | | | 5,000,000 | | | | 5,013,028 | |
| 3.875%, due 05/15/18 | | | 5,000,000 | | | | 5,044,727 | |
| 1.125%, due 06/15/18 | | | 3,000,000 | | | | 2,995,313 | |
| 1.375%, due 07/31/18 | | | 2,000,000 | | | | 1,997,344 | |
| 1.250%, due 10/31/18 | | | 3,000,000 | | | | 2,988,047 | |
| 1.250%, due 12/15/18 | | | 4,000,000 | | | | 3,979,062 | |
| 1.500%, due 01/31/19 | | | 3,000,000 | | | | 2,988,984 | |
| 1.500%, due 02/28/19 | | | 3,000,000 | | | | 2,988,047 | |
| 1.250%, due 03/31/19 | | | 3,000,000 | | | | 2,977,852 | |
| 1.625%, due 04/30/19 | | | 3,000,000 | | | | 2,990,742 | |
| 1.000%, due 11/15/19 | | | 3,000,000 | | | | 2,951,719 | |
| 1.500%, due 11/30/19 | | | 3,000,000 | | | | 2,978,320 | |
| 1.625%, due 12/31/19 | | | 4,000,000 | | | | 3,979,062 | |
| 1.250%, due 01/31/20 | | | 3,000,000 | | | | 2,960,273 | |
| 1.375%, due 02/15/20 | | | 2,000,000 | | | | 1,977,969 | |
| 1.375%, due 02/29/20 | | | 2,000,000 | | | | 1,977,422 | |
| 1.625%, due 03/15/20 | | | 3,000,000 | | | | 2,981,719 | |
| 1.500%, due 04/15/20 | | | 3,000,000 | | | | 2,972,109 | |
| 3.500%, due 05/15/20 | | | 3,000,000 | | | | 3,109,688 | |
| 1.625%, due 06/30/20 | | | 3,000,000 | | | | 2,977,852 | |
| 2.000%, due 07/31/20 | | | 5,000,000 | | | | 5,008,203 | |
| 2.625%, due 08/15/20 | | | 3,000,000 | | | | 3,052,383 | |
| 2.000%, due 09/30/20 | | | 3,000,000 | | | | 3,004,102 | |
| 1.375%, due 10/31/20 | | | 3,000,000 | | | | 2,951,602 | |
| 2.625%, due 11/15/20 | | | 3,000,000 | | | | 3,054,141 | |
| 2.375%, due 12/31/20 | | | 2,000,000 | | | | 2,022,500 | |
| 1.375%, due 01/31/21 | | | 4,000,000 | | | | 3,923,750 | |
| 2.000%, due 02/28/21 | | | 3,000,000 | | | | 2,998,242 | |
| 2.250%, due 03/31/21 | | | 4,000,000 | | | | 4,026,406 | |
| 1.375%, due 04/30/21 | | | 3,000,000 | | | | 2,935,078 | |
| 2.125%, due 08/15/21 | | | 4,000,000 | | | | 4,005,781 | |
| 2.125%, due 09/30/21 | | | 3,000,000 | | | | 3,001,875 | |
| 2.000%, due 10/31/21 | | | 4,000,000 | | | | 3,982,812 | |
42
AVE MARIA BOND FUND
SCHEDULE OF INVESTMENTS
(Continued)
| U.S. TREASURY OBLIGATIONS — 53.7% (Continued) | | Par Value | | | Market Value | |
| U.S. Treasury Notes — 50.5% (Continued) | | | | | | |
| 1.500%, due 01/31/22 | | $ | 3,000,000 | | | $ | 2,926,289 | |
| 1.875%, due 02/28/22 | | | 5,000,000 | | | | 4,945,898 | |
| 1.750%, due 03/31/22 | | | 2,000,000 | | | | 1,967,188 | |
| 1.750%, due 04/30/22 | | | 5,000,000 | | | | 4,913,867 | |
| 1.750%, due 05/31/22 | | | 5,000,000 | | | | 4,912,891 | |
| 2.125%, due 06/30/22 | | | 3,000,000 | | | | 2,994,492 | |
| 2.000%, due 07/31/22 | | | 3,000,000 | | | | 2,977,148 | |
| 1.750%, due 09/30/22 | | | 4,000,000 | | | | 3,919,844 | |
| 1.875%, due 10/31/22 | | | 3,000,000 | | | | 2,956,406 | |
| 1.750%, due 01/31/23 | | | 4,000,000 | | | | 3,910,000 | |
| 2.000%, due 02/15/23 | | | 3,000,000 | | | | 2,969,180 | |
| 1.750%, due 05/15/23 | | | 3,000,000 | | | | 2,926,055 | |
| 2.500%, due 08/15/23 | | | 3,000,000 | | | | 3,040,664 | |
| | | | | | | | 155,155,705 | |
| | | | | | | | | |
Total U.S. Treasury Obligations (Cost $166,533,306) | | | | | | $ | 165,049,040 | |
| |
| CORPORATE BONDS — 28.5% | | Par Value | | | Market Value | |
| Consumer Discretionary — 4.4% | | | | | | |
| Lowe's Companies, Inc., 3.120%, due 04/15/22 | | $ | 3,000,000 | | | $ | 3,060,845 | |
| McDonald's Corporation, 5.350%, due 03/01/18 | | | 2,000,000 | | | | 2,011,914 | |
| Ross Stores, Inc., 3.375%, due 09/15/24 | | | 3,000,000 | | | | 3,041,764 | |
| TJX Companies, Inc. (The), 2.750%, due 06/15/21 | | | 2,305,000 | | | | 2,337,368 | |
| VF Corporation, 3.500%, due 09/01/21 | | | 3,000,000 | | | | 3,096,552 | |
| | | | | | | | 13,548,443 | |
| Consumer Staples — 10.0% | | | | | | | | |
| Coca-Cola Company (The), 1.650%, due 11/01/18 | | | 1,500,000 | | | | 1,498,900 | |
| Coca-Cola Company (The), 3.300%, due 09/01/21 | | | 2,000,000 | | | | 2,067,196 | |
| Colgate-Palmolive Company, 2.450%, due 11/15/21 | | | 3,000,000 | | | | 3,016,138 | |
| Colgate-Palmolive Company, 1.950%, due 02/01/23 | | | 2,263,000 | | | | 2,206,398 | |
| Colgate-Palmolive Company, 3.250%, due 03/15/24 | | | 795,000 | | | | 819,287 | |
| Dr Pepper Snapple Group, Inc., 3.200%, due 11/15/21 | | | 2,000,000 | | | | 2,040,611 | |
| Dr Pepper Snapple Group, Inc., 3.130%, due 12/15/23 | | | 2,000,000 | | | | 2,018,349 | |
| Hershey Company (The), 2.625%, due 05/01/23 | | | 2,831,000 | | | | 2,823,690 | |
| Hormel Foods Corporation, 4.125%, due 04/15/21 | | | 2,564,000 | | | | 2,683,730 | |
| J.M. Smucker Company (The), 3.500%, due 10/15/21 | | | 2,000,000 | | | | 2,056,910 | |
| Kellogg Company, 4.150%, due 11/15/19 | | | 2,042,000 | | | | 2,110,465 | |
| Kimberly-Clark Corporation, 2.400%, due 03/01/22 | | | 2,311,000 | | | | 2,302,181 | |
43
AVE MARIA BOND FUND
SCHEDULE OF INVESTMENTS
(Continued)
| CORPORATE BONDS — 28.5% (Continued) | | Par Value | | | Market Value | |
| Consumer Staples — 10.0% (Continued) | | | | | | |
| McCormick & Company, Inc., 3.900%, due 07/15/21 | | $ | 2,500,000 | | | $ | 2,590,335 | |
| McCormick & Company, Inc., 3.500%, due 09/01/23 | | | 2,500,000 | | | | 2,560,698 | |
| | | | | | | | 30,794,888 | |
| Energy — 2.2% | | | | | | | | |
| Exxon Mobil Corporation, 2.397%, due 03/06/22 | | | 2,000,000 | | | | 1,996,790 | |
| Exxon Mobil Corporation, 3.176%, due 03/15/24 | | | 1,634,000 | | | | 1,685,147 | |
| Occidental Petroleum Corporation, 3.125%, due 02/15/22 | | | 2,940,000 | | | | 3,014,103 | |
| | | | | | | | 6,696,040 | |
| Financials — 0.7% | | | | | | | | |
| Bank of New York Mellon Corporation (The), 2.100%, due 08/01/18 | | | 1,000,000 | | | | 1,000,951 | |
| U.S. Bancorp, 2.200%, due 04/25/19 | | | 1,173,000 | | | | 1,176,321 | |
| | | | | | | | 2,177,272 | |
| Health Care — 1.9% | | | | | | | | |
| Amgen, Inc., 3.875%, due 11/15/21 | | | 2,108,000 | | | | 2,203,254 | |
| Stryker Corporation, 4.375%, due 01/15/20 | | | 1,000,000 | | | | 1,039,501 | |
| Zimmer Holdings, Inc., 4.625%, due 11/30/19 | | | 2,310,000 | | | | 2,398,541 | |
| | | | | | | | 5,641,296 | |
| Industrials — 5.4% | | | | | | | | |
| 3M Company, 2.000%, due 06/26/22 | | | 1,073,000 | | | | 1,054,070 | |
| Emerson Electric Company, 5.250%, due 10/15/18 | | | 1,600,000 | | | | 1,642,551 | |
| Emerson Electric Company, 4.250%, due 11/15/20 | | | 2,109,000 | | | | 2,218,438 | |
| Illinois Tool Works, Inc., 1.950%, due 03/01/19 | | | 2,000,000 | | | | 1,996,768 | |
| Illinois Tool Works, Inc., 6.250%, due 04/01/19 | | | 1,000,000 | | | | 1,049,477 | |
| Norfolk Southern Corporation, 5.750%, due 04/01/18 | | | 885,000 | | | | 893,078 | |
| Norfolk Southern Corporation, 5.900%, due 06/15/19 | | | 441,000 | | | | 463,613 | |
| Snap-on, Inc., 6.125%, due 09/01/21 | | | 2,000,000 | | | | 2,251,582 | |
| Union Pacific Corporation, 2.250%, due 02/15/19 | | | 2,000,000 | | | | 2,002,534 | |
| United Parcel Service, Inc., 5.500%, due 01/15/18 | | | 1,500,000 | | | | 1,501,740 | |
| United Parcel Service, Inc., 5.125%, due 04/01/19 | | | 1,500,000 | | | | 1,555,772 | |
| | | | | | | | 16,629,623 | |
| Information Technology — 2.3% | | | | | | | | |
| Cisco Systems, Inc., 4.450%, due 01/15/20 | | | 606,000 | | | | 633,731 | |
| MasterCard, Inc., 2.000%, due 04/01/19 | | | 2,000,000 | | | | 1,998,448 | |
| MasterCard, Inc., 3.375%, due 04/01/24 | | | 2,300,000 | | | | 2,388,485 | |
| Texas Instruments, Inc., 1.650%, due 08/03/19 | | | 2,000,000 | | | | 1,988,018 | |
| | | | | | | | 7,008,682 | |
| Materials — 0.8% | | | | | | | | |
| Praxair, Inc., 2.250%, due 09/24/20 | | | 2,000,000 | | | | 1,995,967 | |
| Praxair, Inc., 4.050%, due 03/15/21 | | | 500,000 | | | | 525,308 | |
| | | | | | | | 2,521,275 | |
44
AVE MARIA BOND FUND
SCHEDULE OF INVESTMENTS
(Continued)
| CORPORATE BONDS — 28.5% (Continued) | | Par Value | | | Market Value | |
| Utilities — 0.8% | | | | | | |
| Consolidated Edison Company of New York, Inc., 6.650%, due 04/01/19 | | $ | 800,000 | | | $ | 842,598 | |
| Georgia Power Company, 4.250%, due 12/01/19 | | | 1,500,000 | | | | 1,556,595 | |
| | | | | | | | 2,399,193 | |
| | | | | | | | | |
Total Corporate Bonds (Cost $87,568,164) | | | | | | $ | 87,416,712 | |
| COMMON STOCKS — 15.1% | | Shares | | | Market Value | |
| Consumer Discretionary — 1.9% | | | | | | |
| Media — 0.7% | | | | | | | | |
| Omnicom Group, Inc. | | | 30,000 | | | $ | 2,184,900 | |
| | | | | | | | | |
| Textiles, Apparel & Luxury Goods — 1.2% | | | | | | | | |
| VF Corporation | | | 50,000 | | | | 3,700,000 | |
| | | | | | | | | |
| Consumer Staples — 1.2% | | | | | | | | |
| Beverages — 1.2% | | | | | | | | |
| Diageo plc - ADR | | | 25,000 | | | | 3,650,750 | |
| | | | | | | | | |
| Energy — 2.4% | | | | | | | | |
| Oil, Gas & Consumable Fuels — 2.4% | | | | | | | | |
| Exxon Mobil Corporation | | | 40,000 | | | | 3,345,600 | |
| Royal Dutch Shell plc - Class B - ADR | | | 60,000 | | | | 4,097,400 | |
| | | | | | | | 7,443,000 | |
| Financials — 2.1% | | | | | | | | |
| Banks — 1.4% | | | | | | | | |
| Fifth Third Bancorp | | | 90,000 | | | | 2,730,600 | |
| PNC Financial Services Group, Inc. (The) | | | 10,000 | | | | 1,442,900 | |
| | | | | | | | 4,173,500 | |
| Insurance — 0.7% | | | | | | | | |
| Chubb Limited | | | 15,000 | | | | 2,191,950 | |
| | | | | | | | | |
| Health Care — 0.9% | | | | | | | | |
| Biotechnology — 0.9% | | | | | | | | |
| Amgen, Inc. | | | 16,000 | | | | 2,782,400 | |
| | | | | | | | | |
| Industrials — 3.2% | | | | | | | | |
| Air Freight & Logistics — 1.2% | | | | | | | | |
| United Parcel Service, Inc. | | | 30,000 | | | | 3,574,500 | |
45
AVE MARIA BOND FUND
SCHEDULE OF INVESTMENTS
(Continued)
| COMMON STOCKS — 15.1% (Continued) | | Shares | | | Market Value | |
| Industrials — 3.2% (Continued) | | | | | �� | |
| Industrial Conglomerates — 0.8% | | | | | | |
| 3M Company | | | 11,000 | | | $ | 2,589,070 | |
| | | | | | | | | |
| Trading Companies & Distributors — 1.2% | | | | | | | | |
| Fastenal Company | | | 65,000 | | | | 3,554,850 | |
| | | | | | | | | |
| Information Technology — 2.2% | | | | | | | | |
| Communications Equipment — 1.0% | | | | | | | | |
| Cisco Systems, Inc. | | | 80,000 | | | | 3,064,000 | |
| | | | | | | | | |
| Semiconductors & Semiconductor Equipment — 1.2% | | | | | | | | |
| Texas Instruments, Inc. | | | 35,000 | | | | 3,655,400 | |
| | | | | | | | | |
| Materials — 1.2% | | | | | | | | |
| Chemicals — 1.2% | | | | | | | | |
| Praxair, Inc. | | | 25,000 | | | | 3,867,000 | |
| | | | | | | | | |
Total Common Stocks (Cost $34,063,325) | | | | | | $ | 46,431,320 | |
| MONEY MARKET FUNDS — 1.5% | | Shares | | | Market Value | |
Federated Government Obligations Tax-Managed Fund - Institutional Shares, 1.05% (b) (Cost $4,679,958) | | | 4,679,958 | | | $ | 4,679,958 | |
| | | | | | | | | |
Total Investments at Market Value — 98.8% (Cost $292,844,753) | | | | | | $ | 303,577,030 | |
| | | | | | | | | |
Other Assets in Excess of Liabilities — 1.2% | | | | | | | 3,657,357 | |
| | | | | | | | | |
Net Assets — 100.0% | | | | | | $ | 307,234,387 | |
ADR - American Depositary Receipt. |
(a) | Interest rate for this investment is the stated rate. Interest payments are determined based on the inflation adjusted principal. |
(b) | The rate shown is the 7-day effective yield as of December 31, 2017. |
See accompanying notes to financial statements. |
46
AVE MARIA MUTUAL FUNDS
STATEMENTS OF ASSETS AND LIABILITIES
December 31, 2017
| | | Ave Maria
Value Fund | | | Ave Maria
Growth Fund | | | Ave Maria
Rising
Dividend Fund | |
| ASSETS | | | | | | | | | |
| Investment securities: | | | | | | | | | |
| Unaffilliated, at cost | | $ | 185,107,322 | | | $ | 342,861,709 | | | $ | 772,827,047 | |
| Affilliated, at cost | | | 1,096,335 | | | | — | | | | — | |
| Unaffiliated, at market value (Note 1) | | $ | 248,795,010 | | | $ | 482,899,797 | | | $ | 970,096,063 | |
| Affiliated, at market value (Notes 1 and 5) | | | 2,380,000 | | | | — | | | | — | |
| Receivable for capital shares sold | | | 54,232 | | | | 707,480 | | | | 787,024 | |
| Dividends receivable | | | 90,686 | | | | 275,170 | | | | 1,482,076 | |
| Other assets | | | 23,883 | | | | 35,041 | | | | 66,183 | |
| TOTAL ASSETS | | | 251,343,811 | | | | 483,917,488 | | | | 972,431,346 | |
| | | | | | | | | | | | | |
| LIABILITIES | | | | | | | | | | | | |
| Payable for investment securities purchased | | | 542,720 | | | | — | | | | — | |
| Payable for capital shares redeemed | | | 273,877 | | | | 317,674 | | | | 376,392 | |
| Payable to Adviser (Note 2) | | | 589,536 | | | | 1,003,533 | | | | 1,809,451 | |
| Payable to administrator (Note 2) | | | 26,322 | | | | 50,643 | | | | 92,498 | |
| Other accrued expenses | | | 19,781 | | | | 30,506 | | | | 44,471 | |
| TOTAL LIABILITIES | | | 1,452,236 | | | | 1,402,356 | | | | 2,322,812 | |
| | | | | | | | | | | | | |
| NET ASSETS | | $ | 249,891,575 | | | $ | 482,515,132 | | | $ | 970,108,534 | |
| | | | | | | | | | | | | |
| NET ASSETS CONSIST OF: | | | | | | | | | | | | |
| Paid-in capital | | $ | 184,968,849 | | | $ | 342,535,236 | | | $ | 772,682,534 | |
| Undistributed net investment income | | | — | | | | — | | | | 157,032 | |
| Accumulated net realized losses from investment transactions | | | (48,627 | ) | | | (58,192 | ) | | | (48 | ) |
| Net unrealized appreciation on investments | | | 64,971,353 | | | | 140,038,088 | | | | 197,269,016 | |
| NET ASSETS | | $ | 249,891,575 | | | $ | 482,515,132 | | | $ | 970,108,534 | |
| Shares of beneficial interest outstanding (unlimited number of shares authorized, no par value) | | | 11,968,088 | | | | 15,668,550 | | | | 52,622,984 | |
| Net asset value, offering price and redemption price per share (Note 1) | | $ | 20.88 | | | $ | 30.80 | | | $ | 18.44 | |
See accompanying notes to financial statements. |
47
AVE MARIA MUTUAL FUNDS
STATEMENTS OF ASSETS AND LIABILITIES
December 31, 2017 (Continued)
| | | Ave Maria
World
Equity Fund | | | Ave Maria
Bond Fund | |
| ASSETS | | | | | | |
| Investment securities: | | | | | | |
| At cost | | $ | 50,517,861 | | | $ | 292,844,753 | |
| At market value (Note 1) | | $ | 62,323,762 | | | $ | 303,577,030 | |
| Cash | | | 8,605 | | | | — | |
| Receivable for investment securities sold | | | — | | | | 2,007,500 | |
| Receivable for capital shares sold | | | 64,597 | | | | 603,040 | |
| Dividends and interest receivable | | | 53,092 | | | | 1,695,451 | |
| Other assets | | | 11,387 | | | | 28,388 | |
| TOTAL ASSETS | | | 62,461,443 | | | | 307,911,409 | |
| | | | | | | | | |
| LIABILITIES | | | | | | | | |
| Payable for capital shares redeemed | | | 143,791 | | | | 387,517 | |
| Payable to Adviser (Note 2) | | | 126,298 | | | | 234,711 | |
| Payable to administrator (Note 2) | | | 6,491 | | | | 25,316 | |
| Other accrued expenses | | | 14,477 | | | | 29,478 | |
| TOTAL LIABILITIES | | | 291,057 | | | | 677,022 | |
| | | | | | | | | |
| NET ASSETS | | $ | 62,170,386 | | | $ | 307,234,387 | |
| | | | | | | | | |
| NET ASSETS CONSIST OF: | | | | | | | | |
| Paid-in capital | | $ | 50,364,485 | | | $ | 296,502,110 | |
| Net unrealized appreciation on investments | | | 11,805,901 | | | | 10,732,277 | |
| NET ASSETS | | $ | 62,170,386 | | | $ | 307,234,387 | |
| Shares of beneficial interest outstanding (unlimited number of shares authorized, no par value) | | | 4,123,954 | | | | 26,907,018 | |
| Net asset value, offering price and redemption price per share (Note 1) | | $ | 15.08 | | | $ | 11.42 | |
See accompanying notes to financial statements. |
48
AVE MARIA MUTUAL FUNDS
STATEMENTS OF OPERATIONS
For the Year Ended December 31, 2017
| | | Ave Maria
Value Fund | | | Ave Maria
Growth Fund | | | Ave Maria
Rising
Dividend Fund | |
| INVESTMENT INCOME | | | | | | | | | |
| Dividends | | $ | 2,029,628 | | | $ | 4,883,589 | | | $ | 18,489,684 | |
| Foreign withholding taxes on dividends | | | (2,805 | ) | | | — | | | | — | |
| TOTAL INCOME | | | 2,026,823 | | | | 4,883,589 | | | | 18,489,684 | |
| | | | | | | | | | | | | |
| EXPENSES | | | | | | | | | | | | |
| Investment advisory fees (Note 2) | | | 2,219,435 | | | | 3,631,044 | | | | 6,794,590 | |
| Administration, accounting and transfer agent fees (Note 2) | | | 307,363 | | | | 528,083 | | | | 1,039,435 | |
| Trustees’ fees and expenses (Note 2) | | | 60,555 | | | | 60,555 | | | | 60,555 | |
| Legal and audit fees | | | 48,646 | | | | 58,190 | | | | 80,247 | |
| Postage and supplies | | | 34,823 | | | | 52,766 | | | | 79,569 | |
| Registration and filing fees | | | 26,420 | | | | 37,960 | | | | 42,946 | |
| Custodian and bank service fees | | | 15,228 | | | | 25,612 | | | | 55,629 | |
| Compliance service fees and expenses (Note 2) | | | 10,880 | | | | 20,357 | | | | 42,167 | |
| Insurance expense | | | 11,064 | | | | 18,118 | | | | 40,267 | |
| Advisory board fees and expenses (Note 2) | | | 13,771 | | | | 13,771 | | | | 13,771 | |
| Printing of shareholder reports | | | 8,246 | | | | 11,110 | | | | 10,279 | |
| Other expenses | | | 17,461 | | | | 22,413 | | | | 42,087 | |
| TOTAL EXPENSES | | | 2,773,892 | | | | 4,479,979 | | | | 8,301,542 | |
| | | | | | | | | | | | | |
| NET INVESTMENT INCOME (LOSS) | | | (747,069 | ) | | | 403,610 | | | | 10,188,142 | |
| | | | | | | | | | | | | |
| REALIZED AND UNREALIZED GAINS (LOSSES) ON INVESTMENTS | | | | | | | | | | | | |
| Net realized gains from unaffiliated investment transactions | | | 19,008,893 | | | | 41,098,742 | | | | 48,507,186 | |
| Net realized gains from affiliated investment transactions (Note 5) | | | 19,671 | | | | — | | | | — | |
| Net change in unrealized appreciation (depreciation) on unaffiliated investments | | | 20,949,778 | | | | 58,423,052 | | | | 82,923,856 | |
Net change in unrealized appreciation (depreciation) on affiliated
investments (Note 5) | | | (650,902 | ) | | | — | | | | — | |
| NET REALIZED AND UNREALIZED GAINS ON INVESTMENTS | | | 39,327,440 | | | | 99,521,794 | | | | 131,431,042 | |
| | | | | | | | | | | | | |
| NET INCREASE IN NET ASSETS RESULTING FROM OPERATIONS | | $ | 38,580,371 | | | $ | 99,925,404 | | | $ | 141,619,184 | |
See accompanying notes to financial statements. |
49
AVE MARIA MUTUAL FUNDS
STATEMENTS OF OPERATIONS
For the Year Ended December 31, 2017 (Continued)
| | | Ave Maria
World
Equity Fund | | | Ave Maria
Bond Fund | |
| INVESTMENT INCOME | | | | | | |
| Dividends | | $ | 1,000,256 | | | $ | 1,449,738 | |
| Foreign withholding taxes on dividends | | | (59,050 | ) | | | — | |
| Interest | | | — | | | | 4,042,374 | |
| TOTAL INCOME | | | 941,206 | | | | 5,492,112 | |
| | | | | | | | | |
| EXPENSES | | | | | | | | |
| Investment advisory fees (Note 2) | | | 511,453 | | | | 834,271 | |
| Administration, accounting and transfer agent fees (Note 2) | | | 70,744 | | | | 278,142 | |
| Trustees’ fees and expenses (Note 2) | | | 60,555 | | | | 60,555 | |
| Legal and audit fees | | | 40,255 | | | | 50,978 | |
| Postage and supplies | | | 12,670 | | | | 31,533 | |
| Registration and filing fees | | | 23,792 | | | | 40,948 | |
| Custodian and bank service fees | | | 4,406 | | | | 18,079 | |
| Compliance service fees and expenses (Note 2) | | | 2,712 | | | | 13,258 | |
| Insurance expense | | | 2,757 | | | | 12,486 | |
| Advisory board fees and expenses (Note 2) | | | 13,771 | | | | 13,771 | |
| Printing of shareholder reports | | | 3,830 | | | | 9,306 | |
| Other expenses | | | 10,195 | | | | 33,721 | |
| TOTAL EXPENSES | | | 757,140 | | | | 1,397,048 | |
| Less fee reductions by the Adviser (Note 2) | | | (84,176 | ) | | | — | |
| NET EXPENSES | | | 672,964 | | | | 1,397,048 | |
| | | | | | | | | |
| NET INVESTMENT INCOME | | | 268,242 | | | | 4,095,064 | |
| | | | | | | | | |
| REALIZED AND UNREALIZED GAINS ON INVESTMENTS | | | | | | | | |
| Net realized gains from investment transactions | | | 1,569,274 | | | | 1,780,296 | |
| Net change in unrealized appreciation (depreciation) on investments | | | 6,897,006 | | | | 5,434,807 | |
| NET REALIZED AND UNREALIZED GAINS ON INVESTMENTS | | | 8,466,280 | | | | 7,215,103 | |
| | | | | | | | | |
| NET INCREASE IN NET ASSETS RESULTING FROM OPERATIONS | | $ | 8,734,522 | | | $ | 11,310,167 | |
See accompanying notes to financial statements. |
50
AVE MARIA VALUE FUND
STATEMENTS OF CHANGES IN NET ASSETS
| | | Year
Ended
December 31,
2017 | | | Year
Ended
December 31, 2016 | |
| FROM OPERATIONS | | | | | | |
| Net investment loss | | $ | (747,069 | ) | | $ | (315,335 | ) |
| Net realized gains from unaffiliated investment transactions | | | 19,008,893 | | | | 759,085 | |
| Net realized gains from affiliated investment transactions (Note 5) | | | 19,671 | | | | — | |
| Net change in unrealized appreciation (depreciation) on unaffiliated investments | | | 20,949,778 | | | | 31,168,016 | |
| Net change in unrealized appreciation (depreciation) on affiliated investments (Note 5) | | | (650,902 | ) | | | 234,845 | |
| Net increase in net assets resulting from operations | | | 38,580,371 | | | | 31,846,611 | |
| | | | | | | | | |
| FROM DISTRIBUTIONS TO SHAREHOLDERS (Note 1) | | | | | | | | |
| From net realized gains on investments | | | (18,255,479 | ) | | | — | |
| | | | | | | | | |
| FROM CAPITAL SHARE TRANSACTIONS | | | | | | | | |
| Proceeds from shares sold | | | 17,924,288 | | | | 18,785,042 | |
| Reinvestment of distributions to shareholders | | | 17,330,791 | | | | — | |
| Payments for shares redeemed | | | (30,281,644 | ) | | | (37,917,350 | ) |
| Net increase (decrease) in net assets from capital share transactions | | | 4,973,435 | | | | (19,132,308 | ) |
| | | | | | | | | |
| TOTAL INCREASE IN NET ASSETS | | | 25,298,327 | | | | 12,714,303 | |
| | | | | | | | | |
| NET ASSETS | | | | | | | | |
| Beginning of year | | | 224,593,248 | | | | 211,878,945 | |
| End of year | | $ | 249,891,575 | | | $ | 224,593,248 | |
| | | | | | | | | |
| UNDISTRIBUTED NET INVESTMENT INCOME | | $ | — | | | $ | — | |
| | | | | | | | | |
| SUMMARY OF CAPITAL SHARE ACTIVITY | | | | | | | | |
| Shares sold | | | 882,065 | | | | 1,082,577 | |
| Shares issued in reinvestment of distributions to shareholders | | | 826,456 | | | | — | |
| Shares redeemed | | | (1,487,877 | ) | | | (2,236,079 | ) |
| Net increase (decrease) in shares outstanding | | | 220,644 | | | | (1,153,502 | ) |
| Shares outstanding, beginning of year | | | 11,747,444 | | | | 12,900,946 | |
| Shares outstanding, end of year | | | 11,968,088 | | | | 11,747,444 | |
See accompanying notes to financial statements. |
51
AVE MARIA GROWTH FUND
STATEMENTS OF CHANGES IN NET ASSETS
| | | Year
Ended
December 31,
2017 | | | Year
Ended
December 31, 2016 | |
| FROM OPERATIONS | | | | | | |
| Net investment income | | $ | 403,610 | | | $ | 282,606 | |
| Net realized gains from investment transactions | | | 41,098,742 | | | | 19,911,248 | |
| Net change in unrealized appreciation (depreciation) on investments | | | 58,423,052 | | | | 16,379,060 | |
| Net increase in net assets resulting from operations | | | 99,925,404 | | | | 36,572,914 | |
| | | | | | | | | |
| FROM DISTRIBUTIONS TO SHAREHOLDERS (Note 1) | | | | | | | | |
| From net investment income | | | (404,152 | ) | | | (282,071 | ) |
| From net realized gains on investments | | | (41,099,822 | ) | | | (19,859,026 | ) |
| Decrease in net assets from distributions to shareholders | | | (41,503,974 | ) | | | (20,141,097 | ) |
| | | | | | | | | |
| FROM CAPITAL SHARE TRANSACTIONS | | | | | | | | |
| Proceeds from shares sold | | | 87,271,657 | | | | 66,665,565 | |
| Reinvestment of distributions to shareholders | | | 39,499,274 | | | | 19,003,389 | |
| Payments for shares redeemed | | | (53,762,692 | ) | | | (51,134,124 | ) |
| Net increase in net assets from capital share transactions | | | 73,008,239 | | | | 34,534,830 | |
| | | | | | | | | |
| TOTAL INCREASE IN NET ASSETS | | | 131,429,669 | | | | 50,966,647 | |
| | | | | | | | | |
| NET ASSETS | | | | | | | | |
| Beginning of year | | | 351,085,463 | | | | 300,118,816 | |
| End of year | | $ | 482,515,132 | | | $ | 351,085,463 | |
| | | | | | | | | |
| UNDISTRIBUTED NET INVESTMENT INCOME | | $ | — | | | $ | 325 | |
| | | | | | | | | |
| SUMMARY OF CAPITAL SHARE ACTIVITY | | | | | | | | |
| Shares sold | | | 2,910,998 | | | | 2,491,544 | |
| Shares issued in reinvestment of distributions to shareholders | | | 1,277,460 | | | | 716,031 | |
| Shares redeemed | | | (1,798,958 | ) | | | (1,922,757 | ) |
| Net increase in shares outstanding | | | 2,389,500 | | | | 1,284,818 | |
| Shares outstanding, beginning of year | | | 13,279,050 | | | | 11,994,232 | |
| Shares outstanding, end of year | | | 15,668,550 | | | | 13,279,050 | |
See accompanying notes to financial statements. |
52
AVE MARIA RISING DIVIDEND FUND
STATEMENTS OF CHANGES IN NET ASSETS
| | | Year
Ended
December 31,
2017 | | | Year
Ended
December 31, 2016 | |
| FROM OPERATIONS | | | | | | |
| Net investment income | | $ | 10,188,142 | | | $ | 12,621,006 | |
| Net realized gains from investment transactions | | | 48,507,186 | | | | 41,833,619 | |
| Net change in unrealized appreciation (depreciation) on investments | | | 82,923,856 | | | | 56,390,612 | |
| Net increase in net assets resulting from operations | | | 141,619,184 | | | | 110,845,237 | |
| | | | | | | | | |
| FROM DISTRIBUTIONS TO SHAREHOLDERS (Note 1) | | | | | | | | |
| From net investment income | | | (10,053,305 | ) | | | (12,909,764 | ) |
| From net realized gains on investments | | | (48,508,726 | ) | | | (41,895,923 | ) |
| Decrease in net assets from distributions to shareholders | | | (58,562,031 | ) | | | (54,805,687 | ) |
| | | | | | | | | |
| FROM CAPITAL SHARE TRANSACTIONS | | | | | | | | |
| Proceeds from shares sold | | | 168,151,569 | | | | 147,667,667 | |
| Reinvestment of distributions to shareholders | | | 52,929,138 | | | | 49,246,521 | |
| Payments for shares redeemed | | | (162,678,554 | ) | | | (175,194,379 | ) |
| Net increase in net assets from capital share transactions | | | 58,402,153 | | | | 21,719,809 | |
| | | | | | | | | |
| TOTAL INCREASE IN NET ASSETS | | | 141,459,306 | | | | 77,759,359 | |
| | | | | | | | | |
| NET ASSETS | | | | | | | | |
| Beginning of year | | | 828,649,228 | | | | 750,889,869 | |
| End of year | | $ | 970,108,534 | | | $ | 828,649,228 | |
| | | | | | | | | |
| UNDISTRIBUTED NET INVESTMENT INCOME | | $ | 157,032 | | | $ | 23,687 | |
| | | | | | | | | |
| SUMMARY OF CAPITAL SHARE ACTIVITY | | | | | | | | |
| Shares sold | | | 9,503,269 | | | | 8,883,400 | |
| Shares issued in reinvestment of distributions to shareholders | | | 2,872,973 | | | | 2,932,685 | |
| Shares redeemed | | | (9,119,249 | ) | | | (10,655,828 | ) |
| Net increase in shares outstanding | | | 3,256,993 | | | | 1,160,257 | |
| Shares outstanding, beginning of year | | | 49,365,991 | | | | 48,205,734 | |
| Shares outstanding, end of year | | | 52,622,984 | | | | 49,365,991 | |
See accompanying notes to financial statements. |
53
AVE MARIA WORLD EQUITY FUND
STATEMENTS OF CHANGES IN NET ASSETS
| | | Year
Ended
December 31,
2017 | | | Year
Ended
December 31, 2016 | |
| FROM OPERATIONS | | | | | | |
| Net investment income | | $ | 268,242 | | | $ | 214,022 | |
| Net realized gains from security investment transactions | | | 1,569,274 | | | | 662,978 | |
| Net change in unrealized appreciation (depreciation) on investments | | | 6,897,006 | | | | 2,783,627 | |
| Net increase in net assets resulting from operations | | | 8,734,522 | | | | 3,660,627 | |
| | | | | | | | | |
| FROM DISTRIBUTIONS TO SHAREHOLDERS (Note 1) | | | | | | | | |
| From net investment income | | | (268,281 | ) | | | (214,087 | ) |
| From net realized gains on investments | | | (1,569,522 | ) | | | (663,055 | ) |
| Decrease in net assets from distributions to shareholders | | | (1,837,803 | ) | | | (877,142 | ) |
| | | | | | | | | |
| FROM CAPITAL SHARE TRANSACTIONS | | | | | | | | |
| Proceeds from shares sold | | | 12,841,841 | | | | 7,653,870 | |
| Reinvestment of distributions to shareholders | | | 1,682,524 | | | | 795,768 | |
| Payments for shares redeemed | | | (5,280,359 | ) | | | (6,402,287 | ) |
| Net increase in net assets from capital share transactions | | | 9,244,006 | | | | 2,047,351 | |
| | | | | | | | | |
| TOTAL INCREASE IN NET ASSETS | | | 16,140,725 | | | | 4,830,836 | |
| | | | | | | | | |
| NET ASSETS | | | | | | | | |
| Beginning of year | | | 46,029,661 | | | | 41,198,825 | |
| End of year | | $ | 62,170,386 | | | $ | 46,029,661 | |
| | | | | | | | | |
| UNDISTRIBUTED NET INVESTMENT INCOME | | $ | — | | | $ | — | |
| | | | | | | | | |
| SUMMARY OF CAPITAL SHARE ACTIVITY | | | | | | | | |
| Shares sold | | | 882,753 | | | | 602,612 | |
| Shares issued in reinvestment of distributions to shareholders | | | 111,352 | | | | 60,286 | |
| Shares redeemed | | | (361,748 | ) | | | (505,382 | ) |
| Net increase in shares outstanding | | | 632,357 | | | | 157,516 | |
| Shares outstanding, beginning of year | | | 3,491,597 | | | | 3,334,081 | |
| Shares outstanding, end of year | | | 4,123,954 | | | | 3,491,597 | |
See accompanying notes to financial statements. |
54
AVE MARIA BOND FUND
STATEMENTS OF CHANGES IN NET ASSETS
| | | Year
Ended
December 31,
2017 | | | Year
Ended
December 31, 2016 | |
| FROM OPERATIONS | | | | | | |
| Net investment income | | $ | 4,095,064 | | | $ | 3,138,800 | |
| Net realized gains from investment transactions | | | 1,780,296 | | | | 3,861,048 | |
| Net change in unrealized appreciation (depreciation) on investments | | | 5,434,807 | | | | 3,234,642 | |
| Net increase in net assets resulting from operations | | | 11,310,167 | | | | 10,234,490 | |
| | | | | | | | | |
| FROM DISTRIBUTIONS TO SHAREHOLDERS (Note 1) | | | | | | | | |
| From net investment income | | | (4,102,344 | ) | | | (3,155,930 | ) |
| From net realized gains on investments | | | (1,781,882 | ) | | | (3,868,004 | ) |
| Decrease in net assets from distributions to shareholders | | | (5,884,226 | ) | | | (7,023,934 | ) |
| | | | | | | | | |
| FROM CAPITAL SHARE TRANSACTIONS | | | | | | | | |
| Proceeds from shares sold | | | 99,449,677 | | | | 65,462,953 | |
| Reinvestment of distributions to shareholders | | | 5,193,095 | | | | 6,225,863 | |
| Payments for shares redeemed | | | (51,805,590 | ) | | | (49,770,221 | ) |
| Net increase in net assets from capital share transactions | | | 52,837,182 | | | | 21,918,595 | |
| | | | | | | | | |
| TOTAL INCREASE IN NET ASSETS | | | 58,263,123 | | | | 25,129,151 | |
| | | | | | | | | |
| NET ASSETS | | | | | | | | |
| Beginning of year | | | 248,971,264 | | | | 223,842,113 | |
| End of year | | $ | 307,234,387 | | | $ | 248,971,264 | |
| | | | | | | | | |
| UNDISTRIBUTED NET INVESTMENT INCOME | | $ | — | | | $ | 6,363 | |
| | | | | | | | | |
| SUMMARY OF CAPITAL SHARE ACTIVITY | | | | | | | | |
| Shares sold | | | 8,759,908 | | | | 5,795,182 | |
| Shares issued in reinvestment of distributions to shareholders | | | 456,482 | | | | 553,927 | |
| Shares redeemed | | | (4,564,309 | ) | | | (4,412,326 | ) |
| Net increase in shares outstanding | | | 4,652,081 | | | | 1,936,783 | |
| Shares outstanding, beginning of year | | | 22,254,937 | | | | 20,318,154 | |
| Shares outstanding, end of year | | | 26,907,018 | | | | 22,254,937 | |
See accompanying notes to financial statements. |
55
AVE MARIA VALUE FUND
FINANCIAL HIGHLIGHTS
Per Share Data for a Share Outstanding Throughout Each Year
| | | Year
Ended
December 31,
2017 | | | Year
Ended
December 31, 2016 | | | Year
Ended
December 31, 2015 | | | Year
Ended
December 31, 2014 | | | Year
Ended
December 31, 2013 | |
| Net asset value at beginning of year | | $ | 19.12 | | | $ | 16.42 | | | $ | 19.97 | | | $ | 21.21 | | | $ | 17.78 | |
| | | | | | | | | | | | | | | | | | | | | |
| Income (loss) from investment operations: | | | | | | | | | | | | | | | | | | | | |
| Net investment income (loss) | | | (0.06 | ) | | | (0.03 | ) | | | 0.01 | | | | (0.01 | ) | | | (0.00 | )(a) |
| Net realized and unrealized gains (losses) on investments | | | 3.46 | | | | 2.73 | | | | (3.54 | ) | | | 0.63 | | | | 4.66 | |
| Total from investment operations | | | 3.40 | | | | 2.70 | | | | (3.53 | ) | | | 0.62 | | | | 4.66 | |
| | | | | | | | | | | | | | | | | | | | | |
| Less distributions: | | | | | | | | | | | | | | | | | | | | |
| From net investment income | | | — | | | | — | | | | (0.01 | ) | | | — | | | | — | |
| From net realized gains on investments | | | (1.64 | ) | | | — | | | | (0.01 | ) | | | (1.86 | ) | | | (1.23 | ) |
| Total distributions | | | (1.64 | ) | | | — | | | | (0.02 | ) | | | (1.86 | ) | | | (1.23 | ) |
| | | | | | | | | | | | | | | | | | | | | |
| Net asset value at end of year | | $ | 20.88 | | | $ | 19.12 | | | $ | 16.42 | | | $ | 19.97 | | | $ | 21.21 | |
| | | | | | | | | | | | | | | | | | | | | |
Total return (b) | | | 17.7 | % | | | 16.4 | % | | | (17.7 | %) | | | 2.9 | % | | | 26.2 | % |
| | | | | | | | | | | | | | | | | | | | | |
| Ratios/Supplementary Data: | | | | | | | | | | | | | | | | | | | | |
| Net assets at end of year (000’s) | | $ | 249,892 | | | $ | 224,593 | | | $ | 211,879 | | | $ | 246,790 | | | $ | 246,801 | |
| | | | | | | | | | | | | | | | | | | | | |
| Ratio of total expenses to average net assets | | | 1.19 | % | | | 1.20 | % | | | 1.18 | % | | | 1.29 | % | | | 1.42 | % |
| | | | | | | | | | | | | | | | | | | | | |
| Ratio of net investment income (loss) to average net assets | | | (0.32 | %) | | | (0.15 | %) | | | 0.06 | % | | | (0.04 | %) | | | (0.02 | %) |
| | | | | | | | | | | | | | | | | | | | | |
| Portfolio turnover rate | | | 40 | % | | | 47 | % | | | 63 | % | | | 31 | % | | | 29 | % |
(a) | Amount rounds to less than $0.01 per share. |
(b) | Total return is a measure of the change in value of an investment in the Fund over the period covered, which assumes any dividends or capital gains distributions are reinvested in shares of the Fund. The returns shown do not reflect the deduction of taxes a shareholder would pay on Fund distributions or the redemption of Fund shares. |
See accompanying notes to financial statements. |
56
AVE MARIA GROWTH FUND
FINANCIAL HIGHLIGHTS
Per Share Data for a Share Outstanding Throughout Each Year
| | | Year
Ended
December 31,
2017 | | | Year
Ended
December 31, 2016 | | | Year
Ended
December 31, 2015 | | | Year
Ended
December 31, 2014 | | | Year
Ended
December 31, 2013 | |
| Net asset value at beginning of year | | $ | 26.44 | | | $ | 25.02 | | | $ | 28.24 | | | $ | 30.19 | | | $ | 23.71 | |
| | | | | | | | | | | | | | | | | | | | | |
| Income (loss) from investment operations: | | | | | | | | | | | | | | | | | | | | |
| Net investment income (loss) | | | 0.03 | | | | 0.02 | | | | 0.07 | | | | (0.03 | ) | | | (0.08 | ) |
| Net realized and unrealized gains (losses) on investments | | | 7.22 | | | | 3.01 | | | | (0.81 | ) | | | 2.33 | | | | 7.55 | |
| Total from investment operations | | | 7.25 | | | | 3.03 | | | | (0.74 | ) | | | 2.30 | | | | 7.47 | |
| | | | | | | | | | | | | | | | | | | | | |
| Less distributions: | | | | | | | | | | | | | | | | | | | | |
| From net investment income | | | (0.03 | ) | | | (0.02 | ) | | | (0.07 | ) | | | — | | | | — | |
| From net realized gains on investments | | | (2.86 | ) | | | (1.59 | ) | | | (2.41 | ) | | | (4.25 | ) | | | (0.99 | ) |
| Total distributions | | | (2.89 | ) | | | (1.61 | ) | | | (2.48 | ) | | | (4.25 | ) | | | (0.99 | ) |
| | | | | | | | | | | | | | | | | | | | | |
| Net asset value at end of year | | $ | 30.80 | | | $ | 26.44 | | | $ | 25.02 | | | $ | 28.24 | | | $ | 30.19 | |
| | | | | | | | | | | | | | | | | | | | | |
Total return (a) | | | 27.4 | % | | | 12.1 | % | | | (2.7 | %) | | | 7.5 | % | | | 31.5 | % |
| | | | | | | | | | | | | | | | | | | | | |
| Ratios/Supplementary Data: | | | | | | | | | | | | | | | | | | | | |
| Net assets at end of year (000’s) | | $ | 482,515 | | | $ | 351,085 | | | $ | 300,119 | | | $ | 303,840 | | | $ | 285,132 | |
| | | | | | | | | | | | | | | | | | | | | |
| Ratio of total expenses to average net assets | | | 1.08 | % | | | 1.17 | % | | | 1.17 | % | | | 1.28 | % | | | 1.43 | % |
| | | | | | | | | | | | | | | | | | | | | |
| Ratio of net investment income (loss) to average net assets | | | 0.10 | % | | | 0.09 | % | | | 0.24 | % | | | (0.10 | %) | | | (0.29 | %) |
| | | | | | | | | | | | | | | | | | | | | |
| Portfolio turnover rate | | | 26 | % | | | 29 | % | | | 32 | % | | | 36 | % | | | 18 | % |
(a) | Total return is a measure of the change in value of an investment in the Fund over the period covered, which assumes any dividends or capital gains distributions are reinvested in shares of the Fund. The returns shown do not reflect the deduction of taxes a shareholder would pay on Fund distributions or the redemption of Fund shares. |
See accompanying notes to financial statements. |
57
AVE MARIA RISING DIVIDEND FUND
FINANCIAL HIGHLIGHTS
Per Share Data for a Share Outstanding Throughout Each Year
| | | Year
Ended
December 31,
2017 | | | Year
Ended
December 31, 2016 | | | Year
Ended
December 31, 2015 | | | Year
Ended
December 31, 2014 | | | Year
Ended
December 31, 2013 | |
| Net asset value at beginning of year | | $ | 16.79 | | | $ | 15.58 | | | $ | 17.72 | | | $ | 17.56 | | | $ | 13.49 | |
| | | | | | | | | | | | | | | | | | | | | |
| Income (loss) from investment operations: | | | | | | | | | | | | | | | | | | | | |
| Net investment income | | | 0.20 | | | | 0.27 | | | | 0.24 | | | | 0.18 | | | | 0.17 | |
| Net realized and unrealized gains (losses) on investments | | | 2.62 | | | | 2.11 | | | | (1.27 | ) | | | 1.46 | | | | 4.38 | |
| Total from investment operations | | | 2.82 | | | | 2.38 | | | | (1.03 | ) | | | 1.64 | | | | 4.55 | |
| | | | | | | | | | | | | | | | | | | | | |
| Less distributions: | | | | | | | | | | | | | | | | | | | | |
| From net investment income | | | (0.20 | ) | | | (0.28 | ) | | | (0.23 | ) | | | (0.18 | ) | | | (0.17 | ) |
| From net realized gains on investments | | | (0.97 | ) | | | (0.89 | ) | | | (0.88 | ) | | | (1.30 | ) | | | (0.31 | ) |
| Total distributions | | | (1.17 | ) | | | (1.17 | ) | | | (1.11 | ) | | | (1.48 | ) | | | (0.48 | ) |
| | | | | | | | | | | | | | | | | | | | | |
| Net asset value at end of year | | $ | 18.44 | | | $ | 16.79 | | | $ | 15.58 | | | $ | 17.72 | | | $ | 17.56 | |
| | | | | | | | | | | | | | | | | | | | | |
Total return (a) | | | 16.8 | % | | | 15.3 | % | | | (5.9 | %) | | | 9.3 | % | | | 33.9 | % |
| | | | | | | | | | | | | | | | | | | | | |
| Ratios/Supplementary Data: | | | | | | | | | | | | | | | | | | | | |
| Net assets at end of year (000’s) | | $ | 970,109 | | | $ | 828,649 | | | $ | 750,890 | | | $ | 848,096 | | | $ | 710,150 | |
| | | | | | | | | | | | | | | | | | | | | |
| Ratio of total expenses to average net assets | | | 0.92 | % | | | 0.92 | % | | | 0.92 | % | | | 0.92 | % | | | 0.97 | % |
| | | | | | | | | | | | | | | | | | | | | |
| Ratio of net investment income to average net assets | | | 1.12 | % | | | 1.61 | % | | | 1.38 | % | | | 1.01 | % | | | 1.16 | % |
| | | | | | | | | | | | | | | | | | | | | |
| Portfolio turnover rate | | | 26 | % | | | 24 | % | | | 35 | % | | | 29 | % | | | 14 | % |
(a) | Total return is a measure of the change in value of an investment in the Fund over the period covered, which assumes any dividends or capital gains distributions are reinvested in shares of the Fund. The returns shown do not reflect the deduction of taxes a shareholder would pay on Fund distributions or the redemption of Fund shares. |
See accompanying notes to financial statements. |
58
AVE MARIA WORLD EQUITY FUND
FINANCIAL HIGHLIGHTS
Per Share Data for a Share Outstanding Throughout Each Year
| | | Year
Ended
December 31,
2017 | | | Year
Ended
December 31, 2016 | | | Year
Ended
December 31, 2015 | | | Year
Ended
December 31, 2014 | | | Year
Ended
December 31, 2013 | |
| Net asset value at beginning of year | | $ | 13.18 | | | $ | 12.36 | | | $ | 13.22 | | | $ | 13.90 | | | $ | 11.46 | |
| | | | | | | | | | | | | | | | | | | | | |
| Income (loss) from investment operations: | | | | | | | | | | | | | | | | | | | | |
| Net investment income | | | 0.07 | | | | 0.06 | | | | 0.07 | | | | 0.04 | | | | 0.03 | |
| Net realized and unrealized gains (losses) on investments | | | 2.29 | | | | 1.01 | | | | (0.70 | ) | | | 0.04 | | | | 2.66 | |
| Total from investment operations | | | 2.36 | | | | 1.07 | | | | (0.63 | ) | | | 0.08 | | | | 2.69 | |
| | | | | | | | | | | | | | | | | | | | | |
| Less distributions: | | | | | | | | | | | | | | | | | | | | |
| From net investment income | | | (0.07 | ) | | | (0.06 | ) | | | (0.07 | ) | | | (0.04 | ) | | | (0.03 | ) |
| From net realized gains on investments | | | (0.39 | ) | | | (0.19 | ) | | | (0.16 | ) | | | (0.72 | ) | | | (0.22 | ) |
| Total distributions | | | (0.46 | ) | | | (0.25 | ) | | | (0.23 | ) | | | (0.76 | ) | | | (0.25 | ) |
| | | | | | | | | | | | | | | | | | | | | |
| Net asset value at end of year | | $ | 15.08 | | | $ | 13.18 | | | $ | 12.36 | | | $ | 13.22 | | | $ | 13.90 | |
| | | | | | | | | | | | | | | | | | | | | |
Total return (a) | | | 17.9 | % | | | 8.7 | % | | | (4.8 | %) | | | 0.5 | % | | | 23.5 | % |
| | | | | | | | | | | | | | | | | | | | | |
| Ratios/Supplementary Data: | | | | | | | | | | | | | | | | | | | | |
| Net assets at end of year (000’s) | | $ | 62,170 | | | $ | 46,030 | | | $ | 41,199 | | | $ | 42,667 | | | $ | 39,870 | |
| | | | | | | | | | | | | | | | | | | | | |
| Ratio of total expenses to average net assets | | | 1.41 | % | | | 1.45 | % | | | 1.50 | % | | | 1.50 | % | | | 1.55 | % |
| | | | | | | | | | | | | | | | | | | | | |
Ratio of net expenses to average net assets (b) | | | 1.25 | % | | | 1.33 | % | | | 1.50 | % | | | 1.50 | % | | | 1.50 | % |
| | | | | | | | | | | | | | | | | | | | | |
Ratio of net investment income to average net assets (b) | | | 0.50 | % | | | 0.50 | % | | | 0.51 | % | | | 0.29 | % | | | 0.28 | % |
| | | | | | | | | | | | | | | | | | | | | |
| Portfolio turnover rate | | | 29 | % | | | 42 | % | | | 35 | % | | | 36 | % | | | 31 | % |
(a) | Total return is a measure of the change in value of an investment in the Fund over the period covered, which assumes any dividends or capital gains distributions are reinvested in shares of the Fund. The returns shown do not reflect the deduction of taxes a shareholder would pay on Fund distributions or the redemption of Fund shares. |
(b) | Ratio was determined after advisory fee reductions (Note 2). |
See accompanying notes to financial statements. |
59
AVE MARIA BOND FUND
FINANCIAL HIGHLIGHTS
Per Share Data for a Share Outstanding Throughout Each Year
| | | Year
Ended
December 31,
2017 | | | Year
Ended
December 31, 2016 | | | Year
Ended
December 31, 2015 | | | Year
Ended
December 31, 2014 | | | Year
Ended
December 31, 2013 | |
| Net asset value at beginning of year | | $ | 11.19 | | | $ | 11.02 | | | $ | 11.15 | | | $ | 11.38 | | | $ | 11.04 | |
| | | | | | | | | | | | | | | | | | | | | |
| Income (loss) from investment operations: | | | | | | | | | | | | | | | | | | | | |
| Net investment income | | | 0.17 | | | | 0.15 | | | | 0.14 | | | | 0.12 | | | | 0.11 | |
| Net realized and unrealized gains (losses) on investments | | | 0.30 | | | | 0.35 | | | | (0.06 | ) | | | 0.12 | | | | 0.56 | |
| Total from investment operations | | | 0.47 | | | | 0.50 | | | | 0.08 | | | | 0.24 | | | | 0.67 | |
| | | | | | | | | | | | | | | | | | | | | |
| Less distributions: | | | | | | | | | | | | | | | | | | | | |
| From net investment income | | | (0.17 | ) | | | (0.15 | ) | | | (0.14 | ) | | | (0.12 | ) | | | (0.11 | ) |
| From net realized gains on investments | | | (0.07 | ) | | | (0.18 | ) | | | (0.07 | ) | | | (0.35 | ) | | | (0.22 | ) |
| Total distributions | | | (0.24 | ) | | | (0.33 | ) | | | (0.21 | ) | | | (0.47 | ) | | | (0.33 | ) |
| | | | | | | | | | | | | | | | | | | | | |
| Net asset value at end of year | | $ | 11.42 | | | $ | 11.19 | | | $ | 11.02 | | | $ | 11.15 | | | $ | 11.38 | |
| | | | | | | | | | | | | | | | | | | | | |
Total return (a) | | | 4.2 | % | | | 4.5 | % | | | 0.7 | % | | | 2.2 | % | | | 6.1 | % |
| | | | | | | | | | | | | | | | | | | | | |
| Ratios/Supplementary Data: | | | | | | | | | | | | | | | | | | | | |
| Net assets at end of year (000’s) | | $ | 307,234 | | | $ | 248,971 | | | $ | 223,842 | | | $ | 180,718 | | | $ | 149,750 | |
| | | | | | | | | | | | | | | | | | | | | |
| Ratio of net expenses to average net assets | | | 0.50 | % | | | 0.50 | % | | | 0.51 | % | | | 0.54 | % | | | 0.70 | % |
| | | | | | | | | | | | | | | | | | | | | |
| Ratio of net investment income to average net assets | | | 1.47 | % | | | 1.34 | % | | | 1.30 | % | | | 1.10 | % | | | 1.01 | % |
| | | | | | | | | | | | | | | | | | | | | |
| Portfolio turnover rate | | | 19 | % | | | 21 | % | | | 25 | % | | | 21 | % | | | 17 | % |
(a) | Total return is a measure of the change in value of an investment in the Fund over the period covered, which assumes any dividends or capital gains distributions are reinvested in shares of the Fund. The returns shown do not reflect the deduction of taxes a shareholder would pay on Fund distributions or the redemption of Fund shares. |
See accompanying notes to financial statements. |
60
AVE MARIA MUTUAL FUNDS
NOTES TO FINANCIAL STATEMENTS
December 31, 2017
1. Organization and Significant Accounting Policies
The Ave Maria Value Fund (formerly the Ave Maria Catholic Values Fund), the Ave Maria Growth Fund, the Ave Maria Rising Dividend Fund, the Ave Maria World Equity Fund and the Ave Maria Bond Fund (individually, a “Fund” and collectively, the “Funds”) are each a diversified series of the Schwartz Investment Trust (the “Trust”), an open-end management investment company registered under the Investment Company Act of 1940, as amended (the “1940 Act”), and established as an Ohio business trust under a Declaration of Trust dated August 31, 1992. The Ave Maria Value Fund commenced the public offering of its shares on May 1, 2001. The public offering of shares of the Ave Maria Growth Fund and the Ave Maria Bond Fund commenced on May 1, 2003. The Ave Maria Rising Dividend Fund commenced the public offering of its shares on May 2, 2005. The Ave Maria World Equity Fund commenced the public offering of its shares on April 30, 2010.
The investment objective of the Ave Maria Value Fund is to seek long-term capital appreciation from equity investments in companies that do not violate core values and teachings of the Roman Catholic Church. The investment objective of the Ave Maria Growth Fund is to seek long-term capital appreciation, using the growth style, from equity investments in companies that do not violate core values and teachings of the Roman Catholic Church. The investment objective of the Ave Maria Rising Dividend Fund is to provide increasing dividend income over time, long-term growth of capital, and a reasonable level of current income from investments in dividend-paying common stocks of companies that do not violate core values and teachings of the Roman Catholic Church. The investment objective of the Ave Maria World Equity Fund is to seek long-term capital appreciation from equity investments in U.S. and non-U.S. companies that do not violate core values and teachings of the Roman Catholic Church. The investment objective of the Ave Maria Bond Fund is to seek preservation of principal with a reasonable level of current income in corporate debt and equity securities that do not violate core values and teachings of the Roman Catholic Church. See the Funds’ Prospectus for information regarding the investment strategies of each Fund.
Shares of each Fund are sold at net asset value. To calculate the net asset value, a Fund’s assets are valued and totaled, liabilities are subtracted, and the balance is divided by the number of shares outstanding. The offering price and redemption price per share are equal to the net asset value per share for each Fund.
The Funds follow accounting and reporting guidance under Financial Accounting Standards Board Accounting Standards Codification Topic 946, “Financial Services – Investment Companies.” The following is a summary of significant accounting policies followed by the Funds. These policies are in conformity with accounting principles generally accepted in the United States of America (“GAAP”).
61
AVE MARIA MUTUAL FUNDS
NOTES TO FINANCIAL STATEMENTS
(Continued)
(a) Valuation of investments – Securities which are traded on stock exchanges are valued at the closing sales price as of the close of the regular session of trading on the New York Stock Exchange on the day the securities are being valued, or, if not traded on a particular day, at the closing bid price. Securities which are quoted by NASDAQ are valued at the NASDAQ Official Closing Price or, if an Official Closing Price is not available, at the most recently quoted bid price. Securities traded in the over-the-counter market are valued at the last reported sales price or, if there is no reported sale on the valuation date, at the most recently quoted bid price. Securities which are traded both in the over-the-counter market and on a stock exchange are valued according to the broadest and most representative market. Fixed income securities are generally valued using prices provided by an independent pricing service. The independent pricing service uses information with respect to transactions in bonds, quotations from bond dealers, market transactions in comparable securities and various relationships between securities in determining these prices. Investments in shares of other open-end investment companies are valued at their net asset value as reported by such companies. When using quoted prices and when the market for the securities are considered active, the securities will be classified as Level 1 within the fair value hierarchy (see below). Securities for which market quotations are not readily available are valued at their fair value as determined in good faith in accordance with consistently applied procedures established by and under the general supervision of the Board of Trustees, and will be classified as Level 2 or 3 within the fair value hierarchy, depending on the inputs used. Fair value pricing may be used, for example, in situations where (i) a security is so thinly traded that there have been no transactions for that stock over an extended period of time; (ii) the exchange on which the security is principally traded closes early; or (iii) trading of the security is halted during the day and does not resume prior to a Fund’s net asset value calculation. A security’s “fair value” price may differ from the price next available for that security using the Funds’ normal pricing procedures.
GAAP establishes a single authoritative definition of fair value, sets out a framework for measuring fair value and requires additional disclosures about fair value measurements.
Various inputs are used in determining the value of each Fund’s investments. These inputs are summarized in the three broad levels listed below:
| | ● | Level 1 – quoted prices in active markets for identical securities |
| | ● | Level 2 – other significant observable inputs |
| | ● | Level 3 – significant unobservable inputs |
62
AVE MARIA MUTUAL FUNDS
NOTES TO FINANCIAL STATEMENTS
(Continued)
U.S. Treasury Obligations and Corporate Bonds held by the Ave Maria Bond Fund are classified as Level 2 since the values for such securities are based on prices provided by an independent pricing service that utilizes various “other significant observable inputs” including bid and ask quotations, prices of similar securities and interest rates, among other factors.
The inputs or methodology used for valuing securities are not necessarily an indication of the risks associated with investing in those securities. The inputs used to measure fair value may fall into different levels of the fair value hierarchy. In such cases, for disclosure purposes, the level in the fair value hierarchy within which the fair value measurement falls in its entirety is determined based on the lowest level input that is significant to the fair value measurement.
The following is a summary of the inputs used to value the Funds’ investments, by security type, as of December 31, 2017:
| Ave Maria Value Fund | | Level 1 | | | Level 2 | | | Level 3 | | | Total | |
| Common Stocks | | $ | 226,211,602 | | | $ | 2,380,000 | | | $ | — | | | $ | 228,591,602 | |
| Money Market Funds | | | 22,583,408 | | | | — | | | | — | | | | 22,583,408 | |
| Total | | $ | 248,795,010 | | | $ | 2,380,000 | | | $ | — | | | $ | 251,175,010 | |
| Ave Maria Growth Fund | | Level 1 | | | Level 2 | | | Level 3 | | | Total | |
| Common Stocks | | $ | 430,163,180 | | | $ | — | | | $ | — | | | $ | 430,163,180 | |
| Money Market Funds | | | 52,736,617 | | | | — | | | | — | | | | 52,736,617 | |
| Total | | $ | 482,899,797 | | | $ | — | | | $ | — | | | $ | 482,899,797 | |
| Ave Maria Rising Dividend Fund | | Level 1 | | | Level 2 | | | Level 3 | | | Total | |
| Common Stocks | | $ | 902,938,620 | | | $ | — | | | $ | — | | | $ | 902,938,620 | |
| Money Market Funds | | | 67,157,443 | | | | — | | | | — | | | | 67,157,443 | |
| Total | | $ | 970,096,063 | | | $ | — | | | $ | — | | | $ | 970,096,063 | |
| Ave Maria World Equity Fund | | Level 1 | | | Level 2 | | | Level 3 | | | Total | |
| Common Stocks | | $ | 58,320,332 | | | $ | — | | | $ | — | | | $ | 58,320,332 | |
| Money Market Funds | | | 4,003,430 | | | | — | | | | — | | | | 4,003,430 | |
| Total | | $ | 62,323,762 | | | $ | — | | | $ | — | | | $ | 62,323,762 | |
63
AVE MARIA MUTUAL FUNDS
NOTES TO FINANCIAL STATEMENTS
(Continued)
| Ave Maria Bond Fund | | Level 1 | | | Level 2 | | | Level 3 | | | Total | |
| U.S. Treasury Obligations | | $ | — | | | $ | 165,049,040 | | | $ | — | | | $ | 165,049,040 | |
| Corporate Bonds | | | — | | | | 87,416,712 | | | | — | | | | 87,416,712 | |
| Common Stocks | | | 46,431,320 | | | | — | | | | — | | | | 46,431,320 | |
| Money Market Funds | | | 4,679,958 | | | | — | | | | — | | | | 4,679,958 | |
| Total | | $ | 51,111,278 | | | $ | 252,465,752 | | | $ | — | | | $ | 303,577,030 | |
Refer to each Fund’s Schedule of Investments for a listing of the securities by security type and sector or industry type. As of December 31, 2017, the Ave Maria Growth Fund, the Ave Maria Rising Dividend Fund, the Ave Maria World Equity Fund and the Ave Maria Bond Fund did not have any transfers between Levels. There were no Level 3 securities or derivative instruments held by the Funds as of December 31, 2017. It is the Funds’ policy to recognize transfers between Levels at the end of the reporting period. Transfers that occurred between Level 1 and 2 on December 31, 2017 for Ave Maria Value Fund due to fair value procedures was as follows:
| | | Transfers
from Level 1
to Level 2 | |
| Common Stocks | | $ | 2,380,000 | |
(b) Income taxes – Each Fund has qualified and intends to continue to qualify as a regulated investment company under the Internal Revenue Code of 1986, as amended (the “Code”). Qualification generally will relieve each Fund of liability for federal income taxes to the extent 100% of its net investment income and net realized capital gains are distributed in accordance with the Code.
In order to avoid imposition of the excise tax applicable to regulated investment companies, it is also each Fund’s intention to declare as dividends in each calendar year at least 98% of its net investment income and 98.2% of its net realized capital gains plus undistributed amounts from prior years.
The following information is computed on a tax basis for each item as of December 31, 2017:
| | | Ave Maria
Value Fund | | | Ave Maria
Growth
Fund | | | Ave Maria
Rising
Dividend Fund | | | Ave Maria
World Equity Fund | | | Ave Maria
Bond Fund | |
| Undistributed net investment income | | $ | — | | | $ | — | | | $ | 157,032 | | | $ | — | | | $ | — | |
| Net unrealized appreciation | | | 64,922,726 | | | | 139,979,896 | | | | 197,268,968 | | | | 11,805,901 | | | | 10,732,277 | |
| Total distributable earnings | | $ | 64,922,726 | | | $ | 139,979,896 | | | $ | 197,426,000 | | | $ | 11,805,901 | | | $ | 10,732,277 | |
64
AVE MARIA MUTUAL FUNDS
NOTES TO FINANCIAL STATEMENTS
(Continued)
The following information is based upon the federal income tax cost of the Funds’ investment securities as of December 31, 2017:
| | | Ave Maria
Value Fund | | | Ave Maria
Growth
Fund | | | Ave Maria
Rising
Dividend Fund | | | Ave Maria
World
Equity Fund | | | Ave Maria
Bond Fund | |
| Gross unrealized appreciation | | $ | 65,827,677 | | | $ | 141,724,239 | | | $ | 211,962,255 | | | $ | 12,331,556 | | | $ | 12,816,849 | |
| Gross unrealized depreciation | | | (904,951 | ) | | | (1,744,343 | ) | | | (14,693,287 | ) | | | (525,655 | ) | | | (2,084,572 | ) |
| Net unrealized appreciation | | $ | 64,922,726 | | | $ | 139,979,896 | | | $ | 197,268,968 | | | $ | 11,805,901 | | | $ | 10,732,277 | |
| Federal income tax cost | | $ | 186,252,284 | | | $ | 342,919,901 | | | $ | 772,827,095 | | | $ | 50,517,861 | | | $ | 292,844,753 | |
The difference between the federal income tax cost of portfolio investments and the financial statement cost of portfolio investments for the Ave Maria Value Fund, the Ave Maria Growth Fund and the Ave Maria Rising Dividend Fund is due to certain timing differences in the recognition of capital gains and losses under income tax regulations and GAAP. These “book/tax” differences are temporary in nature and are due to the tax deferral of losses on wash sales. There is no difference between the federal income tax cost and the financial statement cost of portfolio investments for the Ave Maria World Equity Fund and the Ave Maria Bond Fund as of December 31, 2017.
During the year ended December 31, 2017, the following reclassifications were made as a result of permanent differences between the financial statements and income tax reporting requirements.
| | | Increase (Decrease) in Undistributed Net Investment Income (Loss) | | | Increase (Decrease) in Accumulated Net Realized Gains on Investments | | | Decrease in Paid-in Capital | |
| Ave Maria Value Fund | | $ | 747,069 | | | $ | (745,648 | ) | | $ | (1,421 | ) |
| Ave Maria Growth Fund | | | 217 | | | | 1,080 | | | | (1,297 | ) |
| Ave Maria Rising Dividend Fund | | | (1,492 | ) | | | 1,492 | | | | — | |
| Ave Maria World Equity Fund | | | 39 | | | | 248 | | | | (287 | ) |
| Ave Maria Bond Fund | | | 917 | | | | 1,586 | | | | (2,503 | ) |
The Funds recognize the tax benefits or expenses of uncertain tax positions only when the position is “more-likely-than-not” to be sustained assuming examination by tax authorities. Management has reviewed the tax positions taken on federal income tax returns for all open tax years (tax years ended December 31, 2014 through December 31, 2017) and has concluded that no provision for unrecognized tax benefits or expenses is required in these financial statements.
65
AVE MARIA MUTUAL FUNDS
NOTES TO FINANCIAL STATEMENTS
(Continued)
(c) Investment transactions and investment income – Investment transactions are accounted for on the trade date. Dividend income is recorded on the ex-dividend date. Interest income is recognized on the accrual basis and includes amortization of premiums and accretion of discounts using the effective yield method. Cost of investments includes amortization of premiums and accretion of discounts. Realized gains and losses on securities sold are determined on a specific identification basis. Withholding taxes on foreign dividends have been recorded in accordance with the Funds’ understanding of the applicable country’s rules and tax rates.
(d) Dividends and distributions – Dividends from net investment income, if any, are declared and paid annually in December for the Ave Maria Value Fund, the Ave Maria Growth Fund and the Ave Maria World Equity Fund. Dividends from net investment income, if any, are declared and paid quarterly for the Ave Maria Rising Dividend Fund and are declared and paid monthly for the Ave Maria Bond Fund. Each Fund expects to distribute any net realized capital gains annually. Dividends and distributions to shareholders are recorded on the ex-dividend date. The tax character of distributions paid to shareholders during the years ended December 31, 2017 and 2016 was as follows:
| Years Ended | | Ordinary
Income | | | Long-Term
Capital Gains | | | Total
Distributions | |
| Ave Maria Value Fund: | | | | | | | | | | | | |
| December 31, 2017 | | $ | 248,730 | | | $ | 18,006,749 | | | $ | 18,255,479 | |
| December 31, 2016 | | $ | — | | | $ | — | | | $ | — | |
| Ave Maria Growth Fund: | | | | | | | | | | | | |
| December 31, 2017 | | $ | 576,743 | | | $ | 40,927,231 | | | $ | 41,503,974 | |
| December 31, 2016 | | $ | 282,281 | | | $ | 19,858,816 | | | $ | 20,141,097 | |
| Ave Maria Rising Dividend Fund: | | | | | | | | | | | | |
| December 31, 2017 | | $ | 12,626,725 | | | $ | 45,935,306 | | | $ | 58,562,031 | |
| December 31, 2016 | | $ | 16,509,599 | | | $ | 38,296,088 | | | $ | 54,805,687 | |
| Ave Maria World Equity Fund: | | | | | | | | | | | | |
| December 31, 2017 | | $ | 268,281 | | | $ | 1,569,522 | | | $ | 1,837,803 | |
| December 31, 2016 | | $ | 214,164 | | | $ | 662,978 | | | $ | 877,142 | |
| Ave Maria Bond Fund | | | | | | | | | | | | |
| December 31, 2017 | | $ | 4,102,344 | | | $ | 1,781,882 | | | $ | 5,884,226 | |
| December 31, 2016 | | $ | 4,368,623 | | | $ | 2,655,311 | | | $ | 7,023,934 | |
66
AVE MARIA MUTUAL FUNDS
NOTES TO FINANCIAL STATEMENTS
(Continued)
(e) Estimates – The preparation of financial statements in conformity with GAAP requires management to make estimates and assumptions that affect the reported amounts of assets and liabilities and disclosure of contingent assets and liabilities as of the date of the financial statements and the reported amounts of revenues and expenses during the reporting period. Actual results could differ from those estimates.
(f) Common expenses – Common expenses of the Trust are allocated among the series of the Trust based on relative net assets of each series or the nature of the services performed and the relative applicability to each series.
2. Investment Advisory Agreements and Transactions with Related Parties
The Chairman and President of the Trust is also the Chairman and Chief Executive Officer of Schwartz Investment Counsel, Inc. (the “Adviser”). Certain other officers of the Trust are officers of the Adviser, or of Ultimus Fund Solutions, LLC (“Ultimus”), the administrative, accounting and transfer agent for the Funds, or of Ultimus Fund Distributors, LLC (the “Distributor”), the Funds’ principal underwriter.
Pursuant to Investment Advisory Agreements between the Trust and the Adviser, the Adviser is responsible for the management of each Fund and provides investment advice along with the necessary personnel, facilities, equipment and certain other services necessary to the operations of the Funds. The Adviser receives from each of the Ave Maria Value Fund and the Ave Maria World Equity Fund a fee, which is accrued daily and paid quarterly, at the annual rate of 0.95% of its average daily net assets. The Adviser receives from each of the Ave Maria Rising Dividend Fund and the Ave Maria Bond Fund a fee, which is accrued daily and paid quarterly, at the annual rate of 0.75% and 0.30%, respectively, of average daily net assets. Prior to May 1, 2017, the Adviser received from the Ave Maria Growth Fund a fee, which was accrued daily and paid quarterly, at the annual rate of 0.95% of its average daily net assets. Effective May 1, 2017, the Adviser received from the Ave Maria Growth Fund a fee, which was accrued daily and paid quarterly, at the annual rate of 0.85% of its average daily net assets. Effective January 1, 2018, the Adviser has contractually agreed to reduce the fee the Adviser will receive from the Ave Maria Growth Fund, which will be accrued daily and paid quarterly, from 0.85% to 0.75% of its average daily net assets.
The Adviser has contractually agreed to reduce its advisory fees or reimburse a portion of operating expenses until at least May 1, 2019 so that the ordinary operating expenses of each of the Ave Maria Value Fund, the Ave Maria Growth Fund, the Ave Maria Rising Dividend Fund and the Ave Maria World Equity Fund do not exceed 1.25% per annum of average daily net assets; and the ordinary operating expenses of the Ave Maria Bond Fund do not exceed 0.60% per annum of average daily net assets. Accordingly, during the year ended December 31, 2017, the Adviser reduced its investment advisory fees by $84,176 with respect to the Ave Maria World Equity Fund.
67
AVE MARIA MUTUAL FUNDS
NOTES TO FINANCIAL STATEMENTS
(Continued)
Any investment advisory fee reductions or expense reimbursements by the Adviser are subject to repayment by the Funds for a period of three years after such fees and expenses were incurred, provided the Funds are able to effect such repayment and remain in compliance with any undertaking by the Adviser to limit expenses of the Funds. As of December 31, 2017, the Adviser may seek recoupment of investment advisory fee reductions from the Ave Maria World Equity Fund totaling $137,003 no later than the dates as stated below:
| | | December 31,
2019 | | | December 31,
2020 | | | Total | |
| Ave Maria World Equity Fund | | $ | 52,827 | | | $ | 84,176 | | | $ | 137,003 | |
The Chief Compliance Officer of the Trust (the “CCO”) is an employee of the Adviser. The Trust pays the Adviser a fee for providing CCO services, of which each Fund pays its proportionate share along with the other series of the Trust. In addition, the Trust reimburses the Adviser for out-of-pocket expenses incurred, if any, for providing these services.
Pursuant to a Mutual Fund Services Agreement between the Trust and Ultimus, Ultimus supplies regulatory and compliance services, calculates the daily net asset value per share of each Fund, maintains the financial books and records of the Funds, maintains the records of each shareholder’s account, and processes purchases and redemptions of each Fund’s shares. For the performance of these services, Ultimus receives fees from each Fund computed as a percentage of such Fund’s average daily net assets, subject to a minimum monthly fee.
Pursuant to a Distribution Agreement between the Trust and the Distributor, the Distributor serves as each Fund’s exclusive agent for the distribution of its shares. The Distributor is an affiliate of Ultimus.
Trustees and officers affiliated with the Adviser or Ultimus are not compensated by the Trust for their services. Each Trustee who is not an affiliated person of the Adviser or Ultimus (“Independent Trustee”) received from the Trust an annual retainer of $40,000 (except that such fee was $50,000 for the Lead Independent Trustee/Chairman of the Governance Committee and $44,000 for the Chairman of the Audit Committee), payable quarterly; a fee of $6,000 for attendance at each meeting of the Board of Trustees; plus reimbursement of travel and other expenses incurred in attending meetings. Effective January 1, 2018, each Independent Trustee will receive from the Trust an annual retainer of $46,000 (except that such fee is $56,000 for the Lead Independent Trustee/Chairman of the Governance Committee and $50,000 for the Chairman of the Audit Committee), payable quarterly; a fee of $6,000 for attendance at each meeting of the Board of Trustees;
68
AVE MARIA MUTUAL FUNDS
NOTES TO FINANCIAL STATEMENTS
(Continued)
plus reimbursement of travel and other expenses incurred in attending meetings. Each Fund pays its proportionate share of the Independent Trustees’ fees and expenses along with the other series of the Trust.
Each member of Catholic Advisory Board (“CAB”), including Emeritus members, receives an annual retainer of $4,000 (except that such fee is $14,000 for the CAB chairman), payable quarterly; a fee of $3,000 for attendance at each meeting of the CAB (including the CAB chairman); plus reimbursement of travel and other expenses incurred in attending meetings. Each Fund pays its proportionate share of CAB members’ fees and expenses.
3. Investment Transactions
During the year ended December 31, 2017, cost of purchases and proceeds from sales and maturities of investment securities, excluding short-term investments and U.S. government securities, were as follows:
| | | Ave Maria
Value Fund | | | Ave Maria
Growth
Fund | | | Ave Maria
Rising
Dividend Fund | | | Ave Maria
World Equity Fund | | | Ave Maria
Bond Fund | |
| Purchases of investment securities | | $ | 85,576,127 | | | $ | 98,579,403 | | | $ | 216,799,487 | | | $ | 20,600,425 | | | $ | 11,414,720 | |
| Proceeds from sales and maturities of investment securities | | $ | 98,675,230 | | | $ | 98,217,549 | | | $ | 234,029,257 | | | $ | 14,451,221 | | | $ | 33,514,300 | |
4. Contingencies and Commitments
The Funds indemnify the Trust’s officers and Trustees for certain liabilities that might arise from their performance of their duties to the Funds. Additionally, in the normal course of business, the Funds enter into contracts that contain a variety of representations and warranties and which provide general indemnifications. The Funds’ maximum exposure under these arrangements is unknown, as this would involve future claims that may be made against the Funds that have not yet occurred. However, based on experience, the Funds expect the risk of loss to be remote.
69
AVE MARIA MUTUAL FUNDS
NOTES TO FINANCIAL STATEMENTS
(Continued)
5. Affiliated Investment
A company is considered an affiliate of a Fund under the 1940 Act if the Fund’s holdings in that company represent 5% or more of the outstanding voting shares of that company. As of December 31, 2017, the Ave Maria Value Fund owns 5.28% of the outstanding voting shares of Unico American Corporation (“Unico”). The industry and percentage of net assets for Unico can be found on the Ave Maria Value Fund’s Schedule of Investments. Further information on this holding for the year ended December 31, 2017 appears below:
| AVE MARIA VALUE FUND |
| Affiliated Issuer Report |
| UNICO AMERICAN CORPORATION |
| From December 31, 2016 to December 31, 2017 |
| Shares at beginning of year | | | 282,945 | |
| Shares sold during the year | | | (2,945 | ) |
| Shares at end of year | | | 280,000 | |
| Market value at beginning of year | | $ | 3,041,659 | |
| Sales during the year | | | (30,428 | ) |
| Net realized gains during the year | | | 19,671 | |
| Change in unrealized appreciation (depreciation) | | | (650,902 | ) |
| Market value at end of year | | $ | 2,380,000 | |
| Dividend income earned during the year | | $ | — | |
6. Sector Risk
If a Fund has significant investments in the securities of issuers in industries within a particular sector, any development affecting that sector will have a greater impact on the value of the net assets of the Fund than would be the case if the Fund did not have significant investments in that sector. In addition, this may increase the risk of loss of an investment in the Fund and increase the volatility of the Fund’s net asset value per share. From time to time, circumstances may affect a particular sector and the companies within such sector. For instance, economic or market factors, regulation or deregulation, and technological or other developments may negatively impact all companies in a particular sector and therefore the value of a Fund’s portfolio will be adversely affected. As of December 31, 2017, the Ave Maria Growth Fund had 27.7% of the value of its net assets invested in stocks within the industrials sector.
70
AVE MARIA MUTUAL FUNDS
NOTES TO FINANCIAL STATEMENTS
(Continued)
7. Subsequent Events
The Funds are required to recognize in the financial statements the effects of all subsequent events that provide additional evidence about conditions that existed as of the date of the Statements of Assets and Liabilities. For non-recognized subsequent events that must be disclosed to keep the financial statements from being misleading, the Funds are required to disclose the nature of the event as well as an estimate of its financial effect, or a statement that such an estimate cannot be made. Management has evaluated subsequent events through the issuance of these financial statements and has noted no such events.
71
AVE MARIA MUTUAL FUNDS
REPORT OF INDEPENDENT REGISTERED
PUBLIC ACCOUNTING FIRM
To the Shareholders and the Board of Trustees of Schwartz Investment Trust
Opinion on the Financial Statements and Financial Highlights
We have audited the accompanying statements of assets and liabilities of Schwartz Investment Trust (the “Funds”) comprising the Ave Maria Value Fund (formerly Ave Maria Catholic Values Fund), Ave Maria Growth Fund, Ave Maria Rising Dividend Fund, Ave Maria World Equity Fund, and Ave Maria Bond Fund, including the schedules of investments, as of December 31, 2017, the related statements of operations for the year then ended, the statements of changes in net assets for each of the two years in the period then ended, the financial highlights for each of the five years in the period then ended, and the related notes. In our opinion, the financial statements and financial highlights present fairly, in all material respects, the financial position of each of the portfolios constituting the Schwartz Investment Trust as of December 31, 2017, and the results of their operations for the year then ended, the changes in their net assets for each of the two years in the period then ended, and the financial highlights for each of the five years in the period then ended, in conformity with accounting principles generally accepted in the United States of America.
Basis for Opinion
These financial statements and financial highlights are the responsibility of the Funds’ management. Our responsibility is to express an opinion on the Funds’ financial statements and financial highlights based on our audits. We are a public accounting firm registered with the Public Company Accounting Oversight Board (United States) (PCAOB) and are required to be independent with respect to the Funds in accordance with the U.S. federal securities laws and the applicable rules and regulations of the Securities and Exchange Commission and the PCAOB.
We conducted our audits in accordance with the standards of the PCAOB. Those standards require that we plan and perform the audits to obtain reasonable assurance about whether the financial statements and financial highlights are free of material misstatement, whether due to error or fraud. The Funds are not required to have, nor were we engaged to perform, an audit of internal control over financial reporting. As part of our audits we are required to obtain an understanding of internal control over financial reporting but not for the purpose of expressing an opinion on the effectiveness of the Funds’ internal control over financial reporting. Accordingly, we express no such opinion.
Our audits included performing procedures to assess the risks of material misstatement of the financial statements and financial highlights, whether due to error or fraud, and performing procedures that respond to those risks. Such procedures included examining, on a test basis, evidence regarding the amounts and disclosures in the financial statements and financial highlights. Our audits also included evaluating the accounting principles
72
AVE MARIA MUTUAL FUNDS
REPORT OF INDEPENDENT REGISTERED
PUBLIC ACCOUNTING FIRM (Continued)
used and significant estimates made by management, as well as evaluating the overall presentation of the financial statements and financial highlights. Our procedures included confirmation of securities owned as of December 31, 2017, by correspondence with the custodian and brokers; when replies were not received from brokers, we performed other auditing procedures. We believe that our audits provide a reasonable basis for our opinion.

Chicago, Illinois
February 16, 2018
We have served as the auditor of one or more Schwartz Investment Trust investment companies since 1993.
73
AVE MARIA MUTUAL FUNDS
BOARD OF TRUSTEES AND EXECUTIVE OFFICERS
(Unaudited)
Overall responsibility for management of the Trust rests with the Board of Trustees. The Trustees serve during the lifetime of the Trust and until its termination, or until death, resignation, retirement or removal. The Trustees, in turn, elect the officers of the Trust to actively supervise its day-to-day operations. The officers have been elected for an annual term. The following are the Trustees and executive officers of the Trust:
Trustee/Officer | Address | Year of Birth | Position Held
with the Trust | Length of
Time Served |
Interested Trustees: | | | | |
* | George P. Schwartz, CFA | 801 W. Ann Arbor Trail,
Plymouth, MI | 1944 | Chairman of the Board/President/Trustee | Since 1992 |
Independent Trustees: | | | | |
| | Louis C. Bosco, Jr. | 801 W. Ann Arbor Trail,
Plymouth, MI | 1936 | Trustee | Since 2008 |
| | Donald J. Dawson, Jr. | 801 W. Ann Arbor Trail,
Plymouth, MI | 1947 | Trustee | Since 1993 |
| | Joseph M. Grace | 801 W. Ann Arbor Trail,
Plymouth, MI | 1936 | Trustee | Since 2007 |
| | John J. McHale, Jr. | 801 W. Ann Arbor Trail,
Plymouth, MI | 1949 | Trustee | Since 2014 |
| | Edward J. Miller | 801 W. Ann Arbor Trail,
Plymouth, MI | 1946 | Trustee | Since 2017 |
Executive Officers: | | | | |
* | Richard L. Platte, Jr., CFA | 801 W. Ann Arbor Trail,
Plymouth, MI | 1951 | Vice President and Secretary | Since 1993 |
* | Robert C. Schwartz, CFP | 801 W. Ann Arbor Trail,
Plymouth, MI | 1976 | Vice President | Since 2013 |
* | Timothy S. Schwartz, CFA | 5060 Annunciation Circle,
Ave Maria, FL | 1971 | Treasurer | Since 2000 |
* | Cathy M. Stoner, CPA, IACCP | 801 W. Ann Arbor Trail,
Plymouth, MI | 1970 | Chief Compliance Officer | Since 2010 |
* | George P. Schwartz, Richard L. Platte, Jr., Robert C. Schwartz, Timothy S. Schwartz and Cathy M. Stoner, as affiliated persons of Schwartz Investment Counsel, Inc., the Funds’ investment adviser, are “interested persons” of the Trust within the meaning of Section 2(a)(19) of the 1940 Act. George P. Schwartz is the father of Robert C. Schwartz and Timothy S. Schwartz. |
74
AVE MARIA MUTUAL FUNDS
BOARD OF TRUSTEES AND EXECUTIVE OFFICERS
(Unaudited) (Continued)
Each Trustee oversees six portfolios of the Trust: the Ave Maria Value Fund, the Ave Maria Growth Fund, the Ave Maria Rising Dividend Fund, the Ave Maria World Equity Fund, the Ave Maria Bond Fund and the Schwartz Value Focused Fund. The principal occupations of the Trustees and executive officers of the Trust during the past five years and public directorships held by the Trustees are set forth below:
George P. Schwartz, CFA is Chairman and Chief Executive Officer of Schwartz Investment Counsel, Inc. and the co-portfolio manager of the Ave Maria Value Fund and the Ave Maria Rising Dividend Fund.
Louis C. Bosco, Jr. retired in April 2012. Prior to his retirement, he was a partner in Bosco Development Company (a real estate firm).
Donald J. Dawson, Jr. retired in March 2015. Prior to retirement, he was Chairman of Payroll 1, Inc. (a payroll processing company) from 1986 – 2015.
Joseph M. Grace is retired Senior Vice President of National Bank of Detroit (renamed JPMorgan Chase & Company).
John J. McHale, Jr. is Special Assistant to Commissioner of Major League Baseball since 2015. He was Executive Vice President of Major League Baseball from 2000 – 2015.
Edward J. Miller is Vice Chairman and Director of Detroit Investment Fund since 2001 and Invest Detroit Foundation since 2010 (financiers for redevelopment of Detroit, Michigan).
Richard L. Platte, Jr., CFA is President and Chief Investment Officer of Schwartz Investment Counsel, Inc. and is the lead portfolio manager of the Ave Maria Rising Divident Fund and the co-portfolio manager of the Ave Maria Growth Fund and the Ave Maria Bond Fund.
Robert C. Schwartz, CFP is Senior Vice President and Secretary of Schwartz Investment Counsel, Inc. and is the co-portfolio manager of the Ave Maria World Equity Fund.
Timothy S. Schwartz, CFA is Executive Vice President and Chief Financial Officer of Schwartz Investment Counsel, Inc. and the lead portfolio manager of the Ave Maria Value Fund.
Cathy M. Stoner, CPA, IACCP is Vice President, Chief Compliance Officer, and Treasurer of Schwartz Investment Counsel, Inc.
Additional information regarding the Trustees and executive officers of the Trust may be found in the Funds’ Statement of Additional Information and is available without charge upon request by calling (888) 726-9931.
75
AVE MARIA MUTUAL FUNDS
CATHOLIC ADVISORY BOARD
(Unaudited)
The Catholic Advisory Board reviews the companies selected by the Adviser to ensure that the companies operate in a way that is consistent with teachings and core values of the Roman Catholic Church. The Catholic Advisory Board evaluates companies using publicly available information, information from the Adviser, and information from shareholders and other sources in making its recommendations. The following are the members of the Catholic Advisory Board:
Member | Address | Year of Birth | Length of
Time Served |
Robert P. George | 801 W. Ann Arbor Trail, Plymouth, MI | 1955 | Since 2016 |
Lou Holtz | 801 W. Ann Arbor Trail, Plymouth, MI | 1937 | Since 2007 |
Lawrence Kudlow | 801 W. Ann Arbor Trail, Plymouth, MI | 1947 | Since 2005 |
Thomas S. Monaghan | 801 W. Ann Arbor Trail, Plymouth, MI | 1937 | Since 2001 |
Melissa Moschella, PhD | 801 W. Ann Arbor Trail, Plymouth, MI | 1979 | Since 2017 |
Gloria Purvis | 801 W. Ann Arbor Trail, Plymouth, MI | 1969 | Since 2017 |
Fr. John Riccardo, STL | 801 W. Ann Arbor Trail, Plymouth, MI | 1965 | Since 2011 |
Paul R. Roney | 801 W. Ann Arbor Trail, Plymouth, MI | 1957 | Since 2001 |
Robert P. George is a legal scholar, political philosopher, and public intellectual who serves as the McCormick Professor of Jurisprudence at Princeton University.
Lou Holtz is the former football coach at University of Notre Dame among others, ESPN college football analyst, author and motivational speaker.
Lawrence Kudlow is CNBC’s Senior Contributor and radio host of the nationally-syndicated “Larry Kudlow Show.”
Thomas S. Monaghan is Chairman of the Ave Maria Foundation (a non-profit foundation supporting Roman Catholic organizations) and Chancellor of Ave Maria University. Prior to December 1998, he was Chairman and Chief Executive Officer of Domino’s Pizza, Inc.
Melissa Moschella, PhD is Assistant Professor of Medical Ethics at Columbia University from August 2013 until June 2017, she was Assistant Professor of Philosophy at The Catholic University of America. She has published articles about moral and political philosophy and ethics in a number of academic publications. She is also a lecturer and recipient of a number of academic honors and fellowships.
76
AVE MARIA MUTUAL FUNDS
CATHOLIC ADVISORY BOARD
(Unaudited) (Continued)
Gloria Purvis is creator and host of Eternal World Television Network (EWTN) series “Authentically Free at Last” and host of “Morning Glory” on EWTN Global Catholic Radio.
Fr. John Riccardo, STL is a priest of the Archdiocese of Detroit and is the pastor of Our Lady of Good Counsel Catholic Church in Plymouth, Michigan. He is also the host of the radio show “Christ is the Answer,” which can be heard on Catholic radio stations throughout the country.
Paul R. Roney is Executive Director of the Ave Maria Foundation and President of Domino’s Farms Corporation. Prior to December 1998, he was Treasurer of Domino’s Pizza, Inc.
Additional information regarding the Funds’ Catholic Advisory Board members may be found in the Funds’ Statement of Additional Information and is available without charge upon request by calling (888) 726-9331.
77
AVE MARIA MUTUAL FUNDS
ABOUT YOUR FUNDS’ EXPENSES
(Unaudited)
We believe it is important for you to understand the impact of costs on your investment. As a shareholder of the Funds, you incur ongoing costs, including management fees and other Fund expenses. The following examples are intended to help you understand your ongoing costs (in dollars) of investing in the Funds and to compare these costs with the ongoing costs of investing in other mutual funds.
A mutual fund’s ongoing costs are expressed as a percentage of its average net assets. This figure is known as the expense ratio. The ongoing costs reflected in the tables below are based on an investment of $1,000 made at the beginning of the most recent semi-annual period (July 1, 2017) and held until the end of the period (December 31, 2017).
The tables that follow illustrate each Fund’s ongoing costs in two ways:
Actual fund return – This section helps you to estimate the actual expenses that you paid over the period. The “Ending Account Value” shown is derived from each Fund’s actual return, and the fourth column shows the dollar amount of operating expenses that would have been paid by an investor who started with $1,000 in the Funds. You may use the information here, together with the amount you invested, to estimate the expenses that you paid over the period.
To do so, simply divide your account value by $1,000 (for example, an $8,600 account value divided by $1,000 = 8.6), then multiply the result by the number given for the Funds under the heading “Expenses Paid During Period.”
Hypothetical 5% return – This section is intended to help you compare each Fund’s ongoing costs with those of other mutual funds. It assumes that each Fund had an annual return of 5% before expenses during the period shown, but that the expense ratio is unchanged. In this case, because the return used is not the Funds’ actual returns, the results do not apply to your investment. The example is useful in making comparisons because the U.S. Securities and Exchange Commission (the “SEC”) requires all mutual funds to calculate expenses based on a 5% return. You can assess each Fund’s ongoing costs by comparing this hypothetical example with the hypothetical examples that appear in shareholder reports of other funds.
Note that expenses shown in the table are meant to highlight and help you compare ongoing costs only. The Funds do not charge sales loads or redemption fees.
The calculations assume no shares were bought or sold during the period. Your actual costs may have been higher or lower, depending on the amount of your investment and the timing of any purchases or redemptions.
More information about the Funds’ expenses, including historical annual expense ratios, can be found in this report. For additional information on operating expenses and other shareholder costs, please refer to the Funds’ Prospectus.
78
AVE MARIA MUTUAL FUNDS
ABOUT YOUR FUNDS’ EXPENSES
(Unaudited) (Continued)
| Beginning
Account Value
July 1, 2017 | Ending
Account Value
December 31, 2017 | Net
Expense Ratio(a) | Expenses Paid During Period(b) |
Ave Maria Value Fund |
Based on Actual Fund Return | $1,000.00 | $1,119.30 | 1.18% | $6.30 |
Based on Hypothetical 5% Return (before expenses) | $1,000.00 | $1,019.26 | 1.18% | $6.01 |
| | | | | |
Ave Maria Growth Fund | | | | |
Based on Actual Fund Return | $1,000.00 | $1,135.70 | 1.05% | $5.65 |
Based on Hypothetical 5% Return (before expenses) | $1,000.00 | $1,019.91 | 1.05% | $5.35 |
| | | | | |
Ave Maria Rising Dividend Fund | | | |
Based on Actual Fund Return | $1,000.00 | $1,108.30 | 0.91% | $4.84 |
Based on Hypothetical 5% Return (before expenses) | $1,000.00 | $1,020.62 | 0.91% | $4.63 |
| | | | | |
Ave Maria World Equity Fund | | | |
Based on Actual Fund Return | $1,000.00 | $1,070.00 | 1.25% | $6.52 |
Based on Hypothetical 5% Return (before expenses) | $1,000.00 | $1,018.90 | 1.25% | $6.36 |
| | | | | |
Ave Maria Bond Fund | | | | |
Based on Actual Fund Return | $1,000.00 | $1,023.20 | 0.50% | $2.55 |
Based on Hypothetical 5% Return (before expenses) | $1,000.00 | $1,022.68 | 0.50% | $2.55 |
(a) | Annualized, based on the Fund’s most recent one-half year expenses. |
(b) | Expenses are equal to each Fund’s annualized net expense ratio multiplied by the average account value over the period, multiplied by 184/365 (to reflect the one-half year period). |
79
AVE MARIA MUTUAL FUNDS
FEDERAL TAX INFORMATION
(Unaudited)
For the fiscal year ended December 31, 2017, the Ave Maria Value Fund, the Ave Maria Growth Fund, the Ave Maria Rising Dividend Fund, the Ave Maria World Equity Fund and the Ave Maria Bond Fund designated $18,006,749, $40,927,231, $45,935,306, $1,569,522, and $1,781,882, respectively, as long-term capital gain distributions.
Qualified Dividend Income – The Ave Maria Value Fund, the Ave Maria Growth Fund, the Ave Maria Rising Dividend Fund, the Ave Maria World Equity Fund and the Ave Maria Bond Fund designates 100%, 100%, 100%, 100% and 32.06%, respectively, or up to the maximum amount of such dividends allowable pursuant to the Internal Revenue Code, as qualified dividend income eligible for the reduced tax rate of 15%.
Dividends Receivable Deduction – Corporate shareholders are generally entitled to take the dividends receivable deduction on the portion of a Fund’s distributions that qualifies under tax law. For the fiscal year ended December 31, 2017, the percentage of ordinary income dividends qualified for the corporate dividends receivable deduction for the Ave Maria Value Fund, the Ave Maria Growth Fund, the Ave Maria Rising Dividend Fund, the Ave Maria World Equity Fund and the Ave Maria Bond Fund was 100%, 100%, 100%, 91.75% and 25.88%, respectively.
AVE MARIA MUTUAL FUNDS
OTHER INFORMATION
(Unaudited)
A description of the policies and procedures the Funds use to determine how to vote proxies relating to portfolio securities is available without charge upon request by calling toll-free (888) 726-9331, or on the SEC’s website at http://www.sec.gov. Information regarding how the Funds voted proxies relating to portfolio securities during the most recent 12-month period ended June 30 is also available without charge upon request by calling toll-free (888) 726-9331, or on the SEC’s website at http://www.sec.gov.
The Trust files a complete listing of portfolio holdings for each of the Funds with the SEC as of the end of the first and third quarters of each fiscal year on Form N-Q. The filings are available free of charge, upon request, by calling (888) 726-9331. Furthermore, you may obtain a copy of the filings on the SEC’s website at http://www.sec.gov. The Trust’s Forms N-Q may also be reviewed and copied at the SEC’s Public Reference Room in Washington, DC, and information on the operation of the Public Reference Room may be obtained by calling (800) SEC-0330.
80
As of the end of the period covered by this report, the registrant has adopted a code of ethics that applies to the registrant’s principal executive officer, principal financial officer, principal accounting officer or controller, or persons performing similar functions, regardless of whether these individuals are employed by the registrant or a third party. Pursuant to Item 12(a)(1), a copy of registrant’s code of ethics is filed as an exhibit to this Form N-CSR. During the period covered by this report, the code of ethics has not been amended, and the registrant has not granted any waivers, including implicit waivers, from the provisions of the code of ethics.
| Item 3. | Audit Committee Financial Expert. |
The registrant’s board of trustees has determined that the registrant has two audit committee financial experts serving on its audit committee. The names of the audit committee financial expert Joseph M. Grace and Edward J. Miller. Mr. Grace and Mr. Miller are “independent” for purposes of this Item.
| Item 4. | Principal Accountant Fees and Services. |
| (a) | Audit Fees. The aggregate fees billed for professional services rendered by the principal accountant for the audit of the registrant’s annual financial statements or for services that are normally provided by the accountant in connection with statutory and regulatory filings or engagements were $138,500 and $134,500 with respect to the registrant’s fiscal years ended December 31, 2017 and 2016, respectively. |
| (b) | Audit-Related Fees. No fees were billed in either of the last two fiscal years for assurance and related services by the principal accountant that are reasonably related to the performance of the audit of the registrant’s financial statements and are not reported under paragraph (a) of this Item. |
| (c) | Tax Fees. The aggregate fees billed for professional services rendered by the principal accountant for tax compliance, tax advice, and tax planning were $17,850 and $17,350 with respect to the registrant’s fiscal years ended December 31, 2017 and 2016, respectively. The services comprising these fees are tax consulting and the preparation of the registrant’s federal income and excise tax returns. |
| (d) | All Other Fees. No fees were billed in either of the last two fiscal years for products and services provided by the principal accountant, other than the services reported in paragraphs (a) through (c) of this Item. |
| (e)(1) | The audit committee has not adopted pre-approval policies and procedures described in paragraph (c)(7) of Rule 2-01 of Regulation S-X. |
| (e)(2) | None of the services described in paragraph (b) through (d) of this Item were approved by the audit committee pursuant to paragraph (c)(7)(i)(C) of Rule 2-01 of Regulation S-X. |
| (f) | Less than 50% of hours expended on the principal accountant’s engagement to audit the registrant’s financial statements for the most recent fiscal year were attributed to work performed by persons other than the principal accountant’s full-time, permanent employees. |
| (g) | During the fiscal years ended December 31, 2017 and 2016, aggregate non-audit fees of $17,850 and $17,350, respectively, were billed by the registrant’s principal accountant for services rendered to the registrant. During the fiscal years ended December 31, 2017 and 2016, aggregate non-audit fees of $13,000 and $12,500, respectively, were billed by the registrant’s principal accountant for services rendered to the registrant’s investment adviser (not including any sub-adviser whose role is primarily portfolio management and is subcontracted with or overseen by another investment adviser), and any entity controlling, controlled by, or under common control with the adviser that provides ongoing services to the registrant. |
| (h) | The registrant’s audit committee determined that the provision of non-audit services that were rendered to the registrant’s investment adviser (not including any sub-adviser whose role is primarily portfolio management and is subcontracted with or overseen by another investment adviser), and any entity controlling, controlled by, or under common control with the investment adviser that provides ongoing services to the registrant, that were not pre-approved pursuant to paragraph (c)(7)(ii) of Rule 2-01 of Regulation S-X is compatible with maintaining the principal accountant’s independence. |
| Item 5. | Audit Committee of Listed Registrants. |
Not applicable
| Item 6. | Schedule of Investments. |
| (a) | Not applicable [schedule filed with Item 1] |
| Item 7. | Disclosure of Proxy Voting Policies and Procedures for Closed-End Management Investment Companies. |
Not applicable
| Item 8. | Portfolio Managers of Closed-End Management Investment Companies. |
Not applicable
| Item 9. | Purchases of Equity Securities by Closed-End Management Investment Company and Affiliated Purchasers. |
Not applicable
| Item 10. | Submission of Matters to a Vote of Security Holders. |
The registrant’s Nominating and Governance Committee shall review shareholder recommendations to fill vacancies on the registrant’s board of trustees if such recommendations are submitted in writing, addressed to the Committee at the registrant’s offices and meet any minimum qualifications adopted by the Committee. The Committee may adopt, by resolution, a policy regarding its procedures for considering candidates for the board of trustees, including any recommended by shareholders.
| Item 11. | Controls and Procedures. |
(a) Based on their evaluation of the registrant’s disclosure controls and procedures (as defined in Rule 30a-3(c) under the Investment Company Act of 1940) as of a date within 90 days of the filing date of this report, the registrant’s principal executive officer and principal financial officer have concluded that such disclosure controls and procedures are reasonably designed and are operating effectively to ensure that material information relating to the registrant, including its consolidated subsidiaries, is made known to them by others within those entities, particularly during the period in which this report is being prepared, and that the information required in filings on Form N-CSR is recorded, processed, summarized, and reported on a timely basis.
(b) There were no changes in the registrant’s internal control over financial reporting (as defined in Rule 30a-3(d) under the Investment Company Act of 1940) that occurred during the second fiscal quarter of the period covered by this report that have materially affected, or are reasonably likely to materially affect, the registrant’s internal control over financial reporting.
File the exhibits listed below as part of this Form. Letter or number the exhibits in the sequence indicated.
(a)(1) Any code of ethics, or amendment thereto, that is the subject of the disclosure required by Item 2, to the extent that the registrant intends to satisfy the Item 2 requirements through filing of an exhibit: Attached hereto
(a)(2) A separate certification for each principal executive officer and principal financial officer of the registrant as required by Rule 30a-2(a) under the Act (17 CFR 270.30a-2(a)): Attached hereto
(a)(3) Any written solicitation to purchase securities under Rule 23c-1 under the Act (17 CFR 270.23c-1) sent or given during the period covered by the report by or on behalf of the registrant to 10 or more persons: Not applicable
(b) Certifications required by Rule 30a-2(b) under the Act (17 CFR 270.30a-2(b)): Attached hereto
| Exhibit 99.CODE ETH | Code of Ethics |
| Exhibit 99.CERT | Certifications required by Rule 30a-2(a) under the Act |
| Exhibit 99.906CERT | Certifications required by Rule 30a-2(b) under the Act |
SIGNATURES
Pursuant to the requirements of the Securities Exchange Act of 1934 and the Investment Company Act of 1940, the registrant has duly caused this report to be signed on its behalf by the undersigned, thereunto duly authorized.
| (Registrant) | Schwartz Investment Trust | | |
| | | | |
| By (Signature and Title)* | /s/ George P. Schwartz | |
| | | George P. Schwartz, President and Principal Executive Officer |
| | | | |
| Date | March 5, 2018 | | |
| | | | |
| Pursuant to the requirements of the Securities Exchange Act of 1934 and the Investment Company Act of 1940, this report has been signed below by the following persons on behalf of the registrant and in the capacities and on the dates indicated. |
| | | | |
| By (Signature and Title)* | /s/ George P. Schwartz | |
| | | George P. Schwartz, President and Principal Executive Officer |
| | | | |
| Date | March 5, 2018 | | |
| | | | |
| By (Signature and Title)* | /s/ Timothy S. Schwartz | |
| | | Timothy S. Schwartz, Treasurer, Principal Financial Officer and Principal Accounting Officer |
| | | | |
| Date | March 5, 2018 | | |
| * | Print the name and title of each signing officer under his or her signature. |