| OMB APPROVAL |
OMB Number: 3235-0570 Expires: January 31, 2017 Estimated average burden hours per response: 20.6 |
UNITED STATES
SECURITIES AND EXCHANGE COMMISSION
Washington, D.C. 20549
FORM N-CSR
CERTIFIED SHAREHOLDER REPORT OF REGISTERED
MANAGEMENT INVESTMENT COMPANIES
| Investment Company Act file number | 811-07148 | |
| Schwartz Investment Trust |
| (Exact name of registrant as specified in charter) |
| 801 W. Ann Arbor Trail, Suite 244 Plymouth, Michigan | 48170 |
| (Address of principal executive offices) | (Zip code) |
George P. Schwartz
| Schwartz Investment Counsel, Inc. 801 W. Ann Arbor Trail, Plymouth, MI 48170 |
| (Name and address of agent for service) |
| Registrant's telephone number, including area code: | (248) 644-8500 | |
| Date of fiscal year end: | December 31 | |
| | | |
| Date of reporting period: | December 31, 2015 | |
Form N-CSR is to be used by management investment companies to file reports with the Commission not later than 10 days after the transmission to stockholders of any report that is required to be transmitted to stockholders under Rule 30e-1 under the Investment Company Act of 1940 (17 CFR 270.30e-1). The Commission may use the information provided on Form N-CSR in its regulatory, disclosure review, inspection, and policymaking roles.
A registrant is required to disclose the information specified by Form N-CSR, and the Commission will make this information public. A registrant is not required to respond to the collection of information contained in Form N-CSR unless the Form displays a currently valid Office of Management and Budget ("OMB") control number. Please direct comments concerning the accuracy of the information collection burden estimate and any suggestions for reducing the burden to the Secretary, Securities and Exchange Commission, 450 Fifth Street, NW, Washington, DC 20549-0609. The OMB has reviewed this collection of information under the clearance requirements of 44 U.S.C. § 3507.
| Item 1. | Reports to Stockholders. |
Schwartz Value Fund
Shareholder Services c/o Ultimus Fund Solutions, LLC P.O. Box 46707 Cincinnati, OH 45246 (888) 726-0753 | | Investment Adviser 801 W. Ann Arbor Trail Suite 244 Plymouth, Michigan 48170 |
Dear Fellow Shareowner:
The Schwartz Value Fund (the “Fund”) had a disappointing year in 2015, down 15.5%, as compared to the benchmark Russell 1000 Index which returned 0.9%. The primary reason for our underperformance was due to our energy-related holdings, which were negatively impacted by the drop in oil and natural gas prices during 2015. We underestimated the depth and duration of the energy glut. However, we believe our energy investments are in safe, high-quality companies that will survive the downturn and then thrive when energy prices rebound. Ironically, the cure for low energy prices is low energy prices (and time). Exploration and production at today’s depressed prices are uneconomic and unsustainable for a large swath of the industry. Consequently, capital spending budgets have been slashed which will curtail production, leading to reduced supplies. Meantime, demand for oil has been relatively stable and generally grows with GDP. Thus, we believe eventually the demand for oil will outstrip depleted supplies and prices will rise commensurately.
Another contributing factor to the Fund’s poor year was the continued underperformance of value stocks compared to growth stocks. Our value-oriented, disciplined approach of buying high-quality companies at prices below intrinsic value remained out-of-favor last year. In the S&P 500 Index (the “S&P 500”), the Value component stocks had a total return of -3.1% as compared to the Growth component stocks which had a total return of 5.5%. Further, while the S&P 500 eked out a positive return for the year, a closer look reveals that many stocks had astonishingly poor performance last year with more than 200 companies in the S&P 500 down at least 20% from their 52-week high. Further, a small number of large-cap, high-flying, high-priced tech stocks accounted for more than all of the S&P 500’s positive return. The high-flyers were the so-called FANG stocks (Facebook, Amazon, Netflix, Alphabet (formerly Google)) and a handful of others. Excluding this group of stocks, the S&P 500’s return was in the negative last year. Investors who did not own the FANG stocks most likely underperformed the broad market in 2015.
Despite the poor results in 2015, the Fund’s longer term track record is in line with the Russell 1000 and S&P 500 Indices. The Fund’s 1, 5, 10 and 15-year performance figures are as follows:
| | Average Annual Total Return
For the Periods Ended 12/31/15 |
| | 1 year | 5 years | 10 years | 15 years |
Schwartz Value Fund | -15.5% | 2.3% | 1.0% | 5.2% |
Russell 1000 Index | 0.9% | 12.4% | 7.4% | 5.3% |
S&P 500 Index | 1.4% | 12.6% | 7.3% | 5.0% |
1
Securities that had a positive impact on performance included ARRIS Group, Inc., Equinix, Inc., PNC Financial Services Group, Inc. (warrants), The Progressive Corporation, and Valeant Pharmaceuticals International, Inc. Equinix and Valeant were both sold from the portfolio during Q3 of 2015 due to their share prices reaching our estimate of intrinsic value. Another holding which was sold after it appreciated substantially was Precision Castparts Corporation, which received a takeover bid from Berkshire Hathaway. Negatively affecting performance were the aforementioned energy related stocks along with Apollo Education Group, Inc., Biglari Holdings, Inc., Graham Holdings Company, Ocwen Financial Corporation, and Unico American Corporation. Apollo and Ocwen were eliminated from the Fund during Q3 of 2015 due to deteriorating fundamentals. We continue to own Biglari, Graham Holdings, and Unico as we believe each company has unrealized value in their shares, with limited downside from these depressed prices.
As a reminder, our investment philosophy is predicated on the belief that the most attractive investment opportunities are those that are out-of-favor and under-owned. We believe Keynes had it right when he said “The central principle of investment is to go contrary to the general opinion on the grounds that if everyone agreed about its merits, the investment is inevitably too dear and therefore unattractive.” And even though the Fund had a disappointing 2015, we are optimistic about the future. We believe the Fund is conservatively invested with significant capital appreciation potential. Many of our companies made good fundamental progress in 2015 in their operations and improved their financial and competitive positions. As a result, the Fund holds a number of stocks that are selling at a large discount to our appraisal of intrinsic value.
Thank you for your continued patience. We believe our time in the sun is coming.
Sincerely,

| 
|
Timothy S. Schwartz, CFA
Lead Portfolio Manager | George P. Schwartz, CFA
Co-Portfolio Manager |
December 31, 2015
Past performance is not predictive of future performance. Investment results and principal value will fluctuate so that shares, when redeemed, may be worth more or less than their original cost. Current performance may be higher or lower than the performance data quoted. Performance data, current to the most recent month end, are available by calling the Fund at 1-888-726-0753.
An investor should consider the investment objectives, risks, charges and expenses of the Fund carefully before investing. The Fund’s prospectus contains this and other important information. To obtain a copy of the prospectus please visit our website at www.schwartzvaluefund.com or call 1-888-726-0753 and a copy will be sent to you free of charge. Please read the prospectus carefully before you invest.
The Letter to Shareholders seeks to describe some of the Adviser’s current opinions and views of the financial markets. Although the Adviser believes it has a reasonable basis for any opinions or views expressed, actual results may differ, sometimes significantly so, from those expected or expressed.
2
SCHWARTZ VALUE FUND
PERFORMANCE
(Unaudited)
Comparison of the Change in Value of a $10,000 Investment
in Schwartz Value Fund and the Russell 1000 Index
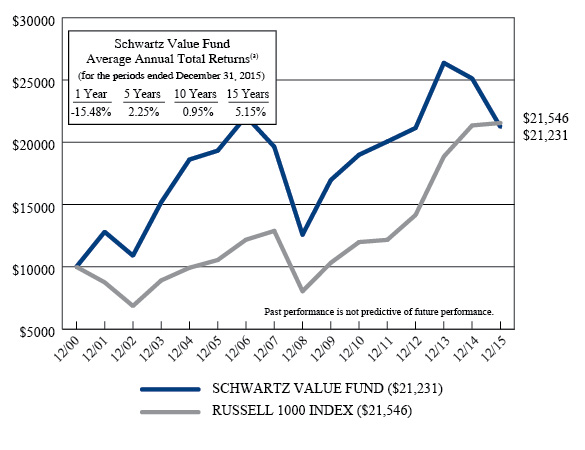
(a) | The returns shown do not reflect the deduction of taxes a shareholder would pay on Fund distributions or the redemption of Fund shares. |
Expense ratio as of 12-31-14 (as disclosed in May 1, 2015 prospectus) | 1.26%* |
Expense ratio for the year ended 12-31-15 | 1.35% |
* | Includes Acquired Fund Fees and Expenses. |
This report is for the information of shareholders, but it may also be used as sales literature when preceded or accompanied by a current prospectus, which gives details about charges, expenses, investment objectives and operating policies of the Fund.The Fund is distributed by Ultimus Fund Distributors, LLC.
3
SCHWARTZ VALUE FUND
ANNUAL TOTAL RATES OF RETURN
COMPARISON WITH MAJOR INDICES (Unaudited)
| SCHWARTZ VALUE
FUND(a) | RUSSELL
1000
INDEX | RUSSELL
2000
INDEX | NASDAQ COMPOSITE(b) | VALUE
LINE
COMPOSITE(c) | S&P 500
INDEX |
1984 | 11.1% | 4.8% | -7.3% | -11.2% | -8.4% | 6.1% |
1985 | 21.7% | 32.3% | 31.1% | 31.4% | 20.7% | 31.6% |
1986 | 16.4% | 17.9% | 5.7% | 7.4% | 5.0% | 18.7% |
1987 | -0.6% | 2.9% | -8.8% | -5.3% | -10.6% | 5.3% |
1988 | 23.1% | 17.3% | 24.9% | 15.4% | 15.4% | 16.8% |
1989 | 8.3% | 30.4% | 16.2% | 19.3% | 11.2% | 31.6% |
1990 | -5.3% | -4.2% | -19.5% | -17.8% | -24.3% | -3.2% |
1991 | 32.0% | 33.0% | 46.1% | 56.8% | 27.2% | 30.4% |
1992 | 22.7% | 8.9% | 18.4% | 15.5% | 7.0% | 7.6% |
1993 | 20.5% | 10.2% | 18.9% | 14.7% | 10.7% | 10.1% |
1994 | -6.8% | 0.4% | -1.8% | -3.2% | -6.0% | 1.3% |
1995 | 16.9% | 37.8% | 28.4% | 39.9% | 19.3% | 37.5% |
1996 | 18.3% | 22.5% | 16.5% | 22.7% | 13.4% | 22.9% |
1997 | 28.0% | 32.9% | 22.4% | 21.6% | 21.1% | 33.4% |
1998 | -10.4% | 27.0% | -2.5% | 39.6% | -3.8% | 28.6% |
1999 | -2.5% | 20.9% | 21.3% | 85.6% | -1.4% | 21.0% |
2000 | 9.3% | -7.8% | -3.0% | -39.3% | -8.7% | -9.1% |
2001 | 28.1% | -12.5% | 2.5% | -21.0% | -6.1% | -11.9% |
2002 | -14.9% | -21.7% | -20.5% | -31.5% | -28.6% | -22.1% |
2003 | 39.3% | 29.9% | 47.3% | 50.0% | 37.4% | 28.7% |
2004 | 22.6% | 11.4% | 18.3% | 8.6% | 11.5% | 10.9% |
2005 | 3.8% | 6.3% | 4.6% | 1.4% | 2.0% | 4.9% |
2006 | 14.3% | 15.5% | 18.4% | 9.5% | 11.0% | 15.8% |
2007 | -11.1% | 5.8% | -1.6% | 10.6% | -3.8% | 5.5% |
2008 | -35.9% | -37.6% | -33.8% | -40.0% | -48.7% | -37.0% |
2009 | 34.8% | 28.4% | 27.2% | 45.3% | 36.8% | 26.5% |
2010 | 12.0% | 16.1% | 26.9% | 18.0% | 20.5% | 15.1% |
2011 | 5.6% | 1.5% | -4.2% | -0.8% | -11.4% | 2.1% |
2012 | 5.4% | 16.4% | 16.4% | 17.5% | 9.5% | 16.0% |
2013 | 24.7% | 33.1% | 38.8% | 40.1% | 35.5% | 32.4% |
2014 | -4.7% | 13.2% | 4.9% | 14.8% | 2.7% | 13.7% |
2015 | -15.5% | 0.9% | -4.4% | 7.0% | -11.2% | 1.4% |
(a) | Schwartz Value Fund’s performance combines the performance of the Fund since its commencement of operations as a registered investment company on July 20, 1993, and the performance of RCM Partners Limited Partnership for periods prior thereto. |
(b) | Excluding dividends for the years ended 1984-2006. Effective 2007, the returns include dividends. |
4
SCHWARTZ VALUE FUND
AVERAGE ANNUAL TOTAL RETURNS
As of December 31, 2015 (Unaudited)
| SCHWARTZ
VALUE
FUND(a) | RUSSELL
1000
INDEX | RUSSELL
2000
INDEX | NASDAQ
COMPOSITE(b) | VALUE
LINE
COMPOSITE(c) | S&P 500
INDEX |
3 Years | 0.1% | 15.0% | 11.7% | 19.8% | 7.3% | 15.1% |
5 Years | 2.3% | 12.4% | 9.2% | 14.9% | 3.7% | 12.6% |
10 Years | 1.0% | 7.4% | 6.8% | 8.6% | 0.8% | 7.3% |
15 Years | 5.2% | 5.3% | 7.3% | 4.8% | 0.8% | 5.0% |
32 Years | 8.3% | 10.9% | 9.2% | 9.5% | 2.6% | 10.9% |
(a) | Schwartz Value Fund’s performance combines the performance of the Fund since its commencement of operations as a registered investment company on July 20, 1993, and the performance of RCM Partners Limited Partnership for periods prior thereto. |
(b) | Excluding dividends for the years ended 1984-2006. Effective 2007, the returns include dividends. |
5
SCHWARTZ VALUE FUND
TEN LARGEST EQUITY HOLDINGS
December 31, 2015 (Unaudited)
Shares | | Security Description | | Market
Value | | | % of
Net Assets | |
| | 180,000 | | Unico American Corporation | | $ | 1,785,600 | | | | 9.5 | % |
| | 30,000 | | ARRIS Group, Inc. | | | 917,100 | | | | 4.9 | % |
| | 20,000 | | Avnet, Inc. | | | 856,800 | | | | 4.6 | % |
| | 30,000 | | Liberty Interactive Corporation - Series A | | | 819,600 | | | | 4.4 | % |
| | 4 | | Berkshire Hathaway, Inc. - Class A | | | 791,200 | | | | 4.2 | % |
| | 25,000 | | PNC Financial Services Group, Inc. (The) - Warrants | | | 717,750 | | | | 3.8 | % |
| | 10,000 | | TJX Companies, Inc. (The) | | | 709,100 | | | | 3.8 | % |
| | 60,000 | | Goldcorp, Inc. | | | 693,600 | | | | 3.7 | % |
| | 1,400 | | Graham Holdings Company - Class B | | | 678,958 | | | | 3.6 | % |
| | 20,000 | | Progressive Corporation (The) | | | 636,000 | | | | 3.4 | % |
ASSET ALLOCATION (Unaudited)
Sector | % of
Net Assets |
Consumer Discretionary | 22.0% |
Energy | 10.6% |
Financials | 21.9% |
Industrials | 9.5% |
Information Technology | 16.9% |
Materials | 6.6% |
Warrants | 3.8% |
Open-End Funds | 0.1% |
Money Market Funds, Other Assets in Excess of Liabilities | 8.6% |
| | 100.0% |
6
SCHWARTZ VALUE FUND
SCHEDULE OF INVESTMENTS
December 31, 2015
| COMMON STOCKS — 87.5% | | Shares | | | Market Value | |
| Consumer Discretionary — 22.0% | | | | | | |
| Auto Components — 1.5% | | | | | | |
| Cie Générale des Établissements Michelin - ADR | | | 15,000 | | | $ | 285,975 | |
| | | | | | | | | |
| Diversified Consumer Services — 3.6% | | | | | | | | |
Graham Holdings Company - Class B | | | 1,400 | | | | 678,958 | |
| | | | | | | | | |
| Hotels, Restaurants & Leisure — 2.8% | | | | | | | | |
Biglari Holdings, Inc. * | | | 1,600 | | | | 521,312 | |
| | | | | | | | | |
| Household Durables — 2.0% | | | | | | | | |
Garmin Ltd. | | | 10,000 | | | | 371,700 | |
| | | | | | | | | |
| Internet & Catalog Retail — 4.4% | | | | | | | | |
Liberty Interactive Corporation - Series A * | | | 30,000 | | | | 819,600 | |
| | | | | | | | | |
| Media — 3.9% | | | | | | | | |
Discovery Communications, Inc. - Series A * | | | 20,000 | | | | 533,600 | |
Liberty Global plc - Series C * | | | 5,000 | | | | 203,850 | |
| | | | | | | | 737,450 | |
| Specialty Retail — 3.8% | | | | | | | | |
TJX Companies, Inc. (The) | | | 10,000 | | | | 709,100 | |
| | | | | | | | | |
| Energy — 10.6% | | | | | | | | |
| Energy Equipment & Services — 3.7% | | | | | | | | |
Rowan Companies plc - Class A | | | 10,000 | | | | 169,500 | |
Schlumberger Limited | | | 7,500 | | | | 523,125 | |
| | | | | | | | 692,625 | |
| Oil, Gas & Consumable Fuels — 6.9% | | | | | | | | |
Apache Corporation | | | 5,000 | | | | 222,350 | |
Devon Energy Corporation | | | 5,000 | | | | 160,000 | |
Exxon Mobil Corporation | | | 5,000 | | | | 389,750 | |
Noble Energy, Inc. | | | 16,260 | | | | 535,442 | |
| | | | | | | | 1,307,542 | |
| Financials — 21.9% | | | | | | | | |
| Banks — 1.0% | | | | | | | | |
Citigroup, Inc. | | | 3,500 | | | | 181,125 | |
| | | | | | | | | |
| Capital Markets — 2.0% | | | | | | | | |
Franklin Resources, Inc. | | | 10,063 | | | | 370,519 | |
| | | | | | | | | |
| Diversified Financial Services — 1.8% | | | | | | | | |
MasterCard, Inc. - Class A | | | 3,500 | | | | 340,760 | |
7
SCHWARTZ VALUE FUND
SCHEDULE OF INVESTMENTS
(Continued)
| COMMON STOCKS — 87.5% (Continued) | | Shares | | | Market Value | |
| Financials — 21.9% (Continued) | | | | | | |
| Insurance — 17.1% | | | | | | |
Berkshire Hathaway, Inc. - Class A * | | | 4 | | | $ | 791,200 | |
Progressive Corporation (The) | | | 20,000 | | | | 636,000 | |
Unico American Corporation * | | | 180,000 | | | | 1,785,600 | |
| | | | | | | | 3,212,800 | |
| Industrials — 9.5% | | | | | | | | |
| Aerospace & Defense — 1.0% | | | | | | | | |
United Technologies Corporation | | | 2,000 | | | | 192,140 | |
| | | | | | | | | |
| Electrical Equipment — 1.4% | | | | | | | | |
Eaton Corporation plc | | | 5,000 | | | | 260,200 | |
| | | | | | | | | |
| Machinery — 4.9% | | | | | | | | |
Colfax Corporation * | | | 15,000 | | | | 350,250 | |
Donaldson Company, Inc. | | | 20,000 | | | | 573,200 | |
| | | | | | | | 923,450 | |
| Trading Companies & Distributors — 2.2% | | | | | | | | |
W.W. Grainger, Inc. | | | 2,000 | | | | 405,180 | |
| | | | | | | | | |
| Information Technology — 16.9% | | | | | | | | |
Communications Equipment — 4.9% | | | | | | | | |
ARRIS Group, Inc. * | | | 30,000 | | | | 917,100 | |
| | | | | | | | | |
| Electronic Equipment, Instruments & Components — 6.6% | | | | | | | | |
Arrow Electronics, Inc. * | | | 7,000 | | | | 379,260 | |
Avnet, Inc. | | | 20,000 | | | | 856,800 | |
| | | | | | | | 1,236,060 | |
| IT Services — 2.5% | | | | | | | | |
International Business Machines Corporation | | | 3,500 | | | | 481,670 | |
| | | | | | | | | |
| Software — 1.0% | | | | | | | | |
ANSYS, Inc. * | | | 2,000 | | | | 185,000 | |
| | | | | | | | | |
| Technology Hardware, Storage & Peripherals — 1.9% | | | | | | | | |
HP, Inc. | | | 30,000 | | | | 355,200 | |
| | | | | | | | | |
| Materials — 6.6% | | | | | | | | |
| Chemicals — 0.9% | | | | | | | | |
Praxair, Inc. | | | 1,700 | | | | 174,080 | |
8
SCHWARTZ VALUE FUND
SCHEDULE OF INVESTMENTS
(Continued)
| COMMON STOCKS — 87.5% (Continued) | | Shares | | | Market Value | |
| Materials — 6.6% (Continued) | | | | | | |
| Metals & Mining — 5.7% | | | | | | |
Barrick Gold Corporation | | | 20,000 | | | $ | 147,600 | |
Goldcorp, Inc. | | | 60,000 | | | | 693,600 | |
Pan American Silver Corporation | | | 35,000 | | | | 227,500 | |
| | | | | | | | 1,068,700 | |
| | | | | | | | | |
Total Common Stocks (Cost $15,548,731) | | | | | | $ | 16,428,246 | |
WARRANTS — 3.8% | | Shares | | | Market Value | |
Financials — 3.8% | | | | | | |
Banks — 3.8% | | | | | | |
PNC Financial Services Group, Inc. (The) * (Cost $508,492) | | | 25,000 | | | $ | 717,750 | |
OPEN-END FUNDS — 0.1% | | Shares | | | Market Value | |
Sequoia Fund, Inc. * (Cost $9,255) | | | 67 | | | $ | 13,974 | |
MONEY MARKET FUNDS — 8.2% | | Shares | | | Market Value | |
Federated Government Obligations Tax-Managed Fund - Institutional Shares, 0.07% (a) | | | 862,759 | | | $ | 862,759 | |
Federated Treasury Obligations Fund - Institutional Shares, 0.07% (a) | | | 667,636 | | | | 667,636 | |
Total Money Market Funds (Cost $1,530,395) | | | | | | $ | 1,530,395 | |
| | | | | | | | | |
Total Investments at Market Value — 99.6%(Cost $17,596,873) | | | | | | $ | 18,690,365 | |
| | | | | | | | | |
Other Assets in Excess of Liabilities — 0.4% | | | | | | | 81,743 | |
| | | | | | | | | |
Net Assets — 100.0% | | | | | | $ | 18,772,108 | |
ADR - American Depositary Receipt. |
* | Non-income producing security. |
(a) | The rate shown is the 7-day effective yield as of December 31, 2015. |
See notes to financial statements. |
9
SCHWARTZ VALUE FUND
STATEMENT OF ASSETS AND LIABILITIES
December 31, 2015
| ASSETS | | | |
| Investments, at market value (cost of $17,596,873) (Note 1) | | $ | 18,690,365 | |
Receivable for capital shares sold | | | 100,000 | |
Dividends receivable | | | 8,583 | |
Other assets | | | 5,612 | |
TOTAL ASSETS | | | 18,804,560 | |
| | | | | |
| LIABILITIES | | | | |
Payable to Adviser (Note 2) | | | 19,804 | |
Payable to administrator (Note 2) | | | 3,000 | |
Other accrued expenses | | | 9,648 | |
TOTAL LIABILITIES | | | 32,452 | |
| | | | | |
NET ASSETS | | $ | 18,772,108 | |
| | | | | |
| NET ASSETS CONSIST OF: | | | | |
Paid-in capital | | $ | 18,217,090 | |
| Accumulated net realized losses from security transactions | | | (538,474 | ) |
Net unrealized appreciation on investments | | | 1,093,492 | |
NET ASSETS | | $ | 18,772,108 | |
| | | | | |
Shares of beneficial interest outstanding (unlimited number of shares authorized, no par value) | | | 886,217 | |
| | | | | |
| Net asset value, offering price and redemption price per share (Note 1) | | $ | 21.18 | |
See notes to financial statements.
10
SCHWARTZ VALUE FUND
STATEMENT OF OPERATIONS
For the Year Ended December 31, 2015
| INVESTMENT INCOME | | | |
Dividends (Net of foreign tax of $10,747) �� | | $ | 220,901 | |
| | | | | |
| EXPENSES | | | | |
Investment advisory fees (Note 2) | | | 222,464 | |
Trustees’ fees and expenses (Note 2) | | | 44,982 | |
| Administration, accounting and transfer agent fees (Note 2) | | | 36,300 | |
Legal and audit fees | | | 30,383 | |
Registration and filing fees | | | 11,813 | |
Custodian and bank service fees | | | 6,644 | |
Printing of shareholder reports | | | 6,363 | |
Postage and supplies | | | 4,533 | |
Insurance expense | | | 1,276 | |
Compliance service fees and expenses (Note 2) | | | 878 | |
Other expenses | | | 6,040 | |
TOTAL EXPENSES | | | 371,676 | |
Less fee reductions by the Adviser (Note 2) | | | (56,616 | ) |
NET EXPENSES | | | 315,060 | |
| | | | | |
NET INVESTMENT LOSS | | | (94,159 | ) |
| | | | | |
| REALIZED AND UNREALIZED LOSSES ON INVESTMENTS | | | | |
Net realized losses from security transactions | | | (538,474 | ) |
| Net change in unrealized appreciation/depreciation on investments | | | (2,972,967 | ) |
| NET REALIZED AND UNREALIZED LOSSES ON INVESTMENTS | | | (3,511,441 | ) |
| | | | | |
NET DECREASE IN NET ASSETS RESULTING FROM OPERATIONS | | $ | (3,605,600 | ) |
See notes to financial statements.
11
SCHWARTZ VALUE FUND
STATEMENTS OF CHANGES IN NET ASSETS
| | Year EndedDecember 31, 2015 | | | Year EndedDecember 31, 2014 | |
FROM OPERATIONS | | | | | | |
Net investment loss | | $ | (94,159 | ) | | $ | (84,929 | ) |
Net realized gains (losses) from security transactions | | | (538,474 | ) | | | 2,215,476 | |
Net change in unrealized appreciation/depreciation on investments | | | (2,972,967 | ) | | | (3,554,000 | ) |
Net decrease in net assets resulting from operations | | | (3,605,600 | ) | | | (1,423,453 | ) |
| | | | | | | | | |
FROM DISTRIBUTIONS TO SHAREHOLDERS | | | | | | | | |
From net realized gains on investments | | | — | | | | (2,215,542 | ) |
| | | | | | | | | |
FROM CAPITAL SHARE TRANSACTIONS | | | | | | | | |
Proceeds from shares sold | | | 1,244,396 | | | | 312,911 | |
Reinvestment of distributions to shareholders | | | — | | | | 2,116,221 | |
Payments for shares redeemed | | | (6,995,249 | ) | | | (2,691,911 | ) |
Net decrease in net assets from capital share transactions | | | (5,750,853 | ) | | | (262,779 | ) |
| | | | | | | | | |
TOTAL DECREASE IN NET ASSETS | | | (9,356,453 | ) | | | (3,901,774 | ) |
| | | | | | | | | |
NET ASSETS | | | | | | | | |
Beginning of year | | | 28,128,561 | | | | 32,030,335 | |
End of year | | $ | 18,772,108 | | | $ | 28,128,561 | |
| | | | | | | | | |
ACCUMULATED NET INVESTMENT LOSS | | $ | — | | | $ | — | |
| | | | | | | | | |
SUMMARY OF CAPITAL SHARE ACTIVITY | | | | | | | | |
Shares sold | | | 51,114 | | | | 11,229 | |
Shares issued in reinvestment of distributions to shareholders | | | — | | | | 84,077 | |
Shares redeemed | | | (287,195 | ) | | | (95,192 | ) |
Net increase (decrease) in shares outstanding | | | (236,081 | ) | | | 114 | |
Shares outstanding, beginning of year | | | 1,122,298 | | | | 1,122,184 | |
Shares outstanding, end of year | | | 886,217 | | | | 1,122,298 | |
See notes to financial statements.
12
SCHWARTZ VALUE FUND
FINANCIAL HIGHLIGHTS
Per Share Data for a Share Outstanding Throughout Each Year
| | Year
Ended
Dec. 31,
2015 | | | Year
Ended
Dec. 31,
2014 | | | Year
Ended
Dec. 31,
2013 | | | Year
Ended
Dec. 31,
2012 | | | Year
Ended
Dec. 31,
2011 | |
Net asset value at beginning of year | | $ | 25.06 | | | $ | 28.54 | | | $ | 23.31 | | | $ | 22.33 | | | $ | 21.21 | |
| | | | | | | | | | | | | | | | | | | | | |
Income (loss) from investment operations: | | | | | | | | | | | | | | | | | | | | |
Net investment income (loss) | | | (0.11 | ) | | | (0.08 | ) | | | (0.04 | ) | | | 0.23 | | | | 0.07 | |
Net realized and unrealized gains (losses) on investments | | | (3.77 | ) | | | (1.26 | ) | | | 5.80 | | | | 0.98 | | | | 1.12 | |
Total from investment operations | | | (3.88 | ) | | | (1.34 | ) | | | 5.76 | | | | 1.21 | | | | 1.19 | |
| | | | | | | | | | | | | | | | | | | | | |
Less distributions: | | | | | | | | | | | | | | | | | | | | |
From net investment income | | | — | | | | — | | | | — | | | | (0.23 | ) | | | (0.07 | ) |
From net realized gains on investments | | | — | | | | (2.14 | ) | | | (0.53 | ) | | | — | | | | — | |
Total distributions | | | — | | | | (2.14 | ) | | | (0.53 | ) | | | (0.23 | ) | | | (0.07 | ) |
| | | | | | | | | | | | | | | | | | | | | |
Net asset value at end of year | | $ | 21.18 | | | $ | 25.06 | | | $ | 28.54 | | | $ | 23.31 | | | $ | 22.33 | |
| | | | | | | | | | | | | | | | | | | | | |
Total return (a) | | | (15.5 | %) | | | (4.7 | %) | | | 24.7 | % | | | 5.4 | % | | | 5.6 | % |
| | | | | | | | | | | | | | | | | | | | | |
Ratios/Supplementary Data: | | | | | | | | | | | | | | | | | | | | |
Net assets at end of year (000’s) | | $ | 18,772 | | | $ | 28,129 | | | $ | 32,030 | | | $ | 30,573 | | | $ | 36,654 | |
| | | | | | | | | | | | | | | | | | | | | |
Ratio of total expenses to average net assets | | | 1.59 | % | | | 1.46 | % | | | 1.45 | % | | | 1.41 | % | | | 1.38 | % |
| | | | | | | | | | | | | | | | | | | | | |
Ratio of net expenses to average net assets | | | 1.35 | %(b) | | | 1.46 | % | | | 1.45 | % | | | 1.41 | % | | | 1.38 | % |
| | | | | | | | | | | | | | | | | | | | | |
Ratio of net investment income (loss) to average net assets | | | (0.40 | %)(b) | | | (0.28 | %) | | | (0.13 | %) | | | 0.90 | % | | | 0.32 | % |
| | | | | | | | | | | | | | | | | | | | | |
Portfolio turnover rate | | | 104 | % | | | 72 | % | | | 57 | % | | | 62 | % | | | 75 | % |
(a) | Total return is a measure of the change in value of an investment in the Fund over the years covered, which assumes any dividends or capital gains distributions are reinvested in shares of the Fund. Returns shown do not reflect the deduction of taxes a shareholder would pay on Fund distributions or the redemption of Fund shares. |
(b) | Ratio was determined after advisory fee reductions (Note 2). |
See notes to financial statements. |
13
SCHWARTZ VALUE FUND
NOTES TO FINANCIAL STATEMENTS
December 31, 2015
1. Significant Accounting Policies
Schwartz Value Fund (the “Fund”) is a diversified series of Schwartz Investment Trust (the “Trust”), an open-end management investment company established as an Ohio business trust under a Declaration of Trust dated August 31, 1992. Other series of the Trust are not incorporated in this report. The Fund is registered under the Investment Company Act of 1940 and commenced operations on July 20, 1993.
The investment objective of the Fund is to seek long-term capital appreciation. See the Prospectus for information regarding the principal investment strategies of the Fund.
Shares of the Fund are sold at net asset value. To calculate the net asset value, the Fund’s assets are valued and totaled, liabilities are subtracted, and the balance is divided by the number of shares outstanding. The offering price and redemption price per share are equal to the net asset value per share.
The following is a summary of significant accounting policies followed by the Fund. The policies are in conformity with accounting principles generally accepted in the United States of America (“GAAP”). As an investment company, as defined in Financial Accounting Standards Board (“FASB”) Accounting Standards Update 2013-08, the Fund follows accounting and reporting guidance under FASB Accounting Standards Codification Topic 946, “Financial Services – Investment Companies.”
(a) Valuation of investments — Securities which are traded on stock exchanges, other than NASDAQ, are valued at the closing sales price as of the close of the regular session of trading on the New York Stock Exchange on the day the securities are being valued, or, if not traded on a particular day, at the closing bid price. Securities which are quoted by NASDAQ are valued at the NASDAQ Official Closing Price or, if an official close price is not available, at the most recently quoted bid price. Securities traded in the over-the-counter market are valued at the last reported sales price or, if there is no reported sale on the valuation date, at the most recently quoted bid price. Securities which are traded both in the over-the-counter market and on a stock exchange are valued according to the broadest and most representative market. Investments representing shares of other open-end investment companies are valued at their net asset value as reported by such companies. Securities (and other assets) for which market quotations are not readily available are valued at their fair value as determined in good faith in accordance with consistently applied procedures established by and under the general supervision of the Board of Trustees, and will be classified as Level 2 or 3 within the fair value hierarchy (see below), depending on the inputs used. Fair value pricing may be used, for example, in situations where (i) a portfolio security is so thinly traded that there have been no transactions for that stock over an extended period of time; (ii) the exchange on which the portfolio security is principally traded closes early; or (iii) trading of the portfolio security is halted during the day and does not resume prior to the Fund’s net asset value calculation. A portfolio security’s “fair value” price may differ from the price next available for that portfolio security using the Fund’s normal pricing procedures.
14
SCHWARTZ VALUE FUND
NOTES TO FINANCIAL STATEMENTS
(Continued)
GAAP establishes a single authoritative definition of fair value, sets out a framework for measuring fair value and requires additional disclosures about fair value measurements.
Various inputs are used in determining the value of the Fund’s investments. These inputs are summarized in the three broad levels listed below:
● Level 1 – quoted prices in active markets for identical securities
● Level 2 – other significant observable inputs
● Level 3 – significant unobservable inputs
The inputs or methodology used for valuing securities are not necessarily an indication of the risks associated with investing in those securities. The inputs used to measure fair value may fall into different levels of the fair value hierarchy. In such cases, for disclosure purposes, the level in the fair value hierarchy within which the fair value measurement falls in its entirety is determined based on the lowest level input that is significant to the fair value measurement.
The following is a summary of the inputs used to value the Fund’s investments, by security type, as of December 31, 2015:
| | Level 1 | | | Level 2 | | | Level 3 | | | Total | |
Common Stocks | | $ | 16,428,246 | | | $ | — | | | $ | — | | | $ | 16,428,246 | |
Warrants | | | 717,750 | | | | — | | | | — | | | | 717,750 | |
Open-End Funds | | | 13,974 | | | | — | | | | — | | | | 13,974 | |
Money Market Funds | | | 1,530,395 | | | | — | | | | — | | | | 1,530,395 | |
Total | | $ | 18,690,365 | | | $ | — | | | $ | — | | | $ | 18,690,365 | |
Refer to the Fund’s Schedule of Investments for a listing of the securities by industry type. As of December 31, 2015, the Fund did not have any transfers into and out of any Level. There were no Level 2 or 3 securities or derivative instruments held by the Fund as of December 31, 2015. It is the Fund’s policy to recognize transfers into and out of any Level at the end of the reporting period.
(b) Income taxes — The Fund has qualified and intends to continue to qualify as a regulated investment company under the Internal Revenue Code of 1986 (the “Code”). Qualification generally will relieve the Fund of liability for federal income taxes to the extent 100% of its net investment income and net realized capital gains are distributed in accordance with the Code. Accordingly, no provision for income tax has been made.
In order to avoid imposition of the excise tax applicable to regulated investment companies, it is also the Fund’s intention to declare as dividends in each calendar year at least 98% of its net investment income and 98.2% of its net realized capital gains plus undistributed amounts from prior years.
15
SCHWARTZ VALUE FUND
NOTES TO FINANCIAL STATEMENTS
(Continued)
The following information is computed on a tax basis for each item as of December 31, 2015:
Federal income tax cost | | $ | 17,629,441 | |
Gross unrealized appreciation | | $ | 2,402,984 | |
Gross unrealized depreciation | | | (1,342,060 | ) |
Net unrealized appreciation | | | 1,060,924 | |
Capital loss carryforwards | | | (505,906 | ) |
Accumulated earnings | | $ | 555,018 | |
The difference between the federal income tax cost of portfolio investments and the financial statement cost of portfolio investments is due to certain timing differences in the recognition capital losses under income tax regulations and GAAP. These “book/tax” differences are temporary in nature and are due to the tax deferral of losses on wash sales.
As of December 31, 2015, the Fund has a short-term capital loss carryforward of $505,906 for federal income tax purposes. This capital loss carryforward, which does not expire, may be utilized in future years to offset net realized capital gains, if any, prior to distributing such gains to shareholders.
During the year ended December 31, 2015, the Fund reclassified $94,159 of net investment loss against paid-in-capital on the Statement of Assets and Liabilities. Such reclassification, the result of permanent differences between the financial statement and income tax reporting requirements, has no effect on the Fund’s net assets or net asset value per share.
The Fund recognizes the tax benefits or expenses of uncertain tax positions only when the position is “more-likely-than-not” to be sustained assuming examination by tax authorities. Management has reviewed the tax positions taken on federal income tax returns for all open tax years (tax years ended December 31, 2012 through December 31, 2015) and has concluded that no provision for unrecognized tax benefits or expenses is required in these financial statements.
(c) Security transactions and investment income — Security transactions are accounted for on the trade date. Dividend income is recorded on the ex-dividend date. Interest income is recognized on the accrual basis. Realized capital gains and losses on security transactions are determined on the identified cost basis. Withholding taxes on foreign dividends have been provided for in accordance with the Fund’s understanding of the appropriate country’s rules and tax rates.
(d) Dividends and distributions — Dividends from net investment income and distributions of net realized capital gains, if any, are declared and paid annually in December. Dividends and distributions to shareholders are recorded on the ex-dividend date. The tax character of distributions paid to shareholders during the period ended December 31, 2014 was long-term capital gains. There were no distributions paid to shareholders during the year ended December 31, 2015.
16
SCHWARTZ VALUE FUND
NOTES TO FINANCIAL STATEMENTS
(Continued)
(e) Estimates — The preparation of financial statements in conformity with GAAP requires management to make estimates and assumptions that affect the reported amounts of assets and liabilities and disclosure of contingent assets and liabilities as of the date of the financial statements and the reported amounts of revenues and expenses during the reporting period. Actual results could differ from those estimates.
(f) Common expenses — Common expenses of the Trust are allocated among the Fund and the other series of the Trust based on relative net assets of each series or the nature of the services performed and the relative applicability to each series.
2. Investment Advisory Agreement and Transactions with Related Parties
The Chairman and President of the Trust is also the Chairman and Chief Executive Officer of Schwartz Investment Counsel, Inc. (the “Adviser”). Certain other officers of the Trust are officers of the Adviser, or of Ultimus Fund Solutions, LLC (“Ultimus”), the administrative, accounting and transfer agent for the Fund, or of Ultimus Fund Distributors, LLC (the “Distributor”), the Fund’s principal underwriter.
Pursuant to an Investment Advisory Agreement between the Trust and the Adviser, the Adviser is responsible for the management of the Fund and provides investment advice along with the necessary personnel, facilities, equipment and certain other services necessary to the operations of the Fund. The Adviser receives from the Fund a quarterly fee at the annual rate of 0.95% per annum of the Fund’s average daily net assets.
Effective May 1, 2015, the Adviser has contractually agreed to reduce its advisory fees or reimburse a portion of the Fund’s expenses until at least May 1, 2017 so that the ordinary operating expenses of the Fund do not exceed 1.25% per annum of average daily net assets. Accordingly, during the year ended December 31, 2015, the Adviser reduced its investment advisory fees by $56,616. Prior to May 1, 2015, the Fund did not have an expense limitation agreement.
Any fee reductions or expense reimbursements by the Adviser are subject to repayment by the Fund for a period of three years from the end of the fiscal year during which such reductions or reimbursements occurred, provided the Fund is able to effect such repayment and remain in compliance with any undertaking by the Adviser to limit expenses of the Fund. As of December 31, 2015, the Advisor may seek recoupment of investment advisory fee reductions totaling $56,616 no later than December 31, 2018.
The Chief Compliance Officer of the Trust (the “CCO”) is an employee of the Adviser. The Trust pays the Adviser a fee for providing CCO services, of which the Fund pays its proportionate share along with the other series of the Trust. In addition, the Trust reimburses the Adviser for out-of-pocket expenses incurred, if any, for providing these services.
17
SCHWARTZ VALUE FUND
NOTES TO FINANCIAL STATEMENTS
(Continued)
Pursuant to a Mutual Fund Services Agreement between the Trust and Ultimus, Ultimus supplies regulatory and compliance services, calculates the daily net asset value per share, maintains the financial books and records of the Fund, maintains the records of each shareholder’s account, and processes purchases and redemptions of the Fund’s shares. For these services Ultimus receives fees computed as a percentage of the average daily net assets of the Fund, subject to a minimum monthly fee.
Pursuant to a Distribution Agreement between the Trust and the Distributor, the Distributor serves as the Fund’s exclusive agent for the distribution of its shares. The Distributor is an affiliate of Ultimus.
Trustees and officers affiliated with the Adviser or Ultimus are not compensated by the Trust for their services. Each Trustee who is not an affiliated person of the Adviser or Ultimus (“Independent Trustee”) receives from the Trust an annual retainer of $30,000 (except that such fee is $38,000 for the Lead Independent Trustee), payable quarterly; a fee of $5,500 for attendance at each meeting of the Board of Trustees; plus reimbursement of travel and other expenses incurred in attending meetings. The Fund pays its proportionate share of Independent Trustees’ fees and expenses along with the other series of the Trust. Effective January 1, 2016, each Independent Trustee will receive from the Trust an annual retainer of $35,000 (except that such fee is $45,000 for the Lead Independent Trustee and $39,000 for the Chairman of the Audit Committee), payable quarterly; a fee of $5,500 for attendance at each meeting of the Board of Trustees; plus reimbursement of travel and other expenses incurred in attending meetings.
3. Investment Transactions
During the year ended December 31, 2015, cost of purchases and proceeds from sales and maturities of investment securities, excluding short-term investments and U.S. government securities, amounted to $21,871,503 and $25,738,353, respectively.
4. Contingencies and Commitments
The Fund indemnifies the Trust’s officers and Trustees for certain liabilities that might arise from their performance of their duties to the Fund. Additionally, in the normal course of business, the Fund enters into contracts that contain a variety of representations and warranties and which provide general indemnifications. The Fund’s maximum exposure under these arrangements is unknown, as this would involve future claims that may be made against the Fund that have not yet occurred. However, based on experience, the Fund expects the risk of loss to be remote.
5. Sector Risk
If a Fund has significant investments in the securities of issuers in industries within a particular sector, any development affecting that sector will have a greater impact on the value of the net assets of the Fund than would be the case if the Fund did not have significant investments in that sector. In addition, this may increase the risk of loss of an investment in the Fund and increase the volatility of the Fund’s net asset value per share. From time to time, circumstances may affect a particular sector and the companies within
18
SCHWARTZ VALUE FUND
NOTES TO FINANCIAL STATEMENTS
(Continued)
such sector. For instance, economic or market factors, regulation or deregulation, and technological or other developments may negatively impact all companies in a particular sector and therefore the value of the Fund’s portfolio will be adversely affected. As of December 31, 2015, the Fund had 25.7% of the value of its net assets invested in stocks within the financials sector.
6. Subsequent Events
The Fund is required to recognize in the financial statements the effects of all subsequent events that provide additional evidence about conditions that existed as of the date of the Statement of Assets and Liabilities. For non-recognized subsequent events that must be disclosed to keep the financial statements from being misleading, the Fund is required to disclose the nature of the event as well as an estimate of its financial effect, or a statement that such an estimate cannot be made. Management has evaluated subsequent events through the issuance of these financial statements and has noted no events.
19
SCHWARTZ VALUE FUND
REPORT OF INDEPENDENT REGISTERED
PUBLIC ACCOUNTING FIRM
Schwartz Value Fund
We have audited the accompanying statement of assets and liabilities, including the schedule of investments, of Schwartz Value Fund (the “Fund”), a series of Schwartz Investment Trust, as of December 31, 2015, and the related statement of operations for the year then ended, the statements of changes in net assets for each of the two years in the period then ended, and the financial highlights for each of the five years in the period then ended. These financial statements and financial highlights are the responsibility of the Fund’s management. Our responsibility is to express an opinion on these financial statements and financial highlights based on our audits.
We conducted our audits in accordance with the standards of the Public Company Accounting Oversight Board (United States). Those standards require that we plan and perform the audits to obtain reasonable assurance about whether the financial statements and financial highlights are free of material misstatement. The Fund is not required to have, nor were we engaged to perform, an audit of internal control over financial reporting. Our audits included consideration of internal control over financial reporting as a basis for designing audit procedures that are appropriate in the circumstances, but not for the purpose of expressing an opinion on the effectiveness of the Fund’s internal control over financial reporting. Accordingly, we express no such opinion. An audit also includes examining, on a test basis, evidence supporting the amounts and disclosures in the financial statements, assessing the accounting principles used and significant estimates made by management, as well as evaluating the overall financial statement presentation. Our procedures included confirmation of securities owned as of December 31, 2015, by correspondence with the custodian and brokers. We believe that our audits provide a reasonable basis for our opinion.
In our opinion, the financial statements and financial highlights referred to above present fairly, in all material respects, the financial position of Schwartz Value Fund as of December 31, 2015, the results of its operations for the year then ended, the changes in its net assets for each of the two years in the period then ended, and the financial highlights for each of the five years in the period then ended, in conformity with accounting principles generally accepted in the United States of America.

Chicago, Illinois
February 16, 2016
20
SCHWARTZ VALUE FUND
BOARD OF TRUSTEES AND EXECUTIVE OFFICERS
(Unaudited)
Overall responsibility for management of the Trust rests with the Board of Trustees. The Trustees serve during the lifetime of the Trust and until its termination, or until death, resignation, retirement or removal. The Trustees, in turn, elect the officers of the Trust to actively supervise its day-to-day operations. The officers have been elected for an annual term. The following are the Trustees and executive officers of the Trust:
Trustee/Officer | Address | Year of
Birth | Position Held
with the Trust | Length of
Time Served |
Interested Trustees: |
* | George P. Schwartz, CFA | 801 W. Ann Arbor Trail
Plymouth, MI | 1944 | Chairman of the Board/President/Trustee | Since 1992 |
Independent Trustees: |
| | Louis C. Bosco, Jr. | 801 W. Ann Arbor Trail
Plymouth, MI | 1936 | Trustee | Since 2008 |
| | Donald J. Dawson, Jr. | 801 W. Ann Arbor Trail
Plymouth, MI | 1947 | Trustee | Since 1993 |
| | Joseph M. Grace | 801 W. Ann Arbor Trail
Plymouth, MI | 1936 | Trustee | Since 2007 |
| | John J. McHale, Jr. | 801 W. Ann Arbor Trail
Plymouth, MI | 1949 | Trustee | Since 2014 |
Executive Officers: |
* | Richard L. Platte, Jr., CFA | 801 W. Ann Arbor Trail
Plymouth, MI | 1951 | Vice President and Secretary | Since 1993 |
* | Robert C. Schwartz, CFP | 801 W. Ann Arbor Trail
Plymouth, MI | 1976 | Vice President | Since 2013 |
* | Timothy S. Schwartz, CFA | 5060 Annunciation Circle
Ave Maria, FL | 1971 | Treasurer | Since 2000 |
* | Cathy M. Stoner, CPA, IACCP | 801 W. Ann Arbor Trail
Plymouth, MI | 1970 | Chief Compliance Officer | Since 2010 |
* | George P. Schwartz, Richard L. Platte, Jr., Robert C. Schwartz, Timothy S. Schwartz and Cathy M. Stoner, as affiliated persons of Schwartz Investment Counsel, Inc., the Fund’s investment adviser, are “interested persons” of the Trust within the meaning of Section 2(a)(19) of the Investment Company Act of 1940. George P. Schwartz is the father of Robert C. Schwartz and Timothy S. Schwartz. |
21
SCHWARTZ VALUE FUND
BOARD OF TRUSTEES AND EXECUTIVE OFFICERS
(Unaudited) (Continued)
Each Trustee oversees six portfolios of the Trust: the Ave Maria Catholic Values Fund, the Ave Maria Growth Fund, the Ave Maria Rising Dividend Fund, the Ave Maria World Equity Fund, the Ave Maria Bond Fund and the Schwartz Value Fund. The principal occupations of the Trustees and executive officers of the Trust during the past five years and public directorships held by the Trustees are set forth below:
George P. Schwartz, CFA is Chairman and Chief Executive Officer of Schwartz Investment Counsel, Inc. and is the co-portfolio manager of the Fund.
Louis C. Bosco, Jr. retired in April 2012. Prior to his retirement, he was a partner in Bosco Development Company (a real estate firm).
Donald J. Dawson, Jr. retired in March 2015. Prior to retirement, he was Chairman of Payroll 1, Inc. (a payroll processing company) from Jan. 1986 – Feb. 2015.
Joseph M. Grace is retired Senior Vice President of National Bank of Detroit (renamed JPMorgan Chase & Company).
John J. McHale, Jr. is Special Assistant to Commissioner of Major League Baseball since 2015; Executive Vice President of Major League Baseball, 2000 – 2015.
Richard L. Platte, Jr., CFA is President and Chief Investment Officer of Schwartz Investment Counsel, Inc.
Robert C. Schwartz, CFP is Vice President and Secretary of Schwartz Investment Counsel, Inc.
Timothy S. Schwartz, CFA is Executive Vice President and Chief Financial Officer of Schwartz Investment Counsel, Inc. and is the co-portfolio manager of the Fund.
Cathy M. Stoner, CPA, IACCP is Vice President and Chief Compliance Officer of Schwartz Investment Counsel, Inc.
Additional information about members of the Board of Trustees and executive officers is available in the Statement of Additional Information (“SAI”). To obtain a free copy of the SAI, please call (888) 726-0753.
22
SCHWARTZ VALUE FUND
ABOUT YOUR FUND’S EXPENSES
(Unaudited)
We believe it is important for you to understand the impact of costs on your investment. As a shareholder of the Fund, you incur ongoing costs, including management fees and other Fund expenses. The following examples are intended to help you understand your ongoing costs (in dollars) of investing in the Fund and to compare these costs with the ongoing costs of investing in other mutual funds.
A mutual fund’s ongoing costs are expressed as a percentage of its average net assets. This figure is known as the expense ratio. The ongoing costs reflected in the table below are based on an investment of $1,000 made at the beginning of the most recent semi-annual period (July 1, 2015) and held until the end of the period (December 31, 2015).
The table below illustrates the Fund’s ongoing costs in two ways:
Actual fund return – This section helps you to estimate the actual expenses that you paid over the period. The “Ending Account Value” shown is derived from the Fund’s actual return, and the third column shows the dollar amount of operating expenses that would have been paid by an investor who started with $1,000 in the Fund. You may use the information here, together with the amount you invested, to estimate the expenses that you paid over the period.
To do so, simply divide your account value by $1,000 (for example, an $8,600 account value divided by $1,000 = 8.6), then multiply the result by the number given for the Fund under the heading “Expenses Paid During Period.”
Hypothetical 5% return – This section is intended to help you compare the Fund’s ongoing costs with those of other mutual funds. It assumes that the Fund had an annual return of 5% before expenses during the period shown, but that the expense ratio is unchanged. In this case, because the return used is not the Fund’s actual return, the result does not apply to your investment. The example is useful in making comparisons because the Securities and Exchange Commission (“SEC”) requires all mutual funds to calculate expenses based on a 5% return. You can assess the Fund’s ongoing costs by comparing this hypothetical example with the hypothetical examples that appear in shareholder reports of other funds.
Note that expenses shown in the table are meant to highlight and help you compare ongoing costs only. The Fund does not charge sales loads or redemption fees.
The calculations assume no shares were bought or sold during the period. Your actual costs may have been higher or lower, depending on the amount of your investment and the timing of any purchases or redemptions.
More information about the Fund’s expenses, including historical annual expense ratios, can be found in this report. For additional information on operating expenses and other shareholder costs, please refer to the Fund’s Prospectus.
| Beginning Account Value July 1, 2015 | Ending
Account Value December 31, 2015 | Expenses Paid During Period* |
Based on Actual Fund Return | $1,000.00 | $874.50 | $5.91 |
Based on Hypothetical 5% Return (before expenses) | $1,000.00 | $1,018.90 | $6.36 |
* | Expenses are equal to the Fund’s annualized expense ratio of 1.25% for the period, multiplied by the average account value over the period, multiplied by 184/365 (to reflect the one-half year period). |
23
SCHWARTZ VALUE FUND
OTHER INFORMATION
(Unaudited)
A description of the policies and procedures the Fund uses to determine how to vote proxies relating to portfolio securities is available without charge upon request by calling toll-free (888) 726-0753, or on the SEC’s website at http://www.sec.gov. Information regarding how the Fund voted proxies relating to portfolio securities during the most recent 12-month period ended June 30 is also available without charge upon request by calling toll-free (888) 726-0753, or on the SEC’s website at http://www.sec.gov.
The Trust files a complete listing of portfolio holdings for the Fund with the SEC as of the end of the first and third quarters of each fiscal year on Form N-Q. The filings are available free of charge, upon request, by calling (888) 726-0753. Furthermore, you may obtain a copy of the filings on the SEC’s website at http://www.sec.gov. The Trust’s Forms N-Q may also be reviewed and copied at the SEC’s Public Reference Room in Washington, DC, and information on the operation of the Public Reference Room may be obtained by calling (800) SEC-0330.
INVESTMENT PHILOSOPHY (Unaudited)
Schwartz Value Fund (the “Fund”) seeks long-term capital appreciation through value investing – purchasing shares of strong, growing companies at reasonable prices. The Fund invests in companies of all sizes from large-caps to micro-caps. Fundamental analysis is used to identify companies with outstanding business characteristics. Sometimes the best values are issues not followed closely by Wall Street analysts.
Most value investors buy fair companies at an excellent price. The Fund attempts to buy excellent companies at a fair price. The essence of value investing is finding companies with great business characteristics, which by their nature offer a margin of safety. A truly fine business requires few assets to provide a consistently expanding stream of income. The Fund purchases shares which are temporarily out-of-favor and selling below intrinsic value.
A common thread in the Fund’s investments is that the market price is often below what a corporate or entrepreneurial buyer might be willing to pay for the entire business. The auction nature and the inefficiencies of the stock market are such that the Fund can sometimes buy a minority interest in a fine company at a small fraction of the price per share necessary to acquire the entire company.
24

Shareholder Services c/o Ultimus Fund Solutions, LLC P.O. Box 46707 Cincinnati, OH 45246 (888) 726-9331 | 
| Corporate Offices 801 W. Ann Arbor Trail Suite 244 Plymouth, MI 48170 (734) 455-7777 Fax (734) 455-7720 |
Dear Fellow Shareholders of:
Ave Maria Catholic Values Fund (AVEMX)
Ave Maria Growth Fund (AVEGX)
Ave Maria Rising Dividend Fund (AVEDX)
Ave Maria World Equity Fund (AVEWX)
Ave Maria Bond Fund (AVEFX)
Ave Maria Money Market Account
As of January 1, 2016, Schwartz Investment Counsel, Inc., the investment adviser to the Ave Maria Mutual Funds, implemented some portfolio management reassignments. For the Ave Maria Catholic Values Fund, Timothy S. Schwartz, CFA was named Lead Portfolio Manager, Joseph W. Skornicka, CFA was named co-Portfolio Manager and George P. Schwartz, CFA remains co-Portfolio Manager. For the Ave Maria Growth Fund, Richard L. Platte, Jr., CFA was named Lead Portfolio Manager and Brian D. Milligan, CFA was named co-Portfolio Manager. For the Ave Maria Rising Dividend Fund, Richard L. Platte, Jr., CFA was named Lead Portfolio Manager and George P. Schwartz, CFA remains co-Portfolio Manager. For the Ave Maria World Equity Fund, Joseph W. Skornicka, CFA was named Lead Portfolio Manager and Robert C. Schwartz, CFP was named co-Portfolio Manager. For the Ave Maria Bond Fund, Brandon S. Scheitler was named Lead Portfolio Manager and Richard L. Platte, Jr., CFA remains co-Portfolio Manager.
As you will see in the enclosed report, investment performance was disappointing in 2015. It should be noted that a handful of stocks in the S&P 500 Index (hereafter referred to as the “S&P 500” or the “Index”) distorted its performance upward. The top 10 largest companies in the S&P 500 were up over 16% on average, and kept the Index from falling more than 5%, which it would have done without them. Over half the stocks in the Index were down more than 20% last year.
What can be expected in 2016 for the U.S. economy, the stock market and Ave Maria Mutual Funds? In my 40+ years of managing other peoples’ money, I’ve never seen a year when politics will be more important to investment success. I agree with those who say the upcoming election for president is monumentally
important, and the future of our democracy, freedom and economic prosperity hangs in the balance. In my opinion, the country badly needs serious policy changes from those of the current administration.
It goes without saying that I believe President Obama’s foreign policy endeavors have been rudderless and mind-boggling. Domestically, it’s no secret that Washington’s regulatory machinery is running wildly out of control and stifling productivity. In my view, the White House has generated unilateral regulations, which have severely limited economic freedom and done immeasurable damage to U.S. economic growth. But he has been successful in one respect. He has accomplished his campaign pledge of 2008 — “to fundamentally transform the country” — sadly for the worse.
Pivotal is the operative word for 2016 politics. Hopefully the Republican Party won’t break apart or see a third party emerge. Such a development would not only be historic, but likely chaotic. If by God’s grace we end up with a pro-growth (and pro-life) president, the outlook could get materially better. The heavy boot of government taxation and regulation could be removed from the neck of capitalism and real prosperity could emerge over time - not immediately, but steadily. What could come quickly though, is increased confidence - confidence in the system, confidence among business decision-makers, consumers and investors. Corporations would again invest in new plants and equipment and create full-time, permanent jobs. Consumer spending would escalate and there would likely be a renewed belief that wages could rise with sustainability. Investors would see corporate profits lifting and P/E’s expanding. Such is the potential.
Today, in a country devoid of effective leadership and with an election looming investors are jittery. Markets are likely to remain reactive. Keep your seatbelt fastened, it may be a bumpy ride with an upward bias, as the day approaches when President Obama leaves office. 2016 should indeed be an interesting and pivotal year. Stay tuned!
Sincerely,

George P. Schwartz, CFA
Chairman & CEO
December 31, 2015
Past performance is not predictive of future performance. Investment results and principal value will fluctuate so that shares, when redeemed, may be worth more or less than their original cost. Current performance may be higher or lower than the performance data quoted. Performance data, current to the most recent month end, is available at the Ave Maria Mutual Funds website at www.avemariafunds.com or by calling 1-888-726-9331.
The Letter to Shareholders and the Portfolio Manager Commentaries that follow seek to describe some of the Adviser’s current opinions and views of the financial markets. Although the Adviser believes it has a reasonable basis for any opinions or views expressed, actual results may differ, sometimes significantly so, from those expected or expressed. Keep in mind that the information and opinions cover the period through the date of this report.
AVE MARIA MUTUAL FUNDS
TABLE OF CONTENTS
Ave Maria Catholic Values Fund: | |
Portfolio Manager Commentary | 2 |
Performance | 4 |
Annual Total Rates of Return Comparison with Major Indices | 5 |
Ten Largest Equity Holdings | 6 |
Asset Allocation | 6 |
Schedule of Investments | 7 |
| | |
Ave Maria Growth Fund: | |
Portfolio Manager Commentary | 11 |
Performance | 13 |
Annual Total Rates of Return Comparison with Major Indices | 14 |
Ten Largest Equity Holdings | 15 |
Asset Allocation | 15 |
Schedule of Investments | 16 |
| | |
Ave Maria Rising Dividend Fund: | |
Portfolio Manager Commentary | 19 |
Performance | 21 |
Annual Total Rates of Return Comparison with Major Indices | 22 |
Ten Largest Equity Holdings | 23 |
Asset Allocation | 23 |
Schedule of Investments | 24 |
| | |
Ave Maria World Equity Fund: | |
Portfolio Manager Commentary | 27 |
Performance | 30 |
Annual Total Rates of Return Comparison with Major Indices | 31 |
Ten Largest Equity Holdings | 32 |
Asset Allocation | 32 |
Schedule of Investments | 33 |
Summary of Common Stocks by Country | 36 |
| | |
Ave Maria Bond Fund: | |
Portfolio Manager Commentary | 37 |
Performance | 39 |
Annual Total Rates of Return Comparison with Major Indices | 40 |
Ten Largest Holdings | 41 |
Asset Allocation | 41 |
Schedule of Investments | 42 |
AVE MARIA MUTUAL FUNDS
TABLE OF CONTENTS
(Continued)
Statements of Assets and Liabilities | 47 |
| | |
Statements of Operations | 49 |
| | |
Statements of Changes in Net Assets: | |
Ave Maria Catholic Values Fund | 51 |
Ave Maria Growth Fund | 52 |
Ave Maria Rising Dividend Fund | 53 |
Ave Maria World Equity Fund | 54 |
Ave Maria Bond Fund | 55 |
| | |
Financial Highlights: | |
Ave Maria Catholic Values Fund | 56 |
Ave Maria Growth Fund | 57 |
Ave Maria Rising Dividend Fund | 58 |
Ave Maria World Equity Fund | 59 |
Ave Maria Bond Fund | 60 |
| | |
Notes to Financial Statements | 61 |
| | |
Report of Independent Registered Public Accounting Firm | 73 |
| | |
Board of Trustees and Executive Officers | 74 |
| | |
Catholic Advisory Board | 76 |
| | |
About Your Funds’ Expenses | 77 |
| | |
Federal Tax Information | 79 |
| | |
Other Information | 80 |
This report is for the information of the shareholders of the Ave Maria Mutual Funds. To obtain a copy of the prospectus, please visit our website at www.avemariafunds.com or call 1-888-726-9331 and a copy will be sent to you free of charge. Please read the prospectus carefully before you invest. The Ave Maria Mutual Funds are distributed by Ultimus Fund Distributors, LLC.
Past performance is not predictive of future performance. Investment results and principal value will fluctuate so that shares, when redeemed, may be worth more or less than their original cost. Current performance may be higher or lower than the performance data quoted. Performance data, current to the most recent month end, is available at the Ave Maria Mutual Funds website at www.avemariafunds.com or by calling 1-888-726-9331.
AVE MARIA CATHOLIC VALUES FUND
PORTFOLIO MANAGER COMMENTARY
(Unaudited)
Dear Fellow Shareowner:
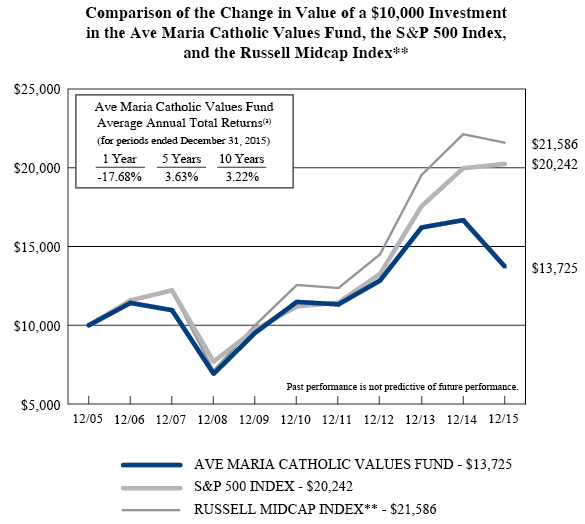
The Ave Maria Catholic Values Fund (the “Fund”) had a total return for 2015 of -17.68%, compared to 1.38% for the S&P 500 Index (the “S&P 500”) and -2.44% for the Russell Midcap Index. Since inception on May 1, 2001, the Fund’s returns verses its benchmarks are:
| | Since 5-01-01 Inception
through 12-31-15
Total Returns |
| | Cumulative | Annualized |
Ave Maria Catholic Values Fund (AVEMX) | 124.46% | 5.67% |
S&P 500 Index | 116.02% | 5.39% |
Russell Midcap Index | 231.18% | 8.51% |
Some investors have asked why the Fund performed so poorly last year in relation to the S&P 500. The best answer is that our disciplined, value-oriented approach of buying high-quality companies at prices below intrinsic value remained out-of-favor last year. The S&P 500 Growth Index returned 5.5% compared to the Value Index’s return of -3.1%. And while the S&P 500 eked out a positive return for the year, a closer look reveals that many stocks had astonishingly poor returns last year with more than 200 stocks in the S&P 500 down at least 20% from their 52-week high. A small number of large-cap, high-flying, high-priced stocks accounted for more than all of the S&P 500’s positive return. The high-flyers were the so-called FANG stocks (Facebook, Amazon, Netflix, Alphabet (formerly Google)) and a handful of others. Excluding this group of stocks, the S&P 500’s return was negative last year. Investors who did not own the FANG stocks most likely underperformed the S&P 500 in 2015.
In 2015, the Fund clearly had too many oil stocks and industrials, which got crushed when the price of oil collapsed. As the year progressed, we increased positions in many of these high quality companies, as their shares fell further below our estimates of intrinsic value. Today, we believe the Fund’s portfolio consists of beaten-down stocks of undervalued, well-managed companies, and no popular momentum stocks with inflated valuations.
Investments which contributed positively to performance in 2015 were: PNC Financial Services Group, Inc. (banking), Phillips 66 (energy), Valeant Pharmaceutical International, Inc. (health care), ANSYS, Inc. (software), Accenture plc (technology services) and Telecity Group plc - ADR (internet colocation facilities), which received a takeover bid from Equinix, Inc. Negatively affecting performance last year were GNC Holdings, Inc. (nutritional supplements), Chico’s FAS, Inc. (apparel retail), Polaris Industries, Inc. (recreational vehicles), Range Resources Corporation,
2
AVE MARIA CATHOLIC VALUES FUND
PORTFOLIO MANAGER COMMENTARY
(Unaudited) (Continued)
and Devon Energy Corporation. We underestimated the duration and depth of oil and natural gas price drops. But, low energy prices (and time) are the cure for low energy prices. Exploration and production at today’s depressed oil and gas prices are uneconomic and unsustainable. Companies are cutting capital spending which will result in production declines and higher prices. We believe the companies held by the Fund will weather the storm and enjoy profitable growth over time.
In the second half of 2015, the Fund eliminated from the portfolio: Anadarko Petroleum Corporation and Phillips 66 (energy); Abbott Laboratories and Valeant Pharmaceutical International, Inc. (health care); Caterpillar, Inc., Constellium N.V., and Eaton Corporation (industrials); Accenture plc, Knowles Corporation and Teradata Corporation (technology); Apollo Education Group, Inc. and the iShares Gold Trust. Some of these stocks were sold because of deteriorating fundamentals, namely: Anadarko, Caterpillar, Constellium, Eaton, Knowles, Teradata and Apollo, while others reached or exceeded our estimates of fair value, such as Abbott, Valeant and Accenture. New additions to the portfolio in the second half of 2015 were: HEICO Corporation (aerospace parts), Polaris Industries, Inc., Graham Holdings Company, (media), FMC Technologies, Inc. (energy equipment), Discover Financial Services (credit cards), Discovery Communications, Inc. (cable T.V. programing), Garmin Ltd. (GPS navigation devices), Graco, Inc (coating sprayers), and two industrial distributors: MSC Industrial Direct Company, Inc., and W.W. Grainger, Inc. All of these companies pass the Ave Maria Funds’ moral screens.
Even though the Fund had a disappointing 2015, we are optimistic about its future. Last year, most of our companies made good fundamental progress in their operations and improved their financial and competitive positions. As a result, the Fund holds a number of stocks selling at a large discount to our appraisal of intrinsic value.
Thank you for being a shareholder.
Sincerely,

| 
|
Timothy S. Schwartz, CFA | George P. Schwartz, CFA |
Lead Portfolio Manager | Co-Portfolio Manager |

| |
Joseph W. Skornicka, CFA | |
Co-Portfolio Manager | |
3
AVE MARIA CATHOLIC VALUES FUND
PERFORMANCE
(Unaudited) |
(a) | The returns shown do not reflect the deduction of taxes a shareholder would pay on Fund distributions or the redemption of Fund shares. |
Expense ratio as of 12-31-14 (as disclosed in May 1, 2015 prospectus) | 1.19%* |
Expense ratio for the year ended 12-31-15 | 1.18% |
* | Includes Acquired Fund Fees and Expenses. |
** | Effective January 1, 2016, the Russell Midcap Index will be the Ave Maria Catholic Values Fund’s primary benchmark instead of the S&P 500 Index. The primary index for the Fund was changed to the Russell Midcap Index for two reasons. First, with the merger of the Ave Maria Opportunity Fund, the Fund has more small and mid-cap holdings than prior to the merger (Note 1). As a result, the Fund’s average weighted market cap has decreased. Secondly, going forward, the Fund will be primarily invested in mid-cap stocks with an average market capitalization comparable to the Russell Midcap Index. |
Past performance is not predictive of future performance. Investment results and principal value will fluctuate so that shares, when redeemed, may be worth more or less than their original cost. Current performance may be higher or lower than the performance data quoted. Performance data, current to the most recent month end, is available at the Ave Maria Mutual Funds website at www.avemariafunds.com or by calling 1-888-726-9331.
4
AVE MARIA CATHOLIC VALUES FUND
ANNUAL TOTAL RATES OF RETURN
COMPARISON WITH MAJOR INDICES (Unaudited) |
| AVE MARIA
CATHOLIC
VALUES FUND | S&P 500
INDEX | RUSSELL
MIDCAP
INDEX | S&P 400
MIDCAP
INDEX | S&P 600
SMALL CAP
INDEX |
2001(a) | 5.3% | -8.5% | -3.5% | -0.5% | 5.0% |
2002 | -9.8% | -22.1% | -16.2% | -14.5% | -14.6% |
2003 | 35.6% | 28.7% | 40.1% | 35.6% | 38.8% |
2004 | 20.1% | 10.9% | 20.2% | 16.5% | 22.7% |
2005 | 5.8% | 4.9% | 12.7% | 12.6% | 7.7% |
2006 | 14.2% | 15.8% | 15.3% | 10.3% | 15.1% |
2007 | -4.0% | 5.5% | 5.6% | 8.0% | -0.3% |
2008 | -36.8% | -37.0% | -41.5% | -36.2% | -31.1% |
2009 | 37.6% | 26.5% | 40.5% | 37.4% | 25.6% |
2010 | 20.5% | 15.1% | 25.5% | 26.7% | 26.3% |
2011 | -1.3% | 2.1% | -1.6% | -1.7% | 1.0% |
2012 | 13.3% | 16.0% | 17.3% | 17.9% | 16.3% |
2013 | 26.2% | 32.4% | 34.8% | 33.5% | 41.3% |
2014 | 2.9% | 13.7% | 13.2% | 9.8% | 5.8% |
2015 | -17.7% | 1.4% | -2.4% | -2.2% | -2.0% |
AVERAGE ANNUAL TOTAL RETURNS
As of December 31, 2015 (Unaudited)
| AVE MARIA
CATHOLIC
VALUES FUND | S&P 500
INDEX | RUSSELL
MIDCAP
INDEX | S&P 400
MIDCAP
INDEX | S&P 600
SMALL CAP
INDEX |
3 Years | 2.3% | 15.1% | 14.2% | 12.8% | 13.6% |
5 Years | 3.6% | 12.6% | 11.4% | 10.7% | 11.5% |
10 Years | 3.2% | 7.3% | 8.0% | 8.2% | 8.0% |
Since Inception (b) | 5.7% | 5.4% | 8.5% | 8.5% | 9.0% |
(a) | Represents the period from the commencement of operations (May 1, 2001) through December 31, 2001. |
(b) | Represents the period from the commencement of operations (May 1, 2001) through December 31, 2015. |
5
AVE MARIA CATHOLIC VALUES FUND
TEN LARGEST EQUITY HOLDINGS
December 31, 2015 (Unaudited)
Shares | | Company | | Market Value | | | % of Net Assets | |
| | 50,000 | | Advance Auto Parts, Inc. | | $ | 7,525,500 | | | | 3.6 | % |
| | 85,000 | | Polaris Industries, Inc. | | | 7,305,750 | | | | 3.4 | % |
| | 350,000 | | Fifth Third Bancorp | | | 7,035,000 | | | | 3.3 | % |
| | 55,000 | | Laboratory Corporation of America Holdings | | | 6,800,200 | | | | 3.2 | % |
| | 100,000 | | St. Jude Medical, Inc. | | | 6,177,000 | | | | 2.9 | % |
| | 30,000 | | W.W. Grainger, Inc. | | | 6,077,700 | | | | 2.9 | % |
| | 183,740 | | Noble Energy, Inc. | | | 6,050,558 | | | | 2.9 | % |
| | 65,000 | | ANSYS, Inc. | | | 6,012,500 | | | | 2.8 | % |
| | 200,000 | | PNC Financial Services Group, Inc. (The) - Warrants | | | 5,742,000 | | | | 2.7 | % |
| | 100,000 | | MSC Industrial Direct Company, Inc. - Class A | | | 5,627,000 | | | | 2.6 | % |
ASSET ALLOCATION (Unaudited)
Sector | % of Net Assets |
Consumer Discretionary | 19.9% |
Energy | 13.5% |
Financials | 18.6% |
Health Care | 9.3% |
Industrials | 13.2% |
Information Technology | 15.5% |
Materials | 5.7% |
Warrants | 2.7% |
Money Market Funds, Liabilities in Excess of Other Assets | 1.6% |
| | 100.0% |
6
AVE MARIA CATHOLIC VALUES FUND
SCHEDULE OF INVESTMENTS
December 31, 2015
| COMMON STOCKS — 95.7% | | Shares | | | Market Value | |
| Consumer Discretionary — 19.9% | | | | | | |
| Diversified Consumer Services — 2.3% | | | | | | |
Graham Holdings Company - Class B | | | 10,000 | | | $ | 4,849,700 | |
| | | | | | | | | |
| Household Durables — 4.0% | | | | | | | | |
Garmin Ltd. | | | 85,000 | | | | 3,159,450 | |
PulteGroup, Inc. | | | 300,000 | | | | 5,346,000 | |
| | | | | | | | 8,505,450 | |
| Leisure Products — 3.4% | | | | | | | | |
Polaris Industries, Inc. | | | 85,000 | | | | 7,305,750 | |
| | | | | | | | | |
| Media — 0.6% | | | | | | | | |
Discovery Communications, Inc. - Series A * | | | 50,000 | | | | 1,334,000 | |
| | | | | | | | | |
| Specialty Retail — 8.4% | | | | | | | | |
Aaron's, Inc. | | | 20,000 | | | | 447,800 | |
Advance Auto Parts, Inc. | | | 50,000 | | | | 7,525,500 | |
Chico's FAS, Inc. | | | 375,000 | | | | 4,001,250 | |
GNC Holdings, Inc. - Class A | | | 100,000 | | | | 3,102,000 | |
Lowe's Companies, Inc. | | | 35,000 | | | | 2,661,400 | |
| | | | | | | | 17,737,950 | |
| Textiles, Apparel & Luxury Goods — 1.2% | | | | | | | | |
VF Corporation | | | 40,000 | | | | 2,490,000 | |
| | | | | | | | | |
| Energy — 13.5% | | | | | | | | |
| Energy Equipment & Services — 7.2% | | | | | | | | |
Baker Hughes Incorporated | | | 120,000 | | | | 5,538,000 | |
FMC Technologies, Inc. * | | | 120,000 | | | | 3,481,200 | |
Halliburton Company | | | 120,000 | | | | 4,084,800 | |
Rowan Companies plc - Class A | | �� | 130,000 | | | | 2,203,500 | |
| | | | | | | | 15,307,500 | |
| Oil, Gas & Consumable Fuels — 6.3% | | | | | | | | |
Devon Energy Corporation | | | 100,000 | | | | 3,200,000 | |
Noble Energy, Inc. | | | 183,740 | | | | 6,050,558 | |
Range Resources Corporation | | | 100,000 | | | | 2,461,000 | |
World Fuel Services Corporation | | | 40,000 | | | | 1,538,400 | |
| | | | | | | | 13,249,958 | |
| Financials — 18.6% | | | | | | | | |
| Banks — 4.9% | | | | | | | | |
Fifth Third Bancorp | | | 350,000 | | | | 7,035,000 | |
PNC Financial Services Group, Inc. (The) | | | 35,000 | | | | 3,335,850 | |
| | | | | | | | 10,370,850 | |
7
AVE MARIA CATHOLIC VALUES FUND
SCHEDULE OF INVESTMENTS
(Continued)
| COMMON STOCKS — 95.7% (Continued) | | Shares | | | Market Value | |
| Financials — 18.6% (Continued) | | | | | | |
| Capital Markets — 2.8% | | | | | | |
Dundee Corporation - Class A * | | | 284,200 | | | $ | 940,702 | |
Federated Investors, Inc. - Class B | | | 175,000 | | | | 5,013,750 | |
| | | | | | | | 5,954,452 | |
| Consumer Finance — 1.5% | | | | | | | | |
Discover Financial Services | | | 60,000 | | | | 3,217,200 | |
| | | | | | | | | |
| Diversified Financial Services — 2.1% | | | | | | | | |
Western Union Company (The) | | | 250,000 | | | | 4,477,500 | |
| | | | | | | | | |
| Insurance — 6.1% | | | | | | | | |
Alleghany Corporation * | | | 10,536 | | | | 5,035,471 | |
Reinsurance Group of America, Inc. | | | 60,000 | | | | 5,133,000 | |
Unico American Corporation *# | | | 282,945 | | | | 2,806,814 | |
| | | | | | | | 12,975,285 | |
| Real Estate Management & Development — 1.2% | | | | | | | | |
Kennedy-Wilson Holdings, Inc. | | | 100,000 | | | | 2,408,000 | |
| | | | | | | | | |
| Health Care — 9.3% | | | | | | | | |
| Health Care Equipment & Supplies — 4.8% | | | | | | | | |
St. Jude Medical, Inc. | | | 100,000 | | | | 6,177,000 | |
Varian Medical Systems, Inc. * | | | 50,000 | | | | 4,040,000 | |
| | | | | | | | 10,217,000 | |
| Health Care Providers & Services — 3.2% | | | | | | | | |
| Laboratory Corporation of America Holdings * | | | 55,000 | | | | 6,800,200 | |
| | | | | | | | | |
| Life Sciences Tools & Services — 1.3% | | | | | | | | |
Waters Corporation * | | | 20,000 | | | | 2,691,600 | |
| | | | | | | | | |
| Industrials — 13.2% | | | | | | | | |
| Aerospace & Defense — 2.4% | | | | | | | | |
Cubic Corporation | | | 30,000 | | | | 1,417,500 | |
HEICO Corporation - Class A | | | 75,000 | | | | 3,690,000 | |
| | | | | | | | 5,107,500 | |
| Construction & Engineering — 2.2% | | | | | | | | |
Fluor Corporation | | | 100,000 | | | | 4,722,000 | |
| | | | | | | | | |
| Machinery — 3.1% | | | | | | | | |
Donaldson Company, Inc. | | | 100,000 | | | | 2,866,000 | |
Graco, Inc. | | | 50,000 | | | | 3,603,500 | |
| | | | | | | | 6,469,500 | |
8
AVE MARIA CATHOLIC VALUES FUND
SCHEDULE OF INVESTMENTS
(Continued)
| COMMON STOCKS — 95.7% (Continued) | | Shares | | | Market Value | |
| Industrials — 13.2% (Continued) | | | | | | |
| Trading Companies & Distributors — 5.5% | | | | | | |
| MSC Industrial Direct Company, Inc. - Class A | | | 100,000 | | | $ | 5,627,000 | |
W.W. Grainger, Inc. | | | 30,000 | | | | 6,077,700 | |
| | | | | | | | 11,704,700 | |
| Information Technology — 15.5% | | | | | | | | |
| Communications Equipment — 1.5% | | | | | | | | |
ARRIS Group, Inc. * | | | 100,000 | | | | 3,057,000 | |
| | | | | | | | | |
| Electronic Equipment, Instruments & Components — 3.6% | | | | | | | | |
Arrow Electronics, Inc. * | | | 75,000 | | | | 4,063,500 | |
Avnet, Inc. | | | 85,000 | | | | 3,641,400 | |
| | | | | | | | 7,704,900 | |
| Internet Software & Services — 1.2% | | | | | | | | |
Telecity Group plc - ADR | | | 70,000 | | | | 2,562,000 | |
| | | | | | | | | |
| IT Services — 1.8% | | | | | | | | |
InterXion Holding N.V. * | | | 125,000 | | | | 3,768,750 | |
| | | | | | | | | |
| Software — 2.8% | | | | | | | | |
ANSYS, Inc. * | | | 65,000 | | | | 6,012,500 | |
| | | | | | | | | |
| Technology Hardware, Storage & Peripherals — 4.6% | | | | | | | | |
EMC Corporation | | | 100,000 | | | | 2,568,000 | |
Hewlett Packard Enterprise Company | | | 200,000 | | | | 3,040,000 | |
HP, Inc. | | | 350,000 | | | | 4,144,000 | |
| | | | | | | | 9,752,000 | |
| Materials — 5.7% | | | | | | | | |
| Chemicals — 5.7% | | | | | | | | |
FMC Corporation | | | 140,000 | | | | 5,478,200 | |
H.B. Fuller Company | | | 55,000 | | | | 2,005,850 | |
Platform Specialty Products Corporation * | | | 350,000 | | | | 4,490,500 | |
| | | | | | | | 11,974,550 | |
| | | | | | | | | |
Total Common Stocks (Cost $191,107,183) | | | | | | $ | 202,727,795 | |
9
AVE MARIA CATHOLIC VALUES FUND
SCHEDULE OF INVESTMENTS
(Continued)
WARRANTS — 2.7% | | Shares | | | Market Value | |
Financials — 2.7% | | | | | | |
Banks — 2.7% | | | | | | |
PNC Financial Services Group, Inc. (The) *(Cost $4,092,996) | | | 200,000 | | | $ | 5,742,000 | |
MONEY MARKET FUNDS — 1.7% | | Shares | | | Market Value | |
Federated Government Obligations Tax-Managed Fund - Institutional Shares, 0.07% (a) (Cost $3,713,260) | | | 3,713,260 | | | $ | 3,713,260 | |
| | | | | | | | | |
Total Investments at Market Value — 100.1%(Cost $198,913,439) | | | | | | $ | 212,183,055 | |
| | | | | | | | | |
Liabilities in Excess of Other Assets — (0.1%) | | | | | | | (304,110 | ) |
| | | | | | | | | |
Net Assets — 100.0% | | | | | | $ | 211,878,945 | |
ADR - American Depositary Receipt. |
* | Non-income producing security. |
# | The Fund owned 5% or more of the company's outstanding voting shares thereby making the company an affiliated company as that term is defined in the Investment Company Act of 1940 (Note 5). |
(a) | The rate shown is the 7-day effective yield as of December 31, 2015. |
See notes to financial statements. |
10
AVE MARIA GROWTH FUND
PORTFOLIO MANAGER COMMENTARY
(Unaudited)
Dear Fellow Shareholders,
For 2015, the Ave Maria Growth Fund (the “Fund”) had a total return of -2.70% compared with the S&P 500 Index (the “S&P 500”) total return of +1.38%. On a market-capitalization basis, the S&P 500’s positive return was largely attributed to very strong performance of a few stocks, such as Amazon.com, Inc., Microsoft Corporation, Alphabet, Inc. (formerly Google), Facebook, Inc., and Netflix, Inc. On an equal-weighted basis, the S&P 500’s return was -2.20%.
The Fund has a growth-at-reasonable-price (GARP) investment style, which has led to the Fund’s 10-year average annual total return of 8.32%. In our opinion, the Fund’s portfolio is composed of companies with above-average profit margins, above-average growth prospects, excellent capital allocation policies, and low financial leverage. The average return on equity of the Fund’s holdings as of year-end was 14.3% vs. 12.3% for the S&P 500. Negative contributors in 2015 included Polaris Industries, Inc., Colfax Corporation, Wolverine World Wide, Inc., and QUALCOMM, Inc. Positive contributors included Cognizant Technology Solutions Corporation, Accenture plc, Altera Corporation, Equinix, Inc., McCormick & Company, Inc., and Ross Stores, Inc.
One of the Fund’s largest holdings is Polaris Industries, a leader in power sports off-road vehicles, motorcycles, and snowmobiles. We added to the position late in 2015, when the stock price came under pressure after softer than anticipated results from the off-road vehicle industry and unusually warm weather in the U.S., reducing snowmobile sales. With a long track record of product innovation and superior quality, the company has created strong brand equity. The proof of Polaris’ competitive advantage would appear to be its internally-generated annual return on invested capital, consistently above 40%. An issue we exited in late 2015 was QUALCOMM, which receives royalties for smartphones and tablets using 3G or 4G technology. The company experienced difficulty enforcing its rights to collect royalties from Chinese OEMs in 2015, we therefore decided to pursue other investment opportunities.
11
AVE MARIA GROWTH FUND
PORTFOLIO MANAGER COMMENTARY
(Unaudited) (Continued)
We expect that the disciplined approach to purchasing stocks of fine companies at attractive prices will continue to produce favorable long-term results for Ave Maria Growth Fund shareholders. We are delighted and honored that you are one of them.
With best regards,

| 
|
Richard L. Platte, Jr., CFA | Brian D. Milligan, CFA |
Lead Portfolio Manager | Co-Portfolio Manager |
12
AVE MARIA GROWTH FUND
PERFORMANCE
(Unaudited) |
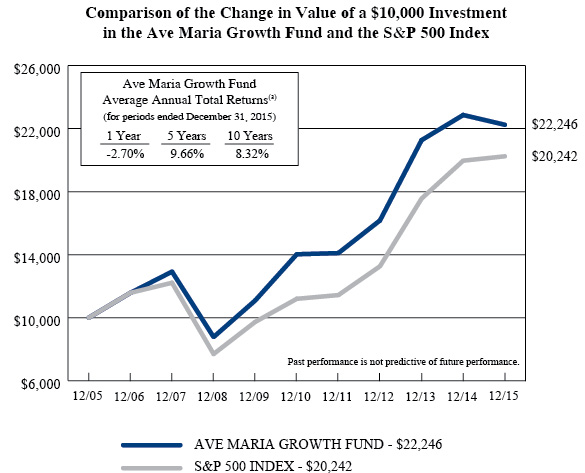
(a) | The returns shown do not reflect the deduction of taxes a shareholder would pay on Fund distributions or the redemption of Fund shares. |
Expense ratio as of 12-31-14 (as disclosed in May 1, 2015 prospectus) | 1.18%* |
Expense ratio for the year ended 12-31-15 | 1.17% |
* | Includes Acquired Fund Fees and Expenses. |
Past performance is not predictive of future performance. Investment results and principal value will fluctuate so that shares, when redeemed, may be worth more or less than their original cost. Current performance may be higher or lower than the performance data quoted. Performance data, current to the most recent month end, is available at the Ave Maria Mutual Funds website at www.avemariafunds.com or by calling 1-888-726-9331.
13
AVE MARIA GROWTH FUND
ANNUAL TOTAL RATES OF RETURN
COMPARISON WITH MAJOR INDICES (Unaudited) |
| AVE MARIA GROWTH FUND | S&P 500 INDEX |
2003(a) | 23.4% | 22.8% |
2004 | 21.5% | 10.9% |
2005 | 0.3% | 4.9% |
2006 | 15.8% | 15.8% |
2007 | 11.6% | 5.5% |
2008 | -32.1% | -37.0% |
2009 | 26.4% | 26.5% |
2010 | 26.5% | 15.1% |
2011 | 0.5% | 2.1% |
2012 | 14.7% | 16.0% |
2013 | 31.5% | 32.4% |
2014 | 7.5% | 13.7% |
2015 | -2.7% | 1.4% |
AVERAGE ANNUAL TOTAL RETURNS
As of December 31, 2015 (Unaudited)
| AVE MARIA GROWTH FUND | S&P 500 INDEX |
3 Years | 11.2% | 15.1% |
5 Years | 9.7% | 12.6% |
10 Years | 8.3% | 7.3% |
Since Inception (b) | 10.0% | 8.7% |
(a) | Represents the period from the commencement of operations (May 1, 2003) through December 31, 2003. |
(b) | Represents the period from the commencement of operations (May 1, 2003) through December 31, 2015. |
14
AVE MARIA GROWTH FUND
TEN LARGEST EQUITY HOLDINGS
December 31, 2015 (Unaudited)
Shares | | Company | | Market Value | | | % of Net Assets | |
| | 125,000 | | ANSYS, Inc. | | $ | 11,562,500 | | | | 3.8 | % |
| | 191,400 | | Cognizant Technology Solutions Corporation - Class A | | | 11,487,828 | | | | 3.8 | % |
| | 90,000 | | Laboratory Corporation of America Holdings | | | 11,127,600 | | | | 3.7 | % |
| | 140,000 | | Omnicom Group, Inc. | | | 10,592,400 | | | | 3.5 | % |
| | 65,000 | | Amgen, Inc. | | | 10,551,450 | | | | 3.5 | % |
| | 192,600 | | AMETEK, Inc. | | | 10,321,434 | | | | 3.4 | % |
| | 270,000 | | Copart, Inc. | | | 10,262,700 | | | | 3.4 | % |
| | 100,000 | | Moody's Corporation | | | 10,034,000 | | | | 3.3 | % |
| | 48,000 | | W.W. Grainger, Inc. | | | 9,724,320 | | | | 3.2 | % |
| | 101,500 | | Danaher Corporation | | | 9,427,320 | | | | 3.1 | % |
ASSET ALLOCATION (Unaudited)
Sector | % of Net Assets |
Consumer Discretionary | 14.8% |
Consumer Staples | 1.6% |
Energy | 5.7% |
Financials | 6.1% |
Health Care | 17.1% |
Industrials | 33.0% |
Information Technology | 12.4% |
Materials | 2.6% |
Money Market Funds, Liabilities in Excess of Other Assets | 6.7% |
| | 100.0% |
15
AVE MARIA GROWTH FUND
SCHEDULE OF INVESTMENTS
December 31, 2015
| COMMON STOCKS — 93.3% | | Shares | | | Market Value | |
| Consumer Discretionary — 14.8% | | | | | | |
| Leisure Products — 2.9% | | | | | | |
Polaris Industries, Inc. | | | 100,000 | | | $ | 8,595,000 | |
| | | | | | | | | |
| Media — 6.3% | | | | | | | | |
Discovery Communications, Inc. - Series A * | | | 315,000 | | | | 8,404,200 | |
Omnicom Group, Inc. | | | 140,000 | | | | 10,592,400 | |
| | | | | | | | 18,996,600 | |
| Specialty Retail — 4.5% | | | | | | | | |
Ross Stores, Inc. | | | 165,000 | | | | 8,878,650 | |
TJX Companies, Inc. (The) | | | 65,000 | | | | 4,609,150 | |
| | | | | | | | 13,487,800 | |
| Textiles, Apparel & Luxury Goods — 1.1% | | | | | | | | |
Wolverine World Wide, Inc. | | | 200,000 | | | | 3,342,000 | |
| | | | | | | | | |
| Consumer Staples — 1.6% | | | | | | | | |
| Food Products — 1.6% | | | | | | | | |
McCormick & Company, Inc. | | | 55,000 | | | | 4,705,800 | |
| | | | | | | | | |
| Energy — 5.7% | | | | | | | | |
| Energy Equipment & Services — 3.1% | | | | | | | | |
Schlumberger Limited | | | 135,000 | | | | 9,416,250 | |
| | | | | | | | | |
| Oil, Gas & Consumable Fuels — 2.6% | | | | | | | | |
Occidental Petroleum Corporation | | | 115,000 | | | | 7,775,150 | |
| | | | | | | | | |
| Financials — 6.1% | | | | | | | | |
| Diversified Financial Services — 6.1% | | | | | | | | |
MasterCard, Inc. - Class A | | | 85,000 | | | | 8,275,600 | |
Moody's Corporation | | | 100,000 | | | | 10,034,000 | |
| | | | | | | | 18,309,600 | |
| Health Care — 17.1% | | | | | | | | |
| Biotechnology — 3.5% | | | | | | | | |
Amgen, Inc. | | | 65,000 | | | | 10,551,450 | |
| | | | | | | | | |
| Health Care Equipment & Supplies — 9.2% | | | | | | | | |
C.R. Bard, Inc. | | | 40,000 | | | | 7,577,600 | |
Medtronic plc | | | 120,000 | | | | 9,230,400 | |
St. Jude Medical, Inc. | | | 30,000 | | | | 1,853,100 | |
Varian Medical Systems, Inc. * | | | 112,000 | | | | 9,049,600 | |
| | | | | | | | 27,710,700 | |
| Health Care Providers & Services — 3.7% | | | | | | | | |
| Laboratory Corporation of America Holdings * | | | 90,000 | | | | 11,127,600 | |
16
AVE MARIA GROWTH FUND
SCHEDULE OF INVESTMENTS
(Continued)
| COMMON STOCKS — 93.3% (Continued) | | Shares | | | Market Value | |
| Health Care — 17.1% (Continued) | | | | | | |
| Health Care Technology — 0.7% | | | | | | |
Cerner Corporation * | | | 35,000 | | | $ | 2,105,950 | |
| | | | | | | | | |
| Industrials — 33.0% | | | | | | | | |
| Aerospace & Defense — 0.8% | | | | | | | | |
Precision Castparts Corporation | | | 10,000 | | | | 2,320,100 | |
| | | | | | | | | |
| Air Freight & Logistics — 6.8% | | | | | | | | |
C.H. Robinson Worldwide, Inc. | | | 80,000 | | | | 4,961,600 | |
Expeditors International of Washington, Inc. | | | 150,000 | | | | 6,765,000 | |
United Parcel Service, Inc. - Class B | | | 90,000 | | | | 8,660,700 | |
| | | | | | | | 20,387,300 | |
| Commercial Services & Supplies — 5.2% | | | | | | | | |
Copart, Inc. * | | | 270,000 | | | | 10,262,700 | |
Rollins, Inc. | | | 200,000 | | | | 5,180,000 | |
| | | | | | | | 15,442,700 | |
| Electrical Equipment — 3.4% | | | | | | | | |
AMETEK, Inc. | | | 192,600 | | | | 10,321,434 | |
| | | | | | | | | |
| Industrial Conglomerates — 3.1% | | | | | | | | |
Danaher Corporation | | | 101,500 | | | | 9,427,320 | |
| | | | | | | | | |
| Machinery — 10.5% | | | | | | | | |
Colfax Corporation * | | | 200,000 | | | | 4,670,000 | |
Donaldson Company, Inc. | | | 285,000 | | | | 8,168,100 | |
Graco, Inc. | | | 130,000 | | | | 9,369,100 | |
Toro Company (The) | | | 125,000 | | | | 9,133,750 | |
| | | | | | | | 31,340,950 | |
| Trading Companies & Distributors — 3.2% | | | | | | | | |
W.W. Grainger, Inc. | | | 48,000 | | | | 9,724,320 | |
| | | | | | | | | |
| Information Technology – 12.4% | | | | | | | | |
| Internet Software & Services — 2.3% | | | | | | | | |
Equinix, Inc. | | | 22,596 | | | | 6,833,030 | |
| | | | | | | | | |
| IT Services — 6.3% | | | | | | | | |
Accenture plc - Class A | | | 70,000 | | | | 7,315,000 | |
Cognizant Technology Solutions Corporation - Class A * | | | 191,400 | | | | 11,487,828 | |
| | | | | | | | 18,802,828 | |
| Software — 3.8% | | | | | | | | |
ANSYS, Inc. * | | | 125,000 | | | | 11,562,500 | |
17
AVE MARIA GROWTH FUND
SCHEDULE OF INVESTMENTS
(Continued)
COMMON STOCKS — 93.3%(Continued) | | Shares | | | Market Value | |
Materials — 2.6% | | | | | | |
Chemicals — 2.6% | | | | | | |
Praxair, Inc. | | | 75,000 | | | $ | 7,680,000 | |
| | | | | | | | | |
Total Common Stocks (Cost $214,730,406) | | | | | | $ | 279,966,382 | |
MONEY MARKET FUNDS — 6.9% | | Shares | | | Market Value | |
Federated Government Obligations Tax-Managed Fund - Institutional Shares, 0.07% (a) | | | 14,587,319 | | | $ | 14,587,319 | |
Federated Treasury Obligations Fund - Institutional Shares, 0.07% (a) | | | 6,101,228 | | | | 6,101,228 | |
Total Money Market Funds (Cost $20,688,547) | | | | | | $ | 20,688,547 | |
| | | | | | | | | |
Total Investments at Market Value — 100.2% (Cost $235,418,953) | | | | | | $ | 300,654,929 | |
| | | | | | | | | |
Liabilities in Excess of Other Assets — (0.2%) | | | | | | | (536,113 | ) |
| | | | | | | | | |
Net Assets — 100.0% | | | | | | $ | 300,118,816 | |
* | Non-income producing security. |
(a) | The rate shown is the 7-day effective yield as of December 31, 2015. |
See notes to financial statements. |
18
AVE MARIA RISING DIVIDEND FUND
PORTFOLIO MANAGER COMMENTARY
(Unaudited)
Dear Fellow Shareholders,
2015 was a year of ups and downs in the market. For the Ave Maria Rising Dividend Fund (the “Fund”), it ended on a down note with a total return of -5.89%. This compares with a return of +1.38% for the S&P 500 Index (the “S&P 500”). In some ways, the bifurcated market in 2015 bore some resemblance to the dot-com bubble of 1999-2000. Investors let their imaginations run wild with a number of social media and hot stocks, pushing their share prices to astronomical highs, while punishing stocks that were affected by the real world concerns of a slowing China, lower energy prices, and the stronger dollar. The performance of the S&P 500 was dominated by strong performance of a small number of large, very popular stocks, including Amazon.com, Inc., Microsoft Corporation, Alphabet, Inc. (Google’s new name), General Electric and Facebook, Inc. Most of these high flyers do not measure up to our investment metrics for quality or valuation. Take out these companies, and the S&P 500’s returns look considerably different. During 2015, on an equal-weighted basis, the S&P 500’s return was -2.20%. It’s also worth noting that during 2015, stocks within the S&P 500 that paid no dividend significantly outperformed dividend-payers, typically a sign of froth in the market.
Three factors dominated corporate earnings in 2015, impacting many of the Fund’s holdings: China, a strong dollar, and lower energy prices. Many of the Fund’s portfolio companies were affected by one or more of these factors. The slowing Chinese economy directly impacted U.S. companies doing business in China. The strong dollar, while good for our sense of national identity and the ability for U.S. consumers to purchase foreign goods more cheaply, meant that American goods cost more, reducing demand for American goods. It also meant that foreign earnings of U.S. corporations converted back into dollars at a lower rate. Finally, the precipitous decline in energy prices affected the Fund’s energy companies and a number of the industrials that manufacture goods for the energy industry.
We believe these factors are expected to largely reverse themselves in 2016 and beyond. China remains a growing economy, just at a slower pace. In our view, Chinese consumers still aspire to join the global middle class, so demand for goods and services will continue to grow. With respect to energy prices, it has been said that the cure for low energy prices is “low energy prices.” Low energy prices means demand increases and supply decreases, the magic of free markets. Given the nature of energy exploration and production, this won’t happen immediately, but it will happen over time. Incidentally, low energy
19
AVE MARIA RISING DIVIDEND FUND
PORTFOLIO MANAGER COMMENTARY
(Unaudited) (Continued)
prices are not all bad. It’s a great shot in the arm for consumers and energy-intensive industries, and will stimulate economic growth for other sectors of the economy.
Looking at performance of the Fund on a more granular basis, positive contributions came from Hasbro, Inc. (toys), Ross Stores, Inc. (discount retailer), Lowe’s Companies, Inc. (buildings supply retailer), and ACE Limited (insurance). The biggest losers were QUALCOMM, Inc. (integrated circuits), Franklin Resources, Inc. (asset manager), Caterpillar, Inc. (heavy equipment), and Norfolk Southern Corporation (rail transport). Of the 38 portfolio holdings at year-end, 32 increased their dividends during the year. More importantly, we believe that the Fund’s portfolio companies continued to increase intrinsic value for shareholders. Owning shares of companies that compound stockholders’ equity through effective capital allocation is the essence of long-term investing.
Our goal in managing the Fund’s portfolio remains the pursuit of investment opportunities in great companies at share prices that don’t reflect the underlying intrinsic value of the businesses.
We appreciate your participation in the Ave Maria Rising Dividend Fund.
Sincerely,

| 
|
Richard L. Platte, Jr., CFA | George P. Schwartz, CFA |
Lead Portfolio Manager | Co-Portfolio Manager |
20
AVE MARIA RISING DIVIDEND FUND
PERFORMANCE
(Unaudited) |
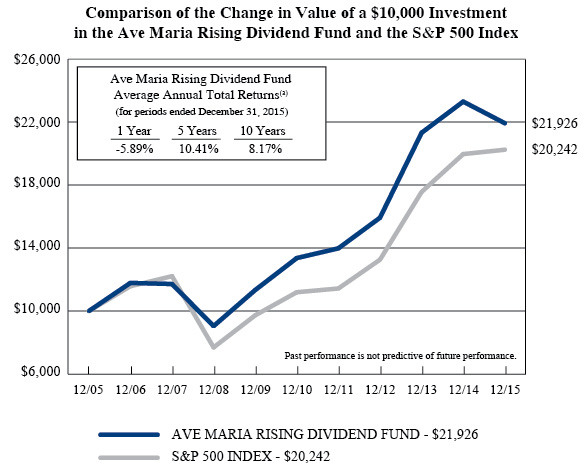
(a) | The returns shown do not reflect the deduction of taxes a shareholder would pay on Fund distributions or the redemption of Fund shares. |
Expense ratio as of 12-31-14 (as disclosed in May 1, 2015 prospectus) | 0.93%* |
Expense ratio for the year ended 12-31-15 | 0.92% |
* | Includes Acquired Fund Fees and Expenses. |
Past performance is not predictive of future performance. Investment results and principal value will fluctuate so that shares, when redeemed, may be worth more or less than their original cost. Current performance may be higher or lower than the performance data quoted. Performance data, current to the most recent month end, is available at the Ave Maria Mutual Funds website at www.avemariafunds.com or by calling 1-888-726-9331.
21
AVE MARIA RISING DIVIDEND FUND
ANNUAL TOTAL RATES OF RETURN
COMPARISON WITH MAJOR INDICES (Unaudited) |
| AVE MARIA
RISING DIVIDEND FUND | S&P 500 INDEX |
2005(a) | 6.7% | 8.8% |
2006 | 17.9% | 15.8% |
2007 | -0.6% | 5.5% |
2008 | -22.8% | -37.0% |
2009 | 25.3% | 26.5% |
2010 | 17.9% | 15.1% |
2011 | 4.6% | 2.1% |
2012 | 13.9% | 16.0% |
2013 | 33.9% | 32.4% |
2014 | 9.3% | 13.7% |
2015 | -5.9% | 1.4% |
AVERAGE ANNUAL TOTAL RETURNS
As of December 31, 2015 (Unaudited) |
| AVE MARIA
RISING DIVIDEND FUND | S&P 500 INDEX |
3 Years | 11.2% | 15.1% |
5 Years | 10.4% | 12.6% |
10 Years | 8.2% | 7.3% |
Since Inception (b) | 8.3% | 7.7% |
(a) | Represents the period from the commencement of operations (May 2, 2005) through December 31, 2005. |
(b) | Represents the period from the commencement of operations (May 2, 2005) through December 31, 2015. |
22
AVE MARIA RISING DIVIDEND FUND
TEN LARGEST EQUITY HOLDINGS
December 31, 2015 (Unaudited)
Shares | | Company | | Market Value | | | % of Net Assets | |
| | 1,000,000 | | Cisco Systems, Inc. | | $ | 27,155,000 | | | | 3.6 | % |
| | 580,000 | | Microchip Technology, Inc. | | | 26,993,200 | | | | 3.6 | % |
| | 340,000 | | Exxon Mobil Corporation | | | 26,503,000 | | | | 3.5 | % |
| | 350,000 | | Omnicom Group, Inc. | | | 26,481,000 | | | | 3.5 | % |
| | 340,000 | | Lowe's Companies, Inc. | | | 25,853,600 | | | | 3.4 | % |
| | 230,000 | | Diageo plc - ADR | | | 25,086,100 | | | | 3.3 | % |
| | 325,000 | | Medtronic plc | | | 24,999,000 | | | | 3.3 | % |
| | 600,000 | | Johnson Controls, Inc. | | | 23,694,000 | | | | 3.1 | % |
| | 145,000 | | Amgen, Inc. | | | 23,537,850 | | | | 3.1 | % |
| | 200,000 | | ACE Limited | | | 23,370,000 | | | | 3.1 | % |
ASSET ALLOCATION (Unaudited)
Sector | % of Net Assets |
Consumer Discretionary | 17.1% |
Consumer Staples | 11.0% |
Energy | 10.0% |
Financials | 14.9% |
Health Care | 9.0% |
Industrials | 21.9% |
Information Technology | 7.7% |
Materials | 2.4% |
Warrants | 1.3% |
Money Market Funds, Liabilities in Excess of Other Assets | 4.7% |
| | 100.0% |
23
AVE MARIA RISING DIVIDEND FUND
SCHEDULE OF INVESTMENTS
December 31, 2015
| COMMON STOCKS — 94.0% | | Shares | | | Market Value | |
| Consumer Discretionary — 17.1% | | | | | | |
| Auto Components — 3.1% | | | | | | |
Johnson Controls, Inc. | | | 600,000 | | | $ | 23,694,000 | |
| | | | | | | | | |
| Leisure Products — 1.9% | | | | | | | | |
Polaris Industries, Inc. | | | 165,000 | | | | 14,181,750 | |
| | | | | | | | | |
| Media — 3.5% | | | | | | | | |
Omnicom Group, Inc. | | | 350,000 | | | | 26,481,000 | |
| | | | | | | | | |
| Specialty Retail — 8.0% | | | | | | | | |
Lowe's Companies, Inc. | | | 340,000 | | | | 25,853,600 | |
Ross Stores, Inc. | | | 400,000 | | | | 21,524,000 | |
TJX Companies, Inc. (The) | | | 175,000 | | | | 12,409,250 | |
| | | | | | | | 59,786,850 | |
| Textiles, Apparel & Luxury Goods — 0.6% | | | | | | | | |
Wolverine World Wide, Inc. | | | 250,000 | | | | 4,177,500 | |
| | | | | | | | | |
| Consumer Staples — 11.0% | | | | | | | | |
| Beverages — 5.9% | | | | | | | | |
Coca-Cola Company (The) | | | 450,000 | | | | 19,332,000 | |
Diageo plc - ADR | | | 230,000 | | | | 25,086,100 | |
| | | | | | | | 44,418,100 | |
| Food Products — 5.1% | | | | | | | | |
Hershey Company (The) | | | 225,000 | | | | 20,085,750 | |
Kraft Heinz Company (The) | | | 250,000 | | | | 18,190,000 | |
| | | | | | | | 38,275,750 | |
| Energy — 10.0% | | | | | | | | |
| Energy Equipment & Services — 5.1% | | | | | | | | |
Baker Hughes Incorporated | | | 70,000 | | | | 3,230,500 | |
Halliburton Company | | | 375,000 | | | | 12,765,000 | |
Schlumberger Limited | | | 325,000 | | | | 22,668,750 | |
| | | | | | | | 38,664,250 | |
| Oil, Gas & Consumable Fuels — 4.9% | | | | | | | | |
Exxon Mobil Corporation | | | 340,000 | | | | 26,503,000 | |
Occidental Petroleum Corporation | | | 150,000 | | | | 10,141,500 | |
| | | | | | | | 36,644,500 | |
| Financials — 14.9% | | | | | | | | |
| Banks — 9.0% | | | | | | | | |
BB&T Corporation | | | 425,000 | | | | 16,069,250 | |
Fifth Third Bancorp | | | 900,000 | | | | 18,090,000 | |
PNC Financial Services Group, Inc. (The) | | | 150,000 | | | | 14,296,500 | |
U.S. Bancorp | | | 450,000 | | | | 19,201,500 | |
| | | | | | | | 67,657,250 | |
24
AVE MARIA RISING DIVIDEND FUND
SCHEDULE OF INVESTMENTS
(Continued)
| COMMON STOCKS — 94.0% (Continued) | | Shares | | | Market Value | |
| Financials — 14.9% (Continued) | | | | | | |
| Capital Markets — 2.8% | | | | | | |
Bank of New York Mellon Corporation (The) | | | 500,000 | | | $ | 20,610,000 | |
| | | | | | | | | |
| Insurance — 3.1% | | | | | | | | |
ACE Limited | | | 200,000 | | | | 23,370,000 | |
| | | | | | | | | |
| Health Care — 9.0% | | | | | | | | |
| Biotechnology — 3.1% | | | | | | | | |
Amgen, Inc. | | | 145,000 | | | | 23,537,850 | |
| | | | | | | | | |
| Health Care Equipment & Supplies — 5.9% | | | | | | | | |
Medtronic plc | | | 325,000 | | | | 24,999,000 | |
St. Jude Medical, Inc. | | | 310,000 | | | | 19,148,700 | |
| | | | | | | | 44,147,700 | |
| Industrials — 21.9% | | | | | | | | |
| Air Freight & Logistics — 4.3% | | | | | | | | |
C.H. Robinson Worldwide, Inc. | | | 190,000 | | | | 11,783,800 | |
United Parcel Service, Inc. - Class B | | | 210,000 | | | | 20,208,300 | |
| | | | | | | | 31,992,100 | |
| Electrical Equipment — 3.0% | | | | | | | | |
Emerson Electric Company | | | 475,000 | | | | 22,719,250 | |
| | | | | | | | | |
| Industrial Conglomerates — 3.0% | | | | | | | | |
3M Company | | | 150,000 | | | | 22,596,000 | |
| | | | | | | | | |
| Machinery — 6.0% | | | | | | | | |
Donaldson Company, Inc. | | | 500,000 | | | | 14,330,000 | |
Dover Corporation | | | 260,000 | | | | 15,940,600 | |
Illinois Tool Works, Inc. | | | 160,000 | | | | 14,828,800 | |
| | | | | | | | 45,099,400 | |
| Road & Rail — 2.6% | | | | | | | | |
Norfolk Southern Corporation | | | 235,000 | | | | 19,878,650 | |
| | | | | | | | | |
| Trading Companies & Distributors — 3.0% | | | | | | | | |
W.W. Grainger, Inc. | | | 110,000 | | | | 22,284,900 | |
| | | | | | | | | |
| Information Technology — 7.7% | | | | | | | | |
| Communications Equipment — 3.6% | | | | | | | | |
Cisco Systems, Inc. | | | 1,000,000 | | | | 27,155,000 | |
25
AVE MARIA RISING DIVIDEND FUND
SCHEDULE OF INVESTMENTS
(Continued)
| COMMON STOCKS — 94.0% (Continued) | | Shares | | | Market Value | |
| Information Technology — 7.7% (Continued) | | | | | | |
| Semiconductors & Semiconductor Equipment — 4.1% | | | | | | |
Intel Corporation | | | 100,000 | | | $ | 3,445,000 | |
Microchip Technology, Inc. | | | 580,000 | | | | 26,993,200 | |
| | | | | | | | 30,438,200 | |
| Materials — 2.4% | | | | | | | | |
| Chemicals — 2.4% | | | | | | | | |
Praxair, Inc. | | | 180,000 | | | | 18,432,000 | |
| | | | | | | | | |
Total Common Stocks (Cost $651,343,549) | | | | | | $ | 706,242,000 | |
WARRANTS — 1.3% | | Shares | | | Market Value | |
Financials — 1.3% | | | | | | |
Banks — 1.3% | | | | | | |
PNC Financial Services Group, Inc. (The) *(Cost $6,561,753) | | | 335,000 | | | $ | 9,617,850 | |
MONEY MARKET FUNDS — 5.0% | | Shares | | | Market Value | |
Federated Government Obligations Tax-Managed Fund - Institutional Shares, 0.07% (a) | | | 36,613,851 | | | $ | 36,613,851 | |
Federated Treasury Obligations Fund - Institutional Shares, 0.07% (a) | | | 771,442 | | | | 771,442 | |
Total Money Market Funds (Cost $37,385,293) | | | | | | $ | 37,385,293 | |
| | | | | | | | | |
Total Investments at Market Value — 100.3%(Cost $695,290,595) | | | | | | $ | 753,245,143 | |
| | | | | | | | | |
Liabilities in Excess of Other Assets — (0.3%) | | | | | | | (2,355,274 | ) |
| | | | | | | | | |
Net Assets — 100.0% | | | | | | $ | 750,889,869 | |
ADR - American Depositary Receipt. |
* | Non-income producing security. |
(a) | The rate shown is the 7-day effective yield as of December 31, 2015. |
See notes to financial statements. |
26
AVE MARIA WORLD EQUITY FUND
PORTFOLIO MANAGER COMMENTARY
(Unaudited)
Dear Fellow Shareholder:
The Ave Maria World Equity Fund (the “Fund”) had a total return of -4.78% for the twelve months ended December 31, 2015. The return for the S&P Global 1200 Index was -0.86%.
Since inception on April 30, 2010, the cumulative and annualized returns for the Fund compared to its benchmark were:
| | Since 4-30-2010 Inception through 12-31-15 Total Returns |
| | Cumulative | Annualized |
Ave Maria World Equity Fund (AVEWX) | 36.66% | 5.66% |
S&P Global 1200 Index | 58.27% | 8.43% |
The year 2015 was a tough one for global equity investors to find positive returns. Except for Japan (TOPIX 150, up 10.5%), the major developed regions were either down (S&P Europe 350, down 2.5%) or up only marginally (U.S. based S&P 500, +1.4%). In the U.S., the positive performance was very narrow (i.e. driven by a few stocks), with the average stock being down around 2%. Emerging markets were an even tougher proposition, with the S&P Emerging BMI down 13.5%. Key developments globally that investors were concerned about included the continued collapse of commodity prices (especially oil), continued slowdown in China (including a devaluation of the Yuan in August), and the Federal Reserve finally raising its benchmark interest rate in December!
The Fund continues to emphasize owning U.S. based companies with large global operations. As a result of the strong dollar, translating foreign revenues and profits back into U.S. dollars continued to have an adverse impact on these companies’ earnings. In addition, the industrials, consumer discretionary and technology sectors also hurt performance. The Fund saw positive contributions from financials and consumer staples. Our financial holdings as a group posted positive returns for the year. Long-time holding AXA S.A., a top-ten position for the Fund, was up over 20% for the year. AXA, a global insurance company based in France, posted solid financial results during the year while its new capital ratio disclosures were also stronger than expected. A newcomer to the portfolio in 2015, Equinix, Inc., was also a strong contributor, up almost 40% from our average purchase price. The company, a global leader in data center hosting and interconnection services, accelerated its international strategies in 2015 with acquisitions in Europe and Japan. Positive performance from the Fund’s consumer staples holdings was driven by Mondelēz International, Inc. and Heineken N.V., both up over 20% for the year. Mondelēz delivered decent
27
AVE MARIA WORLD EQUITY FUND
PORTFOLIO MANAGER COMMENTARY
(Unaudited) (Continued)
organic top-line growth, but more importantly excelled at its expense control initiatives, which led to rising profit margins. Heineken shares gained as the company started to demonstrate accelerating revenue growth.
Fluor Corporation, an engineering and construction firm, was the largest detractor among the Fund’s industrial stocks, due primarily to its heavy exposure to oil and gas. In the consumer discretionary sector, Polaris Industries, Inc. was down significantly since our purchase earlier in the year. Importantly, while the company is seeing slower ORV (off road vehicle) and snowmobile sales, motorcycle sales remain strong and the company remains focused on its lean initiatives. And finally, technology holding QUALCOMM, Inc. underperformed due in large part to pressure on its licensing business in China.
Six new positions, all of which complied with the Ave Maria Mutual Funds’ moral screens, were added to the Fund’s portfolio since June 30, 2015: Amgen, Inc. (biotechnology), Barclays plc (financial services), Brookfield Asset Management, Inc. (asset management), Discover Financial Services (consumer finance), Nestlé S.A. (packaged foods), and Polaris Industries, Inc. (leisure products). Eight positions were eliminated, in favor of what we believe to be more attractive investment opportunities: 3M Company, Abbott Laboratories, BHP Billiton Ltd., Franklin Resources, Inc., POSCO, Tidewater, Inc., Tupperware Brands Corporation, and iShares Gold Trust.
As of December 31, 2015, the Fund’s geographic weightings versus the S&P Global 1200 Index were approximately:
| | Ave Maria World Equity Fund | S&P Global
1200 Index |
Americas | 59.5% | 61.1% |
Europe Developed | 17.6% | 17.0% |
United Kingdom | 7.4% | 7.4% |
Japan | 8.3% | 8.0% |
Asia Developed | 0.0% | 2.0% |
Asia Emerging | 2.8% | 1.9% |
Australasia | 0.0% | 2.6% |
Cash Equivalents | 4.4% | — |
28
AVE MARIA WORLD EQUITY FUND
PORTFOLIO MANAGER COMMENTARY
(Unaudited) (Continued)
Gregory Heilman retired from the Fund management team effective December 31, 2015, and was replaced by Robert Schwartz, as a co-manager on the Fund. We thank Greg for his years of service to the Fund. Joe Skornicka will now be the lead manager of the Fund. The Fund’s strategy of focusing on high quality, large capitalization, and global equities will not change.
Thank you for your continued interest in the Ave Maria World Equity Fund.

| 
|
Joseph W. Skornicka, CFA | Robert C. Schwartz, CFP |
Lead Portfolio Manager | Co-Portfolio Manager |
29
AVE MARIA WORLD EQUITY FUND
PERFORMANCE
(Unaudited) |

(a) | The returns shown do not reflect the deduction of taxes a shareholder would pay on Fund distributions or the redemption of Fund shares. |
(b) | Represents the period from the commencement of operations (April 30, 2010) through December 31, 2015. |
Expense ratio as of 12-31-14 (as disclosed in May 1, 2015 prospectus) | 1.51% |
Expense ratio for the year ended 12-31-15 | 1.50% |
* | Includes Acquired Fund Fees and Expenses. |
Past performance is not predictive of future performance. Investment results and principal value will fluctuate so that shares, when redeemed, may be worth more or less than their original cost. Current performance may be higher or lower than the performance data quoted. Performance data, current to the most recent month end, is available at the Ave Maria Mutual Funds website at www.avemariafunds.com or by calling 1-888-726-9331.
30
AVE MARIA WORLD EQUITY FUND
ANNUAL TOTAL RATES OF RETURN
COMPARISON WITH MAJOR INDICES (Unaudited) |
| AVE MARIA
WORLD EQUITY FUND | S&P 1200
GLOBAL INDEX |
2010(a) | 12.4% | 8.5% |
2011 | -9.6% | -5.1% |
2012 | 13.8% | 16.8% |
2013 | 23.5% | 25.8% |
2014 | 0.5% | 5.4% |
2015 | -4.8% | -0.9% |
AVERAGE ANNUAL TOTAL RETURNS
As of December 31, 2015 (Unaudited)
| AVE MARIA
WORLD EQUITY FUND | S&P 1200
GLOBAL INDEX |
3 Years | 5.7% | 9.6% |
5 Years | 4.0% | 7.8% |
Since Inception(b) | 5.7% | 8.4% |
(a) | Represents the period from the commencement of operations (April 30, 2010) through December 31, 2010. |
(b) | Represents the period from the commencement of operations (April 30, 2010) through December 31, 2015. |
31
AVE MARIA WORLD EQUITY FUND
TEN LARGEST EQUITY HOLDINGS
December 31, 2015 (Unaudited)
Shares | | Company | | Market Value | | | % of Net Assets | |
| | 16,500 | | ACE Limited | | $ | 1,928,025 | | | | 4.7 | % |
| | 36,000 | | Citigroup, Inc. | | | 1,863,000 | | | | 4.5 | % |
| | 26,500 | | St. Jude Medical, Inc. | | | 1,636,905 | | | | 3.9 | % |
| | 12,800 | | Toytoa Motor Corporation - ADR | | | 1,574,912 | | | | 3.8 | % |
| | 55,000 | | AXA S.A. - ADR | | | 1,502,325 | | | | 3.6 | % |
| | 57,000 | | EMC Corporation | | | 1,463,760 | | | | 3.6 | % |
| | 22,500 | | TE Connectivity Ltd. | | | 1,453,725 | | | | 3.5 | % |
| | 18,619 | | Medtronic plc | | | 1,432,173 | | | | 3.5 | % |
| | 12,000 | | Diageo plc - ADR | | | 1,308,840 | | | | 3.2 | % |
| | 29,000 | | Mondelēz International, Inc. - Class A | | | 1,300,360 | | | | 3.2 | % |
ASSET ALLOCATION (Unaudited)
Sector | % of Net Assets |
Consumer Discretionary | 12.5% |
Consumer Staples | 11.1% |
Energy | 6.4% |
Financials | 22.7% |
Health Care | 13.1% |
Industrials | 11.7% |
Information Technology | 14.5% |
Materials | 3.6% |
Money Market Funds, Liabilities in Excess of Other Assets | 4.4% |
| | 100.0% |
32
AVE MARIA WORLD EQUITY FUND
SCHEDULE OF INVESTMENTS
December 31, 2015
| COMMON STOCKS — 95.6% | | Shares | | | Market Value | |
| Consumer Discretionary — 12.5% | | | | | | |
| Auto Components — 4.0% | | | | | | |
Bridgestone Corporation - ADR | | | 65,000 | | | $ | 1,110,525 | |
| Cie Générale des Établissements Michelin - ADR | | | 29,000 | | | | 552,885 | |
| | | | | | | | 1,663,410 | |
| Automobiles — 3.8% | | | | | | | | |
Toyota Motor Corporation - ADR | | | 12,800 | | | | 1,574,912 | |
| | | | | | | | | |
| Hotels, Restaurants & Leisure — 1.3% | | | | | | | | |
McDonald's Corporation | | | 4,500 | | | | 531,630 | |
| | | | | | | | | |
| Leisure Products — 2.3% | | | | | | | | |
Polaris Industries, Inc. | | | 11,000 | | | | 945,450 | |
| | | | | | | | | |
| Media — 1.1% | | | | | | | | |
Discovery Communications, Inc. - Series A * | | | 17,000 | | | | 453,560 | |
| | | | | | | | | |
| Consumer Staples — 11.1% | | | | | | | | |
| Beverages — 6.3% | | | | | | | | |
Diageo plc - ADR | | | 12,000 | | | | 1,308,840 | |
Heineken N.V. - ADR | | | 30,000 | | | | 1,282,500 | |
| | | | | | | | 2,591,340 | |
| Food Products — 4.8% | | | | | | | | |
Mondelēz International, Inc. - Class A | | | 29,000 | | | | 1,300,360 | |
Nestlé S.A. - ADR | | | 9,000 | | | | 669,780 | |
| | | | | | | | 1,970,140 | |
| Energy — 6.4% | | | | | | | | |
| Energy Equipment & Services — 3.9% | | | | | | | | |
Baker Hughes Incorporated | | | 10,000 | | | | 461,500 | |
Schlumberger Limited | | | 16,200 | | | | 1,129,950 | |
| | | | | | | | 1,591,450 | |
| Oil, Gas & Consumable Fuels — 2.5% | | | | | | | | |
Canadian Natural Resources Ltd. | | | 30,000 | | | | 654,900 | |
Exxon Mobil Corporation | | | 5,000 | | | | 389,750 | |
| | | | | | | | 1,044,650 | |
| Financials — 22.7% | | | | | | | | |
| Banks — 7.8% | | | | | | | | |
Barclays plc - ADR | | | 47,121 | | | | 610,688 | |
Citigroup, Inc. | | | 36,000 | | | | 1,863,000 | |
| Sumitomo Mitsui Financial Group, Inc. - ADR | | | 99,000 | | | | 751,410 | |
| | | | | | | | 3,225,098 | |
| Consumer Finance — 1.1% | | | | | | | | |
Discover Financial Services | | | 8,300 | | | | 445,046 | |
33
AVE MARIA WORLD EQUITY FUND
SCHEDULE OF INVESTMENTS
(Continued)
| COMMON STOCKS — 95.6% (Continued) | | Shares | | | Market Value | |
| Financials — 22.7% (Continued) | | | | | | |
| Diversified Financial Services — 1.7% | | | | | | |
Western Union Company (The) | | | 40,000 | | | $ | 716,400 | |
| | | | | | | | | |
| Insurance — 11.0% | | | | | | | | |
ACE Limited | | | 16,500 | | | | 1,928,025 | |
AXA S.A. - ADR | | | 55,000 | | | | 1,502,325 | |
Reinsurance Group of America, Inc. | | | 7,000 | | | | 598,850 | |
Validus Holdings Ltd. | | | 10,400 | | | | 481,416 | |
| | | | | | | | 4,510,616 | |
| Real Estate Management & Development — 1.1% | | | | | | | | |
Brookfield Asset Management, Inc. - Class A | | | 14,000 | | | | 441,420 | |
| | | | | | | | | |
| Health Care — 13.1% | | | | | | | | |
| Biotechnology — 3.0% | | | | | | | | |
Amgen, Inc. | | | 7,500 | | | | 1,217,475 | |
| | | | | | | | | |
| Health Care Equipment & Supplies — 7.4% | | | | | | | | |
Medtronic plc | | | 18,619 | | | | 1,432,173 | |
St. Jude Medical, Inc. | | | 26,500 | | | | 1,636,905 | |
| | | | | | | | 3,069,078 | |
| Pharmaceuticals — 2.7% | | | | | | | | |
Shire plc - ADR | | | 5,500 | | | | 1,127,500 | |
| | | | | | | | | |
| Industrials — 11.7% | | | | | | | | |
| Aerospace & Defense — 1.2% | | | | | | | | |
United Technologies Corporation | | | 5,000 | | | | 480,350 | |
| | | | | | | | | |
| Construction & Engineering — 2.1% | | | | | | | | |
Fluor Corporation | | | 18,600 | | | | 878,292 | |
| | | | | | | | | |
| Electrical Equipment — 2.8% | | | | | | | | |
Eaton Corporation plc | | | 22,000 | | | | 1,144,880 | |
| | | | | | | | | |
| Industrial Conglomerates — 3.2% | | | | | | | | |
Koninklijke Philips Electronics N.V. | | | 16,000 | | | | 407,200 | |
Siemens AG - ADR | | | 9,500 | | | | 913,663 | |
| | | | | | | | 1,320,863 | |
| Road & Rail — 2.4% | | | | | | | | |
Canadian National Railway Company | | | 18,000 | | | | 1,005,840 | |
34
AVE MARIA WORLD EQUITY FUND
SCHEDULE OF INVESTMENTS
(Continued)
| COMMON STOCKS — 95.6% (Continued) | | Shares | | | Market Value | |
| Information Technology — 14.5% | | | | | | |
| Communications Equipment — 1.3% | | | | | | |
QUALCOMM Incorporated | | | 11,000 | | | $ | 549,835 | |
| | | | | | | | | |
| Electronic Equipment, Instruments & Components — 3.5% | | | | | | | | |
TE Connectivity Ltd. | | | 22,500 | | | | 1,453,725 | |
| | | | | | | | | |
| Internet Software & Services — 1.5% | | | | | | | | |
Equinix, Inc. | | | 2,054 | | | | 621,129 | |
| | | | | | | | | |
| IT Services — 1.8% | | | | | | | | |
Accenture plc - Class A | | | 7,000 | | | | 731,500 | |
| | | | | | | | | |
| Semiconductors & Semiconductor Equipment — 2.8% | | | | | | | | |
| Taiwan Semiconductor Manufacturing Company Ltd. - ADR | | | 50,000 | | | | 1,137,500 | |
| | | | | | | | | |
| Technology Hardware, Storage & Peripherals — 3.6% | | | | | | | | |
EMC Corporation | | | 57,000 | | | | 1,463,760 | |
| | | | | | | | | |
| Materials — 3.6% | | | | | | | | |
| Chemicals — 3.6% | | | | | | | | |
FMC Corporation | | | 15,500 | | | | 606,515 | |
International Flavors & Fragrances, Inc. | | | 7,200 | | | | 861,408 | |
| | | | | | | | 1,467,923 | |
| | | | | | | | | |
Total Common Stocks (Cost $37,249,504) | | | | | | $ | 39,374,772 | |
35
AVE MARIA WORLD EQUITY FUND
SCHEDULE OF INVESTMENTS
(Continued)
MONEY MARKET FUNDS — 5.1% | | Shares | | | Market Value | |
Federated Government Obligations Tax-Managed Fund - Institutional Shares, 0.07% (a) | | | 1,990,132 | | | $ | 1,990,132 | |
Federated Treasury Obligations Fund - Institutional Shares, 0.07% (a) | | | 112,005 | | | | 112,005 | |
Total Money Market Funds (Cost $2,102,137) | | | | | | $ | 2,102,137 | |
| | | | | | | | | |
Total Investments at Market Value — 100.7%(Cost $39,351,641) | | | | | | $ | 41,476,909 | |
| | | | | | | | | |
Liabilities in Excess of Other Assets — (0.7%) | | | | | | | (278,084 | ) |
| | | | | | | | | |
Net Assets — 100.0% | | | | | | $ | 41,198,825 | |
ADR - American Depositary Receipt. |
* | Non-income producing security. |
(a) | The rate shown is the 7-day effective yield as of December 31, 2015. |
SUMMARY OF COMMON STOCKS BY COUNTRY
December 31, 2015 |
Country | | Value | | | % of Net Assets | |
United States | | $ | 22,394,859 | | | | 54.4 | % |
Japan | | | 3,436,847 | | | | 8.3 | % |
United Kingdom | | | 3,047,028 | | | | 7.4 | % |
Switzerland | | | 2,597,805 | | | | 6.3 | % |
Canada | | | 2,102,160 | | | | 5.1 | % |
France | | | 2,055,210 | | | | 5.0 | % |
Netherlands | | | 1,689,700 | | | | 4.1 | % |
Taiwan | | | 1,137,500 | | | | 2.8 | % |
Germany | | | 913,663 | | | | 2.2 | % |
| | | $ | 39,374,772 | | | | 95.6 | % |
See notes to financial statements. |
36
AVE MARIA BOND FUND
PORTFOLIO MANAGER COMMENTARY
(Unaudited)
Dear Fellow Shareholders,
In 2015, the Ave Maria Bond Fund (“the Fund”) had a total return of 0.70% vs. 1.07% for the Barclays U.S. Intermediate Government/Credit Index. Interest rates increased slightly as the yield on the ten-year U.S. Treasury started the year at 2.17% and ended at 2.28%. The economy grew slowly in 2015, with most economic indicators showing modest improvement. The Federal Reserve (the “Fed”) finally raised short-term interest rates for the first time in almost a decade. 2016 should be another interesting year as the Fed plans to continue increasing short-term rates, while central banks around the world seem to be going in the other direction.
2015 was the year of economic improvement by baby-steps. Real GDP growth was anemic at about 2%, and unemployment, which started the year at 5.6%, ended at 5.0%. Less encouraging was the labor force participation rate, which kept creeping lower and now sits at 62.5%, the lowest since 1977. With such dismal figures, it’s no wonder that a Pew Research Center study shows 31% of Americans describing economic conditions in the country as poor and 43% as fair, while only 26% describe economic conditions as either excellent or good. Inflation, excluding food and energy, last measured 2.0%, which is right on the Fed’s stated target. Including food and energy, inflation was closer to 0.5%, principally because of dramatically lower energy prices.
While the U.S. economy modestly improved in 2015, the rest of the world struggled. Europe and Japan continue to ramp-up their versions of quantitative easing (QE). China’s government has tried mightily to keep their economy from sliding into a recession. With technology breaking down the barriers of world trade, we can only hope foreign economies improve soon, as the U.S. cannot sustain even modestly steady growth without the prosperity of other nations.
In corporate bonds, credit spreads widened for much of the year for a number of reasons. The supply of bonds increased, as investment-grade companies issued debt to fund share buybacks and dividends. In addition, debt-funded mergers and acquisitions hit a record high in 2015, as some companies took on additional debt to grow through acquisitions. Finally, the weakness in energy, metals and the mining sectors created increased concern amongst bond investors.
In reviewing the performance of the Fund, the three top-performing assets in the Fund were the common stocks of Hasbro, Inc. (toys & games), Texas Instruments, Inc. (semiconductor devices), and ACE Limited (property & casualty insurance). The Fund’s worst-performing assets were the common
37
AVE MARIA BOND FUND
PORTFOLIO MANAGER COMMENTARY
(Unaudited) (Continued)
stocks of Caterpillar, Inc. (construction & mining machinery), Emerson Electric Company (industrial automation controls), and Occidental Petroleum Corporation (energy).
The Fund continues to be managed in a conservative manner, and again, we were able to maintain our record of no down years since the inception of the Fund in 2003. With interest rates extremely low by historical standards, we will continue to keep the average bond maturity low and credit quality high.
We appreciate your participation in the Ave Maria Bond Fund.

| 
|
Brandon S. Scheitler | Richard L. Platte, Jr., CFA |
Lead Portfolio Manager | Co-Portfolio Manager |
38
AVE MARIA BOND FUND
PERFORMANCE
(Unaudited) |
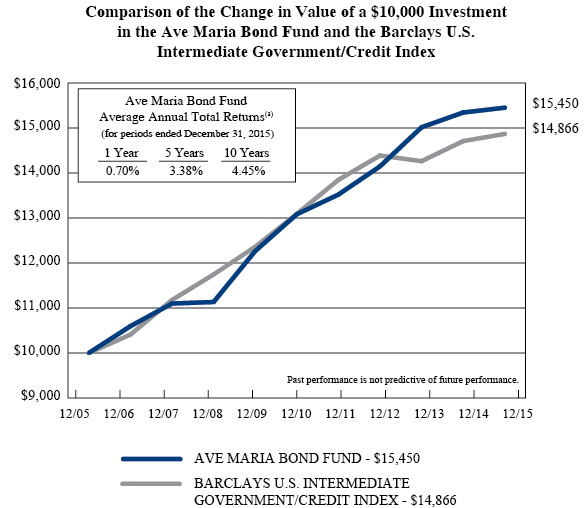
(a) | The returns shown do not reflect the deduction of taxes a shareholder would pay on Fund distributions or the redemption of Fund shares. |
Expense ratio as of 12-31-14 (as disclosed in May 1, 2015 prospectus) | 0.55%* |
Expense ratio for the year ended 12-31-15 | 0.51% |
* | Includes Acquired Fund Fees and Expenses. |
Past performance is not predictive of future performance. Investment results and principal value will fluctuate so that shares, when redeemed, may be worth more or less than their original cost. Current performance may be higher or lower than the performance data quoted. Performance data, current to the most recent month end, is available at the Ave Maria Mutual Funds website at www.avemariafunds.com or by calling 1-888-726-9331.
39
AVE MARIA BOND FUND
ANNUAL TOTAL RATES OF RETURN
COMPARISON WITH MAJOR INDICES (Unaudited) |
| AVE MARIA BOND FUND | BARCLAYS
U.S. INTERMEDIATE
GOVERNMENT/CREDIT INDEX |
2003(a) | 2.4% | 1.9% |
2004 | 5.1% | 3.0% |
2005 | 1.4% | 1.6% |
2006 | 6.0% | 4.1% |
2007 | 4.8% | 7.4% |
2008 | 0.3% | 5.1% |
2009 | 10.2% | 5.2% |
2010 | 6.7% | 5.9% |
2011 | 3.3% | 5.8% |
2012 | 4.6% | 3.9% |
2013 | 6.1% | -0.9% |
2014 | 2.2% | 3.1% |
2015 | 0.7% | 1.1% |
AVERAGE ANNUAL TOTAL RETURNS
As of December 31, 2015 (Unaudited)
| AVE MARIA BOND FUND | BARCLAYS
U.S. INTERMEDIATE
GOVERNMENT/CREDIT INDEX |
3 Years | 3.0% | 1.1% |
5 Years | 3.4% | 2.6% |
10 Years | 4.5% | 4.0% |
Since Inception(b) | 4.2% | 3.7% |
(a) | Represents the period from the commencement of operations (May 1, 2003) through December 31, 2003. |
(b) | Represents the period from the commencement of operations (May 1, 2003) through December 31, 2015. |
40
AVE MARIA BOND FUND
TEN LARGEST HOLDINGS*
December 31, 2015 (Unaudited)
Par Value | | Holding | | Market Value | | | % of Net Assets | |
$ | 5,000,000 | | U.S. Treasury Notes, 3.875%, due 05/15/18 | | $ | 5,319,530 | | | | 2.4 | % |
| | 5,000,000 | | U.S. Treasury Notes, 3.500%, due 02/15/18 | | | 5,249,610 | | | | 2.3 | % |
| | 2,500,000 | | U.S. Treasury Bonds, 8.000%, due 11/15/21 | | | 3,338,182 | | | | 1.5 | % |
| | 3,000,000 | | U.S. Treasury Notes, 2.125%, due 09/30/21 | | | 3,031,641 | | | | 1.4 | % |
| | 3,000,000 | | Colgate-Palmolive Company, 2.450%, due 11/15/21 | | | 3,020,916 | | | | 1.3 | % |
| | 3,000,000 | | U.S. Treasury Notes, 1.500%, due 01/31/19 | | | 3,010,548 | | | | 1.3 | % |
| | 3,000,000 | | U.S. Treasury Notes, 2.625%, due 02/29/16 | | | 3,010,548 | | | | 1.3 | % |
| | 3,000,000 | | U.S. Treasury Notes, 0.875%, due 01/31/17 | | | 3,000,234 | | | | 1.3 | % |
| | 3,000,000 | | U.S. Treasury Notes, 0.875%, due 11/15/17 | | | 2,989,569 | | | | 1.3 | % |
| | 3,000,000 | | U.S. Treasury Notes, 0.875%, due 01/15/18 | | | 2,986,407 | | | | 1.3 | % |
* | Excludes cash equivalents. |
ASSET ALLOCATION (Unaudited)
| % of Net Assets |
U.S. TREASURY OBLIGATIONS | |
U.S. Treasuries | 27.4% |
| | |
CORPORATE BONDS | |
Sector | |
Consumer Discretionary | 5.6% |
Consumer Staples | 12.2% |
Energy | 3.9% |
Financials | 3.9% |
Health Care | 2.8% |
Industrials | 11.6% |
Information Technology | 3.7% |
Materials | 1.2% |
Utilities | 2.0% |
| | |
COMMON STOCKS | |
Sector | |
Consumer Discretionary | 1.0% |
Consumer Staples | 3.8% |
Energy | 1.8% |
Financials | 2.6% |
Industrials | 4.7% |
Information Technology | 3.5% |
Materials | 0.9% |
| | |
MONEY MARKET FUNDS, OTHER ASSETS IN EXCESS OF LIABILITIES | 7.4% |
| | 100.0% |
41
AVE MARIA BOND FUND
SCHEDULE OF INVESTMENTS
December 31, 2015
| U.S. TREASURY OBLIGATIONS — 27.4% | | Par Value | | | Market Value | |
| U.S. Treasury Bonds — 1.5% | | | | | | |
8.000%, due 11/15/21 | | $ | 2,500,000 | | | $ | 3,338,182 | |
| | | | | | | | | |
| U.S. Treasury Inflation-Protected Notes — 3.5% | | | | | | | | |
2.500%, due 07/15/16 | | | 2,355,440 | | | | 2,393,379 | |
2.625%, due 07/15/17 | | | 1,147,570 | | | | 1,198,598 | |
0.125%, due 04/15/18 | | | 2,057,800 | | | | 2,053,835 | |
1.125%, due 01/15/21 | | | 2,174,520 | | | | 2,241,824 | |
| | | | | | | | 7,887,636 | |
| U.S. Treasury Notes — 22.4% | | | | | | | | |
2.625%, due 02/29/16 | | | 3,000,000 | | | | 3,010,548 | |
2.000%, due 04/30/16 | | | 2,500,000 | | | | 2,512,500 | |
1.500%, due 06/30/16 | | | 2,000,000 | | | | 2,009,218 | |
0.625%, due 08/15/16 | | | 2,000,000 | | | | 1,999,532 | |
3.250%, due 12/31/16 | | | 2,500,000 | | | | 2,559,180 | |
0.875%, due 01/31/17 | | | 3,000,000 | | | | 3,000,234 | |
1.000%, due 03/31/17 | | | 2,500,000 | | | | 2,503,905 | |
0.875%, due 04/30/17 | | | 2,500,000 | | | | 2,498,925 | |
0.625%, due 09/30/17 | | | 2,500,000 | | | | 2,482,715 | |
0.875%, due 11/15/17 | | | 3,000,000 | | | | 2,989,569 | |
0.750%, due 12/31/17 | | | 2,000,000 | | | | 1,986,484 | |
0.875%, due 01/15/18 | | | 3,000,000 | | | | 2,986,407 | |
3.500%, due 02/15/18 | | | 5,000,000 | | | | 5,249,610 | |
3.875%, due 05/15/18 | | | 5,000,000 | | | | 5,319,530 | |
1.500%, due 01/31/19 | | | 3,000,000 | | | | 3,010,548 | |
2.125%, due 09/30/21 | | | 3,000,000 | | | | 3,031,641 | |
1.500%, due 01/31/22 | | | 3,000,000 | | | | 2,916,327 | |
| | | | | | | | 50,066,873 | |
| | | | | | | | | |
Total U.S. Treasury Obligations (Cost $61,440,700) | | | | | | $ | 61,292,691 | |
CORPORATE BONDS — 46.9% | | Par Value | | | Market Value | |
Consumer Discretionary — 5.6% | | | | | | |
Johnson Controls, Inc., 5.500%, due 01/15/16 | | $ | 1,000,000 | | | $ | 1,001,084 | |
Lowe's Companies, Inc., 2.125%, due 04/15/16 | | | 1,000,000 | | | | 1,002,386 | |
Lowe's Companies, Inc., 3.120%, due 04/15/22 | | | 2,000,000 | | | | 2,045,302 | |
McDonald's Corporation, 5.350%, due 03/01/18 | | | 2,000,000 | | | | 2,141,538 | |
TJX Companies, Inc. (The), 6.950%, due 04/15/19 | | | 1,285,000 | | | | 1,484,563 | |
TJX Companies, Inc. (The), 2.750%, due 06/15/21 | | | 2,305,000 | | | | 2,339,285 | �� |
VF Corporation, 5.950%, due 11/01/17 | | | 2,270,000 | | | | 2,443,058 | |
| | | | | | | | 12,457,216 | |
42
AVE MARIA BOND FUND
SCHEDULE OF INVESTMENTS
(Continued)
| CORPORATE BONDS — 46.9% (Continued) | | Par Value | | | Market Value | |
| Consumer Staples — 12.2% | | | | | | |
| Coca-Cola Company (The), 1.650%, due 11/01/18 | | $ | 1,500,000 | | | $ | 1,512,509 | |
| Coca-Cola Company (The), 3.300%, due 09/01/21 | | | 2,000,000 | | | | 2,091,696 | |
| Colgate-Palmolive Company, 2.450%, due 11/15/21 | | | 3,000,000 | | | | 3,020,916 | |
| Colgate-Palmolive Company, 1.950%, due 02/01/23 | | | 2,263,000 | | | | 2,171,839 | |
| Colgate-Palmolive Company, 3.250%, due 03/15/24 | | | 795,000 | | | | 826,409 | |
| Dr Pepper Snapple Group, Inc., 3.200%, due 11/15/21 | | | 2,000,000 | | | | 2,008,874 | |
Hershey Company (The), 2.625%, due 05/01/23 | | | 2,831,000 | | | | 2,778,734 | |
| Hormel Foods Corporation, 4.125%, due 04/15/21 | | | 2,000,000 | | | | 2,140,932 | |
| J.M. Smucker Company (The), 3.500%, due 10/15/21 | | | 2,000,000 | | | | 2,057,718 | |
Kellogg Company, 4.150%, due 11/15/19 | | | 2,042,000 | | | | 2,161,616 | |
| Kimberly-Clark Corporation, 6.125%, due 08/01/17 | | | 1,475,000 | | | | 1,584,728 | |
| Kimberly-Clark Corporation, 2.400%, due 03/01/22 | | | 2,311,000 | | | | 2,278,748 | |
| McCormick & Company, Inc., 3.900%, due 07/15/21 | | | 2,500,000 | | | | 2,664,145 | |
| | | | | | | | 27,298,864 | |
| Energy — 3.9% | | | | | | | | |
ConocoPhillips, 1.050%, due 12/15/17 | | | 1,750,000 | | | | 1,718,274 | |
| Exxon Mobil Corporation, 2.397%, due 03/06/22 | | | 2,000,000 | | | | 1,969,240 | |
Occidental Petroleum Corporation, 3.125%,due 02/15/22 | | | 2,940,000 | | | | 2,874,653 | |
Occidental Petroleum Corporation, 2.700%,due 02/15/23 | | | 2,350,000 | | | | 2,211,684 | |
| | | | | | | | 8,773,851 | |
| Financials — 3.9% | | | | | | | | |
Bank of New York Mellon Corporation (The),2.300%, due 07/28/16 | | | 1,500,000 | | | | 1,512,699 | |
Bank of New York Mellon Corporation (The),2.100%, due 08/01/18 | | | 1,000,000 | | | | 1,006,847 | |
Caterpillar Financial Services Corporation,2.650%, due 04/01/16 | | | 1,000,000 | | | | 1,004,690 | |
MasterCard, Inc., 2.000%, due 04/01/19 | | | 2,000,000 | | | | 2,007,828 | |
PACCAR Financial Corporation, 1.600%,due 03/15/17 | | | 2,000,000 | | | | 2,003,950 | |
U.S. Bancorp, 2.200%, due 04/25/19 | | | 1,173,000 | | | | 1,181,592 | |
| | | | | | | | 8,717,606 | |
| Health Care — 2.8% | | | | | | | | |
Amgen, Inc., 3.875%, due 11/15/21 | | | 2,108,000 | | | | 2,196,272 | |
Medtronic plc, 2.625%, due 03/15/16 | | | 500,000 | | | | 501,570 | |
Stryker Corporation, 2.000%, due 09/30/16 | | | 1,150,000 | | | | 1,158,715 | |
Zimmer Holdings, Inc., 4.625%, due 11/30/19 | | | 2,310,000 | | | | 2,466,586 | |
| | | | | | | | 6,323,143 | |
43
AVE MARIA BOND FUND
SCHEDULE OF INVESTMENTS
(Continued)
| CORPORATE BONDS — 46.9% (Continued) | | Par Value | | | Market Value | |
| Industrials — 11.6% | | | | | | |
3M Company, 1.375%, due 09/29/16 | | $ | 1,393,000 | | | $ | 1,396,561 | |
3M Company, 1.000%, due 06/26/17 | | | 2,000,000 | | | | 1,997,188 | |
3M Company, 2.000%, due 06/26/22 | | | 1,073,000 | | | | 1,043,962 | |
| Emerson Electric Company, 5.250%, due 10/15/18 | | | 1,600,000 | | | | 1,742,666 | |
| Emerson Electric Company, 4.250%, due 11/15/20 | | | 2,109,000 | | | | 2,275,134 | |
| General Dynamics Corporation, 2.250%, due 07/15/16 | | | 1,650,000 | | | | 1,660,801 | |
Illinois Tool Works, Inc., 1.950%, due 03/01/19 | | | 2,000,000 | | | | 2,002,102 | |
Illinois Tool Works, Inc., 6.250%, due 04/01/19 | | | 1,000,000 | | | | 1,126,446 | |
| John Deere Capital Corporation, 1.400%, due 03/15/17 | | | 1,700,000 | | | | 1,702,681 | |
| John Deere Capital Corporation, 1.700%, due 01/15/20 | | | 2,000,000 | | | | 1,948,636 | |
| Norfolk Southern Corporation, 5.750%, due 04/01/18 | | | 885,000 | | | | 955,057 | |
| Norfolk Southern Corporation, 5.900%, due 06/15/19 | | | 441,000 | | | | 490,172 | |
Ryder System, Inc., 5.850%, due 11/01/16 | | | 285,000 | | | | 295,428 | |
Snap-on, Inc., 6.125%, due 09/01/21 | | | 1,000,000 | | | | 1,151,395 | |
| Union Pacific Corporation, 2.250%, due 02/15/19 | | | 2,000,000 | | | | 2,014,004 | |
| United Parcel Service, Inc., 5.500%, due 01/15/18 | | | 1,500,000 | | | | 1,623,483 | |
| United Parcel Service, Inc., 5.125%, due 04/01/19 | | | 1,500,000 | | | | 1,655,200 | |
United Technologies Corporation, 5.375%,due 12/15/17 | | | 839,000 | | | | 901,914 | |
| | | | | | | | 25,982,830 | |
| Information Technology — 3.7% | | | | | | | | |
CA, Inc., 5.375%, due 12/01/19 | | | 1,000,000 | | | | 1,079,105 | |
CA, Inc., 4.500%, due 08/15/23 | | | 2,000,000 | | | | 2,023,540 | |
| International Business Machines Corporation, 2.000%, due 01/05/16 | | | 1,410,000 | | | | 1,410,000 | |
National Semiconductor Corporation, 6.600%,due 06/15/17 | | | 1,605,000 | | | | 1,724,775 | |
Texas Instruments, Inc., 1.650%, due 08/03/19 | | | 2,000,000 | | | | 1,979,786 | |
| | | | | | | | 8,217,206 | |
| Materials — 1.2% | | | | | | | | |
PPG Industries, Inc., 6.650%, due 03/15/18 | | | 207,000 | | | | 226,736 | |
Praxair, Inc., 2.250%, due 09/24/20 | | | 2,000,000 | | | | 1,993,814 | |
Praxair, Inc., 4.050%, due 03/15/21 | | | 500,000 | | | | 532,175 | |
| | | | | | | | 2,752,725 | |
| Utilities — 2.0% | | | | | | | | |
| Consolidated Edison Company of New York, Inc., 5.300%, due 12/01/16 | | | 2,000,000 | | | | 2,074,432 | |
| Consolidated Edison Company of New York, Inc., 6.650%, due 04/01/19 | | | 800,000 | | | | 908,001 | |
| Georgia Power Company, 4.250%, due 12/01/19 | | | 1,500,000 | | | | 1,601,101 | |
| | | | | | | | 4,583,534 | |
| | | | | | | | | |
Total Corporate Bonds (Cost $105,580,525) | | | | | | $ | 105,106,975 | |
44
AVE MARIA BOND FUND
SCHEDULE OF INVESTMENTS
(Continued)
| COMMON STOCKS — 18.3% | | Shares | | | Market Value | |
| Consumer Discretionary — 1.0% | | | | | | |
| Media — 1.0% | | | | | | |
Omnicom Group, Inc. | | | 30,000 | | | $ | 2,269,800 | |
| | | | | | | | | |
| Consumer Staples — 3.8% | | | | | | | | |
| Beverages — 1.9% | | | | | | | | |
Coca-Cola Company (The) | | | 50,000 | | | | 2,148,000 | |
Diageo plc - ADR | | | 20,000 | | | | 2,181,400 | |
| | | | | | | | 4,329,400 | |
| Food & Staples Retailing — 0.8% | | | | | | | | |
Sysco Corporation | | | 43,000 | | | | 1,763,000 | |
| | | | | | | | | |
| Food Products — 1.1% | | | | | | | | |
Hershey Company (The) | | | 27,500 | | | | 2,454,925 | |
| | | | | | | | | |
| Energy — 1.8% | | | | | | | | |
| Oil, Gas & Consumable Fuels — 1.8% | | | | | | | | |
Exxon Mobil Corporation | | | 30,000 | | | | 2,338,500 | |
Occidental Petroleum Corporation | | | 25,000 | | | | 1,690,250 | |
| | | | | | | | 4,028,750 | |
| Financials — 2.6% | | | | | | | | |
| Banks — 1.6% | | | | | | | | |
Fifth Third Bancorp | | | 110,000 | | | | 2,211,000 | |
PNC Financial Services Group, Inc. (The) | | | 14,000 | | | | 1,334,340 | |
| | | | | | | | 3,545,340 | |
| Insurance — 1.0% | | | | | | | | |
ACE Limited | | | 20,000 | | | | 2,337,000 | |
| | | | | | | | | |
| Industrials — 4.7% | | | | | | | | |
| Air Freight & Logistics — 1.0% | | | | | | | | |
United Parcel Service, Inc. - Class B | | | 23,000 | | | | 2,213,290 | |
| | | | | | | | | |
| Electrical Equipment — 1.1% | | | | | | | | |
Emerson Electric Company | | | 50,000 | | | | 2,391,500 | |
| | | | | | | | | |
| Industrial Conglomerates — 1.1% | | | | | | | | |
3M Company | | | 16,000 | | | | 2,410,240 | |
| | | | | | | | | |
| Road & Rail — 0.5% | | | | | | | | |
Norfolk Southern Corporation | | | 13,500 | | | | 1,141,965 | |
| | | | | | | | | |
| Trading Companies & Distributors — 1.0% | | | | | | | | |
Fastenal Company | | | 55,000 | | | | 2,245,100 | |
45
AVE MARIA BOND FUND
SCHEDULE OF INVESTMENTS
(Continued)
| COMMON STOCKS — 18.3% (Continued) | | Shares | | | Market Value | |
| Information Technology — 3.5% | | | | | | |
| Communications Equipment — 1.0% | | | | | | |
Cisco Systems, Inc. | | | 80,000 | | | $ | 2,172,400 | |
| | | | | | | | | |
| Semiconductors & Semiconductor Equipment — 1.9% | | | | | | | | |
Microchip Technology, Inc. | | | 45,000 | | | | 2,094,300 | |
Texas Instruments, Inc. | | | 40,000 | | | | 2,192,400 | |
| | | | | | | | 4,286,700 | |
| Software — 0.6% | | | | | | | | |
CA, Inc. | | | 45,000 | | | | 1,285,200 | |
| | | | | | | | | |
| Materials — 0.9% | | | | | | | | |
| Chemicals — 0.9% | | | | | | | | |
Praxair, Inc. | | | 20,000 | | | | 2,048,000 | |
| | | | | | | | | |
Total Common Stocks (Cost $38,238,223) | | | | | | $ | 40,922,610 | |
MONEY MARKET FUNDS — 6.9% | | Shares | | | Market Value | |
Federated Government Obligations Tax-Managed Fund - Institutional Shares, 0.07% (a) | | | 10,659,403 | | | $ | 10,659,403 | |
Federated Treasury Obligations Fund - Institutional Shares, 0.07% (a) | | | 4,744,248 | | | | 4,744,248 | |
Total Money Market Funds (Cost $15,403,651) | | | | | | $ | 15,403,651 | |
| | | | | | | | | |
Total Investments at Market Value — 99.5%(Cost $220,663,099) | | | | | | $ | 222,725,927 | |
| | | | | | | | | |
Other Assets in Excess of Liabilities — 0.5% | | | | | | | 1,116,186 | |
| | | | | | | | | |
Net Assets — 100.0% | | | | | | $ | 223,842,113 | |
ADR - American Depositary Receipt. |
(a) | The rate shown is the 7-day effective yield as of December 31, 2015. |
See notes to financial statements. |
46
AVE MARIA MUTUAL FUNDS
STATEMENTS OF ASSETS AND LIABILITIES
December 31, 2015
| | | Ave Maria
Catholic
Values Fund | | | Ave Maria
Growth Fund | | | Ave Maria
Rising
Dividend Fund | |
| ASSETS | | | | | | | | | |
| Investment securities: | | | | | | | | | |
At cost | | $ | 197,806,347 | | | $ | 235,418,953 | | | $ | 695,290,595 | |
At market value (Note 1) | | $ | 209,376,241 | | | $ | 300,654,929 | | | $ | 753,245,143 | |
Affiliated investments, at market value (Cost $1,107,092) (Note 5) | | | 2,806,814 | | | | — | | | | — | |
Receivable for capital shares sold | | | 100,425 | | | | 706,243 | | | | 598,526 | |
Dividends receivable | | | 233,497 | | | | 365,869 | | | | 1,495,931 | |
Other assets | | | 25,177 | | | | 30,819 | | | | 68,148 | |
TOTAL ASSETS | | | 212,542,154 | | | | 301,757,860 | | | | 755,407,748 | |
| | | | | | | | | | | | | |
| LIABILITIES | | | | | | | | | | | | |
Payable for investment securities purchased | | | — | | | | 608,086 | | | | 1,297,964 | |
Payable for capital shares redeemed | | | 75,305 | | | | 239,650 | | | | 1,631,221 | |
Payable to Adviser (Note 2) | | | 543,928 | | | | 735,697 | | | | 1,471,749 | |
Payable to administrator (Note 2) | | | 24,697 | | | | 34,033 | | | | 76,347 | |
Other accrued expenses | | | 19,279 | | | | 21,578 | | | | 40,598 | |
TOTAL LIABILITIES | | | 663,209 | | | | 1,639,044 | | | | 4,517,879 | |
| | | | | | | | | | | | | |
NET ASSETS | | $ | 211,878,945 | | | $ | 300,118,816 | | | $ | 750,889,869 | |
| | | | | | | | | | | | | |
| NET ASSETS CONSIST OF: | | | | | | | | | | | | |
Paid-in capital | | $ | 199,444,478 | | | $ | 234,993,464 | | | $ | 692,560,572 | |
Undistributed net investment income | | | — | | | | — | | | | 374,749 | |
Accumulated net realized losses from security transactions | | | (835,149 | ) | | | (110,624 | ) | | | — | |
Net unrealized appreciation on investments | | | 13,269,616 | | | | 65,235,976 | | | | 57,954,548 | |
| NET ASSETS | | $ | 211,878,945 | | | $ | 300,118,816 | | | $ | 750,889,869 | |
Shares of beneficial interest outstanding (unlimited number of shares authorized, no par value) | | | 12,900,946 | | | | 11,994,232 | | | | 48,205,734 | |
Net asset value, offering price and redemption price per share (Note 1) | | $ | 16.42 | | | $ | 25.02 | | | $ | 15.58 | |
See notes to financial statements. |
47
AVE MARIA MUTUAL FUNDS
STATEMENTS OF ASSETS AND LIABILITIES
December 31, 2015 (Continued)
| | | Ave Maria
World
Equity Fund | | | Ave Maria
Bond Fund | |
| ASSETS | | | | | | |
| Investment securities: | | | | | | |
At cost | | $ | 39,351,641 | | | $ | 220,663,099 | |
At market value (Note 1) | | $ | 41,476,909 | | | $ | 222,725,927 | |
Cash | | | 9,112 | | | | — | |
Receivable for capital shares sold | | | 19,423 | | | | 168,127 | |
Dividends and interest receivable | | | 76,294 | | | | 1,214,918 | |
Other assets | | | 8,617 | | | | 23,598 | |
TOTAL ASSETS | | | 41,590,355 | | | | 224,132,570 | |
| | | | | | | | | |
| LIABILITIES | | | | | | | | |
Payable for capital shares redeemed | | | 266,273 | | | | 83,992 | |
Payable to Adviser (Note 2) | | | 109,763 | | | | 168,195 | |
Payable to administrator (Note 2) | | | 4,779 | | | | 18,571 | |
Other accrued expenses | | | 10,715 | | | | 19,699 | |
TOTAL LIABILITIES | | | 391,530 | | | | 290,457 | |
| | | | | | | | | |
NET ASSETS | | $ | 41,198,825 | | | $ | 223,842,113 | |
| | | | | | | | | |
| NET ASSETS CONSIST OF: | | | | | | | | |
Paid-in capital | | $ | 39,073,557 | | | $ | 221,748,836 | |
Undistributed net investment income | | | — | | | | 30,339 | |
| Accumulated net realized gains from security transactions | | | — | | | | 110 | |
Net unrealized appreciation on investments | | | 2,125,268 | | | | 2,062,828 | |
| NET ASSETS | | $ | 41,198,825 | | | $ | 223,842,113 | |
| Shares of beneficial interest outstanding (unlimited number of shares authorized, no par value) | | | 3,334,081 | | | | 20,318,154 | |
Net asset value, offering price and redemption price per share (Note 1) | | $ | 12.36 | | | $ | 11.02 | |
See notes to financial statements. |
48
AVE MARIA MUTUAL FUNDS
STATEMENTS OF OPERATIONS
For the Year Ended December 31, 2015
| | Ave Maria
Catholic
Values Fund | | | Ave Maria
Growth Fund | | | Ave Maria
Rising
Dividend Fund | |
INVESTMENT INCOME | | | | | | | | | |
Dividends | | $ | 2,966,926 | | | $ | 4,367,001 | | | $ | 18,897,451 | |
Foreign withholding taxes on dividends | | | (1,425 | ) | | | — | | | | — | |
TOTAL INCOME | | | 2,965,501 | | | | 4,367,001 | | | | 18,897,451 | |
| | | | | | | | | | | | | |
EXPENSES | | | | | | | | | | | | |
Investment advisory fees (Note 2) | | | 2,265,209 | | | | 2,938,543 | | | | 6,166,493 | |
Administration, accounting and transfer agent fees (Note 2) | | | 321,767 | | | | 408,690 | | | | 959,329 | |
Legal and audit fees | | | 43,443 | | | | 48,156 | | | | 77,311 | |
Postage and supplies | | | 43,755 | | | | 54,210 | | | | 94,697 | |
Trustees’ fees and expenses (Note 2) | | | 44,982 | | | | 44,982 | | | | 44,982 | |
Registration and filing fees | | | 29,111 | | | | 35,475 | | | | 56,483 | |
Custodian and bank service fees | | | 17,679 | | | | 20,697 | | | | 51,276 | |
Insurance expense | | | 11,641 | | | | 13,512 | | | | 34,993 | |
Advisory board fees and expenses (Note 2) | | | 11,941 | | | | 11,941 | | | | 11,941 | |
Compliance service fees and expenses (Note 2) | | | 7,675 | | | | 10,359 | | | | 26,505 | |
Printing of shareholder reports | | | 7,751 | | | | 9,403 | | | | 15,044 | |
Other expenses | | | 19,217 | | | | 20,978 | | | | 49,884 | |
TOTAL EXPENSES | | | 2,824,171 | | | | 3,616,946 | | | | 7,588,938 | |
| | | | | | | | | | | | | |
NET INVESTMENT INCOME | | | 141,330 | | | | 750,055 | | | | 11,308,513 | |
| | | | | | | | | | | | | |
REALIZED AND UNREALIZED GAINS (LOSSES) ON INVESTMENTS | | | | | | | | | | | | |
Net realized gains (losses) from security transactions | | | (246,314 | ) | | | 26,341,032 | | | | 40,146,505 | |
Net change in unrealized appreciation/depreciation on investments | | | (45,665,271 | ) | | | (35,373,175 | ) | | | (101,327,744 | ) |
Net change in unrealized depreciation on affiliated investments (Note 5) | | | (517,790 | ) | | | — | | | | — | |
NET REALIZED AND UNREALIZED LOSSES ON INVESTMENTS | | | (46,429,375 | ) | | | (9,032,143 | ) | | | (61,181,239 | ) |
| | | | | | | | | | | | | |
NETDECREASEIN NET ASSETS RESULTING FROM OPERATIONS | | $ | (46,288,045 | ) | | $ | (8,282,088 | ) | | $ | (49,872,726 | ) |
See notes to financial statements. |
49
AVE MARIA MUTUAL FUNDS
STATEMENTS OF OPERATIONS
For the Year Ended December 31, 2015 (Continued)
| | Ave Maria
World
Equity Fund | | | Ave Maria
Bond Fund | |
INVESTMENT INCOME | | | | | | |
Dividends | | $ | 935,948 | | | | 1,020,978 | |
Foreign withholding taxes on dividends | | | (39,501 | ) | | | — | |
Interest | | | — | | | | 2,665,920 | |
TOTAL INCOME | | | 896,447 | | | | 3,686,898 | |
| | | | | | | | | |
EXPENSES | | | | | | | | |
Investment advisory fees (Note 2) | | | 467,977 | * | | | 610,787 | |
Administration, accounting and transfer agent fees (Note 2) | | | 60,258 | | | | 203,642 | |
Legal and audit fees | | | 31,829 | | | | 42,404 | |
Postage and supplies | | | 11,817 | | | | 26,284 | |
Trustees’ fees and expenses (Note 2) | | | 44,982 | | | | 44,982 | |
Registration and filing fees | | | 23,326 | | | | 33,500 | |
Custodian and bank service fees | | | 4,535 | | | | 13,370 | |
Insurance expense | | | 1,930 | | | | 8,258 | |
Advisory board fees and expenses (Note 2) | | | 11,941 | | | | 11,941 | |
Compliance service fees and expenses (Note 2) | | | 1,616 | | | | 7,336 | |
Printing of shareholder reports | | | 2,596 | | | | 5,129 | |
Other expenses | | | 6,811 | | | | 24,443 | |
TOTAL EXPENSES | | | 669,618 | | | | 1,032,076 | |
| | | | | | | | | |
NET INVESTMENT INCOME | | | 226,829 | | | | 2,654,822 | |
| | | | | | | | | |
REALIZED AND UNREALIZED GAINS (LOSSES) ON INVESTMENTS | | | | | | | | |
Net realized gains from security transactions | | | 526,539 | | | | 1,337,200 | |
Net change in unrealized appreciation/depreciation on investments | | | (3,013,908 | ) | | | (2,892,405 | ) |
NET REALIZED AND UNREALIZED LOSSES ON INVESTMENTS | | | (2,487,369 | ) | | | (1,555,205 | ) |
| | | | | | | | | |
NET INCREASE (DECREASE) IN NET ASSETS RESULTING FROM OPERATIONS | | $ | (2,260,540 | ) | | $ | 1,099,617 | |
* | Includes $43,885 of prior years’ advisory fee reductions recouped by the Adviser from the Ave Maria World Equity Fund (Note 2). |
See notes to financial statements. |
50
AVE MARIA CATHOLIC VALUES FUND
STATEMENTS OF CHANGES IN NET ASSETS
| | Year
Ended
December 31, 2015 | | | Year
Ended
December 31, 2014 | |
FROM OPERATIONS | | | | | | |
Net investment income (loss) | | $ | 141,330 | | | $ | (91,380 | ) |
Net realized gains (losses) from security transactions | | | (246,314 | ) | | | 21,236,942 | |
Net change in unrealized appreciation/depreciation on investments | | | (45,665,271 | ) | | | (13,670,285 | ) |
Net change in unrealized depreciation on affiliated investments (Note 5) | | | (517,790 | ) | | | (424,417 | ) |
Net increase (decrease) in net assets resulting from operations | | | (46,288,045 | ) | | | 7,050,860 | |
| | | | | | | | | |
FROM DISTRIBUTIONS TO SHAREHOLDERS | | | | | | | | |
From net investment income | | | (140,481 | ) | | | — | |
From net realized gains on investments | | | (119,860 | ) | | | (21,374,871 | ) |
Decrease in net assets from distributions to shareholders | | | (260,341 | ) | | | (21,374,871 | ) |
| | | | | | | | | |
FROM CAPITAL SHARE TRANSACTIONS | | | | | | | | |
Net assets received in conjunction with fund merger (Note 1) | | | 36,285,741 | | | | — | |
Proceeds from shares sold | | | 18,561,949 | | | | 27,163,466 | |
Reinvestment of distributions to shareholders | | | 244,520 | | | | 19,817,002 | |
Payments for shares redeemed | | | (43,454,457 | ) | | | (32,667,873 | ) |
Net increase in net assets from capital share transactions | | | 11,637,753 | | | | 14,312,595 | |
| | | | | | | | | |
TOTAL DECREASE IN NET ASSETS | | | (34,910,633 | ) | | | (11,416 | ) |
| | | | | | | | | |
NET ASSETS | | | | | | | | |
Beginning of year | | | 246,789,578 | | | | 246,800,994 | |
End of year | | $ | 211,878,945 | | | $ | 246,789,578 | |
| | | | | | | | | |
UNDISTRIBUTED NET INVESTMENT INCOME | | $ | — | | | $ | — | |
| | | | | | | | | |
SUMMARY OF CAPITAL SHARE ACTIVITY | | | | | | | | |
Shares received in conjunction with fund merger (Note 1) | | | 1,858,403 | | | | — | |
Shares sold | | | 975,841 | | | | 1,278,659 | |
Shares issued in reinvestment of distributions to shareholders | | | 14,810 | | | | 987,394 | |
Shares redeemed | | | (2,305,573 | ) | | | (1,543,597 | ) |
Net increase in shares outstanding | | | 543,481 | | | | 722,456 | |
Shares outstanding, beginning of year | | | 12,357,465 | | | | 11,635,009 | |
Shares outstanding, end of year | | | 12,900,946 | | | | 12,357,465 | |
See notes to financial statements. |
51
AVE MARIA GROWTH FUND
STATEMENTS OF CHANGES IN NET ASSETS
| | Year
Ended
December 31, 2015 | | | Year
Ended
December 31, 2014 | |
FROM OPERATIONS | | | | | | |
Net investment income (loss) | | $ | 750,055 | | | $ | (293,042 | ) |
Net realized gains from security transactions | | | 26,341,032 | | | | 40,761,462 | |
Net change in unrealized appreciation/depreciation on investments | | | (35,373,175 | ) | | | (19,086,278 | ) |
Net increase (decrease) in net assets resulting from operations | | | (8,282,088 | ) | | | 21,382,142 | |
| | | | | | | | | |
FROM DISTRIBUTIONS TO SHAREHOLDERS | | | | | | | | |
From net investment income | | | (750,152 | ) | | | — | |
From net realized gains on investments | | | (26,393,498 | ) | | | (40,274,946 | ) |
Decrease in net assets from distributions to shareholders | | | (27,143,650 | ) | | | (40,274,946 | ) |
| | | | | | | | | |
FROM CAPITAL SHARE TRANSACTIONS | | | | | | | | |
Proceeds from shares sold | | | 53,372,551 | | | | 45,290,157 | |
Reinvestment of distributions to shareholders | | | 25,479,551 | | | | 36,776,864 | |
Payments for shares redeemed | | | (47,147,747 | ) | | | (44,466,492 | ) |
Net increase in net assets from capital share transactions | | | 31,704,355 | | | | 37,600,529 | |
| | | | | | | | | |
TOTAL INCREASE (DECREASE) IN NET ASSETS | | | (3,721,383 | ) | | | 18,707,725 | |
| | | | | | | | | |
NET ASSETS | | | | | | | | |
Beginning of year | | | 303,840,199 | | | | 285,132,474 | |
End of year | | $ | 300,118,816 | | | $ | 303,840,199 | |
| | | | | | | | | |
UNDSITRIBUTED NET INVESTMENT INCOME | | $ | — | | | $ | — | |
| | | | | | | | | |
SUMMARY OF CAPITAL SHARE ACTIVITY | | | | | | | | |
Shares sold | | | 1,877,497 | | | | 1,501,583 | |
Shares issued in reinvestment of distributions to shareholders | | | 1,010,692 | | | | 1,290,416 | |
Shares redeemed | | | (1,653,370 | ) | | | (1,475,858 | ) |
Net increase in shares outstanding | | | 1,234,819 | | | | 1,316,141 | |
Shares outstanding, beginning of year | | | 10,759,413 | | | | 9,443,272 | |
Shares outstanding, end of year | | | 11,994,232 | | | | 10,759,413 | |
See notes to financial statements. |
52
AVE MARIA RISING DIVIDEND FUND
STATEMENTS OF CHANGES IN NET ASSETS
| | Year
Ended
December 31, 2015 | | | Year
Ended
December 31, 2014 | |
FROM OPERATIONS | | | | | | |
Net investment income | | $ | 11,308,513 | | | $ | 8,150,378 | |
Net realized gains from security transactions | | | 40,146,505 | | | | 58,334,642 | |
Net change in unrealized appreciation/depreciation on investments | | | (101,327,744 | ) | | | 7,646,334 | |
Net increase (decrease) in net assets resulting from operations | | | (49,872,726 | ) | | | 74,131,354 | |
| | | | | | | | | |
FROM DISTRIBUTIONS TO SHAREHOLDERS | | | | | | | | |
From net investment income | | | (10,933,195 | ) | | | (8,148,417 | ) |
From net realized gains on investments | | | (40,147,214 | ) | | | (58,063,521 | ) |
Decrease in net assets from distributions to shareholders | | | (51,080,409 | ) | | | (66,211,938 | ) |
| | | | | | | | | |
FROM CAPITAL SHARE TRANSACTIONS | | | | | | | | |
Proceeds from shares sold | | | 170,712,568 | | | | 266,425,413 | |
Reinvestment of distributions to shareholders | | | 46,076,735 | | | | 59,558,854 | |
Payments for shares redeemed | | | (213,041,809 | ) | | | (195,958,232 | ) |
Net increase in net assets from capital share transactions | | | 3,747,494 | | | | 130,026,035 | |
| | | | | | | | | |
TOTAL INCREASE (DECREASE) IN NET ASSETS | | | (97,205,641 | ) | | | 137,945,451 | |
| | | | | | | | | |
NET ASSETS | | | | | | | | |
Beginning of year | | | 848,095,510 | | | | 710,150,059 | |
End of year | | $ | 750,889,869 | | | $ | 848,095,510 | |
| | | | | | | | | |
UNDISTRIBUTED NET INVESTMENT INCOME | | $ | 374,749 | | | $ | — | |
| | | | | | | | | |
SUMMARY OF CAPITAL SHARE ACTIVITY | | | | | | | | |
Shares sold | | | 9,847,012 | | | | 14,832,004 | |
Shares issued in reinvestment of distributions to shareholders | | | 2,898,743 | | | | 3,322,588 | |
Shares redeemed | | | (12,391,093 | ) | | | (10,743,572 | ) |
Net increase in shares outstanding | | | 354,662 | | | | 7,411,020 | |
Shares outstanding, beginning of year | | | 47,851,072 | | | | 40,440,052 | |
Shares outstanding, end of year | | | 48,205,734 | | | | 47,851,072 | |
See notes to financial statements. |
53
AVE MARIA WORLD EQUITY FUND
STATEMENTS OF CHANGES IN NET ASSETS
| | Year
Ended
December 31, 2015 | | | Year
Ended
December 31, 2014 | |
FROM OPERATIONS | | | | | | |
Net investment income | | $ | 226,829 | | | $ | 118,028 | |
Net realized gains from security transactions | | | 526,539 | | | | 2,224,009 | |
Net change in unrealized appreciation/depreciation on investments | | | (3,013,908 | ) | | | (2,281,690 | ) |
Net increase (decrease) in net assets resulting from operations | | | (2,260,540 | ) | | | 60,347 | |
| | | | | | | | | |
FROM DISTRIBUTIONS TO SHAREHOLDERS | | | | | | | | |
From net investment income | | | (233,923 | ) | | | (118,182 | ) |
From net realized gains on investments | | | (526,573 | ) | | | (2,224,115 | ) |
Decrease in net assets from distributions to shareholders | | | (760,496 | ) | | | (2,342,297 | ) |
| | | | | | | | | |
FROM CAPITAL SHARE TRANSACTIONS | | | | | | | | |
Proceeds from shares sold | | | 12,203,950 | | | | 11,535,246 | |
Reinvestment of distributions to shareholders | | | 687,264 | | | | 1,967,470 | |
Payments for shares redeemed | | | (11,338,307 | ) | | | (8,423,730 | ) |
Net increase in net assets from capital share transactions | | | 1,552,907 | | | | 5,078,986 | |
| | | | | | | | | |
TOTAL INCREASE (DECREASE) IN NET ASSETS | | | (1,468,129 | ) | | | 2,797,036 | |
| | | | | | | | | |
NET ASSETS | | | | | | | | |
Beginning of year | | | 42,666,954 | | | | 39,869,918 | |
End of year | | $ | 41,198,825 | | | $ | 42,666,954 | |
| | | | | | | | | |
UNDISTRIBUTED NET INVESTMENT INCOME | | $ | — | | | $ | — | |
| | | | | | | | | |
SUMMARY OF CAPITAL SHARE ACTIVITY | | | | | | | | |
Shares sold | | | 918,380 | | | | 826,336 | |
Shares issued in reinvestment of distributions to shareholders | | | 55,158 | | | | 147,597 | |
Shares redeemed | | | (868,084 | ) | | | (613,026 | ) |
Net increase in shares outstanding | | | 105,454 | | | | 360,907 | |
Shares outstanding, beginning of year | | | 3,228,627 | | | | 2,867,720 | |
Shares outstanding, end of year | | | 3,334,081 | | | | 3,228,627 | |
See notes to financial statements. |
54
AVE MARIA BOND FUND
STATEMENTS OF CHANGES IN NET ASSETS
| | Year
Ended
December 31, 2015 | | | Year
Ended
December 31, 2014 | |
FROM OPERATIONS | | | | | | |
Net investment income | | $ | 2,654,822 | | | $ | 1,835,899 | |
Net realized gains from security transactions | | | 1,337,200 | | | | 5,568,721 | |
Net change in unrealized appreciation/depreciation on investments | | | (2,892,405 | ) | | | (3,717,765 | ) |
Net increase in net assets resulting from operations | | | 1,099,617 | | | | 3,686,855 | |
| | | | | | | | | |
FROM DISTRIBUTIONS TO SHAREHOLDERS | | | | | | | | |
From net investment income | | | (2,624,600 | ) | | | (1,835,148 | ) |
From net realized gains on investments | | | (1,337,090 | ) | | | (5,569,365 | ) |
Decrease in net assets from distributions to shareholders | | | (3,961,690 | ) | | | (7,404,513 | ) |
| | | | | | | | | |
FROM CAPITAL SHARE TRANSACTIONS | | | | | | | | |
Proceeds from shares sold | | | 79,697,296 | | | | 68,345,003 | |
Reinvestment of distributions to shareholders | | | 3,435,000 | | | | 6,222,276 | |
Payments for shares redeemed | | | (37,145,763 | ) | | | (39,881,687 | ) |
Net increase in net assets from capital share transactions | | | 45,986,533 | | | | 34,685,592 | |
| | | | | | | | | |
TOTAL INCREASE IN NET ASSETS | | | 43,124,460 | | | | 30,967,934 | |
| | | | | | | | | |
NET ASSETS | | | | | | | | |
Beginning of year | | | 180,717,653 | | | | 149,749,719 | |
End of year | | $ | 223,842,113 | | | $ | 180,717,653 | |
| | | | | | | | | |
UNDISTRIBUTED NET INVESTMENT INCOME | | $ | 30,339 | | | $ | 117 | |
| | | | | | | | | |
SUMMARY OF CAPITAL SHARE ACTIVITY | | | | | | | | |
Shares sold | | | 7,137,744 | | | | 5,978,811 | |
Shares issued in reinvestment of distributions to shareholders | | | 309,462 | | | | 553,992 | |
Shares redeemed | | | (3,330,439 | ) | | | (3,485,512 | ) |
Net increase in shares outstanding | | | 4,116,767 | | | | 3,047,291 | |
Shares outstanding, beginning of year | | | 16,201,387 | | | | 13,154,096 | |
Shares outstanding, end of year | | | 20,318,154 | | | | 16,201,387 | |
See notes to financial statements. |
55
AVE MARIA CATHOLIC VALUES FUND
FINANCIAL HIGHLIGHTS
Per Share Data for a Share Outstanding Throughout Each Year
| | Year
Ended
December 31, 2015 | | | Year
Ended
December 31, 2014 | | | Year
Ended
December 31, 2013 | | | Year
Ended
December 31, 2012 | | | Year
Ended
December 31, 2011 | |
Net asset value at beginning of year | | $ | 19.97 | | | $ | 21.21 | | | $ | 17.78 | | | $ | 16.20 | | | $ | 16.42 | |
| | | | | | | | | | | | | | | | | | | | | |
Income (loss) from investment operations: | | | | | | | | | | | | | | | | | | | | |
Net investment income (loss) | | | 0.01 | | | | (0.01 | ) | | | (0.00 | )(a) | | | 0.06 | | | | (0.01 | ) |
Net realized and unrealized gains (losses) on investments | | | (3.54 | ) | | | 0.63 | | | | 4.66 | | | | 2.09 | | | | (0.21 | ) |
Total from investment operations | | | (3.53 | ) | | | 0.62 | | | | 4.66 | | | | 2.15 | | | | (0.22 | ) |
| | | | | | | | | | | | | | | | | | | | | |
Less distributions: | | | | | | | | | | | | | | | | | | | | |
From net investment income | | | (0.01 | ) | | | — | | | | — | | | | (0.06 | ) | | | — | |
From net realized gains on investments | | | (0.01 | ) | | | (1.86 | ) | | | (1.23 | ) | | | (0.51 | ) | | | — | |
Total distributions | | | (0.02 | ) | | | (1.86 | ) | | | (1.23 | ) | | | (0.57 | ) | | | — | |
| | | | | | | | | | | | | | | | | | | | | |
Net asset value at end of year | | $ | 16.42 | | | $ | 19.97 | | | $ | 21.21 | | | $ | 17.78 | | | $ | 16.20 | |
| | | | | | | | | | | | | | | | | | | | | |
Total return (b) | | | (17.7 | %) | | | 2.9 | % | | | 26.2 | % | | | 13.3 | % | | | (1.3 | %) |
| | | | | | | | | | | | | | | | | | | | | |
Ratios/Supplementary Data: | | | | | | | | | | | | | | | | | | | | |
Net assets at end of year (000’s) | | $ | 211,879 | | | $ | 246,790 | | | $ | 246,801 | | | $ | 191,100 | | | $ | 180,050 | |
| | | | | | | | | | | | | | | | | | | | | |
Ratio of total expenses to average net assets | | | 1.18 | % | | | 1.29 | % | | | 1.42 | % | | | 1.48 | % | | | 1.50 | % |
| | | | | | | | | | | | | | | | | | | | | |
Ratio of net investment income (loss) to average net assets | | | 0.06 | % | | | (0.04 | %) | | | (0.02 | %) | | | 0.35 | % | | | (0.08 | %) |
| | | | | | | | | | | | | | | | | | | | | |
Portfolio turnover rate | | | 63 | % | | | 31 | % | | | 29 | % | | | 25 | % | | | 29 | % |
(a) | Amount rounds to less than $0.01 per share. |
(b) | Total return is a measure of the change in value of an investment in the Fund over the years covered, which assumes any dividends or capital gains distributions are reinvested in shares of the Fund. The returns shown do not reflect the deduction of taxes a shareholder would pay on Fund distributions or the redemption of Fund shares. |
See notes to financial statements. |
56
AVE MARIA GROWTH FUND
FINANCIAL HIGHLIGHTS
Per Share Data for a Share Outstanding Throughout Each Year
| | Year
Ended
December 31, 2015 | | | Year
Ended
December 31, 2014 | | | Year
Ended
December 31, 2013 | | | Year
Ended
December 31, 2012 | | | Year
Ended
December 31, 2011 | |
Net asset value at beginning of year | | $ | 28.24 | | | $ | 30.19 | | | $ | 23.71 | | | $ | 20.67 | | | $ | 20.56 | |
| | | | | | | | | | | | | | | | | | | | | |
Income (loss) from investment operations: | | | | | | | | | | | | | | | | | | | | |
Net investment income (loss) | | | 0.07 | | | | (0.03 | ) | | | (0.08 | ) | | | (0.04 | ) | | | (0.06 | ) |
Net realized and unrealized gains (losses) on investments | | | (0.81 | ) | | | 2.33 | | | | 7.55 | | | | 3.08 | | | | 0.17 | |
Total from investment operations | | | (0.74 | ) | | | 2.30 | | | | 7.47 | | | | 3.04 | | | | 0.11 | |
| | | | | | | | | | | | | | | | | | | | | |
Less distributions: | | | | | | | | | | | | | | | | | | | | |
From net investment income | | | (0.07 | ) | | | — | | | | — | | | | — | | | | — | |
From net realized gains on investments | | | (2.41 | ) | | | (4.25 | ) | | | (0.99 | ) | | | — | | | | — | |
Total distributions | | | (2.48 | ) | | | (4.25 | ) | | | (0.99 | ) | | | — | | | | — | |
| | | | | | | | | | | | | | | | | | | | | |
Net asset value at end of year | | $ | 25.02 | | | $ | 28.24 | | | $ | 30.19 | | | $ | 23.71 | | | $ | 20.67 | |
| | | | | | | | | | | | | | | | | | | | | |
Total return (a) | | | (2.7 | %) | | | 7.5 | % | | | 31.5 | % | | | 14.7 | % | | | 0.5 | % |
| | | | | | | | | | | | | | | | | | | | | |
Ratios/Supplementary Data: | | | | | | | | | | | | | | | | | | | | |
Net assets at end of year (000’s) | | $ | 300,119 | | | $ | 303,840 | | | $ | 285,132 | | | $ | 198,761 | | | $ | 162,072 | |
| | | | | | | | | | | | | | | | | | | | | |
Ratio of total expenses to average net assets | | | 1.17 | % | | | 1.28 | % | | | 1.43 | % | | | 1.50 | % | | | 1.50 | % |
| | | | | | | | | | | | | | | | | | | | | |
Ratio of net investment income (loss) to average net assets | | | 0.24 | % | | | (0.10 | %) | | | (0.29 | %) | | | (0.17 | %) | | | (0.29 | %) |
| | | | | | | | | | | | | | | | | | | | | |
Portfolio turnover rate | | | 32 | % | | | 36 | % | | | 18 | % | | | 33 | % | | | 10 | % |
(a) | Total return is a measure of the change in value of an investment in the Fund over the years covered, which assumes any dividends or capital gains distributions are reinvested in shares of the Fund. The returns shown do not reflect the deduction of taxes a shareholder would pay on Fund distributions or the redemption of Fund shares. |
See notes to financial statements. |
57
AVE MARIA RISING DIVIDEND FUND
FINANCIAL HIGHLIGHTS
Per Share Data for a Share Outstanding Throughout Each Year
| | Year
Ended
December 31, 2015 | | | Year
Ended
December 31, 2014 | | | Year
Ended
December 31, 2013 | | | Year
Ended
December 31, 2012 | | | Year
Ended
December 31, 2011 | |
Net asset value at beginning of year | | $ | 17.72 | | | $ | 17.56 | | | $ | 13.49 | | | $ | 12.68 | | | $ | 12.51 | |
| | | | | | | | | | | | | | | | | | | | | |
Income (loss) from investment operations: | | | | | | | | | | | | | | | | | | | | |
Net investment income | | | 0.24 | | | | 0.18 | | | | 0.17 | | | | 0.23 | | | | 0.18 | |
Net realized and unrealized gains (losses) on investments | | | (1.27 | ) | | | 1.46 | | | | 4.38 | | | | 1.51 | | | | 0.40 | |
Total from investment operations | | | (1.03 | ) | | | 1.64 | | | | 4.55 | | | | 1.74 | | | | 0.58 | |
| | | | | | | | | | | | | | | | | | | | | |
Less distributions: | | | | | | | | | | | | | | | | | | | | |
From net investment income | | | (0.23 | ) | | | (0.18 | ) | | | (0.17 | ) | | | (0.23 | ) | | | (0.18 | ) |
From net realized gains on investments | | | (0.88 | ) | | | (1.30 | ) | | | (0.31 | ) | | | (0.70 | ) | | | (0.23 | ) |
Total distributions | | | (1.11 | ) | | | (1.48 | ) | | | (0.48 | ) | | | (0.93 | ) | | | (0.41 | ) |
| | | | | | | | | | | | | | | | | | | | | |
Net asset value at end of year | | $ | 15.58 | | | $ | 17.72 | | | $ | 17.56 | | | $ | 13.49 | | | $ | 12.68 | |
| | | | | | | | | | | | | | | | | | | | | |
Total return (a) | | | (5.9 | %) | | | 9.3 | % | | | 33.9 | % | | | 13.9 | % | | | 4.6 | % |
| | | | | | | | | | | | | | | | | | | | | |
Ratios/Supplementary Data: | | | | | | | | | | | | | | | | | | | | |
Net assets at end of year (000’s) | | $ | 750,890 | | | $ | 848,096 | | | $ | 710,150 | | | $ | 303,909 | | | $ | 223,982 | |
| | | | | | | | | | | | | | | | | | | | | |
Ratio of total expenses to average net assets | | | 0.92 | % | | | 0.92 | % | | | 0.97 | % | | | 0.99 | % | | | 1.02 | % |
| | | | | | | | | | | | | | | | | | | | | |
Ratio of net investment income to average net assets | | | 1.38 | % | | | 1.01 | % | | | 1.16 | % | | | 1.75 | % | | | 1.45 | % |
| | | | | | | | | | | | | | | | | | | | | |
Portfolio turnover rate | | | 35 | % | | | 29 | % | | | 14 | % | | | 37 | % | | | 22 | % |
(a) | Total return is a measure of the change in value of an investment in the Fund over the years covered, which assumes any dividends or capital gains distributions are reinvested in shares of the Fund. The returns shown do not reflect the deduction of taxes a shareholder would pay on Fund distributions or the redemption of Fund shares. |
See notes to financial statements. |
58
AVE MARIA WORLD EQUITY FUND
FINANCIAL HIGHLIGHTS
Per Share Data for a Share Outstanding Throughout Each Year
| | Year
Ended
December 31, 2015 | | | Year
Ended
December 31, 2014 | | | Year
Ended
December 31, 2013 | | | Year
Ended
December 31, 2012 | | | Year
Ended
December 31, 2011 | |
Net asset value at beginning of year | | $ | 13.22 | | | $ | 13.90 | | | $ | 11.46 | | | $ | 10.11 | | | $ | 11.24 | |
| | | | | | | | | | | | | | | | | | | | | |
Income (loss) from investment operations: | | | | | | | | | | | | | | | | | | | | |
Net investment income | | | 0.07 | | | | 0.04 | | | | 0.03 | | | | 0.05 | | | | 0.05 | |
Net realized and unrealized gains (losses) on investments | | | (0.70 | ) | | | 0.04 | | | | 2.66 | | | | 1.35 | | | | (1.13 | ) |
Total from investment operations | | | (0.63 | ) | | | 0.08 | | | | 2.69 | | | | 1.40 | | | | (1.08 | ) |
| | | | | | | | | | | | | | | | | | | | | |
Less distributions: | | | | | | | | | | | | | | | | | | | | |
From net investment income | | | (0.07 | ) | | | (0.04 | ) | | | (0.03 | ) | | | (0.05 | ) | | | (0.05 | ) |
From net realized gains on investments | | | (0.16 | ) | | | (0.72 | ) | | | (0.22 | ) | | | — | | | | — | |
Total distributions | | | (0.23 | ) | | | (0.76 | ) | | | (0.25 | ) | | | (0.05 | ) | | | (0.05 | ) |
| | | | | | | | | | | | | | | | | | | | | |
Net asset value at end of year | | $ | 12.36 | | | $ | 13.22 | | | $ | 13.90 | | | $ | 11.46 | | | $ | 10.11 | |
| | | | | | | | | | | | | | | | | | | | | |
Total return (a) | | | (4.8 | %) | | | 0.5 | % | | | 23.5 | % | | | 13.8 | % | | | (9.6 | %) |
| | | | | | | | | | | | | | | | | | | | | |
Ratios/Supplementary Data: | | | | | | | | | | | | | | | | | | | | |
Net assets at end of year (000’s) | | $ | 41,199 | | | $ | 42,667 | | | $ | 39,870 | | | $ | 24,236 | | | $ | 20,324 | |
| | | | | | | | | | | | | | | | | | | | | |
Ratio of net expenses to average net assets | | | 1.50 | % | | | 1.50 | % | | | 1.50 | %(b) | | | 1.50 | %(b) | | | 1.50 | %(b) |
| | | | | | | | | | | | | | | | | | | | | |
Ratio of net investment income to average net assets | | | 0.51 | % | | | 0.29 | % | | | 0.28 | % | | | 0.46 | % | | | 0.58 | % |
| | | | | | | | | | | | | | | | | | | | | |
Portfolio turnover rate | | | 35 | % | | | 36 | % | | | 31 | % | | | 33 | % | | | 13 | % |
(a) | Total return is a measure of the change in value of an investment in the Fund over the years covered, which assumes any dividends or capital gains distributions are reinvested in shares of the Fund. The returns shown do not reflect the deduction of taxes a shareholder would pay on Fund distributions or the redemption of Fund shares. |
(b) | Absent investment advisory fee reductions by the Adviser, the ratios of expenses to average net assets would have been 1.55%, 1.63% and 1.78% for the years ended December 31, 2013, 2012 and 2011, respectively (Note 2). |
See notes to financial statements. |
59
AVE MARIA BOND FUND
FINANCIAL HIGHLIGHTS
Per Share Data for a Share Outstanding Throughout Each Year
| | Year
Ended
December 31, 2015 | | | Year
Ended
December 31, 2014 | | | Year
Ended
December 31, 2013 | | | Year
Ended
December 31, 2012 | | | Year
Ended
December 31, 2011 | |
Net asset value at beginning of year | | $ | 11.15 | | | $ | 11.38 | | | $ | 11.04 | | | $ | 10.87 | | | $ | 10.90 | |
| | | | | | | | | | | | | | | | | | | | | |
Income (loss) from investment operations: | | | | | | | | | | | | | | | | | | | | |
Net investment income | | | 0.14 | | | | 0.12 | | | | 0.11 | | | | 0.18 | | | | 0.21 | |
Net realized and unrealized gains (losses) on investments | | | (0.06 | ) | | | 0.12 | | | | 0.56 | | | | 0.32 | | | | 0.15 | |
Total from investment operations | | | 0.08 | | | | 0.24 | | | | 0.67 | | | | 0.50 | | | | 0.36 | |
| | | | | | | | | | | | | | | | | | | | | |
Less distributions: | | | | | | | | | | | | | | | | | | | | |
From net investment income | | | (0.14 | ) | | | (0.12 | ) | | | (0.11 | ) | | | (0.18 | ) | | | (0.21 | ) |
From net realized gains on investments | | | (0.07 | ) | | | (0.35 | ) | | | (0.22 | ) | | | (0.15 | ) | | | (0.18 | ) |
Total distributions | | | (0.21 | ) | | | (0.47 | ) | | | (0.33 | ) | | | (0.33 | ) | | | (0.39 | ) |
| | | | | | | | | | | | | | | | | | | | | |
Net asset value at end of year | | $ | 11.02 | | | $ | 11.15 | | | $ | 11.38 | | | $ | 11.04 | | | $ | 10.87 | |
| | | | | | | | | | | | | | | | | | | | | |
Total return (a) | | | 0.7 | % | | | 2.2 | % | | | 6.1 | % | | | 4.6 | % | | | 3.3 | % |
| | | | | | | | | | | | | | | | | | | | | |
Ratios/Supplementary Data: | | | | | | | | | | | | | | | | | | | | |
Net assets at end of year (000’s) | | $ | 223,842 | | | $ | 180,718 | | | $ | 149,750 | | | $ | 113,043 | | | $ | 92,401 | |
| | | | | | | | | | | | | | | | | | | | | |
Ratio of net expenses to average net assets | | | 0.51 | % | | | 0.54 | % | | | 0.70 | % | | | 0.70 | %(b) | | | 0.70 | %(b) |
| | | | | | | | | | | | | | | | | | | | | |
Ratio of net investment income to average net assets | | | 1.30 | % | | | 1.10 | % | | | 1.01 | % | | | 1.64 | % | | | 1.96 | % |
| | | | | | | | | | | | | | | | | | | | | |
Portfolio turnover rate | | | 25 | % | | | 21 | % | | | 17 | % | | | 21 | % | | | 27 | % |
(a) | Total return is a measure of the change in value of an investment in the Fund over the years covered, which assumes any dividends or capital gains distributions are reinvested in shares of the Fund. The returns shown do not reflect the deduction of taxes a shareholder would pay on Fund distributions or the redemption of Fund shares. |
(b) | Absent investment advisory fee reductions by the Adviser, the ratios of expenses to average net assets would have been 0.71% and 0.73% for the years ended December 31, 2012 and 2011, respectively (Note 2). |
See notes to financial statements. |
60
AVE MARIA MUTUAL FUNDS
NOTES TO FINANCIAL STATEMENTS
December 31, 2015
1. Organization and Significant Accounting Policies
The Ave Maria Catholic Values Fund, the Ave Maria Growth Fund, the Ave Maria Rising Dividend Fund, the Ave Maria World Equity Fund and the Ave Maria Bond Fund (individually, a “Fund” and collectively, the “Funds”) are each a diversified series of the Schwartz Investment Trust (the “Trust”), an open-end management investment company registered under the Investment Company Act of 1940 and established as an Ohio business trust under a Declaration of Trust dated August 31, 1992. The Ave Maria Catholic Values Fund commenced the public offering of its shares on May 1, 2001. The public offering of shares of the Ave Maria Growth Fund and the Ave Maria Bond Fund commenced on May 1, 2003. The Ave Maria Rising Dividend Fund commenced the public offering of its shares on May 2, 2005. The Ave Maria World Equity Fund commenced the public offering of its shares on April 30, 2010.
The investment objective of the Ave Maria Catholic Values Fund is to seek long-term capital appreciation from equity investments in companies that do not violate core values and teachings of the Roman Catholic Church. The investment objective of the Ave Maria Growth Fund is to seek long-term capital appreciation, using the growth style, from equity investments in companies that do not violate core values and teachings of the Roman Catholic Church. The investment objective of the Ave Maria Rising Dividend Fund is to provide increasing dividend income over time, long-term growth of capital, and a reasonable level of current income from investments in dividend-paying common stocks of companies that do not violate core values and teachings of the Roman Catholic Church. The investment objective of the Ave Maria World Equity Fund is to seek long-term capital appreciation from equity investments in U.S. and non-U.S. companies that do not violate core values and teachings of the Roman Catholic Church. The investment objective of the Ave Maria Bond Fund is to seek preservation of principal with a reasonable level of current income in corporate debt and equity securities that do not violate core values and teachings of the Roman Catholic Church. See the Funds’ Prospectus for information regarding the investment strategies of each Fund.
Shares of each Fund are sold at net asset value. To calculate the net asset value, a Fund’s assets are valued and totaled, liabilities are subtracted, and the balance is divided by the number of shares outstanding. The offering price and redemption price per share are equal to the net asset value per share for each Fund.
61
AVE MARIA MUTUAL FUNDS
NOTES TO FINANCIAL STATEMENTS
(Continued)
On August 1, 2015, the Ave Maria Catholic Values Fund consummated a tax-free merger with the Ave Maria Opportunity Fund, previously a series of the Trust. Pursuant to the terms of the merger agreement, each share of the Ave Maria Opportunity Fund was converted into an equivalent dollar amount of shares of the Ave Maria Catholic Values Fund, based on the net asset value of the Ave Maria Catholic Values Fund and the Ave Maria Opportunity Fund as of July 31, 2015 ($19.53 and $10.03, respectively), resulting in a conversion ratio of 0.513864 shares of the Ave Maria Catholic Values Fund for each share of the Ave Maria Opportunity Fund. The Ave Maria Catholic Values Fund issued 1,858,403 shares to shareholders of the Ave Maria Opportunity Fund. The basis of the assets transferred from the Ave Maria Opportunity Fund reflected the historical basis of the assets as of the date of the tax-free merger. Net assets of the Ave Maria Catholic Values Fund and the Ave Maria Opportunity Fund as of the merger date were $230,192,193 and $36,285,741, respectively, including unrealized appreciation (depreciation) on investments of $39,134,887 and ($2,883,304), respectively. The Ave Maria Opportunity Fund’s net assets at the time of the merger included accumulated realized capital losses of $104,851. Total net assets of the Ave Maria Catholic Values Fund immediately after the merger were $266,477,934. Because the combined investment portfolio has been managed as a single integrated portfolio since the merger was completed, it is not practical to state the amounts of net investment income (loss), net realized gains (losses) and change in unrealized appreciation (depreciation) on investments, and net increase (decrease) in net assets resulting from operations, of the former investment portfolio of the Ave Maria Opportunity Fund that has been included in the Ave Maria Catholic Values Fund’s Statement of Operations since August 1, 2015.
| | Ave Maria Opportunity Fund | | | Ave Maria
Catholic Values
Fund | |
Exchange ratio | | | 0.513864 | | | | N/A | |
Ave Maria Opportunity Fund's shares | | | 3,616,521 | | | | N/A | |
Ave Maria Catholic Values Fund's shares | | | N/A | | | | 11,789,464 | |
Ave Maria Opportunities Fund's unrealized depreciation | | $ | 2,883,304 | | | | N/A | |
Net assets before the merger | | $ | 36,285,741 | | | $ | 230,192,193 | |
Aggregated net assets immediately after the merger | | | N/A | | | $ | 266,477,934 | |
62
AVE MARIA MUTUAL FUNDS
NOTES TO FINANCIAL STATEMENTS
(Continued)
The tables below summarize the results of operations of the Ave Maria Opportunity Fund for the period from January 1, 2015 to July 31, 2015, and the Ave Maria Catholic Values Fund’s results of operations for the fiscal year ended December 31, 2015.
For the period from
January 1, 2015 to July 31, 2015: | | Net Investment Loss | | | Net Realized Losses and Net Change in Unrealized Depreciation on Investments | | | Net Decrease in Net Assets Resulting from Operations | |
Ave Maria Opportunity Fund | | $ | (106,238 | ) | | $ | (7,851,130 | ) | | $ | (7,957,368 | ) |
For the fiscal year
ended December 31, 2015: | | Net Investment Income | | | Net Realized Losses and Net Change in Unrealized Depreciation on Investments | | | Net Decrease in Net Assets Resulting from Operations | |
Ave Maria Catholic Values Fund | | $ | 141,330 | | | $ | (46,429,375 | ) | | $ | (46,228,045 | ) |
The following is a summary of significant accounting policies followed by the Funds. The policies are in conformity with accounting principles generally accepted in the United States of America (“GAAP”). As an investment company, as defined in Financial Accounting Standards Board (“FASB”) Accounting Standards Update 2013-08, each Fund follows accounting and reporting guidance under FASB Accounting Standards Codification Topic 946, “Financial Services – Investment Companies.”
(a) Valuation of investments – Securities which are traded on stock exchanges are valued at the closing sales price as of the close of the regular session of trading on the New York Stock Exchange on the day the securities are being valued, or, if not traded on a particular day, at the closing bid price. Securities which are quoted by NASDAQ are valued at the NASDAQ Official Closing Price or, if an Official ClosingPrice is not available, at the most recently quoted bid price. Securities traded in the over-the-counter market are valued at the last reported sales price or, if there is no reported sale on the valuation date, at the most recently quoted bid price. Securities which are traded both in the over-the-counter market and on a stock exchange are valued according to the broadest and most representative market. Fixed income securities are generally valued using prices provided by an independent pricing service. The independent pricing service uses information with respect to transactions in bonds, quotations from bond dealers, market transactions in comparable securities and various relationships between securities in determining these prices.Investments in shares of other open-end investment companies are valued at their net asset value as reported by such companies. Securities for which market quotations are not readily
63
AVE MARIA MUTUAL FUNDS
NOTES TO FINANCIAL STATEMENTS
(Continued)
available are valued at their fair value as determined in good faith in accordance with consistently applied procedures established by and under the general supervision of the Board of Trustees, and will be classified as Level 2 or 3 within the fair value hierarchy (see below), depending on the inputs used. Fair value pricing may be used, for example, in situations where (i) a security is so thinly traded that there have been no transactions for that stock over an extended period of time; (ii) the exchange on which the security is principally traded closes early; or (iii) trading of the security is halted during the day and does not resume prior to a Fund’s net asset value calculation. A security’s “fair value” price may differ from the price next available for that security using the Funds’ normal pricing procedures.
GAAP establishes a single authoritative definition of fair value, sets out a framework for measuring fair value and requires additional disclosures about fair value measurements.
Various inputs are used in determining the value of each Fund’s investments. These inputs are summarized in the three broad levels listed below:
| | ● | Level 1 – quoted prices in active markets for identical securities |
| | ● | Level 2 – other significant observable inputs |
| | ● | Level 3 – significant unobservable inputs |
U.S. Treasury Obligations and Corporate Bonds held by the Ave Maria Bond Fund are classified as Level 2 since the values for such securities are based on prices provided by an independent pricing service that utilizes various “other significant observable inputs” including bid and ask quotations, prices of similar securities and interest rates, among other factors.
The inputs or methodology used for valuing securities are not necessarily an indication of the risks associated with investing in those securities. The inputs used to measure fair value may fall into different levels of the fair value hierarchy. In such cases, for disclosure purposes, the level in the fair value hierarchy within which the fair value measurement falls in its entirety is determined based on the lowest level input that is significant to the fair value measurement.
The following is a summary of the inputs used to value the Funds’ investments, by security type, as of December 31, 2015:
Ave Maria Catholic Values Fund | | Level 1 | | | Level 2 | | | Level 3 | | | Total | |
Common Stocks | | $ | 202,727,795 | | | $ | — | | | $ | — | | | $ | 202,727,795 | |
Warrants | | | 5,742,000 | | | | — | | | | — | | | | 5,742,000 | |
Money Market Funds | | | 3,713,260 | | | | — | | | | — | | | | 3,713,260 | |
Total | | $ | 212,183,055 | | | $ | — | | | $ | — | | | $ | 212,183,055 | |
64
AVE MARIA MUTUAL FUNDS
NOTES TO FINANCIAL STATEMENTS
(Continued)
Ave Maria Growth Fund | | Level 1 | | | Level 2 | | | Level 3 | | | Total | |
Common Stocks | | $ | 279,966,382 | | | $ | — | | | $ | — | | | $ | 279,966,382 | |
Money Market Funds | | | 20,688,547 | | | | — | | | | — | | | | 20,688,547 | |
Total | | $ | 300,654,929 | | | $ | — | | | $ | — | | | $ | 300,654,929 | |
Ave Maria Rising Dividend Fund | | Level 1 | | | Level 2 | | | Level 3 | | | Total | |
Common Stocks | | $ | 706,242,000 | | | $ | — | | | $ | — | | | $ | 706,242,000 | |
Warrants | | | 9,617,850 | | | | — | | | | — | | | | 9,617,850 | |
Money Market Funds | | | 37,385,293 | | | | — | | | | — | | | | 37,385,293 | |
Total | | $ | 753,245,143 | | | $ | — | | | $ | — | | | $ | 753,245,143 | |
Ave Maria World Equity Fund | | Level 1 | | | Level 2 | | | Level 3 | | | Total | |
Common Stocks | | $ | 39,374,772 | | | $ | — | | | $ | — | | | $ | 39,374,772 | |
Money Market Funds | | | 2,102,137 | | | | — | | | | — | | | | 2,102,137 | |
Total | | $ | 41,476,909 | | | $ | — | | | $ | — | | | $ | 41,476,909 | |
Ave Maria Bond Fund | | Level 1 | | | Level 2 | | | Level 3 | | | Total | |
U.S. Treasury Obligations | | $ | — | | | $ | 61,292,691 | | | $ | — | | | $ | 61,292,691 | |
Corporate Bonds | | | — | | | | 105,106,975 | | | | — | | | | 105,106,975 | |
Common Stocks | | | 40,922,610 | | | | — | | | | — | | | | 40,922,610 | |
Money Market Funds | | | 15,403,651 | | | | — | | | | — | | | | 15,403,651 | |
Total | | $ | 56,326,261 | | | $ | 166,399,666 | | | $ | — | | | $ | 222,725,927 | |
Refer to each Fund’s Schedule of Investments for a listing of the securities by security type and sector or industry type. As of December 31, 2015, the Funds did not have any transfers into and out of any Level. There were no Level 3 securities or derivative instruments held by the Funds as of December 31, 2015. It is the Funds’ policy to recognize transfers into and out of all Levels at the end of the reporting period.
(b) Income taxes – Each Fund has qualified and intends to continue to qualify as a regulated investment company under the Internal Revenue Code of 1986 (the “Code”). Qualification generally will relieve each Fund of liability for federal income taxes to the extent 100% of its net investment income and net realized capital gains are distributed in accordance with the Code. Accordingly, no provision for income tax has been made.
65
AVE MARIA MUTUAL FUNDS
NOTES TO FINANCIAL STATEMENTS
(Continued)
In order to avoid imposition of the excise tax applicable to regulated investment companies, it is also each Fund’s intention to declare as dividends in each calendar year at least 98% of its net investment income and 98.2% of its net realized capital gains plus undistributed amounts from prior years.
The following information is computed on a tax basis for each item as of December 31, 2015:
| | Ave Maria
Catholic
Values Fund | | | Ave Maria
Growth
Fund | | | Ave Maria
Rising
Dividend Fund | | | Ave Maria
World Equity Fund | | | Ave Maria
Bond Fund | |
Undistributed ordinary income | | $ | — | | | $ | — | | | $ | 374,749 | | | $ | — | | | $ | 30,339 | |
Undistributed realized gains | | | — | | | | — | | | | — | | | | — | | | | 110 | |
Capital loss carryforwards | | | (707,949 | ) | | | — | | | | — | | | | — | | | | — | |
Net unrealized appreciation | | | 13,142,416 | | | | 65,125,352 | | | | 57,954,548 | | | | 2,125,268 | | | | 2,062,828 | |
Total distributable earnings | | $ | 12,434,467 | | | $ | 65,125,352 | | | $ | 58,329,297 | | | $ | 2,125,268 | | | $ | 2,093,277 | |
The following information is based upon the federal income tax cost of the Funds’ investment securities as of December 31, 2015:
| | Ave Maria
Catholic
Values Fund | | | Ave Maria
Growth
Fund | | | Ave Maria
Rising
Dividend Fund | | | Ave Maria
World
Equity Fund | | | Ave Maria
Bond Fund | |
Gross unrealized appreciation | | $ | 33,066,159 | | | $ | 80,413,425 | | | $ | 94,765,840 | | | $ | 4,761,087 | | | $ | 4,293,297 | |
Gross unrealized depreciation | | | (19,923,743 | ) | | | (15,288,073 | ) | | | (36,811,292 | ) | | | (2,635,819 | ) | | | (2,230,469 | ) |
Net unrealized appreciation | | $ | 13,142,416 | | | $ | 65,125,352 | | | $ | 57,954,548 | | | $ | 2,125,268 | | | $ | 2,062,828 | |
Federal income tax cost | | $ | 199,040,639 | | | $ | 235,529,577 | | | $ | 695,290,595 | | | $ | 39,351,641 | | | $ | 220,663,099 | |
The difference between the federal income tax cost of portfolio investments and the financial statement cost of portfolio investments for the Ave Maria Catholic Values Fund and the Ave Maria Growth Fund is due to certain timing differences in the recognition of capital gains and losses under income tax regulations and GAAP. These “book/tax” differences are temporary in nature and are due to the tax deferral of losses on wash sales. There is no difference between the federal income tax cost and the financial statement cost of portfolio investments for the Ave Maria Rising Dividend Fund, the Ave Maria World Equity Fund and the Ave Maria Bond Fund as of December 31, 2015.
66
AVE MARIA MUTUAL FUNDS
NOTES TO FINANCIAL STATEMENTS
(Continued)
As of December 31, 2015, the Ave Maria Catholic Values Fund has a short-term capital loss carryforward of $707,949 for federal income tax purposes. This capital loss carryforward, which does not expire, may be utilized in future years to offset net realized capital gains, if any, prior to distributing such gains to shareholders.
During the year ended December 31, 2015, the Ave Maria Catholic Values Fund reclassified $325 of distributions in excess of net realized gains against paid-in capital and $849 of undistributed net investment income against accumulated net realized losses from security transactions; the Ave Maria Growth Fund reclassified $97 of distributions in excess of net investment income and $33 of distributions in excess of net realized gains against paid-in capital; the Ave Maria Rising Dividend Fund reclassified $569 and $140 of distributions in excess of net realized gains against undistributed net investment income and paid-in capital, respectively; and the Ave Maria World Equity Fund reclassified $7,094 of distributions in excess of net investment income and $34 of distributions in excess of net realized gains against paid-in capital.
The Funds recognize the tax benefits or expenses of uncertain tax positions only when the position is “more-likely-than-not” to be sustained assuming examination by tax authorities. Management has reviewed the tax positions taken on federal income tax returns for all open tax years (tax years ended December 31, 2012 through December 31, 2015) and has concluded that no provision for unrecognized tax benefits or expenses is required in these financial statements.
(c) Security transactions and investment income – Security transactions are accounted for on the trade date. Dividend income is recorded on the ex-dividend date. Interest income is recognized on the accrual basis and includes amortization of premiums and accretion of discounts using the effective yield method. Cost of investments includes amortization of premiums and accretion of discounts. Realized gains and losses on securities sold are determined on a specific identification basis. Withholding taxes on foreign dividends have been provided for in accordance with each Fund’s understanding of the appropriate country’s rules and tax rates.
67
AVE MARIA MUTUAL FUNDS
NOTES TO FINANCIAL STATEMENTS
(Continued)
(d) Dividends and distributions – Dividends from net investment income, if any, are declared and paid annually in December for the Ave Maria Catholic Values Fund, the Ave Maria Growth Fund and the Ave Maria World Equity Fund. Dividends from net investment income, if any, are declared and paid quarterly for the Ave Maria Rising Dividend Fund and are declared and paid monthly for the Ave Maria Bond Fund. Each Fund expects to distribute any net realized capital gains annually. Dividends and distributions to shareholders are recorded on the ex-dividend date. The tax character of distributions paid to shareholders during the years ended December 31, 2015 and December 31, 2014 was as follows:
Years Ended | | Ordinary
Income | | | Long-Term
Capital Gains | | | Total
Distributions | |
Ave Maria Catholic Values Fund: | | | | | | | | | |
December 31, 2015 | | $ | 140,481 | | | $ | 119,860 | | | $ | 260,341 | |
December 31, 2014 | | $ | — | | | $ | 21,374,871 | | | $ | 21,374,871 | |
Ave Maria Growth Fund: | | | | | | | | | | | | |
December 31, 2015 | | $ | 2,998,414 | | | $ | 24,145,236 | | | $ | 27,143,650 | |
December 31, 2014 | | $ | 1,404,885 | | | $ | 38,870,061 | | | $ | 40,274,946 | |
Ave Maria Rising Dividend Fund: | | | | | | | | | | | | |
December 31, 2015 | | $ | 11,446,317 | | | $ | 39,634,092 | | | $ | 51,080,409 | |
December 31, 2014 | | $ | 8,600,744 | | | $ | 57,611,194 | | | $ | 66,211,938 | |
Ave Maria World Equity Fund: | | | | | | | | | | | | |
December 31, 2015 | | $ | 233,923 | | | $ | 526,573 | | | $ | 760,496 | |
December 31, 2014 | | $ | 118,182 | | | $ | 2,224,115 | | | $ | 2,342,297 | |
Ave Maria Bond Fund | | | | | | | | | | | | |
December 31, 2015 | | $ | 2,624,600 | | | $ | 1,337,090 | | | $ | 3,961,690 | |
December 31, 2014 | | $ | 2,203,292 | | | $ | 5,201,221 | | | $ | 7,404,513 | |
(e) Estimates – The preparation of financial statements in conformity with GAAP requires management to make estimates and assumptions that affect the reported amounts of assets and liabilities and disclosure of contingent assets and liabilities as of the date of the financial statements and the reported amounts of revenues and expenses during the reporting period. Actual results could differ from those estimates.
(f) Common expenses – Common expenses of the Trust are allocated among the series of the Trust based on relative net assets of each series or the nature of the services performed and the relative applicability to each series.
68
AVE MARIA MUTUAL FUNDS
NOTES TO FINANCIAL STATEMENTS
(Continued)
2. Investment Advisory Agreements and Transactions with Related Parties
The Chairman and President of the Trust is also the Chairman and Chief Executive Officer of Schwartz Investment Counsel, Inc. (the “Adviser”). Certain other officers of the Trust are officers of the Adviser, or of Ultimus Fund Solutions, LLC (“Ultimus”), the administrative, accounting and transfer agent for the Funds, or of Ultimus Fund Distributors, LLC (the “Distributor”), the Funds’ principal underwriter.
Pursuant to Investment Advisory Agreements between the Trust and the Adviser, the Adviser is responsible for the management of each Fund and provides investment advice along with the necessary personnel, facilities, equipment and certain other services necessary to the operations of the Funds. The Adviser receives from each of the Ave Maria Catholic Values Fund, the Ave Maria Growth Fund, and the Ave Maria World Equity Fund a quarterly fee at the annual rate of 0.95% of its average daily net assets. The Adviser receives from the Ave Maria Rising Dividend Fund and the Ave Maria Bond Fund a quarterly fee at the annual rate of 0.75% and 0.30%, respectively, of average daily net assets.
The Adviser has contractually agreed to reduce its advisory fees or reimburse a portion of operating expenses until at least May 1, 2017 so that: the ordinary operating expenses of the Ave Maria World Equity Fund do not exceed 1.50% per annum of average daily net assets; the ordinary operating expenses of each of the Ave Maria Catholic Values Fund, the Ave Maria Growth Fund and the Ave Maria Rising Dividend Fund do not exceed 1.25% per annum of average daily net assets; and the ordinary operating expenses of the Ave Maria Bond Fund do not exceed 0.60% per annum of average daily net assets. Prior to May 1, 2015, the Adviser had contractually agreed to reduce its advisory fees or reimburse a portion of operating expenses so that the ordinary operating expenses of each of the Ave Maria Catholic Values Fund and the Ave Maria Growth Fund did not exceed 1.50% per annum of average daily net assets and the ordinary operating expenses of the Ave Maria Bond Fund did not exceed 0.70% per annum of average daily net assets.
Any fee reductions or expense reimbursements by the Adviser are subject to repayment by the Funds for a period of three years from the end of the fiscal year during which such reductions or reimbursements occurred, provided the Funds are able to effect such repayment and remain in compliance with any undertaking by the Adviser to limit expenses of the Funds. During the year ended December 31, 2015, the Adviser recouped previous investment advisory fee reductions of $43,885 from the Ave Maria World Equity Fund. As of December 31, 2015, the Adviser may seek recoupment of investment advisory fee reductions totaling $2,888 no later than December 31, 2016 for the Ave Maria World Equity Fund.
The Chief Compliance Officer of the Trust (the “CCO”) is an employee of the Adviser. The Trust pays the Adviser a fee for providing CCO services, of which each Fund pays its proportionate share along with the other series of the Trust. In addition, the Trust reimburses the Adviser for out-of-pocket expenses incurred, if any, for providing these services.
69
AVE MARIA MUTUAL FUNDS
NOTES TO FINANCIAL STATEMENTS
(Continued)
Pursuant to a Mutual Fund Services Agreement between the Trust and Ultimus, Ultimus supplies regulatory and compliance services, calculates the daily net asset value per share of each Fund, maintains the financial books and records of the Funds, maintains the records of each shareholder’s account, and processes purchases and redemptions of each Fund’s shares. For the performance of these services, Ultimus receives fees from each Fund computed as a percentage of such Fund’s average daily net assets, subject to a minimum monthly fee.
Pursuant to a Distribution Agreement between the Trust and the Distributor, the Distributor serves as each Fund’s exclusive agent for the distribution of its shares. The Distributor is an affiliate of Ultimus.
Trustees and officers affiliated with the Adviser or Ultimus are not compensated by the Trust for their services. Each Trustee who is not an affiliated person of the Adviser or Ultimus (“Independent Trustee”) receives from the Trust an annual retainer of $30,000 (except that such fee is $38,000 for the Lead Independent Trustee), payable quarterly; a fee of $5,500 for attendance at each meeting of the Board of Trustees; plus reimbursement of travel and other expenses incurred in attending meetings. Each Fund pays its proportionate share of the Independent Trustees’ fees and expenses along with the other series of the Trust. Effective January 1, 2016, each Independent Trustee will receive from the Trust an annual retainer of $35,000 (except that such fee is $45,000 for the Lead Independent Trustee and $39,000 for the Chairman of the Audit Committee), payable quarterly; a fee of $5,500 for attendance at each meeting of the Board of Trustees; plus reimbursement of travel and other expenses incurred in attending meetings.
Each member of the Catholic Advisory Board (“CAB”), including Emeritus members, receives an annual retainer of $2,000 (except that such fee is $14,000 for the CAB chairman), payable quarterly; a fee of $2,500 for attendance at each meeting of the CAB (except that such fee is $2,750 for the CAB chairman); plus reimbursement of travel and other expenses incurred in attending meetings. Each Fund pays its proportionate share of CAB members’ fees and expenses.
3. Investment Transactions
During the year ended December 31, 2015, cost of purchases and proceeds from sales and maturities of investment securities, excluding short-term investments and U.S. government securities, were as follows:
| | Ave Maria
Catholic
Values Fund | | | Ave Maria
Growth
Fund | | | Ave Maria
Rising
Dividend Fund | | | Ave Maria
World Equity Fund | | | Ave Maria
Bond Fund | |
Purchases of investment securities | | $ | 140,642,450 | | | $ | 92,832,862 | | | $ | 275,730,061 | | | $ | 17,095,745 | | | $ | 58,261,230 | |
Proceeds from sales and maturities of investment securities | | $ | 158,751,026 | | | $ | 94,690,877 | | | $ | 309,732,474 | | | $ | 14,609,194 | | | $ | 31,385,135 | |
70
AVE MARIA MUTUAL FUNDS
NOTES TO FINANCIAL STATEMENTS
(Continued)
4. Contingencies and Commitments
The Funds indemnify the Trust’s officers and Trustees for certain liabilities that might arise from their performance of their duties to the Funds. Additionally, in the normal course of business, the Funds enter into contracts that contain a variety of representations and warranties and which provide general indemnifications. The Funds’ maximum exposure under these arrangements is unknown, as this would involve future claims that may be made against the Funds that have not yet occurred. However, based on experience, the Funds expect the risk of loss to be remote.
5. Affiliated Investment
A company is considered an affiliate of a Fund under the Investment Company Act of 1940 if the Fund’s holdings in that company represent 5% or more of the outstanding voting shares of that company. As of December 31, 2015, the Ave Maria Catholic Values Fund owns 5.30% of the outstanding voting shares of Unico American Corporation. Further information on this holding for the year ended December 31, 2015 appears below:
AVE MARIA CATHOLIC VALUES FUND | |
Affiliated Issuer Report | |
UNICO AMERICAN CORPORATION | |
From December 31, 2014 to December 31, 2015 | |
Shares at beginning of period | | | 282,945 | |
Shares at end of period | | | 282,945 | |
Market value at beginning of period | | $ | 3,324,604 | |
Change in unrealized appreciation (depreciation) | | | (517,790 | ) |
Market value at end of period | | $ | 2,806,814 | |
Net realized gains (losses) during the period | | $ | — | |
Dividend income earned during the period | | $ | — | |
6. Sector Risk
If a Fund has significant investments in the securities of issuers in industries within a particular sector, any development affecting that sector will have a greater impact on the value of the net assets of the Fund than would be the case if the Fund did not have significant investments in that sector. In addition, this may increase the risk of loss of an investment in the Fund and increase the volatility of the Fund’s net asset value per share. From time to time, circumstances may affect a particular sector and the companies within such sector. For instance, economic or market factors, regulation or deregulation, and technological or other developments may negatively impact all companies in a particular
71
AVE MARIA MUTUAL FUNDS
NOTES TO FINANCIAL STATEMENTS
(Continued)
sector and therefore the value of the Fund’s portfolio will be adversely affected. As of December 31, 2015, the Ave Maria Growth Fund had 33.0% of the value of its net assets invested in stocks within the industrials sector.
7. Subsequent Events
The Funds are required to recognize in the financial statements the effects of all subsequent events that provide additional evidence about conditions that existed as of the date of the Statements of Assets and Liabilities. For non-recognized subsequent events that must be disclosed to keep the financial statements from being misleading, the Funds are required to disclose the nature of the event as well as an estimate of its financial effect, or a statement that such an estimate cannot be made. Management has evaluated subsequent events through the issuance of these financial statements and has noted no such events.
72
AVE MARIA MUTUAL FUNDS
REPORT OF INDEPENDENT REGISTERED
PUBLIC ACCOUNTING FIRM |
Ave Maria Catholic Values Fund, Ave Maria Growth Fund,
Ave Maria Rising Dividend Fund, Ave Maria World Equity Fund and Ave Maria Bond Fund:
We have audited the accompanying statements of assets and liabilities, including the schedules of investments, of Ave Maria Catholic Values Fund, Ave Maria Growth Fund, Ave Maria Rising Dividend Fund, Ave Maria World Equity Fund, and Ave Maria Bond Fund (the “Funds”), each a series of Schwartz Investment Trust, as of December 31, 2015, and the related statements of operations for the year then ended, the statements of changes in net assets for each of the two years in the period then ended, and the financial highlights for each of the five years in the period then ended. These financial statements and financial highlights are the responsibility of the Funds’ management. Our responsibility is to express an opinion on these financial statements and financial highlights based on our audits.
We conducted our audits in accordance with the standards of the Public Company Accounting Oversight Board (United States). Those standards require that we plan and perform the audits to obtain reasonable assurance about whether the financial statements and financial highlights are free of material misstatement. The Funds are not required to have, nor were we engaged to perform, an audit of internal control over financial reporting. Our audits included consideration of internal control over financial reporting as a basis for designing audit procedures that are appropriate in the circumstances, but not for the purpose of expressing an opinion on the effectiveness of the Funds’ internal control over financial reporting. Accordingly, we express no such opinion. An audit also includes examining, on a test basis, evidence supporting the amounts and disclosures in the financial statements, assessing the accounting principles used and significant estimates made by management, as well as evaluating the overall financial statement presentation. Our procedures included confirmation of securities owned as of December 31, 2015, by correspondence with the custodian and brokers. We believe that our audits provide a reasonable basis for our opinion.
In our opinion, the financial statements and financial highlights referred to above present fairly, in all material respects, the financial position of Ave Maria Catholic Values Fund, Ave Maria Growth Fund, Ave Maria Rising Dividend Fund, Ave Maria World Equity Fund, and Ave Maria Bond Fund as of December 31, 2015, the results of their operations for the year then ended, the changes in their net assets for each of the two years in the period then ended, and the financial highlights for each of the five years in the period then ended, in conformity with accounting principles generally accepted in the United States of America.
Chicago, Illinois
February 16, 2016
73
AVE MARIA MUTUAL FUNDS
BOARD OF TRUSTEES AND EXECUTIVE OFFICERS
(Unaudited)
Overall responsibility for management of the Trust rests with the Board of Trustees. The Trustees serve during the lifetime of the Trust and until its termination, or until death, resignation, retirement or removal. The Trustees, in turn, elect the officers of the Trust to actively supervise its day-to-day operations. The officers have been elected for an annual term. The following are the Trustees and executive officers of the Trust:
Trustee/Officer | Address | Year of Birth | Position Held
with the Trust | Length of
Time Served |
Interested Trustees: | | | | |
* | George P. Schwartz, CFA | 801 W. Ann Arbor Trail,
Plymouth, MI | 1944 | Chairman of the Board/President/Trustee | Since 1992 |
Independent Trustees: | | | | |
| | Louis C. Bosco, Jr. | 801 W. Ann Arbor Trail,
Plymouth, MI | 1936 | Trustee | Since 2008 |
| | Donald J. Dawson, Jr. | 801 W. Ann Arbor Trail,
Plymouth, MI | 1947 | Trustee | Since 1993 |
| | Joseph M. Grace | 801 W. Ann Arbor Trail,
Plymouth, MI | 1936 | Trustee | Since 2007 |
| | John J. McHale, Jr. | 801 W. Ann Arbor Trail,
Plymouth, MI | 1949 | Trustee | Since 2014 |
Executive Officers: | | | | |
* | Richard L. Platte, Jr., CFA | 801 W. Ann Arbor Trail,
Plymouth, MI | 1951 | Vice President and Secretary | Since 1993 |
* | Robert C. Schwartz, CFP | 801 W. Ann Arbor Trail,
Plymouth, MI | 1976 | Vice President | Since 2013 |
* | Timothy S. Schwartz, CFA | 5060 Annunciation Circle,
Ave Maria, FL | 1971 | Treasurer | Since 2000 |
* | Cathy M. Stoner, CPA, IACCP | 801 W. Ann Arbor Trail,
Plymouth, MI | 1970 | Chief Compliance Officer | Since 2010 |
* | George P. Schwartz, Richard L. Platte, Jr., Robert C. Schwartz, Timothy S. Schwartz and Cathy M. Stoner, as affiliated persons of Schwartz Investment Counsel, Inc., the Fund’s investment adviser, are “interested persons” of the Trust within the meaning of Section 2(a)(19) of the Investment Company Act of 1940. George P. Schwartz is the father of Robert C. Schwartz and Timothy S. Schwartz. |
74
AVE MARIA MUTUAL FUNDS
BOARD OF TRUSTEES AND EXECUTIVE OFFICERS
(Unaudited) (Continued)
Each Trustee oversees six portfolios of the Trust: the Ave Maria Catholic Values Fund, the Ave Maria Growth Fund, the Ave Maria Rising Dividend Fund, the Ave Maria World Equity Fund, the Ave Maria Bond Fund and the Schwartz Value Fund. The principal occupations of the Trustees and executive officers of the Trust during the past five years and public directorships held by the Trustees are set forth below:
George P. Schwartz, CFA is Chairman and Chief Executive Officer of Schwartz Investment Counsel, Inc. and the co-portfolio manager of the Ave Maria Catholic Values Fund and the Ave Maria Rising Dividend Fund.
Louis C. Bosco, Jr. retired in April 2012. Prior to his retirement, he was a partner in Bosco Development Company (a real estate firm).
Donald J. Dawson, Jr. retired in March 2015. Prior to retirement, he was Chairman of Payroll 1, Inc. (a payroll processing company) from Jan. 1986 – Feb. 2015.
Joseph M. Grace is retired Senior Vice President of National Bank of Detroit (renamed JPMorgan Chase & Company).
John J. McHale, Jr. is Special Assistant to Commissioner of Major League Baseball since 2015; Executive Vice President of Major League Baseball, 2000 – 2015.
Richard L. Platte, Jr., CFA is President and Chief Investment Officer of Schwartz Investment Counsel, Inc. and is the lead portfolio manager of the Ave Maria Growth Fund and the Ave Maria Rising Divident Fund and the co-portfolio manager of the Ave Maria Bond Fund.
Robert C. Schwartz, CFP is Vice President and Secretary of Schwartz Investment Counsel, Inc. and is the co-portfolio manager of the Ave Maria World Equity Fund.
Timothy S. Schwartz, CFA is Executive Vice President and Chief Financial Officer of Schwartz Investment Counsel, Inc. and the lead portfolio manager of the Ave Maria Catholic Values Fund.
Cathy M. Stoner, CPA, IACCP is Vice President and Chief Compliance Officer of Schwartz Investment Counsel, Inc.
Additional information regarding the Trustees and executive officers of the Trust may be found in the Funds’ Statement of Additional Information and is available without charge upon request by calling (888) 726-9931.
75
AVE MARIA MUTUAL FUNDS
CATHOLIC ADVISORY BOARD
(Unaudited)
The Catholic Advisory Board reviews the companies selected by the Adviser to ensure that the companies operate in a way that is consistent with teachings and core values of the Roman Catholic Church. The Catholic Advisory Board evaluates companies using publicly available information, information from the Adviser, and information from shareholders and other sources in making its recommendations. The following are the members of the Catholic Advisory Board:
Member | Address | Year of Birth | Length of
Time Served |
Lou Holtz | 5818 El Camino Real, Carlsbad, CA | 1937 | Since 2007 |
Lawrence Kudlow | 1375 Kings Hwy. East, Suite 260, Fairfield, CT | 1947 | Since 2005 |
Thomas S. Monaghan | One Ave Maria Drive, Ann Arbor, MI | 1937 | Since 2001 |
Michael Novak | 1150 17th Street, NW, Suite 1100, Washington, DC | 1933 | Since 2001 |
Fr. John Riccardo, STL | 1062 Church St., Plymouth, MI | 1965 | Since 2011 |
Paul R. Roney | One Ave Maria Drive, Ann Arbor, MI | 1957 | Since 2001 |
Phyllis Schlafly | 7800 Bonhomme, St. Louis, MO | 1924 | Since 2001 |
Lou Holtz is the former football coach at University of Notre Dame among others, ESPN college football analyst, author and motivational speaker.
Lawrence Kudlow is CNBC’s Senior Contributor and radio host of the nationally-syndicated “Larry Kudlow Show.”
Thomas S. Monaghan is Chairman of the Ave Maria Foundation (a non-profit foundation supporting Roman Catholic organizations) and Chancellor of Ave Maria University. Prior to December 1998, he was Chairman and Chief Executive Officer of Domino’s Pizza, Inc.
Michael Novak is a theologian, author, and former U.S. ambassador. He is the George Frederick Jewett Chair (emeritus) in Religion, Philosophy, and Public Policy at the American Enterprise Institute.
Fr. John Riccardo, STL is a priest of the Archdiocese of Detroit and is the pastor of Our Lady of Good Counsel Catholic Church in Plymouth, Michigan. He is also the host of the radio show “Christ is the Answer,” which can be heard on Catholic radio stations throughout the country.
Paul R. Roney is Executive Director of the Ave Maria Foundation and President of Domino’s Farms Corporation. Prior to December 1998, he was Treasurer of Domino’s Pizza, Inc.
Phyllis Schlafly is an author, columnist and radio commentator. She is President of Eagle Forum (an organization promoting conservative and pro-family values).
Additional information regarding the Funds’ Catholic Advisory Board members may be found in the Funds’ Statement of Additional Information and is available without charge upon request by calling (888) 726-9331.
76
AVE MARIA MUTUAL FUNDS
ABOUT YOUR FUNDS’ EXPENSES
(Unaudited)
We believe it is important for you to understand the impact of costs on your investment. As a shareholder of the Funds, you incur ongoing costs, including management fees and other Fund expenses. The following examples are intended to help you understand your ongoing costs (in dollars) of investing in the Funds and to compare these costs with the ongoing costs of investing in other mutual funds.
A mutual fund’s ongoing costs are expressed as a percentage of its average net assets. This figure is known as the expense ratio. The ongoing costs reflected in the tables below are based on an investment of $1,000 made at the beginning of the most recent semi-annual period (July 1, 2015) and held until the end of the period (December 31, 2015).
The tables that follow illustrate each Fund’s ongoing costs in two ways:
Actual fund return – This section helps you to estimate the actual expenses that you paid over the period. The “Ending Account Value” shown is derived from each Fund’s actual return, and the fourth column shows the dollar amount of operating expenses that would have been paid by an investor who started with $1,000 in the Funds. You may use the information here, together with the amount you invested, to estimate the expenses that you paid over the period.
To do so, simply divide your account value by $1,000 (for example, an $8,600 account value divided by $1,000 = 8.6), then multiply the result by the number given for the Funds under the heading “Expenses Paid During Period.”
Hypothetical 5% return – This section is intended to help you compare each Fund’s ongoing costs with those of other mutual funds. It assumes that each Fund had an annual return of 5% before expenses during the period shown, but that the expense ratio is unchanged. In this case, because the return used is not the Funds’ actual returns, the results do not apply to your investment. The example is useful in making comparisons because the Securities and Exchange Commission (the “SEC”) requires all mutual funds to calculate expenses based on a 5% return. You can assess each Fund’s ongoing costs by comparing this hypothetical example with the hypothetical examples that appear in shareholder reports of other funds.
Note that expenses shown in the table are meant to highlight and help you compare ongoing costs only. The Funds do not charge sales loads or redemption fees.
The calculations assume no shares were bought or sold during the period. Your actual costs may have been higher or lower, depending on the amount of your investment and the timing of any purchases or redemptions.
More information about the Funds’ expenses, including historical annual expense ratios, can be found in this report. For additional information on operating expenses and other shareholder costs, please refer to the Funds’ Prospectus.
77
AVE MARIA MUTUAL FUNDS
ABOUT YOUR FUNDS’ EXPENSES
(Unaudited) (Continued)
| Beginning
Account Value
July 1, 2015 | Ending Account Value December 31, 2015 | Net
Expense Ratio(a) | Expenses Paid During Period(b) |
Ave Maria Catholic Values Fund |
Actual | $1,000.00 | $840.90 | 1.19% | $5.52 |
Hypothetical 5% Return (before expenses) | $1,000.00 | $1,019.21 | 1.19% | $6.06 |
| | | | | |
Ave Maria Growth Fund | | | | |
Actual | $1,000.00 | $949.40 | 1.17% | $5.75 |
Hypothetical 5% Return (before expenses) | $1,000.00 | $1,019.31 | 1.17% | $5.96 |
| | | | | |
Ave Maria Rising Dividend Fund | | | |
Actual | $1,000.00 | $950.40 | 0.92% | $4.52 |
Hypothetical 5% Return (before expenses) | $1,000.00 | $1,020.57 | 0.92% | $4.69 |
| | | | | |
Ave Maria World Equity Fund | | | |
Actual | $1,000.00 | $940.20 | 1.50% | $7.34 |
Hypothetical 5% Return (before expenses) | $1,000.00 | $1,017.64 | 1.50% | $7.63 |
| | | | | |
Ave Maria Bond Fund | | | | |
Actual | $1,000.00 | $1,001.80 | 0.50% | $2.52 |
Hypothetical 5% Return (before expenses) | $1,000.00 | $1,022.68 | 0.50% | $2.55 |
(a) | Annualized, based on the Fund's most recent one-half year expenses. |
(b) | Expenses are equal to each Fund's annualized expense ratio multiplied by the average account value over the period, muliplied by 184/365 (to reflect the one-half year period). |
78
AVE MARIA MUTUAL FUNDS
FEDERAL TAX INFORMATION
(Unaudited)
In accordance with federal tax requirements, the following provides shareholders with information concerning certain ordinary income dividends paid by the Ave Maria Catholic Values Fund, the Ave Maria Growth Fund, the Ave Maria Rising Dividend Fund, the Ave Maria World Equity Fund and the Ave Maria Bond Fund and distributions from net realized gains made by the Ave Maria Catholic Values Fund, the Ave Maria Growth Fund, the Ave Maria Rising Dividend Fund, the Ave Maria World Equity Fund and the Ave Maria Bond Fund during the fiscal year end December 31, 2015. On December 30, 2015, the Ave Maria Catholic Values Fund declared and paid an ordinary income dividend and a long-term capital gain distribution of $0.0109 and $0.0093 per share, respectively; the Ave Maria Growth Fund declared and paid an ordinary income dividend, a short-term capital gain distribution and a long-term capital gain distribution of $0.0684, $0.2050, and $2.2016 per share, respectively; the Ave Maria World Equity Fund declared and paid an ordinary income dividend and a long-term capital gain distribution of $0.0709 and $0.1596 per share, respectively; the Ave Maria Rising Dividend Fund declared and paid both a short-term capital gain distribution and a long-term capital gain distribution of $0.0112 and $0.8651 per share, respectively; and the Ave Maria Bond Fund declared and paid a long-term capital gain distribution of $0.0663 per share. Periodically throughout the year, the Ave Maria Rising Dividend Fund paid ordinary income dividends totaling $0.2322 per share. Periodically throughout the year, the Ave Maria Bond Fund paid ordinary income dividends totaling $0.1422 per share. 100% of the long-term capital gain distributions of $0.0093, $2.2016, $0.8651, $0.1596, and $0.0663 for the Ave Maria Catholic Values Fund, the Ave Maria Growth Fund, the Ave Maria Rising Dividend Fund, the Ave Maria World Equity Fund and the Ave Maria Bond Fund, respectively, and a percentage (100%, 100%, 100%, 100%, and 34.11%) of the ordinary income dividends and/or short-term capital gain distributions paid for the Ave Maria Catholic Values Fund, the Ave Maria Growth Fund, the Ave Maria Rising Dividend Fund, the Ave Maria World Equity Fund and the Ave Maria Bond Fund, respectively, may be subject to a maximum tax rate of 23.8%. Early in 2016, as required by federal regulations, shareholders received notification of their portion of the Funds’ dividends and distributions paid during the 2015 calendar year.
79
AVE MARIA MUTUAL FUNDS
OTHER INFORMATION
(Unaudited)
A description of the policies and procedures the Funds use to determine how to vote proxies relating to portfolio securities is available without charge upon request by calling toll-free (888) 726-9331, or on the SEC’s website at http://www.sec.gov. Information regarding how the Funds voted proxies relating to portfolio securities during the most recent 12-month period ended June 30 is also available without charge upon request by calling toll-free (888) 726-9331, or on the SEC’s website at http://www.sec.gov.
The Trust files a complete listing of portfolio holdings for each of the Funds with the SEC as of the end of the first and third quarters of each fiscal year on Form N-Q. The filings are available free of charge, upon request, by calling (888) 726-9331. Furthermore, you may obtain a copy of the filings on the SEC’s website at http://www.sec.gov. The Trust’s Forms N-Q may also be reviewed and copied at the SEC’s Public Reference Room in Washington, DC, and information on the operation of the Public Reference Room may be obtained by calling (800) SEC-0330.
80
This page intentionally left blank.
This page intentionally left blank.
This page intentionally left blank.
As of the end of the period covered by this report, the registrant has adopted a code of ethics that applies to the registrant’s principal executive officer, principal financial officer, principal accounting officer or controller, or persons performing similar functions, regardless of whether these individuals are employed by the registrant or a third party. Pursuant to Item 12(a)(1), a copy of registrant’s code of ethics is filed as an exhibit to this Form N-CSR. During the period covered by this report, the code of ethics has not been amended, and the registrant has not granted any waivers, including implicit waivers, from the provisions of the code of ethics.
| Item 3. | Audit Committee Financial Expert. |
The registrant’s board of trustees has determined that the registrant has at least one audit committee financial expert serving on its audit committee. The name of the audit committee financial expert is Joseph M. Grace. Mr. Grace is “independent” for purposes of this Item.
| Item 4. | Principal Accountant Fees and Services. |
| (a) | Audit Fees. The aggregate fees billed for professional services rendered by the principal accountant for the audit of the registrant’s annual financial statements or for services that are normally provided by the accountant in connection with statutory and regulatory filings or engagements were $137,900 and $139,230 with respect to the registrant’s fiscal years ended December 31, 2015 and 2014, respectively. |
| (b) | Audit-Related Fees. No fees were billed in either of the last two fiscal years for assurance and related services by the principal accountant that are reasonably related to the performance of the audit of the registrant’s financial statements and are not reported under paragraph (a) of this Item. |
| (c) | Tax Fees. The aggregate fees billed for professional services rendered by the principal accountant for tax compliance, tax advice, and tax planning were $16,500 and $16,000 with respect to the registrant’s fiscal years ended December 31, 2015 and 2014, respectively. The services comprising these fees are tax consulting and the preparation of the registrant’s federal income and excise tax returns. |
| (d) | All Other Fees. No fees were billed in either of the last two fiscal years for products and services provided by the principal accountant, other than the services reported in paragraphs (a) through (c) of this Item. |
| (e)(1) | The audit committee has not adopted pre-approval policies and procedures described in paragraph (c)(7) of Rule 2-01 of Regulation S-X. |
| (e)(2) | None of the services described in paragraph (b) through (d) of this Item were approved by the audit committee pursuant to paragraph (c)(7)(i)(C) of Rule 2-01 of Regulation S-X. |
| (f) | Less than 50% of hours expended on the principal accountant’s engagement to audit the registrant’s financial statements for the most recent fiscal year were attributed to work performed by persons other than the principal accountant’s full-time, permanent employees. |
| (g) | During the fiscal years ended December 31, 2015 and 2014, aggregate non-audit fees of $16,500 and $16,000, respectively, were billed by the registrant’s principal accountant for services rendered to the registrant. During the fiscal years ended December 31, 2015 and 2014, aggregate non-audit fees of $12,000 and $11,700, respectively, were billed by the registrant’s principal accountant for services rendered to the registrant’s investment adviser (not including any sub-adviser whose role is primarily portfolio management and is subcontracted with or overseen by another investment adviser), and any entity controlling, controlled by, or under common control with the adviser that provides ongoing services to the registrant. |
| (h) | The registrant’s Committee of Independent Trustees determined that the provision of non-audit services that were rendered to the registrant’s investment adviser (not including any sub-adviser whose role is primarily portfolio management and is subcontracted with or overseen by another investment adviser), and any entity controlling, controlled by, or under common control with the investment adviser that provides ongoing services to the registrant, that were not pre-approved pursuant to paragraph (c)(7)(ii) of Rule 2-01 of Regulation S-X is compatible with maintaining the principal accountant’s independence. |
| Item 5. | Audit Committee of Listed Registrants. |
Not applicable
| Item 6. | Schedule of Investments. |
| (a) | Not applicable [schedule filed with Item 1] |
| Item 7. | Disclosure of Proxy Voting Policies and Procedures for Closed-End Management Investment Companies. |
Not applicable
| Item 8. | Portfolio Managers of Closed-End Management Investment Companies. |
Not applicable
| Item 9. | Purchases of Equity Securities by Closed-End Management Investment Company and Affiliated Purchasers. |
Not applicable
| Item 10. | Submission of Matters to a Vote of Security Holders. |
The registrant’s Committee of Independent Trustees shall review shareholder recommendations to fill vacancies on the registrant’s board of trustees if such recommendations are submitted in writing, addressed to the Committee at the registrant’s offices and meet any minimum qualifications adopted by the Committee. The Committee may adopt, by resolution, a policy regarding its procedures for considering candidates for the board of trustees, including any recommended by shareholders.
| Item 11. | Controls and Procedures. |
(a) Based on their evaluation of the registrant’s disclosure controls and procedures (as defined in Rule 30a-3(c) under the Investment Company Act of 1940) as of a date within 90 days of the filing date of this report, the registrant’s principal executive officer and principal financial officer have concluded that such disclosure controls and procedures are reasonably designed and are operating effectively to ensure that material information relating to the registrant, including its consolidated subsidiaries, is made known to them by others within those entities, particularly during the period in which this report is being prepared, and that the information required in filings on Form N-CSR is recorded, processed, summarized, and reported on a timely basis.
(b) There were no changes in the registrant’s internal control over financial reporting (as defined in Rule 30a-3(d) under the Investment Company Act of 1940) that occurred during the second fiscal quarter of the period covered by this report that have materially affected, or are reasonably likely to materially affect, the registrant’s internal control over financial reporting.
File the exhibits listed below as part of this Form. Letter or number the exhibits in the sequence indicated.
(a)(1) Any code of ethics, or amendment thereto, that is the subject of the disclosure required by Item 2, to the extent that the registrant intends to satisfy the Item 2 requirements through filing of an exhibit: Attached hereto
(a)(2) A separate certification for each principal executive officer and principal financial officer of the registrant as required by Rule 30a-2(a) under the Act (17 CFR 270.30a-2(a)): Attached hereto
(a)(3) Any written solicitation to purchase securities under Rule 23c-1 under the Act (17 CFR 270.23c-1) sent or given during the period covered by the report by or on behalf of the registrant to 10 or more persons: Not applicable
(b) Certifications required by Rule 30a-2(b) under the Act (17 CFR 270.30a-2(b)): Attached hereto
| Exhibit 99.CODE ETH | Code of Ethics |
| Exhibit 99.CERT | Certifications required by Rule 30a-2(a) under the Act |
| Exhibit 99.906CERT | Certifications required by Rule 30a-2(b) under the Act |
SIGNATURES
Pursuant to the requirements of the Securities Exchange Act of 1934 and the Investment Company Act of 1940, the registrant has duly caused this report to be signed on its behalf by the undersigned, thereunto duly authorized.
| (Registrant) | Schwartz Investment Trust | | |
| | | | |
| By (Signature and Title)* | /s/ George P. Schwartz | |
| | | George P. Schwartz, President and Principal Executive Officer | |
| | | | |
| Date | February 23, 2016 | | |
| | | | |
| Pursuant to the requirements of the Securities Exchange Act of 1934 and the Investment Company Act of 1940, this report has been signed below by the following persons on behalf of the registrant and in the capacities and on the dates indicated. |
| | | | |
| By (Signature and Title)* | /s/ George P. Schwartz | |
| | | George P. Schwartz, President and Principal Executive Officer | |
| | | | |
| Date | February 23, 2016 | | |
| | | | |
| By (Signature and Title)* | /s/ Timothy S. Schwartz | |
| | | Timothy S. Schwartz, Treasurer and Principal Financial Officer | |
| | | | |
| Date | February 23, 2016 | | |
| * | Print the name and title of each signing officer under his or her signature. |