Washington, D.C. 20549
George P. Schwartz
Form N-CSR is to be used by management investment companies to file reports with the Commission not later than 10 days after the transmission to stockholders of any report that is required to be transmitted to stockholders under Rule 30e-1 under the Investment Company Act of 1940 (17 CFR 270.30e-1). The Commission may use the information provided on Form N-CSR in its regulatory, disclosure review, inspection, and policymaking roles.
A registrant is required to disclose the information specified by Form N-CSR, and the Commission will make this information public. A registrant is not required to respond to the collection of information contained in Form N-CSR unless the Form displays a currently valid Office of Management and Budget ("OMB") control number. Please direct comments concerning the accuracy of the information collection burden estimate and any suggestions for reducing the burden to Secretary, Securities and Exchange Commission, 450 Fifth Street, NW, Washington, DC 20549-0609. The OMB has reviewed this collection of information under the clearance requirements of 44 U.S.C. § 3507.
Shareholder Accounts c/o Ultimus Fund Solutions, LLC P.O. Box 46707 Cincinnati, OH 45246 (888) 726-0753 |  | Corporate Offices 3707 W. Maple Road Suite 100 Bloomfield Hills, MI 48301 |
Schwartz Value Fund
Dear Fellow Shareowner:
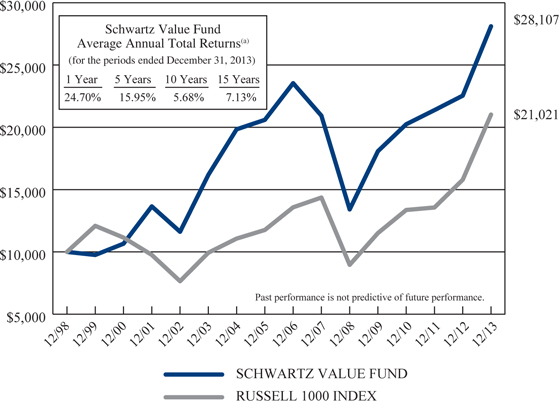
Schwartz Value Fund (the “Fund”) had another good year in 2013, up 24.70%. Stocks generally advanced during the year with all the major indices posting gains, including the Russell 1000 Index, the Fund’s benchmark index, up 33.11% and the S&P 500 Index (the “S&P 500”) up 32.39%. The top performing S&P 500 sectors were the cyclical, economically sensitive, and growth-oriented stocks, with discretionary (+43%), health care (+42%) and industrials (+41%) leading the way. By comparison, defensive sectors such as consumer staples (+26%), utilities (13%) and telecommunications (11%) were laggards. In many respects, 2013 was a repeat of 2012. Stock prices rose across the board, with lower-quality issues performing best. For the second year in a row, small-caps were the big winners. With stock markets soaring, our investment strategy that seeks to mitigate risk modestly lagged the benchmark. The Fund’s 1, 5, 10 and 15-year performance figures compared to the major stock-market indices are as follows:
| | Average Annual Total Returns For Periods Ended 12/31/13 |
| | 1 year | 5 years | 10 years | 15 years |
| Schwartz Value Fund | 24.70% | 15.95% | 5.68% | 7.13% |
| Russell 1000 Index | 33.11% | 18.59% | 7.78% | 5.08% |
| S&P 500 Index | 32.39% | 17.94% | 7.41% | 4.68% |
Several portfolio holdings appreciated substantially during the year. Biglari Holdings, Inc., which was purchased in mid-2013, has been a big winner. The stock price is up 40% from our cost and it is now one of the Fund’s largest positions. The company operates the Steak ‘n Shake restaurant chain, with exciting international expansion opportunities. Despite the higher share price, due to improving fundamentals of the underlying business, we believe Biglari retains significant value not yet recognized by the marketplace.
Other large holdings that positively impacted performance during 2013 were Cimarex Energy Company (oil & gas exploration/production), Microsoft Corporation (PC software & services), Avnet, Inc. (electronic distribution), Berkshire Hathaway, Inc. (insurance and investment management), Hewlett-Packard (technology hardware & services), and Alliant Techsystems, Inc. (aerospace & defense products).
The Fund’s two largest positions, Unico American Corporation and Apple, Inc. were laggards during the year, rising 5% and 8% respectively. Unico, a long-time holding, is a specialty property & casualty insurance company that writes commercial policies in the state of California. We like the fact that management owns a large stake in the company (over 50%) and historically has been very conservative and disciplined in its underwriting. At year end, the stock was trading below book value and significantly
below our estimate of intrinsic value. Likewise, we believe Apple, Inc. is trading substantially below its intrinsic value. Although no longer growing rapidly, this consumer technology pioneer continues to generate high profit margins, an exceptional internal rate of return on invested capital, and strong free cash flow while maintaining a nearly debt-free, cash-rich balance sheet. Management’s recent decision to return excess capital to shareholders through dividends and share buybacks is admirable. With one of the world’s most recognizable brands, by all accounts it is a far superior company than the average S&P 500 company, yet it trades at a below-market multiple of earnings and cash flow. At year end, Apple’s stock price was $561, up significantly from its summer low near $400, but only up 8% from the start of the year.
Holdings that negatively affected performance in 2013 were the gold-related positions, Barrick Gold Corporation, Newmont Mining Corporation, and gold ETF holdings. During the second half of the year, we sold several issues as their share prices reached our estimate of intrinsic value: Becton, Dickinson and Company, Chesapeake Energy Corporation, Exxon Mobil Corporation, H&R Block, Inc., PepsiCo Inc., Range Resources Corporation, and Sysco Corporation. Also eliminated was Weight Watchers International, Inc., due to deteriorating fundamentals. Two new names added were Coach, Inc. and Teradata Corporation.
| | • | Coach, Inc. (COH) is a $15 billion global designer and marketer of handbags, leather goods, and accessories primarily for women. A one time darling of growth stock investors after several years of double-digit growth, recent concerns about weakening sales amid increased competition have landed the stock in the bargain bin. The company has little debt and generates prodigious cash, which the Board has been aggressively returning to shareholders through dividends and share repurchases. The stock yields 2.4%, while shares outstanding over the past 6 years have been reduced by more than 25% through buybacks. |
| | • | Teradata Corporation (TDC) is an $8 billion global data storage company that provides analytic data warehousing products & services. The company generates high profit margins, has a strong balance sheet, and produces excess cash. Due to heightened competitive fears, last year the stock price declined precipitously into our buying range. |
The general market’s outsized gains of 2013 are not likely this year, but 2014 could still be another positive year for equity investors. Although past performance does not guarantee future results, in the last five instances when the S&P 500 gained more than 25% in a calendar year, the following year finished in positive territory all five times.
The year-end distribution of $0.5250 per share consisted of long-term capital gains and was paid on December 30, 2013. The Fund ended the year with a net asset value of $28.54 per share.
As always, the confidence you have shown by your investment in the Fund is most appreciated!
With best regards,
 |  |
George P. Schwartz, CFA Co-Portfolio Manager | Timothy S. Schwartz, CFA Co-Portfolio Manager |
Past performance is not predictive of future performance. Investment results and principal value will fluctuate so that shares, when redeemed, may be worth more or less than their original cost. Current performance may be higher or lower than the performance data quoted. Performance data, current to the most recent month end, are available by calling the Fund at 1-888-726-0753.
An investor should consider the investment objectives, risks, charges and expenses of the Fund carefully before investing. The Fund’s prospectus contains this and other important information. To obtain a copy of the prospectus please visit our website at www.schwartzvaluefund.com or call 1-888-726-0753 and a copy will be sent to you free of charge. Please read the prospectus carefully before you invest.
The Letter to Shareholders seeks to describe some of the Adviser’s current opinions and views of the financial markets. Although the Adviser believes it has a reasonable basis for any opinions or views expressed, actual results may differ, sometimes significantly so, from those expected or expressed.
SCHWARTZ VALUE FUND
PERFORMANCE
(Unaudited)
Comparison of the Change in Value of a $10,000 Investment
in Schwartz Value Fund and the Russell 1000 Index
| (a) | The returns shown do not reflect the deduction of taxes a shareholder would pay on Fund distributions or the redemption of Fund shares. |
| Expense ratio as of 12-31-12 (as disclosed in May 1, 2013 prospectus) | 1.44%* |
| Expense ratio for the year ended 12-31-13 | 1.45% |
| * | Includes Acquired Fund Fees and Expenses. |
This report is for the information of shareholders, but it may also be used as sales literature when preceded or accompanied by a current prospectus, which gives details about charges, expenses, investment objectives and operating policies of the Fund. The Fund is distributed by Ultimus Fund Distributors, LLC.
SCHWARTZ VALUE FUND
ANNUAL TOTAL RATES OF RETURN
COMPARISON WITH MAJOR INDICES (Unaudited)
| | | | | | |
| 1984 | 11.1% | 4.8% | -7.3% | -11.2% | -8.4% | 6.1% |
| 1985 | 21.7% | 32.3% | 31.1% | 31.4% | 20.7% | 31.6% |
| 1986 | 16.4% | 17.9% | 5.7% | 7.4% | 5.0% | 18.7% |
| 1987 | -0.6% | 2.9% | -8.8% | -5.3% | -10.6% | 5.3% |
| 1988 | 23.1% | 17.3% | 24.9% | 15.4% | 15.4% | 16.8% |
| 1989 | 8.3% | 30.4% | 16.2% | 19.3% | 11.2% | 31.6% |
| 1990 | -5.3% | -4.2% | -19.5% | -17.8% | -24.3% | -3.2% |
| 1991 | 32.0% | 33.0% | 46.1% | 56.8% | 27.2% | 30.4% |
| 1992 | 22.7% | 8.9% | 18.4% | 15.5% | 7.0% | 7.6% |
| 1993 | 20.5% | 10.2% | 18.9% | 14.7% | 10.7% | 10.1% |
| 1994 | -6.8% | 0.4% | -1.8% | -3.2% | -6.0% | 1.3% |
| 1995 | 16.9% | 37.8% | 28.4% | 39.9% | 19.3% | 37.5% |
| 1996 | 18.3% | 22.5% | 16.5% | 22.7% | 13.4% | 22.9% |
| 1997 | 28.0% | 32.9% | 22.4% | 21.6% | 21.1% | 33.4% |
| 1998 | -10.4% | 27.0% | -2.5% | 39.6% | -3.8% | 28.6% |
| 1999 | -2.5% | 20.9% | 21.3% | 85.6% | -1.4% | 21.0% |
| 2000 | 9.3% | -7.8% | -3.0% | -39.3% | -8.7% | -9.1% |
| 2001 | 28.1% | -12.5% | 2.5% | -21.0% | -6.1% | -11.9% |
| 2002 | -14.9% | -21.7% | -20.5% | -31.5% | -28.6% | -22.1% |
| 2003 | 39.3% | 29.9% | 47.3% | 50.0% | 37.4% | 28.7% |
| 2004 | 22.6% | 11.4% | 18.3% | 8.6% | 11.5% | 10.9% |
| 2005 | 3.8% | 6.3% | 4.6% | 1.4% | 2.0% | 4.9% |
| 2006 | 14.3% | 15.5% | 18.4% | 9.5% | 11.0% | 15.8% |
| 2007 | -11.1% | 5.8% | -1.6% | 10.6% | -3.8% | 5.5% |
| 2008 | -35.9% | -37.6% | -33.8% | -40.0% | -48.7% | -37.0% |
| 2009 | 34.8% | 28.4% | 27.2% | 45.3% | 36.8% | 26.5% |
| 2010 | 12.0% | 16.1% | 26.9% | 18.0% | 20.5% | 15.1% |
| 2011 | 5.6% | 1.5% | -4.2% | -0.8% | -11.4% | 2.1% |
| 2012 | 5.4% | 16.4% | 16.4% | 17.5% | 9.5% | 16.0% |
| 2013 | 24.7% | 33.1% | 38.8% | 40.1% | 35.5% | 32.4% |
AVERAGE ANNUAL TOTAL RETURNS
As of December 31, 2013 (Unaudited)
| | | | | | |
| 3 Years | 11.6% | 16.3% | 15.7% | 17.7% | 9.5% | 16.2% |
| 5 Years | 16.0% | 18.6% | 20.1% | 22.9% | 16.7% | 17.9% |
| 10 Years | 5.7% | 7.8% | 9.1% | 7.6% | 3.0% | 7.4% |
| 30 Years | 9.7% | 11.1% | 9.8% | 9.4% | 3.1% | 11.1% |
| (a) | Schwartz Value Fund’s performance combines the performance of the Fund since its commencement of operations as a registered investment company on July 20, 1993, and the performance of RCM Partners Limited Partnership for periods prior thereto. |
| | |
| (b) | Excluding dividends for the years ended 1984-2006. Effective 2007, the returns include dividends. |
| | |
| (c) | Excluding dividends. |
SCHWARTZ VALUE FUND
TEN LARGEST EQUITY HOLDINGS
December 31, 2013 (Unaudited)
| | | | | | | | |
| | 180,000 | | Unico American Corporation | | $ | 2,385,000 | | | | 7.4 | % |
| | 3,673 | | Biglari Holdings, Inc. | | | 1,860,889 | | | | 5.8 | % |
| | 3,200 | | Apple, Inc. | | | 1,795,552 | | | | 5.6 | % |
| | 20,000 | | Outerwall, Inc. | | | 1,345,400 | | | | 4.2 | % |
| | 30,000 | | Avnet, Inc. | | | 1,323,300 | | | | 4.1 | % |
| | 15,000 | | National Oilwell Varco, Inc. | | | 1,192,950 | | | | 3.7 | % |
| | 20,000 | | Baker Hughes Incorporated | | | 1,105,200 | | | | 3.5 | % |
| | 40,000 | | Apollo Education Group, Inc. - Class A | | | 1,092,800 | | | | 3.4 | % |
| | 10,000 | | Cimarex Energy Company | | | 1,049,100 | | | | 3.3 | % |
| | 30,000 | | Bank of New York Mellon Corporation (The) | | | 1,048,200 | | | | 3.3 | % |
ASSET ALLOCATION (Unaudited)
| | | |
Consumer Discretionary | | | 18.5 | % |
Consumer Staples | | | 0.5 | % |
Energy | | | 20.0 | % |
Financials | | | 16.2 | % |
Health Care | | | 4.4 | % |
Industrials | | | 2.6 | % |
Information Technology | | | 21.6 | % |
Materials | | | 4.2 | % |
Warrants | | | 1.4 | % |
Exchange-Traded Funds | | | 1.8 | % |
Open-End Funds | | | 0.0 | %(a) |
Money Market Funds, Liabilities in Excess of Other Assets | | | 8.8 | % |
| | | | 100.0 | % |
| (a) | Percentage rounds to less than 0.1%. |
SCHWARTZ VALUE FUND
SCHEDULE OF INVESTMENTS
| | | | | | |
| Consumer Discretionary — 18.5% | | | | | | |
| Diversified Consumer Services — 7.6% | | | | | | |
Apollo Education Group, Inc. - Class A * | | | 40,000 | | | $ | 1,092,800 | |
Outerwall, Inc. * | | | 20,000 | | | | 1,345,400 | |
| | | | | | | | 2,438,200 | |
| Hotels, Restaurants & Leisure — 5.8% | | | | | | | | |
Biglari Holdings, Inc. * | | | 3,673 | | | | 1,860,889 | |
| | | | | | | | | |
| Multiline Retail — 0.9% | | | | | | | | |
Kohl's Corporation | | | 5,000 | | | | 283,750 | |
| | | | | | | | | |
| Specialty Retail — 3.5% | | | | | | | | |
Rent-A-Center, Inc. | | | 11,000 | | | | 366,740 | |
Ross Stores, Inc. | | | 10,000 | | | | 749,300 | |
| | | | | | | | 1,116,040 | |
| Textiles, Apparel & Luxury Goods — 0.7% | | | | | | | | |
Coach, Inc. | | | 4,000 | | | | 224,520 | |
| | | | | | | | | |
| Consumer Staples — 0.5% | | | | | | | | |
| Food & Staples Retailing — 0.5% | | | | | | | | |
Wal-Mart Stores, Inc. | | | 2,000 | | | | 157,380 | |
| | | | | | | | | |
| Energy — 20.0% | | | | | | | | |
| Energy Equipment & Services — 9.0% | | | | | | | | |
Baker Hughes Incorporated | | | 20,000 | | | | 1,105,200 | |
Ensco plc - Class A | | | 10,000 | | | | 571,800 | |
National Oilwell Varco, Inc. | | | 15,000 | | | | 1,192,950 | |
| | | | | | | | 2,869,950 | |
| Oil, Gas & Consumable Fuels — 11.0% | | | | | | | | |
Apache Corporation | | | 10,000 | | | | 859,400 | |
Cimarex Energy Company | | | 10,000 | | | | 1,049,100 | |
Devon Energy Corporation | | | 15,000 | | | | 928,050 | |
Phillips 66 | | | 4,000 | | | | 308,520 | |
Southwestern Energy Company * | | | 10,000 | | | | 393,300 | |
| | | | | | | | 3,538,370 | |
| Financials — 16.2% | | | | | | | | |
| Capital Markets — 3.3% | | | | | | | | |
Bank of New York Mellon Corporation (The) | | | 30,000 | | | | 1,048,200 | |
| | | | | | | | | |
| Diversified Financial Services — 1.6% | | | | | | | | |
Western Union Company (The) | | | 30,000 | | | | 517,500 | |
SCHWARTZ VALUE FUND
SCHEDULE OF INVESTMENTS
COMMON STOCKS — 88.0% (Continued) | | | | | | |
| Financials — 16.2% (Continued) | | | | | | |
| Insurance — 11.3% | | | | | | |
Berkshire Hathaway, Inc. - Class A * | | | 4 | | | $ | 711,600 | |
Progressive Corporation (The) | | | 20,000 | | | | 545,400 | |
Unico American Corporation * | | | 180,000 | | | | 2,385,000 | |
| | | | | | | | 3,642,000 | |
| Health Care — 4.4% | | | | | | | | |
| Health Care Equipment & Supplies — 4.4% | | | | | | | | |
Covidien plc | | | 15,000 | | | | 1,021,500 | |
Stryker Corporation | | | 5,000 | | | | 375,700 | |
| | | | | | | | 1,397,200 | |
| Industrials — 2.6% | | | | | | | | |
| Aerospace & Defense — 0.4% | | | | | | | | |
Alliant Techsystems, Inc. | | | 1,000 | | | | 121,680 | |
| | | | | | | | | |
| Road & Rail — 2.2% | | | | | | | | |
CSX Corporation | | | 25,000 | | | | 719,250 | |
| | | | | | | | | |
| Information Technology — 21.6% | | | | | | | | |
| Communications Equipment — 0.7% | | | | | | | | |
Cisco Systems, Inc. | | | 10,000 | | | | 224,500 | |
| | | | | | | | | |
| Computers & Peripherals — 8.7% | | | | | | | | |
Apple, Inc. | | | 3,200 | | | | 1,795,552 | |
Hewlett-Packard Company | | | 6,000 | | | | 167,880 | |
QLogic Corporation * | | | 70,000 | | | | 828,100 | |
| | | | | | | | 2,791,532 | |
| Electronic Equipment, Instruments & Components — 4.1% | | | | | | | | |
Avnet, Inc. | | | 30,000 | | | | 1,323,300 | |
| | | | | | | | | |
| IT Services — 1.1% | | | | | | | | |
Teradata Corporation * | | | 8,000 | | | | 363,920 | |
| | | | | | | | | |
| Semiconductors & Semiconductor Equipment — 1.4% | | | | | | | | |
Ultratech, Inc. * | | | 15,000 | | | | 435,000 | |
| | | | | | | | | |
| Software — 5.6% | | | | | | | | |
Microsoft Corporation | | | 20,000 | | | | 748,600 | |
Oracle Corporation | | | 27,000 | | | | 1,033,020 | |
| | | | | | | | 1,781,620 | |
| Materials — 4.2% | | | | | | | | |
| Metals & Mining — 4.2% | | | | | | | | |
Barrick Gold Corporation | | | 25,000 | | | | 440,750 | |
SCHWARTZ VALUE FUND
SCHEDULE OF INVESTMENTS
COMMON STOCKS — 88.0% (Continued) | | | | | | |
| Materials — 4.2% (Continued) | | | | | | |
| Metals & Mining — 4.2% (Continued) | | | | | | |
Kinross Gold Corporation | | | 100,000 | | | $ | 438,000 | |
Newmont Mining Corporation | | | 20,000 | | | | 460,600 | |
| | | | | | | | 1,339,350 | |
| | | | | | | | | |
Total Common Stocks (Cost $20,623,245) | | | | | | $ | 28,194,151 | |
| | | | | | |
| Financials — 1.4% | | | | | | |
| Commercial Banks — 1.4% | | | | | | |
PNC Financial Services Group, Inc. (The) * (Cost $437,198) | | | 25,000 | | | $ | 443,750 | |
EXCHANGE-TRADED FUNDS — 1.8% | | | | | | |
iShares Gold Trust * | | | 10,000 | | | $ | 116,800 | |
SPDR Gold Trust * | | | 4,000 | | | | 464,680 | |
Total Exchange-Traded Funds (Cost $544,204) | | | | | | $ | 581,480 | |
OPEN-END FUNDS — 0.0% (a) | | | | | | |
Sequoia Fund * (Cost $8,289) | | | 63 | | | $ | 14,014 | |
SCHWARTZ VALUE FUND
SCHEDULE OF INVESTMENTS
MONEY MARKET FUNDS — 9.0% | | | | | | |
Federated Government Obligations Tax-Managed Fund - Institutional Shares, 0.01% (b) | | | 1,535,666 | | | $ | 1,535,666 | |
Federated Treasury Obligations Fund - Institutional Shares, 0.01% (b) | | | 1,334,864 | | | | 1,334,864 | |
Total Money Market Funds (Cost $2,870,530) | | | | | | $ | 2,870,530 | |
| | | | | | | | | |
Total Investments at Market Value — 100.2% (Cost $24,483,466) | | | | | | $ | 32,103,925 | |
| | | | | | | | | |
Liabilities in Excess of Other Assets — (0.2%) | | | | | | | (73,590 | ) |
| | | | | | | | | |
Net Assets — 100.0% | | | | | | $ | 32,030,335 | |
| * | Non-income producing security. |
| | |
| (a) | Percentage rounds to less than 0.1%. |
| | |
| (b) | The rate shown is the 7-day effective yield as of December 31, 2013. |
| |
| See notes to financial statements. |
SCHWARTZ VALUE FUND
STATEMENT OF ASSETS AND LIABILITIES
| ASSETS | | | |
| Investments, at market value (cost of $24,483,466) (Note 1) | | $ | 32,103,925 | |
| Receivable for capital shares sold | | | 100 | |
| Dividends receivable | | | 8,646 | |
| Other assets | | | 8,661 | |
| TOTAL ASSETS | | | 32,121,332 | |
| | | | | |
| LIABILITIES | | | | |
| Payable to Adviser (Note 2) | | | 78,486 | |
| Payable to administrator (Note 2) | | | 3,641 | |
| Other accrued expenses | | | 8,870 | |
| TOTAL LIABILITIES | | | 90,997 | |
| | | | | |
| NET ASSETS | | $ | 32,030,335 | |
| | | | | |
| NET ASSETS CONSIST OF: | | | | |
| Paid-in capital | | $ | 24,409,876 | |
| Net unrealized appreciation on investments | | | 7,620,459 | |
| NET ASSETS | | $ | 32,030,335 | |
| | | | | |
Shares of beneficial interest outstanding (unlimited number of shares authorized, no par value) | | | 1,122,184 | |
| Net asset value, offering price and redemption price per share (Note 1) | | $ | 28.54 | |
| See notes to financial statements. |
SCHWARTZ VALUE FUND
STATEMENT OF OPERATIONS
For the Year Ended December 31, 2013
| INVESTMENT INCOME | | | |
| Dividends (Net of foreign tax of $2,025) | | $ | 427,145 | |
| | | | | |
| EXPENSES | | | | |
| Investment advisory fees (Note 2) | | | 307,674 | |
| Administration, accounting and transfer agent fees (Note 2) | | | 48,151 | |
| Trustees’ fees and expenses (Note 2) | | | 32,068 | |
| Legal and audit fees | | | 31,535 | |
| Registration and filing fees | | | 22,700 | |
| Custodian and bank service fees | | | 6,527 | |
| Printing of shareholder reports | | | 4,686 | |
| Postage and supplies | | | 3,997 | |
| Insurance expense | | | 1,708 | |
| Compliance service fees and expenses (Note 2) | | | 1,313 | |
| Other expenses | | | 10,076 | |
| TOTAL EXPENSES | | | 470,435 | |
| | | | | |
| NET INVESTMENT LOSS | | | (43,290 | ) |
| | | | | |
| REALIZED AND UNREALIZED GAINS ON INVESTMENTS | | | | |
| Net realized gains from security transactions | | | 2,262,489 | |
| Net realized gains from in-kind redemptions (Note 1) | | | 1,247,364 | |
| Net change in unrealized appreciation/depreciation on investments | | | 3,664,716 | |
| NET REALIZED AND UNREALIZED GAINS ON INVESTMENTS | | | 7,174,569 | |
| | | | | |
NET INCREASE IN NET ASSETS RESULTING FROM OPERATIONS | | $ | 7,131,279 | |
| See notes to financial statements. |
SCHWARTZ VALUE FUND
STATEMENTS OF CHANGES IN NET ASSETS
| | | Year Ended December 31, 2013 | | | Year Ended December 31, 2012 | |
| FROM OPERATIONS | | | | | | |
Net investment income (loss) | | $ | (43,290 | ) | | $ | 299,469 | |
Net realized gains from security transactions | | | 2,262,489 | | | | 3,514,629 | |
| Net realized gains from in-kind redemptions (Note 1) | | | 1,247,364 | | | | — | |
Net change in unrealized appreciation/ depreciation on investments | | | 3,664,716 | | | | (1,855,780 | ) |
| Net increase in net assets resulting from operations | | | 7,131,279 | | | | 1,958,318 | |
| | | | | | | | | |
| FROM DISTRIBUTIONS TO SHAREHOLDERS | | | | | | | | |
From net investment income | | | — | | | | (299,646 | ) |
From net realized gains on investments | | | (579,393 | ) | | | — | |
| Decrease in net assets from distributions to shareholders | | | (579,393 | ) | | | (299,646 | ) |
| | | | | | | | | |
| FROM CAPITAL SHARE TRANSACTIONS | | | | | | | | |
Proceeds from shares sold | | | 1,580,993 | | | | 1,707,312 | |
Reinvestment of distributions to shareholders | | | 526,246 | | | | 240,632 | |
Payments for shares redeemed | | | (7,202,098 | ) | | | (9,687,083 | ) |
| Net decrease in net assets from capital share transactions | | | (5,094,859 | ) | | | (7,739,139 | ) |
| | | | | | | | | |
| TOTAL INCREASE (DECREASE) IN NET ASSETS | | | 1,457,027 | | | | (6,080,467 | ) |
| | | | | | | | | |
| NET ASSETS | | | | | | | | |
Beginning of year | | | 30,573,308 | | | | 36,653,775 | |
End of year | | $ | 32,030,335 | | | $ | 30,573,308 | |
| | | | | | | | | |
| UNDISTRIBUTED NET INVESTMENT INCOME | | $ | — | | | $ | — | |
| | | | | | | | | |
| SUMMARY OF CAPITAL SHARE ACTIVITY | | | | | | | | |
Shares sold | | | 62,146 | | | | 73,436 | |
Shares issued in reinvestment of distributions to shareholders | | | 18,523 | | | | 10,490 | |
Shares redeemed | | | (270,322 | ) | | | (413,867 | ) |
Net decrease in shares outstanding | | | (189,653 | ) | | | (329,941 | ) |
Shares outstanding, beginning of year | | | 1,311,837 | | | | 1,641,778 | |
Shares outstanding, end of year | | | 1,122,184 | | | | 1,311,837 | |
| See notes to financial statements. |
SCHWARTZ VALUE FUND
FINANCIAL HIGHLIGHTS
Per Share Data for a Share Outstanding Throughout Each Year
| | | | | | | | | | | | | | | |
Net asset value at beginning of year | | $ | 23.31 | | | $ | 22.33 | | | $ | 21.21 | | | $ | 19.04 | | | $ | 14.12 | |
| | | | | | | | | | | | | | | | | | | | | |
| Income (loss) from investment operations: | | | | | | | | | | | | | | | | | | | | |
Net investment income (loss) | | | (0.04 | ) | | | 0.23 | | | | 0.07 | | | | 0.11 | | | | (0.01 | ) |
Net realized and unrealized gains on investments | | | 5.80 | | | | 0.98 | | | | 1.12 | | | | 2.17 | | | | 4.93 | |
Total from investment operations | | | 5.76 | | | | 1.21 | | | | 1.19 | | | | 2.28 | | | | 4.92 | |
| | | | | | | | | | | | | | | | | | | | | |
| Less distributions: | | | | | | | | | | | | | | | | | | | | |
From net investment income | | | — | | | | (0.23 | ) | | | (0.07 | ) | | | (0.11 | ) | | | — | |
From net realized gains on investments | | | (0.53 | ) | | | — | | | | — | | | | — | | | | — | |
Total distributions | | | (0.53 | ) | | | (0.23 | ) | | | (0.07 | ) | | | (0.11 | ) | | | — | |
| | | | | | | | | | | | | | | | | | | | | |
Net asset value at end of year | | $ | 28.54 | | | $ | 23.31 | | | $ | 22.33 | | | $ | 21.21 | | | $ | 19.04 | |
| | | | | | | | | | | | | | | | | | | | | |
Total return (a) | | | 24.7% | | | | 5.4% | | | | 5.6% | | | | 12.0% | | | | 34.8% | |
| | | | | | | | | | | | | | | | | | | | | |
| Ratios/Supplementary Data: | | | | | | | | | | | | | | | | | | | | |
Net assets at end of year (000’s) | | $ | 32,030 | | | $ | 30,573 | | | $ | 36,654 | | | $ | 35,161 | | | $ | 34,369 | |
| | | | | | | | | | | | | | | | | | | | | |
Ratio of expenses to average net assets | | | 1.45% | | | | 1.41% | | | | 1.38% | | | | 1.43% | | | | 1.55% | |
| | | | | | | | | | | | | | | | | | | | | |
Ratio of net investment income (loss) to average net assets | | | (0.13% | ) | | | 0.90% | | | | 0.32% | | | | 0.52% | | | | (0.07% | ) |
| | | | | | | | | | | | | | | | | | | | | |
Portfolio turnover rate | | | 57% | | | | 62% | | | | 75% | | | | 69% | | | | 73% | |
| (a) | Total return is a measure of the change in value of an investment in the Fund over the years covered, which assumes any dividends or capital gains distributions are reinvested in shares of the Fund. Returns shown do not reflect the deduction of taxes a shareholder would pay on Fund distributions or the redemption of Fund shares. |
| |
| See notes to financial statements. |
SCHWARTZ VALUE FUND
NOTES TO FINANCIAL STATEMENTS
| 1. | Significant Accounting Policies |
Schwartz Value Fund (the “Fund”) is a diversified series of Schwartz Investment Trust (the “Trust”), an open-end management investment company established as an Ohio business trust under a Declaration of Trust dated August 31, 1992. The Fund is registered under the Investment Company Act of 1940 and commenced operations on July 20, 1993.
The investment objective of the Fund is to seek long-term capital appreciation. See the Prospectus for information regarding the principal investment strategies of the Fund.
Shares of the Fund are sold at net asset value. To calculate the net asset value, the Fund’s assets are valued and totaled, liabilities are subtracted, and the balance is divided by the number of shares outstanding. The offering price and redemption price per share are equal to the net asset value per share.
The following is a summary of significant accounting policies followed by the Fund:
(a) Valuation of investments — Securities which are traded on stock exchanges, other than NASDAQ, are valued at the closing sales price as of the close of the regular session of trading on the New York Stock Exchange on the day the securities are being valued, or, if not traded on a particular day, at the closing bid price. Securities which are quoted by NASDAQ are valued at the NASDAQ Official Closing Price or, if an official close price is not available, at the most recently quoted bid price. Securities traded in the over-the-counter market are valued at the last reported sales price or, if there is no reported sale on the valuation date, at the most recently quoted bid price. Securities which are traded both in the over-the-counter market and on a stock exchange are valued according to the broadest and most representative market. Investments representing shares of other open-end investment companies are valued at their net asset value as reported by such companies. Securities (and other assets) for which market quotations are not readily available are valued at their fair value as determined in good faith in accordance with consistently applied procedures established by and under the general supervision of the Board of Trustees, and will be classified as Level 2 or 3 within the fair value hierarchy (see below), depending on the inputs used. Fair value pricing may be used, for example, in situations where (i) a portfolio security is so thinly traded that there have been no transactions for that stock over an extended period of time; (ii) the exchange on which the portfolio security is principally traded closes early; or (iii) trading of the portfolio security is halted during the day and does not resume prior to the Fund’s net asset value calculation. A portfolio security’s “fair value” price may differ from the price next available for that portfolio security using the Fund’s normal pricing procedures. Short-term instruments (those with remaining maturities of 60 days or less at the time of purchase) are valued at amortized cost, which approximates market value.
Accounting principles generally accepted in the United States (“GAAP”) establish a single authoritative definition of fair value, set out a framework for measuring fair value and require additional disclosures about fair value measurements.
SCHWARTZ VALUE FUND
NOTES TO FINANCIAL STATEMENTS
Various inputs are used in determining the value of the Fund’s investments. These inputs are summarized in the three broad levels listed below:
| | • | Level 1 – quoted prices in active markets for identical securities |
| | • | Level 2 – other significant observable inputs |
| | • | Level 3 – significant unobservable inputs |
The inputs or methodology used for valuing securities are not necessarily an indication of the risks associated with investing in those securities. The inputs used to measure fair value may fall into different levels of the fair value hierarchy. In such cases, for disclosure purposes, the level in the fair value hierarchy within which the fair value measurement falls in its entirety is determined based on the lowest level input that is significant to the fair value measurement.
The following is a summary of the inputs used to value the Fund’s investments, by security type, as of December 31, 2013:
| | | | | | | | | | | | | |
Common Stocks | | $ | 28,194,151 | | | $ | — | | | $ | — | | | $ | 28,194,151 | |
Warrants | | | 443,750 | | | | — | | | | — | | | | 443,750 | |
Exchange-Traded Funds | | | 581,480 | | | | — | | | | — | | | | 581,480 | |
Open-End Funds | | | 14,014 | | | | — | | | | — | | | | 14,014 | |
Money Market Funds | | | 2,870,530 | | | | — | | | | — | | | | 2,870,530 | |
Total | | $ | 32,103,925 | | | $ | — | | | $ | — | | | $ | 32,103,925 | |
Refer to the Fund’s Schedule of Investments for a listing of the securities by industry type. As of December 31, 2013, the Fund did not have any transfers in and out of any Level. There were no Level 2 or 3 securities or derivative instruments held by the Fund as of December 31, 2013. It is the Fund’s policy to recognize transfers into and out of any Level at the end of the reporting period.
(b) Income taxes — It is the Fund’s intention to continue to qualify as a regulated investment company under the Internal Revenue Code of 1986 (the “Code”). Qualification generally will relieve the Fund of liability for federal income taxes to the extent 100% of its net investment income and net realized gains are distributed in accordance with the Code. Accordingly, no provision for income tax has been made.
In order to avoid imposition of the excise tax applicable to regulated investment companies, it is also the Fund’s intention to declare as dividends in each calendar year at least 98% of its net investment income and 98.2% of its net realized capital gains plus undistributed amounts from prior years.
SCHWARTZ VALUE FUND
NOTES TO FINANCIAL STATEMENTS
The following information is computed on a tax basis for each item as of December 31, 2013:
| Federal income tax cost | | $ | 24,483,466 | |
| Gross unrealized appreciation | | $ | 7,711,078 | |
| Gross unrealized depreciation | | | (90,619 | ) |
| Net unrealized appreciation | | | 7,620,459 | |
| Accumulated earnings | | $ | 7,620,459 | |
During the year ended December 31, 2013, the Fund utilized $1,682,882 of capital loss carryforwards to offset current year realized gains. As of December 31, 2013, there are no remaining capital loss carryfowards.
During the year ended December 31, 2013, the Fund realized $1,247,364 of net capital gains resulting from in-kind redemptions – in which shareholders who redeemed Fund shares received securities held by the Fund rather than cash. The Fund recognizes a gain on in-kind redemptions to the extent that the value of the distributed securities on the date of redemption exceeds the cost of those securities. Such gains are not taxable to the Fund and are not required to be distributed to shareholders. The Fund has reclassified this amount against paid-in capital on the Statement of Assets and Liabilities. The Fund also reclassified $42 of distributions in excess of net capital gains and $43,290 of net investment loss against paid-in capital on the Statement of Assets and Liabilities. Such reclassifications, the result of permanent differences between the financial statement and income tax reporting requirements, have no effect on the Fund’s net assets or net asset value per share.
The Fund recognizes the tax benefits or expenses of uncertain tax positions only when the position is “more-likely-than-not” to be sustained assuming examination by tax authorities. Management has reviewed the tax positions taken on federal income tax returns for all open tax years (tax years ended December 31, 2010 through December 31, 2013) and has concluded that no provision for unrecognized tax benefits or expenses is required in these financial statements.
(c) Security transactions and investment income — Security transactions are accounted for on the trade date. Dividend income is recorded on the ex-dividend date. Interest income is recognized on the accrual basis. Realized gains and losses on security transactions are determined on the identified cost basis.
(d) Dividends and distributions — Dividends from net investment income and net capital gains, if any, are declared and paid annually in December. Dividends and distributions to shareholders are recorded on the ex-dividend date. The tax character of distributions paid during the years ended December 31, 2013 and 2012 was as follows:
| | | | | | | | | |
December 31, 2013 | | $ | — | | | $ | 579,393 | | | $ | 579,393 | |
December 31, 2012 | | $ | 299,646 | | | $ | — | | | $ | 299,646 | |
SCHWARTZ VALUE FUND
NOTES TO FINANCIAL STATEMENTS
(e) Estimates — The preparation of financial statements in conformity with GAAP requires management to make estimates and assumptions that affect the reported amounts of assets and liabilities and disclosure of contingent assets and liabilities as of the date of the financial statements and the reported amounts of revenues and expenses during the reporting period. Actual results could differ from those estimates.
(f) Common expenses — Common expenses of the Trust are allocated among the Fund and the other series of the Trust based on relative net assets of each series or the nature of the services performed and the relative applicability to each series.
| 2. | Investment Advisory Agreement and Transactions with Related Parties |
The Chairman and President of the Trust is also the Chairman and Chief Investment Officer of Schwartz Investment Counsel, Inc. (the “Adviser”). Certain other officers of the Trust are officers of the Adviser, or of Ultimus Fund Solutions, LLC (“Ultimus”), the administrative, accounting and transfer agent for the Fund, or of Ultimus Fund Distributors, LLC (the “Distributor”), the Fund’s principal underwriter.
Pursuant to an Investment Advisory Agreement between the Trust and the Adviser, the Adviser is responsible for the management of the Fund and provides investment advice along with the necessary personnel, facilities, equipment and certain other services necessary to the operations of the Fund. The Adviser receives from the Fund a quarterly fee at the annual rate of 0.95% per annum of the Fund’s average daily net assets.
The Chief Compliance Officer of the Trust (the “CCO”) is an employee of the Adviser. The Trust pays the Adviser a fee for providing CCO services, of which the Fund pays its proportionate share along with the other series of the Trust. In addition, the Trust reimburses the Adviser for out-of-pocket expenses incurred, if any, for providing these services.
Pursuant to a Mutual Fund Services Agreement between the Trust and Ultimus, Ultimus supplies regulatory and compliance services, calculates the daily net asset value per share, maintains the financial books and records of the Fund, maintains the records of each shareholder’s account, and processes purchases and redemptions of the Fund’s shares. For these services Ultimus receives fees computed at an annual rate of the daily net assets of the Fund, subject to a minimum monthly fee.
Pursuant to a Distribution Agreement between the Trust and the Distributor, the Distributor serves as the Fund’s exclusive agent for the distribution of its shares. The Distributor is an affiliate of Ultimus.
SCHWARTZ VALUE FUND
NOTES TO FINANCIAL STATEMENTS
Trustees and officers affiliated with the Adviser or Ultimus are not compensated by the Trust for their services. As of July 1, 2013, each Trustee who is not an affiliated person of the Adviser or Ultimus receives from the Trust an annual retainer of $23,000 (except that such fee is $28,000 for the lead independent Trustee), payable quarterly, and a fee of $4,000 for attendance at each meeting of the Board of Trustees, plus reimbursement of travel and other expenses incurred in attending meetings. Prior to July 1, 2013, each Trustee who was not an affiliated person of the Adviser or Ultimus received an annual retainer of $17,000 (except that such fee was $22,000 for the lead independent Trustee), payable quarterly; a fee of $4,000 for attendance at each meeting of the Board of Trustees and $1,500 for attendance at each meeting of any committee of the Board; plus reimbursement of travel and other expenses incurred in attending meetings. Effective January 1, 2014, each Trustee who is not an affiliated person of the Adviser or Ultimus will receive from the Trust an annual retainer of $26,000 (except that such fee is $32,000 for the lead independent Trustee), payable quarterly, and a fee of $4,750 for attendance at each meeting of the Board of Trustees, plus reimbursement of travel and other expenses incurred in attending meetings.
| 3. | Investment Transactions |
During the year ended December 31, 2013, cost of purchases and proceeds from sales and maturities of investment securities, excluding short-term investments and U.S. government securities, amounted to $17,288,894 and $22,635,159, respectively.
| 4. | Contingencies and Commitments |
The Fund indemnifies the Trust’s officers and Trustees for certain liabilities that might arise from their performance of their duties to the Fund. Additionally, in the normal course of business, the Fund enters into contracts that contain a variety of representations and warranties and which provide general indemnifications. The Fund’s maximum exposure under these arrangements is unknown, as this would involve future claims that may be made against the Fund that have not yet occurred. However, based on experience, the Fund expects the risk of loss to be remote.
The Fund is required to recognize in the financial statements the effects of all subsequent events that provide additional evidence about conditions that existed as of the date of the Statement of Assets and Liabilities. For non-recognized subsequent events that must be disclosed to keep the financial statements from being misleading, the Fund is required to disclose the nature of the event as well as an estimate of its financial effect, or a statement that such an estimate cannot be made. Management has evaluated subsequent events through the issuance of these financial statements and has noted no such events.
SCHWARTZ VALUE FUND
REPORT OF INDEPENDENT REGISTERED
Schwartz Value Fund:
We have audited the accompanying statement of assets and liabilities, including the schedule of investments, of Schwartz Value Fund (the “Fund”), a series of Schwartz Investment Trust, as of December 31, 2013, and the related statement of operations for the year then ended, the statements of changes in net assets for each of the two years in the period then ended, and the financial highlights for each of the five years in the period then ended. These financial statements and financial highlights are the responsibility of the Fund’s management. Our responsibility is to express an opinion on these financial statements and financial highlights based on our audits.
We conducted our audits in accordance with the standards of the Public Company Accounting Oversight Board (United States). Those standards require that we plan and perform the audits to obtain reasonable assurance about whether the financial statements and financial highlights are free of material misstatement. The Fund is not required to have, nor were we engaged to perform, an audit of internal control over financial reporting. Our audits included consideration of internal control over financial reporting as a basis for designing audit procedures that are appropriate in the circumstances, but not for the purpose of expressing an opinion on the effectiveness of the Fund’s internal control over financial reporting. Accordingly, we express no such opinion. An audit also includes examining, on a test basis, evidence supporting the amounts and disclosures in the financial statements, assessing the accounting principles used and significant estimates made by management, as well as evaluating the overall financial statement presentation. Our procedures included confirmation of securities owned as of December 31, 2013, by correspondence with the custodian and brokers. We believe that our audits provide a reasonable basis for our opinion.
In our opinion, the financial statements and financial highlights referred to above present fairly, in all material respects, the financial position of Schwartz Value Fund as of December 31, 2013, the results of its operations for the year then ended, the changes in its net assets for each of the two years in the period then ended, and the financial highlights for each of the five years in the period then ended, in conformity with accounting principles generally accepted in the United States of America.
Chicago, Illinois
February 13, 2014
SCHWARTZ VALUE FUND
BOARD OF TRUSTEES AND EXECUTIVE OFFICERS
Overall responsibility for management of the Trust rests with the Board of Trustees. The Trustees serve during the lifetime of the Trust and until its termination, or until death, resignation, retirement or removal. The Trustees, in turn, elect the officers of the Trust to actively supervise its day-to-day operations. The officers have been elected for an annual term. The following are the Trustees and executive officers of the Trust:
| | | Position Held with the Trust | |
| Interested Trustees: |
| * | George P. Schwartz, CFA | 3707 W. Maple Road, Bloomfield Hills, MI | 1944 | Chairman of the Board/President/ Trustee | Since 1992 |
| Independent Trustees: |
| | John E. Barnds | 3707 W. Maple Road, Bloomfield Hills, MI | 1932 | Trustee | Since 2005 |
| | Louis C. Bosco, Jr. | 3707 W. Maple Road, Bloomfield Hills, MI | 1936 | Trustee | Since 2008 |
| | Donald J. Dawson, Jr. | 3707 W. Maple Road, Bloomfield Hills, MI | 1947 | Trustee | Since 1993 |
| | Joseph M. Grace | 3707 W. Maple Road, Bloomfield Hills, MI | 1936 | Trustee | Since 2007 |
| Executive Officers: |
| * | Richard L. Platte, Jr., CFA | 3707 W. Maple Road, Bloomfield Hills, MI | 1951 | Vice President and Secretary | Since 1993 |
| * | Robert C. Schwartz, CFP | 3707 W. Maple Road, Bloomfield Hills, MI | 1976 | Vice President | Since 2013 |
| * | Timothy S. Schwartz, CFA | 3707 W. Maple Road, Bloomfield Hills, MI | 1971 | Treasurer | Since 2000 |
| * | Cathy M. Stoner, CPA, IACCP | 3707 W. Maple Road, Bloomfield Hills, MI | 1970 | Chief Compliance Officer | Since 2010 |
| * | George P. Schwartz, Richard L. Platte, Jr., Robert C. Schwartz, Timothy S. Schwartz and Cathy M. Stoner, as affiliated persons of Schwartz Investment Counsel, Inc., the Fund’s investment adviser, are “interested persons” of the Trust within the meaning of Section 2(a)(19) of the Investment Company Act of 1940. George P. Schwartz is the father of Robert C. Schwartz and Timothy S. Schwartz. |
Each Trustee oversees seven portfolios of the Trust: the Ave Maria Catholic Values Fund, the Ave Maria Growth Fund, the Ave Maria Rising Dividend Fund, the Ave Maria Opportunity Fund, the Ave Maria World Equity Fund, the Ave Maria Bond Fund and the Schwartz Value Fund. The principal occupations of the Trustees and executive officers of the Trust during the past five years and public directorships held by the Trustees are set forth on the following page:
SCHWARTZ VALUE FUND
BOARD OF TRUSTEES AND EXECUTIVE OFFICERS
George P. Schwartz, CFA is Chairman and Chief Investment Officer of Schwartz Investment Counsel, Inc. and is the co-portfolio manager of the Fund.
John E. Barnds is retired First Vice President of National Bank of Detroit (JPMorgan Chase).
Louis C. Bosco, Jr. retired in April 2012. Prior to his retirement, he was a partner in Bosco Development Company (a real estate firm).
Donald J. Dawson, Jr. is Chairman of Payroll 1, Inc. (a payroll processing company).
Joseph M. Grace is retired Senior Vice President of National Bank of Detroit (JPMorgan Chase).
Richard L. Platte, Jr., CFA is President and Secretary of Schwartz Investment Counsel, Inc.
Robert C. Schwartz, CFP is Vice President of Schwartz Investment Counsel, Inc.
Timothy S. Schwartz, CFA is Executive Vice President and Chief Financial Officer of Schwartz Investment Counsel, Inc. and is the co-portfolio manager of the Fund.
Cathy M. Stoner, CPA, IACCP is Vice President and Chief Compliance Officer of Schwartz Investment Counsel, Inc. Prior to July 2009, she was an Audit Manager with Deloitte & Touche LLP.
Additional information about members of the Board of Trustees and executive officers is available in the Statement of Additional Information (“SAI”). To obtain a free copy of the SAI, please call (888) 726-0753.
SCHWARTZ VALUE FUND
ABOUT YOUR FUND’S EXPENSES
We believe it is important for you to understand the impact of costs on your investment. As a shareholder of the Fund, you incur ongoing costs, including management fees and other Fund expenses. The following examples are intended to help you understand your ongoing costs (in dollars) of investing in the Fund and to compare these costs with the ongoing costs of investing in other mutual funds.
A mutual fund’s ongoing costs are expressed as a percentage of its average net assets. This figure is known as the expense ratio. The ongoing costs reflected in the table below are based on an investment of $1,000 made at the beginning of the most recent semi-annual period (July 1, 2013) and held until the end of the period (December 31, 2013).
The table below illustrates the Fund’s ongoing costs in two ways:
Actual fund return – This section helps you to estimate the actual expenses that you paid over the period. The “Ending Account Value” shown is derived from the Fund’s actual return, and the third column shows the dollar amount of operating expenses that would have been paid by an investor who started with $1,000 in the Fund. You may use the information here, together with the amount you invested, to estimate the expenses that you paid over the period.
To do so, simply divide your account value by $1,000 (for example, an $8,600 account value divided by $1,000 = 8.6), then multiply the result by the number given for the Fund under the heading “Expenses Paid During Period.”
Hypothetical 5% return – This section is intended to help you compare the Fund’s ongoing costs with those of other mutual funds. It assumes that the Fund had an annual return of 5% before expenses during the period shown, but that the expense ratio is unchanged. In this case, because the return used is not the Fund’s actual return, the result does not apply to your investment. The example is useful in making comparisons because the Securities and Exchange Commission (“SEC”) requires all mutual funds to calculate expenses based on a 5% return. You can assess the Fund’s ongoing costs by comparing this hypothetical example with the hypothetical examples that appear in shareholder reports of other funds.
Note that expenses shown in the table are meant to highlight and help you compare ongoing costs only. The Fund does not charge sales loads or redemption fees.
The calculations assume no shares were bought or sold during the period. Your actual costs may have been higher or lower, depending on the amount of your investment and the timing of any purchases or redemptions.
More information about the Fund’s expenses, including historical annual expense ratios, can be found in this report. For additional information on operating expenses and other shareholder costs, please refer to the Fund’s Prospectus.
| Beginning Account Value July 1, 2013 | Ending Account Value December 31, 2013 | Expenses Paid During Period* |
| Based on Actual Fund Return | $1,000.00 | $1,148.00 | $7.74 |
| Based on Hypothetical 5% Return (before expenses) | $1,000.00 | $1,018.00 | $7.27 |
| * | Expenses are equal to the Fund’s annualized expense ratio of 1.43% for the period, multiplied by the average account value over the period, multiplied by 184/365 (to reflect the one-half year period). |
SCHWARTZ VALUE FUND
OTHER INFORMATION
A description of the policies and procedures the Fund uses to determine how to vote proxies relating to portfolio securities is available without charge upon request by calling toll-free (888) 726-0753, or on the SEC’s website at http://www.sec.gov. Information regarding how the Fund voted proxies relating to portfolio securities during the most recent 12-month period ended June 30 is also available without charge upon request by calling toll-free (888) 726-0753, or on the SEC’s website at http://www.sec.gov.
The Trust files a complete listing of portfolio holdings for the Fund with the SEC as of the end of the first and third quarters of each fiscal year on Form N-Q. The filings are available free of charge, upon request, by calling (888) 726-0753. Furthermore, you may obtain a copy of the filings on the SEC’s website at http://www.sec.gov. The Trust’s Forms N-Q may also be reviewed and copied at the SEC’s Public Reference Room in Washington, DC, and information on the operation of the Public Reference Room may be obtained by calling (800) SEC-0330.
INVESTMENT PHILOSOPHY (Unaudited)
Schwartz Value Fund (the “Fund”) seeks long-term capital appreciation through value investing – purchasing shares of strong, growing companies at reasonable prices. The Fund invests in companies of all sizes from large-caps to micro-caps. Fundamental analysis is used to identify companies with outstanding business characteristics. Sometimes the best values are issues not followed closely by Wall Street analysts.
Most value investors buy fair companies at an excellent price. The Fund attempts to buy excellent companies at a fair price. The essence of value investing is finding companies with great business characteristics, which by their nature offer a margin of safety. A truly fine business requires few assets to provide a consistently expanding stream of income. The Fund purchases shares which are temporarily out-of-favor and selling below intrinsic value.
A common thread in the Fund’s investments is that the market price is often below what a corporate or entrepreneurial buyer might be willing to pay for the entire business. The auction nature and the inefficiencies of the stock market are such that the Fund can sometimes buy a minority interest in a fine company at a small fraction of the price per share necessary to acquire the entire company.
FEDERAL TAX INFORMATION (Unaudited)
In accordance with federal tax requirements, the following provides shareholders with information concerning distributions from net realized gains paid by the Fund during the year ended December 31, 2013. On December 30, 2013 the Fund declared and paid a long-term capital gain distribution of $0.5250 per share. The long-term capital gain distribution of $0.5250 per share may be subject to a maximum tax rate of 23.8%. Early in 2014, as required by federal regulations, shareholders received notification of their portion of the Fund’s taxable capital gain distribution, if any, paid during the 2013 calendar year.
Shareholder Accounts c/o Ultimus Fund Solutions, LLC P.O. Box 46707 Cincinnati, OH 45246 (888) 726-9331 |  | Corporate Offices 3707 W. Maple Road Suite 100 Bloomfield Hills, MI 48301 (248) 644-8500 Fax (248) 644-4250 |
Dear Fellow Shareholders of:
| | Ave Maria Catholic Values Fund (AVEMX) |
| | Ave Maria Growth Fund (AVEGX) |
| | Ave Maria Rising Dividend Fund (AVEDX) |
| | Ave Maria Opportunity Fund (AVESX) |
| | Ave Maria World Equity Fund (AVEWX) |
| | Ave Maria Bond Fund (AVEFX) |
| | Ave Maria Money Market Account |
A year ago, the nation was addressing issues such as the global economic contraction, instability in the Middle East, an acrimonious election in the U.S., slow economic growth, high unemployment, the fiscal cliff and debt limit ceiling. Few would have said that stock prices would go up by over 25% in 2013. Yet it happened. Things rarely turn out as the “experts” predict.
Today it goes without saying that uncertainty is everywhere. The U.S. economy is still crawling out of a recession that supposedly ended five years ago. Global economic growth remains anemic. Central banks have been engaged in desperate unprecedented monetary stimulation for several years now. (No one knows how that will turn out.) Government debt continues to grow in an unchecked manner. Washington remains dysfunctional and Obamacare has unknowable implications. Everywhere uncertainty.
Indeed, the dominant investor theme is uncertainty and lack of confidence in the stock market. Amid skepticism, a popular parlor game has become – when will the “correction” occur? We have long believed that no one can consistently and accurately predict short-term swings in stock prices. Furthermore, we consider it a fool’s errand to try. Consequently, in all our Funds, we have stayed essentially fully invested with modest cash reserves to meet redemptions and take advantage of opportunities. So how do professional investors make intelligent decisions in the face of such overwhelming uncertainty?
In practicing the art of portfolio management, we focus on the fundamentals of the businesses in which we’ve invested your money. Most important is the sustainability and profitability of the business models represented by the stocks in the portfolios. All the time, remembering that a share of stock is a fractional interest in a business, which must be trading at a discount to our appraisal of intrinsic value for inclusion in one of the Funds. This often means we’re buying stocks that are out of sync with popular views. Being contrarian is often difficult and lonely, but we believe it pays off if good research is done and patience is exercised.
As mentioned in the six-month letter, the Ave Maria Mutual Funds passed the $1 billion mark in assets under management as of June 30, 2013. By year end, Fund assets exceeded $1.5 billion. With this growth, we have made a number of organizational changes. During 2013, Robert C. Schwartz, CFP was named Vice President of Schwartz Investment Trust, the entity which oversees all of our mutual funds. Also, Brandon S. Scheitler was named Co-portfolio Manager of the Ave Maria Bond Fund. Effective January 1, 2014, Schwartz Investment Counsel, Inc., the investment adviser to the Funds, promoted four outstanding colleagues to the following positions: Richard L. Platte, Jr., CFA to President; Timothy S. Schwartz, CFA to Executive Vice President and Chief Financial Officer; Cathy M. Stoner, CPA to Vice President and Chief Compliance Officer; and Laura A. Preston to Director of Operations. I remain Chairman and Chief Executive Officer. Our team of investment professionals continues to expand as the assets under supervision have grown. We have been blessed with an extraordinary group of talented people, dedicated to the task of meeting the investment objectives of the Ave Maria Mutual Funds, in a morally responsible way.
Thank you for your participation.
With best regards,
George P. Schwartz, CFA, Chairman
February 15, 2014
Past performance is not predictive of future performance. Investment results and principal value will fluctuate so that shares, when redeemed, may be worth more or less than their original cost. Current performance may be higher or lower than the performance data quoted. Performance data, current to the most recent month end, is available at the Ave Maria Mutual Funds website at www.avemariafunds.com or by calling 1-888-726-9331.
The Letter to Shareholders and the Portfolio Manager Commentaries that follow seek to describe some of the Adviser’s current opinions and views of the financial markets. Although the Adviser believes it has a reasonable basis for any opinions or views expressed, actual results may differ, sometimes significantly so, from those expected or expressed. Keep in mind that the information and opinions cover the period through the date of this report.
AVE MARIA MUTUAL FUNDS
| Ave Maria Catholic Values Fund: | |
Portfolio Manager Commentary | 2 |
Performance | 4 |
| Annual Total Rates of Return Comparison with Major Indices | 5 |
Ten Largest Equity Holdings | 6 |
Asset Allocation | 6 |
Schedule of Investments | 7 |
| | |
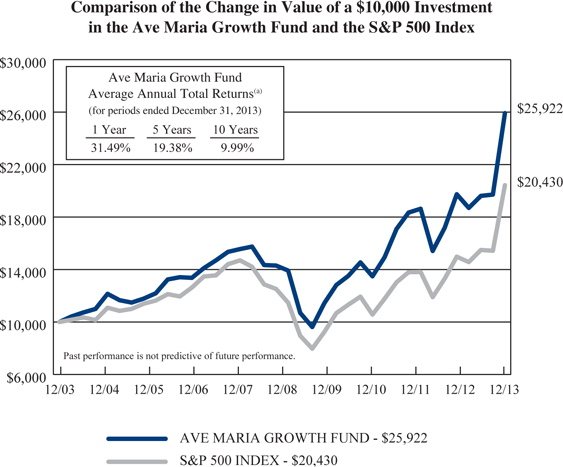
| Ave Maria Growth Fund: | |
Portfolio Manager Commentary | 11 |
Performance | 12 |
| Annual Total Rates of Return Comparison with Major Indices | 13 |
Ten Largest Equity Holdings | 14 |
Asset Allocation | 14 |
Schedule of Investments | 15 |
| | |
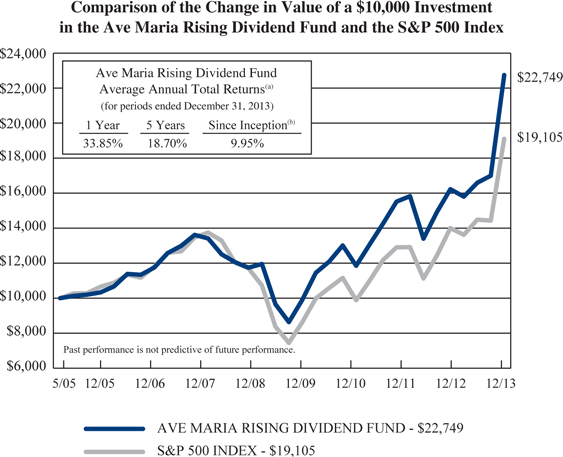
| Ave Maria Rising Dividend Fund: | |
Portfolio Manager Commentary | 18 |
Performance | 20 |
| Annual Total Rates of Return Comparison with Major Indices | 21 |
Ten Largest Equity Holdings | 22 |
Asset Allocation | 22 |
Schedule of Investments | 23 |
| | |
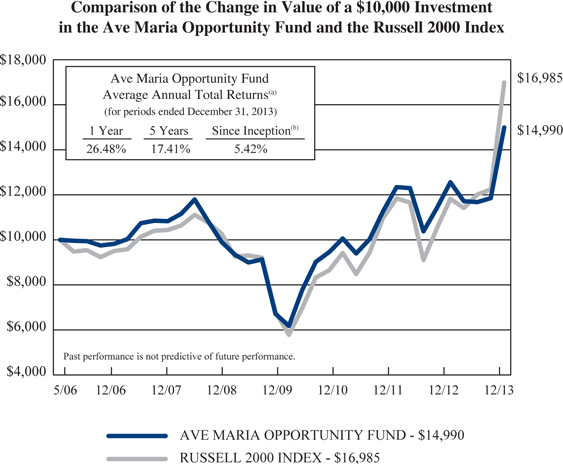
| Ave Maria Opportunity Fund: | |
Portfolio Manager Commentary | 27 |
Performance | 29 |
| Annual Total Rates of Return Comparison with Major Indices | 30 |
Ten Largest Equity Holdings | 31 |
Asset Allocation | 31 |
Schedule of Investments | 32 |
| | |
| Ave Maria World Equity Fund: | |
Portfolio Manager Commentary | 36 |
Performance | 38 |
| Annual Total Rates of Return Comparison with Major Indices | 39 |
Ten Largest Equity Holdings | 40 |
Asset Allocation | 40 |
Schedule of Investments | 41 |
Summary of Common Stock by Country | 44 |
| | |
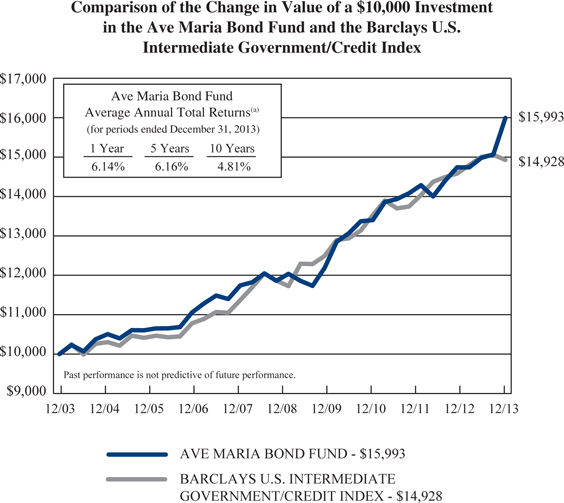
| Ave Maria Bond Fund: | |
Portfolio Manager Commentary | 45 |
Performance | 46 |
| Annual Total Rates of Return Comparison with Major Indices | 47 |
Ten Largest Holdings | 48 |
Asset Allocation | 48 |
Schedule of Investments | 49 |
AVE MARIA MUTUAL FUNDS
TABLE OF CONTENTS
Statements of Assets and Liabilities | 54 |
| | |
Statements of Operations | 56 |
| | |
| Statements of Changes in Net Assets: | |
Ave Maria Catholic Values Fund | 58 |
Ave Maria Growth Fund | 59 |
Ave Maria Rising Dividend Fund | 60 |
Ave Maria Opportunity Fund | 61 |
Ave Maria World Equity Fund | 62 |
Ave Maria Bond Fund | 63 |
| | |
| Financial Highlights: | |
Ave Maria Catholic Values Fund | 64 |
Ave Maria Growth Fund | 65 |
Ave Maria Rising Dividend Fund | 66 |
Ave Maria Opportunity Fund | 67 |
Ave Maria World Equity Fund | 68 |
Ave Maria Bond Fund | 69 |
| | |
Notes to Financial Statements | 70 |
| | |
Report of Independent Registered Public Accounting Firm | 82 |
| | |
Board of Trustees and Executive Officers | 83 |
| | |
Catholic Advisory Board | 85 |
| | |
About Your Funds’ Expenses | 86 |
| | |
Federal Tax Information | 89 |
| | |
Other Information | 90 |
This report is for the information of the shareholders of the Ave Maria Mutual Funds. To obtain a copy of the prospectus, please visit our website at www.avemariafunds.com or call 1-888-726-9331 and a copy will be sent to you free of charge. Please read the prospectus carefully before you invest. The Ave Maria Mutual Funds are distributed by Ultimus Fund Distributors, LLC.
Past performance is not predictive of future performance. Investment results and principal value will fluctuate so that shares, when redeemed, may be worth more or less than their original cost. Current performance may be higher or lower than the performance data quoted. Performance data, current to the most recent month end, is available at the Ave Maria Mutual Funds website at www.avemariafunds.com or by calling 1-888-726-9331.
AVE MARIA CATHOLIC VALUES FUND
PORTFOLIO MANAGER COMMENTARY
Dear Fellow Shareowner:
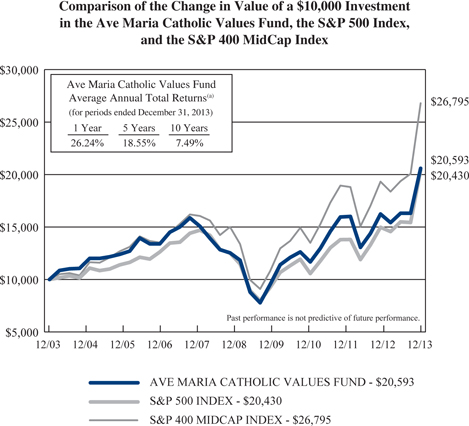
The Ave Maria Catholic Values Fund (the “Fund”) had another good year in 2013, up 26.24%. Stocks generally advanced during the year, with all the major indices posting gains with the S&P 500 Index up 32.39% and the S&P 400 MidCap Index up 33.50%. Since inception on May 1, 2001, the Fund’s return versus its benchmarks’ is:
| | Since 5-01-01 Inception through 12-31-13 Total Returns |
| | Cumulative | Annualized |
| Ave Maria Catholic Values Fund (AVEMX) | 165.07% | 8.00% |
| S&P 500 Index | 87.41% | 5.08% |
| S&P 400 MidCap Index | 209.18% | 9.32% |
2013 was an amazing year for the stock market, especially considering that corporate earnings grew by only mid-single digits, interest rates on U.S. government bonds rose, and there was a parade of disturbing headlines throughout the year about dysfunctional government in Washington D.C., regulatory overreach, and political upheaval and violence in the Middle East.
Currently, the economy seems to have fewer headwinds and more momentum than a year ago. Fiscal policy should be less of a drag. The federal budget deficit has been halved since 2010. Importantly, consumers are in better shape with net worths hitting an all-time high, thanks to the stock market recovery (the S&P 500 Index is currently 173% above its March 2009 low) and double-digit home price appreciation. With low inflation and declining unemployment, the 70% of the economy which is consumer driven should experience better growth. Corporate cash is also at an all-time high and business confidence shows signs of improvement, which will hopefully translate to more hiring and capital investment. We view the Federal Reserve action to begin tapering asset purchases as a sign that extraordinary measures are no longer needed to sustain the economic recovery.
Numerous stocks contributed to the Fund’s performance last year. GNC Holdings, Inc. - Class A (Nutritional Supplements) generated strong U.S. and international growth driven by new products and an effective customer loyalty program. Hewlett-Packard Company (Technology), one of the Fund’s poorest performers in 2012, doubled in price last year as new management advanced its turnaround program and free cash flow exceed expectations. Stryker Corporation (Medical Devices), the Fund’s largest position at the
AVE MARIA CATHOLIC VALUES FUND
PORTFOLIO MANAGER COMMENTARY
beginning of the year, responded positively to better than expected revenue and margin growth as reconstructive surgeries rebounded. Lowe’s Companies, Inc. (Home Improvement Retail) repeated as one of the top contributors this year as the housing rebound gained momentum and the company’s merchandising execution improved. Two energy companies, Halliburton Company and Phillips 66 (also a repeater), helped performance, Halliburton by virtue of its technological leadership in unconventional oil and gas production and Phillips 66 as its chemical and pipeline divisions’ profitability improved. In addition to their better business performance, all of the above mentioned companies increased their dividends and reduced their shares outstanding via share repurchase programs, demonstrating their ability to generate free cash flow and use it in a shareholder friendly manner.
Negatively impacting performance last year were: Teradata Corporation (Information Technology), iShares Gold Trust, SPDR Gold Trust, Anadarko Petroleum Corporation, Peabody Energy Corporation and Joy Global, Inc.
In the second half of 2013, the Fund eliminated several positions from the portfolio, including Chesapeake Energy Corporation, Exxon Mobil Corporation, Peabody Energy Corporation, Tidewater, Inc., General Dynamics Corporation, Thor Industries, Inc., DeVry Education Group, Inc. and Zebra Technologies Corporation - Class A, all of which reached our estimates of fair value. There were two new purchases during this time. Anadarko Petroleum Corporation appeared to offer a more attractive investment than the energy stocks sold by the Fund. The second is The PNC Financial Services Group, Inc. - Warrants, which provides an option to purchase common shares at $67.33 through December, 2018.
We believe the investments in high quality companies has postured the Fund to perform well, especially if the economic expansion continues in 2014.
Thank you for being a shareholder.
Sincerely,
 |  |
| George P. Schwartz, CFA | Gregory R. Heilman, CFA |
| Co-Portfolio Manager | Co-Portfolio Manager |
AVE MARIA CATHOLIC VALUES FUND PERFORMANCE (Unaudited) |
| (a) | The returns shown do not reflect the deduction of taxes a shareholder would pay on Fund distributions or the redemption of Fund shares. |
| Expense ratio as of 12-31-12 (as disclosed in May 1, 2013 prospectus) | 1.50%* |
| Expense ratio for the year ended 12-31-13 | 1.42% |
| * | Includes Acquired Fund Fees and Expenses. |
Past performance is not predictive of future performance. Investment results and principal value will fluctuate so that shares, when redeemed, may be worth more or less than their original cost. Current performance may be higher or lower than the performance data quoted. Performance data, current to the most recent month end, is available at the Ave Maria Mutual Funds website at www.avemariafunds.com or by calling 1-888-726-9331.
AVE MARIA CATHOLIC VALUES FUND ANNUAL TOTAL RATES OF RETURN COMPARISON WITH MAJOR INDICES (Unaudited) |
| AVE MARIA CATHOLIC VALUES FUND | | | | | |
2001(a) | 5.3% | -8.5% | -0.5% | 5.0% | -10.1% | -7.3% |
| 2002 | -9.8% | -22.1% | -14.5% | -14.6% | -31.5% | -28.6% |
| 2003 | 35.6% | 28.7% | 35.6% | 38.8% | 50.0% | 37.4% |
| 2004 | 20.1% | 10.9% | 16.5% | 22.7% | 8.6% | 11.5% |
| 2005 | 5.8% | 4.9% | 12.6% | 7.7% | 1.4% | 2.0% |
| 2006 | 14.2% | 15.8% | 10.3% | 15.1% | 9.5% | 11.0% |
| 2007 | -4.0% | 5.5% | 8.0% | -0.3% | 10.6% | -3.8% |
| 2008 | -36.8% | -37.0% | -36.2% | -31.1% | -40.0% | -48.7% |
| 2009 | 37.6% | 26.5% | 37.4% | 25.6% | 45.3% | 36.8% |
| 2010 | 20.5% | 15.1% | 26.7% | 26.3% | 18.0% | 20.5% |
| 2011 | -1.3% | 2.1% | -1.7% | 1.0% | -0.8% | -11.4% |
| 2012 | 13.3% | 16.0% | 17.9% | 16.3% | 17.5% | 9.5% |
| 2013 | 26.2% | 32.4% | 33.5% | 41.3% | 40.1% | 35.5% |
AVERAGE ANNUAL TOTAL RETURNS As of December 31, 2013 (Unaudited) |
| AVE MARIA CATHOLIC VALUES FUND | | | | | |
| 3 Years | 12.2% | 16.2% | 15.6% | 18.4% | 17.7% | 9.5% |
| 5 Years | 18.6% | 17.9% | 21.9% | 21.4% | 22.9% | 16.7% |
| 10 Years | 7.5% | 7.4% | 10.4% | 10.7% | 7.6% | 3.0% |
Since Inception (d) | 8.0% | 5.1% | 9.3% | 10.2% | 5.3% | 1.6% |
| (a) | Represents the period from the commencement of operations (May 1, 2001) through December 31, 2001. |
| | |
| (b) | Excluding dividends for the years ended 2001-2006. Effective 2007 the returns include dividends. |
| | |
| (c) | Excluding dividends. |
| | |
| (d) | Represents the period from the commencement of operations (May 1, 2001) through December 31, 2013. |
AVE MARIA CATHOLIC VALUES FUND
TEN LARGEST EQUITY HOLDINGS
December 31, 2013 (Unaudited)
| | | | | | | | |
| | 175,000 | | GNC Holdings, Inc. - Class A | | $ | 10,228,750 | | | | 4.1 | % |
| | 120,000 | | Stryker Corporation | | | 9,016,800 | | | | 3.7 | % |
| | 475,000 | | Chico's FAS, Inc. | | | 8,949,000 | | | | 3.6 | % |
| | 175,000 | | Lowe's Companies, Inc. | | | 8,671,250 | | | | 3.5 | % |
| | 110,000 | | Phillips 66 | | | 8,484,300 | | | | 3.4 | % |
| | 100,000 | | Fluor Corporation | | | 8,029,000 | | | | 3.3 | % |
| | 70,000 | | United Technologies Corporation | | | 7,966,000 | | | | 3.2 | % |
| | 150,000 | | Halliburton Company | | | 7,612,500 | | | | 3.1 | % |
| | 300,000 | | EMC Corporation | | | 7,545,000 | | | | 3.1 | % |
| | 90,000 | | Accenture plc - Class A | | | 7,399,800 | | | | 3.0 | % |
ASSET ALLOCATION (Unaudited)
| | |
Consumer Discretionary | | | 24.9 | % |
Energy | | | 13.4 | % |
Financials | | | 17.2 | % |
Health Care | | | 14.6 | % |
Industrials | | | 10.3 | % |
Information Technology | | | 12.0 | % |
Materials | | | 1.8 | % |
Warrants | | | 0.7 | % |
Exchange-Traded Funds | | | 1.3 | % |
Money Market Funds, Liabilities in Excess of Other Assets | | | 3.8 | % |
| | | | 100.0 | % |
AVE MARIA CATHOLIC VALUES FUND
SCHEDULE OF INVESTMENTS
| | | | | | |
| Consumer Discretionary — 24.9% | | | | | | |
| Auto Components — 1.0% | | | | | | |
Gentex Corporation | | | 75,000 | | | $ | 2,474,250 | |
| | | | | | | | | |
| Diversified Consumer Services — 2.2% | | | | | | | | |
Apollo Education Group, Inc. - Class A * | | | 200,000 | | | | 5,464,000 | |
| | | | | | | | | |
| Household Durables — 2.2% | | | | | | | | |
PulteGroup, Inc. | | | 160,000 | | | | 3,259,200 | |
Ryland Group, Inc. (The) | | | 50,000 | | | | 2,170,500 | |
| | | | | | | | 5,429,700 | |
| Specialty Retail — 14.0% | | | | | | | | |
Advance Auto Parts, Inc. | | | 60,000 | | | | 6,640,800 | |
Chico's FAS, Inc. | | | 475,000 | | | | 8,949,000 | |
GNC Holdings, Inc. - Class A | | | 175,000 | | | | 10,228,750 | |
Lowe's Companies, Inc. | | | 175,000 | | | | 8,671,250 | |
| | | | | | | | 34,489,800 | |
| Textiles, Apparel & Luxury Goods — 5.5% | | | | | | | | |
Coach, Inc. | | | 85,000 | | | | 4,771,050 | |
Crocs, Inc. * | | | 325,000 | | | | 5,174,000 | |
VF Corporation | | | 60,000 | | | | 3,740,400 | |
| | | | | | | | 13,685,450 | |
| Energy — 13.4% | | | | | | | | |
| Energy Equipment & Services — 3.1% | | | | | | | | |
Halliburton Company | | | 150,000 | | | | 7,612,500 | |
| | | | | | | | | |
| Oil, Gas & Consumable Fuels — 10.3% | | | | | | | | |
Anadarko Petroleum Corporation | | | 75,000 | | | | 5,949,000 | |
Devon Energy Corporation | | | 75,000 | | | | 4,640,250 | |
Phillips 66 | | | 110,000 | | | | 8,484,300 | |
Range Resources Corporation | | | 75,000 | | | | 6,323,250 | |
| | | | | | | | 25,396,800 | |
| Financials — 17.2% | | | | | | | | |
| Capital Markets — 3.2% | | | | | | | | |
Bank of New York Mellon Corporation (The) | | | 100,000 | | | | 3,494,000 | |
Federated Investors, Inc. - Class B | | | 150,000 | | | | 4,320,000 | |
| | | | | | | | 7,814,000 | |
| Commercial Banks — 4.1% | | | | | | | | |
PNC Financial Services Group, Inc. (The) | | | 65,000 | | | | 5,042,700 | |
U.S. Bancorp | | | 125,000 | | | | 5,050,000 | |
| | | | | | | | 10,092,700 | |
AVE MARIA CATHOLIC VALUES FUND
SCHEDULE OF INVESTMENTS
COMMON STOCKS — 94.2% (Continued) | | | | | | |
| Financials — 17.2% (Continued) | | | | | | |
| Diversified Financial Services — 3.6% | | | | | | |
MasterCard, Inc. - Class A | | | 2,500 | | | $ | 2,088,650 | |
Western Union Company (The) | | | 400,000 | | | | 6,900,000 | |
| | | | | | | | 8,988,650 | |
| Insurance — 5.2% | | | | | | | | |
Alleghany Corporation * | | | 10,000 | | | | 3,999,600 | |
Reinsurance Group of America, Inc. | | | 65,000 | | | | 5,031,650 | |
Unico American Corporation * # | | | 282,945 | | | | 3,749,021 | |
| | | | | | | | 12,780,271 | |
| Real Estate Management & Development — 1.1% | | | | | | | | |
Kennedy-Wilson Holdings, Inc. | | | 125,000 | | | | 2,781,250 | |
| | | | | | | | | |
| Health Care — 14.6% | | | | | | | | |
| Health Care Equipment & Supplies — 10.6% | | | | | | | | |
Covidien plc | | | 100,000 | | | | 6,810,000 | |
St. Jude Medical, Inc. | | | 100,000 | | | | 6,195,000 | |
Stryker Corporation | | | 120,000 | | | | 9,016,800 | |
Varian Medical Systems, Inc. * | | | 55,000 | | | | 4,272,950 | |
| | | | | | | | 26,294,750 | |
| Health Care Providers & Services — 1.7% | | | | | | | | |
Patterson Companies, Inc. | | | 100,000 | | | | 4,120,000 | |
| | | | | | | | | |
| Life Sciences Tools & Services — 1.0% | | | | | | | | |
Waters Corporation * | | | 25,000 | | | | 2,500,000 | |
| | | | | | | | | |
| Pharmaceuticals — 1.3% | | | | | | | | |
AbbVie, Inc. | | | 60,000 | | | | 3,168,600 | |
| | | | | | | | | |
| Industrials — 10.3% | | | | | | | | |
| Aerospace & Defense — 3.2% | | | | | | | | |
United Technologies Corporation | | | 70,000 | | | | 7,966,000 | |
| | | | | | | | | |
| Commercial Services & Supplies — 0.4% | | | | | | | | |
Genuine Parts Company | | | 10,000 | | | | 831,900 | |
| | | | | | | | | |
| Construction & Engineering — 3.3% | | | | | | | | |
Fluor Corporation | | | 100,000 | | | | 8,029,000 | |
| | | | | | | | | |
| Electrical Equipment — 1.2% | | | | | | | | |
General Cable Corporation | | | 100,000 | | | | 2,941,000 | |
AVE MARIA CATHOLIC VALUES FUND
SCHEDULE OF INVESTMENTS
COMMON STOCKS — 94.2% (Continued) | | | | | | |
| Industrials — 10.3% (Continued) | | | | | | |
| Machinery — 2.2% | | | | | | |
Caterpillar, Inc. | | | 35,000 | | | $ | 3,178,350 | |
Joy Global, Inc. | | | 40,000 | | | | 2,339,600 | |
| | | | | | | | 5,517,950 | |
| Information Technology — 12.0% | | | | | | | | |
| Computers & Peripherals — 5.9% | | | | | | | | |
EMC Corporation | | | 300,000 | | | | 7,545,000 | |
Hewlett-Packard Company | | | 250,000 | | | | 6,995,000 | |
| | | | | | | | 14,540,000 | |
| IT Services — 6.1% | | | | | | | | |
Accenture plc - Class A | | | 90,000 | | | | 7,399,800 | |
International Business Machines Corporation | | | 5,000 | | | | 937,850 | |
Teradata Corporation * | | | 150,000 | | | | 6,823,500 | |
| | | | | | | | 15,161,150 | |
| Materials — 1.8% | | | | | | | | |
| Chemicals — 1.8% | | | | | | | | |
FMC Corporation | | | 60,000 | | | | 4,527,600 | |
| | | | | | | | | |
Total Common Stocks (Cost $154,694,744) | | | | | | $ | 232,607,321 | |
| | | | | | |
| Financials — 0.7% | | | | | | |
| Commercial Banks — 0.7% | | | | | | |
PNC Financial Services Group, Inc. (The) * (Cost $1,699,852) | | | 100,000 | | | $ | 1,775,000 | |
EXCHANGE-TRADED FUNDS — 1.3% | | | | | | |
iShares Gold Trust * (Cost $4,769,042) | | | 275,000 | | | $ | 3,212,000 | |
AVE MARIA CATHOLIC VALUES FUND
SCHEDULE OF INVESTMENTS
MONEY MARKET FUNDS — 3.9% | | | | | | |
Federated Government Obligations Tax-Managed Fund - Institutional Shares, 0.01% (a) (Cost $9,503,240) | | | 9,503,240 | | | $ | 9,503,240 | |
| | | | | | | | | |
Total Investments at Market Value — 100.1% (Cost $170,666,878) | | | | | | $ | 247,097,561 | |
| | | | | | | | | |
Liabilities in Excess of Other Assets — (0.1%) | | | | | | | (296,567 | ) |
| | | | | | | | | |
Net Assets — 100.0% | | | | | | $ | 246,800,994 | |
| * | Non-income producing security. |
| | |
| # | The Fund owned 5% or more of the company's outstanding voting shares thereby making the company an affiliated company as that term is defined in the Investment Company Act of 1940 (Note 5). |
| | |
| (a) | The rate shown is the 7-day effective yield as of December 31, 2013. |
| |
| See notes to financial statements. |
AVE MARIA GROWTH FUND
PORTFOLIO MANAGER COMMENTARY
Dear Fellow Shareholders,
For 2013, the Ave Maria Growth Fund (the “Fund”) had a total return of 31.49% vs. 32.39% for the S&P 500 Index, the Fund’s benchmark index. It was a great year, the best since the inception of the Fund in 2003. That it occurred in an environment of insipid economic growth, divisive/dysfunctional Federal government and rising interest rates, made it all the more remarkable.
The strong performance in the portfolio was broadly based, but certain stocks made particularly strong contributions: Gilead Sciences, Inc. (pharmaceuticals), Polaris Industries, Inc. (recreational vehicles) and MasterCard, Inc. (electronic payments processor). At the other end of the performance spectrum was gold-related ETFs and Teradata Corporation (enterprise data warehousing).
Turnover in the portfolio was low for the year, 18%. When selecting individual stocks for the portfolio, it is with the idea of holding them for the indefinite future. The reality is that some turnover is necessary, the world does change, and when individual stocks reach our estimate of their intrinsic value, they get sold and replaced with stocks where the price to value relationship is more favorable.
The prospects for economic growth seem to be improving. Domestically, economic growth is finally picking up and other major economies are slowly improving. U.S. companies have been extracting more and more growth in earnings through expanding profit margins. Long-term earnings growth must come from a growing stream of revenue. Restoring healthy economic growth will be vital to preserving sustained earnings growth and reducing unemployment. Prospects for these things occurring appear better than they have for several years.
We appreciate your participation in the Ave Maria Growth Fund.
With best regards,
 |  |
| Richard L. Platte, Jr., CFA | George P. Schwartz, CFA |
| Co-Portfolio Manager | Co-Portfolio Manager |
AVE MARIA GROWTH FUND PERFORMANCE (Unaudited) |
| (a) | The returns shown do not reflect the deduction of taxes a shareholder would pay on Fund distributions or the redemption of Fund shares. |
| Expense ratio as of 12-31-12 (as disclosed in May 1, 2013 prospectus) | 1.51%* |
| Expense ratio for the year ended 12-31-13 | 1.43% |
| * | Includes Acquired Fund Fees and Expenses. |
Past performance is not predictive of future performance. Investment results and principal value will fluctuate so that shares, when redeemed, may be worth more or less than their original cost. Current performance may be higher or lower than the performance data quoted. Performance data, current to the most recent month end, is available at the Ave Maria Mutual Funds website at www.avemariafunds.com or by calling 1-888-726-9331.
AVE MARIA GROWTH FUND ANNUAL TOTAL RATES OF RETURN COMPARISON WITH MAJOR INDICES (Unaudited) |
| | |
2003(a) | 23.4% | 22.8% |
| 2004 | 21.5% | 10.9% |
| 2005 | 0.3% | 4.9% |
| 2006 | 15.8% | 15.8% |
| 2007 | 11.6% | 5.5% |
| 2008 | -32.1% | -37.0% |
| 2009 | 26.4% | 26.5% |
| 2010 | 26.5% | 15.1% |
| 2011 | 0.5% | 2.1% |
| 2012 | 14.7% | 16.0% |
| 2013 | 31.5% | 32.4% |
AVERAGE ANNUAL TOTAL RETURNS As of December 31, 2013 (Unaudited) |
| | |
| 3 Years | 14.9% | 16.2% |
| 5 Years | 19.4% | 17.9% |
| 10 Years | 10.0% | 7.4% |
Since Inception (b) | 11.5% | 9.0% |
| (a) | Represents the period from the commencement of operations (May 1, 2003) through December 31, 2003. |
| | |
| (b) | Represents the period from the commencement of operations (May 1, 2003) through December 31, 2013. |
AVE MARIA GROWTH FUND
TEN LARGEST EQUITY HOLDINGS
December 31, 2013 (Unaudited)
| | | | | | | | |
| | 170,000 | | Gilead Sciences, Inc. | | $ | 12,775,500 | | | | 4.5 | % |
| | 85,000 | | Polaris Industries, Inc. | | | 12,379,400 | | | | 4.3 | % |
| | 194,000 | | Toro Company (The) | | | 12,338,400 | | | | 4.3 | % |
| | 120,700 | | Cognizant Technology Solutions Corporation - Class A | | | 12,188,286 | | | | 4.3 | % |
| | 14,200 | | MasterCard, Inc. - Class A | | | 11,863,532 | | | | 4.2 | % |
| | 138,000 | | Ross Stores, Inc. | | | 10,340,340 | | | | 3.6 | % |
| | 336,250 | | Rollins, Inc. | | | 10,185,013 | | | | 3.6 | % |
| | 192,600 | | AMETEK, Inc. | | | 10,144,242 | | | | 3.6 | % |
| | 111,700 | | Amphenol Corporation - Class A | | | 9,961,406 | | | | 3.5 | % |
| | 29,500 | | NewMarket Corporation | | | 9,857,425 | | | | 3.4 | % |
ASSET ALLOCATION (Unaudited)
| | |
Consumer Discretionary | | | 17.2 | % |
Consumer Staples | | | 4.3 | % |
Energy | | | 2.0 | % |
Financials | | | 5.1 | % |
Health Care | | | 21.5 | % |
Industrials | | | 28.1 | % |
Information Technology | | | 14.0 | % |
Materials | | | 3.4 | % |
Money Market Funds, Liabilities in Excess of Other Assets | | | 4.4 | % |
| | | | 100.0 | % |
AVE MARIA GROWTH FUND
SCHEDULE OF INVESTMENTS
| | | | | | |
| Consumer Discretionary — 17.2% | | | | | | |
| Hotels, Restaurants & Leisure — 3.1% | | | | | | |
Cracker Barrel Old Country Store, Inc. | | | 80,000 | | | $ | 8,805,600 | |
| | | | | | | | | |
| Leisure Equipment & Products — 4.3% | | | | | | | | |
Polaris Industries, Inc. | | | 85,000 | | | | 12,379,400 | |
| | | | | | | | | |
| Specialty Retail — 6.9% | | | | | | | | |
Buckle, Inc. (The) | | | 140,000 | | | | 7,358,400 | |
O'Reilly Automotive, Inc. * | | | 15,000 | | | | 1,930,650 | |
Ross Stores, Inc. | | | 138,000 | | | | 10,340,340 | |
| | | | | | | | 19,629,390 | |
| Textiles, Apparel & Luxury Goods — 2.9% | | | | | | | | |
Coach, Inc. | | | 145,000 | | | | 8,138,850 | |
| | | | | | | | | |
| Consumer Staples — 4.3% | | | | | | | | |
| Food Products — 4.3% | | | | | | | | |
Kellogg Company | | | 64,500 | | | | 3,939,015 | |
McCormick & Company, Inc. | | | 122,200 | | | | 8,422,024 | |
| | | | | | | | 12,361,039 | |
| Energy — 2.0% | | | | | | | | |
| Oil, Gas & Consumable Fuels — 2.0% | | | | | | | | |
Occidental Petroleum Corporation | | | 60,000 | | | | 5,706,000 | |
| | | | | | | | | |
| Financials — 5.1% | | | | | | | | |
| Capital Markets — 0.9% | | | | | | | | |
SEI Investments Company | | | 74,800 | | | | 2,597,804 | |
| | | | | | | | | |
| Diversified Financial Services — 4.2% | | | | | | | | |
MasterCard, Inc. - Class A | | | 14,200 | | | | 11,863,532 | |
| | | | | | | | | |
| Health Care — 21.5% | | | | | | | | |
| Biotechnology — 7.4% | | | | | | | | |
Amgen, Inc. | | | 73,000 | | | | 8,333,680 | |
Gilead Sciences, Inc. * | | | 170,000 | | | | 12,775,500 | |
| | | | | | | | 21,109,180 | |
| Health Care Equipment & Supplies — 12.1% | | | | | | | | |
C.R. Bard, Inc. | | | 70,000 | | | | 9,375,800 | |
Medtronic, Inc. | | | 148,400 | | | | 8,516,676 | |
Stryker Corporation | | | 106,500 | | | | 8,002,410 | |
Varian Medical Systems, Inc. * | | | 112,000 | | | | 8,701,280 | |
| | | | | | | | 34,596,166 | |
AVE MARIA GROWTH FUND
SCHEDULE OF INVESTMENTS
COMMON STOCKS — 95.6% (Continued) | | | | | | |
| Health Care — 21.5% (Continued) | | | | | | |
| Health Care Providers & Services — 1.9% | | | | | | |
| Laboratory Corporation of America Holdings * | | | 57,500 | | | $ | 5,253,775 | |
| | | | | | | | | |
| Life Sciences Tools & Services — 0.1% | | | | | | | | |
Mettler-Toledo International, Inc. * | | | 1,000 | | | | 242,590 | |
| | | | | | | | | |
| Industrials — 28.1% | | | | | | | | |
| Aerospace & Defense — 1.5% | | | | | | | | |
Precision Castparts Corporation | | | 15,500 | | | | 4,174,150 | |
| | | | | | | | | |
| Air Freight & Logistics — 2.1% | | | | | | | | |
C.H. Robinson Worldwide, Inc. | | | 85,000 | | | | 4,958,900 | |
Expeditors International of Washington, Inc. | | | 24,200 | | | | 1,070,850 | |
| | | | | | | | 6,029,750 | |
| Commercial Services & Supplies — 6.6% | | | | | | | | |
Copart, Inc. * | | | 240,000 | | | | 8,796,000 | |
Rollins, Inc. | | | 336,250 | | | | 10,185,013 | |
| | | | | | | | 18,981,013 | |
| Electrical Equipment — 3.6% | | | | | | | | |
AMETEK, Inc. | | | 192,600 | | | | 10,144,242 | |
| | | | | | | | | |
| Industrial Conglomerates — 2.7% | | | | | | | | |
Danaher Corporation | | | 101,500 | | | | 7,835,800 | |
| | | | | | | | | |
| Machinery — 11.6% | | | | | | | | |
Donaldson Company, Inc. | | | 122,800 | | | | 5,336,888 | |
Flowserve Corporation | | | 75,000 | | | | 5,912,250 | |
Graco, Inc. | | | 120,000 | | | | 9,374,400 | |
Toro Company (The) | | | 194,000 | | | | 12,338,400 | |
| | | | | | | | 32,961,938 | |
| Information Technology — 14.0% | | | | | | | | |
| Electronic Equipment, Instruments & Components — 3.5% | | | | | | | | |
Amphenol Corporation - Class A | | | 111,700 | | | | 9,961,406 | |
| | | | | | | | | |
| IT Services — 8.9% | | | | | | | | |
Accenture plc - Class A | | | 109,400 | | | | 8,994,868 | |
Cognizant Technology Solutions Corporation - Class A * | | | 120,700 | | | | 12,188,286 | |
Teradata Corporation * | | | 95,000 | | | | 4,321,550 | |
| | | | | | | | 25,504,704 | |
AVE MARIA GROWTH FUND
SCHEDULE OF INVESTMENTS
COMMON STOCKS — 95.6% (Continued) | | | | | | |
| Information Technology — 14.0% (Continued) | | | | | | |
| Semiconductors & Semiconductor Equipment — 1.6% | | | | | | |
Altera Corporation | | | 140,000 | | | $ | 4,554,200 | |
| | | | | | | | | |
| Materials — 3.4% | | | | | | | | |
| Chemicals — 3.4% | | | | | | | | |
NewMarket Corporation | | | 29,500 | | | | 9,857,425 | |
| | | | | | | | | |
Total Common Stocks (Cost $152,992,525) | | | | | | $ | 272,687,954 | |
MONEY MARKET FUNDS — 4.4% | | | | | | |
Federated Government Obligations Tax-Managed Fund - Institutional Shares, 0.01% (a) (Cost $12,459,051) | | | 12,459,051 | | | $ | 12,459,051 | |
| | | | | | | | | |
Total Investments at Market Value — 100.0% (Cost $165,451,576) | | | | | | $ | 285,147,005 | |
| | | | | | | | | |
Liabilities in Excess of Other Assets — (0.0%) (b) | | | | | | | (14,531 | ) |
| | | | | | | | | |
Net Assets — 100.0% | | | | | | $ | 285,132,474 | |
| * | Non-income producing security. |
| | |
| (a) | The rate shown is the 7-day effective yield as of December 31, 2013. |
| | |
| (b) | Percentage rounds to greater than (0.1%). |
| |
| See notes to financial statements. |
AVE MARIA RISING DIVIDEND FUND
PORTFOLIO MANAGER COMMENTARY
Dear Fellow Shareholders:
The Ave Maria Rising Dividend Fund (the “Fund”) had a total return of 33.85% in 2013 versus 32.39% for the S&P 500 Index. It was an incredible year and easily the best for the Fund since its inception in May of 2005. What makes 2013 all the more incredible is the environment in which it occurred. Economic growth continued to plod, Washington continued to dysfunction, the Federal debt continued to explode, the Middle East remained highly volatile and interest rates rose during the year.
Positive performance came from Gentex Corporation (automotive supply); Johnson Controls, Inc. (automotive supply/building efficiency/batteries); and St. Jude Medical, Inc. (cardiovascular medical devices). At the other end of the performance spectrum was Weight Watchers International, Inc. (weight control programs) and gold-related ETFs.
Turnover in the portfolio was low during the year, 14%. While we strive to keep turnover as low as makes good investment sense, a year such as 2013, when some stocks were up as much 80% while others were either down slightly or only up modestly, would suggest that the relationship of stock price to value has been altered significantly for a good many stocks. As a result, we expect turnover to be higher in 2014.
In previous reports, we have commented upon what we look for in selecting stocks for the portfolio. In this report, we will comment upon the three sets of circumstances that would cause us to sell a stock. The first is when one of our companies changes its practices in such a manner as to violate one of the moral screens established by our Catholic Advisory Board.The second set of circumstances is when the stock price reaches our estimate of the intrinsic value of the company. Decisions under these circumstances are complicated by the fact that the intrinsic value of these companies held in the portfolio may continue to compound year after year. With all portfolio holdings we take a 3 to 5-year investment outlook, and we expect the prices in 3 to 5 years to be substantially greater than the original purchase price. The final set of circumstances which would trigger a sale of a stock is when those factors which allow a company to earn above-average internal returns begin to deteriorate. The world doesn’t change overnight, but it does change and it’s important to recognize that. Eastman Kodak dominated the market for photographic film until digital photography. Who remembers “Avon calling”? That sales model faltered when the majority of women started working outside of the home. Borders Book Stores with its fancy stores and large inventory was no match for Amazon’s on-line ordering system and heavily discounted prices. And who
AVE MARIA RISING DIVIDEND FUND
PORTFOLIO MANAGER COMMENTARY
knows what digital text books will do to the academic publishing companies. When we determine that a company’s problems are more than temporary, the stock is sold.
2013 was a good year in the stock market, and it seems doubtful that 2014 will be as good. The portfolio is comprised of what we consider to be exceptional companies that will continue to execute their business plans in a disciplined fashion.
We appreciate your participation in the Ave Maria Rising Dividend Fund.
With best regards,
 |  |
| Richard L. Platte, Jr., CFA | George P. Schwartz, CFA |
| Co-Portfolio Manager | Co-Portfolio Manager |
AVE MARIA RISING DIVIDEND FUND PERFORMANCE (Unaudited) |
| (a) | The returns shown do not reflect the deduction of taxes a shareholder would pay on Fund distributions or the redemption of Fund shares. |
| | |
| (b) | Represents the period from the commencement of operations (May 2, 2005) through December 31, 2013. |
| Expense ratio as of 12-31-12 (as disclosed in May 1, 2013 prospectus) | 1.00%* |
| Expense ratio for the year ended 12-31-13 | 0.97% |
| * | Includes Acquired Fund Fees and Expenses. |
Past performance is not predictive of future performance. Investment results and principal value will fluctuate so that shares, when redeemed, may be worth more or less than their original cost. Current performance may be higher or lower than the performance data quoted. Performance data, current to the most recent month end, is available at the Ave Maria Mutual Funds website at www.avemariafunds.com or by calling 1-888-726-9331.
AVE MARIA RISING DIVIDEND FUND ANNUAL TOTAL RATES OF RETURN COMPARISON WITH MAJOR INDICES (Unaudited) |
| AVE MARIA RISING DIVIDEND FUND | |
2005(a) | 6.7% | 8.8% |
| 2006 | 17.9% | 15.8% |
| 2007 | -0.6% | 5.5% |
| 2008 | -22.8% | -37.0% |
| 2009 | 25.3% | 26.5% |
| 2010 | 17.9% | 15.1% |
| 2011 | 4.6% | 2.1% |
| 2012 | 13.9% | 16.0% |
| 2013 | 33.9% | 32.4% |
AVERAGE ANNUAL TOTAL RETURNS As of December 31, 2013 (Unaudited) |
| AVE MARIA RISING DIVIDEND FUND | |
| 3 Years | 16.8% | 16.2% |
| 5 Years | 18.7% | 17.9% |
Since Inception (b) | 10.0% | 7.8% |
| (a) | Represents the period from the commencement of operations (May 2, 2005) through December 31, 2005. |
| | |
| (b) | Represents the period from the commencement of operations (May 2, 2005) through December 31, 2013. |
AVE MARIA RISING DIVIDEND FUND
TEN LARGEST EQUITY HOLDINGS
December 31, 2013 (Unaudited)
| | | | | | | | |
| | 240,000 | | Caterpillar, Inc. | | $ | 21,794,400 | | | | 3.1 | % |
| | 600,000 | | Sysco Corporation | | | 21,660,000 | | | | 3.0 | % |
| | 820,000 | | Intel Corporation | | | 21,287,200 | | | | 3.0 | % |
| | 310,000 | | Covidien plc | | | 21,111,000 | | | | 3.0 | % |
| | 510,000 | | Coca-Cola Company (The) | | | 21,068,100 | | | | 3.0 | % |
| | 360,000 | | Franklin Resources, Inc. | | | 20,782,800 | | | | 2.9 | % |
| | 365,000 | | Coach, Inc. | | | 20,487,450 | | | | 2.9 | % |
| | 220,000 | | Norfolk Southern Corporation | | | 20,422,600 | | | | 2.9 | % |
| | 575,000 | | Bank of NewYork Mellon Corporation (The) | | | 20,090,500 | | | | 2.8 | % |
| | 190,000 | | United Parcel Service, Inc. - Class B | | | 19,965,200 | | | | 2.8 | % |
ASSET ALLOCATION (Unaudited)
| | |
Consumer Discretionary | | | 14.3 | % |
Consumer Staples | | | 10.3 | % |
Energy | | | 8.3 | % |
Financials | | | 13.0 | % |
Health Care | | | 8.4 | % |
Industrials | | | 25.2 | % |
Information Technology | | | 10.9 | % |
Materials | | | 1.5 | % |
Warrants | | | 0.5 | % |
Exchange-Traded Funds | | | 0.8 | % |
Money Market Funds, Other Assets in Excess of Liabilities | | | 6.8 | % |
| | | | 100.0 | % |
AVE MARIA RISING DIVIDEND FUND
SCHEDULE OF INVESTMENTS
| | | | | | |
| Consumer Discretionary — 14.3% | | | | | | |
| Auto Components — 5.4% | | | | | | |
Gentex Corporation | | | 600,000 | | | $ | 19,794,000 | |
Johnson Controls, Inc. | | | 360,000 | | | | 18,468,000 | |
| | | | | | | | 38,262,000 | |
| Leisure Equipment & Products — 2.2% | | | | | | | | |
Hasbro, Inc. | | | 280,000 | | | | 15,402,800 | |
| | | | | | | | | |
| Specialty Retail — 3.8% | | | | | | | | |
Lowe's Companies, Inc. | | | 275,000 | | | | 13,626,250 | |
Ross Stores, Inc. | | | 180,000 | | | | 13,487,400 | |
| | | | | | | | 27,113,650 | |
| Textiles, Apparel & Luxury Goods — 2.9% | | | | | | | | |
Coach, Inc. | | | 365,000 | | | | 20,487,450 | |
| | | | | | | | | |
| Consumer Staples — 10.3% | | | | | | | | |
| Beverages — 3.0% | | | | | | | | |
Coca-Cola Company (The) | | | 510,000 | | | | 21,068,100 | |
| | | | | | | | | |
| Food & Staples Retailing — 3.0% | | | | | | | | |
Sysco Corporation | | | 600,000 | | | | 21,660,000 | |
| | | | | | | | | |
| Food Products — 1.4% | | | | | | | | |
Kellogg Company | | | 160,000 | | | | 9,771,200 | |
| | | | | | | | | |
| Household Products — 2.9% | | | | | | | | |
Clorox Company (The) | | | 150,000 | | | | 13,914,000 | |
Colgate-Palmolive Company | | | 100,000 | | | | 6,521,000 | |
| | | | | | | | 20,435,000 | |
| Energy — 8.3% | | | | | | | | |
| Energy Equipment & Services — 4.8% | | | | | | | | |
Halliburton Company | | | 290,000 | | | | 14,717,500 | |
Schlumberger Limited | | | 215,000 | | | | 19,373,650 | |
| | | | | | | | 34,091,150 | |
| Oil, Gas & Consumable Fuels — 3.5% | | | | | | | | |
ConocoPhillips | | | 90,000 | | | | 6,358,500 | |
Exxon Mobil Corporation | | | 185,000 | | | | 18,722,000 | |
| | | | | | | | 25,080,500 | |
| Financials — 13.0% | | | | | | | | |
| Capital Markets — 5.7% | | | | | | | | |
Bank of New York Mellon Corporation (The) | | | 575,000 | | | | 20,090,500 | |
Franklin Resources, Inc. | | | 360,000 | | | | 20,782,800 | |
| | | | | | | | 40,873,300 | |
AVE MARIA RISING DIVIDEND FUND
SCHEDULE OF INVESTMENTS
COMMON STOCKS — 91.9% (Continued) | | | | | | |
| Financials — 13.0% (Continued) | | | | | | |
| Commercial Banks — 6.4% | | | | | | |
BB&T Corporation | | | 425,000 | | | $ | 15,861,000 | |
PNC Financial Services Group, Inc. (The) | | | 144,100 | | | | 11,179,278 | |
U.S. Bancorp | | | 450,000 | | | | 18,180,000 | |
| | | | | | | | 45,220,278 | |
| Insurance — 0.9% | | | | | | | | |
HCC Insurance Holdings, Inc. | | | 140,000 | | | | 6,459,600 | |
| | | | | | | | | |
| Health Care — 8.4% | | | | | | | | |
| Health Care Equipment & Supplies — 8.4% | | | | | | | | |
Covidien plc | | | 310,000 | | | | 21,111,000 | |
Medtronic, Inc. | | | 185,000 | | | | 10,617,150 | |
St. Jude Medical, Inc. | | | 265,000 | | | | 16,416,750 | |
Stryker Corporation | | | 150,000 | | | | 11,271,000 | |
| | | | | | | | 59,415,900 | |
| Industrials — 25.2% | | | | | | | | |
| Aerospace & Defense — 3.0% | | | | | | | | |
General Dynamics Corporation | | | 125,000 | | | | 11,943,750 | |
United Technologies Corporation | | | 82,500 | | | | 9,388,500 | |
| | | | | | | | 21,332,250 | |
| Air Freight & Logistics — 5.5% | | | | | | | | |
C.H. Robinson Worldwide, Inc. | | | 335,000 | | | | 19,543,900 | |
United Parcel Service, Inc. - Class B | | | 190,000 | | | | 19,965,200 | |
| | | | | | | | 39,509,100 | |
| Commercial Services & Supplies — 0.9% | | | | | | | | |
Republic Services, Inc. | | | 190,000 | | | | 6,308,000 | |
| | | | | | | | | |
| Electrical Equipment — 2.4% | | | | | | | | |
Emerson Electric Company | | | 240,000 | | | | 16,843,200 | |
| | | | | | | | | |
| Industrial Conglomerates — 1.9% | | | | | | | | |
3M Company | | | 95,000 | | | | 13,323,750 | |
| | | | | | | | | |
| Machinery — 8.6% | | | | | | | | |
Caterpillar, Inc. | | | 240,000 | | | | 21,794,400 | |
Dover Corporation | | | 165,000 | | | | 15,929,100 | |
Illinois Tool Works, Inc. | | | 160,000 | | | | 13,452,800 | |
PACCAR, Inc. | | | 165,000 | | | | 9,763,050 | |
| | | | | | | | 60,939,350 | |
| Road & Rail — 2.9% | | | | | | | | |
Norfolk Southern Corporation | | | 220,000 | | | | 20,422,600 | |
AVE MARIA RISING DIVIDEND FUND
SCHEDULE OF INVESTMENTS
COMMON STOCKS — 91.9% (Continued) | | | | | | |
| Information Technology — 10.9% | | | | | | |
| Communications Equipment — 2.5% | | | | | | |
QUALCOMM, Incorporated | | | 240,000 | | | $ | 17,820,000 | |
| | | | | | | | | |
| Computers & Peripherals — 1.5% | | | | | | | | |
Diebold, Incorporated | | | 320,000 | | | | 10,563,200 | |
| | | | | | | | | |
| IT Services — 1.6% | | | | | | | | |
Paychex, Inc. | | | 250,000 | | | | 11,382,500 | |
| | | | | | | | | |
| Semiconductors & Semiconductor Equipment — 5.3% | | | | | | | | |
Intel Corporation | | | 820,000 | | | | 21,287,200 | |
Microchip Technology, Inc. | | | 370,000 | | | | 16,557,500 | |
| | | | | | | | 37,844,700 | |
| Materials — 1.5% | | | | | | | | |
| Chemicals — 1.5% | | | | | | | | |
RPM International, Inc. | | | 140,000 | | | | 5,811,400 | |
Stepan Company | | | 80,000 | | | | 5,250,400 | |
| | | | | | | | 11,061,800 | |
| | | | | | | | | |
Total Common Stocks (Cost $498,680,928) | | | | | | $ | 652,691,378 | |
| | | | | | |
| Financials — 0.5% | | | | | | |
| Commercial Banks — 0.5% | | | | | | |
PNC Financial Services Group, Inc. (The) * (Cost $3,196,575) | | | 189,892 | | | $ | 3,370,583 | |
EXCHANGE-TRADED FUNDS — 0.8% | | | | | | |
iShares Gold Trust * (Cost $7,979,700) | | | 465,000 | | | $ | 5,431,200 | |
AVE MARIA RISING DIVIDEND FUND
SCHEDULE OF INVESTMENTS
MONEY MARKET FUNDS — 6.7% | | | | | | |
Federated Government Obligations Tax-Managed Fund - Institutional Shares, 0.01% (a) | | | 33,820,606 | | | $ | 33,820,606 | |
Federated Treasury Obligations Fund - Institutional Shares, 0.01% (a) | | | 13,814,407 | | | | 13,814,407 | |
Total Money Market Funds (Cost $47,635,013) | | | | | | $ | 47,635,013 | |
| | | | | | | | | |
Total Investments at Market Value — 99.9% (Cost $557,492,216) | | | | | | $ | 709,128,174 | |
| | | | | | | | | |
Other Assets in Excess of Liabilities — 0.1% | | | | | | | 1,021,885 | |
| | | | | | | | | |
Net Assets — 100.0% | | | | | | $ | 710,150,059 | |
| * | Non-income producing security. |
| | |
| (a) | The rate shown is the 7-day effective yield as of December 31, 2013. |
| | |
| See notes to financial statements. |
AVE MARIA OPPORTUNITY FUND
PORTFOLIO MANAGER COMMENTARY
Dear Fellow Shareowner:
Ave Maria Opportunity Fund (the “Fund”) had another good year in 2013, up 26.48%. Stocks generally advanced during the year with all the major indices posting gains. The top performing S&P 500 Index (the “S&P 500”) sectors were the cyclical, economically sensitive, and growth-oriented stocks, with discretionary (+43%), health care (+42%) and industrials (+41%) leading the way. By comparison, defensive sectors such as consumer staples (+26%), utilities (13%) and telecommunications (11%) were laggards. In many respects, 2013 was a repeat of 2012. Stock prices rose across the board, with lower-quality issues performing best. For the second year in a row, speculative micro-caps were the biggest gainers. And with those stocks soaring, our disciplined, value-conscious investment strategy that seeks to mitigate risk lagged the benchmark. The Fund’s 1, 3 and 5-year performance figures compared to the Russell 2000 Index, its benchmark index are as follows:
| | Average Annual Total Returns For Periods Ended 12/31/13 |
| | 1 Year | 3 Years | 5 Years |
| Ave Maria Opportunity Fund | 26.48% | 9.97% | 17.41% |
| Russell 2000 Index | 38.82% | 15.67% | 20.08% |
Several portfolio holdings appreciated substantially during the year. Biglari Holdings, Inc., initially purchased in mid-2013, has been a big winner, up 40%. The company operates the Steak ‘n Shake and Western Sizzlin restaurant chains. Despite the higher share price, due to improving fundamentals of the underlying business, we believe Biglari retains significant value not yet recognized by the marketplace. Other large holdings in the Fund that had a positive impact on performance during 2013 included Apollo Education Group, Inc. (education services), Avnet, Inc. (electronics distribution), Cimarex Energy Company (oil & gas exploration/production), and Conrad Industries, Inc. (ship building). The Fund’s gold-related positions detracted from performance in 2013, including mining stocks Pan American Silver Corporation and Kinross Gold Corporation.
At December 31, 2013 the Fund held the common stocks of 59 companies, with an average market capitalization of $2.1 billion and an average P/E of 13x based on forward earnings. By comparison, the average P/E of the Russell 2000 Index was nearly 30x based on forward earnings. During the second half of the year, we sold the following six holdings from the portfolio as their share prices neared our estimate of intrinsic value: Chesapeake Energy Corporation, Energizer Holdings, Inc., ManTech International Corporation, Spirit AeroSystems Holdings, Inc., Sparton Corporation, and The St. Joe
AVE MARIA OPPORTUNITY FUND
PORTFOLIO MANAGER COMMENTARY
Company. Also eliminated from the Fund due to deteriorating operating results were Weight Watchers International, Inc., Forest Oil Corporation, and Systemax, Inc. Two new companies recently added to the portfolio include Lindsay Corporation and Nordion, Inc.
| | • | Lindsay Corporation (LNN) – Lindsay is a $1.1 billion manufacturer of mechanized irrigation systems for the global farming industry. Owing to its strong brand name and entrenched market position, the company has a long history of rising sales and earnings. Due to a drop in corn prices last year, the share price languished allowing for an attractive entry point. |
| | • | Nordion, Inc. (NDZ) – Nordion is a global health science company that provides medical isotopes and sterilization technologies for the medical products and food industries. The company enjoys a dominant market position and generates stable cash flows with a high return on invested capital. The balance sheet is cash-rich and debt-free. |
The year-end distribution of $.3109 per share consisted of long-term capital gains and was paid on December 30, 2013. The Fund ended the year with a net asset value of $14.08 per share.
Thank you for being a shareholder in the Ave Maria Opportunity Fund.
With best regards,
Timothy S. Schwartz, CFA
Portfolio Manager
AVE MARIA OPPORTUNITY FUND PERFORMANCE (Unaudited) |
| (a) | The returns shown do not reflect the deduction of taxes a shareholder would pay on Fund distributions or the redemption of Fund shares. |
| | |
| (b) | Represents the period from the commencement of operations (May 1, 2006) through December 31, 2013. |
Expense Ratio information as of: | Year Ended 12-31-12 (as disclosed in May 1, 2013 prospectus) | |
| Gross | 1.46%* | 1.40% |
| Net | 1.28%* | 1.25% |
| * | Includes Acquired Fund Fees and Expenses. |
Past performance is not predictive of future performance. Investment results and principal value will fluctuate so that shares, when redeemed, may be worth more or less than their original cost. Current performance may be higher or lower than the performance data quoted. Performance data, current to the most recent month end, is available at the Ave Maria Mutual Funds website at www.avemariafunds.com or by calling 1-888-726-9331.
AVE MARIA OPPORTUNITY FUND ANNUAL TOTAL RATES OF RETURN COMPARISON WITH MAJOR INDICES (Unaudited) |
| AVE MARIA OPPORTUNITY FUND | | |
2006(a) | 8.3% | 4.4% | 2.2% |
| 2007 | -8.5% | -1.6% | -0.3% |
| 2008 | -32.2% | -33.8% | -31.1% |
| 2009 | 40.8% | 27.2% | 25.6% |
| 2010 | 19.2% | 26.9% | 26.3% |
| 2011 | 1.3% | -4.2% | 1.0% |
| 2012 | 3.8% | 16.4% | 16.3% |
| 2013 | 26.5% | 38.8% | 41.3% |
AVERAGE ANNUAL TOTAL RETURNS As of December 31, 2013 (Unaudited) |
| AVE MARIA OPPORTUNITY FUND | | |
| 3 Years | 10.0% | 15.7% | 18.4% |
| 5 Years | 17.4% | 20.1% | 21.4% |
Since Inception (b) | 5.4% | 7.2% | 8.4% |
| (a) | Represents the period from the commencement of operations (May 1, 2006) through December 31, 2006. |
| | |
| (b) | Represents the period from the commencement of operations (May 1, 2006) through December 31, 2013. |
AVE MARIA OPPORTUNITY FUND
TEN LARGEST EQUITY HOLDINGS
December 31, 2013 (Unaudited)
| | | | | | | | |
| | 40,000 | | Outerwall, Inc. | | $ | 2,690,800 | | | | 5.2 | % |
| | 4,896 | | Biglari Holdings, Inc. | | | 2,480,509 | | | | 4.8 | % |
| | 50,000 | | Avnet, Inc. | | | 2,205,500 | | | | 4.3 | % |
| | 55,000 | | Apollo Education Group, Inc. - Class A | | | 1,502,600 | | | | 2.9 | % |
| | 40,543 | | Conrad Industries, Inc. | | | 1,496,848 | | | | 2.9 | % |
| | 50,000 | | Ultratech, Inc. | | | 1,450,000 | | | | 2.8 | % |
| | 30,000 | | Rosetta Resources, Inc. | | | 1,441,200 | | | | 2.8 | % |
| | 80,000 | | Horsehead Holding Corporation | | | 1,296,800 | | | | 2.5 | % |
| | 3,036 | | Alleghany Corporation | | | 1,214,279 | | | | 2.3 | % |
| | 100,000 | | Pan American Silver Corporation | | | 1,170,000 | | | | 2.3 | % |
ASSET ALLOCATION (Unaudited)
| | |
Consumer Discretionary | | | 19.0 | % |
Energy | | | 15.0 | % |
Financials | | | 13.3 | % |
Health Care | | | 1.7 | % |
Industrials | | | 7.9 | % |
Information Technology | | | 19.0 | % |
Materials | | | 7.3 | % |
Rights | | | 0.0 | %(a) |
Exchange-Traded Funds | | | 0.9 | % |
Money Market Funds, Liabilities in Excess of Other Assets | | | 15.9 | % |
| | | | 100.0 | % |
| (a) | Percentage rounds to less than 0.1%. |
AVE MARIA OPPORTUNITY FUND
SCHEDULE OF INVESTMENTS
| | | | | | |
| Consumer Discretionary — 19.0% | | | | | | |
| Diversified Consumer Services — 10.2% | | | | | | |
Apollo Education Group, Inc. - Class A * | | | 55,000 | | | $ | 1,502,600 | |
DeVry Education Group, Inc. | | | 15,000 | | | | 532,500 | |
Matthews International Corporation - Class A | | | 12,500 | | | | 532,625 | |
Outerwall, Inc. * | | | 40,000 | | | | 2,690,800 | |
| | | | | | | | 5,258,525 | |
| Hotels, Restaurants & Leisure — 4.8% | | | | | | | | |
Biglari Holdings, Inc. * | | | 4,896 | | | | 2,480,509 | |
| | | | | | | | | |
| Specialty Retail — 2.9% | | | | | | | | |
Jos. A. Bank Clothiers, Inc. * | | | 8,000 | | | | 437,840 | |
Rent-A-Center, Inc. | | | 25,000 | | | | 833,500 | |
Signet Jewelers Ltd. | | | 3,000 | | | | 236,100 | |
| | | | | | | | 1,507,440 | |
| Textiles, Apparel & Luxury Goods — 1.1% | | | | | | | | |
Crocs, Inc. * | | | 15,000 | | | | 238,800 | |
Iconix Brand Group, Inc. * | | | 8,000 | | | | 317,600 | |
| | | | | | | | 556,400 | |
| Energy — 15.0% | | | | | | | | |
| Energy Equipment & Services — 5.6% | | | | | | | | |
Atwood Oceanics, Inc. * | | | 6,000 | | | | 320,340 | |
CARBO Ceramics, Inc. | | | 5,000 | | | | 582,650 | |
Ensco plc - Class A | | | 10,000 | | | | 571,800 | |
Helmerich & Payne, Inc. | | | 4,000 | | | | 336,320 | |
Patterson-UTI Energy, Inc. | | | 22,000 | | | | 557,040 | |
Rowan Companies plc - Class A * | | | 15,000 | | | | 530,400 | |
| | | | | | | | 2,898,550 | |
| Oil, Gas & Consumable Fuels — 9.4% | | | | | | | | |
Cimarex Energy Company | | | 9,000 | | | | 944,190 | |
Cloud Peak Energy, Inc. * | | | 40,000 | | | | 720,000 | |
EXCO Resources, Inc. | | | 100,000 | | | | 531,000 | |
Newfield Exploration Company * | | | 15,000 | | | | 369,450 | |
Rosetta Resources, Inc. * | | | 30,000 | | | | 1,441,200 | |
SM Energy Company | | | 5,000 | | | | 415,550 | |
World Fuel Services Corporation | | | 10,000 | | | | 431,600 | |
| | | | | | | | 4,852,990 | |
| Financials — 13.3% | | | | | | | | |
| Capital Markets — 1.4% | | | | | | | | |
Federated Investors, Inc. - Class B | | | 25,000 | | | | 720,000 | |
AVE MARIA OPPORTUNITY FUND
SCHEDULE OF INVESTMENTS
COMMON STOCKS — 83.2% (Continued) | | | | | | |
| Financials — 13.3% (Continued) | | | | | | |
| Diversified Financial Services — 4.7% | | | | | | |
Leucadia National Corporation | | | 33,000 | | | $ | 935,220 | |
PICO Holdings, Inc. * | | | 35,000 | | | | 808,850 | |
Western Union Company (The) | | | 40,000 | | | | 690,000 | |
| | | | | | | | 2,434,070 | |
| Insurance — 4.7% | | | | | | | | |
Alleghany Corporation * | | | 3,036 | | | | 1,214,279 | |
Markel Corporation * | | | 500 | | | | 290,175 | |
White Mountains Insurance Group Ltd. | | | 1,500 | | | | 904,620 | |
| | | | | | | | 2,409,074 | |
| Thrifts & Mortgage Finance — 2.5% | | | | | | | | |
FedFirst Financial Corporation | | | 17,020 | | | | 338,698 | |
Oritani Financial Corporation | | | 30,000 | | | | 481,500 | |
Standard Financial Corporation | | | 10,000 | | | | 187,000 | |
ViewPoint Financial Group, Inc. | | | 10,981 | | | | 301,428 | |
| | | | | | | | 1,308,626 | |
| Health Care — 1.7% | | | | | | | | |
| Health Care Equipment & Supplies — 1.2% | | | | | | | | |
Atrion Corporation | | | 2,000 | | | | 592,500 | |
| | | | | | | | | |
| Life Sciences Tools & Services — 0.5% | | | | | | | | |
Nordion, Inc. * | | | 31,193 | | | | 264,829 | |
| | | | | | | | | |
| Industrials — 7.9% | | | | | | | | |
| Aerospace & Defense — 0.9% | | | | | | | | |
Alliant Techsystems, Inc. | | | 1,000 | | | | 121,680 | |
Cubic Corporation | | | 6,000 | | | | 315,960 | |
| | | | | | | | 437,640 | |
| Commercial Services & Supplies — 1.3% | | | | | | | | |
Hudson Technologies, Inc. * | | | 180,000 | | | | 666,000 | |
| | | | | | | | | |
| Construction & Engineering — 1.2% | | | | | | | | |
EMCOR Group, Inc. | | | 15,000 | | | | 636,600 | |
| | | | | | | | | |
| Machinery — 4.5% | | | | | | | | |
Conrad Industries, Inc. | | | 40,543 | | | | 1,496,848 | |
Lindsay Corporation | | | 10,000 | | | | 827,500 | |
| | | | | | | | 2,324,348 | |
| Information Technology — 19.0% | | | | | | | | |
| Communications Equipment — 1.3% | | | | | | | | |
ADTRAN, Inc. | | | 25,000 | | | | 675,250 | |
AVE MARIA OPPORTUNITY FUND
SCHEDULE OF INVESTMENTS
COMMON STOCKS — 83.2% (Continued) | | | | | | |
| Information Technology — 19.0% (Continued) | | | | | | |
| Computers & Peripherals — 4.0% | | | | | | |
Diebold, Incorporated | | | 10,000 | | | $ | 330,100 | |
Lexmark International, Inc. - Class A | | | 10,000 | | | | 355,200 | |
QLogic Corporation * | | | 60,000 | | | | 709,800 | |
Qumu Corporation * | | | 53,200 | | | | 680,960 | |
| | | | | | | | 2,076,060 | |
| Electronic Equipment, Instruments & Components — 9.2% | | | | | | | | |
Arrow Electronics, Inc. * | | | 20,000 | | | | 1,085,000 | |
Avnet, Inc. | | | 50,000 | | | | 2,205,500 | |
Dolby Laboratories, Inc. - Class A * | | | 2,000 | | | | 77,120 | |
FLIR Systems, Inc. | | | 30,000 | | | | 903,000 | |
Ingram Micro, Inc. - Class A * | | | 20,000 | | | | 469,200 | |
| | | | | | | | 4,739,820 | |
| IT Services — 1.7% | | | | | | | | |
Broadridge Financial Solutions, Inc. | | | 10,000 | | | | 395,200 | |
Computer Services, Inc. | | | 15,500 | | | | 514,600 | |
| | | | | | | | 909,800 | |
| Semiconductors & Semiconductor Equipment — 2.8% | | | | | | | | |
Ultratech, Inc. * | | | 50,000 | | | | 1,450,000 | |
| | | | | | | | | |
| Materials — 7.3% | | | | | | | | |
| Chemicals — 1.5% | | | | | | | | |
H.B. Fuller Company | | | 15,000 | | | | 780,600 | |
| | | | | | | | | |
| Metals & Mining — 5.8% | | | | | | | | |
Horsehead Holding Corporation * | | | 80,000 | | | | 1,296,800 | |
Kinross Gold Corporation | | | 125,000 | | | | 547,500 | |
Pan American Silver Corporation | | | 100,000 | | | | 1,170,000 | |
| | | | | | | | 3,014,300 | |
| | | | | | | | | |
Total Common Stocks (Cost $30,576,030) | | | | | | $ | 42,993,931 | |
| | | | | | |
Energy — 0.0% (a) | | | | | | |
Oil, Gas & Consumable Fuels — 0.0% (a) | | | | | | |
EXCO Resources, Inc. * (Cost $7,533) | | | 100,000 | | | $ | 16,000 | |
AVE MARIA OPPORTUNITY FUND
SCHEDULE OF INVESTMENTS
EXCHANGE-TRADED FUNDS — 0.9% | | | | | | |
iShares Gold Trust * | | | 15,000 | | | $ | 175,200 | |
SPDR Gold Trust * | | | 2,700 | | | | 313,659 | |
Total Exchange-Traded Funds (Cost $482,195) | | | | | | $ | 488,859 | |
MONEY MARKET FUNDS — 18.5% | | | | | | |
Federated Government Obligations Tax-Managed Fund - Institutional Shares, 0.01% (b) | | | 2,484,830 | | | $ | 2,484,830 | |
Federated Treasury Obligations Fund - Institutional Shares, 0.01% (b) | | | 2,484,829 | | | | 2,484,829 | |
Federated U.S. Treasury Cash Reserves Fund - Institutional Shares, 0.00% (b) | | | 2,484,830 | | | | 2,484,830 | |
Invesco Short-Term Investments Trust (The) - Treasury Portfolio - Institutional Class, 0.02% (b) | | | 2,102,553 | | | | 2,102,553 | |
Total Money Market Funds (Cost $9,557,042) | | | | | | $ | 9,557,042 | |
| | | | | | | | | |
Total Investments at Market Value — 102.6% (Cost $40,622,800) | | | | | | $ | 53,055,832 | |
| | | | | | | | | |
Liabilities in Excess of Other Assets — (2.6%) | | | | | | | (1,350,787 | ) |
| | | | | | | | | |
Net Assets — 100.0% | | | | | | $ | 51,705,045 | |
| * | Non-income producing security. |
| | |
| (a) | Percentage rounds to less than 0.1%. |
| | |
| (b) | The rate shown is the 7-day effective yield as of December 31, 2013. |
| |
| See notes to financial statements. |
AVE MARIA WORLD EQUITY FUND
PORTFOLIO MANAGER COMMENTARY
Dear Fellow Shareholder:
The Ave Maria World Equity Fund (the “Fund”) had a total return of +23.45% for the year ended December 31, 2013. The return for the S&P Global 1200 Index, the Fund’s benchmark index, was +25.84%.
Since inception on April 30, 2010, the cumulative and annualized returns for the Fund compared to its benchmark were:
| | Since 4-30-2010 Inception through 12-31-2013 Total Returns |
| | Cumulative | Annualized |
| Ave Maria World Equity Fund (AVEWX) | 42.79% | 10.19% |
| S&P Global 1200 Index | 51.47% | 11.97% |
Global developed equity markets were up markedly in 2013. We believe the positive move was primarily driven by continued easy money policies from central banks and modest corporate earnings expansion. Also, many potential negative economic scenarios were averted during the year. In the Far East, for example, an economic hard landing was avoided in China and “Abenomics” produced initial positive results in Japan, including rising GDP growth and low inflation. For Europe, although the overall economy remained at a standstill in 2013, it is expected to show some moderate growth in 2014. Additionally, signs of fiscal progress emerged from some of the more troubled European regions and sovereign debt markets remained calm. The United States did not default on its debt nor fall over the “fiscal cliff.” A government budget agreement was reached and the economy showed enough improvement for the Fed to announce a plan to taper its latest quantitative easing (QE) program. Emerging market equities generally struggled during the year, seemingly in anticipation of the QE tapering and less dollars flowing into their economies, but they did stabilize later in the year. In 2014, we believe equity investors will face fewer global headwinds than the prior year.
Delivering better than benchmark returns for the Fund were the financials, energy, health care, consumer staples, materials and industrial sectors. Within financials, a gain of over 50% from AXA S.A., a French-based, global insurance company, drove sector performance. Energy holding Schlumberger Limited was also up nicely for the year and looks well positioned for 2014 with its strong international operations and market share within oilfield services. In health care, St. Jude Medical, Inc. was also up significantly with better than expected performance from their device leads, solid earnings and more market focus on
AVE MARIA WORLD EQUITY FUND
PORTFOLIO MANAGER COMMENTARY
(Unaudited) (Continued)
their strong new product pipeline. Negatively impacting relative returns were information technology and consumer discretionary sectors. Within information technology, shares of Teradata Corporation were down due to slower than expected orders and sales, as sales cycles have lengthened due to IT budget pressures and the slow global economy. LG Display Company Ltd., a Korean manufacturer of digital display products was also down as TV panel prices have been falling and their average selling prices are increasingly pressured.
Six new positions, all of which comply with the Ave Maria Mutual Funds’ moral screens, were added since June 30, 2013: Abbott Laboratories (healthcare equipment), Credit Suisse Group AG (diversified financial services ), Franklin Resources, Inc. (asset management), Heineken N.V. (beverages), Lenovo Group Ltd. (computer hardware) and The Swatch Group AG (apparel, accessories & luxury goods). Positions eliminated were: Allianz SE, Brookfield Residential Properties, Inc., Hewlett-Packard Company, and International Business Machines Corporation, in favor of what we believe to be more attractive investment opportunities.
As of December 31, 2013, the Fund’s geographic weightings versus the S&P Global 1200 Index were approximately:
| | Ave Maria World Equity Fund | S&P Global 1200 Index |
| Americas | 55% | 57% |
| Europe Developed | 24% | 19% |
| United Kingdom | 8% | 9% |
| Japan | 3% | 8% |
| Asia Developed | 2% | 3% |
| Asia Emerging | 1% | 1% |
| Australasia | 1% | 3% |
| Other | 1% | — |
| Cash Equivalents | 5% | — |
Owning shares of what we consider world-class companies should continue to produce favorable investment results. Thank you for your participation.
 |  |
| Gregory R. Heilman, CFA | Joseph W. Skornicka, CFA |
| Co-Portfolio Manager | Co-Portfolio Manager |
AVE MARIA WORLD EQUITY FUND PERFORMANCE (Unaudited) |
| (a) | The returns shown do not reflect the deduction of taxes a shareholder would pay on Fund distributions or the redemption of Fund shares. |
| | |
| (b) | Represents the period from the commencement of operations (April 30, 2010) through December 31, 2013. |
Expense Ratio information as of: | Period Ended 12-31-12 (as disclosed in May 1, 2013 prospectus) | |
| Gross | 1.65%* | 1.55% |
| Net | 1.52%* | 1.50% |
| * | Includes Acquired Fund Fees and Expenses. |
Past performance is not predictive of future performance. Investment results and principal value will fluctuate so that shares, when redeemed, may be worth more or less than their original cost. Current performance may be higher or lower than the performance data quoted. Performance data, current to the most recent month end, is available at the Ave Maria Mutual Funds website at www.avemariafunds.com or by calling 1-888-726-9331.
AVE MARIA WORLD EQUITY FUND ANNUAL TOTAL RATES OF RETURN COMPARISON WITH MAJOR INDICES (Unaudited) |
| AVE MARIA WORLD EQUITY FUND | |
2010(a) | 12.4% | 8.5% |
| 2011 | -9.6% | -5.1% |
| 2012 | 13.8% | 16.8% |
| 2013 | 23.5% | 25.8% |
AVERAGE ANNUAL TOTAL RETURNS As of December 31, 2013 (Unaudited) |
| AVE MARIA WORLD EQUITY FUND | |
| 3 Years | 8.3% | 11.8% |
Since Inception (b) | 10.2% | 12.0% |
| (a) | Represents the period from the commencement of operations (April 30, 2010) through December 31, 2010. |
| | |
| (b) | Represents the period from the commencement of operations (April 30, 2010) through December 31, 2013. |
AVE MARIA WORLD EQUITY FUND
TEN LARGEST EQUITY HOLDINGS
December 31, 2013 (Unaudited)
| | | | | | | | |
| | 9,500 | | Diageo plc - ADR | | $ | 1,257,990 | | | | 3.2 | % |
| | 23,000 | | Citigroup, Inc. | | | 1,198,530 | | | | 3.0 | % |
| | 42,000 | | AXA S.A. - ADR | | | 1,171,380 | | | | 2.9 | % |
| | 14,500 | | Fluor Corporation | | | 1,164,205 | | | | 2.9 | % |
| | 9,500 | | Toyota Motor Corporation - ADR | | | 1,158,240 | | | | 2.9 | % |
| | 18,500 | | St. Jude Medical, Inc. | | | 1,146,075 | | | | 2.9 | % |
| | 8,000 | | Shire plc - ADR | | | 1,130,320 | | | | 2.8 | % |
| | 15,700 | | Covidien plc | | | 1,069,170 | | | | 2.7 | % |
| | 11,700 | | Schlumberger Limited | | | 1,054,287 | | | | 2.6 | % |
| | 17,500 | | Franklin Resources, Inc. | | | 1,010,275 | | | | 2.5 | % |
ASSET ALLOCATION (Unaudited)
| | |
Consumer Discretionary | | | 7.9 | % |
Consumer Staples | | | 9.6 | % |
Energy | | | 8.9 | % |
Financials | | | 19.7 | % |
Health Care | | | 13.0 | % |
Industrials | | | 16.9 | % |
Information Technology | | | 12.6 | % |
Materials | | | 5.7 | % |
Exchange-Traded Funds | | | 0.9 | % |
Money Market Funds, Liabilities in Excess of Other Assets | | | 4.8 | % |
| | | | 100.0 | % |
AVE MARIA WORLD EQUITY FUND
SCHEDULE OF INVESTMENTS
| | | | | | |
| Consumer Discretionary — 7.9% | | | | | | |
| Automobiles — 5.0% | | | | | | |
Toyota Motor Corporation - ADR | | | 9,500 | | | $ | 1,158,240 | |
Volkswagen AG - ADR | | | 15,000 | | | | 820,500 | |
| | | | | | | | 1,978,740 | |
| Hotels, Restaurants & Leisure — 1.1% | | | | | | | | |
McDonald's Corporation | | | 4,500 | | | | 436,635 | |
| | | | | | | | | |
| Textiles, Apparel & Luxury Goods — 1.8% | | | | | | | | |
Swatch Group AG (The) - ADR | | | 21,500 | | | | 713,800 | |
| | | | | | | | | |
| Consumer Staples — 9.6% | | | | | | | | |
| Beverages — 4.2% | | | | | | | | |
Diageo plc - ADR | | | 9,500 | | | | 1,257,990 | |
Heineken N.V. - ADR | | | 12,000 | | | | 405,120 | |
| | | | | | | | 1,663,110 | |
| Food Products — 4.1% | | | | | | | | |
| Mondelēz International, Inc. - Class A | | | 25,000 | | | | 882,500 | |
Nestlé S.A. - ADR | | | 10,000 | | | | 735,900 | |
| | | | | | | | 1,618,400 | |
| Household Products — 1.3% | | | | | | | | |
Energizer Holdings, Inc. | | | 5,000 | | | | 541,200 | |
| | | | | | | | | |
| Energy — 8.9% | | | | | | | | |
| Energy Equipment & Services — 4.0% | | | | | | | | |
Schlumberger Limited | | | 11,700 | | | | 1,054,287 | |
Tidewater, Inc. | | | 9,000 | | | | 533,430 | |
| | | | | | | | 1,587,717 | |
| Oil, Gas & Consumable Fuels — 4.9% | | | | | | | | |
BP plc - ADR | | | 15,000 | | | | 729,150 | |
Canadian Natural Resources Ltd. | | | 22,000 | | | | 744,480 | |
Exxon Mobil Corporation | | | 5,000 | | | | 506,000 | |
| | | | | | | | 1,979,630 | |
| Financials — 19.7% | | | | | | | | |
| Capital Markets — 4.7% | | | | | | | | |
Credit Suisse Group AG - ADR * | | | 28,000 | | | | 869,120 | |
Franklin Resources, Inc. | | | 17,500 | | | | 1,010,275 | |
| | | | | | | | 1,879,395 | |
| Diversified Financial Services — 5.6% | | | | | | | | |
Citigroup, Inc. | | | 23,000 | | | | 1,198,530 | |
MasterCard, Inc. - Class A | | | 500 | | | | 417,730 | |
Western Union Company (The) | | | 35,000 | | | | 603,750 | |
| | | | | | | | 2,220,010 | |
AVE MARIA WORLD EQUITY FUND
SCHEDULE OF INVESTMENTS
COMMON STOCKS — 94.3% (Continued) | | | | | | |
| Financials — 19.7% (Continued) | | | | | | |
| Insurance — 9.4% | | | | | | |
ACE Limited | | | 9,500 | | | $ | 983,535 | |
AXA S.A. - ADR | | | 42,000 | | | | 1,171,380 | |
Reinsurance Group of America, Inc. | | | 10,500 | | | | 812,805 | |
Validus Holdings Ltd. | | | 20,000 | | | | 805,800 | |
| | | | | | | | 3,773,520 | |
| Health Care — 13.0% | | | | | | | | |
| Health Care Equipment & Supplies — 10.2% | | | | | | | | |
Abbott Laboratories | | | 26,000 | | | | 996,580 | |
Covidien plc | | | 15,700 | | | | 1,069,170 | |
St. Jude Medical, Inc. | | | 18,500 | | | | 1,146,075 | |
Varian Medical Systems, Inc. * | | | 10,900 | | | | 846,821 | |
| | | | | | | | 4,058,646 | |
| Pharmaceuticals — 2.8% | | | | | | | | |
Shire plc - ADR | | | 8,000 | | | | 1,130,320 | |
| | | | | | | | | |
| Industrials — 16.9% | | | | | | | | |
| Aerospace & Defense — 1.6% | | | | | | | | |
United Technologies Corporation | | | 5,500 | | | | 625,900 | |
| | | | | | | | | |
| Construction & Engineering — 2.9% | | | | | | | | |
Fluor Corporation | | | 14,500 | | | | 1,164,205 | |
| | | | | | | | | |
| Electrical Equipment — 3.8% | | | | | | | | |
ABB Limited - ADR * | | | 37,500 | | | | 996,000 | |
Emerson Electric Company | | | 7,000 | | | | 491,260 | |
| | | | | | | | 1,487,260 | |
| Industrial Conglomerates — 5.5% | | | | | | | | |
3M Company | | | 4,000 | | | | 561,000 | |
Koninklijke Philips Electronics N.V. - ADR | | | 18,023 | | | | 666,311 | |
Siemens AG - ADR | | | 7,000 | | | | 969,570 | |
| | | | | | | | 2,196,881 | |
| Machinery — 1.7% | | | | | | | | |
Deere & Company | | | 7,500 | | | | 684,975 | |
| | | | | | | | | |
| Road & Rail — 1.4% | | | | | | | | |
Canadian National Railway Company | | | 10,000 | | | | 570,200 | |
| | | | | | | | | |
| Information Technology — 12.6% | | | | | | | | |
| Communications Equipment — 2.1% | | | | | | | | |
QUALCOMM, Incorporated | | | 11,000 | | | | 816,750 | |
AVE MARIA WORLD EQUITY FUND
SCHEDULE OF INVESTMENTS
COMMON STOCKS — 94.3% (Continued) | | | | | | |
| Information Technology — 12.6% (Continued) | | | | | | |
| Computers & Peripherals — 3.8% | | | | | | |
EMC Corporation | | | 40,000 | | | $ | 1,006,000 | |
Lenovo Group Ltd. - ADR | | | 21,000 | | | | 513,030 | |
| | | | | | | | 1,519,030 | |
| IT Services — 2.9% | | | | | | | | |
Accenture plc - Class A | | | 7,000 | | | | 575,540 | |
Teradata Corporation * | | | 13,000 | | | | 591,370 | |
| | | | | | | | 1,166,910 | |
| Semiconductors & Semiconductor Equipment — 3.8% | | | | | | | | |
Intel Corporation | | | 29,000 | | | | 752,840 | |
| Taiwan Semiconductor Manufacturing Company Ltd. - ADR | | | 44,500 | | | | 776,080 | |
| | | | | | | | 1,528,920 | |
| Materials — 5.7% | | | | | | | | |
| Chemicals — 4.5% | | | | | | | | |
FMC Corporation | | | 8,000 | | | | 603,680 | |
International Flavors & Fragrances, Inc. | | | 9,000 | | | | 773,820 | |
Syngenta AG - ADR | | | 5,000 | | | | 399,700 | |
| | | | | | | | 1,777,200 | |
| Metals & Mining — 1.2% | | | | | | | | |
BHP Billiton Ltd. - ADR | | | 7,000 | | | | 477,400 | |
| | | | | | | | | |
Total Common Stocks (Cost $30,005,724) | | | | | | $ | 37,596,754 | |
EXCHANGE-TRADED FUNDS — 0.9% | | | | | | |
iShares Gold Trust * (Cost $520,564) | | | 30,000 | | | $ | 350,400 | |
AVE MARIA WORLD EQUITY FUND
SCHEDULE OF INVESTMENTS
MONEY MARKET FUNDS — 5.4% | | | | | | |
Federated Government Obligations Tax-Managed Fund - Institutional Shares, 0.01% (a) | | | 1,919,760 | | | $ | 1,919,760 | |
Federated Treasury Obligations Fund - Institutional Shares, 0.01% (a) | | | 248,487 | | | | 248,487 | |
Total Money Market Funds (Cost $2,168,247) | | | | | | $ | 2,168,247 | |
| | | | | | | | | |
Total Investments at Market Value — 100.6% (Cost $32,694,535) | | | | | | $ | 40,115,401 | |
| | | | | | | | | |
Liabilities in Excess of Other Assets — (0.6%) | | | | | | | (245,483 | ) |
| | | | | | | | | |
Net Assets — 100.0% | | | | | | $ | 39,869,918 | |
| ADR - American Depositary Receipt. |
| | |
| * | Non-income producing security. |
| | |
| (a) | The rate shown is the 7-day effective yield as of December 31, 2013. |
SUMMARY OF COMMON STOCKS BY COUNTRY December 31, 2013 (Unaudited) |
| | | | | | |
United States | | $ | 20,439,758 | | | | 51.3 | % |
Switzerland | | | 4,698,055 | | | | 11.8 | % |
United Kingdom | | | 3,117,460 | | | | 7.8 | % |
Germany | | | 1,790,070 | | | | 4.5 | % |
Canada | | | 1,314,680 | | | | 3.3 | % |
France | | | 1,171,380 | | | | 2.9 | % |
Japan | | | 1,158,240 | | | | 2.9 | % |
Netherlands | | | 1,071,431 | | | | 2.7 | % |
Ireland | | | 1,069,170 | | | | 2.7 | % |
Taiwan | | | 776,080 | | | | 1.9 | % |
Hong Kong | | | 513,030 | | | | 1.3 | % |
Australia | | | 477,400 | | | | 1.2 | % |
| | | $ | 37,596,754 | | | | 94.3 | % |
| See notes to financial statements. |
AVE MARIA BOND FUND
PORTFOLIO MANAGER COMMENTARY
Dear Fellow Shareholders,
In 2013, the Ave Maria Bond Fund (“the Fund”) returned 6.14% vs. (0.86)% for the Barclays U.S. Intermediate Government/Credit Index. 2013 saw the first negative return on the Barclays U.S. Intermediate Government/Credit Index since 1994. Interest rates increased and bond prices fell during the year (the yield on the ten-year Treasury started the year at 1.8% and ended the year at 3.0%).
Although interest rates increased significantly during 2013, it’s important to put those rates in their proper historical perspective. Interest rates are still well below historical averages. Over the last 20 years, the average yield on the ten-year Treasury was 4.6%, well above today’s 2.9%. Like a good many things in the world, interest rates tend to be mean reverting, and it remains our view that interest rates will rise further. In that context, we continue to emphasize short-maturity bonds of investment quality. Rising rates provide an opportunity to re-invest cash flows from coupons and maturities at higher rates of returns. We continue to believe that selected dividend-paying common stocks offer an attractive combination of income and potential capital appreciation. Accordingly, 19.1% of the portfolio is thusly committed, which favorably impacted Fund performance in 2013.
The top three performing stocks during 2013 were Gentex Corporation (auto parts), Hasbro, Inc. (toys & games), and 3M Company (diversified industrial manufacturing). The Fund’s worst performing securities were the few relatively longer-maturity bonds.
In managing the Fund, our focus remains preservation of principal while generating a reasonable level of current income in a low interest-rate environment. We appreciate your participation in the Ave Maria Bond Fund.
With best regards,
 |  |
| Richard L. Platte, Jr., CFA | Brandon S. Scheitler |
| Co-Portfolio Manager | Co-Portfolio Manager |
AVE MARIA BOND FUND PERFORMANCE (Unaudited) |
| (a) | The returns shown do not reflect the deduction of taxes a shareholder would pay on Fund distributions or the redemption of Fund shares. |
Expense Ratio information as of: | Year Ended 12-31-12 (as disclosed in May 1, 2013 prospectus) | |
| Gross | 0.72%* | 0.70% |
| Net | 0.71%* | 0.70% |
| * | Includes Acquired Fund Fees and Expenses. |
Past performance is not predictive of future performance. Investment results and principal value will fluctuate so that shares, when redeemed, may be worth more or less than their original cost. Current performance may be higher or lower than the performance data quoted. Performance data, current to the most recent month end, is available at the Ave Maria Mutual Funds website at www.avemariafunds.com or by calling 1-888-726-9331.
AVE MARIA BOND FUND ANNUAL TOTAL RATES OF RETURN COMPARISON WITH MAJOR INDICES (Unaudited) |
| | BARCLAYS U.S. INTERMEDIATE GOVERNMENT/CREDIT INDEX |
2003(a) | 2.4% | 1.9% |
| 2004 | 5.1% | 3.0% |
| 2005 | 1.4% | 1.6% |
| 2006 | 6.0% | 4.1% |
| 2007 | 4.8% | 7.4% |
| 2008 | 0.3% | 5.1% |
| 2009 | 10.2% | 5.2% |
| 2010 | 6.7% | 5.9% |
| 2011 | 3.3% | 5.8% |
| 2012 | 4.6% | 3.9% |
| 2013 | 6.1% | -0.9% |
AVERAGE ANNUAL TOTAL RETURNS As of December 31, 2013 (Unaudited) |
| | BARCLAYS U.S. INTERMEDIATE GOVERNMENT/CREDIT INDEX |
| 3 Years | 4.7% | 2.9% |
| 5 Years | 6.2% | 4.0% |
| 10 Years | 4.8% | 4.1% |
Since Inception (b) | 4.7% | 4.0% |
| (a) | Represents the period from the commencement of operations (May 1, 2003) through December 31, 2003. |
| | |
| (b) | Represents the period from the commencement of operations (May 1, 2003) through December 31, 2013. |
AVE MARIA BOND FUND
TEN LARGEST HOLDINGS*
December 31, 2013 (Unaudited)
| | | | | | | | |
| $ | 7,000,000 | | U.S. Treasury Notes, 1.250%, due 02/15/14 | | $ | 7,009,897 | | | | 4.7 | % |
| | 5,000,000 | | U.S. Treasury Notes, 2.125%, due 12/31/15 | | | 5,171,875 | | | | 3.5 | % |
| | 5,000,000 | | U.S. Treasury Notes, 4.000%, due 02/15/14 | | | 5,023,859 | | | | 3.4 | % |
| | 5,000,000 | | U.S. Treasury Notes, 1.750%, due 03/31/14 | | | 5,020,115 | | | | 3.4 | % |
| | 3,000,000 | | U.S. Treasury Notes, 2.625%, due 02/29/16 | | | 3,142,500 | | | | 2.1 | % |
| | 3,000,000 | | U.S. Treasury Notes, 2.500%, due 04/30/15 | | | 3,090,585 | | | | 2.1 | % |
| | 3,000,000 | | U.S. Treasury Notes, 1.375%, due 11/30/15 | | | 3,058,008 | | | | 2.0 | % |
| | 2,313,080 | | U.S. Treasury Inflation-Protected Notes, 2.500%, due 07/15/16 | | | 2,537,884 | | | | 1.7 | % |
| | 2,500,000 | | U.S. Treasury Notes, 0.875%, due 04/30/17 | | | 2,492,577 | | | | 1.7 | % |
| | 2,500,000 | | U.S. Treasury Notes, 0.625%, due 09/30/17 | | | 2,448,048 | | | | 1.6 | % |
| * | Excludes cash equivalents. |
ASSET ALLOCATION (Unaudited)
| | |
| U.S. TREASURY AND GOVERNMENT AGENCY OBLIGATIONS | | | |
U.S. Treasuries | | | 31.9 | % |
U.S. Government Agencies | | | 0.7 | % |
| | | | | |
| CORPORATE BONDS | | | | |
| Sector | | | | |
Consumer Discretionary | | | 5.9 | % |
Consumer Staples | | | 3.3 | % |
Energy | | | 1.5 | % |
Financials | | | 6.0 | % |
Health Care | | | 3.7 | % |
Industrials | | | 9.6 | % |
Information Technology | | | 4.7 | % |
Materials | | | 3.0 | % |
Utilities | | | 4.4 | % |
| | | | 42.1 | % |
| COMMON STOCKS | | | | |
| Sector | | | | |
Consumer Discretionary | | | 2.1 | % |
Consumer Staples | | | 3.1 | % |
Energy | | | 1.4 | % |
Financials | | | 2.0 | % |
Industrials | | | 6.7 | % |
Information Technology | | | 3.8 | % |
| | | | 19.1 | % |
MONEY MARKET FUNDS, OTHER ASSETS IN EXCESS OF LIABILITIES | | | 6.2 | % |
| | | | 100.0 | % |
AVE MARIA BOND FUND
SCHEDULE OF INVESTMENTS
U.S. TREASURY OBLIGATIONS — 31.9% | | | | | | |
| U.S. Treasury Inflation-Protected Notes — 3.9% | | | | | | |
2.500%, due 07/15/16 | | $ | 2,313,080 | | | $ | 2,537,884 | |
2.625%, due 07/15/17 | | | 1,126,940 | | | | 1,267,632 | |
0.125%, due 04/15/18 | | | 2,020,820 | | | | 2,061,079 | |
| | | | | | | | 5,866,595 | |
| U.S. Treasury Notes — 28.0% | | | | | | | | |
1.250%, due 02/15/14 | | | 7,000,000 | | | | 7,009,897 | |
4.000%, due 02/15/14 | | | 5,000,000 | | | | 5,023,859 | |
1.750%, due 03/31/14 | | | 5,000,000 | | | | 5,020,115 | |
1.875%, due 04/30/14 | | | 2,000,000 | | | | 2,011,484 | |
2.375%, due 08/31/14 | | | 1,500,000 | | | | 1,522,090 | |
2.500%, due 04/30/15 | | | 3,000,000 | | | | 3,090,585 | |
1.375%, due 11/30/15 | | | 3,000,000 | | | | 3,058,008 | |
2.125%, due 12/31/15 | | | 5,000,000 | | | | 5,171,875 | |
2.625%, due 02/29/16 | | | 3,000,000 | | | | 3,142,500 | |
0.875%, due 04/30/17 | | | 2,500,000 | | | | 2,492,577 | |
0.625%, due 09/30/17 | | | 2,500,000 | | | | 2,448,048 | |
0.750%, due 12/31/17 | | | 2,000,000 | | | | 1,955,624 | |
| | | | | | | | 41,946,662 | |
| | | | | | | | | |
Total U.S. Treasury Obligations (Cost $47,473,237) | | | | | | $ | 47,813,257 | |
U.S. GOVERNMENT AGENCY OBLIGATIONS — 0.7% | | | | | | |
| Federal Farm Credit Bank — 0.7% | | | | | | |
4.500%, due 01/22/15 (Cost $1,006,717) | | $ | 1,000,000 | | | $ | 1,045,219 | |
| | | | | | |
| Consumer Discretionary — 5.9% | | | | | | |
| Coca-Cola Company (The), 1.650%, due 11/01/18 | | $ | 1,500,000 | | | $ | 1,480,296 | |
Johnson Controls, Inc., 5.500%, due 01/15/16 | | | 1,000,000 | | | | 1,086,232 | |
Lowe's Companies, Inc., 5.000%, due 10/15/15 | | | 500,000 | | | | 538,461 | |
Lowe's Companies, Inc., 2.125%, due 04/15/16 | | | 1,000,000 | | | | 1,025,682 | |
McDonald's Corporation, 5.350%, due 03/01/18 | | | 2,000,000 | | | | 2,272,508 | |
| TJX Companies, Inc. (The), 4.200%, due 08/15/15 | | | 1,750,000 | | | | 1,845,841 | |
| TJX Companies, Inc. (The), 6.950%, due 04/15/19 | | | 555,000 | | | | 664,757 | |
| | | | | | | | 8,913,777 | |
AVE MARIA BOND FUND
SCHEDULE OF INVESTMENTS
CORPORATE BONDS — 42.1% (Continued) | | | | | | |
| Consumer Staples — 3.3% | | | | | | |
Clorox Company (The), 5.000%, due 01/15/15 | | $ | 1,000,000 | | | $ | 1,045,322 | |
Kellogg Company, 4.150%, due 11/15/19 | | | 2,042,000 | | | | 2,186,006 | |
| Kimberly Clark Corporation, 6.125%, due 08/01/17 | | | 1,475,000 | | | | 1,701,374 | |
| | | | | | | | 4,932,702 | |
| Energy — 1.5% | | | | | | | | |
Apache Corporation, 5.625%, due 01/15/17 | | | 1,750,000 | | | | 1,966,814 | |
ConocoPhillips, 4.750%, due 02/01/14 | | | 360,000 | | | | 361,280 | |
| | | | | | | | 2,328,094 | |
| Financials — 6.0% | | | | | | | | |
| Bank of New York Mellon Corporation (The), 2.300%, due 07/28/16 | | | 1,500,000 | | | | 1,549,165 | |
| Bank of New York Mellon Corporation (The), 2.100%, due 08/01/18 | | | 1,000,000 | | | | 996,260 | |
| Caterpillar Financial Services Corporation, 4.750%, due 02/17/15 | | | 1,000,000 | | | | 1,047,683 | |
| Caterpillar Financial Services Corporation, 2.650%, due 04/01/16 | | | 1,000,000 | | | | 1,036,874 | |
| National Rural Utilities Cooperative Finance Corporation, 4.750%, due 03/01/14 | | | 750,000 | | | | 755,358 | |
| PACCAR Financial Corporation, 1.600%, due 03/15/17 | | | 2,000,000 | | | | 1,997,120 | |
U.S. Bancorp, 2.450%, due 07/27/15 | | | 1,500,000 | | | | 1,542,161 | |
| | | | | | | | 8,924,621 | |
| Health Care — 3.7% | | | | | | | | |
Medtronic, Inc., 4.750%, due 09/15/15 | | | 1,000,000 | | | | 1,070,895 | |
Medtronic, Inc., 2.625%, due 03/15/16 | | | 500,000 | | | | 517,693 | |
Stryker Corporation, 3.000%, due 01/15/15 | | | 1,000,000 | | | | 1,026,428 | |
Stryker Corporation, 2.000%, due 09/30/16 | | | 1,150,000 | | | | 1,181,507 | |
Zimmer Holdings, Inc., 4.625%, due 11/30/19 | | | 1,560,000 | | | | 1,699,269 | |
| | | | | | | | 5,495,792 | |
| Industrials — 9.6% | | | | | | | | |
3M Company, 1.375%, due 09/29/16 | | | 1,150,000 | | | | 1,167,106 | |
| Emerson Electric Company, 5.250%, due 10/15/18 | | | 1,600,000 | | | | 1,813,661 | |
| General Dynamics Corporation, 2.250%, due 07/15/16 | | | 1,650,000 | | | | 1,700,856 | |
| John Deere Capital Corporation, 1.400%, due 03/15/17 | | | 1,200,000 | | | | 1,196,774 | |
| John Deere Capital Corporation, 1.700%, due 01/15/20 | | | 2,000,000 | | | | 1,883,362 | |
| Norfolk Southern Corporation, 5.750%, due 04/01/18 | | | 885,000 | | | | 1,008,296 | |
Ryder System, Inc., 3.150%, due 03/02/15 | | | 1,000,000 | | | | 1,024,411 | |
| Union Pacific Corporation, 5.125%, due 02/15/14 | | | 500,000 | | | | 502,735 | |
| Union Pacific Corporation, 4.875%, due 01/15/15 | | | 750,000 | | | | 783,426 | |
| United Parcel Service, Inc., 5.500%, due 01/15/18 | | | 1,500,000 | | | | 1,715,847 | |
| United Parcel Service, Inc., 5.125%, due 04/01/19 | | | 500,000 | | | | 568,700 | |
| United Technologies Corporation, 5.375%, due 12/15/17 | | | 839,000 | | | | 956,091 | |
| | | | | | | | 14,321,265 | |
AVE MARIA BOND FUND
SCHEDULE OF INVESTMENTS
CORPORATE BONDS — 42.1% (Continued) | | | | | | |
| Information Technology — 4.7% | | | | | | |
Dell, Inc., 2.300%, due 09/10/15 | | $ | 1,000,000 | | | $ | 1,003,750 | |
| Hewlett-Packard Company, 6.125%, due 03/01/14 | | | 1,000,000 | | | | 1,008,475 | |
| Hewlett-Packard Company, 2.125%, due 09/13/15 | | | 500,000 | | | | 509,137 | |
| Hewlett-Packard Company, 2.650%, due 06/01/16 | | | 500,000 | | | | 515,191 | |
| International Business Machines Corporation, 2.000%, due 01/05/16 | | | 1,410,000 | | | | 1,447,169 | |
National Semiconductor Corporation, 6.600%, due 06/15/17 | | | 500,000 | | | | 584,329 | |
Texas Instruments, Inc., 1.650%, due 08/03/19 | | | 2,000,000 | | | | 1,926,506 | |
| | | | | | | | 6,994,557 | |
| Materials — 3.0% | | | | | | | | |
PPG Industries, Inc., 6.650%, due 03/15/18 | | | 1,191,000 | | | | 1,377,263 | |
Praxiar, Inc., 4.625%, due 03/30/15 | | | 2,000,000 | | | | 2,101,112 | |
Sherwin-Williams Company (The), 3.125%, due 12/15/14 | | | 1,000,000 | | | | 1,024,037 | |
| | | | | | | | 4,502,412 | |
| Utilities — 4.4% | | | | | | | | |
| Consolidated Edison Company of New York, Inc., 5.300%, due 12/01/16 | | | 2,000,000 | | | | 2,237,268 | |
| Consolidated Edison Company of New York, Inc., 6.650%, due 04/01/19 | | | 800,000 | | | | 958,448 | |
| Duke Energy Corporation, 3.950%, due 09/15/14 | | | 800,000 | | | | 818,990 | |
| Georgia Power Company, 4.250%, due 12/01/19 | | | 1,500,000 | | | | 1,631,674 | |
NextEra Energy Capital Holdings, Inc., 2.600%, due 09/01/15 | | | 1,000,000 | | | | 1,026,557 | |
| | | | | | | | 6,672,937 | |
| | | | | | | | | |
Total Corporate Bonds (Cost $62,856,268) | | | | | | $ | 63,086,157 | |
| | | | | | |
| Consumer Discretionary — 2.1% | | | | | | |
| Auto Components — 0.3% | | | | | | |
Gentex Corporation | | | 15,000 | | | $ | 494,850 | |
| | | | | | | | | |
| Leisure Equipment & Products — 0.9% | | | | | | | | |
Hasbro, Inc. | | | 25,000 | | | | 1,375,250 | |
| | | | | | | | | |
| Textiles, Apparel & Luxury Goods — 0.9% | | | | | | | | |
Coach, Inc. | | | 23,000 | | | | 1,290,990 | |
AVE MARIA BOND FUND
SCHEDULE OF INVESTMENTS
COMMON STOCKS — 19.1% (Continued) | | | | | | |
| Consumer Staples — 3.1% | | | | | | |
| Beverages — 1.6% | | | | | | |
Coca-Cola Company (The) | | | 56,000 | | | $ | 2,313,360 | |
| | | | | | | | | |
| Food & Staples Retailing — 1.0% | | | | | | | | |
Sysco Corporation | | | 43,000 | | | | 1,552,300 | |
| | | | | | | | | |
| Food Products — 0.5% | | | | | | | | |
Kellogg Company | | | 12,000 | | | | 732,840 | |
| | | | | | | | | |
| Energy — 1.4% | | | | | | | | |
| Oil, Gas & Consumable Fuels — 1.4% | | | | | | | | |
ConocoPhillips | | | 15,000 | | | | 1,059,750 | |
Exxon Mobil Corporation | | | 10,000 | | | | 1,012,000 | |
| | | | | | | | 2,071,750 | |
| Financials — 2.0% | | | | | | | | |
| Capital Markets — 1.0% | | | | | | | | |
Bank of New York Mellon Corporation (The) | | | 45,000 | | | | 1,572,300 | |
| | | | | | | | | |
| Commercial Banks — 1.0% | | | | | | | | |
PNC Financial Services Group, Inc. (The) | | | 19,000 | | | | 1,474,020 | |
| | | | | | | | | |
| Industrials — 6.7% | | | | | | | | |
| Aerospace & Defense — 0.8% | | | | | | | | |
General Dynamics Corporation | | | 12,000 | | | | 1,146,600 | |
| | | | | | | | | |
| Air Freight & Logistics — 1.2% | | | | | | | | |
United Parcel Service, Inc. - Class B | | | 17,000 | | | | 1,786,360 | |
| | | | | | | | | |
| Electrical Equipment — 1.0% | | | | | | | | |
Emerson Electric Company | | | 22,000 | | | | 1,543,960 | |
| | | | | | | | | |
| Industrial Conglomerates — 1.1% | | | | | | | | |
3M Company | | | 12,000 | | | | 1,683,000 | |
| | | | | | | | | |
| Machinery — 1.8% | | | | | | | | |
Dover Corporation | | | 15,000 | | | | 1,448,100 | |
Illinois Tool Works, Inc. | | | 15,000 | | | | 1,261,200 | |
| | | | | | | | 2,709,300 | |
| Road & Rail — 0.8% | | | | | | �� | | |
Norfolk Southern Corporation | | | 12,000 | | | | 1,113,960 | |
AVE MARIA BOND FUND
SCHEDULE OF INVESTMENTS
COMMON STOCKS — 19.1% (Continued) | | | | | | |
| Information Technology — 3.8% | | | | | | |
| Computers & Peripherals — 0.7% | | | | | | |
Diebold, Incorporated | | | 30,000 | | | $ | 990,300 | |
| | | | | | | | | |
| IT Services — 1.0% | | | | | | | | |
Paychex, Inc. | | | 34,000 | | | | 1,548,020 | |
| | | | | | | | | |
| Semiconductors & Semiconductor Equipment — 2.1% | | | | | | | | |
Intel Corporation | | | 60,000 | | | | 1,557,600 | |
Microchip Technology, Inc. | | | 35,000 | | | | 1,566,250 | |
| | | | | | | | 3,123,850 | |
| | | | | | | | | |
Total Common Stocks (Cost $20,458,423) | | | | | | $ | 28,523,010 | |
MONEY MARKET FUNDS — 5.5% | | | | | | |
Federated Government Obligations Tax-Managed Fund - Institutional Shares, 0.01% (a) | | | 7,157,506 | | | $ | 7,157,506 | |
Federated Treasury Obligations Fund - Institutional Shares, 0.01% (a) | | | 1,082,016 | | | | 1,082,016 | |
Total Money Market Funds (Cost $8,239,522) | | | | | | $ | 8,239,522 | |
| | | | | | | | | |
Total Investments at Market Value — 99.3% (Cost $140,034,167) | | | | | | $ | 148,707,165 | |
| | | | | | | | | |
Other Assets in Excess of Liabilities — 0.7% | | | | | | | 1,042,554 | |
| | | | | | | | | |
Net Assets — 100.0% | | | | | | $ | 149,749,719 | |
| (a) | The rate shown is the 7-day effective yield as of December 31, 2013. |
| |
| See notes to financial statements. |
AVE MARIA MUTUAL FUNDS
STATEMENTS OF ASSETS AND LIABILITIES
| | Ave Maria Catholic Values Fund | | | | | | Ave Maria Rising Dividend Fund | |
| ASSETS | | | | | | | | | |
| Investment securities: | | | | | | | | | |
At cost | | $ | 169,559,786 | | | $ | 165,451,576 | | | $ | 557,492,216 | |
At market value (Note 1) | | $ | 243,348,540 | | | $ | 285,147,005 | | | $ | 709,128,174 | |
Affiliated investments, at market value (Cost $1,107,092) (Note 5) | | | 3,749,021 | | | | — | | | | — | |
Receivable for capital shares sold | | | 205,801 | | | | 391,577 | | | | 1,831,181 | |
Dividends receivable | | | 223,258 | | | | 329,788 | | | | 1,044,447 | |
Other assets | | | 16,224 | | | | 18,514 | | | | 38,800 | |
TOTAL ASSETS | | | 247,542,844 | | | | 285,886,884 | | | | 712,042,602 | |
| | | | | | | | | | | | | |
| LIABILITIES | | | | | | | | | | | | |
Payable for capital shares redeemed | | | 34,269 | | | | 49,621 | | | | 529,730 | |
Payable to Adviser (Note 2) | | | 573,206 | | | | 644,760 | | | | 1,223,897 | |
Payable to administrator (Note 2) | | | 27,544 | | | | 31,381 | | | | 69,341 | |
Accrued shareholder servicing fees (Note 2) | | | 87,684 | | | | 6,297 | | | | — | |
Other accrued expenses | | | 19,147 | | | | 22,351 | | | | 69,575 | |
TOTAL LIABILITIES | | | 741,850 | | | | 754,410 | | | | 1,892,543 | |
| | | | | | | | | | | | | |
NET ASSETS | | $ | 246,800,994 | | | $ | 285,132,474 | | | $ | 710,150,059 | |
| | | | | | | | | | | | | |
| NET ASSETS CONSIST OF: | | | | | | | | | | | | |
Paid-in capital | | $ | 170,598,352 | | | $ | 165,689,344 | | | $ | 558,788,009 | |
Accumulated net realized losses from security transactions | | | (228,041 | ) | | | (252,299 | ) | | | (273,908 | ) |
Net unrealized appreciation on investments | | | 76,430,683 | | | | 119,695,429 | | | | 151,635,958 | |
NET ASSETS | | $ | 246,800,994 | | | $ | 285,132,474 | | | $ | 710,150,059 | |
Shares of beneficial interest outstanding unlimited number of shares authorized, no par value) | | | 11,635,009 | | | | 9,443,272 | | | | 40,440,052 | |
Net asset value, offering price and redemption price per share (Note 1) | | $ | 21.21 | | | $ | 30.19 | | | $ | 17.56 | |
| See notes to financial statements. |
AVE MARIA MUTUAL FUNDS
STATEMENTS OF ASSETS AND LIABILITIES
December 31, 2013 (Continued)
| | | | | Ave Maria World Equity Fund | | | | |
| ASSETS | | | | | | | | | |
| Investment securities: | | | | | | | | | |
At amortized cost | | $ | 40,622,800 | | | $ | 32,694,535 | | | $ | 140,034,167 | |
At market value (Note 1) | | $ | 53,055,832 | | | $ | 40,115,401 | | | $ | 148,707,165 | |
Cash | | | — | | | | 1,719 | | | | — | |
Receivable for capital shares sold | | | 44,018 | | | | 82,540 | | | | 353,128 | |
Dividends and interest receivable | | | 8,305 | | | | 30,560 | | | | 965,997 | |
Other assets | | | 8,843 | | | | 7,841 | | | | 15,524 | |
TOTAL ASSETS | | | 53,116,998 | | | | 40,238,061 | | | | 150,041,814 | |
| | | | | | | | | | | | | |
| LIABILITIES | | | | | | | | | | | | |
Due to custodian | | | 1,273,582 | | | | — | | | | — | |
Payable for investment securities purchased | | | — | | | | 244,810 | | | | — | |
Payable for capital shares redeemed | | | 5,780 | | | | 204 | | | | 72,305 | |
Payable to Adviser (Note 2) | | | 116,416 | | | | 108,528 | | | | 187,956 | |
Payable to administrator (Note 2) | | | 5,799 | | | | 4,419 | | | | 12,589 | |
Other accrued expenses | | | 10,376 | | | | 10,182 | | | | 19,245 | |
TOTAL LIABILITIES | | | 1,411,953 | | | | 368,143 | | | | 292,095 | |
| | | | | | | | | | | | | |
NET ASSETS | | $ | 51,705,045 | | | $ | 39,869,918 | | | $ | 149,749,719 | |
| | | | | | | | | | | | | |
| NET ASSETS CONSIST OF: | | | | | | | | | | | | |
Paid-in capital | | $ | 39,302,165 | | | $ | 32,449,052 | | | $ | 141,076,721 | |
Accumulated net realized losses from security transactions | | | (30,152 | ) | | | — | | | | — | |
Net unrealized appreciation on investments | | | 12,433,032 | | | | 7,420,866 | | | | 8,672,998 | |
NET ASSETS | | $ | 51,705,045 | | | $ | 39,869,918 | | | $ | 149,749,719 | |
Shares of beneficial interest outstanding (unlimited number of shares authorized, no par value) | | | 3,672,718 | | | | 2,867,720 | | | | 13,154,096 | |
Net asset value, offering price and redemption price per share (Note 1) | | $ | 14.08 | | | $ | 13.90 | | | $ | 11.38 | |
| See notes to financial statements. |
AVE MARIA MUTUAL FUNDS
STATEMENTS OF OPERATIONS
For the Year Ended December 31, 2013
| | Ave Maria Catholic Values Fund | | | | | | Ave Maria Rising Dividend Fund | |
| INVESTMENT INCOME | | | | | | | | | |
Dividends | | $ | 3,102,767 | | | $ | 2,746,102 | | | $ | 10,384,261 | |
| | | | | | | | | | | | | |
| EXPENSES | | | | | | | | | | | | |
Investment advisory fees (Note 2) | | | 2,112,503 | | | | 2,306,539 | * | | | 3,647,410 | |
Administration, accounting and transfer agent fees (Note 2) | | | 328,044 | | | | 355,735 | | | | 698,632 | |
Shareholder servicing fees (Note 2) | | | 495,066 | | | | 535,858 | | | | — | |
Legal and audit fees | | | 44,876 | | | | 55,298 | | | | 71,453 | |
Registration and filing fees | | | 28,861 | | | | 35,799 | | | | 82,620 | |
Postage and supplies | | | 42,337 | | | | 58,048 | | | | 67,462 | |
Trustees’ fees and expenses (Note 2) | | | 32,069 | | | | 32,069 | | | | 32,069 | |
Custodian and bank service fees | | | 15,741 | | | | 18,165 | | | | 36,271 | |
Advisory board fees and expenses (Note 2) | | | 8,752 | | | | 8,752 | | | | 8,752 | |
Insurance expense | | | 10,997 | | | | 11,160 | | | | 19,880 | |
Compliance service fees and expenses (Note 2) | | | 7,908 | | | | 8,518 | | | | 15,732 | |
Printing of shareholder reports | | | 7,740 | | | | 12,209 | | | | 10,084 | |
Other expenses | | | 18,024 | | | | 16,909 | | | | 20,798 | |
TOTAL EXPENSES | | | 3,152,918 | | | | 3,455,059 | | | | 4,711,163 | |
| | | | | | | | | | | | | |
NET INVESTMENT INCOME (LOSS) | | | (50,151 | ) | | | (708,957 | ) | | | 5,673,098 | |
| | | | | | | | | | | | | |
REALIZED AND UNREALIZED GAINS ON INVESTMENTS | | | | | | | | | | | | |
Net realized gains from security transactions | | | 13,645,029 | | | | 10,866,038 | | | | 12,208,133 | |
Net realized gains from in-kind redemptions (Note 1) | | | 2,217,896 | | | | — | | | | — | |
Net change in unrealized appreciation/ depreciation on investments | | | 35,292,390 | | | | 55,757,941 | | | | 120,534,622 | |
Net change in unrealized appreciation/depreciation on affiliated investments (Note 5) | | | 294,262 | | | | — | | | | — | |
NET REALIZED AND UNREALIZED GAINS ON INVESTMENTS | | | 51,449,577 | | | | 66,623,979 | | | | 132,742,755 | |
| | | | | | | | | | | | | |
NET INCREASE IN NET ASSETS RESULTING FROM OPERATIONS | | $ | 51,399,426 | | | $ | 65,915,022 | | | $ | 138,415,853 | |
| * | Includes $10,260 of prior years’ advisory fee reductions recouped by the Adviser from the Ave Maria Growth Fund (Note 2). |
| |
| See notes to financial statements. |
AVE MARIA MUTUAL FUNDS
STATEMENTS OF OPERATIONS
For the Year Ended December 31, 2013 (Continued)
| | | | | Ave Maria World Equity Fund | | | | |
| INVESTMENT INCOME | | | | | | | | | |
Dividends | | $ | 477,275 | | | $ | 586,555 | | | $ | 650,950 | |
Foreign withholding taxes on dividends | | | (8,344 | ) | | | (24,062 | ) | | | — | |
Interest | | | — | | | | — | | | | 1,592,094 | |
TOTAL INCOME | | | 468,931 | | | | 562,493 | | | | 2,243,044 | |
| | | | | | | | | | | | | |
| EXPENSES | | | | | | | | | | | | |
Investment advisory fees (Note 2) | | | 416,945 | | | | 319,689 | * | | | 510,420 | * |
Administration, accounting and transfer agent fees (Note 2) | | | 64,705 | | | | 49,620 | | | | 130,961 | |
Shareholder servicing fees (Note 2) | | | — | | | | — | | | | 89,881 | |
Legal and audit fees | | | 32,385 | | | | 31,624 | | | | 40,135 | |
Registration and filing fees | | | 24,195 | | | | 24,244 | | | | 35,145 | |
Postage and supplies | | | 12,654 | | | | 7,554 | | | | 22,122 | |
Trustees’ fees and expenses (Note 2) | | | 32,069 | | | | 32,069 | | | | 32,069 | |
Custodian and bank service fees | | | 5,440 | | | | 3,742 | | | | 9,606 | |
Advisory board fees and expenses (Note 2) | | | 8,752 | | | | 8,752 | | | | 8,752 | |
Insurance expense | | | 2,184 | | | | 1,375 | | | | 6,184 | |
Compliance service fees and expenses (Note 2) | | | 1,673 | | | | 1,226 | | | | 4,714 | |
Printing of shareholder reports | | | 2,926 | | | | 2,106 | | | | 3,968 | |
Other expenses | | | 10,581 | | | | 9,516 | | | | 22,261 | |
TOTAL EXPENSES | | | 614,509 | | | | 491,517 | | | | 916,218 | |
Less fee reductions by the Adviser (Note 2) | | | (65,896 | ) | | | (17,122 | ) | | | — | |
NET EXPENSES | | | 548,613 | | | | 474,395 | | | | 916,218 | |
| | | | | | | | | | | | | |
NET INVESTMENT INCOME (LOSS) | | | (79,682 | ) | | | 88,098 | | | | 1,326,826 | |
| | | | | | | | | | | | | |
REALIZED AND UNREALIZED GAINS ON INVESTMENTS | | | | | | | | | | | | |
Net realized gains from security transactions | | | 2,055,099 | | | | 1,304,333 | | | | 2,846,592 | |
Net change in unrealized appreciation/ depreciation on investments | | | 8,192,578 | | | | 5,350,516 | | | | 3,614,498 | |
NET REALIZED AND UNREALIZED GAINS ON INVESTMENTS | | | 10,247,677 | | | | 6,654,849 | | | | 6,461,090 | |
| | | | | | | | | | | | | |
NET INCREASE IN NET ASSETS RESULTING FROM OPERATIONS | | $ | 10,167,995 | | | $ | 6,742,947 | | | $ | 7,787,916 | |
| * | Includes $19,239 and $117,733 of prior years’ advisory fee reductions recouped by the Adviser from the Ave Maria World Equity Fund and the Ave Maria Bond Fund, respectively (Note 2). |
| |
| See notes to financial statements. |
AVE MARIA CATHOLIC VALUES FUND
STATEMENTS OF CHANGES IN NET ASSETS
| | Year Ended December 31, 2013 | | | Year Ended December 31, 2012 | |
| FROM OPERATIONS | | | | | | |
Net investment income (loss) | | $ | (50,151 | ) | | $ | 679,001 | |
Net realized gains from security transactions | | | 13,645,029 | | | | 7,637,745 | |
| Net realized gains from in-kind redemptions (Note 1) | | | 2,217,896 | | | | — | |
| Net change in unrealized appreciation/depreciation on investments | | | 35,292,390 | | | | 15,347,263 | |
Net change in unrealized appreciation/depreciation on affiliated investments (Note 5) | | | 294,262 | | | | — | |
| Net increase in net assets resulting from operations | | | 51,399,426 | | | | 23,664,009 | |
| | | | | | | | | |
| FROM DISTRIBUTIONS TO SHAREHOLDERS | | | | | | | | |
From net investment income | | | — | | | | (668,511 | ) |
From net realized gains on investments | | | (13,593,202 | ) | | | (5,281,341 | ) |
| Decrease in net assets from distributions to shareholders | | | (13,593,202 | ) | | | (5,949,852 | ) |
| | | | | | | | | |
| FROM CAPITAL SHARE TRANSACTIONS | | | | | | | | |
Proceeds from shares sold | | | 29,976,323 | | | | 14,967,453 | |
Reinvestment of distributions to shareholders | | | 12,568,399 | | | | 5,489,285 | |
Payments for shares redeemed | | | (24,649,834 | ) | | | (27,120,724 | ) |
| Net increase (decrease) in net assets from capital share transactions | | | 17,894,888 | | | | (6,663,986 | ) |
| | | | | | | | | |
TOTAL INCREASE IN NET ASSETS | | | 55,701,112 | | | | 11,050,171 | |
| | | | | | | | | |
| NET ASSETS | | | | | | | | |
Beginning of year | | | 191,099,882 | | | | 180,049,711 | |
End of year | | $ | 246,800,994 | | | $ | 191,099,882 | |
| | | | | | | | | |
| UNDISTRIBUTED NET INVESTMENT INCOME | | $ | — | | | $ | — | |
| | | | | | | | | |
| SUMMARY OF CAPITAL SHARE ACTIVITY | | | | | | | | |
Shares sold | | | 1,502,325 | | | | 841,506 | |
| Shares issued in reinvestment of distributions to shareholders | | | 595,095 | | | | 314,212 | |
Shares redeemed | | | (1,213,180 | ) | | | (1,522,132 | ) |
Net increase (decrease) in shares outstanding | | | 884,240 | | | | (366,414 | ) |
Shares outstanding, beginning of year | | | 10,750,769 | | | | 11,117,183 | |
Shares outstanding, end of year | | | 11,635,009 | | | | 10,750,769 | |
| See notes to financial statements. |
AVE MARIA GROWTH FUND
STATEMENTS OF CHANGES IN NET ASSETS
| | Year Ended December 31, 2013 | | | Year Ended December 31, 2012 | |
| FROM OPERATIONS | | | | | | |
Net investment loss | | $ | (708,957 | ) | | $ | (321,035 | ) |
| Net realized gains (losses) from security transactions | | | 10,866,038 | | | | (1,582,438 | ) |
Net change in unrealized appreciation/ depreciation on investments | | | 55,757,941 | | | | 26,029,128 | |
| Net increase in net assets resulting from operations | | | 65,915,022 | | | | 24,125,655 | |
| | | | | | | | | |
| FROM DISTRIBUTIONS TO SHAREHOLDERS | | | | | | | | |
From net realized gains on investments | | | (9,031,799 | ) | | | — | |
| | | | | | | | | |
| FROM CAPITAL SHARE TRANSACTIONS | | | | | | | | |
Proceeds from shares sold | | | 66,833,710 | | | | 49,959,728 | |
Reinvestment of distributions to shareholders | | | 8,286,790 | | | | — | |
Payments for shares redeemed | | | (45,632,663 | ) | | | (37,396,151 | ) |
| Net increase in net assets from capital share transactions | | | 29,487,837 | | | | 12,563,577 | |
| | | | | | | | | |
TOTAL INCREASE IN NET ASSETS | | | 86,371,060 | | | | 36,689,232 | |
| | | | | | | | | |
| NET ASSETS | | | | | | | | |
Beginning of year | | | 198,761,414 | | | | 162,072,182 | |
End of year | | $ | 285,132,474 | | | $ | 198,761,414 | |
| | | | | | | | | |
| UNDISTRIBUTED NET INVESTMENT INCOME | | $ | — | | | $ | — | |
| | | | | | | | | |
| SUMMARY OF CAPITAL SHARE ACTIVITY | | | | | | | | |
Shares sold | | | 2,493,809 | | | | 2,172,221 | |
| Shares issued in reinvestment of distributions to shareholders | | | 274,943 | | | | — | |
Shares redeemed | | | (1,709,714 | ) | | | (1,630,012 | ) |
Net increase in shares outstanding | | | 1,059,038 | | | | 542,209 | |
Shares outstanding, beginning of year | | | 8,384,234 | | | | 7,842,025 | |
Shares outstanding, end of year | | | 9,443,272 | | | | 8,384,234 | |
| See notes to financial statements. |
AVE MARIA RISING DIVIDEND FUND
STATEMENTS OF CHANGES IN NET ASSETS
| | Year Ended December 31, 2013 | | | Year Ended December 31, 2012 | |
| FROM OPERATIONS | | | | | | |
Net investment income | | $ | 5,673,098 | | | $ | 4,873,227 | |
Net realized gains from security transactions | | | 12,208,133 | | | | 14,908,237 | |
Net change in unrealized appreciation/ depreciation on investments | | | 120,534,622 | | | | 15,043,126 | |
| Net increase in net assets resulting from operations | | | 138,415,853 | | | | 34,824,590 | |
| | | | | | | | | |
| FROM DISTRIBUTIONS TO SHAREHOLDERS | | | | | | | | |
From net investment income | | | (5,673,774 | ) | | | (4,872,601 | ) |
From net realized gains on investments | | | (12,211,020 | ) | | | (14,894,513 | ) |
| Decrease in net assets from distributions to shareholders | | | (17,884,794 | ) | | | (19,767,114 | ) |
| | | | | | | | | |
| FROM CAPITAL SHARE TRANSACTIONS | | | | | | | | |
Proceeds from shares sold | | | 338,177,149 | | | | 124,151,161 | |
Reinvestment of distributions to shareholders | | | 16,386,212 | | | | 18,036,998 | |
Payments for shares redeemed | | | (68,852,912 | ) | | | (77,319,148 | ) |
| Net increase in net assets from capital share transactions | | | 285,710,449 | | | | 64,869,011 | |
| | | | | | | | | |
TOTAL INCREASE IN NET ASSETS | | | 406,241,508 | | | | 79,926,487 | |
| | | | | | | | | |
| NET ASSETS | | | | | | | | |
Beginning of year | | | 303,908,551 | | | | 223,982,064 | |
End of year | | $ | 710,150,059 | | | $ | 303,908,551 | |
| | | | | | | | | |
| UNDISTRIBUTED NET INVESTMENT INCOME | | $ | — | | | $ | 1,415 | |
| | | | | | | | | |
| SUMMARY OF CAPITAL SHARE ACTIVITY | | | | | | | | |
Shares sold | | | 21,328,062 | | | | 9,177,197 | |
| Shares issued in reinvestment of distributions to shareholders | | | 956,838 | | | | 1,349,700 | |
Shares redeemed | | | (4,366,681 | ) | | | (5,670,651 | ) |
Net increase in shares outstanding | | | 17,918,219 | | | | 4,856,246 | |
Shares outstanding, beginning of year | | | 22,521,833 | | | | 17,665,587 | |
Shares outstanding, end of year | | | 40,440,052 | | | | 22,521,833 | |
| See notes to financial statements. |
AVE MARIA OPPORTUNITY FUND
STATEMENTS OF CHANGES IN NET ASSETS
| | Year Ended December 31, 2013 | | | Year Ended December 31, 2012 | |
| FROM OPERATIONS | | | | | | |
Net investment income (loss) | | $ | (79,682 | ) | | $ | 93,890 | |
| Net realized gains (losses) from security transactions | | | 2,055,099 | | | | (332,469 | ) |
Net change in unrealized appreciation/ depreciation on investments | | | 8,192,578 | | | | 1,364,895 | |
| Net increase in net assets resulting from operations | | | 10,167,995 | | | | 1,126,316 | |
| | | | | | | | | |
| FROM DISTRIBUTIONS TO SHAREHOLDERS | | | | | | | | |
From net investment income | | | — | | | | (94,090 | ) |
From net realized gains on investments | | | (1,123,357 | ) | | | — | |
| Decrease in net assets from distributions to shareholders | | | (1,123,357 | ) | | | (94,090 | ) |
| | | | | | | | | |
| FROM CAPITAL SHARE TRANSACTIONS | | | | | | | | |
Proceeds from shares sold | | | 12,608,527 | | | | 11,527,201 | |
Reinvestment of distributions to shareholders | | | 1,019,549 | | | | 83,651 | |
Payments for shares redeemed | | | (7,465,029 | ) | | | (9,872,505 | ) |
| Net increase in net assets from capital share transactions | | | 6,163,047 | | | | 1,738,347 | |
| | | | | | | | | |
TOTAL INCREASE IN NET ASSETS | | | 15,207,685 | | | | 2,770,573 | |
| | | | | | | | | |
| NET ASSETS | | | | | | | | |
Beginning of year | | | 36,497,360 | | | | 33,726,787 | |
End of year | | $ | 51,705,045 | | | $ | 36,497,360 | |
| | | | | | | | | |
| UNDISTRIBUTED NET INVESTMENT INCOME | | $ | — | | | $ | — | |
| | | | | | | | | |
| SUMMARY OF CAPITAL SHARE ACTIVITY | | | | | | | | |
Shares sold | | | 977,794 | | | | 999,729 | |
| Shares issued in reinvestment of distributions to shareholders | | | 72,877 | | | | 7,469 | |
Shares redeemed | | | (584,770 | ) | | | (868,673 | ) |
Net increase in shares outstanding | | | 465,901 | | | | 138,525 | |
Shares outstanding, beginning of year | | | 3,206,817 | | | | 3,068,292 | |
Shares outstanding, end of year | | | 3,672,718 | | | | 3,206,817 | |
| See notes to financial statements. |
AVE MARIA WORLD EQUITY FUND
STATEMENTS OF CHANGES IN NET ASSETS
| | Year Ended December 31, 2013 | | | Year Ended December 31, 2012 | |
| FROM OPERATIONS | | | | | | |
Net investment income | | $ | 88,098 | | | $ | 101,294 | |
| Net realized gains (losses) from security transactions | | | 1,304,333 | | | | (178,555 | ) |
Net change in unrealized appreciation/ depreciation on investments | | | 5,350,516 | | | | 2,910,122 | |
| Net increase in net assets resulting from operations | | | 6,742,947 | | | | 2,832,861 | |
| | | | | | | | | |
| FROM DISTRIBUTIONS TO SHAREHOLDERS | | | | | | | | |
From net investment income | | | (88,197 | ) | | | (101,368 | ) |
From net realized gains on investments | | | (610,855 | ) | | | — | |
| Decrease in net assets from distributions to shareholders | | | (699,052 | ) | | | (101,368 | ) |
| | | | | | | | | |
| FROM CAPITAL SHARE TRANSACTIONS | | | | | | | | |
Proceeds from shares sold | | | 13,380,779 | | | | 5,497,022 | |
Reinvestment of distributions to shareholders | | | 585,119 | | | | 83,646 | |
Payments for shares redeemed | | | (4,375,713 | ) | | | (4,400,457 | ) |
| Net increase in net assets from capital share transactions | | | 9,590,185 | | | | 1,180,211 | |
| | | | | | | | | |
TOTAL INCREASE IN NET ASSETS | | | 15,634,080 | | | | 3,911,704 | |
| | | | | | | | | |
| NET ASSETS | | | | | | | | |
Beginning of year | | | 24,235,838 | | | | 20,324,134 | |
End of year | | $ | 39,869,918 | | | $ | 24,235,838 | |
| | | | | | | | | |
| UNDISTRIBUTED NET INVESTMENT INCOME | | $ | — | | | $ | — | |
| | | | | | | | | |
| SUMMARY OF CAPITAL SHARE ACTIVITY | | | | | | | | |
Shares sold | | | 1,054,553 | | | | 499,645 | |
| Shares issued in reinvestment of distributions to shareholders | | | 42,277 | | | | 7,389 | |
Shares redeemed | | | (344,416 | ) | | | (402,013 | ) |
Net increase in shares outstanding | | | 752,414 | | | | 105,021 | |
Shares outstanding, beginning of year | | | 2,115,306 | | | | 2,010,285 | |
Shares outstanding, end of year | | | 2,867,720 | | | | 2,115,306 | |
| See notes to financial statements. |
AVE MARIA BOND FUND
STATEMENTS OF CHANGES IN NET ASSETS
| | Year Ended December 31, 2013 | | | Year Ended December 31, 2012 | |
| FROM OPERATIONS | | | | | | |
Net investment income | | $ | 1,326,826 | | | $ | 1,671,082 | |
Net realized gains from security transactions | | | 2,846,592 | | | | 1,493,385 | |
Net change in unrealized appreciation/ depreciation on investments | | | 3,614,498 | | | | 1,411,899 | |
| Net increase in net assets resulting from operations | | | 7,787,916 | | | | 4,576,366 | |
| | | | | | | | | |
| FROM DISTRIBUTIONS TO SHAREHOLDERS | | | | | | | | |
From net investment income | | | (1,326,871 | ) | | | (1,671,862 | ) |
From net realized gains on investments | | | (2,847,211 | ) | | | (1,493,716 | ) |
| Decrease in net assets from distributions to shareholders | | | (4,174,082 | ) | | | (3,165,578 | ) |
| | | | | | | | | |
| FROM CAPITAL SHARE TRANSACTIONS | | | | | | | | |
Proceeds from shares sold | | | 61,108,576 | | | | 31,120,400 | |
Reinvestment of distributions to shareholders | | | 3,445,382 | | | | 2,483,628 | |
Payments for shares redeemed | | | (31,460,772 | ) | | | (14,373,483 | ) |
| Net increase in net assets from capital share transactions | | | 33,093,186 | | | | 19,230,545 | |
| | | | | | | | | |
TOTAL INCREASE IN NET ASSETS | | | 36,707,020 | | | | 20,641,333 | |
| | | | | | | | | |
| NET ASSETS | | | | | | | | |
Beginning of year | | | 113,042,699 | | | | 92,401,366 | |
End of year | | $ | 149,749,719 | | | $ | 113,042,699 | |
| | | | | | | | | |
| UNDISTRIBUTED NET INVESTMENT INCOME | | $ | — | | | $ | 400 | |
| | | | | | | | | |
| SUMMARY OF CAPITAL SHARE ACTIVITY | | | | | | | | |
Shares sold | | | 5,383,619 | | | | 2,807,708 | |
| Shares issued in reinvestment of distributions to shareholders | | | 303,093 | | | | 224,907 | |
Shares redeemed | | | (2,770,598 | ) | | | (1,297,942 | ) |
Net increase in shares outstanding | | | 2,916,114 | | | | 1,734,673 | |
Shares outstanding, beginning of year | | | 10,237,982 | | | | 8,503,309 | |
Shares outstanding, end of year | | | 13,154,096 | | | | 10,237,982 | |
| See notes to financial statements. |
AVE MARIA CATHOLIC VALUES FUND
FINANCIAL HIGHLIGHTS
Per Share Data for a Share Outstanding Throughout Each Year
| | Year Ended December 31, 2013 | | | Year Ended December 31, 2012 | | | Year Ended December 31, 2011 | | | Year Ended December 31, 2010 | | | Year Ended December 31, 2009 | |
| Net asset value at beginning of year | | $ | 17.78 | | | $ | 16.20 | | | $ | 16.42 | | | $ | 13.63 | | | $ | 9.91 | |
| | | | | | | | | | | | | | | | | | | | | |
| Income (loss) from investment operations: | | | | | | | | | | | | | | | | | | | | |
| Net investment income (loss) | | | (0.00 | )(a) | | | 0.06 | | | | (0.01 | ) | | | 0.01 | | | | 0.01 | |
Net realized and unrealized gains (losses) on investments | | | 4.66 | | | | 2.09 | | | | (0.21 | ) | | | 2.79 | | | | 3.72 | |
| Total from investment operations | | | 4.66 | | | | 2.15 | | | | (0.22 | ) | | | 2.80 | | | | 3.73 | |
| | | | | | | | | | | | | | | | | | | | | |
| Less distributions: | | | | | | | | | | | | | | | | | | | | |
From net investment income | | | — | | | | (0.06 | ) | | | — | | | | (0.01 | ) | | | (0.01 | ) |
| From net realized gains on investments | | | (1.23 | ) | | | (0.51 | ) | | | — | | | | — | | | | — | |
Total distributions | | | (1.23 | ) | | | (0.57 | ) | | | — | | | | (0.01 | ) | | | (0.01 | ) |
| | | | | | | | | | | | | | | | | | | | | |
Net asset value at end of year | | $ | 21.21 | | | $ | 17.78 | | | $ | 16.20 | | | $ | 16.42 | | | $ | 13.63 | |
| | | | | | | | | | | | | | | | | | | | | |
Total return (b) | | | 26.2% | | | | 13.3% | | | | (1.3% | ) | | | 20.5% | | | | 37.6% | |
| | | | | | | | | | | | | | | | | | | | | |
| Ratios/Supplementary Data: | | | | | | | | | | | | | | | | | | | | |
| Net assets at end of year (000’s) | | $ | 246,801 | | | $ | 191,100 | | | $ | 180,050 | | | $ | 187,913 | | | $ | 170,634 | |
| | | | | | | | | | | | | | | | | | | | | |
Ratio of net expenses to average net assets (c) | | | 1.42% | | | | 1.48% | | | | 1.50% | | | | 1.50% | | | | 1.50% | |
| | | | | | | | | | | | | | | | | | | | | |
Ratio of net investment income (loss) to average net assets | | | (0.02% | ) | | | 0.35% | | | | (0.08% | ) | | | 0.04% | | | | 0.07% | |
| | | | | | | | | | | | | | | | | | | | | |
Portfolio turnover rate | | | 29% | | | | 25% | | | | 29% | | | | 33% | | | | 58% | |
| (a) | Amount rounds to less than $0.01 per share. |
| | |
| (b) | Total return is a measure of the change in value of an investment in the Fund over the years covered, which assumes any dividends or capital gains distributions are reinvested in shares of the Fund. The returns shown do not reflect the deduction of taxes a shareholder would pay on Fund distributions or the redemption of Fund shares. |
| | |
| (c) | Absent investment advisory fee reductions by the Adviser, the ratio of expenses to average net assets would have been 1.51% and 1.56% for the years ended December 31, 2010 and 2009, respectively (Note 2). |
| |
| See notes to financial statements. |
AVE MARIA GROWTH FUND
FINANCIAL HIGHLIGHTS
Per Share Data for a Share Outstanding Throughout Each Year
| | Year Ended December 31, 2013 | | | Year Ended December 31, 2012 | | | Year Ended December 31, 2011 | | | Year Ended December 31, 2010 | | | Year Ended December 31, 2009 | |
| Net asset value at beginning of year | | $ | 23.71 | | | $ | 20.67 | | | $ | 20.56 | | | $ | 16.26 | | | $ | 12.86 | |
| | | | | | | | | | | | | | | | | | | | | |
| Income (loss) from investment operations: | | | | | | | | | | | | | | | | | | | | |
Net investment loss | | | (0.08 | ) | | | (0.04 | ) | | | (0.06 | ) | | | (0.05 | ) | | | (0.02 | ) |
Net realized and unrealized gains on investments | | | 7.55 | | | | 3.08 | | | | 0.17 | | | | 4.35 | | | | 3.42 | |
| Total from investment operations | | | 7.47 | | | | 3.04 | | | | 0.11 | | | | 4.30 | | | | 3.40 | |
| | | | | | | | | | | | | | | | | | | | | |
| Less distributions: | | | | | | | | | | | | | | | | | | | | |
| From net realized gains on investments | | | (0.99 | ) | | | — | | | | — | | | | — | | | | — | |
| | | | | | | | | | | | | | | | | | | | | |
Net asset value at end of year | | $ | 30.19 | | | $ | 23.71 | | | $ | 20.67 | | | $ | 20.56 | | | $ | 16.26 | |
| | | | | | | | | | | | | | | | | | | | | |
Total return (a) | | | 31.5% | | | | 14.7% | | | | 0.5% | | | | 26.5% | | | | 26.4% | |
| | | | | | | | | | | | | | | | | | | | | |
| Ratios/Supplementary Data: | | | | | | | | | | | | | | | | | | | | |
| Net assets at end of year (000’s) | | $ | 285,132 | | | $ | 198,761 | | | $ | 162,072 | | | $ | 147,443 | | | $ | 115,626 | |
| | | | | | | | | | | | | | | | | | | | | |
Ratio of net expenses to average net assets (b) | | | 1.43% | | | | 1.50% | | | | 1.50% | | | | 1.50% | | | | 1.50% | |
| | | | | | | | | | | | | | | | | | | | | |
| Ratio of net investment loss to average net assets | | | (0.29% | ) | | | (0.17% | ) | | | (0.29% | ) | | | (0.29% | ) | | | (0.1%6 | ) |
| | | | | | | | | | | | | | | | | | | | | |
Portfolio turnover rate | | | 18% | | | | 33% | | | | 10% | | | | 25% | | | | 9% | |
| (a) | Total return is a measure of the change in value of an investment in the Fund over the years covered, which assumes any dividends or capital gains distributions are reinvested in shares of the Fund. The returns shown do not reflect the deduction of taxes a shareholder would pay on Fund distributions or the redemption of Fund shares. |
| | |
| (b) | Absent investment advisory fee reductions by the Adviser, the ratio of expenses to average net assets would have been 1.52% and 1.61% for the years ended December 31, 2010 and 2009, respectively (Note 2). |
| | |
| See notes to financial statements. |
AVE MARIA RISING DIVIDEND FUND
FINANCIAL HIGHLIGHTS
Per Share Data for a Share Outstanding Throughout Each Year
| | Year Ended December 31, 2013 | | | Year Ended December 31, 2012 | | | Year Ended December 31, 2011 | | | Year Ended December 31, 2010 | | | Year Ended December 31, 2009 | |
| Net asset value at beginning of year | | $ | 13.49 | | | $ | 12.68 | | | $ | 12.51 | | | $ | 10.77 | | | $ | 8.72 | |
| | | | | | | | | | | | | | | | | | | | | |
| Income from investment operations: | | | | | | | | | | | | | | | | | | | | |
Net investment income | | | 0.17 | | | | 0.23 | | | | 0.18 | | | | 0.17 | | | | 0.13 | |
Net realized and unrealized gains on investments | | | 4.38 | | | | 1.51 | | | | 0.40 | | | | 1.74 | | | | 2.05 | |
| Total from investment operations | | | 4.55 | | | | 1.74 | | | | 0.58 | | | | 1.91 | | | | 2.18 | |
| | | | | | | | | | | | | | | | | | | | | |
| Less distributions: | | | | | | | | | | | | | | | | | | | | |
From net investment income | | | (0.17 | ) | | | (0.23 | ) | | | (0.18 | ) | | | (0.17 | ) | | | (0.13 | ) |
| From net realized gains on investments | | | (0.31 | ) | | | (0.70 | ) | | | (0.23 | ) | | | — | | | | — | |
Total distributions | | | (0.48 | ) | | | (0.93 | ) | | | (0.41 | ) | | | (0.17 | ) | | | (0.13 | ) |
| | | | | | | | | | | | | | | | | | | | | |
Net asset value at end of year | | $ | 17.56 | | | $ | 13.49 | | | $ | 12.68 | | | $ | 12.51 | | | $ | 10.77 | |
| | | | | | | | | | | | | | | | | | | | | |
Total return (a) | | | 33.9% | | | | 13.9% | | | | 4.6% | | | | 17.9% | | | | 25.3% | |
| | | | | | | | | | | | | | | | | | | | | |
| Ratios/Supplementary Data: | | | | | | | | | | | | | | | | | | | | |
| Net assets at end of year (000’s) | | $ | 710,150 | | | $ | 303,909 | | | $ | 223,982 | | | $ | 127,022 | | | $ | 102,861 | |
| | | | | | | | | | | | | | | | | | | | | |
| Ratio of expenses to average net assets | | | 0.97% | | | | 0.99% | | | | 1.02% | | | | 1.06% | | | | 1.11% | |
| | | | | | | | | | | | | | | | | | | | | |
Ratio of net investment income to average net assets | | | 1.16% | | | | 1.75% | | | | 1.45% | | | | 1.52% | | | | 1.42% | |
| | | | | | | | | | | | | | | | | | | | | |
Portfolio turnover rate | | | 14% | | | | 37% | | | | 22% | | | | 34% | | | | 63% | |
| (a) | Total return is a measure of the change in value of an investment in the Fund over the years covered, which assumes any dividends or capital gains distributions are reinvested in shares of the Fund. The returns shown do not reflect the deduction of taxes a shareholder would pay on Fund distributions or the redemption of Fund shares. |
| |
| See notes to financial statements. |
AVE MARIA OPPORTUNITY FUND
FINANCIAL HIGHLIGHTS
Per Share Data for a Share Outstanding Throughout Each Year
| | Year Ended December 31, 2013 | | | Year Ended December 31, 2012 | | | Year Ended December 31, 2011 | | | Year Ended December 31, 2010 | | | Year Ended December 31, 2009 | |
| Net asset value at beginning of year | | $ | 11.38 | | | $ | 10.99 | | | $ | 10.85 | | | $ | 9.11 | | | $ | 6.47 | |
| | | | | | | | | | | | | | | | | | | | | |
| Income (loss) from investment operations: | | | | | | | | | | | | | | | | | | | | |
| Net investment income (loss) | | | (0.02 | ) | | | 0.03 | | | | (0.03 | ) | | | 0.01 | | | | (0.02 | ) |
Net realized and unrealized gains on investments | | | 3.03 | | | | 0.39 | | | | 0.17 | | | | 1.74 | | | | 2.66 | |
| Total from investment operations | | | 3.01 | | | | 0.42 | | | | 0.14 | | | | 1.75 | | | | 2.64 | |
| | | | | | | | | | | | | | | | | | | | | |
| Less distributions: | | | | | | | | | | | | | | | | | | | | |
From net investment income | | | — | | | | (0.03 | ) | | | — | | | | (0.01 | ) | | | — | |
| From net realized gains on investments | | | (0.31 | ) | | | — | | | | — | | | | — | | | | — | |
Total distributions | | | (0.31 | ) | | | (0.03 | ) | | | — | | | | (0.01 | ) | | | — | |
| | | | | | | | | | | | | | | | | | | | | |
Net asset value at end of year | | $ | 14.08 | | | $ | 11.38 | | | $ | 10.99 | | | $ | 10.85 | | | $ | 9.11 | |
| | | | | | | | | | | | | | | | | | | | | |
Total return (a) | | | 26.5% | | | | 3.8% | | | | 1.3% | | | | 19.2% | | | | 40.8% | |
| | | | | | | | | | | | | | | | | | | | | |
| Ratios/Supplementary Data: | | | | | | | | | | | | | | | | | | | | |
| Net assets at end of year (000’s) | | $ | 51,705 | | | $ | 36,497 | | | $ | 33,727 | | | $ | 24,794 | | | $ | 16,787 | |
| | | | | | | | | | | | | | | | | | | | | |
Ratio of net expenses to average net assets (b) | | | 1.25% | | | | 1.25% | | | | 1.25% | | | | 1.25% | | | | 1.25% | |
| | | | | | | | | | | | | | | | | | | | | |
Ratio of net investment income (loss) to average net assets | | | (0.18% | ) | | | 0.25% | | | | (0.32% | ) | | | 0.07% | | | | (0.25% | ) |
| | | | | | | | | | | | | | | | | | | | | |
Portfolio turnover rate | | | 58% | | | | 84% | | | | 101% | | | | 81% | | | | 113% | |
| (a) | Total return is a measure of the change in value of an investment in the Fund over the years covered, which assumes any dividends or capital gains distributions are reinvested in shares of the Fund. The returns shown do not reflect the deduction of taxes a shareholder would pay on Fund distributions or the redemption of Fund shares. |
| | |
| (b) | Absent investment advisory fee reductions and expense reimbursements by the Adviser, the ratio of expenses to average net assets would have been 1.40%, 1.43%, 1.48%, 1.79% and 2.31% for the years ended December 31, 2013, 2012, 2011, 2010 and 2009, respectively (Note 2). |
| | |
| See notes to financial statements. |
AVE MARIA WORLD EQUITY FUND
FINANCIAL HIGHLIGHTS
Per Share Data for a Share Outstanding Throughout Each Period
| | Year Ended December 31, 2013 | | | Year Ended December 31, 2012 | | | Year Ended December 31, 2011 | | | Period Ended December 31, 2010(a) | |
| Net asset value at beginning of period | | $ | 11.46 | | | $ | 10.11 | | | $ | 11.24 | | | $ | 10.00 | |
| | | | | | | | | | | | | | | | | |
| Income (loss) from investment operations: | | | | | | | | | | | | | | | | |
| Net investment income | | | 0.03 | | | | 0.05 | | | | 0.05 | | | | 0.00 | (b) |
| Net realized and unrealized gains (losses) on investments | | | 2.66 | | | | 1.35 | | | | (1.13 | ) | | | 1.24 | |
| Total from investment operations | | | 2.69 | | | | 1.40 | | | | (1.08 | ) | | | 1.24 | |
| | | | | | | | | | | | | | | | | |
| Less distributions: | | | | | | | | | | | | | | | | |
| From net investment income | | | (0.03 | ) | | | (0.05 | ) | | | (0.05 | ) | | | — | |
| From net realized gains on investments | | | (0.22 | ) | | | — | | | | — | | | | — | |
| Total distributions | | | (0.25 | ) | | | (0.05 | ) | | | (0.05 | ) | | | — | |
| | | | | | | | | | | | | | | | | |
| Net asset value at end of period | | $ | 13.90 | | | $ | 11.46 | | | $ | 10.11 | | | $ | 11.24 | |
| | | | | | | | | | | | | | | | | |
Total return (c) | | | 23.5% | | | | 13.8% | | | | (9.6% | ) | | | 12.4% | (d) |
| | | | | | | | | | | | | | | | | |
| Ratios/Supplementary Data: | | | | | | | | | | | | | | | | |
| Net assets at end of period (000’s) | | $ | 39,870 | | | $ | 24,236 | | | $ | 20,324 | | | $ | 12,000 | |
| | | | | | | | | | | | | | | | | |
Ratio of net expenses to average net assets (e) | | | 1.50% | | | | 1.50% | | | | 1.50% | | | | 1.50% | (f) |
| | | | | | | | | | | | | | | | | |
| Ratio of net investment income to average net assets | | | 0.28% | | | | 0.46% | | | | 0.58% | | | | 0.01% | (f) |
| | | | | | | | | | | | | | | | | |
| Portfolio turnover rate | | | 31% | | | | 33% | | | | 13% | | | | 5% | (d) |
| (a) | Represents the period from the initial public offering (April 30, 2010) through December 31, 2010. |
| | |
| (b) | Amount rounds to less than $0.01 per share. |
| | |
| (c) | Total return is a measure of the change in value of an investment in the Fund over the periods covered, which assumes any dividends or capital gains distributions are reinvested in shares of the Fund. The returns shown do not reflect the deduction of taxes a shareholder would pay on Fund distributions or the redemption of Fund shares. |
| | |
| (d) | Not annualized. |
| | |
| (e) | Absent investment advisory fee reductions by the Adviser, the ratio of expenses to average net assets would have been 1.55%, 1.63%, 1.78% and 2.45%(f) for the periods ended December 31, 2013, 2012, 2011 and 2010, respectively (Note 2). |
| | |
| (f) | Annualized. |
| | |
| See notes to financial statements. |
AVE MARIA BOND FUND
FINANCIAL HIGHLIGHTS
Per Share Data for a Share Outstanding Throughout Each Year
| | Year Ended December 31, 2013 | | | Year Ended December 31, 2012 | | | Year Ended December 31, 2011 | | | Year Ended December 31, 2010 | | | Year Ended December 31, 2009 | |
| Net asset value at beginning of year | | $ | 11.04 | | | $ | 10.87 | | | $ | 10.90 | | | $ | 10.48 | | | $ | 9.79 | |
| | | | | | | | | | | | | | | | | | | | | |
| Income from investment operations: | | | | | | | | | | | | | | | | | | | | |
Net investment income | | | 0.11 | | | | 0.18 | | | | 0.21 | | | | 0.26 | | | | 0.29 | |
Net realized and unrealized gains on investments | | | 0.56 | | | | 0.32 | | | | 0.15 | | | | 0.43 | | | | 0.69 | |
| Total from investment operations | | | 0.67 | | | | 0.50 | | | | 0.36 | | | | 0.69 | | | | 0.98 | |
| | | | | | | | | | | | | | | | | | | | | |
| Less distributions: | | | | | | | | | | | | | | | | | | | | |
From net investment income | | | (0.11 | ) | | | (0.18 | ) | | | (0.21 | ) | | | (0.26 | ) | | | (0.29 | ) |
| From net realized gains on investments | | | (0.22 | ) | | | (0.15 | ) | | | (0.18 | ) | | | (0.01 | ) | | | — | |
Total distributions | | | (0.33 | ) | | | (0.33 | ) | | | (0.39 | ) | | | (0.27 | ) | | | (0.29 | ) |
| | | | | | | | | | | | | | | | | | | | | |
Net asset value at end of year | | $ | 11.38 | | | $ | 11.04 | | | $ | 10.87 | | | $ | 10.90 | | | $ | 10.48 | |
| | | | | | | | | | | | | | | | | | | | | |
Total return (a) | | | 6.1% | | | | 4.6% | | | | 3.3% | | | | 6.7% | | | | 10.2% | |
| | | | | | | | | | | | | | | | | | | | | |
| Ratios/Supplementary Data: | | | | | | | | | | | | | | | | | | | | |
| Net assets at end of year (000’s) | | $ | 149,750 | | | $ | 113,043 | | | $ | 92,401 | | | $ | 74,606 | | | $ | 51,788 | |
| | | | | | | | | | | | | | | | | | | | | |
Ratio of net expenses to average net assets (b) | | | 0.70% | | | | 0.70% | | | | 0.70% | | | | 0.70% | | | | 0.66% | |
| | | | | | | | | | | | | | | | | | | | | |
Ratio of net investment income to average net assets | | | 1.01% | | | | 1.64% | | | | 1.96% | | | | 2.38% | | | | 2.90% | |
| | | | | | | | | | | | | | | | | | | | | |
Portfolio turnover rate | | | 17% | | | | 21% | | | | 27% | | | | 24% | | | | 27% | |
| (a) | Total return is a measure of the change in value of an investment in the Fund over the years covered, which assumes any dividends or capital gains distributions are reinvested in shares of the Fund. The returns shown do not reflect the deduction of taxes a shareholder would pay on Fund distributions or the redemption of Fund shares. |
| | |
| (b) | Absent investment advisory fee reductions by the Adviser, the ratio of expenses to average net assets would have been 0.71%, 0.73%, 0.85% and 0.93% for the years ended December 31, 2012, 2011, 2010 and 2009, respectively (Note 2). |
| | |
| See notes to financial statements. |
AVE MARIA MUTUAL FUNDS
NOTES TO FINANCIAL STATEMENTS
| 1. | Organization and Significant Accounting Policies |
The Ave Maria Catholic Values Fund, the Ave Maria Growth Fund, the Ave Maria Rising Dividend Fund, the Ave Maria Opportunity Fund, the Ave Maria World Equity Fund and the Ave Maria Bond Fund (collectively, the “Funds”) are each a diversified series of the Schwartz Investment Trust (the “Trust”), an open-end management investment company registered under the Investment Company Act of 1940 and established as an Ohio business trust under a Declaration of Trust dated August 31, 1992. The Ave Maria Catholic Values Fund commenced the public offering of its shares on May 1, 2001. The public offering of shares of the Ave Maria Growth Fund and the Ave Maria Bond Fund commenced on May 1, 2003. The Ave Maria Rising Dividend Fund commenced the public offering of its shares on May 2, 2005. The Ave Maria Opportunity Fund commenced the public offering of its shares on May 1, 2006. The Ave Maria World Equity Fund commenced the public offering of its shares on April 30, 2010.
The investment objective of the Ave Maria Catholic Values Fund is to seek long-term capital appreciation from equity investments in companies that do not violate core values and teachings of the Roman Catholic Church. The investment objective of the Ave Maria Growth Fund is to seek long-term capital appreciation, using the growth style, from equity investments in companies that do not violate core values and teachings of the Roman Catholic Church. The investment objective of the Ave Maria Rising Dividend Fund is to provide increasing dividend income over time, long-term growth of capital, and a reasonable level of current income from investments in dividend-paying common stocks of companies that do not violate core values and teachings of the Roman Catholic Church. The investment objective of the Ave Maria Opportunity Fund is long-term capital appreciation from equity investments in companies that do not violate core values and teachings of the Roman Catholic Church. The investment objective of the Ave Maria World Equity Fund is to seek long-term capital appreciation from equity investments in U.S. and non-U.S. companies that do not violate core values and teachings of the Roman Catholic Church. The investment objective of the Ave Maria Bond Fund is to seek preservation of principal with a reasonable level of current income in corporate debt and equity securities that do not violate core values and teachings of the Roman Catholic Church. See the Funds’ Prospectus for information regarding the investment strategies of each Fund.
Shares of each Fund are sold at net asset value. To calculate the net asset value, each Fund’s assets are valued and totaled, liabilities are subtracted, and the balance is divided by the number of shares outstanding. The offering price and redemption price per share are equal to the net asset value per share for each Fund.
AVE MARIA MUTUAL FUNDS
NOTES TO FINANCIAL STATEMENTS
The following is a summary of significant accounting policies followed by the Funds:
(a) Valuation of investments – Securities which are traded on stock exchanges are valued at the closing sales price as of the close of the regular session of trading on the New York Stock Exchange on the day the securities are being valued, or, if not traded on a particular day, at the closing bid price. Securities which are quoted by NASDAQ are valued at the NASDAQ Official Closing Price or, if an official close price is not available, at the most recently quoted bid price. Securities traded in the over-the-counter market are valued at the last reported sales price or, if there is no reported sale on the valuation date, at the most recently quoted bid price. Securities which are traded both in the over-the-counter market and on a stock exchange are valued according to the broadest and most representative market. Investments in shares of other open-end investment companies are valued at their net asset value as reported by such companies. Securities for which market quotations are not readily available are valued at their fair value as determined in good faith in accordance with consistently applied procedures established by and under the general supervision of the Board of Trustees, and will be classified as Level 2 or 3 within the fair value hierarchy (see below), depending on the inputs used. Fair value pricing may be used, for example, in situations where (i) a portfolio security is so thinly traded that there have been no transactions for that stock over an extended period of time; (ii) the exchange on which the portfolio security is principally traded closes early; or (iii) trading of the portfolio security is halted during the day and does not resume prior to a Fund’s net asset value calculation. A portfolio security’s “fair value” price may differ from the price next available for that portfolio security using the Funds’ normal pricing procedures. Short-term instruments (those with remaining maturities of 60 days or less at the time of purchase) are valued at amortized cost, which approximates market value.
Accounting principles generally accepted in the United States (“GAAP”) establish a single authoritative definition of fair value, set out a framework for measuring fair value and require additional disclosures about fair value measurements.
Various inputs are used in determining the value of each Fund’s investments. These inputs are summarized in the three broad levels listed below:
| | • | Level 1 – quoted prices in active markets for identical securities |
| | • | Level 2 – other significant observable inputs |
| | • | Level 3 – significant unobservable inputs |
AVE MARIA MUTUAL FUNDS
NOTES TO FINANCIAL STATEMENTS
U.S. Treasury Obligations, U.S. Government Agency Obligations and Corporate Bonds held by the Ave Maria Bond Fund are classified as Level 2 since the values for such securities are based on prices provided by an independent pricing service that utilizes various “other significant observable inputs” including bid and ask quotations, prices of similar securities and interest rates, among other factors.
The inputs or methodology used for valuing securities are not necessarily an indication of the risks associated with investing in those securities. The inputs used to measure fair value may fall into different levels of the fair value hierarchy. In such cases, for disclosure purposes, the level in the fair value hierarchy within which the fair value measurement falls in its entirety is determined based on the lowest level input that is significant to the fair value measurement.
The following is a summary of the inputs used to value the Funds’ investments, by security type, as of December 31, 2013:
Ave Maria Catholic Values Fund | | | | | | | | | | | | |
Common Stocks | | $ | 232,607,321 | | | $ | — | | | $ | — | | | $ | 232,607,321 | |
Warrants | | | 1,775,000 | | | | — | | | | — | | | | 1,775,000 | |
Exchange-Traded Funds | | | 3,212,000 | | | | — | | | | — | | | | 3,212,000 | |
Money Market Funds | | | 9,503,240 | | | | — | | | | — | | | | 9,503,240 | |
Total | | $ | 247,097,561 | | | $ | — | | | $ | — | | | $ | 247,097,561 | |
| | | | | | | | | | | | |
Common Stocks | | $ | 272,687,954 | | | $ | — | | | $ | — | | | $ | 272,687,954 | |
Money Market Funds | | | 12,459,051 | | | | — | | | | — | | | | 12,459,051 | |
Total | | $ | 285,147,005 | | | $ | — | | | $ | — | | | $ | 285,147,005 | |
Ave Maria Rising Dividend Fund | | | | | | | | | | | | |
Common Stocks | | $ | 652,691,378 | | | $ | — | | | $ | — | | | $ | 652,691,378 | |
Warrants | | | 3,370,583 | | | | — | | | | — | | | | 3,370,583 | |
Exchange-Traded Funds | | | 5,431,200 | | | | — | | | | — | | | | 5,431,200 | |
Money Market Funds | | | 47,635,013 | | | | — | | | | — | | | | 47,635,013 | |
Total | | $ | 709,128,174 | | | $ | — | | | $ | — | | | $ | 709,128,174 | |
AVE MARIA MUTUAL FUNDS
NOTES TO FINANCIAL STATEMENTS
Ave Maria Opportunity Fund | | | | | | | | | | | | |
Common Stocks | | $ | 42,993,931 | | | $ | — | | | $ | — | | | $ | 42,993,931 | |
Rights | | | 16,000 | | | | — | | | | — | | | | 16,000 | |
Exchange-Traded Funds | | | 488,859 | | | | — | | | | — | | | | 488,859 | |
Money Market Funds | | | 9,557,042 | | | | — | | | | — | | | | 9,557,042 | |
Total | | $ | 53,055,832 | | | $ | — | | | $ | — | | | $ | 53,055,832 | |
Ave Maria World Equity Fund | | | | | | | | | | | | |
Common Stocks | | $ | 37,596,754 | | | $ | — | | | $ | — | | | $ | 37,596,754 | |
Exchange-Traded Funds | | | 350,400 | | | | — | | | | — | | | | 350,400 | |
Money Market Funds | | | 2,168,247 | | | | — | | | | — | | | | 2,168,247 | |
Total | | $ | 40,115,401 | | | $ | — | | | $ | — | | | $ | 40,115,401 | |
| | | | | | | | | | | | |
U.S. Treasury Obligations | | $ | — | | | $ | 47,813,257 | | | $ | — | | | $ | 47,813,257 | |
U.S. Government Agency Obligations | | | — | | | | 1,045,219 | | | | — | | | | 1,045,219 | |
Corporate Bonds | | | — | | | | 63,086,157 | | | | — | | | | 63,086,157 | |
Common Stocks | | | 28,523,010 | | | | — | | | | — | | | | 28,523,010 | |
Money Market Funds | | | 8,239,522 | | | | — | | | | — | | | | 8,239,522 | |
Total | | $ | 36,762,532 | | | $ | 111,944,633 | | | $ | — | | | $ | 148,707,165 | |
Refer to each Fund’s Schedule of Investments for a listing of the securities by security type and sector or industry type. As of December 31, 2013, the Funds did not have any transfers in and out of any Level. There were no Level 3 securities or derivative instruments held by the Funds as of December 31, 2013. It is the Funds’ policy to recognize transfers into and out of all Levels at the end of the reporting period.
(b) Income taxes – It is each Fund’s intention to continue to qualify as a regulated investment company under the Internal Revenue Code of 1986 (the “Code”). Qualification generally will relieve each Fund of liability for federal income taxes to the extent 100% of their net investment income and net realized gains are distributed in accordance with the Code. Accordingly, no provision for income tax has been made.
In order to avoid imposition of the excise tax applicable to regulated investment companies, it is also each Fund’s intention to declare as dividends in each calendar year at least 98% of its net investment income and 98.2% of its net realized capital gains plus undistributed amounts from prior years.
AVE MARIA MUTUAL FUNDS
NOTES TO FINANCIAL STATEMENTS
The following information is computed on a tax basis for each item as of December 31, 2013:
| | Ave Maria Catholic Values Fund | | | | | | Ave Maria Rising Dividend Fund | | | | | | Ave Maria World Equity Fund | | | | |
Net unrealized appreciation | | $ | 76,202,642 | | | $ | 119,443,130 | | | $ | 151,362,050 | | | $ | 12,402,880 | | | $ | 7,420,866 | | | $ | 8,672,998 | |
Total Distributable Earnings | | $ | 76,202,642 | | | $ | 119,443,130 | | | $ | 151,362,050 | | | $ | 12,402,880 | | | $ | 7,420,866 | | | $ | 8,672,998 | |
During the year ended December 31, 2013, the Ave Maria Growth Fund, the Ave Maria Opportunity Fund, and the Ave Maria World Equity Fund utilized short-term capital loss carryforwards in the amount of $1,909,717, $940,370 and $574,048, respectively. The Ave Maria World Equity Fund also utilized long-term capital loss carryforwards in the amount of $119,651. As of December 31, 2013, there are no remaining capital loss carryforwards in any Fund.
The following information is based upon the federal income tax cost of the Funds’ investment securities as of December 31, 2013:
| | Ave Maria Catholic Values Fund | | | | | | Ave Maria Rising Dividend Fund | | | | | | Ave Maria World Equity Fund | | | | |
Gross unrealized appreciation | | $ | 80,907,424 | | | $ | 120,028,068 | | | $ | 154,608,625 | | | $ | 12,610,213 | | | $ | 7,854,947 | | | $ | 9,320,769 | |
Gross unrealized depreciation | | | (4,704,782 | ) | | | (584,938 | ) | | | (3,246,575 | ) | | | (207,333 | ) | | | (434,081 | ) | | | (647,771 | ) |
Net unrealized appreciation | | $ | 76,202,642 | | | $ | 119,443,130 | | | $ | 151,362,050 | | | $ | 12,402,880 | | | $ | 7,420,866 | | | $ | 8,672,998 | |
Federal income tax cost | | $ | 170,894,919 | | | $ | 165,703,875 | | | $ | 557,766,124 | | | $ | 40,652,952 | | | $ | 32,694,535 | | | $ | 140,034,167 | |
The difference between the federal income tax cost of portfolio investments and the financial statement cost for the Ave Maria Catholic Values Fund, the Ave Maria Growth Fund, the Ave Maria Rising Dividend Fund and the Ave Maria Opportunity Fund is due to certain timing differences in the recognition of capital losses under income tax regulations and GAAP. These “book/tax” differences are temporary in nature and are due to the tax deferral of losses on wash sales. There is no difference between the federal income tax cost and the financial statement cost for the Ave Maria World Equity Fund and the Ave Maria Bond Fund as of December 31, 2013.
AVE MARIA MUTUAL FUNDS
NOTES TO FINANCIAL STATEMENTS
During the year ended December 31, 2013, the Ave Maria Catholic Values Fund realized $2,217,896 of net capital gains resulting from in-kind redemptions – in which shareholders who redeemed Fund shares received securities held by the Fund rather than cash. The Fund recognizes a gain on in-kind redemptions to the extent that the value of the distributed securities on the date of redemption exceeds the cost of those securities. Such gains are not taxable to the Fund and are not required to be distributed to shareholders. The Fund has reclassified this amount against paid-in capital on the Statements of Assets and Liabilities.
For the year ended December 31, 2013, the Ave Maria Catholic Values Fund also reclassified $50,151 of net investment loss against net realized gains and $449 of distributions in excess of net realized gains against paid-in capital; the Ave Maria Growth Fund reclassified $708,957 of net investment loss and $818 of distributions in excess of net realized gains against paid-in capital; the Ave Maria Rising Dividend Fund reclassified $739 and $2,148 of distributions in excess of net realized gains against undistributed net investment income and paid-in capital, respectively; the Ave Maria Opportunity Fund reclassified $79,682 of net investment loss and $282 of distributions in excess of net realized gains against paid-in capital; the Ave Maria World Equity Fund reclassified $99 of distributions in excess of net investment income and $221 of distributions in excess of net realized gains against paid-in capital; and the Ave Maria Bond Fund reclassified $355 and $264 of distributions in excess of net realized gains against undistributed net investment income and paid-in capital, respectively. These reclassifications are reflected on the Statements of Assets and Liabilities. Such reclassifications, the result of permanent differences between the financial statement and the income tax reporting requirements, have no effect on each Fund’s net assets or net asset value per share.
The Funds recognize the tax benefits or expenses of uncertain tax positions only when the position is “more-likely-than-not” to be sustained assuming examination by tax authorities. Management has reviewed the tax positions taken on federal income tax returns for all open tax years (tax years ended December 31, 2010 through December 31, 2013) and has concluded that no provision for unrecognized tax benefits or expenses is required in these financial statements.
(c) Security transactions and investment income – Security transactions are accounted for on the trade date. Dividend income is recorded on the ex-dividend date. Interest income is recognized on the accrual basis and includes amortization of premiums and accretion of discounts using the effective yield method. Cost of investments includes amortization of premiums and accretion of discounts. Realized gains and losses on securities sold are determined on a specific identification basis.
AVE MARIA MUTUAL FUNDS
NOTES TO FINANCIAL STATEMENTS
(d) Dividends and distributions – Dividends from net investment income, if any, are declared and paid annually in December for the Ave Maria Catholic Values Fund, the Ave Maria Growth Fund, the Ave Maria Opportunity Fund and the Ave Maria World Equity Fund. Dividends from net investment income, if any, are declared and paid quarterly for the Ave Maria Rising Dividend Fund and are declared and paid monthly for the Ave Maria Bond Fund. Each Fund expects to distribute any net realized capital gains annually. Dividends and distributions to shareholders are recorded on the ex-dividend date. The tax character of distributions paid during the years ended December 31, 2013 and December 31, 2012 was as follows:
| | | | | | | | | |
| Ave Maria Catholic Values Fund: | | | | | | | | | |
December 31, 2013 | | $ | 113,755 | | | $ | 13,479,447 | | | $ | 13,593,202 | |
December 31, 2012 | | $ | 668,511 | | | $ | 5,281,341 | | | $ | 5,949,852 | |
| Ave Maria Growth Fund: | | | | | | | | | | | | |
December 31, 2013 | | $ | — | | | $ | 9,031,799 | | | $ | 9,031,799 | |
December 31, 2012 | | $ | — | | | $ | — | | | $ | — | |
| Ave Maria Rising Dividend Fund: | | | | | | | | | | | | |
December 31, 2013 | | $ | 5,673,774 | | | $ | 12,211,020 | | | $ | 17,884,794 | |
December 31, 2012 | | $ | 4,872,601 | | | $ | 14,894,513 | | | $ | 19,767,114 | |
| Ave Maria Opportunity Fund: | | | | | | | | | | | | |
December 31, 2013 | | $ | — | | | $ | 1,123,357 | | | $ | 1,123,357 | |
December 31, 2012 | | $ | 94,090 | | | $ | — | | | $ | 94,090 | |
| Ave Maria World Equity Fund: | | | | | | | | | | | | |
December 31, 2013 | | $ | 88,197 | | | $ | 610,855 | | | $ | 699,052 | |
December 31, 2012 | | $ | 101,368 | | | $ | — | | | $ | 101,368 | |
| Ave Maria Bond Fund | | | | | | | | | | | | |
December 31, 2013 | | $ | 1,368,228 | | | $ | 2,805,854 | | | $ | 4,174,082 | |
December 31, 2012 | | $ | 1,717,065 | | | $ | 1,448,513 | | | $ | 3,165,578 | |
(e) Estimates – The preparation of financial statements in conformity with GAAP requires management to make estimates and assumptions that affect the reported amounts of assets and liabilities and disclosure of contingent assets and liabilities as of the date of the financial statements and the reported amounts of revenues and expenses during the reporting period. Actual results could differ from those estimates.
(f) Common expenses – Common expenses of the Trust are allocated among the Funds of the Trust based on relative net assets of each Fund or the nature of the services performed and the relative applicability to each Fund.
AVE MARIA MUTUAL FUNDS
NOTES TO FINANCIAL STATEMENTS
| 2. | Investment Advisory Agreements and Transactions with Related Parties |
The Chairman and President of the Trust is also the Chairman and Chief Investment Officer of Schwartz Investment Counsel, Inc. (the “Adviser”). Certain other officers of the Trust are officers of the Adviser, or of Ultimus Fund Solutions, LLC (“Ultimus”), the administrative, accounting and transfer agent for the Funds, or of Ultimus Fund Distributors, LLC (the “Distributor”), the Funds’ principal underwriter.
Pursuant to Investment Advisory Agreements between the Trust and the Adviser, the Adviser is responsible for the management of each Fund and provides investment advice along with the necessary personnel, facilities, equipment and certain other services necessary to the operations of the Funds. The Adviser receives from each of the Ave Maria Catholic Values Fund, the Ave Maria Growth Fund, the Ave Maria Opportunity Fund and the Ave Maria World Equity Fund a quarterly fee at the annual rate of 0.95% of its average daily net assets. The Adviser receives from the Ave Maria Rising Dividend Fund and the Ave Maria Bond Fund a quarterly fee at the annual rate of 0.75% and 0.30%, respectively, of average daily net assets.
The Adviser has contractually agreed to reduce its advisory fees or reimburse a portion of operating expenses until at least May 1, 2014 so that: the net expenses of each of the Ave Maria Catholic Values Fund, the Ave Maria Growth Fund and the Ave Maria World Equity Fund do not exceed 1.50% per annum of average daily net assets; the net expenses of each of the Ave Maria Rising Dividend Fund and the Ave Maria Opportunity Fund do not exceed 1.25% per annum of average daily net assets; and the net expenses of each of the Ave Maria Bond Fund do not exceed 0.70% per annum of average daily net assets. During the year ended December 31, 2013, the Adviser reduced its investment advisory fees by $65,896 with respect to the Ave Maria Opportunity Fund and reduced its investment advisory fees by $17,122 with respect to the Ave Maria World Equity Fund.
Any fee reductions or expense reimbursements by the Adviser are subject to repayment by the Funds for a period of three years from the end of the fiscal year during which such reductions or reimbursements occurred, provided the Funds are able to effect such repayment and remain in compliance with any undertaking by the Adviser to limit expenses of the Funds. During the year ended December 31, 2013, the Adviser recouped previous investment advisory fee reductions of $10,260 from the Ave Maria Growth Fund, $19,239 from the Ave Maria World Equity Fund, and $117,733 from the Ave Maria Bond Fund. As of December 31, 2013, the amounts of fee reductions available for reimbursement to the Adviser are as follows:
| Ave Maria Opportunity Fund | | $ | 205,038 | |
| Ave Maria World Equity Fund | | $ | 95,769 | |
| Ave Maria Bond Fund | | $ | 19,343 | |
AVE MARIA MUTUAL FUNDS
NOTES TO FINANCIAL STATEMENTS
The Adviser may recapture a portion of the above amounts no later than the dates as stated below:
| | | | | | | | | |
Ave Maria Opportunity Fund | | $ | 71,816 | | | $ | 67,326 | | | $ | 65,896 | |
| Ave Maria World Equity Fund | | $ | 48,996 | | | $ | 29,651 | | | $ | 17,122 | |
Ave Maria Bond Fund | | $ | 9,402 | | | $ | 9,941 | | | $ | — | |
The Chief Compliance Officer of the Trust (the “CCO”) is an employee of the Adviser. The Trust pays the Adviser a fee for providing CCO services, of which each Fund pays its proportionate share along with the other series of the Trust. In addition, the Trust reimburses the Adviser for out-of-pocket expenses incurred, if any, for providing these services.
Pursuant to a Mutual Fund Services Agreement between the Trust and Ultimus, Ultimus supplies regulatory and compliance services, calculates the daily net asset value per share of each Fund, maintains the financial books and records of the Funds, maintains the records of each shareholder’s account, and processes purchases and redemptions of each Fund’s shares. For the performance of these services, Ultimus receives fees computed at an annual rate of the daily net assets of each of the Funds, subject to a minimum monthly fee.
Pursuant to a Distribution Agreement between the Trust and the Distributor, the Distributor serves as each Fund’s exclusive agent for the distribution of its shares. The Distributor is an affiliate of Ultimus.
The Ave Maria Catholic Values Fund, the Ave Maria Growth Fund and the Ave Maria Bond Fund have adopted a Shareholder Servicing Plan (the “Plan”) which allows such Funds to make payments to financial organizations (including the Adviser and other affiliates of each Fund) for providing account administration and personnel and account maintenance services to Fund shareholders. The annual service fee may not exceed an amount equal to 0.25% of each Fund’s average daily net assets. During the year ended December 31, 2013, the total expenses incurred pursuant to the Plan were $495,066, $535,858 and $89,881 for the Ave Maria Catholic Values Fund, the Ave Maria Growth Fund and the Ave Maria Bond Fund, respectively. Effective July 1, 2013, the Board of Trustees terminated the Shareholder Servicing Plan as it relates to the Ave Maria Bond Fund, and as a result, the Ave Maria Bond Fund is no longer assessed service fees pursuant to the Plan.
AVE MARIA MUTUAL FUNDS
NOTES TO FINANCIAL STATEMENTS
Trustees and officers affiliated with the Adviser or Ultimus are not compensated by the Trust for their services. As of July 1, 2013, each Trustee who is not an affiliated person of the Adviser or Ultimus receives from the Trust an annual retainer of $23,000 (except that such fee is $28,000 for the lead independent Trustee), payable quarterly, and a fee of $4,000 for attendance at each meeting of the Board of Trustees, plus reimbursement of travel and other expenses incurred in attending meetings. Prior to July 1, 2013, each Trustee who was not an affiliated person of the Adviser or Ultimus received an annual retainer of $17,000 (except that such fee was $22,000 for the lead independent Trustee), payable quarterly; a fee of $4,000 for attendance at each meeting of the Board of Trustees and $1,500 for attendance at each meeting of any committee of the Board; plus reimbursement of travel and other expenses incurred in attending meetings. Effective January 1, 2014, each Trustee who is not an affiliated person of the Adviser or Ultimus will receive from the Trust an annual retainer of $26,000 (except such fee is $32,000 for the lead independent Trustee), payable quarterly, and a fee of $4,750 for attendance at each meeting of the Board of Trustees, plus reimbursement of travel and other expenses incurred in attending meetings.
Each member of the Catholic Advisory Board (“CAB”) received an annual retainer of $2,000 (except that such fee was $12,000 for the chairman), paid quarterly; a fee of $2,000 (except that such fee was $2,500 for the chairman) for attendance at each meeting of the CAB; plus reimbursement of travel and other expenses incurred in attending meetings. Effective January 1, 2014, each CAB member will receive an annual retainer of $2,000 (except that such fee will be $14,000 annually for the chairman), payable quarterly; a fee of $2,500 (except that such fee will be $2,750 for the chairman) for attendance at each meeting of the CAB; plus reimbursement of travel and other expenses incurred in attending meetings.
| 3. | Investment Transactions |
During the year ended December 31, 2013, cost of purchases and proceeds from sales and maturities of investment securities, excluding short-term investments and U.S. government securities, were as follows:
| | Ave Maria Catholic Values Fund | | | | | | Ave Maria Rising Dividend Fund | | | | | | Ave Maria World Equity Fund | | | | |
| Purchases of investment securities | | $ | 67,523,091 | | | $ | 63,966,896 | | | $ | 306,578,556 | | | $ | 23,682,754 | | | $ | 17,862,981 | | | $ | 23,628,781 | |
| Proceeds from sales of investment securities | | $ | 61,475,325 | | | $ | 41,168,634 | | | $ | 65,410,671 | | | $ | 22,906,946 | | | $ | 9,197,316 | | | $ | 15,368,335 | |
AVE MARIA MUTUAL FUNDS
NOTES TO FINANCIAL STATEMENTS
| 4. | Contingencies and Commitments |
The Funds indemnify the Trust’s officers and Trustees for certain liabilities that might arise from their performance of their duties to the Funds. Additionally, in the normal course of business, the Funds enter into contracts that contain a variety of representations and warranties and which provide general indemnifications. The Funds’ maximum exposure under these arrangements is unknown, as this would involve future claims that may be made against the Funds that have not yet occurred. However, based on experience, the Funds expect the risk of loss to be remote.
A company is considered an affiliate of a Fund under the Investment Company Act of 1940 if the Fund’s holdings in that company represent 5% or more of the outstanding voting shares of that company. The Ave Maria Catholic Values Fund owns 5.30% of the outstanding voting shares of Unico American Corporation and is therefore considered an affiliate of the Fund. Further detail on this holding for the year ended December 31, 2013 appears below:
| AVE MARIA CATHOLIC VALUES FUND |
| Affiliated Issuer Report |
| UNICO AMERICAN CORPORATION |
| From December 31, 2012 To December 31, 2013 |
| Shares at beginning of year | | | 282,945 | |
| Shares at end of year | | | 282,945 | |
| Market value at beginning of year | | $ | 3,454,759 | |
| Change in unrealized appreciation (depreciation) | | | 294,262 | |
| Market value at end of year | | $ | 3,749,021 | |
| Net realized gains (losses) during the year | | $ | — | |
| Dividend income earned during the year | | $ | — | |
AVE MARIA MUTUAL FUNDS
NOTES TO FINANCIAL STATEMENTS
If a Fund has significant investments in the securities of issuers in industries within a particular sector, any development affecting that sector will have a greater impact on the value of the net assets of the Fund than would be the case if the Fund did not have significant investments in that sector. In addition, this may increase the risk of loss of an investment in the Fund and increase the volatility of the Fund’s net asset value per share. From time to time, circumstances may affect a particular sector and the companies within such sector. For instance, economic or market factors, regulation or deregulation, and technological or other developments may negatively impact all companies in a particular sector and therefore the value of the Funds’ portfolios will be adversely affected. As of December 31, 2013, the Ave Maria Growth Fund and the Ave Maria Rising Dividend Fund had 28.1% and 25.2%, respectively, of the value of their net assets invested in stocks within the industrials sector.
The Funds are required to recognize in the financial statements the effects of all subsequent events that provide additional evidence about conditions that existed as of the date of the Statements of Assets and Liabilities. For non-recognized subsequent events that must be disclosed to keep the financial statements from being misleading, the Funds are required to disclose the nature of the event as well as an estimate of its financial effect, or a statement that such an estimate cannot be made. Management has evaluated subsequent events through the issuance of these financial statements and has noted no such events.
AVE MARIA MUTUAL FUNDS REPORT OF INDEPENDENT REGISTERED PUBLIC ACCOUNTING FIRM |
Ave Maria Catholic Values Fund, Ave Maria Growth Fund,
Ave Maria Rising Dividend Fund, Ave Maria Opportunity Fund,
Ave Maria World Equity Fund and Ave Maria Bond Fund:
We have audited the accompanying statements of assets and liabilities, including the schedules of investments, of the Ave Maria Catholic Values Fund, Ave Maria Growth Fund, Ave Maria Rising Dividend Fund, Ave Maria Opportunity Fund, Ave Maria World Equity Fund, and Ave Maria Bond Fund (the “Funds”), each a series of Schwartz Investment Trust, as of December 31, 2013, and the related statements of operations for the year then ended, the statements of changes in net assets of each of the two years in the period then ended, and the financial highlights for each of the periods presented. These financial statements and financial highlights are the responsibility of the Funds’ management. Our responsibility is to express an opinion on these financial statements and financial highlights based on our audits.
We conducted our audits in accordance with the standards of the Public Company Accounting Oversight Board (United States). Those standards require that we plan and perform the audits to obtain reasonable assurance about whether the financial statements and financial highlights are free of material misstatement. The Funds are not required to have, nor were we engaged to perform, an audit of internal control over financial reporting. Our audits included consideration of internal control over financial reporting as a basis for designing audit procedures that are appropriate in the circumstances, but not for the purpose of expressing an opinion on the effectiveness of the Funds’ internal control over financial reporting. Accordingly, we express no such opinion. An audit also includes examining, on a test basis, evidence supporting the amounts and disclosures in the financial statements, assessing the accounting principles used and significant estimates made by management, as well as evaluating the overall financial statement presentation.
Our procedures included confirmation of securities owned as of December 31, 2013, by correspondence with the custodian and brokers. We believe that our audits provide a reasonable basis for our opinion.
In our opinion, the financial statements and financial highlights referred to above present fairly, in all material respects, the financial position of Ave Maria Catholic Values Fund, Ave Maria Growth Fund, Ave Maria Rising Dividend Fund, Ave Maria Opportunity Fund, Ave Maria World Equity Fund, and Ave Maria Bond Fund as of December 31, 2013, the results of their operations for the year then ended, the changes in their net assets for each of the two years in the period then ended, and the financial highlights for each of the periods presented, in conformity with accounting principles generally accepted in the United States of America.
Chicago, Illinois
February 13, 2014
AVE MARIA MUTUAL FUNDS BOARD OF TRUSTEES AND EXECUTIVE OFFICERS (Unaudited) |
Overall responsibility for management of the Trust rests with the Board of Trustees. The Trustees serve during the lifetime of the Trust and until its termination, or until death, resignation, retirement or removal. The Trustees, in turn, elect the officers of the Trust to actively supervise its day-to-day operations. The officers have been elected for an annual term. The following are the Trustees and executive officers of the Trust:
| | | Position Held with the Trust | |
| Interested Trustees: | | | | |
| * | George P. Schwartz, CFA | 3707 W. Maple Road, Bloomfield Hills, MI | 1944 | Chairman of the Board/President/Trustee | Since 1992 |
| Independent Trustees: | | | | |
| | John E. Barnds | 3707 W. Maple Road, Bloomfield Hills, MI | 1932 | Trustee | Since 2005 |
| | Louis C. Bosco, Jr. | 3707 W. Maple Road, Bloomfield Hills, MI | 1936 | Trustee | Since 2008 |
| | Donald J. Dawson, Jr. | 3707 W. Maple Road, Bloomfield Hills, MI | 1947 | Trustee | Since 1993 |
| | Joseph M. Grace | 3707 W. Maple Road, Bloomfield Hills, MI | 1936 | Trustee | Since 2007 |
| Executive Officers: | | | | |
| * | Richard L. Platte, Jr., CFA | 3707 W. Maple Road, Bloomfield Hills, MI | 1951 | Vice President and Secretary | Since 1993 |
| * | Robert C. Schwartz, CFP | 3707 W. Maple Road, Bloomfield Hills, MI | 1976 | Vice President | Since 2013 |
| * | Timothy S. Schwartz, CFA | 3707 W. Maple Road, Bloomfield Hills, MI | 1971 | Treasurer | Since 2000 |
| * | Cathy M. Stoner, CPA, IACCP | 3707 W. Maple Road, Bloomfield Hills, MI | 1970 | Chief Compliance Officer | Since 2010 |
| * | George P. Schwartz, Richard L. Platte, Jr., Robert C. Schwartz, Timothy S. Schwartz and Cathy M. Stoner, as affiliated persons of Schwartz Investment Counsel, Inc., the Fund’s investment adviser, are “interested persons” of the Trust within the meaning of Section 2(a)(19) of the Investment Company Act of 1940. George P. Schwartz is the father of Robert C. Schwartz and Timothy S. Schwartz. |
AVE MARIA MUTUAL FUNDS BOARD OF TRUSTEES AND EXECUTIVE OFFICERS (Unaudited) (Continued) |
Each Trustee oversees seven portfolios of the Trust: the Ave Maria Catholic Values Fund, the Ave Maria Growth Fund, the Ave Maria Rising Dividend Fund, the Ave Maria Opportunity Fund, the Ave Maria World Equity Fund, the Ave Maria Bond Fund and the Schwartz Value Fund. The principal occupations of the Trustees and executive officers of the Trust during the past five years and public directorships held by the Trustees are set forth below:
George P. Schwartz, CFA is Chairman and Chief Investment Officer of Schwartz Investment Counsel, Inc. and the co-portfolio manager of the Ave Maria Catholic Values Fund, the Ave Maria Growth Fund and the Ave Maria Rising Dividend Fund.
John E. Barnds is retired First Vice President of National Bank of Detroit (JPMorgan Chase).
Louis C. Bosco, Jr. retired in April 2012. Prior to his retirement, he was a partner in Bosco Development Company (a real estate firm).
Donald J. Dawson, Jr. is Chairman of Payroll 1, Inc. (a payroll processing company).
Joseph M. Grace is retired Senior Vice President of National Bank of Detroit (JPMorgan Chase).
Richard L. Platte, Jr., CFA is President and Secretary of Schwartz Investment Counsel, Inc. and is the co-portfolio manager of the Ave Maria Bond Fund, the Ave Maria Growth Fund and the Ave Maria Rising Dividend Fund.
Robert C. Schwartz, CFP is Vice President of Schwartz Investment Counsel, Inc.
Timothy S. Schwartz, CFA is Executive Vice President and Chief Financial Officer of Schwartz Investment Counsel, Inc. and the portfolio manager of the Ave Maria Opportunity Fund.
Cathy M. Stoner, CPA, IACCP is Vice President and Chief Compliance Officer of Schwartz Investment Counsel, Inc. Prior to July 2009, she was an Audit Manager with Deloitte & Touche LLP.
AVE MARIA MUTUAL FUNDS CATHOLIC ADVISORY BOARD (Unaudited) |
The Catholic Advisory Board reviews the companies selected by the Adviser to ensure that the companies operate in a way that is consistent with teachings and core values of the Roman Catholic Church. The Catholic Advisory Board evaluates companies using publicly available information, information from the Adviser, and information from shareholders and other sources in making its recommendations. The following are the members of the Catholic Advisory Board:
| | | |
| Lou Holtz | 5818 El Camino Real, Carlsbad, CA | 1937 | Since 2007 |
| Lawrence Kudlow | 1375 Kings Hwy. East, Suite 260, Fairfield, CT | 1947 | Since 2005 |
| Thomas S. Monaghan | One Ave Maria Drive, Ann Arbor, MI | 1937 | Since 2001 |
| Michael Novak | 1150 17th Street, NW, Suite 1100, Washington, DC | 1933 | Since 2001 |
| Fr. John Riccardo, STL | 1062 Church St., Plymouth, MI | 1965 | Since 2011 |
| Paul R. Roney | One Ave Maria Drive, Ann Arbor, MI | 1957 | Since 2001 |
| Phyllis Schlafly | 7800 Bonhomme, St. Louis, MO | 1924 | Since 2001 |
Lou Holtz is the former football coach at University of Notre Dame among others, ESPN college football analyst, author and motivational speaker.
Lawrence Kudlow is the host of CNBC’s “The Kudlow Report” and a nationally syndicated columnist.
Thomas S. Monaghan is Chairman of the Ave Maria Foundation (a non-profit foundation supporting Roman Catholic organizations) and Chancellor of Ave Maria University. Prior to December 1998, he was Chairman and Chief Executive Officer of Domino’s Pizza, Inc.
Michael Novak is a theologian, author, and former U.S. ambassador. He is the George Frederick Jewett Chair (emeritus) in Religion, Philosophy, and Public Policy at the American Enterprise Institute.
Fr. John Riccardo, STL is a priest of the Archdiocese of Detroit and is the pastor of Our Lady of Good Counsel Catholic Church in Plymouth, Michigan. He is also the host of the radio show “Christ is the Answer,” which can be heard on Catholic radio stations throughout the country.
Paul R. Roney is Executive Director of the Ave Maria Foundation and President of Domino’s Farms Corporation. Prior to December 1998, he was Treasurer of Domino’s Pizza, Inc.
Phyllis Schlafly is an author, columnist and radio commentator. She is President of Eagle Forum (an organization promoting conservative and pro-family values).
Additional information regarding the Funds’ Trustees, executive officers and Catholic Advisory Board members may be found in the Funds’ Statement of Additional Information and is available without charge upon request by calling (888) 726-9331.
AVE MARIA MUTUAL FUNDS
ABOUT YOUR FUNDS’ EXPENSES
We believe it is important for you to understand the impact of costs on your investment. As a shareholder of the Funds, you incur ongoing costs, including management fees and other Fund expenses. The following examples are intended to help you understand your ongoing costs (in dollars) of investing in the Funds and to compare these costs with the ongoing costs of investing in other mutual funds.
A mutual fund’s ongoing costs are expressed as a percentage of its average net assets. This figure is known as the expense ratio. The ongoing costs reflected in the tables below are based on an investment of $1,000 made at the beginning of the most recent semi-annual period (July 1, 2013) and held until the end of the period (December 31, 2013).
The tables that follow illustrate each Fund’s ongoing costs in two ways:
Actual fund return – This section helps you to estimate the actual expenses that you paid over the period. The “Ending Account Value” shown is derived from each Fund’s actual return, and the third column shows the dollar amount of operating expenses that would have been paid by an investor who started with $1,000 in the Funds. You may use the information here, together with the amount you invested, to estimate the expenses that you paid over the period.
To do so, simply divide your account value by $1,000 (for example, an $8,600 account value divided by $1,000 = 8.6), then multiply the result by the number given for the Funds under the heading “Expenses Paid During Period.”
Hypothetical 5% return – This section is intended to help you compare the Funds’ ongoing costs with those of other mutual funds. It assumes that each Fund had an annual return of 5% before expenses during the period shown, but that the expense ratio is unchanged. In this case, because the return used is not the Funds’ actual returns, the results do not apply to your investment. The example is useful in making comparisons because the Securities and Exchange Commission (the “SEC”) requires all mutual funds to calculate expenses based on a 5% return. You can assess each Fund’s ongoing costs by comparing this hypothetical example with the hypothetical examples that appear in shareholder reports of other funds.
Note that expenses shown in the table are meant to highlight and help you compare ongoing costs only. The Funds do not charge sales loads or redemption fees.
The calculations assume no shares were bought or sold during the period. Your actual costs may have been higher or lower, depending on the amount of your investment and the timing of any purchases or redemptions.
More information about the Funds’ expenses, including historical annual expense ratios, can be found in this report. For additional information on operating expenses and other shareholder costs, please refer to the Funds’ Prospectus.
AVE MARIA MUTUAL FUNDS
ABOUT YOUR FUNDS’ EXPENSES
| Ave Maria Catholic Values Fund |
| Beginning Account Value July 1, 2013 | Ending Account Value December 31, 2013 | Expenses Paid During Period* |
| Based on Actual Fund Return | $1,000.00 | $1,152.30 | $7.49 |
| Based on Hypothetical 5% Return (before expenses) | $1,000.00 | $1,018.25 | $7.02 |
| * | Expenses are equal to the Ave Maria Catholic Values Fund’s annualized expense ratio of 1.38% for the period, multiplied by the average account value over the period, multiplied by 184/365 (to reflect the one-half year period). |
| Beginning Account Value July 1, 2013 | Ending Account Value December 31, 2013 | Expenses Paid During Period* |
| Based on Actual Fund Return | $1,000.00 | $1,198.20 | $7.65 |
| Based on Hypothetical 5% Return (before expenses) | $1,000.00 | $1,018.25 | $7.02 |
| * | Expenses are equal to the Ave Maria Growth Fund’s annualized expense ratio of 1.38% for the period, multiplied by the average account value over the period, multiplied by 184/365 (to reflect the one-half year period). |
| Ave Maria Rising Dividend Fund |
| Beginning Account Value July 1, 2013 | Ending Account Value December 31, 2013 | Expenses Paid During Period* |
| Based on Actual Fund Return | $1,000.00 | $1,171.90 | $5.20 |
| Based on Hypothetical 5% Return (before expenses) | $1,000.00 | $1,020.42 | $4.84 |
| * | Expenses are equal to the Ave Maria Rising Dividend Fund’s annualized expense ratio of 0.95% for the period, multiplied by the average account value over the period, multiplied by 184/365 (to reflect the one-half year period). |
AVE MARIA MUTUAL FUNDS
ABOUT YOUR FUNDS’ EXPENSES
| Ave Maria Opportunity Fund |
| Beginning Account Value July 1, 2013 | Ending Account Value December 31, 2013 | Expenses Paid During Period* |
| Based on Actual Fund Return | $1,000.00 | $1,145.90 | $6.76 |
| Based on Hypothetical 5% Return (before expenses) | $1,000.00 | $1,018.90 | $6.36 |
| * | Expenses are equal to the Ave Maria Opportunity Fund’s annualized expense ratio of 1.25% for the period, multiplied by the average account value over the period, multiplied by 184/365 (to reflect the one-half year period). |
| Ave Maria World Equity Fund |
| Beginning Account Value July 1, 2013 | Ending Account Value December 31, 2013 | Expenses Paid During Period* |
| Based on Actual Fund Return | $1,000.00 | $1,164.40 | $8.18 |
| Based on Hypothetical 5% Return (before expenses) | $1,000.00 | $1,017.64 | $7.63 |
| * | Expenses are equal to the Ave Maria World Equity Fund’s annualized expense ratio of 1.50% for the period, multiplied by the average account value over the period, multiplied by 184/365 (to reflect the one-half year period). |
| Beginning Account Value July 1, 2013 | Ending Account Value December 31, 2013 | Expenses Paid During Period* |
| Based on Actual Fund Return | $1,000.00 | $1,037.10 | $3.59 |
| Based on Hypothetical 5% Return (before expenses) | $1,000.00 | $1,021.68 | $3.57 |
| * | Expenses are equal to the Ave Maria Bond Fund’s annualized expense ratio of 0.70% for the period, multiplied by the average account value over the period, multiplied by 184/365 (to reflect the one-half year period). |
AVE MARIA MUTUAL FUNDS
FEDERAL TAX INFORMATION
In accordance with federal tax requirements, the following provides shareholders with information concerning certain ordinary income dividends paid by the Ave Maria Rising Dividend Fund, the Ave Maria World Equity Fund and the Ave Maria Bond Fund and distributions from net realized gains paid by the Ave Maria Catholic Values Fund, the Ave Maria Growth Fund, the Ave Maria Rising Dividend Fund, the Ave Maria Opportunity Fund, the Ave Maria World Equity Fund and the Ave Maria Bond Fund during the fiscal year end December 31, 2013. On December 30, 2013, the Ave Maria Catholic Values Fund declared and paid a short-term capital gain distribution and a long-term capital gain distribution of $0.0103 and $1.2205 per share, respectively; the Ave Maria Growth Fund declared and paid a long-term capital gain distribution of $0.9855 per share; the Ave Maria Opportunity Fund declared and paid a long-term capital gain distribution of $0.3109 per share; the Ave Maria World Equity Fund declared and paid an ordinary income dividend and a long-term capital gain distribution of $0.0311 and $0.2154 per share, respectively; the Ave Maria Rising Dividend Fund declared and paid a long-term capital gain distribution of $0.3098 per share; and the Ave Maria Bond Fund declared and paid both a short-term capital gain distribution and a long-term capital gain distribution of $0.0032 and $0.2171 per share, respectively. Periodically throughout the year, the Ave Maria Rising Dividend Fund paid ordinary income dividends totaling $0.1683 per share. Periodically throughout the year, the Ave Maria Bond Fund paid ordinary income dividends totaling $0.1142 per share. 100% of the long-term capital gain distributions of $1.2205, $0.9855, $0.3098, $0.3109, $0.2154 and $0.2171 for the Ave Maria Catholic Values Fund, the Ave Maria Growth Fund, the Ave Maria Rising Dividend Fund, the Ave Maria Opportunity Fund, the Ave Maria World Equity Fund and the Ave Maria Bond Fund, respectively, and a percentage (100%, 100%, 100%, and 48.94%) of the ordinary income dividends and/or short-term capital gain distributions paid by the Ave Maria Catholic Values Fund, the Ave Maria Rising Dividend Fund, the Ave Maria World Equity Fund and the Ave Maria Bond Fund, respectively, may be subject to a maximum tax rate of 23.8%. Early in 2014, as required by federal regulations, shareholders received notification of their portion of the Funds’ taxable gain distributions, if any, paid during the 2013 calendar year.
AVE MARIA MUTUAL FUNDS
OTHER INFORMATION
A description of the policies and procedures the Funds use to determine how to vote proxies relating to portfolio securities is available without charge upon request by calling toll-free (888) 726-9331, or on the SEC’s website at http://www.sec.gov. Information regarding how the Funds voted proxies relating to portfolio securities during the most recent 12-month period ended June 30 is also available without charge upon request by calling toll-free (888) 726-9331, or on the SEC’s website at http://www.sec.gov.
The Trust files a complete listing of portfolio holdings for each of the Funds with the SEC as of the end of the first and third quarters of each fiscal year on Form N-Q. The filings are available free of charge, upon request, by calling (888) 726-9331. Furthermore, you may obtain a copy of the filings on the SEC’s website at http://www.sec.gov. The Trust’s Forms N-Q may also be reviewed and copied at the SEC’s Public Reference Room in Washington, DC, and information on the operation of the Public Reference Room may be obtained by calling (800) SEC-0330.
This page intentionally left blank.