Shareholder Accounts c/o Ultimus Fund Solutions, LLC P.O. Box 46707 Cincinnati, OH 45246 (888) 726-9331 |  | Corporate Offices 3707 W. Maple Road Suite 100 Bloomfield Hills, MI 48301 (248) 644-8500 Fax (248) 644-4250 |
Dear Shareowner of the Ave Maria Mutual Funds:
Catholic Advisory Board member Larry Kudlow, says, “Corporate profits are the mother’s milk of economic prosperity.” Well, corporate profits expanded nicely in 2010, up 40%+ by most measures. Investor sentiment also improved. In my mid-2010 report, I wrote:
“What could trigger a positive change in sentiment? One possibility – an election in November, 2010 which sends more representatives to Washington who are freedom-loving, pro-growth, pro-business, low tax-rate oriented, and anti-big-government-spending.”
Fortunately that materialized. Indeed, the American electorate may have reached a breaking point on government spending. It’s encouraging to see Americans demonstrating at tea parties and other gatherings demanding smaller government. The rallying cry seems to be “Give us less!” At the same time, socialized Europeans have marched and burned, demanding more handouts, while their governments teeter on the brink of financial collapse, thanks to unsustainable social benefits previously promised.
There are good reasons for optimism regarding the U.S. capital markets, despite many obvious problems. Between the massive healthcare regulation and the Dodd-Frank financial reform law, the last Congress vastly expanded the government’s intrusion into the private economy. In the next few years, we are hopeful that many of these growth and prosperity-stifling policies will be reversed.
The portfolio managers of the Ave Maria Mutual Funds screen out companies based on the guidelines established by our Catholic Advisory Board. This eliminates from consideration, companies that support abortion, pornography and those that engage in embryonic stem cell research.
I’m happy to report that for the Overall Periods ended December 31, 2010, Morningstar* has rated the Ave Maria Growth Fund (AVEGX out of 677 Mid-Cap Growth Funds) and the Ave Maria Rising Dividend Fund (AVEDX out of 373 Mid-Cap Blend Funds) 5 stars, and rated the Ave Maria Opportunity Fund (AVESX out of 373 Mid-Cap Blend Funds) 4-stars based on each Fund’s risk-adjusted performance. Our investment
research emphasis on fundamentals with a long-term focus seems to be working.
Thanks for being a shareholder.
Sincerely,
George P. Schwartz, CFA
Chairman & President
January 31, 2011
Past performance is not predictive of future performance. Investment results and principal value will fluctuate so that shares, when redeemed, may be worth more or less than their original cost. Current performance may be higher or lower than the performance data quoted. Performance data, current to the most recent month end, is available at the Ave Maria Funds website at www.avemariafunds.com or by calling 1-888-726-9331.
The Letter to Shareholders and the Portfolio Manager Commentaries that follow seek to describe some of the Adviser’s current opinions and views of the financial markets. Although the Adviser believes it has a reasonable basis for any opinions or views expressed, actual results may differ, sometimes significantly so, from those expected or expressed. Keep in mind that the information and opinions cover the period through the date of this report.
* Source: Morningstar 12/31/2010. For each fund with at least a 3-year history, Morningstar calculates a risk-adjusted measure that accounts for variation in a fund’s monthly performance (including the effects of all sales charges), placing more emphasis on downward variations and rewarding consistent performance. The top 10% of funds in each category receive a Morningstar Rating™ of 5 stars, the next 22.5% receive 4 stars, the next 35% receive 3 stars, the next 22.5% receive 2 stars, and the bottom 10% receive 1 star. The Ave Maria Rising Dividend Fund was rated against 373 and 304 Mid-Cap Blend Funds, and received Morningstar Ratings of 5 stars for the 3 and 5 year periods, respectively. The Ave Maria Growth Fund was rated against 677 and 594 Mid-Cap Growth Funds, and received Morningstar Ratings of 4 stars and 5 stars fo r the 3 and 5 year periods, respectively. The Ave Maria Opportunity Fund was rated against 373 and 304 Mid-Cap Blend Funds, and received a Morningstar Rating of 4 stars for the 3 year period. © 2006. Morningstar, Inc. All rights reserved. The information contained herein is proprietary to Morningstar and/or its content providers, may not be copied or distributed and is not warranted to be accurate, complete or timely. Neither Morningstar nor its content providers are responsible for any damages or losses arising from any use of this information.
AVE MARIA MUTUAL FUNDS TABLE OF CONTENTS |
| Ave Maria Catholic Values Fund: | |
Portfolio Manager Commentary | 2 |
Performance | 4 |
| Annual Total Rates of Return Comparison with Major Indices | 5 |
Ten Largest Equity Holdings | 6 |
Asset Allocation | 6 |
Schedule of Investments | 7 |
| | |
| Ave Maria Growth Fund: | |
Portfolio Manager Commentary | 10 |
Performance | 12 |
| Annual Total Rates of Return Comparison with Major Indices | 13 |
Ten Largest Equity Holdings | 14 |
Asset Allocation | 14 |
Schedule of Investments | 15 |
| | |
| Ave Maria Rising Dividend Fund: | |
Portfolio Manager Commentary | 18 |
Performance | 20 |
| Annual Total Rates of Return Comparison with Major Indices | 21 |
Ten Largest Equity Holdings | 22 |
Asset Allocation | 22 |
Schedule of Investments | 23 |
| | |
| Ave Maria Opportunity Fund: | |
Portfolio Manager Commentary | 26 |
Performance | 28 |
| Annual Total Rates of Return Comparison with Major Indices | 29 |
Ten Largest Equity Holdings | 30 |
Asset Allocation | 30 |
Schedule of Investments | 31 |
| | |
| Ave Maria World Equity Fund: | |
Portfolio Manager Commentary | 34 |
Performance | 36 |
Ten Largest Equity Holdings | 37 |
Asset Allocation | 37 |
Schedule of Investments | 38 |
| | |
| Ave Maria Bond Fund: | |
Portfolio Manager Commentary | 42 |
Performance | 43 |
| Annual Total Rates of Return Comparison with Major Indices | 44 |
Ten Largest Holdings | 45 |
Asset Allocation | 45 |
Schedule of Investments | 46 |
AVE MARIA MUTUAL FUNDS TABLE OF CONTENTS (Continued) |
Statements of Assets and Liabilities | 51 |
| | |
Statements of Operations | 53 |
| | |
| Statements of Changes in Net Assets: | |
Ave Maria Catholic Values Fund | 55 |
Ave Maria Growth Fund | 56 |
Ave Maria Rising Dividend Fund | 57 |
Ave Maria Opportunity Fund | 58 |
Ave Maria World Equity Fund | 59 |
Ave Maria Bond Fund | 60 |
| | |
| Financial Highlights: | |
Ave Maria Catholic Values Fund | 61 |
Ave Maria Growth Fund | 62 |
Ave Maria Rising Dividend Fund | 63 |
Ave Maria Opportunity Fund | 64 |
Ave Maria World Equity Fund | 65 |
Ave Maria Bond Fund | 66 |
| | |
Notes to Financial Statements | 67 |
| | |
Report of Independent Registered Public Accounting Firm | 78 |
| | |
Board of Trustees and Executive Officers | 79 |
| | |
Catholic Advisory Board | 81 |
| | |
About Your Funds’ Expenses | 82 |
| | |
Federal Tax Information | 85 |
| | |
Other Information | 85 |
This report is for the information of the shareholders of the Ave Maria Mutual Funds, but it may also be used as sales literature when preceded or accompanied by a current prospectus, which gives details about charges, expenses, investment objectives and operating policies of the Funds. To obtain a copy of the prospectus, please visit our website at www.avemariafunds.com or call 1-888-726-9331 and a copy will be sent to you free of charge. Please read the prospectus carefully before you invest. The Ave Maria Mutual Funds are distributed by Ultimus Fund Distributors, LLC.
Past performance is not predictive of future performance. Investment results and principal value will fluctuate so that shares, when redeemed, may be worth more or less than their original cost. Current performance may be higher or lower than the performance data quoted. Performance data, current to the most recent month end, is available at the Ave Maria Funds website at www.avemariafunds.com or by calling 1-888-726-9331.
AVE MARIA CATHOLIC VALUES FUND PORTFOLIO MANAGER COMMENTARY |
Dear Fellow Shareowner:
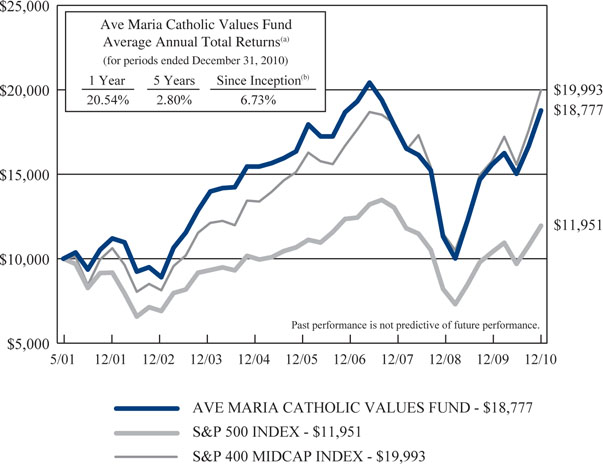
The Ave Maria Catholic Values Fund’s (AVEMX) return for 2010 was 20.5% compared to 15.1% for the S&P 500 Index and 26.7% for the S&P 400 MidCap Index. Since its inception on May 1, 2001, the Fund’s performance versus its benchmarks is:
| | Since 5-01-01 Inception through 12-31-10 |
| | |
| | | |
| Ave Maria Catholic Values Fund (AVEMX) | 87.8% | 6.7% |
| S&P 500 Index | 19.5% | 1.9% |
| S&P 400 MidCap Index | 99.9% | 7.4% |
Six months ago, many market participants were mired in fear of an economic “double dip,” out-of-control Federal spending, Washington’s increasingly anti-business rhetoric, and the prospect of higher taxes. In our semi-annual report, we expressed confidence that mid-term elections would bring change for the better and the economic recovery would not falter.
The market soon thereafter began to recover in anticipation of the Republican victories that put them in control of the House and reduced the Democratic majority in the Senate. The Federal Reserve also announced its second quantitative easing program. From their July lows, most market indices appreciated more than 20% by year-end. Time will tell whether Washington will bring sanity to fiscal policy and roll back regulatory excesses, however things are looking up. Tax increases have been forestalled at least two years. Economic activity is accelerating, and double-digit corporate profit growth is likely for 2011. Unemployment may have finally peaked and should gradually decline. Housing seems to be bottoming, and consumer balance sheets are improving. Meanwhile, Federal Reserve monetary policy remains extremely accommodative. We believe that overall, 2011 will be another good year for stocks. Selectivity, as always, will be important.
Stocks making significant contributions to the Fund’s performance in 2010 were Caterpillar, Inc. (Construction Machinery), FMC Corporation (Specialty Chemicals), BE Aerospace, Inc. (Aircraft Parts), Halliburton Company (Oil Service), The Sherwin Williams Company (Paints), Meadowbrook Insurance Group, Inc., Varian Medical Systems, Inc. (Medical Devices), Genuine Parts Company (Automotive Parts Distribution) and Coach, Inc. (Retail). Negative contributors were ION Geophysical Corporation (Oil Service), Southwestern Energy Company (Natural Gas Exploration), Hewlett-Packard Company (Technology), Abbott Laboratories (Medical Products), and Avon Products, Inc. (Cosmetics).
AVE MARIA CATHOLIC VALUES FUND PORTFOLIO MANAGER COMMENTARY (Continued) |
Over the last six months, the Fund eliminated several stocks from the portfolio. Cisco Systems, Inc. violated the Fund’s moral screens by contributing corporate funds to Planned Parenthood. Other liquidations were: Forest Oil Corporation, Evolution Petroleum Corporation, ION Geophysical Corporation, and Suncor Energy, Inc. CenturyLink, Inc, (Telecommunications), Advance Auto Parts, Inc. (Auto Parts Retail), Balchem Corporation (Specialty Chemicals), and Adtran, Inc. (Telecom Equipment) were selling at our estimate of intrinsic value, after significant price appreciation.
Proceeds from these sales were used to purchase shares in Devon Energy Corporation, Chico’s FAS, Inc., U.S. Bancorp, Hewlett-Packard Company and MasterCard, Inc. Each of these stocks meet our criteria as very high quality companies with strong balance sheets and attractive long-term growth prospects. Importantly, none of these companies violate the Fund’s moral screens.
Thank you for being a shareowner.
Sincerely,
 |  |
| George P. Schwartz, CFA | Gregory R. Heilman, CFA |
| Co-Portfolio Manager | Co-Portfolio Manager |
AVE MARIA CATHOLIC VALUES FUND PERFORMANCE (Unaudited) |
Comparison of the Change in Value of a $10,000 Investment
in the Ave Maria Catholic Values Fund, the S&P 500 Index,
and the S&P 400 MidCap Index
| (a) | The returns shown do not reflect the deduction of taxes a shareholder would pay on Fund distributions or the redemption of Fund shares. |
| | |
| (b) | Represents the period from the commencement of operations (May 1, 2001) through December 31, 2010. |
Expense Ratio information as of: | Year Ended 12-31-09 (as disclosed in April 30, 2010 prospectus) | |
| Gross | 1.52% | 1.51% |
| Net | 1.51% | 1.50% |
Past performance is not predictive of future performance. Investment results and principal value will fluctuate so that shares, when redeemed, may be worth more or less than their original cost. Current performance may be higher or lower than the performance data quoted. Performance data, current to the most recent month end, is available at the Ave Maria Funds website at www.avemariafunds.com or by calling 1-888-726-9331.
AVE MARIA CATHOLIC VALUES FUND ANNUAL TOTAL RATES OF RETURN COMPARISON WITH MAJOR INDICES (Unaudited) |
| AVE MARIA CATHOLIC VALUES FUND | | | | | |
2001 (a) | 5.3% | -8.5% | -0.5% | 5.0% | -10.1% | -7.3% |
| 2002 | -9.8% | -22.1% | -14.5% | -14.6% | -31.5% | -28.6% |
| 2003 | 35.6% | 28.7% | 35.6% | 38.8% | 50.0% | 37.4% |
| 2004 | 20.1% | 10.9% | 16.5% | 22.7% | 8.6% | 11.5% |
| 2005 | 5.8% | 4.9% | 12.6% | 7.7% | 1.4% | 2.0% |
| 2006 | 14.2% | 15.8% | 10.3% | 15.1% | 9.5% | 11.0% |
| 2007 | -4.0% | 5.5% | 8.0% | -0.3% | 9.8% | -3.8% |
| 2008 | -36.8% | -37.0% | -36.2% | -31.1% | -40.5% | -48.7% |
| 2009 | 37.6% | 26.5% | 37.4% | 25.6% | 43.9% | 36.8% |
| 2010 | 20.5% | 15.1% | 26.7% | 26.3% | 16.9% | 20.5% |
AVERAGE ANNUAL TOTAL RETURNS As of December 31, 2010 (Unaudited) |
| AVE MARIA CATHOLIC VALUES FUND | | | | | |
| 3 Years | 1.6% | -2.9% | 3.5% | 3.0% | 0.0% | -5.4% |
| 5 Years | 2.8% | 2.3% | 5.7% | 4.6% | 3.8% | -2.0% |
Since Inception (c) | 6.7% | 1.9% | 7.4% | 7.8% | 2.1% | -0.7% |
| (a) | Represents the period from the commencement of operations (May 1, 2001) through December 31, 2001. |
| | |
| (b) | Excluding dividends. |
| | |
| (c) | Represents the period from the commencement of operations (May 1, 2001) through December 31, 2010. |
AVE MARIA CATHOLIC VALUES FUND TEN LARGEST EQUITY HOLDINGS December 31, 2010 (Unaudited) |
| | | | | | | | |
| | 120,000 | | Stryker Corporation | | $ | 6,444,000 | | | | 3.4 | % |
| | 300,000 | | Western Union Company (The) | | | 5,571,000 | | | | 3.0 | % |
| | 40,000 | | SPDR Gold Trust | | | 5,548,800 | | | | 2.9 | % |
| | 135,000 | | Halliburton Company | | | 5,512,050 | | | | 2.9 | % |
| | 70,000 | | United Technologies Corporation | | | 5,510,400 | | | | 2.9 | % |
| | 75,000 | | Exxon Mobil Corporation | | | 5,484,000 | | | | 2.9 | % |
| | 110,000 | | Accenture PLC - Class A | | | 5,333,900 | | | | 2.8 | % |
| | 150,000 | | General Cable Corporation | | | 5,263,500 | | | | 2.8 | % |
| | 200,000 | | Federated Investors, Inc. - Class B | | | 5,234,000 | | | | 2.8 | % |
| | 120,000 | | Comerica, Inc. | | | 5,068,800 | | | | 2.7 | % |
ASSET ALLOCATION (Unaudited) |
| |
Consumer Discretionary | 10.6% | |
Consumer Staples | 2.1% | |
Energy | 19.0% | |
Financials | 18.9% | |
Health Care | 13.1% | |
Industrials | 14.9% | |
Information Technology | 10.3% | |
Materials | 6.0% | |
Exchange-Traded Funds | 2.9% | |
Cash Equivalents, Other Assets and Liabilities | | |
| | | |
AVE MARIA CATHOLIC VALUES FUND SCHEDULE OF INVESTMENTS December 31, 2010 |
| | | | | | |
| Consumer Discretionary — 10.6% | | | | | | |
| Diversified Consumer Services — 1.9% | | | | | | |
Education Management Corporation * | | | 200,000 | | | $ | 3,620,000 | |
| | | | | | | | | |
| Household Durables — 0.2% | | | | | | | | |
Craftmade International, Inc. * | | | 75,000 | | | | 371,250 | |
| | | | | | | | | |
| Specialty Retail — 5.7% | | | | | | | | |
American Eagle Outfitters, Inc. | | | 100,000 | | | | 1,463,000 | |
Chico's FAS, Inc. | | | 400,000 | | | | 4,812,000 | |
Lowe's Companies, Inc. | | | 175,000 | | | | 4,389,000 | |
| | | | | | | | 10,664,000 | |
| Textiles, Apparel & Luxury Goods — 2.8% | | | | | | | | |
Coach, Inc. | | | 55,000 | | | | 3,042,050 | |
VF Corporation | | | 25,000 | | | | 2,154,500 | |
| | | | | | | | 5,196,550 | |
| Consumer Staples — 2.1% | | | | | | | | |
| Food & Staples Retailing — 0.9% | | | | | | | | |
Sysco Corporation | | | 60,000 | | | | 1,764,000 | |
| | | | | | | | | |
| Personal Products — 1.2% | | | | | | | | |
Avon Products, Inc. | | | 75,000 | | | | 2,179,500 | |
| | | | | | | | | |
| Energy — 19.0% | | | | | | | | |
| Energy Equipment & Services — 7.8% | | | | | | | | |
Halliburton Company | | | 135,000 | | | | 5,512,050 | |
Schlumberger Limited | | | 45,000 | | | | 3,757,500 | |
Tidewater, Inc. | | | 50,000 | | | | 2,692,000 | |
Transocean Ltd. * | | | 40,000 | | | | 2,780,400 | |
| | | | | | | | 14,741,950 | |
| Oil, Gas & Consumable Fuels — 11.2% | | | | | | | | |
ConocoPhillips | | | 35,000 | | | | 2,383,500 | |
Devon Energy Corporation | | | 30,000 | | | | 2,355,300 | |
Exxon Mobil Corporation | | | 75,000 | | | | 5,484,000 | |
Peabody Energy Corporation | | | 50,000 | | | | 3,199,000 | |
Range Resources Corporation | | | 95,000 | | | | 4,273,100 | |
Southwestern Energy Company * | | | 90,000 | | | | 3,368,700 | |
| | | | | | | | 21,063,600 | |
| Financials — 18.9% | | | | | | | | |
| Capital Markets — 2.8% | | | | | | | | |
Federated Investors, Inc. - Class B | | | 200,000 | | | | 5,234,000 | |
| | | | | | | | | |
| Commercial Banks — 4.3% | | | | | | | | |
Comerica, Inc. | | | 120,000 | | | | 5,068,800 | |
U.S. Bancorp | | | 110,000 | | | | 2,966,700 | |
| | | | | | | | 8,035,500 | |
AVE MARIA CATHOLIC VALUES FUND SCHEDULE OF INVESTMENTS (Continued) |
COMMON STOCKS — 94.9% (Continued) | | | | | | |
| Financials — 18.9% (Continued) | | | | | | |
| Diversified Financial Services — 3.8% | | | | | | |
MasterCard, Inc. - Class A | | | 7,500 | | | $ | 1,680,825 | |
Western Union Company (The) | | | 300,000 | | | | 5,571,000 | |
| | | | | | | | 7,251,825 | |
| Insurance — 5.9% | | | | | | | | |
Alleghany Corporation * | | | 12,253 | | | | 3,753,952 | |
Hanover Insurance Group, Inc. (The) | | | 70,000 | | | | 3,270,400 | |
Meadowbrook Insurance Group, Inc. | | | 150,000 | | | | 1,537,500 | |
Unico American Corporation | | | 282,945 | | | | 2,586,117 | |
| | | | | | | | 11,147,969 | |
| Real Estate Investment Trusts — 1.0% | | | | | | | | |
HCP, Inc. | | | 50,000 | | | | 1,839,500 | |
| | | | | | | | | |
| Real Estate Management & Development — 1.1% | | | | | | | | |
Kennedy-Wilson Holdings, Inc. * | | | 200,000 | | | | 1,998,000 | |
| | | | | | | | | |
| Health Care — 13.1% | | | | | | | | |
| Health Care Equipment & Supplies — 5.6% | | | | | | | | |
Stryker Corporation | | | 120,000 | | | | 6,444,000 | |
Varian Medical Systems, Inc. * | | | 60,000 | | | | 4,156,800 | |
| | | | | | | | 10,600,800 | |
| Health Care Providers & Services — 2.2% | | | | | | | | |
Patterson Companies, Inc. | | | 135,000 | | | | 4,135,050 | |
| | | | | | | | | |
| Life Sciences Tools & Services — 3.3% | | | | | | | | |
Mettler-Toledo International, Inc. * | | | 20,000 | | | | 3,024,200 | |
Waters Corporation * | | | 40,000 | | | | 3,108,400 | |
| | | | | | | | 6,132,600 | |
| Pharmaceuticals — 2.0% | | | | | | | | |
Abbott Laboratories | | | 80,000 | | | | 3,832,800 | |
| | | | | | | | | |
| Industrials — 14.9% | | | | | | | | |
| Aerospace & Defense — 4.7% | | | | | | | | |
BE Aerospace, Inc. * | | | 25,000 | | | | 925,750 | |
General Dynamics Corporation | | | 35,000 | | | | 2,483,600 | |
United Technologies Corporation | | | 70,000 | | | | 5,510,400 | |
| | | | | | | | 8,919,750 | |
| Commercial Services & Supplies — 2.2% | | | | | | | | |
Genuine Parts Company | | | 80,000 | | | | 4,107,200 | |
| | | | | | | | | |
| Construction & Engineering — 1.3% | | | | | | | | |
Foster Wheeler AG * | | | 70,000 | | | | 2,416,400 | |
| | | | | | | | | |
| Electrical Equipment — 2.8% | | | | | | | | |
General Cable Corporation * | | | 150,000 | | | | 5,263,500 | |
AVE MARIA CATHOLIC VALUES FUND SCHEDULE OF INVESTMENTS (Continued) |
COMMON STOCKS — 94.9% (Continued) | | | | | | |
| Industrials — 14.9% (Continued) | | | | | | |
| Machinery — 3.9% | | | | | | |
Caterpillar, Inc. | | | 40,000 | | | $ | 3,746,400 | |
Graco, Inc. | | | 90,000 | | | | 3,550,500 | |
| | | | | | | | 7,296,900 | |
| Information Technology — 10.3% | | | | | | | | |
| Computers & Peripherals — 2.6% | | | | | | | | |
Hewlett-Packard Company | | | 115,000 | | | | 4,841,500 | |
| | | | | | | | | |
| IT Services — 6.6% | | | | | | | | |
Accenture PLC - Class A | | | 110,000 | | | | 5,333,900 | |
International Business Machines Corporation | | | 22,500 | | | | 3,302,100 | |
Teradata Corporation * | | | 90,000 | | | | 3,704,400 | |
| | | | | | | | 12,340,400 | |
| Office Electronics — 1.1% | | | | | | | | |
Zebra Technologies Corporation - Class A * | | | 55,000 | | | | 2,089,450 | |
| | | | | | | | | |
| Materials — 6.0% | | | | | | | | |
| Chemicals — 6.0% | | | | | | | | |
FMC Corporation | | | 50,000 | | | | 3,994,500 | |
Lubrizol Corporation (The) | | | 40,000 | | | | 4,275,200 | |
Sherwin-Williams Company (The) | | | 35,000 | | | | 2,931,250 | |
| | | | | | | | 11,200,950 | |
| | | | | | | | | |
Total Common Stocks (Cost $137,589,570) | | | | | | $ | 178,284,944 | |
EXCHANGE-TRADED FUNDS — 2.9% | | | | | | |
SPDR Gold Trust * (Cost $4,115,521) | | | 40,000 | | | $ | 5,548,800 | |
MONEY MARKET FUNDS — 2.4% | | | | | | |
Federated Government Obligations Tax-Managed Fund - Institutional Shares, 0.01% (a) (Cost $4,466,753) | | | 4,466,753 | | | $ | 4,466,753 | |
| | | | | | | | | |
Total Investments at Market Value — 100.2% (Cost $146,171,844) | | | | | | $ | 188,300,497 | |
| | | | | | | | | |
Liabilities in Excess of Other Assets — (0.2%) | | | | | | | (387,665 | ) |
| | | | | | | | | |
Net Assets — 100.0% | | | | | | $ | 187,912,832 | |
| * | Non-income producing security. |
| | |
| (a) | The rate shown is the 7-day effective yield as of December 31, 2010. |
| | |
| See notes to financial statements. |
AVE MARIA GROWTH FUND PORTFOLIO MANAGER COMMENTARY |
Dear Fellow Shareholders:
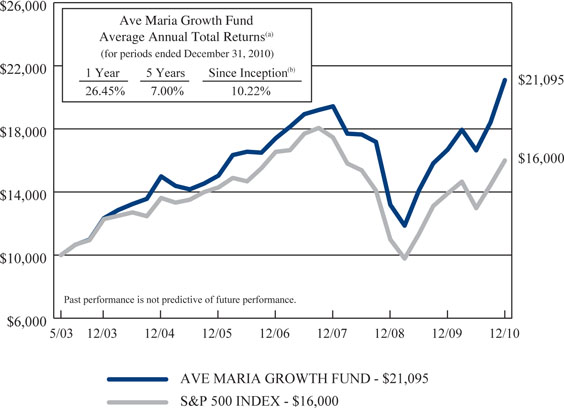
For the year ended December 31, 2010, the Ave Maria Growth Fund had a total return of 26.5% compared with 15.1% for the S&P 500 Index. For the three years ended December 31, 2010, the Fund’s total return was 2.8% annualized compared with -2.9% annualized for the S&P 500 Index. Since inception (May 1, 2003), the Fund’s total return was 10.2%, annualized compared with 6.3% annualized for the S&P 500 Index.
The top five performing issues in the Ave Maria Growth Fund for 2010 were:
| Polaris Industries, Inc. - (all-terrain vehicles, snowmobiles, motorcycles) | +85.8% |
| Expeditors International of Washington, Inc. - (global air & ocean freight forwarder) | +58.4% |
| Dionex Corporation - (analytical instrumentation & related accessories) | +58.1% |
| Cognizant Technologies Solutions Corporation - (software consulting & maintenance) | +57.4% |
| Rollins, Inc. - (pest & termite control services) | +53.5% |
The bottom five performing issues were:
| Gilead Sciences, Inc. - (antiviral, antibacterial & antifungal biopharmaceuticals) | –19.3% |
| Hewlett-Packard Company - (computer products including printers, servers & PCs) | –16.6% |
| VCA Antech, Inc. - (animal healthcare products) | –16.4% |
| Cisco Systems, Inc. - (routers & switching products) | –15.8% |
| Beckman-Coulter, Inc. - (systems & supplies used for biological analysis) | –8.4% |
AVE MARIA GROWTH FUND PORTFOLIO MANAGER COMMENTARY (Continued) |
The Fund is diversified among seven economic sectors:
| Consumer Discretionary | 13.3% |
| Consumer Staples | 8.7% |
| Energy | 5.4% |
| Financials | 7.9% |
| Health Care | 17.8% |
| Industrials | 28.1% |
| Information Technology | 17.7% |
As of December 31, 2010, the Ave Maria Growth Fund’s Overall Morningstar Rating* was 5-stars, placing it in the top ten percent of Mid-Cap Growth Funds. The Fund was rated against 677 Mid-Cap Growth Funds for the overall rating.
Respectfully,
James L. Bashaw, CFA
Portfolio Manager
| * | Past performance is no guarantee of future returns. Morningstar Ratings™ are based on risk-adjusted returns. The Overall Morningstar Rating™ is derived from a weighted average of the performance figures associated with a fund’s 3, 5, and 10-year (if applicable) Morningstar Rating™ metrics. For funds with at least a 3-year history, a Morningstar Rating™ is based on a risk-adjusted return measure (including the effects of sales charges, loads, and redemption fees) with emphasis on downward variations and consistent performance. The top 10% of funds in each category receive 5 stars, the next 22.5% 4 stars, the next 35% 3 stars, the next 22.5% 2 stars, and the bottom 10% one star. For the 3-year and 5-year periods ended December 31, 2010, the Fund was rated 4 stars (out of 677 Mid-Cap Growth Funds) and 5 stars (out of 594 Mid-Cap Growth Funds), respectively. |
AVE MARIA GROWTH FUND PERFORMANCE (Unaudited) |
Comparison of the Change in Value of a $10,000 Investment
in the Ave Maria Growth Fund and the S&P 500 Index
| (a) | The returns shown do not reflect the deduction of taxes a shareholder would pay on Fund distributions or the redemption of Fund shares. |
| | |
| (b) | Represents the period from the commencement of operations (May 1, 2003) through December 31, 2010. |
Expense Ratio information as of: | Year Ended 12-31-09 (as disclosed in April 30, 2010 prospectus) | |
| Gross | 1.56% | 1.52% |
| Net | 1.50% | 1.50% |
Past performance is not predictive of future performance. Investment results and principal value will fluctuate so that shares, when redeemed, may be worth more or less than their original cost. Current performance may be higher or lower than the performance data quoted. Performance data, current to the most recent month end, is available at the Ave Maria Funds website at www.avemariafunds.com or by calling 1-888-726-9331.
AVE MARIA GROWTH FUND ANNUAL TOTAL RATES OF RETURN COMPARISON WITH MAJOR INDICES (Unaudited) |
| | |
2003 (a) | 23.4% | 22.8% |
| 2004 | 21.5% | 10.9% |
| 2005 | 0.3% | 4.9% |
| 2006 | 15.8% | 15.8% |
| 2007 | 11.6% | 5.5% |
| 2008 | -32.1% | -37.0% |
| 2009 | 26.4% | 26.5% |
| 2010 | 26.5% | 15.1% |
AVERAGE ANNUAL TOTAL RETURNS As of December 31, 2010 (Unaudited) |
| | |
| 3 Years | 2.8% | -2.9% |
| 5 Years | 7.0% | 2.3% |
Since Inception (b) | 10.2% | 6.3% |
| (a) | Represents the period from the commencement of operations (May 1, 2003) through December 31, 2003. |
| | |
| (b) | Represents the period from the commencement of operations (May 1, 2003) through December 31, 2010. |
AVE MARIA GROWTH FUND TEN LARGEST EQUITY HOLDINGS December 31, 2010 (Unaudited) | |
| | | | | | | | |
| | 51,900 | | Dionex Corporation | | $ | 6,124,719 | | | | 4.2 | % |
| | 170,900 | | Altera Corporation | | | 6,080,622 | | | | 4.1 | % |
| | 69,500 | | Polaris Industries, Inc. | | | 5,422,390 | | | | 3.7 | % |
| | 274,350 | | Rollins, Inc. | | | 5,418,413 | | | | 3.7 | % |
| | 95,800 | | Coach, Inc. | | | 5,298,698 | | | | 3.6 | % |
| | 71,200 | | Cognizant Technology Solutions Corporation - Class A | | | 5,218,248 | | | | 3.5 | % |
| | 128,400 | | AMETEK, Inc. | | | 5,039,700 | | | | 3.4 | % |
| | 54,300 | | C.R. Bard, Inc. | | | 4,983,111 | | | | 3.4 | % |
| | 94,200 | | Amphenol Corporation - Class A | | | 4,971,876 | | | | 3.4 | % |
| | 117,300 | | Hewlett-Packard Company | | | 4,938,330 | | | | 3.3 | % |
ASSET ALLOCATION (Unaudited) |
| |
Consumer Discretionary | 13.3% | |
Consumer Staples | 8.7% | |
Energy | 5.4% | |
Financials | 7.9% | |
Health Care | 17.8% | |
Industrials | 28.1% | |
Information Technology | 17.7% | |
Cash Equivalents, Other Assets and Liabilities | | |
| | | |
AVE MARIA GROWTH FUND SCHEDULE OF INVESTMENTS December 31, 2010 |
| | | | | | |
| Consumer Discretionary — 13.3% | | | | | | |
| Leisure Equipment & Products — 3.7% | | | | | | |
Polaris Industries, Inc. | | | 69,500 | | | $ | 5,422,390 | |
| | | | | | | | | |
| Specialty Retail — 6.0% | | | | | | | | |
AutoZone, Inc. * | | | 15,000 | | | | 4,088,850 | |
Ross Stores, Inc. | | | 76,600 | | | | 4,844,950 | |
| | | | | | | | 8,933,800 | |
| Textiles, Apparel & Luxury Goods — 3.6% | | | | | | | | |
Coach, Inc. | | | 95,800 | | | | 5,298,698 | |
| | | | | | | | | |
| Consumer Staples — 8.7% | | | | | | | | |
| Food Products — 6.0% | | | | | | | | |
Kellogg Company | | | 81,600 | | | | 4,168,128 | |
McCormick & Company, Inc. | | | 101,300 | | | | 4,713,489 | |
| | | | | | | | 8,881,617 | |
| Household Products — 2.7% | | | | | | | | |
Clorox Company (The) | | | 63,600 | | | | 4,024,608 | |
| | | | | | | | | |
| Energy — 5.4% | | | | | | | | |
| Oil, Gas & Consumable Fuels — 5.4% | | | | | | | | |
Exxon Mobil Corporation | | | 41,400 | | | | 3,027,168 | |
Occidental Petroleum Corporation | | | 50,300 | | | | 4,934,430 | |
| | | | | | | | 7,961,598 | |
| Financials — 7.9% | | | | | | | | |
| Capital Markets — 5.3% | | | | | | | | |
Eaton Vance Corporation | | | 120,000 | | | | 3,627,600 | |
SEI Investments Company | | | 175,900 | | | | 4,184,661 | |
| | | | | | | | 7,812,261 | |
| Insurance — 2.6% | | | | | | | | |
Brown & Brown, Inc. | | | 160,200 | | | | 3,835,188 | |
| | | | | | | | | |
| Health Care — 17.8% | | | | | | | | |
| Biotechnology — 2.9% | | | | | | | | |
Gilead Sciences, Inc. * | | | 118,000 | | | | 4,276,320 | |
| | | | | | | | | |
| Health Care Equipment & Supplies — 9.1% | | | | | | | | |
C.R. Bard, Inc. | | | 54,300 | | | | 4,983,111 | |
Stryker Corporation | | | 65,800 | | | | 3,533,460 | |
Varian Medical Systems, Inc. * | | | 70,700 | | | | 4,898,096 | |
| | | | | | | | 13,414,667 | |
| Life Sciences Tools & Services — 5.8% | | | | | | | | |
Dionex Corporation * | | | 51,900 | | | | 6,124,719 | |
Mettler-Toledo International, Inc. * | | | 16,000 | | | | 2,419,360 | |
| | | | | | | | 8,544,079 | |
AVE MARIA GROWTH FUND SCHEDULE OF INVESTMENTS (Continued) |
COMMON STOCKS — 98.9% (Continued) | | | | | | |
| Industrials — 28.1% | | | | | | |
| Aerospace & Defense — 4.3% | | | | | | |
General Dynamics Corporation | | | 57,700 | | | $ | 4,094,392 | |
Precision Castparts Corporation | | | 15,500 | | | | 2,157,755 | |
| | | | | | | | 6,252,147 | |
| Air Freight & Logistics — 1.8% | | | | | | | | |
Expeditors International of Washington, Inc. | | | 49,100 | | | | 2,680,860 | |
| | | | | | | | | |
| Commercial Services & Supplies — 3.7% | | | | | | | | |
Rollins, Inc. | | | 274,350 | | | | 5,418,413 | |
| | | | | | | | | |
| Electrical Equipment — 3.4% | | | | | | | | |
AMETEK, Inc. | | | 128,400 | | | | 5,039,700 | |
| | | | | | | | | |
| Machinery — 14.9% | | | | | | | | |
Danaher Corporation | | | 101,500 | | | | 4,787,755 | |
Donaldson Company, Inc. | | | 61,400 | | | | 3,578,392 | |
Flowserve Corporation | | | 37,000 | | | | 4,411,140 | |
Graco, Inc. | | | 119,200 | | | | 4,702,440 | |
Toro Company (The) | | | 72,900 | | | | 4,493,556 | |
| | | | | | | | 21,973,283 | |
| Information Technology — 17.7% | | | | | | | | |
| Computers & Peripherals — 3.3% | | | | | | | | |
Hewlett-Packard Company | | | 117,300 | | | | 4,938,330 | |
| | | | | | | | | |
| Electronic Equipment, Instruments & Components — 3.4% | | | | | | | | |
Amphenol Corporation - Class A | | | 94,200 | | | | 4,971,876 | |
| | | | | | | | | |
| IT Services — 6.9% | | | | | | | | |
Accenture PLC - Class A | | | 100,900 | | | | 4,892,641 | |
Cognizant Technology Solutions Corporation - Class A * | | | 71,200 | | | | 5,218,248 | |
| | | | | | | | 10,110,889 | |
| Semiconductors & Semiconductor Equipment — 4.1% | | | | | | | | |
Altera Corporation | | | 170,900 | | | | 6,080,622 | |
| | | | | | | | | |
Total Common Stocks (Cost $108,055,626) | | | | | | $ | 145,871,346 | |
AVE MARIA GROWTH FUND SCHEDULE OF INVESTMENTS (Continued) |
MONEY MARKET FUNDS — 1.8% | | | | | | |
Federated Government Obligations Tax-Managed Fund - Institutional Shares, 0.01% (a) (Cost $2,673,175) | | | 2,673,175 | | | $ | 2,673,175 | |
| | | | | | | | | |
Total Investments at Market Value — 100.7% (Cost $110,728,801) | | | | | | $ | 148,544,521 | |
| | | | | | | | | |
Liabilities in Excess of Other Assets — (0.7%) | | | | | | | (1,101,027 | ) |
| | | | | | | | | |
Net Assets — 100.0% | | | | | | $ | 147,443,494 | |
| * | Non-income producing security. |
| | |
| (a) | The rate shown is the 7-day effective yield as of December 31, 2010. |
| | |
| See notes to financial statements. |
AVE MARIA RISING DIVIDEND FUND PORTFOLIO MANAGER COMMENTARY |
Dear Fellow Shareholders:
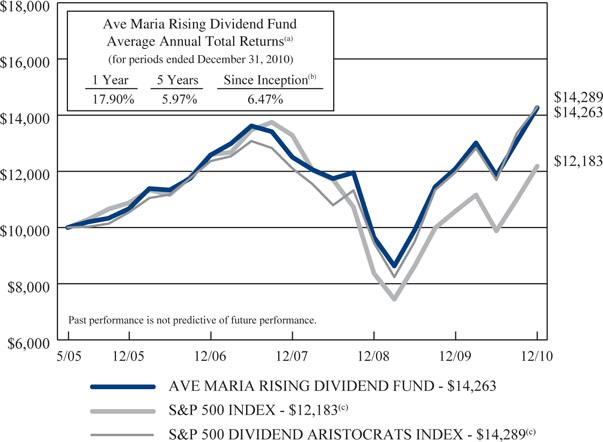
2010 was a good year for the Ave Maria Rising Dividend Fund. The total return for the Fund for the year was 17.9% (compared to 15.1% for the S&P 500 Index.). When we reported to you at June 30, 2010, it didn’t look as though it would be a very good year with the Fund down 2.0%. At that point fears of a “double dip” recession were playing on investors’ emotions. But as the year progressed it became increasingly apparent the economy was growing, and corporate profits were recovering fast.
Positive contributions to performance in the portfolio came from Family Dollar Stores, Inc., Ross Stores, Inc., Halliburton Company and Emerson Electric Company. Conversely, Medtronic, Inc., Abbott Laboratories, FPL Group, Inc., and DENTSPLY International, Inc., were a drag on portfolio returns. Health care stocks as a group hurt our performance in 2010. The controversy surrounding passage of the healthcare bill no doubt contributed to this disappointing showing. Notwithstanding, we continue to believe that carefully selected stocks in the industry offer the opportunity for outstanding long-term performance and we have selectively added to positions in recent months.
A year ago, we made mention in our letter that Standard & Poors had described 2009 as the worst year for dividends since they had started keeping records. Against that dismal backdrop we also reported that of the companies in the portfolio at year end, only five had reduced their dividends during the year, while 28 had increased theirs. This year has been considerably better. Of the 41 companies in the Rising Dividend Fund at year end, none reduced their dividend during the year and 33 raised theirs.
Dividends are getting a lot more attention among investors – and rightly so, in our view. For quite a while now, several decades actually, dividends were seen as “your father’s Oldsmobile” – something for old people content to hold high-dividend stocks for the income and willing to accept little growth in exchange. That seems to be changing. Now that the baby boomers are sweeping towards retirement, they can identify with that need for income, and especially if it is a rising stream of income. In addition, after all of the financial deceit of the last ten years, dividends have come to be seen as “quality assurance” in terms of accounting creditability. You can fake earnings, but you can’t fake a dividend. We consider this increased emphasis on dividends as a trend with staying power.
We are optimistic in our outlook for the economy and solidly confident in the long-term outlook for companies held in the Fund. We select companies that have a record of compounding their earnings and dividends at above-average rates on a sustained basis. And through the last few years, as other companies faltered, these great companies haven’t let us down.
AVE MARIA RISING DIVIDEND FUND PORTFOLIO MANAGER COMMENTARY (Continued) |
Thank you for your participation in the Fund. We appreciate the confidence you have placed in us and work hard to be worthy of it.
With best regards,
|  |
| George P. Schwartz, CFA | Richard L. Platte, Jr., CFA |
| Co-portfolio Manager | Co-portfolio Manager |
AVE MARIA RISING DIVIDEND FUND PERFORMANCE (Unaudited) |
Comparison of the Change in Value of a $10,000 Investment
in the Ave Maria Rising Dividend Fund, the S&P 500 Index,
and the S&P 500 Dividend Aristocrats Index
| (a) | The returns shown do not reflect the deduction of taxes a shareholder would pay on Fund distributions or the redemption of Fund shares. |
| | |
| (b) | Represents the period from the commencement of operations (May 2, 2005) through December 31, 2010. |
| | |
| (c) | Prior to December 31, 2010, the S&P 500 Dividend Aristocrats Index was used as the Fund’s primary benchmark. The S&P 500 Dividend Aristocrats Index measures the performance of large cap, blue chip companies within the S&P 500 that have followed a policy of increasing dividends every year for at least 25 consecutive years. The Fund’s managers believe the S&P 500 Dividend Aristocrats Index is becoming less relevant for comparison purposes because, among other things, S&P has changed the criteria for companies inclusion in the index. The Fund’s managers believe S&P has lowered the standard for a company to qualify for inclusion in the S&P 500 Dividend Aristocrats Index. Therefore, the Fund’s managers believe the S&P 500 Index is the most appropriate index for comparison purposes. |
Expense Ratio information as of: | Year Ended 12-31-09 (as disclosed in April 30, 2010 prospectus) | |
| | 1.13% | 1.06% |
Past performance is not predictive of future performance. Investment results and principal value will fluctuate so that shares, when redeemed, may be worth more or less than their original cost. Current performance may be higher or lower than the performance data quoted. Performance data, current to the most recent month end, is available at the Ave Maria Funds website at www.avemariafunds.com or by calling 1-888-726-9331.
AVE MARIA RISING DIVIDEND FUND ANNUAL TOTAL RATES OF RETURN COMPARISON WITH MAJOR INDICES (Unaudited) |
| AVE MARIA RISING DIVIDEND FUND | | S&P 500 DIVIDEND ARISTOCRATS INDEX |
2005 (a) | 6.7% | 8.8% | 1.3% |
| 2006 | 17.9% | 15.8% | 17.3% |
| 2007 | -0.6% | 5.5% | -2.1% |
| 2008 | -22.8% | -37.0% | -21.9% |
| 2009 | 25.3% | 26.5% | 26.6% |
| 2010 | 17.9% | 15.1% | 19.4% |
AVERAGE ANNUAL TOTAL RETURNS As of December 31, 2010 (Unaudited) |
| AVE MARIA RISING DIVIDEND FUND | | S&P 500 DIVIDEND ARISTOCRATS INDEX |
| 3 Years | 4.5% | -2.9% | 5.7% |
| 5 Years | 6.0% | 2.3% | 6.3% |
Since Inception (b) | 6.5% | 3.6% | 6.5% |
| (a) | Represents the period from the commencement of operations (May 2, 2005) through December 31, 2005. |
| | |
| (b) | Represents the period from the commencement of operations (May 2, 2005) through December 31, 2010. |
AVE MARIA RISING DIVIDEND FUND TEN LARGEST EQUITY HOLDINGS December 31, 2010 (Unaudited) |
| | | | | | | | |
| | 70,000 | | Exxon Mobil Corporation | | $ | 5,118,400 | | | | 4.0 | % |
| | 65,000 | | ConocoPhillips | | | 4,426,500 | | | | 3.5 | % |
| | 50,000 | | 3M Company | | | 4,315,000 | | | | 3.4 | % |
| | 100,000 | | Halliburton Company | | | 4,083,000 | | | | 3.2 | % |
| | 180,000 | | RPM International, Inc. | | | 3,978,000 | | | | 3.1 | % |
| | 55,000 | | General Dynamics Corporation | | | 3,902,800 | | | | 3.1 | % |
| | 125,000 | | Paychex, Inc. | | | 3,863,750 | | | | 3.0 | % |
| | 60,000 | | Procter & Gamble Company (The) | | | 3,859,800 | | | | 3.0 | % |
| | 108,000 | | Home Depot, Inc. (The) | | | 3,786,480 | | | | 3.0 | % |
| | 42,500 | | VF Corporation | | | 3,662,650 | | | | 2.9 | % |
ASSET ALLOCATION (Unaudited) |
| |
Consumer Discretionary | 17.3% | |
Consumer Staples | 17.9% | |
Energy | 13.0% | |
Financials | 11.8% | |
Health Care | 9.0% | |
Industrials | 13.6% | |
Information Technology | 7.1% | |
Materials | 5.7% | |
Cash Equivalents, Other Assets and Liabilities | | |
| | | |
AVE MARIA RISING DIVIDEND FUND SCHEDULE OF INVESTMENTS December 31, 2010 |
| | | | | | |
| Consumer Discretionary — 17.3% | | | | | | |
| Diversified Consumer Services — 2.0% | | | | | | |
Weight Watchers International, Inc. | | | 70,000 | | | $ | 2,624,300 | |
| | | | | | | | | |
| Media — 1.1% | | | | | | | | |
John Wiley & Sons, Inc. - Class A | | | 30,000 | | | | 1,357,200 | |
| | | | | | | | | |
| Multiline Retail — 0.8% | | | | | | | | |
Family Dollar Stores, Inc. | | | 20,000 | | | | 994,200 | |
| | | | | | | | | |
| Specialty Retail — 8.4% | | | | | | | | |
Cato Corporation (The) - Class A | | | 75,000 | | | | 2,055,750 | |
Home Depot, Inc. (The) | | | 108,000 | | | | 3,786,480 | |
Ross Stores, Inc. | | | 45,000 | | | | 2,846,250 | |
Tractor Supply Company | | | 40,000 | | | | 1,939,600 | |
| | | | | | | | 10,628,080 | |
| Textiles, Apparel & Luxury Goods — 5.0% | | | | | | | | |
VF Corporation | | | 42,500 | | | | 3,662,650 | |
Wolverine World Wide, Inc. | | | 85,000 | | | | 2,709,800 | |
| | | | | | | | 6,372,450 | |
| Consumer Staples — 17.9% | | | | | | | | |
| Food & Staples Retailing — 2.8% | | | | | | | | |
Sysco Corporation | | | 120,000 | | | | 3,528,000 | |
| | | | | | | | | |
| Food Products — 6.6% | | | | | | | | |
Hormel Foods Corporation | | | 50,000 | | | | 2,563,000 | |
Kellogg Company | | | 70,000 | | | | 3,575,600 | |
Lancaster Colony Corporation | | | 40,000 | | | | 2,288,000 | |
| | | | | | | | 8,426,600 | |
| Household Products — 5.6% | | | | | | | | |
Clorox Company (The) | | | 52,500 | | | | 3,322,200 | |
Procter & Gamble Company (The) | | | 60,000 | | | | 3,859,800 | |
| | | | | | | | 7,182,000 | |
| Personal Products — 2.9% | | | | | | | | |
Avon Products, Inc. | | | 125,000 | | | | 3,632,500 | |
| | | | | | | | | |
| Energy — 13.0% | | | | | | | | |
| Energy Equipment & Services — 5.5% | | | | | | | | |
Halliburton Company | | | 100,000 | | | | 4,083,000 | |
Schlumberger Limited | | | 35,000 | | | | 2,922,500 | |
| | | | | | | | 7,005,500 | |
| Oil, Gas & Consumable Fuels — 7.5% | | | | | | | | |
ConocoPhillips | | | 65,000 | | | | 4,426,500 | |
Exxon Mobil Corporation | | | 70,000 | | | | 5,118,400 | |
| | | | | | | | 9,544,900 | |
AVE MARIA RISING DIVIDEND FUND SCHEDULE OF INVESTMENTS (Continued) |
COMMON STOCKS — 95.4% (Continued) | | | | | | |
| Financials — 11.8% | | | | | | |
| Capital Markets — 2.7% | | | | | | |
Federated Investors, Inc. - Class B | | | 130,000 | | | $ | 3,402,100 | |
| | | | | | | | | |
| Commercial Banks — 6.1% | | | | | | | | |
BB&T Corporation | | | 100,000 | | | | 2,629,000 | |
Comerica, Inc. | | | 60,000 | | | | 2,534,400 | |
United Bankshares, Inc. | | | 90,000 | | | | 2,628,000 | |
| | | | | | | | 7,791,400 | |
| Insurance — 3.0% | | | | | | | | |
Chubb Corporation (The) | | | 15,000 | | | | 894,600 | |
HCC Insurance Holdings, Inc. | | | 100,000 | | | | 2,894,000 | |
| | | | | | | | 3,788,600 | |
| Health Care — 9.0% | | | | | | | | |
| Health Care Equipment & Supplies — 6.4% | | | | | | | | |
DENTSPLY International, Inc. | | | 20,000 | | | | 683,400 | |
Medtronic, Inc. | | | 55,000 | | | | 2,039,950 | |
Meridian Bioscience, Inc. | | | 80,000 | | | | 1,852,800 | |
Stryker Corporation | | | 66,000 | | | | 3,544,200 | |
| | | | | | | | 8,120,350 | |
| Pharmaceuticals — 2.6% | | | | | | | | |
Abbott Laboratories | | | 70,000 | | | | 3,353,700 | |
| | | | | | | | | |
| Industrials — 13.6% | | | | | | | | |
| Aerospace & Defense — 5.6% | | | | | | | | |
General Dynamics Corporation | | | 55,000 | | | | 3,902,800 | |
United Technologies Corporation | | | 40,000 | | | | 3,148,800 | |
| | | | | | | | 7,051,600 | |
| Commercial Services & Supplies — 2.4% | | | | | | | | |
Republic Services, Inc. | | | 100,000 | | | | 2,986,000 | |
| | | | | | | | | |
| Electrical Equipment — 2.2% | | | | | | | | |
Emerson Electric Company | | | 50,000 | | | | 2,858,500 | |
| | | | | | | | | |
| Industrial Conglomerates — 3.4% | | | | | | | | |
3M Company | | | 50,000 | | | | 4,315,000 | |
| | | | | | | | | |
| Information Technology — 7.1% | | | | | | | | |
| IT Services — 4.5% | | | | | | | | |
Jack Henry & Associates, Inc. | | | 65,000 | | | | 1,894,750 | |
Paychex, Inc. | | | 125,000 | | | | 3,863,750 | |
| | | | | | | | 5,758,500 | |
| Semiconductors & Semiconductor Equipment — 2.6% | | | | | | | | |
Microchip Technology, Inc. | | | 95,000 | | | | 3,249,950 | |
AVE MARIA RISING DIVIDEND FUND SCHEDULE OF INVESTMENTS (Continued) |
COMMON STOCKS — 95.4% (Continued) | | | | | | |
| Materials — 5.7% | | | | | | |
| Chemicals — 5.7% | | | | | | |
Lubrizol Corporation (The) | | | 30,000 | | | $ | 3,206,400 | |
RPM International, Inc. | | | 180,000 | | | | 3,978,000 | |
| | | | | | | | 7,184,400 | |
| | | | | | | | | |
Total Common Stocks (Cost $98,194,771) | | | | | | $ | 121,155,830 | |
MONEY MARKET FUNDS — 4.3% | | | | | | |
Federated Government Obligations Tax-Managed Fund - Institutional Shares, 0.01% (a) (Cost $5,488,017) | | | 5,488,017 | | | $ | 5,488,017 | |
| | | | | | | | | |
Total Investments at Market Value — 99.7% (Cost $103,682,788) | | | | | | $ | 126,643,847 | |
| | | | | | | | | |
Other Assets in Excess of Liabilities — 0.3% | | | | | | | 378,037 | |
| | | | | | | | | |
Net Assets — 100.0% | | | | | | $ | 127,021,884 | |
| (a) | The rate shown is the 7-day effective yield as of December 31, 2010. |
| | |
| See notes to financial statements. |
AVE MARIA OPPORTUNITY FUND PORTFOLIO MANAGER COMMENTARY |
Dear Fellow Shareowner:
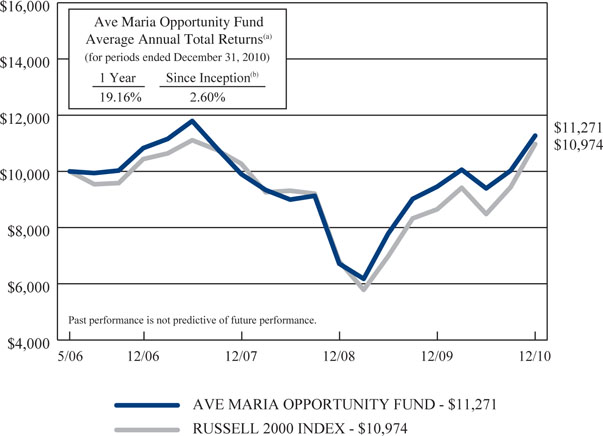
For 2010 the Ave Maria Opportunity Fund had a total return of 19.2%. It was another good year for the Fund, on top of the 40.8% gain achieved in 2009. For the second year in a row, the smallest, most leveraged companies outperformed larger, less leveraged companies. In that environment, our low-risk, value-oriented investment style resulted in the Fund underperforming its two primary benchmarks during 2010. The Fund has outperformed both benchmarks over longer time periods, as outlined in the table below.
| | Average Annual Total Return |
| | For periods ended 12/31/10 |
| | | | | |
| Ave Maria Opportunity Fund | 19.2% | 29.5% | 4.4% | 2.6% |
| S&P 600 Smallcap Index | 26.3% | 25.9% | 3.0% | 2.3% |
| Russell 2000 Index | 26.9% | 27.0% | 2.2% | 2.0% |
* 5/1/06
Several energy related holdings were among the Fund’s best performers in 2010, as oil prices (and many other commodities) rose sharply, based on inflationary fears and the rebounding global economy. Also posting a large gain for the year was Endo Pharmaceuticals Holdings, Inc. Endo, a specialty drug company, made a series of strategic acquisitions in 2010 that should boost long-term growth. Another big winner was Signet Jewelers Ltd., the world’s largest specialty jewelry retailer, with brands such as Kay Jewelers and Jared. The five stocks that performed best for the Fund during 2010 were:
| Cimarex Energy Company | Oil, Gas & Consumable Fuels | +84.6% |
| Rosetta Resources, Inc. | Oil, Gas & Consumable Fuels | +80.8% |
| Endo Pharmaceuticals Holdings, Inc. | Pharmaceuticals | +74.0% |
| Rowan Companies, Inc. | Energy Equipment & Services | +72.8% |
| Signet Jewelers Ltd. | Specialty Retail | +62.5% |
The five stocks that performed worst for the Fund during 2010 were:
| H&R Block, Inc. | Diversified Financial Services | -23.7% |
| Investment Technology Group, Inc. | Financials – Capital Markets | -10.3% |
| Lexmark International, Inc. | Technology Printing & Supplies | -5.9% |
| Federated Investors, Inc. | Financials – Capital Markets | -2.0% |
| Forest Laboratories, Inc. | Pharmaceuticals | -0.4% |
AVE MARIA OPPORTUNITY FUND PORTFOLIO MANAGER COMMENTARY (Continued) |
H&R Block’s stock price suffered as the company reported declining revenue due to the high unemployment rate and fewer customer tax returns filed. Investment Technology Group, Inc. is a service provider to the brokerage and investment community whose revenue and profits were hurt by lackluster institutional equity trading volume last year. Federated Investors, Inc., one of the country’s largest managers of money market funds, was forced to waive a portion of their management fees due to short-term interest rates near 0% for much of the year. We believe each of the companies’ share prices have significant recovery potential from currently depressed levels.
Small and micro-cap stocks have been the biggest winners since the March 2009 low, and the Fund has benefitted a good deal from our small-cap holdings, as reflected above. But as the new decade begins, there appears to be a good bit of speculative froth in many small and micro-cap issues. We of course want to own only high quality, non-speculative shares in our portfolios. And we try to avoid the mistake many investors make during bulls markets – to become unduly focused on return and forget about risk. Managing risk is an essential part of our investment process. As the legendary value investor Seth Klarman says, “the best investors do not target return – they focus first on risk, and only then decide whether the projected return justifies taking each particular risk.”
A fundamental tenet of our investment philosophy is that shares of a well-managed business, purchased at a compelling valuation and held for many years to allow the power of compounding to work, will generate a superior investment result over the long-term. True to this contrarian, value-orientation, the portfolio at year end was heavily represented by what we believe are high quality, low-risk, reasonably priced securities. The average PE ratio for the Fund was 12x. We believe the risk in the portfolio is low and the upside potential is significant.
Thanks for being a shareholder of the Ave Maria Opportunity Fund.
With best regards,
Timothy S. Schwartz, CFA
Portfolio Manager
AVE MARIA OPPORTUNITY FUND PERFORMANCE (Unaudited) |
Comparison of the Change in Value of a $10,000 Investment
in the Ave Maria Opportunity Fund and the Russell 2000 Index
| (a) | The returns shown do not reflect the deduction of taxes a shareholder would pay on Fund distributions or the redemption of Fund shares. |
| | |
| (b) | Represents the period from the commencement of operations (May 1, 2006) through December 31, 2010. |
Expense Ratio information as of: | Year Ended 12-31-09 (as disclosed in April 30, 2010 prospectus) | |
| Gross | 2.29% | 1.79% |
| Net | 1.28% | 1.25% |
Past performance is not predictive of future performance. Investment results and principal value will fluctuate so that shares, when redeemed, may be worth more or less than their original cost. Current performance may be higher or lower than the performance data quoted. Performance data, current to the most recent month end, is available at the Ave Maria Funds website at www.avemariafunds.com or by calling 1-888-726-9331.
AVE MARIA OPPORTUNITY FUND ANNUAL TOTAL RATES OF RETURN COMPARISON WITH MAJOR INDICES (Unaudited) |
| AVE MARIA OPPORTUNITY FUND | | |
2006 (a) | 8.3% | 4.4% | 2.2% |
| 2007 | -8.5% | -1.6% | -0.3% |
| 2008 | -32.2% | -33.8% | -31.1% |
| 2009 | 40.8% | 27.2% | 25.6% |
| 2010 | 19.2% | 26.9% | 26.3% |
AVERAGE ANNUAL TOTAL RETURNS As of December 31, 2010 (Unaudited) |
| AVE MARIA OPPORTUNITY FUND | | |
| 3 Years | 4.4% | 2.2% | 3.0% |
Since Inception (b) | 2.6% | 2.0% | 2.3% |
| (a) | Represents the period from the commencement of operations (May 1, 2006) through December 31, 2006. |
| | |
| (b) | Represents the period from the commencement of operations (May 1, 2006) through December 31, 2010. |
AVE MARIA OPPORTUNITY FUND TEN LARGEST EQUITY HOLDINGS December 31, 2010 (Unaudited) |
| | | | | | | | |
| | 40,000 | | Avnet, Inc. | | $ | 1,321,200 | | | | 5.3 | % |
| | 16,000 | | Exxon Mobil Corporation | | | 1,169,920 | | | | 4.7 | % |
| | 20,000 | | Ensco PLC - ADR | | | 1,067,600 | | | | 4.3 | % |
| | 30,000 | | Arrow Electronics, Inc. | | | 1,027,500 | | | | 4.1 | % |
| | 25,000 | | Nintendo Company Ltd. - ADR | | | 908,250 | | | | 3.7 | % |
| | 6,000 | | SPDR Gold Trust | | | 832,320 | | | | 3.4 | % |
| | 20,000 | | Weight Watchers International, Inc. | | | 749,800 | | | | 3.0 | % |
| | 25,000 | | Federated Investors, Inc. - Class B | | | 654,250 | | | | 2.6 | % |
| | 1,997 | | Alleghany Corporation | | | 611,821 | | | | 2.5 | % |
| | 12,500 | | Accenture PLC - Class A | | | 606,125 | | | | 2.4 | % |
ASSET ALLOCATION (Unaudited) |
| |
Consumer Discretionary | 12.4% | |
Consumer Staples | 1.7% | |
Energy | 17.6% | |
Financials | 22.3% | |
Health Care | 3.7% | |
Industrials | 1.1% | |
Information Technology | 18.9% | |
Exchange-Traded Funds | 4.0% | |
Cash Equivalents, Other Assets and Liabilities | | |
| | | |
AVE MARIA OPPORTUNITY FUND SCHEDULE OF INVESTMENTS December 31, 2010 |
| | | | | | |
| Consumer Discretionary — 12.4% | | | | | | |
| Diversified Consumer Services — 3.0% | | | | | | |
Weight Watchers International, Inc. | | | 20,000 | | | $ | 749,800 | |
| | | | | | | | | |
| Leisure Equipment & Products — 3.7% | | | | | | | | |
Nintendo Company Ltd. - ADR | | | 25,000 | | | | 908,250 | |
| | | | | | | | | |
| Media — 1.5% | | | | | | | | |
John Wiley & Sons, Inc. - Class A | | | 7,934 | | | | 358,934 | |
| | | | | | | | | |
| Specialty Retail — 2.3% | | | | | | | | |
Ross Stores, Inc. | | | 4,000 | | | | 253,000 | |
Signet Jewelers Ltd. * | | | 7,500 | | | | 325,500 | |
| | | | | | | | 578,500 | |
| Textiles, Apparel & Luxury Goods — 1.9% | | | | | | | | |
Wolverine World Wide, Inc. | | | 15,000 | | | | 478,200 | |
| | | | | | | | | |
| Consumer Staples — 1.7% | | | | | | | | |
| Food Products — 1.7% | | | | | | | | |
Lancaster Colony Corporation | | | 7,400 | | | | 423,280 | |
| | | | | | | | | |
| Energy — 17.6% | | | | | | | | |
| Energy Equipment & Services — 9.9% | | | | | | | | |
Atwood Oceanics, Inc. * | | | 8,000 | | | | 298,960 | |
Ensco PLC - ADR | | | 20,000 | | | | 1,067,600 | |
Nabors Industries Ltd. * | | | 12,500 | | | | 293,250 | |
Patterson-UTI Energy, Inc. | | | 25,000 | | | | 538,750 | |
Rowan Companies, Inc. * | | | 7,500 | | | | 261,825 | |
| | | | | | | | 2,460,385 | |
| Oil, Gas & Consumable Fuels — 7.7% | | | | | | | | |
Cimarex Energy Company | | | 2,000 | | | | 177,060 | |
Exxon Mobil Corporation | | | 16,000 | | | | 1,169,920 | |
Rosetta Resources, Inc. * | | | 5,000 | | | | 188,200 | |
Southwestern Energy Company * | | | 10,000 | | | | 374,300 | |
| | | | | | | | 1,909,480 | |
| Financials — 22.3% | | | | | | | | |
| Capital Markets — 4.3% | | | | | | | | |
Federated Investors, Inc. - Class B | | | 25,000 | | | | 654,250 | |
Investment Technology Group, Inc. * | | | 25,000 | | | | 409,250 | |
| | | | | | | | 1,063,500 | |
| Commercial Banks — 1.4% | | | | | | | | |
United Bancorp Inc. * | | | 100,000 | | | | 335,000 | |
| | | | | | | | | |
| Diversified Financial Services — 8.4% | | | | | | | | |
Dun & Bradstreet Corporation (The) | | | 5,000 | | | | 410,450 | |
H&R Block, Inc. | | | 30,000 | | | | 357,300 | |
Leucadia National Corporation | | | 10,000 | | | | 291,800 | |
AVE MARIA OPPORTUNITY FUND SCHEDULE OF INVESTMENTS (Continued) |
COMMON STOCKS — 77.7% (Continued) | | | | | | |
| Financials — 22.3% (Continued) | | | | | | |
| Diversified Financial Services — 8.4% (Continued) | | | | | | |
PICO Holdings, Inc. * | | | 15,000 | | | $ | 477,000 | |
Western Union Company (The) | | | 30,000 | | | | 557,100 | |
| | | | | | | | 2,093,650 | |
| Insurance — 5.8% | | | | | | | | |
Alleghany Corporation * | | | 1,997 | | | | 611,821 | |
Markel Corporation * | | | 500 | | | | 189,065 | |
Meadowbrook Insurance Group, Inc. | | | 30,000 | | | | 307,500 | |
White Mountains Insurance Group Ltd. | | | 1,000 | | | | 335,600 | |
| | | | | | | | 1,443,986 | |
| Real Estate Management & Development — 1.8% | | | | | | | | |
St. Joe Company (The) * | | | 20,000 | | | | 437,000 | |
| | | | | | | | | |
| Thrifts & Mortgage Finance — 0.6% | | | | | | | | |
Oritani Financial Corporation | | | 10,000 | | | | 122,400 | |
ViewPoint Financial Group | | | 2,981 | | | | 34,848 | |
| | | | | | | | 157,248 | |
| Health Care — 3.7% | | | | | | | | |
| Pharmaceuticals — 3.7% | | | | | | | | |
Endo Pharmaceuticals Holdings, Inc. * | | | 12,000 | | | | 428,520 | |
Forest Laboratories, Inc. * | | | 15,000 | | | | 479,700 | |
| | | | | | | | 908,220 | |
| Industrials — 1.1% | | | | | | | | |
| Aerospace & Defense — 1.1% | | | | | | | | |
Sparton Corporation * | | | 33,715 | | | | 277,812 | |
| | | | | | | | | |
| Information Technology — 18.9% | | | | | | | | |
| Computers & Peripherals — 2.3% | | | | | | | | |
Dell, Inc. * | | | 25,000 | | | | 338,750 | |
Lexmark International, Inc. - Class A * | | | 6,800 | | | | 236,776 | |
| | | | | | | | 575,526 | |
| Electronic Equipment, Instruments & Components — 11.0% | | | | | | | | |
Arrow Electronics, Inc. * | | | 30,000 | | | | 1,027,500 | |
Avnet, Inc. * | | | 40,000 | | | | 1,321,200 | |
Ingram Micro, Inc. - Class A * | | | 20,000 | | | | 381,800 | |
| | | | | | | | 2,730,500 | |
| IT Services — 4.2% | | | | | | | | |
Accenture PLC - Class A | | | 12,500 | | | | 606,125 | |
Broadridge Financial Solutions, Inc. | | | 19,800 | | | | 434,214 | |
| | | | | | | | 1,040,339 | |
| Semiconductors & Semiconductor Equipment — 1.4% | | | | | | | | |
Microchip Technology, Inc. | | | 10,000 | | | | 342,100 | |
| | | | | | | | | |
Total Common Stocks (Cost $14,502,173) | | | | | | $ | 19,271,710 | |
AVE MARIA OPPORTUNITY FUND SCHEDULE OF INVESTMENTS (Continued) |
EXCHANGE-TRADED FUNDS — 4.0% | | | | | | |
iShares Barclays TIPS Bond Fund | | | 1,500 | | | $ | 161,280 | |
SPDR Gold Trust * | | | 6,000 | | | | 832,320 | |
Total Exchange-Traded Funds (Cost $759,934) | | | | | | $ | 993,600 | |
REPURCHASE AGREEMENTS (a) — 4.9% | | | | | | |
| U.S. Bank N.A., 0.01%, dated 12/31/10, due 01/03/11, repurchase proceeds: $1,219,290 (Cost $1,219,289) | | $ | 1,219,289 | | | $ | 1,219,289 | |
MONEY MARKET FUNDS — 13.3% | | | | | | |
Federated Government Obligations Tax-Managed Fund - Institutional Shares, 0.01% (b) | | | 1,099,284 | | | $ | 1,099,284 | |
Federated Treasury Obligations Fund - Institutional Shares, 0.01% (b) | | | 1,099,284 | | | | 1,099,284 | |
Federated U.S. Treasury Cash Reserve Fund - Institutional Shares, 0.01% (b) | | | 1,099,284 | | | | 1,099,284 | |
Total Money Market Funds (Cost $3,297,852) | | | | | | $ | 3,297,852 | |
| | | | | | | | | |
Total Investments at Market Value — 99.9% (Cost $19,779,248) | | | | | | $ | 24,782,451 | |
| | | | | | | | | |
Other Assets in Excess of Liabilities — 0.1% | | | | | | | 11,428 | |
| | | | | | | | | |
Net Assets — 100.0% | | | | | | $ | 24,793,879 | |
| ADR - American Depositary Receipt. |
| |
| * | Non-income producing security. |
| | |
| (a) | Repurchase agreement is fully collateralized by $1,178,366 FGCI Pool #G11649, 4.50%, due 02/01/20. The aggregate market value of the collateral at December 31, 2010 was $1,244,010. |
| | |
| (b) | The rate shown is the 7-day effective yield as of December 31, 2010. |
| | |
| See notes to financial statements. |
AVE MARIA WORLD EQUITY FUND PORTFOLIO MANAGER COMMENTARY |
Dear Fellow Shareowners:
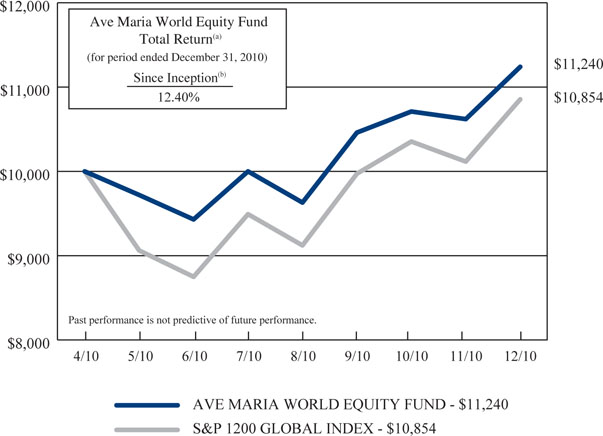
The Ave Maria World Equity Fund (AVEWX) was launched on May 1, 2010. For the period April 30, 2010 (initial public offering) through December 31, 2010 the Fund was up 12.4%, while the S&P 1200 Global Index return was up 8.5% for the same period. Returns from the world’s stock markets varied widely last year especially in Europe due to the ongoing sovereign debt crisis. Markets in weaker countries such as Greece, Portugal and Ireland declined, while Germany, Sweden, Denmark and others experienced double-digit advances. Markets in many developing economies were up 20% or more. Accelerating inflation and rising interest rates held China and Brazil to single-digit gains.
The investment strategy of the Ave Maria World Equity Fund is to invest for long-term capital appreciation, primarily in non-U.S. companies that operate globally. We want companies that generate above-average returns on invested capital by virtue of superior products, good management and efficient utilization of assets. The Fund focuses on non-U.S. companies and U.S. companies with at least 50% of their revenues derived from outside of the U.S. All of the stocks owned by the Fund trade in the United States and are denominated in U.S. dollars with shares of foreign domiciled companies represented by American Depositary Receipts (ADRs).
Stocks with the largest positive impact on Fund performance in 2010 were energy and capital infrastructure related, particularly companies with substantial participation in the developing economies of Asia, the Middle East, Africa and South America. These stocks included Foster Wheeler AG (Engineering and Construction), General Cable Corporation (Electrical Wire & Cable), Siemens AG (Capital Equipment), Schlumberger Limited (Oil Service), and BHP Billiton Ltd. (Mining & Energy). Negative contributors included Banco Santander S.A. (Banking), Mindray Medical International Ltd. (Medical Equipment), Hewlett-Packard Company (Technology), and Delhaize Group (Food Retail).
As of December 31st, the Fund’s geographic weightings versus the S&P Global 1200 Index were approximately:
| | Ave Maria World Equity Fund | |
| United States | 39% | 48% |
| Europe | 21% | 18% |
| United Kingdom | 2% | 10% |
| Japan | 4% | 8% |
| Canada | 9% | 5% |
| Asia ex Japan | 5% | 5% |
| Australia | 2% | 4% |
| Latin America | 3% | 2% |
| Other | 1% | — |
| Cash | 14% | — |
AVE MARIA WORLD EQUITY FUND PORTFOLIO MANAGER COMMENTARY (Continued) |
The Fund’s cash position was elevated by significant new inflows near year end.
All investments comply with the Ave Maria Mutual Fund moral screens established by our Catholic Advisory Board.
Thank you for your interest in the Fund.
Gregory R. Heilman, CFA
Portfolio Manager
AVE MARIA WORLD EQUITY FUND PERFORMANCE (Unaudited) |
Comparison of the Change in Value of a $10,000 Investment
in the Ave Maria World Equity Fund and the S&P 1200 Global Index
| (a) | The return shown does not reflect the deduction of taxes a shareholder would pay on Fund distributions or the redemption of Fund shares. |
| | |
| (b) | Represents the period from the commencement of operations (April 30, 2010) through December 31, 2010. |
| | |
| (c) | Annualized. |
Expense Ratio information as of: | Projected (as disclosed in April 30, 2010 prospectus) | Period Ended 12-31-10 (b) (c) |
| Gross | 3.62% | 2.45% |
| Net | 1.52% | 1.50% |
Past performance is not predictive of future performance. Investment results and principal value will fluctuate so that shares, when redeemed, may be worth more or less than their original cost. Current performance may be higher or lower than the performance data quoted. Performance data, current to the most recent month end, is available at the Ave Maria Funds website at www.avemariafunds.com or by calling 1-888-726-9331.
AVE MARIA WORLD EQUITY FUND TEN LARGEST EQUITY HOLDINGS December 31, 2010 (Unaudited) |
| | | | | | | | |
| | 3,500 | | Toyota Motor Corporation - ADR | | $ | 275,205 | | | | 2.3 | % |
| | 6,500 | | Hewlett-Packard Company | | | 273,650 | | | | 2.3 | % |
| | 11,000 | | Heineken NV - Unsponsored ADR | | | 270,380 | | | | 2.3 | % |
| | 5,000 | | Tidewater, Inc. | | | 269,200 | | | | 2.2 | % |
| | 5,500 | | Accenture PLC - Class A | | | 266,695 | | | | 2.2 | % |
| | 5,500 | | Abbott Laboratories | | | 263,505 | | | | 2.2 | % |
| | 7,500 | | Foster Wheeler AG | | | 258,900 | | | | 2.1 | % |
| | 3,000 | | 3M Company | | | 258,900 | | | | 2.1 | % |
| | 3,200 | | Colgate-Palmolive Company | | | 257,184 | | | | 2.1 | % |
| | 13,500 | | Western Union Company (The) | | | 250,695 | | | | 2.1 | % |
ASSET ALLOCATION (Unaudited) |
| |
Consumer Discretionary | 5.4% | |
Consumer Staples | 12.1% | |
Energy | 14.2% | |
Financials | 10.5% | |
Health Care | 3.7% | |
Industrials | 15.2% | |
Information Technology | 11.4% | |
Materials | 5.6% | |
Telecommunication Services | 6.2% | |
Exchange-Traded Funds | 1.4% | |
Cash Equivalents, Other Assets and Liabilities | | |
| | | |
AVE MARIA WORLD EQUITY FUND SCHEDULE OF INVESTMENTS December 31, 2010 |
| | | | | | |
| Consumer Discretionary — 5.4% | | | | | | |
| Automobiles — 2.3% | | | | | | |
Toyota Motor Corporation - ADR | | | 3,500 | | | $ | 275,205 | |
| | | | | | | | | |
| Hotels, Restaurants & Leisure — 1.9% | | | | | | | | |
McDonald's Corporation | | | 3,000 | | | | 230,280 | |
| | | | | | | | | |
| Leisure Equipment & Products — 1.2% | | | | | | | | |
Nintendo Company Ltd. - ADR | | | 4,000 | | | | 145,320 | |
| | | | | | | | | |
| Consumer Staples — 12.1% | | | | | | | | |
| Beverages — 4.1% | | | | | | | | |
Diageo PLC - ADR | | | 3,000 | | | | 222,990 | |
Heineken NV - Unsponsored ADR | | | 11,000 | | | | 270,380 | |
| | | | | | | | 493,370 | |
| Food & Staples Retailing — 1.8% | | | | | | | | |
Delhaize Group - ADR | | | 3,000 | | | | 221,130 | |
| | | | | | | | | |
| Food Products — 2.0% | | | | | | | | |
Nestlé S.A. - ADR | | | 4,000 | | | | 235,280 | |
| | | | | | | | | |
| Household Products — 2.1% | | | | | | | | |
Colgate-Palmolive Company | | | 3,200 | | | | 257,184 | |
| | | | | | | | | |
| Personal Products — 2.1% | | | | | | | | |
Avon Products, Inc. | | | 8,500 | | | | 247,010 | |
| | | | | | | | | |
| Energy — 14.2% | | | | | | | | |
| Energy Equipment & Services — 6.1% | | | | | | | | |
Schlumberger Limited | | | 3,000 | | | | 250,500 | |
Tidewater, Inc. | | | 5,000 | | | | 269,200 | |
Transocean Ltd. * | | | 3,000 | | | | 208,530 | |
| | | | | | | | 728,230 | |
| Oil, Gas & Consumable Fuels — 8.1% | | | | | | | | |
Advantage Oil & Gas Ltd. * | | | 25,000 | | | | 170,000 | |
Canadian Natural Resources Ltd. | | | 4,500 | | | | 199,890 | |
Exxon Mobil Corporation | | | 3,000 | | | | 219,360 | |
Petróleo Brasileiro S.A. - ADR | | | 5,000 | | | | 189,200 | |
Suncor Energy, Inc. | | | 5,000 | | | | 191,450 | |
| | | | | | | | 969,900 | |
| Financials — 10.5% | | | | | | | | |
| Commercial Banks — 3.3% | | | | | | | | |
Banco Santander S.A. - ADR | | | 16,000 | | | | 170,400 | |
Toronto-Dominion Bank (The) | | | 3,000 | | | | 222,930 | |
| | | | | | | | 393,330 | |
AVE MARIA WORLD EQUITY FUND SCHEDULE OF INVESTMENTS (Continued) |
COMMON STOCKS — 84.3% (Continued) | | | | | | |
| Financials — 10.5% (Continued) | | | | | | |
| Diversified Financial Services — 3.9% | | | | | | |
MasterCard, Inc. - Class A | | | 1,000 | | | $ | 224,110 | |
Western Union Company (The) | | | 13,500 | | | | 250,695 | |
| | | | | | | | 474,805 | |
| Insurance — 3.3% | | | | | | | | |
Allianze SE - ADR | | | 11,000 | | | | 130,570 | |
AXA S.A. - ADR | | | 8,000 | | | | 133,200 | |
Zurich Financial Services AG - ADR | | | 5,000 | | | | 129,450 | |
| | | | | | | | 393,220 | |
| Health Care — 3.7% | | | | | | | | |
| Health Care Equipment & Supplies — 1.5% | | | | | | | | |
Mindray Medical International Ltd. - ADR | | | 7,000 | | | | 184,800 | |
| | | | | | | | | |
| Pharmaceuticals — 2.2% | | | | | | | | |
Abbott Laboratories | | | 5,500 | | | | 263,505 | |
| | | | | | | | | |
| Industrials — 15.2% | | | | | | | | |
| Aerospace & Defense — 2.0% | | | | | | | | |
United Technologies Corporation | | | 3,000 | | | | 236,160 | |
| | | | | | | | | |
| Construction & Engineering — 2.1% | | | | | | | | |
Foster Wheeler AG * | | | 7,500 | | | | 258,900 | |
| | | | | | | | | |
| Electrical Equipment — 2.0% | | | | | | | | |
General Cable Corporation * | | | 7,000 | | | | 245,630 | |
| | | | | | | | | |
| Industrial Conglomerates — 5.8% | | | | | | | | |
3M Company | | | 3,000 | | | | 258,900 | |
Koninklijke Philips Electronics NV - ADR | | | 6,000 | | | | 184,200 | |
Siemens AG - ADR | | | 2,000 | | | | 248,500 | |
| | | | | | | | 691,600 | |
| Machinery — 1.4% | | | | | | | | |
Lincoln Electric Holdings, Inc. | | | 2,500 | | | | 163,175 | |
| | | | | | | | | |
| Road & Rail — 1.9% | | | | | | | | |
Canadian National Railway Company | | | 3,500 | | | | 232,645 | |
| | | | | | | | | |
| Information Technology — 11.4% | | | | | | | | |
| Computers & Peripherals — 2.3% | | | | | | | | |
Hewlett-Packard Company | | | 6,500 | | | | 273,650 | |
| | | | | | | | | |
| Electronic Equipment, Instruments & Components — 1.6% | | | | | | | | |
LG Display Company Ltd. - ADR | | | 11,000 | | | | 195,250 | |
AVE MARIA WORLD EQUITY FUND SCHEDULE OF INVESTMENTS (Continued) |
COMMON STOCKS — 84.3% (Continued) | | | | | | |
| Information Technology — 11.4% (Continued) | | | | | | |
| IT Services — 4.1% | | | | | | |
Accenture PLC - Class A | | | 5,500 | | | $ | 266,695 | |
International Business Machines Corporation | | | 1,500 | | | | 220,140 | |
| | | | | | | | 486,835 | |
| Office Electronics — 1.6% | | | | | | | | |
Zebra Technologies Corporation - Class A * | | | 5,000 | | | | 189,950 | |
| | | | | | | | | |
| Software — 1.8% | | | | | | | | |
Longtop Financial Technologies Limited - ADR * | | | 6,000 | | | | 217,080 | |
| | | | | | | | | |
| Materials — 5.6% | | | | | | | | |
| Chemicals — 3.7% | | | | | | | | |
Lubrizol Corporation (The) | | | 1,900 | | | | 203,072 | |
Syngenta AG - ADR | | | 4,000 | | | | 235,120 | |
| | | | | | | | 438,192 | |
| Metals & Mining — 1.9% | | | | | | | | |
BHP Billiton Ltd. - ADR | | | 2,500 | | | | 232,300 | |
| | | | | | | | | |
| Telecommunication Services — 6.2% | | | | | | | | |
| Diversified Telecommunication Services — 2.9% | | | | | | | | |
CenturyLink, Inc. | | | 4,000 | | | | 184,680 | |
Telefónica S.A. - ADR | | | 2,500 | | | | 171,050 | |
| | | | | | | | 355,730 | |
| Wireless Telecommunication Services — 3.3% | | | | | | | | |
América Móvil S.A.B. de C.V. - Series L - ADR | | | 3,500 | | | | 200,690 | |
Millicom International Cellular S.A. | | | 2,000 | | | | 191,200 | |
| | | | | | | | 391,890 | |
| | | | | | | | | |
Total Common Stocks (Cost $9,108,729) | | | | | | $ | 10,121,556 | |
EXCHANGE-TRADED FUNDS — 1.4% | | | | | | |
SPDR Gold Trust * (Cost $143,155) | | | 1,200 | | | $ | 166,464 | |
AVE MARIA WORLD EQUITY FUND SCHEDULE OF INVESTMENTS (Continued) |
MONEY MARKET FUNDS — 14.3% | | | | | | |
Federated Government Obligations Tax-Managed Fund - Institutional Shares, 0.01% (a) | | | 571,640 | | | $ | 571,640 | |
Federated Treasury Obligations Fund - Institutional Shares, 0.01% (a) | | | 566,692 | | | | 566,692 | |
Federated U.S. Treasury Cash Reserve Fund - Institutional Shares, 0.01% (a) | | | 571,641 | | | | 571,641 | |
Total Money Market Funds (Cost $1,709,973) | | | | | | $ | 1,709,973 | |
| | | | | | | | | |
Total Investments at Market Value — 100.0% (Cost $10,961,857) | | | | | | $ | 11,997,993 | |
| | | | | | | | | |
Other Assets in Excess of Liabilities — 0.0% | | | | | | | 1,615 | |
| | | | | | | | | |
Net Assets — 100.0% | | | | | | $ | 11,999,608 | |
| ADR - American Depositary Receipt. |
| |
| * | Non-income producing security. |
| | |
| (a) | The rate shown is the 7-day effective yield as of December 31, 2010. |
| | |
| See notes to financial statements. |
AVE MARIA BOND FUND PORTFOLIO MANAGER COMMENTARY |
Dear Fellow Shareholders,
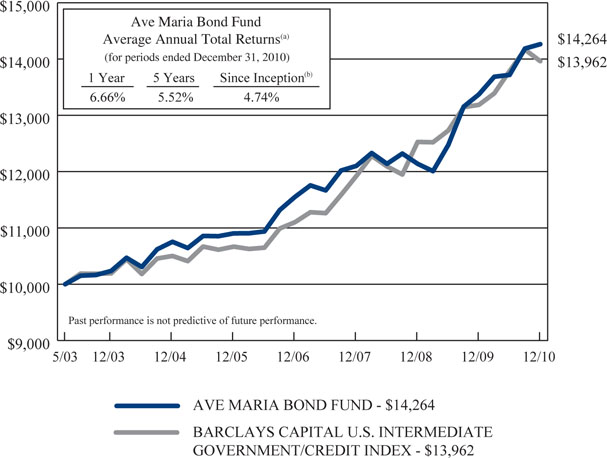
2010 was another good year for the Ave Maria Bond Fund. The Fund had a total return of 6.7% for the year while the Barclays Capital Intermediate Government/Credit Index had a total return of 5.9%.
Portfolio returns for the year were aided by the overweighting of investment grade corporate bonds while the relatively short average maturity of the portfolio acted as a moderate drag on performance. Positions in dividend paying common stocks also added to performance. At year end, the dividend yield on the common stock position was an attractive 3.4%. Of the 22 common stocks held in the portfolio at year end, 19, or 86%, raised their dividend during 2010.
Factors seen as impacting the fixed-income markets in 2011 include an improving economy and continued stimulative monetary policy. There is also reason to hope that with the new Congress there will be a more focused effort to address the runaway budgetary deficits that have mushroomed in recent years. (In our view that would be a distinct positive for the fixed-income markets.) There remains the risk that the Fed will be slow in withdrawing the highly stimulative monetary policy it has applied for so long, the unintended consequences of which could be an increase in the rate of inflation. A recovering economy and increase in the rate of inflation would likely mean higher interest rates. Accordingly, we have structured the bond portion of the portfolio in a defensive manner with a short average maturity. A stronger economy also increase s the likelihood that corporate bonds and dividend-paying stocks will do well. The portfolio currently has an overweight position in investment grade corporate bonds and maximum 20% position in common stocks. We are constructive in our outlook for the capital markets and expect the Ave Maria Bond Fund to have another good year in 2011.
Thank you for your participation in the Fund. We appreciate the confidence you have placed in us and work hard to be worthy of it.
With best regards,
Richard L. Platte, Jr., CFA
Portfolio Manager
AVE MARIA BOND FUND PERFORMANCE (Unaudited) |
Comparison of the Change in Value of a $10,000 Investment
in the Ave Maria Bond Fund and the Barclays Capital U.S.
Intermediate Government/Credit Index
| (a) | The returns shown do not reflect the deduction of taxes a shareholder would pay on Fund distributions or the redemption of Fund shares. |
| | |
| (b) | Represents the period from the commencement of operations (May 1, 2003) through December 31, 2010. |
Expense Ratio information as of: | Year Ended 12-31-09 (as disclosed in April 30, 2010 prospectus) | |
| Gross | 0.95% | 0.85% |
| Net | 0.72% | 0.70% |
Past performance is not predictive of future performance. Investment results and principal value will fluctuate so that shares, when redeemed, may be worth more or less than their original cost. Current performance may be higher or lower than the performance data quoted. Performance data, current to the most recent month end, is available at the Ave Maria Funds website at www.avemariafunds.com or by calling 1-888-726-9331.
AVE MARIA BOND FUND ANNUAL TOTAL RATES OF RETURN COMPARISON WITH MAJOR INDICES (Unaudited) |
| | BARCLAYS CAPITAL U.S. INTERMEDIATE GOVERNMENT/CREDIT INDEX |
2003 (a) | 2.4% | 1.9% |
| 2004 | 5.1% | 3.0% |
| 2005 | 1.4% | 1.6% |
| 2006 | 6.0% | 4.1% |
| 2007 | 4.8% | 7.4% |
| 2008 | 0.3% | 5.1% |
| 2009 | 10.2% | 5.2% |
| 2010 | 6.7% | 5.9% |
AVERAGE ANNUAL TOTAL RETURNS As of December 31, 2010 (Unaudited) |
| | BARCLAYS CAPITAL U.S. INTERMEDIATE GOVERNMENT/CREDIT INDEX |
| 3 Years | 5.6% | 5.4% |
| 5 Years | 5.5% | 5.5% |
Since Inception (b) | 4.7% | 4.5% |
| (a) | Represents the period from the commencement of operations (May 1, 2003) through December 31, 2003. |
| | |
| (b) | Represents the period from the commencement of operations (May 1, 2003) through December 31, 2010. |
AVE MARIA BOND FUND TEN LARGEST HOLDINGS* December 31, 2010 (Unaudited) |
| | | | | | | | |
| $ | 3,000,000 | | U.S. Treasury Notes, 2.500%, due 04/30/15 | | $ | 3,101,484 | | | | 4.2 | % |
| | 2,500,000 | | U.S. Treasury Notes, 1.000%, due 10/31/11 | | | 2,514,647 | | | | 3.4 | % |
| | 2,500,000 | | U.S. Treasury Notes, 0.750%, due 11/30/11 | | | 2,509,863 | | | | 3.4 | % |
| | 2,165,880 | | U.S. Treasury Inflation-Protected Notes, 2.500%, due 07/15/16 | | | 2,430,862 | | | | 3.3 | % |
| | 1,500,000 | | Private Export Funding Corporation, 5.685%, due 05/15/12 | | | 1,605,804 | | | | 2.2 | % |
| | 1,500,000 | | U.S. Treasury Notes, 2.375%, due 08/31/14 | | | 1,553,907 | | | | 2.1 | % |
| | 1,500,000 | | U.S. Treasury Notes, 1.375%, due 10/15/12 | | | 1,522,091 | | | | 2.0 | % |
| | 1,500,000 | | U.S. Treasury Notes, 1.375%, due 03/15/13 | | | 1,521,915 | | | | 2.0 | % |
| | 1,055,230 | | U.S. Treasury Inflation-Protected Notes, 2.625%, due 07/15/17 | | | 1,200,901 | | | | 1.6 | % |
| | 1,000,000 | | Apache Corporation, 5.625%, due 01/15/17 | | | 1,140,527 | | | | 1.5 | % |
| * | Excludes cash equivalents. |
ASSET ALLOCATION (Unaudited) |
| |
| U.S. GOVERNMENT AND AGENCY OBLIGATIONS | | |
U.S. Treasuries | 24.7% | |
U.S. Government Agencies | 9.6% | |
| | | |
| CORPORATE BONDS | | |
| Sector | | |
Consumer Discretionary | 3.7% | |
Consumer Staples | 6.7% | |
Energy | 3.0% | |
Financials | 5.0% | |
Health Care | 1.4% | |
Industrials | 5.4% | |
Information Technology | 3.6% | |
Materials | 2.8% | |
Telecommunication Services | 1.6% | |
Utilities | 3.9% | |
| | | |
| COMMON STOCKS | | |
| Sector | | |
Consumer Discretionary | 2.1% | |
Consumer Staples | 4.6% | |
Energy | 2.1% | |
Financials | 2.7% | |
Health Care | 0.9% | |
Industrials | 2.3% | |
Information Technology | 1.5% | |
Materials | 1.2% | |
Utilities | 2.4% | |
| | | |
| CASH EQUIVALENTS, OTHER ASSETS AND LIABILITIES | | |
| | | |
AVE MARIA BOND FUND SCHEDULE OF INVESTMENTS December 31, 2010 |
U.S. TREASURY OBLIGATIONS — 24.7% | | | | | | |
| U.S. Treasury Inflation-Protected Notes — 4.9% | | | | | | |
2.500%, due 07/15/16 | | $ | 2,165,880 | | | $ | 2,430,862 | |
2.625%, due 07/15/17 | | | 1,055,230 | | | | 1,200,901 | |
| | | | | | | | 3,631,763 | |
| U.S. Treasury Notes — 19.8% | | | | | | | | |
1.000%, due 10/31/11 | | | 2,500,000 | | | | 2,514,647 | |
0.750%, due 11/30/11 | | | 2,500,000 | | | | 2,509,863 | |
1.375%, due 10/15/12 | | | 1,500,000 | | | | 1,522,091 | |
1.375%, due 03/15/13 | | | 1,500,000 | | | | 1,521,915 | |
2.375%, due 08/31/14 | | | 1,500,000 | | | | 1,553,907 | |
2.500%, due 04/30/15 | | | 3,000,000 | | | | 3,101,484 | |
2.625%, due 02/29/16 | | | 1,000,000 | | | | 1,026,328 | |
2.375%, due 03/31/16 | | | 1,000,000 | | | | 1,012,656 | |
| | | | | | | | 14,762,891 | |
| | | | | | | | | |
Total U.S. Treasury Obligations (Cost $17,837,454) | | | | | | $ | 18,394,654 | |
U.S. GOVERNMENT AGENCY OBLIGATIONS — 9.6% | | | | | | |
| Federal Farm Credit Bank — 5.0% | | | | | | |
4.480%, due 08/24/12 | | $ | 1,000,000 | | | $ | 1,063,560 | |
4.600%, due 12/27/12 | | | 1,000,000 | | | | 1,076,843 | |
1.100%, due 09/23/13 | | | 500,000 | | | | 499,367 | |
4.500%, due 01/22/15 | | | 1,000,000 | | | | 1,112,142 | |
| | | | | | | | 3,751,912 | |
| Federal Home Loan Bank — 1.7% | | | | | | | | |
2.650%, due 08/12/13 | | | 750,000 | | | | 758,840 | |
3.740%, due 02/06/14 | | | 500,000 | | | | 517,960 | |
| | | | | | | | 1,276,800 | |
| Private Export Funding Corporation — 2.9% | | | | | | | | |
5.685%, due 05/15/12 | | | 1,500,000 | | | | 1,605,804 | |
3.550%, due 04/15/13 | | | 500,000 | | | | 529,787 | |
| | | | | | | | 2,135,591 | |
Total U.S. Government Agency Obligations (Cost $6,862,325) | | | | | | $ | 7,164,303 | |
AVE MARIA BOND FUND SCHEDULE OF INVESTMENTS (Continued) |
| | | | | | |
| Consumer Discretionary — 3.7% | | | | | | |
Home Depot, Inc. (The), 5.400%, due 03/01/16 | | $ | 1,000,000 | | | $ | 1,120,605 | |
Johnson Controls, Inc., 5.500%, due 01/15/16 | | | 500,000 | | | | 546,775 | |
Lowe's Companies, Inc., 5.000%, due 10/15/15 | | | 500,000 | | | | 554,863 | |
McGraw-Hill Companies, Inc. (The), 5.375%, due 11/15/12 | | | 500,000 | | | | 530,826 | |
| | | | | | | | 2,753,069 | |
| Consumer Staples — 6.7% | | | | | | | | |
Avon Products, Inc., 5.625%, due 03/01/14 | | | 1,000,000 | | | | 1,108,068 | |
Clorox Company (The), 5.000%, due 01/15/15 | | | 1,000,000 | | | | 1,083,979 | |
Hormel Foods Corporation, 6.625%, due 06/01/11 | | | 600,000 | | | | 615,737 | |
| Procter & Gamble Company (The), 4.950%, due 08/15/14 | | | 1,000,000 | | | | 1,110,833 | |
Sysco Corporation, 4.200%, due 02/12/13 | | | 1,000,000 | | | | 1,063,996 | |
| | | | | | | | 4,982,613 | |
| Energy — 3.0% | | | | | | | | |
Apache Corporation, 5.625%, due 01/15/17 | | | 1,000,000 | | | | 1,140,527 | |
ConocoPhillips, 4.750%, due 02/01/14 | | | 1,000,000 | | | | 1,086,262 | |
| | | | | | | | 2,226,789 | |
| Financials — 5.0% | | | | | | | | |
BB&T Corporation, 4.750%, due 10/01/12 | | | 1,000,000 | | | | 1,055,097 | |
Burlington Resources Financial Company, 6.500%, due 12/01/11 | | | 500,000 | | | | 526,327 | |
Caterpillar Financial Services Corporation, 4.750%, due 02/17/15 | | | 1,000,000 | | | | 1,091,867 | |
| National Rural Utilities Cooperative Finance Corporation, 4.750%, due 03/01/14 | | | 1,000,000 | | | | 1,081,082 | |
| | | | | | | | 3,754,373 | |
| Health Care — 1.4% | | | | | | | | |
Stryker Corporation, 3.000%, due 01/15/15 | | | 1,000,000 | | | | 1,021,727 | |
| | | | | | | | | |
| Industrials — 5.4% | | | | | | | | |
Cooper US, Inc., 5.450%, due 04/01/15 | | | 1,000,000 | | | | 1,112,303 | |
Dover Corporation, 6.500%, due 02/15/11 | | | 1,000,000 | | | | 1,007,084 | |
Eaton Corporation, 4.900%, due 05/15/13 | | | 500,000 | | | | 539,342 | |
Union Pacific Corporation, 5.125%, due 02/15/14 | | | 500,000 | | | | 539,592 | |
Union Pacific Corporation, 4.875%, due 01/15/15 | | | 750,000 | | | | 806,512 | |
| | | | | | | | 4,004,833 | |
| Information Technology — 3.6% | | | | | | | | |
Hewlett-Packard Company, 6.125%, due 03/01/14 | | | 1,000,000 | | | | 1,132,423 | |
Hewlett-Packard Company, 2.125%, due 09/13/15 | | | 500,000 | | | | 493,714 | |
International Business Machines Corporation, 4.750%, due 11/29/12 | | | 500,000 | | | | 536,791 | |
International Business Machines Corporation, 6.500%, due 10/15/13 | | | 500,000 | | | | 569,841 | |
| | | | | | | | 2,732,769 | |
AVE MARIA BOND FUND SCHEDULE OF INVESTMENTS (Continued) |
CORPORATE BONDS — 37.1% (Continued) | | | | | | |
| Materials — 2.8% | | | | | | |
Praxair, Inc., 6.375%, due 04/01/12 | | $ | 1,000,000 | | | $ | 1,066,689 | |
Sherwin-Williams Company (The), 3.125%, due 12/15/14 | | | 1,000,000 | | | | 1,028,927 | |
| | | | | | | | 2,095,616 | |
| Telecommunication Services — 1.6% | | | | | | | | |
Verizon Communications, Inc., 4.350%, due 02/15/13 | | | 500,000 | | | | 531,703 | |
Verizon Communications, Inc., 4.900%, due 09/15/15 | | | 600,000 | | | | 658,895 | |
| | | | | | | | 1,190,598 | |
| Utilities — 3.9% | | | | | | | | |
Duke Energy Corporation, 3.950%, due 09/15/14 | | | 800,000 | | | | 838,333 | |
NextEra Energy Capital Holdings, Inc., 5.625%, due 09/01/11 | | | 1,000,000 | | | | 1,030,680 | |
Southern Power Company, 6.250%, due 07/15/12 | | | 1,000,000 | | | | 1,075,141 | |
| | | | | | | | 2,944,154 | |
| | | | | | | | | |
Total Corporate Bonds (Cost $26,799,556) | | | | | | $ | 27,706,541 | |
| | | | | | |
| Consumer Discretionary — 2.1% | | | | | | |
| Specialty Retail — 1.2% | | | | | | |
Home Depot, Inc. (The) | | | 25,000 | | | $ | 876,500 | |
| | | | | | | | | |
| Textiles, Apparel & Luxury Goods — 0.9% | | | | | | | | |
VF Corporation | | | 8,000 | | | | 689,440 | |
| | | | | | | | | |
| Consumer Staples — 4.6% | | | | | | | | |
| Food & Staples Retailing — 1.0% | | | | | | | | |
Sysco Corporation | | | 25,000 | | | | 735,000 | |
| | | | | | | | | |
| Household Products — 2.6% | | | | | | | | |
Clorox Company (The) | | | 10,000 | | | | 632,800 | |
Kimberly-Clark Corporation | | | 11,000 | | | | 693,440 | |
Procter & Gamble Company (The) | | | 10,000 | | | | 643,300 | |
| | | | | | | | 1,969,540 | |
| Personal Products — 1.0% | | | | | | | | |
Avon Products, Inc. | | | 25,000 | | | | 726,500 | |
| | | | | | | | | |
| Energy — 2.1% | | | | | | | | |
| Oil, Gas & Consumable Fuels — 2.1% | | | | | | | | |
ConocoPhillips | | | 12,500 | | | | 851,250 | |
Exxon Mobil Corporation | | | 10,000 | | | | 731,200 | |
| | | | | | | | 1,582,450 | |
AVE MARIA BOND FUND SCHEDULE OF INVESTMENTS (Continued) |
COMMON STOCKS — 19.8% (Continued) | | | | | | |
| Financials — 2.7% | | | | | | |
| Capital Markets — 1.0% | | | | | | |
Federated Investors, Inc. - Class B | | | 30,000 | | | $ | 785,100 | |
| | | | | | | | | |
| Commercial Banks — 1.2% | | | | | | | | |
United Bankshares, Inc. | | | 30,000 | | | | 876,000 | |
| | | | | | | | | |
| Insurance — 0.5% | | | | | | | | |
Chubb Corporation (The) | | | 6,000 | | | | 357,840 | |
| | | | | | | | | |
| Health Care — 0.9% | | | | | | | | |
| Pharmaceuticals — 0.9% | | | | | | | | |
Abbott Laboratories | | | 15,000 | | | | 718,650 | |
| | | | | | | | | |
| Industrials — 2.3% | | | | | | | | |
| Commercial Services & Supplies — 0.3% | | | | | | | | |
Genuine Parts Company | | | 5,000 | | | | 256,700 | |
| | | | | | | | | |
| Electrical Equipment — 0.8% | | | | | | | | |
Emerson Electric Company | | | 10,000 | | | | 571,700 | |
| | | | | | | | | |
| Industrial Conglomerates — 1.2% | | | | | | | | |
3M Company | | | 10,000 | | | | 863,000 | |
| | | | | | | | | |
| Information Technology — 1.5% | | | | | | | | |
| IT Services — 1.0% | | | | | | | | |
Paychex, Inc. | | | 25,000 | | | | 772,750 | |
| | | | | | | | | |
| Semiconductors & Semiconductor Equipment — 0.5% | | | | | | | | |
Microchip Technology, Inc. | | | 10,000 | | | | 342,100 | |
| | | | | | | | | |
| Materials — 1.2% | | | | | | | | |
| Chemicals — 1.2% | | | | | | | | |
RPM International, Inc. | | | 40,000 | | | | 884,000 | |
| | | | | | | | | |
| Utilities — 2.4% | | | | | | | | |
| Electric Utilities — 1.7% | | | | | | | | |
Exelon Corporation | | | 12,500 | | | | 520,500 | |
Southern Company (The) | | | 20,000 | | | | 764,600 | |
| | | | | | | | 1,285,100 | |
| Multi-Utilities — 0.7% | | | | | | | | |
NSTAR | | | 12,000 | | | | 506,280 | |
| | | | | | | | | |
Total Common Stocks (Cost $12,439,305) | | | | | | $ | 14,798,650 | |
AVE MARIA BOND FUND SCHEDULE OF INVESTMENTS (Continued) |
MONEY MARKET FUNDS — 8.0% | | | | | | |
Federated Government Obligations Tax-Managed Fund - Institutional Shares, 0.01% (a) | | | 3,341,701 | | | $ | 3,341,701 | |
Federated U.S. Treasury Cash Reserve Fund - Institutional Shares, 0.01% (a) | | | 2,589,723 | | | | 2,589,723 | |
Total Money Market Funds (Cost $5,931,424) | | | | | | $ | 5,931,424 | |
| | | | | | | | | |
Total Investments at Market Value — 99.2% (Cost $69,870,064) | | | | | | $ | 73,995,572 | |
| | | | | | | | | |
Other Assets in Excess of Liabilities — 0.8% | | | | | | | 610,907 | |
| | | | | | | | | |
Net Assets — 100.0% | | | | | | $ | 74,606,479 | |
| (a) | The rate shown is the 7-day effective yield as of December 31, 2010. |
| | |
| See notes to financial statements. |
AVE MARIA MUTUAL FUNDS STATEMENTS OF ASSETS AND LIABILITIES December 31, 2010 |
| | Ave Maria Catholic Values Fund | | | | | | Ave Maria Rising Dividend Fund | |
| ASSETS | | | | | | | | | |
| Investment securities: | | | | | | | | | |
At cost | | $ | 146,171,844 | | | $ | 110,728,801 | | | $ | 103,682,788 | |
At market value (Note 1) | | $ | 188,300,497 | | | $ | 148,544,521 | | | $ | 126,643,847 | |
Receivable for capital shares sold | | | 129,692 | | | | 234,395 | | | | 208,635 | |
Receivable for investment securities sold | | | — | | | | — | | | | 503,816 | |
Dividends receivable | | | 100,376 | | | | 101,551 | | | | 138,099 | |
Other assets | | | 16,280 | | | | 15,442 | | | | 16,919 | |
TOTAL ASSETS | | | 188,546,845 | | | | 148,895,909 | | | | 127,511,316 | |
| | | | | | | | | | | | | |
| LIABILITIES | | | | | | | | | | | | |
Payable for investment securities purchased | | | — | | | | 1,016,473 | | | | 145,597 | |
Payable for capital shares redeemed | | | 67,109 | | | | 39,743 | | | | 69,182 | |
Payable to Adviser (Note 2) | | | 456,666 | | | | 330,076 | | | | 229,993 | |
Payable to administrator (Note 2) | | | 23,080 | | | | 18,010 | | | | 15,790 | |
Accrued shareholder servicing fees (Note 2) | | | 48,745 | | | | 16,691 | | | | — | |
Other accrued expenses | | | 38,413 | | | | 31,422 | | | | 28,870 | |
TOTAL LIABILITIES | | | 634,013 | | | | 1,452,415 | | | | 489,432 | |
| | | | | | | | | | | | | |
NET ASSETS | | $ | 187,912,832 | | | $ | 147,443,494 | | | $ | 127,021,884 | |
| | | | | | | | | | | | | |
| NET ASSETS CONSIST OF: | | | | | | | | | | | | |
Paid-in capital | | $ | 161,760,192 | | | $ | 110,024,163 | | | $ | 108,998,569 | |
Undistributed net investment income | | | — | | | | — | | | | 756 | |
Accumulated net realized losses from
security transactions | | | (15,976,013 | ) | | | (396,389 | ) | | | (4,938,500 | ) |
Net unrealized appreciation on investments | | | 42,128,653 | | | | 37,815,720 | | | | 22,961,059 | |
| NET ASSETS | | $ | 187,912,832 | | | $ | 147,443,494 | | | $ | 127,021,884 | |
Shares of beneficial interest outstanding
(unlimited number of shares authorized,
no par value) | | | 11,440,914 | | | | 7,170,955 | | | | 10,153,034 | |
Net asset value, offering price and
redemption price per share (Note 1) | | $ | 16.42 | | | $ | 20.56 | | | $ | 12.51 | |
| See notes to financial statements. |
AVE MARIA MUTUAL FUNDS STATEMENTS OF ASSETS AND LIABILITIES December 31, 2010 (Continued) |
| | | | | Ave Maria World Equity Fund | | | | |
| ASSETS | | | | | | | | | |
| Investment securities: | | | | | | | | | |
At amortized cost | | $ | 19,779,248 | | | $ | 10,961,857 | | | $ | 69,870,064 | |
At market value (Note 1) | | $ | 24,782,451 | | | $ | 11,997,993 | | | $ | 73,995,572 | |
Cash | | | — | | | | 692 | | | | — | |
Receivable for capital shares sold | | | 50,097 | | | | 6,478 | | | | 170,756 | |
Dividends and interest receivable | | | 12,815 | | | | 4,522 | | | | 611,596 | |
Other assets | | | 8,760 | | | | 10,752 | | | | 13,871 | |
TOTAL ASSETS | | | 24,854,123 | | | | 12,020,437 | | | | 74,791,795 | |
| | | | | | | | | | | | | |
| LIABILITIES | | | | | | | | | | | | |
Payable for capital shares redeemed | | | 14,944 | | | | 1 | | | | 26,792 | |
Payable to Adviser (Note 2) | | | 28,280 | | | | 7,428 | | | | 113,378 | |
Payable to administrator (Note 2) | | | 4,000 | | | | 2,500 | | | | 6,120 | |
Accrued shareholder servicing fees (Note 2) | | | — | | | | — | | | | 17,573 | |
Other accrued expenses | | | 13,020 | | | | 10,900 | | | | 21,453 | |
TOTAL LIABILITIES | | | 60,244 | | | | 20,829 | | | | 185,316 | |
| | | | | | | | | | | | | |
NET ASSETS | | $ | 24,793,879 | | | $ | 11,999,608 | | | $ | 74,606,479 | |
| | | | | | | | | | | | | |
| NET ASSETS CONSIST OF: | | | | | | | | | | | | |
Paid-in capital | | $ | 22,702,650 | | | $ | 11,018,975 | | | $ | 70,480,363 | |
Undistributed net investment income | | | — | | | | 314 | | | | 608 | |
Accumulated net realized losses from
security transactions | | | (2,911,974 | ) | | | (55,817 | ) | | | — | |
Net unrealized appreciation on investments | | | 5,003,203 | | | | 1,036,136 | | | | 4,125,508 | |
| NET ASSETS | | $ | 24,793,879 | | | $ | 11,999,608 | | | $ | 74,606,479 | |
Shares of beneficial interest outstanding
unlimited number of shares authorized,
no par value) | | | 2,285,384 | | | | 1,067,169 | | | | 6,844,911 | |
Net asset value, offering price and
redemption price per share (Note 1) | | $ | 10.85 | | | $ | 11.24 | | | $ | 10.90 | |
| See notes to financial statements. |
AVE MARIA MUTUAL FUNDS STATEMENTS OF OPERATIONS For the Year Ended December 31, 2010 |
| | Ave Maria Catholic Values Fund | | | | | | Ave Maria Rising Dividend Fund | |
| INVESTMENT INCOME | | | | | | | | | |
Dividends | | $ | 2,656,093 | | | $ | 1,511,653 | | | $ | 2,941,987 | |
Foreign withholding taxes on dividends | | | (2,197 | ) | | | — | | | | (4,845 | ) |
Interest | | | 5 | | | | — | | | | — | |
TOTAL INCOME | | | 2,653,901 | | | | 1,511,653 | | | | 2,937,142 | |
| | | | | | | | | | | | | |
| EXPENSES | | | | | | | | | | | | |
Investment advisory fees (Note 2) | | | 1,662,145 | | | | 1,204,784 | | | | 854,548 | |
Shareholder servicing fees (Note 2) | | | 429,926 | | | | 311,841 | | | | — | |
Administration, accounting and
transfer agent fees (Note 2) | | | 257,949 | | | | 187,148 | | | | 170,919 | |
Postage and supplies | | | 54,141 | | | | 42,199 | | | | 33,300 | |
Legal and audit fees | | | 43,085 | | | | 39,408 | | | | 37,379 | |
Trustees’ fees and expenses | | | 27,533 | | | | 27,533 | | | | 27,533 | |
Registration fees | | | 22,058 | | | | 24,699 | | | | 25,543 | |
Custodian and bank service fees | | | 14,493 | | | | 12,863 | | | | 15,953 | |
Insurance expense | | | 14,216 | | | | 10,167 | | | | 9,420 | |
Printing of shareholder reports | | | 9,462 | | | | 7,452 | | | | 5,775 | |
Compliance service fees and
expenses (Note 2) | | | 8,464 | | | | 6,412 | | | | 5,924 | |
Advisory board fees and expenses | | | 6,702 | | | | 6,702 | | | | 6,702 | |
Other expenses | | | 16,823 | | | | 13,221 | | | | 12,407 | |
TOTAL EXPENSES | | | 2,566,997 | | | | 1,894,429 | | | | 1,205,403 | |
Less fee reductions by the Adviser (Note 2) | | | (11,880 | ) | | | (28,978 | ) | | | — | |
Plus previous investment advisory fee
reductions and expense reimbursements
recouped by the Adviser | | | 24,444 | | | | 3,983 | | | | — | |
NET EXPENSES | | | 2,579,561 | | | | 1,869,434 | | | | 1,205,403 | |
| | | | | | | | | | | | | |
NET INVESTMENT INCOME/(LOSS) | | | 74,340 | | | | (357,781 | ) | | | 1,731,739 | |
| | | | | | | | | | | | | |
REALIZED AND UNREALIZED
GAINS ON INVESTMENTS | | | | | | | | | | | | |
Net realized gains from security transactions | | | 16,045,399 | | | | 2,045,253 | | | | 6,756,690 | |
Net change in unrealized appreciation/
depreciation on investments | | | 16,955,495 | | | | 28,377,461 | | | | 10,852,999 | |
NET REALIZED AND UNREALIZED
GAINS ON INVESTMENTS | | | 33,000,894 | | | | 30,422,714 | | | | 17,609,689 | |
| | | | | | | | | | | | | |
NET INCREASE IN NET ASSETS
RESULTING FROM OPERATIONS | | $ | 33,075,234 | | | $ | 30,064,933 | | | $ | 19,341,428 | |
| See notes to financial statements. |
AVE MARIA MUTUAL FUNDS STATEMENTS OF OPERATIONS For the Year Ended December 31, 2010(a) (Continued) |
| | | | | Ave Maria World Equity Fund | | | | |
| INVESTMENT INCOME | | | | | | | | | |
Dividends | | $ | 264,482 | | | $ | 80,077 | | | $ | 471,910 | |
Foreign withholding taxes on dividends | | | (1,794 | ) | | | (5,984 | ) | | | — | |
Interest | | | 125 | | | | 36 | | | | 1,536,903 | |
TOTAL INCOME | | | 262,813 | | | | 74,129 | | | | 2,008,813 | |
| | | | | | | | | | | | | |
| EXPENSES | | | | | | | | | | | | |
Investment advisory fees (Note 2) | | | 192,864 | | | | 46,749 | | | | 195,192 | |
Administration, accounting and
transfer agent fees (Note 2) | | | 48,000 | | | | 20,000 | | | | 65,115 | |
Shareholder servicing fees (Note 2) | | | — | | | | — | | | | 74,718 | |
Legal and audit fees | | | 25,640 | | | | 16,825 | | | | 31,919 | |
Trustees’ fees and expenses | | | 27,533 | | | | 8,960 | | | | 27,533 | |
Registration fees | | | 21,664 | | | | 11,892 | | | | 22,638 | |
Postage and supplies | | | 12,207 | | | | 2,845 | | | | 18,530 | |
Custodian and bank service fees | | | 7,191 | | | | 3,692 | | | | 7,209 | |
Advisory board fees and expenses | | | 6,702 | | | | 3,250 | | | | 6,702 | |
Insurance expense | | | 1,925 | | | | 301 | | | | 5,768 | |
Printing of shareholder reports | | | 2,599 | | | | 383 | | | | 3,384 | |
Compliance service fees and
expenses (Note 2) | | | 1,485 | | | | 301 | | | | 3,607 | |
Other expenses | | | 10,556 | | | | 5,282 | | | | 17,690 | |
TOTAL EXPENSES | | | 358,366 | | | | 120,480 | | | | 480,005 | |
Less fee reductions
by the Adviser (Note 2) | | | (108,644 | ) | | | (46,665 | ) | | | (101,299 | ) |
Plus previous investment advisory fee
reductions and expense reimbursements
recouped by the Adviser (Note 2) | | | — | | | | — | | | | 73,764 | |
NET EXPENSES | | | 249,722 | | | | 73,815 | | | | 452,470 | |
| | | | | | | | | | | | | |
NET INVESTMENT INCOME | | | 13,091 | | | | 314 | | | | 1,556,343 | |
| | | | | | | | | | | | | |
REALIZED AND UNREALIZED GAINS/
(LOSSES) ON INVESTMENTS | | | | | | | | | | | | |
Net realized gains/(losses) from
security transactions | | | 1,809,414 | | | | (55,817 | ) | | | 1,035,733 | |
Net change in unrealized appreciation/
depreciation on investments | | | 1,805,357 | | | | 1,036,136 | | | | 1,513,777 | |
NET REALIZED AND UNREALIZED
GAINS ON INVESTMENTS | | | 3,614,771 | | | | 980,319 | | | | 2,549,510 | |
| | | | | | | | | | | | | |
NET INCREASE IN NET ASSETS
RESULTING FROM OPERATIONS | | $ | 3,627,862 | | | $ | 980,633 | | | $ | 4,105,853 | |
| (a) | Except for the Ave Maria World Equity Fund, which represents the period from the initial public offering (April 30, 2010) through December 31, 2010. |
| | |
| See notes to financial statements. |
AVE MARIA CATHOLIC VALUES FUND STATEMENTS OF CHANGES IN NET ASSETS |
| | Year Ended December 31, 2010 | | | Year Ended December 31, 2009 | |
| FROM OPERATIONS | | | | | | |
Net investment income | | $ | 74,340 | | | $ | 101,661 | |
Net realized gains/(losses) from security transactions | | | 16,045,399 | | | | (26,952,403 | ) |
Net change in unrealized appreciation/depreciation
on investments | | | 16,955,495 | | | | 73,480,417 | |
Net increase in net assets resulting from operations | | | 33,075,234 | | | | 46,629,675 | |
| | | | | | | | | |
| FROM DISTRIBUTIONS TO SHAREHOLDERS | | | | | | | | |
From net investment income | | | (107,531 | ) | | | (78,832 | ) |
| | | | | | | | | |
| FROM CAPITAL SHARE TRANSACTIONS | | | | | | | | |
Proceeds from shares sold | | | 17,029,400 | | | | 17,706,350 | |
Reinvestment of distributions to shareholders | | | 99,585 | | | | 71,637 | |
Payments for shares redeemed | | | (32,818,126 | ) | | | (26,508,258 | ) |
Net decrease in net assets from capital share transactions | | | (15,689,141 | ) | | | (8,730,271 | ) |
| | | | | | | | | |
TOTAL INCREASE IN NET ASSETS | | | 17,278,562 | | | | 37,820,572 | |
| | | | | | | | | |
| NET ASSETS | | | | | | | | |
Beginning of year | | | 170,634,270 | | | | 132,813,698 | |
End of year | | $ | 187,912,832 | | | $ | 170,634,270 | |
| | | | | | | | | |
UNDISTRIBUTED NET INVESTMENT INCOME | | $ | — | | | $ | 22,829 | |
| | | | | | | | | |
| SUMMARY OF CAPITAL SHARE ACTIVITY | | | | | | | | |
Shares sold | | | 1,181,302 | | | | 1,597,482 | |
Shares issued in reinvestment of distributions to shareholders | | | 6,386 | | | | 5,221 | |
Shares redeemed | | | (2,266,543 | ) | | | (2,490,518 | ) |
Net decrease in shares outstanding | | | (1,078,855 | ) | | | (887,815 | ) |
Shares outstanding, beginning of year | | | 12,519,769 | | | | 13,407,584 | |
Shares outstanding, end of year | | | 11,440,914 | | | | 12,519,769 | |
| See notes to financial statements. |
AVE MARIA GROWTH FUND STATEMENTS OF CHANGES IN NET ASSETS |
| | Year Ended December 31, 2010 | | | Year Ended December 31, 2009 | |
| FROM OPERATIONS | | | | | | |
Net investment loss | | $ | (357,781 | ) | | $ | (147,653 | ) |
Net realized gains/(losses) from security transactions | | | 2,045,253 | | | | (2,247,782 | ) |
Net change in unrealized appreciation/depreciation
on investments | | | 28,377,461 | | | | 26,107,379 | |
Net increase in net assets resulting from operations | | | 30,064,933 | | | | 23,711,944 | |
| | | | | | | | | |
| FROM CAPITAL SHARE TRANSACTIONS | | | | | | | | |
Proceeds from shares sold | | | 29,190,293 | | | | 26,840,519 | |
Payments for shares redeemed | | | (27,438,065 | ) | | | (18,837,145 | ) |
Net increase in net assets from capital share transactions | | | 1,752,228 | | | | 8,003,374 | |
| | | | | | | | | |
TOTAL INCREASE IN NET ASSETS | | | 31,817,161 | | | | 31,715,318 | |
| | | | | | | | | |
| NET ASSETS | | | | | | | | |
Beginning of year | | | 115,626,333 | | | | 83,911,015 | |
End of year | | $ | 147,443,494 | | | $ | 115,626,333 | |
| | | | | | | | | |
UNDISTRIBUTED NET INVESTMENT INCOME | | $ | — | | | $ | — | |
| | | | | | | | | |
| SUMMARY OF CAPITAL SHARE ACTIVITY | | | | | | | | |
Shares sold | | | 1,625,271 | | | | 2,011,419 | |
Shares redeemed | | | (1,566,917 | ) | | | (1,424,147 | ) |
Net increase in shares outstanding | | | 58,354 | | | | 587,272 | |
Shares outstanding, beginning of year | | | 7,112,601 | | | | 6,525,329 | |
Shares outstanding, end of year | | | 7,170,955 | | | | 7,112,601 | |
| See notes to financial statements. |
AVE MARIA RISING DIVIDEND FUND STATEMENTS OF CHANGES IN NET ASSETS |
| | Year Ended December 31, 2010 | | | Year Ended December 31, 2009 | |
| FROM OPERATIONS | | | | | | |
Net investment income | | $ | 1,731,739 | | | $ | 1,169,685 | |
Net realized gains/(losses) from security transactions | | | 6,756,690 | | | | (7,446,166 | ) |
Net change in unrealized appreciation/depreciation
on investments | | | 10,852,999 | | | | 26,648,284 | |
Net increase in net assets resulting from operations | | | 19,341,428 | | | | 20,371,803 | |
| | | | | | | | | |
| FROM DISTRIBUTIONS TO SHAREHOLDERS | | | | | | | | |
From net investment income | | | (1,746,969 | ) | | | (1,175,419 | ) |
| | | | | | | | | |
| FROM CAPITAL SHARE TRANSACTIONS | | | | | | | | |
Proceeds from shares sold | | | 44,251,594 | | | | 34,004,905 | |
Reinvestment of distributions to shareholders | | | 1,420,740 | | | | 902,904 | |
Payments for shares redeemed | | | (39,106,203 | ) | | | (18,344,942 | ) |
Net increase in net assets from capital share transactions | | | 6,566,131 | | | | 16,562,867 | |
| | | | | | | | | |
TOTAL INCREASE IN NET ASSETS | | | 24,160,590 | | | | 35,759,251 | |
| | | | | | | | | |
| NET ASSETS | | | | | | | | |
Beginning of year | | | 102,861,294 | | | | 67,102,043 | |
End of year | | $ | 127,021,884 | | | $ | 102,861,294 | |
| | | | | | | | | |
UNDISTRIBUTED NET INVESTMENT INCOME | | $ | 756 | | | $ | 15,986 | |
| | | | | | | | | |
| SUMMARY OF CAPITAL SHARE ACTIVITY | | | | | | | | |
Shares sold | | | 3,861,627 | | | | 3,739,324 | |
Shares issued in reinvestment of distributions to shareholders | | | 123,135 | | | | 98,164 | |
Shares redeemed | | | (3,383,504 | ) | | | (1,979,482 | ) |
Net increase in shares outstanding | | | 601,258 | | | | 1,858,006 | |
Shares outstanding, beginning of year | | | 9,551,776 | | | | 7,693,770 | |
Shares outstanding, end of year | | | 10,153,034 | | | | 9,551,776 | |
| See notes to financial statements. |
AVE MARIA OPPORTUNITY FUND STATEMENTS OF CHANGES IN NET ASSETS |
| | Year Ended December 31, 2010 | | | Year Ended December 31, 2009 | |
| FROM OPERATIONS | | | | | | |
Net investment income/(loss) | | $ | 13,091 | | | $ | (31,234 | ) |
Net realized gains from security transactions | | | 1,809,414 | | | | 460,366 | |
Net change in unrealized appreciation/depreciation
on investments | | | 1,805,357 | | | | 3,818,418 | |
Net increase in net assets resulting from operations | | | 3,627,862 | | | | 4,247,550 | |
| | | | | | | | | |
| FROM DISTRIBUTIONS TO SHAREHOLDERS | | | | | | | | |
From net investment income | | | (13,091 | ) | | | — | |
| | | | | | | | | |
| FROM CAPITAL SHARE TRANSACTIONS | | | | | | | | |
Proceeds from shares sold | | | 9,114,867 | | | | 6,802,984 | |
Reinvestment of distributions to shareholders | | | 11,827 | | | | — | |
Payments for shares redeemed | | | (4,734,146 | ) | | | (4,123,128 | ) |
Net increase in net assets from capital share transactions | | | 4,392,548 | | | | 2,679,856 | |
| | | | | | | | | |
TOTAL INCREASE IN NET ASSETS | | | 8,007,319 | | | | 6,927,406 | |
| | | | | | | | | |
| NET ASSETS | | | | | | | | |
Beginning of year | | | 16,786,560 | | | | 9,859,154 | |
End of year | | $ | 24,793,879 | | | $ | 16,786,560 | |
| | | | | | | | | |
UNDISTRIBUTED NET INVESTMENT INCOME | | $ | — | | | $ | — | |
| | | | | | | | | |
| SUMMARY OF CAPITAL SHARE ACTIVITY | | | | | | | | |
Shares sold | | | 940,239 | | | | 876,955 | |
Shares issued in reinvestment of distributions to shareholders | | | 1,088 | | | | — | |
Shares redeemed | | | (498,649 | ) | | | (559,180 | ) |
Net increase in shares outstanding | | | 442,678 | | | | 317,775 | |
Shares outstanding, beginning of year | | | 1,842,706 | | | | 1,524,931 | |
Shares outstanding, end of year | | | 2,285,384 | | | | 1,842,706 | |
| See notes to financial statements. |
AVE MARIA WORLD EQUITY FUND STATEMENT OF CHANGES IN NET ASSETS |
| | Period Ended December 31, 2010 (a) | |
| FROM OPERATIONS | | | |
Net investment income | | $ | 314 | |
Net realized losses from security transactions | | | (55,817 | ) |
Net change in unrealized appreciation/depreciation on investments | | | 1,036,136 | |
Net increase in net assets resulting from operations | | | 980,633 | |
| | | | | |
| FROM CAPITAL SHARE TRANSACTIONS | | | | |
Proceeds from shares sold | | | 11,420,388 | |
Payments for shares redeemed | | | (401,413 | ) |
Net increase in net assets from capital share transactions | | | 11,018,975 | |
| | | | | |
TOTAL INCREASE IN NET ASSETS | | | 11,999,608 | |
| | | | | |
| NET ASSETS | | | | |
Beginning of period | | | — | |
End of period | | $ | 11,999,608 | |
| | | | | |
UNDISTRIBUTED NET INVESTMENT INCOME | | $ | 314 | |
| | | | | |
| SUMMARY OF CAPITAL SHARE ACTIVITY | | | | |
Shares sold | | | 1,107,387 | |
Shares redeemed | | | (40,218 | ) |
Net increase in shares outstanding | | | 1,067,169 | |
Shares outstanding, beginning of period | | | — | |
Shares outstanding, end of period | | | 1,067,169 | |
| (a) | Represents the period from the initial public offering (April 30, 2010) through December 31, 2010. |
| | |
| See notes to financial statements. |
AVE MARIA BOND FUND STATEMENTS OF CHANGES IN NET ASSETS | |
| | Year Ended December 31, 2010 | | | Year Ended December 31, 2009 | |
| FROM OPERATIONS | | | | | | |
Net investment income | | $ | 1,556,343 | | | $ | 1,438,413 | |
Net realized gains/(losses) from security transactions | | | 1,035,733 | | | | (867,627 | ) |
Net change in unrealized appreciation/depreciation
on investments | | | 1,513,777 | | | | 4,337,523 | |
Net increase in net assets resulting from operations | | | 4,105,853 | | | | 4,908,309 | |
| | | | | | | | | |
| FROM DISTRIBUTIONS TO SHAREHOLDERS | | | | | | | | |
From net investment income, Class R | | | (1,548,731 | ) | | | (1,311,992 | ) |
From net investment income, Class I | | | (7,253 | ) | | | (129,497 | ) |
From net realized gains on investments, Class R | | | (95,291 | ) | | | — | |
Decrease in net assets from distributions to shareholders | | | (1,651,275 | ) | | | (1,441,489 | ) |
| | | | | | | | | |
| FROM CAPITAL SHARE TRANSACTIONS | | | | | | | | |
| CLASS R (Note 1) | | | | | | | | |
Proceeds from shares sold | | | 31,117,816 | | | | 18,755,472 | |
Reinvestment of distributions to shareholders | | | 1,368,393 | | | | 1,154,469 | |
Payments for shares redeemed | | | (12,110,415 | ) | | | (9,448,338 | ) |
Net increase in net assets from Class R capital share transactions | | | 20,375,794 | | | | 10,461,603 | |
| | | | | | | | | |
| CLASS I (Note 1) | | | | | | | | |
Proceeds from shares sold | | | — | | | | 160,000 | |
Payments for shares redeemed | | | (2,768,633 | ) | | | (3,000,000 | ) |
| Net decrease in net assets from Class I capital share transactions | | | (2,768,633 | ) | | | (2,840,000 | ) |
| | | | | | | | | |
TOTAL INCREASE IN NET ASSETS | | | 20,061,739 | | | | 11,088,423 | |
| | | | | | | | | |
| NET ASSETS | | | | | | | | |
Beginning of year | | | 54,544,740 | | | | 43,456,317 | |
End of year | | | 74,606,479 | | | $ | 54,544,740 | |
| | | | | | | | | |
UNDISTRIBUTED NET INVESTMENT INCOME | | $ | 608 | | | $ | 289 | |
| | | | | | | | | |
| SUMMARY OF CAPITAL SHARE ACTIVITY | | | | | | | | |
| CLASS R (Note 1) | | | | | | | | |
Shares sold | | | 2,898,913 | | | | 1,873,729 | |
Shares issued in reinvestment of distributions to shareholders | | | 127,324 | | | | 114,465 | |
Shares redeemed | | | (1,123,758 | ) | | | (941,361 | ) |
Net increase in shares outstanding | | | 1,902,479 | | | | 1,046,833 | |
Shares outstanding, beginning of year | | | 4,942,432 | | | | 3,895,599 | |
Shares outstanding, end of year | | | 6,844,911 | | | | 4,942,432 | |
| | | | | | | | | |
| CLASS I (Note 1) | | | | | | | | |
Shares sold | | | — | | | | 15,355 | |
Shares redeemed | | | (262,768 | ) | | | (295,342 | ) |
Net decrease in shares outstanding | | | (262,768 | ) | | | (279,987 | ) |
Shares outstanding, beginning of year | | | 262,768 | | | | 542,755 | |
Shares outstanding, end of year | | | — | | | | 262,768 | |
| See notes to financial statements. |
AVE MARIA CATHOLIC VALUES FUND FINANCIAL HIGHLIGHTS Per Share Data for a Share Outstanding Throughout Each Year |
| | Year Ended December 31, 2010 | | | Year Ended December 31, 2009 | | | Year Ended December 31, 2008 | | | Year Ended December 31, 2007 | | | Year Ended December 31, 2006 | |
| Net asset value at beginning of year | | $ | 13.63 | | | $ | 9.91 | | | $ | 15.70 | | | $ | 16.50 | | | $ | 15.06 | |
| | | | | | | | | | | | | | | | | | | | | |
| Income/(loss) from investment operations: | | | | | | | | | | | | | | | | | | | | |
| Net investment income/(loss) | | | 0.01 | | | | 0.01 | | | | (0.00 | )(a) | | | 0.00 | (a) | | | (0.04 | ) |
Net realized and unrealized gains/
(losses) on investments | | | 2.79 | | | | 3.72 | | | | (5.78 | ) | | | (0.67 | ) | | | 2.18 | |
| Total from investment operations | | | 2.80 | | | | 3.73 | | | | (5.78 | ) | | | (0.67 | ) | | | 2.14 | |
| | | | | | | | | | | | | | | | | | | | | |
| Less distributions: | | | | | | | | | | | | | | | | | | | | |
From net investment income | | | (0.01 | ) | | | (0.01 | ) | | | — | | | | (0.00 | )(a) | | | — | |
| From net realized gains on investments | | | — | | | | — | | | | (0.01 | ) | | | (0.13 | ) | | | (0.70 | ) |
Total distributions | | | (0.01 | ) | | | (0.01 | ) | | | (0.01 | ) | | | (0.13 | ) | | | (0.70 | ) |
| | | | | | | | | | | | | | | | | | | | | |
Net asset value at end of year | | $ | 16.42 | | | $ | 13.63 | | | $ | 9.91 | | | $ | 15.70 | | | $ | 16.50 | |
| | | | | | | | | | | | | | | | | | | | | |
Total return (b) | | | 20.5% | | | | 37.6% | | | | (36.8% | )(c) | | | (4.0% | )(c) | | | 14.2% | |
| | | | | | | | | | | | | | | | | | | | | |
| Ratios/Supplementary Data: | | | | | | | | | | | | | | | | | | | | |
| Net assets at end of year (000’s) | | $ | 187,913 | | | $ | 170,634 | | | $ | 132,814 | | | $ | 247,195 | | | $ | 258,012 | |
| | | | | | | | | | | | | | | | | | | | | |
Ratio of net expenses to average net assets (d) | | | 1.50% | | | | 1.50% | | | | 1.50% | | | | 1.50% | | | | 1.50% | |
| | | | | | | | | | | | | | | | | | | | | |
Ratio of net investment income/(loss)
to average net assets | | | 0.04% | | | | 0.07% | | | | (0.03% | ) | | | 0.03% | | | | (0.23% | ) |
| | | | | | | | | | | | | | | | | | | | | |
Portfolio turnover rate | | | 33% | | | | 58% | | | | 53% | | | | 52% | | | | 59% | |
| (a) | Amount rounds to less than $0.01 per share. |
| | |
| (b) | Total return is a measure of the change in value of an investment in the Fund over the years covered, which assumes any dividends or capital gains distributions are reinvested in shares of the Fund. The returns shown do not reflect the deduction of taxes a shareholder would pay on Fund distributions or the redemption of Fund shares. |
| | |
| (c) | During the years ended December 31, 2008 and 2007, the Fund received payments from the Adviser of $71,643 and $176,249, respectively, for losses realized on the disposal of investments purchased in violation of investment restrictions, which otherwise would have reduced the total return by 0.03% and 0.06%, respectively. |
| | |
| (d) | Absent investment advisory fee reductions by the Adviser, the ratio of expenses to average net assets would have been 1.51%, 1.56%, 1.54% and 1.52% for the years ended December 31, 2010, 2009, 2008 and 2006, respectively. |
| | |
| See notes to financial statements. |
AVE MARIA GROWTH FUND FINANCIAL HIGHLIGHTS Per Share Data for a Share Outstanding Throughout Each Year |
| | Year Ended December 31, 2010 | | | Year Ended December 31, 2009 | | | Year Ended December 31, 2008 | | | Year Ended December 31, 2007 | | | Year Ended December 31, 2006 | |
| Net asset value at beginning of year | | $ | 16.26 | | | $ | 12.86 | | | $ | 18.94 | | | $ | 17.22 | | | $ | 15.00 | |
| | | | | | | | | | | | | | | | | | | | | |
| Income/(loss) from investment operations: | | | | | | | | | | | | | | | | | | | | |
Net investment loss | | | (0.05 | ) | | | (0.02 | ) | | | (0.06 | ) | | | (0.09 | ) | | | (0.04 | ) |
Net realized and unrealized gains/
(losses) on investments | | | 4.35 | | | | 3.42 | | | | (6.02 | ) | | | 2.09 | | | | 2.40 | |
| Total from investment operations | | | 4.30 | | | | 3.40 | | | | (6.08 | ) | | | 2.00 | | | | 2.36 | |
| | | | | | | | | | | | | | | | | | | | | |
| Less distributions: | | | | | | | | | | | | | | | | | | | | |
| From net realized gains on investments | | | — | | | | — | | | | — | | | | (0.28 | ) | | | (0.14 | ) |
| | | | | | | | | | | | | | | | | | | | | |
Net asset value at end of year | | $ | 20.56 | | | $ | 16.26 | | | $ | 12.86 | | | $ | 18.94 | | | $ | 17.22 | |
| | | | | | | | | | | | | | | | | | | | | |
Total return (a) | | | 26.5% | | | | 26.4% | | | | (32.1% | ) | | | 11.6% | | | | 15.8% | |
| | | | | | | | | | | | | | | | | | | | | |
| Ratios/Supplementary Data: | | | | | | | | | | | | | | | | | | | | |
| Net assets at end of year (000’s) | | $ | 147,443 | | | $ | 115,626 | | | $ | 83,911 | | | $ | 116,737 | | | $ | 85,211 | |
| | | | | | | | | | | | | | | | | | | | | |
Ratio of net expenses to average net assets (b) | | | 1.50% | | | | 1.50% | | | | 1.50% | | | | 1.50% | | | | 1.50% | |
| | | | | | | | | | | | | | | | | | | | | |
Ratio of net investment loss to
average net assets | | | (0.29% | ) | | | (0.16% | ) | | | (0.35% | ) | | | (0.55% | ) | | | (0.30% | ) |
| | | | | | | | | | | | | | | | | | | | | |
| Portfolio turnover rate | | | 25% | | | | 9% | | | | 22% | | | | 9% | | | | 13% | |
| (a) | Total return is a measure of the change in value of an investment in the Fund over the years covered, which assumes any dividends or capital gains distributions are reinvested in shares of the Fund. The returns shown do not reflect the deduction of taxes a shareholder would pay on Fund distributions or the redemption of Fund shares. |
| | |
| (b) | Absent investment advisory fee reductions by the Adviser, the ratio of expenses to average net assets would have been 1.52%, 1.61%, 1.60%, 1.56% and 1.62% for the years ended December 31, 2010, 2009, 2008, 2007 and 2006, respectively. |
| | |
| See notes to financial statements. |
AVE MARIA RISING DIVIDEND FUND FINANCIAL HIGHLIGHTS Per Share Data for a Share Outstanding Throughout Each Year |
| | Year Ended December 31, 2010 | | | Year Ended December 31, 2009 | | | Year Ended December 31, 2008 | | | Year Ended December 31, 2007 | | | Year Ended December 31, 2006 | |
| Net asset value at beginning of year | | $ | 10.77 | | | $ | 8.72 | | | $ | 11.54 | | | $ | 12.08 | | | $ | 10.59 | |
| | | | | | | | | | | | | | | | | | | | | |
| Income/(loss) from investment operations: | | | | | | | | | | | | | | | | | | | | |
Net investment income | | | 0.17 | | | | 0.13 | | | | 0.15 | | | | 0.16 | | | | 0.14 | |
Net realized and unrealized gains/
(losses) on investments | | | 1.74 | | | | 2.05 | | | | (2.74 | ) | | | (0.22 | ) | | | 1.75 | |
| Total from investment operations | | | 1.91 | | | | 2.18 | | | | (2.59 | ) | | | (0.06 | ) | | | 1.89 | |
| | | | | | | | | | | | | | | | | | | | | |
| Less distributions: | | | | | | | | | | | | | | | | | | | | |
From net investment income | | | (0.17 | ) | | | (0.13 | ) | | | (0.15 | ) | | | (0.16 | ) | | | (0.14 | ) |
| From net realized gains on investments | | | — | | | | — | | | | (0.08 | ) | | | (0.32 | ) | | | (0.26 | ) |
Total distributions | | | (0.17 | ) | | | (0.13 | ) | | | (0.23 | ) | | | (0.48 | ) | | | (0.40 | ) |
| | | | | | | | | | | | | | | | | | | | | |
Net asset value at end of year | | $ | 12.51 | | | $ | 10.77 | | | $ | 8.72 | | | $ | 11.54 | | | $ | 12.08 | |
| | | | | | | | | | | | | | | | | | | | | |
Total return (a) | | | 17.9% | | | | 25.3% | | | | (22.8% | ) | | | (0.6% | ) | | | 17.9% | |
| | | | | | | | | | | | | | | | | | | | | |
| Ratios/Supplementary Data: | | | | | | | | | | | | | | | | | | | | |
| Net assets at end of year (000’s) | | $ | 127,022 | | | $ | 102,861 | | | $ | 67,102 | | | $ | 82,743 | | | $ | 35,051 | |
| | | | | | | | | | | | | | | | | | | | | |
| Ratio of net expenses to average net assets | | | 1.06% | | | | 1.11% | | | | 1.15% | | | | 1.14% | | | | 1.25% | (b) |
| | | | | | | | | | | | | | | | | | | | | |
Ratio of net investment income to
average net assets | | | 1.52% | | | | 1.42% | | | | 1.41% | | | | 1.26% | | | | 1.23% | |
| | | | | | | | | | | | | | | | | | | | | |
| Portfolio turnover rate | | | 34% | | | | 63% | | | | 39% | | | | 41% | | | | 65% | |
| (a) | Total return is a measure of the change in value of an investment in the Fund over the years covered, which assumes any dividends or capital gains distributions are reinvested in shares of the Fund. The returns shown do not reflect the deduction of taxes a shareholder would pay on Fund distributions or the redemption of Fund shares. |
| | |
| (b) | Absent investment advisory fee reductions by the Adviser, the ratio of expenses to average net assets would have been 1.31% for the year ended December 31, 2006. |
| | |
| See notes to financial statements. |
AVE MARIA OPPORTUNITY FUND FINANCIAL HIGHLIGHTS Per Share Data for a Share Outstanding Throughout Each Period |
| | Year Ended December 31, 2010 | | | Year Ended December 31, 2009 | | | Year Ended December 31, 2008 | | | Year Ended December 31, 2007 | | | Period Ended December 31, 2006(a) | |
| Net asset value at beginning of period | | $ | 9.11 | | | $ | 6.47 | | | $ | 9.58 | | | $ | 10.55 | | | $ | 10.00 | |
| | | | | | | | | | | | | | | | | | | | | |
| Income/(loss) from investment operations: | | | | | | | | | | | | | | | | | | | | |
| Net investment income/(loss) | | | 0.01 | | | | (0.02 | ) | | | 0.03 | | | | 0.07 | | | | 0.06 | |
Net realized and unrealized gains/
(losses) on investments | | | 1.74 | | | | 2.66 | | | | (3.11 | ) | | | (0.97 | ) | | | 0.77 | |
| Total from investment operations | | | 1.75 | | | | 2.64 | | | | (3.08 | ) | | | (0.90 | ) | | | 0.83 | |
| | | | | | | | | | | | | | | | | | | | | |
| Less distributions: | | | | | | | | | | | | | | | | | | | | |
From net investment income | | | (0.01 | ) | | | — | | | | (0.03 | ) | | | (0.07 | ) | | | (0.06 | ) |
| From net realized gains on investments | | | — | | | | — | | | | — | | | | — | | | | (0.22 | ) |
Total distributions | | | (0.01 | ) | | | — | | | | (0.03 | ) | | | (0.07 | ) | | | (0.28 | ) |
| | | | | | | | | | | | | | | | | | | | | |
| Net asset value at end of period | | $ | 10.85 | | | $ | 9.11 | | | $ | 6.47 | | | $ | 9.58 | | | $ | 10.55 | |
| | | | | | | | | | | | | | | | | | | | | |
Total return (b) | | | 19.2% | | | | 40.8% | | | | (32.2% | ) | | | (8.5% | ) | | | 8.3% | (c) |
| | | | | | | | | | | | | | | | | | | | | |
| Ratios/Supplementary Data: | | | | | | | | | | | | | | | | | | | | |
| Net assets at end of period (000’s) | | $ | 24,794 | | | $ | 16,787 | | | $ | 9,859 | | | $ | 18,163 | | | $ | 17,714 | |
| | | | | | | | | | | | | | | | | | | | | |
Ratio of net expenses to average net assets (d) | | | 1.25% | | | | 1.25% | | | | 1.25% | | | | 1.25% | | | | 1.24% | (e) |
| | | | | | | | | | | | | | | | | | | | | |
Ratio of net investment income/(loss)
to average net assets | | | 0.07% | | | | (0.25% | ) | | | 0.29% | | | | 0.66% | | | | 0.84% | (e) |
| | | | | | | | | | | | | | | | | | | | | |
| Portfolio turnover rate | | | 81% | | | | 113% | | | | 276% | | | | 126% | | | | 102% | (e) |
| (a) | Represents the period from the initial public offering (May 1, 2006) through December 31, 2006. |
| | |
| (b) | Total return is a measure of the change in value of an investment in the Fund over the periods covered, which assumes any dividends or capital gains distributions are reinvested in shares of the Fund. The returns shown do not reflect the deduction of taxes a shareholder would pay on Fund distributions or the redemption of Fund shares. |
| | |
| (c) | Not annualized. |
| | |
| (d) | Absent investment advisory fee reductions and expense reimbursements by the Adviser, the ratio of expenses to average net assets would have been 1.79%, 2.31%, 2.29%, 1.80% and 1.90%(e) for the periods ended December 31, 2010, 2009, 2008, 2007 and 2006, respectively. |
| | |
| (e) | Annualized. |
| | |
| See notes to financial statements. |
AVE MARIA WORLD EQUITY FUND FINANCIAL HIGHLIGHTS Per Share Data for a Share Outstanding Throughout the Period |
| | Period Ended December 31, 2010(a) | |
| Net asset value at beginning of period | | $ | 10.00 | |
| | | | | |
| Income from investment operations: | | | | |
| Net investment income | | | 0.00 | (b) |
| Net realized and unrealized gains on investments | | | 1.24 | |
| Total from investment operations | | | 1.24 | |
| | | | | |
| Net asset value at end of period | | $ | 11.24 | |
| | | | | |
Total return (c) | | | 12.4% | (d) |
| | | | | |
| Ratios/Supplementary Data: | | | | |
| Net assets at end of period (000’s) | | $ | 12,000 | |
| | | | | |
Ratio of net expenses to average net assets (e) | | | 1.50% | (f) |
| | | | | |
| Ratio of net investment income to average net assets | | | 0.01% | (f) |
| | | | | |
| Portfolio turnover rate | | | 5% | (d) |
| (a) | Represents the period from the initial public offering (April 30, 2010) through December 31, 2010. |
| | |
| (b) | Amount rounds to less than $0.01 per share. |
| | |
| (c) | Total return is a measure of the change in value of an investment in the Fund over the period covered, which assumes any dividends or capital gains distributions are reinvested in shares of the Fund. The return shown does not reflect the deduction of taxes a shareholder would pay on Fund distributions or the redemption of Fund shares. |
| | |
| (d) | Not annualized. |
| | |
| (e) | Absent investment advisory fee reductions by the Adviser, the ratio of expenses to average net assets would have been 2.45%(f). |
| | |
| (f) | Annualized. |
| | |
| See notes to financial statements. |
AVE MARIA BOND FUND(a) FINANCIAL HIGHLIGHTS Per Share Data for a Share Outstanding Throughout Each Year |
| | Year Ended December 31, 2010 | | | Year Ended December 31, 2009 | | | Year Ended December 31, 2008 | | | Year Ended December 31, 2007 | | | Year Ended December 31, 2006 | |
| Net asset value at beginning of year | | $ | 10.48 | | | $ | 9.79 | | | $ | 10.12 | | | $ | 10.25 | | | $ | 10.08 | |
| | | | | | | | | | | | | | | | | | | | | |
| Income/(loss) from investment operations: | | | | | | | | | | | | | | | | | | | | |
Net investment income | | | 0.26 | | | | 0.29 | | | | 0.36 | | | | 0.38 | | | | 0.35 | |
Net realized and unrealized gains/
(losses) on investments | | | 0.43 | | | | 0.69 | | | | (0.33 | ) | | | 0.10 | | | | 0.24 | |
| Total from investment operations | | | 0.69 | | | | 0.98 | | | | 0.03 | | | | 0.48 | | | | 0.59 | |
| | | | | | | | | | | | | | | | | | | | | |
| Less distributions: | | | | | | | | | | | | | | | | | | | | |
From net investment income | | | (0.26 | ) | | | (0.29 | ) | | | (0.36 | ) | | | (0.38 | ) | | | (0.35 | ) |
| From net realized gains on investments | | | (0.01 | ) | | | — | | | | (0.00 | )(b) | | | (0.23 | ) | | | (0.07 | ) |
Total distributions | | | (0.27 | ) | | | (0.29 | ) | | | (0.36 | ) | | | (0.61 | ) | | | (0.42 | ) |
| | | | | | | | | | | | | | | | | | | | | |
Net asset value at end of year | | $ | 10.90 | | | $ | 10.48 | | | $ | 9.79 | | | $ | 10.12 | | | $ | 10.25 | |
| | | | | | | | | | | | | | | | | | | | | |
Total return (c) | | | 6.7% | | | | 10.2% | | | | 0.3% | | | | 4.8% | | | | 6.0% | |
| | | | | | | | | | | | | | | | | | | | | |
| Ratios/Supplementary Data: | | | | | | | | | | | | | | | | | | | | |
| Net assets at end of year (000’s) | | $ | 74,606 | | | $ | 51,788 | | | $ | 38,136 | | | $ | 34,178 | | | $ | 23,382 | |
| | | | | | | | | | | | | | | | | | | | | |
Ratio of net expenses to average net assets (d) | | | 0.70% | | | | 0.66% | | | | 0.62% | | | | 0.65% | | | | 0.60% | |
| | | | | | | | | | | | | | | | | | | | | |
Ratio of net investment income to
average net assets | | | 2.38% | | | | 2.90% | | | | 3.63% | | | | 3.69% | | | | 3.37% | |
| | | | | | | | | | | | | | | | | | | | | |
Portfolio turnover rate | | | 24% | | | | 27% | | | | 63% | | | | 45% | | | | 21% | |
| (a) | Prior to February 13, 2010, formally known as the Ave Maria Bond Fund - Class R (Note 1). |
| | |
| (b) | Amount rounds to less than $0.01 per share. |
| | |
| (c) | Total return is a measure of the change in value of an investment in the Fund over the years covered, which assumes any dividends or capital gains distributions are reinvested in shares of the Fund. The returns shown do not reflect the deduction of taxes a shareholder would pay on Fund distributions or the redemption of Fund shares. |
| | |
| (d) | Absent investment advisory fee reductions and expense reimbursements by the Adviser, the ratio of expenses to average net assets would have been 0.85%, 0.93%, 0.91%, 0.96% and 0.94% for the years ended December 31, 2010, 2009, 2008, 2007 and 2006, respectively. |
| | |
| See notes to financial statements. |
AVE MARIA MUTUAL FUNDS NOTES TO FINANCIAL STATEMENTS December 31, 2010 |
| 1. | Organization and Significant Accounting Policies |
The Ave Maria Catholic Values Fund, the Ave Maria Growth Fund, the Ave Maria Rising Dividend Fund, the Ave Maria Opportunity Fund, the Ave Maria World Equity Fund and the Ave Maria Bond Fund (collectively, the “Funds”) are each a diversified series of the Schwartz Investment Trust (the “Trust”), an open-end management investment company registered under the Investment Company Act of 1940 and established as an Ohio business trust under a Declaration of Trust dated August 31, 1992. The Ave Maria Catholic Values Fund commenced the public offering of its shares on May 1, 2001. The public offering of shares of the Ave Maria Growth Fund and the Ave Maria Bond Fund commenced on May 1, 2003. The Ave Maria Rising Dividend Fund commenced the public offering of its shares on May 2, 2005. The Ave Maria Opportunity Fund comm enced the public offering of its shares on May 1, 2006. The Ave Maria World Equity Fund commenced the public offering of its shares on April 30, 2010.
The investment objective of the Ave Maria Catholic Values Fund is to seek long-term capital appreciation from equity investments in companies that do not violate core values and teachings of the Roman Catholic Church. The investment objective of the Ave Maria Growth Fund is to seek long-term capital appreciation, using the growth style, from equity investments in companies that do not violate core values and teachings of the Roman Catholic Church. The investment objective of the Ave Maria Rising Dividend Fund is to provide increasing dividend income over time, long-term growth of capital, and a reasonable level of current income from investments in dividend-paying common stocks of companies that do not violate core values and teachings of the Roman Catholic Church. The investment objective of the Ave Maria Opportunity Fund is long-term capital appreciation from equity investments in companies that do not violate core values and teachings of the Roman Catholic Church. The investment objective of the Ave Maria World Equity Fund is to seek long-term capital appreciation from equity investments in U.S. and non-U.S. companies that do not violate core values and teachings of the Roman Catholic Church. The investment objective of the Ave Maria Bond Fund is to seek preservation of principal with a reasonable level of current income from investments in companies that do not violate core values and teachings of the Roman Catholic Church. See the Funds’ Prospectus for information regarding the investment strategies of each Fund.
Prior to February 13, 2010, the Ave Maria Bond Fund offered two classes of shares: Class I shares (sold subject to a distribution fee of up to 0.10% of the average daily net assets attributable to Class I shares) and Class R shares (sold subject to a distribution fee of up to 0.25% of the average daily net assets attributable to Class R shares). Each class of shares represented an interest in the same assets of the Fund, had the same rights and was identical in all material respects except that: (1) Class R shares bore the expenses of higher distribution fees; (2) certain other class-specific expenses were borne solely by the class to which such expenses were attributable; (3) each class had exclusive voting rights with respect to matters relating to its own distribution arrangements; and (4)
AVE MARIA MUTUAL FUNDS NOTES TO FINANCIAL STATEMENTS (Continued) |
Class I shares required an initial investment of $10 million. Investment income earned, realized capital gains and losses, and unrealized appreciation and depreciation were allocated daily to each class of shares based upon its proportionate share of total net assets of the Fund. Class-specific expenses were charged directly to the class incurring the expense. Common expenses which are not attributable to a specific class were allocated daily to each class of shares based upon its proportionate share of total net assets of the Fund.
At a meeting held on February 13, 2010, the Board of Trustees approved the termination of Class I shares of the Ave Maria Bond Fund. In addition, the “Class R” designation previously assigned to the sole remaining class of shares of the Ave Maria Bond Fund was eliminated.
Shares of each Fund are sold at net asset value. To calculate the net asset value, each Fund’s assets are valued and totaled, liabilities are subtracted, and the balance is divided by the number of shares outstanding. The offering price and redemption price per share are equal to the net asset value per share for each Fund.
The following is a summary of significant accounting policies followed by the Funds:
(a) Valuation of investments – Securities which are traded on stock exchanges are valued at the closing sales price as of the close of the regular session of trading on the New York Stock Exchange on the day the securities are being valued, or, if not traded on a particular day, at the closing bid price. Securities which are quoted by NASDAQ are valued at the NASDAQ Official Closing Price. Securities traded in the over-the-counter market are valued at the last reported sales price or, if there is no reported sale on the valuation date, at the most recently quoted bid price. Securities which are traded both in the over-the-counter market and on a stock exchange are valued according to the broadest and most representative market. Investments in shares of other open-end invest ment companies are valued at their net asset value as reported by such companies. Securities (and other assets) for which market quotations are not readily available are valued at their fair value as determined in good faith in accordance with consistently applied procedures established by and under the general supervision of the Board of Trustees, and will be classified as Level 2 or 3 within the fair value hierarchy, depending on the inputs used. Short-term instruments (those with remaining maturities of 60 days or less) are valued at amortized cost, which approximates market value.
Accounting principles generally accepted in the United States (“GAAP”) establish a single authoritative definition of fair value, set out a framework for measuring fair value and require additional disclosures about fair value measurements.
AVE MARIA MUTUAL FUNDS NOTES TO FINANCIAL STATEMENTS (Continued) |
Various inputs are used in determining the value of each Fund’s investments. These inputs are summarized in the three broad levels listed below:
| | • | Level 1 – quoted prices in active markets for identical securities |
| | • | Level 2 – other significant observable inputs |
| | • | Level 3 – significant unobservable inputs |
For example, U.S. Treasury Obligations, U.S. Government Agency Obligations and Corporate Bonds held by the Ave Maria Bond Fund are classified as Level 2 since values are based on prices provided by an independent pricing service that utilizes various “other significant observable inputs” including bid and ask quotations, prices of similar securities and interest rates, among other factors.
The inputs or methodology used for valuing securities are not necessarily an indication of the risks associated with investing in those securities. The inputs used to measure fair value may fall into different levels of the fair value hierarchy. In such cases, for disclosure purposes, the level in the fair value hierarchy within which the fair value measurement falls in its entirety is determined based on the lowest level input that is significant to the fair value measurement.
The following is a summary of the inputs used to value the Funds’ investments by security type as of December 31, 2010:
Ave Maria Catholic Values Fund | | | | | | | | | | | | |
Common Stocks | | $ | 178,284,944 | | | $ | — | | | $ | — | | | $ | 178,284,944 | |
Exchange-Traded Funds | | | 5,548,800 | | | | — | | | | — | | | | 5,548,800 | |
Money Market Funds | | | 4,466,753 | | | | — | | | | — | | | | 4,466,753 | |
Total | | $ | 188,300,497 | | | $ | — | | | $ | — | | | $ | 188,300,497 | |
| | | | | | | | | | | | |
Common Stocks | | $ | 145,871,346 | | | $ | — | | | $ | — | | | $ | 145,871,346 | |
Money Market Funds | | | 2,673,175 | | | | — | | | | — | | | | 2,673,175 | |
Total | | $ | 148,544,521 | | | $ | — | | | $ | — | | | $ | 148,544,521 | |
Ave Maria Rising Dividend Fund | | | | | | | | | | | | |
Common Stocks | | $ | 121,155,830 | | | $ | — | | | $ | — | | | $ | 121,155,830 | |
Money Market Funds | | | 5,488,017 | | | | — | | | | — | | | | 5,488,017 | |
Total | | $ | 126,643,847 | | | $ | — | | | $ | — | | | $ | 126,643,847 | |
AVE MARIA MUTUAL FUNDS NOTES TO FINANCIAL STATEMENTS (Continued) |
Ave Maria Opportunity Fund | | | | | | | | | | | | |
Common Stocks | | $ | 19,271,710 | | | $ | — | | | $ | — | | | $ | 19,271,710 | |
Exchange-Traded Funds | | | 993,600 | | | | — | | | | — | | | | 993,600 | |
Repurchase Agreements | | | — | | | | 1,219,289 | | | | — | | | | 1,219,289 | |
Money Market Funds | | | 3,297,852 | | | | — | | | | — | | | | 3,297,852 | |
Total | | $ | 23,563,162 | | | $ | 1,219,289 | | | $ | — | | | $ | 24,782,451 | |
Ave Maria World Equity Fund | | | | | | | | | | | | |
Common Stocks | | $ | 10,121,556 | | | $ | — | | | $ | — | | | $ | 10,121,556 | |
Exchange-Traded Funds | | | 166,464 | | | | — | | | | — | | | | 166,464 | |
Money Market Funds | | | 1,709,973 | | | | — | | | | — | | | | 1,709,973 | |
Total | | $ | 11,997,993 | | | $ | — | | | $ | — | | | $ | 11,997,993 | |
| | | | | | | | | | | | |
Common Stocks | | $ | 14,798,650 | | | $ | — | | | $ | — | | | $ | 14,798,650 | |
U.S. Treasury Obligations | | | — | | | | 18,394,654 | | | | — | | | | 18,394,654 | |
U.S. Government Agency Obligations | | | — | | | | 7,164,303 | | | | — | | | | 7,164,303 | |
Corporate Bonds | | | — | | | | 27,706,541 | | | | — | | | | 27,706,541 | |
Money Market Funds | | | 5,931,424 | | | | — | | | | — | | | | 5,931,424 | |
Total | | $ | 20,730,074 | | | $ | 53,265,498 | | | $ | — | | | $ | 73,995,572 | |
Refer to each respective Fund’s Schedule of Investments for a listing of the securities valued using Level 1 and Level 2 inputs by security type and sector or industry type. During the year ended December 31, 2010, the Funds did not have any significant transfers in and out of Level 1 or Level 2. There were no Level 3 securities or derivative instruments held by the Funds as of or during the year ended December 31, 2010.
(b) Income taxes – It is each Fund’s policy to comply with the special provisions of Subchapter M of the Internal Revenue Code applicable to regulated investment companies. As provided therein, in any fiscal year in which a Fund so qualifies and distributes at least 90% of its taxable income, such Fund (but not the shareholders) will be relieved of federal income tax on the income distributed. Accordingly, no provision for income taxes has been made.
In order to avoid imposition of the excise tax applicable to regulated investment companies, it is also each Fund’s intention to declare as dividends in each calendar year at least 98% of its net investment income and 98% of its net realized capital gains plus undistributed amounts from prior years.
The following information is computed on a tax basis for each item as of December 31, 2010:
AVE MARIA MUTUAL FUNDS NOTES TO FINANCIAL STATEMENTS (Continued) |
| | | Ave Maria Catholic Values Fund | | | | | | Ave Maria Rising Dividend Fund | | | | | | Ave Maria World Equity Fund | | | | |
| Undistributed ordinary income | | $ | — | | | $ | — | | | $ | 756 | | | $ | — | | | $ | 314 | | | $ | 608 | |
Capital loss carryforwards | | | (15,526,882 | ) | | | (218,750 | ) | | | (4,565,142 | ) | | | (2,890,168 | ) | | | (55,817 | ) | | | — | |
Net unrealized appreciation | | | 41,679,522 | | | | 37,638,081 | | | | 22,587,701 | | | | 4,981,397 | | | | 1,036,136 | | | | 4,125,508 | |
Total distributable earnings | | $ | 26,152,640 | | | $ | 37,419,331 | | | $ | 18,023,315 | | | $ | 2,091,229 | | | $ | 980,633 | | | $ | 4,126,116 | |
As of December 31, 2010, the Funds had the following capital loss carryforwards for federal income tax purposes:
| | Ave Maria Catholic Values Fund | | | | | | Ave Maria Rising Dividend Fund | | | | | | Ave Maria World Equity Fund | |
2016 | | $ | — | | | $ | — | | | $ | — | | | $ | 2,890,168 | | | $ | — | |
2017 | | | 15,526,882 | | | | 218,750 | | | | 4,565,142 | | | | — | | | | — | |
2018 | | | — | | | | — | | | | — | | | | — | | | | 55,817 | |
| | | $ | 15,526,882 | | | $ | 218,750 | | | $ | 4,565,142 | | | $ | 2,890,168 | | | $ | 55,817 | |
These capital loss carryforwards may be utilized in future years to offset net realized capital gains, if any, prior to distributing such gains to shareholders.
During the year ended December 31, 2010, the Ave Maria Catholic Values Fund, the Ave Maria Growth Fund, the Ave Maria Rising Dividend Fund, the Ave Maria Opportunity Fund and the Ave Maria Bond Fund utilized capital loss carryforwards to offset current year realized gains in the amount of $15,592,996, $2,045,253, $6,819,341, $1,809,414 and $940,482, respectively.
The following information is based upon the federal income tax cost of the Funds’ investment securities as of December 31, 2010:
| | | Ave Maria Catholic Values Fund | | | | | | Ave Maria Rising Dividend Fund | | | | | | Ave Maria World Equity Fund | | | | |
Gross unrealized appreciation | | $ | 43,571,492 | | | $ | 40,123,669 | | | $ | 23,646,397 | | | $ | 5,020,613 | | | $ | 1,131,530 | | | $ | 4,377,187 | |
Gross unrealized depreciation | | | (1,891,970 | ) | | | (2,485,588 | ) | | | (1,058,696 | ) | | | (39,216 | ) | | | (95,394 | ) | | | (251,679 | ) |
Net unrealized appreciation | | $ | 41,679,522 | | | $ | 37,638,081 | | | $ | 22,587,701 | | | $ | 4,981,397 | | | $ | 1,036,136 | | | $ | 4,125,508 | |
Federal income tax cost | | $ | 146,620,975 | | | $ | 110,906,440 | | | $ | 104,056,146 | | | $ | 19,801,054 | | | $ | 10,961,857 | | | $ | 69,870,064 | |
The difference between the federal income tax cost of portfolio investments and the financial statement cost for the Ave Maria Catholic Values Fund, the Ave Maria Growth Fund, the Ave Maria Rising Dividend Fund and the Ave Maria Opportunity Fund is due to certain timing differences in the recognition of capital losses under income tax regulations and GAAP. These “book/tax” differences are temporary in nature and are due to the tax deferral of losses on wash sales.
AVE MARIA MUTUAL FUNDS NOTES TO FINANCIAL STATEMENTS (Continued) |
For the year ended December 31, 2010, the Ave Maria Catholic Values Fund reclassified $9,867 of distributions in excess of net investment income and $495 of net investment income due to expenses that were non-deductible for tax purposes against paid-in capital; the Ave Maria Growth Fund reclassified $357,781 of net investment loss against paid-in capital; the Ave Maria Rising Dividend Fund reclassified $5,488 of accumulated net realized losses against paid-in capital due to the expiration of capital loss carryforwards and the Ave Maria Bond Fund reclassified $40 of distributions in excess of net realized gains against undistributed net investment income. These reclassifications are reflected on the Statements of Assets and Liabilities. Such reclassifications, the result of permanent differences between the financial statement and the income tax reporting requirements, have no effect on each Fund’s net assets or net asset value per share.
The Funds recognize the tax benefits or expenses of uncertain tax positions only when the position is “more-likely-than-not” to be sustained assuming examination by tax authorities. Management has reviewed the tax positions taken on federal income tax returns for all open tax years (tax years ended December 31, 2007 through December 31, 2010) and has concluded that no provision for unrecognized tax benefits or expenses is required in these financial statements.
(c) Security transactions and investment income – Security transactions are accounted for on the trade date. Dividend income is recorded on the ex-dividend date. Interest income is recognized on the accrual basis. Realized gains and losses on securities sold are determined on a specific identification basis. Discounts and premiums on fixed-income securities purchased are amortized using the interest method.
(d) Dividends and distributions – Dividends from net investment income, if any, are declared and paid annually in December for the Ave Maria Catholic Values Fund, the Ave Maria Growth Fund, the Ave Maria Opportunity Fund and the Ave Maria World Equity Fund. Dividends from net investment income, if any, are declared and paid quarterly for the Ave Maria Rising Dividend Fund and are declared and paid monthly for the Ave Maria Bond Fund. Each Fund expects to distribute any net realized capital gains annually. Dividends and distributions to shareholders are recorded on the ex-dividend date. The tax character of distributions paid during the years ended December 31, 2010 and December 31, 2009 was as follows:
AVE MARIA MUTUAL FUNDS NOTES TO FINANCIAL STATEMENTS (Continued) |
| | | | | | | | | |
| Ave Maria Catholic Values Fund: | | | | | | | | | |
December 31, 2010 | | $ | 107,531 | | | $ | — | | | $ | 107,531 | |
December 31, 2009 | | $ | 78,832 | | | $ | — | | | $ | 78,832 | |
| Ave Maria Rising Dividend Fund: | | | | | | | | | | | | |
December 31, 2010 | | $ | 1,746,969 | | | $ | — | | | $ | 1,746,969 | |
December 31, 2009 | | $ | 1,175,419 | | | $ | — | | | $ | 1,175,419 | |
| Ave Maria Opportunity Fund: | | | | | | | | | | | | |
December 31, 2010 | | $ | 13,091 | | | $ | — | | | $ | 13,091 | |
December 31, 2009 | | $ | — | | | $ | — | | | $ | — | |
| Ave Maria Bond Fund - Class R: | | | | | | | | | | | | |
December 31, 2010 | | $ | 1,548,731 | | | $ | 95,291 | | | $ | 1,644,022 | |
December 31, 2009 | | $ | 1,311,992 | | | $ | — | | | $ | 1,311,992 | |
| Ave Maria Bond Fund - Class I: | | | | | | | | | | | | |
December 31, 2010 | | $ | 7,253 | | | $ | — | | | $ | 7,253 | |
December 31, 2009 | | $ | 129,497 | | | $ | — | | | $ | 129,497 | |
For the period ended December 31, 2010, there were no distributions paid to shareholders of the Ave Maria Growth Fund and the Ave Maria World Equity Fund. In addition, no distributions were paid to shareholders of the Ave Maria Growth Fund during the year ended December 31, 2009.
(e) Repurchase agreements – The Funds may enter into repurchase agreements (agreements to purchase securities subject to the seller’s agreement to repurchase them at a specified time and price) with well-established securities dealers or banks. Repurchase agreements may be deemed to be loans by the Funds. It is each Fund’s policy to take possession of obligations issued or guaranteed by the U.S. Government or its agencies or instrumentalities as collateral under a repurchase agreement and, on a daily basis, mark-to-market such obligations to ensure that their value, including accrued interest, is at least equal to the amount to be repaid to the Fund under the repurchase agreement. If the seller defaults, and the fair value of the collateral declines, realization of the collateral by the Funds may be delayed or limited.
(f) Estimates – The preparation of financial statements in conformity with GAAP requires management to make estimates and assumptions that affect the reported amounts of assets and liabilities and disclosure of contingent assets and liabilities at the date of the financial statements and the reported amounts of revenues and expenses during the reporting period. Actual results could differ from those estimates.
AVE MARIA MUTUAL FUNDS NOTES TO FINANCIAL STATEMENTS (Continued) |
(g) Common expenses – Common expenses of the Trust are allocated among the Funds of the Trust based on relative net assets of each Fund or the nature of the services performed and the relative applicability to each Fund.
| 2. | Investment Advisory Agreements and Transactions with Related Parties |
The Chairman and President of the Trust is also the President and Chief Investment Officer of Schwartz Investment Counsel, Inc. (the “Adviser”). Certain other officers of the Trust are officers of the Adviser, or of Ultimus Fund Solutions, LLC (“Ultimus”), the administrative, accounting and transfer agent for the Funds, or of Ultimus Fund Distributors, LLC (the “Distributor”), the Funds’ principal underwriter.
Pursuant to Investment Advisory Agreements between the Trust and the Adviser, the Adviser is responsible for the management of each Fund and provides investment advice along with the necessary personnel, facilities, equipment and certain other services necessary to the operations of the Funds. Effective May 1, 2010, the Adviser receives from each of the Ave Maria Catholic Values Fund, the Ave Maria Growth Fund, the Ave Maria Opportunity Fund and the Ave Maria World Equity Fund a quarterly fee at the annual rate of 0.95% of its average daily net assets. The Adviser receives from the Ave Maria Rising Dividend Fund and the Ave Maria Bond Fund a quarterly fee at the annual rate of 0.75% and 0.30%, respectively, of average daily net assets. Prior to May 1, 2010, the Adviser received from each of the Ave Maria Catholic Values Fund, the Ave M aria Growth Fund and the Ave Maria Opportunity Fund a quarterly fee at the annual rate of 1.00% of its average daily net assets.
The Adviser has contractually agreed to reduce its advisory fees or reimburse a portion of operating expenses until at least May 1, 2012 so that: the net expenses of the Ave Maria Catholic Values Fund, the Ave Maria Growth Fund and the Ave Maria World Equity Fund do not exceed 1.50% of average daily net assets; the net expenses of the Ave Maria Rising Dividend Fund and the Ave Maria Opportunity Fund do not exceed 1.25% of average daily net assets; and the net expenses of the Ave Maria Bond Fund do not exceed 0.70% of average daily net assets. For the year ended December 31, 2010, the Adviser reduced its investment advisory fees by $11,880 with respect to the Ave Maria Catholic Values Fund; reduced its investment advisory fees by $28,978 with respect to the Ave Maria Growth Fund; reduced its investment advisory fees by $108,644 with res pect to the Ave Maria Opportunity Fund; reduced its investment advisory fees by $46,665 with respect to the Ave Maria World Equity Fund; and reduced its investment advisory fees by $101,299 with respect to the Ave Maria Bond Fund.
AVE MARIA MUTUAL FUNDS NOTES TO FINANCIAL STATEMENTS (Continued) |
Any fee reductions or expense reimbursements by the Adviser are subject to repayment by the Funds for a period of three years from the time such reductions or reimbursements occurred, provided the Funds are able to effect such repayment and remain in compliance with any undertaking by the Adviser to limit expenses of the Funds. During the year ended December 31, 2010, the Adviser recouped previous investment advisory fee reductions and expense reimbursements of $24,444 from the Ave Maria Catholic Values Fund, $3,983 from the Ave Maria Growth Fund and $73,764 from the Ave Maria Bond Fund. As of December 31, 2010, the amount of fee reductions and expense reimbursements available for reimbursement to the Adviser are as follows:
| Ave Maria Catholic Values Fund | | $ | 159,860 | |
| Ave Maria Growth Fund | | $ | 234,156 | |
| Ave Maria Opportunity Fund | | $ | 379,627 | |
| Ave Maria World Equity Fund | | $ | 46,665 | |
| Ave Maria Bond Fund | | $ | 349,235 | |
The Adviser may recapture a portion of the above amounts no later than the dates as stated below:
| | | | | | | | | |
| Ave Maria Catholic Values Fund | | $ | 57,085 | | | $ | 90,895 | | | $ | 11,880 | |
| Ave Maria Growth Fund | | $ | 104,027 | | | $ | 101,151 | | | $ | 28,978 | |
| Ave Maria Opportunity Fund | | $ | 138,377 | | | $ | 132,606 | | | $ | 108,644 | |
| Ave Maria World Equity Fund | | $ | — | | | $ | — | | | $ | 46,665 | |
| Ave Maria Bond Fund | | $ | 112,210 | | | $ | 135,726 | | | $ | 101,299 | |
Fee reductions or expense reimbursements, and expense repayments, are calculated daily and as such, certain Funds may have both fee reductions and expenses recouped in a fiscal year, subject to the expense limitations in place.
The Chief Compliance Officer of the Trust (the “CCO”) is an employee of the Adviser. The Trust pays the Adviser $25,000 annually for providing CCO services, of which each Fund pays its proportionate share along with the other series of the Trust. In addition, the Trust reimburses the Adviser for out-of-pocket expenses incurred, if any, for providing these services.
JLB & Associates, Inc. (“JLB”) has been retained by the Adviser to manage the investments of the Ave Maria Growth Fund pursuant to the terms of a Sub-Advisory Agreement. The Adviser (not the Fund) pays JLB a fee at an annual rate of 0.285% of the average value of the Fund’s daily net assets. JLB’s fees are reduced on a pro rata basis to the extent that the Adviser reduces its advisory fees or reimburses expenses of the Ave Maria Growth Fund.
AVE MARIA MUTUAL FUNDS NOTES TO FINANCIAL STATEMENTS (Continued) |
Pursuant to a Mutual Fund Services Agreement between the Trust and Ultimus, Ultimus supplies regulatory and compliance services, calculates the daily net asset value per share, maintains the financial books and records of the Funds, maintains the records of each shareholder’s account, and processes purchases and redemptions of each Fund’s shares. For the performance of these services, the Ave Maria Bond Fund pays Ultimus a monthly fee at an annual rate of 0.10% of its average daily net assets, and each of the Ave Maria Catholic Values Fund, the Ave Maria Growth Fund, the Ave Maria Rising Dividend Fund, the Ave Maria Opportunity Fund and the Ave Maria World Equity Fund pays Ultimus a monthly fee at an annual rate of 0.15% of its average daily net assets. The fee payable to Ultimus by each Fund is subject to a minimum monthly fee of $4,000, except that the Ave Maria World Equity Fund is subject to a minimum monthly fee of $2,500 for the first 12 months of operations.
Pursuant to a Distribution Agreement between the Trust and the Distributor, the Distributor serves as each Fund’s exclusive agent for the distribution of its shares. The Distributor is an affiliate of Ultimus.
The Ave Maria Catholic Values Fund, the Ave Maria Growth Fund and the Ave Maria Bond Fund have adopted a Shareholder Servicing Plan (the “Plan”) under Section 12(b) of the Investment Company Act of 1940 and Rule 12b-1 thereunder, which allows such Funds to make payments to financial organizations (including the Adviser and other affiliates of each Fund) for providing account administration and personnel and account maintenance services to Fund shareholders. The annual service fee may not exceed an amount equal to 0.25% of each Fund’s average daily net assets. During the year ended December 31, 2010, the total expenses incurred pursuant to the Plan were $429,926, $311,841 and $74,718 for the Ave Maria Catholic Values Fund, the Ave Maria Growth Fund, and the Ave Maria Bond Fund, respectively.
| 3. | Investment Transactions |
During the year ended December 31, 2010, cost of purchases and proceeds from sales and maturities of investment securities, excluding short-term investments and U.S. government securities, were as follows:
| | | Ave Maria Catholic Values Fund | | | | | | Ave Maria Rising Dividend Fund | | | | | | Ave Maria World Equity Fund | | | | |
| Purchases of investment securities | | $ | 57,947,243 | | | $ | 30,832,792 | | | $ | 47,783,945 | | | $ | 16,837,569 | | | $ | 9,647,157 | | | $ | 15,091,053 | |
| Proceeds from sales of investment securities | | $ | 53,190,527 | | | $ | 30,733,646 | | | $ | 36,252,198 | | | $ | 12,906,199 | | | $ | 339,456 | | | $ | 9,204,922 | |
AVE MARIA MUTUAL FUNDS NOTES TO FINANCIAL STATEMENTS (Continued) |
| 4. | Contingencies and Commitments |
The Funds indemnify the Trust’s officers and Trustees for certain liabilities that might arise from their performance of their duties to the Funds. Additionally, in the normal course of business, the Funds enter into contracts that contain a variety of representations and warranties and which provide general indemnifications. The Funds’ maximum exposure under these arrangements is unknown, as this would involve future claims that may be made against the Funds that have not yet occurred. However, based on experience, the Funds expect the risk of loss to be remote.
The Funds are required to recognize in the financial statements the effects of all subsequent events that provide additional evidence about conditions that existed as of the date of the Statements of Assets and Liabilities. For non-recognized subsequent events that must be disclosed to keep the financial statements from being misleading, the Funds are required to disclose the nature of the event as well as an estimate of its financial effect, or a statement that such an estimate cannot be made. Management has evaluated subsequent events through the issuance of these financial statements and has noted no such events.
| 6. | Recent Accounting Pronouncement |
In January 2010, the Financial Accounting Standards Board (“FASB”) issued Accounting Standards Update (“ASU”) No. 2010-06 “Improving Disclosures about Fair Value Measurements.” ASU No. 2010-06 amends FASB Accounting Standards Codification Topic 820, Fair Value Measurements and Disclosures, to require additional disclosures regarding fair value measurements. Certain disclosures required by ASU No. 2010-06 are effective for interim and annual reporting periods beginning after December 15, 2009 and others for fiscal years beginning after December 15, 2010 and for interim periods within those fiscal years. Management has determined that ASU No. 2010-06 has no monetary impact on these financial statements but will continue to evaluate the impact of those portions that are effective next fiscal year.
AVE MARIA MUTUAL FUNDS REPORT OF INDEPENDENT REGISTERED PUBLIC ACCOUNTING FIRM |
To the Shareholders and Board of Trustees of
Ave Maria Catholic Values Fund, Ave Maria Growth Fund,
Ave Maria Rising Dividend Fund, Ave Maria Opportunity Fund,
Ave Maria World Equity Fund, and Ave Maria Bond Fund:
We have audited the accompanying statements of assets and liabilities, including the schedules of investments, of Ave Maria Catholic Values Fund, Ave Maria Growth Fund, Ave Maria Rising Dividend Fund, Ave Maria Opportunity Fund, Ave Maria World Equity Fund, and Ave Maria Bond Fund (the "Funds") as of December 31, 2010, and the related statements of operations for the year or period then ended, the statements of changes in net assets for each of the two years in the period then ended, and the financial highlights for each of the periods presented. These financial statements and financial highlights are the responsibility of the Funds' management. Our responsibility is to express an opinion on these financial statements and financial highlights based on our audits.
We conducted our audits in accordance with the standards of the Public Company Accounting Oversight Board (United States). Those standards require that we plan and perform the audit to obtain reasonable assurance about whether the financial statements and financial highlights are free of material misstatement. The Funds are not required to have, nor were we engaged to perform, an audit of their internal control over financial reporting. Our audits included consideration of internal control over financial reporting as a basis for designing audit procedures that are appropriate in the circumstances, but not for the purpose of expressing an opinion on the effectiveness of the Funds' internal control over financial reporting. Accordingly, we express no such opinion. An audit also includes examining, on a test basis, evidence supportin g the amounts and disclosures in the financial statements, assessing the accounting principles used and significant estimates made by management, as well as evaluating the overall financial statement presentation. Our procedures included confirmation of securities owned as of December 31, 2010, by correspondence with the custodian and brokers; where replies were not received from brokers, we performed other auditing procedures. We believe that our audits provide a reasonable basis for our opinion.
In our opinion, the financial statements and financial highlights referred to above present fairly, in all material respects, the financial position of Ave Maria Catholic Values Fund, Ave Maria Growth Fund, Ave Maria Rising Dividend Fund, Ave Maria Opportunity Fund, Ave Maria World Equity Fund, and Ave Maria Bond Fund as of December 31, 2010, the results of their operations for the year or period then ended, the changes in their net assets for each of the two years in the period then ended, and the financial highlights for the respective stated periods, in conformity with accounting principles generally accepted in the United States of America.
/s/ DELOITTE & TOUCHE LLP
Chicago, Illinois
February 22, 2011
AVE MARIA MUTUAL FUNDS BOARD OF TRUSTEES AND EXECUTIVE OFFICERS (Unaudited) |
Overall responsibility for management of the Trust rests with the Board of Trustees. The Trustees serve during the lifetime of the Trust and until its termination, or until death, resignation, retirement or removal. The Trustees, in turn, elect the officers of the Trust to actively supervise its day-to-day operations. The officers have been elected for an annual term. The following are the Trustees and executive officers of the Trust:
| | | Position Held with the Trust | |
| Interested Trustees: | | | | |
| * | George P. Schwartz, CFA | 3707 W. Maple Road, Bloomfield Hills, MI | 66 | Chairman of the Board/President/Trustee | Since 1992 |
| Independent Trustees: | | | | |
| | John E. Barnds | 3707 W. Maple Road, Bloomfield Hills, MI | 78 | Trustee | Since 2005 |
| | Louis C. Bosco, Jr. | 3707 W. Maple Road, Bloomfield Hills, MI | 74 | Trustee | Since 2008 |
| | Donald J. Dawson, Jr. | 3707 W. Maple Road, Bloomfield Hills, MI | 63 | Trustee | Since 1993 |
| | Joseph M. Grace | 3707 W. Maple Road, Bloomfield Hills, MI | 74 | Trustee | Since 2007 |
| Executive Officers: | | | | |
| * | Richard L. Platte, Jr., CFA | 3707 W. Maple Road, Bloomfield Hills, MI | 59 | Vice President and Secretary | Since 1993 |
| * | Timothy S. Schwartz, CFA | 3707 W. Maple Road, Bloomfield Hills, MI | 39 | Treasurer | Since 2000 |
| * | Cathy M. Stoner, CPA | 3707 W. Maple Road, Bloomfield Hills, MI | 40 | Chief Compliance Officer | Since 2010 |
| * | George P. Schwartz, Richard L. Platte, Jr., Timothy S. Schwartz and Cathy M. Stoner, as affiliated persons of Schwartz Investment Counsel, Inc., the Fund’s investment adviser, are “interested persons” of the Trust within the meaning of Section 2(a)(19) of the Investment Company Act of 1940. George P. Schwartz is the father of Timothy S. Schwartz. |
AVE MARIA MUTUAL FUNDS BOARD OF TRUSTEES AND EXECUTIVE OFFICERS (Unaudited) (Continued) |
Each Trustee oversees seven portfolios of the Trust: the Ave Maria Catholic Values Fund, the Ave Maria Growth Fund, the Ave Maria Rising Dividend Fund, the Ave Maria Opportunity Fund, the Ave Maria World Equity Fund, the Ave Maria Bond Fund and the Schwartz Value Fund. The principal occupations of the Trustees and executive officers of the Trust during the past five years and public directorships held by the Trustees are set forth below:
George P. Schwartz, CFA is President and Chief Investment Officer of Schwartz Investment Counsel, Inc. and the co-portfolio manager of the Ave Maria Catholic Values Fund and the Ave Maria Rising Dividend Fund.
John E. Barnds is retired First Vice President of National Bank of Detroit (JPMorgan Chase).
Louis C. Bosco, Jr. is a partner in Bosco Development Company (a real estate firm).
Donald J. Dawson, Jr. is Chairman of Payroll 1, Inc. (a payroll processing company).
Joseph M. Grace is retired Senior Vice President of National Bank of Detroit (JPMorgan Chase).
Richard L. Platte, Jr., CFA is Executive Vice President and Secretary of Schwartz Investment Counsel, Inc. and is the portfolio manager of the Ave Maria Bond Fund and the co-portfolio manager of the Ave Maria Rising Dividend Fund.
Timothy S. Schwartz, CFA is Vice President and Treasurer of Schwartz Investment Counsel, Inc. and the portfolio manager of the Ave Maria Opportunity Fund.
Cathy M. Stoner, CPA is Chief Compliance Officer and Operations Manager of Schwartz Investment Counsel, Inc. Prior to July 2009, she was an Audit Manager with Deloitte & Touche LLP.
AVE MARIA MUTUAL FUNDS CATHOLIC ADVISORY BOARD (Unaudited) |
The Catholic Advisory Board reviews the companies selected by the Adviser to ensure that the companies operate in a way that is consistent with teachings and core values of the Roman Catholic Church. The Catholic Advisory Board evaluates companies using publicly available information, information from the Adviser, and information from shareholders and other sources in making its recommendations. The following are the members of the Catholic Advisory Board:
| | | |
| Lou Holtz | 5818 El Camino Real, Carlsbad, CA | 74 | Since 2007 |
| Lawrence Kudlow | 1375 Kings Hwy. East, Suite 260, Fairfield, CT | 62 | Since 2005 |
| Thomas S. Monaghan | One Ave Maria Drive, Ann Arbor, MI | 74 | Since 2001 |
| Michael Novak | 1150 17th Street, NW, Suite 1100, Washington, DC | 77 | Since 2001 |
| Paul R. Roney | One Ave Maria Drive, Ann Arbor, MI | 53 | Since 2001 |
| Phyllis Schlafly | 7800 Bonhomme, St. Louis, MO | 86 | Since 2001 |
Lou Holtz is the former football coach at University of Notre Dame among others, ESPN college football analyst, author and motivational speaker.
Lawrence Kudlow is the host of CNBC’s “The Kudlow Report” and a nationally syndicated columnist.
Thomas S. Monaghan is Chairman of the Ave Maria Foundation (a non-profit foundation supporting Roman Catholic organizations) and Chancellor of Ave Maria University. Prior to December 1998, he was Chairman and Chief Executive Officer of Domino’s Pizza, Inc.
Michael Novak is a theologian, author, columnist and former U.S. ambassador. He is Director of Social and Political Studies of the American Enterprise Institute.
Paul R. Roney is Executive Director of the Ave Maria Foundation and President of Domino’s Farms Corporation. Prior to December 1998, he was Treasurer of Domino’s Pizza, Inc.
Phyllis Schlafly is an author, columnist and radio commentator. She is President of Eagle Forum (an organization promoting conservative and pro-family values).
Additional information regarding the Funds’ Trustees, executive officers and Catholic Advisory Board members may be found in the Funds’ Statement of Additional Information and is available without charge upon request by calling (888) 726-9331.
AVE MARIA MUTUAL FUNDS ABOUT YOUR FUNDS’ EXPENSES (Unaudited) |
We believe it is important for you to understand the impact of costs on your investment. As a shareholder of the Funds, you incur ongoing costs, including management fees and other Fund expenses. The following examples are intended to help you understand your ongoing costs (in dollars) of investing in the Funds and to compare these costs with the ongoing costs of investing in other mutual funds.
A mutual fund’s ongoing costs are expressed as a percentage of its average net assets. This figure is known as the expense ratio. The ongoing costs reflected in the tables below are based on an investment of $1,000 made at the beginning of the most recent semi-annual period (July 1, 2010) and held until the end of the period (December 31, 2010).
The tables that follow illustrate each Fund’s costs in two ways:
Actual fund return – This section helps you to estimate the actual expenses that you paid over the period. The “Ending Account Value” shown is derived from each Fund’s actual return, and the third column shows the dollar amount of operating expenses that would have been paid by an investor who started with $1,000 in the Funds. You may use the information here, together with the amount you invested, to estimate the expenses that you paid over the period.
To do so, simply divide your account value by $1,000 (for example, an $8,600 account value divided by $1,000 = 8.6), then multiply the result by the number given for the Funds under the heading “Expenses Paid During Period.”
Hypothetical 5% return – This section is intended to help you compare the Funds’ ongoing costs with those of other mutual funds. It assumes that each Fund had an annual return of 5% before expenses during the period shown, but that the expense ratio is unchanged. In this case, because the return used is not the Funds’ actual returns, the results do not apply to your investment. The example is useful in making comparisons because the Securities and Exchange Commission (the “SEC”) requires all mutual funds to calculate expenses based on a 5% return. You can assess each Fund’s ongoing costs by comparing this hypothetical example with the hypothetical examples that appear in shareholder reports of other funds.
Note that expenses shown in the table are meant to highlight and help you compare ongoing costs only. The Funds do not charge sales loads or redemption fees.
The calculations assume no shares were bought or sold during the period. Your actual costs may have been higher or lower, depending on the amount of your investment and the timing of any purchases or redemptions.
More information about the Funds’ expenses, including historical annual expense ratios, can be found in this report. For additional information on operating expenses and other shareholder costs, please refer to the Funds’ Prospectus.
AVE MARIA MUTUAL FUNDS ABOUT YOUR FUNDS’ EXPENSES (Unaudited) (Continued) |
Ave Maria Catholic Values Fund
| | Beginning Account Value July 1, 2010 | Ending Account Value December 31, 2010 | Expenses Paid During Period* |
| Based on Actual Fund Return | $1,000.00 | $1,249.40 | $8.50 |
| Based on Hypothetical 5% Return (before expenses) | $1,000.00 | $1,017.64 | $7.63 |
| * | Expenses are equal to the Ave Maria Catholic Values Fund’s annualized expense ratio of 1.50% for the period, multiplied by the average account value over the period, multiplied by 184/365 (to reflect the one-half year period). |
Ave Maria Growth Fund
| | Beginning Account Value July 1, 2010 | Ending Account Value December 31, 2010 | Expenses Paid During Period* |
| Based on Actual Fund Return | $1,000.00 | $1,267.60 | $8.57 |
| Based on Hypothetical 5% Return (before expenses) | $1,000.00 | $1,017.64 | $7.63 |
| * | Expenses are equal to the Ave Maria Growth Fund’s annualized expense ratio of 1.50% for the period, multiplied by the average account value over the period, multiplied by 184/365 (to reflect the one-half year period). |
Ave Maria Rising Dividend Fund
| | Beginning Account Value July 1, 2010 | Ending Account Value December 31, 2010 | Expenses Paid During Period* |
| Based on Actual Fund Return | $1,000.00 | $1,203.20 | $5.83 |
| Based on Hypothetical 5% Return (before expenses) | $1,000.00 | $1,019.91 | $5.35 |
| * | Expenses are equal to the Ave Maria Rising Dividend Fund’s annualized expense ratio of 1.05% for the period, multiplied by the average account value over the period, multiplied by 184/365 (to reflect the one-half year period). |
AVE MARIA MUTUAL FUNDS ABOUT YOUR FUNDS’ EXPENSES (Unaudited) (Continued) |
Ave Maria Opportunity Fund
| | Beginning Account Value July 1, 2010 | Ending Account Value December 31, 2010 | Expenses Paid During Period* |
| Based on Actual Fund Return | $1,000.00 | $1,199.50 | $6.93 |
| Based on Hypothetical 5% Return (before expenses) | $1,000.00 | $1,018.90 | $6.36 |
| * | Expenses are equal to the Ave Maria Opportunity Fund’s annualized expense ratio of 1.25% for the period, multiplied by the average account value over the period, multiplied by 184/365 (to reflect the one-half year period). |
Ave Maria World Equity Fund
| | Beginning Account Value July 1, 2010 | Ending Account Value December 31, 2010 | Expenses Paid During Period* |
| Based on Actual Fund Return | $1,000.00 | $1,191.90 | $8.29 |
| Based on Hypothetical 5% Return (before expenses) | $1,000.00 | $1,017.64 | $7.63 |
| * | Expenses are equal to the Ave Maria World Equity Fund’s annualized expense ratio of 1.50% for the period, multiplied by the average account value over the period, multiplied by 184/365 (to reflect the one-half year period). |
Ave Maria Bond Fund
| | Beginning Account Value July 1, 2010 | Ending Account Value December 31, 2010 | Expenses Paid During Period* |
| Based on Actual Fund Return | $1,000.00 | $1,039.80 | $3.60 |
| Based on Hypothetical 5% Return (before expenses) | $1,000.00 | $1,021.68 | $3.57 |
| * | Expenses are equal to the Ave Maria Bond Fund’s annualized expense ratio of 0.70% for the period, multiplied by the average account value over the period, multiplied by 184/365 (to reflect the one-half year period). |
AVE MARIA MUTUAL FUNDS FEDERAL TAX INFORMATION (Unaudited) |
In accordance with federal tax requirements, the following provides shareholders with information concerning certain ordinary income dividends paid by the Ave Maria Catholic Values Fund, the Ave Maria Rising Dividend Fund, the Ave Maria Opportunity Fund and the Ave Maria Bond Fund and distributions from net realized gains made by the Ave Maria Bond Fund during the fiscal year end December 31, 2010. On December 30, 2010, the Ave Maria Opportunity Fund declared and paid an ordinary income dividend of $0.00574 per share and the Ave Maria Bond Fund declared and paid a long-term capital gain distribution of $0.0140 per share. Periodically throughout the year, the Ave Maria Catholic Values Fund paid ordinary income dividends totaling $0.00931 per share. Periodically throughout the year, the Ave Maria Rising Dividend Fund paid ordinary income dividends totaling $0.1716 per share. Periodically throughout the year, the Ave Maria Bond Fund paid ordinary income dividends totaling $0.0276 per share for Class I shares and $0.2567 per share for Class R shares. As provided by the Jobs and Growth Tax Relief Reconciliation Act of 2003, 100% of the long-term capital gain distribution of $0.0140 for the Ave Maria Bond Fund and a percentage (100%, 100%, 100%, and 30.29%) of the ordinary income dividends paid by the Ave Maria Catholic Values Fund, the Ave Maria Rising Dividend Fund, the Ave Maria Opportunity Fund and the Ave Maria Bond Fund, respectively, may be subject to a maximum tax rate of 15%. Early in 2011, as required by federal regulations, shareholders received notification of their portion of the Funds’ taxable gain distribution, if any, paid during the 2010 calendar year.
OTHER INFORMATION (Unaudited) |
A description of the policies and procedures the Funds use to determine how to vote proxies relating to portfolio securities is available without charge upon request by calling toll-free (888) 726-9331, or on the SEC’s website at http://www.sec.gov. Information regarding how the Funds voted proxies relating to portfolio securities during the most recent 12-month period ended June 30 is also available without charge upon request by calling toll-free (888) 726-9331, or on the SEC’s website at http://www.sec.gov.
The Trust files a complete listing of portfolio holdings for each of the Funds with the SEC as of the first and third quarters of each fiscal year on Form N-Q. The filings are available free of charge, upon request, by calling (888) 726-9331. Furthermore, you may obtain a copy of the filings on the SEC’s website at http://www.sec.gov. The Trust’s Forms N-Q may also be reviewed and copied at the SEC’s Public Reference Room in Washington, DC, and information on the operation of the Public Reference Room may be obtained by calling (800) SEC-0330.
This page is intentionally left blank.
This page is intentionally left blank.