Shareholder Accounts c/o Ultimus Fund Solutions, LLC P.O. Box 46707 Cincinnati, OH 45246 (888) 726-9331 |  | Corporate Offices 3707 W. Maple Road Suite 100 Bloomfield Hills, MI 48301 (248) 644-8500 Fax (248) 644-4250 |
Dear Shareowner of:
Ave Maria Catholic Values Fund (AVEMX)
Ave Maria Growth Fund (AVEGX)
Ave Maria Rising Dividend Fund (AVEDX)
Ave Maria Opportunity Fund (AVESX)
Ave Maria World Equity Fund (AVEWX)
Ave Maria Bond Fund (AVEFX)
Ave Maria Money Market Account
2011 was a tumultuous year for capital markets. After a lot of ups and downs, the S&P 500 was unchanged in price for the year – up 2.1% with dividends. Outside the U.S., most stock markets were down sharply. Euro zone markets were down 18%, Japan down 17%. The previously hot BRICs (Brazil, Russia, India and China) lost 18%, 20%, 25% and 22% respectively. Bloomberg estimates that stock market investors worldwide lost over $6 trillion in 2011.
Our Funds collectively had better investment performance than most, as you’ll see in reading each portfolio manager’s letter. And unlike the U.S. mutual fund industry, which saw net redemptions in equity funds, the Ave Maria equity funds had over $123 million of net new money invested during the year. We now have more than 35,000 shareholders in all 50 states. Many have told us they are pro-life and pro-family oriented investors, eager to have their money invested in the manner prescribed by our prestigious Catholic Advisory Board. The portfolio managers of the Ave Maria Mutual Funds screen out companies based on the guidelines established by the Catholic Advisory Board. Eliminated from consideration are companies that support abortion, Planned Parenthood, pornography, and those that engage in embryonic stem cell research.
Despite a myriad of investor concerns, we believe there are several reasons to be bullish on U.S. stocks. Part of our market optimism is based on the likelihood that dividends on many large-cap U.S. companies will be raised substantially over the next few years. U.S. companies can easily raise their dividends because profits are at record high levels and rising, and payout ratios are at a record low 27%. Over the last 25 years, payouts have averaged 40%. Rising dividends could provide a boost to stock prices and help improve investor confidence. Additionally, with the S&P 500 at only 13 times forward earnings (25-year average is 16 times), there is plenty of room for P-Es to expand.
These factors and others lead us to believe that many stocks in the Ave Maria Mutual Funds are undervalued and have a lot of upside potential.
| | Sincerely, | |
| |  | |
| | George P. Schwartz, CFA Chairman & President | |
December 31, 2011
Past performance is not predictive of future performance. Investment results and principal value will fluctuate so that shares, when redeemed, may be worth more or less than their original cost. Current performance may be higher or lower than the performance data quoted. Performance data, current to the most recent month end, is available at the Ave Maria Funds website at www.avemariafunds.com or by calling 1-888-726-9331.
The Letter to Shareholders and the Portfolio Manager Commentaries that follow seek to describe some of the Adviser’s current opinions and views of the financial markets. Although the Adviser believes it has a reasonable basis for any opinions or views expressed, actual results may differ, sometimes significantly so, from those expected or expressed. Keep in mind that the information and opinions cover the period through the date of this report.
AVE MARIA MUTUAL FUNDS
TABLE OF CONTENTS
| Ave Maria Catholic Values Fund: | |
Portfolio Manager Commentary | 2 |
Performance | 4 |
| Annual Total Rates of Return Comparison with Major Indices | 5 |
Ten Largest Equity Holdings | 6 |
Asset Allocation | 6 |
Schedule of Investments | 7 |
| | |
| Ave Maria Growth Fund: | |
Portfolio Manager Commentary | 11 |
Performance | 13 |
| Annual Total Rates of Return Comparison with Major Indices | 14 |
Ten Largest Equity Holdings | 15 |
Asset Allocation | 15 |
Schedule of Investments | 16 |
| | |
| Ave Maria Rising Dividend Fund: | |
Portfolio Manager Commentary | 19 |
Performance | 21 |
| Annual Total Rates of Return Comparison with Major Indices | 22 |
Ten Largest Equity Holdings | 23 |
Asset Allocation | 23 |
Schedule of Investments | 24 |
| | |
| Ave Maria Opportunity Fund: | |
Portfolio Manager Commentary | 27 |
Performance | 29 |
| Annual Total Rates of Return Comparison with Major Indices | 30 |
Ten Largest Equity Holdings | 31 |
Asset Allocation | 31 |
Schedule of Investments | 32 |
| | |
| Ave Maria World Equity Fund: | |
Portfolio Manager Commentary | 36 |
Performance | 38 |
| Annual Total Rates of Return Comparison with Major Indices | 39 |
Ten Largest Equity Holdings | 40 |
Asset Allocation | 40 |
Schedule of Investments | 41 |
| | |
| Ave Maria Bond Fund: | |
Portfolio Manager Commentary | 45 |
Performance | 46 |
| Annual Total Rates of Return Comparison with Major Indices | 47 |
Ten Largest Equity Holdings | 48 |
Asset Allocation | 48 |
Schedule of Investments | 49 |
AVE MARIA MUTUAL FUNDS
TABLE OF CONTENTS
Statements of Assets and Liabilities | 54 |
| | |
Statements of Operations | 56 |
| | |
| Statements of Changes in Net Assets: | |
Ave Maria Catholic Values Fund | 58 |
Ave Maria Growth Fund | 59 |
Ave Maria Rising Dividend Fund | 60 |
Ave Maria Opportunity Fund | 61 |
Ave Maria World Equity Fund | 62 |
Ave Maria Bond Fund | 63 |
| | |
| Financial Highlights: | |
Ave Maria Catholic Values Fund | 64 |
Ave Maria Growth Fund | 65 |
Ave Maria Rising Dividend Fund | 66 |
Ave Maria Opportunity Fund | 67 |
Ave Maria World Equity Fund | 68 |
Ave Maria Bond Fund | 69 |
| | |
Notes to Financial Statements | 70 |
| | |
Report of Independent Registered Public Accounting Firm | 81 |
| | |
Board of Trustees and Executive Officers | 82 |
| | |
Catholic Advisory Board | 84 |
| | |
About Your Funds’ Expenses | 85 |
| | |
Federal Tax Information | 88 |
| | |
Other Information | 88 |
This report is for the information of the shareholders of the Ave Maria Mutual Funds. To obtain a copy of the prospectus, please visit our website at www.avemariafunds.com or call 1-888-726-9331 and a copy will be sent to you free of charge. Please read the prospectus carefully before you invest. The Ave Maria Mutual Funds are distributed by Ultimus Fund Distributors, LLC.
Past performance is not predictive of future performance. Investment results and principal value will fluctuate so that shares, when redeemed, may be worth more or less than their original cost. Current performance may be higher or lower than the performance data quoted. Performance data, current to the most recent month end, is available at the Ave Maria Funds website at www.avemariafunds.com or by calling 1-888-726-9331.
AVE MARIA CATHOLIC VALUES FUND
PORTFOLIO MANAGER COMMENTARY
Dear Fellow Shareowner:
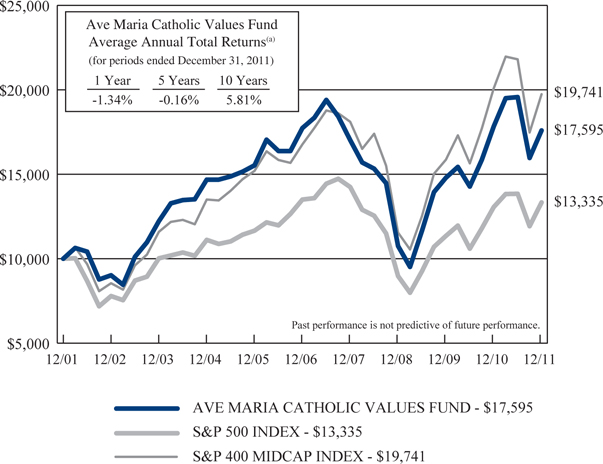
The Ave Maria Catholic Values Fund’s (the “Fund”) return for 2011 was –1.3% compared to 2.1% for the S&P 500 Index and –1.7% for the S&P 400 MidCap Index. Since inception on May 1, 2001, the cumulative and annualized returns for the Fund compared to its benchmarks were:
| | Since 5-01-01 Inception through 12-31-11 Total Returns |
| | Cumulative | Annualized |
| Ave Maria Catholic Values Fund (AVEMX) | 85.3% | 6.0% |
| S&P 500 Index | 22.0% | 1.9% |
| S&P 400 MidCap Index | 96.5% | 6.5% |
The stock market continued on a rollercoaster in 2011. Positive first-half returns vaporized during a severe summer sell-off triggered by the European sovereign debt crisis. Benefiting from a powerful fourth-quarter rally, the S&P 500 Index returned to positive territory by year end. The S&P 400 MidCap Index ended slightly negative for the year, marking the first year since 2006 that it underperformed the S&P 500. Investors’ flight to quality benefited many of the large-cap stocks in the S&P 500 Index.
While Europe is far from resolving its problems and appears to be entering a recession, the U.S. economy is displaying surprising vigor. Bank lending is finally growing, up at a 5.6% annual rate over the last four months. Depressed consumer confidence is rebounding, and employment is slowly recovering. Weekly unemployment claims recently dropped to a four-year low. Commodity prices appear to have peaked, including natural gas, which is off 50% in the last two years. Inflation pressures are subsiding, at least for now. The Consumer Price Index should rise only about 2% this year. Housing and autos will likely add to growth in 2012. We believe the economic expansion is becoming self sustaining, and corporate profits will grow more than 5% in 2012. This year’s elections may result in more responsible government spending and improved investor psychology. That would be a double boost to stock prices. For now, we believe investment opportunities in attractively priced stocks abound, especially when compared to low-yielding, fixed-income alternatives. Perhaps the multi-year trend of money flows out of equities into bonds will finally reverse this year.
In 2011, many of the Fund’s best and worst performing stocks were from the same economic sectors. For example, Range Resources Corporation (Exploration) was the largest positive contributor, while Devon Energy Corporation (Exploration), Peabody Energy Corporation (Coal) and Halliburton Company (Oil Service) were among the poorest performers. The Financials Sector was again one of the weakest, and the Fund’s results were hurt by Comerica, Inc. (Banking) and Federated Investors, Inc. (Asset
AVE MARIA CATHOLIC VALUES FUND
PORTFOLIO MANAGER COMMENTARY
Management). Conversely, MasterCard, Inc. had the second best return of any stock in the Fund. Likewise, healthy returns from International Business Machines Corporation, and Teradata Corporation could not fully offset the negative impact of Hewlett-Packard Company’s poor showing.
Other strong contributors were Lubrizol Corporation (Specialty Chemicals), Abbott Laboratories (Health Care Products), Thor Industries, Inc. (Recreational Vehicles) and VF Corporation (Apparel Manufacturing). Additional detractors from performance were General Cable Corporation (Electrical Products) and Foster Wheeler AG (Engineering and Construction).
In the second half of 2011, the Fund eliminated eight stocks from the portfolio. BE Aerospace, Inc. (Commercial Aerospace), Schlumberger Limited (Oil Service), Meadowbrook Insurance Group, Inc., and Graco, Inc. (Industrial Products) had all reached our price targets. Craftmade International, Inc., Comerica, Inc., Peabody Energy Corporation, and Avon Products, Inc. were liquidated in favor of more attractive investment opportunities.
The Fund added three new positions, all of which were former Fund holdings. After substantial price declines, we felt these stocks were once again attractively priced for purchase: Advance Auto Parts, Inc. (Retail), Thor Industries, Inc. and ADTRAN, Inc. (Telecommunication Equipment).
All of the companies represented in the Fund comply with the Ave Maria Funds’ moral screens.
Thank you for being a shareowner.
Sincerely,
| |  |
| George P. Schwartz, CFA | Gregory R. Heilman, CFA |
| Co-Portfolio Manager | Co-Portfolio Manager |
AVE MARIA CATHOLIC VALUES FUND PERFORMANCE (Unaudited) |
Comparison of the Change in Value of a $10,000 Investment
in the Ave Maria Catholic Values Fund, the S&P 500 Index,
and the S&P 400 MidCap Index
| (a) | The returns shown do not reflect the deduction of taxes a shareholder would pay on Fund distributions or the redemption of Fund shares. |
| Expense ratio as of 12-31-10 (as disclosed in May 1, 2011 prospectus) | 1.52%* |
| Expense ratio for the year ended 12-31-11 | 1.50% |
| * | Includes Acquired Fund Fees and Expenses. |
Past performance is not predictive of future performance. Investment results and principal value will fluctuate so that shares, when redeemed, may be worth more or less than their original cost. Current performance may be higher or lower than the performance data quoted. Performance data, current to the most recent month end, is available at the Ave Maria Funds website at www.avemariafunds.com or by calling 1-888-726-9331.
AVE MARIA CATHOLIC VALUES FUND ANNUAL TOTAL RATES OF RETURN COMPARISON WITH MAJOR INDICES (Unaudited) |
| AVE MARIA CATHOLIC VALUES FUND | | | | | |
2001 (a) | 5.3% | -8.5% | -0.5% | 5.0% | -10.1% | -7.3% |
| 2002 | -9.8% | -22.1% | -14.5% | -14.6% | -31.5% | -28.6% |
| 2003 | 35.6% | 28.7% | 35.6% | 38.8% | 50.0% | 37.4% |
| 2004 | 20.1% | 10.9% | 16.5% | 22.7% | 8.6% | 11.5% |
| 2005 | 5.8% | 4.9% | 12.6% | 7.7% | 1.4% | 2.0% |
| 2006 | 14.2% | 15.8% | 10.3% | 15.1% | 9.5% | 11.0% |
| 2007 | -4.0% | 5.5% | 8.0% | -0.3% | 9.8% | -3.8% |
| 2008 | -36.8% | -37.0% | -36.2% | -31.1% | -40.5% | -48.7% |
| 2009 | 37.6% | 26.5% | 37.4% | 25.6% | 43.9% | 36.8% |
| 2010 | 20.5% | 15.1% | 26.7% | 26.3% | 16.9% | 20.5% |
| 2011 | -1.3% | 2.1% | -1.7% | 1.0% | -0.8% | -11.4% |
AVERAGE ANNUAL TOTAL RETURNS As of December 31, 2011 (Unaudited) |
| AVE MARIA CATHOLIC VALUES FUND | | | | | |
| 3 Years | 17.8% | 14.1% | 19.6% | 17.0% | 19.4% | 13.4% |
| 5 Years | -0.2% | -0.3% | 3.3% | 1.9% | 2.4% | -6.4% |
| 10 Years | 5.8% | 2.9% | 7.0% | 7.1% | 2.9% | -1.1% |
Since Inception (d) | 6.0% | 1.9% | 6.5% | 7.1% | 1.7% | -1.8% |
| (a) | Represents the period from the commencement of operations (May 1, 2001) through December 31, 2001. |
| | |
| (b) | Excluding dividends for the years ended 2001-2006. Effective 2007 the returns include dividends. |
| | |
| (c) | Excluding dividends. |
| | |
| (d) | Represents the period from the commencement of operations (May 1, 2001) through December 31, 2011. |
AVE MARIA CATHOLIC VALUES FUND
TEN LARGEST EQUITY HOLDINGS
December 31, 2011 (Unaudited)
| | | | | | | | |
| | 300,000 | | U.S. Bancorp | | $ | 8,115,000 | | | | 4.5 | % |
| | 50,000 | | SPDR Gold Trust | | | 7,599,500 | | | | 4.2 | % |
| | 120,000 | | Accenture PLC - Class A | | | 6,387,600 | | | | 3.5 | % |
| | 335,000 | | Western Union Company (The) | | | 6,117,100 | | | | 3.4 | % |
| | 120,000 | | Stryker Corporation | | | 5,965,200 | | | | 3.3 | % |
| | 105,000 | | Abbott Laboratories | | | 5,904,150 | | | | 3.3 | % |
| | 225,000 | | Lowe's Companies, Inc. | | | 5,710,500 | | | | 3.2 | % |
| | 75,000 | | ConocoPhillips | | | 5,465,250 | | | | 3.0 | % |
| | 60,000 | | FMC Corporation | | | 5,162,400 | | | | 2.9 | % |
| | 200,000 | | Hewlett-Packard Company | | | 5,152,000 | | | | 2.9 | % |
ASSET ALLOCATION (Unaudited)
| | | |
Consumer Discretionary | | | 17.6 | % |
Consumer Staples | | | 1.3 | % |
Energy | | | 14.9 | % |
Financials | | | 20.4 | % |
Health Care | | | 13.1 | % |
Industrials | | | 10.7 | % |
Information Technology | | | 13.1 | % |
Materials | | | 4.1 | % |
Exchange-Traded Funds | | | 4.2 | % |
Cash Equivalents, Other Assets and Liabilities | | | 0.6 | % |
| | | | 100.0 | % |
AVE MARIA CATHOLIC VALUES FUND
SCHEDULE OF INVESTMENTS
| | | | | | |
| Consumer Discretionary — 17.6% | | | | | | |
| Automobiles — 1.5% | | | | | | |
Thor Industries, Inc. | | | 100,000 | | | $ | 2,743,000 | |
| | | | | | | | | |
| Diversified Consumer Services — 2.4% | | | | | | | | |
DeVry, Inc. | | | 110,000 | | | | 4,230,600 | |
| | | | | | | | | |
| Household Durables — 3.4% | | | | | | | | |
Brookfield Residential Properties, Inc. * | | | 125,000 | | | | 976,250 | |
PulteGroup, Inc. * | | | 450,000 | | | | 2,839,500 | |
Ryland Group, Inc. (The) | | | 150,000 | | | | 2,364,000 | |
| | | | | | | | 6,179,750 | |
| Specialty Retail — 7.4% | | | | | | | | |
Advance Auto Parts, Inc. | | | 45,000 | | | | 3,133,350 | |
Chico's FAS, Inc. | | | 400,000 | | | | 4,456,000 | |
Lowe's Companies, Inc. | | | 225,000 | | | | 5,710,500 | |
| | | | | | | | 13,299,850 | |
| Textiles, Apparel & Luxury Goods — 2.9% | | | | | | | | |
Coach, Inc. | | | 55,000 | | | | 3,357,200 | |
VF Corporation | | | 15,000 | | | | 1,904,850 | |
| | | | | | | | 5,262,050 | |
| Consumer Staples — 1.3% | | | | | | | | |
| Food & Staples Retailing — 1.3% | | | | | | | | |
Sysco Corporation | | | 80,000 | | | | 2,346,400 | |
| | | | | | | | | |
| Energy — 14.9% | | | | | | | | |
| Energy Equipment & Services — 4.3% | | | | | | | | |
Halliburton Company | | | 140,000 | | | | 4,831,400 | |
Tidewater, Inc. | | | 35,000 | | | | 1,725,500 | |
Transocean Ltd. | | | 30,000 | | | | 1,151,700 | |
| | | | | | | | 7,708,600 | |
| Oil, Gas & Consumable Fuels — 10.6% | | | | | | | | |
ConocoPhillips | | | 75,000 | | | | 5,465,250 | |
Devon Energy Corporation | | | 65,000 | | | | 4,030,000 | |
Exxon Mobil Corporation | | | 50,000 | | | | 4,238,000 | |
Range Resources Corporation | | | 50,000 | | | | 3,097,000 | |
Southwestern Energy Company * | | | 70,000 | | | | 2,235,800 | |
| | | | | | | | 19,066,050 | |
| Financials — 20.4% | | | | | | | | |
| Capital Markets — 1.9% | | | | | | | | |
Federated Investors, Inc. - Class B | | | 225,000 | | | | 3,408,750 | |
| | | | | | | | | |
| Commercial Banks — 4.5% | | | | | | | | |
U.S. Bancorp | | | 300,000 | | | | 8,115,000 | |
AVE MARIA CATHOLIC VALUES FUND
SCHEDULE OF INVESTMENTS
COMMON STOCKS — 95.2% (Continued) | | | | | | |
| Financials — 20.4% (Continued) | | | | | | |
| Diversified Financial Services — 5.5% | | | | | | |
MasterCard, Inc. - Class A | | | 10,000 | | | $ | 3,728,200 | |
Western Union Company (The) | | | 335,000 | | | | 6,117,100 | |
| | | | | | | | 9,845,300 | |
| Insurance — 6.0% | | | | | | | | |
Alleghany Corporation * | | | 18,000 | | | | 5,135,220 | |
Hanover Insurance Group, Inc. (The) | | | 65,000 | | | | 2,271,750 | |
Unico American Corporation * | | | 282,945 | | | | 3,409,488 | |
| | | | | | | | 10,816,458 | |
| Real Estate Investment Trusts (REIT) — 1.0% | | | | | | | | |
HCP, Inc. | | | 45,000 | | | | 1,864,350 | |
| | | | | | | | | |
| Real Estate Management & Development — 1.5% | | | | | | | | |
Kennedy-Wilson Holdings, Inc. | | | 250,000 | | | | 2,645,000 | |
| | | | | | | | | |
| Health Care — 13.1% | | | | | | | | |
| Health Care Equipment & Supplies — 5.4% | | | | | | | | |
Stryker Corporation | | | 120,000 | | | | 5,965,200 | |
Varian Medical Systems, Inc. * | | | 55,000 | | | | 3,692,150 | |
| | | | | | | | 9,657,350 | |
| Health Care Providers & Services — 2.2% | | | | | | | | |
Patterson Companies, Inc. | | | 135,000 | | | | 3,985,200 | |
| | | | | | | | | |
| Life Sciences Tools & Services — 2.2% | | | | | | | | |
Mettler-Toledo International, Inc. * | | | 15,000 | | | | 2,215,650 | |
Waters Corporation * | | | 25,000 | | | | 1,851,250 | |
| | | | | | | | 4,066,900 | |
| Pharmaceuticals — 3.3% | | | | | | | | |
Abbott Laboratories | | | 105,000 | | | | 5,904,150 | |
| | | | | | | | | |
| Industrials — 10.7% | | | | | | | | |
| Aerospace & Defense — 4.2% | | | | | | | | |
General Dynamics Corporation | | | 35,000 | | | | 2,324,350 | |
United Technologies Corporation | | | 70,000 | | | | 5,116,300 | |
| | | | | | | | 7,440,650 | |
| Commercial Services & Supplies — 1.7% | | | | | | | | |
Genuine Parts Company | | | 50,000 | | | | 3,060,000 | |
| | | | | | | | | |
| Construction & Engineering — 1.1% | | | | | | | | |
Foster Wheeler AG * | | | 105,000 | | | | 2,009,700 | |
| | | | | | | | | |
| Electrical Equipment — 2.2% | | | | | | | | |
General Cable Corporation * | | | 160,000 | | | | 4,001,600 | |
AVE MARIA CATHOLIC VALUES FUND
SCHEDULE OF INVESTMENTS
COMMON STOCKS — 95.2% (Continued) | | | | | | |
| Industrials — 10.7% (Continued) | | | | | | |
| Machinery — 1.5% | | | | | | |
Caterpillar, Inc. | | | 30,000 | | | $ | 2,718,000 | |
| | | | | | | | | |
| Information Technology — 13.1% | | | | | | | | |
| Communications Equipment — 1.7% | | | | | | | | |
ADTRAN, Inc. | | | 100,000 | | | | 3,016,000 | |
| | | | | | | | | |
| Computers & Peripherals — 2.9% | | | | | | | | |
Hewlett-Packard Company | | | 200,000 | | | | 5,152,000 | |
| | | | | | | | | |
| IT Services — 7.4% | | | | | | | | |
Accenture PLC - Class A | | | 120,000 | | | | 6,387,600 | |
International Business Machines Corporation | | | 25,000 | | | | 4,597,000 | |
Teradata Corporation * | | | 50,000 | | | | 2,425,500 | |
| | | | | | | | 13,410,100 | |
| Office Electronics — 1.1% | | | | | | | | |
Zebra Technologies Corporation - Class A * | | | 55,000 | | | | 1,967,900 | |
| | | | | | | | | |
| Materials — 4.1% | | | | | | | | |
| Chemicals — 4.1% | | | | | | | | |
FMC Corporation | | | 60,000 | | | | 5,162,400 | |
Sherwin-Williams Company (The) | | | 25,000 | | | | 2,231,750 | |
| | | | | | | | 7,394,150 | |
| | | | | | | | | |
Total Common Stocks (Cost $147,686,595) | | | | | | $ | 171,314,858 | |
EXCHANGE-TRADED FUNDS — 4.2% | | | | | | |
SPDR Gold Trust * (Cost $5,730,995) | | | 50,000 | | | $ | 7,599,500 | |
AVE MARIA CATHOLIC VALUES FUND
SCHEDULE OF INVESTMENTS
MONEY MARKET FUNDS — 0.8% | | | | | | |
Federated Government Obligations Tax-Managed Fund - Institutional Shares, 0.01% (a) (Cost $1,503,385) | | | 1,503,385 | | | $ | 1,503,385 | |
| | | | | | | | | |
Total Investments at Market Value — 100.2% (Cost $154,920,975) | | | | | | $ | 180,417,743 | |
| | | | | | | | | |
Liabilities in Excess of Other Assets — (0.2%) | | | | | | | (368,032 | ) |
| | | | | | | | | |
Net Assets — 100.0% | | | | | | $ | 180,049,711 | |
| * | Non-income producing security. |
| | |
| (a) | The rate shown is the 7-day effective yield as of December 31, 2011. |
| |
| See notes to financial statements. |
AVE MARIA GROWTH FUND
PORTFOLIO MANAGER COMMENTARY
Dear Fellow Shareholders:
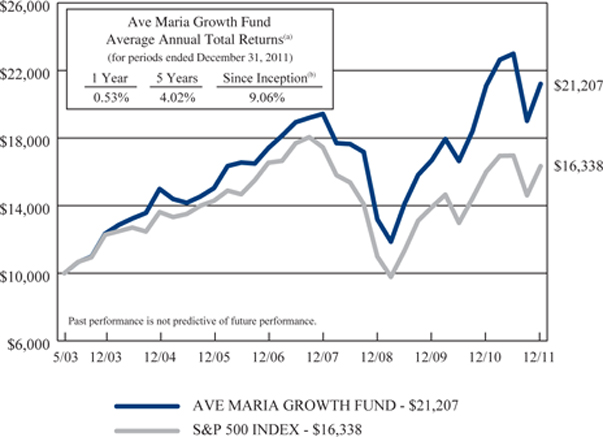
For the year ended December 31, 2011, the Ave Maria Growth Fund (the “Fund”) had a total return of 0.5% compared with 2.1% for S&P 500 Index. For the three years ended December 31, 2011, the Fund’s total return was 17.1% annualized compared with 14.1% annualized for the S&P 500 Index. For the five years ended December 31, 2011, the Fund’s total return was 4.0% annualized compared with -0.3% annualized for the S&P 500 Index. Since inception (May 1, 2003), the Fund’s total return was 9.1% annualized compared with 5.8% annualized for the S&P 500.
The top five performing issues in the Ave Maria Growth Fund for 2011 were:
| Ross Stores, Inc. – (Off-Price Retailer of Branded Apparel) | +51.9% |
| Polaris Industries, Inc. - (All-terrain Vehicles, Snowmobiles, Motorcycles) | +45.6% |
| AutoZone, Inc. – (Retail Automotive Parts & Accessories) | +22.6% |
| Apple, Inc. - (Provider of Mac Computers, iPods, iPhones and iPads) | +20.0% |
| Exxon Mobil Corporation – (World’s Largest Publicly Owned Integrated Oil Company) | +18.6% |
The bottom five performing issues were:
| Walter Energy, Inc. – (Coal Mining, Natural Gas) | -53.2% |
| Hewlett-Packard Company - (Computer Products Including Printers, Servers & PCs) | -39.8% |
| SEI Investments Company – (Investment Processing & Management Outsourcing) | -37.1% |
| Expeditors International of Washington, Inc. - (Global Air & Ocean Freight Forwarder) | -24.1% |
| Eaton Vance Corporation – (Investment Management) | -21.4% |
AVE MARIA GROWTH FUND
PORTFOLIO MANAGER COMMENTARY
The Fund is diversified among seven out of ten economic sectors:
| Consumer Staples | 11.3% |
| Consumer Discretionary | 16.8% |
| Financial | 4.1% |
| Energy | 5.1% |
| Industrials | 26.9% |
| Information Technology | 19.6% |
| Health Care | 14.6% |
| Materials | 1.0% |
As of December 31, 2011, Morningstar* rated the Ave Maria Growth Fund 4 stars overall among 659 Mid-Cap Growth Funds. In 2011, the Fund received the Lipper Fund Award for Best Multi-Cap Core Fund for the 5-year period ended December 31, 2010. The Fund was selected number one among 582 funds in its category. The Lipper awards program highlights funds that have excelled in delivering consistently strong risk-adjusted performance relative to its peers.
Respectfully,
James L. Bashaw, CFA
Portfolio Manager
* Past performance is no guarantee of future returns.
* Source: Morningstar 12-31-11. The Ave Maria Growth Fund was rated 3 stars among 659 Mid-Cap Growth Funds for the 3 year period ended December31, 2011 and 4 stars among 596 Mid-Cap Growth Funds for 5 year period ended December 31, 2011. For each fund with at least a 3-year history, Morningstar calculates a risk-adjusted measure that accounts for variation in a fund’s monthly performance (including the effects of all sales charges), placing more emphasis on downward variations and rewarding consistent performance. The top 10% of each category receive a Morningstar Rating™ of 5 stars, the next 22.5% receive 4 stars, the next 35% receive 3 stars, the next 22.5% receive 2 stars and the bottom 10% receive 1 star. 2011, ©Morningstar, Inc. All rights reserved. The information contained herein is proprietary to Morningstar and/or its content providers, may not be copied or distributed and is not warranted to be accurate, complete or timely. Neither Morningstar nor its content providers are responsible for any damages or losses arising from any use of this information.
AVE MARIA GROWTH FUND PERFORMANCE (Unaudited) |
Comparison of the Change in Value of a $10,000 Investment
in the Ave Maria Growth Fund and the S&P 500 Index
| (a) | The returns shown do not reflect the deduction of taxes a shareholder would pay on Fund distributions or the redemption of Fund shares. |
| | |
| (b) | Represents the period from the commencement of operations (May 1, 2003) through December 31, 2011. |
| Expense ratio as of 12-31-10 (as disclosed in May 1, 2011 prospectus) | 1.50%* |
| Expense ratio for the year ended 12-31-11 | 1.50% |
| * | Includes Acquired Fund Fees and Expenses. |
Past performance is not predictive of future performance. Investment results and principal value will fluctuate so that shares, when redeemed, may be worth more or less than their original cost. Current performance may be higher or lower than the performance data quoted. Performance data, current to the most recent month end, is available at the Ave Maria Funds website at www.avemariafunds.com or by calling 1-888-726-9331.
AVE MARIA GROWTH FUND ANNUAL TOTAL RATES OF RETURN COMPARISON WITH MAJOR INDICES (Unaudited) |
| | |
2003 (a) | 23.4% | 22.8% |
| 2004 | 21.5% | 10.9% |
| 2005 | 0.3% | 4.9% |
| 2006 | 15.8% | 15.8% |
| 2007 | 11.6% | 5.5% |
| 2008 | -32.1% | -37.0% |
| 2009 | 26.4% | 26.5% |
| 2010 | 26.5% | 15.1% |
| 2011 | 0.5% | 2.1% |
AVERAGE ANNUAL TOTAL RETURNS As of December 31, 2011 (Unaudited) |
| | |
| 3 Years | 17.1% | 14.1% |
| 5 Years | 4.0% | -0.3% |
Since Inception (b) | 9.1% | 5.8% |
| (a) | Represents the period from the commencement of operations (May 1, 2003) through December 31, 2003. |
| | |
| (b) | Represents the period from the commencement of operations (May 1, 2003) through December 31, 2011. |
AVE MARIA GROWTH FUND
TEN LARGEST EQUITY HOLDINGS
December 31, 2011 (Unaudited)
| | | | | | | | |
| | 158,000 | | Ross Stores, Inc. | | $ | 7,509,740 | | | | 4.6 | % |
| | 21,300 | | AutoZone, Inc. | | | 6,921,861 | | | | 4.3 | % |
| | 17,000 | | Apple, Inc. | | | 6,885,000 | | | | 4.2 | % |
| | 119,000 | | Polaris Industries, Inc. | | | 6,661,620 | | | | 4.1 | % |
| | 283,350 | | Rollins, Inc. | | | 6,296,037 | | | | 3.9 | % |
| | 101,300 | | Coach, Inc. | | | 6,183,352 | | | | 3.8 | % |
| | 118,200 | | McCormick & Company, Inc. | | | 5,959,644 | | | | 3.7 | % |
| | 140,400 | | Gilead Sciences, Inc. | | | 5,746,572 | | | | 3.5 | % |
| | 93,200 | | Toro Company (The) | | | 5,653,512 | | | | 3.5 | % |
| | 82,900 | | Varian Medical Systems, Inc. | | | 5,565,077 | | | | 3.4 | % |
ASSET ALLOCATION (Unaudited)
| | | |
Consumer Discretionary | | | 16.8 | % |
Consumer Staples | | | 11.3 | % |
Energy | | | 5.1 | % |
Financials | | | 4.1 | % |
Health Care | | | 14.6 | % |
Industrials | | | 26.9 | % |
Information Technology | | | 19.6 | % |
Materials | | | 1.0 | % |
Cash Equivalents, Other Assets and Liabilities | | | 0.6 | % |
| | | | 100.0 | % |
AVE MARIA GROWTH FUND
SCHEDULE OF INVESTMENTS
| | | | | | |
| Consumer Discretionary — 16.8% | | | | | | |
| Leisure Equipment & Products — 4.1% | | | | | | |
Polaris Industries, Inc. | | | 119,000 | | | $ | 6,661,620 | |
| | | | | | | | | |
| Specialty Retail — 8.9% | | | | | | | | |
AutoZone, Inc. * | | | 21,300 | | | | 6,921,861 | |
Ross Stores, Inc. | | | 158,000 | | | | 7,509,740 | |
| | | | | | | | 14,431,601 | |
| Textiles, Apparel & Luxury Goods — 3.8% | | | | | | | | |
Coach, Inc. | | | 101,300 | | | | 6,183,352 | |
| | | | | | | | | |
| Consumer Staples — 11.3% | | | | | | | | |
| Food Products — 6.6% | | | | | | | | |
Kellogg Company | | | 94,600 | | | | 4,783,922 | |
McCormick & Company, Inc. | | | 118,200 | | | | 5,959,644 | |
| | | | | | | | 10,743,566 | |
| Household Products — 3.0% | | | | | | | | |
Clorox Company (The) | | | 71,600 | | | | 4,765,696 | |
| | | | | | | | | |
| Personal Products — 1.7% | | | | | | | | |
Herbalife Ltd. | | | 53,000 | | | | 2,738,510 | |
| | | | | | | | | |
| Energy — 5.1% | | | | | | | | |
| Oil, Gas & Consumable Fuels — 5.1% | | | | | | | | |
Exxon Mobil Corporation | | | 41,400 | | | | 3,509,064 | |
Occidental Petroleum Corporation | | | 50,300 | | | | 4,713,110 | |
| | | | | | | | 8,222,174 | |
| Financials — 4.1% | | | | | | | | |
| Capital Markets — 3.2% | | | | | | | | |
Eaton Vance Corporation | | | 166,600 | | | | 3,938,424 | |
SEI Investments Company | | | 74,800 | | | | 1,297,780 | |
| | | | | | | | 5,236,204 | |
| Diversified Financial Services — 0.9% | | | | | | | | |
MasterCard, Inc. - Class A | | | 4,000 | | | | 1,491,280 | |
| | | | | | | | | |
| Health Care — 14.6% | | | | | | | | |
| Biotechnology — 3.5% | | | | | | | | |
Gilead Sciences, Inc. * | | | 140,400 | | | | 5,746,572 | |
| | | | | | | | | |
| Health Care Equipment & Supplies — 9.6% | | | | | | | | |
C.R. Bard, Inc. | | | 58,700 | | | | 5,018,850 | |
Stryker Corporation | | | 98,800 | | | | 4,911,348 | |
Varian Medical Systems, Inc. * | | | 82,900 | | | | 5,565,077 | |
| | | | | | | | 15,495,275 | |
| Life Sciences Tools & Services — 1.5% | | | | | | | | |
Mettler-Toledo International, Inc. * | | | 16,000 | | | | 2,363,360 | |
AVE MARIA GROWTH FUND
SCHEDULE OF INVESTMENTS
COMMON STOCKS — 99.4% (Continued) | | | | | | |
| Industrials — 26.9% | | | | | | |
| Aerospace & Defense — 3.9% | | | | | | |
General Dynamics Corporation | | | 57,700 | | | $ | 3,831,857 | |
Precision Castparts Corporation | | | 15,500 | | | | 2,554,245 | |
| | | | | | | | 6,386,102 | |
| Air Freight & Logistics — 1.2% | | | | | | | | |
Expeditors International of Washington, Inc. | | | 49,100 | | | | 2,011,136 | |
| | | | | | | | | |
| Commercial Services & Supplies — 3.9% | | | | | | | | |
Rollins, Inc. | | | 283,350 | | | | 6,296,037 | |
| | | | | | | | | |
| Electrical Equipment — 3.3% | | | | | | | | |
AMETEK, Inc. | | | 128,400 | | | | 5,405,640 | |
| | | | | | | | | |
| Industrial Conglomerates — 3.0% | | | | | | | | |
Danaher Corporation | | | 101,500 | | | | 4,774,560 | |
| | | | | | | | | |
| Machinery — 11.6% | | | | | | | | |
Donaldson Company, Inc. | | | 61,400 | | | | 4,180,112 | |
Flowserve Corporation | | | 37,000 | | | | 3,674,840 | |
Graco, Inc. | | | 128,200 | | | | 5,242,098 | |
Toro Company (The) | | | 93,200 | | | | 5,653,512 | |
| | | | | | | | 18,750,562 | |
| Information Technology — 19.6% | | | | | | | | |
| Computers & Peripherals — 7.0% | | | | | | | | |
Apple, Inc. * | | | 17,000 | | | | 6,885,000 | |
Hewlett-Packard Company | | | 173,200 | | | | 4,461,632 | |
| | | | | | | | 11,346,632 | |
| Electronic Equipment, Instruments & Components — 3.0% | | | | | | | | |
Amphenol Corporation - Class A | | | 106,200 | | | | 4,820,418 | |
| | | | | | | | | |
| IT Services — 6.6% | | | | | | | | |
Accenture PLC - Class A | | | 100,900 | | | | 5,370,907 | |
Cognizant Technology Solutions Corporation - Class A * | | | 83,000 | | | | 5,337,730 | |
| | | | | | | | 10,708,637 | |
| Semiconductors & Semiconductor Equipment — 3.0% | | | | | | | | |
Altera Corporation | | | 130,900 | | | | 4,856,390 | |
| | | | | | | | | |
| Materials — 1.0% | | | | | | | | |
| Metals & Mining — 1.0% | | | | | | | | |
Walter Energy, Inc. | | | 28,000 | | | | 1,695,680 | |
| | | | | | | | | |
Total Common Stocks (Cost $123,222,644) | | | | | | $ | 161,131,004 | |
AVE MARIA GROWTH FUND
SCHEDULE OF INVESTMENTS
MONEY MARKET FUNDS — 0.8% | | | | | | |
Federated Government Obligations Tax-Managed Fund - Institutional Shares, 0.01% (a) (Cost $1,300,041) | | | 1,300,041 | | | $ | 1,300,041 | |
| | | | | | | | | |
Total Investments at Market Value — 100.2% (Cost $124,522,685) | | | | | | $ | 162,431,045 | |
| | | | | | | | | |
Liabilities in Excess of Other Assets — (0.2%) | | | | | | | (358,863 | ) |
| | | | | | | | | |
Net Assets — 100.0% | | | | | | $ | 162,072,182 | |
| * | Non-income producing security. |
| | |
| (a) | The rate shown is the 7-day effective yield as of December 31, 2011. |
| |
| See notes to financial statements. |
AVE MARIA RISING DIVIDEND FUND
PORTFOLIO MANAGER COMMENTARY
Dear Fellow Shareholders:
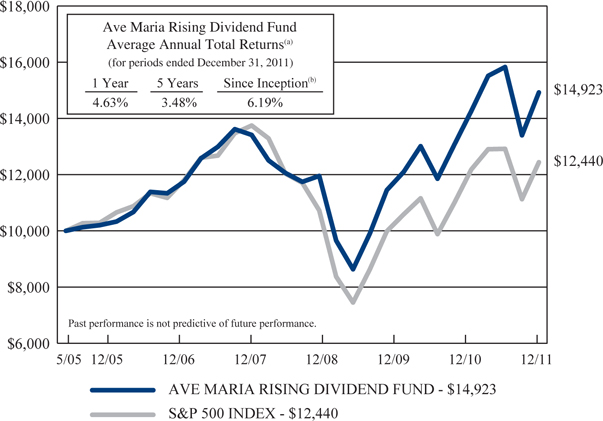
For the year 2011, the return on the Ave Maria Rising Dividend Fund (the “Fund”) was 4.6% compared to the 2.1% return of the S&P 500 Index. The U.S. economy started out 2011 with great hope which was reflected in rising stock prices. But by summer, economic growth was flagging, and concerns that the economy might actually slip back into recession were widespread. Equity prices reacted dramatically to this darkening outlook, with the S&P 500 falling nearly 20% from its high in late April to its low in early October. Then the pendulum swung again with equity prices rising sharply in the 4th quarter anticipating an economic rebound in 2012. To the casual observer, a total return of 2.1% on the S&P 500 would suggest a pretty uneventful year. That certainly wasn’t the case. It was a volatile year marked by the acrimonious debate over raising the debt limit, Standard & Poor’s historic downgrading of U.S. Sovereign debt, and the financial and political crises in the European Union. It was a year of “sturm und drang,” and yet our companies continued to grow profits and dividends.
For the portfolio, the greatest contributions to investment performance came from Weight Watchers International, Inc. (weight loss clinics), VF Corporation (apparel), Ross Stores, Inc. (retail), Exxon Mobil Corporation (energy), and Abbott Laboratories (health care). Performance was hampered by investments in: Avon Products, Inc. (cosmetics), Federated Investors, Inc. (financial services), Hasbro, Inc. (games and toys), DeVry, Inc. (education) and Comerica, Inc. (financial services).
With respect to Federated, Hasbro and DeVry, we believe that the fundamentals of the underlying investment case remained intact. With Avon Products and Comerica, however, it was concluded that there were more attractive alternatives and the positions were liquidated. We sold the position in Meridian Bioscience, Inc. because of the company’s reduced prospects for dividend increases and a fully valued stock price. We also sold positions in Tractor Supply Company and Chubb Corporation because of their appreciated stock prices.
Since June 30, 2011, positions have been initiated in PPG Industries, Inc., a global manufacturer of industrial coatings that has increased its dividend for 39 consecutive years; and Hewlett Packard Company, a technology company with ample cash flow to significantly increase its dividend. In 2011, 38 of the 40 companies in the portfolio raised their dividend.
Looking ahead, there are some obvious clouds on the horizon, as there always are. Europe is engaged in a great debate as to whether the European Union can continue, as the European economies slide into recession. Here at home, the electioneering will be fun to watch, but will provide little insight about the state of our Union. Then, of course, there’s the Middle East, Iran and North Korea.
AVE MARIA RISING DIVIDEND FUND
PORTFOLIO MANAGER COMMENTARY
(Continued)
In our opinion, these obvious clouds are, to a large degree, already reflected in stock prices, and as Brian Rogers of T. Rowe Price recently remarked, “the world doesn’t end often.” We are constructive about the outlook for the U.S. economy; progress is slow, but continuing. In particular, we remain optimistic about the long-term prospects for the companies whose shares are held in this Fund.
Thank you for your investment and statement of trust in the Ave Maria Rising Dividend Fund.
With best regards,
|  |
| George P. Schwartz, CFA | Richard L. Platte, Jr., CFA |
| Co-portfolio Manager | Co-portfolio Manager |
AVE MARIA RISING DIVIDEND FUND PERFORMANCE (Unaudited) |
Comparison of the Change in Value of a $10,000 Investment
in the Ave Maria Rising Dividend Fund and the S&P 500 Index
| (a) | The returns shown do not reflect the deduction of taxes a shareholder would pay on Fund distributions or the redemption of Fund shares. |
| | |
| (b) | Represents the period from the commencement of operations (May 2, 2005) through December 31, 2011. |
| Expense ratio as of 12-31-10 (as disclosed in May 1, 2011 prospectus) | 1.07%* |
| Expense ratio for the year ended 12-31-11 | 1.02% |
| * | Includes Acquired Fund Fees and Expenses. |
Past performance is not predictive of future performance. Investment results and principal value will fluctuate so that shares, when redeemed, may be worth more or less than their original cost. Current performance may be higher or lower than the performance data quoted. Performance data, current to the most recent month end, is available at the Ave Maria Funds website at www.avemariafunds.com or by calling 1-888-726-9331.
AVE MARIA RISING DIVIDEND FUND ANNUAL TOTAL RATES OF RETURN COMPARISON WITH MAJOR INDICES (Unaudited) |
| AVE MARIA RISING DIVIDEND FUND | |
2005 (a) | 6.7% | 8.8% |
| 2006 | 17.9% | 15.8% |
| 2007 | -0.6% | 5.5% |
| 2008 | -22.8% | -37.0% |
| 2009 | 25.3% | 26.5% |
| 2010 | 17.9% | 15.1% |
| 2011 | 4.6% | 2.1% |
AVERAGE ANNUAL TOTAL RETURNS As of December 31, 2011 (Unaudited) |
| AVE MARIA RISING DIVIDEND FUND | |
| 3 Years | 15.6% | 14.1% |
| 5 Years | 3.5% | -0.3% |
Since Inception (b) | 6.2% | 3.3% |
| (a) | Represents the period from the commencement of operations (May 2, 2005) through December 31, 2005. |
| | |
| (b) | Represents the period from the commencement of operations (May 2, 2005) through December 31, 2011. |
AVE MARIA RISING DIVIDEND FUND
TEN LARGEST EQUITY HOLDINGS
December 31, 2011 (Unaudited)
| | | | | | | | |
| | 110,000 | | Exxon Mobil Corporation | | $ | 9,323,600 | | | | 4.1 | % |
| | 300,000 | | Lowe's Companies, Inc. | | | 7,614,000 | | | | 3.4 | % |
| | 90,000 | | 3M Company | | | 7,355,700 | | | | 3.3 | % |
| | 105,000 | | General Dynamics Corporation | | | 6,973,050 | | | | 3.1 | % |
| | 95,000 | | ConocoPhillips | | | 6,922,650 | | | | 3.1 | % |
| | 145,000 | | Illinois Tool Works, Inc. | | | 6,772,950 | | | | 3.0 | % |
| | 250,000 | | U.S. Bancorp | | | 6,762,500 | | | | 3.0 | % |
| | 145,000 | | Emerson Electric Company | | | 6,755,550 | | | | 3.0 | % |
| | 120,000 | | Abbot Laboratories | | | 6,747,600 | | | | 3.0 | % |
| | 240,000 | | Republic Services, Inc. | | | 6,612,000 | | | | 3.0 | % |
ASSET ALLOCATION (Unaudited)
| | | |
Consumer Discretionary | | | 18.7 | % |
Consumer Staples | | | 12.9 | % |
Energy | | | 10.2 | % |
Financials | | | 10.7 | % |
Health Care | | | 7.9 | % |
Industrials | | | 20.1 | % |
Information Technology | | | 9.1 | % |
Materials | | | 4.9 | % |
Cash Equivalents, Other Assets and Liabilities | | | 5.5 | % |
| | | | 100.0 | % |
AVE MARIA RISING DIVIDEND FUND
SCHEDULE OF INVESTMENTS
| | | | | | |
| Consumer Discretionary — 18.7% | | | | | | |
| Diversified Consumer Services — 2.0% | | | | | | |
DeVry, Inc. | | | 115,000 | | | $ | 4,422,900 | |
| | | | | | | | | |
| Hotels, Restaurants & Leisure — 2.0% | | | | | | | | |
Cracker Barrel Old Country Store, Inc. | | | 90,000 | | | | 4,536,900 | |
| | | | | | | | | |
| Leisure Equipment & Products — 2.3% | | | | | | | | |
Hasbro, Inc. | | | 160,000 | | | | 5,102,400 | |
| | | | | | | | | |
| Media — 1.1% | | | | | | | | |
John Wiley & Sons, Inc. - Class A | | | 55,000 | | | | 2,442,000 | |
| | | | | | | | | |
| Specialty Retail — 8.0% | | | | | | | | |
Cato Corporation (The) - Class A | | | 210,000 | | | | 5,082,000 | |
Lowe's Companies, Inc. | | | 300,000 | | | | 7,614,000 | |
Ross Stores, Inc. | | | 110,000 | | | | 5,228,300 | |
| | | | | | | | 17,924,300 | |
| Textiles, Apparel & Luxury Goods — 3.3% | | | | | | | | |
VF Corporation | | | 30,000 | | | | 3,809,700 | |
Wolverine World Wide, Inc. | | | 100,000 | | | | 3,564,000 | |
| | | | | | | | 7,373,700 | |
| Consumer Staples — 12.9% | | | | | | | | |
| Food & Staples Retailing — 3.0% | | | | | | | | |
Sysco Corporation | | | 225,000 | | | | 6,599,250 | |
| | | | | | | | | |
| Food Products — 4.8% | | | | | | | | |
Hormel Foods Corporation | | | 100,000 | | | | 2,929,000 | |
Kellogg Company | | | 100,000 | | | | 5,057,000 | |
Lancaster Colony Corporation | | | 40,000 | | | | 2,773,600 | |
| | | | | | | | 10,759,600 | |
| Household Products — 5.1% | | | | | | | | |
Clorox Company (The) | | | 75,000 | | | | 4,992,000 | |
Colgate-Palmolive Company | | | 70,000 | | | | 6,467,300 | |
| | | | | | | | 11,459,300 | |
| Energy — 10.2% | | | | | | | | |
| Energy Equipment & Services — 3.0% | | | | | | | | |
Halliburton Company | | | 125,000 | | | | 4,313,750 | |
Schlumberger Limited | | | 35,000 | | | | 2,390,850 | |
| | | | | | | | 6,704,600 | |
| Oil, Gas & Consumable Fuels — 7.2% | | | | | | | | |
ConocoPhillips | | | 95,000 | | | | 6,922,650 | |
Exxon Mobil Corporation | | | 110,000 | | | | 9,323,600 | |
| | | | | | | | 16,246,250 | |
AVE MARIA RISING DIVIDEND FUND
SCHEDULE OF INVESTMENTS
COMMON STOCKS — 94.5% (Continued) | | | | | | |
| Financials — 10.7% | | | | | | |
| Capital Markets — 1.7% | | | | | | |
Federated Investors, Inc. - Class B | | | 250,000 | | | $ | 3,787,500 | |
| | | | | | | | | |
| Commercial Banks — 7.2% | | | | | | | | |
BB&T Corporation | | | 235,000 | | | | 5,914,950 | |
U.S. Bancorp | | | 250,000 | | | | 6,762,500 | |
United Bankshares, Inc. | | | 120,000 | | | | 3,392,400 | |
| | | | | | | | 16,069,850 | |
| Insurance — 1.8% | | | | | | | | |
HCC Insurance Holdings, Inc. | | | 150,000 | | | | 4,125,000 | |
| | | | | | | | | |
| Health Care — 7.9% | | | | | | | | |
| Health Care Equipment & Supplies — 4.9% | | | | | | | | |
Medtronic, Inc. | | | 155,000 | | | | 5,928,750 | |
Stryker Corporation | | | 100,000 | | | | 4,971,000 | |
| | | | | | | | 10,899,750 | |
| Pharmaceuticals — 3.0% | | | | | | | | |
Abbott Laboratories | | | 120,000 | | | | 6,747,600 | |
| | | | | | | | | |
| Industrials — 20.1% | | | | | | | | |
| Aerospace & Defense — 4.9% | | | | | | | | |
General Dynamics Corporation | | | 105,000 | | | | 6,973,050 | |
United Technologies Corporation | | | 55,000 | | | | 4,019,950 | |
| | | | | | | | 10,993,000 | |
| Commercial Services & Supplies — 3.0% | | | | | | | | |
Republic Services, Inc. | | | 240,000 | | | | 6,612,000 | |
| | | | | | | | | |
| Electrical Equipment — 3.0% | | | | | | | | |
Emerson Electric Company | | | 145,000 | | | | 6,755,550 | |
| | | | | | | | | |
| Industrial Conglomerates — 3.3% | | | | | | | | |
3M Company | | | 90,000 | | | | 7,355,700 | |
| | | | | | | | | |
| Machinery — 3.0% | | | | | | | | |
Illinois Tool Works, Inc. | | | 145,000 | | | | 6,772,950 | |
| | | | | | | | | |
| Road & Rail — 2.9% | | | | | | | | |
Norfolk Southern Corporation | | | 90,000 | | | | 6,557,400 | |
| | | | | | | | | |
| Information Technology — 9.1% | | | | | | | | |
| Computers & Peripherals — 2.5% | | | | | | | | |
Hewlett-Packard Company | | | 220,000 | | | | 5,667,200 | |
AVE MARIA RISING DIVIDEND FUND
SCHEDULE OF INVESTMENTS
COMMON STOCKS — 94.5% (Continued) | | | | | | |
| Information Technology — 9.1% (Continued) | | | | | | |
| IT Services — 3.7% | | | | | | |
Jack Henry & Associates, Inc. | | | 65,000 | | | $ | 2,184,650 | |
Paychex, Inc. | | | 200,000 | | | | 6,022,000 | |
| | | | | | | | 8,206,650 | |
| Semiconductors & Semiconductor Equipment — 2.9% | | | | | | | | |
Microchip Technology, Inc. | | | 175,000 | | | | 6,410,250 | |
| | | | | | | | | |
| Materials — 4.9% | | | | | | | | |
| Chemicals — 4.9% | | | | | | | | |
PPG Industries, Inc. | | | 65,000 | | | | 5,426,850 | |
RPM International, Inc. | | | 230,000 | | | | 5,646,500 | |
| | | | | | | | 11,073,350 | |
| | | | | | | | | |
Total Common Stocks (Cost $195,546,740) | | | | | | $ | 211,604,950 | |
MONEY MARKET FUNDS — 9.2% | | | | | | |
Federated Government Obligations Tax-Managed Fund - Institutional Shares, 0.01% (a) | | | 10,386,659 | | | $ | 10,386,659 | |
Federated U.S. Treasury Cash Reserve Fund - Institutional Shares, 0.00% (a) | | | 10,275,673 | | | | 10,275,673 | |
Total Money Market Funds (Cost $20,662,332) | | | | | | $ | 20,662,332 | |
| | | | | | | | | |
Total Investments at Market Value — 103.7% (Cost $216,209,072) | | | | | | $ | 232,267,282 | |
| | | | | | | | | |
Liabilities in Excess of Other Assets — (3.7%) | | | | | | | (8,285,218 | ) |
| | | | | | | | | |
Net Assets — 100.0% | | | | | | $ | 223,982,064 | |
| (a) | The rate shown is the 7-day effective yield as of December 31, 2011. |
| |
| See notes to financial statements. |
AVE MARIA OPPORTUNITY FUND
PORTFOLIO MANAGER COMMENTARY
Dear Fellow Shareowner:
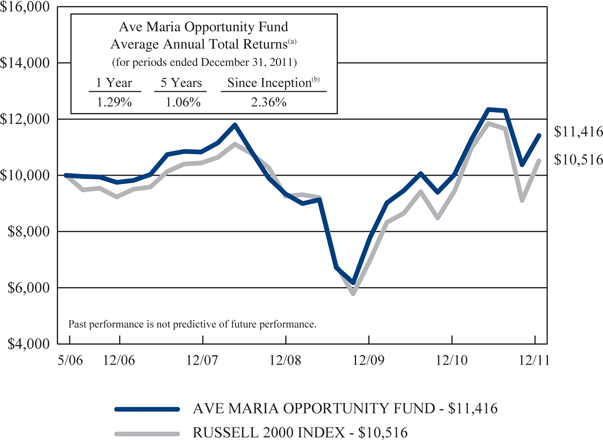
Ave Maria Opportunity Fund (the “Fund”) was up 1.3% in 2011, versus -4.2% for the Russell 2000 Index. It was a relatively good year for the Fund, as it placed in the top 10 percentile of 424 small-blend funds for 2011, as tracked by Morningstar. As of December 31, 2011, the Fund has an Overall Morningstar Rating* of 4 stars among 378 small-blend funds, which is the second highest rating by Morningstar. The Fund’s 1 year, 3 year and 5 year performance figures compared to its primary benchmark are as follows:
| | Average Annual Total Returns For Periods Ended 12/31/11 |
| | 1 year | 3 years | 5 years |
| Ave Maria Opportunity Fund | 1.3% | 19.3% | 1.1% |
| Russell 2000 Index | -4.2% | 15.6% | 0.2% |
The five stocks that performed best for the Fund during 2011 were:
| Weight Watchers International, Inc. | +161.0% |
| H&R Block, Inc. | +66.0% |
| Rent-A-Center, Inc. | +49.5% |
| Atrion Corporation | +46.0% |
| White Mountains Insurance Group Ltd. | +27.6% |
The five stocks that performed worst for the Fund during 2011 were:
| Forest Oil Corporation | -22.3% |
| Applied Materials, Inc. | -29.3% |
| PICO Holdings, Inc. | -32.2% |
| Investment Technology Group, Inc. | -35.1% |
| Federated Investors, Inc. | -37.6% |
Weight Watchers International, Inc. was the Fund’s best performing stock during 2011. When the stock price more than doubled, the position was liquidated, as the stock price exceeded our estimate of the company’s intrinsic value. The Fund’s worst performing stock during 2011 was Federated Investors, Inc. This leading investment manager has a large exposure to the money market fund business. The extremely low interest-rate environment has squeezed profitability, which we believe is temporary. During the past 6 months, 13 positions have been eliminated from the portfolio. One stock, Force Protection, Inc. was acquired by General Dynamics Corporation at a significant premium to the Fund’s cost. We sold 8 issues after their stock prices appreciated to the point where they were no longer bargains, and 4 stocks were sold due to deteriorating operating results.
AVE MARIA OPPORTUNITY FUND
PORTFOLIO MANAGER COMMENTARY
(Continued)
As of December 31, 2011 the Fund held the common stocks of 61 companies, 8 of which were added since June 30, 2011. New holdings include: Alliant Techsystems, Inc. (aerospace & defense), Cimarex Energy Company (oil & gas exploration), FLIR Systems, Inc. (aerospace & defense), PetMed Express, Inc. (online retailing), Rockwell Collins, Inc. (aerospace & defense), Rosetta Stone, Inc. (technology-based language learning), Strayer Education, Inc. (for-profit education), and Veeco Instruments, Inc. (semiconductor capital equipment). Based on earnings estimates, the Fund’s portfolio is trading at 12x forward earnings, while the average market capitalization is $2.4 billion.
The Ave Maria Opportunity Fund did not pay a capital gains distribution in 2011. The Fund used a tax capital loss carryforward to mitigate gains realized during the year.
As always, the confidence you have shown by your investment in this Fund is greatly appreciated.
With best regards,
Timothy S. Schwartz, CFA
Portfolio Manager
January 31, 2012
Past performance is no guarantee of future returns.
* Source: Morningstar 12-31-11. The Ave Maria Opportunity Fund was rated 5 stars among 378 Mid-Cap Blend Funds for the 3 year period ended December31, 2011 and 3 stars among 312 Mid-Cap Blend Funds for 5 year period ended December 31, 2011. For each fund with at least a 3-year history, Morningstar calculates a risk-adjusted measure that accounts for variation in a fund’s monthly performance (including the effects of all sales charges), placing more emphasis on downward variations and rewarding consistent performance. The top 10% of each category receive a Morningstar Rating™ of 5 stars, the next 22.5% receive 4 stars, the next 35% receive 3 stars, the next 22.5% receive 2 stars and the bottom 10% receive 1 star. 2011, ©Morningstar, Inc. All rights reserved. The information contained herein is proprietary to Morningstar and/or its content providers, may not be copied or distributed and is not warranted to be accurate, complete or timely. Neither Morningstar nor its content providers are responsible for any damages or losses arising from any use of this information.
AVE MARIA OPPORTUNITY FUND PERFORMANCE (Unaudited) |
Comparison of the Change in Value of a $10,000 Investment
in the Ave Maria Opportunity Fund and the Russell 2000 Index
| (a) | The returns shown do not reflect the deduction of taxes a shareholder would pay on Fund distributions or the redemption of Fund shares. |
| | |
| (b) | Represents the period from the commencement of operations (May 1, 2006) through December 31, 2011. |
Expense Ratio information as of: | Year Ended 12-31-10 (as disclosed in May 1, 2011 prospectus) | |
| Gross | 1.82% | 1.48%* |
| Net | 1.29% | 1.25% |
| * | Includes Acquired Fund Fees and Expenses. |
Past performance is not predictive of future performance. Investment results and principal value will fluctuate so that shares, when redeemed, may be worth more or less than their original cost. Current performance may be higher or lower than the performance data quoted. Performance data, current to the most recent month end, is available at the Ave Maria Funds website at www.avemariafunds.com or by calling 1-888-726-9331.
AVE MARIA OPPORTUNITY FUND ANNUAL TOTAL RATES OF RETURN COMPARISON WITH MAJOR INDICES (Unaudited) |
| AVE MARIA OPPORTUNITY FUND | | |
2006 (a) | 8.3% | 4.4% | 2.2% |
| 2007 | -8.5% | -1.6% | -0.3% |
| 2008 | -32.2% | -33.8% | -31.1% |
| 2009 | 40.8% | 27.2% | 25.6% |
| 2010 | 19.2% | 26.9% | 26.3% |
| 2011 | 1.3% | -4.2% | 1.0% |
AVERAGE ANNUAL TOTAL RETURNS As of December 31, 2011 (Unaudited) |
| AVE MARIA OPPORTUNITY FUND | | |
| 3 Years | 19.3% | 15.6% | 17.0% |
| 5 Years | 1.1% | 0.2% | 1.9% |
Since Inception (b) | 2.4% | 0.9% | 2.1% |
| (a) | Represents the period from the commencement of operations (May 1, 2006) through December 31, 2006. |
| | |
| (b) | Represents the period from the commencement of operations (May 1, 2006) through December 31, 2011. |
AVE MARIA OPPORTUNITY FUND
TEN LARGEST EQUITY HOLDINGS
December 31, 2011 (Unaudited)
| | | | | | | | |
| | 100,000 | | Federated Investors, Inc. - Class B | | $ | 1,515,000 | | | | 4.5 | % |
| | 9,100 | | SPDR Gold Trust | | | 1,383,109 | | | | 4.1 | % |
| | 40,000 | | Avnet, Inc. | | | 1,243,600 | | | | 3.7 | % |
| | 85,000 | | Dell, Inc. | | | 1,243,550 | | | | 3.7 | % |
| | 25,000 | | Ensco PLC - ADR | | | 1,173,000 | | | | 3.5 | % |
| | 100,000 | | Applied Materials, Inc. | | | 1,071,000 | | | | 3.2 | % |
| | 25,000 | | Rent-A-Center, Inc. | | | 925,000 | | | | 2.7 | % |
| | 50,000 | | Ingram Micro, Inc. - Class A | | | 909,500 | | | | 2.7 | % |
| | 3,036 | | Alleghany Corporation | | | 866,140 | | | | 2.6 | % |
| | 40,000 | | Spirit AeroSystems Holdings, Inc. - Class A | | | 831,200 | | | | 2.5 | % |
ASSET ALLOCATION (Unaudited)
| | | |
Consumer Discretionary | | | 9.2 | % |
Consumer Staples | | | 0.2 | % |
Energy | | | 15.4 | % |
Financials | | | 23.6 | % |
Health Care | | | 0.8 | % |
Industrials | | | 6.5 | % |
Information Technology | | | 28.4 | % |
Materials | | | 1.7 | % |
Exchange-Traded Funds | | | 4.1 | % |
Cash Equivalents, Other Assets and Liabilities | | | 10.1 | % |
| | | | 100.0 | % |
AVE MARIA OPPORTUNITY FUND
SCHEDULE OF INVESTMENTS
| | | | | | |
| Consumer Discretionary — 9.2% | | | | | | |
| Diversified Consumer Services — 0.9% | | | | | | |
Strayer Education, Inc. | | | 3,000 | | | $ | 291,570 | |
| | | | | | | | | |
| Household Durables — 0.2% | | | | | | | | |
Stanley Furniture Company, Inc. * | | | 22,100 | | | | 66,300 | |
| | | | | | | | | |
| Internet & Catalog Retail — 0.6% | | | | | | | | |
PetMed Express, Inc. | | | 20,000 | | | | 207,600 | |
| | | | | | | | | |
| Leisure Equipment & Products — 1.3% | | | | | | | | |
Universal Electronics, Inc. * | | | 25,000 | | | | 421,750 | |
| | | | | | | | | |
| Specialty Retail — 4.4% | | | | | | | | |
Cato Corporation (The) - Class A | | | 10,000 | | | | 242,000 | |
Rent-A-Center, Inc. | | | 25,000 | | | | 925,000 | |
Signet Jewelers Ltd. | | | 7,500 | | | | 329,700 | |
| | | | | | | | 1,496,700 | |
| Textiles, Apparel & Luxury Goods — 1.8% | | | | | | | | |
K-Swiss, Inc. - Class A * | | | 150,000 | | | | 438,000 | |
Wolverine World Wide, Inc. | | | 5,000 | | | | 178,200 | |
| | | | | | | | 616,200 | |
| Consumer Staples — 0.2% | | | | | | | | |
| Food Products — 0.2% | | | | | | | | |
Lancaster Colony Corporation | | | 1,200 | | | | 83,208 | |
| | | | | | | | | |
| Energy — 15.4% | | | | | | | | |
| Energy Equipment & Services — 7.8% | | | | | | | | |
Atwood Oceanics, Inc. * | | | 6,000 | | | | 238,740 | |
Ensco PLC - ADR | | | 25,000 | | | | 1,173,000 | |
Patterson-UTI Energy, Inc. | | | 15,000 | | | | 299,700 | |
Rowan Companies, Inc. * | | | 5,000 | | | | 151,650 | |
Superior Energy Services, Inc. * | | | 10,000 | | | | 284,400 | |
Tidewater, Inc. | | | 10,000 | | | | 493,000 | |
| | | | | | | | 2,640,490 | |
| Oil, Gas & Consumable Fuels — 7.6% | | | | | | | | |
Cimarex Energy Company | | | 10,000 | | | | 619,000 | |
Cloud Peak Energy, Inc. * | | | 20,000 | | | | 386,400 | |
Forest Oil Corporation * | | | 35,000 | | | | 474,250 | |
Lone Pine Resources, Inc. * | | | 21,436 | | | | 150,267 | |
Range Resources Corporation | | | 10,000 | | | | 619,400 | |
Southwestern Energy Company * | | | 10,000 | | | | 319,400 | |
| | | | | | | | 2,568,717 | |
AVE MARIA OPPORTUNITY FUND
SCHEDULE OF INVESTMENTS
COMMON STOCKS — 85.8% (Continued) | | | | | | |
| Financials — 23.6% | | | | | | |
| Capital Markets — 6.9% | | | | | | |
Federated Investors, Inc. - Class B | | | 100,000 | | | $ | 1,515,000 | |
Investment Technology Group, Inc. * | | | 75,000 | | | | 810,750 | |
| | | | | | | | 2,325,750 | |
| Commercial Banks — 0.7% | | | | | | | | |
United Bancorp, Inc. * | | | 100,000 | | | | 250,000 | |
| | | | | | | | | |
| Diversified Financial Services — 6.9% | | | | | | | | |
Dun & Bradstreet Corporation (The) | | | 6,000 | | | | 448,980 | |
H&R Block, Inc. | | | 35,000 | | | | 571,550 | |
PICO Holdings, Inc. * | | | 40,000 | | | | 823,200 | |
Western Union Company (The) | | | 25,000 | | | | 456,500 | |
| | | | | | | | 2,300,230 | |
| Insurance — 5.5% | | | | | | | | |
Alleghany Corporation * | | | 3,036 | | | | 866,140 | |
Markel Corporation * | | | 500 | | | | 207,335 | |
Meadowbrook Insurance Group, Inc. | | | 10,000 | | | | 106,800 | |
White Mountains Insurance Group Ltd. | | | 1,500 | | | | 680,190 | |
| | | | | | | | 1,860,465 | |
| Real Estate Management & Development — 1.3% | | | | | | | | |
St. Joe Company (The) * | | | 30,000 | | | | 439,800 | |
| | | | | | | | | |
| Thrifts & Mortgage Finance — 2.3% | | | | | | | | |
FedFirst Financial Corporation | | | 10,320 | | | | 141,384 | |
Oritani Financial Corporation | | | 25,000 | | | | 319,250 | |
Standard Financial Corporation | | | 5,000 | | | | 75,500 | |
ViewPoint Financial Group, Inc. | | | 17,981 | | | | 233,933 | |
| | | | | | | | 770,067 | |
| Health Care — 0.8% | | | | | | | | |
| Health Care Equipment & Supplies — 0.8% | | | | | | | | |
Atrion Corporation | | | 1,057 | | | | 253,923 | |
| | | | | | | | | |
| Industrials — 6.5% | | | | | | | | |
| Aerospace & Defense — 6.1% | | | | | | | | |
Alliant Techsystems, Inc. | | | 4,000 | | | | 228,640 | |
Rockwell Collins, Inc. | | | 15,000 | | | | 830,550 | |
Sparton Corporation * | | | 20,000 | | | | 174,000 | |
Spirit AeroSystems Holdings, Inc. - Class A * | | | 40,000 | | | | 831,200 | |
| | | | | | | | 2,064,390 | |
| Machinery — 0.4% | | | | | | | | |
Conrad Industries, Inc. * | | | 8,576 | | | | 127,783 | |
AVE MARIA OPPORTUNITY FUND
SCHEDULE OF INVESTMENTS
COMMON STOCKS — 85.8% (Continued) | | | | | | |
| Information Technology — 28.4% | | | | | | |
| Communications Equipment — 1.6% | | | | | | |
Arris Group, Inc. * | | | 50,000 | | | $ | 541,000 | |
| | | | | | | | | |
| Computers & Peripherals — 8.3% | | | | | | | | |
Dell, Inc. * | | | 85,000 | | | | 1,243,550 | |
Diebold, Incorporated | | | 10,000 | | | | 300,700 | |
Lexmark International, Inc. - Class A | | | 20,000 | | | | 661,400 | |
QLogic Corporation * | | | 40,000 | | | | 600,000 | |
| | | | | | | | 2,805,650 | |
| Electronic Equipment, Instruments & Components — 11.0% | | | | | | | | |
Arrow Electronics, Inc. * | | | 10,000 | | | | 374,100 | |
Avnet, Inc. * | | | 40,000 | | | | 1,243,600 | |
Benchmark Electronics, Inc. * | | | 50,000 | | | | 673,500 | |
FLIR Systems, Inc. | | | 10,000 | | | | 250,700 | |
Ingram Micro, Inc. - Class A * | | | 50,000 | | | | 909,500 | |
ScanSource, Inc. * | | | 7,500 | | | | 270,000 | |
| | | | | | | | 3,721,400 | |
| IT Services — 3.0% | | | | | | | | |
Broadridge Financial Solutions, Inc. | | | 25,000 | | | | 563,750 | |
Computer Services, Inc. | | | 15,500 | | | | 441,750 | |
| | | | | | | | 1,005,500 | |
| Semiconductors & Semiconductor Equipment — 3.9% | | | | | | | | |
Applied Materials, Inc. | | | 100,000 | | | | 1,071,000 | |
Veeco Instruments, Inc. * | | | 12,000 | | | | 249,600 | |
| | | | | | | | 1,320,600 | |
| Software — 0.6% | | | | | | | | |
Rosetta Stone, Inc. * | | | 25,000 | | | | 190,750 | |
| | | | | | | | | |
| Materials — 1.7% | | | | | | | | |
| Chemicals — 1.7% | | | | | | | | |
H.B. Fuller Company | | | 25,000 | | | | 577,750 | |
| | | | | | | | | |
Total Common Stocks (Cost $26,422,791) | | | | | | $ | 28,947,593 | |
AVE MARIA OPPORTUNITY FUND
SCHEDULE OF INVESTMENTS
EXCHANGE-TRADED FUNDS — 4.1% | | | | | | |
SPDR Gold Trust * (Cost $1,032,352) | | | 9,100 | | | $ | 1,383,109 | |
REPURCHASE AGREEMENTS (a) — 0.7% | | | | | | |
| U.S. Bank N.A., 0.01%, dated 12/31/11, due 01/03/12, repurchase proceeds: $236,885 (Cost $236,884) | | $ | 236,884 | | | $ | 236,884 | |
MONEY MARKET FUNDS — 13.8% | | | | | | |
Federated Government Obligations Tax-Managed Fund - Institutional Shares, 0.01% (b) | | | 1,553,518 | | | $ | 1,553,518 | |
Federated Treasury Obligations Fund - Institutional Shares, 0.01% (b) | | | 1,553,518 | | | | 1,553,518 | |
Federated U.S. Treasury Cash Reserve Fund - Institutional Shares, 0.00% (b) | | | 1,553,518 | | | | 1,553,518 | |
Total Money Market Funds (Cost $4,660,554) | | | | | | $ | 4,660,554 | |
| | | | | | | | | |
Total Investments at Market Value — 104.4% (Cost $32,352,581) | | | | | | $ | 35,228,140 | |
| | | | | | | | | |
Liabilities in Excess of Other Assets — (4.4%) | | | | | | | (1,501,353 | ) |
| | | | | | | | | |
Net Assets — 100.0% | | | | | | $ | 33,726,787 | |
| ADR - American Depositary Receipt. |
| | |
| * | Non-income producing security. |
| | |
| (a) | Repurchase agreement is fully collateralized by $225,854 FNCL Pool #555647, 4.500%, due 07/01/33. The aggregate market value of the collateral at December 31, 2011 was $241,757. |
| | |
| (b) | The rate shown is the 7-day effective yield as of December 31, 2011. |
| |
| See notes to financial statements. |
AVE MARIA WORLD EQUITY FUND
PORTFOLIO MANAGER COMMENTARY
Dear Fellow Shareowners:
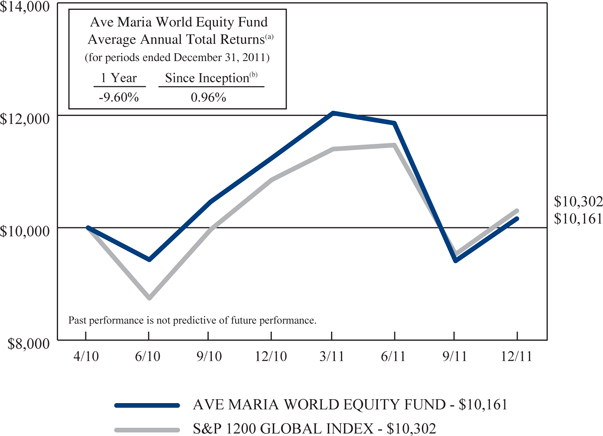
The Ave Maria World Equity Fund (the “Fund”) had a total return of -9.6% for 2011. The return for the S&P Global 1200 Index was -5.1%.
Since inception on May 1, 2010, the cumulative and annualized returns for the Fund compared to its benchmark were:
| | Since 5-01-10 Inception through 12-31-11 Total Returns |
| | Cumulative | Annualized |
| Ave Maria World Equity Fund (AVEWX) | 1.6% | 1.0% |
| S&P Global 1200 Index | 3.0% | 1.8% |
2011 proved to be a difficult year for the world’s equity markets. The United States’ was the only major market with a positive return (S&P 500 Index +2.1%). By contrast, European Stoxx Index declined (-15%) as did Japan (-17%). The markets in higher growth developing countries, such as China (-22%) and Brazil (-18%) also declined. The ongoing European sovereign debt crisis intensified concerns of debt defaults in the peripheral European countries. Credit availability also became an issue due to tougher bank capital requirements. While immediate liquidity issues are currently abating, many of the European Union’s long-term economic and political issues remain unresolved. The region seems headed for recession as the austerity measures being imposed on the weaker members penalize economic growth.
In the face of this turmoil, the U.S. economy remained surprisingly resilient and the U.S. markets became safe havens. The dollar is 9% higher against the Euro since July. Many of the Fund’s U.S. stock holdings, which are selected in part because of their large foreign earnings component, underperformed the U.S. market, reflecting the decreased dollar value of these earnings and lower expectations for foreign growth.
We believe that negative investor sentiment around the globe has led to the undervaluation of many world class companies. The Fund’s focus remains investing in a diversified portfolio of such companies which have the management skill and financial strength to take advantage of the many opportunities presented in this unsettled world. A few such stocks which positively contributed the most to this year’s performance include: MasterCard, Inc. (Financial Services), McDonald’s Corporation (Restaurants), Abbott Laboratories (Medical Products), International Business Machines Corporation (Technology), Lubrizol Corporation (Specialty Chemicals) and Diageo PLC ADR (Food & Beverage).
AVE MARIA WORLD EQUITY FUND
PORTFOLIO MANAGER COMMENTARY
Stocks which detracted from performance were: Longtop Financial Technologies Limited ADR (Technology Services), Hewlett-Packard Company (Technology), Nintendo Company, Ltd. ADR (Consumer Electronics), LG Display Company Ltd. ADR (Electronic Display Components), Avon Products, Inc. (Cosmetics) and Foster Wheeler AG (Engineering and Construction).
The Fund added two new positions in the second half of this year: ABB Limited ADR and Emerson Electric Company. Both companies focus on products that improve productivity and enhance energy efficiency. Like all the Fund’s holdings, both of these companies comply with the Ave Maria Mutual Funds’ moral screens.
Five positions were eliminated: Avon Products, Inc. (Cosmetics), Delhaize Group ADR (Food Retail) and Nintendo Company Ltd. ADR (Consumer Technology) due to deteriorating fundamentals; CenturyLink, Inc. (Telecommunications) violated the Fund’s moral screen which prohibits distribution of pornography, and Longtop Financial Technologies Limited ADR, which was suspended from U.S. trading due to Securities and Exchange rules violations.
As of December 31st. the Fund’s geographic weightings versus the S&P Global 1200 Index were approximately:
| | Ave Maria World Equity Fund | S&P Global 1200 Index |
| United States | 44% | 51% |
| Europe | 15% | 17% |
| United Kingdom | 4% | 10% |
| Japan | 4% | 7% |
| Canada | 9% | 5% |
| Asia ex Japan | 9% | 4% |
| Australia | 2% | 4% |
| Latin America | 3% | 2% |
| Other | 3% | — |
| Cash | 7% | — |
Thank you for being a shareowner of the Ave Maria World Equity Fund.
Gregory R. Heilman
Portfolio Manager
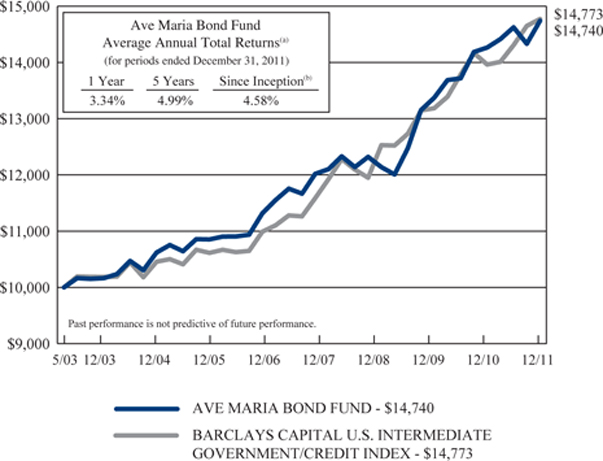
AVE MARIA WORLD EQUITY FUND PERFORMANCE (Unaudited) |
Comparison of the Change in Value of a $10,000 Investment
in the Ave Maria World Equity Fund and the S&P 1200 Global Index
| (a) | The returns shown do not reflect the deduction of taxes a shareholder would pay on Fund distributions or the redemption of Fund shares. |
| | |
| (b) | Represents the period from the commencement of operations (April 30, 2010) through December 31, 2011. |
| | |
| (c) | Represents the period from the commencement of operations (April 30, 2010) through December 31, 2010. |
| | |
| (d) | Annualized. |
Expense Ratio information as of: | Period Ended 12-31-10 (as disclosed in May 1, 2011 prospectus) (c) (d) | |
| Gross | 2.47% | 1.78%* |
| Net | 1.52% | 1.50% |
| * | Includes Acquired Fund Fees and Expenses. |
Past performance is not predictive of future performance. Investment results and principal value will fluctuate so that shares, when redeemed, may be worth more or less than their original cost. Current performance may be higher or lower than the performance data quoted. Performance data, current to the most recent month end, is available at the Ave Maria Funds website at www.avemariafunds.com or by calling 1-888-726-9331.
AVE MARIA WORLD EQUITY FUND ANNUAL TOTAL RATES OF RETURN COMPARISON WITH MAJOR INDICES (Unaudited) |
| AVE MARIA WORLD EQUITY FUND | |
2010 (a) | 12.4% | 8.5% |
| 2011 | -9.6% | -5.1% |
AVERAGE ANNUAL TOTAL RETURNS As of December 31, 2011 (Unaudited) |
| AVE MARIA WORLD EQUITY FUND | |
Since Inception (b) | 1.0% | 1.8% |
| (a) | Represents the period from the commencement of operations (April 30, 2010) through December 31, 2010. |
| | |
| (b) | Represents the period from the commencement of operations (April 30, 2010) through December 31, 2011. |
AVE MARIA WORLD EQUITY FUND
TEN LARGEST EQUITY HOLDINGS
December 31, 2011 (Unaudited)
| | | | | | | | |
| | 4,000 | | SPDR Gold Trust | | $ | 607,960 | | | | 3.0 | % |
| | 6,000 | | McDonald's Corporation | | | 601,980 | | | | 3.0 | % |
| | 6,500 | | Diageo PLC - ADR | | | 568,230 | | | | 2.8 | % |
| | 22,000 | | Hewlett-Packard Company | | | 566,720 | | | | 2.8 | % |
| | 6,000 | | Colgate-Palmolive Company | | | 554,340 | | | | 2.7 | % |
| | 9,500 | | Abbott Laboratories | | | 534,185 | | | | 2.6 | % |
| | 9,000 | | Accenture PLC - Class A | | | 479,070 | | | | 2.4 | % |
| | 9,000 | | International Flavors & Fragrances, Inc. | | | 471,780 | | | | 2.3 | % |
| | 25,000 | | ABB Limited - ADR | | | 470,750 | | | | 2.3 | % |
| | 10,000 | | Emerson Electric Company | | | 465,900 | | | | 2.3 | % |
ASSET ALLOCATION (Unaudited)
| | | |
Consumer Discretionary | | | 7.0 | % |
Consumer Staples | | | 9.4 | % |
Energy | | | 11.4 | % |
Financials | | | 14.0 | % |
Health Care | | | 4.8 | % |
Industrials | | | 18.8 | % |
Information Technology | | | 12.7 | % |
Materials | | | 9.6 | % |
Telecommunication Services | | | 2.6 | % |
Exchange-Traded Funds | | | 3.0 | % |
Cash Equivalents, Other Assets and Liabilities | | | 6.7 | % |
| | | | 100.0 | % |
AVE MARIA WORLD EQUITY FUND
SCHEDULE OF INVESTMENTS
| | | | | | |
| Consumer Discretionary — 7.0% | | | | | | |
| Automobiles — 2.3% | | | | | | |
Toyota Motor Corporation - ADR | | | 7,000 | | | $ | 462,910 | |
| | | | | | | | | |
| Hotels, Restaurants & Leisure — 3.0% | | | | | | | | |
McDonald's Corporation | | | 6,000 | | | | 601,980 | |
| | | | | | | | | |
| Household Durables — 1.7% | | | | | | | | |
Brookfield Residential Properties, Inc. * | | | 45,000 | | | | 351,450 | |
| | | | | | | | | |
| Consumer Staples — 9.4% | | | | | | | | |
| Beverages — 4.7% | | | | | | | | |
Diageo PLC - ADR | | | 6,500 | | | | 568,230 | |
Heineken NV - Unsponsored ADR | | | 17,000 | | | | 391,510 | |
| | | | | | | | 959,740 | |
| Food Products — 2.0% | | | | | | | | |
Nestlé S.A. - ADR | | | 7,000 | | | | 403,970 | |
| | | | | | | | | |
| Household Products — 2.7% | | | | | | | | |
Colgate-Palmolive Company | | | 6,000 | | | | 554,340 | |
| | | | | | | | | |
| Energy — 11.4% | | | | | | | | |
| Energy Equipment & Services — 3.5% | | | | | | | | |
Schlumberger Limited | | | 3,500 | | | | 239,085 | |
Tidewater, Inc. | | | 5,000 | | | | 246,500 | |
Transocean Ltd. | | | 6,000 | | | | 230,340 | |
| | | | | | | | 715,925 | |
| Oil, Gas & Consumable Fuels — 7.9% | | | | | | | | |
Advantage Oil & Gas Ltd. * | | | 40,000 | | | | 165,600 | |
Canadian Natural Resources Ltd. | | | 9,000 | | | | 336,330 | |
CNOOC Limited - ADR | | | 1,500 | | | | 262,020 | |
Exxon Mobil Corporation | | | 5,000 | | | | 423,800 | |
Petróleo Brasileiro S.A. - ADR | | | 10,000 | | | | 248,500 | |
Suncor Energy, Inc. | | | 5,500 | | | | 158,565 | |
| | | | | | | | 1,594,815 | |
| Financials — 14.0% | | | | | | | | |
| Commercial Banks — 4.1% | | | | | | | | |
Banco Santander S.A. - ADR | | | 20,408 | | | | 153,468 | |
Barclays PLC - ADR | | | 16,000 | | | | 175,840 | |
BNP Paribas S.A. - ADR | | | 4,500 | | | | 88,425 | |
Toronto-Dominion Bank (The) | | | 5,500 | | | | 411,455 | |
| | | | | | | | 829,188 | |
| Diversified Financial Services — 3.9% | | | | | | | | |
MasterCard, Inc. - Class A | | | 1,000 | | | | 372,820 | |
Western Union Company (The) | | | 23,000 | | | | 419,980 | |
| | | | | | | | 792,800 | |
AVE MARIA WORLD EQUITY FUND
SCHEDULE OF INVESTMENTS
COMMON STOCKS — 90.3% (Continued) | | | | | | |
| Financials — 14.0% (Continued) | | | | | | |
| Insurance — 6.0% | | | | | | |
ACE Limited | | | 6,500 | | | $ | 455,780 | |
Allianze SE - ADR | | | 16,000 | | | | 151,520 | |
AXA S.A. - ADR | | | 14,000 | | | | 180,040 | |
Tokio Marine Holdings, Inc. - ADR | | | 12,000 | | | | 264,000 | |
Zurich Financial Services AG - ADR * | | | 7,500 | | | | 170,100 | |
| | | | | | | | 1,221,440 | |
| Health Care — 4.8% | | | | | | | | |
| Health Care Equipment & Supplies — 2.2% | | | | | | | | |
Mindray Medical International Ltd. - ADR | | | 17,500 | | | | 448,700 | |
| | | | | | | | | |
| Pharmaceuticals — 2.6% | | | | | | | | |
Abbott Laboratories | | | 9,500 | | | | 534,185 | |
| | | | | | | | | |
| Industrials — 18.8% | | | | | | | | |
| Aerospace & Defense — 2.0% | | | | | | | | |
United Technologies Corporation | | | 5,500 | | | | 401,995 | |
| | | | | | | | | |
| Construction & Engineering — 1.9% | | | | | | | | |
Foster Wheeler AG * | | | 20,000 | | | | 382,800 | |
| | | | | | | | | |
| Electrical Equipment — 6.3% | | | | | | | | |
ABB Limited - ADR * | | | 25,000 | | | | 470,750 | |
Emerson Electric Company | | | 10,000 | | | | 465,900 | |
General Cable Corporation * | | | 14,000 | | | | 350,140 | |
| | | | | | | | 1,286,790 | |
| Industrial Conglomerates — 4.8% | | | | | | | | |
3M Company | | | 5,500 | | | | 449,515 | |
Koninklijke Philips Electronics NV - ADR | | | 8,000 | | | | 167,600 | |
Siemens AG - ADR | | | 3,700 | | | | 353,757 | |
| | | | | | | | 970,872 | |
| Machinery — 1.9% | | | | | | | | |
Lincoln Electric Holdings, Inc. | | | 10,000 | | | | 391,200 | |
| | | | | | | | | |
| Road & Rail — 1.9% | | | | | | | | |
Canadian National Railway Company | | | 5,000 | | | | 392,800 | |
| | | | | | | | | |
| Information Technology — 12.7% | | | | | | | | |
| Computers & Peripherals — 2.8% | | | | | | | | |
Hewlett-Packard Company | | | 22,000 | | | | 566,720 | |
| | | | | | | | | |
| Electronic Equipment, Instruments & Components — 1.8% | | | | | | | | |
LG Display Company Ltd. - ADR | | | 35,000 | | | | 368,550 | |
AVE MARIA WORLD EQUITY FUND
SCHEDULE OF INVESTMENTS
COMMON STOCKS — 90.3% (Continued) | | | | | | |
| Information Technology — 12.7% (Continued) | | | | | | |
| IT Services — 4.6% | | | | | | |
Accenture PLC - Class A | | | 9,000 | | | $ | 479,070 | |
International Business Machines Corporation | | | 2,500 | | | | 459,700 | |
| | | | | | | | 938,770 | |
| Office Electronics — 1.5% | | | | | | | | |
Zebra Technologies Corporation - Class A * | | | 8,500 | | | | 304,130 | |
| | | | | | | | | |
| Semiconductors & Semiconductor Equipment — 2.0% | | | | | | | | |
| Taiwan Semiconductor Manufacturing Company Ltd. - ADR | | | 31,000 | | | | 400,210 | |
| | | | | | | | | |
| Materials — 9.6% | | | | | | | | |
| Chemicals — 6.2% | | | | | | | | |
FMC Corporation | | | 4,500 | | | | 387,180 | |
International Flavors & Fragrances, Inc. | | | 9,000 | | | | 471,780 | |
Syngenta AG - ADR * | | | 7,000 | | | | 412,580 | |
| | | | | | | | 1,271,540 | |
| Metals & Mining — 3.4% | | | | | | | | |
BHP Billiton Ltd. - ADR | | | 4,500 | | | | 317,835 | |
POSCO - ADR | | | 4,500 | | | | 369,450 | |
| | | | | | | | 687,285 | |
| Telecommunication Services — 2.6% | | | | | | | | |
| Diversified Telecommunication Services — 1.1% | | | | | | | | |
Telefónica S.A. - ADR | | | 13,000 | | | | 223,470 | |
| | | | | | | | | |
| Wireless Telecommunication Services — 1.5% | | | | | | | | |
| América Móvil S.A.B. de C.V. - Series L - ADR | | | 13,000 | | | | 293,800 | |
| | | | | | | | | |
Total Common Stocks (Cost $19,222,507) | | | | | | $ | 18,352,375 | |
EXCHANGE-TRADED FUNDS — 3.0% | | | | | | |
SPDR Gold Trust * (Cost $577,600) | | | 4,000 | | | $ | 607,960 | |
AVE MARIA WORLD EQUITY FUND
SCHEDULE OF INVESTMENTS
MONEY MARKET FUNDS — 11.1% | | | | | | |
Federated Government Obligations Tax-Managed Fund - Institutional Shares, 0.01% (a) | | | 930,523 | | | $ | 930,523 | |
Federated Treasury Obligations Fund - Institutional Shares, 0.01% (a) | | | 407,675 | | | | 407,675 | |
Federated U.S. Treasury Cash Reserve Fund - Institutional Shares, 0.00% (a) | | | 915,016 | | | | 915,016 | |
Total Money Market Funds (Cost $2,253,214) | | | | | | $ | 2,253,214 | |
| | | | | | | | | |
Total Investments at Market Value — 104.4% (Cost $22,053,321) | | | | | | $ | 21,213,549 | |
| | | | | | | | | |
Liabilities in Excess of Other Assets — (4.4%) | | | | | | | (889,415 | ) |
| | | | | | | | | |
Net Assets — 100.0% | | | | | | $ | 20,324,134 | |
| ADR - American Depositary Receipt. |
| | |
| * | Non-income producing security. |
| | |
| (a) | The rate shown is the 7-day effective yield as of December 31, 2011. |
SUMMARY OF COMMON STOCKS BY COUNTRY December 31, 2011 (Unaudited) |
| | | | | | |
United States | | $ | 8,575,800 | | | | 42.2 | % |
Switzerland | | | 2,070,540 | | | | 10.2 | % |
Canada | | | 1,816,200 | | | | 8.9 | % |
United Kingdom | | | 744,070 | | | | 3.7 | % |
Japan | | | 726,910 | | | | 3.6 | % |
South Korea | | | 738,000 | | | | 3.6 | % |
China | | | 710,720 | | | | 3.5 | % |
Netherlands | | | 559,110 | | | | 2.7 | % |
Germany | | | 505,277 | | | | 2.5 | % |
Taiwan | | | 400,210 | | | | 2.0 | % |
Spain | | | 376,938 | | | | 1.8 | % |
Australia | | | 317,835 | | | | 1.6 | % |
Mexico | | | 293,800 | | | | 1.5 | % |
France | | | 268,465 | | | | 1.3 | % |
Brazil | | | 248,500 | | | | 1.2 | % |
| | | $ | 18,352,375 | | | | 90.3 | % |
| See notes to financial statements. |
AVE MARIA BOND FUND
PORTFOLIO MANAGER COMMENTARY
Dear Fellow Shareholders,
In 2011, the total return for the Ave Maria Bond Fund (the “Fund”) was 3.3% vs. 5.8% for the Barclays Capital U.S. Intermediate Government/Credit Index. Dividend-paying common stocks contributed positively to performance including VF Corporation (apparel), Abbott Laboratories (healthcare), Kimberly-Clark Corporation (paper products) and ConocoPhillips (energy). U.S. Treasuries, and in particular Treasury Inflation Protected Securities (TIPS), also contributed positively to overall performance. Weakest performers include common stocks of Avon Products, Inc. (cosmetics), Federated Investors, Inc. (financial services), and Hasbro, Inc. (toys and games).
In the current low interest-rate environment, the Fund’s dividend-paying common stocks offer an attractive adjunct to the income produced by the investment grade bond portfolio. At December 31, 2011 the average yield-to-maturity of fixed-income issues in the Fund was 1.2% and the dividend yield on the Fund’s equity holdings was 3.3%, while common stock represented 19.7% of the total portfolio. The fixed-income portion of the portfolio, which equaled 71.8% at year end, was composed of high-quality, short and intermediate-maturity U.S. government and corporate issues. As is always the case, interest rates are being influenced by multiple factors. Ironically, one of the major factors effecting U.S. interest rates is the economic crises in Europe. International investors spent much of 2011 fleeing to the relatively high quality of U.S. Treasuries, driving U.S. Treasury prices higher. Now with interest rates near record lows the next significant change in interest rates will, in all probability, be to higher levels. This change will be a positive for the Fund as it will create the opportunity to re-invest maturing bond proceeds at higher interest rates. For now however, our focus is on limiting interest-rate risk by positioning the portfolio defensively with high-quality, short-maturity issues. This conservative posture is designed to better protect principal in a rising interest-rate environment and enhance the opportunity for above-average future performance.
We appreciate your participation in the Ave Maria Bond Fund.
With best regards,
Richard L. Platte, Jr., CFA
Portfolio Manager
AVE MARIA BOND FUND PERFORMANCE (Unaudited) |
Comparison of the Change in Value of a $10,000 Investment
in the Ave Maria Bond Fund and the Barclays Capital U.S.
Intermediate Government/Credit Index
| (a) | The returns shown do not reflect the deduction of taxes a shareholder would pay on Fund distributions or the redemption of Fund shares. |
| | |
| (b) | Represents the period from the commencement of operations (May 1, 2003) through December 31, 2011. |
Expense Ratio information as of: | Year Ended 12-31-10 (as disclosed in May 1, 2011 prospectus) | |
| Gross | 0.75% | 0.73%* |
| Net | 0.71% | 0.70% |
| * | Includes Acquired Fund Fees and Expenses. |
Past performance is not predictive of future performance. Investment results and principal value will fluctuate so that shares, when redeemed, may be worth more or less than their original cost. Current performance may be higher or lower than the performance data quoted. Performance data, current to the most recent month end, is available at the Ave Maria Funds website at www.avemariafunds.com or by calling 1-888-726-9331.
AVE MARIA BOND FUND ANNUAL TOTAL RATES OF RETURN COMPARISON WITH MAJOR INDICES (Unaudited) |
| | BARCLAYS CAPITAL U.S. INTERMEDIATE GOVERNMENT/CREDIT INDEX |
2003 (a) | 2.4% | 1.9% |
| 2004 | 5.1% | 3.0% |
| 2005 | 1.4% | 1.6% |
| 2006 | 6.0% | 4.1% |
| 2007 | 4.8% | 7.4% |
| 2008 | 0.3% | 5.1% |
| 2009 | 10.2% | 5.2% |
| 2010 | 6.7% | 5.9% |
| 2011 | 3.3% | 5.8% |
AVERAGE ANNUAL TOTAL RETURNS As of December 31, 2011 (Unaudited) |
| | BARCLAYS CAPITAL U.S. INTERMEDIATE GOVERNMENT/CREDIT INDEX |
| 3 Years | 6.7% | 5.7% |
| 5 Years | 5.0% | 5.9% |
Since Inception (b) | 4.6% | 4.6% |
| (a) | Represents the period from the commencement of operations (May 1, 2003) through December 31, 2003. |
| | |
| (b) | Represents the period from the commencement of operations (May 1, 2003) through December 31, 2011. |
AVE MARIA BOND FUND
TEN LARGEST HOLDINGS *
December 31, 2011 (Unaudited)
| | | | | | | | |
| $ | 3,000,000 | | U.S. Treasury Notes, 2.500%, due 04/30/15 | | $ | 3,201,564 | | | | 3.5 | % |
| | 2,242,480 | | U.S. Treasury Inflation-Protected Notes, 2.500%, due 07/15/16 | | | 2,593,567 | | | | 2.8 | % |
| | 2,000,000 | | Consolidated Edison Company of New York, Inc., 5.300%, due 12/01/16 | | | 2,333,748 | | | | 2.5 | % |
| | 2,042,000 | | Kellogg Company, 4.150%, due 11/15/19 | | | 2,209,370 | | | | 2.4 | % |
| | 2,000,000 | | Dell, Inc., 2.300%, due 09/10/15 | | | 2,043,510 | | | | 2.2 | % |
| | 2,000,000 | | U.S. Treasury Notes, 1.250%, due 02/15/14 | | | 2,041,094 | | | | 2.2 | % |
| | 1,650,000 | | General Dynamics Corporation, 2.250%, due 07/15/16 | | | 1,702,685 | | | | 1.8 | % |
| | 1,500,000 | | U.S. Treasury Notes, 2.375%, due 08/31/14 | | | 1,580,157 | | | | 1.7 | % |
| | 1,500,000 | | U.S. Bancorp, 2.450%, due 07/27/15 | | | 1,537,268 | | | | 1.7 | % |
| | 1,500,000 | | Private Export Funding Corporation, 5.685%, due 05/15/12 | | | 1,530,590 | | | | 1.7 | % |
* Excludes cash equivalents.
ASSET ALLOCATION (Unaudited)
| | | | |
| U.S. TREASURY AND GOVERNMENT AGENCY OBLIGATIONS | | | |
U.S. Treasuries | | | 16.1 | % |
U.S. Government Agencies | | | 6.2 | % |
| | | | | |
| CORPORATE BONDS | | | | |
| Sector | | | | |
Consumer Discretionary | | | 4.3 | % |
Consumer Staples | | | 6.9 | % |
Energy | | | 2.5 | % |
Financials | | | 6.3 | % |
Health Care | | | 3.6 | % |
Industrials | | | 8.2 | % |
Information Technology | | | 8.6 | % |
Materials | | | 2.2 | % |
Telecommunication Services | | | 2.4 | % |
Utilities | | | 4.5 | % |
| | | | | |
| COMMON STOCKS | | | | |
| Sector | | | | |
Consumer Discretionary | | | 2.2 | % |
Consumer Staples | | | 2.6 | % |
Energy | | | 2.3 | % |
Financials | | | 2.5 | % |
Health Care | | | 1.7 | % |
Industrials | | | 5.5 | % |
Information Technology | | | 1.8 | % |
Materials | | | 1.1 | % |
Cash Equivalents, Other Assets and Liabilities | | | 8.5 | % |
| | | | 100.0 | % |
AVE MARIA BOND FUND
SCHEDULE OF INVESTMENTS
U.S. TREASURY OBLIGATIONS — 16.1% | | | | | | |
| U.S. Treasury Inflation-Protected Notes — 4.2% | | | | | | |
2.500%, due 07/15/16 | | $ | 2,242,480 | | | $ | 2,593,567 | |
2.625%, due 07/15/17 | | | 1,092,540 | | | | 1,300,550 | |
| | | | | | | | 3,894,117 | |
| U.S. Treasury Notes — 11.9% | | | | | | | | |
1.375%, due 10/15/12 | | | 1,500,000 | | | | 1,514,590 | |
1.375%, due 03/15/13 | | | 1,500,000 | | | | 1,521,387 | |
1.250%, due 02/15/14 | | | 2,000,000 | | | | 2,041,094 | |
2.375%, due 08/31/14 | | | 1,500,000 | | | | 1,580,157 | |
2.500%, due 04/30/15 | | | 3,000,000 | | | | 3,201,564 | |
2.625%, due 02/29/16 | | | 1,000,000 | | | | 1,080,938 | |
| | | | | | | | 10,939,730 | |
| | | | | | | | | |
Total U.S. Treasury Obligations (Cost $13,928,959) | | | | | | $ | 14,833,847 | |
U.S. GOVERNMENT AGENCY OBLIGATIONS — 6.2% | | | | | | |
| Federal Farm Credit Bank — 3.5% | | | | | | |
4.480%, due 08/24/12 | | $ | 1,000,000 | | | $ | 1,027,179 | |
4.600%, due 12/27/12 | | | 1,000,000 | | | | 1,042,500 | |
4.500%, due 01/22/15 | | | 1,000,000 | | | | 1,114,403 | |
| | | | | | | | 3,184,082 | |
| Federal Home Loan Bank — 0.5% | | | | | | | | |
3.740%, due 02/06/14 | | | 500,000 | | | | 501,591 | |
| | | | | | | | | |
| Private Export Funding Corporation — 2.2% | | | | | | | | |
5.685%, due 05/15/12 | | | 1,500,000 | | | | 1,530,590 | |
3.550%, due 04/15/13 | | | 500,000 | | | | 520,121 | |
| | | | | | | | 2,050,711 | |
| | | | | | | | | |
Total U.S. Government Agency Obligations (Cost $5,548,257) | | | | | | $ | 5,736,384 | |
AVE MARIA BOND FUND
SCHEDULE OF INVESTMENTS
| | | | | | |
| Consumer Discretionary — 4.3% | | | | | | |
Johnson Controls, Inc., 5.500%, due 01/15/16 | | $ | 500,000 | | | $ | 559,450 | |
Lowe's Companies, Inc., 5.000%, due 10/15/15 | | | 500,000 | | | | 560,391 | |
Lowe's Companies, Inc., 2.125%, due 04/15/16 | | | 1,000,000 | | | | 1,007,634 | |
McGraw-Hill Companies, Inc. (The), 5.375%, due 11/15/12 | | | 500,000 | | | | 519,873 | |
| TJX Companies, Inc. (The), 4.200%, due 08/15/15 | | | 1,250,000 | | | | 1,373,461 | |
| | | | | | | | 4,020,809 | |
| Consumer Staples — 6.9% | | | | | | | | |
Avon Products, Inc., 5.625%, due 03/01/14 | | | 1,000,000 | | | | 1,063,879 | |
Clorox Company (The), 5.000%, due 01/15/15 | | | 1,000,000 | | | | 1,080,486 | |
Kellogg Company, 4.150%, due 11/15/19 | | | 2,042,000 | | | | 2,209,370 | |
| Kimberly Clark Corporation, 6.125%, due 08/01/17 | | | 800,000 | | | | 978,552 | |
Sysco Corporation, 4.200%, due 02/12/13 | | | 1,000,000 | | | | 1,037,354 | |
| | | | | | | | 6,369,641 | |
| Energy — 2.5% | | | | | | | | |
Apache Corporation, 5.625%, due 01/15/17 | | | 1,000,000 | | | | 1,185,392 | |
ConocoPhillips, 4.750%, due 02/01/14 | | | 1,000,000 | | | | 1,080,019 | |
| | | | | | | | 2,265,411 | |
| Financials — 6.3% | �� | | | | | | | |
BB&T Corporation, 4.750%, due 10/01/12 | | | 1,000,000 | | | | 1,025,213 | |
| Caterpillar Financial Services Corporation, 4.750%, due 02/17/15 | | | 1,000,000 | | | | 1,105,508 | |
| Caterpillar Financial Services Corporation, 2.650%, due 04/01/16 | | | 1,000,000 | | | | 1,041,292 | |
| National Rural Utilities Cooperative Finance Corporation, 4.750%, due 03/01/14 | | | 1,000,000 | | | | 1,078,921 | |
U.S. Bancorp, 2.450%, due 07/27/15 | | | 1,500,000 | | | | 1,537,268 | |
| | | | | | | | 5,788,202 | |
| Health Care — 3.6% | | | | | | | | |
Medtronic, Inc., 4.750%, due 09/15/15 | | | 1,000,000 | | | | 1,119,969 | |
Medtronic, Inc., 2.625%, due 03/15/16 | | | 500,000 | | | | 517,870 | |
Stryker Corporation, 3.000%, due 01/15/15 | | | 1,000,000 | | | | 1,053,778 | |
Stryker Corporation, 2.000%, due 09/30/16 | | | 650,000 | | | | 665,166 | |
| | | | | | | | 3,356,783 | |
| Industrials — 8.2% | | | | | | | | |
3M Company, 1.375%, due 09/29/16 | | | 1,150,000 | | | | 1,159,869 | |
Cooper US, Inc., 5.450%, due 04/01/15 | | | 1,000,000 | | | | 1,118,162 | |
Eaton Corporation, 4.900%, due 05/15/13 | | | 500,000 | | | | 526,687 | |
| General Dynamics Corporation, 2.250%, due 07/15/16 | | | 1,650,000 | | | | 1,702,685 | |
Ryder System, Inc., 3.150%, due 03/02/15 | | | 1,000,000 | | | | 1,027,665 | |
| Union Pacific Corporation, 5.125%, due 02/15/14 | | | 500,000 | | | | 540,934 | |
| Union Pacific Corporation, 4.875%, due 01/15/15 | | | 750,000 | | | | 822,422 | |
| United Technologies Corporation, 5.375%, due 12/15/17 | | | 571,000 | | | | 675,451 | |
| | | | | | | | 7,573,875 | |
AVE MARIA BOND FUND
SCHEDULE OF INVESTMENTS
CORPORATE BONDS — 49.5% (Continued) | | | | | | |
| Information Technology — 8.6% | | | | | | |
Dell, Inc., 2.300%, due 09/10/15 | | $ | 2,000,000 | | | $ | 2,043,510 | |
Harris Corporation, 5.000%, due 10/01/15 | | | 1,000,000 | | | | 1,085,451 | |
| Hewlett-Packard Company, 6.125%, due 03/01/14 | | | 1,000,000 | | | | 1,078,252 | |
| Hewlett-Packard Company, 2.125%, due 09/13/15 | | | 500,000 | | | | 491,199 | |
| Hewlett-Packard Company, 2.650%, due 06/01/16 | | | 500,000 | | | | 496,123 | |
| International Business Machines Corporation, 4.750%, due 11/29/12 | | | 500,000 | | | | 517,030 | |
| International Business Machines Corporation, 6.500%, due 10/15/13 | | | 500,000 | | | | 551,399 | |
| International Business Machines Corporation, 2.000%, due 01/05/16 | | | 1,000,000 | | | | 1,025,717 | |
National Semiconductor Corporation, 6.600%, due 06/15/17 | | | 500,000 | | | | 614,135 | |
| | | | | | | | 7,902,816 | |
| Materials — 2.2% | | | | | | | | |
Praxair, Inc., 6.375%, due 04/01/12 | | | 1,000,000 | | | | 1,013,602 | |
Sherwin-Williams Company (The), 3.125%, due 12/15/14 | | | 1,000,000 | | | | 1,053,727 | |
| | | | | | | | 2,067,329 | |
| Telecommunication Services — 2.4% | | | | | | | | |
| Verizon Communications, Inc., 4.350%, due 02/15/13 | | | 500,000 | | | | 519,578 | |
| Verizon Communications, Inc., 4.900%, due 09/15/15 | | | 600,000 | | | | 673,367 | |
| Verizon Communications, Inc., 3.000%, due 04/01/16 | | | 1,000,000 | | | | 1,047,190 | |
| | | | | | | | 2,240,135 | |
| Utilities — 4.5% | | | | | | | | |
| Consolidated Edison Company of New York, Inc., 5.300%, due 12/01/16 | | | 2,000,000 | | | | 2,333,748 | |
| Duke Energy Corporation, 3.950%, due 09/15/14 | | | 800,000 | | | | 853,536 | |
NextEra Energy Capital Holdings, Inc., 2.600%, due 09/01/15 | | | 1,000,000 | | | | 1,009,119 | |
| | | | | | | | 4,196,403 | |
| | | | | | | | | |
Total Corporate Bonds (Cost $44,665,257) | | | | | | $ | 45,781,404 | |
AVE MARIA BOND FUND
SCHEDULE OF INVESTMENTS
| | | | | | |
| Consumer Discretionary — 2.2% | | | | | | |
| Leisure Equipment & Products — 0.3% | | | | | | |
Hasbro, Inc. | | | 10,000 | | | $ | 318,900 | |
| | | | | | | | | |
| Specialty Retail — 1.5% | | | | | | | | |
Cato Corporation (The) - Class A | | | 30,000 | | | | 726,000 | |
Lowe's Companies, Inc. | | | 25,000 | | | | 634,500 | |
| | | | | | | | 1,360,500 | |
| Textiles, Apparel & Luxury Goods — 0.4% | | | | | | | | |
VF Corporation | | | 3,000 | | | | 380,970 | |
| | | | | | | | | |
| Consumer Staples — 2.6% | | | | | | | | |
| Food & Staples Retailing — 1.0% | | | | | | | | |
Sysco Corporation | | | 32,500 | | | | 953,225 | |
| | | | | | | | | |
| Household Products — 1.6% | | | | | | | | |
Clorox Company (The) | | | 10,000 | | | | 665,600 | |
Kimberly-Clark Corporation | | | 11,000 | | | | 809,160 | |
| | | | | | | | 1,474,760 | |
| Energy — 2.3% | | | | | | | | |
| Oil, Gas & Consumable Fuels — 2.3% | | | | | | | | |
ConocoPhillips | | | 17,500 | | | | 1,275,225 | |
Exxon Mobil Corporation | | | 10,000 | | | | 847,600 | |
| | | | | | | | 2,122,825 | |
| Financials — 2.5% | | | | | | | | |
| Capital Markets — 0.7% | | | | | | | | |
Federated Investors, Inc. - Class B | | | 40,000 | | | | 606,000 | |
| | | | | | | | | |
| Commercial Banks — 1.5% | | | | | | | | |
U.S. Bancorp | | | 20,000 | | | | 541,000 | |
United Bankshares, Inc. | | | 30,000 | | | | 848,100 | |
| | | | | | | | 1,389,100 | |
| Insurance — 0.3% | | | | | | | | |
Chubb Corporation (The) | | | 4,000 | | | | 276,880 | |
| | | | | | | | | |
| Health Care — 1.7% | | | | | | | | |
| Health Care Equipment & Supplies — 0.5% | | | | | | | | |
Medtronic, Inc. | | | 12,000 | | | | 459,000 | |
| | | | | | | | | |
| Pharmaceuticals — 1.2% | | | | | | | | |
Abbott Laboratories | | | 20,000 | | | | 1,124,600 | |
| | | | | | | | | |
| Industrials — 5.5% | | | | | | | | |
| Aerospace & Defense — 0.9% | | | | | | | | |
General Dynamics Corporation | | | 12,000 | | | | 796,920 | |
AVE MARIA BOND FUND
SCHEDULE OF INVESTMENTS
COMMON STOCKS — 19.7% (Continued) | | | | | | |
| Industrials — 5.5% (Continued) | | | | | | |
| Commercial Services & Supplies — 0.7% | | | | | | |
Republic Services, Inc. | | | 25,000 | | | $ | 688,750 | |
| | | | | | | | | |
| Electrical Equipment — 1.0% | | | | | | | | |
Emerson Electric Company | | | 20,000 | | | | 931,800 | |
| | | | | | | | | |
| Industrial Conglomerates — 1.1% | | | | | | | | |
3M Company | | | 12,000 | | | | 980,760 | |
| | | | | | | | | |
| Machinery — 1.0% | | | | | | | | |
Illinois Tool Works, Inc. | | | 20,000 | | | | 934,200 | |
| | | | | | | | | |
| Road & Rail — 0.8% | | | | | | | | |
Norfolk Southern Corporation | | | 10,000 | | | | 728,600 | |
| | | | | | | | | |
| Information Technology — 1.8% | | | | | | | | |
| IT Services — 0.8% | | | | | | | | |
Paychex, Inc. | | | 25,000 | | | | 752,750 | |
| | | | | | | | | |
| Semiconductors & Semiconductor Equipment — 1.0% | | | | | | | | |
Microchip Technology, Inc. | | | 25,000 | | | | 915,750 | |
| | | | | | | | | |
| Materials — 1.1% | | | | | | | | |
| Chemicals — 1.1% | | | | | | | | |
RPM International, Inc. | | | 40,000 | | | | 982,000 | |
| | | | | | | | | |
Total Common Stocks (Cost $16,740,851) | | | | | | $ | 18,178,290 | |
MONEY MARKET FUNDS — 7.9% | | | | | | |
Federated Government Obligations Tax-Managed Fund - Institutional Shares, 0.01% (a) | | | 4,278,581 | | | $ | 4,278,581 | |
Federated U.S. Treasury Cash Reserve Fund - Institutional Shares, 0.00% (a) | | | 3,056,268 | | | | 3,056,268 | |
Total Money Market Funds (Cost $7,334,849) | | | | | | $ | 7,334,849 | |
| | | | | | | | | |
Total Investments at Market Value — 99.4% (Cost $88,218,173) | | | | | | $ | 91,864,774 | |
| | | | | | | | | |
Other Assets in Excess of Liabilities — 0.6% | | | | | | | 536,592 | |
| | | | | | | | | |
Net Assets — 100.0% | | | | | | $ | 92,401,366 | |
| (a) | The rate shown is the 7-day effective yield as of December 31, 2011. |
| |
| See notes to financial statements. |
AVE MARIA MUTUAL FUNDS
STATEMENTS OF ASSETS AND LIABILITIES
| | Ave Maria Catholic Values Fund | | | | | | Ave Maria Rising Dividend Fund | |
| ASSETS | | | | | | | | | |
| Investment securities: | | | | | | | | | |
At cost | | $ | 154,920,975 | | | $ | 124,522,685 | | | $ | 216,209,072 | |
At market value (Note 1) | | $ | 180,417,743 | | | $ | 162,431,045 | | | $ | 232,267,282 | |
Receivable for capital shares sold | | | 55,223 | | | | 94,853 | | | | 1,500,012 | |
Dividends receivable | | | 172,392 | | | | 172,530 | | | | 325,512 | |
Other assets | | | 22,973 | | | | 22,327 | | | | 27,762 | |
TOTAL ASSETS | | | 180,668,331 | | | | 162,720,755 | | | | 234,120,568 | |
| | | | | | | | | | | | | |
| LIABILITIES | | | | | | | | | | | | |
Payable for investment securities purchased | | | — | | | | — | | | | 9,532,297 | |
Payable for capital shares redeemed | | | 32,947 | | | | 101,773 | | | | 152,565 | |
Payable to Adviser (Note 2) | | | 454,807 | | | | 476,187 | | | | 383,628 | |
Payable to administrator (Note 2) | | | 22,696 | | | | 20,161 | | | | 25,856 | |
Accrued shareholder servicing fees (Note 2) | | | 76,861 | | | | 20,000 | | | | — | |
Other accrued expenses | | | 31,309 | | | | 30,452 | | | | 44,158 | |
TOTAL LIABILITIES | | | 618,620 | | | | 648,573 | | | | 10,138,504 | |
| | | | | | | | | | | | | |
NET ASSETS | | $ | 180,049,711 | | | $ | 162,072,182 | | | $ | 223,982,064 | |
| | | | | | | | | | | | | |
| NET ASSETS CONSIST OF: | | | | | | | | | | | | |
Paid-in capital | | $ | 157,150,698 | | | $ | 124,668,740 | | | $ | 208,210,697 | |
Undistributed net investment income | | | — | | | | — | | | | 1,286 | |
Accumulated net realized losses from
security transactions | | | (2,597,755 | ) | | | (504,918 | ) | | | (288,129 | ) |
Net unrealized appreciation on investments | | | 25,496,768 | | | | 37,908,360 | | | | 16,058,210 | |
NET ASSETS | | $ | 180,049,711 | | | $ | 162,072,182 | | | $ | 223,982,064 | |
Shares of beneficial interest outstanding
(unlimited number of shares authorized,
no par value) | | | 11,117,183 | | | | 7,842,025 | | | | 17,665,587 | |
Net asset value, offering price and
redemption price per share (Note 1) | | $ | 16.20 | | | $ | 20.67 | | | $ | 12.68 | |
| See notes to financial statements. |
AVE MARIA MUTUAL FUNDS
STATEMENTS OF ASSETS AND LIABILITIES
December 31, 2011 (Continued)
| | | | | Ave Maria World Equity Fund | | | | |
| ASSETS | | | | | | | | | |
| Investment securities: | | | | | | | | | |
At amortized cost | | $ | 32,352,581 | | | $ | 22,053,321 | | | $ | 88,218,173 | |
At market value (Note 1) | | $ | 35,228,140 | | | $ | 21,213,549 | | | $ | 91,864,774 | |
Cash | | | — | | | | 1,352 | | | | — | |
Receivable for investment securities sold | | | — | | | | 85,997 | | | | — | |
Receivable for capital shares sold | | | 44,940 | | | | 10,448 | | | | 18,984 | |
Dividends and interest receivable | | | 17,119 | | | | 20,550 | | | | 701,800 | |
Other assets | | | 8,813 | | | | 7,314 | | | | 15,509 | |
TOTAL ASSETS | | | 35,299,012 | | | | 21,339,210 | | | | 92,601,067 | |
| | | | | | | | | | | | | |
| LIABILITIES | | | | | | | | | | | | |
Payable for investment securities purchased | | | 1,480,512 | | | | 960,962 | | | | — | |
Payable for capital shares redeemed | | | 12,944 | | | | 1,153 | | | | 79,390 | |
Payable to Adviser (Note 2) | | | 60,316 | | | | 35,822 | | | | 69,301 | |
Payable to administrator (Note 2) | | | 4,000 | | | | 4,000 | | | | 7,607 | |
Accrued shareholder servicing fees (Note 2) | | | — | | | | — | | | | 19,876 | |
Other accrued expenses | | | 14,453 | | | | 13,139 | | | | 23,527 | |
TOTAL LIABILITIES | | | 1,572,225 | | | | 1,015,076 | | | | 199,701 | |
| | | | | | | | | | | | | |
NET ASSETS | | $ | 33,726,787 | | | $ | 20,324,134 | | | $ | 92,401,366 | |
| | | | | | | | | | | | | |
| NET ASSETS CONSIST OF: | | | | | | | | | | | | |
Paid-in capital | | $ | 31,480,935 | | | $ | 21,679,050 | | | $ | 88,753,254 | |
Undistributed net investment income | | | — | | | | — | | | | 1,511 | |
Accumulated net realized losses from
security transactions | | | (629,707 | ) | | | (515,144 | ) | | | — | |
Net unrealized appreciation/(depreciation)
on investments | | | 2,875,559 | | | | (839,772 | ) | | | 3,646,601 | |
NET ASSETS | | $ | 33,726,787 | | | $ | 20,324,134 | | | $ | 92,401,366 | |
Shares of beneficial interest outstanding
(unlimited number of shares authorized,
no par value) | | | 3,068,292 | | | | 2,010,285 | | | | 8,503,309 | |
Net asset value, offering price and
redemption price per share (Note 1) | | $ | 10.99 | | | $ | 10.11 | | | $ | 10.87 | |
| See notes to financial statements. |
AVE MARIA MUTUAL FUNDS
STATEMENTS OF OPERATIONS
For the Year Ended December 31, 2011
| | Ave Maria Catholic Values Fund | | | | | | Ave Maria Rising Dividend Fund | |
| INVESTMENT INCOME | | | | | | | | | |
Dividends | | $ | 2,735,823 | | | $ | 1,949,620 | | | $ | 4,354,408 | |
| | | | | | | | | | | | | |
| EXPENSES | | | | | | | | | | | | |
Investment advisory fees (Note 2) | | | 1,836,401 | | | | 1,532,518 | | | | 1,318,651 | |
Administration, accounting and
transfer agent fees (Note 2) | | | 289,995 | | | | 242,021 | | | | 263,719 | |
Shareholder servicing fees (Note 2) | | | 483,262 | | | | 316,631 | | | | — | |
Legal and audit fees | | | 39,889 | | | | 37,288 | | | | 42,580 | |
Registration fees | | | 24,002 | | | | 31,161 | | | | 42,577 | |
Postage and supplies | | | 48,929 | | | | 47,561 | | | | 41,832 | |
Trustees’ fees and expenses | | | 24,990 | | | | 24,990 | | | | 24,990 | |
Custodian and bank service fees | | | 15,286 | | | | 16,175 | | | | 19,552 | |
Advisory board fees and expenses | | | 8,180 | | | | 8,180 | | | | 8,180 | |
Insurance expense | | | 12,860 | | | | 9,974 | | | | 10,585 | |
Printing of shareholder reports | | | 8,010 | | | | 8,238 | | | | 6,606 | |
Compliance service fees and
expenses (Note 2) | | | 8,153 | | | | 6,909 | | | | 7,717 | |
Other expenses | | | 19,115 | | | | 16,070 | | | | 15,774 | |
TOTAL EXPENSES | | | 2,819,072 | | | | 2,297,716 | | | | 1,802,763 | |
Plus previous investment advisory fee
reductions and expense reimbursements
recouped by the Adviser (Note 2) | | | 80,509 | | | | 122,050 | | | | — | |
NET EXPENSES | | | 2,899,581 | | | | 2,419,766 | | | | 1,802,763 | |
| | | | | | | | | | | | | |
NET INVESTMENT INCOME/(LOSS) | | | (163,758 | ) | | | (470,146 | ) | | | 2,551,645 | |
| | | | | | | | | | | | | |
REALIZED AND UNREALIZED GAINS/
(LOSSES) ON INVESTMENTS | | | | | | | | | | | | |
Net realized gains/(losses) from
security transactions | | | 13,378,258 | | | | (108,529 | ) | | | 8,565,320 | |
Net change in unrealized appreciation/
depreciation on investments | | | (16,631,885 | ) | | | 92,640 | | | | (6,902,849 | ) |
REALIZED AND UNREALIZED
GAINS/(LOSSES) ON INVESTMENTS | | | (3,253,627 | ) | | | (15,889 | ) | | | 1,662,471 | |
| | | | | | | | | | | | | |
NET INCREASE/(DECREASE) IN
NET ASSETS RESULTING FROM
OPERATIONS | | $ | (3,417,385 | ) | | $ | (486,035 | ) | | $ | 4,214,116 | |
| See notes to financial statements. |
AVE MARIA MUTUAL FUNDS
STATEMENTS OF OPERATIONS
For the Year Ended December 31, 2011 (Continued)
| | | | | Ave Maria World Equity Fund | | | | |
| INVESTMENT INCOME | | | | | | | | | |
Dividends | | $ | 283,860 | | | $ | 397,363 | | | $ | 546,170 | |
Foreign withholding taxes on dividends | | | — | | | | (32,273 | ) | | | — | |
Interest | | | 48 | | | | 2 | | | | 1,696,284 | |
TOTAL INCOME | | | 283,908 | | | | 365,092 | | | | 2,242,454 | |
| | | | | | | | | | | | | |
| EXPENSES | | | | | | | | | | | | |
Investment advisory fees (Note 2) | | | 291,374 | | | | 167,034 | | | | 252,453 | |
Administration, accounting and
transfer agent fees (Note 2) | | | 48,755 | | | | 42,000 | | | | 84,159 | |
Shareholder servicing fees (Note 2) | | | — | | | | — | | | | 126,226 | |
Legal and audit fees | | | 21,935 | | | | 20,411 | | | | 29,025 | |
Registration fees | | | 22,174 | | | | 25,140 | | | | 29,952 | |
Postage and supplies | | | 12,204 | | | | 5,626 | | | | 18,030 | |
Trustees’ fees and expenses | | | 24,990 | | | | 24,990 | | | | 24,990 | |
Custodian and bank service fees | | | 8,522 | | | | 5,999 | | | | 8,127 | |
Advisory board fees and expenses | | | 8,180 | | | | 8,180 | | | | 8,180 | |
Insurance expense | | | 2,007 | | | | 1,012 | | | | 6,006 | |
Printing of shareholder reports | | | 2,570 | | | | 1,728 | | | | 3,327 | |
Compliance service fees and
expenses (Note 2) | | | 1,582 | | | | 1,031 | | | | 3,849 | |
Other expenses | | | 10,910 | | | | 9,583 | | | | 20,569 | |
TOTAL EXPENSES | | | 455,203 | | | | 312,734 | | | | 614,893 | |
Less fee reductions by the Adviser (Note 2) | | | (71,816 | ) | | | (48,996 | ) | | | (25,836 | ) |
NET EXPENSES | | | 383,387 | | | | 263,738 | | | | 589,057 | |
| | | | | | | | | | | | | |
NET INVESTMENT INCOME/(LOSS) | | | (99,479 | ) | | | 101,354 | | | | 1,653,397 | |
| | | | | | | | | | | | | |
REALIZED AND UNREALIZED GAINS/
(LOSSES) ON INVESTMENTS | | | | | | | | | | | | |
Net realized gains/(losses) from
security transactions | | | 2,282,267 | | | | (459,327 | ) | | | 1,484,137 | |
Net change in unrealized appreciation/
depreciation on investments | | | (2,127,644 | ) | | | (1,875,908 | ) | | | (478,907 | ) |
NET REALIZED AND UNREALIZED
GAINS/(LOSSES) ON INVESTMENTS | | | 154,623 | | | | (2,335,235 | ) | | | 1,005,230 | |
| | | | | | | | | | | | | |
NET INCREASE/(DECREASE) IN
NET ASSETS RESULTING FROM
OPERATIONS | | $ | 55,144 | | | $ | (2,233,881 | ) | | $ | 2,658,627 | |
| See notes to financial statements. |
AVE MARIA CATHOLIC VALUES FUND
STATEMENTS OF CHANGES IN NET ASSETS
| | Year Ended December 31, 2011 | | | Year Ended December 31, 2010 | |
| FROM OPERATIONS | | | | | | |
Net investment income/(loss) | | $ | (163,758 | ) | | $ | 74,340 | |
Net realized gains from security transactions | | | 13,378,258 | | | | 16,045,399 | |
Net change in unrealized appreciation/depreciation
on investments | | | (16,631,885 | ) | | | 16,955,495 | |
| Net increase/(decrease) in net assets resulting from operations | | | (3,417,385 | ) | | | 33,075,234 | |
| | | | | | | | | |
| FROM DISTRIBUTIONS TO SHAREHOLDERS | | | | | | | | |
From net investment income | | | — | | | | (107,531 | ) |
| | | | | | | | | |
| FROM CAPITAL SHARE TRANSACTIONS | | | | | | | | |
Proceeds from shares sold | | | 25,223,441 | | | | 17,029,400 | |
Reinvestment of distributions to shareholders | | | — | | | | 99,585 | |
Payments for shares redeemed | | | (29,669,177 | ) | | | (32,818,126 | ) |
| Net decrease in net assets from capital share transactions | | | (4,445,736 | ) | | | (15,689,141 | ) |
| | | | | | | | | |
| TOTAL INCREASE/(DECREASE) IN NET ASSETS | | | (7,863,121 | ) | | | 17,278,562 | |
| | | | | | | | | |
| NET ASSETS | | | | | | | | |
Beginning of year | | | 187,912,832 | | | | 170,634,270 | |
End of year | | $ | 180,049,711 | | | $ | 187,912,832 | |
| | | | | | | | | |
| UNDISTRIBUTED NET INVESTMENT INCOME | | $ | — | | | $ | — | |
| | | | | | | | | |
| SUMMARY OF CAPITAL SHARE ACTIVITY | | | | | | | | |
Shares sold | | | 1,460,971 | | | | 1,181,302 | |
| Shares issued in reinvestment of distributions to shareholders | | | — | | | | 6,386 | |
Shares redeemed | | | (1,784,702 | ) | | | (2,266,543 | ) |
Net decrease in shares outstanding | | | (323,731 | ) | | | (1,078,855 | ) |
Shares outstanding, beginning of year | | | 11,440,914 | | | | 12,519,769 | |
Shares outstanding, end of year | | | 11,117,183 | | | | 11,440,914 | |
| See notes to financial statements. |
AVE MARIA GROWTH FUND
STATEMENTS OF CHANGES IN NET ASSETS
| | Year Ended December 31, 2011 | | | Year Ended December 31, 2010 | |
| FROM OPERATIONS | | | | | | |
Net investment loss | | $ | (470,146 | ) | | $ | (357,781 | ) |
| Net realized gains/(losses) from security transactions | | | (108,529 | ) | | | 2,045,253 | |
Net change in unrealized appreciation/depreciation
on investments | | | 92,640 | | | | 28,377,461 | |
| Net increase/(decrease) in net assets resulting from operations | | | (486,035 | ) | | | 30,064,933 | |
| | | | | | | | | |
| FROM CAPITAL SHARE TRANSACTIONS | | | | | | | | |
Proceeds from shares sold | | | 49,561,962 | | | | 29,190,293 | |
Payments for shares redeemed | | | (34,447,239 | ) | | | (27,438,065 | ) |
| Net increase in net assets from capital share transactions | | | 15,114,723 | | | | 1,752,228 | |
| | | | | | | | | |
TOTAL INCREASE IN NET ASSETS | | | 14,628,688 | | | | 31,817,161 | |
| | | | | | | | | |
| NET ASSETS | | | | | | | | |
Beginning of year | | | 147,443,494 | | | | 115,626,333 | |
End of year | | $ | 162,072,182 | | | $ | 147,443,494 | |
| | | | | | | | | |
| UNDISTRIBUTED NET INVESTMENT INCOME | | $ | — | | | $ | — | |
| | | | | | | | | |
| SUMMARY OF CAPITAL SHARE ACTIVITY | | | | | | | | |
Shares sold | | | 2,325,054 | | | | 1,625,271 | |
Shares redeemed | | | (1,653,984 | ) | | | (1,566,917 | ) |
Net increase in shares outstanding | | | 671,070 | | | | 58,354 | |
Shares outstanding, beginning of year | | | 7,170,955 | | | | 7,112,601 | |
Shares outstanding, end of year | | | 7,842,025 | | | | 7,170,955 | |
| See notes to financial statements. |
AVE MARIA RISING DIVIDEND FUND
STATEMENTS OF CHANGES IN NET ASSETS
| | Year Ended December 31, 2011 | | | Year Ended December 31, 2010 | |
| FROM OPERATIONS | | | | | | |
Net investment income | | $ | 2,551,645 | | | $ | 1,731,739 | |
Net realized gains from security transactions | | | 8,565,320 | | | | 6,756,690 | |
Net change in unrealized appreciation/depreciation
on investments | | | (6,902,849 | ) | | | 10,852,999 | |
| Net increase in net assets resulting from operations | | | 4,214,116 | | | | 19,341,428 | |
| | | | | | | | | |
| FROM DISTRIBUTIONS TO SHAREHOLDERS | | | | | | | | |
From net investment income | | | (2,551,115 | ) | | | (1,746,969 | ) |
From net realized gains on investments | | | (3,914,949 | ) | | | — | |
| Decrease in net assets from distributions to shareholders | | | (6,466,064 | ) | | | (1,746,969 | ) |
| | | | | | | | | |
| FROM CAPITAL SHARE TRANSACTIONS | | | | | | | | |
Proceeds from shares sold | | | 144,421,388 | | | | 44,251,594 | |
Reinvestment of distributions to shareholders | | | 5,865,090 | | | | 1,420,740 | |
Payments for shares redeemed | | | (51,074,350 | ) | | | (39,106,203 | ) |
| Net increase in net assets from capital share transactions | | | 99,212,128 | | | | 6,566,131 | |
| | | | | | | | | |
TOTAL INCREASE IN NET ASSETS | | | 96,960,180 | | | | 24,160,590 | |
| | | | | | | | | |
| NET ASSETS | | | | | | | | |
Beginning of year | | | 127,021,884 | | | | 102,861,294 | |
End of year | | $ | 223,982,064 | | | $ | 127,021,884 | |
| | | | | | | | | |
| UNDISTRIBUTED NET INVESTMENT INCOME | | $ | 1,286 | | | $ | 756 | |
| | | | | | | | | |
| SUMMARY OF CAPITAL SHARE ACTIVITY | | | | | | | | |
Shares sold | | | 11,072,249 | | | | 3,861,627 | |
| Shares issued in reinvestment of distributions to shareholders | | | 459,529 | | | | 123,135 | |
Shares redeemed | | | (4,019,225 | ) | | | (3,383,504 | ) |
Net increase in shares outstanding | | | 7,512,553 | | | | 601,258 | |
Shares outstanding, beginning of year | | | 10,153,034 | | | | 9,551,776 | |
Shares outstanding, end of year | | | 17,665,587 | | | | 10,153,034 | |
| See notes to financial statements. |
AVE MARIA OPPORTUNITY FUND
STATEMENTS OF CHANGES IN NET ASSETS
| | Year Ended December 31, 2011 | | | Year Ended December 31, 2010 | |
| FROM OPERATIONS | | | | | | |
Net investment income/(loss) | | $ | (99,479 | ) | | $ | 13,091 | |
Net realized gains from security transactions | | | 2,282,267 | | | | 1,809,414 | |
Net change in unrealized appreciation/depreciation
on investments | | | (2,127,644 | ) | | | 1,805,357 | |
| Net increase in net assets resulting from operations | | | 55,144 | | | | 3,627,862 | |
| | | | | | | | | |
| FROM DISTRIBUTIONS TO SHAREHOLDERS | | | | | | | | |
From net investment income | | | — | | | | (13,091 | ) |
| | | | | | | | | |
| FROM CAPITAL SHARE TRANSACTIONS | | | | | | | | |
Proceeds from shares sold | | | 18,818,224 | | | | 9,114,867 | |
Reinvestment of distributions to shareholders | | | — | | | | 11,827 | |
Payments for shares redeemed | | | (9,940,460 | ) | | | (4,734,146 | ) |
| Net increase in net assets from capital share transactions | | | 8,877,764 | | | | 4,392,548 | |
| | | | | | | | | |
TOTAL INCREASE IN NET ASSETS | | | 8,932,908 | | | | 8,007,319 | |
| | | | | | | | | |
| NET ASSETS | | | | | | | | |
Beginning of year | | | 24,793,879 | | | | 16,786,560 | |
End of year | | $ | 33,726,787 | | | $ | 24,793,879 | |
| | | | | | | | | |
| UNDISTRIBUTED NET INVESTMENT INCOME | | $ | — | | | $ | — | |
| | | | | | | | | |
| SUMMARY OF CAPITAL SHARE ACTIVITY | | | | | | | | |
Shares sold | | | 1,660,349 | | | | 940,239 | |
| Shares issued in reinvestment of distributions to shareholders | | | — | | | | 1,088 | |
Shares redeemed | | | (877,441 | ) | | | (498,649 | ) |
Net increase in shares outstanding | | | 782,908 | | | | 442,678 | |
Shares outstanding, beginning of year | | | 2,285,384 | | | | 1,842,706 | |
Shares outstanding, end of year | | | 3,068,292 | | | | 2,285,384 | |
| See notes to financial statements. |
AVE MARIA WORLD EQUITY FUND
STATEMENTS OF CHANGES IN NET ASSETS
| | Year Ended December 31, 2011 | | | Period Ended December 31, 2010 (a) | |
| FROM OPERATIONS | | | | | | |
Net investment income | | $ | 101,354 | | | $ | 314 | |
Net realized losses from security transactions | | | (459,327 | ) | | | (55,817 | ) |
Net change in unrealized appreciation/depreciation
on investments | | | (1,875,908 | ) | | | 1,036,136 | |
| Net increase/(decrease) in net assets resulting from operations | | | (2,233,881 | ) | | | 980,633 | |
| | | | | | | | | |
| FROM DISTRIBUTIONS TO SHAREHOLDERS | | | | | | | | |
From net investment income | | | (101,671 | ) | | | — | |
| | | | | | | | | |
| FROM CAPITAL SHARE TRANSACTIONS | | | | | | | | |
Proceeds from shares sold | | | 13,105,585 | | | | 11,420,388 | |
Reinvestment of distributions to shareholders | | | 83,237 | | | | — | |
Payments for shares redeemed | | | (2,528,744 | ) | | | (401,413 | ) |
| Net increase in net assets from capital share transactions | | | 10,660,078 | | | | 11,018,975 | |
| | | | | | | | | |
TOTAL INCREASE IN NET ASSETS | | | 8,324,526 | | | | 11,999,608 | |
| | | | | | | | | |
| NET ASSETS | | | | | | | | |
Beginning of period | | | 11,999,608 | | | | — | |
End of period | | $ | 20,324,134 | | | $ | 11,999,608 | |
| | | | | | | | | |
| UNDISTRIBUTED NET INVESTMENT INCOME | | $ | — | | | $ | 314 | |
| | | | | | | | | |
| SUMMARY OF CAPITAL SHARE ACTIVITY | | | | | | | | |
Shares sold | | | 1,168,185 | | | | 1,107,387 | |
| Shares issued in reinvestment of distributions to shareholders | | | 8,233 | | | | — | |
Shares redeemed | | | (233,302 | ) | | | (40,218 | ) |
Net increase in shares outstanding | | | 943,116 | | | | 1,067,169 | |
Shares outstanding, beginning of period | | | 1,067,169 | | | | — | |
Shares outstanding, end of period | | | 2,010,285 | | | | 1,067,169 | |
| (a) | Represents the period from the initial public offering (April 30, 2010) through December 31, 2010. |
| |
| See notes to financial statements. |
AVE MARIA BOND FUND
STATEMENTS OF CHANGES IN NET ASSETS
| | Year Ended December 31, 2011 | | | Year Ended December 31, 2010 | |
| FROM OPERATIONS | | | | | | |
Net investment income | | $ | 1,653,397 | | | $ | 1,556,343 | |
Net realized gains from security transactions | | | 1,484,137 | | | | 1,035,733 | |
Net change in unrealized appreciation/depreciation
on investments | | | (478,907 | ) | | | 1,513,777 | |
| Net increase in net assets resulting from operations | | | 2,658,627 | | | | 4,105,853 | |
| | | | | | | | | |
| FROM DISTRIBUTIONS TO SHAREHOLDERS | | | | | | | | |
From net investment income, Class R | | | (1,652,494 | ) | | | (1,548,731 | ) |
From net investment income, Class I | | | — | | | | (7,253 | ) |
From net realized gains on investments, Class R | | | (1,484,137 | ) | | | (95,291 | ) |
| Decrease in net assets from distributions to shareholders | | | (3,136,631 | ) | | | (1,651,275 | ) |
| | | | | | | | | |
| FROM CAPITAL SHARE TRANSACTIONS | | | | | | | | |
| CLASS R (Note 1) | | | | | | | | |
Proceeds from shares sold | | | 31,882,930 | | | | 31,117,816 | |
Reinvestment of distributions to shareholders | | | 2,505,282 | | | | 1,368,393 | |
Payments for shares redeemed | | | (16,115,321 | ) | | | (12,110,415 | ) |
| Net increase in net assets from Class R capital share transactions | | | 18,272,891 | | | | 20,375,794 | |
| | | | | | | | | |
| CLASS I (Note 1) | | | | | | | | |
Payments for shares redeemed | | | — | | | | (2,768,633 | ) |
| | | | | | | | | |
TOTAL INCREASE IN NET ASSETS | | | 17,794,887 | | | | 20,061,739 | |
| | | | | | | | | |
| NET ASSETS | | | | | | | | |
Beginning of year | | | 74,606,479 | | | | 54,544,740 | |
End of year | | $ | 92,401,366 | | | $ | 74,606,479 | |
| | | | | | | | | |
| UNDISTRIBUTED NET INVESTMENT INCOME | | $ | 1,511 | | | $ | 608 | |
| | | | | | | | | |
| SUMMARY OF CAPITAL SHARE ACTIVITY | | | | | | | | |
| CLASS R (Note 1) | | | | | | | | |
Shares sold | | | 2,897,787 | | | | 2,898,913 | |
| Shares issued in reinvestment of distributions to shareholders | | | 229,151 | | | | 127,324 | |
Shares redeemed | | | (1,468,540 | ) | | | (1,123,758 | ) |
Net increase in shares outstanding | | | 1,658,398 | | | | 1,902,479 | |
Shares outstanding, beginning of year | | | 6,844,911 | | | | 4,942,432 | |
Shares outstanding, end of year | | | 8,503,309 | | | | 6,844,911 | |
| | | | | | | | | |
| CLASS I (Note 1) | | | | | | | | |
Shares redeemed | | | — | | | | (262,768 | ) |
Decrease in shares outstanding | | | — | | | | (262,768 | ) |
Shares outstanding, beginning of year | | | — | | | | 262,768 | |
Shares outstanding, end of year | | | — | | | | — | |
| See notes to financial statements. |
AVE MARIA CATHOLIC VALUES FUND
FINANCIAL HIGHLIGHTS
Per Share Data for a Share Outstanding Throughout Each Year
| | Year Ended December 31, 2011 | | | Year Ended December 31, 2010 | | | Year Ended December 31, 2009 | | | Year Ended December 31, 2008 | | | Year Ended December 31, 2007 | |
| Net asset value at beginning of year | | $ | 16.42 | | | $ | 13.63 | | | $ | 9.91 | | | $ | 15.70 | | | $ | 16.50 | |
| | | | | | | | | | | | | | | | | | | | | |
| Income/(loss) from investment operations: | | | | | | | | | | | | | | | | | | | | |
| Net investment income/(loss) | | | (0.01 | ) | | | 0.01 | | | | 0.01 | | | | (0.00 | )(a) | | | 0.00 | (a) |
Net realized and unrealized
gains/(losses) on investments | | | (0.21 | ) | | | 2.79 | | | | 3.72 | | | | (5.78 | ) | | | (0.67 | ) |
| Total from investment operations | | | (0.22 | ) | | | 2.80 | | | | 3.73 | | | | (5.78 | ) | | | (0.67 | ) |
| | | | | | | | | | | | | | | | | | | | | |
| Less distributions: | | | | | | | | | | | | | | | | | | | | |
From net investment income | | | — | | | | (0.01 | ) | | | (0.01 | ) | | | — | | | | (0.00 | )(a) |
| From net realized gains on investments | | | — | | | | — | | | | — | | | | (0.01 | ) | | | (0.13 | ) |
Total distributions | | | — | | | | (0.01 | ) | | | (0.01 | ) | | | (0.01 | ) | | | (0.13 | ) |
| | | | | | | | | | | | | | | | | | | | | |
Net asset value at end of year | | $ | 16.20 | | | $ | 16.42 | | | $ | 13.63 | | | $ | 9.91 | | | $ | 15.70 | |
| | | | | | | | | | | | | | | | | | | | | |
Total return (b) | | | (1.3% | ) | | | 20.5% | | | | 37.6% | | | | (36.8% | )(c) | | | (4.0% | )(c) |
| | | | | | | | | | | | | | | | | | | | | |
| Ratios/Supplementary Data: | | | | | | | | | | | | | | | | | | | | |
| Net assets at end of year (000’s) | | $ | 180,050 | | | $ | 187,913 | | | $ | 170,634 | | | $ | 132,814 | | | $ | 247,195 | |
| | | | | | | | | | | | | | | | | | | | | |
Ratio of net expenses to
average net assets (d) | | | 1.50% | | | | 1.50% | | | | 1.50% | | | | 1.50% | | | | 1.50% | |
| | | | | | | | | | | | | | | | | | | | | |
Ratio of net investment income/(loss)
to average net assets | | | (0.08% | ) | | | 0.04% | | | | 0.07% | | | | (0.03% | ) | | | 0.03% | |
| | | | | | | | | | | | | | | | | | | | | |
Portfolio turnover rate | | | 29% | | | | 33% | | | | 58% | | | | 53% | | | | 52% | |
| (a) | Amount rounds to less than $0.01 per share. |
| | |
| (b) | Total return is a measure of the change in value of an investment in the Fund over the years covered, which assumes any dividends or capital gains distributions are reinvested in shares of the Fund. The returns shown do not reflect the deduction of taxes a shareholder would pay on Fund distributions or the redemption of Fund shares. |
| | |
| (c) | During the years ended December 31, 2008 and 2007, the Fund received payments from the Adviser of $71,643 and $176,249, respectively, for losses realized on the disposal of investments purchased in violation of investment restrictions, which otherwise would have reduced the total return by 0.03% and 0.06%, respectively. |
| | |
| (d) | Absent investment advisory fee reductions by the Adviser, the ratio of expenses to average net assets would have been 1.51%, 1.56% and 1.54% for the years ended December 31, 2010, 2009 and 2008, respectively. |
| |
| See notes to financial statements. |
AVE MARIA GROWTH FUND
FINANCIAL HIGHLIGHTS
Per Share Data for a Share Outstanding Throughout Each Year
| | Year Ended December 31, 2011 | | | Year Ended December 31, 2010 | | | Year Ended December 31, 2009 | | | Year Ended December 31, 2008 | | | Year Ended December 31, 2007 | |
| Net asset value at beginning of year | | $ | 20.56 | | | $ | 16.26 | | | $ | 12.86 | | | $ | 18.94 | | | $ | 17.22 | |
| | | | | | | | | | | | | | | | | | | | | |
| Income/(loss) from investment operations: | | | | | | | | | | | | | | | | | | | | |
Net investment loss | | | (0.06 | ) | | | (0.05 | ) | | | (0.02 | ) | | | (0.06 | ) | | | (0.09 | ) |
Net realized and unrealized
gains/(losses) on investments | | | 0.17 | | | | 4.35 | | | | 3.42 | | | | (6.02 | ) | | | 2.09 | |
| Total from investment operations | | | 0.11 | | | | 4.30 | | | | 3.40 | | | | (6.08 | ) | | | 2.00 | |
| | | | | | | | | | | | | | | | | | | | | |
| Less distributions: | | | | | | | | | | | | | | | | | | | | |
| From net realized gains on investments | | | — | | | | — | | | | — | | | | — | | | | (0.28 | ) |
| | | | | | | | | | | | | | | | | | | | | |
Net asset value at end of year | | $ | 20.67 | | | $ | 20.56 | | | $ | 16.26 | | | $ | 12.86 | | | $ | 18.94 | |
| | | | | | | | | | | | | | | | | | | | | |
Total return (a) | | | 0.5% | | | | 26.5% | | | | 26.4% | | | | (32.1% | ) | | | 11.6% | |
| | | | | | | | | | | | | | | | | | | | | |
| Ratios/Supplementary Data: | | | | | | | | | | | | | | | | | | | | |
| Net assets at end of year (000’s) | | $ | 162,072 | | | $ | 147,443 | | | $ | 115,626 | | | $ | 83,911 | | | $ | 116,737 | |
| | | | | | | | | | | | | | | | | | | | | |
Ratio of net expenses to
average net assets (b) | | | 1.50% | | | | 1.50% | | | | 1.50% | | | | 1.50% | | | | 1.50% | |
| | | | | | | | | | | | | | | | | | | | | |
Ratio of net investment loss to
average net assets | | | (0.29% | ) | | | (0.29% | ) | | | (0.16% | ) | | | (0.35% | ) | | | (0.55% | ) |
| | | | | | | | | | | | | | | | | | | | | |
Portfolio turnover rate | | | 10% | | | | 25% | | | | 9% | | | | 22% | | | | 9% | |
| (a) | Total return is a measure of the change in value of an investment in the Fund over the years covered, which assumes any dividends or capital gains distributions are reinvested in shares of the Fund. The returns shown do not reflect the deduction of taxes a shareholder would pay on Fund distributions or the redemption of Fund shares. |
| | |
| (b) | Absent investment advisory fee reductions by the Adviser, the ratio of expenses to average net assets would have been 1.52%, 1.61%, 1.60% and 1.56% for the years ended December 31, 2010, 2009, 2008 and 2007, respectively. |
| | |
| See notes to financial statements. |
AVE MARIA RISING DIVIDEND FUND
FINANCIAL HIGHLIGHTS
Per Share Data for a Share Outstanding Throughout Each Year
| | Year Ended December 31, 2011 | | | Year Ended December 31, 2010 | | | Year Ended December 31, 2009 | | | Year Ended December 31, 2008 | | | Year Ended December 31, 2007 | |
| Net asset value at beginning of year | | $ | 12.51 | | | $ | 10.77 | | | $ | 8.72 | | | $ | 11.54 | | | $ | 12.08 | |
| | | | | | | | | | | | | | | | | | | | | |
| Income/(loss) from investment operations: | | | | | | | | | | | | | | | | | | | | |
Net investment income | | | 0.18 | | | | 0.17 | | | | 0.13 | | | | 0.15 | | | | 0.16 | |
Net realized and unrealized gains/(losses)
on investments | | | 0.40 | | | | 1.74 | | | | 2.05 | | | | (2.74 | ) | | | (0.22 | ) |
| Total from investment operations | | | 0.58 | | | | 1.91 | | | | 2.18 | | | | (2.59 | ) | | | (0.06 | ) |
| | | | | | | | | | | | | | | | | | | | | |
| Less distributions: | | | | | | | | | | | | | | | | | | | | |
From net investment income | | | (0.18 | ) | | | (0.17 | ) | | | (0.13 | ) | | | (0.15 | ) | | | (0.16 | ) |
| From net realized gains on investments | | | (0.23 | ) | | | — | | | | — | | | | (0.08 | ) | | | (0.32 | ) |
Total distributions | | | (0.41 | ) | | | (0.17 | ) | | | (0.13 | ) | | | (0.23 | ) | | | (0.48 | ) |
| | | | | | | | | | | | | | | | | | | | | |
Net asset value at end of year | | $ | 12.68 | | | $ | 12.51 | | | $ | 10.77 | | | $ | 8.72 | | | $ | 11.54 | |
| | | | | | | | | | | | | | | | | | | | | |
Total return (a) | | | 4.6% | | | | 17.9% | | | | 25.3% | | | | (22.8% | ) | | | (0.6% | ) |
| | | | | | | | | | | | | | | | | | | | | |
| Ratios/Supplementary Data: | | | | | | | | | | | | | | | | | | | | |
| Net assets at end of year (000’s) | | $ | 223,982 | | | $ | 127,022 | | | $ | 102,861 | | | $ | 67,102 | | | $ | 82,743 | |
| | | | | | | | | | | | | | | | | | | | | |
Ratio of expenses to
average net assets | | | 1.02% | | | | 1.06% | | | | 1.11% | | | | 1.15% | | | | 1.14% | |
| | | | | | | | | | | | | | | | | | | | | |
Ratio of net investment income to
average net assets | | | 1.45% | | | | 1.52% | | | | 1.42% | | | | 1.41% | | | | 1.26% | |
| | | | | | | | | | | | | | | | | | | | | |
Portfolio turnover rate | | | 22% | | | | 34% | | | | 63% | | | | 39% | | | | 41% | |
| (a) | Total return is a measure of the change in value of an investment in the Fund over the years covered, which assumes any dividends or capital gains distributions are reinvested in shares of the Fund. The returns shown do not reflect the deduction of taxes a shareholder would pay on Fund distributions or the redemption of Fund shares. |
| |
| See notes to financial statements. |
AVE MARIA OPPORTUNITY FUND
FINANCIAL HIGHLIGHTS
Per Share Data for a Share Outstanding Throughout Each Year
| | Year Ended December 31, 2011 | | | Year Ended December 31, 2010 | | | Year Ended December 31, 2009 | | | Year Ended December 31, 2008 | | | Year Ended December 31, 2007 | |
| Net asset value at beginning of year | | $ | 10.85 | | | $ | 9.11 | | | $ | 6.47 | | | $ | 9.58 | | | $ | 10.55 | |
| | | | | | | | | | | | | | | | | | | | | |
| Income/(loss) from investment operations: | | | | | | | | | | | | | | | | | | | | |
| Net investment income/(loss) | | | (0.03 | ) | | | 0.01 | | | | (0.02 | ) | | | 0.03 | | | | 0.07 | |
Net realized and unrealized
gains/(losses) on investments | | | 0.17 | | | | 1.74 | | | | 2.66 | | | | (3.11 | ) | | | (0.97 | ) |
| Total from investment operations | | | 0.14 | | | | 1.75 | | | | 2.64 | | | | (3.08 | ) | | | (0.90 | ) |
| | | | | | | | | | | | | | | | | | | | | |
| Less distributions: | | | | | | | | | | | | | | | | | | | | |
From net investment income | | | — | | | | (0.01 | ) | | | — | | | | (0.03 | ) | | | (0.07 | ) |
| | | | | | | | | | | | | | | | | | | | | |
Net asset value at end of year | | $ | 10.99 | | | $ | 10.85 | | | $ | 9.11 | | | $ | 6.47 | | | $ | 9.58 | |
| | | | | | | | | | | | | | | | | | | | | |
Total return (a) | | | 1.3% | | | | 19.2% | | | | 40.8% | | | | (32.2% | ) | | | (8.5% | ) |
| | | | | | | | | | | | | | | | | | | | | |
| Ratios/Supplementary Data: | | | | | | | | | | | | | | | | | | | | |
| Net assets at end of year (000’s) | | $ | 33,727 | | | $ | 24,794 | | | $ | 16,787 | | | $ | 9,859 | | | $ | 18,163 | |
| | | | | | | | | | | | | | | | | | | | | |
Ratio of net expenses to
average net assets (b) | | | 1.25% | | | | 1.25% | | | | 1.25% | | | | 1.25% | | | | 1.25% | |
| | | | | | | | | | | | | | | | | | | | | |
Ratio of net investment income/(loss) to
average net assets | | | (0.32% | ) | | | 0.07% | | | | (0.25% | ) | | | 0.29% | | | | 0.66% | |
| | | | | | | | | | | | | | | | | | | | | |
Portfolio turnover rate | | | 101% | | | | 81% | | | | 113% | | | | 276% | | | | 126% | |
| (a) | Total return is a measure of the change in value of an investment in the Fund over the years covered, which assumes any dividends or capital gains distributions are reinvested in shares of the Fund. The returns shown do not reflect the deduction of taxes a shareholder would pay on Fund distributions or the redemption of Fund shares. |
| | |
| (b) | Absent investment advisory fee reductions and expense reimbursements by the Adviser, the ratio of expenses to average net assets would have been 1.48%, 1.79%, 2.31%, 2.29% and 1.80% for the years ended December 31, 2011, 2010, 2009, 2008 and 2007, respectively. |
| | |
| See notes to financial statements. |
AVE MARIA WORLD EQUITY FUND
FINANCIAL HIGHLIGHTS
Per Share Data for a Share Outstanding Throughout Each Period
| | Year Ended December 31, 2011 | | | Period Ended December 31, 2010(a) | |
| Net asset value at beginning of period | | $ | 11.24 | | | $ | 10.00 | |
| | | | | | | | | |
| Income/(loss) from investment operations: | | | | | | | | |
| Net investment income | | | 0.05 | | | | 0.00 | (b) |
| Net realized and unrealized gains/(losses) on investments | | | (1.13 | ) | | | 1.24 | |
| Total from investment operations | | | (1.08 | ) | | | 1.24 | |
| | | | | | | | | |
| Less distributions: | | | | | | | | |
| From net investment income | | | (0.05 | ) | | | — | |
| | | | | | | | | |
| Net asset value at end of period | | $ | 10.11 | | | $ | 11.24 | |
| | | | | | | | | |
Total return (c) | | | (9.6% | ) | | | 12.4% | (d) |
| | | | | | | | | |
| Ratios/Supplementary Data: | | | | | | | | |
| Net assets at end of period (000’s) | | $ | 20,324 | | | $ | 12,000 | |
| | | | | | | | | |
Ratio of net expenses to average net assets (e) | | | 1.50% | | | | 1.50% | (f) |
| | | | | | | | | |
| Ratio of net investment income to average net assets | | | 0.58% | | | | 0.01% | (f) |
| | | | | | | | | |
| Portfolio turnover rate | | | 13% | | | | 5% | (d) |
| (a) | Represents the period from the initial public offering (April 30, 2010) through December 31, 2010. |
| | |
| (b) | Amount rounds to less than $0.01 per share. |
| | |
| (c) | Total return is a measure of the change in value of an investment in the Fund over the periods covered, which assumes any dividends or capital gains distributions are reinvested in shares of the Fund. The returns shown do not reflect the deduction of taxes a shareholder would pay on Fund distributions or the redemption of Fund shares. |
| | |
| (d) | Not annualized. |
| | |
| (e) | Absent investment advisory fee reductions by the Adviser, the ratio of expenses to average net assets would have been 1.78% and 2.45%(f) for the periods ended December 31, 2011 and 2010, respectively. |
| | |
| (f) | Annualized. |
| | |
| See notes to financial statements. |
AVE MARIA BOND FUND
FINANCIAL HIGHLIGHTS
Per Share Data for a Share Outstanding Throughout Each Year
| | Year Ended December 31, 2011 | | | Year Ended December 31, 2010 | | | Year Ended December 31, 2009 | | | Year Ended December 31, 2008 | | | Year Ended December 31, 2007 | |
| Net asset value at beginning of year | | $ | 10.90 | | | $ | 10.48 | | | $ | 9.79 | | | $ | 10.12 | | | $ | 10.25 | |
| | | | | | | | | | | | | | | | | | | | | |
| Income/(loss) from investment operations: | | | | | | | | | | | | | | | | | | | | |
Net investment income | | | 0.21 | | | | 0.26 | | | | 0.29 | | | | 0.36 | | | | 0.38 | |
Net realized and unrealized
gains/(losses) on investments | | | 0.15 | | | | 0.43 | | | | 0.69 | | | | (0.33 | ) | | | 0.10 | |
| Total from investment operations | | | 0.36 | | | | 0.69 | | | | 0.98 | | | | 0.03 | | | | 0.48 | |
| | | | | | | | | | | | | | | | | | | | | |
| Less distributions: | | | | | | | | | | | | | | | | | | | | |
From net investment income | | | (0.21 | ) | | | (0.26 | ) | | | (0.29 | ) | | | (0.36 | ) | | | (0.38 | ) |
| From net realized gains on investments | | | (0.18 | ) | | | (0.01 | ) | | | — | | | | (0.00 | )(a) | | | (0.23 | ) |
Total distributions | | | (0.39 | ) | | | (0.27 | ) | | | (0.29 | ) | | | (0.36 | ) | | | (0.61 | ) |
| | | | | | | | | | | | | | | | | | | | | |
Net asset value at end of year | | $ | 10.87 | | | $ | 10.90 | | | $ | 10.48 | | | $ | 9.79 | | | $ | 10.12 | |
| | | | | | | | | | | | | | | | | | | | | |
Total return (b) | | | 3.3% | | | | 6.7% | | | | 10.2% | | | | 0.3% | | | | 4.8% | |
| | | | | | | | | | | | | | | | | | | | | |
| Ratios/Supplementary Data: | | | | | | | | | | | | | | | | | | | | |
| Net assets at end of year (000’s) | | $ | 92,401 | | | $ | 74,606 | | | $ | 51,788 | | | $ | 38,136 | | | $ | 34,178 | |
| | | | | | | | | | | | | | | | | | | | | |
Ratio of net expenses to
average net assets (c) | | | 0.70% | | | | 0.70% | | | | 0.66% | | | | 0.62% | | | | 0.65% | |
| | | | | | | | | | | | | | | | | | | | | |
Ratio of net investment income to
average net assets | | | 1.96% | | | | 2.38% | | | | 2.90% | | | | 3.63% | | | | 3.69% | |
| | | | | | | | | | | | | | | | | | | | | |
Portfolio turnover rate | | | 27% | | | | 24% | | | | 27% | | | | 63% | | | | 45% | |
| (a) | Amount rounds to less than $0.01 per share. |
| | |
| (b) | Total return is a measure of the change in value of an investment in the Fund over the years covered, which assumes any dividends or capital gains distributions are reinvested in shares of the Fund. The returns shown do not reflect the deduction of taxes a shareholder would pay on Fund distributions or the redemption of Fund shares. |
| | |
| (c) | Absent investment advisory fee reductions and expense reimbursements by the Adviser, the ratio of expenses to average net assets would have been 0.73%, 0.85%, 0.93%, 0.91% and 0.96% for the years ended December 31, 2011, 2010, 2009, 2008 and 2007, respectively. |
| |
| See notes to financial statements. |
AVE MARIA MUTUAL FUNDS
NOTES TO FINANCIAL STATEMENTS
| 1. | Organization and Significant Accounting Policies |
The Ave Maria Catholic Values Fund, the Ave Maria Growth Fund, the Ave Maria Rising Dividend Fund, the Ave Maria Opportunity Fund, the Ave Maria World Equity Fund and the Ave Maria Bond Fund (collectively, the “Funds”) are each a diversified series of the Schwartz Investment Trust (the “Trust”), an open-end management investment company registered under the Investment Company Act of 1940 and established as an Ohio business trust under a Declaration of Trust dated August 31, 1992. The Ave Maria Catholic Values Fund commenced the public offering of its shares on May 1, 2001. The public offering of shares of the Ave Maria Growth Fund and the Ave Maria Bond Fund commenced on May 1, 2003. The Ave Maria Rising Dividend Fund commenced the public offering of its shares on May 2, 2005. The Ave Maria Opportunity Fund commenced the public offering of its shares on May 1, 2006. The Ave Maria World Equity Fund commenced the public offering of its shares on April 30, 2010.
The investment objective of the Ave Maria Catholic Values Fund is to seek long-term capital appreciation from equity investments in companies that do not violate core values and teachings of the Roman Catholic Church. The investment objective of the Ave Maria Growth Fund is to seek long-term capital appreciation, using the growth style, from equity investments in companies that do not violate core values and teachings of the Roman Catholic Church. The investment objective of the Ave Maria Rising Dividend Fund is to provide increasing dividend income over time, long-term growth of capital, and a reasonable level of current income from investments in dividend-paying common stocks of companies that do not violate core values and teachings of the Roman Catholic Church. The investment objective of the Ave Maria Opportunity Fund is long-term capital appreciation from equity investments in companies that do not violate core values and teachings of the Roman Catholic Church. The investment objective of the Ave Maria World Equity Fund is to seek long-term capital appreciation from equity investments in U.S. and non-U.S. companies that do not violate core values and teachings of the Roman Catholic Church. The investment objective of the Ave Maria Bond Fund is to seek preservation of principal with a reasonable level of current income in corporate debt and equity securities that do not violate core values and teachings of the Roman Catholic Church. See the Funds’ Prospectus for information regarding the investment strategies of each Fund.
Prior to February 13, 2010, the Ave Maria Bond Fund offered two classes of shares: Class I shares (sold subject to a distribution fee of up to 0.10% of the average daily net assets attributable to Class I shares) and Class R shares (sold subject to a distribution fee of up to 0.25% of the average daily net assets attributable to Class R shares). Each class of shares represented an interest in the same assets of the Fund, had the same rights and was identical in all material respects except that: (1) Class R shares bore the expenses of higher distribution fees; (2) certain other class-specific expenses were borne solely by the class to which such expenses were attributable; (3) each class had exclusive voting
AVE MARIA MUTUAL FUNDS
NOTES TO FINANCIAL STATEMENTS
rights with respect to matters relating to its own distribution arrangements; and (4) Class I shares required an initial investment of $10 million. Investment income earned, realized capital gains and losses, and unrealized appreciation and depreciation were allocated daily to each class of shares based upon its proportionate share of total net assets of the Fund. Class-specific expenses were charged directly to the class incurring the expense. Common expenses which were not attributable to a specific class were allocated daily to each class of shares based upon its proportionate share of total net assets of the Fund.
At a meeting held on February 13, 2010, the Board of Trustees approved the termination of Class I shares of the Ave Maria Bond Fund. In addition, the “Class R” designation previously assigned to the sole remaining class of shares of the Ave Maria Bond Fund was eliminated.
Shares of each Fund are sold at net asset value. To calculate the net asset value, each Fund’s assets are valued and totaled, liabilities are subtracted, and the balance is divided by the number of shares outstanding. The offering price and redemption price per share are equal to the net asset value per share for each Fund.
The following is a summary of significant accounting policies followed by the Funds:
(a) Valuation of investments – Securities which are traded on stock exchanges are valued at the closing sales price as of the close of the regular session of trading on the New York Stock Exchange on the day the securities are being valued, or, if not traded on a particular day, at the closing bid price. Securities which are quoted by NASDAQ are valued at the NASDAQ Official Closing Price. Securities traded in the over-the-counter market are valued at the last reported sales price or, if there is no reported sale on the valuation date, at the most recently quoted bid price. Securities which are traded both in the over-the-counter market and on a stock exchange are valued according to the broadest and most representative market. Investments in shares of other open-end investment companies are valued at their net asset value as reported by such companies. Securities (and other assets) for which market quotations are not readily available are valued at their fair value as determined in good faith in accordance with consistently applied procedures established by and under the general supervision of the Board of Trustees, and will be classified as Level 2 or 3 (see below) within the fair value hierarchy, depending on the inputs used. Fair value pricing may be used, for example, in situations where (i) a portfolio security is so thinly traded that there have been no transactions for that stock over an extended period of time; (ii) the exchange on which the portfolio security is principally traded closes early; or (iii) trading of the portfolio security is halted during the day and does not resume prior to a Fund’s net asset value calculation. A portfolio security’s “fair value” price may differ from the price next available for that portfolio security using the Funds’ normal pricing procedures. Short-term instruments (those with remaining maturities of 60 days or less at the time of purchase) are valued at amortized cost, which approximates market value.
AVE MARIA MUTUAL FUNDS
NOTES TO FINANCIAL STATEMENTS
(Continued)
Accounting principles generally accepted in the United States (“GAAP”) establish a single authoritative definition of fair value, set out a framework for measuring fair value and require additional disclosures about fair value measurements.
Various inputs are used in determining the value of each Fund’s investments. These inputs are summarized in the three broad levels listed below:
| | • | Level 1 – quoted prices in active markets for identical securities |
| | • | Level 2 – other significant observable inputs |
| | • | Level 3 – significant unobservable inputs |
For example, Repurchase Agreements held by the Ave Maria Opportunity Fund and U.S. Treasury Obligations, U.S. Government Agency Obligations and Corporate Bonds held by the Ave Maria Bond Fund are classified as Level 2 since values for the underlying collateral for the Repurchase Agreements and the values for U.S. Treasury Obligations, U.S. Government Agency Obligations and Corporate Bonds are based on prices provided by an independent pricing service that utilizes various “other significant observable inputs” including bid and ask quotations, prices of similar securities and interest rates, among other factors.
The inputs or methodology used for valuing securities are not necessarily an indication of the risks associated with investing in those securities. The inputs used to measure fair value may fall into different levels of the fair value hierarchy. In such cases, for disclosure purposes, the level in the fair value hierarchy within which the fair value measurement falls in its entirety is determined based on the lowest level input that is significant to the fair value measurement.
The following is a summary of the inputs used to value the Funds’ investments by security type as of December 31, 2011:
Ave Maria Catholic Values Fund | | | | | | | | | | | | |
Common Stocks | | $ | 171,314,858 | | | $ | — | | | $ | — | | | $ | 171,314,858 | |
Exchange-Traded Funds | | | 7,599,500 | | | | — | | | | — | | | | 7,599,500 | |
Money Market Funds | | | 1,503,385 | | | | — | | | | — | | | | 1,503,385 | |
Total | | $ | 180,417,743 | | | $ | — | | | $ | — | | | $ | 180,417,743 | |
| | | | | | | | | | | | |
Common Stocks | | $ | 161,131,004 | | | $ | — | | | $ | — | | | $ | 161,131,004 | |
Money Market Funds | | | 1,300,041 | | | | — | | | | — | | | | 1,300,041 | |
Total | | $ | 162,431,045 | | | $ | — | | | $ | — | | | $ | 162,431,045 | |
AVE MARIA MUTUAL FUNDS
NOTES TO FINANCIAL STATEMENTS
Ave Maria Rising Dividend Fund | | | | | | | | | | | | |
Common Stocks | | $ | 211,604,950 | | | $ | — | | | $ | — | | | $ | 211,604,950 | |
Money Market Funds | | | 20,662,332 | | | | — | | | | — | | | | 20,662,332 | |
Total | | $ | 232,267,282 | | | $ | — | | | $ | — | | | $ | 232,267,282 | |
Ave Maria Opportunity Fund | | | | | | | | | | | | |
Common Stocks | | $ | 28,947,593 | | | $ | — | | | $ | — | | | $ | 28,947,593 | |
Exchange-Traded Funds | | | 1,383,109 | | | | — | | | | — | | | | 1,383,109 | |
Repurchase Agreements | | | — | | | | 236,884 | | | | — | | | | 236,884 | |
Money Market Funds | | | 4,660,554 | | | | — | | | | — | | | | 4,660,554 | |
Total | | $ | 34,991,256 | | | $ | 236,884 | | | $ | — | | | $ | 35,228,140 | |
Ave Maria World Equity Fund | | | | | | | | | | | | |
Common Stocks | | $ | 18,352,375 | | | $ | — | | | $ | — | | | $ | 18,352,375 | |
Exchange-Traded Funds | | | 607,960 | | | | — | | | | — | | | | 607,960 | |
Money Market Funds | | | 2,253,214 | | | | — | | | | — | | | | 2,253,214 | |
Total | | $ | 21,213,549 | | | $ | — | | | $ | — | | | $ | 21,213,549 | |
| | | | | | | | | | | | |
U.S. Treasury Obligations | | $ | — | | | $ | 14,833,847 | | | $ | — | | | $ | 14,833,847 | |
U.S. Government Agency Obligations | | | — | | | | 5,736,384 | | | | — | | | | 5,736,384 | |
Corporate Bonds | | | — | | | | 45,781,404 | | | | — | | | | 45,781,404 | |
Common Stocks | | | 18,178,290 | | | | — | | | | — | | | | 18,178,290 | |
Money Market Funds | | | 7,334,849 | | | | — | | | | — | | | | 7,334,849 | |
Total | | $ | 25,513,139 | | | $ | 66,351,635 | | | $ | — | | | $ | 91,864,774 | |
Refer to each Fund’s Schedule of Investments for a listing of the securities valued using Level 1 and Level 2 inputs by security type and sector or industry type. As of December 31, 2011, the Funds did not have any significant transfers in and out of any Level. There were no Level 3 securities or derivative instruments held by the Funds as of the year ended December 31, 2011. It is the Funds’ policy to recognize transfers into and out of all Levels at the end of the reporting period.
(b) Income taxes – It is each Fund’s policy to comply with the special provisions of Subchapter M of the Internal Revenue Code applicable to regulated investment companies. As provided therein, in any fiscal year in which a Fund so qualifies and distributes at least 90% of its taxable income, such Fund (but not the shareholders) will be relieved of federal income tax on the income distributed. Accordingly, no provision for income taxes has been made.
AVE MARIA MUTUAL FUNDS
NOTES TO FINANCIAL STATEMENTS
In order to avoid imposition of the excise tax applicable to regulated investment companies, it is also each Fund’s intention to declare as dividends in each calendar year at least 98% of its net investment income and 98.2% of its net realized capital gains plus undistributed amounts from prior years.
The following information is computed on a tax basis for each item as of December 31, 2011:
| | Ave Maria Catholic Values Fund | | | | | | Ave Maria Rising Dividend Fund | | | | | | Ave Maria World Equity Fund | | | | |
Undistributed
ordinary income | | $ | — | | | $ | — | | | $ | 1,286 | | | $ | — | | | $ | — | | | $ | 1,511 | |
Capital loss carryforwards | | | (2,339,741 | ) | | | (327,279 | ) | | | — | | | | (588,611 | ) | | | (515,144 | ) | | | — | |
| Net unrealized appreciation/(depreciation) | | | 25,238,754 | | | | 37,730,721 | | | | 15,770,081 | | | | 2,834,463 | | | | (839,772 | ) | | | 3,646,601 | |
Total distributable
earnings/(deficit) | | $ | 22,899,013 | | | $ | 37,403,442 | | | $ | 15,771,367 | | | $ | 2,245,852 | | | $ | (1,354,916 | ) | | $ | 3,648,112 | |
As of December 31, 2011, the Funds had the following capital loss carryforwards for federal income tax purposes:
| | | Ave Maria Catholic Values Fund | | | | | | | | | Ave Maria World Equity Fund | |
Expires December 31, 2016 | | $ | — | | | $ | — | | | $ | 588,611 | | | $ | — | |
Expires December 31, 2017 | | | 2,339,741 | | | | 218,750 | | | | — | | | | — | |
Expires December 31, 2018 | | | — | | | | — | | | | — | | | | 55,817 | |
No expiration - short-term | | | — | | | | 108,529 | | | | — | | | | 339,676 | |
No expiration - long-term | | | — | | | | — | | | | — | | | | 119,651 | |
| | | $ | 2,339,741 | | | $ | 327,279 | | | $ | 588,611 | | | $ | 515,144 | |
These capital loss carryforwards may be utilized in future years to offset net realized capital gains, if any, prior to distributing such gains to shareholders. Under the recently enacted Regulated Investment Company Modernization Act of 2010, the Funds are permitted to carry forward capital losses incurred in taxable years beginning after December 22, 2010 for an unlimited period. Capital losses incurred during post-enactment taxable years are required to be utilized prior to those losses incurred in pre-enactment taxable years. As a result of this ordering rule, pre-enactment capital loss carryforwards are more likely to expire unused. Also, post-enactment capital losses that are carried forward will retain their character as either short-term or long-term capital losses rather than being considered all short-term as under previous law.
During the year ended December 31, 2011, the Ave Maria Catholic Values Fund, the Ave Maria Rising Dividend Fund and the Ave Maria Opportunity Fund utilized
AVE MARIA MUTUAL FUNDS
NOTES TO FINANCIAL STATEMENTS
capital loss carryforwards to offset current year realized gains in the amount of $13,187,141, $4,565,142 and $2,301,557, respectively.
The following information is based upon the federal income tax cost of the Funds’ investment securities as of December 31, 2011:
| | Ave Maria Catholic Values Fund | | | | | | Ave Maria Rising Dividend Fund | | | | | | Ave Maria World Equity Fund | | | | |
| Gross unrealized appreciation | | $ | 37,152,187 | | | $ | 43,480,068 | | | $ | 24,874,431 | | | $ | 3,742,110 | | | $ | 1,346,837 | | | $ | 4,487,120 | |
| Gross unrealized depreciation | | | (11,913,433 | ) | | | (5,749,347 | ) | | | (9,104,350 | ) | | | (907,647 | ) | | | (2,186,609 | ) | | | (840,519 | ) |
| Net unrealized appreciation/(depreciation) | | $ | 25,238,754 | | | $ | 37,730,721 | | | $ | 15,770,081 | | | $ | 2,834,463 | | | $ | (839,772 | ) | | $ | 3,646,601 | |
Federal income tax cost | | $ | 155,178,989 | | | $ | 124,700,324 | | | $ | 216,497,201 | | | $ | 32,393,677 | | | $ | 22,053,321 | | | $ | 88,218,173 | |
The difference between the federal income tax cost of portfolio investments and the financial statement cost for the Ave Maria Catholic Values Fund, the Ave Maria Growth Fund, the Ave Maria Rising Dividend Fund and the Ave Maria Opportunity Fund is due to certain timing differences in the recognition of capital losses under income tax regulations and GAAP. These “book/tax” differences are temporary in nature and are due to the tax deferral of losses on wash sales.
For the year ended December 31, 2011, the Ave Maria Catholic Values Fund reclassified $163,758 of net investment loss against paid-in capital; the Ave Maria Growth Fund reclassified $470,146 of net investment loss against paid-in capital; the Ave Maria Opportunity Fund reclassified $99,479 of net investment loss against paid-in capital; and the Ave Maria World Equity Fund reclassified $3 of distributions in excess of net investment income against paid-in capital. These reclassifications are reflected on the Statements of Assets and Liabilities. Such reclassifications, the result of permanent differences between the financial statement and the income tax reporting requirements, have no effect on each Fund’s net assets or net asset value per share.
The Funds recognize the tax benefits or expenses of uncertain tax positions only when the position is “more-likely-than-not” to be sustained assuming examination by tax authorities. Management has reviewed the tax positions taken on federal income tax returns for all open tax years (tax years ended December 31, 2008 through December 31, 2011) and has concluded that no provision for unrecognized tax benefits or expenses is required in these financial statements.
(c) Security transactions and investment income – Security transactions are accounted for on the trade date. Dividend income is recorded on the ex-dividend date. Interest income is recognized on the accrual basis. Realized gains and losses on securities sold are determined on a specific identification basis. Discounts and premiums on fixed-income securities purchased are amortized using the interest method.
AVE MARIA MUTUAL FUNDS
NOTES TO FINANCIAL STATEMENTS
(d) Dividends and distributions – Dividends from net investment income, if any, are declared and paid annually in December for the Ave Maria Catholic Values Fund, the Ave Maria Growth Fund, the Ave Maria Opportunity Fund and the Ave Maria World Equity Fund. Dividends from net investment income, if any, are declared and paid quarterly for the Ave Maria Rising Dividend Fund and are declared and paid monthly for the Ave Maria Bond Fund. Each Fund expects to distribute any net realized capital gains annually. Dividends and distributions to shareholders are recorded on the ex-dividend date. The tax character of distributions paid during the years ended December 31, 2011 and December 31, 2010 was as follows:
| | | | | | | | | |
| Ave Maria Catholic Values Fund: | | | | | | | | | |
December 31, 2011 | | $ | — | | | $ | — | | | $ | — | |
December 31, 2010 | | $ | 107,531 | | | $ | — | | | $ | 107,531 | |
| Ave Maria Rising Dividend Fund: | | | | | | | | | | | | |
December 31, 2011 | | $ | 2,551,115 | | | $ | 3,914,949 | | | $ | 6,466,064 | |
December 31, 2010 | | $ | 1,746,969 | | | $ | — | | | $ | 1,746,969 | |
| Ave Maria Opportunity Fund: | | | | | | | | | | | | |
December 31, 2011 | | $ | — | | | $ | — | | | $ | — | |
December 31, 2010 | | $ | 13,091 | | | $ | — | | | $ | 13,091 | |
| Ave Maria World Equity Fund: | | | | | | | | | | | | |
December 31, 2011 | | $ | 101,671 | | | $ | — | | | $ | 101,671 | |
December 31, 2010 | | $ | — | | | $ | — | | | $ | — | |
| Ave Maria Bond Fund - Class R: | | | | | | | | | | | | |
December 31, 2011 | | $ | 1,719,803 | | | $ | 1,416,828 | | | $ | 3,136,631 | |
December 31, 2010 | | $ | 1,548,731 | | | $ | 95,291 | | | $ | 1,644,022 | |
| Ave Maria Bond Fund - Class I: | | | | | | | | | | | | |
December 31, 2011 | | $ | — | | | $ | — | | | $ | — | |
December 31, 2010 | | $ | 7,253 | | | $ | — | | | $ | 7,253 | |
During the years ended December 31, 2011 and December 31, 2010, there were no distributions paid to shareholders of the Ave Maria Growth Fund.
(e) Repurchase agreements – The Funds may enter into repurchase agreements (agreements to purchase securities subject to the seller’s agreement to repurchase them at a specified time and price) with well-established securities dealers or banks. Repurchase agreements may be deemed to be loans by the Funds. It is each Fund’s policy to take possession of obligations issued or guaranteed by the U.S. Government or its agencies or instrumentalities as collateral under a repurchase agreement and, on a daily basis, mark-to-market such obligations to ensure that their value, including
AVE MARIA MUTUAL FUNDS
NOTES TO FINANCIAL STATEMENTS
accrued interest, is at least equal to the amount to be repaid to the Fund under the repurchase agreement. If the seller defaults, and the fair value of the collateral declines, realization of the collateral by the Funds may be delayed or limited.
(f) Estimates – The preparation of financial statements in conformity with GAAP requires management to make estimates and assumptions that affect the reported amounts of assets and liabilities and disclosure of contingent assets and liabilities as of the date of the financial statements and the reported amounts of revenues and expenses during the reporting period. Actual results could differ from those estimates.
(g) Common expenses – Common expenses of the Trust are allocated among the Funds of the Trust based on relative net assets of each Fund of the nature of the services performed and the relative applicability to each Fund.
| 2. | Investment Advisory Agreements and Transactions with Related Parties |
The Chairman and President of the Trust is also the President and Chief Investment Officer of Schwartz Investment Counsel, Inc. (the “Adviser”). Certain other officers of the Trust are officers of the Adviser, or of Ultimus Fund Solutions, LLC (“Ultimus”), the administrative, accounting and transfer agent for the Funds, or of Ultimus Fund Distributors, LLC (the “Distributor”), the Funds’ principal underwriter.
Pursuant to Investment Advisory Agreements between the Trust and the Adviser, the Adviser is responsible for the management of each Fund and provides investment advice along with the necessary personnel, facilities, equipment and certain other services necessary to the operations of the Funds. The Adviser receives from each of the Ave Maria Catholic Values Fund, the Ave Maria Growth Fund, the Ave Maria Opportunity Fund and the Ave Maria World Equity Fund a quarterly fee at the annual rate of 0.95% of its average daily net assets. The Adviser receives from the Ave Maria Rising Dividend Fund and the Ave Maria Bond Fund a quarterly fee at the annual rate of 0.75% and 0.30%, respectively, of average daily net assets.
The Adviser has contractually agreed to reduce its advisory fees or reimburse a portion of operating expenses until at least May 1, 2013 so that: the net expenses of the Ave Maria Catholic Values Fund, the Ave Maria Growth Fund and the Ave Maria World Equity Fund do not exceed 1.50% of average daily net assets; the net expenses of the Ave Maria Rising Dividend Fund and the Ave Maria Opportunity Fund do not exceed 1.25% of average daily net assets; and the net expenses of the Ave Maria Bond Fund do not exceed 0.70% of average daily net assets. For the year ended December 31, 2011, the Adviser reduced its investment advisory fees by $71,816 with respect to the Ave Maria Opportunity Fund; reduced its investment advisory fees by $48,996 with respect to the Ave Maria World Equity Fund; and reduced its investment advisory fees by $25,836 with respect to the Ave Maria Bond Fund.
AVE MARIA MUTUAL FUNDS
NOTES TO FINANCIAL STATEMENTS
Any fee reductions or expense reimbursements by the Adviser are subject to repayment by the Funds for a period of three years from the time such reductions or reimbursements occurred, provided the Funds are able to effect such repayment and remain in compliance with any undertaking by the Adviser to limit expenses of the Funds. During the year ended December 31, 2011, the Adviser recouped previous investment advisory fee reductions and expense reimbursements of $80,509 from the Ave Maria Catholic Values Fund and $122,050 from the Ave Maria Growth Fund. As of December 31, 2011, the amounts of fee reductions and expense reimbursements available for reimbursement to the Adviser are as follows:
| Ave Maria Catholic Values Fund | | $ | 79,351 | |
| Ave Maria Growth Fund | | $ | 112,106 | |
| Ave Maria Opportunity Fund | | $ | 313,066 | |
| Ave Maria World Equity Fund | | $ | 95,661 | |
| Ave Maria Bond Fund | | $ | 262,861 | |
The Adviser may recapture a portion of the above amounts no later than the dates as stated below:
| | | | | | | | | |
| Ave Maria Catholic Values Fund | | $ | 67,471 | | | $ | 11,880 | | | $ | — | |
| Ave Maria Growth Fund | | $ | 83,128 | | | $ | 28,978 | | | $ | — | |
| Ave Maria Opportunity Fund | | $ | 132,606 | | | $ | 108,644 | | | $ | 71,816 | |
| Ave Maria World Equity Fund | | $ | — | | | $ | 46,665 | | | $ | 48,996 | |
| Ave Maria Bond Fund | | $ | 135,726 | | | $ | 101,299 | | | $ | 25,836 | |
The Chief Compliance Officer of the Trust (the “CCO”) is an employee of the Adviser. The Trust pays the Adviser $27,500 annually for providing CCO services, of which each Fund pays its proportionate share along with the other series of the Trust. In addition, the Trust reimburses the Adviser for out-of-pocket expenses incurred, if any, for providing these services.
JLB & Associates, Inc. (“JLB”) has been retained by the Adviser to manage the investments of the Ave Maria Growth Fund pursuant to the terms of a Sub-Advisory Agreement. The Adviser (not the Fund) pays JLB a fee at an annual rate of 0.30% of the average value of the Fund’s daily net assets. JLB’s fees are reduced on a pro rata basis to the extent that the Adviser reduces its advisory fees or reimburses expenses of the Ave Maria Growth Fund.
Pursuant to a Mutual Fund Services Agreement between the Trust and Ultimus, Ultimus supplies regulatory and compliance services, calculates the daily net asset value per share, maintains the financial books and records of the Funds, maintains the
AVE MARIA MUTUAL FUNDS
NOTES TO FINANCIAL STATEMENTS
records of each shareholder’s account, and processes purchases and redemptions of each Fund’s shares. For the performance of these services, the Ave Maria Bond Fund pays Ultimus a monthly fee at an annual rate of 0.10% of its average daily net assets, and each of the Ave Maria Catholic Values Fund, the Ave Maria Growth Fund, the Ave Maria Rising Dividend Fund, the Ave Maria Opportunity Fund and the Ave Maria World Equity Fund pays Ultimus a monthly fee at an annual rate of 0.15% of its average daily net assets. The fee payable to Ultimus by each Fund is subject to a minimum monthly fee of $4,000, except that the Ave Maria World Equity Fund was subject to a minimum monthly fee of $2,500 for its first 12 months of operations (until April 30, 2011).
Pursuant to a Distribution Agreement between the Trust and the Distributor, the Distributor serves as each Fund’s exclusive agent for the distribution of its shares. The Distributor is an affiliate of Ultimus.
The Ave Maria Catholic Values Fund, the Ave Maria Growth Fund and the Ave Maria Bond Fund have adopted a Shareholder Servicing Plan (the “Plan”) under Section 12(b) of the Investment Company Act of 1940 and Rule 12b-1 thereunder, which allows such Funds to make payments to financial organizations (including the Adviser and other affiliates of each Fund) for providing account administration and personnel and account maintenance services to Fund shareholders. The annual service fee may not exceed an amount equal to 0.25% of each Fund’s average daily net assets. During the year ended December 31, 2011, the total expenses incurred pursuant to the Plan were $483,262, $316,631 and $126,226 for the Ave Maria Catholic Values Fund, the Ave Maria Growth Fund, and the Ave Maria Bond Fund, respectively.
| 3. | Investment Transactions |
During the year ended December 31, 2011, cost of purchases and proceeds from sales and maturities of investment securities, excluding short-term investments and U.S. government securities, were as follows:
| | Ave Maria Catholic Values Fund | | | | | | Ave Maria Rising Dividend Fund | | | | | | Ave Maria World Equity Fund | | | | |
Purchases of investment
securities | | $ | 54,975,728 | | | $ | 30,672,230 | | | $ | 125,123,977 | | | $ | 37,296,484 | | | $ | 13,075,251 | | | $ | 33,524,621 | |
Proceeds from sales of
investment securities | | $ | 56,591,784 | | | $ | 15,396,682 | | | $ | 36,327,460 | | | $ | 27,385,715 | | | $ | 2,067,701 | | | $ | 12,358,457 | |
AVE MARIA MUTUAL FUNDS
NOTES TO FINANCIAL STATEMENTS
| 4. | Contingencies and Commitments |
The Funds indemnify the Trust’s officers and Trustees for certain liabilities that might arise from their performance of their duties to the Funds. Additionally, in the normal course of business, the Funds enter into contracts that contain a variety of representations and warranties and which provide general indemnifications. The Funds’ maximum exposure under these arrangements is unknown, as this would involve future claims that may be made against the Funds that have not yet occurred. However, based on experience, the Funds expect the risk of loss to be remote.
The Funds are required to recognize in the financial statements the effects of all subsequent events that provide additional evidence about conditions that existed as of the date of the Statements of Assets and Liabilities. For non-recognized subsequent events that must be disclosed to keep the financial statements from being misleading, the Funds are required to disclose the nature of the event as well as an estimate of its financial effect, or a statement that such an estimate cannot be made. Management has evaluated subsequent events through the issuance of these financial statements and has noted no such events.
| 6. | Recent Accounting Pronouncements |
In May 2011, the Financial Accounting Standards Board (“FASB”) issued ASU No. 2011-04 “Amendments to Achieve Common Fair Value Measurements and Disclosure Requirements” in GAAP and the International Financial Reporting Standards (“IFRSs”). ASU No. 2011-04 amends FASB ASC Topic 820, Fair Value Measurements and Disclosures, to establish common requirements for measuring fair value and for disclosing information about fair value measurements in accordance with GAAP and IFRSs. ASU No. 2011-04 is effective for fiscal years beginning after December 15, 2011 and for interim periods within those fiscal years. Management is currently evaluating the impact these amendments may have on the Funds’ financial statements.
AVE MARIA MUTUAL FUNDS REPORT OF INDEPENDENT REGISTERED PUBLIC ACCOUNTING FIRM |
To the Shareholders and Board of Trustees of
Ave Maria Catholic Values Fund, Ave Maria Growth Fund,
Ave Maria Rising Dividend Fund, Ave Maria Opportunity Fund,
Ave Maria World Equity Fund and Ave Maria Bond Fund:
We have audited the accompanying statements of assets and liabilities, including the schedules of investments, of Ave Maria Catholic Values Fund, Ave Maria Growth Fund, Ave Maria Rising Dividend Fund, Ave Maria Opportunity Fund, Ave Maria World Equity Fund, and Ave Maria Bond Fund (the “Funds”) as of December 31, 2011, and the related statements of operations for the year then ended, the statements of changes in net assets of each period then ended, and the financial highlights for each of the periods presented. These financial statements and financial highlights are the responsibility of the Funds’ management. Our responsibility is to express an opinion on these financial statements and financial highlights based on our audits.
We conducted our audits in accordance with the standards of the Public Company Accounting Oversight Board (United States). Those standards require that we plan and perform the audit to obtain reasonable assurance about whether the financial statements and financial highlights are free of material misstatement. The Funds are not required to have, nor were we engaged to perform, an audit of their internal control over financial reporting. Our audits included consideration of internal control over financial reporting as a basis for designing audit procedures that are appropriate in the circumstances, but not for the purpose of expressing an opinion on the effectiveness of the Funds’ internal control over financial reporting. Accordingly, we express no such opinion. An audit also includes examining, on a test basis, evidence supporting the amounts and disclosures in the financial statements, assessing the accounting principles used and significant estimates made by management, as well as evaluating the overall financial statement presentation. Our procedures included confirmation of securities owned as of December 31, 2011, by correspondence with the custodian and brokers. We believe that our audits provide a reasonable basis for our opinion.
In our opinion, the financial statements and financial highlights referred to above present fairly, in all material respects, the financial position of Ave Maria Catholic Values Fund, Ave Maria Growth Fund, Ave Maria Rising Dividend Fund, Ave Maria Opportunity Fund, Ave Maria World Equity Fund, and Ave Maria Bond Fund as of December 31, 2011, the results of their operations for the year then ended, the changes in their net assets for each period then ended, and the financial highlights for the respective stated periods, in conformity with accounting principles generally accepted in the United States of America.
/s/ DELOITTE & TOUCHE LLP
Chicago, Illinois
February 15, 2012
AVE MARIA MUTUAL FUNDS BOARD OF TRUSTEES AND EXECUTIVE OFFICERS (Unaudited) |
Overall responsibility for management of the Trust rests with the Board of Trustees. The Trustees serve during the lifetime of the Trust and until its termination, or until death, resignation, retirement or removal. The Trustees, in turn, elect the officers of the Trust to actively supervise its day-to-day operations. The officers have been elected for an annual term. The following are the Trustees and executive officers of the Trust:
| | | Position Held with the Trust | |
| Interested Trustees: | | | | |
| * | George P. Schwartz, CFA | 3707 W. Maple Road, Bloomfield Hills, MI | 1944 | Chairman of the Board/President/Trustee | Since 1992 |
| Independent Trustees: | | | | |
| | John E. Barnds | 3707 W. Maple Road, Bloomfield Hills, MI | 1932 | Trustee | Since 2005 |
| | Louis C. Bosco, Jr. | 3707 W. Maple Road, Bloomfield Hills, MI | 1936 | Trustee | Since 2008 |
| | Donald J. Dawson, Jr. | 3707 W. Maple Road, Bloomfield Hills, MI | 1947 | Trustee | Since 1993 |
| | Joseph M. Grace | 3707 W. Maple Road, Bloomfield Hills, MI | 1936 | Trustee | Since 2007 |
| Executive Officers: | | | | |
| * | Richard L. Platte, Jr., CFA | 3707 W. Maple Road, Bloomfield Hills, MI | 1951 | Vice President and Secretary | Since 1993 |
| * | Timothy S. Schwartz, CFA | 3707 W. Maple Road, Bloomfield Hills, MI | 1971 | Treasurer | Since 2000 |
| * | Cathy M. Stoner, CPA, IACCP | 3707 W. Maple Road, Bloomfield Hills, MI | 1970 | Chief Compliance Officer | Since 2010 |
| * | George P. Schwartz, Richard L. Platte, Jr., Timothy S. Schwartz and Cathy M. Stoner, as affiliated persons of Schwartz Investment Counsel, Inc., the Fund’s investment adviser, are “interested persons” of the Trust within the meaning of Section 2(a)(19) of the Investment Company Act of 1940. George P. Schwartz is the father of Timothy S. Schwartz. |
AVE MARIA MUTUAL FUNDS BOARD OF TRUSTEES AND EXECUTIVE OFFICERS (Unaudited) (Continued) |
Each Trustee oversees seven portfolios of the Trust: the Ave Maria Catholic Values Fund, the Ave Maria Growth Fund, the Ave Maria Rising Dividend Fund, the Ave Maria Opportunity Fund, the Ave Maria World Equity Fund, the Ave Maria Bond Fund and the Schwartz Value Fund. The principal occupations of the Trustees and executive officers of the Trust during the past five years and public directorships held by the Trustees are set forth below:
George P. Schwartz, CFA is President and Chief Investment Officer of Schwartz Investment Counsel, Inc. and the co-portfolio manager of the Ave Maria Catholic Values Fund and the Ave Maria Rising Dividend Fund.
John E. Barnds is retired First Vice President of National Bank of Detroit (JPMorgan Chase).
Louis C. Bosco, Jr. is a partner in Bosco Development Company (a real estate firm).
Donald J. Dawson, Jr. is Chairman of Payroll 1, Inc. (a payroll processing company).
Joseph M. Grace is retired Senior Vice President of National Bank of Detroit (JPMorgan Chase).
Richard L. Platte, Jr., CFA is Executive Vice President and Secretary of Schwartz Investment Counsel, Inc. and is the portfolio manager of the Ave Maria Bond Fund and the co-portfolio manager of the Ave Maria Rising Dividend Fund.
Timothy S. Schwartz, CFA is Vice President and Treasurer of Schwartz Investment Counsel, Inc. and the portfolio manager of the Ave Maria Opportunity Fund.
Cathy M. Stoner, CPA, IACCP is Chief Compliance Officer and Operations Manager of Schwartz Investment Counsel, Inc. Prior to July 2009, she was an Audit Manager with Deloitte & Touche LLP.
AVE MARIA MUTUAL FUNDS CATHOLIC ADVISORY BOARD (Unaudited) |
The Catholic Advisory Board reviews the companies selected by the Adviser to ensure that the companies operate in a way that is consistent with teachings and core values of the Roman Catholic Church. The Catholic Advisory Board evaluates companies using publicly available information, information from the Adviser, and information from shareholders and other sources in making its recommendations. The following are the members of the Catholic Advisory Board:
| | | |
| Lou Holtz | 5818 El Camino Real, Carlsbad, CA | 1937 | Since 2007 |
| Lawrence Kudlow | 1375 Kings Hwy. East, Suite 260, Fairfield, CT | 1947 | Since 2005 |
| Thomas S. Monaghan | One Ave Maria Drive, Ann Arbor, MI | 1937 | Since 2001 |
| Michael Novak | 1150 17th Street, NW, Suite 1100, Washington, DC | 1933 | Since 2001 |
| Fr. John Riccardo, STL | 1062 Church St., Plymouth, MI | 1965 | Since 2011 |
| Paul R. Roney | One Ave Maria Drive, Ann Arbor, MI | 1957 | Since 2001 |
| Phyllis Schlafly | 7800 Bonhomme, St. Louis, MO | 1924 | Since 2001 |
Lou Holtz is the former football coach at University of Notre Dame among others, ESPN college football analyst, author and motivational speaker.
Lawrence Kudlow is the host of CNBC’s “The Kudlow Report” and a nationally syndicated columnist.
Thomas S. Monaghan is Chairman of the Ave Maria Foundation (a non-profit foundation supporting Roman Catholic organizations) and Chancellor of Ave Maria University. Prior to December 1998, he was Chairman and Chief Executive Officer of Domino’s Pizza, Inc.
Michael Novak is a theologian, author, and former U.S. ambassador. He is the George Frederick Jewett Chair (emeritus) in Religion, Philosophy, and Public Policy at the American Enterprise Institute.
Fr. John Riccardo, STL is a priest of the Archdiocese of Detroit and is the pastor of Our Lady of Good Counsel Catholic Church in Plymouth, Michigan. He is also the host of the radio show “Christ is the Answer,” which can be heard on Catholic radio stations throughout the country.
Paul R. Roney is Executive Director of the Ave Maria Foundation and President of Domino’s Farms Corporation. Prior to December 1998, he was Treasurer of Domino’s Pizza, Inc.
Phyllis Schlafly is an author, columnist and radio commentator. She is President of Eagle Forum (an organization promoting conservative and pro-family values).
Additional information regarding the Funds’ Trustees, executive officers and Catholic Advisory Board members may be found in the Funds’ Statement of Additional Information and is available without charge upon request by calling (888) 726-9331.
AVE MARIA MUTUAL FUNDS
ABOUT YOUR FUNDS’ EXPENSES
We believe it is important for you to understand the impact of costs on your investment. As a shareholder of the Funds, you incur ongoing costs, including management fees and other Fund expenses. The following examples are intended to help you understand your ongoing costs (in dollars) of investing in the Funds and to compare these costs with the ongoing costs of investing in other mutual funds.
A mutual fund’s ongoing costs are expressed as a percentage of its average net assets. This figure is known as the expense ratio. The ongoing costs reflected in the tables below are based on an investment of $1,000 made at the beginning of the most recent semi-annual period (July 1, 2011) and held until the end of the period (December 31, 2011).
The tables that follow illustrate each Fund’s ongoing costs in two ways:
Actual fund return – This section helps you to estimate the actual expenses that you paid over the period. The “Ending Account Value” shown is derived from each Fund’s actual return, and the third column shows the dollar amount of operating expenses that would have been paid by an investor who started with $1,000 in the Funds. You may use the information here, together with the amount you invested, to estimate the expenses that you paid over the period.
To do so, simply divide your account value by $1,000 (for example, an $8,600 account value divided by $1,000 = 8.6), then multiply the result by the number given for the Funds under the heading “Expenses Paid During Period.”
Hypothetical 5% return – This section is intended to help you compare the Funds’ ongoing costs with those of other mutual funds. It assumes that each Fund had an annual return of 5% before expenses during the period shown, but that the expense ratio is unchanged. In this case, because the return used is not the Funds’ actual returns, the results do not apply to your investment. The example is useful in making comparisons because the Securities and Exchange Commission (the “SEC”) requires all mutual funds to calculate expenses based on a 5% return. You can assess each Fund’s ongoing costs by comparing this hypothetical example with the hypothetical examples that appear in shareholder reports of other funds.
Note that expenses shown in the table are meant to highlight and help you compare ongoing costs only. The Funds do not charge sales loads or redemption fees.
The calculations assume no shares were bought or sold during the period. Your actual costs may have been higher or lower, depending on the amount of your investment and the timing of any purchases or redemptions.
More information about the Funds’ expenses, including historical annual expense ratios, can be found in this report. For additional information on operating expenses and other shareholder costs, please refer to the Funds’ Prospectus.
AVE MARIA MUTUAL FUNDS
ABOUT YOUR FUNDS’ EXPENSES
| Ave Maria Catholic Values Fund |
| Beginning Account Value July 1, 2011 | Ending Account Value December 31, 2011 | Expenses Paid During Period* |
| Based on Actual Fund Return | $1,000.00 | $899.00 | $7.18 |
| Based on Hypothetical 5% Return (before expenses) | $1,000.00 | $1,017.64 | $7.63 |
| * | Expenses are equal to the Ave Maria Catholic Values Fund’s annualized expense ratio of 1.50% for the period, multiplied by the average account value over the period, multiplied by 184/365 (to reflect the one-half year period). |
| Beginning Account Value July 1, 2011 | Ending Account Value December 31, 2011 | Expenses Paid During Period* |
| Based on Actual Fund Return | $1,000.00 | $922.40 | $7.27 |
| Based on Hypothetical 5% Return (before expenses) | $1,000.00 | $1,017.64 | $7.63 |
| * | Expenses are equal to the Ave Maria Growth Fund’s annualized expense ratio of 1.50% for the period, multiplied by the average account value over the period, multiplied by 184/365 (to reflect the one-half year period). |
| Ave Maria Rising Dividend Fund |
| Beginning Account Value July 1, 2011 | Ending Account Value December 31, 2011 | Expenses Paid During Period* |
| Based on Actual Fund Return | $1,000.00 | $942.80 | $4.99 |
| Based on Hypothetical 5% Return (before expenses) | $1,000.00 | $1,020.06 | $5.19 |
| * | Expenses are equal to the Ave Maria Rising Dividend Fund’s annualized expense ratio of 1.02% for the period, multiplied by the average account value over the period, multiplied by 184/365 (to reflect the one-half year period). |
AVE MARIA MUTUAL FUNDS
ABOUT YOUR FUNDS’ EXPENSES
| Ave Maria Opportunity Fund |
| Beginning Account Value July 1, 2011 | Ending Account Value December 31, 2011 | Expenses Paid During Period* |
| Based on Actual Fund Return | $1,000.00 | $928.20 | $6.08 |
| Based on Hypothetical 5% Return (before expenses) | $1,000.00 | $1,018.90 | $6.36 |
| * | Expenses are equal to the Ave Maria Opportunity Fund’s annualized expense ratio of 1.25% for the period, multiplied by the average account value over the period, multiplied by 184/365 (to reflect the one-half year period). |
| Ave Maria World Equity Fund |
| Beginning Account Value July 1, 2011 | Ending Account Value December 31, 2011 | Expenses Paid During Period* |
| Based on Actual Fund Return | $1,000.00 | $856.70 | $7.02 |
| Based on Hypothetical 5% Return (before expenses) | $1,000.00 | $1,017.64 | $7.63 |
| * | Expenses are equal to the Ave Maria World Equity Fund’s annualized expense ratio of 1.50% for the period, multiplied by the average account value over the period, multiplied by 184/365 (to reflect the one-half year period). |
| Beginning Account Value July 1, 2011 | Ending Account Value December 31, 2011 | Expenses Paid During Period* |
| Based on Actual Fund Return | $1,000.00 | $1,008.00 | $3.54 |
| Based on Hypothetical 5% Return (before expenses) | $1,000.00 | $1,021.68 | $3.57 |
| * | Expenses are equal to the Ave Maria Bond Fund’s annualized expense ratio of 0.70% for the period, multiplied by the average account value over the period, multiplied by 184/365 (to reflect the one-half year period). |
AVE MARIA MUTUAL FUNDS
In accordance with federal tax requirements, the following provides shareholders with information concerning certain ordinary income dividends paid by the Ave Maria Rising Dividend Fund, the Ave Maria World Equity Fund and the Ave Maria Bond Fund and distributions from net realized gains made by the Ave Maria Rising Dividend Fund and the Ave Maria Bond Fund during the fiscal year end December 31, 2011. On December 29, 2011, the Ave Maria World Equity Fund declared and paid an ordinary income dividend of $0.0508 per share, the Ave Maria Rising Dividend Fund declared and paid a long-term capital gain distribution of $0.2345 per share and the Ave Maria Bond Fund declared and paid both a short-term capital gain distribution and a long-term capital gain distribution of $0.0080 and $0.1689 per share, respectively. Periodically throughout the year, the Ave Maria Rising Dividend Fund paid ordinary income dividends totaling $0.1754 per share. Periodically throughout the year, the Ave Maria Bond Fund paid ordinary income dividends totaling $0.2147 per share. As provided by the Jobs and Growth Tax Relief Reconciliation Act of 2003, 100% of the long-term capital gain distributions of $0.2345 and $0.1689 for the Ave Maria Rising Dividend Fund and the Ave Maria Bond Fund, respectively, and a percentage (100%, 100%, and 33.03%) of the ordinary income dividends paid for the Ave Maria Rising Dividend Fund, the Ave Maria World Equity Fund and the Ave Maria Bond Fund, respectively, may be subject to a maximum tax rate of 15%. Early in 2012, as required by federal regulations, shareholders received notification of their portion of the Funds’ taxable gain distribution, if any, paid during the 2011 calendar year.
OTHER INFORMATION (Unaudited)
A description of the policies and procedures the Funds use to determine how to vote proxies relating to portfolio securities is available without charge upon request by calling toll-free (888) 726-9331, or on the SEC’s website at http://www.sec.gov. Information regarding how the Funds voted proxies relating to portfolio securities during the most recent 12-month period ended June 30 is also available without charge upon request by calling toll-free (888) 726-9331, or on the SEC’s website at http://www.sec.gov.
The Trust files a complete listing of portfolio holdings for each of the Funds with the SEC as of the end of the first and third quarters of each fiscal year on Form N-Q. The filings are available free of charge, upon request, by calling (888) 726-9331. Furthermore, you may obtain a copy of the filings on the SEC’s website at http://www.sec.gov. The Trust’s Forms N-Q may also be reviewed and copied at the SEC’s Public Reference Room in Washington, DC, and information on the operation of the Public Reference Room may be obtained by calling (800) SEC-0330.
This page intentionally left blank.
This page intentionally left blank.