| OMB APPROVAL |
OMB Number: 3235-0570 Expires: March 31, 2017 Estimated average burden hours per response: 20.6 |
UNITED STATES
SECURITIES AND EXCHANGE COMMISSION
Washington, D.C. 20549
FORM N-CSR
CERTIFIED SHAREHOLDER REPORT OF REGISTERED
MANAGEMENT INVESTMENT COMPANIES
| Investment Company Act file number | 811-07148 | |
| Schwartz Investment Trust |
| (Exact name of registrant as specified in charter) |
| 801 W. Ann Arbor Trail, Suite 244 Plymouth, Michigan | 48170 |
| (Address of principal executive offices) | (Zip code) |
George P. Schwartz
| Schwartz Investment Counsel, Inc. 801 W. Ann Arbor Trail, Plymouth, MI 48170 |
| (Name and address of agent for service) |
| Registrant's telephone number, including area code: | (248) 644-8500 | |
| Date of fiscal year end: | December 31 | |
| | | |
| Date of reporting period: | December 31, 2016 | |
Form N-CSR is to be used by management investment companies to file reports with the Commission not later than 10 days after the transmission to stockholders of any report that is required to be transmitted to stockholders under Rule 30e-1 under the Investment Company Act of 1940 (17 CFR 270.30e-1). The Commission may use the information provided on Form N-CSR in its regulatory, disclosure review, inspection, and policymaking roles.
A registrant is required to disclose the information specified by Form N-CSR, and the Commission will make this information public. A registrant is not required to respond to the collection of information contained in Form N-CSR unless the Form displays a currently valid Office of Management and Budget ("OMB") control number. Please direct comments concerning the accuracy of the information collection burden estimate and any suggestions for reducing the burden to the Secretary, Securities and Exchange Commission, 450 Fifth Street, NW, Washington, DC 20549-0609. The OMB has reviewed this collection of information under the clearance requirements of 44 U.S.C. § 3507.
| Item 1. | Reports to Stockholders. |
Schwartz Value Focused Fund
Shareholder Services c/o Ultimus Fund Solutions, LLC P.O. Box 46707 Cincinnati, OH 45246 (888) 726-0753 | | Investment Adviser Schwartz Investment Counsel, Inc.
801 W. Ann Arbor Trail Suite 244 Plymouth, MI 48170 |
Dear Fellow Shareowner:
2016 was a good year for the Schwartz Value Focused Fund (the “Fund”) with a total return of 18.13%, compared to 13.03% for the S&P 1500 Index and 12.05% for the Russell 1000 Index. The Fund’s outperformance can be attributed mainly to 12 portfolio holdings which each appreciated more than 35% during the year. These issues were from a variety of industry sectors including mining, energy, industrial, financial, retail, and technology. The Fund’s best performing stocks were commodity and industrial related. Pan American Silver Corporation (+133%) and Barrick Gold Corporation (+118%) posted strong gains as their share prices rebounded from 2015’s depressed levels, owing to gold and silver prices that rose sharply in the first half of the year. Energy stocks bottomed early in the year and rebounded concomitantly with the rise in oil prices. At year end, the price of WTI crude oil breached $50/barrel, up 45% for the year and up nearly 100% from the February low. Holdings in the energy sector that produced substantial gains included Texas Pacific Land Trust (+85%), Devon Energy Corporation (+45%), and Apache Corporation (+45%). Industrial stocks benefitted from improving economic growth in the second half and to a lesser extent from rising oil and natural gas prices. Notable outperformers in the industrial sector included Colfax Corporation (+71%), MSC Industrial Direct Company, Inc. (+67%), Donaldson Company, Inc. (+39%), and Eaton Corporation plc (+35%). The Fund’s five best performing stocks in 2016 were:
Company | Industry | 2016 Performance |
Pan American Silver Corporation | Metals & Mining | +132.96% |
Barrick Gold Corp. | Metals & Mining | +118.07% |
Texas Pacific Land Trust | Oil & Gas Royalties/Real Estate | +84.98% |
Colfax Corporation | Industrial Machinery | +71.21% |
MSC Industrial Direct Co., Inc. | Industrial Equipment | +66.84% |
On the negative side, the Fund’s worst performing stock during 2016 was Liberty Interactive Corporation, which owns and operates QVC Group, a multinational corporation that sells consumer goods through its television network and online. The share price fell after the company experienced a U.S. sales decline due to weakness in its fashion business and hair care division. Due to QVC’s loyal customer base and strong viewership, we view this slowdown as temporary. The Fund’s five worst performing stocks in 2016 were:
Company | Industry | 2016 Performance |
Liberty Interactive Corporation | Consumer - Retail | -26.49% |
ServiceMaster Global Holdings | Business Services | -6.41% |
Moody’s Corporation | Business & Financial Services | -6.20% |
Liberty Global | Cable TV & Broadband | -4.07% |
ANSYS, Inc. | Software | -0.01% |
1
During the second half of 2016, six stocks were sold from the portfolio, having reached our estimate of intrinsic value: Citigroup, Inc. (financial services), Cubic Corporation (transportation & defense), Emerson Electric Co. (industrial electrical equipment), Exxon Mobil Corporation (integrated oil & gas), HP, Inc. (technology), and United Technologies Corporation (industrial products). New positions were established in four companies that meet our value investing criteria: AMERCO, AMETEK, Inc., Cognizant Technology Solutions Corp., and Moody’s Corporation. AMERCO owns the U-Haul self-moving and storage franchise. With a dominant market position, the company has an impressive track record of increasing earnings, and has ample growth opportunities. AMETEK manufactures and sells electronic instruments and electromechanical devices worldwide. The company generates high profit margins, strong free cash flow, and a high return on invested capital (ROIC). Cognizant Technology Solutions provides information technology consulting services worldwide. The business is highly profitable and generates strong free cash flow with a high ROIC. Moody’s provides credit ratings, research, and analysis of debt instruments and other securities. As such, the company enjoys a strong business franchise that produces high profit margins and loads of cash, which is used primarily for dividends and share repurchases.
2017 could be another good year for stock investors. We are confident that the new Trump Administration will be more hospitable to corporate America than the Obama Administration. President Trump’s pro-growth agenda of lower tax rates – corporate and personal, a less punishing regulatory environment, and a generally less intrusive government should lead to greater business and consumer confidence, more economic activity, and ultimately higher corporate profits.
As always, we’ll be working tirelessly to invest in well-managed, high-quality companies that are selling at a discount to our estimate of intrinsic value.
No realized capital gains or income distributions were paid at year end. The net asset value of the Fund ended the year at $25.02 per share.
Thank you for being a shareholder in the Schwartz Value Focused Fund.

| 
|
Timothy S. Schwartz, CFA | George P. Schwartz, CFA |
Lead Portfolio Manager | Co-Portfolio Manager |
2
SCHWARTZ VALUE FOCUSED FUND
PERFORMANCE
(Unaudited)
Comparison of the Change in Value of a $10,000 Investment
in Schwartz Value Focused Fund, the S&P 1500 Index**
and the Russell 1000 Index

(a) | The returns shown do not reflect the deduction of taxes a shareholder would pay on Fund distributions or the redemption of Fund shares. |
Net Expense ratio as of 12-31-15 (as disclosed in May 1, 2016 prospectus) | 1.25%* |
Net Expense ratio for the year ended 12-31-16 | 1.25% |
* | Includes Acquired Fund Fees and Expenses. |
| | |
** | Effective January 1, 2017, the S&P 1500 Index will be the Fund’s primary benchmark instead of the Russell 1000 Index. |
This report is for the information of shareholders, but it may also be used as sales literature when preceded or accompanied by a current prospectus, which gives details about charges, expenses, investment objectives and operating policies of the Fund. The Fund is distributed by Ultimus Fund Distributors, LLC.
3
SCHWARTZ VALUE FOCUSED FUND
ANNUAL TOTAL RATES OF RETURN
COMPARISON WITH MAJOR INDICES (Unaudited)
| SCHWARTZ
VALUE
FOCUSED
FUND(a) | S&P 1500
INDEX(b) | RUSSELL
1000
INDEX | NASDAQ
COMPOSITE(c) | VALUE
LINE
COMPOSITE(d) | S&P 500
INDEX |
1984 | 11.1% | N/A | 4.8% | -11.2% | -8.4% | 6.1% |
1985 | 21.7% | N/A | 32.3% | 31.4% | 20.7% | 31.6% |
1986 | 16.4% | N/A | 17.9% | 7.4% | 5.0% | 18.7% |
1987 | -0.6% | N/A | 2.9% | -5.3% | -10.6% | 5.3% |
1988 | 23.1% | N/A | 17.3% | 15.4% | 15.4% | 16.8% |
1989 | 8.3% | N/A | 30.4% | 19.3% | 11.2% | 31.6% |
1990 | -5.3% | N/A | -4.2% | -17.8% | -24.3% | -3.2% |
1991 | 32.0% | N/A | 33.0% | 56.8% | 27.2% | 30.4% |
1992 | 22.7% | N/A | 8.9% | 15.5% | 7.0% | 7.6% |
1993 | 20.5% | N/A | 10.2% | 14.7% | 10.7% | 10.1% |
1994 | -6.8% | N/A | 0.4% | -3.2% | -6.0% | 1.3% |
1995 | 16.9% | 36.5% | 37.8% | 39.9% | 19.3% | 37.5% |
1996 | 18.3% | 22.4% | 22.5% | 22.7% | 13.4% | 22.9% |
1997 | 28.0% | 32.9% | 32.9% | 21.6% | 21.1% | 33.4% |
1998 | -10.4% | 26.4% | 27.0% | 39.6% | -3.8% | 28.6% |
1999 | -2.5% | 20.3% | 20.9% | 85.6% | -1.4% | 21.0% |
2000 | 9.3% | -7.0% | -7.8% | -39.3% | -8.7% | -9.1% |
2001 | 28.1% | -10.6% | -12.5% | -21.0% | -6.1% | -11.9% |
2002 | -14.9% | -21.3% | -21.7% | -31.5% | -28.6% | -22.1% |
2003 | 39.3% | 29.6% | 29.9% | 50.0% | 37.4% | 28.7% |
2004 | 22.6% | 11.8% | 11.4% | 8.6% | 11.5% | 10.9% |
2005 | 3.8% | 5.7% | 6.3% | 1.4% | 2.0% | 4.9% |
2006 | 14.3% | 15.3% | 15.5% | 9.5% | 11.0% | 15.8% |
2007 | -11.1% | 5.5% | 5.8% | 10.6% | -3.8% | 5.5% |
2008 | -35.9% | -36.7% | -37.6% | -40.0% | -48.7% | -37.0% |
2009 | 34.8% | 27.2% | 28.4% | 45.3% | 36.8% | 26.5% |
2010 | 12.0% | 16.4% | 16.1% | 18.0% | 20.5% | 15.1% |
2011 | 5.6% | 1.7% | 1.5% | -0.8% | -11.4% | 2.1% |
2012 | 5.4% | 16.2% | 16.4% | 17.5% | 9.5% | 16.0% |
2013 | 24.7% | 32.8% | 33.1% | 40.1% | 35.5% | 32.4% |
2014 | -4.7% | 13.1% | 13.2% | 14.8% | 2.7% | 13.7% |
2015 | -15.5% | 1.0% | 0.9% | 7.0% | -11.2% | 1.4% |
2016 | 18.1% | 13.0% | 12.1% | 8.9% | 13.5% | 12.0% |
(a) | Schwartz Value Focused Fund’s performance combines the performance of the Fund since its commencement of operations as a registered investment company on July 20, 1993, and the performance of RCM Partners Limited Partnership for periods prior thereto. |
| | |
(b) | Inception date of the S&P 1500 Index is December 30, 1994. |
| | |
(c) | Excluding dividends for the years ended 1984-2006. Effective 2007, the returns include dividends. |
| | |
(d) | Excluding dividends. |
4
SCHWARTZ VALUE FOCUSED FUND
AVERAGE ANNUAL TOTAL RETURNS
As of December 31, 2016 (Unaudited)
| SCHWARTZ
VALUE
FOCUSED
FUND(a) | S&P 1500
INDEX(b) | RUSSELL
1000
INDEX | NASDAQ
COMPOSITE(c) | VALUE
LINE
COMPOSITE(d) | S&P 500
INDEX |
3 Years | -1.7% | 8.9% | 8.6% | 10.1% | 1.2% | 8.9% |
5 Years | 4.6% | 14.8% | 14.7% | 17.1% | 9.0% | 14.7% |
10 Years | 1.3% | 7.2% | 7.1% | 8.3% | 1.0% | 7.0% |
15 Years | 4.6% | 7.1% | 7.0% | 7.0% | 2.1% | 6.7% |
33 Years | 8.6% | N/A | 10.9% | 9.4% | 2.9% | 10.9% |
(a) | Schwartz Value Focused Fund’s performance combines the performance of the Fund since its commencement of operations as a registered investment company on July 20, 1993, and the performance of RCM Partners Limited Partnership for periods prior thereto. |
| | |
(b) | Inception date of the S&P 1500 Index is December 30, 1994. |
| | |
(c) | Excluding dividends for the years ended 1984-2006. Effective 2007, the returns include dividends. |
| | |
(d) | Excluding dividends. |
5
SCHWARTZ VALUE FOCUSED FUND
TEN LARGEST EQUITY HOLDINGS
December 31, 2016 (Unaudited)
Shares | | Security Description | | Market
Value | | | % of
Net Assets | |
| | 180,000 | | Unico American Corporation | | $ | 1,935,000 | | | | 9.2 | % |
| | 50,000 | | ARRIS International plc | | | 1,506,500 | | | | 7.2 | % |
| | 3,500 | | Texas Pacific Land Trust | | | 1,038,695 | | | | 4.9 | % |
| | 4 | | Berkshire Hathaway, Inc. - Class A | | | 976,484 | | | | 4.7 | % |
| | 25,000 | | Colfax Corporation | | | 898,250 | | | | 4.3 | % |
| | 40,000 | | Liberty Interactive Corporation QVC Group - Series A | | | 799,200 | | | | 3.8 | % |
| | 50,000 | | Goldcorp, Inc. | | | 680,000 | | | | 3.2 | % |
| | 1,300 | | Graham Holdings Company - Class B | | | 665,535 | | | | 3.2 | % |
| | 9,000 | | Baker Hughes Incorporated | | | 584,730 | | | | 2.8 | % |
| | 12,000 | | AMETEK, Inc. | | | 583,200 | | | | 2.8 | % |
ASSET ALLOCATION (Unaudited)
Sector | % of
Net Assets |
Consumer Discretionary | 17.7% |
Energy | 10.3% |
Financials | 23.0% |
Industrials | 16.8% |
Information Technology | 14.0% |
Materials | 8.2% |
Warrants | 1.4% |
Open-End Funds | 0.1% |
Money Market Funds, Liabilities in Excess of Other Assets | 8.5% |
| | 100.0% |
6
SCHWARTZ VALUE FOCUSED FUND
SCHEDULE OF INVESTMENTS
December 31, 2016
COMMON STOCKS — 90.0% | | Shares | | | Market Value | |
Consumer Discretionary — 17.7% | | | | | | |
Diversified Consumer Services — 4.1% | | | | | | |
Graham Holdings Company - Class B | | | 1,300 | | | $ | 665,535 | |
ServiceMaster Global Holdings, Inc. * | | | 5,000 | | | | 188,350 | |
| | | | | | | | 853,885 | |
Household Durables — 1.6% | | | | | | | | |
Garmin Ltd. | | | 7,000 | | | | 339,430 | |
| | | | | | | | | |
Internet & Direct Marketing Retail — 3.8% | | | | | | | | |
Liberty Interactive Corporation QVC Group - Series A * | | | 40,000 | | | | 799,200 | |
| | | | | | | | | |
Media — 4.8% | | | | | | | | |
Discovery Communications, Inc. - Series A * | | | 20,000 | | | | 548,200 | |
Liberty Global plc - Series C * | | | 15,000 | | | | 445,500 | |
| | | | | | | | 993,700 | |
Multi-Line Retail — 0.9% | | | | | | | | |
Nordstrom, Inc. | | | 4,000 | | | | 191,720 | |
| | | | | | | | | |
Specialty Retail — 2.5% | | | | | | | | |
TJX Companies, Inc. (The) | | | 7,000 | | | | 525,910 | |
| | | | | | | | | |
Energy — 10.3% | | | | | | | | |
Energy Equipment & Services — 4.8% | | | | | | | | |
Baker Hughes Incorporated | | | 9,000 | | | | 584,730 | |
Schlumberger Limited | | | 5,000 | | | | 419,750 | |
| | | | | | | | 1,004,480 | |
Oil, Gas & Consumable Fuels — 5.5% | | | | | | | | |
Apache Corporation | | | 6,000 | | | | 380,820 | |
Devon Energy Corporation | | | 7,000 | | | | 319,690 | |
Noble Energy, Inc. | | | 12,000 | | | | 456,720 | |
| | | | | | | | 1,157,230 | |
Financials — 23.0% | | | | | | | | |
Capital Markets — 2.2% | | | | | | | | |
Moody's Corporation | | | 5,000 | | | | 471,350 | |
| | | | | | | | | |
Diversified Financial Services — 6.9% | | | | | | | | |
MasterCard, Inc. - Class A | | | 4,000 | | | | 413,000 | |
Texas Pacific Land Trust | | | 3,500 | | | | 1,038,695 | |
| | | | | | | | 1,451,695 | |
Insurance — 13.9% | | | | | | | | |
Berkshire Hathaway, Inc. - Class A * | | | 4 | | | | 976,484 | |
Unico American Corporation * | | | 180,000 | | | | 1,935,000 | |
| | | | | | | | 2,911,484 | |
7
SCHWARTZ VALUE FOCUSED FUND
SCHEDULE OF INVESTMENTS
(Continued)
COMMON STOCKS — 90.0% (Continued) | | Shares | | | Market Value | |
Industrials — 16.8% | | | | | | |
Electrical Equipment — 4.4% | | | | | | |
AMETEK, Inc. | | | 12,000 | | | $ | 583,200 | |
Eaton Corporation plc | | | 5,000 | | | | 335,450 | |
| | | | | | | | 918,650 | |
Machinery — 6.3% | | | | | | | | |
Colfax Corporation * | | | 25,000 | | | | 898,250 | |
Donaldson Company, Inc. | | | 10,000 | | | | 420,800 | |
| | | | | | | | 1,319,050 | |
Road & Rail — 2.6% | | | | | | | | |
AMERCO | | | 1,500 | | | | 554,385 | |
| | | | | | | | | |
Trading Companies & Distributors — 3.5% | | | | | | | | |
MSC Industrial Direct Company, Inc. - Class A | | | 3,000 | | | | 277,170 | |
W.W. Grainger, Inc. | | | 2,000 | | | | 464,500 | |
| | | | | | | | 741,670 | |
Information Technology — 14.0% | | | | | | | | |
Communications Equipment — 7.2% | | | | | | | | |
ARRIS International plc * | | | 50,000 | | | | 1,506,500 | |
| | | | | | | | | |
Electronic Equipment, Instruments & Components — 4.6% | | | | | | | | |
Arrow Electronics, Inc. * | | | 7,000 | | | | 499,100 | |
Avnet, Inc. | | | 10,000 | | | | 476,100 | |
| | | | | | | | 975,200 | |
IT Services — 1.3% | | | | | | | | |
Cognizant Technology Solutions Corporation - Class A * | | | 5,000 | | | | 280,150 | |
| | | | | | | | | |
Software — 0.9% | | | | | | | | |
ANSYS, Inc. * | | | 2,000 | | | | 184,980 | |
| | | | | | | | | |
Materials — 8.2% | | | | | | | | |
Chemicals — 0.9% | | | | | | | | |
Praxair, Inc. | | | 1,700 | | | | 199,223 | |
| | | | | | | | | |
Metals & Mining — 7.3% | | | | | | | | |
Barrick Gold Corporation | | | 20,000 | | | | 319,600 | |
Goldcorp, Inc. | | | 50,000 | | | | 680,000 | |
Pan American Silver Corporation | | | 35,000 | | | | 527,450 | |
| | | | | | | | 1,527,050 | |
| | | | | | | | | |
Total Common Stocks (Cost $14,713,910) | | | | | | $ | 18,906,942 | |
8
SCHWARTZ VALUE FOCUSED FUND
SCHEDULE OF INVESTMENTS
(Continued)
WARRANTS — 1.4% | | Shares | | | Market Value | |
Financials — 1.4% | | | | | | |
Banks — 1.4% | | | | | | |
PNC Financial Services Group, Inc. (The), expires 12/31/18 * (Cost $109,308) | | | 6,000 | | | $ | 297,000 | |
OPEN-END FUNDS — 0.1% | | Shares | | | Market Value | |
Sequoia Fund, Inc. * (Cost $11,397) | | | 81 | | | $ | 13,008 | |
MONEY MARKET FUNDS — 8.6% | | Shares | | | Market Value | |
Federated Government Obligations Tax-Managed Fund - Institutional Shares, 0.35% (a) | | | 980,340 | | | $ | 980,340 | |
Federated Treasury Obligations Fund - Institutional Shares, 0.36% (a) | | | 837,830 | | | | 837,830 | |
Total Money Market Funds (Cost $1,818,170) | | | | | | $ | 1,818,170 | |
| | | | | | | | | |
Total Investments at Market Value — 100.1% (Cost $16,652,785) | | | | | | $ | 21,035,120 | |
| | | | | | | | | |
Liabilities in Excess of Other Assets — (0.1%) | | | | | | | (23,266 | ) |
| | | | | | | | | |
Net Assets — 100.0% | | | | | | $ | 21,011,854 | |
* | Non-income producing security. |
| | |
(a) | The rate shown is the 7-day effective yield as of December 31, 2016. |
| | |
See accompanying notes to financial statements. |
9
SCHWARTZ VALUE FOCUSED FUND
STATEMENT OF ASSETS AND LIABILITIES
December 31, 2016
ASSETS | | | |
Investments, at market value (cost of $16,652,785) (Note 1) | | $ | 21,035,120 | |
Cash | | | 3,570 | |
Dividends receivable | | | 2,928 | |
Other assets | | | 6,134 | |
TOTAL ASSETS | | | 21,047,752 | |
| | | | | |
LIABILITIES | | | | |
Payable to Adviser (Note 2) | | | 21,564 | |
Payable to administrator (Note 2) | | | 3,000 | |
Other accrued expenses | | | 11,334 | |
TOTAL LIABILITIES | | | 35,898 | |
| | | | | |
NET ASSETS | | $ | 21,011,854 | |
| | | | | |
NET ASSETS CONSIST OF: | | | | |
Paid-in capital | | $ | 17,138,776 | |
Accumulated net realized losses from security transactions | | | (509,257 | ) |
Net unrealized appreciation on investments | | | 4,382,335 | |
NET ASSETS | | $ | 21,011,854 | |
| | | | | |
Shares of beneficial interest outstanding (unlimited number of shares authorized, no par value) | | | 839,765 | |
| | | | | |
Net asset value, offering price and redemption price per share (Note 1) | | $ | 25.02 | |
See notes to financial statements. |
10
SCHWARTZ VALUE FOCUSED FUND
STATEMENT OF OPERATIONS
For the Year Ended December 31, 2016
INVESTMENT INCOME | | | |
Dividends (Net of foreign tax of $2,074) | | $ | 173,694 | |
| | | | | |
EXPENSES | | | | |
Investment advisory fees (Note 2) | | | 183,507 | |
Trustees’ fees and expenses (Note 2) | | | 49,892 | |
Administration, accounting and transfer agent fees (Note 2) | | | 36,000 | |
Legal and audit fees | | | 34,941 | |
Registration and filing fees | | | 14,337 | |
Postage and supplies | | | 8,783 | |
Custodian and bank service fees | | | 6,391 | |
Printing of shareholder reports | | | 3,399 | |
Insurance expense | | | 1,187 | |
Compliance service fees and expenses (Note 2) | | | 672 | |
Other expenses | | | 9,216 | |
TOTAL EXPENSES | | | 348,325 | |
Less fee reductions by the Adviser (Note 2) | | | (106,868 | ) |
NET EXPENSES | | | 241,457 | |
| | | | | |
NET INVESTMENT LOSS | | | (67,763 | ) |
| | | | | |
REALIZED AND UNREALIZED GAINS ON INVESTMENTS | | | | |
Net realized gains from security transactions | | | 29,217 | |
Net change in unrealized appreciation (depreciation) on investments | | | 3,288,843 | |
NET REALIZED AND UNREALIZED GAINS ON INVESTMENTS | | | 3,318,060 | |
| | | | | |
NET INCREASE IN NET ASSETS RESULTING FROM OPERATIONS | | $ | 3,250,297 | |
See notes to financial statements. |
11
SCHWARTZ VALUE FOCUSED FUND
STATEMENTS OF CHANGES IN NET ASSETS
| | Year Ended December 31, 2016 | | | Year Ended December 31, 2015 | |
FROM OPERATIONS | | | | | | |
Net investment loss | | $ | (67,763 | ) | | $ | (94,159 | ) |
Net realized gains (losses) from security transactions | | | 29,217 | | | | (538,474 | ) |
Net change in unrealized appreciation (depreciation) on investments | | | 3,288,843 | | | | (2,972,967 | ) |
Net increase (decrease) in net assets resulting from operations | | | 3,250,297 | | | | (3,605,600 | ) |
| | | | | | | | | |
FROM CAPITAL SHARE TRANSACTIONS | | | | | | | | |
Proceeds from shares sold | | | 1,533,951 | | | | 1,244,396 | |
Payments for shares redeemed | | | (2,544,502 | ) | | | (6,995,249 | ) |
Net decrease in net assets from capital share transactions | | | (1,010,551 | ) | | | (5,750,853 | ) |
| | | | | | | | | |
TOTAL INCREASE (DECREASE) IN NET ASSETS | | | 2,239,746 | | | | (9,356,453 | ) |
| | | | | | | | | |
NET ASSETS | | | | | | | | |
Beginning of year | | | 18,772,108 | | | | 28,128,561 | |
End of year | | $ | 21,011,854 | | | $ | 18,772,108 | |
| | | | | | | | | |
ACCUMULATED NET INVESTMENT LOSS | | $ | — | | | $ | — | |
| | | | | | | | | |
SUMMARY OF CAPITAL SHARE ACTIVITY | | | | | | | | |
Shares sold | | | 65,097 | | | | 51,114 | |
Shares redeemed | | | (111,549 | ) | | | (287,195 | ) |
Net decrease in shares outstanding | | | (46,452 | ) | | | (236,081 | ) |
Shares outstanding, beginning of year | | | 886,217 | | | | 1,122,298 | |
Shares outstanding, end of year | | | 839,765 | | | | 886,217 | |
See notes to financial statements. |
12
SCHWARTZ VALUE FOCUSED FUND
FINANCIAL HIGHLIGHTS
Per Share Data for a Share Outstanding Throughout Each Year
| | Year Ended Dec. 31, 2016 | | | Year Ended Dec. 31, 2015 | | | Year Ended Dec. 31, 2014 | | | Year Ended Dec. 31, 2013 | | | Year Ended Dec. 31, 2012 | |
Net asset value at beginning of year | | $ | 21.18 | | | $ | 25.06 | | | $ | 28.54 | | | $ | 23.31 | | | $ | 22.33 | |
| | | | | | | | | | | | | | | | | | | | | |
Income (loss) from investment operations: | | | | | | | | | | | | | | | | | | | | |
Net investment income (loss) | | | (0.08 | ) | | | (0.11 | ) | | | (0.08 | ) | | | (0.04 | ) | | | 0.23 | |
Net realized and unrealized gains (losses) on investments | | | 3.92 | | | | (3.77 | ) | | | (1.26 | ) | | | 5.80 | | | | 0.98 | |
Total from investment operations | | | 3.84 | | | | (3.88 | ) | | | (1.34 | ) | | | 5.76 | | | | 1.21 | |
| | | | | | | | | | | | | | | | | | | | | |
Less distributions: | | | | | | | | | | | | | | | | | | | | |
From net investment income | | | — | | | | — | | | | — | | | | — | | | | (0.23 | ) |
From net realized gains on investments | | | — | | | | — | | | | (2.14 | ) | | | (0.53 | ) | | | — | |
Total distributions | | | — | | | | — | | | | (2.14 | ) | | | (0.53 | ) | | | (0.23 | ) |
| | | | | | | | | | | | | | | | | | | | | |
Net asset value at end of year | | $ | 25.02 | | | $ | 21.18 | | | $ | 25.06 | | | $ | 28.54 | | | $ | 23.31 | |
| | | | | | | | | | | | | | | | | | | | | |
Total return (a) | | | 18.1 | % | | | (15.5 | %) | | | (4.7 | %) | | | 24.7 | % | | | 5.4 | % |
| | | | | | | | | | | | | | | | | | | | | |
Ratios/Supplementary Data: | | | | | | | | | | | | | | | | | | | | |
Net assets at end of year (000’s) | | $ | 21,012 | | | $ | 18,772 | | | $ | 28,129 | | | $ | 32,030 | | | $ | 30,573 | |
| | | | | | | | | | | | | | | | | | | | | |
Ratio of total expenses to average net assets | | | 1.80 | % | | | 1.59 | % | | | 1.46 | % | | | 1.45 | % | | | 1.41 | % |
| | | | | | | | | | | | | | | | | | | | | |
Ratio of net expenses to average net assets | | | 1.25 | %(b) | | | 1.35 | %(b) | | | 1.46 | % | | | 1.45 | % | | | 1.41 | % |
| | | | | | | | | | | | | | | | | | | | | |
Ratio of net investment income (loss) to average net assets | | | (0.35 | %)(b) | | | (0.40 | %)(b) | | | (0.28 | %) | | | (0.13 | %) | | | 0.90 | % |
| | | | | | | | | | | | | | | | | | | | | |
Portfolio turnover rate | | | 48 | % | | | 104 | % | | | 72 | % | | | 57 | % | | | 62 | % |
(a) | Total return is a measure of the change in value of an investment in the Fund over the period covered, which assumes any dividends or capital gains distributions are reinvested in shares of the Fund. Returns shown do not reflect the deduction of taxes a shareholder would pay on Fund distributions or the redemption of Fund shares. |
| | |
(b) | Ratio was determined after advisory fee reductions (Note 2). |
| | |
See notes to financial statements. |
13
SCHWARTZ VALUE FOCUSED FUND
NOTES TO FINANCIAL STATEMENTS
December 31, 2016
1. Significant Accounting Policies
Schwartz Value Focused Fund (the “Fund”), formerly Schwartz Value Fund, is a series of Schwartz Investment Trust (the “Trust”), an open-end management investment company established as an Ohio business trust under a Declaration of Trust dated August 31, 1992. Other series of the Trust are not incorporated in this report. The Fund is registered under the Investment Company Act of 1940 and commenced operations on July 20, 1993. At a meeting held on June 29, 2016, the shareholders of the Fund voted to change the classification of the Fund from a diversified fund to a non-diversified fund.
The investment objective of the Fund is to seek long-term capital appreciation. See the Prospectus for information regarding the principal investment strategies of the Fund.
Shares of the Fund are sold at net asset value (“NAV”). To calculate the NAV, the Fund’s assets are valued and totaled, liabilities are subtracted, and the balance is divided by the number of shares outstanding. The offering price and redemption price per share are equal to the NAV per share.
The following is a summary of significant accounting policies followed by the Fund. The policies are in conformity with accounting principles generally accepted in the United States of America (“GAAP”). As an investment company, as defined in Financial Accounting Standards Board (“FASB”) Accounting Standards Update 2013-08, the Fund follows accounting and reporting guidance under FASB Accounting Standards Codification Topic 946, “Financial Services – Investment Companies.”
In October 2016, the Securities and Exchange Commission (the “SEC”) released its final rule on Investment Company Reporting Modernization (the “Rule”). The Rule, which introduces two new regulatory reporting forms for investment companies – Form N-PORT and Form N-CEN, also contains amendments to Regulation S-X which impact financial statement presentation, particularly the presentation of derivative investments. Although still evaluating the impact of the Rule, management believes that many of the Regulation S-X amendments are consistent with the Fund’s current financial statement presentation and expects that the Fund will be able to comply with the Rule’s Regulation S-X amendments by the August 1, 2017 compliance date.
(a) Valuation of investments — Securities which are traded on stock exchanges, other than NASDAQ, are valued at the closing sales price as of the close of the regular session of trading on the New York Stock Exchange on the day the securities are being valued, or, if not traded on a particular day, at the closing bid price. Securities which are quoted by NASDAQ are valued at the NASDAQ Official Closing Price or, if an official close price is not available, at the most recently quoted bid price. Securities traded in the over-the-counter market are valued at the last reported sales price or, if there is no reported sale on the valuation date, at the most recently quoted bid price. Securities which are traded both in the over-the-counter market and on a stock exchange are valued according to the broadest and most representative market. Investments representing shares of other open-end investment companies are valued at their NAV as reported by such companies. Securities (and other assets) for which market quotations are not readily available are valued at their fair value as determined in good faith in accordance with consistently applied procedures established by and under the general supervision of the Board of
14
SCHWARTZ VALUE FOCUSED FUND
NOTES TO FINANCIAL STATEMENTS
(Continued)
Trustees, and will be classified as Level 2 or 3 within the fair value hierarchy (see below), depending on the inputs used. Fair value pricing may be used, for example, in situations where (i) a portfolio security is so thinly traded that there have been no transactions for that stock over an extended period of time; (ii) the exchange on which the portfolio security is principally traded closes early; or (iii) trading of the portfolio security is halted during the day and does not resume prior to the Fund’s NAV calculation. A portfolio security’s “fair value” price may differ from the price next available for that portfolio security using the Fund’s normal pricing procedures.
GAAP establishes a single authoritative definition of fair value, sets out a framework for measuring fair value and requires additional disclosures about fair value measurements.
Various inputs are used in determining the value of the Fund’s investments. These inputs are summarized in the three broad levels listed below:
| | ● | Level 1 – quoted prices in active markets for identical securities |
| | ● | Level 2 – other significant observable inputs |
| | ● | Level 3 – significant unobservable inputs |
The inputs or methodology used for valuing securities are not necessarily an indication of the risks associated with investing in those securities. The inputs used to measure fair value may fall into different levels of the fair value hierarchy. In such cases, for disclosure purposes, the level in the fair value hierarchy within which the fair value measurement falls in its entirety is determined based on the lowest level input that is significant to the fair value measurement.
The following is a summary of the inputs used to value the Fund’s investments, by security type, as of December 31, 2016:
| | Level 1 | | | Level 2 | | | Level 3 | | | Total | |
Common Stocks | | $ | 18,906,942 | | | $ | — | | | $ | — | | | $ | 18,906,942 | |
Warrants | | | 297,000 | | | | — | | | | — | | | | 297,000 | |
Open-End Funds | | | 13,008 | | | | — | | | | — | | | | 13,008 | |
Money Market Funds | | | 1,818,170 | | | | — | | | | — | | | | 1,818,170 | |
Total | | $ | 21,035,120 | | | $ | — | | | $ | — | | | $ | 21,035,120 | |
Refer to the Fund’s Schedule of Investments for a listing of the securities by industry type. As of December 31, 2016, the Fund did not have any transfers into and out of any Level. There were no Level 2 or 3 securities or derivative instruments held by the Fund as of December 31, 2016. It is the Fund’s policy to recognize transfers into and out of any Level at the end of the reporting period.
(b) Income taxes — The Fund has qualified and intends to continue to qualify as a regulated investment company under the Internal Revenue Code of 1986 (the “Code”). Qualification generally will relieve the Fund of liability for federal income taxes to the extent 100% of its net investment income and net realized capital gains are distributed in accordance with the Code.
15
SCHWARTZ VALUE FOCUSED FUND
NOTES TO FINANCIAL STATEMENTS
(Continued)
In order to avoid imposition of the excise tax applicable to regulated investment companies, it is also the Fund’s intention to declare as dividends in each calendar year at least 98% of its net investment income and 98.2% of its net realized capital gains plus undistributed amounts from prior years.
The following information is computed on a tax basis for each item as of December 31, 2016:
Federal income tax cost | | $ | 16,652,785 | |
Gross unrealized appreciation | | $ | 4,567,673 | |
Gross unrealized depreciation | | | (185,338 | ) |
Net unrealized appreciation | | | 4,382,335 | |
Accumulated capital and other losses | | | (509,257 | ) |
Accumulated earnings | | $ | 3,873,078 | |
As of December 31, 2016, the Fund had a short-term capital loss carryforward of $509,257 for federal income tax purposes. This capital loss carryforward, which does not expire, may be utilized in future years to offset net realized capital gains, if any, prior to distributing such gains to shareholders.
During the year ended December 31, 2016, the Fund reclassified $67,763 of net investment loss against paid-in capital on the Statement of Assets and Liabilities. Such reclassification, the result of permanent differences between the financial statement and income tax reporting requirements, has no effect on the Fund’s net assets or NAV per share.
The Fund recognizes the tax benefits or expenses of uncertain tax positions only when the position is “more-likely-than-not” to be sustained assuming examination by tax authorities. Management has reviewed the tax positions taken on federal income tax returns for all open tax years (tax years ended December 31, 2013 through December 31, 2016) and has concluded that no provision for unrecognized tax benefits or expenses is required in these financial statements.
(c) Security transactions and investment income — Security transactions are accounted for on the trade date. Dividend income is recorded on the ex-dividend date. Interest income is recognized on the accrual basis. Realized capital gains and losses on security transactions are determined on the identified cost basis. Withholding taxes on foreign dividends have been recorded in accordance with the Fund’s understanding of the appropriate country’s rules and tax rates.
(d) Dividends and distributions — Dividends from net investment income and distributions of net realized capital gains, if any, are declared and paid annually in December. Dividends and distributions to shareholders are recorded on the ex-dividend date. There were no distributions paid to shareholders during the years ended December 31, 2016 and 2015.
(e) Estimates — The preparation of financial statements in conformity with GAAP requires management to make estimates and assumptions that affect the reported amounts of assets and liabilities and disclosure of contingent assets and liabilities
16
SCHWARTZ VALUE FOCUSED FUND
NOTES TO FINANCIAL STATEMENTS
(Continued)
as of the date of the financial statements and the reported amounts of revenues and expenses during the reporting period. Actual results could differ from those estimates.
(f) Common expenses — Common expenses of the Trust are allocated among the Fund and the other series of the Trust based on relative net assets of each series or the nature of the services performed and the relative applicability to each series.
2. Investment Advisory Agreement and Transactions with Related Parties
The Chairman and President of the Trust is also the Chairman and Chief Executive Officer of Schwartz Investment Counsel, Inc. (the “Adviser”). Certain other officers of the Trust are officers of the Adviser, or of Ultimus Fund Solutions, LLC (“Ultimus”), the administrative, accounting and transfer agent for the Fund, or of Ultimus Fund Distributors, LLC (the “Distributor”), the Fund’s principal underwriter.
Pursuant to an Investment Advisory Agreement between the Trust and the Adviser, the Adviser is responsible for the management of the Fund and provides investment advice along with the necessary personnel, facilities, equipment and certain other services necessary to the operations of the Fund. The Adviser receives from the Fund a quarterly fee at the annual rate of 0.95% per annum of the Fund’s average daily net assets.
The Adviser has contractually agreed to reduce its advisory fees or reimburse a portion of the Fund’s expenses until at least May 1, 2018 so that the ordinary operating expenses of the Fund do not exceed 1.25% per annum of average daily net assets. Accordingly, during the year ended December 31, 2016, the Adviser reduced its investment advisory fees by $106,868.
Any fee reductions or expense reimbursements by the Adviser are subject to repayment by the Fund for a period of three years after such fees and expenses were incurred, provided repayment to the Adviser does not cause the ordinary operating expenses of the Fund to exceed 1.25% per annum of average daily net assets. As of December 31, 2016, the Advisor may seek recoupment of investment advisory fee reductions totaling $163,484 no later than the dates stated below:
December 31, 2018 | December 31, 2019 |
$56,616 | $106,868 |
The Chief Compliance Officer of the Trust (the “CCO”) is an employee of the Adviser. The Trust pays the Adviser a fee for providing CCO services, of which the Fund pays its proportionate share along with the other series of the Trust. In addition, the Trust reimburses the Adviser for out-of-pocket expenses incurred, if any, for providing these services.
Pursuant to a Mutual Fund Services Agreement between the Trust and Ultimus, Ultimus supplies regulatory and compliance services, calculates the daily NAV per share, maintains the financial books and records of the Fund, maintains the records of each shareholder’s account, and processes purchases and redemptions of the Fund’s shares. For these services Ultimus receives fees computed as a percentage of the average daily net assets of the Fund, subject to a minimum monthly fee.
17
SCHWARTZ VALUE FOCUSED FUND
NOTES TO FINANCIAL STATEMENTS
(Continued)
Pursuant to a Distribution Agreement between the Trust and the Distributor, the Distributor serves as the Fund’s exclusive agent for the distribution of its shares. The Distributor is an affiliate of Ultimus.
Trustees and officers affiliated with the Adviser or Ultimus are not compensated by the Trust for their services. Each Trustee who is not an affiliated person of the Adviser or Ultimus (“Independent Trustee”) receives from the Trust an annual retainer of $35,000 (except that such fee is $45,000 for the Lead Independent Trustee and $39,000 for the Chairman of the Audit Committee), payable quarterly; a fee of $5,500 for attendance at each meeting of the Board of Trustees; plus reimbursement of travel and other expenses incurred in attending meetings. The Fund pays its proportionate share of Independent Trustees’ fees and expenses along with the other series of the Trust. Effective January 1, 2017, each Independent Trustee will receive from the Trust an annual retainer of $40,000 (except that such fee is $50,000 for the Lead Independent Trustee and $44,000 for the Chairman of the Audit Committee), payable quarterly; a fee of $6,000 for attendance at each meeting of the Board of Trustees; plus reimbursement of travel and other expenses incurred in attending meetings.
3. Investment Transactions
During the year ended December 31, 2016, cost of purchases and proceeds from sales and maturities of investment securities, excluding short-term investments and U.S. government securities, amounted to $8,490,036 and $9,734,367, respectively.
4. Contingencies and Commitments
The Fund indemnifies the Trust’s officers and Trustees for certain liabilities that might arise from their performance of their duties to the Fund. Additionally, in the normal course of business, the Fund enters into contracts that contain a variety of representations and warranties and which provide general indemnifications. The Fund’s maximum exposure under these arrangements is unknown, as this would involve future claims that may be made against the Fund that have not yet occurred. However, based on experience, the Fund expects the risk of loss to be remote.
5. Subsequent Events
The Fund is required to recognize in the financial statements the effects of all subsequent events that provide additional evidence about conditions that existed as of the date of the Statement of Assets and Liabilities. For non-recognized subsequent events that must be disclosed to keep the financial statements from being misleading, the Fund is required to disclose the nature of the event as well as an estimate of its financial effect, or a statement that such an estimate cannot be made. Management has evaluated subsequent events through the issuance of these financial statements and has noted no events.
18
SCHWARTZ VALUE FOCUSED FUND
REPORT OF INDEPENDENT REGISTERED
PUBLIC ACCOUNTING FIRM
Schwartz Value Focused Fund
We have audited the accompanying statement of assets and liabilities, including the schedule of investments, of Schwartz Value Focused Fund (formerly Schwartz Value Fund) (the “Fund”), a series of Schwartz Investment Trust, as of December 31, 2016, and the related statement of operations for the year then ended, the statements of changes in net assets for each of the two years in the period then ended, and the financial highlights for each of the five years in the period then ended. These financial statements and financial highlights are the responsibility of the Fund’s management. Our responsibility is to express an opinion on these financial statements and financial highlights based on our audits.
We conducted our audits in accordance with the standards of the Public Company Accounting Oversight Board (United States). Those standards require that we plan and perform the audits to obtain reasonable assurance about whether the financial statements and financial highlights are free of material misstatement. The Fund is not required to have, nor were we engaged to perform, an audit of internal control over financial reporting. Our audits included consideration of internal control over financial reporting as a basis for designing audit procedures that are appropriate in the circumstances, but not for the purpose of expressing an opinion on the effectiveness of the Fund’s internal control over financial reporting. Accordingly, we express no such opinion. An audit also includes examining, on a test basis, evidence supporting the amounts and disclosures in the financial statements, assessing the accounting principles used and significant estimates made by management, as well as evaluating the overall financial statement presentation. Our procedures included confirmation of securities owned as of December 31, 2016, by correspondence with the custodian and brokers. We believe that our audits provide a reasonable basis for our opinion.
In our opinion, the financial statements and financial highlights referred to above present fairly, in all material respects, the financial position of Schwartz Value Focused Fund (formerly Schwartz Value Fund) as of December 31, 2016, the results of its operations for the year then ended, the changes in its net assets for each of the two years in the period then ended, and the financial highlights for each of the five years in the period then ended, in conformity with accounting principles generally accepted in the United States of America.

February 14, 2017
19
SCHWARTZ VALUE FOCUSED FUND
BOARD OF TRUSTEES AND EXECUTIVE OFFICERS
(Unaudited)
Overall responsibility for management of the Trust rests with the Board of Trustees. The Trustees serve during the lifetime of the Trust and until its termination, or until death, resignation, retirement or removal. The Trustees, in turn, elect the officers of the Trust to actively supervise its day-to-day operations. The officers have been elected for an annual term. The following are the Trustees and executive officers of the Trust:
Trustee/Officer | Address | Year of
Birth | Position Held
with the Trust | Length of
Time Served |
Interested Trustees: |
* | George P. Schwartz, CFA | 801 W. Ann Arbor Trail
Plymouth, MI | 1944 | Chairman of the Board/President/ Trustee | Since 1992 |
Independent Trustees: |
| | Louis C. Bosco, Jr. | 801 W. Ann Arbor Trail
Plymouth, MI | 1936 | Trustee | Since 2008 |
| | Donald J. Dawson, Jr. | 801 W. Ann Arbor Trail
Plymouth, MI | 1947 | Trustee | Since 1993 |
| | Joseph M. Grace | 801 W. Ann Arbor Trail
Plymouth, MI | 1936 | Trustee | Since 2007 |
| | John J. McHale, Jr. | 801 W. Ann Arbor Trail
Plymouth, MI | 1949 | Trustee | Since 2014 |
Executive Officers: |
* | Richard L. Platte, Jr., CFA | 801 W. Ann Arbor Trail
Plymouth, MI | 1951 | Vice President and Secretary | Since 1993 |
* | Robert C. Schwartz, CFP | 801 W. Ann Arbor Trail
Plymouth, MI | 1976 | Vice President | Since 2013 |
* | Timothy S. Schwartz, CFA | 5060 Annunciation Circle
Ave Maria, FL | 1971 | Treasurer | Since 2000 |
* | Cathy M. Stoner, CPA, IACCP | 801 W. Ann Arbor Trail
Plymouth, MI | 1970 | Chief Compliance Officer | Since 2010 |
* | George P. Schwartz, Richard L. Platte, Jr., Robert C. Schwartz, Timothy S. Schwartz and Cathy M. Stoner, as affiliated persons of Schwartz Investment Counsel, Inc., the Fund’s investment adviser, are “interested persons” of the Trust within the meaning of Section 2(a)(19) of the Investment Company Act of 1940. George P. Schwartz is the father of Robert C. Schwartz and Timothy S. Schwartz. |
20
SCHWARTZ VALUE FOCUSED FUND
BOARD OF TRUSTEES AND EXECUTIVE OFFICERS
(Unaudited) (Continued)
Each Trustee oversees six portfolios of the Trust: the Ave Maria Catholic Values Fund, the Ave Maria Growth Fund, the Ave Maria Rising Dividend Fund, the Ave Maria World Equity Fund, the Ave Maria Bond Fund and the Schwartz Value Focused Fund. The principal occupations of the Trustees and executive officers of the Trust during the past five years and public directorships held by the Trustees are set forth below:
George P. Schwartz, CFA is Chairman and Chief Executive Officer of Schwartz Investment Counsel, Inc. and is the co-portfolio manager of the Fund.
Louis C. Bosco, Jr. retired in April 2012. Prior to his retirement, he was a partner in Bosco Development Company (a real estate firm).
Donald J. Dawson, Jr. retired in March 2015. Prior to retirement, he was Chairman of Payroll 1, Inc. (a payroll processing company) from 1986 – 2015.
Joseph M. Grace is retired Senior Vice President of National Bank of Detroit (renamed JPMorgan Chase & Company).
John J. McHale, Jr. is Special Assistant to Commissioner of Major League Baseball since 2015. He was Executive Vice President of Major League Baseball from 2000 – 2015.
Richard L. Platte, Jr., CFA is President and Chief Investment Officer of Schwartz Investment Counsel, Inc.
Robert C. Schwartz, CFP is Vice President and Secretary of Schwartz Investment Counsel, Inc.
Timothy S. Schwartz, CFA is Executive Vice President and Chief Financial Officer of Schwartz Investment Counsel, Inc. and is the lead portfolio manager of the Fund.
Cathy M. Stoner, CPA, IACCP is Vice President and Chief Compliance Officer of Schwartz Investment Counsel, Inc.
Additional information about members of the Board of Trustees and executive officers is available in the Statement of Additional Information (“SAI”). To obtain a free copy of the SAI, please call (888) 726-0753.
21
SCHWARTZ VALUE FOCUSED FUND
ABOUT YOUR FUND’S EXPENSES
(Unaudited)
We believe it is important for you to understand the impact of costs on your investment. As a shareholder of the Fund, you incur ongoing costs, including management fees and other Fund expenses. The following examples are intended to help you understand your ongoing costs (in dollars) of investing in the Fund and to compare these costs with the ongoing costs of investing in other mutual funds.
A mutual fund’s ongoing costs are expressed as a percentage of its average net assets. This figure is known as the expense ratio. The ongoing costs reflected in the table below are based on an investment of $1,000 made at the beginning of the most recent semi-annual period (July 1, 2016) and held until the end of the period (December 31, 2016).
The table below illustrates the Fund’s ongoing costs in two ways:
Actual fund return – This section helps you to estimate the actual expenses that you paid over the period. The “Ending Account Value” shown is derived from the Fund’s actual return, and the third column shows the dollar amount of operating expenses that would have been paid by an investor who started with $1,000 in the Fund. You may use the information here, together with the amount you invested, to estimate the expenses that you paid over the period.
To do so, simply divide your account value by $1,000 (for example, an $8,600 account value divided by $1,000 = 8.6), then multiply the result by the number given for the Fund under the heading “Expenses Paid During Period.”
Hypothetical 5% return – This section is intended to help you compare the Fund’s ongoing costs with those of other mutual funds. It assumes that the Fund had an annual return of 5% before expenses during the period shown, but that the expense ratio is unchanged. In this case, because the return used is not the Fund’s actual return, the result does not apply to your investment. The example is useful in making comparisons because the SEC requires all mutual funds to calculate expenses based on a 5% return. You can assess the Fund’s ongoing costs by comparing this hypothetical example with the hypothetical examples that appear in shareholder reports of other funds.
Note that expenses shown in the table are meant to highlight and help you compare ongoing costs only. The Fund does not charge sales loads or redemption fees.
The calculations assume no shares were bought or sold during the period. Your actual costs may have been higher or lower, depending on the amount of your investment and the timing of any purchases or redemptions.
More information about the Fund’s expenses, including historical annual expense ratios, can be found in this report. For additional information on operating expenses and other shareholder costs, please refer to the Fund’s Prospectus.
| Beginning
Account Value
July 1, 2016 | Ending
Account Value
December 31, 2016 | Expenses Paid
During Period* |
Based on Actual Fund Return | $1,000.00 | $1,095.00 | $6.58 |
Based on Hypothetical 5% Return (before expenses) | $1,000.00 | $1,018.85 | $6.34 |
* | Expenses are equal to the Fund’s annualized net expense ratio of 1.25% for the period, multiplied by the average account value over the period, multiplied by 184/366 (to reflect the one-half year period). |
22
SCHWARTZ VALUE FOCUSED FUND
OTHER INFORMATION
(Unaudited)
A description of the policies and procedures the Fund uses to determine how to vote proxies relating to portfolio securities is available without charge upon request by calling toll-free (888) 726-0753, or on the SEC’s website at http://www.sec.gov. Information regarding how the Fund voted proxies relating to portfolio securities during the most recent 12-month period ended June 30 is also available without charge upon request by calling toll-free (888) 726-0753, or on the SEC’s website at http://www.sec.gov.
The Trust files a complete listing of portfolio holdings for the Fund with the SEC as of the end of the first and third quarters of each fiscal year on Form N-Q. The filings are available free of charge, upon request, by calling (888) 726-0753. Furthermore, you may obtain a copy of the filings on the SEC’s website at http://www.sec.gov. The Trust’s Forms N-Q may also be reviewed and copied at the SEC’s Public Reference Room in Washington, DC, and information on the operation of the Public Reference Room may be obtained by calling (800) SEC-0330.
23
This page intentionally left blank.
Shareholder Services c/o Ultimus Fund Solutions, LLC P.O. Box 46707 Cincinnati, OH 45246 (888) 726-9331 | 
| Corporate Offices 801 W. Ann Arbor Trail Suite 244 Plymouth, MI 48170 (734) 455-7777 Fax (734) 455-7720 |
Dear Fellow Shareholders of:
Ave Maria Catholic Values Fund (AVEMX)
Ave Maria Growth Fund (AVEGX)
Ave Maria Rising Dividend Fund (AVEDX)
Ave Maria World Equity Fund (AVEWX)
Ave Maria Bond Fund (AVEFX)
Ave Maria Money Market Account
2016 saw wild swings in the global capital markets and investor sentiment. Throughout the year of many surprises with economic consequences, the words of Catholic Advisory Board member, Larry Kudlow, echoed through our organization “corporate profits are the mother’s milk of economic prosperity”. Despite a great deal of investor angst, U.S. corporate profits advanced modestly in 2016, and may increase another 10% - 15% in 2017, as the new administration is expected to usher in pro-growth policies. And importantly, pro-life policies.
There is a lot of work to be done and regulations to be undone. The Obama administration vastly expanded the government’s intrusion into the private economy, and imposed prosperity-stifling policies on corporations large and small, sapping confidence from business decision-makers, consumers and investors. Thankfully, the reverse seems to be taking place. In the same manner that the implementation of these stifling regulatory measures had negative consequences for economic growth, their removal could release the natural energy of our economy.
As you know, the portfolio managers and analysts of the Ave Maria Mutual Funds screen out companies based on the guidelines established by our Catholic Advisory Board. This eliminates from consideration, companies that support abortion, pornography and those that engage in embryonic stem cell research. That still leaves thousands of fine companies to choose from for the portfolios of the Funds. In 2016, our stock and bond selections were quite good, as each of
the Ave Maria Mutual Funds beat their respective benchmarks for investment performance. Our investment research process with emphasis on fundamentals and a long-term focus, seems to be working.
Thanks for being a shareholder.
Sincerely,

George P. Schwartz, CFA
Chairman & CEO
January 31, 2017
Past performance is not predictive of future performance. Investment results and principal value will fluctuate so that shares, when redeemed, may be worth more or less than their original cost. Current performance may be higher or lower than the performance data quoted. Performance data, current to the most recent month end, is available at the Ave Maria Mutual Funds website at www.avemariafunds.com or by calling 1-888-726-9331.
The Letter to Shareholders and the Portfolio Manager Commentaries that follow seek to describe some of the Adviser’s current opinions and views of the financial markets. Although the Adviser believes it has a reasonable basis for any opinions or views expressed, actual results may differ, sometimes significantly so, from those expected or expressed. Keep in mind that the information and opinions cover the period through the date of this report.
AVE MARIA MUTUAL FUNDS
TABLE OF CONTENTS
Ave Maria Catholic Values Fund: | |
Portfolio Manager Commentary | 2 |
Performance | 5 |
Annual Total Rates of Return Comparison with Major Indices | 6 |
Ten Largest Equity Holdings | 7 |
Asset Allocation | 7 |
Schedule of Investments | 8 |
| | |
Ave Maria Growth Fund: | |
Portfolio Manager Commentary | 12 |
Performance | 13 |
Annual Total Rates of Return Comparison with Major Indices | 14 |
Ten Largest Equity Holdings | 15 |
Asset Allocation | 15 |
Schedule of Investments | 16 |
| | |
Ave Maria Rising Dividend Fund: | |
Portfolio Manager Commentary | 19 |
Performance | 21 |
Annual Total Rates of Return Comparison with Major Indices | 22 |
Ten Largest Equity Holdings | 23 |
Asset Allocation | 23 |
Schedule of Investments | 24 |
| | |
Ave Maria World Equity Fund: | |
Portfolio Manager Commentary | 27 |
Performance | 29 |
Annual Total Rates of Return Comparison with Major Indices | 30 |
Ten Largest Equity Holdings | 31 |
Asset Allocation | 31 |
Schedule of Investments | 32 |
Summary of Common Stocks by Country | 35 |
| | |
Ave Maria Bond Fund: | |
Portfolio Manager Commentary | 36 |
Performance | 38 |
Annual Total Rates of Return Comparison with Major Indices | 39 |
Ten Largest Holdings | 40 |
Asset Allocation | 40 |
Schedule of Investments | 41 |
AVE MARIA MUTUAL FUNDS
TABLE OF CONTENTS
(Continued)
Statements of Assets and Liabilities | 46 |
| | |
Statements of Operations | 48 |
| | |
Statements of Changes in Net Assets: | |
Ave Maria Catholic Values Fund | 50 |
Ave Maria Growth Fund | 51 |
Ave Maria Rising Dividend Fund | 52 |
Ave Maria World Equity Fund | 53 |
Ave Maria Bond Fund | 54 |
| | |
Financial Highlights: | |
Ave Maria Catholic Values Fund | 55 |
Ave Maria Growth Fund | 56 |
Ave Maria Rising Dividend Fund | 57 |
Ave Maria World Equity Fund | 58 |
Ave Maria Bond Fund | 59 |
| | |
Notes to Financial Statements | 60 |
| | |
Report of Independent Registered Public Accounting Firm | 72 |
| | |
Board of Trustees and Executive Officers | 73 |
| | |
Catholic Advisory Board | 75 |
| | |
About Your Funds’ Expenses | 76 |
| | |
Federal Tax Information | 78 |
| | |
Other Information | 79 |
This report is for the information of the shareholders of the Ave Maria Mutual Funds. To obtain a copy of the prospectus, please visit our website at www.avemariafunds.com or call 1-888-726-9331 and a copy will be sent to you free of charge. Please read the prospectus carefully before you invest. The Ave Maria Mutual Funds are distributed by Ultimus Fund Distributors, LLC.
Past performance is not predictive of future performance. Investment results and principal value will fluctuate so that shares, when redeemed, may be worth more or less than their original cost. Current performance may be higher or lower than the performance data quoted. Performance data, current to the most recent month end, is available at the Ave Maria Mutual Funds website at www.avemariafunds.com or by calling 1-888-726-9331.
AVE MARIA CATHOLIC VALUES FUND
PORTFOLIO MANAGER COMMENTARY
(Unaudited)
Dear Fellow Shareowner:
2016 was a good year for the Ave Maria Catholic Values Fund (the “Fund”), with a total return of 16.44%, compared to 20.74% for the S&P 400 Index and 13.8% for the Russell Midcap Index. The Fund’s performance can be attributed mainly to 13 portfolio holdings, which appreciated more than 40% during the year. These issues were from a variety of industry sectors including energy, industrial, financial, retail, and technology. The Fund’s best performing stocks were energy and industrial related. Energy stocks bottomed early in the year and rebounded concomitantly with the rise in oil prices. At year end, the price of WTI crude oil breached $50/barrel, up 45% for the year and up nearly 100% from the February low. Holdings in the energy sector that produced outsized gains included Texas Pacific Land Trust (+90%), Halliburton Company (+61%), and Pioneer Natural Resources Company (+46%). Our industrial stocks benefitted from improving economic growth in the second half, and to a lesser extent, from rising oil and natural gas prices. Notable outperformers in the industrial sector included Colfax Corporation (+68%), MSC Industrial Direct Co., Inc. (+68%), Donaldson Company, Inc. (+50%), and H.B. Fuller Company (+42%). The Fund’s five best performing stocks in 2016 were:
Company | Industry | 2016 Performance |
Texas Pacific Land Trust | Oil & Gas Royalties/Real Estate | +89.56% |
MSC Industrial Direct Co., Inc. | Industrial Equipment | +68.32% |
Colfax Corporation | Industrial Machinery | +67.93% |
Halliburton | Oil & Gas Equipment & Services | +61.48% |
Donaldson Company, Inc. | Industrial Machinery | +50.11% |
2
AVE MARIA CATHOLIC VALUES FUND
PORTFOLIO MANAGER COMMENTARY
(Unaudited) (Continued)
On the negative side, the Fund’s worst performing stock during 2016 was Liberty Interactive Corporation, which owns and operates QVC Group, a multinational corporation that sells consumer goods through its television network and online. The share price fell after the company experienced a U.S. sales decline due to weakness in its fashion business and hair care division. Due to QVC’s loyal customer base and strong viewership, we view this slowdown as temporary. Additionally, the international business appears unaffected by the current U.S. sales slowdown. The Fund’s five worst performing stocks in 2016 were:
Company | Industry | 2016 Performance |
Liberty Interactive Corporation | TV & Internet Retail | -17.41% |
Zimmer Biomet Holdings Inc. | Medical Equipment | -16.40% |
VF Corporation | Apparel | -15.80% |
Moody’s Corporation | Business & Financial Services | - 9.40% |
ANSYS, Inc. | Software | + 0.92% |
During the past six months, six stocks were liquidated from the portfolio, having reached our estimate of intrinsic value: Emerson Electric Co. (industrial electrical equipment), Flour Corporation (industrial goods), HP, Inc. (technology), Polaris Industries, Inc. (recreational vehicles), World Fuel Services Corporation (oil & gas refining), and St. Jude Medical, Inc. (medical equipment), which received a takeover offer from Abbot Laboratories. Finally, we exited Platform Specialty Products Corporation (specialty chemicals) due to heightened concerns regarding the company’s business model.
During the second half of the year, new positions were established in three companies that meet our value investing criteria: AMERCO, Cognizant Technology Solutions Corp., and Zimmer Biomet Holdings Inc. AMERCO owns the U-Haul self-moving and storage franchise. With a dominant market position, the company has an impressive track record of increasing earnings and we believe has ample opportunities for growth. Cognizant Technology Solutions provides information technology (IT) consulting services worldwide. The business is highly profitable and generates strong free cash flow with a high return on invested capital. Zimmer Biomet designs and markets orthopedic implants and fracture management devices and, in our opinion, is well-positioned for long-term growth.
3
AVE MARIA CATHOLIC VALUES FUND
PORTFOLIO MANAGER COMMENTARY
(Unaudited) (Continued)
2017 could be another good year for stocks generally. We are confident that the new Trump Administration will be more hospitable to corporate America than the Obama Administration. President Trump’s pro-growth agenda of lower tax rates – corporate and personal, a less-punishing regulatory environment, and a generally less intrusive government should lead to greater business and consumer confidence, more economy activity, and ultimately higher corporate profits. As always, we’ll be working tirelessly to invest in well-managed, high-quality companies selling at a discount to our estimate of intrinsic value.
No capital gains or income distributions were paid at year end. The net asset value of the Fund ended the year at $19.12 per share.
Thank you for being a shareholder in the Fund.

| 
|
Timothy S. Schwartz, CFA | George P. Schwartz, CFA |
Lead Portfolio Manager | Co-Portfolio Manager |
| | |

| |
Joseph W. Skornicka, CFA | |
Co-Portfolio Manager | |
4
AVE MARIA CATHOLIC VALUES FUND
PERFORMANCE
(Unaudited) |
Comparison of the Change in Value of a $10,000 Investment
in the Ave Maria Catholic Values Fund, the S&P 400 Index**,
and the Russell Midcap Index
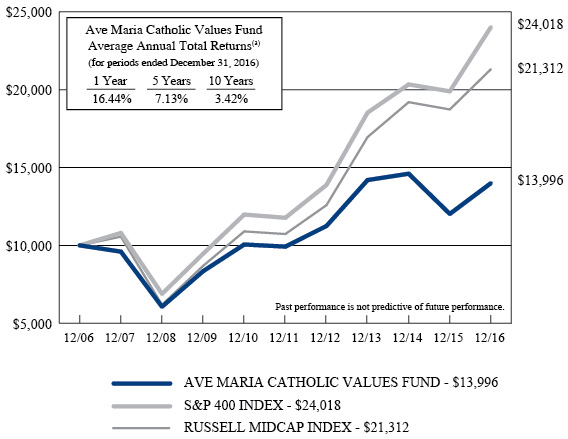
(a) | The returns shown do not reflect the deduction of taxes a shareholder would pay on Fund distributions or the redemption of Fund shares. |
Expense ratio as of 12-31-15 (as disclosed in May 1, 2016 prospectus) | 1.18%* |
Expense ratio for the year ended 12-31-16 | 1.20% |
* | Includes Acquired Fund Fees and Expenses. |
| | |
** | Effective January 1, 2017, the S&P 400 Index will be the Fund’s primary bench mark instead of the Russell Midcap Index. |
Past performance is not predictive of future performance. Investment results and principal value will fluctuate so that shares, when redeemed, may be worth more or less than their original cost. Current performance may be higher or lower than the performance data quoted. Performance data, current to the most recent month end, is available at the Ave Maria Mutual Funds website at www.avemariafunds.com or by calling 1-888-726-9331.
5
AVE MARIA CATHOLIC VALUES FUND
ANNUAL TOTAL RATES OF RETURN
COMPARISON WITH MAJOR INDICES (Unaudited) |
| AVE MARIA
CATHOLIC
VALUES FUND | S&P 400
INDEX | RUSSELL
MIDCAP
INDEX | S&P 500
INDEX |
2001(a) | 5.3% | -0.5% | -3.5% | -8.5% |
2002 | -9.8% | -14.5% | -16.2% | -22.1% |
2003 | 35.6% | 35.6% | 40.1% | 28.7% |
2004 | 20.1% | 16.5% | 20.2% | 10.9% |
2005 | 5.8% | 12.6% | 12.7% | 4.9% |
2006 | 14.2% | 10.3% | 15.3% | 15.8% |
2007 | -4.0% | 8.0% | 5.6% | 5.5% |
2008 | -36.8% | -36.2% | -41.5% | -37.0% |
2009 | 37.6% | 37.4% | 40.5% | 26.5% |
2010 | 20.5% | 26.7% | 25.5% | 15.1% |
2011 | -1.3% | -1.7% | -1.6% | 2.1% |
2012 | 13.3% | 17.9% | 17.3% | 16.0% |
2013 | 26.2% | 33.5% | 34.8% | 32.4% |
2014 | 2.9% | 9.8% | 13.2% | 13.7% |
2015 | -17.7% | -2.2% | -2.4% | 1.4% |
2016 | 16.4% | 20.7% | 13.8% | 12.0% |
AVERAGE ANNUAL TOTAL RETURNS
As of December 31, 2016 (Unaudited)
| AVE MARIA
CATHOLIC
VALUES FUND | S&P 400
INDEX | RUSSELL
MIDCAP
INDEX | S&P 500
INDEX |
3 Years | -0.5% | 9.0% | 7.9% | 8.9% |
5 Years | 7.1% | 15.3% | 14.7% | 14.7% |
10 Years | 3.4% | 9.2% | 7.9% | 7.0% |
Since Inception (b) | 6.3% | 9.3% | 8.8% | 5.8% |
(a) | Represents the period from the commencement of operations (May 1, 2001) through December 31, 2001. |
| | |
(b) | Represents the period from the commencement of operations (May 1, 2001) through December 31, 2016. |
6
AVE MARIA CATHOLIC VALUES FUND
TEN LARGEST EQUITY HOLDINGS
December 31, 2016 (Unaudited)
Shares | | Company | | Market Value | | | % of Net Assets | |
| | 100,000 | | MSC Industrial Direct Company, Inc. - Class A | | $ | 9,239,000 | | | | 4.1 | % |
| | 50,000 | | Pioneer Natural Resources Company | | | 9,003,500 | | | | 4.0 | % |
| | 65,000 | | Laboratory Corporation of America Holdings | | | 8,344,700 | | | | 3.7 | % |
| | 260,000 | | ARRIS International plc | | | 7,833,800 | | | | 3.5 | % |
| | 100,000 | | Discover Financial Services | | | 7,209,000 | | | | 3.2 | % |
| | 100,000 | | HEICO Corporation - Class A | | | 6,790,000 | | | | 3.0 | % |
| | 120,000 | | Halliburton Company | | | 6,490,800 | | | | 2.9 | % |
| | 10,536 | | Alleghany Corporation | | | 6,407,152 | | | | 2.9 | % |
| | 60,000 | | Zimmer Biomet Holdings, Inc. | | | 6,192,000 | | | | 2.8 | % |
| | 20,000 | | Texas Pacific Land Trust | | | 5,935,400 | | | | 2.6 | % |
ASSET ALLOCATION (Unaudited)
Sector | % of Net Assets |
Consumer Discretionary | 11.9% |
Energy | 11.7% |
Financials | 18.8% |
Health Care | 9.7% |
Industrials | 21.9% |
Information Technology | 15.0% |
Materials | 0.6% |
Warrants | 0.5% |
Money Market Funds, Liabilities in Excess of Other Assets | 9.9% |
| | 100.0% |
7
AVE MARIA CATHOLIC VALUES FUND
SCHEDULE OF INVESTMENTS
December 31, 2016
COMMON STOCKS — 89.6% | | Shares | | | Market Value | |
Consumer Discretionary — 11.9% | | | | | | |
Diversified Consumer Services — 2.3% | | | | | | |
Graham Holdings Company - Class B | | | 5,000 | | | $ | 2,559,750 | |
ServiceMaster Global Holdings, Inc. * | | | 70,000 | | | | 2,636,900 | |
| | | | | | | | 5,196,650 | |
Household Durables — 2.1% | | | | | | | | |
Garmin Ltd. | | | 60,000 | | | | 2,909,400 | |
PulteGroup, Inc. | | | 100,000 | | | | 1,838,000 | |
| | | | | | | | 4,747,400 | |
Internet & Direct Marketing Retail — 1.6% | | | | | | | | |
Liberty Interactive Corporation QVC Group - Series A * | | | 180,000 | | | | 3,596,400 | |
| | | | | | | | | |
Media — 2.4% | | | | | | | | |
Discovery Communications, Inc. - Series A * | | | 200,000 | | | | 5,482,000 | |
| | | | | | | | | |
Multi-Line Retail — 1.1% | | | | | | | | |
Nordstrom, Inc. | | | 50,000 | | | | 2,396,500 | |
| | | | | | | | | |
Textiles, Apparel & Luxury Goods — 2.4% | | | | | | | | |
VF Corporation | | | 100,000 | | | | 5,335,000 | |
| | | | | | | | | |
Energy — 11.7% | | | | | | | | |
Energy Equipment & Services — 5.2% | | | | | | | | |
Baker Hughes Incorporated | | | 40,000 | | | | 2,598,800 | |
FMC Technologies, Inc. * | | | 75,000 | | | | 2,664,750 | |
Halliburton Company | | | 120,000 | | | | 6,490,800 | |
| | | | | | | | 11,754,350 | |
Oil, Gas & Consumable Fuels — 6.5% | | | | | | | | |
Noble Energy, Inc. | | | 143,740 | | | | 5,470,744 | |
Pioneer Natural Resources Company | | | 50,000 | | | | 9,003,500 | |
| | | | | | | | 14,474,244 | |
Financials — 18.8% | | | | | | | | |
Banks — 1.5% | | | | | | | | |
Fifth Third Bancorp | | | 125,000 | | | | 3,371,250 | |
| | | | | | | | | |
Capital Markets — 3.6% | | | | | | | | |
Dundee Corporation - Class A * | | | 239,400 | | | | 1,060,542 | |
Federated Investors, Inc. - Class B | | | 50,000 | | | | 1,414,000 | |
Moody's Corporation | | | 60,000 | | | | 5,656,200 | |
| | | | | | | | 8,130,742 | |
Consumer Finance — 3.2% | | | | | | | | |
Discover Financial Services | | | 100,000 | | | | 7,209,000 | |
8
AVE MARIA CATHOLIC VALUES FUND
SCHEDULE OF INVESTMENTS
(Continued)
COMMON STOCKS — 89.6% (Continued) | | Shares | | | Market Value | |
Financials — 18.8% (Continued) | | | | | | |
Diversified Financial Services — 4.6% | | | | | | |
Texas Pacific Land Trust | | | 20,000 | | | $ | 5,935,400 | |
Western Union Company (The) | | | 200,000 | | | | 4,344,000 | |
| | | | | | | | 10,279,400 | |
Insurance — 5.9% | | | | | | | | |
Alleghany Corporation * | | | 10,536 | | | | 6,407,152 | |
Reinsurance Group of America, Inc. | | | 30,000 | | | | 3,774,900 | |
Unico American Corporation * # | | | 282,945 | | | | 3,041,659 | |
| | | | | | | | 13,223,711 | |
Health Care — 9.7% | | | | | | | | |
Health Care Equipment & Supplies — 4.8% | | | | | | | | |
Varian Medical Systems, Inc. * | | | 50,000 | | | | 4,489,000 | |
Zimmer Biomet Holdings, Inc. | | | 60,000 | | | | 6,192,000 | |
| | | | | | | | 10,681,000 | |
Health Care Providers & Services — 3.7% | | | | | | | | |
Laboratory Corporation of America Holdings * | | | 65,000 | | | | 8,344,700 | |
| | | | | | | | | |
Life Sciences Tools & Services — 1.2% | | | | | | | | |
Waters Corporation * | | | 20,000 | | | | 2,687,800 | |
| | | | | | | | | |
Industrials — 21.9% | | | | | | | | |
Aerospace & Defense — 3.0% | | | | | | | | |
HEICO Corporation - Class A | | | 100,000 | | | | 6,790,000 | |
| | | | | | | | | |
Electrical Equipment — 3.9% | | | | | | | | |
AMETEK, Inc. | | | 110,000 | | | | 5,346,000 | |
Eaton Corporation plc | | | 50,000 | | | | 3,354,500 | |
| | | | | | | | 8,700,500 | |
Machinery — 6.3% | | | | | | | | |
Colfax Corporation * | | | 150,000 | | | | 5,389,500 | |
Donaldson Company, Inc. | | | 90,000 | | | | 3,787,200 | |
Graco, Inc. | | | 60,000 | | | | 4,985,400 | |
| | | | | | | | 14,162,100 | |
Road & Rail — 2.5% | | | | | | | | |
AMERCO | | | 15,000 | | | | 5,543,850 | |
| | | | | | | | | |
Trading Companies & Distributors — 6.2% | | | | | | | | |
MSC Industrial Direct Company, Inc. - Class A | | | 100,000 | | | | 9,239,000 | |
W.W. Grainger, Inc. | | | 20,000 | | | | 4,645,000 | |
| | | | | | | | 13,884,000 | |
9
AVE MARIA CATHOLIC VALUES FUND
SCHEDULE OF INVESTMENTS
(Continued)
COMMON STOCKS — 89.6% (Continued) | | Shares | | | Market Value | |
Information Technology — 15.0% | | | | | | |
Communications Equipment — 3.5% | | | | | | |
ARRIS International plc * | | | 260,000 | | | $ | 7,833,800 | |
| | | | | | | | | |
Electronic Equipment, Instruments & Components — 3.9% | | | | | | | | |
Arrow Electronics, Inc. * | | | 75,000 | | | | 5,347,500 | |
Avnet, Inc. | | | 70,000 | | | | 3,332,700 | |
| | | | | | | | 8,680,200 | |
Internet Software & Services — 0.8% | | | | | | | | |
Equinix, Inc. | | | 4,948 | | | | 1,768,465 | |
| | | | | | | | | |
IT Services — 4.2% | | | | | | | | |
Cognizant Technology Solutions Corporation - Class A * | | | 75,000 | | | | 4,202,250 | |
InterXion Holding N.V. * | | | 150,000 | | | | 5,260,500 | |
| | | | | | | | 9,462,750 | |
Software — 1.6% | | | | | | | | |
ANSYS, Inc. * | | | 40,000 | | | | 3,699,600 | |
| | | | | | | | | |
Technology Hardware, Storage & Peripherals — 1.0% | | | | | | | | |
Hewlett Packard Enterprise Company | | | 100,000 | | | | 2,314,000 | |
| | | | | | | | | |
Materials — 0.6% | | | | | | | | |
Chemicals — 0.6% | | | | | | | | |
H.B. Fuller Company | | | 30,000 | | | | 1,449,300 | |
| | | | | | | | | |
Total Common Stocks (Cost $157,291,350) | | | | | | $ | 201,198,712 | |
WARRANTS — 0.5% | | Shares | | | Market Value | |
Financials — 0.5% | | | | | | |
Banks — 0.5% | | | | | | |
PNC Financial Services Group, Inc. (The), expires 12/31/18 * (Cost $472,385) | | | 25,000 | | | $ | 1,237,500 | |
10
AVE MARIA CATHOLIC VALUES FUND
SCHEDULE OF INVESTMENTS
(Continued)
MONEY MARKET FUNDS — 9.9% | | Shares | | | Market Value | |
Federated Government Obligations Tax-Managed Fund - Institutional Shares, 0.35% (a) | | | 10,814,344 | | | $ | 10,814,344 | |
Federated Treasury Obligations Fund - Institutional Shares, 0.36% (a) | | | 10,774,343 | | | | 10,774,343 | |
Federated U.S. Treasury Cash Reserves Fund - Institutional Shares, 0.30% (a) | | | 573,356 | | | | 573,356 | |
Total Money Market Funds (Cost $22,162,043) | | | | | | $ | 22,162,043 | |
| | | | | | | | | |
Total Investments at Market Value — 100.0% (Cost $179,925,778) | | | | | | $ | 224,598,255 | |
| | | | | | | | | |
Liabilities in Excess of Other Assets — (0.0%) (b) | | | | | | | (5,007 | ) |
| | | | | | | | | |
Net Assets — 100.0% | | | | | | $ | 224,593,248 | |
* | Non-income producing security. |
| | |
# | The Fund owned 5% or more of the company's outstanding voting shares thereby making the company an affiliated company as that term is defined in the Investment Company Act of 1940 (Note 5). |
| | |
(a) | The rate shown is the 7-day effective yield as of December 31, 2016. |
| | |
(b) | Percentage rounds to less than 0.1%. |
| | |
See notes to financial statements. |
11
AVE MARIA GROWTH FUND
PORTFOLIO MANAGER COMMENTARY
(Unaudited)
Dear Fellow Shareholders,
For 2016, the Ave Maria Growth Fund (the “Fund”) had a total return of 12.07% compared with the benchmark S&P 500 Index total return of 11.96%. In 2016, the Morningstar mid-cap growth peer group average total return was 6.0% and the large-cap growth peer group average total return was 3.2%. The Fund’s growth-at-a-reasonable-price (GARP) investment style continues to produce consistently favorable results. As of December 31, 2016, the Fund’s 10-year average annual total return was 7.97% compared with the S&P 500 Index average annual total return of 6.95%.
The Fund seeks to invest in companies with sustainable competitive advantages, above-average growth prospects, above-average margins, and low financial leverage. The aggregate return on equity of the Fund’s holdings as of year-end was 18.5% compared with 11.9% for the S&P 500 Index. The Fund generally avoids financial (banking, insurance) and energy (exploration/production, refining/marketing) companies because they lack sustainable competitive advantages, as evidenced by their low returns on equity. It is noteworthy that these two sectors contributed to nearly 40% of the S&P 500’s 12.0% return in 2016. So the Fund’s outperformance came from owning some of the best performers in other sectors, such as industrials, consumer, and healthcare.
Late in the year the Fund purchased a position in Ecolab, a producer and marketer of cleaning and sanitation products for the hospitality, healthcare, and industrial markets. Over 90% of Ecolab’s revenue is recurring, its products are a small percent of their customer’s budgets, and customers save money on labor, energy, and water using its products. These factors are helping Ecolab generate mid-single digit organic revenue growth with high incremental returns on equity. Ecolab is a great example of the type of companies in which we seek to invest, at a reasonable price.
We believe that our disciplined approach of investing in exceptional companies at attractive prices should continue generating favorable long-term results for Fund shareholders. We are delighted and honored that you are one of them.
With best regards,

| 
|
Brian D. Milligan, CFA | Richard L. Platte, Jr., CFA |
Lead Portfolio Manager | Co-Portfolio Manager |
12
AVE MARIA GROWTH FUND
PERFORMANCE
(Unaudited) |
Comparison of the Change in Value of a $10,000 Investment
in the Ave Maria Growth Fund and the S&P 500 Index

(a) | The returns shown do not reflect the deduction of taxes a shareholder would pay on Fund distributions or the redemption of Fund shares. |
Expense ratio as of 12-31-15 (as disclosed in May 1, 2016 prospectus) | 1.17%* |
Expense ratio for the year ended 12-31-16 | 1.17% |
* | Includes Acquired Fund Fees and Expenses. |
Past performance is not predictive of future performance. Investment results and principal value will fluctuate so that shares, when redeemed, may be worth more or less than their original cost. Current performance may be higher or lower than the performance data quoted. Performance data, current to the most recent month end, is available at the Ave Maria Mutual Funds website at www.avemariafunds.com or by calling 1-888-726-9331.
13
AVE MARIA GROWTH FUND
ANNUAL TOTAL RATES OF RETURN
COMPARISON WITH MAJOR INDICES (Unaudited) |
| AVE MARIA GROWTH FUND | S&P 500 INDEX |
2003(a) | 23.4% | 22.8% |
2004 | 21.5% | 10.9% |
2005 | 0.3% | 4.9% |
2006 | 15.8% | 15.8% |
2007 | 11.6% | 5.5% |
2008 | -32.1% | -37.0% |
2009 | 26.4% | 26.5% |
2010 | 26.5% | 15.1% |
2011 | 0.5% | 2.1% |
2012 | 14.7% | 16.0% |
2013 | 31.5% | 32.4% |
2014 | 7.5% | 13.7% |
2015 | -2.7% | 1.4% |
2016 | 12.1% | 12.0% |
AVERAGE ANNUAL TOTAL RETURNS
As of December 31, 2016 (Unaudited)
| AVE MARIA GROWTH FUND | S&P 500 INDEX |
3 Years | 5.4% | 8.9% |
5 Years | 12.1% | 14.7% |
10 Years | 8.0% | 7.0% |
Since Inception (b) | 10.2% | 9.0% |
(a) | Represents the period from the commencement of operations (May 1, 2003) through December 31, 2003. |
| | |
(b) | Represents the period from the commencement of operations (May 1, 2003) through December 31, 2016. |
14
AVE MARIA GROWTH FUND
TEN LARGEST EQUITY HOLDINGS
December 31, 2016 (Unaudited)
Shares | | Company | | Market Value | | | % of Net Assets | |
| | 270,000 | | Copart, Inc. | | $ | 14,960,700 | | | | 4.3 | % |
| | 160,000 | | MSC Industrial Direct Company, Inc. - Class A | | | 14,782,400 | | | | 4.2 | % |
| | 220,000 | | Cognizant Technology Solutions Corporation - Class A | | | 12,326,600 | | | | 3.5 | % |
| | 130,000 | | Moody's Corporation | | | 12,255,100 | | | | 3.5 | % |
| | 145,000 | | Graco, Inc. | | | 12,048,050 | | | | 3.4 | % |
| | 115,000 | | MasterCard, Inc. - Class A | | | 11,873,750 | | | | 3.4 | % |
| | 242,600 | | AMETEK, Inc. | | | 11,790,360 | | | | 3.4 | % |
| | 165,000 | | Lowe's Companies, Inc. | | | 11,734,800 | | | | 3.3 | % |
| | 90,000 | | Laboratory Corporation of America Holdings | | | 11,554,200 | | | | 3.3 | % |
| | 75,000 | | Amgen, Inc. | | | 10,965,750 | | | | 3.1 | % |
ASSET ALLOCATION (Unaudited)
Sector | % of Net Assets |
Consumer Discretionary | 24.1% |
Energy | 1.0% |
Financials | 6.9% |
Health Care | 16.7% |
Industrials | 33.2% |
Information Technology | 9.4% |
Materials | 2.8% |
Money Market Funds, Other Assets in Excess of Liabilities | 5.9% |
| | 100.0% |
15
AVE MARIA GROWTH FUND
SCHEDULE OF INVESTMENTS
December 31, 2016
COMMON STOCKS — 94.1% | | Shares | | | Market Value | |
Consumer Discretionary — 24.1% | | | | | | |
Internet & Direct Marketing Retail — 1.0% | | | | | | |
Priceline Group, Inc. (The) * | | | 2,500 | | | $ | 3,665,150 | |
| | | | | | | | | |
Leisure Products — 1.2% | | | | | | | | |
Polaris Industries, Inc. | | | 50,000 | | | | 4,119,500 | |
| | | | | | | | | |
Media — 7.7% | | | | | | | | |
Discovery Communications, Inc. - Series A * | | | 315,000 | | | | 8,634,150 | |
Omnicom Group, Inc. | | | 125,000 | | | | 10,638,750 | |
Scripps Networks Interactive, Inc. - Class A | | | 110,000 | | | | 7,850,700 | |
| | | | | | | | 27,123,600 | |
Specialty Retail — 11.4% | | | | | | | | |
Lowe's Companies, Inc. | | | 165,000 | | | | 11,734,800 | |
Ross Stores, Inc. | | | 150,000 | | | | 9,840,000 | |
Sally Beauty Holdings, Inc. * | | | 220,000 | | | | 5,812,400 | |
TJX Companies, Inc. (The) | | | 65,000 | | | | 4,883,450 | |
Tractor Supply Company | | | 100,000 | | | | 7,581,000 | |
| | | | | | | | 39,851,650 | |
Textiles, Apparel & Luxury Goods — 2.8% | | | | | | | | |
VF Corporation | | | 185,000 | | | | 9,869,750 | |
| | | | | | | | | |
Energy — 1.0% | | | | | | | | |
Energy Equipment & Services — 1.0% | | | | | | | | |
Schlumberger Limited | | | 40,000 | | | | 3,358,000 | |
| | | | | | | | | |
Financials — 6.9% | | | | | | | | |
Capital Markets — 3.5% | | | | | | | | |
Moody's Corporation | | | 130,000 | | | | 12,255,100 | |
| | | | | | | | | |
Diversified Financial Services — 3.4% | | | | | | | | |
MasterCard, Inc. - Class A | | | 115,000 | | | | 11,873,750 | |
| | | | | | | | | |
Health Care — 16.7% | | | | | | | | |
Biotechnology — 3.1% | | | | | | | | |
Amgen, Inc. | | | 75,000 | | | | 10,965,750 | |
| | | | | | | | | |
Health Care Equipment & Supplies — 7.7% | | | | | | | | |
Danaher Corporation | | | 101,500 | | | | 7,900,760 | |
Medtronic plc | | | 145,000 | | | | 10,328,350 | |
Varian Medical Systems, Inc. * | | | 97,000 | | | | 8,708,660 | |
| | | | | | | | 26,937,770 | |
16
AVE MARIA GROWTH FUND
SCHEDULE OF INVESTMENTS
(Continued)
COMMON STOCKS — 94.1% (Continued) | | Shares | | | Market Value | |
Health Care — 16.7% (Continued) | | | | | | |
Health Care Providers & Services — 3.3% | | | | | | |
Laboratory Corporation of America Holdings * | | | 90,000 | | | $ | 11,554,200 | |
| | | | | | | | | |
Health Care Technology — 2.6% | | | | | | | | |
Cerner Corporation * | | | 195,000 | | | | 9,237,150 | |
| | | | | | | | | |
Industrials — 33.2% | | | | | | | | |
Air Freight & Logistics — 6.1% | | | | | | | | |
Expeditors International of Washington, Inc. | | | 200,000 | | | | 10,592,000 | |
United Parcel Service, Inc. - Class B | | | 95,000 | | | | 10,890,800 | |
| | | | | | | | 21,482,800 | |
Commercial Services & Supplies — 4.8% | | | | | | | | |
Copart, Inc. * | | | 270,000 | | | | 14,960,700 | |
Rollins, Inc. | | | 60,000 | | | | 2,026,800 | |
| | | | | | | | 16,987,500 | |
Electrical Equipment — 6.2% | | | | | | | | |
AMETEK, Inc. | | | 242,600 | | | | 11,790,360 | |
Rockwell Automation, Inc. | | | 75,000 | | | | 10,080,000 | |
| | | | | | | | 21,870,360 | |
Industrial Conglomerates — 1.6% | | | | | | | | |
Roper Technologies, Inc. | | | 30,000 | | | | 5,492,400 | |
| | | | | | | | | |
Machinery — 10.3% | | | | | | | | |
Colfax Corporation * | | | 270,000 | | | | 9,701,100 | |
Donaldson Company, Inc. | | | 255,000 | | | | 10,730,400 | |
Fortive Corporation | | | 50,750 | | | | 2,721,723 | |
Graco, Inc. | | | 145,000 | | | | 12,048,050 | |
Toro Company (The) | | | 15,000 | | | | 839,250 | |
| | | | | | | | 36,040,523 | |
Trading Companies & Distributors — 4.2% | | | | | | | | |
MSC Industrial Direct Company, Inc. - Class A | | | 160,000 | | | | 14,782,400 | |
| | | | | | | | | |
Information Technology — 9.4% | | | | | | | | |
Internet Software & Services — 1.4% | | | | | | | | |
Equinix, Inc. | | | 14,000 | | | | 5,003,740 | |
| | | | | | | | | |
IT Services — 5.9% | | | | | | | | |
Accenture plc - Class A | | | 70,000 | | | | 8,199,100 | |
Cognizant Technology Solutions Corporation - Class A * | | | 220,000 | | | | 12,326,600 | |
| | | | | | | | 20,525,700 | |
17
AVE MARIA GROWTH FUND
SCHEDULE OF INVESTMENTS
(Continued)
COMMON STOCKS — 94.1% (Continued) | | Shares | | | Market Value | |
Information Technology — 9.4% (Continued) | | | | | | |
Software — 2.1% | | | | | | |
ANSYS, Inc. * | | | 80,000 | | | $ | 7,399,200 | |
| | | | | | | | | |
Materials — 2.8% | | | | | | | | |
Chemicals — 2.8% | | | | | | | | |
Ecolab, Inc. | | | 10,000 | | | | 1,172,200 | |
Praxair, Inc. | | | 75,000 | | | | 8,789,250 | |
| | | | | | | | 9,961,450 | |
| | | | | | | | | |
Total Common Stocks (Cost $248,742,407) | | | | | | $ | 330,357,443 | |
MONEY MARKET FUNDS — 5.8% | | Shares | | | Market Value | |
Federated Government Obligations Tax-Managed Fund - Institutional Shares, 0.35% (a) | | | 16,958,625 | | | $ | 16,958,625 | |
Federated Treasury Obligations Fund - Institutional Shares, 0.36% (a) | | | 3,374,813 | | | | 3,374,813 | |
Total Money Market Funds (Cost $20,333,438) | | | | | | $ | 20,333,438 | |
| | | | | | | | | |
Total Investments at Market Value — 99.9% (Cost $269,075,845) | | | | | | $ | 350,690,881 | |
| | | | | | | | | |
Other Assets in Excess of Liabilities — 0.1% | | | | | | | 394,582 | |
| | | | | | | | | |
Net Assets — 100.0% | | | | | | $ | 351,085,463 | |
* | Non-income producing security. |
| | |
(a) | The rate shown is the 7-day effective yield as of December 31, 2016. |
| | |
See notes to financial statements. |
18
AVE MARIA RISING DIVIDEND FUND
PORTFOLIO MANAGER COMMENTARY
(Unaudited)
Dear Fellow Shareholders,
2016 was a good year for the Ave Maria Rising Dividend Fund (the “Fund”) with a total return of 15.33%. This compares with 11.96% for the Standard & Poor’s 500 Index.
The Last Shall be First
Industrial, energy and financial stocks contributed strongly to performance in 2016. You may recall that in 2015, industrial and energy stocks performed poorly for a number of reasons. And while our financials, principally regional banks, contributed strongly to performance for the entirety of 2016, they began the year poorly. Poorly enough to be commented upon in our six month report in June. In that report, we enumerated all the negatives for the regional banks but concluded that the stocks were still attractive because of their improving fundamentals and low stock prices.
This propensity of certain issues to be alternately popular and then unpopular figures into our investment strategy and offers an opportunity to comment on our approach to managing the Fund. Simply stated, it turns on knowing what it is we’re looking for and then being opportunistic. In evaluating individual prospects, we start with the underlying operating fundamentals of the company. Is it well run? Is it capable of producing high returns on capital and equity? Is the balance sheet strong enough to withstand the inevitable downs of the business cycle? Will earnings growth enable higher dividends? These are the critical questions. (It goes without saying that they must also pass muster when it comes to our moral screens.)
Patience and Fortitude
Stock price also matters, and we seek to improve overall returns by purchasing intelligently. This requires patience, but given the ebb and flow of popularity for individual stocks, opportunity eventually presents itself. Not surprisingly, the best opportunities typically occur when a stock, or group of stocks, is out of favor. Being patient and contrarian in our thinking is key, but it requires fortitude. We sell only when fundamentals deteriorate, the company violates the moral screens, or the stock price gets significantly ahead of our estimate of its intrinsic value. It’s important to remember that for companies that are growing, intrinsic value grows as well.
19
AVE MARIA RISING DIVIDEND FUND
PORTFOLIO MANAGER COMMENTARY
(Unaudited) (Continued)
2016 Performance
Breaking out 2016 investment performance in detail reveals the strongest contributions to performance came from the following individual stocks: Microchip Technology, Inc. (semiconductors); Donaldson Company, Inc. (filtration systems); Halliburton Co. (oil service); and PNC Financial Services Group, Inc. (banking). Disappointments in terms of performance came from our holdings of: Zimmer Biomet Holdings, Inc. (orthopedic products); VF Corp. (apparel); and Amgen, Inc. (biotech), all of which we continue to believe have long-term investment merits.
And Beyond
2016 was a good year for equity investors, and there are reasons to be optimistic for the current year. Our research team remains resolute and confident that the exceptional companies held in the portfolio will continue to grow earnings and importantly, dividends. Each company has the demonstrated ability to survive and prosper under the worst of circumstances. To invest in companies with that potential and participate in that growth, remains the focus and purpose of the Ave Maria Rising Dividend Fund.
We appreciate your participation in the Fund.
Sincerely,

| 
|
Richard L. Platte, Jr., CFA | George P. Schwartz, CFA |
Lead Portfolio Manager | Co-Portfolio Manager |
20
AVE MARIA RISING DIVIDEND FUND
PERFORMANCE
(Unaudited) |
Comparison of the Change in Value of a $10,000 Investment
in the Ave Maria Rising Dividend Fund and the S&P 500 Index
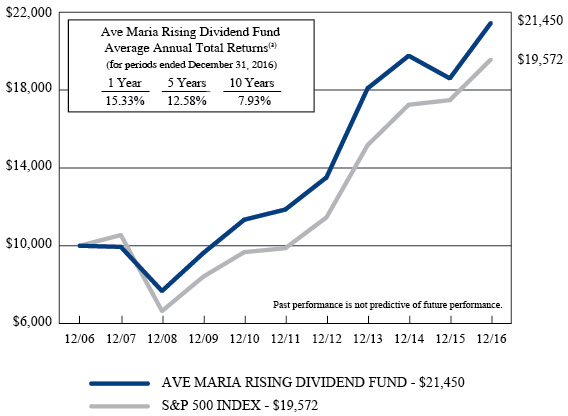
(a) | The returns shown do not reflect the deduction of taxes a shareholder would pay on Fund distributions or the redemption of Fund shares. |
Expense ratio as of 12-31-15 (as disclosed in May 1, 2016 prospectus) | 0.92%* |
Expense ratio for the year ended 12-31-16 | 0.92% |
* | Includes Acquired Fund Fees and Expenses. |
Past performance is not predictive of future performance. Investment results and principal value will fluctuate so that shares, when redeemed, may be worth more or less than their original cost. Current performance may be higher or lower than the performance data quoted. Performance data, current to the most recent month end, is available at the Ave Maria Mutual Funds website at www.avemariafunds.com or by calling 1-888-726-9331.
21
AVE MARIA RISING DIVIDEND FUND
ANNUAL TOTAL RATES OF RETURN
COMPARISON WITH MAJOR INDICES (Unaudited) |
| AVE MARIA
RISING DIVIDEND FUND | S&P 500 INDEX |
2005(a) | 6.7% | 8.8% |
2006 | 17.9% | 15.8% |
2007 | -0.6% | 5.5% |
2008 | -22.8% | -37.0% |
2009 | 25.3% | 26.5% |
2010 | 17.9% | 15.1% |
2011 | 4.6% | 2.1% |
2012 | 13.9% | 16.0% |
2013 | 33.9% | 32.4% |
2014 | 9.3% | 13.7% |
2015 | -5.9% | 1.4% |
2016 | 15.3% | 12.0% |
AVERAGE ANNUAL TOTAL RETURNS
As of December 31, 2016 (Unaudited) |
| AVE MARIA
RISING DIVIDEND FUND | S&P 500 INDEX |
3 Years | 5.9% | 8.9% |
5 Years | 12.6% | 14.7% |
10 Years | 7.9% | 7.0% |
Since Inception (b) | 8.9% | 8.0% |
(a) | Represents the period from the commencement of operations (May 2, 2005) through December 31, 2005. |
| | |
(b) | Represents the period from the commencement of operations (May 2, 2005) through December 31, 2016. |
22
AVE MARIA RISING DIVIDEND FUND
TEN LARGEST EQUITY HOLDINGS
December 31, 2016 (Unaudited)
Shares | | Company | | Market Value | | | % of Net Assets | |
| | 1,000,000 | | Cisco Systems, Inc. | | $ | 30,220,000 | | | | 3.6 | % |
| | 240,000 | | United Parcel Service, Inc. - Class B | | | 27,513,600 | | | | 3.3 | % |
| | 320,000 | | Omnicom Group, Inc. | | | 27,235,200 | | | | 3.3 | % |
| | 150,000 | | 3M Company | | | 26,785,500 | | | | 3.2 | % |
| | 115,000 | | W.W. Grainger, Inc. | | | 26,708,750 | | | | 3.2 | % |
| | 475,000 | | Emerson Electric Company | | | 26,481,250 | | | | 3.2 | % |
| | 225,000 | | PNC Financial Services Group, Inc. (The) | | | 26,316,000 | | | | 3.2 | % |
| | 235,000 | | Norfolk Southern Corporation | | | 25,396,450 | | | | 3.1 | % |
| | 300,000 | | Schlumberger Limited | | | 25,185,000 | | | | 3.0 | % |
| | 350,000 | | Lowe's Companies, Inc. | | | 24,892,000 | | | | 3.0 | % |
ASSET ALLOCATION (Unaudited)
Sector | % of Net Assets |
Consumer Discretionary | 19.0% |
Consumer Staples | 5.0% |
Energy | 7.4% |
Financials | 19.7% |
Health Care | 8.8% |
Industrials | 27.8% |
Information Technology | 4.8% |
Materials | 2.8% |
Money Market Funds, Liabilities in Excess of Other Assets | 4.7% |
| | 100.0% |
23
AVE MARIA RISING DIVIDEND FUND
SCHEDULE OF INVESTMENTS
December 31, 2016
COMMON STOCKS — 95.3% | | Shares | | | Market Value | |
Consumer Discretionary — 19.0% | | | | | | |
Auto Components — 0.4% | | | | | | |
Adient plc * | | | 50,141 | | | $ | 2,938,263 | |
| | | | | | | | | |
Leisure Products — 1.2% | | | | | | | | |
Polaris Industries, Inc. | | | 125,000 | | | | 10,298,750 | |
| | | | | | | | | |
Media — 3.3% | | | | | | | | |
Omnicom Group, Inc. | | | 320,000 | | | | 27,235,200 | |
| | | | | | | | | |
Specialty Retail — 11.2% | | | | | | | | |
Lowe's Companies, Inc. | | | 350,000 | | | | 24,892,000 | |
Ross Stores, Inc. | | | 75,000 | | | | 4,920,000 | |
TJX Companies, Inc. (The) | | | 275,000 | | | | 20,660,750 | |
Tractor Supply Company | | | 250,000 | | | | 18,952,500 | |
Williams-Sonoma, Inc. | | | 475,000 | | | | 22,985,250 | |
| | | | | | | | 92,410,500 | |
Textiles, Apparel & Luxury Goods — 2.9% | | | | | | | | |
VF Corporation | | | 450,000 | | | | 24,007,500 | |
| | | | | | | | | |
Consumer Staples — 5.0% | | | | | | | | |
Beverages — 2.9% | | | | | | | | |
Diageo plc - ADR | | | 230,000 | | | | 23,906,200 | |
| | | | | | | | | |
Food Products — 2.1% | | | | | | | | |
Kraft Heinz Company (The) | | | 200,000 | | | | 17,464,000 | |
| | | | | | | | | |
Energy — 7.4% | | | | | | | | |
Energy Equipment & Services — 5.0% | | | | | | | | |
Halliburton Company | | | 300,000 | | | | 16,227,000 | |
Schlumberger Limited | | | 300,000 | | | | 25,185,000 | |
| | | | | | | | 41,412,000 | |
Oil, Gas & Consumable Fuels — 2.4% | | | | | | | | |
Exxon Mobil Corporation | | | 220,000 | | | | 19,857,200 | |
| | | | | | | | | |
Financials — 19.7% | | | | | | | | |
Banks — 11.1% | | | | | | | | |
BB&T Corporation | | | 425,000 | | | | 19,983,500 | |
Fifth Third Bancorp | | | 850,000 | | | | 22,924,500 | |
PNC Financial Services Group, Inc. (The) | | | 225,000 | | | | 26,316,000 | |
U.S. Bancorp | | | 450,000 | | | | 23,116,500 | |
| | | | | | | | 92,340,500 | |
24
AVE MARIA RISING DIVIDEND FUND
SCHEDULE OF INVESTMENTS
(Continued)
COMMON STOCKS — 95.3% (Continued) | | Shares | | | Market Value | |
Financials — 19.7% (Continued) | | | | | | |
Capital Markets — 4.9% | | | | | | |
Bank of New York Mellon Corporation (The) | | | 500,000 | | | $ | 23,690,000 | |
Moody's Corporation | | | 175,000 | | | | 16,497,250 | |
| | | | | | | | 40,187,250 | |
Consumer Finance — 1.1% | | | | | | | | |
Discover Financial Services | | | 125,000 | | | | 9,011,250 | |
| | | | | | | | | |
Insurance — 2.6% | | | | | | | | |
Chubb Limited | | | 165,000 | | | | 21,799,800 | |
| | | | | | | | | |
Health Care — 8.8% | | | | | | | | |
Biotechnology — 2.9% | | | | | | | | |
Amgen, Inc. | | | 165,000 | | | | 24,124,650 | |
| | | | | | | | | |
Health Care Equipment & Supplies — 5.9% | | | | | | | | |
Medtronic plc | | | 340,000 | | | | 24,218,200 | |
Zimmer Biomet Holdings, Inc. | | | 240,000 | | | | 24,768,000 | |
| | | | | | | | 48,986,200 | |
Industrials — 27.8% | | | | | | | | |
Air Freight & Logistics — 3.3% | | | | | | | | |
United Parcel Service, Inc. - Class B | | | 240,000 | | | | 27,513,600 | |
| | | | | | | | | |
Building Products — 2.5% | | | | | | | | |
Johnson Controls International plc | | | 501,420 | | | | 20,653,490 | |
| | | | | | | | | |
Electrical Equipment — 3.2% | | | | | | | | |
Emerson Electric Company | | | 475,000 | | | | 26,481,250 | |
| | | | | | | | | |
Industrial Conglomerates — 3.2% | | | | | | | | |
3M Company | | | 150,000 | | | | 26,785,500 | |
| | | | | | | | | |
Machinery — 9.3% | | | | | | | | |
Donaldson Company, Inc. | | | 500,000 | | | | 21,040,000 | |
Dover Corporation | | | 260,000 | | | | 19,481,800 | |
Graco, Inc. | | | 200,000 | | | | 16,618,000 | |
Illinois Tool Works, Inc. | | | 160,000 | | | | 19,593,600 | |
| | | | | | | | 76,733,400 | |
Road & Rail — 3.1% | | | | | | | | |
Norfolk Southern Corporation | | | 235,000 | | | | 25,396,450 | |
| | | | | | | | | |
Trading Companies & Distributors — 3.2% | | | | | | | | |
W.W. Grainger, Inc. | | | 115,000 | | | | 26,708,750 | |
25
AVE MARIA RISING DIVIDEND FUND
SCHEDULE OF INVESTMENTS
(Continued)
COMMON STOCKS — 95.3% (Continued) | | Shares | | | Market Value | |
Information Technology — 4.8% | | | | | | |
Communications Equipment — 3.6% | | | | | | |
Cisco Systems, Inc. | | | 1,000,000 | | | $ | 30,220,000 | |
| | | | | | | | | |
Semiconductors & Semiconductor Equipment — 1.2% | | | | | | | | |
Microchip Technology, Inc. | | | 150,000 | | | | 9,622,500 | |
| | | | | | | | | |
Materials — 2.8% | | | | | | | | |
Chemicals — 2.8% | | | | | | | | |
Praxair, Inc. | | | 200,000 | | | | 23,438,000 | |
| | | | | | | | | |
Total Common Stocks (Cost $675,187,043) | | | | | | $ | 789,532,203 | |
MONEY MARKET FUNDS — 4.7% | | Shares | | | Market Value | |
Federated Government Obligations Tax-Managed Fund - Institutional Shares, 0.35% (a) (Cost $39,363,200) | | | 39,363,200 | | | $ | 39,363,200 | |
| | | | | | | | | |
Total Investments at Market Value — 100.0% (Cost $714,550,243) | | | | | | $ | 828,895,403 | |
| | | | | | | | | |
Liabilities in Excess of Other Assets — (0.0%) (b) | | | | | | | (246,175 | ) |
| | | | | | | | | |
Net Assets — 100.0% | | | | | | $ | 828,649,228 | |
ADR - American Depositary Receipt. |
| |
* | Non-income producing security. |
| | |
(a) | The rate shown is the 7-day effective yield as of December 31, 2016. |
| | |
(b) | Percentage rounds to less than 0.1%. |
| | |
See notes to financial statements. |
26
AVE MARIA WORLD EQUITY FUND
PORTFOLIO MANAGER COMMENTARY
(Unaudited)
Dear Fellow Shareholder:
The Ave Maria World Equity Fund (the “Fund”) had a total return of 8.71% for the year ended December 31, 2016. The S&P Global 1200 Index performed similarly, with a total return of 8.89% for the same period.
Globally, several big events occurred during 2016: an early collapse, then sustained rise in oil prices; the vote in the U.K. to exit the European Union (“Brexit”); the election of Donald Trump as President; and a 25 basis point increase in interest rates by the Federal Reserve (the “Fed”) in December. We are excited about the potential positives of the Trump Presidency including tax reform and a more favorable regulatory environment for business. We applaud the move by the Fed and hope to see continued gradual increases in interest rates.
While 2016 was a good year for the global developed equity markets, it was heavily influenced by the performance of the U.S. market (which carries an almost 60% weight in the S&P Global 1200). The S&P 500 was up 11.96% for the year on a total return basis (in USD), but the S&P Europe 350 was up only 0.52%, and the S&P Topix 150 (Japan) was up only 2.93%. So when looking at the attribution analysis for the Fund in 2016, it is not surprising to find that many of the top performers were U.S. based companies (four of the top five were St. Jude Medical, Inc., Reinsurance Group of America, Eaton Corporation plc, and Halliburton Company), while many of the bottom contributors were foreign based (four of the bottom five were Heineken N.V., Coca-Cola European Partners plc, AXA S.A., and Shire plc).
From a sector standpoint, the Fund’s performance was positively impacted by industrials, technology, health care, real estate and energy. Five industrial holdings were up over 20%, led by the aforementioned Eaton Corp., along with Emerson Electric Co., Siemens AG, Koninklijke Phillips Electronics N.V., and Canadian National Railway Company. Technology holdings also had a positive impact, with two holdings up over 30%, Taiwan Semiconductor Manufacturing and QUALCOMM, Inc. Energy holdings were driven by Halliburton, as well as Pioneer Natural Resources Company.
The Fund’s performance was negatively impacted by its consumer staples holdings. Coca-Cola European Partners was down the most. With no real bad news reported by the company, we believe the shares were primarily a casualty of sector rotation, with more defensive and dividend yield oriented areas like consumer staples under-performing more cyclical and interest rate sensitive sectors. Other staple holdings that were a victim of the rotation were Diageo plc and Heineken, two European beverage companies.
27
AVE MARIA WORLD EQUITY FUND
PORTFOLIO MANAGER COMMENTARY
(Unaudited) (Continued)
Five new positions, all of which comply with our moral screens, have been added to the Fund since June 30, 2016: AMETEK, Inc. (electrical components & equipment), Coca-Cola European Partners (soft drinks bottler), FirstService Corporation (real estate services), Royal Dutch Shell (integrated energy), and Zimmer Biomet Holdings, Inc. (medical devices). Four positions were eliminated; EMC Corporation and St. Jude Medical, Inc., which were both to be acquired, as well as Polaris Industries, Inc. and United Technologies Corporation, which were sold in favor of what we believe to be more attractive investment opportunities.
As of December 31, 2016, the Fund’s geographic weightings versus the S&P Global 1200 Index were approximately:
| | Ave Maria World
Equity Fund | S&P Global
1200 Index |
Americas | 54.5% | 63.1% |
Europe Developed | 17.9% | 15.9% |
United Kingdom | 14.1% | 6.6% |
Japan | 5.9% | 7.8% |
Asia Developed | 0.0% | 2.0% |
Asia Emerging | 2.7% | 2.0% |
Australasia | 0.0% | 2.6% |
Cash Equivalents | 4.9% | — |
We are optimistic about 2017, as we continue to carefully implement our strategy of focusing on what we consider to be higher quality, larger capitalization, globally oriented, and attractively valued companies. Thank you for your continued interest in the Ave Maria World Equity Fund.

| 
|
Joseph W. Skornicka, CFA | Robert C. Schwartz, CFP |
Lead Portfolio Manager | Co-Portfolio Manager |
28
AVE MARIA WORLD EQUITY FUND
PERFORMANCE
(Unaudited) |
Comparison of the Change in Value of a $10,000 Investment
in the Ave Maria World Equity Fund and the S&P 1200 Global Index

(a) | The returns shown do not reflect the deduction of taxes a shareholder would pay on Fund distributions or the redemption of Fund shares. |
| | |
(b) | Represents the period from the commencement of operations (April 30, 2010) through December 31, 2016. |
Expense Ratio
information as of: | Year Ended 12-31-15
(as disclosed in May 1, 2016 prospectus) | Year Ended
12-31-16 |
Gross | 1.50%* | 1.45% |
Net | 1.25%* | 1.33% |
* | Includes Acquired Fund Fees and Expenses. |
Past performance is not predictive of future performance. Investment results and principal value will fluctuate so that shares, when redeemed, may be worth more or less than their original cost. Current performance may be higher or lower than the performance data quoted. Performance data, current to the most recent month end, is available at the Ave Maria Mutual Funds website at www.avemariafunds.com or by calling 1-888-726-9331.
29
AVE MARIA WORLD EQUITY FUND
ANNUAL TOTAL RATES OF RETURN
COMPARISON WITH MAJOR INDICES (Unaudited) |
| AVE MARIA
WORLD EQUITY FUND | S&P 1200
GLOBAL INDEX |
2010(a) | 12.4% | 8.5% |
2011 | -9.6% | -5.1% |
2012 | 13.8% | 16.8% |
2013 | 23.5% | 25.8% |
2014 | 0.5% | 5.4% |
2015 | -4.8% | -0.9% |
2016 | 8.7% | 8.9% |
AVERAGE ANNUAL TOTAL RETURNS
As of December 31, 2016 (Unaudited)
| AVE MARIA
WORLD EQUITY FUND | S&P 1200
GLOBAL INDEX |
3 Years | 1.3% | 4.4% |
5 Years | 7.9% | 10.8% |
Since Inception(b) | 6.1% | 8.5% |
(a) | Represents the period from the commencement of operations (April 30, 2010) through December 31, 2010. |
| | |
(b) | Represents the period from the commencement of operations (April 30, 2010) through December 31, 2016. |
30
AVE MARIA WORLD EQUITY FUND
TEN LARGEST EQUITY HOLDINGS
December 31, 2016 (Unaudited)
Shares | | Company | | Market Value | | | % of Net Assets | |
| | 36,000 | | Citigroup, Inc. | | $ | 2,139,480 | | | | 4.7 | % |
| | 11,000 | | Shire plc - ADR | | | 1,874,180 | | | | 4.1 | % |
| | 17,700 | | Zimmer Biomet Holdings, Inc. | | | 1,826,640 | | | | 4.0 | % |
| | 24,000 | | TE Connectivity Ltd. | | | 1,662,720 | | | | 3.6 | % |
| | 12,000 | | Chubb Limited | | | 1,585,440 | | | | 3.4 | % |
| | 21,619 | | Medtronic plc | | | 1,539,921 | | | | 3.3 | % |
| | 48,500 | | Coca-Cola European Partners plc | | | 1,522,900 | | | | 3.3 | % |
| | 81,500 | | Bridgestone Corporation - ADR | | | 1,471,075 | | | | 3.2 | % |
| | 14,000 | | Diageo plc - ADR | | | 1,455,160 | | | | 3.2 | % |
| | 20,000 | | Lowe's Companies, Inc. | | | 1,422,400 | | | | 3.1 | % |
ASSET ALLOCATION (Unaudited)
Sector | % of Net Assets |
Consumer Discretionary | 12.8% |
Consumer Staples | 13.7% |
Energy | 9.6% |
Financials | 17.5% |
Health Care | 13.0% |
Industrials | 13.6% |
Information Technology | 11.4% |
Materials | 0.4% |
Real Estate | 1.0% |
Telecommunication Services | 2.1% |
Money Market Funds, Other Assets in Excess of Liabilities | 4.9% |
| | 100.0% |
31
AVE MARIA WORLD EQUITY FUND
SCHEDULE OF INVESTMENTS
December 31, 2016
COMMON STOCKS — 95.1% | | Shares | | | Market Value | |
Consumer Discretionary — 12.8% | | | | | | |
Auto Components — 3.2% | | | | | | |
Bridgestone Corporation - ADR | | | 81,500 | | | $ | 1,471,075 | |
| | | | | | | | | |
Automobiles — 2.7% | | | | | | | | |
Toyota Motor Corporation - ADR | | | 10,600 | | | | 1,242,320 | |
| | | | | | | | | |
Media — 3.8% | | | | | | | | |
Discovery Communications, Inc. - Series A * | | | 22,500 | | | | 616,725 | |
WPP plc - ADR | | | 10,500 | | | | 1,161,930 | |
| | | | | | | | 1,778,655 | |
Specialty Retail — 3.1% | | | | | | | | |
Lowe's Companies, Inc. | | | 20,000 | | | | 1,422,400 | |
| | | | | | | | | |
Consumer Staples — 13.7% | | | | | | | | |
Beverages — 8.9% | | | | | | | | |
Coca-Cola European Partners plc | | | 48,500 | | | | 1,522,900 | |
Diageo plc - ADR | | | 14,000 | | | | 1,455,160 | |
Heineken N.V. - ADR | | | 30,000 | | | | 1,122,300 | |
| | | | | | | | 4,100,360 | |
Food Products — 4.8% | | | | | | | | |
Mondelēz International, Inc. - Class A | | | 26,000 | | | | 1,152,580 | |
Nestlé S.A. - ADR | | | 14,500 | | | | 1,040,230 | |
| | | | | | | | 2,192,810 | |
Energy — 9.6% | | | | | | | | |
Energy Equipment & Services — 5.0% | | | | | | | | |
Halliburton Company | | | 25,000 | | | | 1,352,250 | |
Schlumberger Limited | | | 11,000 | | | | 923,450 | |
| | | | | | | | 2,275,700 | |
Oil, Gas & Consumable Fuels — 4.6% | | | | | | | | |
Exxon Mobil Corporation | | | 7,700 | | | | 695,002 | |
Pioneer Natural Resources Company | | | 5,400 | | | | 972,378 | |
Royal Dutch Shell plc - Class B - ADR | | | 8,000 | | | | 463,760 | |
| | | | | | | | 2,131,140 | |
Financials — 17.5% | | | | | | | | |
Banks — 4.7% | | | | | | | | |
Citigroup, Inc. | | | 36,000 | | | | 2,139,480 | |
| | | | | | | | | |
Capital Markets — 1.5% | | | | | | | | |
Brookfield Asset Management, Inc. - Class A | | | 21,000 | | | | 693,210 | |
| | | | | | | | | |
Consumer Finance — 1.9% | | | | | | | | |
Discover Financial Services | | | 12,300 | | | | 886,707 | |
32
AVE MARIA WORLD EQUITY FUND
SCHEDULE OF INVESTMENTS
(Continued)
COMMON STOCKS — 95.1% (Continued) | | Shares | | | Market Value | |
Financials — 17.5% (Continued) | | | | | | |
Diversified Financial Services — 1.6% | | | | | | |
Western Union Company (The) | | | 33,500 | | | $ | 727,620 | |
| | | | | | | | | |
Insurance — 7.8% | | | | | | | | |
AXA S.A. - ADR | | | 55,000 | | | | 1,386,000 | |
Chubb Limited | | | 12,000 | | | | 1,585,440 | |
Reinsurance Group of America, Inc. | | | 5,000 | | | | 629,150 | |
| | | | | | | | 3,600,590 | |
Health Care — 13.0% | | | | | | | | |
Biotechnology — 1.6% | | | | | | | | |
Amgen, Inc. | | | 5,000 | | | | 731,050 | |
| | | | | | | | | |
Health Care Equipment & Supplies — 7.3% | | | | | | | | |
Medtronic plc | | | 21,619 | | | | 1,539,921 | |
Zimmer Biomet Holdings, Inc. | | | 17,700 | | | | 1,826,640 | |
| | | | | | | | 3,366,561 | |
Pharmaceuticals — 4.1% | | | | | | | | |
Shire plc - ADR | | | 11,000 | | | | 1,874,180 | |
| | | | | | | | | |
Industrials — 13.6% | | | | | | | | |
Electrical Equipment — 5.7% | | | | | | | | |
AMETEK, Inc. | | | 18,500 | | | | 899,100 | |
Eaton Corporation plc | | | 18,700 | | | | 1,254,583 | |
Emerson Electric Company | | | 8,000 | | | | 446,000 | |
| | | | | | | | 2,599,683 | |
Industrial Conglomerates — 5.3% | | | | | | | | |
Koninklijke Philips N.V. | | | 42,008 | | | | 1,284,185 | |
Siemens AG - ADR | | | 9,500 | | | | 1,162,990 | |
| | | | | | | | 2,447,175 | |
Road & Rail — 2.6% | | | | | | | | |
Canadian National Railway Company | | | 18,000 | | | | 1,213,200 | |
| | | | | | | | | |
Information Technology — 11.4% | | | | | | | | |
Electronic Equipment, Instruments & Components — 3.6% | | | | | | | | |
TE Connectivity Ltd. | | | 24,000 | | | | 1,662,720 | |
| | | | | | | | | |
Internet Software & Services — 1.5% | | | | | | | | |
Equinix, Inc. | | | 2,000 | | | | 714,820 | |
33
AVE MARIA WORLD EQUITY FUND
SCHEDULE OF INVESTMENTS
(Continued)
COMMON STOCKS — 95.1% (Continued) | | Shares | | | Market Value | |
Information Technology — 11.4% (Continued) | | | | | | |
IT Services — 2.7% | | | | | | |
Accenture plc - Class A | | | 5,000 | | | $ | 585,650 | |
InterXion Holding N.V. * | | | 19,000 | | | | 666,330 | |
| | | | | | | | 1,251,980 | |
Semiconductors & Semiconductor Equipment — 3.6% | | | | | | | | |
QUALCOMM Incorporated | | | 6,500 | | | | 423,800 | |
Taiwan Semiconductor Manufacturing Company Ltd. - ADR | | | 42,500 | | | | 1,221,875 | |
| | | | | | | | 1,645,675 | |
Materials — 0.4% | | | | | | | | |
Chemicals — 0.4% | | | | | | | | |
International Flavors & Fragrances, Inc. | | | 1,500 | | | | 176,745 | |
| | | | | | | | | |
Real Estate — 1.0% | | | | | | | | |
Real Estate Management & Development — 1.0% | | | | | | | | |
FirstService Corporation | | | 10,000 | | | | 474,800 | |
| | | | | | | | | |
Telecommunication Services — 2.1% | | | | | | | | |
Diversified Telecommunication Services — 2.1% | | | | | | | | |
Level 3 Communications, Inc. * | | | 17,000 | | | | 958,120 | |
| | | | | | | | | |
Total Common Stocks (Cost $38,869,881) | | | | | | $ | 43,778,776 | |
MONEY MARKET FUNDS — 4.4% | | Shares | | | Market Value | |
Federated Government Obligations Tax-Managed Fund - Institutional Shares, 0.35% (a) (Cost $2,022,745) | | | 2,022,745 | | | $ | 2,022,745 | |
| | | | | | | | | |
Total Investments at Market Value — 99.5% (Cost $40,892,626) | | | | | | $ | 45,801,521 | |
| | | | | | | | | |
Other Assets in Excess of Liabilities — 0.5% | | | | | | | 228,140 | |
| | | | | | | | | |
Net Assets — 100.0% | | | | | | $ | 46,029,661 | |
ADR - American Depositary Receipt. |
| |
* | Non-income producing security. |
| | |
(a) | The rate shown is the 7-day effective yield as of December 31, 2016. |
See notes to financial statements. |
34
AVE MARIA WORLD EQUITY FUND
SUMMARY OF COMMON STOCKS BY COUNTRY
December 31, 2016 (Unaudited)
Country | | Value | | | % of Net Assets | |
United States * | | $ | 22,736,891 | | | | 49.4 | % |
United Kingdom | | | 6,477,930 | | | | 14.1 | % |
Netherlands | | | 3,072,815 | | | | 6.7 | % |
Japan | | | 2,713,395 | | | | 5.9 | % |
Switzerland | | | 2,625,670 | | | | 5.7 | % |
Canada | | | 2,381,210 | | | | 5.1 | % |
France | | | 1,386,000 | | | | 3.0 | % |
Taiwan | | | 1,221,875 | | | | 2.7 | % |
Germany | | | 1,162,990 | | | | 2.5 | % |
| | | $ | 43,778,776 | | | | 95.1 | % |
* | Includes companies deemed to be a “non-U.S. company” as defined in the Fund’s prospectus as the company has at least 50% of its revenues or operations outside of the United States. |
See notes to financial statements. |
35
AVE MARIA BOND FUND
PORTFOLIO MANAGER COMMENTARY
(Unaudited)
In 2016, the Ave Maria Bond Fund (“the Fund”) had a total return of 4.54% vs. 2.08% for the Bloomberg Barclays Intermediate U.S. Government/Credit Index. Interest rates, which drive bond prices, were all over the map last year. The ten-year U.S. Treasury yield started 2016 at 2.28% and steadily declined into July, when it hit its all-time intraday low of 1.36%. From there, rates rose modestly until Election Day. At that point, investors woke up with hopes of tax decreases (both personal and corporate), massive fiscal stimulus through infrastructure spending, repatriation of foreign earnings by domestic companies, deregulation of many industries (especially financials), and the repeal or reduction of the Affordable Care Act. The thought of some of these pro-growth policies coming to fruition sent interest rates higher with the ten-year U.S. Treasury ending the year yielding 2.43% and stocks soaring.
The economic picture gradually improved in 2016, as Real GDP grew at 1.7% and unemployment fell to 4.6%. Inflation, excluding food and energy, is currently registering 2.1%, right at the Federal Reserve’s (the “Fed”) target of 2%. The Fed increased the Fed Funds’ rate once in 2016 by 25 basis points, or 0.25%, though less than the four originally forecasted for the year. For 2017, the Fed is indicating three increases at 25 basis points each.
Around the world, Central Banks have continued their “pedal-to-the-metal” monetary policies that have driven some interest rates below zero. In September, a record $13.3 trillion in global debt carried a negative yield. The European Central Bank has extended its Quantitative Easing program into April, at which point it will reassess the effects of these policies. Hopefully they will realize that negative rates and other extreme monetary policies have done more harm than good.
Corporate bonds fared especially well in 2016. For many of the same reasons the stock market went up, corporate credit spreads tightened. At the end of 2016, corporate credit spreads were below their long-term average. In that context, we have modestly increased the weight of U.S. Treasuries in the Fund.
In reviewing the performance of the Fund, the three top-performing assets were the common stocks of Texas Instruments, Inc. (semiconductor devices), Fifth Third Bancorp (regional bank), and Microchip, Inc. (semiconductor devices). The Fund’s worst-performing assets were the common stock of Williams-Sonoma, Inc. (home products stores), and the bonds of MasterCard, Inc. (consumer finance) and Ross Stores, Inc. (specialty apparel stores).
36
AVE MARIA BOND FUND
PORTFOLIO MANAGER COMMENTARY
(Unaudited) (Continued)
The Fund continues to be managed in a conservative manner, and has generated no down years since the inception of the Fund in 2003. With interest rates still low by historical standards, we continue to keep the average bond maturity low and credit quality high. Dividend-paying common stocks once again contributed positively to the performance of the Fund, and we believe they offer an attractive combination of income and potential capital appreciation.
Your participation in the Fund is appreciated.

| 
|
Brandon S. Scheitler | Richard L. Platte, Jr., CFA |
Lead Portfolio Manager | Co-Portfolio Manager |
37
AVE MARIA BOND FUND
PERFORMANCE
(Unaudited) |
Comparison of the Change in Value of a $10,000 Investment
in the Ave Maria Bond Fund and the Bloomberg Barclays
U.S. Intermediate Government/Credit Index
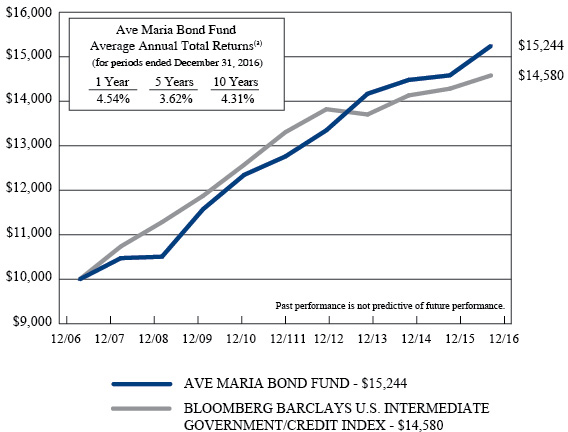
(a) | The returns shown do not reflect the deduction of taxes a shareholder would pay on Fund distributions or the redemption of Fund shares. |
Expense ratio as of 12-31-15 (as disclosed in May 1, 2016 prospectus) | 0.51%* |
Expense ratio for the year ended 12-31-16 | 0.50% |
* | Includes Acquired Fund Fees and Expenses. |
Past performance is not predictive of future performance. Investment results and principal value will fluctuate so that shares, when redeemed, may be worth more or less than their original cost. Current performance may be higher or lower than the performance data quoted. Performance data, current to the most recent month end, is available at the Ave Maria Mutual Funds website at www.avemariafunds.com or by calling 1-888-726-9331.
38
AVE MARIA BOND FUND
ANNUAL TOTAL RATES OF RETURN
COMPARISON WITH MAJOR INDICES (Unaudited) |
| AVE MARIA BOND FUND | BLOOMBERG BARCLAYS
U.S. INTERMEDIATE
GOVERNMENT/CREDIT INDEX |
2003(a) | 2.4% | 1.9% |
2004 | 5.1% | 3.0% |
2005 | 1.4% | 1.6% |
2006 | 6.0% | 4.1% |
2007 | 4.8% | 7.4% |
2008 | 0.3% | 5.1% |
2009 | 10.2% | 5.2% |
2010 | 6.7% | 5.9% |
2011 | 3.3% | 5.8% |
2012 | 4.6% | 3.9% |
2013 | 6.1% | -0.9% |
2014 | 2.2% | 3.1% |
2015 | 0.7% | 1.1% |
2016 | 4.5% | 2.1% |
AVERAGE ANNUAL TOTAL RETURNS
As of December 31, 2016 (Unaudited)
| AVE MARIA BOND FUND | BLOOMBERG BARCLAYS
U.S. INTERMEDIATE
GOVERNMENT/CREDIT INDEX |
3 Years | 2.5% | 2.1% |
5 Years | 3.6% | 1.9% |
10 Years | 4.3% | 3.8% |
Since Inception(b) | 4.2% | 3.6% |
(a) | Represents the period from the commencement of operations (May 1, 2003) through December 31, 2003. |
| | |
(b) | Represents the period from the commencement of operations (May 1, 2003) through December 31, 2016. |
39
AVE MARIA BOND FUND
TEN LARGEST HOLDINGS*
December 31, 2016 (Unaudited)
Par Value | | Holding | | Market Value | | | % of Net Assets | |
$ | 5,000,000 | | U.S. Treasury Notes, 3.875%, due 05/15/18 | | $ | 5,195,115 | | | | 2.1 | % |
| | 5,000,000 | | U.S. Treasury Notes, 3.500%, due 02/15/18 | | | 5,140,235 | | | | 2.1 | % |
| | 2,500,000 | | U.S. Treasury Bonds, 8.000%, due 11/15/21 | | | 3,201,952 | | | | 1.3 | % |
| | 3,000,000 | | U.S. Treasury Notes, 3.500%, due 05/15/20 | | | 3,188,790 | | | | 1.3 | % |
| | 3,000,000 | | U.S. Treasury Notes, 2.625%, due 11/15/20 | | | 3,100,782 | | | | 1.2 | % |
| | 3,000,000 | | Lowe's Companies, Inc., 3.120%, due 04/15/22 | | | 3,073,563 | | | | 1.2 | % |
| | 3,000,000 | | U.S. Treasury Notes, 2.500%, due 08/15/23 | | | 3,053,202 | | | | 1.2 | % |
| | 3,000,000 | | U.S. Treasury Notes, 4.500%, due 05/15/17 | | | 3,041,952 | | | | 1.2 | % |
| | 3,000,000 | | U.S. Treasury Notes, 2.375%, due 07/31/17 | | | 3,028,827 | | | | 1.2 | % |
| | 3,000,000 | | U.S. Treasury Notes, 2.125%, due 09/30/21 | | | 3,026,601 | | | | 1.2 | % |
* | Excludes cash equivalents. |
ASSET ALLOCATION (Unaudited)
| % of Net Assets |
U.S. TREASURY OBLIGATIONS | |
U.S. Treasuries | 36.8% |
| | |
CORPORATE BONDS | |
Sector | |
Consumer Discretionary | 4.8% |
Consumer Staples | 12.0% |
Energy | 4.3% |
Financials | 3.4% |
Health Care | 2.3% |
Industrials | 9.1% |
Information Technology | 3.0% |
Materials | 1.0% |
Utilities | 1.0% |
| | |
COMMON STOCKS | |
Sector | |
Consumer Discretionary | 3.2% |
Consumer Staples | 1.0% |
Energy | 2.8% |
Financials | 2.6% |
Health Care | 1.1% |
Industrials | 4.5% |
Information Technology | 2.4% |
Materials | 1.2% |
| | |
MONEY MARKET FUNDS, OTHER ASSETS IN EXCESS OF LIABILITIES | 3.5% |
| | 100.0% |
40
AVE MARIA BOND FUND
SCHEDULE OF INVESTMENTS
December 31, 2016
U.S. TREASURY OBLIGATIONS — 36.8% | | Par Value | | | Market Value | |
U.S. Treasury Bonds — 2.3% | | | | | | |
8.125%, due 05/15/21 | | $ | 2,000,000 | | | $ | 2,524,062 | |
8.000%, due 11/15/21 | | | 2,500,000 | | | | 3,201,952 | |
| | | | | | | | 5,726,014 | |
U.S. Treasury Inflation-Protected Notes — 2.3% | | | | | | | | |
2.625%, due 07/15/17 | | | 1,166,280 | | | | 1,194,161 | |
0.125%, due 04/15/18 | | | 2,091,360 | | | | 2,110,381 | |
1.125%, due 01/15/21 | | | 2,209,980 | | | | 2,318,413 | |
| | | | | | | | 5,622,955 | |
U.S. Treasury Notes — 32.2% | | | | | | | | |
0.875%, due 01/31/17 | | | 3,000,000 | | | | 3,001,194 | |
4.625%, due 02/15/17 | | | 3,000,000 | | | | 3,014,706 | |
1.000%, due 03/31/17 | | | 2,500,000 | | | | 2,503,095 | |
0.875%, due 04/30/17 | | | 2,500,000 | | | | 2,502,858 | |
4.500%, due 05/15/17 | | | 3,000,000 | | | | 3,041,952 | |
2.375%, due 07/31/17 | | | 3,000,000 | | | | 3,028,827 | |
0.625%, due 09/30/17 | | | 2,500,000 | | | | 2,496,485 | |
0.750%, due 10/31/17 | | | 3,000,000 | | | | 2,997,306 | |
0.875%, due 11/15/17 | | | 3,000,000 | | | | 3,000,117 | |
0.750%, due 12/31/17 | | | 2,000,000 | | | | 1,996,718 | |
0.875%, due 01/15/18 | | | 3,000,000 | | | | 2,998,593 | |
3.500%, due 02/15/18 | | | 5,000,000 | | | | 5,140,235 | |
3.875%, due 05/15/18 | | | 5,000,000 | | | | 5,195,115 | |
1.125%, due 06/15/18 | | | 3,000,000 | | | | 3,002,931 | |
1.375%, due 07/31/18 | | | 2,000,000 | | | | 2,008,906 | |
1.500%, due 01/31/19 | | | 3,000,000 | | | | 3,016,290 | |
1.625%, due 04/30/19 | | | 3,000,000 | | | | 3,023,436 | |
1.000%, due 11/15/19 | | | 3,000,000 | | | | 2,963,907 | |
1.500%, due 11/30/19 | | | 3,000,000 | | | | 3,006,210 | |
1.250%, due 01/31/20 | | | 3,000,000 | | | | 2,977,968 | |
1.375%, due 02/29/20 | | | 2,000,000 | | | | 1,990,468 | |
3.500%, due 05/15/20 | | | 3,000,000 | | | | 3,188,790 | |
2.625%, due 11/15/20 | | | 3,000,000 | | | | 3,100,782 | |
2.375%, due 12/31/20 | | | 2,000,000 | | | | 2,048,828 | |
2.125%, due 09/30/21 | | | 3,000,000 | | | | 3,026,601 | |
1.500%, due 01/31/22 | | | 3,000,000 | | | | 2,932,266 | |
2.500%, due 08/15/23 | | | 3,000,000 | | | | 3,053,202 | |
| | | | | | | | 80,257,786 | |
| | | | | | | | | |
Total U.S. Treasury Obligations (Cost $91,954,275) | | | | | | $ | 91,606,755 | |
41
AVE MARIA BOND FUND
SCHEDULE OF INVESTMENTS
(Continued)
CORPORATE BONDS — 40.9% | | Par Value | | | Market Value | |
Consumer Discretionary — 4.8% | | | | | | |
Lowe's Companies, Inc., 3.120%, due 04/15/22 | | $ | 3,000,000 | | | $ | 3,073,563 | |
McDonald's Corporation, 5.350%, due 03/01/18 | | | 2,000,000 | | | | 2,084,258 | |
Ross Stores, Inc., 3.375%, due 09/15/24 | | | 2,000,000 | | | | 2,015,270 | |
TJX Companies, Inc. (The), 2.750%, due 06/15/21 | | | 2,305,000 | | | | 2,344,969 | |
VF Corporation, 5.950%, due 11/01/17 | | | 2,270,000 | | | | 2,353,529 | |
| | | | | | | | 11,871,589 | |
Consumer Staples — 12.0% | | | | | | | | |
Coca-Cola Company (The), 1.650%, due 11/01/18 | | | 1,500,000 | | | | 1,505,994 | |
Coca-Cola Company (The), 3.300%, due 09/01/21 | | | 2,000,000 | | | | 2,086,992 | |
Colgate-Palmolive Company, 2.450%, due 11/15/21 | | | 3,000,000 | | | | 3,012,303 | |
Colgate-Palmolive Company, 1.950%, due 02/01/23 | | | 2,263,000 | | | | 2,175,474 | |
Colgate-Palmolive Company, 3.250%, due 03/15/24 | | | 795,000 | | | | 821,853 | |
Dr Pepper Snapple Group, Inc., 3.200%, due 11/15/21 | | | 2,000,000 | | | | 2,048,752 | |
Hershey Company (The), 2.625%, due 05/01/23 | | | 2,831,000 | | | | 2,788,872 | |
Hormel Foods Corporation, 4.125%, due 04/15/21 | | | 2,000,000 | | | | 2,145,398 | |
J.M. Smucker Company (The), 3.500%, due 10/15/21 | | | 2,000,000 | | | | 2,079,040 | |
Kellogg Company, 4.150%, due 11/15/19 | | | 2,042,000 | | | | 2,152,425 | |
Kimberly-Clark Corporation, 6.125%, due 08/01/17 | | | 1,475,000 | | | | 1,517,551 | |
Kimberly-Clark Corporation, 2.400%, due 03/01/22 | | | 2,311,000 | | | | 2,293,221 | |
McCormick & Company, Inc., 3.900%, due 07/15/21 | | | 2,500,000 | | | | 2,624,630 | |
McCormick & Company, Inc., 3.500%, due 09/01/23 | | | 2,500,000 | | | | 2,560,743 | |
| | | | | | | | 29,813,248 | |
Energy — 4.3% | | | | | | | | |
ConocoPhillips, 1.050%, due 12/15/17 | | | 1,750,000 | | | | 1,741,049 | |
Exxon Mobil Corporation, 2.397%, due 03/06/22 | | | 2,000,000 | | | | 1,989,770 | |
Exxon Mobil Corporation, 3.176%, due 03/15/24 | | | 1,634,000 | | | | 1,654,018 | |
Occidental Petroleum Corporation, 3.125%, due 02/15/22 | | | 2,940,000 | | | | 3,004,980 | |
Occidental Petroleum Corporation, 2.700%, due 02/15/23 | | | 2,350,000 | | | | 2,327,219 | |
| | | | | | | | 10,717,036 | |
Financials — 3.4% | | | | | | | | |
Bank of New York Mellon Corporation (The), 2.100%, due 08/01/18 | | | 1,000,000 | | | | 1,007,965 | |
MasterCard, Inc., 2.000%, due 04/01/19 | | | 2,000,000 | | | | 2,012,666 | |
MasterCard, Inc., 3.375%, due 04/01/24 | | | 2,300,000 | | | | 2,365,766 | |
PACCAR Financial Corporation, 1.600%, due 03/15/17 | | | 2,000,000 | | | | 2,002,380 | |
U.S. Bancorp, 2.200%, due 04/25/19 | | | 1,173,000 | | | | 1,183,013 | |
| | | | | | | | 8,571,790 | |
42
AVE MARIA BOND FUND
SCHEDULE OF INVESTMENTS
(Continued)
CORPORATE BONDS — 40.9% (Continued) | | Par Value | | | Market Value | |
Health Care — 2.3% | | | | | | |
Amgen, Inc., 3.875%, due 11/15/21 | | $ | 2,108,000 | | | $ | 2,206,690 | |
Stryker Corporation, 4.375%, due 01/15/20 | | | 1,000,000 | | | | 1,064,765 | |
Zimmer Holdings, Inc., 4.625%, due 11/30/19 | | | 2,310,000 | | | | 2,443,142 | |
| | | | | | | | 5,714,597 | |
Industrials — 9.1% | | | | | | | | |
3M Company, 1.000%, due 06/26/17 | | | 2,000,000 | | | | 1,998,244 | |
3M Company, 2.000%, due 06/26/22 | | | 1,073,000 | | | | 1,051,798 | |
Emerson Electric Company, 5.250%, due 10/15/18 | | | 1,600,000 | | | | 1,702,597 | |
Emerson Electric Company, 4.250%, due 11/15/20 | | | 2,109,000 | | | | 2,268,695 | |
Illinois Tool Works, Inc., 1.950%, due 03/01/19 | | | 2,000,000 | | | | 2,010,320 | |
Illinois Tool Works, Inc., 6.250%, due 04/01/19 | | | 1,000,000 | | | | 1,093,778 | |
John Deere Capital Corporation, 1.400%, due 03/15/17 | | | 1,700,000 | | | | 1,701,690 | |
John Deere Capital Corporation, 1.700%, due 01/15/20 | | | 2,000,000 | | | | 1,977,052 | |
Norfolk Southern Corporation, 5.750%, due 04/01/18 | | | 885,000 | | | | 929,228 | |
Norfolk Southern Corporation, 5.900%, due 06/15/19 | | | 441,000 | | | | 481,147 | |
Snap-on, Inc., 6.125%, due 09/01/21 | | | 2,000,000 | | | | 2,308,130 | |
Union Pacific Corporation, 2.250%, due 02/15/19 | | | 2,000,000 | | | | 2,015,764 | |
United Parcel Service, Inc., 5.500%, due 01/15/18 | | | 1,500,000 | | | | 1,563,297 | |
United Parcel Service, Inc., 5.125%, due 04/01/19 | | | 1,500,000 | | | | 1,610,842 | |
| | | | | | | | 22,712,582 | |
Information Technology — 3.0% | | | | | | | | |
CA, Inc., 5.375%, due 12/01/19 | | | 1,000,000 | | | | 1,080,040 | |
CA, Inc., 4.500%, due 08/15/23 | | | 2,000,000 | | | | 2,083,012 | |
Cisco Systems, Inc., 4.450%, due 01/15/20 | | | 606,000 | | | | 649,473 | |
National Semiconductor Corporation, 6.600%, due 06/15/17 | | | 1,605,000 | | | | 1,644,884 | |
Texas Instruments, Inc., 1.650%, due 08/03/19 | | | 2,000,000 | | | | 1,995,514 | |
| | | | | | | | 7,452,923 | |
Materials — 1.0% | | | | | | | | |
Praxair, Inc., 2.250%, due 09/24/20 | | | 2,000,000 | | | | 1,995,442 | |
Praxair, Inc., 4.050%, due 03/15/21 | | | 500,000 | | | | 531,508 | |
| | | | | | | | 2,526,950 | |
Utilities — 1.0% | | | | | | | | |
Consolidated Edison Company of New York, Inc., 6.650%, due 04/01/19 | | | 800,000 | | | | 882,536 | |
Georgia Power Company, 4.250%, due 12/01/19 | | | 1,500,000 | | | | 1,592,379 | |
| | | | | | | | 2,474,915 | |
| | | | | | | | | |
Total Corporate Bonds (Cost $102,037,780) | | | | | | $ | 101,855,630 | |
43
AVE MARIA BOND FUND
SCHEDULE OF INVESTMENTS
(Continued)
COMMON STOCKS — 18.8% | | Shares | | | Market Value | |
Consumer Discretionary — 3.2% | | | | | | |
Media — 1.0% | | | | | | |
Omnicom Group, Inc. | | | 30,000 | | | $ | 2,553,300 | |
| | | | | | | | | |
Specialty Retail — 1.1% | | | | | | | | |
Williams-Sonoma, Inc. | | | 55,000 | | | | 2,661,450 | |
| | | | | | | | | |
Textiles, Apparel & Luxury Goods — 1.1% | | | | | | | | |
VF Corporation | | | 50,000 | | | | 2,667,500 | |
| | | | | | | | | |
Consumer Staples — 1.0% | | | | | | | | |
Beverages — 1.0% | | | | | | | | |
Diageo plc - ADR | | | 25,000 | | | | 2,598,500 | |
| | | | | | | | | |
Energy — 2.8% | | | | | | | | |
Oil, Gas & Consumable Fuels — 2.8% | | | | | | | | |
Exxon Mobil Corporation | | | 30,000 | | | | 2,707,800 | |
Occidental Petroleum Corporation | | | 20,000 | | | | 1,424,600 | |
Royal Dutch Shell plc - Class B - ADR | | | 48,500 | | | | 2,811,545 | |
| | | | | | | | 6,943,945 | |
Financials — 2.6% | | | | | | | | |
Banks — 1.8% | | | | | | | | |
Fifth Third Bancorp | | | 110,000 | | | | 2,966,700 | |
PNC Financial Services Group, Inc. (The) | | | 14,000 | | | | 1,637,440 | |
| | | | | | | | 4,604,140 | |
Insurance — 0.8% | | | | | | | | |
Chubb Limited | | | 15,000 | | | | 1,981,800 | |
| | | | | | | | | |
Health Care — 1.1% | | | | | | | | |
Biotechnology — 1.1% | | | | | | | | |
Amgen, Inc. | | | 19,000 | | | | 2,777,990 | |
| | | | | | | | | |
Industrials — 4.5% | | | | | | | | |
Air Freight & Logistics — 0.9% | | | | | | | | |
United Parcel Service, Inc. - Class B | | | 20,000 | | | | 2,292,800 | |
| | | | | | | | | |
Electrical Equipment — 1.1% | | | | | | | | |
Emerson Electric Company | | | 50,000 | | | | 2,787,500 | |
| | | | | | | | | |
Industrial Conglomerates — 0.8% | | | | | | | | |
3M Company | | | 11,000 | | | | 1,964,270 | |
44
AVE MARIA BOND FUND
SCHEDULE OF INVESTMENTS
(Continued)
COMMON STOCKS — 18.8% (Continued) | | Shares | | | Market Value | |
Industrials — 4.5% (Continued) | | | | | | |
Road & Rail — 0.6% | | | | | | |
Norfolk Southern Corporation | | | 13,500 | | | $ | 1,458,945 | |
| | | | | | | | | |
Trading Companies & Distributors — 1.1% | | | | | | | | |
Fastenal Company | | | 55,000 | | | | 2,583,900 | |
| | | | | | | | | |
Information Technology — 2.4% | | | | | | | | |
Communications Equipment — 1.0% | | | | | | | | |
Cisco Systems, Inc. | | | 80,000 | | | | 2,417,600 | |
| | | | | | | | | |
Semiconductors & Semiconductor Equipment — 1.4% | | | | | | | | |
Microchip Technology, Inc. | | | 15,000 | | | | 962,250 | |
Texas Instruments, Inc. | | | 35,000 | | | | 2,553,950 | |
| | | | | | | | 3,516,200 | |
Materials — 1.2% | | | | | | | | |
Chemicals — 1.2% | | | | | | | | |
Praxair, Inc. | | | 25,000 | | | | 2,929,750 | |
| | | | | | | | | |
Total Common Stocks (Cost $40,912,450) | | | | | | $ | 46,739,590 | |
MONEY MARKET FUNDS — 2.5% | | Shares | | | Market Value | |
Federated Government Obligations Tax-Managed Fund - Institutional Shares, 0.35% (a) (Cost $6,259,115) | | | 6,259,115 | | | $ | 6,259,115 | |
| | | | | | | | | |
Total Investments at Market Value — 99.0% (Cost $241,163,620) | | | | | | $ | 246,461,090 | |
| | | | | | | | | |
Other Assets in Excess of Liabilities — 1.0% | | | | | | | 2,510,174 | |
| | | | | | | | | |
Net Assets — 100.0% | | | | | | $ | 248,971,264 | |
ADR - American Depositary Receipt. |
| |
(a) | The rate shown is the 7-day effective yield as of December 31, 2016. |
| | |
See notes to financial statements. |
45
AVE MARIA MUTUAL FUNDS
STATEMENTS OF ASSETS AND LIABILITIES
December 31, 2016
| | Ave Maria Catholic Values Fund | | | Ave Maria Growth Fund | | | Ave Maria Rising Dividend Fund | |
ASSETS | | | | | | | | | |
Investment securities: | | | | | | | | | |
At cost | | $ | 178,818,686 | | | $ | 269,075,845 | | | $ | 714,550,243 | |
At market value (Note 1) | | $ | 221,556,596 | | | $ | 350,690,881 | | | $ | 828,895,403 | |
Affiliated investment, at market value (Cost $1,107,092) (Note 5) | | | 3,041,659 | | | | — | | | | — | |
Cash | | | 30,600 | | | | — | | | | — | |
Receivable for investment securities sold | | | 403,277 | | | | — | | | | 2,950,021 | |
Receivable for capital shares sold | | | 129,133 | | | | 1,184,269 | | | | 2,005,749 | |
Dividends receivable | | | 60,976 | | | | 183,636 | | | | 1,124,900 | |
Other assets | | | 20,941 | | | | 31,896 | | | | 63,351 | |
TOTAL ASSETS | | | 225,243,182 | | | | 352,090,682 | | | | 835,039,424 | |
| | | | | | | | | | | | | |
LIABILITIES | | | | | | | | | | | | |
Payable for investment securities purchased | | | — | | | | — | | | | 2,858,179 | |
Payable for capital shares redeemed | | | 80,351 | | | | 113,944 | | | | 1,856,834 | |
Payable to Adviser (Note 2) | | | 524,459 | | | | 828,322 | | | | 1,549,731 | |
Payable to administrator (Note 2) | | | 25,980 | | | | 39,228 | | | | 83,136 | |
Other accrued expenses | | | 19,144 | | | | 23,725 | | | | 42,316 | |
TOTAL LIABILITIES | | | 649,934 | | | | 1,005,219 | | | | 6,390,196 | |
| | | | | | | | | | | | | |
NET ASSETS | | $ | 224,593,248 | | | $ | 351,085,463 | | | $ | 828,649,228 | |
| | | | | | | | | | | | | |
NET ASSETS CONSIST OF: | | | | | | | | | | | | |
Paid-in capital | | $ | 179,996,835 | | | $ | 269,528,294 | | | $ | 714,280,381 | |
Undistributed net investment income | | | — | | | | 325 | | | | 23,687 | |
Accumulated net realized losses from security transactions | | | (76,064 | ) | | | (58,192 | ) | | | — | |
Net unrealized appreciation on investments | | | 44,672,477 | | | | 81,615,036 | | | | 114,345,160 | |
NET ASSETS | | $ | 224,593,248 | | | $ | 351,085,463 | | | $ | 828,649,228 | |
Shares of beneficial interest outstanding (unlimited number of shares authorized, no par value) | | | 11,747,444 | | | | 13,279,050 | | | | 49,365,991 | |
Net asset value, offering price and redemption price per share (Note 1) | | $ | 19.12 | | | $ | 26.44 | | | $ | 16.79 | |
See notes to financial statements. |
46
AVE MARIA MUTUAL FUNDS
STATEMENTS OF ASSETS AND LIABILITIES
December 31, 2016 (Continued)
| | Ave Maria World Equity Fund | | | Ave Maria Bond Fund | |
ASSETS | | | | | | |
Investment securities: | | | | | | |
At cost | | $ | 40,892,626 | | | $ | 241,163,620 | |
At market value (Note 1) | | $ | 45,801,521 | | | $ | 246,461,090 | |
Cash | | | 4,266 | | | | — | |
Receivable for investment securities sold | | | 581,100 | | | | 2,500,000 | |
Receivable for capital shares sold | | | 457,324 | | | | 1,171,581 | |
Dividends and interest receivable | | | 78,286 | | | | 1,457,188 | |
Other assets | | | 9,477 | | | | 25,540 | |
TOTAL ASSETS | | | 46,931,974 | | | | 251,615,399 | |
| | | | | | | | | |
LIABILITIES | | | | | | | | |
Payable for investment securities purchased | | | 695,941 | | | | 2,101,936 | |
Payable for capital shares redeemed | | | 101,812 | | | | 312,714 | |
Payable to Adviser (Note 2) | | | 86,938 | | | | 187,151 | |
Payable to administrator (Note 2) | | | 5,270 | | | | 20,488 | |
Other accrued expenses | | | 12,352 | | | | 21,846 | |
TOTAL LIABILITIES | | | 902,313 | | | | 2,644,135 | |
| | | | | | | | | |
NET ASSETS | | $ | 46,029,661 | | | $ | 248,971,264 | |
| | | | | | | | | |
NET ASSETS CONSIST OF: | | | | | | | | |
Paid-in capital | | $ | 41,120,766 | | | $ | 243,667,431 | |
Undistributed net investment income | | | — | | | | 6,363 | |
Net unrealized appreciation on investments | | | 4,908,895 | | | | 5,297,470 | |
NET ASSETS | | $ | 46,029,661 | | | $ | 248,971,264 | |
Shares of beneficial interest outstanding (unlimited number of shares authorized, no par value) | | | 3,491,597 | | | | 22,254,937 | |
Net asset value, offering price and redemption price per share (Note 1) | | $ | 13.18 | | | $ | 11.19 | |
See notes to financial statements. |
47
AVE MARIA MUTUAL FUNDS
STATEMENTS OF OPERATIONS
For the Year Ended December 31, 2016
| | Ave Maria Catholic Values Fund | | | Ave Maria Growth Fund | | | Ave Maria Rising Dividend Fund | |
INVESTMENT INCOME | | | | | | | | | |
Dividends | | $ | 2,206,415 | | | $ | 4,121,918 | | | $ | 19,872,168 | |
Foreign withholding taxes on dividends | | | — | | | | — | | | | (25,071 | ) |
TOTAL INCOME | | | 2,206,415 | | | | 4,121,918 | | | | 19,847,097 | |
| | | | | | | | | | | | | |
EXPENSES | | | | | | | | | | | | |
Investment advisory fees (Note 2) | | | 1,991,507 | | | | 3,119,411 | | | | 5,863,882 | |
Administration, accounting and
transfer agent fees (Note 2) | | | 283,808 | | | | 432,872 | | | | 922,131 | |
Legal and audit fees | | | 54,729 | | | | 51,261 | | | | 74,757 | |
Trustees’ fees and expenses (Note 2) | | | 49,892 | | | | 49,892 | | | | 49,892 | |
Postage and supplies | | | 44,439 | | | | 61,793 | | | | 90,541 | |
Registration and filing fees | | | 24,723 | | | | 32,246 | | | | 39,366 | |
Custodian and bank service fees | | | 14,226 | | | | 20,811 | | | | 48,516 | |
Insurance expense | | | 12,923 | | | | 17,436 | | | | 42,664 | |
Advisory board fees and expenses (Note 2) | | | 12,894 | | | | 12,894 | | | | 12,894 | |
Compliance service fees and
expenses (Note 2) | | | 7,269 | | | | 11,471 | | | | 27,209 | |
Printing of shareholder reports | | | 6,924 | | | | 8,259 | | | | 11,555 | |
Other expenses | | | 18,416 | | | | 20,966 | | | | 42,684 | |
TOTAL EXPENSES | | | 2,521,750 | | | | 3,839,312 | | | | 7,226,091 | |
| | | | | | | | | | | | | |
NET INVESTMENT INCOME (LOSS) | | | (315,335 | ) | | | 282,606 | | | | 12,621,006 | |
| | | | | | | | | | | | | |
REALIZED AND UNREALIZED GAINS ON INVESTMENTS | | | | | | | | | | | | |
Net realized gains from security transactions | | | 759,085 | | | | 19,911,248 | | | | 41,833,619 | |
Net change in unrealized appreciation (depreciation) on unaffiliated investments | | | 31,168,016 | | | | 16,379,060 | | | | 56,390,612 | |
Net change in unrealized appreciation on affiliated investment (Note 5) | | | 234,845 | | | | — | | | | — | |
NET REALIZED AND UNREALIZED GAINS ON INVESTMENTS | | | 32,161,946 | | | | 36,290,308 | | | | 98,224,231 | |
| | | | | | | | | | | | | |
NET INCREASE IN NET ASSETS RESULTING FROM OPERATIONS | | $ | 31,846,611 | | | $ | 36,572,914 | | | $ | 110,845,237 | |
See notes to financial statements. |
48
AVE MARIA MUTUAL FUNDS
STATEMENTS OF OPERATIONS
For the Year Ended December 31, 2016 (Continued)
| | Ave Maria World Equity Fund | | | Ave Maria Bond Fund | |
INVESTMENT INCOME | | | | | | |
Dividends | | $ | 829,180 | | | $ | 1,172,022 | |
Foreign withholding taxes on dividends | | | (50,172 | ) | | | — | |
Interest | | | — | | | | 3,147,100 | |
TOTAL INCOME | | | 779,008 | | | | 4,319,122 | |
| | | | | | | | | |
EXPENSES | | | | | | | | |
Investment advisory fees (Note 2) | | | 404,266 | | | | 703,110 | |
Administration, accounting and transfer agent fees (Note 2) | | | 57,623 | | | | 235,023 | |
Legal and audit fees | | | 36,022 | | | | 46,090 | |
Trustees’ fees and expenses (Note 2) | | | 49,892 | | | | 49,892 | |
Postage and supplies | | | 13,456 | | | | 29,595 | |
Registration and filing fees | | | 23,353 | | | | 35,292 | |
Custodian and bank service fees | | | 4,014 | | | | 14,822 | |
Insurance expense | | | 2,577 | | | | 11,891 | |
Advisory board fees and expenses (Note 2) | | | 12,894 | | | | 12,894 | |
Compliance service fees and expenses (Note 2) | | | 1,482 | | | | 8,148 | |
Printing of shareholder reports | | | 2,165 | | | | 4,458 | |
Other expenses | | | 10,069 | | | | 29,107 | |
TOTAL EXPENSES | | | 617,813 | | | | 1,180,322 | |
Less fee reductions by the Adviser (Note 2) | | | (52,827 | ) | | | — | |
NET EXPENSES | | | 564,986 | | | | 1,180,322 | |
| | | | | | | | | |
NET INVESTMENT INCOME | | | 214,022 | | | | 3,138,800 | |
| | | | | | | | | |
REALIZED AND UNREALIZED GAINS ON INVESTMENTS | | | | | | | | |
Net realized gains from security transactions | | | 662,978 | | | | 3,861,048 | |
Net change in unrealized appreciation (depreciation) on investments | | | 2,783,627 | | | | 3,234,642 | |
NET REALIZED AND UNREALIZED GAINS ON INVESTMENTS | | | 3,446,605 | | | | 7,095,690 | |
| | | | | | | | | |
NET INCREASE IN NET ASSETS RESULTING FROM OPERATIONS | | $ | 3,660,627 | | | $ | 10,234,490 | |
See notes to financial statements. |
49
AVE MARIA CATHOLIC VALUES FUND
STATEMENTS OF CHANGES IN NET ASSETS
| | Year Ended December 31, 2016 | | | Year Ended December 31, 2015 | |
FROM OPERATIONS | | | | | | |
Net investment income (loss) | | $ | (315,335 | ) | | $ | 141,330 | |
Net realized gains (losses) from security transactions | | | 759,085 | | | | (246,314 | ) |
Net change in unrealized appreciation (depreciation) on unaffiliated investments | | | 31,168,016 | | | | (45,665,271 | ) |
Net change in unrealized appreciation (depreciation) on affiliated investment (Note 5) | | | 234,845 | | | | (517,790 | ) |
Net increase (decrease) in net assets resulting from operations | | | 31,846,611 | | | | (46,288,045 | ) |
| | | | | | | | | |
FROM DISTRIBUTIONS TO SHAREHOLDERS (Note 1) | | | | | | | | |
From net investment income | | | — | | | | (140,481 | ) |
From net realized gains on investments | | | — | | | | (119,860 | ) |
Decrease in net assets from distributions to shareholders | | | — | | | | (260,341 | ) |
| | | | | | | | | |
FROM CAPITAL SHARE TRANSACTIONS | | | | | | | | |
Net assets received in conjunction with fund merger (Note 1) | | | — | | | | 36,285,741 | |
Proceeds from shares sold | | | 18,785,042 | | | | 18,561,949 | |
Reinvestment of distributions to shareholders | | | — | | | | 244,520 | |
Payments for shares redeemed | | | (37,917,350 | ) | | | (43,454,457 | ) |
Net increase (decrease) in net assets from capital share transactions | | | (19,132,308 | ) | | | 11,637,753 | |
| | | | | | | | | |
TOTAL INCREASE (DECREASE) IN NET ASSETS | | | 12,714,303 | | | | (34,910,633 | ) |
| | | | | | | | | |
NET ASSETS | | | | | | | | |
Beginning of year | | | 211,878,945 | | | | 246,789,578 | |
End of year | | $ | 224,593,248 | | | $ | 211,878,945 | |
| | | | | | | | | |
UNDISTRIBUTED NET INVESTMENT INCOME | | $ | — | | | $ | — | |
| | | | | | | | | |
SUMMARY OF CAPITAL SHARE ACTIVITY | | | | | | | | |
Shares received in conjunction with fund merger (Note 1) | | | — | | | | 1,858,403 | |
Shares sold | | | 1,082,577 | | | | 975,841 | |
Shares issued in reinvestment of distributions to shareholders | | | — | | | | 14,810 | |
Shares redeemed | | | (2,236,079 | ) | | | (2,305,573 | ) |
Net increase (decrease) in shares outstanding | | | (1,153,502 | ) | | | 543,481 | |
Shares outstanding, beginning of year | | | 12,900,946 | | | | 12,357,465 | |
Shares outstanding, end of year | | | 11,747,444 | | | | 12,900,946 | |
See notes to financial statements. |
50
AVE MARIA GROWTH FUND
STATEMENTS OF CHANGES IN NET ASSETS
| | Year Ended December 31, 2016 | | | Year Ended December 31, 2015 | |
FROM OPERATIONS | | | | | | |
Net investment income | | $ | 282,606 | | | $ | 750,055 | |
Net realized gains from security transactions | | | 19,911,248 | | | | 26,341,032 | |
Net change in unrealized appreciation (depreciation) on investments | | | 16,379,060 | | | | (35,373,175 | ) |
Net increase (decrease) in net assets resulting from operations | | | 36,572,914 | | | | (8,282,088 | ) |
| | | | | | | | | |
FROM DISTRIBUTIONS TO SHAREHOLDERS (Note 1) | | | | | | | | |
From net investment income | | | (282,071 | ) | | | (750,152 | ) |
From net realized gains on investments | | | (19,859,026 | ) | | | (26,393,498 | ) |
Decrease in net assets from distributions to shareholders | | | (20,141,097 | ) | | | (27,143,650 | ) |
| | | | | | | | | |
FROM CAPITAL SHARE TRANSACTIONS | | | | | | | | |
Proceeds from shares sold | | | 66,665,565 | | | | 53,372,551 | |
Reinvestment of distributions to shareholders | | | 19,003,389 | | | | 25,479,551 | |
Payments for shares redeemed | | | (51,134,124 | ) | | | (47,147,747 | ) |
Net increase in net assets from capital share transactions | | | 34,534,830 | | | | 31,704,355 | |
| | | | | | | | | |
TOTAL INCREASE (DECREASE) IN NET ASSETS | | | 50,966,647 | | | | (3,721,383 | ) |
| | | | | | | | | |
NET ASSETS | | | | | | | | |
Beginning of year | | | 300,118,816 | | | | 303,840,199 | |
End of year | | $ | 351,085,463 | | | $ | 300,118,816 | |
| | | | | | | | | |
UNDISTRIBUTED NET INVESTMENT INCOME | | $ | 325 | | | $ | — | |
| | | | | | | | | |
SUMMARY OF CAPITAL SHARE ACTIVITY | | | | | | | | |
Shares sold | | | 2,491,544 | | | | 1,877,497 | |
Shares issued in reinvestment of distributions to shareholders | | | 716,031 | | | | 1,010,692 | |
Shares redeemed | | | (1,922,757 | ) | | | (1,653,370 | ) |
Net increase in shares outstanding | | | 1,284,818 | | | | 1,234,819 | |
Shares outstanding, beginning of year | | | 11,994,232 | | | | 10,759,413 | |
Shares outstanding, end of year | | | 13,279,050 | | | | 11,994,232 | |
See notes to financial statements. |
51
AVE MARIA RISING DIVIDEND FUND
STATEMENTS OF CHANGES IN NET ASSETS
| | Year Ended December 31, 2016 | | | Year Ended December 31, 2015 | |
FROM OPERATIONS | | | | | | |
Net investment income | | $ | 12,621,006 | | | $ | 11,308,513 | |
Net realized gains from security transactions | | | 41,833,619 | | | | 40,146,505 | |
Net change in unrealized appreciation (depreciation) on investments | | | 56,390,612 | | | | (101,327,744 | ) |
Net increase (decrease) in net assets resulting from operations | | | 110,845,237 | | | | (49,872,726 | ) |
| | | | | | | | | |
FROM DISTRIBUTIONS TO SHAREHOLDERS (Note 1) | | | | | | | | |
From net investment income | | | (12,909,764 | ) | | | (10,933,195 | ) |
From net realized gains on investments | | | (41,895,923 | ) | | | (40,147,214 | ) |
Decrease in net assets from distributions to shareholders | | | (54,805,687 | ) | | | (51,080,409 | ) |
| | | | | | | | | |
FROM CAPITAL SHARE TRANSACTIONS | | | | | | | | |
Proceeds from shares sold | | | 147,667,667 | | | | 170,712,568 | |
Reinvestment of distributions to shareholders | | | 49,246,521 | | | | 46,076,735 | |
Payments for shares redeemed | | | (175,194,379 | ) | | | (213,041,809 | ) |
Net increase in net assets from capital share transactions | | | 21,719,809 | | | | 3,747,494 | |
| | | | | | | | | |
TOTAL INCREASE (DECREASE) IN NET ASSETS | | | 77,759,359 | | | | (97,205,641 | ) |
| | | | | | | | | |
NET ASSETS | | | | | | | | |
Beginning of year | | | 750,889,869 | | | | 848,095,510 | |
End of year | | $ | 828,649,228 | | | $ | 750,889,869 | |
| | | | | | | | | |
UNDISTRIBUTED NET INVESTMENT INCOME | | $ | 23,687 | | | $ | 374,749 | |
| | | | | | | | | |
SUMMARY OF CAPITAL SHARE ACTIVITY | | | | | | | | |
Shares sold | | | 8,883,400 | | | | 9,847,012 | |
Shares issued in reinvestment of distributions to shareholders | | | 2,932,685 | | | | 2,898,743 | |
Shares redeemed | | | (10,655,828 | ) | | | (12,391,093 | ) |
Net increase in shares outstanding | | | 1,160,257 | | | | 354,662 | |
Shares outstanding, beginning of year | | | 48,205,734 | | | | 47,851,072 | |
Shares outstanding, end of year | | | 49,365,991 | | | | 48,205,734 | |
See notes to financial statements. |
52
AVE MARIA WORLD EQUITY FUND
STATEMENTS OF CHANGES IN NET ASSETS
| | Year Ended December 31, 2016 | | | Year Ended December 31, 2015 | |
FROM OPERATIONS | | | | | | |
Net investment income | | $ | 214,022 | | | $ | 226,829 | |
Net realized gains from security transactions | | | 662,978 | | | | 526,539 | |
Net change in unrealized appreciation (depreciation) on investments | | | 2,783,627 | | | | (3,013,908 | ) |
Net increase (decrease) in net assets resulting from operations | | | 3,660,627 | | | | (2,260,540 | ) |
| | | | | | | | | |
FROM DISTRIBUTIONS TO SHAREHOLDERS (Note 1) | | | | | | | | |
From net investment income | | | (214,087 | ) | | | (233,923 | ) |
From net realized gains on investments | | | (663,055 | ) | | | (526,573 | ) |
Decrease in net assets from distributions to shareholders | | | (877,142 | ) | | | (760,496 | ) |
| | | | | | | | | |
FROM CAPITAL SHARE TRANSACTIONS | | | | | | | | |
Proceeds from shares sold | | | 7,653,870 | | | | 12,203,950 | |
Reinvestment of distributions to shareholders | | | 795,768 | | | | 687,264 | |
Payments for shares redeemed | | | (6,402,287 | ) | | | (11,338,307 | ) |
Net increase in net assets from capital share transactions | | | 2,047,351 | | | | 1,552,907 | |
| | | | | | | | | |
TOTAL INCREASE (DECREASE) IN NET ASSETS | | | 4,830,836 | | | | (1,468,129 | ) |
| | | | | | | | | |
NET ASSETS | | | | | | | | |
Beginning of year | | �� | 41,198,825 | | | | 42,666,954 | |
End of year | | $ | 46,029,661 | | | $ | 41,198,825 | |
| | | | | | | | | |
UNDISTRIBUTED NET INVESTMENT INCOME | | $ | — | | | $ | — | |
| | | | | | | | | |
SUMMARY OF CAPITAL SHARE ACTIVITY | | | | | | | | |
Shares sold | | | 602,612 | | | | 918,380 | |
Shares issued in reinvestment of distributions to shareholders | | | 60,286 | | | | 55,158 | |
Shares redeemed | | | (505,382 | ) | | | (868,084 | ) |
Net increase in shares outstanding | | | 157,516 | | | | 105,454 | |
Shares outstanding, beginning of year | | | 3,334,081 | | | | 3,228,627 | |
Shares outstanding, end of year | | | 3,491,597 | | | | 3,334,081 | |
See notes to financial statements. |
53
AVE MARIA BOND FUND
STATEMENTS OF CHANGES IN NET ASSETS
| | Year Ended December 31, 2016 | | | Year Ended December 31, 2015 | |
FROM OPERATIONS | | | | | | |
Net investment income | | $ | 3,138,800 | | | $ | 2,654,822 | |
Net realized gains from security transactions | | | 3,861,048 | | | | 1,337,200 | |
Net change in unrealized appreciation (depreciation) on investments | | | 3,234,642 | | | | (2,892,405 | ) |
Net increase in net assets resulting from operations | | | 10,234,490 | | | | 1,099,617 | |
| | | | | | | | | |
FROM DISTRIBUTIONS TO SHAREHOLDERS (Note 1) | | | | | | | | |
From net investment income | | | (3,155,930 | ) | | | (2,624,600 | ) |
From net realized gains on investments | | | (3,868,004 | ) | | | (1,337,090 | ) |
Decrease in net assets from distributions to shareholders | | | (7,023,934 | ) | | | (3,961,690 | ) |
| | | | | | | | | |
FROM CAPITAL SHARE TRANSACTIONS | | | | | | | | |
Proceeds from shares sold | | | 65,462,953 | | | | 79,697,296 | |
Reinvestment of distributions to shareholders | | | 6,225,863 | | | | 3,435,000 | |
Payments for shares redeemed | | | (49,770,221 | ) | | | (37,145,763 | ) |
Net increase in net assets from capital share transactions | | | 21,918,595 | | | | 45,986,533 | |
| | | | | | | | | |
TOTAL INCREASE IN NET ASSETS | | | 25,129,151 | | | | 43,124,460 | |
| | | | | | | | | |
NET ASSETS | | | | | | | | |
Beginning of year | | | 223,842,113 | | | | 180,717,653 | |
End of year | | $ | 248,971,264 | | | $ | 223,842,113 | |
| | | | | | | | | |
UNDISTRIBUTED NET INVESTMENT INCOME | | $ | 6,363 | | | $ | 30,339 | |
| | | | | | | | | |
SUMMARY OF CAPITAL SHARE ACTIVITY | | | | | | | | |
Shares sold | | | 5,795,182 | | | | 7,137,744 | |
Shares issued in reinvestment of distributions to shareholders | | | 553,927 | | | | 309,462 | |
Shares redeemed | | | (4,412,326 | ) | | | (3,330,439 | ) |
Net increase in shares outstanding | | | 1,936,783 | | | | 4,116,767 | |
Shares outstanding, beginning of year | | | 20,318,154 | | | | 16,201,387 | |
Shares outstanding, end of year | | | 22,254,937 | | | | 20,318,154 | |
See notes to financial statements. |
54
AVE MARIA CATHOLIC VALUES FUND
FINANCIAL HIGHLIGHTS
Per Share Data for a Share Outstanding Throughout Each Year
| | Year Ended December 31, 2016 | | | Year Ended December 31, 2015 | | | Year Ended December 31, 2014 | | | Year Ended December 31, 2013 | | | Year Ended December 31, 2012 | |
Net asset value at beginning of year | | $ | 16.42 | | | $ | 19.97 | | | $ | 21.21 | | | $ | 17.78 | | | $ | 16.20 | |
| | | | | | | | | | | | | | | | | | | | | |
Income (loss) from investment operations: | | | | | | | | | | | | | | | | | | | | |
Net investment income (loss) | | | (0.03 | ) | | | 0.01 | | | | (0.01 | ) | | | (0.00 | )(a) | | | 0.06 | |
Net realized and unrealized gains (losses) on investments | | | 2.73 | | | | (3.54 | ) | | | 0.63 | | | | 4.66 | | | | 2.09 | |
Total from investment operations | | | 2.70 | | | | (3.53 | ) | | | 0.62 | | | | 4.66 | | | | 2.15 | |
| | | | | | | | | | | | | | | | | | | | | |
Less distributions: | | | | | | | | | | | | | | | | | | | | |
From net investment income | | | — | | | | (0.01 | ) | | | — | | | | — | | | | (0.06 | ) |
From net realized gains on investments | | | — | | | | (0.01 | ) | | | (1.86 | ) | | | (1.23 | ) | | | (0.51 | ) |
Total distributions | | | — | | | | (0.02 | ) | | | (1.86 | ) | | | (1.23 | ) | | | (0.57 | ) |
| | | | | | | | | | | | | | | | | | | | | |
Net asset value at end of year | | $ | 19.12 | | | $ | 16.42 | | | $ | 19.97 | | | $ | 21.21 | | | $ | 17.78 | |
| | | | | | | | | | | | | | | | | | | | | |
Total return (b) | | | 16.4 | % | | | (17.7 | %) | | | 2.9 | % | | | 26.2 | % | | | 13.3 | % |
| | | | | | | | | | | | | | | | | | | | | |
Ratios/Supplementary Data: | | | | | | | | | | | | | | | | | | | | |
Net assets at end of year (000’s) | | $ | 224,593 | | | $ | 211,879 | | | $ | 246,790 | | | $ | 246,801 | | | $ | 191,100 | |
| | | | | | | | | | | | | | | | | | | | | |
Ratio of total expenses to average net assets | | | 1.20 | % | | | 1.18 | % | | | 1.29 | % | | | 1.42 | % | | | 1.48 | % |
| | | | | | | | | | | | | | | | | | | | | |
Ratio of net investment income (loss) to average net assets | | | (0.15 | %) | | | 0.06 | % | | | (0.04 | %) | | | (0.02 | %) | | | 0.35 | % |
| | | | | | | | | | | | | | | | | | | | | |
Portfolio turnover rate | | | 47 | % | | | 63 | % | | | 31 | % | | | 29 | % | | | 25 | % |
(a) | Amount rounds to less than $0.01 per share. |
| | |
(b) | Total return is a measure of the change in value of an investment in the Fund over the period covered, which assumes any dividends or capital gains distributions are reinvested in shares of the Fund. The returns shown do not reflect the deduction of taxes a shareholder would pay on Fund distributions or the redemption of Fund shares. |
| | |
See notes to financial statements. |
55
AVE MARIA GROWTH FUND
FINANCIAL HIGHLIGHTS
Per Share Data for a Share Outstanding Throughout Each Year
| | Year
Ended
December 31, 2016 | | | Year
Ended
December 31, 2015 | | | Year
Ended
December 31, 2014 | | | Year
Ended
December 31, 2013 | | | Year
Ended
December 31, 2012 | |
Net asset value at beginning of year | | $ | 25.02 | | | $ | 28.24 | | | $ | 30.19 | | | $ | 23.71 | | | $ | 20.67 | |
| | | | | | | | | | | | | | | | | | | | | |
Income (loss) from investment operations: | | | | | | | | | | | | | | | | | | | | |
Net investment income (loss) | | | 0.02 | | | | 0.07 | | | | (0.03 | ) | | | (0.08 | ) | | | (0.04 | ) |
Net realized and unrealized gains (losses) on investments | | | 3.01 | | | | (0.81 | ) | | | 2.33 | | | | 7.55 | | | | 3.08 | |
Total from investment operations | | | 3.03 | | | | (0.74 | ) | | | 2.30 | | | | 7.47 | | | | 3.04 | |
| | | | | | | | | | | | | | | | | | | | | |
Less distributions: | | | | | | | | | | | | | | | | | | | | |
From net investment income | | | (0.02 | ) | | | (0.07 | ) | | | — | | | | — | | | | — | |
From net realized gains on investments | | | (1.59 | ) | | | (2.41 | ) | | | (4.25 | ) | | | (0.99 | ) | | | — | |
Total distributions | | | (1.61 | ) | | | (2.48 | ) | | | (4.25 | ) | | | (0.99 | ) | | | — | |
| | | | | | | | | | | | | | | | | | | | | |
Net asset value at end of year | | $ | 26.44 | | | $ | 25.02 | | | $ | 28.24 | | | $ | 30.19 | | | $ | 23.71 | |
| | | | | | | | | | | | | | | | | | | | | |
Total return (a) | | | 12.1 | % | | | (2.7 | %) | | | 7.5 | % | | | 31.5 | % | | | 14.7 | % |
| | | | | | | | | | | | | | | | | | | | | |
Ratios/Supplementary Data: | | | | | | | | | | | | | | | | | | | | |
Net assets at end of year (000’s) | | $ | 351,085 | | | $ | 300,119 | | | $ | 303,840 | | | $ | 285,132 | | | $ | 198,761 | |
| | | | | | | | | | | | | | | | | | | | | |
Ratio of total expenses to average net assets | | | 1.17 | % | | | 1.17 | % | | | 1.28 | % | | | 1.43 | % | | | 1.50 | % |
| | | | | | | | | | | | | | | | | | | | | |
Ratio of net investment income (loss) to average net assets | | | 0.09 | % | | | 0.24 | % | | | (0.10 | %) | | | (0.29 | %) | | | (0.17 | %) |
| | | | | | | | | | | | | | | | | | | | | |
Portfolio turnover rate | | | 29 | % | | | 32 | % | | | 36 | % | | | 18 | % | | | 33 | % |
(a) | Total return is a measure of the change in value of an investment in the Fund over the period covered, which assumes any dividends or capital gains distributions are reinvested in shares of the Fund. The returns shown do not reflect the deduction of taxes a shareholder would pay on Fund distributions or the redemption of Fund shares. |
| | |
See notes to financial statements. |
56
AVE MARIA RISING DIVIDEND FUND
FINANCIAL HIGHLIGHTS
Per Share Data for a Share Outstanding Throughout Each Year
| | Year
Ended
December 31, 2016 | | | Year
Ended
December 31, 2015 | | | Year
Ended
December 31, 2014 | | | Year
Ended
December 31, 2013 | | | Year
Ended
December 31, 2012 | |
Net asset value at beginning of year | | $ | 15.58 | | | $ | 17.72 | | | $ | 17.56 | | | $ | 13.49 | | | $ | 12.68 | |
| | | | | | | | | | | | | | | | | | | | | |
Income (loss) from investment operations: | | | | | | | | | | | | | | | | | | | | |
Net investment income | | | 0.27 | | | | 0.24 | | | | 0.18 | | | | 0.17 | | | | 0.23 | |
Net realized and unrealized gains (losses) on investments | | | 2.11 | | | | (1.27 | ) | | | 1.46 | | | | 4.38 | | | | 1.51 | |
Total from investment operations | | | 2.38 | | | | (1.03 | ) | | | 1.64 | | | | 4.55 | | | | 1.74 | |
| | | | | | | | | | | | | | | | | | | | | |
Less distributions: | | | | | | | | | | | | | | | | | | | | |
From net investment income | | | (0.28 | ) | | | (0.23 | ) | | | (0.18 | ) | | | (0.17 | ) | | | (0.23 | ) |
From net realized gains on investments | | | (0.89 | ) | | | (0.88 | ) | | | (1.30 | ) | | | (0.31 | ) | | | (0.70 | ) |
Total distributions | | | (1.17 | ) | | | (1.11 | ) | | | (1.48 | ) | | | (0.48 | ) | | | (0.93 | ) |
| | | | | | | | | | | | | | | | | | | | | |
Net asset value at end of year | | $ | 16.79 | | | $ | 15.58 | | | $ | 17.72 | | | $ | 17.56 | | | $ | 13.49 | |
| | | | | | | | | | | | | | | | | | | | | |
Total return (a) | | | 15.3 | % | | | (5.9 | %) | | | 9.3 | % | | | 33.9 | % | | | 13.9 | % |
| | | | | | | | | | | | | | | | | | | | | |
Ratios/Supplementary Data: | | | | | | | | | | | | | | | | | | | | |
Net assets at end of year (000’s) | | $ | 828,649 | | | $ | 750,890 | | | $ | 848,096 | | | $ | 710,150 | | | $ | 303,909 | |
| | | | | | | | | | | | | | | | | | | | | |
Ratio of total expenses to average net assets | | | 0.92 | % | | | 0.92 | % | | | 0.92 | % | | | 0.97 | % | | | 0.99 | % |
| | | | | | | | | | | | | | | | | | | | | |
Ratio of net investment income to average net assets | | | 1.61 | % | | | 1.38 | % | | | 1.01 | % | | | 1.16 | % | | | 1.75 | % |
| | | | | | | | | | | | | | | | | | | | | |
Portfolio turnover rate | | | 24 | % | | | 35 | % | | | 29 | % | | | 14 | % | | | 37 | % |
(a) | Total return is a measure of the change in value of an investment in the Fund over the period covered, which assumes any dividends or capital gains distributions are reinvested in shares of the Fund. The returns shown do not reflect the deduction of taxes a shareholder would pay on Fund distributions or the redemption of Fund shares. |
| | |
See notes to financial statements. |
57
AVE MARIA WORLD EQUITY FUND
FINANCIAL HIGHLIGHTS
Per Share Data for a Share Outstanding Throughout Each Year
| | Year
Ended
December 31, 2016 | | | Year
Ended
December 31, 2015 | | | Year
Ended
December 31, 2014 | | | Year
Ended
December 31, 2013 | | | Year
Ended
December 31, 2012 | |
Net asset value at beginning of year | | $ | 12.36 | | | $ | 13.22 | | | $ | 13.90 | | | $ | 11.46 | | | $ | 10.11 | |
| | | | | | | | | | | | | | | | | | | | | |
Income (loss) from investment operations: | | | | | | | | | | | | | | | | | | | | |
Net investment income | | | 0.06 | | | | 0.07 | | | | 0.04 | | | | 0.03 | | | | 0.05 | |
Net realized and unrealized gains (losses) on investments | | | 1.01 | | | | (0.70 | ) | | | 0.04 | | | | 2.66 | | | | 1.35 | |
Total from investment operations | | | 1.07 | | | | (0.63 | ) | | | 0.08 | | | | 2.69 | | | | 1.40 | |
| | | | | | | | | | | | | | | | | | | | | |
Less distributions: | | | | | | | | | | | | | | | | | | | | |
From net investment income | | | (0.06 | ) | | | (0.07 | ) | | | (0.04 | ) | | | (0.03 | ) | | | (0.05 | ) |
From net realized gains on investments | | | (0.19 | ) | | | (0.16 | ) | | | (0.72 | ) | | | (0.22 | ) | | | — | |
Total distributions | | | (0.25 | ) | | | (0.23 | ) | | | (0.76 | ) | | | (0.25 | ) | | | (0.05 | ) |
| | | | | | | | | | | | | | | | | | | | | |
Net asset value at end of year | | $ | 13.18 | | | $ | 12.36 | | | $ | 13.22 | | | $ | 13.90 | | | $ | 11.46 | |
| | | | | | | | | | | | | | | | | | | | | |
Total return (a) | | | 8.7 | % | | | (4.8 | %) | | | 0.5 | % | | | 23.5 | % | | | 13.8 | % |
| | | | | | | | | | | | | | | | | | | | | |
Ratios/Supplementary Data: | | | | | | | | | | | | | | | | | | | | |
Net assets at end of year (000’s) | | $ | 46,030 | | | $ | 41,199 | | | $ | 42,667 | | | $ | 39,870 | | | $ | 24,236 | |
| | | | | | | | | | | | | | | | | | | | | |
Ratio of total expenses to average net assets | | | 1.45 | % | | | 1.50 | % | | | 1.50 | % | | | 1.55 | % | | | 1.63 | % |
| | | | | | | | | | | | | | | | | | | | | |
Ratio of net expenses to average net assets (b) | | | 1.33 | % | | | 1.50 | % | | | 1.50 | % | | | 1.50 | % | | | 1.50 | % |
| | | | | | | | | | | | | | | | | | | | | |
Ratio of net investment income to average net assets (b) | | | 0.50 | % | | | 0.51 | % | | | 0.29 | % | | | 0.28 | % | | | 0.46 | % |
| | | | | | | | | | | | | | | | | | | | | |
Portfolio turnover rate | | | 42 | % | | | 35 | % | | | 36 | % | | | 31 | % | | | 33 | % |
(a) | Total return is a measure of the change in value of an investment in the Fund over the period covered, which assumes any dividends or capital gains distributions are reinvested in shares of the Fund. The returns shown do not reflect the deduction of taxes a shareholder would pay on Fund distributions or the redemption of Fund shares. |
| | |
(b) | Ratio was determined after advisory fee reductions (Note 2). |
| | |
See notes to financial statements. |
58
AVE MARIA BOND FUND
FINANCIAL HIGHLIGHTS
Per Share Data for a Share Outstanding Throughout Each Year
| | Year
Ended
December 31, 2016 | | | Year
Ended
December 31, 2015 | | | Year
Ended
December 31, 2014 | | | Year
Ended
December 31, 2013 | | | Year
Ended
December 31, 2012 | |
Net asset value at beginning of year | | $ | 11.02 | | | $ | 11.15 | | | $ | 11.38 | | | $ | 11.04 | | | $ | 10.87 | |
| | | | | | | | | | | | | | | | | | | | | |
Income (loss) from investment operations: | | | | | | | | | | | | | | | | | | | | |
Net investment income | | | 0.15 | | | | 0.14 | | | | 0.12 | | | | 0.11 | | | | 0.18 | |
Net realized and unrealized gains (losses) on investments | | | 0.35 | | | | (0.06 | ) | | | 0.12 | | | | 0.56 | | | | 0.32 | |
Total from investment operations | | | 0.50 | | | | 0.08 | | | | 0.24 | | | | 0.67 | | | | 0.50 | |
| | | | | | | | | | | | | | | | | | | | | |
Less distributions: | | | | | | | | | | | | | | | | | | | | |
From net investment income | | | (0.15 | ) | | | (0.14 | ) | | | (0.12 | ) | | | (0.11 | ) | | | (0.18 | ) |
From net realized gains on investments | | | (0.18 | ) | | | (0.07 | ) | | | (0.35 | ) | | | (0.22 | ) | | | (0.15 | ) |
Total distributions | | | (0.33 | ) | | | (0.21 | ) | | | (0.47 | ) | | | (0.33 | ) | | | (0.33 | ) |
| | | | | | | | | | | | | | | | | | | | | |
Net asset value at end of year | | $ | 11.19 | | | $ | 11.02 | | | $ | 11.15 | | | $ | 11.38 | | | $ | 11.04 | |
| | | | | | | | | | | | | | | | | | | | | |
Total return (a) | | | 4.5 | % | | | 0.7 | % | | | 2.2 | % | | | 6.1 | % | | | 4.6 | % |
| | | | | | | | | | | | | | | | | | | | | |
Ratios/Supplementary Data: | | | | | | | | | | | | | | | | | | | | |
Net assets at end of year (000’s) | | $ | 248,971 | | | $ | 223,842 | | | $ | 180,718 | | | $ | 149,750 | | | $ | 113,043 | |
| | | | | | | | | | | | | | | | | | | | | |
Ratio of net expenses to average net assets | | | 0.50 | % | | | 0.51 | % | | | 0.54 | % | | | 0.70 | % | | | 0.70 | %(b) |
| | | | | | | | | | | | | | | | | | | | | |
Ratio of net investment income to average net assets | | | 1.34 | % | | | 1.30 | % | | | 1.10 | % | | | 1.01 | % | | | 1.64 | % |
| | | | | | | | | | | | | | | | | | | | | |
Portfolio turnover rate | | | 21 | % | | | 25 | % | | | 21 | % | | | 17 | % | | | 21 | % |
(a) | Total return is a measure of the change in value of an investment in the Fund over the period covered, which assumes any dividends or capital gains distributions are reinvested in shares of the Fund. The returns shown do not reflect the deduction of taxes a shareholder would pay on Fund distributions or the redemption of Fund shares. |
| | |
(b) | Absent investment advisory fee reductions by the Adviser, the ratio of expenses to average net assets would have been 0.71% for the year ended December 31, 2012. |
| | |
See notes to financial statements. |
59
AVE MARIA MUTUAL FUNDS
NOTES TO FINANCIAL STATEMENTS
December 31, 2016
1. Organization and Significant Accounting Policies
The Ave Maria Catholic Values Fund, the Ave Maria Growth Fund, the Ave Maria Rising Dividend Fund, the Ave Maria World Equity Fund and the Ave Maria Bond Fund (individually, a “Fund” and collectively, the “Funds”) are each a diversified series of the Schwartz Investment Trust (the “Trust”), an open-end management investment company registered under the Investment Company Act of 1940 and established as an Ohio business trust under a Declaration of Trust dated August 31, 1992. The Ave Maria Catholic Values Fund commenced the public offering of its shares on May 1, 2001. The public offering of shares of the Ave Maria Growth Fund and the Ave Maria Bond Fund commenced on May 1, 2003. The Ave Maria Rising Dividend Fund commenced the public offering of its shares on May 2, 2005. The Ave Maria World Equity Fund commenced the public offering of its shares on April 30, 2010.
The investment objective of the Ave Maria Catholic Values Fund is to seek long-term capital appreciation from equity investments in companies that do not violate core values and teachings of the Roman Catholic Church. The investment objective of the Ave Maria Growth Fund is to seek long-term capital appreciation, using the growth style, from equity investments in companies that do not violate core values and teachings of the Roman Catholic Church. The investment objective of the Ave Maria Rising Dividend Fund is to provide increasing dividend income over time, long-term growth of capital, and a reasonable level of current income from investments in dividend-paying common stocks of companies that do not violate core values and teachings of the Roman Catholic Church. The investment objective of the Ave Maria World Equity Fund is to seek long-term capital appreciation from equity investments in U.S. and non-U.S. companies that do not violate core values and teachings of the Roman Catholic Church. The investment objective of the Ave Maria Bond Fund is to seek preservation of principal with a reasonable level of current income in corporate debt and equity securities that do not violate core values and teachings of the Roman Catholic Church. See the Funds’ Prospectus for information regarding the investment strategies of each Fund.
Shares of each Fund are sold at net asset value. To calculate the net asset value, a Fund’s assets are valued and totaled, liabilities are subtracted, and the balance is divided by the number of shares outstanding. The offering price and redemption price per share are equal to the net asset value per share for each Fund.
60
AVE MARIA MUTUAL FUNDS
NOTES TO FINANCIAL STATEMENTS
(Continued)
On August 1, 2015, the Ave Maria Catholic Values Fund consummated a tax-free merger with the Ave Maria Opportunity Fund, previously a series of the Trust. Pursuant to the terms of the merger agreement, each share of the Ave Maria Opportunity Fund was converted into an equivalent dollar amount of shares of the Ave Maria Catholic Values Fund, based on the net asset values of the Ave Maria Catholic Values Fund and the Ave Maria Opportunity Fund as of July 31, 2015 ($19.53 and $10.03, respectively), resulting in a conversion ratio of 0.513864 shares of the Ave Maria Catholic Values Fund for each share of the Ave Maria Opportunity Fund. The Ave Maria Catholic Values Fund issued 1,858,403 shares to shareholders of the Ave Maria Opportunity Fund. The basis of the assets transferred from the Ave Maria Opportunity Fund reflected the historical basis of the assets as of the date of the tax-free merger. Net assets of the Ave Maria Catholic Values Fund and the Ave Maria Opportunity Fund as of the merger date were $230,192,193 and $36,285,741, respectively, including unrealized appreciation (depreciation) on investments of $39,134,887 and ($2,883,304), respectively. The Ave Maria Opportunity Fund’s net assets at the time of the merger included accumulated realized capital losses of $104,851. Total net assets of the Ave Maria Catholic Values Fund immediately after the merger were $266,477,934. Because the combined investment portfolio has been managed as a single integrated portfolio since the merger was completed, it is not practical to state the amounts of net investment income (loss), net realized gains (losses) and change in unrealized appreciation (depreciation) on investments, and net increase (decrease) in net assets resulting from operations, of the former investment portfolio of the Ave Maria Opportunity Fund that has been included in the Ave Maria Catholic Values Fund’s Statement of Operations since August 1, 2015.
| Ave Maria
Opportunity
Fund | Ave Maria
Catholic Values
Fund |
Exchange ratio | 0.513864 | N/A |
Ave Maria Opportunity Fund's shares | 3,616,521 | N/A |
Ave Maria Catholic Values Fund's shares | N/A | 11,789,464 |
Ave Maria Opportunities Fund's unrealized depreciation | $ 2,883,304 | N/A |
Net assets before the merger | $ 36,285,741 | $ 230,192,193 |
Aggregated net assets immediately after the merger | N/A | $ 266,477,934 |
61
AVE MARIA MUTUAL FUNDS
NOTES TO FINANCIAL STATEMENTS
(Continued)
The tables below summarize the results of operations of the Ave Maria Opportunity Fund for the period from January 1, 2015 to July 31, 2015, and the Ave Maria Catholic Values Fund’s results of operations for the fiscal year ended December 31, 2015.
For the period from
January 1, 2015 to July 31, 2015: | | Net Investment Loss | | | Net Realized Losses and Net Change in Unrealized Depreciation on Investments | | | Net Decrease in Net Assets Resulting from Operations | |
Ave Maria Opportunity Fund | | $ | (106,238 | ) | | $ | (7,851,130 | ) | | $ | (7,957,368 | ) |
For the fiscal year
ended December 31, 2015: | | Net Investment Income | | | Net Realized Losses and Net Change in Unrealized Depreciation on Investments | | | Net Decrease in Net Assets Resulting from Operations | |
Ave Maria Catholic Values Fund | | $ | 141,330 | | | $ | (46,429,375 | ) | | $ | (46,228,045 | ) |
The following is a summary of significant accounting policies followed by the Funds. The policies are in conformity with accounting principles generally accepted in the United States of America (“GAAP”). As an investment company, as defined in Financial Accounting Standards Board (“FASB”) Accounting Standards Update 2013-08, each Fund follows accounting and reporting guidance under FASB Accounting Standards Codification Topic 946, “Financial Services – Investment Companies.”
In October 2016, the Securities and Exchange Commission (the “SEC”) released its final rule on Investment Company Reporting Modernization (the “Rule”). The Rule, which introduces two new regulatory reporting forms for investment companies – Form N-PORT and Form N-CEN, also contains amendments to Regulation S-X which impacts financial statement presentation, particularly the presentation of derivative investments. Although still evaluating the impact of the Rule, management believes that many of the Regulation S-X amendments are consistent with the Funds’ current financial statement presentation and expects that the Funds will be able to comply with the Rule’s Regulation S-X amendments by the August 1, 2017 compliance date.
(a) Valuation of investments – Securities which are traded on stock exchanges are valued at the closing sales price as of the close of the regular session of trading on the New York Stock Exchange on the day the securities are being valued, or, if not traded on a particular day, at the closing bid price. Securities which are quoted by NASDAQ are valued at the NASDAQ Official Closing Price or, if an Official Closing Price is not available, at the most recently quoted bid price. Securities traded in the over-the-counter market are
62
AVE MARIA MUTUAL FUNDS
NOTES TO FINANCIAL STATEMENTS
(Continued)
valued at the last reported sales price or, if there is no reported sale on the valuation date, at the most recently quoted bid price. Securities which are traded both in the over-the-counter market and on a stock exchange are valued according to the broadest and most representative market. Fixed income securities are generally valued using prices provided by an independent pricing service. The independent pricing service uses information with respect to transactions in bonds, quotations from bond dealers, market transactions in comparable securities and various relationships between securities in determining these prices. Investments in shares of other open-end investment companies are valued at their net asset value as reported by such companies. Securities for which market quotations are not readily available are valued at their fair value as determined in good faith in accordance with consistently applied procedures established by and under the general supervision of the Board of Trustees, and will be classified as Level 2 or 3 within the fair value hierarchy (see below), depending on the inputs used. Fair value pricing may be used, for example, in situations where (i) a security is so thinly traded that there have been no transactions for that stock over an extended period of time; (ii) the exchange on which the security is principally traded closes early; or (iii) trading of the security is halted during the day and does not resume prior to a Fund’s net asset value calculation. A security’s “fair value” price may differ from the price next available for that security using the Funds’ normal pricing procedures.
GAAP establishes a single authoritative definition of fair value, sets out a framework for measuring fair value and requires additional disclosures about fair value measurements.
Various inputs are used in determining the value of each Fund’s investments. These inputs are summarized in the three broad levels listed below:
| | ● | Level 1 – quoted prices in active markets for identical securities |
| | ● | Level 2 – other significant observable inputs |
| | ● | Level 3 – significant unobservable inputs |
U.S. Treasury Obligations and Corporate Bonds held by the Ave Maria Bond Fund are classified as Level 2 since the values for such securities are based on prices provided by an independent pricing service that utilizes various “other significant observable inputs” including bid and ask quotations, prices of similar securities and interest rates, among other factors.
The inputs or methodology used for valuing securities are not necessarily an indication of the risks associated with investing in those securities. The inputs used to measure fair value may fall into different levels of the fair value hierarchy. In such cases, for disclosure purposes, the level in the fair value hierarchy within which the fair value measurement falls in its entirety is determined based on the lowest level input that is significant to the fair value measurement.
63
AVE MARIA MUTUAL FUNDS
NOTES TO FINANCIAL STATEMENTS
(Continued)
The following is a summary of the inputs used to value the Funds’ investments, by security type, as of December 31, 2016:
Ave Maria Catholic Values Fund | | Level 1 | | | Level 2 | | | Level 3 | | | Total | |
Common Stocks | | $ | 201,198,712 | | | $ | — | | | $ | — | | | $ | 201,198,712 | |
Warrants | | | 1,237,500 | | | | — | | | | — | | | | 1,237,500 | |
Money Market Funds | | | 22,162,043 | | | | — | | | | — | | | | 22,162,043 | |
Total | | $ | 224,598,255 | | | $ | — | | | $ | — | | | $ | 224,598,255 | |
Ave Maria Growth Fund | | Level 1 | | | Level 2 | | | Level 3 | | | Total | |
Common Stocks | | $ | 330,357,443 | | | $ | — | | | $ | — | | | $ | 330,357,443 | |
Money Market Funds | | | 20,333,438 | | | | — | | | | — | | | | 20,333,438 | |
Total | | $ | 350,690,881 | | | $ | — | | | $ | — | | | $ | 350,690,881 | |
Ave Maria Rising Dividend Fund | | Level 1 | | | Level 2 | | | Level 3 | | | Total | |
Common Stocks | | $ | 789,532,203 | | | $ | — | | | $ | — | | | $ | 789,532,203 | |
Money Market Funds | | | 39,363,200 | | | | — | | | | — | | | | 39,363,200 | |
Total | | $ | 828,895,403 | | | $ | — | | | $ | — | | | $ | 828,895,403 | |
Ave Maria World Equity Fund | | Level 1 | | | Level 2 | | | Level 3 | | | Total | |
Common Stocks | | $ | 43,778,776 | | | $ | — | | | $ | — | | | $ | 43,778,776 | |
Money Market Funds | | | 2,022,745 | | | | — | | | | — | | | | 2,022,745 | |
Total | | $ | 45,801,521 | | | $ | — | | | $ | — | | | $ | 45,801,521 | |
Ave Maria Bond Fund | | Level 1 | | | Level 2 | | | Level 3 | | | Total | |
U.S. Treasury Obligations | | $ | — | | | $ | 91,606,755 | | | $ | — | | | $ | 91,606,755 | |
Corporate Bonds | | | — | | | | 101,855,630 | | | | — | | | | 101,855,630 | |
Common Stocks | | | 46,739,590 | | | | — | | | | — | | | | 46,739,590 | |
Money Market Funds | | | 6,259,115 | | | | — | | | | — | | | | 6,259,115 | |
Total | | $ | 52,998,705 | | | $ | 193,462,385 | | | $ | — | | | $ | 246,461,090 | |
Refer to each Fund’s Schedule of Investments for a listing of the securities by security type and sector or industry type. As of December 31, 2016, the Funds did not have any transfers into and out of any Level. There were no Level 3 securities or derivative instruments held by the Funds as of December 31, 2016. It is the Funds’ policy to recognize transfers into and out of all Levels at the end of the reporting period.
64
AVE MARIA MUTUAL FUNDS
NOTES TO FINANCIAL STATEMENTS
(Continued)
(b) Income taxes – Each Fund has qualified and intends to continue to qualify as a regulated investment company under the Internal Revenue Code of 1986 (the “Code”). Qualification generally will relieve each Fund of liability for federal income taxes to the extent 100% of its net investment income and net realized capital gains are distributed in accordance with the Code.
In order to avoid imposition of the excise tax applicable to regulated investment companies, it is also each Fund’s intention to declare as dividends in each calendar year at least 98% of its net investment income and 98.2% of its net realized capital gains plus undistributed amounts from prior years.
The following information is computed on a tax basis for each item as of December 31, 2016:
| | Ave Maria
Catholic
Values Fund | | | Ave Maria
Growth
Fund | | | Ave Maria
Rising
Dividend Fund | | | Ave Maria
World Equity Fund | | | Ave Maria
Bond Fund | |
Undistributed ordinary income | | $ | — | | | $ | 325 | | | $ | 23,687 | | | $ | — | | | $ | 6,363 | |
Net unrealized appreciation | | | 44,623,850 | | | | 81,556,844 | | | | 114,345,160 | | | | 4,908,895 | | | | 5,297,470 | |
Accumulated capital and other losses | | | (27,437 | ) | | | — | | | | — | | | | — | | | | — | |
Total distributable earnings | | $ | 44,596,413 | | | $ | 81,557,169 | | | $ | 114,368,847 | | | $ | 4,908,895 | | | $ | 5,303,833 | |
The following information is based upon the federal income tax cost of the Funds’ investment securities as of December 31, 2016:
| | Ave Maria
Catholic
Values Fund | | | Ave Maria
Growth
Fund | | | Ave Maria
Rising
Dividend Fund | | | Ave Maria
World
Equity Fund | | | Ave Maria
Bond Fund | |
Gross unrealized appreciation | | $ | 47,990,629 | | | $ | 89,879,101 | | | $ | 135,897,330 | | | $ | 5,990,601 | | | $ | 7,406,725 | |
Gross unrealized depreciation | | | (3,366,779 | ) | | | (8,322,257 | ) | | | (21,552,170 | ) | | | (1,081,706 | ) | | | (2,109,255 | ) |
Net unrealized appreciation | | $ | 44,623,850 | | | $ | 81,556,844 | | | $ | 114,345,160 | | | $ | 4,908,895 | | | $ | 5,297,470 | |
Federal income tax cost | | $ | 179,974,405 | | | $ | 269,134,037 | | | $ | 714,550,243 | | | $ | 40,892,626 | | | $ | 241,163,620 | |
The difference between the federal income tax cost of portfolio investments and the financial statement cost of portfolio investments for the Ave Maria Catholic Values Fund and the Ave Maria Growth Fund is due to certain timing differences in the recognition of capital gains and losses under income tax regulations and GAAP. These “book/tax” differences are temporary in nature and are due to the tax deferral of losses on wash sales. There is no difference between the federal income tax cost and the financial statement cost of portfolio investments for the Ave Maria Rising Dividend Fund, the Ave Maria World Equity Fund and the Ave Maria Bond Fund as of December 31, 2016.
65
AVE MARIA MUTUAL FUNDS
NOTES TO FINANCIAL STATEMENTS
(Continued)
As of December 31, 2016, the Ave Maria Catholic Values Fund had a short-term capital loss carryforward of $27,437 for federal income tax purposes. This capital loss carryforward, which does not expire, may be utilized in future years to offset net realized capital gains, if any, prior to distributing such gains to shareholders.
During the year ended December 31, 2016, the following reclassifications were made as a result of permanent differences between the financial statements and income tax reporting requirements:
| | Increase (Decrease) in Undistributed Net Investment Income (Loss) | | | Increase in Accumulated Net Realized Gains on Investments | | | Decrease in Paid-in Capital | |
Ave Maria Catholic Values Fund | | $ | 315,335 | | | $ | — | | | $ | (315,335 | ) |
Ave Maria Growth Fund | | | (210 | ) | | | 210 | | | | — | |
Ave Maria Rising Dividend Fund | | | (62,304 | ) | | | 62,304 | | | | — | |
Ave Maria World Equity Fund | | | 65 | | | | 77 | | | | (142 | ) |
Ave Maria Bond Fund | | | (6,846 | ) | | | 6,846 | | | | — | |
Such reclassifications have no effect on each Fund’s total net assets or its net asset value per share.
The Funds recognize the tax benefits or expenses of uncertain tax positions only when the position is “more-likely-than-not” to be sustained assuming examination by tax authorities. Management has reviewed the tax positions taken on federal income tax returns for all open tax years (tax years ended December 31, 2013 through December 31, 2016) and has concluded that no provision for unrecognized tax benefits or expenses is required in these financial statements.
(c) Security transactions and investment income – Security transactions are accounted for on the trade date. Dividend income is recorded on the ex-dividend date. Interest income is recognized on the accrual basis and includes amortization of premiums and accretion of discounts using the effective yield method. Cost of investments includes amortization of premiums and accretion of discounts. Realized gains and losses on securities sold are determined on a specific identification basis. Withholding taxes on foreign dividends have been recorded in accordance with the Funds’ understanding of the appropriate country’s rules and tax rates.
66
AVE MARIA MUTUAL FUNDS
NOTES TO FINANCIAL STATEMENTS
(Continued)
(d) Dividends and distributions – Dividends from net investment income, if any, are declared and paid annually in December for the Ave Maria Catholic Values Fund, the Ave Maria Growth Fund and the Ave Maria World Equity Fund. Dividends from net investment income, if any, are declared and paid quarterly for the Ave Maria Rising Dividend Fund and are declared and paid monthly for the Ave Maria Bond Fund. Each Fund expects to distribute any net realized capital gains annually. Dividends and distributions to shareholders are recorded on the ex-dividend date. The tax character of distributions paid to shareholders during the years ended December 31, 2016 and 2015 was as follows:
Years Ended | | Ordinary
Income | | | Long-Term
Capital Gains | | | Total
Distributions | |
Ave Maria Catholic Values Fund: | | | | | | | | | |
December 31, 2016 | | $ | — | | | $ | — | | | $ | — | |
December 31, 2015 | | $ | 140,481 | | | $ | 119,860 | | | $ | 260,341 | |
Ave Maria Growth Fund: | | | | | | | | | | | | |
December 31, 2016 | | $ | 282,281 | | | $ | 19,858,816 | | | $ | 20,141,097 | |
December 31, 2015 | | $ | 2,998,414 | | | $ | 24,145,236 | | | $ | 27,143,650 | |
Ave Maria Rising Dividend Fund: | | | | | | | | | | | | |
December 31, 2016 | | $ | 16,509,599 | | | $ | 38,296,088 | | | $ | 54,805,687 | |
December 31, 2015 | | $ | 11,446,317 | | | $ | 39,634,092 | | | $ | 51,080,409 | |
Ave Maria World Equity Fund: | | | | | | | | | | | | |
December 31, 2016 | | $ | 214,164 | | | $ | 662,978 | | | $ | 877,142 | |
December 31, 2015 | | $ | 233,923 | | | $ | 526,573 | | | $ | 760,496 | |
Ave Maria Bond Fund | | | | | | | | | | | | |
December 31, 2016 | | $ | 4,368,623 | | | $ | 2,655,311 | | | $ | 7,023,934 | |
December 31, 2015 | | $ | 2,624,600 | | | $ | 1,337,090 | | | $ | 3,961,690 | |
(e) Estimates – The preparation of financial statements in conformity with GAAP requires management to make estimates and assumptions that affect the reported amounts of assets and liabilities and disclosure of contingent assets and liabilities as of the date of the financial statements and the reported amounts of revenues and expenses during the reporting period. Actual results could differ from those estimates.
(f) Common expenses – Common expenses of the Trust are allocated among the series of the Trust based on relative net assets of each series or the nature of the services performed and the relative applicability to each series.
67
AVE MARIA MUTUAL FUNDS
NOTES TO FINANCIAL STATEMENTS
(Continued)
2. Investment Advisory Agreements and Transactions with Related Parties
The Chairman and President of the Trust is also the Chairman and Chief Executive Officer of Schwartz Investment Counsel, Inc. (the “Adviser”). Certain other officers of the Trust are officers of the Adviser, or of Ultimus Fund Solutions, LLC (“Ultimus”), the administrative, accounting and transfer agent for the Funds, or of Ultimus Fund Distributors, LLC (the “Distributor”), the Funds’ principal underwriter.
Pursuant to Investment Advisory Agreements between the Trust and the Adviser, the Adviser is responsible for the management of each Fund and provides investment advice along with the necessary personnel, facilities, equipment and certain other services necessary to the operations of the Funds. The Adviser receives from each of the Ave Maria Catholic Values Fund, the Ave Maria Growth Fund and the Ave Maria World Equity Fund a quarterly fee at the annual rate of 0.95% of its average daily net assets. The Adviser receives from the Ave Maria Rising Dividend Fund and the Ave Maria Bond Fund a quarterly fee at the annual rate of 0.75% and 0.30%, respectively, of average daily net assets.
Effective May 1, 2016, the Adviser has contractually agreed to reduce its advisory fees or reimburse a portion of operating expenses until at least May 1, 2018 so that the ordinary operating expenses of each of the Ave Maria Catholic Values Fund, the Ave Maria Growth Fund, the Ave Maria Rising Dividend Fund and the Ave Maria World Equity Fund do not exceed 1.25% per annum of average daily net assets; and the ordinary operating expenses of the Ave Maria Bond Fund do not exceed 0.60% per annum of average daily net assets. Prior to May 1, 2016, the Adviser had contractually agreed to reduce its advisory fees or reimburse a portion of operating expenses so that the ordinary operating expenses of the Ave Maria World Equity Fund did not exceed 1.50% per annum of average daily net assets. During the year ended December 31, 2016, the Adviser reduced its investment advisory fees by $52,827 with respect to the Ave Maria World Equity Fund.
Any investment advisory fee reductions or expense reimbursements by the Adviser are subject to repayment by the Funds for a period of three years after such fees and expenses were incurred, provided the Funds are able to effect such repayment and remain in compliance with any undertaking by the Adviser to limit expenses of the Funds. As of December 31, 2016, the Adviser may seek recoupment of investment advisory fee reductions from the Ave Maria World Equity Fund totaling $52,827 no later than December 31, 2019.
The Chief Compliance Officer of the Trust (the “CCO”) is an employee of the Adviser. The Trust pays the Adviser a fee for providing CCO services, of which each Fund pays its proportionate share along with the other series of the Trust. In addition, the Trust reimburses the Adviser for out-of-pocket expenses incurred, if any, for providing these services.
68
AVE MARIA MUTUAL FUNDS
NOTES TO FINANCIAL STATEMENTS
(Continued)
Pursuant to a Mutual Fund Services Agreement between the Trust and Ultimus, Ultimus supplies regulatory and compliance services, calculates the daily net asset value per share of each Fund, maintains the financial books and records of the Funds, maintains the records of each shareholder’s account, and processes purchases and redemptions of each Fund’s shares. For the performance of these services, Ultimus receives fees from each Fund computed as a percentage of such Fund’s average daily net assets, subject to a minimum monthly fee.
Pursuant to a Distribution Agreement between the Trust and the Distributor, the Distributor serves as each Fund’s exclusive agent for the distribution of its shares. The Distributor is an affiliate of Ultimus.
Trustees and officers affiliated with the Adviser or Ultimus are not compensated by the Trust for their services. Each Trustee who is not an affiliated person of the Adviser or Ultimus (“Independent Trustee”) receives from the Trust an annual retainer of $35,000 (except that such fee is $45,000 for the Lead Independent Trustee and $39,000 for the Chairman of the Audit Committee), payable quarterly; a fee of $5,500 for attendance at each meeting of the Board of Trustees; plus reimbursement of travel and other expenses incurred in attending meetings. Each Fund pays its proportionate share of the Independent Trustees’ fees and expenses along with the other series of the Trust. Effective January 1, 2017, each Independent Trustee will receive from the Trust an annual retainer of $40,000 (except that such fee is $50,000 for the Lead Independent Trustee and $44,000 for the Chairman of the Audit Committee), payable quarterly; a fee of $6,000 for attendance at each meeting of the Board of Trustees; plus reimbursement of travel and other expenses incurred in attending meetings.
Effective July 1, 2016, each member of Catholic Advisory Board (“CAB”), including Emeritus members, receives an annual retainer of $4,000 (except that such fee is $14,000 for the CAB chairman), payable quarterly; a fee of $3,000 for attendance at each meeting of the CAB (including the CAB chairman); plus reimbursement of travel and other expenses incurred in attending meetings. Each Fund pays its proportionate share of CAB members’ fees and expenses. Prior to July 1, 2016, each member, including Emeritus members, received an annual retainer of $2,000 (except that such fee was $14,000 for the CAB Chairman), payable quarterly; a fee of $2,500 for attendance at each meeting of the CAB (except that such fee was $2,750 for the CAB Chairman); plus reimbursement of travel and other expenses incurred in attending meetings.
69
AVE MARIA MUTUAL FUNDS
NOTES TO FINANCIAL STATEMENTS
(Continued)
3. Investment Transactions
During the year ended December 31, 2016, cost of purchases and proceeds from sales and maturities of investment securities, excluding short-term investments and U.S. government securities, were as follows:
| | Ave Maria
Catholic
Values Fund | | | Ave Maria
Growth
Fund | | | Ave Maria
Rising
Dividend Fund | | | Ave Maria
World Equity Fund | | | Ave Maria
Bond Fund | |
Purchases of investment securities | | $ | 91,136,407 | | | $ | 105,226,530 | | | $ | 174,871,051 | | | $ | 17,610,295 | | | $ | 28,012,581 | |
Proceeds from sales and maturities of investment securities | | $ | 129,115,635 | | | $ | 91,077,245 | | | $ | 201,067,703 | | | $ | 16,547,268 | | | $ | 31,545,695 | |
4. Contingencies and Commitments
The Funds indemnify the Trust’s officers and Trustees for certain liabilities that might arise from their performance of their duties to the Funds. Additionally, in the normal course of business, the Funds enter into contracts that contain a variety of representations and warranties and which provide general indemnifications. The Funds’ maximum exposure under these arrangements is unknown, as this would involve future claims that may be made against the Funds that have not yet occurred. However, based on experience, the Funds expect the risk of loss to be remote.
5. Affiliated Investment
A company is considered an affiliate of a Fund under the Investment Company Act of 1940 if the Fund’s holdings in that company represent 5% or more of the outstanding voting shares of that company. As of December 31, 2016, the Ave Maria Catholic Values Fund owns 5.33% of the outstanding voting shares of Unico American Corporation. Further information on this holding for the period ended December 31, 2016 appears below:
AVE MARIA CATHOLIC VALUES FUND |
Affiliated Issuer Report |
| |
UNICO AMERICAN CORPORATION |
From December 31, 2015 to December 31, 2016 |
Shares at beginning of year | | | 282,945 | |
Shares at end of year | | | 282,945 | |
Market value at beginning of year | | $ | 2,806,814 | |
Change in unrealized appreciation | | | 234,845 | |
Market value at end of year | | $ | 3,041,659 | |
Net realized gains (losses) during the year | | $ | — | |
Dividend income earned during the year | | $ | — | |
70
AVE MARIA MUTUAL FUNDS
NOTES TO FINANCIAL STATEMENTS
(Continued)
6. Sector Risk
If a Fund has significant investments in the securities of issuers in industries within a particular sector, any development affecting that sector will have a greater impact on the value of the net assets of the Fund than would be the case if the Fund did not have significant investments in that sector. In addition, this may increase the risk of loss of an investment in the Fund and increase the volatility of the Fund’s net asset value per share. From time to time, circumstances may affect a particular sector and the companies within such sector. For instance, economic or market factors, regulation or deregulation, and technological or other developments may negatively impact all companies in a particular sector and therefore the value of a Fund’s portfolio will be adversely affected. As of December 31, 2016, the Ave Maria Growth Fund and the Ave Maria Rising Dividend Fund had 33.2% and 27.8%, respectively, of the value of their net assets invested in stocks within the industrials sector.
7. Subsequent Events
The Funds are required to recognize in the financial statements the effects of all subsequent events that provide additional evidence about conditions that existed as of the date of the Statements of Assets and Liabilities. For non-recognized subsequent events that must be disclosed to keep the financial statements from being misleading, the Funds are required to disclose the nature of the event as well as an estimate of its financial effect, or a statement that such an estimate cannot be made. Management has evaluated subsequent events through the issuance of these financial statements and has noted no such events.
71
AVE MARIA MUTUAL FUNDS
REPORT OF INDEPENDENT REGISTERED
PUBLIC ACCOUNTING FIRM
Ave Maria Catholic Values Fund, Ave Maria Growth Fund, Ave Maria Rising Dividend Fund, Ave Maria World Equity Fund, and Ave Maria Bond Fund:
We have audited the accompanying statements of assets and liabilities, including the schedules of investments, of Ave Maria Catholic Values Fund, Ave Maria Growth Fund, Ave Maria Rising Dividend Fund, Ave Maria World Equity Fund, and Ave Maria Bond Fund (the “Funds”), each a series of Schwartz Investment Trust, as of December 31, 2016, and the related statements of operations for the year then ended, the statements of changes in net assets for each of the two years in the period then ended, and the financial highlights for each of the five years in the period then ended. These financial statements and financial highlights are the responsibility of the Funds’ management. Our responsibility is to express an opinion on these financial statements and financial highlights based on our audits.
We conducted our audits in accordance with the standards of the Public Company Accounting Oversight Board (United States). Those standards require that we plan and perform the audits to obtain reasonable assurance about whether the financial statements and financial highlights are free of material misstatement. The Funds are not required to have, nor were we engaged to perform, an audit of internal control over financial reporting. Our audits included consideration of internal control over financial reporting as a basis for designing audit procedures that are appropriate in the circumstances, but not for the purpose of expressing an opinion on the effectiveness of the Funds’ internal control over financial reporting. Accordingly, we express no such opinion. An audit also includes examining, on a test basis, evidence supporting the amounts and disclosures in the financial statements, assessing the accounting principles used and significant estimates made by management, as well as evaluating the overall financial statement presentation. Our procedures included confirmation of securities owned as of December 31, 2016, by correspondence with the custodian and brokers. We believe that our audits provide a reasonable basis for our opinion.
In our opinion, the financial statements and financial highlights referred to above present fairly, in all material respects, the financial position of Ave Maria Catholic Values Fund, Ave Maria Growth Fund, Ave Maria Rising Dividend Fund, Ave Maria World Equity Fund, and Ave Maria Bond Fund as of December 31, 2016, the results of their operations for the year then ended, the changes in their net assets for each of the two years in the period then ended, and the financial highlights for each of the five years in the period then ended, in conformity with accounting principles generally accepted in the United States of America.

February 14, 2017
72
AVE MARIA MUTUAL FUNDS
BOARD OF TRUSTEES AND EXECUTIVE OFFICERS
(Unaudited)
Overall responsibility for management of the Trust rests with the Board of Trustees. The Trustees serve during the lifetime of the Trust and until its termination, or until death, resignation, retirement or removal. The Trustees, in turn, elect the officers of the Trust to actively supervise its day-to-day operations. The officers have been elected for an annual term. The following are the Trustees and executive officers of the Trust:
Trustee/Officer | Address | Year of Birth | Position Held
with the Trust | Length of
Time Served |
Interested Trustees: | | | | |
* | George P. Schwartz, CFA | 801 W. Ann Arbor Trail,
Plymouth, MI | 1944 | Chairman of the Board/President/Trustee | Since 1992 |
Independent Trustees: | | | | |
| | Louis C. Bosco, Jr. | 801 W. Ann Arbor Trail,
Plymouth, MI | 1936 | Trustee | Since 2008 |
| | Donald J. Dawson, Jr. | 801 W. Ann Arbor Trail,
Plymouth, MI | 1947 | Trustee | Since 1993 |
| | Joseph M. Grace | 801 W. Ann Arbor Trail,
Plymouth, MI | 1936 | Trustee | Since 2007 |
| | John J. McHale, Jr. | 801 W. Ann Arbor Trail,
Plymouth, MI | 1949 | Trustee | Since 2014 |
Executive Officers: | | | | |
* | Richard L. Platte, Jr., CFA | 801 W. Ann Arbor Trail,
Plymouth, MI | 1951 | Vice President and Secretary | Since 1993 |
* | Robert C. Schwartz, CFP | 801 W. Ann Arbor Trail,
Plymouth, MI | 1976 | Vice President | Since 2013 |
* | Timothy S. Schwartz, CFA | 5060 Annunciation Circle,
Ave Maria, FL | 1971 | Treasurer | Since 2000 |
* | Cathy M. Stoner, CPA, IACCP | 801 W. Ann Arbor Trail,
Plymouth, MI | 1970 | Chief Compliance Officer | Since 2010 |
* | George P. Schwartz, Richard L. Platte, Jr., Robert C. Schwartz, Timothy S. Schwartz and Cathy M. Stoner, as affiliated persons of Schwartz Investment Counsel, Inc., the Funds’ investment adviser, are “interested persons” of the Trust within the meaning of Section 2(a)(19) of the Investment Company Act of 1940. George P. Schwartz is the father of Robert C. Schwartz and Timothy S. Schwartz. |
73
AVE MARIA MUTUAL FUNDS
BOARD OF TRUSTEES AND EXECUTIVE OFFICERS
(Unaudited) (Continued)
Each Trustee oversees six portfolios of the Trust: the Ave Maria Catholic Values Fund, the Ave Maria Growth Fund, the Ave Maria Rising Dividend Fund, the Ave Maria World Equity Fund, the Ave Maria Bond Fund and the Schwartz Value Focused Fund. The principal occupations of the Trustees and executive officers of the Trust during the past five years and public directorships held by the Trustees are set forth below:
George P. Schwartz, CFA is Chairman and Chief Executive Officer of Schwartz Investment Counsel, Inc. and the co-portfolio manager of the Ave Maria Catholic Values Fund and the Ave Maria Rising Dividend Fund.
Louis C. Bosco, Jr. retired in April 2012. Prior to his retirement, he was a partner in Bosco Development Company (a real estate firm).
Donald J. Dawson, Jr. retired in March 2015. Prior to retirement, he was Chairman of Payroll 1, Inc. (a payroll processing company) from 1986 – 2015.
Joseph M. Grace is retired Senior Vice President of National Bank of Detroit (renamed JPMorgan Chase & Company).
John J. McHale, Jr. is Special Assistant to Commissioner of Major League Baseball since 2015. He was Executive Vice President of Major League Baseball from 2000 – 2015.
Richard L. Platte, Jr., CFA is President and Chief Investment Officer of Schwartz Investment Counsel, Inc. and is the lead portfolio manager of the Ave Maria Rising Divident Fund and the co-portfolio manager of the Ave Maria Growth Fund and the Ave Maria Bond Fund.
Robert C. Schwartz, CFP is Vice President and Secretary of Schwartz Investment Counsel, Inc. and is the co-portfolio manager of the Ave Maria World Equity Fund.
Timothy S. Schwartz, CFA is Executive Vice President and Chief Financial Officer of Schwartz Investment Counsel, Inc. and the lead portfolio manager of the Ave Maria Catholic Values Fund.
Cathy M. Stoner, CPA, IACCP is Vice President and Chief Compliance Officer of Schwartz Investment Counsel, Inc.
Additional information regarding the Trustees and executive officers of the Trust may be found in the Funds’ Statement of Additional Information and is available without charge upon request by calling (888) 726-9931.
74
AVE MARIA MUTUAL FUNDS
CATHOLIC ADVISORY BOARD
(Unaudited)
The Catholic Advisory Board reviews the companies selected by the Adviser to ensure that the companies operate in a way that is consistent with teachings and core values of the Roman Catholic Church. The Catholic Advisory Board evaluates companies using publicly available information, information from the Adviser, and information from shareholders and other sources in making its recommendations. The following are the members of the Catholic Advisory Board:
Member | Address | Year of Birth | Length of
Time Served |
Robert P. George | 371 Prospect Avenue, Princeton, NJ | 1955 | Since 2016 |
Lou Holtz | 5818 El Camino Real, Carlsbad, CA | 1937 | Since 2007 |
Lawrence Kudlow | 1375 Kings Hwy. East, Suite 260, Fairfield, CT | 1947 | Since 2005 |
Thomas S. Monaghan | One Ave Maria Drive, Ann Arbor, MI | 1937 | Since 2001 |
Michael Novak | 1150 17th Street, NW, Suite 1100, Washington, DC | 1933 | Since 2001 |
Fr. John Riccardo, STL | 1062 Church St., Plymouth, MI | 1965 | Since 2011 |
Paul R. Roney | One Ave Maria Drive, Ann Arbor, MI | 1957 | Since 2001 |
Robert P. George is a legal scholar, political philosopher, and public intellectual who serves as the McCormick Professor of Jurisprudence at Princeton University.
Lou Holtz is the former football coach at University of Notre Dame among others, ESPN college football analyst, author and motivational speaker.
Lawrence Kudlow is CNBC’s Senior Contributor and radio host of the nationally-syndicated “Larry Kudlow Show.”
Thomas S. Monaghan is Chairman of the Ave Maria Foundation (a non-profit foundation supporting Roman Catholic organizations) and Chancellor of Ave Maria University. Prior to December 1998, he was Chairman and Chief Executive Officer of Domino’s Pizza, Inc.
Michael Novak is a theologian, author, and former U.S. ambassador. He is the George Frederick Jewett Chair (emeritus) in Religion, Philosophy, and Public Policy at the American Enterprise Institute.
Fr. John Riccardo, STL is a priest of the Archdiocese of Detroit and is the pastor of Our Lady of Good Counsel Catholic Church in Plymouth, Michigan. He is also the host of the radio show “Christ is the Answer,” which can be heard on Catholic radio stations throughout the country.
Paul R. Roney is Executive Director of the Ave Maria Foundation and President of Domino’s Farms Corporation. Prior to December 1998, he was Treasurer of Domino’s Pizza, Inc.
Additional information regarding the Funds’ Catholic Advisory Board members may be found in the Funds’ Statement of Additional Information and is available without charge upon request by calling (888) 726-9331.
75
AVE MARIA MUTUAL FUNDS
ABOUT YOUR FUNDS’ EXPENSES
(Unaudited)
We believe it is important for you to understand the impact of costs on your investment. As a shareholder of the Funds, you incur ongoing costs, including management fees and other Fund expenses. The following examples are intended to help you understand your ongoing costs (in dollars) of investing in the Funds and to compare these costs with the ongoing costs of investing in other mutual funds.
A mutual fund’s ongoing costs are expressed as a percentage of its average net assets. This figure is known as the expense ratio. The ongoing costs reflected in the tables below are based on an investment of $1,000 made at the beginning of the most recent semi-annual period (July 1, 2016) and held until the end of the period (December 31, 2016).
The tables that follow illustrate each Fund’s ongoing costs in two ways:
Actual fund return – This section helps you to estimate the actual expenses that you paid over the period. The “Ending Account Value” shown is derived from each Fund’s actual return, and the fourth column shows the dollar amount of operating expenses that would have been paid by an investor who started with $1,000 in the Funds. You may use the information here, together with the amount you invested, to estimate the expenses that you paid over the period.
To do so, simply divide your account value by $1,000 (for example, an $8,600 account value divided by $1,000 = 8.6), then multiply the result by the number given for the Funds under the heading “Expenses Paid During Period.”
Hypothetical 5% return – This section is intended to help you compare each Fund’s ongoing costs with those of other mutual funds. It assumes that each Fund had an annual return of 5% before expenses during the period shown, but that the expense ratio is unchanged. In this case, because the return used is not the Funds’ actual returns, the results do not apply to your investment. The example is useful in making comparisons because the SEC requires all mutual funds to calculate expenses based on a 5% return. You can assess each Fund’s ongoing costs by comparing this hypothetical example with the hypothetical examples that appear in shareholder reports of other funds.
Note that expenses shown in the table are meant to highlight and help you compare ongoing costs only. The Funds do not charge sales loads or redemption fees.
The calculations assume no shares were bought or sold during the period. Your actual costs may have been higher or lower, depending on the amount of your investment and the timing of any purchases or redemptions.
More information about the Funds’ expenses, including historical annual expense ratios, can be found in this report. For additional information on operating expenses and other shareholder costs, please refer to the Funds’ Prospectus.
76
AVE MARIA MUTUAL FUNDS
ABOUT YOUR FUNDS’ EXPENSES
(Unaudited) (Continued)
| Beginning
Account Value
July 1, 2016 | Ending
Account Value
December 31, 2016 | Net
Expense Ratio(a) | Expenses Paid During Period(b) |
Ave Maria Catholic Values Fund |
Based on Actual Fund Return | $1,000.00 | $1,124.00 | 1.18% | $6.30 |
Based on Hypothetical 5% Return (before expenses) | $1,000.00 | $1,019.20 | 1.18% | $5.99 |
| | | | | |
Ave Maria Growth Fund | | | | |
Based on Actual Fund Return | $1,000.00 | $1,048.20 | 1.16% | $5.97 |
Based on Hypothetical 5% Return (before expenses) | $1,000.00 | $1,019.30 | 1.16% | $5.89 |
| | | | | |
Ave Maria Rising Dividend Fund | | | |
Based on Actual Fund Return | $1,000.00 | $1,063.50 | 0.92% | $4.77 |
Based on Hypothetical 5% Return (before expenses) | $1,000.00 | $1,020.51 | 0.92% | $4.67 |
| | | | | |
Ave Maria World Equity Fund | | | |
Based on Actual Fund Return | $1,000.00 | $1,057.20 | 1.25% | $6.46 |
Based on Hypothetical 5% Return (before expenses) | $1,000.00 | $1,018.85 | 1.25% | $6.34 |
| | | | | |
Ave Maria Bond Fund | | | | |
Based on Actual Fund Return | $1,000.00 | $1,003.70 | 0.49% | $2.47 |
Based on Hypothetical 5% Return (before expenses) | $1,000.00 | $1,022.67 | 0.49% | $2.49 |
(a) | Annualized, based on the Fund’s most recent one-half year expenses. |
| | |
(b) | Expenses are equal to each Fund’s annualized net expense ratio multiplied by the average account value over the period, muliplied by 184/366 (to reflect the one-half year period). |
77
AVE MARIA MUTUAL FUNDS
FEDERAL TAX INFORMATION
(Unaudited)
In accordance with federal tax requirements, the following provides shareholders with information concerning certain ordinary income dividends and distributions from net realized capital gains paid by the Ave Maria Growth Fund, the Ave Maria Rising Dividend Fund, the Ave Maria World Equity Fund and the Ave Maria Bond Fund during the fiscal year ended December 31, 2016. On December 29, 2016, the Ave Maria Growth Fund declared and paid an ordinary income dividend and a long-term capital gain distribution of $0.0225 and $1.5841 per share, respectively; the Ave Maria World Equity Fund declared and paid an ordinary income dividend and a long-term capital gain distribution of $0.0628 and $0.1945 per share, respectively; the Ave Maria Rising Dividend Fund declared and paid both a short-term capital gain distribution and a long-term capital gain distribution of $0.0755 and $0.8178 per share, respectively; and the Ave Maria Bond Fund declared and paid both a short-term capital gain distribution and a long-term capital gain distribution of $0.0552 and $0.1220 per share, respectively. Periodically throughout the year, the Ave Maria Rising Dividend Fund paid ordinary income dividends totaling $0.2743 per share. Periodically throughout the year, the Ave Maria Bond Fund paid ordinary income dividends totaling $0.1518 per share. 100% of the long-term capital gain distributions of $1.5841, $0.1945, $0.8178, and $0.1220 for the Ave Maria Growth Fund, the Ave Maria Rising Dividend Fund, the Ave Maria World Equity Fund and the Ave Maria Bond Fund, respectively, and a percentage (100%, 100%, 100%, and 35.32%) of the ordinary income dividends and/or short-term capital gain distributions paid by the Ave Maria Growth Fund, the Ave Maria Rising Dividend Fund, the Ave Maria World Equity Fund and the Ave Maria Bond Fund, respectively, may be subject to a maximum tax rate of 23.8%. Early in 2017, as required by federal regulations, shareholders received notification of their portion of the Funds’ dividends and distributions paid during the 2016 calendar year.
78
AVE MARIA MUTUAL FUNDS
OTHER INFORMATION
(Unaudited)
A description of the policies and procedures the Funds use to determine how to vote proxies relating to portfolio securities is available without charge upon request by calling toll-free (888) 726-9331, or on the SEC’s website at http://www.sec.gov. Information regarding how the Funds voted proxies relating to portfolio securities during the most recent 12-month period ended June 30 is also available without charge upon request by calling toll-free (888) 726-9331, or on the SEC’s website at http://www.sec.gov.
The Trust files a complete listing of portfolio holdings for each of the Funds with the SEC as of the end of the first and third quarters of each fiscal year on Form N-Q. The filings are available free of charge, upon request, by calling (888) 726-9331. Furthermore, you may obtain a copy of the filings on the SEC’s website at http://www.sec.gov. The Trust’s Forms N-Q may also be reviewed and copied at the SEC’s Public Reference Room in Washington, DC, and information on the operation of the Public Reference Room may be obtained by calling (800) SEC-0330.
79
As of the end of the period covered by this report, the registrant has adopted a code of ethics that applies to the registrant’s principal executive officer, principal financial officer, principal accounting officer or controller, or persons performing similar functions, regardless of whether these individuals are employed by the registrant or a third party. Pursuant to Item 12(a)(1), a copy of registrant’s code of ethics is filed as an exhibit to this Form N-CSR. During the period covered by this report, the code of ethics has not been amended, and the registrant has not granted any waivers, including implicit waivers, from the provisions of the code of ethics.
| Item 3. | Audit Committee Financial Expert. |
The registrant’s board of trustees has determined that the registrant has at least one audit committee financial expert serving on its audit committee. The name of the audit committee financial expert is Joseph M. Grace. Mr. Grace is “independent” for purposes of this Item.
| Item 4. | Principal Accountant Fees and Services. |
| (a) | Audit Fees. The aggregate fees billed for professional services rendered by the principal accountant for the audit of the registrant’s annual financial statements or for services that are normally provided by the accountant in connection with statutory and regulatory filings or engagements were $134,500 and $137,900 with respect to the registrant’s fiscal years ended December 31, 2016 and 2015, respectively. |
| (b) | Audit-Related Fees. No fees were billed in either of the last two fiscal years for assurance and related services by the principal accountant that are reasonably related to the performance of the audit of the registrant’s financial statements and are not reported under paragraph (a) of this Item. |
| (c) | Tax Fees. The aggregate fees billed for professional services rendered by the principal accountant for tax compliance, tax advice, and tax planning were $17,350 and $16,500 with respect to the registrant’s fiscal years ended December 31, 2016 and 2015, respectively. The services comprising these fees are tax consulting and the preparation of the registrant’s federal income and excise tax returns. |
| (d) | All Other Fees. No fees were billed in either of the last two fiscal years for products and services provided by the principal accountant, other than the services reported in paragraphs (a) through (c) of this Item. |
| (e)(1) | The audit committee has not adopted pre-approval policies and procedures described in paragraph (c)(7) of Rule 2-01 of Regulation S-X. |
| (e)(2) | None of the services described in paragraph (b) through (d) of this Item were approved by the audit committee pursuant to paragraph (c)(7)(i)(C) of Rule 2-01 of Regulation S-X. |
| (f) | Less than 50% of hours expended on the principal accountant’s engagement to audit the registrant’s financial statements for the most recent fiscal year were attributed to work performed by persons other than the principal accountant’s full-time, permanent employees. |
| (g) | During the fiscal years ended December 31, 2016 and 2015, aggregate non-audit fees of $17,350 and $16,500, respectively, were billed by the registrant’s principal accountant for services rendered to the registrant. During the fiscal years ended December 31, 2016 and 2015, aggregate non-audit fees of $12,500 and $12,000, respectively, were billed by the registrant’s principal accountant for services rendered to the registrant’s investment adviser (not including any sub-adviser whose role is primarily portfolio management and is subcontracted with or overseen by another investment adviser), and any entity controlling, controlled by, or under common control with the adviser that provides ongoing services to the registrant. |
| (h) | The registrant’s Committee of Independent Trustees determined that the provision of non-audit services that were rendered to the registrant’s investment adviser (not including any sub-adviser whose role is primarily portfolio management and is subcontracted with or overseen by another investment adviser), and any entity controlling, controlled by, or under common control with the investment adviser that provides ongoing services to the registrant, that were not pre-approved pursuant to paragraph (c)(7)(ii) of Rule 2-01 of Regulation S-X is compatible with maintaining the principal accountant’s independence. |
| Item 5. | Audit Committee of Listed Registrants. |
Not applicable
| Item 6. | Schedule of Investments. |
| (a) | Not applicable [schedule filed with Item 1] |
| Item 7. | Disclosure of Proxy Voting Policies and Procedures for Closed-End Management Investment Companies. |
Not applicable
| Item 8. | Portfolio Managers of Closed-End Management Investment Companies. |
Not applicable
| Item 9. | Purchases of Equity Securities by Closed-End Management Investment Company and Affiliated Purchasers. |
Not applicable
| Item 10. | Submission of Matters to a Vote of Security Holders. |
The registrant’s Committee of Independent Trustees shall review shareholder recommendations to fill vacancies on the registrant’s board of trustees if such recommendations are submitted in writing, addressed to the Committee at the registrant’s offices and meet any minimum qualifications adopted by the Committee. The Committee may adopt, by resolution, a policy regarding its procedures for considering candidates for the board of trustees, including any recommended by shareholders.
| Item 11. | Controls and Procedures. |
(a) Based on their evaluation of the registrant’s disclosure controls and procedures (as defined in Rule 30a-3(c) under the Investment Company Act of 1940) as of a date within 90 days of the filing date of this report, the registrant’s principal executive officer and principal financial officer have concluded that such disclosure controls and procedures are reasonably designed and are operating effectively to ensure that material information relating to the registrant, including its consolidated subsidiaries, is made known to them by others within those entities, particularly during the period in which this report is being prepared, and that the information required in filings on Form N-CSR is recorded, processed, summarized, and reported on a timely basis.
(b) There were no changes in the registrant’s internal control over financial reporting (as defined in Rule 30a-3(d) under the Investment Company Act of 1940) that occurred during the second fiscal quarter of the period covered by this report that have materially affected, or are reasonably likely to materially affect, the registrant’s internal control over financial reporting.
File the exhibits listed below as part of this Form. Letter or number the exhibits in the sequence indicated.
(a)(1) Any code of ethics, or amendment thereto, that is the subject of the disclosure required by Item 2, to the extent that the registrant intends to satisfy the Item 2 requirements through filing of an exhibit: Attached hereto
(a)(2) A separate certification for each principal executive officer and principal financial officer of the registrant as required by Rule 30a-2(a) under the Act (17 CFR 270.30a-2(a)): Attached hereto
(a)(3) Any written solicitation to purchase securities under Rule 23c-1 under the Act (17 CFR 270.23c-1) sent or given during the period covered by the report by or on behalf of the registrant to 10 or more persons: Not applicable
(b) Certifications required by Rule 30a-2(b) under the Act (17 CFR 270.30a-2(b)): Attached hereto
| Exhibit 99.CODE ETH | Code of Ethics |
| Exhibit 99.CERT | Certifications required by Rule 30a-2(a) under the Act |
| Exhibit 99.906CERT | Certifications required by Rule 30a-2(b) under the Act |
SIGNATURES
Pursuant to the requirements of the Securities Exchange Act of 1934 and the Investment Company Act of 1940, the registrant has duly caused this report to be signed on its behalf by the undersigned, thereunto duly authorized.
| (Registrant) | Schwartz Investment Trust | | |
| | | | |
| By (Signature and Title)* | /s/ George P. Schwartz | |
| | | George P. Schwartz, President and Principal Executive Officer |
| | | | |
| Date | February 17, 2017 | | |
| | | | |
| Pursuant to the requirements of the Securities Exchange Act of 1934 and the Investment Company Act of 1940, this report has been signed below by the following persons on behalf of the registrant and in the capacities and on the dates indicated. |
| | | | |
| By (Signature and Title)* | /s/ George P. Schwartz | |
| | | George P. Schwartz, President and Principal Executive Officer |
| | | | |
| Date | February 17, 2017 | | |
| | | | |
| By (Signature and Title)* | /s/ Timothy S. Schwartz | |
| | | Timothy S. Schwartz, Treasurer, Principal Financial Officer and Principal Accounting Officer | |
| | | | |
| Date | February 17, 2017 | | |
* Print the name and title of each signing officer under his or her signature.