UNITED STATES
SECURITIES AND EXCHANGE COMMISSION
Washington, D.C. 20549
FORM N-CSR
CERTIFIED SHAREHOLDER REPORT
OF
REGISTERED MANAGEMENT INVESTMENT COMPANIES
Investment Company Act file number: 811-07043
Name of Registrant: Vanguard Admiral Funds
Address of Registrant:
P.O. Box 2600
Valley Forge, PA 19482
Name and address of agent for service:
Heidi Stam, Esquire
P.O. Box 876
Valley Forge, PA 19482
Registrant’s telephone number, including area code: (610) 669-1000
Date of fiscal year end: August 31
Date of reporting period: September 1, 2012 – August 31, 2013
Item 1: Reports to Shareholders
| |
| Annual Report | August 31, 2013 | |
| Vanguard Money Market Funds | |
 | |
Vanguard’s Principles for Investing Success
We want to give you the best chance of investment success. These principles, grounded in Vanguard’s research and experience, can put you on the right path.
Goals. Create clear, appropriate investment goals.
Balance. Develop a suitable asset allocation using broadly diversified funds. Cost. Minimize cost.
Discipline. Maintain perspective and long-term discipline.
A single theme unites these principles: Focus on the things you can control.We believe there is no wiser course for any investor.
| Contents | |
| Your Fund’s Total Returns. | 1 |
| Chairman’s Letter. | 2 |
| Advisor’s Report. | 9 |
| Prime Money Market Fund. | 11 |
| Federal Money Market Fund. | 35 |
| Admiral Treasury Money Market Fund. | 47 |
| About Your Fund’s Expenses. | 59 |
| Trustees Approve Advisory Arrangement. | 61 |
| Glossary. | 62 |
Please note: The opinions expressed in this report are just that—informed opinions. They should not be considered promises or advice. Also, please keep in mind that the information and opinions cover the period through the date on the front of this report. Of course, the risks of investing in your fund are spelled out in the prospectus.
See the Glossary for definitions of investment terms used in this report.
About the cover: The ship's wheel represents leadership and guidance, essential qualities in navigating difficult seas. This one is a replica based on an 18th-century British vessel. The HMS Vanguard, another ship of that era, served as the flagship for Admiral Horatio Nelson when he defeated a French fleet at the Battle of the Nile.
Your Fund’s Total Returns
| Fiscal Year Ended August 31, 2013 | ||
| 7-Day SEC | Total | |
| Yield | Returns | |
| Vanguard Prime Money Market Fund | ||
| Investor Shares | 0.01% | 0.02% |
| Institutional Shares | 0.04 | 0.07 |
| Money Market Funds Average | 0.00 | |
| Money Market Funds Average: Derived from data provided by Lipper, a Thomson Reuters Company. | ||
| Vanguard Federal Money Market Fund | 0.02% | 0.01% |
| Government Money Market Funds Average | 0.00 | |
| Government Money Market Funds Average: Derived from data provided by Lipper, a Thomson Reuters Company. | ||
| Vanguard Admiral Treasury Money Market Fund | 0.01% | 0.02% |
| iMoneyNet Money Fund Report’s 100% Treasury Funds Average | 0.00 | |
iMoneyNet Money Fund Report’s 100% Treasury Funds Average: Derived from data provided by Lipper, a Thomson Reuters Company.
The 7-day SEC yield of a money market fund more closely reflects the current earnings of the fund than its total return.
Institutional Shares are available to certain institutional investors who meet specific administrative, service, and account-size criteria.
1

Chairman’s Letter
Dear Shareholder,
While longer-term interest rates jumped during the 12 months ended August 31, 2013, because of uncertainty about when the Federal Reserve might start scaling back its stimulus efforts, shorter-term bond yields remained exceptionally low. Consequently, money market returns remained paper thin. Vanguard Prime Money Market Fund returned 0.02% for Investor Shares and 0.07% for Institutional Shares, which have a lower expense ratio. Vanguard Federal Money Market Fund returned 0.01% and Vanguard Admiral Treasury Money Market Fund returned 0.02%. Although it’s of little comfort, the funds managed to do better than the average return of their peer groups, which in each case was 0.00%.
As of August 31, the Prime Money Market Fund’s 7-day SEC yield had slipped to 0.01% from 0.04% a year earlier for Investor Shares and to 0.04% from 0.11% for Institutional Shares. At the end of the period, the 7-day SEC yield was 0.02% for the Federal Money Market Fund and 0.01% for the Admiral Treasury Money Market Fund. (These two funds have been closed to new investors since 2009.)
On a separate note, the Securities and Exchange Commission proposed a number of regulatory changes for money market funds in June. Vanguard has been active in working with the SEC and other
2
agencies to preserve these funds’ time-tested benefits. We will continue to take the lead in advocating for the value we see in these funds for our shareholders and their portfolios.
Bond returns turned negative amid worry about the Fed’s next move
Bonds, which maintained slightly positive returns overall through the first eight months of the period, reversed course in May and then continued to retreat as investors anticipated reductions in the Fed’s bond-buying program.
The broad U.S. taxable bond market returned –2.47% for the 12 months. The yield of the 10-year Treasury note finished at 2.76%, up from 1.56% at the end of August 2012. Municipal bonds suffered more, returning –3.70% for the fiscal year.
Stocks posted robust results despite setbacks at the finish
U.S. stocks advanced about 20% in the 12 months ended August 31 despite slipping in June and August. Through most of the fiscal year, stocks surged as the economy continued to show modest growth and investors appeared more receptive to risk.
Much of the market’s recent weakness was linked to concerns over monetary policy. Heightened strife in the Middle East also contributed to anxiety in the global markets.
| Market Barometer | |||
| Average Annual Total Returns | |||
| Periods Ended August 31, 2013 | |||
| One | Three | Five | |
| Year | Years | Years | |
| Bonds | |||
| Barclays U.S. Aggregate Bond Index (Broad taxable | |||
| market) | -2.47% | 2.58% | 4.93% |
| Barclays Municipal Bond Index (Broad tax-exempt market) | -3.70 | 2.45 | 4.52 |
| Citigroup Three-Month U.S. Treasury Bill Index | 0.07 | 0.08 | 0.17 |
| Stocks | |||
| Russell 1000 Index (Large-caps) | 19.84% | 18.74% | 7.59% |
| Russell 2000 Index (Small-caps) | 26.27 | 20.50 | 7.98 |
| Russell 3000 Index (Broad U.S. market) | 20.32 | 18.87 | 7.63 |
| MSCI All Country World Index ex USA (International) | 12.98 | 6.93 | 1.48 |
| CPI | |||
| Consumer Price Index | 1.52% | 2.32% | 1.32% |
3
International stocks in aggregate finished with a return of about 13%. Developed markets in the Pacific region and Europe posted results closer to those of the United States. Returns for emerging-market stocks were virtually flat as economic growth slowed in China and Brazil.
Although global economic worries and tensions over conflicts abroad have unsettled markets, Jonathan Lemco, a senior sovereign debt analyst in Vanguard’s Taxable Credit Research Group, pointed out that investors can still manage risks amid international instability. “Vanguard believes a diversified portfolio is the best way to spread the risk of geopolitical uncertainty,” he said.
Longer-term rates driven higher, while shorter-term rates stayed low
With growth remaining sluggish and unemployment high, the Federal Reserve continued to provide unprecedented stimulus to the economy throughout the period. Its efforts included buying $40 billion per month of mortgage bonds to support the housing market and $45 billion per month of Treasuries to hold borrowing costs down for households and businesses. The Fed also kept its federal funds target rate—the rate banks charge one another for overnight loans—anchored at 0.00%–0.25% to keep short-term interest rates low.
Given the magnitude of this support, it was not surprising that the financial markets were rattled when Fed officials began
| Expense Ratios | |||
| Your Fund Compared With Its Peer Group | |||
| Investor | Institutional | Peer Group | |
| Shares | Shares | Average | |
| Prime Money Market Fund | 0.16% | 0.09% | 0.23% |
| Federal Money Market Fund | 0.16 | — | 0.12 |
| Admiral Treasury Money Market Fund | 0.10 | — | 0.08 |
The fund expense ratios shown are from the prospectus dated December 28, 2012, and represent estimated costs for the current fiscal year. For the fiscal year ended August 31, 2013, the funds’ expense ratios were: for the Prime Money Market Fund, 0.16% for Investor Shares and 0.10% for Institutional Shares; for the Federal Money Market Fund, 0.13%; for the Admiral Treasury Money Market Fund, 0.08%. The expense ratios for the Prime Money Market Fund Investor Shares, the Federal Money Market Fund, and the Admiral Treasury Money Market Fund reflect a temporary reduction in operating expenses (described in Note B of the Notes to Financial Statements). Before the reduction, the expense ratios were: for the Prime Money Market Fund Investor Shares, 0.17%; for the Federal Money Market Fund, 0.14%; for the Admiral Treasury Money Market Fund, 0.09%.
Peer groups: For the Prime Money Market Fund, Money Market Funds; for the Federal Money Market Fund, Government Money Market Funds; and for the Admiral Treasury Money Market Fund, U.S. Treasury Money Market Funds. In most, if not all, cases, the expense ratios for funds in the peer groups are based on net operating expenses after reimbursement and/or fee waivers by fund sponsors. In contrast, the Vanguard money market funds’ expense ratios in the table above do not reflect expense reductions.
4
signaling in May that further improvements in the housing and labor markets might warrant “letting up a bit on the gas pedal,” as the Fed chairman put it, before the end of the year. The prospect of the central bank beginning to taper its efforts sooner than the market had been anticipating drove the yields of longer-term bonds substantially higher and their prices lower. (Bond yields and prices move in opposite directions.)
Short-term bond yields were affected much less, however, as they more closely track the federal funds target rate, which the Fed expects to keep near zero for some time. Its latest guidance was that the rate will stay exceptionally low at least as long as inflation remains contained and the unemployment rate stays above 6.5% (the rate stood at 7.3% in August).
While money market yields were meager, the funds’ advisor, Vanguard Fixed Income Group, was able to add value by keeping costs low and by seeking out relative value opportunities among securities with high credit quality.
A source of liquidity and safety for all three funds was their “risk-free” holdings in U.S. Treasury bills. During the period, the advisor found more relative value for the Federal and Prime Money Market Funds among U.S. government obligations—primarily notes issued by Fannie Mae and
| Total Returns | |
| Ten Years Ended August 31, 2013 | |
| Average | |
| Annual Return | |
| Prime Money Market Fund Investor Shares | 1.77% |
| Money Market Funds Average | 1.38 |
| Money Market Funds Average: Derived from data provided by Lipper, a Thomson Reuters Company. | |
| Federal Money Market Fund | 1.70% |
| Government Money Market Funds Average | 1.35 |
| Government Money Market Funds Average: Derived from data provided by Lipper, a Thomson Reuters Company. | |
| Admiral Treasury Money Market Fund | 1.61% |
| iMoneyNet Money Fund Report’s 100% Treasury Funds Average | 1.20 |
| iMoneyNet Money Fund Report’s 100% Treasury Funds Average: Derived from data provided by iMoneyNet, Inc. | |
Investment returns will fluctuate. All of the returns in this report represent past performance, which is not a guarantee of future results that may be achieved by the funds. (Current performance may be lower or higher than the performance data cited. For performance data current to the most recent month-end, visit our website at vanguard.com/performance.) An investment in a money market fund is not insured or guaranteed by the Federal Deposit Insurance Corporation or any other government agency. Although a money market fund seeks to preserve the value of your investment at $1 per share, it is possible to lose money by investing in such a fund.
5
Freddie Mac that are not backed by the full faith and credit of the U.S. government but are nonetheless of very high credit quality.
Within the Prime Money Market Fund, which has a broader investment mandate, the advisor also took advantage of opportunities to invest in high-quality foreign debt denominated in U.S. dollars. The yields on offer and the advantage of greater diversification led the advisor to invest in securities of Canadian and Australian banks in particular, while avoiding their European counterparts during the period under review.
Money market returns haven’t always been so low
While short-term interest rates have been negligible for several years now, the annualized return of the funds over the last ten years reflects the higher rates that existed before the financial crisis. The average annual return for the Prime Money Market Fund over the past ten years was 1.77% for Investor Shares and 1.91% for Institutional Shares. The Federal Money Market Fund returned 1.70% and the Admiral Treasury Money Market Fund returned 1.61% for the same period. It’s pleasing to note that the returns of all three funds were well ahead of the average returns of their peer groups, thanks in part to the experienced and
| Changes in Yields | ||
| 7-Day SEC Yield | ||
| August 31, | August 31, | |
| Money Market Fund | 2013 | 2012 |
| Prime | ||
| Investor Shares | 0.01% | 0.04% |
| Institutional Shares | 0.04 | 0.11 |
| Federal | 0.02 | 0.01 |
| Admiral Treasury | 0.01 | 0.02 |
6
astute management team that oversees the funds as well as our low-cost structure for running them.
In pursuing investment goals, your long-term asset mix is key
As I mentioned earlier, financial markets were rattled by the prospect that the Fed might begin scaling back its massive bond-buying program. Bond yields jumped (and so prices fell), and the stock market experienced some turmoil.
Volatility and increased uncertainty can tempt investors to deviate from their investment plan. In the mutual fund industry, for example, the recent rise in bond yields has led to net redemptions from bond funds as investors try to sidestep losses that might arise from a sustained climb in interest rates.
Keep in mind, however, that although interest rates remain low, nobody is certain what their next move will be—much less how financial markets will react to the change.
In fact, it’s precisely because short-term market movements are unpredictable that trying to time the markets often fails, as Vanguard and other researchers have found. A recent Vanguard research paper notes that although many investors alter their portfolios based on emotional reactions to market movements,
| Your fund distributed a small capital gain |
| Shortly after the close of the fiscal year, your money market fund made a small |
| distribution of short-term capital gains. You can view the amount per share on |
| Vanguard’s website by visiting the “Distributions” section of your fund’s profile. |
| Although uncommon for money market funds, capital gains distributions have |
| become more common in recent years because of the unusual interest rate |
| environment. Declining rates drive up the prices of securities, which then may |
| generate a gain if they are sold. These short-term capital gains are taxed as |
| ordinary income. |
| Consistent with their investment objectives, all three funds maintained their |
| share price of $1, as is expected but not guaranteed. |
7
investment success actually is “largely determined by the long-term mixture of assets in a portfolio.” (You can find the full report, Vanguard’s Framework for Constructing Diversified Portfolios, at vanguard.com/research.)
We continue to believe that sticking to a well-diversified portfolio of stocks, bonds, and money market instruments over the long haul—rather than making impulsive changes to try to avoid potential losses or capitalize on perceived opportunities—gives you the best chance of meeting your investment goals.
As always, thank you for your confidence in Vanguard.
Sincerely,

F. William McNabb III
Chairman and Chief Executive Officer
September 13, 2013
8
Advisor’s Report
For the 12 months ended August 31, 2013, returns for the three Vanguard Money Market Funds in this report were negligible, ranging from 0.01% for the Federal Money Market Fund to 0.07% for Institutional Shares of the Prime Money Market Fund. The average return for each fund’s peer group was 0%.
The Federal Reserve has continued to keep short-term rates at extremely low levels since December 2008, extending what has been a challenging environment for money market investors. Moreover, while economic conditions have shown steady improvement, the pace remains subdued, leading us to conclude that we are headed for another year of exceptionally low returns for money market funds.
Portfolio adjustments
Given our outlook for interest rates, we kept the weighted average maturity of the portfolio at the upper end of the permitted range. This allowed us to capture more of the higher yields offered by longer-dated securities.
We continue to manage our investments with an eye toward maintaining a high degree of liquidity and safety in the portfolios. Our allocation to U.S. Treasury and agency securities in the Prime Money Market Fund, our flagship fund, is crucial to achieving this goal. During critical periods throughout the financial crisis, U.S. Treasury and agency securities outperformed other money market assets while remaining highly liquid. Their yields may be lower because of their superior quality and liquidity, but Vanguard’s expense ratio advantage helps balance that out.
That said, the Admiral Treasury Money Market Fund and the Prime Money Market Fund had both lightened their allocation a little to Treasuries by the end of the period in favor of the slightly better yields available from agency securities. In addition, we shifted the asset mix of the Prime Money Market Fund to take advantage of relative value opportunities, primarily in Canadian government debt issued in U.S. dollars and commercial paper issued by U.S. industrial corporations.
The outlook
We have continued to monitor conditions in Europe, but refrained from investing in European banks during the period. While we still believe a number of countries in the southern periphery of Europe remain vulnerable to external shocks and counterproductive domestic policy choices, the conditions that led us to avoid all European bank debt have subsided. As of this writing, we have begun to diversify our holdings, primarily by adding securities issued by a limited number of U.K. and Northern European banks. These institutions were insulated from the conditions that plagued their southern counterparts.
9
The Securities and Exchange Commission (SEC) recently proposed money market fund reforms that go beyond the changes the commission adopted in 2010 in the wake of the financial crisis to enhance the funds’ stability and safety. We appreciate the commission’s efforts in moving this debate forward and have welcomed the opportunity to review and comment on its latest proposal to ensure that your interests are represented.
While the regulatory environment is going to continue to evolve, we remain confident in the stability and safety of our money market funds, in part because we manage our funds conservatively, keep costs low, and invest only in securities that our skilled and experienced credit analysts identify as being of the highest quality.
David R. Glocke, Principal
Vanguard Fixed Income Group
September 19, 2013
10
Prime Money Market Fund
Fund Profile
As of August 31, 2013
| Financial Attributes | ||
| Investor | Institutional | |
| Shares | Shares | |
| Ticker Symbol | VMMXX | VMRXX |
| Expense Ratio1 | 0.16% | 0.09% |
| 7-Day SEC Yield | 0.01% | 0.04% |
| Average Weighted | ||
| Maturity | 59 days | 59 days |
| Sector Diversification (% of portfolio) | |
| Certificates of Deposit | 10.6% |
| Corporate Bonds | 0.2 |
| Repurchase Agreements | 0.1 |
| U.S. Commercial Paper | 11.2 |
| U.S. Government Agency Obligations | 35.4 |
| U.S. Treasury Bills | 14.4 |
| Yankee/Foreign | 25.0 |
| Other | 3.1 |
The agency and mortgage-backed securities sectors may include issues from government-sponsored enterprises; such issues are generally not backed by the full faith and credit of the U.S. government.
| Distribution by Credit Quality (% of portfolio) | |
| First Tier | 100.0% |
For information about these ratings, see the Glossary entry for Credit Quality.
1 The expense ratios shown are from the prospectus dated December 28, 2012, and represent estimated costs for the current fiscal year. For the fiscal year ended August 31, 2013, the expense ratios were 0.16% for Investor Shares and 0.10% for Institutional Shares. The expense ratio for the Prime Money Market Fund Investor Shares reflects a temporary reduction in operating expenses (described in Note B of the Notes to Financial Statements). Before this reduction, the expense ratio for the Prime Money Market Fund Investor Shares was 0.17%.
11
Prime Money Market Fund
Performance Summary
Investment returns will fluctuate. All of the returns in this report represent past performance, which is not a guarantee of future results that may be achieved by the fund. (Current performance may be lower or higher than the performance data cited. For performance data current to the most recent month-end, visit our website at vanguard.com/performance.) The returns shown do not reflect taxes that a shareholder would pay on fund distributions. An investment in a money market fund is not insured or guaranteed by the Federal Deposit Insurance Corporation or any other government agency. Although the fund seeks to preserve the value of your investment at $1 per share, it is possible to lose money by investing in the fund. The fund’s 7-day SEC yield reflects its current earnings more closely than do the average annual returns.
Cumulative Performance: August 31, 2003, Through August 31, 2013
Initial Investment of $10,000
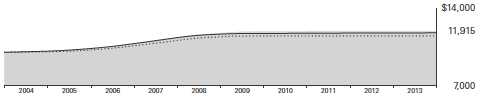
| Average Annual Total Returns | ||||
| Periods Ended August 31, 2013 | Final Value | |||
| One | Five | Ten | of a $10,000 | |
| Year | Years | Years | Investment | |
| Prime Money Market Fund Investor | ||||
| Shares | 0.02% | 0.30% | 1.77% | $11,915 |
| Money Market Funds Average | 0.00 | 0.13 | 1.38 | 11,474 |
| Citigroup Three-Month U.S. Treasury | ||||
| Bill Index | 0.07 | 0.17 | 1.62 | 11,739 |
Money Market Funds Average: Derived from data provided by Lipper, a Thomson Reuters Company.
| Final Value | ||||
| One | Five | Ten | of a $5,000,000 | |
| Year | Years | Years | Investment | |
| Prime Money Market Fund Institutional | ||||
| Shares | 0.07% | 0.41% | 1.91% | $6,044,202 |
| Institutional Money Market Funds Average | 0.01 | 0.22 | 1.66 | 5,893,100 |
| Citigroup Three-Month U.S. Treasury Bill | ||||
| Index | 0.07 | 0.17 | 1.62 | 5,877,371 |
See Financial Highlights for dividend information.
12
Prime Money Market Fund
| Fiscal-Year Total Returns (%): August 31, 2003, Through August 31, 2013 | ||
| Money | ||
| Market | ||
| Funds | ||
| Investor Shares | Average | |
| Fiscal Year | Total Returns | Total Returns |
| 2004 | 0.83% | 0.39% |
| 2005 | 2.31 | 1.68 |
| 2006 | 4.38 | 3.69 |
| 2007 | 5.23 | 4.55 |
| 2008 | 3.60 | 3.02 |
| 2009 | 1.31 | 0.62 |
| 2010 | 0.08 | 0.02 |
| 2011 | 0.06 | 0.00 |
| 2012 | 0.04 | 0.00 |
| 2013 | 0.02 | 0.00 |
| 7-day SEC yield (8/31/2013): 0.01% | ||
| Money Market Funds Average: Derived from data provided by Lipper, a Thomson Reuters Company. | ||
Average Annual Total Returns: Periods Ended June 30, 2013
This table presents returns through the latest calendar quarter—rather than through the end of the fiscal period.
Securities and Exchange Commission rules require that we provide this information.
| Inception | One | Five | Ten | |
| Date | Year | Years | Years | |
| Investor Shares | 6/4/1975 | 0.02% | 0.38% | 1.78% |
| Institutional Shares | 10/3/1989 | 0.09 | 0.49 | 1.93 |
13
Prime Money Market Fund
Financial Statements
Statement of Net Assets
As of August 31, 2013
The fund reports a complete list of its holdings in various monthly and quarterly regulatory filings. The fund publishes its holdings on a monthly basis at vanguard.com and files them with the Securities and Exchange Commission on Form N-MFP. The fund’s Form N-MFP filings become public 60 days after the relevant month-end, and may be viewed at sec.gov or via a link on the “Portfolio Holdings” page on vanguard.com. For the second and fourth fiscal quarters, the lists appear in the fund’s semiannual and annual reports to shareholders. For the first and third fiscal quarters, the fund files the lists with the SEC on Form N-Q. Shareholders can look up the fund’s Forms N-Q on the SEC’s website at sec. gov. Forms N-Q may also be reviewed and copied at the SEC’s Public Reference Room (see the back cover of this report for further information).
| Face | Market | ||||
| Maturity | Amount | Value | |||
| Yield1 | Date | ($000) | ($000) | ||
| U.S. Government and Agency Obligations (50.7%) | |||||
| 2 | Fannie Mae Discount Notes | 0.150% | 9/3/13 | 1,000,000 | 999,992 |
| 2 | Fannie Mae Discount Notes | 0.135%–0.140% | 9/11/13 | 125,486 | 125,481 |
| 2 | Fannie Mae Discount Notes | 0.140% | 12/26/13 | 175,000 | 174,921 |
| 2 | Fannie Mae Discount Notes | 0.110% | 1/8/14 | 250,000 | 249,901 |
| 3 | Federal Home Loan Bank Discount Notes | 0.075%–0.078% | 9/6/13 | 667,766 | 667,759 |
| 3 | Federal Home Loan Bank Discount Notes | 0.078%–0.137% | 9/11/13 | 899,195 | 899,171 |
| 3 | Federal Home Loan Bank Discount Notes | 0.090%–0.140% | 9/13/13 | 812,600 | 812,571 |
| 3 | Federal Home Loan Bank Discount Notes | 0.100% | 9/18/13 | 23,175 | 23,174 |
| 3 | Federal Home Loan Bank Discount Notes | 0.100%–0.130% | 9/20/13 | 1,105,706 | 1,105,644 |
| 3 | Federal Home Loan Bank Discount Notes | 0.120% | 10/9/13 | 42,500 | 42,495 |
| 3 | Federal Home Loan Bank Discount Notes | 0.105%–0.110% | 10/16/13 | 191,039 | 191,014 |
| 3 | Federal Home Loan Bank Discount Notes | 0.105% | 10/18/13 | 781,800 | 781,693 |
| 3 | Federal Home Loan Bank Discount Notes | 0.103% | 10/25/13 | 350,000 | 349,946 |
| 3 | Federal Home Loan Bank Discount Notes | 0.105% | 10/30/13 | 1,303,000 | 1,302,776 |
| 3 | Federal Home Loan Bank Discount Notes | 0.105%–0.108% | 11/1/13 | 128,172 | 128,149 |
| 3 | Federal Home Loan Bank Discount Notes | 0.100% | 11/13/13 | 308,000 | 307,938 |
| 3 | Federal Home Loan Bank Discount Notes | 0.100% | 11/15/13 | 593,770 | 593,646 |
| 3 | Federal Home Loan Bank Discount Notes | 0.100% | 11/19/13 | 44,000 | 43,990 |
| 3 | Federal Home Loan Bank Discount Notes | 0.050%–0.105% | 11/22/13 | 458,000 | 457,926 |
| 3 | Federal Home Loan Bank Discount Notes | 0.100%–0.105% | 11/27/13 | 805,000 | 804,803 |
| 3 | Federal Home Loan Bank Discount Notes | 0.055% | 11/29/13 | 51,000 | 50,993 |
| 3 | Federal Home Loan Bank Discount Notes | 0.098% | 2/12/14 | 42,000 | 41,981 |
| 3 | Federal Home Loan Bank Discount Notes | 0.098%–0.100% | 2/14/14 | 80,842 | 80,805 |
| 3 | Federal Home Loan Bank Discount Notes | 0.095%–0.100% | 2/19/14 | 534,500 | 534,249 |
| 3,4 | Federal Home Loan Banks | 0.133% | 11/22/13 | 150,000 | 149,993 |
| 3,4 | Federal Home Loan Banks | 0.156% | 12/6/13 | 50,000 | 49,999 |
| 3,4 | Federal Home Loan Banks | 0.159% | 12/26/13 | 1,525,000 | 1,525,000 |
| 3,4 | Federal Home Loan Banks | 0.104% | 1/15/14 | 135,000 | 134,998 |
| 3,4 | Federal Home Loan Banks | 0.136% | 4/3/14 | 1,465,000 | 1,465,000 |
| 3,4 | Federal Home Loan Banks | 0.124% | 4/25/14 | 388,000 | 388,000 |
| 3,4 | Federal Home Loan Banks | 0.126% | 6/5/14 | 400,000 | 400,000 |
| 3,4 | Federal Home Loan Banks | 0.126% | 6/5/14 | 150,000 | 150,000 |
| 3,4 | Federal Home Loan Banks | 0.126% | 6/6/14 | 1,400,000 | 1,400,000 |
| 3,4 | Federal Home Loan Banks | 0.126% | 6/6/14 | 931,500 | 931,500 |
| 3,4 | Federal Home Loan Banks | 0.126% | 7/3/14 | 482,000 | 482,000 |
| 3,4 | Federal Home Loan Banks | 0.167% | 10/1/14 | 150,000 | 149,967 |
14
Prime Money Market Fund
| Face | Market | ||||
| Maturity | Amount | Value | |||
| Yield1 | Date | ($000) | ($000) | ||
| 3,4 | Federal Home Loan Banks | 0.139% | 2/27/15 | 496,000 | 495,925 |
| 2,4 | Federal Home Loan Mortgage Corp. | 0.156% | 11/4/13 | 64,780 | 64,780 |
| 2,4 | Federal National Mortgage Assn. | 0.155% | 11/8/13 | 1,365,500 | 1,365,428 |
| 2,4 | Federal National Mortgage Assn. | 0.155% | 11/14/13 | 1,000,000 | 999,940 |
| 2,4 | Federal National Mortgage Assn. | 0.165% | 9/11/14 | 2,350,000 | 2,349,512 |
| 2,4 | Federal National Mortgage Assn. | 0.154% | 2/27/15 | 3,350,000 | 3,348,748 |
| 2,4 | Federal National Mortgage Assn. | 0.156% | 8/5/15 | 1,775,000 | 1,774,305 |
| 2 | Freddie Mac Discount Notes | 0.140% | 9/3/13 | 307,000 | 306,998 |
| 2 | Freddie Mac Discount Notes | 0.133%–0.135% | 9/9/13 | 351,667 | 351,657 |
| 2 | Freddie Mac Discount Notes | 0.128% | 9/16/13 | 58,528 | 58,525 |
| 2 | Freddie Mac Discount Notes | 0.125% | 9/23/13 | 50,000 | 49,996 |
| 2 | Freddie Mac Discount Notes | 0.125% | 9/30/13 | 840,000 | 839,915 |
| 2 | Freddie Mac Discount Notes | 0.090% | 10/22/13 | 50,000 | 49,994 |
| 2 | Freddie Mac Discount Notes | 0.100% | 11/4/13 | 613,484 | 613,375 |
| 2 | Freddie Mac Discount Notes | 0.075%–0.100% | 11/12/13 | 297,995 | 297,940 |
| 2 | Freddie Mac Discount Notes | 0.075%–0.100% | 11/18/13 | 578,467 | 578,364 |
| 2 | Freddie Mac Discount Notes | 0.100% | 11/25/13 | 325,000 | 324,923 |
| 2 | Freddie Mac Discount Notes | 0.100%–0.140% | 12/3/13 | 286,750 | 286,667 |
| 2 | Freddie Mac Discount Notes | 0.150% | 12/16/13 | 121,630 | 121,576 |
| 2 | Freddie Mac Discount Notes | 0.150% | 12/23/13 | 1,040,625 | 1,040,135 |
| 2 | Freddie Mac Discount Notes | 0.138% | 12/30/13 | 520,000 | 519,761 |
| 2 | Freddie Mac Discount Notes | 0.098% | 1/13/14 | 300,000 | 299,891 |
| 2 | Freddie Mac Discount Notes | 0.095%–0.100% | 2/18/14 | 248,500 | 248,384 |
| United States Treasury Bill | 0.120% | 9/5/13 | 850,000 | 849,989 | |
| United States Treasury Bill | 0.113% | 9/12/13 | 1,000,000 | 999,966 | |
| United States Treasury Bill | 0.038%–0.040% | 9/26/13 | 2,500,000 | 2,499,938 | |
| United States Treasury Bill | 0.108%–0.111% | 10/3/13 | 1,710,000 | 1,709,834 | |
| United States Treasury Bill | 0.101% | 10/10/13 | 500,000 | 499,946 | |
| United States Treasury Bill | 0.085% | 11/7/13 | 725,000 | 724,885 | |
| United States Treasury Bill | 0.056%–0.057% | 11/14/13 | 1,500,000 | 1,499,826 | |
| United States Treasury Bill | 0.038%–0.041% | 11/29/13 | 3,600,000 | 3,599,642 | |
| United States Treasury Bill | 0.073% | 1/23/14 | 500,000 | 499,854 | |
| United States Treasury Bill | 0.073%–0.077% | 2/6/14 | 2,828,834 | 2,827,909 | |
| United States Treasury Bill | 0.077% | 2/13/14 | 1,000,000 | 999,647 | |
| United States Treasury Bill | 0.078% | 2/20/14 | 2,190,000 | 2,189,187 | |
| United States Treasury Note/Bond | 3.125% | 9/30/13 | 594,000 | 595,439 | |
| United States Treasury Note/Bond | 0.500% | 10/15/13 | 447,000 | 447,215 | |
| United States Treasury Note/Bond | 2.750% | 10/31/13 | 415,000 | 416,809 | |
| United States Treasury Note/Bond | 0.500% | 11/15/13 | 517,800 | 518,207 | |
| United States Treasury Note/Bond | 4.250% | 11/15/13 | 481,000 | 485,051 | |
| United States Treasury Note/Bond | 0.250% | 11/30/13 | 40,000 | 40,015 | |
| United States Treasury Note/Bond | 2.000% | 11/30/13 | 568,000 | 570,656 | |
| United States Treasury Note/Bond | 0.750% | 12/15/13 | 1,234,000 | 1,236,294 | |
| United States Treasury Note/Bond | 0.125% | 12/31/13 | 148,500 | 148,514 | |
| United States Treasury Note/Bond | 1.000% | 1/15/14 | 1,681,000 | 1,686,553 | |
| United States Treasury Note/Bond | 1.250% | 2/15/14 | 1,304,000 | 1,310,650 | |
| United States Treasury Note/Bond | 4.000% | 2/15/14 | 700,000 | 712,374 | |
| United States Treasury Note/Bond | 0.250% | 2/28/14 | 764,000 | 764,414 | |
| United States Treasury Note/Bond | 1.875% | 2/28/14 | 267,000 | 269,341 | |
| United States Treasury Note/Bond | 1.250% | 3/15/14 | 1,225,000 | 1,232,480 | |
| United States Treasury Note/Bond | 0.250% | 3/31/14 | 357,000 | 357,282 | |
| United States Treasury Note/Bond | 1.750% | 3/31/14 | 746,000 | 752,953 | |
| United States Treasury Note/Bond | 1.250% | 4/15/14 | 599,000 | 603,198 | |
| Total U. S. Government and Agency Obligations (Cost $65,432,282) | 65,432,282 | ||||
15
Prime Money Market Fund
| Face | Market | |||
| Maturity | Amount | Value | ||
| Yield1 | Date | ($000) | ($000) | |
| Commercial Paper (28.0%) | ||||
| Finance—Auto (2.4%) | ||||
| American Honda Finance Corp. | 0.130% | 9/18/13 | 65,000 | 64,996 |
| American Honda Finance Corp. | 0.130% | 9/19/13 | 165,750 | 165,739 |
| American Honda Finance Corp. | 0.150% | 9/23/13 | 10,000 | 9,999 |
| American Honda Finance Corp. | 0.135%–0.150% | 9/24/13 | 81,100 | 81,093 |
| American Honda Finance Corp. | 0.135%–0.180% | 9/25/13 | 65,000 | 64,994 |
| American Honda Finance Corp. | 0.130%–0.160% | 10/4/13 | 125,500 | 125,484 |
| American Honda Finance Corp. | 0.120%–0.150% | 10/21/13 | 248,500 | 248,450 |
| American Honda Finance Corp. | 0.120%–0.130% | 10/22/13 | 36,000 | 35,994 |
| American Honda Finance Corp. | 0.120% | 10/28/13 | 77,700 | 77,685 |
| American Honda Finance Corp. | 0.120% | 10/29/13 | 27,750 | 27,745 |
| American Honda Finance Corp. | 0.120% | 11/6/13 | 55,500 | 55,488 |
| American Honda Finance Corp. | 0.110% | 11/12/13 | 69,250 | 69,235 |
| American Honda Finance Corp. | 0.120% | 11/13/13 | 142,000 | 141,965 |
| 5 BMW US Capital LLC | 0.120% | 9/3/13 | 24,500 | 24,500 |
| 5 BMW US Capital LLC | 0.120% | 9/4/13 | 24,000 | 24,000 |
| 5 BMW US Capital LLC | 0.120% | 9/5/13 | 49,500 | 49,499 |
| 5 BMW US Capital LLC | 0.120% | 9/11/13 | 39,500 | 39,499 |
| 5 BMW US Capital LLC | 0.120% | 9/12/13 | 22,000 | 21,999 |
| 5 BMW US Capital LLC | 0.120% | 9/23/13 | 67,000 | 66,995 |
| 5 BMW US Capital LLC | 0.130% | 10/7/13 | 22,000 | 21,997 |
| 5 BMW US Capital LLC | 0.130% | 10/8/13 | 18,000 | 17,998 |
| 5 BMW US Capital LLC | 0.130% | 10/9/13 | 35,250 | 35,245 |
| 5 BMW US Capital LLC | 0.130% | 10/11/13 | 30,000 | 29,996 |
| 5 BMW US Capital LLC | 0.130% | 10/15/13 | 66,000 | 65,990 |
| 5 BMW US Capital LLC | 0.130% | 10/16/13 | 89,500 | 89,485 |
| 5 BMW US Capital LLC | 0.130% | 10/17/13 | 34,250 | 34,244 |
| 5 BMW US Capital LLC | 0.130% | 10/18/13 | 52,000 | 51,991 |
| 5 BMW US Capital LLC | 0.110% | 10/21/13 | 29,750 | 29,745 |
| 5 BMW US Capital LLC | 0.110% | 10/28/13 | 117,800 | 117,780 |
| 5 BMW US Capital LLC | 0.120% | 11/4/13 | 50,000 | 49,989 |
| 5 BMW US Capital LLC | 0.120% | 11/5/13 | 22,500 | 22,495 |
| Toyota Motor Credit Corp. | 0.210% | 9/11/13 | 32,670 | 32,668 |
| Toyota Motor Credit Corp. | 0.240% | 10/1/13 | 26,250 | 26,245 |
| Toyota Motor Credit Corp. | 0.230% | 10/2/13 | 168,000 | 167,967 |
| Toyota Motor Credit Corp. | 0.220% | 10/15/13 | 32,000 | 31,991 |
| Toyota Motor Credit Corp. | 0.210% | 11/8/13 | 189,000 | 188,925 |
| 4 Toyota Motor Credit Corp. | 0.175% | 12/10/13 | 221,000 | 221,000 |
| 4 Toyota Motor Credit Corp. | 0.175% | 12/11/13 | 194,000 | 194,000 |
| Toyota Motor Credit Corp. | 0.240% | 1/6/14 | 74,000 | 73,937 |
| Toyota Motor Credit Corp. | 0.230% | 2/3/14 | 157,750 | 157,594 |
| 3,056,641 | ||||
| Finance—Other (3.0%) | ||||
| General Electric Capital Corp. | 0.150% | 10/2/13 | 297,000 | 296,962 |
| General Electric Capital Corp. | 0.150% | 10/4/13 | 248,000 | 247,966 |
| General Electric Capital Corp. | 0.150% | 10/8/13 | 198,000 | 197,969 |
| General Electric Capital Corp. | 0.130% | 10/11/13 | 157,000 | 156,977 |
| General Electric Capital Corp. | 0.190% | 10/15/13 | 99,000 | 98,977 |
| General Electric Capital Corp. | 0.130% | 10/18/13 | 150,000 | 149,974 |
| General Electric Capital Corp. | 0.130% | 10/23/13 | 80,000 | 79,985 |
| General Electric Capital Corp. | 0.150% | 10/25/13 | 248,000 | 247,944 |
| General Electric Capital Corp. | 0.150% | 11/1/13 | 196,000 | 195,950 |
| General Electric Capital Corp. | 0.150% | 11/4/13 | 196,000 | 195,948 |
16
Prime Money Market Fund
| Face | Market | ||||
| Maturity | Amount | Value | |||
| Yield1 | Date | ($000) | ($000) | ||
| General Electric Capital Corp. | 0.150% | 11/7/13 | 33,000 | 32,991 | |
| General Electric Capital Corp. | 0.150% | 11/22/13 | 250,000 | 249,915 | |
| General Electric Capital Corp. | 0.150% | 12/5/13 | 175,000 | 174,931 | |
| 5 | Jupiter Securitization Co. LLC | 0.130% | 9/27/13 | 25,000 | 24,998 |
| 5 | Old Line Funding LLC | 0.160% | 9/17/13 | 49,500 | 49,496 |
| 5 | Old Line Funding LLC | 0.120%–0.130% | 9/23/13 | 67,685 | 67,680 |
| 5 | Old Line Funding LLC | 0.170% | 9/25/13 | 134,000 | 133,985 |
| 5 | Old Line Funding LLC | 0.150%–0.200% | 10/17/13 | 260,127 | 260,062 |
| 5 | Old Line Funding LLC | 0.200% | 10/18/13 | 222,000 | 221,942 |
| 5 | Old Line Funding LLC | 0.200% | 10/22/13 | 38,000 | 37,989 |
| 5 | Old Line Funding LLC | 0.200% | 10/23/13 | 14,098 | 14,094 |
| 5 | Old Line Funding LLC | 0.200% | 10/24/13 | 50,000 | 49,985 |
| 5 | Old Line Funding LLC | 0.200% | 10/25/13 | 24,500 | 24,493 |
| 5 | Old Line Funding LLC | 0.200% | 10/29/13 | 40,500 | 40,487 |
| 5 | Old Line Funding LLC | 0.200% | 11/1/13 | 78,000 | 77,974 |
| 5 | Old Line Funding LLC | 0.200% | 11/8/13 | 39,500 | 39,485 |
| 5 | Old Line Funding LLC | 0.200% | 11/12/13 | 222,000 | 221,911 |
| 5 | Old Line Funding LLC | 0.190%–0.200% | 11/18/13 | 133,500 | 133,442 |
| 5 | Old Line Funding LLC | 0.200% | 12/9/13 | 83,500 | 83,454 |
| 5 | Old Line Funding LLC | 0.200% | 12/18/13 | 76,000 | 75,954 |
| 5 | Old Line Funding LLC | 0.200% | 12/23/13 | 40,000 | 39,975 |
| 5 | Old Line Funding LLC | 0.200% | 1/6/14 | 26,000 | 25,982 |
| 3,949,877 | |||||
| Foreign Banks (3.5%) | |||||
| 4,5 | Australia & New Zealand Banking Group, Ltd. | 0.185% | 10/8/13 | 466,500 | 466,500 |
| 4,5 | Australia & New Zealand Banking Group, Ltd. | 0.185% | 10/9/13 | 298,000 | 298,000 |
| 4,5 | Australia & New Zealand Banking Group, Ltd. | 0.185% | 11/8/13 | 240,000 | 240,000 |
| 4,5 | Australia & New Zealand Banking Group, Ltd. | 0.184% | 11/25/13 | 37,000 | 37,000 |
| 4,5 | Australia & New Zealand Banking Group, Ltd. | 0.183% | 12/23/13 | 123,000 | 123,000 |
| 4,5 | Australia & New Zealand Banking Group, Ltd. | 0.174% | 1/24/14 | 264,000 | 264,000 |
| 5 | Commonwealth Bank of Australia | 0.230% | 10/22/13 | 43,000 | 42,986 |
| 5 | Commonwealth Bank of Australia | 0.220% | 10/29/13 | 28,143 | 28,133 |
| 4,5 | Commonwealth Bank of Australia | 0.316% | 11/1/13 | 46,500 | 46,508 |
| 5 | Commonwealth Bank of Australia | 0.225% | 11/12/13 | 100,000 | 99,955 |
| 5 | Commonwealth Bank of Australia | 0.220% | 12/2/13 | 40,000 | 39,978 |
| 5 | Commonwealth Bank of Australia | 0.215% | 12/5/13 | 30,905 | 30,888 |
| 5 | Commonwealth Bank of Australia | 0.215%–0.230% | 12/16/13 | 205,015 | 204,881 |
| 4,5 | Westpac Banking Corp. | 0.184% | 9/25/13 | 185,000 | 185,000 |
| 4,5 | Westpac Banking Corp. | 0.184% | 9/26/13 | 185,000 | 185,000 |
| 4,5 | Westpac Banking Corp. | 0.184% | 9/27/13 | 185,000 | 185,000 |
| 4,5 | Westpac Banking Corp. | 0.182% | 9/30/13 | 670,000 | 670,000 |
| 4,5 | Westpac Banking Corp. | 0.182% | 9/30/13 | 450,000 | 450,000 |
| 4,5 | Westpac Banking Corp. | 0.184% | 10/16/13 | 150,000 | 150,000 |
| 4,5 | Westpac Banking Corp. | 0.184% | 10/21/13 | 150,000 | 150,000 |
| 4,5 | Westpac Banking Corp. | 0.184% | 10/25/13 | 73,000 | 73,000 |
| 4,5 | Westpac Banking Corp. | 0.184% | 10/28/13 | 100,000 | 100,000 |
| 4,5 | Westpac Banking Corp. | 0.186% | 11/7/13 | 218,000 | 218,000 |
| 4,5 | Westpac Banking Corp. | 0.184% | 11/20/13 | 73,000 | 73,000 |
| 4,5 | Westpac Banking Corp. | 0.318% | 1/13/14 | 118,000 | 118,049 |
| 4,5 | Westpac Banking Corp. | 0.315% | 1/24/14 | 39,500 | 39,518 |
| 4,518,396 | |||||
| Foreign Governments (7.1%) | |||||
| Canada | 0.170% | 9/27/13 | 37,000 | 36,995 | |
| Canada | 0.170% | 10/7/13 | 18,000 | 17,997 | |
17
Prime Money Market Fund
| Face | Market | |||
| Maturity | Amount | Value | ||
| Yield1 | Date | ($000) | ($000) | |
| 8 CPPIB Capital Inc. | 0.150% | 9/3/13 | 25,000 | 25,000 |
| 8 CPPIB Capital Inc. | 0.150% | 9/9/13 | 250,000 | 249,992 |
| 8 CPPIB Capital Inc. | 0.150% | 9/10/13 | 298,000 | 297,989 |
| 8 CPPIB Capital Inc. | 0.150% | 9/11/13 | 248,000 | 247,990 |
| 8 CPPIB Capital Inc. | 0.150% | 9/12/13 | 49,500 | 49,498 |
| 8 CPPIB Capital Inc. | 0.150% | 9/17/13 | 77,000 | 76,995 |
| 8 CPPIB Capital Inc. | 0.150% | 9/23/13 | 127,500 | 127,488 |
| 8 CPPIB Capital Inc. | 0.150% | 9/24/13 | 100,000 | 99,990 |
| 8 CPPIB Capital Inc. | 0.150% | 9/25/13 | 44,000 | 43,996 |
| 8 CPPIB Capital Inc. | 0.150% | 10/2/13 | 151,500 | 151,480 |
| 8 CPPIB Capital Inc. | 0.150% | 10/10/13 | 19,000 | 18,997 |
| 8 CPPIB Capital Inc. | 0.150%–0.190% | 10/11/13 | 82,000 | 81,985 |
| 8 CPPIB Capital Inc. | 0.150% | 10/16/13 | 20,000 | 19,996 |
| 8 CPPIB Capital Inc. | 0.150% | 10/21/13 | 15,750 | 15,747 |
| 8 CPPIB Capital Inc. | 0.180% | 10/22/13 | 29,000 | 28,993 |
| 8 CPPIB Capital Inc. | 0.190% | 11/1/13 | 107,000 | 106,966 |
| 8 CPPIB Capital Inc. | 0.190% | 11/7/13 | 148,000 | 147,948 |
| 8 CPPIB Capital Inc. | 0.190% | 11/8/13 | 36,000 | 35,987 |
| 8 CPPIB Capital Inc. | 0.150%–0.190% | 11/12/13 | 221,000 | 220,917 |
| 8 CPPIB Capital Inc. | 0.150% | 11/15/13 | 20,000 | 19,994 |
| 8 CPPIB Capital Inc. | 0.150% | 11/21/13 | 74,000 | 73,975 |
| 8 CPPIB Capital Inc. | 0.180% | 1/16/14 | 15,000 | 14,990 |
| 8 CPPIB Capital Inc. | 0.180% | 1/31/14 | 17,000 | 16,987 |
| Export Development Canada | 0.150% | 9/10/13 | 36,800 | 36,799 |
| Export Development Canada | 0.180% | 10/7/13 | 24,000 | 23,996 |
| Export Development Canada | 0.180%–0.190% | 10/8/13 | 94,000 | 93,982 |
| Export Development Canada | 0.140% | 11/1/13 | 196,000 | 195,954 |
| Export Development Canada | 0.140% | 11/5/13 | 100,000 | 99,975 |
| Export Development Canada | 0.140% | 11/12/13 | 200,000 | 199,944 |
| Export Development Canada | 0.170% | 11/15/13 | 197,000 | 196,930 |
| Export Development Canada | 0.160% | 11/18/13 | 25,000 | 24,991 |
| Export Development Canada | 0.160% | 11/19/13 | 99,000 | 98,965 |
| Export Development Canada | 0.160% | 11/22/13 | 198,000 | 197,928 |
| Export Development Canada | 0.160% | 12/2/13 | 149,000 | 148,939 |
| Export Development Canada | 0.155% | 12/9/13 | 200,000 | 199,915 |
| 5 Hydro-Quebec | 0.120% | 10/16/13 | 40,000 | 39,994 |
| 5 Hydro-Quebec | 0.100% | 11/15/13 | 20,000 | 19,996 |
| Province of British Columbia | 0.130% | 10/10/13 | 36,000 | 35,995 |
| Province of British Columbia | 0.140% | 10/22/13 | 33,000 | 32,993 |
| Province of British Columbia | 0.150% | 11/4/13 | 49,500 | 49,487 |
| Province of British Columbia | 0.145% | 11/12/13 | 9,775 | 9,772 |
| Province of British Columbia | 0.145% | 11/18/13 | 53,000 | 52,983 |
| Province of British Columbia | 0.150% | 11/22/13 | 50,000 | 49,983 |
| Province of British Columbia | 0.160% | 12/4/13 | 54,500 | 54,477 |
| Province of British Columbia | 0.160% | 12/11/13 | 99,000 | 98,956 |
| Province of Ontario | 0.135%–0.150% | 9/6/13 | 91,900 | 91,898 |
| Province of Ontario | 0.150% | 9/12/13 | 44,000 | 43,998 |
| Province of Ontario | 0.140% | 9/19/13 | 49,500 | 49,497 |
| Province of Ontario | 0.140% | 10/4/13 | 21,000 | 20,997 |
| Province of Ontario | 0.180% | 10/7/13 | 137,750 | 137,725 |
| Province of Ontario | 0.120% | 10/8/13 | 22,000 | 21,997 |
| Province of Ontario | 0.180% | 10/9/13 | 143,000 | 142,973 |
| Province of Ontario | 0.180% | 10/11/13 | 76,000 | 75,985 |
| Province of Ontario | 0.140%–0.170% | 10/15/13 | 150,000 | 149,971 |
| Province of Ontario | 0.140% | 10/16/13 | 12,000 | 11,998 |
18
Prime Money Market Fund
| Face | Market | |||
| Maturity | Amount | Value | ||
| Yield1 | Date | ($000) | ($000) | |
| Province of Ontario | 0.110% | 10/29/13 | 20,000 | 19,996 |
| Province of Ontario | 0.150% | 11/1/13 | 28,000 | 27,993 |
| Province of Ontario | 0.140% | 11/5/13 | 49,500 | 49,487 |
| Province of Ontario | 0.120% | 11/6/13 | 49,000 | 48,989 |
| Province of Ontario | 0.130%–0.150% | 11/7/13 | 110,000 | 109,972 |
| Province of Ontario | 0.100%–0.160% | 11/18/13 | 75,000 | 74,977 |
| Province of Ontario | 0.160% | 11/22/13 | 24,500 | 24,491 |
| Province of Ontario | 0.100%–0.160% | 11/25/13 | 125,000 | 124,956 |
| Province of Ontario | 0.100% | 11/26/13 | 104,000 | 103,975 |
| Province of Ontario | 0.100% | 11/27/13 | 20,000 | 19,995 |
| Province of Ontario | 0.160% | 11/29/13 | 25,000 | 24,990 |
| Province of Ontario | 0.160% | 12/5/13 | 144,000 | 143,939 |
| Province of Ontario | 0.150% | 1/21/14 | 60,000 | 59,965 |
| 8 PSP Capital Inc. | 0.200% | 10/7/13 | 19,500 | 19,496 |
| 8 PSP Capital Inc. | 0.190% | 10/15/13 | 26,500 | 26,494 |
| 8 PSP Capital Inc. | 0.190% | 11/12/13 | 90,000 | 89,966 |
| 8 PSP Capital Inc. | 0.190% | 11/13/13 | 156,500 | 156,440 |
| 8 PSP Capital Inc. | 0.190% | 11/15/13 | 83,000 | 82,967 |
| 8 PSP Capital Inc. | 0.180% | 11/18/13 | 14,500 | 14,494 |
| 8 PSP Capital Inc. | 0.190% | 11/21/13 | 29,500 | 29,487 |
| 8 PSP Capital Inc. | 0.180% | 12/6/13 | 15,000 | 14,993 |
| 8 PSP Capital Inc. | 0.190% | 12/11/13 | 28,000 | 27,985 |
| 8 PSP Capital Inc. | 0.190% | 12/13/13 | 24,500 | 24,487 |
| 8 PSP Capital Inc. | 0.180% | 2/3/14 | 17,750 | 17,736 |
| 8 PSP Capital Inc. | 0.190% | 2/18/14 | 11,750 | 11,739 |
| 5 Quebec | 0.150% | 9/5/13 | 32,200 | 32,199 |
| 5 Quebec | 0.130% | 9/11/13 | 100,000 | 99,996 |
| 5 Quebec | 0.130%–0.150% | 9/12/13 | 245,000 | 244,990 |
| 5 Quebec | 0.150% | 9/13/13 | 36,000 | 35,998 |
| 5 Quebec | 0.110%–0.120% | 10/1/13 | 103,100 | 103,090 |
| 5 Quebec | 0.140% | 10/4/13 | 27,000 | 26,997 |
| 5 Quebec | 0.120% | 10/10/13 | 500,000 | 499,935 |
| 5 Quebec | 0.120%–0.130% | 10/17/13 | 468,000 | 467,927 |
| 5 Quebec | 0.130% | 10/24/13 | 100,000 | 99,981 |
| 5 Quebec | 0.120% | 11/1/13 | 22,500 | 22,495 |
| 5 Quebec | 0.120% | 11/6/13 | 32,500 | 32,493 |
| 5 Quebec | 0.100% | 11/19/13 | 49,500 | 49,489 |
| 5 Quebec | 0.100% | 11/20/13 | 503,500 | 503,388 |
| Queensland Treasury Corp. | 0.200% | 9/12/13 | 36,000 | 35,998 |
| Queensland Treasury Corp. | 0.240% | 10/15/13 | 150,000 | 149,956 |
| Queensland Treasury Corp. | 0.240% | 10/18/13 | 75,000 | 74,976 |
| Queensland Treasury Corp. | 0.130% | 10/24/13 | 25,000 | 24,995 |
| Queensland Treasury Corp. | 0.230%–0.240% | 10/29/13 | 151,000 | 150,943 |
| Queensland Treasury Corp. | 0.130% | 10/30/13 | 65,500 | 65,486 |
| Queensland Treasury Corp. | 0.140% | 11/6/13 | 99,000 | 98,975 |
| Queensland Treasury Corp. | 0.150% | 11/14/13 | 30,500 | 30,491 |
| 9,139,692 | ||||
| Foreign Industrial (5.2%) | ||||
| 5 BASF SE | 0.140% | 9/20/13 | 79,000 | 78,994 |
| 5 BASF SE | 0.150% | 9/25/13 | 200,000 | 199,980 |
| 5 BASF SE | 0.150% | 9/26/13 | 100,000 | 99,990 |
| 5 GlaxoSmithKline Finance plc | 0.150% | 9/3/13 | 63,000 | 62,999 |
| 5 GlaxoSmithKline Finance plc | 0.140% | 9/4/13 | 236,000 | 235,997 |
| 5 GlaxoSmithKline Finance plc | 0.100%–0.120% | 10/2/13 | 245,000 | 244,976 |
| 5 GlaxoSmithKline Finance plc | 0.150% | 10/9/13 | 123,500 | 123,480 |
19
Prime Money Market Fund
| Face | Market | |||
| Maturity | Amount | Value | ||
| Yield1 | Date | ($000) | ($000) | |
| 5 Nestle Capital Corp. | 0.200% | 9/6/13 | 47,000 | 46,999 |
| 5 Nestle Capital Corp. | 0.250% | 9/17/13 | 10,000 | 9,999 |
| 5 Nestle Capital Corp. | 0.190% | 10/1/13 | 600,000 | 599,905 |
| 5 Nestle Capital Corp. | 0.140% | 10/7/13 | 396,000 | 395,945 |
| 5 Nestle Capital Corp. | 0.140% | 10/8/13 | 68,000 | 67,990 |
| 5 Nestle Capital Corp. | 0.150% | 11/13/13 | 368,000 | 367,888 |
| 5 Nestle Capital Corp. | 0.145% | 11/14/13 | 113,000 | 112,966 |
| 5 Nestle Capital Corp. | 0.120% | 11/18/13 | 214,000 | 213,944 |
| Nestle Finance International Ltd. | 0.150% | 9/24/13 | 230,000 | 229,978 |
| Nestle Finance International Ltd. | 0.150% | 9/26/13 | 115,000 | 114,988 |
| Nestle Finance International Ltd. | 0.200% | 10/3/13 | 235,000 | 234,958 |
| Nestle Finance International Ltd. | 0.200% | 10/15/13 | 45,000 | 44,989 |
| Nestle Finance International Ltd. | 0.200% | 10/16/13 | 98,000 | 97,976 |
| Nestle Finance International Ltd. | 0.140% | 11/1/13 | 228,000 | 227,946 |
| Nestle Finance International Ltd. | 0.140% | 11/5/13 | 53,000 | 52,987 |
| Nestle Finance International Ltd. | 0.125%–0.130% | 11/7/13 | 356,500 | 356,417 |
| Nestle Finance International Ltd. | 0.165% | 11/13/13 | 198,000 | 197,934 |
| Nestle Finance International Ltd. | 0.165% | 11/14/13 | 149,300 | 149,249 |
| 5 Reckitt Benckiser Treasury Services plc | 0.140% | 9/6/13 | 99,000 | 98,998 |
| 5 Reckitt Benckiser Treasury Services plc | 0.150% | 9/16/13 | 31,444 | 31,442 |
| 5 Reckitt Benckiser Treasury Services plc | 0.125% | 11/7/13 | 159,750 | 159,713 |
| 5 Roche Holdings Inc. | 0.110% | 9/10/13 | 49,500 | 49,499 |
| 5 Roche Holdings Inc. | 0.110%–0.120% | 9/12/13 | 97,000 | 96,997 |
| 5 Roche Holdings Inc. | 0.090% | 11/8/13 | 40,300 | 40,293 |
| 5 Sanofi | 0.140% | 9/19/13 | 224,000 | 223,984 |
| 5 Sanofi | 0.150% | 9/20/13 | 237,100 | 237,081 |
| 5 Sanofi | 0.150% | 9/25/13 | 335,000 | 334,967 |
| 5 Sanofi | 0.140% | 9/27/13 | 107,200 | 107,189 |
| 5 Siemens Capital Co. LLC | 0.120% | 9/10/13 | 200,000 | 199,994 |
| 5 Siemens Capital Co. LLC | 0.120% | 9/12/13 | 75,000 | 74,997 |
| 5 Total Capital Canada Ltd. | 0.160% | 1/13/14 | 200,000 | 199,881 |
| 5 Total Capital Canada Ltd. | 0.140% | 2/3/14 | 72,000 | 71,957 |
| Toyota Credit Canada Inc. | 0.260% | 9/17/13 | 48,500 | 48,494 |
| Toyota Credit Canada Inc. | 0.260% | 9/19/13 | 50,000 | 49,994 |
| Toyota Credit Canada Inc. | 0.220% | 10/21/13 | 19,000 | 18,994 |
| Toyota Credit Canada Inc. | 0.260% | 1/2/14 | 21,000 | 20,981 |
| Toyota Credit Canada Inc. | 0.250% | 1/6/14 | 20,000 | 19,982 |
| 5 Unilever Capital Corp. | 0.110% | 9/9/13 | 90,000 | 89,998 |
| 6,744,909 | ||||
| Industrial (6.8%) | ||||
| Caterpillar Financial Services Corp. | 0.110% | 9/3/13 | 75,000 | 75,000 |
| Caterpillar Financial Services Corp. | 0.110% | 9/4/13 | 58,600 | 58,600 |
| Caterpillar Financial Services Corp. | 0.150% | 9/23/13 | 231,000 | 230,979 |
| Caterpillar Financial Services Corp. | 0.170% | 9/26/13 | 141,000 | 140,983 |
| 5 Chevron Corp. | 0.090% | 9/3/13 | 65,000 | 65,000 |
| 5 Chevron Corp. | 0.090% | 9/4/13 | 200,000 | 199,999 |
| Exxon Mobil Corp. | 0.130% | 10/11/13 | 495,000 | 494,928 |
| Exxon Mobil Corp. | 0.090% | 10/25/13 | 200,000 | 199,973 |
| Exxon Mobil Corp. | 0.090% | 10/30/13 | 43,000 | 42,994 |
| Exxon Mobil Corp. | 0.090% | 10/31/13 | 300,000 | 299,955 |
| Exxon Mobil Corp. | 0.090% | 11/1/13 | 150,000 | 149,977 |
| General Electric Co. | 0.110% | 9/25/13 | 200,000 | 199,985 |
| General Electric Co. | 0.110% | 9/26/13 | 298,000 | 297,977 |
| General Electric Co. | 0.110% | 9/27/13 | 59,000 | 58,995 |
| 5 Google Inc. | 0.150% | 11/5/13 | 21,000 | 20,994 |
20
Prime Money Market Fund
| Face | Market | |||
| Maturity | Amount | Value | ||
| Yield1 | Date | ($000) | ($000) | |
| 5 Google Inc. | 0.120% | 11/13/13 | 99,000 | 98,976 |
| 5 Google Inc. | 0.150% | 1/15/14 | 75,000 | 74,958 |
| 5 Google Inc. | 0.140% | 2/6/14 | 55,000 | 54,966 |
| 5 Honeywell International Inc. | 0.120% | 9/23/13 | 8,900 | 8,899 |
| 5 Honeywell International Inc. | 0.120% | 9/26/13 | 50,000 | 49,996 |
| 5 Procter & Gamble Co. | 0.110% | 10/16/13 | 24,500 | 24,497 |
| 5 Procter & Gamble Co. | 0.150% | 11/4/13 | 471,000 | 470,874 |
| 5 Procter & Gamble Co. | 0.100% | 11/6/13 | 75,750 | 75,736 |
| 5 Procter & Gamble Co. | 0.100% | 11/8/13 | 62,100 | 62,088 |
| 5 Procter & Gamble Co. | 0.090% | 11/15/13 | 75,000 | 74,986 |
| 5 Procter & Gamble Co. | 0.140% | 11/19/13 | 124,000 | 123,962 |
| 5 Procter & Gamble Co. | 0.090% | 11/26/13 | 204,500 | 204,456 |
| 5 Procter & Gamble Co. | 0.080% | 11/27/13 | 36,100 | 36,093 |
| 5 Procter & Gamble Co. | 0.080% | 12/2/13 | 40,300 | 40,292 |
| 5 Procter & Gamble Co. | 0.080% | 12/4/13 | 149,000 | 148,969 |
| 5 Syngenta Wilmington Inc. | 0.100% | 9/17/13 | 55,000 | 54,998 |
| 5 The Coca-Cola Co. | 0.200% | 9/3/13 | 163,000 | 162,998 |
| 5 The Coca-Cola Co. | 0.180% | 10/3/13 | 98,750 | 98,734 |
| 5 The Coca-Cola Co. | 0.180% | 10/7/13 | 208,550 | 208,512 |
| 5 The Coca-Cola Co. | 0.180% | 10/8/13 | 100,000 | 99,982 |
| 5 The Coca-Cola Co. | 0.180% | 10/9/13 | 100,000 | 99,981 |
| 5 The Coca-Cola Co. | 0.140% | 10/23/13 | 99,000 | 98,980 |
| 5 The Coca-Cola Co. | 0.140% | 10/24/13 | 100,000 | 99,979 |
| 5 The Coca-Cola Co. | 0.140% | 10/25/13 | 100,000 | 99,979 |
| 5 The Coca-Cola Co. | 0.190% | 11/4/13 | 187,000 | 186,937 |
| 5 The Coca-Cola Co. | 0.180%–0.190% | 11/5/13 | 326,000 | 325,891 |
| 5 The Coca-Cola Co. | 0.140%–0.170% | 11/6/13 | 257,500 | 257,426 |
| 5 The Coca-Cola Co. | 0.140% | 11/8/13 | 225,000 | 224,941 |
| 5 The Coca-Cola Co. | 0.140% | 11/12/13 | 200,000 | 199,944 |
| 5 The Coca-Cola Co. | 0.170% | 11/19/13 | 303,750 | 303,637 |
| 5 The Coca-Cola Co. | 0.170% | 11/20/13 | 131,000 | 130,951 |
| 5 The Coca-Cola Co. | 0.160% | 12/5/13 | 287,000 | 286,879 |
| 5 The Coca-Cola Co. | 0.160% | 12/6/13 | 173,000 | 172,926 |
| 5 The Coca-Cola Co. | 0.160% | 12/9/13 | 159,000 | 158,930 |
| 5 The Coca-Cola Co. | 0.160% | 12/10/13 | 17,000 | 16,992 |
| 5 The Coca-Cola Co. | 0.160% | 12/11/13 | 49,000 | 48,978 |
| 5 The Coca-Cola Co. | 0.190% | 12/19/13 | 74,000 | 73,957 |
| 5 The Coca-Cola Co. | 0.190% | 1/3/14 | 50,000 | 49,967 |
| 5 The Coca-Cola Co. | 0.190% | 1/7/14 | 38,000 | 37,974 |
| 5 The Coca-Cola Co. | 0.180% | 1/8/14 | 29,000 | 28,981 |
| 5 The Coca-Cola Co. | 0.170% | 2/10/14 | 27,000 | 26,979 |
| 5 The Coca-Cola Co. | 0.170% | 2/27/14 | 104,000 | 103,912 |
| 5 The Coca-Cola Co. | 0.170%–0.180% | 3/3/14 | 215,000 | 214,810 |
| 5 The Coca-Cola Co. | 0.170% | 3/4/14 | 125,000 | 124,891 |
| 5 The Coca-Cola Co. | 0.170% | 3/5/14 | 85,000 | 84,926 |
| 5 Wal-Mart Stores, Inc. | 0.100% | 10/16/13 | 49,500 | 49,494 |
| 5 Wal-Mart Stores, Inc. | 0.100%–0.110% | 10/17/13 | 59,250 | 59,242 |
| 5 Wal-Mart Stores, Inc. | 0.100% | 10/18/13 | 59,500 | 59,492 |
| 5 Wal-Mart Stores, Inc. | 0.100% | 10/21/13 | 29,750 | 29,746 |
| 5 Wal-Mart Stores, Inc. | 0.090% | 11/1/13 | 99,500 | 99,485 |
| 5 Wal-Mart Stores, Inc. | 0.100% | 11/4/13 | 198,500 | 198,465 |
| 5 Wal-Mart Stores, Inc. | 0.100% | 11/5/13 | 99,600 | 99,582 |
| 8,766,565 | ||||
| Total Commercial Paper (Cost $36,176,080) | 36,176,080 |
21
Prime Money Market Fund
| Face | Market | |||
| Maturity | Amount | Value | ||
| Yield1 | Date | ($000) | ($000) | |
| Certificates of Deposit (19.4%) | ||||
| Domestic Banks (4.0%) | ||||
| JPMorgan Chase Bank NA | 0.160% | 10/1/13 | 730,000 | 730,000 |
| JPMorgan Chase Bank NA | 0.180% | 10/1/13 | 280,000 | 280,000 |
| JPMorgan Chase Bank NA | 0.180% | 10/1/13 | 88,000 | 88,000 |
| JPMorgan Chase Bank NA | 0.180% | 10/7/13 | 219,000 | 219,000 |
| 4 Wells Fargo Bank NA | 0.185% | 9/11/13 | 459,000 | 459,000 |
| 4 Wells Fargo Bank NA | 0.175% | 9/13/13 | 834,000 | 834,000 |
| 4 Wells Fargo Bank NA | 0.175% | 10/9/13 | 414,000 | 414,000 |
| 4 Wells Fargo Bank NA | 0.175% | 10/10/13 | 115,000 | 115,000 |
| 4 Wells Fargo Bank NA | 0.184% | 11/27/13 | 192,500 | 192,511 |
| 4 Wells Fargo Bank NA | 0.176% | 2/5/14 | 495,000 | 495,000 |
| Wells Fargo Bank NA | 0.220% | 2/12/14 | 500,000 | 500,000 |
| Wells Fargo Bank NA | 0.220% | 2/19/14 | 495,000 | 495,000 |
| 4 Wells Fargo Bank NA | 0.203% | 2/24/14 | 361,000 | 361,000 |
| 5,182,511 | ||||
| Eurodollar Certificates of Deposit (6.7%) | ||||
| 4 Australia & New Zealand Banking Group, Ltd. | 0.200% | 10/11/13 | 432,000 | 432,000 |
| 4 Australia & New Zealand Banking Group, Ltd. | 0.204% | 10/17/13 | 170,000 | 170,000 |
| 4 Australia & New Zealand Banking Group, Ltd. | 0.204% | 10/24/13 | 432,000 | 432,000 |
| 4 Australia & New Zealand Banking Group, Ltd. | 0.207% | 11/1/13 | 646,000 | 646,000 |
| 4 Commonwealth Bank of Australia | 0.175% | 9/13/13 | 50,000 | 50,000 |
| 4 Commonwealth Bank of Australia | 0.175% | 10/8/13 | 840,000 | 840,000 |
| 4 Commonwealth Bank of Australia | 0.175% | 10/15/13 | 407,000 | 407,000 |
| 4 Commonwealth Bank of Australia | 0.174% | 11/20/13 | 126,000 | 126,000 |
| 4 Commonwealth Bank of Australia | 0.175% | 2/10/14 | 468,000 | 468,000 |
| 4 Commonwealth Bank of Australia | 0.174% | 2/19/14 | 522,000 | 522,000 |
| 4 Commonwealth Bank of Australia | 0.173% | 2/24/14 | 706,000 | 706,000 |
| 4 National Australia Bank Ltd. | 0.174% | 9/18/13 | 121,000 | 121,000 |
| 4 National Australia Bank Ltd. | 0.177% | 10/2/13 | 1,033,000 | 1,033,000 |
| 4 National Australia Bank Ltd. | 0.194% | 10/21/13 | 480,000 | 480,000 |
| 4 National Australia Bank Ltd. | 0.193% | 10/23/13 | 525,000 | 525,000 |
| 4 National Australia Bank Ltd. | 0.196% | 12/6/13 | 64,000 | 64,000 |
| 4 National Australia Bank Ltd. | 0.194% | 12/18/13 | 128,000 | 128,000 |
| 4 National Australia Bank Ltd. | 0.204% | 12/27/13 | 72,000 | 72,000 |
| 4 National Australia Bank Ltd. | 0.206% | 1/6/14 | 50,000 | 50,000 |
| 4 National Australia Bank Ltd. | 0.209% | 1/27/14 | 1,319,000 | 1,319,000 |
| 4 National Australia Bank Ltd. | 0.214% | 2/19/14 | 41,000 | 41,000 |
| 4 National Australia Bank Ltd. | 0.213% | 2/28/14 | 37,000 | 37,000 |
| 8,669,000 | ||||
| Yankee Certificates of Deposit (8.7%) | ||||
| 4 Australia & New Zealand Banking Group, Ltd. | ||||
| (New York Branch) | 0.176% | 12/5/13 | 50,000 | 50,000 |
| 4 Australia & New Zealand Banking Group, Ltd. | ||||
| (New York Branch) | 0.177% | 1/2/14 | 114,000 | 114,000 |
| Australia & New Zealand Banking Group, Ltd. | ||||
| (New York Branch) | 0.200% | 1/10/14 | 54,500 | 54,504 |
| Australia & New Zealand Banking Group, Ltd. | ||||
| (New York Branch) | 0.190% | 2/20/14 | 248,000 | 247,994 |
| Bank of Montreal (Chicago Branch) | 0.180% | 9/13/13 | 590,000 | 590,000 |
| Bank of Montreal (Chicago Branch) | 0.180% | 9/16/13 | 590,000 | 590,000 |
| Bank of Montreal (Chicago Branch) | 0.200% | 10/16/13 | 491,000 | 491,000 |
| Bank of Montreal (Chicago Branch) | 0.150% | 10/22/13 | 465,000 | 465,000 |
| Bank of Montreal (Chicago Branch) | 0.150% | 10/24/13 | 392,000 | 392,000 |
22
Prime Money Market Fund
| Face | Market | |||
| Maturity | Amount | Value | ||
| Yield1 | Date | ($000) | ($000) | |
| Bank of Montreal (Chicago Branch) | 0.180% | 11/8/13 | 21,000 | 21,000 |
| Bank of Montreal (Chicago Branch) | 0.170% | 12/2/13 | 33,000 | 33,000 |
| Bank of Nova Scotia (Houston Branch) | 0.150% | 9/3/13 | 115,000 | 115,000 |
| Bank of Nova Scotia (Houston Branch) | 0.150% | 9/6/13 | 43,000 | 43,000 |
| Bank of Nova Scotia (Houston Branch) | 0.170% | 9/24/13 | 45,000 | 45,000 |
| Bank of Nova Scotia (Houston Branch) | 0.160% | 10/16/13 | 570,000 | 569,997 |
| Bank of Nova Scotia (Houston Branch) | 0.150% | 10/18/13 | 248,000 | 248,000 |
| Bank of Nova Scotia (Houston Branch) | 0.140% | 10/23/13 | 470,000 | 469,997 |
| Bank of Nova Scotia (Houston Branch) | 0.140% | 11/6/13 | 600,000 | 599,995 |
| Bank of Nova Scotia (Houston Branch) | 0.150% | 11/12/13 | 460,000 | 459,995 |
| Bank of Nova Scotia (Houston Branch) | 0.160% | 12/2/13 | 142,000 | 141,998 |
| Canadian Imperial Bank of Commerce | ||||
| (New York Branch) | 0.100% | 10/15/13 | 300,000 | 300,000 |
| Canadian Imperial Bank of Commerce | ||||
| (New York Branch) | 0.080% | 11/26/13 | 250,000 | 250,000 |
| Canadian Imperial Bank of Commerce | ||||
| (New York Branch) | 0.080% | 11/27/13 | 250,000 | 250,000 |
| 4 Commonwealth Bank of Australia | ||||
| (New York Branch) | 0.186% | 9/6/13 | 127,000 | 127,000 |
| 4 Commonwealth Bank of Australia | ||||
| (New York Branch) | 0.184% | 11/18/13 | 111,000 | 111,000 |
| 4 Toronto Dominion Bank (New York Branch) | 0.186% | 9/4/13 | 218,000 | 218,000 |
| 4 Toronto Dominion Bank (New York Branch) | 0.185% | 9/16/13 | 175,000 | 175,000 |
| 4 Toronto Dominion Bank (New York Branch) | 0.183% | 10/23/13 | 198,000 | 198,000 |
| 4 Toronto Dominion Bank (New York Branch) | 0.186% | 11/7/13 | 495,000 | 495,000 |
| 4 Toronto Dominion Bank (New York Branch) | 0.164% | 11/20/13 | 350,000 | 350,000 |
| Toronto Dominion Bank (New York Branch) | 0.220% | 11/22/13 | 39,500 | 39,500 |
| 4 Toronto Dominion Bank (New York Branch) | 0.164% | 11/29/13 | 196,000 | 196,000 |
| 4 Toronto Dominion Bank (New York Branch) | 0.175% | 12/13/13 | 161,000 | 161,000 |
| 4 Toronto Dominion Bank (New York Branch) | 0.234% | 12/20/13 | 172,000 | 172,021 |
| 4 Toronto Dominion Bank (New York Branch) | 0.174% | 12/23/13 | 199,000 | 199,000 |
| Toronto Dominion Bank (New York Branch) | 0.200% | 1/15/14 | 230,000 | 230,000 |
| Toronto Dominion Bank (New York Branch) | 0.220% | 2/3/14 | 400,000 | 400,000 |
| Toronto Dominion Bank (New York Branch) | 0.220% | 2/3/14 | 95,000 | 95,000 |
| Toronto Dominion Bank (New York Branch) | 0.220% | 2/5/14 | 185,000 | 185,000 |
| Toronto Dominion Bank (New York Branch) | 0.220% | 2/13/14 | 175,000 | 175,000 |
| Toronto Dominion Bank (New York Branch) | 0.220% | 2/18/14 | 541,000 | 541,000 |
| Westpac Banking Corp. (New York Branch) | 0.190% | 9/30/13 | 50,000 | 50,000 |
| 4 Westpac Banking Corp. (New York Branch) | 0.184% | 10/24/13 | 73,000 | 73,000 |
| 4 Westpac Banking Corp. (New York Branch) | 0.186% | 11/4/13 | 360,000 | 360,000 |
| 4 Westpac Banking Corp. (New York Branch) | 0.182% | 12/30/13 | 106,000 | 106,000 |
| 4 Westpac Banking Corp. (New York Branch) | 0.184% | 12/30/13 | 50,000 | 50,000 |
| 11,248,001 | ||||
| Total Certificates of Deposit (Cost $25,099,512) | 25,099,512 | |||
| Repurchase Agreements (0.1%) | ||||
| Bank of Nova Scotia | ||||
| (Dated 8/30/13, Repurchase Value $20,000,000, | ||||
| collateralized by U.S. Treasury Note/Bond | ||||
| 2.000%, 1/15/14; with a value of $20,400,000) | 0.040% | 9/3/13 | 20,000 | 20,000 |
| RBC Capital Markets LLC | ||||
| (Dated 8/30/13, Repurchase Value $40,091,000, | ||||
| collateralized by U.S. Treasury Note/Bond | ||||
| 2.000%, 2/15/22; with a value of $40,893,000) | 0.030% | 9/3/13 | 40,091 | 40,091 |
23
Prime Money Market Fund
| Face | Market | |||
| Maturity | Amount | Value | ||
| Yield1 | Date | ($000) | ($000) | |
| TD Securities (USA) LLC | ||||
| (Dated 8/30/13, Repurchase Value $12,000,000, | ||||
| collateralized by U.S. Treasury Note/Bond | ||||
| 0.625%, 8/15/16, and U.S. Treasury Bill | ||||
| 0.000%, 12/26/13; with a value of $12,240,000) | 0.030% | 9/3/13 | 12,000 | 12,000 |
| Total Repurchase Agreements (Cost $72,091) | 72,091 | |||
| Shares | ||||
| Money Market Fund (1.3%) | ||||
| 6 Vanguard Municipal Cash Management Fund | ||||
| (Cost $1,678,903) | 0.079% | 1,678,903,000 | 1,678,903 | |
| Face | ||||
| Amount | ||||
| ($000) | ||||
| Tax-Exempt Municipal Bonds (1.5%) | ||||
| 7 Apache County AZ Industrial Development | ||||
| Authority Pollution Control Revenue | ||||
| (Tucson Electric Power Co. Project) VRDO | 0.080% | 9/6/13 | 37,000 | 37,000 |
| 7 Arizona Health Facilities Authority Revenue | ||||
| (Banner Health) VRDO | 0.080% | 9/6/13 | 35,000 | 35,000 |
| 7 Ascension Parish LA Industrial Development | ||||
| Board Revenue (IMTT-Geismar Project) VRDO | 0.060% | 9/6/13 | 79,000 | 79,000 |
| 7 Burlington KS Environmental Improvement | ||||
| Revenue (Kansas City Power & Light Co. | ||||
| Project) VRDO | 0.070% | 9/6/13 | 29,000 | 29,000 |
| 7 Burlington KS Environmental Improvement | ||||
| Revenue (Kansas City Power & Light Co. | ||||
| Project) VRDO | 0.070% | 9/6/13 | 42,250 | 42,250 |
| 7 California Educational Facilities Authority | ||||
| Revenue (University of San Francisco) VRDO | 0.060% | 9/6/13 | 8,800 | 8,800 |
| 7 California Educational Facilities Authority | ||||
| Revenue (University of San Francisco) VRDO | 0.060% | 9/6/13 | 13,375 | 13,375 |
| 7 California Housing Finance Agency Multifamily | ||||
| Housing Revenue VRDO | 0.050% | 9/6/13 | 20,180 | 20,180 |
| 7 California Statewide Communities Development | ||||
| Authority Multifamily Housing Revenue | ||||
| (Wilshire Court Project) VRDO | 0.050% | 9/6/13 | 11,900 | 11,900 |
| 7 Clackamas County OR Hospital Facility Authority | ||||
| Revenue (Legacy Health System) VRDO | 0.050% | 9/6/13 | 9,700 | 9,700 |
| 7 Clark County NV Airport System Revenue VRDO | 0.070% | 9/6/13 | 12,200 | 12,200 |
| 7 Clark County NV Industrial Development | ||||
| Revenue (Southwest Gas Corp. Project) VRDO | 0.080% | 9/6/13 | 14,300 | 14,300 |
| 7 Cleveland-Cuyahoga County OH Port Authority | ||||
| Revenue (SPC Buildings 1 & 3 LLC) VRDO | 0.070% | 9/6/13 | 16,970 | 16,970 |
| 7 Colorado Health Facilities Authority Revenue | ||||
| (Evangelical Lutheran Good Samaritan | ||||
| Society Project) VRDO | 0.050% | 9/6/13 | 10,000 | 10,000 |
| 7 Columbus OH Regional Airport Authority Airport | ||||
| Revenue (Oasbo Expanded Asset Program) | ||||
| VRDO | 0.060% | 9/6/13 | 16,700 | 16,700 |
| 7 Contra Costa County CA Multifamily Housing | ||||
| Revenue (Park Regency) VRDO | 0.040% | 9/6/13 | 46,700 | 46,700 |
24
Prime Money Market Fund
| Face | Market | |||
| Maturity | Amount | Value | ||
| Yield1 | Date | ($000) | ($000) | |
| Curators of the University of Missouri System | ||||
| Facilities Revenue VRDO | 0.050% | 9/6/13 | 61,940 | 61,940 |
| 7 District of Columbia Revenue | ||||
| (World Wildlife Fund Inc.) VRDO | 0.080% | 9/6/13 | 19,500 | 19,500 |
| 7 Geneva NY Industrial Development Agency | ||||
| Civic Facility Revenue (Colleges of the Seneca | ||||
| Project) VRDO | 0.080% | 9/6/13 | 12,325 | 12,325 |
| 7 Glendale AZ Industrial Development Authority | ||||
| Revenue (Midwestern University) VRDO | 0.080% | 9/6/13 | 33,975 | 33,975 |
| 7 Greenville County SC Hospital System Revenue | ||||
| VRDO | 0.050% | 9/6/13 | 13,000 | 13,000 |
| 7 Gwinnett County GA Development Authority | ||||
| Revenue (Nilhan Hospitality LLC) VRDO | 0.050% | 9/6/13 | 11,400 | 11,400 |
| 7 Hanover County VA Economic Development | ||||
| Authority Revenue (Bon Secours Health | ||||
| System Inc.) VRDO | 0.060% | 9/6/13 | 11,955 | 11,955 |
| 7 Idaho Housing & Finance Association | ||||
| Single Family Mortgage Revenue VRDO | 0.070% | 9/6/13 | 18,200 | 18,200 |
| 7 Illinois Finance Authority Revenue | ||||
| (Carle Foundation) VRDO | 0.060% | 9/6/13 | 18,225 | 18,225 |
| 7 Illinois Finance Authority Revenue (Little Co. of | ||||
| Mary Hospital & Health Care Centers) VRDO | 0.070% | 9/6/13 | 15,620 | 15,620 |
| 7 Illinois Finance Authority Revenue (Northwest | ||||
| Community Hospital) VRDO | 0.060% | 9/6/13 | 27,415 | 27,415 |
| 7 Illinois Finance Authority Revenue (Southern | ||||
| Illinois Healthcare Enterprises Inc.) VRDO | 0.080% | 9/6/13 | 39,000 | 39,000 |
| 7 Johnson City TN Health & Educational Facilities | ||||
| Board Hospital Revenue (STS Health Alliance) | ||||
| VRDO | 0.050% | 9/6/13 | 32,140 | 32,140 |
| 7 Lee Memorial Health System Florida Hospital | ||||
| Revenue VRDO | 0.060% | 9/6/13 | 6,425 | 6,425 |
| 7 Louisiana Public Facilities Authority Hospital | ||||
| Revenue (Franciscan Missionaries | ||||
| of Our Lady Health System Project) VRDO | 0.060% | 9/6/13 | 13,900 | 13,900 |
| 7 Maine Health & Higher Educational Facilities | ||||
| Authority Revenue (Bowdoin College) VRDO | 0.060% | 9/6/13 | 14,600 | 14,600 |
| 7 Maine Health & Higher Educational Facilities | ||||
| Authority Revenue VRDO | 0.070% | 9/6/13 | 55,430 | 55,430 |
| 7 Massachusetts Development Finance Agency | ||||
| Revenue (Wentworth Institute of Technology) | ||||
| VRDO | 0.070% | 9/6/13 | 4,000 | 4,000 |
| 7 Massachusetts Health & Educational Facilities | ||||
| Authority Revenue (Baystate Medical Center) | ||||
| VRDO | 0.050% | 9/6/13 | 11,000 | 11,000 |
| Massachusetts Health & Educational Facilities | ||||
| Authority Revenue (MIT) VRDO | 0.050% | 9/6/13 | 19,320 | 19,320 |
| Missouri Health & Educational Facilities | ||||
| Authority Health Facilities Revenue | ||||
| (BJC Health System) VRDO | 0.060% | 9/6/13 | 18,000 | 18,000 |
| 7 Missouri Health & Educational Facilities | ||||
| Authority Health Facilities Revenue | ||||
| (SSM Health System) VRDO | 0.070% | 9/6/13 | 77,535 | 77,535 |
| 7 New York City NY Housing Development Corp. | ||||
| Multi-Family Rental Housing Revenue | ||||
| (One Columbus Place Development) VRDO | 0.060% | 9/6/13 | 68,100 | 68,100 |
25
Prime Money Market Fund
| Face | Market | |||
| Maturity | Amount | Value | ||
| Yield1 | Date | ($000) | ($000) | |
| 7 New York City NY Housing Development Corp. | ||||
| Multi-Family Rental Housing Revenue | ||||
| (Related-Sierra Development) VRDO | 0.060% | 9/6/13 | 32,500 | 32,500 |
| 7 New York City NY Housing Development Corp. | ||||
| Multi-Family Rental Housing Revenue | ||||
| (West End Towers) VRDO | 0.060% | 9/6/13 | 31,300 | 31,300 |
| 7 New York State Housing Finance Agency Housing | ||||
| Revenue (125 West 31st Street) VRDO | 0.080% | 9/6/13 | 42,300 | 42,300 |
| 7 New York State Housing Finance Agency Housing | ||||
| Revenue (20 River Terrace Housing) VRDO | 0.080% | 9/6/13 | 17,300 | 17,300 |
| 7 New York State Housing Finance Agency Housing | ||||
| Revenue (70 Battery Place) VRDO | 0.060% | 9/6/13 | 12,800 | 12,800 |
| 7 New York State Housing Finance Agency Housing | ||||
| Revenue (Clinton Green North) VRDO | 0.080% | 9/6/13 | 31,845 | 31,845 |
| 7 New York State Housing Finance Agency Housing | ||||
| Revenue (Clinton Green South) VRDO | 0.080% | 9/6/13 | 11,625 | 11,625 |
| 7 New York State Housing Finance Agency Housing | ||||
| Revenue (East 84th Street) VRDO | 0.060% | 9/6/13 | 24,500 | 24,500 |
| 7 New York State Housing Finance Agency Housing | ||||
| Revenue (West 17th Street) VRDO | 0.060% | 9/6/13 | 11,710 | 11,710 |
| 7 North Carolina Medical Care Commission Health | ||||
| Systems Revenue (Catholic Health East) VRDO | 0.070% | 9/6/13 | 6,910 | 6,910 |
| 7 Oakland University of Michigan Revenue VRDO | 0.090% | 9/6/13 | 16,120 | 16,120 |
| Ohio State University General Receipts Revenue | ||||
| VRDO | 0.060% | 9/6/13 | 6,200 | 6,200 |
| 7 Piedmont SC Municipal Power Agency Revenue | ||||
| VRDO | 0.060% | 9/6/13 | 16,000 | 16,000 |
| Posey County IN Economic Development | ||||
| Revenue (Midwest Fertilizer Corp. Project) PUT | 0.750% | 10/17/13 | 306,500 | 306,500 |
| 7 Raleigh Durham NC Airport Authority Revenue | ||||
| VRDO | 0.060% | 9/6/13 | 8,000 | 8,000 |
| 7 Rhode Island Health & Educational Building Corp. | ||||
| Higher Education Facility Revenue | ||||
| (Rogers Williams University) VRDO | 0.060% | 9/6/13 | 7,275 | 7,275 |
| 7 Salem OR Hospital Facility Authority Revenue | ||||
| (Salem Hospital Project) VRDO | 0.060% | 9/6/13 | 16,500 | 16,500 |
| 7 San Francisco CA City & County | ||||
| International Airport Revenue VRDO | 0.060% | 9/6/13 | 33,000 | 33,000 |
| 7 St. Charles County MO Public Water Supply | ||||
| District No.2 Revenue VRDO | 0.060% | 9/6/13 | 13,000 | 13,000 |
| 7 St. Cloud MN Health Care Revenue | ||||
| (Centracare Health System) VRDO | 0.060% | 9/6/13 | 21,995 | 21,995 |
| 7 Sunshine State Governmental Financing | ||||
| Commission Florida Revenue | ||||
| (Miami Dade County Program) VRDO | 0.070% | 9/6/13 | 13,800 | 13,800 |
| Texas Department of Housing & Community | ||||
| Affairs Single Family Revenue VRDO | 0.070% | 9/6/13 | 42,400 | 42,400 |
| Texas Department of Housing & Community | ||||
| Affairs Single Family Revenue VRDO | 0.070% | 9/6/13 | 34,620 | 34,620 |
| Texas Department of Housing & Community | ||||
| Affairs Single Family Revenue VRDO | 0.070% | 9/6/13 | 28,900 | 28,900 |
| Texas Department of Housing & Community | ||||
| Affairs Single Family Revenue VRDO | 0.090% | 9/6/13 | 16,445 | 16,445 |
| Texas Department of Housing & Community | ||||
| Affairs Single Mortgage Revenue VRDO | 0.090% | 9/6/13 | 51,990 | 51,990 |
26
Prime Money Market Fund
| Face | Market | ||||
| Maturity | Amount | Value | |||
| Yield1 | Date | ($000) | ($000) | ||
| 7 | University of Colorado Hospital Authority | ||||
| Revenue VRDO | 0.070% | 9/6/13 | 21,010 | 21,010 | |
| 7 | West Virginia Hospital Finance Authority Hospital | ||||
| Revenue (Charleston Area Medical Center Inc.) | |||||
| VRDO | 0.070% | 9/6/13 | 29,555 | 29,555 | |
| 7 | Wisconsin Health & Educational Facilities | ||||
| Authority Revenue (Gundersen Lutheran) VRDO | 0.080% | 9/6/13 | 11,000 | 11,000 | |
| 7 | Wisconsin Health & Educational Facilities | ||||
| Authority Revenue (University of Wisconsin | |||||
| Medical Foundation) VRDO | 0.070% | 9/6/13 | 20,855 | 20,855 | |
| 7 | Wyoming Student Loan Corp. Student | ||||
| Loan Revenue VRDO | 0.060% | 9/6/13 | 31,180 | 31,180 | |
| Total Tax-Exempt Municipal Bonds (Cost $1,975,215) | 1,975,215 | ||||
| Corporate Bonds (0.2%) | |||||
| Finance (0.2%) | |||||
| 4 | Royal Bank of Canada (New York Branch) | 0.475% | 9/3/13 | 21,500 | 21,500 |
| 4 | Canadian Imperial Bank of Commerce | ||||
| (New York Branch) | 0.716% | 10/31/13 | 80,000 | 80,076 | |
| General Electric Capital Corp. | 1.875% | 9/16/13 | 54,500 | 54,536 | |
| 4,8 | Westpac Banking Corp. | 0.973% | 9/24/13 | 39,000 | 39,019 |
| Total Corporate Bonds (Cost $195,131) | 195,131 | ||||
| Sovereign Bonds (U.S. Dollar-Denominated) (0.0%) | |||||
| Province of Ontario (Cost $10,507) | 1.375% | 1/27/14 | 10,460 | 10,507 | |
| Taxable Municipal Bonds (0.3%) | |||||
| 7,8 | BlackRock Municipal Bond Trust TOB VRDO | 0.090% | 9/3/13 | 18,105 | 18,105 |
| 7,8 | BlackRock Municipal Income Investment | ||||
| Quality Trust TOB VRDO | 0.090% | 9/3/13 | 9,660 | 9,660 | |
| 7,8 | BlackRock Municipal Income Trust TOB VRDO | 0.090% | 9/3/13 | 207,000 | 207,000 |
| 7,8 | BlackRock MuniHoldings Fund II, Inc. TOB VRDO | 0.090% | 9/3/13 | 21,850 | 21,850 |
| 7,8 | BlackRock MuniHoldings Fund, Inc. TOB VRDO | 0.090% | 9/3/13 | 19,165 | 19,165 |
| 7,8 | BlackRock MuniHoldings Quality Fund II, Inc. | ||||
| TOB VRDO | 0.090% | 9/3/13 | 100,000 | 100,000 | |
| 7,8 | BlackRock MuniHoldings Quality Fund II, Inc. | ||||
| TOB VRDO | 0.090% | 9/3/13 | 19,875 | 19,875 | |
| 7,8 | BlackRock MuniYield Investment Quality Fund | ||||
| TOB VRDO | 0.090% | 9/3/13 | 12,910 | 12,910 | |
| 7,8 | BlackRock Strategic Municipal Trust TOB VRDO | 0.090% | 9/3/13 | 9,820 | 9,820 |
| 7,8 | Los Angeles CA Department of Water & Power | ||||
| Revenue TOB VRDO | 0.220% | 9/6/13 | 13,000 | 13,000 | |
| 8 | Massachusetts Transportation Fund Revenue | ||||
| TOB VRDO | 0.220% | 9/6/13 | 13,100 | 13,100 | |
| 8 | Seattle WA Municipal Light & Power Revenue | ||||
| TOB VRDO | 0.220% | 9/6/13 | 6,400 | 6,400 | |
| Total Taxable Municipal Bonds (Cost $450,885) | 450,885 | ||||
| Total Investments (101.5%) (Cost $131,090,606) | 131,090,606 | ||||
| Other Assets and Liabilities (-1.5%) | |||||
| Other Assets | 920,873 | ||||
| Liabilities | (2,837,279) | ||||
| (1,916,406) | |||||
| Net Assets (100%) | 129,174,200 | ||||
27
Prime Money Market Fund
| At August 31, 2013, net assets consisted of: | |
| Amount | |
| ($000) | |
| Paid-in Capital | 129,162,809 |
| Undistributed Net Investment Income | — |
| Accumulated Net Realized Gains | 11,391 |
| Net Assets | 129,174,200 |
| Investor Shares—Net Assets | |
| Applicable to 102,140,983,453 outstanding $.001 par value shares of | |
| beneficial interest (unlimited authorization) | 102,159,532 |
| Net Asset Value Per Share—Investor Shares | $1.00 |
| Institutional Shares—Net Assets | |
| Applicable to 27,011,262,291 outstanding $.001 par value shares of | |
| beneficial interest (unlimited authorization) | 27,014,668 |
| Net Asset Value Per Share—Institutional Shares | $1.00 |
See Note A in Notes to Financial Statements.
1 Represents annualized yield at date of purchase for discount securities, and coupon for coupon-bearing securities.
2 The issuer was placed under federal conservatorship in September 2008; since that time, its daily operations have been managed by the Federal Housing Finance Agency and it receives capital from the U.S. Treasury, as needed to maintain a positive net worth, in exchange for senior preferred stock.
3 The issuer operates under a congressional charter; its securities are generally neither guaranteed by the U.S. Treasury nor backed by the full faith and credit of the U.S. government.
4 Adjustable-rate security.
5 Security exempt from registration under Section 4(2) of the Securities Act of 1933. Such securities may be sold in transactions exempt from registration only to dealers in that program or other “accredited investors.” At August 31, 2013, the aggregate value of these securities was $20,609,460,000, representing 16.0% of net assets.
6 Affiliated money market fund available only to Vanguard funds and certain trusts and accounts managed by Vanguard. Rate shown is the 7-day yield.
7 Scheduled principal and interest payments are guaranteed by bank letter of credit.
8 Security exempt from registration under Rule 144A of the Securities Act of 1933. Such securities may be sold in transactions exempt from registration, normally to qualified institutional buyers. At August 31, 2013, the aggregate value of these securities was $3,180,088,000, representing 2.5% of net assets.
PUT—Put Option Obligation.
TOB—Tender Option Bond.
VRDO—Variable Rate Demand Obligation.
See accompanying Notes, which are an integral part of the Financial Statements.
28
Prime Money Market Fund
| Statement of Operations | |
| Year Ended | |
| August 31, 2013 | |
| ($000) | |
| Investment Income | |
| Income | |
| Interest1 | 209,533 |
| Total Income | 209,533 |
| Expenses | |
| The Vanguard Group—Note B | |
| Investment Advisory Services | 3,308 |
| Management and Administrative—Investor Shares | 127,981 |
| Management and Administrative—Institutional Shares | 17,697 |
| Marketing and Distribution—Investor Shares | 24,956 |
| Marketing and Distribution—Institutional Shares | 6,735 |
| Custodian Fees | 1,515 |
| Auditing Fees | 29 |
| Shareholders’ Reports—Investor Shares | 750 |
| Shareholders’ Reports—Institutional Shares | 151 |
| Trustees’ Fees and Expenses | 165 |
| Total Expenses | 183,287 |
| Expense Reduction—Note B | (10,254) |
| Net Expenses | 173,033 |
| Net Investment Income | 36,500 |
| Realized Net Gain (Loss) on Investment Securities Sold | 1,603 |
| Net Increase (Decrease) in Net Assets Resulting from Operations | 38,103 |
| 1 Interest income from an affiliated company of the fund was $2,099,000. | |
See accompanying Notes, which are an integral part of the Financial Statements.
29
Prime Money Market Fund
| Statement of Changes in Net Assets | ||
| Year Ended August 31, | ||
| 2013 | 2012 | |
| ($000) | ($000) | |
| Increase (Decrease) in Net Assets | ||
| Operations | ||
| Net Investment Income | 36,500 | 57,450 |
| Realized Net Gain (Loss) | 1,603 | 1,405 |
| Net Increase (Decrease) in Net Assets Resulting from Operations | 38,103 | 58,855 |
| Distributions | ||
| Net Investment Income | ||
| Investor Shares | (17,736) | (32,517) |
| Institutional Shares | (18,764) | (24,933) |
| Realized Capital Gain | ||
| Investor Shares | — | — |
| Institutional Shares | — | — |
| Total Distributions | (36,500) | (57,450) |
| Capital Share Transactions | ||
| Investor Shares | 11,946,615 | (2,193,142) |
| Institutional Shares | 2,471,452 | 2,803,343 |
| Net Increase (Decrease) from Capital Share Transactions | 14,418,067 | 610,201 |
| Total Increase (Decrease) | 14,419,670 | 611,606 |
| Net Assets | ||
| Beginning of Period | 114,754,530 | 114,142,924 |
| End of Period | 129,174,200 | 114,754,530 |
See accompanying Notes, which are an integral part of the Financial Statements.
30
Prime Money Market Fund
Financial Highlights
| Investor Shares | |||||
| For a Share Outstanding | Year Ended August 31, | ||||
| Throughout Each Period | 2013 | 2012 | 2011 | 2010 | 2009 |
| Net Asset Value, Beginning of Period | $1.00 | $1.00 | $1.00 | $1.00 | $1.00 |
| Investment Operations | |||||
| Net Investment Income | . 0002 | . 0004 | .001 | .001 | .013 |
| Net Realized and Unrealized Gain (Loss) | |||||
| on Investments | — | — | — | — | — |
| Total from Investment Operations | . 0002 | . 0004 | .001 | .001 | .013 |
| Distributions | |||||
| Dividends from Net Investment Income | (. 0002) | (. 0004) | (. 001) | (. 001) | (. 013) |
| Distributions from Realized Capital Gains | — | — | — | — | — |
| Total Distributions | (. 0002) | (. 0004) | (. 001) | (. 001) | (. 013) |
| Net Asset Value, End of Period | $1.00 | $1.00 | $1.00 | $1.00 | $1.00 |
| Total Return1 | 0.02% | 0.04% | 0.06% | 0.08% | 1.31% |
| Ratios/Supplemental Data | |||||
| Net Assets, End of Period (Millions) | $102,160 | $90,212 | $92,404 | $88,684 | $96,078 |
| Ratio of Expenses to Average Net Assets | 0.16%2 | 0.16% | 0.20% | 0.23% | 0.28%3 |
| Ratio of Net Investment Income to | |||||
| Average Net Assets | 0.02% | 0.04% | 0.06% | 0.08% | 1.25% |
1 Total returns do not include account service fees that may have applied in the periods shown. Fund prospectuses provide information about any applicable account service fees.
2 The ratio of total expenses to average net assets before an expense reduction was 0.17%. See Note B in the Notes to Financial Statements.
3 Includes 0.03% of fees to participate in the Treasury Guarantee Program for Money Market Funds.
See accompanying Notes, which are an integral part of the Financial Statements.
31
Prime Money Market Fund
Financial Highlights
| Institutional Shares | |||||
| For a Share Outstanding | Year Ended August 31, | ||||
| Throughout Each Period | 2013 | 2012 | 2011 | 2010 | 2009 |
| Net Asset Value, Beginning of Period | $1.00 | $1.00 | $1.00 | $1.00 | $1.00 |
| Investment Operations | |||||
| Net Investment Income | . 001 | . 001 | . 002 | . 002 | . 015 |
| Net Realized and Unrealized Gain (Loss) | |||||
| on Investments | — | — | — | — | — |
| Total from Investment Operations | . 001 | . 001 | . 002 | . 002 | . 015 |
| Distributions | |||||
| Dividends from Net Investment Income | (. 001) | (. 001) | (. 002) | (. 002) | (. 015) |
| Distributions from Realized Capital Gains | — | — | — | — | — |
| Total Distributions | (. 001) | (. 001) | (. 002) | (. 002) | (. 015) |
| Net Asset Value, End of Period | $1.00 | $1.00 | $1.00 | $1.00 | $1.00 |
| Total Return | 0.07% | 0.11% | 0.17% | 0.22% | 1.47% |
| Ratios/Supplemental Data | |||||
| Net Assets, End of Period (Millions) | $27,015 | $24,543 | $21,739 | $19,107 | $18,323 |
| Ratio of Expenses to Average Net Assets | 0.10% | 0.09% | 0.09% | 0.09% | 0.13%1 |
| Ratio of Net Investment Income to | |||||
| Average Net Assets | 0.07% | 0.11% | 0.17% | 0.22% | 1.40% |
| 1 Includes 0.03% of fees to participate in the Treasury Guarantee Program for Money Market Funds. | |||||
See accompanying Notes, which are an integral part of the Financial Statements.
32
Prime Money Market Fund
Notes to Financial Statements
Vanguard Prime Money Market Fund is registered under the Investment Company Act of 1940 as an open-end investment company, or mutual fund. The fund invests in short-term debt instruments of companies primarily operating in specific industries, particularly financial services; the issuers’ abilities to meet their obligations may be affected by economic developments in such industries. The fund offers two classes of shares, Investor Shares and Institutional Shares. Investor Shares are available to any investor who meets the fund’s minimum purchase requirements. Institutional Shares are designed for institutional investors who meet certain administrative, service, and account-size criteria.
A. The following significant accounting policies conform to generally accepted accounting principles for U.S. mutual funds. The fund consistently follows such policies in preparing its financial statements.
1. Security Valuation: Securities are valued at amortized cost, which approximates market value. Investments in Vanguard Municipal Cash Management Fund are valued at that fund’s net asset value.
2. Repurchase Agreements: The fund may enter into repurchase agreements with institutional counterparties. Securities pledged as collateral to the fund under repurchase agreements are held by a custodian bank until the agreements mature. Each agreement requires that the market value of the collateral be sufficient to cover payments of interest and principal. The fund further mitigates its counterparty risk by entering into repurchase agreements only with a diverse group of pre-qualified counterparties, monitoring their financial strength, and entering into master repurchase agreements with its counterparties. The master repurchase agreements provide that, in the event of a counter-party’s default (including bankruptcy), the fund may terminate any repurchase agreements with that counterparty, determine the net amount owed, and sell or retain the collateral up to the net amount owed to the fund. Such action may be subject to legal proceedings, which may delay or limit the disposition of collateral.
3. Federal Income Taxes: The fund intends to continue to qualify as a regulated investment company and distribute all of its taxable income. Management has analyzed the fund’s tax positions taken for all open federal income tax years (August 31, 2010–2013), and has concluded that no provision for federal income tax is required in the fund’s financial statements.
4. Distributions: Distributions from net investment income are declared daily and paid on the first business day of the following month.
5. Other: Interest income includes income distributions received from Vanguard Municipal Cash Management Fund and is accrued daily. Premiums and discounts on debt securities purchased are amortized and accreted, respectively, to interest income over the lives of the respective securities. Security transactions are accounted for on the date securities are bought or sold. Costs used to determine realized gains (losses) on the sale of investment securities are those of the specific securities sold.
Each class of shares has equal rights as to assets and earnings, except that each class separately bears certain class-specific expenses related to maintenance of shareholder accounts (included in Management and Administrative expenses) and shareholder reporting. Marketing and distribution expenses are allocated to each class of shares based on a method approved by the board of trustees. Income, other non-class-specific expenses, and gains and losses on investments are allocated to each class of shares based on its relative net assets.
B. The Vanguard Group furnishes at cost investment advisory, corporate management, administrative, marketing, and distribution services. The costs of such services are allocated to the fund under methods approved by the board of trustees. The fund has committed to provide up to 0.40% of its net assets in capital contributions to Vanguard. At August 31, 2013, the fund had contributed capital of
33
Prime Money Market Fund
$15,213,000 to Vanguard (included in Other Assets), representing 0.01% of the fund’s net assets and 6.08% of Vanguard’s capitalization. The fund’s trustees and officers are also directors and officers of Vanguard. Vanguard and the board of trustees have agreed to temporarily limit certain net operating expenses in excess of the fund’s daily yield so as to maintain a zero or positive yield for the fund. Vanguard and the board of trustees may terminate the temporary expense limitation at any time. For the year ended August 31, 2013, Vanguard’s expenses were reduced by $10,254,000 (an effective annual rate of 0.01% of the fund’s average net assets).
C. Various inputs may be used to determine the value of the fund’s investments. These inputs are summarized in three broad levels for financial statement purposes. The inputs or methodologies used to value securities are not necessarily an indication of the risk associated with investing in those securities.
Level 1—Quoted prices in active markets for identical securities.
Level 2—Other significant observable inputs (including quoted prices for similar securities, interest rates, prepayment speeds, credit risk, etc.).
Level 3—Significant unobservable inputs (including the fund’s own assumptions used to determine the fair value of investments).
The fund’s investment in Vanguard Municipal Cash Management Fund is valued based on Level 1 inputs. All of the fund’s other investments were valued using amortized cost, in accordance with rules under the Investment Company Act of 1940. Amortized cost approximates the current fair value of a security, but since the value is not obtained from a quoted price in an active market, securities valued at amortized cost are considered to be valued using Level 2 inputs.
D. Capital share transactions for each class of shares were:
| Year Ended August 31, | ||||
| 2013 | 2012 | |||
| Amount | Shares | Amount | Shares | |
| ($000) | (000) | ($000) | (000) | |
| Investor Shares | ||||
| Issued | 133,084,052 | 133,084,052 | 103,443,975 | 103,443,975 |
| Issued in Lieu of Cash Distributions | 17,373 | 17,373 | 31,844 | 31,844 |
| Redeemed | (121,154,810) | (121,154,810) | (105,668,961) | (105,668,961) |
| Net Increase (Decrease)—Investor Shares | 11,946,615 | 11,946,615 | (2,193,142) | (2,193,142) |
| Institutional Shares | ||||
| Issued | 17,154,977 | 17,154,977 | 18,703,639 | 18,703,639 |
| Issued in Lieu of Cash Distributions | 18,370 | 18,370 | 24,338 | 24,338 |
| Redeemed | (14,701,895) | (14,701,895) | (15,924,634) | (15,924,634) |
| Net Increase (Decrease)—Institutional Shares | 2,471,452 | 2,471,452 | 2,803,343 | 2,803,343 |
E. Management has determined that no material events or transactions occurred subsequent to August 31, 2013, that would require recognition in these financial statements. The fund distributed $11,224,000 ($0.000086 per share) of short-term capital gains to shareholders of record on September 20, 2013.
34
Federal Money Market Fund
Fund Profile
As of August 31, 2013
| Financial Attributes | |
| Ticker Symbol | VMFXX |
| Expense Ratio1 | 0.16% |
| 7-Day SEC Yield | 0.02% |
| Average Weighted | |
| Maturity | 56 days |
| Sector Diversification (% of portfolio) | |
| Repurchase Agreements | 0.1% |
| U.S. Government Agency Obligations | 99.0 |
| U.S. Treasury Bills | 0.9 |
The agency and mortgage-backed securities sectors may include issues from government-sponsored enterprises; such issues are generally not backed by the full faith and credit of the U.S. government.
| Distribution by Credit Quality (% of portfolio) | |
| First Tier | 100.0% |
For information about these ratings, see the Glossary entry for Credit Quality.
1 The expense ratio shown is from the prospectus dated December 28, 2012, and represents estimated costs for the current fiscal year. For the fiscal year ended August 31, 2013, the expense ratio was 0.13%, reflecting a temporary reduction in operating expenses (described in Note B of the Notes to Financial Statements). Before this reduction, the expense ratio was 0.14%.
35
Federal Money Market Fund
Performance Summary
Investment returns will fluctuate. All of the returns in this report represent past performance, which is not a guarantee of future results that may be achieved by the fund. (Current performance may be lower or higher than the performance data cited. For performance data current to the most recent month-end, visit our website at vanguard.com/performance.) The returns shown do not reflect taxes that a shareholder would pay on fund distributions. An investment in a money market fund is not insured or guaranteed by the Federal Deposit Insurance Corporation or any other government agency. Although the fund seeks to preserve the value of your investment at $1 per share, it is possible to lose money by investing in the fund. The fund’s 7-day SEC yield reflects its current earnings more closely than do the average annual returns.
Cumulative Performance: August 31, 2003, Through August 31, 2013
Initial Investment of $10,000
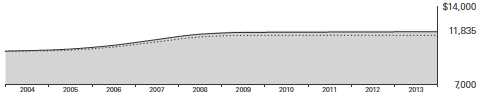
| Average Annual Total Returns | ||||
| Periods Ended August 31, 2013 | ||||
| Final Value | ||||
| One | Five | Ten | of a $10,000 | |
| Year | Years | Years | Investment | |
| Federal Money Market Fund | 0.01% | 0.23% | 1.70% | $11,835 |
| Government Money Market Funds | ||||
| Average | 0.00 | 0.09 | 1.35 | 11,436 |
| Citigroup Three-Month U.S. Treasury | ||||
| Bill Index | 0.07 | 0.17 | 1.62 | 11,739 |
Government Money Market Funds Average: Derived from data provided by Lipper, a Thomson Reuters Company.
See Financial Highlights for dividend information.
36
Federal Money Market Fund
| Fiscal-Year Total Returns (%): August 31, 2003, Through August 31, 2013 | ||
| Gov’t Money | ||
| Market Funds | ||
| Average | ||
| Fiscal Year | Total Returns | Total Returns |
| 2004 | 0.82% | 0.40% |
| 2005 | 2.26 | 1.73 |
| 2006 | 4.31 | 3.78 |
| 2007 | 5.17 | 4.58 |
| 2008 | 3.46 | 2.71 |
| 2009 | 1.06 | 0.43 |
| 2010 | 0.04 | 0.00 |
| 2011 | 0.02 | 0.00 |
| 2012 | 0.01 | 0.00 |
| 2013 | 0.01 | 0.00 |
| 7-day SEC yield (8/31/2013): 0.02% | ||
| Government Money Market Funds Average: Derived from data provided by Lipper, a Thomson Reuters Company. | ||
Average Annual Total Returns: Periods Ended June 30, 2013
This table presents returns through the latest calendar quarter—rather than through the end of the fiscal period.
Securities and Exchange Commission rules require that we provide this information.
| Inception | One | Five | Ten | |
| Date | Year | Years | Years | |
| Federal Money Market Fund | 7/13/1981 | 0.01% | 0.29% | 1.71% |
37
Federal Money Market Fund
Financial Statements
Statement of Net Assets
As of August 31, 2013
The fund reports a complete list of its holdings in various monthly and quarterly regulatory filings. The fund publishes its holdings on a monthly basis at vanguard.com and files them with the Securities and Exchange Commission on Form N-MFP. The fund’s Form N-MFP filings become public 60 days after the relevant month-end, and may be viewed at sec.gov or via a link on the “Portfolio Holdings” page on vanguard.com. For the second and fourth fiscal quarters, the lists appear in the fund’s semiannual and annual reports to shareholders. For the first and third fiscal quarters, the fund files the lists with the SEC on Form N-Q. Shareholders can look up the fund’s Forms N-Q on the SEC’s website at sec. gov. Forms N-Q may also be reviewed and copied at the SEC’s Public Reference Room (see the back cover of this report for further information).
| Face | Market | ||||
| Maturity | Amount | Value | |||
| Yield1 | Date | ($000) | ($000) | ||
| U.S. Government and Agency Obligations (98.4%) | |||||
| 2 | Fannie Mae Discount Notes | 0.070%–0.140% | 9/3/13 | 27,400 | 27,400 |
| 2 | Fannie Mae Discount Notes | 0.075%–0.110% | 9/4/13 | 48,552 | 48,552 |
| 2 | Fannie Mae Discount Notes | 0.080%–0.130% | 9/16/13 | 86,050 | 86,047 |
| 2 | Fannie Mae Discount Notes | 0.090%–0.100% | 9/18/13 | 135,000 | 134,994 |
| 2 | Fannie Mae Discount Notes | 0.130% | 9/25/13 | 1,317 | 1,317 |
| 2 | Fannie Mae Discount Notes | 0.085%–0.140% | 10/1/13 | 51,862 | 51,858 |
| 2 | Fannie Mae Discount Notes | 0.105%–0.130% | 10/2/13 | 14,000 | 13,999 |
| 2 | Fannie Mae Discount Notes | 0.130% | 10/3/13 | 4,100 | 4,099 |
| 2 | Fannie Mae Discount Notes | 0.120% | 10/9/13 | 35,000 | 34,996 |
| 2 | Fannie Mae Discount Notes | 0.125% | 10/15/13 | 8,000 | 7,999 |
| 2 | Fannie Mae Discount Notes | 0.070% | 10/21/13 | 3,100 | 3,100 |
| 2 | Fannie Mae Discount Notes | 0.080%–0.110% | 10/23/13 | 13,330 | 13,328 |
| 2 | Fannie Mae Discount Notes | 0.110%–0.150% | 11/1/13 | 10,124 | 10,122 |
| 2 | Fannie Mae Discount Notes | 0.105%–0.115% | 11/6/13 | 42,700 | 42,692 |
| 2 | Fannie Mae Discount Notes | 0.105% | 11/13/13 | 3,100 | 3,099 |
| 2 | Fannie Mae Discount Notes | 0.090% | 11/18/13 | 2,225 | 2,225 |
| 2 | Fannie Mae Discount Notes | 0.080% | 11/27/13 | 5,000 | 4,999 |
| 2 | Fannie Mae Discount Notes | 0.100% | 12/4/13 | 5,150 | 5,149 |
| 2 | Fannie Mae Discount Notes | 0.160% | 12/11/13 | 2,500 | 2,499 |
| 2 | Fannie Mae Discount Notes | 0.080% | 12/16/13 | 2,000 | 1,999 |
| 2 | Fannie Mae Discount Notes | 0.090%–0.150% | 12/18/13 | 25,592 | 25,583 |
| 2 | Fannie Mae Discount Notes | 0.143% | 12/26/13 | 30,000 | 29,986 |
| 2 | Fannie Mae Discount Notes | 0.100% | 1/2/14 | 1,000 | 1,000 |
| 2 | Fannie Mae Discount Notes | 0.090%–0.110% | 1/8/14 | 15,100 | 15,094 |
| 2 | Fannie Mae Discount Notes | 0.100% | 1/15/14 | 8,790 | 8,787 |
| 2 | Fannie Mae Discount Notes | 0.100%–0.110% | 1/27/14 | 7,200 | 7,197 |
| 2 | Fannie Mae Discount Notes | 0.110% | 2/3/14 | 1,000 | 999 |
| 2 | Fannie Mae Discount Notes | 0.110% | 2/12/14 | 12,549 | 12,543 |
| 3 | Federal Home Loan Bank Discount Notes | 0.110% | 9/3/13 | 8,000 | 8,000 |
| 3 | Federal Home Loan Bank Discount Notes | 0.070%–0.130% | 9/4/13 | 17,850 | 17,850 |
| 3 | Federal Home Loan Bank Discount Notes | 0.080%–0.093% | 9/6/13 | 35,400 | 35,400 |
| 3 | Federal Home Loan Bank Discount Notes | 0.078%–0.140% | 9/11/13 | 37,000 | 36,999 |
| 3 | Federal Home Loan Bank Discount Notes | 0.130%–0.135% | 9/13/13 | 8,700 | 8,700 |
| 3 | Federal Home Loan Bank Discount Notes | 0.090% | 9/20/13 | 2,300 | 2,300 |
| 3 | Federal Home Loan Bank Discount Notes | 0.130% | 9/23/13 | 1,400 | 1,400 |
| 3 | Federal Home Loan Bank Discount Notes | 0.135% | 9/26/13 | 1,000 | 1,000 |
38
Federal Money Market Fund
| Face | Market | ||||
| Maturity | Amount | Value• | |||
| Yield1 | Date | ($000) | ($000) | ||
| 3 | Federal Home Loan Bank Discount Notes | 0.100%–0.140% | 10/2/13 | 27,700 | 27,697 |
| 3 | Federal Home Loan Bank Discount Notes | 0.120% | 10/4/13 | 61,100 | 61,093 |
| 3 | Federal Home Loan Bank Discount Notes | 0.120%–0.135% | 10/9/13 | 23,625 | 23,622 |
| 3 | Federal Home Loan Bank Discount Notes | 0.070% | 10/11/13 | 2,700 | 2,700 |
| 3 | Federal Home Loan Bank Discount Notes | 0.120% | 10/16/13 | 10,000 | 9,998 |
| 3 | Federal Home Loan Bank Discount Notes | 0.075%–0.120% | 10/18/13 | 108,000 | 107,988 |
| 3 | Federal Home Loan Bank Discount Notes | 0.070% | 10/23/13 | 1,000 | 1,000 |
| 3 | Federal Home Loan Bank Discount Notes | 0.103% | 10/25/13 | 35,000 | 34,995 |
| 3 | Federal Home Loan Bank Discount Notes | 0.105% | 10/30/13 | 20,000 | 19,997 |
| 3 | Federal Home Loan Bank Discount Notes | 0.090% | 11/1/13 | 3,200 | 3,199 |
| 3 | Federal Home Loan Bank Discount Notes | 0.069%–0.080% | 11/6/13 | 64,664 | 64,655 |
| 3 | Federal Home Loan Bank Discount Notes | 0.080%–0.085% | 11/8/13 | 12,450 | 12,448 |
| 3 | Federal Home Loan Bank Discount Notes | 0.080% | 11/20/13 | 2,100 | 2,100 |
| 3 | Federal Home Loan Bank Discount Notes | 0.080% | 12/11/13 | 5,000 | 4,999 |
| 3 | Federal Home Loan Bank Discount Notes | 0.140% | 12/13/13 | 3,600 | 3,598 |
| 3 | Federal Home Loan Bank Discount Notes | 0.110% | 12/18/13 | 7,000 | 6,998 |
| 3 | Federal Home Loan Bank Discount Notes | 0.150% | 12/20/13 | 5,000 | 4,998 |
| 3 | Federal Home Loan Bank Discount Notes | 0.110% | 1/8/14 | 11,500 | 11,495 |
| 3 | Federal Home Loan Bank Discount Notes | 0.110% | 1/10/14 | 12,600 | 12,595 |
| 3 | Federal Home Loan Bank Discount Notes | 0.100% | 1/16/14 | 1,000 | 1,000 |
| 3 | Federal Home Loan Bank Discount Notes | 0.100% | 1/17/14 | 10,595 | 10,591 |
| 3 | Federal Home Loan Bank Discount Notes | 0.085%–0.100% | 1/22/14 | 3,300 | 3,299 |
| 3 | Federal Home Loan Bank Discount Notes | 0.110% | 2/7/14 | 3,100 | 3,098 |
| 3 | Federal Home Loan Bank Discount Notes | 0.100%–0.110% | 2/14/14 | 5,195 | 5,192 |
| 3 | Federal Home Loan Bank Discount Notes | 0.085% | 2/21/14 | 12,000 | 11,995 |
| 3,4 | Federal Home Loan Banks | 0.146% | 9/6/13 | 20,000 | 20,000 |
| 3,4 | Federal Home Loan Banks | 0.133% | 11/22/13 | 30,000 | 29,999 |
| 3,4 | Federal Home Loan Banks | 0.159% | 12/26/13 | 25,000 | 25,000 |
| 3,4 | Federal Home Loan Banks | 0.136% | 4/3/14 | 25,000 | 25,000 |
| 3,4 | Federal Home Loan Banks | 0.124% | 4/25/14 | 30,000 | 30,000 |
| 3,4 | Federal Home Loan Banks | 0.127% | 5/1/14 | 40,000 | 39,999 |
| 3,4 | Federal Home Loan Banks | 0.126% | 5/6/14 | 33,000 | 33,000 |
| 3,4 | Federal Home Loan Banks | 0.126% | 6/6/14 | 60,000 | 60,000 |
| 3,4 | Federal Home Loan Banks | 0.126% | 7/3/14 | 14,000 | 14,000 |
| 3,4 | Federal Home Loan Banks | 0.167% | 10/1/14 | 6,000 | 5,999 |
| 3,4 | Federal Home Loan Banks | 0.134% | 12/19/14 | 41,000 | 40,997 |
| 2,4 | Federal Home Loan Mortgage Corp. | 0.156% | 11/4/13 | 59,000 | 59,002 |
| 2,4 | Federal National Mortgage Assn. | 0.155% | 11/8/13 | 50,000 | 49,997 |
| 2,4 | Federal National Mortgage Assn. | 0.155% | 11/14/13 | 65,000 | 64,996 |
| 2,4 | Federal National Mortgage Assn. | 0.164% | 6/20/14 | 47,000 | 46,998 |
| 2,4 | Federal National Mortgage Assn. | 0.165% | 9/11/14 | 150,000 | 149,969 |
| 2,4 | Federal National Mortgage Assn. | 0.154% | 2/27/15 | 60,000 | 59,977 |
| 2,4 | Federal National Mortgage Assn. | 0.156% | 8/5/15 | 30,000 | 29,988 |
| 2 | Freddie Mac Discount Notes | 0.075% | 9/3/13 | 5,000 | 5,000 |
| 2 | Freddie Mac Discount Notes | 0.100%–0.110% | 9/4/13 | 19,400 | 19,400 |
| 2 | Freddie Mac Discount Notes | 0.100%–0.120% | 9/5/13 | 16,000 | 16,000 |
| 2 | Freddie Mac Discount Notes | 0.090%–0.125% | 9/9/13 | 10,546 | 10,546 |
| 2 | Freddie Mac Discount Notes | 0.085% | 9/10/13 | 2,500 | 2,500 |
| 2 | Freddie Mac Discount Notes | 0.140% | 9/13/13 | 2,300 | 2,300 |
| 2 | Freddie Mac Discount Notes | 0.080%–0.140% | 9/16/13 | 28,565 | 28,564 |
| 2 | Freddie Mac Discount Notes | 0.100%–0.130% | 9/23/13 | 42,000 | 41,997 |
| 2 | Freddie Mac Discount Notes | 0.090%–0.093% | 9/30/13 | 48,400 | 48,396 |
| 2 | Freddie Mac Discount Notes | 0.090%–0.140% | 10/1/13 | 3,714 | 3,714 |
| 2 | Freddie Mac Discount Notes | 0.090% | 10/3/13 | 3,500 | 3,500 |
| 2 | Freddie Mac Discount Notes | 0.075%–0.160% | 10/8/13 | 52,503 | 52,497 |
39
Federal Money Market Fund
| Face | Market | |||
| Maturity | Amount | Value | ||
| Yield1 | Date | ($000) | ($000) | |
| 2 Freddie Mac Discount Notes | 0.110% | 10/10/13 | 5,274 | 5,273 |
| 2 Freddie Mac Discount Notes | 0.070%–0.120% | 10/15/13 | 51,365 | 51,359 |
| 2 Freddie Mac Discount Notes | 0.090% | 10/21/13 | 10,000 | 9,999 |
| 2 Freddie Mac Discount Notes | 0.090%–0.130% | 10/22/13 | 32,100 | 32,095 |
| 2 Freddie Mac Discount Notes | 0.080%–0.110% | 10/28/13 | 168,450 | 168,423 |
| 2 Freddie Mac Discount Notes | 0.055%–0.130% | 11/5/13 | 19,920 | 19,916 |
| 2 Freddie Mac Discount Notes | 0.075%–0.120% | 11/12/13 | 121,320 | 121,299 |
| 2 Freddie Mac Discount Notes | 0.115% | 11/18/13 | 3,200 | 3,199 |
| 2 Freddie Mac Discount Notes | 0.120% | 12/2/13 | 3,500 | 3,499 |
| 2 Freddie Mac Discount Notes | 0.140% | 12/3/13 | 20,000 | 19,993 |
| 2 Freddie Mac Discount Notes | 0.100% | 12/5/13 | 4,500 | 4,499 |
| 2 Freddie Mac Discount Notes | 0.080%–0.110% | 12/9/13 | 9,401 | 9,399 |
| 2 Freddie Mac Discount Notes | 0.105%–0.160% | 12/16/13 | 18,200 | 18,194 |
| 2 Freddie Mac Discount Notes | 0.140% | 12/23/13 | 22,468 | 22,458 |
| 2 Freddie Mac Discount Notes | 0.138% | 12/30/13 | 30,000 | 29,986 |
| 2 Freddie Mac Discount Notes | 0.110%–0.125% | 1/14/14 | 4,700 | 4,698 |
| 2 Freddie Mac Discount Notes | 0.100%–0.110% | 1/15/14 | 4,571 | 4,569 |
| 2 Freddie Mac Discount Notes | 0.100% | 1/21/14 | 2,370 | 2,369 |
| 2 Freddie Mac Discount Notes | 0.100% | 1/22/14 | 7,000 | 6,997 |
| 2 Freddie Mac Discount Notes | 0.100%–0.115% | 1/23/14 | 25,444 | 25,433 |
| 2 Freddie Mac Discount Notes | 0.100%–0.105% | 2/3/14 | 22,200 | 22,190 |
| 2 Freddie Mac Discount Notes | 0.095%–0.110% | 2/4/14 | 16,420 | 16,412 |
| 2 Freddie Mac Discount Notes | 0.100% | 2/10/14 | 9,000 | 8,996 |
| 2 Freddie Mac Discount Notes | 0.110%–0.130% | 2/11/14 | 4,128 | 4,126 |
| 2 Freddie Mac Discount Notes | 0.100% | 2/18/14 | 20,000 | 19,990 |
| 2 Freddie Mac Discount Notes | 0.085%–0.110% | 2/24/14 | 29,696 | 29,683 |
| United States Treasury Bill | 0.108% | 9/26/13 | 20,000 | 19,998 |
| United States Treasury Bill | 0.057% | 11/14/13 | 10,000 | 9,999 |
| United States Treasury Note/Bond | 0.750% | 9/15/13 | 13,000 | 13,003 |
| United States Treasury Note/Bond | 0.125% | 9/30/13 | 15,000 | 15,001 |
| United States Treasury Note/Bond | 3.125% | 9/30/13 | 86,407 | 86,615 |
| United States Treasury Note/Bond | 0.500% | 10/15/13 | 10,000 | 10,005 |
| United States Treasury Note/Bond | 2.750% | 10/31/13 | 32,000 | 32,139 |
| United States Treasury Note/Bond | 4.250% | 11/15/13 | 56,487 | 56,966 |
| United States Treasury Note/Bond | 0.500% | 11/15/13 | 66,200 | 66,256 |
| United States Treasury Note/Bond | 0.250% | 11/30/13 | 920 | 920 |
| United States Treasury Note/Bond | 2.000% | 11/30/13 | 36,000 | 36,169 |
| United States Treasury Note/Bond | 0.750% | 12/15/13 | 15,000 | 15,028 |
| United States Treasury Note/Bond | 0.125% | 12/31/13 | 58,439 | 58,445 |
| United States Treasury Note/Bond | 1.500% | 12/31/13 | 70,693 | 71,022 |
| United States Treasury Note/Bond | 4.000% | 2/15/14 | 4,000 | 4,070 |
| United States Treasury Note/Bond | 1.875% | 2/28/14 | 30,000 | 30,264 |
| United States Treasury Note/Bond | 1.750% | 3/31/14 | 90,000 | 90,859 |
| Total U.S. Government and Agency Obligations (Cost $3,465,809) | 3,465,809 | |||
| Repurchase Agreements (0.1%) | ||||
| Bank of Nova Scotia | ||||
| (Dated 8/30/13, Repurchase Value $3,332,000, | ||||
| collateralized by U.S. Treasury Note/Bond | ||||
| 0.125%, 4/15/18; with a value of $3,399,000) | 0.040% | 9/3/13 | 3,332 | 3,332 |
| Total Investments (98.5%) (Cost $3,469,141) | 3,469,141 | |||
40
Federal Money Market Fund
| Market | |
| Value | |
| ($000) | |
| Other Assets and Liabilities (1.5%) | |
| Other Assets | 55,470 |
| Liabilities | (2,942) |
| 52,528 | |
| Net Assets (100%) | |
| Applicable to 3,520,946,353 outstanding $.001 par value shares of | |
| beneficial interest (unlimited authorization) | 3,521,669 |
| Net Asset Value Per Share | $1.00 |
| At August 31, 2013, net assets consisted of: | |
| Amount | |
| ($000) | |
| Paid-in Capital | 3,521,456 |
| Undistributed Net Investment Income | — |
| Accumulated Net Realized Gains | 213 |
| Net Assets | 3,521,669 |
See Note A in Notes to Financial Statements.
1 Represents annualized yield at date of purchase for discount securities, and coupon for coupon-bearing securities.
2 The issuer was placed under federal conservatorship in September 2008; since that time, its daily operations have been managed by the Federal Housing Finance Agency and it receives capital from the U.S. Treasury, as needed to maintain a positive net worth, in exchange for senior preferred stock.
3 The issuer operates under a congressional charter; its securities are generally neither guaranteed by the U.S. Treasury nor backed by the full faith and credit of the U.S. government.
4 Adjustable-rate security.
See accompanying Notes, which are an integral part of the Financial Statements.
41
Federal Money Market Fund
| Statement of Operations | |
| Year Ended | |
| August 31, 2013 | |
| ($000) | |
| Investment Income | |
| Income | |
| Interest | 5,436 |
| Total Income | 5,436 |
| Expenses | |
| The Vanguard Group—Note B | |
| Investment Advisory Services | 105 |
| Management and Administrative | 4,540 |
| Marketing and Distribution | 649 |
| Custodian Fees | 50 |
| Auditing Fees | 28 |
| Shareholders’ Reports | 38 |
| Trustees’ Fees and Expenses | 6 |
| Total Expenses | 5,416 |
| Expense Reduction—Note B | (492) |
| Net Expenses | 4,924 |
| Net Investment Income | 512 |
| Realized Net Gain (Loss) on Investment Securities Sold | 61 |
| Net Increase (Decrease) in Net Assets Resulting from Operations | 573 |
See accompanying Notes, which are an integral part of the Financial Statements.
42
Federal Money Market Fund
| Statement of Changes in Net Assets | ||
| Year Ended August 31, | ||
| 2013 | 2012 | |
| ($000) | ($000) | |
| Increase (Decrease) in Net Assets | ||
| Operations | ||
| Net Investment Income | 512 | 444 |
| Realized Net Gain (Loss) | 61 | 35 |
| Net Increase (Decrease) in Net Assets Resulting from Operations | 573 | 479 |
| Distributions | ||
| Net Investment Income | (512) | (444) |
| Realized Capital Gain | — | — |
| Total Distributions | (512) | (444) |
| Capital Share Transactions (at $1.00 per share) | ||
| Issued | 345,150 | 379,852 |
| Issued in Lieu of Cash Distributions | 503 | 435 |
| Redeemed | (927,215) | (1,071,053) |
| Net Increase (Decrease) from Capital Share Transactions | (581,562) | (690,766) |
| Total Increase (Decrease) | (581,501) | (690,731) |
| Net Assets | ||
| Beginning of Period | 4,103,170 | 4,793,901 |
| End of Period | 3,521,669 | 4,103,170 |
See accompanying Notes, which are an integral part of the Financial Statements.
43
Federal Money Market Fund
Financial Highlights
| For a Share Outstanding | Year Ended August 31, | ||||
| Throughout Each Period | 2013 | 2012 | 2011 | 2010 | 2009 |
| Net Asset Value, Beginning of Period | $1.00 | $1.00 | $1.00 | $1.00 | $1.00 |
| Investment Operations | |||||
| Net Investment Income | . 0001 | . 0001 | . 0002 | . 0004 | .011 |
| Net Realized and Unrealized Gain (Loss) | |||||
| on Investments | — | — | — | — | — |
| Total from Investment Operations | . 0001 | . 0001 | . 0002 | . 0004 | .011 |
| Distributions | |||||
| Dividends from Net Investment Income | (. 0001) | (. 0001) | (. 0002) | (. 0004) | (.011) |
| Distributions from Realized Capital Gains | — | — | — | — | — |
| Total Distributions | (. 0001) | (. 0001) | (. 0002) | (. 0004) | (.011) |
| Net Asset Value, End of Period | $1.00 | $1.00 | $1.00 | $1.00 | $1.00 |
| Total Return1 | 0.01% | 0.01% | 0.02% | 0.04% | 1.06% |
| Ratios/Supplemental Data | |||||
| Net Assets, End of Period (Millions) | $3,522 | $4,103 | $4,794 | $6,048 | $9,386 |
| Ratio of Expenses to Average Net Assets | 0.13%2 | 0.12%2 | 0.19%2 | 0.22% | 0.27%3 |
| Ratio of Net Investment Income to | |||||
| Average Net Assets | 0.01% | 0.01% | 0.02% | 0.04% | 1.03% |
1 Total returns do not include account service fees that may have applied in the periods shown. Fund prospectuses provide information about any applicable account service fees.
2 The ratio of total expenses to average net assets before an expense reduction was 0.14% for 2013, 0.16% for 2012, and 0.20% for 2011.
See Note B in the Notes to Financial Statements.
3 Includes 0.02% of fees to participate in the Treasury Temporary Guarantee Program for Money Market Funds.
See accompanying Notes, which are an integral part of the Financial Statements.
44
Federal Money Market Fund
Notes to Financial Statements
Vanguard Federal Money Market Fund is registered under the Investment Company Act of 1940 as an open-end investment company, or mutual fund. The fund invests in short-term debt instruments issued by the U.S. government or its agencies and instrumentalities, and repurchase agreements collateralized by such instruments.
A. The following significant accounting policies conform to generally accepted accounting principles for U.S. mutual funds. The fund consistently follows such policies in preparing its financial statements.
1. Security Valuation: Securities are valued at amortized cost, which approximates market value.
2. Repurchase Agreements: The fund may enter into repurchase agreements with institutional counterparties. Securities pledged as collateral to the fund under repurchase agreements are held by a custodian bank until the agreements mature. Each agreement requires that the market value of the collateral be sufficient to cover payments of interest and principal. The fund further mitigates its counterparty risk by entering into repurchase agreements only with a diverse group of pre-qualified counterparties, monitoring their financial strength, and entering into master repurchase agreements with its counterparties. The master repurchase agreements provide that, in the event of a counter-party’s default (including bankruptcy), the fund may terminate any repurchase agreements with that counterparty, determine the net amount owed, and sell or retain the collateral up to the net amount owed to the fund. Such action may be subject to legal proceedings, which may delay or limit the disposition of collateral.
3. Federal Income Taxes: The fund intends to continue to qualify as a regulated investment company and distribute all of its taxable income. Management has analyzed the fund’s tax positions taken for all open federal income tax years (August 31, 2010–2013), and has concluded that no provision for federal income tax is required in the fund’s financial statements.
4. Distributions: Distributions from net investment income are declared daily and paid on the first business day of the following month.
5. Other: Interest income is accrued daily. Premiums and discounts on debt securities purchased are amortized and accreted, respectively, to interest income over the lives of the respective securities. Security transactions are accounted for on the date securities are bought or sold. Costs used to determine realized gains (losses) on the sale of investment securities are those of the specific securities sold.
B. The Vanguard Group furnishes at cost investment advisory, corporate management, administrative, marketing, and distribution services. The costs of such services are allocated to the fund under methods approved by the board of trustees. The fund has committed to provide up to 0.40% of its net assets in capital contributions to Vanguard. At August 31, 2013, the fund had contributed capital of $426,000 to Vanguard (included in Other Assets), representing 0.01% of the fund’s net assets and 0.17% of Vanguard’s capitalization. The fund’s trustees and officers are also directors and officers of Vanguard. Vanguard and the board of trustees have agreed to temporarily limit certain net operating expenses in excess of the fund’s daily yield so as to maintain a zero or positive yield for the fund. Vanguard and the board of trustees may terminate the temporary expense limitation at any time. For the year ended August 31, 2013, Vanguard’s expenses were reduced by $492,000 (an effective annual rate of 0.01% of the fund’s average net assets).
45
Federal Money Market Fund
C. Various inputs may be used to determine the value of the fund’s investments. These inputs are summarized in three broad levels for financial statement purposes. The inputs or methodologies used to value securities are not necessarily an indication of the risk associated with investing in those securities.
Level 1—Quoted prices in active markets for identical securities.
Level 2—Other significant observable inputs (including quoted prices for similar securities, interest rates, prepayment speeds, credit risk, etc.).
Level 3—Significant unobservable inputs (including the fund’s own assumptions used to determine the fair value of investments).
At August 31, 2013, 100% of the market value of the fund’s investments was determined using amortized cost, in accordance with rules under the Investment Company Act of 1940. Amortized cost approximates the current fair value of a security, but since the value is not obtained from a quoted price in an active market, securities valued at amortized cost are considered to be valued using Level 2 inputs.
D. Management has determined that no material events or transactions occurred subsequent to August 31, 2013, that would require recognition in these financial statements. The fund distributed $206,000 ($0.000059 per share) of short-term capital gains to shareholders of record on September 20, 2013.
46
Admiral Treasury Money Market Fund
Fund Profile
As of August 31, 2013
| Financial Attributes | |
| Ticker Symbol | VUSXX |
| Expense Ratio1 | 0.10% |
| 7-Day SEC Yield | 0.01% |
| Average Weighted | |
| Maturity | 53 days |
| Sector Diversification (% of portfolio) | |
| U.S. Treasury Bills | 100.0% |
The agency and mortgage-backed securities sectors may include issues from government-sponsored enterprises; such issues are generally not backed by the full faith and credit of the U.S. government.
| Distribution by Credit Quality (% of portfolio) | |
| First Tier | 100.0% |
For information about these ratings, see the Glossary entry for Credit Quality.
1 The expense ratio shown is from the prospectus dated December 28, 2012, and represents estimated costs for the current fiscal year. For the fiscal year ended August 31, 2013, the expense ratio was 0.08%, reflecting a temporary reduction in operating expenses (described in Note B of the Notes to Financial Statements). Before this reduction, the expense ratio was 0.09%.
47
Admiral Treasury Money Market Fund
Performance Summary
Investment returns will fluctuate. All of the returns in this report represent past performance, which is not a guarantee of future results that may be achieved by the fund. (Current performance may be lower or higher than the performance data cited. For performance data current to the most recent month-end, visit our website at vanguard.com/performance.) The returns shown do not reflect taxes that a shareholder would pay on fund distributions. An investment in a money market fund is not insured or guaranteed by the Federal Deposit Insurance Corporation or any other government agency. Although the fund seeks to preserve the value of your investment at $1 per share, it is possible to lose money by investing in the fund. The fund’s 7-day SEC yield reflects its current earnings more closely than do the average annual returns.
Cumulative Performance: August 31, 2003, Through August 31, 2013
Initial Investment of $50,000
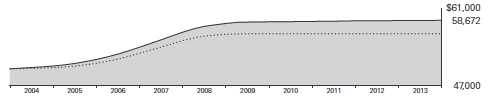
| Average Annual Total Returns | ||||
| Periods Ended August 31, 2013 | ||||
| Final Value | ||||
| One | Five | Ten | of a $50,000 | |
| Year | Years | Years | Investment | |
| Admiral Treasury Money Market | ||||
| Fund | 0.02% | 0.15% | 1.61% | $58,672 |
| iMoneyNet Money Fund Report’s | ||||
| 100% Treasury Funds Average | 0.00 | 0.03 | 1.20 | 56,343 |
| Citigroup Three-Month U.S. Treasury | ||||
| Bill Index | 0.07 | 0.17 | 1.62 | 58,697 |
iMoneyNet Money Fund Report’s 100% Treasury Funds Average: Derived from data provided by iMoneyNet, Inc.
See Financial Highlights for dividend information.
48
Admiral Treasury Money Market Fund
| Fiscal-Year Total Returns (%): August 31, 2003, Through August 31, 2013 | ||
| iMoneyNet | ||
| Average | ||
| Fiscal Year | Total Returns | Total Returns |
| 2004 | 0.91% | 0.39% |
| 2005 | 2.29 | 1.61 |
| 2006 | 4.22 | 3.54 |
| 2007 | 5.01 | 4.34 |
| 2008 | 3.08 | 2.08 |
| 2009 | 0.70 | 0.17 |
| 2010 | 0.03 | 0.00 |
| 2011 | 0.02 | 0.00 |
| 2012 | 0.01 | 0.00 |
| 2013 | 0.02 | 0.00 |
| 7-day SEC yield (8/31/2013): 0.01% | ||
| iMoneyNet Money Fund Report’s 100% Treasury Funds Average: Derived from data provided by iMoneyNet, Inc. | ||
Average Annual Total Returns: Periods Ended June 30, 2013
This table presents returns through the latest calendar quarter—rather than through the end of the fiscal period.
Securities and Exchange Commission rules require that we provide this information.
| Inception | One | Five | Ten | |
| Date | Year | Years | Years | |
| Admiral Treasury Money Market | ||||
| Fund | 12/14/1992 | 0.02% | 0.21% | 1.63% |
49
Admiral Treasury Money Market Fund
Financial Statements
Statement of Net Assets
As of August 31, 2013
The fund reports a complete list of its holdings in various monthly and quarterly regulatory filings. The fund publishes its holdings on a monthly basis at vanguard.com and files them with the Securities and Exchange Commission on Form N-MFP. The fund’s Form N-MFP filings become public 60 days after the relevant month-end, and may be viewed at sec.gov or via a link on the “Portfolio Holdings” page on vanguard.com. For the second and fourth fiscal quarters, the lists appear in the fund’s semiannual and annual reports to shareholders. For the first and third fiscal quarters, the fund files the lists with the SEC on Form N-Q. Shareholders can look up the fund’s Forms N-Q on the SEC’s website at sec. gov. Forms N-Q may also be reviewed and copied at the SEC’s Public Reference Room (see the back cover of this report for further information).
| Face | Market | |||
| Maturity | Amount | Value | ||
| Yield1 | Date | ($000) | ($000) | |
| U.S. Government and Agency Obligations (99.9%) | ||||
| United States Treasury Bill | 0.048%–0.120% | 9/5/13 | 836,481 | 836,476 |
| United States Treasury Bill | 0.051%–0.113% | 9/12/13 | 875,000 | 874,985 |
| United States Treasury Bill | 0.048% | 9/19/13 | 725,000 | 724,983 |
| United States Treasury Bill | 0.049%–0.106% | 9/26/13 | 812,233 | 812,192 |
| United States Treasury Bill | 0.052%–0.111% | 10/3/13 | 870,000 | 869,953 |
| United States Treasury Bill | 0.052% | 10/10/13 | 820,000 | 819,954 |
| United States Treasury Bill | 0.043%–0.088% | 10/17/13 | 800,165 | 800,112 |
| United States Treasury Bill | 0.037% | 10/24/13 | 685,000 | 684,963 |
| United States Treasury Bill | 0.030% | 10/31/13 | 740,536 | 740,499 |
| United States Treasury Bill | 0.038% | 11/7/13 | 895,000 | 894,937 |
| United States Treasury Bill | 0.057% | 11/14/13 | 800,000 | 799,906 |
| United States Treasury Bill | 0.055% | 11/21/13 | 840,000 | 839,896 |
| United States Treasury Bill | 0.041%–0.082% | 11/29/13 | 710,000 | 709,884 |
| United States Treasury Bill | 0.078% | 12/19/13 | 100,000 | 99,976 |
| United States Treasury Bill | 0.103% | 12/26/13 | 200,000 | 199,934 |
| United States Treasury Bill | 0.090% | 1/2/14 | 200,000 | 199,939 |
| United States Treasury Bill | 0.074% | 1/16/14 | 125,000 | 124,965 |
| United States Treasury Bill | 0.073% | 1/23/14 | 115,000 | 114,966 |
| United States Treasury Bill | 0.078% | 2/20/14 | 100,000 | 99,963 |
| United States Treasury Note/Bond | 0.125% | 9/30/13 | 300,000 | 300,014 |
| United States Treasury Note/Bond | 3.125% | 9/30/13 | 93,000 | 93,225 |
| United States Treasury Note/Bond | 2.750% | 10/31/13 | 11,426 | 11,475 |
| Total U. S. Government and Agency Obligations (Cost $11,653,197) | 11,653,197 | |||
| Total Investments (99.9%) (Cost $11,653,197) | 11,653,197 | |||
50
Admiral Treasury Money Market Fund
| Market | |
| Value | |
| ($000) | |
| Other Assets and Liabilities (0.1%) | |
| Other Assets | 12,919 |
| Liabilities | (6,591) |
| 6,328 | |
| Net Assets (100%) | |
| Applicable to 11,656,283,199 outstanding $.001 par value shares of | |
| beneficial interest (unlimited authorization) | 11,659,525 |
| Net Asset Value Per Share | $1.00 |
| At August 31, 2013, net assets consisted of: | |
| Amount | |
| ($000) | |
| Paid-in Capital | 11,659,323 |
| Undistributed Net Investment Income | — |
| Accumulated Net Realized Gains | 202 |
| Net Assets | 11,659,525 |
See Note A in Notes to Financial Statements.
1 Represents annualized yield at date of purchase for discount securities, and coupon for coupon-bearing securities.
See accompanying Notes, which are an integral part of the Financial Statements.
51
Admiral Treasury Money Market Fund
| Statement of Operations | |
| Year Ended | |
| August 31, 2013 | |
| ($000) | |
| Investment Income | |
| Income | |
| Interest | 11,884 |
| Total Income | 11,884 |
| Expenses | |
| The Vanguard Group—Note B | |
| Investment Advisory Services | 343 |
| Management and Administrative | 8,734 |
| Marketing and Distribution | 1,890 |
| Custodian Fees | 120 |
| Auditing Fees | 23 |
| Shareholders’ Reports | 50 |
| Trustees’ Fees and Expenses | 16 |
| Total Expenses | 11,176 |
| Expense Reduction—Note B | (1,281) |
| Net Expenses | 9,895 |
| Net Investment Income | 1,989 |
| Realized Net Gain (Loss) on Investment Securities Sold | 3 |
| Net Increase (Decrease) in Net Assets Resulting from Operations | 1,992 |
See accompanying Notes, which are an integral part of the Financial Statements.
52
Admiral Treasury Money Market Fund
| Statement of Changes in Net Assets | ||
| Year Ended August 31, | ||
| 2013 | 2012 | |
| ($000) | ($000) | |
| Increase (Decrease) in Net Assets | ||
| Operations | ||
| Net Investment Income | 1,989 | 1,553 |
| Realized Net Gain (Loss) | 3 | 46 |
| Net Increase (Decrease) in Net Assets Resulting from Operations | 1,992 | 1,599 |
| Distributions | ||
| Net Investment Income | (1,989) | (1,553) |
| Realized Capital Gain | — | — |
| Total Distributions | (1,989) | (1,553) |
| Capital Share Transactions (at $1.00 per share) | ||
| Issued | 733,020 | 865,430 |
| Issued in Lieu of Cash Distributions | 1,932 | 1,508 |
| Redeemed | (2,429,133) | (2,827,163) |
| Net Increase (Decrease) from Capital Share Transactions | (1,694,181) | (1,960,225) |
| Total Increase (Decrease) | (1,694,178) | (1,960,179) |
| Net Assets | ||
| Beginning of Period | 13,353,703 | 15,313,882 |
| End of Period | 11,659,525 | 13,353,703 |
See accompanying Notes, which are an integral part of the Financial Statements.
53
Admiral Treasury Money Market Fund
Financial Highlights
| For a Share Outstanding | Year Ended August 31, | ||||
| Throughout Each Period | 2013 | 2012 | 2011 | 2010 | 2009 |
| Net Asset Value, Beginning of Period | $1.00 | $1.00 | $1.00 | $1.00 | $1.00 |
| Investment Operations | |||||
| Net Investment Income | . 0002 | . 0001 | . 0002 | . 0003 | . 007 |
| Net Realized and Unrealized Gain (Loss) | |||||
| on Investments | — | — | — | — | — |
| Total from Investment Operations | . 0002 | . 0001 | . 0002 | . 0003 | . 007 |
| Distributions | |||||
| Dividends from Net Investment Income | (. 0002) | (. 0001) | (. 0002) | (. 0003) | (. 007) |
| Distributions from Realized Capital Gains | — | — | — | — | — |
| Total Distributions | (. 0002) | (. 0001) | (. 0002) | (. 0003) | (. 007) |
| Net Asset Value, End of Period | $1.00 | $1.00 | $1.00 | $1.00 | $1.00 |
| Total Return1 | 0.02% | 0.01% | 0.02% | 0.03% | 0.70% |
| Ratios/Supplemental Data | |||||
| Net Assets, End of Period (Millions) | $11,660 | $13,354 | $15,314 | $18,726 | $25,435 |
| Ratio of Expenses to Average Net Assets | 0.08%2 | 0.05%2 | 0.11%2 | 0.14% | 0.15%3 |
| Ratio of Net Investment Income to | |||||
| Average Net Assets | 0.02% | 0.01% | 0.02% | 0.03% | 0.74% |
1 Total returns do not include account service fees that may have applied in the periods shown. Fund prospectuses provide information about any applicable account service fees.
2 The ratio of total expenses to average net assets before an expense reduction was 0.09% for 2013, 0.10% for 2012, and 0.12% for 2011.
See Note B in the Notes to Financial Statements.
3 Includes 0.03% of fees to participate in the Treasury Temporary Guarantee Program for Money Market Funds.
See accompanying Notes, which are an integral part of the Financial Statements.
54
Admiral Treasury Money Market Fund
Notes to Financial Statements
Vanguard Admiral Treasury Money Market Fund is registered under the Investment Company Act of 1940 as an open-end investment company, or mutual fund. The fund invests in short-term debt instruments backed by the full faith and credit of the U.S. government.
A. The following significant accounting policies conform to generally accepted accounting principles for U.S. mutual funds. The fund consistently follows such policies in preparing its financial statements.
1. Security Valuation: Securities are valued at amortized cost, which approximates market value.
2. Federal Income Taxes: The fund intends to continue to qualify as a regulated investment company and distribute all of its taxable income. Management has analyzed the fund’s tax positions taken for all open federal income tax years (August 31, 2010–2013), and has concluded that no provision for federal income tax is required in the fund’s financial statements.
3. Distributions: Distributions from net investment income are declared daily and paid on the first business day of the following month.
4. Other: Interest income is accrued daily. Premiums and discounts on debt securities purchased are amortized and accreted, respectively, to interest income over the lives of the respective securities. Security transactions are accounted for on the date securities are bought or sold. Costs used to determine realized gains (losses) on the sale of investment securities are those of the specific securities sold.
B. The Vanguard Group furnishes at cost investment advisory, corporate management, administrative, marketing, and distribution services. The costs of such services are allocated to the fund under methods approved by the board of trustees. The fund has committed to provide up to 0.40% of its net assets in capital contributions to Vanguard. At August 31, 2013, the fund had contributed capital of $1,410,000 to Vanguard (included in Other Assets), representing 0.01% of the fund’s net assets and 0.56% of Vanguard’s capitalization. The fund’s trustees and officers are also directors and officers of Vanguard. Vanguard and the board of trustees have agreed to temporarily limit certain net operating expenses in excess of the fund’s daily yield so as to maintain a zero or positive yield for the fund. Vanguard and the board of trustees may terminate the temporary expense limitation at any time. For the year ended August 31, 2013, Vanguard’s expenses were reduced by $1,281,000 (an effective annual rate of 0.01% of the fund’s average net assets).
C. Various inputs may be used to determine the value of the fund’s investments. These inputs are summarized in three broad levels for financial statement purposes. The inputs or methodologies used to value securities are not necessarily an indication of the risk associated with investing in those securities.
Level 1—Quoted prices in active markets for identical securities.
Level 2—Other significant observable inputs (including quoted prices for similar securities, interest rates, prepayment speeds, credit risk, etc.).
Level 3—Significant unobservable inputs (including the fund’s own assumptions used to determine the fair value of investments).
55
Admiral Treasury Money Market Fund
At August 31, 2013, 100% of the market value of the fund’s investments was determined using amortized cost, in accordance with rules under the Investment Company Act of 1940. Amortized cost approximates the current fair value of a security, but since the value is not obtained from a quoted price in an active market, securities valued at amortized cost are considered to be valued using Level 2 inputs.
D. Management has determined that no material events or transactions occurred subsequent to August 31, 2013, that would require recognition in these financial statements. The fund distributed $185,000 ($0.000016 per share) of short-term capital gains to shareholders of record on September 20, 2013.
56
Report of Independent Registered Public Accounting Firm
To the Trustees of Vanguard Money Market Reserves and Vanguard Admiral Funds and the Shareholders of Vanguard Prime Money Market Fund, Vanguard Federal Money Market Fund and Vanguard Admiral Treasury Money Market Fund:
In our opinion, the accompanying statements of net assets and the related statements of operations and of changes in net assets and the financial highlights present fairly, in all material respects, the financial position of Vanguard Prime Money Market Fund, Vanguard Federal Money Market Fund and Vanguard Admiral Treasury Money Market Fund (the “Funds”) at August 31, 2013, the results of each of their operations for the year then ended, the changes in each of their net assets for each of the two years in the period then ended, and the financial highlights for each of the five years in the period then ended, in conformity with accounting principles generally accepted in the United States of America. These financial statements and financial highlights (hereafter referred to as “financial statements”) are the responsibility of the Funds’ management; our responsibility is to express an opinion on these financial statements based on our audits. We conducted our audits of these financial statements in accordance with the standards of the Public Company Accounting Oversight Board (United States). Those standards require that we plan and perform the audit to obtain reasonable assurance about whether the financial statements are free of material misstatement. An audit includes examining, on a test basis, evidence supporting the amounts and disclosures in the financial statements, assessing the accounting principles used and significant estimates made by management, and evaluating the overall financial statement presentation. We believe that our audits, which included confirmation of securities at August 31, 2013 by correspondence with the custodian and brokers and by agreement to the underlying ownership records of the transfer agent, provide a reasonable basis for our opinion.
/s/PricewaterhouseCoopers LLP
Philadelphia, Pennsylvania
October 10, 2013
57
Special 2013 tax information (unaudited) for Vanguard Prime Money Market Fund
This information for the fiscal year ended August 31, 2013, is included pursuant to provisions of the Internal Revenue Code.
For nonresident alien shareholders, 67.8% of income dividends are interest-related dividends.
Special 2013 tax information (unaudited) for Vanguard Federal Money Market Fund
This information for the fiscal year ended August 31, 2013, is included pursuant to provisions of the Internal Revenue Code.
For nonresident alien shareholders, 100% of income dividends are interest-related dividends.
Special 2013 tax information (unaudited) for Vanguard Admiral Treasury Money Market Fund
This information for the fiscal year ended August 31, 2013, is included pursuant to provisions of the Internal Revenue Code.
For nonresident alien shareholders, 100% of income dividends are interest-related dividends.
58
About Your Fund’s Expenses
As a shareholder of the fund, you incur ongoing costs, which include costs for portfolio management, administrative services, and shareholder reports (like this one), among others. Operating expenses, which are deducted from a fund’s gross income, directly reduce the investment return of the fund.
A fund’s expenses are expressed as a percentage of its average net assets. This figure is known as the expense ratio. The following examples are intended to help you understand the ongoing costs (in dollars) of investing in your fund and to compare these costs with those of other mutual funds. The examples are based on an investment of $1,000 made at the beginning of the period shown and held for the entire period.
The accompanying table illustrates your fund’s costs in two ways:
• Based on actual fund return. This section helps you to estimate the actual expenses that you paid over the period. The ”Ending Account Value“ shown is derived from the fund‘s actual return, and the third column shows the dollar amount that would have been paid by an investor who started with $1,000 in the fund. You may use the information here, together with the amount you invested, to estimate the expenses that you paid over the period.
To do so, simply divide your account value by $1,000 (for example, an $8,600 account value divided by $1,000 = 8.6), then multiply the result by the number given for your fund under the heading ”Expenses Paid During Period.“
• Based on hypothetical 5% yearly return. This section is intended to help you compare your fund‘s costs with those of other mutual funds. It assumes that the fund had a yearly return of 5% before expenses, but that the expense ratio is unchanged. In this case—because the return used is not the fund’s actual return—the results do not apply to your investment. The example is useful in making comparisons because the Securities and Exchange Commission requires all mutual funds to calculate expenses based on a 5% return. You can assess your fund’s costs by comparing this hypothetical example with the hypothetical examples that appear in shareholder reports of other funds.
Note that the expenses shown in the table are meant to highlight and help you compare ongoing costs only and do not reflect transaction costs incurred by the fund for buying and selling securities. Further, the expenses do not include any purchase, redemption, or account service fees described in the fund prospectus. If such fees were applied to your account, your costs would be higher. Your fund does not carry a “sales load.”
The calculations assume no shares were bought or sold during the period. Your actual costs may have been higher or lower, depending on the amount of your investment and the timing of any purchases or redemptions.
You can find more information about the fund’s expenses, including annual expense ratios, in the Financial Statements section of this report. For additional information on operating expenses and other shareholder costs, please refer to your fund’s current prospectus.
59
| Six Months Ended August 31, 2013 | |||
| Beginning | Ending | Expenses | |
| Account Value | Account Value | Paid During | |
| 2/28/2013 | 8/31/2013 | Period | |
| Based on Actual Fund Return | |||
| Prime Money Market Fund | |||
| Investor Shares | $1,000.00 | $1,000.06 | $0.76 |
| Institutional Shares | 1,000.00 | 1,000.27 | 0.50 |
| Federal Money Market Fund | $1,000.00 | $1,000.09 | $0.55 |
| Admiral Treasury Money Market Fund | $1,000.00 | $1,000.05 | $0.35 |
| Based on Hypothetical 5% Yearly Return | |||
| Prime Money Market Fund | |||
| Investor Shares | $1,000.00 | $1,024.45 | $0.77 |
| Institutional Shares | 1,000.00 | 1,024.70 | 0.51 |
| Federal Money Market Fund | $1,000.00 | $1,024.65 | $0.56 |
| Admiral Treasury Money Market Fund | $1,000.00 | $1,024.85 | $0.36 |
The calculations are based on expenses incurred in the most recent six-month period. The funds’ annualized six-month expense ratios for the period are: for the Prime Money Market Fund, 0.15% for Investor Shares and 0.10% for Institutional Shares; for the Federal Money Market Fund, 0.11%; and for the Admiral Treasury Money Market Fund, 0.07%. The annualized six-month expense ratios for the Prime Money Market Fund Investor Shares, the Federal Money Market Fund, and the Admiral Treasury Money Market Fund reflect a temporary reduction in operating expenses (described in Note B of the Notes to Financial Statements). Before the reduction, the annualized six-month expense ratios were: for the Prime Money Market Fund Investor Shares, 0.16%; for the Federal Money Market Fund, 0.12%; for the Admiral Treasury Money Market Fund, 0.08%.
60
Trustees Approve Advisory Arrangement
The board of trustees of Vanguard Prime Money Market Fund, Federal Money Market Fund, and Admiral Treasury Money Market Fund has renewed the funds’ investment advisory arrangement with The Vanguard Group, Inc. (Vanguard). Vanguard—through its Fixed Income Group—serves as the investment advisor to the funds. The board determined that continuing the funds’ internalized management structure was in the best interests of the funds and their shareholders.
The board based its decision upon an evaluation of the advisor’s investment staff, portfolio management process, and performance. The trustees considered the factors discussed below, among others. However, no single factor determined whether the board approved the arrangement. Rather, it was the totality of the circumstances that drove the board’s decision.
Nature, extent, and quality of services
The board considered the quality of the funds’ investment management services over both the short and long term and took into account the organizational depth and stability of the advisor. The board noted that Vanguard has been managing investments for more than three decades. The Fixed Income Group adheres to a sound, disciplined investment management process; the team has considerable experience, stability, and depth.
The board concluded that Vanguard’s experience, stability, depth, and performance, among other factors, warranted continuation of the advisory arrangement.
Investment performance
The board considered the short- and long-term performance of the funds, including any periods of outperformance or underperformance relative to a benchmark index and peer group. The board concluded that the performance was such that the advisory arrangement should continue. Information about each fund’s most recent performance can be found on the Performance Summary pages of this report.
Cost
The board concluded that each fund’s expense ratio was well below the average expense ratio charged by funds in its peer group and that the funds’ advisory fee rates were also well below their peer-group averages. Information about the funds’ expenses appears in the About Your Fund’s Expenses section of this report as well as in the Financial Statements sections.
The board does not conduct a profitability analysis of Vanguard, because of Vanguard’s unique “at-cost” structure. Unlike most other mutual fund management companies, Vanguard is owned by the funds it oversees, and produces “profits” only in the form of reduced expenses for fund shareholders.
The benefit of economies of scale
The board concluded that the funds’ at-cost arrangement with Vanguard ensures that the funds will realize economies of scale as they grow, with the cost to shareholders declining as fund assets increase.
The board will consider whether to renew the advisory arrangement again after a one-year period.
61
Glossary
SEC Yields. A money market fund’s 7-day SEC yield is calculated by annualizing its income distributions for the previous seven days, as required by the U.S. Securities and Exchange Commission.
Average Weighted Maturity. The average length of time until fixed income securities held by a fund reach maturity and are repaid. The figure reflects the proportion of fund assets represented by each security.
Credit Quality. For Vanguard money market funds, the Distribution by Credit Quality table includes tier ratings for consistency with SEC Rule 2a-7 under the Investment Company Act of 1940, which governs money market funds. A First Tier security is one that is eligible for money market funds and has been rated in the highest short-term rating category for debt obligations by the requisite nationally recognized statistical rating organizations. An unrated security is First Tier if it represents quality comparable to that of a rated security, as determined in accordance with SEC Rule 2a-7. A Second Tier security is one that is eligible for money market funds and is not a First Tier security.
Expense Ratio. A fund’s total annual operating expenses expressed as a percentage of the fund’s average net assets. The expense ratio includes management and administrative expenses, but does not include the transaction costs of buying and selling portfolio securities.
Inception Date. The date on which the assets of a fund (or one of its share classes) are first invested in accordance with the fund’s investment objective. For funds with a subscription period, the inception date is the day after that period ends. Investment performance is measured from the inception date.
62
This page intentionally left blank.
The People Who Govern Your Fund
The trustees of your mutual fund are there to see that the fund is operated and managed in your best interests since, as a shareholder, you are a part owner of the fund. Your fund’s trustees also serve on the board of directors of The Vanguard Group, Inc., which is owned by the Vanguard funds and provides services to them on an at-cost basis.
A majority of Vanguard’s board members are independent, meaning that they have no affiliation with Vanguard or the funds they oversee, apart from the sizable personal investments they have made as private individuals. The independent board members have distinguished backgrounds in business, academia, and public service. Each of the trustees and executive officers oversees 181 Vanguard funds.
The following table provides information for each trustee and executive officer of the fund. More information about the trustees is in the Statement of Additional Information, which can be obtained, without charge, by contacting Vanguard at 800-662-7447, or online at vanguard.com.
| InterestedTrustee1 | and Delphi Automotive LLP (automotive components); |
| Senior Advisor at New Mountain Capital; Trustee of | |
| F. William McNabb III | The Conference Board. |
| Born 1957. Trustee Since July 2009. Chairman of the | |
| Board. Principal Occupation(s) During the Past Five | Amy Gutmann |
| Years: Chairman of the Board of The Vanguard Group, | Born 1949. Trustee Since June 2006. Principal |
| Inc., and of each of the investment companies served | Occupation(s) During the Past Five Years: President |
| by The Vanguard Group, since January 2010; Director | of the University of Pennsylvania; Christopher H. |
| of The Vanguard Group since 2008; Chief Executive | Browne Distinguished Professor of Political Science |
| Officer and President of The Vanguard Group and of | in the School of Arts and Sciences with secondary |
| each of the investment companies served by The | appointments at the Annenberg School for |
| Vanguard Group since 2008; Director of Vanguard | Communication and the Graduate School of Education |
| Marketing Corporation; Managing Director of The | of the University of Pennsylvania; Member of the |
| Vanguard Group (1995–2008). | National Commission on the Humanities and Social |
| Sciences; Trustee of Carnegie Corporation of New | |
| IndependentTrustees | York and of the National Constitution Center; Chair |
| of the U. S. Presidential Commission for the Study | |
| Emerson U. Fullwood | of Bioethical Issues. |
| Born 1948. Trustee Since January 2008. Principal | |
| Occupation(s) During the Past Five Years: Executive | JoAnn Heffernan Heisen |
| Chief Staff and Marketing Officer for North America | Born 1950. Trustee Since July 1998. Principal |
| and Corporate Vice President (retired 2008) of Xerox | Occupation(s) During the Past Five Years: Corporate |
| Corporation (document management products and | Vice President and Chief Global Diversity Officer |
| services); Executive in Residence and 2010 | (retired 2008) and Member of the Executive |
| Distinguished Minett Professor at the Rochester | Committee (1997–2008) of Johnson & Johnson |
| Institute of Technology; Director of SPX Corporation | (pharmaceuticals/medical devices/consumer |
| (multi-industry manufacturing), the United Way of | products); Director of Skytop Lodge Corporation |
| Rochester, Amerigroup Corporation (managed health | (hotels), the University Medical Center at Princeton, |
| care), the University of Rochester Medical Center, | the Robert Wood Johnson Foundation, and the Center |
| Monroe Community College Foundation, and North | for Talent Innovation; Member of the Advisory Board |
| Carolina A&T University. | of the Maxwell School of Citizenship and Public Affairs |
| at Syracuse University. | |
| Rajiv L. Gupta | F. Joseph Loughrey |
| Born 1945. Trustee Since December 2001. 2 | Born 1949. Trustee Since October 2009. Principal |
| Principal Occupation(s) During the Past Five Years: | Occupation(s) During the Past Five Years: President |
| Chairman and Chief Executive Officer (retired 2009) | and Chief Operating Officer (retired 2009) of Cummins |
| and President (2006–2008) of Rohm and Haas Co. | Inc. (industrial machinery); Chairman of the Board of |
| (chemicals); Director of Tyco International, Ltd. | Hillenbrand, Inc. (specialized consumer services) and |
| (diversified manufacturing and services), Hewlett- | of Oxfam America; Director of SKF AB (industrial |
| Packard Co. (electronic computer manufacturing), | |
| machinery) and the Lumina Foundation for Education; | Executive Officers | |
| Member of the Advisory Council for the College of | ||
| Arts and Letters and of the Advisory Board to the | Glenn Booraem | |
| Kellogg Institute for International Studies, both at | Born 1967. Controller Since July 2010. Principal | |
| the University of Notre Dame. | Occupation(s) During the Past Five Years: Principal | |
| of The Vanguard Group, Inc.; Controller of each of | ||
| Mark Loughridge | the investment companies served by The Vanguard | |
| Born 1953. Trustee Since March 2012. Principal | Group; Assistant Controller of each of the investment | |
| Occupation(s) During the Past Five Years: Senior Vice | companies served by The Vanguard Group (2001–2010). | |
| President and Chief Financial Officer at IBM (information | ||
| technology services); Fiduciary Member of IBM’s | Thomas J. Higgins | |
| Retirement Plan Committee. | Born 1957. Chief Financial Officer Since September | |
| 2008. Principal Occupation(s) During the Past Five | ||
| Scott C. Malpass | Years: Principal of The Vanguard Group, Inc.; Chief | |
| Born 1962. Trustee Since March 2012. Principal | Financial Officer of each of the investment companies | |
| Occupation(s) During the Past Five Years: Chief | served by The Vanguard Group; Treasurer of each of | |
| Investment Officer and Vice President at the University | the investment companies served by The Vanguard | |
| of Notre Dame; Assistant Professor of Finance at the | Group (1998–2008). | |
| Mendoza College of Business at Notre Dame; Member | ||
| of the Notre Dame 403(b) Investment Committee; | Kathryn J. Hyatt | |
| Director of TIFF Advisory Services, Inc. (investment | Born 1955. Treasurer Since November 2008. Principal | |
| advisor); Member of the Investment Advisory | Occupation(s) During the Past Five Years: Principal of | |
| Committees of the Financial Industry Regulatory | The Vanguard Group, Inc.; Treasurer of each of the | |
| Authority (FINRA) and of Major League Baseball. | investment companies served by The Vanguard | |
| Group; Assistant Treasurer of each of the investment | ||
| André F. Perold | companies served by The Vanguard Group (1988–2008). | |
| Born 1952. Trustee Since December 2004. Principal | ||
| Occupation(s) During the Past Five Years: George | Heidi Stam | |
| Gund Professor of Finance and Banking at the Harvard | Born 1956. Secretary Since July 2005. Principal | |
| Business School (retired 2011); Chief Investment | Occupation(s) During the Past Five Years: Managing | |
| Officer and Managing Partner of HighVista Strategies | Director of The Vanguard Group, Inc.; General Counsel | |
| LLC (private investment firm); Director of Rand | of The Vanguard Group; Secretary of The Vanguard | |
| Merchant Bank; Overseer of the Museum of Fine | Group and of each of the investment companies | |
| Arts Boston. | served by The Vanguard Group; Director and Senior | |
| Vice President of Vanguard Marketing Corporation. | ||
| Alfred M. Rankin, Jr. | ||
| Born 1941. Trustee Since January 1993. Principal | ||
| Vanguard Senior ManagementTeam | ||
| Occupation(s) During the Past Five Years: Chairman, | ||
| President, and Chief Executive Officer of NACCO | Mortimer J. Buckley | Chris D. McIsaac |
| Industries, Inc. (housewares/lignite) and of Hyster-Yale | Kathleen C. Gubanich | Michael S. Miller |
| Materials Handling, Inc. (forklift trucks); Director of | Paul A. Heller | James M. Norris |
| the National Association of Manufacturers; Chairman | Martha G. King | Glenn W. Reed |
| of the Board of University Hospitals of Cleveland; | John T. Marcante | |
| Advisory Chairman of the Board of The Cleveland | ||
| Museum of Art. | ||
| Chairman Emeritus and Senior Advisor | ||
| Peter F. Volanakis | John J. Brennan | |
| Born 1955. Trustee Since July 2009. Principal | Chairman, 1996–2009 | |
| Occupation(s) During the Past Five Years: President | Chief Executive Officer and President, 1996–2008 | |
| and Chief Operating Officer (retired 2010) of Corning | ||
| Incorporated (communications equipment); Director | Founder | |
| of SPX Corporation (multi-industry manufacturing); | ||
| Overseer of the Amos Tuck School of Business | John C. Bogle | |
| Administration at Dartmouth College; Advisor to the | Chairman and Chief Executive Officer, 1974–1996 | |
| Norris Cotton Cancer Center. | ||
1 Mr. McNabb is considered an “interested person,” as defined in the Investment Company Act of 1940, because he is an officer of the Vanguard funds.
2 December 2002 for Vanguard Equity Income Fund, Vanguard Growth Equity Fund, the Vanguard Municipal Bond Funds, and the Vanguard State Tax-Exempt Funds.
 | |
| P.O. Box 2600 | |
| Valley Forge, PA 19482-2600 | |
Connect with Vanguard® > vanguard.com | |
Fund Information > 800-662-7447 | |
© 2013 The Vanguard Group, Inc. |
|
| Annual Report | August 31, 2013 |
| Vanguard S&P Mid-Cap 400 |
| Index Funds |
 |
Vanguard’s Principles for Investing Success
We want to give you the best chance of investment success. These principles, grounded in Vanguard’s research and experience, can put you on the right path.
Goals. Create clear, appropriate investment goals.
Balance. Develop a suitable asset allocation using broadly diversified funds.
Cost. Minimize cost.
Discipline. Maintain perspective and long-term discipline.
A single theme unites these principles: Focus on the things you can control. We believe there is no wiser course for any investor.
| Contents | |
| Your Fund’s Total Returns. | 1 |
| Chairman’s Letter. | 2 |
| S&P Mid-Cap 400 Index Fund. | 9 |
| S&P Mid-Cap 400 Value Index Fund. | 26 |
| S&P Mid-Cap 400 Growth Index Fund. | 42 |
| Your Fund’s After-Tax Returns. | 59 |
| About Your Fund’s Expenses. | 60 |
| Trustees Approve Advisory Arrangement. | 62 |
| Glossary. | 63 |
Please note: The opinions expressed in this report are just that—informed opinions. They should not be considered promises or advice. Also, please keep in mind that the information and opinions cover the period through the date on the front of this report. Of course, the risks of investing in your fund are spelled out in the prospectus.
See the Glossary for definitions of investment terms used in this report.
About the cover: The ship's wheel represents leadership and guidance, essential qualities in navigating difficult seas. This one is a replica based on an 18th-century British vessel. The HMS Vanguard, another ship of that era, served as the flagship for Admiral Horatio Nelson when he defeated a French fleet at the Battle of the Nile.
Your Fund’s Total Returns
| Fiscal Year Ended August 31, 2013 | |
| Total | |
| Returns | |
| Vanguard S&P Mid-Cap 400 Index Fund | |
| Institutional Shares | 23.65% |
| ETF Shares | |
| Market Price | 23.53 |
| Net Asset Value | 23.57 |
| S&P MidCap 400 Index | 23.71 |
| Mid-Cap Core Funds Average | 24.05 |
| Mid-Cap Core Funds Average: Derived from data provided by Lipper, a Thomson Reuters Company. | |
| Vanguard S&P Mid-Cap 400 Value Index Fund | |
| Institutional Shares | 26.47% |
| ETF Shares | |
| Market Price | 26.34 |
| Net Asset Value | 26.31 |
| S&P MidCap 400 Value Index | 26.55 |
| Mid-Cap Value Funds Average | 26.66 |
| Mid-Cap Value Funds Average: Derived from data provided by Lipper, a Thomson Reuters Company. | |
| Vanguard S&P Mid-Cap 400 Growth Index Fund | |
| Institutional Shares | 20.97% |
| ETF Shares | |
| Market Price | 20.80 |
| Net Asset Value | 20.83 |
| S&P MidCap 400 Growth Index | 21.03 |
| Mid-Cap Growth Funds Average | 21.94 |
| Mid-Cap Growth Funds Average: Derived from data provided by Lipper, a Thomson Reuters Company. | |
Institutional Shares are available to certain institutional investors who meet specific administrative, service, and account-size criteria. The Vanguard ETF® Shares shown are traded on the NYSE Arca exchange and are available only through brokers. The table provides ETF returns based on both the NYSE Arca market price and the net asset value for a share. U.S. Pat. No. 6,879,964; 7,337,138; 7,720,749; 7,925,573; 8,090,646.
For the ETF Shares, the market price is determined by the midpoint of the bid-offer spread as of the closing time of the New York Stock Exchange (generally 4 p.m., Eastern time). The net asset value is also determined as of the NYSE closing time. For more information about how the ETF Shares' market prices have compared with their net asset value, visit vanguard.com, select your ETF, and then select the Price and Performance tab. The ETF premium/discount analysis there shows the percentages of days on which the ETF Shares' market price was above or below the NAV.
1

Chairman’s Letter
Dear Shareholder,
Stocks of midsized companies generally outperformed both their large-capitalization counterparts and the broad U.S. market for the fiscal year—a turnabout from a year earlier. Mid-cap returns approached those of small companies, the market’s sweet spot during the period.
For the 12 months ended August 31, 2013, returns for the Vanguard S&P Mid-Cap 400 Index Funds ranged from almost 21% for the Growth Fund to more than 26% for the Value Fund. Vanguard S&P Mid-Cap 400 Index Fund, which encompasses both growth and value stocks, returned more than 23%.
Each fund achieved its objective of closely tracking the performance of its target index but lagged the average return of its peer group. In all three funds, every industry sector notched significant gains. Industrial, financial, and consumer discretionary stocks were among the top contributors, as they were for the previous fiscal year.
If you hold your shares in a taxable account, you may want to review the information on after-tax returns that appears later in this report.
Stocks posted robust results despite setbacks at the finish
U.S. stocks advanced about 20% in the 12 months ended August 31 despite slipping in June and August. Through most of the fiscal year, stocks surged
2
as the economy continued to show modest growth and investors appeared more receptive to risk.
Much of the market’s recent weakness was linked to fear that the Federal Reserve would begin scaling back its stimulative bond-buying program sooner rather than later. Heightened strife in the Middle East also contributed to anxiety in the global markets.
International stocks in aggregate finished with a return of about 13%. Developed markets in the Pacific region and Europe posted results closer to those of the United States. Returns for emerging-market stocks overall were virtually flat as economic growth slowed in China and Brazil.
Although global economic growth concerns and tensions over conflicts abroad have unsettled markets, Jonathan Lemco, a senior sovereign-debt analyst in Vanguard’s Taxable Credit Research Group, pointed out that investors can still manage risks amid international instability. “Vanguard believes a diversified portfolio is the best way to spread the risk of geopolitical uncertainty,” he said.
Bond returns turned negative amid worry about Fed’s next move
Bonds, which generated slightly positive returns through the first eight months of the period, reversed course in May and then continued to retreat as investors anticipated reductions in the Fed’s bond-buying program.
| Market Barometer | |||
| Average Annual Total Returns | |||
| Periods Ended August 31, 2013 | |||
| One | Three | Five | |
| Year | Years | Years | |
| Stocks | |||
| Russell 1000 Index (Large-caps) | 19.84% | 18.74% | 7.59% |
| Russell 2000 Index (Small-caps) | 26.27 | 20.50 | 7.98 |
| Russell 3000 Index (Broad U.S. market) | 20.32 | 18.87 | 7.63 |
| MSCI All Country World Index ex USA (International) | 12.98 | 6.93 | 1.48 |
| Bonds | |||
| Barclays U.S. Aggregate Bond Index (Broad taxable market) | -2.47% | 2.58% | 4.93% |
| Barclays Municipal Bond Index (Broad tax-exempt market) | -3.70 | 2.45 | 4.52 |
| Citigroup Three-Month U.S. Treasury Bill Index | 0.07 | 0.08 | 0.17 |
| CPI | |||
| Consumer Price Index | 1.52% | 2.32% | 1.32% |
3
The broad U.S. taxable bond market returned –2.47% for the 12 months. The yield of the 10-year Treasury note finished at 2.76%, up from 1.56% at the end of August 2012. (Bond yields and prices move in opposite directions.) Municipal bonds suffered more, returning –3.70% for the fiscal year.
Returns for money markets and savings accounts were minuscule as the Fed kept its target for short-term interest rates at 0%–0.25%.
Midsized companies rode the market’s rising tide
The U.S. stock market’s smallest slices were the biggest beneficiaries of the improving investor sentiment that helped drive the period’s almost uninterrupted rally. Small-cap stocks led the way: The S&P SmallCap 600 Index, representing about 3% of the total value of the U.S. stock market, returned almost 27%. Midsized companies were close behind, with a gain of nearly 24% for the S&P MidCap 400 Index, which represents about 7% of the overall U.S. market.
Value stocks of all sizes generally outperformed their growth-oriented counterparts, making the Mid-Cap 400 Value Index Fund the best performer of the three funds. Financials and industrials, the fund’s two largest sectors, contributed the most to its total return. Regional banks bolstered their balance sheets and reported significant growth in profits—a development that would have appeared unlikely five years ago when
| Expense Ratios | |||
| Your Fund Compared With Its Peer Group | |||
| Institutional | ETF | Peer Group | |
| Shares | Shares | Average | |
| S&P Mid-Cap 400 Index Fund | 0.09% | 0.16% | 1.23% |
| S&P Mid-Cap 400 Value Index Fund | 0.10 | 0.22 | 1.31 |
| S&P Mid-Cap 400 Growth Index Fund | 0.08 | 0.20 | 1.35 |
The fund expense ratios shown are from the prospectus dated December 28, 2012, and represent estimated costs for the current fiscal year. For the fiscal year ended August 31, 2013, the funds’ expense ratios were: for the S&P Mid-Cap 400 Index Fund, 0.08% for Institutional Shares and 0.15% for ETF Shares; for the S&P Mid-Cap 400 Value Index Fund, 0.08% for Institutional Shares and 0.20% for ETF Shares; and for the S&P Mid-Cap 400 Growth Index Fund, 0.08% for Institutional Shares and 0.20% for ETF Shares. Peer-group expense ratios are derived from data provided by Lipper, a Thomson Reuters Company, and capture information through year-end 2012.
Peer groups: For the S&P Mid-Cap 400 Index Fund, Mid-Cap Core Funds; for the S&P Mid-Cap 400 Value Index Fund, Mid-Cap Value Funds; and for the S&P Mid-Cap 400 Growth Index Fund, Mid-Cap Growth Funds.
4
| Investment insight |
| Growth stocks versus value stocks: A case for both |
| Growth and value stocks typically take turns outperforming each other. The chart |
| here shows how they have switched off during the past 20 years in leading or |
| lagging a broader market average. |
| These two styles of investing are typically considered complementary—when growth |
| is performing well, value typically isn’t, and vice versa. Generally speaking, growth |
| stocks represent companies that are expected to expand their businesses at a rapid |
| pace, while value stocks typically represent more established, slower-growing |
| companies. |
| Which does better in the long run? Neither. Vanguard research has shown that there |
| is no significant long-term difference in the risk/reward characteristics of growth and |
| value stocks. But, because their performance can vary considerably over shorter time |
| periods, a truly diversified portfolio should have exposure to both. |
| Rolling 12-month return differences, 1993–2012 |
 |
5
the collapse of Lehman Brothers sparked the financial crisis. Insurance companies also performed very well. And, as the U.S. and global economy gained strength, the standouts in industrials included makers of construction, farm, and industrial machinery, along with aerospace and defense contractors.
Similar themes played out in the Mid-Cap 400 Index Fund, which includes both value and growth stocks. With households loosening the grip on their wallets, the consumer discretionary sector joined financials and industrials—the largest sectors in this fund, too—as the leading contributors to return. Sources of strength in consumer discretionary included home furnishings and housewares—reflecting the recovering housing market—as well as apparel.
Industrials were also the top contributors in the Mid-Cap 400 Growth Index Fund, where they were the fourth-largest sector. Consumer discretionary, the second-largest sector, and the smaller health care sector were also leading contributors. Within the health care group, biotechnol-ogy stocks provided a notable boost.
The funds continued to build a strong index-tracking record
The ETF Shares of all three S&P Mid-Cap 400 Index Funds, which launched on September 7, 2010, were just shy of their
| A note on expense ratios |
| The Expense Ratios table in each shareholder report’s Chairman’s Letter displays |
| fund expense ratios from the most recent prospectus. These figures include |
| the funds’ actual operating expenses. For some funds, the figures also include |
| “acquired fund fees and expenses,” which result from the funds’ holdings in |
| business development companies (BDCs). |
| Although the Securities and Exchange Commission requires that BDC costs be |
| included in a fund’s expense ratio, these fees are not incurred by the fund. They |
| have no impact on a fund’s total return or on its tracking error relative to an index. |
| A footnote to the Expense Ratios table reports the fund’s actual expenses for the |
| fiscal year, a more relevant tally of the operating costs incurred by shareholders. |
6
three-year anniversary at the end of the fiscal period. (The Institutional Shares came later.) In your fund’s Performance Summary, provided later in this report, you’ll find a year-by-year comparison of the fund’s return with that of its target index.
Vanguard encourages investors to view fund performance over long periods, and it’s certainly true that three years doesn’t constitute “long-term.” But the funds’ close tracking of their target indexes to date underscores the skill and experience of Vanguard’s Equity Investment Group, which is supported by state-of-the-art technology that helps to control risk and keep trading efficient in all market conditions. And Vanguard’s low expense ratios help the funds’ returns come closer to those of their benchmark indexes, which incur no expenses.
In challenging markets, index funds can be a solid portfolio foundation
As you know, index funds seek to capture the return of the market they track, minus only their operating expenses, which—at least at Vanguard—are typically very low. The funds do so by investing in an entire market or by relying on a sophisticated market-sampling technique.
In actively managed funds, by contrast, advisors troll the markets and reel in selected stocks or bonds that their analysis suggests will allow them to outperform their benchmarks. As we show in The Case for Index Fund Investing, a paper available at vanguard.com/research, there’s typically a big gap between hope and reality: Consistent outperformance by any one active manager has been rare.
I use the word “typically” because we believe that some actively managed funds, including Vanguard’s, can increase the odds of outperforming benchmarks over the long term. As demonstrated in a companion paper, The Case for Vanguard Active Management: Solving the Low-Cost/Top-Talent Paradox? (also at vanguard.com/research), the most reliable quantitative indicator of future manager success is low expenses—a Vanguard hallmark. And, as the paper’s title implies, finding talented advisors is a key aspect of active investing. We believe we have the process in place to identify the best.
Even so, investors in actively managed funds should expect, and be comfortable with, the extended periods of underperfor-mance that such funds can undergo. The challenges of active investing, conversely, point to the potential benefits of indexing. Well-run index funds offer you virtually the market return, year in and year out. In a portfolio that is diversified within asset classes, and balanced among them, low-cost index funds can be the bedrock of a sound investment plan.
As always, thank you for investing with Vanguard.
Sincerely,

F. William McNabb III
Chairman and Chief Executive Officer
September 19, 2013
7
| Your Fund’s Performance at a Glance | ||||
| August 31, 2012, Through August 31, 2013 | ||||
| Distributions Per Share | ||||
| Starting | Ending | Income | Capital | |
| Share Price | Share Price | Dividends | Gains | |
| Vanguard S&P Mid-Cap 400 Index Fund | ||||
| Institutional Shares | $130.17 | $159.20 | $1.499 | $0.000 |
| ETF Shares | 65.20 | 79.72 | 0.725 | 0.000 |
| Vanguard S&P Mid-Cap 400 Value Index Fund | ||||
| Institutional Shares | $125.30 | $155.83 | $2.226 | $0.000 |
| ETF Shares | 62.71 | 77.93 | 1.079 | 0.000 |
| Vanguard S&P Mid-Cap 400 Growth Index | ||||
| Fund | ||||
| Institutional Shares | $134.20 | $161.12 | $1.056 | $0.000 |
| ETF Shares | 67.47 | 80.96 | 0.488 | 0.000 |
8
S&P Mid-Cap 400 Index Fund
Fund Profile
As of August 31, 2013
| Share-Class Characteristics | ||
| Institutional | ETF | |
| Shares | Shares | |
| Ticker Symbol | VSPMX | IVOO |
| Expense Ratio1 | 0.09% | 0.16% |
| 30-Day SEC Yield | 1.39% | 1.32% |
| Portfolio Characteristics | |||
| DJ U.S. | |||
| Total | |||
| S&P | Market | ||
| MidCap | FA | ||
| Fund 400 Index | Index | ||
| Number of Stocks | 401 | 400 | 3,631 |
| Median Market Cap | $4.3B | $4.3B | $39.3B |
| Price/Earnings Ratio | 22.4x | 22.4x | 18.7x |
| Price/Book Ratio | 2.3x | 2.3x | 2.4x |
| Return on Equity | 12.0% | 12.0% | 16.6% |
| Earnings Growth | |||
| Rate | 12.3% | 12.3% | 11.1% |
| Dividend Yield | 1.5% | 1.5% | 2.0% |
| Foreign Holdings | 0.0% | 0.0% | 0.0% |
| Turnover Rate | 10% | — | — |
| Short-Term Reserves | -0.1% | — | — |
| Sector Diversification (% of equity exposure) | |||
| DJ U.S. | |||
| S&P | Total | ||
| MidCap | Market | ||
| Fund | 400 Index | FA Index | |
| Consumer | |||
| Discretionary | 13.6% | 13.5% | 13.1% |
| Consumer Staples | 4.3 | 4.3 | 8.9 |
| Energy | 5.5 | 5.5 | 9.8 |
| Financials | 22.6 | 22.6 | 17.5 |
| Health Care | 9.8 | 9.8 | 12.6 |
| Industrials | 16.4 | 16.5 | 11.2 |
| Information | |||
| Technology | 15.4 | 15.4 | 17.6 |
| Materials | 6.9 | 6.9 | 3.8 |
| Telecommunication | |||
| Services | 0.5 | 0.5 | 2.3 |
| Utilities | 5.0 | 5.0 | 3.2 |
| Ten Largest Holdings (% of total net assets) | ||
| Vertex Pharmaceuticals | ||
| Inc. | Biotechnology | 1.3% |
| Green Mountain Coffee | Packaged Foods & | |
| Roasters Inc. | Meats | 0.8 |
| AMETEK Inc. | Electrical | |
| Components & | ||
| Equipment | 0.8 | |
| Alliance Data Systems | Data Processing & | |
| Corp. | Outsourced Services | 0.7 |
| Affiliated Managers | Asset Management | |
| Group Inc. | & Custody Banks | 0.7 |
| HollyFrontier Corp. | Oil & Gas Refining & | |
| Marketing | 0.7 | |
| Henry Schein Inc. | Health Care | |
| Distributors | 0.6 | |
| LKQ Corp. | Distributors | 0.6 |
| Equinix Inc. | Internet Software & | |
| Services | 0.6 | |
| Tractor Supply Co. | Specialty Stores | 0.6 |
| Top Ten | 7.4% | |
The holdings listed exclude any temporary cash investments and equity index products.
Investment Focus
1 The expense ratios shown are from the prospectus dated December 28, 2012, and represent estimated costs for the current fiscal year. For the fiscal year ended August 31, 2013, the expense ratios were 0.08% for Institutional Shares and 0.15% for ETF Shares.
9
S&P Mid-Cap 400 Index Fund
Performance Summary
All of the returns in this report represent past performance, which is not a guarantee of future results that may be achieved by the fund. (Current performance may be lower or higher than the performance data cited. For performance data current to the most recent month-end, visit our website at vanguard.com/performance.) Note, too, that both investment returns and principal value can fluctuate widely, so an investor’s shares, when sold, could be worth more or less than their original cost. The returns shown do not reflect taxes that a shareholder would pay on fund distributions or on the sale of fund shares.
Cumulative Performance: September 7, 2010, Through August 31, 2013
Initial Investment of $10,000
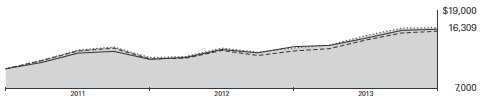
| Average Annual Total Returns | |||
| Periods Ended August 31, 2013 | |||
| Since | Final Value | ||
| One | Inception | of a $10,000 | |
| Year | (9/7/2010) | Investment | |
| S&P Mid-Cap 400 Index Fund*ETF | |||
| Shares Net Asset Value | 23.57% | 17.83% | $16,309 |
| S&P Mid-Cap 400 Index Fund*ETF | |||
| Shares Market Price | 23.53 | 17.82 | 16,305 |
| S&P MidCap 400 Index | 23.71 | 17.99 | 16,376 |
| Mid-Cap Core Funds Average | 24.05 | 16.66 | 15,828 |
| Dow Jones U.S. Total Stock Market | |||
| Float Adjusted Index | 20.15 | 17.40 | 16,132 |
Mid-Cap Core Funds Average: Derived from data provided by Lipper, a Thomson Reuters Company.
"Since Inception" performance is calculated from the ETF Shares’ inception date for both the fund and its comparative standards.
| Since | Final Value | ||
| One | Inception | of a $5,000,000 | |
| Year | (3/28/2011) | Investment | |
| S&P Mid-Cap 400 Index Fund Institutional | |||
| Shares | 23.65% | 10.29% | $6,341,625 |
| S&P MidCap 400 Index | 23.71 | 10.36 | 6,351,780 |
| Dow Jones U.S. Total Stock Market Float | |||
| Adjusted Index | 20.15 | 11.83 | 6,559,457 |
"Since Inception" performance is calculated from the Institutional Shares’ inception date for both the fund and its comparative standards. Institutional Shares were first issued on December 15, 2010, and the sole shareholder redeemed shortly thereafter. Institutional Shares were next issued on March 28, 2011. The total returns shown are based on the period beginning March 28, 2011.
See Financial Highlights for dividend and capital gains information.
10
S&P Mid-Cap 400 Index Fund
| Cumulative Returns of ETF Shares: September 7, 2010, Through August 31, 2013 | ||
| Since | ||
| One | Inception | |
| Year | (9/7/2010) | |
| S&P Mid-Cap 400 Index Fund ETF Shares Market | ||
| Price | 23.53% | 63.05% |
| S&P Mid-Cap 400 Index Fund ETF Shares Net Asset | ||
| Value | 23.57 | 63.09 |
| S&P MidCap 400 Index | 23.71 | 63.76 |
| "Since Inception" performance is calculated from the ETF Shares’ inception date for both the fund and its comparative standards. | ||
Fiscal-Year Total Returns (%): September 7, 2010, Through August 31, 2013

Average Annual Total Returns: Periods Ended June 30, 2013
This table presents returns through the latest calendar quarter—rather than through the end of the fiscal period.
Securities and Exchange Commission rules require that we provide this information.
| Inception | One | Since | |
| Date | Year | Inception | |
| Institutional Shares | 3/28/20111 | 25.12% | 10.03% |
| ETF Shares | 9/7/2010 | ||
| Market Price | 24.85 | 18.03 | |
| Net Asset Value | 25.03 | 18.09 |
1 Institutional Shares were first issued on December 15, 2010, and the sole shareholder redeemed shortly thereafter. Institutional Shares were next issued on March 28, 2011. The total returns shown are based on the period beginning March 28, 2011.
11
S&P Mid-Cap 400 Index Fund
Financial Statements
Statement of Net Assets
As of August 31, 2013
The fund reports a complete list of its holdings in regulatory filings four times in each fiscal year, at the quarter-ends. For the second and fourth fiscal quarters, the lists appear in the fund’s semiannual and annual reports to shareholders. For the first and third fiscal quarters, the fund files the lists with the Securities and Exchange Commission on Form N-Q. Shareholders can look up the fund’s Forms N-Q on the SEC’s website at sec.gov. Forms N-Q may also be reviewed and copied at the SEC’s Public Reference Room (see the back cover of this report for further information).
| Market | |||
| Value | |||
| Shares | ($000) | ||
| Common Stocks (99.5%)1 | |||
| Consumer Discretionary (13.5%) | |||
| * | LKQ Corp. | 88,764 | 2,595 |
| Tractor Supply Co. | 20,745 | 2,539 | |
| * | Mohawk Industries Inc. | 18,099 | 2,126 |
| Polaris Industries Inc. | 19,002 | 2,075 | |
| Hanesbrands Inc. | 29,291 | 1,742 | |
| Advance Auto Parts Inc. | 21,738 | 1,741 | |
| * | Under Armour Inc. Class A | 23,110 | 1,679 |
| Signet Jewelers Ltd. | 24,039 | 1,596 | |
| Williams-Sonoma Inc. | 25,552 | 1,441 | |
| Foot Locker Inc. | 44,621 | 1,437 | |
| Dick’s Sporting Goods Inc. | 29,776 | 1,382 | |
| * | Toll Brothers Inc. | 44,786 | 1,371 |
| * | Panera Bread Co. Class A | 8,326 | 1,366 |
| * | Jarden Corp. | 30,037 | 1,290 |
| Tupperware Brands Corp. | 15,719 | 1,270 | |
| Service Corp. International | 62,909 | 1,137 | |
| Carter’s Inc. | 15,143 | 1,115 | |
| * | NVR Inc. | 1,294 | 1,107 |
| * | AMC Networks Inc. Class A | 17,163 | 1,064 |
| Domino’s Pizza Inc. | 16,717 | 1,027 | |
| Gentex Corp. | 42,728 | 963 | |
| Sotheby’s | 20,320 | 937 | |
| * | Cabela’s Inc. | 13,833 | 907 |
| Cinemark Holdings Inc. | 30,276 | 892 | |
| Brinker International Inc. | 20,995 | 840 | |
| * | Bally Technologies Inc. | 11,496 | 829 |
| American Eagle | |||
| Outfitters Inc. | 52,181 | 755 | |
| Chico’s FAS Inc. | 48,283 | 753 | |
| * | Lamar Advertising Co. | ||
| Class A | 16,556 | 697 | |
| * | Tempur Sealy | ||
| International Inc. | 17,962 | 692 | |
| Thor Industries Inc. | 13,081 | 670 | |
| Wendy’s Co. | 84,150 | 636 | |
| * | Ascena Retail Group Inc. | 37,835 | 617 |
| Cheesecake Factory Inc. | 14,734 | 615 | |
| Market | |||
| Value | |||
| Shares | ($000) | ||
| * | Big Lots Inc. | 17,296 | 613 |
| John Wiley & Sons Inc. | |||
| Class A | 13,740 | 602 | |
| * | Deckers Outdoor Corp. | 10,235 | 601 |
| * | DreamWorks Animation | ||
| SKG Inc. Class A | 21,131 | 598 | |
| Rent-A-Center Inc. | 15,861 | 595 | |
| * | Life Time Fitness Inc. | 11,766 | 588 |
| HSN Inc. | 10,624 | 572 | |
| Aaron’s Inc. | 20,945 | 567 | |
| Guess? Inc. | 18,149 | 554 | |
| * | Apollo Group Inc. Class A | 29,774 | 553 |
| * | CST Brands Inc. | 17,919 | 529 |
| DeVry Inc. | 16,813 | 505 | |
| * | Murphy USA Inc. | 13,486 | 498 |
| * | ANN Inc. | 14,002 | 486 |
| * | Saks Inc. | 29,889 | 476 |
| Meredith Corp. | 10,703 | 460 | |
| * | WMS Industries Inc. | 16,336 | 420 |
| Bob Evans Farms Inc. | 8,307 | 407 | |
| * | New York Times Co. | ||
| Class A | 36,375 | 406 | |
| KB Home | 24,411 | 391 | |
| * | Office Depot Inc. | 85,195 | 357 |
| MDC Holdings Inc. | 11,644 | 324 | |
| Valassis | |||
| Communications Inc. | 11,564 | 319 | |
| Matthews International | |||
| Corp. Class A | 8,224 | 303 | |
| Regis Corp. | 16,877 | 266 | |
| International Speedway | |||
| Corp. Class A | 7,608 | 236 | |
| Scholastic Corp. | 7,889 | 233 | |
| * | Scientific Games Corp. | ||
| Class A | 15,705 | 224 | |
| * | Aeropostale Inc. | 23,389 | 190 |
| * | Barnes & Noble Inc. | 11,252 | 154 |
| 54,930 |
12
S&P Mid-Cap 400 Index Fund
| Market | |||
| Value | |||
| Shares | ($000) | ||
| Consumer Staples (4.3%) | |||
| * | Green Mountain Coffee | ||
| Roasters Inc. | 36,810 | 3,177 | |
| Church & Dwight Co. Inc. | 41,077 | 2,438 | |
| Energizer Holdings Inc. | 18,500 | 1,829 | |
| Ingredion Inc. | 23,026 | 1,449 | |
| * | Smithfield Foods Inc. | 37,168 | 1,246 |
| Hillshire Brands Co. | 36,577 | 1,182 | |
| Flowers Foods Inc. | 51,211 | 1,065 | |
| * | United Natural Foods Inc. | 14,676 | 890 |
| Harris Teeter | |||
| Supermarkets Inc. | 14,722 | 724 | |
| * | WhiteWave Foods Co. | ||
| Class A | 32,800 | 627 | |
| * | Dean Foods Co. | 27,729 | 531 |
| * | SUPERVALU Inc. | 59,579 | 427 |
| Lancaster Colony Corp. | 5,760 | 425 | |
| * | Post Holdings Inc. | 9,703 | 414 |
| * | WhiteWave Foods Co. | ||
| Class B | 18,684 | 354 | |
| Universal Corp. | 6,956 | 341 | |
| Tootsie Roll Industries Inc. | 6,237 | 187 | |
| 17,306 | |||
| Energy (5.5%) | |||
| HollyFrontier Corp. | 60,441 | 2,688 | |
| Oceaneering | |||
| International Inc. | 32,162 | 2,495 | |
| Cimarex Energy Co. | 25,697 | 2,154 | |
| * | Oil States International Inc. | 16,336 | 1,457 |
| Energen Corp. | 21,466 | 1,423 | |
| * | Dresser-Rand Group Inc. | 22,638 | 1,379 |
| SM Energy Co. | 19,698 | 1,346 | |
| * | Superior Energy | ||
| Services Inc. | 47,428 | 1,165 | |
| * | Dril-Quip Inc. | 10,856 | 1,107 |
| * | Atwood Oceanics Inc. | 17,037 | 949 |
| Patterson-UTI Energy Inc. | 43,576 | 854 | |
| * | Rosetta Resources Inc. | 18,181 | 846 |
| World Fuel Services Corp. | 21,613 | 824 | |
| Tidewater Inc. | 14,728 | 795 | |
| * | Helix Energy Solutions | ||
| Group Inc. | 29,321 | 734 | |
| * | Unit Corp. | 12,979 | 598 |
| CARBO Ceramics Inc. | 5,841 | 477 | |
| * | Alpha Natural | ||
| Resources Inc. | 65,955 | 401 | |
| * | Bill Barrett Corp. | 14,529 | 313 |
| Arch Coal Inc. | 63,220 | 283 | |
| 22,288 | |||
| Financials (22.4%) | |||
| * | Affiliated Managers | ||
| Group Inc. | 15,677 | 2,733 | |
| SL Green Realty Corp. | 27,228 | 2,374 | |
| Realty Income Corp. | 58,331 | 2,304 | |
| Market | |||
| Value | |||
| Shares | ($000) | ||
| Rayonier Inc. | 37,461 | 2,069 | |
| Everest Re Group Ltd. | 14,854 | 2,034 | |
| * | Alleghany Corp. | 5,007 | 1,938 |
| New York Community | |||
| Bancorp Inc. | 131,042 | 1,920 | |
| Federal Realty | |||
| Investment Trust | 19,393 | 1,887 | |
| UDR Inc. | 74,529 | 1,684 | |
| Essex Property Trust Inc. | 11,294 | 1,619 | |
| Camden Property Trust | 25,216 | 1,558 | |
| Arthur J Gallagher & Co. | 37,675 | 1,557 | |
| Fidelity National | |||
| Financial Inc. Class A | 63,526 | 1,506 | |
| Liberty Property Trust | 41,981 | 1,453 | |
| Raymond James | |||
| Financial Inc. | 33,619 | 1,406 | |
| Reinsurance Group | |||
| of America Inc. Class A | 21,548 | 1,397 | |
| Duke Realty Corp. | 95,606 | 1,395 | |
| Eaton Vance Corp. | 36,085 | 1,391 | |
| WR Berkley Corp. | 32,750 | 1,347 | |
| * | MSCI Inc. Class A | 35,880 | 1,346 |
| Regency Centers Corp. | 27,226 | 1,295 | |
| Alexandria Real Estate | |||
| Equities Inc. | 20,934 | 1,291 | |
| Taubman Centers Inc. | 18,952 | 1,278 | |
| Senior Housing | |||
| Properties Trust | 55,898 | 1,272 | |
| Extra Space Storage Inc. | 30,797 | 1,270 | |
| Cullen/Frost Bankers Inc. | 17,835 | 1,263 | |
| HCC Insurance | |||
| Holdings Inc. | 29,840 | 1,259 | |
| * | Signature Bank | 14,045 | 1,232 |
| Waddell & Reed | |||
| Financial Inc. Class A | 25,539 | 1,216 | |
| CBOE Holdings Inc. | 25,937 | 1,190 | |
| SEI Investments Co. | 39,966 | 1,189 | |
| East West Bancorp Inc. | 40,471 | 1,183 | |
| American Financial | |||
| Group Inc. | 22,446 | 1,157 | |
| Corrections Corp. | |||
| of America | 34,241 | 1,128 | |
| Hospitality Properties Trust | 41,529 | 1,122 | |
| * | SVB Financial Group | 13,397 | 1,109 |
| BRE Properties Inc. | 22,904 | 1,099 | |
| Brown & Brown Inc. | 35,100 | 1,093 | |
| Kilroy Realty Corp. | 22,393 | 1,093 | |
| Jones Lang LaSalle Inc. | 13,105 | 1,078 | |
| National Retail | |||
| Properties Inc. | 35,177 | 1,077 | |
| First Niagara Financial | |||
| Group Inc. | 105,191 | 1,062 | |
| FirstMerit Corp. | 49,256 | 1,042 | |
| American Campus | |||
| Communities Inc. | 31,178 | 1,039 |
13
S&P Mid-Cap 400 Index Fund
| Market | |||
| Value | |||
| Shares | ($000) | ||
| BioMed Realty Trust Inc. | 55,442 | 1,021 | |
| Old Republic | |||
| International Corp. | 71,835 | 1,020 | |
| Commerce Bancshares Inc. | 22,906 | 989 | |
| Omega Healthcare | |||
| Investors Inc. | 34,565 | 982 | |
| Protective Life Corp. | 23,345 | 976 | |
| Home Properties Inc. | 16,691 | 963 | |
| Weingarten Realty | |||
| Investors | 33,350 | 957 | |
| Synovus Financial Corp. | 291,112 | 929 | |
| City National Corp. | 14,180 | 928 | |
| Highwoods Properties Inc. | 26,570 | 898 | |
| Prosperity Bancshares Inc. | 13,992 | 837 | |
| Hancock Holding Co. | 25,262 | 812 | |
| Associated Banc-Corp | 49,912 | 796 | |
| First Horizon National Corp. | 71,789 | 794 | |
| Federated Investors Inc. | |||
| Class B | 28,069 | 762 | |
| Aspen Insurance | |||
| Holdings Ltd. | 20,273 | 721 | |
| Webster Financial Corp. | 26,863 | 711 | |
| Fulton Financial Corp. | 58,081 | 702 | |
| Hanover Insurance | |||
| Group Inc. | 13,099 | 698 | |
| StanCorp Financial | |||
| Group Inc. | 13,176 | 689 | |
| Bank of Hawaii Corp. | 13,346 | 687 | |
| TCF Financial Corp. | 48,754 | 685 | |
| First American | |||
| Financial Corp. | 32,198 | 673 | |
| Washington Federal Inc. | 31,011 | 648 | |
| Valley National Bancorp | 59,195 | 597 | |
| Corporate Office | |||
| Properties Trust | 25,482 | 580 | |
| Kemper Corp. | 16,036 | 544 | |
| Mack-Cali Realty Corp. | 24,814 | 536 | |
| Apollo Investment Corp. | 66,765 | 527 | |
| Primerica Inc. | 13,712 | 509 | |
| Trustmark Corp. | 19,951 | 496 | |
| BancorpSouth Inc. | 24,881 | 482 | |
| Cathay General Bancorp | 21,787 | 480 | |
| Mercury General Corp. | 10,768 | 473 | |
| Janus Capital Group Inc. | 56,399 | 471 | |
| Potlatch Corp. | 12,027 | 464 | |
| * | Alexander & Baldwin Inc. | 12,787 | 460 |
| Equity One Inc. | 18,452 | 392 | |
| Westamerica | |||
| Bancorporation | 8,040 | 378 | |
| Greenhill & Co. Inc. | 7,812 | 370 | |
| International | |||
| Bancshares Corp. | 16,219 | 356 | |
| Astoria Financial Corp. | 24,446 | 301 | |
| 91,249 |
| Market | |||
| Value | |||
| Shares | ($000) | ||
| Health Care (9.8%) | |||
| * | Vertex Pharmaceuticals Inc. | 69,211 | 5,201 |
| * | Henry Schein Inc. | 25,901 | 2,617 |
| ResMed Inc. | 42,347 | 2,000 | |
| * | Mettler-Toledo | ||
| International Inc. | 8,972 | 1,976 | |
| Cooper Cos. Inc. | 14,462 | 1,889 | |
| Universal Health | |||
| Services Inc. Class B | 26,512 | 1,796 | |
| * | Hologic Inc. | 80,047 | 1,708 |
| Omnicare Inc. | 31,187 | 1,696 | |
| * | IDEXX Laboratories Inc. | 16,080 | 1,509 |
| * | MEDNAX Inc. | 14,866 | 1,447 |
| * | Endo Health Solutions Inc. | 33,360 | 1,371 |
| * | Covance Inc. | 16,608 | 1,346 |
| Community Health | |||
| Systems Inc. | 28,013 | 1,100 | |
| * | Salix Pharmaceuticals Ltd. | 15,506 | 1,038 |
| * | Health Management | ||
| Associates Inc. Class A | 77,170 | 992 | |
| * | United Therapeutics Corp. | 13,746 | 975 |
| Teleflex Inc. | 12,234 | 943 | |
| * | WellCare Health Plans Inc. | 12,935 | 824 |
| Techne Corp. | 10,305 | 799 | |
| * | Allscripts Healthcare | ||
| Solutions Inc. | 52,754 | 767 | |
| Mallinckrodt plc | 17,503 | 764 | |
| * | VCA Antech Inc. | 26,350 | 719 |
| STERIS Corp. | 17,543 | 717 | |
| * | Health Net Inc. | 23,615 | 713 |
| * | Bio-Rad Laboratories Inc. | ||
| Class A | 6,029 | 687 | |
| * | Charles River Laboratories | ||
| International Inc. | 14,593 | 672 | |
| * | HMS Holdings Corp. | 26,058 | 651 |
| Owens & Minor Inc. | 18,815 | 642 | |
| * | LifePoint Hospitals Inc. | 14,080 | 637 |
| * | Thoratec Corp. | 17,033 | 609 |
| Hill-Rom Holdings Inc. | 17,755 | 606 | |
| Masimo Corp. | 15,295 | 378 | |
| 39,789 | |||
| Industrials (16.3%) | |||
| AMETEK Inc. | 72,394 | 3,107 | |
| * | B/E Aerospace Inc. | 31,131 | 2,123 |
| JB Hunt Transport | |||
| Services Inc. | 26,912 | 1,938 | |
| Fortune Brands Home | |||
| & Security Inc. | 49,049 | 1,807 | |
| Wabtec Corp. | 28,593 | 1,673 | |
| AGCO Corp. | 28,924 | 1,636 | |
| Hubbell Inc. Class B | 15,878 | 1,609 | |
| Waste Connections Inc. | 36,683 | 1,554 | |
| Lincoln Electric | |||
| Holdings Inc. | 24,653 | 1,542 | |
| * | United Rentals Inc. | 28,009 | 1,534 |
14
S&P Mid-Cap 400 Index Fund
| Market | |||
| Value | |||
| Shares | ($000) | ||
| Manpowergroup Inc. | 22,925 | 1,487 | |
| IDEX Corp. | 24,441 | 1,451 | |
| Donaldson Co. Inc. | 40,182 | 1,416 | |
| Towers Watson & Co. | |||
| Class A | 16,778 | 1,380 | |
| * | Kirby Corp. | 16,868 | 1,357 |
| Timken Co. | 23,720 | 1,330 | |
| KBR Inc. | 43,931 | 1,312 | |
| * | Genesee & Wyoming Inc. | ||
| Class A | 14,717 | 1,274 | |
| Graco Inc. | 18,207 | 1,265 | |
| Carlisle Cos. Inc. | 18,911 | 1,259 | |
| Alaska Air Group Inc. | 20,876 | 1,182 | |
| * | Oshkosh Corp. | 26,150 | 1,175 |
| Nordson Corp. | 16,794 | 1,119 | |
| URS Corp. | 22,556 | 1,117 | |
| Triumph Group Inc. | 15,332 | 1,103 | |
| Acuity Brands Inc. | 12,730 | 1,088 | |
| MSC Industrial | |||
| Direct Co. Inc. Class A | 13,937 | 1,059 | |
| SPX Corp. | 13,906 | 1,030 | |
| * | Copart Inc. | 31,729 | 1,008 |
| Kennametal Inc. | 23,430 | 996 | |
| Trinity Industries Inc. | 23,569 | 995 | |
| * | Terex Corp. | 33,090 | 960 |
| Huntington Ingalls | |||
| Industries Inc. | 14,923 | 945 | |
| Valmont Industries Inc. | 6,996 | 944 | |
| Lennox International Inc. | 13,627 | 935 | |
| Alliant Techsystems Inc. | 9,577 | 927 | |
| * | Clean Harbors Inc. | 16,033 | 911 |
| RR Donnelley & Sons Co. | 53,981 | 900 | |
| * | AECOM Technology Corp. | 30,676 | 894 |
| ITT Corp. | 26,753 | 879 | |
| Regal-Beloit Corp. | 13,388 | 853 | |
| Crane Co. | 14,458 | 830 | |
| Exelis Inc. | 55,989 | 824 | |
| Watsco Inc. | 8,836 | 793 | |
| CLARCOR Inc. | 14,786 | 792 | |
| Landstar System Inc. | 13,857 | 757 | |
| * | Esterline Technologies Corp. | 9,310 | 710 |
| Con-way Inc. | 16,768 | 698 | |
| Woodward Inc. | 18,009 | 694 | |
| Corporate Executive | |||
| Board Co. | 9,986 | 647 | |
| GATX Corp. | 13,904 | 629 | |
| Deluxe Corp. | 15,111 | 595 | |
| Harsco Corp. | 23,964 | 564 | |
| UTi Worldwide Inc. | 31,050 | 513 | |
| Rollins Inc. | 19,554 | 484 | |
| HNI Corp. | 13,503 | 452 | |
| General Cable Corp. | 14,780 | 451 | |
| Mine Safety Appliances Co. | 9,267 | 446 | |
| Herman Miller Inc. | 17,340 | 442 | |
| * | JetBlue Airways Corp. | 67,251 | 414 |
| Market | |||
| Value | |||
| Shares | ($000) | ||
| * | FTI Consulting Inc. | 12,010 | 402 |
| Brink’s Co. | 14,291 | 369 | |
| Matson Inc. | 12,710 | 338 | |
| Werner Enterprises Inc. | 13,313 | 307 | |
| Granite Construction Inc. | 10,613 | 301 | |
| 66,526 | |||
| Information Technology (15.3%) | |||
| * | Alliance Data Systems Corp. | 14,621 | 2,861 |
| * | Equinix Inc. | 14,670 | 2,549 |
| * | ANSYS Inc. | 27,706 | 2,327 |
| * | Cree Inc. | 35,052 | 1,945 |
| * | Trimble Navigation Ltd. | 76,034 | 1,920 |
| * | NCR Corp. | 48,865 | 1,739 |
| * | Synopsys Inc. | 45,703 | 1,657 |
| * | Gartner Inc. | 27,865 | 1,615 |
| * | Avnet Inc. | 40,735 | 1,571 |
| * | Rackspace Hosting Inc. | 32,840 | 1,472 |
| * | Arrow Electronics Inc. | 31,110 | 1,444 |
| * | Skyworks Solutions Inc. | 56,827 | 1,441 |
| * | 3D Systems Corp. | 27,549 | 1,416 |
| * | Concur Technologies Inc. | 13,606 | 1,330 |
| Jack Henry | |||
| & Associates Inc. | 25,593 | 1,277 | |
| FactSet Research | |||
| Systems Inc. | 12,025 | 1,231 | |
| * | Informatica Corp. | 32,121 | 1,149 |
| * | MICROS Systems Inc. | 23,377 | 1,143 |
| * | Cadence Design | ||
| Systems Inc. | 84,106 | 1,133 | |
| Global Payments Inc. | 22,995 | 1,096 | |
| * | CommVault Systems Inc. | 12,846 | 1,077 |
| Broadridge Financial | |||
| Solutions Inc. | 36,027 | 1,072 | |
| Solera Holdings Inc. | 20,474 | 1,057 | |
| * | TIBCO Software Inc. | 46,328 | 1,044 |
| * | Ingram Micro Inc. | 45,331 | 1,002 |
| * | NeuStar Inc. Class A | 19,581 | 990 |
| * | PTC Inc. | 35,577 | 927 |
| * | Atmel Corp. | 127,551 | 926 |
| * | WEX Inc. | 11,546 | 924 |
| Lender Processing | |||
| Services Inc. | 25,278 | 806 | |
| National Instruments Corp. | 28,313 | 786 | |
| AOL Inc. | 23,050 | 759 | |
| * | Riverbed Technology Inc. | 48,637 | 751 |
| * | CoreLogic Inc. | 28,421 | 730 |
| * | Zebra Technologies Corp. | 15,156 | 691 |
| Compuware Corp. | 63,523 | 678 | |
| * | SolarWinds Inc. | 18,353 | 669 |
| Lexmark International Inc. | |||
| Class A | 18,755 | 641 | |
| * | VeriFone Systems Inc. | 32,245 | 639 |
| DST Systems Inc. | 8,870 | 633 | |
| Mentor Graphics Corp. | 28,168 | 624 | |
| * | Ciena Corp. | 30,164 | 601 |
15
S&P Mid-Cap 400 Index Fund
| Market | |||
| Value | |||
| Shares | ($000) | ||
| * | Semtech Corp. | 20,053 | 596 |
| * | ACI Worldwide Inc. | 11,839 | 576 |
| Plantronics Inc. | 12,859 | 556 | |
| * | Tech Data Corp. | 11,218 | 551 |
| * | Rovi Corp. | 30,711 | 551 |
| Convergys Corp. | 31,213 | 550 | |
| * | Acxiom Corp. | 21,958 | 546 |
| Diebold Inc. | 18,911 | 535 | |
| Fair Isaac Corp. | 10,656 | 534 | |
| * | Polycom Inc. | 51,252 | 509 |
| SunEdison Inc. | 68,865 | 507 | |
| * | International Rectifier Corp. | 20,630 | 493 |
| * | Vishay Intertechnology Inc. | 39,245 | 481 |
| * | Fairchild Semiconductor | ||
| International Inc. Class A | 37,789 | 461 | |
| Cypress Semiconductor | |||
| Corp. | 40,183 | 455 | |
| * | ValueClick Inc. | 21,280 | 450 |
| * | Silicon Laboratories Inc. | 11,599 | 449 |
| * | Itron Inc. | 11,742 | 440 |
| InterDigital Inc. | 12,223 | 434 | |
| ADTRAN Inc. | 17,605 | 425 | |
| * | RF Micro Devices Inc. | 83,538 | 414 |
| Intersil Corp. Class A | 37,899 | 393 | |
| * | Integrated Device | ||
| Technology Inc. | 43,967 | 383 | |
| Advent Software Inc. | 11,947 | 322 | |
| ManTech International Corp. | |||
| Class A | 7,081 | 201 | |
| * | Monster Worldwide Inc. | 34,761 | 156 |
| 62,311 | |||
| Materials (6.9%) | |||
| Rock Tenn Co. Class A | 21,382 | 2,376 | |
| Ashland Inc. | 21,844 | 1,905 | |
| Packaging Corp. of America | 29,156 | 1,546 | |
| Reliance Steel | |||
| & Aluminum Co. | 22,794 | 1,520 | |
| Valspar Corp. | 24,292 | 1,510 | |
| Albemarle Corp. | 24,186 | 1,509 | |
| RPM International Inc. | 39,383 | 1,338 | |
| Martin Marietta | |||
| Materials Inc. | 13,649 | 1,311 | |
| Aptargroup Inc. | 19,822 | 1,166 | |
| Royal Gold Inc. | 19,330 | 1,122 | |
| Sonoco Products Co. | 30,084 | 1,120 | |
| Steel Dynamics Inc. | 65,585 | 1,001 | |
| Eagle Materials Inc. | 13,996 | 898 | |
| NewMarket Corp. | 3,173 | 870 | |
| Cytec Industries Inc. | 10,859 | 812 | |
| Compass Minerals | |||
| International Inc. | 9,913 | 731 | |
| Cabot Corp. | 17,854 | 714 | |
| Carpenter Technology Corp. | 13,180 | 709 | |
| Domtar Corp. | 10,003 | 660 | |
| Silgan Holdings Inc. | 13,447 | 634 | |
| Market | |||
| Value | |||
| Shares | ($000) | ||
| * | Louisiana-Pacific Corp. | 41,406 | 619 |
| Sensient Technologies Corp. | 14,868 | 616 | |
| Scotts Miracle-Gro Co. | |||
| Class A | 11,549 | 609 | |
| Olin Corp. | 23,854 | 551 | |
| Worthington Industries Inc. | 15,842 | 528 | |
| Commercial Metals Co. | 34,721 | 517 | |
| Greif Inc. Class A | 9,039 | 487 | |
| Minerals Technologies Inc. | 10,355 | 460 | |
| Intrepid Potash Inc. | 16,033 | 199 | |
| 28,038 | |||
| Telecommunication Services (0.5%) | |||
| * | tw telecom inc Class A | 44,677 | 1,279 |
| Telephone & Data | |||
| Systems Inc. | 29,912 | 828 | |
| 2,107 | |||
| Utilities (5.0%) | |||
| OGE Energy Corp. | 58,924 | 2,075 | |
| NV Energy Inc. | 69,982 | 1,641 | |
| Alliant Energy Corp. | 32,969 | 1,636 | |
| National Fuel Gas Co. | 24,833 | 1,621 | |
| MDU Resources Group Inc. | 56,125 | 1,499 | |
| UGI Corp. | 33,835 | 1,326 | |
| Aqua America Inc. | 41,830 | 1,270 | |
| Westar Energy Inc. | 37,711 | 1,173 | |
| Questar Corp. | 52,026 | 1,140 | |
| Atmos Energy Corp. | 26,910 | 1,086 | |
| Great Plains Energy Inc. | 45,742 | 1,003 | |
| Cleco Corp. | 17,989 | 812 | |
| Vectren Corp. | 24,485 | 798 | |
| Hawaiian Electric | |||
| Industries Inc. | 29,328 | 734 | |
| IDACORP Inc. | 14,951 | 716 | |
| WGL Holdings Inc. | 15,362 | 641 | |
| Black Hills Corp. | 13,204 | 634 | |
| PNM Resources Inc. | 23,663 | 518 | |
| 20,323 | |||
| Total Common Stocks | |||
| (Cost $356,321) | 404,867 | ||
16
S&P Mid-Cap 400 Index Fund
| Market | ||
| Value | ||
| Shares | ($000) | |
| Temporary Cash Investments (0.4%)1 | ||
| Money Market Fund (0.4%) | ||
| 2 Vanguard Market | ||
| Liquidity Fund, 0.122% | 1,775,000 | 1,775 |
| Face | ||
| Amount | ||
| ($000) | ||
| U.S. Government and Agency Obligations (0.0%) | ||
| 3,4 Freddie Mac Discount | ||
| Notes, 0.095%, 11/18/13 | 100 | 100 |
| Total Temporary Cash Investments | ||
| (Cost $1,875) | 1,875 | |
| Total Investments (99.9%) | ||
| (Cost $358,196) | 406,742 | |
| Other Assets and Liabilities (0.1%) | ||
| Other Assets | 1,168 | |
| Liabilities | (895) | |
| 273 | ||
| Net Assets (100%) | 407,015 | |
| At August 31, 2013, net assets consisted of: | |
| Amount | |
| ($000) | |
| Paid-in Capital | 358,318 |
| Undistributed Net Investment Income | 2,805 |
| Accumulated Net Realized Losses | (2,604) |
| Unrealized Appreciation (Depreciation) | |
| Investment Securities | 48,546 |
| Futures Contracts | (50) |
| Net Assets | 407,015 |
| Institutional Shares—Net Assets | |
| Applicable to 1,354,844 outstanding | |
| $.001 par value shares of beneficial | |
| interest (unlimited authorization) | 215,689 |
| Net Asset Value Per Share— | |
| Institutional Shares | $159.20 |
| ETF Shares—Net Assets | |
| Applicable to 2,400,000 outstanding | |
| $.001 par value shares of beneficial | |
| interest (unlimited authorization) | 191,326 |
| Net Asset Value Per Share— | |
| ETF Shares | $79.72 |
See Note A in Notes to Financial Statements.
* Non-income-producing security.
1 The fund invests a portion of its cash reserves in equity markets through the use of index futures contracts. After giving effect to futures investments, the fund’s effective common stock and temporary cash investment positions represent 100% and -0.1%, respectively, of net assets.
2 Affiliated money market fund available only to Vanguard funds and certain trusts and accounts managed by Vanguard. Rate shown is the 7-day yield.
3 The issuer was placed under federal conservatorship in September 2008; since that time, its daily operations have been managed by the Federal Housing Finance Agency and it receives capital from the U.S. Treasury, as needed to maintain a positive new worth, in exchange for senior preferred stock.
4 Securities with a value of $100,000 have been segregated as initial margin for open futures contracts.
See accompanying Notes, which are an integral part of the Financial Statements.
17
S&P Mid-Cap 400 Index Fund
| Statement of Operations | |
| Year Ended | |
| August 31, 2013 | |
| ($000) | |
| Investment Income | |
| Income | |
| Dividends | 4,505 |
| Interest1 | 2 |
| Securities Lending | 4 |
| Total Income | 4,511 |
| Expenses | |
| The Vanguard Group—Note B | |
| Investment Advisory Services | 28 |
| Management and Administrative—Institutional Shares | 19 |
| Management and Administrative—ETF Shares | 101 |
| Marketing and Distribution—Institutional Shares | 30 |
| Marketing and Distribution—ETF Shares | 29 |
| Custodian Fees | 74 |
| Auditing Fees | 21 |
| Shareholders’ Reports—Institutional Shares | — |
| Shareholders’ Reports—ETF Shares | 9 |
| Total Expenses | 311 |
| Net Investment Income | 4,200 |
| Realized Net Gain (Loss) | |
| Investment Securities Sold | 3,586 |
| Futures Contracts | 172 |
| Realized Net Gain (Loss) | 3,758 |
| Change in Unrealized Appreciation (Depreciation) | |
| Investment Securities | 43,409 |
| Futures Contracts | (51) |
| Change in Unrealized Appreciation (Depreciation) | 43,358 |
| Net Increase (Decrease) in Net Assets Resulting from Operations | 51,316 |
| 1 Interest income from an affiliated company of the fund was $2,000. | |
See accompanying Notes, which are an integral part of the Financial Statements.
18
S&P Mid-Cap 400 Index Fund
| Statement of Changes in Net Assets | ||
| Year Ended August 31, | ||
| 2013 | 2012 | |
| ($000) | ($000) | |
| Increase (Decrease) in Net Assets | ||
| Operations | ||
| Net Investment Income | 4,200 | 1,377 |
| Realized Net Gain (Loss) | 3,758 | 1,452 |
| Change in Unrealized Appreciation (Depreciation) | 43,358 | 8,569 |
| Net Increase (Decrease) in Net Assets Resulting from Operations | 51,316 | 11,398 |
| Distributions | ||
| Net Investment Income | ||
| Institutional Shares | (1,230) | (478) |
| ETF Shares | (1,087) | (214) |
| Realized Capital Gain | ||
| Institutional Shares | — | — |
| ETF Shares | — | — |
| Total Distributions | (2,317) | (692) |
| Capital Share Transactions | ||
| Institutional Shares | 99,201 | 44,187 |
| ETF Shares | 95,694 | 36,520 |
| Net Increase (Decrease) from Capital Share Transactions | 194,895 | 80,707 |
| Total Increase (Decrease) | 243,894 | 91,413 |
| Net Assets | ||
| Beginning of Period | 163,121 | 71,708 |
| End of Period1 | 407,015 | 163,121 |
| 1 Net Assets—End of Period includes undistributed net investment income of $2,805,000 and $922,000. | ||
See accompanying Notes, which are an integral part of the Financial Statements.
19
S&P Mid-Cap 400 Index Fund
Financial Highlights
| Institutional Shares | |||
| March 28, | |||
| Year Ended | 20111 to | ||
| August 31, | August 31, | ||
| For a Share Outstanding Throughout Each Period | 2013 | 2012 | 2011 |
| Net Asset Value, Beginning of Period | $130.17 | $116.52 | $128.01 |
| Investment Operations | |||
| Net Investment Income | 2.3552 | 1.372 | .240 |
| Net Realized and Unrealized Gain (Loss) on Investments | 28.174 | 13.297 | (11.730) |
| Total from Investment Operations | 30.529 | 14.669 | (11.490) |
| Distributions | |||
| Dividends from Net Investment Income | (1.499) | (1.019) | — |
| Distributions from Realized Capital Gains | — | — | — |
| Total Distributions | (1.499) | (1.019) | — |
| Net Asset Value, End of Period | $159.20 | $130.17 | $116.52 |
| Total Return | 23.65% | 12.69% | -8.98% |
| Ratios/Supplemental Data | |||
| Net Assets, End of Period (Millions) | $216 | $91 | $40 |
| Ratio of Total Expenses to Average Net Assets | 0.08% | 0.08% | 0.08%3 |
| Ratio of Net Investment Income to Average Net Assets | 1.57% | 1.42% | 1.28%3 |
| Portfolio Turnover Rate4 | 10% | 13% | 26% |
1 Inception.
2 Calculated based on average shares outstanding.
3 Annualized.
4 Excludes the value of portfolio securities received or delivered as a result of in-kind purchases or redemptions of the fund’s capital shares, including ETF Creation Units.
See accompanying Notes, which are an integral part of the Financial Statements.
20
S&P Mid-Cap 400 Index Fund
Financial Highlights
| ETF Shares | |||
| Sept. 7, | |||
| Year Ended | 20101 to | ||
| August 31, | August 31, | ||
| For a Share Outstanding Throughout Each Period | 2013 | 2012 | 2011 |
| Net Asset Value, Beginning of Period | $65.20 | $58.37 | $49.95 |
| Investment Operations | |||
| Net Investment Income | 1.1332 | .648 | .383 |
| Net Realized and Unrealized Gain (Loss) on Investments | 14.112 | 6.657 | 8.217 |
| Total from Investment Operations | 15.245 | 7.305 | 8.600 |
| Distributions | |||
| Dividends from Net Investment Income | (.725) | (.475) | (.180) |
| Distributions from Realized Capital Gains | — | — | — |
| Total Distributions | (.725) | (.475) | (.180) |
| Net Asset Value, End of Period | $79.72 | $65.20 | $58.37 |
| Total Return | 23.57% | 12.60% | 17.21% |
| Ratios/Supplemental Data | |||
| Net Assets, End of Period (Millions) | $191 | $72 | $32 |
| Ratio of Total Expenses to Average Net Assets | 0.15% | 0.15% | 0.15%3 |
| Ratio of Net Investment Income to Average Net Assets | 1.50% | 1.35% | 1.21%3 |
| Portfolio Turnover Rate4 | 10% | 13% | 26% |
1 Inception.
2 Calculated based on average shares outstanding.
3 Annualized.
4 Excludes the value of portfolio securities received or delivered as a result of in-kind purchases or redemptions of the fund’s capital shares, including ETF Creation Units.
See accompanying Notes, which are an integral part of the Financial Statements.
21
S&P Mid-Cap 400 Index Fund
Notes to Financial Statements
Vanguard S&P Mid-Cap 400 Index Fund is registered under the Investment Company Act of 1940 as an open-end investment company, or mutual fund. The fund offers two classes of shares: Institutional Shares and ETF Shares. Institutional Shares are designed for investors who meet certain administrative, service, and account-size criteria. ETF Shares are listed for trading on NYSE Arca; they can be purchased and sold through a broker.
A. The following significant accounting policies conform to generally accepted accounting principles for U.S. mutual funds. The fund consistently follows such policies in preparing its financial statements.
1. Security Valuation: Securities are valued as of the close of trading on the New York Stock Exchange (generally 4 p.m., Eastern time) on the valuation date. Equity securities are valued at the latest quoted sales prices or official closing prices taken from the primary market in which each security trades; such securities not traded on the valuation date are valued at the mean of the latest quoted bid and asked prices. Securities for which market quotations are not readily available, or whose values have been materially affected by events occurring before the fund’s pricing time but after the close of the securities’ primary markets, are valued by methods deemed by the board of trustees to represent fair value. Investments in Vanguard Market Liquidity Fund are valued at that fund’s net asset value. Temporary cash investments acquired over 60 days to maturity are valued using the latest bid prices or using valuations based on a matrix system (which considers such factors as security prices, yields, maturities, and ratings), both as furnished by independent pricing services. Other temporary cash investments are valued at amortized cost, which approximates market value.
2. Futures Contracts: The fund may use index futures contracts to a limited extent, with the objectives of maintaining full exposure to the stock market, enhancing returns, maintaining liquidity, and minimizing transaction costs. The fund may purchase futures contracts to immediately invest incoming cash in the market, or sell futures in response to cash outflows, thereby simulating a fully invested position in the underlying index while maintaining a cash balance for liquidity. The fund may seek to enhance returns by using futures contracts instead of the underlying securities when futures are believed to be priced more attractively than the underlying securities. The primary risks associated with the use of futures contracts are imperfect correlation between changes in market values of stocks held by the fund and the prices of futures contracts, and the possibility of an illiquid market. Counterparty risk involving futures is mitigated because a regulated clearinghouse is the counterparty instead of the clearing broker. To further mitigate counterparty risk, the fund trades futures contracts on an exchange; monitors the financial strength of its clearing brokers and clearinghouse; and has entered into clearing agreements with its clearing brokers. The clearinghouse imposes initial margin requirements to secure the fund’s performance and requires daily settlement of variation margin representing changes in the market value of each contract.
Futures contracts are valued at their quoted daily settlement prices. The aggregate notional amounts of the contracts are not recorded in the Statement of Net Assets. Fluctuations in the value of the contracts are recorded in the Statement of Net Assets as an asset (liability) and in the Statement of Operations as unrealized appreciation (depreciation) until the contracts are closed, when they are recorded as realized futures gains (losses).
During the year ended August 31, 2013, the fund’s average investments in long and short futures contracts represented less than 1% and 0% of net assets, respectively, based on quarterly average aggregate settlement values.
22
S&P Mid-Cap 400 Index Fund
3. Federal Income Taxes: The fund intends to continue to qualify as a regulated investment company and distribute all of its taxable income. Management has analyzed the fund’s tax positions taken for all open federal income tax years (August 31, 2011–2013), and has concluded that no provision for federal income tax is required in the fund’s financial statements.
4. Distributions: Distributions to shareholders are recorded on the ex-dividend date.
5. Securities Lending: To earn additional income, the fund may lend its securities to qualified institutional borrowers. Security loans are required to be secured at all times by collateral in an amount at least equal to the market value of securities loaned. Daily market fluctuations could cause the value of loaned securities to be more or less than the value of the collateral received. When this occurs, the collateral is adjusted and settled on the next business day. The fund further mitigates its counterparty risk by entering into securities lending transactions only with a diverse group of pre-qualified counterparties, monitoring their financial strength, and entering into master securities lending agreements with its counterparties. The master securities lending agreements provide that, in the event of a counterparty’s default (including bankruptcy), the fund may terminate any loans with that borrower, determine the net amount owed, and sell or retain the collateral up to the net amount owed to the fund, provided that such actions may be subject to legal proceedings. While collateral mitigates counterparty risk, in the absence of a default, the fund may experience delays and costs in recovering the securities loaned. The fund invests cash collateral received in Vanguard Market Liquidity Fund, and records a liability for the return of the collateral, during the period the securities are on loan. Securities lending income represents fees charged to borrowers plus income earned on invested cash collateral, less expenses associated with the loan.
6. Other: Dividend income is recorded on the ex-dividend date. Interest income includes income distributions received from Vanguard Market Liquidity Fund and is accrued daily. Premiums and discounts on debt securities purchased are amortized and accreted, respectively, to interest income over the lives of the respective securities. Security transactions are accounted for on the date securities are bought or sold. Costs used to determine realized gains (losses) on the sale of investment securities are those of the specific securities sold.
Each class of shares has equal rights as to assets and earnings, except that each class separately bears certain class-specific expenses related to maintenance of shareholder accounts (included in Management and Administrative expenses) and shareholder reporting. Marketing and distribution expenses are allocated to each class of shares based on a method approved by the board of trustees. Income, other non-class-specific expenses, and gains and losses on investments are allocated to each class of shares based on its relative net assets.
B. The Vanguard Group furnishes at cost investment advisory, corporate management, administrative, marketing, and distribution services. The costs of such services are allocated to the fund under methods approved by the board of trustees. The fund has committed to provide up to 0.40% of its net assets in capital contributions to Vanguard. At August 31, 2013, the fund had contributed capital of $49,000 to Vanguard (included in Other Assets), representing 0.01% of the fund’s net assets and 0.02% of Vanguard’s capitalization. The fund’s trustees and officers are also directors and officers of Vanguard.
C. Various inputs may be used to determine the value of the fund’s investments. These inputs are summarized in three broad levels for financial statement purposes. The inputs or methodologies used to value securities are not necessarily an indication of the risk associated with investing in those securities.
23
S&P Mid-Cap 400 Index Fund
Level 1—Quoted prices in active markets for identical securities.
Level 2—Other significant observable inputs (including quoted prices for similar securities, interest rates, prepayment speeds, credit risk, etc.).
Level 3—Significant unobservable inputs (including the fund’s own assumptions used to determine the fair value of investments).
The following table summarizes the market value of the fund’s investments as of August 31, 2013, based on the inputs used to value them:
| Level 1 | Level 2 | Level 3 | |
| Investments | ($000) | ($000) | ($000) |
| Common Stocks | 404,867 | — | — |
| Temporary Cash Investments | 1,775 | 100 | — |
| Futures Contracts—Liabilities1 | (30) | — | — |
| Total | 406,612 | 100 | — |
| 1 Represents variation margin on the last day of the reporting period. |
D. At August 31, 2013, the aggregate settlement value of open futures contracts and the related unrealized appreciation (depreciation) were:
| ($000) | ||||
| Aggregate | ||||
| Number of | Settlement | Unrealized | ||
| Long (Short) | Value | Appreciation | ||
| Futures Contracts | Expiration | Contracts | Long (Short) | (Depreciation) |
| E-mini S&P Mid-Cap 400 Index | September 2013 | 18 | 2,129 | (50) |
Unrealized appreciation (depreciation) on open futures contracts is required to be treated as realized gain (loss) for tax purposes.
E. Distributions are determined on a tax basis and may differ from net investment income and realized capital gains for financial reporting purposes. Differences may be permanent or temporary. Permanent differences are reclassified among capital accounts in the financial statements to reflect their tax character. Temporary differences arise when certain items of income, expense, gain, or loss are recognized in different periods for financial statement and tax purposes; these differences will reverse at some time in the future. Differences in classification may also result from the treatment of short-term gains as ordinary income for tax purposes.
During the year ended August 31, 2013, the fund realized $4,225,000 of net capital gains resulting from in-kind redemptions—in which shareholders exchanged fund shares for securities held by the fund rather than for cash. Because such gains are not taxable to the fund, and are not distributed to shareholders, they have been reclassified from accumulated net realized losses to paid-in capital.
For tax purposes, at August 31, 2013, the fund had $2,839,000 of ordinary income available for distribution. The fund had available capital losses totaling $2,595,000 that may be carried forward indefinitely to offset future net capital gains.
At August 31, 2013, the cost of investment securities for tax purposes was $358,255,000. Net unrealized appreciation of investment securities for tax purposes was $48,487,000, consisting of unrealized gains of $55,247,000 on securities that had risen in value since their purchase and $6,760,000 in unrealized losses on securities that had fallen in value since their purchase.
24
S&P Mid-Cap 400 Index Fund
F. During the year ended August 31, 2013, the fund purchased $235,375,000 of investment securities and sold $40,225,000 of investment securities, other than temporary cash investments. Purchases and sales include $125,089,000 and $14,188,000, respectively, in connection with in-kind purchases and redemptions of the fund’s capital shares.
G. Capital share transactions for each class of shares were:
| Year Ended August 31, | ||||
| 2013 | 2012 | |||
| Amount | Shares | Amount | Shares | |
| ($000) | (000) | ($000) | (000) | |
| Institutional Shares | ||||
| Issued | 123,250 | 807 | 51,421 | 420 |
| Issued in Lieu of Cash Distributions | 1,090 | 8 | 387 | 3 |
| Redeemed | (25,139) | (162) | (7,621) | (61) |
| Net Increase (Decrease) —Institutional Shares | 99,201 | 653 | 44,187 | 362 |
| ETF Shares | ||||
| Issued | 107,558 | 1,450 | 59,242 | 950 |
| Issued in Lieu of Cash Distributions | — | — | — | — |
| Redeemed | (11,864) | (150) | (22,722) | (400) |
| Net Increase (Decrease)—ETF Shares | 95,694 | 1,300 | 36,520 | 550 |
H. Management has determined that no material events or transactions occurred subsequent to August 31, 2013, that would require recognition or disclosure in these financial statements.
25
S&P Mid-Cap 400 Value Index Fund
Fund Profile
As of August 31, 2013
| Share-Class Characteristics | ||
| Institutional | ETF | |
| Shares | Shares | |
| Ticker Symbol | VMFVX | IVOV |
| Expense Ratio1 | 0.10% | 0.22% |
| 30-Day SEC Yield | 1.81% | 1.69% |
| Portfolio Characteristics | |||
| DJ U.S. | |||
| S&P | Total | ||
| MidCap | Market | ||
| 400 Value | FA | ||
| Fund | Index | Index | |
| Number of Stocks | 295 | 294 | 3,631 |
| Median Market Cap | $3.7B | $3.7B | $39.3B |
| Price/Earnings Ratio | 20.6x | 20.6x | 18.7x |
| Price/Book Ratio | 1.8x | 1.8x | 2.4x |
| Return on Equity | 10.3% | 10.3% | 16.6% |
| Earnings Growth | |||
| Rate | 6.1% | 6.1% | 11.1% |
| Dividend Yield | 1.9% | 1.9% | 2.0% |
| Foreign Holdings | 0.0% | 0.0% | 0.0% |
| Turnover Rate | 74% | — | — |
| Short-Term Reserves | 0.0% | — | — |
| Sector Diversification (% of equity exposure) | |||
| S&P | DJ U.S. | ||
| MidCap | Total | ||
| 400 Value | Market | ||
| Fund | Index | FA Index | |
| Consumer | |||
| Discretionary | 7.7% | 7.6% | 13.1% |
| Consumer Staples | 5.2 | 5.2 | 8.9 |
| Energy | 6.6 | 6.6 | 9.8 |
| Financials | 27.3 | 27.4 | 17.5 |
| Health Care | 8.5 | 8.5 | 12.6 |
| Industrials | 15.9 | 15.9 | 11.2 |
| Information | |||
| Technology | 10.8 | 10.8 | 17.6 |
| Materials | 8.0 | 8.0 | 3.8 |
| Telecommunication | |||
| Services | 0.4 | 0.4 | 2.3 |
| Utilities | 9.6 | 9.6 | 3.2 |
| Ten Largest Holdings (% of total net assets) | ||
| Rock Tenn Co. | Paper Packaging | 1.2% |
| SL Green Realty Corp. | Office REITs | 1.2 |
| OGE Energy Corp. | Electric Utilities | 1.0 |
| Everest Re Group Ltd. | Reinsurance | 1.0 |
| New York Community | Thrifts & Mortgage | |
| Bancorp Inc. | Finance | 1.0 |
| Energizer Holdings Inc. | Household Products | 0.9 |
| Universal Health | ||
| Services Inc. | Health Care Facilities | 0.9 |
| Omnicare Inc. | Health Care Services | 0.8 |
| NV Energy Inc. | Electric Utilities | 0.8 |
| AGCO Corp. | Construction & Farm | |
| Machinery & Heavy | ||
| Trucks | 0.8 | |
| Top Ten | 9.6% | |
The holdings listed exclude any temporary cash investments and equity index products.
Investment Focus
1 The expense ratios shown are from the prospectus dated December 28, 2012, and represent estimated costs for the current fiscal year. For the fiscal year ended August 31, 2013, the expense ratios were 0.08% for Institutional Shares and 0.20% for ETF Shares.
26
S&P Mid-Cap 400 Value Index Fund
Performance Summary
All of the returns in this report represent past performance, which is not a guarantee of future results that may be achieved by the fund. (Current performance may be lower or higher than the performance data cited. For performance data current to the most recent month-end, visit our website at vanguard.com/performance.) Note, too, that both investment returns and principal value can fluctuate widely, so an investor’s shares, when sold, could be worth more or less than their original cost. The returns shown do not reflect taxes that a shareholder would pay on fund distributions or on the sale of fund shares.
Cumulative Performance: September 7, 2010, Through August 31, 2013
Initial Investment of $10,000

| Average Annual Total Returns | |||
| Periods Ended August 31, 2013 | |||
| Since | Final Value | ||
| One | Inception | of a $10,000 | |
| Year | (9/7/2010) | Investment | |
| S&P Mid-Cap 400 Value Index | |||
| Fund*ETF Shares Net Asset Value | 26.31% | 17.51% | $16,178 |
| S&P Mid-Cap 400 Value Index | |||
| Fund*ETF Shares Market Price | 26.34 | 17.53 | 16,184 |
| S&P MidCap 400 Value Index | 26.55 | 17.75 | 16,274 |
| Mid-Cap Value Funds Average | 26.66 | 16.62 | 15,814 |
| Dow Jones U.S. Total Stock Market | |||
| Float Adjusted Index | 20.15 | 17.40 | 16,132 |
Mid-Cap Value Funds Average: Derived from data provided by Lipper, a Thomson Reuters Company.
"Since Inception" performance is calculated from the ETF Shares’ inception date for both the fund and its comparative standards.
| Since | Final Value | ||
| One | Inception | of a $5,000,000 | |
| Year | (11/2/2010) | Investment | |
| S&P Mid-Cap 400 Value Index Fund | |||
| Institutional Shares | 26.47% | 14.79% | $7,384,439 |
| S&P MidCap 400 Value Index | 26.55 | 14.87 | 7,400,159 |
| Dow Jones U.S. Total Stock Market Float | |||
| Adjusted Index | 20.15 | 14.43 | 7,320,227 |
| "Since Inception" performance is calculated from the Institutional Shares’ inception date for both the fund and its comparative standards. | |||
See Financial Highlights for dividend and capital gains information.
27
S&P Mid-Cap 400 Value Index Fund
| Cumulative Returns of ETF Shares: September 7, 2010, Through August 31, 2013 | ||
| Since | ||
| One | Inception | |
| Year | (9/7/2010) | |
| S&P Mid-Cap 400 Value Index Fund ETF Shares | ||
| Market Price | 26.34% | 61.84% |
| S&P Mid-Cap 400 Value Index Fund ETF Shares Net | ||
| Asset Value | 26.31 | 61.78 |
| S&P MidCap 400 Value Index | 26.55 | 62.74 |
| "Since Inception" performance is calculated from the ETF Shares’ inception date for both the fund and its comparative standards. | ||
Fiscal-Year Total Returns (%): September 7, 2010, Through August 31, 2013

Average Annual Total Returns: Periods Ended June 30, 2013
This table presents returns through the latest calendar quarter—rather than through the end of the fiscal period.
Securities and Exchange Commission rules require that we provide this information.
| Inception | One | Since | |
| Date | Year | Inception | |
| Institutional Shares | 11/2/2010 | 26.94% | 14.87% |
| ETF Shares | 9/7/2010 | ||
| Market Price | 26.66 | 17.75 | |
| Net Asset Value | 26.78 | 17.77 |
28
S&P Mid-Cap 400 Value Index Fund
Financial Statements
Statement of Net Assets
As of August 31, 2013
The fund reports a complete list of its holdings in regulatory filings four times in each fiscal year, at the quarter-ends. For the second and fourth fiscal quarters, the lists appear in the fund’s semiannual and annual reports to shareholders. For the first and third fiscal quarters, the fund files the lists with the Securities and Exchange Commission on Form N-Q. Shareholders can look up the fund’s Forms N-Q on the SEC’s website at sec.gov. Forms N-Q may also be reviewed and copied at the SEC’s Public Reference Room (see the back cover of this report for further information).
| Market | |||
| Value | |||
| Shares | ($000) | ||
| Common Stocks (99.8%)1 | |||
| Consumer Discretionary (7.7%) | |||
| Signet Jewelers Ltd. | 4,928 | 327 | |
| Advance Auto Parts Inc. | 3,961 | 317 | |
| * | Mohawk Industries Inc. | 2,474 | 291 |
| Wendy’s Co. | 31,958 | 242 | |
| * | Big Lots Inc. | 6,569 | 233 |
| John Wiley & Sons Inc. | |||
| Class A | 5,219 | 229 | |
| * | Deckers Outdoor Corp. | 3,888 | 228 |
| * | DreamWorks Animation | ||
| SKG Inc. Class A | 8,026 | 227 | |
| Rent-A-Center Inc. | 6,023 | 226 | |
| Aaron’s Inc. | 7,955 | 215 | |
| Guess? Inc. | 6,894 | 210 | |
| * | Apollo Group Inc. Class A | 11,309 | 210 |
| Tupperware Brands Corp. | 2,388 | 193 | |
| DeVry Inc. | 6,387 | 192 | |
| * | Saks Inc. | 11,355 | 181 |
| Meredith Corp. | 4,066 | 175 | |
| * | NVR Inc. | 186 | 159 |
| * | WMS Industries Inc. | 6,188 | 159 |
| * | New York Times Co. | ||
| Class A | 13,777 | 154 | |
| Domino’s Pizza Inc. | 2,466 | 152 | |
| Sotheby’s | 2,610 | 120 | |
| Valassis Communications Inc. | 4,365 | 120 | |
| * | Life Time Fitness Inc. | 2,360 | 118 |
| Matthews International Corp. | |||
| Class A | 3,104 | 115 | |
| * | Tempur Sealy | ||
| International Inc. | 2,782 | 107 | |
| Cheesecake Factory Inc. | 2,453 | 102 | |
| Regis Corp. | 6,369 | 100 | |
| * | CST Brands Inc. | 3,391 | 100 |
| Brinker International Inc. | 2,459 | 98 | |
| * | Murphy USA Inc. | 2,555 | 94 |
| International Speedway | |||
| Corp. Class A | 2,871 | 89 | |
| Market | |||
| Value | |||
| Shares | ($000) | ||
| Scholastic Corp. | 2,977 | 88 | |
| * | Scientific Games Corp. | ||
| Class A | 5,926 | 85 | |
| * | Aeropostale Inc. | 8,820 | 72 |
| * | Office Depot Inc. | 15,122 | 63 |
| * | Barnes & Noble Inc. | 4,243 | 58 |
| 5,849 | |||
| Consumer Staples (5.2%) | |||
| Energizer Holdings Inc. | 7,022 | 694 | |
| * | Smithfield Foods Inc. | 14,109 | 473 |
| Hillshire Brands Co. | 13,885 | 449 | |
| * | Green Mountain Coffee | ||
| Roasters Inc. | 4,890 | 422 | |
| Church & Dwight Co. Inc. | 6,704 | 398 | |
| Harris Teeter | |||
| Supermarkets Inc. | 5,581 | 274 | |
| Flowers Foods Inc. | 9,904 | 206 | |
| * | Dean Foods Co. | 10,532 | 202 |
| * | United Natural Foods Inc. | 2,772 | 168 |
| * | Post Holdings Inc. | 3,687 | 157 |
| Universal Corp. | 2,634 | 129 | |
| * | WhiteWave Foods Co. | ||
| Class B | 6,182 | 117 | |
| * | SUPERVALU Inc. | 12,403 | 89 |
| Lancaster Colony Corp. | 1,156 | 85 | |
| * | WhiteWave Foods Co. | ||
| Class A | 3,775 | 72 | |
| Tootsie Roll Industries Inc. | 1,152 | 35 | |
| 3,970 | |||
| Energy (6.6%) | |||
| Energen Corp. | 8,148 | 540 | |
| Cimarex Energy Co. | 5,560 | 466 | |
| * | Superior Energy Services Inc. | 18,004 | 442 |
| Oceaneering International Inc. | 5,127 | 398 | |
| * | Atwood Oceanics Inc. | 6,460 | 360 |
| World Fuel Services Corp. | 8,194 | 313 | |
| Tidewater Inc. | 5,584 | 301 | |
| * | Dresser-Rand Group Inc. | 4,727 | 288 |
29
S&P Mid-Cap 400 Value Index Fund
| Market | |||
| Value | |||
| Shares | ($000) | ||
| * | Helix Energy Solutions | ||
| Group Inc. | 11,116 | 278 | |
| * | Oil States International Inc. | 2,605 | 232 |
| * | Unit Corp. | 4,930 | 227 |
| SM Energy Co. | 3,141 | 215 | |
| * | Dril-Quip Inc. | 2,062 | 210 |
| Patterson-UTI Energy Inc. | 8,098 | 159 | |
| * | Alpha Natural Resources Inc. | 24,878 | 151 |
| * | Rosetta Resources Inc. | 2,884 | 134 |
| * | Bill Barrett Corp. | 5,483 | 118 |
| Arch Coal Inc. | 23,861 | 107 | |
| CARBO Ceramics Inc. | 1,150 | 94 | |
| 5,033 | |||
| Financials (27.3%) | |||
| SL Green Realty Corp. | 10,333 | 901 | |
| Everest Re Group Ltd. | 5,638 | 772 | |
| New York Community | |||
| Bancorp Inc. | 49,733 | 729 | |
| Liberty Property Trust | 15,915 | 551 | |
| Reinsurance Group | |||
| of America Inc. Class A | 8,179 | 530 | |
| WR Berkley Corp. | 12,431 | 511 | |
| Alexandria Real Estate | |||
| Equities Inc. | 7,947 | 490 | |
| Cullen/Frost Bankers Inc. | 6,770 | 480 | |
| HCC Insurance Holdings Inc. | 11,327 | 478 | |
| East West Bancorp Inc. | 15,363 | 449 | |
| American Financial | |||
| Group Inc. | 8,521 | 439 | |
| Hospitality Properties Trust | 15,765 | 426 | |
| First Niagara Financial | |||
| Group Inc. | 39,932 | 403 | |
| FirstMerit Corp. | 18,699 | 396 | |
| BioMed Realty Trust Inc. | 21,020 | 387 | |
| Old Republic | |||
| International Corp. | 27,236 | 387 | |
| Realty Income Corp. | 9,520 | 376 | |
| Commerce Bancshares Inc. | 8,696 | 376 | |
| UDR Inc. | 16,408 | 371 | |
| Protective Life Corp. | 8,851 | 370 | |
| * | Alleghany Corp. | 913 | 353 |
| Prosperity Bancshares Inc. | 5,305 | 317 | |
| Essex Property Trust Inc. | 2,187 | 313 | |
| Federal Realty | |||
| Investment Trust | 3,166 | 308 | |
| Hancock Holding Co. | 9,578 | 308 | |
| Rayonier Inc. | 5,546 | 306 | |
| Associated Banc-Corp | 18,923 | 302 | |
| Camden Property Trust | 4,786 | 296 | |
| Duke Realty Corp. | 19,961 | 291 | |
| Federated Investors Inc. | |||
| Class B | 10,642 | 289 | |
| Arthur J Gallagher & Co. | 6,865 | 284 | |
| Aspen Insurance | |||
| Holdings Ltd. | 7,686 | 273 | |
| Market | |||
| Value | |||
| Shares | ($000) | ||
| Hanover Insurance Group Inc. | 4,966 | 265 | |
| StanCorp Financial Group Inc. | 4,995 | 261 | |
| Bank of Hawaii Corp. | 5,060 | 261 | |
| TCF Financial Corp. | 18,483 | 260 | |
| Fidelity National | |||
| Financial Inc. Class A | 10,852 | 257 | |
| BRE Properties Inc. | 5,131 | 246 | |
| Senior Housing | |||
| Properties Trust | 10,611 | 241 | |
| Valley National Bancorp | 22,482 | 227 | |
| Raymond James | |||
| Financial Inc. | 5,361 | 224 | |
| Kilroy Realty Corp. | 4,507 | 220 | |
| National Retail Properties Inc. | 7,079 | 217 | |
| Regency Centers Corp. | 4,548 | 216 | |
| Kemper Corp. | 6,091 | 207 | |
| American Campus | |||
| Communities Inc. | 6,148 | 205 | |
| * | MSCI Inc. Class A | 5,449 | 204 |
| Mack-Cali Realty Corp. | 9,426 | 204 | |
| Home Properties Inc. | 3,481 | 201 | |
| Apollo Investment Corp. | 25,360 | 200 | |
| Taubman Centers Inc. | 2,951 | 199 | |
| Primerica Inc. | 5,209 | 193 | |
| SEI Investments Co. | 6,374 | 190 | |
| Trustmark Corp. | 7,579 | 188 | |
| Brown & Brown Inc. | 5,998 | 187 | |
| Weingarten Realty Investors | 6,450 | 185 | |
| BancorpSouth Inc. | 9,452 | 183 | |
| CBOE Holdings Inc. | 3,940 | 181 | |
| Mercury General Corp. | 4,091 | 179 | |
| Janus Capital Group Inc. | 21,425 | 179 | |
| * | Alexander & Baldwin Inc. | 4,858 | 175 |
| First Horizon National Corp. | 13,884 | 154 | |
| Westamerica Bancorporation | 3,033 | 143 | |
| Highwoods Properties Inc. | 4,028 | 136 | |
| International | |||
| Bancshares Corp. | 6,117 | 134 | |
| Corporate Office | |||
| Properties Trust | 5,688 | 130 | |
| Webster Financial Corp. | 4,566 | 121 | |
| Fulton Financial Corp. | 9,652 | 117 | |
| Astoria Financial Corp. | 9,226 | 113 | |
| Equity One Inc. | 3,899 | 83 | |
| Potlatch Corp. | 1,958 | 75 | |
| Greenhill & Co. Inc. | 1,327 | 63 | |
| 20,886 | |||
| Health Care (8.5%) | |||
| Universal Health Services Inc. | |||
| Class B | 10,063 | 682 | |
| Omnicare Inc. | 11,837 | 644 | |
| Community Health | |||
| Systems Inc. | 10,634 | 417 | |
| * | Henry Schein Inc. | 4,031 | 407 |
30
S&P Mid-Cap 400 Value Index Fund
| Market | |||
| Value | |||
| Shares | ($000) | ||
| * | Health Management | ||
| Associates Inc. Class A | 29,258 | 376 | |
| Teleflex Inc. | 4,639 | 357 | |
| * | WellCare Health Plans Inc. | 4,904 | 312 |
| * | Hologic Inc. | 14,281 | 305 |
| * | Allscripts Healthcare | ||
| Solutions Inc. | 20,000 | 291 | |
| * | VCA Antech Inc. | 9,990 | 273 |
| STERIS Corp. | 6,651 | 272 | |
| * | Health Net Inc. | 8,953 | 270 |
| * | MEDNAX Inc. | 2,709 | 264 |
| * | Bio-Rad Laboratories Inc. | ||
| Class A | 2,286 | 261 | |
| * | Endo Health Solutions Inc. | 5,953 | 245 |
| Owens & Minor Inc. | 7,146 | 244 | |
| * | LifePoint Hospitals Inc. | 5,348 | 242 |
| Hill-Rom Holdings Inc. | 6,744 | 230 | |
| * | Covance Inc. | 2,523 | 204 |
| Techne Corp. | 1,829 | 142 | |
| Masimo Corp. | 2,537 | 63 | |
| 6,501 | |||
| Industrials (15.8%) | |||
| AGCO Corp. | 10,979 | 621 | |
| Manpowergroup Inc. | 8,702 | 564 | |
| Towers Watson & Co. | |||
| Class A | 6,369 | 524 | |
| KBR Inc. | 16,675 | 498 | |
| * | Oshkosh Corp. | 9,927 | 446 |
| URS Corp. | 8,563 | 424 | |
| SPX Corp. | 5,280 | 391 | |
| Kennametal Inc. | 8,884 | 378 | |
| Trinity Industries Inc. | 8,936 | 377 | |
| Huntington Ingalls | |||
| Industries Inc. | 5,658 | 358 | |
| Alliant Techsystems Inc. | 3,631 | 351 | |
| RR Donnelley & Sons Co. | 20,465 | 341 | |
| * | AECOM Technology Corp. | 11,630 | 339 |
| Crane Co. | 5,482 | 315 | |
| Exelis Inc. | 21,227 | 312 | |
| Waste Connections Inc. | 6,824 | 289 | |
| * | Esterline Technologies Corp. | 3,530 | 269 |
| Con-way Inc. | 6,357 | 264 | |
| Woodward Inc. | 6,828 | 263 | |
| Hubbell Inc. Class B | 2,532 | 257 | |
| GATX Corp. | 5,281 | 239 | |
| * | Kirby Corp. | 2,882 | 232 |
| Harsco Corp. | 9,102 | 214 | |
| Donaldson Co. Inc. | 5,950 | 210 | |
| Carlisle Cos. Inc. | 3,016 | 201 | |
| UTi Worldwide Inc. | 11,795 | 195 | |
| * | Genesee & Wyoming Inc. | ||
| Class A | 2,180 | 189 | |
| IDEX Corp. | 3,063 | 182 | |
| * | United Rentals Inc. | 3,297 | 181 |
| ITT Corp. | 5,276 | 173 | |
| Market | |||
| Value | |||
| Shares | ($000) | ||
| HNI Corp. | 5,130 | 172 | |
| General Cable Corp. | 5,616 | 171 | |
| CLARCOR Inc. | 3,140 | 168 | |
| Triumph Group Inc. | 2,329 | 168 | |
| * | JetBlue Airways Corp. | 25,471 | 157 |
| Acuity Brands Inc. | 1,830 | 156 | |
| * | FTI Consulting Inc. | 4,549 | 152 |
| Regal-Beloit Corp. | 2,387 | 152 | |
| Brink’s Co. | 5,390 | 139 | |
| Deluxe Corp. | 3,259 | 128 | |
| Matson Inc. | 4,798 | 128 | |
| Watsco Inc. | 1,302 | 117 | |
| Werner Enterprises Inc. | 5,024 | 116 | |
| Granite Construction Inc. | 4,006 | 113 | |
| Landstar System Inc. | 2,042 | 112 | |
| Corporate Executive | |||
| Board Co. | 1,587 | 103 | |
| Herman Miller Inc. | 3,675 | 94 | |
| Mine Safety Appliances Co. | 1,930 | 93 | |
| Rollins Inc. | 3,331 | 82 | |
| 12,118 | |||
| Information Technology (10.7%) | |||
| * | Avnet Inc. | 15,461 | 596 |
| * | Arrow Electronics Inc. | 11,809 | 548 |
| * | Informatica Corp. | 12,193 | 436 |
| * | Ingram Micro Inc. | 17,187 | 380 |
| * | ANSYS Inc. | 3,786 | 318 |
| * | Synopsys Inc. | 8,154 | 296 |
| Compuware Corp. | 24,082 | 257 | |
| Lexmark International Inc. | |||
| Class A | 7,110 | 243 | |
| DST Systems Inc. | 3,369 | 240 | |
| * | MICROS Systems Inc. | 4,616 | 226 |
| * | NCR Corp. | 6,308 | 224 |
| Broadridge Financial | |||
| Solutions Inc. | 7,250 | 216 | |
| * | Tech Data Corp. | 4,261 | 210 |
| * | Rovi Corp. | 11,664 | 209 |
| Convergys Corp. | 11,855 | 209 | |
| Diebold Inc. | 7,183 | 203 | |
| FactSet Research | |||
| Systems Inc. | 1,964 | 201 | |
| Global Payments Inc. | 4,191 | 200 | |
| * | Polycom Inc. | 19,469 | 193 |
| SunEdison Inc. | 26,156 | 193 | |
| * | PTC Inc. | 7,285 | 190 |
| * | International Rectifier Corp. | 7,837 | 187 |
| * | Vishay Intertechnology Inc. | 14,908 | 183 |
| Jack Henry & Associates Inc. | 3,596 | 179 | |
| * | Fairchild Semiconductor | ||
| International Inc. Class A | 14,356 | 175 | |
| AOL Inc. | 4,982 | 164 | |
| ADTRAN Inc. | 6,689 | 161 | |
| Lender Processing | |||
| Services Inc. | 4,793 | 153 | |
31
S&P Mid-Cap 400 Value Index Fund
| Market | |||
| Value | |||
| Shares | ($000) | ||
| Solera Holdings Inc. | 2,877 | 149 | |
| Intersil Corp. Class A | 14,295 | 148 | |
| * | VeriFone Systems Inc. | 6,222 | 123 |
| * | Zebra Technologies Corp. | 2,405 | 110 |
| Cypress Semiconductor | |||
| Corp. | 8,060 | 91 | |
| * | RF Micro Devices Inc. | 17,391 | 86 |
| Plantronics Inc. | 1,947 | 84 | |
| * | Silicon Laboratories Inc. | 2,064 | 80 |
| * | Acxiom Corp. | 3,076 | 77 |
| ManTech International Corp. | |||
| Class A | 2,671 | 76 | |
| * | Integrated Device | ||
| Technology Inc. | 7,798 | 68 | |
| Advent Software Inc. | 2,262 | 61 | |
| * | Monster Worldwide Inc. | 13,105 | 59 |
| 8,202 | |||
| Materials (8.0%) | |||
| Rock Tenn Co. Class A | 8,115 | 902 | |
| Reliance Steel | |||
| & Aluminum Co. | 8,652 | 577 | |
| Aptargroup Inc. | 7,525 | 443 | |
| Sonoco Products Co. | 11,421 | 425 | |
| Steel Dynamics Inc. | 24,866 | 380 | |
| Ashland Inc. | 3,980 | 347 | |
| Cabot Corp. | 6,769 | 271 | |
| RPM International Inc. | 7,625 | 259 | |
| Martin Marietta Materials Inc. | 2,643 | 254 | |
| Domtar Corp. | 3,793 | 250 | |
| Sensient Technologies Corp. | 5,647 | 234 | |
| Scotts Miracle-Gro Co. | |||
| Class A | 4,387 | 231 | |
| Albemarle Corp. | 3,672 | 229 | |
| Olin Corp. | 9,061 | 209 | |
| Commercial Metals Co. | 13,189 | 196 | |
| Greif Inc. Class A | 3,434 | 185 | |
| Minerals Technologies Inc. | 3,935 | 175 | |
| Compass Minerals | |||
| International Inc. | 2,105 | 155 | |
| Silgan Holdings Inc. | 2,646 | 125 | |
| Cytec Industries Inc. | 1,605 | 120 | |
| Carpenter Technology Corp. | 1,494 | 80 | |
| Intrepid Potash Inc. | 6,047 | 75 | |
| 6,122 | |||
| Telecommunication Services (0.4%) | |||
| Telephone & Data | |||
| Systems Inc. | 11,341 | 314 | |
| Utilities (9.6%) | |||
| OGE Energy Corp. | 22,363 | 787 | |
| NV Energy Inc. | 26,561 | 623 | |
| Alliant Energy Corp. | 12,514 | 621 | |
| National Fuel Gas Co. | 9,426 | 615 | |
| MDU Resources Group Inc. | 21,303 | 569 | |
| Market | ||
| Value | ||
| Shares | ($000) | |
| UGI Corp. | 12,843 | 504 |
| Westar Energy Inc. | 14,315 | 445 |
| Questar Corp. | 19,749 | 433 |
| Atmos Energy Corp. | 10,216 | 412 |
| Great Plains Energy Inc. | 17,343 | 380 |
| Cleco Corp. | 6,820 | 308 |
| Vectren Corp. | 9,283 | 303 |
| Hawaiian Electric | ||
| Industries Inc. | 11,119 | 278 |
| IDACORP Inc. | 5,668 | 271 |
| WGL Holdings Inc. | 5,834 | 244 |
| Black Hills Corp. | 5,015 | 241 |
| Aqua America Inc. | 7,305 | 222 |
| PNM Resources Inc. | 4,299 | 94 |
| 7,350 | ||
| Total Common Stocks | ||
| (Cost $68,247) | 76,345 | |
| Temporary Cash Investments (0.1%)1 | ||
| Money Market Fund (0.0%) | ||
| 2 Vanguard Market | ||
| Liquidity Fund, 0.122% | 23,283 | 23 |
| Face | ||
| Amount | ||
| ($000) | ||
| U.S. Government and Agency Obligations (0.1%) | ||
| 3,4 Federal Home Loan | ||
| Bank Discount Notes, | ||
| 0.135%, 9/20/13 | 100 | 100 |
| Total Temporary Cash Investments | ||
| (Cost $123) | 123 | |
| Total Investments (99.9%) | ||
| (Cost $68,370) | 76,468 | |
| Other Assets and Liabilities (0.1%) | ||
| Other Assets | 172 | |
| Liabilities | (128) | |
| 44 | ||
| Net Assets (100%) | 76,512 | |
32
S&P Mid-Cap 400 Value Index Fund
| At August 31, 2013, net assets consisted of: | |
| Amount | |
| ($000) | |
| Paid-in Capital | 70,671 |
| Undistributed Net Investment Income | 804 |
| Accumulated Net Realized Losses | (3,059) |
| Unrealized Appreciation (Depreciation) | |
| Investment Securities | 8,098 |
| Futures Contracts | (2) |
| Net Assets | 76,512 |
| Institutional Shares—Net Assets | |
| Applicable to 315,957 outstanding | |
| $.001 par value shares of beneficial | |
| interest (unlimited authorization) | 49,236 |
| Net Asset Value Per Share— | |
| Institutional Shares | $155.83 |
| ETF Shares—Net Assets | |
| Applicable to 350,000 outstanding | |
| $.001 par value shares of beneficial | |
| interest (unlimited authorization) | 27,276 |
| Net Asset Value Per Share— | |
| ETF Shares | $77.93 |
See Note A in Notes to Financial Statements.
* Non-income-producing security.
1 The fund invests a portion of its cash reserves in equity markets through the use of index futures contracts. After giving effect to futures investments, the fund’s effective common stock and temporary cash investment positions represent 99.9% and 0.0%, respectively, of net assets.
2 Affiliated money market fund available only to Vanguard funds and certain trusts and accounts managed by Vanguard. Rate shown is the 7-day yield.
3 The issuer operates under a congressional charter; its securities are generally neither guaranteed by the U.S. Treasury nor backed by the full faith and credit of the U.S. government.
4 Securities with a value of $100,000 have been segregated as initial margin for open futures contracts.
See accompanying Notes, which are an integral part of the Financial Statements.
33
S&P Mid-Cap 400 Value Index Fund
| Statement of Operations | |
| Year Ended | |
| August 31, 2013 | |
| ($000) | |
| Investment Income | |
| Income | |
| Dividends | 1,142 |
| Total Income | 1,142 |
| Expenses | |
| The Vanguard Group—Note B | |
| Management and Administrative—Institutional Shares | 1 |
| Management and Administrative—ETF Shares | 20 |
| Custodian Fees | 21 |
| Auditing Fees | 21 |
| Shareholders’ Reports—Institutional Shares | — |
| Shareholders’ Reports—ETF Shares | 2 |
| Total Expenses | 65 |
| Net Investment Income | 1,077 |
| Realized Net Gain (Loss) | |
| Investment Securities Sold | 4,983 |
| Futures Contracts | 39 |
| Realized Net Gain (Loss) | 5,022 |
| Change in Unrealized Appreciation (Depreciation) | |
| Investment Securities | 5,319 |
| Futures Contracts | (2) |
| Change in Unrealized Appreciation (Depreciation) | 5,317 |
| Net Increase (Decrease) in Net Assets Resulting from Operations | 11,416 |
See accompanying Notes, which are an integral part of the Financial Statements.
34
S&P Mid-Cap 400 Value Index Fund
| Statement of Changes in Net Assets | ||
| Year Ended August 31, | ||
| 2013 | 2012 | |
| ($000) | ($000) | |
| Increase (Decrease) in Net Assets | ||
| Operations | ||
| Net Investment Income | 1,077 | 912 |
| Realized Net Gain (Loss) | 5,022 | 8 |
| Change in Unrealized Appreciation (Depreciation) | 5,317 | 5,835 |
| Net Increase (Decrease) in Net Assets Resulting from Operations | 11,416 | 6,755 |
| Distributions | ||
| Net Investment Income | ||
| Institutional Shares | (706) | (535) |
| ETF Shares | (162) | (159) |
| Realized Capital Gain | ||
| Institutional Shares | — | — |
| ETF Shares | — | — |
| Total Distributions | (868) | (694) |
| Capital Share Transactions | ||
| Institutional Shares | 1,872 | 866 |
| ETF Shares | 14,425 | 2,458 |
| Net Increase (Decrease) from Capital Share Transactions | 16,297 | 3,324 |
| Total Increase (Decrease) | 26,845 | 9,385 |
| Net Assets | ||
| Beginning of Period | 49,667 | 40,282 |
| End of Period1 | 76,512 | 49,667 |
| 1 Net Assets—End of Period includes undistributed net investment income of $804,000 and $595,000. | ||
See accompanying Notes, which are an integral part of the Financial Statements.
35
S&P Mid-Cap 400 Value Index Fund
Financial Highlights
| Institutional Shares | |||
| Nov. 2, | |||
| Year Ended | 20101 to | ||
| August 31, | August 31, | ||
| For a Share Outstanding Throughout Each Period | 2013 | 2012 | 2011 |
| Net Asset Value, Beginning of Period | $125.30 | $111.20 | $109.35 |
| Investment Operations | |||
| Net Investment Income | 2.392 | 2.124 | 1.146 |
| Net Realized and Unrealized Gain (Loss) on Investments | 30.364 | 13.624 | 1.233 |
| Total from Investment Operations | 32.756 | 15.748 | 2.379 |
| Distributions | |||
| Dividends from Net Investment Income | (2.226) | (1.648) | (.529) |
| Distributions from Realized Capital Gains | — | — | — |
| Total Distributions | (2.226) | (1.648) | (.529) |
| Net Asset Value, End of Period | $155.83 | $125.30 | $111.20 |
| Total Return | 26.47% | 14.32% | 2.15% |
| Ratios/Supplemental Data | |||
| Net Assets, End of Period (Millions) | $49 | $40 | $35 |
| Ratio of Total Expenses to Average Net Assets | 0.08% | 0.08% | 0.08%2 |
| Ratio of Net Investment Income to Average Net Assets | 1.99% | 1.92% | 1.94%2 |
| Portfolio Turnover Rate3 | 74% | 31% | 48% |
1 Inception.
2 Annualized.
3 Excludes the value of portfolio securities received or delivered as a result of in-kind purchases or redemptions of the fund’s capital shares, including ETF Creation Units.
See accompanying Notes, which are an integral part of the Financial Statements.
36
S&P Mid-Cap 400 Value Index Fund
Financial Highlights
| ETF Shares | |||
| Sept. 7, | |||
| Year Ended | 20101 to | ||
| August 31, | August 31, | ||
| For a Share Outstanding Throughout Each Period | 2013 | 2012 | 2011 |
| Net Asset Value, Beginning of Period | $62.71 | $55.69 | $49.86 |
| Investment Operations | |||
| Net Investment Income | 1.153 | 1.001 | .746 |
| Net Realized and Unrealized Gain (Loss) on Investments | 15.146 | 6.814 | 5.340 |
| Total from Investment Operations | 16.299 | 7.815 | 6.086 |
| Distributions | |||
| Dividends from Net Investment Income | (1.079) | (.795) | (.256) |
| Distributions from Realized Capital Gains | — | — | — |
| Total Distributions | (1.079) | (.795) | (.256) |
| Net Asset Value, End of Period | $77.93 | $62.71 | $55.69 |
| Total Return | 26.31% | 14.18% | 12.18% |
| Ratios/Supplemental Data | |||
| Net Assets, End of Period (Millions) | $27 | $9 | $6 |
| Ratio of Total Expenses to Average Net Assets | 0.20% | 0.20% | 0.20%2 |
| Ratio of Net Investment Income to Average Net Assets | 1.87% | 1.80% | 1.82%2 |
| Portfolio Turnover Rate3 | 74% | 31% | 48% |
1 Inception.
2 Annualized.
3 Excludes the value of portfolio securities received or delivered as a result of in-kind purchases or redemptions of the fund’s capital shares, including ETF Creation Units.
See accompanying Notes, which are an integral part of the Financial Statements.
37
S&P Mid-Cap 400 Value Index Fund
Notes to Financial Statements
Vanguard S&P Mid-Cap 400 Value Index Fund is registered under the Investment Company Act of 1940 as an open-end investment company, or mutual fund. The fund offers two classes of shares: Institutional Shares and ETF Shares. Institutional Shares are designed for investors who meet certain administrative, service, and account-size criteria. ETF Shares are listed for trading on NYSE Arca; they can be purchased and sold through a broker.
A. The following significant accounting policies conform to generally accepted accounting principles for U.S. mutual funds. The fund consistently follows such policies in preparing its financial statements.
1. Security Valuation: Securities are valued as of the close of trading on the New York Stock Exchange (generally 4 p.m., Eastern time) on the valuation date. Equity securities are valued at the latest quoted sales prices or official closing prices taken from the primary market in which each security trades; such securities not traded on the valuation date are valued at the mean of the latest quoted bid and asked prices. Securities for which market quotations are not readily available, or whose values have been materially affected by events occurring before the fund’s pricing time but after the close of the securities’ primary markets, are valued by methods deemed by the board of trustees to represent fair value. Investments in Vanguard Market Liquidity Fund are valued at that fund’s net asset value. Temporary cash investments acquired over 60 days to maturity are valued using the latest bid prices or using valuations based on a matrix system (which considers such factors as security prices, yields, maturities, and ratings), both as furnished by independent pricing services. Other temporary cash investments are valued at amortized cost, which approximates market value.
2. Futures Contracts: The fund may use index futures contracts to a limited extent, with the objectives of maintaining full exposure to the stock market, enhancing returns, maintaining liquidity, and minimizing transaction costs. The fund may purchase futures contracts to immediately invest incoming cash in the market, or sell futures in response to cash outflows, thereby simulating a fully invested position in the underlying index while maintaining a cash balance for liquidity. The fund may seek to enhance returns by using futures contracts instead of the underlying securities when futures are believed to be priced more attractively than the underlying securities. The primary risks associated with the use of futures contracts are imperfect correlation between changes in market values of stocks held by the fund and the prices of futures contracts, and the possibility of an illiquid market. Counterparty risk involving futures is mitigated because a regulated clearinghouse is the counterparty instead of the clearing broker. To further mitigate counterparty risk, the fund trades futures contracts on an exchange; monitors the financial strength of its clearing brokers and clearinghouse; and has entered into clearing agreements with its clearing brokers. The clearinghouse imposes initial margin requirements to secure the fund’s performance and requires daily settlement of variation margin representing changes in the market value of each contract.
Futures contracts are valued at their quoted daily settlement prices. The aggregate notional amounts of the contracts are not recorded in the Statement of Net Assets. Fluctuations in the value of the contracts are recorded in the Statement of Net Assets as an asset (liability) and in the Statement of Operations as unrealized appreciation (depreciation) until the contracts are closed, when they are recorded as realized futures gains (losses).
During the year ended August 31, 2013, the fund’s average investments in long and short futures contracts represented less than 1% and 0% of net assets, respectively, based on quarterly average aggregate settlement values.
38
S&P Mid-Cap 400 Value Index Fund
3. Federal Income Taxes: The fund intends to continue to qualify as a regulated investment company and distribute all of its taxable income. Management has analyzed the fund’s tax positions taken for all open federal income tax years (August 31, 2011–2013), and has concluded that no provision for federal income tax is required in the fund’s financial statements.
4. Distributions: Distributions to shareholders are recorded on the ex-dividend date.
5. Other: Dividend income is recorded on the ex-dividend date. Interest income is accrued daily. Premiums and discounts on debt securities purchased are amortized and accreted, respectively, to interest income over the lives of the respective securities. Security transactions are accounted for on the date securities are bought or sold. Costs used to determine realized gains (losses) on the sale of investment securities are those of the specific securities sold.
Each class of shares has equal rights as to assets and earnings, except that each class separately bears certain class-specific expenses related to maintenance of shareholder accounts (included in Management and Administrative expenses) and shareholder reporting. Marketing and distribution expenses are allocated to each class of shares based on a method approved by the board of trustees. Income, other non-class-specific expenses, and gains and losses on investments are allocated to each class of shares based on its relative net assets.
B. The Vanguard Group furnishes at cost investment advisory, corporate management, administrative, marketing, and distribution services. The costs of such services are allocated to the fund under methods approved by the board of trustees. The fund has committed to provide up to 0.40% of its net assets in capital contributions to Vanguard. At August 31, 2013, the fund had contributed capital of $10,000 to Vanguard (included in Other Assets), representing 0.01% of the fund’s net assets and 0.00% of Vanguard’s capitalization. The fund’s trustees and officers are also directors and officers of Vanguard.
C. Various inputs may be used to determine the value of the fund’s investments. These inputs are summarized in three broad levels for financial statement purposes. The inputs or methodologies used to value securities are not necessarily an indication of the risk associated with investing in those securities.
Level 1—Quoted prices in active markets for identical securities.
Level 2—Other significant observable inputs (including quoted prices for similar securities, interest rates, prepayment speeds, credit risk, etc.).
Level 3—Significant unobservable inputs (including the fund’s own assumptions used to determine the fair value of investments).
The following table summarizes the market value of the fund’s investments as of August 31, 2013, based on the inputs used to value them:
| Level 1 | Level 2 | Level 3 | |
| Investments | ($000) | ($000) | ($000) |
| Common Stocks | 76,345 | — | — |
| Temporary Cash Investments | 23 | 100 | — |
| Futures Contracts—Liabilities1 | (2) | — | — |
| Total | 76,366 | 100 | — |
| 1 Represents variation margin on the last day of the reporting period. |
39
S&P Mid-Cap 400 Value Index Fund
D. At August 31, 2013, the aggregate settlement value of open futures contracts and the related unrealized appreciation (depreciation) were:
| ($000) | ||||
| Aggregate | ||||
| Number of | Settlement | Unrealized | ||
| Long (Short) | Value | Appreciation | ||
| Futures Contracts | Expiration | Contracts | Long (Short) | (Depreciation) |
| E-mini S&P Mid-Cap 400 Index | September 2013 | 1 | 118 | (2) |
Unrealized appreciation (depreciation) on open futures contracts is required to be treated as realized gain (loss) for tax purposes.
E. Distributions are determined on a tax basis and may differ from net investment income and realized capital gains for financial reporting purposes. Differences may be permanent or temporary. Permanent differences are reclassified among capital accounts in the financial statements to reflect their tax character. Temporary differences arise when certain items of income, expense, gain, or loss are recognized in different periods for financial statement and tax purposes; these differences will reverse at some time in the future. Differences in classification may also result from the treatment of short-term gains as ordinary income for tax purposes.
During the year ended August 31, 2013, the fund realized $5,267,000 of net capital gains resulting from in-kind redemptions—in which shareholders exchanged fund shares for securities held by the fund rather than for cash. Because such gains are not taxable to the fund, and are not distributed to shareholders, they have been reclassified from accumulated net realized losses to paid-in capital.
For tax purposes, at August 31, 2013, the fund had $805,000 of ordinary income available for distribution. At August 31, 2013, the fund had available capital losses totaling $3,060,000 that may be carried forward indefinitely to offset future net capital gains.
At August 31, 2013, the cost of investment securities for tax purposes was $68,371,000. Net unrealized appreciation of investment securities for tax purposes was $8,097,000, consisting of unrealized gains of $9,025,000 on securities that had risen in value since their purchase and $928,000 in unrealized losses on securities that had fallen in value since their purchase.
F. During the year ended August 31, 2013, the fund purchased $75,455,000 of investment securities and sold $58,930,000 of investment securities, other than temporary cash investments. Purchases and sales include $31,578,000 and $17,204,000, respectively, in connection with in-kind purchases and redemptions of the fund’s capital shares.
40
S&P Mid-Cap 400 Value Index Fund
G. Capital share transactions for each class of shares were:
| Year Ended August 31, | ||||
| 2013 | 2012 | |||
| Amount | Shares | Amount | Shares | |
| ($000) | (000) | ($000) | (000) | |
| Institutional Shares | ||||
| Issued | 25,332 | 167 | 3,195 | 29 |
| Issued in Lieu of Cash Distributions | 706 | 5 | 535 | 5 |
| Redeemed | (24,166) | (177) | (2,864) | (25) |
| Net Increase (Decrease) —Institutional Shares | 1,872 | (5) | 866 | 9 |
| ETF Shares | ||||
| Issued | 31,614 | 450 | 13,970 | 250 |
| Issued in Lieu of Cash Distributions | — | — | — | — |
| Redeemed | (17,189) | (250) | (11,512) | (200) |
| Net Increase (Decrease)—ETF Shares | 14,425 | 200 | 2,458 | 50 |
At August 31, 2013, one shareholder was the record or beneficial owner of 26% of the fund’s net assets. If the shareholder were to redeem its investment in the fund, the redemption might result in an increase in the fund’s expense ratio, cause the fund to incur higher transaction costs, or lead to the realization of taxable capital gains.
H. Management has determined that no material events or transactions occurred subsequent to August 31, 2013, that would require recognition or disclosure in these financial statements.
41
S&P Mid-Cap 400 Growth Index Fund
Fund Profile
As of August 31, 2013
| Share-Class Characteristics | ||
| Institutional | ETF | |
| Shares | Shares | |
| Ticker Symbol | VMFGX | IVOG |
| Expense Ratio1 | 0.08% | 0.20% |
| 30-Day SEC Yield | 0.99% | 0.87% |
| Portfolio Characteristics | |||
| S&P | DJ U.S. | ||
| MidCap | Total | ||
| 400 | Market | ||
| Growth | FA | ||
| Fund | Index | Index | |
| Number of Stocks | 228 | 226 | 3,631 |
| Median Market Cap | $4.8B | $4.8B | $39.3B |
| Price/Earnings Ratio | 24.4x | 24.4x | 18.7x |
| Price/Book Ratio | 3.2x | 3.2x | 2.4x |
| Return on Equity | 13.9% | 13.9% | 16.6% |
| Earnings Growth | |||
| Rate | 18.7% | 18.7% | 11.1% |
| Dividend Yield | 1.1% | 1.1% | 2.0% |
| Foreign Holdings | 0.0% | 0.0% | 0.0% |
| Turnover Rate | 35% | — | — |
| Short-Term Reserves | 0.0% | — | — |
| Sector Diversification (% of equity exposure) | |||
| S&P | |||
| MidCap | DJ U.S. | ||
| 400 | Total | ||
| Growth | Market | ||
| Fund | Index | FA Index | |
| Consumer | |||
| Discretionary | 19.4% | 19.3% | 13.1% |
| Consumer Staples | 3.4 | 3.4 | 8.9 |
| Energy | 4.4 | 4.4 | 9.8 |
| Financials | 17.8 | 17.8 | 17.5 |
| Health Care | 11.1 | 11.1 | 12.6 |
| Industrials | 17.0 | 17.0 | 11.2 |
| Information | |||
| Technology | 19.9 | 20.0 | 17.6 |
| Materials | 5.9 | 5.9 | 3.8 |
| Telecommunication | |||
| Services | 0.6 | 0.6 | 2.3 |
| Utilities | 0.5 | 0.5 | 3.2 |
| Ten Largest Holdings (% of total net assets) | ||
| Vertex Pharmaceuticals | ||
| Inc. | Biotechnology | 2.5% |
| AMETEK Inc. | Electrical | |
| Components & | ||
| Equipment | 1.5 | |
| Alliance Data Systems | Data Processing & | |
| Corp. | Outsourced Services | 1.4 |
| Affiliated Managers | Asset Management | |
| Group Inc. | & Custody Banks | 1.3 |
| HollyFrontier Corp. | Oil & Gas Refining & | |
| Marketing | 1.3 | |
| LKQ Corp. | Distributors | 1.3 |
| Equinix Inc. | Internet Software & | |
| Services | 1.2 | |
| Tractor Supply Co. | Specialty Stores | 1.2 |
| B/E Aerospace Inc. | Aerospace & | |
| Defense | 1.0 | |
| Polaris Industries Inc. | Leisure Products | 1.0 |
| Top Ten | 13.7% | |
The holdings listed exclude any temporary cash investments and equity index products.
Investment Focus

1 The expense ratios shown are from the prospectus dated December 28, 2012, and represent estimated costs for the current fiscal year. For the fiscal year ended August 31, 2013, the expense ratios were 0.08% for Institutional Shares and 0.20% for ETF Shares.
42
S&P Mid-Cap 400 Growth Index Fund
Performance Summary
All of the returns in this report represent past performance, which is not a guarantee of future results that may be achieved by the fund. (Current performance may be lower or higher than the performance data cited. For performance data current to the most recent month-end, visit our website at vanguard.com/performance.) Note, too, that both investment returns and principal value can fluctuate widely, so an investor’s shares, when sold, could be worth more or less than their original cost. The returns shown do not reflect taxes that a shareholder would pay on fund distributions or on the sale of fund shares.
Cumulative Performance: September 7, 2010, Through August 31, 2013
Initial Investment of $10,000

| Average Annual Total Returns | |||
| Periods Ended August 31, 2013 | |||
| Since | Final Value | ||
| One | Inception | of a $10,000 | |
| Year | (9/7/2010) | Investment | |
| S&P Mid-Cap 400 Growth Index | |||
| Fund*ETF Shares Net Asset Value | 20.83% | 18.07% | $16,408 |
| S&P Mid-Cap 400 Growth Index | |||
| Fund*ETF Shares Market Price | 20.80 | 18.08 | 16,410 |
| S&P MidCap 400 Growth Index | 21.03 | 18.27 | 16,491 |
| Mid-Cap Growth Funds Average | 21.94 | 16.47 | 15,754 |
| Dow Jones U.S. Total Stock Market | |||
| Float Adjusted Index | 20.15 | 17.40 | 16,132 |
Mid-Cap Growth Funds Average: Derived from data provided by Lipper, a Thomson Reuters Company.
"Since Inception" performance is calculated from the ETF Shares’ inception date for both the fund and its comparative standards.
| Since | Final Value | ||
| One | Inception | of a $5,000,000 | |
| Year | (3/28/2011) | Investment | |
| S&P Mid-Cap 400 Growth Index Fund | |||
| Institutional Shares | 20.97% | 9.84% | $6,279,725 |
| S&P MidCap 400 Growth Index | 21.03 | 9.90 | 6,287,054 |
| Dow Jones U.S. Total Stock Market Float | |||
| Adjusted Index | 20.15 | 11.83 | 6,559,457 |
"Since Inception" performance is calculated from the Institutional Shares’ inception date for both the fund and its comparative standards. Institutional Shares were first issued on December 15, 2010, and the sole shareholder redeemed shortly thereafter. Institutional Shares were next issued on March 28, 2011. The total returns shown are based on the period beginning March 28, 2011.
See Financial Highlights for dividend and capital gains information.
43
S&P Mid-Cap 400 Growth Index Fund
| Cumulative Returns of ETF Shares: September 7, 2010, Through August 31, 2013 | ||
| Since | ||
| One | Inception | |
| Year | (9/7/2010) | |
| S&P Mid-Cap 400 Growth Index Fund ETF Shares | ||
| Market Price | 20.80% | 64.10% |
| S&P Mid-Cap 400 Growth Index Fund ETF Shares | ||
| Net Asset Value | 20.83 | 64.08 |
| S&P MidCap 400 Growth Index | 21.03 | 64.91 |
| "Since Inception" performance is calculated from the ETF Shares’ inception date for both the fund and its comparative standards. | ||
Fiscal-Year Total Returns (%): September 7, 2010, Through August 31, 2013

Average Annual Total Returns: Periods Ended June 30, 2013
This table presents returns through the latest calendar quarter—rather than through the end of the fiscal period.
Securities and Exchange Commission rules require that we provide this information.
| Inception | One | Since | |
| Date | Year | Inception | |
| Institutional Shares | 3/28/20111 | 23.38% | 9.54% |
| ETF Shares | 9/7/2010 | ||
| Market Price | 23.13 | 18.31 | |
| Net Asset Value | 23.23 | 18.33 |
1 Institutional Shares were first issued on December 15, 2010, and the sole shareholder redeemed shortly thereafter. Institutional Shares were next issued on March 28, 2011. The total returns shown are based on the period beginning March 28, 2011.
44
S&P Mid-Cap 400 Growth Index Fund
Financial Statements
Statement of Net Assets
As of August 31, 2013
The fund reports a complete list of its holdings in regulatory filings four times in each fiscal year, at the quarter-ends. For the second and fourth fiscal quarters, the lists appear in the fund’s semiannual and annual reports to shareholders. For the first and third fiscal quarters, the fund files the lists with the Securities and Exchange Commission on Form N-Q. Shareholders can look up the fund’s Forms N-Q on the SEC’s website at sec.gov. Forms N-Q may also be reviewed and copied at the SEC’s Public Reference Room (see the back cover of this report for further information).
| Market | |||
| Value | |||
| Shares | ($000) | ||
| Common Stocks (99.7%)1 | |||
| Consumer Discretionary (19.4%) | |||
| * | LKQ Corp. | 97,663 | 2,856 |
| Tractor Supply Co. | 22,825 | 2,793 | |
| Polaris Industries Inc. | 20,909 | 2,283 | |
| Hanesbrands Inc. | 32,231 | 1,917 | |
| * | Under Armour Inc. Class A | 25,430 | 1,847 |
| Williams-Sonoma Inc. | 28,120 | 1,586 | |
| Foot Locker Inc. | 49,105 | 1,581 | |
| Dick’s Sporting Goods Inc. | 32,769 | 1,521 | |
| * | Toll Brothers Inc. | 49,287 | 1,509 |
| * | Panera Bread Co. Class A | 9,163 | 1,503 |
| * | Mohawk Industries Inc. | 12,747 | 1,498 |
| * | Jarden Corp. | 33,056 | 1,420 |
| Service Corp. International | 69,237 | 1,252 | |
| Carter’s Inc. | 16,667 | 1,227 | |
| * | AMC Networks Inc. Class A | 18,891 | 1,171 |
| Gentex Corp. | 46,967 | 1,058 | |
| * | Cabela’s Inc. | 15,205 | 996 |
| Advance Auto Parts Inc. | 12,440 | 996 | |
| Cinemark Holdings Inc. | 33,280 | 981 | |
| * | Bally Technologies Inc. | 12,636 | 911 |
| Tupperware Brands Corp. | 10,381 | 838 | |
| American Eagle | |||
| Outfitters Inc. | 57,356 | 830 | |
| Chico’s FAS Inc. | 53,070 | 828 | |
| Signet Jewelers Ltd. | 12,171 | 808 | |
| * | Lamar Advertising Co. | ||
| Class A | 18,198 | 766 | |
| * | NVR Inc. | 884 | 756 |
| Thor Industries Inc. | 14,403 | 738 | |
| Domino’s Pizza Inc. | 11,226 | 690 | |
| * | Ascena Retail Group Inc. | 41,660 | 680 |
| Sotheby’s | 14,743 | 680 | |
| Brinker International Inc. | 15,925 | 637 | |
| HSN Inc. | 11,700 | 630 | |
| * | ANN Inc. | 15,423 | 535 |
| * | Tempur Sealy | ||
| International Inc. | 11,651 | 449 | |
| Market | |||
| Value | |||
| Shares | ($000) | ||
| Bob Evans Farms Inc. | 9,122 | 447 | |
| KB Home | 26,806 | 430 | |
| Cheesecake Factory Inc. | 9,088 | 380 | |
| MDC Holdings Inc. | 12,794 | 356 | |
| * | Life Time Fitness Inc. | 6,092 | 305 |
| * | CST Brands Inc. | 9,871 | 291 |
| * | Murphy USA Inc. | 7,423 | 274 |
| * | Office Depot Inc. | 47,913 | 201 |
| 43,455 | |||
| Consumer Staples (3.4%) | |||
| * | Green Mountain Coffee | ||
| Roasters Inc. | 26,326 | 2,272 | |
| Ingredion Inc. | 25,340 | 1,595 | |
| Church & Dwight Co. Inc. | 25,764 | 1,529 | |
| Flowers Foods Inc. | 27,590 | 574 | |
| * | WhiteWave Foods Co. | ||
| Class A | 27,048 | 517 | |
| * | United Natural Foods Inc. | 8,068 | 489 |
| Lancaster Colony Corp. | 2,923 | 216 | |
| * | SUPERVALU Inc. | 28,615 | 205 |
| Tootsie Roll Industries Inc. | 3,368 | 101 | |
| * | WhiteWave Foods Co. | ||
| Class B | 689 | 13 | |
| 7,511 | |||
| Energy (4.4%) | |||
| HollyFrontier Corp. | 66,501 | 2,958 | |
| Oceaneering | |||
| International Inc. | 20,526 | 1,592 | |
| Cimarex Energy Co. | 12,160 | 1,019 | |
| * | Oil States International Inc. | 10,429 | 931 |
| SM Energy Co. | 12,575 | 859 | |
| * | Dresser-Rand Group Inc. | 11,213 | 683 |
| * | Dril-Quip Inc. | 5,976 | 610 |
| * | Rosetta Resources Inc. | 11,593 | 539 |
| Patterson-UTI Energy Inc. | 24,434 | 479 | |
| CARBO Ceramics Inc. | 3,090 | 252 | |
| 9,922 | |||
45
S&P Mid-Cap 400 Growth Index Fund
| Market | |||
| Value | |||
| Shares | ($000) | ||
| Financials (17.7%) | |||
| * | Affiliated Managers | ||
| Group Inc. | 17,249 | 3,007 | |
| Eaton Vance Corp. | 39,711 | 1,531 | |
| Realty Income Corp. | 36,586 | 1,445 | |
| Extra Space Storage Inc. | 33,894 | 1,397 | |
| Rayonier Inc. | 25,146 | 1,389 | |
| * | Signature Bank | 15,458 | 1,356 |
| Waddell & Reed | |||
| Financial Inc. Class A | 28,108 | 1,339 | |
| Corrections Corp. | |||
| of America | 37,686 | 1,241 | |
| * | SVB Financial Group | 14,746 | 1,221 |
| Jones Lang LaSalle Inc. | 14,424 | 1,186 | |
| Federal Realty | |||
| Investment Trust | 12,165 | 1,184 | |
| * | Alleghany Corp. | 2,866 | 1,109 |
| Omega Healthcare | |||
| Investors Inc. | 37,995 | 1,079 | |
| Synovus Financial Corp. | 319,999 | 1,021 | |
| City National Corp. | 15,587 | 1,020 | |
| Fidelity National | |||
| Financial Inc. Class A | 38,453 | 912 | |
| Raymond James | |||
| Financial Inc. | 21,461 | 898 | |
| Arthur J Gallagher & Co. | 21,561 | 891 | |
| * | MSCI Inc. Class A | 23,694 | 889 |
| Essex Property Trust Inc. | 6,091 | 873 | |
| Camden Property Trust | 13,877 | 857 | |
| Taubman Centers Inc. | 12,308 | 830 | |
| Regency Centers Corp. | 16,782 | 798 | |
| CBOE Holdings Inc. | 17,130 | 786 | |
| UDR Inc. | 34,451 | 778 | |
| SEI Investments Co. | 25,515 | 759 | |
| First American | |||
| Financial Corp. | 35,390 | 740 | |
| Washington Federal Inc. | 34,085 | 712 | |
| Senior Housing | |||
| Properties Trust | 30,764 | 700 | |
| Duke Realty Corp. | 47,354 | 691 | |
| Brown & Brown Inc. | 21,251 | 662 | |
| Highwoods Properties Inc. | 17,526 | 592 | |
| Kilroy Realty Corp. | 11,587 | 565 | |
| National Retail | |||
| Properties Inc. | 18,201 | 558 | |
| American Campus | |||
| Communities Inc. | 16,455 | 548 | |
| Cathay General Bancorp | 23,996 | 528 | |
| Weingarten Realty Investors | 17,967 | 516 | |
| BRE Properties Inc. | 10,339 | 496 | |
| Home Properties Inc. | 8,259 | 477 | |
| Fulton Financial Corp. | 35,758 | 432 | |
| Webster Financial Corp. | 16,243 | 430 | |
| First Horizon National Corp. | 38,676 | 428 | |
| Potlatch Corp. | 7,554 | 291 | |
| Market | |||
| Value | |||
| Shares | ($000) | ||
| Corporate Office | |||
| Properties Trust | 11,511 | 262 | |
| Greenhill & Co. Inc. | 4,720 | 224 | |
| Equity One Inc. | 8,609 | 183 | |
| 39,831 | |||
| Health Care (11.1%) | |||
| * | Vertex Pharmaceuticals Inc. | 76,141 | 5,722 |
| ResMed Inc. | 46,596 | 2,201 | |
| * | Mettler-Toledo | ||
| International Inc. | 9,873 | 2,174 | |
| Cooper Cos. Inc. | 15,914 | 2,079 | |
| * | Henry Schein Inc. | 16,815 | 1,699 |
| * | IDEXX Laboratories Inc. | 17,696 | 1,660 |
| * | Salix Pharmaceuticals Ltd. | 17,045 | 1,141 |
| * | United Therapeutics Corp. | 15,110 | 1,071 |
| * | Hologic Inc. | 46,689 | 996 |
| * | Covance Inc. | 10,968 | 889 |
| Mallinckrodt plc | 19,238 | 840 | |
| * | MEDNAX Inc. | 8,509 | 829 |
| * | Endo Health Solutions Inc. | 19,461 | 800 |
| * | Charles River Laboratories | ||
| International Inc. | 16,039 | 739 | |
| * | HMS Holdings Corp. | 28,692 | 717 |
| * | Thoratec Corp. | 18,756 | 670 |
| Techne Corp. | 6,005 | 465 | |
| Masimo Corp. | 9,410 | 233 | |
| 24,925 | |||
| Industrials (16.9%) | |||
| AMETEK Inc. | 79,650 | 3,419 | |
| * | B/E Aerospace Inc. | 34,255 | 2,336 |
| JB Hunt Transport | |||
| Services Inc. | 29,613 | 2,132 | |
| Fortune Brands Home | |||
| & Security Inc. | 53,972 | 1,988 | |
| Wabtec Corp. | 31,464 | 1,841 | |
| Lincoln Electric Holdings Inc. | 27,130 | 1,696 | |
| Timken Co. | 26,104 | 1,463 | |
| Graco Inc. | 20,038 | 1,392 | |
| Alaska Air Group Inc. | 22,977 | 1,301 | |
| Nordson Corp. | 18,484 | 1,232 | |
| * | United Rentals Inc. | 21,269 | 1,165 |
| MSC Industrial | |||
| Direct Co. Inc. Class A | 15,321 | 1,164 | |
| * | Copart Inc. | 34,878 | 1,108 |
| IDEX Corp. | 18,022 | 1,070 | |
| * | Terex Corp. | 36,374 | 1,055 |
| Valmont Industries Inc. | 7,702 | 1,040 | |
| Lennox International Inc. | 15,001 | 1,030 | |
| Hubbell Inc. Class B | 10,136 | 1,027 | |
| * | Clean Harbors Inc. | 17,623 | 1,002 |
| Donaldson Co. Inc. | 26,977 | 951 | |
| Waste Connections Inc. | 20,591 | 872 | |
| * | Genesee & Wyoming Inc. | ||
| Class A | 9,882 | 856 | |

S&P Mid-Cap 400 Growth Index Fund
| Market | |||
| Value | |||
| Shares | ($000) | ||
| * | Kirby Corp. | 10,212 | 821 |
| Carlisle Cos. Inc. | 12,073 | 804 | |
| Acuity Brands Inc. | 8,688 | 743 | |
| Triumph Group Inc. | 10,126 | 729 | |
| Watsco Inc. | 5,926 | 532 | |
| Landstar System Inc. | 9,293 | 508 | |
| Regal-Beloit Corp. | 7,801 | 497 | |
| ITT Corp. | 14,119 | 464 | |
| Corporate Executive | |||
| Board Co. | 6,379 | 414 | |
| CLARCOR Inc. | 7,154 | 383 | |
| Rollins Inc. | 11,849 | 293 | |
| Deluxe Corp. | 7,159 | 282 | |
| Mine Safety Appliances Co. | 4,450 | 214 | |
| Herman Miller Inc. | 8,117 | 207 | |
| 38,031 | |||
| Information Technology (19.9%) | |||
| * | Alliance Data Systems Corp. | 16,087 | 3,148 |
| * | Equinix Inc. | 16,142 | 2,804 |
| * | Cree Inc. | 38,570 | 2,140 |
| * | Trimble Navigation Ltd. | 83,664 | 2,113 |
| * | Gartner Inc. | 30,664 | 1,778 |
| * | ANSYS Inc. | 19,511 | 1,639 |
| * | Rackspace Hosting Inc. | 36,140 | 1,620 |
| * | Skyworks Solutions Inc. | 62,536 | 1,586 |
| * | 3D Systems Corp. | 30,318 | 1,558 |
| * | Concur Technologies Inc. | 14,975 | 1,463 |
| * | NCR Corp. | 35,491 | 1,263 |
| * | Cadence Design | ||
| Systems Inc. | 92,566 | 1,247 | |
| * | CommVault Systems Inc. | 14,140 | 1,185 |
| * | TIBCO Software Inc. | 50,991 | 1,149 |
| * | NeuStar Inc. Class A | 21,524 | 1,088 |
| * | Atmel Corp. | 140,206 | 1,018 |
| * | WEX Inc. | 12,692 | 1,016 |
| * | Synopsys Inc. | 26,658 | 967 |
| Jack Henry & Associates Inc. | 17,747 | 886 | |
| National Instruments Corp. | 31,121 | 864 | |
| * | Riverbed Technology Inc. | 53,460 | 825 |
| * | CoreLogic Inc. | 31,239 | 803 |
| FactSet Research | |||
| Systems Inc. | 7,545 | 772 | |
| * | SolarWinds Inc. | 20,172 | 735 |
| Solera Holdings Inc. | 14,199 | 733 | |
| Mentor Graphics Corp. | 31,015 | 687 | |
| * | Ciena Corp. | 33,214 | 662 |
| * | Semtech Corp. | 22,082 | 656 |
| * | ACI Worldwide Inc. | 13,037 | 634 |
| Global Payments Inc. | 13,163 | 627 | |
| * | MICROS Systems Inc. | 12,353 | 604 |
| Fair Isaac Corp. | 11,736 | 588 | |
| Broadridge Financial | |||
| Solutions Inc. | 18,641 | 555 | |
| * | ValueClick Inc. | 23,440 | 496 |
| * | Itron Inc. | 12,935 | 485 |
| Market | |||
| Value | |||
| Shares | ($000) | ||
| InterDigital Inc. | 13,464 | 478 | |
| * | PTC Inc. | 17,994 | 469 |
| Lender Processing | |||
| Services Inc. | 13,896 | 443 | |
| * | Zebra Technologies Corp. | 9,664 | 441 |
| * | Acxiom Corp. | 15,238 | 379 |
| Plantronics Inc. | 8,499 | 367 | |
| AOL Inc. | 10,899 | 359 | |
| * | VeriFone Systems Inc. | 17,403 | 345 |
| * | Silicon Laboratories Inc. | 6,775 | 262 |
| Cypress | |||
| Semiconductor Corp. | 20,813 | 236 | |
| * | Integrated Device | ||
| Technology Inc. | 25,598 | 223 | |
| * | RF Micro Devices Inc. | 39,991 | 198 |
| Advent Software Inc. | 6,364 | 172 | |
| 44,766 | |||
| Materials (5.8%) | |||
| Packaging Corp. of America | 32,084 | 1,702 | |
| Valspar Corp. | 26,732 | 1,662 | |
| Royal Gold Inc. | 21,275 | 1,235 | |
| Ashland Inc. | 12,501 | 1,090 | |
| Albemarle Corp. | 15,971 | 996 | |
| Eagle Materials Inc. | 15,384 | 987 | |
| NewMarket Corp. | 3,488 | 956 | |
| RPM International Inc. | 21,241 | 722 | |
| Martin Marietta | |||
| Materials Inc. | 7,362 | 707 | |
| * | Louisiana-Pacific Corp. | 45,591 | 682 |
| Worthington Industries Inc. | 17,447 | 581 | |
| Carpenter Technology Corp. | 10,142 | 545 | |
| Cytec Industries Inc. | 7,282 | 545 | |
| Compass Minerals | |||
| International Inc. | 4,796 | 354 | |
| Silgan Holdings Inc. | 7,110 | 335 | |
| 13,099 | |||
| Telecommunication Services (0.6%) | |||
| * | tw telecom inc Class A | 49,169 | 1,407 |
| Utilities (0.5%) | |||
| Aqua America Inc. | 24,863 | 755 | |
| PNM Resources Inc. | 13,557 | 297 | |
| 1,052 | |||
| Total Common Stocks | |||
| (Cost $195,107) | 223,999 | ||
47
S&P Mid-Cap 400 Growth Index Fund
| Market | |
| Value | |
| Shares | ($000) |
| Temporary Cash Investments (0.2%)1 | |
| Money Market Fund (0.2%) | |
| 2 Vanguard Market | |
| Liquidity Fund, 0.122% 336,820 | 337 |
| Face | |
| Amount | |
| ($000) | |
| U.S. Government and Agency Obligations (0.0%) | |
| 3,4 Freddie Mac Discount | |
| Notes, 0.095%, 11/18/13 100 | 100 |
| Total Temporary Cash Investments | |
| (Cost $437) | 437 |
| Total Investments (99.9%) | |
| (Cost $195,544) | 224,436 |
| Other Assets and Liabilities (0.1%) | |
| Other Assets | 8,227 |
| Liabilities | (8,062) |
| 165 | |
| Net Assets (100%) | 224,601 |
| At August 31, 2013, net assets consisted of: | |
| Amount | |
| ($000) | |
| Paid-in Capital | 202,002 |
| Undistributed Net Investment Income | 1,344 |
| Accumulated Net Realized Losses | (7,619) |
| Unrealized Appreciation (Depreciation) | |
| Investment Securities | 28,892 |
| Futures Contracts | (18) |
| Net Assets | 224,601 |
| Institutional Shares—Net Assets | |
| Applicable to 263,355 outstanding | |
| $.001 par value shares of beneficial | |
| interest (unlimited authorization) | 42,433 |
| Net Asset Value Per Share— | |
| Institutional Shares | $161.12 |
| ETF Shares—Net Assets | |
| Applicable to 2,250,000 outstanding | |
| $.001 par value shares of beneficial | |
| interest (unlimited authorization) | 182,168 |
| Net Asset Value Per Share— | |
| ETF Shares | $80.96 |
See Note A in Notes to Financial Statements.
* Non-income-producing security.
1 The fund invests a portion of its cash reserves in equity markets through the use of index futures contracts. After giving effect to futures investments, the fund’s effective common stock and temporary cash investment positions represent 99.9% and 0.0%, respectively, of net assets.
2 Affiliated money market fund available only to Vanguard funds and certain trusts and accounts managed by Vanguard. Rate shown is the 7-day yield.
3 The issuer was placed under federal conservatorship in September 2008; since that time, its daily operations have been managed by the Federal Housing Finance Agency and it receives capital from the U.S. Treasury, as needed to maintain a positive net worth, in exchange for senior preferred stock.
4 Securities with a value of $100,000 have been segregated as initial margin for open futures contracts.
See accompanying Notes, which are an integral part of the Financial Statements.
48
S&P Mid-Cap 400 Growth Index Fund
| Statement of Operations | |
| Year Ended | |
| August 31, 2013 | |
| ($000) | |
| Investment Income | |
| Income | |
| Dividends | 2,116 |
| Interest1 | 1 |
| Securities Lending | 1 |
| Total Income | 2,118 |
| Expenses | |
| The Vanguard Group—Note B | |
| Investment Advisory Services | 18 |
| Management and Administrative—Institutional Shares | 5 |
| Management and Administrative—ETF Shares | 184 |
| Marketing and Distribution—Institutional Shares | 8 |
| Marketing and Distribution—ETF Shares | 31 |
| Custodian Fees | 18 |
| Auditing Fees | 21 |
| Shareholders’ Reports—Institutional Shares | — |
| Shareholders’ Reports—ETF Shares | 10 |
| Total Expenses | 295 |
| Net Investment Income | 1,823 |
| Realized Net Gain (Loss) | |
| Investment Securities Sold | 3,272 |
| Futures Contracts | 61 |
| Realized Net Gain (Loss) | 3,333 |
| Change in Unrealized Appreciation (Depreciation) | |
| Investment Securities | 23,863 |
| Futures Contracts | (21) |
| Change in Unrealized Appreciation (Depreciation) | 23,842 |
| Net Increase (Decrease) in Net Assets Resulting from Operations | 28,998 |
| 1 Interest income from an affiliated company of the fund was $1,000. | |
See accompanying Notes, which are an integral part of the Financial Statements.
49
S&P Mid-Cap 400 Growth Index Fund
| Statement of Changes in Net Assets | ||
| Year Ended August 31, | ||
| 2013 | 2012 | |
| ($000) | ($000) | |
| Increase (Decrease) in Net Assets | ||
| Operations | ||
| Net Investment Income | 1,823 | 565 |
| Realized Net Gain (Loss) | 3,333 | (789) |
| Change in Unrealized Appreciation (Depreciation) | 23,842 | 6,482 |
| Net Increase (Decrease) in Net Assets Resulting from Operations | 28,998 | 6,258 |
| Distributions | ||
| Net Investment Income | ||
| Institutional Shares | (187) | (137) |
| ETF Shares | (708) | (166) |
| Realized Capital Gain | ||
| Institutional Shares | — | — |
| ETF Shares | — | — |
| Total Distributions | (895) | (303) |
| Capital Share Transactions | ||
| Institutional Shares | 14,378 | (1,788) |
| ETF Shares | 68,116 | 56,830 |
| Net Increase (Decrease) from Capital Share Transactions | 82,494 | 55,042 |
| Total Increase (Decrease) | 110,597 | 60,997 |
| Net Assets | ||
| Beginning of Period | 114,004 | 53,007 |
| End of Period1 | 224,601 | 114,004 |
| 1 Net Assets—End of Period includes undistributed net investment income of $1,344,000 and $416,000. | ||
See accompanying Notes, which are an integral part of the Financial Statements.
50
S&P Mid-Cap 400 Growth Index Fund
Financial Highlights
| Institutional Shares | |||
| March 28, | |||
| Year Ended | 20111 to | ||
| August 31, | August 31, | ||
| For a Share Outstanding Throughout Each Period | 2013 | 2012 | 2011 |
| Net Asset Value, Beginning of Period | $134.20 | $121.54 | $130.08 |
| Investment Operations | |||
| Net Investment Income | 1.584 | .915 | .304 |
| Net Realized and Unrealized Gain (Loss) on Investments | 26.392 | 12.506 | (8.844) |
| Total from Investment Operations | 27.976 | 13.421 | (8.540) |
| Distributions | |||
| Dividends from Net Investment Income | (1.056) | (.761) | — |
| Distributions from Realized Capital Gains | — | — | — |
| Total Distributions | (1.056) | (.761) | — |
| Net Asset Value, End of Period | $161.12 | $134.20 | $121.54 |
| Total Return | 20.97% | 11.12% | -6.57% |
| Ratios/Supplemental Data | |||
| Net Assets, End of Period (Millions) | $42 | $23 | $22 |
| Ratio of Total Expenses to Average Net Assets | 0.08% | 0.08% | 0.08%2 |
| Ratio of Net Investment Income to Average Net Assets | 1.20% | 0.88% | 0.75%2 |
| Portfolio Turnover Rate3 | 35% | 26% | 40% |
1 Inception.
2 Annualized.
3 Excludes the value of portfolio securities received or delivered as a result of in-kind purchases or redemptions of the fund’s capital shares, including ETF Creation Units.
See accompanying Notes, which are an integral part of the Financial Statements.
51
S&P Mid-Cap 400 Growth Index Fund
Financial Highlights
| ETF Shares | |||
| Sept. 7, | |||
| Year Ended | 20101 to | ||
| August 31, | August 31, | ||
| For a Share Outstanding Throughout Each Period | 2013 | 2012 | 2011 |
| Net Asset Value, Beginning of Period | $67.47 | $61.13 | $50.04 |
| Investment Operations | |||
| Net Investment Income | .721 | .405 | .280 |
| Net Realized and Unrealized Gain (Loss) on Investments | 13.257 | 6.266 | 10.910 |
| Total from Investment Operations | 13.978 | 6.671 | 11.190 |
| Distributions | |||
| Dividends from Net Investment Income | (.488) | (.331) | (.100) |
| Distributions from Realized Capital Gains | — | — | — |
| Total Distributions | (.488) | (.331) | (.100) |
| Net Asset Value, End of Period | $80.96 | $67.47 | $61.13 |
| Total Return | 20.83% | 10.97% | 22.36% |
| Ratios/Supplemental Data | |||
| Net Assets, End of Period (Millions) | $182 | $91 | $31 |
| Ratio of Total Expenses to Average Net Assets | 0.20% | 0.20% | 0.20%2 |
| Ratio of Net Investment Income to Average Net Assets | 1.08% | 0.76% | 0.63%2 |
| Portfolio Turnover Rate3 | 35% | 26% | 40% |
1 Inception.
2 Annualized.
3 Excludes the value of portfolio securities received or delivered as a result of in-kind purchases or redemptions of the fund’s capital shares, including ETF Creation Units.
See accompanying Notes, which are an integral part of the Financial Statements.
52
S&P Mid-Cap 400 Growth Index Fund
Notes to Financial Statements
Vanguard S&P Mid-Cap 400 Growth Index Fund is registered under the Investment Company Act of 1940 as an open-end investment company, or mutual fund. The fund offers two classes of shares: Institutional Shares and ETF Shares. Institutional Shares are designed for investors who meet certain administrative, service, and account-size criteria. ETF Shares are listed for trading on NYSE Arca; they can be purchased and sold through a broker.
A. The following significant accounting policies conform to generally accepted accounting principles for U.S. mutual funds. The fund consistently follows such policies in preparing its financial statements.
1. Security Valuation: Securities are valued as of the close of trading on the New York Stock Exchange (generally 4 p.m., Eastern time) on the valuation date. Equity securities are valued at the latest quoted sales prices or official closing prices taken from the primary market in which each security trades; such securities not traded on the valuation date are valued at the mean of the latest quoted bid and asked prices. Securities for which market quotations are not readily available, or whose values have been materially affected by events occurring before the fund’s pricing time but after the close of the securities’ primary markets, are valued by methods deemed by the board of trustees to represent fair value. Investments in Vanguard Market Liquidity Fund are valued at that fund’s net asset value. Temporary cash investments acquired over 60 days to maturity are valued using the latest bid prices or using valuations based on a matrix system (which considers such factors as security prices, yields, maturities, and ratings), both as furnished by independent pricing services. Other temporary cash investments are valued at amortized cost, which approximates market value.
2. Futures Contracts: The fund may use index futures contracts to a limited extent, with the objectives of maintaining full exposure to the stock market, enhancing returns, maintaining liquidity, and minimizing transaction costs. The fund may purchase futures contracts to immediately invest incoming cash in the market, or sell futures in response to cash outflows, thereby simulating a fully invested position in the underlying index while maintaining a cash balance for liquidity. The fund may seek to enhance returns by using futures contracts instead of the underlying securities when futures are believed to be priced more attractively than the underlying securities. The primary risks associated with the use of futures contracts are imperfect correlation between changes in market values of stocks held by the fund and the prices of futures contracts, and the possibility of an illiquid market. Counterparty risk involving futures is mitigated because a regulated clearinghouse is the counterparty instead of the clearing broker. To further mitigate counterparty risk, the fund trades futures contracts on an exchange; monitors the financial strength of its clearing brokers and clearinghouse; and has entered into clearing agreements with its clearing brokers. The clearinghouse imposes initial margin requirements to secure the fund’s performance and requires daily settlement of variation margin representing changes in the market value of each contract.
Futures contracts are valued at their quoted daily settlement prices. The aggregate notional amounts of the contracts are not recorded in the Statement of Net Assets. Fluctuations in the value of the contracts are recorded in the Statement of Net Assets as an asset (liability) and in the Statement of Operations as unrealized appreciation (depreciation) until the contracts are closed, when they are recorded as realized futures gains (losses).
During the year ended August 31, 2013, the fund’s average investments in long and short futures contracts represented less than 1% and 0% of net assets, respectively, based on quarterly average aggregate settlement values.
53
S&P Mid-Cap 400 Growth Index Fund
3. Federal Income Taxes: The fund intends to continue to qualify as a regulated investment company and distribute all of its taxable income. Management has analyzed the fund’s tax positions taken for all open federal income tax years (August 31, 2011–2013), and has concluded that no provision for federal income tax is required in the fund’s financial statements.
4. Distributions: Distributions to shareholders are recorded on the ex-dividend date.
5. Securities Lending: To earn additional income, the fund may lend its securities to qualified institutional borrowers. Security loans are required to be secured at all times by collateral in an amount at least equal to the market value of securities loaned. Daily market fluctuations could cause the value of loaned securities to be more or less than the value of the collateral received. When this occurs, the collateral is adjusted and settled on the next business day. The fund further mitigates its counterparty risk by entering into securities lending transactions only with a diverse group of pre-qualified counterparties, monitoring their financial strength, and entering into master securities lending agreements with its counterparties. The master securities lending agreements provide that, in the event of a counterparty’s default (including bankruptcy), the fund may terminate any loans with that borrower, determine the net amount owed, and sell or retain the collateral up to the net amount owed to the fund, provided that such actions may be subject to legal proceedings. While collateral mitigates counterparty risk, in the absence of a default, the fund may experience delays and costs in recovering the securities loaned. The fund invests cash collateral received in Vanguard Market Liquidity Fund, and records a liability for the return of the collateral, during the period the securities are on loan. Securities lending income represents fees charged to borrowers plus income earned on invested cash collateral, less expenses associated with the loan.
6. Other: Dividend income is recorded on the ex-dividend date. Interest income includes income distributions received from Vanguard Market Liquidity Fund and is accrued daily. Premiums and discounts on debt securities purchased are amortized and accreted, respectively, to interest income over the lives of the respective securities. Security transactions are accounted for on the date securities are bought or sold. Costs used to determine realized gains (losses) on the sale of investment securities are those of the specific securities sold.
Each class of shares has equal rights as to assets and earnings, except that each class separately bears certain class-specific expenses related to maintenance of shareholder accounts (included in Management and Administrative expenses) and shareholder reporting. Marketing and distribution expenses are allocated to each class of shares based on a method approved by the board of trustees. Income, other non-class-specific expenses, and gains and losses on investments are allocated to each class of shares based on its relative net assets.
B. The Vanguard Group furnishes at cost investment advisory, corporate management, administrative, marketing, and distribution services. The costs of such services are allocated to the fund under methods approved by the board of trustees. The fund has committed to provide up to 0.40% of its net assets in capital contributions to Vanguard. At August 31, 2013, the fund had contributed capital of $27,000 to Vanguard (included in Other Assets), representing 0.01% of the fund’s net assets and 0.01% of Vanguard’s capitalization. The fund’s trustees and officers are also directors and officers of Vanguard.
C. Various inputs may be used to determine the value of the fund’s investments. These inputs are summarized in three broad levels for financial statement purposes. The inputs or methodologies used to value securities are not necessarily an indication of the risk associated with investing in those securities.
54
S&P Mid-Cap 400 Growth Index Fund
Level 1—Quoted prices in active markets for identical securities.
Level 2—Other significant observable inputs (including quoted prices for similar securities, interest rates, prepayment speeds, credit risk, etc.).
Level 3—Significant unobservable inputs (including the fund’s own assumptions used to determine the fair value of investments).
The following table summarizes the market value of the fund’s investments as of August 31, 2013, based on the inputs used to value them:
| Level 1 | Level 2 | Level 3 | |
| Investments | ($000) | ($000) | ($000) |
| Common Stocks | 223,999 | — | — |
| Temporary Cash Investments | 337 | 100 | — |
| Futures Contracts—Liabilities1 | (7) | — | — |
| Total | 224,329 | 100 | — |
| 1 Represents variation margin on the last day of the reporting period. | |||
D. At August 31, 2013, the aggregate settlement value of open futures contracts and the related unrealized appreciation (depreciation) were:
| ($000) | ||||
| Aggregate | ||||
| Number of | Settlement | Unrealized | ||
| Long (Short) | Value | Appreciation | ||
| Futures Contracts | Expiration | Contracts | Long (Short) | (Depreciation) |
| E-mini S&P Mid-Cap 400 Index | September 2013 | 4 | 473 | (18) |
Unrealized appreciation (depreciation) on open futures contracts is required to be treated as realized gain (loss) for tax purposes.
E. Distributions are determined on a tax basis and may differ from net investment income and realized capital gains for financial reporting purposes. Differences may be permanent or temporary. Permanent differences are reclassified among capital accounts in the financial statements to reflect their tax character. Temporary differences arise when certain items of income, expense, gain, or loss are recognized in different periods for financial statement and tax purposes; these differences will reverse at some time in the future. Differences in classification may also result from the treatment of short-term gains as ordinary income for tax purposes.
During the year ended August 31, 2013, the fund realized $6,960,000 of net capital gains resulting from in-kind redemptions—in which shareholders exchanged fund shares for securities held by the fund rather than for cash. Because such gains are not taxable to the fund, and are not distributed to shareholders, they have been reclassified from accumulated net realized losses to paid-in capital.
For tax purposes, at August 31, 2013, the fund had $1,364,000 of ordinary income available for distribution. The fund had available capital losses totaling $7,588,000 that may be carried forward indefinitely to offset future net capital gains.
At August 31, 2013, the cost of investment securities for tax purposes was $195,593,000. Net unrealized appreciation of investment securities for tax purposes was $28,843,000, consisting of unrealized gains of $33,001,000 on securities that had risen in value since their purchase and $4,158,000 in unrealized losses on securities that had fallen in value since their purchase.
55
S&P Mid-Cap 400 Growth Index Fund
F. During the year ended August 31, 2013, the fund purchased $172,273,000 of investment securities and sold $89,204,000 of investment securities, other than temporary cash investments. Purchases and sales include $103,170,000 and $31,308,000, respectively, in connection with in-kind purchases and redemptions of the fund’s capital shares.
G. Capital share transactions for each class of shares were:
| Year Ended August 31, | ||||
| 2013 | 2012 | |||
| Amount | Shares | Amount | Shares | |
| ($000) | (000) | ($000) | (000) | |
| Institutional Shares | ||||
| Issued | 25,934 | 172 | 2,422 | 19 |
| Issued in Lieu of Cash Distributions | 187 | 1 | 137 | 1 |
| Redeemed | (11,743) | (80) | (4,347) | (34) |
| Net Increase (Decrease) —Institutional Shares | 14,378 | 93 | (1,788) | (14) |
| ETF Shares | ||||
| Issued | 97,354 | 1,300 | 69,018 | 1,050 |
| Issued in Lieu of Cash Distributions | — | — | — | — |
| Redeemed | (29,238) | (400) | (12,188) | (200) |
| Net Increase (Decrease) —ETF Shares | 68,116 | 900 | 56,830 | 850 |
H. Management has determined that no material events or transactions occurred subsequent to August 31, 2013, that would require recognition or disclosure in these financial statements.
56
Report of Independent Registered Public Accounting Firm
To the Trustees of Vanguard Admiral Funds and the Shareholders of Vanguard S&P Mid-Cap 400 Index Fund, Vanguard S&P Mid-Cap 400 Value Index Fund and Vanguard S&P Mid-Cap 400 Growth Index Fund:
In our opinion, the accompanying statements of net assets and the related statements of operations and of changes in net assets and the financial highlights present fairly, in all material respects, the financial position of Vanguard S&P Mid-Cap 400 Index Fund, Vanguard S&P Mid-Cap 400 Value Index Fund and Vanguard S&P Mid-Cap 400 Growth Index Fund (constituting separate portfolios of Vanguard Admiral Funds, hereafter referred to as the “Funds”) at August 31, 2013, the results of each of their operations for the year then ended, the changes in each of their net assets for each of the two years in the period then ended, and the financial highlights for each of the periods indicated, in conformity with accounting principles generally accepted in the United States of America. These financial statements and financial highlights (hereafter referred to as “financial statements”) are the responsibility of the Funds’ management; our responsibility is to express an opinion on these financial statements based on our audits. We conducted our audits of these financial statements in accordance with the standards of the Public Company Accounting Oversight Board (United States). Those standards require that we plan and perform the audit to obtain reasonable assurance about whether the financial statements are free of material misstatement. An audit includes examining, on a test basis, evidence supporting the amounts and disclosures in the financial statements, assessing the accounting principles used and significant estimates made by management, and evaluating the overall financial statement presentation. We believe that our audits, which included confirmation of securities at August 31, 2013 by correspondence with the custodian and broker and by agreement to the underlying ownership records of the transfer agent, provide a reasonable basis for our opinion.
/s/PricewaterhouseCoopers LLP
Philadelphia, Pennsylvania
October 16, 2013
57
Special 2013 tax information (unaudited) for Vanguard S&P Mid-Cap 400 Index Funds
This information for the fiscal year ended August 31, 2013, is included pursuant to provisions of the Internal Revenue Code.
The funds distributed qualified dividend income to shareholders during the fiscal year as follows:
| Qualified Dividend Income | |
| Fund | ($000) |
| S&P Mid-Cap 400 Index Fund | 2,044 |
| S&P Mid-Cap 400 Value Index Fund | 760 |
| S&P Mid-Cap 400 Growth Index Fund | 797 |
For corporate shareholders, the percentage of investment income (dividend income plus short-term gains, if any) that qualifies for the dividends-received deduction is as follows:
| Fund | Percentage |
| S&P Mid-Cap 400 Index Fund | 80.4% |
| S&P Mid-Cap 400 Value Index Fund | 87.4 |
| S&P Mid-Cap 400 Growth Index Fund | 80.5 |
58
Your Fund’s After-Tax Returns
This table presents returns for your fund both before and after taxes. The after-tax returns are shown in two ways: (1) assuming that an investor owned the fund during the entire period and paid taxes on the fund’s distributions, and (2) assuming that an investor paid taxes on the fund’s distributions and sold all shares at the end of each period.
Calculations are based on the highest individual federal income tax and capital gains tax rates in effect at the times of the distributions and the hypothetical sales. State and local taxes were not considered. After-tax returns reflect any qualified dividend income, using actual prior-year figures and estimates for 2013. (In the example, returns after the sale of fund shares may be higher than those assuming no sale. This occurs when the sale would have produced a capital loss. The calculation assumes that the investor received a tax deduction for the loss.)
The table shows returns for one share class only; returns for other share classes will differ. Please note that your actual after-tax returns will depend on your tax situation and may differ from those shown. Also note that if you own the fund in a tax-deferred account, such as an individual retirement account or a 401(k) plan, this information does not apply to you. Such accounts are not subject to current taxes.
Finally, keep in mind that a fund’s performance—whether before or after taxes—does not guarantee future results.
| Average Annual Total Returns: S&P Mid-Cap 400 Index Funds | ||
| Periods Ended August 31, 2013 | ||
| Since | ||
| One | Inception | |
| Year | (9/7/2010) | |
| S&P Mid-Cap 400 Index Fund ETF Shares | ||
| Returns Before Taxes | 23.57% | 17.83% |
| Returns After Taxes on Distributions | 23.35 | 17.68 |
| Returns After Taxes on Distributions and Sale of Fund Shares | 13.61 | 14.08 |
| Since | ||
| One | Inception | |
| Year | (9/7/2010) | |
| S&P Mid-Cap 400 Value Index Fund ETF Shares | ||
| Returns Before Taxes | 26.31% | 17.51% |
| Returns After Taxes on Distributions | 25.95 | 17.26 |
| Returns After Taxes on Distributions and Sale of Fund Shares | 15.30 | 13.82 |
| Since | ||
| One | Inception | |
| Year | (9/7/2010) | |
| S&P Mid-Cap 400 Growth Index Fund ETF Shares | ||
| Returns Before Taxes | 20.83% | 18.07% |
| Returns After Taxes on Distributions | 20.69 | 17.97 |
| Returns After Taxes on Distributions and Sale of Fund Shares | 11.97 | 14.27 |
59
About Your Fund’s Expenses
As a shareholder of the fund, you incur ongoing costs, which include costs for portfolio management, administrative services, and shareholder reports (like this one), among others. Operating expenses, which are deducted from a fund’s gross income, directly reduce the investment return of the fund.
A fund’s expenses are expressed as a percentage of its average net assets. This figure is known as the expense ratio. The following examples are intended to help you understand the ongoing costs (in dollars) of investing in your fund and to compare these costs with those of other mutual funds. The examples are based on an investment of $1,000 made at the beginning of the period shown and held for the entire period.
The accompanying table illustrates your fund’s costs in two ways:
• Based on actual fund return. This section helps you to estimate the actual expenses that you paid over the period. The ”Ending Account Value“ shown is derived from the fund‘s actual return, and the third column shows the dollar amount that would have been paid by an investor who started with $1,000 in the fund. You may use the information here, together with the amount you invested, to estimate the expenses that you paid over the period.
To do so, simply divide your account value by $1,000 (for example, an $8,600 account value divided by $1,000 = 8.6), then multiply the result by the number given for your fund under the heading ”Expenses Paid During Period.“
• Based on hypothetical 5% yearly return. This section is intended to help you compare your fund‘s costs with those of other mutual funds. It assumes that the fund had a yearly return of 5% before expenses, but that the expense ratio is unchanged. In this case—because the return used is not the fund’s actual return—the results do not apply to your investment. The example is useful in making comparisons because the Securities and Exchange Commission requires all mutual funds to calculate expenses based on a 5% return. You can assess your fund’s costs by comparing this hypothetical example with the hypothetical examples that appear in shareholder reports of other funds.
Note that the expenses shown in the table are meant to highlight and help you compare ongoing costs only and do not reflect transaction costs incurred by the fund for buying and selling securities. Further, the expenses do not include any purchase, redemption, or account service fees described in the fund prospectus. If such fees were applied to your account, your costs would be higher. Your fund does not carry a “sales load.”
The calculations assume no shares were bought or sold during the period. Your actual costs may have been higher or lower, depending on the amount of your investment and the timing of any purchases or redemptions.
You can find more information about the fund’s expenses, including annual expense ratios, in the Financial Statements section of this report. For additional information on operating expenses and other shareholder costs, please refer to your fund’s current prospectus.
60
| Six Months Ended August 31, 2013 | |||
| Beginning | Ending | Expenses | |
| Account Value | Account Value | Paid During | |
| 2/28/2013 | 8/31/2013 | Period | |
| Based on Actual Fund Return | |||
| S&P Mid-Cap 400 Index Fund | |||
| Institutional Shares | $1,000.00 | $1,081.52 | $0.42 |
| ETF Shares | 1,000.00 | 1,081.10 | 0.79 |
| S&P Mid-Cap 400 Value Index Fund | |||
| Institutional Shares | $1,000.00 | $1,084.71 | $0.42 |
| ETF Shares | 1,000.00 | 1,084.02 | 1.05 |
| S&P Mid-Cap 400 Growth Index Fund | |||
| Institutional Shares | $1,000.00 | $1,078.09 | $0.42 |
| ETF Shares | 1,000.00 | 1,077.46 | 1.05 |
| Based on Hypothetical 5% Yearly Return | |||
| S&P Mid-Cap 400 Index Fund | |||
| Institutional Shares | $1,000.00 | $1,024.80 | $0.41 |
| ETF Shares | 1,000.00 | 1,024.45 | 0.77 |
| S&P Mid-Cap 400 Value Index Fund | |||
| Institutional Shares | $1,000.00 | $1,024.80 | $0.41 |
| ETF Shares | 1,000.00 | 1,024.20 | 1.02 |
| S&P Mid-Cap 400 Growth Index Fund | |||
| Institutional Shares | $1,000.00 | $1,024.80 | $0.41 |
| ETF Shares | 1,000.00 | 1,024.20 | 1.02 |
The calculations are based on expenses incurred in the most recent six-month period. The funds’ annualized six-month expense ratios for that period are: for the S&P Mid-Cap 400 Index Fund, 0.08% for Institutional Shares and 0.15% for ETF Shares; for the S&P Mid-Cap 400 Value Index Fund, 0.08% for Institutional Shares and 0.20% for ETF Shares; and for the S&P Mid-Cap 400 Growth Index Fund, 0.08% for Institutional Shares and 0.20% for ETF Shares. The dollar amounts shown as “Expenses Paid” are equal to the annualized expense ratio multiplied by the average account value over the period, multiplied by the number of days in the most recent six-month period, then divided by the number of days in the most recent 12-month period.
61
Trustees Approve Advisory Arrangement
The board of trustees of Vanguard S&P Mid-Cap 400 Index Fund, S&P Mid-Cap 400 Value Index Fund, and S&P Mid-Cap 400 Growth Index Fund has renewed the funds’ investment advisory arrangement with The Vanguard Group, Inc. (Vanguard). Vanguard—through its Equity Investment Group—serves as investment advisor to the funds. The board determined that continuing the funds’ internalized management structure was in the best interests of the funds and their shareholders.
The board based its decision upon an evaluation of the advisor’s investment staff, portfolio management process, and performance. The trustees considered the factors discussed below, among others. However, no single factor determined whether the board approved the arrangement. Rather, it was the totality of the circumstances that drove the board’s decision.
Nature, extent, and quality of services
The board considered the quality of the investment management services provided to the funds since their inception in 2010, and took into account the organizational depth and stability of the advisor. The board noted that Vanguard has been managing investments for more than three decades. The Equity Investment Group adheres to a sound, disciplined investment management process; the team has considerable experience, stability, and depth.
The board concluded that Vanguard’s experience, stability, depth, and performance, among other factors, warranted approval of the advisory arrangement.
Investment performance
The board considered the funds’ performance since their inception, including any periods of outperformance or underperformance relative to a target index and peer group. The board concluded that the performance was such that the advisory arrangement should continue. Information about each fund’s most recent performance can be found in the Performance Summary pages of this report.
Cost
The board concluded that each fund’s expense ratio was well below the average expense ratios charged by funds in its respective peer group and that the funds’ advisory fee rates were also well below their peer-group averages. Information about the funds’ expenses appears in the About Your Fund’s Expenses section of this report as well as in the Financial Statements sections.
The board does not conduct a profitability analysis of Vanguard, because of Vanguard’s unique “at-cost” structure. Unlike most other mutual fund management companies, Vanguard is owned by the funds it oversees, and produces “profits” only in the form of reduced expenses for fund shareholders.
The benefit of economies of scale
The board concluded that the funds’ at-cost arrangement with Vanguard ensures that the funds will realize economies of scale as they grow, with the cost to shareholders declining as fund assets increase.
The board will consider whether to renew the advisory arrangement again after a one-year period.
62
Glossary
30-Day SEC Yield. A fund’s 30-day SEC yield is derived using a formula specified by the U.S. Securities and Exchange Commission. Under the formula, data related to the fund’s security holdings in the previous 30 days are used to calculate the fund’s hypothetical net income for that period, which is then annualized and divided by the fund’s estimated average net assets over the calculation period. For the purposes of this calculation, a security’s income is based on its current market yield to maturity (for bonds), its actual income (for asset-backed securities), or its projected dividend yield (for stocks). Because the SEC yield represents hypothetical annualized income, it will differ—at times significantly—from the fund’s actual experience. As a result, the fund’s income distributions may be higher or lower than implied by the SEC yield.
Dividend Yield. Dividend income earned by stocks, expressed as a percentage of the aggregate market value (or of net asset value, for a fund). The yield is determined by dividing the amount of the annual dividends by the aggregate value (or net asset value) at the end of the period. For a fund, the dividend yield is based solely on stock holdings and does not include any income produced by other investments.
Earnings Growth Rate. The average annual rate of growth in earnings over the past five years for the stocks now in a fund.
Equity Exposure. A measure that reflects a fund’s investments in stocks and stock futures. Any holdings in short-term reserves are excluded.
Expense Ratio. A fund’s total annual operating expenses expressed as a percentage of the fund’s average net assets. The expense ratio includes management and administrative expenses, but does not include the transaction costs of buying and selling portfolio securities.
Foreign Holdings. The percentage of a fund represented by securities or depositary receipts of companies based outside the United States.
Inception Date. The date on which the assets of a fund (or one of its share classes) are first invested in accordance with the fund’s investment objective. For funds with a subscription period, the inception date is the day after that period ends. Investment performance is measured from the inception date.
Median Market Cap. An indicator of the size of companies in which a fund invests; the midpoint of market capitalization (market price x shares outstanding) of a fund’s stocks, weighted by the proportion of the fund’s assets invested in each stock. Stocks representing half of the fund’s assets have market capitalizations above the median, and the rest are below it.
Price/Book Ratio. The share price of a stock divided by its net worth, or book value, per share. For a fund, the weighted average price/book ratio of the stocks it holds.
Price/Earnings Ratio. The ratio of a stock’s current price to its per-share earnings over the past year. For a fund, the weighted average P/E of the stocks it holds. P/E is an indicator of market expectations about corporate prospects; the higher the P/E, the greater the expectations for a company’s future growth.
Return on Equity. The annual average rate of return generated by a company during the past five years for each dollar of shareholder’s equity (net income divided by shareholder’s equity). For a fund, the weighted average return on equity for the companies whose stocks it holds.
63
Short-Term Reserves. The percentage of a fund invested in highly liquid, short-term securities that can be readily converted to cash.
Turnover Rate. An indication of the fund’s trading activity. Funds with high turnover rates incur higher transaction costs and may be more likely to distribute capital gains (which may be taxable to investors). The turnover rate excludes in-kind transactions, which have minimal impact on costs.
64
This page intentionally left blank.
This page intentionally left blank.
This page intentionally left blank.
The People Who Govern Your Fund
The trustees of your mutual fund are there to see that the fund is operated and managed in your best interests since, as a shareholder, you are a part owner of the fund. Your fund’s trustees also serve on the board of directors of The Vanguard Group, Inc., which is owned by the Vanguard funds and provides services to them on an at-cost basis.
A majority of Vanguard’s board members are independent, meaning that they have no affiliation with Vanguard or the funds they oversee, apart from the sizable personal investments they have made as private individuals. The independent board members have distinguished backgrounds in business, academia, and public service. Each of the trustees and executive officers oversees 181 Vanguard funds.
The following table provides information for each trustee and executive officer of the fund. More information about the trustees is in the Statement of Additional Information, which can be obtained, without charge, by contacting Vanguard at 800-662-7447, or online at vanguard.com.
| InterestedTrustee1 | and Delphi Automotive LLP (automotive components); |
| Senior Advisor at New Mountain Capital; Trustee of | |
| F. William McNabb III | The Conference Board. |
| Born 1957. Trustee Since July 2009. Chairman of the | |
| Board. Principal Occupation(s) During the Past Five | Amy Gutmann |
| Years: Chairman of the Board of The Vanguard Group, | Born 1949. Trustee Since June 2006. Principal |
| Inc., and of each of the investment companies served | Occupation(s) During the Past Five Years: President |
| by The Vanguard Group, since January 2010; Director | of the University of Pennsylvania; Christopher H. |
| of The Vanguard Group since 2008; Chief Executive | Browne Distinguished Professor of Political Science |
| Officer and President of The Vanguard Group and of | in the School of Arts and Sciences with secondary |
| each of the investment companies served by The | appointments at the Annenberg School for |
| Vanguard Group since 2008; Director of Vanguard | Communication and the Graduate School of Education |
| Marketing Corporation; Managing Director of The | of the University of Pennsylvania; Member of the |
| Vanguard Group (1995–2008). | National Commission on the Humanities and Social |
| Sciences; Trustee of Carnegie Corporation of New | |
| IndependentTrustees | York and of the National Constitution Center; Chair |
| of the U. S. Presidential Commission for the Study | |
| Emerson U. Fullwood | of Bioethical Issues. |
| Born 1948. Trustee Since January 2008. Principal | |
| Occupation(s) During the Past Five Years: Executive | JoAnn Heffernan Heisen |
| Chief Staff and Marketing Officer for North America | Born 1950. Trustee Since July 1998. Principal |
| and Corporate Vice President (retired 2008) of Xerox | Occupation(s) During the Past Five Years: Corporate |
| Corporation (document management products and | Vice President and Chief Global Diversity Officer |
| services); Executive in Residence and 2010 | (retired 2008) and Member of the Executive |
| Distinguished Minett Professor at the Rochester | Committee (1997–2008) of Johnson & Johnson |
| Institute of Technology; Director of SPX Corporation | (pharmaceuticals/medical devices/consumer |
| (multi-industry manufacturing), the United Way of | products); Director of Skytop Lodge Corporation |
| Rochester, Amerigroup Corporation (managed health | (hotels), the University Medical Center at Princeton, |
| care), the University of Rochester Medical Center, | the Robert Wood Johnson Foundation, and the Center |
| Monroe Community College Foundation, and North | for Talent Innovation; Member of the Advisory Board |
| Carolina A&T University. | of the Maxwell School of Citizenship and Public Affairs |
| at Syracuse University. | |
| Rajiv L. Gupta | F. Joseph Loughrey |
| Born 1945. Trustee Since December 2001.2 | Born 1949. Trustee Since October 2009. Principal |
| Principal Occupation(s) During the Past Five Years: | Occupation(s) During the Past Five Years: President |
| Chairman and Chief Executive Officer (retired 2009) | and Chief Operating Officer (retired 2009) of Cummins |
| and President (2006–2008) of Rohm and Haas Co. | Inc. (industrial machinery); Chairman of the Board of |
| (chemicals); Director of Tyco International, Ltd. | Hillenbrand, Inc. (specialized consumer services) and |
| (diversified manufacturing and services), Hewlett- | of Oxfam America; Director of SKF AB (industrial |
| Packard Co. (electronic computer manufacturing), | |
| machinery) and the Lumina Foundation for Education; | Executive Officers | |
| Member of the Advisory Council for the College of | ||
| Arts and Letters and of the Advisory Board to the | Glenn Booraem | |
| Kellogg Institute for International Studies, both at | Born 1967. Controller Since July 2010. Principal | |
| the University of Notre Dame. | Occupation(s) During the Past Five Years: Principal | |
| of The Vanguard Group, Inc.; Controller of each of | ||
| Mark Loughridge | the investment companies served by The Vanguard | |
| Born 1953. Trustee Since March 2012. Principal | Group; Assistant Controller of each of the investment | |
| Occupation(s) During the Past Five Years: Senior Vice | companies served by The Vanguard Group (2001–2010). | |
| President and Chief Financial Officer at IBM (information | ||
| technology services); Fiduciary Member of IBM’s | Thomas J. Higgins | |
| Retirement Plan Committee. | Born 1957. Chief Financial Officer Since September | |
| 2008. Principal Occupation(s) During the Past Five | ||
| Scott C. Malpass | Years: Principal of The Vanguard Group, Inc.; Chief | |
| Born 1962. Trustee Since March 2012. Principal | Financial Officer of each of the investment companies | |
| Occupation(s) During the Past Five Years: Chief | served by The Vanguard Group; Treasurer of each of | |
| Investment Officer and Vice President at the University | the investment companies served by The Vanguard | |
| of Notre Dame; Assistant Professor of Finance at the | Group (1998–2008). | |
| Mendoza College of Business at Notre Dame; Member | ||
| of the Notre Dame 403(b) Investment Committee; | Kathryn J. Hyatt | |
| Director of TIFF Advisory Services, Inc. (investment | Born 1955. Treasurer Since November 2008. Principal | |
| advisor); Member of the Investment Advisory | Occupation(s) During the Past Five Years: Principal of | |
| Committees of the Financial Industry Regulatory | The Vanguard Group, Inc.; Treasurer of each of the | |
| Authority (FINRA) and of Major League Baseball. | investment companies served by The Vanguard | |
| Group; Assistant Treasurer of each of the investment | ||
| André F. Perold | companies served by The Vanguard Group (1988–2008). | |
| Born 1952. Trustee Since December 2004. Principal | ||
| Occupation(s) During the Past Five Years: George | Heidi Stam | |
| Gund Professor of Finance and Banking at the Harvard | Born 1956. Secretary Since July 2005. Principal | |
| Business School (retired 2011); Chief Investment | Occupation(s) During the Past Five Years: Managing | |
| Officer and Managing Partner of HighVista Strategies | Director of The Vanguard Group, Inc.; General Counsel | |
| LLC (private investment firm); Director of Rand | of The Vanguard Group; Secretary of The Vanguard | |
| Merchant Bank; Overseer of the Museum of Fine | Group and of each of the investment companies | |
| Arts Boston. | served by The Vanguard Group; Director and Senior | |
| Vice President of Vanguard Marketing Corporation. | ||
| Alfred M. Rankin, Jr. | ||
| Born 1941. Trustee Since January 1993. Principal | Vanguard Senior ManagementTeam | |
| Occupation(s) During the Past Five Years: Chairman, | ||
| President, and Chief Executive Officer of NACCO | Mortimer J. Buckley | Chris D. McIsaac |
| Industries, Inc. (housewares/lignite) and of Hyster-Yale | Kathleen C. Gubanich | Michael S. Miller |
| Materials Handling, Inc. (forklift trucks); Director of | Paul A. Heller | James M. Norris |
| the National Association of Manufacturers; Chairman | Martha G. King | Glenn W. Reed |
| of the Board of University Hospitals of Cleveland; | John T. Marcante | |
| Advisory Chairman of the Board of The Cleveland | ||
| Museum of Art. | ||
| Chairman Emeritus and Senior Advisor | ||
| Peter F. Volanakis | ||
| Born 1955. Trustee Since July 2009. Principal | John J. Brennan | |
| Occupation(s) During the Past Five Years: President | Chairman, 1996–2009 | |
| and Chief Operating Officer (retired 2010) of Corning | Chief Executive Officer and President, 1996–2008 | |
| Incorporated (communications equipment); Director | ||
| of SPX Corporation (multi-industry manufacturing); | Founder | |
| Overseer of the Amos Tuck School of Business | ||
| Administration at Dartmouth College; Advisor to the | John C. Bogle | |
| Norris Cotton Cancer Center. | Chairman and Chief Executive Officer, 1974–1996 | |
1 Mr. McNabb is considered an “interested person,” as defined in the Investment Company Act of 1940, because he is an officer of the Vanguard funds.
2 December 2002 for Vanguard Equity Income Fund, Vanguard Growth Equity Fund, the Vanguard Municipal Bond Funds, and the Vanguard State Tax-Exempt Funds.
 | |
| P.O. Box 2600 | |
| Valley Forge, PA 19482-2600 |
Connect with Vanguard® > vanguard.com
| S&P® and S&P 500® are registered trademarks of | |
| Fund Information > 800-662-7447 | Standard & Poor’s Financial Services LLC (“S&P”) and |
| Direct Investor Account Services > 800-662-2739 | have been licensed for use by S&P Dow Jones Indices |
| Institutional Investor Services > 800-523-1036 | LLC and its affiliates and sublicensed for certain |
| Text Telephone for People | purposes by Vanguard. The S&P Index is a product of |
| With Hearing Impairment > 800-749-7273 | S&P Dow Jones Indices LLC and has been licensed for |
| use by Vanguard. The Vanguard funds are not | |
| This material may be used in conjunction | sponsored, endorsed, sold, or promoted by S&P Dow |
| with the offering of shares of any Vanguard | Jones Indices LLC, Dow Jones, S&P, or their respective |
| fund only if preceded or accompanied by | affiliates, and none of S&P Dow Jones Indices LLC, |
| the fund’s current prospectus. | Dow Jones, S&P, nor their respective affiliates makes |
| any representation regarding the advisability of | |
| All comparative mutual fund data are from Lipper, a | investing in such products. |
| Thomson Reuters Company, or Morningstar, Inc., unless | |
| otherwise noted. | |
| You can obtain a free copy of Vanguard’s proxy voting | |
| guidelines by visiting vanguard.com/proxyreporting or by | |
| calling Vanguard at 800-662-2739. The guidelines are | |
| also available from the SEC’s website, sec.gov. In | |
| addition, you may obtain a free report on how your fund | |
| voted the proxies for securities it owned during the 12 | |
| months ended June 30. To get the report, visit either | |
| vanguard.com/proxyreporting or sec.gov. | |
| You can review and copy information about your fund at | |
| the SEC’s Public Reference Room in Washington, D.C. To | |
| find out more about this public service, call the SEC at | |
| 202-551-8090. Information about your fund is also | |
| available on the SEC’s website, and you can receive | |
| copies of this information, for a fee, by sending a | |
| request in either of two ways: via e-mail addressed to | |
| publicinfo@sec.gov or via regular mail addressed to the | |
| Public Reference Section, Securities and Exchange | |
| Commission, Washington, DC 20549-1520. | |
| © 2013 The Vanguard Group, Inc. | |
| All rights reserved. | |
| Vanguard Marketing Corporation, Distributor. | |
| Q18420 102013 | |
|
| Annual Report | August 31, 2013 |
| Vanguard S&P 500 Value |
| and Growth Index Funds |
 |
Vanguard’s Principles for Investing Success
We want to give you the best chance of investment success. These principles, grounded in Vanguard’s research and experience, can put you on the right path.
Goals. Create clear, appropriate investment goals.
Balance. Develop a suitable asset allocation using broadly diversified funds.
Cost. Minimize cost.
Discipline. Maintain perspective and long-term discipline.
A single theme unites these principles: Focus on the things you can control.
We believe there is no wiser course for any investor.
| Contents | |
| Your Fund’s Total Returns. | 1 |
| Chairman’s Letter. | 2 |
| S&P 500 Value Index Fund. | 8 |
| S&P 500 Growth Index Fund. | 21 |
| Your Fund’s After-Tax Returns. | 36 |
| About Your Fund’s Expenses. | 37 |
| Trustees Approve Advisory Arrangement. | 39 |
| Glossary. | 40 |
Please note: The opinions expressed in this report are just that—informed opinions. They should not be considered promises or advice. Also, please keep in mind that the information and opinions cover the period through the date on the front of this report. Of course, the risks of investing in your fund are spelled out in the prospectus.
See the Glossary for definitions of investment terms used in this report.
About the cover: The ship's wheel represents leadership and guidance, essential qualities in navigating difficult seas. This one is a replica based on an 18th-century British vessel. The HMS Vanguard, another ship of that era, served as the flagship for Admiral Horatio Nelson when he defeated a French fleet at the Battle of the Nile.
Your Fund’s Total Returns
| Fiscal Year Ended August 31, 2013 | |
| Total | |
| Returns | |
| Vanguard S&P 500 Value Index Fund | |
| ETF Shares | |
| Market Price | 22.67% |
| Net Asset Value | 22.79 |
| S&P 500 Value Index | 22.94 |
| Large-Cap Value Funds Average | 22.08 |
| Large-Cap Value Funds Average: Derived from data provided by Lipper, a Thomson Reuters Company. | |
| Vanguard S&P 500 Growth Index Fund | |
| ETF Shares | |
| Market Price | 15.01% |
| Net Asset Value | 15.00 |
| S&P 500 Growth Index | 15.16 |
| Large-Cap Growth Funds Average | 16.24 |
| Large-Cap Growth Funds Average: Derived from data provided by Lipper, a Thomson Reuters Company. | |
The Vanguard ETF® Shares shown are traded on the NYSE Arca exchange and are available only through brokers. The table provides ETF returns based on both the NYSE Arca market price and the net asset value for a share. U.S. Pat. No. 6,879,964; 7,337,138; 7,720,749; 7,925,573; 8,090,646.
For the ETF Shares, the market price is determined by the midpoint of the bid-offer spread as of the closing time of the New York Stock Exchange (generally 4 p.m., Eastern time). The net asset value is also determined as of the NYSE closing time. For more information about how the ETF Shares' market prices have compared with their net asset value, visit vanguard.com, select your ETF, and then select the Price and Performance tab. The ETF premium/discount analysis there shows the percentages of days on which the ETF Shares' market price was above or below the NAV.
| Your Fund’s Performance at a Glance | ||||
| August 31, 2012, Through August 31, 2013 | ||||
| Distributions Per Share | ||||
| Starting | Ending | |||
| Share | Share | Income | Capital | |
| Price | Price | Dividends | Gains | |
| Vanguard S&P 500 Value Index Fund | ||||
| ETF Shares | $61.42 | $73.72 | $1.526 | $0.000 |
| Vanguard S&P 500 Growth Index Fund | ||||
| ETF Shares | $68.43 | $77.29 | $1.279 | $0.000 |
1

Chairman’s Letter
Dear Shareholder,
Vanguard S&P 500 Growth Index Fund and Vanguard S&P 500 Value Index Fund delivered strong performances for the 12 months ended August 31, 2013. Both funds closely tracked their target indexes.
U.S. stocks generally performed well. While both large-capitalization growth and large-cap value stocks produced double-digit results for the period, value stocks outpaced their growth counterparts by several percentage points. In this investment environment, the S&P 500 Value Index Fund returned about 23% and the S&P 500 Growth Index Fund returned about 15%.
If you hold shares of your fund in a taxable account, you may wish to review the information on the fund’s after-tax returns that appears later in this report.
Stocks posted robust results despite setbacks at the finish
U.S. stocks advanced about 20% in the 12 months ended August 31 despite slipping in June and August. Through most of the fiscal year, stocks surged as the economy continued to show modest growth and investors appeared more receptive to risk.
Much of the market’s recent weakness stemmed from fear that the Federal Reserve would begin scaling back its stimulative bond-buying program.
2
Heightened strife in the Middle East also contributed to anxiety in the global markets.
International stocks in aggregate finished with a return of about 13%. Developed markets in the Pacific region and Europe posted results closer to those of the United States. Returns for emerging-market stocks overall were virtually flat as economic growth slowed in China and Brazil.
Although global economic worries and tensions over conflicts abroad have unsettled markets, Jonathan Lemco, a senior sovereign debt analyst in Vanguard Taxable Credit Research Group, pointed out that investors can still manage risks amid international instability. “Vanguard believes a diversified portfolio is the best way to spread the risk of geopolitical uncertainty,” he said.
Bond returns turned negative amid worry about the Fed’s next move
Bonds, which maintained slightly positive returns through the first eight months of the period, reversed course in May and then continued to retreat as investors anticipated reductions in the Fed’s bond-buying program.
The broad U.S. taxable bond market returned –2.47% for the 12 months. The yield of the 10-year Treasury note finished at 2.76%, up from 1.56% at the end of August 2012. (Bond yields and prices
| Market Barometer | |||
| Average Annual Total Returns | |||
| Periods Ended August 31, 2013 | |||
| One | Three | Five | |
| Year | Years | Years | |
| Stocks | |||
| Russell 1000 Index (Large-caps) | 19.84% | 18.74% | 7.59% |
| Russell 2000 Index (Small-caps) | 26.27 | 20.50 | 7.98 |
| Russell 3000 Index (Broad U.S. market) | 20.32 | 18.87 | 7.63 |
| MSCI All Country World Index ex USA (International) | 12.98 | 6.93 | 1.48 |
| Bonds | |||
| Barclays U.S. Aggregate Bond Index (Broad taxable market) | -2.47% | 2.58% | 4.93% |
| Barclays Municipal Bond Index (Broad tax-exempt market) | -3.70 | 2.45 | 4.52 |
| Citigroup Three-Month U.S. Treasury Bill Index | 0.07 | 0.08 | 0.17 |
| CPI | |||
| Consumer Price Index | 1.52% | 2.32% | 1.32% |
3
move in opposite directions.) Municipal bonds suffered more, returning –3.70% for the fiscal year. Returns for money markets and savings accounts were minuscule as the Fed kept its target for short-term interest rates between 0% and 0.25%.
Value stocks outpaced their growth counterparts
Vanguard S&P 500 Index Funds provide exposure to some of the biggest companies in the United States. Investors may choose to invest broadly in the large-cap segment of the market through the 500 Index Fund (this fund is covered in a separate report), or to focus on its growth or value sectors through the S&P 500 Growth Index Fund or the S&P 500 Value Index Fund.
As I mentioned, value stocks generally outperformed their growth counterparts for the most recent fiscal period. The S&P 500 Value Index Fund’s largest sector holding, financials, contributed most to its results, adding about 8 percentage points to total return. After several years of dismal results following the 2008–2009 financial crisis, financial stocks were among the market’s top performers. The industry’s widespread resurgence persisted throughout the 12 months, generating strong returns across the sector.
Industrial, health care, and consumer discretionary stocks were also key contributors to performance. Aerospace and defense contractors and industrial conglomerates led the way in industrials.
| Expense Ratios | ||
| Your Fund Compared With Its Peer Group | ||
| ETF | Peer Group | |
| Shares | Average | |
| S&P 500 Value Index Fund | 0.15% | 1.19% |
| S&P 500 Growth Index Fund | 0.15 | 1.28 |
The fund expense ratios shown are from the prospectus dated December 28, 2012, and represent estimated costs for the current fiscal year. For the fiscal year ended August 31, 2013, the funds’ expense ratios were: for the S&P 500 Value Index Fund, 0.15%; and for the S&P 500 Growth Index Fund, 0.15%. Peer-group expense ratios are derived from data provided by Lipper, a Thomson Reuters Company, and capture information through year-end 2012.
Peer groups: For the S&P 500 Value Index Fund, Large-Cap Value Funds, and for the S&P 500 Growth Index Fund, Large-Cap Growth Funds.
4
| Investment insight |
| Growth stocks versus value stocks: A case for both |
| Growth and value stocks typically take turns outperforming each other. The chart |
| here shows how they have switched off during the past 20 years in leading or |
| lagging a broader market average. |
| These two styles of investing are typically considered complementary—when growth |
| is performing well, value typically isn’t, and vice versa. Generally speaking, growth |
| stocks represent companies that are expected to expand their businesses at a rapid |
| pace, while value stocks typically represent more established, slower-growing |
| companies. |
| Which does better in the long run? Neither. Vanguard research has shown that there |
| is no significant long-term difference in the risk/reward characteristics of growth and |
| value stocks. But, because their performance can vary considerably over shorter time |
| periods, a truly diversified portfolio should have exposure to both. |
| Rolling 12-month return differences, 1993–2012 |
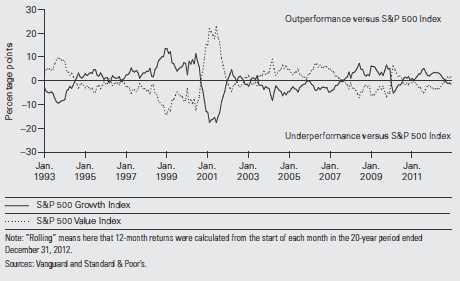 |
5
In the health care sector, managed health care companies and pharmaceutical firms were the top performers for the period, as the health care industry overall continued to benefit from favorable rulings by the Food and Drug Administration and improved pipelines of new medicines. Growing consumer confidence boosted performance across the consumer discretionary sector, with stocks of media companies, automakers, and specialty retailers contributing most to the fund’s performance.
Health care, consumer discretionary, and industrial stocks also contributed notably to the performance of the S&P 500 Growth Index Fund. Technology stocks, the fund’s largest sector holding for the period, significantly underperformed the broad market and added very little to fund results. While some areas of the sector did well, computer hardware companies ended the period in negative territory as consumers continued to gravitate toward tablets rather than personal computers. Competition in the smartphone arena remained fierce, and key players fell short of earnings expectations.
The fund had minimal exposure to the top-performing financial sector—stocks of financial companies aren’t typically considered growth stocks—which also hindered its results compared with the S&P 500 Value Index Fund.
Both funds have closely tracked their benchmarks since inception
The S&P 500 Value and Growth Index Funds were launched just over three years ago, on September 7, 2010. While that’s not a very long track record, so far the funds have been successful in meeting their investment objective of closely tracking their target indexes.
Credit for this good start is due to the funds’ advisor, Vanguard Equity Investment Group, whose deep experience and sophisticated portfolio tracking techniques have enabled the funds to capture the returns of their benchmarks. The advisor has been aided in this task by the funds’ low expenses.
In challenging markets, index funds can be a solid portfolio foundation
As you know, index funds seek to capture the return of the market they track, minus only their operating expenses, which—at least at Vanguard—are typically very low. The funds do so by investing in an entire market or segment of it, or by relying on a sophisticated market-sampling technique.
6
In actively managed funds, by contrast, advisors troll the markets and reel in selected stocks or bonds that their analysis suggests will allow them to outperform their benchmarks. As we show in The Case for Index-Fund Investing, a paper available at vanguard.com/research, there’s typically a big gap between hope and reality: Consistent outperformance by any one active manager has been rare.
I use the word “typically” because we believe that some actively managed funds, including Vanguard’s, can increase the odds of outperforming benchmarks over the long term. As demonstrated in a companion paper, The Case for Vanguard Active Management: Solving the Low-Cost/Top-Talent Paradox? (also at vanguard.com/research), the most reliable quantitative indicator of future manager success is low expenses—a Vanguard hallmark. And, as the paper’s title implies, finding talented advisors is a key aspect of active investing. We believe we have the process in place to identify the best.
Even so, investors in actively managed funds should expect, and be comfortable with, the extended periods of under-performance that actively managed funds can undergo. The challenges of active investing point to the potential benefits of indexing. Well-run index funds can offer you virtually the market return, year in and year out. In a portfolio that is diversified within asset classes, and balanced among them, low-cost index funds can be the bedrock of a sound investment plan.
As always, thank you for entrusting your assets to Vanguard.
Sincerely,

F. William McNabb III
Chairman and Chief Executive Officer
September 19, 2013
7
S&P 500 Value Index Fund
Fund Profile
As of August 31, 2013
| Portfolio Characteristics | |||
| DJ U.S. | |||
| S&P 500 | Total | ||
| Value | Market | ||
| Fund | Index | FA Index | |
| Number of Stocks | 357 | 357 | 3,631 |
| Median Market Cap | $48.8B | $48.8B | $39.3B |
| Price/Earnings Ratio | 16.2x | 16.2x | 18.7x |
| Price/Book Ratio | 1.8x | 1.8x | 2.4x |
| Return on Equity | 14.2% | 14.1% | 16.6% |
| Earnings Growth Rate | 6.0% | 6.0% | 11.1% |
| Dividend Yield | 2.5% | 2.5% | 2.0% |
| Foreign Holdings | 0.0% | 0.0% | 0.0% |
| Turnover Rate | 25% | — | — |
| Ticker Symbol | VOOV | — | — |
| Expense Ratio1 | 0.15% | — | — |
| 30-Day SEC Yield | 2.33% | — | — |
| Short-Term Reserves | 0.0% | — | — |
| Sector Diversification (% of equity exposure) | |||
| DJ U.S. | |||
| Total | |||
| S&P 500 | Market | ||
| Value | FA | ||
| Fund | Index | Index | |
| Consumer Discretionary | 6.7% | 6.7% | 13.1% |
| Consumer Staples | 9.9 | 9.9 | 8.9 |
| Energy | 15.0 | 15.0 | 9.8 |
| Financials | 23.8 | 23.8 | 17.5 |
| Health Care | 9.1 | 9.1 | 12.6 |
| Industrials | 12.8 | 12.8 | 11.2 |
| Information Technology | 8.5 | 8.5 | 17.6 |
| Materials | 3.7 | 3.7 | 3.8 |
| Telecommunication | |||
| Services | 4.0 | 4.0 | 2.3 |
| Utilities | 6.5 | 6.5 | 3.2 |
| Ten Largest Holdings (% of total net assets) | ||
| General Electric Co. | Industrial | |
| Conglomerates | 3.4% | |
| Chevron Corp. | Integrated Oil & Gas | 3.3 |
| Berkshire Hathaway Inc. | Property & Casualty | |
| Insurance | 2.9 | |
| Wells Fargo & Co. | Diversified Banks | 2.9 |
| JPMorgan Chase & Co. | Diversified Financial | |
| Services | 2.7 | |
| AT&T Inc. | Integrated | |
| Telecommunication | ||
| Services | 2.6 | |
| Exxon Mobil Corp. | Integrated Oil & Gas | 2.5 |
| Citigroup Inc. | Diversified Financial | |
| Services | 2.1 | |
| Wal-Mart Stores Inc. | Hypermarkets & | |
| Super Centers | 1.7 | |
| Johnson & Johnson | Pharmaceuticals | 1.6 |
| Top Ten | 25.7% | |
The holdings listed exclude any temporary cash investments and equity index products.
Investment Focus
1 The expense ratio shown is from the prospectus dated December 28, 2012, and represents estimated costs for the current fiscal year. For the fiscal year ended August 31, 2013, the expense ratio was 0.15%.
8
S&P 500 Value Index Fund
Performance Summary
All of the returns in this report represent past performance, which is not a guarantee of future results that may be achieved by the fund. (Current performance may be lower or higher than the performance data cited. For performance data current to the most recent month-end, visit our website at vanguard.com/performance.) Note, too, that both investment returns and principal value can fluctuate widely, so an investor’s shares, when sold, could be worth more or less than their original cost. The returns shown do not reflect taxes that a shareholder would pay on fund distributions or on the sale of fund shares.
Cumulative Performance: September 7, 2010, Through August 31, 2013
Initial Investment of $10,000
| Average Annual Total Returns | |||
| Periods Ended August 31, 2013 | |||
| Since | Final Value | ||
| One | Inception | of a $10,000 | |
| Year | (9/7/2010) | Investment | |
| S&P 500 Value Index Fund*ETF | |||
| Shares Net Asset Value | 22.79% | 16.26% | $15,668 |
| S&P 500 Value Index Fund*ETF | |||
| Shares Market Price | 22.67 | 16.25 | 15,663 |
| S&P 500 Value Index | 22.94 | 16.44 | 15,742 |
| Large-Cap Value Funds Average | 22.08 | 15.16 | 15,232 |
| Dow Jones U.S. Total Stock Market | |||
| Float Adjusted Index | 20.15 | 17.40 | 16,132 |
Large-Cap Value Funds Average: Derived from data provided by Lipper, a Thomson Reuters Company.
"Since Inception" performance is calculated from the ETF Shares’ inception date for both the fund and its comparative standards.
| Cumulative Returns of ETF Shares: September 7, 2010, Through August 31, 2013 | ||
| Since | ||
| One | Inception | |
| Year | (9/7/2010) | |
| S&P 500 Value Index Fund ETF Shares Market Price | 22.67% | 56.63% |
| S&P 500 Value Index Fund ETF Shares Net Asset | ||
| Value | 22.79 | 56.68 |
| S&P 500 Value Index | 22.94 | 57.42 |
| "Since Inception" performance is calculated from the ETF Shares’ inception date for both the fund and its comparative standards. | ||
See Financial Highlights for dividend and capital gains information.
9
S&P 500 Value Index Fund
Fiscal-Year Total Returns (%): September 7, 2010, Through August 31, 2013

Average Annual Total Returns: Periods Ended June 30, 2013
This table presents returns through the latest calendar quarter—rather than through the end of the fiscal period.
Securities and Exchange Commission rules require that we provide this information.
| Inception | One | Since | |
| Date | Year | Inception | |
| ETF Shares | 9/7/2010 | ||
| Market Price | 24.92% | 16.81% | |
| Net Asset Value | 24.88 | 16.78 |
10
S&P 500 Value Index Fund
Financial Statements
Statement of Net Assets
As of August 31, 2013
The fund reports a complete list of its holdings in regulatory filings four times in each fiscal year, at the quarter-ends. For the second and fourth fiscal quarters, the lists appear in the fund’s semiannual and annual reports to shareholders. For the first and third fiscal quarters, the fund files the lists with the Securities and Exchange Commission on Form N-Q. Shareholders can look up the fund’s Forms N-Q on the SEC’s website at sec.gov. Forms N-Q may also be reviewed and copied at the SEC’s Public Reference Room (see the back cover of this report for further information).
| Market | |||
| Value | |||
| Shares | ($000) | ||
| Common Stocks (99.9%) | |||
| Consumer Discretionary (6.7%) | |||
| Ford Motor Co. | 65,433 | 1,059 | |
| McDonald’s Corp. | 8,010 | 756 | |
| Target Corp. | 10,681 | 676 | |
| Walt Disney Co. | 8,995 | 547 | |
| Johnson Controls Inc. | 11,401 | 462 | |
| * | General Motors Co. | 9,994 | 341 |
| NIKE Inc. Class B | 5,060 | 318 | |
| Macy’s Inc. | 6,382 | 284 | |
| Carnival Corp. | 7,393 | 267 | |
| Viacom Inc. Class B | 3,268 | 260 | |
| Genuine Parts Co. | 2,580 | 199 | |
| Yum! Brands Inc. | 2,620 | 183 | |
| Kohl’s Corp. | 3,394 | 174 | |
| Whirlpool Corp. | 1,319 | 170 | |
| Best Buy Co. Inc. | 4,475 | 161 | |
| Staples Inc. | 11,033 | 153 | |
| * | Bed Bath & Beyond Inc. | 1,817 | 134 |
| Omnicom Group Inc. | 1,981 | 120 | |
| Darden Restaurants Inc. | 2,163 | 100 | |
| GameStop Corp. Class A | 1,983 | 100 | |
| Harley-Davidson Inc. | 1,496 | 90 | |
| * | Dollar General Corp. | 1,656 | 89 |
| Hasbro Inc. | 1,913 | 87 | |
| * | Goodyear Tire & Rubber Co. | 4,084 | 82 |
| International Game | |||
| Technology | 4,342 | 82 | |
| Starwood Hotels & | |||
| Resorts Worldwide Inc. | 1,266 | 81 | |
| Tiffany & Co. | 1,020 | 79 | |
| Garmin Ltd. | 1,817 | 74 | |
| Harman International | |||
| Industries Inc. | 1,129 | 72 | |
| News Corp. Class A | 4,547 | 71 | |
| H&R Block Inc. | 2,529 | 71 | |
| Marriott International Inc. | |||
| Class A | 1,708 | 68 | |
| * | CarMax Inc. | 1,424 | 68 |
| Market | |||
| Value | |||
| Shares | ($000) | ||
| * | Chipotle Mexican Grill Inc. | ||
| Class A | 165 | 67 | |
| Interpublic Group of Cos. | |||
| Inc. | 4,055 | 64 | |
| Cablevision Systems Corp. | |||
| Class A | 3,592 | 64 | |
| Gannett Co. Inc. | 2,067 | 50 | |
| Abercrombie & Fitch Co. | 1,299 | 46 | |
| Washington Post Co. | |||
| Class B | 75 | 42 | |
| * | JC Penney Co. Inc. | 3,190 | 40 |
| Expedia Inc. | 517 | 24 | |
| * | AutoNation Inc. | 352 | 16 |
| 7,891 | |||
| Consumer Staples (9.9%) | |||
| Wal-Mart Stores Inc. | 27,269 | 1,990 | |
| Procter & Gamble Co. | 23,266 | 1,812 | |
| CVS Caremark Corp. | 20,380 | 1,183 | |
| Mondelez International Inc. | |||
| Class A | 29,701 | 911 | |
| Walgreen Co. | 14,351 | 690 | |
| Kraft Foods Group Inc. | 9,895 | 512 | |
| Altria Group Inc. | 14,377 | 487 | |
| Costco Wholesale Corp. | 4,143 | 464 | |
| Archer-Daniels-Midland Co. | 10,971 | 386 | |
| Colgate-Palmolive Co. | 5,542 | 320 | |
| Kroger Co. | 8,649 | 317 | |
| Sysco Corp. | 9,884 | 317 | |
| General Mills Inc. | 5,902 | 291 | |
| Kimberly-Clark Corp. | 2,689 | 251 | |
| ConAgra Foods Inc. | 6,931 | 234 | |
| Beam Inc. | 2,680 | 168 | |
| Avon Products Inc. | 7,205 | 142 | |
| Tyson Foods Inc. Class A | 4,723 | 137 | |
| Reynolds American Inc. | 2,808 | 134 | |
| Molson Coors Brewing Co. | |||
| Class B | 2,618 | 128 | |
| Kellogg Co. | 1,990 | 121 | |
| Mead Johnson Nutrition Co. | 1,586 | 119 | |
11
S&P 500 Value Index Fund
| Market | |||
| Value | |||
| Shares | ($000) | ||
| Safeway Inc. | 4,003 | 104 | |
| Estee Lauder Cos. Inc. | |||
| Class A | 1,563 | 102 | |
| Hormel Foods Corp. | 2,244 | 93 | |
| JM Smucker Co. | 859 | 91 | |
| Clorox Co. | 986 | 82 | |
| Coca-Cola Enterprises Inc. | 1,720 | 64 | |
| Campbell Soup Co. | 1,434 | 62 | |
| 11,712 | |||
| Energy (15.0%) | |||
| Chevron Corp. | 32,274 | 3,887 | |
| Exxon Mobil Corp. | 34,044 | 2,967 | |
| ConocoPhillips | 20,351 | 1,349 | |
| Occidental Petroleum Corp. | 13,410 | 1,183 | |
| Schlumberger Ltd. | 8,631 | 699 | |
| Phillips 66 | 10,309 | 589 | |
| Apache Corp. | 6,524 | 559 | |
| National Oilwell Varco Inc. | 7,112 | 528 | |
| Marathon Oil Corp. | 11,792 | 406 | |
| Kinder Morgan Inc. | 10,509 | 399 | |
| Halliburton Co. | 8,182 | 393 | |
| Anadarko Petroleum Corp. | 4,088 | 374 | |
| Hess Corp. | 4,971 | 372 | |
| Spectra Energy Corp. | 11,139 | 369 | |
| Devon Energy Corp. | 6,281 | 359 | |
| Baker Hughes Inc. | 7,351 | 342 | |
| Valero Energy Corp. | 9,070 | 322 | |
| Chesapeake Energy Corp. | 8,628 | 223 | |
| Ensco plc Class A | 3,880 | 216 | |
| Marathon Petroleum Corp. | 2,920 | 212 | |
| Williams Cos. Inc. | 5,790 | 210 | |
| Murphy Oil Corp. | 3,016 | 203 | |
| Noble Corp. | 4,213 | 157 | |
| * | Cameron International Corp. | 2,183 | 124 |
| CONSOL Energy Inc. | 3,799 | 119 | |
| EQT Corp. | 1,351 | 116 | |
| * | FMC Technologies Inc. | 2,132 | 114 |
| Helmerich & Payne Inc. | 1,768 | 111 | |
| Cabot Oil & Gas Corp. | 2,810 | 110 | |
| * | Southwestern Energy Co. | 2,808 | 107 |
| Range Resources Corp. | 1,111 | 83 | |
| QEP Resources Inc. | 2,978 | 81 | |
| Peabody Energy Corp. | 4,492 | 77 | |
| Nabors Industries Ltd. | 4,892 | 75 | |
| Diamond Offshore Drilling | |||
| Inc. | 1,155 | 74 | |
| * | Rowan Cos. plc Class A | 2,065 | 73 |
| * | WPX Energy Inc. | 3,333 | 62 |
| * | Newfield Exploration Co. | 2,249 | 53 |
| 17,697 | |||
| Financials (23.7%) | |||
| * | Berkshire Hathaway Inc. | ||
| Class B | 30,364 | 3,377 | |
| Wells Fargo & Co. | 81,984 | 3,368 | |
| Market | |||
| Value | |||
| Shares | ($000) | ||
| JPMorgan Chase & Co. | 62,911 | 3,179 | |
| Citigroup Inc. | 50,647 | 2,448 | |
| * | American International | ||
| Group Inc. | 24,573 | 1,142 | |
| Goldman Sachs Group Inc. | 7,174 | 1,091 | |
| MetLife Inc. | 18,227 | 842 | |
| PNC Financial Services | |||
| Group Inc. | 8,812 | 637 | |
| Capital One Financial Corp. | 9,725 | 628 | |
| Morgan Stanley | 22,840 | 588 | |
| State Street Corp. | 7,592 | 507 | |
| Travelers Cos. Inc. | 6,267 | 501 | |
| ACE Ltd. | 5,663 | 497 | |
| Aflac Inc. | 7,762 | 449 | |
| BB&T Corp. | 11,674 | 396 | |
| Charles Schwab Corp. | 18,312 | 382 | |
| Allstate Corp. | 7,803 | 374 | |
| CME Group Inc. | 5,113 | 364 | |
| Chubb Corp. | 4,316 | 359 | |
| Prudential Financial Inc. | 4,187 | 313 | |
| Prologis Inc. | 8,285 | 292 | |
| SunTrust Banks Inc. | 8,971 | 287 | |
| Bank of New York Mellon | |||
| Corp. | 9,467 | 282 | |
| Simon Property Group Inc. | 1,915 | 279 | |
| Fifth Third Bancorp | 14,568 | 266 | |
| Progressive Corp. | 9,230 | 231 | |
| Loews Corp. | 5,117 | 227 | |
| Hartford Financial Services | |||
| Group Inc. | 7,582 | 224 | |
| BlackRock Inc. | 832 | 217 | |
| Host Hotels & Resorts Inc. | 12,400 | 211 | |
| Northern Trust Corp. | 3,624 | 199 | |
| Principal Financial Group Inc. | 4,593 | 188 | |
| Lincoln National Corp. | 4,463 | 188 | |
| Marsh & McLennan Cos. | |||
| Inc. | 4,491 | 185 | |
| NYSE Euronext | 4,048 | 169 | |
| Public Storage | 1,106 | 169 | |
| XL Group plc Class A | 4,816 | 142 | |
| HCP Inc. | 3,329 | 136 | |
| Unum Group | 4,441 | 131 | |
| Aon plc | 1,956 | 130 | |
| Equity Residential | 2,502 | 130 | |
| Leucadia National Corp. | 4,918 | 123 | |
| AvalonBay Communities Inc. | 972 | 120 | |
| Boston Properties Inc. | 1,159 | 119 | |
| Vornado Realty Trust | 1,413 | 115 | |
| Regions Financial Corp. | 12,203 | 115 | |
| Cincinnati Financial Corp. | 2,443 | 112 | |
| Torchmark Corp. | 1,540 | 106 | |
| Ventas Inc. | 1,611 | 100 | |
| Weyerhaeuser Co. | 3,552 | 97 | |
| * | Genworth Financial Inc. | ||
| Class A | 8,217 | 97 |
12
S&P 500 Value Index Fund
| Market | |||
| Value | |||
| Shares | ($000) | ||
| McGraw Hill Financial Inc. | 1,597 | 93 | |
| KeyCorp | 7,500 | 87 | |
| M&T Bank Corp. | 696 | 79 | |
| * | IntercontinentalExchange | ||
| Inc. | 437 | 79 | |
| Invesco Ltd. | 2,585 | 78 | |
| People’s United Financial | |||
| Inc. | 5,283 | 75 | |
| Macerich Co. | 1,301 | 73 | |
| Hudson City Bancorp Inc. | 7,907 | 73 | |
| Comerica Inc. | 1,709 | 70 | |
| Assurant Inc. | 1,284 | 68 | |
| * | E*TRADE Financial Corp. | 4,766 | 67 |
| Kimco Realty Corp. | 3,188 | 64 | |
| Legg Mason Inc. | 1,860 | 60 | |
| NASDAQ OMX Group Inc. | 1,952 | 58 | |
| Plum Creek Timber Co. Inc. | 1,268 | 56 | |
| * | CBRE Group Inc. Class A | 2,014 | 44 |
| Apartment Investment & | |||
| Management Co. Class A | 1,149 | 32 | |
| 27,985 | |||
| Health Care (9.1%) | |||
| Johnson & Johnson | 21,974 | 1,899 | |
| Pfizer Inc. | 45,539 | 1,285 | |
| UnitedHealth Group Inc. | 16,978 | 1,218 | |
| Bristol-Myers Squibb Co. | 12,030 | 502 | |
| McKesson Corp. | 3,774 | 458 | |
| Medtronic Inc. | 8,586 | 444 | |
| WellPoint Inc. | 5,000 | 426 | |
| * | Express Scripts Holding Co. | 6,252 | 399 |
| Aetna Inc. | 6,298 | 399 | |
| Cigna Corp. | 4,751 | 374 | |
| Abbott Laboratories | 9,606 | 320 | |
| Cardinal Health Inc. | 5,686 | 286 | |
| Humana Inc. | 2,624 | 242 | |
| St. Jude Medical Inc. | 4,719 | 238 | |
| AmerisourceBergen Corp. | |||
| Class A | 3,844 | 219 | |
| Covidien plc | 2,894 | 172 | |
| Thermo Fisher Scientific Inc. | 1,909 | 170 | |
| * | Forest Laboratories Inc. | 3,899 | 166 |
| Becton Dickinson and Co. | 1,616 | 157 | |
| Allergan Inc. | 1,778 | 157 | |
| Quest Diagnostics Inc. | 2,630 | 154 | |
| * | Laboratory Corp. | ||
| of America Holdings | 1,545 | 148 | |
| Stryker Corp. | 2,200 | 147 | |
| * | Boston Scientific Corp. | 12,796 | 135 |
| * | CareFusion Corp. | 3,655 | 131 |
| * | Hospira Inc. | 2,758 | 108 |
| * | Tenet Healthcare Corp. | 1,728 | 67 |
| Zimmer Holdings Inc. | 814 | 64 | |
| Patterson Cos. Inc. | 1,392 | 55 | |
| * | Waters Corp. | 557 | 55 |
| Market | |||
| Value | |||
| Shares | ($000) | ||
| CR Bard Inc. | 452 | 52 | |
| * | Varian Medical Systems Inc. | 619 | 44 |
| DENTSPLY International Inc. | 930 | 39 | |
| 10,730 | |||
| Industrials (12.8%) | |||
| General Electric Co. | 172,105 | 3,983 | |
| United Technologies Corp. | 14,078 | 1,409 | |
| Caterpillar Inc. | 10,944 | 903 | |
| Honeywell International Inc. | 6,810 | 542 | |
| FedEx Corp. | 4,906 | 527 | |
| 3M Co. | 4,546 | 516 | |
| United Parcel Service Inc. | |||
| Class B | 5,795 | 496 | |
| General Dynamics Corp. | 5,527 | 460 | |
| CSX Corp. | 17,011 | 419 | |
| Raytheon Co. | 5,405 | 408 | |
| Emerson Electric Co. | 6,584 | 397 | |
| Norfolk Southern Corp. | 5,247 | 379 | |
| Northrop Grumman Corp. | 3,911 | 361 | |
| Lockheed Martin Corp. | 2,436 | 298 | |
| Waste Management Inc. | 7,302 | 295 | |
| Tyco International Ltd. | 7,724 | 255 | |
| Eaton Corp. plc | 4,015 | 254 | |
| Danaher Corp. | 3,873 | 254 | |
| Parker Hannifin Corp. | 2,483 | 248 | |
| Stanley Black & Decker Inc. | 2,693 | 230 | |
| Precision Castparts Corp. | 1,072 | 226 | |
| Deere & Co. | 2,066 | 173 | |
| Fluor Corp. | 2,710 | 172 | |
| Republic Services Inc. | |||
| Class A | 4,938 | 161 | |
| L-3 Communications | |||
| Holdings Inc. | 1,497 | 135 | |
| * | Jacobs Engineering Group | ||
| Inc. | 2,181 | 127 | |
| Textron Inc. | 4,638 | 125 | |
| Ingersoll-Rand plc | 1,940 | 115 | |
| Dover Corp. | 1,252 | 106 | |
| Pentair Ltd. | 1,634 | 98 | |
| WW Grainger Inc. | 368 | 91 | |
| Joy Global Inc. | 1,767 | 87 | |
| Rockwell Collins Inc. | 1,177 | 83 | |
| Nielsen Holdings NV | 2,329 | 80 | |
| Rockwell Automation Inc. | 814 | 79 | |
| Kansas City Southern | 717 | 76 | |
| CH Robinson Worldwide Inc. | 1,314 | 75 | |
| Expeditors International | |||
| of Washington Inc. | 1,828 | 74 | |
| Pall Corp. | 870 | 60 | |
| ADT Corp. | 1,462 | 58 | |
| Pitney Bowes Inc. | 3,354 | 55 | |
| Flowserve Corp. | 880 | 49 | |
| Ryder System Inc. | 864 | 48 | |
| Xylem Inc. | 1,675 | 42 | |
13
S&P 500 Value Index Fund
| Market | |||
| Value | |||
| Shares | ($000) | ||
| Iron Mountain Inc. | 1,367 | 35 | |
| Dun & Bradstreet Corp. | 324 | 32 | |
| Robert Half International Inc. | 901 | 32 | |
| 15,128 | |||
| Information Technology (8.5%) | |||
| Microsoft Corp. | 56,295 | 1,880 | |
| International Business | |||
| Machines Corp. | 8,327 | 1,518 | |
| Cisco Systems Inc. | 47,145 | 1,099 | |
| Hewlett-Packard Co. | 32,100 | 717 | |
| Corning Inc. | 24,552 | 345 | |
| Dell Inc. | 24,428 | 336 | |
| Texas Instruments Inc. | 7,196 | 275 | |
| Accenture plc Class A | 3,789 | 274 | |
| Motorola Solutions Inc. | 4,520 | 253 | |
| Automatic Data Processing | |||
| Inc. | 3,391 | 241 | |
| SanDisk Corp. | 4,046 | 223 | |
| Western Digital Corp. | 3,541 | 220 | |
| Xerox Corp. | 20,441 | 204 | |
| TE Connectivity Ltd. | 3,798 | 186 | |
| Western Union Co. | 9,259 | 162 | |
| CA Inc. | 5,509 | 161 | |
| * | Juniper Networks Inc. | 8,435 | 160 |
| NVIDIA Corp. | 9,600 | 142 | |
| * | Electronic Arts Inc. | 5,044 | 134 |
| * | Micron Technology Inc. | 9,784 | 133 |
| Symantec Corp. | 4,511 | 116 | |
| * | Citrix Systems Inc. | 1,307 | 93 |
| NetApp Inc. | 2,221 | 92 | |
| Paychex Inc. | 2,323 | 90 | |
| Altera Corp. | 2,447 | 86 | |
| Analog Devices Inc. | 1,692 | 78 | |
| FLIR Systems Inc. | 2,367 | 74 | |
| Xilinx Inc. | 1,667 | 72 | |
| SAIC Inc. | 4,730 | 71 | |
| Jabil Circuit Inc. | 3,073 | 70 | |
| Fidelity National Information | |||
| Services Inc. | 1,466 | 65 | |
| * | Lam Research Corp. | 1,106 | 52 |
| Linear Technology Corp. | 1,276 | 49 | |
| * | Autodesk Inc. | 1,314 | 48 |
| Computer Sciences Corp. | 947 | 48 | |
| Microchip Technology Inc. | 1,218 | 47 | |
| Harris Corp. | 818 | 46 | |
| * | First Solar Inc. | 1,109 | 41 |
| Total System Services Inc. | 1,398 | 39 | |
| * | BMC Software Inc. | 815 | 38 |
| * | Advanced Micro Devices Inc. | 10,125 | 33 |
| Molex Inc. | 1,113 | 32 | |
| 10,043 | |||
| Market | ||
| Value | ||
| Shares | ($000) | |
| Materials (3.7%) | ||
| Dow Chemical Co. | 20,133 | 753 |
| Freeport-McMoRan Copper | ||
| & Gold Inc. | 17,281 | 522 |
| LyondellBasell Industries NV | ||
| Class A | 6,324 | 444 |
| EI du Pont de Nemours & Co. | 7,815 | 443 |
| Air Products & Chemicals Inc. | 3,468 | 354 |
| International Paper Co. | 7,404 | 350 |
| Newmont Mining Corp. | 8,272 | 263 |
| Praxair Inc. | 2,115 | 248 |
| Alcoa Inc. | 17,778 | 137 |
| Nucor Corp. | 2,751 | 125 |
| MeadWestvaco Corp. | 2,939 | 105 |
| * Owens-Illinois Inc. | 2,732 | 78 |
| Avery Dennison Corp. | 1,659 | 71 |
| Sigma-Aldrich Corp. | 840 | 69 |
| Cliffs Natural Resources Inc. | 2,545 | 53 |
| Airgas Inc. | 470 | 48 |
| Allegheny Technologies Inc. | 1,788 | 48 |
| Sealed Air Corp. | 1,660 | 47 |
| International Flavors | ||
| & Fragrances Inc. | 556 | 44 |
| United States Steel Corp. | 2,412 | 43 |
| Bemis Co. Inc. | 988 | 39 |
| Vulcan Materials Co. | 688 | 33 |
| 4,317 | ||
| Telecommunication Services (4.0%) | ||
| AT&T Inc. | 89,546 | 3,029 |
| Verizon Communications | ||
| Inc. | 25,240 | 1,196 |
| CenturyLink Inc. | 10,142 | 336 |
| Windstream Corp. | 9,848 | 79 |
| Frontier Communications | ||
| Corp. | 16,589 | 72 |
| 4,712 | ||
| Utilities (6.5%) | ||
| Duke Energy Corp. | 11,747 | 771 |
| Southern Co. | 14,489 | 603 |
| NextEra Energy Inc. | 7,069 | 568 |
| Dominion Resources Inc. | 9,615 | 561 |
| Exelon Corp. | 14,245 | 434 |
| American Electric Power Co. | ||
| Inc. | 8,092 | 346 |
| PPL Corp. | 10,516 | 323 |
| PG&E Corp. | 7,360 | 304 |
| Consolidated Edison Inc. | 4,875 | 274 |
| Public Service Enterprise | ||
| Group Inc. | 8,422 | 273 |
| FirstEnergy Corp. | 6,962 | 261 |
| Edison International | 5,423 | 249 |
14
S&P 500 Value Index Fund
| Market | ||
| Value | ||
| Shares | ($000) | |
| Xcel Energy Inc. | 8,273 | 231 |
| Northeast Utilities | 5,234 | 214 |
| DTE Energy Co. | 2,896 | 194 |
| Entergy Corp. | 2,967 | 188 |
| ONEOK Inc. | 3,433 | 177 |
| CenterPoint Energy Inc. | 7,127 | 163 |
| Sempra Energy | 1,877 | 158 |
| Wisconsin Energy Corp. | 3,808 | 156 |
| NiSource Inc. | 5,193 | 152 |
| NRG Energy Inc. | 5,374 | 141 |
| Ameren Corp. | 4,036 | 136 |
| AES Corp. | 10,298 | 131 |
| CMS Energy Corp. | 4,428 | 118 |
| SCANA Corp. | 2,318 | 112 |
| Pinnacle West Capital Corp. | 1,831 | 99 |
| AGL Resources Inc. | 1,967 | 86 |
| Pepco Holdings Inc. | 4,144 | 79 |
| Integrys Energy Group Inc. | 1,316 | 74 |
| TECO Energy Inc. | 3,392 | 56 |
| 7,632 | ||
| Total Investments (99.9%) | ||
| (Cost $104,986) | 117,847 | |
| Other Assets and Liabilities (0.1%) | ||
| Other Assets | 328 | |
| Liabilities | (216) | |
| 112 | ||
| ETF Shares—Net Assets (100%) | ||
| Applicable to 1,600,000 outstanding | ||
| $.001 par value shares of beneficial | ||
| interest (unlimited authorization) | 117,959 | |
| Net Asset Value Per Share—ETF Shares | $73.72 | |
| At August 31, 2013, net assets consisted of: | |
| Amount | |
| ($000) | |
| Paid-in Capital | 106,691 |
| Undistributed Net Investment Income | 576 |
| Accumulated Net Realized Losses | (2,169) |
| Unrealized Appreciation (Depreciation) | 12,861 |
| Net Assets | 117,959 |
See Note A in Notes to Financial Statements.
* Non-income-producing security.
See accompanying Notes, which are an integral part of the Financial Statements.
15
S&P 500 Value Index Fund
| Statement of Operations | |
| Year Ended | |
| August 31, 2013 | |
| ($000) | |
| Investment Income | |
| Income | |
| Dividends | 2,175 |
| Total Income | 2,175 |
| Expenses | |
| The Vanguard Group—Note B | |
| Management and Administrative | 71 |
| Marketing and Distribution | 4 |
| Custodian Fees | 19 |
| Auditing Fees | 26 |
| Shareholders’ Reports | 5 |
| Total Expenses | 125 |
| Net Investment Income | 2,050 |
| Realized Net Gain (Loss) on Investment Securities Sold | 5,063 |
| Change in Unrealized Appreciation (Depreciation) of Investment Securities | 7,839 |
| Net Increase (Decrease) in Net Assets Resulting from Operations | 14,952 |
See accompanying Notes, which are an integral part of the Financial Statements.
16
S&P 500 Value Index Fund
| Statement of Changes in Net Assets | ||
| Year Ended August 31, | ||
| 2013 | 2012 | |
| ($000) | ($000) | |
| Increase (Decrease) in Net Assets | ||
| Operations | ||
| Net Investment Income | 2,050 | 912 |
| Realized Net Gain (Loss) | 5,063 | (109) |
| Change in Unrealized Appreciation (Depreciation) | 7,839 | 5,020 |
| Net Increase (Decrease) in Net Assets Resulting from Operations | 14,952 | 5,823 |
| Distributions | ||
| Net Investment Income | (1,731) | (758) |
| Realized Capital Gain | — | — |
| Total Distributions | (1,731) | (758) |
| Capital Share Transactions | ||
| Issued | 75,827 | 28,417 |
| Issued in Lieu of Cash Distributions | — | — |
| Redeemed | (23,299) | (8,067) |
| Net Increase (Decrease) from Capital Share Transactions | 52,528 | 20,350 |
| Total Increase (Decrease) | 65,749 | 25,415 |
| Net Assets | ||
| Beginning of Period | 52,210 | 26,795 |
| End of Period1 | 117,959 | 52,210 |
| 1 Net Assets—End of Period includes undistributed net investment income of $576,000 and $257,000. | ||
See accompanying Notes, which are an integral part of the Financial Statements.
17
S&P 500 Value Index Fund
Financial Highlights
| ETF Shares | |||
| Sept. 7, | |||
| Year Ended | 20101 to | ||
| August 31, | August 31, | ||
| For a Share Outstanding Throughout Each Period | 2013 | 2012 | 2011 |
| Net Asset Value, Beginning of Period | $61.42 | $53.59 | $49.93 |
| Investment Operations | |||
| Net Investment Income | 1.584 | 1.329 | 1.051 |
| Net Realized and Unrealized Gain (Loss) on Investments | 12.242 | 7.734 | 3.454 |
| Total from Investment Operations | 13.826 | 9.063 | 4.505 |
| Distributions | |||
| Dividends from Net Investment Income | (1.526) | (1.233) | (. 845) |
| Distributions from Realized Capital Gains | — | — | — |
| Total Distributions | (1.526) | (1.233) | (. 845) |
| Net Asset Value, End of Period | $73.72 | $61.42 | $53.59 |
| Total Return | 22.79% | 17.16% | 8.92% |
| Ratios/Supplemental Data | |||
| Net Assets, End of Period (Millions) | $118 | $52 | $27 |
| Ratio of Total Expenses to Average Net Assets | 0.15% | 0.15% | 0.15%2 |
| Ratio of Net Investment Income to Average Net Assets | 2.45% | 2.43% | 2.25%2 |
| Portfolio Turnover Rate 3 | 25% | 20% | 23% |
1 Inception.
2 Annualized.
3 Excludes the value of portfolio securities received or delivered as a result of in-kind purchases or redemptions of the fund’s capital shares, including ETF Creation Units.
See accompanying Notes, which are an integral part of the Financial Statements.
18
S&P 500 Value Index Fund
Notes to Financial Statements
Vanguard S&P 500 Value Index Fund is registered under the Investment Company Act of 1940 as an open-end investment company, or mutual fund. The fund offers two classes of shares: Institutional Shares and ETF Shares. Institutional Shares are designed for investors who meet certain administrative, service, and account-size criteria. The fund has not issued any Institutional Shares as of August 31, 2013. ETF Shares are listed for trading on NYSE Arca; they can be purchased and sold through a broker.
A. The following significant accounting policies conform to generally accepted accounting principles for U.S. mutual funds. The fund consistently follows such policies in preparing its financial statements.
1. Security Valuation: Securities are valued as of the close of trading on the New York Stock Exchange (generally 4 p.m., Eastern time) on the valuation date. Equity securities are valued at the latest quoted sales prices or official closing prices taken from the primary market in which each security trades; such securities not traded on the valuation date are valued at the mean of the latest quoted bid and asked prices. Securities for which market quotations are not readily available, or whose values have been materially affected by events occurring before the fund’s pricing time but after the close of the securities’ primary markets, are valued by methods deemed by the board of trustees to represent fair value.
2. Federal Income Taxes: The fund intends to continue to qualify as a regulated investment company and distribute all of its taxable income. Management has analyzed the fund’s tax positions taken for all open federal income tax years (August 31, 2011–2013), and has concluded that no provision for federal income tax is required in the fund’s financial statements.
3. Distributions: Distributions to shareholders are recorded on the ex-dividend date.
4. Other: Dividend income is recorded on the ex-dividend date. Security transactions are accounted for on the date securities are bought or sold. Costs used to determine realized gains (losses) on the sale of investment securities are those of the specific securities sold.
B. The Vanguard Group furnishes at cost investment advisory, corporate management, administrative, marketing, and distribution services. The costs of such services are allocated to the fund under methods approved by the board of trustees. The fund has committed to provide up to 0.40% of its net assets in capital contributions to Vanguard. At August 31, 2013, the fund had contributed capital of $14,000 to Vanguard (included in Other Assets), representing 0.01% of the fund’s net assets and 0.01% of Vanguard’s capitalization. The fund’s trustees and officers are also directors and officers of Vanguard.
C. Various inputs may be used to determine the value of the fund’s investments. These inputs are summarized in three broad levels for financial statement purposes. The inputs or methodologies used to value securities are not necessarily an indication of the risk associated with investing in those securities.
Level 1—Quoted prices in active markets for identical securities.
Level 2—Other significant observable inputs (including quoted prices for similar securities, interest rates, prepayment speeds, credit risk, etc.).
Level 3—Significant unobservable inputs (including the fund’s own assumptions used to determine the fair value of investments).
At August 31, 2013, 100% of the market value of the fund’s investments was determined based on Level 1 inputs.
19
S&P 500 Value Index Fund
D. Distributions are determined on a tax basis and may differ from net investment income and realized capital gains for financial reporting purposes. Differences may be permanent or temporary. Permanent differences are reclassified among capital accounts in the financial statements to reflect their tax character. Temporary differences arise when certain items of income, expense, gain, or loss are recognized in different periods for financial statement and tax purposes; these differences will reverse at some time in the future. Differences in classification may also result from the treatment of short-term gains as ordinary income for tax purposes.
During the year ended August 31, 2013, the fund realized $5,794,000 of net capital gains resulting from in-kind redemptions—in which shareholders exchanged fund shares for securities held by the fund rather than for cash. Because such gains are not taxable to the fund, and are not distributed to shareholders, they have been reclassified from accumulated net realized losses to paid-in capital.
For tax purposes, at August 31, 2013, the fund had $634,000 of ordinary income available for distribution. The fund had available capital losses totaling $2,169,000 that may be carried forward indefinitely to offset future net capital gains.
At August 31, 2013, the cost of investment securities for tax purposes was $104,986,000. Net unrealized appreciation of investment securities for tax purposes was $12,861,000, consisting of unrealized gains of $13,749,000 on securities that had risen in value since their purchase and $888,000 in unrealized losses on securities that had fallen in value since their purchase.
E. During the year ended August 31, 2013, the fund purchased $96,355,000 of investment securities and sold $43,591,000 of investment securities, other than temporary cash investments. Purchases and sales include $75,809,000 and $22,839,000, respectively, in connection with in-kind purchases and redemptions of the fund’s capital shares.
F. Capital shares issued and redeemed were:
| Year Ended August 31, | ||
| 2013 | 2012 | |
| Shares | Shares | |
| (000) | (000) | |
| ETF Shares | ||
| Issued | 1,100 | 500 |
| Issued in Lieu of Cash Distributions | — | — |
| Redeemed | (350) | (150) |
| Net Increase (Decrease) in Shares Outstanding | 750 | 350 |
G. Management has determined that no material events or transactions occurred subsequent to August 31, 2013, that would require recognition or disclosure in these financial statements.
20
S&P 500 Growth Index Fund
Fund Profile
As of August 31, 2013
| Portfolio Characteristics | |||
| DJ U.S. | |||
| S&P 500 | Total | ||
| Growth | Market | ||
| Fund | Index | FA Index | |
| Number of Stocks | 295 | 295 | 3,631 |
| Median Market Cap | $72.5B | $72.5B | $39.3B |
| Price/Earnings Ratio | 18.7x | 18.7x | 18.7x |
| Price/Book Ratio | 3.4x | 3.4x | 2.4x |
| Return on Equity | 22.1% | 21.9% | 16.6% |
| Earnings Growth Rate | 15.3% | 15.3% | 11.1% |
| Dividend Yield | 1.9% | 1.9% | 2.0% |
| Foreign Holdings | 0.0% | 0.0% | 0.0% |
| Turnover Rate | 24% | — | — |
| Ticker Symbol | VOOG | — | — |
| Expense Ratio1 | 0.15% | — | — |
| 30-Day SEC Yield | 1.74% | — | — |
| Short-Term Reserves | 0.0% | — | — |
| Sector Diversification (% of equity exposure) | |||
| DJ U.S. | |||
| Total | |||
| S&P 500 | Market | ||
| Growth | FA | ||
| Fund | Index | Index | |
| Consumer Discretionary | 17.6% | 17.6% | 13.1% |
| Consumer Staples | 10.5 | 10.5 | 8.9 |
| Energy | 6.5 | 6.5 | 9.8 |
| Financials | 9.4 | 9.4 | 17.5 |
| Health Care | 16.5 | 16.5 | 12.6 |
| Industrials | 7.9 | 7.9 | 11.2 |
| Information Technology | 27.2 | 27.2 | 17.6 |
| Materials | 3.2 | 3.2 | 3.8 |
| Telecommunication | |||
| Services | 1.1 | 1.1 | 2.3 |
| Utilities | 0.1 | 0.1 | 3.2 |
| Ten Largest Holdings (% of total net assets) | ||
| Apple Inc. | Computer Hardware | 6.1% |
| Google Inc. | Internet Software & | |
| Services | 3.1 | |
| Exxon Mobil Corp. | Integrated Oil & Gas | 2.8 |
| Bank of America Corp. | Diversified Financial | |
| Services | 2.0 | |
| Coca-Cola Co. | Soft Drinks | 2.0 |
| Merck & Co. Inc. | Pharmaceuticals | 1.9 |
| Microsoft Corp. | Systems Software | 1.9 |
| Philip Morris | ||
| International Inc. | Tobacco | 1.8 |
| Johnson & Johnson | Pharmaceuticals | 1.7 |
| PepsiCo Inc. | Soft Drinks | 1.7 |
| Top Ten | 25.0% | |
The holdings listed exclude any temporary cash investments and equity index products.
Investment Focus

1 The expense ratio shown is from the prospectus dated December 28, 2012, and represents estimated costs for the current fiscal year. For the fiscal year ended August 31, 2013, the expense ratio was 0.15%.
21
S&P 500 Growth Index Fund
Performance Summary
All of the returns in this report represent past performance, which is not a guarantee of future results that may be achieved by the fund. (Current performance may be lower or higher than the performance data cited. For performance data current to the most recent month-end, visit our website at vanguard.com/performance.) Note, too, that both investment returns and principal value can fluctuate widely, so an investor’s shares, when sold, could be worth more or less than their original cost. The returns shown do not reflect taxes that a shareholder would pay on fund distributions or on the sale of fund shares.
Cumulative Performance: September 7, 2010, Through August 31, 2013
Initial Investment of $10,000
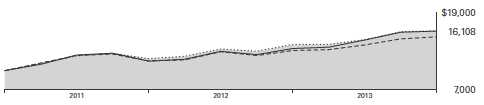
| Average Annual Total Returns | |||
| Periods Ended August 31, 2013 | |||
| Since | Final Value | ||
| One | Inception | of a $10,000 | |
| Year | (9/7/2010) | Investment | |
| S&P 500 Growth Index Fund*ETF | |||
| Shares Net Asset Value | 15.00% | 17.34% | $16,108 |
| S&P 500 Growth Index Fund*ETF | |||
| Shares Market Price | 15.01 | 17.34 | 16,107 |
| S&P 500 Growth Index | 15.16 | 17.53 | 16,186 |
| Large-Cap Growth Funds Average | 16.24 | 15.19 | 15,241 |
| Dow Jones U.S. Total Stock Market | |||
| Float Adjusted Index | 20.15 | 17.40 | 16,132 |
Large-Cap Growth Funds Average: Derived from data provided by Lipper, a Thomson Reuters Company.
"Since Inception" performance is calculated from the ETF Shares’ inception date for both the fund and its comparative standards.
See Financial Highlights for dividend and capital gains information.
22
S&P 500 Growth Index Fund
| Cumulative Returns of ETF Shares: September 7, 2010, Through August 31, 2013 | ||
| Since | ||
| One | Inception | |
| Year | (9/7/2010) | |
| S&P 500 Growth Index Fund ETF Shares Market | ||
| Price | 15.01% | 61.07% |
| S&P 500 Growth Index Fund ETF Shares Net Asset | ||
| Value | 15.00 | 61.08 |
| S&P 500 Growth Index | 15.16 | 61.86 |
| "Since Inception" performance is calculated from the ETF Shares’ inception date for both the fund and its comparative standards. | ||
Fiscal-Year Total Returns (%): September 7, 2010, Through August 31, 2013

Average Annual Total Returns: Periods Ended June 30, 2013
This table presents returns through the latest calendar quarter—rather than through the end of the fiscal period.
Securities and Exchange Commission rules require that we provide this information.
| Inception | One | Since | |
| Date | Year | Inception | |
| ETF Shares | 9/7/2010 | ||
| Market Price | 16.59% | 17.37% | |
| Net Asset Value | 16.60 | 17.36 |
23
S&P 500 Growth Index Fund
Financial Statements
Statement of Net Assets
As of August 31, 2013
The fund reports a complete list of its holdings in regulatory filings four times in each fiscal year, at the quarter-ends. For the second and fourth fiscal quarters, the lists appear in the fund’s semiannual and annual reports to shareholders. For the first and third fiscal quarters, the fund files the lists with the Securities and Exchange Commission on Form N-Q. Shareholders can look up the fund’s Forms N-Q on the SEC’s website at sec.gov. Forms N-Q may also be reviewed and copied at the SEC’s Public Reference Room (see the back cover of this report for further information).
| Market | |||
| Value | |||
| Shares | ($000) | ||
| Common Stocks (99.8%) | |||
| Consumer Discretionary (17.5%) | |||
| Comcast Corp. Class A | 51,852 | 2,182 | |
| Home Depot Inc. | 28,763 | 2,143 | |
| * | Amazon.com Inc. | 7,171 | 2,015 |
| Walt Disney Co. | 24,823 | 1,510 | |
| * | Twenty-First Century | ||
| Fox Inc. | 39,193 | 1,228 | |
| Time Warner Inc. | 18,355 | 1,111 | |
| Starbucks Corp. | 14,742 | 1,040 | |
| McDonald’s Corp. | 10,265 | 969 | |
| Lowe’s Cos. Inc. | 21,116 | 968 | |
| * | priceline.com Inc. | 1,016 | 954 |
| TJX Cos. Inc. | 14,173 | 747 | |
| * | DIRECTV | 11,000 | 640 |
| Time Warner Cable Inc. | 5,727 | 615 | |
| CBS Corp. Class B | 11,240 | 574 | |
| NIKE Inc. Class B | 8,270 | 519 | |
| Yum! Brands Inc. | 5,756 | 403 | |
| Viacom Inc. Class B | 4,920 | 391 | |
| * | Discovery | ||
| Communications Inc. | |||
| Class A | 4,820 | 374 | |
| VF Corp. | 1,726 | 323 | |
| Delphi Automotive plc | 5,726 | 315 | |
| * | Netflix Inc. | 1,106 | 314 |
| * | AutoZone Inc. | 715 | 300 |
| Coach Inc. | 5,534 | 292 | |
| Ross Stores Inc. | 4,331 | 291 | |
| Mattel Inc. | 6,804 | 276 | |
| L Brands Inc. | 4,731 | 271 | |
| * | O’Reilly Automotive Inc. | 2,176 | 267 |
| * | Dollar Tree Inc. | 4,412 | 232 |
| Gap Inc. | 5,712 | 231 | |
| Wynn Resorts Ltd. | 1,573 | 222 | |
| BorgWarner Inc. | 2,275 | 220 | |
| * | Dollar General Corp. | 3,977 | 215 |
| PVH Corp. | 1,594 | 205 | |
| Ralph Lauren Corp. Class A | 1,199 | 198 | |
| Market | |||
| Value | |||
| Shares | ($000) | ||
| * | Chipotle Mexican Grill Inc. | ||
| Class A | 414 | 169 | |
| Omnicom Group Inc. | 2,753 | 167 | |
| Nordstrom Inc. | 2,924 | 163 | |
| * | TripAdvisor Inc. | 2,172 | 161 |
| Harley-Davidson Inc. | 2,645 | 159 | |
| Wyndham Worldwide Corp. | 2,671 | 159 | |
| * | Bed Bath & Beyond Inc. | 2,150 | 159 |
| Starwood Hotels & | |||
| Resorts Worldwide Inc. | 2,336 | 149 | |
| Newell Rubbermaid Inc. | 5,677 | 144 | |
| PetSmart Inc. | 2,037 | 143 | |
| Family Dollar Stores Inc. | 1,876 | 134 | |
| * | CarMax Inc. | 2,738 | 130 |
| Scripps Networks | |||
| Interactive Inc. Class A | 1,673 | 123 | |
| * | Fossil Group Inc. | 1,038 | 121 |
| * | General Motors Co. | 3,331 | 113 |
| Marriott International Inc. | |||
| Class A | 2,687 | 107 | |
| Lennar Corp. Class A | 3,254 | 103 | |
| PulteGroup Inc. | 6,704 | 103 | |
| DR Horton Inc. | 5,513 | 98 | |
| * | Urban Outfitters Inc. | 2,175 | 91 |
| Tiffany & Co. | 1,157 | 89 | |
| Leggett & Platt Inc. | 2,812 | 81 | |
| News Corp. Class A | 4,400 | 69 | |
| H&R Block Inc. | 2,358 | 66 | |
| Expedia Inc. | 1,232 | 58 | |
| Interpublic Group of Cos. | |||
| Inc. | 3,612 | 57 | |
| Gannett Co. Inc. | 2,069 | 50 | |
| * | AutoNation Inc. | 343 | 16 |
| 25,737 | |||
| Consumer Staples (10.5%) | |||
| Coca-Cola Co. | 75,417 | 2,879 | |
| Philip Morris | |||
| International Inc. | 32,203 | 2,687 | |
| PepsiCo Inc. | 30,449 | 2,428 | |
| Procter & Gamble Co. | 26,444 | 2,060 | |
24
S&P 500 Growth Index Fund
| Market | |||
| Value | |||
| Shares | ($000) | ||
| Altria Group Inc. | 22,544 | 764 | |
| Colgate-Palmolive Co. | 10,706 | 618 | |
| Costco Wholesale Corp. | 3,697 | 413 | |
| Kimberly-Clark Corp. | 4,392 | 410 | |
| Whole Foods Market Inc. | 6,790 | 358 | |
| Lorillard Inc. | 7,439 | 315 | |
| General Mills Inc. | 5,714 | 282 | |
| Hershey Co. | 2,949 | 271 | |
| Brown-Forman Corp. | |||
| Class B | 2,984 | 200 | |
| Estee Lauder Cos. Inc. | |||
| Class A | 2,885 | 188 | |
| Dr Pepper Snapple Group | |||
| Inc. | 4,013 | 180 | |
| McCormick & Co. Inc. | 2,600 | 176 | |
| * | Constellation Brands Inc. | ||
| Class A | 3,033 | 164 | |
| * | Monster Beverage Corp. | 2,840 | 163 |
| Kellogg Co. | 2,646 | 161 | |
| Mead Johnson Nutrition Co. | 2,116 | 159 | |
| Reynolds American Inc. | 2,942 | 140 | |
| Clorox Co. | 1,423 | 118 | |
| JM Smucker Co. | 1,099 | 117 | |
| Coca-Cola Enterprises Inc. | 3,042 | 114 | |
| Campbell Soup Co. | 1,824 | 79 | |
| 15,444 | |||
| Energy (6.5%) | |||
| Exxon Mobil Corp. | 47,277 | 4,121 | |
| Schlumberger Ltd. | 15,968 | 1,292 | |
| EOG Resources Inc. | 5,358 | 842 | |
| Pioneer Natural Resources | |||
| Co. | 2,690 | 471 | |
| Anadarko Petroleum Corp. | 5,034 | 460 | |
| Noble Energy Inc. | 7,072 | 434 | |
| Halliburton Co. | 7,302 | 351 | |
| Williams Cos. Inc. | 6,580 | 238 | |
| Marathon Petroleum Corp. | 2,944 | 213 | |
| Cabot Oil & Gas Corp. | 4,986 | 195 | |
| Range Resources Corp. | 1,893 | 142 | |
| * | Southwestern Energy Co. | 3,605 | 138 |
| * | Cameron International Corp. | 2,292 | 130 |
| * | Denbury Resources Inc. | 7,345 | 127 |
| Tesoro Corp. | 2,670 | 123 | |
| EQT Corp. | 1,364 | 117 | |
| * | FMC Technologies Inc. | 2,145 | 115 |
| 9,509 | |||
| Financials (9.4%) | |||
| Bank of America Corp. | 212,265 | 2,997 | |
| American Express Co. | 18,820 | 1,353 | |
| US Bancorp | 36,420 | 1,316 | |
| Simon Property Group Inc. | 3,858 | 562 | |
| American Tower | |||
| Corporation | 7,785 | 541 | |
| Discover Financial Services | 9,657 | 456 | |
| Market | |||
| Value | |||
| Shares | ($000) | ||
| BlackRock Inc. | 1,474 | 384 | |
| Franklin Resources Inc. | 8,161 | 377 | |
| T. Rowe Price Group Inc. | 5,107 | 358 | |
| Bank of New York Mellon | |||
| Corp. | 11,656 | 347 | |
| Health Care REIT Inc. | 5,601 | 344 | |
| Ameriprise Financial Inc. | 3,969 | 342 | |
| Prudential Financial Inc. | 4,222 | 316 | |
| Aon plc | 3,776 | 251 | |
| Moody’s Corp. | 3,822 | 243 | |
| Ventas Inc. | 3,871 | 241 | |
| Public Storage | 1,534 | 234 | |
| Marsh & McLennan Cos. | |||
| Inc. | 5,532 | 228 | |
| SLM Corp. | 8,756 | 210 | |
| McGraw Hill Financial Inc. | 3,511 | 205 | |
| HCP Inc. | 5,005 | 204 | |
| Weyerhaeuser Co. | 7,144 | 196 | |
| M&T Bank Corp. | 1,591 | 180 | |
| Equity Residential | 3,341 | 173 | |
| Invesco Ltd. | 5,685 | 173 | |
| Boston Properties Inc. | 1,614 | 165 | |
| * | IntercontinentalExchange | ||
| Inc. | 916 | 165 | |
| AvalonBay Communities Inc. | 1,244 | 154 | |
| Vornado Realty Trust | 1,676 | 136 | |
| Huntington Bancshares Inc. | 16,510 | 136 | |
| Regions Financial Corp. | 13,340 | 125 | |
| KeyCorp | 9,238 | 108 | |
| Zions Bancorporation | 3,624 | 101 | |
| Kimco Realty Corp. | 4,255 | 85 | |
| * | CBRE Group Inc. Class A | 3,593 | 79 |
| Plum Creek Timber Co. Inc. | 1,694 | 75 | |
| Comerica Inc. | 1,655 | 68 | |
| Macerich Co. | 1,166 | 66 | |
| Apartment Investment & | |||
| Management Co. Class A | 1,531 | 42 | |
| 13,736 | |||
| Health Care (16.5%) | |||
| Merck & Co. Inc. | 59,456 | 2,812 | |
| Johnson & Johnson | 29,313 | 2,533 | |
| Pfizer Inc. | 77,524 | 2,187 | |
| * | Gilead Sciences Inc. | 30,035 | 1,810 |
| Amgen Inc. | 14,767 | 1,609 | |
| AbbVie Inc. | 31,184 | 1,329 | |
| * | Celgene Corp. | 8,214 | 1,150 |
| Eli Lilly & Co. | 19,521 | 1,003 | |
| * | Biogen Idec Inc. | 4,674 | 996 |
| Bristol-Myers Squibb Co. | 18,112 | 755 | |
| Baxter International Inc. | 10,671 | 742 | |
| Abbott Laboratories | 19,338 | 645 | |
| * | Express Scripts Holding Co. | 8,676 | 554 |
| Medtronic Inc. | 9,753 | 505 | |
| Thermo Fisher Scientific Inc. | 4,805 | 427 | |
| * | Alexion Pharmaceuticals Inc. | 3,842 | 414 |
25
S&P 500 Growth Index Fund
| Market | |||
| Value | |||
| Shares | ($000) | ||
| * | Regeneron Pharmaceuticals | ||
| Inc. | 1,503 | 364 | |
| Covidien plc | 5,835 | 347 | |
| * | Actavis Inc. | 2,516 | 340 |
| Allergan Inc. | 3,736 | 330 | |
| Agilent Technologies Inc. | 6,784 | 316 | |
| * | Intuitive Surgical Inc. | 791 | 306 |
| Zoetis Inc. | 9,849 | 287 | |
| * | Mylan Inc. | 7,507 | 265 |
| * | Cerner Corp. | 5,756 | 265 |
| * | Life Technologies Corp. | 3,395 | 253 |
| Perrigo Co. | 1,739 | 211 | |
| Stryker Corp. | 3,059 | 205 | |
| Becton Dickinson and Co. | 1,912 | 186 | |
| Zimmer Holdings Inc. | 2,351 | 186 | |
| * | DaVita HealthCare Partners | ||
| Inc. | 1,667 | 179 | |
| * | Edwards Lifesciences Corp. | 2,221 | 156 |
| * | Boston Scientific Corp. | 11,415 | 121 |
| CR Bard Inc. | 943 | 108 | |
| * | Waters Corp. | 1,027 | 102 |
| * | Varian Medical Systems Inc. | 1,411 | 99 |
| PerkinElmer Inc. | 2,206 | 79 | |
| DENTSPLY International Inc. | 1,717 | 72 | |
| 24,248 | |||
| Industrials (7.9%) | |||
| Union Pacific Corp. | 9,191 | 1,411 | |
| Boeing Co. | 13,445 | 1,397 | |
| 3M Co. | 7,127 | 809 | |
| United Parcel Service Inc. | |||
| Class B | 7,136 | 611 | |
| Honeywell International Inc. | 7,437 | 592 | |
| Illinois Tool Works Inc. | 8,161 | 583 | |
| Danaher Corp. | 6,875 | 450 | |
| Deere & Co. | 5,197 | 435 | |
| Cummins Inc. | 3,474 | 428 | |
| Emerson Electric Co. | 6,369 | 385 | |
| PACCAR Inc. | 6,965 | 373 | |
| Precision Castparts Corp. | 1,614 | 341 | |
| Eaton Corp. plc | 4,567 | 289 | |
| Lockheed Martin Corp. | 2,359 | 289 | |
| Roper Industries Inc. | 1,949 | 241 | |
| Fastenal Co. | 5,320 | 234 | |
| * | Stericycle Inc. | 1,698 | 191 |
| Ingersoll-Rand plc | 3,179 | 188 | |
| WW Grainger Inc. | 742 | 184 | |
| Southwest Airlines Co. | 14,203 | 182 | |
| Rockwell Automation Inc. | 1,787 | 174 | |
| Dover Corp. | 1,885 | 160 | |
| Equifax Inc. | 2,371 | 140 | |
| Kansas City Southern | 1,322 | 139 | |
| Masco Corp. | 7,020 | 133 | |
| Pentair Ltd. | 2,090 | 126 | |
| * | Quanta Services Inc. | 4,195 | 110 |
| Snap-on Inc. | 1,146 | 107 | |
| Market | |||
| Value | |||
| Shares | ($000) | ||
| ADT Corp. | 2,584 | 103 | |
| Flowserve Corp. | 1,773 | 99 | |
| Cintas Corp. | 2,054 | 98 | |
| CH Robinson Worldwide Inc. | 1,611 | 92 | |
| Rockwell Collins Inc. | 1,286 | 91 | |
| Pall Corp. | 1,166 | 81 | |
| Expeditors International of | |||
| Washington Inc. | 1,916 | 78 | |
| Robert Half International Inc. | 1,676 | 59 | |
| Nielsen Holdings NV | 1,356 | 47 | |
| Iron Mountain Inc. | 1,681 | 43 | |
| Xylem Inc. | 1,674 | 41 | |
| Dun & Bradstreet Corp. | 407 | 40 | |
| 11,574 | |||
| Information Technology (27.1%) | |||
| Apple Inc. | 18,482 | 9,002 | |
| * | Google Inc. Class A | 5,292 | 4,482 |
| Microsoft Corp. | 81,394 | 2,719 | |
| Oracle Corp. | 72,347 | 2,305 | |
| QUALCOMM Inc. | 34,021 | 2,255 | |
| Intel Corp. | 97,879 | 2,151 | |
| International Business | |||
| Machines Corp. | 10,672 | 1,945 | |
| Visa Inc. Class A | 9,979 | 1,741 | |
| Mastercard Inc. Class A | 2,059 | 1,248 | |
| Cisco Systems Inc. | 49,458 | 1,153 | |
| * | eBay Inc. | 22,998 | 1,150 |
| EMC Corp. | 41,366 | 1,066 | |
| Accenture plc Class A | 8,323 | 601 | |
| * | Salesforce.com Inc. | 10,683 | 525 |
| Texas Instruments Inc. | 13,316 | 509 | |
| * | Yahoo! Inc. | 18,683 | 507 |
| * | Adobe Systems Inc. | 9,884 | 452 |
| * | Cognizant Technology | ||
| Solutions Corp. Class A | 5,939 | 435 | |
| Automatic Data Processing | |||
| Inc. | 5,542 | 394 | |
| Applied Materials Inc. | 23,660 | 355 | |
| Intuit Inc. | 5,495 | 349 | |
| Broadcom Corp. Class A | 10,350 | 261 | |
| * | Fiserv Inc. | 2,624 | 253 |
| Seagate Technology plc | 6,288 | 241 | |
| Amphenol Corp. Class A | 3,145 | 238 | |
| Symantec Corp. | 8,375 | 215 | |
| * | Red Hat Inc. | 3,728 | 188 |
| * | Teradata Corp. | 3,214 | 188 |
| Analog Devices Inc. | 4,061 | 188 | |
| NetApp Inc. | 4,465 | 185 | |
| TE Connectivity Ltd. | 3,677 | 180 | |
| KLA-Tencor Corp. | 3,262 | 180 | |
| Fidelity National Information | |||
| Services Inc. | 4,037 | 180 | |
| * | Akamai Technologies Inc. | 3,494 | 161 |
| * | Citrix Systems Inc. | 2,134 | 151 |
| * | VeriSign Inc. | 2,964 | 142 |
26
S&P 500 Growth Index Fund
| Market | |||
| Value | |||
| Shares | ($000) | ||
| Paychex Inc. | 3,629 | 140 | |
| Xilinx Inc. | 3,220 | 140 | |
| * | F5 Networks Inc. | 1,551 | 129 |
| Altera Corp. | 3,402 | 120 | |
| * | Micron Technology Inc. | 8,722 | 118 |
| Linear Technology Corp. | 3,080 | 118 | |
| * | Autodesk Inc. | 2,874 | 106 |
| Microchip Technology Inc. | 2,451 | 95 | |
| Computer Sciences Corp. | 1,833 | 92 | |
| * | Lam Research Corp. | 1,889 | 88 |
| * | LSI Corp. | 10,818 | 80 |
| * | BMC Software Inc. | 1,648 | 76 |
| Harris Corp. | 1,189 | 67 | |
| * | JDS Uniphase Corp. | 4,661 | 60 |
| * | Teradyne Inc. | 3,745 | 58 |
| Molex Inc. | 1,450 | 42 | |
| Total System Services Inc. | 1,513 | 42 | |
| 39,866 | |||
| Materials (3.2%) | |||
| Monsanto Co. | 10,512 | 1,029 | |
| EI du Pont de Nemours | |||
| & Co. | 8,877 | 503 | |
| Ecolab Inc. | 5,246 | 479 | |
| PPG Industries Inc. | 2,810 | 439 | |
| Praxair Inc. | 3,320 | 390 | |
| Sherwin-Williams Co. | 1,686 | 291 | |
| Eastman Chemical Co. | 3,055 | 232 | |
| Mosaic Co. | 5,453 | 227 | |
| CF Industries Holdings Inc. | 1,167 | 222 | |
| FMC Corp. | 2,684 | 179 | |
| Nucor Corp. | 3,001 | 136 | |
| Ball Corp. | 2,927 | 130 | |
| Sigma-Aldrich Corp. | 1,374 | 113 | |
| Vulcan Materials Co. | 1,741 | 83 | |
| Airgas Inc. | 740 | 75 | |
| International Flavors | |||
| & Fragrances Inc. | 949 | 75 | |
| Sealed Air Corp. | 1,888 | 54 | |
| Bemis Co. Inc. | 847 | 34 | |
| 4,691 | |||
| Market | ||
| Value | ||
| Shares | ($000) | |
| Telecommunication Services (1.1%) | ||
| Verizon Communications Inc. | 26,478 | 1,254 |
| * Crown Castle International Corp.5,773 | 401 | |
| 1,655 | ||
| Utilities (0.1%) | ||
| Sempra Energy | 2,222 | 188 |
| Total Common Stocks | ||
| (Cost $123,316) | 146,648 | |
| Temporary Cash Investment (0.1%) | ||
| Money Market Fund (0.1%) | ||
| 1 Vanguard Market | ||
| Liquidity Fund, 0.122% | ||
| (Cost $97) | 96,748 | 97 |
| Total Investments (99.9%) | ||
| (Cost $123,413) | 146,745 | |
| Other Assets and Liabilities (0.1%) | ||
| Other Assets | 282 | |
| Liabilities | (182) | |
| 100 | ||
| ETF Shares—Net Assets (100%) | ||
| Applicable to 1,900,000 outstanding | ||
| $.001 par value shares of beneficial | ||
| interest (unlimited authorization) | 146,845 | |
| Net Asset Value Per Share—ETF Shares | $77.29 | |
| At August 31, 2013, net assets consisted of: | |
| Amount | |
| ($000) | |
| Paid-in Capital | 126,575 |
| Undistributed Net Investment Income | 485 |
| Accumulated Net Realized Losses | (3,547) |
| Unrealized Appreciation (Depreciation) | 23,332 |
| Net Assets | 146,845 |
See Note A in Notes to Financial Statements.
* Non-income-producing security.
1 Affiliated money market fund available only to Vanguard funds and certain trusts and accounts managed by Vanguard. Rate shown is the 7-day yield.
REIT—Real Estate Investment Trust.
See accompanying Notes, which are an integral part of the Financial Statements.
27
S&P 500 Growth Index Fund
| Statement of Operations | |
| Year Ended | |
| August 31, 2013 | |
| ($000) | |
| Investment Income | |
| Income | |
| Dividends | 2,330 |
| Securities Lending | 1 |
| Total Income | 2,331 |
| Expenses | |
| The Vanguard Group—Note B | |
| Investment Advisory Services | 10 |
| Management and Administrative | 101 |
| Marketing and Distribution | 21 |
| Custodian Fees | 14 |
| Auditing Fees | 26 |
| Shareholders’ Reports | 6 |
| Total Expenses | 178 |
| Net Investment Income | 2,153 |
| Realized Net Gain (Loss) on Investment Securities Sold | 1,416 |
| Change in Unrealized Appreciation (Depreciation) of Investment Securities | 12,692 |
| Net Increase (Decrease) in Net Assets Resulting from Operations | 16,261 |
See accompanying Notes, which are an integral part of the Financial Statements.
28
S&P 500 Growth Index Fund
| Statement of Changes in Net Assets | ||
| Year Ended August 31, | ||
| 2013 | 2012 | |
| ($000) | ($000) | |
| Increase (Decrease) in Net Assets | ||
| Operations | ||
| Net Investment Income | 2,153 | 1,213 |
| Realized Net Gain (Loss) | 1,416 | 1,005 |
| Change in Unrealized Appreciation (Depreciation) | 12,692 | 8,544 |
| Net Increase (Decrease) in Net Assets Resulting from Operations | 16,261 | 10,762 |
| Distributions | ||
| Net Investment Income | (2,009) | (1,030) |
| Realized Capital Gain | — | — |
| Total Distributions | (2,009) | (1,030) |
| Capital Share Transactions | ||
| Issued | 57,363 | 50,381 |
| Issued in Lieu of Cash Distributions | — | — |
| Redeemed | (20,566) | (20,183) |
| Net Increase (Decrease) from Capital Share Transactions | 36,797 | 30,198 |
| Total Increase (Decrease) | 51,049 | 39,930 |
| Net Assets | ||
| Beginning of Period | 95,796 | 55,866 |
| End of Period1 | 146,845 | 95,796 |
| 1 Net Assets—End of Period includes undistributed net investment income of $485,000 and $341,000. | ||
See accompanying Notes, which are an integral part of the Financial Statements.
29
S&P 500 Growth Index Fund
Financial Highlights
| ETF Shares | |||
| Sept. 7, | |||
| Year Ended | 20101 to | ||
| August 31, | August 31, | ||
| For a Share Outstanding Throughout Each Period | 2013 | 2012 | 2011 |
| Net Asset Value, Beginning of Period | $68.43 | $58.81 | $50.23 |
| Investment Operations | |||
| Net Investment Income | 1.291 | 1.135 | .797 |
| Net Realized and Unrealized Gain (Loss) on Investments | 8.848 | 9.543 | 8.414 |
| Total from Investment Operations | 10.139 | 10.678 | 9.211 |
| Distributions | |||
| Dividends from Net Investment Income | (1.279) | (1.058) | (.631) |
| Distributions from Realized Capital Gains | — | — | — |
| Total Distributions | (1.279) | (1.058) | (.631) |
| Net Asset Value, End of Period | $77.29 | $68.43 | $58.81 |
| Total Return | 15.00% | 18.38% | 18.33% |
| Ratios/Supplemental Data | |||
| Net Assets, End of Period (Millions) | $147 | $96 | $56 |
| Ratio of Total Expenses to Average Net Assets | 0.15% | 0.15% | 0.15%2 |
| Ratio of Net Investment Income to Average Net Assets | 1.81% | 1.82% | 1.63%2 |
| Portfolio Turnover Rate 3 | 24% | 22% | 26% |
1 Inception.
2 Annualized.
3 Excludes the value of portfolio securities received or delivered as a result of in-kind purchases or redemptions of the fund’s capital shares, including ETF Creation Units.
See accompanying Notes, which are an integral part of the Financial Statements.
30
S&P 500 Growth Index Fund
Notes to Financial Statements
Vanguard S&P 500 Growth Index Fund is registered under the Investment Company Act of 1940 as an open-end investment company, or mutual fund. The fund offers two classes of shares: Institutional Shares and ETF Shares. Institutional Shares are designed for investors who meet certain administrative, service, and account-size criteria. The fund has not issued any Institutional Shares as of August 31, 2013. ETF Shares are listed for trading on NYSE Arca; they can be purchased and sold through a broker.
A. The following significant accounting policies conform to generally accepted accounting principles for U.S. mutual funds. The fund consistently follows such policies in preparing its financial statements.
1. Security Valuation: Securities are valued as of the close of trading on the New York Stock Exchange (generally 4 p.m., Eastern time) on the valuation date. Equity securities are valued at the latest quoted sales prices or official closing prices taken from the primary market in which each security trades; such securities not traded on the valuation date are valued at the mean of the latest quoted bid and asked prices. Securities for which market quotations are not readily available, or whose values have been materially affected by events occurring before the fund’s pricing time but after the close of the securities’ primary markets, are valued by methods deemed by the board of trustees to represent fair value. Investments in Vanguard Market Liquidity Fund are valued at that fund’s net asset value.
2. Federal Income Taxes: The fund intends to continue to qualify as a regulated investment company and distribute all of its taxable income. Management has analyzed the fund’s tax positions taken for all open federal income tax years (August 31, 2011–2013), and has concluded that no provision for federal income tax is required in the fund’s financial statements.
3. Distributions: Distributions to shareholders are recorded on the ex-dividend date.
4. Securities Lending: To earn additional income, the fund may lend its securities to qualified institutional borrowers. Security loans are required to be secured at all times by collateral in an amount at least equal to the market value of securities loaned. Daily market fluctuations could cause the value of loaned securities to be more or less than the value of the collateral received. When this occurs, the collateral is adjusted and settled on the next business day. The fund further mitigates its counterparty risk by entering into securities lending transactions only with a diverse group of pre-qualified counter-parties, monitoring their financial strength, and entering into master securities lending agreements with its counterparties. The master securities lending agreements provide that, in the event of a counterparty’s default (including bankruptcy), the fund may terminate any loans with that borrower, determine the net amount owed, and sell or retain the collateral up to the net amount owed to the fund, provided that such actions may be subject to legal proceedings. While collateral mitigates counterparty risk, in the absence of a default, the fund may experience delays and costs in recovering the securities loaned. The fund invests cash collateral received in Vanguard Market Liquidity Fund, and records a liability for the return of the collateral, during the period the securities are on loan. Securities lending income represents fees charged to borrowers plus income earned on invested cash collateral, less expenses associated with the loan.
5. Other: Dividend income is recorded on the ex-dividend date. Security transactions are accounted for on the date securities are bought or sold. Costs used to determine realized gains (losses) on the sale of investment securities are those of the specific securities sold.
B. The Vanguard Group furnishes at cost investment advisory, corporate management, administrative, marketing, and distribution services. The costs of such services are allocated to the fund under methods approved by the board of trustees. The fund has committed to provide up to 0.40% of its net assets in capital contributions to Vanguard. At August 31, 2013, the fund had
31
S&P 500 Growth Index Fund
contributed capital of $18,000 to Vanguard (included in Other Assets), representing 0.01% of the fund’s net assets and 0.01% of Vanguard’s capitalization. The fund’s trustees and officers are also directors and officers of Vanguard.
C. Various inputs may be used to determine the value of the fund’s investments. These inputs are summarized in three broad levels for financial statement purposes. The inputs or methodologies used to value securities are not necessarily an indication of the risk associated with investing in those securities.
Level 1—Quoted prices in active markets for identical securities.
Level 2—Other significant observable inputs (including quoted prices for similar securities, interest rates, prepayment speeds, credit risk, etc.).
Level 3—Significant unobservable inputs (including the fund’s own assumptions used to determine the fair value of investments).
At August 31, 2013, 100% of the market value of the fund’s investments was determined based on Level 1 inputs.
D. Distributions are determined on a tax basis and may differ from net investment income and realized capital gains for financial reporting purposes. Differences may be permanent or temporary. Permanent differences are reclassified among capital accounts in the financial statements to reflect their tax character. Temporary differences arise when certain items of income, expense, gain, or loss are recognized in different periods for financial statement and tax purposes; these differences will reverse at some time in the future. Differences in classification may also result from the treatment of short-term gains as ordinary income for tax purposes.
During the year ended August 31, 2013, the fund realized $2,901,000 of net capital gains resulting from in-kind redemptions—in which shareholders exchanged fund shares for securities held by the fund rather than for cash. Because such gains are not taxable to the fund, and are not distributed to shareholders, they have been reclassified from accumulated net realized losses to paid-in capital.
For tax purposes, at August 31, 2013, the fund had $560,000 of ordinary income available for distribution. At August 31, 2013, the fund had available capital losses totaling $3,547,000 that may be carried forward indefinitely to offset future net capital gains.
At August 31, 2013, the cost of investment securities for tax purposes was $123,413,000. Net unrealized appreciation of investment securities for tax purposes was $23,332,000, consisting of unrealized gains of $23,915,000 on securities that had risen in value since their purchase and $583,000 in unrealized losses on securities that had fallen in value since their purchase.
E. During the year ended August 31, 2013, the fund purchased $85,440,000 of investment securities and sold $48,663,000 of investment securities, other than temporary cash investments. Purchases and sales include $57,331,000 and $19,523,000, respectively, in connection with in-kind purchases and redemptions of the fund’s capital shares.
32
S&P 500 Growth Index Fund
F. Capital shares issued and redeemed were:
| Year Ended August 31, | ||
| 2013 | 2012 | |
| Shares | Shares | |
| (000) | (000) | |
| ETF Shares | ||
| Issued | 800 | 800 |
| Issued in Lieu of Cash Distributions | — | — |
| Redeemed | (300) | (350) |
| Net Increase (Decrease) in Shares Outstanding | 500 | 450 |
G. Management has determined that no material events or transactions occurred subsequent to August 31, 2013, that would require recognition or disclosure in these financial statements.
33
Report of Independent Registered Public Accounting Firm
To the Trustees of Vanguard Admiral Funds and the Shareholders of Vanguard S&P 500 Value Index Fund and Vanguard S&P 500 Growth Index Fund:
In our opinion, the accompanying statements of net assets and the related statements of operations and of changes in net assets and the financial highlights present fairly, in all material respects, the financial position of Vanguard S&P 500 Value Index Fund and Vanguard S&P 500 Growth Index Fund (constituting separate portfolios of Vanguard Admiral Funds, hereafter referred to as the “Funds”) at August 31, 2013, the results of each of their operations for the year then ended, the changes in each of their net assets for each of the two years in the period then ended, and the financial highlights for each of the periods indicated, in conformity with accounting principles generally accepted in the United States of America. These financial statements and financial highlights (hereafter referred to as “financial statements”) are the responsibility of the Funds’ management; our responsibility is to express an opinion on these financial statements based on our audits. We conducted our audits of these financial statements in accordance with the standards of the Public Company Accounting Oversight Board (United States). Those standards require that we plan and perform the audit to obtain reasonable assurance about whether the financial statements are free of material misstatement. An audit includes examining, on a test basis, evidence supporting the amounts and disclosures in the financial statements, assessing the accounting principles used and significant estimates made by management, and evaluating the overall financial statement presentation. We believe that our audits, which included confirmation of securities at August 31, 2013 by correspondence with the custodian and by agreement to the underlying ownership records of the transfer agent, provide a reasonable basis for our opinion.
/s/PricewaterhouseCoopers LLP
Philadelphia, Pennsylvania
October 16, 2013
34
Special 2013 tax information (unaudited) for Vanguard S&P 500 Index Funds
This information for the fiscal year ended August 31, 2013, is included pursuant to provisions of the Internal Revenue Code.
The funds distributed qualified dividend income to shareholders during the period as follows:
| Fund | ($000) |
| S&P 500 Value Index | 1,731 |
| S&P 500 Growth Index | 2,009 |
For corporate shareholders, the percentage of investment income (dividend income plus short-term gains, if any) that qualifies for the dividends-received deduction is as follows:
| Fund | Percentage |
| S&P 500 Value Index | 98.6% |
| S&P 500 Growth Index | 98.5 |
35
Your Fund’s After-Tax Returns
This table presents returns for your fund both before and after taxes. The after-tax returns are shown in two ways: (1) assuming that an investor owned the fund during the entire period and paid taxes on the fund’s distributions, and (2) assuming that an investor paid taxes on the fund’s distributions and sold all shares at the end of each period.
Calculations are based on the highest individual federal income tax and capital gains tax rates in effect at the times of the distributions and the hypothetical sales. State and local taxes were not considered. After-tax returns reflect any qualified dividend income, using actual prior-year figures and estimates for 2013. (In the example, returns after the sale of fund shares may be higher than those assuming no sale. This occurs when the sale would have produced a capital loss. The calculation assumes that the investor received a tax deduction for the loss.)
The table shows returns for ETF Shares only; returns for other share classes will differ. Please note that your actual after-tax returns will depend on your tax situation and may differ from those shown. Also note that if you own the fund in a tax-deferred account, such as an individual retirement account or a 401(k) plan, this information does not apply to you. Such accounts are not subject to current taxes.
Finally, keep in mind that a fund’s performance—whether before or after taxes—does not guarantee future results.
| Average Annual Total Returns: S&P 500 Value and Growth Index Funds | ||
| Periods Ended August 31, 2013 | ||
| Since | ||
| One | Inception | |
| Year | (9/7/2010) | |
| S&P 500 Value Index Fund | ||
| Returns Before Taxes | 22.79% | 16.26% |
| Returns After Taxes on Distributions | 22.25 | 15.88 |
| Returns After Taxes on Distributions and Sale of Fund Shares | 13.47 | 12.86 |
| Since | ||
| One | Inception | |
| Year | (9/7/2010) | |
| S&P 500 Growth Index Fund | ||
| Returns Before Taxes | 15.00% | 17.34% |
| Returns After Taxes on Distributions | 14.60 | 17.04 |
| Returns After Taxes on Distributions and Sale of Fund Shares | 8.93 | 13.74 |
36
About Your Fund’s Expenses
As a shareholder of the fund, you incur ongoing costs, which include costs for portfolio management, administrative services, and shareholder reports (like this one), among others. Operating expenses, which are deducted from a fund’s gross income, directly reduce the investment return of the fund.
A fund’s expenses are expressed as a percentage of its average net assets. This figure is known as the expense ratio. The following examples are intended to help you understand the ongoing costs (in dollars) of investing in your fund and to compare these costs with those of other mutual funds. The examples are based on an investment of $1,000 made at the beginning of the period shown and held for the entire period.
The accompanying table illustrates your fund’s costs in two ways:
• Based on actual fund return. This section helps you to estimate the actual expenses that you paid over the period. The ”Ending Account Value“ shown is derived from the fund‘s actual return, and the third column shows the dollar amount that would have been paid by an investor who started with $1,000 in the fund. You may use the information here, together with the amount you invested, to estimate the expenses that you paid over the period.
To do so, simply divide your account value by $1,000 (for example, an $8,600 account value divided by $1,000 = 8.6), then multiply the result by the number given for your fund under the heading ”Expenses Paid During Period.“
• Based on hypothetical 5% yearly return. This section is intended to help you compare your fund‘s costs with those of other mutual funds. It assumes that the fund had a yearly return of 5% before expenses, but that the expense ratio is unchanged. In this case—because the return used is not the fund’s actual return—the results do not apply to your investment. The example is useful in making comparisons because the Securities and Exchange Commission requires all mutual funds to calculate expenses based on a 5% return. You can assess your fund’s costs by comparing this hypothetical example with the hypothetical examples that appear in shareholder reports of other funds.
Note that the expenses shown in the table are meant to highlight and help you compare ongoing costs only and do not reflect transaction costs incurred by the fund for buying and selling securities. Further, the expenses do not include any purchase, redemption, or account service fees described in the fund prospectus. If such fees were applied to your account, your costs would be higher. Your fund does not carry a “sales load.”
The calculations assume no shares were bought or sold during the period. Your actual costs may have been higher or lower, depending on the amount of your investment and the timing of any purchases or redemptions.
You can find more information about the fund’s expenses, including annual expense ratios, in the Financial Statements section of this report. For additional information on operating expenses and other shareholder costs, please refer to your fund’s current prospectus.
37
| Six Months Ended August 31, 2013 | |||
| Beginning | Ending | Expenses | |
| Account Value | Account Value | Paid During | |
| 2/28/2013 | 8/31/2013 | Period | |
| Based on Actual Fund Return | |||
| S&P 500 Value Index Fund | |||
| ETF Shares | $1,000.00 | $1,085.69 | $0.79 |
| S&P 500 Growth Index Fund | |||
| ETF Shares | $1,000.00 | $1,091.78 | $0.79 |
| Based on Hypothetical 5% Yearly Return | |||
| S&P 500 Value Index Fund | |||
| ETF Shares | $1,000.00 | $1,024.45 | $0.77 |
| S&P 500 Growth Index Fund | |||
| ETF Shares | $1,000.00 | $1,024.45 | $0.77 |
The calculations are based on expenses incurred in the most recent six-month period. The funds’ annualized six-month expense ratios for that period are: for the S&P Value Index Fund, 0.15%; and for the S&P Growth Index Fund, 0.15%. The dollar amounts shown as “Expenses Paid” are equal to the annualized expense ratio multiplied by the average account value over the period, multiplied by the number of days in the most recent six-month peiod, then divided by the number of days in the most recent 12-month period.
38
Trustees Approve Advisory Arrangement
The board of trustees of Vanguard S&P 500 Value Index Fund, and S&P 500 Growth Index Fund has renewed the funds’ investment advisory arrangement with The Vanguard Group, Inc. (Vanguard). Vanguard—through its Equity Investment Group—serves as investment advisor to the funds. The board determined that continuing the funds’ internalized management structure was in the best interest of the funds and their shareholders.
The board based its decision upon an evaluation of the advisor’s investment staff, portfolio management process, and performance. The trustees considered the factors discussed below, among others. However, no single factor determined whether the board approved the arrangement. Rather, it was the totality of the circumstances that drove the board’s decision.
Nature, extent, and quality of services
The board considered the quality of the investment management services provided to the funds since their inception in 2010, and took into account the organizational depth and stability of the advisor. The board noted that Vanguard has been managing investments for more than three decades. The Equity Investment Group adheres to a sound, disciplined investment management process; the team has considerable experience, stability, and depth.
The board concluded that Vanguard’s experience, stability, depth, and performance, among other factors, warranted approval of the advisory arrangement.
Investment performance
The board considered the funds’ performance since their inception, including any periods of outperformance or underperformance relative to a target index and peer group. The board concluded that the performance was such that the advisory arrangement should continue. Information about each fund’s most recent performance can be found in the Performance Summary pages of this report.
Cost
The board concluded that each fund’s expense ratio was well below the average expense ratios charged by funds in its respective peer group and that the funds’ advisory fee rates were also well below their peer group averages. Information about the funds’ expenses appears in the About Your Fund’s Expenses section of this report as well as in the Financial Statements sections.
The board does not conduct a profitability analysis of Vanguard, because of Vanguard’s unique “at-cost” structure. Unlike most other mutual fund management companies, Vanguard is owned by the funds it oversees, and produces “profits” only in the form of reduced expenses for fund shareholders.
The benefit of economies of scale
The board concluded that the funds’ at-cost arrangement with Vanguard ensures that the funds will realize economies of scale as they grow, with the cost to shareholders declining as fund assets increase.
The board will consider whether to renew the advisory arrangement again after a one-year period.
39
Glossary
30-Day SEC Yield. A fund’s 30-day SEC yield is derived using a formula specified by the U.S. Securities and Exchange Commission. Under the formula, data related to the fund’s security holdings in the previous 30 days are used to calculate the fund’s hypothetical net income for that period, which is then annualized and divided by the fund’s estimated average net assets over the calculation period. For the purposes of this calculation, a security’s income is based on its current market yield to maturity (for bonds), its actual income (for asset-backed securities), or its projected dividend yield (for stocks). Because the SEC yield represents hypothetical annualized income, it will differ—at times significantly—from the fund’s actual experience. As a result, the fund’s income distributions may be higher or lower than implied by the SEC yield.
Dividend Yield. Dividend income earned by stocks, expressed as a percentage of the aggregate market value (or of net asset value, for a fund). The yield is determined by dividing the amount of the annual dividends by the aggregate value (or net asset value) at the end of the period. For a fund, the dividend yield is based solely on stock holdings and does not include any income produced by other investments.
Earnings Growth Rate. The average annual rate of growth in earnings over the past five years for the stocks now in a fund.
Equity Exposure. A measure that reflects a fund’s investments in stocks and stock futures. Any holdings in short-term reserves are excluded.
Expense Ratio. A fund’s total annual operating expenses expressed as a percentage of the fund’s average net assets. The expense ratio includes management and administrative expenses, but does not include the transaction costs of buying and selling portfolio securities.
Foreign Holdings. The percentage of a fund represented by securities or depositary receipts of companies based outside the United States.
Inception Date. The date on which the assets of a fund (or one of its share classes) are first invested in accordance with the fund’s investment objective. For funds with a subscription period, the inception date is the day after that period ends. Investment performance is measured from the inception date.
Median Market Cap. An indicator of the size of companies in which a fund invests; the midpoint of market capitalization (market price x shares outstanding) of a fund’s stocks, weighted by the proportion of the fund’s assets invested in each stock. Stocks representing half of the fund’s assets have market capitalizations above the median, and the rest are below it.
Price/Book Ratio. The share price of a stock divided by its net worth, or book value, per share. For a fund, the weighted average price/book ratio of the stocks it holds.
Price/Earnings Ratio. The ratio of a stock’s current price to its per-share earnings over the past year. For a fund, the weighted average P/E of the stocks it holds. P/E is an indicator of market expectations about corporate prospects; the higher the P/E, the greater the expectations for a company’s future growth.
Return on Equity. The annual average rate of return generated by a company during the past five years for each dollar of shareholder’s equity (net income divided by shareholder’s equity). For a fund, the weighted average return on equity for the companies whose stocks it holds.
40
Short-Term Reserves. The percentage of a fund invested in highly liquid, short-term securities that can be readily converted to cash.
Turnover Rate. An indication of the fund’s trading activity. Funds with high turnover rates incur higher transaction costs and may be more likely to distribute capital gains (which may be taxable to investors). The turnover rate excludes in-kind transactions, which have minimal impact on costs.
41
This page intentionally left blank.
This page intentionally left blank.
The People Who Govern Your Fund
The trustees of your mutual fund are there to see that the fund is operated and managed in your best interests since, as a shareholder, you are a part owner of the fund. Your fund’s trustees also serve on the board of directors of The Vanguard Group, Inc., which is owned by the Vanguard funds and provides services to them on an at-cost basis.
A majority of Vanguard’s board members are independent, meaning that they have no affiliation with Vanguard or the funds they oversee, apart from the sizable personal investments they have made as private individuals. The independent board members have distinguished backgrounds in business, academia, and public service. Each of the trustees and executive officers oversees 181 Vanguard funds.
The following table provides information for each trustee and executive officer of the fund. More information about the trustees is in the Statement of Additional Information, which can be obtained, without charge, by contacting Vanguard at 800-662-7447, or online at vanguard.com.
| InterestedTrustee1 | and Delphi Automotive LLP (automotive components); |
| Senior Advisor at New Mountain Capital; Trustee of | |
| F. William McNabb III | The Conference Board. |
| Born 1957. Trustee Since July 2009. Chairman of the | |
| Board. Principal Occupation(s) During the Past Five | Amy Gutmann |
| Years: Chairman of the Board of The Vanguard Group, | Born 1949. Trustee Since June 2006. Principal |
| Inc., and of each of the investment companies served | Occupation(s) During the Past Five Years: President |
| by The Vanguard Group, since January 2010; Director | of the University of Pennsylvania; Christopher H. |
| of The Vanguard Group since 2008; Chief Executive | Browne Distinguished Professor of Political Science |
| Officer and President of The Vanguard Group and of | in the School of Arts and Sciences with secondary |
| each of the investment companies served by The | appointments at the Annenberg School for |
| Vanguard Group since 2008; Director of Vanguard | Communication and the Graduate School of Education |
| Marketing Corporation; Managing Director of The | of the University of Pennsylvania; Member of the |
| Vanguard Group (1995–2008). | National Commission on the Humanities and Social |
| Sciences; Trustee of Carnegie Corporation of New | |
| IndependentTrustees | York and of the National Constitution Center; Chair |
| of the U. S. Presidential Commission for the Study | |
| Emerson U. Fullwood | of Bioethical Issues. |
| Born 1948. Trustee Since January 2008. Principal | |
| Occupation(s) During the Past Five Years: Executive | JoAnn Heffernan Heisen |
| Chief Staff and Marketing Officer for North America | Born 1950. Trustee Since July 1998. Principal |
| and Corporate Vice President (retired 2008) of Xerox | Occupation(s) During the Past Five Years: Corporate |
| Corporation (document management products and | Vice President and Chief Global Diversity Officer |
| services); Executive in Residence and 2010 | (retired 2008) and Member of the Executive |
| Distinguished Minett Professor at the Rochester | Committee (1997–2008) of Johnson & Johnson |
| Institute of Technology; Director of SPX Corporation | (pharmaceuticals/medical devices/consumer |
| (multi-industry manufacturing), the United Way of | products); Director of Skytop Lodge Corporation |
| Rochester, Amerigroup Corporation (managed health | (hotels), the University Medical Center at Princeton, |
| care), the University of Rochester Medical Center, | the Robert Wood Johnson Foundation, and the Center |
| Monroe Community College Foundation, and North | for Talent Innovation; Member of the Advisory Board |
| Carolina A&T University. | of the Maxwell School of Citizenship and Public Affairs |
| at Syracuse University. | |
| Rajiv L. Gupta | F. Joseph Loughrey |
| Born 1945. Trustee Since December 2001.2 | Born 1949. Trustee Since October 2009. Principal |
| Principal Occupation(s) During the Past Five Years: | Occupation(s) During the Past Five Years: President |
| Chairman and Chief Executive Officer (retired 2009) | and Chief Operating Officer (retired 2009) of Cummins |
| and President (2006–2008) of Rohm and Haas Co. | Inc. (industrial machinery); Chairman of the Board of |
| (chemicals); Director of Tyco International, Ltd. | Hillenbrand, Inc. (specialized consumer services) and |
| (diversified manufacturing and services), Hewlett- | of Oxfam America; Director of SKF AB (industrial |
| Packard Co. (electronic computer manufacturing), | |
| machinery) and the Lumina Foundation for Education; | Executive Officers | |
| Member of the Advisory Council for the College of | ||
| Arts and Letters and of the Advisory Board to the | Glenn Booraem | |
| Kellogg Institute for International Studies, both at | Born 1967. Controller Since July 2010. Principal | |
| the University of Notre Dame. | Occupation(s) During the Past Five Years: Principal | |
| of The Vanguard Group, Inc.; Controller of each of | ||
| Mark Loughridge | the investment companies served by The Vanguard | |
| Born 1953. Trustee Since March 2012. Principal | Group; Assistant Controller of each of the investment | |
| Occupation(s) During the Past Five Years: Senior Vice | companies served by The Vanguard Group (2001–2010). | |
| President and Chief Financial Officer at IBM (information | ||
| technology services); Fiduciary Member of IBM’s | Thomas J. Higgins | |
| Retirement Plan Committee. | Born 1957. Chief Financial Officer Since September | |
| 2008. Principal Occupation(s) During the Past Five | ||
| Scott C. Malpass | Years: Principal of The Vanguard Group, Inc.; Chief | |
| Born 1962. Trustee Since March 2012. Principal | Financial Officer of each of the investment companies | |
| Occupation(s) During the Past Five Years: Chief | served by The Vanguard Group; Treasurer of each of | |
| Investment Officer and Vice President at the University | the investment companies served by The Vanguard | |
| of Notre Dame; Assistant Professor of Finance at the | Group (1998–2008). | |
| Mendoza College of Business at Notre Dame; Member | ||
| of the Notre Dame 403(b) Investment Committee; | Kathryn J. Hyatt | |
| Director of TIFF Advisory Services, Inc. (investment | Born 1955. Treasurer Since November 2008. Principal | |
| advisor); Member of the Investment Advisory | Occupation(s) During the Past Five Years: Principal of | |
| Committees of the Financial Industry Regulatory | The Vanguard Group, Inc.; Treasurer of each of the | |
| Authority (FINRA) and of Major League Baseball. | investment companies served by The Vanguard | |
| Group; Assistant Treasurer of each of the investment | ||
| André F. Perold | companies served by The Vanguard Group (1988–2008). | |
| Born 1952. Trustee Since December 2004. Principal | ||
| Occupation(s) During the Past Five Years: George | Heidi Stam | |
| Gund Professor of Finance and Banking at the Harvard | Born 1956. Secretary Since July 2005. Principal | |
| Business School (retired 2011); Chief Investment | Occupation(s) During the Past Five Years: Managing | |
| Officer and Managing Partner of HighVista Strategies | Director of The Vanguard Group, Inc.; General Counsel | |
| LLC (private investment firm); Director of Rand | of The Vanguard Group; Secretary of The Vanguard | |
| Merchant Bank; Overseer of the Museum of Fine | Group and of each of the investment companies | |
| Arts Boston. | served by The Vanguard Group; Director and Senior | |
| Vice President of Vanguard Marketing Corporation. | ||
| Alfred M. Rankin, Jr. | ||
| Born 1941. Trustee Since January 1993. Principal | Vanguard Senior ManagementTeam | |
| Occupation(s) During the Past Five Years: Chairman, | ||
| President, and Chief Executive Officer of NACCO | Mortimer J. Buckley | Chris D. McIsaac |
| Industries, Inc. (housewares/lignite) and of Hyster-Yale | Kathleen C. Gubanich | Michael S. Miller |
| Materials Handling, Inc. (forklift trucks); Director of | Paul A. Heller | James M. Norris |
| the National Association of Manufacturers; Chairman | Martha G. King | Glenn W. Reed |
| of the Board of University Hospitals of Cleveland; | John T. Marcante | |
| Advisory Chairman of the Board of The Cleveland | ||
| Museum of Art. | ||
| Chairman Emeritus and Senior Advisor | ||
| Peter F. Volanakis | ||
| Born 1955. Trustee Since July 2009. Principal | John J. Brennan | |
| Occupation(s) During the Past Five Years: President | Chairman, 1996–2009 | |
| and Chief Operating Officer (retired 2010) of Corning | Chief Executive Officer and President, 1996–2008 | |
| Incorporated (communications equipment); Director | ||
| of SPX Corporation (multi-industry manufacturing); | Founder | |
| Overseer of the Amos Tuck School of Business | ||
| Administration at Dartmouth College; Advisor to the | John C. Bogle | |
| Norris Cotton Cancer Center. | Chairman and Chief Executive Officer, 1974–1996 | |
1 Mr. McNabb is considered an “interested person,” as defined in the Investment Company Act of 1940, because he is an officer of the Vanguard funds.
2 December 2002 for Vanguard Equity Income Fund, Vanguard Growth Equity Fund, the Vanguard Municipal Bond Funds, and the Vanguard State Tax-Exempt Funds.
 | |
| P.O. Box 2600 | |
| Valley Forge, PA 19482-2600 |
Connect with Vanguard® > vanguard.com
| S&P® and S&P 500® are registered trademarks of | |
| Fund Information > 800-662-7447 | Standard & Poor’s Financial Services LLC (“S&P”) and |
| Direct Investor Account Services > 800-662-2739 | have been licensed for use by S&P Dow Jones Indices |
| Institutional Investor Services > 800-523-1036 | LLC and its affiliates and sublicensed for certain |
| Text Telephone for People | purposes by Vanguard. The S&P Index is a product of |
| With Hearing Impairment > 800-749-7273 | S&P Dow Jones Indices LLC and has been licensed for |
| use by Vanguard. The Vanguard funds are not | |
| This material may be used in conjunction | sponsored, endorsed, sold, or promoted by S&P Dow |
| with the offering of shares of any Vanguard | Jones Indices LLC, Dow Jones, S&P, or their respective |
| fund only if preceded or accompanied by | affiliates, and none of S&P Dow Jones Indices LLC, |
| the fund’s current prospectus. | Dow Jones, S&P, nor their respective affiliates makes |
| any representation regarding the advisability of | |
| All comparative mutual fund data are from Lipper, a | investing in such products. |
| Thomson Reuters Company, or Morningstar, Inc., unless | |
| otherwise noted. | |
| You can obtain a free copy of Vanguard’s proxy voting | |
| guidelines by visiting vanguard.com/proxyreporting or by | |
| calling Vanguard at 800-662-2739. The guidelines are | |
| also available from the SEC’s website, sec.gov. In | |
| addition, you may obtain a free report on how your fund | |
| voted the proxies for securities it owned during the 12 | |
| months ended June 30. To get the report, visit either | |
| vanguard.com/proxyreporting or sec.gov. | |
| You can review and copy information about your fund at | |
| the SEC’s Public Reference Room in Washington, D.C. To | |
| find out more about this public service, call the SEC at | |
| 202-551-8090. Information about your fund is also | |
| available on the SEC’s website, and you can receive | |
| copies of this information, for a fee, by sending a | |
| request in either of two ways: via e-mail addressed to | |
| publicinfo@sec.gov or via regular mail addressed to the | |
| Public Reference Section, Securities and Exchange | |
| Commission, Washington, DC 20549-1520. | |
| © 2013 The Vanguard Group, Inc. | |
| All rights reserved. | |
| Vanguard Marketing Corporation, Distributor. | |
| Q18400 102013 | |
|
| Annual Report | August 31, 2013 |
| Vanguard S&P Small-Cap 600 |
| Index Funds |
 |
Vanguard’s Principles for Investing Success
We want to give you the best chance of investment success. These principles, grounded in Vanguard’s research and experience, can put you on the right path.
Goals. Create clear, appropriate investment goals.
Balance. Develop a suitable asset allocation using broadly diversified funds.
Cost. Minimize cost.
Discipline. Maintain perspective and long-term discipline.
A single theme unites these principles: Focus on the things you can control.
We believe there is no wiser course for any investor.
| Contents | |
| Your Fund’s Total Returns. | 1 |
| Chairman’s Letter. | 2 |
| S&P Small-Cap 600 Index Fund. | 9 |
| S&P Small-Cap 600 Value Index Fund. | 28 |
| S&P Small-Cap 600 Growth Index Fund. | 42 |
| Your Fund’s After-Tax Returns. | 58 |
| About Your Fund’s Expenses. | 59 |
| Trustees Approve Advisory Arrangement. | 61 |
| Glossary. | 62 |
Please note: The opinions expressed in this report are just that—informed opinions. They should not be considered promises or advice. Also, please keep in mind that the information and opinions cover the period through the date on the front of this report. Of course, the risks of investing in your fund are spelled out in the prospectus.
See the Glossary for definitions of investment terms used in this report.
About the cover: The ship's wheel represents leadership and guidance, essential qualities in navigating difficult seas. This one is a replica based on an 18th-century British vessel. The HMS Vanguard, another ship of that era, served as the flagship for Admiral Horatio Nelson when he defeated a French fleet at the Battle of the Nile.
Your Fund’s Total Returns
| Fiscal Year Ended August 31, 2013 | |
| Total | |
| Returns | |
| Vanguard S&P Small-Cap 600 Index Fund | |
| Institutional Shares | 26.65% |
| ETF Shares | |
| Market Price | 26.54 |
| Net Asset Value | 26.57 |
| S&P SmallCap 600 Index | 26.69 |
| Small-Cap Core Funds Average | 25.00 |
| Small-Cap Core Funds Average: Derived from data provided by Lipper, a Thomson Reuters Company. | |
| Vanguard S&P Small-Cap 600 Value Index Fund | |
| ETF Shares | |
| Market Price | 27.84% |
| Net Asset Value | 27.45 |
| S&P SmallCap 600 Value Index | 27.72 |
| Small-Cap Value Funds Average | 26.46 |
| Small-Cap Value Funds Average: Derived from data provided by Lipper, a Thomson Reuters Company. | |
| Vanguard S&P Small-Cap 600 Growth Index Fund | |
| ETF Shares | |
| Market Price | 25.70% |
| Net Asset Value | 25.59 |
| S&P SmallCap 600 Growth Index | 25.77 |
| Small-Cap Growth Funds Average | 25.95 |
| Small-Cap Growth Funds Average: Derived from data provided by Lipper, a Thomson Reuters Company. | |
Institutional Shares are available to certain institutional investors who meet specific administrative, service, and account-size criteria. The Vanguard ETF® Shares shown are traded on the NYSE Arca exchange and are available only through brokers. The table provides ETF returns based on both the NYSE Arca market price and the net asset value for a share. U.S. Pat. No. 6,879,964; 7,337,138; 7,720,749; 7,925,573; 8,090,646.
For the ETF Shares, the market price is determined by the midpoint of the bid-offer spread as of the closing time of the New York Stock Exchange (generally 4 p.m., Eastern time). The net asset value is also determined as of the NYSE closing time. For more information about how the ETF Shares' market prices have compared with their net asset value, visit vanguard.com, select your ETF, and then select the Price and Performance tab. The ETF premium/discount analysis there shows the percentages of days on which the ETF Shares' market price was above or below the NAV.
1

Chairman’s Letter
Dear Shareholder,
Sluggish but sustained growth in the U.S. economy was enough to lift investor sentiment and push the broad stock market significantly higher during the fiscal year. Small-capitalization stocks led the surge, outperforming their larger-cap counterparts.
For the 12 months ended August 31, 2013, value stocks garnered slightly more investor favor, with the S&P Small-Cap 600 Value Index Fund advancing 27.45%. (The returns cited in this letter are for ETF Shares based on net asset value.) The return of the S&P Small-Cap 600 Growth Index Fund was lower at 25.59%, while the return of the S&P Small-Cap 600 Index Fund, which includes growth and value stocks, fell between the two others at 26.57%.
All three funds met their investment objective of closely tracking the returns of their target indexes. The broader S&P Small-Cap 600 Index Fund and the value fund each finished the year with a return that was higher than the average return of its peer group, while the growth fund did not.
If you hold shares of your fund in a taxable account, you may wish to review the information on the fund’s after-tax returns that appears later in this report.
Stocks posted robust results despite setbacks at the finish
U.S. stocks advanced about 20% in the 12 months ended August 31 despite slipping in October because of concerns about the
2
so-called fiscal cliff and in June and August on the possibility that the Federal Reserve would begin scaling back its stimulative bond-buying program sooner rather than later. Heightened strife in the Middle East also contributed to anxiety in the global markets.
Through most of the fiscal year, U.S. stocks rallied as the economy continued to show modest growth and investors appeared more receptive to risk.
International stocks in aggregate finished with a return of about 13%. Developed markets in the Pacific region and Europe posted results closer to those of the United States. Returns for emerging-market stocks were virtually flat as growth slowed in China and Brazil.
Although global economic worries and tensions over conflicts abroad have unsettled markets, Jonathan Lemco, a senior sovereign-debt analyst in the Vanguard Taxable Credit Research Group, pointed out that investors can still manage risks amid international instability. “Vanguard believes a diversified portfolio is the best way to spread the risk of geopolitical uncertainty,” he said.
Bond returns turned negative
amid worry about the Fed’s next plans Bonds, which maintained slightly positive returns overall through the first eight months of the period, reversed course in May and then continued to retreat as investors anticipated reductions in the Fed’s bond-buying program.
| Market Barometer | |||
| Average Annual Total Returns | |||
| Periods Ended August 31, 2013 | |||
| One | Three | Five | |
| Year | Years | Years | |
| Stocks | |||
| Russell 1000 Index (Large-caps) | 19.84% | 18.74% | 7.59% |
| Russell 2000 Index (Small-caps) | 26.27 | 20.50 | 7.98 |
| Russell 3000 Index (Broad U.S. market) | 20.32 | 18.87 | 7.63 |
| MSCI All Country World Index ex USA (International) | 12.98 | 6.93 | 1.48 |
| Bonds | |||
| Barclays U.S. Aggregate Bond Index (Broad taxable market) | -2.47% | 2.58% | 4.93% |
| Barclays Municipal Bond Index (Broad tax-exempt market) | -3.70 | 2.45 | 4.52 |
| Citigroup Three-Month U.S. Treasury Bill Index | 0.07 | 0.08 | 0.17 |
| CPI | |||
| Consumer Price Index | 1.52% | 2.32% | 1.32% |
3
The broad U.S. taxable bond market returned –2.47% for the 12 months. The yield of the 10-year Treasury note finished at 2.76%, up from 1.56% at the end of August 2012. (Bond yields and prices move in opposite directions.) Municipal bonds suffered more, returning –3.70% for the fiscal year.
Returns for money markets and savings accounts were minuscule as the Fed kept its target for short-term interest rates between 0% and 0.25%.
A rising tide lifted nearly all stocks
Small-cap stocks, which tend to benefit first from a strengthening economy, rose faster than larger-cap stocks for the 12-month period. Eight of the ten sectors that make up the S&P Small-Cap 600 Index Fund posted returns in excess of 20%.
Consumer confidence improved over the period as the housing market continued to recover and the unemployment rate ticked down. That helped drive sector returns of about 30% or more for consumer discretionary and industrials in the S&P Small-Cap 600 Index Fund. Among the stocks posting the highest gains were retailers, restaurants, and building product manufacturers. An even higher return from its consumer discretionary stocks and a heavier weighting in industrials helped the value fund outpace the returns of the two other funds for the period.
| Expense Ratios | |||
| Your Fund Compared With Its Peer Group | |||
| Institutional | ETF | Peer Group | |
| Shares | Shares | Average | |
| S&P Small-Cap 600 Index Fund | 0.10% | 0.17% | 1.34% |
| S&P Small-Cap 600 Value Index Fund | — | 0.24 | 1.40 |
| S&P Small-Cap 600 Growth Index Fund | — | 0.20 | 1.47 |
The fund expense ratios shown are from the prospectus dated December 28, 2012, and represent estimated costs for the current fiscal year. For fiscal year ended August 31, 2013, the funds’ expense ratios were: for the S&P Small-Cap 600 Index Fund, 0.08% for Institutional Shares and 0.15% for ETF Shares; for the S&P Small-Cap 600 Value Index Fund, 0.20% for ETF Shares; and for the S&P Small-Cap 600 Growth Index Fund, 0.20% for ETF Shares. Peer-group expense ratios are derived from data provided by Lipper, a Thomson Reuters Company, and capture information through year-end 2012.
Peer groups: For the S&P Small-Cap 600 Index Fund, Small-Cap Core Funds; for the S&P Small-Cap 600 Value Index Fund, Small-Cap Value Funds; and for the S&P Small-Cap 600 Growth Index Fund, Small-Cap Growth Funds.
4
The technology sector was another strong performer, generating returns of 27% or more for the three funds, with electronic equipment manufacturers and software developers leading the way. Here, the stocks in the value fund performed better, but the growth fund invested more of its assets in the sector.
Financials were another heavyweight, accounting for about 20% or more of the assets in each fund at the end of the period. Banks in particular continued to recover amid strong corporate earnings, healthier balance sheets, and increased lending activity. The sector as a whole, however, returned roughly 20% for the funds, which was among the lower range of sector returns.
Utilities also turned in a subpar performance for all three funds. Given the improvement in the economic outlook, investors were less drawn to the relative stability of earnings in this sector. The same was true of some telecommunication services stocks, although they didn’t dampen performance much, as the sector constituted only a very small part of each fund’s assets.
Track records are short but strong for all three S&P small-cap funds
The S&P Small-Cap 600 Index Funds were launched just over three years ago, on September 7, 2010. Since then, they have posted average annual returns of about 20% to 22%.
Timing was admittedly on their side; these funds started operations shortly after the stock market began to rebound from the steep price declines of 2008–2009. Although that timing contributed to their impressive absolute returns, credit is due to the funds’ advisor, Vanguard Equity Investment Group, for capturing so much of the performance of their target indexes. The advisor’s deep
| A note on expense ratios |
| The Expense Ratios table in each shareholder report’s Chairman’s Letter displays |
| fund expense ratios from the most recent prospectus. These figures include |
| the funds’ actual operating expenses. For some funds, the figures also include |
| “acquired fund fees and expenses,” which result from the funds’ holdings in |
| business development companies (BDCs). |
| Although the Securities and Exchange Commission requires that BDC costs be |
| included in a fund’s expense ratio, these fees are not incurred by the fund. They |
| have no impact on a fund’s total return or on its tracking error relative to an index. |
| A footnote to the Expense Ratios table reports the fund’s actual expenses for the |
| fiscal year, a more relevant tally of the operating costs incurred by shareholders. |
5
| Investment insight |
| Growth stocks versus value stocks: A case for both |
| Growth and value stocks typically take turns outperforming each other. The chart |
| here shows how they have switched off during the past 17 years in leading or |
| lagging a broader market average. |
| These two styles of investing are typically considered complementary—when growth |
| is performing well, value typically isn’t, and vice versa. Generally speaking, growth |
| stocks represent companies that are expected to expand their businesses at a rapid |
| pace, while value stocks typically represent more established, slower-growing |
| companies. |
| Which does better in the long run? Neither. Vanguard research has shown that there |
| is no significant long-term difference in the risk/reward characteristics of growth and |
| value stocks. But, because their performance can vary considerably over shorter time |
| periods, a truly diversified portfolio should have exposure to both. |
| Rolling 12-month return differences, 1996–2012 |
 |
6
experience and sophisticated portfolio tracking techniques, along with its ability to keep costs low, also enabled all three funds since their inception to outpace the average annual returns of their peer groups.
In challenging markets, index funds can be a solid portfolio foundation
As you know, index funds seek to capture the return of the market they track, minus only their operating expenses, which—at least at Vanguard—are typically very low. The funds do so by investing in an entire market or segment of it, or by relying on a sophisticated market-sampling technique.
In actively managed funds, by contrast, advisors troll the markets and reel in selected stocks or bonds that their analysis suggests will allow them to outperform their benchmarks. As we show in The Case for Index-Fund Investing, a paper available at vanguard.com/research, there’s typically a big gap between hope and reality: Consistent outperformance by any one active manager has been rare.
I use the word “typically” because we believe that some actively managed funds, including Vanguard’s, can increase the odds of outperforming benchmarks over the long term. As demonstrated in a companion paper, The Case for Vanguard Active Management: Solving the Low-Cost/Top-Talent Paradox? (also available at vanguard.com/research), the most reliable quantitative indicator of future manager success is low expenses—a Vanguard hallmark. And, as the paper’s title implies, finding talented advisors is a key aspect of active investing. We believe we have the process in place to identify the best.
Even so, investors in actively managed funds should expect, and be comfortable with, the extended periods of under-performance that actively managed funds can undergo. The challenges of active investing point to the potential benefits of indexing. Well-run index funds can offer you virtually the market return, year in and year out. In a portfolio that is diversified within asset classes, and balanced among them, low-cost index funds can be the bedrock of a sound investment plan.
As always, thank you for entrusting your assets to Vanguard.
Sincerely,

F. William McNabb III
Chairman and Chief Executive Officer
September 19, 2013
7
| Your Fund’s Performance at a Glance | ||||
| August 31, 2012, Through August 31, 2013 | ||||
| Distributions Per Share | ||||
| Starting | Ending | Income | Capital | |
| Share Price | Share Price | Dividends | Gains | |
| Vanguard S&P Small-Cap 600 Index Fund | ||||
| Institutional Shares | $136.79 | $170.71 | $2.094 | $0.000 |
| ETF Shares | 68.12 | 84.98 | 1.018 | 0.000 |
| Vanguard S&P Small-Cap 600 Value Index Fund | ||||
| ETF Shares | $65.79 | $82.76 | $0.907 | $0.000 |
| Vanguard S&P Small-Cap 600 Growth Index | ||||
| Fund | ||||
| ETF Shares | $70.70 | $87.79 | $0.815 | $0.000 |
8
S&P Small-Cap 600 Index Fund
Fund Profile
As of August 31, 2013
| Share-Class Characteristics | ||
| Institutional | ETF | |
| Shares | Shares | |
| Ticker Symbol | VSMSX | VIOO |
| Expense Ratio1 | 0.10% | 0.17% |
| 30-Day SEC Yield | 1.14% | 1.07% |
| Portfolio Characteristics | |||
| DJ U.S. | |||
| Total | |||
| S&P | Market | ||
| SmallCap | FA | ||
| Fund | 600 Index | Index | |
| Number of Stocks | 602 | 600 | 3,631 |
| Median Market Cap | $1.4B | $1.4B | $39.3B |
| Price/Earnings Ratio | 24.7x | 24.7x | 18.7x |
| Price/Book Ratio | 2.1x | 2.1x | 2.4x |
| Return on Equity | 9.9% | 9.9% | 16.6% |
| Earnings Growth | |||
| Rate | 11.4% | 11.4% | 11.1% |
| Dividend Yield | 1.2% | 1.2% | 2.0% |
| Foreign Holdings | 0.0% | 0.0% | 0.0% |
| Turnover Rate | 12% | — | — |
| Short-Term Reserves | 0.0% | — | — |
| Sector Diversification (% of equity exposure) | |||
| DJ U.S. | |||
| S&P | Total | ||
| SmallCap | Market | ||
| Fund | 600 Index | FA Index | |
| Consumer | |||
| Discretionary | 16.2% | 16.2% | 13.1% |
| Consumer Staples | 4.2 | 4.2 | 8.9 |
| Energy | 4.5 | 4.5 | 9.8 |
| Financials | 21.0 | 21.0 | 17.5 |
| Health Care | 11.2 | 11.2 | 12.6 |
| Industrials | 14.9 | 14.9 | 11.2 |
| Information | |||
| Technology | 18.3 | 18.3 | 17.6 |
| Materials | 5.7 | 5.7 | 3.8 |
| Telecommunication | |||
| Services | 0.4 | 0.4 | 2.3 |
| Utilities | 3.6 | 3.6 | 3.2 |
| Ten Largest Holdings (% of total net assets) | ||
| Cubist Pharmaceuticals | ||
| Inc. | Biotechnology | 0.7% |
| Gulfport Energy Corp. | Oil & Gas Exploration | |
| & Production | 0.7 | |
| Questcor | ||
| Pharmaceuticals Inc. | Pharmaceuticals | 0.6 |
| Hain Celestial Group Inc. | Packaged Foods & | |
| Meats | 0.6 | |
| Brunswick Corp. | Leisure Products | 0.5 |
| AO Smith Corp. | Building Products | 0.5 |
| FEI Co. | Electronic Equipment | |
| & Instruments | 0.5 | |
| Align Technology Inc. | Health Care Supplies | 0.5 |
| Centene Corp. | Managed Health | |
| Care | 0.5 | |
| Old Dominion Freight | ||
| Line Inc. | Trucking | 0.5 |
| Top Ten | 5.6% | |
The holdings listed exclude any temporary cash investments and equity index products.
Investment Focus
1 The expense ratios shown are from the prospectus dated December 28, 2012, and represent estimated costs for the current fiscal year. For the fiscal year ended August 31, 2013, the expense ratios were 0.08% for Institutional Shares and 0.15% for ETF Shares.
9
S&P Small-Cap 600 Index Fund
Performance Summary
All of the returns in this report represent past performance, which is not a guarantee of future results that may be achieved by the fund. (Current performance may be lower or higher than the performance data cited. For performance data current to the most recent month-end, visit our website at vanguard.com/performance.) Note, too, that both investment returns and principal value can fluctuate widely, so an investor’s shares, when sold, could be worth more or less than their original cost. The returns shown do not reflect taxes that a shareholder would pay on fund distributions or on the sale of fund shares.
Cumulative Performance: September 7, 2010, Through August 31, 2013
Initial Investment of $10,000
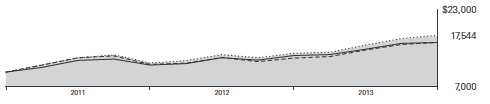
| Average Annual Total Returns | |||
| Periods Ended August 31, 2013 | |||
| Since | Final Value | ||
| One | Inception | of a $10,000 | |
| Year | (9/7/2010) | Investment | |
| S&P Small-Cap 600 Index Fund*ETF | |||
| Shares Net Asset Value | 26.57% | 20.75% | $17,544 |
| S&P Small-Cap 600 Index Fund*ETF | |||
| Shares Market Price | 26.54 | 20.77 | 17,549 |
| • S&P SmallCap 600 Index | 26.69 | 20.96 | 17,632 |
| Small-Cap Core Funds Average | 25.00 | 17.40 | 16,130 |
| Dow Jones U.S. Total Stock Market | |||
| Float Adjusted Index | 20.15 | 17.40 | 16,132 |
Small-Cap Core Funds Average: Derived from data provided by Lipper, a Thomson Reuters Company.
"Since Inception" performance is calculated from the ETF Shares’ inception date for both the fund and its comparative standards.
| Since | Final Value | ||
| One | Inception | of a $5,000,000 | |
| Year | (4/1/2011) | Investment | |
| S&P Small-Cap 600 Index Fund Institutional | |||
| Shares | 26.65% | 11.96% | $6,569,429 |
| S&P SmallCap 600 Index | 26.69 | 12.08 | 6,585,997 |
| Dow Jones U.S. Total Stock Market Float | |||
| Adjusted Index | 20.15 | 10.98 | 6,430,800 |
"Since Inception" performance is calculated from the Institutional Shares’ inception date for both the fund and its comparative standards.
Institutional Shares were first issued on December 15, 2010, and the sole shareholder redeemed shortly thereafter. Institutional Shares were next issued on April 1, 2011. The total returns shown are based on the period beginning April 1, 2011.
See Financial Highlights for dividend and capital gains information.
10
S&P Small-Cap 600 Index Fund
| Cumulative Returns of ETF Shares: September 7, 2010, Through August 31, 2013 | ||
| Since | ||
| One | Inception | |
| Year | (9/7/2010) | |
| S&P Small-Cap 600 Index Fund ETF Shares Market | ||
| Price | 26.54% | 75.49% |
| S&P Small-Cap 600 Index Fund ETF Shares Net | ||
| Asset Value | 26.57 | 75.44 |
| S&P SmallCap 600 Index | 26.69 | 76.32 |
| "Since Inception" performance is calculated from the ETF Shares’ inception date for both the fund and its comparative standards. | ||
Fiscal-Year Total Returns (%): September 7, 2010, Through August 31, 2013

Average Annual Total Returns: Periods Ended June 30, 2013
This table presents returns through the latest calendar quarter—rather than through the end of the fiscal period.
Securities and Exchange Commission rules require that we provide this information.
| Inception | One | Since | |
| Date | Year | Inception | |
| Institutional Shares | 4/1/2011 | 25.12% | 10.85% |
| ETF Shares | 9/7/2010 | ||
| Market Price | 24.94 | 20.32 | |
| Net Asset Value | 25.02 | 20.35 |
Institutional Shares were first issued on December 15, 2010, and the sole shareholder redeemed shortly thereafter. Institutional Shares were next issued on April 1, 2011. The total returns shown are based on the period beginning April 1, 2011.
11
S&P Small-Cap 600 Index Fund
Financial Statements
Statement of Net Assets
As of August 31, 2013
The fund reports a complete list of its holdings in regulatory filings four times in each fiscal year, at the quarter-ends. For the second and fourth fiscal quarters, the lists appear in the fund’s semiannual and annual reports to shareholders. For the first and third fiscal quarters, the fund files the lists with the Securities and Exchange Commission on Form N-Q. Shareholders can look up the fund’s Forms N-Q on the SEC’s website at sec.gov. Forms N-Q may also be reviewed and copied at the SEC’s Public Reference Room (see the back cover of this report for further information).
| Market | |||
| Value | |||
| Shares | ($000) | ||
| Common Stocks (99.5%)1 | |||
| Consumer Discretionary (16.2%) | |||
| Brunswick Corp. | 34,913 | 1,269 | |
| * | Fifth & Pacific Cos. Inc. | 46,261 | 1,103 |
| Wolverine World Wide Inc. | 19,351 | 1,089 | |
| * | Lumber Liquidators | ||
| Holdings Inc. | 10,589 | 1,053 | |
| * | Live Nation | ||
| Entertainment Inc. | 55,827 | 941 | |
| Pool Corp. | 17,991 | 937 | |
| Cracker Barrel Old Country | |||
| Store Inc. | 9,214 | 907 | |
| * | Steven Madden Ltd. | 15,843 | 856 |
| * | Buffalo Wild Wings Inc. | 7,267 | 755 |
| * | Iconix Brand Group Inc. | 21,962 | 721 |
| Men’s Wearhouse Inc. | 18,314 | 690 | |
| * | Jack in the Box Inc. | 17,244 | 681 |
| Outerwall Inc. | 10,870 | 676 | |
| Group 1 Automotive Inc. | 8,403 | 645 | |
| Ryland Group Inc. | 17,866 | 622 | |
| Hillenbrand Inc. | 24,235 | 600 | |
| * | Genesco Inc. | 9,246 | 570 |
| Texas Roadhouse Inc. | |||
| Class A | 22,466 | 558 | |
| Buckle Inc. | 10,671 | 553 | |
| Lithia Motors Inc. Class A | 8,167 | 536 | |
| * | Pinnacle Entertainment Inc. | 22,623 | 536 |
| * | Select Comfort Corp. | 21,564 | 533 |
| Dorman Products Inc. | 10,454 | 525 | |
| * | Hibbett Sports Inc. | 10,077 | 522 |
| Monro Muffler Brake Inc. | 11,338 | 502 | |
| * | SHFL Entertainment Inc. | 21,863 | 498 |
| * | Helen of Troy Ltd. | 12,303 | 494 |
| * | Vitamin Shoppe Inc. | 11,705 | 493 |
| * | Marriott Vacations | ||
| Worldwide Corp. | 11,294 | 492 | |
| Arbitron Inc. | 10,340 | 487 | |
| * | Meritage Homes Corp. | 12,184 | 486 |
| Market | |||
| Value | |||
| Shares | ($000) | ||
| * | Children’s Place Retail | ||
| Stores Inc. | 8,682 | 462 | |
| * | Crocs Inc. | 34,135 | 459 |
| * | Skechers U.S.A. Inc. Class A | 14,782 | 454 |
| * | Multimedia Games | ||
| Holding Co. Inc. | 11,111 | 436 | |
| La-Z-Boy Inc. | 20,306 | 432 | |
| * | Jos A Bank Clothiers Inc. | 10,835 | 431 |
| * | Papa John’s International Inc. | 6,318 | 430 |
| DineEquity Inc. | 6,251 | 414 | |
| * | Standard Pacific Corp. | 57,801 | 413 |
| * | Francesca’s Holdings Corp. | 17,055 | 411 |
| Finish Line Inc. Class A | 19,032 | 399 | |
| Sturm Ruger & Co. Inc. | 7,488 | 392 | |
| OfficeMax Inc. | 33,748 | 367 | |
| Brown Shoe Co. Inc. | 15,655 | 351 | |
| * | Boyd Gaming Corp. | 28,027 | 340 |
| Oxford Industries Inc. | 5,471 | 339 | |
| * | iRobot Corp. | 10,326 | 337 |
| * | Sonic Corp. | 20,502 | 327 |
| Interval Leisure Group Inc. | 15,107 | 326 | |
| * | Red Robin Gourmet | ||
| Burgers Inc. | 5,012 | 325 | |
| Drew Industries Inc. | 7,387 | 310 | |
| * | BJ’s Restaurants Inc. | 9,629 | 301 |
| Movado Group Inc. | 6,852 | 292 | |
| Sonic Automotive Inc. | |||
| Class A | 13,257 | 289 | |
| * | American Public | ||
| Education Inc. | 6,850 | 274 | |
| Arctic Cat Inc. | 5,095 | 274 | |
| CEC Entertainment Inc. | 6,477 | 262 | |
| Cato Corp. Class A | 10,395 | 262 | |
| Ethan Allen Interiors Inc. | 9,987 | 260 | |
| * | rue21 inc | 6,039 | 247 |
| * | Winnebago Industries Inc. | 10,875 | 242 |
| * | Quiksilver Inc. | 48,813 | 242 |
| * | Capella Education Co. | 4,333 | 236 |
| Stage Stores Inc. | 12,536 | 234 | |
| Standard Motor Products Inc. | 7,568 | 232 |
12
S&P Small-Cap 600 Index Fund
| Market | |||
| Value | |||
| Shares | ($000) | ||
| * | Pep Boys-Manny | ||
| Moe & Jack | 20,500 | 230 | |
| * | Zumiez Inc. | 8,350 | 223 |
| * | Maidenform Brands Inc. | 8,912 | 209 |
| Fred’s Inc. Class A | 13,090 | 205 | |
| * | Tuesday Morning Corp. | 16,589 | 204 |
| * | Biglari Holdings Inc. | 467 | 195 |
| Callaway Golf Co. | 27,608 | 191 | |
| Haverty Furniture Cos. Inc. | 7,694 | 186 | |
| * | M/I Homes Inc. | 9,433 | 177 |
| * | Universal Electronics Inc. | 5,855 | 177 |
| * | Blue Nile Inc. | 4,842 | 175 |
| * | EW Scripps Co. Class A | 11,307 | 172 |
| * | ITT Educational Services Inc. | 5,959 | 172 |
| Strayer Education Inc. | 4,176 | 167 | |
| Ruth’s Hospitality | |||
| Group Inc. | 13,866 | 164 | |
| * | Ruby Tuesday Inc. | 22,383 | 163 |
| Superior Industries | |||
| International Inc. | 9,050 | 158 | |
| Harte-Hanks Inc. | 16,895 | 140 | |
| Nutrisystem Inc. | 10,875 | 138 | |
| Stein Mart Inc. | 10,811 | 131 | |
| * | Zale Corp. | 10,171 | 127 |
| * | Digital Generation Inc. | 9,798 | 120 |
| PetMed Express Inc. | 7,627 | 116 | |
| * | MarineMax Inc. | 9,463 | 116 |
| * | Kirkland’s Inc. | 5,780 | 113 |
| Big 5 Sporting Goods Corp. | 6,661 | 111 | |
| * | VOXX International Corp. | ||
| Class A | 7,274 | 88 | |
| Marcus Corp. | 7,113 | 87 | |
| Universal Technical | |||
| Institute Inc. | 8,026 | 85 | |
| Perry Ellis International Inc. | 4,565 | 84 | |
| * | Christopher & Banks Corp. | 13,977 | 77 |
| Spartan Motors Inc. | 11,934 | 68 | |
| * | Monarch Casino & | ||
| Resort Inc. | 3,564 | 67 | |
| * | Corinthian Colleges Inc. | 29,632 | 65 |
| * | Career Education Corp. | 20,133 | 53 |
| Lincoln Educational | |||
| Services Corp. | 8,511 | 43 | |
| JAKKS Pacific Inc. | 8,303 | 43 | |
| Blyth Inc. | 3,985 | 37 | |
| * | Biglari Holdings Inc. | ||
| Rights Exp. 09/16/2013 | 467 | 14 | |
| 38,223 | |||
| Consumer Staples (4.2%) | |||
| * | Hain Celestial Group Inc. | 18,236 | 1,491 |
| Casey’s General Stores Inc. | 14,848 | 979 | |
| * | Darling International Inc. | 45,787 | 926 |
| * | TreeHouse Foods Inc. | 13,970 | 908 |
| B&G Foods Inc. | 20,478 | 694 | |
| * | Boston Beer Co. Inc. Class A | 3,238 | 686 |
| * | Prestige Brands Holdings Inc. | 19,726 | 641 |
| Market | |||
| Value | |||
| Shares | ($000) | ||
| Sanderson Farms Inc. | 7,757 | 508 | |
| Snyders-Lance Inc. | 18,666 | 502 | |
| J&J Snack Foods Corp. | 5,757 | 443 | |
| Andersons Inc. | 6,685 | 439 | |
| WD-40 Co. | 5,635 | 328 | |
| Cal-Maine Foods Inc. | 5,387 | 246 | |
| * | Diamond Foods Inc. | 8,599 | 178 |
| Spartan Stores Inc. | 8,500 | 175 | |
| Inter Parfums Inc. | 6,297 | 167 | |
| Calavo Growers Inc. | 4,822 | 119 | |
| * | Medifast Inc. | 4,643 | 115 |
| Nash Finch Co. | 4,634 | 113 | |
| * | Central Garden and Pet Co. | ||
| Class A | 16,447 | 103 | |
| * | Alliance One | ||
| International Inc. | 32,432 | 92 | |
| * | Seneca Foods Corp. Class A | 2,943 | 87 |
| 9,940 | |||
| Energy (4.4%) | |||
| * | Gulfport Energy Corp. | 26,588 | 1,569 |
| Bristow Group Inc. | 14,005 | 920 | |
| * | PDC Energy Inc. | 13,425 | 770 |
| * | Exterran Holdings Inc. | 25,445 | 698 |
| * | Hornbeck Offshore | ||
| Services Inc. | 12,478 | 680 | |
| SEACOR Holdings Inc. | 7,402 | 615 | |
| * | Stone Energy Corp. | 19,381 | 531 |
| * | Carrizo Oil & Gas Inc. | 14,237 | 488 |
| * | Cloud Peak Energy Inc. | 23,625 | 372 |
| * | C&J Energy Services Inc. | 17,246 | 354 |
| * | TETRA Technologies Inc. | 30,037 | 353 |
| * | Geospace Technologies Corp. | 4,996 | 349 |
| * | Approach Resources Inc. | 12,895 | 300 |
| * | Northern Oil and Gas Inc. | 23,059 | 297 |
| * | Forest Oil Corp. | 45,713 | 254 |
| Comstock Resources Inc. | 17,306 | 253 | |
| * | ION Geophysical Corp. | 46,353 | 222 |
| * | Swift Energy Co. | 16,647 | 188 |
| * | Tesco Corp. | 12,100 | 187 |
| * | Era Group Inc. | 7,304 | 181 |
| Contango Oil & Gas Co. | 4,960 | 178 | |
| * | Pioneer Energy | ||
| Services Corp. | 24,177 | 163 | |
| * | Matrix Service Co. | 10,152 | 158 |
| Gulf Island Fabrication Inc. | 5,678 | 133 | |
| * | Basic Energy Services Inc. | 10,684 | 124 |
| * | Penn Virginia Corp. | 20,703 | 100 |
| * | PetroQuest Energy Inc. | 21,336 | 90 |
| 10,527 | |||
| Financials (20.9%) | |||
| ProAssurance Corp. | 23,854 | 1,124 | |
| Tanger Factory Outlet | |||
| Centers | 36,422 | 1,124 | |
| * | Portfolio Recovery | ||
| Associates Inc. | 19,551 | 1,037 | |
13
S&P Small-Cap 600 Index Fund
| Market | |||
| Value | |||
| Shares | ($000) | ||
| Mid-America Apartment | |||
| Communities Inc. | 16,474 | 1,016 | |
| LaSalle Hotel Properties | 36,827 | 977 | |
| Prospect Capital Corp. | 87,306 | 966 | |
| Post Properties Inc. | 21,040 | 952 | |
| * | Stifel Financial Corp. | 22,903 | 917 |
| Susquehanna | |||
| Bancshares Inc. | 72,231 | 911 | |
| EPR Properties | 18,223 | 893 | |
| Financial Engines Inc. | 16,482 | 881 | |
| Geo Group Inc. | 27,735 | 866 | |
| Lexington Realty Trust | 71,306 | 836 | |
| Healthcare Realty Trust Inc. | 36,972 | 832 | |
| Sovran Self Storage Inc. | 12,167 | 806 | |
| UMB Financial Corp. | 12,565 | 751 | |
| MarketAxess Holdings Inc. | 14,536 | 738 | |
| DiamondRock Hospitality Co. | 75,713 | 734 | |
| Medical Properties Trust Inc. | 61,853 | 714 | |
| Colonial Properties Trust | 32,123 | 710 | |
| Umpqua Holdings Corp. | 43,372 | 704 | |
| * | Texas Capital | ||
| Bancshares Inc. | 15,798 | 696 | |
| FNB Corp. | 56,178 | 678 | |
| First Financial Bankshares Inc. | 11,605 | 667 | |
| EastGroup Properties Inc. | 11,722 | 659 | |
| Glacier Bancorp Inc. | 27,901 | 658 | |
| Cousins Properties Inc. | 65,008 | 646 | |
| Wintrust Financial Corp. | 15,352 | 609 | |
| MB Financial Inc. | 21,229 | 573 | |
| * | First Cash Financial | ||
| Services Inc. | 10,327 | 571 | |
| PrivateBancorp Inc. | 24,255 | 529 | |
| Bank of the Ozarks Inc. | 11,641 | 528 | |
| Community Bank System Inc. | 15,524 | 516 | |
| Old National Bancorp | 39,268 | 516 | |
| RLI Corp. | 6,596 | 515 | |
| PS Business Parks Inc. | 6,977 | 507 | |
| PacWest Bancorp | 15,238 | 507 | |
| Evercore Partners Inc. | |||
| Class A | 11,304 | 504 | |
| Acadia Realty Trust | 21,235 | 495 | |
| Government Properties | |||
| Income Trust | 21,176 | 495 | |
| Selective Insurance | |||
| Group Inc. | 21,512 | 493 | |
| United Bankshares Inc. | 17,729 | 492 | |
| Northwest Bancshares Inc. | 36,311 | 484 | |
| Cash America | |||
| International Inc. | 11,003 | 471 | |
| LTC Properties Inc. | 13,202 | 468 | |
| National Penn | |||
| Bancshares Inc. | 45,677 | 459 | |
| Columbia Banking | |||
| System Inc. | 19,702 | 457 | |
| Home BancShares Inc. | 17,872 | 454 |
| Market | |||
| Value | |||
| Shares | ($000) | ||
| Pennsylvania REIT | 24,120 | 447 | |
| First Midwest Bancorp Inc. | 29,143 | 438 | |
| CVB Financial Corp. | 34,179 | 435 | |
| * | World Acceptance Corp. | 4,790 | 410 |
| Franklin Street | |||
| Properties Corp. | 33,663 | 410 | |
| BBCN Bancorp Inc. | 30,596 | 409 | |
| Horace Mann | |||
| Educators Corp. | 15,387 | 406 | |
| * | Virtus Investment | ||
| Partners Inc. | 2,248 | 392 | |
| * | Encore Capital Group Inc. | 9,022 | 387 |
| NBT Bancorp Inc. | 16,900 | 362 | |
| * | Pinnacle Financial | ||
| Partners Inc. | 12,766 | 357 | |
| Provident Financial | |||
| Services Inc. | 20,818 | 337 | |
| First Financial Bancorp | 22,243 | 334 | |
| Inland Real Estate Corp. | 33,477 | 328 | |
| Employers Holdings Inc. | 12,045 | 319 | |
| Sabra Health Care REIT Inc. | 14,400 | 318 | |
| Independent Bank Corp. | 8,894 | 316 | |
| * | Ezcorp Inc. Class A | 18,282 | 310 |
| Boston Private Financial | |||
| Holdings Inc. | 30,318 | 310 | |
| HFF Inc. Class A | 12,611 | 290 | |
| First Commonwealth | |||
| Financial Corp. | 38,035 | 279 | |
| Interactive Brokers | |||
| Group Inc. | 16,608 | 279 | |
| ViewPoint Financial | |||
| Group Inc. | 13,993 | 278 | |
| Infinity Property & | |||
| Casualty Corp. | 4,470 | 270 | |
| Associated Estates | |||
| Realty Corp. | 19,530 | 269 | |
| * | Forestar Group Inc. | 13,393 | 267 |
| Parkway Properties Inc. | 16,292 | 266 | |
| * | United Community | ||
| Banks Inc. | 17,902 | 261 | |
| S&T Bancorp Inc. | 11,506 | 259 | |
| CoreSite Realty Corp. | 8,309 | 253 | |
| City Holding Co. | 6,029 | 246 | |
| Safety Insurance Group Inc. | 4,911 | 246 | |
| Brookline Bancorp Inc. | 27,180 | 246 | |
| * | First BanCorp | 38,391 | 245 |
| Stewart Information | |||
| Services Corp. | 7,993 | 245 | |
| * | Investment Technology | ||
| Group Inc. | 14,225 | 242 | |
| United Fire Group Inc. | 8,402 | 241 | |
| Oritani Financial Corp. | 15,094 | 234 | |
| AMERISAFE Inc. | 7,155 | 233 | |
| Banner Corp. | 6,769 | 232 | |
| * | Navigators Group Inc. | 4,082 | 223 |
14
S&P Small-Cap 600 Index Fund
| Market | |||
| Value | |||
| Shares | ($000) | ||
| Saul Centers Inc. | 4,935 | 214 | |
| TrustCo Bank Corp. NY | 36,451 | 213 | |
| Tower Group | |||
| International Ltd. | 15,061 | 213 | |
| Hanmi Financial Corp. | 12,244 | 200 | |
| Universal Health Realty | |||
| Income Trust | 4,911 | 197 | |
| * | eHealth Inc. | 7,118 | 197 |
| Wilshire Bancorp Inc. | 24,158 | 196 | |
| Urstadt Biddle | |||
| Properties Inc. Class A | 9,968 | 195 | |
| Tompkins Financial Corp. | 4,479 | 194 | |
| Cardinal Financial Corp. | 11,687 | 192 | |
| Kite Realty Group Trust | 33,278 | 192 | |
| Getty Realty Corp. | 10,348 | 189 | |
| * | Piper Jaffray Cos. | 5,739 | 187 |
| Dime Community | |||
| Bancshares Inc. | 11,278 | 180 | |
| Simmons First National | |||
| Corp. Class A | 6,442 | 156 | |
| Sterling Bancorp | 12,106 | 154 | |
| Agree Realty Corp. | 4,837 | 131 | |
| * | Taylor Capital Group Inc. | 5,509 | 117 |
| Meadowbrook Insurance | |||
| Group Inc. | 18,290 | 109 | |
| Cedar Realty Trust Inc. | 21,565 | 105 | |
| Bank Mutual Corp. | 16,327 | 97 | |
| Calamos Asset | |||
| Management Inc. Class A | 7,730 | 77 | |
| * | SWS Group Inc. | 10,894 | 57 |
| 49,527 | |||
| Health Care (11.1%) | |||
| * | Cubist Pharmaceuticals Inc. | 25,180 | 1,595 |
| Questcor | |||
| Pharmaceuticals Inc. | 22,603 | 1,507 | |
| * | Align Technology Inc. | 27,688 | 1,206 |
| * | Centene Corp. | 20,994 | 1,200 |
| * | PAREXEL | ||
| International Corp. | 21,923 | 1,018 | |
| West Pharmaceutical | |||
| Services Inc. | 13,331 | 986 | |
| * | Haemonetics Corp. | 19,787 | 789 |
| * | Medidata Solutions Inc. | 8,809 | 788 |
| * | ViroPharma Inc. | 25,180 | 759 |
| * | Medicines Co. | 23,872 | 755 |
| * | MWI Veterinary Supply Inc. | 4,661 | 709 |
| * | Magellan Health | ||
| Services Inc. | 10,441 | 587 | |
| Air Methods Corp. | 13,556 | 555 | |
| * | Acorda Therapeutics Inc. | 15,729 | 532 |
| * | Impax Laboratories Inc. | 25,208 | 514 |
| Chemed Corp. | 7,278 | 507 | |
| * | Akorn Inc. | 26,465 | 476 |
| * | Neogen Corp. | 8,686 | 470 |
| Market | |||
| Value | |||
| Shares | ($000) | ||
| * | Cyberonics Inc. | 9,207 | 468 |
| * | Amsurg Corp. Class A | 12,313 | 459 |
| * | Hanger Inc. | 13,445 | 413 |
| * | NuVasive Inc. | 17,083 | 402 |
| * | Molina Healthcare Inc. | 11,215 | 374 |
| Meridian Bioscience Inc. | 15,919 | 358 | |
| Analogic Corp. | 4,762 | 355 | |
| * | ICU Medical Inc. | 4,959 | 354 |
| CONMED Corp. | 10,746 | 334 | |
| * | IPC The Hospitalist Co. Inc. | 6,433 | 331 |
| Cantel Medical Corp. | 12,610 | 327 | |
| * | ABIOMED Inc. | 13,511 | 318 |
| Quality Systems Inc. | 15,371 | 318 | |
| Abaxis Inc. | 8,074 | 316 | |
| * | Greatbatch Inc. | 9,291 | 316 |
| * | Integra LifeSciences | ||
| Holdings Corp. | 7,759 | 315 | |
| Kindred Healthcare Inc. | 20,925 | 308 | |
| * | Luminex Corp. | 14,607 | 297 |
| * | Omnicell Inc. | 13,175 | 286 |
| * | Bio-Reference Labs Inc. | 9,388 | 272 |
| Ensign Group Inc. | 6,808 | 263 | |
| * | HealthStream Inc. | 7,672 | 254 |
| * | Healthways Inc. | 13,190 | 252 |
| * | Momenta | ||
| Pharmaceuticals Inc. | 17,612 | 248 | |
| * | AMN Healthcare | ||
| Services Inc. | 17,705 | 241 | |
| Computer Programs & | |||
| Systems Inc. | 4,042 | 222 | |
| * | Merit Medical Systems Inc. | 15,557 | 199 |
| * | Amedisys Inc. | 12,095 | 197 |
| Hi-Tech Pharmacal Co. Inc. | 4,348 | 187 | |
| * | Emergent Biosolutions Inc. | 9,982 | 176 |
| Landauer Inc. | 3,690 | 175 | |
| Invacare Corp. | 11,311 | 170 | |
| Spectrum | |||
| Pharmaceuticals Inc. | 21,288 | 163 | |
| * | Cynosure Inc. Class A | 7,074 | 162 |
| * | Cambrex Corp. | 11,679 | 159 |
| * | Natus Medical Inc. | 11,709 | 154 |
| * | Affymetrix Inc. | 27,163 | 151 |
| * | Corvel Corp. | 4,505 | 148 |
| * | PharMerica Corp. | 11,544 | 142 |
| * | Gentiva Health Services Inc. | 11,273 | 129 |
| * | LHC Group Inc. | 5,618 | 127 |
| * | Symmetry Medical Inc. | 14,536 | 114 |
| * | SurModics Inc. | 4,602 | 91 |
| * | Cross Country | ||
| Healthcare Inc. | 12,072 | 68 | |
| * | Arqule Inc. | 22,904 | 64 |
| Almost Family Inc. | 3,221 | 61 | |
| CryoLife Inc. | 9,775 | 59 | |
| 26,250 |
15
S&P Small-Cap 600 Index Fund
| Market | |||
| Value | |||
| Shares | ($000) | ||
| Industrials (14.8%) | |||
| AO Smith Corp. | 30,053 | 1,264 | |
| * | Old Dominion | ||
| Freight Line Inc. | 27,259 | 1,184 | |
| Toro Co. | 22,176 | 1,171 | |
| * | Teledyne Technologies Inc. | 14,415 | 1,112 |
| Actuant Corp. Class A | 28,215 | 1,008 | |
| EMCOR Group Inc. | 25,881 | 973 | |
| EnerSys Inc. | 18,549 | 951 | |
| * | Moog Inc. Class A | 17,466 | 887 |
| Applied Industrial | |||
| Technologies Inc. | 16,242 | 773 | |
| Curtiss-Wright Corp. | 18,043 | 753 | |
| Healthcare Services | |||
| Group Inc. | 26,364 | 638 | |
| United Stationers Inc. | 15,617 | 621 | |
| Brady Corp. Class A | 18,016 | 595 | |
| Mueller Industries Inc. | 10,893 | 583 | |
| * | Tetra Tech Inc. | 25,157 | 573 |
| Watts Water | |||
| Technologies Inc. Class A | 10,916 | 566 | |
| Barnes Group Inc. | 18,020 | 563 | |
| UniFirst Corp. | 5,814 | 557 | |
| Allegiant Travel Co. Class A | 5,806 | 549 | |
| Franklin Electric Co. Inc. | 14,966 | 538 | |
| * | On Assignment Inc. | 17,136 | 517 |
| * | Hub Group Inc. Class A | 13,709 | 509 |
| Simpson Manufacturing | |||
| Co. Inc. | 15,613 | 488 | |
| ABM Industries Inc. | 19,634 | 474 | |
| * | WageWorks Inc. | 11,083 | 463 |
| * | Atlas Air Worldwide | ||
| Holdings Inc. | 9,981 | 461 | |
| * | EnPro Industries Inc. | 8,043 | 458 |
| * | Mobile Mini Inc. | 14,800 | 450 |
| Forward Air Corp. | 11,654 | 429 | |
| * | Orbital Sciences Corp. | 23,239 | 403 |
| * | II-VI Inc. | 20,793 | 401 |
| Interface Inc. Class A | 22,304 | 394 | |
| CIRCOR International Inc. | 6,811 | 392 | |
| G&K Services Inc. Class A | 7,599 | 391 | |
| Cubic Corp. | 7,784 | 391 | |
| * | TrueBlue Inc. | 15,794 | 384 |
| AAR Corp. | 15,271 | 383 | |
| Lindsay Corp. | 4,988 | 379 | |
| Knight Transportation Inc. | 22,939 | 373 | |
| AZZ Inc. | 9,861 | 370 | |
| Kaman Corp. | 10,507 | 370 | |
| Tennant Co. | 7,092 | 364 | |
| Albany International Corp. | 11,235 | 363 | |
| Briggs & Stratton Corp. | 18,696 | 357 | |
| Kaydon Corp. | 12,499 | 356 | |
| * | GenCorp Inc. | 23,277 | 351 |
| Titan International Inc. | 20,796 | 338 | |
| Market | |||
| Value | |||
| Shares | ($000) | ||
| * | Korn/Ferry International | 18,930 | 335 |
| Exponent Inc. | 5,060 | 330 | |
| * | Aegion Corp. Class A | 15,130 | 324 |
| * | Dycom Industries Inc. | 12,714 | 323 |
| Apogee Enterprises Inc. | 11,156 | 311 | |
| ESCO Technologies Inc. | 10,150 | 311 | |
| Universal Forest | |||
| Products Inc. | 7,613 | 285 | |
| * | Federal Signal Corp. | 24,143 | 282 |
| Astec Industries Inc. | 8,083 | 279 | |
| Insperity Inc. | 8,512 | 272 | |
| Encore Wire Corp. | 7,182 | 271 | |
| * | Navigant Consulting Inc. | 19,569 | 267 |
| Standex International Corp. | 4,904 | 262 | |
| SkyWest Inc. | 19,961 | 257 | |
| * | DXP Enterprises Inc. | 3,767 | 256 |
| AAON Inc. | 10,804 | 252 | |
| Heartland Express Inc. | 17,670 | 246 | |
| John Bean | |||
| Technologies Corp. | 11,177 | 245 | |
| Quanex Building | |||
| Products Corp. | 14,261 | 237 | |
| Arkansas Best Corp. | 9,279 | 231 | |
| * | Engility Holdings Inc. | 6,559 | 221 |
| Comfort Systems USA Inc. | 14,426 | 218 | |
| Resources Connection Inc. | 15,900 | 195 | |
| Griffon Corp. | 17,464 | 193 | |
| Kelly Services Inc. Class A | 10,555 | 192 | |
| * | Powell Industries Inc. | 3,529 | 186 |
| Viad Corp. | 7,861 | 177 | |
| * | Consolidated Graphics Inc. | 3,195 | 171 |
| American Science & | |||
| Engineering Inc. | 2,975 | 168 | |
| * | Aerovironment Inc. | 7,452 | 163 |
| * | Gibraltar Industries Inc. | 11,032 | 142 |
| National Presto | |||
| Industries Inc. | 1,916 | 132 | |
| * | Orion Marine Group Inc. | 10,664 | 105 |
| * | Lydall Inc. | 6,439 | 100 |
| Heidrick & Struggles | |||
| International Inc. | 6,492 | 98 | |
| CDI Corp. | 5,414 | 73 | |
| * | Vicor Corp. | 6,937 | 54 |
| 35,032 | |||
| Information Technology (18.2%) | |||
| FEI Co. | 16,129 | 1,263 | |
| * | ViaSat Inc. | 15,800 | 1,007 |
| MAXIMUS Inc. | 26,463 | 993 | |
| Belden Inc. | 16,971 | 963 | |
| * | Microsemi Corp. | 35,994 | 926 |
| * | Sourcefire Inc. | 12,009 | 906 |
| Cognex Corp. | 15,654 | 892 | |
| * | Anixter International Inc. | 10,453 | 873 |
| j2 Global Inc. | 16,725 | 824 | |
16
S&P Small-Cap 600 Index Fund
| Market | |||
| Value | |||
| Shares | ($000) | ||
| * | Tyler Technologies Inc. | 10,495 | 775 |
| * | ARRIS Group Inc. | 44,304 | 694 |
| * | Dealertrack Technologies Inc. | 16,860 | 667 |
| * | Manhattan Associates Inc. | 7,503 | 656 |
| * | OpenTable Inc. | 8,779 | 654 |
| * | Take-Two Interactive | ||
| Software Inc. | 35,452 | 651 | |
| * | Hittite Microwave Corp. | 10,458 | 640 |
| Blackbaud Inc. | 17,683 | 637 | |
| Littelfuse Inc. | 8,511 | 628 | |
| * | Cardtronics Inc. | 17,378 | 603 |
| * | CACI International Inc. | ||
| Class A | 8,901 | 600 | |
| Power Integrations Inc. | 11,181 | 583 | |
| * | Cirrus Logic Inc. | 24,488 | 551 |
| * | Veeco Instruments Inc. | 15,170 | 533 |
| * | Electronics For Imaging Inc. | 18,010 | 527 |
| Coherent Inc. | 9,373 | 526 | |
| * | OSI Systems Inc. | 7,224 | 525 |
| * | Progress Software Corp. | 21,266 | 520 |
| Heartland Payment | |||
| Systems Inc. | 14,010 | 518 | |
| MKS Instruments Inc. | 20,542 | 515 | |
| NIC Inc. | 22,864 | 509 | |
| * | SYNNEX Corp. | 10,263 | 488 |
| * | Synaptics Inc. | 12,589 | 487 |
| * | TriQuint Semiconductor Inc. | 63,371 | 478 |
| * | Benchmark Electronics Inc. | 21,104 | 464 |
| * | Plexus Corp. | 13,211 | 432 |
| * | NETGEAR Inc. | 14,924 | 432 |
| Monolithic Power | |||
| Systems Inc. | 12,700 | 389 | |
| Monotype Imaging | |||
| Holdings Inc. | 14,852 | 382 | |
| * | Bottomline Technologies | ||
| de Inc. | 13,933 | 379 | |
| Tessera Technologies Inc. | 20,279 | 372 | |
| * | Synchronoss | ||
| Technologies Inc. | 10,770 | 370 | |
| MTS Systems Corp. | 6,118 | 368 | |
| * | Rogers Corp. | 6,630 | 368 |
| * | QLogic Corp. | 34,493 | 365 |
| * | comScore Inc. | 12,554 | 358 |
| * | Interactive Intelligence | ||
| Group Inc. | 5,943 | 350 | |
| * | Diodes Inc. | 13,792 | 343 |
| * | Netscout Systems Inc. | 13,743 | 341 |
| * | ScanSource Inc. | 10,838 | 336 |
| Methode Electronics Inc. | 13,639 | 326 | |
| * | Cabot Microelectronics Corp. | 8,967 | 324 |
| * | Insight Enterprises Inc. | 16,874 | 322 |
| * | Kulicke & Soffa | ||
| Industries Inc. | 28,847 | 319 | |
| * | Blucora Inc. | 15,745 | 315 |
| Market | |||
| Value | |||
| Shares | ($000) | ||
| * | MicroStrategy Inc. Class A | 3,428 | 315 |
| CSG Systems | |||
| International Inc. | 13,206 | 311 | |
| * | Ultratech Inc. | 10,754 | 304 |
| * | ATMI Inc. | 12,311 | 302 |
| * | Ixia | 20,813 | 302 |
| * | GT Advanced | ||
| Technologies Inc. | 46,185 | 298 | |
| * | Measurement | ||
| Specialties Inc. | 6,064 | 287 | |
| * | Liquidity Services Inc. | 9,589 | 284 |
| United Online Inc. | 35,576 | 279 | |
| * | Harmonic Inc. | 39,289 | 278 |
| * | iGATE Corp. | 11,846 | 277 |
| * | ExlService Holdings Inc. | 10,199 | 276 |
| * | Sykes Enterprises Inc. | 15,370 | 262 |
| * | Advanced Energy | ||
| Industries Inc. | 14,139 | 258 | |
| * | Tangoe Inc. | 12,154 | 253 |
| * | LogMeIn Inc. | 8,370 | 249 |
| Badger Meter Inc. | 5,529 | 249 | |
| * | FARO Technologies Inc. | 6,561 | 244 |
| * | Rofin-Sinar Technologies Inc. | 10,823 | 243 |
| * | Digital River Inc. | 13,660 | 236 |
| * | Newport Corp. | 15,233 | 234 |
| * | Checkpoint Systems Inc. | 15,803 | 232 |
| Brooks Automation Inc. | 25,576 | 225 | |
| * | Volterra Semiconductor Corp. | 9,800 | 225 |
| * | Stamps.com Inc. | 5,312 | 222 |
| * | Exar Corp. | 17,923 | 219 |
| * | Intermec Inc. | 21,774 | 215 |
| * | TeleTech Holdings Inc. | 8,527 | 209 |
| * | Perficient Inc. | 12,916 | 208 |
| * | Virtusa Corp. | 7,892 | 208 |
| * | CalAmp Corp. | 12,323 | 202 |
| Park Electrochemical Corp. | 7,525 | 200 | |
| * | TTM Technologies Inc. | 20,465 | 195 |
| CTS Corp. | 13,067 | 182 | |
| * | LivePerson Inc. | 19,002 | 177 |
| Forrester Research Inc. | 5,121 | 169 | |
| Micrel Inc. | 18,301 | 168 | |
| Black Box Corp. | 6,164 | 164 | |
| * | Dice Holdings Inc. | 19,215 | 160 |
| Daktronics Inc. | 14,550 | 156 | |
| * | Ceva Inc. | 8,475 | 154 |
| EPIQ Systems Inc. | 12,479 | 153 | |
| Comtech | |||
| Telecommunications Corp. | 6,266 | 150 | |
| * | Entropic | ||
| Communications Inc. | 35,014 | 146 | |
| * | DTS Inc. | 7,086 | 142 |
| Ebix Inc. | 12,324 | 140 | |
| * | Oplink Communications Inc. | 7,453 | 139 |
| * | Super Micro Computer Inc. | 10,463 | 134 |
17
S&P Small-Cap 600 Index Fund
| Market | |||
| Value | |||
| Shares | ($000) | ||
| * | Rudolph Technologies Inc. | 12,699 | 131 |
| * | XO Group Inc. | 9,768 | 117 |
| * | Nanometrics Inc. | 8,004 | 114 |
| * | Mercury Systems Inc. | 12,701 | 111 |
| Electro Scientific | |||
| Industries Inc. | 9,900 | 109 | |
| * | Procera Networks Inc. | 7,785 | 101 |
| * | CIBER Inc. | 26,820 | 98 |
| * | Higher One Holdings Inc. | 12,888 | 96 |
| * | Digi International Inc. | 9,889 | 92 |
| * | VASCO Data Security | ||
| International Inc. | 11,506 | 91 | |
| Supertex Inc. | 3,938 | 91 | |
| Cohu Inc. | 8,737 | 87 | |
| * | QuinStreet Inc. | 9,776 | 85 |
| *,^ | Rubicon Technology Inc. | 6,791 | 83 |
| * | Kopin Corp. | 23,358 | 77 |
| * | Symmetricom Inc. | 15,590 | 76 |
| Bel Fuse Inc. Class B | 4,062 | 73 | |
| * | Avid Technology Inc. | 11,627 | 63 |
| * | Agilysys Inc. | 5,542 | 63 |
| * | Sigma Designs Inc. | 13,037 | 62 |
| * | Pericom | ||
| Semiconductor Corp. | 8,319 | 58 | |
| PC-Tel Inc. | 6,914 | 56 | |
| * | DSP Group Inc. | 8,414 | 53 |
| * | Intevac Inc. | 8,759 | 52 |
| * | Radisys Corp. | 8,424 | 29 |
| 42,970 | |||
| Materials (5.7%) | |||
| PolyOne Corp. | 38,320 | 1,035 | |
| HB Fuller Co. | 19,492 | 727 | |
| Schweitzer-Mauduit | |||
| International Inc. | 12,155 | 696 | |
| KapStone Paper and | |||
| Packaging Corp. | 15,095 | 634 | |
| Balchem Corp. | 11,442 | 548 | |
| * | Stillwater Mining Co. | 45,538 | 519 |
| * | Texas Industries Inc. | 8,152 | 479 |
| Kaiser Aluminum Corp. | 6,371 | 440 | |
| * | SunCoke Energy Inc. | 27,181 | 428 |
| PH Glatfelter Co. | 16,626 | 426 | |
| Innophos Holdings Inc. | 8,476 | 415 | |
| * | Clearwater Paper Corp. | 8,602 | 410 |
| Stepan Co. | 6,832 | 386 | |
| * | RTI International Metals Inc. | 11,860 | 367 |
| * | Calgon Carbon Corp. | 20,966 | 361 |
| * | OM Group Inc. | 12,385 | 352 |
| Quaker Chemical Corp. | 5,105 | 339 | |
| * | Flotek Industries Inc. | 16,974 | 336 |
| AMCOL International Corp. | 9,861 | 325 | |
| Globe Specialty Metals Inc. | 24,624 | 316 | |
| Koppers Holdings Inc. | 8,056 | 312 | |
| A Schulman Inc. | 11,496 | 310 | |
| Market | |||
| Value | |||
| Shares | ($000) | ||
| Deltic Timber Corp. | 4,200 | 253 | |
| * | Headwaters Inc. | 28,046 | 240 |
| American Vanguard Corp. | 9,331 | 234 | |
| Materion Corp. | 7,902 | 232 | |
| * | Kraton Performance | ||
| Polymers Inc. | 12,461 | 231 | |
| Neenah Paper Inc. | 6,164 | 226 | |
| Myers Industries Inc. | 11,976 | 222 | |
| * | LSB Industries Inc. | 7,276 | 218 |
| Haynes International Inc. | 4,773 | 211 | |
| Tredegar Corp. | 9,309 | 208 | |
| Wausau Paper Corp. | 17,985 | 197 | |
| * | AK Steel Holding Corp. | 53,012 | 178 |
| * | Century Aluminum Co. | 19,938 | 156 |
| Hawkins Inc. | 3,596 | 133 | |
| Zep Inc. | 8,780 | 124 | |
| * | AM Castle & Co. | 6,613 | 105 |
| Olympic Steel Inc. | 3,511 | 91 | |
| 13,420 | |||
| Telecommunication Services (0.4%) | |||
| * | Cincinnati Bell Inc. | 79,929 | 239 |
| Atlantic Tele-Network Inc. | 3,653 | 172 | |
| USA Mobility Inc. | 8,293 | 117 | |
| * | General Communication Inc. | ||
| Class A | 12,298 | 110 | |
| NTELOS Holdings Corp. | 5,756 | 96 | |
| Lumos Networks Corp. | 5,954 | 94 | |
| * | Cbeyond Inc. | 11,925 | 78 |
| 906 | |||
| Utilities (3.6%) | |||
| Piedmont Natural | |||
| Gas Co. Inc. | 29,197 | 942 | |
| Southwest Gas Corp. | 17,949 | 840 | |
| UIL Holdings Corp. | 19,708 | 744 | |
| UNS Energy Corp. | 15,974 | 731 | |
| South Jersey Industries Inc. | 12,444 | 719 | |
| New Jersey Resources Corp. | 16,184 | 697 | |
| ALLETE Inc. | 13,919 | 657 | |
| Avista Corp. | 23,119 | 607 | |
| NorthWestern Corp. | 14,595 | 586 | |
| El Paso Electric Co. | 15,577 | 536 | |
| Laclede Group Inc. | 11,708 | 521 | |
| Northwest Natural Gas Co. | 10,440 | 428 | |
| American States Water Co. | 7,471 | 393 | |
| 8,401 | |||
| Total Common Stocks | |||
| (Cost $194,953) | 235,196 | ||
| Temporary Cash Investments (0.6%)1 | |||
| Money Market Fund (0.4%) | |||
| 2,3 | Vanguard Market Liquidity | ||
| Fund, 0.122% | 1,005,000 | 1,005 | |
18
S&P Small-Cap 600 Index Fund
| Face | Market | |
| Amount | Value | |
| ($000) | ($000) | |
| U.S. Government and Agency Obligations (0.2%) | ||
| 4,5 Freddie Mac Discount | ||
| Notes, 0.100%, 9/16/13 | 500 | 500 |
| Total Temporary Cash Investments | ||
| (Cost $1,504) | 1,505 | |
| Total Investments (100.1%) | ||
| (Cost $196,457) | 236,701 | |
| Other Assets and Liabilities (-0.1%) | ||
| Other Assets | 210 | |
| Liabilities3 | (423) | |
| (213) | ||
| Net Assets (100%) | 236,488 | |
| At August 31, 2013, net assets consisted of: | |
| Amount | |
| ($000) | |
| Paid-in Capital | 195,844 |
| Undistributed Net Investment Income | 1,441 |
| Accumulated Net Realized Losses | (1,006) |
| Unrealized Appreciation (Depreciation) | |
| Investment Securities | 40,244 |
| Futures Contracts | (35) |
| Net Assets | 236,488 |
| Institutional Shares—Net Assets | |
| Applicable to 887,466 outstanding | |
| $.001 par value shares of beneficial | |
| interest (unlimited authorization) | 151,504 |
| Net Asset Value Per Share— | |
| Institutional Shares | $170.71 |
| ETF Shares—Net Assets | |
| Applicable to 1,000,000 outstanding | |
| $.001 par value shares of beneficial | |
| interest (unlimited authorization) | 84,984 |
| Net Asset Value Per Share— | |
| ETF Shares | $84.98 |
See Note A in Notes to Financial Statements.
* Non-income-producing security.
^ Part of security position is on loan to broker-dealers. The total value of securities on loan is $66,000.
1 The fund invests a portion of its cash reserves in equity markets through the use of index futures contracts. After giving effect to futures investments, the fund’s effective common stock and temporary cash investment positions represent 100.1% and 0.0%, respectively, of net assets.
2 Affiliated money market fund available only to Vanguard funds and certain trusts and accounts managed by Vanguard. Rate shown is the 7-day yield.
3 Includes $70,000 of collateral received for securities on loan.
4 The issuer was placed under federal conservatorship in September 2008; since that time, its daily operations have been managed by the Federal Housing Finance Agency and it receives capital from the U.S. Treasury, as needed to maintain a positive net worth, in exchange for senior preferred stock.
5 Securities with a value of $100,000 have been segregated as initial margin for open futures contracts.
REIT—Real Estate Investment Trust.
See accompanying Notes, which are an integral part of the Financial Statements.
19
S&P Small-Cap 600 Index Fund
| Statement of Operations | |
| Year Ended | |
| August 31, 2013 | |
| ($000) | |
| Investment Income | |
| Income | |
| Dividends | 2,929 |
| Interest1 | 1 |
| Securities Lending | 27 |
| Total Income | 2,957 |
| Expenses | |
| The Vanguard Group—Note B | |
| Investment Advisory Services | 24 |
| Management and Administrative—Institutional Shares | 6 |
| Management and Administrative—ETF Shares | 42 |
| Marketing and Distribution—Institutional Shares | 29 |
| Marketing and Distribution—ETF Shares | 13 |
| Custodian Fees | 46 |
| Auditing Fees | 21 |
| Shareholders’ Reports—Institutional Shares | — |
| Shareholders’ Reports—ETF Shares | 4 |
| Total Expenses | 185 |
| Net Investment Income | 2,772 |
| Realized Net Gain (Loss) | |
| Investment Securities Sold | 4,598 |
| Futures Contracts | 42 |
| Realized Net Gain (Loss) | 4,640 |
| Change in Unrealized Appreciation (Depreciation) | |
| Investment Securities | 35,112 |
| Futures Contracts | (35) |
| Change in Unrealized Appreciation (Depreciation) | 35,077 |
| Net Increase (Decrease) in Net Assets Resulting from Operations | 42,489 |
| 1 Interest income from an affiliated company of the fund was $1,000. | |
See accompanying Notes, which are an integral part of the Financial Statements.
20
S&P Small-Cap 600 Index Fund
| Statement of Changes in Net Assets | ||
| Year Ended August 31, | ||
| 2013 | 2012 | |
| ($000) | ($000) | |
| Increase (Decrease) in Net Assets | ||
| Operations | ||
| Net Investment Income | 2,772 | 1,404 |
| Realized Net Gain (Loss) | 4,640 | 1,026 |
| Change in Unrealized Appreciation (Depreciation) | 35,077 | 13,679 |
| Net Increase (Decrease) in Net Assets Resulting from Operations | 42,489 | 16,109 |
| Distributions | ||
| Net Investment Income | ||
| Institutional Shares | (1,617) | (681) |
| ETF Shares | (713) | (95) |
| Realized Capital Gain | ||
| Institutional Shares | — | — |
| ETF Shares | — | — |
| Total Distributions | (2,330) | (776) |
| Capital Share Transactions | ||
| Institutional Shares | 23,397 | 14,924 |
| ETF Shares | 38,265 | 19,745 |
| Net Increase (Decrease) from Capital Share Transactions | 61,662 | 34,669 |
| Total Increase (Decrease) | 101,821 | 50,002 |
| Net Assets | ||
| Beginning of Period | 134,667 | 84,665 |
| End of Period1 | 236,488 | 134,667 |
| 1 Net Assets—End of Period includes undistributed net investment income of $1,441,000 and $999,000. | ||
See accompanying Notes, which are an integral part of the Financial Statements.
21
S&P Small-Cap 600 Index Fund
Financial Highlights
| Institutional Shares | |||
| April 1, | |||
| Year Ended | 20111 to | ||
| August 31, | Aug. 31, | ||
| For a Share Outstanding Throughout Each Period | 2013 | 2012 | 2011 |
| Net Asset Value, Beginning of Period | $136.79 | $118.12 | $132.94 |
| Investment Operations | |||
| Net Investment Income | 2.131 | 1.558 | . 290 |
| Net Realized and Unrealized Gain (Loss) on Investments | 33.883 | 18.126 | (15.110) |
| Total from Investment Operations | 36.014 | 19.684 | (14.820) |
| Distributions | |||
| Dividends from Net Investment Income | (2.094) | (1.014) | — |
| Distributions from Realized Capital Gains | — | — | — |
| Total Distributions | (2.094) | (1.014) | — |
| Net Asset Value, End of Period | $170.71 | $136.79 | $118.12 |
| Total Return | 26.65% | 16.75% | -11.15% |
| Ratios/Supplemental Data | |||
| Net Assets, End of Period (Millions) | $152 | $101 | $73 |
| Ratio of Total Expenses to Average Net Assets | 0.08% | 0.08% | 0.08%2 |
| Ratio of Net Investment Income to Average Net Assets | 1.55% | 1.35% | 1.03%2 |
| Portfolio Turnover Rate 3 | 12% | 12% | 42% |
1 Inception.
2 Annualized.
3 Excludes the value of portfolio securities received or delivered as a result of in-kind purchases or redemptions of the fund’s capital shares, including ETF Creation Units.
See accompanying Notes, which are an integral part of the Financial Statements.
22
S&P Small-Cap 600 Index Fund
Financial Highlights
| ETF Shares | |||
| Sept. 7, | |||
| Year Ended | 20101 to | ||
| August 31, | Aug. 31, | ||
| For a Share Outstanding Throughout Each Period | 2013 | 2012 | 2011 |
| Net Asset Value, Beginning of Period | $68.12 | $58.84 | $49.81 |
| Investment Operations | |||
| Net Investment Income | 1.024 | .745 | .605 |
| Net Realized and Unrealized Gain (Loss) on Investments | 16.854 | 9.012 | 8.785 |
| Total from Investment Operations | 17.878 | 9.757 | 9.390 |
| Distributions | |||
| Dividends from Net Investment Income | (1.018) | (. 477) | (.360) |
| Distributions from Realized Capital Gains | — | — | — |
| Total Distributions | (1.018) | (. 477) | (.360) |
| Net Asset Value, End of Period | $84.98 | $68.12 | $58.84 |
| Total Return | 26.57% | 16.66% | 18.81% |
| Ratios/Supplemental Data | |||
| Net Assets, End of Period (Millions) | $85 | $34 | $12 |
| Ratio of Total Expenses to Average Net Assets | 0.15% | 0.15% | 0.15%2 |
| Ratio of Net Investment Income to Average Net Assets | 1.48% | 1.28% | 0.96%2 |
| Portfolio Turnover Rate 3 | 12% | 12% | 42% |
1 Inception.
2 Annualized.
3 Excludes the value of portfolio securities received or delivered as a result of in-kind purchases or redemptions of the fund’s capital shares, including ETF Creation Units.
See accompanying Notes, which are an integral part of the Financial Statements.
23
S&P Small-Cap 600 Index Fund
Notes to Financial Statements
Vanguard S&P Small-Cap 600 Index Fund is registered under the Investment Company Act of 1940 as an open-end investment company, or mutual fund. The fund offers two classes of shares: Institutional Shares and ETF Shares. Institutional Shares are designed for investors who meet certain administrative, service, and account-size criteria. ETF Shares are listed for trading on NYSE Arca; they can be purchased and sold through a broker.
A. The following significant accounting policies conform to generally accepted accounting principles for U.S. mutual funds. The fund consistently follows such policies in preparing its financial statements.
1. Security Valuation: Securities are valued as of the close of trading on the New York Stock Exchange (generally 4 p.m., Eastern time) on the valuation date. Equity securities are valued at the latest quoted sales prices or official closing prices taken from the primary market in which each security trades; such securities not traded on the valuation date are valued at the mean of the latest quoted bid and asked prices. Securities for which market quotations are not readily available, or whose values have been materially affected by events occurring before the fund’s pricing time but after the close of the securities’ primary markets, are valued by methods deemed by the board of trustees to represent fair value. Investments in Vanguard Market Liquidity Fund are valued at that fund’s net asset value. Temporary cash investments acquired over 60 days to maturity are valued using the latest bid prices or using valuations based on a matrix system (which considers such factors as security prices, yields, maturities, and ratings), both as furnished by independent pricing services. Other temporary cash investments are valued at amortized cost, which approximates market value.
2. Futures Contracts: The fund may use index futures contracts to a limited extent, with the objectives of maintaining full exposure to the stock market, enhancing returns, maintaining liquidity, and minimizing transaction costs. The fund may purchase futures contracts to immediately invest incoming cash in the market, or sell futures in response to cash outflows, thereby simulating a fully invested position in the underlying index while maintaining a cash balance for liquidity. The fund may seek to enhance returns by using futures contracts instead of the underlying securities when futures are believed to be priced more attractively than the underlying securities. The primary risks associated with the use of futures contracts are imperfect correlation between changes in market values of stocks held by the fund and the prices of futures contracts, and the possibility of an illiquid market. Counterparty risk involving futures is mitigated because a regulated clearinghouse is the counterparty instead of the clearing broker. To further mitigate counterparty risk, the fund trades futures contracts on an exchange; monitors the financial strength of its clearing brokers and clearinghouse; and has entered into clearing agreements with its clearing brokers. The clearinghouse imposes initial margin requirements to secure the fund’s performance and requires daily settlement of variation margin representing changes in the market value of each contract.
Futures contracts are valued at their quoted daily settlement prices. The aggregate notional amounts of the contracts are not recorded in the Statement of Net Assets. Fluctuations in the value of the contracts are recorded in the Statement of Net Assets as an asset (liability) and in the Statement of Operations as unrealized appreciation (depreciation) until the contracts are closed, when they are recorded as realized futures gains (losses).
During the year ended August 31, 2013, the fund’s average investments in long and short futures contracts represented less than 1% and 0% of net assets, respectively, based on quarterly average aggregate settlement values.
24
S&P Small-Cap 600 Index Fund
3. Federal Income Taxes: The fund intends to continue to qualify as a regulated investment company and distribute all of its taxable income. Management has analyzed the fund’s tax positions taken for all open federal income tax years (August 31, 2011–2013), and has concluded that no provision for federal income tax is required in the fund’s financial statements.
4. Distributions: Distributions to shareholders are recorded on the ex-dividend date.
5. Securities Lending: To earn additional income, the fund may lend its securities to qualified institutional borrowers. Security loans are required to be secured at all times by collateral in an amount at least equal to the market value of securities loaned. Daily market fluctuations could cause the value of loaned securities to be more or less than the value of the collateral received. When this occurs, the collateral is adjusted and settled on the next business day. The fund further mitigates its counterparty risk by entering into securities lending transactions only with a diverse group of pre-qualified counterparties, monitoring their financial strength, and entering into master securities lending agreements with its counterparties. The master securities lending agreements provide that, in the event of a counterparty’s default (including bankruptcy), the fund may terminate any loans with that borrower, determine the net amount owed, and sell or retain the collateral up to the net amount owed to the fund, provided that such actions may be subject to legal proceedings. While collateral mitigates counterparty risk, in the absence of a default, the fund may experience delays and costs in recovering the securities loaned. The fund invests cash collateral received in Vanguard Market Liquidity Fund, and records a liability for the return of the collateral, during the period the securities are on loan. Securities lending income represents fees charged to borrowers plus income earned on invested cash collateral, less expenses associated with the loan.
6. Other: Interest income includes income distributions received from Vanguard Market Liquidity Fund and is accrued daily. Premiums and discounts on debt securities purchased are amortized and accreted, respectively, to interest income over the lives of the respective securities. Security transactions are accounted for on the date securities are bought or sold. Costs used to determine realized gains (losses) on the sale of investment securities are those of the specific securities sold.
Each class of shares has equal rights as to assets and earnings, except that each class separately bears certain class-specific expenses related to maintenance of shareholder accounts (included in Management and Administrative expenses) and shareholder reporting. Marketing and distribution expenses are allocated to each class of shares based on a method approved by the board of trustees. Income, other non-class-specific expenses, and gains and losses on investments are allocated to each class of shares based on its relative net assets.
B. The Vanguard Group furnishes at cost investment advisory, corporate management, administrative, marketing, and distribution services. The costs of such services are allocated to the fund under methods approved by the board of trustees. The fund has committed to provide up to 0.40% of its net assets in capital contributions to Vanguard. At August 31, 2013, the fund had contributed capital of $29,000 to Vanguard (included in Other Assets), representing 0.01% of the fund’s net assets and 0.01% of Vanguard’s capitalization. The fund’s trustees and officers are also directors and officers of Vanguard.
25
S&P Small-Cap 600 Index Fund
C. Various inputs may be used to determine the value of the fund’s investments. These inputs are summarized in three broad levels for financial statement purposes. The inputs or methodologies used to value securities are not necessarily an indication of the risk associated with investing in those securities.
Level 1—Quoted prices in active markets for identical securities.
Level 2—Other significant observable inputs (including quoted prices for similar securities, interest rates, prepayment speeds, credit risk, etc.).
Level 3—Significant unobservable inputs (including the fund’s own assumptions used to determine the fair value of investments).
The following table summarizes the market value of the fund’s investments as of August 31, 2013, based on the inputs used to value them:
| Level 1 | Level 2 | Level 3 | |
| Investments | ($000) | ($000) | ($000) |
| Common Stocks | 235,196 | — | — |
| Temporary Cash Investments | 1,005 | 500 | — |
| Futures Contracts—Assets1 | 1 | — | — |
| Futures Contracts—Liabilities1 | (23) | — | — |
| Total | 236,179 | 500 | — |
| 1 Represents variation margin on the last day of the reporting period. |
D. At August 31, 2013, the aggregate settlement value of open futures contracts and the related unrealized appreciation (depreciation) were:
| ($000) | ||||
| Aggregate | ||||
| Number of | Settlement | Unrealized | ||
| Long (Short) | Value | Appreciation | ||
| Futures Contracts | Expiration | Contracts | Long (Short) | (Depreciation) |
| E-mini Russell 2000 Index | September 2013 | 14 | 1,414 | (35) |
Unrealized appreciation (depreciation) on open futures contracts is required to be treated as realized gain (loss) for tax purposes.
E. Distributions are determined on a tax basis and may differ from net investment income and realized capital gains for financial reporting purposes. Differences may be permanent or temporary. Permanent differences are reclassified among capital accounts in the financial statements to reflect their tax character. Temporary differences arise when certain items of income, expense, gain, or loss are recognized in different periods for financial statement and tax purposes; these differences will reverse at some time in the future. Differences in classification may also result from the treatment of short-term gains as ordinary income for tax purposes.
During the year ended August 31, 2013, the fund realized $4,906,000 of net capital gains resulting from in-kind redemptions—in which shareholders exchanged fund shares for securities held by the fund rather than for cash. Because such gains are not taxable to the fund, and are not distributed to shareholders, they have been reclassified from accumulated net realized losses to paid-in capital.
26
S&P Small-Cap 600 Index Fund
For tax purposes, at August 31, 2013, the fund had $1,478,000 of ordinary income available for distribution. The fund had available capital losses totaling $1,022,000 that may be carried forward indefinitely to offset future net capital gains.
At August 31, 2013, the cost of investment securities for tax purposes was $196,488,000. Net unrealized appreciation of investment securities for tax purposes was $40,213,000, consisting of unrealized gains of $46,769,000 on securities that had risen in value since their purchase and $6,556,000 in unrealized losses on securities that had fallen in value since their purchase.
F. During the year ended August 31, 2013, the fund purchased $96,866,000 of investment securities and sold $36,178,000 of investment securities, other than temporary cash investments. Purchases and sales include $58,420,000 and $14,338,000, respectively, in connection with in-kind purchases and redemptions of the fund’s capital shares.
G. Capital share transactions for each class of shares were:
| Year Ended August 31, | ||||
| 2013 | 2012 | |||
| Amount | Shares | Amount | Shares | |
| ($000) | (000) | ($000) | (000) | |
| Institutional Shares | ||||
| Issued | 50,427 | 318 | 24,308 | 191 |
| Issued in Lieu of Cash Distributions | 1,594 | 11 | 681 | 5 |
| Redeemed | (28,624) | (177) | (10,065) | (78) |
| Net Increase (Decrease) —Institutional Shares | 23,397 | 152 | 14,924 | 118 |
| ETF Shares | ||||
| Issued | 41,757 | 550 | 22,750 | 350 |
| Issued in Lieu of Cash Distributions | — | — | — | — |
| Redeemed | (3,492) | (50) | (3,005) | (50) |
| Net Increase (Decrease)—ETF Shares | 38,265 | 500 | 19,745 | 300 |
At August 31, 2013, one shareholder was the record or beneficial owner of 44% of the fund’s net assets. If the shareholder were to redeem its investment in the fund, the redemption might result in an increase in the fund’s expense ratio, cause the fund to incur higher transaction costs, or lead to the realization of taxable capital gains.
H. Management has determined that no material events or transactions occurred subsequent to August 31, 2013, that would require recognition or disclosure in these financial statements.
27
S&P Small-Cap 600 Value Index Fund
Fund Profile
As of August 31, 2013
| Portfolio Characteristics | |||
| S&P | DJ U.S. | ||
| SmallCap | Total | ||
| 600 Value | Market | ||
| Fund | Index | FA Index | |
| Number of Stocks | 444 | 442 | 3,631 |
| Median Market Cap | $1.3B | $1.3B | $39.3B |
| Price/Earnings Ratio | 24.3x | 24.3x | 18.7x |
| Price/Book Ratio | 1.7x | 1.7x | 2.4x |
| Return on Equity | 8.1% | 8.1% | 16.6% |
| Earnings Growth Rate | 5.3% | 5.4% | 11.1% |
| Dividend Yield | 1.5% | 1.5% | 2.0% |
| Foreign Holdings | 0.0% | 0.0% | 0.0% |
| Turnover Rate | 37% | — | — |
| Ticker Symbol | VIOV | — | — |
| Expense Ratio1 | 0.24% | — | — |
| 30-Day SEC Yield | 1.31% | — | — |
| Short-Term Reserves | 0.0% | — | — |
| Sector Diversification (% of equity exposure) | |||
| DJ U.S. | |||
| S&P | Total | ||
| SmallCap | Market | ||
| 600 Value | FA | ||
| Fund | Index | Index | |
| Consumer Discretionary | 15.0% | 14.9% | 13.1% |
| Consumer Staples | 4.1 | 4.1 | 8.9 |
| Energy | 5.6 | 5.6 | 9.8 |
| Financials | 22.5 | 22.5 | 17.5 |
| Health Care | 6.9 | 6.9 | 12.6 |
| Industrials | 18.1 | 18.1 | 11.2 |
| Information Technology | 14.3 | 14.4 | 17.6 |
| Materials | 6.2 | 6.2 | 3.8 |
| Telecommunication | |||
| Services | 0.4 | 0.4 | 2.3 |
| Utilities | 6.9 | 6.9 | 3.2 |
| Ten Largest Holdings (% of total net assets) | ||
| Centene Corp. | Managed Health | |
| Care | 1.0% | |
| ProAssurance Corp. | Property & Casualty | |
| Insurance | 1.0 | |
| LaSalle Hotel Properties | Specialized REITs | 0.8 |
| Casey's General Stores | ||
| Inc. | Food Retail | 0.8 |
| EMCOR Group Inc. | Construction & | |
| Engineering | 0.8 | |
| Piedmont Natural Gas | ||
| Co. Inc. | Gas Utilities | 0.8 |
| Live Nation | Movies & | |
| Entertainment Inc. | Entertainment | 0.8 |
| Bristow Group Inc. | Oil & Gas Equipment | |
| & Services | 0.8 | |
| Stifel Financial Corp. | Investment Banking | |
| & Brokerage | 0.8 | |
| TreeHouse Foods Inc. | Packaged Foods & | |
| Meats | 0.8 | |
| Top Ten | 8.4% | |
The holdings listed exclude any temporary cash investments and equity index products.
Investment Focus
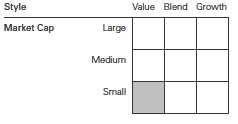
1 The expense ratio shown is from the prospectus dated December 28, 2012, and represents estimated costs for the current fiscal year. For the fiscal year ended August 31, 2013, the expense ratio was 0.20%.
28
S&P Small-Cap 600 Value Index Fund
Performance Summary
All of the returns in this report represent past performance, which is not a guarantee of future results that may be achieved by the fund. (Current performance may be lower or higher than the performance data cited. For performance data current to the most recent month-end, visit our website at vanguard.com/performance.) Note, too, that both investment returns and principal value can fluctuate widely, so an investor’s shares, when sold, could be worth more or less than their original cost. The returns shown do not reflect taxes that a shareholder would pay on fund distributions or on the sale of fund shares.
Cumulative Performance: September 7, 2010, Through August 31, 2013
Initial Investment of $10,000
| Average Annual Total Returns | |||
| Periods Ended August 31, 2013 | |||
| Since | Final Value | ||
| One | Inception | of a $10,000 | |
| Year | (9/7/2010) | Investment | |
| S&P Small-Cap 600 Value Index | |||
| Fund*ETF Shares Net Asset Value | 27.45% | 19.78% | $17,126 |
| S&P Small-Cap 600 Value Index | |||
| Fund*ETF Shares Market Price | 27.84 | 19.79 | 17,128 |
| S&P SmallCap 600 Value Index | 27.72 | 20.00 | 17,220 |
| Small-Cap Value Funds Average | 26.46 | 17.14 | 16,024 |
| Dow Jones U.S. Total Stock Market | |||
| Float Adjusted Index | 20.15 | 17.40 | 16,132 |
Small-Cap Value Funds Average: Derived from data provided by Lipper, a Thomson Reuters Company.
"Since Inception" performance is calculated from the ETF Shares’ inception date for both the fund and its comparative standards.
See Financial Highlights for dividend and capital gains information.
29
S&P Small-Cap 600 Value Index Fund
| Cumulative Returns of ETF Shares: September 7, 2010, Through August 31, 2013 | ||
| Since | ||
| One | Inception | |
| Year | (9/7/2010) | |
| S&P Small-Cap 600 Value Index Fund ETF Shares | ||
| Market Price | 27.84% | 71.28% |
| S&P Small-Cap 600 Value Index Fund ETF Shares | ||
| Net Asset Value | 27.45 | 71.26 |
| S&P SmallCap 600 Value Index | 27.72 | 72.20 |
| "Since Inception" performance is calculated from the ETF Shares’ inception date for both the fund and its comparative standards. | ||
Fiscal-Year Total Returns (%): September 7, 2010, Through August 31, 2013

Average Annual Total Returns: Periods Ended June 30, 2013
This table presents returns through the latest calendar quarter—rather than through the end of the fiscal period.
Securities and Exchange Commission rules require that we provide this information.
| Inception | One | Since | |
| Date | Year | Inception | |
| ETF Shares | 9/7/2010 | ||
| Market Price | 28.11% | 19.85% | |
| Net Asset Value | 28.20 | 19.88 |
30
S&P Small-Cap 600 Value Index Fund
Financial Statements
Statement of Net Assets
As of August 31, 2013
The fund reports a complete list of its holdings in regulatory filings four times in each fiscal year, at the quarter-ends. For the second and fourth fiscal quarters, the lists appear in the fund’s semiannual and annual reports to shareholders. For the first and third fiscal quarters, the fund files the lists with the Securities and Exchange Commission on Form N-Q. Shareholders can look up the fund’s Forms N-Q on the SEC’s website at sec.gov. Forms N-Q may also be reviewed and copied at the SEC’s Public Reference Room (see the back cover of this report for further information).
| Market | |||
| Value | |||
| Shares | ($000) | ||
| Common Stocks (100.1%) | |||
| Consumer Discretionary (15.0%) | |||
| * | Live Nation | ||
| Entertainment Inc. | 13,680 | 231 | |
| Cracker Barrel Old | |||
| Country Store Inc. | 2,258 | 222 | |
| Men’s Wearhouse Inc. | 4,486 | 169 | |
| Group 1 Automotive Inc. | 2,058 | 158 | |
| * | Fifth & Pacific Cos. Inc. | 6,035 | 144 |
| * | Genesco Inc. | 2,280 | 141 |
| * | Pinnacle Entertainment Inc. | 5,546 | 131 |
| Wolverine World Wide Inc. | 2,096 | 118 | |
| * | Children’s Place Retail | ||
| Stores Inc. | 2,137 | 114 | |
| * | Skechers U.S.A. Inc. Class A | 3,642 | 112 |
| * | Jos A Bank Clothiers Inc. | 2,660 | 106 |
| * | Jack in the Box Inc. | 2,612 | 103 |
| Finish Line Inc. Class A | 4,685 | 98 | |
| * | Iconix Brand Group Inc. | 2,811 | 92 |
| OfficeMax Inc. | 8,279 | 90 | |
| * | Boyd Gaming Corp. | 6,882 | 83 |
| Hillenbrand Inc. | 3,274 | 81 | |
| * | Red Robin Gourmet | ||
| Burgers Inc. | 1,219 | 79 | |
| Monro Muffler Brake Inc. | 1,620 | 72 | |
| Sonic Automotive Inc. | |||
| Class A | 3,258 | 71 | |
| Cato Corp. Class A | 2,556 | 64 | |
| Lithia Motors Inc. Class A | 980 | 64 | |
| CEC Entertainment Inc. | 1,587 | 64 | |
| Texas Roadhouse Inc. | |||
| Class A | 2,525 | 63 | |
| DineEquity Inc. | 909 | 60 | |
| * | Helen of Troy Ltd. | 1,484 | 60 |
| Arbitron Inc. | 1,263 | 59 | |
| * | Quiksilver Inc. | 11,916 | 59 |
| * | Capella Education Co. | 1,055 | 57 |
| Standard Motor Products Inc. | 1,870 | 57 | |
| Market | |||
| Value | |||
| Shares | ($000) | ||
| * | Pep Boys-Manny Moe & Jack | 5,057 | 57 |
| * | Marriott Vacations | ||
| Worldwide Corp. | 1,255 | 55 | |
| * | Maidenform Brands Inc. | 2,219 | 52 |
| Buckle Inc. | 992 | 51 | |
| Fred’s Inc. Class A | 3,214 | 50 | |
| * | Biglari Holdings Inc. | 114 | 48 |
| Brown Shoe Co. Inc. | 2,060 | 46 | |
| La-Z-Boy Inc. | 2,028 | 43 | |
| * | ITT Educational Services Inc. | 1,492 | 43 |
| * | EW Scripps Co. Class A | 2,824 | 43 |
| * | Universal Electronics Inc. | 1,419 | 43 |
| * | Crocs Inc. | 3,168 | 43 |
| Strayer Education Inc. | 1,025 | 41 | |
| * | Ruby Tuesday Inc. | 5,459 | 40 |
| * | BJ’s Restaurants Inc. | 1,248 | 39 |
| * | Sonic Corp. | 2,407 | 38 |
| Nutrisystem Inc. | 2,733 | 35 | |
| * | Standard Pacific Corp. | 4,808 | 34 |
| Harte-Hanks Inc. | 4,085 | 34 | |
| Stein Mart Inc. | 2,637 | 32 | |
| * | MarineMax Inc. | 2,291 | 28 |
| * | Kirkland’s Inc. | 1,418 | 28 |
| Big 5 Sporting Goods Corp. | 1,616 | 27 | |
| Callaway Golf Co. | 3,885 | 27 | |
| Haverty Furniture Cos. Inc. | 1,079 | 26 | |
| * | VOXX International Corp. | ||
| Class A | 1,834 | 22 | |
| Marcus Corp. | 1,774 | 22 | |
| Stage Stores Inc. | 1,170 | 22 | |
| Universal Technical | |||
| Institute Inc. | 1,995 | 21 | |
| Perry Ellis International Inc. | 1,107 | 20 | |
| * | Zumiez Inc. | 726 | 19 |
| Superior Industries | |||
| International Inc. | 1,093 | 19 | |
| * | Blue Nile Inc. | 484 | 18 |
| * | Monarch Casino & Resort Inc. | 898 | 17 |
| Spartan Motors Inc. | 2,939 | 17 |
31
S&P Small-Cap 600 Value Index Fund
| Market | |||
| Value | |||
| Shares | ($000) | ||
| * | Corinthian Colleges Inc. | 7,367 | 16 |
| PetMed Express Inc. | 1,057 | 16 | |
| * | Zale Corp. | 1,286 | 16 |
| * | Digital Generation Inc. | 1,201 | 15 |
| * | Career Education Corp. | 4,810 | 13 |
| Lincoln Educational | |||
| Services Corp. | 2,134 | 11 | |
| JAKKS Pacific Inc. | 2,000 | 10 | |
| Blyth Inc. | 999 | 9 | |
| * | Christopher & Banks Corp. | 1,531 | 9 |
| * | Biglari Holdings Inc. | ||
| Rights Exp. 09/16/2013 | 114 | 3 | |
| 4,340 | |||
| Consumer Staples (4.1%) | |||
| Casey’s General Stores Inc. | 3,639 | 240 | |
| * | TreeHouse Foods Inc. | 3,441 | 224 |
| Sanderson Farms Inc. | 1,901 | 124 | |
| Snyders-Lance Inc. | 4,586 | 123 | |
| Andersons Inc. | 1,652 | 108 | |
| B&G Foods Inc. | 1,905 | 64 | |
| J&J Snack Foods Corp. | 636 | 49 | |
| * | Diamond Foods Inc. | 2,111 | 44 |
| Spartan Stores Inc. | 2,083 | 43 | |
| WD-40 Co. | 611 | 36 | |
| Nash Finch Co. | 1,158 | 28 | |
| Cal-Maine Foods Inc. | 588 | 27 | |
| * | Central Garden and Pet Co. | ||
| Class A | 3,959 | 25 | |
| * | Alliance One | ||
| International Inc. | 7,771 | 22 | |
| * | Seneca Foods Corp. Class A | 736 | 22 |
| Calavo Growers Inc. | 684 | 17 | |
| 1,196 | |||
| Energy (5.6%) | |||
| Bristow Group Inc. | 3,432 | 225 | |
| * | Hornbeck Offshore | ||
| Services Inc. | 3,059 | 167 | |
| SEACOR Holdings Inc. | 1,814 | 151 | |
| * | Stone Energy Corp. | 4,748 | 130 |
| * | PDC Energy Inc. | 2,051 | 118 |
| * | Cloud Peak Energy Inc. | 5,787 | 91 |
| * | Exterran Holdings Inc. | 3,306 | 91 |
| * | TETRA Technologies Inc. | 7,421 | 87 |
| * | Carrizo Oil & Gas Inc. | 1,568 | 54 |
| * | Swift Energy Co. | 4,135 | 47 |
| * | Era Group Inc. | 1,820 | 45 |
| Contango Oil & Gas Co. | 1,218 | 44 | |
| * | Pioneer Energy Services Corp. | 5,913 | 40 |
| * | Matrix Service Co. | 2,476 | 39 |
| Comstock Resources Inc. | 2,566 | 37 | |
| * | Tesco Corp. | 2,297 | 35 |
| * | Approach Resources Inc. | 1,461 | 34 |
| Gulf Island Fabrication Inc. | 1,380 | 32 | |
| * | Forest Oil Corp. | 5,621 | 31 |
| Market | |||
| Value | |||
| Shares | ($000) | ||
| * | Basic Energy Services Inc. | 2,624 | 31 |
| * | ION Geophysical Corp. | 6,343 | 30 |
| * | Penn Virginia Corp. | 5,180 | 25 |
| * | C&J Energy Services Inc. | 1,019 | 21 |
| * | PetroQuest Energy Inc. | 2,395 | 10 |
| 1,615 | |||
| Financials (22.5%) | |||
| ProAssurance Corp. | 5,868 | 277 | |
| LaSalle Hotel Properties | 9,069 | 241 | |
| * | Stifel Financial Corp. | 5,613 | 225 |
| EPR Properties | 4,466 | 219 | |
| DiamondRock Hospitality Co. | 18,553 | 180 | |
| Umpqua Holdings Corp. | 10,628 | 173 | |
| Mid-America Apartment | |||
| Communities Inc. | 2,069 | 128 | |
| Old National Bancorp | 9,623 | 126 | |
| RLI Corp. | 1,617 | 126 | |
| Community Bank System Inc. | 3,798 | 126 | |
| Tanger Factory Outlet Centers | 3,948 | 122 | |
| United Bankshares Inc. | 4,362 | 121 | |
| Selective Insurance Group Inc. | 5,272 | 121 | |
| Lexington Realty Trust | 10,142 | 119 | |
| Northwest Bancshares Inc. | 8,901 | 119 | |
| Cash America | |||
| International Inc. | 2,710 | 116 | |
| UMB Financial Corp. | 1,756 | 105 | |
| Colonial Properties Trust | 4,730 | 104 | |
| Susquehanna Bancshares Inc. | 8,156 | 103 | |
| Prospect Capital Corp. | 9,222 | 102 | |
| Financial Engines Inc. | 1,895 | 101 | |
| Franklin Street | |||
| Properties Corp. | 8,290 | 101 | |
| Glacier Bancorp Inc. | 4,239 | 100 | |
| Horace Mann Educators Corp. | 3,768 | 99 | |
| Medical Properties Trust Inc. | 8,205 | 95 | |
| Healthcare Realty Trust Inc. | 4,177 | 94 | |
| NBT Bancorp Inc. | 4,149 | 89 | |
| Provident Financial | |||
| Services Inc. | 5,090 | 82 | |
| First Financial Bancorp | 5,477 | 82 | |
| Wintrust Financial Corp. | 2,004 | 79 | |
| * | Ezcorp Inc. Class A | 4,521 | 77 |
| Cousins Properties Inc. | 7,668 | 76 | |
| Government Properties | |||
| Income Trust | 3,225 | 75 | |
| First Financial Bankshares Inc. | 1,280 | 74 | |
| Sovran Self Storage Inc. | 1,104 | 73 | |
| EastGroup Properties Inc. | 1,290 | 72 | |
| Evercore Partners Inc. | |||
| Class A | 1,579 | 70 | |
| CVB Financial Corp. | 5,441 | 69 | |
| Interactive Brokers Group Inc. | 4,092 | 69 | |
| Infinity Property & | |||
| Casualty Corp. | 1,094 | 66 | |
32
S&P Small-Cap 600 Value Index Fund
| Market | |||
| Value | |||
| Shares | ($000) | ||
| * | Forestar Group Inc. | 3,294 | 66 |
| * | United Community Banks Inc. | 4,390 | 64 |
| S&T Bancorp Inc. | 2,826 | 64 | |
| MB Financial Inc. | 2,292 | 62 | |
| Safety Insurance Group Inc. | 1,212 | 61 | |
| * | First BanCorp. | 9,462 | 60 |
| * | Investment Technology | ||
| Group Inc. | 3,534 | 60 | |
| Stewart Information | |||
| Services Corp. | 1,953 | 60 | |
| United Fire Group Inc. | 2,062 | 59 | |
| First Midwest Bancorp Inc. | 3,926 | 59 | |
| LTC Properties Inc. | 1,658 | 59 | |
| AMERISAFE Inc. | 1,751 | 57 | |
| Banner Corp. | 1,665 | 57 | |
| PS Business Parks Inc. | 770 | 56 | |
| Columbia Banking | |||
| System Inc. | 2,376 | 55 | |
| * | Navigators Group Inc. | 1,004 | 55 |
| Acadia Realty Trust | 2,252 | 53 | |
| TrustCo Bank Corp. NY | 8,952 | 52 | |
| Tower Group International Ltd. | 3,694 | 52 | |
| Hanmi Financial Corp. | 3,001 | 49 | |
| Tompkins Financial Corp. | 1,097 | 48 | |
| Kite Realty Group Trust | 8,195 | 47 | |
| Employers Holdings Inc. | 1,763 | 47 | |
| Independent Bank Corp. | 1,260 | 45 | |
| Pennsylvania REIT | 2,384 | 44 | |
| * | World Acceptance Corp. | 513 | 44 |
| Associated Estates | |||
| Realty Corp. | 3,016 | 42 | |
| Inland Real Estate Corp. | 4,199 | 41 | |
| Parkway Properties Inc. | 2,361 | 39 | |
| City Holding Co. | 941 | 38 | |
| Simmons First National Corp. | |||
| Class A | 1,569 | 38 | |
| Sterling Bancorp | 2,920 | 37 | |
| Getty Realty Corp. | 1,461 | 27 | |
| Meadowbrook Insurance | |||
| Group Inc. | 4,414 | 26 | |
| Urstadt Biddle Properties | |||
| Inc. Class A | 1,302 | 25 | |
| Bank Mutual Corp. | 4,065 | 24 | |
| Brookline Bancorp Inc. | 2,575 | 23 | |
| Agree Realty Corp. | 797 | 22 | |
| Saul Centers Inc. | 494 | 21 | |
| Dime Community | |||
| Bancshares Inc. | 1,228 | 20 | |
| Calamos Asset | |||
| Management Inc. Class A | 1,924 | 19 | |
| * | Piper Jaffray Cos. | 561 | 18 |
| Cedar Realty Trust Inc. | 2,891 | 14 | |
| * | SWS Group Inc. | 2,668 | 14 |
| * | Taylor Capital Group Inc. | 314 | 7 |
| 6,526 |
| Market | |||
| Value | |||
| Shares | ($000) | ||
| Health Care (6.9%) | |||
| * | Centene Corp. | 5,166 | 295 |
| * | Cubist Pharmaceuticals Inc. | 2,478 | 157 |
| * | Magellan Health Services Inc. | 2,574 | 145 |
| * | Amsurg Corp. Class A | 3,041 | 113 |
| * | NuVasive Inc. | 4,188 | 98 |
| * | Molina Healthcare Inc. | 2,765 | 92 |
| West Pharmaceutical | |||
| Services Inc. | 1,152 | 85 | |
| CONMED Corp. | 2,629 | 82 | |
| Kindred Healthcare Inc. | 5,130 | 75 | |
| Ensign Group Inc. | 1,682 | 65 | |
| * | Amedisys Inc. | 2,994 | 49 |
| Chemed Corp. | 699 | 49 | |
| Hi-Tech Pharmacal Co. Inc. | 1,064 | 46 | |
| * | Emergent Biosolutions Inc. | 2,439 | 43 |
| * | IPC The Hospitalist Co. Inc. | 814 | 42 |
| Quality Systems Inc. | 2,014 | 42 | |
| Invacare Corp. | 2,774 | 42 | |
| Meridian Bioscience Inc. | 1,816 | 41 | |
| * | Integra LifeSciences | ||
| Holdings Corp. | 935 | 38 | |
| * | Affymetrix Inc. | 6,765 | 38 |
| * | PharMerica Corp. | 2,821 | 35 |
| * | LHC Group Inc. | 1,395 | 31 |
| * | Gentiva Health Services Inc. | 2,743 | 31 |
| * | Merit Medical Systems Inc. | 2,372 | 30 |
| * | ABIOMED Inc. | 1,228 | 29 |
| * | Symmetry Medical Inc. | 3,537 | 28 |
| * | Omnicell Inc. | 1,262 | 27 |
| * | Healthways Inc. | 1,405 | 27 |
| * | AMN Healthcare Services Inc. | 1,821 | 25 |
| Computer Programs & | |||
| Systems Inc. | 364 | 20 | |
| * | Corvel Corp. | 568 | 19 |
| * | Cross Country Healthcare Inc. | 2,915 | 16 |
| Almost Family Inc. | 783 | 15 | |
| * | Natus Medical Inc. | 1,048 | 14 |
| * | SurModics Inc. | 505 | 10 |
| CryoLife Inc. | 1,460 | 9 | |
| 2,003 | |||
| Industrials (18.1%) | |||
| EMCOR Group Inc. | 6,371 | 239 | |
| * | Moog Inc. Class A | 4,302 | 219 |
| Curtiss-Wright Corp. | 4,445 | 186 | |
| * | Teledyne Technologies Inc. | 2,235 | 172 |
| AO Smith Corp. | 3,697 | 155 | |
| United Stationers Inc. | 3,850 | 153 | |
| * | Tetra Tech Inc. | 6,164 | 140 |
| Watts Water | |||
| Technologies Inc. Class A | 2,685 | 139 | |
| Barnes Group Inc. | 4,439 | 139 | |
| ABM Industries Inc. | 4,833 | 117 | |
| * | Atlas Air Worldwide | ||
| Holdings Inc. | 2,456 | 113 | |
33
S&P Small-Cap 600 Value Index Fund
| Market | |||
| Value | |||
| Shares | ($000) | ||
| * | Mobile Mini Inc. | 3,639 | 111 |
| * | Orbital Sciences Corp. | 5,682 | 99 |
| EnerSys Inc. | 1,922 | 99 | |
| Applied Industrial | |||
| Technologies Inc. | 2,035 | 97 | |
| CIRCOR International Inc. | 1,668 | 96 | |
| G&K Services Inc. Class A | 1,853 | 95 | |
| AAR Corp. | 3,776 | 95 | |
| * | TrueBlue Inc. | 3,864 | 94 |
| Albany International Corp. | 2,763 | 89 | |
| Brady Corp. Class A | 2,641 | 87 | |
| Briggs & Stratton Corp. | 4,559 | 87 | |
| UniFirst Corp. | 868 | 83 | |
| * | Korn/Ferry International | 4,614 | 82 |
| * | Dycom Industries Inc. | 3,129 | 80 |
| Actuant Corp. Class A | 2,219 | 79 | |
| Universal Forest Products Inc. | 1,877 | 70 | |
| * | Federal Signal Corp. | 5,927 | 69 |
| Astec Industries Inc. | 1,993 | 69 | |
| Insperity Inc. | 2,082 | 66 | |
| * | WageWorks Inc. | 1,585 | 66 |
| * | Navigant Consulting Inc. | 4,788 | 65 |
| SkyWest Inc. | 4,918 | 63 | |
| Simpson Manufacturing | |||
| Co. Inc. | 2,026 | 63 | |
| John Bean Technologies Corp. | 2,752 | 60 | |
| * | Hub Group Inc. Class A | 1,618 | 60 |
| Arkansas Best Corp. | 2,270 | 56 | |
| Kaman Corp. | 1,586 | 56 | |
| Kaydon Corp. | 1,957 | 56 | |
| * | Engility Holdings Inc. | 1,633 | 55 |
| Comfort Systems USA Inc. | 3,545 | 54 | |
| Tennant Co. | 1,033 | 53 | |
| Mueller Industries Inc. | 990 | 53 | |
| * | EnPro Industries Inc. | 930 | 53 |
| Cubic Corp. | 1,043 | 52 | |
| Griffon Corp. | 4,276 | 47 | |
| Kelly Services Inc. Class A | 2,583 | 47 | |
| Knight Transportation Inc. | 2,814 | 46 | |
| * | Powell Industries Inc. | 863 | 46 |
| Viad Corp. | 1,930 | 44 | |
| * | Aegion Corp. Class A | 2,004 | 43 |
| * | Consolidated Graphics Inc. | 781 | 42 |
| ESCO Technologies Inc. | 1,331 | 41 | |
| Forward Air Corp. | 1,084 | 40 | |
| * | Aerovironment Inc. | 1,798 | 39 |
| Titan International Inc. | 2,330 | 38 | |
| * | II-VI Inc. | 1,902 | 37 |
| Interface Inc. Class A | 2,031 | 36 | |
| Exponent Inc. | 549 | 36 | |
| * | Gibraltar Industries Inc. | 2,755 | 35 |
| Apogee Enterprises Inc. | 1,256 | 35 | |
| AAON Inc. | 1,397 | 33 | |
| Heartland Express Inc. | 2,294 | 32 |
| Market | |||
| Value | |||
| Shares | ($000) | ||
| National Presto Industries Inc. | 462 | 32 | |
| * | GenCorp Inc. | 2,111 | 32 |
| Encore Wire Corp. | 773 | 29 | |
| American Science & | |||
| Engineering Inc. | 462 | 26 | |
| * | Orion Marine Group Inc. | 2,562 | 25 |
| Heidrick & Struggles | |||
| International Inc. | 1,544 | 23 | |
| Resources Connection Inc. | 1,599 | 20 | |
| CDI Corp. | 1,314 | 18 | |
| * | DXP Enterprises Inc. | 214 | 15 |
| * | Vicor Corp. | 1,706 | 13 |
| 5,234 | |||
| Information Technology (14.3%) | |||
| * | Anixter International Inc. | 2,562 | 214 |
| * | ViaSat Inc. | 2,412 | 154 |
| * | CACI International Inc. | ||
| Class A | 2,190 | 148 | |
| * | SYNNEX Corp. | 2,515 | 120 |
| * | TriQuint Semiconductor Inc. | 15,517 | 117 |
| * | Benchmark Electronics Inc. | 5,191 | 114 |
| Belden Inc. | 1,877 | 106 | |
| * | Plexus Corp. | 3,244 | 106 |
| Tessera Technologies Inc. | 5,016 | 92 | |
| * | QLogic Corp. | 8,441 | 89 |
| j2 Global Inc. | 1,760 | 87 | |
| * | ScanSource Inc. | 2,647 | 82 |
| Methode Electronics Inc. | 3,353 | 80 | |
| Blackbaud Inc. | 2,210 | 80 | |
| * | Insight Enterprises Inc. | 4,128 | 79 |
| * | Progress Software Corp. | 3,138 | 77 |
| * | Synaptics Inc. | 1,976 | 76 |
| * | Take-Two Interactive | ||
| Software Inc. | 4,095 | 75 | |
| * | GT Advanced | ||
| Technologies Inc. | 11,324 | 73 | |
| Power Integrations Inc. | 1,376 | 72 | |
| United Online Inc. | 8,756 | 69 | |
| * | Cardtronics Inc. | 1,965 | 68 |
| * | Harmonic Inc. | 9,583 | 68 |
| MKS Instruments Inc. | 2,572 | 64 | |
| * | Sykes Enterprises Inc. | 3,752 | 64 |
| * | Digital River Inc. | 3,342 | 58 |
| * | Checkpoint Systems Inc. | 3,905 | 57 |
| * | Newport Corp. | 3,724 | 57 |
| Brooks Automation Inc. | 6,317 | 56 | |
| * | TeleTech Holdings Inc. | 2,079 | 51 |
| Coherent Inc. | 904 | 51 | |
| Park Electrochemical Corp. | 1,845 | 49 | |
| Heartland Payment | |||
| Systems Inc. | 1,313 | 49 | |
| * | comScore Inc. | 1,641 | 47 |
| * | OSI Systems Inc. | 638 | 46 |
34
S&P Small-Cap 600 Value Index Fund
| Market | |||
| Value | |||
| Shares | ($000) | ||
| * | Synchronoss | ||
| Technologies Inc. | 1,348 | 46 | |
| CTS Corp. | 3,183 | 44 | |
| Black Box Corp. | 1,537 | 41 | |
| * | LogMeIn Inc. | 1,356 | 40 |
| * | Bottomline | ||
| Technologies de Inc. | 1,474 | 40 | |
| * | Cabot Microelectronics Corp. | 1,106 | 40 |
| Comtech | |||
| Telecommunications Corp. | 1,565 | 38 | |
| EPIQ Systems Inc. | 3,057 | 37 | |
| Monotype Imaging | |||
| Holdings Inc. | 1,447 | 37 | |
| * | ATMI Inc. | 1,509 | 37 |
| * | Tangoe Inc. | 1,759 | 37 |
| * | MicroStrategy Inc. Class A | 383 | 35 |
| * | Rofin-Sinar Technologies Inc. | 1,533 | 34 |
| * | Rogers Corp. | 620 | 34 |
| * | Diodes Inc. | 1,354 | 34 |
| CSG Systems | |||
| International Inc. | 1,422 | 33 | |
| * | Super Micro Computer Inc. | 2,534 | 33 |
| MTS Systems Corp. | 498 | 30 | |
| * | TTM Technologies Inc. | 3,019 | 29 |
| * | FARO Technologies Inc. | 720 | 27 |
| * | Mercury Systems Inc. | 3,044 | 27 |
| Forrester Research Inc. | 737 | 24 | |
| * | Intermec Inc. | 2,436 | 24 |
| * | CIBER Inc. | 6,476 | 24 |
| * | Ceva Inc. | 1,288 | 23 |
| * | Digi International Inc. | 2,480 | 23 |
| Daktronics Inc. | 2,140 | 23 | |
| Supertex Inc. | 984 | 23 | |
| * | Virtusa Corp. | 859 | 23 |
| Cohu Inc. | 2,194 | 22 | |
| Micrel Inc. | 2,368 | 22 | |
| * | DTS Inc. | 1,083 | 22 |
| * | QuinStreet Inc. | 2,422 | 21 |
| * | Oplink Communications Inc. | 1,082 | 20 |
| * | Rubicon Technology Inc. | 1,617 | 20 |
| * | Volterra Semiconductor Corp. | 827 | 19 |
| Bel Fuse Inc. Class B | 988 | 18 | |
| Ebix Inc. | 1,544 | 18 | |
| * | Avid Technology Inc. | 2,864 | 15 |
| * | Higher One Holdings Inc. | 1,949 | 14 |
| * | Pericom Semiconductor Corp. | 2,012 | 14 |
| * | Intevac Inc. | 2,218 | 13 |
| Electro Scientific | |||
| Industries Inc. | 1,203 | 13 | |
| * | DSP Group Inc. | 2,057 | 13 |
| * | Kopin Corp. | 3,722 | 12 |
| * | Sigma Designs Inc. | 1,963 | 9 |
| * | Agilysys Inc. | 761 | 9 |
| Market | |||
| Value | |||
| Shares | ($000) | ||
| * | Symmetricom Inc. | 1,735 | 8 |
| * | Radisys Corp. | 2,169 | 7 |
| PC-Tel Inc. | 902 | 7 | |
| 4,151 | |||
| Materials (6.2%) | |||
| KapStone Paper and | |||
| Packaging Corp. | 3,700 | 155 | |
| Kaiser Aluminum Corp. | 1,558 | 108 | |
| PH Glatfelter Co. | 4,080 | 105 | |
| Innophos Holdings Inc. | 2,086 | 102 | |
| Schweitzer-Mauduit | |||
| International Inc. | 1,783 | 102 | |
| * | Clearwater Paper Corp. | 2,113 | 101 |
| Stepan Co. | 1,674 | 95 | |
| * | RTI International Metals Inc. | 2,899 | 90 |
| * | OM Group Inc. | 3,028 | 86 |
| A Schulman Inc. | 2,806 | 76 | |
| Balchem Corp. | 1,382 | 66 | |
| * | Kraton Performance | ||
| Polymers Inc. | 3,095 | 57 | |
| Materion Corp. | 1,949 | 57 | |
| * | Calgon Carbon Corp. | 3,091 | 53 |
| Haynes International Inc. | 1,171 | 52 | |
| * | Stillwater Mining Co. | 4,493 | 51 |
| AMCOL International Corp. | 1,544 | 51 | |
| Wausau Paper Corp. | 4,420 | 49 | |
| Koppers Holdings Inc. | 1,199 | 47 | |
| * | Century Aluminum Co. | 4,902 | 38 |
| * | Flotek Industries Inc. | 1,911 | 38 |
| * | LSB Industries Inc. | 1,113 | 33 |
| Zep Inc. | 2,146 | 30 | |
| Myers Industries Inc. | 1,522 | 28 | |
| * | AK Steel Holding Corp. | 7,697 | 26 |
| * | AM Castle & Co. | 1,602 | 25 |
| Neenah Paper Inc. | 630 | 23 | |
| Olympic Steel Inc. | 865 | 22 | |
| Tredegar Corp. | 886 | 20 | |
| Hawkins Inc. | 503 | 19 | |
| 1,805 | |||
| Telecommunication Services (0.4%) | |||
| USA Mobility Inc. | 2,065 | 29 | |
| NTELOS Holdings Corp. | 1,451 | 24 | |
| Atlantic Tele-Network Inc. | 468 | 22 | |
| * | Cbeyond Inc. | 2,883 | 19 |
| Lumos Networks Corp. | 775 | 12 | |
| * | General Communication Inc. | ||
| Class A | 1,195 | 11 | |
| 117 | |||
| Utilities (7.0%) | |||
| Piedmont Natural Gas Co. Inc. | 7,191 | 232 | |
| Southwest Gas Corp. | 4,398 | 206 | |
| UIL Holdings Corp. | 4,830 | 182 | |
| UNS Energy Corp. | 3,936 | 180 | |
35
S&P Small-Cap 600 Value Index Fund
| Market | ||
| Value | ||
| Shares | ($000) | |
| South Jersey Industries Inc. | 3,049 | 176 |
| New Jersey Resources Corp. | 3,966 | 171 |
| ALLETE Inc. | 3,411 | 161 |
| Avista Corp. | 5,688 | 149 |
| NorthWestern Corp. | 3,597 | 145 |
| El Paso Electric Co. | 3,818 | 131 |
| Laclede Group Inc. | 2,884 | 128 |
| Northwest Natural Gas Co. | 2,562 | 105 |
| American States Water Co. | 808 | 43 |
| 2,009 | ||
| Total Investments (100.1%) | ||
| (Cost $24,879) | 28,996 | |
| Other Assets and Liabilities (-0.1%) | ||
| Other Assets | 38 | |
| Liabilities | (67) | |
| (29) | ||
| ETF Shares—Net Assets (100%) | ||
| Applicable to 350,000 outstanding | ||
| $.001 par value shares of beneficial | ||
| interest (unlimited authorization) | 28,967 | |
| Net Asset Value Per Share—ETF Shares | $82.76 | |
| At August 31, 2013, net assets consisted of: | |
| Amount | |
| ($000) | |
| Paid-in Capital | 25,463 |
| Undistributed Net Investment Income | 307 |
| Accumulated Net Realized Losses | (920) |
| Unrealized Appreciation (Depreciation) | 4,117 |
| Net Assets | 28,967 |
See Note A in Notes to Financial Statements.
* Non-income-producing security.
REIT—Real Estate Investment Trust.
See accompanying Notes, which are an integral part of the Financial Statements.
36
S&P Small-Cap 600 Value Index Fund
| Statement of Operations | |
| Year Ended | |
| August 31, 2013 | |
| ($000) | |
| Investment Income | |
| Income | |
| Dividends | 417 |
| Total Income | 417 |
| Expenses | |
| The Vanguard Group—Note B | |
| Management and Administrative | 12 |
| Custodian Fees | 8 |
| Auditing Fees | 21 |
| Shareholders’ Reports | 2 |
| Total Expenses | 43 |
| Net Investment Income | 374 |
| Realized Net Gain (Loss) on Investment Securities Sold | 2,295 |
| Change in Unrealized Appreciation (Depreciation) of Investment Securities | 2,191 |
| Net Increase (Decrease) in Net Assets Resulting from Operations | 4,860 |
See accompanying Notes, which are an integral part of the Financial Statements.
37
S&P Small-Cap 600 Value Index Fund
| Statement of Changes in Net Assets | ||
| Year Ended August 31, | ||
| 2013 | 2012 | |
| ($000) | ($000) | |
| Increase (Decrease) in Net Assets | ||
| Operations | ||
| Net Investment Income | 374 | 241 |
| Realized Net Gain (Loss) | 2,295 | 199 |
| Change in Unrealized Appreciation (Depreciation) | 2,191 | 2,022 |
| Net Increase (Decrease) in Net Assets Resulting from Operations | 4,860 | 2,462 |
| Distributions | ||
| Net Investment Income | (227) | (163) |
| Realized Capital Gain | — | — |
| Total Distributions | (227) | (163) |
| Capital Share Transactions | ||
| Issued | 14,888 | 2,868 |
| Issued in Lieu of Cash Distributions | — | — |
| Redeemed | (7,001) | (2,890) |
| Net Increase (Decrease) from Capital Share Transactions | 7,887 | (22) |
| Total Increase (Decrease) | 12,520 | 2,277 |
| Net Assets | ||
| Beginning of Period | 16,447 | 14,170 |
| End of Period1 | 28,967 | 16,447 |
| 1 Net Assets—End of Period includes undistributed net investment income of $307,000 and $160,000. | ||
See accompanying Notes, which are an integral part of the Financial Statements.
38
S&P Small-Cap 600 Value Index Fund
Financial Highlights
| ETF Shares | |||
| Sept. 7, | |||
| Year Ended | 20101 to | ||
| August 31, | Aug. 31, | ||
| For a Share Outstanding Throughout Each Period | 2013 | 2012 | 2011 |
| Net Asset Value, Beginning of Period | $65.79 | $56.68 | $49.79 |
| Investment Operations | |||
| Net Investment Income | 1.146 | .960 | .741 |
| Net Realized and Unrealized Gain (Loss) on Investments | 16.731 | 8.801 | 6.519 |
| Total from Investment Operations | 17.877 | 9.761 | 7.260 |
| Distributions | |||
| Dividends from Net Investment Income | (. 907) | (. 651) | (. 370) |
| Distributions from Realized Capital Gains | — | — | — |
| Total Distributions | (. 907) | (. 651) | (. 370) |
| Net Asset Value, End of Period | $82.76 | $65.79 | $56.68 |
| Total Return | 27.45% | 17.33% | 14.52% |
| Ratios/Supplemental Data | |||
| Net Assets, End of Period (Millions) | $29 | $16 | $14 |
| Ratio of Total Expenses to Average Net Assets | 0.20% | 0.20% | 0.20%2 |
| Ratio of Net Investment Income to Average Net Assets | 1.73% | 1.56% | 1.32%2 |
| Portfolio Turnover Rate 3 | 37% | 29% | 70% |
1 Inception.
2 Annualized.
3 Excludes the value of portfolio securities received or delivered as a result of in-kind purchases or redemptions of the fund’s capital shares, including ETF Creation Units.
See accompanying Notes, which are an integral part of the Financial Statements.
39
S&P Small-Cap 600 Value Index Fund
Notes to Financial Statements
Vanguard S&P Small-Cap 600 Value Index Fund is registered under the Investment Company Act of 1940 as an open-end investment company, or mutual fund. The fund offers two classes of shares: Institutional Shares and ETF Shares. Institutional Shares are designed for investors who meet certain administrative, service, and account-size criteria. During the year ended August 31, 2013, there were no investors in the Institutional share class. ETF Shares are listed for trading on NYSE Arca; they can be purchased and sold through a broker.
A. The following significant accounting policies conform to generally accepted accounting principles for U.S. mutual funds. The fund consistently follows such policies in preparing its financial statements.
1. Security Valuation: Securities are valued as of the close of trading on the New York Stock Exchange (generally 4 p.m., Eastern time) on the valuation date. Equity securities are valued at the latest quoted sales prices or official closing prices taken from the primary market in which each security trades; such securities not traded on the valuation date are valued at the mean of the latest quoted bid and asked prices. Securities for which market quotations are not readily available, or whose values have been materially affected by events occurring before the fund’s pricing time but after the close of the securities’ primary markets, are valued by methods deemed by the board of trustees to represent fair value.
2. Federal Income Taxes: The fund intends to continue to qualify as a regulated investment company and distribute all of its taxable income. Management has analyzed the fund’s tax positions taken for all open federal income tax years (August 31, 2011–2013), and has concluded that no provision for federal income tax is required in the fund’s financial statements.
3. Distributions: Distributions to shareholders are recorded on the ex-dividend date.
4. Other: Dividend income is recorded on the ex-dividend date. Interest income is accrued daily. Security transactions are accounted for on the date securities are bought or sold. Costs used to determine realized gains (losses) on the sale of investment securities are those of the specific securities sold.
B. The Vanguard Group furnishes at cost investment advisory, corporate management, administrative, marketing, and distribution services. The costs of such services are allocated to the fund under methods approved by the board of trustees. The fund has committed to provide up to 0.40% of its net assets in capital contributions to Vanguard. At August 31, 2013, the fund had contributed capital of $4,000 to Vanguard (included in Other Assets), representing 0.01% of the fund’s net assets and 0.00% of Vanguard’s capitalization. The fund’s trustees and officers are also directors and officers of Vanguard.
C. Various inputs may be used to determine the value of the fund’s investments. These inputs are summarized in three broad levels for financial statement purposes. The inputs or methodologies used to value securities are not necessarily an indication of the risk associated with investing in those securities.
Level 1—Quoted prices in active markets for identical securities.
Level 2—Other significant observable inputs (including quoted prices for similar securities, interest rates, prepayment speeds, credit risk, etc.).
Level 3—Significant unobservable inputs (including the fund’s own assumptions used to determine the fair value of investments).
At August 31, 2013, 100% of the market value of the fund’s investments was determined based on Level 1 inputs.
40
S&P Small-Cap 600 Value Index Fund
D. Distributions are determined on a tax basis and may differ from net investment income and realized capital gains for financial reporting purposes. Differences may be permanent or temporary. Permanent differences are reclassified among capital accounts in the financial statements to reflect their tax character. Temporary differences arise when certain items of income, expense, gain, or loss are recognized in different periods for financial statement and tax purposes; these differences will reverse at some time in the future. Differences in classification may also result from the treatment of short-term gains as ordinary income for tax purposes.
During the year ended August 31, 2013, the fund realized $2,340,000 of net capital gains resulting from in-kind redemptions—in which shareholders exchanged fund shares for securities held by the fund rather than for cash. Because such gains are not taxable to the fund, and are not distributed to shareholders, they have been reclassified from accumulated net realized losses to paid-in capital.
For tax purposes, at August 31, 2013, the fund had $307,000 of ordinary income available for distribution. The fund had available capital losses totaling $920,000 that may be carried forward indefinitely to offset future net capital gains.
At August 31, 2013, the cost of investment securities for tax purposes was $24,879,000. Net unrealized appreciation of investment securities for tax purposes was $4,117,000, consisting of unrealized gains of $4,619,000 on securities that had risen in value since their purchase and $502,000 in unrealized losses on securities that had fallen in value since their purchase.
E. During the year ended August 31, 2013, the fund purchased $22,779,000 of investment securities and sold $14,705,000 of investment securities, other than temporary cash investments. Purchases and sales include $14,882,000 and $6,880,000, respectively, in connection with in-kind purchases and redemptions of the fund’s capital shares.
F. Capital shares issued and redeemed were:
| Year Ended August 31, | ||
| 2013 | 2012 | |
| Shares | Shares | |
| (000) | (000) | |
| Issued | 200 | 50 |
| Issued in Lieu of Cash Distributions | — | — |
| Redeemed | (100) | (50) |
| Net Increase (Decrease) in Shares Outstanding | 100 | — |
G. Management has determined that no material events or transactions occurred subsequent to August 31, 2013, that would require recognition or disclosure in these financial statements.
41
S&P Small-Cap 600 Growth Index Fund
Fund Profile
As of August 31, 2013
| Portfolio Characteristics | |||
| S&P | |||
| SmallCap | DJ U.S. | ||
| 600 | Total | ||
| Growth | Market | ||
| Fund | Index | FA Index | |
| Number of Stocks | 356 | 356 | 3,631 |
| Median Market Cap | $1.6B | $1.6B | $39.3B |
| Price/Earnings Ratio | 25.1x | 25.2x | 18.7x |
| Price/Book Ratio | 2.7x | 2.8x | 2.4x |
| Return on Equity | 11.7% | 11.7% | 16.6% |
| Earnings Growth Rate | 18.1% | 18.1% | 11.1% |
| Dividend Yield | 0.9% | 0.9% | 2.0% |
| Foreign Holdings | 0.0% | 0.0% | 0.0% |
| Turnover Rate | 39% | — | — |
| Ticker Symbol | VIOG | — | — |
| Expense Ratio1 | 0.20% | — | — |
| 30-Day SEC Yield | 0.73% | — | — |
| Short-Term Reserves | 0.5% | — | — |
| Sector Diversification (% of equity exposure) | |||
| S&P | DJ U.S. | ||
| SmallCap | Total | ||
| 600 | Market | ||
| Growth | FA | ||
| Fund | Index | Index | |
| Consumer Discretionary | 17.5% | 17.5% | 13.1% |
| Consumer Staples | 4.3 | 4.3 | 8.9 |
| Energy | 3.4 | 3.4 | 9.8 |
| Financials | 19.6 | 19.5 | 17.5 |
| Health Care | 15.5 | 15.5 | 12.6 |
| Industrials | 11.7 | 11.7 | 11.2 |
| Information Technology | 22.2 | 22.3 | 17.6 |
| Materials | 5.2 | 5.2 | 3.8 |
| Telecommunication | |||
| Services | 0.4 | 0.4 | 2.3 |
| Utilities | 0.2 | 0.2 | 3.2 |
| Ten Largest Holdings (% of total net assets) | ||
| Gulfport Energy Corp. | Oil & Gas Exploration | |
| & Production | 1.3% | |
| Questcor | ||
| Pharmaceuticals Inc. | Pharmaceuticals | 1.3 |
| Hain Celestial Group Inc. Packaged Foods & | ||
| Meats | 1.3 | |
| Brunswick Corp. | Leisure Products | 1.1 |
| FEI Co. | Electronic Equipment | |
| & Instruments | 1.1 | |
| Align Technology Inc. | Health Care Supplies | 1.0 |
| Old Dominion Freight | ||
| Line Inc. | Trucking | 1.0 |
| Toro Co. | Construction & Farm | |
| Machinery & Heavy | ||
| Trucks | 1.0 | |
| Lumber Liquidators | Home Improvement | |
| Holdings Inc. | Retail | 0.9 |
| Portfolio Recovery | ||
| Associates Inc. | Consumer Finance | 0.9 |
| Top Ten | 10.9% | |
The holdings listed exclude any temporary cash investments and equity index products.
Investment Focus

1 The expense ratio shown is from the prospectus dated December 28, 2012, and represents estimated costs for the current fiscal year. For the fiscal year ended August 31, 2013, the expense ratio was 0.20%.
42
S&P Small-Cap 600 Growth Index Fund
Performance Summary
All of the returns in this report represent past performance, which is not a guarantee of future results that may be achieved by the fund. (Current performance may be lower or higher than the performance data cited. For performance data current to the most recent month-end, visit our website at vanguard.com/performance.) Note, too, that both investment returns and principal value can fluctuate widely, so an investor’s shares, when sold, could be worth more or less than their original cost. The returns shown do not reflect taxes that a shareholder would pay on fund distributions or on the sale of fund shares.
Cumulative Performance: September 7, 2010, Through August 31, 2013
Initial Investment of $10,000

| Average Annual Total Returns | |||
| Periods Ended August 31, 2013 | |||
| Since | Final Value | ||
| One | Inception | of a $10,000 | |
| Year | (9/7/2010) | Investment | |
| S&P Small-Cap 600 Growth Index | |||
| Fund*ETF Shares Net Asset Value | 25.59% | 21.81% | $18,005 |
| S&P Small-Cap 600 Growth Index | |||
| Fund*ETF Shares Market Price | 25.70 | 21.83 | 18,013 |
| S&P SmallCap 600 Growth Index | 25.77 | 22.02 | 18,100 |
| Small-Cap Growth Funds Average | 25.95 | 18.84 | 16,727 |
| Dow Jones U.S. Total Stock Market | |||
| Float Adjusted Index | 20.15 | 17.40 | 16,132 |
Small-Cap Growth Funds Average: Derived from data provided by Lipper, a Thomson Reuters Company.
"Since Inception" performance is calculated from the ETF Shares’ inception date for both the fund and its comparative standards.
See Financial Highlights for dividend and capital gains information.
43
S&P Small-Cap 600 Growth Index Fund
| Cumulative Returns of ETF Shares: September 7, 2010, Through August 31, 2013 | ||
| Since | ||
| One | Inception | |
| Year | (9/7/2010) | |
| S&P Small-Cap 600 Growth Index Fund ETF Shares | ||
| Market Price | 25.70% | 80.13% |
| S&P Small-Cap 600 Growth Index Fund ETF Shares | ||
| Net Asset Value | 25.59 | 80.05 |
| S&P SmallCap 600 Growth Index | 25.77 | 81.00 |
| "Since Inception" performance is calculated from the ETF Shares’ inception date for both the fund and its comparative standards. | ||
Fiscal-Year Total Returns (%): September 7, 2010, Through August 31, 2013
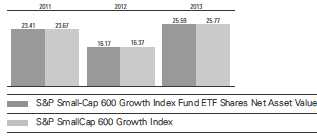
Average Annual Total Returns: Periods Ended June 30, 2013
This table presents returns through the latest calendar quarter—rather than through the end of the fiscal period.
Securities and Exchange Commission rules require that we provide this information.
| Inception | One | Since | |
| Date | Year | Inception | |
| ETF Shares | 9/7/2010 | ||
| Market Price | 21.77% | 20.84% | |
| Net Asset Value | 21.85 | 20.89 |
44
S&P Small-Cap 600 Growth Index Fund
Financial Statements
Statement of Net Assets
As of August 31, 2013
The fund reports a complete list of its holdings in regulatory filings four times in each fiscal year, at the quarter-ends. For the second and fourth fiscal quarters, the lists appear in the fund’s semiannual and annual reports to shareholders. For the first and third fiscal quarters, the fund files the lists with the Securities and Exchange Commission on Form N-Q. Shareholders can look up the fund’s Forms N-Q on the SEC’s website at sec.gov. Forms N-Q may also be reviewed and copied at the SEC’s Public Reference Room (see the back cover of this report for further information).
| Market | |||
| Value | |||
| Shares | ($000) | ||
| Common Stocks (100.0%) | |||
| Consumer Discretionary (17.5%) | |||
| Brunswick Corp. | 6,551 | 238 | |
| * | Lumber Liquidators | ||
| Holdings Inc. | 1,987 | 198 | |
| Pool Corp. | 3,378 | 176 | |
| * | Steven Madden Ltd. | 2,983 | 161 |
| * | Buffalo Wild Wings Inc. | 1,359 | 141 |
| Outerwall Inc. | 2,034 | 126 | |
| Ryland Group Inc. | 3,343 | 116 | |
| Wolverine World Wide Inc. | 2,036 | 115 | |
| * | Select Comfort Corp. | 4,024 | 99 |
| Dorman Products Inc. | 1,961 | 99 | |
| * | Hibbett Sports Inc. | 1,882 | 97 |
| * | Fifth & Pacific Cos. Inc. | 4,083 | 97 |
| * | SHFL Entertainment Inc. | 4,087 | 93 |
| * | Vitamin Shoppe Inc. | 2,185 | 92 |
| * | Meritage Homes Corp. | 2,275 | 91 |
| * | Multimedia Games | ||
| Holding Co. Inc. | 2,087 | 82 | |
| * | Papa John’s International Inc. | 1,187 | 81 |
| * | Francesca’s Holdings Corp. | 3,194 | 77 |
| Sturm Ruger & Co. Inc. | 1,396 | 73 | |
| * | Iconix Brand Group Inc. | 1,976 | 65 |
| Buckle Inc. | 1,238 | 64 | |
| Oxford Industries Inc. | 1,029 | 64 | |
| * | iRobot Corp. | 1,930 | 63 |
| Interval Leisure Group Inc. | 2,822 | 61 | |
| Drew Industries Inc. | 1,388 | 58 | |
| Texas Roadhouse Inc. Class A | 2,272 | 56 | |
| Movado Group Inc. | 1,291 | 55 | |
| * | Crocs Inc. | 3,950 | 53 |
| Arctic Cat Inc. | 955 | 51 | |
| * | American Public Education Inc. | 1,280 | 51 |
| Lithia Motors Inc. Class A | 780 | 51 | |
| * | Standard Pacific Corp. | 7,119 | 51 |
| * | Marriott Vacations | ||
| Worldwide Corp. | 1,163 | 51 | |
| Hillenbrand Inc. | 2,036 | 50 | |
| Ethan Allen Interiors Inc. | 1,892 | 49 | |
| Market | |||
| Value | |||
| Shares | ($000) | ||
| * | Jack in the Box Inc. | 1,229 | 49 |
| La-Z-Boy Inc. | 2,247 | 48 | |
| * | Helen of Troy Ltd. | 1,175 | 47 |
| * | rue21 inc | 1,127 | 46 |
| Arbitron Inc. | 968 | 46 | |
| * | Winnebago Industries Inc. | 2,041 | 45 |
| Monro Muffler Brake Inc. | 899 | 40 | |
| * | Tuesday Morning Corp. | 3,084 | 38 |
| * | M/I Homes Inc. | 1,758 | 33 |
| DineEquity Inc. | 480 | 32 | |
| * | Sonic Corp. | 1,990 | 32 |
| Brown Shoe Co. Inc. | 1,387 | 31 | |
| Ruth’s Hospitality Group Inc. | 2,615 | 31 | |
| Stage Stores Inc. | 1,473 | 27 | |
| * | Zumiez Inc. | 996 | 27 |
| * | BJ’s Restaurants Inc. | 850 | 27 |
| * | Blue Nile Inc. | 523 | 19 |
| Callaway Golf Co. | 2,182 | 15 | |
| Haverty Furniture Cos. Inc. | 619 | 15 | |
| Superior Industries | |||
| International Inc. | 841 | 15 | |
| * | Zale Corp. | 895 | 11 |
| * | Digital Generation Inc. | 898 | 11 |
| PetMed Express Inc. | 628 | 10 | |
| * | Christopher & Banks Corp. | 1,455 | 8 |
| 3,848 | |||
| Consumer Staples (4.3%) | |||
| * | Hain Celestial Group Inc. | 3,422 | 280 |
| * | Darling International Inc. | 8,554 | 173 |
| * | Boston Beer Co. Inc. Class A | 608 | 129 |
| * | Prestige Brands Holdings Inc. | 3,707 | 120 |
| B&G Foods Inc. | 2,378 | 81 | |
| J&J Snack Foods Corp. | 590 | 45 | |
| WD-40 Co. | 586 | 34 | |
| Inter Parfums Inc. | 1,186 | 31 | |
| Cal-Maine Foods Inc. | 564 | 26 | |
| * | Medifast Inc. | 883 | 22 |
| Calavo Growers Inc. | 403 | 10 | |
| 951 | |||
45
S&P Small-Cap 600 Growth Index Fund
| Market | |||
| Value | |||
| Shares | ($000) | ||
| Energy (3.4%) | |||
| * | Gulfport Energy Corp. | 4,983 | 294 |
| * | Geospace Technologies Corp. | 931 | 65 |
| * | Exterran Holdings Inc. | 2,236 | 61 |
| * | Northern Oil and Gas Inc. | 4,284 | 55 |
| * | PDC Energy Inc. | 954 | 55 |
| * | C&J Energy Services Inc. | 2,474 | 51 |
| * | Carrizo Oil & Gas Inc. | 1,466 | 50 |
| * | Approach Resources Inc. | 1,306 | 31 |
| * | Forest Oil Corp. | 4,335 | 24 |
| * | ION Geophysical Corp. | 3,976 | 19 |
| Comstock Resources Inc. | 1,304 | 19 | |
| * | PetroQuest Energy Inc. | 2,298 | 10 |
| * | Tesco Corp. | 529 | 8 |
| 742 | |||
| Financials (19.6%) | |||
| * | Portfolio Recovery | ||
| Associates Inc. | 3,672 | 195 | |
| Post Properties Inc. | 3,951 | 179 | |
| Geo Group Inc. | 5,181 | 162 | |
| MarketAxess Holdings Inc. | 2,720 | 138 | |
| * | Texas Capital | ||
| Bancshares Inc. | 2,956 | 130 | |
| FNB Corp. | 10,503 | 127 | |
| Tanger Factory | |||
| Outlet Centers | 3,833 | 118 | |
| * | First Cash Financial | ||
| Services Inc. | 1,943 | 107 | |
| Prospect Capital Corp. | 9,325 | 103 | |
| PrivateBancorp Inc. | 4,553 | 99 | |
| Bank of the Ozarks Inc. | 2,179 | 99 | |
| Sovran Self Storage Inc. | 1,430 | 95 | |
| PacWest Bancorp | 2,848 | 95 | |
| Mid-America Apartment | |||
| Communities Inc. | 1,514 | 93 | |
| Susquehanna Bancshares Inc. | 7,305 | 92 | |
| Financial Engines Inc. | 1,631 | 87 | |
| National Penn Bancshares Inc. | 8,545 | 86 | |
| Home BancShares Inc. | 3,342 | 85 | |
| Healthcare Realty Trust Inc. | 3,723 | 84 | |
| BBCN Bancorp Inc. | 5,714 | 76 | |
| * | Virtus Investment Partners Inc. | 420 | 73 |
| * | Encore Capital Group Inc. | 1,688 | 72 |
| First Financial Bankshares Inc. | 1,189 | 68 | |
| EastGroup Properties Inc. | 1,207 | 68 | |
| * | Pinnacle Financial Partners Inc. | 2,386 | 67 |
| Lexington Realty Trust | 5,581 | 65 | |
| Cousins Properties Inc. | 6,328 | 63 | |
| Medical Properties Trust Inc. | 5,348 | 62 | |
| UMB Financial Corp. | 1,010 | 60 | |
| Sabra Health Care REIT Inc. | 2,706 | 60 | |
| MB Financial Inc. | 2,216 | 60 | |
| Boston Private Financial | |||
| Holdings Inc. | 5,711 | 58 | |
| HFF Inc. Class A | 2,369 | 55 | |
| Market | |||
| Value | |||
| Shares | ($000) | ||
| Wintrust Financial Corp. | 1,357 | 54 | |
| Acadia Realty Trust | 2,283 | 53 | |
| Colonial Properties Trust | 2,410 | 53 | |
| PS Business Parks Inc. | 719 | 52 | |
| First Commonwealth | |||
| Financial Corp. | 7,118 | 52 | |
| ViewPoint Financial | |||
| Group Inc. | 2,601 | 52 | |
| Pennsylvania REIT | 2,714 | 50 | |
| CoreSite Realty Corp. | 1,554 | 47 | |
| Glacier Bancorp Inc. | 1,990 | 47 | |
| Columbia Banking System Inc. | 1,892 | 44 | |
| Oritani Financial Corp. | 2,817 | 44 | |
| * | World Acceptance Corp. | 501 | 43 |
| LTC Properties Inc. | 1,208 | 43 | |
| Evercore Partners Inc. | |||
| Class A | 913 | 41 | |
| * | eHealth Inc. | 1,337 | 37 |
| First Midwest Bancorp Inc. | 2,457 | 37 | |
| Universal Health Realty | |||
| Income Trust | 920 | 37 | |
| Wilshire Bancorp Inc. | 4,491 | 37 | |
| Cardinal Financial Corp. | 2,200 | 36 | |
| Government Properties | |||
| Income Trust | 1,505 | 35 | |
| Inland Real Estate Corp. | 3,057 | 30 | |
| CVB Financial Corp. | 2,230 | 28 | |
| Brookline Bancorp Inc. | 3,086 | 28 | |
| Independent Bank Corp. | 693 | 25 | |
| Saul Centers Inc. | 564 | 24 | |
| Employers Holdings Inc. | 894 | 24 | |
| * | Piper Jaffray Cos. | 648 | 21 |
| Parkway Properties Inc. | 1,251 | 20 | |
| Dime Community | |||
| Bancshares Inc. | 1,178 | 19 | |
| Associated Estates | |||
| Realty Corp. | 1,353 | 19 | |
| City Holding Co. | 422 | 17 | |
| Urstadt Biddle Properties Inc. | |||
| Class A | 871 | 17 | |
| * | Taylor Capital Group Inc. | 801 | 17 |
| Getty Realty Corp. | 819 | 15 | |
| Cedar Realty Trust Inc. | 1,785 | 9 | |
| Agree Realty Corp. | 300 | 8 | |
| 4,296 | |||
| Health Care (15.5%) | |||
| Questcor Pharmaceuticals Inc. | 4,240 | 283 | |
| * | Align Technology Inc. | 5,198 | 226 |
| * | PAREXEL International Corp. | 4,116 | 191 |
| * | Cubist Pharmaceuticals Inc. | 2,831 | 179 |
| * | Medidata Solutions Inc. | 1,657 | 148 |
| * | Haemonetics Corp. | 3,705 | 148 |
| * | ViroPharma Inc. | 4,737 | 143 |
| * | Medicines Co. | 4,478 | 142 |
| * | MWI Veterinary Supply Inc. | 871 | 132 |
46
S&P Small-Cap 600 Growth Index Fund
| Market | |||
| Value | |||
| Shares | ($000) | ||
| West Pharmaceutical | |||
| Services Inc. | 1,629 | 120 | |
| Air Methods Corp. | 2,531 | 104 | |
| * | Acorda Therapeutics Inc. | 2,936 | 99 |
| * | Impax Laboratories Inc. | 4,702 | 96 |
| * | Akorn Inc. | 4,938 | 89 |
| * | Neogen Corp. | 1,626 | 88 |
| * | Cyberonics Inc. | 1,724 | 88 |
| * | Hanger Inc. | 2,504 | 77 |
| * | ICU Medical Inc. | 931 | 67 |
| Analogic Corp. | 887 | 66 | |
| Cantel Medical Corp. | 2,359 | 61 | |
| * | Greatbatch Inc. | 1,732 | 59 |
| Abaxis Inc. | 1,500 | 59 | |
| Chemed Corp. | 836 | 58 | |
| * | Luminex Corp. | 2,735 | 56 |
| * | Bio-Reference Labs Inc. | 1,764 | 51 |
| * | HealthStream Inc. | 1,452 | 48 |
| * | Momenta | ||
| Pharmaceuticals Inc. | 3,300 | 46 | |
| * | ABIOMED Inc. | 1,612 | 38 |
| Meridian Bioscience Inc. | 1,626 | 37 | |
| * | Omnicell Inc. | 1,523 | 33 |
| Landauer Inc. | 695 | 33 | |
| * | Cynosure Inc. Class A | 1,342 | 31 |
| Spectrum | |||
| Pharmaceuticals Inc. | 4,001 | 31 | |
| * | Integra LifeSciences | ||
| Holdings Corp. | 752 | 31 | |
| * | IPC The Hospitalist Co. Inc. | 590 | 30 |
| * | Cambrex Corp. | 2,191 | 30 |
| Quality Systems Inc. | 1,352 | 28 | |
| * | Healthways Inc. | 1,408 | 27 |
| * | AMN Healthcare | ||
| Services Inc. | 1,943 | 26 | |
| Computer Programs & | |||
| Systems Inc. | 476 | 26 | |
| * | Natus Medical Inc. | 1,378 | 18 |
| * | Corvel Corp. | 416 | 14 |
| * | Merit Medical Systems Inc. | 1,055 | 13 |
| * | Arqule Inc. | 4,318 | 12 |
| * | SurModics Inc. | 477 | 9 |
| CryoLife Inc. | 671 | 4 | |
| 3,395 | |||
| Industrials (11.7%) | |||
| * | Old Dominion | ||
| Freight Line Inc. | 5,117 | 222 | |
| Toro Co. | 4,165 | 220 | |
| Actuant Corp. Class A | 3,607 | 129 | |
| Healthcare Services | |||
| Group Inc. | 4,949 | 120 | |
| AO Smith Corp. | 2,823 | 119 | |
| EnerSys Inc. | 2,017 | 103 | |
| Allegiant Travel Co. Class A | 1,090 | 103 | |
| Franklin Electric Co. Inc. | 2,811 | 101 | |
| * | On Assignment Inc. | 3,200 | 97 |
| Market | |||
| Value | |||
| Shares | ($000) | ||
| * | Teledyne Technologies Inc. | 1,000 | 77 |
| Applied Industrial | |||
| Technologies Inc. | 1,499 | 71 | |
| Lindsay Corp. | 932 | 71 | |
| AZZ Inc. | 1,850 | 69 | |
| Mueller Industries Inc. | 1,280 | 69 | |
| Forward Air Corp. | 1,360 | 50 | |
| * | Hub Group Inc. Class A | 1,333 | 49 |
| Standex International Corp. | 922 | 49 | |
| * | II-VI Inc. | 2,477 | 48 |
| Interface Inc. Class A | 2,622 | 46 | |
| * | EnPro Industries Inc. | 801 | 46 |
| Quanex Building | |||
| Products Corp. | 2,693 | 45 | |
| Brady Corp. Class A | 1,348 | 44 | |
| Simpson | |||
| Manufacturing Co. Inc. | 1,368 | 43 | |
| * | GenCorp Inc. | 2,754 | 41 |
| UniFirst Corp. | 425 | 41 | |
| * | DXP Enterprises Inc. | 545 | 37 |
| * | WageWorks Inc. | 877 | 37 |
| Knight Transportation Inc. | 2,146 | 35 | |
| Exponent Inc. | 535 | 35 | |
| Titan International Inc. | 2,088 | 34 | |
| Cubic Corp. | 654 | 33 | |
| Apogee Enterprises Inc. | 1,125 | 31 | |
| Encore Wire Corp. | 756 | 29 | |
| * | Aegion Corp. Class A | 1,304 | 28 |
| Tennant Co. | 541 | 28 | |
| ESCO Technologies Inc. | 902 | 28 | |
| Kaman Corp. | 743 | 26 | |
| Kaydon Corp. | 839 | 24 | |
| AAON Inc. | 956 | 22 | |
| Heartland Express Inc. | 1,563 | 22 | |
| Resources Connection Inc. | 1,742 | 21 | |
| * | Lydall Inc. | 1,237 | 19 |
| American Science & | |||
| Engineering Inc. | 210 | 12 | |
| 2,574 | |||
| Information Technology (22.2%) | |||
| FEI Co. | 3,023 | 237 | |
| MAXIMUS Inc. | 4,945 | 185 | |
| * | Microsemi Corp. | 6,725 | 173 |
| * | Sourcefire Inc. | 2,253 | 170 |
| Cognex Corp. | 2,923 | 167 | |
| * | Tyler Technologies Inc. | 1,965 | 145 |
| * | ARRIS Group Inc. | 8,295 | 130 |
| * | Dealertrack Technologies Inc. | 3,155 | 125 |
| * | Manhattan Associates Inc. | 1,409 | 123 |
| * | OpenTable Inc. | 1,651 | 123 |
| * | Hittite Microwave Corp. | 1,963 | 120 |
| Littelfuse Inc. | 1,602 | 118 | |
| * | Cirrus Logic Inc. | 4,586 | 103 |
| * | Veeco Instruments Inc. | 2,832 | 99 |
| Belden Inc. | 1,753 | 99 | |
| * | Electronics For Imaging Inc. | 3,360 | 98 |
47
S&P Small-Cap 600 Growth Index Fund
| Market | |||
| Value | |||
| Shares | ($000) | ||
| NIC Inc. | 4,282 | 95 | |
| j2 Global Inc. | 1,778 | 88 | |
| * | NETGEAR Inc. | 2,784 | 81 |
| Monolithic Power | |||
| Systems Inc. | 2,377 | 73 | |
| * | ViaSat Inc. | 1,131 | 72 |
| * | Interactive Intelligence | ||
| Group Inc. | 1,106 | 65 | |
| * | Take-Two Interactive | ||
| Software Inc. | 3,515 | 65 | |
| * | Netscout Systems Inc. | 2,570 | 64 |
| * | OSI Systems Inc. | 867 | 63 |
| * | Cardtronics Inc. | 1,758 | 61 |
| Heartland Payment | |||
| Systems Inc. | 1,637 | 60 | |
| * | Kulicke & Soffa | ||
| Industries Inc. | 5,454 | 60 | |
| Coherent Inc. | 1,073 | 60 | |
| * | Blucora Inc. | 2,977 | 60 |
| Blackbaud Inc. | 1,624 | 58 | |
| * | Ixia | 3,932 | 57 |
| * | Ultratech Inc. | 2,014 | 57 |
| Power Integrations Inc. | 1,049 | 55 | |
| * | Measurement Specialties Inc. | 1,127 | 53 |
| * | Liquidity Services Inc. | 1,790 | 53 |
| * | ExlService Holdings Inc. | 1,921 | 52 |
| * | iGATE Corp. | 2,226 | 52 |
| * | Advanced Energy | ||
| Industries Inc. | 2,646 | 48 | |
| MKS Instruments Inc. | 1,882 | 47 | |
| Badger Meter Inc. | 1,039 | 47 | |
| MTS Systems Corp. | 770 | 46 | |
| Monotype Imaging | |||
| Holdings Inc. | 1,668 | 43 | |
| * | Rogers Corp. | 767 | 43 |
| * | Stamps.com Inc. | 1,010 | 42 |
| * | Exar Corp. | 3,345 | 41 |
| * | Bottomline Technologies | ||
| de Inc. | 1,490 | 41 | |
| * | Progress Software Corp. | 1,603 | 39 |
| * | Perficient Inc. | 2,428 | 39 |
| * | Diodes Inc. | 1,570 | 39 |
| * | CalAmp Corp. | 2,342 | 38 |
| * | Synchronoss | ||
| Technologies Inc. | 989 | 34 | |
| * | LivePerson Inc. | 3,591 | 33 |
| * | MicroStrategy Inc. Class A | 356 | 33 |
| CSG Systems | |||
| International Inc. | 1,387 | 33 | |
| * | Synaptics Inc. | 842 | 33 |
| * | comScore Inc. | 1,108 | 32 |
| * | Cabot Microelectronics Corp. | 846 | 31 |
| * | Dice Holdings Inc. | 3,657 | 30 |
| * | ATMI Inc. | 1,156 | 28 |
| * | Volterra Semiconductor Corp. | 1,188 | 27 |
| Market | |||
| Value | |||
| Shares | ($000) | ||
| * | Entropic Communications Inc. | 6,441 | 27 |
| * | FARO Technologies Inc. | 687 | 26 |
| * | Rudolph Technologies Inc. | 2,364 | 24 |
| * | XO Group Inc. | 1,849 | 22 |
| * | Intermec Inc. | 2,193 | 22 |
| * | Virtusa Corp. | 822 | 22 |
| * | Nanometrics Inc. | 1,509 | 22 |
| * | Tangoe Inc. | 954 | 20 |
| * | Rofin-Sinar Technologies Inc. | 870 | 20 |
| * | Procera Networks Inc. | 1,506 | 20 |
| * | VASCO Data Security | ||
| International Inc. | 2,098 | 17 | |
| * | LogMeIn Inc. | 554 | 17 |
| Micrel Inc. | 1,606 | 15 | |
| * | TTM Technologies Inc. | 1,546 | 15 |
| Forrester Research Inc. | 400 | 13 | |
| Ebix Inc. | 1,137 | 13 | |
| Daktronics Inc. | 1,076 | 11 | |
| * | Ceva Inc. | 620 | 11 |
| * | Oplink Communications Inc. | 544 | 10 |
| Electro Scientific Industries Inc. | 912 | 10 | |
| * | DTS Inc. | 490 | 10 |
| * | Symmetricom Inc. | 1,592 | 8 |
| * | Higher One Holdings Inc. | 909 | 7 |
| * | Kopin Corp. | 1,568 | 5 |
| * | Agilysys Inc. | 431 | 5 |
| PC-Tel Inc. | 553 | 4 | |
| * | Sigma Designs Inc. | 900 | 4 |
| 4,886 | |||
| Materials (5.2%) | |||
| PolyOne Corp. | 7,196 | 194 | |
| HB Fuller Co. | 3,649 | 136 | |
| * | Texas Industries Inc. | 1,520 | 89 |
| * | SunCoke Energy Inc. | 5,053 | 79 |
| Quaker Chemical Corp. | 953 | 63 | |
| Globe Specialty Metals Inc. | 4,642 | 60 | |
| * | Stillwater Mining Co. | 5,143 | 59 |
| Balchem Corp. | 1,099 | 53 | |
| Schweitzer-Mauduit | |||
| International Inc. | 906 | 52 | |
| Deltic Timber Corp. | 795 | 48 | |
| * | Headwaters Inc. | 5,274 | 45 |
| American Vanguard Corp. | 1,752 | 44 | |
| * | Flotek Industries Inc. | 1,716 | 34 |
| * | Calgon Carbon Corp. | 1,576 | 27 |
| Neenah Paper Inc. | 670 | 24 | |
| Tredegar Corp. | 1,079 | 24 | |
| Koppers Holdings Inc. | 579 | 22 | |
| AMCOL International Corp. | 661 | 22 | |
| Myers Industries Inc. | 1,064 | 20 | |
| * | LSB Industries Inc. | 518 | 16 |
| * | AK Steel Holding Corp. | 3,989 | 13 |
| Hawkins Inc. | 285 | 11 | |
| 1,135 | |||
48
S&P Small-Cap 600 Growth Index Fund
| Market | |||
| Value | |||
| Shares | ($000) | ||
| Telecommunication Services (0.4%) | |||
| * | Cincinnati Bell Inc. | 15,116 | 45 |
| Atlantic Tele-Network Inc. | 321 | 15 | |
| * | General Communication Inc. | ||
| Class A | 1,400 | 13 | |
| Lumos Networks Corp. | 526 | 8 | |
| 81 | |||
| Utilities (0.2%) | |||
| American States Water Co. | 780 | 41 | |
| Total Common Stocks | |||
| (Cost $17,926) | 21,949 | ||
| Temporary Cash Investment (0.5%) | |||
| Face | |||
| Amount | |||
| ($000) | |||
| U.S. Government and Agency Obligations (0.5%) | |||
| 1 | Freddie Mac Discount | ||
| Notes, 0.110%, 11/12/13 | |||
| (Cost $100) | 100 | 100 | |
| Total Investments (100.5%) | |||
| (Cost $18,026) | 22,049 | ||
| Other Assets and Liabilities (-0.5%) | |||
| Other Assets | 12 | ||
| Liabilities | (115) | ||
| (103) | |||
| ETF Shares—Net Assets (100%) | |||
| Applicable to 250,000 outstanding | |||
| $.001 par value shares of beneficial | |||
| interest (unlimited authorization) | 21,946 | ||
| Net Asset Value Per Share— | |||
| ETF Shares | $87.79 | ||
| At August 31, 2013, net assets consisted of: | |
| Amount | |
| ($000) | |
| Paid-in Capital | 18,697 |
| Undistributed Net Investment Income | 125 |
| Accumulated Net Realized Losses | (899) |
| Unrealized Appreciation (Depreciation) | 4,023 |
| Net Assets | 21,946 |
See Note A in Notes to Financial Statements.
* Non-income-producing security.
1 The issuer was placed under federal conservatorship in September 2008; since that time, its daily operations have been managed by the Federal Housing Finance Agency and it receives capital from the U.S. Treasury, as needed to maintain a positive net worth, in exchange for senior preferred stock.
REIT—Real Estate Investment Trust.
See accompanying Notes, which are an integral part of the Financial Statements.
49
S&P Small-Cap 600 Growth Index Fund
| Statement of Operations | |
| Year Ended | |
| August 31, 2013 | |
| ($000) | |
| Investment Income | |
| Income | |
| Dividends | 226 |
| Total Income | 226 |
| Expenses | |
| The Vanguard Group—Note B | |
| Management and Administrative | 7 |
| Custodian Fees | 7 |
| Auditing Fees | 21 |
| Shareholders’ Reports | 2 |
| Total Expenses | 37 |
| Net Investment Income | 189 |
| Realized Net Gain (Loss) on Investment Securities Sold | 1,457 |
| Change in Unrealized Appreciation (Depreciation) of Investment Securities | 2,459 |
| Net Increase (Decrease) in Net Assets Resulting from Operations | 4,105 |
See accompanying Notes, which are an integral part of the Financial Statements.
50
S&P Small-Cap 600 Growth Index Fund
| Statement of Changes in Net Assets | ||
| Year Ended August 31, | ||
| 2013 | 2012 | |
| ($000) | ($000) | |
| Increase (Decrease) in Net Assets | ||
| Operations | ||
| Net Investment Income | 189 | 150 |
| Realized Net Gain (Loss) | 1,457 | 2,513 |
| Change in Unrealized Appreciation (Depreciation) | 2,459 | 90 |
| Net Increase (Decrease) in Net Assets Resulting from Operations | 4,105 | 2,753 |
| Distributions | ||
| Net Investment Income | ||
| Institutional Shares | — | — |
| ETF Shares | (163) | (101) |
| Realized Capital Gain | ||
| Institutional Shares | — | — |
| ETF Shares | — | — |
| Total Distributions | (163) | (101) |
| Capital Share Transactions | ||
| Institutional Shares | (1) | — |
| ETF Shares | 3,865 | (16,044) |
| Net Increase (Decrease) from Capital Share Transactions | 3,864 | (16,044) |
| Total Increase (Decrease) | 7,806 | (13,392) |
| Net Assets | ||
| Beginning of Period | 14,140 | 27,532 |
| End of Period1 | 21,946 | 14,140 |
| 1 Net Assets—End of Period includes undistributed net investment income of $125,000 and $99,000. | ||
See accompanying Notes, which are an integral part of the Financial Statements.
51
S&P Small-Cap 600 Growth Index Fund
Financial Highlights
| ETF Shares | |||
| Sept. 7, | |||
| Year Ended | 20101 to | ||
| August 31, | Aug. 31, | ||
| For a Share Outstanding Throughout Each Period | 2013 | 2012 | 2011 |
| Net Asset Value, Beginning of Period | $70.70 | $61.18 | $49.82 |
| Investment Operations | |||
| Net Investment Income | . 822 | . 5312 | .422 |
| Net Realized and Unrealized Gain (Loss) on Investments | 17.083 | 9.326 | 11.248 |
| Total from Investment Operations | 17.905 | 9.857 | 11.670 |
| Distributions | |||
| Dividends from Net Investment Income | (. 815) | (. 337) | (.310) |
| Distributions from Realized Capital Gains | — | — | — |
| Total Distributions | (. 815) | (. 337) | (.310) |
| Net Asset Value, End of Period | $87.79 | $70.70 | $61.18 |
| Total Return | 25.59% | 16.17% | 23.41% |
| Ratios/Supplemental Data | |||
| Net Assets, End of Period (Millions) | $22 | $14 | $28 |
| Ratio of Total Expenses to Average Net Assets | 0.20% | 0.20% | 0.20%3 |
| Ratio of Net Investment Income to Average Net Assets | 1.03% | 0.83% | 0.78% 3 |
| Portfolio Turnover Rate 4 | 39% | 45% | 106% |
1 Inception.
2 Calculated based on average shares outstanding.
3 Annualized.
4 Excludes the value of portfolio securities received or delivered as a result of in-kind purchases or redemptions of the fund’s capital shares, including ETF Creation Units.
See accompanying Notes, which are an integral part of the Financial Statements.
52
S&P Small-Cap 600 Growth Index Fund
Notes to Financial Statements
Vanguard S&P Small-Cap 600 Growth Index Fund is registered under the Investment Company Act of 1940 as an open-end investment company, or mutual fund. The fund offers two classes of shares: Institutional Shares and ETF Shares. Institutional Shares are designed for investors who meet certain administrative, service, and account-size criteria. Institutional Shares were issued and redeemed during the year. As of August 31, 2013, there were no investors in the Institutional share class. ETF Shares are listed for trading on NYSE Arca; they can be purchased and sold through a broker.
A. The following significant accounting policies conform to generally accepted accounting principles for U.S. mutual funds. The fund consistently follows such policies in preparing its financial statements.
1. Security Valuation: Securities are valued as of the close of trading on the New York Stock Exchange (generally 4 p.m., Eastern time) on the valuation date. Equity securities are valued at the latest quoted sales prices or official closing prices taken from the primary market in which each security trades; such securities not traded on the valuation date are valued at the mean of the latest quoted bid and asked prices. Securities for which market quotations are not readily available, or whose values have been materially affected by events occurring before the fund’s pricing time but after the close of the securities’ primary markets, are valued by methods deemed by the board of trustees to represent fair value. Temporary cash investments acquired over 60 days to maturity are valued using the latest bid prices or using valuations based on a matrix system (which considers such factors as security prices, yields, maturities, and ratings), both as furnished by independent pricing services. Other temporary cash investments are valued at amortized cost, which approximates market value.
2. Federal Income Taxes: The fund intends to continue to qualify as a regulated investment company and distribute all of its taxable income. Management has analyzed the fund’s tax positions taken for all open federal income tax years (August 31, 2011–2013), and has concluded that no provision for federal income tax is required in the fund’s financial statements.
3. Distributions: Distributions to shareholders are recorded on the ex-dividend date.
4. Other: Dividend income is recorded on the ex-dividend date. Interest income is accrued daily. Premiums and discounts on debt securities purchased are amortized and accreted, respectively, to interest income over the lives of the respective securities. Security transactions are accounted for on the date securities are bought or sold. Costs used to determine realized gains (losses) on the sale of investment securities are those of the specific securities sold.
B. The Vanguard Group furnishes at cost investment advisory, corporate management, administrative, marketing, and distribution services. The costs of such services are allocated to the fund under methods approved by the board of trustees. The fund has committed to provide up to 0.40% of its net assets in capital contributions to Vanguard. At August 31, 2013, the fund had contributed capital of $3,000 to Vanguard (included in Other Assets), representing 0.01% of the fund’s net assets and 0.00% of Vanguard’s capitalization. The fund’s trustees and officers are also directors and officers of Vanguard.
53
S&P Small-Cap 600 Growth Index Fund
C. Various inputs may be used to determine the value of the fund’s investments. These inputs are summarized in three broad levels for financial statement purposes. The inputs or methodologies used to value securities are not necessarily an indication of the risk associated with investing in those securities.
Level 1—Quoted prices in active markets for identical securities.
Level 2—Other significant observable inputs (including quoted prices for similar securities, interest rates, prepayment speeds, credit risk, etc.).
Level 3—Significant unobservable inputs (including the fund’s own assumptions used to determine the fair value of investments).
The following table summarizes the market value of the fund’s investments as of August 31, 2013, based on the inputs used to value them:
| Level 1 | Level 2 | Level 3 | |
| Investments | ($000) | ($000) | ($000) |
| Common Stocks | 21,949 | — | — |
| Temporary Cash Investments | — | 100 | — |
| Total | 21,949 | 100 | — |
D. Distributions are determined on a tax basis and may differ from net investment income and realized capital gains for financial reporting purposes. Differences may be permanent or temporary. Permanent differences are reclassified among capital accounts in the financial statements to reflect their tax character. Temporary differences arise when certain items of income, expense, gain, or loss are recognized in different periods for financial statement and tax purposes; these differences will reverse at some time in the future. Differences in classification may also result from the treatment of short-term gains as ordinary income for tax purposes.
During the year ended August 31, 2013, the fund realized $1,616,000 of net capital gains resulting from in-kind redemptions—in which shareholders exchanged fund shares for securities held by the fund rather than for cash. Because such gains are not taxable to the fund, and are not distributed to shareholders, they have been reclassified from accumulated net realized losses to paid-in capital.
For tax purposes, at August 31, 2013, the fund had $137,000 of ordinary income available for distribution. The fund had available capital losses totaling $910,000 that may be carried forward indefinitely to offset future net capital gains.
At August 31, 2013, the cost of investment securities for tax purposes was $18,026,000. Net unrealized appreciation of investment securities for tax purposes was $4,023,000, consisting of unrealized gains of $4,444,000 on securities that had risen in value since their purchase and $421,000 in unrealized losses on securities that had fallen in value since their purchase.
E. During the year ended August 31, 2013, the fund purchased $19,043,000 of investment securities and sold $15,130,000 of investment securities, other than temporary cash investments. Purchases and sales include $11,876,000 and $6,433,000, respectively, in connection with in-kind purchases and redemptions of the fund’s capital shares.
54
S&P Small-Cap 600 Growth Index Fund
F. Capital share transactions for each class of shares were:
| Year Ended August 31, | ||||
| 2013 | 2012 | |||
| Amount | Shares | Amount | Shares | |
| ($000) | (000) | ($000) | (000) | |
| Institutional Shares1 | ||||
| Issued | 510 | 3 | — | — |
| Issued in Lieu of Cash Distributions | — | — | — | — |
| Redeemed | (511) | (3) | — | — |
| Net Increase (Decrease) —Institutional Shares | (1) | — | — | — |
| ETF Shares | ||||
| Issued | 11,428 | 150 | 3,107 | 50 |
| Issued in Lieu of Cash Distributions | — | — | — | — |
| Redeemed | (7,563) | (100) | (19,151) | (300) |
| Net Increase (Decrease)—ETF Shares | 3,865 | 50 | (16,044) | (250) |
1 Institutional Shares were issued and redeemed during the year. As of August 31, 2013, there were no investors in the Institutional share class.
G. Management has determined that no material events or transactions occurred subsequent to August 31, 2013, that would require recognition or disclosure in these financial statements.
55
Report of Independent Registered Public Accounting Firm
To the Trustees of Vanguard Admiral Funds and the Shareholders of Vanguard S&P Small-Cap 600 Index Fund, Vanguard S&P Small-Cap 600 Value Index Fund and Vanguard S&P Small-Cap 600 Growth Index Fund:
In our opinion, the accompanying statements of net assets and the related statements of operations and of changes in net assets and the financial highlights present fairly, in all material respects, the financial position of Vanguard S&P Small-Cap 600 Index Fund, Vanguard S&P Small-Cap 600 Value Index Fund and Vanguard S&P Small-Cap 600 Growth Index Fund (constituting separate portfolios of Vanguard Admiral Funds, hereafter referred to as the “Funds”) at August 31, 2013, the results of each of their operations for the year then ended, the changes in each of their net assets for each of the two years in the period then ended, and the financial highlights for each of the periods indicated, in conformity with accounting principles generally accepted in the United States of America. These financial statements and financial highlights (hereafter referred to as “financial statements”) are the responsibility of the Funds’ management; our responsibility is to express an opinion on these financial statements based on our audits. We conducted our audits of these financial statements in accordance with the standards of the Public Company Accounting Oversight Board (United States). Those standards require that we plan and perform the audit to obtain reasonable assurance about whether the financial statements are free of material misstatement. An audit includes examining, on a test basis, evidence supporting the amounts and disclosures in the financial statements, assessing the accounting principles used and significant estimates made by management, and evaluating the overall financial statement presentation. We believe that our audits, which included confirmation of securities at August 31, 2013 by correspondence with the custodian and broker and by agreement to the underlying ownership records of the transfer agent, provide a reasonable basis for our opinion.
/s/PricewaterhouseCoopers LLP
Philadelphia, Pennsylvania
October 16, 2013
56
Special 2013 tax information (unaudited) for Vanguard S&P Small-Cap 600 Index Funds
This information for the fiscal year ended August 31, 2013, is included pursuant to provisions of the Internal Revenue Code.
The funds distributed qualified dividend income to shareholders during the fiscal year as follows:
| Fund | ($000) |
| S&P Small-Cap 600 Index Fund | 2,033 |
| S&P Small-Cap 600 Value Index Fund | 208 |
| S&P Small-Cap 600 Growth Index Fund | 163 |
For corporate shareholders, the percentage of investment income (dividend income plus short-term gains, if any) that qualifies for the dividends-received deduction is as follows:
| Fund | Percentage |
| S&P Small-Cap 600 Index Fund | 81.6% |
| S&P Small-Cap 600 Value Index Fund | 85.6 |
| S&P Small-Cap 600 Growth Index Fund | 92.8 |
57
Your Fund’s After-Tax Returns
This table presents returns for your fund both before and after taxes. The after-tax returns are shown in two ways: (1) assuming that an investor owned the fund during the entire period and paid taxes on the fund’s distributions, and (2) assuming that an investor paid taxes on the fund’s distributions and sold all shares at the end of each period.
Calculations are based on the highest individual federal income tax and capital gains tax rates in effect at the times of the distributions and the hypothetical sales. State and local taxes were not considered. After-tax returns reflect any qualified dividend income, using actual prior-year figures and estimates for 2013. (In the example, returns after the sale of fund shares may be higher than those assuming no sale. This occurs when the sale would have produced a capital loss. The calculation assumes that the investor received a tax deduction for the loss.)
The table shows returns for ETF Shares only; returns for other share classes will differ. Please note that your actual after-tax returns will depend on your tax situation and may differ from those shown. Also note that if you own the fund in a tax-deferred account, such as an individual retirement account or a 401(k) plan, this information does not apply to you. Such accounts are not subject to current taxes.
Finally, keep in mind that a fund’s performance—whether before or after taxes—does not guarantee future results.
| Average Annual Total Returns: S&P Small Cap 600 Index Funds | ||
| Periods Ended August 31, 2013 | ||
| Since | ||
| One | Inception | |
| Year | (9/7/2010) | |
| S&P Small-Cap 600 Index Fund ETF Shares | ||
| Returns Before Taxes | 26.57% | 20.75% |
| Returns After Taxes on Distributions | 26.25 | 20.54 |
| Returns After Taxes on Distributions and Sale of Fund Shares | 15.39 | 16.45 |
| Since | ||
| One | Inception | |
| Year | (9/7/2010) | |
| S&P Small-Cap 600 Value Index Fund ETF Shares | ||
| Returns Before Taxes | 27.45% | 19.78% |
| Returns After Taxes on Distributions | 27.18 | 19.57 |
| Returns After Taxes on Distributions and Sale of Fund Shares | 15.88 | 15.67 |
| Since | ||
| One | Inception | |
| Year | (9/7/2010) | |
| S&P Small-Cap 600 Growth Index Fund ETF Shares | ||
| Returns Before Taxes | 25.59% | 21.81% |
| Returns After Taxes on Distributions | 25.38 | 21.67 |
| Returns After Taxes on Distributions and Sale of Fund Shares | 14.79 | 17.33 |
58
About Your Fund’s Expenses
As a shareholder of the fund, you incur ongoing costs, which include costs for portfolio management, administrative services, and shareholder reports (like this one), among others. Operating expenses, which are deducted from a fund’s gross income, directly reduce the investment return of the fund.
A fund’s expenses are expressed as a percentage of its average net assets. This figure is known as the expense ratio. The following examples are intended to help you understand the ongoing costs (in dollars) of investing in your fund and to compare these costs with those of other mutual funds. The examples are based on an investment of $1,000 made at the beginning of the period shown and held for the entire period.
The accompanying table illustrates your fund’s costs in two ways:
• Based on actual fund return. This section helps you to estimate the actual expenses that you paid over the period. The ”Ending Account Value“ shown is derived from the fund‘s actual return, and the third column shows the dollar amount that would have been paid by an investor who started with $1,000 in the fund. You may use the information here, together with the amount you invested, to estimate the expenses that you paid over the period.
To do so, simply divide your account value by $1,000 (for example, an $8,600 account value divided by $1,000 = 8.6), then multiply the result by the number given for your fund under the heading ”Expenses Paid During Period.“
• Based on hypothetical 5% yearly return. This section is intended to help you compare your fund‘s costs with those of other mutual funds. It assumes that the fund had a yearly return of 5% before expenses, but that the expense ratio is unchanged. In this case—because the return used is not the fund’s actual return—the results do not apply to your investment. The example is useful in making comparisons because the Securities and Exchange Commission requires all mutual funds to calculate expenses based on a 5% return. You can assess your fund’s costs by comparing this hypothetical example with the hypothetical examples that appear in shareholder reports of other funds.
Note that the expenses shown in the table are meant to highlight and help you compare ongoing costs only and do not reflect transaction costs incurred by the fund for buying and selling securities. Further, the expenses do not include any purchase, redemption, or account service fees described in the fund prospectus. If such fees were applied to your account, your costs would be higher. Your fund does not carry a “sales load.”
The calculations assume no shares were bought or sold during the period. Your actual costs may have been higher or lower, depending on the amount of your investment and the timing of any purchases or redemptions.
You can find more information about the fund’s expenses, including annual expense ratios, in the Financial Statements section of this report. For additional information on operating expenses and other shareholder costs, please refer to your fund’s current prospectus.
59
| Six Months Ended August 31, 2013 | |||
| Beginning | Ending | Expenses | |
| Account Value | Account Value | Paid During | |
| 2/28/2013 | 8/31/2013 | Period | |
| Based on Actual Fund Return | |||
| S&P Small-Cap 600 Index Fund | |||
| Institutional Shares | $1,000.00 | $1,128.89 | $0.43 |
| ETF Shares | 1,000.00 | 1,128.40 | 0.80 |
| S&P Small-Cap 600 Value Index Fund | |||
| ETF Shares | $1,000.00 | $1,117.47 | $1.07 |
| S&P Small-Cap 600 Growth Index Fund | |||
| ETF Shares | $1,000.00 | $1,139.39 | $1.08 |
| Based on Hypothetical 5% Yearly Return | |||
| S&P Small-Cap 600 Index Fund | |||
| Institutional Shares | $1,000.00 | $1,024.80 | $0.41 |
| ETF Shares | 1,000.00 | 1,024.45 | 0.77 |
| S&P Small-Cap 600 Value Index Fund | |||
| ETF Shares | $1,000.00 | $1,024.20 | $1.02 |
| S&P Small-Cap 600 Growth Index Fund | |||
| ETF Shares | $1,000.00 | $1,024.20 | $1.02 |
The calculations are based on expenses incurred in the most recent six-month period. The funds’ annualized six-month expense ratios for that period are: for the S&P Small-Cap 600 Index Fund, 0.08% for Institutional Shares and 0.15% for ETF Shares; for the S&P Small-Cap 600 Value Index Fund, 0.20% for ETF Shares; and for the S&P Small-Cap 600 Growth Index Fund, 0.20% for ETF Shares. The dollar amounts shown as “Expenses Paid” are equal to the annualized expense ratio multiplied by the average account value over the period, multiplied by the number of days in the most recent six-month period, then divided by the number of days in the most recent 12-month period.
60
Trustees Approve Advisory Arrangement
The board of trustees of Vanguard S&P Small-Cap 600 Index Fund, S&P Small-Cap 600 Value Index Fund, and S&P Small-Cap 600 Growth Index Fund has renewed the funds’ investment advisory arrangement with The Vanguard Group, Inc. (Vanguard). Vanguard—through its Equity Investment Group—serves as investment advisor to the funds. The board determined that continuing the funds’ internalized management structure was in the best interest of the funds and their shareholders.
The board based its decision upon an evaluation of the advisor’s investment staff, portfolio management process, and performance. The trustees considered the factors discussed below, among others. However, no single factor determined whether the board approved the arrangement. Rather, it was the totality of the circumstances that drove the board’s decision.
Nature, extent, and quality of services
The board considered the quality of the investment management services provided to the funds since their inception in 2010, and took into account the organizational depth and stability of the advisor. The board noted that Vanguard has been managing investments for more than three decades. The Equity Investment Group adheres to a sound, disciplined investment management process; the team has considerable experience, stability, and depth.
The board concluded that Vanguard’s experience, stability, depth, and performance, among other factors, warranted approval of the advisory arrangement.
Investment performance
The board considered the funds’ performance since their inception, including any periods of outperformance or underperformance relative to a target index and peer group. The board concluded that the performance was such that the advisory arrangement should continue. Information about each fund’s most recent performance can be found in the Performance Summary pages of this report.
Cost
The board concluded that each fund’s expense ratio was well below the average expense ratios charged by funds in its respective peer group and that the funds’ advisory fee rates were also well below their peer group averages. Information about the funds’ expenses appears in the About Your Fund’s Expenses section of this report as well as in the Financial Statements sections.
The board does not conduct a profitability analysis of Vanguard, because of Vanguard’s unique “at-cost” structure. Unlike most other mutual fund management companies, Vanguard is owned by the funds it oversees, and produces “profits” only in the form of reduced expenses for fund shareholders.
The benefit of economies of scale
The board concluded that the funds’ at-cost arrangement with Vanguard ensures that the funds will realize economies of scale as they grow, with the cost to shareholders declining as fund assets increase.
The board will consider whether to renew the advisory arrangement again after a one-year period.
61
Glossary
30-Day SEC Yield. A fund’s 30-day SEC yield is derived using a formula specified by the U.S. Securities and Exchange Commission. Under the formula, data related to the fund’s security holdings in the previous 30 days are used to calculate the fund’s hypothetical net income for that period, which is then annualized and divided by the fund’s estimated average net assets over the calculation period. For the purposes of this calculation, a security’s income is based on its current market yield to maturity (for bonds), its actual income (for asset-backed securities), or its projected dividend yield (for stocks). Because the SEC yield represents hypothetical annualized income, it will differ—at times significantly—from the fund’s actual experience. As a result, the fund’s income distributions may be higher or lower than implied by the SEC yield.
Dividend Yield. Dividend income earned by stocks, expressed as a percentage of the aggregate market value (or of net asset value, for a fund). The yield is determined by dividing the amount of the annual dividends by the aggregate value (or net asset value) at the end of the period. For a fund, the dividend yield is based solely on stock holdings and does not include any income produced by other investments.
Earnings Growth Rate. The average annual rate of growth in earnings over the past five years for the stocks now in a fund.
Equity Exposure. A measure that reflects a fund’s investments in stocks and stock futures. Any holdings in short-term reserves are excluded.
Expense Ratio. A fund’s total annual operating expenses expressed as a percentage of the fund’s average net assets. The expense ratio includes management and administrative expenses, but does not include the transaction costs of buying and selling portfolio securities.
Foreign Holdings. The percentage of a fund represented by securities or depositary receipts of companies based outside the United States.
Inception Date. The date on which the assets of a fund (or one of its share classes) are first invested in accordance with the fund’s investment objective. For funds with a subscription period, the inception date is the day after that period ends. Investment performance is measured from the inception date.
Median Market Cap. An indicator of the size of companies in which a fund invests; the midpoint of market capitalization (market price x shares outstanding) of a fund’s stocks, weighted by the proportion of the fund’s assets invested in each stock. Stocks representing half of the fund’s assets have market capitalizations above the median, and the rest are below it.
Price/Book Ratio. The share price of a stock divided by its net worth, or book value, per share. For a fund, the weighted average price/book ratio of the stocks it holds.
Price/Earnings Ratio. The ratio of a stock’s current price to its per-share earnings over the past year. For a fund, the weighted average P/E of the stocks it holds. P/E is an indicator of market expectations about corporate prospects; the higher the P/E, the greater the expectations for a company’s future growth.
Return on Equity. The annual average rate of return generated by a company during the past five years for each dollar of shareholder’s equity (net income divided by shareholder’s equity). For a fund, the weighted average return on equity for the companies whose stocks it holds.
62
Short-Term Reserves. The percentage of a fund invested in highly liquid, short-term securities that can be readily converted to cash.
Turnover Rate. An indication of the fund’s trading activity. Funds with high turnover rates incur higher transaction costs and may be more likely to distribute capital gains (which may be taxable to investors). The turnover rate excludes in-kind transactions, which have minimal impact on costs.
63
The People Who Govern Your Fund
The trustees of your mutual fund are there to see that the fund is operated and managed in your best interests since, as a shareholder, you are a part owner of the fund. Your fund’s trustees also serve on the board of directors of The Vanguard Group, Inc., which is owned by the Vanguard funds and provides services to them on an at-cost basis.
A majority of Vanguard’s board members are independent, meaning that they have no affiliation with Vanguard or the funds they oversee, apart from the sizable personal investments they have made as private individuals. The independent board members have distinguished backgrounds in business, academia, and public service. Each of the trustees and executive officers oversees 181 Vanguard funds.
The following table provides information for each trustee and executive officer of the fund. More information about the trustees is in the Statement of Additional Information, which can be obtained, without charge, by contacting Vanguard at 800-662-7447, or online at vanguard.com.
| InterestedTrustee1 | and Delphi Automotive LLP (automotive components); |
| Senior Advisor at New Mountain Capital; Trustee of | |
| F. William McNabb III | The Conference Board. |
| Born 1957. Trustee Since July 2009. Chairman of the | |
| Board. Principal Occupation(s) During the Past Five | Amy Gutmann |
| Years: Chairman of the Board of The Vanguard Group, | Born 1949. Trustee Since June 2006. Principal |
| Inc., and of each of the investment companies served | Occupation(s) During the Past Five Years: President |
| by The Vanguard Group, since January 2010; Director | of the University of Pennsylvania; Christopher H. |
| of The Vanguard Group since 2008; Chief Executive | Browne Distinguished Professor of Political Science |
| Officer and President of The Vanguard Group and of | in the School of Arts and Sciences with secondary |
| each of the investment companies served by The | appointments at the Annenberg School for |
| Vanguard Group since 2008; Director of Vanguard | Communication and the Graduate School of Education |
| Marketing Corporation; Managing Director of The | of the University of Pennsylvania; Member of the |
| Vanguard Group (1995–2008). | National Commission on the Humanities and Social |
| Sciences; Trustee of Carnegie Corporation of New | |
| IndependentTrustees | York and of the National Constitution Center; Chair |
| of the U. S. Presidential Commission for the Study | |
| Emerson U. Fullwood | of Bioethical Issues. |
| Born 1948. Trustee Since January 2008. Principal | JoAnn Heffernan Heisen |
| Occupation(s) During the Past Five Years: Executive | Born 1950. Trustee Since July 1998. Principal |
| Chief Staff and Marketing Officer for North America | Occupation(s) During the Past Five Years: Corporate |
| and Corporate Vice President (retired 2008) of Xerox | Vice President and Chief Global Diversity Officer |
| Corporation (document management products and | (retired 2008) and Member of the Executive |
| services); Executive in Residence and 2010 | Committee (1997–2008) of Johnson & Johnson |
| Distinguished Minett Professor at the Rochester | (pharmaceuticals/medical devices/consumer |
| Institute of Technology; Director of SPX Corporation | products); Director of Skytop Lodge Corporation |
| (multi-industry manufacturing), the United Way of | (hotels), the University Medical Center at Princeton, |
| Rochester, Amerigroup Corporation (managed health | the Robert Wood Johnson Foundation, and the Center |
| care), the University of Rochester Medical Center, | for Talent Innovation; Member of the Advisory Board |
| Monroe Community College Foundation, and North | of the Maxwell School of Citizenship and Public Affairs |
| Carolina A&T University. | at Syracuse University. |
| Rajiv L. Gupta | F. Joseph Loughrey |
| Born 1945. Trustee Since December 2001. 2 | Born 1949. Trustee Since October 2009. Principal |
| Principal Occupation(s) During the Past Five Years: | Occupation(s) During the Past Five Years: President |
| Chairman and Chief Executive Officer (retired 2009) | and Chief Operating Officer (retired 2009) of Cummins |
| and President (2006–2008) of Rohm and Haas Co. | Inc. (industrial machinery); Chairman of the Board of |
| (chemicals); Director of Tyco International, Ltd. | Hillenbrand, Inc. (specialized consumer services) and |
| (diversified manufacturing and services), Hewlett- | of Oxfam America; Director of SKF AB (industrial |
| Packard Co. (electronic computer manufacturing), | |
| machinery) and the Lumina Foundation for Education; | Executive Officers | |
| Member of the Advisory Council for the College of | ||
| Arts and Letters and of the Advisory Board to the | Glenn Booraem | |
| Kellogg Institute for International Studies, both at | Born 1967. Controller Since July 2010. Principal | |
| the University of Notre Dame. | Occupation(s) During the Past Five Years: Principal | |
| of The Vanguard Group, Inc.; Controller of each of | ||
| Mark Loughridge | the investment companies served by The Vanguard | |
| Born 1953. Trustee Since March 2012. Principal | Group; Assistant Controller of each of the investment | |
| Occupation(s) During the Past Five Years: Senior Vice | companies served by The Vanguard Group (2001–2010). | |
| President and Chief Financial Officer at IBM (information | ||
| technology services); Fiduciary Member of IBM’s | Thomas J. Higgins | |
| Retirement Plan Committee. | Born 1957. Chief Financial Officer Since September | |
| 2008. Principal Occupation(s) During the Past Five | ||
| Scott C. Malpass | Years: Principal of The Vanguard Group, Inc.; Chief | |
| Born 1962. Trustee Since March 2012. Principal | Financial Officer of each of the investment companies | |
| Occupation(s) During the Past Five Years: Chief | served by The Vanguard Group; Treasurer of each of | |
| Investment Officer and Vice President at the University | the investment companies served by The Vanguard | |
| of Notre Dame; Assistant Professor of Finance at the | Group (1998–2008). | |
| Mendoza College of Business at Notre Dame; Member | ||
| of the Notre Dame 403(b) Investment Committee; | Kathryn J. Hyatt | |
| Director of TIFF Advisory Services, Inc. (investment | Born 1955. Treasurer Since November 2008. Principal | |
| advisor); Member of the Investment Advisory | Occupation(s) During the Past Five Years: Principal of | |
| Committees of the Financial Industry Regulatory | The Vanguard Group, Inc.; Treasurer of each of the | |
| Authority (FINRA) and of Major League Baseball. | investment companies served by The Vanguard | |
| Group; Assistant Treasurer of each of the investment | ||
| André F. Perold | companies served by The Vanguard Group (1988–2008). | |
| Born 1952. Trustee Since December 2004. Principal | ||
| Occupation(s) During the Past Five Years: George | Heidi Stam | |
| Gund Professor of Finance and Banking at the Harvard | Born 1956. Secretary Since July 2005. Principal | |
| Business School (retired 2011); Chief Investment | Occupation(s) During the Past Five Years: Managing | |
| Officer and Managing Partner of HighVista Strategies | Director of The Vanguard Group, Inc.; General Counsel | |
| LLC (private investment firm); Director of Rand | of The Vanguard Group; Secretary of The Vanguard | |
| Merchant Bank; Overseer of the Museum of Fine | Group and of each of the investment companies | |
| Arts Boston. | served by The Vanguard Group; Director and Senior | |
| Vice President of Vanguard Marketing Corporation. | ||
| Alfred M. Rankin, Jr. | ||
| Born 1941. Trustee Since January 1993. Principal | Vanguard Senior ManagementTeam | |
| Occupation(s) During the Past Five Years: Chairman, | ||
| President, and Chief Executive Officer of NACCO | Mortimer J. Buckley | Chris D. McIsaac |
| Industries, Inc. (housewares/lignite) and of Hyster-Yale | Kathleen C. Gubanich | Michael S. Miller |
| Materials Handling, Inc. (forklift trucks); Director of | Paul A. Heller | James M. Norris |
| the National Association of Manufacturers; Chairman | Martha G. King | Glenn W. Reed |
| of the Board of University Hospitals of Cleveland; | John T. Marcante | |
| Advisory Chairman of the Board of The Cleveland | ||
| Museum of Art. | ||
| Chairman Emeritus and Senior Advisor | ||
| Peter F. Volanakis | ||
| Born 1955. Trustee Since July 2009. Principal | John J. Brennan | |
| Occupation(s) During the Past Five Years: President | Chairman, 1996–2009 | |
| and Chief Operating Officer (retired 2010) of Corning | Chief Executive Officer and President, 1996–2008 | |
| Incorporated (communications equipment); Director | ||
| of SPX Corporation (multi-industry manufacturing); | Founder | |
| Overseer of the Amos Tuck School of Business | ||
| Administration at Dartmouth College; Advisor to the | John C. Bogle | |
| Norris Cotton Cancer Center. | Chairman and Chief Executive Officer, 1974–1996 | |
1 Mr. McNabb is considered an “interested person,” as defined in the Investment Company Act of 1940, because he is an officer of the Vanguard funds.
2 December 2002 for Vanguard Equity Income Fund, Vanguard Growth Equity Fund, the Vanguard Municipal Bond Funds, and the Vanguard State Tax-Exempt Funds.
|
| |
| P.O. Box 2600 | |
| Valley Forge, PA 19482-2600 |

Connect with Vanguard® > vanguard.com
| S&P®, S&P 500®, and S&P SmallCap 600® are | |
| Fund Information > 800-662-7447 | registered trademarks of Standard & Poor’s Financial |
| Direct Investor Account Services > 800-662-2739 | Services LLC (”S&P”) and have been licensed for use by |
| Institutional Investor Services > 800-523-1036 | S&P Dow Jones Indices LLC and its affiliates and |
| Text Telephone for People | sublicensed for certain purposes by Vanguard. The S&P |
| With Hearing Impairment > 800-749-7273 | Index is a product of S&P Dow Jones Indices LLC and |
| has been licensed for use by Vanguard. The Vanguard | |
| This material may be used in conjunction | fund(s) is not sponsored, endorsed, sold, or promoted |
| with the offering of shares of any Vanguard | by S&P Dow Jones Indices LLC, Dow Jones, S&P, or |
| fund only if preceded or accompanied by | their respective affiliates, and none of S&P Dow Jones |
| the fund’s current prospectus. | Indices LLC, Dow Jones, S&P, nor their respective |
| affiliates makes any representation regarding the | |
| All comparative mutual fund data are from Lipper, a | advisability of investing in such product(s). |
| Thomson Reuters Company, or Morningstar, Inc., unless | |
| otherwise noted. | |
| You can obtain a free copy of Vanguard’s proxy voting | |
| guidelines by visiting vanguard.com/proxyreporting or by | |
| calling Vanguard at 800-662-2739. The guidelines are | |
| also available from the SEC’s website, sec.gov. In | |
| addition, you may obtain a free report on how your fund | |
| voted the proxies for securities it owned during the 12 | |
| months ended June 30. To get the report, visit either | |
| vanguard.com/proxyreporting or sec.gov. | |
| You can review and copy information about your fund at | |
| the SEC’s Public Reference Room in Washington, D.C. To | |
| find out more about this public service, call the SEC at | |
| 202-551-8090. Information about your fund is also | |
| available on the SEC’s website, and you can receive | |
| copies of this information, for a fee, by sending a | |
| request in either of two ways: via e-mail addressed to | |
| publicinfo@sec.gov or via regular mail addressed to the | |
| Public Reference Section, Securities and Exchange | |
| Commission, Washington, DC 20549-1520. | |
| © 2013 The Vanguard Group, Inc. | |
| All rights reserved. | |
| Vanguard Marketing Corporation, Distributor. | |
| Q18450 102013 | |
Item 2: Code of Ethics. The Registrant has adopted a code of ethics that applies to the Registrant’s principal executive officer, principal financial officer, principal accounting officer or controller or persons performing similar functions. The Code of Ethics was amended during the reporting period covered by this report to make certain technical, non-material changes.
Item 3: Audit Committee Financial Expert. The following members of the Audit Committee have been determined by the Registrant’s Board of Trustees to be Audit Committee Financial Experts serving on its Audit Committee, and to be independent: Rajiv L. Gupta, Amy Gutmann, JoAnn Heffernan Heisen, F. Joseph Loughrey, Mark Loughridge, Scott C. Malpass, André F. Perold, and Alfred M. Rankin, Jr.
Item 4: Principal Accountant Fees and Services.
(a) Audit Fees.
Audit Fees of the Registrant
Fiscal Year Ended August 31, 2013: $201,000
Fiscal Year Ended August 31, 2012: $168,000
Aggregate Audit Fees of Registered Investment Companies in the Vanguard Group.
Fiscal Year Ended August 31, 2013: $5,714,113
Fiscal Year Ended August 31, 2012: $4,809,780
Includes fees billed in connection with audits of the Registrant and other registered investment companies in the Vanguard complex. Also includes fees billed in connection with audits of The Vanguard Group, Inc. and Vanguard Marketing Corporation for Fiscal Year Ended August 31, 2013.
(b) Audit-Related Fees.
Fiscal Year Ended August 31, 2013: $1,552,950
Fiscal Year Ended August 31, 2012: $1,812,565
Includes fees billed in connection with assurance and related services provided to the Registrant, other registered investment companies in the Vanguard complex, The Vanguard Group, Inc., and Vanguard Marketing Corporation.
(c) Tax Fees.
Fiscal Year Ended August 31, 2013: $110,000
Fiscal Year Ended August 31, 2012: $490,518
Includes fees billed in connection with tax compliance, planning, and advice services provided to the Registrant, other registered investment companies in the Vanguard complex, The Vanguard Group, Inc., and Vanguard Marketing Corporation. Also includes fees billed in connection with certain tax services related to audits of the Registrant and other registered investment companies in the Vanguard complex for Fiscal Year Ended August 31, 2012.
(d) All Other Fees.
Fiscal Year Ended August 31, 2013: $132,000
Fiscal Year Ended August 31, 2012: $16,000
Includes fees billed in connection with tax compliance, planning, and advice services provided to the Registrant, other registered investment companies in the Vanguard complex, The Vanguard Group, Inc., and Vanguard Marketing Corporation.
(e) (1) Pre-Approval Policies. The policy of the Registrant’s Audit Committee is to consider and, if appropriate, approve before the principal accountant is engaged for such services, all specific audit and non-audit services provided to: the Registrant, other registered investment companies in the Vanguard complex, The Vanguard Group, Inc., and entities controlled by The Vanguard Group, Inc. that provide ongoing services to the Registrant. In making a determination, the Audit Committee considers whether the services are consistent with maintaining the principal accountant’s independence.
In the event of a contingency situation in which the principal accountant is needed to provide services in between scheduled Audit Committee meetings, the Chairman of the Audit Committee would be called on to consider and, if appropriate, pre-approve audit or permitted non-audit services in an amount sufficient to complete services through the next Audit Committee meeting, and to determine if such services would be consistent with maintaining the accountant’s independence. At the next scheduled Audit Committee meeting, services and fees would be presented to the Audit Committee for formal consideration, and, if appropriate, approval by the entire Audit Committee. The Audit Committee would again consider whether such services and fees are consistent with maintaining the principal accountant’s independence.
The Registrant’s Audit Committee is informed at least annually of all audit and non-audit services provided by the principal accountant to the Vanguard complex, whether such services are provided to: the Registrant, other registered investment companies in the Vanguard complex, The Vanguard Group, Inc., or other entities controlled by The Vanguard Group, Inc. that provide ongoing services to the Registrant.
(2) No percentage of the principal accountant’s fees or services were approved pursuant to the waiver provision of paragraph (c)(7)(i)(C) of Rule 2-01 of Regulation S-X.
(f) For the most recent fiscal year, over 50% of the hours worked under the principal accountant’s engagement were not performed by persons other than full-time, permanent employees of the principal accountant.
(g) Aggregate Non-Audit Fees.
Fiscal Year Ended August 31, 2013: $242,000
Fiscal Year Ended August 31, 2012: $506,518
Includes fees billed for non-audit services provided to the Registrant, other registered investment companies in the Vanguard complex, The Vanguard Group, Inc., and Vanguard Marketing Corporation.
(h) For the most recent fiscal year, the Audit Committee has determined that the provision of all non-audit services was consistent with maintaining the principal accountant’s independence.
Item 5: Audit Committee of Listed Registrants.
The Registrant is a listed issuer as defined in rule 10A-3 under the Securities Exchange Act of 1934 (“Exchange Act”). The Registrant has a separately-designated standing audit committee established in accordance with Section 3(a)(58)(A) of the Exchange Act. The Registrant’s audit committee members are: Emerson U. Fullwood, Rajiv L. Gupta, Amy Gutmann, JoAnn Heffernan Heisen, F. Joseph Loughrey, Mark Loughridge, Scott C. Malpass, André F. Perold, Alfred M. Rankin, Jr., and Peter F. Volanakis.
Item 6: Investments.
Not Applicable.
Item 7: Disclosure of Proxy Voting Policies and Procedures for Closed-End Management Investment Companies.
Not Applicable.
Item 8: Portfolio Managers of Closed-End Management Investment Companies.
Not Applicable.
Item 9: Purchase of Equity Securities by Closed-End Management Investment Company and Affiliated Purchasers.
Not Applicable.
Item 10: Submission of Matters to a Vote of Security Holders.
Not Applicable.
Item 11: Controls and Procedures.
(a) Disclosure Controls and Procedures. The Principal Executive and Financial Officers concluded that the Registrant’s Disclosure Controls and Procedures are effective based on their evaluation of the Disclosure Controls and Procedures as of a date within 90 days of the filing date of this report.
(b) Internal Control Over Financial Reporting. There were no significant changes in Registrant’s Internal Control Over Financial Reporting or in other factors that could significantly affect this control subsequent to the date of the evaluation, including any corrective actions with regard to significant deficiencies and material weaknesses.
Item 12: Exhibits.
(a) Code of Ethics.
(b) Certifications.
Pursuant to the requirements of the Securities Exchange Act of 1934 and the Investment Company Act of 1940, the registrant has duly caused this report to be signed on its behalf by the undersigned, thereunto duly authorized.
| VANGUARD ADMIRAL FUNDS | |
| By: | /s/ F. WILLIAM MCNABB III* |
| F. WILLIAM MCNABB III | |
| CHIEF EXECUTIVE OFFICER | |
| Date: October 21, 2013 | |
Pursuant to the requirements of the Securities Exchange Act of 1934 and the Investment Company Act of 1940, this report has been signed below by the following persons on behalf of the registrant and in the capacities and on the dates indicated.
| VANGUARD ADMIRAL FUNDS | |
| By: | /s/ F. WILLIAM MCNABB III* |
| F. WILLIAM MCNABB III | |
| CHIEF EXECUTIVE OFFICER | |
| Date: October 21, 2013 | |
| VANGUARD ADMIRAL FUNDS | |
| By: | /s/ THOMAS J. HIGGINS* |
| THOMAS J. HIGGINS | |
| CHIEF FINANCIAL OFFICER | |
| Date: October 21, 2013 | |
* By: /s/ Heidi Stam
Heidi Stam, pursuant to a Power of Attorney filed on March 27, 2012 see file Number 2-11444, Incorporated by Reference.