UNITED STATES
SECURITIES AND EXCHANGE COMMISSION
Washington, D.C. 20549
FORM N-CSR
CERTIFIED SHAREHOLDER REPORT
OF
REGISTERED MANAGEMENT INVESTMENT COMPANIES
| Investment Company Act file number: | 811-07043 | |
Name of Registrant: | Vanguard Admiral Funds | |
Address of Registrant: | P.O. Box 2600 | |
| Valley Forge, PA 19482 | ||
Name and address of agent for service: | Heidi Stam, Esquire | |
| P.O. Box 876 | ||
| Valley Forge, PA 19482 | ||
Registrant’s telephone number, including area code: (610) 669-1000 | ||
Date of fiscal year end: August 31 | ||
Date of reporting period: September 1, 2014 – August 31, 2015 | ||
Item 1: Reports to Shareholders | ||
Annual Report | August 31, 2015
Vanguard Money Market Funds
Vanguard Prime Money Market Fund
Vanguard Federal Money Market Fund
Vanguard Admiral™ Treasury Money Market Fund
Vanguard’s Principles for Investing Success
We want to give you the best chance of investment success. These principles, grounded in Vanguard’s research and experience, can put you on the right path.
Goals. Create clear, appropriate investment goals.
Balance. Develop a suitable asset allocation using broadly diversified funds. Cost. Minimize cost.
Discipline. Maintain perspective and long-term discipline.
A single theme unites these principles: Focus on the things you can control.
We believe there is no wiser course for any investor.
| Contents | |
| Your Fund’s Total Returns. | 1 |
| Chairman’s Letter. | 2 |
| Advisor’s Report. | 8 |
| Prime Money Market Fund. | 10 |
| Federal Money Market Fund. | 32 |
| Admiral Treasury Money Market Fund. | 45 |
| About Your Fund’s Expenses. | 57 |
| Trustees Approve Advisory Arrangements. | 59 |
| Glossary. | 60 |
Please note: The opinions expressed in this report are just that—informed opinions. They should not be considered promises or advice.
Also, please keep in mind that the information and opinions cover the period through the date on the front of this report. Of course, the
risks of investing in your fund are spelled out in the prospectus.
See the Glossary for definitions of investment terms used in this report.
About the cover: Pictured is a sailing block on the Brilliant, a 1932 schooner docked in Mystic, Connecticut. A type of pulley, the
sailing block helps coordinate the setting of the sails. At Vanguard, the intricate coordination of technology and people allows
us to help millions of clients around the world reach their financial goals.
Your Fund’s Total Returns
| Fiscal Year Ended August 31, 2015 | ||
| 7-Day SEC | Total | |
| Yield | Returns | |
| Vanguard Prime Money Market Fund | ||
| Investor Shares | 0.06% | 0.02% |
| Money Market Funds Average | 0.00 | |
| Institutional Shares | 0.12 | 0.07 |
| Institutional Money Market Funds Average | 0.00 | |
| Money Market Funds Average and Institutional Money Market Funds Average: Derived from data provided by Lipper, a Thomson Reuters | ||
| Company. | ||
| Vanguard Federal Money Market Fund | 0.02% | 0.01% |
| Government Money Market Funds Average | 0.00 | |
| Government Money Market Funds Average: Derived from data provided by Lipper, a Thomson Reuters Company. | ||
| Vanguard Admiral Treasury Money Market Fund | 0.01% | 0.01% |
| iMoneyNet Money Fund Report’s 100% Treasury Funds Average | 0.00 | |
iMoneyNet Money Fund Report’s 100% Treasury Funds Average: Derived from data provided by iMoneyNet, Inc.
The 7-day SEC yield of a money market fund more closely reflects the current earnings of the fund than its total return.
Institutional Shares are available to certain institutional investors who meet specific administrative, service, and account-size criteria.
1

Chairman’s Letter
Dear Shareholder,
The fiscal year ended August 31, 2015, was a volatile one for bonds, fueled in part by uncertainty about when the Federal Reserve might begin raising interest rates. Other factors contributing to the bumpy ride included the unsteady pace of global growth, disinflationary pressures from the fall in commodity prices, the strength of the U.S. dollar, and seemingly stretched stock market valuations.
Although the timing of the Fed’s first rate hike in almost a decade was still up in the air, short-term yields rose slightly in anticipation. Vanguard Prime Money Market Fund returned 0.02% for Investor Shares, while Institutional Shares, with their lower expense ratio, returned 0.07%. Vanguard Federal Money Market Fund and Vanguard Admiral Treasury Money Market Fund both returned 0.01%. Those returns, although slim, were more than the 0.00% average return of the funds’ peer groups.
As of August 31, the Prime Money Market Fund’s 7-day SEC yield had risen to 0.06% from 0.01% a year earlier for Investor Shares and to 0.12% from 0.05% for Institutional Shares. The yield of the Federal Money Market Fund inched up to 0.02% from 0.01%, and the yield of the Admiral Treasury Money Market Fund held steady at 0.01%.
Before I discuss the markets and your fund’s performance further, I want to address Vanguard’s response to the
2
Securities and Exchange Commission’s new money market rules. As you may recall from my previous letters, the SEC adopted these rules in 2014, with the compliance date for the core reforms set for autumn 2016. In June, we announced plans that preserve our money market funds as a cash management option with a stable price for both individual and institutional clients.
In addition, for greater clarity, the Admiral Treasury Money Market Fund will change its name to Vanguard Treasury Money Market Fund, and the Institutional Shares of the Prime Money Market Fund will be reclassified as Admiral Shares.
For more details, please see the box on page 7.
Bond results were muted both at home and abroad
The broad U.S. taxable bond market returned 1.56% for the 12 months, outpacing the broad U.S. stock market. Bond prices, which generally fell slightly, received support at various times from global investors looking for higher yields than those available in many other developed markets and from investors seeking shelter from stock market volatility. The yield of the 10-year Treasury note slid from 2.34% at the beginning of the fiscal year to 1.75% at the end of January, before retracing some of its steps to end the period at 2.18%. Given the heightened level of risk aversion in the market, Treasuries outperformed their corporate counterparts.
| Market Barometer | |||
| Average Annual Total Returns | |||
| Periods Ended August 31, 2015 | |||
| One | Three | Five | |
| Year | Years | Years | |
| Bonds | |||
| Barclays U.S. Aggregate Bond Index (Broad taxable market) | 1.56% | 1.53% | 2.98% |
| Barclays Municipal Bond Index (Broad tax-exempt market) | 2.52 | 2.83 | 3.96 |
| Citigroup Three-Month U.S. Treasury Bill Index | 0.02 | 0.03 | 0.05 |
| Stocks | |||
| Russell 1000 Index (Large-caps) | 0.40% | 14.68% | 16.07% |
| Russell 2000 Index (Small-caps) | 0.03 | 14.12 | 15.55 |
| Russell 3000 Index (Broad U.S. market) | 0.36 | 14.63 | 16.03 |
| FTSE All-World ex US Index (International) | -11.50 | 5.79 | 5.17 |
| CPI | |||
| Consumer Price Index | 0.20% | 1.14% | 1.77% |
3
Limited by the dollar’s strength, international bond markets (as measured by the Barclays Global Aggregate Index ex USD) returned –11.97%. International bonds returned about 3% without this currency effect.
August’s anxious stock markets led to disappointing returns
U.S. stocks generally moved in opposite directions over the two halves of the fiscal year. Ultimately, the ride ended about where it started, with the market returning less than 1%. The broad stock market’s first-half advance of about 6% was followed by a second-half retreat of about –5%.
For U.S. investors, international stocks returned about –12%, a result that would have been a bit better if not for the dollar’s strength against many foreign currencies. China’s troubles buffeted emerging markets in particular, which produced lower returns than the developed markets of Europe and the Pacific region.
The Fed was still waiting for the right moment
With the financial crisis in the rearview mirror and the economy showing more strength toward the end of 2014, the Fed ended its third bond-buying program in October and seemed to be edging closer to raising interest rates from the near-zero levels where they have been for nearly 7 years. (Shortly after the close of the reporting period, the Fed announced at its September meeting that it would leave rates unchanged for the time being.)
| Expense Ratios | ||
| Your Fund Compared With Its Peer Group | ||
| Peer | ||
| Group | ||
| Fund | Average | |
| Prime Money Market Fund | ||
| Investor Shares | 0.16% | 0.17% |
| Institutional Shares | 0.10 | 0.17 |
| Federal Money Market Fund | 0.11 | 0.09 |
| Admiral Treasury Money Market Fund | 0.09 | 0.06 |
The fund expense ratios shown are from the prospectus dated December 19, 2014, and represent estimated costs for the current fiscal year.
For the fiscal year ended August 31, 2015, the funds’ expense ratios were: for the Prime Money Market Fund, 0.15% for Investor Shares and
0.10% for Institutional Shares; for the Federal Money Market Fund, 0.10%; for the Admiral Treasury Money Market Fund, 0.04%. The expense
ratios for the Prime Money Market Fund Investor Shares, the Federal Money Market Fund, and the Admiral Treasury Money Market Fund
reflect a temporary reduction in operating expenses (described in Note B of the Notes to Financial Statements). Before the reduction, the
expense ratios were: for the Prime Money Market Fund Investor Shares, 0.16%; for the Federal Money Market Fund, 0.11%; for the Admiral
Treasury Money Market Fund, 0.09%.
Peer groups: For the Prime Money Market Fund Investor Shares, Money Market Funds; and for the Institutional Shares, Institutional Money
Market Funds; for the Federal Money Market Fund, Government Money Market Funds; and for the Admiral Treasury Money Market Fund;
iMoneyNet Fund Report’s 100% Treasury Fund.
4
Growth ground almost to a halt in the first quarter, though, in part because of severe winter weather and a West Coast port strike. And the slide in the price of oil and the strong U.S. dollar helped push inflation even further below the Fed’s target of 2%.
International developments also muddied the picture, including recurring flare-ups in the Greek debt crisis and repercussions from events in China—notably the surprise devaluation of its currency, the sharp correction in mainland China stock markets, and a marked downturn in manufacturing.
While continuing to maintain safety and liquidity as priorities, the funds’ advisor, Vanguard Fixed Income Group, was able to find some relative value opportunities over the period while avoiding some trouble spots.
In the Prime Money Market Fund, the advisor added to its holdings in Australian and Canadian banks to enhance the fund’s diversification and to obtain the yield premium being offered over U.S. Treasuries. The fund had no exposure to Southern European banks, and it minimized its exposure to Northern European banks as the Greek debt crisis intensified. The fund also had no direct exposure to China or other emerging markets.
For a more detailed discussion of the management of the funds during the year, please see the Advisor’s Report that follows this letter.
| Total Returns | |
| Ten Years Ended August 31, 2015 | |
| Average | |
| Annual Return | |
| Prime Money Market Fund Investor Shares | 1.46% |
| Money Market Funds Average | 1.18 |
| Money Market Funds Average: Derived from data provided by Lipper, a Thomson Reuters Company. | |
| Federal Money Market Fund | 1.39% |
| Government Money Market Funds Average | 1.14 |
| Government Money Market Funds Average: Derived from data provided by Lipper, a Thomson Reuters Company. | |
| Admiral Treasury Money Market Fund | 1.29% |
| iMoneyNet Money Fund Report’s 100% Treasury Funds Average | 1.00 |
iMoneyNet Money Fund Report’s 100% Treasury Funds Average: Derived from data provided by iMoneyNet, Inc.
Investment returns will fluctuate. All of the returns in this report represent past performance, which is not a guarantee
of future results that may be achieved by the funds. (Current performance may be lower or higher than the
performance data cited. For performance data current to the most recent month-end, visit our website at
vanguard.com/performance.) An investment in a money market fund is not insured or guaranteed by the Federal
Deposit Insurance Corporation or any other government agency. Although a money market fund seeks to preserve the
value of your investment at $1 per share, it is possible to lose money by investing in such a fund.
5
Ten-year returns reflect higher pre-crisis rates
Interest rates have been frustratingly low for savers since the 2008–09 financial crisis, but fortunately, that hasn’t always been the case. For example, as recently as 2007, the yield of the 3-month Treasury bill was above 5%.
In looking at the funds’ track record, those more substantial yields early on helped buoy performance for the decade as a whole. For the ten years ended August 31, 2015, the average annual return was 1.46% for Investor Shares of the Prime Money Market Fund, 1.39% for the Federal Money Market Fund, and 1.29% for the Admiral Treasury Money Market Fund.
Versus their peers, the funds outperformed by an average of 25 to 29 basis points every year over the decade, a testament to the advisor’s stewardship of the funds as well as to the merit of our low-cost structure. (A basis point is one-hundredth of a percentage point.)
When the markets are volatile, maintaining perspective is key
The volatility in the markets, particularly in the stock market in the final weeks of August, may have evoked painful memories of previous financial setbacks. And inevitably, that can lead some investors to make rash moves with their portfolios.
During periods of market adversity, however, it’s more important than ever to keep sight of one of Vanguard’s key
| Changes in Yields | ||
| SEC 7-Day Annualized Yield | ||
| August 31, | August 31, | |
| Money Market Fund | 2015 | 2014 |
| Prime | ||
| Investor Shares | 0.06% | 0.01% |
| Institutional Shares | 0.12 | 0.05 |
| Federal | 0.02 | 0.01 |
| Admiral Treasury | 0.01 | 0.01 |
6
principles: Maintain perspective and long-term discipline. Whether you’re investing for yourself or on behalf of clients, your success is affected greatly by how you react––or don’t react––when the markets turn turbulent. (You can read Vanguard’s Principles for Investing Success at vanguard.com/research.)
As I’ve written in the past, the best course for long-term investors generally is to ignore daily market moves and not make decisions based on emotion. This is also a good time to evaluate your portfolio and make sure your asset allocation is aligned with your time horizon, goals, and risk tolerance.
The markets are unpredictable and often confounding. Keeping our long-term plans clearly in focus can be key as we weather these periodic storms.
As always, thank you for your confidence in Vanguard.
Sincerely,

F. William McNabb III
Chairman and Chief Executive Officer
September 17, 2015
| Stable-price options for individual and institutional investors |
| In response to rules adopted by the Securities and Exchange Commission, Vanguard in |
| June announced plans for our money market mutual fund lineup that enable individual and |
| institutional investors to continue to have access to cash management vehicles at a stable |
| $1 net asset value (NAV). |
| Our plans call for designating Vanguard Prime Money Market Fund as a “retail” fund. As such, |
| the fund will be required to comply with the SEC’s new requirements for liquidity fees and |
| redemption restrictions, and individual investors will continue to have access to the fund at a |
| share price that remains at $1, rather than fluctuates. |
| In addition, we’ve designated Vanguard Admiral Treasury Money Market Fund and Vanguard |
| Federal Money Market Fund as “government” funds because they meet the SEC’s require- |
| ment of investing more than 99.5% of their assets in U.S. government securities or repurchase |
| agreements. This is significant because government funds, unlike retail funds, are open to |
| institutional investors, giving them a stable-price cash management option, and are not subject |
| to the new fees and redemption restrictions. |
| We’ve reopened the Federal Money Market Fund to both institutional and individual investors. |
| The Admiral Treasury Money Market Fund, soon to be renamed Vanguard Treasury Money |
| Market Fund, will remain closed to new investors. |
7
Advisor’s Report
Money market yields began to inch higher toward the end of the fiscal year, reflecting an increased expectation that the Federal Reserve was close to ending a nearly seven-year freeze in the federal funds rate. The slight increase in yields did not lift the returns of our money market funds much; still, the funds continued to provide shareholders with a high-quality, very liquid investment appropriate for short-term savings goals or cash management.
For the 12 months ended August 31, 2015, Vanguard Prime Money Market Fund returned 0.02% for Investor Shares and 0.07% for Institutional Shares. Vanguard Federal Money Market Fund and Vanguard Admiral Treasury Money Market Fund each returned 0.01%. The average return for the peer groups of all three funds was 0.00%.
The investment environment
Monetary policy in the United States appeared to be on a different trajectory than in much of the rest of the world over the 12 months. The Fed was comfortable enough with the economy’s underlying strength to end quantitative easing in the fourth quarter of 2014. With the exception of a weather-related slump in the first quarter, growth continued at a moderate pace. The U.S. labor market made gains despite job losses in the energy sector, consumer confidence held up, and the construction sector continued to heal. And though the sharp fall in the price of oil has weighed on consumer prices, inflation was expected to pick up, with further tightening in the job market pushing wages higher.
This backdrop, along with statements from Fed officials, suggested that the question of liftoff had become not “if” but “when.”
In contrast, many other central banks pursued looser monetary policies. Europe’s economy showed signs of weakness, prompting the European Central Bank to embark on its own quantitative-easing program in March. That led to yields on some European sovereign bonds dipping into negative territory at times. Japan continued the quantitative easing it had begun in 2013. And China, whose economy has been decelerating for some time, made a series of interest rate cuts and reduced reserve requirements for banks.
U.S. intermediate- and long-term Treasury yields ended the period lower. A combination of factors contributed to that development, including a more muted outlook for inflation and global growth, a flight to safety amid concerns about Greece and turmoil in China, and a rise in the relative attractiveness of Treasuries for international buyers.
On the prospect of a Fed rate hike, yields on money market instruments ended the fiscal year a little higher but still not far above zero.
Management of the funds
For much of the year, we kept the weighted average maturities of the funds fairly long in the belief that the Fed was not ready to move. The call
8
provided a bit of a boost to the funds, but we have since moved shorter as our expectation on that front has changed.
With strong demand in the marketplace for Treasury bills driving their prices higher, we looked for relative value opportunities to exploit among other securities. Toward the end of 2014 and the beginning of this year, a wave of selling pushed the prices of Treasury floating-rate notes down to attractive levels. Because these securities also have the advantage of their yields adjusting higher if interest rates rise, we included them in all three funds.
More recently, we increased our exposure to agency discount notes—securities without a coupon that agencies issue at a discount to their par value—in the Prime and Federal Money Market Funds as their yield spread with Treasuries widened. Investors’ appetite for Treasury bills pushed their yields lower, and agencies’ increased issuance of discount notes pushed their yields higher.
In the Prime Money Market Fund, we’ve taken a cautious stance toward Europe for some time. We had no direct exposure to Southern European financial institutions during the period, and we pared our exposure to Northern Europe as troubles in Greece intensified. We also took the step of limiting our purchases in this region to only very short-term securities. Elsewhere, we increased our exposure to Australia and Canada and continued to have no direct exposure to China or other emerging markets.
The outlook
The economy is growing modestly, inflation remains subdued, and the job market is improving. Although those economic conditions lead us to expect that the Fed will make its initial rate hike not long from now, subsequent increases are likely to be slow and gradual, given the fragile state of the global economy and lingering disinflationary pressures.
We see the Fed’s moving toward a normalization of monetary policy as a positive. It will, of course, be good for money market investors, as they will begin to see higher returns, but it also will be a signal that the economy has improved enough since the global financial crisis that it no longer needs emergency monetary support.
Volatility is likely to remain elevated as that process takes place, but we are aware of the risks in such an environment and will continue to position the funds with them in mind.
David R. Glocke, Principal
Vanguard Fixed Income Group
September 17, 2015
9
Prime Money Market Fund
Fund Profile
As of August 31, 2015
| Financial Attributes | ||
| Investor | Institutional | |
| Shares | Shares | |
| Ticker Symbol | VMMXX | VMRXX |
| Expense Ratio1 | 0.16% | 0.10% |
| 7-Day SEC Yield | 0.06% | 0.12% |
| Average Weighted | ||
| Maturity | 46 days | 46 days |
| Sector Diversification (% of portfolio) | |
| Certificates of Deposit | 9.8% |
| U.S. Commercial Paper | 10.5 |
| Other | 0.7 |
| Repurchase Agreements | 0.3 |
| U.S. Government Obligations | 29.5 |
| U.S. Treasury Bills | 2.7 |
| Yankee/Foreign | 46.5 |
The agency and mortgage-backed securities sectors may include issues from government-sponsored enterprises; such issues are generally not backed by the full faith and credit of the U.S. government
| Distribution by Credit Quality (% of portfolio) | |
| First Tier | 100.0% |
A First Tier security is one that is eligible for money market funds and has been rated in the highest short-term rating category for
debt obligations by nationally recognized statistical rating organizations. Credit-quality ratings are obtained from Moody's,
Fitch, and S&P. For securities rated by all three agencies, where two of them are in agreement and assign the highest rating
category, the highest rating applies. If a security is only rated by two agencies, and their ratings are in different categories, the
lower of the ratings applies. An unrated security is First Tier if it represents quality comparable to that of a rated security, as
determined in accordance with SEC Rule 2a-7. For more information about these ratings, see the Glossary entry for Credit Quality.
1 The expense ratios shown are from the prospectus dated December 19, 2014, and represent estimated costs for the current fiscal year. For the
fiscal year ended August 31, 2015, the expense ratios were 0.15% for Investor Shares and 0.10% for Institutional Shares. The expense ratio for the
Prime Money Market Fund Investor Shares reflects a temporary reduction in operating expenses (described in Note B of the Notes to Financial
Statements). Before this reduction, the expense ratio for the Prime Money Market Fund Investor Shares was 0.16%.
10
Prime Money Market Fund
Performance Summary
Investment returns will fluctuate. All of the returns in this report represent past performance, which is not a guarantee of future results that may be achieved by the fund. (Current performance may be lower or higher than the performance data cited. For performance data current to the most recent month-end, visit our website at vanguard.com/performance.) The returns shown do not reflect taxes that a shareholder would pay on fund distributions. An investment in a money market fund is not insured or guaranteed by the Federal Deposit Insurance Corporation or any other government agency. Although the fund seeks to preserve the value of your investment at $1 per share, it is possible to lose money by investing in the fund. The fund’s 7-day SEC yield reflects its current earnings more closely than do the average annual returns.
Cumulative Performance: August 31, 2005, Through August 31, 2015
Initial Investment of $10,000

| Average Annual Total Returns | ||||
| Periods Ended August 31, 2015 | ||||
| Final Value | ||||
| One | Five | Ten | of a $10,000 | |
| Year | Years | Years | Investment | |
| Prime Money Market Fund Investor | ||||
| Shares | 0.02% | 0.03% | 1.46% | $11,555 |
| •••••••• Money Market Funds Average | 0.00 | 0.00 | 1.18 | 11,240 |
| Citigroup Three-Month U.S. Treasury | ||||
| Bill Index | 0.02 | 0.05 | 1.28 | 11,375 |
Money Market Funds Average: Derived from data provided by Lipper, a Thomson Reuters Company.
| Final Value | ||||
| One | Five | Ten | of a $5,000,000 | |
| Year | Years | Years | Investment | |
| Prime Money Market Fund Institutional | ||||
| Shares | 0.07% | 0.10% | 1.57% | $5,842,419 |
| Institutional Money Market Funds Average | 0.00 | 0.02 | 1.37 | 5,726,502 |
| Citigroup Three-Month U.S. Treasury Bill | ||||
| Index | 0.02 | 0.05 | 1.28 | 5,687,636 |
See Financial Highlights for dividend information.
11
Prime Money Market Fund
Fiscal-Year Total Returns (%): August 31, 2005, Through August 31, 2015
| Money | ||
| Market | ||
| Funds | ||
| Investor Shares | Average | |
| Fiscal Year | Total Returns | Total Returns |
| 2006 | 4.38% | 3.69% |
| 2007 | 5.23 | 4.55 |
| 2008 | 3.60 | 3.02 |
| 2009 | 1.31 | 0.62 |
| 2010 | 0.08 | 0.02 |
| 2011 | 0.06 | 0.00 |
| 2012 | 0.04 | 0.00 |
| 2013 | 0.02 | 0.00 |
| 2014 | 0.02 | 0.00 |
| 2015 | 0.02 | 0.00 |
| 7-day SEC yield (8/31/2015): 0.06% | ||
| Money Market Funds Average: Derived from data provided by Lipper, a Thomson Reuters Company. | ||
Average Annual Total Returns: Periods Ended June 30, 2015
This table presents returns through the latest calendar quarter—rather than through the end of the fiscal period.
Securities and Exchange Commission rules require that we provide this information.
| Inception | One | Five | Ten | |
| Date | Year | Years | Years | |
| Investor Shares | 6/4/1975 | 0.01% | 0.03% | 1.51% |
| Institutional Shares | 10/3/1989 | 0.06 | 0.10 | 1.62 |
12
Prime Money Market Fund
Financial Statements
Statement of Net Assets
As of August 31, 2015
The fund reports a complete list of its holdings in various monthly and quarterly regulatory filings. The fund publishes its holdings on a monthly basis at vanguard.com and files them with the Securities and Exchange Commission on Form N-MFP. The fund’s Form N-MFP filings become public 60 days after the relevant month-end, and may be viewed at sec.gov or via a link on the “Portfolio Holdings” page on vanguard.com. For the second and fourth fiscal quarters, the lists appear in the fund’s semiannual and annual reports to shareholders. For the first and third fiscal quarters, the fund files the lists with the SEC on Form N-Q. Shareholders can look up the fund’s Forms N-Q on the SEC’s website at sec.gov. Forms N-Q may also be reviewed and copied at the SEC’s Public Reference Room (see the back cover of this report for further information).
| Face | Market | ||||
| Maturity | Amount | Value• | |||
| Yield1 | Date | ($000) | ($000) | ||
| U.S. Government and Agency Obligations (32.2%) | |||||
| 2 | Federal Home Loan Bank Discount Notes | 0.070%–0.072% | 9/4/15 | 2,334,770 | 2,334,756 |
| 2 | Federal Home Loan Bank Discount Notes | 0.070%–0.090% | 9/9/15 | 1,330,800 | 1,330,777 |
| 2 | Federal Home Loan Bank Discount Notes | 0.070%–0.093% | 9/11/15 | 961,547 | 961,525 |
| 2 | Federal Home Loan Bank Discount Notes | 0.075% | 9/14/15 | 25,000 | 24,999 |
| 2 | Federal Home Loan Bank Discount Notes | 0.070% | 9/15/15 | 37,000 | 36,999 |
| 2 | Federal Home Loan Bank Discount Notes | 0.070% | 9/16/15 | 213,000 | 212,994 |
| 2 | Federal Home Loan Bank Discount Notes | 0.070%–0.090% | 9/18/15 | 604,300 | 604,279 |
| 2 | Federal Home Loan Bank Discount Notes | 0.075%–0.079% | 9/25/15 | 104,648 | 104,643 |
| 2 | Federal Home Loan Bank Discount Notes | 0.080%–0.088% | 9/30/15 | 1,635,000 | 1,634,894 |
| 2 | Federal Home Loan Bank Discount Notes | 0.080% | 10/2/15 | 23,000 | 22,998 |
| 2 | Federal Home Loan Bank Discount Notes | 0.120% | 10/7/15 | 107,000 | 106,987 |
| 2 | Federal Home Loan Bank Discount Notes | 0.120% | 10/9/15 | 1,425,700 | 1,425,519 |
| 2 | Federal Home Loan Bank Discount Notes | 0.170%–0.175% | 10/14/15 | 890,000 | 889,814 |
| 2 | Federal Home Loan Bank Discount Notes | 0.159%–0.170% | 10/16/15 | 3,072,000 | 3,071,377 |
| 2 | Federal Home Loan Bank Discount Notes | 0.170% | 10/19/15 | 517,500 | 517,383 |
| 2 | Federal Home Loan Bank Discount Notes | 0.150%–0.170% | 10/21/15 | 1,706,000 | 1,705,610 |
| 2 | Federal Home Loan Bank Discount Notes | 0.165% | 10/22/15 | 396,000 | 395,908 |
| 2 | Federal Home Loan Bank Discount Notes | 0.140%–0.150% | 10/23/15 | 3,191,000 | 3,190,338 |
| 2 | Federal Home Loan Bank Discount Notes | 0.155% | 10/26/15 | 87,900 | 87,879 |
| 2 | Federal Home Loan Bank Discount Notes | 0.150% | 10/27/15 | 200,000 | 199,953 |
| 2 | Federal Home Loan Bank Discount Notes | 0.114% | 10/28/15 | 539,000 | 538,903 |
| 2 | Federal Home Loan Bank Discount Notes | 0.150% | 10/30/15 | 100,000 | 99,975 |
| 2 | Federal Home Loan Bank Discount Notes | 0.130%–0.160% | 11/2/15 | 54,063 | 54,049 |
| 2 | Federal Home Loan Bank Discount Notes | 0.130% | 11/4/15 | 790,000 | 789,817 |
| 2 | Federal Home Loan Bank Discount Notes | 0.160% | 11/6/15 | 200,000 | 199,941 |
| 2 | Federal Home Loan Bank Discount Notes | 0.170% | 11/19/15 | 77,400 | 77,371 |
| 2 | Federal Home Loan Bank Discount Notes | 0.189% | 11/25/15 | 989,000 | 988,559 |
| 2 | Federal Home Loan Bank Discount Notes | 0.192% | 11/27/15 | 1,300,000 | 1,299,397 |
| 3,4 | Federal National Mortgage Assn. | 0.192% | 10/21/15 | 112,000 | 112,008 |
| 4 | Freddie Mac Discount Notes | 0.079% | 10/2/15 | 24,500 | 24,498 |
| 4 | Freddie Mac Discount Notes | 0.130% | 10/14/15 | 351,648 | 351,593 |
| United States Treasury Bill | 0.145%–0.146% | 9/17/15 | 900,000 | 899,942 | |
| United States Treasury Bill | 0.091% | 12/31/15 | 1,000,000 | 999,695 | |
| United States Treasury Bill | 0.200%–0.201% | 2/25/16 | 1,784,000 | 1,782,244 | |
| 3 | United States Treasury Floating Rate Note | 0.095% | 1/31/16 | 415,000 | 414,956 |
13
Prime Money Market Fund
| Face | Market | |||
| Maturity | Amount | Value• | ||
| Yield1 | Date | ($000) | ($000) | |
| 3 United States Treasury Floating Rate Note | 0.119% | 4/30/16 | 1,041,000 | 1,040,958 |
| 3 United States Treasury Floating Rate Note | 0.120% | 7/31/16 | 350,000 | 349,978 |
| 3 United States Treasury Floating Rate Note | 0.103% | 10/31/16 | 2,912,200 | 2,910,435 |
| 3 United States Treasury Floating Rate Note | 0.134% | 1/31/17 | 1,779,183 | 1,779,158 |
| United States Treasury Note/Bond | 0.250% | 9/30/15 | 354,000 | 354,053 |
| United States Treasury Note/Bond | 0.250% | 10/15/15 | 768,000 | 768,144 |
| United States Treasury Note/Bond | 4.500% | 11/15/15 | 3,003,170 | 3,030,134 |
| United States Treasury Note/Bond | 0.375% | 1/15/16 | 1,467,000 | 1,468,451 |
| United States Treasury Note/Bond | 2.000% | 1/31/16 | 1,619,000 | 1,631,493 |
| United States Treasury Note/Bond | 0.375% | 2/15/16 | 1,339,000 | 1,340,375 |
| United States Treasury Note/Bond | 4.500% | 2/15/16 | 171,454 | 174,817 |
| United States Treasury Note/Bond | 0.375% | 3/15/16 | 300,000 | 300,290 |
| United States Treasury Note/Bond | 0.375% | 3/31/16 | 139,045 | 139,182 |
| United States Treasury Note/Bond | 2.250% | 3/31/16 | 402,500 | 407,258 |
| United States Treasury Note/Bond | 2.375% | 3/31/16 | 164,000 | 166,061 |
| Total U.S. Government and Agency Obligations (Cost $43,353,367) | 43,353,367 | |||
| Commercial Paper (33.6%) | ||||
| Bank Holding Company (0.9%) | ||||
| 5 Bank of New York Mellon Corp. | 0.130% | 9/2/15 | 1,097,000 | 1,096,996 |
| State Street Corp. | 0.200% | 9/18/15 | 55,000 | 54,995 |
| 1,151,991 | ||||
| Finance—Auto (2.4%) | ||||
| American Honda Finance Corp. | 0.140% | 9/4/15 | 200,500 | 200,498 |
| American Honda Finance Corp. | 0.140% | 9/9/15 | 133,750 | 133,746 |
| American Honda Finance Corp. | 0.140% | 9/10/15 | 54,000 | 53,998 |
| American Honda Finance Corp. | 0.140% | 9/11/15 | 90,000 | 89,997 |
| American Honda Finance Corp. | 0.150% | 10/6/15 | 34,000 | 33,995 |
| 5 BMW US Capital LLC | 0.140% | 9/4/15 | 43,000 | 43,000 |
| 5 BMW US Capital LLC | 0.140% | 9/8/15 | 45,500 | 45,499 |
| 5 BMW US Capital LLC | 0.140% | 9/9/15 | 118,500 | 118,496 |
| 5 BMW US Capital LLC | 0.140% | 9/11/15 | 73,500 | 73,497 |
| 5 BMW US Capital LLC | 0.140% | 9/14/15 | 131,750 | 131,743 |
| 5 BMW US Capital LLC | 0.140% | 9/16/15 | 111,000 | 110,994 |
| 5 BMW US Capital LLC | 0.140% | 9/18/15 | 37,000 | 36,998 |
| 5 BMW US Capital LLC | 0.140% | 9/22/15 | 37,000 | 36,997 |
| 5 BMW US Capital LLC | 0.150% | 9/24/15 | 43,250 | 43,246 |
| 5 BMW US Capital LLC | 0.150% | 9/25/15 | 36,000 | 35,996 |
| 5 BMW US Capital LLC | 0.150% | 10/1/15 | 129,000 | 128,984 |
| 5 BMW US Capital LLC | 0.160% | 10/8/15 | 81,000 | 80,987 |
| 5 BMW US Capital LLC | 0.160% | 10/9/15 | 27,500 | 27,495 |
| 5 BMW US Capital LLC | 0.230% | 11/24/15 | 29,500 | 29,484 |
| 5 BMW US Capital LLC | 0.240% | 11/30/15 | 22,250 | 22,237 |
| 5 BMW US Capital LLC | 0.240% | 12/1/15 | 22,250 | 22,237 |
| 5 BMW US Capital LLC | 0.220%–0.240% | 12/2/15 | 63,250 | 63,212 |
| 5 BMW US Capital LLC | 0.240% | 12/4/15 | 22,250 | 22,236 |
| Toyota Motor Credit Corp. | 0.220% | 10/27/15 | 74,250 | 74,225 |
| Toyota Motor Credit Corp. | 0.290% | 10/28/15 | 150,000 | 149,931 |
| Toyota Motor Credit Corp. | 0.250% | 11/2/15 | 34,500 | 34,485 |
| Toyota Motor Credit Corp. | 0.240% | 11/4/15 | 27,000 | 26,988 |
| Toyota Motor Credit Corp. | 0.280% | 11/23/15 | 113,000 | 112,927 |
| 3 Toyota Motor Credit Corp. | 0.279% | 11/24/15 | 201,000 | 201,000 |
| Toyota Motor Credit Corp. | 0.280% | 12/3/15 | 174,000 | 173,874 |
| Toyota Motor Credit Corp. | 0.280% | 12/7/15 | 45,000 | 44,966 |
| Toyota Motor Credit Corp. | 0.280%–0.290% | 12/8/15 | 121,000 | 120,905 |
14
Prime Money Market Fund
| Face | Market | ||||
| Maturity | Amount | Value• | |||
| Yield1 | Date | ($000) | ($000) | ||
| Toyota Motor Credit Corp. | 0.250% | 12/17/15 | 30,000 | 29,978 | |
| Toyota Motor Credit Corp. | 0.320% | 1/5/16 | 198,000 | 197,778 | |
| Toyota Motor Credit Corp. | 0.310% | 1/12/16 | 39,750 | 39,704 | |
| Toyota Motor Credit Corp. | 0.310% | 1/19/16 | 23,000 | 22,972 | |
| 3 | Toyota Motor Credit Corp. | 0.299% | 4/15/16 | 452,000 | 452,000 |
| 3,267,305 | |||||
| Finance—Other (1.0%) | |||||
| 5 | Chariot Funding LLC | 0.200% | 9/15/15 | 25,000 | 24,998 |
| 5 | Chariot Funding LLC | 0.190% | 10/13/15 | 36,500 | 36,492 |
| General Electric Capital Corp. | 0.150% | 9/10/15 | 147,500 | 147,494 | |
| General Electric Capital Corp. | 0.300% | 9/17/15 | 38,750 | 38,745 | |
| General Electric Capital Corp. | 0.150% | 9/22/15 | 37,000 | 36,997 | |
| General Electric Capital Corp. | 0.300% | 9/24/15 | 115,250 | 115,228 | |
| General Electric Capital Corp. | 0.160% | 9/28/15 | 173,000 | 172,979 | |
| General Electric Capital Corp. | 0.320% | 12/7/15 | 198,000 | 197,829 | |
| General Electric Capital Corp. | 0.320% | 12/8/15 | 198,000 | 197,828 | |
| General Electric Capital Corp. | 0.240% | 12/11/15 | 25,000 | 24,983 | |
| General Electric Capital Corp. | 0.280% | 12/16/15 | 99,000 | 98,918 | |
| General Electric Capital Corp. | 0.320% | 12/23/15 | 198,000 | 197,801 | |
| 5 | John Deere Financial Ltd. | 0.160% | 10/1/15 | 31,000 | 30,996 |
| 1,321,288 | |||||
| Foreign Banks (12.4%) | |||||
| 3,5 | Australia & New Zealand Banking Group, Ltd. | 0.278% | 10/27/15 | 228,000 | 227,998 |
| 5 | Australia & New Zealand Banking Group, Ltd. | 0.280% | 10/30/15 | 175,000 | 174,920 |
| 3,5 | Australia & New Zealand Banking Group, Ltd. | 0.278% | 11/3/15 | 376,000 | 376,000 |
| 3,5 | Australia & New Zealand Banking Group, Ltd. | 0.308% | 1/15/16 | 496,000 | 495,991 |
| 3,5 | Australia & New Zealand Banking Group, Ltd. | 0.308% | 1/29/16 | 217,500 | 217,500 |
| 3,5 | Australia & New Zealand Banking Group, Ltd. | 0.308% | 1/29/16 | 297,000 | 297,000 |
| 3,5 | Australia & New Zealand Banking Group, Ltd. | 0.302% | 2/2/16 | 200,000 | 200,000 |
| 3,5 | Australia & New Zealand Banking Group, Ltd. | 0.302% | 4/8/16 | 357,000 | 357,000 |
| 3,5 | Australia & New Zealand Banking Group, Ltd. | 0.363% | 6/20/16 | 415,000 | 415,000 |
| 5 | Bank of Nova Scotia | 0.315% | 11/9/15 | 670,000 | 669,595 |
| 5 | Bank of Nova Scotia | 0.310% | 12/1/15 | 320,000 | 319,749 |
| 3,5 | Commonwealth Bank of Australia | 0.293% | 10/2/15 | 50,000 | 50,000 |
| 3,5 | Commonwealth Bank of Australia | 0.284% | 10/6/15 | 189,000 | 189,000 |
| 3,5 | Commonwealth Bank of Australia | 0.284% | 10/7/15 | 115,000 | 115,000 |
| 3,5 | Commonwealth Bank of Australia | 0.283% | 10/9/15 | 348,000 | 348,000 |
| 3,5 | Commonwealth Bank of Australia | 0.287% | 10/13/15 | 297,000 | 297,000 |
| 3,5 | Commonwealth Bank of Australia | 0.292% | 10/14/15 | 276,000 | 276,000 |
| 3,5 | Commonwealth Bank of Australia | 0.290% | 1/29/16 | 300,000 | 299,994 |
| 3,5 | Commonwealth Bank of Australia | 0.293% | 2/8/16 | 150,000 | 149,997 |
| 3,5 | Commonwealth Bank of Australia | 0.305% | 2/19/16 | 217,000 | 216,995 |
| 3,5 | Commonwealth Bank of Australia | 0.300% | 2/22/16 | 55,000 | 54,999 |
| 3,5 | Commonwealth Bank of Australia | 0.370% | 2/24/16 | 181,000 | 181,000 |
| 3,5 | Commonwealth Bank of Australia | 0.358% | 2/29/16 | 30,000 | 29,999 |
| 3,5 | Commonwealth Bank of Australia | 0.361% | 3/7/16 | 280,000 | 280,000 |
| 3,5 | Commonwealth Bank of Australia | 0.323% | 3/14/16 | 249,000 | 248,993 |
| 3,5 | Commonwealth Bank of Australia | 0.309% | 3/18/16 | 350,000 | 350,000 |
| 3,5 | Commonwealth Bank of Australia | 0.310% | 3/24/16 | 145,000 | 145,000 |
| 3,5 | Commonwealth Bank of Australia | 0.308% | 3/30/16 | 125,000 | 124,997 |
| 3,5 | Commonwealth Bank of Australia | 0.308% | 3/31/16 | 40,000 | 39,999 |
| 3,5 | Commonwealth Bank of Australia | 0.332% | 5/13/16 | 100,000 | 99,996 |
| 3,5 | Commonwealth Bank of Australia | 0.340% | 5/23/16 | 375,000 | 374,988 |
| 3,5 | Commonwealth Bank of Australia | 0.370% | 6/24/16 | 59,000 | 58,998 |
15
Prime Money Market Fund
| Face | Market | ||||
| Maturity | Amount | Value• | |||
| Yield1 | Date | ($000) | ($000) | ||
| Lloyds Bank plc | 0.130% | 9/1/15 | 2,268,000 | 2,268,000 | |
| 5 | National Australia Bank Ltd. | 0.340% | 12/14/15 | 1,000,000 | 999,018 |
| 5 | National Australia Bank Ltd. | 0.340% | 12/21/15 | 425,000 | 424,554 |
| 3,5 | National Australia Bank Ltd. | 0.349% | 2/25/16 | 1,032,000 | 1,032,000 |
| 3,5 | Westpac Banking Corp. | 0.278% | 9/2/15 | 428,000 | 428,000 |
| 3,5 | Westpac Banking Corp. | 0.282% | 9/4/15 | 500,000 | 500,000 |
| 3,5 | Westpac Banking Corp. | 0.288% | 9/15/15 | 695,000 | 694,999 |
| 3,5 | Westpac Banking Corp. | 0.281% | 10/9/15 | 380,000 | 380,000 |
| 3,5 | Westpac Banking Corp. | 0.331% | 1/8/16 | 175,000 | 174,997 |
| 3,5 | Westpac Banking Corp. | 0.310% | 2/22/16 | 105,000 | 105,000 |
| 3,5 | Westpac Banking Corp. | 0.358% | 2/26/16 | 311,750 | 311,750 |
| 3,5 | Westpac Banking Corp. | 0.358% | 2/29/16 | 638,250 | 638,250 |
| 3,5 | Westpac Banking Corp. | 0.310% | 3/24/16 | 100,000 | 100,000 |
| 3,5 | Westpac Banking Corp. | 0.310% | 3/24/16 | 220,000 | 220,000 |
| 3,5 | Westpac Banking Corp. | 0.348% | 5/27/16 | 100,000 | 100,000 |
| 3,5 | Westpac Banking Corp. | 0.348% | 5/27/16 | 317,000 | 316,999 |
| 3,5 | Westpac Banking Corp. | 0.339% | 6/2/16 | 245,000 | 245,000 |
| 3,5 | Westpac Banking Corp. | 0.341% | 6/10/16 | 135,000 | 134,993 |
| 16,755,268 | |||||
| Foreign Governments (4.5%) | |||||
| Canada | 0.150% | 10/27/15 | 149,000 | 148,965 | |
| 5 | CDP Financial Inc. | 0.180%–0.200% | 9/15/15 | 55,500 | 55,496 |
| 5 | CDP Financial Inc. | 0.200% | 9/16/15 | 22,000 | 21,998 |
| 5 | CDP Financial Inc. | 0.200% | 9/30/15 | 11,000 | 10,998 |
| 5 | CDP Financial Inc. | 0.200% | 10/2/15 | 35,500 | 35,494 |
| 5 | CDP Financial Inc. | 0.200% | 10/5/15 | 34,750 | 34,744 |
| 5 | CDP Financial Inc. | 0.220% | 10/14/15 | 22,250 | 22,244 |
| 5 | CDP Financial Inc. | 0.200% | 10/15/15 | 56,500 | 56,486 |
| 5 | CDP Financial Inc. | 0.260% | 11/6/15 | 33,000 | 32,984 |
| 5 | CDP Financial Inc. | 0.240% | 11/16/15 | 79,250 | 79,210 |
| 5 | CDP Financial Inc. | 0.240% | 11/19/15 | 134,000 | 133,929 |
| 6 | CPPIB Capital Inc. | 0.155% | 9/3/15 | 163,750 | 163,749 |
| 6 | CPPIB Capital Inc. | 0.155% | 9/9/15 | 54,177 | 54,175 |
| 6 | CPPIB Capital Inc. | 0.155%–0.160% | 9/10/15 | 231,000 | 230,991 |
| 6 | CPPIB Capital Inc. | 0.160% | 9/11/15 | 33,750 | 33,749 |
| 6 | CPPIB Capital Inc. | 0.150% | 9/14/15 | 72,000 | 71,996 |
| 6 | CPPIB Capital Inc. | 0.170% | 10/13/15 | 109,000 | 108,978 |
| 6 | CPPIB Capital Inc. | 0.175% | 10/14/15 | 164,500 | 164,466 |
| 6 | CPPIB Capital Inc. | 0.175% | 10/19/15 | 157,750 | 157,713 |
| 6 | CPPIB Capital Inc. | 0.160% | 10/21/15 | 202,000 | 201,955 |
| 6 | CPPIB Capital Inc. | 0.205% | 10/30/15 | 226,000 | 225,924 |
| 6 | CPPIB Capital Inc. | 0.205% | 11/2/15 | 158,750 | 158,694 |
| 6 | CPPIB Capital Inc. | 0.175% | 11/3/15 | 160,000 | 159,951 |
| 6 | CPPIB Capital Inc. | 0.205% | 11/9/15 | 39,750 | 39,734 |
| 6 | CPPIB Capital Inc. | 0.205% | 11/10/15 | 353,250 | 353,109 |
| 6 | CPPIB Capital Inc. | 0.205% | 11/12/15 | 288,250 | 288,132 |
| Export Development Canada | 0.200% | 10/13/15 | 144,000 | 143,966 | |
| Export Development Canada | 0.190% | 11/5/15 | 74,000 | 73,975 | |
| Export Development Canada | 0.200% | 11/16/15 | 49,500 | 49,479 | |
| Province of Ontario | 0.140% | 9/1/15 | 277,860 | 277,860 | |
| Province of Ontario | 0.130% | 9/17/15 | 48,141 | 48,138 | |
| 6 | PSP Capital Inc. | 0.160%–0.190% | 9/8/15 | 60,750 | 60,748 |
| 6 | PSP Capital Inc. | 0.270% | 9/17/15 | 99,000 | 98,988 |
| 6 | PSP Capital Inc. | 0.170% | 9/18/15 | 29,500 | 29,498 |
| 6 | PSP Capital Inc. | 0.270% | 9/21/15 | 39,500 | 39,494 |
16
Prime Money Market Fund
| Face | Market | |||
| Maturity | Amount | Value• | ||
| Yield1 | Date | ($000) | ($000) | |
| 6 PSP Capital Inc. | 0.180% | 9/28/15 | 69,500 | 69,491 |
| 6 PSP Capital Inc. | 0.180% | 10/5/15 | 14,500 | 14,498 |
| 6 PSP Capital Inc. | 0.170% | 10/6/15 | 59,000 | 58,990 |
| 6 PSP Capital Inc. | 0.180% | 10/8/15 | 42,500 | 42,492 |
| 6 PSP Capital Inc. | 0.180% | 10/9/15 | 36,250 | 36,243 |
| 6 PSP Capital Inc. | 0.180% | 10/14/15 | 82,000 | 81,982 |
| 6 PSP Capital Inc. | 0.260% | 11/10/15 | 18,950 | 18,940 |
| 6 PSP Capital Inc. | 0.260% | 11/16/15 | 18,250 | 18,240 |
| 6 PSP Capital Inc. | 0.250%–0.260% | 11/19/15 | 126,750 | 126,680 |
| 6 PSP Capital Inc. | 0.250% | 11/20/15 | 79,500 | 79,456 |
| 6 PSP Capital Inc. | 0.280% | 11/24/15 | 82,000 | 81,947 |
| 5 Quebec | 0.145% | 9/1/15 | 744,000 | 744,000 |
| 5 Quebec | 0.150% | 9/14/15 | 36,500 | 36,498 |
| 5 Quebec | 0.150% | 9/15/15 | 36,500 | 36,498 |
| 5 Quebec | 0.140%–0.150% | 9/17/15 | 605,375 | 605,337 |
| 5 Quebec | 0.150% | 9/22/15 | 129,500 | 129,489 |
| 6,048,791 | ||||
| Foreign Industrial (4.5%) | ||||
| 5 BASF SE | 0.210% | 9/1/15 | 138,000 | 138,000 |
| 5 BASF SE | 0.140% | 9/25/15 | 98,360 | 98,351 |
| 5 BASF SE | 0.170%–0.220% | 9/28/15 | 166,750 | 166,728 |
| 5 BASF SE | 0.170%–0.300% | 9/29/15 | 651,500 | 651,377 |
| 5 BASF SE | 0.170% | 9/30/15 | 145,000 | 144,980 |
| 5 John Deere Canada ULC | 0.170% | 10/13/15 | 41,500 | 41,492 |
| 5 Nestle Capital Corp. | 0.150%–0.155% | 9/8/15 | 84,500 | 84,497 |
| 5 Nestle Capital Corp. | 0.150% | 9/9/15 | 126,750 | 126,746 |
| 5 Nestle Capital Corp. | 0.180% | 11/9/15 | 108,500 | 108,463 |
| 5 Nestle Capital Corp. | 0.180% | 11/13/15 | 108,500 | 108,460 |
| 5 Nestle Capital Corp. | 0.180% | 11/16/15 | 244,000 | 243,907 |
| 5 Nestle Capital Corp. | 0.180% | 11/17/15 | 99,000 | 98,962 |
| 5 Nestle Capital Corp. | 0.180% | 11/19/15 | 83,500 | 83,467 |
| Nestle Finance International Ltd. | 0.135%–0.140% | 9/14/15 | 139,400 | 139,393 |
| Nestle Finance International Ltd. | 0.140% | 9/15/15 | 59,750 | 59,747 |
| Nestle Finance International Ltd. | 0.140% | 9/18/15 | 149,000 | 148,990 |
| Nestle Finance International Ltd. | 0.140% | 9/21/15 | 171,000 | 170,987 |
| Nestle Finance International Ltd. | 0.140% | 9/28/15 | 43,500 | 43,495 |
| Nestle Finance International Ltd. | 0.140%–0.170% | 10/1/15 | 47,750 | 47,744 |
| Nestle Finance International Ltd. | 0.150% | 10/14/15 | 151,000 | 150,973 |
| Nestle Finance International Ltd. | 0.150% | 10/26/15 | 37,000 | 36,991 |
| Nestle Finance International Ltd. | 0.150% | 10/27/15 | 74,000 | 73,983 |
| Nestle Finance International Ltd. | 0.180% | 11/17/15 | 100,000 | 99,961 |
| Nestle Finance International Ltd. | 0.180% | 11/18/15 | 95,000 | 94,963 |
| 5 Reckitt Benckiser Treasury Services plc | 0.150%–0.180% | 9/1/15 | 176,500 | 176,500 |
| 5 Reckitt Benckiser Treasury Services plc | 0.180% | 9/9/15 | 35,500 | 35,499 |
| 5 Reckitt Benckiser Treasury Services plc | 0.250% | 11/2/15 | 18,500 | 18,492 |
| 5 Reckitt Benckiser Treasury Services plc | 0.270% | 12/4/15 | 111,000 | 110,922 |
| 5 Sanofi | 0.170%–0.175% | 9/25/15 | 357,500 | 357,459 |
| 5 Sanofi | 0.160%–0.175% | 9/30/15 | 228,000 | 227,969 |
| 5 Siemens Capital Co. LLC | 0.180% | 9/25/15 | 36,500 | 36,496 |
| 5 Siemens Capital Co. LLC | 0.150%–0.180% | 9/28/15 | 810,500 | 810,395 |
| 5 Total Capital Canada Ltd. | 0.140% | 9/14/15 | 33,455 | 33,453 |
| 5 Total Capital Canada Ltd. | 0.140% | 9/30/15 | 33,750 | 33,746 |
| 5 Total Capital Canada Ltd. | 0.160% | 10/13/15 | 67,000 | 66,987 |
| 5 Total Capital Canada Ltd. | 0.220% | 10/29/15 | 199,209 | 199,138 |
| 5 Total Capital Canada Ltd. | 0.220% | 11/12/15 | 46,000 | 45,980 |
17
Prime Money Market Fund
| Face | Market | |||
| Maturity | Amount | Value• | ||
| Yield1 | Date | ($000) | ($000) | |
| 5 Total Capital Canada Ltd. | 0.250% | 11/23/15 | 169,000 | 168,903 |
| 5 Total Capital Canada Ltd. | 0.290% | 12/21/15 | 329,000 | 328,706 |
| Toyota Credit Canada Inc. | 0.250% | 10/13/15 | 45,000 | 44,987 |
| Toyota Credit Canada Inc. | 0.290% | 10/28/15 | 35,000 | 34,984 |
| Toyota Credit Canada Inc. | 0.290% | 11/16/15 | 49,500 | 49,470 |
| Toyota Credit Canada Inc. | 0.320% | 12/7/15 | 24,750 | 24,729 |
| 5 Unilever Capital Corp. | 0.160% | 10/13/15 | 75,000 | 74,986 |
| 6,042,458 | ||||
| Industrial (7.9%) | ||||
| 5 Apple Inc. | 0.140% | 10/6/15 | 596,500 | 596,419 |
| 5 Apple Inc. | 0.200% | 11/2/15 | 99,000 | 98,966 |
| Caterpillar Financial Services Corp. | 0.190% | 10/13/15 | 144,000 | 143,968 |
| 5 Chevron Corp. | 0.140% | 10/5/15 | 149,000 | 148,980 |
| 5 Chevron Corp. | 0.140% | 10/13/15 | 300,000 | 299,951 |
| 5 Chevron Corp. | 0.140% | 10/14/15 | 112,400 | 112,381 |
| 5 Chevron Corp. | 0.140% | 10/15/15 | 195,290 | 195,257 |
| 5 Danaher Corp. | 0.200% | 9/3/15 | 74,000 | 73,999 |
| 5 Danaher Corp. | 0.200% | 9/11/15 | 149,000 | 148,992 |
| 5 Danaher Corp. | 0.200% | 9/21/15 | 56,000 | 55,994 |
| 5 Emerson Electric Co. | 0.150% | 9/9/15 | 21,050 | 21,049 |
| 5 Emerson Electric Co. | 0.190% | 10/13/15 | 55,000 | 54,988 |
| Exxon Mobil Corp. | 0.140% | 9/11/15 | 250,000 | 249,990 |
| Exxon Mobil Corp. | 0.140% | 9/14/15 | 200,000 | 199,990 |
| Exxon Mobil Corp. | 0.140% | 9/15/15 | 595,000 | 594,968 |
| Exxon Mobil Corp. | 0.140% | 9/16/15 | 89,000 | 88,995 |
| Exxon Mobil Corp. | 0.140% | 10/1/15 | 200,000 | 199,977 |
| Exxon Mobil Corp. | 0.140% | 10/21/15 | 200,000 | 199,961 |
| Exxon Mobil Corp. | 0.140% | 10/22/15 | 100,000 | 99,980 |
| Exxon Mobil Corp. | 0.140% | 10/23/15 | 145,000 | 144,971 |
| 5 Henkel of America Inc. | 0.190% | 9/17/15 | 148,500 | 148,487 |
| 5 Henkel of America Inc. | 0.200% | 9/24/15 | 76,000 | 75,990 |
| 5 Honeywell International Inc. | 0.140% | 9/3/15 | 50,000 | 50,000 |
| 5 Honeywell International Inc. | 0.140% | 9/4/15 | 50,000 | 49,999 |
| 5 Honeywell International Inc. | 0.140% | 9/9/15 | 100,000 | 99,997 |
| 5 Honeywell International Inc. | 0.150% | 10/6/15 | 50,000 | 49,993 |
| 5 Honeywell International Inc. | 0.140% | 10/8/15 | 50,000 | 49,993 |
| 5 Honeywell International Inc. | 0.170% | 10/26/15 | 37,000 | 36,990 |
| 5 Honeywell International Inc. | 0.170% | 10/27/15 | 37,000 | 36,990 |
| 5 Honeywell International Inc. | 0.180% | 10/28/15 | 37,000 | 36,989 |
| 5 Honeywell International Inc. | 0.180% | 10/29/15 | 37,000 | 36,989 |
| 5 Honeywell International Inc. | 0.270% | 12/2/15 | 37,000 | 36,974 |
| 5 John Deere Capital Corp. | 0.140% | 9/11/15 | 74,000 | 73,997 |
| 5 John Deere Capital Corp. | 0.140% | 9/14/15 | 29,913 | 29,911 |
| 5 John Deere Financial Inc. | 0.140% | 9/11/15 | 66,000 | 65,997 |
| 5 John Deere Financial Ltd. | 0.140% | 9/9/15 | 71,000 | 70,998 |
| 5 Novartis Finance Corp. | 0.200% | 9/1/15 | 189,000 | 189,000 |
| 5 Novartis Finance Corp. | 0.200% | 9/2/15 | 150,000 | 149,999 |
| 5 Novartis Finance Corp. | 0.200% | 9/3/15 | 100,000 | 99,999 |
| 5 Novartis Finance Corp. | 0.190% | 9/8/15 | 50,000 | 49,998 |
| 5 Novartis Finance Corp. | 0.220% | 10/1/15 | 496,000 | 495,909 |
| 5 Novartis Finance Corp. | 0.220% | 10/2/15 | 60,500 | 60,489 |
| 5 Novartis Finance Corp. | 0.270% | 11/3/15 | 80,000 | 79,962 |
| 5 Novartis Finance Corp. | 0.270% | 11/4/15 | 120,000 | 119,942 |
| 5 Novartis Finance Corp. | 0.270% | 11/5/15 | 56,000 | 55,973 |
| 5 Pfizer Inc | 0.140% | 10/15/15 | 171,750 | 171,721 |
18
Prime Money Market Fund
| Face | Market | |||
| Maturity | Amount | Value• | ||
| Yield1 | Date | ($000) | ($000) | |
| 5 The Coca-Cola Co. | 0.290% | 9/3/15 | 123,500 | 123,498 |
| 5 The Coca-Cola Co. | 0.290% | 9/4/15 | 148,500 | 148,496 |
| 5 The Coca-Cola Co. | 0.280% | 9/10/15 | 99,250 | 99,243 |
| 5 The Coca-Cola Co. | 0.280% | 9/11/15 | 25,000 | 24,998 |
| 5 The Coca-Cola Co. | 0.270% | 9/17/15 | 99,000 | 98,988 |
| 5 The Coca-Cola Co. | 0.290%–0.300% | 9/23/15 | 297,000 | 296,946 |
| 5 The Coca-Cola Co. | 0.290% | 9/24/15 | 223,000 | 222,959 |
| 5 The Coca-Cola Co. | 0.280% | 9/25/15 | 99,000 | 98,982 |
| 5 The Coca-Cola Co. | 0.260% | 11/9/15 | 145,000 | 144,928 |
| 5 The Coca-Cola Co. | 0.250% | 11/10/15 | 181,250 | 181,162 |
| 5 The Coca-Cola Co. | 0.250% | 11/13/15 | 254,500 | 254,371 |
| 5 The Coca-Cola Co. | 0.240% | 11/16/15 | 124,000 | 123,937 |
| 5 The Coca-Cola Co. | 0.240% | 11/17/15 | 24,750 | 24,737 |
| 5 The Coca-Cola Co. | 0.250% | 11/18/15 | 158,500 | 158,414 |
| 5 The Coca-Cola Co. | 0.240% | 11/19/15 | 99,000 | 98,948 |
| 5 The Coca-Cola Co. | 0.260% | 12/3/15 | 74,250 | 74,200 |
| 5 The Coca-Cola Co. | 0.260% | 12/4/15 | 134,250 | 134,159 |
| 5 The Coca-Cola Co. | 0.260% | 12/7/15 | 194,000 | 193,864 |
| 5 The Coca-Cola Co. | 0.260% | 12/8/15 | 199,500 | 199,359 |
| 5 The Coca-Cola Co. | 0.260% | 12/16/15 | 114,675 | 114,587 |
| 5 The Coca-Cola Co. | 0.250%–0.300% | 12/17/15 | 285,000 | 284,766 |
| 5 The Coca-Cola Co. | 0.400%–0.420% | 1/28/16 | 173,500 | 173,211 |
| 5 The Coca-Cola Co. | 0.400%–0.420% | 1/29/16 | 149,000 | 148,748 |
| 5 The Coca-Cola Co. | 0.440%–0.460% | 2/17/16 | 244,500 | 243,977 |
| 5 The Coca-Cola Co. | 0.460% | 2/18/16 | 259,000 | 258,437 |
| 5 The Coca-Cola Co. | 0.460% | 2/19/16 | 50,000 | 49,891 |
| 5 The Coca-Cola Co. | 0.460% | 2/22/16 | 199,000 | 198,558 |
| 5 The Coca-Cola Co. | 0.500% | 3/16/16 | 50,000 | 49,863 |
| 5 The Walt Disney Co. | 0.130% | 10/1/15 | 50,000 | 49,995 |
| 5 The Walt Disney Co. | 0.150% | 10/15/15 | 92,000 | 91,983 |
| 5 The Walt Disney Co. | 0.150% | 10/23/15 | 83,500 | 83,482 |
| 5 United Technologies Corp. | 0.160% | 9/29/15 | 40,500 | 40,495 |
| 10,643,244 | ||||
| Total Commercial Paper (Cost $45,230,345) | 45,230,345 | |||
| Certificates of Deposit (30.1%) | ||||
| Domestic Banks (7.5%) | ||||
| Citibank NA | 0.200% | 9/24/15 | 734,000 | 734,000 |
| Citibank NA | 0.210% | 9/24/15 | 100,000 | 100,000 |
| Citibank NA | 0.200% | 10/1/15 | 75,000 | 75,000 |
| Citibank NA | 0.200% | 10/5/15 | 73,500 | 73,500 |
| Citibank NA | 0.200% | 10/6/15 | 109,500 | 109,500 |
| Citibank NA | 0.200% | 10/8/15 | 179,000 | 179,000 |
| Citibank NA | 0.240% | 10/20/15 | 204,000 | 204,000 |
| Citibank NA | 0.250% | 10/26/15 | 112,000 | 112,000 |
| Citibank NA | 0.300% | 11/12/15 | 204,000 | 204,000 |
| Citibank NA | 0.290% | 11/13/15 | 223,000 | 223,000 |
| 3 State Street Bank & Trust Co. | 0.300% | 12/23/15 | 725,000 | 725,000 |
| 3 State Street Bank & Trust Co. | 0.298% | 12/29/15 | 361,000 | 361,000 |
| 3 State Street Bank & Trust Co. | 0.291% | 1/6/16 | 1,490,000 | 1,490,000 |
| 3 State Street Bank & Trust Co. | 0.291% | 1/11/16 | 500,000 | 500,000 |
| 3 State Street Bank & Trust Co. | 0.351% | 1/11/16 | 87,000 | 87,000 |
| 3 State Street Bank & Trust Co. | 0.333% | 1/13/16 | 638,000 | 638,000 |
| 3 State Street Bank & Trust Co. | 0.358% | 1/15/16 | 177,000 | 177,000 |
| 3 Wells Fargo Bank NA | 0.298% | 10/30/15 | 895,000 | 895,000 |
19
Prime Money Market Fund
| Face | Market | |||
| Maturity | Amount | Value• | ||
| Yield1 | Date | ($000) | ($000) | |
| 3 Wells Fargo Bank NA | 0.300% | 11/24/15 | 495,000 | 495,000 |
| 3 Wells Fargo Bank NA | 0.334% | 1/8/16 | 50,000 | 50,000 |
| 3 Wells Fargo Bank NA | 0.320% | 1/20/16 | 250,000 | 250,000 |
| 3 Wells Fargo Bank NA | 0.318% | 1/27/16 | 375,000 | 375,000 |
| 3 Wells Fargo Bank NA | 0.312% | 2/4/16 | 495,000 | 495,000 |
| 3 Wells Fargo Bank NA | 0.363% | 2/22/16 | 335,000 | 335,000 |
| 3 Wells Fargo Bank NA | 0.312% | 3/9/16 | 400,000 | 400,000 |
| 3 Wells Fargo Bank NA | 0.308% | 4/1/16 | 220,000 | 220,000 |
| 3 Wells Fargo Bank NA | 0.322% | 5/6/16 | 405,000 | 405,000 |
| 3 Wells Fargo Bank NA | 0.419% | 5/25/16 | 40,000 | 40,000 |
| 3 Wells Fargo Bank NA | 0.348% | 5/27/16 | 100,000 | 100,000 |
| 10,052,000 | ||||
| Eurodollar Certificates of Deposit (1.9%) | ||||
| Australia & New Zealand Banking Group, Ltd. | 0.280% | 11/2/15 | 349,000 | 349,000 |
| Australia & New Zealand Banking Group, Ltd. | 0.320% | 12/1/15 | 200,000 | 200,000 |
| Australia & New Zealand Banking Group, Ltd. | 0.380% | 1/26/16 | 396,000 | 396,000 |
| 3 National Australia Bank Ltd. | 0.258% | 10/15/15 | 1,070,000 | 1,070,000 |
| 3 National Australia Bank Ltd. | 0.270% | 11/23/15 | 535,000 | 535,000 |
| 2,550,000 | ||||
| Yankee Certificates of Deposit (20.7%) | ||||
| Bank of Montreal (Chicago Branch) | 0.220% | 10/8/15 | 410,000 | 410,000 |
| 3 Bank of Montreal (Chicago Branch) | 0.279% | 11/25/15 | 200,000 | 199,998 |
| Bank of Montreal (Chicago Branch) | 0.310% | 12/3/15 | 496,000 | 496,000 |
| Bank of Montreal (Chicago Branch) | 0.310% | 12/7/15 | 250,000 | 250,000 |
| Bank of Montreal (Chicago Branch) | 0.310% | 12/9/15 | 496,000 | 496,000 |
| 3 Bank of Montreal (Chicago Branch) | 0.281% | 12/10/15 | 235,000 | 235,000 |
| 3 Bank of Montreal (Chicago Branch) | 0.291% | 12/11/15 | 165,000 | 165,000 |
| 3 Bank of Nova Scotia (Houston Branch) | 0.268% | 11/16/15 | 400,000 | 400,000 |
| Bank of Nova Scotia (Houston Branch) | 0.320% | 11/23/15 | 625,000 | 625,000 |
| 3 Bank of Nova Scotia (Houston Branch) | 0.350% | 12/24/15 | 50,000 | 50,000 |
| 3 Bank of Nova Scotia (Houston Branch) | 0.359% | 2/25/16 | 445,000 | 445,000 |
| 3 Bank of Nova Scotia (Houston Branch) | 0.359% | 2/26/16 | 885,000 | 885,000 |
| Bank of Tokyo-Mitsubishi UFJ Ltd. | ||||
| (New York Branch) | 0.280% | 9/8/15 | 467,000 | 467,000 |
| Bank of Tokyo-Mitsubishi UFJ Ltd. | ||||
| (New York Branch) | 0.260% | 10/1/15 | 45,000 | 45,000 |
| Bank of Tokyo-Mitsubishi UFJ Ltd. | ||||
| (New York Branch) | 0.350% | 11/18/15 | 750,000 | 750,000 |
| Bank of Tokyo-Mitsubishi UFJ Ltd. | ||||
| (New York Branch) | 0.360% | 12/8/15 | 30,000 | 30,000 |
| 3 Bank of Tokyo-Mitsubishi UFJ Ltd. | ||||
| (New York Branch) | 0.303% | 12/14/15 | 771,000 | 771,000 |
| Bank of Tokyo-Mitsubishi UFJ Ltd. | ||||
| (New York Branch) | 0.340% | 12/21/15 | 750,000 | 749,994 |
| Bank of Tokyo-Mitsubishi UFJ Ltd. | ||||
| (New York Branch) | 0.350% | 12/29/15 | 35,000 | 35,000 |
| Bank of Tokyo-Mitsubishi UFJ Ltd. | ||||
| (New York Branch) | 0.360% | 12/29/15 | 440,000 | 440,000 |
| 3 Bank of Tokyo-Mitsubishi UFJ Ltd. | ||||
| (New York Branch) | 0.385% | 1/19/16 | 547,000 | 547,000 |
| Canadian Imperial Bank of Commerce | ||||
| (New York Branch) | 0.310% | 11/2/15 | 99,500 | 99,504 |
| Canadian Imperial Bank of Commerce | ||||
| (New York Branch) | 0.300% | 11/16/15 | 833,000 | 833,000 |
20
Prime Money Market Fund
| Face | Market | |||
| Maturity | Amount | Value• | ||
| Yield1 | Date | ($000) | ($000) | |
| Canadian Imperial Bank of Commerce | ||||
| (New York Branch) | 0.320% | 12/9/15 | 500,000 | 500,000 |
| Canadian Imperial Bank of Commerce | ||||
| (New York Branch) | 0.350% | 12/22/15 | 420,000 | 420,000 |
| Canadian Imperial Bank of Commerce | ||||
| (New York Branch) | 0.350% | 12/24/15 | 148,000 | 148,000 |
| Canadian Imperial Bank of Commerce | ||||
| (New York Branch) | 0.360% | 1/4/16 | 992,000 | 992,000 |
| Canadian Imperial Bank of Commerce | ||||
| (New York Branch) | 0.390% | 1/8/16 | 365,000 | 365,000 |
| 3 Commonwealth Bank of Australia | ||||
| (New York Branch) | 0.300% | 2/24/16 | 72,500 | 72,500 |
| DNB Bank ASA (New York Branch) | 0.130% | 9/1/15 | 98,000 | 98,000 |
| DNB Bank ASA (New York Branch) | 0.130% | 9/8/15 | 2,200,000 | 2,200,000 |
| 3 Royal Bank of Canada (New York Branch) | 0.270% | 9/18/15 | 541,250 | 541,250 |
| 3 Royal Bank of Canada (New York Branch) | 0.251% | 10/9/15 | 368,000 | 368,000 |
| 3 Royal Bank of Canada (New York Branch) | 0.260% | 10/22/15 | 517,250 | 517,250 |
| Royal Bank of Canada (New York Branch) | 0.280% | 11/3/15 | 394,000 | 394,000 |
| 3 Royal Bank of Canada (New York Branch) | 0.262% | 11/4/15 | 428,500 | 428,500 |
| Royal Bank of Canada (New York Branch) | 0.300% | 11/19/15 | 60,000 | 60,000 |
| 3 Royal Bank of Canada (New York Branch) | 0.273% | 11/20/15 | 287,750 | 287,750 |
| 3 Royal Bank of Canada (New York Branch) | 0.278% | 11/25/15 | 1,350,000 | 1,350,000 |
| Royal Bank of Canada (New York Branch) | 0.360% | 1/4/16 | 60,000 | 60,000 |
| Skandinaviska Enskilda Banken | ||||
| (New York Branch) | 0.140% | 9/1/15 | 3,000,000 | 3,000,000 |
| Swedbank AB (New York Branch) | 0.130% | 9/8/15 | 2,000,000 | 2,000,000 |
| Toronto Dominion Bank (New York Branch) | 0.270% | 10/5/15 | 94,250 | 94,250 |
| Toronto Dominion Bank (New York Branch) | 0.300% | 10/20/15 | 250,000 | 250,000 |
| Toronto Dominion Bank (New York Branch) | 0.290% | 11/13/15 | 625,000 | 625,000 |
| Toronto Dominion Bank (New York Branch) | 0.300% | 11/20/15 | 30,000 | 30,000 |
| Toronto Dominion Bank (New York Branch) | 0.270% | 11/23/15 | 255,000 | 255,000 |
| Toronto Dominion Bank (New York Branch) | 0.310% | 12/1/15 | 290,000 | 290,000 |
| 3 Toronto Dominion Bank (New York Branch) | 0.288% | 12/15/15 | 215,000 | 215,000 |
| 3 Toronto Dominion Bank (New York Branch) | 0.344% | 1/7/16 | 40,000 | 40,000 |
| 3 Toronto Dominion Bank (New York Branch) | 0.360% | 2/24/16 | 640,000 | 640,000 |
| 3 Toronto Dominion Bank (New York Branch) | 0.359% | 2/25/16 | 811,000 | 811,000 |
| 3 Toronto Dominion Bank (New York Branch) | 0.359% | 3/3/16 | 825,000 | 825,000 |
| 3 Westpac Banking Corp. (New York Branch) | 0.302% | 3/9/16 | 40,000 | 40,000 |
| 3 Westpac Banking Corp. (New York Branch) | 0.339% | 6/3/16 | 350,000 | 350,000 |
| 3 Westpac Banking Corp. (New York Branch) | 0.341% | 7/6/16 | 240,000 | 240,000 |
| 27,931,996 | ||||
| Total Certificates of Deposit (Cost $40,533,996) | 40,533,996 | |||
| Other Notes (2.3%) | ||||
| Bank of America NA | 0.250% | 9/2/15 | 175,000 | 175,000 |
| Bank of America NA | 0.240% | 9/17/15 | 496,000 | 496,000 |
| Bank of America NA | 0.270% | 10/6/15 | 55,500 | 55,504 |
| Bank of America NA | 0.240% | 10/13/15 | 183,000 | 183,000 |
| Bank of America NA | 0.240% | 10/20/15 | 185,000 | 185,000 |
| Bank of America NA | 0.250% | 11/5/15 | 223,250 | 223,250 |
| Bank of America NA | 0.250% | 11/9/15 | 223,000 | 223,000 |
| Bank of America NA | 0.300% | 11/9/15 | 37,000 | 37,001 |
| Bank of America NA | 0.260% | 11/16/15 | 184,000 | 184,000 |
| Bank of America NA | 0.280% | 11/19/15 | 406,000 | 406,000 |
21
Prime Money Market Fund
| Face | Market | ||||
| Maturity | Amount | Value• | |||
| Yield1 | Date | ($000) | ($000) | ||
| Bank of America NA | 0.480% | 3/1/16 | 496,000 | 496,000 | |
| Bank of America NA | 0.480% | 3/2/16 | 496,000 | 496,000 | |
| Total Other Notes (Cost $3,159,755) | 3,159,755 | ||||
| Repurchase Agreements (0.3%) | |||||
| Federal Reserve Bank of New York | |||||
| (Dated 8/31/15, Repurchase Value | |||||
| $90,000,000, collateralized by U.S. | |||||
| Treasury Note/Bond 3.750%, 8/15/41, | |||||
| with a value of $90,000,000) | 0.050% | 9/1/15 | 90,000 | 90,000 | |
| TD Securities (USA) LLC | |||||
| (Dated 8/25/15, Repurchase Value | |||||
| $158,003,000, collateralized by U.S. | |||||
| Treasury Note/Bond 0.250%–4.375%, | |||||
| 9/30/15–5/15/44, with a value of | |||||
| $161,160,000) | 0.090% | 9/1/15 | 158,000 | 158,000 | |
| TD Securities (USA) LLC | |||||
| (Dated 8/26/15, Repurchase Value | |||||
| $87,002,000, collateralized by U.S. | |||||
| Treasury Note/Bond 1.875%–2.875%, | |||||
| 11/30/20–5/15/43, with a value of | |||||
| $88,740,000) | 0.090% | 9/2/15 | 87,000 | 87,000 | |
| TD Securities (USA) LLC | |||||
| (Dated 8/31/15, Repurchase Value | |||||
| $111,003,000, collateralized by U.S. | |||||
| Treasury Note/Bond 1.000%–3.750%, | |||||
| 11/15/18–9/30/19, with a value of | |||||
| $113,220,000) | 0.140% | 9/8/15 | 111,000 | 111,000 | |
| Total Repurchase Agreements (Cost $446,000) | 446,000 | ||||
| Corporate Bonds (0.8%) | |||||
| Finance (0.1%) | |||||
| 3,6 | Commonwealth Bank of Australia | 1.086% | 9/18/15 | 56,550 | 56,571 |
| Royal Bank of Canada | 0.800% | 10/30/15 | 36,787 | 36,815 | |
| 93,386 | |||||
| Industrial (0.7%) | |||||
| 3 | Toyota Motor Credit Corp. | 0.302% | 6/13/16 | 734,000 | 734,000 |
| 3 | Toyota Motor Credit Corp. | 0.436% | 9/18/15 | 8,520 | 8,520 |
| 3 | Toyota Motor Credit Corp. | 0.294% | 10/29/15 | 266,000 | 266,000 |
| 1,008,520 | |||||
| Total Corporate Bonds (Cost $1,101,906) | 1,101,906 | ||||
| Taxable Municipal Bonds (0.6%) | |||||
| 6,7 | BlackRock Municipal Bond Trust TOB VRDO | 0.150% | 9/1/15 | 25,930 | 25,930 |
| 6,7 | BlackRock Municipal Income Investment Quality | ||||
| Trust TOB VRDO | 0.150% | 9/1/15 | 30,715 | 30,715 | |
| 6 | BlackRock Municipal Income Trust II TOB VRDO | 0.150% | 9/1/15 | 81,250 | 81,250 |
| 6,7 | BlackRock Municipal Income Trust TOB VRDO | 0.150% | 9/1/15 | 207,000 | 207,000 |
| 6,7 | BlackRock MuniHoldings Fund II, Inc. TOB VRDO | 0.150% | 9/1/15 | 40,385 | 40,385 |
| 6,7 | BlackRock MuniHoldings Fund, Inc. TOB VRDO | 0.150% | 9/1/15 | 19,165 | 19,165 |
| 6,7 | BlackRock MuniHoldings Quality Fund II, Inc. | ||||
| TOB VRDO | 0.150% | 9/1/15 | 38,905 | 38,905 | |
| 6,7 | BlackRock MuniHoldings Quality Fund II, Inc. | ||||
| TOB VRDO | 0.150% | 9/1/15 | 100,000 | 100,000 | |
| 6,7 | BlackRock MuniVest Fund II, Inc. TOB VRDO | 0.150% | 9/1/15 | 74,850 | 74,850 |
22
Prime Money Market Fund
| Face | Market | ||||
| Maturity | Amount | Value• | |||
| Yield1 | Date | ($000) | ($000) | ||
| 6 | BlackRock MuniVest Fund, Inc. TOB VRDO | 0.150% | 9/1/15 | 130,340 | 130,340 |
| 6,7 | BlackRock MuniYield Investment Quality Fund | ||||
| TOB VRDO | 0.150% | 9/1/15 | 12,910 | 12,910 | |
| 6,7 | BlackRock Strategic Municipal Trust TOB VRDO | 0.150% | 9/1/15 | 16,555 | 16,555 |
| 6,7 | Los Angeles CA Department of Water & Power | ||||
| Revenue TOB VRDO | 0.180% | 9/8/15 | 13,000 | 13,000 | |
| 6 | Massachusetts Transportation Fund Revenue | ||||
| TOB VRDO | 0.180% | 9/8/15 | 13,100 | 13,100 | |
| 6 | Seattle WA Municipal Light & Power Revenue | ||||
| TOB VRDO | 0.180% | 9/8/15 | 6,400 | 6,400 | |
| Total Taxable Municipal Bonds (Cost $810,505) | 810,505 | ||||
| Total Investments (99.9%) (Cost $134,635,874) | 134,635,874 | ||||
| Amount | |||||
| ($000) | |||||
| Other Assets and Liabilities (0.1%) | |||||
| Other Assets | |||||
| Investment in Vanguard | 11,973 | ||||
| Receivables for Accrued Income | 66,680 | ||||
| Receivables for Capital Shares Issued | 580,696 | ||||
| Other Assets | 90,648 | ||||
| Total Other Assets | 749,997 | ||||
| Liabilities | |||||
| Payables for Investment Securities Purchased | (129,413) | ||||
| Payables for Capital Shares Redeemed | (443,771) | ||||
| Payables for Distributions | (121) | ||||
| Payables to Vanguard | (4,355) | ||||
| Total Liabilities | (577,660) | ||||
| Net Assets (100%) | 134,808,211 | ||||
23
Prime Money Market Fund
| At August 31, 2015, net assets consisted of: | |
| Amount | |
| ($000) | |
| Paid-in Capital | 134,805,216 |
| Overdistributed Net Investment Income | (1) |
| Accumulated Net Realized Gains | 2,996 |
| Net Assets | 134,808,211 |
| Investor Shares—Net Assets | |
| Applicable to 105,808,511,961 outstanding $.001 par value shares of | |
| beneficial interest (unlimited authorization) | 105,820,432 |
| Net Asset Value Per Share—Investor Shares | $1.00 |
| Institutional Shares—Net Assets | |
| Applicable to 28,986,140,406 outstanding $.001 par value shares of | |
| beneficial interest (unlimited authorization) | 28,987,779 |
| Net Asset Value Per Share—Institutional Shares | $1.00 |
• See Note A in Notes to Financial Statements.
1 Represents annualized yield at date of purchase for discount securities, and coupon for coupon-bearing securities.
2 The issuer operates under a congressional charter; its securities are generally neither guaranteed by the U.S. Treasury nor backed by the
full faith and credit of the U.S. government.
3 Adjustable-rate security.
4 The issuer was placed under federal conservatorship in September 2008; since that time, its daily operations have been managed by the
Federal Housing Finance Agency and it receives capital from the U.S. Treasury, as needed to maintain a positive net worth, in exchange for
senior preferred stock.
5 Security exempt from registration under Section 4(2) of the Securities Act of 1933. Such securities may be sold in transactions exempt from
registration only to dealers in that program or other “accredited investors.” At August 31, 2015, the aggregate value of these securities was
$32,326,998,000, representing 24.0% of net assets.
6 Security exempt from registration under Rule 144A of the Securities Act of 1933. Such securities may be sold in transactions exempt from
registration, normally to qualified institutional buyers. At August 31, 2015, the aggregate value of these securities was $4,138,079,000,
representing 3.1% of net assets.
7 Scheduled principal and interest payments are guaranteed by bank letter of credit.
TOB—Tender Option Bond.
VRDO—Variable Rate Demand Obligation.
See accompanying Notes, which are an integral part of the Financial Statements.
24
Prime Money Market Fund
Statement of Operations
| Year Ended | |
| August 31, 2015 | |
| ($000) | |
| Investment Income | |
| Income | |
| Interest1 | 222,298 |
| Total Income | 222,298 |
| Expenses | |
| The Vanguard Group—Note B | |
| Investment Advisory Services | 3,335 |
| Management and Administrative—Investor Shares | 136,486 |
| Management and Administrative—Institutional Shares | 23,222 |
| Marketing and Distribution—Investor Shares | 24,155 |
| Marketing and Distribution—Institutional Shares | 5,005 |
| Custodian Fees | 1,490 |
| Auditing Fees | 33 |
| Shareholders’ Reports—Investor Shares | 643 |
| Shareholders’ Reports—Institutional Shares | 182 |
| Trustees’ Fees and Expenses | 117 |
| Total Expenses | 194,668 |
| Expense Reduction—Note B | (8,715) |
| Net Expenses | 185,953 |
| Net Investment Income | 36,345 |
| Realized Net Gain (Loss) on Investment Securities Sold | 1,570 |
| Net Increase (Decrease) in Net Assets Resulting from Operations | 37,915 |
| 1 Interest income from an affiliated company of the fund was $217,000. | |
See accompanying Notes, which are an integral part of the Financial Statements.
25
Prime Money Market Fund
Statement of Changes in Net Assets
| Year Ended August 31, | ||
| 2015 | 2014 | |
| ($000) | ($000) | |
| Increase (Decrease) in Net Assets | ||
| Operations | ||
| Net Investment Income | 36,345 | 25,597 |
| Realized Net Gain (Loss) | 1,570 | 1,258 |
| Net Increase (Decrease) in Net Assets Resulting from Operations | 37,915 | 26,855 |
| Distributions | ||
| Net Investment Income | ||
| Investor Shares | (16,453) | (10,239) |
| Institutional Shares | (19,893) | (15,358) |
| Realized Capital Gain1 | ||
| Investor Shares | — | (8,860) |
| Institutional Shares | — | (2,363) |
| Total Distributions | (36,346) | (36,820) |
| Capital Share Transactions (at $1.00 per share) | ||
| Investor Shares | 3,908,734 | (241,205) |
| Institutional Shares | 288,391 | 1,686,487 |
| Net Increase (Decrease) from Capital Share Transactions | 4,197,125 | 1,445,282 |
| Total Increase (Decrease) | 4,198,694 | 1,435,317 |
| Net Assets | ||
| Beginning of Period | 130,609,517 | 129,174,200 |
| End of Period2 | 134,808,211 | 130,609,517 |
1 Includes fiscal 2014 short-term gain distributions totaling $11,223,000. Short-term gain distributions are treated as ordinary income
dividends for tax purposes.
2 Net Assets—End of Period includes undistributed (overdistributed) net investment income of ($1,000) and $0.
See accompanying Notes, which are an integral part of the Financial Statements.
26
Prime Money Market Fund
Financial Highlights
| Investor Shares | |||||
| For a Share Outstanding | Year Ended August 31, | ||||
| Throughout Each Period | 2015 | 2014 | 2013 | 2012 | 2011 |
| Net Asset Value, Beginning of Period | $1.00 | $1.00 | $1.00 | $1.00 | $1.00 |
| Investment Operations | |||||
| Net Investment Income | .0002 | .0001 | .0002 | .0004 | .001 |
| Net Realized and Unrealized Gain (Loss) | |||||
| on Investments | — | — | — | — | — |
| Total from Investment Operations | .0002 | .0001 | .0002 | .0004 | .001 |
| Distributions | |||||
| Dividends from Net Investment Income | (.0002) | (.0001) | (.0002) | (.0004) | (.001) |
| Distributions from Realized Capital Gains | — | (.0000)1 | — | — | — |
| Total Distributions | (.0002) | (.0001) | (.0002) | (.0004) | (.001) |
| Net Asset Value, End of Period | $1.00 | $1.00 | $1.00 | $1.00 | $1.00 |
| Total Return2 | 0.02% | 0.02% | 0.02% | 0.04% | 0.06% |
| Ratios/Supplemental Data | |||||
| Net Assets, End of Period (Millions) | $105,820 | $101,910 | $102,160 | $90,212 | $92,404 |
| Ratio of Expenses to Average Net Assets | 0.15%3 | 0.14%3 | 0.16%3 | 0.16% | 0.20% |
| Ratio of Net Investment Income to | |||||
| Average Net Assets | 0.02% | 0.01% | 0.02% | 0.04% | 0.06% |
1 Distribution was less than $.0001 per share.
2 Total returns do not include account service fees that may have applied in the periods shown. Fund prospectuses provide information about
any applicable account service fees.
3 The ratio of total expenses to average net assets before an expense reduction was 0.16% for 2015, 0.16% for 2014 and 0.17% for 2013.
See Note B in the Notes to Financial Statements.
See accompanying Notes, which are an integral part of the Financial Statements.
27
Prime Money Market Fund
Financial Highlights
| Institutional Shares | |||||
| For a Share Outstanding | Year Ended August 31, | ||||
| Throughout Each Period | 2015 | 2014 | 2013 | 2012 | 2011 |
| Net Asset Value, Beginning of Period | $1.00 | $1.00 | $1.00 | $1.00 | $1.00 |
| Investment Operations | |||||
| Net Investment Income | .001 | .001 | .001 | .001 | .002 |
| Net Realized and Unrealized Gain (Loss) | |||||
| on Investments | — | — | — | — | — |
| Total from Investment Operations | .001 | .001 | .001 | .001 | .002 |
| Distributions | |||||
| Dividends from Net Investment Income | (. 001) | (. 001) | (. 001) | (. 001) | (. 002) |
| Distributions from Realized Capital Gains | — | (.000)1 | — | — | — |
| Total Distributions | (. 001) | (. 001) | (. 001) | (. 001) | (. 002) |
| Net Asset Value, End of Period | $1.00 | $1.00 | $1.00 | $1.00 | $1.00 |
| Total Return | 0.07% | 0.06% | 0.07% | 0.11% | 0.17% |
| Ratios/Supplemental Data | |||||
| Net Assets, End of Period (Millions) | $28,988 | $28,699 | $27,015 | $24,543 | $21,739 |
| Ratio of Expenses to Average Net Assets | 0.10% | 0.10% | 0.10% | 0.09% | 0.09% |
| Ratio of Net Investment Income to | |||||
| Average Net Assets | 0.07% | 0.05% | 0.07% | 0.11% | 0.17% |
| 1 Distribution was less than $.001 per share. | |||||
See accompanying Notes, which are an integral part of the Financial Statements.
28
Prime Money Market Fund
Notes to Financial Statements
Vanguard Prime Money Market Fund is registered under the Investment Company Act of 1940 as an open-end investment company, or mutual fund. The fund invests in short-term debt instruments of companies primarily operating in specific industries, particularly financial services; the issuers’ abilities to meet their obligations may be affected by economic developments in such industries. The fund offers two classes of shares, Investor Shares and Institutional Shares. Investor Shares are available to any investor who meets the fund’s minimum purchase requirements. Institutional Shares are designed for institutional investors who meet certain administrative, service, and account-size criteria. Effective December 2015, the Institutional Shares will be renamed Admiral Shares.
A. The following significant accounting policies conform to generally accepted accounting principles for U.S. investment companies. The fund consistently follows such policies in preparing its financial statements.
1. Security Valuation: Securities are valued as of the close of trading on the New York Stock Exchange (generally 4 p.m., Eastern time) on the valuation date. Securities are valued at amortized cost, which approximates market value. Investments in Vanguard Municipal Cash Management Fund are valued at that fund’s net asset value.
2. Repurchase Agreements: The fund enters into repurchase agreements with institutional counter-parties. Securities pledged as collateral to the fund under repurchase agreements are held by a custodian bank until the agreements mature. Each agreement requires that the market value of the collateral be sufficient to cover payments of interest and principal. The fund further mitigates its counterparty risk by entering into repurchase agreements only with a diverse group of prequalified counterparties, monitoring their financial strength, and entering into master repurchase agreements with its counterparties. The master repurchase agreements provide that, in the event of a counter-party’s default (including bankruptcy), the fund may terminate any repurchase agreements with that counterparty, determine the net amount owed, and sell or retain the collateral up to the net amount owed to the fund. Such action may be subject to legal proceedings, which may delay or limit the disposition of collateral.
3. Federal Income Taxes: The fund intends to continue to qualify as a regulated investment company and distribute all of its taxable income. Management has analyzed the fund’s tax positions taken for all open federal income tax years (August 31, 2012–2015), and has concluded that no provision for federal income tax is required in the fund’s financial statements.
4. Distributions: Distributions from net investment income are declared daily and paid on the first business day of the following month.
5. Credit Facility: The fund and certain other funds managed by The Vanguard Group (“Vanguard”) participate in a $3 billion committed credit facility provided by a syndicate of lenders pursuant to a credit agreement that may be renewed annually; each fund is individually liable for its borrowings, if any, under the credit facility. Borrowings may be utilized for temporary and emergency purposes, and are subject to the fund’s regulatory and contractual borrowing restrictions. The participating funds are charged administrative fees and an annual commitment fee of 0.06% of the undrawn amount of the facility; these fees are allocated to the funds based on a method approved by the fund’s board of trustees and included in Management and Administrative expenses on the fund’s Statement of Operations. Any borrowings under this facility bear interest at a rate equal to the higher of the federal funds rate or LIBOR reference rate plus an agreed-upon spread.
29
Prime Money Market Fund
The fund had no borrowings outstanding at August 31, 2015, or at any time during the period then ended.
6. Other: Interest income includes income distributions received from Vanguard Municipal Cash Management Fund and is accrued daily. Premiums and discounts on debt securities purchased are amortized and accreted, respectively, to interest income over the lives of the respective securities. Security transactions are accounted for on the date securities are bought or sold. Costs used to determine realized gains (losses) on the sale of investment securities are those of the specific securities sold.
Each class of shares has equal rights as to assets and earnings, except that each class separately bears certain class-specific expenses related to maintenance of shareholder accounts (included in Management and Administrative expenses) and shareholder reporting. Marketing and distribution expenses are allocated to each class of shares based on a method approved by the board of trustees. Income, other non-class-specific expenses, and gains and losses on investments are allocated to each class of shares based on its relative net assets.
B. In accordance with the terms of a Funds’ Service Agreement (the “FSA”) between Vanguard and the fund, Vanguard furnishes to the fund investment advisory, corporate management, administrative, marketing, and distribution services at Vanguard’s cost of operations (as defined by the FSA). These costs of operations are allocated to the fund based on methods and guidelines approved by the board of trustees. Vanguard does not require reimbursement in the current period for certain costs of operations (such as deferred compensation/benefits and risk/insurance costs); the fund’s liability for these costs of operations is included in Payables to Vanguard on the Statement of Net Assets.
Upon the request of Vanguard, the fund may invest up to 0.40% of its net assets as capital in Vanguard. At August 31, 2015, the fund had contributed to Vanguard capital in the amount of $11,973,000, representing 0.01% of the fund’s net assets and 4.79% of Vanguard’s capitalization. The fund’s trustees and officers are also directors and employees, respectively, of Vanguard.
Vanguard and the board of trustees have agreed to temporarily limit certain net operating expenses in excess of the fund’s daily yield in order to maintain a zero or positive yield for the fund. Vanguard and the board of trustees may terminate the temporary expense limitation at any time. For the year ended August 31, 2015, Vanguard’s expenses were reduced by $8,715,000 (an effective annual rate of 0.01% of the fund’s average net assets); the fund is not obligated to repay this amount to Vanguard.
C. Various inputs may be used to determine the value of the fund’s investments. These inputs are summarized in three broad levels for financial statement purposes. The inputs or methodologies used to value securities are not necessarily an indication of the risk associated with investing in those securities.
Level 1—Quoted prices in active markets for identical securities.
Level 2—Other significant observable inputs (including quoted prices for similar securities, interest rates, prepayment speeds, credit risk, etc.).
Level 3—Significant unobservable inputs (including the fund’s own assumptions used to determine the fair value of investments).
At August 31, 2015, 100% of the market value of the fund’s investments was determined using amortized cost, in accordance with rules under the Investment Company Act of 1940. Amortized cost approximates the current fair value of a security, but since the value is not obtained from a quoted price in an active market, securities valued at amortized cost are considered to be valued using Level 2 inputs.
30
Prime Money Market Fund
D. Capital share transactions for each class of shares were:
| Year Ended August 31, | ||||
| 2015 | 2014 | |||
| Amount | Shares | Amount | Shares | |
| ($000) | (000) | ($000) | (000) | |
| Investor Shares | ||||
| Issued | 136,070,155 | 136,070,155 | 130,693,911 | 130,693,911 |
| Issued in Lieu of Cash Distributions | 16,094 | 16,094 | 18,799 | 18,799 |
| Redeemed | (132,177,515) | (132,177,515) | (130,953,915) | (130,953,915) |
| Net Increase (Decrease)—Investor Shares | 3,908,734 | 3,908,734 | (241,205) | (241,205) |
| Institutional Shares | ||||
| Issued | 19,863,406 | 19,863,406 | 17,139,226 | 17,139,226 |
| Issued in Lieu of Cash Distributions | 19,409 | 19,409 | 17,388 | 17,388 |
| Redeemed | (19,594,424) | (19,594,424) | (15,470,127) | (15,470,127) |
| Net Increase (Decrease)—Institutional Shares | 288,391 | 288,391 | 1,686,487 | 1,686,487 |
E. Management has determined that no material events or transactions occurred subsequent to August 31, 2015, that would require recognition or disclosure in these financial statements.
31
Federal Money Market Fund
Fund Profile
As of August 31, 2015
| Financial Attributes | |
| Ticker Symbol | VMFXX |
| Expense Ratio1 | 0.11% |
| 7-Day SEC Yield | 0.02% |
| Average Weighted | |
| Maturity | 43 days |
| Sector Diversification (% of portfolio) | |
| U.S. Government Obligations | 82.3% |
| Repurchase Agreements | 17.7 |
The agency and mortgage-backed securities sectors may include
issues from government-sponsored enterprises; such issues are
generally not backed by the full faith and credit of the U.S.
government.
| Distribution by Credit Quality (% of portfolio) | |
| First Tier | 100.0% |
A First Tier security is one that is eligible for money market funds
and has been rated in the highest short-term rating category for
debt obligations by nationally recognized statistical rating
organizations. Credit-quality ratings are obtained from Moody's,
Fitch, and S&P. For securities rated by all three agencies, where
two of them are in agreement and assign the highest rating
category, the highest rating applies. If a security is only rated by
two agencies, and their ratings are in different categories, the
lower of the ratings applies. An unrated security is First Tier if it
represents quality comparable to that of a rated security, as
determined in accordance with SEC Rule 2a-7. For more
information about these ratings, see the Glossary entry for Credit
Quality.
1 The expense ratio shown is from the prospectus dated December 19, 2014, and represents estimated costs for the current fiscal year. For the fiscal
year ended August 31, 2015, the expense ratio was 0.10%, reflecting a temporary reduction in operating expenses (described in Note B of the Notes
to Financial Statements). Before this reduction, the expense ratio was 0.11%.
32
Federal Money Market Fund
Performance Summary
Investment returns will fluctuate. All of the returns in this report represent past performance, which is not a guarantee of future results that may be achieved by the fund. (Current performance may be lower or higher than the performance data cited. For performance data current to the most recent month-end, visit our website at vanguard.com/performance.) The returns shown do not reflect taxes that a shareholder would pay on fund distributions. An investment in a money market fund is not insured or guaranteed by the Federal Deposit Insurance Corporation or any other government agency. Although the fund seeks to preserve the value of your investment at $1 per share, it is possible to lose money by investing in the fund. The fund’s 7-day SEC yield reflects its current earnings more closely than do the average annual returns.
Cumulative Performance: August 31, 2005, Through August 31, 2015
Initial Investment of $10,000

| Average Annual Total Returns | ||||
| Periods Ended August 31, 2015 | ||||
| Final Value | ||||
| One | Five | Ten | of a $10,000 | |
| Year | Years | Years | Investment | |
| Federal Money Market Fund | 0.01% | 0.01% | 1.39% | $11,483 |
| Government Money Market Funds | ||||
| •••••••• Average | 0.00 | 0.00 | 1.14 | 11,197 |
| Citigroup Three-Month U.S. Treasury | ||||
| Bill Index | 0.02 | 0.05 | 1.28 | 11,375 |
| Government Money Market Funds Average: Derived from data provided by Lipper, a Thomson Reuters Company. | ||||
See Financial Highlights for dividend information.
33
Federal Money Market Fund
Fiscal-Year Total Returns (%): August 31, 2005, Through August 31, 2015
| Gov't Money | ||
| Market Funds Average | ||
| Fiscal Year | Total Returns | Total Returns |
| 2006 | 4.31% | 3.78% |
| 2007 | 5.17 | 4.58 |
| 2008 | 3.46 | 2.71 |
| 2009 | 1.06 | 0.43 |
| 2010 | 0.04 | 0.00 |
| 2011 | 0.02 | 0.00 |
| 2012 | 0.01 | 0.00 |
| 2013 | 0.01 | 0.00 |
| 2014 | 0.02 | 0.00 |
| 2015 | 0.01 | 0.00 |
| 7-day SEC yield (8/31/2015): 0.02% | ||
| Government Money Market Funds Average: Derived from data provided by Lipper, a Thomson Reuters Company. | ||
Average Annual Total Returns: Periods Ended June 30, 2015
This table presents returns through the latest calendar quarter—rather than through the end of the fiscal period.
Securities and Exchange Commission rules require that we provide this information.
| Inception | One | Five | Ten | |
| Date | Year | Years | Years | |
| Federal Money Market Fund | 7/13/1981 | 0.01% | 0.01% | 1.45% |
34
Federal Money Market Fund
Financial Statements
Statement of Net Assets
As of August 31, 2015
The fund reports a complete list of its holdings in various monthly and quarterly regulatory filings. The fund publishes its holdings on a monthly basis at vanguard.com and files them with the Securities and Exchange Commission on Form N-MFP. The fund’s Form N-MFP filings become public 60 days after the relevant month-end, and may be viewed at sec.gov or via a link on the “Portfolio Holdings” page on vanguard.com. For the second and fourth fiscal quarters, the lists appear in the fund’s semiannual and annual reports to shareholders. For the first and third fiscal quarters, the fund files the lists with the SEC on Form N-Q. Shareholders can look up the fund’s Forms N-Q on the SEC’s website at sec.gov. Forms N-Q may also be reviewed and copied at the SEC’s Public Reference Room (see the back cover of this report for further information).
| Face | Market | ||||
| Maturity | Amount | Value• | |||
| Yield1 | Date | ($000) | ($000) | ||
| U.S. Government and Agency Obligations (85.9%) | |||||
| 2 | Fannie Mae Discount Notes | 0.180% | 9/1/15 | 25,000 | 25,000 |
| 2 | Fannie Mae Discount Notes | 0.070%–0.080% | 9/2/15 | 31,226 | 31,226 |
| 2 | Fannie Mae Discount Notes | 0.085% | 9/11/15 | 969 | 969 |
| 2 | Fannie Mae Discount Notes | 0.080% | 9/18/15 | 2,200 | 2,200 |
| 2 | Fannie Mae Discount Notes | 0.070%–0.080% | 9/23/15 | 39,300 | 39,298 |
| 2 | Fannie Mae Discount Notes | 0.080% | 9/25/15 | 5,000 | 5,000 |
| 2 | Fannie Mae Discount Notes | 0.070%–0.090% | 9/30/15 | 61,095 | 61,091 |
| 2 | Fannie Mae Discount Notes | 0.085%–0.110% | 10/1/15 | 40,137 | 40,134 |
| 2 | Fannie Mae Discount Notes | 0.080%–0.125% | 10/7/15 | 81,762 | 81,752 |
| 2 | Fannie Mae Discount Notes | 0.160% | 10/14/15 | 14,400 | 14,397 |
| 2 | Fannie Mae Discount Notes | 0.160% | 10/19/15 | 2,900 | 2,899 |
| 2 | Fannie Mae Discount Notes | 0.130%–0.140% | 10/28/15 | 15,957 | 15,954 |
| 2 | Fannie Mae Discount Notes | 0.170%–0.180% | 11/4/15 | 6,857 | 6,855 |
| 2 | Fannie Mae Discount Notes | 0.170%–0.180% | 11/12/15 | 37,600 | 37,587 |
| 2 | Fannie Mae Discount Notes | 0.170%–0.180% | 11/18/15 | 7,391 | 7,388 |
| 2 | Fannie Mae Discount Notes | 0.170% | 11/20/15 | 7,340 | 7,337 |
| 2 | Fannie Mae Discount Notes | 0.115% | 11/25/15 | 10,000 | 9,997 |
| 2 | Fannie Mae Discount Notes | 0.150% | 12/1/15 | 50,000 | 49,981 |
| 2 | Fannie Mae Discount Notes | 0.128% | 12/2/15 | 743 | 743 |
| 2 | Fannie Mae Discount Notes | 0.135% | 12/9/15 | 16,000 | 15,994 |
| 2 | Fannie Mae Discount Notes | 0.155% | 12/23/15 | 402 | 402 |
| 2 | Fannie Mae Discount Notes | 0.155% | 12/30/15 | 8,333 | 8,329 |
| 2 | Fannie Mae Discount Notes | 0.150%–0.160% | 1/13/16 | 83,772 | 83,724 |
| 2 | Fannie Mae Discount Notes | 0.301% | 2/24/16 | 18,044 | 18,017 |
| 2 | Fannie Mae Discount Notes | 0.251% | 4/1/16 | 2,850 | 2,846 |
| 3 | Federal Home Loan Bank Discount Notes | 0.085%–0.112% | 9/2/15 | 12,435 | 12,435 |
| 3 | Federal Home Loan Bank Discount Notes | 0.080%–0.090% | 9/4/15 | 16,286 | 16,286 |
| 3 | Federal Home Loan Bank Discount Notes | 0.080% | 9/9/15 | 3,400 | 3,400 |
| 3 | Federal Home Loan Bank Discount Notes | 0.070%–0.100% | 9/11/15 | 46,270 | 46,269 |
| 3 | Federal Home Loan Bank Discount Notes | 0.090%–0.100% | 9/15/15 | 44,500 | 44,498 |
| 3 | Federal Home Loan Bank Discount Notes | 0.198% | 9/16/15 | 25,000 | 24,998 |
| 3 | Federal Home Loan Bank Discount Notes | 0.080%–0.090% | 9/18/15 | 129,301 | 129,295 |
| 3 | Federal Home Loan Bank Discount Notes | 0.080% | 9/23/15 | 6,400 | 6,400 |
| 3 | Federal Home Loan Bank Discount Notes | 0.078%–0.090% | 9/25/15 | 95,000 | 94,995 |
| 3 | Federal Home Loan Bank Discount Notes | 0.090%–0.095% | 10/2/15 | 1,639 | 1,639 |
35
| Federal Money Market Fund | |||||
| Face | Market | ||||
| Maturity | Amount | Value• | |||
| Yield1 | Date | ($000) | ($000) | ||
| 3 | Federal Home Loan Bank Discount Notes | 0.090% | 10/5/15 | 20,000 | 19,998 |
| 3 | Federal Home Loan Bank Discount Notes | 0.090%–0.100% | 10/7/15 | 28,815 | 28,812 |
| 3 | Federal Home Loan Bank Discount Notes | 0.110% | 10/9/15 | 6,100 | 6,099 |
| 3 | Federal Home Loan Bank Discount Notes | 0.120% | 10/14/15 | 1,920 | 1,920 |
| 3 | Federal Home Loan Bank Discount Notes | 0.170% | 10/16/15 | 1,800 | 1,800 |
| 3 | Federal Home Loan Bank Discount Notes | 0.170% | 10/19/15 | 50,000 | 49,989 |
| 3 | Federal Home Loan Bank Discount Notes | 0.095%–0.160% | 10/21/15 | 67,000 | 66,989 |
| 3 | Federal Home Loan Bank Discount Notes | 0.147%–0.180% | 10/23/15 | 60,440 | 60,427 |
| 3 | Federal Home Loan Bank Discount Notes | 0.114%–0.170% | 10/28/15 | 50,129 | 50,120 |
| 3 | Federal Home Loan Bank Discount Notes | 0.121%–0.125% | 10/30/15 | 27,900 | 27,894 |
| 3 | Federal Home Loan Bank Discount Notes | 0.130%–0.185% | 11/4/15 | 62,500 | 62,485 |
| 3 | Federal Home Loan Bank Discount Notes | 0.160%–0.170% | 11/6/15 | 30,000 | 29,991 |
| 3 | Federal Home Loan Bank Discount Notes | 0.180% | 11/9/15 | 6,500 | 6,498 |
| 3 | Federal Home Loan Bank Discount Notes | 0.130%–0.174% | 11/12/15 | 70,675 | 70,652 |
| 3 | Federal Home Loan Bank Discount Notes | 0.130%–0.189% | 11/13/15 | 30,800 | 30,789 |
| 3 | Federal Home Loan Bank Discount Notes | 0.185%–0.190% | 11/16/15 | 19,200 | 19,192 |
| 3 | Federal Home Loan Bank Discount Notes | 0.155%–0.185% | 11/18/15 | 53,100 | 53,082 |
| 3 | Federal Home Loan Bank Discount Notes | 0.170% | 11/19/15 | 20,000 | 19,993 |
| 3 | Federal Home Loan Bank Discount Notes | 0.185% | 11/20/15 | 5,200 | 5,198 |
| 3 | Federal Home Loan Bank Discount Notes | 0.192% | 11/27/15 | 30,000 | 29,986 |
| 3 | Federal Home Loan Bank Discount Notes | 0.145% | 12/4/15 | 1,087 | 1,087 |
| 3 | Federal Home Loan Bank Discount Notes | 0.140% | 12/9/15 | 5,000 | 4,998 |
| 3 | Federal Home Loan Bank Discount Notes | 0.165% | 1/15/16 | 25,000 | 24,984 |
| 3 | Federal Home Loan Bank Discount Notes | 0.220% | 1/27/16 | 20,000 | 19,982 |
| 2,4 | Federal Home Loan Mortgage Corp. | 0.178% | 10/16/15 | 52,710 | 52,711 |
| 2,4 | Federal Home Loan Mortgage Corp. | 0.189% | 11/25/15 | 85,000 | 85,002 |
| 2,4 | Federal Home Loan Mortgage Corp. | 0.197% | 7/21/16 | 50,000 | 49,995 |
| 2,4 | Federal Home Loan Mortgage Corp. | 0.143% | 8/17/16 | 50,000 | 50,000 |
| 2,4 | Federal Home Loan Mortgage Corp. | 0.000% | 9/2/16 | 200,000 | 200,000 |
| 2,4 | Federal National Mortgage Assn. | 0.192% | 10/21/15 | 109,000 | 109,006 |
| 2,4 | Federal National Mortgage Assn. | 0.218% | 8/15/16 | 55,605 | 55,629 |
| 2 | Freddie Mac Discount Notes | 0.095% | 9/2/15 | 4,250 | 4,250 |
| 2 | Freddie Mac Discount Notes | 0.075% | 9/9/15 | 2,075 | 2,075 |
| 2 | Freddie Mac Discount Notes | 0.075%–0.115% | 9/11/15 | 15,700 | 15,700 |
| 2 | Freddie Mac Discount Notes | 0.070% | 9/14/15 | 3,154 | 3,154 |
| 2 | Freddie Mac Discount Notes | 0.080% | 9/17/15 | 1,215 | 1,215 |
| 2 | Freddie Mac Discount Notes | 0.075% | 9/21/15 | 12,000 | 11,999 |
| 2 | Freddie Mac Discount Notes | 0.080% | 9/28/15 | 25,000 | 24,998 |
| 2 | Freddie Mac Discount Notes | 0.080% | 9/30/15 | 2,320 | 2,320 |
| 2 | Freddie Mac Discount Notes | 0.095%–0.100% | 10/1/15 | 18,200 | 18,198 |
| 2 | Freddie Mac Discount Notes | 0.079% | 10/5/15 | 7,800 | 7,799 |
| 2 | Freddie Mac Discount Notes | 0.079% | 10/6/15 | 5,700 | 5,700 |
| 2 | Freddie Mac Discount Notes | 0.130% | 10/9/15 | 2,200 | 2,200 |
| 2 | Freddie Mac Discount Notes | 0.160% | 10/13/15 | 5,800 | 5,799 |
| 2 | Freddie Mac Discount Notes | 0.130%–0.135% | 10/20/15 | 34,958 | 34,952 |
| 2 | Freddie Mac Discount Notes | 0.090% | 10/23/15 | 8,500 | 8,499 |
| 2 | Freddie Mac Discount Notes | 0.100%–0.110% | 10/28/15 | 1,909 | 1,909 |
| 2 | Freddie Mac Discount Notes | 0.085%–0.110% | 10/29/15 | 44,648 | 44,641 |
| 2 | Freddie Mac Discount Notes | 0.120% | 11/4/15 | 9,000 | 8,998 |
| 2 | Freddie Mac Discount Notes | 0.170% | 11/5/15 | 14,899 | 14,894 |
| 2 | Freddie Mac Discount Notes | 0.150% | 11/20/15 | 914 | 914 |
| 2 | Freddie Mac Discount Notes | 0.200% | 12/7/15 | 511 | 511 |
| 2 | Freddie Mac Discount Notes | 0.145% | 12/8/15 | 11,200 | 11,196 |
| 2 | Freddie Mac Discount Notes | 0.140% | 12/14/15 | 12,042 | 12,037 |
| 2 | Freddie Mac Discount Notes | 0.150% | 12/28/15 | 111 | 111 |
36
| Federal Money Market Fund | ||||
| Face | Market | |||
| Maturity | Amount | Value• | ||
| Yield1 | Date | ($000) | ($000) | |
| 2 Freddie Mac Discount Notes | 0.153% | 1/11/16 | 21,890 | 21,878 |
| 2 Freddie Mac Discount Notes | 0.200% | 2/19/16 | 6,000 | 5,994 |
| 2 Freddie Mac Discount Notes | 0.280%–0.300% | 2/22/16 | 28,531 | 28,490 |
| 2 Freddie Mac Discount Notes | 0.240% | 3/16/16 | 25,000 | 24,967 |
| 4 United States Treasury Floating Rate Note | 0.095% | 1/31/16 | 7,000 | 6,999 |
| 4 United States Treasury Floating Rate Note | 0.119% | 4/30/16 | 4,000 | 4,000 |
| 4 United States Treasury Floating Rate Note | 0.103% | 10/31/16 | 50,000 | 49,970 |
| 4 United States Treasury Floating Rate Note | 0.134% | 1/31/17 | 18,234 | 18,234 |
| United States Treasury Note/Bond | 0.250% | 9/30/15 | 25,000 | 25,004 |
| United States Treasury Note/Bond | 0.250% | 10/15/15 | 90,000 | 90,017 |
| United States Treasury Note/Bond | 4.500% | 11/15/15 | 50,000 | 50,447 |
| United States Treasury Note/Bond | 2.250% | 3/31/16 | 20,000 | 20,237 |
| United States Treasury Note/Bond | 0.375% | 3/31/16 | 19,955 | 19,975 |
| Total U.S. Government and Agency Obligations (Cost $2,854,924) | 2,854,924 | |||
| Repurchase Agreements (18.5%) | ||||
| Bank of Nova Scotia | ||||
| (Dated 8/31/15, Repurchase Value | ||||
| $40,000,000, collateralized by U.S. | ||||
| Treasury Bond/Note 0.500%–2.250%, | ||||
| 3/31/16–7/31/20; with a value of | ||||
| $40,800,000) | 0.130% | 9/1/15 | 40,000 | 40,000 |
| RBC Capital Markets LLC | ||||
| (Dated 7/13/15, Repurchase Value | ||||
| $50,008,000, collateralized by | ||||
| Federal Home Loan Mortgage Corp. | ||||
| 3.500%–5.000%, 7/1/25–7/1/45, | ||||
| Federal National Mortgage Assn. | ||||
| 2.500%–6.000%, 3/1/18–9/1/45; | ||||
| with a value of $51,500,000) | 0.100% | 9/11/15 | 50,000 | 50,000 |
| TD Securities (USA) LLC | ||||
| (Dated 8/25/15, Repurchase Value | ||||
| $90,002,000, collateralized by U.S. | ||||
| Treasury Bill 0.000%, 3/3/16, U.S. | ||||
| Treasury Bond/Note 0.750%–2.500%, | ||||
| 3/31/18–5/15/24; with a value of | ||||
| $91,800,000) | 0.090% | 9/1/15 | 90,000 | 90,000 |
| TD Securities (USA) LLC | ||||
| (Dated 8/26/15, Repurchase Value | ||||
| $85,001,000, collateralized by U.S. | ||||
| Treasury Bond/Note 0.375%–3.625%, | ||||
| 1/31/16–8/15/43; with a value of | ||||
| $86,700,000) | 0.090% | 9/2/15 | 85,000 | 85,000 |
| TD Securities (USA) LLC | ||||
| (Dated 8/27/15, Repurchase Value | ||||
| $250,005,000, collateralized by | ||||
| Federal Home Loan Mortgage Corp. | ||||
| 0.000%, 10/16/15, Federal National | ||||
| Mortgage Assn. 1.125%, 7/20/18, U.S. | ||||
| Treasury Note/Bond 0.625%–8.500%, | ||||
| 9/30/15–5/15/44; with a value of | ||||
| $255,010,000) | 0.100% | 9/3/15 | 250,000 | 250,000 |
37
| Federal Money Market Fund | ||||
| Face | Market | |||
| Maturity | Amount | Value• | ||
| Yield1 | Date | ($000) | ($000) | |
| TD Securities (USA) LLC | ||||
| (Dated 8/31/15, Repurchase Value | ||||
| $100,003,000, collateralized by Federal | ||||
| Home Loan Mortgage Corp. 0.000%, | ||||
| 10/16/15, U.S. Treasury Bond/Note | ||||
| 1.875%–2.125%, 8/31/17–9/30/21; with | ||||
| a value of $102,046,000) | 0.140% | 9/8/15 | 100,000 | 100,000 |
| Total Repurchase Agreements (Cost $615,000) | 615,000 | |||
| Total Investments (104.4%) (Cost $3,469,924) | 3,469,924 | |||
| Other Assets and Liabilities (-4.4%) | ||||
| Other Assets | 58,829 | |||
| Liabilities | (204,003) | |||
| (145,174) | ||||
| Net Assets (100%) | ||||
| Applicable to 3,324,200,746 outstanding $.001 par value shares of | ||||
| beneficial interest (unlimited authorization) | 3,324,750 | |||
| Net Asset Value Per Share | $1.00 | |||
| Amount | ||||
| ($000) | ||||
| Statement of Assets and Liabilities | ||||
| Assets | ||||
| Investments in Unaffiliated Issuers, at Value | 3,469,924 | |||
| Investment in Vanguard | 269 | |||
| Receivables for Investment Securities Sold | 40,882 | |||
| Receivables for Units Issued | 12,638 | |||
| Receivables for Accrued Income | 1,048 | |||
| Other Assets | 3,992 | |||
| Total Assets | 3,528,753 | |||
| Liabilities | ||||
| Payables for Investment Securities Purchased | 200,000 | |||
| Payables for Units Redeemed | 3,924 | |||
| Payables for Distributions | 1 | |||
| Payables to Vanguard | 78 | |||
| Total Liabilities | 204,003 | |||
| Net Assets | 3,324,750 | |||
38
Federal Money Market Fund
| At August 31, 2015, net assets consisted of: | |
| Amount | |
| ($000) | |
| Paid-in Capital | 3,324,711 |
| Undistributed Net Investment Income | — |
| Accumulated Net Realized Gains | 39 |
| Net Assets | 3,324,750 |
• See Note A in Notes to Financial Statements.
1 Represents annualized yield at date of purchase for discount securities, and coupon for coupon-bearing securities.
2 The issuer was placed under federal conservatorship in September 2008; since that time, its daily operations have been managed by the
Federal Housing Finance Agency and it receives capital from the U.S. Treasury, as needed to maintain a positive net worth, in exchange for
senior preferred stock.
3 The issuer operates under a congressional charter; its securities are generally neither guaranteed by the U.S. Treasury nor backed by the
full faith and credit of the U.S. government.
4 Adjustable-rate security.
See accompanying Notes, which are an integral part of the Financial Statements.
39
Federal Money Market Fund
Statement of Operations
| Year Ended | |
| August 31, 2015 | |
| ($000) | |
| Investment Income | |
| Income | |
| Interest | 3,203 |
| Total Income | 3,203 |
| Expenses | |
| The Vanguard Group—Note B | |
| Investment Advisory Services | 75 |
| Management and Administrative | 2,623 |
| Marketing and Distribution | 459 |
| Custodian Fees | 34 |
| Auditing Fees | 33 |
| Shareholders’ Reports | 32 |
| Trustees’ Fees and Expenses | 3 |
| Total Expenses | 3,259 |
| Expense Reduction—Note B | (373) |
| Net Expenses | 2,886 |
| Net Investment Income | 317 |
| Realized Net Gain (Loss) on Investment Securities Sold | 14 |
| Net Increase (Decrease) in Net Assets Resulting from Operations | 331 |
See accompanying Notes, which are an integral part of the Financial Statements.
40
Federal Money Market Fund
Statement of Changes in Net Assets
| Year Ended August 31, | ||
| 2015 | 2014 | |
| ($000) | ($000) | |
| Increase (Decrease) in Net Assets | ||
| Operations | ||
| Net Investment Income | 317 | 331 |
| Realized Net Gain (Loss) | 14 | 18 |
| Net Increase (Decrease) in Net Assets Resulting from Operations | 331 | 349 |
| Distributions | ||
| Net Investment Income | (317) | (331) |
| Realized Capital Gain1 | — | (206) |
| Total Distributions | (317) | (537) |
| Capital Share Transactions (at $1.00 per share) | ||
| Issued | 972,690 | 307,101 |
| Issued in Lieu of Cash Distributions | 311 | 528 |
| Redeemed | (756,637) | (720,738) |
| Net Increase (Decrease) from Capital Share Transactions | 216,364 | (413,109) |
| Total Increase (Decrease) | 216,378 | (413,297) |
| Net Assets | ||
| Beginning of Period | 3,108,372 | 3,521,669 |
| End of Period | 3,324,750 | 3,108,372 |
| 1 Includes fiscal 2014 short-term gain distributions totaling $206,000. Short-term gain distributions are treated as ordinary income dividends for tax purposes. | ||
See accompanying Notes, which are an integral part of the Financial Statements.
41
Federal Money Market Fund
Financial Highlights
| For a Share Outstanding | Year Ended August 31, | ||||
| Throughout Each Period | 2015 | 2014 | 2013 | 2012 | 2011 |
| Net Asset Value, Beginning of Period | $1.00 | $1.00 | $1.00 | $1.00 | $1.00 |
| Investment Operations | |||||
| Net Investment Income | .0001 | .0001 | .0001 | .0001 | .0002 |
| Net Realized and Unrealized Gain (Loss) | |||||
| on Investments | — | — | — | — | — |
| Total from Investment Operations | .0001 | .0001 | .0001 | .0001 | .0002 |
| Distributions | |||||
| Dividends from Net Investment Income | (.0001) | (.0001) | (.0001) | (.0001) | (.0002) |
| Distributions from Realized Capital Gains | — | (.0000)1 | — | — | — |
| Total Distributions | (.0001) | (.0001) | (.0001) | (.0001) | (.0002) |
| Net Asset Value, End of Period | $1.00 | $1.00 | $1.00 | $1.00 | $1.00 |
| Total Return2 | 0.01% | 0.02% | 0.01% | 0.01% | 0.02% |
| Ratios/Supplemental Data | |||||
| Net Assets, End of Period (Millions) | $3,325 | $3,108 | $3,522 | $4,103 | $4,794 |
| Ratio of Expenses to Average Net Assets | 0.10%3 | 0.09%3 | 0.13%3 | 0.12%3 | 0.19%3 |
| Ratio of Net Investment Income to | |||||
| Average Net Assets | 0.01% | 0.01% | 0.01% | 0.01% | 0.02% |
1 Distribution was less than $.0001 per share.
2 Total returns do not include account service fees that may have applied in the periods shown. Fund prospectuses provide information about any applicable account service fees.
3 The ratio of total expenses to average net assets before an expense reduction was 0.11% for 2015, 0.11% for 2014, 0.14% for 2013, 0.16% for 2012, and 0.20% for 2011. See Note B in the Notes to Financial Statements.
See accompanying Notes, which are an integral part of the Financial Statements.
42
Federal Money Market Fund
Notes to Financial Statements
Vanguard Federal Money Market Fund is registered under the Investment Company Act of 1940 as an open-end investment company, or mutual fund. The fund invests in short-term debt instruments issued by the U.S. government or its agencies and instrumentalities, and repurchase agreements collateralized by such instruments.
A. The following significant accounting policies conform to generally accepted accounting principles for U.S. investment companies. The fund consistently follows such policies in preparing its financial statements.
1. Security Valuation: Securities are valued as of the close of trading on the New York Stock Exchange (generally 4 p.m., Eastern time) on the valuation date. Securities are valued at amortized cost, which approximates market value.
2. Repurchase Agreements: The fund enters into repurchase agreements with institutional counter-parties. Securities pledged as collateral to the fund under repurchase agreements are held by a custodian bank until the agreements mature. Each agreement requires that the market value of the collateral be sufficient to cover payments of interest and principal. The fund further mitigates its counterparty risk by entering into repurchase agreements only with a diverse group of prequalified counterparties, monitoring their financial strength, and entering into master repurchase agreements with its counterparties. The master repurchase agreements provide that, in the event of a counter-party’s default (including bankruptcy), the fund may terminate any repurchase agreements with that counterparty, determine the net amount owed, and sell or retain the collateral up to the net amount owed to the fund. Such action may be subject to legal proceedings, which may delay or limit the disposition of collateral.
3. Federal Income Taxes: The fund intends to continue to qualify as a regulated investment company and distribute all of its taxable income. Management has analyzed the fund’s tax positions taken for all open federal income tax years (August 31, 2012–2015), and has concluded that no provision for federal income tax is required in the fund’s financial statements.
4. Distributions: Distributions from net investment income are declared daily and paid on the first business day of the following month.
5. Credit Facility: The fund and certain other funds managed by The Vanguard Group (“Vanguard”) participate in a $3 billion committed credit facility provided by a syndicate of lenders pursuant to a credit agreement that may be renewed annually; each fund is individually liable for its borrowings, if any, under the credit facility. Borrowings may be utilized for temporary and emergency purposes, and are subject to the fund’s regulatory and contractual borrowing restrictions. The participating funds are charged administrative fees and an annual commitment fee of 0.06% of the undrawn amount of the facility; these fees are allocated to the funds based on a method approved by the fund’s board of trustees and included in Management and Administrative expenses on the fund’s Statement of Operations. Any borrowings under this facility bear interest at a rate equal to the higher of the federal funds rate or LIBOR reference rate plus an agreed-upon spread.
The fund had no borrowings outstanding at August 31, 2015, or at any time during the period then ended.
6. Other: Interest income is accrued daily. Premiums and discounts on debt securities purchased are amortized and accreted, respectively, to interest income over the lives of the respective securities. Security transactions are accounted for on the date securities are bought or sold. Costs used to determine realized gains (losses) on the sale of investment securities are those of the specific securities sold.
43
Federal Money Market Fund
B. In accordance with the terms of a Funds’ Service Agreement (the “FSA”) between Vanguard and the fund, Vanguard furnishes to the fund investment advisory, corporate management, administrative, marketing, and distribution services at Vanguard’s cost of operations (as defined by the FSA). These costs of operations are allocated to the fund based on methods and guidelines approved by the board of trustees. Vanguard does not require reimbursement in the current period for certain costs of operations (such as deferred compensation/benefits and risk/insurance costs); the fund’s liability for these costs of operations is included in Payables to Vanguard on the Statement of Net Assets.
Upon the request of Vanguard, the fund may invest up to 0.40% of its net assets as capital in Vanguard. At August 31, 2015, the fund had contributed to Vanguard capital in the amount of $269,000, representing 0.01% of the fund’s net assets and 0.11% of Vanguard’s capitalization. The fund’s trustees and officers are also directors and employees, respectively, of Vanguard.
Vanguard and the board of trustees have agreed to temporarily limit certain net operating expenses in excess of the fund’s daily yield in order to maintain a zero or positive yield for the fund. Vanguard and the board of trustees may terminate the temporary expense limitation at any time. For the year ended August 31, 2015, Vanguard’s expenses were reduced by $373,000 (an effective annual rate of 0.01% of the fund’s average net assets); the fund is not obligated to repay this amount to Vanguard.
C. Various inputs may be used to determine the value of the fund’s investments. These inputs are summarized in three broad levels for financial statement purposes. The inputs or methodologies used to value securities are not necessarily an indication of the risk associated with investing in those securities.
Level 1—Quoted prices in active markets for identical securities.
Level 2—Other significant observable inputs (including quoted prices for similar securities, interest rates, prepayment speeds, credit risk, etc.).
Level 3—Significant unobservable inputs (including the fund’s own assumptions used to determine the fair value of investments).
At August 31, 2015, 100% of the market value of the fund’s investments was determined using amortized cost, in accordance with rules under the Investment Company Act of 1940. Amortized cost approximates the current fair value of a security, but since the value is not obtained from a quoted price in an active market, securities valued at amortized cost are considered to be valued using Level 2 inputs.
D. Management has determined that no material events or transactions occurred subsequent to August 31, 2015, that would require recognition or disclosure in these financial statements.
44
Admiral Treasury Money Market Fund
Fund Profile
As of August 31, 2015
| Financial Attributes | |
| Ticker Symbol | VUSXX |
| Expense Ratio1 | 0.09% |
| 7-Day SEC Yield | 0.01% |
| Average Weighted | |
| Maturity | 54 days |
| Sector Diversification (% of portfolio) | |
| U.S. Treasury Bills | 100.0% |
The agency and mortgage-backed securities sectors may include issues from government-sponsored enterprises; such issues are
generally not backed by the full faith and credit of the U.S. government.
| Distribution by Credit Quality (% of portfolio) | |
| First Tier | 100.0% |
A First Tier security is one that is eligible for money market funds and has been rated in the highest short-term rating category for
debt obligations by nationally recognized statistical rating organizations. Credit-quality ratings are obtained from Moody's,
Fitch, and S&P. For securities rated by all three agencies, where two of them are in agreement and assign the highest rating
category, the highest rating applies. If a security is only rated by two agencies, and their ratings are in different categories, the
lower of the ratings applies. An unrated security is First Tier if it represents quality comparable to that of a rated security, as
determined in accordance with SEC Rule 2a-7. For more information about these ratings, see the Glossary entry for Credit Quality.
1 The expense ratio shown is from the prospectus dated December 19, 2014, and represents estimated costs for the current fiscal year. For the fiscal
year ended August 31, 2015, the expense ratio was 0.04%, reflecting a temporary reduction in operating expenses (described in Note B of the Notes
to Financial Statements). Before this reduction, the expense ratio was 0.09%.
45
Admiral Treasury Money Market Fund
Performance Summary
Investment returns will fluctuate. All of the returns in this report represent past performance, which is not a guarantee of future results that may be achieved by the fund. (Current performance may be lower or higher than the performance data cited. For performance data current to the most recent month-end, visit our website at vanguard.com/performance.) The returns shown do not reflect taxes that a shareholder would pay on fund distributions. An investment in a money market fund is not insured or guaranteed by the Federal Deposit Insurance Corporation or any other government agency. Although the fund seeks to preserve the value of your investment at $1 per share, it is possible to lose money by investing in the fund. The fund’s 7-day SEC yield reflects its current earnings more closely than do the average annual returns.
Cumulative Performance: August 31, 2005, Through August 31, 2015
Initial Investment of $50,000
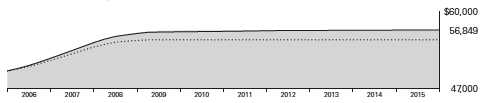
| Average Annual Total Returns | ||||
| Periods Ended August 31, 2015 | ||||
| Final Value | ||||
| One | Five | Ten | of a $50,000 | |
| Year | Years | Years | Investment | |
| Admiral Treasury Money Market | ||||
| Fund | 0.01% | 0.01% | 1.29% | $56,849 |
| iMoneyNet Money Fund Report’s | ||||
| •••••••• 100% Treasury Funds Average | 0.00 | 0.00 | 1.00 | 55,234 |
| Citigroup Three-Month U.S. Treasury | ||||
| Bill Index | 0.02 | 0.05 | 1.28 | 56,876 |
| iMoneyNet Money Fund Report’s 100% Treasury Funds Average: Derived from data provided by iMoneyNet, Inc. | ||||
See Financial Highlights for dividend information.
46
Admiral Treasury Money Market Fund
Fiscal-Year Total Returns (%): August 31, 2005, Through August 31, 2015
| iMoneyNet | ||
| Average | ||
| Fiscal Year | Total Returns | Total Returns |
| 2006 | 4.22% | 3.54% |
| 2007 | 5.01 | 4.34 |
| 2008 | 3.08 | 2.08 |
| 2009 | 0.70 | 0.17 |
| 2010 | 0.03 | 0.00 |
| 2011 | 0.02 | 0.00 |
| 2012 | 0.01 | 0.00 |
| 2013 | 0.02 | 0.00 |
| 2014 | 0.01 | 0.00 |
| 2015 | 0.01 | 0.00 |
7-day SEC yield (8/31/2015): 0.01%
iMoneyNet Money Fund Report’s 100% Treasury Funds Average: Derived from data provided by iMoneyNet, Inc.
Average Annual Total Returns: Periods Ended June 30, 2015
This table presents returns through the latest calendar quarter—rather than through the end of the fiscal period.
Securities and Exchange Commission rules require that we provide this information.
| Inception | One | Five | Ten | |
| Date | Year | Years | Years | |
| Admiral Treasury Money Market | ||||
| Fund | 12/14/1992 | 0.01% | 0.01% | 1.34% |
47
Admiral Treasury Money Market Fund
Financial Statements
Statement of Net Assets
As of August 31, 2015
The fund reports a complete list of its holdings in various monthly and quarterly regulatory filings. The fund publishes its holdings on a monthly basis at vanguard.com and files them with the Securities and Exchange Commission on Form N-MFP. The fund’s Form N-MFP filings become public 60 days after the relevant month-end, and may be viewed at sec.gov or via a link on the “Portfolio Holdings” page on vanguard.com. For the second and fourth fiscal quarters, the lists appear in the fund’s semiannual and annual reports to shareholders. For the first and third fiscal quarters, the fund files the lists with the SEC on Form N-Q. Shareholders can look up the fund’s Forms N-Q on the SEC’s website at sec.gov. Forms N-Q may also be reviewed and copied at the SEC’s Public Reference Room (see the back cover of this report for further information).
| Face | Market | ||||
| Maturity | Amount | Value• | |||
| Yield1 | Date | ($000) | ($000) | ||
| U.S. Government and Agency Obligations (101.0%) | |||||
| United States Treasury Bill | 0.030% | 9/3/15 | 133,911 | 133,912 | |
| United States Treasury Bill | 0.017%–0.046% | 9/10/15 | 1,549,995 | 1,549,987 | |
| United States Treasury Bill | 0.002% | 9/17/15 | 5,253 | 5,253 | |
| United States Treasury Bill | 0.043% | 9/24/15 | 400,000 | 399,989 | |
| United States Treasury Bill | 0.123% | 11/12/15 | 157,000 | 156,961 | |
| United States Treasury Bill | 0.113% | 11/19/15 | 228,000 | 227,944 | |
| United States Treasury Bill | 0.098% | 12/3/15 | 133,000 | 132,967 | |
| United States Treasury Bill | 0.136% | 1/21/16 | 172,000 | 171,908 | |
| 2 | United States Treasury Floating Rate Note | 0.119% | 4/30/16 | 35,000 | 34,998 |
| 2 | United States Treasury Floating Rate Note | 0.120% | 7/31/16 | 150,000 | 150,000 |
| 2 | United States Treasury Floating Rate Note | 0.103% | 10/31/16 | 640,000 | 639,824 |
| 2 | United States Treasury Floating Rate Note | 0.134% | 1/31/17 | 200,287 | 200,280 |
| United States Treasury Note/Bond | 1.250% | 9/30/15 | 1,675,000 | 1,676,582 | |
| United States Treasury Note/Bond | 0.250% | 10/15/15 | 175,000 | 175,033 | |
| United States Treasury Note/Bond | 1.250% | 10/31/15 | 153,000 | 153,293 | |
| United States Treasury Note/Bond | 0.375% | 11/15/15 | 50,000 | 50,021 | |
| United States Treasury Note/Bond | 4.500% | 11/15/15 | 1,538,330 | 1,552,150 | |
| United States Treasury Note/Bond | 1.375% | 11/30/15 | 600,000 | 601,898 | |
| United States Treasury Note/Bond | 0.250% | 11/30/15 | 975,000 | 975,309 | |
| United States Treasury Note/Bond | 2.625% | 2/29/16 | 490,000 | 495,971 | |
| Total U. S. Government and Agency Obligations (Cost $9,484,280) | 9,484,280 | ||||
| Total Investments (101.0%) (Cost $9,484,280) | 9,484,280 | ||||
| Amount | |||||
| ($000) | |||||
| Other Assets and Liabilities (-1.0%) | |||||
| Other Assets | |||||
| Investment in Vanguard | 844 | ||||
| Receivables for Accrued Income | 33,064 | ||||
| Receivables for Capital Shares Issued | 3,388 | ||||
| Other Assets | 3,993 | ||||
| Total Other Assets | 41,289 | ||||
48
Admiral Treasury Money Market Fund
| Amount | |
| ($000) | |
| Liabilities | |
| Payables for Investment Securities Purchased | (132,967) |
| Payables for Capital Shares Redeemed | (4,511) |
| Payables for Distributions | (2) |
| Payables to Vanguard | (157) |
| Total Liabilities | (137,637) |
| Net Assets (100%) | |
| Applicable to 9,384,892,139 outstanding $.001 par value shares of | |
| beneficial interest (unlimited authorization) | 9,387,932 |
| Net Asset Value Per Share | $1.00 |
| At August 31, 2015, net assets consisted of: | |
| Amount | |
| ($000) | |
| Paid-in Capital | 9,387,932 |
| Undistributed Net Investment Income | — |
| Accumulated Net Realized Gains | — |
| Net Assets | 9,387,932 |
• See Note A in Notes to Financial Statements.
1 Represents annualized yield at date of purchase for discount securities, and coupon for coupon-bearing securities.
2 Adjustable-rate security.
See accompanying Notes, which are an integral part of the Financial Statements.
49
Admiral Treasury Money Market Fund
Statement of Operations
| Year Ended | |
| August 31, 2015 | |
| ($000) | |
| Investment Income | |
| Income | |
| Interest | 5,340 |
| Total Income | 5,340 |
| Expenses | |
| The Vanguard Group—Note B | |
| Investment Advisory Services | 253 |
| Management and Administrative | 7,082 |
| Marketing and Distribution | 1,354 |
| Custodian Fees | 105 |
| Auditing Fees | 28 |
| Shareholders’ Reports | 48 |
| Trustees’ Fees and Expenses | 8 |
| Total Expenses | 8,878 |
| Expense Reduction—Note B | (4,523) |
| Net Expenses | 4,355 |
| Net Investment Income | 985 |
| Realized Net Gain (Loss) on Investment Securities Sold | 37 |
| Net Increase (Decrease) in Net Assets Resulting from Operations | 1,022 |
See accompanying Notes, which are an integral part of the Financial Statements.
50
Admiral Treasury Money Market Fund
Statement of Changes in Net Assets
| Year Ended August 31, | ||
| 2015 | 2014 | |
| ($000) | ($000) | |
| Increase (Decrease) in Net Assets | ||
| Operations | ||
| Net Investment Income | 985 | 1,096 |
| Realized Net Gain (Loss) | 37 | (54) |
| Net Increase (Decrease) in Net Assets Resulting from Operations | 1,022 | 1,042 |
| Distributions | ||
| Net Investment Income | (985) | (1,096) |
| Realized Capital Gain1 | — | (185) |
| Total Distributions | (985) | (1,281) |
| Capital Share Transactions (at $1.00 per share) | ||
| Issued | 568,831 | 615,277 |
| Issued in Lieu of Cash Distributions | 960 | 1,248 |
| Redeemed | (1,546,511) | (1,911,196) |
| Net Increase (Decrease) from Capital Share Transactions | (976,720) | (1,294,671) |
| Total Increase (Decrease) | (976,683) | (1,294,910) |
| Net Assets | ||
| Beginning of Period | 10,364,615 | 11,659,525 |
| End of Period | 9,387,932 | 10,364,615 |
| 1 Includes fiscal 2014 short-term gain distributions totaling $185,000. Short-term gain distributions are treated as ordinary income dividends for tax purposes. | ||
See accompanying Notes, which are an integral part of the Financial Statements.
51
Admiral Treasury Money Market Fund
Financial Highlights
| For a Share Outstanding | Year Ended August 31, | ||||
| Throughout Each Period | 2015 | 2014 | 2013 | 2012 | 2011 |
| Net Asset Value, Beginning of Period | $1.00 | $1.00 | $1.00 | $1.00 | $1.00 |
| Investment Operations | |||||
| Net Investment Income | .0001 | .0001 | .0002 | .0001 | .0002 |
| Net Realized and Unrealized Gain (Loss) | |||||
| on Investments | — | — | — | — | — |
| Total from Investment Operations | .0001 | .0001 | .0002 | .0001 | .0002 |
| Distributions | |||||
| Dividends from Net Investment Income | (.0001) | (.0001) | (.0002) | (.0001) | (.0002) |
| Distributions from Realized Capital Gains | — | (.0000)1 | — | — | — |
| Total Distributions | (.0001) | (.0001) | (.0002) | (.0001) | (.0002) |
| Net Asset Value, End of Period | $1.00 | $1.00 | $1.00 | $1.00 | $1.00 |
| Total Return2 | 0.01% | 0.01% | 0.02% | 0.01% | 0.02% |
| Ratios/Supplemental Data | |||||
| Net Assets, End of Period (Millions) | $9,388 | $10,365 | $11,660 | $13,354 | $15,314 |
| Ratio of Expenses to Average Net Assets3 | 0.04% | 0.05% | 0.08% | 0.05% | 0.11% |
| Ratio of Net Investment Income to | |||||
| Average Net Assets | 0.01% | 0.01% | 0.02% | 0.01% | 0.02% |
1 Distributions from realized capital gains were less than $.0001 per share.
2 Total returns do not include account service fees that may have applied in the periods shown. Fund prospectuses provide information about any applicable account service fees.
3 The ratio of total expenses to average net assets before an expense reduction was 0.09%, 0.09%, 0.09%, 0.10%, and 0.12%. See Note B in the Notes to Financial Statements.
See accompanying Notes, which are an integral part of the Financial Statements.
52
Admiral Treasury Money Market Fund
Notes to Financial Statements
Vanguard Admiral Treasury Money Market Fund is registered under the Investment Company Act of 1940 as an open-end investment company, or mutual fund. Effective December 2015, the fund will change its name to Vanguard Treasury Money Market Fund. The fund invests in short-term debt instruments backed by the full faith and credit of the U.S. government.
A. The following significant accounting policies conform to generally accepted accounting principles for U.S. investment companies. The fund consistently follows such policies in preparing its financial statements.
1. Security Valuation: Securities are valued as of the close of trading on the New York Stock Exchange (generally 4 p.m., Eastern time) on the valuation date. Securities are valued at amortized cost, which approximates market value.
2. Federal Income Taxes: The fund intends to continue to qualify as a regulated investment company and distribute all of its taxable income. Management has analyzed the fund’s tax positions taken for all open federal income tax years (August 31, 2012–2015), and has concluded that no provision for federal income tax is required in the fund’s financial statements.
3. Distributions: Distributions from net investment income are declared daily and paid on the first business day of the following month.
4. Credit Facility: The fund and certain other funds managed by The Vanguard Group (“Vanguard”) participate in a $3 billion committed credit facility provided by a syndicate of lenders pursuant to a credit agreement that may be renewed annually; each fund is individually liable for its borrowings, if any, under the credit facility. Borrowings may be utilized for temporary and emergency purposes, and are subject to the fund’s regulatory and contractual borrowing restrictions. The participating funds are charged administrative fees and an annual commitment fee of 0.06% of the undrawn amount of the facility; these fees are allocated to the funds based on a method approved by the fund’s board of trustees and included in Management and Administrative expenses on the fund’s Statement of Operations. Any borrowings under this facility bear interest at a rate equal to the higher of the federal funds rate or LIBOR reference rate plus an agreed-upon spread.
The fund had no borrowings outstanding at August 31, 2015, or at any time during the period then ended.
5. Other: Interest income is accrued daily. Premiums and discounts on debt securities purchased are amortized and accreted, respectively, to interest income over the lives of the respective securities. Security transactions are accounted for on the date securities are bought or sold. Costs used to determine realized gains (losses) on the sale of investment securities are those of the specific securities sold.
B. In accordance with the terms of a Funds’ Service Agreement (the “FSA”) between Vanguard and the fund, Vanguard furnishes to the fund investment advisory, corporate management, administrative, marketing, and distribution services at Vanguard’s cost of operations (as defined by the FSA). These costs of operations are allocated to the fund based on methods and guidelines approved by the board of trustees. Vanguard does not require reimbursement in the current period for certain costs of operations (such as deferred compensation/benefits and risk/insurance costs); the fund’s liability for these costs of operations is included in Payables to Vanguard on the Statement of Net Assets.
Upon the request of Vanguard, the fund may invest up to 0.40% of its net assets as capital in Vanguard. At August 31, 2015, the fund had contributed to Vanguard capital in the amount of $844,000, representing 0.01% of the fund’s net assets and 0.34% of Vanguard’s capitalization. The fund’s trustees and officers are also directors and employees, respectively, of Vanguard.
53
Admiral Treasury Money Market Fund
Vanguard and the board of trustees have agreed to temporarily limit certain net operating expenses in excess of the fund’s daily yield in order to maintain a zero or positive yield for the fund. Vanguard and the board of trustees may terminate the temporary expense limitation at any time. For the year ended August 31, 2015, Vanguard’s expenses were reduced by $4,523,000 (an effective annual rate of 0.05% of the fund’s average net assets); the fund is not obligated to repay this amount to Vanguard.
C. Various inputs may be used to determine the value of the fund’s investments. These inputs are summarized in three broad levels for financial statement purposes. The inputs or methodologies used to value securities are not necessarily an indication of the risk associated with investing in those securities.
Level 1—Quoted prices in active markets for identical securities.
Level 2—Other significant observable inputs (including quoted prices for similar securities, interest rates, prepayment speeds, credit risk, etc.).
Level 3—Significant unobservable inputs (including the fund’s own assumptions used to determine the fair value of investments).
At August 31, 2015, 100% of the market value of the fund’s investments was determined using amortized cost, in accordance with rules under the Investment Company Act of 1940. Amortized cost approximates the current fair value of a security, but since the value is not obtained from a quoted price in an active market, securities valued at amortized cost are considered to be valued using Level 2 inputs.
D. Management has determined that no material events or transactions occurred subsequent to August 31, 2015, that would require recognition or disclosure in these financial statements.
54
Report of Independent Registered
Public Accounting Firm
To the Board of Trustees of Vanguard Money Market Reserves and Vanguard Admiral Funds and the Shareholders of Vanguard Prime Money Market Fund, Vanguard Federal Money Market Fund and Vanguard Admiral Treasury Money Market Fund:
In our opinion, the accompanying statements of net assets, the statement of assets and liabilities and the related statements of operations and of changes in net assets and the financial highlights present fairly, in all material respects, the financial position of Vanguard Prime Money Market Fund and Vanguard Federal Money Market Fund (constituting separate portfolios of Vanguard Money Market Reserves) and Vanguard Admiral Treasury Money Market Fund (constituting a separate portfolio of Vanguard Admiral Funds) (hereafter referred to as the “Funds”) at August 31, 2015, the results of each of their operations for the year then ended, the changes in each of their net assets for each of the two years in the period then ended, and the financial highlights for each of the five years in the period then ended, in conformity with accounting principles generally accepted in the United States of America. These financial statements and financial highlights (hereafter referred to as “financial statements”) are the responsibility of the Funds’ management. Our responsibility is to express an opinion on these financial statements based on our audits. We conducted our audits of these financial statements in accordance with the standards of the Public Company Accounting Oversight Board (United States). Those standards require that we plan and perform the audit to obtain reasonable assurance about whether the financial statements are free of material misstatement. An audit includes examining, on a test basis, evidence supporting the amounts and disclosures in the financial statements, assessing the accounting principles used and significant estimates made by management, and evaluating the overall financial statement presentation. We believe that our audits, which included confirmation of securities at August 31, 2015 by correspondence with the custodian and brokers and the application of alternative auditing procedures where securities purchased had not been received, provide a reasonable basis for our opinion.
/s/PricewaterhouseCoopers LLP
Philadelphia, Pennsylvania
October 12, 2015
55

This information for the fiscal year ended August 31, 2015, is included pursuant to provisions of the
Internal Revenue Code.
For nonresident alien shareholders, 64.9% of income dividends are interest-related dividends.

This information for the fiscal year ended August 31, 2015, is included pursuant to provisions of the
Internal Revenue Code.
For nonresident alien shareholders, 99.5% of income dividends are interest-related dividends.

This information for the fiscal year ended August 31, 2015, is included pursuant to provisions of the
Internal Revenue Code.
For nonresident alien shareholders, 100% of income dividends are interest-related dividends.

About Your Fund’s Expenses
As a shareholder of the fund, you incur ongoing costs, which include costs for portfolio management, administrative services, and shareholder reports (like this one), among others. Operating expenses, which are deducted from a fund’s gross income, directly reduce the investment return of the fund.
A fund’s expenses are expressed as a percentage of its average net assets. This figure is known as the expense ratio. The following examples are intended to help you understand the ongoing costs (in dollars) of investing in your fund and to compare these costs with those of other mutual funds. The examples are based on an investment of $1,000 made at the beginning of the period shown and held for the entire period.
The accompanying table illustrates your fund’s costs in two ways:
• Based on actual fund return. This section helps you to estimate the actual expenses that you paid over the period. The ”Ending Account Value“ shown is derived from the fund‘s actual return, and the third column shows the dollar amount that would have been paid by an investor who started with $1,000 in the fund. You may use the information here, together with the amount you invested, to estimate the expenses that you paid over the period.
To do so, simply divide your account value by $1,000 (for example, an $8,600 account value divided by $1,000 = 8.6), then multiply the result by the number given for your fund under the heading ”Expenses Paid During Period.“
• Based on hypothetical 5% yearly return. This section is intended to help you compare your fund‘s costs with those of other mutual funds. It assumes that the fund had a yearly return of 5% before expenses, but that the expense ratio is unchanged. In this case—because the return used is not the fund’s actual return—the results do not apply to your investment. The example is useful in making comparisons because the Securities and Exchange Commission requires all mutual funds to calculate expenses based on a 5% return. You can assess your fund’s costs by comparing this hypothetical example with the hypothetical examples that appear in shareholder reports of other funds.
Note that the expenses shown in the table are meant to highlight and help you compare ongoing costs only and do not reflect transaction costs incurred by the fund for buying and selling securities. Further, the expenses do not include any purchase, redemption, or account service fees described in the fund prospectus. If such fees were applied to your account, your costs would be higher. Your fund does not carry a “sales load.”
The calculations assume no shares were bought or sold during the period. Your actual costs may have been higher or lower, depending on the amount of your investment and the timing of any purchases or redemptions.
You can find more information about the fund’s expenses, including annual expense ratios, in the Financial Statements section of this report. For additional information on operating expenses and other shareholder costs, please refer to your fund’s current prospectus.
57
| Six Months Ended August 31, 2015 | |||
| Beginning | Ending | Expenses | |
| Account Value | Account Value | Paid During | |
| 2/28/2015 | 8/31/2015 | Period | |
| Based on Actual Fund Return | |||
| Prime Money Market Fund | |||
| Investor Shares | $1,000.00 | $1,000.11 | $0.81 |
| Institutional Shares | 1,000.00 | 1,000.41 | 0.50 |
| Federal Money Market Fund | $1,000.00 | $1,000.06 | $0.50 |
| Admiral Treasury Money Market Fund | $1,000.00 | $1,000.05 | $0.30 |
| Based on Hypothetical 5% Yearly Return | |||
| Prime Money Market Fund | |||
| Investor Shares | $1,000.00 | $1,024.40 | $0.82 |
| Institutional Shares | 1,000.00 | 1,024.70 | 0.51 |
| Federal Money Market Fund | $1,000.00 | $1,024.70 | $0.51 |
| Admiral Treasury Money Market Fund | $1,000.00 | $1,024.90 | $0.31 |
The calculations are based on expenses incurred in the most recent six-month period. The funds’ annualized six-month expense ratios for the
period are: for the Prime Money Market Fund, 0.16% for Investor Shares and 0.10% for Institutional Shares; for the Federal Money Market
Fund, 0.10%; and for the Admiral Treasury Money Market Fund, 0.06%. The annualized six-month expense ratios for the Prime Money Market
Fund Investor Shares, the Federal Money Market Fund, and the Admiral Treasury Money Market Fund reflect a temporary reduction in
operating expenses (described in Note B of the Notes to Financial Statements). Before the reduction, the annualized six-month expense ratios
were: for the Prime Money Market Fund Investor Shares, 0.16%; for the Federal Money Market Fund, 0.11%; for the Admiral Treasury Money
Market Fund, 0.09%.
58
Trustees Approve Advisory Arrangements
The board of trustees of Vanguard Prime Money Market Fund, Federal Money Market Fund, and Admiral Treasury Money Market Fund has renewed each fund’s investment advisory arrangement with The Vanguard Group, Inc. (Vanguard). Vanguard—through its Fixed Income Group—serves as the investment advisor for each fund. The board determined that continuing each fund’s internalized management structure was in the best interests of each fund and its shareholders.
The board based its decision upon an evaluation of the advisor’s investment staff, portfolio management process, and performance. The trustees considered the factors discussed below, among others. However, no single factor determined whether the board approved the arrangements. Rather, it was the totality of the circumstances that drove the board’s decision.
Nature, extent, and quality of services
The board reviewed the quality of each fund’s investment management services over both the short and long term and took into account the organizational depth and stability of the advisor. The board considered that Vanguard has been managing investments for more than three decades. The Fixed Income Group adheres to a sound, disciplined investment management process; the team has considerable experience, stability, and depth.
The board concluded that Vanguard’s experience, stability, depth, and performance, among other factors, warranted continuation of each advisory arrangement.
Investment performance
The board considered the short- and long-term performance of the funds, including any periods of outperformance or underperformance relative to a benchmark index and peer group. The board concluded that the performance was such that each advisory arrangement should continue. Information about the funds’ most recent performance can be found on the Performance Summary pages of this report.
Cost
The board concluded that each fund’s expense ratio was well below the average expense ratio charged by funds in its peer group and that each fund’s advisory fee rate was also well below its peer-group average. Information about the funds’ expenses appears in the About Your Fund’s Expenses section of this report as well as in the Financial Statements sections.
The board does not conduct a profitability analysis of Vanguard, because of Vanguard’s unique “at-cost” structure. Unlike most other mutual fund management companies, Vanguard is owned by the funds it oversees, and produces “profits” only in the form of reduced expenses for fund shareholders.
The benefit of economies of scale
The board concluded that each fund’s at-cost arrangement with Vanguard ensures that the funds will realize economies of scale as they grow, with the cost to shareholders declining as fund assets increase.
The board will consider whether to renew the advisory arrangements again after a one-year period.
59
Glossary
SEC Yields. A money market fund’s 7-day SEC yield is calculated by annualizing its income distributions for the previous seven days, as required by the U.S. Securities and Exchange Commission.
Average Weighted Maturity. The average length of time until fixed income securities held by a fund reach maturity and are repaid. The figure reflects the proportion of fund assets represented by each security.
Credit Quality. For Vanguard money market funds, the Distribution by Credit Quality table includes tier ratings for consistency with SEC Rule 2a-7 under the Investment Company Act of 1940, which governs money market funds. A First Tier security is one that is eligible for money market funds and has been rated in the highest short-term rating category for debt obligations by nationally recognized statistical rating organizations. Credit-quality ratings are obtained from Moody’s, Fitch, and S&P. For securities rated by all three agencies, where two of them are in agreement and assign the highest rating category, the highest rating applies. If a security is only rated by two agencies, and their ratings are in different categories, the lower of the ratings applies. An unrated security is First Tier if it represents quality comparable to that of a rated security, as determined in accordance with SEC Rule 2a-7.
Expense Ratio. A fund’s total annual operating expenses expressed as a percentage of the fund’s average net assets. The expense ratio includes management and administrative expenses, but does not include the transaction costs of buying and selling portfolio securities.
Inception Date. The date on which the assets of a fund (or one of its share classes) are first invested in accordance with the fund’s investment objective. For funds with a subscription period, the inception date is the day after that period ends. Investment performance is measured from the inception date.
60
This page intentionally left blank.
This page intentionally left blank.
This page intentionally left blank.
The People Who Govern Your Fund
The trustees of your mutual fund are there to see that the fund is operated and managed in your best interests since, as a shareholder, you are a part owner of the fund. Your fund’s trustees also serve on the board of directors of The Vanguard Group, Inc., which is owned by the Vanguard funds and provides services to them on an at-cost basis.
A majority of Vanguard’s board members are independent, meaning that they have no affiliation with Vanguard or the funds they oversee, apart from the sizable personal investments they have made as private individuals. The independent board members have distinguished backgrounds in business, academia, and public service. Each of the trustees and executive officers oversees 194 Vanguard funds.
The following table provides information for each trustee and executive officer of the fund. More information about the trustees is in the Statement of Additional Information, which can be obtained, without charge, by contacting Vanguard at 800-662-7447, or online at vanguard.com.
| InterestedTrustee1 | Rajiv L. Gupta |
| Born 1945. Trustee Since December 2001.2 Principal | |
| F. William McNabb III | Occupation(s) During the Past Five Years and Other |
| Born 1957. Trustee Since July 2009. Chairman of | Experience: Chairman and Chief Executive Officer |
| the Board. Principal Occupation(s) During the Past | (retired 2009) and President (2006–2008) of |
| Five Years and Other Experience: Chairman of the | Rohm and Haas Co. (chemicals); Director of Tyco |
| Board of The Vanguard Group, Inc., and of each of | International PLC (diversified manufacturing and |
| the investment companies served by The Vanguard | services), Hewlett-Packard Co. (electronic computer |
| Group, since January 2010; Director of The Vanguard | manufacturing), and Delphi Automotive PLC |
| Group since 2008; Chief Executive Officer and | (automotive components); Senior Advisor at New |
| President of The Vanguard Group, and of each of | Mountain Capital. |
| the investment companies served by The Vanguard | |
| Group, since 2008; Director of Vanguard Marketing | Amy Gutmann |
| Corporation; Managing Director of The Vanguard | Born 1949. Trustee Since June 2006. Principal |
| Group (1995–2008). | Occupation(s) During the Past Five Years and |
| Other Experience: President of the University of | |
| IndependentTrustees | Pennsylvania; Christopher H. Browne Distinguished |
| Professor of Political Science, School of Arts and | |
| Emerson U. Fullwood | Sciences, and Professor of Communication, Annenberg |
| Born 1948. Trustee Since January 2008. Principal | School for Communication, with secondary faculty |
| Occupation(s) During the Past Five Years and | appointments in the Department of Philosophy, School |
| Other Experience: Executive Chief Staff and | of Arts and Sciences, and at the Graduate School of |
| Marketing Officer for North America and Corporate | Education, University of Pennsylvania; Trustee of the |
| Vice President (retired 2008) of Xerox Corporation | National Constitution Center; Chair of the Presidential |
| (document management products and services); | Commission for the Study of Bioethical Issues. |
| Executive in Residence and 2009–2010 Distinguished | |
| Minett Professor at the Rochester Institute of | JoAnn Heffernan Heisen |
| Technology; Director of SPX Corporation (multi-industry | Born 1950. Trustee Since July 1998. Principal |
| manufacturing), the United Way of Rochester, | Occupation(s) During the Past Five Years and Other |
| Amerigroup Corporation (managed health care), the | Experience: Corporate Vice President and Chief |
| University of Rochester Medical Center, Monroe | Global Diversity Officer (retired 2008) and Member |
| Community College Foundation, and North Carolina | of the Executive Committee (1997–2008) of Johnson |
| A&T University. | & Johnson (pharmaceuticals/medical devices/ |
| consumer products); Director of Skytop Lodge | |
| Corporation (hotels), the University Medical Center | |
| at Princeton, the Robert Wood Johnson Foundation, | |
| and the Center for Talent Innovation; Member of | |
| the Advisory Board of the Institute for Women’s | |
| Leadership at Rutgers University. |
| F. Joseph Loughrey | Executive Officers | |
| Born 1949. Trustee Since October 2009. Principal | ||
| Occupation(s) During the Past Five Years and Other | Glenn Booraem | |
| Experience: President and Chief Operating Officer | Born 1967. Treasurer Since May 2015. Principal | |
| (retired 2009) of Cummins Inc. (industrial machinery); | Occupation(s) During the Past Five Years and | |
| Chairman of the Board of Hillenbrand, Inc. (specialized | Other Experience: Principal of The Vanguard Group, | |
| consumer services), and of Oxfam America; Director | Inc.; Treasurer of each of the investment companies | |
| of SKF AB (industrial machinery), Hyster-Yale Materials | served by The Vanguard Group; Controller of each of | |
| Handling, Inc. (forklift trucks), the Lumina Foundation | the investment companies served by The Vanguard | |
| for Education, and the V Foundation for Cancer | Group (2010–2015); Assistant Controller of each of | |
| Research; Member of the Advisory Council for the | the investment companies served by The Vanguard | |
| College of Arts and Letters and of the Advisory Board | Group (2001–2010). | |
| to the Kellogg Institute for International Studies, both | ||
| at the University of Notre Dame. | Thomas J. Higgins | |
| Born 1957. Chief Financial Officer Since September | ||
| Mark Loughridge | 2008. Principal Occupation(s) During the Past Five | |
| Born 1953. Trustee Since March 2012. Principal | Years and Other Experience: Principal of The Vanguard | |
| Occupation(s) During the Past Five Years and Other | Group, Inc.; Chief Financial Officer of each of the | |
| Experience: Senior Vice President and Chief Financial | investment companies served by The Vanguard Group; | |
| Officer (retired 2013) at IBM (information technology | Treasurer of each of the investment companies served | |
| services); Fiduciary Member of IBM’s Retirement Plan | by The Vanguard Group (1998–2008). | |
| Committee (2004–2013); Director of the Dow Chemical | ||
| Company; Member of the Council on Chicago Booth. | Peter Mahoney | |
| Born 1974. Controller Since May 2015. Principal | ||
| Scott C. Malpass | Occupation(s) During the Past Five Years and | |
| Born 1962. Trustee Since March 2012. Principal | Other Experience: Head of Global Fund Accounting | |
| Occupation(s) During the Past Five Years and Other | at The Vanguard Group, Inc.; Controller of each of the | |
| Experience: Chief Investment Officer and Vice | investment companies served by The Vanguard Group; | |
| President at the University of Notre Dame; Assistant | Head of International Fund Services at The Vanguard | |
| Professor of Finance at the Mendoza College of | Group (2008–2014). | |
| Business at Notre Dame; Member of the Notre Dame | ||
| 403(b) Investment Committee; Board Member of | Heidi Stam | |
| TIFF Advisory Services, Inc., and Catholic Investment | Born 1956. Secretary Since July 2005. Principal | |
| Services, Inc. (investment advisors); Member of | Occupation(s) During the Past Five Years and Other | |
| the Investment Advisory Committee of Major | Experience: Managing Director of The Vanguard | |
| League Baseball. | Group, Inc.; General Counsel of The Vanguard Group; | |
| Secretary of The Vanguard Group and of each of the | ||
| André F. Perold | investment companies served by The Vanguard Group; | |
| Born 1952. Trustee Since December 2004. Principal | Director and Senior Vice President of Vanguard | |
| Occupation(s) During the Past Five Years and Other | Marketing Corporation. | |
| Experience: George Gund Professor of Finance and | ||
| Banking, Emeritus at the Harvard Business School | Vanguard Senior ManagementTeam | |
| (retired 2011); Chief Investment Officer and Managing | Mortimer J. Buckley | Chris D. McIsaac |
| Partner of HighVista Strategies LLC (private investment | Kathleen C. Gubanich | James M. Norris |
| firm); Director of Rand Merchant Bank; Overseer of | Paul A. Heller | Thomas M. Rampulla |
| the Museum of Fine Arts Boston. | Martha G. King | Glenn W. Reed |
| John T. Marcante | Karin A. Risi | |
| Peter F. Volanakis | ||
| Born 1955. Trustee Since July 2009. Principal | ||
| Occupation(s) During the Past Five Years and Other | ||
| Experience: President and Chief Operating Officer | ||
| (retired 2010) of Corning Incorporated (communications | Chairman Emeritus and Senior Advisor | |
| equipment); Trustee of Colby-Sawyer College; | ||
| Member of the Advisory Board of the Norris Cotton | John J. Brennan | |
| Cancer Center and of the Advisory Board of the | Chairman, 1996–2009 | |
| Parthenon Group (strategy consulting). | Chief Executive Officer and President, 1996–2008 | |
| Founder | ||
| John C. Bogle | ||
| Chairman and Chief Executive Officer, 1974–1996 | ||
1 Mr. McNabb is considered an “interested person,” as defined in the Investment Company Act of 1940, because he is an officer of the Vanguard funds.
2 December 2002 for Vanguard Equity Income Fund, the Vanguard Municipal Bond Funds, and the Vanguard State Tax-Exempt Funds.
 | |
| P.O. Box 2600 | |
| Valley Forge, PA 19482-2600 | |
| Connect with Vanguard® > vanguard.com | |
| Fund Information > 800-662-7447 | |
| Direct Investor Account Services > 800-662-2739 | |
| Institutional Investor Services > 800-523-1036 | |
| Text Telephone for People | |
| Who Are Deaf or Hard of Hearing> 800-749-7273 | |
| This material may be used in conjunction | |
| with the offering of shares of any Vanguard | |
| fund only if preceded or accompanied by | |
| the fund’s current prospectus. | |
| All comparative mutual fund data are from Lipper, a | |
| Thomson Reuters Company, or Morningstar, Inc., unless | |
| otherwise noted. | |
| You can obtain a free copy of Vanguard’s proxy voting | |
| guidelines by visiting vanguard.com/proxyreporting or by | |
| calling Vanguard at 800-662-2739. The guidelines are | |
| also available from the SEC’s website, sec.gov. In | |
| addition, you may obtain a free report on how your fund | |
| voted the proxies for securities it owned during the 12 | |
| months ended June 30. To get the report, visit either | |
| vanguard.com/proxyreporting or sec.gov. | |
| You can review and copy information about your fund at | |
| the SEC’s Public Reference Room in Washington, D.C. To | |
| find out more about this public service, call the SEC at | |
| 202-551-8090. Information about your fund is also | |
| available on the SEC’s website, and you can receive | |
| copies of this information, for a fee, by sending a | |
| request in either of two ways: via email addressed to | |
| publicinfo@sec.gov or via regular mail addressed to the | |
| Public Reference Section, Securities and Exchange | |
| Commission, Washington, DC 20549-1520. | |
| © 2015 The Vanguard Group, Inc. | |
| All rights reserved. | |
| Vanguard Marketing Corporation, Distributor. | |
| Q300 102015 | |
Annual Report | August 31, 2015
Vanguard S&P Mid-Cap 400 Index Funds
Vanguard S&P Mid-Cap 400 Index Fund
Vanguard S&P Mid-Cap 400 Value Index Fund
Vanguard S&P Mid-Cap 400 Growth Index Fund
Vanguard’s Principles for Investing Success
We want to give you the best chance of investment success. These principles, grounded in Vanguard’s research and experience, can put you on the right path.
Goals. Create clear, appropriate investment goals.
Balance. Develop a suitable asset allocation using broadly diversified funds. Cost. Minimize cost.
Discipline. Maintain perspective and long-term discipline.
A single theme unites these principles: Focus on the things you can control.
We believe there is no wiser course for any investor.
| Contents | |
| Your Fund’s Total Returns. | 1 |
| Chairman’s Letter. | 2 |
| S&P Mid-Cap 400 Index Fund. | 9 |
| S&P Mid-Cap 400 Value Index Fund. | 27 |
| S&P Mid-Cap 400 Growth Index Fund. | 44 |
| Your Fund’s After-Tax Returns. | 62 |
| About Your Fund’s Expenses. | 63 |
| Trustees Approve Advisory Arrangements. | 65 |
| Glossary. | 66 |
Please note: The opinions expressed in this report are just that—informed opinions. They should not be considered promises or advice.
Also, please keep in mind that the information and opinions cover the period through the date on the front of this report. Of course, the
risks of investing in your fund are spelled out in the prospectus.
See the Glossary for definitions of investment terms used in this report.
About the cover: Pictured is a sailing block on the Brilliant, a 1932 schooner docked in Mystic, Connecticut. A type of pulley, the
sailing block helps coordinate the setting of the sails. At Vanguard, the intricate coordination of technology and people allows
us to help millions of clients around the world reach their financial goals.
Your Fund’s Total Returns
| Fiscal Year Ended August 31, 2015 | |
| Total | |
| Returns | |
| Vanguard S&P Mid-Cap 400 Index Fund | |
| ETF Shares | |
| Market Price | -0.06% |
| Net Asset Value | -0.12 |
| Institutional Shares | -0.04 |
| S&P MidCap 400 Index | 0.01 |
| Mid-Cap Core Funds Average | -1.65 |
| Mid-Cap Core Funds Average: Derived from data provided by Lipper, a Thomson Reuters Company. | |
| Vanguard S&P Mid-Cap 400 Value Index Fund | |
| ETF Shares | |
| Market Price | -4.16% |
| Net Asset Value | -4.17 |
| Institutional Shares | -4.05 |
| S&P MidCap 400 Value Index | -3.98 |
| Mid-Cap Value Funds Average | -2.77 |
| Mid-Cap Value Funds Average: Derived from data provided by Lipper, a Thomson Reuters Company. | |
| Vanguard S&P Mid-Cap 400 Growth Index Fund | |
| ETF Shares | |
| Market Price | 3.63% |
| Net Asset Value | 3.60 |
| Institutional Shares | 3.72 |
| S&P MidCap 400 Growth Index | 3.79 |
| Mid-Cap Growth Funds Average | 2.23 |
| Mid-Cap Growth Funds Average: Derived from data provided by Lipper, a Thomson Reuters Company. |
Institutional Shares are available to certain institutional investors who meet specific administrative, service, and account-size criteria. The
Vanguard ETF® Shares shown are traded on the NYSE Arca exchange and are available only through brokers. The table provides ETF returns
based on both the NYSE Arca market price and the net asset value for a share. U.S. Pat. Nos. 6,879,964; 7,337,138; 7,720,749; 7,925,573;
8,090,646; and 8,417,623.
For the ETF Shares, the market price is determined by the midpoint of the bid-offer spread as of the closing time of the New York Stock
Exchange (generally 4 p.m., Eastern time). The net asset value is also determined as of the NYSE closing time. For more information about
how the ETF Shares' market prices have compared with their net asset value, visit vanguard.com, select your ETF, and then select the Price
and Performance tab. The ETF premium/discount analysis there shows the percentages of days on which the ETF Shares' market price was
above or below the NAV.
1

Chairman’s Letter
Dear Shareholder,
After delivering strong returns in the prior fiscal year, U.S. stocks turned in a generally lackluster performance over the 12 months ended August 31, 2015. Growth stocks were something of an exception to this trend, as they got a boost from a rally by health care stocks. Value stocks, meanwhile, lagged.
Results for the three Vanguard mid-capitalization stock index funds reviewed in this report reflected these market dynamics. The S&P Mid-Cap 400 Growth Index Fund returned 3.60%, while the S&P Mid-Cap 400 Value Index Fund returned –4.17%. The S&P Mid-Cap 400 Index Fund, which includes both growth and value stocks, returned –0.12%. (Returns cited are for ETF Shares, based on net asset value.)
All three funds closely tracked their target benchmarks. Returns for the Growth Index Fund and the Index Fund were better than the average returns of their peer funds. The Value Index Fund’s result lagged the average performance of its peers.
If you hold your shares in a taxable account, you may want to review the information on after-tax returns that appears later in this report.
August stock market anxiety led to flat 12-month returns
U.S. stocks generally moved in opposite directions over the two halves of the fiscal year. Ultimately, the broad stock market ended about where it started, returning
2
less than 1%. The market’s first-half advance of about 6% was followed by a second-half retreat of about –5%.
Much of the decline came in August, when stocks tumbled over fears about the global impact of China’s economic deceleration. Greece’s debt crisis, the strong U.S. dollar, perceived high valuations, and speculation over when the Federal Reserve might start to raise short-term interest rates also weighed on the market at times. (Shortly after the close of your fund’s reporting period, the Fed announced at its September meeting that it would leave rates unchanged for the time being.)
For U.S. investors, international stocks returned about –12%, a result that would have been better if not for the dollar’s strength against many foreign currencies. China’s troubles buffeted emerging markets, which produced lower returns than the developed markets of Europe and the Pacific region.
Bond results were muted as the Fed weighed a rate hike
The broad U.S. taxable bond market returned 1.56%. Bond prices, which generally fell slightly, were helped at times by demand from global investors seeking shelter from stock market volatility or seeking higher yields than
| Market Barometer | |||
| Average Annual Total Returns | |||
| Periods Ended August 31, 2015 | |||
| One | Three | Five | |
| Year | Years | Years | |
| Stocks | |||
| Russell 1000 Index (Large-caps) | 0.40% | 14.68% | 16.07% |
| Russell 2000 Index (Small-caps) | 0.03 | 14.12 | 15.55 |
| Russell 3000 Index (Broad U.S. market) | 0.36 | 14.63 | 16.03 |
| FTSE All-World ex US Index (International) | -11.50 | 5.79 | 5.17 |
| Bonds | |||
| Barclays U.S. Aggregate Bond Index (Broad taxable market) | 1.56% | 1.53% | 2.98% |
| Barclays Municipal Bond Index (Broad tax-exempt market) | 2.52 | 2.83 | 3.96 |
| Citigroup Three-Month U.S. Treasury Bill Index | 0.02 | 0.03 | 0.05 |
| CPI | |||
| Consumer Price Index | 0.20% | 1.14% | 1.77% |
3
those available in many other developed markets. The yield of the 10-year U.S. Treasury note ended August at 2.18%, down from 2.34% a year earlier.
Limited by the dollar’s strength, international bond markets (as measured by the Barclays Global Aggregate Index ex USD) returned –11.97%. Without this currency effect, international bonds returned about 3%.
The Fed’s 0%–0.25% target for short-term interest rates continued to restrain returns for money market funds and savings accounts.
Lifted by the health care sector, growth stocks moved out front
As I mentioned, growth stocks generally outpaced value stocks over the 12 months. You’ll recall that value stocks tend to sell at relatively low prices in relation to their earnings or book value, reflecting the lower sales and earnings growth prospects of their underlying companies. Growth stocks, by contrast, typically have higher valuations because of their underlying companies’ earnings and revenue potential. As an experienced investor knows, these two categories frequently swap leadership positions from one period to another. For this reason, we counsel that broad diversification is the best course.
| Expense Ratios | |||
| Your Fund Compared With Its Peer Group | |||
| ETF | Institutional | Peer Group | |
| Shares | Shares | Average | |
| S&P Mid-Cap 400 Index Fund | 0.15% | 0.08% | 1.19% |
| S&P Mid-Cap 400 Value Index Fund | 0.20 | 0.08 | 1.29 |
| S&P Mid-Cap 400 Growth Index Fund | 0.20 | 0.08 | 1.31 |
The fund expense ratios shown are from the prospectus dated December 19, 2014, and represent estimated costs for the current fiscal year.
For the fiscal year ended August 31, 2015, the funds’ expense ratios were: for the S&P Mid-Cap 400 Index Fund, 0.15% for ETF Shares and
0.08% for Institutional Shares; for the S&P Mid-Cap 400 Value Index Fund, 0.20% for ETF Shares and 0.08% for Institutional Shares; and for
the S&P Mid-Cap 400 Growth Index Fund, 0.20% for ETF Shares and 0.08% for Institutional Shares. Peer-group expense ratios are derived
from data provided by Lipper, a Thomson Reuters Company, and capture information through year-end 2014.
Peer groups: For the S&P Mid-Cap 400 Index Fund, Mid-Cap Core Funds; for the S&P Mid-Cap 400 Value Index Fund, Mid-Cap Value Funds;
and for the S&P Mid-Cap 400 Growth Index Fund, Mid-Cap Growth Funds.
4
Robust returns for health care stocks helped give the growth segment the edge in the latest fiscal year. A rapid pace of mergers and acquisitions, coupled with investors’ optimism about new medicines, propelled pharmaceutical and biotechnology stocks. Longer-term trends also buoyed the sector: The aging population requires more health care in all forms, health care has become more accessible across the globe, and more Americans are insured as a result of the Affordable Care Act.
Of the three funds covered in this report, the Growth Index Fund had the highest weighting in the health care sector and, consequently, benefited the most from its rally.
At the other end of the scale, many energy stocks struggled. Oil prices fell about 50%, in part because of high output from some leading oil-producing countries and concerns about slower growth in China, the world’s largest oil importer. Natural gas prices also declined, but not as dramatically, amid burgeoning U.S. production.
In this challenging environment, energy stocks plummeted. The Value Index Fund, which among the three funds had the highest weighting in energy, suffered the most from the sector’s retreat.
| Total Returns | |
| Inception Through August 31, 2015 | |
| Average | |
| Annual | |
| Return | |
| S&P Mid-Cap 400 Index Fund ETF Shares Net Asset Value (Returns since inception: 9/7/2010) | 14.98% |
| S&P MidCap 400 Index | 15.14 |
| Mid-Cap Core Funds Average | 13.77 |
| Mid-Cap Core Funds Average: Derived from data provided by Lipper, a Thomson Reuters Company. | |
| S&P Mid-Cap 400 Value Index Fund ETF Shares Net Asset Value (Returns since inception: 9/7/2010) | 14.25% |
| S&P MidCap 400 Value Index | 14.48 |
| Mid-Cap Value Funds Average | 13.82 |
| Mid-Cap Value Funds Average: Derived from data provided by Lipper, a Thomson Reuters Company. | |
| S&P Mid-Cap 400 Growth Index Fund ETF Shares Net Asset Value (Returns since inception: 9/7/2010) | 15.55% |
| S&P MidCap 400 Growth Index | 15.75 |
| Mid-Cap Growth Funds Average | 14.07 |
| Mid-Cap Growth Funds Average: Derived from data provided by Lipper, a Thomson Reuters Company. | |
The figures shown represent past performance, which is not a guarantee of future results. (Current performance may be
lower or higher than the performance data cited. For performance data current to the most recent month-end, visit our
website at vanguard.com/performance.) Note, too, that both investment returns and principal value can fluctuate widely, so
an investor’s shares, when sold, could be worth more or less than their original cost.
5
Since inception, each fund has closely tracked its index
The hallmark of a successful index fund is its ability to closely track the return of its benchmark index over time, after allowing for normal operating expenses. Using sophisticated portfolio construction and trading strategies developed and refined over many years, Vanguard Equity Index Group, your fund’s advisor, has achieved that standard of success for each one of the funds covered in this report.
From their inception about five years ago through August 31, 2015, the funds’ ETF Shares posted average annual returns ranging from 14.25% for the Value Index Fund to 15.55% for the Growth Index Fund.
When the markets are volatile, maintaining perspective is key
As I noted earlier, volatility returned to the stock market with a vengeance in the final weeks of August. Stocks were unsettled as investors grew more worried that a slowdown in China’s growth could affect markets across the globe.
| An indexing benefit that’s worth keeping in mind |
| As a Vanguard investor, you’re probably familiar with the cost and diversification benefits that |
| index funds typically offer. But there’s a lesser-known—yet important—advantage to indexing |
| as well: relative predictability. |
| Simply put, index funds help you capture the market’s return more predictably than actively |
| managed funds. |
| By definition, an index fund is built and managed to track the return of its designated broad |
| market or market segment. Some do so more closely than others. But what’s key is that you |
| know what to expect: whatever the market returns—good or bad—minus the fund’s costs. |
| Active managers, in contrast, seek to beat the market—and do so with varying degrees of |
| success at different times. |
| The relative predictability of indexing can help you stay on course with your investment goals, |
| by reducing the likelihood of particular surprises—such as being out of step with market |
| performance. The confidence of knowing that you’ll earn a market-like return can reduce |
| the temptation to trade based on emotions. |
| We recognize that some investors want the opportunity to outperform the market. That’s |
| why Vanguard also offers low-cost active funds managed by carefully selected, world-class |
| advisors, so you can choose an investment strategy that aligns with both your goals and your |
| risk appetite. |
6
This turmoil may have evoked painful memories of previous financial setbacks—memories that had been receding after more than six years of strong U.S. stock performance. And inevitably, that sort of upheaval can lead some investors to make rash moves with their portfolios.
During periods of market adversity, however, it’s more important than ever to keep sight of one of Vanguard’s key principles: Maintain perspective and long-term discipline. Whether you’re investing for yourself or on behalf of clients, your success is affected greatly by how you react––or don’t react––when the markets turn turbulent. (You can read Vanguard’s Principles for Investing Success at vanguard.com/research.)
As I’ve written in the past, the best course for long-term investors generally is to ignore daily market moves and not make decisions based on emotion. This is also a good time to evaluate your portfolio and make sure your asset allocation is aligned with your time horizon, goals, and risk tolerance.
The markets are unpredictable and often confounding. Keeping long-term plans clearly in focus can help you weather these periodic storms.
As always, thank you for investing with Vanguard.
Sincerely,

F. William McNabb III
Chairman and Chief Executive Officer
September 18, 2015
7
| Your Fund’s Performance at a Glance | ||||
| August 31, 2014, Through August 31, 2015 | ||||
| Distributions Per Share | ||||
| Starting | Ending | Income | Capital | |
| Share Price | Share Price | Dividends | Gains | |
| Vanguard S&P Mid-Cap 400 Index Fund | ||||
| ETF Shares | $97.19 | $95.87 | $1.225 | $0.000 |
| Institutional Shares | 194.13 | 191.51 | 2.570 | 0.000 |
| Vanguard S&P Mid-Cap 400 Value Index Fund | ||||
| ETF Shares | $96.78 | $91.40 | $1.417 | $0.000 |
| Institutional Shares | 193.66 | 182.92 | 3.033 | 0.000 |
| Vanguard S&P Mid-Cap 400 Growth Index | ||||
| Fund | ||||
| ETF Shares | $97.18 | $99.88 | $0.792 | $0.000 |
| Institutional Shares | 193.45 | 198.85 | 1.771 | 0.000 |
8
S&P Mid-Cap 400 Index Fund
Fund Profile
As of August 31, 2015
| Share-Class Characteristics | ||
| ETF | Institutional | |
| Shares | Shares | |
| Ticker Symbol | IVOO | VSPMX |
| Expense Ratio1 | 0.15% | 0.08% |
| 30-Day SEC Yield | 1.50% | 1.60% |
| Portfolio Characteristics | |||
| DJ | |||
| U.S. | |||
| Total | |||
| S&P | Market | ||
| MidCap | FA | ||
| Fund | 400 Index | Index | |
| Number of Stocks | 400 | 400 | 3,828 |
| Median Market Cap | $4.5B | $4.5B | $47.2B |
| Price/Earnings Ratio | 22.5x | 22.5x | 20.8x |
| Price/Book Ratio | 2.3x | 2.3x | 2.6x |
| Return on Equity | 14.1% | 14.1% | 17.1% |
| Earnings Growth | |||
| Rate | 13.0% | 13.0% | 10.2% |
| Dividend Yield | 1.7% | 1.7% | 2.1% |
| Foreign Holdings | 0.0% | 0.0% | 0.0% |
| Turnover Rate | 12% | — | — |
| Short-Term | |||
| Reserves | 0.0% | — | — |
| Volatility Measures | ||
| DJ | ||
| S&P | U.S. Total | |
| MidCap | Market | |
| 400 Index | FA Index | |
| R-Squared | 1.00 | 0.85 |
| Beta | 1.00 | 1.04 |
| These measures show the degree and timing of the fund’s | ||
| fluctuations compared with the indexes over 36 months. | ||
| Ten Largest Holdings (% of total net assets) | ||
| Church & Dwight Co. | ||
| Inc. | Household Products | 0.7% |
| Jarden Corp. | Housewares & | |
| Specialties | 0.7 | |
| Foot Locker Inc. | Apparel Retail | 0.7 |
| Alaska Air Group Inc. | Airlines | 0.6 |
| Hologic Inc. | Health Care | |
| Equipment | 0.6 | |
| Wabtec Corp. | Construction | |
| Machinery & Heavy | ||
| Trucks | 0.6 | |
| HollyFrontier Corp. | Oil & Gas Refining & | |
| Marketing | 0.6 | |
| LKQ Corp. | Distributors | 0.6 |
| Extra Space Storage Inc. Specialized REITs | 0.6 | |
| Federal Realty | ||
| Investment Trust | Retail REITs | 0.6 |
| Top Ten | 6.3% | |
| The holdings listed exclude any temporary cash investments and equity index products. | ||
Investment Focus
![]()
1 The expense ratios shown are from the prospectus dated December 19, 2014, and represent estimated costs for the current fiscal year. For the
fiscal year ended August 31, 2015, the expense ratios were 0.15% for ETF Shares and 0.08% for Institutional Shares.
9
S&P Mid-Cap 400 Index Fund
| Sector Diversification (% of equity exposure) | |||
| DJ | |||
| U.S. | |||
| Total | |||
| S&P | Market | ||
| MidCap | FA | ||
| Fund | 400 Index | Index | |
| Consumer Discretionary 13.8% | 13.8% | 13.5% | |
| Consumer Staples | 4.5 | 4.5 | 8.4 |
| Energy | 3.7 | 3.7 | 6.6 |
| Financials | 25.6 | 25.5 | 18.2 |
| Health Care | 9.5 | 9.5 | 15.0 |
| Industrials | 15.3 | 15.3 | 10.7 |
| Information Technology 15.8 | 15.9 | 19.1 | |
| Materials | 6.9 | 6.9 | 3.3 |
| Telecommunication | |||
| Services | 0.2 | 0.2 | 2.2 |
| Utilities | 4.7 | 4.7 | 3.0 |
10
S&P Mid-Cap 400 Index Fund
Performance Summary
All of the returns in this report represent past performance, which is not a guarantee of future
results that may be achieved by the fund. (Current performance may be lower or higher than
the performance data cited. For performance data current to the most recent month-end, visit
our website at vanguard.com/performance.) Note, too, that both investment returns and principal
value can fluctuate widely, so an investor’s shares, when sold, could be worth more or less than
their original cost. The returns shown do not reflect taxes that a shareholder would pay on fund
distributions or on the sale of fund shares.
Cumulative Performance: September 7, 2010, Through August 31, 2015
Initial Investment of $10,000
| Average Annual Total Returns | ||||
| Periods Ended August 31, 2015 | ||||
| Since | Final Value | |||
| One | Inception | of a $10,000 | ||
| Year | (9/7/2010) | Investment | ||
| S&P Mid-Cap 400 Index Fund*ETF | ||||
| Shares Net Asset Value | -0.12% | 14.98% | $20,046 | |
| S&P Mid-Cap 400 Index Fund*ETF | ||||
| Shares Market Price | -0.06 | 14.99 | 20,050 | |
| •••••••• | S&P MidCap 400 Index | 0.01 | 15.14 | 20,184 |
| – – – – | Mid-Cap Core Funds Average | -1.65 | 13.77 | 19,017 |
| Dow Jones U.S. Total Stock Market | ||||
| Float Adjusted Index | 0.29 | 15.13 | 20,172 | |
| Mid-Cap Core Funds Average: Derived from data provided by Lipper, a Thomson Reuters Company. | ||||
| "Since Inception" performance is calculated from the ETF Shares’ inception date for both the fund and its comparative standards. | ||||
| Since | Final Value | ||
| One | Inception | of a $5,000,000 | |
| Year | (3/28/2011) | Investment | |
| S&P Mid-Cap 400 Index Fund Institutional | |||
| Shares | -0.04% | 10.59% | $7,806,921 |
| S&P MidCap 400 Index | 0.01 | 10.66 | 7,828,958 |
| Dow Jones U.S. Total Stock Market Float | |||
| Adjusted Index | 0.29 | 11.83 | 8,202,256 |
"Since Inception" performance is calculated from the Institutional Shares’ inception date for both the fund and its comparative standards.
Institutional Shares were first issued on December 15, 2010, and the sole shareholder redeemed shortly thereafter. Institutional Shares were
next issued on March 28, 2011. The total returns shown are based on the period beginning March 28, 2011.
See Financial Highlights for dividend and capital gains information.
11
S&P Mid-Cap 400 Index Fund
| Cumulative Returns of ETF Shares: September 7, 2010, Through August 31, 2015 | ||
| Since | ||
| One | Inception | |
| Year | (9/7/2010) | |
| S&P Mid-Cap 400 Index Fund ETF Shares Market | ||
| Price | -0.06% | 100.50% |
| S&P Mid-Cap 400 Index Fund ETF Shares Net Asset | ||
| Value | -0.12 | 100.46 |
| S&P MidCap 400 Index | 0.01 | 101.84 |
| "Since Inception" performance is calculated from the ETF Shares’ inception date for both the fund and its comparative standards. | ||
Fiscal-Year Total Returns (%): September 7, 2010, Through August 31, 2015
Average Annual Total Returns: Periods Ended June 30, 2015
This table presents returns through the latest calendar quarter—rather than through the end of the fiscal period.
Securities and Exchange Commission rules require that we provide this information.
| Inception | One | Since | |
| Date | Year | Inception | |
| ETF Shares | 9/7/2010 | ||
| Market Price | 6.28% | 16.92% | |
| Net Asset Value | 6.27 | 16.91 | |
| Institutional Shares | 3/28/20111 | 6.35 | 12.51 |
1 Institutional Shares were first issued on December 15, 2010, and the sole shareholder redeemed shortly thereafter. Institutional Shares
were next issued on March 28, 2011. The total returns shown are based on the period beginning March 28, 2011.
12
S&P Mid-Cap 400 Index Fund
Financial Statements
Statement of Net Assets
As of August 31, 2015
The fund reports a complete list of its holdings in regulatory filings four times in each fiscal year, at the quarter-ends. For the second and fourth fiscal quarters, the lists appear in the fund’s semiannual and annual reports to shareholders. For the first and third fiscal quarters, the fund files the lists with the Securities and Exchange Commission on Form N-Q. Shareholders can look up the fund’s Forms N-Q on the SEC’s website at sec.gov. Forms N-Q may also be reviewed and copied at the SEC’s Public Reference Room (see the back cover of this report for further information).
| Market | |||
| Value• | |||
| Shares | ($000) | ||
| Common Stocks (99.6%)1 | |||
| Consumer Discretionary (13.7%) | |||
| * | Jarden Corp. | 134,178 | 6,889 |
| Foot Locker Inc. | 96,745 | 6,849 | |
| * | LKQ Corp. | 210,433 | 6,311 |
| Polaris Industries Inc. | 42,298 | 5,493 | |
| Williams-Sonoma Inc. | 58,964 | 4,483 | |
| Service Corp. International | 139,810 | 4,145 | |
| * | Toll Brothers Inc. | 110,870 | 4,099 |
| * | NVR Inc. | 2,672 | 4,061 |
| Domino’s Pizza Inc. | 38,185 | 4,045 | |
| * | Skechers U.S.A. Inc. Class A | 28,438 | 4,002 |
| Carter’s Inc. | 36,351 | 3,574 | |
| Dick’s Sporting Goods Inc. | 67,204 | 3,369 | |
| Dunkin’ Brands Group Inc. | 66,583 | 3,340 | |
| Brunswick Corp. | 64,138 | 3,188 | |
| Gentex Corp. | 203,549 | 3,155 | |
| * | Panera Bread Co. Class A | 17,551 | 3,129 |
| * | Tempur Sealy | ||
| International Inc. | 42,223 | 3,083 | |
| * | AMC Networks Inc. Class A | 41,010 | 2,968 |
| * | Office Depot Inc. | 341,077 | 2,705 |
| Cinemark Holdings Inc. | 72,709 | 2,585 | |
| * | Buffalo Wild Wings Inc. | 13,144 | 2,493 |
| * | Live Nation | ||
| Entertainment Inc. | 100,971 | 2,486 | |
| Cracker Barrel Old | |||
| Country Store Inc. | 16,578 | 2,390 | |
| Brinker International Inc. | 42,241 | 2,244 | |
| American Eagle | |||
| Outfitters Inc. | 121,530 | 2,068 | |
| * | Vista Outdoor Inc. | 43,955 | 2,055 |
| Graham Holdings Co. | |||
| Class B | 3,064 | 2,027 | |
| Jack in the Box Inc. | 25,828 | 2,019 | |
| Dana Holding Corp. | 112,724 | 1,977 | |
| * | JC Penney Co. Inc. | 211,061 | 1,923 |
| CST Brands Inc. | 53,236 | 1,848 | |
| Big Lots Inc. | 37,272 | 1,789 | |
| Tupperware Brands Corp. | 34,443 | 1,765 | |
| Thor Industries Inc. | 31,500 | 1,719 | |
| Cheesecake Factory Inc. | 31,339 | 1,701 | |
| Aaron’s Inc. | 44,635 | 1,681 | |
| * | Kate Spade & Co. | 88,219 | 1,673 |
| John Wiley & Sons Inc. | |||
| Class A | 32,057 | 1,653 | |
| Time Inc. | 75,688 | 1,572 | |
| Sotheby’s | 42,739 | 1,505 | |
| * | Murphy USA Inc. | 29,404 | 1,503 |
| * | Cabela’s Inc. | 33,147 | 1,491 |
| * | Deckers Outdoor Corp. | 23,012 | 1,482 |
| Chico’s FAS Inc. | 99,075 | 1,477 | |
| Wendy’s Co. | 159,766 | 1,455 | |
| * | Ascena Retail Group Inc. | 118,156 | 1,426 |
| * | TRI Pointe Group Inc. | 101,657 | 1,411 |
| HSN Inc. | 22,485 | 1,367 | |
| * | Cable One Inc. | 3,065 | 1,273 |
| Meredith Corp. | 25,275 | 1,194 | |
| New York Times Co. Class A | 90,674 | 1,103 | |
| DeVry Education Group Inc. | 39,647 | 1,037 | |
| * | DreamWorks Animation | ||
| SKG Inc. Class A | 50,444 | 1,006 | |
| Rent-A-Center Inc. | 36,661 | 986 | |
| Guess? Inc. | 44,500 | 984 | |
| Abercrombie & Fitch Co. | 48,174 | 957 | |
| KB Home | 62,940 | 922 | |
| MDC Holdings Inc. | 27,067 | 771 | |
| * | Apollo Education Group Inc. | 66,807 | 742 |
| International Speedway | |||
| Corp. Class A | 19,366 | 621 | |
| 143,269 | |||
| Consumer Staples (4.5%) | |||
| Church & Dwight Co. Inc. | 90,533 | 7,811 | |
| * | WhiteWave Foods Co. | ||
| Class A | 121,144 | 5,589 | |
| * | Hain Celestial Group Inc. | 70,982 | 4,320 |
| Ingredion Inc. | 49,500 | 4,274 | |
| * | Edgewell Personal Care Co. | 43,026 | 3,789 |
| Flowers Foods Inc. | 127,912 | 2,969 | |
13
S&P Mid-Cap 400 Index Fund
| Market | |||
| Value• | |||
| Shares | ($000) | ||
| Casey’s General Stores Inc. | 26,798 | 2,837 | |
| * | Post Holdings Inc. | 41,997 | 2,741 |
| * | TreeHouse Foods Inc. | 29,668 | 2,355 |
| Energizer Holdings Inc. | 42,975 | 1,795 | |
| * | United Natural Foods Inc. | 34,604 | 1,666 |
| Avon Products Inc. | 300,686 | 1,560 | |
| * | Boston Beer Co. Inc. | ||
| Class A | 6,305 | 1,293 | |
| Lancaster Colony Corp. | 13,425 | 1,273 | |
| * | SUPERVALU Inc. | 142,951 | 1,178 |
| Dean Foods Co. | 65,226 | 1,074 | |
| Tootsie Roll Industries Inc. | 14,127 | 439 | |
| 46,963 | |||
| Energy (3.7%) | |||
| HollyFrontier Corp. | 135,584 | 6,353 | |
| Oceaneering | |||
| International Inc. | 68,322 | 2,994 | |
| Energen Corp. | 54,516 | 2,835 | |
| * | Gulfport Energy Corp. | 73,801 | 2,644 |
| Nabors Industries Ltd. | 201,465 | 2,325 | |
| Noble Corp. plc | 167,191 | 2,177 | |
| Western Refining Inc. | 48,838 | 2,101 | |
| World Fuel Services Corp. | 49,880 | 1,928 | |
| * | Dril-Quip Inc. | 26,917 | 1,856 |
| SM Energy Co. | 46,623 | 1,711 | |
| Patterson-UTI Energy Inc. | 102,202 | 1,664 | |
| Superior Energy | |||
| Services Inc. | 103,978 | 1,654 | |
| QEP Resources Inc. | 112,327 | 1,577 | |
| Rowan Cos. plc Class A | 86,228 | 1,549 | |
| * | WPX Energy Inc. | 162,272 | 1,186 |
| Denbury Resources Inc. | 246,923 | 1,072 | |
| * | Oil States International Inc. | 35,723 | 1,013 |
| California Resources Corp. | 213,930 | 830 | |
| Atwood Oceanics Inc. | 41,640 | 796 | |
| * | Helix Energy Solutions | ||
| Group Inc. | 68,292 | 475 | |
| 38,740 | |||
| Financials (25.4%) | |||
| Extra Space Storage Inc. | 85,268 | 6,265 | |
| Federal Realty | |||
| Investment Trust | 47,513 | 6,133 | |
| UDR Inc. | 179,163 | 5,787 | |
| New York Community | |||
| Bancorp Inc. | 307,349 | 5,428 | |
| Everest Re Group Ltd. | 30,738 | 5,404 | |
| * | Alleghany Corp. | 11,112 | 5,220 |
| HCC Insurance Holdings Inc. | 66,206 | 5,116 | |
| Arthur J Gallagher & Co. | 116,190 | 5,080 | |
| MSCI Inc. Class A | 77,777 | 4,707 | |
| * | Signature Bank | 35,168 | 4,695 |
| Raymond James | |||
| Financial Inc. | 88,566 | 4,693 | |
| Jones Lang LaSalle Inc. | 31,035 | 4,620 | |
| SEI Investments Co. | 89,654 | 4,535 | |
| * | SVB Financial Group | 35,450 | 4,434 |
| Camden Property Trust | 60,081 | 4,328 | |
| Duke Realty Corp. | 238,714 | 4,311 | |
| Alexandria Real Estate | |||
| Equities Inc. | 49,840 | 4,286 | |
| Reinsurance Group of | |||
| America Inc. Class A | 45,798 | 4,162 | |
| Mid-America Apartment | |||
| Communities Inc. | 52,128 | 4,097 | |
| East West Bancorp Inc. | 100,154 | 4,047 | |
| Kilroy Realty Corp. | 60,918 | 3,951 | |
| Regency Centers Corp. | 65,258 | 3,870 | |
| Omega Healthcare | |||
| Investors Inc. | 111,249 | 3,758 | |
| WR Berkley Corp. | 69,097 | 3,751 | |
| CBOE Holdings Inc. | 57,752 | 3,653 | |
| American Financial | |||
| Group Inc. | 51,091 | 3,528 | |
| StanCorp Financial | |||
| Group Inc. | 29,203 | 3,321 | |
| RenaissanceRe | |||
| Holdings Ltd. | 31,863 | 3,248 | |
| National Retail | |||
| Properties Inc. | 92,718 | 3,222 | |
| Liberty Property Trust | 103,417 | 3,179 | |
| Lamar Advertising Co. | |||
| Class A | 55,982 | 2,986 | |
| Home Properties Inc. | 40,072 | 2,974 | |
| Taubman Centers Inc. | 42,767 | 2,950 | |
| City National Corp. | 33,472 | 2,938 | |
| First American | |||
| Financial Corp. | 75,001 | 2,915 | |
| PacWest Bancorp | 67,733 | 2,888 | |
| Eaton Vance Corp. | 81,602 | 2,829 | |
| Synovus Financial Corp. | 92,166 | 2,805 | |
| Endurance Specialty | |||
| Holdings Ltd. | 41,909 | 2,672 | |
| Hospitality Properties Trust | 103,763 | 2,669 | |
| American Campus | |||
| Communities Inc. | 77,713 | 2,662 | |
| Old Republic | |||
| International Corp. | 166,913 | 2,622 | |
| Douglas Emmett Inc. | 94,872 | 2,621 | |
| BioMed Realty Trust Inc. | 140,827 | 2,605 | |
| Commerce Bancshares Inc. | 57,803 | 2,590 | |
| Brown & Brown Inc. | 79,915 | 2,562 | |
| Senior Housing | |||
| Properties Trust | 162,615 | 2,553 | |
| Umpqua Holdings Corp. | 152,616 | 2,550 | |
| * | SLM Corp. | 294,553 | 2,498 |
| Weingarten Realty Investors | 78,877 | 2,496 | |
| Highwoods Properties Inc. | 65,079 | 2,469 | |
| Cullen/Frost Bankers Inc. | 38,034 | 2,459 | |
| LaSalle Hotel Properties | 78,165 | 2,459 |
14
S&P Mid-Cap 400 Index Fund
| Market | |||
| Value• | |||
| Shares | ($000) | ||
| CNO Financial Group Inc. | 136,275 | 2,438 | |
| Hanover Insurance | |||
| Group Inc. | 30,597 | 2,414 | |
| Corrections Corp. of America | 80,976 | 2,379 | |
| First Horizon National Corp. | 161,575 | 2,348 | |
| Waddell & Reed Financial | |||
| Inc. Class A | 58,318 | 2,278 | |
| First Niagara Financial | |||
| Group Inc. | 243,796 | 2,255 | |
| Sovran Self Storage Inc. | 24,824 | 2,227 | |
| Webster Financial Corp. | 62,820 | 2,223 | |
| * | Stifel Financial Corp. | 46,902 | 2,186 |
| Prosperity Bancshares Inc. | 41,622 | 2,151 | |
| Tanger Factory Outlet | |||
| Centers Inc. | 66,217 | 2,095 | |
| FirstMerit Corp. | 114,554 | 2,057 | |
| Federated Investors Inc. | |||
| Class B | 66,021 | 2,047 | |
| Bank of the Ozarks Inc. | 48,567 | 2,030 | |
| Rayonier Inc. | 87,743 | 2,018 | |
| Aspen Insurance | |||
| Holdings Ltd. | 42,577 | 1,955 | |
| Associated Banc-Corp | 105,390 | 1,935 | |
| Bank of Hawaii Corp. | 30,138 | 1,870 | |
| * | Care Capital Properties Inc. | 57,158 | 1,817 |
| TCF Financial Corp. | 116,726 | 1,812 | |
| Communications Sales & | |||
| Leasing Inc. | 82,829 | 1,665 | |
| WP GLIMCHER Inc. | 127,976 | 1,550 | |
| Cathay General Bancorp | 51,361 | 1,522 | |
| Janus Capital Group Inc. | 102,252 | 1,521 | |
| Primerica Inc. | 35,699 | 1,517 | |
| Hancock Holding Co. | 53,832 | 1,512 | |
| Washington Federal Inc. | 65,538 | 1,487 | |
| Fulton Financial Corp. | 122,108 | 1,485 | |
| WisdomTree | |||
| Investments Inc. | 77,653 | 1,456 | |
| Valley National Bancorp | 152,664 | 1,444 | |
| BancorpSouth Inc. | 59,386 | 1,411 | |
| Corporate Office | |||
| Properties Trust | 65,334 | 1,374 | |
| Urban Edge Properties | 63,801 | 1,334 | |
| Equity One Inc. | 55,474 | 1,304 | |
| Mercury General Corp. | 25,158 | 1,280 | |
| Kemper Corp. | 34,033 | 1,205 | |
| Mack-Cali Realty Corp. | 57,912 | 1,085 | |
| Trustmark Corp. | 46,701 | 1,076 | |
| Alexander & Baldwin Inc. | 31,406 | 1,062 | |
| International | |||
| Bancshares Corp. | 39,947 | 1,025 | |
| Potlatch Corp. | 28,167 | 930 | |
| 265,381 |
| Health Care (9.4%) | |||
| * | Hologic Inc. | 169,100 | 6,563 |
| * | Mettler-Toledo | ||
| International Inc. | 19,349 | 5,738 | |
| Cooper Cos. Inc. | 33,614 | 5,460 | |
| * | MEDNAX Inc. | 64,704 | 5,212 |
| * | Centene Corp. | 82,266 | 5,077 |
| ResMed Inc. | 97,491 | 5,064 | |
| * | United Therapeutics Corp. | 31,977 | 4,816 |
| * | IDEXX Laboratories Inc. | 64,749 | 4,628 |
| * | Community Health | ||
| Systems Inc. | 81,659 | 4,385 | |
| Teleflex Inc. | 28,732 | 3,758 | |
| * | Sirona Dental Systems Inc. | 38,437 | 3,666 |
| * | Health Net Inc. | 53,370 | 3,419 |
| * | VCA Inc. | 56,847 | 3,148 |
| * | Align Technology Inc. | 50,285 | 2,846 |
| West Pharmaceutical | |||
| Services Inc. | 49,783 | 2,780 | |
| * | WellCare Health Plans Inc. | 30,474 | 2,763 |
| STERIS Corp. | 41,325 | 2,647 | |
| * | PAREXEL International Corp. | 38,174 | 2,509 |
| Bio-Techne Corp. | 25,708 | 2,429 | |
| * | LifePoint Health Inc. | 30,660 | 2,395 |
| * | Thoratec Corp. | 37,505 | 2,356 |
| * | Charles River Laboratories | ||
| International Inc. | 32,773 | 2,258 | |
| * | Akorn Inc. | 54,609 | 2,173 |
| * | Catalent Inc. | 67,841 | 2,157 |
| * | Molina Healthcare Inc. | 27,809 | 2,074 |
| Hill-Rom Holdings Inc. | 39,151 | 2,069 | |
| * | Bio-Rad Laboratories Inc. | ||
| Class A | 14,293 | 1,991 | |
| * | Allscripts Healthcare | ||
| Solutions Inc. | 117,498 | 1,618 | |
| Owens & Minor Inc. | 43,632 | 1,483 | |
| * | Halyard Health Inc. | 32,173 | 1,012 |
| 98,494 | |||
| Industrials (15.3%) | |||
| Alaska Air Group Inc. | 89,678 | 6,713 | |
| Wabtec Corp. | 66,836 | 6,400 | |
| Acuity Brands Inc. | 30,045 | 5,855 | |
| Towers Watson & Co. | |||
| Class A | 47,957 | 5,694 | |
| Fortune Brands Home & | |||
| Security Inc. | 110,287 | 5,277 | |
| ManpowerGroup Inc. | 54,117 | 4,703 | |
| Carlisle Cos. Inc. | 45,198 | 4,551 | |
| Waste Connections Inc. | 85,694 | 4,076 | |
| * | JetBlue Airways Corp. | 182,052 | 4,063 |
| IDEX Corp. | 53,925 | 3,873 | |
| Huntington Ingalls | |||
| Industries Inc. | 33,650 | 3,788 | |
| Hubbell Inc. Class B | 36,827 | 3,634 | |
15
S&P Mid-Cap 400 Index Fund
| Market | |||
| Value• | |||
| Shares | ($000) | ||
| B/E Aerospace Inc. | 73,451 | 3,581 | |
| Lennox International Inc. | 28,641 | 3,381 | |
| AO Smith Corp. | 51,841 | 3,344 | |
| * | Old Dominion Freight | ||
| Line Inc. | 46,879 | 3,117 | |
| Orbital ATK Inc. | 41,119 | 3,113 | |
| Lincoln Electric Holdings Inc. | 52,298 | 3,067 | |
| Trinity Industries Inc. | 107,209 | 2,894 | |
| * | AECOM | 104,050 | 2,861 |
| Graco Inc. | 40,602 | 2,801 | |
| * | Copart Inc. | 78,790 | 2,759 |
| Donaldson Co. Inc. | 87,486 | 2,739 | |
| * | Kirby Corp. | 38,603 | 2,723 |
| AGCO Corp. | 55,443 | 2,719 | |
| Nordson Corp. | 39,147 | 2,604 | |
| * | Genesee & Wyoming Inc. | ||
| Class A | 35,511 | 2,428 | |
| * | Teledyne Technologies Inc. | 24,451 | 2,394 |
| MSC Industrial Direct Co. | |||
| Inc. Class A | 35,008 | 2,370 | |
| Watsco Inc. | 19,001 | 2,327 | |
| ITT Corp. | 61,632 | 2,306 | |
| Oshkosh Corp. | 54,040 | 2,272 | |
| RR Donnelley & Sons Co. | 144,348 | 2,266 | |
| Regal Beloit Corp. | 30,960 | 2,064 | |
| Landstar System Inc. | 30,686 | 2,031 | |
| Deluxe Corp. | 34,500 | 2,001 | |
| CLARCOR Inc. | 34,660 | 1,954 | |
| Rollins Inc. | 66,479 | 1,856 | |
| Woodward Inc. | 40,172 | 1,832 | |
| * | Clean Harbors Inc. | 36,891 | 1,812 |
| Crane Co. | 33,665 | 1,769 | |
| * | Esterline Technologies Corp. | 21,290 | 1,740 |
| KBR Inc. | 99,683 | 1,739 | |
| Valmont Industries Inc. | 16,278 | 1,730 | |
| Terex Corp. | 72,630 | 1,695 | |
| Triumph Group Inc. | 34,050 | 1,682 | |
| Kennametal Inc. | 54,786 | 1,671 | |
| SPX Corp. | 28,351 | 1,665 | |
| CEB Inc. | 23,123 | 1,656 | |
| Timken Co. | 50,152 | 1,592 | |
| GATX Corp. | 30,341 | 1,504 | |
| HNI Corp. | 30,744 | 1,437 | |
| * | KLX Inc. | 36,457 | 1,426 |
| Con-way Inc. | 39,830 | 1,402 | |
| * | NOW Inc. | 74,086 | 1,264 |
| * | FTI Consulting Inc. | 28,755 | 1,146 |
| Herman Miller Inc. | 41,236 | 1,118 | |
| MSA Safety Inc. | 21,766 | 990 | |
| Granite Construction Inc. | 25,179 | 869 | |
| Werner Enterprises Inc. | 30,864 | 818 | |
| 159,156 |
| Information Technology (15.8%) | |||
| * | ANSYS Inc. | 62,104 | 5,502 |
| CDK Global Inc. | 110,907 | 5,494 | |
| Global Payments Inc. | 45,976 | 5,121 | |
| * | Synopsys Inc. | 107,290 | 5,035 |
| * | Gartner Inc. | 57,438 | 4,912 |
| Broadridge Financial | |||
| Solutions Inc. | 82,933 | 4,378 | |
| FactSet Research | |||
| Systems Inc. | 26,873 | 4,244 | |
| * | Fortinet Inc. | 98,540 | 4,152 |
| * | Cadence Design | ||
| Systems Inc. | 202,484 | 4,054 | |
| Avnet Inc. | 93,969 | 3,984 | |
| Jack Henry & | |||
| Associates Inc. | 56,577 | 3,845 | |
| * | Keysight Technologies Inc. | 117,158 | 3,754 |
| * | Arrow Electronics Inc. | 66,200 | 3,702 |
| * | Ultimate Software | ||
| Group Inc. | 19,774 | 3,484 | |
| * | Trimble Navigation Ltd. | 179,514 | 3,393 |
| * | Tyler Technologies Inc. | 23,299 | 3,216 |
| * | Manhattan Associates Inc. | 51,051 | 2,985 |
| * | Zebra Technologies Corp. | 35,789 | 2,966 |
| * | NCR Corp. | 117,279 | 2,943 |
| Ingram Micro Inc. | 108,117 | 2,926 | |
| MAXIMUS Inc. | 45,592 | 2,761 | |
| Teradyne Inc. | 148,448 | 2,678 | |
| * | PTC Inc. | 79,566 | 2,635 |
| Jabil Circuit Inc. | 134,072 | 2,594 | |
| * | WEX Inc. | 26,744 | 2,528 |
| * | Rackspace Hosting Inc. | 82,023 | 2,494 |
| * | VeriFone Systems Inc. | 79,086 | 2,471 |
| * | ARRIS Group Inc. | 91,805 | 2,425 |
| * | NetScout Systems Inc. | 65,023 | 2,377 |
| * | CoreLogic Inc. | 62,424 | 2,369 |
| Atmel Corp. | 288,395 | 2,356 | |
| Cypress | |||
| Semiconductor Corp. | 229,332 | 2,293 | |
| Solera Holdings Inc. | 46,376 | 2,234 | |
| FEI Co. | 28,715 | 2,167 | |
| Cognex Corp. | 60,201 | 2,141 | |
| * | SunEdison Inc. | 201,420 | 2,095 |
| * | IPG Photonics Corp. | 24,728 | 2,088 |
| *,^ | Cree Inc. | 75,397 | 2,052 |
| National Instruments Corp. | 69,954 | 2,043 | |
| DST Systems Inc. | 19,525 | 2,000 | |
| * | Integrated Device | ||
| Technology Inc. | 102,517 | 1,947 | |
| * | Ciena Corp. | 82,722 | 1,850 |
| Fair Isaac Corp. | 21,459 | 1,836 | |
| * | SolarWinds Inc. | 45,923 | 1,825 |
| Leidos Holdings Inc. | 43,179 | 1,817 | |
16
S&P Mid-Cap 400 Index Fund
| Market | |||
| Value• | |||
| Shares | ($000) | ||
| * | Synaptics Inc. | 25,452 | 1,784 |
| Mentor Graphics Corp. | 68,286 | 1,765 | |
| * | ACI Worldwide Inc. | 80,676 | 1,721 |
| * | Tech Data Corp. | 25,391 | 1,657 |
| Convergys Corp. | 68,301 | 1,544 | |
| Belden Inc. | 29,474 | 1,485 | |
| Diebold Inc. | 44,817 | 1,395 | |
| Science Applications | |||
| International Corp. | 27,360 | 1,334 | |
| Plantronics Inc. | 24,355 | 1,295 | |
| Lexmark International Inc. | |||
| Class A | 42,369 | 1,270 | |
| InterDigital Inc. | 24,931 | 1,233 | |
| * | Silicon Laboratories Inc. | 27,458 | 1,194 |
| * | Acxiom Corp. | 54,039 | 1,133 |
| * | Fairchild Semiconductor | ||
| International Inc. Class A | 80,489 | 1,095 | |
| * | NeuStar Inc. Class A | 38,276 | 1,070 |
| * | CommVault Systems Inc. | 29,392 | 1,053 |
| * | Polycom Inc. | 93,371 | 1,005 |
| *,^ | 3D Systems Corp. | 72,768 | 999 |
| *,^ | Knowles Corp. | 61,085 | 994 |
| Intersil Corp. Class A | 91,145 | 961 | |
| Vishay Intertechnology Inc. | 93,866 | 927 | |
| *,^ | Advanced Micro | ||
| Devices Inc. | 436,490 | 790 | |
| * | Rovi Corp. | 61,251 | 678 |
| 164,548 | |||
| Materials (6.9%) | |||
| Packaging Corp. of America | 68,540 | 4,600 | |
| Ashland Inc. | 43,011 | 4,515 | |
| RPM International Inc. | 92,168 | 4,041 | |
| Valspar Corp. | 51,715 | 3,791 | |
| Cytec Industries Inc. | 49,397 | 3,665 | |
| Albemarle Corp. | 77,619 | 3,509 | |
| Steel Dynamics Inc. | 167,300 | 3,259 | |
| Reliance Steel & | |||
| Aluminum Co. | 51,399 | 2,987 | |
| AptarGroup Inc. | 43,314 | 2,918 | |
| Bemis Co. Inc. | 67,421 | 2,860 | |
| Eagle Materials Inc. | 34,758 | 2,844 | |
| NewMarket Corp. | 7,319 | 2,805 | |
| Sonoco Products Co. | 69,816 | 2,745 | |
| Royal Gold Inc. | 45,113 | 2,171 | |
| Sensient Technologies Corp. | 32,293 | 2,104 | |
| PolyOne Corp. | 61,628 | 2,001 | |
| Scotts Miracle-Gro Co. | |||
| Class A | 30,900 | 1,922 | |
| Compass Minerals | |||
| International Inc. | 23,262 | 1,884 | |
| Domtar Corp. | 44,233 | 1,779 | |
| United States Steel Corp. | 100,673 | 1,649 | |
| * | Louisiana-Pacific Corp. | 98,443 | 1,618 |
| Silgan Holdings Inc. | 28,856 | 1,511 | |
| Cabot Corp. | 43,863 | 1,486 | |
| Allegheny Technologies Inc. | 75,484 | 1,458 | |
| Carpenter Technology Corp. | 34,839 | 1,359 | |
| Minerals Technologies Inc. | 24,007 | 1,291 | |
| Commercial Metals Co. | 79,994 | 1,256 | |
| Chemours Co. | 125,146 | 1,210 | |
| Olin Corp. | 53,584 | 1,069 | |
| Worthington Industries Inc. | 33,497 | 857 | |
| Greif Inc. Class A | 23,522 | 689 | |
| 71,853 | |||
| Telecommunication Services (0.2%) | |||
| Telephone & Data | |||
| Systems Inc. | 67,935 | 1,932 | |
| Utilities (4.7%) | |||
| Alliant Energy Corp. | 78,160 | 4,429 | |
| UGI Corp. | 119,341 | 4,067 | |
| OGE Energy Corp. | 138,075 | 3,872 | |
| Atmos Energy Corp. | 69,890 | 3,829 | |
| Westar Energy Inc. Class A | 97,728 | 3,572 | |
| National Fuel Gas Co. | 58,410 | 3,152 | |
| Aqua America Inc. | 122,513 | 3,107 | |
| Great Plains Energy Inc. | 106,922 | 2,665 | |
| MDU Resources Group Inc. | 134,776 | 2,414 | |
| Questar Corp. | 121,587 | 2,348 | |
| Vectren Corp. | 57,177 | 2,300 | |
| Cleco Corp. | 41,789 | 2,239 | |
| Hawaiian Electric | |||
| Industries Inc. | 74,220 | 2,098 | |
| IDACORP Inc. | 34,787 | 2,065 | |
| WGL Holdings Inc. | 34,362 | 1,862 | |
| ONE Gas Inc. | 36,346 | 1,562 | |
| PNM Resources Inc. | 55,048 | 1,410 | |
| Black Hills Corp. | 30,980 | 1,232 | |
| * Talen Energy Corp. | 57,739 | 823 | |
| 49,046 | |||
| Total Common Stocks | |||
| (Cost $1,002,724) | 1,039,382 | ||
| Temporary Cash Investments (0.5%)1 | |||
| Money Market Fund (0.5%) | |||
| 2,3 Vanguard Market Liquidity | |||
| Fund, 0.168% | 5,161,545 | 5,162 | |
| Face | |||
| Amount | |||
| ($000) | |||
| U.S. Government and Agency Obligations (0.0%) | |||
| 4,5 Federal Home Loan Bank | |||
| Discount Notes, 0.105%, | |||
| 11/2/15 | 200 | 200 | |
| Total Temporary Cash Investments | |||
| (Cost $5,362) | 5,362 | ||
| Total Investments (100.1%) | |||
| (Cost $1,008,086) | 1,044,744 | ||
17
S&P Mid-Cap 400 Index Fund
| Amount | |
| ($000) | |
| Other Assets and Liabilities (-0.1%) | |
| Other Assets | |
| Investment in Vanguard | 96 |
| Receivables for Accrued Income | 1,309 |
| Receivables for Capital Shares Issued | 43 |
| Other Assets | 11 |
| Total Other Assets | 1,459 |
| Liabilities | |
| Payables for Investment | |
| Securities Purchased | (1,615) |
| Collateral for Securities on Loan | (815) |
| Payables for Capital Shares Redeemed | (87) |
| Payables to Vanguard | (209) |
| Other Liabilities | (42) |
| Total Liabilities | (2,768) |
| Net Assets (100%) | 1,043,435 |
| At August 31, 2015, net assets consisted of: | |
| Amount | |
| ($000) | |
| Paid-in Capital | 1,009,946 |
| Undistributed Net Investment Income | 9,301 |
| Accumulated Net Realized Losses | (12,398) |
| Unrealized Appreciation (Depreciation) | |
| Investment Securities | 36,658 |
| Futures Contracts | (72) |
| Net Assets | 1,043,435 |
| ETF Shares—Net Assets | |
| Applicable to 3,950,000 outstanding | |
| $.001 par value shares of beneficial | |
| interest (unlimited authorization) | 378,689 |
| Net Asset Value Per Share— | |
| ETF Shares | $95.87 |
| Institutional Shares—Net Assets | |
| Applicable to 3,471,043 outstanding | |
| $.001 par value shares of beneficial | |
| interest (unlimited authorization) | 664,746 |
| Net Asset Value Per Share— | |
| Institutional Shares | $191.51 |
• See Note A in Notes to Financial Statements.
* Non-income-producing security.
^ Includes partial security positions on loan to broker-dealers. The total value of securities on loan is $780,000.
1 The fund invests a portion of its cash reserves in equity markets through the use of index futures contracts. After giving effect to futures
investments, the fund’s effective common stock and temporary cash investment positions represent 100.0% and 0.1%, respectively, of
net assets.
2 Affiliated money market fund available only to Vanguard funds and certain trusts and accounts managed by Vanguard. Rate shown is
the 7-day yield.
3 Includes $815,000 of collateral received for securities on loan.
4 The issuer operates under a congressional charter; its securities are generally neither guaranteed by the U.S. Treasury nor backed by the
full faith and credit of the U.S. government.
5 Securities with a value of $200,000 have been segregated as initial margin for open futures contracts.
See accompanying Notes, which are an integral part of the Financial Statements.
18
S&P Mid-Cap 400 Index Fund
Statement of Operations
| Year Ended | |
| August 31, 2015 | |
| ($000) | |
| Investment Income | |
| Income | |
| Dividends | 15,072 |
| Interest1 | 7 |
| Securities Lending | 165 |
| Total Income | 15,244 |
| Expenses | |
| The Vanguard Group—Note B | |
| Investment Advisory Services | 166 |
| Management and Administrative—ETF Shares | 386 |
| Management and Administrative—Institutional Shares | 218 |
| Marketing and Distribution—ETF Shares | 54 |
| Marketing and Distribution—Institutional Shares | 78 |
| Custodian Fees | 69 |
| Auditing Fees | 24 |
| Shareholders’ Reports—ETF Shares | 12 |
| Shareholders’ Reports—Institutional Shares | 5 |
| Trustees’ Fees and Expenses | 1 |
| Total Expenses | 1,013 |
| Net Investment Income | 14,231 |
| Realized Net Gain (Loss) | |
| Investment Securities Sold | 82,479 |
| Futures Contracts | 135 |
| Realized Net Gain (Loss) | 82,614 |
| Change in Unrealized Appreciation (Depreciation) | |
| Investment Securities | (103,352) |
| Futures Contracts | (178) |
| Change in Unrealized Appreciation (Depreciation) | (103,530) |
| Net Increase (Decrease) in Net Assets Resulting from Operations | (6,685) |
| 1 Interest income from an affiliated company of the fund was $6,000. | |
See accompanying Notes, which are an integral part of the Financial Statements.
19
S&P Mid-Cap 400 Index Fund
Statement of Changes in Net Assets
| Year Ended August 31, | ||
| 2015 | 2014 | |
| ($000) | ($000) | |
| Increase (Decrease) in Net Assets | ||
| Operations | ||
| Net Investment Income | 14,231 | 9,030 |
| Realized Net Gain (Loss) | 82,614 | 27,882 |
| Change in Unrealized Appreciation (Depreciation) | (103,530) | 91,620 |
| Net Increase (Decrease) in Net Assets Resulting from Operations | (6,685) | 128,532 |
| Distributions | ||
| Net Investment Income | ||
| ETF Shares | (4,471) | (2,451) |
| Institutional Shares | (7,100) | (2,743) |
| Realized Capital Gain | ||
| ETF Shares | — | — |
| Institutional Shares | — | — |
| Total Distributions | (11,571) | (5,194) |
| Capital Share Transactions | ||
| ETF Shares | 38,682 | 100,548 |
| Institutional Shares | 155,270 | 236,838 |
| Net Increase (Decrease) from Capital Share Transactions | 193,952 | 337,386 |
| Total Increase (Decrease) | 175,696 | 460,724 |
| Net Assets | ||
| Beginning of Period | 867,739 | 407,015 |
| End of Period1 | 1,043,435 | 867,739 |
| 1 Net Assets—End of Period includes undistributed (overdistributed) net investment income of $9,301,000 and $6,641,000. | ||
See accompanying Notes, which are an integral part of the Financial Statements.
20
S&P Mid-Cap 400 Index Fund
Financial Highlights
| ETF Shares | |||||
| Sept. 7, | |||||
| 20101 to | |||||
| For a Share Outstanding | Year Ended August 31, | August 31, | |||
| Throughout Each Period | 2015 | 2014 | 2013 | 2012 | 2011 |
| Net Asset Value, Beginning of Period | $97.19 | $79.72 | $65.20 | $58.37 | $49.95 |
| Investment Operations | |||||
| Net Investment Income | 1.330 | 1.016 | 1.1332 | .648 | . 383 |
| Net Realized and Unrealized Gain (Loss) | |||||
| on Investments | (1.425) | 17.285 | 14.112 | 6.657 | 8.217 |
| Total from Investment Operations | (.095) | 18.301 | 15.245 | 7.305 | 8.600 |
| Distributions | |||||
| Dividends from Net Investment Income | (1.225) | (.831) | (.725) | (.475) | (.180) |
| Distributions from Realized Capital Gains | — | — | — | — | — |
| Total Distributions | (1.225) | (.831) | (.725) | (.475) | (.180) |
| Net Asset Value, End of Period | $95.87 | $97.19 | $79.72 | $65.20 | $58.37 |
| Total Return | -0.12% | 23.06% | 23.57% | 12.60% | 17.21% |
| Ratios/Supplemental Data | |||||
| Net Assets, End of Period (Millions) | $379 | $345 | $191 | $72 | $32 |
| Ratio of Total Expenses to Average Net Assets | 0.15% | 0.15% | 0.15% | 0.15% | 0.15%3 |
| Ratio of Net Investment Income to | |||||
| Average Net Assets | 1.45% | 1.28% | 1.50% | 1.35% | 1.21%3 |
| Portfolio Turnover Rate 4 | 12% | 14% | 10% | 13% | 26% |
1 Inception.
2 Calculated based on average shares outstanding.
3 Annualized.
4 Excludes the value of portfolio securities received or delivered as a result of in-kind purchases or redemptions of the fund’s capital shares,
including ETF Creation Units.
See accompanying Notes, which are an integral part of the Financial Statements.
21
S&P Mid-Cap 400 Index Fund
Financial Highlights
| Institutional Shares | |||||
| March 28, | |||||
| 20111 to | |||||
| For a Share Outstanding | Year Ended August 31, | August 31, | |||
| Throughout Each Period | 2015 | 2014 | 2013 | 2012 | 2011 |
| Net Asset Value, Beginning of Period | $194.13 | $159.20 | $130.17 | $116.52 | $128.01 |
| Investment Operations | |||||
| Net Investment Income | 2.794 | 2.135 | 2.355 2 | 1.372 | .240 |
| Net Realized and Unrealized Gain (Loss) | |||||
| on Investments | (2.844) | 34.537 | 28.174 | 13.297 | (11.730) |
| Total from Investment Operations | (.050) | 36.672 | 30.529 | 14.669 | (11.490) |
| Distributions | |||||
| Dividends from Net Investment Income | (2.570) | (1.742) | (1.499) | (1.019) | — |
| Distributions from Realized Capital Gains | — | — | — | — | — |
| Total Distributions | (2.570) | (1.742) | (1.499) | (1.019) | — |
| Net Asset Value, End of Period | $191.51 | $194.13 | $159.20 | $130.17 | $116.52 |
| Total Return | -0.04% | 23.16% | 23.65% | 12.69% | -8.98% |
| Ratios/Supplemental Data | |||||
| Net Assets, End of Period (Millions) | $665 | $523 | $216 | $91 | $40 |
| Ratio of Total Expenses to Average Net Assets | 0.08% | 0.08% | 0.08% | 0.08% | 0.08%3 |
| Ratio of Net Investment Income to | |||||
| Average Net Assets | 1.52% | 1.35% | 1.57% | 1.42% | 1.28%3 |
| Portfolio Turnover Rate 4 | 12% | 14% | 10% | 13% | 26% |
1 Inception.
2 Calculated based on average shares outstanding.
3 Annualized.
4 Excludes the value of portfolio securities received or delivered as a result of in-kind purchases or redemptions of the fund’s capital shares,
including ETF Creation Units.
See accompanying Notes, which are an integral part of the Financial Statements.
22
S&P Mid-Cap 400 Index Fund
Notes to Financial Statements
Vanguard S&P Mid-Cap 400 Index Fund is registered under the Investment Company Act of 1940 as an open-end investment company, or mutual fund. The fund offers two classes of shares: ETF Shares and Institutional Shares. ETF Shares are listed for trading on NYSE Arca; they can be purchased and sold through a broker. Institutional Shares are designed for investors who meet certain administrative, service, and account-size criteria.
A. The following significant accounting policies conform to generally accepted accounting principles for U.S. investment companies. The fund consistently follows such policies in preparing its financial statements.
1. Security Valuation: Securities are valued as of the close of trading on the New York Stock Exchange (generally 4 p.m., Eastern time) on the valuation date. Equity securities are valued at the latest quoted sales prices or official closing prices taken from the primary market in which each security trades; such securities not traded on the valuation date are valued at the mean of the latest quoted bid and asked prices. Securities for which market quotations are not readily available, or whose values have been materially affected by events occurring before the fund’s pricing time but after the close of the securities’ primary markets, are valued by methods deemed by the board of trustees to represent fair value. Investments in Vanguard Market Liquidity Fund are valued at that fund’s net asset value. Temporary cash investments acquired over 60 days to maturity are valued using the latest bid prices or using valuations based on a matrix system (which considers such factors as security prices, yields, maturities, and ratings), both as furnished by independent pricing services. Other temporary cash investments are valued at amortized cost, which approximates market value.
2. Futures Contracts: The fund uses index futures contracts to a limited extent, with the objectives of maintaining full exposure to the stock market, enhancing returns, maintaining liquidity, and minimizing transaction costs. The fund may purchase futures contracts to immediately invest incoming cash in the market, or sell futures in response to cash outflows, thereby simulating a fully invested position in the underlying index while maintaining a cash balance for liquidity. The fund may seek to enhance returns by using futures contracts instead of the underlying securities when futures are believed to be priced more attractively than the underlying securities. The primary risks associated with the use of futures contracts are imperfect correlation between changes in market values of stocks held by the fund and the prices of futures contracts, and the possibility of an illiquid market. Counterparty risk involving futures is mitigated because a regulated clearinghouse is the counterparty instead of the clearing broker. To further mitigate counterparty risk, the fund trades futures contracts on an exchange, monitors the financial strength of its clearing brokers and clearinghouse, and has entered into clearing agreements with its clearing brokers. The clearinghouse imposes initial margin requirements to secure the fund’s performance and requires daily settlement of variation margin representing changes in the market value of each contract.
Futures contracts are valued at their quoted daily settlement prices. The aggregate settlement values of the contracts are not recorded in the Statement of Net Assets. Fluctuations in the value of the contracts are recorded in the Statement of Net Assets as an asset (liability) and in the Statement of Operations as unrealized appreciation (depreciation) until the contracts are closed, when they are recorded as realized futures gains (losses).
During the year ended August 31, 2015, the fund’s average investments in long and short futures contracts represented less than 1% and 0% of net assets, respectively, based on the average of aggregate settlement values at each quarter-end during the period.
23
S&P Mid-Cap 400 Index Fund
3. Federal Income Taxes: The fund intends to continue to qualify as a regulated investment company and distribute all of its taxable income. Management has analyzed the fund’s tax positions taken for all open federal income tax years (August 31, 2012–2015), and has concluded that no provision for federal income tax is required in the fund’s financial statements.
4. Distributions: Distributions to shareholders are recorded on the ex-dividend date.
5. Securities Lending: To earn additional income, the fund lends its securities to qualified institutional borrowers. Security loans are required to be secured at all times by collateral in an amount at least equal to the market value of securities loaned. Daily market fluctuations could cause the value of loaned securities to be more or less than the value of the collateral received. When this occurs, the collateral is adjusted and settled on the next business day. The fund further mitigates its counterparty risk by entering into securities lending transactions only with a diverse group of prequalified counter-parties, monitoring their financial strength, and entering into master securities lending agreements with its counterparties. The master securities lending agreements provide that, in the event of a counterparty’s default (including bankruptcy), the fund may terminate any loans with that borrower, determine the net amount owed, and sell or retain the collateral up to the net amount owed to the fund; however, such actions may be subject to legal proceedings. While collateral mitigates counter-party risk, in the absence of a default the fund may experience delays and costs in recovering the securities loaned. The fund invests cash collateral received in Vanguard Market Liquidity Fund, and records a liability in the Statement of Net Assets for the return of the collateral, during the period the securities are on loan. Securities lending income represents fees charged to borrowers plus income earned on invested cash collateral, less expenses associated with the loan.
6. Credit Facility: The fund and certain other funds managed by The Vanguard Group (“Vanguard”) participate in a $3 billion committed credit facility provided by a syndicate of lenders pursuant to a credit agreement that may be renewed annually; each fund is individually liable for its borrowings, if any, under the credit facility. Borrowings may be utilized for temporary and emergency purposes, and are subject to the fund’s regulatory and contractual borrowing restrictions. The participating funds are charged administrative fees and an annual commitment fee of 0.06% of the undrawn amount of the facility; these fees are allocated to the funds based on a method approved by the fund’s board of trustees and included in Management and Administrative expenses on the fund’s Statement of Operations. Any borrowings under this facility bear interest at a rate equal to the higher of the federal funds rate or LIBOR reference rate plus an agreed-upon spread.
The fund had no borrowings outstanding at August 31, 2015, or at any time during the period then ended.
7. Other: Dividend income is recorded on the ex-dividend date. Interest income includes income distributions received from Vanguard Market Liquidity Fund and is accrued daily. Premiums and discounts on debt securities purchased are amortized and accreted, respectively, to interest income over the lives of the respective securities. Security transactions are accounted for on the date securities are bought or sold. Costs used to determine realized gains (losses) on the sale of investment securities are those of the specific securities sold.
Each class of shares has equal rights as to assets and earnings, except that each class separately bears certain class-specific expenses related to maintenance of shareholder accounts (included in Management and Administrative expenses) and shareholder reporting. Marketing and distribution expenses are allocated to each class of shares based on a method approved by the board of trustees. Income, other non-class-specific expenses, and gains and losses on investments are allocated to each class of shares based on its relative net assets.
24
S&P Mid-Cap 400 Index Fund
B. In accordance with the terms of a Funds’ Service Agreement (the “FSA”) between Vanguard and the fund, Vanguard furnishes to the fund investment advisory, corporate management, administrative, marketing, and distribution services at Vanguard’s cost of operations (as defined by the FSA). These costs of operations are allocated to the fund based on methods and guidelines approved by the board of trustees. Vanguard does not require reimbursement in the current period for certain costs of operations (such as deferred compensation/benefits and risk/insurance costs); the fund’s liability for these costs of operations is included in Payables to Vanguard on the Statement of Net Assets.
Upon the request of Vanguard, the fund may invest up to 0.40% of its net assets as capital in Vanguard. At August 31, 2015, the fund had contributed to Vanguard capital in the amount of $96,000, representing 0.01% of the fund’s net assets and 0.04% of Vanguard’s capitalization. The fund’s trustees and officers are also directors and employees, respectively, of Vanguard.
C. Various inputs may be used to determine the value of the fund’s investments. These inputs are summarized in three broad levels for financial statement purposes. The inputs or methodologies used to value securities are not necessarily an indication of the risk associated with investing in those securities.
Level 1—Quoted prices in active markets for identical securities.
Level 2—Other significant observable inputs (including quoted prices for similar securities, interest rates, prepayment speeds, credit risk, etc.).
Level 3—Significant unobservable inputs (including the fund’s own assumptions used to determine the fair value of investments).
The following table summarizes the market value of the fund’s investments as of August 31, 2015, based on the inputs used to value them:
| Level 1 | Level 2 | Level 3 | |
| Investments | ($000) | ($000) | ($000) |
| Common Stocks | 1,039,382 | — | — |
| Temporary Cash Investments | 5,162 | 200 | — |
| Futures Contracts—Liabilities1 | (42) | — | — |
| Total | 1,044,502 | 200 | — |
| 1 Represents variation margin on the last day of the reporting period. | |||
D. At August 31, 2015, the aggregate settlement value of open futures contracts and the related unrealized appreciation (depreciation) were:
| ($000) | ||||
| Aggregate | ||||
| Number of | Settlement | Unrealized | ||
| Long (Short) | Value | Appreciation | ||
| Futures Contracts | Expiration | Contracts | Long (Short) | (Depreciation) |
| E-mini S&P Mid-Cap 400 Index | September 2015 | 28 | 3,961 | (72) |
Unrealized appreciation (depreciation) on open futures contracts is required to be treated as realized gain (loss) for tax purposes.
25
S&P Mid-Cap 400 Index Fund
E. Distributions are determined on a tax basis and may differ from net investment income and realized capital gains for financial reporting purposes. Differences may be permanent or temporary. Permanent differences are reclassified among capital accounts in the financial statements to reflect their tax character. Temporary differences arise when certain items of income, expense, gain, or loss are recognized in different periods for financial statement and tax purposes. These differences will reverse at some time in the future. Differences in classification may also result from the treatment of short-term gains as ordinary income for tax purposes.
During the year ended August 31, 2015, the fund realized $92,252,000 of net capital gains resulting from in-kind redemptions—in which shareholders exchanged fund shares for securities held by the fund rather than for cash. Because such gains are not taxable to the fund, and are not distributed to shareholders, they have been reclassified from accumulated net realized losses to paid-in capital.
For tax purposes, at August 31, 2015, the fund had $9,485,000 of ordinary income available for distribution. The fund had available capital losses totaling $12,470,000 that may be carried forward indefinitely to offset future net capital gains.
At August 31, 2015, the cost of investment securities for tax purposes was $1,008,086,000. Net unrealized appreciation of investment securities for tax purposes was $36,658,000, consisting of unrealized gains of $113,381,000 on securities that had risen in value since their purchase and $76,723,000 in unrealized losses on securities that had fallen in value since their purchase.
F. During the year ended August 31, 2015, the fund purchased $582,212,000 of investment securities and sold $384,140,000 of investment securities, other than temporary cash investments. Purchases and sales include $266,023,000 and $274,470,000, respectively, in connection with in-kind purchases and redemptions of the fund’s capital shares.
G. Capital share transactions for each class of shares were:
| Year Ended August 31, | ||||
| 2015 | 2014 | |||
| Amount | Shares | Amount | Shares | |
| ($000) | (000) | ($000) | (000) | |
| ETF Shares | ||||
| Issued | 367,265 | 3,675 | 200,557 | 2,250 |
| Issued in Lieu of Cash Distributions | — | — | — | — |
| Redeemed | (328,583) | (3,275) | (100,009) | (1,100) |
| Net Increase (Decrease)—ETF Shares | 38,682 | 400 | 100,548 | 1,150 |
| Institutional Shares | ||||
| Issued | 233,449 | 1,167 | 283,336 | 1,592 |
| Issued in Lieu of Cash Distributions | 5,218 | 27 | 2,689 | 15 |
| Redeemed | (83,397) | (415) | (49,187) | (269) |
| Net Increase (Decrease) —Institutional Shares | 155,270 | 779 | 236,838 | 1,338 |
H. Management has determined that no material events or transactions occurred subsequent to August 31, 2015, that would require recognition or disclosure in these financial statements.
26
S&P Mid-Cap 400 Value Index Fund
Fund Profile
As of August 31, 2015
| Share-Class Characteristics | ||
| ETF | Institutional | |
| Shares | Shares | |
| Ticker Symbol | IVOV | VMFVX |
| Expense Ratio1 | 0.20% | 0.08% |
| 30-Day SEC Yield | 1.84% | 1.97% |
| Portfolio Characteristics | |||
| DJ | |||
| U.S. | |||
| S&P | Total | ||
| MidCap | Market | ||
| 400 Value | FA | ||
| Fund | Index | Index | |
| Number of Stocks | 297 | 297 | 3,828 |
| Median Market Cap | $3.8B | $3.8B | $47.2B |
| Price/Earnings Ratio | 20.4x | 20.4x | 20.8x |
| Price/Book Ratio | 1.7x | 1.7x | 2.6x |
| Return on Equity | 12.0% | 12.0% | 17.1% |
| Earnings Growth | |||
| Rate | 7.2% | 7.2% | 10.2% |
| Dividend Yield | 2.1% | 2.1% | 2.1% |
| Foreign Holdings | 0.0% | 0.0% | 0.0% |
| Turnover Rate | 47% | — | — |
| Short-Term | |||
| Reserves | 0.0% | — | — |
| Volatility Measures | ||
| DJ | ||
| S&P MidCap | U.S. Total | |
| 400 Value | Market | |
| Index | FA Index | |
| R-Squared | 1.00 | 0.81 |
| Beta | 1.00 | 1.05 |
| These measures show the degree and timing of the fund’s | ||
| fluctuations compared with the indexes over 36 months. | ||
| Ten Largest Holdings (% of total net assets) | ||
| HollyFrontier Corp. | Oil & Gas Refining & | |
| Marketing | 1.3% | |
| Towers Watson & Co. | Human Resource & | |
| Employment | ||
| Services | 1.1 | |
| New York Community | Thrifts & Mortgage | |
| Bancorp Inc. | Finance | 1.1 |
| Everest Re Group Ltd. | Reinsurance | 1.1 |
| HCC Insurance Holdings | ||
| Inc. | Multi-line Insurance | 1.0 |
| ManpowerGroup Inc. | Human Resource & | |
| Employment | ||
| Services | 0.9 | |
| Alliant Energy Corp. | Multi-Utilities | 0.9 |
| Community Health | ||
| Systems Inc. | Health Care Facilities | 0.9 |
| Ingredion Inc. | Agricultural Products | 0.9 |
| Reinsurance Group of | ||
| America Inc. | Reinsurance | 0.8 |
| Top Ten | 10.0% | |
| The holdings listed exclude any temporary cash investments and equity index products. | ||
Investment Focus
1 The expense ratios shown are from the prospectus dated December 19, 2014, and represent estimated costs for the current fiscal year. For the
fiscal year ended August 31, 2015, the expense ratios were 0.20% for ETF Shares and 0.08% for Institutional Shares.
27
S&P Mid-Cap 400 Value Index Fund
| Sector Diversification (% of equity exposure) | |||
| DJ | |||
| U.S. | |||
| S&P | Total | ||
| MidCap | Market | ||
| 400 Value | FA | ||
| Fund | Index | Index | |
| Consumer Discretionary 10.4% | 10.4% | 13.5% | |
| Consumer Staples | 4.4 | 4.4 | 8.4 |
| Energy | 7.2 | 7.2 | 6.6 |
| Financials | 26.8 | 26.8 | 18.2 |
| Health Care | 5.3 | 5.3 | 15.0 |
| Industrials | 16.0 | 16.0 | 10.7 |
| Information Technology 13.3 | 13.3 | 19.1 | |
| Materials | 8.6 | 8.6 | 3.3 |
| Telecommunication | |||
| Services | 0.4 | 0.4 | 2.2 |
| Utilities | 7.6 | 7.6 | 3.0 |
28
S&P Mid-Cap 400 Value Index Fund
Performance Summary
All of the returns in this report represent past performance, which is not a guarantee of future results that may be achieved by the fund. (Current performance may be lower or higher than the performance data cited. For performance data current to the most recent month-end, visit our website at vanguard.com/performance.) Note, too, that both investment returns and principal value can fluctuate widely, so an investor’s shares, when sold, could be worth more or less than their original cost. The returns shown do not reflect taxes that a shareholder would pay on fund distributions or on the sale of fund shares.
Cumulative Performance: September 7, 2010, Through August 31, 2015
Initial Investment of $10,000
| Average Annual Total Returns | ||||
| Periods Ended August 31, 2015 | ||||
| Since | Final Value | |||
| One | Inception | of a $10,000 | ||
| Year | (9/7/2010) | Investment | ||
| S&P Mid-Cap 400 Value Index | ||||
| Fund*ETF Shares Net Asset Value | -4.17% | 14.25% | $19,420 | |
| S&P Mid-Cap 400 Value Index | ||||
| Fund*ETF Shares Market Price | -4.16 | 14.25 | 19,417 | |
| •••••••• | S&P MidCap 400 Value Index | -3.98 | 14.48 | 19,616 |
| – – – – | Mid-Cap Value Funds Average | -2.77 | 13.82 | 19,058 |
| Dow Jones U.S. Total Stock Market | ||||
| Float Adjusted Index | 0.29 | 15.13 | 20,172 | |
Mid-Cap Value Funds Average: Derived from data provided by Lipper, a Thomson Reuters Company.
"Since Inception" performance is calculated from the ETF Shares’ inception date for both the fund and its comparative standards.
| Since | Final Value | ||
| One | Inception | of a $5,000,000 | |
| Year | (11/2/2010) | Investment | |
| S&P Mid-Cap 400 Value Index Fund | |||
| Institutional Shares | -4.05% | 12.65% | $8,886,447 |
| S&P MidCap 400 Value Index | -3.98 | 12.74 | 8,920,091 |
| Dow Jones U.S. Total Stock Market Float | |||
| Adjusted Index | 0.29 | 13.34 | 9,153,559 |
"Since Inception" performance is calculated from the Institutional Shares’ inception date for both the fund and its comparative standards.
See Financial Highlights for dividend and capital gains information.
29
S&P Mid-Cap 400 Value Index Fund
Cumulative Returns of ETF Shares: September 7, 2010, Through August 31, 2015
| Since | ||
| One | Inception | |
| Year | (9/7/2010) | |
| S&P Mid-Cap 400 Value Index Fund ETF Shares | ||
| Market Price | -4.16% | 94.17% |
| S&P Mid-Cap 400 Value Index Fund ETF Shares Net | ||
| Asset Value | -4.17 | 94.20 |
| S&P MidCap 400 Value Index | -3.98 | 96.16 |
| "Since Inception" performance is calculated from the ETF Shares’ inception date for both the fund and its comparative standards. | ||
Fiscal-Year Total Returns (%): September 7, 2010, Through August 31, 2015
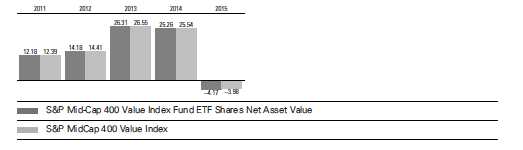
Average Annual Total Returns: Periods Ended June 30, 2015
This table presents returns through the latest calendar quarter—rather than through the end of the fiscal period.
Securities and Exchange Commission rules require that we provide this information.
| Inception | One | Since | |
| Date | Year | Inception | |
| ETF Shares | 9/7/2010 | ||
| Market Price | 3.24% | 16.45% | |
| Net Asset Value | 3.35 | 16.45 | |
| Institutional Shares | 11/2/2010 | 3.47 | 14.82 |
30
S&P Mid-Cap 400 Value Index Fund
Financial Statements
Statement of Net Assets
As of August 31, 2015
The fund reports a complete list of its holdings in regulatory filings four times in each fiscal year, at the quarter-ends. For the second and fourth fiscal quarters, the lists appear in the fund’s semiannual and annual reports to shareholders. For the first and third fiscal quarters, the fund files the lists with the Securities and Exchange Commission on Form N-Q. Shareholders can look up the fund’s Forms N-Q on the SEC’s website at sec.gov. Forms N-Q may also be reviewed and copied at the SEC’s Public Reference Room (see the back cover of this report for further information).
| Market | |||
| Value• | |||
| Shares | ($000) | ||
| Common Stocks (99.7%)1 | |||
| Consumer Discretionary (10.4%) | |||
| Dick’s Sporting Goods Inc. | 33,325 | 1,671 | |
| * | Jarden Corp. | 27,284 | 1,401 |
| * | Office Depot Inc. | 169,119 | 1,341 |
| American Eagle | |||
| Outfitters Inc. | 60,342 | 1,027 | |
| Graham Holdings Co. Class B | 1,522 | 1,007 | |
| Dana Holding Corp. | 55,969 | 982 | |
| * | JC Penney Co. Inc. | 104,789 | 955 |
| CST Brands Inc. | 26,432 | 918 | |
| Tupperware Brands Corp. | 17,101 | 876 | |
| Aaron’s Inc. | 22,161 | 834 | |
| Time Inc. | 37,576 | 780 | |
| Sotheby’s | 21,219 | 747 | |
| * | Murphy USA Inc. | 14,598 | 746 |
| * | Cabela’s Inc. | 16,455 | 740 |
| Chico’s FAS Inc. | 49,184 | 733 | |
| * | Ascena Retail Group Inc. | 58,683 | 708 |
| * | Vista Outdoor Inc. | 13,750 | 643 |
| Cinemark Holdings Inc. | 17,305 | 615 | |
| Meredith Corp. | 12,544 | 592 | |
| New York Times Co. Class A | 45,004 | 547 | |
| * | DreamWorks Animation | ||
| SKG Inc. Class A | 25,034 | 499 | |
| Rent-A-Center Inc. | 18,194 | 489 | |
| Guess? Inc. | 22,051 | 488 | |
| Thor Industries Inc. | 8,915 | 487 | |
| Cracker Barrel Old | |||
| Country Store Inc. | 3,371 | 486 | |
| * | Panera Bread Co. Class A | 2,699 | 481 |
| Abercrombie & Fitch Co. | 23,870 | 474 | |
| * | TRI Pointe Group Inc. | 33,309 | 462 |
| Big Lots Inc. | 9,622 | 462 | |
| * | Kate Spade & Co. | 21,899 | 415 |
| Cheesecake Factory Inc. | 7,624 | 414 | |
| John Wiley & Sons Inc. | |||
| Class A | 7,799 | 402 | |
| MDC Holdings Inc. | 13,409 | 382 | |
| * | Apollo Education Group Inc. | 33,094 | 368 |
| Wendy’s Co. | 37,279 | 340 | |
| International Speedway | |||
| Corp. Class A | 9,562 | 307 | |
| DeVry Education Group Inc. | 10,397 | 272 | |
| KB Home | 17,750 | 260 | |
| * | Cable One Inc. | 442 | 184 |
| 25,535 | |||
| Consumer Staples (4.4%) | |||
| Ingredion Inc. | 24,548 | 2,119 | |
| Flowers Foods Inc. | 63,425 | 1,472 | |
| Casey’s General Stores Inc. | 13,287 | 1,407 | |
| * | Edgewell Personal Care Co. | 10,029 | 883 |
| * | United Natural Foods Inc. | 17,180 | 827 |
| Avon Products Inc. | 149,272 | 775 | |
| * | Post Holdings Inc. | 10,620 | 693 |
| * | TreeHouse Foods Inc. | 8,238 | 654 |
| Dean Foods Co. | 32,374 | 533 | |
| Energizer Holdings Inc. | 12,376 | 517 | |
| Lancaster Colony Corp. | 3,333 | 316 | |
| * | SUPERVALU Inc. | 37,608 | 310 |
| Tootsie Roll Industries Inc. | 6,971 | 217 | |
| 10,723 | |||
| Energy (7.2%) | |||
| HollyFrontier Corp. | 67,241 | 3,151 | |
| Energen Corp. | 27,031 | 1,406 | |
| * | Gulfport Energy Corp. | 36,593 | 1,311 |
| Nabors Industries Ltd. | 100,033 | 1,154 | |
| Noble Corp. plc | 83,015 | 1,081 | |
| Western Refining Inc. | 24,250 | 1,043 | |
| World Fuel Services Corp. | 24,767 | 957 | |
| SM Energy Co. | 23,147 | 850 | |
| Patterson-UTI Energy Inc. | 50,738 | 826 | |
| Superior Energy | |||
| Services Inc. | 51,619 | 821 | |
| QEP Resources Inc. | 55,762 | 783 | |
| Rowan Cos. plc Class A | 42,806 | 769 | |
| Oceaneering | |||
| International Inc. | 13,891 | 609 | |
31
S&P Mid-Cap 400 Value Index Fund
| Market | |||
| Value• | |||
| Shares | ($000) | ||
| * | WPX Energy Inc. | 80,539 | 589 |
| Denbury Resources Inc. | 122,355 | 531 | |
| * | Oil States International Inc. | 17,701 | 502 |
| * | Dril-Quip Inc. | 7,083 | 488 |
| Atwood Oceanics Inc. | 20,628 | 394 | |
| * | Helix Energy Solutions | ||
| Group Inc. | 33,695 | 234 | |
| California Resources Corp. | 39,082 | 152 | |
| 17,651 | |||
| Financials (26.8%) | |||
| New York Community | |||
| Bancorp Inc. | 152,423 | 2,692 | |
| Everest Re Group Ltd. | 15,244 | 2,680 | |
| HCC Insurance Holdings Inc. | 32,834 | 2,537 | |
| Reinsurance Group of | |||
| America Inc. Class A | 22,711 | 2,064 | |
| American Financial | |||
| Group Inc. | 25,335 | 1,750 | |
| StanCorp Financial | |||
| Group Inc. | 14,481 | 1,647 | |
| Liberty Property Trust | 51,282 | 1,576 | |
| City National Corp. | 16,598 | 1,457 | |
| First American | |||
| Financial Corp. | 37,190 | 1,445 | |
| Synovus Financial Corp. | 45,700 | 1,391 | |
| * | Alleghany Corp. | 2,921 | 1,372 |
| Old Republic | |||
| International Corp. | 82,761 | 1,300 | |
| Commerce Bancshares Inc. | 28,660 | 1,284 | |
| Umpqua Holdings Corp. | 75,670 | 1,264 | |
| Raymond James | |||
| Financial Inc. | 23,279 | 1,234 | |
| Cullen/Frost Bankers Inc. | 18,859 | 1,219 | |
| CNO Financial Group Inc. | 67,567 | 1,209 | |
| Hanover Insurance | |||
| Group Inc. | 15,171 | 1,197 | |
| Corrections Corp. | |||
| of America | 40,149 | 1,180 | |
| First Niagara Financial | |||
| Group Inc. | 120,873 | 1,118 | |
| Webster Financial Corp. | 31,146 | 1,102 | |
| * | Stifel Financial Corp. | 23,289 | 1,085 |
| Prosperity Bancshares Inc. | 20,668 | 1,068 | |
| East West Bancorp Inc. | 26,323 | 1,064 | |
| WR Berkley Corp. | 19,188 | 1,042 | |
| FirstMerit Corp. | 56,880 | 1,022 | |
| Rayonier Inc. | 43,567 | 1,002 | |
| Aspen Insurance | |||
| Holdings Ltd. | 21,140 | 971 | |
| Associated Banc-Corp | 52,328 | 961 | |
| Bank of Hawaii Corp. | 14,965 | 929 | |
| Endurance Specialty | |||
| Holdings Ltd. | 14,546 | 927 | |
| TCF Financial Corp. | 57,955 | 899 | |
| Arthur J Gallagher & Co. | 20,168 | 882 | |
| * | SVB Financial Group | 7,033 | 880 |
| PacWest Bancorp | 18,137 | 773 | |
| MSCI Inc. Class A | 12,729 | 770 | |
| WP GLIMCHER Inc. | 63,538 | 769 | |
| Cathay General Bancorp | 25,499 | 756 | |
| Mid-America Apartment | |||
| Communities Inc. | 9,565 | 752 | |
| Hancock Holding Co. | 26,724 | 750 | |
| Washington Federal Inc. | 32,536 | 738 | |
| Fulton Financial Corp. | 60,621 | 737 | |
| Valley National Bancorp | 75,788 | 717 | |
| BancorpSouth Inc. | 29,481 | 701 | |
| Home Properties Inc. | 9,340 | 693 | |
| Alexandria Real Estate | |||
| Equities Inc. | 7,909 | 680 | |
| * | SLM Corp. | 77,406 | 656 |
| National Retail Properties Inc. | 18,851 | 655 | |
| Senior Housing | |||
| Properties Trust | 41,121 | 646 | |
| Mercury General Corp. | 12,489 | 635 | |
| BioMed Realty Trust Inc. | 34,217 | 633 | |
| Eaton Vance Corp. | 18,209 | 631 | |
| Waddell & Reed Financial | |||
| Inc. Class A | 15,325 | 599 | |
| Kemper Corp. | 16,893 | 598 | |
| First Horizon National Corp. | 39,255 | 570 | |
| Mack-Cali Realty Corp. | 28,745 | 538 | |
| Trustmark Corp. | 23,178 | 534 | |
| International | |||
| Bancshares Corp. | 19,826 | 509 | |
| Hospitality Properties Trust | 18,523 | 476 | |
| Federated Investors Inc. | |||
| Class B | 15,081 | 468 | |
| Brown & Brown Inc. | 14,265 | 457 | |
| Taubman Centers Inc. | 6,363 | 439 | |
| American Campus | |||
| Communities Inc. | 11,946 | 409 | |
| Highwoods Properties Inc. | 10,649 | 404 | |
| Janus Capital Group Inc. | 23,353 | 348 | |
| Tanger Factory Outlet | |||
| Centers Inc. | 9,507 | 301 | |
| Corporate Office | |||
| Properties Trust | 11,642 | 245 | |
| Communications Sales & | |||
| Leasing Inc. | 11,890 | 239 | |
| Equity One Inc. | 9,060 | 213 | |
| Urban Edge Properties | 10,105 | 211 | |
| Potlatch Corp. | 6,122 | 202 | |
| 65,902 | |||
| Health Care (5.2%) | |||
| * | Community Health | ||
| Systems Inc. | 40,495 | 2,175 | |
| * | Health Net Inc. | 26,465 | 1,695 |
| * | WellCare Health Plans Inc. | 15,110 | 1,370 |
| * | Thoratec Corp. | 18,596 | 1,168 |
32
S&P Mid-Cap 400 Value Index Fund
| Market | |||
| Value• | |||
| Shares | ($000) | ||
| * | Bio-Rad Laboratories Inc. | ||
| Class A | 7,097 | 989 | |
| * | Allscripts Healthcare | ||
| Solutions Inc. | 58,334 | 803 | |
| ResMed Inc. | 14,505 | 753 | |
| Owens & Minor Inc. | 21,661 | 736 | |
| Teleflex Inc. | 4,988 | 653 | |
| * | LifePoint Health Inc. | 7,601 | 594 |
| West Pharmaceutical | |||
| Services Inc. | 10,122 | 565 | |
| * | Halyard Health Inc. | 15,966 | 502 |
| Hill-Rom Holdings Inc. | 9,331 | 493 | |
| Bio-Techne Corp. | 4,335 | 410 | |
| 12,906 | |||
| Industrials (16.0%) | |||
| Towers Watson & Co. | |||
| Class A | 23,784 | 2,824 | |
| ManpowerGroup Inc. | 26,837 | 2,332 | |
| Orbital ATK Inc. | 20,389 | 1,544 | |
| * | AECOM | 51,593 | 1,419 |
| AGCO Corp. | 27,490 | 1,348 | |
| Carlisle Cos. Inc. | 11,656 | 1,174 | |
| Watsco Inc. | 9,421 | 1,154 | |
| Oshkosh Corp. | 26,833 | 1,128 | |
| RR Donnelley & Sons Co. | 71,568 | 1,124 | |
| Huntington Ingalls | |||
| Industries Inc. | 9,178 | 1,033 | |
| Regal Beloit Corp. | 15,373 | 1,025 | |
| Hubbell Inc. Class B | 9,862 | 973 | |
| * | Clean Harbors Inc. | 18,317 | 900 |
| Fortune Brands Home & | |||
| Security Inc. | 18,597 | 890 | |
| Crane Co. | 16,714 | 878 | |
| KBR Inc. | 49,492 | 863 | |
| Valmont Industries Inc. | 8,082 | 859 | |
| Terex Corp. | 36,059 | 841 | |
| Triumph Group Inc. | 16,906 | 835 | |
| Kennametal Inc. | 27,199 | 830 | |
| Waste Connections Inc. | 17,424 | 829 | |
| SPX Corp. | 14,076 | 827 | |
| Timken Co. | 24,898 | 790 | |
| IDEX Corp. | 10,696 | 768 | |
| Lincoln Electric Holdings Inc. | 12,967 | 760 | |
| * | KLX Inc. | 18,098 | 708 |
| Con-way Inc. | 19,773 | 696 | |
| Donaldson Co. Inc. | 22,124 | 693 | |
| B/E Aerospace Inc. | 13,113 | 639 | |
| * | NOW Inc. | 36,773 | 627 |
| Lennox International Inc. | 5,113 | 604 | |
| * | FTI Consulting Inc. | 14,272 | 569 |
| AO Smith Corp. | 8,741 | 564 | |
| Herman Miller Inc. | 20,468 | 555 | |
| MSC Industrial Direct Co. | |||
| Inc. Class A | 7,985 | 540 | |
| * | Kirby Corp. | 7,657 | 540 |
| * | Teledyne Technologies Inc. | 4,729 | 463 |
| Graco Inc. | 6,443 | 444 | |
| Granite Construction Inc. | 12,475 | 430 | |
| * | Genesee & Wyoming Inc. | ||
| Class A | 6,163 | 421 | |
| CLARCOR Inc. | 6,884 | 388 | |
| Deluxe Corp. | 6,510 | 378 | |
| GATX Corp. | 7,381 | 366 | |
| * | Esterline Technologies Corp. | 4,124 | 337 |
| Woodward Inc. | 7,380 | 337 | |
| HNI Corp. | 6,411 | 300 | |
| Rollins Inc. | 9,873 | 276 | |
| MSA Safety Inc. | 5,816 | 264 | |
| Werner Enterprises Inc. | 7,623 | 202 | |
| 39,289 | |||
| Information Technology (13.2%) | |||
| Avnet Inc. | 46,598 | 1,976 | |
| * | Arrow Electronics Inc. | 32,828 | 1,836 |
| * | NCR Corp. | 58,153 | 1,459 |
| Ingram Micro Inc. | 53,609 | 1,451 | |
| Teradyne Inc. | 73,606 | 1,328 | |
| Jabil Circuit Inc. | 66,477 | 1,286 | |
| Atmel Corp. | 143,197 | 1,170 | |
| * | Cree Inc. | 37,437 | 1,019 |
| * | ANSYS Inc. | 11,396 | 1,010 |
| * | Ciena Corp. | 41,072 | 918 |
| Leidos Holdings Inc. | 21,440 | 902 | |
| CDK Global Inc. | 18,151 | 899 | |
| Mentor Graphics Corp. | 33,904 | 876 | |
| * | Synopsys Inc. | 18,623 | 874 |
| * | Tech Data Corp. | 12,607 | 822 |
| Convergys Corp. | 33,909 | 766 | |
| Broadridge Financial | |||
| Solutions Inc. | 13,162 | 695 | |
| Diebold Inc. | 22,248 | 692 | |
| * | Trimble Navigation Ltd. | 36,497 | 690 |
| Science Applications | |||
| International Corp. | 13,582 | 662 | |
| Lexmark International Inc. | |||
| Class A | 21,031 | 631 | |
| Jack Henry & Associates Inc. | 9,259 | 629 | |
| Cypress Semiconductor Corp. | 61,493 | 615 | |
| * | CoreLogic Inc. | 14,857 | 564 |
| * | Acxiom Corp. | 26,821 | 562 |
| FEI Co. | 7,415 | 560 | |
| * | Keysight Technologies Inc. | 17,430 | 558 |
| * | Fairchild Semiconductor | ||
| International Inc. Class A | 39,947 | 543 | |
| * | NeuStar Inc. Class A | 18,997 | 531 |
| * | Polycom Inc. | 46,337 | 499 |
| * | Knowles Corp. | 30,268 | 493 |
| Intersil Corp. Class A | 45,230 | 477 | |
| DST Systems Inc. | 4,558 | 467 | |
| Vishay Intertechnology Inc. | 46,581 | 460 | |
| National Instruments Corp. | 15,632 | 457 | |
| Solera Holdings Inc. | 9,442 | 455 | |
| * | SunEdison Inc. | 40,008 | 416 |
33
S&P Mid-Cap 400 Value Index Fund
| Market | |||
| Value• | |||
| Shares | ($000) | ||
| *,^ | Advanced Micro | ||
| Devices Inc. | 216,232 | 391 | |
| Belden Inc. | 6,878 | 347 | |
| * | IPG Photonics Corp. | 4,052 | 342 |
| * | Integrated Device | ||
| Technology Inc. | 15,225 | 289 | |
| * | CommVault Systems Inc. | 6,545 | 235 |
| * | 3D Systems Corp. | 15,098 | 207 |
| Plantronics Inc. | 3,615 | 192 | |
| * | Silicon Laboratories Inc. | 4,212 | 183 |
| * | Rovi Corp. | 16,028 | 177 |
| 32,611 | |||
| Materials (8.6%) | |||
| Albemarle Corp. | 38,489 | 1,740 | |
| Steel Dynamics Inc. | 82,959 | 1,616 | |
| Reliance Steel & | |||
| Aluminum Co. | 25,487 | 1,481 | |
| AptarGroup Inc. | 21,477 | 1,447 | |
| Bemis Co. Inc. | 33,431 | 1,418 | |
| Sonoco Products Co. | 34,618 | 1,361 | |
| Ashland Inc. | 10,879 | 1,142 | |
| Domtar Corp. | 21,962 | 883 | |
| United States Steel Corp. | 49,981 | 819 | |
| * | Louisiana-Pacific Corp. | 48,873 | 804 |
| Silgan Holdings Inc. | 14,326 | 750 | |
| Cabot Corp. | 21,775 | 738 | |
| Allegheny Technologies Inc. | 37,471 | 724 | |
| RPM International Inc. | 15,540 | 681 | |
| Carpenter Technology Corp. | 17,293 | 674 | |
| Commercial Metals Co. | 39,706 | 623 | |
| Olin Corp. | 26,595 | 531 | |
| Sensient Technologies Corp. | 7,696 | 501 | |
| Scotts Miracle-Gro Co. | |||
| Class A | 7,979 | 496 | |
| PolyOne Corp. | 13,465 | 437 | |
| Worthington Industries Inc. | 16,596 | 425 | |
| Chemours Co. | 42,240 | 408 | |
| NewMarket Corp. | 1,053 | 404 | |
| Compass Minerals | |||
| International Inc. | 4,852 | 393 | |
| Royal Gold Inc. | 8,053 | 388 | |
| Greif Inc. Class A | 11,651 | 341 | |
| 21,225 | |||
| Telecommunication Services (0.4%) | |||
| Telephone & Data | |||
| Systems Inc. | 33,731 | 959 | |
| Utilities (7.5%) | |||
| Alliant Energy Corp. | 38,760 | 2,196 | |
| OGE Energy Corp. | 68,470 | 1,920 | |
| Atmos Energy Corp. | 34,659 | 1,899 | |
| Westar Energy Inc. Class A | 48,462 | 1,771 | |
| Great Plains Energy Inc. | 53,017 | 1,321 | |
| MDU Resources Group Inc. | 66,823 | 1,197 | |
| Cleco Corp. | 20,751 | 1,112 |
| Hawaiian Electric | ||
| Industries Inc. | 36,854 | 1,042 |
| WGL Holdings Inc. | 17,062 | 925 |
| National Fuel Gas Co. | 15,931 | 860 |
| ONE Gas Inc. | 18,045 | 775 |
| Aqua America Inc. | 25,516 | 647 |
| Black Hills Corp. | 15,379 | 612 |
| Questar Corp. | 31,348 | 605 |
| IDACORP Inc. | 9,328 | 554 |
| Vectren Corp. | 13,041 | 525 |
| PNM Resources Inc. | 15,031 | 385 |
| * Talen Energy Corp. | 15,400 | 219 |
| 18,565 | ||
| Total Common Stocks | ||
| (Cost $255,492) | 245,366 | |
| Temporary Cash Investments (0.2%)1 | ||
| Money Market Fund (0.2%) | ||
| 2,3 Vanguard Market Liquidity | ||
| Fund, 0.168% | 518,883 | 519 |
| Face | ||
| Amount | ||
| ($000) | ||
| U.S. Government and Agency Obligations (0.0%) | ||
| 4,5 Federal Home Loan Bank | ||
| Discount Notes, 0.100%, | ||
| 10/23/15 | 100 | 100 |
| Total Temporary Cash Investments | ||
| (Cost $619) | 619 | |
| Total Investments (99.9%) | ||
| (Cost $256,111) | 245,985 | |
| Amount | ||
| ($000) | ||
| Other Assets and Liabilities (0.1%) | ||
| Other Assets | ||
| Investment in Vanguard | 23 | |
| Receivables for Accrued Income | 435 | |
| Receivables for Capital Shares Issued | 3 | |
| Other Assets | 22 | |
| Total Other Assets | 483 | |
| Liabilities | ||
| Collateral for Securities on Loan | (100) | |
| Payables for Capital Shares Redeemed | (129) | |
| Payables to Vanguard | (48) | |
| Other Liabilities | (7) | |
| Total Liabilities | (284) | |
| Net Assets (100%) | 246,184 | |
34
S&P Mid-Cap 400 Value Index Fund
| At August 31, 2015, net assets consisted of: | |
| Amount | |
| ($000) | |
| Paid-in Capital | 261,463 |
| Undistributed Net Investment Income | 2,862 |
| Accumulated Net Realized Losses | (7,972) |
| Unrealized Appreciation (Depreciation) | |
| Investment Securities | (10,126) |
| Futures Contracts | (43) |
| Net Assets | 246,184 |
| ETF Shares—Net Assets | |
| Applicable to 1,125,000 outstanding | |
| $.001 par value shares of beneficial | |
| interest (unlimited authorization) | 102,824 |
| Net Asset Value Per Share— | |
| ETF Shares | $91.40 |
| Institutional Shares—Net Assets | |
| Applicable to 783,726 outstanding | |
| $.001 par value shares of beneficial | |
| interest (unlimited authorization) | 143,360 |
| Net Asset Value Per Share— | |
| Institutional Shares | $182.92 |
• See Note A in Notes to Financial Statements.
* Non-income-producing security.
^ Includes partial security positions on loan to broker-dealers. The total value of securities on loan is $91,000.
1 The fund invests a portion of its cash reserves in equity markets through the use of index futures contracts. After giving effect to futures
investments, the fund’s effective common stock and temporary cash investment positions represent 99.9% and 0.0%, respectively, of
net assets.
2 Affiliated money market fund available only to Vanguard funds and certain trusts and accounts managed by Vanguard. Rate shown is
the 7-day yield.
3 Includes $100,000 of collateral received for securities on loan.
4 The issuer operates under a congressional charter; its securities are generally neither guaranteed by the U.S. Treasury nor backed by the
full faith and credit of the U.S. government.
5 Securities with a value of $100,000 have been segregated as initial margin for open futures contracts.
See accompanying Notes, which are an integral part of the Financial Statements.
35
S&P Mid-Cap 400 Value Index Fund
Statement of Operations
| Year Ended | |
| August 31, 2015 | |
| ($000) | |
| Investment Income | |
| Income | |
| Dividends | 4,805 |
| Interest1 | 2 |
| Securities Lending | 42 |
| Total Income | 4,849 |
| Expenses | |
| The Vanguard Group—Note B | |
| Investment Advisory Services | 44 |
| Management and Administrative—ETF Shares | 141 |
| Management and Administrative—Institutional Shares | 33 |
| Marketing and Distribution—ETF Shares | 14 |
| Marketing and Distribution—Institutional Shares | 22 |
| Custodian Fees | 35 |
| Auditing Fees | 24 |
| Shareholders’ Reports—ETF Shares | 6 |
| Shareholders’ Reports—Institutional Shares | — |
| Total Expenses | 319 |
| Net Investment Income | 4,530 |
| Realized Net Gain (Loss) | |
| Investment Securities Sold | 16,235 |
| Futures Contracts | 46 |
| Realized Net Gain (Loss) | 16,281 |
| Change in Unrealized Appreciation (Depreciation) | |
| Investment Securities | (29,080) |
| Futures Contracts | (56) |
| Change in Unrealized Appreciation (Depreciation) | (29,136) |
| Net Increase (Decrease) in Net Assets Resulting from Operations | (8,325) |
| 1 Interest income from an affiliated company of the fund was $1,000. | |
See accompanying Notes, which are an integral part of the Financial Statements.
36
S&P Mid-Cap 400 Value Index Fund
Statement of Changes in Net Assets
| Year Ended August 31, | ||
| 2015 | 2014 | |
| ($000) | ($000) | |
| Increase (Decrease) in Net Assets | ||
| Operations | ||
| Net Investment Income | 4,530 | 2,639 |
| Realized Net Gain (Loss) | 16,281 | 16,837 |
| Change in Unrealized Appreciation (Depreciation) | (29,136) | 10,871 |
| Net Increase (Decrease) in Net Assets Resulting from Operations | (8,325) | 30,347 |
| Distributions | ||
| Net Investment Income | ||
| ETF Shares | (1,346) | (632) |
| Institutional Shares | (2,346) | (787) |
| Realized Capital Gain | ||
| ETF Shares | — | — |
| Institutional Shares | — | — |
| Total Distributions | (3,692) | (1,419) |
| Capital Share Transactions | ||
| ETF Shares | 19,749 | 48,434 |
| Institutional Shares | 14,582 | 69,996 |
| Net Increase (Decrease) from Capital Share Transactions | 34,331 | 118,430 |
| Total Increase (Decrease) | 22,314 | 147,358 |
| Net Assets | ||
| Beginning of Period | 223,870 | 76,512 |
| End of Period1 | 246,184 | 223,870 |
| 1 Net Assets—End of Period includes undistributed (overdistributed) net investment income of $2,862,000 and $2,024,000. | ||
See accompanying Notes, which are an integral part of the Financial Statements.
37
S&P Mid-Cap 400 Value Index Fund
Financial Highlights
| ETF Shares | |||||
| Sept. 7, | |||||
| 20101 to | |||||
| For a Share Outstanding | Year Ended August 31, | August 31, | |||
| Throughout Each Period | 2015 | 2014 | 2013 | 2012 | 2011 |
| Net Asset Value, Beginning of Period | $96.78 | $77.93 | $62.71 | $55.69 | $49.86 |
| Investment Operations | |||||
| Net Investment Income | 1.600 | 1.5002 | 1.153 | 1.001 | .746 |
| Net Realized and Unrealized Gain (Loss) | |||||
| on Investments | (5.563) | 18.094 | 15.146 | 6.814 | 5.340 |
| Total from Investment Operations | (3.963) | 19.594 | 16.299 | 7.815 | 6.086 |
| Distributions | |||||
| Dividends from Net Investment Income | (1.417) | (.744) | (1.079) | (.795) | (.256) |
| Distributions from Realized Capital Gains | — | — | — | — | — |
| Total Distributions | (1.417) | (.744) | (1.079) | (.795) | (.256) |
| Net Asset Value, End of Period | $91.40 | $96.78 | $77.93 | $62.71 | $55.69 |
| Total Return | -4.17% | 25.26% | 26.31% | 14.18% | 12.18% |
| Ratios/Supplemental Data | |||||
| Net Assets, End of Period (Millions) | $103 | $87 | $27 | $9 | $6 |
| Ratio of Total Expenses to Average Net Assets | 0.20% | 0.20% | 0.20% | 0.20% | 0.20%3 |
| Ratio of Net Investment Income to | |||||
| Average Net Assets | 1.75% | 1.66% | 1.87% | 1.80% | 1.82%3 |
| Portfolio Turnover Rate 4 | 47% | 35% | 74% | 31% | 48% |
1 Inception.
2 Calculated based on average shares outstanding.
3 Annualized.
4 Excludes the value of portfolio securities received or delivered as a result of in-kind purchases or redemptions of the fund’s capital shares,
including ETF Creation Units.
See accompanying Notes, which are an integral part of the Financial Statements.
38
S&P Mid-Cap 400 Value Index Fund
Financial Highlights
| Institutional Shares | |||||
| Nov. 2, | |||||
| 20101 to | |||||
| For a Share Outstanding | Year Ended August 31, | August 31, | |||
| Throughout Each Period | 2015 | 2014 | 2013 | 2012 | 2011 |
| Net Asset Value, Beginning of Period | $193.66 | $155.83 | $125.30 | $111.20 | $109.35 |
| Investment Operations | |||||
| Net Investment Income | 3.420 | 3.1912 | 2.392 | 2.124 | 1.146 |
| Net Realized and Unrealized Gain (Loss) | |||||
| on Investments | (11.127) | 36.207 | 30.364 | 13.624 | 1.233 |
| Total from Investment Operations | (7.707) | 39.398 | 32.756 | 15.748 | 2.379 |
| Distributions | |||||
| Dividends from Net Investment Income | (3.033) | (1.568) | (2.226) | (1.648) | (.529) |
| Distributions from Realized Capital Gains | — | — | — | — | — |
| Total Distributions | (3.033) | (1.568) | (2.226) | (1.648) | (.529) |
| Net Asset Value, End of Period | $182.92 | $193.66 | $155.83 | $125.30 | $111.20 |
| Total Return | -4.05% | 25.42% | 26.47% | 14.32% | 2.15% |
| Ratios/Supplemental Data | |||||
| Net Assets, End of Period (Millions) | $143 | $137 | $49 | $40 | $35 |
| Ratio of Total Expenses to Average Net Assets | 0.08% | 0.08% | 0.08% | 0.08% | 0.08%3 |
| Ratio of Net Investment Income to | |||||
| Average Net Assets | 1.87% | 1.78% | 1.99% | 1.92% | 1.94%3 |
| Portfolio Turnover Rate 4 | 47% | 35% | 74% | 31% | 48% |
1 Inception.
2 Calculated based on average shares outstanding.
3 Annualized.
4 Excludes the value of portfolio securities received or delivered as a result of in-kind purchases or redemptions of the fund’s capital shares,
including ETF Creation Units.
See accompanying Notes, which are an integral part of the Financial Statements.
39
S&P Mid-Cap 400 Value Index Fund
Notes to Financial Statements
Vanguard S&P Mid-Cap 400 Value Index Fund is registered under the Investment Company Act of 1940 as an open-end investment company, or mutual fund. The fund offers two classes of shares: ETF Shares and Institutional Shares. ETF Shares are listed for trading on NYSE Arca; they can be purchased and sold through a broker. Institutional Shares are designed for investors who meet certain administrative, service, and account-size criteria.
A. The following significant accounting policies conform to generally accepted accounting principles for U.S. investment companies. The fund consistently follows such policies in preparing its financial statements.
1. Security Valuation: Securities are valued as of the close of trading on the New York Stock Exchange (generally 4 p.m., Eastern time) on the valuation date. Equity securities are valued at the latest quoted sales prices or official closing prices taken from the primary market in which each security trades; such securities not traded on the valuation date are valued at the mean of the latest quoted bid and asked prices. Securities for which market quotations are not readily available, or whose values have been materially affected by events occurring before the fund’s pricing time but after the close of the securities’ primary markets, are valued by methods deemed by the board of trustees to represent fair value. Investments in Vanguard Market Liquidity Fund are valued at that fund’s net asset value. Temporary cash investments acquired over 60 days to maturity are valued using the latest bid prices or using valuations based on a matrix system (which considers such factors as security prices, yields, maturities, and ratings), both as furnished by independent pricing services. Other temporary cash investments are valued at amortized cost, which approximates market value.
2. Futures Contracts: The fund uses index futures contracts to a limited extent, with the objectives of maintaining full exposure to the stock market, enhancing returns, maintaining liquidity, and minimizing transaction costs. The fund may purchase futures contracts to immediately invest incoming cash in the market, or sell futures in response to cash outflows, thereby simulating a fully invested position in the underlying index while maintaining a cash balance for liquidity. The fund may seek to enhance returns by using futures contracts instead of the underlying securities when futures are believed to be priced more attractively than the underlying securities. The primary risks associated with the use of futures contracts are imperfect correlation between changes in market values of stocks held by the fund and the prices of futures contracts, and the possibility of an illiquid market. Counterparty risk involving futures is mitigated because a regulated clearinghouse is the counterparty instead of the clearing broker. To further mitigate counterparty risk, the fund trades futures contracts on an exchange, monitors the financial strength of its clearing brokers and clearinghouse, and has entered into clearing agreements with its clearing brokers. The clearinghouse imposes initial margin requirements to secure the fund’s performance and requires daily settlement of variation margin representing changes in the market value of each contract.
Futures contracts are valued at their quoted daily settlement prices. The aggregate settlement values of the contracts are not recorded in the Statement of Net Assets. Fluctuations in the value of the contracts are recorded in the Statement of Net Assets as an asset (liability) and in the Statement of Operations as unrealized appreciation (depreciation) until the contracts are closed, when they are recorded as realized futures gains (losses).
During the year ended August 31, 2015, the fund’s average investments in long and short futures contracts represented less than 1% and 0% of net assets, respectively, based on the average of aggregate settlement values at each quarter-end during the period.
40
S&P Mid-Cap 400 Value Index Fund
3. Federal Income Taxes: The fund intends to continue to qualify as a regulated investment company and distribute all of its taxable income. Management has analyzed the fund’s tax positions taken for all open federal income tax years (August 31, 2012–2015), and has concluded that no provision for federal income tax is required in the fund’s financial statements.
4. Distributions: Distributions to shareholders are recorded on the ex-dividend date.
5. Securities Lending: To earn additional income, the fund lends its securities to qualified institutional borrowers. Security loans are required to be secured at all times by collateral in an amount at least equal to the market value of securities loaned. Daily market fluctuations could cause the value of loaned securities to be more or less than the value of the collateral received. When this occurs, the collateral is adjusted and settled on the next business day. The fund further mitigates its counterparty risk by entering into securities lending transactions only with a diverse group of prequalified counter-parties, monitoring their financial strength, and entering into master securities lending agreements with its counterparties. The master securities lending agreements provide that, in the event of a counterparty’s default (including bankruptcy), the fund may terminate any loans with that borrower, determine the net amount owed, and sell or retain the collateral up to the net amount owed to the fund; however, such actions may be subject to legal proceedings. While collateral mitigates counter-party risk, in the absence of a default the fund may experience delays and costs in recovering the securities loaned. The fund invests cash collateral received in Vanguard Market Liquidity Fund, and records a liability in the Statement of Net Assets for the return of the collateral, during the period the securities are on loan. Securities lending income represents fees charged to borrowers plus income earned on invested cash collateral, less expenses associated with the loan.
6. Credit Facility: The fund and certain other funds managed by The Vanguard Group (“Vanguard”) participate in a $3 billion committed credit facility provided by a syndicate of lenders pursuant to a credit agreement that may be renewed annually; each fund is individually liable for its borrowings, if any, under the credit facility. Borrowings may be utilized for temporary and emergency purposes, and are subject to the fund’s regulatory and contractual borrowing restrictions. The participating funds are charged administrative fees and an annual commitment fee of 0.06% of the undrawn amount of the facility; these fees are allocated to the funds based on a method approved by the fund’s board of trustees and included in Management and Administrative expenses on the fund’s Statement of Operations. Any borrowings under this facility bear interest at a rate equal to the higher of the federal funds rate or LIBOR reference rate plus an agreed-upon spread.
The fund had no borrowings outstanding at August 31, 2015, or at any time during the period then ended.
7. Other: Dividend income is recorded on the ex-dividend date. Interest income includes income distributions received from Vanguard Market Liquidity Fund and is accrued daily. Premiums and discounts on debt securities purchased are amortized and accreted, respectively, to interest income over the lives of the respective securities. Security transactions are accounted for on the date securities are bought or sold. Costs used to determine realized gains (losses) on the sale of investment securities are those of the specific securities sold.
Each class of shares has equal rights as to assets and earnings, except that each class separately bears certain class-specific expenses related to maintenance of shareholder accounts (included in Management and Administrative expenses) and shareholder reporting. Marketing and distribution expenses are allocated to each class of shares based on a method approved by the board of trustees. Income, other non-class-specific expenses, and gains and losses on investments are allocated to each class of shares based on its relative net assets.
41
S&P Mid-Cap 400 Value Index Fund
B. In accordance with the terms of a Funds’ Service Agreement (the “FSA”) between Vanguard and the fund, Vanguard furnishes to the fund investment advisory, corporate management, administrative, marketing, and distribution services at Vanguard’s cost of operations (as defined by the FSA). These costs of operations are allocated to the fund based on methods and guidelines approved by the board of trustees. Vanguard does not require reimbursement in the current period for certain costs of operations (such as deferred compensation/benefits and risk/insurance costs); the fund’s liability for these costs of operations is included in Payables to Vanguard on the Statement of Net Assets.
Upon the request of Vanguard, the fund may invest up to 0.40% of its net assets as capital in Vanguard. At August 31, 2015, the fund had contributed to Vanguard capital in the amount of $23,000, representing 0.01% of the fund’s net assets and 0.01% of Vanguard’s capitalization. The fund’s trustees and officers are also directors and employees, respectively, of Vanguard.
C. Various inputs may be used to determine the value of the fund’s investments. These inputs are summarized in three broad levels for financial statement purposes. The inputs or methodologies used to value securities are not necessarily an indication of the risk associated with investing in those securities.
Level 1—Quoted prices in active markets for identical securities.
Level 2—Other significant observable inputs (including quoted prices for similar securities, interest rates, prepayment speeds, credit risk, etc.).
Level 3—Significant unobservable inputs (including the fund’s own assumptions used to determine the fair value of investments).
The following table summarizes the market value of the fund’s investments as of August 31, 2015, based on the inputs used to value them:
| Level 1 | Level 2 | Level 3 | |
| Investments | ($000) | ($000) | ($000) |
| Common Stocks | 245,366 | — | — |
| Temporary Cash Investments | 519 | 100 | — |
| Futures Contracts—Liabilities1 | (8) | — | — |
| Total | 245,877 | 100 | — |
| 1 Represents variation margin on the last day of the reporting period. | |||
D. At August 31, 2015, the aggregate settlement value of open futures contracts and the related unrealized appreciation (depreciation) were:
| ($000) | ||||
| Aggregate | ||||
| Number of | Settlement | Unrealized | ||
| Long (Short) | Value | Appreciation | ||
| Futures Contracts | Expiration | Contracts | Long (Short) | (Depreciation) |
| E-mini S&P Mid-Cap 400 Index | September 2015 | 5 | 707 | (43) |
Unrealized appreciation (depreciation) on open futures contracts is required to be treated as realized gain (loss) for tax purposes.
42
S&P Mid-Cap 400 Value Index Fund
E. Distributions are determined on a tax basis and may differ from net investment income and realized capital gains for financial reporting purposes. Differences may be permanent or temporary. Permanent differences are reclassified among capital accounts in the financial statements to reflect their tax character. Temporary differences arise when certain items of income, expense, gain, or loss are recognized in different periods for financial statement and tax purposes. These differences will reverse at some time in the future. Differences in classification may also result from the treatment of short-term gains as ordinary income for tax purposes.
During the year ended August 31, 2015, the fund realized $21,380,000 of net capital gains resulting from in-kind redemptions—in which shareholders exchanged fund shares for securities held by the fund rather than for cash. Because such gains are not taxable to the fund, and are not distributed to shareholders, they have been reclassified from accumulated net realized losses to paid-in capital.
For tax purposes, at August 31, 2015, the fund had $2,903,000 of ordinary income available for distribution. The fund had available capital losses totaling $8,016,000 that may be carried forward indefinitely to offset future net capital gains.
At August 31, 2015, the cost of investment securities for tax purposes was $256,111,000. Net unrealized depreciation of investment securities for tax purposes was $10,126,000, consisting of unrealized gains of $14,461,000 on securities that had risen in value since their purchase and $24,587,000 in unrealized losses on securities that had fallen in value since their purchase.
F. During the year ended August 31, 2015, the fund purchased $256,993,000 of investment securities and sold $221,626,000 of investment securities, other than temporary cash investments. Purchases and sales include $126,323,000 and $106,595,000, respectively, in connection with in-kind purchases and redemptions of the fund’s capital shares.
G. Capital share transactions for each class of shares were:
| Year Ended August 31, | ||||
| 2015 | 2014 | |||
| Amount | Shares | Amount | Shares | |
| ($000) | (000) | ($000) | (000) | |
| ETF Shares | ||||
| Issued | 152,983 | 1,600 | 133,382 | 1,500 |
| Issued in Lieu of Cash Distributions | — | — | — | — |
| Redeemed | (133,234) | (1,375) | (84,948) | (950) |
| Net Increase (Decrease)—ETF Shares | 19,749 | 225 | 48,434 | 550 |
| Institutional Shares | ||||
| Issued | 30,861 | 160 | 78,767 | 439 |
| Issued in Lieu of Cash Distributions | 1,205 | 6 | 278 | 2 |
| Redeemed | (17,484) | (89) | (9,049) | (51) |
| Net Increase (Decrease) —Institutional Shares | 14,582 | 77 | 69,996 | 390 |
H. Management has determined that no material events or transactions occurred subsequent to August 31, 2015, that would require recognition or disclosure in these financial statements.
43
S&P Mid-Cap 400 Growth Index Fund
Fund Profile
As of August 31, 2015
| Share-Class Characteristics | ||
| ETF | Institutional | |
| Shares | Shares | |
| Ticker Symbol | IVOG | VMFGX |
| Expense Ratio1 | 0.20% | 0.08% |
| 30-Day SEC Yield | 1.10% | 1.23% |
| Portfolio Characteristics | |||
| DJ | |||
| U.S. | |||
| S&P | Total | ||
| MidCap | Market | ||
| 400 Growth | FA | ||
| Fund | Index | Index | |
| Number of Stocks | 229 | 228 | 3,828 |
| Median Market Cap | $5.6B | $5.6B | $47.2B |
| Price/Earnings Ratio | 24.8x | 24.8x | 20.8x |
| Price/Book Ratio | 3.5x | 3.5x | 2.6x |
| Return on Equity | 16.1% | 16.1% | 17.1% |
| Earnings Growth | |||
| Rate | 18.2% | 18.2% | 10.2% |
| Dividend Yield | 1.4% | 1.4% | 2.1% |
| Foreign Holdings | 0.0% | 0.0% | 0.0% |
| Turnover Rate | 47% | — | — |
| Short-Term | |||
| Reserves | 0.1% | — | — |
| Volatility Measures | ||
| S&P | DJ | |
| MidCap | U.S. Total | |
| 400 Growth | Market | |
| Index | FA Index | |
| R-Squared | 1.00 | 0.80 |
| Beta | 1.00 | 1.04 |
| These measures show the degree and timing of the fund’s | ||
| fluctuations compared with the indexes over 36 months. | ||
| Ten Largest Holdings (% of total net assets) | ||
| Church & Dwight Co. | ||
| Inc. | Household Products | 1.4% |
| Foot Locker Inc. | Apparel Retail | 1.3 |
| Alaska Air Group Inc. | Airlines | 1.2 |
| Hologic Inc. | Health Care | |
| Equipment | 1.2 | |
| Wabtec Corp. | Construction | |
| Machinery & Heavy | ||
| Trucks | 1.2 | |
| LKQ Corp. | Distributors | 1.2 |
| Extra Space Storage Inc. Specialized REITs | 1.2 | |
| Federal Realty | ||
| Investment Trust | Retail REITs | 1.1 |
| Acuity Brands Inc. | Electrical | |
| Components & | ||
| Equipment | 1.1 | |
| UDR Inc. | Residential REITs | 1.1 |
| Top Ten | 12.0% | |
| The holdings listed exclude any temporary cash investments and equity index products. | ||
Investment Focus
1 The expense ratios shown are from the prospectus dated December 19, 2014, and represent estimated costs for the current fiscal year. For the
fiscal year ended August 31, 2015, the expense ratios were 0.20% for ETF Shares and 0.08% for Institutional Shares.
44
S&P Mid-Cap 400 Growth Index Fund
Sector Diversification (% of equity exposure)
| DJ | |||
| S&P | U.S. | ||
| MidCap | Total | ||
| 400 | Market | ||
| Growth | FA | ||
| Fund | Index | Index | |
| Consumer Discretionary 16.9% | 16.9% | 13.5% | |
| Consumer Staples | 4.7 | 4.7 | 8.4 |
| Energy | 0.6 | 0.6 | 6.6 |
| Financials | 24.3 | 24.3 | 18.2 |
| Health Care | 13.3 | 13.3 | 15.0 |
| Industrials | 14.7 | 14.7 | 10.7 |
| Information Technology | 18.1 | 18.1 | 19.1 |
| Materials | 5.3 | 5.3 | 3.3 |
| Telecommunication | |||
| Services | 0.0 | 0.0 | 2.2 |
| Utilities | 2.1 | 2.1 | 3.0 |
45
S&P Mid-Cap 400 Growth Index Fund
Performance Summary
All of the returns in this report represent past performance, which is not a guarantee of future results that may be achieved by the fund. (Current performance may be lower or higher than the performance data cited. For performance data current to the most recent month-end, visit our website at vanguard.com/performance.) Note, too, that both investment returns and principal value can fluctuate widely, so an investor’s shares, when sold, could be worth more or less than their original cost. The returns shown do not reflect taxes that a shareholder would pay on fund distributions or on the sale of fund shares.
Cumulative Performance: September 7, 2010, Through August 31, 2015
Initial Investment of $10,000
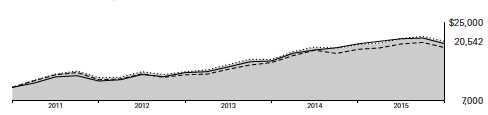
| Average Annual Total Returns | ||||
| Periods Ended August 31, 2015 | ||||
| Since | Final Value | |||
| One | Inception | of a $10,000 | ||
| Year | (9/7/2010) | Investment | ||
| S&P Mid-Cap 400 Growth Index | ||||
| Fund*ETF Shares Net Asset Value | 3.60% | 15.55% | $20,542 | |
| S&P Mid-Cap 400 Growth Index | ||||
| Fund*ETF Shares Market Price | 3.63 | 15.55 | 20,539 | |
| •••••••• | S&P MidCap 400 Growth Index | 3.79 | 15.75 | 20,722 |
| – – – – | Mid-Cap Growth Funds Average | 2.23 | 14.07 | 19,262 |
| Dow Jones U.S. Total Stock Market | ||||
| Float Adjusted Index | 0.29 | 15.13 | 20,172 | |
Mid-Cap Growth Funds Average: Derived from data provided by Lipper, a Thomson Reuters Company.
"Since Inception" performance is calculated from the ETF Shares’ inception date for both the fund and its comparative standards.
| Since | Final Value | ||
| One | Inception | of a $5,000,000 | |
| Year | (3/28/2011) | Investment | |
| S&P Mid-Cap 400 Growth Index Fund | |||
| Institutional Shares | 3.72% | 10.82% | $7,880,890 |
| S&P MidCap 400 Growth Index | 3.79 | 10.88 | 7,900,227 |
| Dow Jones U.S. Total Stock Market Float | |||
| Adjusted Index | 0.29 | 11.83 | 8,202,256 |
"Since Inception" performance is calculated from the Institutional Shares’ inception date for both the fund and its comparative standards.
Institutional Shares were first issued on December 15, 2010, and the sole shareholder redeemed shortly thereafter. Institutional Shares were
next issued on March 28, 2011. The total returns shown are based on the period beginning March 28, 2011.
See Financial Highlights for dividend and capital gains information.
46
S&P Mid-Cap 400 Growth Index Fund
Cumulative Returns of ETF Shares: September 7, 2010, Through August 31, 2015
| Since | ||
| One | Inception | |
| Year | (9/7/2010) | |
| S&P Mid-Cap 400 Growth Index Fund ETF Shares | ||
| Market Price | 3.63% | 105.39% |
| S&P Mid-Cap 400 Growth Index Fund ETF Shares | ||
| Net Asset Value | 3.60 | 105.42 |
| S&P MidCap 400 Growth Index | 3.79 | 107.22 |
| "Since Inception" performance is calculated from the ETF Shares’ inception date for both the fund and its comparative standards. | ||
Fiscal-Year Total Returns (%): September 7, 2010, Through August 31, 2015

Average Annual Total Returns: Periods Ended June 30, 2015
This table presents returns through the latest calendar quarter—rather than through the end of the fiscal period.
Securities and Exchange Commission rules require that we provide this information.
| Inception | One | Since | |
| Date | Year | Inception | |
| ETF Shares | 9/7/2010 | ||
| Market Price | 8.79% | 17.24% | |
| Net Asset Value | 8.85 | 17.23 | |
| Institutional Shares | 3/28/20111 | 8.98 | 12.45 |
1 Institutional Shares were first issued on December 15, 2010, and the sole shareholder redeemed shortly thereafter. Institutional Shares
were next issued on March 28, 2011. The total returns shown are based on the period beginning March 28, 2011.
47
S&P Mid-Cap 400 Growth Index Fund
Financial Statements
Statement of Net Assets
As of August 31, 2015
The fund reports a complete list of its holdings in regulatory filings four times in each fiscal year, at
the quarter-ends. For the second and fourth fiscal quarters, the lists appear in the fund’s semiannual
and annual reports to shareholders. For the first and third fiscal quarters, the fund files the lists with
the Securities and Exchange Commission on Form N-Q. Shareholders can look up the fund’s Forms
N-Q on the SEC’s website at sec.gov. Forms N-Q may also be reviewed and copied at the SEC’s
Public Reference Room (see the back cover of this report for further information).
| Market | |||
| Value• | |||
| Shares | ($000) | ||
| Common Stocks (100.0%)1 | |||
| Consumer Discretionary (16.9%) | |||
| Foot Locker Inc. | 83,999 | 5,946 | |
| * | LKQ Corp. | 182,707 | 5,479 |
| Polaris Industries Inc. | 36,723 | 4,769 | |
| Williams-Sonoma Inc. | 51,191 | 3,892 | |
| Service Corp. International | 121,378 | 3,599 | |
| * | Toll Brothers Inc. | 96,253 | 3,559 |
| * | Jarden Corp. | 68,736 | 3,529 |
| * | NVR Inc. | 2,319 | 3,525 |
| Domino’s Pizza Inc. | 33,150 | 3,512 | |
| * | Skechers U.S.A. Inc. | ||
| Class A | 24,687 | 3,474 | |
| Carter’s Inc. | 31,556 | 3,102 | |
| Dunkin’ Brands Group Inc. | 57,802 | 2,899 | |
| Brunswick Corp. | 55,677 | 2,768 | |
| Gentex Corp. | 176,699 | 2,739 | |
| * | Tempur Sealy | ||
| International Inc. | 36,653 | 2,676 | |
| * | AMC Networks Inc. Class A | 35,599 | 2,577 |
| * | Buffalo Wild Wings Inc. | 11,408 | 2,164 |
| * | Live Nation | ||
| Entertainment Inc. | 87,643 | 2,158 | |
| Brinker International Inc. | 36,719 | 1,951 | |
| * | Panera Bread Co. Class A | 10,512 | 1,874 |
| Jack in the Box Inc. | 22,451 | 1,755 | |
| * | Deckers Outdoor Corp. | 19,998 | 1,288 |
| Cracker Barrel Old | |||
| Country Store Inc. | 8,496 | 1,225 | |
| HSN Inc. | 19,554 | 1,189 | |
| Cinemark Holdings Inc. | 32,841 | 1,168 | |
| * | Cable One Inc. | 1,892 | 786 |
| Cheesecake Factory Inc. | 13,879 | 753 | |
| Big Lots Inc. | 15,535 | 746 | |
| John Wiley & Sons Inc. | |||
| Class A | 14,197 | 732 | |
| * | Kate Spade & Co. | 38,304 | 726 |
| Wendy’s Co. | 73,527 | 670 | |
| * | Vista Outdoor Inc. | 14,124 | 660 |
| Thor Industries Inc. | 11,762 | 642 | |
| DeVry Education Group Inc. | 16,174 | 423 | |
| * | TRI Pointe Group Inc. | 30,080 | 418 |
| KB Home | 23,509 | 344 | |
| 79,717 | |||
| Consumer Staples (4.7%) | |||
| Church & Dwight Co. Inc. | 78,607 | 6,782 | |
| * | WhiteWave Foods Co. | ||
| Class A | 105,180 | 4,853 | |
| * | Hain Celestial Group Inc. | 61,624 | 3,750 |
| * | Edgewell Personal Care Co. | 19,796 | 1,743 |
| * | Post Holdings Inc. | 17,875 | 1,167 |
| * | Boston Beer Co. Inc. | ||
| Class A | 5,483 | 1,124 | |
| * | TreeHouse Foods Inc. | 11,321 | 899 |
| Energizer Holdings Inc. | 15,674 | 654 | |
| Lancaster Colony Corp. | 5,828 | 553 | |
| * | SUPERVALU Inc. | 58,331 | 481 |
| 22,006 | |||
| Energy (0.6%) | |||
| Oceaneering | |||
| International Inc. | 34,991 | 1,533 | |
| * | Dril-Quip Inc. | 10,985 | 758 |
| California Resources Corp. | 116,746 | 453 | |
| 2,744 | |||
| Financials (24.3%) | |||
| Extra Space Storage Inc. | 74,033 | 5,440 | |
| Federal Realty | |||
| Investment Trust | 41,252 | 5,325 | |
| UDR Inc. | 155,555 | 5,024 | |
| * | Signature Bank | 30,531 | 4,076 |
| Jones Lang LaSalle Inc. | 26,943 | 4,011 | |
| SEI Investments Co. | 77,835 | 3,937 | |
| Camden Property Trust | 52,161 | 3,757 | |
| Duke Realty Corp. | 207,247 | 3,743 | |
| Kilroy Realty Corp. | 52,886 | 3,430 | |
| Regency Centers Corp. | 56,653 | 3,360 | |
| Omega Healthcare | |||
| Investors Inc. | 96,580 | 3,262 | |
48
S&P Mid-Cap 400 Growth Index Fund
| Market | |||
| Value• | |||
| Shares | ($000) | ||
| CBOE Holdings Inc. | 50,136 | 3,172 | |
| Arthur J Gallagher & Co. | 65,569 | 2,867 | |
| RenaissanceRe Holdings Ltd. | 27,660 | 2,820 | |
| MSCI Inc. Class A | 45,242 | 2,738 | |
| Lamar Advertising Co. | |||
| Class A | 48,596 | 2,592 | |
| Alexandria Real Estate | |||
| Equities Inc. | 29,422 | 2,530 | |
| * | SVB Financial Group | 18,465 | 2,310 |
| Douglas Emmett Inc. | 82,352 | 2,275 | |
| Mid-America Apartment | |||
| Communities Inc. | 28,511 | 2,241 | |
| Weingarten Realty Investors | 68,467 | 2,166 | |
| LaSalle Hotel Properties | 67,848 | 2,134 | |
| * | Alleghany Corp. | 4,534 | 2,130 |
| Sovran Self Storage Inc. | 21,561 | 1,935 | |
| Raymond James | |||
| Financial Inc. | 36,139 | 1,915 | |
| Taubman Centers Inc. | 25,986 | 1,793 | |
| Bank of the Ozarks Inc. | 42,215 | 1,765 | |
| East West Bancorp Inc. | 40,865 | 1,651 | |
| National Retail Properties Inc. | 47,488 | 1,650 | |
| American Campus | |||
| Communities Inc. | 46,545 | 1,594 | |
| * | Care Capital Properties Inc. | 49,683 | 1,579 |
| Hospitality Properties Trust | 57,644 | 1,483 | |
| Highwoods Properties Inc. | 37,848 | 1,436 | |
| WR Berkley Corp. | 26,393 | 1,433 | |
| Brown & Brown Inc. | 44,395 | 1,423 | |
| Home Properties Inc. | 18,435 | 1,368 | |
| Eaton Vance Corp. | 38,959 | 1,351 | |
| Primerica Inc. | 31,034 | 1,319 | |
| Tanger Factory Outlet | |||
| Centers Inc. | 40,868 | 1,293 | |
| WisdomTree | |||
| Investments Inc. | 67,489 | 1,265 | |
| BioMed Realty Trust Inc. | 62,387 | 1,154 | |
| PacWest Bancorp | 27,065 | 1,154 | |
| Senior Housing | |||
| Properties Trust | 69,213 | 1,087 | |
| First Horizon National Corp. | 71,574 | 1,040 | |
| Communications | |||
| Sales & Leasing Inc. | 51,149 | 1,028 | |
| * | SLM Corp. | 120,250 | 1,020 |
| Federated Investors Inc. | |||
| Class B | 31,012 | 961 | |
| Waddell & Reed | |||
| Financial Inc. Class A | 23,807 | 930 | |
| Alexander & Baldwin Inc. | 27,307 | 924 | |
| Urban Edge Properties | 37,671 | 788 | |
| Corporate Office | |||
| Properties Trust | 36,309 | 764 | |
| Equity One Inc. | 32,272 | 759 | |
| Janus Capital Group Inc. | 47,948 | 713 |
| Endurance Specialty | |||
| Holdings Ltd. | 10,904 | 695 | |
| Potlatch Corp. | 13,673 | 451 | |
| 115,061 | |||
| Health Care (13.3%) | |||
| * | Hologic Inc. | 146,821 | 5,698 |
| * | Mettler-Toledo | ||
| International Inc. | 16,798 | 4,981 | |
| Cooper Cos. Inc. | 29,184 | 4,740 | |
| * | MEDNAX Inc. | 56,176 | 4,525 |
| * | Centene Corp. | 71,424 | 4,408 |
| * | United Therapeutics Corp. | 27,761 | 4,181 |
| * | IDEXX Laboratories Inc. | 56,214 | 4,018 |
| * | Sirona Dental Systems Inc. | 33,367 | 3,183 |
| ResMed Inc. | 59,249 | 3,077 | |
| * | VCA Inc. | 49,348 | 2,733 |
| * | Align Technology Inc. | 43,650 | 2,471 |
| STERIS Corp. | 35,871 | 2,297 | |
| * | PAREXEL International Corp. | 33,135 | 2,178 |
| Teleflex Inc. | 16,213 | 2,121 | |
| * | Charles River Laboratories | ||
| International Inc. | 28,445 | 1,960 | |
| * | Akorn Inc. | 47,424 | 1,887 |
| * | Catalent Inc. | 58,972 | 1,875 |
| * | Molina Healthcare Inc. | 24,172 | 1,803 |
| West Pharmaceutical | |||
| Services Inc. | 25,495 | 1,424 | |
| Bio-Techne Corp. | 14,727 | 1,391 | |
| * | LifePoint Health Inc. | 13,316 | 1,040 |
| Hill-Rom Holdings Inc. | 17,709 | 936 | |
| * | Community Health | ||
| Systems Inc. | |||
| Rights Exp. 1/4/2016 | 29,782 | — | |
| 62,927 | |||
| Industrials (14.7%) | |||
| Alaska Air Group Inc. | 77,863 | 5,829 | |
| Wabtec Corp. | 58,030 | 5,557 | |
| Acuity Brands Inc. | 26,086 | 5,083 | |
| * | JetBlue Airways Corp. | 158,050 | 3,528 |
| Fortune Brands | |||
| Home & Security Inc. | 63,196 | 3,024 | |
| * | Old Dominion Freight | ||
| Line Inc. | 40,694 | 2,706 | |
| Trinity Industries Inc. | 93,062 | 2,512 | |
| * | Copart Inc. | 68,393 | 2,395 |
| Nordson Corp. | 33,980 | 2,260 | |
| Waste Connections Inc. | 43,893 | 2,088 | |
| IDEX Corp. | 28,088 | 2,018 | |
| ITT Corp. | 53,575 | 2,004 | |
| B/E Aerospace Inc. | 40,809 | 1,989 | |
| AO Smith Corp. | 29,702 | 1,916 | |
| Carlisle Cos. Inc. | 18,834 | 1,897 | |
| Lennox International Inc. | 15,912 | 1,878 | |
| Landstar System Inc. | 26,674 | 1,766 | |
49
S&P Mid-Cap 400 Growth Index Fund
| Market | |||
| Value• | |||
| Shares | ($000) | ||
| Graco Inc. | 23,965 | 1,653 | |
| Huntington Ingalls | |||
| Industries Inc. | 13,145 | 1,480 | |
| Hubbell Inc. Class B | 14,706 | 1,451 | |
| CEB Inc. | 20,096 | 1,439 | |
| * | Kirby Corp. | 20,105 | 1,418 |
| * | Genesee & Wyoming Inc. | ||
| Class A | 20,034 | 1,370 | |
| Lincoln Electric Holdings Inc. | 22,699 | 1,331 | |
| * | Teledyne Technologies Inc. | 12,946 | 1,268 |
| Donaldson Co. Inc. | 37,237 | 1,166 | |
| Rollins Inc. | 40,477 | 1,130 | |
| MSC Industrial | |||
| Direct Co. Inc. Class A | 16,420 | 1,111 | |
| Deluxe Corp. | 18,607 | 1,079 | |
| CLARCOR Inc. | 18,089 | 1,020 | |
| Woodward Inc. | 22,013 | 1,004 | |
| * | Esterline Technologies Corp. | 11,296 | 923 |
| HNI Corp. | 15,483 | 724 | |
| GATX Corp. | 13,435 | 666 | |
| MSA Safety Inc. | 8,697 | 395 | |
| Werner Enterprises Inc. | 13,382 | 354 | |
| 69,432 | |||
| Information Technology (18.1%) | |||
| Global Payments Inc. | 39,916 | 4,446 | |
| * | Gartner Inc. | 49,868 | 4,264 |
| FactSet Research | |||
| Systems Inc. | 23,329 | 3,684 | |
| * | Fortinet Inc. | 85,549 | 3,605 |
| * | Cadence Design | ||
| Systems Inc. | 175,788 | 3,519 | |
| CDK Global Inc. | 64,514 | 3,196 | |
| * | Ultimate Software | ||
| Group Inc. | 17,165 | 3,024 | |
| * | ANSYS Inc. | 33,969 | 3,010 |
| * | Synopsys Inc. | 60,547 | 2,841 |
| * | Tyler Technologies Inc. | 20,224 | 2,792 |
| * | Manhattan Associates Inc. | 44,316 | 2,592 |
| Broadridge Financial | |||
| Solutions Inc. | 48,960 | 2,585 | |
| * | Zebra Technologies Corp. | 31,067 | 2,575 |
| MAXIMUS Inc. | 39,576 | 2,396 | |
| * | PTC Inc. | 69,067 | 2,288 |
| * | Keysight Technologies Inc. | 71,196 | 2,281 |
| Jack Henry & Associates Inc. | 32,908 | 2,236 | |
| * | WEX Inc. | 23,213 | 2,194 |
| * | Rackspace Hosting Inc. | 71,197 | 2,165 |
| * | VeriFone Systems Inc. | 68,647 | 2,145 |
| * | ARRIS Group Inc. | 79,686 | 2,105 |
| * | NetScout Systems Inc. | 56,439 | 2,063 |
| Cognex Corp. | 52,331 | 1,861 | |
| * | Trimble Navigation Ltd. | 91,943 | 1,738 |
| Fair Isaac Corp. | 18,650 | 1,596 | |
| * | SolarWinds Inc. | 39,915 | 1,587 |
| * | Synaptics Inc. | 22,121 | 1,550 |
| * | ACI Worldwide Inc. | 70,121 | 1,496 |
| * | IPG Photonics Corp. | 14,412 | 1,217 |
| * | Integrated Device | ||
| Technology Inc. | 62,417 | 1,185 | |
| Solera Holdings Inc. | 23,801 | 1,147 | |
| * | SunEdison Inc. | 105,126 | 1,093 |
| InterDigital Inc. | 21,678 | 1,072 | |
| * | CoreLogic Inc. | 28,195 | 1,070 |
| National Instruments Corp. | 33,467 | 978 | |
| DST Systems Inc. | 9,002 | 922 | |
| Cypress | |||
| Semiconductor Corp. | 91,626 | 916 | |
| FEI Co. | 11,990 | 905 | |
| Plantronics Inc. | 14,802 | 787 | |
| * | Silicon Laboratories Inc. | 16,448 | 715 |
| Belden Inc. | 13,565 | 684 | |
| * | CommVault Systems Inc. | 14,032 | 503 |
| * | 3D Systems Corp. | 36,577 | 502 |
| * | Rovi Corp. | 24,955 | 276 |
| 85,806 | |||
| Materials (5.3%) | |||
| Packaging Corp. of America | 59,505 | 3,993 | |
| Valspar Corp. | 44,895 | 3,291 | |
| Cytec Industries Inc. | 42,883 | 3,182 | |
| Eagle Materials Inc. | 30,171 | 2,469 | |
| RPM International Inc. | 52,811 | 2,316 | |
| Ashland Inc. | 18,296 | 1,920 | |
| NewMarket Corp. | 4,510 | 1,728 | |
| Royal Gold Inc. | 25,059 | 1,206 | |
| Minerals Technologies Inc. | 20,875 | 1,123 | |
| PolyOne Corp. | 30,020 | 975 | |
| Sensient Technologies Corp. | 14,607 | 952 | |
| Compass Minerals | |||
| International Inc. | 11,736 | 951 | |
| Scotts Miracle-Gro Co. | |||
| Class A | 12,881 | 801 | |
| Chemours Co. | 34,792 | 336 | |
| 25,243 | |||
| Utilities (2.1%) | |||
| UGI Corp. | 103,607 | 3,531 | |
| Aqua America Inc. | 61,684 | 1,564 | |
| National Fuel Gas Co. | 22,833 | 1,232 | |
| Vectren Corp. | 26,818 | 1,079 | |
| Questar Corp. | 50,692 | 979 | |
| IDACORP Inc. | 13,909 | 826 | |
| PNM Resources Inc. | 21,510 | 551 | |
| * | Talen Energy Corp. | 23,031 | 328 |
| 10,090 | |||
| Total Common Stocks | |||
| (Cost $442,384) | 473,026 | ||
50
S&P Mid-Cap 400 Growth Index Fund
| Market | |||
| Value• | |||
| Shares | ($000) | ||
| Temporary Cash Investments (0.0%)1 | |||
| Money Market Fund (0.0%) | |||
| 2 | Vanguard Market Liquidity | ||
| Fund, 0.168% | 1 | — | |
| Face | |||
| Amount | |||
| ($000) | |||
| U.S. Government and Agency Obligations (0.0%) | |||
| 3,4 | Federal Home Loan Bank | ||
| Discount Notes, | |||
| 0.150%, 11/13/15 | 100 | 100 | |
| 5 | Freddie Mac Discount | ||
| Notes, 0.125%, 10/30/15 | 100 | 100 | |
| 200 | |||
| Total Temporary Cash Investments | |||
| (Cost $200) | 200 | ||
| Total Investments (100.0%) | |||
| (Cost $442,584) | 473,226 | ||
| Amount | |||
| ($000) | |||
| Other Assets and Liabilities (0.0%) | |||
| Other Assets | |||
| Investment in Vanguard | 45 | ||
| Receivables for Accrued Income | 395 | ||
| Other Assets | 100 | ||
| Total Other Assets | 540 | ||
| Liabilities | |||
| Payables for Capital Shares Redeemed | (24) | ||
| Payables to Vanguard | (123) | ||
| Other Liabilities | (606) | ||
| Total Liabilities | (753) | ||
| Net Assets (100%) | 473,013 | ||
| At August 31, 2015, net assets consisted of: | |
| Amount | |
| ($000) | |
| Paid-in Capital | 460,488 |
| Undistributed Net Investment Income | 3,297 |
| Accumulated Net Realized Losses | (21,419) |
| Unrealized Appreciation (Depreciation) | |
| Investment Securities | 30,642 |
| Futures Contracts | 5 |
| Net Assets | 473,013 |
| ETF Shares—Net Assets | |
| Applicable to 3,775,000 outstanding | |
| $.001 par value shares of beneficial | |
| interest (unlimited authorization) | 377,030 |
| Net Asset Value Per Share— | |
| ETF Shares | $99.88 |
| Institutional Shares—Net Assets | |
| Applicable to 482,678 outstanding | |
| $.001 par value shares of beneficial | |
| interest (unlimited authorization) | 95,983 |
| Net Asset Value Per Share— | |
| Institutional Shares | $198.85 |
• See Note A in Notes to Financial Statements.
* Non-income-producing security.
1 The fund invests a portion of its cash reserves in equity markets through the use of index futures contracts. After giving effect to futures
investments, the fund’s effective common stock and temporary cash investment positions represent 100.0% and 0.0%, respectively, of
net assets.
2 Affiliated money market fund available only to Vanguard funds and certain trusts and accounts managed by Vanguard. Rate shown is
the 7-day yield.
3 The issuer operates under a congressional charter; its securities are generally neither guaranteed by the U.S. Treasury nor backed by the
full faith and credit of the U.S. government.
4 Securities with a value of $100,000 have been segregated as initial margin for open futures contracts.
5 The issuer was placed under federal conservatorship in September 2008; since that time, its daily operations have been managed by the
Federal Housing Finance Agency and it receives capital from the U.S. Treasury, as needed to maintain a positive net worth, in exchange
for senior preferred stock.
See accompanying Notes, which are an integral part of the Financial Statements.
51
S&P Mid-Cap 400 Growth Index Fund
Statement of Operations
| Year Ended | |
| August 31, 2015 | |
| ($000) | |
| Investment Income | |
| Income | |
| Dividends | 5,555 |
| Interest1 | 1 |
| Securities Lending | 73 |
| Total Income | 5,629 |
| Expenses | |
| The Vanguard Group—Note B | |
| Investment Advisory Services | 77 |
| Management and Administrative—ETF Shares | 524 |
| Management and Administrative—Institutional Shares | 35 |
| Marketing and Distribution—ETF Shares | 48 |
| Marketing and Distribution—Institutional Shares | 12 |
| Custodian Fees | 34 |
| Auditing Fees | 24 |
| Shareholders’ Reports—ETF Shares | 12 |
| Shareholders’ Reports—Institutional Shares | — |
| Total Expenses | 766 |
| Net Investment Income | 4,863 |
| Realized Net Gain (Loss) | |
| Investment Securities Sold | 39,998 |
| Futures Contracts | 53 |
| Realized Net Gain (Loss) | 40,051 |
| Change in Unrealized Appreciation (Depreciation) | |
| Investment Securities | (31,212) |
| Futures Contracts | 1 |
| Change in Unrealized Appreciation (Depreciation) | (31,211) |
| Net Increase (Decrease) in Net Assets Resulting from Operations | 13,703 |
| 1 Interest income from an affiliated company of the fund was $1,000. | |
See accompanying Notes, which are an integral part of the Financial Statements.
52
S&P Mid-Cap 400 Growth Index Fund
Statement of Changes in Net Assets
| Year Ended August 31, | ||
| 2015 | 2014 | |
| ($000) | ($000) | |
| Increase (Decrease) in Net Assets | ||
| Operations | ||
| Net Investment Income | 4,863 | 2,732 |
| Realized Net Gain (Loss) | 40,051 | 20,341 |
| Change in Unrealized Appreciation (Depreciation) | (31,211) | 32,984 |
| Net Increase (Decrease) in Net Assets Resulting from Operations | 13,703 | 56,057 |
| Distributions | ||
| Net Investment Income | ||
| ETF Shares | (2,534) | (1,700) |
| Institutional Shares | (810) | (598) |
| Realized Capital Gain | ||
| ETF Shares | — | — |
| Institutional Shares | — | — |
| Total Distributions | (3,344) | (2,298) |
| Capital Share Transactions | ||
| ETF Shares | 77,454 | 67,226 |
| Institutional Shares | 3,968 | 35,646 |
| Net Increase (Decrease) from Capital Share Transactions | 81,422 | 102,872 |
| Total Increase (Decrease) | 91,781 | 156,631 |
| Net Assets | ||
| Beginning of Period | 381,232 | 224,601 |
| End of Period1 | 473,013 | 381,232 |
| 1 Net Assets—End of Period includes undistributed (overdistributed) net investment income of $3,297,000 and $1,778,000. | ||
See accompanying Notes, which are an integral part of the Financial Statements.
53
S&P Mid-Cap 400 Growth Index Fund
Financial Highlights
| ETF Shares | |||||
| Sept. 7, | |||||
| 20101 to | |||||
| For a Share Outstanding | Year Ended August 31, | August 31, | |||
| Throughout Each Period | 2015 | 2014 | 2013 | 2012 | 2011 |
| Net Asset Value, Beginning of Period | $97.18 | $80.96 | $67.47 | $61.13 | $50.04 |
| Investment Operations | |||||
| Net Investment Income | 1.036 | . 571 | .721 | .405 | .280 |
| Net Realized and Unrealized Gain (Loss) | |||||
| on Investments | 2.456 | 16.256 | 13.257 | 6.266 | 10.910 |
| Total from Investment Operations | 3.492 | 16.827 | 13.978 | 6.671 | 11.190 |
| Distributions | |||||
| Dividends from Net Investment Income | (.792) | (.607) | (. 488) | (. 331) | (.100) |
| Distributions from Realized Capital Gains | — | — | — | — | — |
| Total Distributions | (.792) | (.607) | (. 488) | (. 331) | (.100) |
| Net Asset Value, End of Period | $99.88 | $97.18 | $80.96 | $67.47 | $61.13 |
| Total Return | 3.60% | 20.84% | 20.83% | 10.97% | 22.36% |
| Ratios/Supplemental Data | |||||
| Net Assets, End of Period (Millions) | $377 | $292 | $182 | $91 | $31 |
| Ratio of Total Expenses to Average Net Assets | 0.20% | 0.20% | 0.20% | 0.20% | 0.20%2 |
| Ratio of Net Investment Income to | |||||
| Average Net Assets | 1.08% | 0.81% | 1.08% | 0.76% | 0.63%2 |
| Portfolio Turnover Rate 3 | 47% | 38% | 35% | 26% | 40% |
1 Inception.
2 Annualized.
3 Excludes the value of portfolio securities received or delivered as a result of in-kind purchases or redemptions of the fund’s capital shares,
including ETF Creation Units.
See accompanying Notes, which are an integral part of the Financial Statements.
54
S&P Mid-Cap 400 Growth Index Fund
Financial Highlights
| Institutional Shares | |||||
| March 28, | |||||
| 20111 to | |||||
| For a Share Outstanding | Year Ended August 31, | August 31, | |||
| Throughout Each Period | 2015 | 2014 | 2013 | 2012 | 2011 |
| Net Asset Value, Beginning of Period | $193.45 | $161.12 | $134.20 | $121.54 | $130.08 |
| Investment Operations | |||||
| Net Investment Income | 2.271 | 1.316 | 1.584 | .915 | .304 |
| Net Realized and Unrealized Gain (Loss) | |||||
| on Investments | 4.900 | 32.386 | 26.392 | 12.506 | (8.844) |
| Total from Investment Operations | 7.171 | 33.702 | 27.976 | 13.421 | (8.540) |
| Distributions | |||||
| Dividends from Net Investment Income | (1.771) | (1.372) | (1.056) | (.761) | — |
| Distributions from Realized Capital Gains | — | — | — | — | — |
| Total Distributions | (1.771) | (1.372) | (1.056) | (.761) | — |
| Net Asset Value, End of Period | $198.85 | $193.45 | $161.12 | $134.20 | $121.54 |
| Total Return | 3.72% | 20.99% | 20.97% | 11.12% | -6.57% |
| Ratios/Supplemental Data | |||||
| Net Assets, End of Period (Millions) | $96 | $90 | $42 | $23 | $22 |
| Ratio of Total Expenses to Average Net Assets | 0.08% | 0.08% | 0.08% | 0.08% | 0.08%2 |
| Ratio of Net Investment Income to | |||||
| Average Net Assets | 1.20% | 0.93% | 1.20% | 0.88% | 0.75%2 |
| Portfolio Turnover Rate 3 | 47% | 38% | 35% | 26% | 40% |
1 Inception.
2 Annualized.
3 Excludes the value of portfolio securities received or delivered as a result of in-kind purchases or redemptions of the fund’s capital shares,
including ETF Creation Units.
See accompanying Notes, which are an integral part of the Financial Statements.
55
S&P Mid-Cap 400 Growth Index Fund
Notes to Financial Statements
Vanguard S&P Mid-Cap 400 Growth Index Fund is registered under the Investment Company Act of 1940 as an open-end investment company, or mutual fund. The fund offers two classes of shares: ETF Shares and Institutional Shares. ETF Shares are listed for trading on NYSE Arca; they can be purchased and sold through a broker. Institutional Shares are designed for investors who meet certain administrative, service, and account-size criteria.
A. The following significant accounting policies conform to generally accepted accounting principles for U.S. investment companies. The fund consistently follows such policies in preparing its financial statements.
1. Security Valuation: Securities are valued as of the close of trading on the New York Stock Exchange (generally 4 p.m., Eastern time) on the valuation date. Equity securities are valued at the latest quoted sales prices or official closing prices taken from the primary market in which each security trades; such securities not traded on the valuation date are valued at the mean of the latest quoted bid and asked prices. Securities for which market quotations are not readily available, or whose values have been materially affected by events occurring before the fund’s pricing time but after the close of the securities’ primary markets, are valued by methods deemed by the board of trustees to represent fair value. Investments in Vanguard Market Liquidity Fund are valued at that fund’s net asset value. Temporary cash investments acquired over 60 days to maturity are valued using the latest bid prices or using valuations based on a matrix system (which considers such factors as security prices, yields, maturities, and ratings), both as furnished by independent pricing services. Other temporary cash investments are valued at amortized cost, which approximates market value.
2. Futures Contracts: The fund uses index futures contracts to a limited extent, with the objectives of maintaining full exposure to the stock market, enhancing returns, maintaining liquidity, and minimizing transaction costs. The fund may purchase futures contracts to immediately invest incoming cash in the market, or sell futures in response to cash outflows, thereby simulating a fully invested position in the underlying index while maintaining a cash balance for liquidity. The fund may seek to enhance returns by using futures contracts instead of the underlying securities when futures are believed to be priced more attractively than the underlying securities. The primary risks associated with the use of futures contracts are imperfect correlation between changes in market values of stocks held by the fund and the prices of futures contracts, and the possibility of an illiquid market. Counterparty risk involving futures is mitigated because a regulated clearinghouse is the counterparty instead of the clearing broker. To further mitigate counterparty risk, the fund trades futures contracts on an exchange, monitors the financial strength of its clearing brokers and clearinghouse, and has entered into clearing agreements with its clearing brokers. The clearinghouse imposes initial margin requirements to secure the fund’s performance and requires daily settlement of variation margin representing changes in the market value of each contract.
Futures contracts are valued at their quoted daily settlement prices. The aggregate settlement values of the contracts are not recorded in the Statement of Net Assets. Fluctuations in the value of the contracts are recorded in the Statement of Net Assets as an asset (liability) and in the Statement of Operations as unrealized appreciation (depreciation) until the contracts are closed, when they are recorded as realized futures gains (losses).
During the year ended August 31, 2015, the fund’s average investments in long and short futures contracts represented less than 1% and 0% of net assets, respectively, based on the average of aggregate settlement values at each quarter-end during the period.
56
S&P Mid-Cap 400 Growth Index Fund
3. Federal Income Taxes: The fund intends to continue to qualify as a regulated investment company and distribute all of its taxable income. Management has analyzed the fund’s tax positions taken for all open federal income tax years (August 31, 2012–2015), and has concluded that no provision for federal income tax is required in the fund’s financial statements.
4. Distributions: Distributions to shareholders are recorded on the ex-dividend date.
5. Securities Lending: To earn additional income, the fund lends its securities to qualified institutional borrowers. Security loans are required to be secured at all times by collateral in an amount at least equal to the market value of securities loaned. Daily market fluctuations could cause the value of loaned securities to be more or less than the value of the collateral received. When this occurs, the collateral is adjusted and settled on the next business day. The fund further mitigates its counterparty risk by entering into securities lending transactions only with a diverse group of prequalified counter-parties, monitoring their financial strength, and entering into master securities lending agreements with its counterparties. The master securities lending agreements provide that, in the event of a counterparty’s default (including bankruptcy), the fund may terminate any loans with that borrower, determine the net amount owed, and sell or retain the collateral up to the net amount owed to the fund; however, such actions may be subject to legal proceedings. While collateral mitigates counter-party risk, in the absence of a default the fund may experience delays and costs in recovering the securities loaned. The fund invests cash collateral received in Vanguard Market Liquidity Fund, and records a liability in the Statement of Net Assets for the return of the collateral, during the period the securities are on loan. Securities lending income represents fees charged to borrowers plus income earned on invested cash collateral, less expenses associated with the loan.
6. Credit Facility: The fund and certain other funds managed by The Vanguard Group (“Vanguard”) participate in a $3 billion committed credit facility provided by a syndicate of lenders pursuant to a credit agreement that may be renewed annually; each fund is individually liable for its borrowings, if any, under the credit facility. Borrowings may be utilized for temporary and emergency purposes, and are subject to the fund’s regulatory and contractual borrowing restrictions. The participating funds are charged administrative fees and an annual commitment fee of 0.06% of the undrawn amount of the facility; these fees are allocated to the funds based on a method approved by the fund’s board of trustees and included in Management and Administrative expenses on the fund’s Statement of Operations. Any borrowings under this facility bear interest at a rate equal to the higher of the federal funds rate or LIBOR reference rate plus an agreed-upon spread.
The fund had no borrowings outstanding at August 31, 2015, or at any time during the period then ended.
7. Other: Dividend income is recorded on the ex-dividend date. Interest income includes income distributions received from Vanguard Market Liquidity Fund and is accrued daily. Premiums and discounts on debt securities purchased are amortized and accreted, respectively, to interest income over the lives of the respective securities. Security transactions are accounted for on the date securities are bought or sold. Costs used to determine realized gains (losses) on the sale of investment securities are those of the specific securities sold.
Each class of shares has equal rights as to assets and earnings, except that each class separately bears certain class-specific expenses related to maintenance of shareholder accounts (included in Management and Administrative expenses) and shareholder reporting. Marketing and distribution expenses are allocated to each class of shares based on a method approved by the board of trustees. Income, other non-class-specific expenses, and gains and losses on investments are allocated to each class of shares based on its relative net assets.
57
S&P Mid-Cap 400 Growth Index Fund
B. In accordance with the terms of a Funds’ Service Agreement (the “FSA”) between Vanguard and the fund, Vanguard furnishes to the fund investment advisory, corporate management, administrative, marketing, and distribution services at Vanguard’s cost of operations (as defined by the FSA). These costs of operations are allocated to the fund based on methods and guidelines approved by the board of trustees. Vanguard does not require reimbursement in the current period for certain costs of operations (such as deferred compensation/benefits and risk/insurance costs); the fund’s liability for these costs of operations is included in Payables to Vanguard on the Statement of Net Assets .
Upon the request of Vanguard, the fund may invest up to 0.40% of its net assets as capital in Vanguard. At August 31, 2015, the fund had contributed to Vanguard capital in the amount of $45,000, representing 0.01% of the fund’s net assets and 0.02% of Vanguard’s capitalization. The fund’s trustees and officers are also directors and employees, respectively, of Vanguard.
C. Various inputs may be used to determine the value of the fund’s investments. These inputs are summarized in three broad levels for financial statement purposes. The inputs or methodologies used to value securities are not necessarily an indication of the risk associated with investing in those securities.
Level 1—Quoted prices in active markets for identical securities.
Level 2—Other significant observable inputs (including quoted prices for similar securities, interest rates, prepayment speeds, credit risk, etc.).
Level 3—Significant unobservable inputs (including the fund’s own assumptions used to determine the fair value of investments).
The following table summarizes the market value of the fund’s investments as of August 31, 2015, based on the inputs used to value them:
| Level 1 | Level 2 | Level 3 | |
| Investments | ($000) | ($000) | ($000) |
| Common Stocks | 473,026 | — | — |
| Temporary Cash Investments | — | 200 | — |
| Futures Contracts—Liabilities1 | (2) | — | — |
| Total | 473,024 | 200 | — |
| 1 Represents variation margin on the last day of the reporting period. | |||
D. At August 31, 2015, the aggregate settlement value of open futures contracts and the related unrealized appreciation (depreciation) were:
| ($000) | ||||
| Aggregate | ||||
| Number of | Settlement | Unrealized | ||
| Long (Short) | Value | Appreciation | ||
| Futures Contracts | Expiration | Contracts | Long (Short) | (Depreciation) |
| E-mini S&P Mid-Cap 400 Index | September 2015 | 1 | 141 | 5 |
Unrealized appreciation (depreciation) on open futures contracts is required to be treated as realized gain (loss) for tax purposes.
58
S&P Mid-Cap 400 Growth Index Fund
E. Distributions are determined on a tax basis and may differ from net investment income and realized capital gains for financial reporting purposes. Differences may be permanent or temporary. Permanent differences are reclassified among capital accounts in the financial statements to reflect their tax character. Temporary differences arise when certain items of income, expense, gain, or loss are recognized in different periods for financial statement and tax purposes. These differences will reverse at some time in the future. Differences in classification may also result from the treatment of short-term gains as ordinary income for tax purposes.
During the year ended August 31, 2015, the fund realized $54,136,000 of net capital gains resulting from in-kind redemptions—in which shareholders exchanged fund shares for securities held by the fund rather than for cash. Because such gains are not taxable to the fund, and are not distributed to shareholders, they have been reclassified from accumulated net realized losses to paid-in capital.
For tax purposes, at August 31, 2015, the fund had $3,401,000 of ordinary income available for distribution. The fund had available capital losses totaling $21,414,000 that may be carried forward indefinitely to offset future net capital gains.
At August 31, 2015, the cost of investment securities for tax purposes was $442,584,000. Net unrealized appreciation of investment securities for tax purposes was $30,642,000, consisting of unrealized gains of $53,319,000 on securities that had risen in value since their purchase and $22,677,000 in unrealized losses on securities that had fallen in value since their purchase.
F. During the year ended August 31, 2015, the fund purchased $475,078,000 of investment securities and sold $391,501,000 of investment securities, other than temporary cash investments. Purchases and sales include $243,000,000 and $185,488,000, respectively, in connection with in-kind purchases and redemptions of the fund’s capital shares.
G. Capital share transactions for each class of shares were:
| Year Ended August 31, | ||||
| 2015 | 2014 | |||
| Amount | Shares | Amount | Shares | |
| ($000) | (000) | ($000) | (000) | |
| ETF Shares | ||||
| Issued | 307,135 | 3,025 | 149,297 | 1,650 |
| Issued in Lieu of Cash Distributions | — | — | — | — |
| Redeemed | (229,681) | (2,250) | (82,071) | (900) |
| Net Increase (Decrease)—ETF Shares | 77,454 | 775 | 67,226 | 750 |
| Institutional Shares | ||||
| Issued | 15,445 | 75 | 42,737 | 238 |
| Issued in Lieu of Cash Distributions | 347 | 2 | 283 | 2 |
| Redeemed | (11,824) | (58) | (7,374) | (40) |
| Net Increase (Decrease)—Institutional Shares | 3,968 | 19 | 35,646 | 200 |
H. Management has determined that no material events or transactions occurred subsequent to August 31, 2015, that would require recognition or disclosure in these financial statements.
59
Report of Independent Registered
Public Accounting Firm
To the Board of Trustees of Vanguard Admiral Funds and the Shareholders of Vanguard S&P Mid-Cap 400 Index Fund, Vanguard S&P Mid-Cap 400 Value Index Fund and Vanguard S&P Mid-Cap 400 Growth Index Fund: In our opinion, the accompanying statements of net assets and the related statements of operations and of changes in net assets and the financial highlights present fairly, in all material respects, the financial position of Vanguard S&P Mid-Cap 400 Index Fund, Vanguard S&P Mid-Cap 400 Value Index Fund and Vanguard S&P Mid-Cap 400 Growth Index Fund (constituting separate portfolios of Vanguard Admiral Funds, hereafter referred to as the “Funds”) at August 31, 2015, the results of each of their operations for the year then ended, the changes in each of their net assets for each of the two years in the period then ended, and the financial highlights for each of the periods indicated, in conformity with accounting principles generally accepted in the United States of America. These financial statements and financial highlights (hereafter referred to as “financial statements”) are the responsibility of the Funds’ management. Our responsibility is to express an opinion on these financial statements based on our audits. We conducted our audits of these financial statements in accordance with the standards of the Public Company Accounting Oversight Board (United States). Those standards require that we plan and perform the audit to obtain reasonable assurance about whether the financial statements are free of material misstatement. An audit includes examining, on a test basis, evidence supporting the amounts and disclosures in the financial statements, assessing the accounting principles used and significant estimates made by management, and evaluating the overall financial statement presentation. We believe that our audits, which included confirmation of securities at August 31, 2015 by correspondence with the custodian and brokers, by agreement to the underlying ownership records of the transfer agent and the application of alternative auditing procedures where securities purchased had not been received, provide a reasonable basis for our opinion.
/s/PricewaterhouseCoopers LLP
Philadelphia, Pennsylvania
October 15, 2015
60

This information for the fiscal year ended August 31, 2015, is included pursuant to provisions of the
Internal Revenue Code.
The funds distributed qualified dividend income to shareholders during the fiscal year as follows:
| Fund | ($000) |
| S&P Mid-Cap 400 Index Fund | 9,352 |
| S&P Mid-Cap 400 Value Index Fund | 2,844 |
| S&P Mid-Cap 400 Growth Index Fund | 3,056 |
For corporate shareholders, the percentage of investment income (dividend income plus short-term gains, if any) that qualifies for the dividends-received deduction is as follows:
| Fund | Percentage |
| S&P Mid-Cap 400 Index Fund | 76.9% |
| S&P Mid-Cap 400 Value Index Fund | 82.3 |
| S&P Mid-Cap 400 Growth Index Fund | 69.5 |
61
Your Fund’s After-Tax Returns
This table presents returns for your fund both before and after taxes. The after-tax returns are shown in two ways: (1) assuming that an investor owned the fund during the entire period and paid taxes on the fund’s distributions, and (2) assuming that an investor paid taxes on the fund’s distributions and sold all shares at the end of each period.
Calculations are based on the highest individual federal income tax and capital gains tax rates in effect at the times of the distributions and the hypothetical sales. State and local taxes were not considered. After-tax returns reflect any qualified dividend income, using actual prior-year figures and estimates for 2015. (In the example, returns after the sale of fund shares may be higher than those assuming no sale. This occurs when the sale would have produced a capital loss. The calculation assumes that the investor received a tax deduction for the loss.)
The table shows returns for ETF Shares only; returns for other share classes will differ. Please note that your actual after-tax returns will depend on your tax situation and may differ from those shown. Also note that if you own the fund in a tax-deferred account, such as an individual retirement account or a 401(k) plan, this information does not apply to you. Such accounts are not subject to current taxes.
Finally, keep in mind that a fund’s performance—whether before or after taxes—does not guarantee future results.
Average Annual Total Returns: S&P Mid-Cap 400 Index Funds
Periods Ended August 31, 2015
| Since | ||
| One | Inception | |
| Year | (9/7/2010) | |
| S&P Mid-Cap 400 Index Fund ETF Shares | ||
| Returns Before Taxes | -0.12% | 14.98% |
| Returns After Taxes on Distributions | -0.46 | 14.75 |
| Returns After Taxes on Distributions and Sale of Fund Shares | 0.14 | 12.06 |
| Since | ||
| One | Inception | |
| Year | (9/7/2010) | |
| S&P Mid-Cap 400 Value Index Fund ETF Shares | ||
| Returns Before Taxes | -4.17% | 14.25% |
| Returns After Taxes on Distributions | -4.56 | 13.96 |
| Returns After Taxes on Distributions and Sale of Fund Shares | -2.13 | 11.44 |
| Since | ||
| One | Inception | |
| Year | (9/7/2010) | |
| S&P Mid-Cap 400 Growth Index Fund ETF Shares | ||
| Returns Before Taxes | 3.60% | 15.55% |
| Returns After Taxes on Distributions | 3.39 | 15.40 |
| Returns After Taxes on Distributions and Sale of Fund Shares | 2.18 | 12.55 |
62
About Your Fund’s Expenses
As a shareholder of the fund, you incur ongoing costs, which include costs for portfolio management, administrative services, and shareholder reports (like this one), among others. Operating expenses, which are deducted from a fund’s gross income, directly reduce the investment return of the fund.
A fund’s expenses are expressed as a percentage of its average net assets. This figure is known as the expense ratio. The following examples are intended to help you understand the ongoing costs (in dollars) of investing in your fund and to compare these costs with those of other mutual funds. The examples are based on an investment of $1,000 made at the beginning of the period shown and held for the entire period.
The accompanying table illustrates your fund’s costs in two ways:
• Based on actual fund return. This section helps you to estimate the actual expenses that you paid over the period. The ”Ending Account Value“ shown is derived from the fund‘s actual return, and the third column shows the dollar amount that would have been paid by an investor who started with $1,000 in the fund. You may use the information here, together with the amount you invested, to estimate the expenses that you paid over the period.
To do so, simply divide your account value by $1,000 (for example, an $8,600 account value divided by $1,000 = 8.6), then multiply the result by the number given for your fund under the heading ”Expenses Paid During Period.“
• Based on hypothetical 5% yearly return. This section is intended to help you compare your fund‘s costs with those of other mutual funds. It assumes that the fund had a yearly return of 5% before expenses, but that the expense ratio is unchanged. In this case—because the return used is not the fund’s actual return—the results do not apply to your investment. The example is useful in making comparisons because the Securities and Exchange Commission requires all mutual funds to calculate expenses based on a 5% return. You can assess your fund’s costs by comparing this hypothetical example with the hypothetical examples that appear in shareholder reports of other funds.
Note that the expenses shown in the table are meant to highlight and help you compare ongoing costs only and do not reflect transaction costs incurred by the fund for buying and selling securities. Further, the expenses do not include any purchase, redemption, or account service fees described in the fund prospectus. If such fees were applied to your account, your costs would be higher. Your fund does not carry a “sales load.”
The calculations assume no shares were bought or sold during the period. Your actual costs may have been higher or lower, depending on the amount of your investment and the timing of any purchases or redemptions.
You can find more information about the fund’s expenses, including annual expense ratios, in the Financial Statements section of this report. For additional information on operating expenses and other shareholder costs, please refer to your fund’s current prospectus.
63
| Six Months Ended August 31, 2015 | |||
| Beginning | Ending | Expenses | |
| Account Value | Account Value | Paid During | |
| 2/28/2015 | 8/31/2015 | Period | |
| Based on Actual Fund Return | |||
| S&P Mid-Cap 400 Index Fund | |||
| ETF Shares | $1,000.00 | $947.14 | $0.74 |
| Institutional Shares | 1,000.00 | 947.51 | 0.39 |
| S&P Mid-Cap 400 Value Index Fund | |||
| ETF Shares | $1,000.00 | $923.51 | $0.97 |
| Institutional Shares | 1,000.00 | 924.07 | 0.39 |
| S&P Mid-Cap 400 Growth Index Fund | |||
| ETF Shares | $1,000.00 | $968.96 | $0.99 |
| Institutional Shares | 1,000.00 | 969.48 | 0.40 |
| Based on Hypothetical 5% Yearly Return | |||
| S&P Mid-Cap 400 Index Fund | |||
| ETF Shares | $1,000.00 | $1,024.45 | $0.77 |
| Institutional Shares | 1,000.00 | 1,024.80 | 0.41 |
| S&P Mid-Cap 400 Value Index Fund | |||
| ETF Shares | $1,000.00 | $1,024.20 | $1.02 |
| Institutional Shares | 1,000.00 | 1,024.80 | 0.41 |
| S&P Mid-Cap 400 Growth Index Fund | |||
| ETF Shares | $1,000.00 | $1,024.20 | $1.02 |
| Institutional Shares | 1,000.00 | 1,024.80 | 0.41 |
The calculations are based on expenses incurred in the most recent six-month period. The funds’ annualized six-month expense ratios for that
period are: for the S&P Mid-Cap 400 Index Fund, 0.15% for ETF Shares and 0.08% for Institutional Shares; for the S&P Mid-Cap 400 Value
Index Fund, 0.20% for ETF Shares and 0.08% for Institutional Shares; and for the S&P Mid-Cap 400 Growth Index Fund, 0.20% for ETF Shares
and 0.08% for Institutional Shares. The dollar amounts shown as “Expenses Paid” are equal to the annualized expense ratio multiplied by the
average account value over the period, multiplied by the number of days in the most recent six-month period, then divided by the number of
days in the most recent 12-month period (184/365).
64
Trustees Approve Advisory Arrangements
The board of trustees of Vanguard S&P Mid-Cap 400 Index Fund, S&P Mid-Cap 400 Value Index Fund, and S&P Mid-Cap 400 Growth Index Fund has renewed each fund’s investment advisory arrangement with The Vanguard Group, Inc. (Vanguard). Vanguard—through its Equity Index Group—serves as investment advisor for each fund. The board determined that continuing each fund’s internalized management structure was in the best interests of each fund and its shareholders.
The board based its decision upon an evaluation of the advisor’s investment staff, portfolio management process, and performance. The trustees considered the factors discussed below, among others. However, no single factor determined whether the board approved the arrangements. Rather, it was the totality of the circumstances that drove the board’s decision.
Nature, extent, and quality of services
The board reviewed the quality of each fund’s investment management services provided to the funds since their inception in 2010, and took into account the organizational depth and stability of the advisor. The board considered that Vanguard has been managing investments for more than three decades. The Equity Index Group adheres to a sound, disciplined investment management process; the team has considerable experience, stability, and depth.
The board concluded that Vanguard’s experience, stability, depth, and performance, among other factors, warranted continuation of each advisory arrangement.
Investment performance
The board considered the funds’ performance since their inception, including any periods of outperformance or underperformance relative to a target index and peer group. The board concluded that the performance was such that each advisory arrangement should continue. Information about the funds’ most recent performance can be found in the Performance Summary pages of this report.
Cost
The board concluded that each fund’s expense ratio was well below the average expense ratios charged by funds in its respective peer group and that each fund’s advisory fee rate was also well below its peer-group average. Information about the funds’ expenses appears in the About Your Fund’s Expenses section of this report as well as in the Financial Statements sections.
The board does not conduct a profitability analysis of Vanguard, because of Vanguard’s unique “at-cost” structure. Unlike most other mutual fund management companies, Vanguard is owned by the funds it oversees, and produces “profits” only in the form of reduced expenses for fund shareholders.
The benefit of economies of scale
The board concluded that each fund’s at-cost arrangement with Vanguard ensures that the funds will realize economies of scale as they grow, with the cost to shareholders declining as fund assets increase.
The board will consider whether to renew the advisory arrangements again after a one-year period.
65
Glossary
30-Day SEC Yield. A fund’s 30-day SEC yield is derived using a formula specified by the U.S. Securities and Exchange Commission. Under the formula, data related to the fund’s security holdings in the previous 30 days are used to calculate the fund’s hypothetical net income for that period, which is then annualized and divided by the fund’s estimated average net assets over the calculation period. For the purposes of this calculation, a security’s income is based on its current market yield to maturity (for bonds), its actual income (for asset-backed securities), or its projected dividend yield (for stocks). Because the SEC yield represents hypothetical annualized income, it will differ—at times significantly—from the fund’s actual experience. As a result, the fund’s income distributions may be higher or lower than implied by the SEC yield.
Beta. A measure of the magnitude of a fund’s past share-price fluctuations in relation to the ups and downs of a given market index. The index is assigned a beta of 1.00. Compared with a given index, a fund with a beta of 1.20 typically would have seen its share price rise or fall by 12% when the index rose or fell by 10%. For this report, beta is based on returns over the past 36 months for both the fund and the index. Note that a fund’s beta should be reviewed in conjunction with its R-squared (see definition). The lower the R-squared, the less correlation there is between the fund and the index, and the less reliable beta is as an indicator of volatility.
Dividend Yield. Dividend income earned by stocks, expressed as a percentage of the aggregate market value (or of net asset value, for a fund). The yield is determined by dividing the amount of the annual dividends by the aggregate value (or net asset value) at the end of the period. For a fund, the dividend yield is based solely on stock holdings and does not include any income produced by other investments.
Earnings Growth Rate. The average annual rate of growth in earnings over the past five years for the stocks now in a fund.
Equity Exposure. A measure that reflects a fund’s investments in stocks and stock futures. Any holdings in short-term reserves are excluded.
Expense Ratio. A fund’s total annual operating expenses expressed as a percentage of the fund’s average net assets. The expense ratio includes management and administrative expenses, but does not include the transaction costs of buying and selling portfolio securities.
Foreign Holdings. The percentage of a fund represented by securities or depositary receipts of companies based outside the United States.
Inception Date. The date on which the assets of a fund (or one of its share classes) are first invested in accordance with the fund’s investment objective. For funds with a subscription period, the inception date is the day after that period ends. Investment performance is measured from the inception date.
Median Market Cap. An indicator of the size of companies in which a fund invests; the midpoint of market capitalization (market price x shares outstanding) of a fund’s stocks, weighted by the proportion of the fund’s assets invested in each stock. Stocks representing half of the fund’s assets have market capitalizations above the median, and the rest are below it.
Price/Book Ratio. The share price of a stock divided by its net worth, or book value, per share. For a fund, the weighted average price/book ratio of the stocks it holds.
66
Price/Earnings Ratio. The ratio of a stock’s current price to its per-share earnings over the past year. For a fund, the weighted average P/E of the stocks it holds. P/E is an indicator of market expectations about corporate prospects; the higher the P/E, the greater the expectations for a company’s future growth.
R-Squared. A measure of how much of a fund’s past returns can be explained by the returns from the market in general, as measured by a given index. If a fund’s total returns were precisely synchronized with an index’s returns, its R-squared would be 1.00. If the fund’s returns bore no relationship to the index’s returns, its R-squared would be 0. For this report, R-squared is based on returns over the past 36 months for both the fund and the index.
Return on Equity. The annual average rate of return generated by a company during the past five years for each dollar of shareholder’s equity (net income divided by shareholder’s equity). For a fund, the weighted average return on equity for the companies whose stocks it holds.
Short-Term Reserves. The percentage of a fund invested in highly liquid, short-term securities that can be readily converted to cash.
Turnover Rate. An indication of the fund’s trading activity. Funds with high turnover rates incur higher transaction costs and may be more likely to distribute capital gains (which may be taxable to investors). The turnover rate excludes in-kind transactions, which have minimal impact on costs.
67
The People Who Govern Your Fund
The trustees of your mutual fund are there to see that the fund is operated and managed in your best interests since, as a shareholder, you are a part owner of the fund. Your fund’s trustees also serve on the board of directors of The Vanguard Group, Inc., which is owned by the Vanguard funds and provides services to them on an at-cost basis.
A majority of Vanguard’s board members are independent, meaning that they have no affiliation with Vanguard or the funds they oversee, apart from the sizable personal investments they have made as private individuals. The independent board members have distinguished backgrounds in business, academia, and public service. Each of the trustees and executive officers oversees 194 Vanguard funds.
The following table provides information for each trustee and executive officer of the fund. More information about the trustees is in the Statement of Additional Information, which can be obtained, without charge, by contacting Vanguard at 800-662-7447, or online at vanguard.com.
| InterestedTrustee1 | Rajiv L. Gupta |
| Born 1945. Trustee Since December 2001.2 Principal | |
| F. William McNabb III | Occupation(s) During the Past Five Years and Other |
| Born 1957. Trustee Since July 2009. Chairman of | Experience: Chairman and Chief Executive Officer |
| the Board. Principal Occupation(s) During the Past | (retired 2009) and President (2006–2008) of |
| Five Years and Other Experience: Chairman of the | Rohm and Haas Co. (chemicals); Director of Tyco |
| Board of The Vanguard Group, Inc., and of each of | International PLC (diversified manufacturing and |
| the investment companies served by The Vanguard | services), Hewlett-Packard Co. (electronic computer |
| Group, since January 2010; Director of The Vanguard | manufacturing), and Delphi Automotive PLC |
| Group since 2008; Chief Executive Officer and | (automotive components); Senior Advisor at New |
| President of The Vanguard Group, and of each of | Mountain Capital. |
| the investment companies served by The Vanguard | |
| Group, since 2008; Director of Vanguard Marketing | Amy Gutmann |
| Corporation; Managing Director of The Vanguard | Born 1949. Trustee Since June 2006. Principal |
| Group (1995–2008). | Occupation(s) During the Past Five Years and |
| Other Experience: President of the University of | |
| IndependentTrustees | Pennsylvania; Christopher H. Browne Distinguished |
| Professor of Political Science, School of Arts and | |
| Emerson U. Fullwood | Sciences, and Professor of Communication, Annenberg |
| Born 1948. Trustee Since January 2008. Principal | School for Communication, with secondary faculty |
| Occupation(s) During the Past Five Years and | appointments in the Department of Philosophy, School |
| Other Experience: Executive Chief Staff and | of Arts and Sciences, and at the Graduate School of |
| Marketing Officer for North America and Corporate | Education, University of Pennsylvania; Trustee of the |
| Vice President (retired 2008) of Xerox Corporation | National Constitution Center; Chair of the Presidential |
| (document management products and services); | Commission for the Study of Bioethical Issues. |
| Executive in Residence and 2009–2010 Distinguished | |
| Minett Professor at the Rochester Institute of | JoAnn Heffernan Heisen |
| Technology; Director of SPX Corporation (multi-industry | Born 1950. Trustee Since July 1998. Principal |
| manufacturing), the United Way of Rochester, | Occupation(s) During the Past Five Years and Other |
| Amerigroup Corporation (managed health care), the | Experience: Corporate Vice President and Chief |
| University of Rochester Medical Center, Monroe | Global Diversity Officer (retired 2008) and Member |
| Community College Foundation, and North Carolina | of the Executive Committee (1997–2008) of Johnson |
| A&T University. | & Johnson (pharmaceuticals/medical devices/ |
| consumer products); Director of Skytop Lodge | |
| Corporation (hotels), the University Medical Center | |
| at Princeton, the Robert Wood Johnson Foundation, | |
| and the Center for Talent Innovation; Member of | |
| the Advisory Board of the Institute for Women’s | |
| Leadership at Rutgers University. |
| F. Joseph Loughrey | Executive Officers | |
| Born 1949. Trustee Since October 2009. Principal | ||
| Occupation(s) During the Past Five Years and Other | Glenn Booraem | |
| Experience: President and Chief Operating Officer | Born 1967. Treasurer Since May 2015. Principal | |
| (retired 2009) of Cummins Inc. (industrial machinery); | Occupation(s) During the Past Five Years and | |
| Chairman of the Board of Hillenbrand, Inc. (specialized | Other Experience: Principal of The Vanguard Group, | |
| consumer services), and of Oxfam America; Director | Inc.; Treasurer of each of the investment companies | |
| of SKF AB (industrial machinery), Hyster-Yale Materials | served by The Vanguard Group; Controller of each of | |
| Handling, Inc. (forklift trucks), the Lumina Foundation | the investment companies served by The Vanguard | |
| for Education, and the V Foundation for Cancer | Group (2010–2015); Assistant Controller of each of | |
| Research; Member of the Advisory Council for the | the investment companies served by The Vanguard | |
| College of Arts and Letters and of the Advisory Board | Group (2001–2010). | |
| to the Kellogg Institute for International Studies, both | ||
| at the University of Notre Dame. | Thomas J. Higgins | |
| Born 1957. Chief Financial Officer Since September | ||
| Mark Loughridge | 2008. Principal Occupation(s) During the Past Five | |
| Born 1953. Trustee Since March 2012. Principal | Years and Other Experience: Principal of The Vanguard | |
| Occupation(s) During the Past Five Years and Other | Group, Inc.; Chief Financial Officer of each of the | |
| Experience: Senior Vice President and Chief Financial | investment companies served by The Vanguard Group; | |
| Officer (retired 2013) at IBM (information technology | Treasurer of each of the investment companies served | |
| services); Fiduciary Member of IBM’s Retirement Plan | by The Vanguard Group (1998–2008). | |
| Committee (2004–2013); Director of the Dow Chemical | ||
| Company; Member of the Council on Chicago Booth. | Peter Mahoney | |
| Born 1974. Controller Since May 2015. Principal | ||
| Scott C. Malpass | Occupation(s) During the Past Five Years and | |
| Born 1962. Trustee Since March 2012. Principal | Other Experience: Head of Global Fund Accounting | |
| Occupation(s) During the Past Five Years and Other | at The Vanguard Group, Inc.; Controller of each of the | |
| Experience: Chief Investment Officer and Vice | investment companies served by The Vanguard Group; | |
| President at the University of Notre Dame; Assistant | Head of International Fund Services at The Vanguard | |
| Professor of Finance at the Mendoza College of | Group (2008–2014). | |
| Business at Notre Dame; Member of the Notre Dame | ||
| 403(b) Investment Committee; Board Member of | Heidi Stam | |
| TIFF Advisory Services, Inc., and Catholic Investment | Born 1956. Secretary Since July 2005. Principal | |
| Services, Inc. (investment advisors); Member of | Occupation(s) During the Past Five Years and Other | |
| the Investment Advisory Committee of Major | Experience: Managing Director of The Vanguard | |
| League Baseball. | Group, Inc.; General Counsel of The Vanguard Group; | |
| Secretary of The Vanguard Group and of each of the | ||
| André F. Perold | investment companies served by The Vanguard Group; | |
| Born 1952. Trustee Since December 2004. Principal | Director and Senior Vice President of Vanguard | |
| Occupation(s) During the Past Five Years and Other | Marketing Corporation. | |
| Experience: George Gund Professor of Finance and | ||
| Banking, Emeritus at the Harvard Business School | Vanguard Senior ManagementTeam | |
| (retired 2011); Chief Investment Officer and Managing | Mortimer J. Buckley | Chris D. McIsaac |
| Partner of HighVista Strategies LLC (private investment | Kathleen C. Gubanich | James M. Norris |
| firm); Director of Rand Merchant Bank; Overseer of | Paul A. Heller | Thomas M. Rampulla |
| the Museum of Fine Arts Boston. | Martha G. King | Glenn W. Reed |
| John T. Marcante | Karin A. Risi | |
| Peter F. Volanakis | ||
| Born 1955. Trustee Since July 2009. Principal | ||
| Occupation(s) During the Past Five Years and Other | Chairman Emeritus and Senior Advisor | |
| Experience: President and Chief Operating Officer | John J. Brennan | |
| (retired 2010) of Corning Incorporated (communications | Chairman, 1996–2009 | |
| equipment); Trustee of Colby-Sawyer College; | Chief Executive Officer and President, 1996–2008 | |
| Member of the Advisory Board of the Norris Cotton | ||
| Cancer Center and of the Advisory Board of the | ||
| Parthenon Group (strategy consulting). | Founder | |
| John C. Bogle | ||
| Chairman and Chief Executive Officer, 1974–1996 | ||
1 Mr. McNabb is considered an “interested person,” as defined in the Investment Company Act of 1940, because he is an officer of the
Vanguard funds.
2 December 2002 for Vanguard Equity Income Fund, the Vanguard Municipal Bond Funds, and the Vanguard State Tax-Exempt Funds.
 | |
| P.O. Box 2600 | |
| Valley Forge, PA 19482-2600 | |
| Connect with Vanguard® > vanguard.com | |
| Fund Information > 800-662-7447 | The index is a product of S&P Dow Jones Indices LLC |
| Direct Investor Account Services > 800-662-2739 | (“SPDJI”), and has been licensed for use by Vanguard. |
| Standard & Poor’s® and S&P® are registered | |
| Institutional Investor Services > 800-523-1036 | trademarks of Standard & Poor’s Financial Services LLC |
| Text Telephone for People | (“S&P”); Dow Jones® is a registered trademark of Dow |
| Who Are Deaf or Hard of Hearing> 800-749-7273 | Jones Trademark Holdings LLC (“Dow Jones”); S&P® |
| and S&P 500® are trademarks of S&P; and these | |
| This material may be used in conjunction | trademarks have been licensed for use by SPDJI and |
| with the offering of shares of any Vanguard | sublicensed for certain purposes by Vanguard. |
| fund only if preceded or accompanied by | Vanguard product(s) are not sponsored, endorsed, sold |
| the fund’s current prospectus. | or promoted by SPDJI, Dow Jones, S&P, or their |
| respective affiliates and none of such parties make any | |
| All comparative mutual fund data are from Lipper, a | representation regarding the advisability of investing in |
| Thomson Reuters Company, or Morningstar, Inc., unless | such product(s) nor do they have any liability for any |
| otherwise noted. | errors, omissions, or interruptions of the index. |
| You can obtain a free copy of Vanguard’s proxy voting | |
| guidelines by visiting vanguard.com/proxyreporting or by | |
| calling Vanguard at 800-662-2739. The guidelines are | |
| also available from the SEC’s website, sec.gov. In | |
| addition, you may obtain a free report on how your fund | |
| voted the proxies for securities it owned during the 12 | |
| months ended June 30. To get the report, visit either | |
| vanguard.com/proxyreporting or sec.gov. | |
| You can review and copy information about your fund at | |
| the SEC’s Public Reference Room in Washington, D.C. To | |
| find out more about this public service, call the SEC at | |
| 202-551-8090. Information about your fund is also | |
| available on the SEC’s website, and you can receive | |
| copies of this information, for a fee, by sending a | |
| request in either of two ways: via email addressed to | |
| publicinfo@sec.gov or via regular mail addressed to the | |
| Public Reference Section, Securities and Exchange | |
| Commission, Washington, DC 20549-1520. | |
| © 2015 The Vanguard Group, Inc. | |
| All rights reserved. | |
| Vanguard Marketing Corporation, Distributor. | |
| Q18420 102015 | |
| Annual Report | August 31, 2015 |
| Vanguard S&P 500 Value and Growth |
| Index Funds |
| Vanguard S&P 500 Value Index Fund |
| Vanguard S&P 500 Growth Index Fund |
Vanguard’s Principles for Investing Success
We want to give you the best chance of investment success. These principles, grounded in Vanguard’s research and experience, can put you on the right path.
Goals. Create clear, appropriate investment goals.
Balance. Develop a suitable asset allocation using broadly diversified funds.
Cost. Minimize cost.
Discipline. Maintain perspective and long-term discipline.
A single theme unites these principles: Focus on the things you can control.
We believe there is no wiser course for any investor.
| Contents | |
| Your Fund’s Total Returns. | 1 |
| Chairman’s Letter. | 2 |
| S&P 500 Value Index Fund. | 9 |
| S&P 500 Growth Index Fund. | 26 |
| Your Fund’s After-Tax Returns. | 43 |
| About Your Fund’s Expenses. | 44 |
| Trustees Approve Advisory Arrangements. | 46 |
| Glossary. | 47 |
Please note: The opinions expressed in this report are just that—informed opinions. They should not be considered promises or advice.
Also, please keep in mind that the information and opinions cover the period through the date on the front of this report. Of course, the
risks of investing in your fund are spelled out in the prospectus.
See the Glossary for definitions of investment terms used in this report.
About the cover: Pictured is a sailing block on the Brilliant, a 1932 schooner docked in Mystic, Connecticut. A type of pulley, the
sailing block helps coordinate the setting of the sails. At Vanguard, the intricate coordination of technology and people allows
us to help millions of clients around the world reach their financial goals.
Your Fund’s Total Returns
| Fiscal Year Ended August 31, 2015 | |
| Total | |
| Returns | |
| Vanguard S&P 500 Value Index Fund | |
| ETF Shares | |
| Market Price | -3.38% |
| Net Asset Value | -3.41 |
| Institutional Shares (Inception: 3/3/2015) | -6.84 |
| S&P 500 Value Index | -3.27 |
| Large-Cap Value Funds Average | -3.71 |
| Large-Cap Value Funds Average: Derived from data provided by Lipper, a Thomson Reuters Company. | |
| Vanguard S&P 500 Growth Index Fund | |
| ETF Shares | |
| Market Price | 3.83% |
| Net Asset Value | 3.80 |
| S&P 500 Growth Index | 3.95 |
| Large-Cap Growth Funds Average | 3.53 |
| Large-Cap Growth Funds Average: Derived from data provided by Lipper, a Thomson Reuters Company. | |
Institutional Shares are available to certain institutional investors who meet specific administrative, service, and account-size criteria. The
Vanguard ETF® Shares shown are traded on the NYSE Arca exchange and are available only through brokers. The table provides ETF returns
based on both the NYSE Arca market price and the net asset value for a share. U.S. Pat. Nos. 6,879,964; 7,337,138; 7,720,749; 7,925,573;
8,090,646; and 8,417,623.
For the ETF Shares, the market price is determined by the midpoint of the bid-offer spread as of the closing time of the New York Stock
Exchange (generally 4 p.m., Eastern time). The net asset value is also determined as of the NYSE closing time. For more information about
how the ETF Shares' market prices have compared with their net asset value, visit vanguard.com, select your ETF, and then select the Price
and Performance tab. The ETF premium/discount analysis there shows the percentages of days on which the ETF Shares' market price was
above or below the NAV.
1

Chairman’s Letter
Dear Shareholder,
While U.S. stocks overall traced a jagged line on their way to flat returns for the fiscal year ended August 31, 2015, the two style segments that make up the large-capitalization market fared differently. Growth stocks continued on their positive trek and value stocks slipped. Large-, mid-, and small-capitalization stocks finished in close proximity to each other.
This investment environment was reflected in the performance of Vanguard S&P 500 Growth Index Fund and Vanguard S&P 500 Value Index Fund, as measured by the ETF Shares’ net asset value. The Growth Index Fund notched a result of almost 4%, while the Value Index Fund returned about –3%. Both funds closely tracked their target indexes and surpassed the average returns of their large-cap fund peers.
On another note, Institutional Shares for the Value Index Fund were introduced in March. These shares require a minimum initial investment of $5 million.
If you hold shares of your fund in a taxable account, you may wish to review the information on after-tax returns that appears later in this report.
August’s moody markets led to flat 12-month returns
U.S. stocks generally moved in opposite directions over the two halves of the fiscal year ended August 31. Ultimately, the ride ended about where it started, with the broad market returning less than 1%.
2
The broad stock market’s first-half advance of about 6% was followed by a second-half retreat of about –5%.
Much of the decline came in August, when stocks tumbled over fears about the global impact of China’s economic deceleration. Greece’s debt crisis, the strong U.S. dollar, perceived high valuations, and speculation over when the Federal Reserve might raise short-term interest rates also weighed on the market at times. (Shortly after the close of the reporting period, the Fed announced at its September meeting that it would leave rates unchanged for the time being.)
For U.S. investors, international stocks returned about –12%, a result that would have been a bit better if not for the dollar’s strength against many foreign currencies. China’s troubles buffeted emerging markets, which produced lower returns than the developed markets of Europe and the Pacific region.
Bonds notched muted results as Fed weighed rate-hike timing
The broad U.S. taxable bond market returned 1.56%. Bond prices, which generally fell slightly, received support at various times during the year from global investors looking for higher yields than those available in many other developed markets and from investors seeking shelter from stock market volatility. The yield of the 10-year Treasury note ended August at 2.18%, down from 2.34% a year earlier.
| Market Barometer | |||
| Average Annual Total Returns | |||
| Periods Ended August 31, 2015 | |||
| One | Three | Five | |
| Year | Years | Years | |
| Stocks | |||
| Russell 1000 Index (Large-caps) | 0.40% | 14.68% | 16.07% |
| Russell 2000 Index (Small-caps) | 0.03 | 14.12 | 15.55 |
| Russell 3000 Index (Broad U.S. market) | 0.36 | 14.63 | 16.03 |
| FTSE All-World ex US Index (International) | -11.50 | 5.79 | 5.17 |
| Bonds | |||
| Barclays U.S. Aggregate Bond Index (Broad taxable market) | 1.56% | 1.53% | 2.98% |
| Barclays Municipal Bond Index (Broad tax-exempt market) | 2.52 | 2.83 | 3.96 |
| Citigroup Three-Month U.S. Treasury Bill Index | 0.02 | 0.03 | 0.05 |
| CPI | |||
| Consumer Price Index | 0.20% | 1.14% | 1.77% |
3
Limited by the dollar’s strength, international bond markets (as measured by the Barclays Global Aggregate Index ex USD) returned –11.97%. International bonds returned about 3% without this currency effect.
The Fed’s 0%–0.25% target for short-term interest rates continued to restrain money market fund and savings account returns.
Health care set the pace, while energy lagged
The S&P 500 Growth Index Fund and S&P 500 Value Index Fund represent the two style elements of the broader S&P 500 Index, a benchmark that encompasses approximately 500 of the largest companies in the United States. Together, these companies account for about three-quarters of the broad U.S. stock market’s value. Investors may choose to invest broadly in the large-cap segment of the market through Vanguard 500 Index Fund (this fund is covered in a separate report), or to focus on the growth or value versions.
Recall that value stocks tend to sell at relatively low prices in relation to their earnings or book value, reflecting the lower sales and earnings growth prospects of the underlying companies. Growth stocks, by contrast, typically have higher valuations because of their underlying companies’ earnings and revenue potential.
Growth stocks have generally outperformed value stocks in recent years. But it would be a mistake to assume that pattern will persist indefinitely. An experienced investor knows
| Expense Ratios | |||
| Your Fund Compared With Its Peer Group | |||
| ETF | Institutional | Peer Group | |
| Shares | Shares | Average | |
| S&P 500 Value Index Fund | 0.15% | 0.08% | 1.13% |
| S&P 500 Growth Index Fund | 0.15 | — | 1.21 |
The fund expense ratios shown are from the prospectus dated December 19, 2014, and represent estimated costs for the current fiscal year.
For the fiscal year ended August 31, 2015, the funds’ expense ratios were: for the S&P 500 Value Index Fund, 0.15% for ETF Shares, and
0.08% for Institutional Shares (annualized since inception); and for the S&P 500 Growth Index Fund, 0.15%. Peer-group expense ratios are
derived from data provided by Lipper, a Thomson Reuters Company, and capture information through year-end 2014.
Peer groups: For the S&P 500 Value Index Fund, Large-Cap Value Funds, and for the S&P 500 Growth Index Fund, Large-Cap Growth Funds.
4
that the various categories of investments alternate leadership. One period it might be large-cap growth at the forefront, the next it might be small-cap value. This unpredictable variation in market leadership is one of the reasons that Vanguard believes broad diversification is the wisest choice for most investors.
The health care sector, traditionally a growth domain, was the top performer in the Value Index Fund with a return of about 13% and delivered the second-best showing in the Growth Index Fund with a return of about 11%. The trends favoring health care are familiar: An aging population requires more health care in all forms, health care is more accessible across the globe, and the Affordable Care Act has provided insurance coverage for more people. Managed-care companies, which received a boost from merger and acquisition activity, helped the Value Index Fund the most. The Growth Index Fund benefited mostly from pharmaceutical and biotechnology firms that are producing innovative new drugs.
Consumer discretionary stocks, with a return of about 14%, were the Growth Index Fund’s leading contributor. Returns from internet retailers were particularly robust, and the sector got a boost from the housing market’s sustained rebound. Homebuilders, home improvement retailers, and companies that produce furnishings and housewares excelled and offset some weakness in the media and auto industries.
| Total Returns | |
| Inception Through August 31, 2015 | |
| Average | |
| Annual Return | |
| S&P 500 Value Index Fund ETF Shares Net Asset Value (Returns since | |
| inception: 9/7/2010) | 13.22% |
| S&P 500 Value Index | 13.39 |
| Large-Cap Value Funds Average | 12.51 |
| Large-Cap Value Funds Average: Derived from data provided by Lipper, a Thomson Reuters Company. | |
| S&P 500 Growth Index Fund ETF Shares Net Asset Value (Returns since | |
| inception: 9/7/2010) | 16.38% |
| S&P 500 Growth Index | 16.56 |
| Large-Cap Growth Funds Average | 14.63 |
| Large-Cap Growth Funds Average: Derived from data provided by Lipper, a Thomson Reuters Company. | |
The figures shown represent past performance, which is not a guarantee of future results. (Current performance may be
lower or higher than the performance data cited. For performance data current to the most recent month-end, visit our
website at vanguard.com/performance.) Note, too, that both investment returns and principal value can fluctuate widely, so
an investor’s shares, when sold, could be worth more or less than their original cost.
5
For both funds, returns for the eight other sectors were either in the single digits or negative. By far the Value Index Fund’s largest exposure was to the financial sector, which constituted about one-quarter of its assets and returned about 4% for the fund. (It produced a slightly negative return for the Growth Index Fund.) While the sector has benefited from the long bull market, it has also been restrained by the toughened regulatory environment and exceptionally low interest rates.
The Growth Index Fund’s largest sector was information technology, which constituted nearly one-third of its assets.
IT stocks have cooled off a bit from previous periods; they returned about 4% for the fund, which got a lift in particular from electronic-payment corporations that benefited from increased access to credit around the world.
Stragglers included energy, materials, industrials, telecommunication services, and utilities, all traditional value-oriented sectors. Energy stocks were punished by the decline in oil and gas prices. This same commodity crunch put pressure on the prices of metals and mining firms and materials and processing companies.
| An indexing benefit that’s worth keeping in mind |
| As a Vanguard investor, you’re probably familiar with the cost and diversification benefits that |
| index funds typically offer. But there’s a lesser-known—yet important—advantage to indexing |
| as well: relative predictability. |
| Simply put, index funds help you capture the market’s return more predictably than actively |
| managed funds. |
| By definition, an index fund is built and managed to track the return of its designated broad |
| market or market segment. Some do so more closely than others. But what’s key is that you |
| know what to expect: whatever the market returns—good or bad—minus the fund’s costs. |
| Active managers, in contrast, seek to beat the market—and do so with varying degrees of |
| success at different times. |
| The relative predictability of indexing can help you stay on course with your investment goals, |
| by reducing the likelihood of particular surprises—such as being out of step with market |
| performance. The confidence of knowing that you’ll earn a market-like return can reduce |
| the temptation to trade based on emotions. |
| We recognize that some investors want the opportunity to outperform the market. That’s |
| why Vanguard also offers low-cost active funds managed by carefully selected, world-class |
| advisors, so you can choose an investment strategy that aligns with both your goals and your |
| risk appetite. |
6
The funds have been successful in tightly tracking their indexes
The S&P 500 Growth and Value Index Funds launched in September 2010 as an extension of Vanguard’s indexing franchise Since then, they’ve met their primary goal of capturing virtually all of the returns of their target indexes. Reflecting the overall strength of the stock markets, both funds also recorded double-digit average annual returns over the half-decade.
Vanguard’s Equity Index Group, the funds’ advisor, is responsible for the index tracking success. The group has kept the funds on target with sophisticated portfolio and management techniques refined over several decades. Low expenses—which allow you to keep more of the funds’ returns—have helped the group’s efforts.
When the markets are volatile, maintaining perspective is key
Volatility returned to the stock market with a vengeance in the final weeks of August. Stocks were unsettled as investors became more worried that a slowdown in China’s economic growth could affect markets across the globe.
This turmoil may have evoked painful memories of previous financial setbacks—memories that had been receding after more than six years of strong U.S. stock performance. And inevitably, that sort of upheaval can lead some investors to make rash moves with their portfolios.
During periods of market adversity, however, it’s more important than ever to keep sight of one of Vanguard’s key principles: Maintain perspective and long-term discipline. Whether you’re investing for yourself or on behalf of clients, your success is affected greatly by how you react—or don’t react—when the markets turn turbulent. (You can read Vanguard’s Principles for Investing Success at vanguard.com/research.)
As I’ve written in the past, the best course for long-term investors generally is to ignore daily market moves and not make decisions based on emotion. This is also a good time to evaluate your portfolio and make sure your asset allocation is aligned with your time horizon, goals, and risk tolerance.
The markets are unpredictable and often confounding. Keeping our long-term plans clearly in focus can be key as we weather these periodic storms.
As always, thank you for investing with Vanguard.
Sincerely,

F. William McNabb III
Chairman and Chief Executive Officer
September 17, 2015
7
| Your Fund’s Performance at a Glance | ||||
| August 31, 2014, Through August 31, 2015 | ||||
| Distributions Per Share | ||||
| Starting | Ending | Income | Capital | |
| Share Price | Share Price | Dividends | Gains | |
| Vanguard S&P 500 Value Index Fund | ||||
| ETF Shares | $88.54 | $83.75 | $1.884 | $0.000 |
| Institutional Shares (Inception: 3/3/2015) | 199.34 | 183.75 | 2.112 | 0.000 |
| Vanguard S&P 500 Growth Index Fund | ||||
| ETF Shares | $96.99 | $99.21 | $1.496 | $0.000 |
8
S&P 500 Value Index Fund
Fund Profile
As of August 31, 2015
| Share-Class Characteristics | ||
| ETF | Institutional | |
| Shares | Shares | |
| Ticker Symbol | VOOV | VSPVX |
| Expense Ratio1 | 0.15% | 0.08% |
| 30-Day SEC Yield | 2.55% | 2.64% |
| Portfolio Characteristics | |||
| DJ | |||
| U.S. | |||
| Total | |||
| S&P 500 | Market | ||
| Value | FA | ||
| Fund | Index | Index | |
| Number of Stocks | 358 | 358 | 3,828 |
| Median Market Cap | $67.4B | $67.4B | $47.2B |
| Price/Earnings Ratio | 16.9x | 16.8x | 20.8x |
| Price/Book Ratio | 1.9x | 1.9x | 2.6x |
| Return on Equity | 14.9% | 14.8% | 17.1% |
| Earnings Growth | |||
| Rate | 5.7% | 5.7% | 10.2% |
| Dividend Yield | 2.7% | 2.7% | 2.1% |
| Foreign Holdings | 0.0% | 0.0% | 0.0% |
| Turnover Rate | 23% | — | — |
| Short-Term Reserves | 0.0% | — | — |
| Volatility Measures | ||
| DJ | ||
| S&P 500 | U.S. Total | |
| Value | Market | |
| Index | FA Index | |
| R-Squared | 1.00 | 0.92 |
| Beta | 1.00 | 0.98 |
These measures show the degree and timing of the fund’s fluctuations compared with the indexes over 36 months.
| Ten Largest Holdings (% of total net assets) | ||
| Exxon Mobil Corp. | Integrated Oil & Gas | 3.9% |
| General Electric Co. | Industrial | |
| Conglomerates | 3.1 | |
| Berkshire Hathaway Inc. Multi-Sector Holdings | 3.0 | |
| JPMorgan Chase & Co. | Diversified Banks | 2.9 |
| AT&T Inc. | Integrated | |
| Telecommunication | ||
| Services | 2.5 | |
| Pfizer Inc. | Pharmaceuticals | 2.4 |
| Verizon Communications Integrated | ||
| Inc. | Telecommunication | |
| Services | 2.3 | |
| Bank of America Corp. | Diversified Banks | 2.1 |
| Citigroup Inc. | Diversified Banks | 2.0 |
| Chevron Corp. | Integrated Oil & Gas | 1.9 |
| Top Ten | 26.1% | |
The holdings listed exclude any temporary cash investments and equity index products.
Investment Focus
![]()
1 The expense ratio shown is from the prospectus dated December 19, 2014, and represents estimated costs for the current fiscal year. For the fiscal
year ended August 31, 2015, the expense ratios were 0.15% for ETF Shares and 0.08% for Institutional Shares (annualized since inception).
9
S&P 500 Value Index Fund
| Sector Diversification (% of equity exposure) | |||
| DJ | |||
| U.S. | |||
| Total | |||
| S&P 500 | Market | ||
| Value | FA | ||
| Fund | Index | Index | |
| Consumer Discretionary | 8.1% | 8.0% | 13.5% |
| Consumer Staples | 10.2 | 10.2 | 8.4 |
| Energy | 12.3 | 12.3 | 6.6 |
| Financials | 25.6 | 25.7 | 18.2 |
| Health Care | 10.8 | 10.8 | 15.0 |
| Industrials | 12.4 | 12.4 | 10.7 |
| Information Technology | 6.6 | 6.5 | 19.1 |
| Materials | 3.6 | 3.6 | 3.3 |
| Telecommunication | |||
| Services | 5.0 | 5.1 | 2.2 |
| Utilities | 5.4 | 5.4 | 3.0 |
10
S&P 500 Value Index Fund
Performance Summary
All of the returns in this report represent past performance, which is not a guarantee of future results that may be achieved by the fund. (Current performance may be lower or higher than the performance data cited. For performance data current to the most recent month-end, visit our website at vanguard.com/performance.) Note, too, that both investment returns and principal value can fluctuate widely, so an investor’s shares, when sold, could be worth more or less than their original cost. The returns shown do not reflect taxes that a shareholder would pay on fund distributions or on the sale of fund shares.
Cumulative Performance: September 7, 2010, Through August 31, 2015
Initial Investment of $10,000

| Average Annual Total Returns | ||||
| Periods Ended August 31, 2015 | ||||
| Since | Final Value | |||
| One | Inception | of a $10,000 | ||
| Year | (9/7/2010) | Investment | ||
| S&P 500 Value Index Fund*ETF | ||||
| Shares Net Asset Value | -3.41% | 13.22% | $18,560 | |
| S&P 500 Value Index Fund*ETF | ||||
| Shares Market Price | -3.38 | 13.24 | 18,573 | |
| •••••••• | S&P 500 Value Index | -3.27 | 13.39 | 18,703 |
| – – – – | Large-Cap Value Funds Average | -3.71 | 12.51 | 17,991 |
| Dow Jones U.S. Total Stock Market | ||||
| Float Adjusted Index | 0.29 | 15.13 | 20,172 | |
Large-Cap Value Funds Average: Derived from data provided by Lipper, a Thomson Reuters Company.
"Since Inception" performance is calculated from the ETF Shares’ inception date for both the fund and its comparative standards.
| Since | Final Value | |
| Inception | of a $5,000,000 | |
| (3/3/2015) | Investment | |
| S&P 500 Value Index Fund Institutional | ||
| Shares | -6.84% | $4,658,150 |
| S&P 500 Value Index | -6.81 | 4,659,286 |
| Dow Jones U.S. Total Stock Market Float | ||
| Adjusted Index | -5.51 | 4,724,438 |
"Since Inception" performance is calculated from the Institutional Shares’ inception date for both the fund and its comparative standards.
See Financial Highlights for dividend and capital gains information.
11
S&P 500 Value Index Fund
Cumulative Returns of ETF Shares: September 7, 2010, Through August 31, 2015
| Since | ||
| One | Inception | |
| Year | (9/7/2010) | |
| S&P 500 Value Index Fund ETF Shares Market Price | -3.38% | 85.73% |
| S&P 500 Value Index Fund ETF Shares Net Asset | ||
| Value | -3.41 | 85.60 |
| S&P 500 Value Index | -3.27 | 87.03 |
| "Since Inception" performance is calculated from the ETF Shares’ inception date for both the fund and its comparative standards. | ||
Fiscal-Year Total Returns (%): September 7, 2010, Through August 31, 2015
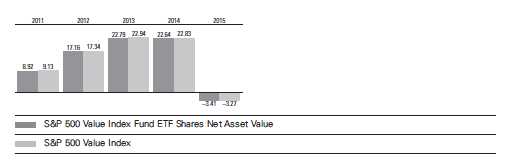
Average Annual Total Returns: Periods Ended June 30, 2015
This table presents returns through the latest calendar quarter—rather than through the end of the fiscal period.
Securities and Exchange Commission rules require that we provide this information.
| Inception | One | Since | |
| Date | Year | Inception | |
| ETF Shares | 9/7/2010 | ||
| Market Price | 4.44% | 15.11% | |
| Net Asset Value | 4.42 | 15.10 | |
| Institutional Shares | 3/3/2015 | — | -1.29 |
12
S&P 500 Value Index Fund
Financial Statements
Statement of Net Assets
As of August 31, 2015
The fund reports a complete list of its holdings in regulatory filings four times in each fiscal year, at the quarter-ends. For the second and fourth fiscal quarters, the lists appear in the fund’s semiannual and annual reports to shareholders. For the first and third fiscal quarters, the fund files the lists with the Securities and Exchange Commission on Form N-Q. Shareholders can look up the fund’s Forms N-Q on the SEC’s website at sec.gov. Forms N-Q may also be reviewed and copied at the SEC’s Public Reference Room (see the back cover of this report for further information).
| Market | |||
| Value• | |||
| Shares | ($000) | ||
| Common Stocks (99.5%)1 | |||
| Consumer Discretionary (8.0%) | |||
| Ford Motor Co. | 139,620 | 1,936 | |
| Target Corp. | 22,425 | 1,743 | |
| Comcast Corp. Class A | 29,132 | 1,641 | |
| McDonald’s Corp. | 16,159 | 1,535 | |
| General Motors Co. | 47,414 | 1,396 | |
| Starbucks Corp. | 17,391 | 951 | |
| Johnson Controls Inc. | 22,998 | 946 | |
| Carnival Corp. | 15,839 | 780 | |
| Delphi Automotive plc | 10,142 | 766 | |
| Twenty-First Century Fox | |||
| Inc. Class A | 26,721 | 732 | |
| Time Warner Cable Inc. | 3,265 | 607 | |
| TJX Cos. Inc. | 8,133 | 572 | |
| Yum! Brands Inc. | 6,688 | 533 | |
| Whirlpool Corp. | 2,750 | 462 | |
| Macy’s Inc. | 6,740 | 395 | |
| CBS Corp. Class B | 8,595 | 389 | |
| Best Buy Co. Inc. | 10,256 | 377 | |
| Kohl’s Corp. | 6,956 | 355 | |
| BorgWarner Inc. | 7,946 | 347 | |
| PVH Corp. | 2,904 | 345 | |
| Staples Inc. | 22,500 | 320 | |
| Darden Restaurants Inc. | 4,370 | 297 | |
| Dollar General Corp. | 3,968 | 296 | |
| Coach Inc. | 9,713 | 294 | |
| Goodyear Tire & Rubber Co. | 9,493 | 283 | |
| Mattel Inc. | 11,882 | 278 | |
| Omnicom Group Inc. | 4,122 | 276 | |
| Viacom Inc. Class B | 6,154 | 251 | |
| * | News Corp. Class A | 17,587 | 240 |
| * | Mohawk Industries Inc. | 1,158 | 228 |
| Royal Caribbean Cruises Ltd. | 2,553 | 225 | |
| * | CarMax Inc. | 3,674 | 224 |
| L Brands Inc. | 2,584 | 217 | |
| Cablevision Systems Corp. | |||
| Class A | 7,726 | 194 | |
| * | Bed Bath & Beyond Inc. | 3,072 | 191 |
| * | TEGNA Inc. | 7,968 | 190 |
| Starwood Hotels & Resorts | |||
| Worldwide Inc. | 2,639 | 189 | |
| Genuine Parts Co. | 2,244 | 187 | |
| Harley-Davidson Inc. | 3,087 | 173 | |
| Gap Inc. | 5,176 | 170 | |
| GameStop Corp. Class A | 3,752 | 159 | |
| Hasbro Inc. | 2,011 | 150 | |
| Interpublic Group of Cos. Inc. | 7,405 | 140 | |
| Newell Rubbermaid Inc. | 3,209 | 135 | |
| PulteGroup Inc. | 5,417 | 112 | |
| H&R Block Inc. | 3,197 | 109 | |
| Ralph Lauren Corp. Class A | 955 | 106 | |
| * | Urban Outfitters Inc. | 3,422 | 106 |
| Tiffany & Co. | 1,229 | 101 | |
| * | AutoNation Inc. | 1,531 | 92 |
| Garmin Ltd. | 1,829 | 69 | |
| * | Fossil Group Inc. | 528 | 32 |
| 22,842 | |||
| Consumer Staples (10.1%) | |||
| Wal-Mart Stores Inc. | 55,423 | 3,587 | |
| Procter & Gamble Co. | 48,595 | 3,434 | |
| Walgreens Boots Alliance | |||
| Inc. | 30,647 | 2,652 | |
| Mondelez International Inc. | |||
| Class A | 57,130 | 2,420 | |
| Coca-Cola Co. | 60,620 | 2,384 | |
| Costco Wholesale Corp. | 15,434 | 2,161 | |
| Philip Morris International | |||
| Inc. | 24,483 | 1,954 | |
| PepsiCo Inc. | 20,735 | 1,927 | |
| Archer-Daniels-Midland Co. | 21,787 | 980 | |
| Sysco Corp. | 20,860 | 832 | |
| Colgate-Palmolive Co. | 12,243 | 769 | |
| Kraft Heinz Co. | 10,400 | 756 | |
| Kroger Co. | 18,266 | 630 | |
| Kimberly-Clark Corp. | 5,630 | 600 | |
| General Mills Inc. | 10,477 | 595 | |
| Tyson Foods Inc. Class A | 10,245 | 433 | |
| Whole Foods Market Inc. | 12,595 | 413 | |
| JM Smucker Co. | 3,406 | 401 | |
13
S&P 500 Value Index Fund
| Market | |||
| Value• | |||
| Shares | ($000) | ||
| ConAgra Foods Inc. | 9,149 | 381 | |
| Kellogg Co. | 4,492 | 298 | |
| Estee Lauder Cos. Inc. | |||
| Class A | 3,456 | 276 | |
| Clorox Co. | 1,934 | 215 | |
| Coca-Cola Enterprises Inc. | 3,617 | 186 | |
| Hershey Co. | 1,959 | 175 | |
| McCormick & Co. Inc. | 2,020 | 160 | |
| Campbell Soup Co. | 2,629 | 126 | |
| Hormel Foods Corp. | 2,040 | 125 | |
| 28,870 | |||
| Energy (12.3%) | |||
| Exxon Mobil Corp. | 146,846 | 11,049 | |
| Chevron Corp. | 66,044 | 5,349 | |
| ConocoPhillips | 43,302 | 2,128 | |
| Occidental Petroleum Corp. | 26,977 | 1,969 | |
| Schlumberger Ltd. | 23,635 | 1,829 | |
| Phillips 66 | 19,047 | 1,506 | |
| Halliburton Co. | 29,884 | 1,176 | |
| Valero Energy Corp. | 17,863 | 1,060 | |
| Marathon Petroleum Corp. | 19,080 | 903 | |
| Baker Hughes Inc. | 15,265 | 855 | |
| Anadarko Petroleum Corp. | 8,565 | 613 | |
| Apache Corp. | 13,243 | 599 | |
| Devon Energy Corp. | 13,572 | 579 | |
| National Oilwell Varco Inc. | 13,621 | 576 | |
| Hess Corp. | 8,558 | 509 | |
| Noble Energy Inc. | 15,030 | 502 | |
| Marathon Oil Corp. | 23,705 | 410 | |
| Tesoro Corp. | 4,399 | 405 | |
| Spectra Energy Corp. | 11,081 | 322 | |
| ONEOK Inc. | 7,340 | 264 | |
| * | Cameron International Corp. | 3,769 | 252 |
| Helmerich & Payne Inc. | 3,792 | 224 | |
| * | Southwestern Energy Co. | 13,542 | 220 |
| Pioneer Natural Resources | |||
| Co. | 1,627 | 200 | |
| * | Newfield Exploration Co. | 5,664 | 189 |
| Murphy Oil Corp. | 5,876 | 182 | |
| Cimarex Energy Co. | 1,616 | 178 | |
| ^ | Transocean Ltd. | 11,993 | 171 |
| Ensco plc Class A | 8,250 | 149 | |
| ^ | Chesapeake Energy Corp. | 18,221 | 142 |
| EQT Corp. | 1,818 | 141 | |
| CONSOL Energy Inc. | 8,050 | 123 | |
| * | FMC Technologies Inc. | 2,579 | 90 |
| Columbia Pipeline Group | |||
| Inc. | 2,789 | 71 | |
| Diamond Offshore Drilling | |||
| Inc. | 2,305 | 55 | |
| 34,990 | |||
| Financials (25.6%) | |||
| * | Berkshire Hathaway Inc. | ||
| Class B | 64,054 | 8,586 | |
| JPMorgan Chase & Co. | 130,339 | 8,355 | |
| Bank of America Corp. | 368,848 | 6,027 | |
| Citigroup Inc. | 106,563 | 5,699 |
| Wells Fargo & Co. | 98,743 | 5,266 |
| American International | ||
| Group Inc. | 46,830 | 2,826 |
| Goldman Sachs Group Inc. | 14,111 | 2,661 |
| MetLife Inc. | 39,189 | 1,963 |
| Morgan Stanley | 53,968 | 1,859 |
| PNC Financial Services | ||
| Group Inc. | 18,190 | 1,657 |
| Bank of New York Mellon | ||
| Corp. | 39,388 | 1,568 |
| Capital One Financial Corp. | 19,190 | 1,492 |
| US Bancorp | 32,380 | 1,371 |
| Prudential Financial Inc. | 15,910 | 1,284 |
| ACE Ltd. | 11,469 | 1,172 |
| Travelers Cos. Inc. | 11,192 | 1,114 |
| CME Group Inc. | 11,144 | 1,052 |
| State Street Corp. | 14,457 | 1,040 |
| BB&T Corp. | 27,276 | 1,007 |
| Chubb Corp. | 8,068 | 975 |
| American Express Co. | 12,578 | 965 |
| Aflac Inc. | 15,238 | 893 |
| SunTrust Banks Inc. | 18,130 | 732 |
| Prologis Inc. | 18,422 | 700 |
| Hartford Financial Services | ||
| Group Inc. | 14,762 | 678 |
| Fifth Third Bancorp | 28,473 | 567 |
| Progressive Corp. | 18,770 | 562 |
| M&T Bank Corp. | 4,669 | 552 |
| Allstate Corp. | 8,482 | 494 |
| BlackRock Inc. | 1,606 | 486 |
| Principal Financial Group Inc. | 9,634 | 485 |
| Lincoln National Corp. | 8,893 | 452 |
| Charles Schwab Corp. | 14,220 | 432 |
| KeyCorp | 29,821 | 410 |
| Marsh & McLennan Cos. Inc. | 7,565 | 406 |
| XL Group plc Class A | 10,779 | 402 |
| Aon plc | 4,147 | 388 |
| Loews Corp. | 10,445 | 381 |
| McGraw Hill Financial Inc. | 3,556 | 345 |
| Huntington Bancshares Inc. | 28,397 | 310 |
| Unum Group | 8,771 | 294 |
| Comerica Inc. | 6,252 | 275 |
| Northern Trust Corp. | 3,929 | 274 |
| Franklin Resources Inc. | 6,717 | 273 |
| Cincinnati Financial Corp. | 5,203 | 272 |
| Intercontinental Exchange | ||
| Inc. | 1,178 | 269 |
| HCP Inc. | 7,139 | 265 |
| Torchmark Corp. | 4,434 | 259 |
| Discover Financial Services | 4,666 | 251 |
| Regions Financial Corp. | 25,891 | 248 |
| Leucadia National Corp. | 11,074 | 238 |
| Invesco Ltd. | 6,500 | 222 |
| T. Rowe Price Group Inc. | 3,030 | 218 |
| NASDAQ OMX Group Inc. | 4,163 | 213 |
14
S&P 500 Value Index Fund
| Market | |||
| Value• | |||
| Shares | ($000) | ||
| Vornado Realty Trust | 2,401 | 209 | |
| Zions Bancorporation | 7,146 | 207 | |
| Assurant Inc. | 2,388 | 178 | |
| People’s United Financial | |||
| Inc. | 10,855 | 168 | |
| * | E*TRADE Financial Corp. | 6,104 | 160 |
| Hudson City Bancorp Inc. | 16,950 | 158 | |
| Weyerhaeuser Co. | 5,279 | 148 | |
| SL Green Realty Corp. | 1,287 | 133 | |
| * | Affiliated Managers Group | ||
| Inc. | 710 | 132 | |
| Plum Creek Timber Co. Inc. | 3,101 | 119 | |
| * | Genworth Financial Inc. | ||
| Class A | 17,491 | 91 | |
| 72,888 | |||
| Health Care (10.7%) | |||
| Pfizer Inc. | 216,266 | 6,968 | |
| Johnson & Johnson | 40,905 | 3,844 | |
| Merck & Co. Inc. | 42,667 | 2,298 | |
| UnitedHealth Group Inc. | 17,050 | 1,973 | |
| Bristol-Myers Squibb Co. | 27,516 | 1,636 | |
| Abbott Laboratories | 31,373 | 1,421 | |
| Anthem Inc. | 9,289 | 1,310 | |
| Eli Lilly & Co. | 13,376 | 1,101 | |
| * | Express Scripts Holding Co. | 12,581 | 1,052 |
| Humana Inc. | 5,261 | 962 | |
| Cardinal Health Inc. | 11,626 | 956 | |
| McKesson Corp. | 4,717 | 932 | |
| Aetna Inc. | 6,752 | 773 | |
| Cigna Corp. | 5,061 | 713 | |
| Perrigo Co. plc | 2,571 | 470 | |
| Agilent Technologies Inc. | 11,713 | 425 | |
| * | Boston Scientific Corp. | 25,307 | 424 |
| * | Laboratory Corp. of America | ||
| Holdings | 3,526 | 415 | |
| Quest Diagnostics Inc. | 5,048 | 342 | |
| * | Vertex Pharmaceuticals Inc. | 2,473 | 315 |
| Baxter International Inc. | 7,836 | 301 | |
| St. Jude Medical Inc. | 3,741 | 265 | |
| * | Endo International plc | 2,840 | 219 |
| Universal Health Services | |||
| Inc. Class B | 1,507 | 207 | |
| Zimmer Biomet Holdings | |||
| Inc. | 1,976 | 205 | |
| Baxalta Inc. | 5,357 | 188 | |
| * | HCA Holdings Inc. | 2,142 | 186 |
| * | Henry Schein Inc. | 940 | 129 |
| * | Waters Corp. | 1,015 | 123 |
| DENTSPLY International Inc. | 1,844 | 97 | |
| * | Varian Medical Systems Inc. | 1,093 | 89 |
| * | Tenet Healthcare Corp. | 1,735 | 85 |
| PerkinElmer Inc. | 1,593 | 78 | |
| Patterson Cos. Inc. | 1,203 | 55 | |
| 30,557 | |||
| Industrials (12.3%) | ||
| General Electric Co. | 353,881 | 8,783 |
| United Technologies Corp. | 29,077 | 2,664 |
| Caterpillar Inc. | 21,201 | 1,621 |
| Boeing Co. | 11,293 | 1,476 |
| Honeywell International Inc. | 13,453 | 1,335 |
| Emerson Electric Co. | 23,471 | 1,120 |
| Raytheon Co. | 10,717 | 1,099 |
| 3M Co. | 7,351 | 1,045 |
| United Parcel Service Inc. | ||
| Class B | 10,480 | 1,023 |
| Deere & Co. | 11,725 | 959 |
| Eaton Corp. plc | 16,406 | 936 |
| Danaher Corp. | 9,298 | 809 |
| Cummins Inc. | 5,888 | 717 |
| Lockheed Martin Corp. | 3,197 | 643 |
| FedEx Corp. | 4,167 | 628 |
| Northrop Grumman Corp. | 3,678 | 602 |
| Stanley Black & Decker Inc. | 5,405 | 549 |
| Parker-Hannifin Corp. | 4,875 | 525 |
| General Dynamics Corp. | 3,623 | 515 |
| Precision Castparts Corp. | 2,234 | 514 |
| Ingersoll-Rand plc | 9,273 | 513 |
| Illinois Tool Works Inc. | 5,231 | 442 |
| Waste Management Inc. | 7,483 | 375 |
| Republic Services Inc. | ||
| Class A | 8,769 | 359 |
| Dover Corp. | 5,636 | 349 |
| Pentair plc | 6,314 | 349 |
| PACCAR Inc. | 5,856 | 345 |
| L-3 Communications | ||
| Holdings Inc. | 2,891 | 305 |
| Norfolk Southern Corp. | 3,536 | 275 |
| American Airlines Group Inc. | 7,056 | 275 |
| Tyco International plc | 7,544 | 274 |
| Rockwell Automation Inc. | 2,318 | 259 |
| WW Grainger Inc. | 1,068 | 239 |
| Fluor Corp. | 5,177 | 236 |
| Flowserve Corp. | 4,731 | 214 |
| Textron Inc. | 5,361 | 208 |
| Xylem Inc. | 6,376 | 207 |
| ADT Corp. | 6,027 | 198 |
| AMETEK Inc. | 3,396 | 183 |
| * Jacobs Engineering Group | ||
| Inc. | 4,413 | 178 |
| Masco Corp. | 6,713 | 176 |
| Expeditors International of | ||
| Washington Inc. | 3,559 | 174 |
| Roper Technologies Inc. | 1,062 | 172 |
| Kansas City Southern | 1,788 | 166 |
| Ryder System Inc. | 1,867 | 153 |
| Rockwell Collins Inc. | 1,719 | 141 |
| Pitney Bowes Inc. | 7,099 | 141 |
| Fastenal Co. | 3,542 | 136 |
15
S&P 500 Value Index Fund
| Market | |||
| Value• | |||
| Shares | ($000) | ||
| Equifax Inc. | 1,253 | 123 | |
| Snap-on Inc. | 696 | 111 | |
| * | Quanta Services Inc. | 3,947 | 96 |
| Joy Global Inc. | 3,428 | 83 | |
| Allegion plc | 1,158 | 69 | |
| Dun & Bradstreet Corp. | 444 | 47 | |
| 35,134 | |||
| Information Technology (6.5%) | |||
| International Business | |||
| Machines Corp. | 32,163 | 4,757 | |
| Hewlett-Packard Co. | 63,443 | 1,780 | |
| Cisco Systems Inc. | 64,306 | 1,664 | |
| Oracle Corp. | 38,068 | 1,412 | |
| Accenture plc Class A | 9,457 | 892 | |
| Texas Instruments Inc. | 13,167 | 630 | |
| EMC Corp. | 19,799 | 492 | |
| * | salesforce.com inc | 6,819 | 473 |
| TE Connectivity Ltd. | 7,712 | 457 | |
| * | PayPal Holdings Inc. | 12,805 | 448 |
| Corning Inc. | 25,220 | 434 | |
| * | Adobe Systems Inc. | 5,174 | 407 |
| Xerox Corp. | 36,481 | 371 | |
| Harris Corp. | 4,328 | 332 | |
| Juniper Networks Inc. | 12,354 | 318 | |
| CA Inc. | 11,129 | 304 | |
| Analog Devices Inc. | 5,380 | 301 | |
| Computer Sciences Corp. | 4,836 | 300 | |
| Fidelity National Information | |||
| Services Inc. | 3,686 | 255 | |
| Altera Corp. | 5,191 | 252 | |
| Applied Materials Inc. | 15,577 | 251 | |
| Symantec Corp. | 10,758 | 220 | |
| Motorola Solutions Inc. | 3,393 | 220 | |
| Xilinx Inc. | 4,635 | 194 | |
| Paychex Inc. | 4,143 | 185 | |
| NetApp Inc. | 5,271 | 168 | |
| Linear Technology Corp. | 3,874 | 156 | |
| KLA-Tencor Corp. | 3,093 | 155 | |
| Western Union Co. | 7,987 | 147 | |
| * | First Solar Inc. | 2,651 | 127 |
| Microchip Technology Inc. | 2,806 | 119 | |
| Total System Services Inc. | 1,816 | 83 | |
| FLIR Systems Inc. | 2,558 | 73 | |
| * | Teradata Corp. | 2,345 | 69 |
| 18,446 | |||
| Materials (3.6%) | |||
| Dow Chemical Co. | 38,061 | 1,665 | |
| LyondellBasell Industries NV | |||
| Class A | 13,796 | 1,178 | |
| EI du Pont de Nemours & | |||
| Co. | 15,896 | 819 | |
| International Paper Co. | 14,851 | 641 | |
| Monsanto Co. | 5,691 | 556 | |
| WestRock Co. | 9,149 | 543 | |
| Praxair Inc. | 4,763 | 504 | |
| Nucor Corp. | 11,208 | 485 | |
| Mosaic Co. | 10,910 | 445 |
| Alcoa Inc. | 45,991 | 435 |
| Freeport-McMoRan Inc. | 36,527 | 389 |
| Eastman Chemical Co. | 5,235 | 379 |
| Newmont Mining Corp. | 18,587 | 317 |
| PPG Industries Inc. | 3,246 | 309 |
| Air Products & Chemicals | ||
| Inc. | 1,969 | 275 |
| CF Industries Holdings Inc. | 3,805 | 218 |
| FMC Corp. | 4,695 | 199 |
| Avery Dennison Corp. | 3,187 | 185 |
| Vulcan Materials Co. | 1,862 | 174 |
| Sealed Air Corp. | 2,666 | 137 |
| International Flavors & | ||
| Fragrances Inc. | 1,223 | 134 |
| * Owens-Illinois Inc. | 5,670 | 118 |
| Airgas Inc. | 1,095 | 106 |
| Ball Corp. | 1,500 | 99 |
| 10,310 | ||
| Telecommunication Services (5.0%) | ||
| AT&T Inc. | 214,986 | 7,137 |
| Verizon Communications | ||
| Inc. | 143,243 | 6,591 |
| CenturyLink Inc. | 19,817 | 536 |
| Frontier Communications | ||
| Corp. | 22,727 | 115 |
| 14,379 | ||
| Utilities (5.4%) | ||
| Duke Energy Corp. | 24,287 | 1,722 |
| Southern Co. | 31,898 | 1,385 |
| American Electric Power | ||
| Co. Inc. | 17,206 | 934 |
| Exelon Corp. | 30,247 | 930 |
| PG&E Corp. | 16,863 | 836 |
| Dominion Resources Inc. | 11,046 | 771 |
| NextEra Energy Inc. | 7,642 | 752 |
| PPL Corp. | 23,464 | 727 |
| Public Service Enterprise | ||
| Group Inc. | 17,767 | 715 |
| Consolidated Edison Inc. | 10,287 | 647 |
| Xcel Energy Inc. | 17,820 | 601 |
| Eversource Energy | 11,157 | 527 |
| DTE Energy Co. | 6,303 | 492 |
| FirstEnergy Corp. | 14,833 | 474 |
| Entergy Corp. | 6,310 | 412 |
| Edison International | 6,407 | 375 |
| Sempra Energy | 3,670 | 348 |
| Ameren Corp. | 8,522 | 343 |
| CMS Energy Corp. | 9,700 | 318 |
| AES Corp. | 23,968 | 288 |
| CenterPoint Energy Inc. | 15,135 | 282 |
| WEC Energy Group Inc. | 5,645 | 269 |
| SCANA Corp. | 5,019 | 265 |
| NRG Energy Inc. | 11,723 | 234 |
| Pinnacle West Capital Corp. | 3,895 | 232 |
| Pepco Holdings Inc. | 8,902 | 205 |
16
S&P 500 Value Index Fund
| Market | ||
| Value• | ||
| Shares | ($000) | |
| TECO Energy Inc. | 8,258 | 174 |
| AGL Resources Inc. | 2,530 | 154 |
| NiSource Inc. | 5,902 | 99 |
| 15,511 | ||
| Total Common Stocks | ||
| (Cost $280,074) | 283,927 | |
| Temporary Cash Investments (0.2%)1 | ||
| Money Market Fund (0.2%) | ||
| 2,3 Vanguard Market | ||
| Liquidity Fund, 0.168% | 546,105 | 546 |
| Face | ||
| Amount | ||
| ($000) | ||
| U.S. Government and Agency Obligations (0.0%) | ||
| 4,5 Federal Home Loan | ||
| Bank Discount Notes, | ||
| 0.093%, 10/2/15 | 100 | 100 |
| Total Temporary Cash Investments | ||
| (Cost $646) | 646 | |
| Total Investments (99.7%) | ||
| (Cost $280,720) | 284,573 | |
| Amount | |
| ($000) | |
| Other Assets and Liabilities (0.3%) | |
| Other Assets | |
| Investment in Vanguard | 27 |
| Receivables for Accrued Income | 869 |
| Other Assets | 165 |
| Total Other Assets | 1,061 |
| Liabilities | |
| Collateral for Securities on Loan | (132) |
| Payables to Vanguard | (91) |
| Other Liabilities | (15) |
| Total Liabilities | (238) |
| Net Assets (100%) | 285,396 |
| At August 31, 2015, net assets consisted of: | |
| Amount | |
| ($000) | |
| Paid-in Capital | 282,943 |
| Undistributed Net Investment Income | 1,386 |
| Accumulated Net Realized Losses | (2,728) |
| Unrealized Appreciation (Depreciation) | |
| Investment Securities | 3,853 |
| Futures Contracts | (58) |
| Net Assets | 285,396 |
| ETF Shares—Net Assets | |
| Applicable to 3,275,000 outstanding | |
| $.001 par value shares of beneficial | |
| interest (unlimited authorization) | 274,292 |
| Net Asset Value Per Share— | |
| ETF Shares | $83.75 |
| Institutional Shares—Net Assets | |
| Applicable to 60,431 outstanding | |
| $.001 par value shares of beneficial | |
| interest (unlimited authorization) | 11,104 |
| Net Asset Value Per Share— | |
| Institutional Shares | $183.75 |
• See Note A in Notes to Financial Statements.
* Non-income-producing security.
^ Includes partial security positions on loan to broker-dealers. The total value of securities on loan is $133,000.
1 The fund invests a portion of its cash reserves in equity markets through the use of index futures contracts. After giving effect to futures
investments, the fund’s effective common stock and temporary cash investment positions represent 100.0% and -0.3%, respectively,
of net assets.
2 Includes $132,000 of collateral received for securities on loan. The fund received additional collateral of $7,000 on the next business day.
3 Affiliated money market fund available only to Vanguard funds and certain trusts and accounts managed by Vanguard. Rate shown is the
7-day yield.
4 The issuer operates under a congressional charter; its securities are generally neither guaranteed by the U.S. Treasury nor backed by the
full faith and credit of the U.S. government.
5 Securities with a value of $100,000 have been segregated as initial margin for open futures contracts.
See accompanying Notes, which are an integral part of the Financial Statements.
17
S&P 500 Value Index Fund
Statement of Operations
| Year Ended | |
| August 31, 2015 | |
| ($000) | |
| Investment Income | |
| Income | |
| Dividends | 6,582 |
| Interest | 2 |
| Securities Lending | 6 |
| Total Income | 6,590 |
| Expenses | |
| The Vanguard Group—Note B | |
| Investment Advisory Services | 45 |
| Management and Administrative—ETF Shares | 241 |
| Management and Administrative—Institutional Shares | 2 |
| Marketing and Distribution—ETF Shares | 35 |
| Marketing and Distribution—Institutional Shares | — |
| Custodian Fees | 27 |
| Auditing Fees | 30 |
| Shareholders’ Reports—ETF Shares | 8 |
| Shareholders’ Reports—Institutional Shares | — |
| Total Expenses | 388 |
| Net Investment Income | 6,202 |
| Realized Net Gain (Loss) | |
| Investment Securities Sold | 11,780 |
| Futures Contracts | 8 |
| Realized Net Gain (Loss) | 11,788 |
| Change in Unrealized Appreciation (Depreciation) | |
| Investment Securities | (26,647) |
| Futures Contracts | (58) |
| Change in Unrealized Appreciation (Depreciation) | (26,705) |
| Net Increase (Decrease) in Net Assets Resulting from Operations | (8,715) |
See accompanying Notes, which are an integral part of the Financial Statements.
18
S&P 500 Value Index Fund
Statement of Changes in Net Assets
| Year Ended August 31, | ||
| 2015 | 2014 | |
| ($000) | ($000) | |
| Increase (Decrease) in Net Assets | ||
| Operations | ||
| Net Investment Income | 6,202 | 3,489 |
| Realized Net Gain (Loss) | 11,788 | 9,485 |
| Change in Unrealized Appreciation (Depreciation) | (26,705) | 17,639 |
| Net Increase (Decrease) in Net Assets Resulting from Operations | (8,715) | 30,613 |
| Distributions | ||
| Net Investment Income | ||
| ETF Shares | (5,543) | (3,246) |
| Institutional Shares | (92) | — |
| Realized Capital Gain | ||
| ETF Shares | — | — |
| Institutional Shares | — | — |
| Total Distributions | (5,635) | (3,246) |
| Capital Share Transactions | ||
| ETF Shares | 84,010 | 58,316 |
| Institutional Shares | 12,094 | — |
| Net Increase (Decrease) from Capital Share Transactions | 96,104 | 58,316 |
| Total Increase (Decrease) | 81,754 | 85,683 |
| Net Assets | ||
| Beginning of Period | 203,642 | 117,959 |
| End of Period1 | 285,396 | 203,642 |
| 1 Net Assets—End of Period includes undistributed (overdistributed) net investment income of $1,386,000 and $819,000. | ||
See accompanying Notes, which are an integral part of the Financial Statements.
19
S&P 500 Value Index Fund
Financial Highlights
| ETF Shares | |||||
| Sept. 7, | |||||
| 20101 to | |||||
| For a Share Outstanding | Year Ended August 31, | Aug. 31, | |||
| Throughout Each Period | 2015 | 2014 | 2013 | 2012 | 2011 |
| Net Asset Value, Beginning of Period | $88.54 | $73.72 | $61.42 | $53.59 | $49.93 |
| lnvestment Operations | |||||
| Net Investment Income | 1.932 | 1.702 | 1.584 | 1.329 | 1.051 |
| Net Realized and Unrealized Gain (Loss) | |||||
| on Investments | (4.838) | 14.824 | 12.242 | 7.734 | 3.454 |
| Total from Investment Operations | (2.906) | 16.526 | 13.826 | 9.063 | 4.505 |
| Distributions | |||||
| Dividends from Net Investment Income | (1.884) | (1.706) | (1.526) | (1.233) | (.845) |
| Distributions from Realized Capital Gains | — | — | — | — | — |
| Total Distributions | (1.884) | (1.706) | (1.526) | (1.233) | (.845) |
| Net Asset Value, End of Period | $83.75 | $88.54 | $73.72 | $61.42 | $53.59 |
| Total Return | -3.41% | 22.64% | 22.79% | 17.16% | 8.92% |
| Ratios/Supplemental Data | |||||
| Net Assets, End of Period (Millions) | $274 | $204 | $118 | $52 | $27 |
| Ratio of Total Expenses to Average Net Assets | 0.15% | 0.15% | 0.15% | 0.15% | 0.15%2 |
| Ratio of Net Investment Income to | |||||
| Average Net Assets | 2.37% | 2.31% | 2.45% | 2.43% | 2.25%2 |
| Portfolio Turnover Rate 3 | 23% | 25% | 25% | 20% | 23% |
1 Inception.
2 Annualized.
3 Excludes the value of portfolio securities received or delivered as a result of in-kind purchases or redemptions of the fund’s capital shares,
including ETF Creation Units.
See accompanying Notes, which are an integral part of the Financial Statements.
20
S&P 500 Value Index Fund
Financial Highlights
| Institutional Shares | |
| March 3, 20151 to | |
| For a Share Outstanding Throughout the Period | August 31, 2015 |
| Net Asset Value, Beginning of Period | $199.34 |
| Investment Operations | |
| Net Investment Income | 2.352 |
| Net Realized and Unrealized Gain (Loss) on Investments | (15.830) |
| Total from Investment Operations | (13.478) |
| Distributions | |
| Dividends from Net Investment Income | (2.112) |
| Distributions from Realized Capital Gains | — |
| Total Distributions | (2.112) |
| Net Asset Value, End of Period | $183.75 |
| Total Return | -6.84% |
| Ratios/Supplemental Data | |
| Net Assets, End of Period (Millions) | $11 |
| Ratio of Total Expenses to Average Net Assets | 0.08%2 |
| Ratio of Net Investment Income to Average Net Assets | 2.44%2 |
| Portfolio Turnover Rate3 | 23% |
1 Inception.
2 Annualized.
3 Excludes the value of portfolio securities received or delivered as a result of in-kind purchases or redemptions of the fund’s capital shares,
including ETF Creation Units.
See accompanying Notes, which are an integral part of the Financial Statements.
21
S&P 500 Value Index Fund
Notes to Financial Statements
Vanguard S&P 500 Value Index Fund is registered under the Investment Company Act of 1940 as an open-end investment company, or mutual fund. The fund offers two classes of shares: ETF Shares and Institutional Shares. ETF Shares are listed for trading on NYSE Arca; they can be purchased and sold through a broker. Institutional Shares are designed for investors who meet certain administrative, service, and account-size criteria.
A. The following significant accounting policies conform to generally accepted accounting principles for U.S. investment companies. The fund consistently follows such policies in preparing its financial statements.
1. Security Valuation: Securities are valued as of the close of trading on the New York Stock Exchange (generally 4 p.m., Eastern time) on the valuation date. Equity securities are valued at the latest quoted sales prices or official closing prices taken from the primary market in which each security trades; such securities not traded on the valuation date are valued at the mean of the latest quoted bid and asked prices. Securities for which market quotations are not readily available, or whose values have been materially affected by events occurring before the fund’s pricing time but after the close of the securities’ primary markets, are valued by methods deemed by the board of trustees to represent fair value. Investments in Vanguard Market Liquidity Fund are valued at that fund’s net asset value. Temporary cash investments acquired over 60 days to maturity are valued using the latest bid prices or using valuations based on a matrix system (which considers such factors as security prices, yields, maturities, and ratings), both as furnished by independent pricing services. Other temporary cash investments are valued at amortized cost, which approximates market value.
2. Futures Contracts: The fund uses index futures contracts to a limited extent, with the objectives of maintaining full exposure to the stock market, enhancing returns, maintaining liquidity, and minimizing transaction costs. The fund may purchase futures contracts to immediately invest incoming cash in the market, or sell futures in response to cash outflows, thereby simulating a fully invested position in the underlying index while maintaining a cash balance for liquidity. The fund may seek to enhance returns by using futures contracts instead of the underlying securities when futures are believed to be priced more attractively than the underlying securities. The primary risks associated with the use of futures contracts are imperfect correlation between changes in market values of stocks held by the fund and the prices of futures contracts, and the possibility of an illiquid market. Counterparty risk involving futures is mitigated because a regulated clearinghouse is the counterparty instead of the clearing broker. To further mitigate counterparty risk, the fund trades futures contracts on an exchange, monitors the financial strength of its clearing brokers and clearinghouse, and has entered into clearing agreements with its clearing brokers. The clearinghouse imposes initial margin requirements to secure the fund’s performance and requires daily settlement of variation margin representing changes in the market value of each contract.
Futures contracts are valued at their quoted daily settlement prices. The aggregate settlement values of the contracts are not recorded in the Statement of Net Assets. Fluctuations in the value of the contracts are recorded in the Statement of Net Assets as an asset (liability) and in the Statement of Operations as unrealized appreciation (depreciation) until the contracts are closed, when they are recorded as realized futures gains (losses).
During the year ended August 31, 2015, the fund’s average investments in long and short futures contracts represented less than 1% and 0% of net assets, respectively, based on the average of aggregate settlement values at each quarter-end during the period.
22
S&P 500 Value Index Fund
3. Federal Income Taxes: The fund intends to continue to qualify as a regulated investment company and distribute all of its taxable income. Management has analyzed the fund’s tax positions taken for all open federal income tax years (August 31, 2012–2015), and has concluded that no provision for federal income tax is required in the fund’s financial statements.
4. Distributions: Distributions to shareholders are recorded on the ex-dividend date.
5. Securities Lending: To earn additional income, the fund lends its securities to qualified institutional borrowers. Security loans are required to be secured at all times by collateral in an amount at least equal to the market value of securities loaned. Daily market fluctuations could cause the value of loaned securities to be more or less than the value of the collateral received. When this occurs, the collateral is adjusted and settled on the next business day. The fund further mitigates its counterparty risk by entering into securities lending transactions only with a diverse group of prequalified counterparties, monitoring their financial strength, and entering into master securities lending agreements with its counterparties. The master securities lending agreements provide that, in the event of a counterparty’s default (including bankruptcy), the fund may terminate any loans with that borrower, determine the net amount owed, and sell or retain the collateral up to the net amount owed to the fund; however, such actions may be subject to legal proceedings. While collateral mitigates counterparty risk, in the absence of a default the fund may experience delays and costs in recovering the securities loaned. The fund invests cash collateral received in Vanguard Market Liquidity Fund, and records a liability in the Statement of Net Assets for the return of the collateral, during the period the securities are on loan. Securities lending income represents fees charged to borrowers plus income earned on invested cash collateral, less expenses associated with the loan.
6. Credit Facility: The fund and certain other funds managed by The Vanguard Group (“Vanguard”) participate in a $3 billion committed credit facility provided by a syndicate of lenders pursuant to a credit agreement that may be renewed annually; each fund is individually liable for its borrowings, if any, under the credit facility. Borrowings may be utilized for temporary and emergency purposes, and are subject to the fund’s regulatory and contractual borrowing restrictions. The participating funds are charged administrative fees and an annual commitment fee of 0.06% of the undrawn amount of the facility; these fees are allocated to the funds based on a method approved by the fund’s board of trustees and included in Management and Administrative expenses on the fund’s Statement of Operations. Any borrowings under this facility bear interest at a rate equal to the higher of the federal funds rate or LIBOR reference rate plus an agreed-upon spread.
The fund had no borrowings outstanding at August 31, 2015, or at any time during the period then ended.
7. Other: Dividend income is recorded on the ex-dividend date. Interest income includes income distributions received from Vanguard Market Liquidity Fund and is accrued daily. Premiums and discounts on debt securities purchased are amortized and accreted, respectively, to interest income over the lives of the respective securities. Security transactions are accounted for on the date securities are bought or sold. Costs used to determine realized gains (losses) on the sale of investment securities are those of the specific securities sold.
Each class of shares has equal rights as to assets and earnings, except that each class separately bears certain class-specific expenses related to maintenance of shareholder accounts (included in Management and Administrative expenses) and shareholder reporting. Marketing and distribution
23
S&P 500 Value Index Fund
expenses are allocated to each class of shares based on a method approved by the board of trustees. Income, other non-class-specific expenses, and gains and losses on investments are allocated to each class of shares based on its relative net assets.
B. In accordance with the terms of a Funds’ Service Agreement (the “FSA”) between Vanguard and the fund, Vanguard furnishes to the fund investment advisory, corporate management, administrative, marketing, and distribution services at Vanguard’s cost of operations (as defined by the FSA). These costs of operations are allocated to the fund based on methods and guidelines approved by the board of trustees. Vanguard does not require reimbursement in the current period for certain costs of operations (such as deferred compensation/benefits and risk/insurance costs); the fund’s liability for these costs of operations is included in Payables to Vanguard on the Statement of Net Assets.
Upon the request of Vanguard, the fund may invest up to 0.40% of its net assets as capital in Vanguard. At August 31, 2015, the fund had contributed to Vanguard capital in the amount of $27,000, representing 0.01% of the fund’s net assets and 0.01% of Vanguard’s capitalization. The fund’s trustees and officers are also directors and employees, respectively, of Vanguard.
C. Various inputs may be used to determine the value of the fund’s investments. These inputs are summarized in three broad levels for financial statement purposes. The inputs or methodologies used to value securities are not necessarily an indication of the risk associated with investing in those securities.
Level 1—Quoted prices in active markets for identical securities.
Level 2—Other significant observable inputs (including quoted prices for similar securities, interest rates, prepayment speeds, credit risk, etc.).
Level 3—Significant unobservable inputs (including the fund’s own assumptions used to determine the fair value of investments).
The following table summarizes the market value of the fund’s investments as of August 31, 2015, based on the inputs used to value them:
| Level 1 | Level 2 | Level 3 | |
| Investments | ($000) | ($000) | ($000) |
| Common Stocks | 283,927 | — | — |
| Temporary Cash Investments | 546 | 100 | — |
| Futures Contracts—Liabilities1 | (14) | — | — |
| Total | 284,459 | 100 | — |
| 1 Represents variation margin on the last day of the reporting period. | |||
D. At August 31, 2015, the aggregate settlement value of open futures contracts and the related unrealized appreciation (depreciation) were:
| ($000) | ||||
| Aggregate | ||||
| Number of | Settlement | Unrealized | ||
| Long (Short) | Value | Appreciation | ||
| Futures Contracts | Expiration | Contracts | Long (Short) | (Depreciation) |
| E-mini S&P 500 Index | September 2015 | 14 | 1,378 | (58) |
Unrealized appreciation (depreciation) on open futures contracts is required to be treated as realized gain (loss) for tax purposes.
24
S&P 500 Value Index Fund
E. Distributions are determined on a tax basis and may differ from net investment income and realized capital gains for financial reporting purposes. Differences may be permanent or temporary. Permanent differences are reclassified among capital accounts in the financial statements to reflect their tax character. Temporary differences arise when certain items of income, expense, gain, or loss are recognized in different periods for financial statement and tax purposes. These differences will reverse at some time in the future. Differences in classification may also result from the treatment of short-term gains as ordinary income for tax purposes.
During the year ended August 31, 2015, the fund realized $12,545,000 of net capital gains resulting from in-kind redemptions—in which shareholders exchanged fund shares for securities held by the fund rather than for cash. Because such gains are not taxable to the fund, and are not distributed to shareholders, they have been reclassified from accumulated net realized losses to paid-in capital.
For tax purposes, at August 31, 2015, the fund had $1,467,000 of ordinary income available for distribution. The fund had available capital losses totaling $2,787,000 that may be carried forward indefinitely to offset future net capital gains.
At August 31, 2015, the cost of investment securities for tax purposes was $280,720,000. Net unrealized appreciation of investment securities for tax purposes was $3,853,000 consisting of unrealized gains of $21,614,000 on securities that had risen in value since their purchase and $17,761,000 in unrealized losses on securities that had fallen in value since their purchase.
F. During the year ended August 31, 2015, the fund purchased $196,928,000 of investment securities and sold $101,586,000 of investment securities, other than temporary cash investments. Purchases and sales include $129,194,000 and $43,364,000, respectively, in connection with in-kind purchases and redemptions of the fund’s capital shares.
G. Capital share transactions for each class of shares were:
| Year Ended August 31, | ||||
| 2015 | 2014 | |||
| Amount | Shares | Amount | Shares | |
| ($000) | (000) | ($000) | (000) | |
| ETF Shares | ||||
| Issued | 129,195 | 1,475 | 94,133 | 1,150 |
| Issued in Lieu of Cash Distributions | — | — | — | — |
| Redeemed | (45,185) | (500) | (35,817) | (450) |
| Net Increase (Decrease)—ETF Shares | 84,010 | 975 | 58,316 | 700 |
| Institutional Shares1 | ||||
| Issued | 12,002 | 60 | — | — |
| Issued in Lieu of Cash Distributions | 92 | —2 | — | — |
| Redeemed | — | — | — | — |
| Net Increase (Decrease)—Institutional Shares | 12,094 | 60 | — | — |
| 1 Inception was March 3, 2015 for Institutional Shares. | ||||
| 2 Represents less than 1,000 shares. | ||||
H. Management has determined that no material events or transactions occurred subsequent to August 31, 2015, that would require recognition or disclosure in these financial statements.
25
S&P 500 Growth Index Fund
Fund Profile
As of August 31, 2015
| Portfolio Characteristics | |||
| DJ | |||
| U.S. | |||
| Total | |||
| S&P 500 | Market | ||
| Growth | FA | ||
| Fund | Index | Index | |
| Number of Stocks | 328 | 328 | 3,828 |
| Median Market Cap | $91.1B | $91.1B | $47.2B |
| Price/Earnings Ratio | 22.3x | 22.3x | 20.8x |
| Price/Book Ratio | 4.1x | 4.1x | 2.6x |
| Return on Equity | 21.6% | 21.4% | 17.1% |
| Earnings Growth | |||
| Rate | 13.8% | 13.7% | 10.2% |
| Dividend Yield | 1.8% | 1.8% | 2.1% |
| Foreign Holdings | 0.0% | 0.0% | 0.0% |
| Turnover Rate | 21% | — | — |
| Ticker Symbol | VOOG | — | — |
| Expense Ratio1 | 0.15% | — | — |
| 30-Day SEC Yield | 1.60% | — | — |
| Short-Term Reserves | -0.3% | — | — |
| Sector Diversification (% of equity exposure) | |||
| DJ | |||
| U.S. | |||
| Total | |||
| S&P 500 | Market | ||
| Growth | FA | ||
| Fund | Index | Index | |
| Consumer Discretionary | 17.1% | 17.1% | 13.5% |
| Consumer Staples | 9.2 | 9.2 | 8.4 |
| Energy | 2.9 | 2.9 | 6.6 |
| Financials | 8.8 | 8.8 | 18.2 |
| Health Care | 19.1 | 19.1 | 15.0 |
| Industrials | 7.8 | 7.8 | 10.7 |
| Information Technology | 31.7 | 31.7 | 19.1 |
| Materials | 2.4 | 2.4 | 3.3 |
| Telecommunication | |||
| Services | 0.2 | 0.2 | 2.2 |
| Utilities | 0.8 | 0.8 | 3.0 |
| Volatility Measures | ||
| DJ | ||
| S&P 500 | U.S. Total | |
| Growth | Market | |
| Index | FA Index | |
| R-Squared | 1.00 | 0.93 |
| Beta | 1.00 | 0.98 |
These measures show the degree and timing of the fund’s fluctuations compared with the indexes over 36 months.
| Ten Largest Holdings (% of total net assets) | ||
| Apple Inc. | Technology | |
| Hardware, Storage & | ||
| Peripherals | 7.0% | |
| Google Inc. | Internet Software & | |
| Services | 3.9 | |
| Microsoft Corp. | Systems Software | 3.8 |
| Amazon.com Inc. | Internet Retail | 2.1 |
| Facebook Inc. | Internet Software & | |
| Services | 2.0 | |
| Walt Disney Co. | Movies & | |
| Entertainment | 1.7 | |
| Gilead Sciences Inc. | Biotechnology | 1.7 |
| Home Depot Inc. | Home Improvement | |
| Retail | 1.6 | |
| Johnson & Johnson | Pharmaceuticals | 1.6 |
| Visa Inc. | Data Processing & | |
| Outsourced Services | 1.5 | |
| Top Ten | 26.9% | |
The holdings listed exclude any temporary cash investments and equity index products.
Investment Focus
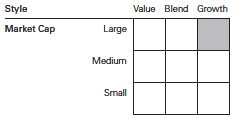
1 The expense ratio shown is from the prospectus dated December 19, 2014, and represents estimated costs for the current fiscal year. For the fiscal
year ended August 31, 2015, the expense ratio was 0.15%.
26
S&P 500 Growth Index Fund
Performance Summary
All of the returns in this report represent past performance, which is not a guarantee of future results that may be achieved by the fund. (Current performance may be lower or higher than the performance data cited. For performance data current to the most recent month-end, visit our website at vanguard.com/performance.) Note, too, that both investment returns and principal value can fluctuate widely, so an investor’s shares, when sold, could be worth more or less than their original cost. The returns shown do not reflect taxes that a shareholder would pay on fund distributions or on the sale of fund shares.
Cumulative Performance: September 7, 2010, Through August 31, 2015
Initial Investment of $10,000
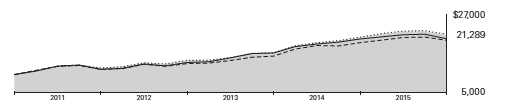
| Average Annual Total Returns | ||||
| Periods Ended August 31, 2015 | ||||
| Since | Final Value | |||
| One | Inception | of a $10,000 | ||
| Year | (9/7/2010) | Investment | ||
| S&P 500 Growth Index Fund*ETF | ||||
| Shares Net Asset Value | 3.80% | 16.38% | $21,289 | |
| S&P 500 Growth Index Fund*ETF | ||||
| Shares Market Price | 3.83 | 16.39 | 21,296 | |
| •••••••• | S&P 500 Growth Index | 3.95 | 16.56 | 21,455 |
| – – – – | Large-Cap Growth Funds Average | 3.53 | 14.63 | 19,739 |
| Dow Jones U.S. Total Stock Market | ||||
| Float Adjusted Index | 0.29 | 15.13 | 20,172 | |
Large-Cap Growth Funds Average: Derived from data provided by Lipper, a Thomson Reuters Company.
"Since Inception" performance is calculated from the ETF Shares’ inception date for both the fund and its comparative standards.
Cumulative Returns of ETF Shares: September 7, 2010, Through August 31, 2015
| Since | ||
| One | Inception | |
| Year | (9/7/2010) | |
| S&P 500 Growth Index Fund ETF Shares Market | ||
| Price | 3.83% | 112.96% |
| S&P 500 Growth Index Fund ETF Shares Net Asset | ||
| Value | 3.80 | 112.89 |
| S&P 500 Growth Index | 3.95 | 114.55 |
| "Since Inception" performance is calculated from the ETF Shares’ inception date for both the fund and its comparative standards. | ||
See Financial Highlights for dividend and capital gains information.
27
S&P 500 Growth Index Fund
Fiscal-Year Total Returns (%): September 7, 2010, Through August 31, 2015
Average Annual Total Returns: Periods Ended June 30, 2015
This table presents returns through the latest calendar quarter—rather than through the end of the fiscal period.
Securities and Exchange Commission rules require that we provide this information.
| Inception | One | Since | |
| Date | Year | Inception | |
| ETF Shares | 9/7/2010 | ||
| Market Price | 10.02% | 17.70% | |
| Net Asset Value | 9.92 | 17.68 |
28
S&P 500 Growth Index Fund
Financial Statements
Statement of Net Assets
As of August 31, 2015
The fund reports a complete list of its holdings in regulatory filings four times in each fiscal year, at the quarter-ends. For the second and fourth fiscal quarters, the lists appear in the fund’s semiannual and annual reports to shareholders. For the first and third fiscal quarters, the fund files the lists with the Securities and Exchange Commission on Form N-Q. Shareholders can look up the fund’s Forms N-Q on the SEC’s website at sec.gov. Forms N-Q may also be reviewed and copied at the SEC’s Public Reference Room (see the back cover of this report for further information).
| Market | |||
| Value• | |||
| Shares | ($000) | ||
| Common Stocks (99.9%)1 | |||
| Consumer Discretionary (17.1%) | |||
| * | Amazon.com Inc. | 23,348 | 11,975 |
| Walt Disney Co. | 95,418 | 9,721 | |
| Home Depot Inc. | 79,408 | 9,248 | |
| Comcast Corp. Class A | 102,944 | 5,799 | |
| NIKE Inc. Class B | 42,566 | 4,757 | |
| * | Priceline Group Inc. | 3,172 | 3,961 |
| Lowe’s Cos. Inc. | 57,012 | 3,943 | |
| Time Warner Inc. | 50,402 | 3,584 | |
| Starbucks Corp. | 61,450 | 3,362 | |
| * | Netflix Inc. | 25,942 | 2,984 |
| McDonald’s Corp. | 30,472 | 2,895 | |
| Time Warner Cable Inc. | 11,573 | 2,153 | |
| TJX Cos. Inc. | 27,444 | 1,930 | |
| Twenty-First Century Fox | |||
| Inc. Class A | 61,648 | 1,688 | |
| VF Corp. | 20,777 | 1,505 | |
| * | O’Reilly Automotive Inc. | 6,176 | 1,483 |
| * | AutoZone Inc. | 1,934 | 1,385 |
| * | Chipotle Mexican Grill Inc. | ||
| Class A | 1,895 | 1,345 | |
| Ross Stores Inc. | 25,293 | 1,230 | |
| Yum! Brands Inc. | 14,797 | 1,180 | |
| * | Dollar Tree Inc. | 13,621 | 1,039 |
| * | Under Armour Inc. Class A | 10,281 | 982 |
| Marriott International Inc. | |||
| Class A | 12,608 | 891 | |
| L Brands Inc. | 10,499 | 881 | |
| Dollar General Corp. | 11,261 | 839 | |
| Advance Auto Parts Inc. | 4,468 | 783 | |
| Hanesbrands Inc. | 24,555 | 739 | |
| Tractor Supply Co. | 8,336 | 711 | |
| Expedia Inc. | 6,101 | 702 | |
| Signet Jewelers Ltd. | 4,844 | 668 | |
| Nordstrom Inc. | 8,625 | 629 | |
| DR Horton Inc. | 20,398 | 619 | |
| CBS Corp. Class B | 12,727 | 576 | |
| Wyndham Worldwide Corp. | 7,339 | 561 | |
| Lennar Corp. Class A | 10,912 | 555 | |
| * | Michael Kors Holdings Ltd. | 12,148 | 528 |
| Omnicom Group Inc. | 7,769 | 520 | |
| Macy’s Inc. | 8,837 | 518 | |
| Royal Caribbean Cruises Ltd. | 5,646 | 498 | |
| * | TripAdvisor Inc. | 6,846 | 478 |
| Newell Rubbermaid Inc. | 10,827 | 456 | |
| Viacom Inc. Class B | 11,132 | 454 | |
| Genuine Parts Co. | 5,390 | 450 | |
| Harman International | |||
| Industries Inc. | 4,346 | 425 | |
| Starwood Hotels & Resorts | |||
| Worldwide Inc. | 5,844 | 418 | |
| Harley-Davidson Inc. | 7,400 | 415 | |
| * | Discovery Communications | ||
| Inc. | 15,938 | 404 | |
| * | CarMax Inc. | 6,391 | 390 |
| Tiffany & Co. | 4,739 | 390 | |
| H&R Block Inc. | 11,260 | 383 | |
| Wynn Resorts Ltd. | 4,988 | 374 | |
| Leggett & Platt Inc. | 8,419 | 374 | |
| * | Mohawk Industries Inc. | 1,791 | 353 |
| * | Bed Bath & Beyond Inc. | 5,121 | 318 |
| Scripps Networks | |||
| Interactive Inc. Class A | 5,800 | 308 | |
| Hasbro Inc. | 3,357 | 250 | |
| * | Discovery Communications | ||
| Inc. Class A | 9,139 | 243 | |
| Interpublic Group of Cos. | |||
| Inc. | 12,403 | 234 | |
| Gap Inc. | 7,095 | 233 | |
| Ralph Lauren Corp. Class A | 2,032 | 226 | |
| PulteGroup Inc. | 10,658 | 220 | |
| Garmin Ltd. | 4,194 | 158 | |
| * | AutoNation Inc. | 1,932 | 116 |
| * | Fossil Group Inc. | 1,706 | 105 |
| 97,542 | |||
| Consumer Staples (9.2%) | |||
| CVS Health Corp. | 68,670 | 7,032 | |
| Altria Group Inc. | 120,209 | 6,441 | |
| Procter & Gamble Co. | 81,265 | 5,743 | |
29
S&P 500 Growth Index Fund
| Market | |||
| Value• | |||
| Shares | ($000) | ||
| Coca-Cola Co. | 134,284 | 5,280 | |
| PepsiCo Inc. | 54,141 | 5,031 | |
| Philip Morris International | |||
| Inc. | 52,086 | 4,156 | |
| Reynolds American Inc. | 25,414 | 2,128 | |
| Colgate-Palmolive Co. | 30,661 | 1,926 | |
| Kimberly-Clark Corp. | 12,461 | 1,327 | |
| Constellation Brands Inc. | |||
| Class A | 10,356 | 1,326 | |
| Kraft Heinz Co. | 18,106 | 1,316 | |
| * | Monster Beverage Corp. | 8,986 | 1,244 |
| General Mills Inc. | 18,215 | 1,034 | |
| Kroger Co. | 28,172 | 972 | |
| Mead Johnson Nutrition Co. | 12,383 | 970 | |
| Brown-Forman Corp. | |||
| Class B | 9,520 | 934 | |
| Dr Pepper Snapple Group | |||
| Inc. | 11,720 | 899 | |
| Molson Coors Brewing Co. | |||
| Class B | 9,753 | 664 | |
| Estee Lauder Cos. Inc. | |||
| Class A | 7,639 | 609 | |
| Clorox Co. | 4,648 | 517 | |
| Kellogg Co. | 7,510 | 498 | |
| Hershey Co. | 5,560 | 498 | |
| ConAgra Foods Inc. | 10,166 | 424 | |
| Keurig Green Mountain Inc. | 7,055 | 399 | |
| Coca-Cola Enterprises Inc. | 6,811 | 351 | |
| McCormick & Co. Inc. | 4,295 | 340 | |
| Campbell Soup Co. | 6,288 | 302 | |
| Hormel Foods Corp. | 4,685 | 286 | |
| 52,647 | |||
| Energy (2.9%) | |||
| Kinder Morgan Inc. | 106,027 | 3,436 | |
| Schlumberger Ltd. | 36,483 | 2,823 | |
| EOG Resources Inc. | 33,555 | 2,628 | |
| Williams Cos. Inc. | 41,203 | 1,986 | |
| Anadarko Petroleum Corp. | 16,142 | 1,155 | |
| Pioneer Natural Resources | |||
| Co. | 6,292 | 774 | |
| Spectra Energy Corp. | 21,754 | 632 | |
| Cabot Oil & Gas Corp. | 25,283 | 598 | |
| EQT Corp. | 6,143 | 478 | |
| Range Resources Corp. | 10,164 | 393 | |
| Columbia Pipeline Group Inc. | 14,532 | 369 | |
| * | Cameron International Corp. | 5,137 | 343 |
| * | FMC Technologies Inc. | 9,591 | 334 |
| Cimarex Energy Co. | 2,929 | 324 | |
| 16,273 | |||
| Financials (8.8%) | |||
| Wells Fargo & Co. | 114,576 | 6,110 | |
| Simon Property Group Inc. | 19,030 | 3,412 | |
| American Express Co. | 31,505 | 2,417 | |
| American Tower Corporation | 25,868 | 2,385 | |
| US Bancorp | 52,018 | 2,203 | |
| Public Storage | 8,883 | 1,788 | |
| Crown Castle International | |||
| Corp. | 20,633 | 1,721 | |
| Equity Residential | 22,252 | 1,585 | |
| BlackRock Inc. | 4,973 | 1,504 | |
| Charles Schwab Corp. | 45,929 | 1,395 | |
| Health Care REIT Inc. | 21,453 | 1,359 | |
| AvalonBay Communities Inc. | 8,079 | 1,334 | |
| Ameriprise Financial Inc. | 11,085 | 1,249 | |
| Ventas Inc. | 20,226 | 1,113 | |
| Moody’s Corp. | 10,871 | 1,112 | |
| Intercontinental Exchange | |||
| Inc. | 4,785 | 1,093 | |
| Boston Properties Inc. | 9,380 | 1,064 | |
| Marsh & McLennan Cos. Inc. | 19,748 | 1,061 | |
| McGraw Hill Financial Inc. | 10,542 | 1,022 | |
| Discover Financial Services | 18,930 | 1,017 | |
| General Growth Properties | |||
| Inc. | 38,458 | 976 | |
| Equinix Inc. | 3,478 | 938 | |
| Aon plc | 9,983 | 933 | |
| Essex Property Trust Inc. | 3,990 | 856 | |
| Host Hotels & Resorts Inc. | 46,320 | 821 | |
| T. Rowe Price Group Inc. | 10,763 | 774 | |
| Macerich Co. | 8,604 | 655 | |
| Realty Income Corp. | 14,217 | 635 | |
| Weyerhaeuser Co. | 22,474 | 628 | |
| Allstate Corp. | 10,256 | 598 | |
| HCP Inc. | 15,807 | 586 | |
| Kimco Realty Corp. | 25,234 | 582 | |
| Vornado Realty Trust | 6,524 | 569 | |
| * | CBRE Group Inc. Class A | 17,093 | 547 |
| Invesco Ltd. | 15,003 | 512 | |
| Franklin Resources Inc. | 12,161 | 494 | |
| Northern Trust Corp. | 6,576 | 459 | |
| SL Green Realty Corp. | 3,835 | 397 | |
| * | Affiliated Managers Group | ||
| Inc. | 2,106 | 393 | |
| Regions Financial Corp. | 36,829 | 353 | |
| Apartment Investment & | |||
| Management Co. | 9,549 | 344 | |
| Iron Mountain Inc. | 11,470 | 325 | |
| Navient Corp. | 23,755 | 304 | |
| Legg Mason Inc. | 5,958 | 264 | |
| Plum Creek Timber Co. Inc. | 5,357 | 206 | |
| * | E*TRADE Financial Corp. | 7,102 | 187 |
| 50,280 | |||
| Health Care (19.1%) | |||
| Gilead Sciences Inc. | 89,834 | 9,439 | |
| Johnson & Johnson | 98,318 | 9,240 | |
| * | Allergan plc | 23,984 | 7,285 |
| Amgen Inc. | 46,474 | 7,054 | |
| AbbVie Inc. | 105,113 | 6,560 | |
| Medtronic plc | 87,110 | 6,297 | |
| * | Celgene Corp. | 48,483 | 5,725 |
30
S&P 500 Growth Index Fund
| Market | |||
| Value• | |||
| Shares | ($000) | ||
| Merck & Co. Inc. | 98,436 | 5,301 | |
| * | Biogen Inc. | 14,385 | 4,277 |
| UnitedHealth Group Inc. | 28,511 | 3,299 | |
| Bristol-Myers Squibb Co. | 54,006 | 3,212 | |
| Thermo Fisher Scientific Inc. | 24,334 | 3,051 | |
| Eli Lilly & Co. | 36,414 | 2,999 | |
| * | Regeneron Pharmaceuticals | ||
| Inc. | 4,608 | 2,366 | |
| * | Alexion Pharmaceuticals Inc. | 13,693 | 2,358 |
| Becton Dickinson and Co. | 12,804 | 1,806 | |
| Stryker Corp. | 18,279 | 1,803 | |
| Abbott Laboratories | 36,397 | 1,648 | |
| * | Express Scripts Holding Co. | 19,414 | 1,623 |
| Zoetis Inc. | 30,562 | 1,371 | |
| * | Vertex Pharmaceuticals Inc. | 10,579 | 1,349 |
| AmerisourceBergen Corp. | |||
| Class A | 12,763 | 1,277 | |
| Mylan NV | 25,163 | 1,248 | |
| * | HCA Holdings Inc. | 14,007 | 1,213 |
| McKesson Corp. | 5,947 | 1,175 | |
| * | Cerner Corp. | 18,713 | 1,156 |
| * | Intuitive Surgical Inc. | 2,256 | 1,153 |
| Aetna Inc. | 9,609 | 1,100 | |
| Cigna Corp. | 6,921 | 974 | |
| * | Hospira Inc. | 10,563 | 950 |
| * | Edwards Lifesciences Corp. | 6,580 | 927 |
| CR Bard Inc. | 4,542 | 880 | |
| Baxalta Inc. | 23,951 | 842 | |
| Perrigo Co. plc | 4,465 | 817 | |
| * | DaVita HealthCare Partners | ||
| Inc. | 10,515 | 795 | |
| Baxter International Inc. | 19,624 | 755 | |
| St. Jude Medical Inc. | 10,614 | 752 | |
| Zimmer Biomet Holdings Inc. | 6,983 | 723 | |
| * | Boston Scientific Corp. | 37,698 | 631 |
| * | Mallinckrodt plc | 7,149 | 617 |
| * | Endo International plc | 7,433 | 572 |
| * | Henry Schein Inc. | 3,475 | 475 |
| Universal Health Services | |||
| Inc. Class B | 2,952 | 405 | |
| * | Waters Corp. | 3,278 | 398 |
| * | Varian Medical Systems Inc. | 4,201 | 341 |
| DENTSPLY International Inc. | 5,292 | 277 | |
| PerkinElmer Inc. | 4,146 | 202 | |
| * | Tenet Healthcare Corp. | 3,031 | 149 |
| Patterson Cos. Inc. | 3,080 | 141 | |
| 109,008 | |||
| Industrials (7.8%) | |||
| Union Pacific Corp. | 53,524 | 4,589 | |
| 3M Co. | 25,979 | 3,693 | |
| Boeing Co. | 19,661 | 2,569 | |
| Honeywell International Inc. | 24,370 | 2,419 | |
| United Parcel Service Inc. | |||
| Class B | 24,177 | 2,361 | |
| Delta Air Lines Inc. | 50,206 | 2,198 | |
| Lockheed Martin Corp. | 10,795 | 2,172 | |
| Danaher Corp. | 21,452 | 1,867 | |
| General Dynamics Corp. | 12,795 | 1,817 | |
| CSX Corp. | 60,395 | 1,654 | |
| Southwest Airlines Co. | 40,855 | 1,499 | |
| FedEx Corp. | 8,869 | 1,336 | |
| American Airlines Group Inc. | 30,070 | 1,172 | |
| Precision Castparts Corp. | 4,565 | 1,051 | |
| * | Nielsen Holdings plc | 22,560 | 1,020 |
| Illinois Tool Works Inc. | 11,575 | 978 | |
| Norfolk Southern Corp. | 12,481 | 972 | |
| Northrop Grumman Corp. | 5,453 | 893 | |
| * | Stericycle Inc. | 5,204 | 735 |
| Roper Technologies Inc. | 4,305 | 698 | |
| PACCAR Inc. | 11,495 | 678 | |
| Waste Management Inc. | 13,019 | 652 | |
| CH Robinson Worldwide Inc. | 8,918 | 601 | |
| Equifax Inc. | 5,091 | 498 | |
| Cintas Corp. | 5,801 | 493 | |
| AMETEK Inc. | 8,873 | 478 | |
| Rockwell Automation Inc. | 4,193 | 469 | |
| Tyco International plc | 12,600 | 457 | |
| Robert Half International Inc. | 8,249 | 421 | |
| Rockwell Collins Inc. | 5,086 | 416 | |
| * | United Rentals Inc. | 5,924 | 411 |
| JB Hunt Transport Services | |||
| Inc. | 5,618 | 409 | |
| Fastenal Co. | 10,463 | 403 | |
| WW Grainger Inc. | 1,785 | 399 | |
| Snap-on Inc. | 2,350 | 376 | |
| Kansas City Southern | 3,647 | 338 | |
| Textron Inc. | 7,637 | 296 | |
| Expeditors International of | |||
| Washington Inc. | 5,491 | 269 | |
| Masco Corp. | 9,557 | 251 | |
| Allegion plc | 3,804 | 227 | |
| Dun & Bradstreet Corp. | 1,409 | 149 | |
| * | Quanta Services Inc. | 6,100 | 148 |
| 44,532 | |||
| Information Technology (31.6%) | |||
| Apple Inc. | 352,156 | 39,709 | |
| Microsoft Corp. | 494,495 | 21,520 | |
| * | Facebook Inc. Class A | 128,742 | 11,513 |
| * | Google Inc. Class A | 17,494 | 11,333 |
| * | Google Inc. Class C | 17,541 | 10,845 |
| Visa Inc. Class A | 117,646 | 8,388 | |
| Intel Corp. | 289,988 | 8,276 | |
| QUALCOMM Inc. | 99,612 | 5,636 | |
| MasterCard Inc. Class A | 58,989 | 5,449 | |
| Cisco Systems Inc. | 198,969 | 5,149 | |
| Oracle Corp. | 128,618 | 4,771 | |
| * | Cognizant Technology | ||
| Solutions Corp. Class A | 37,315 | 2,349 | |
| Automatic Data Processing | |||
| Inc. | 28,703 | 2,219 | |
31
S&P 500 Growth Index Fund
| Market | |||
| Value• | |||
| Shares | ($000) | ||
| EMC Corp. | 84,289 | 2,096 | |
| Accenture plc Class A | 21,821 | 2,057 | |
| Avago Technologies Ltd. | |||
| Class A | 15,881 | 2,001 | |
| Texas Instruments Inc. | 40,699 | 1,947 | |
| * | eBay Inc. | 67,575 | 1,832 |
| * | salesforce.com inc | 25,339 | 1,758 |
| * | Yahoo! Inc. | 53,347 | 1,720 |
| Broadcom Corp. Class A | 33,248 | 1,718 | |
| * | PayPal Holdings Inc. | 45,276 | 1,585 |
| * | Adobe Systems Inc. | 20,043 | 1,575 |
| Intuit Inc. | 16,847 | 1,445 | |
| * | Electronic Arts Inc. | 19,011 | 1,258 |
| * | Fiserv Inc. | 14,475 | 1,234 |
| Western Digital Corp. | 13,272 | 1,088 | |
| * | Micron Technology Inc. | 65,858 | 1,081 |
| Skyworks Solutions Inc. | 11,684 | 1,021 | |
| Seagate Technology plc | 19,396 | 997 | |
| Amphenol Corp. Class A | 18,882 | 989 | |
| * | Alliance Data Systems Corp. | 3,799 | 977 |
| Activision Blizzard Inc. | 30,317 | 868 | |
| * | Red Hat Inc. | 11,209 | 809 |
| * | Akamai Technologies Inc. | 10,916 | 778 |
| Applied Materials Inc. | 48,187 | 775 | |
| Fidelity National Information | |||
| Services Inc. | 10,922 | 754 | |
| Lam Research Corp. | 9,677 | 704 | |
| NVIDIA Corp. | 31,243 | 702 | |
| SanDisk Corp. | 12,706 | 693 | |
| TE Connectivity Ltd. | 11,436 | 678 | |
| * | Citrix Systems Inc. | 9,803 | 668 |
| * | Autodesk Inc. | 13,922 | 651 |
| Paychex Inc. | 12,794 | 571 | |
| Corning Inc. | 33,082 | 569 | |
| Analog Devices Inc. | 9,781 | 546 | |
| * | F5 Networks Inc. | 4,396 | 534 |
| * | Qorvo Inc. | 9,128 | 507 |
| Symantec Corp. | 22,892 | 469 | |
| Altera Corp. | 9,379 | 455 | |
| * | VeriSign Inc. | 6,401 | 441 |
| Motorola Solutions Inc. | 5,445 | 353 | |
| Microchip Technology Inc. | 7,966 | 339 | |
| Western Union Co. | 17,658 | 326 | |
| Xilinx Inc. | 7,741 | 324 | |
| Linear Technology Corp. | 7,911 | 319 | |
| NetApp Inc. | 9,898 | 316 | |
| Total System Services Inc. | 6,816 | 312 | |
| KLA-Tencor Corp. | 4,409 | 221 | |
| * | Teradata Corp. | 4,614 | 135 |
| FLIR Systems Inc. | 4,027 | 115 | |
| 180,468 | |||
| Materials (2.4%) | |||
| Monsanto Co. | 19,214 | 1,876 | |
| Ecolab Inc. | 16,378 | 1,788 | |
| EI du Pont de Nemours & | |||
| Co. | 27,663 | 1,425 | |
| Sherwin-Williams Co. | 4,841 | 1,238 |
| Air Products & Chemicals Inc. | 8,395 | 1,171 |
| PPG Industries Inc. | 10,972 | 1,046 |
| Sigma-Aldrich Corp. | 7,304 | 1,018 |
| Praxair Inc. | 9,346 | 988 |
| Martin Marietta Materials Inc. | 3,802 | 638 |
| Vulcan Materials Co. | 4,864 | 455 |
| CF Industries Holdings Inc. | 7,763 | 445 |
| Sealed Air Corp. | 8,216 | 423 |
| Ball Corp. | 5,804 | 383 |
| International Flavors & | ||
| Fragrances Inc. | 2,812 | 308 |
| Airgas Inc. | 2,247 | 217 |
| 13,419 | ||
| Telecommunication Services (0.2%) | ||
| * Level 3 Communications Inc. | 17,981 | 804 |
| Frontier Communications | ||
| Corp. | 31,089 | 158 |
| 962 | ||
| Utilities (0.8%) | ||
| NextEra Energy Inc. | 13,843 | 1,362 |
| Dominion Resources Inc. | 17,048 | 1,189 |
| Sempra Energy | 7,824 | 742 |
| Edison International | 8,762 | 512 |
| WEC Energy Group Inc. | 9,441 | 450 |
| AGL Resources Inc. | 2,946 | 180 |
| NiSource Inc. | 9,137 | 154 |
| 4,589 | ||
| Total Common Stocks | ||
| (Cost $514,669) | 569,720 | |
| Temporary Cash Investments (0.1%)1 | ||
| Money Market Fund (0.1%) | ||
| 2 Vanguard Market | ||
| Liquidity Fund, 0.168% | 671,000 | 671 |
| Face | ||
| Amount | ||
| ($000) | ||
| U.S. Government and Agency Obligations (0.0%) | ||
| 3,4 Federal Home Loan | ||
| Bank Discount Notes, | ||
| 0.150%, 11/13/15 | 100 | 100 |
| Total Temporary Cash Investments | ||
| (Cost $771) | 771 | |
| Total Investments (100.0%) | ||
| (Cost $515,440) | 570,491 | |
32
S&P 500 Growth Index Fund
| Amount | |
| ($000) | |
| Other Assets and Liabilities (0.0%) | |
| Other Assets | |
| Investment in Vanguard | 51 |
| Receivables for Investment Securities Sold | 10 |
| Receivables for Accrued Income | 824 |
| Receivables for Capital Shares Issued | 99 |
| Other Assets | 2,502 |
| Total Other Assets | 3,486 |
| Liabilities | |
| Payables for Investment Securities Purchased (867) | |
| Payables for Capital Shares Redeemed | (1,983) |
| Payables to Vanguard | (148) |
| Other Liabilities | (529) |
| Total Liabilities | (3,527) |
| ETF Shares—Net Assets (100%) | |
| Applicable to 5,750,009 outstanding | |
| $.001 par value shares of beneficial | |
| interest (unlimited authorization) | 570,450 |
| Net Asset Value Per Share— | |
| ETF Shares | $99.21 |
| At August 31, 2015, net assets consisted of: | |
| Amount | |
| ($000) | |
| Paid-in Capital | 514,968 |
| Undistributed Net Investment Income | 1,535 |
| Accumulated Net Realized Losses | (1,067) |
| Unrealized Appreciation (Depreciation) | |
| Investment Securities | 55,051 |
| Futures Contracts | (37) |
| Net Assets | 570,450 |
• See Note A in Notes to Financial Statements.
* Non-income-producing security.
1 The fund invests a portion of its cash reserves in equity markets through the use of index futures contracts. After giving effect to futures
investments, the fund’s effective common stock and temporary cash investment positions represent 100.0% and 0.0%, respectively,
of net assets.
2 Affiliated money market fund available only to Vanguard funds and certain trusts and accounts managed by Vanguard. Rate shown is the
7-day yield
3 The issuer operates under a congressional charter; its securities are generally neither guaranteed by the U.S. Treasury nor backed by the full
faith and credit of the U.S. government
4 Securities with a value of $100,000 have been segregated as initial margin for open futures contracts.
REIT—Real Estate Investment Trust.
See accompanying Notes, which are an integral part of the Financial Statements.
33
S&P 500 Growth Index Fund
Statement of Operations
| Year Ended | |
| August 31, 2015 | |
| ($000) | |
| Investment Income | |
| Income | |
| Dividends | 8,373 |
| Interest | 1 |
| Securities Lending | 1 |
| Total Income | 8,375 |
| Expenses | |
| The Vanguard Group—Note B | |
| Investment Advisory Services | 81 |
| Management and Administrative | 474 |
| Marketing and Distribution | 66 |
| Custodian Fees | 31 |
| Auditing Fees | 30 |
| Shareholders’ Reports | 19 |
| Total Expenses | 701 |
| Net Investment Income | 7,674 |
| Realized Net Gain (Loss) | |
| Investment Securities Sold | 13,693 |
| Futures Contracts | (14) |
| Realized Net Gain (Loss) | 13,679 |
| Change in Unrealized Appreciation (Depreciation) | |
| Investment Securities | (8,140) |
| Futures Contracts | (37) |
| Change in Unrealized Appreciation (Depreciation) | (8,177) |
| Net Increase (Decrease) in Net Assets Resulting from Operations | 13,176 |
See accompanying Notes, which are an integral part of the Financial Statements.
34
S&P 500 Growth Index Fund
Statement of Changes in Net Assets
| Year Ended August 31, | ||
| 2015 | 2014 | |
| ($000) | ($000) | |
| Increase (Decrease) in Net Assets | ||
| Operations | ||
| Net Investment Income | 7,674 | 3,501 |
| Realized Net Gain (Loss) | 13,679 | 8,182 |
| Change in Unrealized Appreciation (Depreciation) | (8,177) | 39,859 |
| Net Increase (Decrease) in Net Assets Resulting from Operations | 13,176 | 51,542 |
| Distributions | ||
| Net Investment Income | (6,944) | (3,181) |
| Realized Capital Gain | — | — |
| Total Distributions | (6,944) | (3,181) |
| Capital Share Transactions | ||
| Issued | 302,814 | 168,869 |
| Issued in Lieu of Cash Distributions | — | — |
| Redeemed | (63,511) | (39,160) |
| Net Increase (Decrease) from Capital Share Transactions | 239,303 | 129,709 |
| Total Increase (Decrease) | 245,535 | 178,070 |
| Net Assets | ||
| Beginning of Period | 324,915 | 146,845 |
| End of Period1 | 570,450 | 324,915 |
| 1 Net Assets—End of Period includes undistributed (overdistributed) net investment income of $1,535,000 and $805,000. | ||
See accompanying Notes, which are an integral part of the Financial Statements.
35
S&P 500 Growth Index Fund
Financial Highlights
| ETF Shares | |||||
| Sept. 7, | |||||
| 20101 to | |||||
| For a Share Outstanding | Year Ended August 31, | Aug. 31, | |||
| Throughout Each Period | 2015 | 2014 | 2013 | 2012 | 2011 |
| Net Asset Value, Beginning of Period | $96.99 | $77.29 | $68.43 | $58.81 | $50.23 |
| Investment Operations | |||||
| Net Investment Income | 1.523 | 1.257 | 1.291 | 1.135 | 0.797 |
| Net Realized and Unrealized Gain (Loss) | |||||
| on Investments | 2.193 | 19.715 | 8.848 | 9.543 | 8.414 |
| Total from Investment Operations | 3.716 | 20.972 | 10.139 | 10.678 | 9.211 |
| Distributions | |||||
| Dividends from Net Investment Income | (1.496) | (1.272) | (1.279) | (1.058) | (.631) |
| Distributions from Realized Capital Gains | — | — | — | — | — |
| Total Distributions | (1.496) | (1.272) | (1.279) | (1.058) | (.631) |
| Net Asset Value, End of Period | $99.21 | $96.99 | $77.29 | $68.43 | $58.81 |
| Total Return | 3.80% | 27.33% | 15.00% | 18.38% | 18.33% |
| Ratios/Supplemental Data | |||||
| Net Assets, End of Period (Millions) | $570 | $325 | $147 | $96 | $56 |
| Ratio of Total Expenses to Average Net Assets | 0.15% | 0.15% | 0.15% | 0.15% | 0.15%2 |
| Ratio of Net Investment Income to | |||||
| Average Net Assets | 1.62% | 1.56% | 1.81% | 1.82% | 1.63%2 |
| Portfolio Turnover Rate 3 | 21% | 23% | 24% | 22% | 26% |
1 Inception.
2 Annualized.
3 Excludes the value of portfolio securities received or delivered as a result of in-kind purchases or redemptions of the fund’s capital shares,
including ETF Creation Units.
See accompanying Notes, which are an integral part of the Financial Statements.
36
S&P 500 Growth Index Fund
Notes to Financial Statements
Vanguard S&P 500 Growth Index Fund is registered under the Investment Company Act of 1940 as an open-end investment company, or mutual fund. The fund offers two classes of shares: ETF Shares and Institutional Shares. ETF Shares are listed for trading on NYSE Arca; they can be purchased and sold through a broker. Institutional Shares are designed for investors who meet certain administrative, service, and account-size criteria. The fund has not issued any Institutional Shares as of August 31, 2015.
A. The following significant accounting policies conform to generally accepted accounting principles for U.S. investment companies. The fund consistently follows such policies in preparing its financial statements.
1. Security Valuation: Securities are valued as of the close of trading on the New York Stock Exchange (generally 4 p.m., Eastern time) on the valuation date. Equity securities are valued at the latest quoted sales prices or official closing prices taken from the primary market in which each security trades; such securities not traded on the valuation date are valued at the mean of the latest quoted bid and asked prices. Securities for which market quotations are not readily available, or whose values have been materially affected by events occurring before the fund’s pricing time but after the close of the securities’ primary markets, are valued by methods deemed by the board of trustees to represent fair value. Investments in Vanguard Market Liquidity Fund are valued at that fund’s net asset value. Temporary cash investments acquired over 60 days to maturity are valued using the latest bid prices or using valuations based on a matrix system (which considers such factors as security prices, yields, maturities, and ratings), both as furnished by independent pricing services. Other temporary cash investments are valued at amortized cost, which approximates market value.
2. Futures Contracts: The fund uses index futures contracts to a limited extent, with the objectives of maintaining full exposure to the stock market, enhancing returns, maintaining liquidity, and minimizing transaction costs. The fund may purchase futures contracts to immediately invest incoming cash in the market, or sell futures in response to cash outflows, thereby simulating a fully invested position in the underlying index while maintaining a cash balance for liquidity. The fund may seek to enhance returns by using futures contracts instead of the underlying securities when futures are believed to be priced more attractively than the underlying securities. The primary risks associated with the use of futures contracts are imperfect correlation between changes in market values of stocks held by the fund and the prices of futures contracts, and the possibility of an illiquid market. Counterparty risk involving futures is mitigated because a regulated clearinghouse is the counterparty instead of the clearing broker. To further mitigate counterparty risk, the fund trades futures contracts on an exchange, monitors the financial strength of its clearing brokers and clearinghouse, and has entered into clearing agreements with its clearing brokers. The clearinghouse imposes initial margin requirements to secure the fund’s performance and requires daily settlement of variation margin representing changes in the market value of each contract.
Futures contracts are valued at their quoted daily settlement prices. The aggregate settlement values of the contracts are not recorded in the Statement of Net Assets. Fluctuations in the value of the contracts are recorded in the Statement of Net Assets as an asset (liability) and in the Statement of Operations as unrealized appreciation (depreciation) until the contracts are closed, when they are recorded as realized futures gains (losses).
During the year ended August 31, 2015, the fund’s average investments in long and short futures contracts represented less than 1% and 0% of net assets, respectively, based on the average of aggregate settlement values at each quarter-end during the period.
37
S&P 500 Growth Index Fund
3. Federal Income Taxes: The fund intends to continue to qualify as a regulated investment company and distribute all of its taxable income. Management has analyzed the fund’s tax positions taken for all open federal income tax years (August 31, 2012–2015), and has concluded that no provision for federal income tax is required in the fund’s financial statements.
4. Distributions: Distributions to shareholders are recorded on the ex-dividend date.
5. Securities Lending: To earn additional income, the fund lends its securities to qualified institutional borrowers. Security loans are required to be secured at all times by collateral in an amount at least equal to the market value of securities loaned. Daily market fluctuations could cause the value of loaned securities to be more or less than the value of the collateral received. When this occurs, the collateral is adjusted and settled on the next business day. The fund further mitigates its counterparty risk by entering into securities lending transactions only with a diverse group of prequalified counterparties, monitoring their financial strength, and entering into master securities lending agreements with its counterparties. The master securities lending agreements provide that, in the event of a counterparty’s default (including bankruptcy), the fund may terminate any loans with that borrower, determine the net amount owed, and sell or retain the collateral up to the net amount owed to the fund; however, such actions may be subject to legal proceedings. While collateral mitigates counterparty risk, in the absence of a default the fund may experience delays and costs in recovering the securities loaned. The fund invests cash collateral received in Vanguard Market Liquidity Fund, and records a liability in the Statement of Net Assets for the return of the collateral, during the period the securities are on loan. Securities lending income represents fees charged to borrowers plus income earned on invested cash collateral, less expenses associated with the loan.
6. Credit Facility: The fund and certain other funds managed by The Vanguard Group (“Vanguard”) participate in a $3 billion committed credit facility provided by a syndicate of lenders pursuant to a credit agreement that may be renewed annually; each fund is individually liable for its borrowings, if any, under the credit facility. Borrowings may be utilized for temporary and emergency purposes, and are subject to the fund’s regulatory and contractual borrowing restrictions. The participating funds are charged administrative fees and an annual commitment fee of 0.06% of the undrawn amount of the facility; these fees are allocated to the funds based on a method approved by the fund’s board of trustees and included in Management and Administrative expenses on the fund’s Statement of Operations. Any borrowings under this facility bear interest at a rate equal to the higher of the federal funds rate or LIBOR reference rate plus an agreed-upon spread.
The fund had no borrowings outstanding at August 31, 2015, or at any time during the period then ended.
7. Other: Dividend income is recorded on the ex-dividend date. Interest income includes income distributions received from Vanguard Market Liquidity Fund and is accrued daily. Premiums and discounts on debt securities purchased are amortized and accreted, respectively, to interest income over the lives of the respective securities. Security transactions are accounted for on the date securities are bought or sold. Costs used to determine realized gains (losses) on the sale of investment securities are those of the specific securities sold.
38
S&P 500 Growth Index Fund
B. In accordance with the terms of a Funds’ Service Agreement (the “FSA”) between Vanguard and the fund, Vanguard furnishes to the fund investment advisory, corporate management, administrative, marketing, and distribution services at Vanguard’s cost of operations (as defined by the FSA). These costs of operations are allocated to the fund based on methods and guidelines approved by the board of trustees. Vanguard does not require reimbursement in the current period for certain costs of operations (such as deferred compensation/benefits and risk/insurance costs); the fund’s liability for these costs of operations is included in Payables to Vanguard on the Statement of Net Assets.
Upon the request of Vanguard, the fund may invest up to 0.40% of its net assets as capital in Vanguard. At August 31, 2015, the fund had contributed to Vanguard capital in the amount of $51,000, representing 0.01% of the fund’s net assets and 0.02% of Vanguard’s capitalization. The fund’s trustees and officers are also directors and employees, respectively, of Vanguard.
C. Various inputs may be used to determine the value of the fund’s investments. These inputs are summarized in three broad levels for financial statement purposes. The inputs or methodologies used to value securities are not necessarily an indication of the risk associated with investing in those securities.
Level 1—Quoted prices in active markets for identical securities.
Level 2—Other significant observable inputs (including quoted prices for similar securities, interest rates, prepayment speeds, credit risk, etc.).
Level 3—Significant unobservable inputs (including the fund’s own assumptions used to determine the fair value of investments).
The following table summarizes the market value of the fund’s investments as of August 31, 2015, based on the inputs used to value them:
| Level 1 | Level 2 | Level 3 | |
| Investments | ($000) | ($000) | ($000) |
| Common Stocks | 569,720 | — | — |
| Temporary Cash Investments | 671 | 100 | — |
| Futures Contracts—Liabilities1 | (7) | — | — |
| Total | 570,384 | 100 | — |
| 1 Represents variation margin on the last day of the reporting period. | |||
D. At August 31, 2015, the aggregate settlement value of open futures contracts and the related unrealized appreciation (depreciation) were:
| ($000) | ||||
| Aggregate | ||||
| Number of | Settlement | Unrealized | ||
| Long (Short) | Value | Appreciation | ||
| Futures Contracts | Expiration | Contracts | Long (Short) | (Depreciation) |
| E-mini S&P 500 Index | September 2015 | 7 | 689 | (37) |
Unrealized appreciation (depreciation) on open futures contracts is required to be treated as realized gain (loss) for tax purposes.
39
S&P 500 Growth Index Fund
E. Distributions are determined on a tax basis and may differ from net investment income and realized capital gains for financial reporting purposes. Differences may be permanent or temporary. Permanent differences are reclassified among capital accounts in the financial statements to reflect their tax character. Temporary differences arise when certain items of income, expense, gain, or loss are recognized in different periods for financial statement and tax purposes. These differences will reverse at some time in the future. Differences in classification may also result from the treatment of short-term gains as ordinary income for tax purposes.
During the year ended August 31, 2015, the fund realized $12,835,000 of net capital gains resulting from in-kind redemptions—in which shareholders exchanged fund shares for securities held by the fund rather than for cash. Because such gains are not taxable to the fund, and are not distributed to shareholders, they have been reclassified from accumulated net realized losses to paid-in capital.
For tax purposes, at August 31, 2015, the fund had $1,663,000 of ordinary income available for distribution. The fund used capital loss carryforwards of $807,000 to offset taxable capital gains realized during the year ended August 31, 2015. At August 31, 2015, the fund had available capital losses totaling $1,104,000 that may be carried forward indefinitely to offset future net capital gains.
At August 31, 2015, the cost of investment securities for tax purposes was $515,440,000. Net unrealized appreciation of investment securities for tax purposes was $55,051,000, consisting of unrealized gains of $72,271,000 on securities that had risen in value since their purchase and $17,220,000 in unrealized losses on securities that had fallen in value since their purchase.
F. During the year ended August 31, 2015, the fund purchased $386,151,000 of investment securities and sold $146,744,000 of investment securities, other than temporary cash investments. Purchases and sales include $289,224,000 and $49,834,000, respectively, in connection with in-kind purchases and redemptions of the fund’s capital shares.
G. Capital shares issued and redeemed were:
| Year Ended August 31, | ||
| 2015 | 2014 | |
| Shares | Shares | |
| (000) | (000) | |
| ETF Shares | ||
| Issued | 3,025 | 1,900 |
| Issued in Lieu of Cash Distributions | — | — |
| Redeemed | (625) | (450) |
| Net Increase (Decrease) in Shares Outstanding | 2,400 | 1,450 |
H. Management has determined that no material events or transactions occurred subsequent to August 31, 2015, that would require recognition or disclosure in these financial statements.
40
Report of Independent Registered
Public Accounting Firm
To the Board of Trustees of Vanguard Admiral Funds and the Shareholders of Vanguard S&P 500 Value Index Fund and Vanguard S&P 500 Growth Index Fund:
In our opinion, the accompanying statements of net assets and the related statements of operations and of changes in net assets and the financial highlights present fairly, in all material respects, the financial position of Vanguard S&P 500 Value Index Fund and Vanguard S&P 500 Growth Index Fund (constituting separate portfolios of Vanguard Admiral Funds, hereafter referred to as the “Funds”) at August 31, 2015, the results of each of their operations for the year then ended, the changes in each of their net assets for each of the two years in the period then ended, and the financial highlights for each of the periods indicated, in conformity with accounting principles generally accepted in the United States of America. These financial statements and financial highlights (hereafter referred to as “financial statements”) are the responsibility of the Funds’ management. Our responsibility is to express an opinion on these financial statements based on our audits. We conducted our audits of these financial statements in accordance with the standards of the Public Company Accounting Oversight Board (United States). Those standards require that we plan and perform the audit to obtain reasonable assurance about whether the financial statements are free of material misstatement. An audit includes examining, on a test basis, evidence supporting the amounts and disclosures in the financial statements, assessing the accounting principles used and significant estimates made by management, and evaluating the overall financial statement presentation. We believe that our audits, which included confirmation of securities at August 31, 2015 by correspondence with the custodian and brokers, by agreement to the underlying ownership records of the transfer agent and the application of alternative auditing procedures where securities purchased had not been received, provide a reasonable basis for our opinion.
/s/PricewaterhouseCoopers LLP
Philadelphia, Pennsylvania
October 15, 2015
41

This information for the fiscal year ended August 31, 2015, is included pursuant to provisions of the
Internal Revenue Code.
The funds distributed qualified dividend income to shareholders during the period as follows:
| Fund | ($000) |
| S&P 500 Value Index | 5,635 |
| S&P 500 Growth Index | 6,944 |
For corporate shareholders, the percentage of investment income (dividend income plus short-term gains, if any) that qualifies for the dividends-received deduction is as follows:
| Fund | Percentage |
| S&P 500 Value Index | 100% |
| S&P 500 Growth Index | 90.1 |
42
Your Fund’s After-Tax Returns
This table presents returns for your fund both before and after taxes. The after-tax returns are shown in two ways: (1) assuming that an investor owned the fund during the entire period and paid taxes on the fund’s distributions, and (2) assuming that an investor paid taxes on the fund’s distributions and sold all shares at the end of each period.
Calculations are based on the highest individual federal income tax and capital gains tax rates in effect at the times of the distributions and the hypothetical sales. State and local taxes were not considered. After-tax returns reflect any qualified dividend income, using actual prior-year figures and estimates for 2015. (In the example, returns after the sale of fund shares may be higher than those assuming no sale. This occurs when the sale would have produced a capital loss. The calculation assumes that the investor received a tax deduction for the loss.)
Please note that your actual after-tax returns will depend on your tax situation and may differ from those shown. Also note that if you own the fund in a tax-deferred account, such as an individual retirement account or a 401(k) plan, this information does not apply to you. Such accounts are not subject to current taxes.
Finally, keep in mind that a fund’s performance—whether before or after taxes—does not guarantee future results.
Average Annual Total Returns: S&P 500 Value and Growth Index Funds
Periods Ended August 31, 2015
| Since | ||
| One | Inception | |
| Year | (9/7/2010) | |
| S&P 500 Value Index Fund ETF Shares | ||
| Returns Before Taxes | -3.41% | 13.22% |
| Returns After Taxes on Distributions | -3.89 | 12.77 |
| Returns After Taxes on Distributions and Sale of Fund Shares | -1.49 | 10.62 |
| Since | ||
| One | Inception | |
| Year | (9/7/2010) | |
| S&P 500 Growth Index Fund ETF Shares | ||
| Returns Before Taxes | 3.80% | 16.38% |
| Returns After Taxes on Distributions | 3.44 | 16.04 |
| Returns After Taxes on Distributions and Sale of Fund Shares | 2.46 | 13.26 |
43
About Your Fund’s Expenses
As a shareholder of the fund, you incur ongoing costs, which include costs for portfolio management, administrative services, and shareholder reports (like this one), among others. Operating expenses, which are deducted from a fund’s gross income, directly reduce the investment return of the fund.
A fund’s expenses are expressed as a percentage of its average net assets. This figure is known as the expense ratio. The following examples are intended to help you understand the ongoing costs (in dollars) of investing in your fund and to compare these costs with those of other mutual funds. The examples are based on an investment of $1,000 made at the beginning of the period shown and held for the entire period.
The accompanying table illustrates your fund’s costs in two ways:
• Based on actual fund return. This section helps you to estimate the actual expenses that you paid over the period. The ”Ending Account Value“ shown is derived from the fund‘s actual return, and the third column shows the dollar amount that would have been paid by an investor who started with $1,000 in the fund. You may use the information here, together with the amount you invested, to estimate the expenses that you paid over the period.
To do so, simply divide your account value by $1,000 (for example, an $8,600 account value divided by $1,000 = 8.6), then multiply the result by the number given for your fund under the heading ”Expenses Paid During Period.“
• Based on hypothetical 5% yearly return. This section is intended to help you compare your fund‘s costs with those of other mutual funds. It assumes that the fund had a yearly return of 5% before expenses, but that the expense ratio is unchanged. In this case—because the return used is not the fund’s actual return—the results do not apply to your investment. The example is useful in making comparisons because the Securities and Exchange Commission requires all mutual funds to calculate expenses based on a 5% return. You can assess your fund’s costs by comparing this hypothetical example with the hypothetical examples that appear in shareholder reports of other funds.
Note that the expenses shown in the table are meant to highlight and help you compare ongoing costs only and do not reflect transaction costs incurred by the fund for buying and selling securities. Further, the expenses do not include any purchase, redemption, or account service fees described in the fund prospectus. If such fees were applied to your account, your costs would be higher. Your fund does not carry a “sales load.”
The calculations assume no shares were bought or sold during the period. Your actual costs may have been higher or lower, depending on the amount of your investment and the timing of any purchases or redemptions.
You can find more information about the fund’s expenses, including annual expense ratios, in the Financial Statements section of this report. For additional information on operating expenses and other shareholder costs, please refer to your fund’s current prospectus.
44
| Six Months Ended August 31, 2015 | |||
| Beginning | Ending | Expenses | |
| Account Value | Account Value | Paid During | |
| 2/28/2015 | 8/31/2015 | Period | |
| Based on Actual Fund Return | |||
| S&P 500 Value Index Fund | |||
| ETF Shares | $1,000.00 | $931.46 | $0.73 |
| S&P 500 Growth Index Fund | |||
| ETF Shares | $1,000.00 | $959.21 | $0.74 |
| Based on Hypothetical 5% Yearly Return | |||
| S&P 500 Value Index Fund | |||
| ETF Shares | $1,000.00 | $1,024.45 | $0.77 |
| S&P 500 Growth Index Fund | |||
| ETF Shares | $1,000.00 | $1,024.45 | $0.77 |
The calculations are based on expenses incurred in the most recent six-month period. The funds’ annualized six-month expense ratios for that
period are: for the S&P 500 Value Index Fund, 0.15%; and for the S&P 500 Growth Index Fund, 0.15%. The dollar amounts shown as
“Expenses Paid” are equal to the annualized expense ratio multiplied by the average account value over the period, multiplied by the number
of days in the most recent six-month peiod, then divided by the number of days in the most recent 12-month period (184/365). The table does
not include data for share classes with less than six months of history.
45
Trustees Approve Advisory Arrangements
The board of trustees of Vanguard S&P 500 Value Index Fund and S&P 500 Growth Index Fund has renewed each fund’s investment advisory arrangement with The Vanguard Group, Inc. (Vanguard). Vanguard—through its Equity Index Group—serves as investment advisor for each fund. The board determined that continuing each fund’s internalized management structure was in the best interests of each fund and its shareholders.
The board based its decision upon an evaluation of the advisor’s investment staff, portfolio management process, and performance. The trustees considered the factors discussed below, among others. However, no single factor determined whether the board approved the arrangements. Rather, it was the totality of the circumstances that drove the board’s decision.
Nature, extent, and quality of services
The board reviewed the quality of each fund’s investment management services provided to the funds since their inception in 2010, and took into account the organizational depth and stability of the advisor. The board considered that Vanguard has been managing investments for more than three decades. The Equity Index Group adheres to a sound, disciplined investment management process; the team has considerable experience, stability, and depth.
The board concluded that Vanguard’s experience, stability, depth, and performance, among other factors, warranted continuation of each advisory arrangement.
Investment performance
The board considered the funds’ performance since their inception, including any periods of outperformance or underperformance relative to a target index and peer group. The board concluded that the performance was such that each advisory arrangement should continue. Information about the funds’ most recent performance can be found in the Performance Summary pages of this report.
Cost
The board concluded that each fund’s expense ratio was well below the average expense ratios charged by funds in its respective peer group and that each fund’s advisory fee rate was also well below its peer-group average. Information about the funds’ expenses appears in the About Your Fund’s Expenses section of this report as well as in the Financial Statements sections.
The board does not conduct a profitability analysis of Vanguard, because of Vanguard’s unique “at-cost” structure. Unlike most other mutual fund management companies, Vanguard is owned by the funds it oversees, and produces “profits” only in the form of reduced expenses for fund shareholders.
The benefit of economies of scale
The board concluded that each fund’s at-cost arrangement with Vanguard ensures that the funds will realize economies of scale as they grow, with the cost to shareholders declining as fund assets increase.
The board will consider whether to renew the advisory arrangements again after a one-year period.
46
Glossary
30-Day SEC Yield. A fund’s 30-day SEC yield is derived using a formula specified by the U.S. Securities and Exchange Commission. Under the formula, data related to the fund’s security holdings in the previous 30 days are used to calculate the fund’s hypothetical net income for that period, which is then annualized and divided by the fund’s estimated average net assets over the calculation period. For the purposes of this calculation, a security’s income is based on its current market yield to maturity (for bonds), its actual income (for asset-backed securities), or its projected dividend yield (for stocks). Because the SEC yield represents hypothetical annualized income, it will differ—at times significantly—from the fund’s actual experience. As a result, the fund’s income distributions may be higher or lower than implied by the SEC yield.
Beta. A measure of the magnitude of a fund’s past share-price fluctuations in relation to the ups and downs of a given market index. The index is assigned a beta of 1.00. Compared with a given index, a fund with a beta of 1.20 typically would have seen its share price rise or fall by 12% when the index rose or fell by 10%. For this report, beta is based on returns over the past 36 months for both the fund and the index. Note that a fund’s beta should be reviewed in conjunction with its R-squared (see definition). The lower the R-squared, the less correlation there is between the fund and the index, and the less reliable beta is as an indicator of volatility.
Dividend Yield. Dividend income earned by stocks, expressed as a percentage of the aggregate market value (or of net asset value, for a fund). The yield is determined by dividing the amount of the annual dividends by the aggregate value (or net asset value) at the end of the period. For a fund, the dividend yield is based solely on stock holdings and does not include any income produced by other investments.
Earnings Growth Rate. The average annual rate of growth in earnings over the past five years for the stocks now in a fund.
Equity Exposure. A measure that reflects a fund’s investments in stocks and stock futures. Any holdings in short-term reserves are excluded.
Expense Ratio. A fund’s total annual operating expenses expressed as a percentage of the fund’s average net assets. The expense ratio includes management and administrative expenses, but does not include the transaction costs of buying and selling portfolio securities.
Foreign Holdings. The percentage of a fund represented by securities or depositary receipts of companies based outside the United States.
Inception Date. The date on which the assets of a fund (or one of its share classes) are first invested in accordance with the fund’s investment objective. For funds with a subscription period, the inception date is the day after that period ends. Investment performance is measured from the inception date.
Median Market Cap. An indicator of the size of companies in which a fund invests; the midpoint of market capitalization (market price x shares outstanding) of a fund’s stocks, weighted by the proportion of the fund’s assets invested in each stock. Stocks representing half of the fund’s assets have market capitalizations above the median, and the rest are below it.
Price/Book Ratio. The share price of a stock divided by its net worth, or book value, per share. For a fund, the weighted average price/book ratio of the stocks it holds.
47
Price/Earnings Ratio. The ratio of a stock’s current price to its per-share earnings over the past year. For a fund, the weighted average P/E of the stocks it holds. P/E is an indicator of market expectations about corporate prospects; the higher the P/E, the greater the expectations for a company’s future growth.
R-Squared. A measure of how much of a fund’s past returns can be explained by the returns from the market in general, as measured by a given index. If a fund’s total returns were precisely synchronized with an index’s returns, its R-squared would be 1.00. If the fund’s returns bore no relationship to the index’s returns, its R-squared would be 0. For this report, R-squared is based on returns over the past 36 months for both the fund and the index.
Return on Equity. The annual average rate of return generated by a company during the past five years for each dollar of shareholder’s equity (net income divided by shareholder’s equity). For a fund, the weighted average return on equity for the companies whose stocks it holds.
Short-Term Reserves. The percentage of a fund invested in highly liquid, short-term securities that can be readily converted to cash.
Turnover Rate. An indication of the fund’s trading activity. Funds with high turnover rates incur higher transaction costs and may be more likely to distribute capital gains (which may be taxable to investors). The turnover rate excludes in-kind transactions, which have minimal impact on costs.
48
This page intentionally left blank.
This page intentionally left blank.
This page intentionally left blank.
The People Who Govern Your Fund
The trustees of your mutual fund are there to see that the fund is operated and managed in your best interests since, as a shareholder, you are a part owner of the fund. Your fund’s trustees also serve on the board of directors of The Vanguard Group, Inc., which is owned by the Vanguard funds and provides services to them on an at-cost basis.
A majority of Vanguard’s board members are independent, meaning that they have no affiliation with Vanguard or the funds they oversee, apart from the sizable personal investments they have made as private individuals. The independent board members have distinguished backgrounds in business, academia, and public service. Each of the trustees and executive officers oversees 194 Vanguard funds.
The following table provides information for each trustee and executive officer of the fund. More information about the trustees is in the Statement of Additional Information, which can be obtained, without charge, by contacting Vanguard at 800-662-7447, or online at vanguard.com.
| InterestedTrustee1 | Rajiv L. Gupta |
| Born 1945. Trustee Since December 2001.2 Principal | |
| F. William McNabb III | Occupation(s) During the Past Five Years and Other |
| Born 1957. Trustee Since July 2009. Chairman of | Experience: Chairman and Chief Executive Officer |
| the Board. Principal Occupation(s) During the Past | (retired 2009) and President (2006–2008) of |
| Five Years and Other Experience: Chairman of the | Rohm and Haas Co. (chemicals); Director of Tyco |
| Board of The Vanguard Group, Inc., and of each of | International PLC (diversified manufacturing and |
| the investment companies served by The Vanguard | services), Hewlett-Packard Co. (electronic computer |
| Group, since January 2010; Director of The Vanguard | manufacturing), and Delphi Automotive PLC |
| Group since 2008; Chief Executive Officer and | (automotive components); Senior Advisor at New |
| President of The Vanguard Group, and of each of | Mountain Capital. |
| the investment companies served by The Vanguard | |
| Group, since 2008; Director of Vanguard Marketing | Amy Gutmann |
| Corporation; Managing Director of The Vanguard | Born 1949. Trustee Since June 2006. Principal |
| Group (1995–2008). | Occupation(s) During the Past Five Years and |
| Other Experience: President of the University of | |
| IndependentTrustees | Pennsylvania; Christopher H. Browne Distinguished |
| Professor of Political Science, School of Arts and | |
| Emerson U. Fullwood | Sciences, and Professor of Communication, Annenberg |
| Born 1948. Trustee Since January 2008. Principal | School for Communication, with secondary faculty |
| Occupation(s) During the Past Five Years and | appointments in the Department of Philosophy, School |
| Other Experience: Executive Chief Staff and | of Arts and Sciences, and at the Graduate School of |
| Marketing Officer for North America and Corporate | Education, University of Pennsylvania; Trustee of the |
| Vice President (retired 2008) of Xerox Corporation | National Constitution Center; Chair of the Presidential |
| (document management products and services); | Commission for the Study of Bioethical Issues. |
| Executive in Residence and 2009–2010 Distinguished | |
| Minett Professor at the Rochester Institute of | JoAnn Heffernan Heisen |
| Technology; Director of SPX Corporation (multi-industry | Born 1950. Trustee Since July 1998. Principal |
| manufacturing), the United Way of Rochester, | Occupation(s) During the Past Five Years and Other |
| Amerigroup Corporation (managed health care), the | Experience: Corporate Vice President and Chief |
| University of Rochester Medical Center, Monroe | Global Diversity Officer (retired 2008) and Member |
| Community College Foundation, and North Carolina | of the Executive Committee (1997–2008) of Johnson |
| A&T University. | & Johnson (pharmaceuticals/medical devices/ |
| consumer products); Director of Skytop Lodge | |
| Corporation (hotels), the University Medical Center | |
| at Princeton, the Robert Wood Johnson Foundation, | |
| and the Center for Talent Innovation; Member of | |
| the Advisory Board of the Institute for Women’s | |
| Leadership at Rutgers University. |
| F. Joseph Loughrey | Executive Officers | |
| Born 1949. Trustee Since October 2009. Principal | ||
| Occupation(s) During the Past Five Years and Other | Glenn Booraem | |
| Experience: President and Chief Operating Officer | Born 1967. Treasurer Since May 2015. Principal | |
| (retired 2009) of Cummins Inc. (industrial machinery); | Occupation(s) During the Past Five Years and | |
| Chairman of the Board of Hillenbrand, Inc. (specialized | Other Experience: Principal of The Vanguard Group, | |
| consumer services), and of Oxfam America; Director | Inc.; Treasurer of each of the investment companies | |
| of SKF AB (industrial machinery), Hyster-Yale Materials | served by The Vanguard Group; Controller of each of | |
| Handling, Inc. (forklift trucks), the Lumina Foundation | the investment companies served by The Vanguard | |
| for Education, and the V Foundation for Cancer | Group (2010–2015); Assistant Controller of each of | |
| Research; Member of the Advisory Council for the | the investment companies served by The Vanguard | |
| College of Arts and Letters and of the Advisory Board | Group (2001–2010). | |
| to the Kellogg Institute for International Studies, both | ||
| at the University of Notre Dame. | Thomas J. Higgins | |
| Born 1957. Chief Financial Officer Since September | ||
| Mark Loughridge | 2008. Principal Occupation(s) During the Past Five | |
| Born 1953. Trustee Since March 2012. Principal | Years and Other Experience: Principal of The Vanguard | |
| Occupation(s) During the Past Five Years and Other | Group, Inc.; Chief Financial Officer of each of the | |
| Experience: Senior Vice President and Chief Financial | investment companies served by The Vanguard Group; | |
| Officer (retired 2013) at IBM (information technology | Treasurer of each of the investment companies served | |
| services); Fiduciary Member of IBM’s Retirement Plan | by The Vanguard Group (1998–2008). | |
| Committee (2004–2013); Director of the Dow Chemical | ||
| Company; Member of the Council on Chicago Booth. | ||
| Peter Mahoney | ||
| Born 1974. Controller Since May 2015. Principal | ||
| Scott C. Malpass | Occupation(s) During the Past Five Years and | |
| Born 1962. Trustee Since March 2012. Principal | Other Experience: Head of Global Fund Accounting | |
| Occupation(s) During the Past Five Years and Other | at The Vanguard Group, Inc.; Controller of each of the | |
| Experience: Chief Investment Officer and Vice | investment companies served by The Vanguard Group; | |
| President at the University of Notre Dame; Assistant | Head of International Fund Services at The Vanguard | |
| Professor of Finance at the Mendoza College of | Group (2008–2014). | |
| Business at Notre Dame; Member of the Notre Dame | ||
| 403(b) Investment Committee; Board Member of | Heidi Stam | |
| TIFF Advisory Services, Inc., and Catholic Investment | Born 1956. Secretary Since July 2005. Principal | |
| Services, Inc. (investment advisors); Member of | Occupation(s) During the Past Five Years and Other | |
| the Investment Advisory Committee of Major | Experience: Managing Director of The Vanguard | |
| League Baseball. | Group, Inc.; General Counsel of The Vanguard Group; | |
| Secretary of The Vanguard Group and of each of the | ||
| André F. Perold | investment companies served by The Vanguard Group; | |
| Born 1952. Trustee Since December 2004. Principal | Director and Senior Vice President of Vanguard | |
| Occupation(s) During the Past Five Years and Other | Marketing Corporation. | |
| Experience: George Gund Professor of Finance and | ||
| Banking, Emeritus at the Harvard Business School | Vanguard Senior ManagementTeam | |
| (retired 2011); Chief Investment Officer and Managing | Mortimer J. Buckley | Chris D. McIsaac |
| Partner of HighVista Strategies LLC (private investment | Kathleen C. Gubanich | James M. Norris |
| firm); Director of Rand Merchant Bank; Overseer of | Paul A. Heller | Thomas M. Rampulla |
| the Museum of Fine Arts Boston. | Martha G. King | Glenn W. Reed |
| John T. Marcante | Karin A. Risi | |
| Peter F. Volanakis | ||
| Born 1955. Trustee Since July 2009. Principal | ||
| Occupation(s) During the Past Five Years and Other | Chairman Emeritus and Senior Advisor | |
| Experience: President and Chief Operating Officer | ||
| (retired 2010) of Corning Incorporated (communications | John J. Brennan | |
| equipment); Trustee of Colby-Sawyer College; | Chairman, 1996–2009 | |
| Member of the Advisory Board of the Norris Cotton | Chief Executive Officer and President, 1996–2008 | |
| Cancer Center and of the Advisory Board of the | ||
| Parthenon Group (strategy consulting). | ||
| Founder | ||
| John C. Bogle | ||
| Chairman and Chief Executive Officer, 1974–1996 | ||
1 Mr. McNabb is considered an “interested person,” as defined in the Investment Company Act of 1940, because he is an officer of the Vanguard funds.
2 December 2002 for Vanguard Equity Income Fund, the Vanguard Municipal Bond Funds, and the Vanguard State Tax-Exempt Funds.
 | |
| P.O. Box 2600 | |
| Valley Forge, PA 19482-2600 | |
| Connect with Vanguard® > vanguard.com | |
| Fund Information > 800-662-7447 | The index is a product of S&P Dow Jones Indices LLC |
| Direct Investor Account Services > 800-662-2739 | (“SPDJI”), and has been licensed for use by Vanguard. |
| Standard & Poor’s® and S&P® are registered | |
| Institutional Investor Services > 800-523-1036 | trademarks of Standard & Poor’s Financial Services LLC |
| Text Telephone for People | (“S&P”); Dow Jones® is a registered trademark of Dow |
| Who Are Deaf or Hard of Hearing> 800-749-7273 | Jones Trademark Holdings LLC (“Dow Jones”); S&P® |
| and S&P 500® are trademarks of S&P; and these | |
| This material may be used in conjunction | trademarks have been licensed for use by SPDJI and |
| with the offering of shares of any Vanguard | sublicensed for certain purposes by Vanguard. |
| fund only if preceded or accompanied by | Vanguard product(s) are not sponsored, endorsed, sold |
| the fund’s current prospectus. | or promoted by SPDJI, Dow Jones, S&P, or their |
| respective affiliates and none of such parties make any | |
| All comparative mutual fund data are from Lipper, a | representation regarding the advisability of investing in |
| Thomson Reuters Company, or Morningstar, Inc., unless | such product(s) nor do they have any liability for any |
| otherwise noted. | errors, omissions, or interruptions of the index. |
| You can obtain a free copy of Vanguard’s proxy voting | |
| guidelines by visiting vanguard.com/proxyreporting or by | |
| calling Vanguard at 800-662-2739. The guidelines are | |
| also available from the SEC’s website, sec.gov. In | |
| addition, you may obtain a free report on how your fund | |
| voted the proxies for securities it owned during the 12 | |
| months ended June 30. To get the report, visit either | |
| vanguard.com/proxyreporting or sec.gov. | |
| You can review and copy information about your fund at | |
| the SEC’s Public Reference Room in Washington, D.C. To | |
| find out more about this public service, call the SEC at | |
| 202-551-8090. Information about your fund is also | |
| available on the SEC’s website, and you can receive | |
| copies of this information, for a fee, by sending a | |
| request in either of two ways: via email addressed to | |
| publicinfo@sec.gov or via regular mail addressed to the | |
| Public Reference Section, Securities and Exchange | |
| Commission, Washington, DC 20549-1520. | |
| © 2015 The Vanguard Group, Inc. | |
| All rights reserved. | |
| Vanguard Marketing Corporation, Distributor. | |
| Q18400 102015 | |
Annual Report | August 31, 2015
Vanguard S&P Small-Cap 600 Index Funds
Vanguard S&P Small-Cap 600 Index Fund
Vanguard S&P Small-Cap 600 Value Index Fund
Vanguard S&P Small-Cap 600 Growth Index Fund
Vanguard’s Principles for Investing Success
We want to give you the best chance of investment success. These principles, grounded in Vanguard’s research and experience, can put you on the right path.
Goals. Create clear, appropriate investment goals.
Balance. Develop a suitable asset allocation using broadly diversified funds. Cost. Minimize cost.
Discipline. Maintain perspective and long-term discipline.
A single theme unites these principles: Focus on the things you can control.
We believe there is no wiser course for any investor.
| Contents | |
| Your Fund’s Total Returns. | 1 |
| Chairman’s Letter. | 2 |
| S&P Small-Cap 600 Index Fund. | 9 |
| S&P Small-Cap 600 Value Index Fund. | 29 |
| S&P Small-Cap 600 Growth Index Fund. | 48 |
| Your Fund’s After-Tax Returns. | 65 |
| About Your Fund’s Expenses. | 66 |
| Trustees Approve Advisory Arrangements. | 68 |
| Glossary. | 69 |
Please note: The opinions expressed in this report are just that—informed opinions. They should not be considered promises or advice.
Also, please keep in mind that the information and opinions cover the period through the date on the front of this report. Of course, the
risks of investing in your fund are spelled out in the prospectus.
See the Glossary for definitions of investment terms used in this report.
About the cover: Pictured is a sailing block on the Brilliant, a 1932 schooner docked in Mystic, Connecticut. A type of pulley, the
sailing block helps coordinate the setting of the sails. At Vanguard, the intricate coordination of technology and people allows
us to help millions of clients around the world reach their financial goals.
Your Fund’s Total Returns
| Fiscal Year Ended August 31, 2015 | |
| Total | |
| Returns | |
| Vanguard S&P Small-Cap 600 Index Fund | |
| ETF Shares | |
| Market Price | 1.79% |
| Net Asset Value | 1.69 |
| Institutional Shares | 1.77 |
| S&P SmallCap 600 Index | 1.80 |
| Small-Cap Core Funds Average | -2.19 |
| Small-Cap Core Funds Average: Derived from data provided by Lipper, a Thomson Reuters Company. | |
| Vanguard S&P Small-Cap 600 Value Index Fund | |
| ETF Shares | |
| Market Price | -3.05% |
| Net Asset Value | -3.09 |
| Institutional Shares (Inception: 11/19/2014) | -2.79 |
| S&P SmallCap 600 Value Index | -2.90 |
| Small-Cap Value Funds Average | -4.82 |
| Small-Cap Value Funds Average: Derived from data provided by Lipper, a Thomson Reuters Company. | |
| Vanguard S&P Small-Cap 600 Growth Index Fund | |
| ETF Shares | |
| Market Price | 6.40% |
| Net Asset Value | 6.32 |
| S&P SmallCap 600 Growth Index | 6.55 |
| Small-Cap Growth Funds Average | 4.10 |
| Small-Cap Growth Funds Average: Derived from data provided by Lipper, a Thomson Reuters Company. | |
Benchmark returns are calculated from the start of the reporting period or from the earliest share-class inception date.
Institutional Shares are available to certain institutional investors who meet specific administrative, service, and account-size criteria. The
Vanguard ETF® Shares shown are traded on the NYSE Arca exchange and are available only through brokers. The table provides ETF returns
based on both the NYSE Arca market price and the net asset value for a share. U.S. Pat. Nos. 6,879,964; 7,337,138; 7,720,749; 7,925,573;
8,090,646; and 8,417,623.
For the ETF Shares, the market price is determined by the midpoint of the bid-offer spread as of the closing time of the New York Stock
Exchange (generally 4 p.m., Eastern time). The net asset value is also determined as of the NYSE closing time. For more information about
how the ETF Shares' market prices have compared with their net asset value, visit vanguard.com, select your ETF, and then select the Price
and Performance tab. The ETF premium/discount analysis there shows the percentages of days on which the ETF Shares' market price was
above or below the NAV.
1

Chairman’s Letter
Dear Shareholder,
Opposing forces tugged the broad U.S. stock market back and forth over the 12 months ended August 31, 2015, leaving it clinging to slight gains. Growth stocks outpaced value stocks, while stocks of large, midsize, and small companies finished in close proximity to one another.
This uneven investment environment was mirrored in the performance of the Vanguard S&P Small-Cap 600 Index Funds. Their results ranged from 6.32% for the Growth Fund to –3.09% for the Value Fund. Vanguard S&P Small-Cap 600 Index Fund, which includes both growth and value stocks, returned 1.69%. (All returns cited are for the funds’ ETF Shares, based on net asset value.)
All three funds closely tracked their target small-capitalization indexes and exceeded the average returns of their peers.
If you hold shares of your fund in a taxable account, you may wish to review the information on after-tax returns that appears later in this report.
August stock market anxiety led to flat 12-month returns
U.S. stocks generally moved in opposite directions over the two halves of the fiscal year. A first-half advance of about 6% was followed by a second-half retreat of about –5%. Ultimately, the broad market ended about where it started, returning less than 1%.
2
Much of the decline came in August, when stocks tumbled over fears about the global impact of China’s economic deceleration. Greece’s debt crisis, the strong U.S. dollar, perceived high valuations, and speculation about when the Federal Reserve might start to raise short-term interest rates also played a part. (Shortly after the close of the reporting period, the Fed announced at its September meeting that it would leave rates unchanged for the time being.)
For U.S. investors, international stocks returned about –12%, a result that would have been better if not for the dollar’s strength against many foreign currencies. China’s troubles buffeted emerging markets, which produced lower returns than the developed markets of Europe and the Pacific region.
Bond markets generally saw more muted results
The broad U.S. taxable bond market returned 1.56%. Bond prices generally fell slightly but drew some support from global investors seeking higher yields than those available in many other developed markets. Demand from buyers looking for shelter from stock market volatility also helped. The yield of the 10-year U.S. Treasury note ended August at 2.18%, down from 2.34% a year earlier. (Bond prices and yields move in opposite directions.)
Limited by the dollar’s strength, international bond markets (as measured by the Barclays Global Aggregate Index ex USD) returned –11.97%. Without this currency effect, they returned about 3%.
| Market Barometer | |||
| Average Annual Total Returns | |||
| Periods Ended August 31, 2015 | |||
| One | Three | Five | |
| Year | Years | Years | |
| Stocks | |||
| Russell 1000 Index (Large-caps) | 0.40% | 14.68% | 16.07% |
| Russell 2000 Index (Small-caps) | 0.03 | 14.12 | 15.55 |
| Russell 3000 Index (Broad U.S. market) | 0.36 | 14.63 | 16.03 |
| FTSE All-World ex US Index (International) | -11.50 | 5.79 | 5.17 |
| Bonds | |||
| Barclays U.S. Aggregate Bond Index (Broad taxable market) | 1.56% | 1.53% | 2.98% |
| Barclays Municipal Bond Index (Broad tax-exempt market) | 2.52 | 2.83 | 3.96 |
| Citigroup Three-Month U.S. Treasury Bill Index | 0.02 | 0.03 | 0.05 |
| CPI | |||
| Consumer Price Index | 0.20% | 1.14% | 1.77% |
3
The Fed’s 0%–0.25% target for short-term interest rates continued to restrain returns for money market funds and savings accounts.
Health care led the pack; energy brought up the rear
The Vanguard S&P Small-Cap 600 Index Funds encompass the small-cap segment of the broad U.S. stock market. Using a full replication strategy, the Small-Cap 600 Index Fund alone holds all 600 stocks that are in its index.
The Growth and Value Funds represent market segments within the broader fund. Growth stocks, which have mostly outperformed value over the past five years, clearly led again over the latest period. Growth stocks are typically priced at a premium to the rest of the market because their growth prospects are perceived to be stronger.
Health care stocks, traditionally a growth domain, generated returns of 22% to 31% for the three funds. The trends favoring health care are familiar ones. The aging U.S. population requires more health care in all forms, health care is increasingly accessible worldwide, and more Americans are insured as a result of the Affordable Care Act.
Pharmaceutical and biotechnology companies generated solid returns amid promising developments in the industry’s pipeline and in mergers and acquisitions. Health care services and medical equipment companies also boosted results.
| Expense Ratios | |||
| Your Fund Compared With Its Peer Group | |||
| ETF | Institutional | Peer Group | |
| Shares | Shares | Average | |
| S&P Small-Cap 600 Index Fund | 0.15% | 0.08% | 1.29% |
| S&P Small-Cap 600 Value Index Fund | 0.20 | 0.08 | 1.35 |
| S&P Small-Cap 600 Growth Index Fund | 0.20 | — | 1.39 |
The fund expense ratios shown are from the prospectus dated December 19, 2014, and represent estimated costs for the current fiscal year.
For fiscal year ended August 31, 2015, the funds’ expense ratios were: for the S&P Small-Cap 600 Index Fund, 0.15% for ETF Shares and
0.08% for Institutional Shares; for the S&P Small-Cap 600 Value Index Fund, 0.20% for ETF Shares and 0.08% for Institutional Shares; and for
the S&P Small-Cap 600 Growth Index Fund, 0.20% for ETF Shares. Peer-group expense ratios are derived from data provided by Lipper, a
Thomson Reuters Company, and capture information through year-end 2014.
Peer groups: For the S&P Small-Cap 600 Index Fund, Small-Cap Core Funds; for the S&P Small-Cap 600 Value Index Fund, Small-Cap Value
Funds; and for the S&P Small-Cap 600 Growth Index Fund, Small-Cap Growth Funds.
4
The consumer discretionary sector contributed to performance across the board as retail spending continued to grow. Returns for leisure-oriented companies, including hotels and restaurants, were particularly robust. Those gains offset weakness in education services.
Financial stocks, the largest portion of all three funds, delivered single-digit returns. Although the sector has benefited from the long bull market, it has also been restrained by a tougher regulatory environment and exceptionally low interest rates.
The energy sector was the biggest drag on performance, returning –56% or lower for the three funds. Oil prices fell nearly 50% over the period. High output from some leading oil-producing countries and concerns about the slower growth in China—the world’s largest oil importer—put nearly constant pressure on prices. At the same time, burgeoning U.S. production of natural gas helped drive down its price by about one-third.
Materials, another traditionally value-oriented sector, registered notably negative returns (about –22%) in all three funds because of declining commodity prices.
| Total Returns | |
| Inception Through August 31, 2015 | |
| Average | |
| Annual Return | |
| S&P Small-Cap 600 Index Fund ETF Shares Net Asset Value (Returns since | |
| inception: 9/7/2010) | 16.21% |
| S&P SmallCap 600 Index | 16.40 |
| Small-Cap Core Funds Average | 13.34 |
| Small-Cap Core Funds Average: Derived from data provided by Lipper, a Thomson Reuters Company. | |
| S&P Small-Cap 600 Value Index Fund ETF Shares Net Asset Value (Returns since | |
| inception: 9/7/2010) | 14.96% |
| S&P SmallCap 600 Value Index | 15.18 |
| Small-Cap Value Funds Average | 12.72 |
| Small-Cap Value Funds Average: Derived from data provided by Lipper, a Thomson Reuters Company. | |
| S&P Small-Cap 600 Growth Index Fund ETF Shares Net Asset Value (Returns since | |
| inception: 9/7/2010) | 17.38% |
| S&P SmallCap 600 Growth Index | 17.61 |
| Small-Cap Growth Funds Average | 14.78 |
| Small-Cap Growth Funds Average: Derived from data provided by Lipper, a Thomson Reuters Company. | |
The figures shown represent past performance, which is not a guarantee of future results. (Current performance may be
lower or higher than the performance data cited. For performance data current to the most recent month-end, visit our
website at vanguard.com/performance.) Note, too, that both investment returns and principal value can fluctuate widely, so
an investor’s shares, when sold, could be worth more or less than their original cost.
5
The funds have been successful in tightly tracking their indexes
The three Vanguard S&P Small-Cap 600 Index Funds launched their ETF Shares on September 7, 2010, as an extension of Vanguard’s indexing lineup. In the five years since, the funds met their primary goal of capturing virtually all the returns of their target indexes. Reflecting the overall strength of the stock markets, all three funds also recorded double-digit average annual returns and outdistanced their peer fund averages.
Vanguard Equity Index Group, the funds’ advisor, is responsible for this index tracking success. The group has kept the funds on target with sophisticated portfolio and management techniques refined over the decades. Low expenses––which allow you to keep more of the funds’ returns––have helped in these efforts.
When the markets are volatile, maintaining perspective is key
As I noted earlier, volatility returned to the stock market with a vengeance in the final weeks of August as investors worried that a slowdown in China’s growth could affect world markets.
| An indexing benefit that’s worth keeping in mind |
| As a Vanguard investor, you’re probably familiar with the cost and diversification benefits that |
| index funds typically offer. But there’s a lesser-known—yet important—advantage to indexing |
| as well: relative predictability. |
| Simply put, index funds help you capture the market’s return more predictably than actively |
| managed funds. |
| By definition, an index fund is built and managed to track the return of its designated broad |
| market or market segment. Some do so more closely than others. But what’s key is that you |
| know what to expect: whatever the market returns—good or bad—minus the fund’s costs. |
| Active managers, in contrast, seek to beat the market—and do so with varying degrees of |
| success at different times. |
| The relative predictability of indexing can help you stay on course with your investment goals, |
| by reducing the likelihood of particular surprises—such as being out of step with market |
| performance. The confidence of knowing that you’ll earn a market-like return can reduce |
| the temptation to trade based on emotions. |
| We recognize that some investors want the opportunity to outperform the market. That’s |
| why Vanguard also offers low-cost active funds managed by carefully selected, world-class |
| advisors, so you can choose an investment strategy that aligns with both your goals and your |
| risk appetite. |
6
This turmoil may have evoked painful memories of previous financial setbacks—memories that had been receding after more than six years of strong U.S. stock performance. Inevitably, that sort of upheaval can lead some investors to make rash moves with their portfolios.
During periods of market adversity, however, it’s more important than ever to keep sight of one of Vanguard’s key principles: Maintain perspective and long-term discipline. Whether you’re investing for yourself or on behalf of clients, your success is affected greatly by how you react––or don’t react––when the markets turn turbulent. (You can read more in Vanguard’s Principles for Investing Success at vanguard.com/research.)
As I’ve written in the past, the best course for long-term investors generally is to ignore daily market moves and not make decisions based on emotion. This is also a good time to evaluate your portfolio and make sure your asset allocation is aligned with your time horizon, goals, and risk tolerance.
The markets are unpredictable and often confounding. Keeping long-term plans clearly in focus can be crucial as we weather these periodic storms.
As always, thank you for entrusting your assets to Vanguard.
Sincerely,

F. William McNabb III
Chairman and Chief Executive Officer
September 18, 2015
7
| Your Fund’s Performance at a Glance | ||||
| August 31, 2014, Through August 31, 2015 | ||||
| Distributions Per Share | ||||
| Starting | Ending | Income | Capital | |
| Share Price | Share Price | Dividends | Gains | |
| Vanguard S&P Small-Cap 600 Index Fund | ||||
| ETF Shares | $99.81 | $100.42 | $1.091 | $0.000 |
| Institutional Shares | 200.56 | 201.83 | 2.294 | 0.000 |
| Vanguard S&P Small-Cap 600 Value Index Fund | ||||
| ETF Shares | $98.93 | $94.66 | $1.284 | $0.000 |
| Institutional Shares (Inception: 11/19/2014) | 206.40 | 198.02 | 2.761 | 0.000 |
| Vanguard S&P Small-Cap 600 Growth Index | ||||
| Fund | ||||
| ETF Shares | $101.36 | $106.99 | $0.758 | $0.000 |
8
S&P Small-Cap 600 Index Fund
Fund Profile
As of August 31, 2015
| Share-Class Characteristics | ||
| ETF | Institutional | |
| Shares | Shares | |
| Ticker Symbol | VIOO | VSMSX |
| Expense Ratio1 | 0.15% | 0.08% |
| 30-Day SEC Yield | 1.30% | 1.38% |
| Portfolio Characteristics | |||
| DJ | |||
| U.S. | |||
| Total | |||
| S&P | Market | ||
| SmallCap | FA | ||
| Fund | 600 Index | Index | |
| Number of Stocks | 601 | 600 | 3,828 |
| Median Market Cap | $1.5B | $1.5B | $47.2B |
| Price/Earnings Ratio | 25.2x | 25.2x | 20.8x |
| Price/Book Ratio | 2.0x | 2.0x | 2.6x |
| Return on Equity | 11.3% | 11.3% | 17.1% |
| Earnings Growth | |||
| Rate | 10.0% | 10.0% | 10.2% |
| Dividend Yield | 1.4% | 1.4% | 2.1% |
| Foreign Holdings | 0.0% | 0.0% | 0.0% |
| Turnover Rate | 11% | — | — |
| Short-Term Reserves | -0.1% | — | — |
| Volatility Measures | ||
| DJ | ||
| S&P | U.S. Total | |
| SmallCap | Market | |
| 600 Index | FA Index | |
| R-Squared | 1.00 | 0.72 |
| Beta | 1.00 | 1.09 |
| These measures show the degree and timing of the fund’s | ||
| fluctuations compared with the indexes over 36 months. | ||
| Ten Largest Holdings (% of total net assets) | ||
| Toro Co. | Agricultural & Farm | |
| Machinery | 0.6% | |
| Amsurg Corp. | Health Care Facilities | 0.6 |
| ABIOMED Inc. | Health Care | |
| Equipment | 0.6 | |
| MarketAxess Holdings | ||
| Inc. | Specialized Finance | 0.5 |
| j2 Global Inc. | Internet Software & | |
| Services | 0.5 | |
| Curtiss-Wright Corp. | Aerospace & | |
| Defense | 0.5 | |
| Piedmont Natural Gas | ||
| Co. Inc. | Gas Utilities | 0.5 |
| Pool Corp. | Distributors | 0.5 |
| Microsemi Corp. | Semiconductors | 0.5 |
| Post Properties Inc. | Residential REITs | 0.5 |
| Top Ten | 5.3% | |
| The holdings listed exclude any temporary cash investments and equity index products. | ||
Investment Focus
1 The expense ratios shown are from the prospectus dated December 19, 2014, and represent estimated costs for the current fiscal year. For the
fiscal year ended August 31, 2015, the expense ratios were 0.15% for ETF Shares and 0.08% for Institutional Shares.
9
S&P Small-Cap 600 Index Fund
| Sector Diversification (% of equity exposure) | |||
| DJ | |||
| U.S. | |||
| Total | |||
| S&P | Market | ||
| SmallCap | FA | ||
| Fund | 600 Index | Index | |
| Consumer Discretionary 14.7% | 14.7% | 13.5% | |
| Consumer Staples | 2.8 | 2.8 | 8.4 |
| Energy | 3.0 | 3.0 | 6.6 |
| Financials | 23.3 | 23.3 | 18.2 |
| Health Care | 13.7 | 13.6 | 15.0 |
| Industrials | 16.9 | 17.0 | 10.7 |
| Information Technology | 16.0 | 16.0 | 19.1 |
| Materials | 5.0 | 5.0 | 3.3 |
| Telecommunication | |||
| Services | 0.7 | 0.7 | 2.2 |
| Utilities | 3.9 | 3.9 | 3.0 |
10
S&P Small-Cap 600 Index Fund
Performance Summary
All of the returns in this report represent past performance, which is not a guarantee of future results that may be achieved by the fund. (Current performance may be lower or higher than the performance data cited. For performance data current to the most recent month-end, visit our website at vanguard.com/performance.) Note, too, that both investment returns and principal value can fluctuate widely, so an investor’s shares, when sold, could be worth more or less than their original cost. The returns shown do not reflect taxes that a shareholder would pay on fund distributions or on the sale of fund shares.
Cumulative Performance: September 7, 2010, Through August 31, 2015
Initial Investment of $10,000
| Average Annual Total Returns | ||||
| Periods Ended August 31, 2015 | ||||
| Since | Final Value | |||
| One | Inception | of a $10,000 | ||
| Year | (9/7/2010) | Investment | ||
| S&P Small-Cap 600 Index Fund*ETF | ||||
| Shares Net Asset Value | 1.69% | 16.21% | $21,135 | |
| S&P Small-Cap 600 Index Fund*ETF | ||||
| Shares Market Price | 1.79 | 16.22 | 21,138 | |
| •••••••• | S&P SmallCap 600 Index | 1.80 | 16.40 | 21,306 |
| – – – – | Small-Cap Core Funds Average | -2.19 | 13.34 | 18,658 |
| Dow Jones U.S. Total Stock Market | ||||
| Float Adjusted Index | 0.29 | 15.13 | 20,172 | |
| Small-Cap Core Funds Average: Derived from data provided by Lipper, a Thomson Reuters Company. | ||||
| "Since Inception" performance is calculated from the ETF Shares’ inception date for both the fund and its comparative standards. | ||||
| Since | Final Value | ||
| One | Inception | of a $5,000,000 | |
| Year | (4/1/2011) | Investment | |
| S&P Small-Cap 600 Index Fund Institutional | |||
| Shares | 1.77% | 11.00% | $7,927,173 |
| S&P SmallCap 600 Index | 1.80 | 11.10 | 7,958,306 |
| Dow Jones U.S. Total Stock Market Float | |||
| Adjusted Index | 0.29 | 11.36 | 8,041,377 |
"Since Inception" performance is calculated from the Institutional Shares’ inception date for both the fund and its comparative standards.
Institutional Shares were first issued on December 15, 2010, and the sole shareholder redeemed shortly thereafter. Institutional Shares were
next issued on April 1, 2011. The total returns shown are based on the period beginning April 1, 2011.
See Financial Highlights for dividend and capital gains information.
11
S&P Small-Cap 600 Index Fund
Cumulative Returns of ETF Shares: September 7, 2010, Through August 31, 2015
| Since | ||
| One | Inception | |
| Year | (9/7/2010) | |
| S&P Small-Cap 600 Index Fund ETF Shares Market | ||
| Price | 1.79% | 111.38% |
| S&P Small-Cap 600 Index Fund ETF Shares Net | ||
| Asset Value | 1.69 | 111.35 |
| S&P SmallCap 600 Index | 1.80 | 113.06 |
| "Since Inception" performance is calculated from the ETF Shares’ inception date for both the fund and its comparative standards. | ||
Fiscal-Year Total Returns (%): September 7, 2010, Through August 31, 2015
Average Annual Total Returns: Periods Ended June 30, 2015
This table presents returns through the latest calendar quarter—rather than through the end of the fiscal period.
Securities and Exchange Commission rules require that we provide this information.
| Inception | One | Since | |
| Date | Year | Inception | |
| ETF Shares | 9/7/2010 | ||
| Market Price | 6.72% | 18.37% | |
| Net Asset Value | 6.60 | 18.34 | |
| Institutional Shares | 4/1/2011 | 6.68 | 13.09 |
Institutional Shares were first issued on December 15, 2010, and the sole shareholder redeemed shortly thereafter. Institutional Shares were
next issued on April 1, 2011. The total returns shown are based on the period beginning April 1, 2011.
12
S&P Small-Cap 600 Index Fund
Financial Statements
Statement of Net Assets
As of August 31, 2015
The fund reports a complete list of its holdings in regulatory filings four times in each fiscal year, at the quarter-ends. For the second and fourth fiscal quarters, the lists appear in the fund’s semiannual and annual reports to shareholders. For the first and third fiscal quarters, the fund files the lists with the Securities and Exchange Commission on Form N-Q. Shareholders can look up the fund’s Forms N-Q on the SEC’s website at sec.gov. Forms N-Q may also be reviewed and copied at the SEC’s Public Reference Room (see the back cover of this report for further information).
| Market | |||
| Value• | |||
| Shares | ($000) | ||
| Common Stocks (99.5%)1 | |||
| Consumer Discretionary (14.6%) | |||
| Pool Corp. | 29,966 | 2,088 | |
| Wolverine World Wide Inc. | 70,907 | 1,911 | |
| * | G-III Apparel Group Ltd. | 26,230 | 1,819 |
| Men’s Wearhouse Inc. | 31,494 | 1,778 | |
| Lithia Motors Inc. Class A | 15,721 | 1,676 | |
| * | Pinnacle Entertainment Inc. | 41,522 | 1,568 |
| * | Steven Madden Ltd. | 38,378 | 1,568 |
| * | Helen of Troy Ltd. | 18,376 | 1,565 |
| Texas Roadhouse Inc. | |||
| Class A | 43,165 | 1,554 | |
| Ryland Group Inc. | 32,102 | 1,388 | |
| Monro Muffler Brake Inc. | 21,830 | 1,384 | |
| Papa John’s International Inc. | 20,197 | 1,358 | |
| Marriott Vacations Worldwide | |||
| Corp. | 18,943 | 1,345 | |
| Group 1 Automotive Inc. | 14,651 | 1,281 | |
| * | Express Inc. | 58,050 | 1,184 |
| * | Gentherm Inc. | 24,602 | 1,122 |
| * | Meritage Homes Corp. | 25,786 | 1,087 |
| DineEquity Inc. | 11,360 | 1,085 | |
| * | Dorman Products Inc. | 21,123 | 1,064 |
| * | Gannett Co. Inc. | 77,820 | 1,020 |
| Caleres Inc. | 30,124 | 1,003 | |
| * | Genesco Inc. | 16,489 | 988 |
| La-Z-Boy Inc. | 35,168 | 971 | |
| Sonic Corp. | 33,977 | 917 | |
| Drew Industries Inc. | 16,591 | 917 | |
| * | Popeyes Louisiana | ||
| Kitchen Inc. | 15,917 | 885 | |
| * | Boyd Gaming Corp. | 54,608 | 879 |
| * | Select Comfort Corp. | 35,830 | 872 |
| * | Standard Pacific Corp. | 102,193 | 864 |
| Children’s Place Inc. | 14,158 | 848 | |
| Oxford Industries Inc. | 10,017 | 843 | |
| * | TopBuild Corp. | 26,512 | 841 |
| Finish Line Inc. Class A | 31,517 | 831 | |
| Buckle Inc. | 19,463 | 821 | |
| Sturm Ruger & Co. Inc. | 12,978 | 816 | |
| Scholastic Corp. | 18,452 | 797 | |
| Outerwall Inc. | 12,688 | 782 | |
| * | Crocs Inc. | 52,890 | 779 |
| * | Red Robin Gourmet | ||
| Burgers Inc. | 9,704 | 765 | |
| * | Vitamin Shoppe Inc. | 20,416 | 731 |
| Bob Evans Farms Inc. | 15,317 | 692 | |
| * | Hibbett Sports Inc. | 16,896 | 667 |
| Barnes & Noble Inc. | 42,358 | 661 | |
| * | BJ’s Restaurants Inc. | 14,933 | 642 |
| EW Scripps Co. Class A | 36,396 | 638 | |
| Cato Corp. Class A | 17,711 | 622 | |
| * | iRobot Corp. | 20,372 | 597 |
| Nutrisystem Inc. | 20,078 | 562 | |
| Interval Leisure Group Inc. | 27,189 | 545 | |
| Ethan Allen Interiors Inc. | 17,889 | 532 | |
| Standard Motor Products Inc. | 14,307 | 506 | |
| * | Universal Electronics Inc. | 10,897 | 497 |
| Sonic Automotive Inc. | |||
| Class A | 22,714 | 489 | |
| Callaway Golf Co. | 53,349 | 472 | |
| * | Iconix Brand Group Inc. | 32,586 | 453 |
| * | Pep Boys-Manny Moe | ||
| & Jack | 36,815 | 445 | |
| * | M/I Homes Inc. | 16,867 | 421 |
| * | Strayer Education Inc. | 7,518 | 393 |
| Ruth’s Hospitality Group Inc. | 23,955 | 385 | |
| Winnebago Industries Inc. | 18,548 | 380 | |
| * | Scientific Games Corp. | ||
| Class A | 34,411 | 379 | |
| * | FTD Cos. Inc. | 12,512 | 374 |
| Capella Education Co. | 7,476 | 364 | |
| * | Zumiez Inc. | 14,888 | 347 |
| * | Barnes & Noble | ||
| Education Inc. | 26,776 | 345 | |
| Movado Group Inc. | 11,710 | 332 | |
| Haverty Furniture Cos. Inc. | 14,250 | 329 | |
| * | Francesca’s Holdings Corp. | 29,118 | 327 |
| * | Regis Corp. | 30,177 | 327 |
13
S&P Small-Cap 600 Index Fund
| Market | |||
| Value• | |||
| Shares | ($000) | ||
| Fred’s Inc. Class A | 23,907 | 314 | |
| Superior Industries | |||
| International Inc. | 16,006 | 306 | |
| * | Unifi Inc. | 9,923 | 288 |
| * | MarineMax Inc. | 17,450 | 284 |
| * | Ruby Tuesday Inc. | 42,853 | 282 |
| *,^ | Lumber Liquidators | ||
| Holdings Inc. | 18,642 | 282 | |
| * | Blue Nile Inc. | 8,068 | 275 |
| * | Biglari Holdings Inc. | 723 | 270 |
| * | American Public | ||
| Education Inc. | 11,703 | 257 | |
| Marcus Corp. | 12,483 | 242 | |
| * | Tuesday Morning Corp. | 30,310 | 240 |
| Arctic Cat Inc. | 8,950 | 237 | |
| Stage Stores Inc. | 21,853 | 235 | |
| PetMed Express Inc. | 14,062 | 233 | |
| Kirkland’s Inc. | 10,216 | 228 | |
| Stein Mart Inc. | 19,704 | 212 | |
| * | Perry Ellis International Inc. | 8,174 | 202 |
| * | Career Education Corp. | 40,858 | 152 |
| Big 5 Sporting Goods Corp. | 12,367 | 142 | |
| * | Monarch Casino & Resort Inc. | 6,856 | 120 |
| Harte-Hanks Inc. | 28,983 | 112 | |
| * | VOXX International Corp. | ||
| Class A | 13,450 | 104 | |
| * | Sizmek Inc. | 14,359 | 94 |
| Universal Technical | |||
| Institute Inc. | 14,658 | 65 | |
| * | Christopher & Banks Corp. | 25,109 | 44 |
| 64,938 | |||
| Consumer Staples (2.7%) | |||
| * | Darling Ingredients Inc. | 113,353 | 1,456 |
| Snyder’s-Lance Inc. | 35,796 | 1,209 | |
| B&G Foods Inc. | 39,728 | 1,207 | |
| J&J Snack Foods Corp. | 10,251 | 1,168 | |
| Cal-Maine Foods Inc. | 20,593 | 1,094 | |
| Sanderson Farms Inc. | 13,714 | 947 | |
| WD-40 Co. | 9,400 | 787 | |
| Universal Corp. | 15,505 | 763 | |
| SpartanNash Co. | 25,821 | 731 | |
| Andersons Inc. | 18,316 | 648 | |
| Calavo Growers Inc. | 10,597 | 617 | |
| * | Diamond Foods Inc. | 18,133 | 547 |
| * | Central Garden & Pet Co. | ||
| Class A | 28,823 | 365 | |
| Inter Parfums Inc. | 11,724 | 301 | |
| * | Medifast Inc. | 7,781 | 216 |
| * | Seneca Foods Corp. Class A | 4,475 | 132 |
| 12,188 | |||
| Energy (3.0%) | |||
| * | PDC Energy Inc. | 27,469 | 1,543 |
| * | Carrizo Oil & Gas Inc. | 32,493 | 1,184 |
| Exterran Holdings Inc. | 47,754 | 1,066 | |
| Bristow Group Inc. | 23,969 | 888 | |
| * | SEACOR Holdings Inc. | 11,904 | 768 |
| US Silica Holdings Inc. | 36,733 | 738 | |
| * | Synergy Resources Corp. | 62,074 | 667 |
| Tidewater Inc. | 32,138 | 576 | |
| Green Plains Inc. | 23,604 | 502 | |
| * | Unit Corp. | 32,302 | 491 |
| * | Hornbeck Offshore | ||
| Services Inc. | 21,741 | 429 | |
| * | Newpark Resources Inc. | 57,704 | 423 |
| * | TETRA Technologies Inc. | 54,912 | 422 |
| CARBO Ceramics Inc. | 13,576 | 372 | |
| * | Matrix Service Co. | 18,423 | 369 |
| * | Northern Oil and Gas Inc. | 39,643 | 239 |
| * | Era Group Inc. | 13,443 | 227 |
| * | Stone Energy Corp. | 39,141 | 222 |
| Tesco Corp. | 24,491 | 208 | |
| * | Bonanza Creek Energy Inc. | 26,655 | 204 |
| * | Cloud Peak Energy Inc. | 42,585 | 204 |
| * | Bill Barrett Corp. | 34,331 | 188 |
| * | REX American Resources | ||
| Corp. | 3,358 | 180 | |
| Gulfmark Offshore Inc. | 17,544 | 158 | |
| * | Geospace Technologies | ||
| Corp. | 8,936 | 158 | |
| * | Pioneer Energy Services | ||
| Corp. | 44,240 | 146 | |
| * | Basic Energy Services Inc. | 23,761 | 124 |
| * | Rex Energy Corp. | 33,806 | 117 |
| Gulf Island Fabrication Inc. | 9,076 | 115 | |
| * | Contango Oil & Gas Co. | 10,569 | 98 |
| * | Approach Resources Inc. | 25,374 | 65 |
| * | Penn Virginia Corp. | 48,651 | 60 |
| * | ION Geophysical Corp. | 87,202 | 45 |
| 13,196 | |||
| Financials (23.2%) | |||
| MarketAxess Holdings Inc. | 25,597 | 2,315 | |
| Post Properties Inc. | 37,422 | 2,072 | |
| EPR Properties | 39,198 | 1,995 | |
| Medical Properties Trust Inc. | 160,485 | 1,873 | |
| PrivateBancorp Inc. | 48,602 | 1,840 | |
| ProAssurance Corp. | 37,744 | 1,820 | |
| * | PRA Group Inc. | 33,194 | 1,769 |
| * | Texas Capital Bancshares Inc. | 31,405 | 1,691 |
| Wintrust Financial Corp. | 32,534 | 1,659 | |
| United Bankshares Inc. | 43,834 | 1,640 | |
| DiamondRock | |||
| Hospitality Co. | 137,704 | 1,619 | |
| Healthcare Realty Trust Inc. | 68,802 | 1,576 | |
| Interactive Brokers | |||
| Group Inc. | 39,385 | 1,572 | |
| Home BancShares Inc. | 40,336 | 1,538 | |
| GEO Group Inc. | 51,191 | 1,537 | |
| FNB Corp. | 119,533 | 1,501 | |
| MB Financial Inc. | 44,252 | 1,458 | |
| UMB Financial Corp. | 28,044 | 1,406 | |
14
S&P Small-Cap 600 Index Fund
| Market | |||
| Value• | |||
| Shares | ($000) | ||
| Acadia Realty Trust | 47,191 | 1,395 | |
| First Financial | |||
| Bankshares Inc. | 44,007 | 1,370 | |
| American Equity Investment | |||
| Life Holding Co. | 55,817 | 1,354 | |
| Kite Realty Group Trust | 57,342 | 1,348 | |
| Glacier Bancorp Inc. | 51,816 | 1,348 | |
| RLI Corp. | 25,479 | 1,328 | |
| Evercore Partners Inc. | |||
| Class A | 24,990 | 1,309 | |
| Cousins Properties Inc. | 141,176 | 1,295 | |
| EastGroup Properties Inc. | 22,148 | 1,196 | |
| Selective Insurance | |||
| Group Inc. | 39,037 | 1,184 | |
| Chesapeake Lodging Trust | 40,894 | 1,182 | |
| Lexington Realty Trust | 145,588 | 1,175 | |
| Financial Engines Inc. | 35,676 | 1,158 | |
| National Penn | |||
| Bancshares Inc. | 96,027 | 1,154 | |
| Sterling Bancorp | 81,943 | 1,150 | |
| Columbia Banking | |||
| System Inc. | 36,786 | 1,115 | |
| Pinnacle Financial | |||
| Partners Inc. | 23,165 | 1,099 | |
| Retail Opportunity | |||
| Investments Corp. | 67,710 | 1,079 | |
| CVB Financial Corp. | 66,224 | 1,076 | |
| * | BofI Holding Inc. | 9,262 | 1,073 |
| Sabra Health Care REIT Inc. | 44,644 | 1,070 | |
| Old National Bancorp | 72,922 | 1,006 | |
| Community Bank System Inc. | 27,929 | 996 | |
| LTC Properties Inc. | 24,354 | 993 | |
| Astoria Financial Corp. | 61,155 | 989 | |
| American Assets Trust Inc. | 25,521 | 983 | |
| PS Business Parks Inc. | 13,287 | 969 | |
| Education Realty Trust Inc. | 33,128 | 969 | |
| First Midwest Bancorp Inc. | 53,636 | 946 | |
| Pennsylvania REIT | 47,530 | 943 | |
| Horace Mann Educators | |||
| Corp. | 28,308 | 940 | |
| Parkway Properties Inc. | 57,961 | 918 | |
| Northwest Bancshares Inc. | 69,797 | 896 | |
| CoreSite Realty Corp. | 18,223 | 887 | |
| HFF Inc. Class A | 22,632 | 822 | |
| Independent Bank Corp. | 18,124 | 821 | |
| * | First Cash Financial | ||
| Services Inc. | 19,339 | 798 | |
| BBCN Bancorp Inc. | 54,644 | 795 | |
| Westamerica Bancorporation | 17,552 | 792 | |
| NBT Bancorp Inc. | 30,250 | 784 | |
| First Financial Bancorp | 42,372 | 781 | |
| Government Properties | |||
| Income Trust | 48,310 | 765 | |
| Summit Hotel Properties Inc. | 59,366 | 720 |
| Provident Financial | |||
| Services Inc. | 37,167 | 704 | |
| LegacyTexas Financial | |||
| Group Inc. | 24,852 | 704 | |
| Talmer Bancorp Inc. Class A | 42,927 | 698 | |
| Capstead Mortgage Corp. | 65,731 | 685 | |
| United Community | |||
| Banks Inc. | 34,840 | 682 | |
| Boston Private Financial | |||
| Holdings Inc. | 56,985 | 678 | |
| * | Encore Capital Group Inc. | 16,604 | 675 |
| Greenhill & Co. Inc. | 18,893 | 663 | |
| Franklin Street Properties | |||
| Corp. | 61,171 | 637 | |
| AMERISAFE Inc. | 13,014 | 608 | |
| Infinity Property & Casualty | |||
| Corp. | 7,868 | 608 | |
| Banner Corp. | 13,229 | 588 | |
| Stewart Information Services | |||
| Corp. | 15,130 | 586 | |
| S&T Bancorp Inc. | 19,549 | 585 | |
| * | Navigators Group Inc. | 7,513 | 571 |
| Virtus Investment | |||
| Partners Inc. | 4,759 | 548 | |
| First Commonwealth | |||
| Financial Corp. | 60,900 | 539 | |
| Hanmi Financial Corp. | 21,964 | 532 | |
| Cash America | |||
| International Inc. | 18,798 | 519 | |
| Wilshire Bancorp Inc. | 48,312 | 516 | |
| Universal Insurance | |||
| Holdings Inc. | 20,875 | 514 | |
| Inland Real Estate Corp. | 60,537 | 509 | |
| Brookline Bancorp Inc. | 48,225 | 509 | |
| City Holding Co. | 10,414 | 496 | |
| Cardinal Financial Corp. | 22,013 | 491 | |
| * | Green Dot Corp. Class A | 27,724 | 490 |
| Employers Holdings Inc. | 21,859 | 482 | |
| Northfield Bancorp Inc. | 32,108 | 481 | |
| United Fire Group Inc. | 14,426 | 479 | |
| Simmons First National Corp. | |||
| Class A | 10,677 | 468 | |
| * | LendingTree Inc. | 4,420 | 468 |
| Safety Insurance Group Inc. | 8,666 | 456 | |
| Central Pacific Financial Corp. | 21,546 | 447 | |
| * | Walker & Dunlop Inc. | 18,223 | 443 |
| * | Piper Jaffray Cos. | 10,388 | 435 |
| Tompkins Financial Corp. | 8,180 | 429 | |
| Universal Health Realty | |||
| Income Trust | 9,143 | 421 | |
| Southside Bancshares Inc. | 15,989 | 416 | |
| Oritani Financial Corp. | 25,840 | 390 | |
| Investment Technology | |||
| Group Inc. | 23,650 | 388 | |
| TrustCo Bank Corp. NY | 65,255 | 386 |
15
S&P Small-Cap 600 Index Fund
| Market | |||
| Value• | |||
| Shares | ($000) | ||
| Saul Centers Inc. | 7,798 | 385 | |
| * | First NBC Bank Holding Co. | 10,936 | 383 |
| Dime Community | |||
| Bancshares Inc. | 20,838 | 355 | |
| CareTrust REIT Inc. | 31,391 | 352 | |
| Urstadt Biddle Properties Inc. | |||
| Class A | 19,299 | 346 | |
| Agree Realty Corp. | 12,143 | 345 | |
| Cedar Realty Trust Inc. | 50,967 | 319 | |
| * | Forestar Group Inc. | 23,227 | 300 |
| * | First BanCorp | 71,767 | 288 |
| Getty Realty Corp. | 18,011 | 284 | |
| OFG Bancorp | 30,690 | 265 | |
| HCI Group Inc. | 6,068 | 241 | |
| * | Enova International Inc. | 18,205 | 237 |
| *,^ | World Acceptance Corp. | 5,850 | 220 |
| Bank Mutual Corp. | 29,496 | 213 | |
| * | Ezcorp Inc. Class A | 33,182 | 210 |
| * | eHealth Inc. | 12,114 | 181 |
| United Insurance Holdings | |||
| Corp. | 11,573 | 152 | |
| Calamos Asset Management | |||
| Inc. Class A | 11,581 | 122 | |
| 102,974 | |||
| Health Care (13.6%) | |||
| * | Amsurg Corp. | 33,215 | 2,605 |
| * | ABIOMED Inc. | 25,764 | 2,471 |
| * | Impax Laboratories Inc. | 45,809 | 1,876 |
| * | Medicines Co. | 45,435 | 1,863 |
| * | Medidata Solutions Inc. | 37,924 | 1,821 |
| * | NuVasive Inc. | 33,176 | 1,749 |
| * | Prestige Brands Holdings Inc. | 35,879 | 1,669 |
| Chemed Corp. | 11,716 | 1,597 | |
| * | Masimo Corp. | 32,617 | 1,325 |
| * | Neogen Corp. | 25,387 | 1,311 |
| * | Haemonetics Corp. | 35,451 | 1,280 |
| Cantel Medical Corp. | 24,210 | 1,202 | |
| * | Cyberonics Inc. | 17,839 | 1,166 |
| Kindred Healthcare Inc. | 57,199 | 1,149 | |
| * | Integra LifeSciences Holdings | ||
| Corp. | 19,126 | 1,147 | |
| * | Ligand Pharmaceuticals Inc. | 12,261 | 1,127 |
| * | Depomed Inc. | 41,199 | 1,109 |
| * | AMN Healthcare | ||
| Services Inc. | 32,564 | 1,094 | |
| * | ICU Medical Inc. | 9,546 | 1,084 |
| * | Magellan Health Inc. | 18,711 | 1,048 |
| * | Cambrex Corp. | 21,438 | 1,025 |
| CONMED Corp. | 18,900 | 1,003 | |
| * | Greatbatch Inc. | 17,538 | 997 |
| * | Nektar Therapeutics | 90,041 | 995 |
| * | IPC Healthcare Inc. | 11,941 | 948 |
| * | Acorda Therapeutics Inc. | 29,419 | 941 |
| * | Air Methods Corp. | 24,705 | 925 |
| * | Natus Medical Inc. | 22,567 | 918 |
| * | Amedisys Inc. | 23,161 | 895 |
| * | Lannett Co. Inc. | 18,359 | 880 |
| * | MedAssets Inc. | 41,490 | 876 |
| * | ExamWorks Group Inc. | 24,128 | 864 |
| Select Medical Holdings | |||
| Corp. | 66,491 | 858 | |
| * | Omnicell Inc. | 24,919 | 847 |
| * | Momenta | ||
| Pharmaceuticals Inc. | 40,863 | 797 | |
| Ensign Group Inc. | 15,720 | 738 | |
| * | Repligen Corp. | 21,185 | 722 |
| Analogic Corp. | 8,534 | 688 | |
| * | Merit Medical Systems Inc. | 30,224 | 688 |
| Abaxis Inc. | 14,620 | 687 | |
| * | HealthEquity Inc. | 23,411 | 686 |
| * | Emergent BioSolutions Inc. | 20,528 | 683 |
| * | PharMerica Corp. | 20,854 | 682 |
| * | MiMedx Group Inc. | 65,665 | 638 |
| * | HMS Holdings Corp. | 60,583 | 633 |
| Meridian Bioscience Inc. | 28,621 | 548 | |
| * | Affymetrix Inc. | 52,879 | 493 |
| * | Cynosure Inc. Class A | 15,157 | 480 |
| * | Luminex Corp. | 26,282 | 479 |
| * | Hanger Inc. | 24,161 | 433 |
| Aceto Corp. | 18,797 | 421 | |
| Quality Systems Inc. | 30,211 | 411 | |
| * | HealthStream Inc. | 16,471 | 409 |
| * | Vascular Solutions Inc. | 10,784 | 373 |
| * | Providence Service Corp. | 8,234 | 369 |
| * | LHC Group Inc. | 8,491 | 368 |
| * | Anika Therapeutics Inc. | 10,086 | 357 |
| * | Supernus | ||
| Pharmaceuticals Inc. | 19,617 | 356 | |
| * | Albany Molecular | ||
| Research Inc. | 17,824 | 355 | |
| Invacare Corp. | 20,162 | 355 | |
| Computer Programs & | |||
| Systems Inc. | 7,204 | 332 | |
| * | Inogen Inc. | 6,614 | 326 |
| * | Enanta Pharmaceuticals Inc. | 8,001 | 312 |
| * | Sagent Pharmaceuticals Inc. | 15,605 | 312 |
| * | Healthways Inc. | 24,547 | 300 |
| * | Spectrum | ||
| Pharmaceuticals Inc. | 40,354 | 293 | |
| * | Cross Country | ||
| Healthcare Inc. | 20,815 | 289 | |
| * | ANI Pharmaceuticals Inc. | 5,657 | 276 |
| * | AngioDynamics Inc. | 17,769 | 262 |
| Landauer Inc. | 6,493 | 249 | |
| * | Almost Family Inc. | 5,462 | 242 |
| * | SurModics Inc. | 8,793 | 200 |
| * | CorVel Corp. | 5,960 | 179 |
| CryoLife Inc. | 17,553 | 172 | |
| 60,258 |
16
S&P Small-Cap 600 Index Fund
| Market | |||
| Value• | |||
| Shares | ($000) | ||
| Industrials (16.9%) | |||
| Toro Co. | 37,757 | 2,692 | |
| Curtiss-Wright Corp. | 32,597 | 2,142 | |
| EMCOR Group Inc. | 43,064 | 1,985 | |
| Allegiant Travel Co. Class A | 9,226 | 1,875 | |
| * | Moog Inc. Class A | 26,565 | 1,676 |
| * | Dycom Industries Inc. | 23,383 | 1,662 |
| Healthcare Services | |||
| Group Inc. | 48,988 | 1,638 | |
| EnerSys | 30,502 | 1,631 | |
| Barnes Group Inc. | 33,810 | 1,306 | |
| Mueller Industries Inc. | 39,024 | 1,241 | |
| Korn/Ferry International | 34,548 | 1,177 | |
| Hillenbrand Inc. | 43,547 | 1,174 | |
| Applied Industrial | |||
| Technologies Inc. | 27,561 | 1,167 | |
| UniFirst Corp. | 10,763 | 1,167 | |
| ABM Industries Inc. | 35,961 | 1,151 | |
| Knight Transportation Inc. | 42,277 | 1,150 | |
| * | On Assignment Inc. | 31,905 | 1,148 |
| Matson Inc. | 29,779 | 1,122 | |
| Interface Inc. Class A | 45,275 | 1,098 | |
| Mobile Mini Inc. | 31,657 | 1,077 | |
| Tetra Tech Inc. | 41,292 | 1,073 | |
| Watts Water Technologies | |||
| Inc. Class A | 19,427 | 1,066 | |
| Apogee Enterprises Inc. | 20,004 | 1,043 | |
| Matthews International Corp. | |||
| Class A | 20,341 | 1,033 | |
| * | WageWorks Inc. | 22,862 | 1,024 |
| Simpson Manufacturing | |||
| Co. Inc. | 28,731 | 1,003 | |
| Brink’s Co. | 33,459 | 959 | |
| Forward Air Corp. | 21,290 | 959 | |
| G&K Services Inc. Class A | 13,738 | 929 | |
| Essendant Inc. | 26,368 | 910 | |
| AZZ Inc. | 17,707 | 896 | |
| * | Aerojet Rocketdyne | ||
| Holdings Inc. | 43,105 | 887 | |
| * | Hub Group Inc. Class A | 23,504 | 886 |
| Actuant Corp. Class A | 40,941 | 878 | |
| * | TASER International Inc. | 36,752 | 860 |
| * | Hawaiian Holdings Inc. | 37,602 | 852 |
| Universal Forest | |||
| Products Inc. | 13,729 | 825 | |
| Franklin Electric Co. Inc. | 27,143 | 795 | |
| Heartland Express Inc. | 37,976 | 769 | |
| Exponent Inc. | 17,836 | 763 | |
| EnPro Industries Inc. | 15,670 | 743 | |
| US Ecology Inc. | 14,870 | 743 | |
| Kaman Corp. | 18,685 | 726 | |
| Tennant Co. | 12,632 | 724 | |
| Brady Corp. Class A | 32,760 | 719 | |
| Comfort Systems USA Inc. | 25,651 | 711 | |
| * | Atlas Air Worldwide | ||
| Holdings Inc. | 17,165 | 709 | |
| Standex International Corp. | 8,757 | 701 | |
| Insperity Inc. | 15,581 | 692 | |
| * | TrueBlue Inc. | 28,777 | 691 |
| John Bean Technologies | |||
| Corp. | 20,057 | 664 | |
| * | Saia Inc. | 17,216 | 646 |
| ESCO Technologies Inc. | 17,895 | 646 | |
| Harsco Corp. | 55,027 | 636 | |
| Albany International Corp. | 19,753 | 630 | |
| Cubic Corp. | 14,932 | 629 | |
| Lindsay Corp. | 8,100 | 618 | |
| Briggs & Stratton Corp. | 30,563 | 611 | |
| Federal Signal Corp. | 42,959 | 608 | |
| AAON Inc. | 28,582 | 591 | |
| * | American Woodmark Corp. | 8,630 | 572 |
| AAR Corp. | 23,150 | 563 | |
| SkyWest Inc. | 35,406 | 563 | |
| * | Chart Industries Inc. | 20,879 | 534 |
| CIRCOR International Inc. | 11,735 | 531 | |
| * | Navigant Consulting Inc. | 33,043 | 522 |
| Astec Industries Inc. | 12,885 | 509 | |
| General Cable Corp. | 33,419 | 486 | |
| ArcBest Corp. | 16,577 | 479 | |
| * | Aegion Corp. Class A | 25,672 | 472 |
| Griffon Corp. | 27,961 | 465 | |
| * | UTi Worldwide Inc. | 63,386 | 451 |
| * | Roadrunner Transportation | ||
| Systems Inc. | 20,779 | 451 | |
| * | PGT Inc. | 32,714 | 437 |
| Quanex Building Products | |||
| Corp. | 23,269 | 418 | |
| Encore Wire Corp. | 12,752 | 414 | |
| * | MYR Group Inc. | 14,331 | 411 |
| * | Echo Global Logistics Inc. | 17,604 | 410 |
| Resources Connection Inc. | 25,888 | 406 | |
| Viad Corp. | 13,820 | 378 | |
| Celadon Group Inc. | 18,603 | 355 | |
| Titan International Inc. | 36,998 | 340 | |
| * | Engility Holdings Inc. | 12,063 | 335 |
| * | Aerovironment Inc. | 13,823 | 332 |
| * | Gibraltar Industries Inc. | 19,991 | 328 |
| * | Lydall Inc. | 11,760 | 319 |
| Marten Transport Ltd. | 16,442 | 304 | |
| Kelly Services Inc. Class A | 20,584 | 297 | |
| National Presto Industries Inc. | 3,404 | 279 | |
| * | DXP Enterprises Inc. | 8,741 | 260 |
| Heidrick & Struggles | |||
| International Inc. | 11,356 | 221 | |
| * | Veritiv Corp. | 5,545 | 199 |
| American Science & | |||
| Engineering Inc. | 4,892 | 192 | |
| Powell Industries Inc. | 6,135 | 180 | |
| * | Orion Marine Group Inc. | 18,707 | 134 |
17
S&P Small-Cap 600 Index Fund
| Market | |||
| Value• | |||
| Shares | ($000) | ||
| * | Vicor Corp. | 11,302 | 110 |
| * | Republic Airways | ||
| Holdings Inc. | 34,794 | 107 | |
| CDI Corp. | 9,875 | 101 | |
| 74,992 | |||
| Information Technology (15.9%) | |||
| j2 Global Inc. | 31,398 | 2,185 | |
| * | Microsemi Corp. | 65,230 | 2,072 |
| * | Dealertrack Technologies Inc. | 30,845 | 1,936 |
| Blackbaud Inc. | 32,158 | 1,837 | |
| * | ViaSat Inc. | 30,111 | 1,770 |
| * | Take-Two Interactive | ||
| Software Inc. | 57,997 | 1,689 | |
| SYNNEX Corp. | 19,274 | 1,526 | |
| Heartland Payment | |||
| Systems Inc. | 25,110 | 1,496 | |
| * | Electronics For Imaging Inc. | 32,165 | 1,408 |
| Littelfuse Inc. | 15,485 | 1,390 | |
| * | Cirrus Logic Inc. | 43,477 | 1,311 |
| * | CACI International Inc. | ||
| Class A | 16,583 | 1,300 | |
| * | MicroStrategy Inc. Class A | 6,215 | 1,235 |
| MKS Instruments Inc. | 36,584 | 1,233 | |
| Monolithic Power | |||
| Systems Inc. | 25,201 | 1,212 | |
| * | comScore Inc. | 23,151 | 1,209 |
| * | Anixter International Inc. | 18,755 | 1,194 |
| * | Sanmina Corp. | 56,774 | 1,092 |
| * | Cardtronics Inc. | 30,798 | 1,062 |
| * | LogMeIn Inc. | 16,918 | 1,055 |
| Tessera Technologies Inc. | 32,077 | 1,050 | |
| * | Synchronoss | ||
| Technologies Inc. | 25,214 | 1,018 | |
| * | Virtusa Corp. | 18,539 | 981 |
| * | Coherent Inc. | 16,386 | 955 |
| * | Progress Software Corp. | 34,788 | 942 |
| * | OSI Systems Inc. | 12,796 | 935 |
| * | Plexus Corp. | 23,079 | 879 |
| * | Viavi Solutions Inc. | 159,149 | 855 |
| * | Stamps.com Inc. | 10,360 | 853 |
| * | Itron Inc. | 26,434 | 793 |
| Power Integrations Inc. | 20,197 | 793 | |
| * | ExlService Holdings Inc. | 21,896 | 792 |
| NIC Inc. | 41,794 | 787 | |
| * | Semtech Corp. | 45,601 | 773 |
| * | Benchmark Electronics Inc. | 36,015 | 770 |
| * | ScanSource Inc. | 19,640 | 750 |
| * | Cabot Microelectronics Corp. | 16,969 | 736 |
| * | Rogers Corp. | 12,785 | 712 |
| Methode Electronics Inc. | 26,312 | 699 | |
| CSG Systems | |||
| International Inc. | 22,470 | 695 | |
| * | Bottomline Technologies | ||
| de Inc. | 25,878 | 692 | |
| * | Super Micro Computer Inc. | 24,634 | 674 |
| * | Insight Enterprises Inc. | 26,596 | 673 |
| * | Sykes Enterprises Inc. | 26,730 | 672 |
| * | NETGEAR Inc. | 22,114 | 672 |
| * | Advanced Energy | ||
| Industries Inc. | 26,374 | 640 | |
| * | Veeco Instruments Inc. | 27,695 | 639 |
| * | Lumentum Holdings Inc. | 32,316 | 638 |
| * | Ixia | 40,854 | 632 |
| * | QLogic Corp. | 59,805 | 618 |
| MTS Systems Corp. | 10,219 | 608 | |
| * | II-VI Inc. | 35,583 | 601 |
| Monotype Imaging | |||
| Holdings Inc. | 27,452 | 581 | |
| Badger Meter Inc. | 9,917 | 578 | |
| * | Kulicke & Soffa | ||
| Industries Inc. | 52,583 | 555 | |
| ADTRAN Inc. | 34,346 | 550 | |
| * | Constant Contact Inc. | 22,068 | 546 |
| ^ | Ebix Inc. | 19,162 | 544 |
| * | Diodes Inc. | 25,333 | 499 |
| * | Rofin-Sinar Technologies Inc. | 19,265 | 491 |
| Brooks Automation Inc. | 46,163 | 479 | |
| * | FARO Technologies Inc. | 11,883 | 462 |
| * | Monster Worldwide Inc. | 62,542 | 455 |
| ManTech International Corp. | |||
| Class A | 16,196 | 444 | |
| CTS Corp. | 22,722 | 428 | |
| * | Newport Corp. | 27,188 | 416 |
| * | CalAmp Corp. | 25,026 | 416 |
| * | Interactive Intelligence | ||
| Group Inc. | 11,783 | 412 | |
| * | Fabrinet | 20,446 | 406 |
| * | Perficient Inc. | 24,256 | 402 |
| * | Blucora Inc. | 28,267 | 395 |
| * | Mercury Systems Inc. | 22,387 | 355 |
| * | Harmonic Inc. | 60,937 | 352 |
| *,^ | VASCO Data Security | ||
| International Inc. | 20,338 | 340 | |
| * | LivePerson Inc. | 35,522 | 325 |
| * | Ultratech Inc. | 18,896 | 325 |
| TeleTech Holdings Inc. | 12,003 | 325 | |
| * | DTS Inc. | 12,104 | 321 |
| * | ePlus Inc. | 4,067 | 308 |
| * | TTM Technologies Inc. | 43,508 | 297 |
| Comtech | |||
| Telecommunications Corp. | 11,042 | 295 | |
| * | Rudolph Technologies Inc. | 21,922 | 280 |
| Epiq Systems Inc. | 21,964 | 279 | |
| * | CEVA Inc. | 14,106 | 271 |
| Park Electrochemical Corp. | 13,960 | 246 | |
| * | XO Group Inc. | 16,427 | 241 |
| Daktronics Inc. | 27,132 | 236 | |
| Checkpoint Systems Inc. | 28,916 | 234 | |
| Forrester Research Inc. | 7,360 | 233 | |
| * | Nanometrics Inc. | 16,545 | 230 |
18
S&P Small-Cap 600 Index Fund
| Market | |||
| Value• | |||
| Shares | ($000) | ||
| * | DHI Group Inc. | 26,360 | 206 |
| * | Exar Corp. | 32,886 | 194 |
| * | Tangoe Inc. | 25,209 | 189 |
| * | Digi International Inc. | 17,079 | 175 |
| Cohu Inc. | 17,868 | 173 | |
| Pericom Semiconductor | |||
| Corp. | 13,829 | 168 | |
| * | Ciber Inc. | 48,117 | 165 |
| Black Box Corp. | 10,439 | 161 | |
| * | DSP Group Inc. | 15,300 | 134 |
| * | QuinStreet Inc. | 23,591 | 130 |
| Bel Fuse Inc. Class B | 7,268 | 128 | |
| * | Kopin Corp. | 41,236 | 128 |
| * | Liquidity Services Inc. | 16,707 | 125 |
| * | Agilysys Inc. | 10,275 | 105 |
| Electro Scientific | |||
| Industries Inc. | 18,181 | 84 | |
| 70,556 | |||
| Materials (5.0%) | |||
| KapStone Paper and | |||
| Packaging Corp. | 58,093 | 1,266 | |
| HB Fuller Co. | 34,633 | 1,255 | |
| Balchem Corp. | 21,313 | 1,247 | |
| * | Headwaters Inc. | 50,687 | 1,023 |
| Kaiser Aluminum Corp. | 11,964 | 1,000 | |
| * | Boise Cascade Co. | 27,161 | 881 |
| Innospec Inc. | 16,640 | 817 | |
| * | Stillwater Mining Co. | 82,790 | 791 |
| Schweitzer-Mauduit | |||
| International Inc. | 20,920 | 739 | |
| * | Clearwater Paper Corp. | 13,081 | 733 |
| Quaker Chemical Corp. | 9,156 | 727 | |
| OM Group Inc. | 20,819 | 697 | |
| A Schulman Inc. | 20,177 | 693 | |
| * | Flotek Industries Inc. | 34,176 | 669 |
| Neenah Paper Inc. | 11,475 | 662 | |
| Innophos Holdings Inc. | 13,519 | 650 | |
| Globe Specialty Metals Inc. | 43,990 | 604 | |
| Stepan Co. | 13,135 | 592 | |
| Calgon Carbon Corp. | 36,095 | 587 | |
| PH Glatfelter Co. | 29,564 | 534 | |
| SunCoke Energy Inc. | 44,616 | 512 | |
| Deltic Timber Corp. | 7,600 | 472 | |
| TimkenSteel Corp. | 25,629 | 458 | |
| * | Kraton Performance | ||
| Polymers Inc. | 21,610 | 456 | |
| Materion Corp. | 13,797 | 427 | |
| * | AK Steel Holding Corp. | 121,790 | 376 |
| Haynes International Inc. | 8,598 | 329 | |
| * | LSB Industries Inc. | 13,508 | 323 |
| * | Intrepid Potash Inc. | 38,810 | 307 |
| Koppers Holdings Inc. | 14,123 | 294 | |
| Wausau Paper Corp. | 34,566 | 269 | |
| Tredegar Corp. | 17,663 | 256 | |
| Hawkins Inc. | 6,438 | 245 | |
| Myers Industries Inc. | 16,900 | 241 | |
| American Vanguard Corp. | 17,249 | 230 | |
| Rayonier Advanced | |||
| Materials Inc. | 29,424 | 201 | |
| * | Century Aluminum Co. | 34,476 | 193 |
| FutureFuel Corp. | 15,155 | 153 | |
| Olympic Steel Inc. | 6,203 | 80 | |
| 21,989 | |||
| Other (0.0%)2 | |||
| * | Gerber Scientific Inc. CVR | 4,758 | — |
| Telecommunication Services (0.7%) | |||
| Consolidated Communications | |||
| Holdings Inc. | 32,203 | 628 | |
| Atlantic Tele-Network Inc. | 6,918 | 494 | |
| * | Cincinnati Bell Inc. | 143,822 | 493 |
| * | 8x8 Inc. | 60,351 | 467 |
| * | Iridium Communications Inc. | 54,864 | 409 |
| * | General Communication Inc. | ||
| Class A | 20,562 | 347 | |
| Spok Holdings Inc. | 15,031 | 248 | |
| Lumos Networks Corp. | 14,234 | 167 | |
| 3,253 | |||
| Utilities (3.9%) | |||
| Piedmont Natural Gas | |||
| Co. Inc. | 54,267 | 2,094 | |
| UIL Holdings Corp. | 39,055 | 1,778 | |
| Southwest Gas Corp. | 32,138 | 1,771 | |
| NorthWestern Corp. | 32,272 | 1,667 | |
| New Jersey Resources Corp. | 58,650 | 1,658 | |
| Laclede Group Inc. | 29,720 | 1,573 | |
| ALLETE Inc. | 30,771 | 1,470 | |
| Avista Corp. | 39,288 | 1,233 | |
| South Jersey Industries Inc. | 46,723 | 1,126 | |
| El Paso Electric Co. | 27,866 | 986 | |
| American States Water Co. | 25,989 | 981 | |
| Northwest Natural Gas Co. | 18,770 | 826 | |
| 17,163 | |||
| Total Common Stocks | |||
| (Cost $443,445) | 441,507 | ||
19
S&P Small-Cap 600 Index Fund
| Market | ||
| Value• | ||
| Shares | ($000) | |
| Temporary Cash Investments (0.7%)1 | ||
| Money Market Fund (0.6%) | ||
| 3,4 Vanguard Market Liquidity | ||
| Fund, 0.168% | 2,758,474 | 2,758 |
| Face | ||
| Amount | ||
| ($000) | ||
| U.S. Government and Agency Obligations (0.1%) | ||
| 5,6 Federal Home Loan | ||
| Bank Discount Notes, | ||
| 0.093%, 10/2/15 | 200 | 200 |
| Total Temporary Cash Investments | ||
| (Cost $2,959) | 2,958 | |
| Total Investments (100.2%) | ||
| (Cost $446,404) | 444,465 | |
| Amount | ||
| ($000) | ||
| Other Assets and Liabilities (-0.2%) | ||
| Other Assets | ||
| Investment in Vanguard | 42 | |
| Receivables for Investment Securities Sold | 138 | |
| Receivables for Accrued Income | 355 | |
| Receivables for Capital Shares Issued | 17 | |
| Other Assets | 2,503 | |
| Total Other Assets | 3,055 | |
| Liabilities | ||
| Payables for Investment Securities Purchased (135) | ||
| Collateral for Securities on Loan | (585) | |
| Payables to Investment Advisor | — | |
| Payables for Capital Shares Redeemed | (407) | |
| Payables for Distributions | — | |
| Payables to Vanguard | (97) | |
| Other Liabilities | (2,608) | |
| Total Liabilities | (3,832) | |
| Net Assets (100%) | 443,688 | |
| At August 31, 2015, net assets consisted of: | |
| Amount | |
| ($000) | |
| Paid-in Capital | 450,388 |
| Undistributed Net Investment Income | 3,408 |
| Accumulated Net Realized Losses | (8,099) |
| Unrealized Appreciation (Depreciation) | |
| Investment Securities | (1,939) |
| Futures Contracts | (70) |
| Net Assets | 443,688 |
| ETF Shares—Net Assets | |
| Applicable to 2,050,000 outstanding | |
| $.001 par value shares of beneficial | |
| interest (unlimited authorization) | 205,864 |
| Net Asset Value Per Share— | |
| ETF Shares | $100.42 |
| Institutional Shares—Net Assets | |
| Applicable to 1,178,349 outstanding | |
| $.001 par value shares of beneficial | |
| interest (unlimited authorization) | 237,824 |
| Net Asset Value Per Share— | |
| Institutional Shares | $201.83 |
• See Note A in Notes to Financial Statements.
* Non-income-producing security.
^ Includes partial security positions on loan to broker-dealers. The total value of securities on loan is $553,000.
1 The fund invests a portion of its cash reserves in equity markets through the use of index futures contracts. After giving effect to futures
investments, the fund’s effective common stock and temporary cash investment positions represent 100.1% and 0.1%, respectively, of
net assets.
2 “Other” represents securities that are not classified by the fund’s benchmark index.
3 Includes $585,000 of collateral received for securities on loan.
4 Affiliated money market fund available only to Vanguard funds and certain trusts and accounts managed by Vanguard. Rate shown is the
7-day yield.
5 The issuer operates under a congressional charter; its securities are generally neither guaranteed by the U.S. Treasury nor backed by the
full faith and credit of the U.S. government.
6 Securities with a value of $200,000 have been segregated as initial margin for open futures contracts.
REIT—Real Estate Investment Trust.
See accompanying Notes, which are an integral part of the Financial Statements.
20
S&P Small-Cap 600 Index Fund
Statement of Operations
| Year Ended | |
| August 31, 2015 | |
| ($000) | |
| Investment Income | |
| Income | |
| Dividends | 5,637 |
| Interest1 | 2 |
| Securities Lending | 69 |
| Total Income | 5,708 |
| Expenses | |
| The Vanguard Group—Note B | |
| Investment Advisory Services | 70 |
| Management and Administrative—ETF Shares | 165 |
| Management and Administrative—Institutional Shares | 46 |
| Marketing and Distribution—ETF Shares | 27 |
| Marketing and Distribution—Institutional Shares | 29 |
| Custodian Fees | 82 |
| Auditing Fees | 23 |
| Shareholders’ Reports—ETF Shares | 9 |
| Shareholders’ Reports—Institutional Shares | 3 |
| Total Expenses | 454 |
| Net Investment Income | 5,254 |
| Realized Net Gain (Loss) | |
| Investment Securities Sold | 50,546 |
| Futures Contracts | 143 |
| Realized Net Gain (Loss) | 50,689 |
| Change in Unrealized Appreciation (Depreciation) | |
| Investment Securities | (52,820) |
| Futures Contracts | (81) |
| Change in Unrealized Appreciation (Depreciation) | (52,901) |
| Net Increase (Decrease) in Net Assets Resulting from Operations | 3,042 |
| 1 Interest income from an affiliated company of the fund was $2,000. | |
See accompanying Notes, which are an integral part of the Financial Statements.
21
S&P Small-Cap 600 Index Fund
Statement of Changes in Net Assets
| Year Ended August 31, | ||
| 2015 | 2014 | |
| ($000) | ($000) | |
| Increase (Decrease) in Net Assets | ||
| Operations | ||
| Net Investment Income | 5,254 | 3,534 |
| Realized Net Gain (Loss) | 50,689 | 32,640 |
| Change in Unrealized Appreciation (Depreciation) | (52,901) | 10,683 |
| Net Increase (Decrease) in Net Assets Resulting from Operations | 3,042 | 46,857 |
| Distributions | ||
| Net Investment Income | ||
| ETF Shares | (1,964) | (1,138) |
| Institutional Shares | (2,125) | (1,594) |
| Realized Capital Gain | ||
| ETF Shares | — | — |
| Institutional Shares | — | — |
| Total Distributions | (4,089) | (2,732) |
| Capital Share Transactions | ||
| ETF Shares | 41,744 | 62,188 |
| Institutional Shares | 59,230 | 960 |
| Net Increase (Decrease) from Capital Share Transactions | 100,974 | 63,148 |
| Total Increase (Decrease) | 99,927 | 107,273 |
| Net Assets | ||
| Beginning of Period | 343,761 | 236,488 |
| End of Period1 | 443,688 | 343,761 |
| 1 Net Assets—End of Period includes undistributed (overdistributed) net investment income of $3,408,000 and $2,243,000. | ||
See accompanying Notes, which are an integral part of the Financial Statements.
22
S&P Small-Cap 600 Index Fund
Financial Highlights
| ETF Shares | |||||
| Sept. 7, | |||||
| Year Ended August 31, | 20101 to | ||||
| For a Share Outstanding | Aug. 31, | ||||
| Throughout Each Period | 2015 | 2014 | 2013 | 2012 | 2011 |
| Net Asset Value, Beginning of Period | $99.81 | $84.98 | $68.12 | $58.84 | $49.81 |
| Investment Operations | |||||
| Net Investment Income | 1.204 | .976 | 1.024 | .745 | .605 |
| Net Realized and Unrealized Gain (Loss) | |||||
| on Investments | .497 | 14.697 | 16.854 | 9.012 | 8.785 |
| Total from Investment Operations | 1.701 | 15.673 | 17.878 | 9.757 | 9.390 |
| Distributions | |||||
| Dividends from Net Investment Income | (1.091) | (.843) | (1.018) | (. 477) | (.360) |
| Distributions from Realized Capital Gains | — | — | — | — | — |
| Total Distributions | (1.091) | (.843) | (1.018) | (. 477) | (.360) |
| Net Asset Value, End of Period | $100.42 | $99.81 | $84.98 | $68.12 | $58.84 |
| Total Return | 1.69% | 18.47% | 26.57% | 16.66% | 18.81% |
| Ratios/Supplemental Data | |||||
| Net Assets, End of Period (Millions) | $206 | $165 | $85 | $34 | $12 |
| Ratio of Total Expenses to Average Net Assets | 0.15% | 0.15% | 0.15% | 0.15% | 0.15%2 |
| Ratio of Net Investment Income to | |||||
| Average Net Assets | 1.27% | 1.10% | 1.48% | 1.28% | 0.96%2 |
| Portfolio Turnover Rate 3 | 11% | 16% | 12% | 12% | 42% |
1 Inception.
2 Annualized.
3 Excludes the value of portfolio securities received or delivered as a result of in-kind purchases or redemptions of the fund’s capital shares,
including ETF Creation Units.
See accompanying Notes, which are an integral part of the Financial Statements.
23
S&P Small-Cap 600 Index Fund
Financial Highlights
| Institutional Shares | |||||
| April 1, | |||||
| 20111 to | |||||
| For a Share Outstanding | Year Ended August 31, | Aug. 31, | |||
| Throughout Each Period | 2015 | 2014 | 2013 | 2012 | 2011 |
| Net Asset Value, Beginning of Period | $200.56 | $170.71 | $136.79 | $118.12 | $132.94 |
| Investment Operations | |||||
| Net Investment Income | 2.545 | 2.049 | 2.131 | 1.558 | .290 |
| Net Realized and Unrealized Gain (Loss) | |||||
| on Investments | 1.019 | 29.565 | 33.883 | 18.126 | (15.110) |
| Total from Investment Operations | 3.564 | 31.614 | 36.014 | 19.684 | (14.820) |
| Distributions | |||||
| Dividends from Net Investment Income | (2.294) | (1.764) | (2.094) | (1.014) | — |
| Distributions from Realized Capital Gains | — | — | — | — | — |
| Total Distributions | (2.294) | (1.764) | (2.094) | (1.014) | — |
| Net Asset Value, End of Period | $201.83 | $200.56 | $170.71 | $136.79 | $118.12 |
| Total Return | 1.77% | 18.57% | 26.65% | 16.75% | -11.15% |
| Ratios/Supplemental Data | |||||
| Net Assets, End of Period (Millions) | $238 | $179 | $152 | $101 | $73 |
| Ratio of Total Expenses to Average Net Assets | 0.08% | 0.08% | 0.08% | 0.08% | 0.08%2 |
| Ratio of Net Investment Income to | |||||
| Average Net Assets | 1.34% | 1.17% | 1.55% | 1.35% | 1.03%2 |
| Portfolio Turnover Rate 3 | 11% | 16% | 12% | 12% | 42% |
1 Inception.
2 Annualized.
3 Excludes the value of portfolio securities received or delivered as a result of in-kind purchases or redemptions of the fund’s capital shares,
including ETF Creation Units.
See accompanying Notes, which are an integral part of the Financial Statements.
24
S&P Small-Cap 600 Index Fund
Notes to Financial Statements
Vanguard S&P Small-Cap 600 Index Fund is registered under the Investment Company Act of 1940 as an open-end investment company, or mutual fund. The fund offers two classes of shares: ETF Shares and Institutional Shares. ETF Shares are listed for trading on NYSE Arca; they can be purchased and sold through a broker. Institutional Shares are designed for investors who meet certain administrative, service, and account-size criteria.
A. The following significant accounting policies conform to generally accepted accounting principles for U.S. investment companies. The fund consistently follows such policies in preparing its financial statements.
1. Security Valuation: Securities are valued as of the close of trading on the New York Stock Exchange (generally 4 p.m., Eastern time) on the valuation date. Equity securities are valued at the latest quoted sales prices or official closing prices taken from the primary market in which each security trades; such securities not traded on the valuation date are valued at the mean of the latest quoted bid and asked prices. Securities for which market quotations are not readily available, or whose values have been materially affected by events occurring before the fund’s pricing time but after the close of the securities’ primary markets, are valued by methods deemed by the board of trustees to represent fair value. Investments in Vanguard Market Liquidity Fund are valued at that fund’s net asset value. Temporary cash investments acquired over 60 days to maturity are valued using the latest bid prices or using valuations based on a matrix system (which considers such factors as security prices, yields, maturities, and ratings), both as furnished by independent pricing services. Other temporary cash investments are valued at amortized cost, which approximates market value.
2. Futures Contracts: The fund uses index futures contracts to a limited extent, with the objectives of maintaining full exposure to the stock market, enhancing returns, maintaining liquidity, and minimizing transaction costs. The fund may purchase futures contracts to immediately invest incoming cash in the market, or sell futures in response to cash outflows, thereby simulating a fully invested position in the underlying index while maintaining a cash balance for liquidity. The fund may seek to enhance returns by using futures contracts instead of the underlying securities when futures are believed to be priced more attractively than the underlying securities. The primary risks associated with the use of futures contracts are imperfect correlation between changes in market values of stocks held by the fund and the prices of futures contracts, and the possibility of an illiquid market. Counterparty risk involving futures is mitigated because a regulated clearinghouse is the counterparty instead of the clearing broker. To further mitigate counterparty risk, the fund trades futures contracts on an exchange, monitors the financial strength of its clearing brokers and clearinghouse, and has entered into clearing agreements with its clearing brokers. The clearinghouse imposes initial margin requirements to secure the fund’s performance and requires daily settlement of variation margin representing changes in the market value of each contract.
Futures contracts are valued at their quoted daily settlement prices. The aggregate settlement values of the contracts are not recorded in the Statement of Net Assets. Fluctuations in the value of the contracts are recorded in the Statement of Net Assets as an asset (liability) and in the Statement of Operations as unrealized appreciation (depreciation) until the contracts are closed, when they are recorded as realized futures gains (losses).
During the year ended August 31, 2015, the fund’s average investments in long and short futures contracts represented less than 1% and 0% of net assets, respectively, based on the average of aggregate settlement values at each quarter-end during the period.
25
S&P Small-Cap 600 Index Fund
3. Federal Income Taxes: The fund intends to continue to qualify as a regulated investment company and distribute all of its taxable income. Management has analyzed the fund’s tax positions taken for all open federal income tax years (August 31, 2012–2015), and has concluded that no provision for federal income tax is required in the fund’s financial statements.
4. Distributions: Distributions to shareholders are recorded on the ex-dividend date.
5. Securities Lending: To earn additional income, the fund lends its securities to qualified institutional borrowers. Security loans are required to be secured at all times by collateral in an amount at least equal to the market value of securities loaned. Daily market fluctuations could cause the value of loaned securities to be more or less than the value of the collateral received. When this occurs, the collateral is adjusted and settled on the next business day. The fund further mitigates its counterparty risk by entering into securities lending transactions only with a diverse group of prequalified counter-parties, monitoring their financial strength, and entering into master securities lending agreements with its counterparties. The master securities lending agreements provide that, in the event of a counterparty’s default (including bankruptcy), the fund may terminate any loans with that borrower, determine the net amount owed, and sell or retain the collateral up to the net amount owed to the fund; however, such actions may be subject to legal proceedings. While collateral mitigates counter-party risk, in the absence of a default the fund may experience delays and costs in recovering the securities loaned. The fund invests cash collateral received in Vanguard Market Liquidity Fund, and records a liability in the Statement of Net Assets for the return of the collateral, during the period the securities are on loan. Securities lending income represents fees charged to borrowers plus income earned on invested cash collateral, less expenses associated with the loan.
6. Credit Facility: The fund and certain other funds managed by The Vanguard Group (“Vanguard”) participate in a $3 billion committed credit facility provided by a syndicate of lenders pursuant to a credit agreement that may be renewed annually; each fund is individually liable for its borrowings, if any, under the credit facility. Borrowings may be utilized for temporary and emergency purposes, and are subject to the fund’s regulatory and contractual borrowing restrictions. The participating funds are charged administrative fees and an annual commitment fee of 0.06% of the undrawn amount of the facility; these fees are allocated to the funds based on a method approved by the fund’s board of trustees and included in Management and Administrative expenses on the fund’s Statement of Operations. Any borrowings under this facility bear interest at a rate equal to the higher of the federal funds rate or LIBOR reference rate plus an agreed-upon spread.
The fund had no borrowings outstanding at August 31, 2015, or at any time during the period then ended.
7. Other: Dividend income is recorded on the ex-dividend date. Interest income includes income distributions received from Vanguard Market Liquidity Fund and is accrued daily. Premiums and discounts on debt securities purchased are amortized and accreted, respectively, to interest income over the lives of the respective securities. Security transactions are accounted for on the date securities are bought or sold. Costs used to determine realized gains (losses) on the sale of investment securities are those of the specific securities sold.
Each class of shares has equal rights as to assets and earnings, except that each class separately bears certain class-specific expenses related to maintenance of shareholder accounts (included in Management and Administrative expenses) and shareholder reporting. Marketing and distribution expenses are allocated to each class of shares based on a method approved by the board of trustees. Income, other non-class-specific expenses, and gains and losses on investments are allocated to each class of shares based on its relative net assets.
26
S&P Small-Cap 600 Index Fund
B. In accordance with the terms of a Funds’ Service Agreement (the “FSA”) between Vanguard and the fund, Vanguard furnishes to the fund investment advisory, corporate management, administrative, marketing, and distribution services at Vanguard’s cost of operations (as defined by the FSA). These costs of operations are allocated to the fund based on methods and guidelines approved by the board of trustees. Vanguard does not require reimbursement in the current period for certain costs of operations (such as deferred compensation/benefits and risk/insurance costs); the fund’s liability for these costs of operations is included in Payables to Vanguard on the Statement of Net Assets.
Upon the request of Vanguard, the fund may invest up to 0.40% of its net assets as capital in Vanguard. At August 31, 2015, the fund had contributed to Vanguard capital in the amount of $42,000, representing 0.01% of the fund’s net assets and 0.02% of Vanguard’s capitalization. The fund’s trustees and officers are also directors and employees, respectively, of Vanguard.
C. Various inputs may be used to determine the value of the fund’s investments. These inputs are summarized in three broad levels for financial statement purposes. The inputs or methodologies used to value securities are not necessarily an indication of the risk associated with investing in those securities.
Level 1—Quoted prices in active markets for identical securities.
Level 2—Other significant observable inputs (including quoted prices for similar securities, interest rates, prepayment speeds, credit risk, etc.).
Level 3—Significant unobservable inputs (including the fund’s own assumptions used to determine the fair value of investments).
The following table summarizes the market value of the fund’s investments as of August 31, 2015, based on the inputs used to value them:
| Level 1 | Level 2 | Level 3 | |
| Investments | ($000) | ($000) | ($000) |
| Common Stocks | 441,507 | — | — |
| Temporary Cash Investments | 2,758 | 200 | — |
| Futures Contracts—Liabilities1 | (16) | — | — |
| Total | 444,249 | 200 | — |
| 1 Represents variation margin on the last day of the reporting period. | |||
D. At August 31, 2015, the aggregate settlement value of open futures contracts and the related unrealized appreciation (depreciation) were:
| ($000) | ||||
| Aggregate | ||||
| Number of | Settlement | Unrealized | ||
| Long (Short) | Value | Appreciation | ||
| Futures Contracts | Expiration | Contracts | Long (Short) | (Depreciation) |
| E-mini Russell 2000 Index | September 2015 | 24 | 2,778 | (70) |
Unrealized appreciation (depreciation) on open futures contracts is required to be treated as realized gain (loss) for tax purposes.
27
S&P Small-Cap 600 Index Fund
E. Distributions are determined on a tax basis and may differ from net investment income and realized capital gains for financial reporting purposes. Differences may be permanent or temporary. Permanent differences are reclassified among capital accounts in the financial statements to reflect their tax character. Temporary differences arise when certain items of income, expense, gain, or loss are recognized in different periods for financial statement and tax purposes. These differences will reverse at some time in the future. Differences in classification may also result from the treatment of short-term gains as ordinary income for tax purposes.
During the year ended August 31, 2015, the fund realized $55,665,000 of net capital gains resulting from in-kind redemptions—in which shareholders exchanged fund shares for securities held by the fund rather than for cash. Because such gains are not taxable to the fund, and are not distributed to shareholders, they have been reclassified from accumulated net realized losses to paid-in capital.
For tax purposes, at August 31, 2015, the fund had $3,505,000 of ordinary income available for distribution. The fund had available capital losses totaling $7,914,000 that may be carried forward indefinitely to offset future net capital gains.
At August 31, 2015, the cost of investment securities for tax purposes was $446,671,000. Net unrealized depreciation of investment securities for tax purposes was $2,206,000, consisting of unrealized gains of $39,490,000 on securities that had risen in value since their purchase and $41,696,000 in unrealized losses on securities that had fallen in value since their purchase.
F. During the year ended August 31, 2015, the fund purchased $321,821,000 of investment securities and sold $220,869,000 of investment securities, other than temporary cash investments. Purchases and sales include $194,493,000 and $176,737,000, respectively, in connection with in-kind purchases and redemptions of the fund’s capital shares.
G. Capital share transactions for each class of shares were:
| Year Ended August 31, | ||||
| 2015 | 2014 | |||
| Amount | Shares | Amount | Shares | |
| ($000) | (000) | ($000) | (000) | |
| ETF Shares | ||||
| Issued | 286,089 | 2,750 | 198,190 | 2,050 |
| Issued in Lieu of Cash Distributions | — | — | — | — |
| Redeemed | (244,345) | (2,350) | (136,002) | (1,400) |
| Net Increase (Decrease)—ETF Shares | 41,744 | 400 | 62,188 | 650 |
| Institutional Shares | ||||
| Issued | 95,360 | 461 | 32,633 | 170 |
| Issued in Lieu of Cash Distributions | 2,125 | 10 | 1,594 | 8 |
| Redeemed | (38,255) | (186) | (33,267) | (173) |
| Net Increase (Decrease)—Institutional Shares | 59,230 | 285 | 960 | 5 |
H. Management has determined that no material events or transactions occurred subsequent to August 31, 2015, that would require recognition or disclosure in these financial statements.
28
S&P Small-Cap 600 Value Index Fund
Fund Profile
As of August 31, 2015
| Share-Class Characteristics | ||
| ETF | Institutional | |
| Shares | Shares | |
| Ticker Symbol | VIOV | VSMVX |
| Expense Ratio1 | 0.20% | 0.08% |
| 30-Day SEC Yield | 1.42% | 1.54% |
| Portfolio Characteristics | |||
| DJ | |||
| U.S. | |||
| S&P | Total | ||
| SmallCap | Market | ||
| 600 Value | FA | ||
| Fund | Index | Index | |
| Number of Stocks | 463 | 462 | 3,828 |
| Median Market Cap | $1.2B | $1.2B | $47.2B |
| Price/Earnings Ratio | 24.4x | 24.4x | 20.8x |
| Price/Book Ratio | 1.6x | 1.6x | 2.6x |
| Return on Equity | 9.5% | 9.5% | 17.1% |
| Earnings Growth | |||
| Rate | 7.0% | 7.0% | 10.2% |
| Dividend Yield | 1.6% | 1.6% | 2.1% |
| Foreign Holdings | 0.0% | 0.0% | 0.0% |
| Turnover Rate | 43% | — | — |
| Short-Term Reserves | 0.0% | — | — |
| Volatility Measures | ||
| S&P | DJ | |
| SmallCap | U.S. Total | |
| 600 Value | Market | |
| Index | FA Index | |
| R-Squared | 1.00 | 0.72 |
| Beta | 1.00 | 1.10 |
| These measures show the degree and timing of the fund’s | ||
| fluctuations compared with the indexes over 36 months. | ||
| Ten Largest Holdings (% of total net assets) | ||
| EMCOR Group Inc. | Construction & | |
| Engineering | 0.9% | |
| ProAssurance Corp. | Property & Casualty | |
| Insurance | 0.8 | |
| UIL Holdings Corp. | Electric Utilities | 0.8 |
| Men's Wearhouse Inc. | Apparel Retail | 0.8 |
| Southwest Gas Corp. | Gas Utilities | 0.8 |
| Wintrust Financial Corp. | Regional Banks | 0.7 |
| EnerSys | Electrical | |
| Components & | ||
| Equipment | 0.7 | |
| Laclede Group Inc. | Gas Utilities | 0.7 |
| Interactive Brokers | Investment Banking | |
| Group Inc. | & Brokerage | 0.7 |
| PDC Energy Inc. | Oil & Gas Exploration | |
| & Production | 0.7 | |
| Top Ten | 7.6% | |
| The holdings listed exclude any temporary cash investments and equity index products. | ||
Investment Focus
![]()
1 The expense ratios shown are from the prospectus dated December 19, 2014, and represent estimated costs for the current fiscal year. For the
fiscal year ended August 31, 2015, the expense ratios were 0.20% for ETF Shares and 0.08% for Institutional Shares.
29
S&P Small-Cap 600 Value Index Fund
| Sector Diversification (% of equity exposure) | |||
| DJ | |||
| U.S. | |||
| S&P | Total | ||
| SmallCap | Market | ||
| 600 Value | FA | ||
| Fund | Index | Index | |
| Consumer Discretionary 12.7% | 12.7% | 13.5% | |
| Consumer Staples | 2.8 | 2.7 | 8.4 |
| Energy | 4.6 | 4.6 | 6.6 |
| Financials | 22.9 | 22.9 | 18.2 |
| Health Care | 9.2 | 9.2 | 15.0 |
| Industrials | 19.3 | 19.4 | 10.7 |
| Information Technology 15.3 | 15.3 | 19.1 | |
| Materials | 6.1 | 6.2 | 3.3 |
| Telecommunication | |||
| Services | 0.8 | 0.7 | 2.2 |
| Utilities | 6.3 | 6.3 | 3.0 |
30
S&P Small-Cap 600 Value Index Fund
Performance Summary
All of the returns in this report represent past performance, which is not a guarantee of future results that may be achieved by the fund. (Current performance may be lower or higher than the performance data cited. For performance data current to the most recent month-end, visit our website at vanguard.com/performance.) Note, too, that both investment returns and principal value can fluctuate widely, so an investor’s shares, when sold, could be worth more or less than their original cost. The returns shown do not reflect taxes that a shareholder would pay on fund distributions or on the sale of fund shares.
Cumulative Performance: September 7, 2010, Through August 31, 2015
Initial Investment of $10,000

| Average Annual Total Returns | ||||
| Periods Ended August 31, 2015 | ||||
| Since | Final Value | |||
| One | Inception | of a $10,000 | ||
| Year | (9/7/2010) | Investment | ||
| S&P Small-Cap 600 Value Index | ||||
| Fund*ETF Shares Net Asset Value | -3.09% | 14.96% | $20,022 | |
| S&P Small-Cap 600 Value Index | ||||
| Fund*ETF Shares Market Price | -3.05 | 14.95 | 20,015 | |
| •••••••• | S&P SmallCap 600 Value Index | -2.90 | 15.18 | 20,219 |
| – – – – | Small-Cap Value Funds Average | -4.82 | 12.72 | 18,159 |
| Dow Jones U.S. Total Stock Market | ||||
| Float Adjusted Index | 0.29 | 15.13 | 20,172 | |
Small-Cap Value Funds Average: Derived from data provided by Lipper, a Thomson Reuters Company.
"Since Inception" performance is calculated from the ETF Shares’ inception date for both the fund and its comparative standards.
| Since | Final Value | |
| Inception | of a $5,000,000 | |
| (11/19/2014) | Investment | |
| S&P Small-Cap 600 Value Index Fund | ||
| Institutional Shares | -2.79% | $4,860,513 |
| S&P SmallCap 600 Value Index | -2.74 | 4,862,838 |
| Dow Jones U.S. Total Stock Market Float | ||
| Adjusted Index | -1.61 | 4,919,267 |
| "Since Inception" performance is calculated from the Institutional Shares’ inception date for both the fund and its comparative standards. | ||
See Financial Highlights for dividend and capital gains information.
31
S&P Small-Cap 600 Value Index Fund
Cumulative Returns of ETF Shares: September 7, 2010, Through August 31, 2015
| Since | ||
| One | Inception | |
| Year | (9/7/2010) | |
| S&P Small-Cap 600 Value Index Fund ETF Shares | ||
| Market Price | -3.05% | 100.15% |
| S&P Small-Cap 600 Value Index Fund ETF Shares | ||
| Net Asset Value | -3.09 | 100.22 |
| S&P SmallCap 600 Value Index | -2.90 | 102.19 |
| "Since Inception" performance is calculated from the ETF Shares’ inception date for both the fund and its comparative standards. | ||
Fiscal-Year Total Returns (%): September 7, 2010, Through August 31, 2015
Average Annual Total Returns: Periods Ended June 30, 2015
This table presents returns through the latest calendar quarter—rather than through the end of the fiscal period.
Securities and Exchange Commission rules require that we provide this information.
| Inception | One | Since | |
| Date | Year | Inception | |
| ETF Shares | 9/7/2010 | ||
| Market Price | 3.60% | 17.35% | |
| Net Asset Value | 3.53 | 17.33 | |
| Institutional Shares | 11/19/2014 | — | 4.70 |
32
S&P Small-Cap 600 Value Index Fund
Financial Statements
Statement of Net Assets
As of August 31, 2015
The fund reports a complete list of its holdings in regulatory filings four times in each fiscal year, at the quarter-ends. For the second and fourth fiscal quarters, the lists appear in the fund’s semiannual and annual reports to shareholders. For the first and third fiscal quarters, the fund files the lists with the Securities and Exchange Commission on Form N-Q. Shareholders can look up the fund’s Forms N-Q on the SEC’s website at sec.gov. Forms N-Q may also be reviewed and copied at the SEC’s Public Reference Room (see the back cover of this report for further information).
| Market | |||
| Value• | |||
| Shares | ($000) | ||
| Common Stocks (99.8%)1 | |||
| Consumer Discretionary (12.7%) | |||
| Men’s Wearhouse Inc. | 15,577 | 879 | |
| * | Express Inc. | 28,675 | 585 |
| * | Genesco Inc. | 8,155 | 488 |
| La-Z-Boy Inc. | 17,370 | 480 | |
| * | Boyd Gaming Corp. | 26,965 | 434 |
| Children’s Place Inc. | 6,996 | 419 | |
| Lithia Motors Inc. Class A | 3,732 | 398 | |
| Scholastic Corp. | 9,119 | 394 | |
| * | Crocs Inc. | 26,123 | 385 |
| * | Red Robin Gourmet | ||
| Burgers Inc. | 4,792 | 378 | |
| Barnes & Noble Inc. | 20,943 | 327 | |
| Group 1 Automotive Inc. | 3,697 | 323 | |
| * | Gannett Co. Inc. | 24,249 | 318 |
| * | Steven Madden Ltd. | 7,201 | 294 |
| Caleres Inc. | 8,323 | 277 | |
| Monro Muffler Brake Inc. | 4,212 | 267 | |
| Ethan Allen Interiors Inc. | 8,841 | 263 | |
| DineEquity Inc. | 2,643 | 252 | |
| Standard Motor Products Inc. | 7,098 | 251 | |
| Sonic Automotive Inc. | |||
| Class A | 11,220 | 241 | |
| Callaway Golf Co. | 26,489 | 234 | |
| * | Pep Boys-Manny Moe | ||
| & Jack | 18,250 | 221 | |
| * | TopBuild Corp. | 6,815 | 216 |
| Oxford Industries Inc. | 2,474 | 208 | |
| * | M/I Homes Inc. | 8,321 | 208 |
| Finish Line Inc. Class A | 7,813 | 206 | |
| Buckle Inc. | 4,809 | 203 | |
| Bob Evans Farms Inc. | 4,468 | 202 | |
| * | Vitamin Shoppe Inc. | 5,551 | 199 |
| Sturm Ruger & Co. Inc. | 3,142 | 198 | |
| Drew Industries Inc. | 3,357 | 186 | |
| * | Hibbett Sports Inc. | 4,594 | 181 |
| * | Dorman Products Inc. | 3,543 | 178 |
| Movado Group Inc. | 5,799 | 164 | |
| * | Regis Corp. | 15,002 | 163 |
| Haverty Furniture Cos. Inc. | 6,994 | 162 | |
| Fred’s Inc. Class A | 11,850 | 155 | |
| Cato Corp. Class A | 4,290 | 151 | |
| Superior Industries | |||
| International Inc. | 7,863 | 150 | |
| Nutrisystem Inc. | 5,366 | 150 | |
| * | Unifi Inc. | 4,876 | 142 |
| * | iRobot Corp. | 4,737 | 139 |
| * | Ruby Tuesday Inc. | 21,047 | 138 |
| * | Barnes & Noble | ||
| Education Inc. | 10,446 | 135 | |
| * | Biglari Holdings Inc. | 357 | 133 |
| Interval Leisure Group Inc. | 6,314 | 127 | |
| Marcus Corp. | 6,223 | 121 | |
| Stage Stores Inc. | 10,821 | 116 | |
| Arctic Cat Inc. | 4,390 | 116 | |
| PetMed Express Inc. | 6,929 | 115 | |
| Kirkland’s Inc. | 5,045 | 113 | |
| Ruth’s Hospitality Group Inc. | 6,534 | 105 | |
| Stein Mart Inc. | 9,732 | 105 | |
| * | Perry Ellis International Inc. | 4,091 | 101 |
| * | Career Education Corp. | 20,559 | 76 |
| * | American Public | ||
| Education Inc. | 3,385 | 74 | |
| Capella Education Co. | 1,517 | 74 | |
| * | FTD Cos. Inc. | 2,431 | 73 |
| Big 5 Sporting Goods Corp. | 6,217 | 71 | |
| * | Blue Nile Inc. | 1,939 | 66 |
| * | Lumber Liquidators | ||
| Holdings Inc. | 4,239 | 64 | |
| * | MarineMax Inc. | 3,904 | 64 |
| Harte-Hanks Inc. | 14,558 | 56 | |
| * | VOXX International Corp. | ||
| Class A | 6,744 | 52 | |
| * | Sizmek Inc. | 7,340 | 48 |
| * | Monarch Casino & Resort Inc. | 1,892 | 33 |
| Universal Technical | |||
| Institute Inc. | 7,106 | 32 | |
| * | Christopher & Banks Corp. | 6,626 | 12 |
| 13,889 |
33
S&P Small-Cap 600 Value Index Fund
| Market | |||
| Value• | |||
| Shares | ($000) | ||
| Consumer Staples (2.8%) | |||
| * | Darling Ingredients Inc. | 56,066 | 720 |
| Universal Corp. | 7,666 | 377 | |
| SpartanNash Co. | 12,763 | 361 | |
| Andersons Inc. | 9,061 | 321 | |
| B&G Foods Inc. | 9,244 | 281 | |
| Sanderson Farms Inc. | 3,045 | 210 | |
| * | Central Garden & Pet Co. | ||
| Class A | 14,238 | 180 | |
| Inter Parfums Inc. | 5,781 | 149 | |
| WD-40 Co. | 1,718 | 144 | |
| * | Diamond Foods Inc. | 4,662 | 141 |
| * | Seneca Foods Corp. Class A | 2,222 | 65 |
| * | Medifast Inc. | 1,727 | 48 |
| 2,997 | |||
| Energy (4.6%) | |||
| * | PDC Energy Inc. | 13,590 | 764 |
| Exterran Holdings Inc. | 23,554 | 526 | |
| Bristow Group Inc. | 11,822 | 438 | |
| * | SEACOR Holdings Inc. | 5,883 | 380 |
| Tidewater Inc. | 15,959 | 286 | |
| Green Plains Inc. | 11,718 | 249 | |
| * | Unit Corp. | 15,906 | 242 |
| * | Hornbeck Offshore | ||
| Services Inc. | 10,783 | 213 | |
| * | Newpark Resources Inc. | 28,541 | 209 |
| * | TETRA Technologies Inc. | 27,024 | 208 |
| CARBO Ceramics Inc. | 6,710 | 184 | |
| * | Matrix Service Co. | 9,066 | 181 |
| * | Northern Oil and Gas Inc. | 19,708 | 119 |
| * | Stone Energy Corp. | 19,461 | 110 |
| Tesco Corp. | 12,066 | 102 | |
| * | Cloud Peak Energy Inc. | 21,021 | 101 |
| * | Bill Barrett Corp. | 17,027 | 93 |
| * | Geospace Technologies Corp. | 4,474 | 79 |
| Gulfmark Offshore Inc. | 8,724 | 79 | |
| * | Pioneer Energy Services | ||
| Corp. | 21,878 | 72 | |
| * | Basic Energy Services Inc. | 11,752 | 61 |
| * | Era Group Inc. | 3,527 | 60 |
| * | Rex Energy Corp. | 16,928 | 58 |
| Gulf Island Fabrication Inc. | 4,552 | 58 | |
| * | Contango Oil & Gas Co. | 5,412 | 50 |
| * | Bonanza Creek Energy Inc. | 5,404 | 41 |
| * | Penn Virginia Corp. | 23,433 | 29 |
| * | REX American Resources | ||
| Corp. | 528 | 28 | |
| * | ION Geophysical Corp. | 41,774 | 22 |
| * | Approach Resources Inc. | 6,523 | 17 |
| 5,059 | |||
| Financials (22.8%) | |||
| ProAssurance Corp. | 18,668 | 900 | |
| Wintrust Financial Corp. | 16,091 | 821 | |
| Interactive Brokers Group Inc. | 19,482 | 778 | |
| FNB Corp. | 59,122 | 743 | |
| UMB Financial Corp. | 13,849 | 694 | |
| Kite Realty Group Trust | 28,362 | 667 | |
| Selective Insurance | |||
| Group Inc. | 19,325 | 586 | |
| National Penn | |||
| Bancshares Inc. | 47,542 | 571 | |
| Sterling Bancorp | 40,483 | 568 | |
| Old National Bancorp | 36,125 | 499 | |
| Community Bank | |||
| System Inc. | 13,835 | 493 | |
| Astoria Financial Corp. | 30,200 | 488 | |
| United Bankshares Inc. | 13,008 | 487 | |
| EPR Properties | 9,120 | 464 | |
| Horace Mann Educators | |||
| Corp. | 13,961 | 464 | |
| Northwest Bancshares Inc. | 34,450 | 442 | |
| BBCN Bancorp Inc. | 26,995 | 393 | |
| NBT Bancorp Inc. | 14,948 | 387 | |
| First Financial Bancorp | 20,932 | 386 | |
| RLI Corp. | 7,310 | 381 | |
| Government Properties | |||
| Income Trust | 23,877 | 378 | |
| MarketAxess Holdings Inc. | 4,179 | 378 | |
| American Equity Investment | |||
| Life Holding Co. | 14,632 | 355 | |
| Provident Financial | |||
| Services Inc. | 18,369 | 348 | |
| Capstead Mortgage Corp. | 32,513 | 339 | |
| United Community Banks Inc. | 17,231 | 337 | |
| GEO Group Inc. | 11,141 | 335 | |
| Columbia Banking | |||
| System Inc. | 10,196 | 309 | |
| Evercore Partners Inc. | |||
| Class A | 5,809 | 304 | |
| Infinity Property & Casualty | |||
| Corp. | 3,890 | 301 | |
| First Financial Bankshares Inc. | 9,577 | 298 | |
| Stewart Information Services | |||
| Corp. | 7,487 | 290 | |
| S&T Bancorp Inc. | 9,682 | 290 | |
| CVB Financial Corp. | 17,718 | 288 | |
| * | Navigators Group Inc. | 3,712 | 282 |
| * | Texas Capital Bancshares Inc. | 4,970 | 268 |
| Hanmi Financial Corp. | 10,887 | 264 | |
| Acadia Realty Trust | 8,869 | 262 | |
| Cash America | |||
| International Inc. | 9,324 | 257 | |
| Wilshire Bancorp Inc. | 23,959 | 256 | |
| Independent Bank Corp. | 5,461 | 247 | |
| City Holding Co. | 5,162 | 246 | |
| Employers Holdings Inc. | 10,822 | 239 | |
| United Fire Group Inc. | 7,131 | 237 | |
| Westamerica Bancorporation | 5,202 | 235 | |
| Safety Insurance Group Inc. | 4,301 | 226 | |
| ^ | Financial Engines Inc. | 6,885 | 223 |
34
S&P Small-Cap 600 Value Index Fund
| Market | |||
| Value• | |||
| Shares | ($000) | ||
| Central Pacific Financial Corp. | 10,702 | 222 | |
| Lexington Realty Trust | 27,382 | 221 | |
| Tompkins Financial Corp. | 4,064 | 213 | |
| EastGroup Properties Inc. | 3,946 | 213 | |
| Parkway Properties Inc. | 12,616 | 200 | |
| LegacyTexas Financial | |||
| Group Inc. | 6,881 | 195 | |
| LTC Properties Inc. | 4,703 | 192 | |
| TrustCo Bank Corp. NY | 32,256 | 191 | |
| Investment Technology | |||
| Group Inc. | 11,615 | 191 | |
| PS Business Parks Inc. | 2,567 | 187 | |
| Pennsylvania REIT | 8,912 | 177 | |
| Dime Community | |||
| Bancshares Inc. | 10,283 | 175 | |
| Summit Hotel Properties Inc. | 14,089 | 171 | |
| Greenhill & Co. Inc. | 4,576 | 161 | |
| Franklin Street Properties | |||
| Corp. | 15,430 | 161 | |
| First Commonwealth | |||
| Financial Corp. | 17,501 | 155 | |
| Banner Corp. | 3,470 | 154 | |
| Talmer Bancorp Inc. Class A | 9,130 | 148 | |
| AMERISAFE Inc. | 3,156 | 148 | |
| * | Forestar Group Inc. | 11,400 | 147 |
| * | Encore Capital Group Inc. | 3,611 | 147 |
| * | First Cash Financial | ||
| Services Inc. | 3,536 | 146 | |
| * | Green Dot Corp. Class A | 8,214 | 145 |
| * | First BanCorp | 35,508 | 142 |
| Getty Realty Corp. | 8,841 | 139 | |
| OFG Bancorp | 15,167 | 131 | |
| Brookline Bancorp Inc. | 12,184 | 129 | |
| Cardinal Financial Corp. | 5,559 | 124 | |
| Northfield Bancorp Inc. | 7,628 | 114 | |
| Southside Bancshares Inc. | 4,045 | 105 | |
| * | Ezcorp Inc. Class A | 16,613 | 105 |
| * | Piper Jaffray Cos. | 2,416 | 101 |
| Virtus Investment Partners Inc. | 871 | 100 | |
| Simmons First National Corp. | |||
| Class A | 2,272 | 100 | |
| * | Walker & Dunlop Inc. | 3,899 | 95 |
| Oritani Financial Corp. | 5,982 | 90 | |
| Agree Realty Corp. | 2,935 | 84 | |
| Urstadt Biddle Properties Inc. | |||
| Class A | 3,812 | 68 | |
| * | First NBC Bank Holding Co. | 1,943 | 68 |
| Calamos Asset Management | |||
| Inc. Class A | 5,799 | 61 | |
| * | World Acceptance Corp. | 1,280 | 48 |
| * | eHealth Inc. | 3,169 | 47 |
| Cedar Realty Trust Inc. | 7,551 | 47 | |
| United Insurance Holdings | |||
| Corp. | 1,601 | 21 | |
| 24,983 |
| Health Care (9.2%) | |||
| Kindred Healthcare Inc. | 28,319 | 569 | |
| * | Medicines Co. | 13,035 | 534 |
| * | Magellan Health Inc. | 9,272 | 519 |
| * | Amsurg Corp. | 6,242 | 490 |
| * | IPC Healthcare Inc. | 5,900 | 468 |
| * | NuVasive Inc. | 6,727 | 355 |
| * | Medidata Solutions Inc. | 7,127 | 342 |
| Analogic Corp. | 4,221 | 340 | |
| * | Merit Medical Systems Inc. | 14,941 | 340 |
| * | PharMerica Corp. | 10,312 | 337 |
| * | Haemonetics Corp. | 8,944 | 323 |
| * | Integra LifeSciences Holdings | ||
| Corp. | 4,828 | 290 | |
| CONMED Corp. | 5,338 | 283 | |
| * | Masimo Corp. | 6,454 | 262 |
| * | Neogen Corp. | 4,651 | 240 |
| * | Amedisys Inc. | 5,826 | 225 |
| * | Cyberonics Inc. | 3,439 | 225 |
| * | Hanger Inc. | 11,993 | 215 |
| * | Momenta | ||
| Pharmaceuticals Inc. | 10,694 | 209 | |
| * | ICU Medical Inc. | 1,790 | 203 |
| * | Air Methods Corp. | 5,243 | 196 |
| * | Greatbatch Inc. | 3,377 | 192 |
| * | MedAssets Inc. | 9,013 | 190 |
| Select Medical Holdings Corp. 14,483 | 187 | ||
| * | LHC Group Inc. | 4,207 | 182 |
| Invacare Corp. | 9,991 | 176 | |
| * | Acorda Therapeutics Inc. | 5,370 | 172 |
| * | HMS Holdings Corp. | 14,407 | 151 |
| Meridian Bioscience Inc. | 7,779 | 149 | |
| * | Healthways Inc. | 12,107 | 148 |
| * | HealthEquity Inc. | 4,736 | 139 |
| * | AngioDynamics Inc. | 8,765 | 129 |
| Quality Systems Inc. | 9,098 | 124 | |
| * | Almost Family Inc. | 2,680 | 119 |
| Aceto Corp. | 4,915 | 110 | |
| * | Emergent BioSolutions Inc. | 3,258 | 108 |
| * | Luminex Corp. | 5,487 | 100 |
| * | Providence Service Corp. | 1,924 | 86 |
| * | Spectrum | ||
| Pharmaceuticals Inc. | 11,837 | 86 | |
| * | Cross Country Healthcare Inc. | 5,145 | 71 |
| Computer Programs & | |||
| Systems Inc. | 1,505 | 69 | |
| * | Inogen Inc. | 1,313 | 65 |
| * | Enanta Pharmaceuticals Inc. | 1,617 | 63 |
| Landauer Inc. | 1,565 | 60 | |
| * | CorVel Corp. | 1,522 | 46 |
| * | ANI Pharmaceuticals Inc. | 895 | 44 |
| * | Vascular Solutions Inc. | 1,230 | 43 |
| CryoLife Inc. | 4,252 | 42 | |
| * | SurModics Inc. | 1,816 | 41 |
| 10,057 | |||
35
S&P Small-Cap 600 Value Index Fund
| Market | |||
| Value• | |||
| Shares | ($000) | ||
| Industrials (19.3%) | |||
| EMCOR Group Inc. | 21,273 | 980 | |
| EnerSys | 15,087 | 807 | |
| Barnes Group Inc. | 16,732 | 646 | |
| Applied Industrial | |||
| Technologies Inc. | 13,627 | 577 | |
| ABM Industries Inc. | 17,804 | 570 | |
| Interface Inc. Class A | 22,422 | 543 | |
| Tetra Tech Inc. | 20,448 | 531 | |
| Brink’s Co. | 16,502 | 473 | |
| * | Moog Inc. Class A | 7,489 | 473 |
| Essendant Inc. | 13,012 | 449 | |
| * | Hub Group Inc. Class A | 11,596 | 437 |
| Actuant Corp. Class A | 20,211 | 433 | |
| Universal Forest Products Inc. | 6,782 | 407 | |
| * | Dycom Industries Inc. | 5,435 | 386 |
| Kaman Corp. | 9,239 | 359 | |
| Mueller Industries Inc. | 11,205 | 356 | |
| Brady Corp. Class A | 16,195 | 356 | |
| Comfort Systems USA Inc. | 12,688 | 352 | |
| * | Atlas Air Worldwide | ||
| Holdings Inc. | 8,485 | 350 | |
| Insperity Inc. | 7,702 | 342 | |
| * | TrueBlue Inc. | 14,232 | 342 |
| Harsco Corp. | 27,177 | 314 | |
| Cubic Corp. | 7,389 | 311 | |
| Korn/Ferry International | 9,066 | 309 | |
| UniFirst Corp. | 2,824 | 306 | |
| Briggs & Stratton Corp. | 15,134 | 302 | |
| Watts Water Technologies | |||
| Inc. Class A | 5,271 | 289 | |
| SkyWest Inc. | 17,536 | 279 | |
| AAR Corp. | 11,460 | 279 | |
| Simpson Manufacturing | |||
| Co. Inc. | 7,688 | 268 | |
| Matthews International Corp. | |||
| Class A | 5,237 | 266 | |
| * | Chart Industries Inc. | 10,364 | 265 |
| CIRCOR International Inc. | 5,819 | 263 | |
| * | Navigant Consulting Inc. | 16,369 | 258 |
| Mobile Mini Inc. | 7,530 | 256 | |
| Astec Industries Inc. | 6,395 | 253 | |
| * | WageWorks Inc. | 5,638 | 253 |
| General Cable Corp. | 16,589 | 241 | |
| * | Aerojet Rocketdyne | ||
| Holdings Inc. | 11,489 | 236 | |
| * | Aegion Corp. Class A | 12,717 | 234 |
| G&K Services Inc. Class A | 3,459 | 234 | |
| Griffon Corp. | 13,857 | 231 | |
| * | UTi Worldwide Inc. | 31,294 | 223 |
| * | Roadrunner Transportation | ||
| Systems Inc. | 10,226 | 222 | |
| * | Hawaiian Holdings Inc. | 9,655 | 219 |
| Franklin Electric Co. Inc. | 7,378 | 216 | |
| Quanex Building Products | |||
| Corp. | 11,494 | 206 | |
| Encore Wire Corp. | 6,334 | 206 | |
| Resources Connection Inc. | 12,750 | 200 | |
| EnPro Industries Inc. | 3,949 | 187 | |
| John Bean Technologies Corp. | 5,653 | 187 | |
| Viad Corp. | 6,805 | 186 | |
| ESCO Technologies Inc. | 5,046 | 182 | |
| Albany International Corp. | 5,570 | 178 | |
| Celadon Group Inc. | 9,221 | 176 | |
| Titan International Inc. | 18,242 | 167 | |
| * | Engility Holdings Inc. | 5,978 | 166 |
| Tennant Co. | 2,872 | 165 | |
| * | Aerovironment Inc. | 6,807 | 164 |
| * | Gibraltar Industries Inc. | 9,875 | 162 |
| * | MYR Group Inc. | 5,247 | 151 |
| Federal Signal Corp. | 10,389 | 147 | |
| Exponent Inc. | 3,436 | 147 | |
| Kelly Services Inc. Class A | 10,109 | 146 | |
| National Presto Industries Inc. | 1,668 | 137 | |
| * | DXP Enterprises Inc. | 4,293 | 128 |
| Standex International Corp. | 1,559 | 125 | |
| Lindsay Corp. | 1,520 | 116 | |
| Heidrick & Struggles | |||
| International Inc. | 5,586 | 109 | |
| * | Veritiv Corp. | 2,777 | 100 |
| Marten Transport Ltd. | 5,353 | 99 | |
| American Science & | |||
| Engineering Inc. | 2,432 | 96 | |
| * | American Woodmark Corp. | 1,411 | 94 |
| Powell Industries Inc. | 3,097 | 91 | |
| * | Echo Global Logistics Inc. | 2,700 | 63 |
| CDI Corp. | 4,947 | 51 | |
| * | Republic Airways | ||
| Holdings Inc. | 13,146 | 40 | |
| * | Orion Marine Group Inc. | 5,164 | 37 |
| * | Vicor Corp. | 3,004 | 29 |
| 21,134 | |||
| Information Technology (15.2%) | |||
| SYNNEX Corp. | 9,519 | 754 | |
| * | CACI International Inc. | ||
| Class A | 8,204 | 643 | |
| * | Anixter International Inc. | 9,282 | 591 |
| * | Sanmina Corp. | 28,038 | 539 |
| * | Coherent Inc. | 8,086 | 471 |
| * | Plexus Corp. | 11,400 | 434 |
| * | Viavi Solutions Inc. | 79,456 | 427 |
| * | Microsemi Corp. | 12,918 | 410 |
| * | Itron Inc. | 13,048 | 391 |
| * | Benchmark Electronics Inc. | 17,794 | 380 |
| * | ScanSource Inc. | 9,712 | 371 |
| CSG Systems | |||
| International Inc. | 11,113 | 344 | |
| MKS Instruments Inc. | 10,142 | 342 | |
| * | Insight Enterprises Inc. | 13,154 | 333 |
36
S&P Small-Cap 600 Value Index Fund
| Market | |||
| Value• | |||
| Shares | ($000) | ||
| * | Sykes Enterprises Inc. | 13,226 | 333 |
| * | NETGEAR Inc. | 10,907 | 331 |
| * | Advanced Energy | ||
| Industries Inc. | 13,043 | 317 | |
| * | QLogic Corp. | 29,611 | 306 |
| * | II-VI Inc. | 17,614 | 298 |
| * | Kulicke & Soffa | ||
| Industries Inc. | 26,068 | 275 | |
| ADTRAN Inc. | 16,942 | 271 | |
| * | Cirrus Logic Inc. | 8,822 | 266 |
| Littelfuse Inc. | 2,834 | 254 | |
| * | Rofin-Sinar Technologies Inc. | 9,556 | 243 |
| Brooks Automation Inc. | 22,899 | 238 | |
| Heartland Payment | |||
| Systems Inc. | 3,974 | 237 | |
| * | OSI Systems Inc. | 3,222 | 235 |
| * | Monster Worldwide Inc. | 30,881 | 225 |
| ManTech International Corp. | |||
| Class A | 8,022 | 220 | |
| CTS Corp. | 11,265 | 212 | |
| * | Progress Software Corp. | 7,726 | 209 |
| * | Newport Corp. | 13,394 | 205 |
| * | Ixia | 13,139 | 203 |
| * | Fabrinet | 10,098 | 201 |
| * | Blucora Inc. | 13,882 | 194 |
| * | Cabot Microelectronics Corp. | 4,446 | 193 |
| * | Semtech Corp. | 11,272 | 191 |
| * | Lumentum Holdings Inc. | 9,534 | 188 |
| Power Integrations Inc. | 4,793 | 188 | |
| * | Rogers Corp. | 3,286 | 183 |
| * | Bottomline Technologies | ||
| de Inc. | 6,784 | 181 | |
| * | Mercury Systems Inc. | 11,022 | 175 |
| * | Veeco Instruments Inc. | 7,535 | 174 |
| * | Harmonic Inc. | 30,037 | 173 |
| TeleTech Holdings Inc. | 5,917 | 160 | |
| * | ExlService Holdings Inc. | 4,218 | 153 |
| * | TTM Technologies Inc. | 21,362 | 146 |
| ^ | Ebix Inc. | 5,125 | 145 |
| NIC Inc. | 7,648 | 144 | |
| MTS Systems Corp. | 2,375 | 141 | |
| * | Rudolph Technologies Inc. | 10,827 | 138 |
| Daktronics Inc. | 13,317 | 116 | |
| Checkpoint Systems Inc. | 14,315 | 116 | |
| Monotype Imaging | |||
| Holdings Inc. | 5,292 | 112 | |
| * | Ultratech Inc. | 6,293 | 108 |
| * | Perficient Inc. | 6,029 | 100 |
| Badger Meter Inc. | 1,676 | 98 | |
| * | Interactive Intelligence | ||
| Group Inc. | 2,640 | 92 | |
| * | Diodes Inc. | 4,651 | 92 |
| * | FARO Technologies Inc. | 2,248 | 87 |
| * | Digi International Inc. | 8,482 | 87 |
| Cohu Inc. | 8,816 | 86 |
| * | Ciber Inc. | 24,144 | 83 |
| Black Box Corp. | 5,229 | 81 | |
| * | ePlus Inc. | 1,047 | 79 |
| Comtech | |||
| Telecommunications Corp. | 2,962 | 79 | |
| * | CalAmp Corp. | 4,315 | 72 |
| * | Nanometrics Inc. | 5,142 | 71 |
| * | CEVA Inc. | 3,647 | 70 |
| Park Electrochemical Corp. | 3,885 | 68 | |
| * | Liquidity Services Inc. | 8,374 | 63 |
| Epiq Systems Inc. | 4,583 | 58 | |
| * | LivePerson Inc. | 6,007 | 55 |
| * | Tangoe Inc. | 7,236 | 54 |
| * | Exar Corp. | 9,156 | 54 |
| * | XO Group Inc. | 3,646 | 53 |
| * | QuinStreet Inc. | 8,515 | 47 |
| Forrester Research Inc. | 1,326 | 42 | |
| * | Kopin Corp. | 12,491 | 39 |
| Pericom Semiconductor Corp. | 3,119 | 38 | |
| * | DSP Group Inc. | 3,466 | 30 |
| Electro Scientific | |||
| Industries Inc. | 6,175 | 29 | |
| * | Agilysys Inc. | 2,780 | 29 |
| 16,664 | |||
| Materials (6.1%) | |||
| Kaiser Aluminum Corp. | 5,900 | 493 | |
| Innospec Inc. | 8,220 | 404 | |
| Schweitzer-Mauduit | |||
| International Inc. | 10,341 | 365 | |
| HB Fuller Co. | 9,940 | 360 | |
| OM Group Inc. | 10,298 | 345 | |
| A Schulman Inc. | 9,992 | 343 | |
| Stepan Co. | 6,502 | 293 | |
| PH Glatfelter Co. | 14,655 | 265 | |
| SunCoke Energy Inc. | 22,135 | 254 | |
| TimkenSteel Corp. | 12,759 | 228 | |
| * | Kraton Performance | ||
| Polymers Inc. | 10,631 | 224 | |
| * | Boise Cascade Co. | 6,841 | 222 |
| * | Stillwater Mining Co. | 22,936 | 219 |
| Materion Corp. | 6,838 | 212 | |
| Quaker Chemical Corp. | 2,578 | 205 | |
| * | Clearwater Paper Corp. | 3,556 | 199 |
| * | AK Steel Holding Corp. | 60,329 | 186 |
| Innophos Holdings Inc. | 3,667 | 176 | |
| Haynes International Inc. | 4,260 | 163 | |
| Calgon Carbon Corp. | 9,832 | 160 | |
| * | LSB Industries Inc. | 6,632 | 159 |
| Globe Specialty Metals Inc. | 11,316 | 155 | |
| * | Intrepid Potash Inc. | 19,230 | 152 |
| Koppers Holdings Inc. | 6,963 | 145 | |
| Tredegar Corp. | 8,747 | 127 | |
| Hawkins Inc. | 3,201 | 122 | |
| Myers Industries Inc. | 8,286 | 118 | |
| American Vanguard Corp. | 8,621 | 115 | |
37
S&P Small-Cap 600 Value Index Fund
| Market | |||
| Value• | |||
| Shares | ($000) | ||
| Rayonier Advanced | |||
| Materials Inc. | 14,577 | 99 | |
| Wausau Paper Corp. | 11,245 | 88 | |
| FutureFuel Corp. | 7,588 | 77 | |
| Olympic Steel Inc. | 3,107 | 40 | |
| 6,713 | |||
| Other (0.0%)2 | |||
| * | Gerber Scientific Inc. CVR | 1,604 | — |
| Telecommunication Services (0.8%) | |||
| Atlantic Tele-Network Inc. | 3,429 | 245 | |
| * | Iridium Communications Inc. | 17,564 | 131 |
| * | 8x8 Inc. | 16,437 | 127 |
| Spok Holdings Inc. | 7,368 | 121 | |
| * | Cincinnati Bell Inc. | 29,970 | 103 |
| Lumos Networks Corp. | 7,046 | 83 | |
| 810 | |||
| Utilities (6.3%) | |||
| UIL Holdings Corp. | 19,317 | 879 | |
| Southwest Gas Corp. | 15,896 | 876 | |
| Laclede Group Inc. | 14,700 | 778 | |
| ALLETE Inc. | 15,220 | 727 | |
| Avista Corp. | 19,441 | 610 | |
| Piedmont Natural Gas | |||
| Co. Inc. | 14,475 | 558 | |
| South Jersey Industries Inc. | 23,137 | 558 | |
| El Paso Electric Co. | 13,754 | 487 | |
| NorthWestern Corp. | 8,300 | 429 | |
| New Jersey Resources Corp. | 15,101 | 427 | |
| Northwest Natural Gas Co. | 9,275 | 408 | |
| American States Water Co. | 4,999 | 189 | |
| 6,926 | |||
| Total Common Stocks | |||
| (Cost $117,204) | 109,232 | ||
| Temporary Cash Investments (0.2%)1 | ||
| Money Market Fund (0.1%) | ||
| 3,4 Vanguard Market Liquidity | ||
| Fund, 0.168% | 87,497 | 87 |
| Face | ||
| Amount | ||
| ($000) | ||
| U.S. Government and Agency Obligations (0.1%) | ||
| 5,6 Federal Home Loan | ||
| Bank Discount Notes, | ||
| 0.090%, 9/11/15 | 100 | 100 |
| Total Temporary Cash Investments | ||
| (Cost $187) | 187 | |
| Total Investments (100.0%) | ||
| (Cost $117,391) | 109,419 | |
| Amount | ||
| ($000) | ||
| Other Assets and Liabilities (0.0%) | ||
| Other Assets | ||
| Investment in Vanguard | 10 | |
| Receivables for Investment Securities Sold | 38 | |
| Receivables for Accrued Income | 113 | |
| Receivables for Capital Shares Issued | — | |
| Other Assets | 5 | |
| Total Other Assets | 166 | |
| Liabilities | ||
| Payables for Investment Securities Purchased (48) | ||
| Collateral for Securities on Loan | (64) | |
| Payables to Investment Advisor | — | |
| Payables for Capital Shares Redeemed | — | |
| Payables for Distributions | — | |
| Payables to Vanguard | (11) | |
| Other Liabilities | (8) | |
| Total Liabilities | (131) | |
| Net Assets (100%) | 109,454 | |
38
S&P Small-Cap 600 Value Index Fund
| At August 31, 2015, net assets consisted of: | |
| Amount | |
| ($000) | |
| Paid-in Capital | 121,072 |
| Undistributed Net Investment Income | 874 |
| Accumulated Net Realized Losses | (4,503) |
| Unrealized Appreciation (Depreciation) | |
| Investment Securities | (7,972) |
| Futures Contracts | (17) |
| Net Assets | 109,454 |
| ETF Shares—Net Assets | |
| Applicable to 1,000,000 outstanding | |
| $.001 par value shares of beneficial | |
| interest (unlimited authorization) | 94,661 |
| Net Asset Value Per Share— | |
| ETF Shares | $94.66 |
| Institutional Shares—Net Assets | |
| Applicable to 74,703 outstanding | |
| $.001 par value shares of beneficial | |
| interest (unlimited authorization) | 14,793 |
| Net Asset Value Per Share— | |
| Institutional Shares | $198.02 |
• See Note A in Notes to Financial Statements.
* Non-income-producing security.
^ Includes partial security positions on loan to broker-dealers. The total value of securities on loan is $62,000.
1 The fund invests a portion of its cash reserves in equity markets through the use of index futures contracts. After giving effect to futures
investments, the fund’s effective common stock and temporary cash investment positions represent 100.0% and 0.0%, respectively, of
net assets.
2 “Other” represents securities that are not classified by the fund’s benchmark index.
3 Affiliated money market fund available only to Vanguard funds and certain trusts and accounts managed by Vanguard. Rate shown is the
7-day yield.
4 Includes $64,000 of collateral received for securities on loan.
5 The issuer operates under a congressional charter; its securities are generally neither guaranteed by the U.S. Treasury nor backed by the
full faith and credit of the U.S. government.
6 Securities with a value of $100,000 have been segregated as initial margin for open futures contracts.
REIT—Real Estate Investment Trust.
See accompanying Notes, which are an integral part of the Financial Statements.
39
S&P Small-Cap 600 Value Index Fund
Statement of Operations
| Year Ended | |
| August 31, 2015 | |
| ($000) | |
| Investment Income | |
| Income | |
| Dividends | 1,608 |
| Securities Lending | 3 |
| Total Income | 1,611 |
| Expenses | |
| The Vanguard Group—Note B | |
| Investment Advisory Services | 7 |
| Management and Administrative—ETF Shares | 110 |
| Management and Administrative—Institutional Shares | 1 |
| Marketing and Distribution—ETF Shares | 1 |
| Marketing and Distribution—Institutional Shares | — |
| Custodian Fees | 39 |
| Auditing Fees | 23 |
| Shareholders’ Reports—ETF Shares | 6 |
| Shareholders’ Reports—Institutional Shares | — |
| Total Expenses | 187 |
| Net Investment Income | 1,424 |
| Realized Net Gain (Loss) | |
| Investment Securities Sold | 4,052 |
| Futures Contracts | 2 |
| Realized Net Gain (Loss) | 4,054 |
| Change in Unrealized Appreciation (Depreciation) | |
| Investment Securities | (9,070) |
| Futures Contracts | (17) |
| Change in Unrealized Appreciation (Depreciation) | (9,087) |
| Net Increase (Decrease) in Net Assets Resulting from Operations | (3,609) |
See accompanying Notes, which are an integral part of the Financial Statements.
40
S&P Small-Cap 600 Value Index Fund
Statement of Changes in Net Assets
| Year Ended August 31, | ||
| 2015 | 2014 | |
| ($000) | ($000) | |
| Increase (Decrease) in Net Assets | ||
| Operations | ||
| Net Investment Income | 1,424 | 876 |
| Realized Net Gain (Loss) | 4,054 | 10,565 |
| Change in Unrealized Appreciation (Depreciation) | (9,087) | (3,019) |
| Net Increase (Decrease) in Net Assets Resulting from Operations | (3,609) | 8,422 |
| Distributions | ||
| Net Investment Income | ||
| ETF Shares | (1,091) | (522) |
| Institutional Shares | (120) | — |
| Realized Capital Gain | ||
| ETF Shares | — | — |
| Institutional Shares | — | — |
| Total Distributions | (1,211) | (522) |
| Capital Share Transactions | ||
| ETF Shares | 5,043 | 57,116 |
| Institutional Shares | 15,248 | — |
| Net Increase (Decrease) from Capital Share Transactions | 20,291 | 57,116 |
| Total Increase (Decrease) | 15,471 | 65,016 |
| Net Assets | ||
| Beginning of Period | 93,983 | 28,967 |
| End of Period1 | 109,454 | 93,983 |
| 1 Net Assets—End of Period includes undistributed (overdistributed) net investment income of $874,000 and $661,000. | ||
See accompanying Notes, which are an integral part of the Financial Statements.
41
S&P Small-Cap 600 Value Index Fund
Financial Highlights
| ETF Shares | |||||
| Sept. 7, | |||||
| 20101 to | |||||
| For a Share Outstanding | Year Ended August 31, | Aug. 31, | |||
| Throughout Each Period | 2015 | 2014 | 2013 | 2012 | 2011 |
| Net Asset Value, Beginning of Period | $98.93 | $82.76 | $65.79 | $56.68 | $49.79 |
| Investment Operations | |||||
| Net Investment Income | 1.337 | 1.3552 | 1.146 | .960 | .741 |
| Net Realized and Unrealized Gain (Loss) | |||||
| on Investments | (4.323) | 15.685 | 16.731 | 8.801 | 6.519 |
| Total from Investment Operations | (2.986) | 17.040 | 17.877 | 9.761 | 7.260 |
| Distributions | |||||
| Dividends from Net Investment Income | (1.284) | (.870) | (. 907) | (. 651) | (. 370) |
| Distributions from Realized Capital Gains | — | — | — | — | — |
| Total Distributions | (1.284) | (.870) | (. 907) | (. 651) | (. 370) |
| Net Asset Value, End of Period | $94.66 | $98.93 | $82.76 | $65.79 | $56.68 |
| Total Return | -3.09% | 20.64% | 27.45% | 17.33% | 14.52% |
| Ratios/Supplemental Data | |||||
| Net Assets, End of Period (Millions) | $95 | $94 | $29 | $16 | $14 |
| Ratio of Total Expenses to Average Net Assets | 0.20% | 0.20% | 0.20% | 0.20% | 0.20%3 |
| Ratio of Net Investment Income to | |||||
| Average Net Assets | 1.43% | 1.43% | 1.73% | 1.56% | 1.32%3 |
| Portfolio Turnover Rate 4 | 43% | 32% | 37% | 29% | 70% |
1 Inception.
2 Calculated based on average shares outstanding.
3 Annualized.
4 Excludes the value of portfolio securities received or delivered as a result of in-kind purchases or redemptions of the fund’s capital shares,
including ETF Creation Units.
See accompanying Notes, which are an integral part of the Financial Statements.
42
S&P Small-Cap 600 Value Index Fund
Financial Highlights
| Institutional Shares | |
| November 19, 20141 to | |
| For a Share Outstanding Throughout the Period | August 31, 2015 |
| Net Asset Value, Beginning of Period | $206.40 |
| Investment Operations | |
| Net Investment Income | 2.201 |
| Net Realized and Unrealized Gain (Loss) on Investments | (7.820) |
| Total from Investment Operations | (5.619) |
| Distributions | |
| Dividends from Net Investment Income | (2.761) |
| Distributions from Realized Capital Gains | — |
| Total Distributions | (2.761) |
| Net Asset Value, End of Period | $198.02 |
| Total Return | -2.79% |
| Ratios/Supplemental Data | |
| Net Assets, End of Period (Millions) | $15 |
| Ratio of Total Expenses to Average Net Assets | 0.08%2 |
| Ratio of Net Investment Income to Average Net Assets | 1.55%2 |
| Portfolio Turnover Rate 3 | 43% |
1 Inception—See Notes to Financial Statements.
2 Annualized.
3 Excludes the value of portfolio securities received or delivered as a result of in-kind purchases or redemptions of the fund’s capital shares,
including ETF Creation Units.
See accompanying Notes, which are an integral part of the Financial Statements.
43
S&P Small-Cap 600 Value Index Fund
Notes to Financial Statements
Vanguard S&P Small-Cap 600 Value Index Fund is registered under the Investment Company Act of 1940 as an open-end investment company, or mutual fund. The fund offers two classes of shares: ETF Shares and Institutional Shares. ETF Shares are listed for trading on NYSE Arca; they can be purchased and sold through a broker. Institutional Shares are designed for investors who meet certain administrative, service, and account-size criteria. Institutional Shares were first issued on December 15, 2010; the sole shareholder redeemed shortly thereafter. Institutional Shares were next issued on November 19, 2014. The Financial Highlights included in these financial statements are based on activity of the Institutional Shares since November 19, 2014.
A. The following significant accounting policies conform to generally accepted accounting principles for U.S. investment companies. The fund consistently follows such policies in preparing its financial statements.
1. Security Valuation: Securities are valued as of the close of trading on the New York Stock Exchange (generally 4 p.m., Eastern time) on the valuation date. Equity securities are valued at the latest quoted sales prices or official closing prices taken from the primary market in which each security trades; such securities not traded on the valuation date are valued at the mean of the latest quoted bid and asked prices. Securities for which market quotations are not readily available, or whose values have been materially affected by events occurring before the fund’s pricing time but after the close of the securities’ primary markets, are valued by methods deemed by the board of trustees to represent fair value. Investments in Vanguard Market Liquidity Fund are valued at that fund’s net asset value. Temporary cash investments acquired over 60 days to maturity are valued using the latest bid prices or using valuations based on a matrix system (which considers such factors as security prices, yields, maturities, and ratings), both as furnished by independent pricing services. Other temporary cash investments are valued at amortized cost, which approximates market value.
2. Futures Contracts: The fund uses index futures contracts to a limited extent, with the objectives of maintaining full exposure to the stock market, enhancing returns, maintaining liquidity, and minimizing transaction costs. The fund may purchase futures contracts to immediately invest incoming cash in the market, or sell futures in response to cash outflows, thereby simulating a fully invested position in the underlying index while maintaining a cash balance for liquidity. The fund may seek to enhance returns by using futures contracts instead of the underlying securities when futures are believed to be priced more attractively than the underlying securities. The primary risks associated with the use of futures contracts are imperfect correlation between changes in market values of stocks held by the fund and the prices of futures contracts, and the possibility of an illiquid market. Counterparty risk involving futures is mitigated because a regulated clearinghouse is the counterparty instead of the clearing broker. To further mitigate counterparty risk, the fund trades futures contracts on an exchange, monitors the financial strength of its clearing brokers and clearinghouse, and has entered into clearing agreements with its clearing brokers. The clearinghouse imposes initial margin requirements to secure the fund’s performance and requires daily settlement of variation margin representing changes in the market value of each contract.
Futures contracts are valued at their quoted daily settlement prices. The aggregate settlement values of the contracts are not recorded in the Statement of Net Assets. Fluctuations in the value of the contracts are recorded in the Statement of Net Assets as an asset (liability) and in the Statement of Operations as unrealized appreciation (depreciation) until the contracts are closed, when they are recorded as realized futures gains (losses).
44
S&P Small-Cap 600 Value Index Fund
During the year ended August 31, 2015, the fund’s average investments in long and short futures contracts represented less than 1% and 0% of net assets, respectively, based on the average of aggregate settlement values at each quarter-end during the period.
3. Federal Income Taxes: The fund intends to continue to qualify as a regulated investment company and distribute all of its taxable income. Management has analyzed the fund’s tax positions taken for all open federal income tax years (August 31, 2012–2015), and has concluded that no provision for federal income tax is required in the fund’s financial statements.
4. Distributions: Distributions to shareholders are recorded on the ex-dividend date.
5. Securities Lending: To earn additional income, the fund lends its securities to qualified institutional borrowers. Security loans are required to be secured at all times by collateral in an amount at least equal to the market value of securities loaned. Daily market fluctuations could cause the value of loaned securities to be more or less than the value of the collateral received. When this occurs, the collateral is adjusted and settled on the next business day. The fund further mitigates its counterparty risk by entering into securities lending transactions only with a diverse group of prequalified counter-parties, monitoring their financial strength, and entering into master securities lending agreements with its counterparties. The master securities lending agreements provide that, in the event of a counterparty’s default (including bankruptcy), the fund may terminate any loans with that borrower, determine the net amount owed, and sell or retain the collateral up to the net amount owed to the fund; however, such actions may be subject to legal proceedings. While collateral mitigates counter-party risk, in the absence of a default the fund may experience delays and costs in recovering the securities loaned. The fund invests cash collateral received in Vanguard Market Liquidity Fund, and records a liability in the Statement of Net Assets for the return of the collateral, during the period the securities are on loan. Securities lending income represents fees charged to borrowers plus income earned on invested cash collateral, less expenses associated with the loan.
6. Credit Facility: The fund and certain other funds managed by The Vanguard Group (“Vanguard”) participate in a $3 billion committed credit facility provided by a syndicate of lenders pursuant to a credit agreement that may be renewed annually; each fund is individually liable for its borrowings, if any, under the credit facility. Borrowings may be utilized for temporary and emergency purposes, and are subject to the fund’s regulatory and contractual borrowing restrictions. The participating funds are charged administrative fees and an annual commitment fee of 0.06% of the undrawn amount of the facility; these fees are allocated to the funds based on a method approved by the fund’s board of trustees and included in Management and Administrative expenses on the fund’s Statement of Operations. Any borrowings under this facility bear interest at a rate equal to the higher of the federal funds rate or LIBOR reference rate plus an agreed-upon spread.
The fund had no borrowings outstanding at August 31, 2015, or at any time during the period then ended.
7. Other: Dividend income is recorded on the ex-dividend date. Interest income includes income distributions received from Vanguard Market Liquidity Fund and is accrued daily. Premiums and discounts on debt securities purchased are amortized and accreted, respectively, to interest income over the lives of the respective securities. Security transactions are accounted for on the date securities are bought or sold. Costs used to determine realized gains (losses) on the sale of investment securities are those of the specific securities sold.
Each class of shares has equal rights as to assets and earnings, except that each class separately bears certain class-specific expenses related to maintenance of shareholder accounts (included in Management and Administrative expenses) and shareholder reporting. Marketing and distribution
45
S&P Small-Cap 600 Value Index Fund
expenses are allocated to each class of shares based on a method approved by the board of trustees. Income, other non-class-specific expenses, and gains and losses on investments are allocated to each class of shares based on its relative net assets.
B. In accordance with the terms of a Funds’ Service Agreement (the “FSA”) between Vanguard and the fund, Vanguard furnishes to the fund investment advisory, corporate management, administrative, marketing, and distribution services at Vanguard’s cost of operations (as defined by the FSA). These costs of operations are allocated to the fund based on methods and guidelines approved by the board of trustees. Vanguard does not require reimbursement in the current period for certain costs of operations (such as deferred compensation/benefits and risk/insurance costs); the fund’s liability for these costs of operations is included in Payables to Vanguard on the Statement of Net Assets.
Upon the request of Vanguard, the fund may to invest up to 0.40% of its net assets as capital in Vanguard. At August 31, 2015, the fund had contributed to Vanguard capital in the amount of $10,000, representing 0.01% of the fund’s net assets and 0.00% of Vanguard’s capitalization. The fund’s trustees and officers are also directors and employees, respectively, of Vanguard.
C. Various inputs may be used to determine the value of the fund’s investments. These inputs are summarized in three broad levels for financial statement purposes. The inputs or methodologies used to value securities are not necessarily an indication of the risk associated with investing in those securities.
Level 1—Quoted prices in active markets for identical securities.
Level 2—Other significant observable inputs (including quoted prices for similar securities, interest rates, prepayment speeds, credit risk, etc.).
Level 3—Significant unobservable inputs (including the fund’s own assumptions used to determine the fair value of investments).
The following table summarizes the market value of the fund’s investments as of August 31, 2015, based on the inputs used to value them:
| Level 1 | Level 2 | Level 3 | |
| Investments | ($000) | ($000) | ($000) |
| Common Stocks | 109,232 | — | — |
| Temporary Cash Investments | 87 | 100 | |
| Futures Contracts—Liabilites1 | (1) | — | — |
| Total | 109,318 | 100 | — |
| 1 Represents variation margin on the last day of the reporting period. | |||
D. At August 31, 2015, the aggregate settlement value of open futures contracts and the related unrealized appreciation (depreciation) were:
| ($000) | ||||
| Aggregate | ||||
| Number of | Settlement | Unrealized | ||
| Long (Short) | Value | Appreciation | ||
| Futures Contracts | Expiration | Contracts | Long (Short) | (Depreciation) |
| E-mini Russell 2000 Index | September 2015 | 2 | 232 | (17) |
Unrealized appreciation (depreciation) on open futures contracts is required to be treated as realized gain (loss) for tax purposes.
46
S&P Small-Cap 600 Value Index Fund
E. Distributions are determined on a tax basis and may differ from net investment income and realized capital gains for financial reporting purposes. Differences may be permanent or temporary. Permanent differences are reclassified among capital accounts in the financial statements to reflect their tax character. Temporary differences arise when certain items of income, expense, gain, or loss are recognized in different periods for financial statement and tax purposes. These differences will reverse at some time in the future. Differences in classification may also result from the treatment of short-term gains as ordinary income for tax purposes.
During the year ended August 31, 2015, the fund realized $7,466,000 of net capital gains resulting from in-kind redemptions—in which shareholders exchanged fund shares for securities held by the fund rather than for cash. Because such gains are not taxable to the fund, and are not distributed to shareholders, they have been reclassified from accumulated net realized losses to paid-in capital.
For tax purposes, at August 31, 2015, the fund had $882,000 of ordinary income available for distribution. The fund had available capital losses totaling $4,521,000 that may be carried forward indefinitely to offset future net capital gains.
At August 31, 2015, the cost of investment securities for tax purposes was $117,391,000. Net unrealized depreciation of investment securities for tax purposes was $7,972,000, consisting of unrealized gains of $5,038,000 on securities that had risen in value since their purchase and $13,010,000 in unrealized losses on securities that had fallen in value since their purchase.
F. During the year ended August 31, 2015, the fund purchased $121,427,000 of investment securities and sold $100,996,000 of investment securities, other than temporary cash investments. Purchases and sales include $67,263,000 and $57,977,000, respectively, in connection with in-kind purchases and redemptions of the fund’s capital shares.
G. Capital share transactions for each class of shares were:
| Year Ended August 31, | ||||
| 2015 | 2014 | |||
| Amount | Shares | Amount | Shares | |
| ($000) | (000) | ($000) | (000) | |
| ETF Shares | ||||
| Issued | 82,573 | 825 | 133,752 | 1,400 |
| Issued in Lieu of Cash Distributions | — | — | — | — |
| Redeemed | (77,530) | (775) | (76,636) | (800) |
| Net Increase (Decrease)—ETF Shares | 5,043 | 50 | 57,116 | 600 |
| Institutional Shares1 | ||||
| Issued | 15,248 | 75 | — | — |
| Issued in Lieu of Cash Distributions | 120 | 1 | — | — |
| Redeemed | (120) | (1) | — | — |
| Net Increase (Decrease)—Institutional Shares | 15,248 | 75 | — | — |
| 1 Inception was November 19, 2014. | ||||
H. Management has determined that no material events or transactions occurred subsequent to August 31, 2015, that would require recognition or disclosure in these financial statements.
47
S&P Small-Cap 600 Growth Index Fund
Fund Profile
As of August 31, 2015
| Portfolio Characteristics | |||
| DJ | |||
| S&P | U.S. | ||
| SmallCap | Total | ||
| 600 | Market | ||
| Growth | FA | ||
| Fund | Index | Index | |
| Number of Stocks | 353 | 353 | 3,828 |
| Median Market Cap | $1.8B | $1.8B | $47.2B |
| Price/Earnings Ratio | 26.1x | 26.1x | 20.8x |
| Price/Book Ratio | 2.7x | 2.7x | 2.6x |
| Return on Equity | 13.2% | 13.2% | 17.1% |
| Earnings Growth | |||
| Rate | 13.3% | 13.3% | 10.2% |
| Dividend Yield | 1.3% | 1.3% | 2.1% |
| Foreign Holdings | 0.0% | 0.0% | 0.0% |
| Turnover Rate | 63% | — | — |
| Ticker Symbol | VIOG | — | — |
| Expense Ratio1 | 0.20% | — | — |
| 30-Day SEC Yield | 1.10% | — | — |
| Short-Term Reserves | 0.0% | — | — |
| Sector Diversification (% of equity exposure) | |||
| DJ | |||
| S&P | U.S. | ||
| SmallCap | Total | ||
| 600 | Market | ||
| Growth | FA | ||
| Fund | Index | Index | |
| Consumer Discretionary 16.7% | 16.7% | 13.5% | |
| Consumer Staples | 2.8 | 2.8 | 8.4 |
| Energy | 1.4 | 1.4 | 6.6 |
| Financials | 23.8 | 23.8 | 18.2 |
| Health Care | 18.1 | 18.1 | 15.0 |
| Industrials | 14.6 | 14.6 | 10.7 |
| Information Technology | 16.7 | 16.7 | 19.1 |
| Materials | 3.8 | 3.8 | 3.3 |
| Telecommunication | |||
| Services | 0.7 | 0.7 | 2.2 |
| Utilities | 1.4 | 1.4 | 3.0 |
| Volatility Measures | ||
| S&P | DJ | |
| SmallCap | U.S. Total | |
| 600 Growth | Market | |
| Index | FA Index | |
| R-Squared | 1.00 | 0.67 |
| Beta | 1.00 | 1.07 |
| These measures show the degree and timing of the fund’s fluctuations compared with the indexes over 36 months. | ||
| Ten Largest Holdings (% of total net assets) | ||
| Toro Co. | Agricultural & Farm | |
| Machinery | 1.2% | |
| ABIOMED Inc. | Health Care | |
| Equipment | 1.1 | |
| j2 Global Inc. | Internet Software & | |
| Services | 1.0 | |
| Curtiss-Wright Corp. | Aerospace & | |
| Defense | 1.0 | |
| Pool Corp. | Distributors | 0.9 |
| Post Properties Inc. | Residential REITs | 0.9 |
| Dealertrack | Internet Software & | |
| Technologies Inc. | Services | 0.9 |
| Wolverine World Wide | ||
| Inc. | Footwear | 0.9 |
| Allegiant Travel Co. | Airlines | 0.8 |
| Impax Laboratories Inc. | Pharmaceuticals | 0.8 |
| Top Ten | 9.5% | |
| The holdings listed exclude any temporary cash investments and equity index products. | ||
Investment Focus
1 The expense ratio shown is from the prospectus dated December 19, 2014, and represents estimated costs for the current fiscal year. For the fiscal
year ended August 31, 2015, the expense ratio was 0.20%.
48
S&P Small-Cap 600 Growth Index Fund
Performance Summary
All of the returns in this report represent past performance, which is not a guarantee of future results that may be achieved by the fund. (Current performance may be lower or higher than the performance data cited. For performance data current to the most recent month-end, visit our website at vanguard.com/performance.) Note, too, that both investment returns and principal value can fluctuate widely, so an investor’s shares, when sold, could be worth more or less than their original cost. The returns shown do not reflect taxes that a shareholder would pay on fund distributions or on the sale of fund shares.
Cumulative Performance: September 7, 2010, Through August 31, 2015
Initial Investment of $10,000
| Average Annual Total Returns | ||||
| Periods Ended August 31, 2015 | ||||
| Since | Final Value | |||
| One | Inception | of a $10,000 | ||
| Year | (9/7/2010) | Investment | ||
| S&P Small-Cap 600 Growth Index | ||||
| Fund*ETF Shares Net Asset Value | 6.32% | 17.38% | $22,219 | |
| S&P Small-Cap 600 Growth Index | ||||
| Fund*ETF Shares Market Price | 6.40 | 17.38 | 22,217 | |
| •••••••• | S&P SmallCap 600 Growth Index | 6.55 | 17.61 | 22,435 |
| – – – – | Small-Cap Growth Funds Average | 4.10 | 14.78 | 19,870 |
| Dow Jones U.S. Total Stock Market | ||||
| Float Adjusted Index | 0.29 | 15.13 | 20,172 | |
Small-Cap Growth Funds Average: Derived from data provided by Lipper, a Thomson Reuters Company.
"Since Inception" performance is calculated from the ETF Shares’ inception date for both the fund and its comparative standards.
| Cumulative Returns of ETF Shares: September 7, 2010, Through August 31, 2015 | ||
| Since | ||
| One | Inception | |
| Year | (9/7/2010) | |
| S&P Small-Cap 600 Growth Index Fund ETF Shares | ||
| Market Price | 6.40% | 122.17% |
| S&P Small-Cap 600 Growth Index Fund ETF Shares | ||
| Net Asset Value | 6.32 | 122.19 |
| S&P SmallCap 600 Growth Index | 6.55 | 124.35 |
| "Since Inception" performance is calculated from the ETF Shares’ inception date for both the fund and its comparative standards. | ||
See Financial Highlights for dividend and capital gains information.
49
S&P Small-Cap 600 Growth Index Fund
Fiscal-Year Total Returns (%): September 7, 2010, Through August 31, 2015
Average Annual Total Returns: Periods Ended June 30, 2015
This table presents returns through the latest calendar quarter—rather than through the end of the fiscal period.
Securities and Exchange Commission rules require that we provide this information.
| Inception | One | Since | |
| Date | Year | Inception | |
| ETF Shares | 9/7/2010 | ||
| Market Price | 9.47% | 19.32% | |
| Net Asset Value | 9.37 | 19.29 |
50
S&P Small-Cap 600 Growth Index Fund
Financial Statements
Statement of Net Assets
As of August 31, 2015
The fund reports a complete list of its holdings in regulatory filings four times in each fiscal year, at the quarter-ends. For the second and fourth fiscal quarters, the lists appear in the fund’s semiannual and annual reports to shareholders. For the first and third fiscal quarters, the fund files the lists with the Securities and Exchange Commission on Form N-Q. Shareholders can look up the fund’s Forms N-Q on the SEC’s website at sec.gov. Forms N-Q may also be reviewed and copied at the SEC’s Public Reference Room (see the back cover of this report for further information).
| Market | |||
| Value• | |||
| Shares | ($000) | ||
| Common Stocks (99.9%)1 | |||
| Consumer Discretionary (16.7%) | |||
| Pool Corp. | 10,143 | 707 | |
| Wolverine World Wide Inc. | 24,000 | 647 | |
| * | G-III Apparel Group Ltd. | 8,890 | 616 |
| * | Pinnacle Entertainment Inc. | 14,072 | 532 |
| * | Helen of Troy Ltd. | 6,229 | 530 |
| Texas Roadhouse Inc. | |||
| Class A | 14,648 | 527 | |
| Ryland Group Inc. | 10,880 | 471 | |
| Papa John’s International Inc. | 6,845 | 460 | |
| Marriott Vacations | |||
| Worldwide Corp. | 6,420 | 456 | |
| * | Gentherm Inc. | 8,349 | 381 |
| * | Meritage Homes Corp. | 8,751 | 369 |
| * | Steven Madden Ltd. | 8,052 | 329 |
| Sonic Corp. | 11,487 | 310 | |
| * | Popeyes Louisiana | ||
| Kitchen Inc. | 5,383 | 299 | |
| * | Select Comfort Corp. | 12,161 | 296 |
| Lithia Motors Inc. Class A | 2,771 | 295 | |
| * | Standard Pacific Corp. | 34,575 | 292 |
| Monro Muffler Brake Inc. | 4,515 | 286 | |
| Outerwall Inc. | 4,291 | 264 | |
| * | Dorman Products Inc. | 4,714 | 237 |
| * | BJ’s Restaurants Inc. | 5,062 | 218 |
| EW Scripps Co. Class A | 12,332 | 216 | |
| Group 1 Automotive Inc. | 2,434 | 213 | |
| DineEquity Inc. | 2,043 | 195 | |
| Drew Industries Inc. | 3,311 | 183 | |
| * | Universal Electronics Inc. | 3,689 | 168 |
| * | Iconix Brand Group Inc. | 11,100 | 154 |
| Caleres Inc. | 4,482 | 149 | |
| Oxford Industries Inc. | 1,696 | 143 | |
| Finish Line Inc. Class A | 5,354 | 141 | |
| Sturm Ruger & Co. Inc. | 2,242 | 141 | |
| Buckle Inc. | 3,296 | 139 | |
| * | TopBuild Corp. | 4,311 | 137 |
| * | Strayer Education Inc. | 2,552 | 133 |
| Winnebago Industries Inc. | 6,262 | 128 | |
| * | Gannett Co. Inc. | 9,759 | 128 |
| * | Scientific Games Corp. | ||
| Class A | 11,574 | 128 | |
| * | Zumiez Inc. | 5,026 | 117 |
| * | Vitamin Shoppe Inc. | 3,112 | 112 |
| * | Francesca’s Holdings Corp. | 9,840 | 111 |
| Cato Corp. Class A | 3,062 | 108 | |
| * | iRobot Corp. | 3,664 | 107 |
| * | Hibbett Sports Inc. | 2,576 | 102 |
| Interval Leisure Group Inc. | 4,884 | 98 | |
| Bob Evans Farms Inc. | 2,128 | 96 | |
| Nutrisystem Inc. | 3,134 | 88 | |
| * | Tuesday Morning Corp. | 10,296 | 82 |
| * | FTD Cos. Inc. | 2,598 | 78 |
| Capella Education Co. | 1,492 | 73 | |
| Ruth’s Hospitality Group Inc. | 3,653 | 59 | |
| * | MarineMax Inc. | 3,261 | 53 |
| * | Lumber Liquidators | ||
| Holdings Inc. | 3,401 | 51 | |
| * | Blue Nile Inc. | 1,435 | 49 |
| * | American Public Education Inc. | 1,656 | 36 |
| * | Barnes & Noble Education Inc. 1,884 | 24 | |
| * | Monarch Casino & Resort Inc. | 1,046 | 18 |
| * | Christopher & Banks Corp. | 3,803 | 7 |
| 12,487 | |||
| Consumer Staples (2.8%) | |||
| Snyder’s-Lance Inc. | 12,148 | 410 | |
| J&J Snack Foods Corp. | 3,477 | 396 | |
| Cal-Maine Foods Inc. | 6,988 | 371 | |
| B&G Foods Inc. | 7,143 | 217 | |
| Calavo Growers Inc. | 3,598 | 210 | |
| Sanderson Farms Inc. | 2,551 | 176 | |
| WD-40 Co. | 2,006 | 168 | |
| * | Diamond Foods Inc. | 2,952 | 89 |
| * | Medifast Inc. | 1,427 | 40 |
| 2,077 | |||
51
S&P Small-Cap 600 Growth Index Fund
| Market | |||
| Value• | |||
| Shares | ($000) | ||
| Energy (1.3%) | |||
| * | Carrizo Oil & Gas Inc. | 11,007 | 401 |
| US Silica Holdings Inc. | 12,433 | 250 | |
| * | Synergy Resources Corp. | 21,052 | 226 |
| * | REX American Resources | ||
| Corp. | 752 | 40 | |
| * | Bonanza Creek Energy Inc. | 5,255 | 40 |
| * | Era Group Inc. | 2,114 | 36 |
| * | Approach Resources Inc. | 3,930 | 10 |
| 1,003 | |||
| Financials (23.8%) | |||
| Post Properties Inc. | 12,694 | 703 | |
| Medical Properties Trust Inc. | 54,389 | 635 | |
| PrivateBancorp Inc. | 16,451 | 623 | |
| * | PRA Group Inc. | 11,236 | 599 |
| DiamondRock Hospitality Co. | 46,669 | 549 | |
| Healthcare Realty Trust Inc. | 23,343 | 535 | |
| MarketAxess Holdings Inc. | 5,815 | 526 | |
| Home BancShares Inc. | 13,671 | 521 | |
| MB Financial Inc. | 14,998 | 494 | |
| Glacier Bancorp Inc. | 17,562 | 457 | |
| Cousins Properties Inc. | 47,845 | 439 | |
| Chesapeake Lodging Trust | 13,870 | 401 | |
| * | Texas Capital Bancshares Inc. | 7,238 | 390 |
| Pinnacle Financial | |||
| Partners Inc. | 7,834 | 371 | |
| Retail Opportunity | |||
| Investments Corp. | 22,965 | 366 | |
| * | BofI Holding Inc. | 3,142 | 364 |
| Sabra Health Care REIT Inc. | 15,145 | 363 | |
| EPR Properties | 7,048 | 359 | |
| American Assets Trust Inc. | 8,661 | 334 | |
| Education Realty Trust Inc. | 11,243 | 329 | |
| First Midwest Bancorp Inc. | 18,129 | 320 | |
| CoreSite Realty Corp. | 6,167 | 300 | |
| Acadia Realty Trust | 9,917 | 293 | |
| GEO Group Inc. | 9,716 | 292 | |
| HFF Inc. Class A | 7,654 | 278 | |
| First Financial Bankshares Inc. | 8,352 | 260 | |
| EastGroup Properties Inc. | 4,808 | 260 | |
| Lexington Realty Trust | 30,612 | 247 | |
| Financial Engines Inc. | 7,380 | 240 | |
| Evercore Partners Inc. | |||
| Class A | 4,489 | 235 | |
| Boston Private Financial | |||
| Holdings Inc. | 19,311 | 230 | |
| United Bankshares Inc. | 5,943 | 222 | |
| American Equity Investment | |||
| Life Holding Co. | 8,891 | 216 | |
| LTC Properties Inc. | 5,041 | 206 | |
| PS Business Parks Inc. | 2,753 | 201 | |
| Pennsylvania REIT | 9,964 | 198 | |
| RLI Corp. | 3,628 | 189 | |
| Universal Insurance | |||
| Holdings Inc. | 7,085 | 174 | |
| Parkway Properties Inc. | 11,003 | 174 | |
| Inland Real Estate Corp. | 20,551 | 173 | |
| * | First Cash Financial | ||
| Services Inc. | 4,131 | 170 | |
| CVB Financial Corp. | 10,342 | 168 | |
| Columbia Banking System Inc. | 5,490 | 166 | |
| * | LendingTree Inc. | 1,492 | 158 |
| Universal Health Realty | |||
| Income Trust | 3,093 | 142 | |
| Talmer Bancorp Inc. Class A | 8,293 | 135 | |
| Saul Centers Inc. | 2,650 | 131 | |
| * | Encore Capital Group Inc. | 3,152 | 128 |
| Summit Hotel Properties Inc. | 10,460 | 127 | |
| CareTrust REIT Inc. | 10,641 | 119 | |
| Virtus Investment | |||
| Partners Inc. | 1,019 | 117 | |
| Greenhill & Co. Inc. | 3,265 | 115 | |
| Independent Bank Corp. | 2,393 | 108 | |
| Westamerica Bancorporation | 2,377 | 107 | |
| Franklin Street Properties | |||
| Corp. | 10,159 | 106 | |
| AMERISAFE Inc. | 2,252 | 105 | |
| LegacyTexas Financial | |||
| Group Inc. | 3,705 | 105 | |
| Banner Corp. | 2,109 | 94 | |
| Simmons First National Corp. | |||
| Class A | 2,058 | 90 | |
| * | Walker & Dunlop Inc. | 3,531 | 86 |
| * | First NBC Bank Holding Co. | 2,453 | 86 |
| Northfield Bancorp Inc. | 5,672 | 85 | |
| Brookline Bancorp Inc. | 8,029 | 85 | |
| HCI Group Inc. | 2,076 | 82 | |
| Cardinal Financial Corp. | 3,665 | 82 | |
| * | Enova International Inc. | 6,139 | 80 |
| * | Piper Jaffray Cos. | 1,862 | 78 |
| First Commonwealth | |||
| Financial Corp. | 8,688 | 77 | |
| Cedar Realty Trust Inc. | 12,040 | 75 | |
| Bank Mutual Corp. | 10,084 | 73 | |
| Urstadt Biddle Properties Inc. | |||
| Class A | 3,908 | 70 | |
| Oritani Financial Corp. | 4,610 | 69 | |
| Southside Bancshares Inc. | 2,656 | 69 | |
| * | Green Dot Corp. Class A | 3,755 | 66 |
| Agree Realty Corp. | 2,088 | 59 | |
| * | World Acceptance Corp. | 1,101 | 41 |
| United Insurance Holdings | |||
| Corp. | 2,769 | 36 | |
| * | eHealth Inc. | 1,977 | 29 |
| 17,785 | |||
| Health Care (18.1%) | |||
| * | ABIOMED Inc. | 8,734 | 838 |
| * | Impax Laboratories Inc. | 15,505 | 635 |
| * | Prestige Brands Holdings Inc. | 12,160 | 566 |
| * | Amsurg Corp. | 6,980 | 547 |
52
S&P Small-Cap 600 Growth Index Fund
| Market | |||
| Value• | |||
| Shares | ($000) | ||
| Chemed Corp. | 3,971 | 541 | |
| Cantel Medical Corp. | 8,212 | 408 | |
| * | Medidata Solutions Inc. | 7,969 | 383 |
| * | Ligand Pharmaceuticals Inc. | 4,162 | 383 |
| * | Depomed Inc. | 13,943 | 375 |
| * | AMN Healthcare | ||
| Services Inc. | 11,058 | 372 | |
| * | NuVasive Inc. | 6,634 | 350 |
| * | Cambrex Corp. | 7,281 | 348 |
| * | Nektar Therapeutics | 30,582 | 338 |
| * | Natus Medical Inc. | 7,665 | 312 |
| * | Lannett Co. Inc. | 6,237 | 299 |
| * | ExamWorks Group Inc. | 8,171 | 293 |
| * | Omnicell Inc. | 8,428 | 286 |
| * | Neogen Corp. | 5,426 | 280 |
| * | Masimo Corp. | 6,635 | 270 |
| * | Medicines Co. | 6,468 | 265 |
| Ensign Group Inc. | 5,326 | 250 | |
| * | Repligen Corp. | 7,181 | 245 |
| * | Cyberonics Inc. | 3,687 | 241 |
| Abaxis Inc. | 4,956 | 233 | |
| * | ICU Medical Inc. | 2,002 | 227 |
| * | MiMedx Group Inc. | 22,227 | 216 |
| * | Haemonetics Corp. | 5,889 | 213 |
| * | Greatbatch Inc. | 3,620 | 206 |
| * | Acorda Therapeutics Inc. | 6,269 | 200 |
| * | Integra LifeSciences Holdings | ||
| Corp. | 3,179 | 191 | |
| * | Air Methods Corp. | 4,763 | 178 |
| * | Affymetrix Inc. | 17,979 | 168 |
| * | MedAssets Inc. | 7,860 | 166 |
| * | Cynosure Inc. Class A | 5,153 | 163 |
| Select Medical Holdings | |||
| Corp. | 12,631 | 163 | |
| * | Emergent BioSolutions Inc. | 4,731 | 157 |
| * | Amedisys Inc. | 3,836 | 148 |
| CONMED Corp. | 2,760 | 146 | |
| * | HealthStream Inc. | 5,579 | 139 |
| * | HealthEquity Inc. | 4,673 | 137 |
| * | Momenta Pharmaceuticals Inc. | 6,499 | 127 |
| * | Supernus Pharmaceuticals Inc. | 6,664 | 121 |
| * | Anika Therapeutics Inc. | 3,401 | 120 |
| * | Albany Molecular | ||
| Research Inc. | 5,995 | 120 | |
| * | HMS Holdings Corp. | 10,706 | 112 |
| * | Sagent Pharmaceuticals Inc. | 5,298 | 106 |
| * | Vascular Solutions Inc. | 2,813 | 97 |
| * | Luminex Corp. | 5,178 | 94 |
| Meridian Bioscience Inc. | 4,365 | 84 | |
| Aceto Corp. | 2,991 | 67 | |
| * | Providence Service Corp. | 1,483 | 66 |
| * | Inogen Inc. | 1,346 | 66 |
| Computer Programs & | |||
| Systems Inc. | 1,420 | 65 | |
| * | ANI Pharmaceuticals Inc. | 1,300 | 63 |
| * | Enanta Pharmaceuticals Inc. | 1,590 | 62 |
| Quality Systems Inc. | 3,992 | 54 | |
| * | Cross Country Healthcare Inc. | 3,516 | 49 |
| Landauer Inc. | 1,159 | 45 | |
| * | SurModics Inc. | 1,787 | 41 |
| * | Spectrum | ||
| Pharmaceuticals Inc. | 5,558 | 40 | |
| * | CorVel Corp. | 988 | 30 |
| CryoLife Inc. | 2,991 | 29 | |
| 13,534 | |||
| Industrials (14.6%) | |||
| Toro Co. | 12,798 | 913 | |
| Curtiss-Wright Corp. | 11,058 | 727 | |
| Allegiant Travel Co. Class A | 3,129 | 636 | |
| Healthcare Services | |||
| Group Inc. | 16,622 | 556 | |
| Hillenbrand Inc. | 14,772 | 398 | |
| Knight Transportation Inc. | 14,348 | 390 | |
| * | On Assignment Inc. | 10,825 | 390 |
| Matson Inc. | 10,104 | 381 | |
| Apogee Enterprises Inc. | 6,788 | 354 | |
| Forward Air Corp. | 7,202 | 324 | |
| AZZ Inc. | 5,991 | 303 | |
| * | Dycom Industries Inc. | 4,201 | 299 |
| * | TASER International Inc. | 12,428 | 291 |
| Heartland Express Inc. | 12,860 | 260 | |
| US Ecology Inc. | 5,038 | 252 | |
| * | Moog Inc. Class A | 3,872 | 244 |
| * | Saia Inc. | 5,834 | 219 |
| AAON Inc. | 9,693 | 200 | |
| Mobile Mini Inc. | 5,590 | 190 | |
| Korn/Ferry International | 5,510 | 188 | |
| UniFirst Corp. | 1,717 | 186 | |
| Mueller Industries Inc. | 5,560 | 177 | |
| * | WageWorks Inc. | 3,864 | 173 |
| Matthews International Corp. | |||
| Class A | 3,313 | 168 | |
| ArcBest Corp. | 5,624 | 162 | |
| Watts Water Technologies | |||
| Inc. Class A | 2,956 | 162 | |
| Exponent Inc. | 3,686 | 158 | |
| Simpson Manufacturing | |||
| Co. Inc. | 4,488 | 157 | |
| G&K Services Inc. Class A | 2,278 | 154 | |
| Standex International Corp. | 1,902 | 152 | |
| * | PGT Inc. | 11,105 | 148 |
| * | Hawaiian Holdings Inc. | 6,107 | 138 |
| * | Aerojet Rocketdyne | ||
| Holdings Inc. | 6,707 | 138 | |
| Tennant Co. | 2,311 | 132 | |
| Lindsay Corp. | 1,703 | 130 | |
| * | American Woodmark Corp. | 1,958 | 130 |
| EnPro Industries Inc. | 2,601 | 123 | |
| Franklin Electric Co. Inc. | 4,137 | 121 | |
| * | Lydall Inc. | 3,957 | 107 |
53
S&P Small-Cap 600 Growth Index Fund
| Market | |||
| Value• | |||
| Shares | ($000) | ||
| Federal Signal Corp. | 7,415 | 105 | |
| John Bean Technologies Corp. | 2,922 | 97 | |
| * | Echo Global Logistics Inc. | 4,117 | 96 |
| ESCO Technologies Inc. | 2,609 | 94 | |
| Albany International Corp. | 2,880 | 92 | |
| * | MYR Group Inc. | 1,250 | 36 |
| Marten Transport Ltd. | 1,864 | 35 | |
| * | Orion Marine Group Inc. | 2,856 | 21 |
| * | Vicor Corp. | 1,803 | 18 |
| * | Republic Airways Holdings Inc. | 2,733 | 8 |
| 10,933 | |||
| Information Technology (16.7%) | |||
| j2 Global Inc. | 10,649 | 741 | |
| * | Dealertrack Technologies Inc. | 10,454 | 656 |
| Blackbaud Inc. | 10,899 | 623 | |
| * | ViaSat Inc. | 10,206 | 600 |
| * | Take-Two Interactive | ||
| Software Inc. | 19,673 | 573 | |
| * | Electronics For Imaging Inc. | 10,901 | 477 |
| * | Microsemi Corp. | 13,278 | 422 |
| * | MicroStrategy Inc. Class A | 2,107 | 419 |
| Monolithic Power | |||
| Systems Inc. | 8,548 | 411 | |
| * | comScore Inc. | 7,849 | 410 |
| * | Cardtronics Inc. | 10,434 | 360 |
| * | LogMeIn Inc. | 5,726 | 357 |
| Tessera Technologies Inc. | 10,888 | 356 | |
| * | Synchronoss | ||
| Technologies Inc. | 8,554 | 346 | |
| Heartland Payment | |||
| Systems Inc. | 5,787 | 345 | |
| * | Virtusa Corp. | 6,274 | 332 |
| Littelfuse Inc. | 3,307 | 297 | |
| * | Stamps.com Inc. | 3,507 | 289 |
| * | Cirrus Logic Inc. | 8,699 | 262 |
| Methode Electronics Inc. | 8,917 | 237 | |
| * | Super Micro Computer Inc. | 8,353 | 228 |
| * | Constant Contact Inc. | 7,478 | 185 |
| MKS Instruments Inc. | 5,461 | 184 | |
| * | Progress Software Corp. | 6,471 | 175 |
| NIC Inc. | 8,929 | 168 | |
| * | ExlService Holdings Inc. | 4,523 | 164 |
| * | OSI Systems Inc. | 2,122 | 155 |
| Power Integrations Inc. | 3,559 | 140 | |
| * | Semtech Corp. | 7,724 | 131 |
| Badger Meter Inc. | 2,222 | 130 | |
| Monotype Imaging | |||
| Holdings Inc. | 5,679 | 120 | |
| * | Cabot Microelectronics Corp. | 2,702 | 117 |
| * | Rogers Corp. | 2,079 | 116 |
| * | VASCO Data Security | ||
| International Inc. | 6,844 | 114 | |
| * | Bottomline Technologies | ||
| de Inc. | 4,123 | 110 | |
| MTS Systems Corp. | 1,837 | 109 | |
| * | DTS Inc. | 4,113 | 109 |
| * | Diodes Inc. | 5,412 | 107 |
| * | Veeco Instruments Inc. | 4,226 | 98 |
| * | FARO Technologies Inc. | 2,506 | 97 |
| * | CalAmp Corp. | 5,475 | 91 |
| * | Lumentum Holdings Inc. | 4,357 | 86 |
| Ebix Inc. | 2,994 | 85 | |
| * | Interactive Intelligence | ||
| Group Inc. | 2,205 | 77 | |
| * | Ixia | 4,848 | 75 |
| * | LivePerson Inc. | 7,968 | 73 |
| * | DHI Group Inc. | 8,955 | 70 |
| * | Perficient Inc. | 4,120 | 68 |
| Epiq Systems Inc. | 4,325 | 55 | |
| Forrester Research Inc. | 1,610 | 51 | |
| * | ePlus Inc. | 661 | 50 |
| Comtech Telecommunications | |||
| Corp. | 1,725 | 46 | |
| * | XO Group Inc. | 3,045 | 45 |
| * | CEVA Inc. | 2,302 | 44 |
| Bel Fuse Inc. Class B | 2,477 | 44 | |
| Park Electrochemical Corp. | 2,063 | 36 | |
| * | Ultratech Inc. | 2,095 | 36 |
| Pericom Semiconductor Corp. | 2,576 | 31 | |
| * | Exar Corp. | 4,862 | 29 |
| * | Nanometrics Inc. | 2,041 | 28 |
| * | Tangoe Inc. | 3,541 | 27 |
| * | DSP Group Inc. | 2,725 | 24 |
| * | Kopin Corp. | 5,627 | 17 |
| * | Agilysys Inc. | 1,480 | 15 |
| * | QuinStreet Inc. | 2,180 | 12 |
| Electro Scientific | |||
| Industries Inc. | 1,794 | 8 | |
| 12,493 | |||
| Materials (3.8%) | |||
| KapStone Paper and | |||
| Packaging Corp. | 19,696 | 429 | |
| Balchem Corp. | 7,229 | 423 | |
| * | Headwaters Inc. | 17,147 | 346 |
| * | Flotek Industries Inc. | 11,566 | 226 |
| Neenah Paper Inc. | 3,889 | 224 | |
| HB Fuller Co. | 4,932 | 179 | |
| Deltic Timber Corp. | 2,583 | 160 | |
| * | Boise Cascade Co. | 4,505 | 146 |
| * | Stillwater Mining Co. | 12,348 | 118 |
| * | Clearwater Paper Corp. | 1,994 | 112 |
| Quaker Chemical Corp. | 1,333 | 106 | |
| Innophos Holdings Inc. | 2,057 | 99 | |
| Globe Specialty Metals Inc. | 7,161 | 98 | |
| Calgon Carbon Corp. | 5,515 | 90 | |
| * | Century Aluminum Co. | 11,707 | 66 |
| Wausau Paper Corp. | 3,915 | 31 | |
| 2,853 | |||
54
S&P Small-Cap 600 Growth Index Fund
| Market | |||
| Value• | |||
| Shares | ($000) | ||
| Telecommunication Services (0.7%) | |||
| Consolidated Communications | |||
| Holdings Inc. | 10,922 | 213 | |
| * | General Communication Inc. | ||
| Class A | 6,982 | 118 | |
| * | Cincinnati Bell Inc. | 28,280 | 97 |
| * | 8x8 Inc. | 9,224 | 71 |
| * | Iridium Communications Inc. | 6,466 | 48 |
| 547 | |||
| Utilities (1.4%) | |||
| Piedmont Natural Gas Co. Inc. | 8,450 | 326 | |
| NorthWestern Corp. | 5,250 | 271 | |
| New Jersey Resources Corp. | 9,552 | 270 | |
| American States Water Co. | 5,359 | 203 | |
| 1,070 | |||
| Total Common Stocks | |||
| (Cost $80,695) | 74,782 | ||
| Temporary Cash Investments (0.1%)1 | |||
| Face | |||
| Amount | |||
| ($000) | |||
| U.S. Government and Agency Obligations (0.1%) | |||
| 2,3 | Federal Home Loan | ||
| Bank Discount Notes, | |||
| 0.120%, 10/30/15 | |||
| (Cost $100) | 100 | 100 | |
| Total Investments (100.0%) | |||
| (Cost $80,795) | 74,882 | ||
| Amount | |||
| ($000) | |||
| Other Assets and Liabilities (0.0%) | |||
| Other Assets | |||
| Investment in Vanguard | 7 | ||
| Receivables for Investment Securities Sold | 20 | ||
| Receivables for Accrued Income | 39 | ||
| Receivables for Capital Shares Issued | 1 | ||
| Other Assets | — | ||
| Total Other Assets | 67 | ||
| Amount | |
| ($000) | |
| Liabilities | |
| Payables for Investment Securities Purchased (12) | |
| Collateral for Securities on Loan | — |
| Payables to Investment Advisor | — |
| Payables for Capital Shares Redeemed | — |
| Payables for Distributions | — |
| Payables to Vanguard | (3) |
| Other Liabilities | (44) |
| Total Liabilities | (59) |
| ETF Shares—Net Assets (100%) | |
| Applicable to 700,000 outstanding | |
| $.001 par value shares of beneficial | |
| interest (unlimited authorization) | 74,890 |
| Net Asset Value Per Share— | |
| ETF Shares | $106.99 |
| At August 31, 2015, net assets consisted of: | |
| Amount | |
| ($000) | |
| Paid-in Capital | 83,734 |
| Undistributed Net Investment Income | 461 |
| Accumulated Net Realized Losses | (3,384) |
| Unrealized Appreciation (Depreciation) | |
| Investment Securities | (5,913) |
| Futures Contracts | (8) |
| Net Assets | 74,890 |
| • See Note A in Notes to Financial Statements. |
| * Non-income-producing security. |
| 1 The fund invests a portion of its cash reserves in equity markets through the use of index futures contracts. After giving effect to futures |
| investments, the fund’s effective common stock and temporary cash investment positions represent 100.0% and 0.0%, respectively, of |
| net assets. |
| 2 Securities with a value of $100,000 have been segregated as initial margin for open futures contracts. |
| 3 The issuer operates under a congressional charter; its securities are generally neither guaranteed by the U.S. Treasury nor backed by the |
| full faith and credit of the U.S. government. |
| REIT—Real Estate Investment Trust. |
| See accompanying Notes, which are an integral part of the Financial Statements. |
55
S&P Small-Cap 600 Growth Index Fund
Statement of Operations
| Year Ended | |
| August 31, 2015 | |
| ($000) | |
| Investment Income | |
| Income | |
| Dividends | 831 |
| Interest1 | 1 |
| Total Income | 832 |
| Expenses | |
| The Vanguard Group—Note B | |
| Management and Administrative | 83 |
| Custodian Fees | 28 |
| Auditing Fees | 23 |
| Shareholders’ Reports | 6 |
| Total Expenses | 140 |
| Net Investment Income | 692 |
| Realized Net Gain (Loss) | |
| Investment Securities Sold | 9,084 |
| Futures Contracts | 7 |
| Realized Net Gain (Loss) | 9,091 |
| Change in Unrealized Appreciation (Depreciation) | |
| Investment Securities | (6,292) |
| Futures Contracts | (8) |
| Change in Unrealized Appreciation (Depreciation) | (6,300) |
| Net Increase (Decrease) in Net Assets Resulting from Operations | 3,483 |
| 1 Interest income from an affiliated company of the fund was $1,000. | |
See accompanying Notes, which are an integral part of the Financial Statements.
56
S&P Small-Cap 600 Growth Index Fund
Statement of Changes in Net Assets
| Year Ended August 31, | ||
| 2015 | 2014 | |
| ($000) | ($000) | |
| Increase (Decrease) in Net Assets | ||
| Operations | ||
| Net Investment Income | 692 | 338 |
| Realized Net Gain (Loss) | 9,091 | 8,437 |
| Change in Unrealized Appreciation (Depreciation) | (6,300) | (3,644) |
| Net Increase (Decrease) in Net Assets Resulting from Operations | 3,483 | 5,131 |
| Distributions | ||
| Net Investment Income | ||
| ETF Shares | (455) | (239) |
| Institutional Shares | — | — |
| Realized Capital Gain | ||
| ETF Shares | — | — |
| Institutional Shares | — | — |
| Total Distributions | (455) | (239) |
| Capital Share Transactions | ||
| ETF Shares | 11,047 | 33,985 |
| Institutional Shares | — | (8) |
| Net Increase (Decrease) from Capital Share Transactions | 11,047 | 33,977 |
| Total Increase (Decrease) | 14,075 | 38,869 |
| Net Assets | ||
| Beginning of Period | 60,815 | 21,946 |
| End of Period1 | 74,890 | 60,815 |
| 1 Net Assets—End of Period includes undistributed (overdistributed) net investment income of $461,000 and $224,000. | ||
See accompanying Notes, which are an integral part of the Financial Statements.
57
S&P Small-Cap 600 Growth Index Fund
Financial Highlights
| ETF Shares | |||||
| Sept. 7, | |||||
| 20101 to | |||||
| For a Share Outstanding | Year Ended August 31, | Aug. 31, | |||
| Throughout Each Period | 2015 | 2014 | 2013 | 2012 | 2011 |
| Net Asset Value, Beginning of Period | $101.36 | $87.79 | $70.70 | $61.18 | $49.82 |
| Investment Operations | |||||
| Net Investment Income | 1.043 | .6682 | .822 | .5312 | .422 |
| Net Realized and Unrealized Gain (Loss) | |||||
| on Investments | 5.345 | 13.432 | 17.083 | 9.326 | 11.248 |
| Total from Investment Operations | 6.388 | 14.100 | 17.905 | 9.857 | 11.670 |
| Distributions | |||||
| Dividends from Net Investment Income | (.758) | (. 530) | (. 815) | (. 337) | (.310) |
| Distributions from Realized Capital Gains | — | — | — | — | — |
| Total Distributions | (.758) | (. 530) | (. 815) | (. 337) | (.310) |
| Net Asset Value, End of Period | $106.99 | $101.36 | $87.79 | $70.70 | $61.18 |
| Total Return | 6.32% | 16.07% | 25.59% | 16.17% | 23.41% |
| Ratios/Supplemental Data | |||||
| Net Assets, End of Period (Millions) | $75 | $61 | $22 | $14 | $28 |
| Ratio of Total Expenses to Average Net Assets | 0.20% | 0.20% | 0.20% | 0.20% | 0.20%3 |
| Ratio of Net Investment Income to | |||||
| Average Net Assets | 0.98% | 0.66% | 1.03% | 0.83% | 0.78%3 |
| Portfolio Turnover Rate 4 | 63% | 44% | 39% | 45% | 106% |
1 Inception.
2 Calculated based on average shares outstanding.
3 Annualized.
4 Excludes the value of portfolio securities received or delivered as a result of in-kind purchases or redemptions of the fund’s capital shares,
including ETF Creation Units.
See accompanying Notes, which are an integral part of the Financial Statements.
58
S&P Small-Cap 600 Growth Index Fund
Notes to Financial Statements
Vanguard S&P Small-Cap 600 Growth Index Fund is registered under the Investment Company Act of 1940 as an open-end investment company, or mutual fund. The fund offers two classes of shares: ETF Shares and Institutional Shares. ETF Shares are listed for trading on NYSE Arca; they can be purchased and sold through a broker. Institutional Shares are designed for investors who meet certain administrative, service, and account-size criteria. During the year ended August 31, 2015, there were no investors in the Institutional share class.
A. The following significant accounting policies conform to generally accepted accounting principles for U.S. investment companies. The fund consistently follows such policies in preparing its financial statements.
1. Security Valuation: Securities are valued as of the close of trading on the New York Stock Exchange (generally 4 p.m., Eastern time) on the valuation date. Equity securities are valued at the latest quoted sales prices or official closing prices taken from the primary market in which each security trades; such securities not traded on the valuation date are valued at the mean of the latest quoted bid and asked prices. Securities for which market quotations are not readily available, or whose values have been materially affected by events occurring before the fund’s pricing time but after the close of the securities’ primary markets, are valued by methods deemed by the board of trustees to represent fair value. Investments in Vanguard Market Liquidity Fund are valued at that fund’s net asset value. Temporary cash investments acquired over 60 days to maturity are valued using the latest bid prices or using valuations based on a matrix system (which considers such factors as security prices, yields, maturities, and ratings), both as furnished by independent pricing services. Other temporary cash investments are valued at amortized cost, which approximates market value.
2. Futures Contracts: The fund uses index futures contracts to a limited extent, with the objectives of maintaining full exposure to the stock market, enhancing returns, maintaining liquidity, and minimizing transaction costs. The fund may purchase futures contracts to immediately invest incoming cash in the market, or sell futures in response to cash outflows, thereby simulating a fully invested position in the underlying index while maintaining a cash balance for liquidity. The fund may seek to enhance returns by using futures contracts instead of the underlying securities when futures are believed to be priced more attractively than the underlying securities. The primary risks associated with the use of futures contracts are imperfect correlation between changes in market values of stocks held by the fund and the prices of futures contracts, and the possibility of an illiquid market. Counterparty risk involving futures is mitigated because a regulated clearinghouse is the counterparty instead of the clearing broker. To further mitigate counterparty risk, the fund trades futures contracts on an exchange, monitors the financial strength of its clearing brokers and clearinghouse, and has entered into clearing agreements with its clearing brokers. The clearinghouse imposes initial margin requirements to secure the fund’s performance and requires daily settlement of variation margin representing changes in the market value of each contract.
Futures contracts are valued at their quoted daily settlement prices. The aggregate settlement values of the contracts are not recorded in the Statement of Net Assets. Fluctuations in the value of the contracts are recorded in the Statement of Net Assets as an asset (liability) and in the Statement of Operations as unrealized appreciation (depreciation) until the contracts are closed, when they are recorded as realized futures gains (losses).
During the year ended August 31, 2015, the fund’s average investments in long and short futures contracts represented less than 1% and 0% of net assets, respectively, based on the average of aggregate settlement values at each quarter-end during the period.
59
S&P Small-Cap 600 Growth Index Fund
3. Federal Income Taxes: The fund intends to continue to qualify as a regulated investment company and distribute all of its taxable income. Management has analyzed the fund’s tax positions taken for all open federal income tax years (August 31, 2012–2015), and has concluded that no provision for federal income tax is required in the fund’s financial statements.
4. Distributions: Distributions to shareholders are recorded on the ex-dividend date.
5. Credit Facility: The fund and certain other funds managed by The Vanguard Group (“Vanguard”) participate in a $3 billion committed credit facility provided by a syndicate of lenders pursuant to a credit agreement that may be renewed annually; each fund is individually liable for its borrowings, if any, under the credit facility. Borrowings may be utilized for temporary and emergency purposes, and are subject to the fund’s regulatory and contractual borrowing restrictions. The participating funds are charged administrative fees and an annual commitment fee of 0.06% of the undrawn amount of the facility; these fees are allocated to the funds based on a method approved by the fund’s board of trustees and included in Management and Administrative expenses on the fund’s Statement of Operations. Any borrowings under this facility bear interest at a rate equal to the higher of the federal funds rate or LIBOR reference rate plus an agreed-upon spread.
The fund had no borrowings outstanding at August 31, 2015, or at any time during the period then ended.
6. Other: Dividend income is recorded on the ex-dividend date. Interest income includes income distributions received from Vanguard Market Liquidity Fund and is accrued daily. Premiums and discounts on debt securities purchased are amortized and accreted, respectively, to interest income over the lives of the respective securities. Security transactions are accounted for on the date securities are bought or sold. Costs used to determine realized gains (losses) on the sale of investment securities are those of the specific securities sold.
B. In accordance with the terms of a Funds’ Service Agreement (the “FSA”) between Vanguard and the fund, Vanguard furnishes to the fund investment advisory, corporate management, administrative, marketing, and distribution services at Vanguard’s cost of operations (as defined by the FSA). These costs of operations are allocated to the fund based on methods and guidelines approved by the board of trustees. Vanguard does not require reimbursement in the current period for certain costs of operations (such as deferred compensation/benefits and risk/insurance costs); the fund’s liability for these costs of operations is included in Payables to Vanguard on the Statement of Net Assets.
Upon the request of Vanguard, the fund may invest up to 0.40% of its net assets as capital in Vanguard. At August 31, 2015, the fund had contributed to Vanguard capital in the amount of $7,000, representing 0.01% of the fund’s net assets and 0.00% of Vanguard’s capitalization. The fund’s trustees and officers are also directors and employees, respectively, of Vanguard.
C. Various inputs may be used to determine the value of the fund’s investments. These inputs are summarized in three broad levels for financial statement purposes. The inputs or methodologies used to value securities are not necessarily an indication of the risk associated with investing in those securities.
Level 1—Quoted prices in active markets for identical securities.
Level 2—Other significant observable inputs (including quoted prices for similar securities, interest rates, prepayment speeds, credit risk, etc.).
Level 3—Significant unobservable inputs (including the fund’s own assumptions used to determine the fair value of investments).
60
S&P Small-Cap 600 Growth Index Fund
The following table summarizes the market value of the fund’s investments as of August 31, 2015, based on the inputs used to value them:
| Level 1 | Level 2 | Level 3 | |
| Investments | ($000) | ($000) | ($000) |
| Common Stocks | 74,782 | — | — |
| Temporary Cash Investments | — | 100 | — |
| Futures Contracts—Liabilities1 | (1) | — | — |
| Total | 74,781 | 100 | — |
| 1 Represents variation margin on the last day of the reporting period. | |||
D. At August 31, 2015, the aggregate settlement value of open futures contracts and the related unrealized appreciation (depreciation) were:
| ($000) | ||||
| Aggregate | ||||
| Number of | Settlement | Unrealized | ||
| Long (Short) | Value | Appreciation | ||
| Futures Contracts | Expiration | Contracts | Long (Short) | (Depreciation) |
| E-mini Russell 2000 Index | September 2015 | 1 | 116 | (8) |
Unrealized appreciation (depreciation) on open futures contracts is required to be treated as realized gain (loss) for tax purposes.
E. Distributions are determined on a tax basis and may differ from net investment income and realized capital gains for financial reporting purposes. Differences may be permanent or temporary. Permanent differences are reclassified among capital accounts in the financial statements to reflect their tax character. Temporary differences arise when certain items of income, expense, gain, or loss are recognized in different periods for financial statement and tax purposes. These differences will reverse at some time in the future. Differences in classification may also result from the treatment of short-term gains as ordinary income for tax purposes.
During the year ended August 31, 2015, the fund realized $12,216,000 of net capital gains resulting from in-kind redemptions—in which shareholders exchanged fund shares for securities held by the fund rather than for cash. Because such gains are not taxable to the fund, and are not distributed to shareholders, they have been reclassified from accumulated net realized losses to paid-in capital.
For tax purposes, at August 31, 2015, the fund had $472,000 of ordinary income available for distribution. The fund had available capital losses totaling $3,403,000 that may be carried forward indefinitely to offset future net capital gains.
At August 31, 2015, the cost of investment securities for tax purposes was $80,795,000. Net unrealized depreciation of investment securities for tax purposes was $5,913,000, consisting of unrealized gains of $2,412,000 on securities that had risen in value since their purchase and $8,325,000 in unrealized losses on securities that had fallen in value since their purchase.
F. During the year ended August 31, 2015, the fund purchased $135,102,000 of investment securities and sold $123,853,000 of investment securities, other than temporary cash investments. Purchases and sales include $87,307,000 and $79,763,000, respectively, in connection with in-kind purchases and redemptions of the fund’s capital shares.
61
S&P Small-Cap 600 Growth Index Fund
G. Capital share transactions for each class of shares were:
| Year Ended August 31, | ||||
| 2015 | 2014 | |||
| Amount | Shares | Amount | Shares | |
| ($000) | (000) | ($000) | (000) | |
| ETF Shares | ||||
| Issued | 158,094 | 1,450 | 99,669 | 1,000 |
| Issued in Lieu of Cash Distributions | — | — | — | — |
| Redeemed | (147,047) | (1,350) | (65,684) | (650) |
| Net Increase (Decrease) —ETF Shares | 11,047 | 100 | 33,985 | 350 |
| Institutional Shares1 | ||||
| Issued | — | — | 658 | 3 |
| Issued in Lieu of Cash Distributions | — | — | — | — |
| Redeemed | — | — | (666) | (3) |
| Net Increase (Decrease)—Institutional Shares | — | — | (8) | — |
1 Institutional Shares were issued and redeemed during the fiscal year ended August 31, 2014. As of August 31, 2015, there were no
investors in the Institutional share class.
H. Management has determined that no material events or transactions occurred subsequent to August 31, 2015, that would require recognition or disclosure in these financial statements.
62
Report of Independent Registered
Public Accounting Firm
To the Board of Trustees of Vanguard Admiral Funds and the Shareholders of Vanguard S&P Small-Cap 600 Index Fund, Vanguard S&P Small-Cap 600 Value Index Fund and Vanguard S&P Small-Cap 600 Growth Index Fund:
In our opinion, the accompanying statements of net assets and the related statements of operations and of changes in net assets and the financial highlights present fairly, in all material respects, the financial position of Vanguard S&P Small-Cap 600 Index Fund, Vanguard S&P Small-Cap 600 Value Index Fund and Vanguard S&P Small-Cap 600 Growth Index Fund (constituting separate portfolios of Vanguard Admiral Funds, hereafter referred to as the “Funds”) at August 31, 2015, the results of each of their operations for the year then ended, the changes in each of their net assets for each of the two years in the period then ended, and the financial highlights for each of the periods indicated, in conformity with accounting principles generally accepted in the United States of America. These financial statements and financial highlights (hereafter referred to as “financial statements”) are the responsibility of the Funds’ management. Our responsibility is to express an opinion on these financial statements based on our audits. We conducted our audits of these financial statements in accordance with the standards of the Public Company Accounting Oversight Board (United States). Those standards require that we plan and perform the audit to obtain reasonable assurance about whether the financial statements are free of material misstatement. An audit includes examining, on a test basis, evidence supporting the amounts and disclosures in the financial statements, assessing the accounting principles used and significant estimates made by management, and evaluating the overall financial statement presentation. We believe that our audits, which included confirmation of securities at August 31, 2015 by correspondence with the custodian and brokers, by agreement to the underlying ownership records of the transfer agent and the application of alternative auditing procedures where securities purchased had not been received, provide a reasonable basis for our opinion.
/s/PricewaterhouseCoopers LLP
Philadelphia, Pennsylvania
October 15, 2015
63

This information for the fiscal year ended August 31, 2015, is included pursuant to provisions of the
Internal Revenue Code.
The funds distributed qualified dividend income to shareholders during the fiscal year as follows:
| Fund | ($000) |
| S&P Small-Cap 600 Index Fund | 3,257 |
| S&P Small-Cap 600 Value Index Fund | 966 |
| S&P Small-Cap 600 Growth Index Fund | 407 |
For corporate shareholders, the percentage of investment income (dividend income plus short-term gains, if any) that qualifies for the dividends-received deduction is as follows:
| Fund | Percentage |
| S&P Small-Cap 600 Index Fund | 79.6% |
| S&P Small-Cap 600 Value Index Fund | 92.8 |
| S&P Small-Cap 600 Growth Index Fund | 72.2 |
64
Your Fund’s After-Tax Returns
This table presents returns for your fund both before and after taxes. The after-tax returns are shown in two ways: (1) assuming that an investor owned the fund during the entire period and paid taxes on the fund’s distributions, and (2) assuming that an investor paid taxes on the fund’s distributions and sold all shares at the end of each period.
Calculations are based on the highest individual federal income tax and capital gains tax rates in effect at the times of the distributions and the hypothetical sales. State and local taxes were not considered. After-tax returns reflect any qualified dividend income, using actual prior-year figures and estimates for 2015. (In the example, returns after the sale of fund shares may be higher than those assuming no sale. This occurs when the sale would have produced a capital loss. The calculation assumes that the investor received a tax deduction for the loss.)
The table shows returns for ETF Shares only; returns for other share classes will differ. Please note that your actual after-tax returns will depend on your tax situation and may differ from those shown. Also note that if you own the fund in a tax-deferred account, such as an individual retirement account or a 401(k) plan, this information does not apply to you. Such accounts are not subject to current taxes.
Finally, keep in mind that a fund’s performance—whether before or after taxes—does not guarantee future results.
| Average Annual Total Returns: S&P Small Cap 600 Index Funds | ||
| Periods Ended August 31, 2015 | ||
| Since | ||
| One | Inception | |
| Year | (9/7/2010) | |
| S&P Small-Cap 600 Index Fund ETF Shares | ||
| Returns Before Taxes | 1.69% | 16.21% |
| Returns After Taxes on Distributions | 1.39 | 15.97 |
| Returns After Taxes on Distributions and Sale of Fund Shares | 1.13 | 13.09 |
| Since | ||
| One | Inception | |
| Year | (9/7/2010) | |
| S&P Small-Cap 600 Value Index Fund ETF Shares | ||
| Returns Before Taxes | -3.09% | 14.96% |
| Returns After Taxes on Distributions | -3.43 | 14.70 |
| Returns After Taxes on Distributions and Sale of Fund Shares | -1.54 | 12.04 |
| Since | ||
| One | Inception | |
| Year | (9/7/2010) | |
| S&P Small-Cap 600 Growth Index Fund ETF Shares | ||
| Returns Before Taxes | 6.32% | 17.38% |
| Returns After Taxes on Distributions | 6.12 | 17.22 |
| Returns After Taxes on Distributions and Sale of Fund Shares | 3.71 | 14.11 |
65
About Your Fund’s Expenses
As a shareholder of the fund, you incur ongoing costs, which include costs for portfolio management, administrative services, and shareholder reports (like this one), among others. Operating expenses, which are deducted from a fund’s gross income, directly reduce the investment return of the fund.
A fund’s expenses are expressed as a percentage of its average net assets. This figure is known as the expense ratio. The following examples are intended to help you understand the ongoing costs (in dollars) of investing in your fund and to compare these costs with those of other mutual funds. The examples are based on an investment of $1,000 made at the beginning of the period shown and held for the entire period.
The accompanying table illustrates your fund’s costs in two ways:
• Based on actual fund return. This section helps you to estimate the actual expenses that you paid over the period. The ”Ending Account Value“ shown is derived from the fund‘s actual return, and the third column shows the dollar amount that would have been paid by an investor who started with $1,000 in the fund. You may use the information here, together with the amount you invested, to estimate the expenses that you paid over the period.
To do so, simply divide your account value by $1,000 (for example, an $8,600 account value divided by $1,000 = 8.6), then multiply the result by the number given for your fund under the heading ”Expenses Paid During Period.“
• Based on hypothetical 5% yearly return. This section is intended to help you compare your fund‘s costs with those of other mutual funds. It assumes that the fund had a yearly return of 5% before expenses, but that the expense ratio is unchanged. In this case—because the return used is not the fund’s actual return—the results do not apply to your investment. The example is useful in making comparisons because the Securities and Exchange Commission requires all mutual funds to calculate expenses based on a 5% return. You can assess your fund’s costs by comparing this hypothetical example with the hypothetical examples that appear in shareholder reports of other funds.
Note that the expenses shown in the table are meant to highlight and help you compare ongoing costs only and do not reflect transaction costs incurred by the fund for buying and selling securities. Further, the expenses do not include any purchase, redemption, or account service fees described in the fund prospectus. If such fees were applied to your account, your costs would be higher. Your fund does not carry a “sales load.”
The calculations assume no shares were bought or sold during the period. Your actual costs may have been higher or lower, depending on the amount of your investment and the timing of any purchases or redemptions.
You can find more information about the fund’s expenses, including annual expense ratios, in the Financial Statements section of this report. For additional information on operating expenses and other shareholder costs, please refer to your fund’s current prospectus.
66
| Six Months Ended August 31, 2015 | |||
| Beginning | Ending | Expenses | |
| Account Value | Account Value | Paid During | |
| 2/28/2015 | 8/31/2015 | Period | |
| Based on Actual Fund Return | |||
| S&P Small-Cap 600 Index Fund | |||
| ETF Shares | $1,000.00 | $956.65 | $0.74 |
| Institutional Shares | 1,000.00 | 956.99 | 0.39 |
| S&P Small-Cap 600 Value Index Fund | |||
| ETF Shares | $1,000.00 | $931.60 | $0.97 |
| Institutional Shares | 1,000.00 | 932.17 | 0.39 |
| S&P Small-Cap 600 Growth Index Fund | |||
| ETF Shares | $1,000.00 | $980.21 | $1.00 |
| Based on Hypothetical 5% Yearly Return | |||
| S&P Small-Cap 600 Index Fund | |||
| ETF Shares | $1,000.00 | $1,024.45 | $0.77 |
| Institutional Shares | 1,000.00 | 1,024.80 | 0.41 |
| S&P Small-Cap 600 Value Index Fund | |||
| ETF Shares | $1,000.00 | $1,024.20 | $1.02 |
| Institutional Shares | 1,000.00 | 1,024.80 | 0.41 |
| S&P Small-Cap 600 Growth Index Fund | |||
| ETF Shares | $1,000.00 | $1,024.20 | $1.02 |
The calculations are based on expenses incurred in the most recent six-month period. The funds’ annualized six-month expense ratios for that
period are: for the S&P Small-Cap 600 Index Fund, 0.15% for ETF Shares and 0.08% for Institutional Shares; for the S&P Small-Cap 600 Value
Index Fund, 0.20% for ETF Shares and 0.08% for Institutional Shares; and for the S&P Small-Cap 600 Growth Index Fund, 0.20% for ETF
Shares. The dollar amounts shown as “Expenses Paid” are equal to the annualized expense ratio multiplied by the average account value over
the period, multiplied by the number of days in the most recent six-month period, then divided by the number of days in the most recent
12-month period (184/365).
67
Trustees Approve Advisory Arrangements
The board of trustees of Vanguard S&P Small-Cap 600 Index Fund, S&P Small-Cap 600 Value Index Fund, and S&P Small-Cap 600 Growth Index Fund has renewed each fund’s investment advisory arrangement with The Vanguard Group, Inc. (Vanguard). Vanguard—through its Equity Index Group—serves as investment advisor for each fund. The board determined that continuing each fund’s internalized management structure was in the best interest of each fund and its shareholders.
The board based its decision upon an evaluation of the advisor’s investment staff, portfolio management process, and performance. The trustees considered the factors discussed below, among others. However, no single factor determined whether the board approved the arrangements. Rather, it was the totality of the circumstances that drove the board’s decision.
Nature, extent, and quality of services
The board reviewed the quality of each fund’s investment management services provided to the funds since their inception in 2010, and took into account the organizational depth and stability of the advisor. The board considered that Vanguard has been managing investments for more than three decades. The Equity Index Group adheres to a sound, disciplined investment management process; the team has considerable experience, stability, and depth.
The board concluded that Vanguard’s experience, stability, depth, and performance, among other factors, warranted continuation of each advisory arrangement.
Investment performance
The board considered the funds’ performance since their inception, including any periods of outperformance or underperformance relative to a target index and peer group. The board concluded that the performance was such that each advisory arrangement should continue. Information about the funds’ most recent performance can be found in the Performance Summary pages of this report.
Cost
The board concluded that each fund’s expense ratio was well below the average expense ratios charged by funds in its respective peer group and that each fund’s advisory fee rate was also well below its peer-group average. Information about the funds’ expenses appears in the About Your Fund’s Expenses section of this report as well as in the Financial Statements sections.
The board does not conduct a profitability analysis of Vanguard, because of Vanguard’s unique “at-cost” structure. Unlike most other mutual fund management companies, Vanguard is owned by the funds it oversees, and produces “profits” only in the form of reduced expenses for fund shareholders.
The benefit of economies of scale
The board concluded that each fund’s at-cost arrangement with Vanguard ensures that the funds will realize economies of scale as they grow, with the cost to shareholders declining as fund assets increase.
The board will consider whether to renew the advisory arrangements again after a one-year period.
68
Glossary
30-Day SEC Yield. A fund’s 30-day SEC yield is derived using a formula specified by the U.S. Securities and Exchange Commission. Under the formula, data related to the fund’s security holdings in the previous 30 days are used to calculate the fund’s hypothetical net income for that period, which is then annualized and divided by the fund’s estimated average net assets over the calculation period. For the purposes of this calculation, a security’s income is based on its current market yield to maturity (for bonds), its actual income (for asset-backed securities), or its projected dividend yield (for stocks). Because the SEC yield represents hypothetical annualized income, it will differ—at times significantly—from the fund’s actual experience. As a result, the fund’s income distributions may be higher or lower than implied by the SEC yield.
Beta. A measure of the magnitude of a fund’s past share-price fluctuations in relation to the ups and downs of a given market index. The index is assigned a beta of 1.00. Compared with a given index, a fund with a beta of 1.20 typically would have seen its share price rise or fall by 12% when the index rose or fell by 10%. For this report, beta is based on returns over the past 36 months for both the fund and the index. Note that a fund’s beta should be reviewed in conjunction with its R-squared (see definition). The lower the R-squared, the less correlation there is between the fund and the index, and the less reliable beta is as an indicator of volatility.
Dividend Yield. Dividend income earned by stocks, expressed as a percentage of the aggregate market value (or of net asset value, for a fund). The yield is determined by dividing the amount of the annual dividends by the aggregate value (or net asset value) at the end of the period. For a fund, the dividend yield is based solely on stock holdings and does not include any income produced by other investments.
Earnings Growth Rate. The average annual rate of growth in earnings over the past five years for the stocks now in a fund.
Equity Exposure. A measure that reflects a fund’s investments in stocks and stock futures. Any holdings in short-term reserves are excluded.
Expense Ratio. A fund’s total annual operating expenses expressed as a percentage of the fund’s average net assets. The expense ratio includes management and administrative expenses, but does not include the transaction costs of buying and selling portfolio securities.
Foreign Holdings. The percentage of a fund represented by securities or depositary receipts of companies based outside the United States.
Inception Date. The date on which the assets of a fund (or one of its share classes) are first invested in accordance with the fund’s investment objective. For funds with a subscription period, the inception date is the day after that period ends. Investment performance is measured from the inception date.
Median Market Cap. An indicator of the size of companies in which a fund invests; the midpoint of market capitalization (market price x shares outstanding) of a fund’s stocks, weighted by the proportion of the fund’s assets invested in each stock. Stocks representing half of the fund’s assets have market capitalizations above the median, and the rest are below it.
Price/Book Ratio. The share price of a stock divided by its net worth, or book value, per share. For a fund, the weighted average price/book ratio of the stocks it holds.
69
Price/Earnings Ratio. The ratio of a stock’s current price to its per-share earnings over the past year. For a fund, the weighted average P/E of the stocks it holds. P/E is an indicator of market expectations about corporate prospects; the higher the P/E, the greater the expectations for a company’s future growth.
R-Squared. A measure of how much of a fund’s past returns can be explained by the returns from the market in general, as measured by a given index. If a fund’s total returns were precisely synchronized with an index’s returns, its R-squared would be 1.00. If the fund’s returns bore no relationship to the index’s returns, its R-squared would be 0. For this report, R-squared is based on returns over the past 36 months for both the fund and the index.
Return on Equity. The annual average rate of return generated by a company during the past five years for each dollar of shareholder’s equity (net income divided by shareholder’s equity). For a fund, the weighted average return on equity for the companies whose stocks it holds.
Short-Term Reserves. The percentage of a fund invested in highly liquid, short-term securities that can be readily converted to cash.
Turnover Rate. An indication of the fund’s trading activity. Funds with high turnover rates incur higher transaction costs and may be more likely to distribute capital gains (which may be taxable to investors). The turnover rate excludes in-kind transactions, which have minimal impact on costs.
70
This page intentionally left blank.
The People Who Govern Your Fund
The trustees of your mutual fund are there to see that the fund is operated and managed in your best interests since, as a shareholder, you are a part owner of the fund. Your fund’s trustees also serve on the board of directors of The Vanguard Group, Inc., which is owned by the Vanguard funds and provides services to them on an at-cost basis.
A majority of Vanguard’s board members are independent, meaning that they have no affiliation with Vanguard or the funds they oversee, apart from the sizable personal investments they have made as private individuals. The independent board members have distinguished backgrounds in business, academia, and public service. Each of the trustees and executive officers oversees 194 Vanguard funds.
The following table provides information for each trustee and executive officer of the fund. More information about the trustees is in the Statement of Additional Information, which can be obtained, without charge, by contacting Vanguard at 800-662-7447, or online at vanguard.com.
| InterestedTrustee1 | Rajiv L. Gupta |
| Born 1945. Trustee Since December 2001.2 Principal | |
| F. William McNabb III | Occupation(s) During the Past Five Years and Other |
| Born 1957. Trustee Since July 2009. Chairman of | Experience: Chairman and Chief Executive Officer |
| the Board. Principal Occupation(s) During the Past | (retired 2009) and President (2006–2008) of |
| Five Years and Other Experience: Chairman of the | Rohm and Haas Co. (chemicals); Director of Tyco |
| Board of The Vanguard Group, Inc., and of each of | International PLC (diversified manufacturing and |
| the investment companies served by The Vanguard | services), Hewlett-Packard Co. (electronic computer |
| Group, since January 2010; Director of The Vanguard | manufacturing), and Delphi Automotive PLC |
| Group since 2008; Chief Executive Officer and | (automotive components); Senior Advisor at New |
| President of The Vanguard Group, and of each of | Mountain Capital. |
| the investment companies served by The Vanguard | |
| Group, since 2008; Director of Vanguard Marketing | Amy Gutmann |
| Corporation; Managing Director of The Vanguard | Born 1949. Trustee Since June 2006. Principal |
| Group (1995–2008). | Occupation(s) During the Past Five Years and |
| Other Experience: President of the University of | |
| IndependentTrustees | Pennsylvania; Christopher H. Browne Distinguished |
| Professor of Political Science, School of Arts and | |
| Emerson U. Fullwood | Sciences, and Professor of Communication, Annenberg |
| Born 1948. Trustee Since January 2008. Principal | School for Communication, with secondary faculty |
| Occupation(s) During the Past Five Years and | appointments in the Department of Philosophy, School |
| Other Experience: Executive Chief Staff and | of Arts and Sciences, and at the Graduate School of |
| Marketing Officer for North America and Corporate | Education, University of Pennsylvania; Trustee of the |
| Vice President (retired 2008) of Xerox Corporation | National Constitution Center; Chair of the Presidential |
| (document management products and services); | Commission for the Study of Bioethical Issues. |
| Executive in Residence and 2009–2010 Distinguished | |
| Minett Professor at the Rochester Institute of | JoAnn Heffernan Heisen |
| Technology; Director of SPX Corporation (multi-industry | Born 1950. Trustee Since July 1998. Principal |
| manufacturing), the United Way of Rochester, | Occupation(s) During the Past Five Years and Other |
| Amerigroup Corporation (managed health care), the | Experience: Corporate Vice President and Chief |
| University of Rochester Medical Center, Monroe | Global Diversity Officer (retired 2008) and Member |
| Community College Foundation, and North Carolina | of the Executive Committee (1997–2008) of Johnson |
| A&T University. | & Johnson (pharmaceuticals/medical devices/ |
| consumer products); Director of Skytop Lodge | |
| Corporation (hotels), the University Medical Center | |
| at Princeton, the Robert Wood Johnson Foundation, | |
| and the Center for Talent Innovation; Member of | |
| the Advisory Board of the Institute for Women’s | |
| Leadership at Rutgers University. |
| F. Joseph Loughrey | Executive Officers | |
| Born 1949. Trustee Since October 2009. Principal | ||
| Occupation(s) During the Past Five Years and Other | Glenn Booraem | |
| Experience: President and Chief Operating Officer | Born 1967. Treasurer Since May 2015. Principal | |
| (retired 2009) of Cummins Inc. (industrial machinery); | Occupation(s) During the Past Five Years and | |
| Chairman of the Board of Hillenbrand, Inc. (specialized | Other Experience: Principal of The Vanguard Group, | |
| consumer services), and of Oxfam America; Director | Inc.; Treasurer of each of the investment companies | |
| of SKF AB (industrial machinery), Hyster-Yale Materials | served by The Vanguard Group; Controller of each of | |
| Handling, Inc. (forklift trucks), the Lumina Foundation | the investment companies served by The Vanguard | |
| for Education, and the V Foundation for Cancer | Group (2010–2015); Assistant Controller of each of | |
| Research; Member of the Advisory Council for the | the investment companies served by The Vanguard | |
| College of Arts and Letters and of the Advisory Board | Group (2001–2010). | |
| to the Kellogg Institute for International Studies, both | ||
| at the University of Notre Dame. | Thomas J. Higgins | |
| Born 1957. Chief Financial Officer Since September | ||
| Mark Loughridge | 2008. Principal Occupation(s) During the Past Five | |
| Born 1953. Trustee Since March 2012. Principal | Years and Other Experience: Principal of The Vanguard | |
| Occupation(s) During the Past Five Years and Other | Group, Inc.; Chief Financial Officer of each of the | |
| Experience: Senior Vice President and Chief Financial | investment companies served by The Vanguard Group; | |
| Officer (retired 2013) at IBM (information technology | Treasurer of each of the investment companies served | |
| services); Fiduciary Member of IBM’s Retirement Plan | by The Vanguard Group (1998–2008). | |
| Committee (2004–2013); Director of the Dow Chemical | ||
| Company; Member of the Council on Chicago Booth. | Peter Mahoney | |
| Born 1974. Controller Since May 2015. Principal | ||
| Scott C. Malpass | Occupation(s) During the Past Five Years and | |
| Born 1962. Trustee Since March 2012. Principal | Other Experience: Head of Global Fund Accounting | |
| Occupation(s) During the Past Five Years and Other | at The Vanguard Group, Inc.; Controller of each of the | |
| Experience: Chief Investment Officer and Vice | investment companies served by The Vanguard Group; | |
| President at the University of Notre Dame; Assistant | Head of International Fund Services at The Vanguard | |
| Professor of Finance at the Mendoza College of | Group (2008–2014). | |
| Business at Notre Dame; Member of the Notre Dame | ||
| 403(b) Investment Committee; Board Member of | Heidi Stam | |
| TIFF Advisory Services, Inc., and Catholic Investment | Born 1956. Secretary Since July 2005. Principal | |
| Services, Inc. (investment advisors); Member of | Occupation(s) During the Past Five Years and Other | |
| the Investment Advisory Committee of Major | Experience: Managing Director of The Vanguard | |
| League Baseball. | Group, Inc.; General Counsel of The Vanguard Group; | |
| Secretary of The Vanguard Group and of each of the | ||
| André F. Perold | investment companies served by The Vanguard Group; | |
| Born 1952. Trustee Since December 2004. Principal | Director and Senior Vice President of Vanguard | |
| Occupation(s) During the Past Five Years and Other | Marketing Corporation. | |
| Experience: George Gund Professor of Finance and | ||
| Banking, Emeritus at the Harvard Business School | Vanguard Senior ManagementTeam | |
| (retired 2011); Chief Investment Officer and Managing | Mortimer J. Buckley | Chris D. McIsaac |
| Partner of HighVista Strategies LLC (private investment | Kathleen C. Gubanich | James M. Norris |
| firm); Director of Rand Merchant Bank; Overseer of | Paul A. Heller | Thomas M. Rampulla |
| the Museum of Fine Arts Boston. | Martha G. King | Glenn W. Reed |
| John T. Marcante | Karin A. Risi | |
| Peter F. Volanakis | ||
| Born 1955. Trustee Since July 2009. Principal | ||
| Occupation(s) During the Past Five Years and Other | Chairman Emeritus and Senior Advisor | |
| Experience: President and Chief Operating Officer | ||
| (retired 2010) of Corning Incorporated (communications | John J. Brennan | |
| equipment); Trustee of Colby-Sawyer College; | Chairman, 1996–2009 | |
| Member of the Advisory Board of the Norris Cotton | Chief Executive Officer and President, 1996–2008 | |
| Cancer Center and of the Advisory Board of the | ||
| Parthenon Group (strategy consulting). | ||
| Founder | ||
| John C. Bogle | ||
| Chairman and Chief Executive Officer, 1974–1996 | ||
1 Mr. McNabb is considered an “interested person,” as defined in the Investment Company Act of 1940, because he is an officer of the Vanguard funds.
2 December 2002 for Vanguard Equity Income Fund, the Vanguard Municipal Bond Funds, and the Vanguard State Tax-Exempt Funds.
 | |
| P.O. Box 2600 | |
| Valley Forge, PA 19482-2600 | |
| Connect with Vanguard® > vanguard.com | |
| Fund Information > 800-662-7447 | The index is a product of S&P Dow Jones Indices LLC |
| Direct Investor Account Services > 800-662-2739 | (“SPDJI”), and has been licensed for use by Vanguard. |
| Standard & Poor’s® and S&P® are registered | |
| Institutional Investor Services > 800-523-1036 | trademarks of Standard & Poor’s Financial Services LLC |
| Text Telephone for People | (“S&P”); Dow Jones® is a registered trademark of Dow |
| Who Are Deaf or Hard of Hearing> 800-749-7273 | Jones Trademark Holdings LLC (“Dow Jones”); S&P® |
| and S&P 500® are trademarks of S&P; and these | |
| This material may be used in conjunction | trademarks have been licensed for use by SPDJI and |
| with the offering of shares of any Vanguard | sublicensed for certain purposes by Vanguard. |
| fund only if preceded or accompanied by | Vanguard product(s) are not sponsored, endorsed, sold |
| the fund’s current prospectus. | or promoted by SPDJI, Dow Jones, S&P, or their |
| respective affiliates and none of such parties make any | |
| All comparative mutual fund data are from Lipper, a | representation regarding the advisability of investing in |
| Thomson Reuters Company, or Morningstar, Inc., unless | such product(s) nor do they have any liability for any |
| otherwise noted. | errors, omissions, or interruptions of the index. |
| You can obtain a free copy of Vanguard’s proxy voting | |
| guidelines by visiting vanguard.com/proxyreporting or by | |
| calling Vanguard at 800-662-2739. The guidelines are | |
| also available from the SEC’s website, sec.gov. In | |
| addition, you may obtain a free report on how your fund | |
| voted the proxies for securities it owned during the 12 | |
| months ended June 30. To get the report, visit either | |
| vanguard.com/proxyreporting or sec.gov. | |
| You can review and copy information about your fund at | |
| the SEC’s Public Reference Room in Washington, D.C. To | |
| find out more about this public service, call the SEC at | |
| 202-551-8090. Information about your fund is also | |
| available on the SEC’s website, and you can receive | |
| copies of this information, for a fee, by sending a | |
| request in either of two ways: via email addressed to | |
| publicinfo@sec.gov or via regular mail addressed to the | |
| Public Reference Section, Securities and Exchange | |
| Commission, Washington, DC 20549-1520. | |
| © 2015 The Vanguard Group, Inc. | |
| All rights reserved. | |
| Vanguard Marketing Corporation, Distributor. | |
| Q18450 102015 | |
Item 2: Code of Ethics. The Registrant has adopted a code of ethics that applies to the Registrant’s principal executive officer, principal financial officer, principal accounting officer or controller or persons performing similar functions. The Code of Ethics was amended during the reporting period covered by this report to make certain technical, non-material changes.
Item 3: Audit Committee Financial Expert. The following members of the Audit Committee have been determined by the Registrant’s Board of Trustees to be Audit Committee Financial Experts serving on its Audit Committee, and to be independent: Rajiv L. Gupta, Amy Gutmann, JoAnn Heffernan Heisen, F. Joseph Loughrey, Mark Loughridge, Scott C. Malpass, and André F. Perold.
Item 4: Principal Accountant Fees and Services.
(a) Audit Fees.
Audit Fees of the Registrant
Fiscal Year Ended August 31, 2015: $229,000
Fiscal Year Ended August 31, 2014: $212,000
Aggregate Audit Fees of Registered Investment Companies in the Vanguard Group.
Fiscal Year Ended August 31, 2015: $7,000,200
Fiscal Year Ended August 31, 2014: $6,605,127
Includes fees billed in connection with audits of the Registrant, other registered investment companies in the Vanguard complex, The Vanguard Group, Inc. and Vanguard Marketing Corporation.
(b) Audit-Related Fees.
Fiscal Year Ended August 31, 2015: $2,899,096
Fiscal Year Ended August 31, 2014: $2,176,479
Includes fees billed in connection with assurance and related services provided to the Registrant, other registered investment companies in the Vanguard complex, The Vanguard Group, Inc., and Vanguard Marketing Corporation.
(c) Tax Fees.
Fiscal Year Ended August 31, 2015: $353,389
Fiscal Year Ended August 31, 2014: $316,869
Includes fees billed in connection with tax compliance, planning, and advice services provided to the Registrant, other registered investment companies in the Vanguard complex, The Vanguard Group, Inc., and Vanguard Marketing Corporation.
(d) All Other Fees.
Fiscal Year Ended August 31, 2015: $202,313
Fiscal Year Ended August 31, 2014: $198,163
Includes fees billed for services related to tax reported information provided to the Registrant, other registered investment companies in the Vanguard complex, The Vanguard Group, Inc., and Vanguard Marketing Corporation.
(e) (1) Pre-Approval Policies. The policy of the Registrant’s Audit Committee is to consider and, if appropriate, approve before the principal accountant is engaged for such services, all specific audit and non-audit services provided to: the Registrant, other registered investment companies in the Vanguard complex, The Vanguard Group, Inc., and entities controlled by The Vanguard Group, Inc. that provide ongoing services to the Registrant. In making a determination, the Audit Committee considers whether the services are consistent with maintaining the principal accountant’s independence.
In the event of a contingency situation in which the principal accountant is needed to provide services in between scheduled Audit Committee meetings, the Chairman of the Audit Committee would be called on to consider and, if appropriate, pre-approve audit or permitted non-audit services in an amount sufficient to complete services through the next Audit Committee meeting, and to determine if such services would be consistent with maintaining the accountant’s independence. At the next scheduled Audit Committee meeting, services and fees would be presented to the Audit Committee for formal consideration, and, if appropriate, approval by the entire Audit Committee. The Audit Committee would again consider whether such services and fees are consistent with maintaining the principal accountant’s independence.
The Registrant’s Audit Committee is informed at least annually of all audit and non-audit services provided by the principal accountant to the Vanguard complex, whether such services are provided to: the Registrant, other registered investment companies in the Vanguard complex, The Vanguard Group, Inc., or other entities controlled by The Vanguard Group, Inc. that provide ongoing services to the Registrant.
(2) No percentage of the principal accountant’s fees or services were approved pursuant to the waiver provision of paragraph (c)(7)(i)(C) of Rule 2-01 of Regulation S-X.
(f) For the most recent fiscal year, over 50% of the hours worked under the principal accountant’s engagement were not performed by persons other than full-time, permanent employees of the principal accountant.
(g) Aggregate Non-Audit Fees.
Fiscal Year Ended August 31, 2015: $555,702
Fiscal Year Ended August 31, 2014: $515,032
Includes fees billed for non-audit services provided to the Registrant, other registered investment companies in the Vanguard complex, The Vanguard Group, Inc., and Vanguard Marketing Corporation.
(h) For the most recent fiscal year, the Audit Committee has determined that the provision of all non-audit services was consistent with maintaining the principal accountant’s independence.
Item 5: Audit Committee of Listed Registrants.
The Registrant is a listed issuer as defined in rule 10A-3 under the Securities Exchange Act of 1934 (“Exchange Act”). The Registrant has a separately-designated standing audit committee established in accordance with Section 3(a)(58)(A) of the Exchange Act. The Registrant’s audit committee members are: Emerson U. Fullwood, Rajiv L. Gupta, Amy Gutmann, JoAnn Heffernan Heisen, F. Joseph Loughrey, Mark Loughridge, Scott C. Malpass, André F. Perold, and Peter F. Volanakis.
Item 6: Investments.
Not Applicable.
Item 7: Disclosure of Proxy Voting Policies and Procedures for Closed-End Management Investment Companies.
Not Applicable.
Item 8: Portfolio Managers of Closed-End Management Investment Companies.
Not Applicable.
Item 9: Purchase of Equity Securities by Closed-End Management Investment Company and Affiliated Purchasers.
Not Applicable.
Item 10: Submission of Matters to a Vote of Security Holders.
Not Applicable.
Item 11: Controls and Procedures.
(a) Disclosure Controls and Procedures. The Principal Executive and Financial Officers concluded that the Registrant’s Disclosure Controls and Procedures are effective based on their evaluation of the Disclosure Controls and Procedures as of a date within 90 days of the filing date of this report.
(b) Internal Control Over Financial Reporting. There were no significant changes in Registrant’s Internal Control Over Financial Reporting or in other factors that could significantly affect this control subsequent to the date of the evaluation, including any corrective actions with regard to significant deficiencies and material weaknesses.
Item 12: Exhibits.
(a) Code of Ethics.
(b) Certifications.
Pursuant to the requirements of the Securities Exchange Act of 1934 and the Investment Company Act of 1940, the registrant has duly caused this report to be signed on its behalf by the undersigned, thereunto duly authorized.
| VANGUARD ADMIRAL FUNDS | |
| BY: | /s/ F. WILLIAM MCNABB III* |
| F. WILLIAM MCNABB III | |
| CHIEF EXECUTIVE OFFICER | |
| Date: October 16, 2015 | |
Pursuant to the requirements of the Securities Exchange Act of 1934 and the Investment Company Act of 1940, this report has been signed below by the following persons on behalf of the registrant and in the capacities and on the dates indicated.
| VANGUARD ADMIRAL FUNDS | |
| BY: | /s/ F. WILLIAM MCNABB III* |
| F. WILLIAM MCNABB III | |
| CHIEF EXECUTIVE OFFICER | |
Date: October 16, 2015 | |
| VANGUARD ADMIRAL FUNDS |
BY: | /s/ THOMAS J. HIGGINS* |
| THOMAS J. HIGGINS | |
| CHIEF FINANCIAL OFFICER | |
Date: October 16, 2015 | |
* By: /s/ Heidi Stam
Heidi Stam, pursuant to a Power of Attorney filed on April 22, 2014 see file Number 2-17620, Incorporated by Reference.