UNITED STATES
SECURITIES AND EXCHANGE COMMISSION
Washington, D.C. 20549
FORM N-CSR
CERTIFIED SHAREHOLDER REPORT
OF
REGISTERED MANAGEMENT INVESTMENT COMPANIES
| Investment Company Act file number: 811-07043 | ||
Name of Registrant: | Vanguard Admiral Funds | |
Address of Registrant: | P.O. Box 2600 | |
| Valley Forge, PA 19482 | ||
Name and address of agent for service: | Anne E. Robinson, Esquire P.O. Box 876 Valley Forge, PA 19482 | |
Registrant’s telephone number, including area code: (610) 669-1000 | ||
Date of fiscal year end: August 31 | ||
Date of reporting period: September 1, 2016 – August 31, 2017 | ||
Item 1: Reports to Shareholders | ||
Annual Report | August 31, 2017
Vanguard Money Market Funds
Vanguard Prime Money Market Fund
Vanguard Federal Money Market Fund
Vanguard Treasury Money Market Fund
Vanguard’s Principles for Investing Success
We want to give you the best chance of investment success. These principles, grounded in Vanguard’s research and experience, can put you on the right path.
Goals. Create clear, appropriate investment goals.
Balance. Develop a suitable asset allocation using broadly diversified funds. Cost. Minimize cost.
Discipline. Maintain perspective and long-term discipline.
A single theme unites these principles: Focus on the things you can control.
We believe there is no wiser course for any investor.
| Contents | |
| Your Fund’s Performance at a Glance. | 1 |
| Chairman’s Perspective. | 3 |
| Advisor’s Report. | 7 |
| Prime Money Market Fund. | 10 |
| Federal Money Market Fund. | 29 |
| Treasury Money Market Fund. | 43 |
| About Your Fund’s Expenses. | 55 |
| Trustees Approve Advisory Arrangements. | 57 |
| Glossary. | 59 |
Please note: The opinions expressed in this report are just that—informed opinions. They should not be considered promises or advice. Also, please keep in mind that the information and opinions cover the period through the date on the front of this report. Of course, the risks of investing in your fund are spelled out in the prospectus.
See the Glossary for definitions of investment terms used in this report.
About the cover: Nautical images have been part of Vanguard’s rich heritage since its start in 1975. For an incoming ship, a lighthouse offers a beacon and safe path to shore. You can similarly depend on Vanguard to put you first––and light the way––as you strive to meet your financial goals. Our client focus and low costs, stemming from our unique ownership structure, assure that your interests are paramount.
Your Fund’s Performance at a Glance
• For the 12 months ended August 31, 2017, Investor Shares of Vanguard Prime Money Market Fund returned 0.83%, while Admiral Shares, with their lower expense ratio, returned 0.89%. Vanguard Federal Money Market Fund returned 0.57% and Vanguard Treasury Money Market Fund returned 0.54%. The results for all three funds exceeded the average returns of their peer groups.
• During the 12 months, the Federal Reserve raised the federal funds rate three times, pushing its target range to 1%–1.25%. It also signaled it would begin trimming its $4.5 trillion balance sheet.
• The period also coincided with the final implementation of new money market regulations. Under the rules, all three funds covered by this report seek to maintain a stable net asset value of $1 per share.
• Toward the end of the period, the funds made portfolio moves that helped insulate them from a spike in rates that occurred in the wake of a debt-ceiling debate.
| Total Returns: Fiscal Year Ended August 31, 2017 | ||
| 7-Day SEC | Total | |
| Yield | Returns | |
| Vanguard Prime Money Market Fund | ||
| Investor Shares | 1.10% | 0.83% |
| Admiral™ Shares | 1.16 | 0.89 |
| Money Market Funds Average | 0.43 |
Money Market Funds Average: Derived from data provided by Lipper, a Thomson Reuters Company. In April 2017, the Institutional Money Market Funds Average was replaced with the Money Market Funds Average.
| ||
| Vanguard Federal Money Market Fund | 0.97% | 0.57% |
| Government Money Market Funds Average | 0.19 | |
| Government Money Market Funds Average: Derived from data provided by Lipper, a Thomson Reuters Company. | ||
| Vanguard Treasury Money Market Fund | 0.93% | 0.54% |
| iMoneyNet Money Fund Report’s 100% Treasury Funds Average | 0.19 | |
iMoneyNet Money Fund Report’s 100% Treasury Funds Average: Derived from data provided by iMoneyNet, Inc.
The 7-day SEC yield of a money market fund more closely reflects the current earnings of the fund than its total return.
Admiral Shares carry lower expenses and are available to investors who meet certain account-balance requirements.
1
| Total Returns: Ten Years Ended August 31, 2017 | |
| Average | |
| Annual Return | |
| Prime Money Market Fund Investor Shares | 0.62% |
| Money Market Funds Average | 0.41 |
| Money Market Funds Average: Derived from data provided by Lipper, a Thomson Reuters Company. | |
| Federal Money Market Fund | 0.54% |
| Government Money Market Funds Average | 0.33 |
| Government Money Market Funds Average: Derived from data provided by Lipper, a Thomson Reuters Company. | |
| Treasury Money Market Fund | 0.45% |
| iMoneyNet Money Fund Report’s 100% Treasury Funds Average | 0.24 |
| iMoneyNet Money Fund Report’s 100% Treasury Funds Average: Derived from data provided by iMoneyNet, Inc. |
Investment returns will fluctuate. All of the returns in this report represent past performance, which is not a guarantee of future results that may be achieved by the funds. (Current performance may be lower or higher than
the performance data cited. For performance data current to the most recent month-end, visit our website at vanguard.com/performance.)
| Expense Ratios | ||
| Your Fund Compared With Its Peer Group | ||
| Peer Group | ||
| Fund | Average | |
| Prime Money Market Fund | ||
| Investor Shares | 0.16% | 0.32% |
| Admiral Shares | 0.10 | 0.32 |
| Federal Money Market Fund | 0.11 | 0.26 |
| Treasury Money Market Fund | 0.09 | 0.16 |
The fund expense ratios shown are from the prospectus dated December 23, 2016, and represent estimated costs for the current fiscal
year. For the fiscal year ended August 31, 2017, the funds’ expense ratios were: for the Prime Money Market Fund, 0.16% for Investor
Shares and 0.10% for Admiral Shares; for the Federal Money Market Fund, 0.11%; and for the Treasury Money Market Fund, 0.09%.
Peer groups: For the Prime Money Market Fund Investor Shares and Admiral Shares, Money Market Funds; for the Federal Money Market
Fund, Government Money Market Funds; and for the Treasury Money Market Fund, iMoneyNet Money Fund Report’s 100% Treasury
Funds.
2
Chairman’s Perspective

Bill McNabb
Chairman and Chief Executive Officer
Dear Shareholder,
Since mid-August we’ve been reaching out to you about the proposals put forth by the Vanguard funds that, if approved, will enable us to manage the funds more efficiently and effectively. As the November deadline for voting approaches, I’d like to offer some perspective on a few of the proposals that I believe are important to the way Vanguard operates and manages your investments. I hope you consider this information and promptly cast your ballot.
Your biggest advocate
The main driver for this proxy solicitation is to ask all our fund shareholders to elect a full slate of trustees who oversee each U.S.-based Vanguard mutual fund. These trustees serve an important role, making sure your funds are managed in your best interests. This includes monitoring fund performance, approving advisory agreements, and ensuring that we’re keeping your investment costs as low as possible. Simply put, they are your biggest advocate.
Each trustee brings a variety of skills and professional experiences that contribute to the board’s strength and diversity.
Of the 12 nominees, nine currently serve on the board, and three are new. If elected, the new board would include ten independent members, meaning they have no affiliation with Vanguard or the funds apart from any investments they may choose to make as private individuals.
3
These are the proposed new trustees:
• Sarah Bloom Raskin is a former member of the Federal Reserve Board of Governors and former deputy secretary of the U.S. Treasury Department. She is an expert in cybersecurity—a critically important issue at Vanguard, as we place a premium on protecting clients’ assets and sensitive data.
• Deanna Mulligan is chief executive officer of The Guardian Life Insurance Company of America. It’s rare to find a CEO such as Deanna who leads a company with a mutual ownership structure similar to Vanguard’s.
• Tim Buckley is president and a director of Vanguard and will succeed me in January as CEO. (I’ll remain chairman for a period to be determined by the board.) I interviewed Tim when he applied for his first job here in 1991 and again when he was graduating from Harvard Business School. I was thrilled he picked Vanguard as a place to build his career, and I’ve been delighted to see him take on several leadership positions, including as head of our Retail Investor Group, chief information officer, and chief investment officer. I can think of no one better prepared to succeed me.
| Market Barometer | |||
| Average Annual Total Returns | |||
| Periods Ended August 31, 2017 | |||
| One Year | Three Years | Five Years | |
| Stocks | |||
| Russell 1000 Index (Large-caps) | 16.16% | 9.21% | 14.37% |
| Russell 2000 Index (Small-caps) | 14.91 | 7.67 | 13.15 |
| Russell 3000 Index (Broad U.S. market) | 16.06 | 9.08 | 14.27 |
| FTSE All-World ex US Index (International) | 18.74 | 2.80 | 7.76 |
| Bonds | |||
| Bloomberg Barclays U.S. Aggregate Bond Index | |||
| (Broad taxable market) | 0.49% | 2.64% | 2.19% |
| Bloomberg Barclays Municipal Bond Index | |||
| (Broad tax-exempt market) | 0.88 | 3.40 | 3.23 |
| Citigroup Three-Month U.S. Treasury Bill Index | 0.58 | 0.25 | 0.16 |
| CPI | |||
| Consumer Price Index | 1.94% | 1.06% | 1.28% |
4
Vanguard believes that diversity of thought, background, and experience, as well as diversity of personal characteristics, meaningfully contributes to the board’s ability to effectively serve shareholders. If Sarah and Deanna are elected, women will account for 40% of the board’s independent trustees.
I should note that even as Vanguard is nominating three new board members, we’re saying goodbye to trustee Rajiv Gupta. Rajiv was a legendary CEO of Rohm and Haas Co., and Vanguard and our clients have benefited greatly from his expertise. I wish him a happy retirement.
Summarizing the proposals
Among the trustees’ leading responsibilities is overseeing the funds’ internal and external investment advisory agreements. The trustees, in consultation with our Global Investment Committee and our Portfolio Review Department, choose the investment advisors that manage client assets. Over decades, we have built a strong track record of picking advisors whose portfolio management strategies have served clients well.
Two proposals in the proxy focus on this oversight responsibility. Shareholders of 48 Vanguard funds have already voted to allow the board to make external advisor changes without obtaining prior shareholder approval. The new proposals would extend that policy across our entire U.S.-based fund lineup and expand it to include internal advisory agreements with Vanguard subsidiaries. Eliminating the need for shareholder approval removes a step that is costly and time-consuming if done frequently or on an individual fund basis. Although there are no current plans to employ the policy on any Vanguard-managed funds, standardizing it enables the trustees to retain an advisory firm to diversify a fund’s management team or ensure management continuity should a contingency arise.
I also encourage shareholders of several specific Vanguard index funds to read the proxy proposals that affect those funds. One proposal would change the investment objective of Vanguard REIT Index Fund and Vanguard Variable Insurance Fund REIT Index Portfolio to include real estate-related securities, aligning the funds with updated industry-sector classification methodology. Another proposal seeks to change the diversification status of the REIT Index Fund to enable it to better track its benchmark. Finally, we seek your approval of the Funds’ Service Agreement for Vanguard Institutional Index Fund and Vanguard Institutional Total Stock Market Index Fund. If approved, this arrangement would then be standardized across Vanguard’s entire publicly available U.S. mutual fund lineup. It should also reduce costs and minimum initial investment requirements in select share classes.
5
At the ballot box
We hope you’ll make it a priority to cast your ballot. We want to avoid the added time and cost of soliciting sufficient votes should we not obtain a quorum by the shareholder meeting on November 15, when voting concludes. Ultimately, we believe the proposals I’ve discussed are in your best interest as Vanguard fund shareholders, and the trustees recommend that you vote in favor of them. For more information, visit vanguard.com and enter the search term “proxy.”
As always, thank you for investing with Vanguard.
Sincerely,

F. William McNabb III
Chairman and Chief Executive Officer
September 14, 2017
6
Advisor’s Report
For the 12 months ended August 31, 2017, Investor Shares of Vanguard Prime Money Market Fund returned 0.83%, while Admiral Shares, with their lower expense ratio, returned 0.89%. Vanguard Federal Money Market Fund returned 0.57% and Vanguard Treasury Money Market Fund 0.54%. The results for all three funds exceeded the average returns of their peer groups.
The investment environment
The period began with a wave of optimism, as investor attention turned from disappointing economic results in early 2016 to stronger-than-expected third-quarter GDP. That enthusiasm gained momentum in the wake of the U.S. presidential election as investors anticipated benefits from the new administration’s policy initiatives focused on tax reform, infrastructure spending, and greater deregulation. That fueled a shift to riskier assets, propelling many bellwether stock indexes to record highs in early 2017.
The Federal Reserve also acknowledged the economy’s strength. In December, it raised the federal funds target rate by a quarter percentage point—only the second increase in a decade. Although 2017 got off to a slow start, it picked up in the spring as consumers opened their wallets and the unemployment rate continued to grind lower. Those developments most likely played a large part in the Fed’s further raising of rates in March and June, which pushed its target range to 1%–1.25%. Those moves, along with the establishment of a framework for trimming its $4.5 trillion balance sheet, took the Fed closer to normalizing monetary policy after its emergency intervention in the wake of the Great Recession.
Inflation measures, on the other hand, disappointed. Annualized core inflation, which had been running at or above 2%, softened a little. In response, the Fed scaled back its 2017 inflation forecast but still expected inflation to move closer to its 2% target over the medium term. Further tightening in the labor market should help, although wage gains have been modest. Continued weakness in the dollar also could eventually feed through to higher prices.
Abroad, many major central banks including the Bank of Japan, the Bank of England, and the European Central Bank remained in accommodative policy mode as they struggled to balance growth and inflation concerns. Even with a weaker U.S. dollar, comparatively low yields across many developed markets kept U.S. bonds attractive to international investors.
The period concluded on an uncertain note, with investors fretting about a possible U.S. government shutdown over a debt-ceiling debate. Because the Fed’s rate moves were telegraphed in advance, the market responded with a measured increase in short-term rates. But the unexpected rhetoric around the debt-ceiling debate led to a sell-off in short-term bonds, causing their yields to spike as your fund’s fiscal year came to a close.
7
The yield of the 3-month U.S. Treasury note increased 66 basis points over the period, to 0.99%. The 2-year yield jumped 52 bps to 1.33%. On the longer end of the curve, the 10-year yield rose 54 bps to 2.12% and the 30-year yield rose 50 bps to 2.73%.
Management of the funds
The start of the fiscal year coincided with final implementation of new money market regulations. In the run-up to the final compliance deadline in October 2016, more than $1 trillion in assets industrywide moved to government money market funds from prime money market funds; that led spreads to widen between short-term government securities and bank certificates of deposit.
In the weeks before the compliance deadline, we took steps to prepare for the volatility, including maintaining the funds’ liquidity in excess of U.S. Securities and Exchange Commission targets and shortening the weighted average maturity. These measures allowed us to provide maximum safety and liquidity. The volatility associated with final implementation has since dissipated.
Throughout the period, we added to the Prime Money Market Fund’s exposure to floating-rate securities. These debt instruments reset, typically every month, at prevailing interest rates. They performed well as the Fed raised rates, generating a large portion of the fund’s returns. We continued to purchase high-quality bonds, such as short-term corporate and bank debt. Some of those bonds were from non-U.S. companies, enhancing the fund’s diversification.
We followed a similar strategy with the Federal Money Market Fund, increasing its exposure to floating-rate agency securities, and with the Treasury Money Market Fund, adding to its floating-rate Treasury securities; these moves allowed us to generate incremental yield while maintaining the funds’ short maturity profiles. We also continued to add to the Federal Money Market Fund’s Treasury exposure.
Across all three funds, as the debt-ceiling debate heated up, we sold Treasuries that were vulnerable to related market volatility. We reallocated those proceeds to other Treasury securities. We are closely monitoring any debt-ceiling developments that may occur later this year that could affect the markets.
A look ahead
Absent any external shocks, the U.S. economy is set to continue on its trajectory of modest but steady growth, with real GDP expanding by about 2% in 2017. The pace could pick up a little next year depending on the timing and size of any fiscal stimulus the government may enact.
We agree with the Fed’s assessment that the recent disinflation is transitory and that we will see consumer prices gradually rise through 2019. The Fed is likely to remain patient and cautious,
8
however, in carrying out monetary tightening. Some Fed officials have indicated they would favor waiting for inflation to reach or even modestly exceed 2% for some time before moving to raise rates more quickly. That could mean we won’t see another rate hike until the second half of 2018, especially if the Fed begins reducing its balance sheet later this year.
David R. Glocke, Principal
Vanguard Fixed Income Group
September 18, 2017
9
Prime Money Market Fund
Fund Profile
As of August 31, 2017
| Financial Attributes | ||
| Investor | Admiral | |
| Shares | Shares | |
| Ticker Symbol | VMMXX | VMRXX |
| Expense Ratio1 | 0.16% | 0.10% |
| 7-Day SEC Yield | 1.10% | 1.16% |
| Average Weighted | ||
| Maturity | 44 days | 44 days |
| Sector Diversification (% of portfolio) | ||
| Certificates of Deposit | 7.3% | |
| U.S. Commercial Paper | 2.2 | |
| Other | 0.1 | |
| Repurchase Agreements | 4.3 | |
| U.S. Government Obligations | 1.6 | |
| U.S. Treasury Bills | 26.2 | |
| Yankee/Foreign | 58.3 | |
The agency and mortgage-backed securities sectors may include issues from government-sponsored enterprises; such issues are generally not backed by the full faith and credit of the U.S. government.
1 The expense ratios shown are from the prospectus dated December 23, 2016, and represent estimated costs for the current fiscal year. For the fiscal year ended August 31, 2017, the expense ratios were 0.16% for Investor Shares and 0.10% for Admiral Shares.
10
Prime Money Market Fund
Performance Summary
Investment returns will fluctuate. All of the returns in this report represent past performance, which is not a guarantee of future results that may be achieved by the fund. (Current performance may be lower or higher than the performance data cited. For performance data current to the most recent month-end, visit our website at vanguard.com/performance.) The returns shown do not reflect taxes that a shareholder would pay on fund distributions. The fund is only available to retail investors (natural persons). You could lose money by investing in the fund. Although the fund seeks to preserve the value of your investment at $1 per share, it cannot guarantee it will do so. The fund may impose a fee upon sale of your shares or may temporarily suspend your ability to sell shares if the fund’s liquidity falls below required minimums because of market conditions or other factors. An investment in the fund is not insured or guaranteed by the Federal Deposit Insurance Corporation or any other government agency. The fund’s sponsor has no legal obligation to provide financial support to the fund, and you should not expect that the sponsor will provide financial support to the fund at any time. The fund’s 7-day SEC yield reflects its current earnings more closely than do the average annual returns.
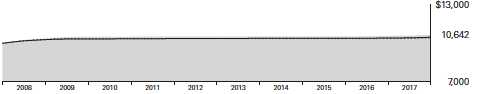
Cumulative Performance: August 31, 2007, Through August 31, 2017
Initial Investment of $10,000
| Average Annual Total Returns | ||||
| Periods Ended August 31, 2017 | ||||
| Final Value | ||||
| One | Five | Ten | of a $10,000 | |
| Year | Years | Years | Investment | |
| Prime Money Market Fund Investor | ||||
| Shares | 0.83% | 0.24% | 0.62% | $10,642 |
| • • • • • • • • Money Market Funds Average | 0.43 | 0.09 | 0.41 | 10,417 |
| Citigroup Three-Month U.S. Treasury | ||||
| Bill Index | 0.58 | 0.16 | 0.44 | 10,444 |
| Money Market Funds Average: Derived from data provided by Lipper, a Thomson Reuters Company. | ||||
See Financial Highlights for dividend information.
11
Prime Money Market Fund
| Average Annual Total Returns | ||||
| Periods Ended August 31, 2017 | ||||
| Final Value | ||||
| One | Five | Ten | of a $5,000,000 | |
| Year | Years | Years | Investment | |
| Prime Money Market Fund Admiral Shares | 0.89% | 0.29% | 0.71% | $5,368,605 |
| Money Market Funds Average | 0.43 | 0.09 | 0.41 | 5,208,500 |
| Citigroup Three-Month U.S. Treasury Bill | ||||
| Index | 0.58 | 0.16 | 0.44 | 5,222,100 |
Fiscal-Year Total Returns (%): August 31, 2007, Through August 31, 2017
| Money | ||
| Market | ||
| Funds | ||
| Investor Shares | Average | |
| Fiscal Year | Total Returns | Total Returns |
| 2008 | 3.60% | 3.02% |
| 2009 | 1.31 | 0.62 |
| 2010 | 0.08 | 0.02 |
| 2011 | 0.06 | 0.00 |
| 2012 | 0.04 | 0.00 |
| 2013 | 0.02 | 0.00 |
| 2014 | 0.02 | 0.00 |
| 2015 | 0.02 | 0.00 |
| 2016 | 0.32 | 0.04 |
| 2017 | 0.83 | 0.43 |
7-day SEC yield (8/31/2017): 1.10%
Money Market Funds Average: Derived from data provided by Lipper, a Thomson Reuters Company.
Average Annual Total Returns: Periods Ended June 30, 2017
This table presents returns through the latest calendar quarter—rather than through the end of the fiscal period.
Securities and Exchange Commission rules require that we provide this information.
| Inception | One | Five | Ten | |
| Date | Year | Years | Years | |
| Investor Shares | 6/4/1975 | 0.72% | 0.20% | 0.69% |
| Admiral Shares | 10/3/1989 | 0.78 | 0.26 | 0.78 |
12
Prime Money Market Fund
Financial Statements
Statement of Net Assets
As of August 31, 2017
The fund reports a complete list of its holdings in various monthly and quarterly regulatory filings. The fund publishes its holdings on a monthly basis at vanguard.com and files them with the Securities and Exchange Commission on Form N-MFP. The fund’s Form N-MFP filings may be viewed at sec.gov or via a link on the “Portfolio Holdings” page on vanguard.com. For the second and fourth fiscal quarters, the lists appear in the fund’s semiannual and annual reports to shareholders. For the first and third fiscal quarters, the fund files the lists with the SEC on Form N-Q. Shareholders can look up the fund’s Forms N-Q on the SEC’s website at sec.gov. Forms N-Q may also be reviewed and copied at the SEC’s Public Reference Room (see the back cover of this report for further information).
| Face | Market | |||||
| Maturity | Amount | Value • | ||||
| Yield1 | Date | ($000) | ($000) | |||
| U.S. Government and Agency Obligations (27.7%) | ||||||
| United States Treasury Bill | 0.949% | 10/19/17 | 599,981 | 599,225 | ||
| United States Treasury Bill | 0.960%–0.965% | 10/26/17 | 1,500,000 | 1,497,806 | ||
| United States Treasury Bill | 0.000%–0.980% | 11/2/17 | 2,490,000 | 2,485,827 | ||
| United States Treasury Bill | 1.020%–1.043% | 11/9/17 | 4,000,000 | 3,992,122 | ||
| United States Treasury Bill | 1.025% | 11/16/17 | 1,591,090 | 1,587,664 | ||
| United States Treasury Bill | 1.056% | 11/24/17 | 2,500,000 | 2,493,875 | ||
| United States Treasury Bill | 1.066% | 11/30/17 | 2,000,000 | 1,994,700 | ||
| United States Treasury Bill | 1.103%–1.106% | 12/7/17 | 700,000 | 697,928 | ||
| United States Treasury Bill | 1.116% | 12/28/17 | 1,000,000 | 996,362 | ||
| United States Treasury Bill | 1.136% | 1/4/18 | 2,000,000 | 1,992,153 | ||
| United States Treasury Bill | 1.131% | 1/11/18 | 1,500,000 | 1,493,812 | ||
| United States Treasury Bill | 1.111% | 1/18/18 | 1,500,000 | 1,493,600 | ||
| United States Treasury Bill | 1.121% | 2/15/18 | 2,000,000 | 1,989,655 | ||
| United States Treasury Bill | 1.121% | 3/1/18 | 2,000,000 | 1,988,788 | ||
| 2 | United States Treasury Floating Rate Note | 1.193% | 10/31/18 | 1,500,000 | 1,500,017 | |
| Total U.S. Government and Agency Obligations (Cost $26,803,534) | 26,803,534 | |||||
| Commercial Paper (34.4%) | ||||||
| Bank Holding Company (0.3%) | ||||||
| 3 | ABN Amro Funding USA LLC | 1.235% | 9/15/17 | 119,500 | 119,443 | |
| 3 | ABN Amro Funding USA LLC | 1.225% | 9/21/17 | 173,250 | 173,132 | |
| 292,575 | ||||||
| Finance—Auto (1.0%) | ||||||
| American Honda Finance Corp. | 1.294% | 10/5/17 | 16,550 | 16,530 | ||
| American Honda Finance Corp. | 1.294% | 10/16/17 | 212,300 | 211,958 | ||
| 3 | BMW US Capital LLC | 1.203% | 9/11/17 | 59,500 | 59,480 | |
| 3 | BMW US Capital LLC | 1.194% | 9/14/17 | 86,250 | 86,213 | |
| 3 | BMW US Capital LLC | 1.204% | 9/25/17 | 158,750 | 158,623 | |
| 4 | Toyota Motor Credit Corp. | 1.649% | 9/14/17 | 155,000 | 155,000 | |
| 4 | Toyota Motor Credit Corp. | 1.647% | 9/15/17 | 131,000 | 131,000 | |
| 4 | Toyota Motor Credit Corp. | 1.629% | 10/6/17 | 69,500 | 69,500 | |
| 4 | Toyota Motor Credit Corp. | 1.629% | 10/10/17 | 52,250 | 52,250 | |
| 940,554 | ||||||
13
Prime Money Market Fund
| Face | Market | ||||
| Maturity | Amount | Value • | |||
| Yield1 | Date | ($000) | ($000) | ||
| Finance—Other (0.3%) | |||||
| GE Capital Treasury Services US LLC | 1.147% | 9/13/17 | 100,000 | 99,962 | |
| 4 | GE Capital Treasury Services US LLC | 1.304% | 1/24/18 | 63,500 | 63,500 |
| 4 | GE Capital Treasury Services US LLC | 1.312% | 3/2/18 | 99,000 | 99,000 |
| 262,462 | |||||
| Foreign Banks (28.0%) | |||||
| 3,4 | Australia & New Zealand Banking Group Ltd. | 1.381% | 9/7/17 | 337,250 | 337,250 |
| 3,4 | Australia & New Zealand Banking Group Ltd. | 1.369% | 9/12/17 | 113,750 | 113,748 |
| 3 | Australia & New Zealand Banking Group Ltd. | 1.197% | 10/12/17 | 150,000 | 149,797 |
| 3,4 | Australia & New Zealand Banking Group Ltd. | 1.335% | 1/22/18 | 240,000 | 239,999 |
| 3,4 | Australia & New Zealand Banking Group Ltd. | 1.335% | 1/22/18 | 117,000 | 117,000 |
| 3 | Australia & New Zealand Banking Group Ltd. | 1.395% | 3/1/18 | 99,000 | 98,311 |
| 3,4 | Australia & New Zealand Banking Group Ltd. | 1.351% | 3/21/18 | 156,000 | 156,000 |
| 3,4 | Australia & New Zealand Banking Group Ltd. | 1.344% | 3/22/18 | 121,500 | 121,483 |
| 3,4 | Australia & New Zealand Banking Group Ltd. | 1.381% | 6/21/18 | 156,000 | 156,000 |
| 3,4 | Australia & New Zealand Banking Group Ltd. | 1.384% | 7/26/18 | 63,000 | 62,994 |
| 3,4 | Australia & New Zealand Banking Group Ltd. | 1.392% | 8/2/18 | 107,000 | 107,000 |
| 3,4 | Australia & New Zealand Banking Group Ltd. | 1.389% | 8/7/18 | 240,000 | 240,000 |
| 3,4 | Australia & New Zealand Banking Group Ltd. | 1.389% | 8/8/18 | 89,000 | 88,996 |
| 3,4 | Australia & New Zealand Banking Group Ltd. | 1.389% | 8/9/18 | 118,000 | 118,000 |
| 3,4 | Australia & New Zealand Banking Group Ltd. | 1.397% | 8/14/18 | 161,500 | 161,485 |
| 3 | Bank of Nova Scotia | 1.207% | 10/5/17 | 194,000 | 193,780 |
| 3 | Bank of Nova Scotia | 1.228% | 10/10/17 | 257,750 | 257,409 |
| 3,4 | Bank of Nova Scotia | 1.426% | 10/23/17 | 163,000 | 163,000 |
| 3,4 | Bank of Nova Scotia | 1.401% | 11/10/17 | 258,000 | 258,000 |
| 3,4 | Bank of Nova Scotia | 1.321% | 11/20/17 | 151,500 | 151,500 |
| 3,4 | Bank of Nova Scotia | 1.321% | 12/7/17 | 195,000 | 195,000 |
| 3,4 | Bank of Nova Scotia | 1.345% | 12/22/17 | 156,000 | 156,000 |
| 3,4 | Bank of Nova Scotia | 1.342% | 1/2/18 | 185,000 | 185,000 |
| 3 | Bank Nederlandse Gemeenten NV | 1.180% | 9/1/17 | 418,500 | 418,500 |
| 3 | Bank Nederlandse Gemeenten NV | 1.190% | 9/5/17 | 193,500 | 193,474 |
| BNP Paribas SA (New York Branch) | 1.140% | 9/5/17 | 644,000 | 643,918 | |
| 3 | Canadian Imperial Bank of Commerce | 1.228% | 9/28/17 | 485,500 | 485,056 |
| 3,4 | Canadian Imperial Bank of Commerce | 1.364% | 2/26/18 | 378,000 | 378,000 |
| 3,4 | Commonwealth Bank of Australia | 1.916% | 9/25/17 | 134,250 | 134,250 |
| 3,4 | Commonwealth Bank of Australia | 1.748% | 1/12/18 | 75,000 | 75,000 |
| 3,4 | Commonwealth Bank of Australia | 1.702% | 1/25/18 | 248,000 | 248,000 |
| 3,4 | Commonwealth Bank of Australia | 1.702% | 1/29/18 | 182,000 | 182,000 |
| 3,4 | Commonwealth Bank of Australia | 1.594% | 2/26/18 | 63,000 | 63,000 |
| 3,4 | Commonwealth Bank of Australia | 1.572% | 3/1/18 | 100,000 | 100,000 |
| 3,4 | Commonwealth Bank of Australia | 1.572% | 3/2/18 | 350,000 | 349,990 |
| 3,4 | Commonwealth Bank of Australia | 1.429% | 5/11/18 | 100,000 | 100,000 |
| 3,4 | Commonwealth Bank of Australia | 1.428% | 5/17/18 | 148,000 | 148,000 |
| 3,4 | Commonwealth Bank of Australia | 1.428% | 5/18/18 | 99,000 | 99,000 |
| 3,4 | Commonwealth Bank of Australia | 1.391% | 6/4/18 | 99,000 | 98,996 |
| 3,4 | Commonwealth Bank of Australia | 1.387% | 6/15/18 | 99,000 | 99,000 |
| 3,4 | Commonwealth Bank of Australia | 1.399% | 7/13/18 | 300,000 | 300,000 |
| 3,4 | Commonwealth Bank of Australia | 1.399% | 8/2/18 | 132,000 | 131,988 |
| 3,4 | Commonwealth Bank of Australia | 1.399% | 8/3/18 | 110,000 | 110,000 |
| 3,4 | Commonwealth Bank of Australia | 1.409% | 8/9/18 | 268,000 | 268,000 |
| Credit Agricole Corporate and Investment | |||||
| Bank (New York) | 1.080% | 9/1/17 | 1,935,000 | 1,935,000 | |
| 3 | Danske Corp. | 1.194% | 9/5/17 | 50,500 | 50,493 |
| 3 | Danske Corp. | 1.194% | 9/6/17 | 205,500 | 205,466 |
14
Prime Money Market Fund
| Face | Market | ||||
| Maturity | Amount | Value • | |||
| Yield1 | Date | ($000) | ($000) | ||
| 3 | Danske Corp. | 1.194% | 9/7/17 | 56,970 | 56,959 |
| 3 | Danske Corp. | 1.244% | 9/8/17 | 230,000 | 229,945 |
| 3 | Danske Corp. | 1.244% | 9/14/17 | 439,000 | 438,803 |
| 3 | Danske Corp. | 1.244% | 9/15/17 | 260,000 | 259,875 |
| 3 | Danske Corp. | 1.325% | 11/10/17 | 78,950 | 78,747 |
| 3 | Danske Corp. | 1.314% | 11/28/17 | 45,000 | 44,856 |
| 3 | Danske Corp. | 1.314% | 11/29/17 | 290,000 | 289,061 |
| 3 | DNB Bank ASA | 1.165% | 9/15/17 | 250,000 | 249,887 |
| 3 | DNB Bank ASA | 1.165% | 9/18/17 | 250,000 | 249,863 |
| 3,4 | DNB Bank ASA | 1.318% | 11/16/17 | 475,000 | 475,000 |
| 3 | DNB Bank ASA | 1.314% | 12/11/17 | 495,000 | 493,188 |
| 3 | DNB Bank ASA | 1.314% | 12/13/17 | 500,000 | 498,133 |
| 3,4 | HSBC Bank plc | 1.481% | 12/20/17 | 305,500 | 305,500 |
| 3,4 | HSBC Bank plc | 1.561% | 3/19/18 | 160,750 | 160,750 |
| 3,4 | HSBC Bank plc | 1.466% | 4/24/18 | 110,000 | 110,000 |
| 3,4 | HSBC Bank plc | 1.464% | 4/25/18 | 63,000 | 63,000 |
| ING US Funding LLC | 1.225% | 9/21/17 | 495,000 | 494,665 | |
| ING US Funding LLC | 1.225% | 9/22/17 | 500,000 | 499,644 | |
| 3,4 | National Australia Bank Ltd. | 1.679% | 9/8/17 | 600,000 | 600,000 |
| 3,4 | National Australia Bank Ltd. | 1.474% | 11/28/17 | 484,000 | 484,000 |
| 3,4 | National Australia Bank Ltd. | 1.402% | 1/3/18 | 283,000 | 283,000 |
| 3,4 | National Australia Bank Ltd. | 1.331% | 1/19/18 | 360,000 | 360,000 |
| 3,4 | National Australia Bank Ltd. | 1.339% | 2/12/18 | 100,000 | 100,000 |
| 3,4 | National Australia Bank Ltd. | 1.386% | 5/30/18 | 186,000 | 186,000 |
| 3,4 | National Australia Bank Ltd. | 1.389% | 5/31/18 | 160,000 | 160,000 |
| Natixis (New York Branch) | 1.180% | 9/5/17 | 1,000,000 | 999,869 | |
| 3 | Nederlandse Waterschapsbank NV | 1.190% | 9/6/17 | 512,000 | 511,915 |
| 3 | Nordea Bank AB | 1.192% | 9/13/17 | 500,000 | 499,803 |
| 3 | Nordea Bank AB | 1.182% | 9/20/17 | 500,000 | 499,690 |
| 3 | Nordea Bank AB | 1.182% | 10/4/17 | 550,000 | 549,408 |
| 3 | Nordea Bank AB | 1.279% | 12/4/17 | 47,350 | 47,193 |
| 3 | Nordea Bank AB | 1.323% | 12/22/17 | 400,000 | 398,360 |
| 3 | Nordea Bank AB | 1.395% | 3/1/18 | 190,000 | 188,677 |
| 3 | Svenska Handelsbanken AB | 1.270% | 11/28/17 | 445,750 | 444,377 |
| 3 | Svenska Handelsbanken AB | 1.270% | 11/29/17 | 385,250 | 384,050 |
| Swedbank AB | 1.180% | 9/11/17 | 200,000 | 199,935 | |
| Swedbank AB | 1.180% | 9/12/17 | 180,000 | 179,935 | |
| Swedbank AB | 1.180% | 9/13/17 | 163,000 | 162,936 | |
| Swedbank AB | 1.180% | 9/14/17 | 163,000 | 162,931 | |
| Swedbank AB | 1.180% | 9/15/17 | 163,000 | 162,926 | |
| Swedbank AB | 1.306% | 11/6/17 | 200,000 | 199,523 | |
| Swedbank AB | 1.306% | 11/7/17 | 200,000 | 199,516 | |
| Swedbank AB | 1.331% | 11/27/17 | 200,000 | 199,360 | |
| Swedbank AB | 1.331% | 11/28/17 | 120,000 | 119,611 | |
| Swedbank AB | 1.331% | 11/29/17 | 50,200 | 50,036 | |
| Swedbank AB | 1.321% | 12/27/17 | 159,000 | 158,321 | |
| Swedbank AB | 1.400% | 3/1/18 | 126,750 | 125,864 | |
| 3,4 | Westpac Banking Corp. | 1.914% | 9/28/17 | 150,000 | 150,000 |
| 3,5 | Westpac Banking Corp. | 1.703% | 9/29/17 | 100,000 | 100,000 |
| 3,5 | Westpac Banking Corp. | 1.702% | 10/6/17 | 200,000 | 200,000 |
| 3,4 | Westpac Banking Corp. | 1.881% | 10/6/17 | 198,000 | 198,000 |
| 3,4 | Westpac Banking Corp. | 1.749% | 12/14/17 | 355,000 | 355,000 |
| 3,4 | Westpac Banking Corp. | 1.749% | 1/8/18 | 200,000 | 200,000 |
| 3,4 | Westpac Banking Corp. | 1.682% | 2/2/18 | 600,000 | 600,000 |
15
Prime Money Market Fund
| Face | Market | ||||
| Maturity | Amount | Value • | |||
| Yield1 | Date | ($000) | ($000) | ||
| 3,4 | Westpac Banking Corp. | 1.572% | 3/1/18 | 198,000 | 198,000 |
| 3,4 | Westpac Banking Corp. | 1.414% | 5/25/18 | 312,000 | 312,000 |
| 3,4 | Westpac Banking Corp. | 1.389% | 6/14/18 | 186,000 | 186,000 |
| 3,4 | Westpac Banking Corp. | 1.387% | 6/15/18 | 400,000 | 400,000 |
| 27,158,995 | |||||
| Foreign Governments (1.8%) | |||||
| 3 | CDP Financial Inc. | 1.359% | 9/27/17 | 29,000 | 28,972 |
| 3 | CDP Financial Inc. | 1.369% | 10/2/17 | 57,000 | 56,933 |
| 3 | CDP Financial Inc. | 1.349% | 10/5/17 | 22,500 | 22,472 |
| 6 | CPPIB Capital Inc. | 1.215% | 10/12/17 | 297,000 | 296,591 |
| 6 | CPPIB Capital Inc. | 1.215% | 10/13/17 | 297,000 | 296,581 |
| Export Development Canada | 1.100% | 9/6/17 | 3,230 | 3,230 | |
| Export Development Canada | 1.306% | 1/3/18 | 146,500 | 145,844 | |
| Export Development Canada | 1.306% | 1/8/18 | 64,000 | 63,702 | |
| Export Development Canada | 1.306% | 1/9/18 | 127,500 | 126,901 | |
| Export Development Canada | 1.306% | 1/10/18 | 63,750 | 63,448 | |
| Export Development Canada | 1.306% | 1/11/18 | 63,750 | 63,446 | |
| 3 | Ontario Teachers’ Finance Trust | 1.308% | 9/6/17 | 14,830 | 14,827 |
| 3 | Ontario Teachers’ Finance Trust | 1.308% | 9/15/17 | 15,000 | 14,992 |
| 3 | Ontario Teachers’ Finance Trust | 1.259% | 9/18/17 | 49,500 | 49,471 |
| 3 | Ontario Teachers’ Finance Trust | 1.308% | 9/21/17 | 20,000 | 19,986 |
| 3,4 | Ontario Teachers’ Finance Trust | 1.449% | 10/13/17 | 100,250 | 100,250 |
| 3 | Ontario Teachers’ Finance Trust | 1.361% | 10/27/17 | 65,500 | 65,362 |
| 3 | Ontario Teachers’ Finance Trust | 1.361% | 11/13/17 | 39,000 | 38,893 |
| 3 | Ontario Teachers’ Finance Trust | 1.361% | 11/16/17 | 16,250 | 16,204 |
| 3 | Ontario Teachers’ Finance Trust | 1.341% | 11/27/17 | 24,800 | 24,720 |
| 6 | PSP Capital Inc. | 1.187%–1.207% | 10/10/17 | 80,750 | 80,646 |
| 6 | PSP Capital Inc. | 1.207% | 10/12/17 | 29,000 | 28,960 |
| 4,6 | PSP Capital Inc. | 1.328% | 10/18/17 | 84,500 | 84,500 |
| 1,706,931 | |||||
| Foreign Industrial (1.7%) | |||||
| 3 | Nestle Capital Corp. | 1.225% | 10/13/17 | 124,000 | 123,824 |
| 3 | Nestle Capital Corp. | 1.225% | 10/16/17 | 93,000 | 92,858 |
| 3 | Nestle Capital Corp. | 1.225% | 10/17/17 | 93,000 | 92,855 |
| 3 | Nestle Capital Corp. | 1.225% | 10/18/17 | 198,000 | 197,685 |
| Nestle Finance International Ltd. | 1.143% | 9/8/17 | 61,750 | 61,736 | |
| Nestle Finance International Ltd. | 1.143% | 9/11/17 | 49,500 | 49,484 | |
| Nestle Finance International Ltd. | 1.225% | 10/13/17 | 124,000 | 123,824 | |
| Nestle Finance International Ltd. | 1.225% | 10/16/17 | 161,250 | 161,004 | |
| 3 | Total Credit Canada Inc. | 1.204% | 9/14/17 | 307,750 | 307,617 |
| 3 | Total Credit Canada Inc. | 1.204% | 9/15/17 | 109,000 | 108,949 |
| 3 | Total Credit Canada Inc. | 1.204% | 9/18/17 | 270,000 | 269,847 |
| Toyota Capital Canada Ltd. | 1.306% | 12/12/17 | 49,500 | 49,318 | |
| Toyota Capital Canada Ltd. | 1.376% | 12/18/17 | 16,000 | 15,934 | |
| Toyota Capital Canada Ltd. | 1.377% | 12/19/17 | 32,000 | 31,867 | |
| 1,686,802 | |||||
| Industrial (1.3%) | |||||
| 3 | Apple Inc. | 1.204% | 10/16/17 | 150,000 | 149,775 |
| 3 | Apple Inc. | 1.204% | 10/17/17 | 238,000 | 237,635 |
| 3 | Cisco Systems Inc. | 1.203% | 9/13/17 | 245,108 | 245,010 |
| 3 | Henkel of America Inc. | 1.314% | 9/6/17 | 24,750 | 24,745 |
| 3 | Henkel of America Inc. | 1.234% | 9/18/17 | 93,650 | 93,596 |
| 3 | Microsoft Corp. | 1.204% | 10/2/17 | 297,000 | 296,693 |
16
Prime Money Market Fund
| Face | Market | |||
| Maturity | Amount | Value • | ||
| Yield1 | Date | ($000) | ($000) | |
| 3 The Coca-Cola Co. | 1.244% | 12/4/17 | 173,000 | 172,440 |
| 3 The Coca-Cola Co. | 1.244% | 12/5/17 | 49,750 | 49,587 |
| 1,269,481 | ||||
| Total Commercial Paper (Cost $33,317,800) | 33,317,800 | |||
| Certificates of Deposit (32.3%) | ||||
| Domestic Banks (6.0%) | ||||
| Citibank NA | 1.180% | 9/7/17 | 224,000 | 224,000 |
| Citibank NA | 1.180% | 9/8/17 | 224,000 | 224,000 |
| Citibank NA | 1.180% | 9/11/17 | 191,000 | 191,000 |
| Citibank NA | 1.210% | 9/20/17 | 74,000 | 74,000 |
| Citibank NA | 1.210% | 9/21/17 | 148,500 | 148,500 |
| Citibank NA | 1.240% | 10/2/17 | 145,000 | 145,000 |
| Citibank NA | 1.270% | 11/6/17 | 302,500 | 302,500 |
| Citibank NA | 1.290% | 11/10/17 | 49,000 | 49,000 |
| 4 HSBC Bank USA NA | 1.612% | 9/1/17 | 407,000 | 407,000 |
| HSBC Bank USA NA | 1.415% | 9/19/17 | 31,500 | 31,503 |
| 4 HSBC Bank USA NA | 1.452% | 10/2/17 | 200,000 | 200,000 |
| 4 HSBC Bank USA NA | 1.592% | 3/2/18 | 67,250 | 67,250 |
| 4 HSBC Bank USA NA | 1.591% | 3/6/18 | 101,250 | 101,250 |
| 4 HSBC Bank USA NA | 1.542% | 4/3/18 | 130,000 | 130,000 |
| 4 HSBC Bank USA NA | 1.511% | 4/19/18 | 63,000 | 63,000 |
| 4 HSBC Bank USA NA | 1.472% | 5/3/18 | 273,500 | 273,500 |
| 4 HSBC Bank USA NA | 1.421% | 6/5/18 | 150,000 | 150,000 |
| 4 HSBC Bank USA NA | 1.428% | 8/16/18 | 48,300 | 48,300 |
| 4 HSBC Bank USA NA | 1.436% | 8/21/18 | 99,000 | 99,000 |
| 4 Wells Fargo Bank NA | 1.391% | 9/6/17 | 270,000 | 270,000 |
| Wells Fargo Bank NA | 1.200% | 9/18/17 | 205,000 | 205,000 |
| 4 Wells Fargo Bank NA | 1.359% | 10/13/17 | 472,000 | 472,000 |
| 4 Wells Fargo Bank NA | 1.329% | 11/9/17 | 500,000 | 500,000 |
| 4 Wells Fargo Bank NA | 1.332% | 12/1/17 | 209,000 | 209,000 |
| 4 Wells Fargo Bank NA | 1.338% | 1/16/18 | 600,000 | 600,000 |
| 4 Wells Fargo Bank NA | 1.338% | 1/17/18 | 600,000 | 600,000 |
| 5,784,803 | ||||
| Eurodollar Certificates of Deposit (0.9%) | ||||
| 4 National Australia Bank Ltd. | 1.621% | 11/6/17 | 890,000 | 890,000 |
| Yankee Certificates of Deposit (25.4%) | ||||
| 4 Bank of Montreal (Chicago Branch) | 1.422% | 9/1/17 | 378,000 | 378,000 |
| 4 Bank of Montreal (Chicago Branch) | 1.401% | 9/6/17 | 169,000 | 169,000 |
| 4 Bank of Montreal (Chicago Branch) | 1.421% | 9/20/17 | 140,000 | 140,000 |
| 4 Bank of Montreal (Chicago Branch) | 1.362% | 11/3/17 | 250,000 | 250,000 |
| 4 Bank of Montreal (Chicago Branch) | 1.338% | 11/17/17 | 192,000 | 192,000 |
| 4 Bank of Montreal (Chicago Branch) | 1.341% | 12/6/17 | 153,250 | 153,250 |
| 4 Bank of Montreal (Chicago Branch) | 1.341% | 12/7/17 | 231,250 | 231,250 |
| 4 Bank of Montreal (Chicago Branch) | 1.344% | 12/27/17 | 325,000 | 325,000 |
| Bank of Montreal (Chicago Branch) | 1.352% | 1/29/18 | 322,000 | 322,000 |
| 4 Bank of Montreal (Chicago Branch) | 1.359% | 2/9/18 | 245,000 | 244,994 |
| 4 Bank of Montreal (Chicago Branch) | 1.364% | 2/26/18 | 392,000 | 391,990 |
| 4 Bank of Montreal (Chicago Branch) | 1.369% | 3/2/18 | 168,000 | 168,000 |
| Bank of Nova Scotia (Houston Branch) | 1.560% | 11/6/17 | 28,000 | 28,014 |
| 4 Bank of Nova Scotia (Houston Branch) | 1.319% | 12/11/17 | 185,000 | 185,000 |
| 4 Bank of Nova Scotia (Houston Branch) | 1.365% | 2/22/18 | 633,000 | 633,000 |
17
Prime Money Market Fund
| Face | Market | |||
| Maturity | Amount | Value • | ||
| Yield1 | Date | ($000) | ($000) | |
| Bank of Tokyo-Mitsubishi UFJ Ltd. | ||||
| (New York Branch) | 1.250% | 9/11/17 | 925,000 | 925,000 |
| Bank of Tokyo-Mitsubishi UFJ Ltd. | ||||
| (New York Branch) | 1.250% | 9/25/17 | 265,000 | 265,000 |
| Bank of Tokyo-Mitsubishi UFJ Ltd. | ||||
| (New York Branch) | 1.280% | 10/2/17 | 715,000 | 715,000 |
| 4 Canadian Imperial Bank of Commerce | ||||
| (New York Branch) | 1.361% | 2/20/18 | 945,000 | 945,000 |
| Canadian Imperial Bank of Commerce | ||||
| (New York Branch) | 1.200% | 10/5/17 | 253,000 | 253,000 |
| Canadian Imperial Bank of Commerce | ||||
| (New York Branch) | 1.270% | 10/20/17 | 193,000 | 193,000 |
| 4 Canadian Imperial Bank of Commerce | ||||
| (New York Branch) | 1.338% | 12/18/17 | 150,000 | 150,000 |
| Credit Industriel et Commercial | ||||
| (New York Branch) | 1.170% | 9/5/17 | 1,278,000 | 1,278,000 |
| Credit Industriel et Commercial | ||||
| (New York Branch) | 1.160% | 9/6/17 | 528,000 | 528,000 |
| Credit Industriel et Commercial | ||||
| (New York Branch) | 1.170% | 9/6/17 | 129,000 | 129,000 |
| Credit Suisse AG (New York Branch) | 1.430% | 11/3/17 | 100,000 | 100,020 |
| Credit Suisse AG (New York Branch) | 1.320% | 12/1/17 | 300,000 | 300,000 |
| 4 DNB Bank ASA (New York Branch) | 1.344% | 2/28/18 | 450,000 | 450,000 |
| KBC Bank NV (New York Branch) | 1.180% | 9/5/17 | 500,000 | 500,000 |
| Lloyds Bank plc (New York Branch) | 1.220% | 9/25/17 | 345,000 | 345,000 |
| Lloyds Bank plc (New York Branch) | 1.220% | 9/26/17 | 62,750 | 62,750 |
| Natixis (New York Branch) | 1.180% | 9/5/17 | 935,000 | 935,000 |
| Nordea Bank AB (New York Branch) | 1.315% | 12/14/17 | 518,000 | 518,000 |
| 4 Royal Bank of Canada (New York Branch) | 1.411% | 9/20/17 | 701,630 | 701,630 |
| 4 Royal Bank of Canada (New York Branch) | 1.321% | 12/19/17 | 371,000 | 371,000 |
| 4 Royal Bank of Canada (New York Branch) | 1.491% | 12/20/17 | 225,000 | 225,000 |
| 4 Royal Bank of Canada (New York Branch) | 1.324% | 12/28/17 | 118,000 | 118,000 |
| 4 Royal Bank of Canada (New York Branch) | 1.358% | 2/20/18 | 245,000 | 245,000 |
| 4 Royal Bank of Canada (New York Branch) | 1.581% | 3/7/18 | 100,875 | 100,875 |
| 4 Royal Bank of Canada (New York Branch) | 1.358% | 3/16/18 | 979,000 | 979,000 |
| 4 Royal Bank of Canada (New York Branch) | 1.551% | 3/20/18 | 128,400 | 128,400 |
| Skandinaviska Enskilda Banken AB | ||||
| (New York Branch) | 1.160% | 9/6/17 | 500,000 | 500,000 |
| 4 Skandinaviska Enskilda Banken AB | ||||
| (New York Branch) | 1.371% | 11/20/17 | 129,750 | 129,750 |
| 4 Skandinaviska Enskilda Banken AB | ||||
| (New York Branch) | 1.325% | 12/22/17 | 148,500 | 148,498 |
| 4 Skandinaviska Enskilda Banken AB | ||||
| (New York Branch) | 1.325% | 12/22/17 | 148,500 | 148,498 |
| 4 Skandinaviska Enskilda Banken AB | ||||
| (New York Branch) | 1.335% | 12/22/17 | 673,000 | 673,000 |
| 4 Skandinaviska Enskilda Banken AB | ||||
| (New York Branch) | 1.314% | 12/28/17 | 63,000 | 62,999 |
| 4 Skandinaviska Enskilda Banken AB | ||||
| (New York Branch) | 1.324% | 12/28/17 | 152,000 | 152,000 |
| 4 Sumitomo Mitsui Banking Corp. | ||||
| (New York Branch) | 1.327% | 10/16/17 | 423,000 | 423,000 |
| 4 Sumitomo Mitsui Banking Corp. | ||||
| (New York Branch) | 1.327% | 10/17/17 | 462,000 | 462,000 |
18
Prime Money Market Fund
| Face | Market | |||
| Maturity | Amount | Value • | ||
| Yield1 | Date | ($000) | ($000) | |
| 4 Sumitomo Mitsui Banking Corp. | ||||
| (New York Branch) | 1.352% | 11/1/17 | 250,000 | 250,000 |
| 4 Sumitomo Mitsui Banking Corp. | ||||
| (New York Branch) | 1.352% | 12/1/17 | 315,750 | 315,750 |
| 4 Sumitomo Mitsui Banking Corp. | ||||
| (New York Branch) | 1.349% | 12/11/17 | 482,000 | 482,000 |
| 4 Svenska HandelsBanken AB | ||||
| (New York Branch) | 1.349% | 12/8/17 | 189,000 | 189,000 |
| 4 Svenska HandelsBanken AB | ||||
| (New York Branch) | 1.354% | 1/29/18 | 941,000 | 941,000 |
| 4 Svenska HandelsBanken AB | ||||
| (New York Branch) | 1.361% | 2/20/18 | 785,000 | 785,000 |
| 4 Svenska HandelsBanken AB | ||||
| (New York Branch) | 1.386% | 4/30/18 | 135,000 | 135,000 |
| Swedbank AB (New York Branch) | 1.310% | 12/28/17 | 440,000 | 440,000 |
| 4 Toronto Dominion Bank (New York Branch) | 1.692% | 9/5/17 | 500,000 | 500,000 |
| 4 Toronto Dominion Bank (New York Branch) | 1.672% | 11/1/17 | 807,000 | 807,000 |
| Toronto Dominion Bank (New York Branch) | 1.400% | 12/8/17 | 405,000 | 405,000 |
| 4 Toronto Dominion Bank (New York Branch) | 1.407% | 6/15/18 | 490,000 | 490,000 |
| 4 Toronto Dominion Bank (New York Branch) | 1.431% | 8/10/18 | 694,000 | 694,000 |
| UBS AG (Stamford Branch) | 1.200% | 9/6/17 | 200,000 | 200,000 |
| 24,605,668 | ||||
| Total Certificates of Deposit (Cost $31,280,471) | 31,280,471 | |||
| Other Notes (1.3%) | ||||
| Bank of America NA | 1.300% | 10/2/17 | 275,000 | 275,000 |
| 4 Bank of America NA | 1.411% | 10/4/17 | 162,000 | 162,000 |
| 4 Bank of America NA | 1.409% | 10/11/17 | 156,500 | 156,500 |
| 4 Bank of America NA | 1.349% | 11/14/17 | 124,000 | 124,000 |
| 4 Bank of America NA | 1.351% | 12/4/17 | 153,000 | 153,000 |
| 4 Bank of America NA | 1.342% | 1/2/18 | 157,000 | 157,000 |
| 4 Bank of America NA | 1.339% | 1/8/18 | 247,500 | 247,500 |
| Total Other Notes (Cost $1,275,000) | 1,275,000 | |||
| Repurchase Agreements (4.3%) | ||||
| Federal Reserve Bank of New York | ||||
| (Dated 8/31/17, Repurchase Value | ||||
| $4,214,117,000, collateralized by | ||||
| U.S. Treasury Note/Bond 1.625%–2.750%, | ||||
| 8/15/22–11/15/42, with a value of | ||||
| $4,214,117,000) | 1.000% | 9/1/17 | 4,214,000 | 4,214,000 |
| Total Repurchase Agreements (Cost $4,214,000) | 4,214,000 | |||
| Taxable Municipal Bonds (0.1%) | ||||
| 7 Greene County GA Development Authority | ||||
| Revenue VRDO | 1.180% | 9/7/17 | 6,250 | 6,250 |
| 6 Los Angeles CA Department of Water | ||||
| & Power Revenue TOB VRDO | 1.170% | 9/7/17 | 9,900 | 9,900 |
| 6 Massachusetts Transportation Fund Revenue | ||||
| TOB VRDO | 1.170% | 9/7/17 | 9,900 | 9,900 |
| 6 Seattle WA Municipal Light & Power Revenue | ||||
| TOB VRDO | 1.170% | 9/7/17 | 9,900 | 9,900 |
| University of Texas System Revenue | 1.100% | 9/7/17 | 62,000 | 62,000 |
19
Prime Money Market Fund
| Face | Market | |||
| Maturity | Amount | Value • | ||
| Yield1 | Date | ($000) | ($000) | |
| University of Texas System Revenue | ||||
| Financing System Revenue VRDO | 1.100% | 9/7/17 | 34,500 | 34,500 |
| Total Taxable Municipal Bonds (Cost $132,450) | 132,450 | |||
| Total Investments (100.1%) (Cost $97,023,255) | 97,023,255 | |||
| Amount | ||||
| ($000) | ||||
| Other Assets and Liabilities (-0.1%) | ||||
| Other Assets | ||||
| Investment in Vanguard | 6,121 | |||
| Receivables for Accrued Income | 52,014 | |||
| Receivables for Capital Shares Issued | 152,687 | |||
| Other Assets | 91,297 | |||
| Total Other Assets | 302,119 | |||
| Liabilities | ||||
| Payables for Investment Securities Purchased | (300,000) | |||
| Payables for Capital Shares Redeemed | (129,656) | |||
| Payables for Distributions | (4,957) | |||
| Payables to Vanguard | (7,280) | |||
| Total Liabilities | (441,893) | |||
| Net Assets (100%) | 96,883,481 | |||
| At August 31, 2017, net assets consisted of: | ||||
| Amount | ||||
| ($000) | ||||
| Paid-in Capital | 96,875,505 | |||
| Undistributed Net Investment Income | 45 | |||
| Accumulated Net Realized Gains | 7,931 | |||
| Net Assets | 96,883,481 | |||
| Investor Shares—Net Assets | ||||
| Applicable to 84,870,047,409 outstanding $.001 par value shares of | ||||
| beneficial interest (unlimited authorization) | 84,886,286 | |||
| Net Asset Value Per Share—Investor Shares | $1.00 | |||
20
Prime Money Market Fund
| Amount | |
| ($000) | |
| Admiral Shares—Net Assets | |
| Applicable to 11,994,893,859 outstanding $.001 par value shares of | |
| beneficial interest (unlimited authorization) | 11,997,195 |
| Net Asset Value Per Share—Admiral Shares | $1.00 |
• See Note A in Notes to Financial Statements.
1 Represents annualized yield at date of purchase for discount securities, and coupon for coupon-bearing securities.
2 Adjustable-rate security based upon 3-month U.S. Treasury Bill Auction High Money Market Yield plus spread.
3 Security exempt from registration under Section 4(2) of the Securities Act of 1933. Such securities may be sold in transactions exempt
from registration only to dealers in that program or other “accredited investors.” At August 31, 2017, the aggregate value of these
securities was $24,178,094,000, representing 25.0% of net assets.
4 Adjustable-rate security based upon 1-month USD LIBOR plus spread.
5 Adjustable-rate security based upon 3-month USD LIBOR plus spread.
6 Security exempt from registration under Rule 144A of the Securities Act of 1933. Such securities may be sold in transactions exempt
from registration, normally to qualified institutional buyers. At August 31, 2017, the aggregate value of these securities was
$816,978,000, representing 0.8% of net assets.
7 Scheduled principal and interest payments are guaranteed by bank letter of credit.
TOB—Tender Option Bond.
VRDO—Variable Rate Demand Obligation.
See accompanying Notes, which are an integral part of the Financial Statements.
21
Prime Money Market Fund
Statement of Operations
| Year Ended | |
| August 31,2017 | |
| ($000) | |
| Investment Income | |
| Income | |
| Interest | 987,891 |
| Total Income | 987,891 |
| Expenses | |
| The Vanguard Group—Note B | |
| Investment Advisory Services | 3,200 |
| Management and Administrative—Investor Shares | 114,064 |
| Management and Administrative—Admiral Shares | 11,069 |
| Marketing and Distribution—Investor Shares | 19,502 |
| Marketing and Distribution—Admiral Shares | 613 |
| Custodian Fees | 1,170 |
| Auditing Fees | 33 |
| Shareholders’ Reports and Proxy—Investor Shares | 3,923 |
| Shareholders’ Reports and Proxy—Admiral Shares | 63 |
| Trustees’ Fees and Expenses | 113 |
| Total Expenses | 153,750 |
| Net Investment Income | 834,141 |
| Realized Net Gain (Loss) on Investment Securities Sold | 1,961 |
| Net Increase (Decrease) in Net Assets Resulting from Operations | 836,102 |
See accompanying Notes, which are an integral part of the Financial Statements.
22
Prime Money Market Fund
Statement of Changes in Net Assets
| Year Ended August 31, | ||
| 2017 | 2016 | |
| ($000) | ($000) | |
| Increase (Decrease) in Net Assets | ||
| Operations | ||
| Net Investment Income | 834,141 | 444,857 |
| Realized Net Gain (Loss) | 1,961 | 2,974 |
| Net Increase (Decrease) in Net Assets Resulting from Operations | 836,102 | 447,831 |
| Distributions | ||
| Net Investment Income | ||
| Investor Shares | (726,141) | (344,430) |
| Admiral Shares1 | (107,955) | (100,426) |
| Realized Capital Gain | ||
| Investor Shares | — | — |
| Admiral Shares1 | — | — |
| Total Distributions | (834,096) | (444,856) |
| Capital Share Transactions (at $1.00 per share) | ||
| Investor Shares | (15,325,634) | (5,612,729) |
| Admiral Shares1 | (4,432,381) | (12,558,967) |
| Net Increase (Decrease) from Capital Share Transactions | (19,758,015) | (18,171,696) |
| Total Increase (Decrease) | (19,756,009) | (18,168,721) |
| Net Assets | ||
| Beginning of Period | 116,639,490 | 134,808,211 |
| End of Period2 | 96,883,481 | 116,639,490 |
1 Institutional Shares were renamed Admiral Shares in December 2015.
2 Net Assets—End of Period includes undistributed (overdistributed) net investment income of $45,000 and $0.
See accompanying Notes, which are an integral part of the Financial Statements.
23
Prime Money Market Fund
Financial Highlights
Investor Shares
| For a Share Outstanding | Year Ended August 31, | ||||
| Throughout Each Period | 2017 | 2016 | 2015 | 2014 | 2013 |
| Net Asset Value, Beginning of Period | $1.00 | $1.00 | $1.00 | $1.00 | $1.00 |
| Investment Operations | |||||
| Net Investment Income | . 0081 | .0032 | .0002 | .0001 | .0002 |
| Net Realized and Unrealized Gain (Loss) | |||||
| on Investments | — | — | — | — | — |
| Total from Investment Operations | .008 | .0032 | .0002 | .0001 | .0002 |
| Distributions | |||||
| Dividends from Net Investment Income | (.008) | (.0032) | (.0002) | (.0001) | (.0002) |
| Distributions from Realized Capital Gains | — | — | — | (.0000)2 | — |
| Total Distributions | (.008) | (.0032) | (.0002) | (.0001) | (.0002) |
| Net Asset Value, End of Period | $1.00 | $1.00 | $1.00 | $1.00 | $1.00 |
| Total Return3 | 0.83% | 0.32% | 0.02% | 0.02% | 0.02% |
| Ratios/Supplemental Data | |||||
| Net Assets, End of Period (Millions) | $84,886 | $100,210 | $105,820 | $101,910 | $102,160 |
| Ratio of Total Expenses to Average Net Assets | 0.16% | 0.16%4 | 0.15% 4 | 0.14% 4 | 0.16% 4 |
| Ratio of Net Investment Income to | |||||
| Average Net Assets | 0.82% | 0.32% | 0.02% | 0.01% | 0.02% |
1 Calculated based on average shares outstanding.
2 Distribution was less than $.0001 per share.
3 Total returns do not include account service fees that may have applied in the periods shown. Fund prospectuses provide information
about any applicable account service fees.
4 The ratio of total expenses to average net assets before an expense reduction was 0.16% for 2016, 0.16% for 2015, 0.16% for 2014, and
0.17% for 2013. For the year ended August 31, 2017, there was no expense reduction. See Note B in the Notes to Financial Statements.
See accompanying Notes, which are an integral part of the Financial Statements.
24
Prime Money Market Fund
Financial Highlights
Admiral Shares
| For a Share Outstanding | Year Ended August 31, | ||||
| Throughout Each Period | 2017 | 2016 | 2015 | 2014 | 2013 |
| Net Asset Value, Beginning of Period | $1.00 | $1.00 | $1.00 | $1.00 | $1.00 |
| Investment Operations | |||||
| Net Investment Income | . 0091 | .004 | .001 | .001 | .001 |
| Net Realized and Unrealized Gain (Loss) | |||||
| on Investments | — | — | — | — | — |
| Total from Investment Operations | .009 | .004 | .001 | .001 | .001 |
| Distributions | |||||
| Dividends from Net Investment Income | (. 009) | (. 004) | (. 001) | (. 001) | (. 001) |
| Distributions from Realized Capital Gains | — | — | — | (.000)2 | — |
| Total Distributions | (. 009) | (. 004) | (. 001) | (. 001) | (. 001) |
| Net Asset Value, End of Period | $1.00 | $1.00 | $1.00 | $1.00 | $1.00 |
| Total Return3 | 0.89% | 0.38% | 0.07% | 0.06% | 0.07% |
| Ratios/Supplemental Data | |||||
| Net Assets, End of Period (Millions) | $11,997 | $16,429 | $28,988 | $28,699 | $27,015 |
| Ratio of Total Expenses to Average Net Assets | 0.10% | 0.10% | 0.10% | 0.10% | 0.10% |
| Ratio of Net Investment Income to | |||||
| Average Net Assets | 0.88% | 0.38% | 0.07% | 0.05% | 0.07% |
Institutional Shares were renamed Admiral Shares in December 2015. Prior periods’ Financial Highlights are for the Institutional class.
1 Calculated based on average shares outstanding.
2 Distribution was less than $.0001 per share.
3 Total returns do not include account service fees that may have applied in the periods shown. Fund prospectuses provide information
about any applicable account service fees.
See accompanying Notes, which are an integral part of the Financial Statements.
25
Prime Money Market Fund
Notes to Financial Statements
Vanguard Prime Money Market Fund is registered under the Investment Company Act of 1940 as an open-end investment company, or mutual fund. The fund invests in short-term debt instruments of companies primarily operating in specific industries, particularly financial services; the issuers’ abilities to meet their obligations may be affected by economic developments in such industries. The fund offers two classes of shares, Investor Shares and Admiral Shares. Investor Shares are available to any investor who meets the fund’s minimum purchase requirements. Admiral Shares are designed for investors who meet certain administrative, service, and account-size criteria. Effective December 2015, Institutional Shares were renamed Admiral Shares.
A. The following significant accounting policies conform to generally accepted accounting principles for U.S. investment companies. The fund consistently follows such policies in preparing its financial statements.
1. Security Valuation: Securities are valued as of the close of trading on the New York Stock Exchange (generally 4 p.m., Eastern time) on the valuation date. Securities are valued at amortized cost, which approximates market value.
2. Repurchase Agreements: The fund enters into repurchase agreements with institutional counterparties. Securities pledged as collateral to the fund under repurchase agreements are held by a custodian bank until the agreements mature, and in the absence of a default, such collateral cannot be repledged, resold, or rehypothecated. Each agreement requires that the market value of the collateral be sufficient to cover payments of interest and principal. The fund further mitigates its counterparty risk by entering into repurchase agreements only with a diverse group of prequalified counterparties, monitoring their financial strength, and entering into master repurchase agreements with its counterparties. The master repurchase agreements provide that, in the event of a counter-party’s default (including bankruptcy), the fund may terminate any repurchase agreements with that counterparty, determine the net amount owed, and sell or retain the collateral up to the net amount owed to the fund. Such action may be subject to legal proceedings, which may delay or limit the disposition of collateral.
3. Federal Income Taxes: The fund intends to continue to qualify as a regulated investment company and distribute all of its taxable income. Management has analyzed the fund’s tax positions taken for all open federal income tax years (August 31, 2014–2017), and has concluded that no provision for federal income tax is required in the fund’s financial statements.
4. Distributions: Distributions from net investment income are declared daily and paid on the first business day of the following month.
5. Credit Facility: The fund and certain other funds managed by The Vanguard Group (“Vanguard”) participate in a $3.1 billion committed credit facility provided by a syndicate of lenders pursuant to a credit agreement that may be renewed annually; each fund is individually liable for its borrowings, if any, under the credit facility. Borrowings may be utilized for temporary and emergency purposes, and are subject to the fund’s regulatory and contractual borrowing restrictions. The participating funds are charged administrative fees and an annual commitment fee of 0.10% of the undrawn amount of the facility; these fees are allocated to the funds based on a method approved by the fund’s board of trustees and included in Management and Administrative expenses on the fund’s Statement of Operations. Any borrowings under this facility bear interest at a rate based upon the higher of the one-month London Interbank Offered Rate, federal funds effective rate, or overnight bank funding rate plus an agreed-upon spread.
26
Prime Money Market Fund
The fund had no borrowings outstanding at August 31, 2017, or at any time during the period then ended.
6. Other: Interest income is accrued daily. Premiums and discounts on debt securities purchased are amortized and accreted, respectively, to interest income over the lives of the respective securities. Security transactions are accounted for on the date securities are bought or sold. Costs used to determine realized gains (losses) on the sale of investment securities are those of the specific securities sold.
Each class of shares has equal rights as to assets and earnings, except that each class separately bears certain class-specific expenses related to maintenance of shareholder accounts (included in Management and Administrative expenses), shareholder reporting, and the proxy. Marketing and distribution expenses are allocated to each class of shares based on a method approved by the board of trustees. Income, other non-class-specific expenses, and gains and losses on investments are allocated to each class of shares based on its relative net assets.
B. In accordance with the terms of a Funds’ Service Agreement (the “FSA”) between Vanguard and the fund, Vanguard furnishes to the fund investment advisory, corporate management, administrative, marketing, and distribution services at Vanguard’s cost of operations (as defined by the FSA). These costs of operations are allocated to the fund based on methods and guidelines approved by the board of trustees. Vanguard does not require reimbursement in the current period for certain costs of operations (such as deferred compensation/benefits and risk/insurance costs); the fund’s liability for these costs of operations is included in Payables to Vanguard on the Statement of Net Assets.
Upon the request of Vanguard, the fund may invest up to 0.40% of its net assets as capital in Vanguard. At August 31, 2017, the fund had contributed to Vanguard capital in the amount of $6,121,000, representing 0.01% of the fund’s net assets and 2.45% of Vanguard’s capitalization. The fund’s trustees and officers are also directors and employees, respectively, of Vanguard.
Vanguard and the board of trustees have agreed to temporarily limit certain net operating expenses in excess of the fund’s daily yield in order to maintain a zero or positive yield for the fund. Vanguard and the board of trustees may terminate the temporary expense limitation at any time. The fund is not obligated to repay this amount to Vanguard. For the year ended August 31, 2017, the fund did not receive an expense reduction from Vanguard.
C. Various inputs may be used to determine the value of the fund’s investments. These inputs are summarized in three broad levels for financial statement purposes. The inputs or methodologies used to value securities are not necessarily an indication of the risk associated with investing in those securities.
Level 1—Quoted prices in active markets for identical securities.
Level 2—Other significant observable inputs (including quoted prices for similar securities, interest rates, prepayment speeds, credit risk, etc.).
Level 3—Significant unobservable inputs (including the fund’s own assumptions used to determine the fair value of investments). Any investments valued with significant unobservable inputs are
noted on the Statement of Net Assets.
27
Prime Money Market Fund
At August 31, 2017, 100% of the market value of the fund’s investments was determined using amortized cost, in accordance with rules under the Investment Company Act of 1940. Amortized cost approximates the current fair value of a security, but since the value is not obtained from a quoted price in an active market, securities valued at amortized cost are considered to be valued using Level 2 inputs.
| D. Capital share transactions for each class of shares were: | ||||
| Year Ended August 31, | ||||
| 2017 | 2016 | |||
| Amount | Shares | Amount | Shares | |
| ($000) | (000) | ($000) | (000) | |
| Investor Shares | ||||
| Issued | 64,128,512 | 64,127,620 | 101,526,451 | 101,527,243 |
| Issued in Lieu of Cash Distributions | 680,319 | 680,319 | 335,584 | 335,584 |
| Redeemed | (80,134,465) | (80,134,468) | (107,474,764) | (107,474,762) |
| Net Increase (Decrease)—Investor Shares | (15,325,634) | (15,326,529) | (5,612,729) | (5,611,935) |
| Admiral Shares1 | ||||
| Issued | 8,144,434 | 8,145,324 | 17,763,247 | 17,762,458 |
| Issued in Lieu of Cash Distributions | 102,733 | 102,733 | 96,589 | 96,589 |
| Redeemed | (12,679,548) | (12,679,548) | (30,418,803) | (30,418,803) |
| Net Increase (Decrease) —Admiral Shares | (4,432,381) | (4,431,491) | (12,558,967) | (12,559,756) |
| 1 Institutional Shares were renamed Admiral Shares in December 2015. | ||||
E. Management has determined that no material events or transactions occurred subsequent to August 31, 2017, that would require recognition or disclosure in these financial statements.
28
Federal Money Market Fund
Fund Profile
As of August 31, 2017
| Financial Attributes | |
| Ticker Symbol | VMFXX |
| Expense Ratio1 | 0.11% |
| 7-Day SEC Yield | 0.97% |
| Average Weighted | |
| Maturity | 58 days |
| Sector Diversification (% of portfolio) | |
| U.S. Treasury Bills | 42.5% |
| U.S. Government Obligations | 32.5 |
| Repurchase Agreements | 25.0 |
The agency and mortgage-backed securities sectors may include issues from government-sponsored enterprises; such issues are
generally not backed by the full faith and credit of the U.S. government.
1 The expense ratio shown is from the prospectus dated December 23, 2016, and represents estimated costs for the current fiscal year. For the fiscal year ended August 31, 2017, the expense ratio was 0.11%.
29
Federal Money Market Fund
Performance Summary
Investment returns will fluctuate. All of the returns in this report represent past performance, which is not a guarantee of future results that may be achieved by the fund. (Current performance may be lower or higher than the performance data cited. For performance data current to the most recent month-end, visit our website at vanguard.com/performance.) The returns shown do not reflect taxes that a shareholder would pay on fund distributions. The fund is only available to retail investors (natural persons). You could lose money by investing in the fund. Although the fund seeks to preserve the value of your investment at $1 per share, it cannot guarantee it will do so. The fund may impose a fee upon sale of your shares or may temporarily suspend your ability to sell shares if the fund’s liquidity falls below required minimums because of market conditions or other factors. An investment in the fund is not insured or guaranteed by the Federal Deposit Insurance Corporation or any other government agency. The fund’s sponsor has no legal obligation to provide financial support to the fund, and you should not expect that the sponsor will provide financial support to the fund at any time. The fund’s 7-day SEC yield reflects its current earnings more closely than do the average annual returns.
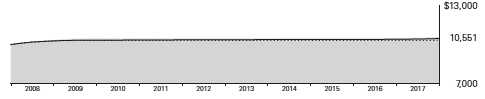
Cumulative Performance: August 31, 2007, Through August 31, 2017
Initial Investment of $10,000
| Average Annual Total Returns | ||||
| Periods Ended August 31, 2017 | ||||
| Final Value | ||||
| One | Five | Ten | of a $10,000 | |
| Year | Years | Years | Investment | |
| Federal Money Market Fund | 0.57% | 0.17% | 0.54% | $10,551 |
| Government Money Market Funds | ||||
| • • • • • • • • | ||||
| Average | 0.19 | 0.04 | 0.33 | 10,335 |
| Citigroup Three-Month U.S. Treasury | ||||
| Bill Index | 0.58 | 0.16 | 0.44 | 10,444 |
| Government Money Market Funds Average: Derived from data provided by Lipper, a Thomson Reuters Company. | ||||
See Financial Highlights for dividend information.
30
Federal Money Market Fund
Fiscal-Year Total Returns (%): August 31, 2007, Through August 31, 2017
| Gov't Money | ||
| Market Funds Average | ||
| Fiscal Year | Total Returns | Total Returns |
| 2008 | 3.46% | 2.71% |
| 2009 | 1.06 | 0.43 |
| 2010 | 0.04 | 0.00 |
| 2011 | 0.02 | 0.00 |
| 2012 | 0.01 | 0.00 |
| 2013 | 0.01 | 0.00 |
| 2014 | 0.02 | 0.00 |
| 2015 | 0.01 | 0.00 |
| 2016 | 0.23 | 0.00 |
| 2017 | 0.57 | 0.19 |
7-day SEC yield (8/31/2017): 0.97%
Government Money Market Funds Average: Derived from data provided by Lipper, a Thomson Reuters Company.
Average Annual Total Returns: Periods Ended June 30, 2017
This table presents returns through the latest calendar quarter—rather than through the end of the fiscal period.
Securities and Exchange Commission rules require that we provide this information.
| Inception | One | Five | Ten | |
| Date | Year | Years | Years | |
| Federal Money Market Fund | 7/13/1981 | 0.46% | 0.14% | 0.61% |
31
Federal Money Market Fund
Financial Statements
Statement of Net Assets
As of August 31, 2017
The fund reports a complete list of its holdings in various monthly and quarterly regulatory filings. The fund publishes its holdings on a monthly basis at vanguard.com and files them with the Securities and Exchange Commission on Form N-MFP. The fund’s Form N-MFP filings may be viewed at sec.gov or via a link on the “Portfolio Holdings” page on vanguard.com. For the second and fourth fiscal quarters, the lists appear in the fund’s semiannual and annual reports to shareholders. For the first and third fiscal quarters, the fund files the lists with the SEC on Form N-Q. Shareholders can look up the fund’s Forms N-Q on the SEC’s website at sec.gov. Forms N-Q may also be reviewed and copied at the SEC’s Public Reference Room (see the back cover of this report for further information).
| Face | Market | ||||
| Maturity | Amount | Value • | |||
| Yield1 | Date | ($000) | ($000) | ||
| U.S. Government and Agency Obligations (73.8%) | |||||
| 2 | Federal Home Loan Bank Discount | ||||
| Notes | 1.000% | 9/6/17 | 155 | 155 | |
| 2 | Federal Home Loan Bank Discount | ||||
| Notes | 1.043% | 9/8/17 | 137,095 | 137,067 | |
| 2 | Federal Home Loan Bank Discount | ||||
| Notes | 1.028%–1.043% | 9/13/17 | 626,305 | 626,089 | |
| 2 | Federal Home Loan Bank Discount | ||||
| Notes | 0.983% | 9/14/17 | 350,000 | 349,876 | |
| 2 | Federal Home Loan Bank Discount | ||||
| Notes | 0.983% | 9/15/17 | 200,000 | 199,924 | |
| 2 | Federal Home Loan Bank Discount | ||||
| Notes | 0.983% | 9/18/17 | 100,000 | 99,954 | |
| 2 | Federal Home Loan Bank Discount | ||||
| Notes | 1.029%–1.03% | 9/20/17 | 1,463,200 | 1,462,407 | |
| 2 | Federal Home Loan Bank Discount | ||||
| Notes | 0.983% | 9/21/17 | 250,000 | 249,864 | |
| 2 | Federal Home Loan Bank Discount | ||||
| Notes | 1.074% | 10/4/17 | 1,400,000 | 1,398,627 | |
| 2 | Federal Home Loan Bank Discount | ||||
| Notes | 1.027%–1.031% | 10/11/17 | 1,851,379 | 1,849,264 | |
| 2 | Federal Home Loan Bank Discount | ||||
| Notes | 1.084% | 10/12/17 | 250,000 | 249,692 | |
| 2 | Federal Home Loan Bank Discount | ||||
| Notes | 1.027%–1.029% | 10/13/17 | 704,400 | 703,556 | |
| 2 | Federal Home Loan Bank Discount | ||||
| Notes | 1.022% | 10/18/17 | 1,287,650 | 1,285,935 | |
| 2 | Federal Home Loan Bank Discount | ||||
| Notes | 1.022% | 10/20/17 | 1,357,000 | 1,355,116 | |
| 2 | Federal Home Loan Bank Discount | ||||
| Notes | 1.053% | 11/15/17 | 197,000 | 196,569 | |
| 2 | Federal Home Loan Bank Discount | ||||
| Notes | 1.049% | 11/17/17 | 300,000 | 299,329 | |
| 2 | Federal Home Loan Bank Discount | ||||
| Notes | 1.063% | 11/27/17 | 70,000 | 69,821 | |
32
Federal Money Market Fund
| Face | Market | |||||
| Maturity | Amount | Value • | ||||
| Yield1 | Date | ($000) | ($000) | |||
| 2 | Federal Home Loan Bank Discount Notes | 1.079% | 12/15/17 | 50,000 | 49,843 | |
| 2,3 | Federal Home Loan Banks | 0.991% | 10/6/17 | 250,000 | 249,990 | |
| 2,3 | Federal Home Loan Banks | 1.241% | 10/19/17 | 250,000 | 250,000 | |
| 2,4 | Federal Home Loan Banks | 1.179% | 11/28/17 | 500,000 | 500,000 | |
| 2,4 | Federal Home Loan Banks | 1.181% | 11/28/17 | 250,000 | 250,000 | |
| 2,4 | Federal Home Loan Banks | 1.181% | 11/28/17 | 250,000 | 250,000 | |
| 2,3 | Federal Home Loan Banks | 1.101% | 2/1/18 | 495,000 | 495,026 | |
| 2,4 | Federal Home Loan Banks | 1.282% | 3/2/18 | 250,000 | 250,001 | |
| 2,4 | Federal Home Loan Banks | 1.211% | 3/7/18 | 500,000 | 500,000 | |
| 2,4 | Federal Home Loan Banks | 1.256% | 3/23/18 | 500,000 | 500,000 | |
| 2,4 | Federal Home Loan Banks | 1.094% | 5/9/18 | 500,000 | 500,000 | |
| 2,4 | Federal Home Loan Banks | 1.096% | 5/17/18 | 500,000 | 500,000 | |
| 2,4 | Federal Home Loan Banks | 1.093% | 5/23/18 | 750,000 | 750,000 | |
| 2,4 | Federal Home Loan Banks | 1.093% | 5/25/18 | 750,000 | 750,000 | |
| 2,4 | Federal Home Loan Banks | 1.113% | 8/24/18 | 750,000 | 750,000 | |
| 2,4 | Federal Home Loan Banks | 1.139% | 11/8/18 | 100,000 | 99,995 | |
| 2,4 | Federal Home Loan Banks | 1.151% | 11/21/18 | 500,000 | 500,000 | |
| 2,4 | Federal Home Loan Banks | 1.156% | 11/23/18 | 230,000 | 230,000 | |
| 2,4 | Federal Home Loan Banks | 1.143% | 11/28/18 | 600,000 | 600,000 | |
| 4,5 | Federal Home Loan Mortgage Corp. | 1.269% | 11/13/17 | 600,000 | 600,000 | |
| 4,5 | Federal Home Loan Mortgage Corp. | 1.296% | 1/5/18 | 285,000 | 285,000 | |
| 3,5 | Federal Home Loan Mortgage Corp. | 1.274% | 1/8/18 | 125,000 | 125,000 | |
| 4,5 | Federal Home Loan Mortgage Corp. | 1.079% | 1/11/18 | 750,000 | 750,000 | |
| 3,5 | Federal Home Loan Mortgage Corp. | 1.274% | 1/12/18 | 25,000 | 25,000 | |
| 4,5 | Federal Home Loan Mortgage Corp. | 1.298% | 1/16/18 | 275,000 | 275,000 | |
| 4,5 | Federal Home Loan Mortgage Corp. | 1.284% | 1/29/18 | 500,000 | 500,000 | |
| 4,5 | Federal Home Loan Mortgage Corp. | 1.219% | 2/26/18 | 500,000 | 500,000 | |
| 4,5 | Federal Home Loan Mortgage Corp. | 1.214% | 3/9/18 | 650,000 | 650,000 | |
| 4,5 | Federal Home Loan Mortgage Corp. | 1.246% | 7/6/18 | 750,000 | 750,000 | |
| 4,5 | Federal National Mortgage Assn. | 1.239% | 9/8/17 | 360,000 | 359,999 | |
| 4,5 | Federal National Mortgage Assn. | 1.241% | 10/5/17 | 331,890 | 331,887 | |
| 3,5 | Federal National Mortgage Assn. | 1.230% | 3/21/18 | 400,000 | 400,159 | |
| 5 | Freddie Mac Discount Notes | 0.690%–1.179% | 9/1/17 | 756 | 756 | |
| 5 | Freddie Mac Discount Notes | 1.010% | 9/6/17 | 206 | 206 | |
| 5 | Freddie Mac Discount Notes | 0.984% | 10/3/17 | 750,000 | 749,347 | |
| 5 | Freddie Mac Discount Notes | 0.984% | 10/4/17 | 600,000 | 599,461 | |
| United States Treasury Bill | 0.982% | 9/7/17 | 2,200,000 | 2,199,641 | ||
| United States Treasury Bill | 0.975% | 11/2/17 | 2,000,000 | 1,996,659 | ||
| United States Treasury Bill | 1.020%–1.043% | 11/9/17 | 3,500,000 | 3,493,095 | ||
| United States Treasury Bill | 1.018%–1.025% | 11/16/17 | 4,030,400 | 4,021,748 | ||
| United States Treasury Bill | 1.106% | 12/14/17 | 2,750,000 | 2,741,261 | ||
| United States Treasury Bill | 1.116% | 12/28/17 | 750,000 | 747,271 | ||
| United States Treasury Bill | 1.131% | 1/11/18 | 2,500,000 | 2,489,687 | ||
| United States Treasury Bill | 1.111% | 1/18/18 | 3,250,000 | 3,236,134 | ||
| United States Treasury Bill | 1.136% | 1/25/18 | 2,500,000 | 2,488,543 | ||
| United States Treasury Bill | 1.136% | 2/1/18 | 3,000,000 | 2,985,592 | ||
| United States Treasury Bill | 1.121% | 2/15/18 | 1,000,000 | 994,828 | ||
| United States Treasury Bill | 1.121% | 2/22/18 | 2,750,000 | 2,735,180 | ||
| United States Treasury Bill | 1.121% | 3/1/18 | 2,500,000 | 2,485,985 | ||
| 6 | United States Treasury Floating Rate Note | 1.193% | 10/31/18 | 600,000 | 600,007 | |
| Total U.S. Government and Agency Obligations (Cost $58,625,546) | 58,625,546 | |||||
33
Federal Money Market Fund
| Face | Market | |||
| Maturity | Amount | Value • | ||
| Yield1 | Date | ($000) | ($000) | |
| Repurchase Agreements (24.6%) | ||||
| Bank of Montreal | ||||
| (Dated 8/31/17, Repurchase Value | ||||
| $300,009,000, collateralized by | ||||
| Treasury Inflation Indexed Note/Bond | ||||
| 0.125%–2.125%, 1/15/19–4/15/22, | ||||
| and U.S. Treasury Note/Bond | ||||
| 2.000%–3.625%, 7/31/24–11/15/45, | ||||
| with a value of $306,000,000) | 1.060% | 9/1/17 | 300,000 | 300,000 |
| Bank of Nova Scotia | ||||
| (Dated 8/31/17, Repurchase Value | ||||
| $1,250,037,000, collateralized by | ||||
| Treasury Inflation Indexed Note/Bond | ||||
| 0.125%–3.625%, 4/15/18–2/15/45, | ||||
| U.S. Treasury Bill 0.000%, | ||||
| 11/2/17–2/8/18, and U.S. Treasury | ||||
| Note/Bond 0.750%–6.125%, | ||||
| 3/31/18–5/15/47, with a value of | ||||
| $1,275,000,000) | 1.060% | 9/1/17 | 1,250,000 | 1,250,000 |
| Canadian Imperial Bank of Commerce | ||||
| (Dated 8/31/17, Repurchase Value | ||||
| $2,000,058,000, collateralized by | ||||
| Treasury Inflation Indexed Note/Bond | ||||
| 0.125%, 1/15/23, and U.S. Treasury | ||||
| Note/Bond 1.125%–5.000%, | ||||
| 8/15/20–11/15/45, with a value | ||||
| of $2,040,000,000) | 1.050% | 9/1/17 | 2,000,000 | 2,000,000 |
| Credit Agricole Corporate & Investment | ||||
| Bank NY Branch (Dated 8/25/17, | ||||
| Repurchase Value $500,100,000, | ||||
| collateralized by U.S. Treasury | ||||
| Note/Bond 0.750%–3.000%, | ||||
| 7/31/18–2/15/47, with a value | ||||
| of $510,000,000) | 1.030% | 9/1/17 | 500,000 | 500,000 |
| Credit Agricole Corporate & Investment | ||||
| Bank NY Branch (Dated 8/31/17, | ||||
| Repurchase Value $2,000,059,000, | ||||
| collateralized by Treasury Inflation Indexed | ||||
| Note/Bond 0.625%, 7/15/21–1/15/26, and | ||||
| U.S. Treasury Note/Bond 1.625%–2.250%, | ||||
| 5/15/22–2/15/27, with a value of | ||||
| $2,040,000,000) | 1.060% | 9/1/17 | 2,000,000 | 2,000,000 |
| Credit Agricole Corporate & Investment | ||||
| Bank NY Branch (Dated 8/29/17, | ||||
| Repurchase Value $500,100,000, | ||||
| collateralized by U.S. Treasury Note/Bond | ||||
| 0.875%–2.000%, 3/31/18–11/15/22, | ||||
| with a value of $510,000,000) | 1.030% | 9/5/17 | 500,000 | 500,000 |
| Credit Agricole Corporate & Investment | ||||
| Bank NY Branch (Dated 8/30/17, | ||||
| Repurchase Value $500,100,000, | ||||
| collateralized by U.S. Treasury Note/Bond | ||||
| 0.875%–2.125%, 5/15/18–12/31/22, | ||||
| with a value of $510,000,000) | 1.030% | 9/6/17 | 500,000 | 500,000 |
34
Federal Money Market Fund
| Face | Market | |||
| Maturity | Amount | Value • | ||
| Yield1 | Date | ($000) | ($000) | |
| Federal Reserve Bank of New York | ||||
| (Dated 8/31/17, Repurchase Value | ||||
| $8,341,232,000, collateralized by | ||||
| U.S. Treasury Note/Bond 1.125%–4.750%, | ||||
| 11/15/20–8/15/43, with a value of | ||||
| $8,341,232,000) | 1.000% | 9/1/17 | 8,341,000 | 8,341,000 |
| JP Morgan Securities LLC | ||||
| (Dated 8/31/17, Repurchase Value | ||||
| $500,015,000, collateralized by Treasury | ||||
| Inflation Indexed Note/Bond 0.125%, | ||||
| 4/15/19–1/15/22, with a value of | ||||
| $510,003,000) | 1.060% | 9/1/17 | 500,000 | 500,000 |
| JP Morgan Securities LLC | ||||
| (Dated 8/31/17, Repurchase Value | ||||
| $50,001,000, collateralized by U.S. | ||||
| Treasury Note/Bond 1.375%, 4/30/21, | ||||
| with a value of $51,005,000) | 1.060% | 9/1/17 | 50,000 | 50,000 |
| Merrill Lynch Pierce Fenner & Smith Inc. | ||||
| (Dated 8/31/17, Repurchase Value | ||||
| $175,005,000, collateralized by U. S. | ||||
| Treasury Note/Bond 2.000%, 6/30/24, | ||||
| with a value of $178,500,000) | 1.060% | 9/1/17 | 175,000 | 175,000 |
| Mizuho Securities (USA) Inc. | ||||
| (Dated 8/31/17, Repurchase Value | ||||
| $250,008,000, collateralized by U. S. | ||||
| Treasury Bill 0.000%, 9/14/17–10/26/17, | ||||
| and U.S. Treasury Note/Bond | ||||
| 0.750%–1.750%, 1/31/18–1/31/23, | ||||
| with a value of $255,000,000) | 1.090% | 9/1/17 | 250,000 | 250,000 |
| RBC Capital Markets LLC | ||||
| (Dated 8/25/17, Repurchase Value | ||||
| $500,101,000, collateralized by Treasury | ||||
| Inflation Indexed Note/Bond | ||||
| 0.125%–3.625%, 4/15/20–4/15/28, | ||||
| and U.S. Treasury Note/Bond | ||||
| 0.875%– 6.625%, 5/31/18–8/15/45, | ||||
| with a value of $510,000,000) | 1.040% | 9/1/17 | 500,000 | 500,000 |
| RBC Capital Markets LLC | ||||
| (Dated 8/31/17, Repurchase Value | ||||
| $500,015,000, collateralized by Treasury | ||||
| Inflation Indexed Note/Bond | ||||
| 0.625%–2.125%, 1/15/26–2/15/41, and | ||||
| U.S. Treasury Note/Bond 1.000%–5.375%, | ||||
| 10/31/17–11/15/46, with a value of | ||||
| $510,000,000) | 1.060% | 9/1/17 | 500,000 | 500,000 |
| RBC Capital Markets LLC | ||||
| (Dated 8/31/17, Repurchase Value | ||||
| $1,000,206,000, collateralized by | ||||
| Treasury Inflation Indexed Note/Bond | ||||
| 0.125%–2.375%, 1/15/21–2/15/42, U. S. | ||||
| Treasury Bill 0.000%, 9/7/17–8/16/18, | ||||
| and U.S. Treasury Note/Bond | ||||
| 0.625%–9.125%, 9/30/17–8/15/46, | ||||
| with a value of $1,020,000,000) | 1.060% | 9/7/17 | 1,000,000 | 1,000,000 |
35
Federal Money Market Fund
| Face | Market | |||
| Maturity | Amount | Value • | ||
| Yield1 | Date | ($000) | ($000) | |
| TD Securities (USA) LLC | ||||
| (Dated 8/28/17, Repurchase Value | ||||
| $400,047,000, collateralized by U.S. | ||||
| Treasury Bill 0.000%, 9/21/17, and | ||||
| U.S. Treasury Note/Bond | ||||
| 1.375%–6.250%, 7/31/19–5/15/46, | ||||
| with a value of $408,000,000) | 1.050% | 9/1/17 | 400,000 | 400,000 |
| TD Securities (USA) LLC | ||||
| (Dated 8/30/17, Repurchase Value | ||||
| $100,020,000, collateralized by U. S. | ||||
| Treasury Bill 0.000%, 8/16/18, and | ||||
| U.S. Treasury Note/Bond 1.125%–2.125%, | ||||
| 8/31/20–5/31/23, with a value of | ||||
| $102,000,000) | 1.030% | 9/6/17 | 100,000 | 100,000 |
| TD Securities (USA) LLC | ||||
| (Dated 8/30/17, Repurchase Value | ||||
| $275,056,000, collateralized by U. S. | ||||
| Treasury Note/Bond 1.500%–3.500%, | ||||
| 2/15/18–5/15/43, with a value of | ||||
| $280,500,000) | 1.040% | 9/6/17 | 275,000 | 275,000 |
| TD Securities (USA) LLC | ||||
| (Dated 8/31/17, Repurchase Value | ||||
| $400,086,000, collateralized by U.S. | ||||
| Treasury Note/Bond 2.500%–4.625%, | ||||
| 8/15/39–2/15/46, with a value of | ||||
| $408,000,000) | 1.100% | 9/7/17 | 400,000 | 400,000 |
| Total Repurchase Agreements (Cost $19,541,000) | 19,541,000 | |||
| Total Investments (98.4%) (Cost $78,166,546) | 78,166,546 | |||
| Amount | ||||
| ($000) | ||||
| Other Assets and Liabilities (1.6%) | ||||
| Other Assets | ||||
| Investment in Vanguard | 4,851 | |||
| Receivables for Investment Securities Sold | 999,855 | |||
| Receivables for Accrued Income | 10,412 | |||
| Receivables for Capital Shares Issued | 326,147 | |||
| Other Assets | 24,004 | |||
| Total Other Assets | 1,365,269 | |||
| Liabilities | ||||
| Payables for Capital Shares Redeemed | (74,955) | |||
| Payables for Distributions | (1,007) | |||
| Payables to Vanguard | (4,268) | |||
| Total Liabilities | (80,230) | |||
| Net Assets (100%) | ||||
| Applicable to 79,451,566,077 outstanding $.001 par value shares of | ||||
| beneficial interest (unlimited authorization) | 79,451,585 | |||
| Net Asset Value Per Share | $1.00 | |||
36
Federal Money Market Fund
At August 31, 2017, net assets consisted of:
| Amount | |
| ($000) | |
| Paid-in Capital | 79,452,076 |
| Undistributed Net Investment Income | 49 |
| Accumulated Net Realized Losses | (540) |
| Net Assets | 79,451,585 |
• See Note A in Notes to Financial Statements.
1 Represents annualized yield at date of purchase for discount securities, and coupon for coupon-bearing securities.
2 The issuer operates under a congressional charter; its securities are generally neither guaranteed by the U.S. Treasury nor backed
by the full faith and credit of the U.S. government.
3 Adjustable-rate security based upon 3-month USD LIBOR plus spread.
4 Adjustable-rate security based upon 1-month USD LIBOR plus spread.
5 The issuer was placed under federal conservatorship in September 2008; since that time, its daily operations have been managed by the
Federal Housing Finance Agency and it receives capital from the U.S. Treasury, as needed to maintain a positive net worth, in exchange
for senior preferred stock.
6 Adjustable-rate security based upon 3-month U.S. Treasury Bill Auction High Money Market Yield plus spread.
See accompanying Notes, which are an integral part of the Financial Statements.
37
Federal Money Market Fund
Statement of Operations
| Year Ended | |
| August 31,2017 | |
| ($000) | |
| Investment Income | |
| Income | |
| Interest | 476,853 |
| Total Income | 476,853 |
| Expenses | |
| The Vanguard Group—Note B | |
| Investment Advisory Services | 2,216 |
| Management and Administrative | 57,617 |
| Marketing and Distribution | 12,977 |
| Custodian Fees | 549 |
| Auditing Fees | 32 |
| Shareholders’ Reports and Proxy | 572 |
| Trustees’ Fees and Expenses | 49 |
| Total Expenses | 74,012 |
| Net Investment Income | 402,841 |
| Realized Net Gain (Loss) on Investment Securities Sold | (596) |
| Net Increase (Decrease) in Net Assets Resulting from Operations | 402,245 |
See accompanying Notes, which are an integral part of the Financial Statements.
38
Federal Money Market Fund
Statement of Changes in Net Assets
| Year Ended August 31, | ||
| 2017 | 2016 | |
| ($000) | ($000) | |
| Increase (Decrease) in Net Assets | ||
| Operations | ||
| Net Investment Income | 402,841 | 29,268 |
| Realized Net Gain (Loss) | (596) | 17 |
| Net Increase (Decrease) in Net Assets Resulting from Operations | 402,245 | 29,285 |
| Distributions | ||
| Net Investment Income | (402,787) | (29,273) |
| Realized Capital Gain | — | — |
| Total Distributions | (402,787) | (29,273) |
| Capital Share Transactions (at $1.00 per share) | ||
| Issued | 88,362,924 | 44,011,167 |
| Issued in Lieu of Cash Distributions | 395,681 | 28,230 |
| Redeemed | (48,110,472) | (8,560,165) |
| Net Increase (Decrease) from Capital Share Transactions | 40,648,133 | 35,479,232 |
| Total Increase (Decrease) | 40,647,591 | 35,479,244 |
| Net Assets | ||
| Beginning of Period | 38,803,994 | 3,324,750 |
| End of Period1 | 79,451,585 | 38,803,994 |
1 Net Assets—End of Period includes undistributed (overdistributed) net investment income of $49,000 and ($5,000).
See accompanying Notes, which are an integral part of the Financial Statements.
39
| Federal Money Market Fund | |||||
| Financial Highlights | |||||
| For a Share Outstanding | Year Ended August 31, | ||||
| Throughout Each Period | 2017 | 2016 | 2015 | 2014 | 2013 |
| Net Asset Value, Beginning of Period | $1.00 | $1.00 | $1.00 | $1.00 | $1.00 |
| Investment Operations | |||||
| Net Investment Income | . 0061 | .0022 | .0001 | .0001 | .0001 |
| Net Realized and Unrealized Gain (Loss) | |||||
| on Investments | — | — | — | — | — |
| Total from Investment Operations | .006 | .0022 | .0001 | .0001 | .0001 |
| Distributions | |||||
| Dividends from Net Investment Income | (.006) | (.0022) | (.0001) | (.0001) | (.0001) |
| Distributions from Realized Capital Gains | — | — | — | (.0000)2 | — |
| Total Distributions | (.006) | (.0022) | (.0001) | (.0001) | (.0001) |
| Net Asset Value, End of Period | $1.00 | $1.00 | $1.00 | $1.00 | $1.00 |
| Total Return3 | 0.57% | 0.23% | 0.01% | 0.02% | 0.01% |
| Ratios/Supplemental Data | |||||
| Net Assets, End of Period (Millions) | $79,452 | $38,804 | $3,325 | $3,108 | $3,522 |
| Ratio of Total Expenses to | |||||
| Average Net Assets | 0.11% | 0.11%4 | 0.10% 4 | 0.09% 4 | 0.13% 4 |
| Ratio of Net Investment Income to | |||||
| Average Net Assets | 0.60% | 0.27% | 0.01% | 0.01% | 0.01% |
1 Calculated based on average shares outstanding.
2 Distribution was less than $.0001 per share.
3 Total returns do not include transaction fees that may have applied in the periods shown. Fund prospectuses provide information about any applicable transaction fees.
4 The ratio of total expenses to average net assets before an expense reduction was 0.11% for 2016, 0.11% for 2015, 0.11% for 2014, and 0.14% for 2013. For the year ended August 31, 2017, there was no expense reduction. See Note B in the Notes to Financial Statements.
See accompanying Notes, which are an integral part of the Financial Statements.
40
Federal Money Market Fund
Notes to Financial Statements
Vanguard Federal Money Market Fund is registered under the Investment Company Act of 1940 as an open-end investment company, or mutual fund. The fund invests in short-term debt instruments issued by the U.S. government or its agencies and instrumentalities, and repurchase agreements collateralized by such instruments.
A. The following significant accounting policies conform to generally accepted accounting principles for U.S. investment companies. The fund consistently follows such policies in preparing its financial statements.
1. Security Valuation: Securities are valued as of the close of trading on the New York Stock Exchange (generally 4 p.m., Eastern time) on the valuation date. Securities are valued at amortized cost, which approximates market value.
2. Repurchase Agreements: The fund enters into repurchase agreements with institutional counterparties. Securities pledged as collateral to the fund under repurchase agreements are held by a custodian bank until the agreements mature, and in the absence of a default, such collateral cannot be repledged, resold, or rehypothecated. Each agreement requires that the market value of the collateral be sufficient to cover payments of interest and principal. The fund further mitigates its counterparty risk by entering into repurchase agreements only with a diverse group of prequalified counterparties, monitoring their financial strength, and entering into master repurchase agreements with its counterparties. The master repurchase agreements provide that, in the event of a counterparty’s default (including bankruptcy), the fund may terminate any repurchase agreements with that counterparty, determine the net amount owed, and sell or retain the collateral up to the net amount owed to the fund. Such action may be subject to legal proceedings, which may delay or limit the disposition of collateral.
3. Federal Income Taxes: The fund intends to continue to qualify as a regulated investment company and distribute all of its taxable income. Management has analyzed the fund’s tax positions taken for all open federal income tax years (August 31, 2014–2017), and has concluded that no provision for federal income tax is required in the fund’s financial statements.
4. Distributions: Distributions from net investment income are declared daily and paid on the first business day of the following month.
5. Credit Facility: The fund and certain other funds managed by The Vanguard Group (“Vanguard”) participate in a $3.1 billion committed credit facility provided by a syndicate of lenders pursuant to a credit agreement that may be renewed annually; each fund is individually liable for its borrowings, if any, under the credit facility. Borrowings may be utilized for temporary and emergency purposes, and are subject to the fund’s regulatory and contractual borrowing restrictions. The participating funds are charged administrative fees and an annual commitment fee of 0.10% of the undrawn amount of the facility; these fees are allocated to the funds based on a method approved by the fund’s board of trustees and included in Management and Administrative expenses on the fund’s Statement of Operations. Any borrowings under this facility bear interest at a rate based upon the higher of the one-month London Interbank Offered Rate, federal funds effective rate, or overnight bank funding rate plus an agreed-upon spread.
The fund had no borrowings outstanding at August 31, 2017, or at any time during the period then ended.
41
Federal Money Market Fund
6. Other: Interest income is accrued daily. Premiums and discounts on debt securities purchased are amortized and accreted, respectively, to interest income over the lives of the respective securities. Security transactions are accounted for on the date securities are bought or sold. Costs used to determine realized gains (losses) on the sale of investment securities are those of the specific securities sold.
B. In accordance with the terms of a Funds’ Service Agreement (the “FSA”) between Vanguard and the fund, Vanguard furnishes to the fund investment advisory, corporate management, administrative, marketing, and distribution services at Vanguard’s cost of operations (as defined by the FSA). These costs of operations are allocated to the fund based on methods and guidelines approved by the board of trustees. Vanguard does not require reimbursement in the current period for certain costs of operations (such as deferred compensation/benefits and risk/insurance costs); the fund’s liability for these costs of operations is included in Payables to Vanguard on the Statement of Net Assets.
Upon the request of Vanguard, the fund may invest up to 0.40% of its net assets as capital in Vanguard. At August 31, 2017, the fund had contributed to Vanguard capital in the amount of $4,851,000, representing 0.01% of the fund’s net assets and 1.94% of Vanguard’s capitalization. The fund’s trustees and officers are also directors and employees, respectively, of Vanguard.
C. Various inputs may be used to determine the value of the fund’s investments. These inputs are summarized in three broad levels for financial statement purposes. The inputs or methodologies used to value securities are not necessarily an indication of the risk associated with investing in those securities.
Level 1—Quoted prices in active markets for identical securities.
Level 2—Other significant observable inputs (including quoted prices for similar securities, interest rates, prepayment speeds, credit risk, etc.).
Level 3—Significant unobservable inputs (including the fund’s own assumptions used to determine the fair value of investments). Any investments valued with significant unobservable inputs are
noted on the Statement of Net Assets.
At August 31, 2017, 100% of the market value of the fund’s investments was determined using amortized cost, in accordance with rules under the Investment Company Act of 1940. Amortized cost approximates the current fair value of a security, but since the value is not obtained from a quoted price in an active market, securities valued at amortized cost are considered to be valued using Level 2 inputs.
D. Management has determined that no material events or transactions occurred subsequent to August 31, 2017, that would require recognition or disclosure in these financial statements.
42
Treasury Money Market Fund
Fund Profile
As of August 31, 2017
| Financial Attributes | |
| Ticker Symbol | VUSXX |
| Expense Ratio1 | 0.09% |
| 7-Day SEC Yield | 0.93% |
| Average Weighted | |
| Maturity | 56 days |
| Sector Diversification (% of portfolio) | |
| U.S. Treasury Bills | 100.0% |
The agency and mortgage-backed securities sectors may include issues from government-sponsored enterprises; such issues are
generally not backed by the full faith and credit of the U.S.government.
1 The expense ratio shown is from the prospectus dated December 23, 2016, and represents estimated costs for the current fiscal year. For the fiscal year ended August 31, 2017, the expense ratio was 0.09%.
43
Treasury Money Market Fund
Performance Summary
Investment returns will fluctuate. All of the returns in this report represent past performance, which is not a guarantee of future results that may be achieved by the fund. (Current performance may be lower or higher than the performance data cited. For performance data current to the most recent month-end, visit our website at vanguard.com/performance.) The returns shown do not reflect taxes that a shareholder would pay on fund distributions. The fund is only available to retail investors (natural persons). You could lose money by investing in the fund. Although the fund seeks to preserve the value of your investment at $1 per share, it cannot guarantee it will do so. The fund may impose a fee upon sale of your shares or may temporarily suspend your ability to sell shares if the fund’s liquidity falls below required minimums because of market conditions or other factors. An investment in the fund is not insured or guaranteed by the Federal Deposit Insurance Corporation or any other government agency. The fund’s sponsor has no legal obligation to provide financial support to the fund, and you should not expect that the sponsor will provide financial support to the fund at any time. The fund’s 7-day SEC yield reflects its current earnings more closely than do the average annual returns.
Cumulative Performance: August 31, 2007, Through August 31, 2017
Initial Investment of $50,000
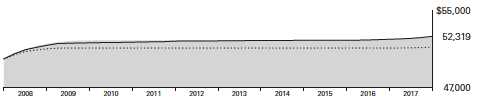
| Average Annual Total Returns | ||||
| Periods Ended August 31, 2017 | ||||
| Final Value | ||||
| One | Five | Ten | of a $50,000 | |
| Year | Years | Years | Investment | |
| Treasury Money Market Fund | 0.54% | 0.15% | 0.45% | $52,319 |
| iMoneyNet Money Fund Report’s | ||||
| • • • • • • • • | ||||
| 100% Treasury Funds Average | 0.19 | 0.04 | 0.24 | 51,224 |
| Citigroup Three-Month U.S. Treasury | ||||
| Bill Index | 0.58 | 0.16 | 0.44 | 52,221 |
| iMoneyNet Money Fund Report’s 100% Treasury Funds Average: Derived from data provided by iMoneyNet, Inc. | ||||
See Financial Highlights for dividend information.
44
Treasury Money Market Fund
Fiscal-Year Total Returns (%): August 31, 2007, Through August 31, 2017
| iMoneyNet | ||
| Average | ||
| Fiscal Year | Total Returns | Total Returns |
| 2008 | 3.08% | 2.08% |
| 2009 | 0.70 | 0.17 |
| 2010 | 0.03 | 0.00 |
| 2011 | 0.02 | 0.00 |
| 2012 | 0.01 | 0.00 |
| 2013 | 0.02 | 0.00 |
| 2014 | 0.01 | 0.00 |
| 2015 | 0.01 | 0.00 |
| 2016 | 0.17 | 0.00 |
| 2017 | 0.54 | 0.19 |
7-day SEC yield (8/31/2017): 0.93%
iMoneyNet Money Fund Report’s 100% Treasury Funds Average: Derived from data provided by iMoneyNet, Inc.
Average Annual Total Returns: Periods Ended June 30, 2017
This table presents returns through the latest calendar quarter—rather than through the end of the fiscal period.
Securities and Exchange Commission rules require that we provide this information.
| Inception | One | Five | Ten | |
| Date | Year | Years | Years | |
| Treasury Money Market Fund | 12/14/1992 | 0.43% | 0.12% | 0.52% |
45
Treasury Money Market Fund
Financial Statements
Statement of Net Assets
As of August 31, 2017
The fund reports a complete list of its holdings in various monthly and quarterly regulatory filings. The fund publishes its holdings on a monthly basis at vanguard.com and files them with the Securities and Exchange Commission on Form N-MFP. The fund’s Form N-MFP filings may be viewed at sec.gov or via a link on the “Portfolio Holdings” page on vanguard.com. For the second and fourth fiscal quarters, the lists appear in the fund’s semiannual and annual reports to shareholders. For the first and third fiscal quarters, the fund files the lists with the SEC on Form N-Q. Shareholders can look up the fund’s Forms N-Q on the SEC’s website at sec.gov. Forms N-Q may also be reviewed and copied at the SEC’s Public Reference Room (see the back cover of this report for further information).
| Face | Market | ||||
| Maturity | Amount | Value • | |||
| Yield1 | Date | ($000) | ($000) | ||
| U.S. Government and Agency Obligations (100.0%) | |||||
| United States Treasury Bill | 0.850%–0.982% | 9/7/17 | 865,724 | 865,583 | |
| United States Treasury Bill | 0.992%–1.018% | 9/14/17 | 1,519,000 | 1,518,446 | |
| United States Treasury Bill | 0.993%–1.014% | 9/21/17 | 1,163,209 | 1,162,556 | |
| United States Treasury Bill | 0.994%–1.008% | 9/28/17 | 1,181,910 | 1,181,024 | |
| United States Treasury Bill | 1.053%–1.124% | 10/19/17 | 144,706 | 144,503 | |
| United States Treasury Bill | 0.960% | 10/26/17 | 60,994 | 60,905 | |
| United States Treasury Bill | 0.980%–1.073% | 11/2/17 | 959,618 | 957,934 | |
| United States Treasury Bill | 1.016%–1.043% | 11/9/17 | 1,187,679 | 1,185,314 | |
| United States Treasury Bill | 1.009%–1.018% | 11/16/17 | 1,454,111 | 1,451,001 | |
| United States Treasury Bill | 0.999%–1.067% | 11/24/17 | 2,125,288 | 2,120,329 | |
| United States Treasury Bill | 1.020%–1.023% | 11/30/17 | 3,865,819 | 3,855,961 | |
| 2 | United States Treasury Floating | ||||
| Rate Note | 1.191% | 10/31/17 | 100,000 | 99,980 | |
| 2 | United States Treasury Floating | ||||
| Rate Note | 1.295% | 1/31/18 | 135,000 | 135,018 | |
| 2 | United States Treasury Floating | ||||
| Rate Note | 1.193% | 10/31/18 | 899,825 | 899,835 | |
| Total U.S. Government and Agency Obligations (Cost $15,638,389) | 15,638,389 | ||||
| Total Investments (100.0%) (Cost $15,638,389) | 15,638,389 | ||||
46
| Treasury Money Market Fund | |
| Amount | |
| ($000) | |
| Other Assets and Liabilities (0.0%) | |
| Other Assets | |
| Investment in Vanguard | 983 |
| Receivables for Accrued Income | 1,230 |
| Receivables for Capital Shares Issued | 35,235 |
| Other Assets | 4,000 |
| Total Other Assets | 41,448 |
| Liabilities | |
| Payables for Capital Shares Redeemed | (40,087) |
| Payables for Distributions | (306) |
| Payables to Vanguard | (691) |
| Total Liabilities | (41,084) |
| Net Assets (100%) | |
| Applicable to 15,636,136,304 outstanding $.001 par value shares of | |
| beneficial interest (unlimited authorization) | 15,638,753 |
| Net Asset Value Per Share | $1.00 |
| At August 31, 2017, net assets consisted of: | |
| Amount | |
| ($000) | |
| Paid-in Capital | 15,639,176 |
| Undistributed Net Investment Income | 9 |
| Accumulated Net Realized Losses | (432) |
| Net Assets | 15,638,753 |
• See Note A in Notes to Financial Statements.
1 Represents annualized yield at date of purchase for discount securities, and coupon for coupon-bearing securities.
2 Adjustable-rate security based upon 3-month U.S. Treasury Bill Auction High Money Market Yield plus spread.
See accompanying Notes, which are an integral part of the Financial Statements.
47
Treasury Money Market Fund
Statement of Operations
| Year Ended | |
| August 31,2017 | |
| ($000) | |
| Investment Income | |
| Income | |
| Interest | 94,070 |
| Total Income | 94,070 |
| Expenses | |
| The Vanguard Group—Note B | |
| Investment Advisory Services | 474 |
| Management and Administrative | 9,618 |
| Marketing and Distribution | 2,694 |
| Custodian Fees | 147 |
| Auditing Fees | 28 |
| Shareholders’ Reports and Proxy | 215 |
| Trustees’ Fees and Expenses | 12 |
| Total Expenses | 13,188 |
| Net Investment Income | 80,882 |
| Realized Net Gain (Loss) on Investment Securities Sold | (407) |
| Net Increase (Decrease) in Net Assets Resulting from Operations | 80,475 |
See accompanying Notes, which are an integral part of the Financial Statements.
48
Treasury Money Market Fund
Statement of Changes in Net Assets
| Year Ended August 31, | ||
| 2017 | 2016 | |
| ($000) | ($000) | |
| Increase (Decrease) in Net Assets | ||
| Operations | ||
| Net Investment Income | 80,882 | 17,671 |
| Realized Net Gain (Loss) | (407) | (25) |
| Net Increase (Decrease) in Net Assets Resulting from Operations | 80,475 | 17,646 |
| Distributions | ||
| Net Investment Income | (80,873) | (17,671) |
| Realized Capital Gain | — | — |
| Total Distributions | (80,873) | (17,671) |
| Capital Share Transactions (at $1.00 per share) | ||
| Issued | 9,585,836 | 5,596,836 |
| Issued in Lieu of Cash Distributions | 78,567 | 17,175 |
| Redeemed | (6,828,339) | (2,198,831) |
| Net Increase (Decrease) from Capital Share Transactions | 2,836,064 | 3,415,180 |
| Total Increase (Decrease) | 2,835,666 | 3,415,155 |
| Net Assets | ||
| Beginning of Period | 12,803,087 | 9,387,932 |
| End of Period1 | 15,638,753 | 12,803,087 |
1 Net Assets—End of Period includes undistributed (overdistributed) net investment income of $9,000 and $0.
See accompanying Notes, which are an integral part of the Financial Statements.
49
Treasury Money Market Fund
Financial Highlights
| For a Share Outstanding | Year Ended August 31, | ||||
| Throughout Each Period | 2017 | 2016 | 2015 | 2014 | 2013 |
| Net Asset Value, Beginning of Period | $1.00 | $1.00 | $1.00 | $1.00 | $1.00 |
| Investment Operations | |||||
| Net Investment Income | . 0051 | .0017 | .0001 | .0001 | .0002 |
| Net Realized and Unrealized Gain (Loss) | |||||
| on Investments | — | — | — | — | — |
| Total from Investment Operations | .005 | .0017 | .0001 | .0001 | .0002 |
| Distributions | |||||
| Dividends from Net Investment Income | (.005) | (.0017) | (.0001) | (.0001) | (.0002) |
| Distributions from Realized Capital Gains | — | — | — | (.0000)2 | — |
| Total Distributions | (.005) | (.0017) | (.0001) | (.0001) | (.0002) |
| Net Asset Value, End of Period | $1.00 | $1.00 | $1.00 | $1.00 | $1.00 |
| Total Return3 | 0.54% | 0.17% | 0.01% | 0.01% | 0.02% |
| Ratios/Supplemental Data | |||||
| Net Assets, End of Period (Millions) | $15,639 | $12,803 | $9,388 | $10,365 | $11,660 |
| Ratio of Total Expenses to Average Net Assets4 | 0.09% | 0.09% | 0.04% | 0.05% | 0.08% |
| Ratio of Net Investment Income to | |||||
| Average Net Assets | 0.55% | 0.18% | 0.01% | 0.01% | 0.02% |
1 Calculated based on average shares outstanding.
2 Distributions from realized capital gains were less than $.0001 per share.
3 Total returns do not include account service fees that may have applied in the periods shown. Fund prospectuses provide information
about any applicable account service fees.
4 The ratio of total expenses to average net assets before an expense reduction was 0.09% for 2016, 0.09% for 2015, 0.09% for 2014, and
0.09% for 2013. For the year ended August 31, 2017, there was no expense reduction. See Note B in the Notes to Financial Statements.
See accompanying Notes, which are an integral part of the Financial Statements.
50
Treasury Money Market Fund
Notes to Financial Statements
Vanguard Treasury Money Market Fund is registered under the Investment Company Act of 1940 as an open-end investment company, or mutual fund. The fund invests in short-term debt instruments backed by the full faith and credit of the U.S. government.
A. The following significant accounting policies conform to generally accepted accounting principles for U.S. investment companies. The fund consistently follows such policies in preparing its financial statements.
1. Security Valuation: Securities are valued as of the close of trading on the New York Stock Exchange (generally 4 p.m., Eastern time) on the valuation date. Securities are valued at amortized cost, which approximates market value.
2. Federal Income Taxes: The fund intends to continue to qualify as a regulated investment company and distribute all of its taxable income. Management has analyzed the fund’s tax positions taken for all open federal income tax years (August 31, 2014–2017), and has concluded that no provision for federal income tax is required in the fund’s financial statements.
3. Distributions: Distributions from net investment income are declared daily and paid on the first business day of the following month.
4. Credit Facility: The fund and certain other funds managed by The Vanguard Group (“Vanguard”) participate in a $3.1 billion committed credit facility provided by a syndicate of lenders pursuant to a credit agreement that may be renewed annually; each fund is individually liable for its borrowings, if any, under the credit facility. Borrowings may be utilized for temporary and emergency purposes, and are subject to the fund’s regulatory and contractual borrowing restrictions. The participating funds are charged administrative fees and an annual commitment fee of 0.10% of the undrawn amount of the facility; these fees are allocated to the funds based on a method approved by the fund’s board of trustees and included in Management and Administrative expenses on the fund’s Statement of Operations. Any borrowings under this facility bear interest at a rate based upon the higher of the one-month London Interbank Offered Rate, federal funds effective rate, or overnight bank funding rate plus an agreed-upon spread.
The fund had no borrowings outstanding at August 31, 2017, or at any time during the period then ended.
5. Other: Interest income is accrued daily. Premiums and discounts on debt securities purchased are amortized and accreted, respectively, to interest income over the lives of the respective securities. Security transactions are accounted for on the date securities are bought or sold. Costs used to determine realized gains (losses) on the sale of investment securities are those of the specific securities sold.
B. In accordance with the terms of a Funds’ Service Agreement (the “FSA”) between Vanguard and the fund, Vanguard furnishes to the fund investment advisory, corporate management, administrative, marketing, and distribution services at Vanguard’s cost of operations (as defined by the FSA). These costs of operations are allocated to the fund based on methods and guidelines approved by the board of trustees. Vanguard does not require reimbursement in the current period for certain costs of operations (such as deferred compensation/benefits and risk/insurance costs); the fund’s liability for these costs of operations is included in Payables to Vanguard on the Statement of Net Assets.
51
Treasury Money Market Fund
Upon the request of Vanguard, the fund may invest up to 0.40% of its net assets as capital in Vanguard. At August 31, 2017, the fund had contributed to Vanguard capital in the amount of $983,000, representing 0.01% of the fund’s net assets and 0.39% of Vanguard’s capitalization. The fund’s trustees and officers are also directors and employees, respectively, of Vanguard.
Vanguard and the board of trustees have agreed to temporarily limit certain net operating expenses in excess of the fund’s daily yield in order to maintain a zero or positive yield for the fund. Vanguard and the board of trustees may terminate the temporary expense limitation at any time. The fund is not obligated to repay this amount to Vanguard. For the year ended August 31, 2017, the fund did not receive an expense reduction from Vanguard.
C. Various inputs may be used to determine the value of the fund’s investments. These inputs are summarized in three broad levels for financial statement purposes. The inputs or methodologies used to value securities are not necessarily an indication of the risk associated with investing in those securities.
Level 1—Quoted prices in active markets for identical securities.
Level 2—Other significant observable inputs (including quoted prices for similar securities, interest rates, prepayment speeds, credit risk, etc.).
Level 3—Significant unobservable inputs (including the fund’s own assumptions used to determine the fair value of investments). Any investments valued with significant unobservable inputs are
noted on the Statement of Net Assets.
At August 31, 2017, 100% of the market value of the fund’s investments was determined using amortized cost, in accordance with rules under the Investment Company Act of 1940. Amortized cost approximates the current fair value of a security, but since the value is not obtained from a quoted price in an active market, securities valued at amortized cost are considered to be valued using Level 2 inputs.
D. Management has determined that no material events or transactions occurred subsequent to August 31, 2017, that would require recognition or disclosure in these financial statements.
52
Report of Independent Registered Public Accounting Firm
To the Board of Trustees of Vanguard Money Market Reserves and Vanguard Admiral Funds and the Shareholders of Vanguard Prime Money Market Fund, Vanguard Federal Money Market Fund and Vanguard Treasury Money Market Fund:
In our opinion, the accompanying statements of net assets and the related statements of operations and of changes in net assets and the financial highlights present fairly, in all material respects, the financial position of Vanguard Prime Money Market Fund and Vanguard Federal Money Market Fund (constituting separate portfolios of Vanguard Money Market Reserves) and Vanguard Treasury Money Market Fund (constituting a separate portfolio of Vanguard Admiral Funds) (hereafter referred to as the “Funds”) as of August 31, 2017, the results of each of their operations for the year then ended, the changes in each of their net assets for each of the two years in the period then ended and the financial highlights for each of the five years in the period then ended, in conformity with accounting principles generally accepted in the United States of America. These financial statements and financial highlights (hereafter referred to as “financial statements”) are the responsibility of the Funds’ management. Our responsibility is to express an opinion on these financial statements based on our audits. We conducted our audits of these financial statements in accordance with the standards of the Public Company Accounting Oversight Board (United States). Those standards require that we plan and perform the audit to obtain reasonable assurance about whether the financial statements are free of material misstatement. An audit includes examining, on a test basis, evidence supporting the amounts and disclosures in the financial statements, assessing the accounting principles used and significant estimates made by management, and evaluating the overall financial statement presentation. We believe that our audits, which included confirmation of securities as of August 31, 2017 by correspondence with the custodian and brokers, provide a reasonable basis for our opinion.
/s/PricewaterhouseCoopers LLP
Philadelphia, Pennsylvania
October 13, 2017
53
| Special 2017 tax information (unaudited) for Vanguard Prime Money Market Fund |
| This information for the fiscal year ended August 31, 2017, is included pursuant to provisions |
| of the Internal Revenue Code. |
| For nonresident alien shareholders, 69.5% of income dividends are interest-related dividends. |
| Special 2017 tax information (unaudited) for Vanguard Federal Money Market Fund |
| This information for the fiscal year ended August 31, 2017, is included pursuant to provisions |
| of the Internal Revenue Code. |
| For nonresident alien shareholders, 100% of income dividends are interest-related dividends. |
| Special 2017 tax information (unaudited) for Vanguard Treasury Money Market Fund |
| This information for the fiscal year ended August 31, 2017, is included pursuant to provisions |
| of the Internal Revenue Code. |
| For nonresident alien shareholders, 100% of income dividends are interest-related dividends. |
54
About Your Fund’s Expenses
As a shareholder of the fund, you incur ongoing costs, which include costs for portfolio management, administrative services, and shareholder reports (like this one), among others. Operating expenses, which are deducted from a fund’s gross income, directly reduce the investment return of the fund.
A fund’s expenses are expressed as a percentage of its average net assets. This figure is known as the expense ratio. The following examples are intended to help you understand the ongoing costs (in dollars) of investing in your fund and to compare these costs with those of other mutual funds. The examples are based on an investment of $1,000 made at the beginning of the period shown and held for the entire period.
The accompanying table illustrates your fund’s costs in two ways:
• Based on actual fund return. This section helps you to estimate the actual expenses that you paid over the period. The ”Ending Account Value“ shown is derived from the fund‘s actual return, and the third column shows the dollar amount that would have been paid by an investor who started with $1,000 in the fund. You may use the information here, together with the amount you invested, to estimate the expenses that you paid over the period.
To do so, simply divide your account value by $1,000 (for example, an $8,600 account value divided by $1,000 = 8.6), then multiply the result by the number given for your fund under the heading ”Expenses Paid During Period.“
• Based on hypothetical 5% yearly return. This section is intended to help you compare your fund‘s costs with those of other mutual funds. It assumes that the fund had a yearly return of 5% before expenses, but that the expense ratio is unchanged. In this case—because the return used is not the fund’s actual return—the results do not apply to your investment. The example is useful in making comparisons because the Securities and Exchange Commission requires all mutual funds to calculate expenses based on a 5% return. You can assess your fund’s costs by comparing this hypothetical example with the hypothetical examples that appear in shareholder reports of other funds.
Note that the expenses shown in the table are meant to highlight and help you compare ongoing costs only and do not reflect transaction costs incurred by the fund for buying and selling securities. Further, the expenses do not include any purchase, redemption, or account service fees described in the fund prospectus. If such fees were applied to your account, your costs would be higher. Your fund does not carry a “sales load.”
The calculations assume no shares were bought or sold during the period. Your actual costs may have been higher or lower, depending on the amount of your investment and the timing of any purchases or redemptions.
You can find more information about the fund’s expenses, including annual expense ratios, in the Financial Statements section of this report. For additional information on operating expenses and other shareholder costs, please refer to your fund’s current prospectus.
55
| Six Months Ended August 31, 2017 | |||
| Beginning | Ending | Expenses | |
| Account Value | Account Value | Paid During | |
| 2/28/2017 | 8/31/2017 | Period | |
| Based on Actual Fund Return | |||
| Prime Money Market Fund | |||
| Investor Shares | $1,000.00 | $1,004.99 | $0.81 |
| Admiral Shares | 1,000.00 | 1,005.29 | 0.51 |
| Federal Money Market Fund | $1,000.00 | $1,003.84 | $0.56 |
| Treasury Money Market Fund | $1,000.00 | $1,003.76 | $0.45 |
| Based on Hypothetical 5% Yearly Return | |||
| Prime Money Market Fund | |||
| Investor Shares | $1,000.00 | $1,024.40 | $0.82 |
| Admiral Shares | 1,000.00 | 1,024.70 | 0.51 |
| Federal Money Market Fund | $1,000.00 | $1,024.65 | $0.56 |
| Treasury Money Market Fund | $1,000.00 | $1,024.75 | $0.46 |
The calculations are based on expenses incurred in the most recent six-month period. The funds’ annualized six-month expense ratios for
the period are: for the Prime Money Market Fund, 0.16% for Investor Shares and 0.10% for Admiral Shares; for the Federal Money Market
Fund, 0.11%; and for the Treasury Money Market Fund, 0.09%. The dollar amounts shown as “Expenses Paid” are equal to the annualized
expense ratio multiplied by the average account value over the period, multiplied by the number of days in the most recent six-month
period, then divided by the number of days in the most recent 12-month period (184/365).
56
Trustees Approve Advisory Arrangements
The board of trustees of Vanguard Prime Money Market Fund, Vanguard Federal Money Market Fund, and Vanguard Treasury Money Market Fund has renewed each fund’s investment advisory arrangement with The Vanguard Group, Inc. (Vanguard), through its Fixed Income Group. The board determined that continuing each fund’s internalized management structure was in the best interests of the fund and its shareholders.
The board based its decision upon an evaluation of the advisor’s investment staff, portfolio management process, and performance. This evaluation included information provided to the board by Vanguard’s Portfolio Review Department, which is responsible for fund and advisor oversight and product management. The Portfolio Review Department met regularly with the advisor and made monthly presentations to the board during the fiscal year that directed the board’s focus to relevant information and topics.
The board, or an investment committee made up of board members, also received information throughout the year through advisor presentations. For each advisor presentation, the board was provided with letters and reports that included information about, among other things, the advisory firm and the advisor’s assessment of the investment environment, portfolio performance, and portfolio characteristics.
In addition, the board received monthly reports, which included a Market and Economic Report, a Fund Dashboard Monthly Summary, and a Fund Performance Report.
Prior to their meeting, the trustees were provided with a memo and materials that summarized the information they had received over the course of the year. They also considered the factors discussed below, among others. However, no single factor determined whether the board approved the arrangements. Rather, it was the totality of the circumstances that drove the board’s decision.
Nature, extent, and quality of services
The board reviewed the quality of each fund’s investment management services over both the short and long term and took into account the organizational depth and stability of the advisor. The board considered that Vanguard has been managing investments for more than three decades. The Fixed Income Group adheres to a sound, disciplined investment management process; the team has considerable experience, stability, and depth.
The board concluded that Vanguard’s experience, stability, depth, and performance, among other factors, warranted continuation of each advisory arrangement.
Investment performance
The board considered the short- and long-term performance of each fund, including any periods of outperformance or underperformance compared with a relevant benchmark index and peer group. The board concluded that the performance was such that each advisory arrangement should continue. Information about each fund’s most recent performance can be found on the Performance Summary pages of this report.
57
Cost
The board concluded that each fund’s expense ratio was well below the average expense ratio charged by funds in its peer group and that each fund’s advisory expenses were also well below its peer-group average. Information about the funds’ expenses appears in the About Your Fund’s Expenses section of this report as well as in the Financial Statements sections.
The board does not conduct a profitability analysis of Vanguard because of Vanguard’s unique “at-cost” structure. Unlike most other mutual fund management companies, Vanguard is owned by the funds it oversees and produces “profits” only in the form of reduced expenses for fund shareholders.
The benefit of economies of scale
The board concluded that each fund’s at-cost arrangement with Vanguard ensures that the funds will realize economies of scale as they grow, with the cost to shareholders declining as fund assets increase.
The board will consider whether to renew the advisory arrangements again after a one-year period.
58
Glossary
SEC Yields. A money market fund’s 7-day SEC yield is calculated by annualizing its income distributions for the previous seven days, as required by the U.S. Securities and Exchange Commission.
Average Weighted Maturity. The average length of time until fixed income securities held by a fund reach maturity and are repaid. The figure reflects the proportion of fund assets represented by each security.
Expense Ratio. A fund’s total annual operating expenses expressed as a percentage of the fund’s average net assets. The expense ratio includes management and administrative expenses, but does not include the transaction costs of buying and selling portfolio securities.
Inception Date. The date on which the assets of a fund (or one of its share classes) are first invested in accordance with the fund’s investment objective. For funds with a subscription period, the inception date is the day after that period ends. Investment performance is measured from the inception date.
59
This page intentionally left blank.
This page intentionally left blank.
This page intentionally left blank.
This page intentionally left blank.
This page intentionally left blank.
This page intentionally left blank.
This page intentionally left blank.
The People Who Govern Your Fund
The trustees of your mutual fund are there to see that the fund is operated and managed in your best interests since, as a shareholder, you are a part owner of the fund. Your fund’s trustees also serve on the board of directors of The Vanguard Group, Inc., which is owned by the Vanguard funds and provides services to them on an at-cost basis.
A majority of Vanguard’s board members are independent, meaning that they have no affiliation with Vanguard or the funds they oversee, apart from the sizable personal investments they have made as private individuals. The independent board members have distinguished backgrounds in business, academia, and public service. Each of the trustees and executive officers oversees 195 Vanguard funds.
Information for each trustee and executive officer of the fund appears below. The mailing address of the trustees and officers is P.O. Box 876, Valley Forge, PA 19482. More information about the trustees is in the Statement of Additional Information, which can be obtained, without charge, by contacting Vanguard at 800-662-7447, or online at vanguard.com.
Interested Trustee1
F. William McNabb III
Born 1957. Trustee Since July 2009. Chairman of the Board. Principal Occupation(s) During the Past Five Years and Other Experience: Chairman of the Board of The Vanguard Group, Inc., and of each of the investment companies served by The Vanguard Group, since January 2010; Chief Executive Officer and Director of The Vanguard Group and President and Chief Executive Officer of each of the investment companies served by The Vanguard Group, since 2008; Director of Vanguard Marketing Corporation; President of The Vanguard Group (2008–2017); Managing Director of The Vanguard Group (1995–2008).
Independent Trustees
Emerson U. Fullwood
Born 1948. Trustee Since January 2008. Principal Occupation(s) During the Past Five Years and Other Experience: Executive Chief Staff and Marketing Officer for North America and Corporate Vice President (retired 2008) of Xerox Corporation (document management products and services); Executive in Residence and 2009–2010 Distinguished Minett Professor at the Rochester Institute of Technology; Lead Director of SPX FLOW, Inc. (multi-industry manufacturing); Director of the United Way of Rochester, the University of Rochester Medical Center, Monroe Community College Foundation, North Carolina A&T University, and Roberts Wesleyan College; Trustee of the University of Rochester.
Rajiv L. Gupta
Born 1945. Trustee Since December 2001.2 Principal Occupation(s) During the Past Five Years and Other Experience: Chairman and Chief Executive Officer (retired 2009) and President (2006–2008) of Rohm and Haas Co. (chemicals); Director of Arconic Inc. (diversified manufacturer), HP Inc. (printer and personal computer manufacturing), and Delphi Automotive plc (automotive components); Senior Advisor at New Mountain Capital.
Amy Gutmann
Born 1949. Trustee Since June 2006. Principal Occupation(s) During the Past Five Years and Other Experience: President of the University of Pennsylvania; Christopher H. Browne
1 Mr. McNabb is considered an “interested person,” as defined in the Investment Company Act of 1940, because he is an officer of the Vanguard funds.
2 December 2002 for Vanguard Equity Income Fund, the Vanguard Municipal Bond Funds, and the Vanguard State Tax-Exempt Funds.
Distinguished Professor of Political Science, School of Arts and Sciences, and Professor of Communication, Annenberg School for Communication, with secondary faculty appointments in the Department of Philosophy, School of Arts and Sciences, and at the Graduate School of Education, University of Pennsylvania; Trustee of the National Constitution Center.
JoAnn Heffernan Heisen
Born 1950. Trustee Since July 1998. Principal Occupation(s) During the Past Five Years and Other Experience: Corporate Vice President and Member of the Executive Committee (1997–2008), Chief Global Diversity Officer (retired 2008), Vice President and Chief Information Officer (1997–2006), Controller (1995–1997), Treasurer (1991–1995), and Assistant Treasurer (1989–1991) of Johnson & Johnson (pharmaceuticals/medical devices/ consumer products); Director of Skytop Lodge Corporation (hotels) and the Robert Wood Johnson Foundation; Member of the Advisory Board of the Institute for Women’s Leadership at Rutgers University.
F. Joseph Loughrey
Born 1949. Trustee Since October 2009. Principal Occupation(s) During the Past Five Years and Other Experience: President and Chief Operating Officer (retired 2009) of Cummins Inc. (industrial machinery); Chairman of the Board of Hillenbrand, Inc. (specialized consumer services), Oxfam America, and the Lumina Foundation for Education; Director of the V Foundation for Cancer Research; Member of the Advisory Council for the College of Arts and Letters and Chair of the Advisory Board to the Kellogg Institute for International Studies, both at the University of Notre Dame.
Mark Loughridge
Born 1953. Trustee Since March 2012. Principal Occupation(s) During the Past Five Years and Other Experience: Senior Vice President and Chief Financial Officer (retired 2013) at IBM (information technology services); Fiduciary Member of IBM’s Retirement Plan Committee (2004–2013); Director of the Dow Chemical Company; Member of the Council on Chicago Booth.
Scott C. Malpass
Born 1962. Trustee Since March 2012. Principal Occupation(s) During the Past Five Years and Other Experience: Chief Investment Officer and Vice President at the University of Notre Dame; Assistant Professor of Finance at the Mendoza College of Business at Notre Dame; Member of the Notre Dame 403(b) Investment Committee, the Board of Advisors for Spruceview Capital Partners, the Board of Catholic Investment Services, Inc. (investment advisor), and the Board of Superintendence of the Institute for the Works of Religion; Chairman of the Board of TIFF Advisory Services, Inc. (investment advisor).
André F. Perold
Born 1952. Trustee Since December 2004. Principal Occupation(s) During the Past Five Years and Other Experience: George Gund Professor of Finance and Banking, Emeritus at the Harvard Business School (retired 2011); Chief Investment Officer and Co-Managing Partner of HighVista Strategies LLC (private investment firm); Overseer of the Museum of Fine Arts Boston.
Peter F. Volanakis
Born 1955. Trustee Since July 2009. Principal Occupation(s) During the Past Five Years and Other Experience: President and Chief Operating Officer (retired 2010) of Corning Incorporated (communications equipment); Chairman of the Board of Trustees of Colby-Sawyer College; Member of the Board of Hypertherm, Inc. (industrial cutting systems, software, and consumables).
Executive Officers
Glenn Booraem
Born 1967. Investment Stewardship Officer Since February 2017. Principal Occupation(s) During the Past Five Years and Other Experience: Principal of The Vanguard Group, Inc.; Treasurer (2015–2017), Controller (2010–2015), and Assistant Controller (2001–2010) of each of the investment companies served by The Vanguard Group.
Thomas J. Higgins
Born 1957. Chief Financial Officer Since September 2008. Principal Occupation(s) During the Past Five Years and Other Experience: Principal of The Vanguard Group, Inc.; Chief Financial Officer of each of the investment companies served by The Vanguard Group; Treasurer of each of the investment companies served by The Vanguard Group (1998–2008).
Peter Mahoney
Born 1974. Controller Since May 2015. Principal Occupation(s) During the Past Five Years and Other Experience: Principal of The Vanguard Group, Inc.; Controller of each of the investment companies served by The Vanguard Group; Head of International Fund Services at The Vanguard Group (2008–2014).
Anne E. Robinson
Born 1970. Secretary Since September 2016. Principal Occupation(s) During the Past Five Years and Other Experience: Managing Director of The Vanguard Group, Inc.; General Counsel of The Vanguard Group; Secretary of The Vanguard Group and of each of the investment companies served by The Vanguard Group; Director and Senior Vice President of Vanguard Marketing Corporation; Managing Director and General Counsel of Global Cards and Consumer Services at Citigroup (2014–2016); Counsel at American Express (2003–2014).
Michael Rollings
Born 1963. Treasurer Since February 2017. Principal Occupation(s) During the Past Five Years and Other Experience: Managing Director of The Vanguard Group, Inc.; Treasurer of each of the investment companies served by The Vanguard Group; Director of Vanguard Marketing Corporation; Executive Vice President and Chief Financial Officer of MassMutual Financial Group (2006–2016).
| Vanguard Senior Management Team | |
| Mortimer J. Buckley | Chris D. McIsaac |
| Gregory Davis | James M. Norris |
| John James | Thomas M. Rampulla |
| Martha G. King | Karin A. Risi |
| John T. Marcante | |
| Chairman Emeritus and Senior Advisor | |
| John J. Brennan | |
| Chairman, 1996–2009 | |
| Chief Executive Officer and President, 1996–2008 | |
| Founder | |
| John C. Bogle | |
| Chairman and Chief Executive Officer, 1974–1996 | |
 | |
| P.O. Box 2600 | |
| Valley Forge, PA 19482-2600 | |
| Connect with Vanguard® > vanguard.com | |
| Fund Information > 800-662-7447 | |
| Direct Investor Account Services > 800-662-2739 | |
| Institutional Investor Services > 800-523-1036 | |
| Text Telephone for People | |
| Who Are Deaf or Hard of Hearing> 800-749-7273 | |
| This material may be used in conjunction | |
| with the offering of shares of any Vanguard | |
| fund only if preceded or accompanied by | |
| the fund’s current prospectus. | |
| All comparative mutual fund data are from Lipper, a | |
| Thomson Reuters Company, or Morningstar, Inc., unless | |
| otherwise noted. | |
| You can obtain a free copy of Vanguard’s proxy voting | |
| guidelines by visiting vanguard.com/proxyreporting or by | |
| calling Vanguard at 800-662-2739. The guidelines are | |
| also available from the SEC’s website, sec.gov. In | |
| addition, you may obtain a free report on how your fund | |
| voted the proxies for securities it owned during the 12 | |
| months ended June 30. To get the report, visit either | |
| vanguard.com/proxyreporting or sec.gov. | |
| You can review and copy information about your fund at | |
| the SEC’s Public Reference Room in Washington, D.C. To | |
| find out more about this public service, call the SEC at | |
| 202-551-8090. Information about your fund is also | |
| available on the SEC’s website, and you can receive | |
| copies of this information, for a fee, by sending a | |
| request in either of two ways: via email addressed to | |
| publicinfo@sec.gov or via regular mail addressed to the | |
| Public Reference Section, Securities and Exchange | |
| Commission, Washington, DC 20549-1520. | |
| © 2017 The Vanguard Group, Inc. | |
| All rights reserved. | |
| Vanguard Marketing Corporation, Distributor. | |
| Q300 102017 | |
Annual Report | August 31, 2017
Vanguard S&P Mid-Cap 400 Index Funds
Vanguard S&P Mid-Cap 400 Index Fund
Vanguard S&P Mid-Cap 400 Value Index Fund
Vanguard S&P Mid-Cap 400 Growth Index Fund
Vanguard’s Principles for Investing Success
We want to give you the best chance of investment success. These principles, grounded in Vanguard’s research and experience, can put you on the right path.
Goals. Create clear, appropriate investment goals.
Balance. Develop a suitable asset allocation using broadly diversified funds. Cost. Minimize cost.
Discipline. Maintain perspective and long-term discipline.
A single theme unites these principles: Focus on the things you can control.
We believe there is no wiser course for any investor.
| Contents | |
| Your Fund’s Performance at a Glance. | 1 |
| Chairman’s Perspective. | 4 |
| S&P Mid-Cap 400 Index Fund. | 8 |
| S&P Mid-Cap 400 Value Index Fund. | 28 |
| S&P Mid-Cap 400 Growth Index Fund. | 47 |
| Your Fund’s After-Tax Returns. | 67 |
| About Your Fund’s Expenses. | 68 |
| Trustees Approve Advisory Arrangements. | 70 |
| Glossary. | 72 |
Please note: The opinions expressed in this report are just that—informed opinions. They should not be considered promises or advice. Also, please keep in mind that the information and opinions cover the period through the date on the front of this report. Of course, the risks of investing in your fund are spelled out in the prospectus.
See the Glossary for definitions of investment terms used in this report.
About the cover: Nautical images have been part of Vanguard’s rich heritage since its start in 1975. For an incoming ship, a lighthouse offers a beacon and safe path to shore. You can similarly depend on Vanguard to put you first––and light the way––as you strive to meet your financial goals. Our client focus and low costs, stemming from our unique ownership structure, assure that your interests are paramount.
Your Fund’s Performance at a Glance
• Mid-capitalization growth and value stocks performed similarly during the 12 months ended August 31, 2017. This market trend was mirrored in the performance of the Vanguard S&P Mid-Cap 400 Index Funds.
• The S&P Mid-Cap 400 Index Fund, which includes both value and growth stocks, returned about 12%. The S&P Mid-Cap 400 Value Index Fund also returned about 12%, and the S&P Mid-Cap 400 Growth Index Fund was slightly behind it.
• All three funds closely tracked their target indexes, and only the Growth Index Fund failed to outperform its mid-cap peers.
• Information technology was the leading sector for all three funds, returning 25% or more. Firms focused on electronic equipment, IT services, and semiconductors did particularly well. Financials, industrials, health care, and materials were also strong performers, returning 15% or more. Energy was the most notable detractor.
| Total Returns: Fiscal Year Ended August 31, 2017 | |
| Total | |
| Returns | |
| Vanguard S&P Mid-Cap 400 Index Fund | |
| ETF Shares | |
| Market Price | 12.20% |
| Net Asset Value | 12.22 |
| Institutional Shares | 12.31 |
| S&P MidCap 400 Index | 12.37 |
| Mid-Cap Core Funds Average | 12.02 |
| Mid-Cap Core Funds Average: Derived from data provided by Lipper, a Thomson Reuters Company. | |
| Vanguard S&P Mid-Cap 400 Value Index Fund | |
| ETF Shares | |
| Market Price | 11.85% |
| Net Asset Value | 11.91 |
| Institutional Shares | 12.05 |
| S&P MidCap 400 Value Index | 12.09 |
| Mid-Cap Value Funds Average | 10.95 |
| Mid-Cap Value Funds Average: Derived from data provided by Lipper, a Thomson Reuters Company. | |
1
| Total | |
| Returns | |
| Vanguard S&P Mid-Cap 400 Growth Index Fund | |
| ETF Shares | |
| Market Price | 11.59% |
| Net Asset Value | 11.67 |
| Institutional Shares | 11.80 |
| S&P MidCap 400 Growth Index | 11.86 |
| Mid-Cap Growth Funds Average | 15.51 |
Mid-Cap Growth Funds Average: Derived from data provided by Lipper, a Thomson Reuters Company.
Institutional Shares are available to certain institutional investors who meet specific administrative, service, and account-size criteria. The
Vanguard ETF® Shares shown are traded on the NYSE Arca exchange and are available only through brokers. The table provides ETF
returns based on both the NYSE Arca market price and the net asset value for a share. U.S. Pat. Nos. 6,879,964; 7,337,138; 7,720,749;
7,925,573; 8,090,646; and 8,417,623.
For the ETF Shares, the market price is determined by the midpoint of the bid-offer spread as of the closing time of the New York Stock
Exchange (generally 4 p.m., Eastern time). The net asset value is also determined as of the NYSE closing time. For more information about
how the ETF Shares' market prices have compared with their net asset value, visit vanguard.com, select your ETF, and then select the
Price and Performance tab. The ETF premium/discount analysis there shows the percentages of days on which the ETF Shares' market
price was above or below the NAV.
| Total Returns: Inception Through August 31, 2017 | |
| Average | |
| Annual Return | |
| S&P Mid-Cap 400 Index Fund ETF Shares Net Asset Value (Returns since inception: 9/7/2010) | 14.18% |
| S&P MidCap 400 Index | 14.34 |
| Mid-Cap Core Funds Average | 12.50 |
| Mid-Cap Core Funds Average: Derived from data provided by Lipper, a Thomson Reuters Company. | |
| S&P Mid-Cap 400 Value Index Fund ETF Shares Net Asset Value (Returns since inception: 9/7/2010) | 13.75% |
| S&P MidCap 400 Value Index | 13.97 |
| Mid-Cap Value Funds Average | 12.62 |
| Mid-Cap Value Funds Average: Derived from data provided by Lipper, a Thomson Reuters Company. | |
| S&P Mid-Cap 400 Growth Index Fund ETF Shares Net Asset Value (Returns since inception: 9/7/2010) | 14.33% |
| S&P MidCap 400 Growth Index | 14.53 |
| Mid-Cap Growth Funds Average | 12.61 |
| Mid-Cap Growth Funds Average: Derived from data provided by Lipper, a Thomson Reuters Company. | |
The figures shown represent past performance, which is not a guarantee of future results. (Current performance may be lower or higher than the performance data cited. For performance data current to the most recent month-end, visit our website at vanguard.com/performance.) Note, too, that both investment returns and principal value can fluctuate widely, so an investor’s shares, when sold, could be worth more or less than their original cost.
2
| Expense Ratios | |||
| Your Fund Compared With Its Peer Group | |||
| ETF | Institutional | Peer Group | |
| Shares | Shares | Average | |
| S&P Mid-Cap 400 Index Fund | 0.15% | 0.08% | 1.13% |
| S&P Mid-Cap 400 Value Index Fund | 0.20 | 0.08 | 1.20 |
| S&P Mid-Cap 400 Growth Index Fund | 0.20 | 0.08 | 1.28 |
The fund expense ratios shown are from the prospectus dated December 23, 2016, and represent estimated costs for the current fiscal
year. For the fiscal year ended August 31, 2017, the funds’ expense ratios were: for the S&P Mid-Cap 400 Index Fund, 0.15% for ETF
Shares and 0.08% for Institutional Shares; for the S&P Mid-Cap 400 Value Index Fund, 0.20% for ETF Shares and 0.08% for Institutional
Shares; and for the S&P Mid-Cap 400 Growth Index Fund, 0.20% for ETF Shares and 0.08% for Institutional Shares. Peer-group expense
ratios are derived from data provided by Lipper, a Thomson Reuters Company, and capture information through year-end 2016.
Peer groups: For the S&P Mid-Cap 400 Index Fund, Mid-Cap Core Funds; for the S&P Mid-Cap 400 Value Index Fund, Mid-Cap Value Funds;
and for the S&P Mid-Cap 400 Growth Index Fund, Mid-Cap Growth Funds.
3
Chairman’s Perspective

Bill McNabb
Chairman and Chief Executive Officer
Dear Shareholder,
Since mid-August we’ve been reaching out to you about the proposals put forth by the Vanguard funds that, if approved, will enable us to manage the funds more efficiently and effectively. As the November deadline for voting approaches, I’d like to offer some perspective on a few of the proposals that I believe are important to the way Vanguard operates and manages your investments. I hope you consider this information and promptly cast your ballot.
Your biggest advocate
The main driver for this proxy solicitation is to ask all our fund shareholders to elect a full slate of trustees who oversee each U.S.-based Vanguard mutual fund. These trustees serve an important role, making sure your funds are managed in your best interests. This includes monitoring fund performance, approving advisory agreements, and ensuring that we’re keeping your investment costs as low as possible. Simply put, they are your biggest advocate.
Each trustee brings a variety of skills and professional experiences that contribute to the board’s strength and diversity. Of the 12 nominees, nine currently serve on the board, and three are new. If elected, the new board would include ten independent members, meaning they have no affiliation with Vanguard or the funds apart from any investments they may choose to make as private individuals.
4
These are the proposed new trustees:
• Sarah Bloom Raskin is a former member of the Federal Reserve Board of Governors and former deputy secretary of the U.S. Treasury Department. She is an expert in cybersecurity—a critically important issue at Vanguard, as we place a premium on protecting clients’ assets and sensitive data.
• Deanna Mulligan is chief executive officer of The Guardian Life Insurance Company of America. It’s rare to find a CEO such as Deanna who leads a company with a mutual ownership structure similar to Vanguard’s.
• Tim Buckley is president and a director of Vanguard and will succeed me in January as CEO. (I’ll remain chairman for a period to be determined by the board.) I interviewed Tim when he applied for his first job here in 1991 and again when he was graduating from Harvard Business School. I was thrilled he picked Vanguard as a place to build his career, and I’ve been delighted to see him take on several leadership positions, including as head of our Retail Investor Group, chief information officer, and chief investment officer. I can think of no one better prepared to succeed me.
| Market Barometer | |||
| Average Annual Total Returns | |||
| Periods Ended August 31, 2017 | |||
| One Year | Three Years | Five Years | |
| Stocks | |||
| Russell 1000 Index (Large-caps) | 16.16% | 9.21% | 14.37% |
| Russell 2000 Index (Small-caps) | 14.91 | 7.67 | 13.15 |
| Russell 3000 Index (Broad U.S. market) | 16.06 | 9.08 | 14.27 |
| FTSE All-World ex US Index (International) | 18.74 | 2.80 | 7.76 |
| Bonds | |||
| Bloomberg Barclays U.S. Aggregate Bond Index | |||
| (Broad taxable market) | 0.49% | 2.64% | 2.19% |
| Bloomberg Barclays Municipal Bond Index | |||
| (Broad tax-exempt market) | 0.88 | 3.40 | 3.23 |
| Citigroup Three-Month U.S. Treasury Bill Index | 0.58 | 0.25 | 0.16 |
| CPI | |||
| Consumer Price Index | 1.94% | 1.06% | 1.28% |
5
Vanguard believes that diversity of thought, background, and experience, as well as diversity of personal characteristics, meaningfully contributes to the board’s ability to effectively serve shareholders. If Sarah and Deanna are elected, women will account for 40% of the board’s independent trustees.
I should note that even as Vanguard is nominating three new board members, we’re saying goodbye to trustee Rajiv Gupta. Rajiv was a legendary CEO of Rohm and Haas Co., and Vanguard and our clients have benefited greatly from his expertise. I wish him a happy retirement.
Summarizing the proposals
Among the trustees’ leading responsibilities is overseeing the funds’ internal and external investment advisory agreements. The trustees, in consultation with our Global Investment Committee and our Portfolio Review Department, choose the investment advisors that manage client assets. Over decades, we have built a strong track record of picking advisors whose portfolio management strategies have served clients well.
Two proposals in the proxy focus on this oversight responsibility. Shareholders of 48 Vanguard funds have already voted to allow the board to make external advisor changes without obtaining prior shareholder approval. The new proposals would extend that policy across our entire U.S.-based fund lineup and expand it to include internal advisory agreements with Vanguard subsidiaries. Eliminating the need for shareholder approval removes a step that is costly and time-consuming if done frequently or on an individual fund basis. Although there are no current plans to employ the policy on any Vanguard-managed funds, standardizing it enables the trustees to retain an advisory firm to diversify a fund’s management team or ensure management continuity should a contingency arise.
I also encourage shareholders of several specific Vanguard index funds to read the proxy proposals that affect those funds. One proposal would change the investment objective of Vanguard REIT Index Fund and Vanguard Variable Insurance Fund REIT Index Portfolio to include real estate-related securities, aligning the funds with updated industry-sector classification methodology. Another proposal seeks to change the diversification status of the REIT Index Fund to enable it to better track its benchmark. Finally, we seek your approval of the Funds’ Service Agreement for Vanguard Institutional Index Fund and Vanguard Institutional Total Stock Market Index Fund. If approved, this arrangement would then be standardized across Vanguard’s entire publicly available U.S. mutual fund lineup. It should also reduce costs and minimum initial investment requirements in select share classes.
6
At the ballot box
We hope you’ll make it a priority to cast your ballot. We want to avoid the added time and cost of soliciting sufficient votes should we not obtain a quorum by the shareholder meeting on November 15, when voting concludes. Ultimately, we believe the proposals I’ve discussed are in your best interest as Vanguard fund shareholders, and the trustees recommend that you vote in favor of them. For more information, visit vanguard.com and enter the search term “proxy.”
As always, thank you for investing with Vanguard.
Sincerely,

F. William McNabb III
Chairman and Chief Executive Officer
September 14, 2017
S&P Mid-Cap 400 Index Fund
Fund Profile
As of August 31, 2017
| Share-Class Characteristics | ||
| ETF | Institutional | |
| Shares | Shares | |
| Ticker Symbol | IVOO | VSPMX |
| Expense Ratio1 | 0.15% | 0.08% |
| 30-Day SEC Yield | 1.47% | 1.53% |
| Portfolio Characteristics | |||
| DJ | |||
| U.S. | |||
| Total | |||
| S&P | Market | ||
| MidCap | FA | ||
| Fund 400 Index | Index | ||
| Number of Stocks | 401 | 400 | 3,769 |
| Median Market Cap | $5.0B | $5.0B | $63.1B |
| Price/Earnings Ratio | 22.8x | 22.8x | 21.6x |
| Price/Book Ratio | 2.2x | 2.2x | 2.8x |
| Return on Equity | 11.5% | 11.5% | 15.1% |
| Earnings Growth | |||
| Rate | 9.0% | 8.9% | 9.4% |
| Dividend Yield | 1.6% | 1.6% | 1.8% |
| Foreign Holdings | 0.0% | 0.0% | 0.0% |
| Turnover Rate | 13% | — | — |
| Short-Term Reserves | -0.1% | — | — |
| Volatility Measures | ||
| DJ | ||
| S&P | U.S. Total | |
| MidCap | Market | |
| 400 Index | FA Index | |
| R-Squared | 1.00 | 0.84 |
| Beta | 1.00 | 1.00 |
| These measures show the degree and timing of the fund’s fluctuations compared with the indexes over 36 months. | ||
| Ten Largest Holdings (% of total net assets) | ||
| Cadence Design | ||
| Systems Inc. | Application Software | 0.7% |
| MSCI Inc. | Financial Exchanges | |
| & Data | 0.6 | |
| Take-Two Interactive | Home Entertainment | |
| Software Inc. | Software | 0.6 |
| Huntington Ingalls | Aerospace & | |
| Industries Inc. | Defense | 0.6 |
| Trimble Inc. | Electronic Equipment | |
| & Instruments | 0.6 | |
| Teleflex Inc. | Health Care | |
| Equipment | 0.6 | |
| NVR Inc. | Homebuilding | 0.6 |
| Cognex Corp. | Electronic Equipment | |
| & Instruments | 0.6 | |
| CDK Global Inc. | Application Software | 0.6 |
| Atmos Energy Corp. | Gas Utilities | 0.6 |
| Top Ten | 6.1% | |
| The holdings listed exclude any temporary cash investments and equity index products. | ||
Investment Focus
1 The expense ratios shown are from the prospectus dated December 23, 2016, and represent estimated costs for the current fiscal year. For the fiscal year ended August 31, 2017, the expense ratios were 0.15% for ETF Shares and 0.08% for Institutional Shares.
8
S&P Mid-Cap 400 Index Fund
Sector Diversification (% of equity exposure)
| DJ | |||
| S&P | U.S. Total | ||
| MidCap | Market | ||
| Fund | 400 Index | FA Index | |
| Consumer Discretionary 11.3% | 11.3% | 12.4% | |
| Consumer Staples | 3.7 | 3.7 | 7.6 |
| Energy | 3.5 | 3.5 | 5.3 |
| Financials | 16.2 | 16.3 | 14.7 |
| Health Care | 8.7 | 8.7 | 14.1 |
| Industrials | 14.8 | 14.8 | 10.7 |
| Information Technology | 18.7 | 18.6 | 22.6 |
| Materials | 7.2 | 7.2 | 3.3 |
| Real Estate | 9.9 | 9.9 | 4.1 |
| Telecommunication | |||
| Services | 0.2 | 0.2 | 1.9 |
| Utilities | 5.8 | 5.8 | 3.3 |
Sector categories are based on the Global Industry Classification Standard (“GICS”), except for the “Other” category (if applicable),
which includes securities that have not been provided a GICS classification as of the effective reporting period.
9
S&P Mid-Cap 400 Index Fund
Performance Summary
All of the returns in this report represent past performance, which is not a guarantee of future results that may be achieved by the fund. (Current performance may be lower or higher than the performance data cited. For performance data current to the most recent month-end, visit our website at vanguard.com/performance.) Note, too, that both investment returns and principal value can fluctuate widely, so an investor’s shares, when sold, could be worth more or less than their original cost. The returns shown do not reflect taxes that a shareholder would pay on fund distributions or on the sale of fund shares.
Cumulative Performance: September 7, 2010, Through August 31, 2017
Initial Investment of $10,000

| Average Annual Total Returns | |||||
| Periods Ended August 31, 2017 | |||||
| Since | Final Value | ||||
| One | Five | Inception | of a $10,000 | ||
| Year | Years | (9/7/2010) | Investment | ||
| S&P Mid-Cap 400 Index Fund*ETF | |||||
| Shares Net Asset Value | 12.22% | 13.84% | 14.18% | $25,238 | |
| S&P Mid-Cap 400 Index Fund*ETF | |||||
| Shares Market Price | 12.20 | 13.84 | 14.18 | 25,236 | |
| • • • • • • • • | S&P MidCap 400 Index | 12.37 | 13.99 | 14.34 | 25,477 |
| – – – – | Mid-Cap Core Funds Average | 12.02 | 12.27 | 12.50 | 22,759 |
| Dow Jones U.S. Total Stock Market | |||||
| Float Adjusted Index | 16.05 | 14.19 | 14.71 | 26,064 | |
Mid-Cap Core Funds Average: Derived from data provided by Lipper, a Thomson Reuters Company.
"Since Inception" performance is calculated from the ETF Shares’ inception date for both the fund and its comparative standards.
| Since | Final Value | |||
| One | Five | Inception | of a $5,000,000 | |
| Year | Years | (3/28/2011) | Investment | |
| S&P Mid-Cap 400 Index Fund Institutional | ||||
| Shares | 12.31% | 13.93% | 11.11% | $9,842,820 |
| S&P MidCap 400 Index | 12.37 | 13.99 | 11.18 | 9,881,858 |
| Dow Jones U.S. Total Stock Market Float | ||||
| Adjusted Index | 16.05 | 14.19 | 12.40 | 10,597,716 |
"Since Inception" performance is calculated from the Institutional Shares’ inception date for both the fund and its comparative standards
Institutional Shares were first issued on December 15, 2010, and the sole shareholder redeemed shortly thereafter. Institutional Shares
were next issued on March 28, 2011. The total returns shown are based on the period beginning March 28, 2011.
See Financial Highlights for dividend and capital gains information.
10
S&P Mid-Cap 400 Index Fund
| Cumulative Returns of ETF Shares: September 7, 2010, Through August 31, 2017 | |||
| Since | |||
| One | Five | Inception | |
| Year | Years | (9/7/2010) | |
| S&P Mid-Cap 400 Index Fund ETF Shares Market | |||
| Price | 12.20% | 91.19% | 152.36% |
| S&P Mid-Cap 400 Index Fund ETF Shares Net Asset | |||
| Value | 12.22 | 91.23 | 152.38 |
| S&P MidCap 400 Index | 12.37 | 92.46 | 154.77 |
| "Since Inception" performance is calculated from the ETF Shares’ inception date for both the fund and its comparative standards. | |||
Fiscal-Year Total Returns (%): September 7, 2010, Through August 31, 2017
Average Annual Total Returns: Periods Ended June 30, 2017
This table presents returns through the latest calendar quarter—rather than through the end of the fiscal period.
Securities and Exchange Commission rules require that we provide this information.
| Inception | One | Five | Since | |
| Date | Year | Years | Inception | |
| ETF Shares | 9/7/2010 | |||
| Market Price | 18.34% | 14.76% | 14.67% | |
| Net Asset Value | 18.40 | 14.77 | 14.67 | |
| Institutional Shares | 3/28/20111 | 18.48 | 14.85 | 11.55 |
| 1 Institutional Shares were first issued on December 15, 2010, and the sole shareholder redeemed shortly thereafter. Institutional Shares | ||||
| were next issued on March 28, 2011. The total returns shown are based on the period beginning March 28, 2011. | ||||
S&P Mid-Cap 400 Index Fund
Financial Statements
Statement of Net Assets
As of August 31, 2017
The fund reports a complete list of its holdings in regulatory filings four times in each fiscal year, at the quarter-ends. For the second and fourth fiscal quarters, the lists appear in the fund’s semiannual and annual reports to shareholders. For the first and third fiscal quarters, the fund files the lists with the Securities and Exchange Commission on Form N-Q. Shareholders can look up the fund’s Forms N-Q on the SEC’s website at sec.gov. Forms N-Q may also be reviewed and copied at the SEC’s Public Reference Room (see the back cover of this report for further information).
| Market | |||
| Value• | |||
| Shares | ($000) | ||
| Common Stocks (99.5%)1 | |||
| Consumer Discretionary (11.2%) | |||
| * | NVR Inc. | 3,950 | 10,747 |
| Domino’s Pizza Inc. | 54,494 | 9,932 | |
| Service Corp. International | 213,007 | 7,528 | |
| Toll Brothers Inc. | 167,930 | 6,543 | |
| ^ | Polaris Industries Inc. | 66,483 | 6,198 |
| * | Live Nation Entertainment | ||
| Inc. | 151,574 | 6,057 | |
| Gentex Corp. | 326,003 | 5,956 | |
| Thor Industries Inc. | 54,304 | 5,900 | |
| Dunkin’ Brands Group Inc. | 104,583 | 5,392 | |
| Brunswick Corp. | 101,348 | 5,319 | |
| Carter’s Inc. | 54,909 | 4,761 | |
| Pool Corp. | 46,924 | 4,678 | |
| Bed Bath & Beyond Inc. | 164,710 | 4,544 | |
| ^ | Williams-Sonoma Inc. | 90,441 | 4,160 |
| Cracker Barrel Old | |||
| Country Store Inc. | 27,236 | 4,049 | |
| Cable One Inc. | 5,328 | 4,043 | |
| * | Skechers U. S. A. Inc. | ||
| Class A | 151,809 | 4,012 | |
| Cinemark Holdings Inc. | 120,220 | 4,002 | |
| Dana Inc. | 163,756 | 3,942 | |
| * | AMC Networks Inc. | ||
| Class A | 59,129 | 3,594 | |
| Texas Roadhouse Inc. | |||
| Class A | 73,108 | 3,469 | |
| *,^ | AutoNation Inc. | 74,602 | 3,385 |
| Tupperware Brands Corp. | 57,457 | 3,325 | |
| * | Tempur Sealy | ||
| International Inc. | 53,112 | 3,288 | |
| Wendy’s Co. | 216,866 | 3,236 | |
| Aaron’s Inc. | 71,231 | 3,153 | |
| * | Cabela’s Inc. | 58,542 | 3,144 |
| Jack in the Box Inc. | 33,321 | 3,119 | |
| Graham Holdings Co. | |||
| Class B | 5,269 | 3,094 | |
| Market | |||
| Value• | |||
| Shares | ($000) | ||
| TEGNA Inc. | 243,204 | 3,069 | |
| CalAtlantic Group Inc. | 87,192 | 3,030 | |
| * | Sally Beauty Holdings Inc. | 155,659 | 2,894 |
| Churchill Downs Inc. | 14,691 | 2,871 | |
| * | Helen of Troy Ltd. | 30,643 | 2,767 |
| John Wiley & Sons Inc. | |||
| Class A | 50,722 | 2,736 | |
| * | Michaels Cos. Inc. | 119,794 | 2,689 |
| Dick’s Sporting Goods | |||
| Inc. | 99,405 | 2,620 | |
| New York Times Co. | |||
| Class A | 138,352 | 2,580 | |
| * | Murphy USA Inc. | 39,151 | 2,524 |
| Office Depot Inc. | 585,075 | 2,510 | |
| Big Lots Inc. | 50,722 | 2,414 | |
| * | Sotheby’s | 51,895 | 2,329 |
| * | Deckers Outdoor Corp. | 36,226 | 2,315 |
| * | TRI Pointe Group Inc. | 180,126 | 2,295 |
| Meredith Corp. | 41,535 | 2,257 | |
| American Eagle Outfitters | |||
| Inc. | 188,390 | 2,251 | |
| Papa John’s International | |||
| Inc. | 29,979 | 2,242 | |
| * | Adtalem Global Education | ||
| Inc. | 64,536 | 2,207 | |
| GameStop Corp. Class A | 114,683 | 2,122 | |
| ^ | Cheesecake Factory Inc. | 50,511 | 2,093 |
| * | Urban Outfitters Inc. | 100,072 | 2,045 |
| Cooper Tire & Rubber Co. | 59,937 | 2,014 | |
| ^ | KB Home | 94,094 | 2,014 |
| * | Buffalo Wild Wings Inc. | 18,274 | 1,878 |
| Brinker International Inc. | 55,736 | 1,740 | |
| ^ | Dillard’s Inc. Class A | 24,678 | 1,500 |
| HSN Inc. | 36,442 | 1,337 | |
| International Speedway | |||
| Corp. Class A | 28,560 | 1,018 | |
| Chico’s FAS Inc. | 232 | 2 | |
| 206,933 |
12
S&P Mid-Cap 400 Index Fund
| Market | |||
| Value• | |||
| Shares | ($000) | ||
| Consumer Staples (3.7%) | |||
| Ingredion Inc. | 81,224 | 10,057 | |
| Lamb Weston Holdings | |||
| Inc. | 157,230 | 7,151 | |
| * | Post Holdings Inc. | 75,204 | 6,402 |
| * | Edgewell Personal Care | ||
| Co. | 65,159 | 4,948 | |
| * | Hain Celestial Group Inc. | 117,392 | 4,722 |
| Casey’s General Stores | |||
| Inc. | 44,460 | 4,687 | |
| * | TreeHouse Foods Inc. | 64,617 | 4,329 |
| Flowers Foods Inc. | 208,574 | 3,623 | |
| Snyder’s-Lance Inc. | 97,422 | 3,460 | |
| Nu Skin Enterprises Inc. | |||
| Class A | 56,262 | 3,422 | |
| Energizer Holdings Inc. | 70,035 | 3,092 | |
| * | Sprouts Farmers Market | ||
| Inc. | 146,399 | 2,919 | |
| Lancaster Colony Corp. | 22,067 | 2,570 | |
| * | United Natural Foods Inc. | 57,288 | 1,991 |
| * | Boston Beer Co. Inc. | ||
| Class A | 10,538 | 1,570 | |
| * | Avon Products Inc. | 501,006 | 1,248 |
| Dean Foods Co. | 103,544 | 1,139 | |
| ^ | Tootsie Roll Industries Inc. | 20,063 | 749 |
| 68,079 | |||
| Energy (3.5%) | |||
| HollyFrontier Corp. | 201,267 | 6,302 | |
| * | Energen Corp. | 110,154 | 5,649 |
| * | WPX Energy Inc. | 451,189 | 4,507 |
| ^ | Core Laboratories NV | 50,054 | 4,414 |
| Murphy Oil Corp. | 184,047 | 4,170 | |
| *,^ | Transocean Ltd. | 443,930 | 3,622 |
| * | Southwestern Energy Co. | 572,987 | 3,123 |
| Patterson-UTI Energy Inc. | 187,271 | 2,991 | |
| ^ | PBF Energy Inc. Class A | 124,223 | 2,942 |
| * | CONSOL Energy Inc. | 200,633 | 2,919 |
| World Fuel Services Corp. | 78,216 | 2,701 | |
| Oceaneering International | |||
| Inc. | 111,281 | 2,509 | |
| * | Matador Resources Co. | 105,522 | 2,488 |
| * | Gulfport Energy Corp. | 180,127 | 2,257 |
| Nabors Industries Ltd. | 323,641 | 2,120 | |
| * | QEP Resources Inc. | 273,859 | 2,068 |
| * | Dril-Quip Inc. | 43,114 | 1,619 |
| SM Energy Co. | 111,626 | 1,491 | |
| ^ | Ensco plc Class A | 345,805 | 1,470 |
| * | Superior Energy Services | ||
| Inc. | 174,275 | 1,436 | |
| * | Rowan Cos. plc Class A | 143,659 | 1,401 |
| * | Oil States International Inc. | 58,818 | 1,279 |
| *,^ | Diamond Offshore Drilling | ||
| Inc. | 73,582 | 836 | |
| 64,314 | |||
| Market | |||
| Value• | |||
| Shares | ($000) | ||
| Financials (16.1%) | |||
| MSCI Inc. Class A | 102,602 | 11,759 | |
| * | SVB Financial Group | 59,484 | 10,073 |
| * | Alleghany Corp. | 17,494 | 9,845 |
| Reinsurance Group | |||
| of America Inc. Class A | 72,965 | 9,810 | |
| East West Bancorp Inc. | 163,717 | 9,065 | |
| SEI Investments Co. | 151,061 | 8,831 | |
| American Financial | |||
| Group Inc. | 83,413 | 8,492 | |
| MarketAxess Holdings Inc. | 42,588 | 8,217 | |
| * | Signature Bank | 60,827 | 7,807 |
| WR Berkley Corp. | 109,887 | 7,323 | |
| Janus Henderson | |||
| Group plc | 204,705 | 7,075 | |
| FactSet Research | |||
| Systems Inc. | 44,781 | 7,039 | |
| New York Community | |||
| Bancorp Inc. | 555,034 | 6,688 | |
| RenaissanceRe | |||
| Holdings Ltd. | 46,099 | 6,415 | |
| Eaton Vance Corp. | 130,488 | 6,209 | |
| PacWest Bancorp | 136,041 | 6,142 | |
| First American Financial | |||
| Corp. | 125,151 | 6,140 | |
| Bank of the Ozarks | 137,811 | 5,920 | |
| Brown & Brown Inc. | 130,529 | 5,869 | |
| Synovus Financial Corp. | 138,791 | 5,846 | |
| Commerce Bancshares | |||
| Inc. | 99,173 | 5,453 | |
| Cullen/Frost Bankers Inc. | 64,591 | 5,439 | |
| Old Republic International | |||
| Corp. | 278,179 | 5,310 | |
| Pinnacle Financial | |||
| Partners Inc. | 82,273 | 5,117 | |
| Webster Financial Corp. | 104,636 | 4,884 | |
| Hanover Insurance | |||
| Group Inc. | 48,424 | 4,754 | |
| Prosperity Bancshares | |||
| Inc. | 78,854 | 4,712 | |
| FNB Corp. | 366,648 | 4,653 | |
| Wintrust Financial Corp. | 63,158 | 4,599 | |
| First Horizon National | |||
| Corp. | 265,285 | 4,566 | |
| Umpqua Holdings Corp. | 250,102 | 4,377 | |
| CNO Financial Group Inc. | 194,391 | 4,345 | |
| Hancock Holding Co. | 95,907 | 4,215 | |
| * | Texas Capital Bancshares | ||
| Inc. | 56,241 | 4,176 | |
| * | SLM Corp. | 397,609 | 4,044 |
| United Bankshares Inc. | 118,970 | 3,991 | |
| Primerica Inc. | 51,545 | 3,946 | |
| Associated Banc-Corp | 172,834 | 3,785 | |
| Bank of Hawaii Corp. | 48,385 | 3,780 | |
13
S&P Mid-Cap 400 Index Fund
| Market | |||
| Value• | |||
| Shares | ($000) | ||
| Stifel Financial Corp. | 77,540 | 3,703 | |
| Legg Mason Inc. | 96,644 | 3,691 | |
| Chemical Financial Corp. | 80,565 | 3,658 | |
| Fulton Financial Corp. | 198,022 | 3,455 | |
| Valley National Bancorp | 298,858 | 3,344 | |
| UMB Financial Corp. | 49,691 | 3,335 | |
| Home BancShares Inc. | 142,970 | 3,333 | |
| MB Financial Inc. | 80,713 | 3,210 | |
| Washington Federal Inc. | 101,307 | 3,166 | |
| Aspen Insurance Holdings | |||
| Ltd. | 67,948 | 3,071 | |
| TCF Financial Corp. | 193,944 | 3,012 | |
| Cathay General Bancorp | 84,999 | 2,998 | |
| Federated Investors Inc. | |||
| Class B | 105,078 | 2,870 | |
| BancorpSouth Inc. | 94,143 | 2,735 | |
| Kemper Corp. | 55,188 | 2,643 | |
| Mercury General Corp. | 41,341 | 2,376 | |
| International Bancshares | |||
| Corp. | 65,828 | 2,366 | |
| Trustmark Corp. | 76,700 | 2,272 | |
| * | Genworth Financial Inc. | ||
| Class A | 564,953 | 1,938 | |
| 297,887 | |||
| Health Care (8.7%) | |||
| Teleflex Inc. | 50,970 | 10,793 | |
| * | WellCare Health Plans Inc. | 50,415 | 8,806 |
| * | VCA Inc. | 92,085 | 8,560 |
| STERIS plc | 96,237 | 8,388 | |
| West Pharmaceutical | |||
| Services Inc. | 83,340 | 7,254 | |
| * | ABIOMED Inc. | 46,248 | 6,974 |
| * | Bioverativ Inc. | 122,753 | 6,959 |
| * | United Therapeutics Corp. | 51,136 | 6,689 |
| * | Charles River Laboratories | ||
| International Inc. | 54,062 | 5,882 | |
| * | Catalent Inc. | 141,801 | 5,855 |
| Bio-Techne Corp. | 42,362 | 5,244 | |
| Hill-Rom Holdings Inc. | 67,915 | 5,227 | |
| * | Bio-Rad Laboratories Inc. | ||
| Class A | 23,622 | 5,145 | |
| HealthSouth Corp. | 112,057 | 5,127 | |
| * | PAREXEL International | ||
| Corp. | 57,603 | 5,063 | |
| * | MEDNAX Inc. | 105,559 | 4,734 |
| * | Medidata Solutions Inc. | 62,910 | 4,716 |
| * | Mallinckrodt plc | 112,691 | 4,629 |
| * | Masimo Corp. | 51,652 | 4,358 |
| * | Acadia Healthcare Co. Inc. | 86,703 | 4,070 |
| * | INC Research Holdings | ||
| Inc. Class A | 61,286 | 3,597 | |
| * | NuVasive Inc. | 57,487 | 3,592 |
| * | Akorn Inc. | 98,759 | 3,249 |
| * | Molina Healthcare Inc. | 48,424 | 3,099 |
| Market | |||
| Value• | |||
| Shares | ($000) | ||
| * | LivaNova plc | 49,112 | 3,073 |
| * | Prestige Brands Holdings | ||
| Inc. | 59,980 | 3,042 | |
| * | Allscripts Healthcare | ||
| Solutions Inc. | 205,523 | 2,701 | |
| * | LifePoint Health Inc. | 45,716 | 2,649 |
| * | Globus Medical Inc. | 81,769 | 2,472 |
| * | Halyard Health Inc. | 52,851 | 2,394 |
| * | Endo International plc | 226,098 | 1,987 |
| Owens & Minor Inc. | 69,707 | 1,948 | |
| *,^ | Tenet Healthcare Corp. | 91,610 | 1,573 |
| 159,849 | |||
| Industrials (14.7%) | |||
| Huntington Ingalls | |||
| Industries Inc. | 52,147 | 11,157 | |
| IDEX Corp. | 86,467 | 10,167 | |
| ManpowerGroup Inc. | 76,006 | 8,475 | |
| Old Dominion Freight | |||
| Line Inc. | 78,466 | 7,839 | |
| * | Copart Inc. | 232,273 | 7,593 |
| Toro Co. | 121,901 | 7,519 | |
| * | JetBlue Airways Corp. | 378,076 | 7,490 |
| Orbital ATK Inc. | 65,497 | 7,308 | |
| Graco Inc. | 63,045 | 7,282 | |
| Lennox International Inc. | 43,587 | 7,224 | |
| Donaldson Co. Inc. | 149,924 | 7,084 | |
| Carlisle Cos. Inc. | 73,314 | 6,942 | |
| ^ | Wabtec Corp. | 98,016 | 6,917 |
| Nordson Corp. | 60,834 | 6,649 | |
| Hubbell Inc. Class B | 58,092 | 6,552 | |
| Oshkosh Corp. | 84,880 | 6,332 | |
| Lincoln Electric Holdings | |||
| Inc. | 70,189 | 6,095 | |
| * | Teledyne Technologies Inc. | 40,043 | 6,009 |
| * | AECOM | 176,729 | 5,920 |
| AGCO Corp. | 75,734 | 5,184 | |
| Watsco Inc. | 34,494 | 5,083 | |
| Trinity Industries Inc. | 172,680 | 4,980 | |
| Curtiss-Wright Corp. | 50,209 | 4,861 | |
| Rollins Inc. | 108,849 | 4,834 | |
| * | Genesee & Wyoming Inc. | ||
| Class A | 69,813 | 4,786 | |
| Ryder System Inc. | 60,776 | 4,716 | |
| Dun & Bradstreet Corp. | 41,868 | 4,666 | |
| EMCOR Group Inc. | 67,216 | 4,439 | |
| Landstar System Inc. | 47,493 | 4,434 | |
| Woodward Inc. | 62,575 | 4,393 | |
| Crane Co. | 57,301 | 4,253 | |
| ITT Inc. | 100,607 | 4,061 | |
| Terex Corp. | 101,506 | 3,913 | |
| Regal Beloit Corp. | 50,846 | 3,834 | |
| * | Kirby Corp. | 61,177 | 3,830 |
| Deluxe Corp. | 55,032 | 3,816 | |
| Valmont Industries Inc. | 25,584 | 3,673 | |
14
S&P Mid-Cap 400 Index Fund
| Market | |||
| Value• | |||
| Shares | ($000) | ||
| Timken Co. | 79,513 | 3,566 | |
| MSC Industrial Direct Co. | |||
| Inc. Class A | 51,072 | 3,518 | |
| * | Avis Budget Group Inc. | 95,413 | 3,457 |
| Kennametal Inc. | 91,243 | 3,194 | |
| * | Clean Harbors Inc. | 58,966 | 3,190 |
| EnerSys | 49,292 | 3,160 | |
| Knight Transportation Inc. | 75,600 | 2,952 | |
| * | Esterline Technologies | ||
| Corp. | 33,722 | 2,880 | |
| * | Dycom Industries Inc. | 35,200 | 2,840 |
| * | KLX Inc. | 58,581 | 2,808 |
| Pitney Bowes Inc. | 211,226 | 2,714 | |
| GATX Corp. | 44,284 | 2,683 | |
| KBR Inc. | 162,121 | 2,638 | |
| MSA Safety Inc. | 35,663 | 2,598 | |
| Granite Construction Inc. | 45,091 | 2,490 | |
| Herman Miller Inc. | 67,702 | 2,278 | |
| HNI Corp. | 50,221 | 1,841 | |
| Werner Enterprises Inc. | 50,689 | 1,678 | |
| * | NOW Inc. | 122,637 | 1,430 |
| 272,225 | |||
| Information Technology (18.6%) | |||
| * | Cadence Design Systems | ||
| Inc. | 316,836 | 12,448 | |
| * | Take-Two Interactive | ||
| Software Inc. | 117,664 | 11,506 | |
| * | Trimble Inc. | 286,571 | 11,085 |
| Cognex Corp. | 98,182 | 10,699 | |
| CDK Global Inc. | 164,526 | 10,612 | |
| Broadridge Financial | |||
| Solutions Inc. | 133,233 | 10,409 | |
| Leidos Holdings Inc. | 162,582 | 9,482 | |
| Jack Henry & Associates | |||
| Inc. | 87,988 | 9,069 | |
| * | Keysight Technologies Inc. | 209,283 | 8,551 |
| Teradyne Inc. | 225,428 | 8,027 | |
| * | Arrow Electronics Inc. | 100,665 | 7,996 |
| * | IPG Photonics Corp. | 42,645 | 7,497 |
| * | PTC Inc. | 131,106 | 7,342 |
| LogMeIn Inc. | 59,787 | 6,840 | |
| * | Ultimate Software Group | ||
| Inc. | 33,724 | 6,775 | |
| * | Tyler Technologies Inc. | 38,298 | 6,618 |
| * | Microsemi Corp. | 131,052 | 6,602 |
| * | Coherent Inc. | 27,945 | 6,520 |
| Jabil Inc. | 206,875 | 6,486 | |
| * | Fortinet Inc. | 169,548 | 6,477 |
| * | Zebra Technologies Corp. | 59,879 | 6,173 |
| * | ARRIS International plc | 213,102 | 5,937 |
| Brocade Communications | |||
| Systems Inc. | 465,335 | 5,761 | |
| Avnet Inc. | 141,845 | 5,471 | |
| Market | |||
| Value• | |||
| Shares | ($000) | ||
| Cypress Semiconductor | |||
| Corp. | 373,851 | 5,118 | |
| * | NCR Corp. | 137,539 | 5,024 |
| Fair Isaac Corp. | 35,139 | 4,946 | |
| National Instruments Corp. | 120,591 | 4,871 | |
| Littelfuse Inc. | 25,751 | 4,794 | |
| * | WEX Inc. | 43,804 | 4,781 |
| * | Teradata Corp. | 148,529 | 4,741 |
| Blackbaud Inc. | 54,511 | 4,601 | |
| Versum Materials Inc. | 123,314 | 4,554 | |
| * | CoreLogic Inc. | 96,044 | 4,511 |
| MAXIMUS Inc. | 73,554 | 4,471 | |
| Monolithic Power | |||
| Systems Inc. | 43,078 | 4,365 | |
| * | Tech Data Corp. | 39,301 | 4,334 |
| Sabre Corp. | 233,526 | 4,306 | |
| * | Cirrus Logic Inc. | 73,091 | 4,238 |
| * | First Solar Inc. | 88,750 | 4,168 |
| j2 Global Inc. | 54,688 | 4,117 | |
| SYNNEX Corp. | 33,007 | 3,948 | |
| * | ViaSat Inc. | 60,117 | 3,824 |
| * | Integrated Device | ||
| Technology Inc. | 150,649 | 3,723 | |
| Belden Inc. | 47,884 | 3,690 | |
| Science Applications | |||
| International Corp. | 49,508 | 3,658 | |
| * | Silicon Laboratories Inc. | 47,970 | 3,641 |
| DST Systems Inc. | 69,964 | 3,591 | |
| * | Ciena Corp. | 160,862 | 3,476 |
| * | NetScout Systems Inc. | 103,896 | 3,403 |
| * | Manhattan Associates Inc. | 78,659 | 3,308 |
| * | ACI Worldwide Inc. | 133,699 | 3,043 |
| * | CommVault Systems Inc. | 47,344 | 2,890 |
| * | WebMD Health Corp. | 42,736 | 2,839 |
| InterDigital Inc. | 39,281 | 2,803 | |
| Vishay Intertechnology | |||
| Inc. | 151,814 | 2,687 | |
| * | Cree Inc. | 110,179 | 2,681 |
| Convergys Corp. | 106,600 | 2,505 | |
| * | VeriFone Systems Inc. | 126,404 | 2,499 |
| *,^ | Cars.com Inc. | 81,513 | 2,108 |
| * | Acxiom Corp. | 89,399 | 2,082 |
| ^ | Diebold Nixdorf Inc. | 86,021 | 1,759 |
| * | Synaptics Inc. | 39,067 | 1,624 |
| Plantronics Inc. | 38,081 | 1,623 | |
| *,^ | 3D Systems Corp. | 123,124 | 1,546 |
| * | Knowles Corp. | 101,644 | 1,491 |
| 342,765 | |||
| Materials (7.2%) | |||
| Chemours Co. | 209,023 | 10,257 | |
| Steel Dynamics Inc. | 273,975 | 9,438 | |
| RPM International Inc. | 151,358 | 7,412 | |
| Royal Gold Inc. | 74,150 | 6,917 | |
| Olin Corp. | 188,269 | 6,068 | |
15
S&P Mid-Cap 400 Index Fund
| Market | |||
| Value• | |||
| Shares | ($000) | ||
| Reliance Steel & | |||
| Aluminum Co. | 82,711 | 5,990 | |
| AptarGroup Inc. | 70,849 | 5,924 | |
| Sonoco Products Co. | 112,783 | 5,443 | |
| Eagle Materials Inc. | 55,080 | 5,356 | |
| United States Steel Corp. | 198,199 | 5,274 | |
| Valvoline Inc. | 232,067 | 4,941 | |
| Scotts Miracle-Gro Co. | 50,022 | 4,781 | |
| * | Owens-Illinois Inc. | 184,619 | 4,549 |
| Bemis Co. Inc. | 104,340 | 4,446 | |
| NewMarket Corp. | 10,489 | 4,390 | |
| Ashland Global Holdings | |||
| Inc. | 70,614 | 4,381 | |
| * | Louisiana-Pacific Corp. | 163,971 | 4,178 |
| Cabot Corp. | 70,771 | 3,728 | |
| Sensient Technologies | |||
| Corp. | 50,135 | 3,617 | |
| PolyOne Corp. | 92,608 | 3,347 | |
| Domtar Corp. | 70,888 | 2,867 | |
| * | Allegheny Technologies | ||
| Inc. | 123,244 | 2,567 | |
| Compass Minerals | |||
| International Inc. | 38,305 | 2,559 | |
| Silgan Holdings Inc. | 84,932 | 2,556 | |
| Minerals Technologies Inc. | 39,736 | 2,543 | |
| Worthington Industries | |||
| Inc. | 49,762 | 2,486 | |
| Commercial Metals Co. | 131,115 | 2,477 | |
| Carpenter Technology | |||
| Corp. | 52,928 | 2,145 | |
| Greif Inc. Class A | 29,226 | 1,767 | |
| 132,404 | |||
| Real Estate (9.8%) | |||
| Camden Property Trust | 99,308 | 8,886 | |
| Kilroy Realty Corp. | 111,362 | 7,710 | |
| American Campus | |||
| Communities Inc. | 151,914 | 7,230 | |
| ^ | Omega Healthcare | ||
| Investors Inc. | 223,360 | 7,119 | |
| Liberty Property Trust | 167,072 | 7,117 | |
| National Retail Properties | |||
| Inc. | 169,256 | 7,080 | |
| Douglas Emmett Inc. | 175,346 | 6,831 | |
| Lamar Advertising Co. | |||
| Class A | 94,756 | 6,307 | |
| Jones Lang LaSalle Inc. | 51,395 | 6,266 | |
| DCT Industrial Trust Inc. | 104,319 | 6,087 | |
| Highwoods Properties Inc. | 115,776 | 6,047 | |
| CyrusOne Inc. | 88,600 | 5,584 | |
| Medical Properties Trust | |||
| Inc. | 413,065 | 5,436 | |
| Senior Housing Properties | |||
| Trust | 269,563 | 5,316 | |
| Market | |||
| Value• | |||
| Shares | ($000) | ||
| Hospitality Properties | |||
| Trust | 186,412 | 5,100 | |
| EPR Properties | 72,702 | 5,064 | |
| Healthcare Realty Trust | |||
| Inc. | 140,393 | 4,672 | |
| CoreSite Realty Corp. | 38,728 | 4,599 | |
| Cousins Properties Inc. | 475,322 | 4,444 | |
| Weingarten Realty | |||
| Investors | 134,030 | 4,294 | |
| Rayonier Inc. | 146,181 | 4,241 | |
| First Industrial Realty | |||
| Trust Inc. | 132,851 | 4,116 | |
| Sabra Health Care | |||
| REIT Inc. | 181,109 | 3,957 | |
| GEO Group Inc. | 141,192 | 3,903 | |
| Life Storage Inc. | 52,671 | 3,876 | |
| Corporate Office | |||
| Properties Trust | 112,637 | 3,758 | |
| LaSalle Hotel Properties | 128,250 | 3,640 | |
| Taubman Centers Inc. | 68,868 | 3,598 | |
| CoreCivic Inc. | 133,832 | 3,587 | |
| Uniti Group Inc. | 179,184 | 3,451 | |
| * | JBG SMITH Properties | 97,899 | 3,204 |
| Education Realty Trust | |||
| Inc. | 82,893 | 3,203 | |
| Urban Edge Properties | 118,857 | 2,989 | |
| Tanger Factory Outlet | |||
| Centers Inc. | 109,243 | 2,556 | |
| Mack-Cali Realty Corp. | 101,748 | 2,329 | |
| Alexander & Baldwin Inc. | 52,317 | 2,271 | |
| Potlatch Corp. | 45,983 | 2,198 | |
| Washington Prime Group | |||
| Inc. | 209,840 | 1,752 | |
| * | Quality Care Properties | ||
| Inc. | 106,726 | 1,464 | |
| 181,282 | |||
| Telecommunication Services (0.2%) | |||
| Telephone & Data | |||
| Systems Inc. | 106,245 | 3,114 | |
| *,^ | Frontier Communications | ||
| Corp. | 88,658 | 1,194 | |
| 4,308 | |||
| Utilities (5.8%) | |||
| Atmos Energy Corp. | 119,307 | 10,504 | |
| UGI Corp. | 196,171 | 9,693 | |
| Westar Energy Inc. | |||
| Class A | 160,951 | 8,258 | |
| OGE Energy Corp. | 226,283 | 8,083 | |
| Great Plains Energy Inc. | 244,297 | 7,498 | |
| Aqua America Inc. | 201,560 | 6,732 | |
| Vectren Corp. | 94,142 | 6,177 | |
| MDU Resources | |||
| Group Inc. | 221,641 | 5,993 | |
| National Fuel Gas Co. | 95,759 | 5,552 | |
16
S&P Mid-Cap 400 Index Fund
| Market | |||
| Value• | |||
| Shares | ($000) | ||
| IDACORP Inc. | 57,184 | 5,088 | |
| WGL Holdings Inc. | 58,121 | 4,897 | |
| ONE Gas Inc. | 59,512 | 4,478 | |
| Southwest Gas Holdings | |||
| Inc. | 53,967 | 4,291 | |
| New Jersey Resources | |||
| Corp. | 98,082 | 4,281 | |
| Black Hills Corp. | 60,662 | 4,269 | |
| Hawaiian Electric | |||
| Industries Inc. | 123,397 | 4,124 | |
| PNM Resources Inc. | 90,233 | 3,826 | |
| NorthWestern Corp. | 54,875 | 3,310 | |
| 107,054 | |||
| Total Common Stocks | |||
| (Cost $1,697,277) | 1,837,100 | ||
| Temporary Cash Investments (1.2%)1 | |||
| Money Market Fund (1.2%) | |||
| 2,3 | Vanguard Market Liquidity | ||
| Fund, 1.224% | 208 | 20,887 | |
| Face | |||
| Amount | |||
| ($000) | |||
| U. S. Government and Agency Obligations (0.0%) | |||
| 4 | United States Treasury Bill, | ||
| 0.982%, 9/14/17 | 300 | 300 | |
| 4 | United States Treasury Bill, | ||
| 1.056%, 11/9/17 | 200 | 200 | |
| 500 | |||
| Total Temporary Cash Investments | |||
| (Cost $21,385) | 21,387 | ||
| Total Investments (100.7%) | |||
| (Cost $1,718,662) | 1,858,487 | ||
| Amount | |
| ($000) | |
| Other Assets and Liabilities (-0.7%) | |
| Other Assets | |
| Investment in Vanguard | 120 |
| Receivables for Accrued Income | 2,193 |
| Receivables for Capital Shares Issued | 187 |
| Variation Margin Receivable— | |
| Futures Contracts | 71 |
| Other Assets | 41 |
| Total Other Assets | 2,612 |
| Liabilities | |
| Payables for Investment Securities | |
| Purchased | (6) |
| Collateral for Securities on Loan | (14,936) |
| Payables for Capital Shares Redeemed | (438) |
| Payables to Vanguard | (409) |
| Total Liabilities | (15,789) |
| Net Assets (100%) | 1,845,310 |
| At August 31, 2017, net assets consisted of: | |
| Amount | |
| ($000) | |
| Paid-in Capital | 1,725,596 |
| Undistributed Net Investment Income | 5,070 |
| Accumulated Net Realized Losses | (25,254) |
| Unrealized Appreciation (Depreciation) | |
| Investment Securities | 139,825 |
| Futures Contracts | 73 |
| Net Assets | 1,845,310 |
| ETF Shares—Net Assets | |
| Applicable to 6,225,000 outstanding | |
| $.001 par value shares of beneficial | |
| interest (unlimited authorization) | 726,683 |
| Net Asset Value Per Share— | |
| ETF Shares | $116.74 |
17
S&P Mid-Cap 400 Index Fund
| Amount | |
| ($000) | |
| Institutional Shares—Net Assets | |
| Applicable to 4,804,695 outstanding | |
| $.001 par value shares of beneficial | |
| interest (unlimited authorization) | 1,118,627 |
| Net Asset Value Per Share— | |
| Institutional Shares | $232.82 |
• See Note A in Notes to Financial Statements.
* Non-income-producing security.
^ Includes partial security positions on loan to broker-dealers.
The total value of securities on loan is $14,466,000.
1 The fund invests a portion of its cash reserves in equity markets
through the use of index futures contracts. After giving effect to
futures investments, the fund’s effective common stock and
temporary cash investment positions represent 100.0% and
0.7%, respectively, of net assets.
2 Affiliated money market fund available only to Vanguard funds
and certain trusts and accounts managed by Vanguard. Rate
shown is the 7-day yield.
3 Includes $14,936,000 of collateral received for securities on loan.
4 Securities with a value of $500,000 have been segregated as
initial margin for open futures contracts.
| Derivative Financial Instruments Outstanding as of Period End | ||||
| Futures Contracts | ||||
| ($000) | ||||
| Value and | ||||
| Number of | Unrealized | |||
| Long (Short) | Notional | Appreciation | ||
| Expiration | Contracts | Amount | (Depreciation) | |
| Long Futures Contracts | ||||
| E-mini S&P Mid-Cap 400 Index | September 2017 | 48 | 8,306 | 73 |
Unrealized appreciation (depreciation) on open futures contracts is required to be treated as realized gain (loss) for tax purposes.
See accompanying Notes, which are an integral part of the Financial Statements.
18
| S&P Mid-Cap 400 Index Fund | |
| Statement of Operations | |
| Year Ended | |
| August 31,2017 | |
| ($000) | |
| Investment Income | |
| Income | |
| Dividends | 24,665 |
| Interest1 | 51 |
| Securities Lending—Net | 123 |
| Total Income | 24,839 |
| Expenses | |
| The Vanguard Group—Note B | |
| Investment Advisory Services | 349 |
| Management and Administrative—ETF Shares | 694 |
| Management and Administrative—Institutional Shares | 491 |
| Marketing and Distribution—ETF Shares | 41 |
| Marketing and Distribution—Institutional Shares | 47 |
| Custodian Fees | 90 |
| Auditing Fees | 32 |
| Shareholders’ Reports and Proxy—ETF Shares | 41 |
| Shareholders’ Reports and Proxy—Institutional Shares | 7 |
| Trustees’ Fees and Expenses | 1 |
| Total Expenses | 1,793 |
| Net Investment Income | 23,046 |
| Realized Net Gain (Loss) | |
| Investment Securities Sold1 | 90,844 |
| Futures Contracts | 477 |
| Realized Net Gain (Loss) | 91,321 |
| Change in Unrealized Appreciation (Depreciation) | |
| Investment Securities | 68,366 |
| Futures Contracts | 73 |
| Change in Unrealized Appreciation (Depreciation) | 68,439 |
| Net Increase (Decrease) in Net Assets Resulting from Operations | 182,806 |
1 Interest income and realized net gain (loss) from an affiliated company of the fund were $49,000 and $1,000, respectively.
See accompanying Notes, which are an integral part of the Financial Statements.
19
| S&P Mid-Cap 400 Index Fund | ||
| Statement of Changes in Net Assets | ||
| Year Ended August 31, | ||
| 2017 | 2016 | |
| ($000) | ($000) | |
| Increase (Decrease) in Net Assets | ||
| Operations | ||
| Net Investment Income | 23,046 | 18,065 |
| Realized Net Gain (Loss) | 91,321 | 91,423 |
| Change in Unrealized Appreciation (Depreciation) | 68,439 | 34,873 |
| Net Increase (Decrease) in Net Assets Resulting from Operations | 182,806 | 144,361 |
| Distributions | ||
| Net Investment Income | ||
| ETF Shares | (8,335) | (7,195) |
| Institutional Shares | (14,448) | (15,380) |
| Realized Capital Gain | ||
| ETF Shares | — | — |
| Institutional Shares | — | — |
| Total Distributions | (22,783) | (22,575) |
| Capital Share Transactions | ||
| ETF Shares | 181,495 | 64,169 |
| Institutional Shares | 170,668 | 103,734 |
| Net Increase (Decrease) from Capital Share Transactions | 352,163 | 167,903 |
| Total Increase (Decrease) | 512,186 | 289,689 |
| Net Assets | ||
| Beginning of Period | 1,333,124 | 1,043,435 |
| End of Period1 | 1,845,310 | 1,333,124 |
1 Net Assets—End of Period includes undistributed (overdistributed) net investment income of $5,070,000 and $4,807,000.
See accompanying Notes, which are an integral part of the Financial Statements.
20
| S&P Mid-Cap 400 Index Fund | |||||
| Financial Highlights | |||||
| ETF Shares | |||||
| For a Share Outstanding | Year Ended August 31, | ||||
| Throughout Each Period | 2017 | 2016 | 2015 | 2014 | 2013 |
| Net Asset Value, Beginning of Period | $105.51 | $95.87 | $97.19 | $79.72 | $65.20 |
| Investment Operations | |||||
| Net Investment Income | 1.5101 | 1.393 | 1.330 | 1.016 | 1.1331 |
| Net Realized and Unrealized Gain (Loss) | |||||
| on Investments | 11.294 | 10.091 | (1.425) | 17.285 | 14.112 |
| Total from Investment Operations | 12.804 | 11.484 | (.095) | 18.301 | 15.245 |
| Distributions | |||||
| Dividends from Net Investment Income | (1.574) | (1.844) | (1.225) | (.831) | (.725) |
| Distributions from Realized Capital Gains | — | — | — | — | — |
| Total Distributions | (1.574) | (1.844) | (1.225) | (.831) | (.725) |
| Net Asset Value, End of Period | $116.74 | $105.51 | $95.87 | $97.19 | $79.72 |
| Total Return | 12.22% | 12.19% | -0.12% | 23.06% | 23.57% |
| Ratios/Supplemental Data | |||||
| Net Assets, End of Period (Millions) | $727 | $485 | $379 | $345 | $191 |
| Ratio of Total Expenses to | |||||
| Average Net Assets | 0.15% | 0.15% | 0.15% | 0.15% | 0.15% |
| Ratio of Net Investment Income to | |||||
| Average Net Assets | 1.34% | 1.56% | 1.45% | 1.28% | 1.50% |
| Portfolio Turnover Rate2 | 13% | 11% | 12% | 14% | 10% |
1 Calculated based on average shares outstanding.
2 Excludes the value of portfolio securities received or delivered as a result of in-kind purchases or redemptions of the fund’s capital shares, including ETF Creation Units.
See accompanying Notes, which are an integral part of the Financial Statements.
21
| S&P Mid-Cap 400 Index Fund | |||||
| Financial Highlights | |||||
| Institutional Shares | |||||
| For a Share Outstanding | Year Ended August 31, | ||||
| Throughout Each Period | 2017 | 2016 | 2015 | 2014 | 2013 |
| Net Asset Value, Beginning of Period | $210.40 | $191.51 | $194.13 | $159.20 | $130.17 |
| Investment Operations | |||||
| Net Investment Income | 3.1761 | 3.171 | 2.794 | 2.135 | 2.3551 |
| Net Realized and Unrealized Gain (Loss) | |||||
| on Investments | 22.516 | 19.869 | (2.844) | 34.537 | 28.174 |
| Total from Investment Operations | 25.692 | 23.040 | (.050) | 36.672 | 30.529 |
| Distributions | |||||
| Dividends from Net Investment Income | (3.272) | (4.150) | (2.570) | (1.742) | (1.499) |
| Distributions from Realized Capital Gains | — | — | — | — | — |
| Total Distributions | (3.272) | (4.150) | (2.570) | (1.742) | (1.499) |
| Net Asset Value, End of Period | $232.82 | $210.40 | $191.51 | $194.13 | $159.20 |
| Total Return | 12.31% | 12.26% | -0.04% | 23.16% | 23.65% |
| Ratios/Supplemental Data | |||||
| Net Assets, End of Period (Millions) | $1,119 | $848 | $665 | $523 | $216 |
| Ratio of Total Expenses to | |||||
| Average Net Assets | 0.08% | 0.08% | 0.08% | 0.08% | 0.08% |
| Ratio of Net Investment Income to | |||||
| Average Net Assets | 1.41% | 1.63% | 1.52% | 1.35% | 1.57% |
| Portfolio Turnover Rate2 | 13% | 11% | 12% | 14% | 10% |
1 Calculated based on average shares outstanding.
2 Excludes the value of portfolio securities received or delivered as a result of in-kind purchases or redemptions of the fund’s capital shares, including ETF Creation Units.
See accompanying Notes, which are an integral part of the Financial Statements.
22
S&P Mid-Cap 400 Index Fund
Notes to Financial Statements
Vanguard S&P Mid-Cap 400 Index Fund is registered under the Investment Company Act of 1940 as an open-end investment company, or mutual fund. The fund offers two classes of shares: ETF Shares and Institutional Shares. ETF Shares are listed for trading on NYSE Arca; they can be purchased and sold through a broker. Institutional Shares are designed for investors who meet certain administrative, service, and account-size criteria.
A. The following significant accounting policies conform to generally accepted accounting principles for U.S. investment companies. The fund consistently follows such policies in preparing its financial statements.
1. Security Valuation: Securities are valued as of the close of trading on the New York Stock Exchange (generally 4 p.m., Eastern time) on the valuation date. Equity securities are valued at the latest quoted sales prices or official closing prices taken from the primary market in which each security trades; such securities not traded on the valuation date are valued at the mean of the latest quoted bid and asked prices. Securities for which market quotations are not readily available, or whose values have been materially affected by events occurring before the fund’s pricing time but after the close of the securities’ primary markets, are valued by methods deemed by the board of trustees to represent fair value. Investments in Vanguard Market Liquidity Fund are valued at that fund’s net asset value. Temporary cash investments are valued using the latest bid prices or using valuations based on a matrix system (which considers such factors as security prices, yields, maturities, and ratings), both as furnished by independent pricing services.
2. Futures Contracts: The fund uses index futures contracts to a limited extent, with the objectives of maintaining full exposure to the stock market, enhancing returns, maintaining liquidity, and minimizing transaction costs. The fund may purchase futures contracts to immediately invest incoming cash in the market, or sell futures in response to cash outflows, thereby simulating a fully invested position in the underlying index while maintaining a cash balance for liquidity. The fund may seek to enhance returns by using futures contracts instead of the underlying securities when futures are believed to be priced more attractively than the underlying securities. The primary risks associated with the use of futures contracts are imperfect correlation between changes in market values of stocks held by the fund and the prices of futures contracts, and the possibility of an illiquid market. Counterparty risk involving futures is mitigated because a regulated clearinghouse is the counterparty instead of the clearing broker. To further mitigate counterparty risk, the fund trades futures contracts on an exchange, monitors the financial strength of its clearing brokers and clearinghouse, and has entered into clearing agreements with its clearing brokers. The clearinghouse imposes initial margin requirements to secure the fund’s performance and requires daily settlement of variation margin representing changes in the market value of each contract.
Futures contracts are valued at their quoted daily settlement prices. The notional amounts of the contracts are not recorded in the Statement of Net Assets. Fluctuations in the value of the contracts are recorded in the Statement of Net Assets as an asset (liability) and in the Statement of Operations as unrealized appreciation (depreciation) until the contracts are closed, when they are recorded as realized futures gains (losses).
During the year ended August 31, 2017, the fund’s average investments in long and short futures contracts represented less than 1% and 0% of net assets, respectively, based on the average of the notional amounts at each quarter-end during the period.
23
S&P Mid-Cap 400 Index Fund
3. Federal Income Taxes: The fund intends to continue to qualify as a regulated investment company and distribute all of its taxable income. Management has analyzed the fund’s tax positions taken for all open federal income tax years (August 31, 2014–2017), and has concluded that no provision for federal income tax is required in the fund’s financial statements.
4. Distributions: Distributions to shareholders are recorded on the ex-dividend date.
5. Securities Lending: To earn additional income, the fund lends its securities to qualified institutional borrowers. Security loans are subject to termination by the fund at any time, and are required to be secured at all times by collateral in an amount at least equal to the market value of securities loaned. Daily market fluctuations could cause the value of loaned securities to be more or less than the value of the collateral received. When this occurs, the collateral is adjusted and settled on the next business day. The fund further mitigates its counterparty risk by entering into securities lending transactions only with a diverse group of prequalified counterparties, monitoring their financial strength, and entering into master securities lending agreements with its counterparties. The master securities lending agreements provide that, in the event of a counterparty’s default (including bankruptcy), the fund may terminate any loans with that borrower, determine the net amount owed, and sell or retain the collateral up to the net amount owed to the fund; however, such actions may be subject to legal proceedings. While collateral mitigates counterparty risk, in the event of a default, the fund may experience delays and costs in recovering the securities loaned. The fund invests cash collateral received in Vanguard Market Liquidity Fund, and records a liability in the Statement of Net Assets for the return of the collateral, during the period the securities are on loan. Securities lending income represents fees charged to borrowers plus income earned on invested cash collateral, less expenses associated with the loan. During the term of the loan, the fund is entitled to all distributions made on or in respect of the loaned securities.
6. Credit Facility: The fund and certain other funds managed by The Vanguard Group (“Vanguard”) participate in a $3.1 billion committed credit facility provided by a syndicate of lenders pursuant to a credit agreement that may be renewed annually; each fund is individually liable for its borrowings, if any, under the credit facility. Borrowings may be utilized for temporary and emergency purposes, and are subject to the fund’s regulatory and contractual borrowing restrictions. The participating funds are charged administrative fees and an annual commitment fee of 0.10% of the undrawn amount of the facility; these fees are allocated to the funds based on a method approved by the fund’s board of trustees and included in Management and Administrative expenses on the fund’s Statement of Operations. Any borrowings under this facility bear interest at a rate based upon the higher of the one-month London Interbank Offered Rate, federal funds effective rate, or overnight bank funding rate plus an agreed-upon spread.
The fund had no borrowings outstanding at August 31, 2017, or at any time during the period then ended.
7. Other: Dividend income is recorded on the ex-dividend date. Interest income includes income distributions received from Vanguard Market Liquidity Fund and is accrued daily. Premiums and discounts on debt securities purchased are amortized and accreted, respectively, to interest income over the lives of the respective securities. Security transactions are accounted for on the date securities are bought or sold. Costs used to determine realized gains (losses) on the sale of investment securities are those of the specific securities sold.
24
S&P Mid-Cap 400 Index Fund
Each class of shares has equal rights as to assets and earnings, except that each class separately bears certain class-specific expenses related to maintenance of shareholder accounts (included in Management and Administrative expenses), shareholder reporting, and the proxy. Marketing and distribution expenses are allocated to each class of shares based on a method approved by the board of trustees. Income, other non-class-specific expenses, and gains and losses on investments are allocated to each class of shares based on its relative net assets.
B. In accordance with the terms of a Funds’ Service Agreement (the “FSA”) between Vanguard and the fund, Vanguard furnishes to the fund investment advisory, corporate management, administrative, marketing, and distribution services at Vanguard’s cost of operations (as defined by the FSA). These costs of operations are allocated to the fund based on methods and guidelines approved by the board of trustees. Vanguard does not require reimbursement in the current period for certain costs of operations (such as deferred compensation/benefits and risk/insurance costs); the fund’s liability for these costs of operations is included in Payables to Vanguard on the Statement of Net Assets.
Upon the request of Vanguard, the fund may invest up to 0.40% of its net assets as capital in Vanguard. At August 31, 2017, the fund had contributed to Vanguard capital in the amount of $120,000, representing 0.01% of the fund’s net assets and 0.05% of Vanguard’s capitalization. The fund’s trustees and officers are also directors and employees, respectively, of Vanguard.
C. Various inputs may be used to determine the value of the fund’s investments. These inputs are summarized in three broad levels for financial statement purposes. The inputs or methodologies used to value securities are not necessarily an indication of the risk associated with investing in those securities.
Level 1—Quoted prices in active markets for identical securities.
Level 2—Other significant observable inputs (including quoted prices for similar securities, interest rates, prepayment speeds, credit risk, etc.).
Level 3—Significant unobservable inputs (including the fund’s own assumptions used to determine the fair value of investments). Any investments valued with significant unobservable inputs are
noted on the Statement of Net Assets.
The following table summarizes the market value of the fund’s investments as of August 31, 2017, based on the inputs used to value them:
| Level 1 | Level 2 | Level 3 | |
| Investments | ($000) | ($000) | ($000) |
| Common Stocks | 1,837,100 | — | — |
| Temporary Cash Investments | 20,887 | 500 | — |
| Futures Contracts—Assets1 | 71 | — | — |
| Total | 1,858,058 | 500 | — |
| 1 Represents variation margin on the last day of the reporting period. |
25
S&P Mid-Cap 400 Index Fund
D. Distributions are determined on a tax basis and may differ from net investment income and realized capital gains for financial reporting purposes. Differences may be permanent or temporary. Permanent differences are reclassified among capital accounts in the financial statements to reflect their tax character. Temporary differences arise when certain items of income, expense, gain, or loss are recognized in different periods for financial statement and tax purposes. These differences will reverse at some time in the future. Differences in classification may also result from the treatment of short-term gains as ordinary income for tax purposes.
During the year ended August 31, 2017, the fund realized $99,274,000 of net capital gains resulting from in-kind redemptions—in which shareholders exchanged fund shares for securities held by the fund rather than for cash. Because such gains are not taxable to the fund, and are not distributed to shareholders, they have been reclassified from accumulated net realized losses to paid-in capital.
For tax purposes, at August 31, 2017, the fund had $5,387,000 of ordinary income available for distribution. The fund had available capital losses totaling $25,181,000 that may be carried forward indefinitely to offset future net capital gains.
At August 31, 2017, the cost of investment securities for tax purposes was $1,718,662,000. Net unrealized appreciation of investment securities for tax purposes was $139,825,000, consisting of unrealized gains of $255,175,000 on securities that had risen in value since their purchase and $115,350,000 in unrealized losses on securities that had fallen in value since their purchase.
E. During the year ended August 31, 2017, the fund purchased $885,593,000 of investment securities and sold $537,751,000 of investment securities, other than temporary cash investments. Purchases and sales include $419,189,000 and $328,773,000, respectively, in connection with in-kind purchases and redemptions of the fund’s capital shares.
The fund purchased securities from and sold securities to other Vanguard funds or accounts managed by Vanguard or its affiliates, in accordance with procedures adopted by the board of trustees in compliance with Rule 17a-7 of the Investment Company Act of 1940. For the year ended August 31, 2017, such purchases and sales were $85,969,000 and $59,321,000, respectively; these amounts are included in the purchases and sales of investment securities noted above.
26
S&P Mid-Cap 400 Index Fund
| F. Capital share transactions for each class of shares were: | ||||
| Year Ended August 31, | ||||
| 2017 | 2016 | |||
| Amount | Shares | Amount | Shares | |
| ($000) | (000) | ($000) | (000) | |
| ETF Shares | ||||
| Issued | 530,214 | 4,625 | 427,039 | 4,300 |
| Issued in Lieu of Cash Distributions | — | — | — | — |
| Redeemed | (348,719) | (3,000) | (362,870) | (3,650) |
| Net Increase (Decrease)—ETF Shares | 181,495 | 1,625 | 64,169 | 650 |
| Institutional Shares | ||||
| Issued | 301,445 | 1,345 | 306,256 | 1,555 |
| Issued in Lieu of Cash Distributions | 14,259 | 64 | 12,604 | 66 |
| Redeemed | (145,036) | (634) | (215,126) | (1,063) |
| Net Increase (Decrease)—Institutional Shares | 170,668 | 775 | 103,734 | 558 |
G. Management has determined that no material events or transactions occurred subsequent to August 31, 2017, that would require recognition or disclosure in these financial statements.
27
S&P Mid-Cap 400 Value Index Fund
Fund Profile
As of August 31, 2017
| Share-Class Characteristics | ||
| ETF | Institutional | |
| Shares | Shares | |
| Ticker Symbol | IVOV | VMFVX |
| Expense Ratio1 | 0.20% | 0.08% |
| 30-Day SEC Yield | 1.76% | 1.87% |
| Portfolio Characteristics | |||
| DJ | |||
| U.S. | |||
| S&P | Total | ||
| MidCap | Market | ||
| 400 Value | FA | ||
| Fund | Index | Index | |
| Number of Stocks | 286 | 286 | 3,769 |
| Median Market Cap | $4.2B | $4.2B | $63.1B |
| Price/Earnings Ratio | 19.8x | 19.8x | 21.6x |
| Price/Book Ratio | 1.6x | 1.6x | 2.8x |
| Return on Equity | 9.7% | 9.7% | 15.1% |
| Earnings Growth | |||
| Rate | 6.9% | 6.9% | 9.4% |
| Dividend Yield | 1.9% | 1.9% | 1.8% |
| Foreign Holdings | 0.0% | 0.0% | 0.0% |
| Turnover Rate | 39% | — | — |
| Short-Term Reserves | -0.1% | — | — |
| Volatility Measures | ||
| DJ | ||
| S&P MidCap | U.S. Total | |
| 400 Value | Market | |
| Index | FA Index | |
| R-Squared | 1.00 | 0.76 |
| Beta | 1.00 | 1.08 |
| These measures show the degree and timing of the fund’s fluctuations compared with the indexes over 36 months. | ||
| Ten Largest Holdings (% of total net assets) | ||
| Atmos Energy Corp. | Gas Utilities | 1.2% |
| Alleghany Corp. | Reinsurance | 1.1 |
| Reinsurance Group of | ||
| America Inc. | Reinsurance | 1.1 |
| UGI Corp. | Gas Utilities | 1.1 |
| Leidos Holdings Inc. | IT Consulting & | |
| Other Services | 1.1 | |
| American Financial | ||
| Group Inc. | Multi-line Insurance | 1.0 |
| ManpowerGroup Inc. | Human Resource & | |
| Employment | ||
| Services | 1.0 | |
| STERIS plc | Health Care | |
| Equipment | 0.9 | |
| OGE Energy Corp. | Electric Utilities | 0.9 |
| Arrow Electronics Inc. | Technology | |
| Distributors | 0.9 | |
| Top Ten | 10.3% | |
The holdings listed exclude any temporary cash investments and equity index products.
Investment Focus

1 The expense ratios shown are from the prospectus dated December 23, 2016, and represent estimated costs for the current fiscal year. For the fiscal year ended August 31, 2017, the expense ratios were 0.20% for ETF Shares and 0.08% for Institutional Shares.
28
S&P Mid-Cap 400 Value Index Fund
Sector Diversification (% of equity exposure)
| S&P | DJ | ||
| MidCap | U.S. Total | ||
| 400 Value | Market | ||
| Fund | Index | FA Index | |
| Consumer Discretionary 10.6% | 10.6% | 12.4% | |
| Consumer Staples | 4.9 | 4.9 | 7.6 |
| Energy | 5.1 | 5.1 | 5.3 |
| Financials | 19.7 | 19.7 | 14.7 |
| Health Care | 6.7 | 6.7 | 14.1 |
| Industrials | 12.5 | 12.5 | 10.7 |
| Information Technology | 12.8 | 12.8 | 22.6 |
| Materials | 8.8 | 8.8 | 3.3 |
| Real Estate | 9.3 | 9.3 | 4.1 |
| Telecommunication | |||
| Services | 0.5 | 0.5 | 1.9 |
| Utilities | 9.1 | 9.1 | 3.3 |
Sector categories are based on the Global Industry Classification Standard (“GICS”), except for the “Other” category (if applicable), which includes securities that have not been provided a GICS classification as of the effective reporting period.
29
S&P Mid-Cap 400 Value Index Fund
Performance Summary
All of the returns in this report represent past performance, which is not a guarantee of future results that may be achieved by the fund. (Current performance may be lower or higher than the performance data cited. For performance data current to the most recent month-end, visit our website at vanguard.com/performance.) Note, too, that both investment returns and principal value can fluctuate widely, so an investor’s shares, when sold, could be worth more or less than their original cost. The returns shown do not reflect taxes that a shareholder would pay on fund distributions or on the sale of fund shares.
Cumulative Performance: September 7, 2010, Through August 31, 2017
Initial Investment of $10,000

| Average Annual Total Returns | |||||
| Periods Ended August 31, 2017 | |||||
| Since | Final Value | ||||
| One | Five | Inception | of a $10,000 | ||
| Year | Years | (9/7/2010) | Investment | ||
| S&P Mid-Cap 400 Value Index | |||||
| Fund*ETF Shares Net Asset Value | 11.91% | 13.93% | 13.75% | $24,587 | |
| S&P Mid-Cap 400 Value Index | |||||
| Fund*ETF Shares Market Price | 11.85 | 13.92 | 13.75 | 24,574 | |
| • • • • • • • • | S&P MidCap 400 Value Index | 12.09 | 14.14 | 13.97 | 24,915 |
| – – – – | Mid-Cap Value Funds Average | 10.95 | 12.93 | 12.62 | 22,928 |
| Dow Jones U.S. Total Stock Market | |||||
| Float Adjusted Index | 16.05 | 14.19 | 14.71 | 26,064 | |
Mid-Cap Value Funds Average: Derived from data provided by Lipper, a Thomson Reuters Company.
"Since Inception" performance is calculated from the ETF Shares’ inception date for both the fund and its comparative standards.
| Since | Final Value | |||
| One | Five | Inception | of a $5,000,000 | |
| Year | Years | (11/2/2010) | Investment | |
| S&P Mid-Cap 400 Value Index Fund | ||||
| Institutional Shares | 12.05% | 14.07% | 12.65% | $11,276,665 |
| S&P MidCap 400 Value Index | 12.09 | 14.14 | 12.73 | 11,329,617 |
| Dow Jones U.S. Total Stock Market Float | ||||
| Adjusted Index | 16.05 | 14.19 | 13.44 | 11,826,845 |
"Since Inception" performance is calculated from the Institutional Shares’ inception date for both the fund and its comparative standards.
See Financial Highlights for dividend and capital gains information.
30
S&P Mid-Cap 400 Value Index Fund
Cumulative Returns of ETF Shares: September 7, 2010, Through August 31, 2017
| Since | |||
| One | Five | Inception | |
| Year | Years | (9/7/2010) | |
| S&P Mid-Cap 400 Value Index Fund ETF Shares | |||
| Market Price | 11.85% | 91.84% | 145.74% |
| S&P Mid-Cap 400 Value Index Fund ETF Shares Net | |||
| Asset Value | 11.91 | 91.96 | 145.87 |
| S&P MidCap 400 Value Index | 12.09 | 93.75 | 149.15 |
| "Since Inception" performance is calculated from the ETF Shares’ inception date for both the fund and its comparative standards. | |||
Fiscal-Year Total Returns (%): September 7, 2010, Through August 31, 2017
Average Annual Total Returns: Periods Ended June 30, 2017
This table presents returns through the latest calendar quarter—rather than through the end of the fiscal period.
Securities and Exchange Commission rules require that we provide this information.
| Inception | One | Five | Since | |
| Date | Year | Years | Inception | |
| ETF Shares | 9/7/2010 | |||
| Market Price | 18.19% | 14.75% | 14.31% | |
| Net Asset Value | 18.26 | 14.77 | 14.31 | |
| Institutional Shares | 11/2/2010 | 18.42 | 14.91 | 13.19 |
31
S&P Mid-Cap 400 Value Index Fund
Financial Statements
Statement of Net Assets
As of August 31, 2017
The fund reports a complete list of its holdings in regulatory filings four times in each fiscal year, at the quarter-ends. For the second and fourth fiscal quarters, the lists appear in the fund’s semiannual and annual reports to shareholders. For the first and third fiscal quarters, the fund files the lists with the Securities and Exchange Commission on Form N-Q. Shareholders can look up the fund’s Forms N-Q on the SEC’s website at sec.gov. Forms N-Q may also be reviewed and copied at the SEC’s Public Reference Room (see the back cover of this report for further information).
| Market | |||
| Value• | |||
| Shares | ($000) | ||
| Common Stocks (99.6%)1 | |||
| Consumer Discretionary (10.6%) | |||
| Toll Brothers Inc. | 149,802 | 5,836 | |
| Brunswick Corp. | 90,414 | 4,745 | |
| Bed Bath & Beyond Inc. | 146,953 | 4,054 | |
| ^ | Williams-Sonoma Inc. | 80,694 | 3,712 |
| Dana Inc. | 146,351 | 3,523 | |
| * | AutoNation Inc. | 66,636 | 3,023 |
| ^ | Polaris Industries Inc. | 30,841 | 2,875 |
| Aaron’s Inc. | 63,667 | 2,819 | |
| Graham Holdings Co. | |||
| Class B | 4,710 | 2,766 | |
| TEGNA Inc. | 217,379 | 2,743 | |
| CalAtlantic Group Inc. | 77,936 | 2,708 | |
| * | Live Nation | ||
| Entertainment Inc. | 64,908 | 2,594 | |
| Service Corp. | |||
| International | 72,323 | 2,556 | |
| * | Helen of Troy Ltd. | 27,390 | 2,473 |
| New York Times Co. | |||
| Class A | 123,677 | 2,307 | |
| * | Murphy USA Inc. | 34,998 | 2,256 |
| Office Depot Inc. | 523,050 | 2,244 | |
| ^ | Big Lots Inc. | 45,342 | 2,158 |
| * | TRI Pointe Group Inc. | 161,031 | 2,052 |
| American Eagle | |||
| Outfitters Inc. | 168,422 | 2,013 | |
| * | Adtalem Global | ||
| Education Inc. | 57,698 | 1,973 | |
| GameStop Corp. | |||
| Class A | 102,521 | 1,897 | |
| Cooper Tire & Rubber | |||
| Co. | 53,591 | 1,801 | |
| ^ | KB Home | 84,128 | 1,800 |
| Tupperware Brands Corp. | 29,787 | 1,724 | |
| Cinemark Holdings Inc. | 46,122 | 1,535 | |
| ^ | Dillard’s Inc. Class A | 21,924 | 1,333 |
| Market | |||
| Value• | |||
| Shares | ($000) | ||
| John Wiley & Sons Inc. | |||
| Class A | 24,032 | 1,296 | |
| * | Cabela’s Inc. | 23,503 | 1,262 |
| * | Tempur Sealy | ||
| International Inc. | 19,465 | 1,205 | |
| * | Michaels Cos. Inc. | 53,548 | 1,202 |
| HSN Inc. | 32,285 | 1,185 | |
| * | Sally Beauty Holdings Inc. | 61,107 | 1,136 |
| * | AMC Networks Inc. | ||
| Class A | 18,455 | 1,122 | |
| * | Deckers Outdoor Corp. | 15,834 | 1,012 |
| Cracker Barrel Old Country | |||
| Store Inc. | 6,800 | 1,011 | |
| International Speedway | |||
| Corp. Class A | 25,561 | 911 | |
| Meredith Corp. | 16,340 | 888 | |
| 83,750 | |||
| Consumer Staples (4.8%) | |||
| Ingredion Inc. | 38,462 | 4,762 | |
| * | Edgewell Personal Care | ||
| Co. | 58,133 | 4,415 | |
| * | Hain Celestial Group Inc. | 104,730 | 4,212 |
| ^ | Casey’s General Stores | ||
| Inc. | 39,666 | 4,181 | |
| * | TreeHouse Foods Inc. | 57,646 | 3,862 |
| Flowers Foods Inc. | 186,406 | 3,238 | |
| Snyder’s-Lance Inc. | 87,070 | 3,093 | |
| Lamb Weston Holdings | |||
| Inc. | 53,385 | 2,428 | |
| * | United Natural Foods Inc. | 51,222 | 1,780 |
| * | Sprouts Farmers Market | ||
| Inc. | 66,734 | 1,331 | |
| * | Avon Products Inc. | 444,466 | 1,107 |
| Energizer Holdings Inc. | 23,790 | 1,050 | |
| Dean Foods Co. | 92,014 | 1,012 | |
| Nu Skin Enterprises Inc. | |||
| Class A | 15,590 | 948 | |
32
S&P Mid-Cap 400 Value Index Fund
| Market | |||
| Value• | |||
| Shares | ($000) | ||
| * | Boston Beer Co. Inc. | ||
| Class A | 4,306 | 642 | |
| ^ | Tootsie Roll Industries Inc. | 5,903 | 220 |
| 38,281 | |||
| Energy (5.1%) | |||
| HollyFrontier Corp. | 179,551 | 5,622 | |
| ^,* | Transocean Ltd. | 395,892 | 3,231 |
| * | Energen Corp. | 56,996 | 2,923 |
| ^ | PBF Energy Inc. Class A | 111,049 | 2,630 |
| * | CONSOL Energy Inc. | 179,335 | 2,609 |
| World Fuel Services Corp. | 69,919 | 2,415 | |
| Oceaneering | |||
| International Inc. | 99,479 | 2,243 | |
| ^ | Core Laboratories NV | 22,329 | 1,969 |
| Nabors Industries Ltd. | 289,349 | 1,895 | |
| * | WPX Energy Inc. | 189,193 | 1,890 |
| Patterson-UTI Energy Inc. | 90,393 | 1,444 | |
| * | Dril-Quip Inc. | 38,305 | 1,438 |
| ^ | Ensco plc Class A | 307,372 | 1,306 |
| * | Rowan Cos. plc Class A | 127,481 | 1,243 |
| * | Southwestern Energy Co. | 225,352 | 1,228 |
| * | Matador Resources Co. | 49,998 | 1,179 |
| * | QEP Resources Inc. | 150,968 | 1,140 |
| * | Oil States International | ||
| Inc. | 52,283 | 1,137 | |
| * | Gulfport Energy Corp. | 66,032 | 827 |
| * | Superior Energy Services | ||
| Inc. | 91,041 | 750 | |
| ^,* | Diamond Offshore Drilling | ||
| Inc. | 65,300 | 742 | |
| SM Energy Co. | 51,548 | 689 | |
| 40,550 | |||
| Financials (19.7%) | |||
| * | Alleghany Corp. | 15,631 | 8,797 |
| Reinsurance Group of | |||
| America Inc. Class A | 65,190 | 8,765 | |
| American Financial | |||
| Group Inc. | 74,527 | 7,588 | |
| WR Berkley Corp. | 98,183 | 6,543 | |
| Janus Henderson Group | |||
| plc | 182,607 | 6,311 | |
| New York Community | |||
| Bancorp Inc. | 495,110 | 5,966 | |
| PacWest Bancorp | 121,355 | 5,479 | |
| First American Financial | |||
| Corp. | 111,646 | 5,477 | |
| Old Republic International | |||
| Corp. | 248,173 | 4,738 | |
| Hanover Insurance Group | |||
| Inc. | 43,202 | 4,242 | |
| Prosperity Bancshares Inc. | 70,350 | 4,203 | |
| FNB Corp. | 327,103 | 4,151 | |
| Wintrust Financial Corp. | 56,349 | 4,103 | |
| Umpqua Holdings Corp. | 223,135 | 3,905 | |
| Market | |||
| Value• | |||
| Shares | ($000) | ||
| CNO Financial Group Inc. | 173,435 | 3,876 | |
| Hancock Holding Co. | 85,567 | 3,761 | |
| * | SVB Financial Group | 20,727 | 3,510 |
| Associated Banc-Corp | 154,208 | 3,377 | |
| Stifel Financial Corp. | 69,299 | 3,309 | |
| Legg Mason Inc. | 86,374 | 3,299 | |
| RenaissanceRe Holdings | |||
| Ltd. | 22,208 | 3,090 | |
| SEI Investments Co. | 52,638 | 3,077 | |
| Valley National Bancorp | 267,110 | 2,989 | |
| East West Bancorp Inc. | 52,659 | 2,916 | |
| Aspen Insurance Holdings | |||
| Ltd. | 60,732 | 2,745 | |
| TCF Financial Corp. | 173,355 | 2,692 | |
| Cathay General Bancorp | 75,975 | 2,680 | |
| Synovus Financial Corp. | 60,671 | 2,555 | |
| BancorpSouth Inc. | 84,153 | 2,445 | |
| Cullen/Frost Bankers Inc. | 28,235 | 2,377 | |
| Kemper Corp. | 49,333 | 2,363 | |
| * | Signature Bank | 17,935 | 2,302 |
| Mercury General Corp. | 36,958 | 2,124 | |
| Eaton Vance Corp. | 44,236 | 2,105 | |
| United Bankshares Inc. | 59,443 | 1,994 | |
| FactSet Research | |||
| Systems Inc. | 11,186 | 1,758 | |
| * | Genworth Financial Inc. | ||
| Class A | 505,144 | 1,733 | |
| Webster Financial Corp. | 33,607 | 1,569 | |
| Fulton Financial Corp. | 88,494 | 1,544 | |
| Federated Investors Inc. | |||
| Class B | 47,904 | 1,308 | |
| * | Texas Capital Bancshares | ||
| Inc. | 17,062 | 1,267 | |
| MB Financial Inc. | 30,963 | 1,231 | |
| Chemical Financial Corp. | 26,592 | 1,207 | |
| Trustmark Corp. | 37,030 | 1,097 | |
| International Bancshares | |||
| Corp. | 29,426 | 1,058 | |
| Bank of Hawaii Corp. | 12,944 | 1,011 | |
| UMB Financial Corp. | 14,213 | 954 | |
| 155,591 | |||
| Health Care (6.7%) | |||
| STERIS plc | 85,985 | 7,495 | |
| * | Mallinckrodt plc | 100,578 | 4,132 |
| Teleflex Inc. | 19,127 | 4,050 | |
| * | Catalent Inc. | 73,376 | 3,030 |
| * | Acadia Healthcare Co. Inc. | 61,887 | 2,905 |
| * | Molina Healthcare Inc. | 43,284 | 2,770 |
| * | LivaNova plc | 43,898 | 2,747 |
| * | Allscripts Healthcare | ||
| Solutions Inc. | 183,716 | 2,414 | |
| * | LifePoint Health Inc. | 40,867 | 2,368 |
| * | Bio-Rad Laboratories Inc. | ||
| Class A | 10,748 | 2,341 | |
33
S&P Mid-Cap 400 Value Index Fund
| Market | |||
| Value• | |||
| Shares | ($000) | ||
| * | PAREXEL International | ||
| Corp. | 26,211 | 2,304 | |
| * | Halyard Health Inc. | 47,250 | 2,140 |
| * | Charles River Laboratories | ||
| International Inc. | 18,328 | 1,994 | |
| * | United Therapeutics Corp. | 13,686 | 1,790 |
| Hill-Rom Holdings Inc. | 23,025 | 1,772 | |
| * | Endo International plc | 201,037 | 1,767 |
| Owens & Minor Inc. | 61,962 | 1,731 | |
| * | MEDNAX Inc. | 35,786 | 1,605 |
| ^,* | Tenet Healthcare Corp. | 81,424 | 1,398 |
| * | Globus Medical Inc. | 38,745 | 1,171 |
| * | Prestige Brands Holdings | ||
| Inc. | 23,011 | 1,167 | |
| 53,091 | |||
| Industrials (12.4%) | |||
| ManpowerGroup Inc. | 67,910 | 7,573 | |
| * | JetBlue Airways Corp. | 337,806 | 6,692 |
| Orbital ATK Inc. | 58,428 | 6,519 | |
| * | AECOM | 157,663 | 5,282 |
| AGCO Corp. | 67,564 | 4,625 | |
| Trinity Industries Inc. | 154,059 | 4,443 | |
| Ryder System Inc. | 54,224 | 4,208 | |
| ITT Inc. | 89,763 | 3,623 | |
| Terex Corp. | 90,508 | 3,489 | |
| * | Kirby Corp. | 54,676 | 3,423 |
| Regal Beloit Corp. | 45,365 | 3,420 | |
| Timken Co. | 71,065 | 3,187 | |
| * | Clean Harbors Inc. | 52,706 | 2,851 |
| Oshkosh Corp. | 36,348 | 2,712 | |
| * | Esterline Technologies | ||
| Corp. | 30,144 | 2,574 | |
| * | KLX Inc. | 52,365 | 2,510 |
| Pitney Bowes Inc. | 188,815 | 2,426 | |
| KBR Inc. | 144,930 | 2,358 | |
| * | Genesee & Wyoming Inc. | ||
| Class A | 33,013 | 2,263 | |
| Hubbell Inc. Class B | 19,693 | 2,221 | |
| ^ | Wabtec Corp. | 30,604 | 2,160 |
| EMCOR Group Inc. | 31,184 | 2,059 | |
| Herman Miller Inc. | 60,527 | 2,037 | |
| Donaldson Co. Inc. | 40,123 | 1,896 | |
| Watsco Inc. | 12,310 | 1,814 | |
| * | Teledyne Technologies Inc. | 11,433 | 1,716 |
| Valmont Industries Inc. | 10,976 | 1,576 | |
| Kennametal Inc. | 44,040 | 1,541 | |
| Werner Enterprises Inc. | 45,333 | 1,500 | |
| GATX Corp. | 22,169 | 1,343 | |
| * | NOW Inc. | 109,007 | 1,271 |
| * | Dycom Industries Inc. | 15,389 | 1,242 |
| Deluxe Corp. | 16,696 | 1,158 | |
| HNI Corp. | 18,751 | 687 | |
| 98,399 | |||
| Market | |||
| Value• | |||
| Shares | ($000) | ||
| Information Technology (12.8%) | |||
| Leidos Holdings Inc. | 145,259 | 8,471 | |
| * | Arrow Electronics Inc. | 89,943 | 7,144 |
| Jabil Inc. | 184,548 | 5,786 | |
| Avnet Inc. | 126,543 | 4,881 | |
| * | Teradata Corp. | 132,510 | 4,230 |
| * | Tech Data Corp. | 35,123 | 3,874 |
| * | First Solar Inc. | 79,188 | 3,719 |
| SYNNEX Corp. | 29,500 | 3,528 | |
| * | Trimble Inc. | 89,611 | 3,466 |
| * | Keysight Technologies Inc. | 80,406 | 3,285 |
| DST Systems Inc. | 62,530 | 3,210 | |
| * | ARRIS International plc | 112,165 | 3,125 |
| * | Cadence Design Systems | ||
| Inc. | 79,259 | 3,114 | |
| * | Ciena Corp. | 143,525 | 3,102 |
| Teradyne Inc. | 86,610 | 3,084 | |
| * | NetScout Systems Inc. | 92,858 | 3,041 |
| Cypress Semiconductor | |||
| Corp. | 193,444 | 2,648 | |
| Vishay Intertechnology | |||
| Inc. | 135,710 | 2,402 | |
| * | Cree Inc. | 98,495 | 2,396 |
| * | VeriFone Systems Inc. | 113,000 | 2,234 |
| National Instruments | |||
| Corp. | 54,869 | 2,216 | |
| Sabre Corp. | 108,337 | 1,998 | |
| * | PTC Inc. | 35,088 | 1,965 |
| ^,* | Cars.com Inc. | 72,461 | 1,874 |
| Brocade Communications | |||
| Systems Inc. | 145,297 | 1,799 | |
| Belden Inc. | 21,399 | 1,649 | |
| ^ | Diebold Nixdorf Inc. | 76,415 | 1,563 |
| Versum Materials Inc. | 40,710 | 1,503 | |
| * | Synaptics Inc. | 34,732 | 1,444 |
| * | ACI Worldwide Inc. | 63,340 | 1,442 |
| * | Knowles Corp. | 90,332 | 1,325 |
| Convergys Corp. | 54,320 | 1,276 | |
| * | ViaSat Inc. | 18,739 | 1,192 |
| * | Acxiom Corp. | 43,618 | 1,016 |
| * | Manhattan Associates Inc. | 23,203 | 976 |
| Plantronics Inc. | 10,444 | 445 | |
| ^,* | 3D Systems Corp. | 31,591 | 397 |
| 100,820 | |||
| Materials (8.7%) | |||
| Olin Corp. | 167,955 | 5,413 | |
| Reliance Steel & | |||
| Aluminum Co. | 73,785 | 5,343 | |
| Chemours Co. | 85,905 | 4,215 | |
| * | Owens-Illinois Inc. | 164,714 | 4,058 |
| Bemis Co. Inc. | 93,091 | 3,967 | |
| Ashland Global Holdings | |||
| Inc. | 63,002 | 3,909 | |
34
| S&P Mid-Cap 400 Value Index Fund | |||
| Market | |||
| Value• | |||
| Shares | ($000) | ||
| * | Louisiana-Pacific Corp. | 146,541 | 3,734 |
| Cabot Corp. | 63,250 | 3,332 | |
| PolyOne Corp. | 82,770 | 2,991 | |
| AptarGroup Inc. | 34,130 | 2,854 | |
| Steel Dynamics Inc. | 80,780 | 2,783 | |
| Domtar Corp. | 63,366 | 2,562 | |
| RPM International Inc. | 51,392 | 2,517 | |
| United States Steel Corp. | 88,414 | 2,353 | |
| Sonoco Products Co. | 48,296 | 2,331 | |
| * | Allegheny Technologies | ||
| Inc. | 110,172 | 2,295 | |
| Silgan Holdings Inc. | 75,924 | 2,285 | |
| Commercial Metals Co. | 117,216 | 2,214 | |
| Valvoline Inc. | 99,378 | 2,116 | |
| Carpenter Technology | |||
| Corp. | 47,322 | 1,918 | |
| NewMarket Corp. | 4,212 | 1,763 | |
| Greif Inc. Class A | 26,137 | 1,580 | |
| Compass Minerals | |||
| International Inc. | 18,799 | 1,256 | |
| Sensient Technologies | |||
| Corp. | 16,995 | 1,226 | |
| 69,015 | |||
| Real Estate (9.2%) | |||
| ^ | Omega Healthcare | ||
| Investors Inc. | 199,246 | 6,350 | |
| Jones Lang LaSalle Inc. | 45,848 | 5,589 | |
| Medical Properties Trust | |||
| Inc. | 368,503 | 4,850 | |
| Senior Housing Properties | |||
| Trust | 240,487 | 4,742 | |
| Hospitality Properties | |||
| Trust | 166,303 | 4,550 | |
| Cousins Properties Inc. | 424,088 | 3,965 | |
| Camden Property Trust | 41,703 | 3,732 | |
| Life Storage Inc. | 47,073 | 3,464 | |
| LaSalle Hotel Properties | 114,623 | 3,253 | |
| CoreCivic Inc. | 119,615 | 3,206 | |
| National Retail Properties | |||
| Inc. | 63,415 | 2,653 | |
| American Campus | |||
| Communities Inc. | 55,652 | 2,648 | |
| CyrusOne Inc. | 37,942 | 2,392 | |
| Highwoods Properties Inc. | 43,380 | 2,266 | |
| Rayonier Inc. | 71,735 | 2,081 | |
| EPR Properties | 25,297 | 1,762 | |
| Sabra Health Care REIT Inc. | 79,213 | 1,731 | |
| GEO Group Inc. | 60,469 | 1,671 | |
| Washington Prime Group | |||
| Inc. | 187,641 | 1,567 | |
| Taubman Centers Inc. | 27,652 | 1,445 | |
| * | JBG SMITH Properties | 43,600 | 1,427 |
| Market | |||
| Value• | |||
| Shares | ($000) | ||
| * | Quality Care Properties Inc. | 94,762 | 1,300 |
| Healthcare Realty Trust Inc. | 37,497 | 1,248 | |
| Corporate Office | |||
| Properties Trust | 31,208 | 1,041 | |
| Urban Edge Properties | 37,105 | 933 | |
| Alexander & Baldwin Inc. | 21,009 | 912 | |
| Mack-Cali Realty Corp. | 35,477 | 812 | |
| Tanger Factory Outlet | |||
| Centers Inc. | 30,275 | 708 | |
| Potlatch Corp. | 13,980 | 668 | |
| 72,966 | |||
| Telecommunication Services (0.5%) | |||
| Telephone & Data | |||
| Systems Inc. | 94,962 | 2,783 | |
| ^,* | Frontier Communications | ||
| Corp. | 79,179 | 1,067 | |
| 3,850 | |||
| Utilities (9.1%) | |||
| Atmos Energy Corp. | 106,592 | 9,384 | |
| UGI Corp. | 175,267 | 8,660 | |
| OGE Energy Corp. | 202,177 | 7,222 | |
| Great Plains Energy Inc. | 218,275 | 6,699 | |
| Vectren Corp. | 83,982 | 5,510 | |
| IDACORP Inc. | 51,016 | 4,539 | |
| ONE Gas Inc. | 53,097 | 3,995 | |
| New Jersey Resources | |||
| Corp. | 87,511 | 3,820 | |
| Hawaiian Electric | |||
| Industries Inc. | 110,098 | 3,679 | |
| PNM Resources Inc. | 80,642 | 3,419 | |
| NorthWestern Corp. | 49,046 | 2,958 | |
| Westar Energy Inc. | |||
| Class A | 57,523 | 2,952 | |
| Aqua America Inc. | 86,306 | 2,883 | |
| National Fuel Gas Co. | 39,221 | 2,274 | |
| WGL Holdings Inc. | 26,965 | 2,272 | |
| Black Hills Corp. | 21,651 | 1,524 | |
| 71,790 | |||
| Total Common Stocks | |||
| (Cost $751,523) | 788,103 | ||
35
S&P Mid-Cap 400 Value Index Fund
| Market | ||
| Value• | ||
| Shares | ($000) | |
| Temporary Cash Investments (1.3%)1 | ||
| Money Market Fund (1.3%) | ||
| 2,3 Vanguard Market | ||
| Liquidity Fund, 1.224% | 100 | 10,012 |
| Face | ||
| Amount | ||
| ($000) | ||
| U. S. Government and Agency Obligations (0.0%) | ||
| 4 United States | ||
| Treasury Bill, | ||
| 0.990%, 9/21/17 | 200 | 200 |
| Total Temporary Cash Investments | ||
| (Cost $10,212) | 10,212 | |
| Total Investments (100.9%) | ||
| (Cost $761,735) | 798,315 | |
| Amount | ||
| ($000) | ||
| Other Assets and Liabilities (-0.9%) | ||
| Other Assets | ||
| Investment in Vanguard | 52 | |
| Receivables for Accrued Income | 1,195 | |
| Receivables for Capital Shares Issued | 1,421 | |
| Variation Margin Receivable— | ||
| Futures Contracts | 27 | |
| Total Other Assets | 2,695 | |
| Liabilities | ||
| Payables for Investment Securities | ||
| Purchased | (1,511) | |
| Collateral for Securities on Loan | (8,067) | |
| Payables for Capital Shares Redeemed | (56) | |
| Payables to Vanguard | (181) | |
| Other Liabilities | (7) | |
| Total Liabilities | (9,822) | |
| Net Assets (100%) | 791,188 | |
| At August 31, 2017, net assets consisted of: | |
| Amount | |
| ($000) | |
| Paid-in Capital | 776,314 |
| Undistributed Net Investment Income | 7,329 |
| Accumulated Net Realized Losses | (29,059) |
| Unrealized Appreciation (Depreciation) | |
| Investment Securities | 36,580 |
| Futures Contracts | 24 |
| Net Assets | 791,188 |
| ETF Shares—Net Assets | |
| Applicable to 5,625,000 outstanding | |
| $.001 par value shares of beneficial | |
| interest (unlimited authorization) | 631,753 |
| Net Asset Value Per Share— | |
| ETF Shares | $112.31 |
| Institutional Shares—Net Assets | |
| Applicable to 708,448 outstanding | |
| $.001 par value shares of beneficial | |
| interest (unlimited authorization) | 159,435 |
| Net Asset Value Per Share— | |
| Institutional Shares | $225.05 |
• See Note A in Notes to Financial Statements.
^ Includes partial security positions on loan to broker-dealers.
The total value of securities on loan is $7,758,000.
* Non-income-producing security.
1 The fund invests a portion of its cash reserves in equity markets
through the use of index futures contracts. After giving effect to
futures investments, the fund’s effective common stock and
temporary cash investment positions represent 100.0% and
0.9%, respectively, of net assets.
2 Affiliated money market fund available only to Vanguard funds
and certain trusts and accounts managed by Vanguard. Rate
shown is the 7-day yield.
3 Includes $8,067,000 of collateral received for securities on loan.
4 Securities with a value of $150,000 have been segregated as
initial margin for open futures contracts.
36
| S&P Mid-Cap 400 Value Index Fund | ||||
| Derivative Financial Instruments Outstanding as of Period End | ||||
| Futures Contracts | ||||
| ($000) | ||||
| Value and | ||||
| Number of | Unrealized | |||
| Long (Short) | Notional | Appreciation | ||
| Expiration | Contracts | Amount | (Depreciation) | |
| Long Futures Contracts | ||||
| E-mini S&P Mid-Cap 400 Index | September 2017 | 18 | 3,115 | 24 |
Unrealized appreciation (depreciation) on open futures contracts is required to be treated as realized gain (loss) for tax purposes.
See accompanying Notes, which are an integral part of the Financial Statements.
37
| S&P Mid-Cap 400 Value Index Fund | |
| Statement of Operations | |
| Year Ended | |
| August 31,2017 | |
| ($000) | |
| Investment Income | |
| Income | |
| Dividends | 13,475 |
| Interest1 | 15 |
| Securities Lending—Net | 65 |
| Total Income | 13,555 |
| Expenses | |
| The Vanguard Group—Note B | |
| Investment Advisory Services | 155 |
| Management and Administrative—ETF Shares | 948 |
| Management and Administrative—Institutional Shares | 68 |
| Marketing and Distribution—ETF Shares | 38 |
| Marketing and Distribution—Institutional Shares | 5 |
| Custodian Fees | 49 |
| Auditing Fees | 32 |
| Shareholders’ Reports and Proxy—ETF Shares | 32 |
| Shareholders’ Reports and Proxy—Institutional Shares | — |
| Trustees’ Fees and Expenses | 1 |
| Total Expenses | 1,328 |
| Net Investment Income | 12,227 |
| Realized Net Gain (Loss) | |
| Investment Securities Sold1 | 56,515 |
| Futures Contracts | 114 |
| Realized Net Gain (Loss) | 56,629 |
| Change in Unrealized Appreciation (Depreciation) | |
| Investment Securities | 3,633 |
| Futures Contracts | 24 |
| Change in Unrealized Appreciation (Depreciation) | 3,657 |
| Net Increase (Decrease) in Net Assets Resulting from Operations | 72,513 |
1 Interest income and realized net gain (loss) from an affiliated company of the fund were $12,000 and $1,000, respectively.
See accompanying Notes, which are an integral part of the Financial Statements.
38
| S&P Mid-Cap 400 Value Index Fund | ||
| Statement of Changes in Net Assets | ||
| Year Ended August 31, | ||
| 2017 | 2016 | |
| ($000) | ($000) | |
| Increase (Decrease) in Net Assets | ||
| Operations | ||
| Net Investment Income | 12,227 | 6,855 |
| Realized Net Gain (Loss) | 56,629 | 1,128 |
| Change in Unrealized Appreciation (Depreciation) | 3,657 | 43,116 |
| Net Increase (Decrease) in Net Assets Resulting from Operations | 72,513 | 51,099 |
| Distributions | ||
| Net Investment Income | ||
| ETF Shares | (7,918) | (2,390) |
| Institutional Shares | (2,032) | (2,275) |
| Realized Capital Gain | ||
| ETF Shares | — | — |
| Institutional Shares | — | — |
| Total Distributions | (9,950) | (4,665) |
| Capital Share Transactions | ||
| ETF Shares | 122,285 | 325,114 |
| Institutional Shares | (775) | (10,617) |
| Net Increase (Decrease) from Capital Share Transactions | 121,510 | 314,497 |
| Total Increase (Decrease) | 184,073 | 360,931 |
| Net Assets | ||
| Beginning of Period | 607,115 | 246,184 |
| End of Period1 | 791,188 | 607,115 |
1 Net Assets—End of Period includes undistributed (overdistributed) net investment income of $7,329,000 and $5,052,000.
See accompanying Notes, which are an integral part of the Financial Statements.
39
| S&P Mid-Cap 400 Value Index Fund | |||||
| Financial Highlights | |||||
| ETF Shares | |||||
| For a Share Outstanding | Year Ended August 31, | ||||
| Throughout Each Period | 2017 | 2016 | 2015 | 2014 | 2013 |
| Net Asset Value, Beginning of Period | $101.70 | $91.40 | $96.78 | $77.93 | $62.71 |
| Investment Operations | |||||
| Net Investment Income | 1.7671 | 1.8911 | 1.600 | 1.5001 | 1.153 |
| Net Realized and Unrealized Gain | |||||
| (Loss) on Investments | 10.344 | 9.880 | (5.563) | 18.094 | 15.146 |
| Total from Investment Operations | 12.111 | 11.771 | (3.963) | 19.594 | 16.299 |
| Distributions | |||||
| Dividends from Net Investment Income | (1.501) | (1.471) | (1.417) | (.744) | (1.079) |
| Distributions from Realized Capital Gains | — | — | — | — | — |
| Total Distributions | (1.501) | (1.471) | (1.417) | (.744) | (1.079) |
| Net Asset Value, End of Period | $112.31 | $101.70 | $91.40 | $96.78 | $77.93 |
| Total Return | 11.91% | 13.13% | -4.17% | 25.26% | 26.31% |
| Ratios/Supplemental Data | |||||
| Net Assets, End of Period (Millions) | $632 | $460 | $103 | $87 | $27 |
| Ratio of Total Expenses to | |||||
| Average Net Assets | 0.20% | 0.20% | 0.20% | 0.20% | 0.20% |
| Ratio of Net Investment Income to | |||||
| Average Net Assets | 1.61% | 1.97% | 1.75% | 1.66% | 1.87% |
| Portfolio Turnover Rate2 | 39% | 26% | 47% | 35% | 74% |
1 Calculated based on average shares outstanding.
2 Excludes the value of portfolio securities received or delivered as a result of in-kind purchases or redemptions of the fund’s capital shares, including ETF Creation Units.
See accompanying Notes, which are an integral part of the Financial Statements.
40
| S&P Mid-Cap 400 Value Index Fund | |||||
| Financial Highlights | |||||
| Institutional Shares | |||||
| For a Share Outstanding | Year Ended August 31, | ||||
| Throughout Each Period | 2017 | 2016 | 2015 | 2014 | 2013 |
| Net Asset Value, Beginning of Period | $203.65 | $182.92 | $193.66 | $155.83 | $125.30 |
| Investment Operations | |||||
| Net Investment Income | 3.8661 | 3.7741 | 3.420 | 3.1911 | 2.392 |
| Net Realized and Unrealized Gain (Loss) | |||||
| on Investments | 20.656 | 20.020 | (11.127) | 36.207 | 30.364 |
| Total from Investment Operations | 24.522 | 23.794 | (7.707) | 39.398 | 32.756 |
| Distributions | |||||
| Dividends from Net Investment Income | (3.122) | (3.064) | (3.033) | (1.568) | (2.226) |
| Distributions from Realized Capital Gains | — | — | — | — | — |
| Total Distributions | (3.122) | (3.064) | (3.033) | (1.568) | (2.226) |
| Net Asset Value, End of Period | $225.05 | $203.65 | $182.92 | $193.66 | $155.83 |
| Total Return | 12.05% | 13.25% | -4.05% | 25.42% | 26.47% |
| Ratios/Supplemental Data | |||||
| Net Assets, End of Period (Millions) | $159 | $147 | $143 | $137 | $49 |
| Ratio of Total Expenses to | |||||
| Average Net Assets | 0.08% | 0.08% | 0.08% | 0.08% | 0.08% |
| Ratio of Net Investment Income to | |||||
| Average Net Assets | 1.73% | 2.09% | 1.87% | 1.78% | 1.99% |
| Portfolio Turnover Rate2 | 39% | 26% | 47% | 35% | 74% |
1 Calculated based on average shares outstanding.
2 Excludes the value of portfolio securities received or delivered as a result of in-kind purchases or redemptions of the fund’s capital shares, including ETF Creation Units.
See accompanying Notes, which are an integral part of the Financial Statements.
41
S&P Mid-Cap 400 Value Index Fund
Notes to Financial Statements
Vanguard S&P Mid-Cap 400 Value Index Fund is registered under the Investment Company Act of 1940 as an open-end investment company, or mutual fund. The fund offers two classes of shares: ETF Shares Shares and Institutional Shares. ETF Shares are listed for trading on NYSE Arca; they can be purchased and sold through a broker. Institutional Shares are designed for investors who meet certain administrative, service, and account-size criteria.
A. The following significant accounting policies conform to generally accepted accounting principles for U.S. investment companies. The fund consistently follows such policies in preparing its financial statements.
1. Security Valuation: Securities are valued as of the close of trading on the New York Stock Exchange (generally 4 p.m., Eastern time) on the valuation date. Equity securities are valued at the latest quoted sales prices or official closing prices taken from the primary market in which each security trades; such securities not traded on the valuation date are valued at the mean of the latest quoted bid and asked prices. Securities for which market quotations are not readily available, or whose values have been materially affected by events occurring before the fund’s pricing time but after the close of the securities’ primary markets, are valued by methods deemed by the board of trustees to represent fair value. Investments in Vanguard Market Liquidity Fund are valued at that fund’s net asset value. Temporary cash investments are valued using the latest bid prices or using valuations based on a matrix system (which considers such factors as security prices, yields, maturities, and ratings), both as furnished by independent pricing services.
2. Futures Contracts: The fund uses index futures contracts to a limited extent, with the objectives of maintaining full exposure to the stock market, enhancing returns, maintaining liquidity, and minimizing transaction costs. The fund may purchase futures contracts to immediately invest incoming cash in the market, or sell futures in response to cash outflows, thereby simulating a fully invested position in the underlying index while maintaining a cash balance for liquidity. The fund may seek to enhance returns by using futures contracts instead of the underlying securities when futures are believed to be priced more attractively than the underlying securities. The primary risks associated with the use of futures contracts are imperfect correlation between changes in market values of stocks held by the fund and the prices of futures contracts, and the possibility of an illiquid market. Counterparty risk involving futures is mitigated because a regulated clearinghouse is the counterparty instead of the clearing broker. To further mitigate counterparty risk, the fund trades futures contracts on an exchange, monitors the financial strength of its clearing brokers and clearinghouse, and has entered into clearing agreements with its clearing brokers. The clearinghouse imposes initial margin requirements to secure the fund’s performance and requires daily settlement of variation margin representing changes in the market value of each contract.
Futures contracts are valued at their quoted daily settlement prices. The notional amounts of the contracts are not recorded in the Statement of Net Assets. Fluctuations in the value of the contracts are recorded in the Statement of Net Assets as an asset (liability) and in the Statement of Operations as unrealized appreciation (depreciation) until the contracts are closed, when they are recorded as realized futures gains (losses).
During the year ended August 31, 2017, the fund’s average investments in long and short futures contracts represented less than 1% and 0% of net assets, respectively, based on the average of the notional amounts at each quarter-end during the period.
42
S&P Mid-Cap 400 Value Index Fund
3. Federal Income Taxes: The fund intends to continue to qualify as a regulated investment company and distribute all of its taxable income. Management has analyzed the fund’s tax positions taken for all open federal income tax years (August 31, 2014–2017), and has concluded that no provision for federal income tax is required in the fund’s financial statements.
4. Distributions: Distributions to shareholders are recorded on the ex-dividend date.
5. Securities Lending: To earn additional income, the fund lends its securities to qualified institutional borrowers. Security loans are subject to termination by the fund at any time, and are required to be secured at all times by collateral in an amount at least equal to the market value of securities loaned. Daily market fluctuations could cause the value of loaned securities to be more or less than the value of the collateral received. When this occurs, the collateral is adjusted and settled on the next business day. The fund further mitigates its counterparty risk by entering into securities lending transactions only with a diverse group of prequalified counterparties, monitoring their financial strength, and entering into master securities lending agreements with its counterparties. The master securities lending agreements provide that, in the event of a counterparty’s default (including bankruptcy), the fund may terminate any loans with that borrower, determine the net amount owed, and sell or retain the collateral up to the net amount owed to the fund; however, such actions may be subject to legal proceedings. While collateral mitigates counterparty risk, in the event of a default, the fund may experience delays and costs in recovering the securities loaned. The fund invests cash collateral received in Vanguard Market Liquidity Fund, and records a liability in the Statement of Net Assets for the return of the collateral, during the period the securities are on loan. Securities lending income represents fees charged to borrowers plus income earned on invested cash collateral, less expenses associated with the loan. During the term of the loan, the fund is entitled to all distributions made on or in respect of the loaned securities.
6. Credit Facility: The fund and certain other funds managed by The Vanguard Group (“Vanguard”) participate in a $3.1 billion committed credit facility provided by a syndicate of lenders pursuant to a credit agreement that may be renewed annually; each fund is individually liable for its borrowings, if any, under the credit facility. Borrowings may be utilized for temporary and emergency purposes, and are subject to the fund’s regulatory and contractual borrowing restrictions. The participating funds are charged administrative fees and an annual commitment fee of 0.10% of the undrawn amount of the facility; these fees are allocated to the funds based on a method approved by the fund’s board of trustees and included in Management and Administrative expenses on the fund’s Statement of Operations. Any borrowings under this facility bear interest at a rate based upon the higher of the one-month London Interbank Offered Rate, federal funds effective rate, or overnight bank funding rate plus an agreed-upon spread.
The fund had no borrowings outstanding at August 31,2017, or at any time during the period then ended.
7. Other: Dividend income is recorded on the ex-dividend date. Interest income includes income distributions received from Vanguard Market Liquidity Fund and is accrued daily. Premiums and discounts on debt securities purchased are amortized and accreted, respectively, to interest income over the lives of the respective securities. Security transactions are accounted for on the date securities are bought or sold. Costs used to determine realized gains (losses) on the sale of investment securities are those of the specific securities sold.
43
S&P Mid-Cap 400 Value Index Fund
Each class of shares has equal rights as to assets and earnings, except that each class separately bears certain class-specific expenses related to maintenance of shareholder accounts (included in Management and Administrative expenses), shareholder reporting, and the proxy. Marketing and distribution expenses are allocated to each class of shares based on a method approved by the board of trustees. Income, other non-class-specific expenses, and gains and losses on investments are allocated to each class of shares based on its relative net assets.
B. In accordance with the terms of a Funds’ Service Agreement (the “FSA”) between Vanguard and the fund, Vanguard furnishes to the fund investment advisory, corporate management, administrative, marketing, and distribution services at Vanguard’s cost of operations (as defined by the FSA). These costs of operations are allocated to the fund based on methods and guidelines approved by the board of trustees. Vanguard does not require reimbursement in the current period for certain costs of operations (such as deferred compensation/benefits and risk/insurance costs); the fund’s liability for these costs of operations is included in Payables to Vanguard on the Statement of Net Assets.
Upon the request of Vanguard, the fund may invest up to 0.40% of its net assets as capital in Vanguard. At August 31, 2017, the fund had contributed to Vanguard capital in the amount of $52,000, representing 0.01% of the fund’s net assets and 0.02% of Vanguard’s capitalization. The fund’s trustees and officers are also directors and employees, respectively, of Vanguard.
C. Various inputs may be used to determine the value of the fund’s investments. These inputs are summarized in three broad levels for financial statement purposes. The inputs or methodologies used to value securities are not necessarily an indication of the risk associated with investing in those securities.
Level 1—Quoted prices in active markets for identical securities.
Level 2—Other significant observable inputs (including quoted prices for similar securities, interest rates, prepayment speeds, credit risk, etc.).
Level 3—Significant unobservable inputs (including the fund’s own assumptions used to determine the fair value of investments). Any investments valued with significant unobservable inputs are noted on the Statement of Net Assets. Any investments valued with significant unobservable inputs are noted on the Statement of Net Assets.
The following table summarizes the market value of the fund’s investments as of August 31, 2017, based on the inputs used to value them:
| Level 1 | Level 2 | Level 3 | |
| Investments | ($000) | ($000) | ($000) |
| Common Stocks | 788,103 | — | — |
| Temporary Cash Investments | 10,012 | 200 | — |
| Futures Contracts—Assets1 | 27 | — | — |
| Total | 798,142 | 200 | — |
| 1 Represents variation margin on the last day of the reporting period. |
S&P Mid-Cap 400 Value Index Fund
D. Distributions are determined on a tax basis and may differ from net investment income and realized capital gains for financial reporting purposes. Differences may be permanent or temporary. Permanent differences are reclassified among capital accounts in the financial statements to reflect their tax character. Temporary differences arise when certain items of income, expense, gain, or loss are recognized in different periods for financial statement and tax purposes. These differences will reverse at some time in the future. Differences in classification may also result from the treatment of short-term gains as ordinary income for tax purposes.
During the year ended August 31, 2017, the fund realized $64,703,000 of net capital gains resulting from in-kind redemptions—in which shareholders exchanged fund shares for securities held by the fund rather than for cash. Because such gains are not taxable to the fund, and are not distributed to shareholders, they have been reclassified from accumulated net realized losses to paid-in capital.
For tax purposes, at August 31, 2017, the fund had $7,446,000 of ordinary income available for distribution. The fund had available capital losses totaling $29,036,000 that may be carried forward indefinitely to offset future net capital gains.
At August 31, 2017, the cost of investment securities for tax purposes was $761,735,000. Net unrealized appreciation of investment securities for tax purposes was $36,580,000, consisting of unrealized gains of $82,664,000 on securities that had risen in value since their purchase and $46,084,000 in unrealized losses on securities that had fallen in value since their purchase.
E. During the year ended August 31, 2017, the fund purchased $676,721,000 of investment securities and sold $554,434,000 of investment securities, other than temporary cash investments. Purchases and sales include $346,297,000 and $267,712,000, respectively, in connection with in-kind purchases and redemptions of the fund’s capital shares.
The fund purchased securities from and sold securities to other Vanguard funds or accounts managed by Vanguard or its affiliates, in accordance with procedures adopted by the board of trustees in compliance with Rule 17a-7 of the Investment Company Act of 1940. For the year ended August 31, 2017, such purchases and sales were $79,960,000 and $65,738,000, respectively; these amounts are included in the purchases and sales of investment securities noted above.
45
S&P Mid-Cap 400 Value Index Fund
| F. Capital share transactions for each class of shares were: | ||||
| Year Ended August 31, | ||||
| 2017 | 2016 | |||
| Amount | Shares | Amount | Shares | |
| ($000) | (000) | ($000) | (000) | |
| ETF Shares | ||||
| Issued | 397,751 | 3,550 | 416,496 | 4,400 |
| Issued in Lieu of Cash Distributions | — | — | — | — |
| Redeemed | (275,466) | (2,450) | (91,382) | (1,000) |
| Net Increase (Decrease)—ETF Shares | 122,285 | 1,100 | 325,114 | 3,400 |
| Institutional Shares | ||||
| Issued | 45,048 | 200 | 12,200 | 69 |
| Issued in Lieu of Cash Distributions | 1,071 | 5 | 1,307 | 7 |
| Redeemed | (46,894) | (218) | (24,124) | (138) |
| Net Increase (Decrease) —Institutional Shares | (775) | (13) | (10,617) | (62) |
G. Management has determined that no material events or transactions occurred subsequent to August 31, 2017, that would require recognition or disclosure in these financial statements.
46
S&P Mid-Cap 400 Growth Index Fund
Fund Profile
As of August 31, 2017
| Share-Class Characteristics | ||
| ETF | Institutional | |
| Shares | Shares | |
| Ticker Symbol | IVOG | VMFGX |
| Expense Ratio1 | 0.20% | 0.08% |
| 30-Day SEC Yield | 1.11% | 1.22% |
| Portfolio Characteristics | |||
| DJ | |||
| S&P | U.S. | ||
| MidCap | Total | ||
| 400 | Market | ||
| Growth | FA | ||
| Fund | Index | Index | |
| Number of Stocks | 247 | 242 | 3,769 |
| Median Market Cap | $5.6B | $5.6B | $63.1B |
| Price/Earnings Ratio | 26.3x | 26.3x | 21.6x |
| Price/Book Ratio | 3.4x | 3.4x | 2.8x |
| Return on Equity | 14.3% | 14.3% | 15.1% |
| Earnings Growth | |||
| Rate | 10.8% | 10.7% | 9.4% |
| Dividend Yield | 1.3% | 1.3% | 1.8% |
| Foreign Holdings | 0.0% | 0.0% | 0.0% |
| Turnover Rate | 40% | — | — |
| Short-Term Reserves | -0.2% | — | — |
| Volatility Measures | ||
| S&P | DJ | |
| MidCap | U.S. Total | |
| 400 Growth | Market | |
| Index | FA Index | |
| R-Squared | 1.00 | 0.82 |
| Beta | 1.00 | 0.93 |
| These measures show the degree and timing of the fund’s fluctuations compared with the indexes over 36 months. | ||
| Ten Largest Holdings (% of total net assets) | ||
| MSCI Inc. | Financial Exchanges | |
| & Data | 1.2% | |
| Take-Two Interactive | Home Entertainment | |
| Software Inc. | Software | 1.2 |
| Huntington Ingalls | Aerospace & | |
| Industries Inc. | Defense | 1.2 |
| NVR Inc. | Homebuilding | 1.1 |
| Cognex Corp. | Electronic Equipment | |
| & Instruments | 1.1 | |
| CDK Global Inc. | Application Software | 1.1 |
| Broadridge Financial | Data Processing & | |
| Solutions Inc. | Outsourced Services | 1.1 |
| IDEX Corp. | Industrial Machinery | 1.1 |
| Domino's Pizza Inc. | Restaurants | 1.0 |
| Jack Henry & Associates Data Processing & | ||
| Inc. | Outsourced Services | 0.9 |
| Top Ten | 11.0% | |
| The holdings listed exclude any temporary cash investments and equity index products. | ||
Investment Focus
1 The expense ratios shown are from the prospectus dated December 23, 2016, and represent estimated costs for the current fiscal year. For the fiscal year ended August 31, 2017, the expense ratios were 0.20% for ETF Shares and 0.08% for Institutional Shares.
47
Sector Diversification (% of equity exposure)
| S&P | |||
| MidCap | DJ | ||
| 400 | U.S. Total | ||
| Growth | Market | ||
| Fund | Index | FA Index | |
| Consumer Discretionary | 11.9% | 11.8% | 12.4% |
| Consumer Staples | 2.6 | 2.6 | 7.6 |
| Energy | 2.0 | 2.0 | 5.3 |
| Financials | 12.9 | 13.0 | 14.7 |
| Health Care | 10.5 | 10.5 | 14.1 |
| Industrials | 17.0 | 17.0 | 10.7 |
| Information Technology | 24.1 | 24.1 | 22.6 |
| Materials | 5.8 | 5.8 | 3.3 |
| Real Estate | 10.4 | 10.4 | 4.1 |
| Telecommunication | |||
| Services | 0.0 | 0.0 | 1.9 |
| Utilities | 2.8 | 2.8 | 3.3 |
Sector categories are based on the Global Industry Classification
Standard (“GICS”), except for the “Other” category (if applicable),
which includes securities that have not been provided a GICS
classification as of the effective reporting period.
48
S&P Mid-Cap 400 Growth Index Fund
Performance Summary
All of the returns in this report represent past performance, which is not a guarantee of future results that may be achieved by the fund. (Current performance may be lower or higher than the performance data cited. For performance data current to the most recent month-end, visit our website at vanguard.com/performance.) Note, too, that both investment returns and principal value can fluctuate widely, so an investor’s shares, when sold, could be worth more or less than their original cost. The returns shown do not reflect taxes that a shareholder would pay on fund distributions or on the sale of fund shares.
Cumulative Performance: September 7, 2010, Through August 31, 2017
Initial Investment of $10,000
| Average Annual Total Returns | |||||
| Periods Ended August 31, 2017 | |||||
| Since | Final Value | ||||
| One | Five | Inception | of a $10,000 | ||
| Year | Years | (9/7/2010) | Investment | ||
| S&P Mid-Cap 400 Growth Index | |||||
| Fund*ETF Shares Net Asset Value | 11.67% | 13.41% | 14.33% | $25,472 | |
| S&P Mid-Cap 400 Growth Index | |||||
| Fund*ETF Shares Market Price | 11.59 | 13.39 | 14.33 | 25,466 | |
| • • • • • • • • | S&P MidCap 400 Growth Index | 11.86 | 13.61 | 14.53 | 25,785 |
| – – – – | Mid-Cap Growth Funds Average | 15.51 | 12.14 | 12.61 | 22,916 |
| Dow Jones U.S. Total Stock Market | |||||
| Float Adjusted Index | 16.05 | 14.19 | 14.71 | 26,064 | |
Mid-Cap Growth Funds Average: Derived from data provided by Lipper, a Thomson Reuters Company.
"Since Inception" performance is calculated from the ETF Shares’ inception date for both the fund and its comparative standards.
| Since | Final Value | |||
| One | Five | Inception | of a $5,000,000 | |
| Year | Years | (3/28/2011) | Investment | |
| S&P Mid-Cap 400 Growth Index Fund | ||||
| Institutional Shares | 11.80% | 13.54% | 11.03% | $9,795,946 |
| S&P MidCap 400 Growth Index | 11.86 | 13.61 | 11.09 | 9,830,756 |
| Dow Jones U.S. Total Stock Market Float | ||||
| Adjusted Index | 16.05 | 14.19 | 12.40 | 10,597,716 |
"Since Inception" performance is calculated from the Institutional Shares’ inception date for both the fund and its comparative standards.
Institutional Shares were first issued on December 15, 2010, and the sole shareholder redeemed shortly thereafter. Institutional Shares were next issued on March 28, 2011. The total returns shown are based on the period beginning March 28, 2011.
See Financial Highlights for dividend and capital gains information.
49
S&P Mid-Cap 400 Growth Index Fund
Cumulative Returns of ETF Shares: September 7, 2010, Through August 31, 2017
| Since | |||
| One | Five | Inception | |
| Year | Years | (9/7/2010) | |
| S&P Mid-Cap 400 Growth Index Fund ETF Shares | |||
| Market Price | 11.59% | 87.47% | 154.66% |
| S&P Mid-Cap 400 Growth Index Fund ETF Shares | |||
| Net Asset Value | 11.67 | 87.58 | 154.72 |
| S&P MidCap 400 Growth Index | 11.86 | 89.25 | 157.85 |
| "Since Inception" performance is calculated from the ETF Shares’ inception date for both the fund and its comparative standards. | |||
Fiscal-Year Total Returns (%): September 7, 2010, Through August 31, 2017
Average Annual Total Returns: Periods Ended June 30, 2017
This table presents returns through the latest calendar quarter—rather than through the end of the fiscal period.
Securities and Exchange Commission rules require that we provide this information.
| Inception | One | Five | Since | |
| Date | Year | Years | Inception | |
| ETF Shares | 9/7/2010 | |||
| Market Price | 17.63% | 14.40% | 14.76% | |
| Net Asset Value | 17.68 | 14.41 | 14.76 | |
| Institutional Shares | 3/28/20111 | 17.83 | 14.55 | 11.39 |
| 1 Institutional Shares were first issued on December 15, 2010, and the sole shareholder redeemed shortly thereafter. Institutional Shares | ||||
| were next issued on March 28, 2011. The total returns shown are based on the period beginning March 28, 2011. | ||||
50
S&P Mid-Cap 400 Growth Index Fund
Financial Statements
Statement of Net Assets
As of August 31, 2017
The fund reports a complete list of its holdings in regulatory filings four times in each fiscal year, at the quarter-ends. For the second and fourth fiscal quarters, the lists appear in the fund’s semiannual and annual reports to shareholders. For the first and third fiscal quarters, the fund files the lists with the Securities and Exchange Commission on Form N-Q. Shareholders can look up the fund’s Forms N-Q on the SEC’s website at sec.gov. Forms N-Q may also be reviewed and copied at the SEC’s Public Reference Room (see the back cover of this report for further information).
| Market | |||
| Value• | |||
| Shares | ($000) | ||
| Common Stocks (99.7%)1 | |||
| Consumer Discretionary (11.8%) | |||
| * | NVR Inc. | 4,136 | 11,253 |
| Domino’s Pizza Inc. | 57,205 | 10,426 | |
| Gentex Corp. | 342,322 | 6,254 | |
| Thor Industries Inc. | 57,026 | 6,195 | |
| Dunkin’ Brands Group Inc. | 109,817 | 5,662 | |
| Carter’s Inc. | 57,665 | 5,000 | |
| Pool Corp. | 49,280 | 4,913 | |
| Service Corp. International | 138,880 | 4,908 | |
| Cable One Inc. | 5,596 | 4,246 | |
| * | Skechers U. S. A. Inc. | ||
| Class A | 159,420 | 4,214 | |
| Texas Roadhouse Inc. | |||
| Class A | 76,907 | 3,649 | |
| Wendy’s Co. | 227,872 | 3,400 | |
| * | Live Nation Entertainment | ||
| Inc. | 82,746 | 3,307 | |
| Jack in the Box Inc. | 35,046 | 3,281 | |
| ^ | Polaris Industries Inc. | 33,498 | 3,123 |
| Cracker Barrel Old Country | |||
| Store Inc. | 20,629 | 3,067 | |
| Churchill Downs Inc. | 15,411 | 3,011 | |
| Dick’s Sporting Goods Inc. | 104,584 | 2,757 | |
| * | AMC Networks Inc. | ||
| Class A | 40,272 | 2,448 | |
| * | Sotheby’s | 54,542 | 2,447 |
| Cinemark Holdings Inc. | 71,864 | 2,392 | |
| Papa John’s International | |||
| Inc. | 31,494 | 2,356 | |
| ^ | Cheesecake Factory Inc. | 53,038 | 2,197 |
| * | Urban Outfitters Inc. | 105,083 | 2,148 |
| * | Tempur Sealy International | ||
| Inc. | 32,898 | 2,036 | |
| * | Buffalo Wild Wings Inc. | 19,230 | 1,976 |
| * | Cabela’s Inc. | 33,965 | 1,824 |
| Brinker International Inc. | 58,233 | 1,818 | |
| * | Sally Beauty Holdings Inc. | 92,147 | 1,713 |
| Market | |||
| Value• | |||
| Shares | ($000) | ||
| Tupperware Brands Corp. | 25,347 | 1,467 | |
| * | Michaels Cos. Inc. | 63,598 | 1,428 |
| John Wiley & Sons Inc. | |||
| Class A | 25,198 | 1,359 | |
| Meredith Corp. | 24,585 | 1,336 | |
| * | Deckers Outdoor Corp. | 19,586 | 1,252 |
| 118,863 | |||
| Consumer Staples (2.6%) | |||
| * | Post Holdings Inc. | 78,975 | 6,723 |
| Ingredion Inc. | 40,147 | 4,971 | |
| Lamb Weston Holdings | |||
| Inc. | 102,516 | 4,663 | |
| Lancaster Colony Corp. | 23,220 | 2,705 | |
| Nu Skin Enterprises Inc. | |||
| Class A | 40,757 | 2,479 | |
| Energizer Holdings Inc. | 45,669 | 2,016 | |
| * | Sprouts Farmers Market | ||
| Inc. | 75,545 | 1,506 | |
| * | Boston Beer Co. Inc. | ||
| Class A | 5,941 | 885 | |
| ^ | Tootsie Roll Industries Inc. | 14,450 | 540 |
| 26,488 | |||
| Energy (2.0%) | |||
| Murphy Oil Corp. | 191,364 | 4,336 | |
| * | WPX Energy Inc. | 250,785 | 2,505 |
| * | Energen Corp. | 48,571 | 2,491 |
| ^ | Core Laboratories NV | 26,246 | 2,314 |
| * | Southwestern Energy Co. | 336,813 | 1,836 |
| Patterson-UTI Energy Inc. | 91,058 | 1,454 | |
| * | Gulfport Energy Corp. | 111,786 | 1,401 |
| * | Matador Resources Co. | 52,147 | 1,230 |
| * | QEP Resources Inc. | 109,459 | 826 |
| SM Energy Co. | 56,501 | 755 | |
| * | Superior Energy Services | ||
| Inc. | 75,366 | 621 | |
| 19,769 | |||
51
S&P Mid-Cap 400 Growth Index Fund
| Market | |||
| Value• | |||
| Shares | ($000) | ||
| Financials (12.9%) | |||
| MSCI Inc. Class A | 107,694 | 12,343 | |
| MarketAxess Holdings | |||
| Inc. | 44,718 | 8,628 | |
| * | SVB Financial Group | 38,160 | 6,462 |
| Bank of the Ozarks | 144,700 | 6,216 | |
| Brown & Brown Inc. | 137,075 | 6,163 | |
| East West Bancorp Inc. | 110,191 | 6,101 | |
| Commerce Bancshares | |||
| Inc. | 104,141 | 5,727 | |
| SEI Investments Co. | 96,912 | 5,665 | |
| * | Signature Bank | 42,868 | 5,502 |
| Pinnacle Financial | |||
| Partners Inc. | 86,306 | 5,368 | |
| FactSet Research | |||
| Systems Inc. | 33,849 | 5,320 | |
| First Horizon National | |||
| Corp. | 278,562 | 4,794 | |
| * | SLM Corp. | 421,036 | 4,282 |
| Primerica Inc. | 54,156 | 4,146 | |
| Eaton Vance Corp. | 84,841 | 4,037 | |
| Home BancShares Inc. | 150,231 | 3,502 | |
| Washington Federal Inc. | 106,445 | 3,326 | |
| Webster Financial Corp. | 70,230 | 3,278 | |
| Synovus Financial Corp. | 74,235 | 3,127 | |
| RenaissanceRe Holdings | |||
| Ltd. | 22,246 | 3,096 | |
| Cullen/Frost Bankers Inc. | 34,542 | 2,908 | |
| * | Texas Capital Bancshares | ||
| Inc. | 38,921 | 2,890 | |
| Bank of Hawaii Corp. | 35,618 | 2,783 | |
| Chemical Financial Corp. | 53,375 | 2,424 | |
| UMB Financial Corp. | 35,498 | 2,383 | |
| MB Financial Inc. | 48,294 | 1,921 | |
| United Bankshares Inc. | 54,849 | 1,840 | |
| Fulton Financial Corp. | 103,915 | 1,813 | |
| Federated Investors Inc. | |||
| Class B | 54,429 | 1,486 | |
| International Bancshares | |||
| Corp. | 34,793 | 1,251 | |
| Trustmark Corp. | 37,301 | 1,105 | |
| 129,887 | |||
| Health Care (10.5%) | |||
| * | WellCare Health Plans Inc. | 52,917 | 9,244 |
| * | VCA Inc. | 96,668 | 8,986 |
| West Pharmaceutical | |||
| Services Inc. | 87,476 | 7,614 | |
| * | ABIOMED Inc. | 48,566 | 7,324 |
| * | Bioverativ Inc. | 128,644 | 7,293 |
| Teleflex Inc. | 31,095 | 6,584 | |
| Bio-Techne Corp. | 44,498 | 5,508 | |
| HealthSouth Corp. | 117,386 | 5,370 | |
| * | Medidata Solutions Inc. | 66,025 | 4,949 |
| * | United Therapeutics Corp. | 37,586 | 4,916 |
| Market | |||
| Value• | |||
| Shares | ($000) | ||
| * | Masimo Corp. | 54,250 | 4,578 |
| * | Charles River Laboratories | ||
| International Inc. | 35,152 | 3,824 | |
| * | INC Research Holdings | ||
| Inc. Class A | 64,396 | 3,780 | |
| * | NuVasive Inc. | 60,377 | 3,772 |
| * | Akorn Inc. | 103,871 | 3,417 |
| Hill-Rom Holdings Inc. | 44,124 | 3,396 | |
| * | MEDNAX Inc. | 68,708 | 3,082 |
| * | Bio-Rad Laboratories Inc. | ||
| Class A | 12,144 | 2,645 | |
| * | PAREXEL International | ||
| Corp. | 29,636 | 2,605 | |
| * | Catalent Inc. | 62,398 | 2,576 |
| * | Prestige Brands Holdings | ||
| Inc. | 35,913 | 1,821 | |
| * | Globus Medical Inc. | 40,642 | 1,229 |
| * | Acadia Healthcare Co. Inc. | 18,313 | 860 |
| ResMed Inc. | 330 | 26 | |
| * | Community Health | ||
| Systems Inc. Rights | |||
| Exp. 12/31/2099 | 29,782 | — | |
| 105,399 | |||
| Industrials (16.9%) | |||
| Huntington Ingalls | |||
| Industries Inc. | 54,737 | 11,712 | |
| IDEX Corp. | 90,760 | 10,672 | |
| Old Dominion Freight | |||
| Line Inc. | 82,365 | 8,228 | |
| * | Copart Inc. | 243,825 | 7,971 |
| Toro Co. | 127,958 | 7,892 | |
| Graco Inc. | 66,201 | 7,647 | |
| Lennox International Inc. | 45,679 | 7,570 | |
| Carlisle Cos. Inc. | 76,838 | 7,276 | |
| Nordson Corp. | 63,751 | 6,968 | |
| Lincoln Electric Holdings | |||
| Inc. | 73,699 | 6,400 | |
| Donaldson Co. Inc. | 110,190 | 5,206 | |
| Curtiss-Wright Corp. | 52,715 | 5,104 | |
| Rollins Inc. | 114,290 | 5,076 | |
| Dun & Bradstreet Corp. | 43,963 | 4,899 | |
| Wabtec Corp. | 66,897 | 4,721 | |
| Landstar System Inc. | 49,959 | 4,664 | |
| Woodward Inc. | 65,696 | 4,613 | |
| Crane Co. | 60,200 | 4,469 | |
| * | Teledyne Technologies | ||
| Inc. | 28,562 | 4,286 | |
| Hubbell Inc. Class B | 37,816 | 4,265 | |
| MSC Industrial Direct Co. | |||
| Inc. Class A | 53,662 | 3,696 | |
| * | Avis Budget Group Inc. | 100,253 | 3,632 |
| Oshkosh Corp. | 46,290 | 3,453 | |
| EnerSys | 51,790 | 3,320 | |
| Watsco Inc. | 21,719 | 3,200 | |
52
S&P Mid-Cap 400 Growth Index Fund
| Market | |||
| Value• | |||
| Shares | ($000) | ||
| Knight Transportation Inc. | 79,433 | 3,102 | |
| MSA Safety Inc. | 37,445 | 2,728 | |
| Deluxe Corp. | 38,137 | 2,645 | |
| Granite Construction Inc. | 47,330 | 2,614 | |
| * | Genesee & Wyoming Inc. | ||
| Class A | 34,378 | 2,357 | |
| EMCOR Group Inc. | 33,800 | 2,232 | |
| Valmont Industries Inc. | 13,966 | 2,005 | |
| Kennametal Inc. | 44,377 | 1,553 | |
| * | Dycom Industries Inc. | 18,978 | 1,531 |
| GATX Corp. | 20,598 | 1,248 | |
| HNI Corp. | 30,675 | 1,124 | |
| AO Smith Corp. | 519 | 29 | |
| 170,108 | |||
| Information Technology (24.0%) | |||
| * | Take-Two Interactive | ||
| Software Inc. | 123,498 | 12,077 | |
| Cognex Corp. | 103,060 | 11,230 | |
| CDK Global Inc. | 172,696 | 11,139 | |
| Broadridge Financial | |||
| Solutions Inc. | 139,854 | 10,927 | |
| Jack Henry & Associates | |||
| Inc. | 92,363 | 9,520 | |
| * | Cadence Design Systems | ||
| Inc. | 239,443 | 9,408 | |
| * | IPG Photonics Corp. | 44,789 | 7,873 |
| * | Trimble Inc. | 195,518 | 7,563 |
| LogMeIn Inc. | 62,774 | 7,181 | |
| * | Ultimate Software Group | ||
| Inc. | 35,342 | 7,100 | |
| * | Tyler Technologies Inc. | 40,141 | 6,936 |
| * | Microsemi Corp. | 137,606 | 6,933 |
| * | Coherent Inc. | 29,291 | 6,834 |
| * | Fortinet Inc. | 177,957 | 6,798 |
| * | Zebra Technologies Corp. | 62,870 | 6,481 |
| * | PTC Inc. | 96,351 | 5,396 |
| * | NCR Corp. | 144,418 | 5,276 |
| Fair Isaac Corp. | 36,897 | 5,194 | |
| * | Keysight Technologies Inc. | 125,310 | 5,120 |
| Littelfuse Inc. | 27,038 | 5,033 | |
| * | WEX Inc. | 45,998 | 5,020 |
| Blackbaud Inc. | 57,202 | 4,828 | |
| Teradyne Inc. | 135,121 | 4,812 | |
| * | CoreLogic Inc. | 100,851 | 4,737 |
| MAXIMUS Inc. | 77,247 | 4,695 | |
| Monolithic Power Systems | |||
| Inc. | 45,233 | 4,583 | |
| * | Cirrus Logic Inc. | 76,756 | 4,450 |
| j2 Global Inc. | 57,428 | 4,323 | |
| Brocade Communications | |||
| Systems Inc. | 316,973 | 3,924 | |
| * | Integrated Device | ||
| Technology Inc. | 158,298 | 3,912 | |
| Market | |||
| Value• | |||
| Shares | ($000) | ||
| Science Applications | |||
| International Corp. | 52,014 | 3,843 | |
| * | Silicon Laboratories Inc. | 50,394 | 3,825 |
| * | CommVault Systems Inc. | 49,793 | 3,040 |
| Versum Materials Inc. | 81,562 | 3,012 | |
| * | WebMD Health Corp. | 44,953 | 2,987 |
| InterDigital Inc. | 41,269 | 2,945 | |
| * | ViaSat Inc. | 41,020 | 2,609 |
| * | ARRIS International plc | 91,638 | 2,553 |
| National Instruments Corp. | 62,047 | 2,506 | |
| * | Manhattan Associates Inc. | 55,372 | 2,328 |
| Cypress Semiconductor | |||
| Corp. | 164,516 | 2,252 | |
| Sabre Corp. | 117,551 | 2,168 | |
| Belden Inc. | 25,315 | 1,951 | |
| * | ACI Worldwide Inc. | 66,258 | 1,508 |
| Plantronics Inc. | 27,624 | 1,178 | |
| ^,* | 3D Systems Corp. | 91,727 | 1,152 |
| Convergys Corp. | 48,148 | 1,132 | |
| * | Acxiom Corp. | 42,306 | 985 |
| 241,277 | |||
| Materials (5.8%) | |||
| Royal Gold Inc. | 77,849 | 7,262 | |
| Steel Dynamics Inc. | 193,040 | 6,650 | |
| Chemours Co. | 118,467 | 5,813 | |
| Eagle Materials Inc. | 57,838 | 5,625 | |
| Scotts Miracle-Gro Co. | 52,524 | 5,021 | |
| RPM International Inc. | 98,685 | 4,833 | |
| Sonoco Products Co. | 61,569 | 2,971 | |
| AptarGroup Inc. | 34,210 | 2,860 | |
| United States Steel Corp. | 103,931 | 2,766 | |
| Valvoline Inc. | 126,693 | 2,697 | |
| Minerals Technologies Inc. | 41,766 | 2,673 | |
| Worthington Industries Inc. | 52,288 | 2,612 | |
| NewMarket Corp. | 6,054 | 2,534 | |
| Sensient Technologies | |||
| Corp. | 32,699 | 2,359 | |
| Compass Minerals | |||
| International Inc. | 18,283 | 1,221 | |
| Packaging Corp. of | |||
| America | 332 | 38 | |
| 57,935 | |||
| Real Estate (10.4%) | |||
| Kilroy Realty Corp. | 116,908 | 8,094 | |
| Liberty Property Trust | 175,092 | 7,459 | |
| Douglas Emmett Inc. | 183,996 | 7,168 | |
| Lamar Advertising Co. | |||
| Class A | 99,487 | 6,622 | |
| DCT Industrial Trust Inc. | 109,538 | 6,392 | |
| Camden Property Trust | 55,348 | 4,953 | |
| CoreSite Realty Corp. | 40,494 | 4,809 | |
| Weingarten Realty | |||
| Investors | 140,745 | 4,509 | |
53
S&P Mid-Cap 400 Growth Index Fund
| Market | |||
| Value• | |||
| Shares | ($000) | ||
| American Campus | |||
| Communities Inc. | 94,160 | 4,481 | |
| First Industrial Realty | |||
| Trust Inc. | 139,734 | 4,329 | |
| National Retail | |||
| Properties Inc. | 102,961 | 4,307 | |
| Highwoods Properties | |||
| Inc. | 70,438 | 3,679 | |
| Uniti Group Inc. | 188,162 | 3,624 | |
| Healthcare Realty Trust | |||
| Inc. | 102,968 | 3,427 | |
| Education Realty Trust | |||
| Inc. | 87,192 | 3,369 | |
| EPR Properties | 46,514 | 3,240 | |
| CyrusOne Inc. | 48,374 | 3,049 | |
| Corporate Office | |||
| Properties Trust | 81,803 | 2,729 | |
| GEO Group Inc. | 76,932 | 2,126 | |
| Sabra Health Care | |||
| REIT Inc. | 96,670 | 2,112 | |
| Taubman Centers Inc. | 39,697 | 2,074 | |
| Urban Edge Properties | 80,953 | 2,036 | |
| Rayonier Inc. | 68,916 | 1,999 | |
| Tanger Factory Outlet | |||
| Centers Inc. | 79,208 | 1,853 | |
| * | JBG SMITH Properties | 51,235 | 1,677 |
| Potlatch Corp. | 32,095 | 1,534 | |
| Mack-Cali Realty Corp. | 65,211 | 1,493 | |
| Alexander & Baldwin Inc. | 30,508 | 1,324 | |
| Duke Realty Corp. | 1,254 | 37 | |
| 104,505 | |||
| Utilities (2.8%) | |||
| MDU Resources Group | |||
| Inc. | 232,735 | 6,293 | |
| Westar Energy Inc. | |||
| Class A | 101,556 | 5,211 | |
| Southwest Gas | |||
| Holdings Inc. | 56,670 | 4,507 | |
| Aqua America Inc. | 110,036 | 3,675 | |
| National Fuel Gas Co. | 55,248 | 3,203 | |
| Black Hills Corp. | 38,175 | 2,687 | |
| WGL Holdings Inc. | 29,291 | 2,468 | |
| 28,044 | |||
| Total Common Stocks | |||
| (Cost $908,211) | 1,002,275 | ||
| Market | ||
| Value• | ||
| Shares | ($000) | |
| Temporary Cash Investments (0.4%)1 | ||
| Money Market Fund (0.4%) | ||
| 2,3 Vanguard Market | ||
| Liquidity Fund, 1.224% | 41 | 4,074 |
| Face | ||
| Amount | ||
| ($000) | ||
| U. S. Government and Agency Obligations (0.0%) | ||
| 4 United States | ||
| Treasury Bill, | ||
| 0.982%, 9/14/17 | 300 | 300 |
| Total Temporary Cash Investments | ||
| (Cost $4,373) | 4,374 | |
| Total Investments (100.1%) | ||
| (Cost $912,584) | 1,006,649 | |
| Amount | ||
| ($000) | ||
| Other Assets and Liabilities (-0.1%) | ||
| Other Assets | ||
| Investment in Vanguard | 67 | |
| Receivables for Accrued Income | 878 | |
| Receivables for Capital Shares Issued | 1,498 | |
| Variation Margin Receivable— | ||
| Futures Contracts | 12 | |
| Other Assets | 37 | |
| Total Other Assets | 2,492 | |
| Liabilities | ||
| Payables for Investment Securities | ||
| Purchased | (2) | |
| Collateral for Securities on Loan | (3,496) | |
| Payables for Capital Shares Redeemed | (59) | |
| Payables to Vanguard | (259) | |
| Total Liabilities | (3,816) | |
| Net Assets (100%) | 1,005,325 | |
54
S&P Mid-Cap 400 Growth Index Fund
| At August 31, 2017, net assets consisted of: | |
| Amount | |
| ($000) | |
| Paid-in Capital | 946,376 |
| Undistributed Net Investment Income | 4,944 |
| Accumulated Net Realized Losses | (40,064) |
| Unrealized Appreciation (Depreciation) | |
| Investment Securities | 94,065 |
| Futures Contracts | 4 |
| Net Assets | 1,005,325 |
| ETF Shares—Net Assets | |
| Applicable to 5,650,000 outstanding | |
| $.001 par value shares of beneficial | |
| interest (unlimited authorization) | 685,504 |
| Net Asset Value Per Share— | |
| ETF Shares | $121.33 |
| Amount | |
| ($000) | |
| Institutional Shares—Net Assets | |
| Applicable to 1,323,342 outstanding | |
| $.001 par value shares of beneficial | |
| interest (unlimited authorization) | 319,821 |
| Net Asset Value Per Share— | |
| Institutional Shares | $241.68 |
• See Note A in Notes to Financial Statements.
^ Includes partial security positions on loan to broker-dealers.
The total value of securities on loan is $3,423,000.
* Non-income-producing security.
1 The fund invests a portion of its cash reserves in equity markets
through the use of index futures contracts. After giving effect to
futures investments, the fund’s effective common stock and
temporary cash investment positions represent 99.9% and 0.2%,
respectively, of net assets.
2 Affiliated money market fund available only to Vanguard funds
and certain trusts and accounts managed by Vanguard. Rate
shown is the 7-day yield.
3 Includes $3,496,000 of collateral received for securities on loan.
4 Securities with a value of $300,000 have been segregated as
initial margin for open futures contracts.
| Derivative Financial Instruments Outstanding as of Period End | ||||
| Futures Contracts | ||||
| ($000) | ||||
| Value and | ||||
| Number of | Unrealized | |||
| Long (Short) | Notional | Appreciation | ||
| Expiration | Contracts | Amount | (Depreciation) | |
| Long Futures Contracts | ||||
| E-mini S&P Mid-Cap 400 Index | September 2017 | 17 | 2,942 | 4 |
Unrealized appreciation (depreciation) on open futures contracts is required to be treated as realized gain (loss) for tax purposes.
See accompanying Notes, which are an integral part of the Financial Statements.
55
| S&P Mid-Cap 400 Growth Index Fund | |
| Statement of Operations | |
| Year Ended | |
| August 31,2017 | |
| ($000) | |
| Investment Income | |
| Income | |
| Dividends | 10,159 |
| Interest1 | 31 |
| Securities Lending—Net | 53 |
| Total Income | 10,243 |
| Expenses | |
| The Vanguard Group—Note B | |
| Investment Advisory Services | 183 |
| Management and Administrative—ETF Shares | 981 |
| Management and Administrative—Institutional Shares | 105 |
| Marketing and Distribution—ETF Shares | 36 |
| Marketing and Distribution—Institutional Shares | 13 |
| Custodian Fees | 39 |
| Auditing Fees | 32 |
| Shareholders’ Reports and Proxy—ETF Shares | 43 |
| Shareholders’ Reports and Proxy—Institutional Shares | — |
| Trustees’ Fees and Expenses | 1 |
| Total Expenses | 1,433 |
| Net Investment Income | 8,810 |
| Realized Net Gain (Loss) | |
| Investment Securities Sold1 | 71,260 |
| Futures Contracts | 110 |
| Realized Net Gain (Loss) | 71,370 |
| Change in Unrealized Appreciation (Depreciation) | |
| Investment Securities | 11,963 |
| Futures Contracts | 4 |
| Change in Unrealized Appreciation (Depreciation) | 11,967 |
| Net Increase (Decrease) in Net Assets Resulting from Operations | 92,147 |
1 Interest income and realized net gain (loss) from an affiliated company of the fund were $28,000 and $0, respectively.
See accompanying Notes, which are an integral part of the Financial Statements.
56
| S&P Mid-Cap 400 Growth Index Fund | ||
| Statement of Changes in Net Assets | ||
| Year Ended August 31, | ||
| 2017 | 2016 | |
| ($000) | ($000) | |
| Increase (Decrease) in Net Assets | ||
| Operations | ||
| Net Investment Income | 8,810 | 6,123 |
| Realized Net Gain (Loss) | 71,370 | 5,353 |
| Change in Unrealized Appreciation (Depreciation) | 11,967 | 51,455 |
| Net Increase (Decrease) in Net Assets Resulting from Operations | 92,147 | 62,931 |
| Distributions | ||
| Net Investment Income | ||
| ETF Shares | (5,674) | (4,524) |
| Institutional Shares | (2,068) | (1,029) |
| Realized Capital Gain | ||
| ETF Shares | — | — |
| Institutional Shares | — | — |
| Total Distributions | (7,742) | (5,553) |
| Capital Share Transactions | ||
| ETF Shares | 109,562 | 93,098 |
| Institutional Shares | 128,195 | 59,674 |
| Net Increase (Decrease) from Capital Share Transactions | 237,757 | 152,772 |
| Total Increase (Decrease) | 322,162 | 210,150 |
| Net Assets | ||
| Beginning of Period | 683,163 | 473,013 |
| End of Period1 | 1,005,325 | 683,163 |
1 Net Assets—End of Period includes undistributed (overdistributed) net investment income of $4,944,000 and $3,875,000.
See accompanying Notes, which are an integral part of the Financial Statements.
57
| S&P Mid-Cap 400 Growth Index Fund | |||||
| Financial Highlights | |||||
| ETF Shares | |||||
| For a Share Outstanding | Year Ended August 31, | ||||
| Throughout Each Period | 2017 | 2016 | 2015 | 2014 | 2013 |
| Net Asset Value, Beginning of Period | $109.76 | $99.88 | $97.18 | $80.96 | $67.47 |
| Investment Operations | |||||
| Net Investment Income | 1.1521 | .954 | 1.036 | .571 | .721 |
| Net Realized and Unrealized Gain (Loss) | |||||
| on Investments | 11.576 | 9.960 | 2.456 | 16.256 | 13.257 |
| Total from Investment Operations | 12.728 | 10.914 | 3.492 | 16.827 | 13.978 |
| Distributions | |||||
| Dividends from Net Investment Income | (1.158) | (1.034) | (.792) | (.607) | (.488) |
| Distributions from Realized Capital Gains | — | — | — | — | — |
| Total Distributions | (1.158) | (1.034) | (.792) | (.607) | (.488) |
| Net Asset Value, End of Period | $121.33 | $109.76 | $99.88 | $97.18 | $80.96 |
| Total Return | 11.67% | 11.04% | 3.60% | 20.84% | 20.83% |
| Ratios/Supplemental Data | |||||
| Net Assets, End of Period (Millions) | $686 | $513 | $377 | $292 | $182 |
| Ratio of Total Expenses to | |||||
| Average Net Assets | 0.20% | 0.20% | 0.20% | 0.20% | 0.20% |
| Ratio of Net Investment Income to | |||||
| Average Net Assets | 0.99% | 1.08% | 1.08% | 0.81% | 1.08% |
| Portfolio Turnover Rate2 | 40% | 38% | 47% | 38% | 35% |
1 Calculated based on average shares outstanding.
2 Excludes the value of portfolio securities received or delivered as a result of in-kind purchases or redemptions of the fund’s capital shares, including ETF Creation Units.
See accompanying Notes, which are an integral part of the Financial Statements.
58
| S&P Mid-Cap 400 Growth Index Fund | |||||
| Financial Highlights | |||||
| Institutional Shares | |||||
| For a Share Outstanding | Year Ended August 31, | ||||
| Throughout Each Period | 2017 | 2016 | 2015 | 2014 | 2013 |
| Net Asset Value, Beginning of Period | $218.61 | $198.85 | $193.45 | $161.12 | $134.20 |
| Investment Operations | |||||
| Net Investment Income | 2.6041 | 2.094 | 2.271 | 1.316 | 1.584 |
| Net Realized and Unrealized Gain (Loss) | |||||
| on Investments | 23.011 | 19.906 | 4.900 | 32.386 | 26.392 |
| Total from Investment Operations | 25.615 | 22.000 | 7.171 | 33.702 | 27.976 |
| Distributions | |||||
| Dividends from Net Investment Income | (2.545) | (2.240) | (1.771) | (1.372) | (1.056) |
| Distributions from Realized Capital Gains | — | — | — | — | — |
| Total Distributions | (2.545) | (2.240) | (1.771) | (1.372) | (1.056) |
| Net Asset Value, End of Period | $241.68 | $218.61 | $198.85 | $193.45 | $161.12 |
| Total Return | 11.80% | 11.18% | 3.72% | 20.99% | 20.97% |
| Ratios/Supplemental Data | |||||
| Net Assets, End of Period (Millions) | $320 | $170 | $96 | $90 | $42 |
| Ratio of Total Expenses to | |||||
| Average Net Assets | 0.08% | 0.08% | 0.08% | 0.08% | 0.08% |
| Ratio of Net Investment Income to | |||||
| Average Net Assets | 1.11% | 1.20% | 1.20% | 0.93% | 1.20% |
| Portfolio Turnover Rate2 | 40% | 38% | 47% | 38% | 35% |
1 Calculated based on average shares outstanding.
2 Excludes the value of portfolio securities received or delivered as a result of in-kind purchases or redemptions of the fund’s capital shares, including ETF Creation Units.
See accompanying Notes, which are an integral part of the Financial Statements.
59
S&P Mid-Cap 400 Growth Index Fund
Notes to Financial Statements
Vanguard S&P Mid-Cap 400 Growth Index Fund is registered under the Investment Company Act of 1940 as an open-end investment company, or mutual fund. The fund offers two classes of shares: ETF Shares and Institutional Shares. ETF Shares are listed for trading on NYSE Arca; they can be purchased and sold through a broker. Institutional Shares are designed for investors who meet certain administrative, service, and account-size criteria.
A. The following significant accounting policies conform to generally accepted accounting principles for U.S. investment companies. The fund consistently follows such policies in preparing its financial statements.
1. Security Valuation: Securities are valued as of the close of trading on the New York Stock Exchange (generally 4 p.m., Eastern time) on the valuation date. Equity securities are valued at the latest quoted sales prices or official closing prices taken from the primary market in which each security trades; such securities not traded on the valuation date are valued at the mean of the latest quoted bid and asked prices. Securities for which market quotations are not readily available, or whose values have been materially affected by events occurring before the fund’s pricing time but after the close of the securities’ primary markets, are valued by methods deemed by the board of trustees to represent fair value. Investments in Vanguard Market Liquidity Fund are valued at that fund’s net asset value. Temporary cash investments are valued using the latest bid prices or using valuations based on a matrix system (which considers such factors as security prices, yields, maturities, and ratings), both as furnished by independent pricing services.
2. Futures Contracts: The fund uses index futures contracts to a limited extent, with the objectives of maintaining full exposure to the stock market, enhancing returns, maintaining liquidity, and minimizing transaction costs. The fund may purchase futures contracts to immediately invest incoming cash in the market, or sell futures in response to cash outflows, thereby simulating a fully invested position in the underlying index while maintaining a cash balance for liquidity. The fund may seek to enhance returns by using futures contracts instead of the underlying securities when futures are believed to be priced more attractively than the underlying securities. The primary risks associated with the use of futures contracts are imperfect correlation between changes in market values of stocks held by the fund and the prices of futures contracts, and the possibility of an illiquid market. Counterparty risk involving futures is mitigated because a regulated clearinghouse is the counterparty instead of the clearing broker. To further mitigate counterparty risk, the fund trades futures contracts on an exchange, monitors the financial strength of its clearing brokers and clearinghouse, and has entered into clearing agreements with its clearing brokers. The clearinghouse imposes initial margin requirements to secure the fund’s performance and requires daily settlement of variation margin representing changes in the market value of each contract.
Futures contracts are valued at their quoted daily settlement prices. The notional amounts of the contracts are not recorded in the Statement of Net Assets. Fluctuations in the value of the contracts are recorded in the Statement of Net Assets as an asset (liability) and in the Statement of Operations as unrealized appreciation (depreciation) until the contracts are closed, when they are recorded as realized futures gains (losses).
During the year ended August 31, 2017, the fund’s average investments in long and short futures contracts represented less than 1% and 0% of net assets, respectively, based on the average of the notional amounts at each quarter-end during the period.
60
S&P Mid-Cap 400 Growth Index Fund
3. Federal Income Taxes: The fund intends to continue to qualify as a regulated investment company and distribute all of its taxable income. Management has analyzed the fund’s tax positions taken for all open federal income tax years (August 31, 2014–2017), and has concluded that no provision for federal income tax is required in the fund’s financial statements.
4. Distributions: Distributions to shareholders are recorded on the ex-dividend date.
5. Securities Lending: To earn additional income, the fund lends its securities to qualified institutional borrowers. Security loans are subject to termination by the fund at any time, and are required to be secured at all times by collateral in an amount at least equal to the market value of securities loaned. Daily market fluctuations could cause the value of loaned securities to be more or less than the value of the collateral received. When this occurs, the collateral is adjusted and settled on the next business day. The fund further mitigates its counterparty risk by entering into securities lending transactions only with a diverse group of prequalified counterparties, monitoring their financial strength, and entering into master securities lending agreements with its counterparties. The master securities lending agreements provide that, in the event of a counterparty’s default (including bankruptcy), the fund may terminate any loans with that borrower, determine the net amount owed, and sell or retain the collateral up to the net amount owed to the fund; however, such actions may be subject to legal proceedings. While collateral mitigates counterparty risk, in the event of a default, the fund may experience delays and costs in recovering the securities loaned. The fund invests cash collateral received in Vanguard Market Liquidity Fund, and records a liability in the Statement of Net Assets for the return of the collateral, during the period the securities are on loan. Securities lending income represents fees charged to borrowers plus income earned on invested cash collateral, less expenses associated with the loan. During the term of the loan, the fund is entitled to all distributions made on or in respect of the loaned securities.
6. Credit Facility: The fund and certain other funds managed by The Vanguard Group (“Vanguard”) participate in a $3.1 billion committed credit facility provided by a syndicate of lenders pursuant to a credit agreement that may be renewed annually; each fund is individually liable for its borrowings, if any, under the credit facility. Borrowings may be utilized for temporary and emergency purposes, and are subject to the fund’s regulatory and contractual borrowing restrictions. The participating funds are charged administrative fees and an annual commitment fee of 0.10% of the undrawn amount of the facility; these fees are allocated to the funds based on a method approved by the fund’s board of trustees and included in Management and Administrative expenses on the fund’s Statement of Operations. Any borrowings under this facility bear interest at a rate based upon the higher of the one-month London Interbank Offered Rate, federal funds effective rate, or overnight bank funding rate plus an agreed-upon spread.
The fund had no borrowings outstanding at August 31, 2017, or at any time during the period then ended.
7. Other: Dividend income is recorded on the ex-dividend date. Interest income includes income distributions received from Vanguard Market Liquidity Fund and is accrued daily. Premiums and discounts on debt securities purchased are amortized and accreted, respectively, to interest income over the lives of the respective securities. Security transactions are accounted for on the date securities are bought or sold. Costs used to determine realized gains (losses) on the sale of investment securities are those of the specific securities sold.
61
S&P Mid-Cap 400 Growth Index Fund
Each class of shares has equal rights as to assets and earnings, except that each class separately bears certain class-specific expenses related to maintenance of shareholder accounts (included in Management and Administrative expenses), shareholder reporting, and the proxy. Marketing and distribution expenses are allocated to each class of shares based on a method approved by the board of trustees. Income, other non-class-specific expenses, and gains and losses on investments are allocated to each class of shares based on its relative net assets.
B. In accordance with the terms of a Funds’ Service Agreement (the “FSA”) between Vanguard and the fund, Vanguard furnishes to the fund investment advisory, corporate management, administrative, marketing, and distribution services at Vanguard’s cost of operations (as defined by the FSA). These costs of operations are allocated to the fund based on methods and guidelines approved by the board of trustees. Vanguard does not require reimbursement in the current period for certain costs of operations (such as deferred compensation/benefits and risk/insurance costs); the fund’s liability for these costs of operations is included in Payables to Vanguard on the Statement of Net Assets.
Upon the request of Vanguard, the fund may invest up to 0.40% of its net assets as capital in Vanguard. At August 31, 2017, the fund had contributed to Vanguard capital in the amount of $67,000, representing 0.01% of the fund’s net assets and 0.03% of Vanguard’s capitalization. The fund’s trustees and officers are also directors and employees, respectively, of Vanguard.
C. Various inputs may be used to determine the value of the fund’s investments. These inputs are summarized in three broad levels for financial statement purposes. The inputs or methodologies used to value securities are not necessarily an indication of the risk associated with investing in those securities.
Level 1—Quoted prices in active markets for identical securities.
Level 2—Other significant observable inputs (including quoted prices for similar securities, interest rates, prepayment speeds, credit risk, etc.).
Level 3—Significant unobservable inputs (including the fund’s own assumptions used to determine the fair value of investments). Any investments valued with significant unobservable inputs are
noted on the Statement of Net Assets.
The following table summarizes the market value of the fund’s investments as of August 31, 2017, based on the inputs used to value them:
| Level 1 | Level 2 | Level 3 | |
| Investments | ($000) | ($000) | ($000) |
| Common Stocks | 1,002,275 | — | — |
| Temporary Cash Investments | 4,074 | 300 | — |
| Futures Contracts—Assets1 | 12 | — | — |
| Total | 1,006,361 | 300 | — |
| 1 Represents variation margin on the last day of the reporting period. |
D. Distributions are determined on a tax basis and may differ from net investment income and realized capital gains for financial reporting purposes. Differences may be permanent or temporary. Permanent differences are reclassified among capital accounts in the financial statements to reflect their tax character. Temporary differences arise when certain items of income, expense, gain, or
62
S&P Mid-Cap 400 Growth Index Fund
loss are recognized in different periods for financial statement and tax purposes. These differences will reverse at some time in the future. Differences in classification may also result from the treatment of short-term gains as ordinary income for tax purposes.
During the year ended August 31, 2017, the fund realized $69,762,000 of net capital gains resulting from in-kind redemptions—in which shareholders exchanged fund shares for securities held by the fund rather than for cash. Because such gains are not taxable to the fund, and are not distributed to shareholders, they have been reclassified from accumulated net realized losses to paid-in capital.
For tax purposes, at August 31, 2017, the fund had $5,126,000 of ordinary income available for distribution. The fund used capital losses of $1,612,000 to offset taxable capital gains realized during the year ended August 31, 2017. At August 31, 2017, the fund had available capital losses totaling $40,060,000 that may be carried forward indefinitely to offset future net capital gains.
At August 31, 2017, the cost of investment securities for tax purposes was $912,584,000. Net unrealized appreciation of investment securities for tax purposes was $94,065,000, consisting of unrealized gains of $133,626,000 on securities that had risen in value since their purchase and $39,561,000 in unrealized losses on securities that had fallen in value since their purchase.
E. During the year ended August 31, 2017, the fund purchased $814,258,000 of investment securities and sold $576,580,000 of investment securities, other than temporary cash investments. Purchases and sales include $298,942,000 and $237,026,000, respectively, in connection with in-kind purchases and redemptions of the fund’s capital shares.
The fund purchased securities from and sold securities to other Vanguard funds or accounts managed by Vanguard or its affiliates, in accordance with procedures adopted by the board of trustees in compliance with Rule 17a-7 of the Investment Company Act of 1940. For the year ended August 31, 2017, such purchases and sales were $121,492,000 and $68,005,000, respectively; these amounts are included in the purchases and sales of investment securities noted above.
63
S&P Mid-Cap 400 Growth Index Fund
| F. Capital share transactions for each class of shares were: | ||||
| Year Ended August 31, | ||||
| 2017 | 2016 | |||
| Amount | Shares | Amount | Shares | |
| ($000) | (000) | ($000) | (000) | |
| ETF Shares | ||||
| Issued | 361,088 | 3,075 | 198,705 | 1,950 |
| Issued in Lieu of Cash Distributions | — | — | — | — |
| Redeemed | (251,526) | (2,100) | (105,607) | (1,050) |
| Net Increase (Decrease)—ETF Shares | 109,562 | 975 | 93,098 | 900 |
| Institutional Shares | ||||
| Issued | 162,354 | 692 | 87,252 | 431 |
| Issued in Lieu of Cash Distributions | 430 | 2 | 407 | 2 |
| Redeemed | (34,589) | (148) | (27,985) | (138) |
| Net Increase (Decrease)—Institutional Shares | 128,195 | 546 | 59,674 | 295 |
G. Management has determined that no material events or transactions occurred subsequent to August 31, 2017, that would require recognition or disclosure in these financial statements.
64
Report of Independent Registered Public Accounting Firm
To the Board of Trustees of Vanguard Admiral Funds and the Shareholders of Vanguard S&P Mid-Cap 400 Index Fund, Vanguard S&P Mid-Cap 400 Value Index Fund and Vanguard S&P Mid-Cap 400 Growth Index Fund:
In our opinion, the accompanying statements of net assets and the related statements of operations and of changes in net assets and the financial highlights present fairly, in all material respects, the financial position of Vanguard S&P Mid-Cap 400 Index Fund, Vanguard S&P Mid-Cap 400 Value Index Fund and Vanguard S&P Mid-Cap 400 Growth Index Fund (constituting separate portfolios of Vanguard Admiral Funds, hereafter referred to as the “Funds”) as of August 31, 2017, the results of each of their operations for the year then ended, the changes in each of their net assets for each of the two years in the period then ended and the financial highlights for each of the five years in the period then ended, in conformity with accounting principles generally accepted in the United States of America. These financial statements and financial highlights (hereafter referred to as “financial statements”) are the responsibility of the Funds’ management.
Our responsibility is to express an opinion on these financial statements based on our audits. We conducted our audits of these financial statements in accordance with the standards of the Public Company Accounting Oversight Board (United States). Those standards require that we plan and perform the audit to obtain reasonable assurance about whether the financial statements are free of material misstatement. An audit includes examining, on a test basis, evidence supporting the amounts and disclosures in the financial statements, assessing the accounting principles used and significant estimates made by management, and evaluating the overall financial statement presentation. We believe that our audits, which included confirmation of securities as of August 31, 2017 by correspondence with the custodian and brokers and by agreement to the underlying ownership records of the transfer agent, provide a reasonable basis for our opinion.
/s/PricewaterhouseCoopers LLP
Philadelphia, Pennsylvania
October 17, 2017
65
Special 2017 tax information (unaudited) for Vanguard S&P Mid-Cap 400 Index Funds
This information for the fiscal year ended August 31, 2017, is included pursuant to provisions
of the Internal Revenue Code.
The funds distributed qualified dividend income to shareholders during the fiscal year as follows:
| Fund | ($000) |
| S&P Mid-Cap 400 Index Fund | 18,563 |
| S&P Mid-Cap 400 Value Index Fund | 8,304 |
| S&P Mid-Cap 400 Growth Index Fund | 5,285 |
For corporate shareholders, the percentage of investment income (dividend income plus short-term gains, if any) that qualifies for the dividends-received deduction is as follows:
| Fund | Percentage |
| S&P Mid-Cap 400 Index Fund | 79.9% |
| S&P Mid-Cap 400 Value Index Fund | 81.4 |
| S&P Mid-Cap 400 Growth Index Fund | 84.3 |
66
Your Fund’s After-Tax Returns
This table presents returns for your fund both before and after taxes. The after-tax returns are shown in two ways: (1) assuming that an investor owned the fund during the entire period and paid taxes on the fund’s distributions, and (2) assuming that an investor paid taxes on the fund’s distributions and sold all shares at the end of each period.
Calculations are based on the highest individual federal income tax and capital gains tax rates in effect at the times of the distributions and the hypothetical sales. State and local taxes were not considered. After-tax returns reflect any qualified dividend income, using actual prior-year figures and estimates for 2017. (In the example, returns after the sale of fund shares may be higher than those assuming no sale. This occurs when the sale would have produced a capital loss. The calculation assumes that the investor received a tax deduction for the loss.)
The table shows returns for ETF Shares only; returns for other share classes will differ. Please note that your actual after-tax returns will depend on your tax situation and may differ from those shown. Also note that if you own the fund in a tax-deferred account, such as an individual retirement account or a 401(k) plan, this information does not apply to you. Such accounts are not subject to current taxes.
Finally, keep in mind that a fund’s performance—whether before or after taxes—does not guarantee future results.
Average Annual Total Returns: S&P Mid-Cap 400 Index Funds
Periods Ended August 31, 2017
| Since | |||
| One | Five | Inception | |
| Year | Years | (9/7/2010) | |
| S&P Mid-Cap 400 Index Fund ETF Shares | |||
| Returns Before Taxes | 12.22% | 13.84% | 14.18% |
| Returns After Taxes on Distributions | 11.78 | 13.46 | 13.87 |
| Returns After Taxes on Distributions and Sale of | |||
| Fund Shares | 7.14 | 11.03 | 11.59 |
| Since | |||
| One | Five | Inception | |
| Year | Years | (9/7/2010) | |
| S&P Mid-Cap 400 Value Index Fund ETF Shares | |||
| Returns Before Taxes | 11.91% | 13.93% | 13.75% |
| Returns After Taxes on Distributions | 11.51 | 13.55 | 13.42 |
| Returns After Taxes on Distributions and Sale of | |||
| Fund Shares | 6.98 | 11.12 | 11.22 |
| Since | |||
| One | Five | Inception | |
| Year | Years | (9/7/2010) | |
| S&P Mid-Cap 400 Growth Index Fund ETF Shares | |||
| Returns Before Taxes | 11.67% | 13.41% | 14.33% |
| Returns After Taxes on Distributions | 11.33 | 13.15 | 14.12 |
| Returns After Taxes on Distributions and Sale of | |||
| Fund Shares | 6.73 | 10.69 | 11.74 |
67
About Your Fund’s Expenses
As a shareholder of the fund, you incur ongoing costs, which include costs for portfolio management, administrative services, and shareholder reports (like this one), among others. Operating expenses, which are deducted from a fund’s gross income, directly reduce the investment return of the fund.
A fund’s expenses are expressed as a percentage of its average net assets. This figure is known as the expense ratio. The following examples are intended to help you understand the ongoing costs (in dollars) of investing in your fund and to compare these costs with those of other mutual funds. The examples are based on an investment of $1,000 made at the beginning of the period shown and held for the entire period.
The accompanying table illustrates your fund’s costs in two ways:
• Based on actual fund return. This section helps you to estimate the actual expenses that you paid over the period. The ”Ending Account Value“ shown is derived from the fund‘s actual return, and the third column shows the dollar amount that would have been paid by an investor who started with $1,000 in the fund. You may use the information here, together with the amount you invested, to estimate the expenses that you paid over the period.
To do so, simply divide your account value by $1,000 (for example, an $8,600 account value divided by $1,000 = 8.6), then multiply the result by the number given for your fund under the heading ”Expenses Paid During Period.“
• Based on hypothetical 5% yearly return. This section is intended to help you compare your fund‘s costs with those of other mutual funds. It assumes that the fund had a yearly return of 5% before expenses, but that the expense ratio is unchanged. In this case—because the return used is not the fund’s actual return—the results do not apply to your investment. The example is useful in making comparisons because the Securities and Exchange Commission requires all mutual funds to calculate expenses based on a 5% return. You can assess your fund’s costs by comparing this hypothetical example with the hypothetical examples that appear in shareholder reports of other funds.
Note that the expenses shown in the table are meant to highlight and help you compare ongoing costs only and do not reflect transaction costs incurred by the fund for buying and selling securities. Further, the expenses do not include any purchase, redemption, or account service fees described in the fund prospectus. If such fees were applied to your account, your costs would be higher. Your fund does not carry a “sales load.”
The calculations assume no shares were bought or sold during the period. Your actual costs may have been higher or lower, depending on the amount of your investment and the timing of any purchases or redemptions.
You can find more information about the fund’s expenses, including annual expense ratios, in the Financial Statements section of this report. For additional information on operating expenses and other shareholder costs, please refer to your fund’s current prospectus.
68
| Six Months Ended August 31, 2017 | |||
| Beginning | Ending | Expenses | |
| Account Value | Account Value | Paid During | |
| 2/28/2017 | 8/31/2017 | Period | |
| Based on Actual Fund Return | |||
| S&P Mid-Cap 400 Index Fund | |||
| ETF Shares | $1,000.00 | $1,008.40 | $0.76 |
| Institutional Shares | 1,000.00 | 1,008.73 | 0.41 |
| S&P Mid-Cap 400 Value Index Fund | |||
| ETF Shares | $1,000.00 | $986.39 | $1.00 |
| Institutional Shares | 1,000.00 | 986.97 | 0.40 |
| S&P Mid-Cap 400 Growth Index Fund | |||
| ETF Shares | $1,000.00 | $1,028.48 | $1.02 |
| Institutional Shares | 1,000.00 | 1,029.13 | 0.41 |
| Based on Hypothetical 5% Yearly Return | |||
| S&P Mid-Cap 400 Index Fund | |||
| ETF Shares | $1,000.00 | $1,024.45 | $0.77 |
| Institutional Shares | 1,000.00 | 1,024.80 | 0.41 |
| S&P Mid-Cap 400 Value Index Fund | |||
| ETF Shares | $1,000.00 | $1,024.20 | $1.02 |
| Institutional Shares | 1,000.00 | 1,024.80 | 0.41 |
| S&P Mid-Cap 400 Growth Index Fund | |||
| ETF Shares | $1,000.00 | $1,024.20 | $1.02 |
| Institutional Shares | 1,000.00 | 1,024.80 | 0.41 |
The calculations are based on expenses incurred in the most recent six-month period. The funds’ annualized six-month expense ratios for that period are: for the S&P Mid-Cap 400 Index Fund, 0.15% for ETF Shares and 0.08% for Institutional Shares; for the S&P Mid-Cap 400 Value Index Fund, 0.20% for ETF Shares and 0.08% for Institutional Shares; and for the S&P Mid-Cap 400 Growth Index Fund, 0.20% for ETF Shares and 0.08% for Institutional Shares. The dollar amounts shown as “Expenses Paid” are equal to the annualized expense ratio multiplied by the average account value over the period, multiplied by the number of days in the most recent six-month period, then divided by the number of days in the most recent 12-month period (184/365).
69
Trustees Approve Advisory Arrangements
The board of trustees of Vanguard S&P Mid-Cap 400 Index Fund, Vanguard S&P Mid-Cap 400 Value Index Fund, and Vanguard S&P Mid-Cap 400 Growth Index Fund has renewed each fund’s investment advisory arrangement with The Vanguard Group, Inc. (Vanguard), through its Equity Index Group. The board determined that continuing each fund’s internalized management structure was in the best interests of the fund and its shareholders.
The board based its decision upon an evaluation of the advisor’s investment staff, portfolio management process, and performance. This evaluation included information provided to the board by Vanguard’s Portfolio Review Department, which is responsible for fund and advisor oversight and product management. The Portfolio Review Department met regularly with the advisor and made monthly presentations to the board during the fiscal year that directed the board’s focus to relevant information and topics.
The board, or an investment committee made up of board members, also received information throughout the year through advisor presentations. For each advisor presentation, the board was provided with letters and reports that included information about, among other things, the advisory firm and the advisor’s assessment of the investment environment, portfolio performance, and portfolio characteristics.
In addition, the board received monthly reports, which included a Market and Economic Report, a Fund Dashboard Monthly Summary, and a Fund Performance Report.
Prior to their meeting, the trustees were provided with a memo and materials that summarized the information they had received over the course of the year. They also considered the factors discussed below, among others. However, no single factor determined whether the board approved the arrangements. Rather, it was the totality of the circumstances that drove the board’s decision.
Nature, extent, and quality of services
The board reviewed the quality of the investment management services provided to the funds since their inception in 2010 and took into account the organizational depth and stability of the advisor. The board considered that Vanguard has been managing investments for more than three decades. The Equity Index Group adheres to a sound, disciplined investment management process; the team has considerable experience, stability, and depth.
The board concluded that Vanguard’s experience, stability, depth, and performance, among other factors, warranted continuation of each advisory arrangement.
Investment performance
The board considered each fund’s performance since its inception, including any periods of outperformance or underperformance compared with its target index and peer group. The board concluded that the performance was such that each advisory arrangement should continue. Information about each fund’s most recent performance can be found in the Performance Summary pages of this report.
70
Cost
The board concluded that each fund’s expense ratio was well below the average expense ratio charged by funds in its peer group and that each fund’s advisory expenses were also well below the peer group average. Information about the funds’ expenses appears in the About Your Fund’s Expenses section of this report as well as in the Financial Statements sections.
The board does not conduct a profitability analysis of Vanguard because of Vanguard’s unique “at-cost” structure. Unlike most other mutual fund management companies, Vanguard is owned by the funds it oversees and produces “profits” only in the form of reduced expenses for fund shareholders.
The benefit of economies of scale
The board concluded that each fund’s at-cost arrangement with Vanguard ensures that the funds will realize economies of scale as they grow, with the cost to shareholders declining as fund assets increase.
The board will consider whether to renew the advisory arrangements again after a one-year period.
71
Glossary
30-Day SEC Yield. A fund’s 30-day SEC yield is derived using a formula specified by the U.S. Securities and Exchange Commission. Under the formula, data related to the fund’s security holdings in the previous 30 days are used to calculate the fund’s hypothetical net income for that period, which is then annualized and divided by the fund’s estimated average net assets over the calculation period. For the purposes of this calculation, a security’s income is based on its current market yield to maturity (for bonds), its actual income (for asset-backed securities), or its projected dividend yield (for stocks). Because the SEC yield represents hypothetical annualized income, it will differ—at times significantly—from the fund’s actual experience. As a result, the fund’s income distributions may be higher or lower than implied by the SEC yield.
Beta. A measure of the magnitude of a fund’s past share-price fluctuations in relation to the ups and downs of a given market index. The index is assigned a beta of 1.00. Compared with a given index, a fund with a beta of 1.20 typically would have seen its share price rise or fall by 12% when the index rose or fell by 10%. For this report, beta is based on returns over the past 36 months for both the fund and the index. Note that a fund’s beta should be reviewed in conjunction with its R-squared (see definition). The lower the R-squared, the less correlation there is between the fund and the index, and the less reliable beta is as an indicator of volatility.
Dividend Yield. Dividend income earned by stocks, expressed as a percentage of the aggregate market value (or of net asset value, for a fund). The yield is determined by dividing the amount of the annual dividends by the aggregate value (or net asset value) at the end of the period. For a fund, the dividend yield is based solely on stock holdings and does not include any income produced by other investments.
Earnings Growth Rate. The average annual rate of growth in earnings over the past five years for the stocks now in a fund.
Equity Exposure. A measure that reflects a fund’s investments in stocks and stock futures. Any holdings in short-term reserves are excluded.
Expense Ratio. A fund’s total annual operating expenses expressed as a percentage of the fund’s average net assets. The expense ratio includes management and administrative expenses, but does not include the transaction costs of buying and selling portfolio securities.
Foreign Holdings. The percentage of a fund represented by securities or depositary receipts of companies based outside the United States.
Inception Date. The date on which the assets of a fund (or one of its share classes) are first invested in accordance with the fund’s investment objective. For funds with a subscription period, the inception date is the day after that period ends. Investment performance is measured from the inception date.
Median Market Cap. An indicator of the size of companies in which a fund invests; the midpoint of market capitalization (market price x shares outstanding) of a fund’s stocks, weighted by the proportion of the fund’s assets invested in each stock. Stocks representing half of the fund’s assets have market capitalizations above the median, and the rest are below it.
Price/Book Ratio. The share price of a stock divided by its net worth, or book value, per share.
For a fund, the weighted average price/book ratio of the stocks it holds.
72
Price/Earnings Ratio. The ratio of a stock’s current price to its per-share earnings over the past year. For a fund, the weighted average P/E of the stocks it holds. P/E is an indicator of market expectations about corporate prospects; the higher the P/E, the greater the expectations for a company’s future growth.
R-Squared. A measure of how much of a fund’s past returns can be explained by the returns from the market in general, as measured by a given index. If a fund’s total returns were precisely synchronized with an index’s returns, its R-squared would be 1.00. If the fund’s returns bore no relationship to the index’s returns, its R-squared would be 0. For this report, R-squared is based on returns over the past 36 months for both the fund and the index.
Return on Equity. The annual average rate of return generated by a company during the past five years for each dollar of shareholder’s equity (net income divided by shareholder’s equity). For a fund, the weighted average return on equity for the companies whose stocks it holds.
Short-Term Reserves. The percentage of a fund invested in highly liquid, short-term securities that can be readily converted to cash.
Turnover Rate. An indication of the fund’s trading activity. Funds with high turnover rates incur higher transaction costs and may be more likely to distribute capital gains (which may be taxable to investors). The turnover rate excludes in-kind transactions, which have minimal impact on costs.
73
The Global Industry Classification Standard (“GICS”) was developed by and is the exclusive property and a service mark of MSCI Inc. (“MSCI”) and Standard and Poor’s, a division of McGraw-Hill Companies, Inc. (“S&P”), and is licensed for use by Vanguard. Neither MSCI, S&P nor any third party involved in making or compiling the GICS or any GICS classification makes any express or implied warranties or representations with respect to such standard or classification (or the results to be obtained by the use thereof), and all such parties hereby expressly disclaim all warranties of originality, accuracy, completeness, merchantability or fitness for a particular purpose with respect to any such standard or classification. Without limiting any of the foregoing, in no event shall MSCI, S&P, any of its affiliates or any third party involved in making or compiling the GICS or any GICS classification have any liability for any direct, indirect, special, punitive, consequential or any other damages (including lost profits) even if notified of the possibility of such damages.
74
The People Who Govern Your Fund
The trustees of your mutual fund are there to see that the fund is operated and managed in your best interests since, as a shareholder, you are a part owner of the fund. Your fund’s trustees also serve on the board of directors of The Vanguard Group, Inc., which is owned by the Vanguard funds and provides services to them on an at-cost basis.
A majority of Vanguard’s board members are independent, meaning that they have no affiliation with Vanguard or the funds they oversee, apart from the sizable personal investments they have made as private individuals. The independent board members have distinguished backgrounds in business, academia, and public service. Each of the trustees and executive officers oversees 195 Vanguard funds.
Information for each trustee and executive officer of the fund appears below. The mailing address of the trustees and officers is P.O. Box 876, Valley Forge, PA 19482. More information about the trustees is in the Statement of Additional Information, which can be obtained, without charge, by contacting Vanguard at 800-662-7447, or online at vanguard.com.
Interested Trustee1
F. William McNabb III
Born 1957. Trustee Since July 2009. Chairman of the Board. Principal Occupation(s) During the Past Five Years and Other Experience: Chairman of the Board of The Vanguard Group, Inc., and of each of the investment companies served by The Vanguard Group, since January 2010; Chief Executive Officer and Director of The Vanguard Group and President and Chief Executive Officer of each of the investment companies served by The Vanguard Group, since 2008; Director of Vanguard Marketing Corporation; President of The Vanguard Group (2008–2017); Managing Director of The Vanguard Group (1995–2008).
Independent Trustees
Emerson U. Fullwood
Born 1948. Trustee Since January 2008. Principal Occupation(s) During the Past Five Years and Other Experience: Executive Chief Staff and Marketing Officer for North America and Corporate Vice President (retired 2008) of Xerox Corporation (document management products and services); Executive in Residence and 2009–2010 Distinguished Minett Professor at the Rochester Institute of Technology; Lead Director of SPX FLOW, Inc. (multi-industry manufacturing); Director of the United Way of Rochester, the University of Rochester Medical Center, Monroe Community College Foundation, North Carolina A&T University, and Roberts Wesleyan College; Trustee of the University of Rochester.
Rajiv L. Gupta
Born 1945. Trustee Since December 2001.2 Principal Occupation(s) During the Past Five Years and Other Experience: Chairman and Chief Executive Officer (retired 2009) and President (2006–2008) of Rohm and Haas Co. (chemicals); Director of Arconic Inc. (diversified manufacturer), HP Inc. (printer and personal computer manufacturing), and Delphi Automotive plc (automotive components); Senior Advisor at New Mountain Capital.
Amy Gutmann
Born 1949. Trustee Since June 2006. Principal Occupation(s) During the Past Five Years and Other Experience: President of the University of Pennsylvania; Christopher H. Browne
1 Mr. McNabb is considered an “interested person,” as defined in the Investment Company Act of 1940, because he is an officer of the Vanguard funds.
2 December 2002 for Vanguard Equity Income Fund, the Vanguard Municipal Bond Funds, and the Vanguard State Tax-Exempt Funds.
Distinguished Professor of Political Science, School of Arts and Sciences, and Professor of Communication, Annenberg School for Communication, with secondary faculty appointments in the Department of Philosophy, School of Arts and Sciences, and at the Graduate School of Education, University of Pennsylvania; Trustee of the National Constitution Center.
JoAnn Heffernan Heisen
Born 1950. Trustee Since July 1998. Principal Occupation(s) During the Past Five Years and Other Experience: Corporate Vice President and Member of the Executive Committee (1997–2008), Chief Global Diversity Officer (retired 2008), Vice President and Chief Information Officer (1997–2006), Controller (1995–1997), Treasurer (1991–1995), and Assistant Treasurer (1989–1991) of Johnson & Johnson (pharmaceuticals/medical devices/ consumer products); Director of Skytop Lodge Corporation (hotels) and the Robert Wood Johnson Foundation; Member of the Advisory Board of the Institute for Women’s Leadership at Rutgers University.
F. Joseph Loughrey
Born 1949. Trustee Since October 2009. Principal Occupation(s) During the Past Five Years and Other Experience: President and Chief Operating Officer (retired 2009) of Cummins Inc. (industrial machinery); Chairman of the Board of Hillenbrand, Inc. (specialized consumer services), Oxfam America, and the Lumina Foundation for Education; Director of the V Foundation for Cancer Research; Member of the Advisory Council for the College of Arts and Letters and Chair of the Advisory Board to the Kellogg Institute for International Studies, both at the University of Notre Dame.
Mark Loughridge
Born 1953. Trustee Since March 2012. Principal Occupation(s) During the Past Five Years and Other Experience: Senior Vice President and Chief Financial Officer (retired 2013) at IBM (information technology services); Fiduciary Member of IBM’s Retirement Plan Committee (2004–2013); Director of the Dow Chemical Company; Member of the Council on Chicago Booth.
Scott C. Malpass
Born 1962. Trustee Since March 2012. Principal Occupation(s) During the Past Five Years and Other Experience: Chief Investment Officer and Vice President at the University of Notre Dame; Assistant Professor of Finance at the Mendoza College of Business at Notre Dame; Member of the Notre Dame 403(b) Investment Committee, the Board of Advisors for Spruceview Capital Partners, the Board of Catholic Investment Services, Inc. (investment advisor), and the Board of Superintendence of the Institute for the Works of Religion; Chairman of the Board of TIFF Advisory Services, Inc. (investment advisor).
André F. Perold
Born 1952. Trustee Since December 2004. Principal Occupation(s) During the Past Five Years and Other Experience: George Gund Professor of Finance and Banking, Emeritus at the Harvard Business School (retired 2011); Chief Investment Officer and Co-Managing Partner of HighVista Strategies LLC (private investment firm); Overseer of the Museum of Fine Arts Boston.
Peter F. Volanakis
Born 1955. Trustee Since July 2009. Principal Occupation(s) During the Past Five Years and Other Experience: President and Chief Operating Officer (retired 2010) of Corning Incorporated (communications equipment); Chairman of the Board of Trustees of Colby-Sawyer College; Member of the Board of Hypertherm, Inc. (industrial cutting systems, software, and consumables).
Executive Officers
Glenn Booraem
Born 1967. Investment Stewardship Officer Since February 2017. Principal Occupation(s) During the Past Five Years and Other Experience: Principal of The Vanguard Group, Inc.; Treasurer (2015–2017), Controller (2010–2015), and Assistant Controller (2001–2010) of each of the investment companies served by The Vanguard Group.
Thomas J. Higgins
Born 1957. Chief Financial Officer Since September 2008. Principal Occupation(s) During the Past Five Years and Other Experience: Principal of The Vanguard Group, Inc.; Chief Financial Officer of each of the investment companies served by The Vanguard Group; Treasurer of each of the investment companies served by The Vanguard Group (1998–2008).
Peter Mahoney
Born 1974. Controller Since May 2015. Principal Occupation(s) During the Past Five Years and Other Experience: Principal of The Vanguard Group, Inc.; Controller of each of the investment companies served by The Vanguard Group; Head of International Fund Services at The Vanguard Group (2008–2014).
Anne E. Robinson
Born 1970. Secretary Since September 2016. Principal Occupation(s) During the Past Five Years and Other Experience: Managing Director of The Vanguard Group, Inc.; General Counsel of The Vanguard Group; Secretary of The Vanguard Group and of each of the investment companies served by The Vanguard Group; Director and Senior Vice President of Vanguard Marketing Corporation; Managing Director and General Counsel of Global Cards and Consumer Services at Citigroup (2014–2016); Counsel at American Express (2003–2014).
Michael Rollings
Born 1963. Treasurer Since February 2017. Principal Occupation(s) During the Past Five Years and Other Experience: Managing Director of The Vanguard Group, Inc.; Treasurer of each of the investment companies served by The Vanguard Group; Director of Vanguard Marketing Corporation; Executive Vice President and Chief Financial Officer of MassMutual Financial Group (2006–2016).
| Vanguard Senior Management Team | |
| Mortimer J. Buckley | Chris D. McIsaac |
| Gregory Davis | James M. Norris |
| John James | Thomas M. Rampulla |
| Martha G. King | Karin A. Risi |
| John T. Marcante | |
| Chairman Emeritus and Senior Advisor | |
| John J. Brennan | |
| Chairman, 1996–2009 | |
| Chief Executive Officer and President, 1996–2008 | |
| Founder | |
| John C. Bogle | |
| Chairman and Chief Executive Officer, 1974–1996 | |
 | |
| P.O. Box 2600 | |
| Valley Forge, PA 19482-2600 | |
| Connect with Vanguard® > vanguard.com | |
| Fund Information > 800-662-7447 | The index is a product of S&P Dow Jones Indices LLC |
| Direct Investor Account Services > 800-662-2739 | (“SPDJI”), and has been licensed for use by Vanguard. |
| Standard & Poor’s® and S&P® are registered | |
| Institutional Investor Services > 800-523-1036 | trademarks of Standard & Poor’s Financial Services LLC |
| Text Telephone for People | (“S&P”); Dow Jones® is a registered trademark of Dow |
| Who Are Deaf or Hard of Hearing> 800-749-7273 | Jones Trademark Holdings LLC (“Dow Jones”); S&P® |
| and S&P 500® are trademarks of S&P; and these | |
| This material may be used in conjunction | trademarks have been licensed for use by SPDJI and |
| with the offering of shares of any Vanguard | sublicensed for certain purposes by Vanguard. |
| fund only if preceded or accompanied by | Vanguard product(s) are not sponsored, endorsed, sold |
| or promoted by SPDJI, Dow Jones, S&P, or their | |
| the fund’s current prospectus. | respective affiliates and none of such parties make any |
| All comparative mutual fund data are from Lipper, a | representation regarding the advisability of investing in |
| Thomson Reuters Company, or Morningstar, Inc., unless | such product(s) nor do they have any liability for any |
| otherwise noted. | errors, omissions, or interruptions of the index. |
| You can obtain a free copy of Vanguard’s proxy voting | |
| guidelines by visiting vanguard.com/proxyreporting or by | |
| calling Vanguard at 800-662-2739. The guidelines are | |
| also available from the SEC’s website, sec.gov. In | |
| addition, you may obtain a free report on how your fund | |
| voted the proxies for securities it owned during the 12 | |
| months ended June 30. To get the report, visit either | |
| vanguard.com/proxyreporting or sec.gov. | |
| You can review and copy information about your fund at | |
| the SEC’s Public Reference Room in Washington, D.C. To | |
| find out more about this public service, call the SEC at | |
| 202-551-8090. Information about your fund is also | |
| available on the SEC’s website, and you can receive | |
| copies of this information, for a fee, by sending a | |
| request in either of two ways: via email addressed to | |
| publicinfo@sec.gov or via regular mail addressed to the | |
| Public Reference Section, Securities and Exchange | |
| Commission, Washington, DC 20549-1520. | |
| © 2017 The Vanguard Group, Inc. | |
| All rights reserved. | |
| Vanguard Marketing Corporation, Distributor. | |
| Q18420 102017 | |
Annual Report | August 31, 2017
Vanguard S&P 500 Value and Growth
Index Funds
Vanguard S&P 500 Value Index Fund
Vanguard S&P 500 Growth Index Fund
Vanguard’s Principles for Investing Success
We want to give you the best chance of investment success. These principles, grounded in Vanguard’s research and experience, can put you on the right path.
Goals. Create clear, appropriate investment goals.
Balance. Develop a suitable asset allocation using broadly diversified funds. Cost. Minimize cost.
Discipline. Maintain perspective and long-term discipline.
A single theme unites these principles: Focus on the things you can control.
We believe there is no wiser course for any investor.
| Contents | |
| Your Fund’s Performance at a Glance. | 1 |
| Chairman’s Perspective. | 4 |
| S&P 500 Value Index Fund. | 8 |
| S&P 500 Growth Index Fund. | 26 |
| Your Fund’s After-Tax Returns. | 44 |
| About Your Fund’s Expenses. | 45 |
| Trustees Approve Advisory Arrangements. | 47 |
| Glossary. | 49 |
Please note: The opinions expressed in this report are just that—informed opinions. They should not be considered promises or advice. Also, please keep in mind that the information and opinions cover the period through the date on the front of this report. Of course, the risks of investing in your fund are spelled out in the prospectus.
See the Glossary for definitions of investment terms used in this report.
About the cover: Nautical images have been part of Vanguard’s rich heritage since its start in 1975. For an incoming ship, a lighthouse offers a beacon and safe path to shore. You can similarly depend on Vanguard to put you first––and light the way––as you strive to meet your financial goals. Our client focus and low costs, stemming from our unique ownership structure, assure that your interests are paramount.
Your Fund’s Performance at a Glance
• Large-capitalization growth stocks outperformed their value counterparts for the 12 months ended August 31, 2017. Vanguard S&P 500 Growth Index Fund returned about 19% and Vanguard S&P 500 Value Index Fund returned about 12%.
• Both funds closely tracked their target indexes and trailed the average returns of their large-cap fund peers.
• Information technology stocks, which make up about one-third of the Growth Index Fund, accounted for more than half of that fund’s return. Consumer discretionary, health care, financials, and industrials also boosted performance. Energy and telecommunication services produced negative returns.
• For the Value Index Fund, financials contributed the most to returns. Industrials, health care, information technology, and utilities stocks also performed strongly. Telecommunication services, energy, and real estate were the only sectors to produce negative returns.
| Total Returns: Fiscal Year Ended August 31, 2017 | |
| Total | |
| Returns | |
| Vanguard S&P 500 Value Index Fund | |
| ETF Shares | |
| Market Price | 12.13% |
| Net Asset Value | 12.19 |
| Institutional Shares | 12.27 |
| S&P 500 Value Index | 12.35 |
| Large-Cap Value Funds Average | 13.34 |
| Large-Cap Value Funds Average: Derived from data provided by Lipper, a Thomson Reuters Company. |
| Total | |
| Returns | |
| Vanguard S&P 500 Growth Index Fund | |
| ETF Shares | |
| Market Price | 18.81% |
| Net Asset Value | 18.85 |
| S&P 500 Growth Index | 19.05 |
| Large-Cap Growth Funds Average | 19.84 |
Large-Cap Growth Funds Average: Derived from data provided by Lipper, a Thomson Reuters Company.
Institutional Shares are available to certain institutional investors who meet specific administrative, service, and account-size criteria. The Vanguard ETF® Shares shown are traded on the NYSE Arca exchange and are available only through brokers. The table provides ETF returns based on both the NYSE Arca market price and the net asset value for a share. U.S. Pat. Nos. 6,879,964; 7,337,138; 7,720,749; 7,925,573; 8,090,646; and 8,417,623.
For the ETF Shares, the market price is determined by the midpoint of the bid-offer spread as of the closing time of the New York Stock Exchange (generally 4 p.m., Eastern time). The net asset value is also determined as of the NYSE closing time. For more information about how the ETF Shares' market prices have compared with their net asset value, visit vanguard.com, select your ETF, and then select the Price and Performance tab. The ETF premium/discount analysis there shows the percentages of days on which the ETF Shares' market price was above or below the NAV.
| Total Returns: Inception Through August 31, 2017 | |
| Average | |
| Annual Return | |
| S&P 500 Value Index Fund ETF Shares Net Asset Value (Returns since inception: 9/7/2010) | 13.04% |
| S&P 500 Value Index | 13.21 |
| Large-Cap Value Funds Average | 12.07 |
| Large-Cap Value Funds Average: Derived from data provided by Lipper, a Thomson Reuters Company. | |
| S&P 500 Growth Index Fund ETF Shares Net Asset Value (Returns since inception: 9/7/2010) | 16.04% |
| S&P 500 Growth Index | 16.22 |
| Large-Cap Growth Funds Average: Derived from data provided by Lipper, a Thomson Reuters Company. | |
The figures shown represent past performance, which is not a guarantee of future results. (Current performance may be lower or higher than the performance data cited. For performance data current to the most recent month-end, visit our website at vanguard.com/performance.) Note, too, that both investment returns and principal value can fluctuate widely, so an investor’s shares, when sold, could be worth more or less than their original cost.
2
| Expense Ratios | |||
| Your Fund Compared With Its Peer Group | |||
| ETF | Institutional | Peer Group | |
| Shares | Shares | Average | |
| S&P 500 Value Index Fund | 0.15% | 0.08% | 1.09% |
| S&P 500 Growth Index Fund | 0.15 | — | 1.14 |
The fund expense ratios shown are from the prospectus dated December 23, 2016, and represent estimated costs for the current fiscal year. For the fiscal year ended August 31, 2017, the funds’ expense ratios were: for the S&P 500 Value Index Fund, 0.15% for ETF Shares and 0.08% for Institutional Shares; and for the S&P 500 Growth Index Fund, 0.15%. Peer-group expense ratios are derived from data provided by Lipper, a Thomson Reuters Company, and capture information through year-end 2016.
Peer groups: For the S&P 500 Value Index Fund, Large-Cap Value Funds, and for the S&P 500 Growth Index Fund, Large-Cap Growth Funds.
3
Chairman’s Perspective

Bill McNabb
Chairman and Chief Executive Officer
Dear Shareholder,
Since mid-August we’ve been reaching out to you about the proposals put forth by the Vanguard funds that, if approved, will enable us to manage the funds more efficiently and effectively. As the November deadline for voting approaches, I’d like to offer some perspective on a few of the proposals that I believe are important to the way Vanguard operates and manages your investments. I hope you consider this information and promptly cast your ballot.
Your biggest advocate
The main driver for this proxy solicitation is to ask all our fund shareholders to elect a full slate of trustees who oversee each U.S.-based Vanguard mutual fund. These trustees serve an important role, making sure your funds are managed in your best interests. This includes monitoring fund performance, approving advisory agreements, and ensuring that we’re keeping your investment costs as low as possible. Simply put, they are your biggest advocate.
Each trustee brings a variety of skills and professional experiences that contribute to the board’s strength and diversity. Of the 12 nominees, nine currently serve on the board, and three are new. If elected, the new board would include ten independent members, meaning they have no affiliation with Vanguard or the funds apart from any investments they may choose to make as private individuals.
4
These are the proposed new trustees:
• Sarah Bloom Raskin is a former member of the Federal Reserve Board of Governors and former deputy secretary of the U.S. Treasury Department. She is an expert in cybersecurity—a critically important issue at Vanguard, as we place a premium on protecting clients’ assets and sensitive data.
• Deanna Mulligan is chief executive officer of The Guardian Life Insurance Company of America. It’s rare to find a CEO such as Deanna who leads a company with a mutual ownership structure similar to Vanguard’s.
• Tim Buckley is president and a director of Vanguard and will succeed me in January as CEO. (I’ll remain chairman for a period to be determined by the board.) I interviewed Tim when he applied for his first job here in 1991 and again when he was graduating from Harvard Business School. I was thrilled he picked Vanguard as a place to build his career, and I’ve been delighted to see him take on several leadership positions, including as head of our Retail Investor Group, chief information officer, and chief investment officer. I can think of no one better prepared to succeed me.
| Market Barometer | |||
| Average Annual Total Returns | |||
| Periods Ended August 31, 2017 | |||
| One Year | Three Years | Five Years | |
| Stocks | |||
| Russell 1000 Index (Large-caps) | 16.16% | 9.21% | 14.37% |
| Russell 2000 Index (Small-caps) | 14.91 | 7.67 | 13.15 |
| Russell 3000 Index (Broad U.S. market) | 16.06 | 9.08 | 14.27 |
| FTSE All-World ex US Index (International) | 18.74 | 2.80 | 7.76 |
| Bonds | |||
| Bloomberg Barclays U.S. Aggregate Bond Index | |||
| (Broad taxable market) | 0.49% | 2.64% | 2.19% |
| Bloomberg Barclays Municipal Bond Index | |||
| (Broad tax-exempt market) | 0.88 | 3.40 | 3.23 |
| Citigroup Three-Month U.S. Treasury Bill Index | 0.58 | 0.25 | 0.16 |
| CPI | |||
| Consumer Price Index | 1.94% | 1.06% | 1.28% |
5
Vanguard believes that diversity of thought, background, and experience, as well as diversity of personal characteristics, meaningfully contributes to the board’s ability to effectively serve shareholders. If Sarah and Deanna are elected, women will account for 40% of the board’s independent trustees.
I should note that even as Vanguard is nominating three new board members, we’re saying goodbye to trustee Rajiv Gupta. Rajiv was a legendary CEO of Rohm and Haas Co., and Vanguard and our clients have benefited greatly from his expertise. I wish him a happy retirement.
Summarizing the proposals
Among the trustees’ leading responsibilities is overseeing the funds’ internal and external investment advisory agreements. The trustees, in consultation with our Global Investment Committee and our Portfolio Review Department, choose the investment advisors that manage client assets. Over decades, we have built a strong track record of picking advisors whose portfolio management strategies have served clients well.
Two proposals in the proxy focus on this oversight responsibility. Shareholders of 48 Vanguard funds have already voted to allow the board to make external advisor changes without obtaining prior shareholder approval. The new proposals would extend that policy across our entire U.S.-based fund lineup and expand it to include internal advisory agreements with Vanguard subsidiaries. Eliminating the need for shareholder approval removes a step that is costly and time-consuming if done frequently or on an individual fund basis. Although there are no current plans to employ the policy on any Vanguard-managed funds, standardizing it enables the trustees to retain an advisory firm to diversify a fund’s management team or ensure management continuity should a contingency arise.
I also encourage shareholders of several specific Vanguard index funds to read the proxy proposals that affect those funds. One proposal would change the investment objective of Vanguard REIT Index Fund and Vanguard Variable Insurance Fund REIT Index Portfolio to include real estate-related securities, aligning the funds with updated industry-sector classification methodology. Another proposal seeks to change the diversification status of the REIT Index Fund to enable it to better track its benchmark. Finally, we seek your approval of the Funds’ Service Agreement for Vanguard Institutional Index Fund and Vanguard Institutional Total Stock Market Index Fund. If approved, this arrangement would then be standardized across Vanguard’s entire publicly available U.S. mutual fund lineup. It should also reduce costs and minimum initial investment requirements in select share classes.
6
At the ballot box
We hope you’ll make it a priority to cast your ballot. We want to avoid the added time and cost of soliciting sufficient votes should we not obtain a quorum by the shareholder meeting on November 15, when voting concludes Ultimately, we believe the proposals I’ve discussed are in your best interest as Vanguard fund shareholders, and the trustees recommend that you vote in favor of them. For more information, visit vanguard.com and enter the search term “proxy.”
As always, thank you for investing with Vanguard.
Sincerely,

F. William McNabb III
Chairman and Chief Executive Officer
September 14, 2017
S&P 500 Value Index Fund
Fund Profile
As of August 31, 2017
| Share-Class Characteristics | ||
| ETF | Institutional | |
| Shares | Shares | |
| Ticker Symbol | VOOV | VSPVX |
| Expense Ratio1 | 0.15% | 0.08% |
| 30-Day SEC Yield | 2.36% | 2.41% |
| Portfolio Characteristics | |||
| DJ | |||
| U.S. | |||
| Total | |||
| S&P 500 | Market | ||
| Value | FA | ||
| Fund | Index | Index | |
| Number of Stocks | 351 | 349 | 3,769 |
| Median Market Cap | $78.5B | $78.5B | $63.1B |
| Price/Earnings Ratio | 18.7x | 18.6x | 21.6x |
| Price/Book Ratio | 1.9x | 1.9x | 2.8x |
| Return on Equity | 11.9% | 11.9% | 15.1% |
| Earnings Growth Rate | 5.6% | 5.5% | 9.4% |
| Dividend Yield | 2.4% | 2.4% | 1.8% |
| Foreign Holdings | 0.1% | 0.0% | 0.0% |
| Turnover Rate | 16% | — | — |
| Short-Term Reserves | 0.1% | — | — |
| Volatility Measures | ||
| DJ | ||
| S&P 500 | U.S. Total | |
| Value | Market | |
| Index | FA Index | |
| R-Squared | 1.00 | 0.92 |
| Beta | 1.00 | 0.96 |
| These measures show the degree and timing of the fund’s fluctuations compared with the indexes over 36 months. | ||
| Ten Largest Holdings (% of total net assets) | ||
| Berkshire Hathaway Inc. Multi-Sector | ||
| Holdings | 3.7% | |
| Exxon Mobil Corp. | Integrated Oil & Gas | 3.5 |
| JPMorgan Chase & Co. | Diversified Banks | 3.5 |
| Bank of America Corp. | Diversified Banks | 2.6 |
| AT&T Inc. | Integrated | |
| Telecommunication | ||
| Services | 2.5 | |
| Wells Fargo & Co. | Diversified Banks | 2.5 |
| Chevron Corp. | Integrated Oil & Gas | 2.2 |
| Citigroup Inc. | Diversified Banks | 2.0 |
| Cisco Systems Inc. | Communications | |
| Equipment | 1.7 | |
| Johnson & Johnson | Pharmaceuticals | 1.5 |
| Top Ten | 25.7% | |
| The holdings listed exclude any temporary cash investments and equity index products. | ||
1 The expense ratios shown are from the prospectus dated December 23, 2016, and represent estimated costs for the current fiscal year. For the fiscal year ended August 31, 2017, the expense ratios were 0.15% for ETF Shares and 0.08% for Institutional Shares.
8
S&P 500 Value Index Fund
Sector Diversification (% of equity exposure)
| DJ | |||
| S&P 500 | U.S. Total | ||
| Value | Market | ||
| Fund | Index | FA Index | |
| Consumer Discretionary | 6.8% | 6.8% | 12.4% |
| Consumer Staples | 11.3 | 11.3 | 7.6 |
| Energy | 10.5 | 10.5 | 5.3 |
| Financials | 27.2 | 27.4 | 14.7 |
| Health Care | 12.7 | 12.8 | 14.1 |
| Industrials | 8.9 | 8.9 | 10.7 |
| Information Technology | 6.8 | 6.8 | 22.6 |
| Materials | 4.0 | 3.6 | 3.3 |
| Real Estate | 1.8 | 1.8 | 4.1 |
| Telecommunication | |||
| Services | 3.6 | 3.7 | 1.9 |
| Utilities | 6.4 | 6.4 | 3.3 |
Sector categories are based on the Global Industry Classification
Standard (“GICS”), except for the “Other” category (if applicable),
which includes securities that have not been provided a GICS
classification as of the effective reporting period.
9
S&P 500 Value Index Fund
Performance Summary
All of the returns in this report represent past performance, which is not a guarantee of future results that may be achieved by the fund. (Current performance may be lower or higher than the performance data cited. For performance data current to the most recent month-end, visit our website at vanguard.com/performance.) Note, too, that both investment returns and principal value can fluctuate widely, so an investor’s shares, when sold, could be worth more or less than their original cost. The returns shown do not reflect taxes that a shareholder would pay on fund distributions or on the sale of fund shares.
Cumulative Performance: September 7, 2010, Through August 31, 2017
Initial Investment of $10,000
| Average Annual Total Returns | |||||
| Periods Ended August 31, 2017 | |||||
| Since | Final Value | ||||
| One | Five | Inception | of a $10,000 | ||
| Year | Years | (9/7/2010) | Investment | ||
| S&P 500 Value Index Fund*ETF Shares | |||||
| Net Asset Value | 12.19% | 13.02% | 13.04% | $23,536 | |
| S&P 500 Value Index Fund*ETF Shares | |||||
| Market Price | 12.13 | 13.01 | 13.04 | 23,533 | |
| • • • • • • • • | S&P 500 Value Index | 12.35 | 13.18 | 13.21 | 23,780 |
| – – – – | Large-Cap Value Funds Average | 13.34 | 12.17 | 12.07 | 22,158 |
| Dow Jones U.S. Total Stock Market | |||||
| Float Adjusted Index | 16.05 | 14.19 | 14.71 | 26,064 | |
| Large-Cap Value Funds Average: Derived from data provided by Lipper, a Thomson Reuters Company. | |||||
| "Since Inception" performance is calculated from the ETF Shares’ inception date for both the fund and its comparative standards. | |||||
| Since | Final Value | ||
| One | Inception | of a $5,000,000 | |
| Year | (3/3/2015) | Investment | |
| S&P 500 Value Index Fund Institutional | |||
| Shares | 12.27% | 6.96% | $5,914,671 |
| S&P 500 Value Index | 12.35 | 7.03 | 5,924,041 |
| Dow Jones U.S. Total Stock Market Float | |||
| Adjusted Index | 16.05 | 8.32 | 6,104,204 |
| "Since Inception" performance is calculated from the Institutional Shares’ inception date for both the fund and its comparative standards. | |||
See Financial Highlights for dividend and capital gains information.
10
S&P 500 Value Index Fund
Cumulative Returns of ETF Shares: September 7, 2010, Through August 31, 2017
| Since | |||
| One | Five | Inception | |
| Year | Years | (9/7/2010) | |
| S&P 500 Value Index Fund ETF Shares Market Price | 12.13% | 84.30% | 135.33% |
| S&P 500 Value Index Fund ETF Shares Net Asset Value | 12.19 | 84.45 | 135.36 |
| S&P 500 Value Index | 12.35 | 85.71 | 137.80 |
| "Since Inception" performance is calculated from the ETF Shares’ inception date for both the fund and its comparative standards. | |||
Fiscal-Year Total Returns (%): September 7, 2010, Through August 31, 2017
Average Annual Total Returns: Periods Ended June 30, 2017
This table presents returns through the latest calendar quarter—rather than through the end of the fiscal period.
Securities and Exchange Commission rules require that we provide this information.
| Inception | One | Five | Since | |
| Date | Year | Years | Inception | |
| ETF Shares | 9/7/2010 | |||
| Market Price | 15.83% | 13.67% | 13.37% | |
| Net Asset Value | 15.68 | 13.66 | 13.36 | |
| Institutional Shares | 3/3/2015 | 15.76 | — | 7.40 |
11
S&P 500 Value Index Fund
Financial Statements
Statement of Net Assets
As of August 31, 2017
The fund reports a complete list of its holdings in regulatory filings four times in each fiscal year, at the quarter-ends. For the second and fourth fiscal quarters, the lists appear in the fund’s semiannual and annual reports to shareholders. For the first and third fiscal quarters, the fund files the lists with the Securities and Exchange Commission on Form N-Q. Shareholders can look up the fund’s Forms N-Q on the SEC’s website at sec.gov. Forms N-Q may also be reviewed and copied at the SEC’s Public Reference Room (see the back cover of this report for further information).
| Market | |||
| Value• | |||
| Shares | ($000) | ||
| Common Stocks (99.8%)1 | |||
| Consumer Discretionary (6.8%) | |||
| Walt Disney Co. | 49,360 | 4,995 | |
| General Motors Co. | 113,646 | 4,153 | |
| McDonald’s Corp. | 25,632 | 4,100 | |
| Ford Motor Co. | 323,672 | 3,570 | |
| NIKE Inc. Class B | 47,159 | 2,490 | |
| Target Corp. | 45,658 | 2,490 | |
| Carnival Corp. | 34,639 | 2,407 | |
| Delphi Automotive plc | 22,171 | 2,137 | |
| Lowe’s Cos. Inc. | 25,565 | 1,889 | |
| VF Corp. | 26,514 | 1,667 | |
| Twenty-First Century Fox | |||
| Inc. Class A | 45,288 | 1,249 | |
| Whirlpool Corp. | 6,122 | 1,051 | |
| DR Horton Inc. | 28,286 | 1,023 | |
| Genuine Parts Co. | 12,169 | 1,008 | |
| Lennar Corp. Class A | 16,817 | 870 | |
| Royal Caribbean Cruises | |||
| Ltd. | 6,804 | 847 | |
| Viacom Inc. Class B | 29,158 | 834 | |
| PVH Corp. | 6,478 | 816 | |
| BorgWarner Inc. | 16,456 | 764 | |
| Newell Brands Inc. | 15,594 | 753 | |
| Best Buy Co. Inc. | 13,344 | 724 | |
| * | Mohawk Industries Inc. | 2,772 | 702 |
| Goodyear Tire & Rubber | |||
| Co. | 20,753 | 629 | |
| PulteGroup Inc. | 23,502 | 607 | |
| * | CarMax Inc. | 8,501 | 571 |
| Twenty-First Century Fox | |||
| Inc. | 20,897 | 566 | |
| Kohl’s Corp. | 14,111 | 561 | |
| News Corp. Class A | 41,369 | 553 | |
| Staples Inc. | 53,830 | 550 | |
| Macy’s Inc. | 25,123 | 522 | |
| MGM Resorts International | 14,726 | 485 | |
| Coach Inc. | 11,596 | 484 | |
| Market | |||
| Value• | |||
| Shares | ($000) | ||
| H&R Block Inc. | 17,422 | 466 | |
| * | DISH Network Corp. | ||
| Class A | 8,060 | 462 | |
| Gap Inc. | 18,162 | 429 | |
| Nordstrom Inc. | 9,367 | 418 | |
| Ralph Lauren Corp. | |||
| Class A | 4,608 | 405 | |
| Tiffany & Co. | 4,332 | 396 | |
| Omnicom Group Inc. | 5,407 | 391 | |
| L Brands Inc. | 10,527 | 381 | |
| Hanesbrands Inc. | 14,875 | 361 | |
| Signet Jewelers Ltd. | 5,700 | 359 | |
| * | Chipotle Mexican Grill Inc. | ||
| Class A | 1,071 | 339 | |
| Interpublic Group of Cos. | |||
| Inc. | 14,652 | 295 | |
| Wyndham Worldwide | |||
| Corp. | 2,843 | 283 | |
| Tractor Supply Co. | 4,567 | 272 | |
| Hilton Worldwide Holdings | |||
| Inc. | 3,553 | 229 | |
| Leggett & Platt Inc. | 4,374 | 201 | |
| Mattel Inc. | 12,112 | 196 | |
| * | TripAdvisor Inc. | 3,886 | 166 |
| Foot Locker Inc. | 4,249 | 150 | |
| 52,266 | |||
| Consumer Staples (11.3%) | |||
| Procter & Gamble Co. | 107,945 | 9,960 | |
| Wal-Mart Stores Inc. | 122,239 | 9,543 | |
| Coca-Cola Co. | 155,929 | 7,102 | |
| Philip Morris International | |||
| Inc. | 57,840 | 6,763 | |
| CVS Health Corp. | 84,312 | 6,521 | |
| PepsiCo Inc. | 52,016 | 6,020 | |
| Walgreens Boots Alliance | |||
| Inc. | 70,670 | 5,760 | |
| Costco Wholesale Corp. | 36,297 | 5,689 | |
12
S&P 500 Value Index Fund
| Market | |||
| Value• | |||
| Shares | ($000) | ||
| Mondelez International Inc. | |||
| Class A | 125,564 | 5,105 | |
| Kraft Heinz Co. | 49,376 | 3,987 | |
| Colgate-Palmolive Co. | 32,164 | 2,304 | |
| Archer-Daniels-Midland Co. | 47,228 | 1,951 | |
| Kimberly-Clark Corp. | 14,100 | 1,738 | |
| Kroger Co. | 75,526 | 1,652 | |
| Tyson Foods Inc. Class A | 23,851 | 1,510 | |
| Molson Coors Brewing Co. | |||
| Class B | 15,283 | 1,372 | |
| General Mills Inc. | 21,457 | 1,143 | |
| Conagra Brands Inc. | 33,455 | 1,086 | |
| JM Smucker Co. | 9,636 | 1,009 | |
| Sysco Corp. | 19,115 | 1,007 | |
| Estee Lauder Cos. Inc. | |||
| Class A | 7,782 | 833 | |
| * | Monster Beverage Corp. | 13,347 | 745 |
| Hormel Foods Corp. | 22,326 | 686 | |
| Clorox Co. | 4,779 | 662 | |
| Kellogg Co. | 9,574 | 627 | |
| Dr Pepper Snapple Group | |||
| Inc. | 6,060 | 552 | |
| Coty Inc. Class A | 22,537 | 374 | |
| Church & Dwight Co. Inc. | 7,321 | 367 | |
| McCormick & Co. Inc./MD | 3,349 | 319 | |
| Brown-Forman Corp. | |||
| Class B | 5,918 | 314 | |
| Campbell Soup Co. | 6,170 | 285 | |
| 86,986 | |||
| Energy (10.5%) | |||
| Exxon Mobil Corp. | 350,655 | 26,765 | |
| Chevron Corp. | 156,785 | 16,873 | |
| ConocoPhillips | 102,378 | 4,470 | |
| Schlumberger Ltd. | 63,244 | 4,017 | |
| Kinder Morgan Inc. | 158,885 | 3,071 | |
| Phillips 66 | 36,305 | 3,043 | |
| Valero Energy Corp. | 37,012 | 2,521 | |
| Marathon Petroleum Corp. | 42,930 | 2,252 | |
| Occidental Petroleum Corp. | 36,067 | 2,153 | |
| EOG Resources Inc. | 22,932 | 1,949 | |
| Andeavor | 12,508 | 1,253 | |
| Halliburton Co. | 30,167 | 1,176 | |
| Williams Cos. Inc. | 37,611 | 1,118 | |
| * | TechnipFMC plc | 38,616 | 997 |
| National Oilwell Varco Inc. | 31,453 | 965 | |
| Anadarko Petroleum Corp. | 23,188 | 949 | |
| Hess Corp. | 22,365 | 870 | |
| Marathon Oil Corp. | 70,348 | 782 | |
| Baker Hughes a GE Co. | 20,073 | 680 | |
| * | Concho Resources Inc. | 5,622 | 624 |
| Devon Energy Corp. | 19,580 | 615 | |
| Noble Energy Inc. | 21,759 | 517 | |
| Cabot Oil & Gas Corp. | 20,202 | 516 | |
| Market | |||
| Value• | |||
| Shares | ($000) | ||
| ONEOK Inc. | 9,417 | 510 | |
| Apache Corp. | 11,276 | 438 | |
| Helmerich & Payne Inc. | 8,960 | 379 | |
| EQT Corp. | 5,714 | 356 | |
| Cimarex Energy Co. | 3,451 | 344 | |
| Range Resources Corp. | 9,629 | 167 | |
| * | Newfield Exploration Co. | 5,377 | 141 |
| * | Chesapeake Energy Corp. | 33,063 | 120 |
| 80,631 | |||
| Financials (27.2%) | |||
| * | Berkshire Hathaway Inc. | ||
| Class B | 157,193 | 28,477 | |
| JPMorgan Chase & Co. | 294,013 | 26,723 | |
| Bank of America Corp. | 823,571 | 19,675 | |
| Wells Fargo & Co. | 372,199 | 19,008 | |
| Citigroup Inc. | 227,847 | 15,500 | |
| Goldman Sachs Group Inc. | 30,295 | 6,778 | |
| Chubb Ltd. | 38,641 | 5,465 | |
| Morgan Stanley | 117,872 | 5,363 | |
| PNC Financial Services | |||
| Group Inc. | 40,046 | 5,022 | |
| Bank of New York Mellon | |||
| Corp. | 86,057 | 4,499 | |
| American International | |||
| Group Inc. | 72,783 | 4,402 | |
| MetLife Inc. | 89,414 | 4,187 | |
| Prudential Financial Inc. | 35,503 | 3,624 | |
| Capital One Financial Corp. | 39,969 | 3,182 | |
| BB&T Corp. | 67,147 | 3,095 | |
| US Bancorp | 57,685 | 2,956 | |
| Travelers Cos. Inc. | 23,124 | 2,802 | |
| American Express Co. | 32,309 | 2,782 | |
| Allstate Corp. | 30,167 | 2,730 | |
| Aflac Inc. | 32,842 | 2,711 | |
| State Street Corp. | 29,269 | 2,707 | |
| Progressive Corp. | 48,074 | 2,235 | |
| SunTrust Banks Inc. | 40,012 | 2,205 | |
| BlackRock Inc. | 5,118 | 2,145 | |
| Synchrony Financial | 63,745 | 1,963 | |
| M&T Bank Corp. | 12,734 | 1,883 | |
| Hartford Financial Services | |||
| Group Inc. | 30,403 | 1,644 | |
| Fifth Third Bancorp | 62,092 | 1,622 | |
| Willis Towers Watson plc | 10,517 | 1,561 | |
| Regions Financial Corp. | 99,482 | 1,404 | |
| Principal Financial Group | |||
| Inc. | 22,184 | 1,387 | |
| CME Group Inc. | 10,405 | 1,309 | |
| Lincoln National Corp. | 18,565 | 1,260 | |
| Franklin Resources Inc. | 28,338 | 1,225 | |
| Huntington Bancshares | |||
| Inc. | 89,971 | 1,133 | |
| Invesco Ltd. | 33,672 | 1,104 | |
13
S&P 500 Value Index Fund
| Market | |||
| Value• | |||
| Shares | ($000) | ||
| Loews Corp. | 22,850 | 1,064 | |
| Unum Group | 18,857 | 909 | |
| Ameriprise Financial Inc. | 6,550 | 907 | |
| XL Group Ltd. | 21,753 | 891 | |
| Citizens Financial Group | |||
| Inc. | 25,929 | 859 | |
| Everest Re Group Ltd. | 3,399 | 858 | |
| Affiliated Managers Group | |||
| Inc. | 4,685 | 828 | |
| KeyCorp | 46,266 | 796 | |
| Zions Bancorporation | 16,771 | 732 | |
| Torchmark Corp. | 9,005 | 693 | |
| Leucadia National Corp. | 26,803 | 635 | |
| T. Rowe Price Group Inc. | 6,973 | 588 | |
| Northern Trust Corp. | 6,402 | 567 | |
| People’s United Financial | |||
| Inc. | 28,377 | 474 | |
| * | Brighthouse Financial Inc. | 8,102 | 462 |
| Comerica Inc. | 6,561 | 448 | |
| Assurant Inc. | 4,622 | 438 | |
| Cincinnati Financial Corp. | 5,441 | 418 | |
| Nasdaq Inc. | 5,086 | 383 | |
| Raymond James Financial | |||
| Inc. | 4,761 | 373 | |
| Navient Corp. | 23,431 | 309 | |
| CBOE Holdings Inc. | 2,655 | 268 | |
| 209,668 | |||
| Health Care (12.7%) | |||
| Johnson & Johnson | 86,943 | 11,509 | |
| Medtronic plc | 113,283 | 9,133 | |
| Pfizer Inc. | 217,304 | 7,371 | |
| Abbott Laboratories | 143,604 | 7,315 | |
| Allergan plc | 27,795 | 6,378 | |
| Merck & Co. Inc. | 86,014 | 5,493 | |
| Amgen Inc. | 27,405 | 4,872 | |
| Anthem Inc. | 21,930 | 4,299 | |
| Cigna Corp. | 21,187 | 3,857 | |
| Bristol-Myers Squibb Co. | 61,352 | 3,711 | |
| Eli Lilly & Co. | 44,999 | 3,658 | |
| * | Express Scripts Holding Co. | 49,119 | 3,086 |
| McKesson Corp. | 17,454 | 2,606 | |
| Baxter International Inc. | 40,366 | 2,504 | |
| Thermo Fisher Scientific | |||
| Inc. | 12,627 | 2,363 | |
| Danaher Corp. | 23,759 | 1,982 | |
| Cardinal Health Inc. | 26,142 | 1,764 | |
| * | Vertex Pharmaceuticals Inc. | 8,864 | 1,423 |
| * | Centene Corp. | 14,258 | 1,267 |
| * | Mylan NV | 38,148 | 1,201 |
| * | Henry Schein Inc. | 6,566 | 1,140 |
| AmerisourceBergen Corp. | |||
| Class A | 13,735 | 1,102 | |
| Dentsply Sirona Inc. | 18,972 | 1,073 | |
| Market | |||
| Value• | |||
| Shares | ($000) | ||
| Perrigo Co. plc | 11,866 | 937 | |
| * | HCA Healthcare Inc. | 11,598 | 912 |
| * | Illumina Inc. | 3,746 | 766 |
| * | DaVita Inc. | 12,839 | 752 |
| Zimmer Biomet Holdings | |||
| Inc. | 5,973 | 682 | |
| * | Laboratory Corp. of | ||
| America Holdings | 3,884 | 609 | |
| PerkinElmer Inc. | 9,070 | 608 | |
| Agilent Technologies Inc. | 9,337 | 604 | |
| Quest Diagnostics Inc. | 4,334 | 470 | |
| Universal Health Services | |||
| Inc. Class B | 4,049 | 438 | |
| * | Waters Corp. | 2,243 | 412 |
| * | Hologic Inc. | 9,238 | 357 |
| ResMed Inc. | 3,976 | 308 | |
| * | Envision Healthcare Corp. | 5,723 | 300 |
| Cooper Cos. Inc. | 1,134 | 284 | |
| Patterson Cos. Inc. | 6,729 | 259 | |
| 97,805 | |||
| Industrials (8.8%) | |||
| General Electric Co. | 381,968 | 9,377 | |
| United Technologies Corp. | 61,665 | 7,383 | |
| Boeing Co. | 15,330 | 3,674 | |
| Honeywell International Inc. | 25,867 | 3,577 | |
| 3M Co. | 15,826 | 3,234 | |
| Johnson Controls | |||
| International plc | 77,635 | 3,074 | |
| Norfolk Southern Corp. | 23,982 | 2,890 | |
| Delta Air Lines Inc. | 60,913 | 2,875 | |
| Caterpillar Inc. | 23,404 | 2,750 | |
| Eaton Corp. plc | 37,018 | 2,656 | |
| Union Pacific Corp. | 20,715 | 2,181 | |
| American Airlines Group | |||
| Inc. | 40,766 | 1,824 | |
| Emerson Electric Co. | 28,802 | 1,700 | |
| Raytheon Co. | 7,950 | 1,447 | |
| Deere & Co. | 12,421 | 1,440 | |
| CSX Corp. | 28,254 | 1,418 | |
| AMETEK Inc. | 19,044 | 1,205 | |
| Dover Corp. | 12,884 | 1,094 | |
| Textron Inc. | 22,155 | 1,088 | |
| Stanley Black & Decker | |||
| Inc. | 6,584 | 948 | |
| Arconic Inc. | 36,479 | 929 | |
| PACCAR Inc. | 13,955 | 926 | |
| Kansas City Southern | 8,759 | 906 | |
| * | IHS Markit Ltd. | 18,912 | 886 |
| Roper Technologies Inc. | 3,791 | 874 | |
| Pentair plc | 13,877 | 861 | |
| Rockwell Collins Inc. | 4,973 | 652 | |
| L3 Technologies Inc. | 3,536 | 642 | |
| Parker-Hannifin Corp. | 3,549 | 571 | |
14
S&P 500 Value Index Fund
| Market | |||
| Value• | |||
| Shares | ($000) | ||
| Jacobs Engineering Group | |||
| Inc. | 9,968 | 543 | |
| * | Stericycle Inc. | 7,026 | 505 |
| Nielsen Holdings plc | 12,469 | 484 | |
| Robert Half International | |||
| Inc. | 10,485 | 475 | |
| Fluor Corp. | 11,520 | 444 | |
| Flowserve Corp. | 10,779 | 423 | |
| CH Robinson Worldwide | |||
| Inc. | 5,831 | 412 | |
| Masco Corp. | 10,130 | 372 | |
| Snap-on Inc. | 2,245 | 331 | |
| Expeditors International of | |||
| Washington Inc. | 5,505 | 309 | |
| Alaska Air Group Inc. | 3,671 | 274 | |
| Fortune Brands Home | |||
| & Security Inc. | 3,681 | 230 | |
| Allegion plc | 2,833 | 223 | |
| Ryder System Inc. | 75 | 6 | |
| 68,113 | |||
| Information Technology (6.7%) | |||
| Cisco Systems Inc. | 413,781 | 13,328 | |
| Intel Corp. | 202,643 | 7,107 | |
| Oracle Corp. | 104,402 | 5,255 | |
| International Business | |||
| Machines Corp. | 30,424 | 4,352 | |
| * | Micron Technology Inc. | 86,062 | 2,751 |
| HP Inc. | 139,308 | 2,658 | |
| Hewlett Packard Enterprise | |||
| Co. | 137,776 | 2,488 | |
| Western Digital Corp. | 24,103 | 2,128 | |
| * | eBay Inc. | 50,815 | 1,836 |
| TE Connectivity Ltd. | 14,692 | 1,169 | |
| Cognizant Technology | |||
| Solutions Corp. Class A | 14,624 | 1,035 | |
| DXC Technology Co. | 11,015 | 936 | |
| CA Inc. | 25,935 | 860 | |
| Symantec Corp. | 25,998 | 779 | |
| Seagate Technology plc | 24,581 | 775 | |
| * | Qorvo Inc. | 10,519 | 770 |
| * | Autodesk Inc. | 5,451 | 624 |
| Xerox Corp. | 17,612 | 568 | |
| Xilinx Inc. | 7,173 | 474 | |
| Alliance Data Systems | |||
| Corp. | 1,863 | 420 | |
| Juniper Networks Inc. | 13,873 | 385 | |
| * | ANSYS Inc. | 2,682 | 345 |
| NetApp Inc. | 8,624 | 333 | |
| Western Union Co. | 13,799 | 261 | |
| CSRA Inc. | 6,238 | 197 | |
| FLIR Systems Inc. | 3,333 | 127 | |
| * | Teradata Corp. | 180 | 6 |
| 51,967 | |||
| Market | |||
| Value• | |||
| Shares | ($000) | ||
| Materials (4.0%) | |||
| Dow Chemical Co. | 138,644 | 9,241 | |
| EI du Pont de Nemours | |||
| & Co. | 35,877 | 3,011 | |
| LyondellBasell Industries | |||
| NV Class A | 27,335 | 2,476 | |
| International Paper Co. | 34,171 | 1,841 | |
| Monsanto Co. | 11,985 | 1,405 | |
| Praxair Inc. | 10,410 | 1,369 | |
| Ecolab Inc. | 9,722 | 1,296 | |
| WestRock Co. | 20,782 | 1,183 | |
| Ball Corp. | 28,976 | 1,159 | |
| Air Products & Chemicals | |||
| Inc. | 7,749 | 1,126 | |
| Eastman Chemical Co. | 12,069 | 1,040 | |
| PPG Industries Inc. | 9,966 | 1,040 | |
| Sherwin-Williams Co. | 2,074 | 704 | |
| * | Freeport-McMoRan Inc. | 42,826 | 633 |
| Nucor Corp. | 10,795 | 595 | |
| Mosaic Co. | 28,927 | 578 | |
| CF Industries Holdings Inc. | 19,231 | 557 | |
| International Flavors | |||
| & Fragrances Inc. | 2,737 | 374 | |
| Sealed Air Corp. | 7,585 | 337 | |
| Avery Dennison Corp. | 3,436 | 324 | |
| FMC Corp. | 3,753 | 323 | |
| 30,612 | |||
| Real Estate (1.8%) | |||
| Weyerhaeuser Co. | 62,176 | 2,028 | |
| Simon Property Group Inc. | 8,785 | 1,378 | |
| Crown Castle International | |||
| Corp. | 11,662 | 1,265 | |
| HCP Inc. | 38,780 | 1,156 | |
| Public Storage | 4,331 | 889 | |
| Ventas Inc. | 12,630 | 865 | |
| SL Green Realty Corp. | 8,428 | 812 | |
| Essex Property Trust Inc. | 2,546 | 677 | |
| Equity Residential | 10,028 | 673 | |
| Boston Properties Inc. | 4,445 | 536 | |
| Vornado Realty Trust | 7,095 | 529 | |
| Macerich Co. | 9,886 | 522 | |
| * | CBRE Group Inc. Class A | 13,894 | 501 |
| Realty Income Corp. | 8,550 | 492 | |
| Mid-America Apartment | |||
| Communities Inc. | 3,655 | 389 | |
| * | SBA Communications | ||
| Corp. Class A | 2,308 | 354 | |
| Iron Mountain Inc. | 8,722 | 344 | |
| Regency Centers Corp. | 4,468 | 287 | |
| Federal Realty Investment | |||
| Trust | 2,204 | 280 | |
| 13,977 | |||
15
S&P 500 Value Index Fund
| Market | |||
| Value• | |||
| Shares | ($000) | ||
| Telecommunication Services (3.6%) | |||
| AT&T Inc. | 508,779 | 19,059 | |
| Verizon Communications | |||
| Inc. | 158,668 | 7,611 | |
| ^ | CenturyLink Inc. | 45,421 | 896 |
| * | Level 3 Communications | ||
| Inc. | 10,614 | 578 | |
| 28,144 | |||
| Utilities (6.4%) | |||
| Duke Energy Corp. | 57,920 | 5,056 | |
| Southern Co. | 82,310 | 3,972 | |
| American Electric Power | |||
| Co. Inc. | 40,693 | 2,996 | |
| NextEra Energy Inc. | 19,760 | 2,974 | |
| PG&E Corp. | 42,257 | 2,974 | |
| Exelon Corp. | 76,641 | 2,902 | |
| Sempra Energy | 20,759 | 2,448 | |
| PPL Corp. | 56,538 | 2,219 | |
| Dominion Energy Inc. | 27,589 | 2,173 | |
| Edison International | 26,964 | 2,162 | |
| Consolidated Edison Inc. | 25,273 | 2,130 | |
| Xcel Energy Inc. | 42,022 | 2,080 | |
| Public Service Enterprise | |||
| Group Inc. | 41,866 | 1,961 | |
| DTE Energy Co. | 14,846 | 1,668 | |
| Eversource Energy | 26,226 | 1,652 | |
| Ameren Corp. | 20,081 | 1,205 | |
| FirstEnergy Corp. | 36,724 | 1,196 | |
| Entergy Corp. | 14,853 | 1,176 | |
| CMS Energy Corp. | 23,211 | 1,127 | |
| Pinnacle West Capital Corp. | 9,233 | 831 | |
| WEC Energy Group Inc. | 12,537 | 818 | |
| NiSource Inc. | 26,770 | 719 | |
| SCANA Corp. | 11,829 | 714 | |
| NRG Energy Inc. | 26,078 | 650 | |
| AES Corp. | 54,637 | 603 | |
| CenterPoint Energy Inc. | 14,982 | 444 | |
| Alliant Energy Corp. | 9,963 | 426 | |
| 49,276 | |||
| Total Common Stocks | |||
| (Cost $705,066) | 769,445 | ||
| Market | |||
| Value• | |||
| Shares | ($000) | ||
| Temporary Cash Investments (0.4%)1 | |||
| Money Market Fund (0.4%) | |||
| 2,3 | Vanguard Market | ||
| Liquidity Fund, | |||
| 1.224% | 29,666 | 2,967 | |
| Face | |||
| Amount | |||
| ($000) | |||
| U. S. Government and Agency Obligations (0.0%) | |||
| 4 | United States | ||
| Treasury Bill, | |||
| 1.023%, 10/5/17 | 100 | 100 | |
| 4 | United States | ||
| Treasury Bill, | |||
| 1.033%, 11/2/17 | 100 | 100 | |
| 200 | |||
| Total Temporary Cash Investments | |||
| (Cost $3,167) | 3,167 | ||
| Total Investments (100.2%) | |||
| (Cost $708,233) | 772,612 | ||
| Amount | |||
| ($000) | |||
| Other Assets and Liabilities (-0.2%) | |||
| Other Assets | |||
| Investment in Vanguard | 50 | ||
| Receivables for Accrued Income | 2,330 | ||
| Variation Margin Receivable— | |||
| Futures Contracts | 43 | ||
| Total Other Assets | 2,423 | ||
| Liabilities | |||
| Payables for Investment Securities | |||
| Purchased | (3,399) | ||
| Collateral for Securities on Loan | (174) | ||
| Payables to Vanguard | (179) | ||
| Other Liabilities | (18) | ||
| Total Liabilities | (3,770) | ||
| Net Assets (100%) | 771,265 | ||
16
S&P 500 Value Index Fund
| At August 31, 2017, net assets consisted of: | |
| Amount | |
| ($000) | |
| Paid-in Capital | 713,736 |
| Undistributed Net Investment Income | 4,058 |
| Accumulated Net Realized Losses | (10,905) |
| Unrealized Appreciation (Depreciation) | |
| Investment Securities | 64,379 |
| Futures Contracts | (3) |
| Net Assets | 771,265 |
| ETF Shares—Net Assets | |
| Applicable to 7,575,000 outstanding | |
| $.001 par value shares of beneficial | |
| interest (unlimited authorization) | 767,552 |
| Net Asset Value Per Share— | |
| ETF Shares | $101.33 |
| Amount | |
| ($000) | |
| Institutional Shares—Net Assets | |
| Applicable to 16,708 outstanding | |
| $.001 par value shares of beneficial | |
| interest (unlimited authorization) | 3,713 |
| Net Asset Value Per Share— | |
| Institutional Shares | $222.23 |
• See Note A in Notes to Financial Statements.
* Non-income-producing security.
^ Includes partial security positions on loan to broker-dealers.
The total value of securities on loan is $164,000.
1 The fund invests a portion of its cash reserves in equity markets
through the use of index futures contracts. After giving effect
to futures investments, the fund’s effective common stock and
temporary cash investment positions represent 100.0% and
0.2%, respectively, of net assets.
2 Affiliated money market fund available only to Vanguard funds
and certain trusts and accounts managed by Vanguard. Rate
shown is the 7-day yield.
3 Includes $174,000 of collateral received for securities on loan.
4 Securities with a value of $200,000 have been segregated as
initial margin for open futures contracts.
| Derivative Financial Instruments Outstanding as of Period End | ||||
| Futures Contracts | ||||
| ($000) | ||||
| Value and | ||||
| Number of | Unrealized | |||
| Long (Short) | Notional | Appreciation | ||
| Expiration | Contracts | Amount | (Depreciation) | |
| Long Futures Contracts | ||||
| E-mini S&P 500 Index | September 2017 | 15 | 1,853 | (3) |
Unrealized appreciation (depreciation) on open futures contracts is required to be treated as realized gain (loss) for tax purposes.
See accompanying Notes, which are an integral part of the Financial Statements.
17
S&P 500 Value Index Fund
Statement of Operations
| Year Ended | |
| August 31,2017 | |
| ($000) | |
| Investment Income | |
| Income | |
| Dividends | 16,914 |
| Interest1 | 15 |
| Securities Lending—Net | 12 |
| Total Income | 16,941 |
| Expenses | |
| The Vanguard Group—Note B | |
| Investment Advisory Services | 137 |
| Management and Administrative—ETF Shares | 690 |
| Management and Administrative—Institutional Shares | 2 |
| Marketing and Distribution—ETF Shares | 39 |
| Marketing and Distribution—Institutional Shares | — |
| Custodian Fees | 49 |
| Auditing Fees | 32 |
| Shareholders’ Reports and Proxy—ETF Shares | 27 |
| Shareholders’ Reports and Proxy—Institutional Shares | — |
| Total Expenses | 976 |
| Expenses Paid Indirectly | (7) |
| Net Expenses | 969 |
| Net Investment Income | 15,972 |
| Realized Net Gain (Loss) | |
| Investment Securities Sold1 | 26,115 |
| Futures Contracts | 303 |
| Realized Net Gain (Loss) | 26,418 |
| Change in Unrealized Appreciation (Depreciation) | |
| Investment Securities | 24,615 |
| Futures Contracts | (6) |
| Change in Unrealized Appreciation (Depreciation) | 24,609 |
| Net Increase (Decrease) in Net Assets Resulting from Operations | 66,999 |
| 1 Interest income and realized net gain (loss) from an affiliated company of the fund were $15,000 and $0, respectively. | |
See accompanying Notes, which are an integral part of the Financial Statements.
18
S&P 500 Value Index Fund
Statement of Changes in Net Assets
| Year Ended August 31, | ||
| 2017 | 2016 | |
| ($000) | ($000) | |
| Increase (Decrease) in Net Assets | ||
| Operations | ||
| Net Investment Income | 15,972 | 9,552 |
| Realized Net Gain (Loss) | 26,418 | 3,069 |
| Change in Unrealized Appreciation (Depreciation) | 24,609 | 35,972 |
| Net Increase (Decrease) in Net Assets Resulting from Operations | 66,999 | 48,593 |
| Distributions | ||
| Net Investment Income | ||
| ETF Shares | (14,252) | (8,238) |
| Institutional Shares | (117) | (245) |
| Realized Capital Gain | ||
| ETF Shares | — | — |
| Institutional Shares | — | — |
| Total Distributions | (14,369) | (8,483) |
| Capital Share Transactions | ||
| ETF Shares | 227,736 | 173,732 |
| Institutional Shares | (3,373) | (4,966) |
| Net Increase (Decrease) from Capital Share Transactions | 224,363 | 168,766 |
| Total Increase (Decrease) | 276,993 | 208,876 |
| Net Assets | ||
| Beginning of Period | 494,272 | 285,396 |
| End of Period1 | 771,265 | 494,272 |
| 1 Net Assets—End of Period includes undistributed (overdistributed) net investment income of $4,058,000 and $2,455,000. | ||
See accompanying Notes, which are an integral part of the Financial Statements.
19
| S&P 500 Value Index Fund | |||||
| Financial Highlights | |||||
| ETF Shares | |||||
| For a Share Outstanding | Year Ended August 31, | ||||
| Throughout Each Period | 2017 | 2016 | 2015 | 2014 | 2013 |
| Net Asset Value, Beginning of Period | $92.41 | $83.75 | $88.54 | $73.72 | $61.42 |
| Investment Operations | |||||
| Net Investment Income | 2.4221 | 2.125 | 1.932 | 1.702 | 1.584 |
| Net Realized and Unrealized Gain (Loss) | |||||
| on Investments | 8.726 | 8.605 | (4.838) | 14.824 | 12.242 |
| Total from Investment Operations | 11.148 | 10.730 | (2.906) | 16.526 | 13.826 |
| Distributions | |||||
| Dividends from Net Investment Income | (2.228) | (2.070) | (1.884) | (1.706) | (1.526) |
| Distributions from Realized Capital Gains | — | — | — | — | — |
| Total Distributions | (2.228) | (2.070) | (1.884) | (1.706) | (1.526) |
| Net Asset Value, End of Period | $101.33 | $92.41 | $83.75 | $88.54 | $73.72 |
| Total Return | 12.19% | 13.03% | -3.41% | 22.64% | 22.79% |
| Ratios/Supplemental Data | |||||
| Net Assets, End of Period (Millions) | $768 | $487 | $274 | $204 | $118 |
| Ratio of Total Expenses to Average Net Assets | 0.15% | 0.15% | 0.15% | 0.15% | 0.15% |
| Ratio of Net Investment Income to | |||||
| Average Net Assets | 2.46% | 2.64% | 2.37% | 2.31% | 2.45% |
| Portfolio Turnover Rate2 | 16% | 22% | 23% | 25% | 25% |
1 Calculated based on average shares outstanding.
2 Excludes the value of portfolio securities received or delivered as a result of in-kind purchases or redemptions of the fund’s capital shares, including ETF Creation Units.
See accompanying Notes, which are an integral part of the Financial Statements.
20
| S&P 500 Value Index Fund | |||
| Financial Highlights | |||
| Institutional Shares | |||
| March 3, | |||
| Year Ended | 20151 to | ||
| August 31, | Aug. 31, | ||
| For a Share Outstanding Throughout Each Period | 2017 | 2016 | 2015 |
| Net Asset Value, Beginning of Period | $202.64 | $183.75 | $199.34 |
| Investment Operations | |||
| Net Investment Income | 5.202 2 | 4.765 | 2.352 |
| Net Realized and Unrealized Gain (Loss) on Investments | 19.393 | 18.875 | (15.830) |
| Total from Investment Operations | 24.595 | 23.640 | (13.478) |
| Distributions | |||
| Dividends from Net Investment Income | (5.005) | (4.750) | (2.112) |
| Distributions from Realized Capital Gains | — | — | — |
| Total Distributions | (5.005) | (4.750) | (2.112) |
| Net Asset Value, End of Period | $222.23 | $202.64 | $183.75 |
| Total Return | 12.27% | 13.09% | -6.84% |
| Ratios/Supplemental Data | |||
| Net Assets, End of Period (Millions) | $4 | $7 | $11 |
| Ratio of Total Expenses to Average Net Assets | 0.08% | 0.08% | 0.08%3 |
| Ratio of Net Investment Income to Average Net Assets | 2.53% | 2.71% | 2.44%3 |
| Portfolio Turnover Rate 4 | 16% | 22% | 23% |
1 Inception.
2 Calculated based on average shares outstanding.
3 Annualized.
4 Excludes the value of portfolio securities received or delivered as a result of in-kind purchases or redemptions of the fund’s capital shares, including ETF Creation Units.
See accompanying Notes, which are an integral part of the Financial Statements.
21
S&P 500 Value Index Fund
Notes to Financial Statements
Vanguard S&P 500 Value Index Fund is registered under the Investment Company Act of 1940 as an open-end investment company, or mutual fund. The fund offers two classes of shares: ETF Shares and Institutional Shares. ETF Shares are listed for trading on NYSE Arca; they can be purchased and sold through a broker. Institutional Shares are designed for investors who meet certain administrative, service, and account-size criteria.
A. The following significant accounting policies conform to generally accepted accounting principles for U.S. investment companies. The fund consistently follows such policies in preparing its financial statements.
1. Security Valuation: Securities are valued as of the close of trading on the New York Stock Exchange (generally 4 p.m., Eastern time) on the valuation date. Equity securities are valued at the latest quoted sales prices or official closing prices taken from the primary market in which each security trades; such securities not traded on the valuation date are valued at the mean of the latest quoted bid and asked prices. Securities for which market quotations are not readily available, or whose values have been materially affected by events occurring before the fund’s pricing time but after the close of the securities’ primary markets, are valued by methods deemed by the board of trustees to represent fair value. Investments in Vanguard Market Liquidity Fund are valued at that fund’s net asset value. Temporary cash investments are valued using the latest bid prices or using valuations based on a matrix system (which considers such factors as security prices, yields, maturities, and ratings), both as furnished by independent pricing services.
2. Futures Contracts: The fund uses index futures contracts to a limited extent, with the objectives of maintaining full exposure to the stock market, enhancing returns, maintaining liquidity, and minimizing transaction costs. The fund may purchase futures contracts to immediately invest incoming cash in the market, or sell futures in response to cash outflows, thereby simulating a fully invested position in the underlying index while maintaining a cash balance for liquidity. The fund may seek to enhance returns by using futures contracts instead of the underlying securities when futures are believed to be priced more attractively than the underlying securities. The primary risks associated with the use of futures contracts are imperfect correlation between changes in market values of stocks held by the fund and the prices of futures contracts, and the possibility of an illiquid market. Counterparty risk involving futures is mitigated because a regulated clearinghouse is the counterparty instead of the clearing broker. To further mitigate counterparty risk, the fund trades futures contracts on an exchange, monitors the financial strength of its clearing brokers and clearinghouse, and has entered into clearing agreements with its clearing brokers. The clearinghouse imposes initial margin requirements to secure the fund’s performance and requires daily settlement of variation margin representing changes in the market value of each contract.
Futures contracts are valued at their quoted daily settlement prices. The notional amounts of the contracts are not recorded in the Statement of Net Assets. Fluctuations in the value of the contracts are recorded in the Statement of Net Assets as an asset (liability) and in the Statement of Operations as unrealized appreciation (depreciation) until the contracts are closed, when they are recorded as realized futures gains (losses).
During the year ended August 31, 2017, the fund’s average investments in long and short futures contracts represented less than 1% and 0% of net assets, respectively, based on the average of the notional amounts at each quarter-end during the period.
22
S&P 500 Value Index Fund
3. Federal Income Taxes: The fund intends to continue to qualify as a regulated investment company and distribute all of its taxable income. Management has analyzed the fund’s tax positions taken for all open federal income tax years (August 31, 2014–2017), and has concluded that no provision for federal income tax is required in the fund’s financial statements.
4. Distributions: Distributions to shareholders are recorded on the ex-dividend date.
5. Securities Lending: To earn additional income, the fund lends its securities to qualified institutional borrowers. Security loans are subject to termination by the fund at any time, and are required to be secured at all times by collateral in an amount at least equal to the market value of securities loaned. Daily market fluctuations could cause the value of loaned securities to be more or less than the value of the collateral received. When this occurs, the collateral is adjusted and settled on the next business day. The fund further mitigates its counterparty risk by entering into securities lending transactions only with a diverse group of prequalified counterparties, monitoring their financial strength, and entering into master securities lending agreements with its counterparties. The master securities lending agreements provide that, in the event of a counterparty’s default (including bankruptcy), the fund may terminate any loans with that borrower, determine the net amount owed, and sell or retain the collateral up to the net amount owed to the fund; however, such actions may be subject to legal proceedings. While collateral mitigates counterparty risk, in the event of a default, the fund may experience delays and costs in recovering the securities loaned. The fund invests cash collateral received in Vanguard Market Liquidity Fund, and records a liability in the Statement of Net Assets for the return of the collateral, during the period the securities are on loan. Securities lending income represents fees charged to borrowers plus income earned on invested cash collateral, less expenses associated with the loan. During the term of the loan, the fund is entitled to all distributions made on or in respect of the loaned securities.
6. Credit Facility: The fund and certain other funds managed by The Vanguard Group (“Vanguard”) participate in a $3.1 billion committed credit facility provided by a syndicate of lenders pursuant to a credit agreement that may be renewed annually; each fund is individually liable for its borrowings, if any, under the credit facility. Borrowings may be utilized for temporary and emergency purposes, and are subject to the fund’s regulatory and contractual borrowing restrictions. The participating funds are charged administrative fees and an annual commitment fee of 0.10% of the undrawn amount of the facility; these fees are allocated to the funds based on a method approved by the fund’s board of trustees and included in Management and Administrative expenses on the fund’s Statement of Operations. Any borrowings under this facility bear interest at a rate based upon the higher of the one-month London Interbank Offered Rate, federal funds effective rate, or overnight bank funding rate plus an agreed-upon spread.
The fund had no borrowings outstanding at August 31, 2017, or at any time during the period then ended.
7. Other: Dividend income is recorded on the ex-dividend date. Interest income includes income distributions received from Vanguard Market Liquidity Fund and is accrued daily. Premiums and discounts on debt securities purchased are amortized and accreted, respectively, to interest income over the lives of the respective securities. Security transactions are accounted for on the date securities are bought or sold. Costs used to determine realized gains (losses) on the sale of investment securities are those of the specific securities sold.
23
S&P 500 Value Index Fund
Each class of shares has equal rights as to assets and earnings, except that each class separately bears certain class-specific expenses related to maintenance of shareholder accounts (included in Management and Administrative expenses), shareholder reporting, and the proxy. Marketing and distribution expenses are allocated to each class of shares based on a method approved by the board of trustees. Income, other non-class-specific expenses, and gains and losses on investments are allocated to each class of shares based on its relative net assets.
B. In accordance with the terms of a Funds’ Service Agreement (the “FSA”) between Vanguard and the fund, Vanguard furnishes to the fund investment advisory, corporate management, administrative, marketing, and distribution services at Vanguard’s cost of operations (as defined by the FSA). These costs of operations are allocated to the fund based on methods and guidelines approved by the board of trustees. Vanguard does not require reimbursement in the current period for certain costs of operations (such as deferred compensation/benefits and risk/insurance costs); the fund’s liability for these costs of operations is included in Payables to Vanguard on the Statement of Net Assets.
Upon the request of Vanguard, the fund may invest up to 0.40% of its net assets as capital in Vanguard. At August 31, 2017, the fund had contributed to Vanguard capital in the amount of $50,000, representing 0.01% of the fund’s net assets and 0.02% of Vanguard’s capitalization. The fund’s trustees and officers are also directors and employees, respectively, of Vanguard.
C. The fund’s custodian bank has agreed to reduce its fees when the fund maintains cash on deposit in the non-interest-bearing custody account. For the year ended August 31, 2017, custodian fee offset arrangements reduced the fund’s expenses by $7,000 (an annual rate of 0.00% of average net assets).
D. Various inputs may be used to determine the value of the fund’s investments. These inputs are summarized in three broad levels for financial statement purposes. The inputs or methodologies used to value securities are not necessarily an indication of the risk associated with investing in those securities.
Level 1—Quoted prices in active markets for identical securities.
Level 2—Other significant observable inputs (including quoted prices for similar securities, interest rates, prepayment speeds, credit risk, etc.).
Level 3—Significant unobservable inputs (including the fund’s own assumptions used to determine the fair value of investments). Any investments valued with significant unobservable inputs are
noted on the Statement of Net Assets.
The following table summarizes the market value of the fund’s investments as of August 31, 2017, based on the inputs used to value them:
| Level 1 | Level 2 | Level 3 | |
| Investments | ($000) | ($000) | ($000) |
| Common Stocks | 769,445 | — | — |
| Temporary Cash Investments | 2,967 | 200 | — |
| Futures Contracts—Assets1 | 43 | — | — |
| Total | 772,455 | 200 | — |
| 1 Represents variation margin on the last day of the reporting period. |
24
S&P 500 Value Index Fund
E. Distributions are determined on a tax basis and may differ from net investment income and realized capital gains for financial reporting purposes. Differences may be permanent or temporary. Permanent differences are reclassified among capital accounts in the financial statements to reflect their tax character. Temporary differences arise when certain items of income, expense, gain, or loss are recognized in different periods for financial statement and tax purposes. These differences will reverse at some time in the future. Differences in classification may also result from the treatment of short-term gains as ordinary income for tax purposes.
During the year ended August 31, 2017, the fund realized $29,241,000 of net capital gains resulting from in-kind redemptions—in which shareholders exchanged fund shares for securities held by the fund rather than for cash. Because such gains are not taxable to the fund, and are not distributed to shareholders, they have been reclassified from accumulated net realized losses to paid-in capital.
For tax purposes, at August 31, 2017, the fund had $4,184,000 of ordinary income available for distribution. The fund had available capital losses totaling $10,909,000 that may be carried forward indefinitely to offset future net capital gains.
At August 31, 2017, the cost of investment securities for tax purposes was $708,233,000. Net unrealized appreciation of investment securities for tax purposes was $64,379,000, consisting of unrealized gains of $88,820,000 on securities that had risen in value since their purchase and $24,441,000 in unrealized losses on securities that had fallen in value since their purchase.
F. During the year ended August 31, 2017, the fund purchased $448,848,000 of investment securities and sold $223,341,000 of investment securities, other than temporary cash investments. Purchases and sales include $330,143,000 and $118,137,000, respectively, in connection with in-kind purchases and redemptions of the fund’s capital shares.
| G. Capital share transactions for each class of shares were: | ||||
| Year Ended August 31, | ||||
| 2017 | 2016 | |||
| Amount | Shares | Amount | Shares | |
| ($000) | (000) | ($000) | (000) | |
| ETF Shares | ||||
| Issued | 347,607 | 3,525 | 215,592 | 2,500 |
| Issued in Lieu of Cash Distributions | — | — | — | — |
| Redeemed | (119,871) | (1,225) | (41,860) | (500) |
| Net Increase (Decrease)—ETF Shares | 227,736 | 2,300 | 173,732 | 2,000 |
| Institutional Shares | ||||
| Issued | 1,590 | 7 | 39 | — |
| Issued in Lieu of Cash Distributions | 117 | 1 | 245 | 1 |
| Redeemed | (5,080) | (25) | (5,250) | (28) |
| Net Increase (Decrease)—Institutional Shares | (3,373) | (17) | (4,966) | (27) |
H. Management has determined that no material events or transactions occurred subsequent to August 31, 2017, that would require recognition or disclosure in these financial statements.
25
S&P 500 Growth Index Fund
Fund Profile
As of August 31, 2017
Portfolio Characteristics
| DJ | |||
| U.S. | |||
| Total | |||
| S&P 500 | Market | ||
| Growth | FA | ||
| Fund | Index | Index | |
| Number of Stocks | 333 | 330 | 3,769 |
| Median Market Cap | $102.8B | $102.8B | $63.1B |
| Price/Earnings Ratio | 25.4x | 25.4x | 21.6x |
| Price/Book Ratio | 5.2x | 5.2x | 2.8x |
| Return on Equity | 19.2% | 19.2% | 15.1% |
| Earnings Growth Rate | 11.9% | 11.9% | 9.4% |
| Dividend Yield | 1.5% | 1.5% | 1.8% |
| Foreign Holdings | 0.0% | 0.0% | 0.0% |
| Turnover Rate | 19% | — | — |
| Ticker Symbol | VOOG | — | — |
| Expense Ratio1 | 0.15% | — | — |
| 30-Day SEC Yield | 1.47% | — | — |
| Short-Term Reserves | -0.1% | — | — |
Sector Diversification (% of equity exposure)
| DJ | |||
| S&P 500 | U.S. Total | ||
| Growth | Market | ||
| Fund | Index | FA Index | |
| Consumer Discretionary 16.1% | 16.1% | 12.4% | |
| Consumer Staples | 6.3 | 6.2 | 7.6 |
| Energy | 1.9 | 1.9 | 5.3 |
| Financials | 4.1 | 4.0 | 14.7 |
| Health Care | 16.1 | 16.1 | 14.1 |
| Industrials | 11.1 | 11.1 | 10.7 |
| Information Technology | 36.5 | 36.5 | 22.6 |
| Materials | 2.1 | 2.4 | 3.3 |
| Real Estate | 4.0 | 3.9 | 4.1 |
| Telecommunication | |||
| Services | 1.0 | 1.0 | 1.9 |
| Utilities | 0.8 | 0.8 | 3.3 |
Sector categories are based on the Global Industry Classification
Standard (“GICS”), except for the “Other” category (if applicable),
which includes securities that have not been provided a GICS
classification as of the effective reporting period.
| Volatility Measures | ||
| DJ | ||
| S&P 500 | U.S. Total | |
| Growth | Market | |
| Index | FA Index | |
| R-Squared | 1.00 | 0.89 |
| Beta | 1.00 | 0.98 |
| These measures show the degree and timing of the fund’s fluctuations compared with the indexes over 36 months. | ||
| Ten Largest Holdings (% of total net assets) | ||
| Apple Inc. | Technology | |
| Hardware, Storage & | ||
| Peripherals | 7.2% | |
| Microsoft Corp. | Systems Software | 4.8 |
| Alphabet Inc. | Internet Software & | |
| Services | 4.7 | |
| Facebook Inc. | Internet Software & | |
| Services | 3.4 | |
| Amazon.com Inc. | Internet & Direct | |
| Marketing Retail | 3.3 | |
| Johnson & Johnson | Pharmaceuticals | 1.8 |
| Comcast Corp. | Cable & Satellite | 1.6 |
| UnitedHealth Group Inc. | Managed Health | |
| Care | 1.6 | |
| Visa Inc. | Data Processing & | |
| Outsourced Services | 1.6 | |
| Home Depot Inc. | Home Improvement | |
| Retail | 1.5 | |
| Top Ten | 31.5% | |
| The holdings listed exclude any temporary cash investments and equity index products. | ||
Investment Focus
1 The expense ratio shown is from the prospectus dated December 23, 2016, and represents estimated costs for the current fiscal year. For the fiscal year ended August 31, 2017, the expense ratio was 0.15%.
26
S&P 500 Growth Index Fund
Performance Summary
All of the returns in this report represent past performance, which is not a guarantee of future results that may be achieved by the fund. (Current performance may be lower or higher than the performance data cited. For performance data current to the most recent month-end, visit our website at vanguard.com/performance.) Note, too, that both investment returns and principal value can fluctuate widely, so an investor’s shares, when sold, could be worth more or less than their original cost. The returns shown do not reflect taxes that a shareholder would pay on fund distributions or on the sale of fund shares.
Cumulative Performance: September 7, 2010, Through August 31, 2017
Initial Investment of $10,000
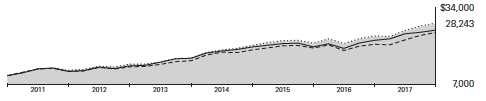
| Average Annual Total Returns | |||||
| Periods Ended August 31, 2017 | |||||
| Since | Final Value | ||||
| One | Five | Inception | of a $10,000 | ||
| Year | Years | (9/7/2010) | Investment | ||
| S&P 500 Growth Index Fund*ETF | |||||
| Shares Net Asset Value | 18.85% | 15.06% | 16.04% | $28,243 | |
| S&P 500 Growth Index Fund*ETF | |||||
| Shares Market Price | 18.81 | 15.06 | 16.04 | 28,245 | |
| • • • • • • • • | S&P 500 Growth Index | 19.05 | 15.23 | 16.22 | 28,551 |
| – – – – | Large-Cap Growth Funds Average | 19.84 | 13.99 | 14.18 | 25,239 |
| Dow Jones U.S. Total Stock Market | |||||
| Float Adjusted Index | 16.05 | 14.19 | 14.71 | 26,064 | |
Large-Cap Growth Funds Average: Derived from data provided by Lipper, a Thomson Reuters Company.
"Since Inception" performance is calculated from the ETF Shares’ inception date for both the fund and its comparative standards.
| Cumulative Returns of ETF Shares: September 7, 2010, Through August 31, 2017 | |||
| Since | |||
| One | Five | Inception | |
| Year | Years | (9/7/2010) | |
| S&P 500 Growth Index Fund ETF Shares Market Price | 18.81% | 101.69% | 182.45% |
| S&P 500 Growth Index Fund ETF Shares Net Asset Value | 18.85 | 101.63 | 182.43 |
| S&P 500 Growth Index | 19.05 | 103.13 | 185.51 |
| "Since Inception" performance is calculated from the ETF Shares’ inception date for both the fund and its comparative standards. | |||
See Financial Highlights for dividend and capital gains information.
27
S&P 500 Growth Index Fund
Fiscal-Year Total Returns (%): September 7, 2010, Through August 31, 2017
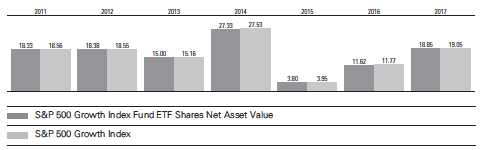
Average Annual Total Returns: Periods Ended June 30, 2017
This table presents returns through the latest calendar quarter—rather than through the end of the fiscal period.
Securities and Exchange Commission rules require that we provide this information.
| Inception | One | Five | Since | |
| Date | Year | Years | Inception | |
| ETF Shares | 9/7/2010 | |||
| Market Price | 19.21% | 15.07% | 15.79% | |
| Net Asset Value | 19.11 | 15.07 | 15.78 |
S&P 500 Growth Index Fund
Financial Statements
Statement of Net Assets
As of August 31, 2017
The fund reports a complete list of its holdings in regulatory filings four times in each fiscal year, at the quarter-ends. For the second and fourth fiscal quarters, the lists appear in the fund’s semiannual and annual reports to shareholders. For the first and third fiscal quarters, the fund files the lists with the Securities and Exchange Commission on Form N-Q. Shareholders can look up the fund’s Forms N-Q on the SEC’s website at sec.gov. Forms N-Q may also be reviewed and copied at the SEC’s Public Reference Room (see the back cover of this report for further information).
| Market | |||
| Value• | |||
| Shares | ($000) | ||
| Common Stocks (99.6%)1 | |||
| Consumer Discretionary (16.1%) | |||
| * | Amazon.com Inc. | 55,345 | 54,271 |
| Comcast Corp. Class A | 660,251 | 26,813 | |
| Home Depot Inc. | 166,790 | 24,997 | |
| * | Priceline Group Inc. | 6,860 | 12,705 |
| Walt Disney Co. | 119,740 | 12,118 | |
| * | Charter Communications | ||
| Inc. Class A | 30,090 | 11,992 | |
| McDonald’s Corp. | 70,500 | 11,278 | |
| Starbucks Corp. | 202,022 | 11,083 | |
| Time Warner Inc. | 108,194 | 10,938 | |
| * | Netflix Inc. | 60,129 | 10,505 |
| TJX Cos. Inc. | 89,743 | 6,488 | |
| Lowe’s Cos. Inc. | 76,612 | 5,661 | |
| NIKE Inc. Class B | 105,382 | 5,565 | |
| Marriott International Inc. | |||
| Class A | 43,344 | 4,490 | |
| Yum! Brands Inc. | 46,153 | 3,546 | |
| CBS Corp. Class B | 51,588 | 3,305 | |
| Ross Stores Inc. | 54,687 | 3,196 | |
| * | Dollar Tree Inc. | 32,943 | 2,624 |
| Dollar General Corp. | 35,190 | 2,553 | |
| Expedia Inc. | 16,920 | 2,510 | |
| * | O’Reilly Automotive Inc. | 12,733 | 2,497 |
| * | AutoZone Inc. | 3,917 | 2,070 |
| Newell Brands Inc. | 41,119 | 1,985 | |
| Twenty-First Century Fox | |||
| Inc. Class A | 70,406 | 1,943 | |
| * | Ulta Beauty Inc. | 8,144 | 1,800 |
| Omnicom Group Inc. | 23,526 | 1,703 | |
| Wynn Resorts Ltd. | 11,115 | 1,545 | |
| Hasbro Inc. | 15,660 | 1,539 | |
| * | LKQ Corp. | 43,009 | 1,490 |
| Royal Caribbean Cruises | |||
| Ltd. | 11,880 | 1,479 | |
| Hilton Worldwide | |||
| Holdings Inc. | 22,583 | 1,453 | |
| Market | |||
| Value• | |||
| Shares | ($000) | ||
| Darden Restaurants Inc. | 17,250 | 1,416 | |
| MGM Resorts | |||
| International | 42,432 | 1,399 | |
| Harley-Davidson Inc. | 24,451 | 1,149 | |
| Scripps Networks | |||
| Interactive Inc. Class A | 13,380 | 1,146 | |
| * | Mohawk Industries Inc. | 4,173 | 1,056 |
| * | DISH Network Corp. | ||
| Class A | 18,089 | 1,036 | |
| Advance Auto Parts Inc. | 10,303 | 1,009 | |
| Wyndham Worldwide | |||
| Corp. | 9,722 | 969 | |
| * | Michael Kors Holdings | ||
| Ltd. | 21,673 | 915 | |
| Twenty-First Century Fox | |||
| Inc. | 32,437 | 879 | |
| Garmin Ltd. | 15,945 | 821 | |
| Best Buy Co. Inc. | 15,127 | 821 | |
| Coach Inc. | 19,452 | 811 | |
| * | CarMax Inc. | 11,907 | 800 |
| * | Chipotle Mexican Grill Inc. | ||
| Class A | 2,201 | 697 | |
| Tiffany & Co. | 7,588 | 694 | |
| Hanesbrands Inc. | 26,334 | 639 | |
| Tractor Supply Co. | 10,466 | 623 | |
| * | Discovery | ||
| Communications Inc. | 29,313 | 616 | |
| Interpublic Group of | |||
| Cos. Inc. | 30,277 | 610 | |
| L Brands Inc. | 15,857 | 574 | |
| Leggett & Platt Inc. | 11,118 | 511 | |
| * | Discovery | ||
| Communications Inc. | |||
| Class A | 21,452 | 476 | |
| Mattel Inc. | 27,019 | 438 | |
| *,^ | Under Armour Inc. | ||
| Class A | 25,402 | 410 | |
| Foot Locker Inc. | 11,419 | 402 |
29
S&P 500 Growth Index Fund
| Market | |||
| Value• | |||
| Shares | ($000) | ||
| * | TripAdvisor Inc. | 9,292 | 397 |
| * | Under Armour Inc. | 25,561 | 386 |
| 267,842 | |||
| Consumer Staples (6.2%) | |||
| Altria Group Inc. | 269,480 | 17,085 | |
| Procter & Gamble Co. | 174,836 | 16,132 | |
| Philip Morris International | |||
| Inc. | 119,172 | 13,935 | |
| PepsiCo Inc. | 111,602 | 12,916 | |
| Coca-Cola Co. | 273,590 | 12,462 | |
| Colgate-Palmolive Co. | 68,990 | 4,942 | |
| Constellation Brands Inc. | |||
| Class A | 23,962 | 4,795 | |
| Kimberly-Clark Corp. | 25,800 | 3,181 | |
| General Mills Inc. | 44,291 | 2,359 | |
| Hershey Co. | 19,531 | 2,049 | |
| Estee Lauder Cos. Inc. | |||
| Class A | 18,057 | 1,932 | |
| Sysco Corp. | 36,284 | 1,911 | |
| * | Monster Beverage Corp. | 33,972 | 1,896 |
| Dr Pepper Snapple Group | |||
| Inc. | 15,407 | 1,403 | |
| Clorox Co. | 9,920 | 1,374 | |
| Kellogg Co. | 18,914 | 1,238 | |
| Church & Dwight Co. Inc. | 22,525 | 1,130 | |
| McCormick & Co. Inc. | 10,175 | 968 | |
| Brown-Forman Corp. | |||
| Class B | 15,225 | 808 | |
| Campbell Soup Co. | 16,534 | 764 | |
| Coty Inc. Class A | 27,889 | 462 | |
| 103,742 | |||
| Energy (1.9%) | |||
| Schlumberger Ltd. | 87,206 | 5,539 | |
| EOG Resources Inc. | 41,878 | 3,559 | |
| Pioneer Natural | |||
| Resources Co. | 23,674 | 3,069 | |
| Occidental Petroleum | |||
| Corp. | 45,866 | 2,738 | |
| Halliburton Co. | 70,224 | 2,737 | |
| ONEOK Inc. | 36,981 | 2,003 | |
| Anadarko Petroleum | |||
| Corp. | 39,086 | 1,600 | |
| Williams Cos. Inc. | 51,674 | 1,536 | |
| Apache Corp. | 33,962 | 1,319 | |
| Devon Energy Corp. | 40,338 | 1,267 | |
| * | Concho Resources Inc. | 11,106 | 1,232 |
| EQT Corp. | 14,508 | 904 | |
| Baker Hughes a GE Co. | 25,423 | 862 | |
| Cabot Oil & Gas Corp. | 31,695 | 810 | |
| Cimarex Energy Co. | 7,355 | 733 | |
| Noble Energy Inc. | 26,564 | 631 | |
| * | Newfield Exploration Co. | 18,620 | 487 |
| * | Chesapeake Energy Corp. | 48,686 | 177 |
| Market | |||
| Value• | |||
| Shares | ($000) | ||
| Range Resources Corp. | 9,724 | 169 | |
| Murphy Oil Corp. | 43 | 1 | |
| 31,373 | |||
| Financials (4.0%) | |||
| Charles Schwab Corp. | 169,753 | 6,773 | |
| US Bancorp | 123,762 | 6,343 | |
| Marsh & McLennan | |||
| Cos. Inc. | 71,893 | 5,613 | |
| S&P Global Inc. | 35,965 | 5,551 | |
| Intercontinental | |||
| Exchange Inc. | 82,650 | 5,345 | |
| Aon plc | 36,561 | 5,088 | |
| American Express Co. | 50,276 | 4,329 | |
| CME Group Inc. | 29,864 | 3,757 | |
| BlackRock Inc. | 8,275 | 3,467 | |
| Discover Financial | |||
| Services | 53,040 | 3,127 | |
| Moody’s Corp. | 23,165 | 3,105 | |
| T. Rowe Price Group Inc. | 21,882 | 1,846 | |
| Northern Trust Corp. | 19,269 | 1,705 | |
| * | E*TRADE Financial Corp. | 38,231 | 1,568 |
| Arthur J Gallagher & Co. | 24,982 | 1,446 | |
| Ameriprise Financial Inc. | 10,176 | 1,409 | |
| KeyCorp | 74,663 | 1,285 | |
| Comerica Inc. | 13,577 | 927 | |
| Cincinnati Financial Corp. | 11,684 | 898 | |
| Citizens Financial Group | |||
| Inc. | 26,981 | 894 | |
| CBOE Holdings Inc. | 8,332 | 841 | |
| Raymond James | |||
| Financial Inc. | 9,836 | 770 | |
| Nasdaq Inc. | 7,287 | 549 | |
| 66,636 | |||
| Health Care (16.1%) | |||
| Johnson & Johnson | 229,245 | 30,345 | |
| UnitedHealth Group Inc. | 134,439 | 26,740 | |
| AbbVie Inc. | 222,033 | 16,719 | |
| Pfizer Inc. | 466,235 | 15,815 | |
| Gilead Sciences Inc. | 182,300 | 15,260 | |
| * | Celgene Corp. | 108,932 | 15,134 |
| Merck & Co. Inc. | 236,578 | 15,108 | |
| Amgen Inc. | 56,465 | 10,038 | |
| * | Biogen Inc. | 29,801 | 9,434 |
| Bristol-Myers Squibb Co. | 126,407 | 7,645 | |
| Aetna Inc. | 46,275 | 7,298 | |
| Becton Dickinson and Co. | 31,718 | 6,326 | |
| Thermo Fisher Scientific | |||
| Inc. | 33,293 | 6,230 | |
| Stryker Corp. | 43,279 | 6,118 | |
| * | Regeneron | ||
| Pharmaceuticals Inc. | 10,630 | 5,282 | |
| * | Boston Scientific Corp. | 191,043 | 5,263 |
| Humana Inc. | 20,134 | 5,187 | |
30
S&P 500 Growth Index Fund
| Market | |||
| Value• | |||
| Shares | ($000) | ||
| * | Intuitive Surgical Inc. | 5,140 | 5,164 |
| Eli Lilly & Co. | 59,603 | 4,845 | |
| * | Alexion Pharmaceuticals | ||
| Inc. | 31,328 | 4,461 | |
| Zoetis Inc. | 68,492 | 4,294 | |
| Danaher Corp. | 45,165 | 3,768 | |
| * | Edwards Lifesciences | ||
| Corp. | 29,269 | 3,327 | |
| * | Incyte Corp. | 23,656 | 3,251 |
| CR Bard Inc. | 10,103 | 3,241 | |
| * | Vertex Pharmaceuticals | ||
| Inc. | 19,761 | 3,172 | |
| * | Illumina Inc. | 14,104 | 2,884 |
| * | Cerner Corp. | 41,015 | 2,780 |
| * | Mettler-Toledo | ||
| International Inc. | 3,632 | 2,198 | |
| Zimmer Biomet Holdings | |||
| Inc. | 17,905 | 2,046 | |
| * | IDEXX Laboratories Inc. | 12,295 | 1,911 |
| Agilent Technologies Inc. | 29,213 | 1,891 | |
| * | Align Technology Inc. | 10,512 | 1,858 |
| * | Quintiles IMS Holdings | ||
| Inc. | 19,079 | 1,832 | |
| * | HCA Healthcare Inc. | 20,294 | 1,596 |
| * | Varian Medical Systems | ||
| Inc. | 12,958 | 1,377 | |
| * | Waters Corp. | 7,390 | 1,356 |
| Quest Diagnostics Inc. | 11,902 | 1,290 | |
| Cooper Cos. Inc. | 4,898 | 1,229 | |
| * | Laboratory Corp. of | ||
| America Holdings | 7,799 | 1,223 | |
| ResMed Inc. | 12,980 | 1,007 | |
| * | Hologic Inc. | 23,349 | 901 |
| Universal Health Services | |||
| Inc. Class B | 5,634 | 609 | |
| * | Envision Healthcare Corp. | 6,802 | 356 |
| 267,809 | |||
| Industrials (11.0%) | |||
| General Electric Co. | 571,020 | 14,019 | |
| Boeing Co. | 52,468 | 12,575 | |
| 3M Co. | 56,692 | 11,583 | |
| United Parcel Service Inc. | |||
| Class B | 96,089 | 10,989 | |
| Lockheed Martin Corp. | 34,727 | 10,605 | |
| Honeywell International | |||
| Inc. | 62,748 | 8,676 | |
| Union Pacific Corp. | 77,725 | 8,184 | |
| General Dynamics Corp. | 39,549 | 7,963 | |
| FedEx Corp. | 34,317 | 7,357 | |
| Northrop Grumman Corp. | 24,355 | 6,630 | |
| Illinois Tool Works Inc. | 43,374 | 5,964 | |
| Caterpillar Inc. | 42,740 | 5,022 | |
| Raytheon Co. | 27,207 | 4,952 | |
| Market | |||
| Value• | |||
| Shares | ($000) | ||
| Southwest Airlines Co. | 84,355 | 4,398 | |
| Waste Management Inc. | 56,704 | 4,372 | |
| CSX Corp. | 81,018 | 4,067 | |
| Cummins Inc. | 21,559 | 3,436 | |
| Ingersoll-Rand plc | 35,718 | 3,050 | |
| Rockwell Automation Inc. | 17,974 | 2,949 | |
| Fortive Corp. | 41,969 | 2,727 | |
| Emerson Electric Co. | 41,259 | 2,436 | |
| * | United Continental | ||
| Holdings Inc. | 39,312 | 2,436 | |
| Equifax Inc. | 16,733 | 2,384 | |
| Deere & Co. | 20,070 | 2,327 | |
| Republic Services Inc. | |||
| Class A | 32,019 | 2,089 | |
| Parker-Hannifin Corp. | 12,635 | 2,033 | |
| Rockwell Collins Inc. | 14,272 | 1,870 | |
| Roper Technologies Inc. | 7,817 | 1,803 | |
| TransDigm Group Inc. | 6,798 | 1,772 | |
| * | Verisk Analytics Inc. | ||
| Class A | 21,556 | 1,747 | |
| Fastenal Co. | 40,355 | 1,722 | |
| PACCAR Inc. | 25,484 | 1,690 | |
| Cintas Corp. | 12,022 | 1,623 | |
| Xylem Inc. | 25,072 | 1,556 | |
| Stanley Black & Decker | |||
| Inc. | 10,244 | 1,475 | |
| * | United Rentals Inc. | 11,791 | 1,392 |
| WW Grainger Inc. | 7,470 | 1,214 | |
| JB Hunt Transport | |||
| Services Inc. | 12,115 | 1,198 | |
| AO Smith Corp. | 20,420 | 1,137 | |
| Acuity Brands Inc. | 6,122 | 1,082 | |
| Masco Corp. | 27,577 | 1,014 | |
| Nielsen Holdings plc | 25,669 | 997 | |
| Fortune Brands Home | |||
| & Security Inc. | 15,217 | 952 | |
| L3 Technologies Inc. | 4,880 | 886 | |
| Expeditors International | |||
| of Washington Inc. | 15,693 | 880 | |
| Alaska Air Group Inc. | 10,992 | 821 | |
| * | Quanta Services Inc. | 20,978 | 754 |
| CH Robinson Worldwide | |||
| Inc. | 9,800 | 692 | |
| Allegion plc | 8,517 | 670 | |
| Snap-on Inc. | 4,290 | 633 | |
| * | IHS Markit Ltd. | 12,351 | 579 |
| 183,382 | |||
| Information Technology (36.4%) | |||
| Apple Inc. | 727,372 | 119,289 | |
| Microsoft Corp. | 1,077,073 | 80,533 | |
| * | Facebook Inc. Class A | 329,760 | 56,709 |
| * | Alphabet Inc. Class A | 41,522 | 39,663 |
| * | Alphabet Inc. Class C | 41,628 | 39,102 |
31
| S&P 500 Growth Index Fund | |||
| Market | |||
| Value• | |||
| Shares | ($000) | ||
| Visa Inc. Class A | 257,567 | 26,663 | |
| Mastercard Inc. Class A | 130,858 | 17,443 | |
| Broadcom Ltd. | 55,994 | 14,114 | |
| NVIDIA Corp. | 83,008 | 14,065 | |
| Oracle Corp. | 243,046 | 12,233 | |
| Texas Instruments Inc. | 138,995 | 11,512 | |
| Accenture plc Class A | 86,507 | 11,312 | |
| Intel Corp. | 315,333 | 11,059 | |
| QUALCOMM Inc. | 206,115 | 10,774 | |
| * | Adobe Systems Inc. | 69,015 | 10,708 |
| International Business | |||
| Machines Corp. | 67,985 | 9,724 | |
| * | PayPal Holdings Inc. | 155,855 | 9,613 |
| * | salesforce.com Inc. | 93,283 | 8,908 |
| Applied Materials Inc. | 149,844 | 6,761 | |
| Automatic Data | |||
| Processing Inc. | 62,418 | 6,646 | |
| Activision Blizzard Inc. | 96,731 | 6,342 | |
| * | Electronic Arts Inc. | 43,252 | 5,255 |
| Intuit Inc. | 33,957 | 4,803 | |
| Fidelity National | |||
| Information Services Inc. | 46,120 | 4,285 | |
| Analog Devices Inc. | 51,202 | 4,284 | |
| Cognizant Technology | |||
| Solutions Corp. Class A | 57,520 | 4,071 | |
| Lam Research Corp. | 22,564 | 3,745 | |
| Corning Inc. | 128,380 | 3,692 | |
| * | Fiserv Inc. | 29,629 | 3,665 |
| Amphenol Corp. Class A | 42,789 | 3,463 | |
| Microchip Technology Inc. | 32,004 | 2,778 | |
| Skyworks Solutions Inc. | 25,732 | 2,711 | |
| * | Red Hat Inc. | 24,849 | 2,671 |
| Paychex Inc. | 44,644 | 2,546 | |
| Harris Corp. | 16,951 | 2,083 | |
| * | Autodesk Inc. | 17,893 | 2,048 |
| KLA-Tencor Corp. | 21,820 | 2,044 | |
| Global Payments Inc. | 21,254 | 2,030 | |
| Motorola Solutions Inc. | 22,991 | 2,026 | |
| * | eBay Inc. | 54,739 | 1,978 |
| TE Connectivity Ltd. | 24,682 | 1,965 | |
| DXC Technology Co. | 20,847 | 1,772 | |
| * | Synopsys Inc. | 20,970 | 1,686 |
| * | Citrix Systems Inc. | 21,015 | 1,644 |
| Total System Services Inc. | 23,055 | 1,594 | |
| * | Gartner Inc. | 12,588 | 1,518 |
| Xilinx Inc. | 22,653 | 1,496 | |
| * | Advanced Micro Devices | ||
| Inc. | 107,859 | 1,402 | |
| * | VeriSign Inc. | 12,276 | 1,274 |
| Symantec Corp. | 42,273 | 1,267 | |
| * | Akamai Technologies Inc. | 23,962 | 1,130 |
| * | F5 Networks Inc. | 9,042 | 1,079 |
| Market | |||
| Value• | |||
| Shares | ($000) | ||
| Alliance Data Systems | |||
| Corp. | 4,657 | 1,050 | |
| * | ANSYS Inc. | 7,395 | 953 |
| NetApp Inc. | 23,641 | 914 | |
| Juniper Networks Inc. | 29,808 | 827 | |
| Western Union Co. | 43,450 | 822 | |
| FLIR Systems Inc. | 13,163 | 500 | |
| CSRA Inc. | 9,678 | 305 | |
| 606,549 | |||
| Materials (2.1%) | |||
| Monsanto Co. | 41,016 | 4,807 | |
| Praxair Inc. | 22,282 | 2,931 | |
| Newmont Mining Corp. | 74,220 | 2,846 | |
| Ecolab Inc. | 20,030 | 2,670 | |
| Sherwin-Williams Co. | 7,800 | 2,646 | |
| Air Products & Chemicals | |||
| Inc. | 17,275 | 2,511 | |
| Vulcan Materials Co. | 18,437 | 2,236 | |
| PPG Industries Inc. | 18,930 | 1,975 | |
| Martin Marietta Materials | |||
| Inc. | 8,782 | 1,862 | |
| Albemarle Corp. | 15,565 | 1,810 | |
| * | Freeport-McMoRan Inc. | 112,768 | 1,667 |
| Packaging Corp. of | |||
| America | 13,143 | 1,477 | |
| Nucor Corp. | 26,262 | 1,447 | |
| EI du Pont de Nemours | |||
| & Co. | 15,130 | 1,270 | |
| FMC Corp. | 12,260 | 1,057 | |
| International Flavors | |||
| & Fragrances Inc. | 6,410 | 877 | |
| Sealed Air Corp. | 14,445 | 641 | |
| Avery Dennison Corp. | 6,643 | 626 | |
| 35,356 | |||
| Real Estate (4.0%) | |||
| American Tower Corp. | 59,293 | 8,778 | |
| Equinix Inc. | 10,870 | 5,092 | |
| Prologis Inc. | 73,983 | 4,688 | |
| Simon Property Group | |||
| Inc. | 28,746 | 4,509 | |
| Crown Castle | |||
| International Corp. | 36,509 | 3,959 | |
| Welltower Inc. | 51,083 | 3,740 | |
| AvalonBay Communities | |||
| Inc. | 19,223 | 3,609 | |
| Public Storage | 13,527 | 2,778 | |
| Digital Realty Trust Inc. | 22,239 | 2,632 | |
| Equity Residential | 34,319 | 2,304 | |
| * | SBA Communications | ||
| Corp. Class A | 12,960 | 1,990 | |
| Ventas Inc. | 28,220 | 1,931 | |
| Host Hotels & Resorts | |||
| Inc. | 103,201 | 1,870 | |
32
S&P 500 Growth Index Fund
| Market | |||
| Value• | |||
| Shares | ($000) | ||
| Boston Properties Inc. | 13,952 | 1,683 | |
| GGP Inc. | 80,969 | 1,680 | |
| Alexandria Real Estate | |||
| Equities Inc. | 12,659 | 1,536 | |
| Duke Realty Corp. | 49,608 | 1,474 | |
| UDR Inc. | 37,304 | 1,448 | |
| Extra Space Storage Inc. | 17,566 | 1,364 | |
| Realty Income Corp. | 23,566 | 1,356 | |
| Essex Property Trust Inc. | 4,839 | 1,287 | |
| Kimco Realty Corp. | 59,382 | 1,165 | |
| Mid-America Apartment | |||
| Communities Inc. | 9,650 | 1,027 | |
| Apartment Investment | |||
| & Management Co. | 21,764 | 987 | |
| Vornado Realty Trust | 12,016 | 895 | |
| Regency Centers Corp. | 12,856 | 827 | |
| Federal Realty Investment | |||
| Trust | 6,349 | 806 | |
| Iron Mountain Inc. | 19,377 | 764 | |
| * | CBRE Group Inc. Class A | 18,579 | 670 |
| * | JBG SMITH Properties | 35 | 1 |
| 66,850 | |||
| Telecommunication Services (1.0%) | |||
| Verizon Communications | |||
| Inc. | 301,625 | 14,469 | |
| * | Level 3 Communications | ||
| Inc. | 22,869 | 1,245 | |
| 15,714 | |||
| Utilities (0.8%) | |||
| NextEra Energy Inc. | 32,004 | 4,817 | |
| Dominion Energy Inc. | 41,242 | 3,249 | |
| American Water Works | |||
| Co. Inc. | 24,860 | 2,011 | |
| WEC Energy Group Inc. | 22,894 | 1,493 | |
| CenterPoint Energy Inc. | 34,633 | 1,026 | |
| Alliant Energy Corp. | 14,848 | 634 | |
| 13,230 | |||
| Total Common Stocks | |||
| (Cost $1,307,622) | 1,658,483 | ||
| Market | |||
| Value• | |||
| Shares | ($000) | ||
| Temporary Cash Investments (0.4%)1 | |||
| Money Market Fund (0.3%) | |||
| 2,3 | Vanguard Market | ||
| Liquidity Fund, | |||
| 1.224% | 50,288 | 5,030 | |
| Face | |||
| Amount | |||
| ($000) | |||
| U. S. Government and Agency Obligations (0.1%) | |||
| 4 | United States | ||
| Treasury Bill, | |||
| 0.923%, 9/21/17 | 100 | 100 | |
| 4 | United States | ||
| Treasury Bill, | |||
| 0.980%, 10/5/17 | 100 | 100 | |
| 4 | United States | ||
| Treasury Bill, | |||
| 1.036%%–1.079%, | |||
| 11/2/17 | 520 | 519 | |
| 719 | |||
| Total Temporary Cash Investments | |||
| (Cost $5,748) | 5,749 | ||
| Total Investments (100.0%) | |||
| (Cost $1,313,370) | 1,664,232 | ||
| Amount | |||
| ($000) | |||
| Other Assets and Liabilities (0.0%) | |||
| Other Assets | |||
| Investment in Vanguard | 105 | ||
| Receivables for Investment Securities Sold 3,786 | |||
| Receivables for Accrued Income | 2,629 | ||
| Receivables for Capital Shares Issued | 4 | ||
| Variation Margin Receivable— | |||
| Futures Contracts | 41 | ||
| Total Other Assets | 6,565 | ||
| Liabilities | |||
| Payables for Investment Securities | |||
| Purchased | (5,796) | ||
| Collateral for Securities on Loan | (255) | ||
| Payables to Vanguard | (355) | ||
| Other Liabilities | (3) | ||
| Total Liabilities | (6,409) | ||
| Net Assets (100%) | 1,664,388 | ||
33
S&P 500 Growth Index Fund
| At August 31, 2017, net assets consisted of: | |
| Amount | |
| ($000) | |
| Paid-in Capital | 1,334,002 |
| Undistributed Net Investment Income | 5,002 |
| Accumulated Net Realized Losses | (25,540) |
| Unrealized Appreciation (Depreciation) | |
| Investment Securities | 350,862 |
| Futures Contracts | 62 |
| Net Assets | 1,664,388 |
| ETF Shares—Net Assets | |
| Applicable to 13,025,000 outstanding | |
| $.001 par value shares of beneficial | |
| interest (unlimited authorization) | 1,664,388 |
| Net Asset Value Per Share— | |
| ETF Shares | $127.78 |
• See Note A in Notes to Financial Statements.
*Non-income-producing security.
^ Includes partial security positions on loan to broker-dealers.
The total value of securities on loan is $242,000.
1 The fund invests a portion of its cash reserves in equity markets
through the use of index futures contracts. After giving effect
to futures investments, the fund’s effective common stock and
temporary cash investment positions represent 100.1% and
-0.1%, respectively, of net assets.
2 Includes $255,000 of collateral received for securities on loan.
3 Affiliated money market fund available only to Vanguard funds
and certain trusts and accounts managed by Vanguard. Rate
shown is the 7-day yield.
4 Securities with a value of $350,000 have been segregated as
initial margin for open futures contracts.
| Derivative Financial Instruments Outstanding as of Period End | ||||
| Futures Contracts | ||||
| ($000) | ||||
| Value and | ||||
| Number of | Unrealized | |||
| Long (Short) | Notional | Appreciation | ||
| Expiration | Contracts | Amount | (Depreciation) | |
| Long Futures Contracts | ||||
| E-mini S&P 500 Index | September 2017 | 58 | 7,163 | 62 |
Unrealized appreciation (depreciation) on open futures contracts is required to be treated as realized gain (loss) for tax purposes.
See accompanying Notes, which are an integral part of the Financial Statements.
34
| S&P 500 Growth Index Fund | |
| Statement of Operations | |
| Year Ended | |
| August 31,2017 | |
| ($000) | |
| Investment Income | |
| Income | |
| Dividends | 23,258 |
| Interest1 | 30 |
| Securities Lending—Net | 29 |
| Total Income | 23,317 |
| Expenses | |
| The Vanguard Group—Note B | |
| Investment Advisory Services | 282 |
| Management and Administrative | 1,498 |
| Marketing and Distribution | 82 |
| Custodian Fees | 44 |
| Auditing Fees | 35 |
| Shareholders’ Reports and Proxy | 79 |
| Trustees’ Fees and Expenses | 1 |
| Total Expenses | 2,021 |
| Net Investment Income | 21,296 |
| Realized Net Gain (Loss) | |
| Investment Securities Sold1 | 17,172 |
| Futures Contracts | 427 |
| Realized Net Gain (Loss) | 17,599 |
| Change in Unrealized Appreciation (Depreciation) | |
| Investment Securities | 205,535 |
| Futures Contracts | 42 |
| Change in Unrealized Appreciation (Depreciation) | 205,577 |
| Net Increase (Decrease) in Net Assets Resulting from Operations | 244,472 |
1 Interest income and realized net gain (loss) from an affiliated company of the fund were $28,000 and $0, respectively.
See accompanying Notes, which are an integral part of the Financial Statements.
35
| S&P 500 Growth Index Fund | ||
| Statement of Changes in Net Assets | ||
| Year Ended August 31, | ||
| 2017 | 2016 | |
| ($000) | ($000) | |
| Increase (Decrease) in Net Assets | ||
| Operations | ||
| Net Investment Income | 21,296 | 12,234 |
| Realized Net Gain (Loss) | 17,599 | (12,411) |
| Change in Unrealized Appreciation (Depreciation) | 205,577 | 90,333 |
| Net Increase (Decrease) in Net Assets Resulting from Operations | 244,472 | 90,156 |
| Distributions | ||
| Net Investment Income | (19,314) | (10,749) |
| Realized Capital Gain | — | — |
| Total Distributions | (19,314) | (10,749) |
| Capital Share Transactions | ||
| Issued | 455,621 | 409,258 |
| Issued in Lieu of Cash Distributions | — | — |
| Redeemed | (47,587) | (27,919) |
| Net Increase (Decrease) from Capital Share Transactions | 408,034 | 381,339 |
| Total Increase (Decrease) | 633,192 | 460,746 |
| Net Assets | ||
| Beginning of Period | 1,031,196 | 570,450 |
| End of Period1 | 1,664,388 | 1,031,196 |
1 Net Assets—End of Period includes undistributed (overdistributed) net investment income of $5,002,000 and $3,020,000.
See accompanying Notes, which are an integral part of the Financial Statements.
36
| S&P 500 Growth Index Fund | |||||
| Financial Highlights | |||||
| ETF Shares | |||||
| For a Share Outstanding | Year Ended August 31, | ||||
| Throughout Each Period | 2017 | 2016 | 2015 | 2014 | 2013 |
| Net Asset Value, Beginning of Period | $109.12 | $99.21 | $96.99 | $77.29 | $68.43 |
| Investment Operations | |||||
| Net Investment Income | 1.8411 | 1.565 | 1.523 | 1.257 | 1.291 |
| Net Realized and Unrealized Gain (Loss) | |||||
| on Investments | 18.527 | 9.857 | 2.193 | 19.715 | 8.848 |
| Total from Investment Operations | 20.368 | 11.422 | 3.716 | 20.972 | 10.139 |
| Distributions | |||||
| Dividends from Net Investment Income | (1.708) | (1.512) | (1.496) | (1.272) | (1.279) |
| Distributions from Realized Capital Gains | — | — | — | — | — |
| Total Distributions | (1.708) | (1.512) | (1.496) | (1.272) | (1.279) |
| Net Asset Value, End of Period | $127.78 | $109.12 | $99.21 | $96.99 | $77.29 |
| Total Return | 18.85% | 11.62% | 3.80% | 27.33% | 15.00% |
| Ratios/Supplemental Data | |||||
| Net Assets, End of Period (Millions) | $1,664 | $1,031 | $570 | $325 | $147 |
| Ratio of Total Expenses to Average Net Assets | 0.15% | 0.15% | 0.15% | 0.15% | 0.15% |
| Ratio of Net Investment Income to | |||||
| Average Net Assets | 1.57% | 1.59% | 1.62% | 1.56% | 1.81% |
| Portfolio Turnover Rate2 | 19% | 20% | 21% | 23% | 24% |
1 Calculated based on average shares outstanding.
2 Excludes the value of portfolio securities received or delivered as a result of in-kind purchases or redemptions of the fund’s capital shares, including ETF Creation Units.
See accompanying Notes, which are an integral part of the Financial Statements.
37
S&P 500 Growth Index Fund
Notes to Financial Statements
Vanguard S&P 500 Growth Index Fund is registered under the Investment Company Act of 1940 as an open-end investment company, or mutual fund. The fund offers two classes of shares: ETF Shares and Institutional Shares. ETF Shares are listed for trading on NYSE Arca; they can be purchased and sold through a broker. Institutional Shares are designed for investors who meet certain administrative, service, and account-size criteria. The fund has not issued any Institutional Shares as of August 31, 2017.
A. The following significant accounting policies conform to generally accepted accounting principles for U.S. investment companies. The fund consistently follows such policies in preparing its financial statements.
1. Security Valuation: Securities are valued as of the close of trading on the New York Stock Exchange (generally 4 p.m., Eastern time) on the valuation date. Equity securities are valued at the latest quoted sales prices or official closing prices taken from the primary market in which each security trades; such securities not traded on the valuation date are valued at the mean of the latest quoted bid and asked prices. Securities for which market quotations are not readily available, or whose values have been materially affected by events occurring before the fund’s pricing time but after the close of the securities’ primary markets, are valued by methods deemed by the board of trustees to represent fair value. Investments in Vanguard Market Liquidity Fund are valued at that fund’s net asset value. Temporary cash investments are valued using the latest bid prices or using valuations based on a matrix system (which considers such factors as security prices, yields, maturities, and ratings), both as furnished by independent pricing services.
2. Futures Contracts: The fund uses index futures contracts to a limited extent, with the objectives of maintaining full exposure to the stock market, enhancing returns, maintaining liquidity, and minimizing transaction costs. The fund may purchase futures contracts to immediately invest incoming cash in the market, or sell futures in response to cash outflows, thereby simulating a fully invested position in the underlying index while maintaining a cash balance for liquidity. The fund may seek to enhance returns by using futures contracts instead of the underlying securities when futures are believed to be priced more attractively than the underlying securities. The primary risks associated with the use of futures contracts are imperfect correlation between changes in market values of stocks held by the fund and the prices of futures contracts, and the possibility of an illiquid market. Counterparty risk involving futures is mitigated because a regulated clearinghouse is the counterparty instead of the clearing broker. To further mitigate counterparty risk, the fund trades futures contracts on an exchange, monitors the financial strength of its clearing brokers and clearinghouse, and has entered into clearing agreements with its clearing brokers. The clearinghouse imposes initial margin requirements to secure the fund’s performance and requires daily settlement of variation margin representing changes in the market value of each contract.
Futures contracts are valued at their quoted daily settlement prices. The notional amounts of the contracts are not recorded in the Statement of Net Assets. Fluctuations in the value of the contracts are recorded in the Statement of Net Assets as an asset (liability) and in the Statement of Operations as unrealized appreciation (depreciation) until the contracts are closed, when they are recorded as realized futures gains (losses).
During the year ended August 31, 2017, the fund’s average investments in long and short futures contracts represented less than 1% and 0% of net assets, respectively, based on the average of the notional amounts at each quarter-end during the period.
38
S&P 500 Growth Index Fund
3. Federal Income Taxes: The fund intends to continue to qualify as a regulated investment company and distribute all of its taxable income. Management has analyzed the fund’s tax positions taken for all open federal income tax years (August 31, 2014–2017), and has concluded that no provision for federal income tax is required in the fund’s financial statements.
4. Distributions: Distributions to shareholders are recorded on the ex-dividend date.
5. Securities Lending: To earn additional income, the fund lends its securities to qualified institutional borrowers. Security loans are subject to termination by the fund at any time, and are required to be secured at all times by collateral in an amount at least equal to the market value of securities loaned. Daily market fluctuations could cause the value of loaned securities to be more or less than the value of the collateral received. When this occurs, the collateral is adjusted and settled on the next business day. The fund further mitigates its counterparty risk by entering into securities lending transactions only with a diverse group of prequalified counterparties, monitoring their financial strength, and entering into master securities lending agreements with its counterparties. The master securities lending agreements provide that, in the event of a counterparty’s default (including bankruptcy), the fund may terminate any loans with that borrower, determine the net amount owed, and sell or retain the collateral up to the net amount owed to the fund; however, such actions may be subject to legal proceedings. While collateral mitigates counterparty risk, in the event of a default, the fund may experience delays and costs in recovering the securities loaned. The fund invests cash collateral received in Vanguard Market Liquidity Fund, and records a liability in the Statement of Net Assets for the return of the collateral, during the period the securities are on loan. Securities lending income represents fees charged to borrowers plus income earned on invested cash collateral, less expenses associated with the loan. During the term of the loan, the fund is entitled to all distributions made on or in respect of the loaned securities.
6. Credit Facility: The fund and certain other funds managed by The Vanguard Group (“Vanguard”) participate in a $3.1 billion committed credit facility provided by a syndicate of lenders pursuant to a credit agreement that may be renewed annually; each fund is individually liable for its borrowings, if any, under the credit facility. Borrowings may be utilized for temporary and emergency purposes, and are subject to the fund’s regulatory and contractual borrowing restrictions. The participating funds are charged administrative fees and an annual commitment fee of 0.10% of the undrawn amount of the facility; these fees are allocated to the funds based on a method approved by the fund’s board of trustees and included in Management and Administrative expenses on the fund’s Statement of Operations. Any borrowings under this facility bear interest at a rate based upon the higher of the one-month London Interbank Offered Rate, federal funds effective rate, or overnight bank funding rate plus an agreed-upon spread.
The fund had no borrowings outstanding at August 31, 2017, or at any time during the period then ended.
7. Other: Dividend income is recorded on the ex-dividend date. Interest income includes income distributions received from Vanguard Market Liquidity Fund and is accrued daily. Premiums and discounts on debt securities purchased are amortized and accreted, respectively, to interest income over the lives of the respective securities. Security transactions are accounted for on the date securities are bought or sold. Costs used to determine realized gains (losses) on the sale of investment securities are those of the specific securities sold.
39
S&P 500 Growth Index Fund
B. In accordance with the terms of a Funds’ Service Agreement (the “FSA”) between Vanguard and the fund, Vanguard furnishes to the fund investment advisory, corporate management, administrative, marketing, and distribution services at Vanguard’s cost of operations (as defined by the FSA). These costs of operations are allocated to the fund based on methods and guidelines approved by the board of trustees. Vanguard does not require reimbursement in the current period for certain costs of operations (such as deferred compensation/benefits and risk/insurance costs); the fund’s liability for these costs of operations is included in Payables to Vanguard on the Statement of Net Assets.
Upon the request of Vanguard, the fund may invest up to 0.40% of its net assets as capital in Vanguard. At August 31, 2017, the fund had contributed to Vanguard capital in the amount of $105,000, representing 0.01% of the fund’s net assets and 0.04% of Vanguard’s capitalization. The fund’s trustees and officers are also directors and employees, respectively, of Vanguard.
C. Various inputs may be used to determine the value of the fund’s investments. These inputs are summarized in three broad levels for financial statement purposes. The inputs or methodologies used to value securities are not necessarily an indication of the risk associated with investing in those securities.
Level 1—Quoted prices in active markets for identical securities.
Level 2—Other significant observable inputs (including quoted prices for similar securities, interest rates, prepayment speeds, credit risk, etc.).
Level 3—Significant unobservable inputs (including the fund’s own assumptions used to determine the fair value of investments). Any investments valued with significant unobservable inputs are
noted on the Statement of Net Assets.
The following table summarizes the market value of the fund’s investments as of August 31, 2017, based on the inputs used to value them:
| Level 1 | Level 2 | Level 3 | |
| Investments | ($000) | ($000) | ($000) |
| Common Stocks | 1,658,483 | — | — |
| Temporary Cash Investments | 5,030 | 719 | — |
| Futures Contracts—Assets1 | 41 | — | — |
| Total | 1,663,554 | 719 | — |
| 1 Represents variation margin on the last day of the reporting period. |
D. Distributions are determined on a tax basis and may differ from net investment income and realized capital gains for financial reporting purposes. Differences may be permanent or temporary. Permanent differences are reclassified among capital accounts in the financial statements to reflect their tax character. Temporary differences arise when certain items of income, expense, gain, or loss are recognized in different periods for financial statement and tax purposes. These differences will reverse at some time in the future. Differences in classification may also result from the treatment of short-term gains as ordinary income for tax purposes.
40
S&P 500 Growth Index Fund
During the year ended August 31, 2017, the fund realized $21,639,000 of net capital gains resulting from in-kind redemptions—in which shareholders exchanged fund shares for securities held by the fund rather than for cash. Because such gains are not taxable to the fund, and are not distributed to shareholders, they have been reclassified from accumulated net realized losses to paid-in capital.
For tax purposes, at August 31, 2017, the fund had $5,244,000 of ordinary income available for distribution. The fund had available capital losses totaling $25,477,000 that may be carried forward indefinitely to offset future net capital gains.
At August 31, 2017, the cost of investment securities for tax purposes was $1,313,370,000. Net unrealized appreciation of investment securities for tax purposes was $350,862,000, consisting of unrealized gains of $375,107,000 on securities that had risen in value since their purchase and $24,245,000 in unrealized losses on securities that had fallen in value since their purchase.
E. During the year ended August 31, 2017, the fund purchased $708,155,000 of investment securities and sold $300,425,000 of investment securities, other than temporary cash investments. Purchases and sales include $435,418,000 and $47,057,000, respectively, in connection with in-kind purchases and redemptions of the fund’s capital shares.
The fund purchased securities from and sold securities to other Vanguard funds or accounts managed by Vanguard or its affiliates, in accordance with procedures adopted by the board of trustees in compliance with Rule 17a-7 of the Investment Company Act of 1940. For the year ended August 31, 2017, such purchases and sales were $83,068,000 and $22,785,000, respectively; these amounts are included in the purchases and sales of investment securities noted above.
| F. Capital shares issued and redeemed were: | ||
| Year Ended August 31, | ||
| 2017 | 2016 | |
| Shares | Shares | |
| (000) | (000) | |
| Issued | 3,975 | 3,975 |
| Issued in Lieu of Cash Distributions | — | — |
| Redeemed | (400) | (275) |
| Net Increase (Decrease) in Shares Outstanding | 3,575 | 3,700 |
G. Management has determined that no material events or transactions occurred subsequent to August 31, 2017, that would require recognition or disclosure in these financial statements.
41
Report of Independent Registered Public Accounting Firm
To the Board of Trustees of Vanguard Admiral Funds and the Shareholders of Vanguard S&P 500 Value Index Fund and Vanguard S&P 500 Growth Index Fund:
In our opinion, the accompanying statements of net assets and the related statements of operations and of changes in net assets and the financial highlights present fairly, in all material respects, the financial position of Vanguard S&P 500 Value Index Fund and Vanguard S&P 500 Growth Index Fund (constituting separate portfolios of Vanguard Admiral Funds, hereafter referred to as the “Funds”) as of August 31, 2017, the results of each of their operations for the year then ended, the changes in each of their net assets for each of the two years in the period then ended and the financial highlights for each of the periods indicated, in conformity with accounting principles generally accepted in the United States of America. These financial statements and financial highlights (hereafter referred to as “financial statements”) are the responsibility of the Funds’ management. Our responsibility is to express an opinion on these financial statements based on our audits. We conducted our audits of these financial statements in accordance with the standards of the Public Company Accounting Oversight Board (United States). Those standards require that we plan and perform the audit to obtain reasonable assurance about whether the financial statements are free of material misstatement. An audit includes examining, on a test basis, evidence supporting the amounts and disclosures in the financial statements, assessing the accounting principles used and significant estimates made by management, and evaluating the overall financial statement presentation. We believe that our audits, which included confirmation of securities as of August 31, 2017 by correspondence with the custodian and brokers and by agreement to the underlying ownership records of the transfer agent, provide a reasonable basis for our opinion.
/s/PricewaterhouseCoopers LLP
Philadelphia, Pennsylvania
October 17, 2017
42
Special 2017 tax information (unaudited) for Vanguard S&P 500 Index Funds
This information for the fiscal year ended August 31, 2017, is included pursuant to provisions of the Internal Revenue Code.
The funds distributed qualified dividend income to shareholders during the fiscal year as follows:
| Fund | ($000) |
| S&P 500 Value Index | 14,369 |
| S&P 500 Growth Index | 19,314 |
For corporate shareholders, the percentage of investment income (dividend income plus short-term gains, if any) that qualifies for the dividends-received deduction is as follows:
| Fund | Percentage |
| S&P 500 Value Index | 97.3% |
| S&P 500 Growth Index | 98.7 |
43
Your Fund’s After-Tax Returns
This table presents returns for your fund both before and after taxes. The after-tax returns are shown in two ways: (1) assuming that an investor owned the fund during the entire period and paid taxes on the fund’s distributions, and (2) assuming that an investor paid taxes on the fund’s distributions and sold all shares at the end of each period.
Calculations are based on the highest individual federal income tax and capital gains tax rates in effect at the times of the distributions and the hypothetical sales. State and local taxes were not considered. After-tax returns reflect any qualified dividend income, using actual prior-year figures and estimates for 2017. (In the example, returns after the sale of fund shares may be higher than those assuming no sale. This occurs when the sale would have produced a capital loss. The calculation assumes that the investor received a tax deduction for the loss.)
Please note that your actual after-tax returns will depend on your tax situation and may differ from those shown. Also note that if you own the fund in a tax-deferred account, such as an individual retirement account or a 401(k) plan, this information does not apply to you. Such accounts are not subject to current taxes.
Finally, keep in mind that a fund’s performance—whether before or after taxes—does not guarantee future results.
| Average Annual Total Returns: S&P 500 Value and Growth Index Funds | |||
| Periods Ended August 31, 2017 | |||
| Since | |||
| One | Five | Inception | |
| Year | Years | (9/7/2010) | |
| S&P 500 Value Index Fund ETF Shares | |||
| Returns Before Taxes | 12.19% | 13.02% | 13.04% |
| Returns After Taxes on Distributions | 11.58 | 12.45 | 12.55 |
| Returns After Taxes on Distributions and Sale of | |||
| Fund Shares | 7.36 | 10.36 | 10.61 |
| Since | |||
| One | Five | Inception | |
| Year | Years | (9/7/2010) | |
| S&P 500 Growth Index Fund ETF Shares | |||
| Returns Before Taxes | 18.85% | 15.06% | 16.04% |
| Returns After Taxes on Distributions | 18.44 | 14.66 | 15.68 |
| Returns After Taxes on Distributions and Sale of | |||
| Fund Shares | 10.95 | 12.07 | 13.22 |
44
About Your Fund’s Expenses
As a shareholder of the fund, you incur ongoing costs, which include costs for portfolio management, administrative services, and shareholder reports (like this one), among others. Operating expenses, which are deducted from a fund’s gross income, directly reduce the investment return of the fund.
A fund’s expenses are expressed as a percentage of its average net assets. This figure is known as the expense ratio. The following examples are intended to help you understand the ongoing costs (in dollars) of investing in your fund and to compare these costs with those of other mutual funds. The examples are based on an investment of $1,000 made at the beginning of the period shown and held for the entire period.
The accompanying table illustrates your fund’s costs in two ways:
• Based on actual fund return. This section helps you to estimate the actual expenses that you paid over the period. The ”Ending Account Value“ shown is derived from the fund‘s actual return, and the third column shows the dollar amount that would have been paid by an investor who started with $1,000 in the fund. You may use the information here, together with the amount you invested, to estimate the expenses that you paid over the period.
To do so, simply divide your account value by $1,000 (for example, an $8,600 account value divided by $1,000 = 8.6), then multiply the result by the number given for your fund under the heading ”Expenses Paid During Period.“
• Based on hypothetical 5% yearly return. This section is intended to help you compare your fund‘s costs with those of other mutual funds. It assumes that the fund had a yearly return of 5% before expenses, but that the expense ratio is unchanged. In this case—because the return used is not the fund’s actual return—the results do not apply to your investment. The example is useful in making comparisons because the Securities and Exchange Commission requires all mutual funds to calculate expenses based on a 5% return. You can assess your fund’s costs by comparing this hypothetical example with the hypothetical examples that appear in shareholder reports of other funds.
Note that the expenses shown in the table are meant to highlight and help you compare ongoing costs only and do not reflect transaction costs incurred by the fund for buying and selling securities. Further, the expenses do not include any purchase, redemption, or account service fees described in the fund prospectus. If such fees were applied to your account, your costs would be higher. Your fund does not carry a “sales load.”
The calculations assume no shares were bought or sold during the period. Your actual costs may have been higher or lower, depending on the amount of your investment and the timing of any purchases or redemptions.
You can find more information about the fund’s expenses, including annual expense ratios, in the Financial Statements section of this report. For additional information on operating expenses and other shareholder costs, please refer to your fund’s current prospectus.
45
| Six Months Ended August 31, 2017 | |||
| Beginning | Ending | Expenses | |
| Account Value | Account Value | Paid During | |
| 2/28/2017 | 8/31/2017 | Period | |
| Based on Actual Fund Return | |||
| S&P 500 Value Index Fund | |||
| ETF Shares | $1,000.00 | $1,003.87 | $0.76 |
| Institutional Shares | 1,000.00 | 1,004.57 | 0.45 |
| S&P 500 Growth Index Fund | |||
| ETF Shares | $1,000.00 | $1,099.88 | $0.79 |
| Based on Hypothetical 5% Yearly Return | |||
| S&P 500 Value Index Fund | |||
| ETF Shares | $1,000.00 | $1,024.11 | $0.77 |
| Institutional Shares | 1,000.00 | 1,024.41 | 0.46 |
| S&P 500 Growth Index Fund | |||
| ETF Shares | $1,000.00 | $1,024.11 | $0.77 |
The calculations are based on expenses incurred in the most recent six-month period. The funds’ annualized six-month expense ratios that period are: for the S&P 500 Value Index Fund, 0.15% for ETF Shares and 0.09% for Institutional Shares; and for the S&P 500 Growth Index Fund, 0.15%. The dollar amounts shown as “Expenses Paid” are equal to the annualized expense ratio multiplied by the average account value over the period, multiplied by the number of days in the most recent six-month peiod, then divided by the number of days the most recent 12-month period (184/365).
46
Trustees Approve Advisory Arrangements
The board of trustees of Vanguard S&P 500 Value Index Fund and Vanguard S&P 500 Growth Index Fund has renewed each fund’s investment advisory arrangement with The Vanguard Group, Inc. (Vanguard), through its Equity Index Group. The board determined that continuing each fund’s internalized management structure was in the best interests of the fund and its shareholders.
The board based its decision upon an evaluation of the advisor’s investment staff, portfolio management process, and performance. This evaluation included information provided to the board by Vanguard’s Portfolio Review Department, which is responsible for fund and advisor oversight and product management. The Portfolio Review Department met regularly with the advisor and made monthly presentations to the board during the fiscal year that directed the board’s focus to relevant information and topics.
The board, or an investment committee made up of board members, also received information throughout the year through advisor presentations. For each advisor presentation, the board was provided with letters and reports that included information about, among other things, the advisory firm and the advisor’s assessment of the investment environment, portfolio performance, and portfolio characteristics.
In addition, the board received monthly reports, which included a Market and Economic Report, a Fund Dashboard Monthly Summary, and a Fund Performance Report.
Prior to their meeting, the trustees were provided with a memo and materials that summarized the information they had received over the course of the year. They also considered the factors discussed below, among others. However, no single factor determined whether the board approved the arrangements. Rather, it was the totality of the circumstances that drove the board’s decision.
Nature, extent, and quality of services
The board reviewed the quality of investment management services provided to the funds since their inception in 2010, and took into account the organizational depth and stability of the advisor. The board considered that Vanguard has been managing investments for more than three decades. The Equity Index Group adheres to a sound, disciplined investment management process; the team has considerable experience, stability, and depth.
The board concluded that Vanguard’s experience, stability, depth, and performance, among other factors, warranted continuation of each advisory arrangement.
Investment performance
The board considered each fund’s performance since its inception in 2010, including any periods of outperformance or underperformance compared with its target index and peer group. The board concluded that the performance was such that each advisory arrangement should continue. Information about each fund’s most recent performance can be found in the Performance Summary pages of this report.
47
Cost
The board concluded that each fund’s expense ratio was well below the average expense ratio charged by funds in its peer group. The board also concluded that the S&P 500 Growth Index Fund’s advisory expenses were well below the advisory expenses of funds in its peer group, while the S&P 500 Value Index Fund’s advisory expenses were reasonable compared with the advisory expenses of funds in its peer group. Information about the funds’ expenses appears in the About Your Fund’s Expenses section of this report as well as in the Financial Statements sections.
The board does not conduct a profitability analysis of Vanguard because of Vanguard’s unique “at-cost” structure. Unlike most other mutual fund management companies, Vanguard is owned by the funds it oversees and produces “profits” only in the form of reduced expenses for fund shareholders.
The benefit of economies of scale
The board concluded that each fund’s at-cost arrangement with Vanguard ensures that the funds will realize economies of scale as they grow, with the cost to shareholders declining as fund assets increase.
The board will consider whether to renew the advisory arrangements again after a one-year period.
48
Glossary
30-Day SEC Yield. A fund’s 30-day SEC yield is derived using a formula specified by the U.S. Securities and Exchange Commission. Under the formula, data related to the fund’s security holdings in the previous 30 days are used to calculate the fund’s hypothetical net income for that period, which is then annualized and divided by the fund’s estimated average net assets over the calculation period. For the purposes of this calculation, a security’s income is based on its current market yield to maturity (for bonds), its actual income (for asset-backed securities), or its projected dividend yield (for stocks). Because the SEC yield represents hypothetical annualized income, it will differ—at times significantly—from the fund’s actual experience. As a result, the fund’s income distributions may be higher or lower than implied by the SEC yield.
Beta. A measure of the magnitude of a fund’s past share-price fluctuations in relation to the ups and downs of a given market index. The index is assigned a beta of 1.00. Compared with a given index, a fund with a beta of 1.20 typically would have seen its share price rise or fall by 12% when the index rose or fell by 10%. For this report, beta is based on returns over the past 36 months for both the fund and the index. Note that a fund’s beta should be reviewed in conjunction with its R-squared (see definition). The lower the R-squared, the less correlation there is between the fund and the index, and the less reliable beta is as an indicator of volatility.
Dividend Yield. Dividend income earned by stocks, expressed as a percentage of the aggregate market value (or of net asset value, for a fund). The yield is determined by dividing the amount of the annual dividends by the aggregate value (or net asset value) at the end of the period. For a fund, the dividend yield is based solely on stock holdings and does not include any income produced by other investments.
Earnings Growth Rate. The average annual rate of growth in earnings over the past five years for the stocks now in a fund.
Equity Exposure. A measure that reflects a fund’s investments in stocks and stock futures. Any holdings in short-term reserves are excluded.
Expense Ratio. A fund’s total annual operating expenses expressed as a percentage of the fund’s average net assets. The expense ratio includes management and administrative expenses, but does not include the transaction costs of buying and selling portfolio securities.
Foreign Holdings. The percentage of a fund represented by securities or depositary receipts of companies based outside the United States.
Inception Date. The date on which the assets of a fund (or one of its share classes) are first invested in accordance with the fund’s investment objective. For funds with a subscription period, the inception date is the day after that period ends. Investment performance is measured from the inception date.
Median Market Cap. An indicator of the size of companies in which a fund invests; the midpoint of market capitalization (market price x shares outstanding) of a fund’s stocks, weighted by the proportion of the fund’s assets invested in each stock. Stocks representing half of the fund’s assets have market capitalizations above the median, and the rest are below it.
Price/Book Ratio. The share price of a stock divided by its net worth, or book value, per share.
For a fund, the weighted average price/book ratio of the stocks it holds.
49
Price/Earnings Ratio. The ratio of a stock’s current price to its per-share earnings over the past year. For a fund, the weighted average P/E of the stocks it holds. P/E is an indicator of market expectations about corporate prospects; the higher the P/E, the greater the expectations for a company’s future growth.
R-Squared. A measure of how much of a fund’s past returns can be explained by the returns from the market in general, as measured by a given index. If a fund’s total returns were precisely synchronized with an index’s returns, its R-squared would be 1.00. If the fund’s returns bore no relationship to the index’s returns, its R-squared would be 0. For this report, R-squared is based on returns over the past 36 months for both the fund and the index.
Return on Equity. The annual average rate of return generated by a company during the past five years for each dollar of shareholder’s equity (net income divided by shareholder’s equity). For a fund, the weighted average return on equity for the companies whose stocks it holds.
Short-Term Reserves. The percentage of a fund invested in highly liquid, short-term securities that can be readily converted to cash.
Turnover Rate. An indication of the fund’s trading activity. Funds with high turnover rates incur higher transaction costs and may be more likely to distribute capital gains (which may be taxable to investors). The turnover rate excludes in-kind transactions, which have minimal impact on costs.
50
The Global Industry Classification Standard (“GICS”) was developed by and is the exclusive property and a service mark of MSCI Inc. (“MSCI”) and Standard and Poor’s, a division of McGraw-Hill Companies, Inc. (“S&P”), and is licensed for use by Vanguard. Neither MSCI, S&P nor any third party involved in making or compiling the GICS or any GICS classification makes any express or implied warranties or representations with respect to such standard or classification (or the results to be obtained by the use thereof), and all such parties hereby expressly disclaim all warranties of originality, accuracy, completeness, merchantability or fitness for a particular purpose with respect to any such standard or classification. Without limiting any of the foregoing, in no event shall MSCI, S&P, any of its affiliates or any third party involved in making or compiling the GICS or any GICS classification have any liability for any direct, indirect, special, punitive, consequential or any other damages (including lost profits) even if notified of the possibility of such damages.
51
This page intentionally left blank.
This page intentionally left blank.
This page intentionally left blank.
The People Who Govern Your Fund
The trustees of your mutual fund are there to see that the fund is operated and managed in your best interests since, as a shareholder, you are a part owner of the fund. Your fund’s trustees also serve on the board of directors of The Vanguard Group, Inc., which is owned by the Vanguard funds and provides services to them on an at-cost basis.
A majority of Vanguard’s board members are independent, meaning that they have no affiliation with Vanguard or the funds they oversee, apart from the sizable personal investments they have made as private individuals. The independent board members have distinguished backgrounds in business, academia, and public service. Each of the trustees and executive officers oversees 195 Vanguard funds.
Information for each trustee and executive officer of the fund appears below. The mailing address of the trustees and officers is P.O. Box 876, Valley Forge, PA 19482. More information about the trustees is in the Statement of Additional Information, which can be obtained, without charge, by contacting Vanguard at 800-662-7447, or online at vanguard.com.
Interested Trustee1
F. William McNabb III
Born 1957. Trustee Since July 2009. Chairman of the Board. Principal Occupation(s) During the Past Five Years and Other Experience: Chairman of the Board of The Vanguard Group, Inc., and of each of the investment companies served by The Vanguard Group, since January 2010; Chief Executive Officer and Director of The Vanguard Group and President and Chief Executive Officer of each of the investment companies served by The Vanguard Group, since 2008; Director of Vanguard Marketing Corporation; President of The Vanguard Group (2008–2017); Managing Director of The Vanguard Group (1995–2008).
Independent Trustees
Emerson U. Fullwood
Born 1948. Trustee Since January 2008. Principal Occupation(s) During the Past Five Years and Other Experience: Executive Chief Staff and Marketing Officer for North America and Corporate Vice President (retired 2008) of Xerox Corporation (document management products and services); Executive in Residence and 2009–2010 Distinguished Minett Professor at the Rochester Institute of Technology; Lead Director of SPX FLOW, Inc. (multi-industry manufacturing); Director of the United Way of Rochester, the University of Rochester Medical Center, Monroe Community College Foundation, North Carolina A&T University, and Roberts Wesleyan College; Trustee of the University of Rochester.
Rajiv L. Gupta
Born 1945. Trustee Since December 2001.2 Principal Occupation(s) During the Past Five Years and Other Experience: Chairman and Chief Executive Officer (retired 2009) and President (2006–2008) of Rohm and Haas Co. (chemicals); Director of Arconic Inc. (diversified manufacturer), HP Inc. (printer and personal computer manufacturing), and Delphi Automotive plc (automotive components); Senior Advisor at New Mountain Capital.
Amy Gutmann
Born 1949. Trustee Since June 2006. Principal Occupation(s) During the Past Five Years and Other Experience: President of the University of Pennsylvania; Christopher H. Browne
1 Mr. McNabb is considered an “interested person,” as defined in the Investment Company Act of 1940, because he is an officer of the Vanguard funds.
2 December 2002 for Vanguard Equity Income Fund, the Vanguard Municipal Bond Funds, and the Vanguard State Tax-Exempt Funds.
Distinguished Professor of Political Science, School of Arts and Sciences, and Professor of Communication, Annenberg School for Communication, with secondary faculty appointments in the Department of Philosophy, School of Arts and Sciences, and at the Graduate School of Education, University of Pennsylvania; Trustee of the National Constitution Center.
JoAnn Heffernan Heisen
Born 1950. Trustee Since July 1998. Principal Occupation(s) During the Past Five Years and Other Experience: Corporate Vice President and Member of the Executive Committee (1997–2008), Chief Global Diversity Officer (retired 2008), Vice President and Chief Information Officer (1997–2006), Controller (1995–1997), Treasurer (1991–1995), and Assistant Treasurer (1989–1991) of Johnson & Johnson (pharmaceuticals/medical devices/ consumer products); Director of Skytop Lodge Corporation (hotels) and the Robert Wood Johnson Foundation; Member of the Advisory Board of the Institute for Women’s Leadership at Rutgers University.
F. Joseph Loughrey
Born 1949. Trustee Since October 2009. Principal Occupation(s) During the Past Five Years and Other Experience: President and Chief Operating Officer (retired 2009) of Cummins Inc. (industrial machinery); Chairman of the Board of Hillenbrand, Inc. (specialized consumer services), Oxfam America, and the Lumina Foundation for Education; Director of the V Foundation for Cancer Research; Member of the Advisory Council for the College of Arts and Letters and Chair of the Advisory Board to the Kellogg Institute for International Studies, both at the University of Notre Dame.
Mark Loughridge
Born 1953. Trustee Since March 2012. Principal Occupation(s) During the Past Five Years and Other Experience: Senior Vice President and Chief Financial Officer (retired 2013) at IBM (information technology services); Fiduciary Member of IBM’s Retirement Plan Committee (2004–2013); Director of the Dow Chemical Company; Member of the Council on Chicago Booth.
Scott C. Malpass
Born 1962. Trustee Since March 2012. Principal Occupation(s) During the Past Five Years and Other Experience: Chief Investment Officer and Vice President at the University of Notre Dame; Assistant Professor of Finance at the Mendoza College of Business at Notre Dame; Member of the Notre Dame 403(b) Investment Committee, the Board of Advisors for Spruceview Capital Partners, the Board of Catholic Investment Services, Inc. (investment advisor), and the Board of Superintendence of the Institute for the Works of Religion; Chairman of the Board of TIFF Advisory Services, Inc. (investment advisor).
André F. Perold
Born 1952. Trustee Since December 2004. Principal Occupation(s) During the Past Five Years and Other Experience: George Gund Professor of Finance and Banking, Emeritus at the Harvard Business School (retired 2011); Chief Investment Officer and Co-Managing Partner of HighVista Strategies LLC (private investment firm); Overseer of the Museum of Fine Arts Boston.
Peter F. Volanakis
Born 1955. Trustee Since July 2009. Principal Occupation(s) During the Past Five Years and Other Experience: President and Chief Operating Officer (retired 2010) of Corning Incorporated (communications equipment); Chairman of the Board of Trustees of Colby-Sawyer College; Member of the Board of Hypertherm, Inc. (industrial cutting systems, software, and consumables).
Executive Officers
Glenn Booraem
Born 1967. Investment Stewardship Officer Since February 2017. Principal Occupation(s) During the Past Five Years and Other Experience: Principal of The Vanguard Group, Inc.; Treasurer (2015–2017), Controller (2010–2015), and Assistant Controller (2001–2010) of each of the investment companies served by The Vanguard Group.
Thomas J. Higgins
Born 1957. Chief Financial Officer Since September 2008. Principal Occupation(s) During the Past Five Years and Other Experience: Principal of The Vanguard Group, Inc.; Chief Financial Officer of each of the investment companies served by The Vanguard Group; Treasurer of each of the investment companies served by The Vanguard Group (1998–2008).
Peter Mahoney
Born 1974. Controller Since May 2015. Principal Occupation(s) During the Past Five Years and Other Experience: Principal of The Vanguard Group, Inc.; Controller of each of the investment companies served by The Vanguard Group; Head of International Fund Services at The Vanguard Group (2008–2014).
Anne E. Robinson
Born 1970. Secretary Since September 2016. Principal Occupation(s) During the Past Five Years and Other Experience: Managing Director of The Vanguard Group, Inc.; General Counsel of The Vanguard Group; Secretary of The Vanguard Group and of each of the investment companies served by The Vanguard Group; Director and Senior Vice President of Vanguard Marketing Corporation; Managing Director and General Counsel of Global Cards and Consumer Services at Citigroup (2014–2016); Counsel at American Express (2003–2014).
Michael Rollings
Born 1963. Treasurer Since February 2017. Principal Occupation(s) During the Past Five Years and Other Experience: Managing Director of The Vanguard Group, Inc.; Treasurer of each of the investment companies served by The Vanguard Group; Director of Vanguard Marketing Corporation; Executive Vice President and Chief Financial Officer of MassMutual Financial Group (2006–2016).
| Vanguard Senior Management Team | |
| Mortimer J. Buckley | Chris D. McIsaac |
| Gregory Davis | James M. Norris |
| John James | Thomas M. Rampulla |
| Martha G. King | Karin A. Risi |
| John T. Marcante | |
| Chairman Emeritus and Senior Advisor | |
| John J. Brennan | |
| Chairman, 1996–2009 | |
| Chief Executive Officer and President, 1996–2008 | |
| Founder | |
| John C. Bogle | |
| Chairman and Chief Executive Officer, 1974–1996 | |
 | |
| P.O. Box 2600 | |
| Valley Forge, PA 19482-2600 | |
| Connect with Vanguard® > vanguard.com | |
| Fund Information > 800-662-7447 | The index is a product of S&P Dow Jones Indices LLC |
| Direct Investor Account Services > 800-662-2739 | (“SPDJI”), and has been licensed for use by Vanguard. |
| Standard & Poor’s® and S&P® are registered | |
| Institutional Investor Services > 800-523-1036 | trademarks of Standard & Poor’s Financial Services LLC |
| Text Telephone for People | (“S&P”); Dow Jones® is a registered trademark of Dow |
| Who Are Deaf or Hard of Hearing> 800-749-7273 | Jones Trademark Holdings LLC (“Dow Jones”); S&P® |
| and S&P 500® are trademarks of S&P; and these | |
| This material may be used in conjunction | trademarks have been licensed for use by SPDJI and |
| with the offering of shares of any Vanguard | sublicensed for certain purposes by Vanguard. |
| fund only if preceded or accompanied by | Vanguard product(s) are not sponsored, endorsed, sold |
| or promoted by SPDJI, Dow Jones, S&P, or their | |
| the fund’s current prospectus. | respective affiliates and none of such parties make any |
| All comparative mutual fund data are from Lipper, a | representation regarding the advisability of investing in |
| Thomson Reuters Company, or Morningstar, Inc., unless | such product(s) nor do they have any liability for any |
| otherwise noted. | errors, omissions, or interruptions of the index. |
| You can obtain a free copy of Vanguard’s proxy voting | |
| guidelines by visiting vanguard.com/proxyreporting or by | |
| calling Vanguard at 800-662-2739. The guidelines are | |
| also available from the SEC’s website, sec.gov. In | |
| addition, you may obtain a free report on how your fund | |
| voted the proxies for securities it owned during the 12 | |
| months ended June 30. To get the report, visit either | |
| vanguard.com/proxyreporting or sec.gov. | |
| You can review and copy information about your fund at | |
| the SEC’s Public Reference Room in Washington, D.C. To | |
| find out more about this public service, call the SEC at | |
| 202-551-8090. Information about your fund is also | |
| available on the SEC’s website, and you can receive | |
| copies of this information, for a fee, by sending a | |
| request in either of two ways: via email addressed to | |
| publicinfo@sec.gov or via regular mail addressed to the | |
| Public Reference Section, Securities and Exchange | |
| Commission, Washington, DC 20549-1520. | |
| © 2017 The Vanguard Group, Inc. | |
| All rights reserved. | |
| Vanguard Marketing Corporation, Distributor. | |
| Q18400 102017 | |
Annual Report | August 31, 2017
Vanguard S&P Small-Cap 600 Index Funds
Vanguard S&P Small-Cap 600 Index Fund
Vanguard S&P Small-Cap 600 Value Index Fund
Vanguard S&P Small-Cap 600 Growth Index Fund
Vanguard’s Principles for Investing Success
We want to give you the best chance of investment success. These principles, grounded in Vanguard’s research and experience, can put you on the right path.
Goals. Create clear, appropriate investment goals.
Balance. Develop a suitable asset allocation using broadly diversified funds. Cost. Minimize cost.
Discipline. Maintain perspective and long-term discipline.
A single theme unites these principles: Focus on the things you can control.
We believe there is no wiser course for any investor.
| Contents | |
| Your Fund’s Performance at a Glance. | 1 |
| Chairman’s Perspective. | 4 |
| S&P Small-Cap 600 Index Fund. | 8 |
| S&P Small-Cap 600 Value Index Fund. | 31 |
| S&P Small-Cap 600 Growth Index Fund. | 51 |
| Your Fund’s After-Tax Returns. | 69 |
| About Your Fund’s Expenses. | 70 |
| Trustees Approve Advisory Arrangements. | 72 |
| Glossary. | 74 |
Please note: The opinions expressed in this report are just that—informed opinions. They should not be considered promises or advice. Also, please keep in mind that the information and opinions cover the period through the date on the front of this report. Of course, the risks of investing in your fund are spelled out in the prospectus.
See the Glossary for definitions of investment terms used in this report.
About the cover: Nautical images have been part of Vanguard’s rich heritage since its start in 1975. For an incoming ship, a lighthouse offers a beacon and safe path to shore. You can similarly depend on Vanguard to put you first––and light the way––as you strive to meet your financial goals. Our client focus and low costs, stemming from our unique ownership structure, assure that your interests are paramount.
Your Fund’s Performance at a Glance
• Small-capitalization growth stocks generally outperformed their value counterparts for the 12 months ended August 31, 2017. The performance of the Vanguard S&P Small-Cap 600 Index Funds reflected this trend.
• Results ranged from about 12% for the Value Index Fund to almost 14% for the Growth Index Fund. Vanguard S&P Small-Cap 600 Index Fund, which includes both value and growth stocks, returned about 13%.
• All three funds closely tracked their target indexes. The Index and Value Index Funds exceeded the average returns of their peers, while the Growth Index Fund trailed its peer average.
• The information technology sector was the leading contributor for all three funds. Financials, industrials, health care, and materials stocks were also among the better performers.
• All three funds posted negative returns in the energy sector as oil prices have mostly sagged this calendar year.
| Total Returns: Fiscal Year Ended August 31, 2017 | |
| Total | |
| Returns | |
| Vanguard S&P Small-Cap 600 Index Fund | |
| ETF Shares | |
| Market Price | 13.18% |
| Net Asset Value | 13.18 |
| Institutional Shares | 13.26 |
| S&P SmallCap 600 Index | 13.11 |
| Small-Cap Core Funds Average | 12.74 |
| Small-Cap Core Funds Average: Derived from data provided by Lipper, a Thomson Reuters Company. |
| Vanguard S&P Small-Cap 600 Value Index Fund | |
| ETF Shares | |
| Market Price | 12.12% |
| Net Asset Value | 12.11 |
| Institutional Shares | 12.25 |
| S&P SmallCap 600 Value Index | 12.14 |
| Small-Cap Value Funds Average | 11.02 |
| Small-Cap Value Funds Average: Derived from data provided by Lipper, a Thomson Reuters Company. |
| Total | |
| Returns | |
| Vanguard S&P Small-Cap 600 Growth Index Fund | |
| ETF Shares | |
| Market Price | 13.59% |
| Net Asset Value | 13.67 |
| S&P SmallCap 600 Growth Index | 13.86 |
| Small-Cap Growth Funds Average | 15.61 |
Small-Cap Growth Funds Average: Derived from data provided by Lipper, a Thomson Reuters Company.
Institutional Shares are available to certain institutional investors who meet specific administrative, service, and account-size criteria. The Vanguard ETF® Shares shown are traded on the NYSE Arca exchange and are available only through brokers. The table provides ETF returns based on both the NYSE Arca market price and the net asset value for a share. U.S. Pat. Nos. 6,879,964; 7,337,138; 7,720,749; 7,925,573; 8,090,646; and 8,417,623.
For the ETF Shares, the market price is determined by the midpoint of the bid-offer spread as of the closing time of the New York Stock Exchange (generally 4 p.m., Eastern time). The net asset value is also determined as of the NYSE closing time. For more information about how the ETF Shares' market prices have compared with their net asset value, visit vanguard.com, select your ETF, and then select the Price and Performance tab. The ETF premium/discount analysis there shows the percentages of days on which the ETF Shares' market price was above or below the NAV.
| Total Returns: Inception Through August 31, 2017 | |
| Average | |
| Annual Return | |
| S&P Small-Cap 600 Index Fund ETF Shares Net Asset Value (Returns since inception: 9/7/2010) | 15.33% |
| S&P SmallCap 600 Index | 15.47 |
| Small-Cap Core Funds Average | 12.42 |
| Small-Cap Core Funds Average: Derived from data provided by Lipper, a Thomson Reuters Company. | |
| S&P Small-Cap 600 Value Index Fund ETF Shares Net Asset Value (Returns since inception: 9/7/2010) | 14.57% |
| S&P SmallCap 600 Value Index | 14.77 |
| Small-Cap Value Funds Average | 12.06 |
| Small-Cap Value Funds Average: Derived from data provided by Lipper, a Thomson Reuters Company. | |
| S&P Small-Cap 600 Growth Index Fund ETF Shares Net Asset Value (Returns since inception: | |
| 9/7/2010) | 15.95% |
| S&P SmallCap 600 Growth Index | 16.16 |
| Small-Cap Growth Funds Average | 13.07 |
| Small-Cap Growth Funds Average: Derived from data provided by Lipper, a Thomson Reuters Company. |
The figures shown represent past performance, which is not a guarantee of future results. (Current performance may be lower or higher than the performance data cited. For performance data current to the most recent month-end, visit our website at vanguard.com/performance.) Note, too, that both investment returns and principal value can fluctuate widely, so an investor’s shares, when sold, could be worth more or less than their original cost.
2
| Expense Ratios | |||
| Your Fund Compared With Its Peer Group | |||
| ETF | Institutional | Peer Group | |
| Shares | Shares | Average | |
| S&P Small-Cap 600 Index Fund | 0.15% | 0.08% | 1.24% |
| S&P Small-Cap 600 Value Index Fund | 0.20 | 0.08 | 1.32 |
| S&P Small-Cap 600 Growth Index Fund | 0.20 | — | 1.34 |
The fund expense ratios shown are from the prospectus dated December 23, 2016, and represent estimated costs for the current fiscal year. For fiscal year ended August 31, 2017, the funds’ expense ratios were: for the S&P Small-Cap 600 Index Fund, 0.15% for ETF Shares and 0.08% for Institutional Shares; for the S&P Small-Cap 600 Value Index Fund, 0.20% for ETF Shares and 0.08% for Institutional Shares; and for the S&P Small-Cap 600 Growth Index Fund, 0.20% for ETF Shares. Peer-group expense ratios are derived from data provided by Lipper, a Thomson Reuters Company, and capture information through year-end 2016.
Peer groups: For the S&P Small-Cap 600 Index Fund, Small-Cap Core Funds; for the S&P Small-Cap 600 Value Index Fund, Small-Cap Value Funds; and for the S&P Small-Cap 600 Growth Index Fund, Small-Cap Growth Funds.
3
Chairman’s Perspective

Bill McNabb
Chairman and Chief Executive Officer
Dear Shareholder,
Since mid-August we’ve been reaching out to you about the proposals put forth by the Vanguard funds that, if approved, will enable us to manage the funds more efficiently and effectively. As the November deadline for voting approaches, I’d like to offer some perspective on a few of the proposals that I believe are important to the way Vanguard operates and manages your investments. I hope you consider this information and promptly cast your ballot.
Your biggest advocate
The main driver for this proxy solicitation is to ask all our fund shareholders to elect a full slate of trustees who oversee each U.S.-based Vanguard mutual fund. These trustees serve an important role, making sure your funds are managed in your best interests. This includes monitoring fund performance, approving advisory agreements, and ensuring that we’re keeping your investment costs as low as possible. Simply put, they are your biggest advocate.
Each trustee brings a variety of skills and professional experiences that contribute to the board’s strength and diversity. Of the 12 nominees, nine currently serve on the board, and three are new. If elected, the new board would include ten independent members, meaning they have no affiliation with Vanguard or the funds apart from any investments they may choose to make as private individuals.
4
These are the proposed new trustees:
• Sarah Bloom Raskin is a former member of the Federal Reserve Board of Governors and former deputy secretary of the U.S. Treasury Department. She is an expert in cybersecurity—a critically important issue at Vanguard, as we place a premium on protecting clients’ assets and sensitive data.
• Deanna Mulligan is chief executive officer of The Guardian Life Insurance Company of America. It’s rare to find a CEO such as Deanna who leads a company with a mutual ownership structure similar to Vanguard’s.
• Tim Buckley is president and a director of Vanguard and will succeed me in January as CEO. (I’ll remain chairman for a period to be determined by the board.) I interviewed Tim when he applied for his first job here in 1991 and again when he was graduating from Harvard Business School. I was thrilled he picked Vanguard as a place to build his career, and I’ve been delighted to see him take on several leadership positions, including as head of our Retail Investor Group, chief information officer, and chief investment officer. I can think of no one better prepared to succeed me.
| Market Barometer | |||
| Average Annual Total Returns | |||
| Periods Ended August 31, 2017 | |||
| One Year | Three Years | Five Years | |
| Stocks | |||
| Russell 1000 Index (Large-caps) | 16.16% | 9.21% | 14.37% |
| Russell 2000 Index (Small-caps) | 14.91 | 7.67 | 13.15 |
| Russell 3000 Index (Broad U.S. market) | 16.06 | 9.08 | 14.27 |
| FTSE All-World ex US Index (International) | 18.74 | 2.80 | 7.76 |
| Bonds | |||
| Bloomberg Barclays U.S. Aggregate Bond Index | |||
| (Broad taxable market) | 0.49% | 2.64% | 2.19% |
| Bloomberg Barclays Municipal Bond Index | |||
| (Broad tax-exempt market) | 0.88 | 3.40 | 3.23 |
| Citigroup Three-Month U.S. Treasury Bill Index | 0.58 | 0.25 | 0.16 |
| CPI | |||
| Consumer Price Index | 1.94% | 1.06% | 1.28% |
5
Vanguard believes that diversity of thought, background, and experience, as well as diversity of personal characteristics, meaningfully contributes to the board’s ability to effectively serve shareholders. If Sarah and Deanna are elected, women will account for 40% of the board’s independent trustees.
I should note that even as Vanguard is nominating three new board members, we’re saying goodbye to trustee Rajiv Gupta. Rajiv was a legendary CEO of Rohm and Haas Co., and Vanguard and our clients have benefited greatly from his expertise. I wish him a happy retirement.
Summarizing the proposals
Among the trustees’ leading responsibilities is overseeing the funds’ internal and external investment advisory agreements. The trustees, in consultation with our Global Investment Committee and our Portfolio Review Department, choose the investment advisors that manage client assets. Over decades, we have built a strong track record of picking advisors whose portfolio management strategies have served clients well.
Two proposals in the proxy focus on this oversight responsibility. Shareholders of 48 Vanguard funds have already voted to allow the board to make external advisor changes without obtaining prior shareholder approval. The new proposals would extend that policy across our entire U.S.-based fund lineup and expand it to include internal advisory agreements with Vanguard subsidiaries. Eliminating the need for shareholder approval removes a step that is costly and time-consuming if done frequently or on an individual fund basis. Although there are no current plans to employ the policy on any Vanguard-managed funds, standardizing it enables the trustees to retain an advisory firm to diversify a fund’s management team or ensure management continuity should a contingency arise.
I also encourage shareholders of several specific Vanguard index funds to read the proxy proposals that affect those funds. One proposal would change the investment objective of Vanguard REIT Index Fund and Vanguard Variable Insurance Fund REIT Index Portfolio to include real estate-related securities, aligning the funds with updated industry-sector classification methodology. Another proposal seeks to change the diversification status of the REIT Index Fund to enable it to better track its benchmark. Finally, we seek your approval of the Funds’ Service Agreement for Vanguard Institutional Index Fund and Vanguard Institutional Total Stock Market Index Fund. If approved, this arrangement would then be standardized across Vanguard’s entire publicly available U.S. mutual fund lineup. It should also reduce costs and minimum initial investment requirements in select share classes.
6
At the ballot box
We hope you’ll make it a priority to cast your ballot. We want to avoid the added time and cost of soliciting sufficient votes should we not obtain a quorum by the shareholder meeting on November 15, when voting concludes. Ultimately, we believe the proposals I’ve discussed are in your best interest as Vanguard fund shareholders, and the trustees recommend that you vote in favor of them. For more information, visit vanguard.com and enter the search term “proxy.”
As always, thank you for investing with Vanguard.
Sincerely,

F. William McNabb III
Chairman and Chief Executive Officer
September 14, 2017
S&P Small-Cap 600 Index Fund
Fund Profile
As of August 31, 2017
| Share-Class Characteristics | ||
| ETF | Institutional | |
| Shares | Shares | |
| Ticker Symbol | VIOO | VSMSX |
| Expense Ratio1 | 0.15% | 0.08% |
| 30-Day SEC Yield | 1.20% | 1.27% |
| Portfolio Characteristics | |||
| DJ | |||
| U.S. | |||
| Total | |||
| S&P | Market | ||
| SmallCap | FA | ||
| Fund 600 Index | Index | ||
| Number of Stocks | 603 | 601 | 3,769 |
| Median Market Cap | $1.6B | $1.6B | $63.1B |
| Price/Earnings Ratio | 23.4x | 23.4x | 21.6x |
| Price/Book Ratio | 2.1x | 2.1x | 2.8x |
| Return on Equity | 8.9% | 8.9% | 15.1% |
| Earnings Growth Rate | 7.8% | 7.6% | 9.4% |
| Dividend Yield | 1.3% | 1.3% | 1.8% |
| Foreign Holdings | 0.0% | 0.0% | 0.0% |
| Turnover Rate | 22% | — | — |
| Short-Term Reserves | -0.1% | — | — |
| Volatility Measures | ||
| DJ | ||
| S&P | U.S. Total | |
| SmallCap | Market | |
| 600 Index | FA Index | |
| R-Squared | 1.00 | 0.66 |
| Beta | 1.00 | 1.11 |
| These measures show the degree and timing of the fund’s fluctuations compared with the indexes over 36 months. | ||
| Ten Largest Holdings(% of total net assets) | ||
| MKS Instruments Inc. | Semiconductor | |
| Equipment | 0.6% | |
| ALLETE Inc. | Electric Utilities | 0.6 |
| Healthcare Services | Diversified Support | |
| Group Inc. | Services | 0.5 |
| Spire Inc. | Gas Utilities | 0.5 |
| Brink's Co. | Security & Alarm | |
| Services | 0.5 | |
| Avista Corp. | Multi-Utilities | 0.5 |
| Nektar Therapeutics | Pharmaceuticals | 0.5 |
| CACI International Inc. | IT Consulting & | |
| Other Services | 0.5 | |
| Chemed Corp. | Health Care Services | 0.5 |
| Lumentum Holdings Inc. Communications | ||
| Equipment | 0.5 | |
| Top Ten | 5.2% | |
| The holdings listed exclude any temporary cash investments and equity index products. | ||
1 The expense ratios shown are from the prospectus dated December 23, 2016, and represent estimated costs for the current fiscal year. For the fiscal year ended August 31, 2017, the expense ratios were 0.15% for ETF Shares and 0.08% for Institutional Shares.
8
S&P Small-Cap 600 Index Fund
| Sector Diversification (% of equity exposure) | |||
| DJ | |||
| S&P | U.S. Total | ||
| SmallCap | Market | ||
| Fund | 600 Index | FA Index | |
| Consumer Discretionary 15.5% | 15.4% | 12.4% | |
| Consumer Staples | 3.1 | 3.1 | 7.6 |
| Energy | 2.5 | 2.6 | 5.3 |
| Financials | 16.1 | 16.1 | 14.7 |
| Health Care | 13.0 | 13.0 | 14.1 |
| Industrials | 18.8 | 18.8 | 10.7 |
| Information Technology | 15.1 | 15.1 | 22.6 |
| Materials | 5.2 | 5.2 | 3.3 |
| Real Estate | 6.3 | 6.3 | 4.1 |
| Telecommunication | |||
| Services | 1.3 | 1.3 | 1.9 |
| Utilities | 3.1 | 3.1 | 3.3 |
Sector categories are based on the Global Industry Classification Standard (“GICS”), except for the “Other” category (if applicable), which includes securities that have not been provided a GICS classification as of the effective reporting period.
9
S&P Small-Cap 600 Index Fund
Performance Summary
All of the returns in this report represent past performance, which is not a guarantee of future results that may be achieved by the fund. (Current performance may be lower or higher than the performance data cited. For performance data current to the most recent month-end, visit our website at vanguard.com/performance.) Note, too, that both investment returns and principal value can fluctuate widely, so an investor’s shares, when sold, could be worth more or less than their original cost. The returns shown do not reflect taxes that a shareholder would pay on fund distributions or on the sale of fund shares.
Cumulative Performance: September 7, 2010, Through August 31, 2017
Initial Investment of $10,000
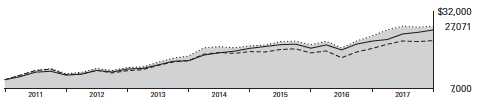
| Average Annual Total Returns | |||||
| Periods Ended August 31, 2017 | |||||
| Since | Final Value | ||||
| One | Five | Inception | of a $10,000 | ||
| Year | Years | (9/7/2010) | Investment | ||
| S&P Small-Cap 600 Index Fund*ETF | |||||
| Shares Net Asset Value | 13.18% | 14.33% | 15.33% | $27,071 | |
| S&P Small-Cap 600 Index Fund*ETF | |||||
| Shares Market Price | 13.18 | 14.31 | 15.33 | 20,331 | |
| • • • • • • • • | S&P SmallCap 600 Index | 13.11 | 14.42 | 15.47 | 27,293 |
| – – – – | Small-Cap Core Funds Average | 12.74 | 11.90 | 12.42 | 22,643 |
| Dow Jones U.S. Total Stock Market | |||||
| Float Adjusted Index | 16.05 | 14.19 | 14.71 | 26,064 | |
Small-Cap Core Funds Average: Derived from data provided by Lipper, a Thomson Reuters Company.
"Since Inception" performance is calculated from the ETF Shares’ inception date for both the fund and its comparative standards.
See Financial Highlights for dividend and capital gains information.
10
S&P Small-Cap 600 Index Fund
| Average Annual Total Returns | ||||
| Periods Ended August 31, 2017 | ||||
| Since | Final Value | |||
| One | Five | Inception | of a $5,000,000 | |
| Year | Years | (4/1/2011) | Investment | |
| S&P Small-Cap 600 Index Fund Institutional | ||||
| Shares | 13.26% | 14.40% | 11.69% | $10,165,514 |
| S&P SmallCap 600 Index | 13.11 | 14.42 | 11.74 | 10,194,925 |
| Dow Jones U.S. Total Stock Market Float | ||||
| Adjusted Index | 16.05 | 14.19 | 12.07 | 10,389,852 |
"Since Inception" performance is calculated from the Institutional Shares’ inception date for both the fund and its comparative standards.
Institutional Shares were first issued on December 15, 2010, and the sole shareholder redeemed shortly thereafter. Institutional Shares were next issued on April 1, 2011. The total returns shown are based on the period beginning April 1, 2011.
| Cumulative Returns of ETF Shares: September 7, 2010, Through August 31, 2017 | |||
| Since | |||
| One | Five | Inception | |
| Year | Years | (9/7/2010) | |
| S&P Small-Cap 600 Index Fund ETF Shares Market | |||
| Price | 13.18% | 95.19% | 170.71% |
| S&P Small-Cap 600 Index Fund ETF Shares Net | |||
| Asset Value | 13.18 | 95.30 | 170.71 |
| S&P SmallCap 600 Index | 13.11 | 96.12 | 172.93 |
| "Since Inception" performance is calculated from the ETF Shares’ inception date for both the fund and its comparative standards. | |||
Fiscal-Year Total Returns (%): September 7, 2010, Through August 31, 2017

S&P Small-Cap 600 Index Fund
Average Annual Total Returns: Periods Ended June 30, 2017
This table presents returns through the latest calendar quarter—rather than through the end of the fiscal period.
Securities and Exchange Commission rules require that we provide this information.
| Inception | One | Five | Since | |
| Date | Year | Years | Inception | |
| ETF Shares | 9/7/2010 | |||
| Market Price | 22.36% | 15.35% | 16.00% | |
| Net Asset Value | 22.50 | 15.36 | 16.02 | |
| Institutional Shares | 4/1/2011 | 22.57 | 15.44 | 12.31 |
Institutional Shares were first issued on December 15, 2010, and the sole shareholder redeemed shortly thereafter. Institutional Shares were next issued on April 1, 2011. The total returns shown are based on the period beginning April 1, 2011.
12
S&P Small-Cap 600 Index Fund
Financial Statements
Statement of Net Assets
As of August 31, 2017
The fund reports a complete list of its holdings in regulatory filings four times in each fiscal year, at the quarter-ends. For the second and fourth fiscal quarters, the lists appear in the fund’s semiannual and annual reports to shareholders. For the first and third fiscal quarters, the fund files the lists with the Securities and Exchange Commission on Form N-Q. Shareholders can look up the fund’s Forms N-Q on the SEC’s website at sec.gov. Forms N-Q may also be reviewed and copied at the SEC’s Public Reference Room (see the back cover of this report for further information).
| Market | |||
| Value• | |||
| Shares | ($000) | ||
| Common Stocks (100.0%)1 | |||
| Consumer Discretionary (15.5%) | |||
| Marriott Vacations | |||
| Worldwide Corp. | 47,266 | 5,500 | |
| ILG Inc. | 205,149 | 5,416 | |
| * | Five Below Inc. | 106,602 | 5,071 |
| * | iRobot Corp. | 53,037 | 5,061 |
| Lithia Motors Inc. Class A | 45,994 | 4,967 | |
| Wolverine World Wide Inc. | 187,465 | 4,930 | |
| LCI Industries | 48,195 | 4,762 | |
| * | Steven Madden Ltd. | 103,509 | 4,389 |
| * | TopBuild Corp. | 71,658 | 4,253 |
| * | Dave & Buster’s | ||
| Entertainment Inc. | 72,430 | 4,234 | |
| Boyd Gaming Corp. | 159,912 | 4,228 | |
| *,^ | Ollie’s Bargain Outlet | ||
| Holdings Inc. | 93,367 | 3,907 | |
| * | Dorman Products Inc. | 58,388 | 3,878 |
| Children’s Place Inc. | 34,170 | 3,627 | |
| * | Penn National Gaming Inc. | 159,869 | 3,547 |
| * | Scientific Games Corp. | ||
| Class A | 99,639 | 3,507 | |
| * | Cooper-Standard Holdings | ||
| Inc. | 34,550 | 3,475 | |
| Nutrisystem Inc. | 57,855 | 3,142 | |
| Monro Inc. | 63,255 | 3,017 | |
| * | Meritage Homes Corp. | 73,320 | 2,984 |
| * | Shutterfly Inc. | 65,329 | 2,978 |
| * | Fox Factory Holding Corp. | 67,033 | 2,681 |
| Bob Evans Farms Inc. | 38,246 | 2,631 | |
| Callaway Golf Co. | 183,154 | 2,553 | |
| Time Inc. | 194,058 | 2,552 | |
| MDC Holdings Inc. | 80,482 | 2,515 | |
| DSW Inc. Class A | 131,636 | 2,439 | |
| Core-Mark Holding Co. Inc. | 89,626 | 2,425 | |
| * | Select Comfort Corp. | 80,644 | 2,381 |
| * | American Axle & | ||
| Manufacturing Holdings | |||
| Inc. | 162,706 | 2,377 | |
| Market | |||
| Value• | |||
| Shares | ($000) | ||
| *,^ | JC Penney Co. Inc. | 604,518 | 2,339 |
| Group 1 Automotive Inc. | 38,967 | 2,339 | |
| * | G-III Apparel Group Ltd. | 84,738 | 2,330 |
| * | Vista Outdoor Inc. | 111,320 | 2,282 |
| Caleres Inc. | 83,985 | 2,266 | |
| * | Installed Building | ||
| Products Inc. | 39,162 | 2,260 | |
| La-Z-Boy Inc. | 94,465 | 2,253 | |
| * | Gentherm Inc. | 71,066 | 2,214 |
| * | Cavco Industries Inc. | 16,358 | 2,201 |
| * | Belmond Ltd. Class A | 165,403 | 2,109 |
| * | Lumber Liquidators | ||
| Holdings Inc. | 55,391 | 2,079 | |
| Scholastic Corp. | 52,636 | 2,075 | |
| * | Asbury Automotive | ||
| Group Inc. | 36,728 | 1,978 | |
| * | EW Scripps Co. Class A | 109,949 | 1,966 |
| Chico’s FAS Inc. | 252,693 | 1,941 | |
| ^ | Sonic Corp. | 82,182 | 1,924 |
| Gannett Co. Inc. | 221,668 | 1,882 | |
| Winnebago Industries Inc. | 51,780 | 1,872 | |
| Guess? Inc. | 118,603 | 1,848 | |
| ^ | Wingstop Inc. | 56,108 | 1,818 |
| * | RH | 38,742 | 1,813 |
| Standard Motor Products | |||
| Inc. | 39,195 | 1,728 | |
| Oxford Industries Inc. | 29,287 | 1,693 | |
| ^ | Abercrombie & Fitch Co. | 132,746 | 1,691 |
| * | Universal Electronics Inc. | 28,014 | 1,640 |
| World Wrestling | |||
| Entertainment Inc. | |||
| Class A | 75,158 | 1,638 | |
| Strayer Education Inc. | 20,304 | 1,625 | |
| ^ | Sturm Ruger & Co. Inc. | 34,475 | 1,579 |
| Capella Education Co. | 22,465 | 1,513 | |
| Ethan Allen Interiors Inc. | 49,734 | 1,455 | |
| PetMed Express Inc. | 39,732 | 1,441 | |
| New Media Investment | |||
| Group Inc. | 104,376 | 1,439 | |
| * | LGI Homes Inc. | 33,506 | 1,425 |
13
| S&P Small-Cap 600 Index Fund | |||
| Market | |||
| Value• | |||
| Shares | ($000) | ||
| * | Red Robin Gourmet | ||
| Burgers Inc. | 24,927 | 1,421 | |
| DineEquity Inc. | 32,994 | 1,312 | |
| * | Crocs Inc. | 143,630 | 1,283 |
| Rent-A-Center Inc. | 103,292 | 1,250 | |
| * | Career Education Corp. | 125,860 | 1,210 |
| * | M/I Homes Inc. | 48,406 | 1,191 |
| Tailored Brands Inc. | 95,776 | 1,132 | |
| Ruth’s Hospitality Group | |||
| Inc. | 57,678 | 1,128 | |
| *,^ | Shake Shack Inc. Class A | 36,209 | 1,120 |
| *,^ | William Lyon Homes | ||
| Class A | 46,124 | 1,107 | |
| * | BJ’s Restaurants Inc. | 34,684 | 1,044 |
| * | Nautilus Inc. | 59,972 | 981 |
| Tile Shop Holdings Inc. | 64,221 | 967 | |
| * | Motorcar Parts of | ||
| America Inc. | 36,293 | 953 | |
| Sonic Automotive Inc. | |||
| Class A | 51,507 | 932 | |
| * | Unifi Inc. | 29,893 | 929 |
| Marcus Corp. | 37,250 | 928 | |
| * | Fiesta Restaurant Group | ||
| Inc. | 52,619 | 916 | |
| * | Regis Corp. | 68,741 | 913 |
| Haverty Furniture Cos. | |||
| Inc. | 37,561 | 881 | |
| Barnes & Noble Inc. | 107,908 | 836 | |
| Movado Group Inc. | 29,992 | 832 | |
| * | Genesco Inc. | 38,263 | 809 |
| ^ | Buckle Inc. | 55,351 | 783 |
| * | MarineMax Inc. | 47,575 | 768 |
| * | Monarch Casino & | ||
| Resort Inc. | 21,441 | 763 | |
| * | Fossil Group Inc. | 81,733 | 678 |
| Finish Line Inc. Class A | 78,557 | 654 | |
| Superior Industries | |||
| International Inc. | 43,805 | 642 | |
| * | Chuy’s Holdings Inc. | 32,993 | 620 |
| * | Express Inc. | 97,274 | 620 |
| * | Iconix Brand Group Inc. | 110,805 | 619 |
| Cato Corp. Class A | 46,897 | 617 | |
| * | Biglari Holdings Inc. | 1,980 | 590 |
| * | American Public | ||
| Education Inc. | 31,649 | 584 | |
| * | Perry Ellis International Inc. | 23,840 | 520 |
| * | Francesca’s Holdings Corp. | 71,105 | 516 |
| Shoe Carnival Inc. | 24,148 | 485 | |
| * | El Pollo Loco Holdings Inc. | 41,787 | 474 |
| * | FTD Cos. Inc. | 33,575 | 450 |
| * | Zumiez Inc. | 34,488 | 429 |
| ^ | Fred’s Inc. Class A | 69,787 | 413 |
| * | Barnes & Noble | ||
| Education Inc. | 75,385 | 390 | |
| Market | |||
| Value• | |||
| Shares | ($000) | ||
| * | Vera Bradley Inc. | 37,076 | 335 |
| * | Kirkland’s Inc. | 28,707 | 331 |
| * | Ascena Retail Group Inc. | 144,435 | 295 |
| ^ | Big 5 Sporting Goods Corp. | 35,335 | 270 |
| * | Ruby Tuesday Inc. | 119,787 | 258 |
| * | Hibbett Sports Inc. | 12,923 | 159 |
| * | Vitamin Shoppe Inc. | 7,785 | 42 |
| 209,463 | |||
| Consumer Staples (3.1%) | |||
| Sanderson Farms Inc. | 38,715 | 5,711 | |
| * | Darling Ingredients Inc. | 318,623 | 5,544 |
| B&G Foods Inc. | 128,599 | 3,922 | |
| J&J Snack Foods Corp. | 28,970 | 3,693 | |
| WD-40 Co. | 27,210 | 2,965 | |
| Universal Corp. | 49,313 | 2,821 | |
| * | Central Garden & Pet Co. | ||
| Class A | 65,712 | 2,240 | |
| *,^ | Cal-Maine Foods Inc. | 57,626 | 2,100 |
| Calavo Growers Inc. | 29,841 | 2,004 | |
| Coca-Cola Bottling Co. | |||
| Consolidated | 8,984 | 1,919 | |
| SpartanNash Co. | 73,274 | 1,806 | |
| Andersons Inc. | 51,096 | 1,627 | |
| Inter Parfums Inc. | 33,192 | 1,309 | |
| Medifast Inc. | 21,889 | 1,239 | |
| * | SUPERVALU Inc. | 55,403 | 1,108 |
| John B Sanfilippo & Son | |||
| Inc. | 16,837 | 1,045 | |
| * | Central Garden & Pet Co. | 19,827 | 699 |
| * | Seneca Foods Corp. | ||
| Class A | 12,279 | 366 | |
| 42,118 | |||
| Energy (2.5%) | |||
| * | PDC Energy Inc. | 108,140 | 4,253 |
| US Silica Holdings Inc. | 141,140 | 3,841 | |
| * | McDermott International | ||
| Inc. | 549,189 | 3,372 | |
| * | SRC Energy Inc. | 388,565 | 3,066 |
| * | Carrizo Oil & Gas Inc. | 148,170 | 1,991 |
| * | Exterran Corp. | 61,774 | 1,714 |
| * | Helix Energy Solutions | ||
| Group Inc. | 268,023 | 1,681 | |
| * | Unit Corp. | 103,096 | 1,641 |
| * | Noble Corp. plc | 477,563 | 1,557 |
| Archrock Inc. | 138,566 | 1,413 | |
| * | Newpark Resources Inc. | 173,439 | 1,396 |
| Green Plains Inc. | 72,037 | 1,336 | |
| * | SEACOR Holdings Inc. | 31,868 | 1,223 |
| *,^ | Atwood Oceanics Inc. | 146,240 | 961 |
| * | REX American Resources | ||
| Corp. | 11,015 | 954 | |
| * | Denbury Resources Inc. | 777,807 | 825 |
| * | Matrix Service Co. | 51,670 | 612 |
| * | Bill Barrett Corp. | 149,232 | 446 |
14
| S&P Small-Cap 600 Index Fund | |||
| Market | |||
| Value• | |||
| Shares | ($000) | ||
| * | Geospace Technologies | ||
| Corp. | 26,314 | 397 | |
| * | Era Group Inc. | 38,738 | 341 |
| Gulf Island Fabrication Inc. | 26,961 | 302 | |
| *,^ | CARBO Ceramics Inc. | 41,589 | 273 |
| ^ | Bristow Group Inc. | 28,584 | 236 |
| * | Contango Oil & Gas Co. | 45,017 | 207 |
| * | Tesco Corp. | 44,182 | 194 |
| * | TETRA Technologies Inc. | 72,985 | 150 |
| * | Cloud Peak Energy Inc. | 23,511 | 74 |
| * | Pioneer Energy Services | ||
| Corp. | 6,505 | 11 | |
| 34,467 | |||
| Financials (16.1%) | |||
| Evercore Inc. Class A | 79,369 | 5,988 | |
| Sterling Bancorp | 262,286 | 5,888 | |
| ^ | Interactive Brokers Group | ||
| Inc. | 138,242 | 5,796 | |
| Selective Insurance Group | |||
| Inc. | 112,674 | 5,679 | |
| ProAssurance Corp. | 103,289 | 5,500 | |
| FirstCash Inc. | 93,436 | 5,485 | |
| ^ | First Financial Bankshares | ||
| Inc. | 127,928 | 5,123 | |
| Glacier Bancorp Inc. | 148,218 | 4,922 | |
| Community Bank System | |||
| Inc. | 95,144 | 4,896 | |
| American Equity | |||
| Investment Life Holding | |||
| Co. | 171,690 | 4,766 | |
| Old National Bancorp | 261,879 | 4,282 | |
| Columbia Banking System | |||
| Inc. | 112,867 | 4,195 | |
| CVB Financial Corp. | 198,155 | 4,102 | |
| * | Green Dot Corp. Class A | 84,697 | 4,081 |
| Great Western Bancorp | |||
| Inc. | 113,545 | 4,079 | |
| Financial Engines Inc. | 121,625 | 4,020 | |
| Hope Bancorp Inc. | 245,954 | 3,970 | |
| RLI Corp. | 74,006 | 3,961 | |
| Independent Bank Corp. | 52,684 | 3,651 | |
| United Community Banks | |||
| Inc. | 137,283 | 3,584 | |
| Astoria Financial Corp. | 177,126 | 3,470 | |
| First Midwest Bancorp Inc. | 157,059 | 3,311 | |
| Apollo Commercial Real | |||
| Estate Finance Inc. | 182,466 | 3,301 | |
| * | LendingTree Inc. | 14,095 | 3,255 |
| Ameris Bancorp | 71,840 | 3,165 | |
| Northwest Bancshares | |||
| Inc. | 197,324 | 3,045 | |
| Simmons First National | |||
| Corp. Class A | 57,698 | 3,012 | |
| Market | |||
| Value• | |||
| Shares | ($000) | ||
| Waddell & Reed Financial | |||
| Inc. Class A | 161,778 | 3,011 | |
| *,^ | BofI Holding Inc. | 111,609 | 2,959 |
| ServisFirst Bancshares Inc. | 85,865 | 2,929 | |
| Provident Financial | |||
| Services Inc. | 117,401 | 2,917 | |
| LegacyTexas Financial | |||
| Group Inc. | 80,697 | 2,904 | |
| First Financial Bancorp | 120,213 | 2,879 | |
| Banner Corp. | 50,736 | 2,797 | |
| NBT Bancorp Inc. | 84,059 | 2,760 | |
| Horace Mann Educators | |||
| Corp. | 78,445 | 2,757 | |
| * | Walker & Dunlop Inc. | 54,871 | 2,644 |
| Employers Holdings Inc. | 62,456 | 2,632 | |
| Westamerica | |||
| Bancorporation | 50,885 | 2,623 | |
| * | PRA Group Inc. | 89,672 | 2,591 |
| S&T Bancorp Inc. | 67,689 | 2,433 | |
| Navigators Group Inc. | 43,333 | 2,418 | |
| Boston Private Financial | |||
| Holdings Inc. | 162,802 | 2,393 | |
| First Commonwealth | |||
| Financial Corp. | 171,193 | 2,159 | |
| Brookline Bancorp Inc. | 148,120 | 2,125 | |
| WisdomTree | |||
| Investments Inc. | 222,071 | 2,036 | |
| * | First BanCorp | 357,411 | 2,030 |
| AMERISAFE Inc. | 37,215 | 2,002 | |
| Safety Insurance Group | |||
| Inc. | 27,686 | 1,977 | |
| City Holding Co. | 30,207 | 1,913 | |
| Infinity Property & | |||
| Casualty Corp. | 21,386 | 1,892 | |
| * | Encore Capital Group Inc. | 45,826 | 1,849 |
| Tompkins Financial Corp. | 23,916 | 1,816 | |
| Capstead Mortgage Corp. | 187,332 | 1,811 | |
| Banc of California Inc. | 97,543 | 1,809 | |
| United Fire Group Inc. | 41,467 | 1,744 | |
| Southside Bancshares Inc. | 52,664 | 1,721 | |
| Central Pacific Financial | |||
| Corp. | 59,294 | 1,720 | |
| Hanmi Financial Corp. | 62,776 | 1,676 | |
| National Bank Holdings | |||
| Corp. Class A | 51,715 | 1,664 | |
| Stewart Information | |||
| Services Corp. | 46,085 | 1,663 | |
| * | Customers Bancorp Inc. | 56,208 | 1,584 |
| Piper Jaffray Cos. | 27,616 | 1,531 | |
| TrustCo Bank Corp. NY | 185,857 | 1,468 | |
| Northfield Bancorp Inc. | 88,170 | 1,420 | |
| * | Donnelley Financial | ||
| Solutions Inc. | 63,996 | 1,370 |
15
| S&P Small-Cap 600 Index Fund | |||
| Market | |||
| Value• | |||
| Shares | ($000) | ||
| Universal Insurance | |||
| Holdings Inc. | 63,598 | 1,364 | |
| Virtus Investment | |||
| Partners Inc. | 12,855 | 1,363 | |
| * | HomeStreet Inc. | 49,018 | 1,238 |
| Investment Technology | |||
| Group Inc. | 61,476 | 1,235 | |
| Oritani Financial Corp. | 74,884 | 1,202 | |
| Dime Community | |||
| Bancshares Inc. | 60,544 | 1,147 | |
| * | INTL. FCStone Inc. | 29,236 | 1,038 |
| Maiden Holdings Ltd. | 142,585 | 1,034 | |
| Fidelity Southern Corp. | 41,518 | 908 | |
| * | World Acceptance Corp. | 11,600 | 868 |
| * | Opus Bank | 35,488 | 795 |
| * | eHealth Inc. | 32,693 | 794 |
| Bank Mutual Corp. | 82,289 | 753 | |
| OFG Bancorp | 85,849 | 747 | |
| HCI Group Inc. | 16,002 | 624 | |
| United Insurance Holdings | |||
| Corp. | 35,111 | 553 | |
| * | Enova International Inc. | 45,827 | 545 |
| Greenhill & Co. Inc. | 29,602 | 445 | |
| * | EZCORP Inc. Class A | 39,359 | 356 |
| 218,163 | |||
| Health Care (13.0%) | |||
| * | Nektar Therapeutics | ||
| Class A | 300,116 | 6,311 | |
| Chemed Corp. | 31,109 | 6,137 | |
| * | Integra LifeSciences | ||
| Holdings Corp. | 117,024 | 5,967 | |
| Cantel Medical Corp. | 70,219 | 5,705 | |
| * | Medicines Co. | 139,602 | 5,122 |
| * | Neogen Corp. | 73,739 | 5,081 |
| * | ICU Medical Inc. | 29,110 | 5,075 |
| * | Ligand Pharmaceuticals | ||
| Inc. | 36,827 | 4,746 | |
| * | Supernus Pharmaceuticals | ||
| Inc. | 97,273 | 4,455 | |
| * | Haemonetics Corp. | 101,494 | 4,366 |
| * | Myriad Genetics Inc. | 131,780 | 4,018 |
| * | Merit Medical Systems Inc. | 96,569 | 3,988 |
| * | Select Medical Holdings | ||
| Corp. | 207,921 | 3,867 | |
| * | Magellan Health Inc. | 45,884 | 3,712 |
| * | Omnicell Inc. | 71,899 | 3,688 |
| * | HealthEquity Inc. | 85,761 | 3,668 |
| * | AMN Healthcare Services | ||
| Inc. | 92,675 | 3,461 | |
| * | Cambrex Corp. | 63,008 | 3,283 |
| *,^ | MiMedx Group Inc. | 197,345 | 3,211 |
| * | Repligen Corp. | 71,371 | 3,117 |
| * | Impax Laboratories Inc. | 142,607 | 3,087 |
| * | Inogen Inc. | 31,460 | 3,014 |
| Market | |||
| Value• | |||
| Shares | ($000) | ||
| * | HMS Holdings Corp. | 162,304 | 2,876 |
| * | Amedisys Inc. | 54,166 | 2,830 |
| * | Tivity Health Inc. | 65,215 | 2,556 |
| * | Emergent BioSolutions Inc. | 67,928 | 2,536 |
| * | Integer Holdings Corp. | 54,353 | 2,498 |
| CONMED Corp. | 48,001 | 2,381 | |
| * | OraSure Technologies Inc. | 111,776 | 2,281 |
| * | Varex Imaging Corp. | 72,641 | 2,218 |
| * | Momenta Pharmaceuticals | ||
| Inc. | 129,225 | 2,177 | |
| * | BioTelemetry Inc. | 58,191 | 2,162 |
| * | Natus Medical Inc. | 64,037 | 2,152 |
| * | Innoviva Inc. | 150,252 | 2,110 |
| Abaxis Inc. | 43,841 | 2,026 | |
| Ensign Group Inc. | 92,241 | 1,895 | |
| * | LHC Group Inc. | 29,011 | 1,893 |
| * | Acorda Therapeutics Inc. | 90,340 | 1,879 |
| * | PharMerica Corp. | 60,686 | 1,784 |
| Analogic Corp. | 24,172 | 1,730 | |
| * | Orthofix International NV | 34,929 | 1,719 |
| * | Community Health | ||
| Systems Inc. | 200,195 | 1,529 | |
| * | Anika Therapeutics Inc. | 28,412 | 1,526 |
| Luminex Corp. | 77,499 | 1,498 | |
| * | Cytokinetics Inc. | 98,692 | 1,466 |
| US Physical Therapy Inc. | 24,442 | 1,464 | |
| * | Diplomat Pharmacy Inc. | 85,261 | 1,428 |
| * | Quality Systems Inc. | 89,815 | 1,415 |
| * | Spectrum Pharmaceuticals | ||
| Inc. | 144,350 | 1,409 | |
| Kindred Healthcare Inc. | 167,277 | 1,355 | |
| Phibro Animal Health | |||
| Corp. Class A | 36,346 | 1,290 | |
| * | Heska Corp. | 12,421 | 1,263 |
| Landauer Inc. | 18,822 | 1,168 | |
| * | Providence Service Corp. | 22,456 | 1,164 |
| * | HealthStream Inc. | 49,466 | 1,162 |
| * | Enanta Pharmaceuticals | ||
| Inc. | 27,022 | 1,158 | |
| Meridian Bioscience Inc. | 81,783 | 1,137 | |
| * | AMAG Pharmaceuticals | ||
| Inc. | 67,865 | 1,133 | |
| * | AngioDynamics Inc. | 66,299 | 1,129 |
| * | Almost Family Inc. | 23,116 | 1,126 |
| * | Amphastar Pharmaceuticals | ||
| Inc. | 69,268 | 1,109 | |
| * | SciClone Pharmaceuticals | ||
| Inc. | 100,366 | 1,104 | |
| * | CryoLife Inc. | 52,953 | 1,101 |
| * | Lantheus Holdings Inc. | 57,087 | 999 |
| * | CorVel Corp. | 18,892 | 981 |
| * | Albany Molecular | ||
| Research Inc. | 43,115 | 937 | |
| LeMaitre Vascular Inc. | 24,495 | 892 |
16
| S&P Small-Cap 600 Index Fund | |||
| Market | |||
| Value• | |||
| Shares | ($000) | ||
| Invacare Corp. | 62,623 | 845 | |
| * | Eagle Pharmaceuticals Inc. | 15,148 | 826 |
| * | Cross Country Healthcare | ||
| Inc. | 61,687 | 764 | |
| * | ANI Pharmaceuticals Inc. | 15,617 | 750 |
| * | Surmodics Inc. | 25,891 | 673 |
| Computer Programs & | |||
| Systems Inc. | 20,819 | 627 | |
| Aceto Corp. | 58,624 | 622 | |
| *,^ | Lannett Co. Inc. | 35,152 | 617 |
| *,^ | Sucampo Pharmaceuticals | ||
| Inc. Class A | 48,841 | 574 | |
| * | Depomed Inc. | 77,309 | 470 |
| * | Progenics Pharmaceuticals | ||
| Inc. | 64,303 | 433 | |
| * | Quorum Health Corp. | 400 | 2 |
| 175,928 | |||
| Industrials (18.8%) | |||
| Healthcare Services Group | |||
| Inc. | 141,182 | 7,228 | |
| Brink’s Co. | 87,717 | 6,881 | |
| Barnes Group Inc. | 96,647 | 6,042 | |
| John Bean Technologies | |||
| Corp. | 61,172 | 5,426 | |
| * | Moog Inc. Class A | 62,441 | 4,793 |
| ABM Industries Inc. | 107,704 | 4,785 | |
| Tetra Tech Inc. | 110,570 | 4,710 | |
| * | WageWorks Inc. | 76,492 | 4,509 |
| * | On Assignment Inc. | 94,002 | 4,484 |
| * | Mercury Systems Inc. | 92,843 | 4,480 |
| * | Hawaiian Holdings Inc. | 103,762 | 4,446 |
| Hillenbrand Inc. | 121,829 | 4,355 | |
| * | Trex Co. Inc. | 56,879 | 4,323 |
| Applied Industrial | |||
| Technologies Inc. | 75,507 | 4,304 | |
| UniFirst Corp. | 29,914 | 4,296 | |
| * | Aerojet Rocketdyne | ||
| Holdings Inc. | 144,249 | 4,274 | |
| Matthews International | |||
| Corp. Class A | 62,295 | 3,753 | |
| Korn/Ferry International | 111,091 | 3,701 | |
| SkyWest Inc. | 100,097 | 3,473 | |
| Universal Forest Products | |||
| Inc. | 39,696 | 3,462 | |
| Simpson Manufacturing | |||
| Co. Inc. | 78,620 | 3,442 | |
| Exponent Inc. | 50,053 | 3,409 | |
| * | Proto Labs Inc. | 47,159 | 3,386 |
| Watts Water Technologies | |||
| Inc. Class A | 53,938 | 3,328 | |
| Mueller Industries Inc. | 111,444 | 3,324 | |
| * | Atlas Air Worldwide | ||
| Holdings Inc. | 48,877 | 3,265 | |
| Brady Corp. Class A | 92,401 | 3,082 | |
| Market | |||
| Value• | |||
| Shares | ($000) | ||
| Forward Air Corp. | 58,460 | 3,038 | |
| Allegiant Travel Co. Class A | 25,429 | 3,001 | |
| Albany International Corp. | 55,916 | 2,997 | |
| Insperity Inc. | 36,280 | 2,913 | |
| EnPro Industries Inc. | 41,324 | 2,912 | |
| Franklin Electric Co. Inc. | 74,598 | 2,876 | |
| Actuant Corp. Class A | 116,448 | 2,801 | |
| * | Saia Inc. | 49,237 | 2,784 |
| * | SPX FLOW Inc. | 82,526 | 2,762 |
| ESCO Technologies Inc. | 50,300 | 2,739 | |
| * | FTI Consulting Inc. | 80,627 | 2,734 |
| * | Harsco Corp. | 156,471 | 2,676 |
| Kaman Corp. | 52,967 | 2,597 | |
| Mobile Mini Inc. | 85,533 | 2,587 | |
| Triumph Group Inc. | 96,735 | 2,544 | |
| * | Hub Group Inc. Class A | 64,775 | 2,491 |
| AAON Inc. | 76,335 | 2,488 | |
| Wabash National Corp. | 117,356 | 2,467 | |
| AZZ Inc. | 50,390 | 2,464 | |
| Comfort Systems USA Inc. | 72,311 | 2,462 | |
| Apogee Enterprises Inc. | 55,688 | 2,434 | |
| Greenbrier Cos. Inc. | 55,413 | 2,377 | |
| Standex International Corp. | 24,682 | 2,356 | |
| Interface Inc. Class A | 121,537 | 2,309 | |
| * | Patrick Industries Inc. | 30,808 | 2,280 |
| * | American Woodmark Corp. | 27,014 | 2,237 |
| AAR Corp. | 61,864 | 2,231 | |
| *,^ | Axon Enterprise Inc. | 102,029 | 2,215 |
| Federal Signal Corp. | 116,666 | 2,180 | |
| US Ecology Inc. | 42,231 | 2,171 | |
| Viad Corp. | 39,439 | 2,167 | |
| Matson Inc. | 83,663 | 2,158 | |
| Tennant Co. | 34,746 | 2,118 | |
| Cubic Corp. | 48,333 | 2,076 | |
| Multi-Color Corp. | 25,590 | 2,042 | |
| * | Chart Industries Inc. | 59,454 | 2,006 |
| * | SPX Corp. | 82,724 | 1,994 |
| * | Aerovironment Inc. | 39,976 | 1,960 |
| Raven Industries Inc. | 69,847 | 1,956 | |
| Heartland Express Inc. | 83,825 | 1,858 | |
| Astec Industries Inc. | 37,078 | 1,842 | |
| Lindsay Corp. | 20,746 | 1,796 | |
| * | Gibraltar Industries Inc. | 61,207 | 1,790 |
| Briggs & Stratton Corp. | 83,480 | 1,748 | |
| Encore Wire Corp. | 40,190 | 1,724 | |
| * | TrueBlue Inc. | 83,064 | 1,699 |
| Alamo Group Inc. | 18,332 | 1,682 | |
| General Cable Corp. | 96,864 | 1,642 | |
| * | Lydall Inc. | 33,477 | 1,573 |
| CIRCOR International Inc. | 32,194 | 1,546 | |
| * | Navigant Consulting Inc. | 92,231 | 1,414 |
| * | Aegion Corp. Class A | 64,833 | 1,405 |
| ArcBest Corp. | 46,594 | 1,384 |
17
| S&P Small-Cap 600 Index Fund | |||
| Market | |||
| Value• | |||
| Shares | ($000) | ||
| Quanex Building Products | |||
| Corp. | 66,727 | 1,308 | |
| Marten Transport Ltd. | 74,885 | 1,284 | |
| Shares | Market | ||
| * | PGT Innovations Inc. | 95,861 | 1,265 |
| RR Donnelley & Sons Co. | 136,676 | 1,261 | |
| Kelly Services Inc. Class A | 56,677 | 1,226 | |
| Griffon Corp. | 60,569 | 1,124 | |
| * | Engility Holdings Inc. | 34,467 | 1,071 |
| LSC Communications Inc. | 66,275 | 1,068 | |
| National Presto Industries | |||
| Inc. | 9,655 | 962 | |
| Insteel Industries Inc. | 33,989 | 852 | |
| * | MYR Group Inc. | 32,043 | 827 |
| Titan International Inc. | 94,384 | 810 | |
| Resources Connection Inc. | 57,732 | 736 | |
| Heidrick & Struggles | |||
| International Inc. | 36,489 | 666 | |
| * | Veritiv Corp. | 22,075 | 618 |
| * | Vicor Corp. | 31,511 | 613 |
| * | DXP Enterprises Inc. | 18,814 | 510 |
| Powell Industries Inc. | 16,635 | 474 | |
| Essendant Inc. | 37,748 | 448 | |
| * | Roadrunner Transportation | ||
| Systems Inc. | 59,247 | 443 | |
| * | Team Inc. | 27,594 | 341 |
| * | Orion Group Holdings Inc. | 54,441 | 329 |
| * | Echo Global Logistics Inc. | 21,624 | 329 |
| * | CDI Corp. | 27,432 | 225 |
| 254,454 | |||
| Information Technology (15.1%) | |||
| MKS Instruments Inc. | 104,657 | 8,619 | |
| * | CACI International Inc. | ||
| Class A | 47,307 | 6,140 | |
| * | Lumentum Holdings Inc. | 107,641 | 6,119 |
| * | Stamps.com Inc. | 30,470 | 5,827 |
| * | Advanced Energy | ||
| Industries Inc. | 76,937 | 5,658 | |
| * | Sanmina Corp. | 146,115 | 5,472 |
| * | Semtech Corp. | 127,163 | 4,781 |
| * | Itron Inc. | 65,047 | 4,722 |
| * | Viavi Solutions Inc. | 439,088 | 4,408 |
| TiVo Corp. | 234,369 | 4,289 | |
| Power Integrations Inc. | 57,443 | 4,185 | |
| * | Rogers Corp. | 35,068 | 4,157 |
| * | Anixter International Inc. | 55,279 | 4,080 |
| * | II-VI Inc. | 106,252 | 3,809 |
| * | ExlService Holdings Inc. | 65,149 | 3,667 |
| Brooks Automation Inc. | 134,738 | 3,513 | |
| Cabot Microelectronics | |||
| Corp. | 48,860 | 3,499 | |
| * | Plexus Corp. | 65,233 | 3,397 |
| * | Electronics For Imaging Inc. | 89,904 | 3,197 |
| Progress Software Corp. | 93,391 | 3,136 | |
| * | Benchmark Electronics Inc. | 96,228 | 3,127 |
| Market | |||
| Value• | |||
| Shares | ($000) | ||
| * | NETGEAR Inc. | 62,792 | 3,014 |
| Methode Electronics Inc. | 71,775 | 2,936 | |
| * | OSI Systems Inc. | 34,334 | 2,852 |
| * | Fabrinet | 72,226 | 2,805 |
| * | Rambus Inc. | 216,179 | 2,804 |
| * | Insight Enterprises Inc. | 69,172 | 2,772 |
| * | Qualys Inc. | 58,041 | 2,757 |
| * | Gigamon Inc. | 60,948 | 2,618 |
| * | Kulicke & Soffa Industries | ||
| Inc. | 137,351 | 2,614 | |
| Xperi Corp. | 95,658 | 2,607 | |
| Badger Meter Inc. | 56,334 | 2,586 | |
| CSG Systems International | |||
| Inc. | 65,375 | 2,531 | |
| * | 8x8 Inc. | 177,286 | 2,509 |
| Ebix Inc. | 42,102 | 2,429 | |
| * | TTM Technologies Inc. | 165,367 | 2,355 |
| * | MicroStrategy Inc. Class A | 18,204 | 2,348 |
| * | Cardtronics plc Class A | 88,311 | 2,294 |
| * | MaxLinear Inc. | 102,184 | 2,207 |
| * | ePlus Inc. | 25,481 | 2,133 |
| * | Bottomline Technologies | ||
| de Inc. | 69,951 | 2,120 | |
| * | Diodes Inc. | 73,954 | 2,081 |
| *,^ | Oclaro Inc. | 246,028 | 2,069 |
| ADTRAN Inc. | 93,520 | 2,067 | |
| * | SPS Commerce Inc. | 33,272 | 2,027 |
| *,^ | Applied Optoelectronics | ||
| Inc. | 34,193 | 2,021 | |
| * | Sykes Enterprises Inc. | 75,710 | 2,018 |
| ManTech International | |||
| Corp. Class A | 49,555 | 1,993 | |
| NIC Inc. | 120,460 | 1,970 | |
| * | Super Micro Computer Inc. | 73,505 | 1,957 |
| * | Virtusa Corp. | 53,625 | 1,948 |
| * | ScanSource Inc. | 49,009 | 1,924 |
| * | Veeco Instruments Inc. | 92,856 | 1,755 |
| * | Blucora Inc. | 76,531 | 1,745 |
| * | CEVA Inc. | 41,637 | 1,688 |
| MTS Systems Corp. | 32,444 | 1,570 | |
| * | SolarEdge Technologies | ||
| Inc. | 56,269 | 1,505 | |
| Monotype Imaging | |||
| Holdings Inc. | 81,179 | 1,482 | |
| CTS Corp. | 63,592 | 1,431 | |
| * | LivePerson Inc. | 104,086 | 1,395 |
| * | Rudolph Technologies Inc. | 61,374 | 1,363 |
| * | Barracuda Networks Inc. | 55,792 | 1,351 |
| * | CalAmp Corp. | 68,676 | 1,273 |
| * | Nanometrics Inc. | 49,016 | 1,264 |
| * | Perficient Inc. | 68,244 | 1,249 |
| * | Shutterstock Inc. | 37,115 | 1,246 |
| TeleTech Holdings Inc. | 30,138 | 1,196 | |
| * | FARO Technologies Inc. | 32,433 | 1,117 |
| * | Cray Inc. | 55,739 | 1,051 |
18
| S&P Small-Cap 600 Index Fund | |||
| Market | |||
| Value• | |||
| Shares | ($000) | ||
| * | Synchronoss Technologies | ||
| Inc. | 56,724 | 952 | |
| Cohu Inc. | 49,397 | 927 | |
| Comtech | |||
| Telecommunications Corp. | 45,779 | 896 | |
| * | XO Group Inc. | 47,377 | 882 |
| * | Control4 Corp. | 35,313 | 874 |
| Forrester Research Inc. | 19,014 | 775 | |
| Daktronics Inc. | 78,139 | 752 | |
| * | VASCO Data Security | ||
| International Inc. | 58,653 | 736 | |
| Park Electrochemical Corp. | 36,875 | 670 | |
| * | Electro Scientific | ||
| Industries Inc. | 49,052 | 604 | |
| * | DSP Group Inc. | 43,169 | 514 |
| * | Harmonic Inc. | 156,574 | 509 |
| * | Kopin Corp. | 118,853 | 478 |
| * | Digi International Inc. | 51,745 | 476 |
| Bel Fuse Inc. Class B | 17,125 | 437 | |
| * | QuinStreet Inc. | 70,223 | 376 |
| * | Agilysys Inc. | 29,747 | 306 |
| * | Liquidity Services Inc. | 48,470 | 276 |
| Black Box Corp. | 30,570 | 92 | |
| * | DHI Group Inc. | 450 | 1 |
| 204,382 | |||
| Materials (5.2%) | |||
| * | Ingevity Corp. | 81,442 | 5,128 |
| HB Fuller Co. | 97,742 | 4,906 | |
| Balchem Corp. | 61,647 | 4,621 | |
| KapStone Paper and | |||
| Packaging Corp. | 170,403 | 3,812 | |
| Quaker Chemical Corp. | 25,714 | 3,580 | |
| *,^ | AK Steel Holding Corp. | 609,009 | 3,410 |
| Kaiser Aluminum Corp. | 33,224 | 3,200 | |
| Stepan Co. | 37,933 | 2,934 | |
| Innospec Inc. | 46,692 | 2,591 | |
| Neenah Paper Inc. | 32,757 | 2,530 | |
| * | US Concrete Inc. | 28,801 | 2,306 |
| Schweitzer-Mauduit | |||
| International Inc. | 59,920 | 2,273 | |
| * | Boise Cascade Co. | 75,196 | 2,256 |
| * | Kraton Corp. | 60,794 | 1,996 |
| * | AdvanSix Inc. | 59,395 | 1,896 |
| * | Century Aluminum Co. | 96,262 | 1,879 |
| A Schulman Inc. | 56,996 | 1,733 | |
| Innophos Holdings Inc. | 37,726 | 1,723 | |
| Deltic Timber Corp. | 20,653 | 1,612 | |
| * | Koppers Holdings Inc. | 40,351 | 1,582 |
| * | Clearwater Paper Corp. | 32,073 | 1,491 |
| Materion Corp. | 38,738 | 1,480 | |
| PH Glatfelter Co. | 85,023 | 1,473 | |
| Calgon Carbon Corp. | 99,073 | 1,209 | |
| * | SunCoke Energy Inc. | 125,566 | 1,170 |
| Market | |||
| Value• | |||
| Shares | ($000) | ||
| Rayonier Advanced | |||
| Materials Inc. | 84,479 | 1,159 | |
| * | TimkenSteel Corp. | 76,243 | 1,131 |
| American Vanguard Corp. | 50,835 | 1,029 | |
| Myers Industries Inc. | 42,898 | 806 | |
| Tredegar Corp. | 49,286 | 803 | |
| Hawkins Inc. | 18,662 | 665 | |
| FutureFuel Corp. | 44,274 | 597 | |
| * | Flotek Industries Inc. | 106,302 | 551 |
| Olympic Steel Inc. | 17,741 | 324 | |
| Haynes International Inc. | 10,471 | 320 | |
| * | LSB Industries Inc. | 40,258 | 246 |
| 70,422 | |||
| Other (0.0%)2 | |||
| *,3 | Gerber Scientific Inc. CVR | 4,758 | 1 |
| Real Estate (6.3%) | |||
| EastGroup Properties Inc. | 65,570 | 5,827 | |
| PS Business Parks Inc. | 37,865 | 5,116 | |
| Acadia Realty Trust | 163,908 | 4,702 | |
| DiamondRock Hospitality | |||
| Co. | 387,422 | 4,258 | |
| Retail Opportunity | |||
| Investments Corp. | 212,277 | 4,212 | |
| Lexington Realty Trust | 418,501 | 4,126 | |
| LTC Properties Inc. | 76,559 | 3,723 | |
| Government Properties | |||
| Income Trust | 185,998 | 3,450 | |
| American Assets Trust Inc. | 80,525 | 3,271 | |
| Kite Realty Group Trust | 161,691 | 3,253 | |
| Summit Hotel Properties | |||
| Inc. | 201,665 | 2,993 | |
| Chesapeake Lodging Trust | 116,274 | 2,975 | |
| Four Corners Property | |||
| Trust Inc. | 116,135 | 2,951 | |
| Agree Realty Corp. | 55,129 | 2,763 | |
| CareTrust REIT Inc. | 140,378 | 2,708 | |
| ^ | CBL & Associates | ||
| Properties Inc. | 333,821 | 2,671 | |
| HFF Inc. Class A | 68,848 | 2,625 | |
| RE/MAX Holdings Inc. | |||
| Class A | 34,534 | 2,115 | |
| Franklin Street Properties | |||
| Corp. | 207,513 | 2,069 | |
| Ramco-Gershenson | |||
| Properties Trust | 154,831 | 2,036 | |
| National Storage Affiliates | |||
| Trust | 86,369 | 1,928 | |
| Parkway Inc. | 82,742 | 1,900 | |
| Universal Health Realty | |||
| Income Trust | 24,330 | 1,842 | |
| Getty Realty Corp. | 62,706 | 1,728 | |
| Chatham Lodging Trust | 74,866 | 1,518 | |
19
| S&P Small-Cap 600 Index Fund | |||
| Market | |||
| Value• | |||
| Shares | ($000) | ||
| Hersha Hospitality Trust | |||
| Class A | 81,535 | 1,512 | |
| Saul Centers Inc. | 22,962 | 1,391 | |
| Independence Realty | |||
| Trust Inc. | 115,841 | 1,192 | |
| Urstadt Biddle Properties | |||
| Inc. Class A | 57,636 | 1,192 | |
| Armada Hoffler Properties | |||
| Inc. | 87,694 | 1,172 | |
| * | Forestar Group Inc. | 64,685 | 1,113 |
| Pennsylvania REIT | 96,464 | 968 | |
| Cedar Realty Trust Inc. | 148,731 | 750 | |
| 86,050 | |||
| Telecommunication Services (1.3%) | |||
| Cogent Communications | |||
| Holdings Inc. | 79,222 | 3,692 | |
| * | Vonage Holdings Corp. | 378,041 | 3,138 |
| Consolidated | |||
| Communications Holdings | |||
| Inc. | 124,359 | 2,294 | |
| * | General Communication | ||
| Inc. Class A | 51,699 | 2,230 | |
| * | Iridium Communications | ||
| Inc. | 158,337 | 1,757 | |
| Cincinnati Bell Inc. | 82,230 | 1,731 | |
| ATN International Inc. | 20,715 | 1,254 | |
| * | Lumos Networks Corp. | 46,649 | 839 |
| Spok Holdings Inc. | 40,043 | 671 | |
| 17,606 | |||
| Utilities (3.1%) | |||
| ALLETE Inc. | 98,377 | 7,608 | |
| Spire Inc. | 93,347 | 7,141 | |
| Avista Corp. | 124,548 | 6,402 | |
| South Jersey Industries | |||
| Inc. | 153,738 | 5,516 | |
| El Paso Electric Co. | 78,513 | 4,361 | |
| Northwest Natural Gas Co. | 55,416 | 3,674 | |
| American States Water Co. | 70,840 | 3,492 | |
| California Water Service | |||
| Group | 92,815 | 3,476 | |
| 41,670 | |||
| Total Common Stocks | |||
| (Cost $1,255,179) | 1,354,724 | ||
| Market | |||
| Value• | |||
| Shares | ($000) | ||
| Temporary Cash Investments (0.9%)1 | |||
| Money Market Fund (0.9%) | |||
| 4,5 | Vanguard Market Liquidity | ||
| Fund, 1.224% | 115,578 | 11,560 | |
| Face | |||
| Amount | |||
| ($000) | |||
| U. S. Government and Agency Obligations (0.0%) | |||
| 6 | United States Treasury | ||
| Bill, 0.980%, 10/5/17 | 100 | 100 | |
| United States Treasury | |||
| Bill, 1.038%, 11/2/17 | 200 | 200 | |
| 6 | United States Treasury | ||
| Bill, 1.044%, 11/24/17 | 50 | 50 | |
| 6 | United States Treasury | ||
| Bill, 1.107%, 12/28/17 | 50 | 50 | |
| 400 | |||
| Total Temporary Cash Investments | |||
| (Cost $11,958) | 11,960 | ||
| Total Investments (100.9%) | |||
| (Cost $1,267,137) | 1,366,684 | ||
| Amount | |||
| ($000) | |||
| Other Assets and Liabilities (-0.9%) | |||
| Other Assets | |||
| Investment in Vanguard | 86 | ||
| Receivables for Accrued Income | 1,086 | ||
| Receivables for Capital Shares Issued | 5,448 | ||
| Variable Margin Receivable – | |||
| Futures Contracts | 11 | ||
| Other Assets 5 | 1,047 | ||
| Total Other Assets | 7,678 | ||
| Liabilities | |||
| Payables for Investment | |||
| Securities Purchased | (4,075) | ||
| Collateral for Securities on Loan | (12,601) | ||
| Payables for Capital Shares Redeemed | (1,052) | ||
| Payables to Vanguard | (237) | ||
| Other Liabilities | (1,513) | ||
| Total Liabilities | (19,478) | ||
| Net Assets (100%) | 1,354,884 | ||
20
S&P Small-Cap 600 Index Fund
| At August 31, 2017, net assets consisted of: | |
| Amount | |
| ($000) | |
| Paid-in Capital | 1,261,976 |
| Undistributed Net Investment Income | 9,672 |
| Accumulated Net Realized Losses | (16,304) |
| Unrealized Appreciation (Depreciation) | |
| Investment Securities | 99,547 |
| Futures Contracts | (7) |
| Net Assets | 1,354,884 |
| ETF Shares—Net Assets | |
| Applicable to 5,425,000 outstanding | |
| $.001 par value shares of beneficial | |
| interest (unlimited authorization) | 682,653 |
| Net Asset Value Per Share— | |
| ETF Shares | $125.83 |
| Amount | |
| ($000) | |
| Institutional Shares—Net Assets | |
| Applicable to 2,657,270 outstanding | |
| $.001 par value shares of beneficial | |
| interest (unlimited authorization) | 672,231 |
| Net Asset Value Per Share— | |
| Institutional Shares | $252.98 |
• See Note A in Notes to Financial Statements.
* Non-income-producing security.
^ Includes partial security positions on loan to broker-dealers.
The total value of securities on loan is $12,032,000.
1 The fund invests a portion of its cash reserves in equity markets
through the use of index futures contracts. After giving effect to
futures investments, the fund’s effective common stock and
temporary cash investment positions represent 100.1% and
0.8%, respectively, of net assets.
2 “Other” represents securities that are not classified by the fund’s
benchmark index.
3 Security value determined using significant unobservable inputs.
4 Affiliated money market fund available only to Vanguard funds
and certain trusts and accounts managed by Vanguard. Rate
shown is the 7-day yield.
5 Includes $12,601,000 of collateral received for securities on loan,
of which $11,555,000 is held in Vanguard Market Liquidity Fund
and $1,046,000 is held in cash.
6 Securities with a value of $200,000 have been segregated as
initial margin for open futures contracts.
CVR—Contingent Value Rights.
REIT—Real Estate Investment Trust.
| Derivative Financial Instruments Outstanding as of Period End | ||||
| Futures Contracts | ||||
| ($000) | ||||
| Value and | ||||
| Number of | Unrealized | |||
| Long (Short) | Notional | Appreciation | ||
| Expiration | Contracts | Amount | (Depreciation) | |
| Long Futures Contracts | ||||
| E-mini Russell 2000 Index | September 2017 | 17 | 1,194 | (7) |
Unrealized appreciation (depreciation) on open futures contracts is required to be treated as realized gain (loss) for tax purposes.
See accompanying Notes, which are an integral part of the Financial Statements.
21
S&P Small-Cap 600 Index Fund
Statement of Operations
| Year Ended | |
| August 31,2017 | |
| ($000) | |
| Investment Income | |
| Income | |
| Dividends | 14,589 |
| Interest1 | 38 |
| Securities Lending—Net | 375 |
| Total Income | 15,002 |
| Expenses | |
| The Vanguard Group—Note B | |
| Investment Advisory Services | 231 |
| Management and Administrative—ETF Shares | 494 |
| Management and Administrative—Institutional Shares | 156 |
| Marketing and Distribution—ETF Shares | 34 |
| Marketing and Distribution—Institutional Shares | 28 |
| Custodian Fees | 197 |
| Auditing Fees | 32 |
| Shareholders’ Reports and Proxy—ETF Shares | 45 |
| Shareholders’ Reports and Proxy—Institutional Shares | 6 |
| Trustees’ Fees and Expenses | 1 |
| Total Expenses | 1,224 |
| Net Investment Income | 13,778 |
| Realized Net Gain (Loss) | |
| Investment Securities Sold1 | 29,576 |
| Futures Contracts | 85 |
| Realized Net Gain (Loss) | 29,661 |
| Change in Unrealized Appreciation (Depreciation) | |
| Investment Securities | 57,683 |
| Futures Contracts | (34) |
| Change in Unrealized Appreciation (Depreciation) | 57,649 |
| Net Increase (Decrease) in Net Assets Resulting from Operations | 101,088 |
1 Interest income and realized net gain (loss) from an affiliated company of the fund were $32,000 and $1,000, respectively.
See accompanying Notes, which are an integral part of the Financial Statements.
22
| S&P Small-Cap 600 Index Fund | ||
| Statement of Changes in Net Assets | ||
| Year Ended August 31, | ||
| 2017 | 2016 | |
| ($000) | ($000) | |
| Increase (Decrease) in Net Assets | ||
| Operations | ||
| Net Investment Income | 13,778 | 7,230 |
| Realized Net Gain (Loss) | 29,661 | 21,804 |
| Change in Unrealized Appreciation (Depreciation) | 57,649 | 43,900 |
| Net Increase (Decrease) in Net Assets Resulting from Operations | 101,088 | 72,934 |
| Distributions | ||
| Net Investment Income | ||
| ETF Shares | (4,355) | (2,746) |
| Institutional Shares | (4,245) | (3,398) |
| Realized Capital Gain | ||
| ETF Shares | — | — |
| Institutional Shares | — | — |
| Total Distributions | (8,600) | (6,144) |
| Capital Share Transactions | ||
| ETF Shares | 293,444 | 104,022 |
| Institutional Shares | 295,662 | 58,790 |
| Net Increase (Decrease) from Capital Share Transactions | 589,106 | 162,812 |
| Total Increase (Decrease) | 681,594 | 229,602 |
| Net Assets | ||
| Beginning of Period | 673,290 | 443,688 |
| End of Period1 | 1,354,884 | 673,290 |
1 Net Assets—End of Period includes undistributed (overdistributed) net investment income of $9,672,000 and $4,494,000.
See accompanying Notes, which are an integral part of the Financial Statements.
23
| S&P Small-Cap 600 Index Fund | |||||
| Financial Highlights | |||||
| ETF Shares | |||||
| For a Share Outstanding | Year Ended August 31, | ||||
| Throughout Each Period | 2017 | 2016 | 2015 | 2014 | 2013 |
| Net Asset Value, Beginning of Period | $112.23 | $100.42 | $99.81 | $84.98 | $68.12 |
| Investment Operations | |||||
| Net Investment Income | 1.5731 | 1.3751 | 1.204 | .976 | 1.024 |
| Net Realized and Unrealized Gain (Loss) | |||||
| on Investments | 13.212 | 11.683 | . 497 | 14.697 | 16.854 |
| Total from Investment Operations | 14.785 | 13.058 | 1.701 | 15.673 | 17.878 |
| Distributions | |||||
| Dividends from Net Investment Income | (1.185) | (1.248) | (1.091) | (.843) | (1.018) |
| Distributions from Realized Capital Gains | — | — | — | — | — |
| Total Distributions | (1.185) | (1.248) | (1.091) | (.843) | (1.018) |
| Net Asset Value, End of Period | $125.83 | $112.23 | $100.42 | $99.81 | $84.98 |
| Total Return | 13.18% | 13.17% | 1.69% | 18.47% | 26.57% |
| Ratios/Supplemental Data | |||||
| Net Assets, End of Period (Millions) | $683 | $342 | $206 | $165 | $85 |
| Ratio of Total Expenses to | |||||
| Average Net Assets | 0.15% | 0.15% | 0.15% | 0.15% | 0.15% |
| Ratio of Net Investment Income to | |||||
| Average Net Assets | 1.27% | 1.36% | 1.27% | 1.10% | 1.48% |
| Portfolio Turnover Rate2 | 22% | 15% | 11% | 16% | 12% |
1 Calculated based on average shares outstanding.
2 Excludes the value of portfolio securities received or delivered as a result of in-kind purchases or redemptions of the fund’s capital shares, including ETF Creation Units.
See accompanying Notes, which are an integral part of the Financial Statements.
24
| S&P Small-Cap 600 Index Fund | |||||
| Financial Highlights | |||||
| Institutional Shares | |||||
| For a Share Outstanding | Year Ended August 31, | ||||
| Throughout Each Period | 2017 | 2016 | 2015 | 2014 | 2013 |
| Net Asset Value, Beginning of Period | $225.56 | $201.83 | $200.56 | $170.71 | $136.79 |
| Investment Operations | |||||
| Net Investment Income | 3.3031 | 2.9251 | 2.545 | 2.049 | 2.131 |
| Net Realized and Unrealized Gain (Loss) | |||||
| on Investments | 26.605 | 23.454 | 1.019 | 29.565 | 33.883 |
| Total from Investment Operations | 29.908 | 26.379 | 3.564 | 31.614 | 36.014 |
| Distributions | |||||
| Dividends from Net Investment Income | (2.488) | (2.649) | (2.294) | (1.764) | (2.094) |
| Distributions from Realized Capital Gains | — | — | — | — | — |
| Total Distributions | (2.488) | (2.649) | (2.294) | (1.764) | (2.094) |
| Net Asset Value, End of Period | $252.98 | $225.56 | $201.83 | $200.56 | $170.71 |
| Total Return | 13.26% | 13.22% | 1.77% | 18.57% | 26.65% |
| Ratios/Supplemental Data | |||||
| Net Assets, End of Period (Millions) | $672 | $331 | $238 | $179 | $152 |
| Ratio of Total Expenses to | |||||
| Average Net Assets | 0.08% | 0.08% | 0.08% | 0.08% | 0.08% |
| Ratio of Net Investment Income to | |||||
| Average Net Assets | 1.34% | 1.43% | 1.34% | 1.17% | 1.55% |
| Portfolio Turnover Rate2 | 22% | 15% | 11% | 16% | 12% |
1 Calculated based on average shares outstanding.
2 Excludes the value of portfolio securities received or delivered as a result of in-kind purchases or redemptions of the fund’s capital shares, including ETF Creation Units.
See accompanying Notes, which are an integral part of the Financial Statements.
25
S&P Small-Cap 600 Index Fund
Notes to Financial Statements
Vanguard S&P Small-Cap 600 Index Fund is registered under the Investment Company Act of 1940 as an open-end investment company, or mutual fund. The fund offers two classes of shares: ETF Shares and Institutional Shares. ETF Shares are listed for trading on NYSE Arca; they can be purchased and sold through a broker. Institutional Shares are designed for investors who meet certain administrative, service, and account-size criteria.
A. The following significant accounting policies conform to generally accepted accounting principles for U.S. investment companies. The fund consistently follows such policies in preparing its financial statements.
1. Security Valuation: Securities are valued as of the close of trading on the New York Stock Exchange (generally 4 p.m., Eastern time) on the valuation date. Equity securities are valued at the latest quoted sales prices or official closing prices taken from the primary market in which each security trades; such securities not traded on the valuation date are valued at the mean of the latest quoted bid and asked prices. Securities for which market quotations are not readily available, or whose values have been materially affected by events occurring before the fund’s pricing time but after the close of the securities’ primary markets, are valued by methods deemed by the board of trustees to represent fair value. Investments in Vanguard Market Liquidity Fund are valued at that fund’s net asset value. Temporary cash investments are valued using the latest bid prices or using valuations based on a matrix system (which considers such factors as security prices, yields, maturities, and ratings), both as furnished by independent pricing services.
2. Futures Contracts: The fund uses index futures contracts to a limited extent, with the objectives of maintaining full exposure to the stock market, enhancing returns, maintaining liquidity, and minimizing transaction costs. The fund may purchase futures contracts to immediately invest incoming cash in the market, or sell futures in response to cash outflows, thereby simulating a fully invested position in the underlying index while maintaining a cash balance for liquidity. The fund may seek to enhance returns by using futures contracts instead of the underlying securities when futures are believed to be priced more attractively than the underlying securities. The primary risks associated with the use of futures contracts are imperfect correlation between changes in market values of stocks held by the fund and the prices of futures contracts, and the possibility of an illiquid market. Counterparty risk involving futures is mitigated because a regulated clearinghouse is the counterparty instead of the clearing broker. To further mitigate counterparty risk, the fund trades futures contracts on an exchange, monitors the financial strength of its clearing brokers and clearinghouse, and has entered into clearing agreements with its clearing brokers. The clearing-house imposes initial margin requirements to secure the fund’s performance and requires daily settlement of variation margin representing changes in the market value of each contract.
Futures contracts are valued at their quoted daily settlement prices. The notional amounts of the contracts are not recorded in the Statement of Net Assets. Fluctuations in the value of the contracts are recorded in the Statement of Net Assets as an asset (liability) and in the Statement of Operations as unrealized appreciation (depreciation) until the contracts are closed, when they are recorded as realized futures gains (losses).
During the year ended August 31, 2017, the fund’s average investments in long and short futures contracts represented less than 1% and 0% of net assets, respectively, based on the average of the notional amounts at each quarter-end during the period.
26
S&P Small-Cap 600 Index Fund
3. Federal Income Taxes: The fund intends to continue to qualify as a regulated investment company and distribute all of its taxable income. Management has analyzed the fund’s tax positions taken for all open federal income tax years (August 31, 2014–2017), and has concluded that no provision for federal income tax is required in the fund’s financial statements.
4. Distributions: Distributions to shareholders are recorded on the ex-dividend date.
5. Securities Lending: To earn additional income, the fund lends its securities to qualified institutional borrowers. Security loans are subject to termination by the fund at any time, and are required to be secured at all times by collateral in an amount at least equal to the market value of securities loaned. Daily market fluctuations could cause the value of loaned securities to be more or less than the value of the collateral received. When this occurs, the collateral is adjusted and settled on the next business day. The fund further mitigates its counterparty risk by entering into securities lending transactions only with a diverse group of prequalified counterparties, monitoring their financial strength, and entering into master securities lending agreements with its counterparties. The master securities lending agreements provide that, in the event of a counterparty’s default (including bankruptcy), the fund may terminate any loans with that borrower, determine the net amount owed, and sell or retain the collateral up to the net amount owed to the fund; however, such actions may be subject to legal proceedings. While collateral mitigates counterparty risk, in the event of a default, the fund may experience delays and costs in recovering the securities loaned. The fund invests cash collateral received in Vanguard Market Liquidity Fund, and records a liability in the Statement of Net Assets for the return of the collateral, during the period the securities are on loan. Securities lending income represents fees charged to borrowers plus income earned on invested cash collateral, less expenses associated with the loan. During the term of the loan, the fund is entitled to all distributions made on or in respect of the loaned securities.
6. Credit Facility: The fund and certain other funds managed by The Vanguard Group (“Vanguard”) participate in a $3.1 billion committed credit facility provided by a syndicate of lenders pursuant to a credit agreement that may be renewed annually; each fund is individually liable for its borrowings, if any, under the credit facility. Borrowings may be utilized for temporary and emergency purposes, and are subject to the fund’s regulatory and contractual borrowing restrictions. The participating funds are charged administrative fees and an annual commitment fee of 0.10% of the undrawn amount of the facility; these fees are allocated to the funds based on a method approved by the fund’s board of trustees and included in Management and Administrative expenses on the fund’s Statement of Operations. Any borrowings under this facility bear interest at a rate based upon the higher of the one-month London Interbank Offered Rate, federal funds effective rate, or overnight bank funding rate plus an agreed-upon spread.
The fund had no borrowings outstanding at August 31, 2017, or at any time during the period then ended.
7. Other: Dividend income is recorded on the ex-dividend date. Interest income includes income distributions received from Vanguard Market Liquidity Fund and is accrued daily. Premiums and discounts on debt securities purchased are amortized and accreted, respectively, to interest income over the lives of the respective securities. Security transactions are accounted for on the date securities are bought or sold. Costs used to determine realized gains (losses) on the sale of investment securities are those of the specific securities sold.
27
S&P Small-Cap 600 Index Fund
Each class of shares has equal rights as to assets and earnings, except that each class separately bears certain class-specific expenses related to maintenance of shareholder accounts (included in Management and Administrative expenses), shareholder reporting, and the proxy. Marketing and distribution expenses are allocated to each class of shares based on a method approved by the board of trustees. Income, other non-class-specific expenses, and gains and losses on investments are allocated to each class of shares based on its relative net assets.
B. In accordance with the terms of a Funds’ Service Agreement (the “FSA”) between Vanguard and the fund, Vanguard furnishes to the fund investment advisory, corporate management, administrative, marketing, and distribution services at Vanguard’s cost of operations (as defined by the FSA). These costs of operations are allocated to the fund based on methods and guidelines approved by the board of trustees. Vanguard does not require reimbursement in the current period for certain costs of operations (such as deferred compensation/benefits and risk/insurance costs); the fund’s liability for these costs of operations is included in Payables to Vanguard on the Statement of Net Assets.
Upon the request of Vanguard, the fund may invest up to 0.40% of its net assets as capital in Vanguard. At August 31, 2017, the fund had contributed to Vanguard capital in the amount of $86,000, representing 0.01% of the fund’s net assets and 0.03% of Vanguard’s capitalization. The fund’s trustees and officers are also directors and employees, respectively, of Vanguard.
C. Various inputs may be used to determine the value of the fund’s investments. These inputs are summarized in three broad levels for financial statement purposes. The inputs or methodologies used to value securities are not necessarily an indication of the risk associated with investing in those securities.
Level 1—Quoted prices in active markets for identical securities.
Level 2—Other significant observable inputs (including quoted prices for similar securities, interest rates, prepayment speeds, credit risk, etc.).
Level 3—Significant unobservable inputs (including the fund’s own assumptions used to determine the fair value of investments). Any investments valued with significant unobservable inputs are
noted on the Statement of Net Assets.
The following table summarizes the market value of the fund’s investments as of August 31, 2017, based on the inputs used to value them:
| Level 1 | Level 2 | Level 3 | |
| Investments | ($000) | ($000) | ($000) |
| Common Stocks | 1,354,723 | — | 1 |
| Temporary Cash Investments | 11,560 | 400 | — |
| Futures Contracts—Assets1 | 11 | — | — |
| Total | 1,366,294 | 400 | 1 |
| 1 Represents variation margin on the last day of the reporting period. |
28
S&P Small-Cap 600 Index Fund
D. Distributions are determined on a tax basis and may differ from net investment income and realized capital gains for financial reporting purposes. Differences may be permanent or temporary. Permanent differences are reclassified among capital accounts in the financial statements to reflect their tax character. Temporary differences arise when certain items of income, expense, gain, or loss are recognized in different periods for financial statement and tax purposes. These differences will reverse at some time in the future. Differences in classification may also result from the treatment of short-term gains as ordinary income for tax purposes.
During the year ended August 31, 2017, the fund realized $37,223,000 of net capital gains resulting from in-kind redemptions—in which shareholders exchanged fund shares for securities held by the fund rather than for cash. Because such gains are not taxable to the fund, and are not distributed to shareholders, they have been reclassified from accumulated net realized losses to paid-in capital.
For tax purposes, at August 31, 2017, the fund had $9,851,000 of ordinary income available for distribution. The fund had available capital losses totaling $16,323,000 that may be carried forward indefinitely to offset future net capital gains.
At August 31, 2017, the cost of investment securities for tax purposes was $1,267,137,000. Net unrealized appreciation of investment securities for tax purposes was $99,547,000, consisting of unrealized gains of $181,914,000 on securities that had risen in value since their purchase and $82,367,000 in unrealized losses on securities that had fallen in value since their purchase.
E. During the year ended August 31, 2017, the fund purchased $927,942,000 of investment securities and sold $331,782,000 of investment securities, other than temporary cash investments. Purchases and sales include $435,172,000 and $96,858,000, respectively, in connection with in-kind purchases and redemptions of the fund’s capital shares.
The fund purchased securities from and sold securities to other Vanguard funds or accounts managed by Vanguard or its affiliates, in accordance with procedures adopted by the board of trustees in compliance with Rule 17a-7 of the Investment Company Act of 1940. For the year ended August 31, 2017, such purchases and sales were $17,675,000 and $35,200,000, respectively; these amounts are included in the purchases and sales of investment securities notes above.
29
S&P Small-Cap 600 Index Fund
| F. Capital share transactions for each class of shares were: | ||||
| Year Ended August 31, | ||||
| 2017 | 2016 | |||
| Amount | Shares | Amount | Shares | |
| ($000) | (000) | ($000) | (000) | |
| ETF Shares | ||||
| Issued | 407,916 | 3,300 | 195,784 | 1,900 |
| Issued in Lieu of Cash Distributions | — | — | — | — |
| Redeemed | (114,472) | (925) | (91,762) | (900) |
| Net Increase (Decrease)—ETF Shares | 293,444 | 2,375 | 104,022 | 1,000 |
| Institutional Shares | ||||
| Issued | 387,035 | 1,558 | 95,096 | 466 |
| Issued in Lieu of Cash Distributions | 2,776 | 11 | 1,960 | 10 |
| Redeemed | (94,149) | (379) | (38,266) | (187) |
| Net Increase (Decrease)—Institutional Shares | 295,662 | 1,190 | 58,790 | 289 |
G. Management has determined that no material events or transactions occurred subsequent to August 31, 2017, that would require recognition or disclosure in these financial statements.
30
S&P Small-Cap 600 Value Index Fund
Fund Profile
As of August 31, 2017
| Share-Class Characteristics | ||
| ETF | Institutional | |
| Shares | Shares | |
| Ticker Symbol | VIOV | VSMVX |
| Expense Ratio1 | 0.20% | 0.08% |
| 30-Day SEC Yield | 1.32% | 1.45% |
| Portfolio Characteristics | |||
| DJ | |||
| U.S. | |||
| S&P | Total | ||
| SmallCap | Market | ||
| 600 Value | FA | ||
| Fund | Index | Index | |
| Number of Stocks | 443 | 441 | 3,769 |
| Median Market Cap | $1.4B | $1.4B | $63.1B |
| Price/Earnings Ratio | 21.2x | 21.2x | 21.6x |
| Price/Book Ratio | 1.7x | 1.7x | 2.8x |
| Return on Equity | 8.4% | 8.4% | 15.1% |
| Earnings Growth Rate | 4.7% | 4.7% | 9.4% |
| Dividend Yield | 1.5% | 1.5% | 1.8% |
| Foreign Holdings | 0.0% | 0.0% | 0.0% |
| Turnover Rate | 46% | — | — |
| Short-Term Reserves | -0.2% | — | — |
| Volatility Measures | ||
| S&P | DJ | |
| SmallCap | U.S. Total | |
| 600 Value | Market | |
| Index | FA Index | |
| R-Squared | 1.00 | 0.63 |
| Beta | 1.00 | 1.15 |
| These measures show the degree and timing of the fund’s fluctuations compared with the indexes over 36 months. | ||
| Ten Largest Holdings(% of total net assets) | ||
| ALLETE Inc. | Electric Utilities | 1.1% |
| Spire Inc. | Gas Utilities | 1.0 |
| Brink's Co. | Security & Alarm | |
| Services | 1.0 | |
| Avista Corp. | Multi-Utilities | 0.9 |
| CACI International Inc. | IT Consulting & | |
| Other Services | 0.9 | |
| Interactive Brokers | Investment Banking | |
| Group Inc. | & Brokerage | 0.8 |
| Sanderson Farms Inc. | Packaged Foods & | |
| Meats | 0.8 | |
| Selective Insurance | Property & Casualty | |
| Group Inc. | Insurance | 0.8 |
| Darling Ingredients Inc. | Agricultural Products | 0.8 |
| ProAssurance Corp. | Property & Casualty | |
| Insurance | 0.8 | |
| Top Ten | 8.9% | |
| The holdings listed exclude any temporary cash investments and equity index products. | ||
Equity Investment Focus
.
1 The expense ratios shown are from the prospectus dated December 23, 2016, and represent estimated costs for the current fiscal year. For the fiscal year ended August 31, 2017, the expense ratios were 0.20% for ETF Shares and 0.08% for Institutional Shares.
31
S&P Small-Cap 600 Value Index Fund
Sector Diversification (% of equity exposure)
| S&P | DJ | ||
| SmallCap | U.S. Total | ||
| 600 Value | Market | ||
| Fund | Index | FA Index | |
| Consumer Discretionary 17.3% | 17.4% | 12.4% | |
| Consumer Staples | 3.7 | 3.7 | 7.6 |
| Energy | 3.2 | 3.2 | 5.3 |
| Financials | 17.5 | 17.5 | 14.7 |
| Health Care | 10.2 | 10.0 | 14.1 |
| Industrials | 18.8 | 18.9 | 10.7 |
| Information Technology | 12.2 | 12.2 | 22.6 |
| Materials | 6.3 | 6.3 | 3.3 |
| Real Estate | 4.9 | 4.9 | 4.1 |
| Telecommunication | |||
| Services | 1.3 | 1.3 | 1.9 |
| Utilities | 4.6 | 4.6 | 3.3 |
Sector categories are based on the Global Industry Classification Standard (“GICS”), except for the “Other” category (if applicable), which includes securities that have not been provided a GICS classification as of the effective reporting period.
32
S&P Small-Cap 600 Value Index Fund
Performance Summary
All of the returns in this report represent past performance, which is not a guarantee of future results that may be achieved by the fund. (Current performance may be lower or higher than the performance data cited. For performance data current to the most recent month-end, visit our website at vanguard.com/performance.) Note, too, that both investment returns and principal value can fluctuate widely, so an investor’s shares, when sold, could be worth more or less than their original cost. The returns shown do not reflect taxes that a shareholder would pay on fund distributions or on the sale of fund shares.
Cumulative Performance: September 7, 2010, Through August 31, 2017
Initial Investment of $10,000
| Average Annual Total Returns | |||||
| Periods Ended August 31, 2017 | |||||
| Since | Final Value | ||||
| One | Five | Inception | of a $10,000 | ||
| Year | Years | (9/7/2010) | Investment | ||
| S&P Small-Cap 600 Value Index | |||||
| Fund*ETF Shares Net Asset Value | 12.11% | 13.98% | 14.57% | $25,847 | |
| S&P Small-Cap 600 Value Index | |||||
| Fund*ETF Shares Market Price | 12.12 | 14.05 | 14.57 | 25,847 | |
| • • • • • • • • | S&P SmallCap 600 Value Index | 12.14 | 14.17 | 14.77 | 26,156 |
| – – – – | Small-Cap Value Funds Average | 11.02 | 11.80 | 12.06 | 22,135 |
| Dow Jones U.S. Total Stock Market | |||||
| Float Adjusted Index | 16.05 | 14.19 | 14.71 | 26,064 | |
Small-Cap Value Funds Average: Derived from data provided by Lipper, a Thomson Reuters Company.
"Since Inception" performance is calculated from the ETF Shares’ inception date for both the fund and its comparative standards.
See Financial Highlights for dividend and capital gains information.
33
S&P Small-Cap 600 Value Index Fund
| Average Annual Total Returns | |||
| Periods Ended August 31, 2017 | |||
| Since | Final Value | ||
| One | Inception | of a $5,000,000 | |
| Year | (11/19/2014) | Investment | |
| S&P Small-Cap 600 Value Index Fund | |||
| Institutional Shares | 12.25% | 8.60% | $6,289,736 |
| S&P SmallCap 600 Value Index | 12.14 | 8.61 | 6,290,623 |
| Dow Jones U.S. Total Stock Market Float | |||
| Adjusted Index | 16.05 | 9.01 | 6,355,933 |
"Since Inception" performance is calculated from the Institutional Shares’ inception date for both the fund and its comparative standards.
Institutional Shares were first issued on December 15, 2010, and the sole shareholder redeemed shortly thereafter. Institutional Shares
were next issued on November 19, 2014. The total returns shown are based on the period beginning November 19, 2014.
| Cumulative Returns of ETF Shares: September 7, 2010, Through August 31, 2017 | |||
| Since | |||
| One | Five | Inception | |
| Year | Years | (9/7/2010) | |
| S&P Small-Cap 600 Value Index Fund ETF Shares | |||
| Market Price | 12.12% | 92.95% | 158.52% |
| S&P Small-Cap 600 Value Index Fund ETF Shares | |||
| Net Asset Value | 12.11 | 92.36 | 158.47 |
| S&P SmallCap 600 Value Index | 12.14 | 94.00 | 161.56 |
| "Since Inception" performance is calculated from the ETF Shares’ inception date for both the fund and its comparative standards. | |||
Fiscal-Year Total Returns (%): September 7, 2010, Through August 31, 2017
S&P Small-Cap 600 Value Index Fund
Average Annual Total Returns: Periods Ended June 30, 2017
This table presents returns through the latest calendar quarter—rather than through the end of the fiscal period.
Securities and Exchange Commission rules require that we provide this information.
| Inception | One | Five | Since | |
| Date | Year | Years | Inception | |
| ETF Shares | 9/7/2010 | |||
| Market Price | 21.55% | 15.22% | 15.30% | |
| Net Asset Value | 21.70 | 15.24 | 15.31 | |
| Institutional Shares | 11/19/2014 | 21.86 | — | 10.06 |
Institutional Shares were first issued on December 15, 2010, and the sole shareholder redeemed shortly thereafter. Institutional Shares were next issued on November 19, 2014. The total returns shown are based on the period beginning November 19, 2014.
35
S&P Small-Cap 600 Value Index Fund
Financial Statements
Statement of Net Assets
As of August 31, 2017
The fund reports a complete list of its holdings in regulatory filings four times in each fiscal year, at the quarter-ends. For the second and fourth fiscal quarters, the lists appear in the fund’s semiannual and annual reports to shareholders. For the first and third fiscal quarters, the fund files the lists with the Securities and Exchange Commission on Form N-Q. Shareholders can look up the fund’s Forms N-Q on the SEC’s website at sec.gov. Forms N-Q may also be reviewed and copied at the SEC’s Public Reference Room (see the back cover of this report for further information).
| Market | |||
| Value• | |||
| Shares | ($000) | ||
| Common Stocks (99.2%)1 | |||
| Consumer Discretionary (17.2%) | |||
| Lithia Motors Inc. Class A | 14,930 | 1,612 | |
| Wolverine World Wide Inc. | 60,856 | 1,601 | |
| Boyd Gaming Corp. | 51,909 | 1,373 | |
| * | Penn National Gaming Inc. | 51,891 | 1,151 |
| * | Cooper-Standard Holdings | ||
| Inc. | 11,214 | 1,128 | |
| * | Meritage Homes Corp. | 23,797 | 969 |
| Time Inc. | 62,456 | 821 | |
| MDC Holdings Inc. | 25,903 | 809 | |
| Core-Mark Holding Co. Inc. | 29,086 | 787 | |
| ILG Inc. | 29,303 | 774 | |
| * | American Axle & | ||
| Manufacturing Holdings | |||
| Inc. | 52,363 | 765 | |
| * | G-III Apparel Group Ltd. | 27,496 | 756 |
| *,^ | JC Penney Co. Inc. | 194,546 | 753 |
| Group 1 Automotive Inc. | 12,539 | 753 | |
| La-Z-Boy Inc. | 30,656 | 731 | |
| Caleres Inc. | 27,027 | 729 | |
| * | Gentherm Inc. | 23,061 | 718 |
| * | Cavco Industries Inc. | 5,308 | 714 |
| Scholastic Corp. | 17,079 | 673 | |
| * | Lumber Liquidators | ||
| Holdings Inc. | 17,824 | 669 | |
| * | Asbury Automotive Group | ||
| Inc. | 11,818 | 636 | |
| * | EW Scripps Co. Class A | 35,381 | 633 |
| Gannett Co. Inc. | 71,328 | 606 | |
| Guess? Inc. | 38,158 | 595 | |
| * | RH | 12,466 | 583 |
| DSW Inc. Class A | 31,348 | 581 | |
| Standard Motor Products | |||
| Inc. | 12,611 | 556 | |
| * | Steven Madden Ltd. | 13,104 | 556 |
| Monro Inc. | 11,496 | 548 | |
| Abercrombie & Fitch Co. | 42,699 | 544 | |
| Market | |||
| Value• | |||
| Shares | ($000) | ||
| Marriott Vacations | |||
| Worldwide Corp. | 4,449 | 518 | |
| Sturm Ruger & Co. Inc. | 11,092 | 508 | |
| New Media Investment | |||
| Group Inc. | 33,578 | 463 | |
| * | Red Robin Gourmet | ||
| Burgers Inc. | 8,081 | 461 | |
| * | Crocs Inc. | 46,524 | 415 |
| * | Vista Outdoor Inc. | 20,063 | 411 |
| Bob Evans Farms Inc. | 5,958 | 410 | |
| Rent-A-Center Inc. | 33,406 | 404 | |
| * | M/I Homes Inc. | 15,571 | 383 |
| Callaway Golf Co. | 25,935 | 362 | |
| * | Select Comfort Corp. | 11,515 | 340 |
| * | BJ’s Restaurants Inc. | 11,236 | 338 |
| Chico’s FAS Inc. | 42,284 | 325 | |
| * | Express Inc. | 49,237 | 314 |
| * | Motorcar Parts of | ||
| America Inc. | 11,739 | 308 | |
| Sonic Automotive Inc. | |||
| Class A | 16,559 | 300 | |
| * | Unifi Inc. | 9,612 | 299 |
| * | Fiesta Restaurant Group | ||
| Inc. | 16,996 | 296 | |
| * | Regis Corp. | 22,101 | 294 |
| Oxford Industries Inc. | 4,994 | 289 | |
| Haverty Furniture Cos. | |||
| Inc. | 12,131 | 284 | |
| Barnes & Noble Inc. | 34,688 | 269 | |
| Movado Group Inc. | 9,638 | 267 | |
| * | Genesco Inc. | 12,304 | 260 |
| Strayer Education Inc. | 3,228 | 258 | |
| Buckle Inc. | 17,792 | 252 | |
| * | MarineMax Inc. | 15,291 | 247 |
| * | Monarch Casino & | ||
| Resort Inc. | 6,925 | 246 | |
| Sonic Corp. | 10,391 | 243 | |
| * | Fossil Group Inc. | 26,477 | 220 |
| * | Ascena Retail Group Inc. | 106,502 | 217 |
36
| S&P Small-Cap 600 Value Index Fund | |||
| Market | |||
| Value• | |||
| Shares | ($000) | ||
| Finish Line Inc. Class A | 25,340 | 211 | |
| DineEquity Inc. | 5,307 | 211 | |
| Ethan Allen Interiors Inc. | 7,200 | 211 | |
| Superior Industries | |||
| International Inc. | 14,076 | 206 | |
| * | William Lyon Homes | ||
| Class A | 8,455 | 203 | |
| Cato Corp. Class A | 15,071 | 198 | |
| Tailored Brands Inc. | 16,324 | 193 | |
| Ruth’s Hospitality Group | |||
| Inc. | 9,713 | 190 | |
| * | American Public Education | ||
| Inc. | 10,194 | 188 | |
| * | Perry Ellis International Inc. | 7,731 | 169 |
| PetMed Express Inc. | 4,511 | 164 | |
| * | Career Education Corp. | 16,378 | 157 |
| Shoe Carnival Inc. | 7,803 | 157 | |
| * | FTD Cos. Inc. | 10,853 | 145 |
| ^ | Fred’s Inc. Class A | 22,499 | 133 |
| * | Barnes & Noble Education | ||
| Inc. | 24,210 | 125 | |
| * | Iconix Brand Group Inc. | 21,541 | 120 |
| * | Vera Bradley Inc. | 11,836 | 107 |
| * | Kirkland’s Inc. | 9,224 | 106 |
| * | Shake Shack Inc. Class A | 3,328 | 103 |
| * | Nautilus Inc. | 6,171 | 101 |
| Big 5 Sporting Goods Corp. | 11,328 | 87 | |
| * | Ruby Tuesday Inc. | 38,281 | 82 |
| * | Vitamin Shoppe Inc. | 14,956 | 80 |
| * | Biglari Holdings Inc. | 261 | 78 |
| * | Hibbett Sports Inc. | 5,776 | 71 |
| * | El Pollo Loco Holdings Inc. | 5,292 | 60 |
| 38,181 | |||
| Consumer Staples (3.7%) | |||
| Sanderson Farms Inc. | 12,568 | 1,854 | |
| * | Darling Ingredients Inc. | 103,436 | 1,800 |
| Universal Corp. | 15,872 | 908 | |
| * | Cal-Maine Foods Inc. | 18,693 | 681 |
| J&J Snack Foods Corp. | 4,231 | 539 | |
| Andersons Inc. | 16,560 | 528 | |
| * | SUPERVALU Inc. | 24,013 | 480 |
| WD-40 Co. | 3,267 | 356 | |
| Coca-Cola Bottling Co. | |||
| Consolidated | 1,544 | 330 | |
| Inter Parfums Inc. | 5,598 | 221 | |
| John B Sanfilippo & Son | |||
| Inc. | 3,108 | 193 | |
| Medifast Inc. | 3,038 | 172 | |
| * | Seneca Foods Corp. | ||
| Class A | 3,938 | 117 | |
| 8,179 | |||
| Market | |||
| Value• | |||
| Shares | ($000) | ||
| Energy (3.2%) | |||
| * | McDermott International | ||
| Inc. | 99,825 | 613 | |
| * | PDC Energy Inc. | 15,093 | 594 |
| * | Exterran Corp. | 19,887 | 552 |
| * | SRC Energy Inc. | 68,102 | 537 |
| * | Noble Corp. plc | 153,656 | 501 |
| * | Newpark Resources Inc. | 55,793 | 449 |
| Green Plains Inc. | 23,366 | 433 | |
| * | SEACOR Holdings Inc. | 10,249 | 393 |
| * | Unit Corp. | 20,235 | 322 |
| * | Helix Energy Solutions | ||
| Group Inc. | 50,015 | 314 | |
| * | Atwood Oceanics Inc. | 47,024 | 309 |
| * | Carrizo Oil & Gas Inc. | 22,585 | 304 |
| Archrock Inc. | 25,406 | 259 | |
| * | Matrix Service Co. | 16,703 | 198 |
| Bristow Group Inc. | 20,124 | 166 | |
| * | Denbury Resources Inc. | 150,087 | 159 |
| * | Cloud Peak Energy Inc. | 47,133 | 148 |
| * | REX American Resources | ||
| Corp. | 1,626 | 141 | |
| * | Era Group Inc. | 12,419 | 109 |
| * | TETRA Technologies Inc. | 48,786 | 100 |
| Gulf Island Fabrication Inc. | 8,556 | 96 | |
| *,^ | CARBO Ceramics Inc. | 13,391 | 88 |
| * | Tesco Corp. | 19,475 | 86 |
| * | Bill Barrett Corp. | 24,881 | 74 |
| * | Geospace Technologies | ||
| Corp. | 4,759 | 72 | |
| * | Pioneer Energy Services | ||
| Corp. | 28,268 | 48 | |
| * | Contango Oil & Gas Co. | 8,878 | 41 |
| 7,106 | |||
| Financials (17.3%) | |||
| Interactive Brokers Group | |||
| Inc. | 44,890 | 1,882 | |
| Selective Insurance Group | |||
| Inc. | 36,578 | 1,844 | |
| ProAssurance Corp. | 33,531 | 1,786 | |
| FirstCash Inc. | 30,332 | 1,780 | |
| American Equity | |||
| Investment Life Holding | |||
| Co. | 55,735 | 1,547 | |
| Old National Bancorp | 85,009 | 1,390 | |
| Hope Bancorp Inc. | 79,838 | 1,289 | |
| Astoria Financial Corp. | 57,493 | 1,126 | |
| Waddell & Reed Financial | |||
| Inc. Class A | 52,508 | 977 | |
| Banner Corp. | 16,467 | 908 | |
| Horace Mann Educators | |||
| Corp. | 25,460 | 895 | |
37
| S&P Small-Cap 600 Value Index Fund | |||
| Market | |||
| Value• | |||
| Shares | ($000) | ||
| Employers Holdings Inc. | 20,269 | 854 | |
| * | PRA Group Inc. | 29,103 | 841 |
| Apollo Commercial Real | |||
| Estate Finance Inc. | 43,826 | 793 | |
| S&T Bancorp Inc. | 21,967 | 789 | |
| Navigators Group Inc. | 14,062 | 785 | |
| Community Bank System | |||
| Inc. | 12,972 | 668 | |
| * | Green Dot Corp. Class A | 13,472 | 649 |
| RLI Corp. | 12,011 | 643 | |
| Safety Insurance Group Inc. | 8,983 | 641 | |
| Columbia Banking System | |||
| Inc. | 17,219 | 640 | |
| Infinity Property & Casualty | |||
| Corp. | 6,939 | 614 | |
| * | Encore Capital Group Inc. | 14,869 | 600 |
| Capstead Mortgage Corp. | 60,279 | 583 | |
| Banc of California Inc. | 31,388 | 582 | |
| United Fire Group Inc. | 13,454 | 566 | |
| CVB Financial Corp. | 27,015 | 559 | |
| Great Western Bancorp Inc. | 15,480 | 556 | |
| Stewart Information | |||
| Services Corp. | 14,845 | 536 | |
| Glacier Bancorp Inc. | 14,915 | 495 | |
| Financial Engines Inc. | 13,818 | 457 | |
| First Midwest Bancorp Inc. | 21,410 | 451 | |
| Virtus Investment Partners | |||
| Inc. | 4,169 | 442 | |
| * | Donnelley Financial | ||
| Solutions Inc. | 20,586 | 441 | |
| Simmons First National | |||
| Corp. Class A | 8,427 | 440 | |
| Provident Financial | |||
| Services Inc. | 17,527 | 436 | |
| Independent Bank Corp. | 6,156 | 427 | |
| * | HomeStreet Inc. | 15,864 | 401 |
| Investment Technology | |||
| Group Inc. | 19,774 | 397 | |
| Northwest Bancshares Inc. | 24,977 | 385 | |
| NBT Bancorp Inc. | 10,639 | 349 | |
| Westamerica | |||
| Bancorporation | 6,605 | 340 | |
| First Financial Bancorp | 14,045 | 336 | |
| * | INTL. FCStone Inc. | 9,470 | 336 |
| Maiden Holdings Ltd. | 46,200 | 335 | |
| Boston Private Financial | |||
| Holdings Inc. | 22,191 | 326 | |
| Fidelity Southern Corp. | 13,406 | 293 | |
| City Holding Co. | 4,604 | 292 | |
| * | World Acceptance Corp. | 3,753 | 281 |
| * | EZCORP Inc. Class A | 30,617 | 277 |
| AMERISAFE Inc. | 5,072 | 273 | |
| * | eHealth Inc. | 10,532 | 256 |
| * | Opus Bank | 11,408 | 256 |
| Brookline Bancorp Inc. | 17,779 | 255 | |
| Market | |||
| Value• | |||
| Shares | ($000) | ||
| First Commonwealth | |||
| Financial Corp. | 19,833 | 250 | |
| WisdomTree Investments | |||
| Inc. | 26,663 | 245 | |
| OFG Bancorp | 27,597 | 240 | |
| TrustCo Bank Corp. NY | 25,923 | 205 | |
| HCI Group Inc. | 5,141 | 200 | |
| Oritani Financial Corp. | 11,858 | 190 | |
| United Insurance Holdings | |||
| Corp. | 11,274 | 177 | |
| * | Enova International Inc. | 14,722 | 175 |
| Dime Community | |||
| Bancshares Inc. | 8,435 | 160 | |
| Greenhill & Co. Inc. | 9,500 | 143 | |
| Bank Mutual Corp. | 11,411 | 104 | |
| 38,389 | |||
| Health Care (10.0%) | |||
| * | Myriad Genetics Inc. | 42,776 | 1,304 |
| * | Select Medical Holdings | ||
| Corp. | 67,491 | 1,255 | |
| * | Medicines Co. | 28,097 | 1,031 |
| * | Impax Laboratories Inc. | 46,282 | 1,002 |
| Chemed Corp. | 4,746 | 936 | |
| * | Amedisys Inc. | 17,579 | 918 |
| * | Nektar Therapeutics | ||
| Class A | 40,920 | 861 | |
| * | Integer Holdings Corp. | 17,493 | 804 |
| CONMED Corp. | 15,578 | 773 | |
| * | Integra LifeSciences | ||
| Holdings Corp. | 13,676 | 697 | |
| * | Haemonetics Corp. | 16,143 | 695 |
| * | Magellan Health Inc. | 7,744 | 627 |
| * | LHC Group Inc. | 9,412 | 614 |
| * | Acorda Therapeutics Inc. | 29,300 | 609 |
| * | PharMerica Corp. | 19,526 | 574 |
| * | Community Health | ||
| Systems Inc. | 72,022 | 550 | |
| * | HealthEquity Inc. | 12,248 | 524 |
| * | Diplomat Pharmacy Inc. | 27,429 | 459 |
| * | Quality Systems Inc. | 29,135 | 459 |
| * | Spectrum Pharmaceuticals | ||
| Inc. | 46,724 | 456 | |
| * | Emergent BioSolutions Inc. | 11,805 | 441 |
| Kindred Healthcare Inc. | 53,806 | 436 | |
| * | Tivity Health Inc. | 10,582 | 415 |
| * | Natus Medical Inc. | 11,637 | 391 |
| * | Providence Service Corp. | 7,273 | 377 |
| * | Inogen Inc. | 3,880 | 372 |
| * | AngioDynamics Inc. | 21,485 | 366 |
| * | Almost Family Inc. | 7,485 | 365 |
| * | Orthofix International NV | 6,912 | 340 |
| * | Cambrex Corp. | 6,340 | 330 |
| *,^ | Lannett Co. Inc. | 18,470 | 324 |
| Analogic Corp. | 4,392 | 314 | |
38
| S&P Small-Cap 600 Value Index Fund | |||
| Market | |||
| Value• | |||
| Shares | ($000) | ||
| * | Albany Molecular | ||
| Research Inc. | 14,020 | 305 | |
| Ensign Group Inc. | 14,366 | 295 | |
| Abaxis Inc. | 5,975 | 276 | |
| Invacare Corp. | 20,133 | 272 | |
| Phibro Animal Health Corp. | |||
| Class A | 6,713 | 238 | |
| Computer Programs & | |||
| Systems Inc. | 6,715 | 202 | |
| Aceto Corp. | 18,902 | 201 | |
| Meridian Bioscience Inc. | 14,046 | 195 | |
| * | CorVel Corp. | 3,492 | 181 |
| * | Anika Therapeutics Inc. | 2,944 | 158 |
| * | Amphastar | ||
| Pharmaceuticals Inc. | 7,198 | 115 | |
| * | Depomed Inc. | 17,211 | 105 |
| * | Quorum Health Corp. | 18,858 | 83 |
| 22,245 | |||
| Industrials (18.7%) | |||
| Brink’s Co. | 28,477 | 2,234 | |
| * | Moog Inc. Class A | 20,269 | 1,556 |
| Korn/Ferry International | 36,059 | 1,201 | |
| SkyWest Inc. | 32,490 | 1,127 | |
| Mueller Industries Inc. | 36,173 | 1,079 | |
| * | Atlas Air Worldwide | ||
| Holdings Inc. | 15,864 | 1,060 | |
| * | SPX FLOW Inc. | 26,561 | 889 |
| * | FTI Consulting Inc. | 25,949 | 880 |
| Barnes Group Inc. | 13,805 | 863 | |
| Kaman Corp. | 17,072 | 837 | |
| Triumph Group Inc. | 31,134 | 819 | |
| * | Hub Group Inc. Class A | 21,021 | 808 |
| ABM Industries Inc. | 18,181 | 808 | |
| Healthcare Services | |||
| Group Inc. | 15,583 | 798 | |
| Comfort Systems USA Inc. | 23,401 | 797 | |
| Wabash National Corp. | 37,769 | 794 | |
| Greenbrier Cos. Inc. | 17,834 | 765 | |
| Standex International Corp. | 8,003 | 764 | |
| Interface Inc. Class A | 39,442 | 749 | |
| * | On Assignment Inc. | 15,257 | 728 |
| AAR Corp. | 20,048 | 723 | |
| Federal Signal Corp. | 37,544 | 702 | |
| Matson Inc. | 27,075 | 699 | |
| Hillenbrand Inc. | 19,377 | 693 | |
| Cubic Corp. | 15,662 | 673 | |
| * | SPX Corp. | 26,621 | 642 |
| UniFirst Corp. | 4,077 | 585 | |
| Briggs & Stratton Corp. | 26,863 | 563 | |
| Universal Forest Products | |||
| Inc. | 6,442 | 562 | |
| Encore Wire Corp. | 13,030 | 559 | |
| * | TrueBlue Inc. | 26,726 | 547 |
| General Cable Corp. | 31,167 | 528 | |
| Market | |||
| Value• | |||
| Shares | ($000) | ||
| * | Aerojet Rocketdyne | ||
| Holdings Inc. | 16,856 | 499 | |
| Watts Water Technologies | |||
| Inc. Class A | 7,702 | 475 | |
| Actuant Corp. Class A | 19,489 | 469 | |
| EnPro Industries Inc. | 6,572 | 463 | |
| Mobile Mini Inc. | 15,267 | 462 | |
| Applied Industrial | |||
| Technologies Inc. | 8,088 | 461 | |
| * | Aegion Corp. Class A | 21,031 | 456 |
| ArcBest Corp. | 15,088 | 448 | |
| * | Harsco Corp. | 26,186 | 448 |
| Franklin Electric Co. Inc. | 11,379 | 439 | |
| RR Donnelley & Sons Co. | 43,964 | 406 | |
| Kelly Services Inc. Class A | 18,383 | 398 | |
| * | Saia Inc. | 6,712 | 380 |
| Albany International Corp. | 7,078 | 379 | |
| Exponent Inc. | 5,523 | 376 | |
| Matthews International | |||
| Corp. Class A | 6,065 | 365 | |
| * | Engility Holdings Inc. | 11,084 | 344 |
| LSC Communications Inc. | 21,314 | 343 | |
| * | American Woodmark Corp. | 4,120 | 341 |
| * | Aerovironment Inc. | 6,739 | 330 |
| * | Chart Industries Inc. | 9,644 | 325 |
| Forward Air Corp. | 6,261 | 325 | |
| Apogee Enterprises Inc. | 7,409 | 324 | |
| National Presto Industries | |||
| Inc. | 3,104 | 309 | |
| Lindsay Corp. | 3,271 | 283 | |
| Brady Corp. Class A | 8,397 | 280 | |
| AZZ Inc. | 5,723 | 280 | |
| Essendant Inc. | 23,548 | 279 | |
| Raven Industries Inc. | 9,518 | 267 | |
| * | DXP Enterprises Inc. | 9,734 | 264 |
| * | Echo Global Logistics Inc. | 17,204 | 262 |
| Titan International Inc. | 30,345 | 260 | |
| Tennant Co. | 4,025 | 245 | |
| CIRCOR International Inc. | 5,075 | 244 | |
| Resources Connection Inc. | 18,622 | 237 | |
| * | Team Inc. | 18,722 | 231 |
| Multi-Color Corp. | 2,823 | 225 | |
| Heartland Express Inc. | 10,064 | 223 | |
| Heidrick & Struggles | |||
| International Inc. | 11,765 | 215 | |
| Marten Transport Ltd. | 12,145 | 208 | |
| Alamo Group Inc. | 2,260 | 207 | |
| * | Veritiv Corp. | 7,093 | 199 |
| Powell Industries Inc. | 5,383 | 153 | |
| * | Roadrunner Transportation | ||
| Systems Inc. | 19,013 | 142 | |
| * | CDI Corp. | 8,685 | 71 |
| 41,372 |
39
| S&P Small-Cap 600 Value Index Fund | |||
| Market | |||
| Value• | |||
| Shares | ($000) | ||
| Information Technology (12.1%) | |||
| * | CACI International Inc. | ||
| Class A | 15,358 | 1,993 | |
| * | Sanmina Corp. | 47,433 | 1,776 |
| * | Viavi Solutions Inc. | 142,536 | 1,431 |
| * | Anixter International Inc. | 17,944 | 1,324 |
| * | Plexus Corp. | 21,173 | 1,103 |
| * | Benchmark Electronics Inc. | 31,232 | 1,015 |
| * | OSI Systems Inc. | 11,143 | 926 |
| * | Insight Enterprises Inc. | 22,449 | 900 |
| * | Diodes Inc. | 23,997 | 675 |
| * | Sykes Enterprises Inc. | 24,567 | 655 |
| ManTech International | |||
| Corp. Class A | 16,080 | 647 | |
| * | Virtusa Corp. | 17,400 | 632 |
| * | ScanSource Inc. | 15,896 | 624 |
| * | Semtech Corp. | 15,273 | 574 |
| * | Blucora Inc. | 24,831 | 566 |
| Brooks Automation Inc. | 21,430 | 559 | |
| * | Electronics For Imaging Inc. | 14,590 | 519 |
| MTS Systems Corp. | 10,513 | 509 | |
| * | SolarEdge Technologies Inc. | 18,232 | 488 |
| * | Cray Inc. | 25,299 | 477 |
| Methode Electronics Inc. | 10,395 | 425 | |
| * | NETGEAR Inc. | 8,763 | 421 |
| *,^ | Applied Optoelectronics Inc. | 7,101 | 420 |
| * | ExlService Holdings Inc. | 7,400 | 417 |
| * | Kulicke & Soffa Industries | ||
| Inc. | 21,396 | 407 | |
| * | Perficient Inc. | 22,134 | 405 |
| * | Rogers Corp. | 3,414 | 405 |
| TeleTech Holdings Inc. | 9,739 | 387 | |
| * | MicroStrategy Inc. Class A | 2,716 | 350 |
| * | Bottomline Technologies | ||
| de Inc. | 11,122 | 337 | |
| * | ePlus Inc. | 3,969 | 332 |
| * | Super Micro Computer Inc. | 11,686 | 311 |
| CSG Systems International | |||
| Inc. | 7,849 | 304 | |
| Cohu Inc. | 15,970 | 300 | |
| Comtech | |||
| Telecommunications Corp. | 14,790 | 289 | |
| * | Veeco Instruments Inc. | 15,064 | 285 |
| Monotype Imaging | |||
| Holdings Inc. | 15,504 | 283 | |
| * | Electro Scientific | ||
| Industries Inc. | 20,896 | 257 | |
| * | LivePerson Inc. | 18,908 | 253 |
| ADTRAN Inc. | 11,228 | 248 | |
| Daktronics Inc. | 25,182 | 243 | |
| * | CalAmp Corp. | 12,653 | 235 |
| Park Electrochemical Corp. | 11,944 | 217 | |
| * | Control4 Corp. | 8,111 | 201 |
| Market | |||
| Value• | |||
| Shares | ($000) | ||
| * | FARO Technologies Inc. | 4,926 | 170 |
| * | DSP Group Inc. | 13,829 | 165 |
| * | Harmonic Inc. | 50,571 | 164 |
| * | Barracuda Networks Inc. | 6,544 | 158 |
| * | Digi International Inc. | 16,664 | 153 |
| * | XO Group Inc. | 7,372 | 137 |
| * | VASCO Data Security | ||
| International Inc. | 10,791 | 135 | |
| * | QuinStreet Inc. | 22,720 | 122 |
| * | Agilysys Inc. | 9,462 | 97 |
| * | Liquidity Services Inc. | 15,489 | 88 |
| * | Kopin Corp. | 21,146 | 85 |
| Bel Fuse Inc. Class B | 2,442 | 62 | |
| * | DHI Group Inc. | 19,991 | 39 |
| Black Box Corp. | 9,380 | 28 | |
| 26,728 | |||
| Materials (6.2%) | |||
| HB Fuller Co. | 31,729 | 1,593 | |
| KapStone Paper and | |||
| Packaging Corp. | 55,312 | 1,237 | |
| Kaiser Aluminum Corp. | 10,783 | 1,039 | |
| Schweitzer-Mauduit | |||
| International Inc. | 19,284 | 731 | |
| * | Boise Cascade Co. | 24,200 | 726 |
| * | AdvanSix Inc. | 19,112 | 610 |
| * | Century Aluminum Co. | 31,234 | 610 |
| * | AK Steel Holding Corp. | 86,979 | 487 |
| * | Clearwater Paper Corp. | 10,318 | 480 |
| Materion Corp. | 12,550 | 479 | |
| PH Glatfelter Co. | 27,353 | 474 | |
| Innospec Inc. | 7,728 | 429 | |
| Calgon Carbon Corp. | 31,872 | 389 | |
| * | SunCoke Energy Inc. | 40,383 | 376 |
| Rayonier Advanced | |||
| Materials Inc. | 27,171 | 373 | |
| * | TimkenSteel Corp. | 24,521 | 364 |
| Stepan Co. | 4,542 | 351 | |
| American Vanguard Corp. | 16,458 | 333 | |
| A Schulman Inc. | 10,533 | 320 | |
| Neenah Paper Inc. | 3,689 | 285 | |
| Tredegar Corp. | 15,972 | 260 | |
| Myers Industries Inc. | 13,789 | 259 | |
| Haynes International Inc. | 7,854 | 240 | |
| * | US Concrete Inc. | 2,994 | 240 |
| Deltic Timber Corp. | 2,726 | 213 | |
| FutureFuel Corp. | 14,286 | 193 | |
| * | Koppers Holdings Inc. | 4,834 | 190 |
| Innophos Holdings Inc. | 3,424 | 156 | |
| Olympic Steel Inc. | 5,703 | 104 | |
| * | Flotek Industries Inc. | 19,811 | 103 |
| Hawkins Inc. | 2,340 | 83 | |
| * | LSB Industries Inc. | 12,812 | 78 |
| 13,805 | |||
40
| S&P Small-Cap 600 Value Index Fund | |||
| Market | |||
| Value• | |||
| Shares | ($000) | ||
| Other (0.0%)2 | |||
| *,3 | Gerber Scientific Inc. CVR | 1,604 | — |
| Real Estate (4.8%) | |||
| Government Properties | |||
| Income Trust | 60,372 | 1,120 | |
| Kite Realty Group Trust | 52,481 | 1,056 | |
| Chesapeake Lodging Trust | 37,739 | 966 | |
| Acadia Realty Trust | 30,328 | 870 | |
| RE/MAX Holdings Inc. | |||
| Class A | 11,113 | 681 | |
| DiamondRock Hospitality | |||
| Co. | 60,365 | 664 | |
| ^ | CBL & Associates | ||
| Properties Inc. | 82,732 | 662 | |
| PS Business Parks Inc. | 4,302 | 581 | |
| Retail Opportunity | |||
| Investments Corp. | 22,739 | 451 | |
| LTC Properties Inc. | 8,449 | 411 | |
| * | Forestar Group Inc. | 20,803 | 358 |
| Franklin Street Properties | |||
| Corp. | 32,322 | 322 | |
| Parkway Inc. | 13,147 | 302 | |
| HFF Inc. Class A | 7,354 | 280 | |
| Independence Realty | |||
| Trust Inc. | 26,082 | 268 | |
| Pennsylvania REIT | 24,962 | 250 | |
| Chatham Lodging Trust | 12,283 | 249 | |
| Cedar Realty Trust Inc. | 47,808 | 241 | |
| Armada Hoffler Properties | |||
| Inc. | 16,359 | 219 | |
| Hersha Hospitality Trust | |||
| Class A | 11,279 | 209 | |
| Universal Health Realty | |||
| Income Trust | 2,669 | 202 | |
| Ramco-Gershenson | |||
| Properties Trust | 10,961 | 144 | |
| Saul Centers Inc. | 2,299 | 139 | |
| 10,645 | |||
| Telecommunication Services (1.4%) | |||
| * | General Communication Inc. | ||
| Class A | 16,776 | 724 | |
| * | Vonage Holdings Corp. | 72,685 | 603 |
| * | Iridium Communications | ||
| Inc. | 51,373 | 570 | |
| Consolidated | |||
| Communications Holdings | |||
| Inc. | 14,529 | 268 | |
| Cincinnati Bell Inc. | 11,113 | 234 | |
| Spok Holdings Inc. | 12,896 | 216 | |
| ATN International Inc. | 3,355 | 203 | |
| * | Lumos Networks Corp. | 8,445 | 152 |
| 2,970 | |||
| Market | ||
| Value• | ||
| Shares | ($000) | |
| Utilities (4.6%) | ||
| ALLETE Inc. | 31,939 | 2,470 |
| Spire Inc. | 30,305 | 2,318 |
| Avista Corp. | 40,433 | 2,078 |
| El Paso Electric Co. | 25,469 | 1,415 |
| Northwest Natural Gas Co. | 17,987 | 1,193 |
| American States Water Co. | 11,956 | 589 |
| 10,063 | ||
| Total Common Stocks | ||
| (Cost $215,003) | 219,683 | |
| Temporary Cash Investments (1.1%)1 | ||
| Money Market Fund (1.0%) | ||
| 4,5 Vanguard Market Liquidity | ||
| Fund, 1.224% | 23,501 | 2,350 |
| Face | ||
| Amount | ||
| ($000) | ||
| U. S. Government and Agency Obligations (0.1%) | ||
| 6 United States Treasury | ||
| Bill, 0.980%, 10/5/17 | 150 | 150 |
| Total Temporary Cash Investments | ||
| (Cost $2,500) | 2,500 | |
| Total Investments (100.3%) | ||
| (Cost $217,503) | 222,183 | |
| Amount | ||
| ($000) | ||
| Other Assets and Liabilities (-0.3%) | ||
| Other Assets | ||
| Investment in Vanguard | 15 | |
| Receivables for Investment Securities Sold | 6 | |
| Receivables for Accrued Income | 215 | |
| Receivables for Capital Shares Issued | 1 | |
| Variation Margin Receivable – | ||
| Futures Contracts | 21 | |
| Other Assets | 5 | |
| Total Other Assets | 263 | |
| Liabilities | ||
| Payables for Investment Securities Purchased (7) | ||
| Collateral for Securities on Loan | (793) | |
| Payables to Vanguard | (49) | |
| Other Liabilities | (8) | |
| Total Liabilities | (857) | |
| Net Assets (100%) | 221,589 | |
41
S&P Small-Cap 600 Value Index Fund
| At August 31, 2017, net assets consisted of: | |
| Amount | |
| ($000) | |
| Paid-in Capital | 230,302 |
| Undistributed Net Investment Income | 694 |
| Accumulated Net Realized Losses | (14,105) |
| Unrealized Appreciation (Depreciation) | |
| Investment Securities | 4,680 |
| Futures Contracts | 18 |
| Net Assets | 221,589 |
| ETF Shares—Net Assets | |
| Applicable to 1,775,000 outstanding | |
| $.001 par value shares of beneficial | |
| interest (unlimited authorization) | 209,850 |
| Net Asset Value Per Share— | |
| ETF Shares | $118.23 |
| Amount | |
| ($000) | |
| Institutional Shares—Net Assets | |
| Applicable to 47,475 outstanding | |
| $.001 par value shares of beneficial | |
| interest (unlimited authorization) | 11,739 |
| Net Asset Value Per Share— | |
| Institutional Shares | $247.26 |
• See Note A in Notes to Financial Statements.
* Non-income-producing security.
^ Includes partial security positions on loan to broker-dealers. The
total value of securities on loan is $743,000.
1 The fund invests a portion of its cash reserves in equity markets
through the use of index futures contracts. After giving effect to
futures investments, the fund’s effective common stock and
temporary cash investment positions represent 100.1% and
0.2%, respectively, of net assets.
2 “Other” represents securities that are not classified by the fund’s
benchmark index.
3 Security value determined using significant unobservable inputs.
4 Affiliated money market fund available only to Vanguard funds
and certain trusts and accounts managed by Vanguard. Rate
shown is the 7-day yield.
5 Includes $793,000 of collateral received for securities on loan.
6 Securities with a value of $150,000 have been segregated as
initial margin for open futures contracts.
CVR—Contingent Value Rights.
REIT—Real Estate Investment Trust.
| Derivative Financial Instruments Outstanding as of Period End | ||||
| Futures Contracts | ||||
| ($000) | ||||
| Value and | ||||
| Number of | Unrealized | |||
| Long (Short) | Notional | Appreciation | ||
| Expiration | Contracts | Amount | (Depreciation) | |
| Long Futures Contracts | ||||
| E-mini Russell 2000 Index | September 2017 | 31 | 2,177 | 18 |
Unrealized appreciation (depreciation) on open futures contracts is required to be treated as realized gain (loss) for tax purposes.
See accompanying Notes, which are an integral part of the Financial Statements.
42
S&P Small-Cap 600 Value Index Fund
Statement of Operations
| Year Ended | |
| August 31,2017 | |
| ($000) | |
| Investment Income | |
| Income | |
| Dividends | 3,395 |
| Interest1 | 5 |
| Securities Lending—Net | 87 |
| Total Income | 3,487 |
| Expenses | |
| The Vanguard Group—Note B | |
| Investment Advisory Services | 44 |
| Management and Administrative—ETF Shares | 200 |
| Management and Administrative—Institutional Shares | — |
| Marketing and Distribution—ETF Shares | 12 |
| Marketing and Distribution—Institutional Shares | 1 |
| Custodian Fees | 83 |
| Auditing Fees | 32 |
| Shareholders’ Reports and Proxy—ETF Shares | 20 |
| Shareholders’ Reports and Proxy—Institutional Shares | — |
| Total Expenses | 392 |
| Net Investment Income | 3,095 |
| Realized Net Gain (Loss) | |
| Investment Securities Sold1 | 13,268 |
| Futures Contracts | 51 |
| Realized Net Gain (Loss) | 13,319 |
| Change in Unrealized Appreciation (Depreciation) | |
| Investment Securities | (397) |
| Futures Contracts | 18 |
| Change in Unrealized Appreciation (Depreciation) | (379) |
| Net Increase (Decrease) in Net Assets Resulting from Operations | 16,035 |
1 Interest income and realized net gain (loss) from an affiliated company of the fund were $2,000 and $0, respectively.
See accompanying Notes, which are an integral part of the Financial Statements.
43
| S&P Small-Cap 600 Value Index Fund | ||
| Statement of Changes in Net Assets | ||
| Year Ended August 31, | ||
| 2017 | 2016 | |
| ($000) | ($000) | |
| Increase (Decrease) in Net Assets | ||
| Operations | ||
| Net Investment Income | 3,095 | 1,853 |
| Realized Net Gain (Loss) | 13,319 | 4,359 |
| Change in Unrealized Appreciation (Depreciation) | (379) | 13,066 |
| Net Increase (Decrease) in Net Assets Resulting from Operations | 16,035 | 19,278 |
| Distributions | ||
| Net Investment Income | ||
| ETF Shares | (2,596) | (1,886) |
| Institutional Shares | (318) | (331) |
| Realized Capital Gain | ||
| ETF Shares | — | — |
| Institutional Shares | — | — |
| Total Distributions | (2,914) | (2,217) |
| Capital Share Transactions | ||
| ETF Shares | 71,827 | 16,679 |
| Institutional Shares | (24,173) | 17,620 |
| Net Increase (Decrease) from Capital Share Transactions | 47,654 | 34,299 |
| Total Increase (Decrease) | 60,775 | 51,360 |
| Net Assets | ||
| Beginning of Period | 160,814 | 109,454 |
| End of Period1 | 221,589 | 160,814 |
1 Net Assets—End of Period includes undistributed (overdistributed) net investment income of $694,000 and $510,000.
See accompanying Notes, which are an integral part of the Financial Statements.
44
| S&P Small-Cap 600 Value Index Fund | |||||
| Financial Highlights | |||||
| ETF Shares | |||||
| For a Share Outstanding | Year Ended August 31, | ||||
| Throughout Each Period | 2017 | 2016 | 2015 | 2014 | 2013 |
| Net Asset Value, Beginning of Period | $106.98 | $94.66 | $98.93 | $82.76 | $65.79 |
| Investment Operations | |||||
| Net Investment Income | 1.7491 | 1.352 | 1.337 | 1.3551 | 1.146 |
| Net Realized and Unrealized Gain (Loss) | |||||
| on Investments | 11.165 | 12.736 | (4.323) | 15.685 | 16.731 |
| Total from Investment Operations | 12.914 | 14.088 | (2.986) | 17.040 | 17.877 |
| Distributions | |||||
| Dividends from Net Investment Income | (1.664) | (1.768) | (1.284) | (.870) | (.907) |
| Distributions from Realized Capital Gains | — | — | — | — | — |
| Total Distributions | (1.664) | (1.768) | (1.284) | (.870) | (.907) |
| Net Asset Value, End of Period | $118.23 | $106.98 | $94.66 | $98.93 | $82.76 |
| Total Return | 12.11% | 15.14% | -3.09% | 20.64% | 27.45% |
| Ratios/Supplemental Data | |||||
| Net Assets, End of Period (Millions) | $210 | $126 | $95 | $94 | $29 |
| Ratio of Total Expenses to | |||||
| Average Net Assets | 0.20% | 0.20% | 0.20% | 0.20% | 0.20% |
| Ratio of Net Investment Income to | |||||
| Average Net Assets | 1.49% | 1.49% | 1.43% | 1.43% | 1.73% |
| Portfolio Turnover Rate2 | 46% | 42% | 43% | 32% | 37% |
1 Calculated based on average shares outstanding.
2 Excludes the value of portfolio securities received or delivered as a result of in-kind purchases or redemptions of the fund’s capital shares, including ETF Creation Units.
See accompanying Notes, which are an integral part of the Financial Statements.
45
S&P Small-Cap 600 Value Index Fund
Financial Highlights
Institutional Shares
| Nov. 19, | |||
| Year Ended | 20141 to | ||
| August 31, | Aug. 31, | ||
| For a Share Outstanding Throughout Each Period | 2017 | 2016 | 2015 |
| Net Asset Value, Beginning of Period | $223.74 | $198.02 | $206.40 |
| Investment Operations | |||
| Net Investment Income | 3.829 2 | 3.057 | 2.201 |
| Net Realized and Unrealized Gain (Loss) on Investments | 23.461 | 26.649 | (7.820) |
| Total from Investment Operations | 27.290 | 29.706 | (5.619) |
| Distributions | |||
| Dividends from Net Investment Income | (3.770) | (3.986) | (2.761) |
| Distributions from Realized Capital Gains | — | — | — |
| Total Distributions | (3.770) | (3.986) | (2.761) |
| Net Asset Value, End of Period | $247.26 | $223.74 | $198.02 |
| Total Return | 12.25% | 15.28% | -2.79% |
| Ratios/Supplemental Data | |||
| Net Assets, End of Period (Millions) | $12 | $35 | $15 |
| Ratio of Total Expenses to Average Net Assets | 0.08% | 0.08% | 0.08%3 |
| Ratio of Net Investment Income to Average Net Assets | 1.61% | 1.61% | 1.55%3 |
| Portfolio Turnover Rate 4 | 46% | 42% | 43% |
1 Inception—See Notes to Financial Statements.
2 Calculated based on average shares outstanding.
3 Annualized.
4 Excludes the value of portfolio securities received or delivered as a result of in-kind purchases or redemptions of the fund’s capital
shares, including ETF Creation Units.
See accompanying Notes, which are an integral part of the Financial Statements.
46
S&P Small-Cap 600 Value Index Fund
Notes to Financial Statements
Vanguard S&P Small-Cap 600 Value Index Fund is registered under the Investment Company Act of 1940 as an open-end investment company, or mutual fund. The fund offers two classes of shares: ETF Shares and Institutional Shares. ETF Shares are listed for trading on NYSE Arca; they can be purchased and sold through a broker. Institutional Shares are designed for investors who meet certain administrative, service, and account-size criteria. Institutional Shares were first issued on December 15, 2010; the sole shareholder redeemed shortly thereafter. Institutional Shares were next issued on November 19, 2014. The Financial Highlights included in these financial statements are based on activity of the Institutional Shares since November 19, 2014.
A. The following significant accounting policies conform to generally accepted accounting principles for U.S. investment companies. The fund consistently follows such policies in preparing its financial statements.
1. Security Valuation: Securities are valued as of the close of trading on the New York Stock Exchange (generally 4 p.m., Eastern time) on the valuation date. Equity securities are valued at the latest quoted sales prices or official closing prices taken from the primary market in which each security trades; such securities not traded on the valuation date are valued at the mean of the latest quoted bid and asked prices. Securities for which market quotations are not readily available, or whose values have been materially affected by events occurring before the fund’s pricing time but after the close of the securities’ primary markets, are valued by methods deemed by the board of trustees to represent fair value. Investments in Vanguard Market Liquidity Fund are valued at that fund’s net asset value. Temporary cash investments are valued using the latest bid prices or using valuations based on a matrix system (which considers such factors as security prices, yields, maturities, and ratings), both as furnished by independent pricing services.
2. Futures Contracts: The fund uses index futures contracts to a limited extent, with the objectives of maintaining full exposure to the stock market, enhancing returns, maintaining liquidity, and minimizing transaction costs. The fund may purchase futures contracts to immediately invest incoming cash in the market, or sell futures in response to cash outflows, thereby simulating a fully invested position in the underlying index while maintaining a cash balance for liquidity. The fund may seek to enhance returns by using futures contracts instead of the underlying securities when futures are believed to be priced more attractively than the underlying securities. The primary risks associated with the use of futures contracts are imperfect correlation between changes in market values of stocks held by the fund and the prices of futures contracts, and the possibility of an illiquid market. Counterparty risk involving futures is mitigated because a regulated clearinghouse is the counterparty instead of the clearing broker. To further mitigate counterparty risk, the fund trades futures contracts on an exchange, monitors the financial strength of its clearing brokers and clearinghouse, and has entered into clearing agreements with its clearing brokers. The clearing-house imposes initial margin requirements to secure the fund’s performance and requires daily settlement of variation margin representing changes in the market value of each contract.
Futures contracts are valued at their quoted daily settlement prices. The notional amounts of the contracts are not recorded in the Statement of Net Assets. Fluctuations in the value of the contracts are recorded in the Statement of Net Assets as an asset (liability) and in the Statement of Operations as unrealized appreciation (depreciation) until the contracts are closed, when they are recorded as realized futures gains (losses).
47
S&P Small-Cap 600 Value Index Fund
During the year ended August 31, 2017, the fund’s average investments in long and short futures contracts represented less than 1% and 0% of net assets, respectively, based on the average of the notional amounts at each quarter-end during the period.
3. Federal Income Taxes: The fund intends to continue to qualify as a regulated investment company and distribute all of its taxable income. Management has analyzed the fund’s tax positions taken for all open federal income tax years (August 31, 2014–2017), and has concluded that no provision for federal income tax is required in the fund’s financial statements.
4. Distributions: Distributions to shareholders are recorded on the ex-dividend date.
5. Securities Lending: To earn additional income, the fund lends its securities to qualified institutional borrowers. Security loans are subject to termination by the fund at any time, and are required to be secured at all times by collateral in an amount at least equal to the market value of securities loaned. Daily market fluctuations could cause the value of loaned securities to be more or less than the value of the collateral received. When this occurs, the collateral is adjusted and settled on the next business day. The fund further mitigates its counterparty risk by entering into securities lending transactions only with a diverse group of prequalified counterparties, monitoring their financial strength, and entering into master securities lending agreements with its counterparties. The master securities lending agreements provide that, in the event of a counterparty’s default (including bankruptcy), the fund may terminate any loans with that borrower, determine the net amount owed, and sell or retain the collateral up to the net amount owed to the fund; however, such actions may be subject to legal proceedings. While collateral mitigates counterparty risk, in the event of a default, the fund may experience delays and costs in recovering the securities loaned. The fund invests cash collateral received in Vanguard Market Liquidity Fund, and records a liability in the Statement of Net Assets for the return of the collateral, during the period the securities are on loan. Securities lending income represents fees charged to borrowers plus income earned on invested cash collateral, less expenses associated with the loan. During the term of the loan, the fund is entitled to all distributions made on or in respect of the loaned securities.
6. Credit Facility: The fund and certain other funds managed by The Vanguard Group (“Vanguard”) participate in a $3.1 billion committed credit facility provided by a syndicate of lenders pursuant to a credit agreement that may be renewed annually; each fund is individually liable for its borrowings, if any, under the credit facility. Borrowings may be utilized for temporary and emergency purposes, and are subject to the fund’s regulatory and contractual borrowing restrictions. The participating funds are charged administrative fees and an annual commitment fee of 0.10% of the undrawn amount of the facility; these fees are allocated to the funds based on a method approved by the fund’s board of trustees and included in Management and Administrative expenses on the fund’s Statement of Operations. Any borrowings under this facility bear interest at a rate based upon the higher of the one-month London Interbank Offered Rate, federal funds effective rate, or overnight bank funding rate plus an agreed-upon spread.
The fund had no borrowings outstanding at August 31, 2017, or at any time during the period then ended.
7. Other: Dividend income is recorded on the ex-dividend date. Interest income includes income distributions received from Vanguard Market Liquidity Fund and is accrued daily. Premiums and discounts on debt securities purchased are amortized and accreted, respectively, to interest income
48
S&P Small-Cap 600 Value Index Fund
over the lives of the respective securities. Security transactions are accounted for on the date securities are bought or sold. Costs used to determine realized gains (losses) on the sale of investment securities are those of the specific securities sold.
Each class of shares has equal rights as to assets and earnings, except that each class separately bears certain class-specific expenses related to maintenance of shareholder accounts (included in Management and Administrative expenses), shareholder reporting, and the proxy. Marketing and distribution expenses are allocated to each class of shares based on a method approved by the board of trustees. Income, other non-class-specific expenses, and gains and losses on investments are allocated to each class of shares based on its relative net assets.
B. In accordance with the terms of a Funds’ Service Agreement (the “FSA”) between Vanguard and the fund, Vanguard furnishes to the fund investment advisory, corporate management, administrative, marketing, and distribution services at Vanguard’s cost of operations (as defined by the FSA). These costs of operations are allocated to the fund based on methods and guidelines approved by the board of trustees. Vanguard does not require reimbursement in the current period for certain costs of operations (such as deferred compensation/benefits and risk/insurance costs); the fund’s liability for these costs of operations is included in Payables to Vanguard on the Statement of Net Assets.
Upon the request of Vanguard, the fund may invest up to 0.40% of its net assets as capital in Vanguard. At August 31, 2017, the fund had contributed to Vanguard capital in the amount of $15,000, representing 0.01% of the fund’s net assets and 0.01% of Vanguard’s capitalization. The fund’s trustees and officers are also directors and employees, respectively, of Vanguard.
C. Various inputs may be used to determine the value of the fund’s investments. These inputs are summarized in three broad levels for financial statement purposes. The inputs or methodologies used to value securities are not necessarily an indication of the risk associated with investing in those securities.
Level 1—Quoted prices in active markets for identical securities.
Level 2—Other significant observable inputs (including quoted prices for similar securities, interest rates, prepayment speeds, credit risk, etc.).
Level 3—Significant unobservable inputs (including the fund’s own assumptions used to determine the fair value of investments). Any investments valued with significant unobservable inputs are
noted on the Statement of Net Assets.
The following table summarizes the market value of the fund’s investments as of August 31, 2017, based on the inputs used to value them:
| Level 1 | Level 2 | Level 3 | |
| Investments | ($000) | ($000) | ($000) |
| Common Stocks | 219,683 | — | — |
| Temporary Cash Investments | 2,350 | 150 | — |
| Futures Contracts—Assets1 | 21 | — | — |
| Total | 222,054 | 150 | — |
| 1 Represents variation margin on the last day of the reporting period. |
49
S&P Small-Cap 600 Value Index Fund
D. Distributions are determined on a tax basis and may differ from net investment income and realized capital gains for financial reporting purposes. Differences may be permanent or temporary. Permanent differences are reclassified among capital accounts in the financial statements to reflect their tax character. Temporary differences arise when certain items of income, expense, gain, or loss are recognized in different periods for financial statement and tax purposes. These differences will reverse at some time in the future. Differences in classification may also result from the treatment of short-term gains as ordinary income for tax purposes.
During the year ended August 31, 2017, the fund realized $19,906,000 of net capital gains resulting from in-kind redemptions—in which shareholders exchanged fund shares for securities held by the fund rather than for cash. Because such gains are not taxable to the fund, and are not distributed to shareholders, they have been reclassified from accumulated net realized losses to paid-in capital.
For tax purposes, at August 31, 2017, the fund had $724,000 of ordinary income available for distribution. The fund had available capital losses totaling $14,087,000 that may be carried forward indefinitely to offset future net capital gains.
At August 31, 2017, the cost of investment securities for tax purposes was $217,503,000. Net unrealized appreciation of investment securities for tax purposes was $4,680,000, consisting of unrealized gains of $27,205,000 on securities that had risen in value since their purchase and $22,525,000 in unrealized losses on securities that had fallen in value since their purchase.
E. During the year ended August 31, 2017, the fund purchased $224,530,000 of investment securities and sold $178,035,000 of investment securities, other than temporary cash investments. Purchases and sales include $131,770,000 and $82,322,000, respectively, in connection with in-kind purchases and redemptions of the fund’s capital shares.
| F. Capital share transactions for each class of shares were: | ||||
| Year Ended August 31, | ||||
| 2017 | 2016 | |||
| Amount | Shares | Amount | Shares | |
| ($000) | (000) | ($000) | (000) | |
| ETF Shares | ||||
| Issued | 155,430 | 1,325 | 72,083 | 750 |
| Issued in Lieu of Cash Distributions | — | — | — | — |
| Redeemed | (83,603) | (725) | (55,404) | (575) |
| Net Increase (Decrease)—ETF Shares | 71,827 | 600 | 16,679 | 175 |
| Institutional Shares | ||||
| Issued | 1,384 | 6 | 17,622 | 82 |
| Issued in Lieu of Cash Distributions | 318 | 1 | 331 | 2 |
| Redeemed | (25,875) | (116) | (333) | (2) |
| Net Increase (Decrease) —Institutional Shares | (24,173) | (109) | 17,620 | 82 |
G. Management has determined that no material events or transactions occurred subsequent to August 31, 2017, that would require recognition or disclosure in these financial statements.
50
S&P Small-Cap 600 Growth Index Fund
Fund Profile
As of August 31, 2017
| Portfolio Characteristics | |||
| DJ | |||
| S&P | U.S. | ||
| SmallCap | Total | ||
| 600 | Market | ||
| Growth | FA | ||
| Fund | Index | Index | |
| Number of Stocks | 352 | 352 | 3,769 |
| Median Market Cap | $1.8B | $1.8B | $63.1B |
| Price/Earnings Ratio | 25.9x | 25.9x | 21.6x |
| Price/Book Ratio | 2.7x | 2.7x | 2.8x |
| Return on Equity | 9.1% | 9.1% | 15.1% |
| Earnings Growth | |||
| Rate | 9.7% | 9.7% | 9.4% |
| Dividend Yield | 1.1% | 1.1% | 1.8% |
| Foreign Holdings | 0.0% | 0.0% | 0.0% |
| Turnover Rate | 48% | — | — |
| Ticker Symbol | VIOG | — | — |
| Expense Ratio1 | 0.20% | — | — |
| 30-Day SEC Yield | 1.01% | — | — |
| Short-Term Reserves | -0.1% | — | — |
| Sector Diversification (% of equity exposure) | |||
| S&P | |||
| SmallCap | DJ | ||
| 600 | U.S. Total | ||
| Growth | Market | ||
| Fund | Index | FA Index | |
| Consumer Discretionary 13.5% | 13.5% | 12.4% | |
| Consumer Staples | 2.5 | 2.5 | 7.6 |
| Energy | 2.0 | 2.0 | 5.3 |
| Financials | 14.7 | 14.7 | 14.7 |
| Health Care | 15.9 | 15.9 | 14.1 |
| Industrials | 18.7 | 18.7 | 10.7 |
| Information Technology | 18.0 | 18.0 | 22.6 |
| Materials | 4.1 | 4.1 | 3.3 |
| Real Estate | 7.8 | 7.8 | 4.1 |
| Telecommunication | |||
| Services | 1.2 | 1.2 | 1.9 |
| Utilities | 1.6 | 1.6 | 3.3 |
Sector categories are based on the Global Industry Classification Standard (“GICS”), except for the “Other” category (if applicable), which includes securities that have not been provided a GICS classification as of the effective reporting period.
| Volatility Measures | ||
| S&P | DJ | |
| SmallCap | U.S. Total | |
| 600 Growth | Market | |
| Index | FA Index | |
| R-Squared | 1.00 | 0.65 |
| Beta | 1.00 | 1.07 |
| These measures show the degree and timing of the fund’s fluctuations compared with the indexes over 36 months. | ||
| Ten Largest Holdings (% of total net assets) | ||
| MKS Instruments Inc. | Semiconductor | |
| Equipment | 1.2% | |
| Lumentum Holdings Inc. Communications | ||
| Equipment | 0.9 | |
| Evercore Inc. | Investment Banking | |
| & Brokerage | 0.9 | |
| Sterling Bancorp | Regional Banks | 0.9 |
| Stamps.com Inc. | Internet Software & | |
| Services | 0.8 | |
| EastGroup Properties | ||
| Inc. | Industrial REITs | 0.8 |
| Cantel Medical Corp. | Health Care | |
| Equipment | 0.8 | |
| Advanced Energy | Semiconductor | |
| Industries Inc. | Equipment | 0.8 |
| South Jersey Industries | ||
| Inc. | Gas Utilities | 0.8 |
| John Bean Technologies | ||
| Corp. | Industrial Machinery | 0.8 |
| Top Ten | 8.7% | |
| The holdings listed exclude any temporary cash investments and equity index products. | ||
1 The expense ratio shown is from the prospectus dated December 23, 2016, and represents estimated costs for the current fiscal year. For the fiscal year ended August 31, 2017, the expense ratio was 0.20%.
51
S&P Small-Cap 600 Growth Index Fund
Performance Summary
All of the returns in this report represent past performance, which is not a guarantee of future results that may be achieved by the fund. (Current performance may be lower or higher than the performance data cited. For performance data current to the most recent month-end, visit our website at vanguard.com/performance.) Note, too, that both investment returns and principal value can fluctuate widely, so an investor’s shares, when sold, could be worth more or less than their original cost. The returns shown do not reflect taxes that a shareholder would pay on fund distributions or on the sale of fund shares.
Cumulative Performance: September 7, 2010, Through August 31, 2017
Initial Investment of $10,000
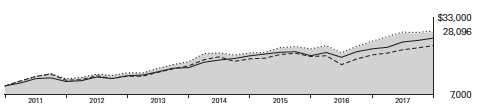
| Average Annual Total Returns | |||||
| Periods Ended August 31, 2017 | |||||
| Since | Final Value | ||||
| One | Five | Inception | of a $10,000 | ||
| Year | Years | (9/7/2010) | Investment | ||
| S&P Small-Cap 600 Growth Index | |||||
| Fund*ETF Shares Net Asset Value | 13.67% | 14.40% | 15.95% | $28,096 | |
| S&P Small-Cap 600 Growth Index | |||||
| Fund*ETF Shares Market Price | 13.59 | 14.41 | 15.95 | 28,096 | |
| • • • • • • • • | S&P SmallCap 600 Growth Index | 13.86 | 14.61 | 16.16 | 28,462 |
| – – – – | Small-Cap Growth Funds Average | 15.61 | 12.16 | 13.07 | 23,576 |
| Dow Jones U.S. Total Stock Market | |||||
| Float Adjusted Index | 16.05 | 14.19 | 14.71 | 26,064 | |
| Small-Cap Growth Funds Average: Derived from data provided by Lipper, a Thomson Reuters Company. | |||||
| "Since Inception" performance is calculated from the ETF Shares’ inception date for both the fund and its comparative standards. | |||||
See Financial Highlights for dividend and capital gains information.
52
S&P Small-Cap 600 Growth Index Fund
Cumulative Returns of ETF Shares: September 7, 2010, Through August 31, 2017
| Since | |||
| One | Five | Inception | |
| Year | Years | (9/7/2010) | |
| S&P Small-Cap 600 Growth Index Fund ETF Shares | |||
| Market Price | 13.59% | 96.04% | 180.93% |
| S&P Small-Cap 600 Growth Index Fund ETF Shares | |||
| Net Asset Value | 13.67 | 95.98 | 180.96 |
| S&P SmallCap 600 Growth Index | 13.86 | 97.76 | 184.62 |
| "Since Inception" performance is calculated from the ETF Shares’ inception date for both the fund and its comparative standards. | |||
Fiscal-Year Total Returns (%): September 7, 2010, Through August 31, 2017
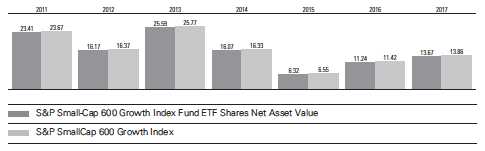
Average Annual Total Returns: Periods Ended June 30, 2017
This table presents returns through the latest calendar quarter—rather than through the end of the fiscal period.
Securities and Exchange Commission rules require that we provide this information.
| Inception | One | Five | Since | |
| Date | Year | Years | Inception | |
| ETF Shares | 9/7/2010 | |||
| Market Price | 22.64% | 15.24% | 16.58% | |
| Net Asset Value | 22.71 | 15.25 | 16.58 |
53
S&P Small-Cap 600 Growth Index Fund
Financial Statements
Statement of Net Assets
As of August 31, 2017
The fund reports a complete list of its holdings in regulatory filings four times in each fiscal year, at the quarter-ends. For the second and fourth fiscal quarters, the lists appear in the fund’s semiannual and annual reports to shareholders. For the first and third fiscal quarters, the fund files the lists with the Securities and Exchange Commission on Form N-Q. Shareholders can look up the fund’s Forms N-Q on the SEC’s website at sec.gov. Forms N-Q may also be reviewed and copied at the SEC’s Public Reference Room (see the back cover of this report for further information).
| Market | |||
| Value• | |||
| Shares | ($000) | ||
| Common Stocks (98.8%)1 | |||
| Consumer Discretionary (13.3%) | |||
| * | Five Below Inc. | 40,686 | 1,935 |
| * | iRobot Corp. | 20,242 | 1,931 |
| LCI Industries | 18,386 | 1,817 | |
| * | TopBuild Corp. | 27,348 | 1,623 |
| * | Dave & Buster’s | ||
| Entertainment Inc. | 27,641 | 1,616 | |
| * | Ollie’s Bargain Outlet | ||
| Holdings Inc. | 35,630 | 1,491 | |
| Marriott Vacations | |||
| Worldwide Corp. | 12,807 | 1,490 | |
| * | Dorman Products Inc. | 22,282 | 1,480 |
| Children’s Place Inc. | 13,039 | 1,384 | |
| * | Scientific Games Corp. | ||
| Class A | 38,022 | 1,338 | |
| Nutrisystem Inc. | 22,078 | 1,199 | |
| ILG Inc. | 43,846 | 1,158 | |
| * | Shutterfly Inc. | 24,928 | 1,136 |
| * | Fox Factory Holding Corp. | 25,576 | 1,023 |
| * | Steven Madden Ltd. | 24,097 | 1,022 |
| * | Installed Building Products | ||
| Inc. | 14,818 | 855 | |
| * | Belmond Ltd. Class A | 62,577 | 798 |
| Winnebago Industries Inc. | 19,587 | 708 | |
| Wingstop Inc. | 21,393 | 693 | |
| * | Universal Electronics Inc. | 10,686 | 626 |
| World Wrestling | |||
| Entertainment Inc. | |||
| Class A | 28,429 | 620 | |
| Capella Education Co. | 8,556 | 576 | |
| * | LGI Homes Inc. | 12,758 | 543 |
| Callaway Golf Co. | 38,807 | 541 | |
| Bob Evans Farms Inc. | 7,588 | 522 | |
| * | Select Comfort Corp. | 17,231 | 509 |
| Monro Inc. | 10,620 | 507 | |
| ^ | Sonic Corp. | 19,109 | 447 |
| * | Vista Outdoor Inc. | 18,534 | 380 |
| Tile Shop Holdings Inc. | 24,400 | 367 | |
| Market | |||
| Value• | |||
| Shares | ($000) | ||
| PetMed Express Inc. | 9,850 | 357 | |
| Chico’s FAS Inc. | 45,887 | 352 | |
| Marcus Corp. | 14,081 | 351 | |
| Strayer Education Inc. | 3,949 | 316 | |
| Ethan Allen Interiors Inc. | 10,347 | 303 | |
| Oxford Industries Inc. | 5,207 | 301 | |
| * | Shake Shack Inc. Class A | 9,722 | 301 |
| * | Career Education Corp. | 28,743 | 276 |
| * | Nautilus Inc. | 15,418 | 252 |
| DineEquity Inc. | 6,239 | 248 | |
| DSW Inc. Class A | 12,949 | 240 | |
| * | Chuy’s Holdings Inc. | 12,473 | 234 |
| Ruth’s Hospitality Group | |||
| Inc. | 10,547 | 206 | |
| Tailored Brands Inc. | 17,019 | 201 | |
| * | Francesca’s Holdings Corp. | 27,068 | 197 |
| * | William Lyon Homes | ||
| Class A | 7,500 | 180 | |
| * | Zumiez Inc. | 13,021 | 162 |
| * | Biglari Holdings Inc. | 443 | 132 |
| * | El Pollo Loco Holdings Inc. | 9,689 | 110 |
| * | Hibbett Sports Inc. | 8,587 | 106 |
| * | Iconix Brand Group Inc. | 16,851 | 94 |
| 35,254 | |||
| Consumer Staples (2.5%) | |||
| B&G Foods Inc. | 49,077 | 1,497 | |
| * | Central Garden & Pet Co. | ||
| Class A | 25,071 | 855 | |
| J&J Snack Foods Corp. | 6,081 | 775 | |
| Calavo Growers Inc. | 11,385 | 764 | |
| WD-40 Co. | 6,542 | 713 | |
| SpartanNash Co. | 27,940 | 688 | |
| Coca-Cola Bottling Co. | |||
| Consolidated | 1,611 | 344 | |
| Medifast Inc. | 4,718 | 267 | |
| * | Central Garden & Pet Co. | 7,540 | 266 |
| Inter Parfums Inc. | 6,075 | 240 | |
| John B Sanfilippo & Son Inc. | 2,758 | 171 | |
| 6,580 | |||
54
| S&P Small-Cap 600 Growth Index Fund | |||
| Market | |||
| Value• | |||
| Shares | ($000) | ||
| Energy (2.0%) | |||
| US Silica Holdings Inc. | 53,862 | 1,466 | |
| * | PDC Energy Inc. | 23,524 | 925 |
| * | McDermott International | ||
| Inc. | 92,209 | 566 | |
| * | SRC Energy Inc. | 68,204 | 538 |
| * | Carrizo Oil & Gas Inc. | 29,942 | 402 |
| * | Helix Energy Solutions | ||
| Group Inc. | 42,581 | 267 | |
| * | Unit Corp. | 15,211 | 242 |
| Archrock Inc. | 22,533 | 230 | |
| * | REX American Resources | ||
| Corp. | 2,249 | 195 | |
| * | Denbury Resources Inc. | 117,633 | 125 |
| * | Bill Barrett Corp. | 26,720 | 80 |
| * | Geospace Technologies | ||
| Corp. | 4,316 | 65 | |
| * | TETRA Technologies Inc. | 28,157 | 58 |
| * | Tesco Corp. | 11,728 | 52 |
| * | Pioneer Energy Services | ||
| Corp. | 23,681 | 40 | |
| * | Contango Oil & Gas Co. | 6,382 | 29 |
| 5,280 | |||
| Financials (14.5%) | |||
| Evercore Inc. Class A | 30,293 | 2,286 | |
| Sterling Bancorp | 100,105 | 2,247 | |
| ^ | First Financial Bankshares | ||
| Inc. | 48,824 | 1,955 | |
| United Community Banks | |||
| Inc. | 52,388 | 1,368 | |
| Glacier Bancorp Inc. | 39,031 | 1,296 | |
| * | LendingTree Inc. | 5,378 | 1,242 |
| Ameris Bancorp | 27,412 | 1,207 | |
| * | BofI Holding Inc. | 42,589 | 1,129 |
| ServisFirst Bancshares Inc. | 32,765 | 1,118 | |
| LegacyTexas Financial | |||
| Group Inc. | 30,793 | 1,108 | |
| Community Bank System | |||
| Inc. | 21,061 | 1,084 | |
| * | Walker & Dunlop Inc. | 20,762 | 1,000 |
| Financial Engines Inc. | 30,166 | 997 | |
| CVB Financial Corp. | 43,861 | 908 | |
| Great Western Bancorp Inc. | 25,133 | 903 | |
| Independent Bank Corp. | 12,867 | 892 | |
| Columbia Banking System | |||
| Inc. | 22,829 | 848 | |
| * | Green Dot Corp. Class A | 16,486 | 794 |
| * | First BanCorp | 135,401 | 769 |
| RLI Corp. | 14,122 | 756 | |
| First Midwest Bancorp Inc. | 34,762 | 733 | |
| Northwest Bancshares Inc. | 45,932 | 709 | |
| First Financial Bancorp | 29,358 | 703 | |
| Tompkins Financial Corp. | 9,123 | 693 | |
| Central Pacific Financial | |||
| Corp. | 22,617 | 656 | |
| Market | |||
| Value• | |||
| Shares | ($000) | ||
| Southside Bancshares Inc. | 20,074 | 656 | |
| NBT Bancorp Inc. | 19,565 | 642 | |
| Hanmi Financial Corp. | 23,921 | 639 | |
| National Bank Holdings | |||
| Corp. Class A | 19,724 | 635 | |
| Simmons First National | |||
| Corp. Class A | 12,109 | 632 | |
| Provident Financial | |||
| Services Inc. | 24,191 | 601 | |
| Westamerica | |||
| Bancorporation | 11,650 | 601 | |
| * | Customers Bancorp Inc. | 21,260 | 599 |
| Piper Jaffray Cos. | 10,447 | 579 | |
| Northfield Bancorp Inc. | 33,540 | 540 | |
| Boston Private Financial | |||
| Holdings Inc. | 36,026 | 530 | |
| First Commonwealth | |||
| Financial Corp. | 41,452 | 523 | |
| Universal Insurance | |||
| Holdings Inc. | 24,082 | 517 | |
| Brookline Bancorp Inc. | 35,591 | 511 | |
| WisdomTree Investments | |||
| Inc. | 53,374 | 489 | |
| AMERISAFE Inc. | 8,234 | 443 | |
| City Holding Co. | 6,104 | 387 | |
| Apollo Commercial Real | |||
| Estate Finance Inc. | 18,104 | 327 | |
| TrustCo Bank Corp. NY | 40,405 | 319 | |
| Dime Community | |||
| Bancshares Inc. | 13,146 | 249 | |
| Oritani Financial Corp. | 14,511 | 233 | |
| Bank Mutual Corp. | 17,784 | 163 | |
| Greenhill & Co. Inc. | 9,140 | 137 | |
| 38,353 | |||
| Health Care (15.7%) | |||
| Cantel Medical Corp. | 26,800 | 2,177 | |
| * | Neogen Corp. | 28,143 | 1,939 |
| * | ICU Medical Inc. | 11,110 | 1,937 |
| * | Ligand Pharmaceuticals | ||
| Inc. | 14,055 | 1,811 | |
| * | Supernus Pharmaceuticals | ||
| Inc. | 37,122 | 1,700 | |
| * | Merit Medical Systems Inc. | 36,853 | 1,522 |
| * | Integra LifeSciences | ||
| Holdings Corp. | 28,585 | 1,458 | |
| * | Omnicell Inc. | 27,438 | 1,408 |
| * | Nektar Therapeutics | ||
| Class A | 66,435 | 1,397 | |
| * | AMN Healthcare | ||
| Services Inc. | 35,365 | 1,321 | |
| Chemed Corp. | 6,293 | 1,242 | |
| * | MiMedx Group Inc. | 75,306 | 1,225 |
| * | Repligen Corp. | 27,233 | 1,189 |
| * | HMS Holdings Corp. | 61,931 | 1,097 |
| * | OraSure Technologies Inc. | 42,645 | 870 |
55
| S&P Small-Cap 600 Growth Index Fund | |||
| Market | |||
| Value• | |||
| Shares | ($000) | ||
| * | Cambrex Corp. | 16,590 | 864 |
| * | Haemonetics Corp. | 19,755 | 850 |
| * | Varex Imaging Corp. | 27,713 | 846 |
| * | Momenta Pharmaceuticals | ||
| Inc. | 49,301 | 831 | |
| * | BioTelemetry Inc. | 22,194 | 824 |
| * | Innoviva Inc. | 57,321 | 805 |
| * | HealthEquity Inc. | 18,328 | 784 |
| * | Medicines Co. | 20,247 | 743 |
| * | Inogen Inc. | 7,443 | 713 |
| * | Magellan Health Inc. | 8,404 | 680 |
| Luminex Corp. | 29,512 | 570 | |
| * | Cytokinetics Inc. | 37,634 | 559 |
| US Physical Therapy Inc. | 9,245 | 554 | |
| * | Tivity Health Inc. | 12,441 | 488 |
| * | Heska Corp. | 4,728 | 481 |
| Abaxis Inc. | 9,702 | 448 | |
| * | HealthStream Inc. | 18,831 | 442 |
| Landauer Inc. | 7,117 | 442 | |
| * | Emergent BioSolutions | ||
| Inc. | 11,823 | 441 | |
| * | Enanta Pharmaceuticals Inc. | 10,260 | 440 |
| * | AMAG Pharmaceuticals Inc. | 25,873 | 432 |
| * | SciClone Pharmaceuticals | ||
| Inc. | 38,194 | 420 | |
| * | CryoLife Inc. | 20,136 | 419 |
| * | Anika Therapeutics Inc. | 7,357 | 395 |
| * | Lantheus Holdings Inc. | 21,733 | 380 |
| Ensign Group Inc. | 18,297 | 376 | |
| * | Natus Medical Inc. | 10,750 | 361 |
| * | Progenics Pharmaceuticals | ||
| Inc. | 51,846 | 349 | |
| LeMaitre Vascular Inc. | 9,305 | 339 | |
| * | Eagle Pharmaceuticals Inc. | 5,760 | 314 |
| Analogic Corp. | 4,058 | 290 | |
| * | Cross Country Healthcare | ||
| Inc. | 23,402 | 290 | |
| * | Amphastar Pharmaceuticals | ||
| Inc. | 17,909 | 287 | |
| * | ANI Pharmaceuticals Inc. | 5,928 | 285 |
| * | Orthofix International NV | 5,196 | 256 |
| * | Surmodics Inc. | 9,802 | 255 |
| * | Sucampo Pharmaceuticals | ||
| Inc. Class A | 18,524 | 218 | |
| Phibro Animal Health Corp. | |||
| Class A | 5,955 | 211 | |
| Meridian Bioscience Inc. | 14,643 | 203 | |
| * | CorVel Corp. | 3,098 | 161 |
| * | Depomed Inc. | 25,754 | 157 |
| 41,496 | |||
| Industrials (18.5%) | |||
| John Bean Technologies | |||
| Corp. | 23,348 | 2,071 | |
| Healthcare Services | |||
| Group Inc. | 35,566 | 1,821 | |
| Market | |||
| Value• | |||
| Shares | ($000) | ||
| Tetra Tech Inc. | 42,199 | 1,798 | |
| * | WageWorks Inc. | 29,193 | 1,721 |
| * | Mercury Systems Inc. | 35,433 | 1,710 |
| * | Hawaiian Holdings Inc. | 39,599 | 1,697 |
| * | Trex Co. Inc. | 21,707 | 1,650 |
| Simpson Manufacturing | |||
| Co. Inc. | 29,906 | 1,309 | |
| * | Proto Labs Inc. | 17,995 | 1,292 |
| Barnes Group Inc. | 20,657 | 1,291 | |
| Allegiant Travel Co. Class A | 9,704 | 1,145 | |
| Insperity Inc. | 13,843 | 1,111 | |
| Applied Industrial | |||
| Technologies Inc. | 19,307 | 1,100 | |
| * | Aerojet Rocketdyne | ||
| Holdings Inc. | 35,231 | 1,044 | |
| ESCO Technologies Inc. | 19,071 | 1,038 | |
| Matthews International | |||
| Corp. Class A | 16,642 | 1,003 | |
| UniFirst Corp. | 6,622 | 951 | |
| AAON Inc. | 29,126 | 949 | |
| ABM Industries Inc. | 19,730 | 877 | |
| * | Patrick Industries Inc. | 11,754 | 870 |
| Exponent Inc. | 12,607 | 858 | |
| * | On Assignment Inc. | 17,938 | 856 |
| Hillenbrand Inc. | 23,712 | 848 | |
| Brady Corp. Class A | 25,387 | 847 | |
| *,^ | Axon Enterprise Inc. | 38,926 | 845 |
| US Ecology Inc. | 16,112 | 828 | |
| Viad Corp. | 15,047 | 827 | |
| Forward Air Corp. | 14,946 | 777 | |
| Watts Water | |||
| Technologies Inc. Class A | 11,526 | 711 | |
| Astec Industries Inc. | 14,131 | 702 | |
| Albany International Corp. | 13,015 | 698 | |
| * | Gibraltar Industries Inc. | 23,316 | 682 |
| Universal Forest | |||
| Products Inc. | 7,575 | 661 | |
| * | Saia Inc. | 10,898 | 616 |
| AZZ Inc. | 12,498 | 611 | |
| * | Lydall Inc. | 12,719 | 598 |
| Franklin Electric Co. Inc. | 15,086 | 581 | |
| EnPro Industries Inc. | 8,043 | 567 | |
| Apogee Enterprises Inc. | 12,536 | 548 | |
| * | Navigant Consulting Inc. | 34,883 | 535 |
| Multi-Color Corp. | 6,444 | 514 | |
| Tennant Co. | 8,413 | 513 | |
| Actuant Corp. Class A | 21,151 | 509 | |
| Quanex Building Products | |||
| Corp. | 25,430 | 498 | |
| * | Harsco Corp. | 28,418 | 486 |
| * | PGT Innovations Inc. | 36,487 | 482 |
| * | American Woodmark Corp. | 5,462 | 452 |
| Heartland Express Inc. | 20,145 | 447 | |
| Mobile Mini Inc. | 14,686 | 444 | |
| Raven Industries Inc. | 15,455 | 433 |
56
| S&P Small-Cap 600 Growth Index Fund | |||
| Market | |||
| Value• | |||
| Shares | ($000) | ||
| Griffon Corp. | 23,041 | 427 | |
| Alamo Group Inc. | 4,335 | 398 | |
| * | Chart Industries Inc. | 11,339 | 382 |
| * | Aerovironment Inc. | 7,315 | 358 |
| Lindsay Corp. | 4,002 | 346 | |
| Insteel Industries Inc. | 12,923 | 324 | |
| * | MYR Group Inc. | 12,162 | 314 |
| CIRCOR International Inc. | 6,211 | 298 | |
| Marten Transport Ltd. | 14,279 | 245 | |
| * | Vicor Corp. | 11,912 | 232 |
| * | Orion Group Holdings Inc. | 20,518 | 124 |
| 48,870 | |||
| Information Technology (17.8%) | |||
| MKS Instruments Inc. | 39,948 | 3,290 | |
| * | Lumentum Holdings Inc. | 41,084 | 2,336 |
| * | Stamps.com Inc. | 11,630 | 2,224 |
| * | Advanced Energy | ||
| Industries Inc. | 29,364 | 2,159 | |
| * | Itron Inc. | 24,825 | 1,802 |
| TiVo Corp. | 89,443 | 1,637 | |
| Power Integrations Inc. | 21,923 | 1,597 | |
| * | II-VI Inc. | 40,548 | 1,454 |
| Cabot Microelectronics | |||
| Corp. | 18,646 | 1,335 | |
| Progress Software Corp. | 35,638 | 1,197 | |
| * | Semtech Corp. | 30,575 | 1,150 |
| * | Rogers Corp. | 9,368 | 1,111 |
| * | Fabrinet | 27,559 | 1,070 |
| * | Rambus Inc. | 82,488 | 1,070 |
| * | Qualys Inc. | 22,146 | 1,052 |
| Xperi Corp. | 36,498 | 995 | |
| * | Gigamon Inc. | 23,061 | 990 |
| Badger Meter Inc. | 21,494 | 987 | |
| * | 8x8 Inc. | 67,643 | 957 |
| Ebix Inc. | 16,063 | 927 | |
| * | ExlService Holdings Inc. | 16,160 | 909 |
| * | TTM Technologies Inc. | 63,093 | 898 |
| * | Cardtronics plc Class A | 33,693 | 875 |
| * | MaxLinear Inc. | 38,661 | 835 |
| * | Oclaro Inc. | 93,861 | 789 |
| * | SPS Commerce Inc. | 12,694 | 773 |
| NIC Inc. | 45,955 | 751 | |
| Brooks Automation Inc. | 26,223 | 684 | |
| * | NETGEAR Inc. | 13,658 | 656 |
| * | CEVA Inc. | 15,860 | 643 |
| Methode Electronics Inc. | 14,938 | 611 | |
| * | Electronics For Imaging Inc. | 17,154 | 610 |
| CSG Systems | |||
| International Inc. | 15,715 | 608 | |
| CTS Corp. | 24,254 | 546 | |
| * | Synchronoss | ||
| Technologies Inc. | 31,839 | 535 | |
| * | Kulicke & Soffa Industries | ||
| Inc. | 27,251 | 519 | |
| * | Rudolph Technologies Inc. | 23,212 | 515 |
| Market | |||
| Value• | |||
| Shares | ($000) | ||
| ADTRAN Inc. | 22,477 | 497 | |
| * | MicroStrategy Inc. Class A | 3,751 | 484 |
| * | Nanometrics Inc. | 18,644 | 481 |
| * | Shutterstock Inc. | 14,036 | 471 |
| * | ePlus Inc. | 5,055 | 423 |
| * | Bottomline Technologies | ||
| de Inc. | 13,611 | 413 | |
| * | Super Micro Computer Inc. | 14,300 | 381 |
| * | Veeco Instruments Inc. | 17,711 | 335 |
| * | Barracuda Networks Inc. | 13,487 | 326 |
| Forrester Research Inc. | 7,203 | 293 | |
| *,^ | Applied Optoelectronics | ||
| Inc. | 4,697 | 278 | |
| * | LivePerson Inc. | 17,467 | 234 |
| Monotype Imaging | |||
| Holdings Inc. | 12,668 | 231 | |
| * | FARO Technologies Inc. | 6,532 | 225 |
| * | CalAmp Corp. | 11,223 | 208 |
| * | XO Group Inc. | 9,349 | 174 |
| * | VASCO Data Security | ||
| International Inc. | 9,459 | 119 | |
| * | Control4 Corp. | 3,897 | 96 |
| Bel Fuse Inc. Class B | 3,620 | 92 | |
| * | Kopin Corp. | 19,846 | 80 |
| * | DHI Group Inc. | 13,656 | 27 |
| 46,965 | |||
| Materials (4.1%) | |||
| * | Ingevity Corp. | 31,082 | 1,957 |
| Balchem Corp. | 23,527 | 1,764 | |
| Quaker Chemical Corp. | 9,813 | 1,366 | |
| * | Kraton Corp. | 23,000 | 755 |
| * | AK Steel Holding Corp. | 130,145 | 729 |
| Stepan Co. | 9,093 | 704 | |
| Neenah Paper Inc. | 8,057 | 622 | |
| *,^ | US Concrete Inc. | 7,473 | 598 |
| Innospec Inc. | 8,729 | 485 | |
| Innophos Holdings Inc. | 10,354 | 473 | |
| * | Koppers Holdings Inc. | 9,677 | 379 |
| Deltic Timber Corp. | 4,618 | 360 | |
| A Schulman Inc. | 9,342 | 284 | |
| Hawkins Inc. | 4,305 | 154 | |
| * | Flotek Industries Inc. | 16,866 | 87 |
| 10,717 | |||
| Real Estate (7.7%) | |||
| EastGroup Properties Inc. | 25,027 | 2,224 | |
| Lexington Realty Trust | 159,710 | 1,575 | |
| PS Business Parks Inc. | 9,394 | 1,269 | |
| American Assets Trust Inc. | 30,610 | 1,243 | |
| Summit Hotel Properties | |||
| Inc. | 76,951 | 1,142 | |
| Four Corners Property | |||
| Trust Inc. | 44,314 | 1,126 | |
| Retail Opportunity | |||
| Investments Corp. | 54,277 | 1,077 | |
| Agree Realty Corp. | 20,860 | 1,046 | |
57
S&P Small-Cap 600 Growth Index Fund
| Market | |||
| Value• | |||
| Shares | ($000) | ||
| CareTrust REIT Inc. | 53,563 | 1,033 | |
| LTC Properties Inc. | 19,284 | 938 | |
| DiamondRock Hospitality | |||
| Co. | 76,882 | 845 | |
| Acadia Realty Trust | 26,899 | 772 | |
| National Storage Affiliates | |||
| Trust | 32,673 | 729 | |
| HFF Inc. Class A | 17,554 | 669 | |
| Getty Realty Corp. | 23,719 | 654 | |
| Ramco-Gershenson | |||
| Properties Trust | 45,692 | 601 | |
| Universal Health Realty | |||
| Income Trust | 6,091 | 461 | |
| Urstadt Biddle Properties | |||
| Inc. Class A | 21,949 | 454 | |
| Franklin Street Properties | |||
| Corp. | 41,167 | 411 | |
| Parkway Inc. | 16,089 | 369 | |
| Saul Centers Inc. | 6,023 | 365 | |
| Hersha Hospitality Trust | |||
| Class A | 17,578 | 326 | |
| Chatham Lodging Trust | 13,876 | 281 | |
| CBL & Associates | |||
| Properties Inc. | 29,053 | 233 | |
| Pennsylvania REIT | 22,140 | 222 | |
| Armada Hoffler Properties | |||
| Inc. | 13,928 | 186 | |
| Independence Realty Trust | |||
| Inc. | 13,142 | 135 | |
| 20,386 | |||
| Telecommunication Services (1.2%) | |||
| Cogent Communications | |||
| Holdings Inc. | 30,232 | 1,409 | |
| Consolidated | |||
| Communications Holdings | |||
| Inc. | 30,365 | 560 | |
| * | Vonage Holdings Corp. | 59,036 | 490 |
| Cincinnati Bell Inc. | 18,042 | 380 | |
| ATN International Inc. | 3,944 | 239 | |
| * | Lumos Networks Corp. | 7,777 | 140 |
| 3,218 | |||
| Utilities (1.5%) | |||
| South Jersey Industries | |||
| Inc. | 58,675 | 2,105 | |
| California Water Service | |||
| Group | 35,419 | 1,327 | |
| American States Water Co. | 12,977 | 640 | |
| 4,072 | |||
| Total Common Stocks | |||
| (Cost $239,841) | 261,191 | ||
| Market | |||
| Value• | |||
| Shares | ($000) | ||
| Temporary Cash Investments (1.5%)1 | |||
| Money Market Fund (1.0%) | |||
| 2,3 | Vanguard Market Liquidity | ||
| Fund, 1.224% | 25,853 | 2,586 | |
| Face | |||
| Amount | |||
| ($000) | |||
| U. S. Government and Agency Obligations (0.5%) | |||
| United States Treasury | |||
| Bill, 0.987%, 9/7/17 | 100 | 100 | |
| United States Treasury | |||
| Bill, 0.976%, 10/5/17 | 100 | 100 | |
| 4 | United States Treasury | ||
| Bill, 1.052%, 11/24/17 | 100 | 99 | |
| 4 | United States Treasury | ||
| Bill, 1.093%, 2/22/18 | 1,000 | 995 | |
| 1,294 | |||
| Total Temporary Cash Investments | |||
| (Cost $3,880) | 3,880 | ||
| Total Investments (100.3%) | |||
| (Cost $243,721) | 265,071 | ||
| Amount | |||
| ($000) | |||
| Other Assets and Liabilities (-0.3%) | |||
| Other Assets | |||
| Investment in Vanguard | 17 | ||
| Receivables for Accrued Income | 164 | ||
| Receivables for Capital Shares Issued | 1 | ||
| Variation Margin Receivable – | |||
| Futures Contracts | 30 | ||
| Total Other Assets | 212 | ||
| Liabilities | |||
| Payables for Investment Securities | |||
| Purchased | (1) | ||
| Collateral for Securities on Loan | (1,036) | ||
| Payables to Vanguard | (46) | ||
| Other Liabilities | (5) | ||
| Total Liabilities | (1,088) | ||
| ETF Shares—Net Assets (100%) | |||
| Applicable to 2,000,000 outstanding | |||
| $.001 par value shares of beneficial | |||
| interest (unlimited authorization) | 264,195 | ||
| Net Asset Value Per Share— | |||
| ETF Shares | $132.10 | ||
58
S&P Small-Cap 600 Growth Index Fund
| At August 31, 2017, net assets consisted of: | |
| Amount | |
| ($000) | |
| Paid-in Capital | 249,214 |
| Undistributed Net Investment Income | 486 |
| Accumulated Net Realized Losses | (6,869) |
| Unrealized Appreciation (Depreciation) | |
| Investment Securities | 21,350 |
| Futures Contracts | 14 |
| Net Assets | 264,195 |
• See Note A in Notes to Financial Statements.
* Non-income-producing security.
^ Includes partial security positions on loan to broker-dealers.
The total value of securities on loan is $994,000.
1 The fund invests a portion of its cash reserves in equity markets
through the use of index futures contracts. After giving effect to
futures investments, the fund’s effective common stock and
temporary cash investment positions represent 100.0% and
0.3%, respectively, of net assets.
2 Affiliated money market fund available only to Vanguard funds
and certain trusts and accounts managed by Vanguard. Rate
shown is the 7-day yield.
3 Includes $1,036,000 of collateral received for securities on loan.
4 Securities with a value of $249,000 have been segregated as
initial margin for open futures contracts.
REIT—Real Estate Investment Trust.
| Derivative Financial Instruments Outstanding as of Period End | ||||
| Futures Contracts | ||||
| ($000) | ||||
| Value and | ||||
| Number of | Unrealized | |||
| Long (Short) | Notional | Appreciation | ||
| Expiration | Contracts | Amount | (Depreciation) | |
| Long Futures Contracts | ||||
| E-mini Russell 2000 Index | September 2017 | 45 | 3,160 | 14 |
Unrealized appreciation (depreciation) on open futures contracts is required to be treated as realized gain (loss) for tax purposes.
See accompanying Notes, which are an integral part of the Financial Statements.
59
| S&P Small-Cap 600 Growth Index Fund | |
| Statement of Operations | |
| Year Ended | |
| August 31,2017 | |
| ($000) | |
| Investment Income | |
| Income | |
| Dividends | 2,385 |
| Interest1 | 10 |
| Securities Lending—Net | 34 |
| Total Income | 2,429 |
| Expenses | |
| The Vanguard Group—Note B | |
| Investment Advisory Services | 46 |
| Management and Administrative | 221 |
| Marketing and Distribution | 14 |
| Custodian Fees | 84 |
| Auditing Fees | 32 |
| Shareholders’ Reports and Proxy | 25 |
| Total Expenses | 422 |
| Net Investment Income | 2,007 |
| Realized Net Gain (Loss) | |
| Investment Securities Sold1 | 9,929 |
| Futures Contracts | 76 |
| Realized Net Gain (Loss) | 10,005 |
| Change in Unrealized Appreciation (Depreciation) | |
| Investment Securities | 10,935 |
| Futures Contracts | 14 |
| Change in Unrealized Appreciation (Depreciation) | 10,949 |
| Net Increase (Decrease) in Net Assets Resulting from Operations | 22,961 |
1 Interest income and realized net gain (loss) from an affiliated company of the fund were $8,000 and $0, respectively.
See accompanying Notes, which are an integral part of the Financial Statements.
60
| S&P Small-Cap 600 Growth Index Fund | ||
| Statement of Changes in Net Assets | ||
| Year Ended August 31, | ||
| 2017 | 2016 | |
| ($000) | ($000) | |
| Increase (Decrease) in Net Assets | ||
| Operations | ||
| Net Investment Income | 2,007 | 1,197 |
| Realized Net Gain (Loss) | 10,005 | (5,037) |
| Change in Unrealized Appreciation (Depreciation) | 10,949 | 16,336 |
| Net Increase (Decrease) in Net Assets Resulting from Operations | 22,961 | 12,496 |
| Distributions | ||
| Net Investment Income | (1,784) | (1,395) |
| Realized Capital Gain | — | — |
| Total Distributions | (1,784) | (1,395) |
| Capital Share Transactions | ||
| Issued | 129,921 | 86,678 |
| Issued in Lieu of Cash Distributions | — | — |
| Redeemed | (18,805) | (40,767) |
| Net Increase (Decrease) from Capital Share Transactions | 111,116 | 45,911 |
| Total Increase (Decrease) | 132,293 | 57,012 |
| Net Assets | ||
| Beginning of Period | 131,902 | 74,890 |
| End of Period1 | 264,195 | 131,902 |
1 Net Assets—End of Period includes undistributed (overdistributed) net investment income of $486,000 and $263,000.
See accompanying Notes, which are an integral part of the Financial Statements.
61
| S&P Small-Cap 600 Growth Index Fund | |||||
| Financial Highlights | |||||
| ETF Shares | |||||
| For a Share Outstanding | Year Ended August 31, | ||||
| Throughout Each Period | 2017 | 2016 | 2015 | 2014 | 2013 |
| Net Asset Value, Beginning of Period | $117.25 | $106.99 | $101.36 | $87.79 | $70.70 |
| Investment Operations | |||||
| Net Investment Income | 1.2221 | 1.180 | 1.043 | .6681 | .822 |
| Net Realized and Unrealized Gain (Loss) | |||||
| on Investments | 14.762 | 10.685 | 5.345 | 13.432 | 17.083 |
| Total from Investment Operations | 15.984 | 11.865 | 6.388 | 14.100 | 17.905 |
| Distributions | |||||
| Dividends from Net Investment Income | (1.134) | (1.605) | (.758) | (.530) | (.815) |
| Distributions from Realized Capital Gains | — | — | — | — | — |
| Total Distributions | (1.134) | (1.605) | (.758) | (.530) | (.815) |
| Net Asset Value, End of Period | $132.10 | $117.25 | $106.99 | $101.36 | $87.79 |
| Total Return | 13.67% | 11.24% | 6.32% | 16.07% | 25.59% |
| Ratios/Supplemental Data | |||||
| Net Assets, End of Period (Millions) | $264 | $132 | $75 | $61 | $22 |
| Ratio of Total Expenses to | |||||
| Average Net Assets | 0.20% | 0.20% | 0.20% | 0.20% | 0.20% |
| Ratio of Net Investment Income to | |||||
| Average Net Assets | 0.95% | 1.15% | 0.98% | 0.66% | 1.03% |
| Portfolio Turnover Rate2 | 48% | 48% | 63% | 44% | 39% |
1 Calculated based on average shares outstanding.
2 Excludes the value of portfolio securities received or delivered as a result of in-kind purchases or redemptions of the fund’s capital
shares, including ETF Creation Units.
See accompanying Notes, which are an integral part of the Financial Statements.
62
S&P Small-Cap 600 Growth Index Fund
Notes to Financial Statements
Vanguard S&P Small-Cap 600 Growth Index Fund is registered under the Investment Company Act of 1940 as an open-end investment company, or mutual fund. The fund offers two classes of shares: ETF Shares and Institutional Shares. ETF Shares are listed for trading on NYSE Arca; they can be purchased and sold through a broker. Institutional Shares are designed for investors who meet certain administrative, service, and account-size criteria. During the year ended August 31, 2017, there were no investors in the Institutional share class.
A. The following significant accounting policies conform to generally accepted accounting principles for U.S. investment companies. The fund consistently follows such policies in preparing its financial statements.
1. Security Valuation: Securities are valued as of the close of trading on the New York Stock Exchange (generally 4 p.m., Eastern time) on the valuation date. Equity securities are valued at the latest quoted sales prices or official closing prices taken from the primary market in which each security trades; such securities not traded on the valuation date are valued at the mean of the latest quoted bid and asked prices. Securities for which market quotations are not readily available, or whose values have been materially affected by events occurring before the fund’s pricing time but after the close of the securities’ primary markets, are valued by methods deemed by the board of trustees to represent fair value. Investments in Vanguard Market Liquidity Fund are valued at that fund’s net asset value. Temporary cash investments are valued using the latest bid prices or using valuations based on a matrix system (which considers such factors as security prices, yields, maturities, and ratings), both as furnished by independent pricing services.
2. Futures Contracts: The fund uses index futures contracts to a limited extent, with the objectives of maintaining full exposure to the stock market, enhancing returns, maintaining liquidity, and minimizing transaction costs. The fund may purchase futures contracts to immediately invest incoming cash in the market, or sell futures in response to cash outflows, thereby simulating a fully invested position in the underlying index while maintaining a cash balance for liquidity. The fund may seek to enhance returns by using futures contracts instead of the underlying securities when futures are believed to be priced more attractively than the underlying securities. The primary risks associated with the use of futures contracts are imperfect correlation between changes in market values of stocks held by the fund and the prices of futures contracts, and the possibility of an illiquid market. Counterparty risk involving futures is mitigated because a regulated clearinghouse is the counterparty instead of the clearing broker. To further mitigate counterparty risk, the fund trades futures contracts on an exchange, monitors the financial strength of its clearing brokers and clearinghouse, and has entered into clearing agreements with its clearing brokers. The clearing-house imposes initial margin requirements to secure the fund’s performance and requires daily settlement of variation margin representing changes in the market value of each contract.
Futures contracts are valued at their quoted daily settlement prices. The notional amounts of the contracts are not recorded in the Statement of Net Assets. Fluctuations in the value of the contracts are recorded in the Statement of Net Assets as an asset (liability) and in the Statement of Operations as unrealized appreciation (depreciation) until the contracts are closed, when they are recorded as realized futures gains (losses).
During the year ended August 31, 2017, the fund’s average investments in long and short futures contracts represented less than 1% and 0% of net assets, respectively, based on the average of the notional amounts at each quarter-end during the period.
63
S&P Small-Cap 600 Growth Index Fund
3. Federal Income Taxes: The fund intends to continue to qualify as a regulated investment company and distribute all of its taxable income. Management has analyzed the fund’s tax positions taken for all open federal income tax years (August 31, 2014–2017), and has concluded that no provision for federal income tax is required in the fund’s financial statements.
4. Distributions: Distributions to shareholders are recorded on the ex-dividend date.
5. Securities Lending: To earn additional income, the fund lends its securities to qualified institutional borrowers. Security loans are subject to termination by the fund at any time, and are required to be secured at all times by collateral in an amount at least equal to the market value of securities loaned. Daily market fluctuations could cause the value of loaned securities to be more or less than the value of the collateral received. When this occurs, the collateral is adjusted and settled on the next business day. The fund further mitigates its counterparty risk by entering into securities lending transactions only with a diverse group of prequalified counterparties, monitoring their financial strength, and entering into master securities lending agreements with its counterparties. The master securities lending agreements provide that, in the event of a counterparty’s default (including bankruptcy), the fund may terminate any loans with that borrower, determine the net amount owed, and sell or retain the collateral up to the net amount owed to the fund; however, such actions may be subject to legal proceedings. While collateral mitigates counterparty risk, in the event of a default, the fund may experience delays and costs in recovering the securities loaned. The fund invests cash collateral received in Vanguard Market Liquidity Fund, and records a liability in the Statement of Net Assets for the return of the collateral, during the period the securities are on loan. Securities lending income represents fees charged to borrowers plus income earned on invested cash collateral, less expenses associated with the loan. During the term of the loan, the fund is entitled to all distributions made on or in respect of the loaned securities.
6. Credit Facility: The fund and certain other funds managed by The Vanguard Group (“Vanguard”) participate in a $3.1 billion committed credit facility provided by a syndicate of lenders pursuant to a credit agreement that may be renewed annually; each fund is individually liable for its borrowings, if any, under the credit facility. Borrowings may be utilized for temporary and emergency purposes, and are subject to the fund’s regulatory and contractual borrowing restrictions. The participating funds are charged administrative fees and an annual commitment fee of 0.10% of the undrawn amount of the facility; these fees are allocated to the funds based on a method approved by the fund’s board of trustees and included in Management and Administrative expenses on the fund’s Statement of Operations. Any borrowings under this facility bear interest at a rate based upon the higher of the one-month London Interbank Offered Rate, federal funds effective rate, or overnight bank funding rate plus an agreed-upon spread.
The fund had no borrowings outstanding at August 31, 2017, or at any time during the period then ended.
7. Other: Dividend income is recorded on the ex-dividend date. Interest income includes income distributions received from Vanguard Market Liquidity Fund and is accrued daily. Premiums and discounts on debt securities purchased are amortized and accreted, respectively, to interest income over the lives of the respective securities. Security transactions are accounted for on the date securities are bought or sold. Costs used to determine realized gains (losses) on the sale of investment securities are those of the specific securities sold.
64
S&P Small-Cap 600 Growth Index Fund
B. In accordance with the terms of a Funds’ Service Agreement (the “FSA”) between Vanguard and the fund, Vanguard furnishes to the fund investment advisory, corporate management, administrative, marketing, and distribution services at Vanguard’s cost of operations (as defined by the FSA). These costs of operations are allocated to the fund based on methods and guidelines approved by the board of trustees. Vanguard does not require reimbursement in the current period for certain costs of operations (such as deferred compensation/benefits and risk/insurance costs); the fund’s liability for these costs of operations is included in Payables to Vanguard on the Statement of Net Assets.
Upon the request of Vanguard, the fund may invest up to 0.40% of its net assets as capital in Vanguard. At August 31, 2017, the fund had contributed to Vanguard capital in the amount of $17,000, representing 0.01% of the fund’s net assets and 0.01% of Vanguard’s capitalization. The fund’s trustees and officers are also directors and employees, respectively, of Vanguard.
C. Various inputs may be used to determine the value of the fund’s investments. These inputs are summarized in three broad levels for financial statement purposes. The inputs or methodologies used to value securities are not necessarily an indication of the risk associated with investing in those securities.
Level 1—Quoted prices in active markets for identical securities.
Level 2—Other significant observable inputs (including quoted prices for similar securities, interest rates, prepayment speeds, credit risk, etc.).
Level 3—Significant unobservable inputs (including the fund’s own assumptions used to determine the fair value of investments). Any investments valued with significant unobservable inputs are
noted on the Statement of Net Assets.
The following table summarizes the market value of the fund’s investments as of August 31, 2017, based on the inputs used to value them:
| Level 1 | Level 2 | Level 3 | |
| Investments | ($000) | ($000) | ($000) |
| Common Stocks | 261,191 | — | — |
| Temporary Cash Investments | 2,586 | 1,294 | — |
| Futures Contracts—Assets1 | 30 | — | — |
| Total | 263,807 | 1,294 | — |
| 1 Represents variation margin on the last day of the reporting period. |
D. Distributions are determined on a tax basis and may differ from net investment income and realized capital gains for financial reporting purposes. Differences may be permanent or temporary. Permanent differences are reclassified among capital accounts in the financial statements to reflect their tax character. Temporary differences arise when certain items of income, expense, gain, or loss are recognized in different periods for financial statement and tax purposes. These differences will reverse at some time in the future. Differences in classification may also result from the treatment of short-term gains as ordinary income for tax purposes.
65
S&P Small-Cap 600 Growth Index Fund
During the year ended August 31, 2017, the fund realized $4,524,000 of net capital gains resulting from in-kind redemptions—in which shareholders exchanged fund shares for securities held by the fund rather than for cash. Because such gains are not taxable to the fund, and are not distributed to shareholders, they have been reclassified from accumulated net realized losses to paid-in capital.
For tax purposes, at August 31, 2017, the fund had $520,000 of ordinary income available for distribution. The fund used capital loss carryforwards of $5,495,000 to offset taxable capital gains realized during the year ended August 31, 2017. At August 31, 2017, the fund had available capital losses totaling $6,866,000 that may be carried forward indefinitely to offset future net capital gains.
At August 31, 2017, the cost of investment securities for tax purposes was $243,721,000. Net unrealized appreciation of investment securities for tax purposes was $21,350,000, consisting of unrealized gains of $36,234,000 on securities that had risen in value since their purchase and $14,884,000 in unrealized losses on securities that had fallen in value since their purchase.
E. During the year ended August 31, 2017, the fund purchased $230,461,000 of investment securities and sold $121,837,000 of investment securities, other than temporary cash investments. Purchases and sales include $129,844,000 and $12,124,000, respectively, in connection with in-kind purchases and redemptions of the fund’s capital shares.
The fund purchased securities from and sold securities to other Vanguard funds or accounts managed by Vanguard or its affiliates, in accordance with procedures adopted by the board of trustees in compliance with Rule 17a-7 of the Investment Company Act of 1940. For the year ended August 31, 2017, such purchases and sales were $12,181,000 and $19,435,000, respectively; these amounts are included in the purchases and sales of investment securities noted above.
| F. Capital shares issued and redeemed were: | ||
| Year Ended August 31, | ||
| 2017 | 2016 | |
| Shares | Shares | |
| (000) | (000) | |
| Issued | 1,025 | 800 |
| Issued in Lieu of Cash Distributions | — | — |
| Redeemed | (150) | (375) |
| Net Increase (Decrease) in Shares Outstanding | 875 | 425 |
G. Management has determined that no material events or transactions occurred subsequent to August 31, 2017, that would require recognition or disclosure in these financial statements.
66
Report of Independent Registered Public Accounting Firm
To the Board of Trustees of Vanguard Admiral Funds and the Shareholders of Vanguard S&P Small-Cap 600 Index Fund, Vanguard S&P Small-Cap 600 Value Index Fund and Vanguard S&P Small-Cap 600 Growth Index Fund: In our opinion, the accompanying statements of net assets and the related statements of operations and of changes in net assets and the financial highlights present fairly, in all material respects, the financial position of Vanguard S&P Small-Cap 600 Index Fund, Vanguard S&P Small-Cap 600 Value Index Fund and Vanguard S&P Small-Cap 600 Growth Index Fund (constituting separate portfolios of Vanguard Admiral Funds, hereafter referred to as the “Funds”) as of August 31, 2017, the results of each of their operations for the year then ended, the changes in each of their net assets for each of the two years in the period then ended and the financial highlights for each of the periods indicated, in conformity with accounting principles generally accepted in the United States of America. These financial statements and financial highlights (hereafter referred to as “financial statements”) are the responsibility of the Funds’ management. Our responsibility is to express an opinion on these financial statements based on our audits. We conducted our audits of these financial statements in accordance with the standards of the Public Company Accounting Oversight Board (United States). Those standards require that we plan and perform the audit to obtain reasonable assurance about whether the financial statements are free of material misstatement.
An audit includes examining, on a test basis, evidence supporting the amounts and disclosures in the financial statements, assessing the accounting principles used and significant estimates made by management, and evaluating the overall financial statement presentation. We believe that our audits, which included confirmation of securities as of August 31, 2017 by correspondence with the custodian and brokers and by agreement to the underlying ownership records of the transfer agent, provide a reasonable basis for our opinion.
/s/PricewaterhouseCoopers LLP
Philadelphia, Pennsylvania
October 17, 2017
67
Special 2017 tax information (unaudited) for Vanguard S&P Small-Cap 600 Index Funds
This information for the fiscal year ended August 31, 2017, is included pursuant to provisions of the Internal Revenue Code.
The funds distributed qualified dividend income to shareholders during the fiscal year as follows:
| Fund | ($000) |
| S&P Small-Cap 600 Index Fund | 7,078 |
| S&P Small-Cap 600 Value Index Fund | 2,634 |
| S&P Small-Cap 600 Growth Index Fund | 1,541 |
For corporate shareholders, the percentage of investment income (dividend income plus short-term gains, if any) that qualifies for the dividends-received deduction is as follows:
| Fund | Percentage |
| S&P Small-Cap 600 Index Fund | 85.1% |
| S&P Small-Cap 600 Value Index Fund | 92.8 |
| S&P Small-Cap 600 Growth Index Fund | 88.5 |
68
Your Fund’s After-Tax Returns
This table presents returns for your fund both before and after taxes. The after-tax returns are shown in two ways: (1) assuming that an investor owned the fund during the entire period and paid taxes on the fund’s distributions, and (2) assuming that an investor paid taxes on the fund’s distributions and sold all shares at the end of each period.
Calculations are based on the highest individual federal income tax and capital gains tax rates in effect at the times of the distributions and the hypothetical sales. State and local taxes were not considered. After-tax returns reflect any qualified dividend income, using actual prior-year figures and estimates for 2017. (In the example, returns after the sale of fund shares may be higher than those assuming no sale. This occurs when the sale would have produced a capital loss. The calculation assumes that the investor received a tax deduction for the loss.)
The table shows returns for ETF Shares only; returns for other share classes will differ. Please note that your actual after-tax returns will depend on your tax situation and may differ from those shown. Also note that if you own the fund in a tax-deferred account, such as an individual retirement account or a 401(k) plan, this information does not apply to you. Such accounts are not subject to current taxes.
Finally, keep in mind that a fund’s performance—whether before or after taxes—does not guarantee future results.
Average Annual Total Returns: S&P Small Cap 600 Index Funds
Periods Ended August 31, 2017
| Since | |||
| One | Five | Inception | |
| Year | Years | (9/7/2010) | |
| S&P Small-Cap 600 Index Fund ETF Shares | |||
| Returns Before Taxes | 13.18% | 14.33% | 15.33% |
| Returns After Taxes on Distributions | 12.89 | 14.01 | 15.06 |
| Returns After Taxes on Distributions and Sale of | |||
| Fund Shares | 7.63 | 11.46 | 12.60 |
| Since | |||
| One | Five | Inception | |
| Year | Years | (9/7/2010) | |
| S&P Small-Cap 600 Value Index Fund ETF Shares | |||
| Returns Before Taxes | 12.11% | 13.98% | 14.57% |
| Returns After Taxes on Distributions | 11.70 | 13.61 | 14.25 |
| Returns After Taxes on Distributions and Sale of | |||
| Fund Shares | 7.13 | 11.17 | 11.94 |
| Since | |||
| One | Five | Inception | |
| Year | Years | (9/7/2010) | |
| S&P Small-Cap 600 Growth Index Fund ETF Shares | |||
| Returns Before Taxes | 13.67% | 14.40% | 15.95% |
| Returns After Taxes on Distributions | 13.40 | 14.14 | 15.73 |
| Returns After Taxes on Distributions and Sale of | |||
| Fund Shares | 7.90 | 11.54 | 13.16 |
69
About Your Fund’s Expenses
As a shareholder of the fund, you incur ongoing costs, which include costs for portfolio management, administrative services, and shareholder reports (like this one), among others. Operating expenses, which are deducted from a fund’s gross income, directly reduce the investment return of the fund.
A fund’s expenses are expressed as a percentage of its average net assets. This figure is known as the expense ratio. The following examples are intended to help you understand the ongoing costs (in dollars) of investing in your fund and to compare these costs with those of other mutual funds. The examples are based on an investment of $1,000 made at the beginning of the period shown and held for the entire period.
The accompanying table illustrates your fund’s costs in two ways:
• Based on actual fund return. This section helps you to estimate the actual expenses that you paid over the period. The ”Ending Account Value“ shown is derived from the fund‘s actual return, and the third column shows the dollar amount that would have been paid by an investor who started with $1,000 in the fund. You may use the information here, together with the amount you invested, to estimate the expenses that you paid over the period.
To do so, simply divide your account value by $1,000 (for example, an $8,600 account value divided by $1,000 = 8.6), then multiply the result by the number given for your fund under the heading ”Expenses Paid During Period.“
• Based on hypothetical 5% yearly return. This section is intended to help you compare your fund‘s costs with those of other mutual funds. It assumes that the fund had a yearly return of 5% before expenses, but that the expense ratio is unchanged. In this case—because the return used is not the fund’s actual return—the results do not apply to your investment. The example is useful in making comparisons because the Securities and Exchange Commission requires all mutual funds to calculate expenses based on a 5% return. You can assess your fund’s costs by comparing this hypothetical example with the hypothetical examples that appear in shareholder reports of other funds.
Note that the expenses shown in the table are meant to highlight and help you compare ongoing costs only and do not reflect transaction costs incurred by the fund for buying and selling securities. Further, the expenses do not include any purchase, redemption, or account service fees described in the fund prospectus. If such fees were applied to your account, your costs would be higher. Your fund does not carry a “sales load.”
The calculations assume no shares were bought or sold during the period. Your actual costs may have been higher or lower, depending on the amount of your investment and the timing of any purchases or redemptions.
You can find more information about the fund’s expenses, including annual expense ratios, in the Financial Statements section of this report. For additional information on operating expenses and other shareholder costs, please refer to your fund’s current prospectus.
70
| Six Months Ended August 31, 2017 | |||
| Beginning | Ending | Expenses | |
| Account Value | Account Value | Paid During | |
| 2/28/2017 | 8/31/2017 | Period | |
| Based on Actual Fund Return | |||
| S&P Small-Cap 600 Index Fund | |||
| ETF Shares | $1,000.00 | $1,131.83 | $0.81 |
| Institutional Shares | 1,000.00 | 1,132.59 | 0.43 |
| S&P Small-Cap 600 Value Index Fund | |||
| ETF Shares | $1,000.00 | $1,121.15 | $1.02 |
| Institutional Shares | 1,000.00 | 1,122.52 | 0.37 |
| S&P Small-Cap 600 Growth Index Fund | |||
| ETF Shares | $1,000.00 | $1,136.72 | $1.02 |
| Based on Hypothetical 5% Yearly Return | |||
| S&P Small-Cap 600 Index Fund | |||
| ETF Shares | $1,000.00 | $1,024.45 | $0.77 |
| Institutional Shares | 1,000.00 | 1,024.80 | 0.41 |
| S&P Small-Cap 600 Value Index Fund | |||
| ETF Shares | $1,000.00 | $1,024.25 | $0.97 |
| Institutional Shares | 1,000.00 | 1,024.85 | 0.36 |
| S&P Small-Cap 600 Growth Index Fund | |||
| ETF Shares | $1,000.00 | $1,024.25 | $0.97 |
The calculations are based on expenses incurred in the most recent six-month period. The funds’ annualized six-month expense ratios for that period are: for the S&P Small-Cap 600 Index Fund, 0.15% for ETF Shares and 0.08% for Institutional Shares; for the S&P Small-Cap 600 Value Index Fund, 0.19% for ETF Shares and 0.07% for Institutional Shares; and for the S&P Small-Cap 600 Growth Index Fund, 0.19% for ETF Shares. The dollar amounts shown as “Expenses Paid” are equal to the annualized expense ratio multiplied by the average account value over the period, multiplied by the number of days in the most recent six-month period, then divided by the number of days in the most recent 12-month period (184/365).
71
Trustees Approve Advisory Arrangements
The board of trustees of Vanguard S&P Small-Cap 600 Index Fund, Vanguard S&P Small-Cap 600 Value Index Fund, and Vanguard S&P Small-Cap 600 Growth Index Fund has renewed each fund’s investment advisory arrangement with The Vanguard Group, Inc. (Vanguard), through its Equity Index Group. The board determined that continuing each fund’s internalized management structure was in the best interest of the fund and its shareholders.
The board based its decision upon an evaluation of the advisor’s investment staff, portfolio management process, and performance. This evaluation included information provided to the board by Vanguard’s Portfolio Review Department, which is responsible for fund and advisor oversight and product management. The Portfolio Review Department met regularly with the advisor and made monthly presentations to the board during the fiscal year that directed the board’s focus to relevant information and topics.
The board, or an investment committee made up of board members, also received information throughout the year through advisor presentations. For each advisor presentation, the board was provided with letters and reports that included information about, among other things, the advisory firm and the advisor’s assessment of the investment environment, portfolio performance, and portfolio characteristics.
In addition, the board received monthly reports, which included a Market and Economic Report, a Fund Dashboard Monthly Summary, and a Fund Performance Report.
Prior to their meeting, the trustees were provided with a memo and materials that summarized the information they had received over the course of the year. They also considered the factors discussed below, among others. However, no single factor determined whether the board approved the arrangements. Rather, it was the totality of the circumstances that drove the board’s decision.
Nature, extent, and quality of services
The board reviewed the quality of the investment management services provided to the funds since their inception in 2010, and took into account the organizational depth and stability of the advisor. The board considered that Vanguard has been managing investments for more than three decades. The Equity Index Group adheres to a sound, disciplined investment management process; the team has considerable experience, stability, and depth.
The board concluded that Vanguard’s experience, stability, depth, and performance, among other factors, warranted continuation of each advisory arrangement.
Investment performance
The board considered each fund’s performance since its inception in 2010, including any periods of outperformance or underperformance compared with its target index and peer group. The board concluded that the performance was such that each advisory arrangement should continue. Information about each fund’s most recent performance can be found in the Performance Summary pages of this report.
72
Cost
The board concluded that each fund’s expense ratio was well below the average expense ratio charged by funds in its peer group and that each fund’s advisory expenses were also well below the peer group average. Information about the funds’ expenses appears in the About Your Fund’s Expenses section of this report as well as in the Financial Statements sections.
The board does not conduct a profitability analysis of Vanguard because of Vanguard’s unique “at-cost” structure. Unlike most other mutual fund management companies, Vanguard is owned by the funds it oversees and produces “profits” only in the form of reduced expenses for fund shareholders.
The benefit of economies of scale
The board concluded that each fund’s at-cost arrangement with Vanguard ensures that the funds will realize economies of scale as they grow, with the cost to shareholders declining as fund assets increase.
The board will consider whether to renew the advisory arrangements again after a one-year period.
73
Glossary
30-Day SEC Yield. A fund’s 30-day SEC yield is derived using a formula specified by the U.S. Securities and Exchange Commission. Under the formula, data related to the fund’s security holdings in the previous 30 days are used to calculate the fund’s hypothetical net income for that period, which is then annualized and divided by the fund’s estimated average net assets over the calculation period. For the purposes of this calculation, a security’s income is based on its current market yield to maturity (for bonds), its actual income (for asset-backed securities), or its projected dividend yield (for stocks). Because the SEC yield represents hypothetical annualized income, it will differ—at times significantly—from the fund’s actual experience. As a result, the fund’s income distributions may be higher or lower than implied by the SEC yield.
Beta. A measure of the magnitude of a fund’s past share-price fluctuations in relation to the ups and downs of a given market index. The index is assigned a beta of 1.00. Compared with a given index, a fund with a beta of 1.20 typically would have seen its share price rise or fall by 12% when the index rose or fell by 10%. For this report, beta is based on returns over the past 36 months for both the fund and the index. Note that a fund’s beta should be reviewed in conjunction with its R-squared (see definition). The lower the R-squared, the less correlation there is between the fund and the index, and the less reliable beta is as an indicator of volatility.
Dividend Yield. Dividend income earned by stocks, expressed as a percentage of the aggregate market value (or of net asset value, for a fund). The yield is determined by dividing the amount of the annual dividends by the aggregate value (or net asset value) at the end of the period. For a fund, the dividend yield is based solely on stock holdings and does not include any income produced by other investments.
Earnings Growth Rate. The average annual rate of growth in earnings over the past five years for the stocks now in a fund.
Equity Exposure. A measure that reflects a fund’s investments in stocks and stock futures. Any holdings in short-term reserves are excluded.
Expense Ratio. A fund’s total annual operating expenses expressed as a percentage of the fund’s average net assets. The expense ratio includes management and administrative expenses, but does not include the transaction costs of buying and selling portfolio securities.
Foreign Holdings. The percentage of a fund represented by securities or depositary receipts of companies based outside the United States.
Inception Date. The date on which the assets of a fund (or one of its share classes) are first invested in accordance with the fund’s investment objective. For funds with a subscription period, the inception date is the day after that period ends. Investment performance is measured from the inception date.
Median Market Cap. An indicator of the size of companies in which a fund invests; the midpoint of market capitalization (market price x shares outstanding) of a fund’s stocks, weighted by the proportion of the fund’s assets invested in each stock. Stocks representing half of the fund’s assets have market capitalizations above the median, and the rest are below it.
Price/Book Ratio. The share price of a stock divided by its net worth, or book value, per share.
For a fund, the weighted average price/book ratio of the stocks it holds.
74
Price/Earnings Ratio. The ratio of a stock’s current price to its per-share earnings over the past year. For a fund, the weighted average P/E of the stocks it holds. P/E is an indicator of market expectations about corporate prospects; the higher the P/E, the greater the expectations for a company’s future growth.
R-Squared. A measure of how much of a fund’s past returns can be explained by the returns from the market in general, as measured by a given index. If a fund’s total returns were precisely synchronized with an index’s returns, its R-squared would be 1.00. If the fund’s returns bore no relationship to the index’s returns, its R-squared would be 0. For this report, R-squared is based on returns over the past 36 months for both the fund and the index.
Return on Equity. The annual average rate of return generated by a company during the past five years for each dollar of shareholder’s equity (net income divided by shareholder’s equity). For a fund, the weighted average return on equity for the companies whose stocks it holds.
Short-Term Reserves. The percentage of a fund invested in highly liquid, short-term securities that can be readily converted to cash.
Turnover Rate. An indication of the fund’s trading activity. Funds with high turnover rates incur higher transaction costs and may be more likely to distribute capital gains (which may be taxable to investors). The turnover rate excludes in-kind transactions, which have minimal impact on costs.
75
The Global Industry Classification Standard (“GICS”) was developed by and is the exclusive property and a service mark of MSCI Inc. (“MSCI”) and Standard and Poor’s, a division of McGraw-Hill Companies, Inc. (“S&P”), and is licensed for use by Vanguard. Neither MSCI, S&P nor any third party involved in making or compiling the GICS or any GICS classification makes any express or implied warranties or representations with respect to such standard or classification (or the results to be obtained by the use thereof), and all such parties hereby expressly disclaim all warranties of originality, accuracy, completeness, merchantability or fitness for a particular purpose with respect to any such standard or classification. Without limiting any of the foregoing, in no event shall MSCI, S&P, any of its affiliates or any third party involved in making or compiling the GICS or any GICS classification have any liability for any direct, indirect, special, punitive, consequential or any other damages (including lost profits) even if notified of the possibility of such damages.
76
This page intentionally left blank.
This page intentionally left blank.
The People Who Govern Your Fund
The trustees of your mutual fund are there to see that the fund is operated and managed in your best interests since, as a shareholder, you are a part owner of the fund. Your fund’s trustees also serve on the board of directors of The Vanguard Group, Inc., which is owned by the Vanguard funds and provides services to them on an at-cost basis.
A majority of Vanguard’s board members are independent, meaning that they have no affiliation with Vanguard or the funds they oversee, apart from the sizable personal investments they have made as private individuals. The independent board members have distinguished backgrounds in business, academia, and public service. Each of the trustees and executive officers oversees 195 Vanguard funds.
Information for each trustee and executive officer of the fund appears below. The mailing address of the trustees and officers is P.O. Box 876, Valley Forge, PA 19482. More information about the trustees is in the Statement of Additional Information, which can be obtained, without charge, by contacting Vanguard at 800-662-7447, or online at vanguard.com.
Interested Trustee1
F. William McNabb III
Born 1957. Trustee Since July 2009. Chairman of the Board. Principal Occupation(s) During the Past Five Years and Other Experience: Chairman of the Board of The Vanguard Group, Inc., and of each of the investment companies served by The Vanguard Group, since January 2010; Chief Executive Officer and Director of The Vanguard Group and President and Chief Executive Officer of each of the investment companies served by The Vanguard Group, since 2008; Director of Vanguard Marketing Corporation; President of The Vanguard Group (2008–2017); Managing Director of The Vanguard Group (1995–2008).
Independent Trustees
Emerson U. Fullwood
Born 1948. Trustee Since January 2008. Principal Occupation(s) During the Past Five Years and Other Experience: Executive Chief Staff and Marketing Officer for North America and Corporate Vice President (retired 2008) of Xerox Corporation (document management products and services); Executive in Residence and 2009–2010 Distinguished Minett Professor at the Rochester Institute of Technology; Lead Director of SPX FLOW, Inc. (multi-industry manufacturing); Director of the United Way of Rochester, the University of Rochester Medical Center, Monroe Community College Foundation, North Carolina A&T University, and Roberts Wesleyan College; Trustee of the University of Rochester.
Rajiv L. Gupta
Born 1945. Trustee Since December 2001.2 Principal Occupation(s) During the Past Five Years and Other Experience: Chairman and Chief Executive Officer (retired 2009) and President (2006–2008) of Rohm and Haas Co. (chemicals); Director of Arconic Inc. (diversified manufacturer), HP Inc. (printer and personal computer manufacturing), and Delphi Automotive plc (automotive components); Senior Advisor at New Mountain Capital.
Amy Gutmann
Born 1949. Trustee Since June 2006. Principal Occupation(s) During the Past Five Years and Other Experience: President of the University of Pennsylvania; Christopher H. Browne
1 Mr. McNabb is considered an “interested person,” as defined in the Investment Company Act of 1940, because he is an officer of the Vanguard funds.
2 December 2002 for Vanguard Equity Income Fund, the Vanguard Municipal Bond Funds, and the Vanguard State Tax-Exempt Funds.
Distinguished Professor of Political Science, School of Arts and Sciences, and Professor of Communication, Annenberg School for Communication, with secondary faculty appointments in the Department of Philosophy, School of Arts and Sciences, and at the Graduate School of Education, University of Pennsylvania; Trustee of the National Constitution Center.
JoAnn Heffernan Heisen
Born 1950. Trustee Since July 1998. Principal Occupation(s) During the Past Five Years and Other Experience: Corporate Vice President and Member of the Executive Committee (1997–2008), Chief Global Diversity Officer (retired 2008), Vice President and Chief Information Officer (1997–2006), Controller (1995–1997), Treasurer (1991–1995), and Assistant Treasurer (1989–1991) of Johnson & Johnson (pharmaceuticals/medical devices/ consumer products); Director of Skytop Lodge Corporation (hotels) and the Robert Wood Johnson Foundation; Member of the Advisory Board of the Institute for Women’s Leadership at Rutgers University.
F. Joseph Loughrey
Born 1949. Trustee Since October 2009. Principal Occupation(s) During the Past Five Years and Other Experience: President and Chief Operating Officer (retired 2009) of Cummins Inc. (industrial machinery); Chairman of the Board of Hillenbrand, Inc. (specialized consumer services), Oxfam America, and the Lumina Foundation for Education; Director of the V Foundation for Cancer Research; Member of the Advisory Council for the College of Arts and Letters and Chair of the Advisory Board to the Kellogg Institute for International Studies, both at the University of Notre Dame.
Mark Loughridge
Born 1953. Trustee Since March 2012. Principal Occupation(s) During the Past Five Years and Other Experience: Senior Vice President and Chief Financial Officer (retired 2013) at IBM (information technology services); Fiduciary Member of IBM’s Retirement Plan Committee (2004–2013); Director of the Dow Chemical Company; Member of the Council on Chicago Booth.
Scott C. Malpass
Born 1962. Trustee Since March 2012. Principal Occupation(s) During the Past Five Years and Other Experience: Chief Investment Officer and Vice President at the University of Notre Dame; Assistant Professor of Finance at the Mendoza College of Business at Notre Dame; Member of the Notre Dame 403(b) Investment Committee, the Board of Advisors for Spruceview Capital Partners, the Board of Catholic Investment Services, Inc. (investment advisor), and the Board of Superintendence of the Institute for the Works of Religion; Chairman of the Board of TIFF Advisory Services, Inc. (investment advisor).
André F. Perold
Born 1952. Trustee Since December 2004. Principal Occupation(s) During the Past Five Years and Other Experience: George Gund Professor of Finance and Banking, Emeritus at the Harvard Business School (retired 2011); Chief Investment Officer and Co-Managing Partner of HighVista Strategies LLC (private investment firm); Overseer of the Museum of Fine Arts Boston.
Peter F. Volanakis
Born 1955. Trustee Since July 2009. Principal Occupation(s) During the Past Five Years and Other Experience: President and Chief Operating Officer (retired 2010) of Corning Incorporated (communications equipment); Chairman of the Board of Trustees of Colby-Sawyer College; Member of the Board of Hypertherm, Inc. (industrial cutting systems, software, and consumables).
Executive Officers
Glenn Booraem
Born 1967. Investment Stewardship Officer Since February 2017. Principal Occupation(s) During the Past Five Years and Other Experience: Principal of The Vanguard Group, Inc.; Treasurer (2015–2017), Controller (2010–2015), and Assistant Controller (2001–2010) of each of the investment companies served by The Vanguard Group.
Thomas J. Higgins
Born 1957. Chief Financial Officer Since September 2008. Principal Occupation(s) During the Past Five Years and Other Experience: Principal of The Vanguard Group, Inc.; Chief Financial Officer of each of the investment companies served by The Vanguard Group; Treasurer of each of the investment companies served by The Vanguard Group (1998–2008).
Peter Mahoney
Born 1974. Controller Since May 2015. Principal Occupation(s) During the Past Five Years and Other Experience: Principal of The Vanguard Group, Inc.; Controller of each of the investment companies served by The Vanguard Group; Head of International Fund Services at The Vanguard Group (2008–2014).
Anne E. Robinson
Born 1970. Secretary Since September 2016. Principal Occupation(s) During the Past Five Years and Other Experience: Managing Director of The Vanguard Group, Inc.; General Counsel of The Vanguard Group; Secretary of The Vanguard Group and of each of the investment companies served by The Vanguard Group; Director and Senior Vice President of Vanguard Marketing Corporation; Managing Director and General Counsel of Global Cards and Consumer Services at Citigroup (2014–2016); Counsel at American Express (2003–2014).
Michael Rollings
Born 1963. Treasurer Since February 2017. Principal Occupation(s) During the Past Five Years and Other Experience: Managing Director of The Vanguard Group, Inc.; Treasurer of each of the investment companies served by The Vanguard Group; Director of Vanguard Marketing Corporation; Executive Vice President and Chief Financial Officer of MassMutual Financial Group (2006–2016).
| Vanguard Senior Management Team | |
| Mortimer J. Buckley | Chris D. McIsaac |
| Gregory Davis | James M. Norris |
| John James | Thomas M. Rampulla |
| Martha G. King | Karin A. Risi |
| John T. Marcante | |
| Chairman Emeritus and Senior Advisor | |
| John J. Brennan | |
| Chairman, 1996–2009 | |
| Chief Executive Officer and President, 1996–2008 | |
| Founder | |
| John C. Bogle | |
| Chairman and Chief Executive Officer, 1974–1996 | |
 | |
| P.O. Box 2600 | |
| Valley Forge, PA 19482-2600 | |
| Connect with Vanguard® > vanguard.com | |
| Fund Information > 800-662-7447 | The index is a product of S&P Dow Jones Indices LLC |
| Direct Investor Account Services > 800-662-2739 | (“SPDJI”), and has been licensed for use by Vanguard. |
| Standard & Poor’s® and S&P® are registered | |
| Institutional Investor Services > 800-523-1036 | trademarks of Standard & Poor’s Financial Services LLC |
| Text Telephone for People | (“S&P”); Dow Jones® is a registered trademark of Dow |
| Who Are Deaf or Hard of Hearing> 800-749-7273 | Jones Trademark Holdings LLC (“Dow Jones”); S&P® |
| and S&P 500® are trademarks of S&P; and these | |
| This material may be used in conjunction | trademarks have been licensed for use by SPDJI and |
| with the offering of shares of any Vanguard | sublicensed for certain purposes by Vanguard. |
| fund only if preceded or accompanied by | Vanguard product(s) are not sponsored, endorsed, sold |
| or promoted by SPDJI, Dow Jones, S&P, or their | |
| the fund’s current prospectus. | respective affiliates and none of such parties make any |
| All comparative mutual fund data are from Lipper, a | representation regarding the advisability of investing in |
| Thomson Reuters Company, or Morningstar, Inc., unless | such product(s) nor do they have any liability for any |
| otherwise noted. | errors, omissions, or interruptions of the index. |
| You can obtain a free copy of Vanguard’s proxy voting | |
| guidelines by visiting vanguard.com/proxyreporting or by | |
| calling Vanguard at 800-662-2739. The guidelines are | |
| also available from the SEC’s website, sec.gov. In | |
| addition, you may obtain a free report on how your fund | |
| voted the proxies for securities it owned during the 12 | |
| months ended June 30. To get the report, visit either | |
| vanguard.com/proxyreporting or sec.gov. | |
| You can review and copy information about your fund at | |
| the SEC’s Public Reference Room in Washington, D.C. To | |
| find out more about this public service, call the SEC at | |
| 202-551-8090. Information about your fund is also | |
| available on the SEC’s website, and you can receive | |
| copies of this information, for a fee, by sending a | |
| request in either of two ways: via email addressed to | |
| publicinfo@sec.gov or via regular mail addressed to the | |
| Public Reference Section, Securities and Exchange | |
| Commission, Washington, DC 20549-1520. | |
| © 2017 The Vanguard Group, Inc. | |
| All rights reserved. | |
| Vanguard Marketing Corporation, Distributor. | |
| Q18450 102017 | |
Item 2: Code of Ethics. The Registrant has adopted a code of ethics that applies to the Registrant’s principal executive officer, principal financial officer, principal accounting officer or controller or persons performing similar functions. The Code of Ethics was amended during the reporting period covered by this report to make certain technical, non-material changes.
Item 3: Audit Committee Financial Expert. All members of the Audit Committee have been determined by the Registrant’s Board of Trustees to be Audit Committee Financial Experts and to be independent: Rajiv L. Gupta, JoAnn Heffernan Heisen, F. Joseph Loughrey, Mark Loughridge, and Peter F. Volanakis.
Item 4: Principal Accountant Fees and Services.
(a) Audit Fees.
Audit Fees of the Registrant
Fiscal Year Ended August 31, 2017: $287,000
Fiscal Year Ended August 31, 2016: $286,000
Aggregate Audit Fees of Registered Investment Companies in the Vanguard Group.
Fiscal Year Ended August 31, 2017: $8,424,459
Fiscal Year Ended August 31, 2016: $9,629,849
Includes fees billed in connection with audits of the Registrant, other registered investment companies in the Vanguard complex, The Vanguard Group, Inc. and Vanguard Marketing Corporation.
(b) Audit-Related Fees.
Fiscal Year Ended August 31, 2017: $3,194,093
Fiscal Year Ended August 31, 2016: $2,717,627
Includes fees billed in connection with assurance and related services provided to the Registrant, other registered investment companies in the Vanguard complex, The Vanguard Group, Inc., and Vanguard Marketing Corporation.
(c) Tax Fees.
Fiscal Year Ended August 31, 2017: $274,313
Fiscal Year Ended August 31, 2016: $254,050
Includes fees billed in connection with tax compliance, planning, and advice services provided to the Registrant, other registered investment companies in the Vanguard complex, The Vanguard Group, Inc., and Vanguard Marketing Corporation.
(d) All Other Fees.
Fiscal Year Ended August 31, 2017: $0
Fiscal Year Ended August 31, 2016: $214,225
Includes fees billed for services related to tax reported information provided to the Registrant, other registered investment companies in the Vanguard complex, The Vanguard Group, Inc., and Vanguard Marketing Corporation.
(e) (1) Pre-Approval Policies. The policy of the Registrant’s Audit Committee is to consider and, if appropriate, approve before the principal accountant is engaged for such services, all specific audit and non-audit services provided to: the Registrant, other registered investment companies in the Vanguard complex, The Vanguard Group, Inc., and entities controlled by The Vanguard Group, Inc. that provide ongoing services to the Registrant. In making a determination, the Audit Committee considers whether the services are consistent with maintaining the principal accountant’s independence.
In the event of a contingency situation in which the principal accountant is needed to provide services in between scheduled Audit Committee meetings, the Chairman of the Audit Committee would be called on to consider and, if appropriate, pre-approve audit or permitted non-audit services in an amount sufficient to complete services through the next Audit Committee meeting, and to determine if such services would be consistent with maintaining the accountant’s independence. At the next scheduled Audit Committee meeting, services and fees would be presented to the Audit Committee for formal consideration, and, if appropriate, approval by the entire Audit Committee. The Audit Committee would again consider whether such services and fees are consistent with maintaining the principal accountant’s independence.
The Registrant’s Audit Committee is informed at least annually of all audit and non-audit services provided by the principal accountant to the Vanguard complex, whether such services are provided to: the Registrant, other registered investment companies in the Vanguard complex, The Vanguard Group, Inc., or other entities controlled by The Vanguard Group, Inc. that provide ongoing services to the Registrant.
(2) No percentage of the principal accountant’s fees or services were approved pursuant to the waiver provision of paragraph (c)(7)(i)(C) of Rule 2-01 of Regulation S-X.
(f) For the most recent fiscal year, over 50% of the hours worked under the principal accountant’s engagement were not performed by persons other than full-time, permanent employees of the principal accountant.
(g) Aggregate Non-Audit Fees.
Fiscal Year Ended August 31, 2017: $274,313
Fiscal Year Ended August 31, 2016: $468,275
Includes fees billed for non-audit services provided to the Registrant, other registered investment companies in the Vanguard complex, The Vanguard Group, Inc., and Vanguard Marketing Corporation.
(h) For the most recent fiscal year, the Audit Committee has determined that the provision of all non-audit services was consistent with maintaining the principal accountant’s independence.
Item 5: Audit Committee of Listed Registrants.
The Registrant is a listed issuer as defined in rule 10A-3 under the Securities Exchange Act of 1934 (“Exchange Act”). The Registrant has a separately-designated standing audit committee established in accordance with Section 3(a)(58)(A) of the Exchange Act. The Registrant’s audit committee members are: Rajiv L. Gupta, JoAnn Heffernan Heisen, F. Joseph Loughrey, Mark Loughridge, and Peter F. Volanakis.
Item 6: Investments.
Not Applicable.
Item 7: Disclosure of Proxy Voting Policies and Procedures for Closed-End Management Investment Companies.
Not Applicable.
Item 8: Portfolio Managers of Closed-End Management Investment Companies.
Not Applicable.
Item 9: Purchase of Equity Securities by Closed-End Management Investment Company and Affiliated Purchasers.
Not Applicable.
Item 10: Submission of Matters to a Vote of Security Holders.
Not Applicable.
Item 11: Controls and Procedures.
(a) Disclosure Controls and Procedures. The Principal Executive and Financial Officers concluded that the Registrant’s Disclosure Controls and Procedures are effective based on their evaluation of the Disclosure Controls and Procedures as of a date within 90 days of the filing date of this report.
(b) Internal Control Over Financial Reporting. There were no significant changes in Registrant’s Internal Control Over Financial Reporting or in other factors that could
significantly affect this control subsequent to the date of the evaluation, including any corrective actions with regard to significant deficiencies and material weaknesses.
Item 12: Disclosure of Securities Lending Activities for Closed-End Management Investment Companies.
Not Applicable.
Item 13: Exhibits.
(a) Code of Ethics. (b) Certifications.
Pursuant to the requirements of the Securities Exchange Act of 1934 and the Investment Company Act of 1940, the registrant has duly caused this report to be signed on its behalf by the undersigned, thereunto duly authorized.
| VANGUARD ADMIRAL FUNDS | |
| BY: | /s/ F. WILLIAM MCNABB III* |
| F. WILLIAM MCNABB III | |
| CHIEF EXECUTIVE OFFICER | |
| Date: October 18, 2017 | |
Pursuant to the requirements of the Securities Exchange Act of 1934 and the Investment Company Act of 1940, this report has been signed below by the following persons on behalf of the registrant and in the capacities and on the dates indicated.
| VANGUARD ADMIRAL FUNDS | |
| BY: | /s/ F. WILLIAM MCNABB III* |
| F. WILLIAM MCNABB III | |
| CHIEF EXECUTIVE OFFICER | |
| Date: October 18, 2017 | |
| VANGUARD ADMIRAL FUNDS | |
| BY: | /s/ THOMAS J. HIGGINS* |
| THOMAS J. HIGGINS | |
| CHIEF FINANCIAL OFFICER | |
Date: October 18, 2017
* By: /s/ Anne E. Robinson
Anne E. Robinson, pursuant to a Power of Attorney filed on October 4, 2016 see file Number 33-32548, Incorporated by Reference.