FORM 6-K
SECURITIES AND EXCHANGE COMMISSION
Washington, D.C. 20549
Report of Foreign Issuer
Pursuant to Rule 13a-16 or 15d-16
of the Securities Exchange Act of 1934
For the month of March, 2020
Commission File Number: 001-12518
Banco Santander, S.A.
(Exact name of registrant as specified in its charter)
Ciudad Grupo Santander
28660 Boadilla del Monte (Madrid) Spain
(Address of principal executive office)
Indicate by check mark whether the registrant files or will file annual reports under cover of Form 20-F or Form 40-F:
Form 20-F ☒ Form 40-F ☐
Indicate by check mark if the registrant is submitting the Form 6-K in paper as permitted by Regulation S-T Rule 101(b)(1):
Yes ☐ No ☒
Indicate by check mark if the registrant is submitting the Form 6-K in paper as permitted by Regulation S-T Rule 101(b)(7):
Yes ☐ No ☒

Banco Santander, S.A.
TABLE OF CONTENTS

| 2019 Pillar 3 Disclosures |
| Index | |||||
| Pillar 3 - Disclosures Report | |||||
| Pillar 3 | |||||
| Image omitted | |||||
5 |
| 2019 Pillar 3 Disclosures |
| Image omitted | ||||
Introduction (Ch.1) | Capital (Ch.2) | ||||
| Capital | |||||
| Pillar 1 - Regulatory Capital | |||||
| Pillar 2 - Economic Capital | |||||
Risks (Ch. 3, 4, 5, 6, 7 and 8) | Santander Group (Ch. 9 and 10) | ||||
Other appendices available on the Santander Group website. Pillar 3 editable format tables. | |||||
| Image omitted | |||||
6 |
| 2019 Pillar 3 Disclosures |
| Navigability Enhancements | ||||||
| Image omitted | ||||||
7 |
| INTRODUCTION 2019 Pillar 3 Disclosures Report |
| Image omitted | ||||
 | Bookmarks (web version of the Report) | |
| The inclusion of bookmarks for the different sections allow improved navigability across the Pillar 3 Disclosures Report | ||
| Excel tables | ||
| Every table disclosed in the Pillar 3 Report is published in Excel format (editable) for further analysis | ||
QR Codes (written version of the Report) | ||
| QR codes are included in the Report to facilitate further consultation on other relevant documents of Santander Group | ||
| CRR Cross references | ||
| Incorporation of an Appendix containing all disclosures required under part VIII of the Capital Requirements Regulation (CRR) and their locations in the Pillar 3 Disclosures Report | ||
8 |
| INTRODUCTION 2019 Pillar 3 Disclosures Report |
| 1 | ||||||
| Introduction | ||||||
| Image omitted | ||||||
9 |
| INTRODUCTION 2019 Pillar 3 Disclosures Report |
| Image omitted | ||||
10 |
| INTRODUCTION 2019 Pillar 3 Disclosures Report |
1.Introduction
1.1. Executive summary
Santander is one of the largest banks in the eurozone. As at end December 2019, our market capitalisation was EUR 61,986 million, and had approximately four million shareholders. We have a EUR 1,522,695 million of assets on our balance sheet and control EUR 1,050,765 million of total funds.
Our main purpose is to help people and businesses prosper. We do not merely meet our legal and regulatory obligations, but we aspire to exceed people's expectations. As such, we focus on the areas where, as a Group, our activity can have the greatest impact, helping more people and businesses prosper, in an inclusive and sustainable way.
This means that the Group engages in all types of activities, operations and services that are typical of the banking business in general. Our scale, business model and diversification enable us to aim to be the best open digital financial services platform, acting responsibly and earning the lasting loyalty of our stakeholders (customers, shareholders, people and communities).
We have close to 200,000 employees who serve more than 145 million customers worldwide, including individuals, private banking clients, SMEs, businesses and large corporates, whenever, wherever and however the customer needs. To do this, our strategy focuses on continuing to strengthen loyalty and digitalisation.
We interact with our customers through a global network of 11,952 branches, the largest branch network among international banks. The distribution network has both universal offices as well as specialised ones aimed at certain customer segments and new collaborative spaces with increased digital capabilities. Examples of these are the Work Café branches, SmartBank and Ágil branches.
As well as the branch network, we have contact centres which have received various awards for their quality of service.
In addition, our progress in the digitalisation process which combines our commercial network strength with that of our technology, is key to increasing our number of customers and improving their experience.
As a result, our loyal and digital customers continued to grow this year. The number of loyal customers reached 21.6 million (+9% in the year), with an increase in both individuals and corporates. Digital customers rose 15% in the year to close to 37 million.
On average, our customers accessed digital touchpoints five times per week and digital sales increased to 36% of total sales. We also aim to be one of the top three banks for customer satisfaction in our main countries.
In April 2019, we presented our strategic plan for the medium term to drive growth and increase profitability by accelerating digitalisation, improving operational performance and continuing to improve capital allocation. We will invest over EUR 20 billion in digital transformation and technology over the next four years with the aim of improving and personalising customer experience and, as a consequence, increasing trust and loyalty while at the same time reducing costs.
In this strategic plan, we laid out a new organisational structure, three geographical regions and a new reporting unit segment, Santander Global Platform (SGP), which will enable us to accelerate our commercial and digital transformation, while making progress towards our financial and non-financial objectives.
This new simplified management structure for Europe, North America and South America, together with a management committee with increased business focus will allow better and more agile execution throughout the Group.
Europe primarily includes Spain, the United Kingdom, Portugal, Poland and Santander Consumer Finance (SCF). The latter also plays a significant role in consumer finance in 15 European countries.
Given the current environment characterised by lower for longer interest rates, we are progressing toward a common organisational structure under which we can take advantage of the strengths, innovation and leadership of each market, applying what we learn in one country to the rest and avoiding overlaps.
North America includes the United States and Mexico. Both countries are increasing coordination with each other and capturing new opportunities, reducing cost duplication and improving efficiency.
South America includes Brazil, Chile, Argentina, Uruguay and Andean Region (Peru and Colombia).
The focus is to accelerate profitable growth and lead the retail financial industry. To this end, we have a strategy that seeks to strengthen a more connected regional network and facilitate the expansion of successful businesses to other countries in the region.
Finally, with the creation of SGP we are taking another step forward in our digital transformation, which combines our experience in banking and technology. Our goal is to extend the benefits of the talent and scale of the Group to the payments and digital businesses with the highest growth potential. We are building platforms only once to be used by all countries, which will allow us to be best-in-class, and provide faster and better digital banking and global payment solutions to individuals and SMEs.
In addition, we have two transversal global businesses which add value to our local businesses: Santander Corporate and Investment Banking (SCIB) and Wealth Management and Insurance (WM&I).
11 |
| INTRODUCTION 2019 Pillar 3 Disclosures Report |
SCIB is the global business division for corporate and institutional customers who require a tailored service and value-added wholesale products suited to their complexity and sophistication. It is a business with high levels of profitability and with resilient returns through the economic cycle.
WM&I includes the asset management, private banking and insurance businesses. It is a very capital efficient business with significant growth potential and high returns.
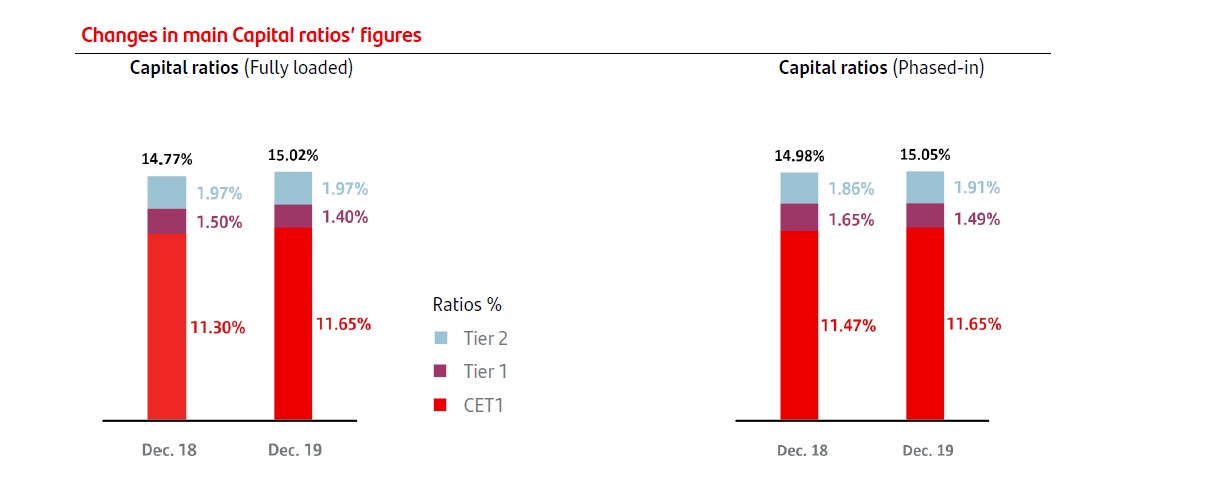
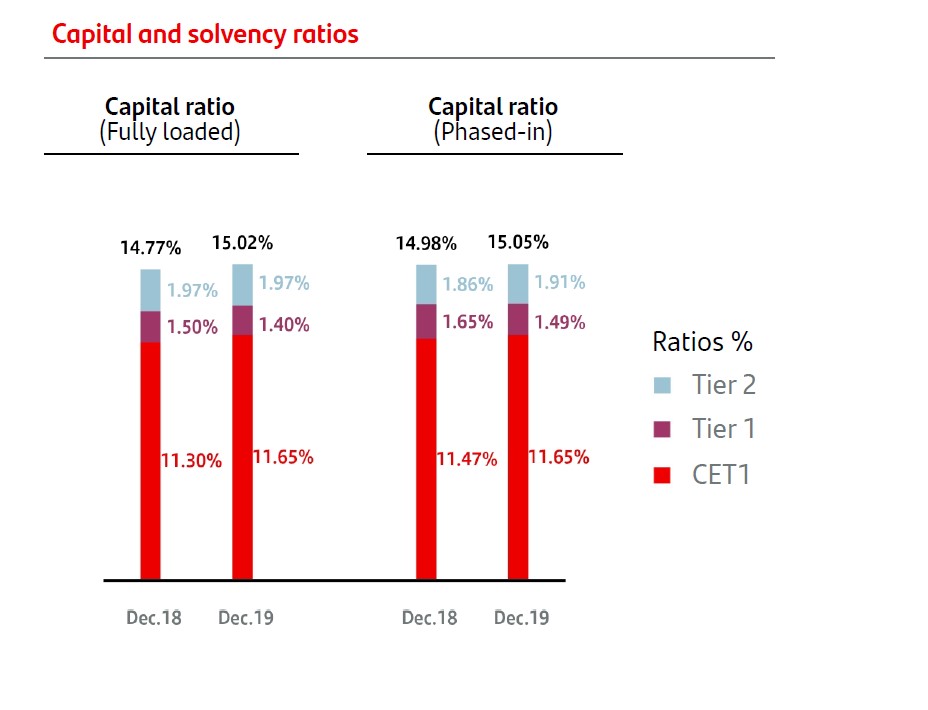
The Group’s CET1 capital ratio increased to 11.65%
| Fully loaded | Phased-in | ||||||||
| Millon euros | Dec-2019 | Dec-2018 | Dec-2019 | Dec-2018 | |||||
| Common Equity (CET1) | 70,497 | 66,904 | 70,497 | 67,962 | |||||
| Tier 1 | 78,964 | 75,838 | 79,536 | 77,716 | |||||
| Total capital | 90,937 | 87,506 | 91,067 | 88,725 | |||||
| Risk weighted assets | 605,244 | 592,319 | 605,244 | 592,319 | |||||
| CET1 Ratio | 11.65 | % | 11.30 | % | 11.65 | % | 11.47 | % | |
| Tier 1 Ratio | 13.05 | % | 12.80 | % | 13.14 | % | 13.12 | % | |
| Total capital ratio | 15.02 | % | 14.77 | % | 15.05 | % | 14.98 | % | |
| Leverage Ratio | 5.11 | % | 5.10 | % | 5.15 | % | 5.22 | % | |
2018 and 2019 data has been calculated under application of IFRS 9 transitional arrangements, unless otherwise indicated.
Note: this English version is a translation of the original in Spanish for information purposes only. In the event of discrepancy, the original Spanish-language version prevails.
| 12 | 2019 Pillar 3 Disclosures Report | ||
| INTRODUCTION 2019 Pillar 3 Disclosures Report |
2019 a record-high year in terms of gross capital generation, partially offset by regulatory headwinds
| 2019 Fully Loaded CET1 evolution |
| % |
| +35bps |
13 |
| INTRODUCTION 2019 Pillar 3 Disclosures Report |
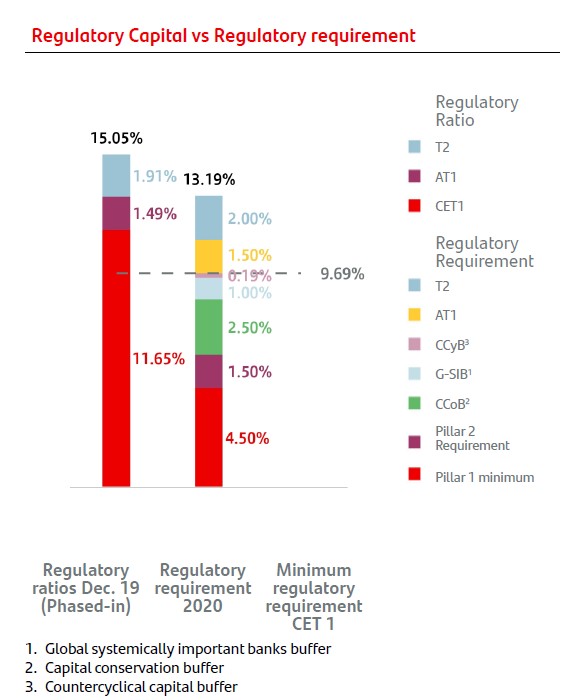
We comfortably met the minimum ratios set by the ECB on a consolidated basis
| Regulatory Capital vs Regulatory requirement | |
| Regulatory ratio | |
| n | T2 |
| n | AT1 |
| n | CET1 |
| Regulatory requirement | |
| n | T2 |
| n | AT1 |
| n | CCyB3 |
| n | G-SIB1 |
| n | CCoB2 |
| n | Pillar 2 Requirement |
| n | Pillar 1 minimum |
Regulatory ratios Dec. 19 (Phased-in) | Regulatory requirement 2020 | Minimum regulatory requirement CET 1 |
| 1. | Global systemically important banks buffer |
| 2. | Capital conservation buffer |
| 3. | Countercyclical capital buffer |
1.2. Santander Group Pillar 3 report overview
1.2.1. Background information on Santander Group
Banco Santander, S.A. is a private-law company, subject to the rules and regulations applicable to banks operating in Spain. In addition to its own activities, Banco Santander is the parent of a group of subsidiaries engaged in a variety of activities, which together make up Santander Group. The CRR and CRD IV and their transposition in Spain through Bank of Spain Circular 2/2016, on supervision and solvency, apply on a consolidated level across the entire Santander Group.
Santander Group does not make use of the exemption contemplated in article 49 of the CRR, therefore the disclosure of table INS1 (Non-deducted participations in insurance undertakings) does not apply.
As of 31 December 2019, under article 7 and 9 of the CRR, the subsidiaries Santander Leasing S.A. EFC and Santander Factoring y Confirming S.A. EFC are exempt from the minimum capital requirements, the limit on large exposures and the internal corporate governance obligations. No use of the exemptions under the applicable regulations has been made for any other Santander Group subsidiaries.
Santander Group is one of the banks that have not required state aid in any of the countries in which it operates.
For all those aspects for which disclosure is required under Part Eight of the CRR and which are not applicable to Santander Group, see Appendix II – CRR Mapping – , where they are reported as “N/A” (not applicable).
As of 31 December 2019, none of the financial institutions included consolidated in Santander Group had less than the minimum capital required under applicable regulation.
| 14 | 2019 Pillar 3 Disclosures Report | ||
| INTRODUCTION 2019 Pillar 3 Disclosures Report |
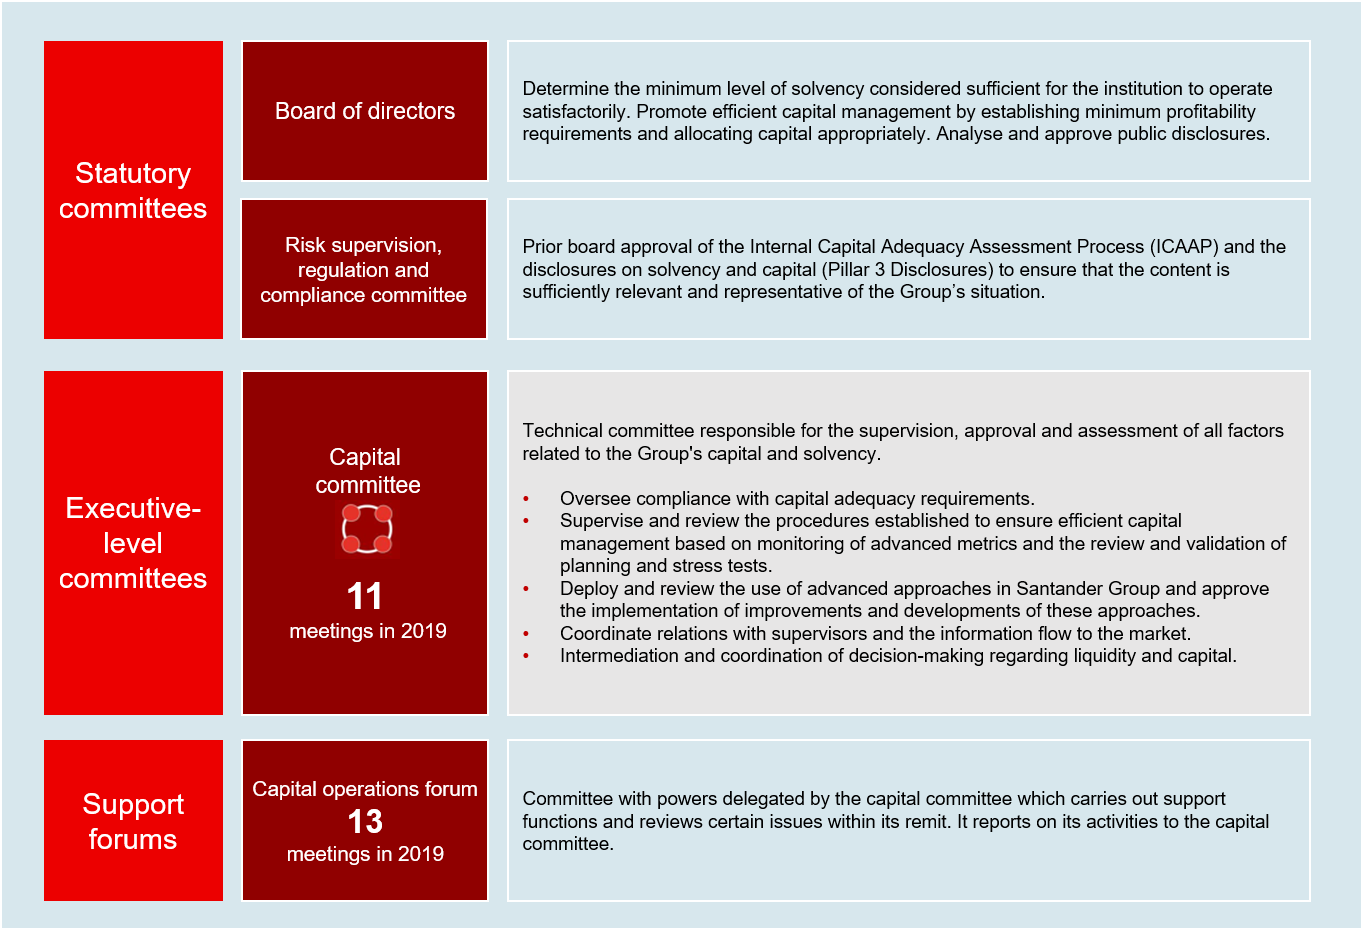
1.2.2. Governance: approval and publication
Pursuant to the official disclosure policy, Santander Group publishes its annual Pillar 3 disclosures report following board approval. Prior to the board of directors’ approval on 27 February 2020, the report was reviewed by the risk supervision, regulation and compliance committee at a meeting held on 17 February, and also by the capital committee at a meeting held on 21 January 2020.
Additionally, on 24 February 2020, the report was reviewed by the audit committee.
Furthermore, a set of quarterly information has been published since March 2015 in compliance with the EBA’s Guidelines on materiality, proprietary and confidentiality and on disclosure frequency, pursuant to article 432, sections 1 and 2 and article 433 of Regulation (EU) 575/2013.
No exceptions have been made to the publication of information considered proprietary or confidential.
Appendix II contains a list showing the location of the information disclosed in accordance with the relevant articles of Part Eight of the Regulation.
The information contained in this report has been subject to review by the external auditor (PwC), who did not find any issue with regard to the reasonableness of the disclosures and compliance with the reporting requirements established in the CRD IV and the CRR.
Governing bodies’ certification
The board of directors of Santander Group certifies that the publication of the Pillar 3 disclosures report is compliant with the guidelines of Part Eight of Regulation (EU) 575/2013 and consistent with the “Pillar 3 Disclosures Policy” adopted by the board of directors.
The Pillar 3 Disclosures Report relies on a range of processes relating to the internal control framework, with duties and responsibilities having been defined for review and certification of the information set out in the report at several levels of the organisation.
Further information on Santander Group's internal control model (ICM) can be found in section VIII of the chapter on Corporate governance of the 2019 Annual Report.
In addition, the external auditors carry out an ex ante review, and the work plans for recurring reviews by internal audit also cover this report.
The Pillar 3 disclosures report is available in the Shareholders and Investors section of the Santander Group website (www.santander.com), under “Financial and Economic Information”.
Disclosures of Santander Group subsidiaries
In addition to the information contained in this report, Santander Group subsidiaries that are considered to have significant importance for their local market, pursuant to article 13 of the CRR (Application of disclosure requirements on a consolidated basis), publish information at individual level on their websites in relation to: own funds, capital requirements, capital buffers, credit risk adjustments, remuneration policy and the application of credit risk mitigation techniques.
1.2.3. Transparency enhancements
In recent years, Santander Group has taken note of the recommendations issued by different international bodies with the aim of improving the transparency of the information published each year in the Pillar 3 disclosures report.
In December 2016, the European Banking Association (EBA) published its final guidelines on disclosure requirements under Part Eight of the Capital Requirements Regulation. These guidelines provide guidance to financial institutions on how to comply with applicable regulations.
Further, in March 2017 and December 2018 the Basel Committee published the second and third phase of its Revised Pillar 3 Disclosure Requirements.
Santander Group has now incorporated all of this year’s applicable enhancements. Appendix II provides a list showing the location of the information required under the different articles of Part Eight of the CRR, while the Santander Group website includes a file containing all of the tables shown in this document in editable format to facilitate their treatment.
A detail of the applicable enhancements can be found in the Appendix I.
15 |
| INTRODUCTION 2019 Pillar 3 Disclosures Report |
1.2.4. Disclosure criteria used in this report
This report has been prepared in accordance with the applicable European Capital Requirements Regulation (CRR).
Below are the details of the type of information that best reflects the discrepancies between the regulatory information shown in this report, and the information shown in the Annual Report and the accounting information:
| • | The measures of credit risk exposure used for calculating regulatory capital requirements include: |
| • | Not only current exposures, but also potential future risk exposures arising from future commitments (contingent liabilities and commitments) or changes in market risk factors (derivative instruments). |
| • | The mitigating factors of these exposures (netting agreements and collateral agreements for derivative exposures, and collateral and personal guarantees for on-balance-sheet exposures). |
| • | Criteria used when classifying defaulted exposures in portfolios subject to advanced approaches for calculation of regulatory capital are more conservative than those used for preparing the disaggregated information provided in the Annual Report. |
1.3. Scope of consolidation
Santander Group companies included in the scope of consolidation for the purposes of calculating the capital adequacy ratio under the CRR are the same as those included in the scope of consolidation for accounting purposes under Bank of Spain Circular 2/2018.
1.3.1. Differences between the consolidation method for accounting purposes and the consolidation method for regulatory capital calculation purposes
In application of Part I (General Provisions) of the CRR, certain Santander Group companies are consolidated using a different method to that used for accounting consolidation.
The companies for which a different consolidation method is used, based on the regulations applied are listed in Appendix V of the 2019 Pillar 3 Appendix document available on the Santander Group website. To this day, both the participations in significant financial institutions and insurance companies are exempt from deductions under CRR article 48.
For the purposes of calculating the capital adequacy ratio based on the nature of their business activities, Santander Group units included in the prudential scope of consolidation are consolidated using the full consolidation method, with the exception of jointly controlled entities, which uses proportionate consolidation. All companies that cannot be consolidated based on their business activities are accounted for using the equity method and so are treated as equity exposures.
The basis of the information used for accounting purposes differs from that used for the calculation of regulatory capital requirements. The measures of risk exposure may differ depending on the purpose for which they are calculated, such as financial reporting, regulatory capital reporting or management information. The exposure data included in the quantitative disclosures in this document are used for calculating regulatory capital.
The following table shows the relationship between the various categories of the financial statements and the risk categories in accordance with prudential requirements.
| 16 | 2019 Pillar 3 Disclosures Report | ||
| INTRODUCTION 2019 Pillar 3 Disclosures Report |
| Table 1. Differences between accounting and regulatory scopes of consolidation and mapping of financial statements categories with regulatory risk categories (LI1) | ||||||||||||||
| Million euros | ||||||||||||||
| 31 Dec. 2019 | ||||||||||||||
| Carrying values as reported in published financial statements | Carrying values under scope of regulatory consolidation | Carrying values of items: | ||||||||||||
| Subject to credit risk framework | Subject to the CCR framework | Subject to securitisation framework | Subject to market risk framework | Not subject to capital requirements or subject to deduction from capital | ||||||||||
| Assets | ||||||||||||||
| Cash and cash balances at central banks | 101,067 | 101,204 | 101,204 | — | — | 0 | — | |||||||
| Financial assets held for trading | 108,230 | 108,226 | — | 63,415 | 97 | 108,128 | — | |||||||
| Financial assets designated at fair value through profit or loss | 66,980 | 63,716 | 1,081 | 40,055 | 588 | 55,574 | — | |||||||
| Financial assets at fair value through other comprehensive income | 125,708 | 110,824 | 107,325 | — | 3,499 | — | — | |||||||
| Financial assets at amortised cost | 995,482 | 999,334 | 957,670 | 38,644 | 2,940 | — | 79 | |||||||
| Derivatives - Hedge accounting | 7,216 | 7,216 | — | 7,216 | — | — | — | |||||||
| Fair value changes of the hedged items in portfolio hedge of interest rate risk | 1,702 | 1,702 | — | — | — | — | 1,702 | |||||||
| Investments in subsidiaries, joint ventures and associates | 8,772 | 9,647 | 7,783 | — | — | — | 1,864 | |||||||
| Reinsurance assets | 292 | — | — | — | — | — | — | |||||||
| Tangible assets | 35,235 | 32,643 | 32,643 | — | — | — | — | |||||||
| Intangible assets | 27,687 | 27,929 | — | — | — | — | 27,929 | |||||||
| Tax assets | 29,585 | 29,637 | 26,213 | — | — | — | 3,424 | |||||||
| Other assets | 10,138 | 10,441 | 9,539 | — | — | — | 903 | |||||||
| Non-current assets and disposal groups classified as held for sale | 4,601 | 4,753 | 4,740 | — | — | 12 | 1 | |||||||
| Total assets | 1,522,695 | 1,507,272 | 1,248,198 | 149,330 | 7,125 | 163,714 | 35,902 | |||||||
| Liabilities | ||||||||||||||
| Financial liabilities held for trading | (77,139 | ) | (77,164 | ) | — | (63,041 | ) | — | (77,164 | ) | — | |||
| Financial liabilities designated at fair value through profit or loss | (60,995 | ) | (40,268 | ) | — | (19,125 | ) | — | (40,268 | ) | — | |||
| Financial liabilities measured at amortised cost | (1,230,745 | ) | (1,237,314 | ) | — | — | — | — | (1,237,314 | ) | ||||
| Derivatives – Hedge accounting | (6,048 | ) | (6,071 | ) | — | (6,071 | ) | — | — | — | ||||
| Fair value changes of the hedged items in portfolio hedge of interest rate risk | (269 | ) | (269 | ) | — | — | — | — | — | |||||
| Liabilities under insurance contracts | (739 | ) | — | — | — | — | — | — | ||||||
| Provisions | (13,987 | ) | (13,980 | ) | (739 | ) | — | — | — | (13,241 | ) | |||
| Tax liabilities | (9,322 | ) | (9,185 | ) | — | — | — | — | (9,185 | ) | ||||
| Other liabilities | (12,792 | ) | (12,386 | ) | — | — | — | — | (12,655 | ) | ||||
| Total liabilities | (1,412,036 | ) | (1,396,637 | ) | (739 | ) | (88,238 | ) | — | (117,433 | ) | (1,272,395 | ) | |
17 |
| INTRODUCTION 2019 Pillar 3 Disclosures Report |
Shown below are the main differences between the carrying amounts appearing on the financial statements and the exposures for prudential purposes:
| Table 2. Main sources of differences between regulatory exposure amounts and carrying values in financial statements (LI2) | |||||||||||
| Million euros | |||||||||||
| 31 Dec. 2019 | |||||||||||
| Total | Items subject to: | ||||||||||
| Credit risk framework | CCR framework | Securitisation frameweork | Market risk framework | ||||||||
| Asset carrying value amount under scope of regulatory consolidation (as per template EU LI1) | 1,568,368 | 1,248,198 | 149,330 | 7,125 | 163,714 | ||||||
| Liabilities carrying value amount under regulatory scope of consolidation (as per template EU LI1) | (206,410 | ) | (739 | ) | (88,238 | ) | — | (117,433 | ) | ||
| Total net amount under regulatory scope of consolidation | 1,361,959 | 1,247,459 | 61,093 | 7,125 | 46,282 | ||||||
| Off-balance sheet amounts | 300,792 | 300,791 | 1 | — | |||||||
| Regulatory Add-on | 54,032 | — | 54,032 | — | — | ||||||
| Differences in valuations | — | — | — | — | |||||||
| Differences due to different netting rules, other than those already included in row 2 | (84,811 | ) | — | (38,529 | ) | — | (46,282 | ) | |||
| Non-eligibility of the balances corresponding to accounting hedges (derivatives) | (7,216 | ) | — | (7,216 | ) | — | — | ||||
| Securitisations with risk transfer | (3,837 | ) | (39,090 | ) | — | 35,254 | — | ||||
| Other | (16,942 | ) | (18,220 | ) | — | 1,278 | — | ||||
| Differences due to consideration of provisions | 8,332 | 8,388 | — | (56 | ) | — | |||||
| Differences due to CRMs | (38,617 | ) | (7,839 | ) | (30,778 | ) | — | — | |||
| Differences due to CCFs | (219,003 | ) | (219,003 | ) | — | — | — | ||||
| Exposure amounts considered for regulatory purposes (EAD) | 1,354,689 | 1,272,485 | 38,601 | 43,602 | — | ||||||
The reconciliation of public and non-public balance sheets is shown in Appendix VI on the Santander Group website.
1.3.2. Substantial amendments due to a change in perimeter and corporate transactions
For more information on the main acquisitions and disposals of stakes in other companies, and other major corporate transactions by Santander Group last year, see section 3 of Auditor’s Report and Financial Statements available in the 2019 Annual Report.
1.4. Regulatory framework
On 26 June 2013 the Basel III legal framework was incorporated in the European legal order via Directive 2013/36 (CRD IV), which repeals Directives 2006/48 and 2006/49, and Regulation 575/2013 on prudential requirements for credit institutions and investment firms (the CRR).
CRD IV was introduced into Spanish law through Law 10/2014 on the regulation, supervision and solvency of credit institutions, and its subsequent regulatory implementation via Royal Decree 84/2015 and Circular 2/2016 of the Bank of Spain, which completes its adaptation to the Spanish system of laws.
The CRR, which is immediately applicable in all European countries, includes a calendar for the phase-in period that will allow institutions to adapt gradually to the new requirements in the European Union in relation to AT1 and T2 equity instruments. These calendars have been introduced into Spanish regulations through the Bank of Spain Circular 2/2014, which affects both the new deductions and those issues and elements of own funds that cease to be eligible as such under this new regulation.
On 27 December 2017, Regulation 2017/2395 was published which modified CRR in relation to the transitory provisions to mitigate the impact of the introduction of IFRS 9, which took place on 1 January 2018. The calendar envisages a five-year gradual phase-in period, and the applicable factor for the current year (2020) will be 0.7.
| 18 | 2019 Pillar 3 Disclosures Report | ||
| INTRODUCTION 2019 Pillar 3 Disclosures Report |
In addition, on 28 December 2017, Regulations 2017/2401 and 2017/2402 were published, which include the new securitisations framework. The first of these regulations, establishes a new calculation methodology of capital requirements for securitisations and a transition period which ended on 31 December 2019; while the second one defines an STS (simple, transparent and standardised) securitisation, which because of its characteristics of simplicity, being used to finance the real economy, etc., receives preferential treatment in terms of lower capital requirements.
Regulations have been published with respect to non-performing exposures (NPEs), with the aim of applying the "Action plan to tackle non-performing loans in Europe" released by the European Council in July 2017. The most significant of which are:
| • | ECB supervisory expectations to deal with the NPEs stock through provisioning. |
| • | The European Central Bank Guidance on non-performing loans for credit institutions, published in March 2017: Calendars with quantitative supervisory expectations for the provisioning of this type of exposure are established in the addendum to this guidance, published in March 2018. Applicable to exposures originating before 26 April 2019 and which have been converted into NPE from 1 April 2018 and their non-compliance might imply a higher Pillar 2 charge. |
| • | Amendment of the CRR through Regulation 2019/630 as regards minimum loss coverage for non-performing exposures (prudential backstop), published in April 2019: This regulation includes calendars of quantitative requirements for the minimum provisioning of NPEs. It applies to NPEs originating after 26 April 2019 and their non-compliance would cause a CET1 deduction of the entities. |
On 20 May 2019, the new regulatory package was approved, which consisted of Regulation 2019/876 (CRR II) and the Directive 2019/878 (CRD V).
As a general rule, it is established that CRR II will come into force from 28 June 2021, except for certain exceptions which will come into force over a period of time, which started on 1 January 2019 and ends on 28 June 2023.
Of particular note among these exceptions are the entry into force on 27 June 2019, of the main changes in own funds, capital deductions, standard credit risk and IRB, and authorisations.
CRD V came into force on 27 June, but has not yet been applied, as the member states have until 28 December 2020 to transpose it into their domestic systems of laws. CRD V includes significant changes such as those to Pillar 2 guidance (P2G).
The regulatory package published in June 2019, sees the inclusion in CRR II of the principles established in the TLAC term sheet, set internationally by the FSB (Financial Stability Board), as a Pillar 1 minimum requirement for own funds and eligible liabilities for G-SIBs.
This package of changes also includes the substitution of the Bank Recovery and Resolution Directive (BRRD) by BRRD II, which establishes Pillar 2 MREL requirements for all resolution entities, whether systemically important or not, in which the resolution authority will decide the requirements on a case-by-case basis. For the G-SIBs, the CRR II introduces the minimum requirement established in the TLAC term sheet (16%/18%) which will have to be made up of subordinated liabilities, except for a certain percentage of senior debt (2.5%/3.5%). BRRD II sets a minimum subordination requirement of the higher of 13.5% of risk-weighted assets or 5% of the leverage ratio exposure measure for large banks (defined as those with total assets over EUR 100,000 million), or other institutions which, without being large, the resolution authority considers may be systemically important. For all other institutions, the subordinated requirement will be determined by the resolution authority on a case-by-case basis.
1.4.1. Regulatory changes in 2019
The most notable milestone in 2019 is the approval of capital and resolution regulations in Europe after more than two years of intensive negotiations. After the 2017 Basel accord, supplemented by the market risk framework agreement in January 2019, the next milestone will be its implementation in the various jurisdictions. Also of note is the European legislative agenda in relation to climate change and sustainable financing, which has progressed significantly during the year. Finally, the digital agenda, including the possibility of adopting new technologies, and discussions about the supervisory and regulatory framework that needs to be applied to non-banking players, have also occupied a large part of the current regulatory environment.
International framework
In 2019, the Basel Committee continued to work on, among other issues, the following:
| • | Market risk. The final standard on the Minimum capital requirements for market risk was published in January. |
| • | Consolidated Basel framework. In April, the Basel Committee launched a new section of its website that sets out a consolidated version of its Global standards for the regulation and supervision of banks. |
| • | Leverage ratio. In June, the final document on the Leverage ratio treatment of client cleared derivatives was published, with the aim of aligning it with the standardised approach to measuring counterparty credit risk (SA-CCR). |
| • | Margin requirements for non-centrally cleared derivatives. The Basel Committee and the International Organisation of Securities Commissions reviewed the Margin requirements for non-centrally cleared derivatives framework and extended its implementation deadline. |
| • | Interaction and cooperation between prudential and anti-money laundering/countering financing of terrorism supervision. In November, the Basel Committee launched a consultative document on the Introduction of guidelines on interaction and cooperation between prudential and AML/CFT Supervision. The deadline for comments is 6 February 2020. |
19 |
| INTRODUCTION 2019 Pillar 3 Disclosures Report |
| • | Pillar 3 disclosure requirements. In June, the Committee published its final text on Revisions to leverage ratio disclosure requirements, establishing additional disclosure requirements for this ratio as calculated using daily averages of securities financing transactions. In November, the Basel Committee launched two consultative documents asking for comments on: (i) Sovereign exposures disclosure templates, the implementation of which is voluntary, unless requested by national supervisors; (ii) Revisions to market risk exposures disclosure templates, to reflect the changes introduced by the final standard on the Minimum capital requirements for market risk. The deadline for comments was 14 February 2020. |
| • | Sectoral countercyclical capital buffer. In November, the Basel Committee issued the Guiding principles for the operationalisation of a sectoral countercyclical capital buffer, which are intended to support the implementation of the Basel III countercyclical capital buffer on a consistent basis across jurisdictions. |
| • | Credit valuation adjustment (CVA) risk. The Basel Committee launched a consultative document in December, on a set of adjustments to the CVA risk framework published in December 2017, with the aim of aligning it with the final standard on the Minimum capital requirements for market risk and the Capital requirements for bank exposures to central counterparties. The deadline for comments was 25 February 2020. |
With respect to crisis management framework, the Financial Stability Board (FSB) issued a report in 2019 on the implementation of the Total Loss Absorbing Capacity (TLAC) process in the different jurisdictions and concluded that no changes were necessary. The FSB will continue to monitor the implementation of TLAC in the various jurisdictions, including the volume of issuances of TLAC instruments. It is expected that progress in these aspects will be subject to at least annual review.
In November 2019, the FSB updated the list of G-SIBs for 2020. Santander remains within the least systemically important group of banks and is subject to the minimum additional capital buffer for global systemically important banks (1%).
In the digital arena, the fintech phenomenon and the need to review the regulatory and supervisory framework are increasingly pressing points on the agendas of international authorities. The most important in 2019 are those published by the various authorities (FSB, BIS) on the consequences of the entry of Bigtechs into financial services, both directly (as banking services providers) or indirectly (as technology services providers on which the banks are dependant, such as cloud services). Various ideas have been proposed, such as allowing all types of financial services operators greater access to data, and not only banks; the need to review the suitability of the regulatory and supervisory framework; the potential risks for financial stability resulting from the use of the cloud by financial institutions and the small number of major global players.
Also in the digital arena, the OECD is leading the multilateral initiatives to address the tax challenges resulting from the digitalisation of the economy to ensure that digital companies pay tax wherever they have consumers and their activities generate profits. This year, two consultative documents have been published and an agreement is expected to be reached in 2020.
European regulation
June 2019, saw the publication of the final texts reviewing the capital framework and the resolution framework (review of the CRR/CRD/BRRD). This package implements a set of factors agreed in the Basel Committee and the FSB, among them the net stable funding ratio (NSFR); the total loss absorbing capacity (TLAC) requirement for global systemically important banks; the revised standards on large exposures; counterparty credit risk; the leverage ratio; investment fund units; disclosure requirements and the new market risk reporting framework.
The following is of particular note within the new CRR II/CRD V capital framework: the extension of the scope of the support factor for the funding of SMEs; the introduction of a support factor for infrastructure financing; the recognition in the European Union of the issuance of capital from third countries in the calculation of consolidated capital; and the possible exemption of certain intangible software assets from deduction from own funds under certain circumstances to be determined by the EBA.
The EBA has published a set of roadmaps in which it outlines its action plan to deliver on the mandates resulting from this new capital and resolution framework for each of the issues. One of these mandates is the drafting of the technical standards to develop the new prudential treatment of the banks' software assets.
The implementation process in the European Union of the final Basel III framework, approved in December 2017, has continued during 2019.
In compliance with the mandate given to it by the European Commission in 2018, the EBA has issued two advisory reports on the implementation of Basel III, which include the impact on capital requirements for European banks with some policy recommendations
In October 2019, the European Commission launched the consultative document, "Implementing the final Basel III reforms in the EU", with a deadline for comments of 3 January 2020, which also includes other issues other than Basel III standards. The European Commission is expected to issue a legislative proposal for the review of CRR/CRD in 2020.
In March 2019, the European Commission recognised the equivalence of the prudential supervision and regulatory framework of Argentina. This decision permits certain categories of exposures to this country to benefit from preferential treatment in terms of capital requirements.
| 20 | 2019 Pillar 3 Disclosures Report | ||
| INTRODUCTION 2019 Pillar 3 Disclosures Report |
With respect to supervision, the supervisory activity conducted by the Single Supervisory Mechanism (SSM) within the framework of the Supervisory Review and Evaluation Process (SREP) is notable. In this area, Banco Santander’s Joint Supervisory Team (JST) from the European Central Bank worked tirelessly in 2019, holding over 100 meetings with the Bank, most of which were related to its inspection and monitoring activities.
Along with a busy supervisory agenda, in 2019 the SSM continued to make great strides towards the harmonisation of supervisory policies across countries, and improving the transparency of their expectations.
Europe also continues to make progress in the implementation of the crisis management framework. The Single Resolution Mechanism (SRM), the second pillar of the Banking Union after the Single Supervisory Mechanism, has been operational since 1 January 2016. The Single Resolution Board, together with the national resolution authorities, have defined the framework for establishing MREL (minimum requirement for own funds and eligible liabilities) and continue to work towards ensuring the effectiveness of the resolution framework.
Turning to the Single Resolution Fund managed by the Single Resolution Board, the period of gradual mutualisation will allow for a transition from the national resolution funds to the Single Resolution Fund, which will be fully implemented by 2024. The funding target of the Single Resolution Fund is 1% of covered deposits in 2024.
In 2019, the main features were agreed for the creation of a backstop for the Single Resolution Fund, after an agreement was reached on the design and allocation for funds for the European Stability Mechanism (ESM), which will act as the backstop. A final agreement is expected to be signed in the first quarter of 2020. However, the issue of the provision of liquidity on resolution remains unresolved.
Negotiations on Pillar 3 of the banking union, the European Deposit Insurance Scheme (EDIS), for which the European Commission already submitted a proposal in 2015, are making very slow progress. For this purpose, a high-level work group was set up at the end of 2018, with the aim of moving the proposal forward. At the end of 2019, the work group set out a roadmap for 2020 with the goal of continuing to work on completing Banking Union.
Further, in March 2018, the Commission published a raft of measures to address the high rates of non-performing loans (NPLs). Along these same lines, in March 2019, the Commission published a regulation in relation to minimum loss coverage for non-performing exposures. The European Banking Authority (EBA) has issued a draft of proposed new guidelines on loan origination and monitoring. One of the objectives of these guidelines is to clarify internal governance and control framework for the credit granting, set out requirements for information and data collection from borrowers, along with documentation and requirements for their creditworthiness assessment. The guidelines also include environmental, social and governance, anti-money laundering and counter-terrorist financing, and technological innovation factors.
In the digital area, the Commission continued to roll out its fintech action plan, in which developments to facilitate the adoption of new technologies particularly stand out. A particular highlight was the publication in April of the Ethics guidelines for trustworthy artificial intelligence (including an assessment survey, the final version of which will be published in early 2020), the results of the workgroup on regulatory barriers to financial innovation
In addition, there have been changes in the following areas:
| • | In addition, the authorities, especially the competition authorities, have shown interest in opening up data access. Of particular note in this area is the report, "Competition policy for the digital era", published by the European Commission, along with other similar reports in the United Kingdom and Germany. |
| • | With regard to infrastructure access, a number of competition cases have been opened against large platforms in relation to data use or blocking of access by competitors. In addition, a regulation has been approved in Germany which requires payment technology infrastructures to allow access to other operators. |
| • | In the area of platforms, the Regulation on platform-to-business relations was approved in July 2019, with the aim of ensuring fairness and transparency for business users. At the same time, the European Commission created an Observatory on the online platform economy to monitor this economic area. |
| • | In the area of provider management, in February 2019, the EBA published its Guidelines on outsourcing agreements, which specify the internal governance systems, including adequate risk management, that must be applied in the outsourcing of functions, including the use of the cloud. The guidelines entered into force on 30 September of 2019. |
The Commission has also decided to strengthen the anti-money laundering and counter-terrorist financing framework. In July 2019, the Commission published a Communication calling for a better implementation of the EU’s regulatory and supervisory framework. Among the options considered are the creation of a European Supervisory Authority (or to grant these powers to an already existing authority) and, if necessary, a European regulation that avoids the inconsistencies generated by a directives-based framework. Along this same line, in July 2019 the EBA issued an Opinion highlighting the importance of also considering anti-money laundering and counter-terrorist financing risks from a prudential perspective, and invited the prudential supervisors to notify the financial institutions that AML/CFT supervisors' assessments will be factored into the prudential supervisory process.
The legislative agenda in relation to climate change and sustainable financing has progressed significantly. Specifically, the following have been approved as part of the European Commission Action Plan:
| • | The Disclosure Regulation, which clarifies asset managers’ and institutional investors’ duties to consider sustainability in the investment process and strengthen disclosure requirements. |
21 |
| INTRODUCTION 2019 Pillar 3 Disclosures Report |
| • | The review of the non-binding guidelines on reporting of non-financial information focused on information about climate change, which aims to increase the transparency of corporate reports. The guidelines include the conclusions of the FSB Task Force on Climate-related Financial Disclosures. |
| • | Changes to the Benchmarks Regulation, which includes the development of climate change benchmarks: the EU Paris-aligned benchmarks and the information related to sustainability in these benchmarks. To ensure that these benchmarks are reliable, only asset managers that meet the requirements of this regulation will be able to use these labels when marketing their benchmarks in the EU. |
| • | In addition, a preliminary political agreement has been reached between the European Parliament and Council in the taxonomy framework, to establish a unified classification system for sustainable assets and the technical criteria for their identification. |
The EBA continues to carry out the mandates relating to sustainable financing received through the review of the CRD and CRR: the possibility of including environmental, social and corporate governance risks (ESG) in the SREP; greater transparency for companies with regard to ESG risk and the mandate enabling the EBA to carry out an analysis to assess the viability of recalibrating the capital requirements for banks (green/brown factor). In relation to this, in December 2019 the EBA published a roadmap with the 2019 -2025 work plan in relation to the sustainability agenda.
Santander Group holds and passes on the views from corporate and local level on the matters being discussed in the financial sector where these may affect its activities. The corporate and local Public Policy function, in coordination with the business and support units concerned in each case, identifies the regulatory alerts and establishes the position of Santander Group.
The main courses of action taken along these lines are as follows:
| • | Santander Group has been a keen participant in the main banking associations worldwide and in Europe, and in the main markets in which we operate, providing responses to existing regulatory consultations. |
| • | Santander Group maintains proactive and constructive dialogue with policy-makers through the existing channels (public hearings, consultations, forums and conferences) and sends individual replies to official consultations on issues considered relevant to Santander Group. |
| • | Santander Group particularly defends the recognition of the strength of our organisational model through autonomous subsidiaries with control of their own capital and liquidity, the benefits of our geographic diversification and of our equivalence in the jurisdictions of third countries where we operate. |
| • | Santander also maintains that the regulatory framework should enable banks to play an active role in the new digital economy, and implement their transformation so that they can continue to respond to changing consumer needs. |
| 22 | 2019 Pillar 3 Disclosures Report | ||
| INTRODUCTION 2019 Pillar 3 Disclosures Report |
| 2 | |||||
| Capital | |||||
| Image omitted | |||||
23 |
| INTRODUCTION 2019 Pillar 3 Disclosures Report |
| Image omitted | |||||
24 |
| CAPITAL 2019 Pillar 3 Disclosures Report |
2. Capital
| Table 3. Main capital figures and capital adequacy ratios | |||||||||
| Million euros | |||||||||
| Fully loaded | Phased-in | ||||||||
| Dec-2019 | Dec-2018 | Dec-2019 | Dec-2019 | ||||||
| Common Equity (CET1) | 70,497 | 66,904 | 70,497 | 67,962 | |||||
| Tier 1 | 78,964 | 75,838 | 79,536 | 77,716 | |||||
| Total capital | 90,937 | 87,506 | 91,067 | 88,725 | |||||
| Risk weighted assets | 605,244 | 592,319 | 605,244 | 592,319 | |||||
| CET1 Ratio | 11.65 | % | 11.30 | % | 11.65 | % | 11.47 | % | |
| Tier 1 Ratio | 13.05 | % | 12.80 | % | 13.14 | % | 13.12 | % | |
| Total capital ratio | 15.02 | % | 14.77 | % | 15.05 | % | 14.98 | % | |
| Leverage Ratio | 5.11 | % | 5.10 | % | 5.15 | % | 5.22 | % | |
| Fully loaded CET1 Capital evolution | |
| % | |

Note: 2018 and 2019 figures are calculated applying the transitional arrangements of IFRS 9 unless specified otherwise.
2.1. Capital
Capital management and control at Santander Group is a fully transversal process that seeks to guarantee the Bank’s capital adequacy, while complying with regulatory requirements and maximising profitability. It is determined by the strategic objectives and by risk appetite set by the board of directors. To achieve this, the following policies have been established to shape the approach that the Group applies to capital management:
| • | Establish adequate capital planning, so as to meet current needs and provide the necessary resources to meet the needs of the business plans, regulatory requirements and the associated risks in the short and medium term, while maintaining the risk profile approved by the board. |
| • | Ensure that the Group and its companies maintain sufficient capital to cover requirements during stress scenarios due to the increase in risks as the macroeconomic climate deteriorates. |
| • | Optimise capital use through appropriate allocation of capital among the businesses, based on the relative return on regulatory and economic capital and taking the risk appetite, growth and strategic objectives into account. |
Santander Group maintains a very comfortable capital adequacy position, well above the levels required by applicable regulations and by the European Central Bank.
Santander Group’s solvency ratios at 31 December 2019 are as shown in table 3. Phased-in ratios are calculated applying the transitory schedules for implementation of Basel III, whereas fully loaded ratios are calculated without applying any schedules, hence, using the final regulation.
IFRS 9 became effective on 1 January 2019, implying changes in accounting that affect capital ratios. Santander decided to apply the transitional arrangements, implying a five-year transitional period.
25 |
| CAPITAL 2019 Pillar 3 Disclosures Report |
Had it not applied the IFRS 9 transitional arrangements, the total impact on the fully loaded CET 1 ratio at December would have been -24 bps. For further details, see Appendix XII.
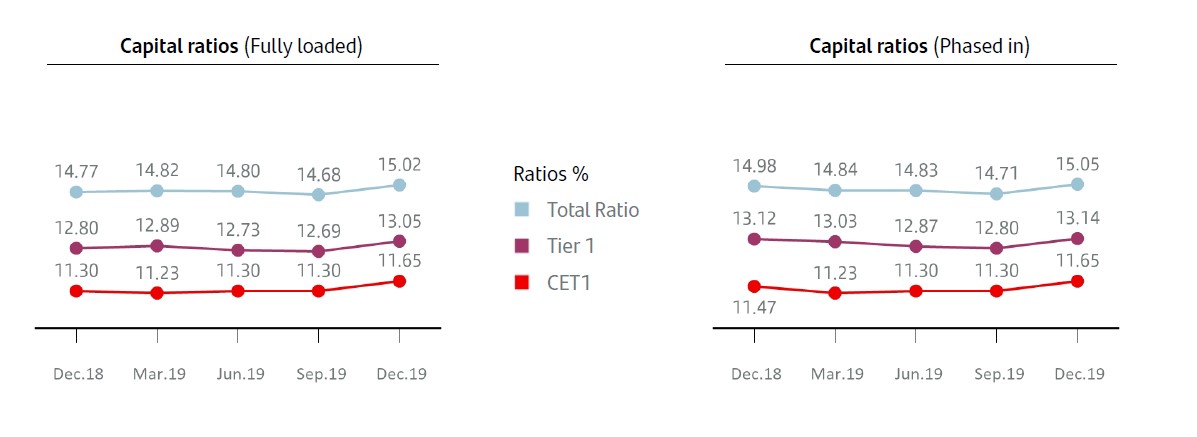
In fully-loaded terms CET1 in December stood at 11.65%, increasing by 35 bps during the year and reaching the goal at year-end which was announced at the beginning of the year. The fully-loaded capital ratio was 15.02%, up 25 bps during the year.
| 2019 Fully Loaded CET1 evolution | |
| +35bps |
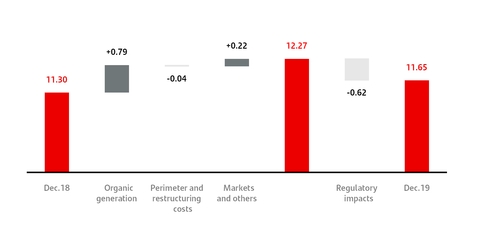
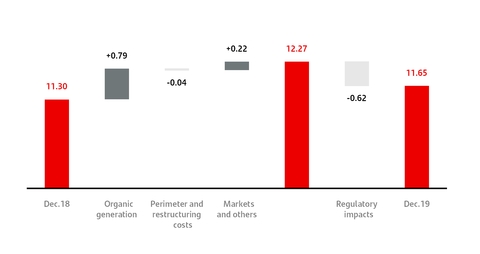
The 35 basis point increase in the year was mainly due to underlying profit generation and proactive RWA management, resulting in an organic generation of 79 bps.
Additionally, there was a favourable evolution from markets (+22 bps) due to recovery in the Held to Collect & Sell portfolios (driven by falls in interest rates) and a positive 11 basis point perimeter impact (mainly related to increased minority interests in Mexico and the incorporation of the custody business), in part offset by the negative impact from restructuring costs (-15 bps).
As a result, there was a 97 basis point increase in the year, bringing the fully-loaded CET1 ratio to 12.27% in December before accounting and regulatory impacts (-62 bps, primarily due to IFRS 16 and TRIM).
From a qualitative perspective, Grupo Santander has solid ratios that are suited to its business model, the structure balance sheet and its risk profile. Santander Group exceeds 186 basis points over the minimum regulatory requirement for the total ratio for 2020 taking into account the shortfalls in AT1 and T2.
| ¤ | For further information, see section 2.1.5. |
| 26 | 2019 Pillar 3 Disclosures Report | ||
| CAPITAL 2019 Pillar 3 Disclosures Report |
| Strategic principles of the capital function |

• Autonomy. The Group’s corporate structure is based on a legally independent subsidiary model, each responsible for its own capital and liquidity. This provides advantages when raising funds and limits the risk of contagion, thus reducing systemic risk. Under this structure, subsidiaries are subject to two tiers of supervision and internal control: local and global. Each unit must raise and manage its own financial resources accordingly in order to maintain the required levels of capital at all times. Local units must have the necessary capital to carry on their activity autonomously and meet local regulatory requirements and the expectations of their local market. | • Solvency. The Group and its subsidiaries must ensure at all times that the structure and level of their capital is suitable in view of the risks to which they are exposed. Capital must be allocated accordingly so as to ensure the effective management of the risks assumed within the subsidiaries and it must be assigned proportionately among all those risks. | • Efficiency. The Group and its subsidiaries must roll out mechanisms to actively seek and promote an efficient use of capital and to ensure that the value created by an investment exceeds at least the cost of the capital invested. Capital is a scarce commodity that must be used as efficiently as possible, given the high cost of generating capital, whether organically or through the markets. Subsidiaries must have on - going monitoring mechanisms in place to optimise their capital consumption. | ||||
• Centralised monitoring. The capital management model must ensure a holistic view, through a corporate environment of global coordination and review (every business, every geography). The first level of monitoring, by the local units themselves, is supplemented by the monitoring activity of the corporate units. One of the main ways the Group achieves this is by defining and applying standard policies, metrics, methodologies and tools across the Group, though these may be adapted accordingly to bring them in line with local regulations and supervisory requirements and to reflect the degree of progress made by each subsidiary. | ||||||
2.1.1. Capital function
The core principles establish the basic guidelines governing the actions of Santander Group entities in capital management, monitoring and control processes.
2.1.1.1. Organisation
The organisational structure has been defined with the aim of guaranteeing compliance with the core principles in relation to capital and ensuring that the relationship between the subsidiaries and the corporate centre is maintained. This function allows twin objectives to be met: comply with the subsidiary’s financial autonomy while at the same time retaining coordinated monitoring at Group level.
Santander Group’s risk management and control model is based on three lines of defence. The first line comprises the business functions or activities that assume or generate exposure to risk. Risks undertaken or generated within the first line of defence must be compatible with the risk appetite and limits in place. To carry out its function, the first line of defence must have the resources to identify, measure, address and report the risks assumed. The second line of defence comprises the function of controlling and supervising risk, along with the Compliance function. This second line of defence is charged with effective control of risks and ensures that they are managed in accordance with the established risk appetite.
Internal Audit is the third line of defence and the last layer of control, and regularly assesses policies, methods and procedures to ensure they are suitable, and also checks they are operational.
The risk control function, the compliance function and the internal audit function are sufficiently separate and independent from each other and also regarding the other functions they control and supervise when carrying out their tasks. They likewise have access to the board of directors and/or to its committees at the highest level.
2.1.1.2. Capital governance
To ensure the Capital function operates properly when it comes to both decision-making and supervision and control, Santander Group has developed a structure of agile and efficient governing bodies which ensure the involvement of all the areas concerned and the necessary involvement of senior management. Because of Santander Group’s characteristic subsidiary-based structure, the governance structure of the capital function must be adapted to preserve the subsidiaries’ capital autonomy, while allowing centralised monitoring and coordinated management at Group level. There are also various committees that have responsibilities at regional level and also for coordination at Group level. The local committees must report to the corporate committees in due time and proper form on any relevant aspects of their activity that may affect capital so as to ensure proper coordination between the subsidiaries and the corporate centre.
27 |
| CAPITAL 2019 Pillar 3 Disclosures Report |
| Governance of the Capital function |
2.1.2. Capital management and adequacy
The aim of capital management and adequacy at Santander Group is to guarantee the entity’s solvency and maximise its profitability, while ensuring compliance with internal capital targets and regulatory requirements. Capital management is a fundamental strategic tool for decision making at both local and corporate level and serves to create a common framework of action by establishing uniform definitions of capital management criteria, policies, functions, metrics and processes.
| 28 | 2019 Pillar 3 Disclosures Report | ||
| CAPITAL 2019 Pillar 3 Disclosures Report |
| Key capital figures | ||||||
| The Group works with the following variables relating to the concept of capital: | ||||||
| Regulatory capital | Return on risk-adjusted capital (RoRAC) | |||||
• Capital requirements: The minimum amount of capital the supervisory authority requires the entity to hold to safeguard its solvency, based on the amount of risk assumed, in terms of credit, market and operational risk.• Eligible capital: The capital the regulator considers eligible to meet capital requirements. The main components of eligible capital are accounting capital and reserves. | The return (understood as net profit after tax) on internally required economic capital, Therefore, the higher the economic capital, the lower the RoRAC. For this reason, the Bank must demand a higher return from transactions or business units that consume more capital. RoRAC takes the investment risk into account and so provides a risk-adjusted measure of return. The use of RoRAC allows the Bank to better manage its activities, assess the real risk-adjusted return of businesses and be more efficient in decision-making relating to investments. | |||||
| Economic capital | ||||||
• Internal capital requirements: The minimum amount of capital that the Group needs with a specified level of probability to absorb unexpected losses deriving from its current exposure to all risks taken on by the entity (including risks additional to those contemplated under the regulatory capital requirements).• Available capital: The amount of capital the Group itself considers eligible, on management criteria, to meet capital needs. | Return on Risk Weighted Asset (RoRWA) | |||||
Defined as the return (understood as net profit after tax) on a business’ risk-weighted assets. The use of RoRWA allows the Bank to set up strategies to allocate regulatory capital and ensure the maximum return is obtained. | ||||||
| Cost of Capital | Value creation | |||||
| The minimum return required by investors (shareholders) as compensation for the opportunity cost incurred and the risk assumed on investing their capital in the entity. This cost of capital represents a “cut-off rate” or “minimum return” to be achieved and allows comparisons to be made between the different business units and their efficiency to be assessed. | Any profit generated above and beyond the cost of economic capital. The Bank will create value when the risk-adjusted return, measured by RoRAC, is higher than its cost of capital. Otherwise value will be destroyed. It measures the risk-adjusted return in absolute terms (monetary units), supplementing the RoRAC result. | |||||
| Leverage ratio | Expected loss | |||||
| Regulatory measure that monitors the financial solidity and strength of the Entity by linking size and capital. This ratio is calculated dividing the Tier 1 by the leverage exposure, which takes into account the balance sheet exposure and adjustments due to derivatives, secured financing transactions (SFTs) and off-balance sheet items. | Average NPL losses expected by the entity over the course of an economic cycle. From the point of view of expected loss, defaults are considered a “cost” that could be eliminated or reduced through appropriate selection of borrowers. | |||||
The Group’s Capital function is carried out on two levels:
| • | Regulatory capital: regulatory capital management is based on an analysis of the capital base, the solvency ratios as defined by applicable regulations and the scenarios used in capital planning. The objective is for the capital structure to be as efficient as possible, in terms of both cost and compliance with regulatory requirements. Active capital management includes strategies for the allocation of capital and its efficient use in business units, securitisations, asset sales and issuances of equity instruments (capital and subordinated debt hybrids). |
| • | Economic capital: the objective of the economic capital model is to ensure that the Group has adequately allocated its available capital to cover all the risks to which it is exposed as a result of its activity and risk appetite. It also aims to optimise value creation in the Group and all of the business units that comprise it. |
The real economic measurement of the capital needed for an activity, together with its return, enables value creation to be optimised by selecting those activities that maximise the return on capital. This allocation is carried out under different economic scenarios, both expected as well as unlikely but plausible, and with the level of solvency set by Santander Group.
29 |
| CAPITAL 2019 Pillar 3 Disclosures Report |
2.1.3. Capital management priorities 2019
The Group’s most notable capital management activities are:
| • | Establishing solvency and capital contributions targets aligned with the minimum regulatory requirements and internal policies, in order to guarantee a solid level of capital, consistent with the Group’s risk profile, and an efficient use of capital to maximise shareholder value. |
| • | Developing a capital plan to meet those objectives consistent with the strategic plan. Capital planning is an essential part of executing the three-year strategic plan. |
| • | Assessing capital adequacy in order to ensure that the capital plan is consistent with the Group’s risk profile and the risk appetite framework in stress scenarios. |
| • | Developing the annual capital budget as part of the Group’s budgetary process. |
| • | Monitoring and controlling budget execution and drawing up action plans to correct any deviation from the budget. |
| • | Calculating capital metrics |
| • | Preparing internal capital reports, as well as reports for the supervisory authorities and the market. |
Details of the most significant actions undertaken in 2019 are set out below:
Issuances of financial instruments
In February 2019, Banco Santander S.A. made one issue of contingent convertible bonds (CoCos) for USD 1,200 million to replace the early repayment of an issuance in dollars for a similar amount made in 2014.
After the removal of the need for pre-approval for the inclusion of third-country issuances (through Royal Decree 309/2019), the Group’s total capital includes EUR 800 million corresponding to T2 issuances of Chile and Mexico that meet the eligibility requirements.
Dividend policy*
For 2019, as stated in the material fact published on 26 February 2019, in order to align ourselves with our European peers' current practice, it is the board’s intention to set a pay-out ratio of 40-50% in the mid-term, increasing it from the 30-40% of 2018; that the proportion of dividend paid in cash is not lower than that of the last year; and, as was announced in the 2018 AGM, to make two payments against the results of 2019.
In December 2015, the European Central Bank issued a recommendation on the distribution of dividends policy applicable to all eurozone credit entities as at 2016. The recommendation calls for conservative dividend policies and prudent assumptions and has been fully observed by Banco Santander, S.A.
Finally, in some geographies, restrictions on the payment of dividends have been implemented. These include Poland, where the competent national authority (KNF) has imposed stricter minimum restrictions on the payment of dividends, with additional limits for entities with large mortgage exposures in foreign currency; and Argentina, where, in its “A6464" communication issued in 2018, the BCRA amended the rules on the distribution of profits and coupons on perpetual instruments, making them more restrictive.
For further information, see chapter on Corporate governance (section 3.3) of the 2019 Annual report.
| (*) | Dividends charged to 2019 results are subject to the approval of the general shareholders' meeting. So far, Santander's board has only approved the first dividend charged to 2019 results for EUR 0.10 per share. |
| 30 | 2019 Pillar 3 Disclosures Report | ||
| CAPITAL 2019 Pillar 3 Disclosures Report |
2.1.4. Capital targets
Santander Group is working towards a fully loaded CET1 ratio from 11% to 12% in the medium term.
| Fully loaded CET1 Capital evolution | |
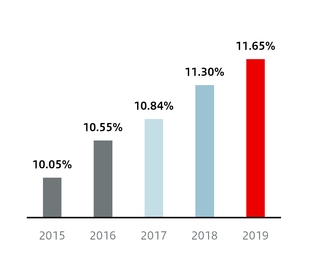
The continuous improvement in the capital ratios reflects Santander Group's profitable growth strategy and a culture of active capital management at all levels of the organisation.
Highlights:
| • | The reinforcement of teams dedicated to capital management and greater coordination with the corporate centre and local teams. |
| • | All countries and business units have developed individual capital plans focused on achieving a business that maximises the return on capital. |
| • | A higher weighting of capital management in incentives. Certain aspects relating to capital management and returns are now taken into account when setting the variable remuneration payable to members of the senior management: |
| • | The relevant metrics include the Group’s fully-loaded CET1, the capital contribution of the countries to the Group ratio or the return on tangible equity (RoTE). |
| • | The qualitative aspects considered include the proper management of regulatory changes affecting capital, effective management of capital relating to business decisions, capital generation sustainable over time and an effective capital allocation. |
At the same time, the Group continues to develop a programme of action to ensure the ongoing improvement of infrastructure, processes and methodologies that support all aspects relating to capital, with the aim of encouraging ever more active capital management, enabling the Group to respond in a more agile way to the numerous and growing number of regulatory requirements and carrying out all associated activities more efficiently.
2.1.5. Capital buffers and eligible capital requirements
Santander Group must comply, at all times, with the combined capital buffer requirement, defined as the total CET1 capital necessary to meet the following obligations:
| • | Capital conservation buffer (CCoB): mandatory for all entities and to be phased-in from 1 January 2016. The buffer for banks in 2019 was 2.5%. |
| • | Buffers for systemically important banks (G-SIB and D-SIB): Applicable from 1 January 2016 to the most systemically important institutions. There are two types with their corresponding methodologies, which classifies the financial institutions into buckets. These buckets determine their systemic risk (either global or domestic) and the buffer rate applicable. Where an institution is subject to both buffers on the same basis of consolidation, the higher of the two shall apply. The different types are: |
| i) | G-SIB buffer (global systemically important banks): Common methodology following the Basel framework. Applicable at consolidated level. |
| ii) | D-SIB buffer (domestic systemically important banks): Common methodology following EBA guidelines. May be required at consolidated, sub-consolidated or individual level |
| • | Systemic risk buffer (SRB):The competent national authority may require this to mitigate counter-cyclical systemic risks which are not covered by the systemically important institutions buffer and that could trigger a disturbance in the financial system with serious consequences for both it and the real economy. Its application by the authorities is discretionary, with a buffer being required for the entire financial sector or one or more of its sub-sectors (domestic, business, etc.). |
If the SRB is required for the whole financial sector, the highest of the three systemic buffer rates will be applied. If the SRB applies to one or more sectors, the SRB buffer will be added to the greater of the other two systemic buffers (G-SIB or D-SIB).
| • | Countercyclical capital buffer (CCyB): This will be applied when the national authorities consider that lending is growing excessively in a certain jurisdiction and with the aim of constraining it. This buffer is specifically calculated for each entity or group and consists of the weighted average of the countercyclical buffer rates applied in regions in which the bank’s major exposures are located. As with the other buffers, it has also been applicable since 1 January 2016. In November 2019, the Basel Committee issued the guiding principles which would offer the competent authorities the possibility of applying this capital buffer to individual sectors in their jurisdiction. |
31 |
| CAPITAL 2019 Pillar 3 Disclosures Report |
The table below summarises the required regulatory rates based on the different capital buffers to be applied and Banco Santander’s position in 2020:
| Application | Buffers (% RWAs) | 2020 | |||
| All entities | Conservation (CCoB) | 2.5 | % | ||
| Designated entities | G-SIB entities (1%-3.5%) (1) | 100% of the buffer | |||
D-SIB entities (2) | 100% of the buffer | ||||
| At the discretion of competent national authority | Systemic risk (SRB) (3) | 0%-5% | |||
Countercyclical (CCyB) (4) | 0% - 2.5% | ||||
| Consolidated combined buffer | CCoB + CCyB + Max (5) (G-SIB, D-SIB, SRB) | ||||
(1) Bank of Spain requires a 1% buffer from Santander Group for 2020
(2) Bank of Spain requires a 1% buffer from Santander Group for 2020
(3) This requirement is 0% for Santander Group
(4) % countercyclical buffer applicable during 2020 according to data from the European Systemic Risk Board (ESRB):
| a) | Exposures to customers resident in Spain: 0%, according to Bank of Spain data for the first quarter of 2020 |
| b) | Exposures to customers resident in the United Kingdom: from 1% to 2% (from 16 December) |
| c) | Exposures to customers resident in Belgium: from 0% to 0.5% (from 1 July) |
| d) | Exposures to customers resident in Bulgaria: from 0.5% to 1% (from 1 April) |
| e) | Exposures to customers resident in the Czech Republic: from 1.75% to 2% (from 1 July) |
| f) | Exposures to customers resident in Denmark: from 1% to 1.5% (from 30 June) to 2% (from 30 December) |
| g) | Exposures to customers resident in France: 0.25% to 0.5% (from 2 April) |
| h) | Exposures to customers resident in Norway: 2.5% |
| i) | Exposures to customers resident in Germany: from 0% to 0.25% (from 1 July) |
| j) | Exposures to customers resident in Iceland: from 1.75% to 2% (from 1 February) |
| k) | Exposures to customers resident in Ireland: 1% |
| l) | Exposures to customers resident in Lithuania: 1% |
| m) | Exposures to customers resident in Luxembourg: 0.25% |
| n) | Exposures to customers resident in Slovakia: from 1.5% to 2% (from 1 August) |
| o) | Exposures to customers resident in Sweden: 2.5% |
(5) The highest of the three buffers applies if the SRB buffer covers all exposures. Otherwise, the higher of G-SIB and D-SIB plus the SRB buffer applies.
The geographic distribution of relevant lending exposures for calculating the countercyclical capital buffer is available in Appendix XI on the Santander Group website.
Eligible capital requirements
The decision on capital resulting from the Supervisory Review and Evaluation Process (SREP) under the European Central Bank’s (ECB) Single Supervisory Mechanism comprises a Pillar 2 Requirement (Pillar 2R) and Pillar 2 Guidance (Pillar 2G). Pillar 2R is binding, and failure to comply may have direct consequences for banks. Pillar 2G is not directly binding, and failure to comply has no bearing on the maximum distributable amount (MDA) threshold. Moreover, Pillar 2G does not automatically trigger action by the ECB. However, the ECB does expect compliance with Pillar 2G at all times. If a bank is not compliant with Pillar 2G, the ECB will give careful consideration to the reasons and circumstances and may define additional supervisory control measures.
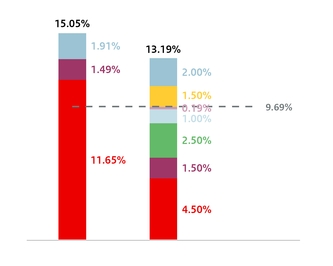
Pursuant to notification received from the ECB, on 10 December 2019, Santander Group must report a Common Equity Tier 1 (CET1) ratio of at least 9.69% at consolidated level during 2020. This requirement includes the Pillar 1 requirement (4.5%); the Pillar 2 requirement (1.5%); the capital conservation buffer (2.5%) and the requirement deriving from its status as a global systemically important institution (1%). In addition, the countercyclical capital buffer requirement of various competent authorities is 0.19% of CET1 in Santander Group. Santander Group must also maintain a minimum capital ratio of 11.19% for T1 and a minimum total ratio of 13.19%.
At 31 December 2019, Banco Santander had a CET1 regulatory capital ratio of 11.65% and a total ratio of 15.05% in application of IFRS 9 transitional arrangements.
| 32 | 2019 Pillar 3 Disclosures Report | ||
| CAPITAL 2019 Pillar 3 Disclosures Report |
As of 31 December 2019, Santander Group meets all the minimum capital requirements under current regulations.
2.1.5.1. Global systemically important institutions
Santander Group is one of 30 entities designated as global systemically important institutions (G-SIIs) in 2019.
The position of a global systemically important institutions may pose a risk to financial stability.
The insolvency of a systemically important institution, or even just the expectation that it might become insolvent, is difficult to predict but could certainly undermine the financial system and even the real economy.
This warrants special prudential treatment, which has led to the introduction of specific capital buffer requirements for both global (G-SIB) and domestic (D-SIB) systemically important banks.
This designation requires Santander Group to meet additional requirements mainly relating to the following:
| • | Its capital buffer (Santander Group is included in the group of banks with the smallest capital buffer, 1%) |
| • | TLAC (total loss-absorbing capacity) requirements |
| • | The requirement to publish relevant information more often than other banks |
| • | Stricter regulatory requirements for internal control bodies |
| • | Special supervision |
| • | Requirement to submit special reports to the supervisors. |
The Basel Committee and the Financial Stability Board jointly decide which banks qualify as global systemically important institutions, using a method based on five indicators: size, cross-jurisdiction activity, interconnectedness with other financial institutions, substitutability of financial services/infrastructure and complexity (with each category given an equal weighting of 20%).
This methodology has been changed and will come into effect from January 2021. The main changes in the methodology are as follows: change in the definition of cross-jurisdiction indicators, inclusion of a trading volume indicator modifying the weighting of the remaining indicators in the substitutability category and inclusion of insurance companies in the reporting scope.
| Indicators for systemically important institutions | ||
| Category | Individual indicator | Supervisor jurisdiction |
| Size | Exposure used for the leverage ratio calculation | An indicator of the weight of the bank in the financial system |
| Cross-jurisdictional activity | Cross-jurisdictional assets | Snapshot of a bank’s global footprint |
| Cross-jurisdictional liabilities | ||
| Interconnectedness | Intra-financial system assets | Measures a bank’s interconnectedness with other financial institutions |
| Intra-financial system liabilities | ||
| Securities outstanding | ||
| Substitutability/financial infrastructure | Assets under custody | Measures whether the bank’s activity can be substituted by other banks |
| Payments activity | ||
| Transactions subscribed in debt and equity markets | ||
| Complexity | Notional amount of over-the-counter (OTC) derivatives | Measures the complexity of a financial entity |
| Level 3 assets | ||
| Held for trading and available-for-sale securities | ||
The information needed to evaluate the indicators is requested yearly from banks whose leverage exposure exceeds EUR 200,000 million, or from any other banks at the supervisor’s discretion (in December 2018 a total of 76 banks were considered). All these institutions are then required to publish the information before 30 April of the following year.
The information is used to produce a global indicator. The score obtained by each bank will determine the size of the capital buffer required of it, which is based on a set of buckets defined by the regulators (CET1 surcharge ranging from 1% to 3.5%).
33 |
| CAPITAL 2019 Pillar 3 Disclosures Report |
In November 2019, the Financial Stability Board (FSB) published the list of global systemically important institutions, based on December 2018 data, and which will be fully applied in 2021. Compliance with these requirements gives Santander Group greater solidity than its domestic peers. Santander Group is currently subject to a systemic capital buffer of 1%, which will become fully effective in 2020.
| Global systemically important institutions | |
| Capital buffer | Entity |
| 5 (3.50%) | (Empty) |
| 4 (2.50%) | JP Morgan Chase |
| 3 (2.00%) | Citigroup HSBC |
| 2 (1.50%) | Bank of America Bank of China Barclays BNP Paribas Deutsche Bank Goldman Sachs Industrial and Commercial Bank of China Limited Mitsubishi UFJ FG Wells Fargo |
| 1 (1.00%) | Agricultural Bank of China Bank of New York Mellon China Construction Bank Credit Suisse Group BpsCE Group Crédit Agricole ING Bank Mizuho FG Morgan Stanley Royal Bank of Canada Santander Société Générale Standard Chartered State Street Sumitomo Mitsui FG UBS Unicredit Group |
2.1.5.2. Domestic Systemically Important Institutions
When identifying domestic systemically important institutions (D-SIIs), the Bank of Spain, according to the methodology established on rule 14 of Circular 2/2016, applies a mix of guidelines based on size, importance, complexity (cross-jurisdiction activity) and the degree of interconnectedness between the institutions and the financial system. The Bank of Spain conducts a yearly review of this classification and the following institutions are included on its list for 2020:
| Systemical buffer | ||
| Domestic Systemically Important Institutions | ||
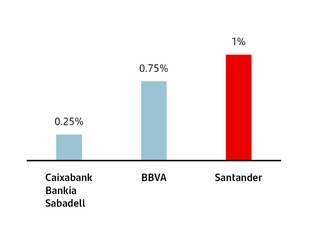
Santander Group appears on the lists of both global and domestic systemically important institutions. The Bank of Spain, based on rule 23 of Circular 2/2016, requires that the higher of the two buffers be applied. Since both buffers are the same for Banco Santander, the buffer applicable in 2020 will be 1%.
2.2. Pillar 1 - Regulatory capital
The current regulatory framework for capital calculation is based on three pillars:
| • | Pillar 1 sets the minimum capital requirements for credit risk, market risk and operational risk, allowing internal ratings and models to be used. The aim is to make regulatory requirements more sensitive to the risks actually incurred by financial institutions when carrying out their business activities. |
| • | Pillar 2 establishes a system of supervisory review, aimed at improving banks’ internal risk management and capital adequacy assessment in line with their risk profile. |
| • | Pillar 3 is intended to enhance market discipline by developing a set of disclosure requirements that will allow market agents to appraise key information relating to the application of Basel II, capital, risk exposures, risk assessment processes and, by extension, the bank’s capital adequacy. |
| 34 | 2019 Pillar 3 Disclosures Report | ||
| CAPITAL 2019 Pillar 3 Disclosures Report |
2.2.1. Eligible capital
Equity at 31 December 2019 stood at EUR 110,659 million, up EUR 3,298 million from the year before.
The reconciliation between equity and capital eligible as Tier 1 is set out below:
| Table 4. Reconciliation of accounting capital with regulatory capital | ||||
| Million euros | ||||
| 31 Dec. 2019 | 31 Dec. 2018 | |||
| Subscribed capital | 8,309 | 8,118 | ||
| Share premium account | 52,446 | 50,993 | ||
| Reserves | 56,526 | 53,988 | ||
| Treasury shares | (31 | ) | (59 | ) |
| Attributable profit | 6,515 | 7,810 | ||
| Approved dividend | (1,662 | ) | (2,237 | ) |
| Shareholders' equity on public balance sheet | 122,103 | 118,613 | ||
| Valuation adjustments | (22,032 | ) | (22,141 | ) |
| Non-controlling interests | 10,588 | 10,889 | ||
| Total equity on public balance sheet | 110,659 | 107,361 | ||
| Goodwill and intangible assets | (28,478 | ) | (28,644 | ) |
| Eligible preference shares and participating securities | 9,039 | 9,754 | ||
| Accrued dividend | (1,761 | ) | (1,055 | ) |
| Other adjustments | (9,923 | ) | (9,700 | ) |
| Tier 1 (Phased-in) | 79,536 | 77,716 | ||
The following table provides a breakdown of the Group’s eligible capital and a comparison with the previous year:
| Table 5. Eligible capital | ||||
| Million euros | ||||
| 31 Dec. 2019 | 31 Dec. 2018 | |||
| Common Equity Tier 1 (CET1) | 70,497 | 67,962 | ||
| Capital | 8,309 | 8,118 | ||
| (-) Treasury shares and own shares financed | (63 | ) | (64 | ) |
| Share premium | 52,446 | 50,993 | ||
| Reserves | 57,368 | 55,036 | ||
| Other retained earnings | (22,933 | ) | (23,022 | ) |
| Minority interests | 6,441 | 6,981 | ||
| Attributable profit net of dividends | 3,092 | 4,518 | ||
| Deductions | (34,163 | ) | (34,598 | ) |
| Goodwill and intangible assets | (28,478 | ) | (28,644 | ) |
| Others | (5,685 | ) | (5,954 | ) |
| Aditional Tier 1 (AT1) | 9,039 | 9,754 | ||
| Eligible instruments AT1 | 9,209 | 9,666 | ||
| T1 excesses - subsidiaries | (170 | ) | 88 | |
| Residual value of intangibles | — | — | ||
| Deductions | — | — | ||
| Tier 2 (T2) | 11,531 | 11,009 | ||
| Eligible instruments T2 | 12,360 | 11,306 | ||
| Gen. funds and surplus loan loss prov. IRB | — | — | ||
| T2 excesses - subsidiaries | (829 | ) | (297 | ) |
| Others | — | — | ||
| Total eligible capital | 91,067 | 88,725 | ||
35 |
| CAPITAL 2019 Pillar 3 Disclosures Report |
Common equity Tier 1 capital (CET1) comprises the elements of Tier 1 capital (after applying prudential filters) and CET1 deductions after applying the threshold exemptions specified in the CRR. The regulation provides for a phased-in period that will give institutions time to adapt to the new requirements in the European Union. This phased-in applies to Santander Group under Regulation (EU) 2016/445 of the European Central Bank on the exercise of options and national discretions, published on 14 March 2016.
Without considering the phased-in schedule, CET1 is made up of:
| • | Subscribed share capital, which stood at EUR 8,309 million at the end of December 2019. |
| • | Other tier 1 capital items: (i) paid-up share premium; (ii) effective and disclosed reserves generated against profits and those amounts that are not taken to the income statement but are recorded under “Other reserves” (any item); (iii) other retained earnings, which includes certain valuation adjustments, primarily for exchange differences and for hedges of net investments in foreign operations. |
| • | The paid-up portion of any non-controlling interests arising from the issue of ordinary shares by consolidated subsidiaries, subject to the limits set in the CRR. |
| • | Profit net of dividends, which stood at EUR 3,092 million in December 2019. |
| • | The prudential filters exclude any gain or loss on cash flow hedges. They also exclude gains or losses on liabilities and derivative liabilities measured at fair value resulting from changes in the institution’s own credit quality. In addition, prudential filters include the additional value adjustments considered according to art. 34 of the CRR. |
| • | Deductions from CET1 items include mainly treasury shares; current-year losses; goodwill and other intangible assets recognised in the balance sheet; deferred tax assets that rely on future earnings (subject to the limits set in the CRR); and the shortfall in allowances relative to expected loss on exposures using internal credit risk models and defined benefit pension fund assets shown on the balance sheet. |
Tier 1 Capital comprises CET1 capital plus Additional Tier 1 capital (AT1) including preferred securities issued by Santander Group.
Tier 2 capital comprises Tier 1 capital plus Tier 2 capital (T2 and includes, inter alia, capital instruments and subordinated loans where the conditions laid down in the CRR are met.
| Table 6. Regulatory capital. Changes | ||
| Million euros | ||
| 31 Dec. 2019 | ||
| Common Equity Tier 1 (CET1) | ||
| Starting figure (31/12/2018) | 67,962 | |
| Shares issued during the year and share premium account | 1,644 | |
| Treasury shares and own shares financed | 1 | |
| Reserves | (2,185 | ) |
| Attributable profit net of dividends | 3,092 | |
| Other retained earnings | 89 | |
| Minority interests | (540 | ) |
| Decrease/(increase) in goodwill and other intangibles | 166 | |
| Other deductions | 269 | |
| Ending figure (31/12/2019) | 70,497 | |
| Additional Tier 1 (AT1) | ||
| Starting figure (31/12/2018) | 9,754 | |
| Eligible instruments AT1 | (457 | ) |
| T1 excesses - subsidiaries | (258 | ) |
| Residual value of intangibles | — | |
| Deductions | — | |
| Ending figure (31/12/2019) | 9,039 | |
| Tier 2 (T2) | ||
| Starting figure (31/12/2018) | 11,009 | |
| Eligible instruments T2 | 1,054 | |
| Gen. funds and surplus loan loss prov. IRB | — | |
| T2 excesses - subsidiaries | (532 | ) |
| Deductions | — | |
| Ending figure (31/12/2019) | 11,531 | |
| Deductions from total capital | — | |
| Final figure for total capital (31/12/2019) | 91,067 | |
| Eligible capital evolution | |
| 2.6% |
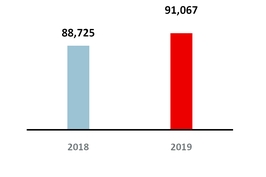
Total eligible capital increased by EUR 2,342 million in 2019 to EUR 91,067 million.
| 36 | 2019 Pillar 3 Disclosures Report | ||
| CAPITAL 2019 Pillar 3 Disclosures Report |
In addition to movements in equity, changes in regulatory capital reflect the dividend not distributed in 2019 of EUR 1,761 million. Therefore, profit net of dividends amounted to EUR 3,092 million
The changes in non-controlling interests were mainly due to the capital increase carried out by Banco Santander México, S.A. on 10 September 2019, which reduced non-controlling interests by EUR 1,012 million, partially offset by the profit for the period attributed to non-controlling interests.
With regard to the performance of goodwill and other intangible assets, the impact of the impairment of the goodwill assigned to the United Kingdom is noteworthy, which was partially offset by that generated following the agreement with Crédit Agricole, S.A. on the depository and custody business.
Similarly, the change included in deductions and prudential filters was increased as a result of changes in the shortfall of provisions for expected loss and the deduction for defined benefit pension fund assets shown on the balance sheet, partially offset by the prudential filters and deductions as an alternative to 1250%.
The decrease in Tier 1 capital is mainly explained by the failure of certain issues to qualify in the period, as Banco Santander, S.A. launched a preference issue for USD 1,200 million applicable to Tier 1 capital.
The increase in tier 2 capital is mainly due to the recognition of subordinated debt issues by Group subsidiaries in third countries.
2.2.2. Capital requirements
This section gives details of capital requirements by geography (see table 8).
Table 7 shows that capital requirements have barely changed from 2018, maintaining a Pillar I risk distribution similar to that of the prior year: credit risk 86%, market risk 4% and operational risk 10%.
Capital requirements for credit risk decreased by 3.3% compared to 2018 to EUR 41,902 million, while capital requirements for market risk decreased by 14.7% and those for operational risk barely changed compared to the previous year.
| RWA Evolution | |
| 2.2% |
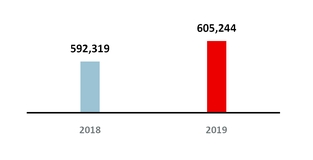

37 |
| CAPITAL 2019 Pillar 3 Disclosures Report |
Shown below is a general overview of the total RWAs by risk. The following sections provide additional breakdowns.
| Table 7. Overview of RWAs (OV1) | |||||||
| Million euros | |||||||
| RWA | Minimum Capital Requirements | ||||||
| 2019 | 2018 | 2019 | |||||
| Credit risk (excluding CRR) | 483,341 | 469,074 | 38,667 | ||||
| Of which, standardised approach (SA) | 283,385 | 277,394 | 22,671 | ||||
| Of which, the foundation IRB (FIRB) approach* | 35,583 | 37,479 | 2,847 | ||||
| Of which, the advanced IRB (AIRB) approach | 161,548 | 150,373 | 12,924 | ||||
| Of which, Equity IRB under the Simple risk weight or the IMA | 2,825 | 3,828 | 226 | ||||
| CCR | 11,070 | 11,987 | 886 | ||||
| Of which, mark to market method (IRB) | 7,549 | 7,867 | 604 | ||||
| Of which, mark to market method (Standardised) | 2,274 | 1,795 | 182 | ||||
| Of which, risk exposure amount for contributions to the default fund of a CCP | 259 | 233 | 21 | ||||
| Of which, CVA | 988 | 2,092 | 79 | ||||
| Settlement risk | 2 | 1 | 0 | ||||
| Securitisation exposures in the banking book (after the cap) | 6,629 | 5,014 | 530 | ||||
| Of which, IRB approach | 2,374 | 4,276 | 190 | ||||
| Of which, IRB supervisory formula approach (SFA) | 932 | 1,915 | 75 | ||||
| Of which, SEC-IRBA approach | 2,030 | — | 162 | ||||
| Of which, SEC-SA approach | 1,014 | — | 81 | ||||
| Of which, SEC-ERBA approach | 866 | — | 69 | ||||
| Of which, standardised approach | 346 | 738 | 28 | ||||
| Market risk | 21,807 | 25,012 | 1,745 | ||||
| Of which, standardised approach | 7,596 | 11,858 | 608 | ||||
| Of which, IMA | 14,211 | 13,154 | 1,137 | ||||
| Operational risk | 59,661 | 60,043 | 4,773 | ||||
| Of which, standardised approach | 59,661 | 60,043 | 4,773 | ||||
| Amounts below the thresholds for deduction (subject to 250% risk weight) | 22,734 | 21,188 | 1,819 | ||||
| Floor adjustment | — | — | — | ||||
| Total | 605,244 | 592,319 | 48,420 | ||||
| * | Includes equities under the PD/LGD approach. |
As of 31 December 2019, Santander Group had no additional capital requirements arising from the floors set by Regulation (EU) No 575/2013 of the European Parliament and of the Council of 26 June 2013 on prudential requirements for credit institutions and investment firms, in Part Ten, Title 1.
| 38 | 2019 Pillar 3 Disclosures Report | ||
| CAPITAL 2019 Pillar 3 Disclosures Report |
The table below shows capital requirements by geography:
| Table 8. Capital requirements by geographical region | ||||||||||||||||||
| Million euros | 31 Dec. 2019 | |||||||||||||||||
| Total | Europe | Of which, Spain | Of which, UK | North America | Of which, USA | South America | Of which, Brazil | Other | ||||||||||
| Credit risk | 39,271 | 23,317 | 10,523 | 5,271 | 6,920 | 5,290 | 8,362 | 5,494 | 672 | |||||||||
| Of which, internal rating-based (IRB) approach (*) | 15,644 | 13,014 | 6,340 | 3,820 | 1,176 | 434 | 868 | 587 | 586 | |||||||||
| Central governments and Central Banks | 67 | 1 | 1 | — | — | — | 11 | 5 | 55 | |||||||||
| Institutions | 666 | 402 | 124 | 123 | 131 | 63 | 57 | 9 | 77 | |||||||||
| Corporates – SME | 8,954 | 6,827 | 4,036 | 1,305 | 1,040 | 367 | 797 | 573 | 289 | |||||||||
| Of which, specialised lending | 1,485 | 1,158 | 437 | 428 | 195 | 33 | 67 | 1 | 66 | |||||||||
| Of which, other | 7,469 | 5,669 | 3,599 | 877 | 845 | 334 | 730 | 572 | 224 | |||||||||
| Retail - Secured by real estate SME | 86 | 84 | 84 | — | 1 | 1 | — | — | — | |||||||||
| Retail - Secured by real estate non-SME | 3,477 | 3,462 | 1,170 | 2,039 | 3 | 2 | 2 | 1 | 11 | |||||||||
| Retail - Qualifying revolving | 334 | 333 | 129 | 181 | — | — | — | — | — | |||||||||
| Retail - Other SME | 356 | 355 | 239 | — | — | — | — | — | — | |||||||||
| Retail - Other non-SME | 1,704 | 1,549 | 555 | 172 | 1 | — | 1 | — | 153 | |||||||||
| Other non-credit-obligation assets | — | — | — | — | — | — | — | — | — | |||||||||
| Of which, standardised approach (SA) | 22,671 | 9,396 | 3,277 | 1,450 | 5,744 | 4,856 | 7,445 | 4,859 | 86 | |||||||||
| Central governments or central banks | 1,116 | 594 | 579 | — | 89 | — | 433 | 393 | — | |||||||||
| Regional governments or local authorities | 25 | 10 | 6 | — | — | — | 15 | 8 | — | |||||||||
| Public sector entities | 33 | 4 | 1 | — | 19 | 18 | 11 | — | — | |||||||||
| Multilateral Development Banks | — | — | — | — | — | — | — | — | — | |||||||||
| International Organisations | — | — | — | — | — | — | — | — | — | |||||||||
| Institutions | 451 | 160 | 80 | 12 | 135 | 107 | 153 | 126 | 3 | |||||||||
| Corporates | 4,943 | 2,081 | 418 | 477 | 867 | 850 | 1,994 | 1,298 | 1 | |||||||||
| Retail | 8,611 | 3,147 | 421 | 535 | 2,611 | 2,198 | 2,772 | 2,154 | 81 | |||||||||
| Secured by mortgages on immovable property | 3,135 | 958 | 204 | 50 | 1,033 | 844 | 1,144 | 309 | — | |||||||||
| Exposures in default | 607 | 215 | 64 | 14 | 125 | 94 | 266 | 157 | 1 | |||||||||
| Items associated with particular high risk | 175 | 36 | — | 16 | 8 | 8 | 131 | 39 | — | |||||||||
| Covered bonds | 17 | 17 | — | 14 | — | — | — | — | — | |||||||||
| Claims on institutions and corporates with a short-term credit assessment | 0 | 0 | 0 | — | — | — | — | — | — | |||||||||
| Collective investments undertakings (CIU) | 15 | 15 | 6 | 1 | — | — | — | — | — | |||||||||
| Equity exposures | 26 | 19 | — | — | — | — | 7 | — | — | |||||||||
| Other items | 3,517 | 2,139 | 1,497 | 331 | 858 | 736 | 519 | 374 | 1 | |||||||||
| Of which, Equity IRB | 956 | 906 | 906 | — | — | — | 50 | 48 | — | |||||||||
| Simple method | 226 | 176 | 176 | — | — | — | 50 | 48 | — | |||||||||
| Under the PD/LGD method | 730 | 730 | 730 | — | — | — | — | — | — | |||||||||
| Counterparty credit risk | 282 | 174 | 85 | 53 | 45 | 31 | 62 | 41 | 1 | |||||||||
| Of which, standardised approach | 182 | 97 | 19 | 44 | 39 | 31 | 45 | 33 | 1 | |||||||||
| Of which, risk exposure amount for contributions to the default fund of a CCP | 21 | 20 | 16 | 4 | 1 | — | — | — | — | |||||||||
| Of which, CVA | 79 | 57 | 50 | 5 | 5 | — | 17 | 8 | — | |||||||||
| Settlement risk | 0 | 0 | 0 | — | — | — | — | — | — | |||||||||
| Securitisations exposures in banking book (after cap) | 530 | 462 | 184 | 63 | 41 | 41 | 27 | — | — | |||||||||
| Market risk | 1,745 | 1,083 | 1,053 | 15 | 170 | 9 | 487 | 259 | 5 | |||||||||
| Of which, Standardised approach (SA) | 608 | 324 | 294 | 15 | 11 | 9 | 267 | 259 | 5 | |||||||||
| Of which, internal model approaches (IMA) | 1,137 | 759 | 759 | — | 159 | — | 219 | — | — | |||||||||
| Operational risk | 4,773 | 2,443 | 729 | 656 | 1,198 | 913 | 1,121 | 649 | 11 | |||||||||
| Of which, Standardised approach | 4,773 | 2,443 | 729 | 656 | 1,198 | 913 | 1,121 | 649 | 11 | |||||||||
| Amount below the threshold for deduction (subject to 250% risk weight) | 1,819 | 1,161 | 1,017 | 17 | 231 | 140 | 424 | 348 | 3 | |||||||||
| Floor adjustments | — | — | — | — | — | — | — | — | — | |||||||||
| Total | 48,420 | 28,640 | 13,591 | 6,075 | 8,605 | 6,425 | 10,483 | 6,791 | 692 | |||||||||
| * | Including counterparty credit risk |
39 |
| CAPITAL 2019 Pillar 3 Disclosures Report |
2.2.2.1. Plan to deploy advanced internal models and supervisory approval
Santander Group remains committed to adopting the advanced internal ratings-based (AIRB) approach for its banks, increasing the amount of exposure managed using internal models. This approach will be applied progressively over the coming years. The commitment assumed with the supervisor means adapting the advanced models in the core markets in which Santander Group operates.
Santander Group continued to pursue this objective during 2020 through its plan to gradually implement the necessary technology platforms and methodological improvements to enable the progressive application of AIRB models for calculating regulatory capital at the rest of the Group’s units.
Santander Group has supervisory approval to use advanced approaches for calculating regulatory capital for credit risk for the parent and its main subsidiaries in Spain, the United Kingdom and Portugal, in addition to some portfolios in Germany, Mexico, Brazil, Chile, the Nordics (Sweden, Finland and Norway), France and the United States.
The strategy to implement Basel regulations in the Group focuses on the use of advanced approaches for the main American and European banks.
The following chart shows the percentage of IRB coverage by region:
| IRB coverage by region |
| % |
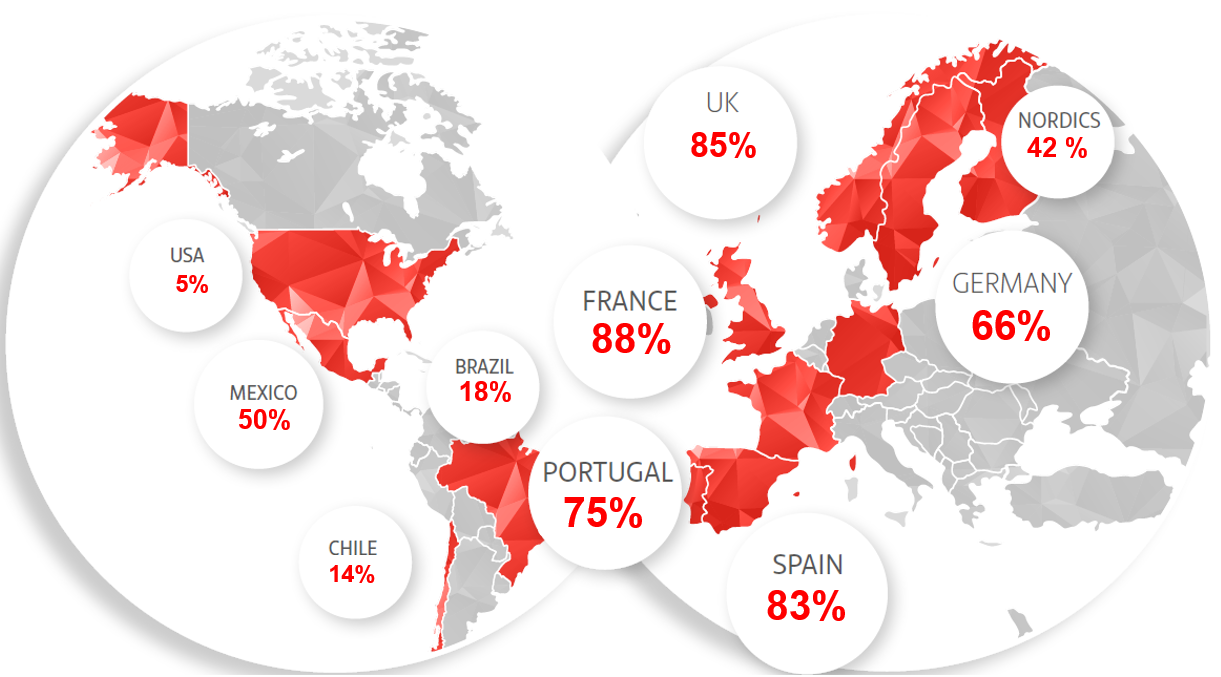
Isolating sovereign bonds in local currency and non-financial assets, which are not subject to the internal model deployment plan, as of December 2019 Santander Group reports 62,7% of the EAD in IRB.
By geography, the main contributors are Spain (27%), the United Kingdom (24%), the global portfolio of companies in Chile, Brazil and the United States (3%), Portugal (3%), Germany (2%), Mexico (2%),the Nordics (1%) and France (1%).
Of the remaining exposure, which is currently calculated using the standard method, 34% is subject to advanced model implementation plans, with the objective of obtaining supervisory approval, in order to calculate requirements of capital per IRB model.
The remaining portfolios not included in the advanced model deployment plan are subject to analysis in order to assess the suitability of including them in the plan; additionally, these other portfolios include the portfolios authorised by the supervisor to remain permanently under the standardised approach.
The distribution of exposure to credit and counterparty credit risk according to the capital requirements calculation method is shown in the chart below.
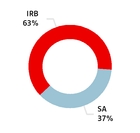
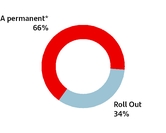
| * | To simplify: the 66% permanent SA includes those portfolios already authorised by the regulator and those pending approval (candidates for permanent SA or roll out). |
| 40 | 2019 Pillar 3 Disclosures Report | ||
| CAPITAL 2019 Pillar 3 Disclosures Report |
The medium-term objective of achieving a high degree of IRB model coverage in the main markets in which the Group operates is conditioned by the acquisition of new business as occurred in 2017 with the integration of the various established Banco Popular units or during 2018 with the acquisition of Deutsche Bank Polska S.A. business.
The following table shows the geographical scope of the internal models for credit risk (AIRB or FIRB) in the different portfolios:
| List of authorised IRB models by legal entity | ||
| Country | Legal Entity | IRB portfolio (AIRB or FIRB) |
| United Kingdom | Santander UK PLC | Institutions, Corporates, Corporates SMEs, Corporates Project Finance, Mortgages, Qualifying Revolving, Other Retail. |
| Abbey National Treasury Services | Institutions, Corporates, Corporates SMEs, Corporates Project Finance. | |
| Abbey Covered Bonds LLP | Institutions | |
| Spain | Banco Santander, S.A. | Sovereigns, Institutions, Corporates, Corporates SMEs, Corporates Project Finance, Mortgages, Qualifying Revolving, Retail SMEs, Other Retail |
| Santander Factoring y Confirming S.A. | Institutions, Corporates, Corporates SMEs, Corporates Project Finance, Mortgages, Retail SMEs, Other Retail | |
| Santander Lease, S.A. E.F.C. | Institutions, Corporates Corporates SMEs, Mortgages, Retail SMEs, Other Retail | |
| Santander Consumer EFC, S.A. | Corporates, Corporates SMEs, Qualifying Revolving, Other Retail. | |
| Santander Consumer Finance, S.A. | Corporates, Corporates SMEs, Qualifying Revolving, Other Retail. | |
| Portugal | Banco Santander Totta | Institutions, Corporates, Corporates SMEs, Corporates Project Finance, Mortgages, Qualifying Revolving, Retail SMEs, Other Retail. |
| Brazil | Banco Santander Brazil | Corporates |
| Santander Brazil EFC | Corporates | |
| Germany | Santander Consumer Bank AG | Corporates, Corporates SMEs, Mortages, Revolving and Other Retail |
| Mexico | Banco Santader Mexico | Institutions, Corporates, Corporates SMEs, Corporates Project Finance |
| USA | Santander Bank, National Association | Corporates |
| France | Société Financiére de Banque - SOFIB | Corporates, Corporates SMEs, Retail SMEs, Other Retail |
| Nordics | Santander Consumer Bank A.S. | Other Retail |
| Santander Consumer Finance OY | Other Retail | |
| Chile | Banco Santader - Chile | Sovereigns, Institutions and Corporates |
The following table shows the market risk internal models (IMA) of the different portfolios distributed by geography:
| List of authorised IMA models by legal entity | ||
| Country | Legal entity | IMA portfolio (product) |
| Spain | Banco Santander, S.A. | Trading book |
| Santander London Branch | Trading book | |
| Chile | Banco Santander - Chile | Trading book |
| Santander Agente de Valores Limitada | Trading book | |
| Santander Investment Chile Limitada | Trading book | |
| Santander Corredores de Bolsa Limitada | Trading book | |
| Mexico | Banco Santander México | Trading book |
| Casa de Bolsa Santander, S.A. de C.V. | Trading book | |
41 |
| CAPITAL 2019 Pillar 3 Disclosures Report |
| ¤ | For further information on the market risk, see chapter 6. |
| ¤ | For further information on the Operational Risk, see chapter 7. |
As additional information, Appendix XIII shows a breakdown of exposure according to the capital calculation method employed in each region and for each portfolio.
Supervisory validation process
As established by the European Parliament, the primary element of Banking Union is the Single Supervisory Mechanism (SSM). Under this mechanism, direct banking supervision falls to the European Central Bank, thus ensuring that the largest European banks are independently supervised by just one entity and are subject to a set of standard regulations.Eeurozone countries are required to participate, while participation is voluntary for non-eurozone EU member states.
The second key element is the Single Resolution Mechanism (SRM), which oversees the preparation in the event of a worst-case scenario, meaning bank failure. The aim is to ensure that any such situation can be resolved in an orderly fashion and at a minimum cost for taxpayers. The focus on keeping taxpayers from bearing the cost of future bank resolutions led to a change in the underlying regulations, namely: the Bank Recovery and Resolution Directive (BRRD), under which the bank’s shareholders and creditors will bear the brunt of resolution costs. Under certain circumstances, banks may also obtain supplementary financing from the recently-created Single Resolution Fund (SRF), which is financed by the banking sector.
Both the SSM and the SRM are operational: the SSM became effective on 4 November 2014, but the SRM was not applied until 1 January 2016.
Moreover, the SRF is expected to meet its target funding level by 2023.
The European Central Bank has gradually been deploying its new structure and functions to effectively become the single European supervisor. The European Banking Authority (EBA) will continue to actively collaborate in adapting regulations. Each body’s responsibilities are as follows:
| Supervisory validation process |
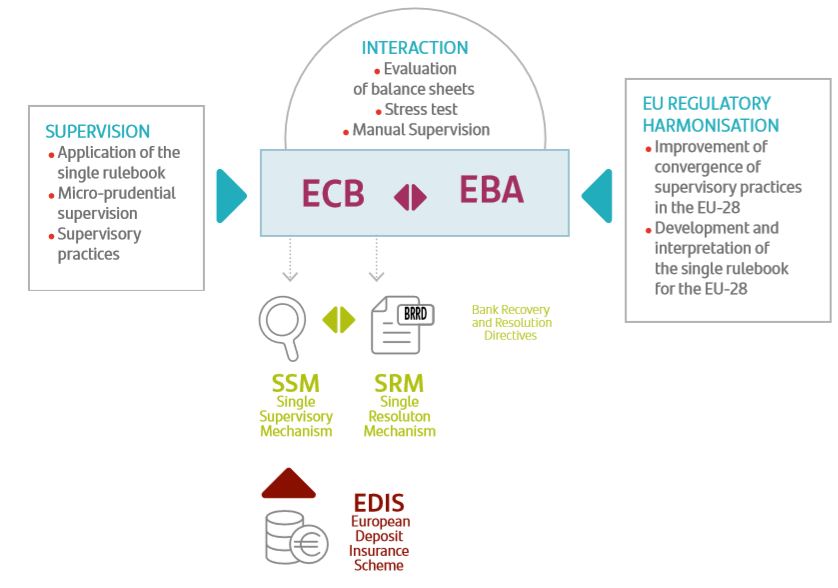
| 42 | 2019 Pillar 3 Disclosures Report | ||
| CAPITAL 2019 Pillar 3 Disclosures Report |
| The European supervisor has put in place a new governance process, involving the following steps: | 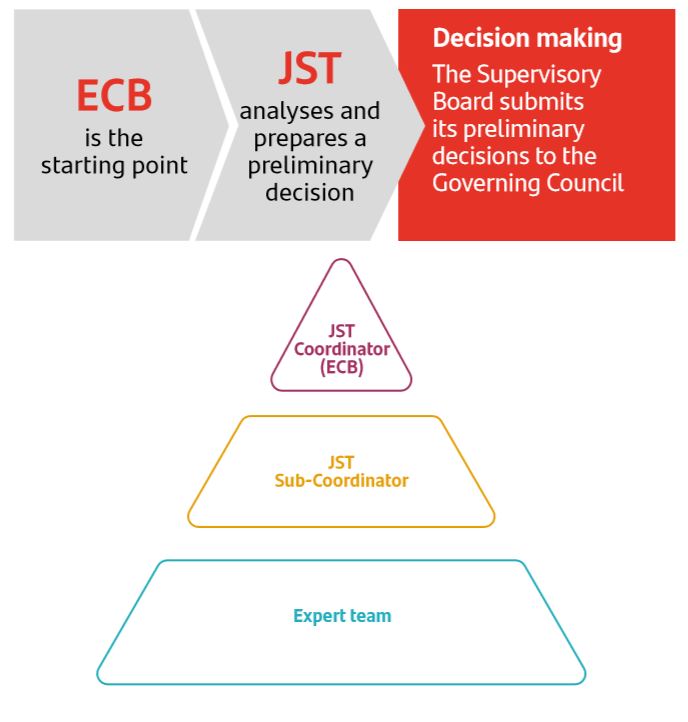 |
• The Joint Supervisory Team (JST), consisting of a mixed team of experts, analyses the entity’s situation and issues a technical report to the ECB’s Supervisory Board. | |
• The Supervisory Board then submits its preliminary decisions to the Governing Council. | |
• The Governing Council then issues its final decision authorising or not the use of the internal models. | |
| The supervisor uses the documentation provided by the entity as the basis for its assessment of whether the minimum requirements for using advanced models to calculate regulatory capital have been met. This information must be sufficiently thorough and detailed to provide a third party with a clear idea of the entity’s rating systems, methodologies, technological infrastructure, capital calculation process and internal governance and must be able to replicate the outputs of the model. The unit itself is responsible for preparing this documentation, which forms part of the formal application required for the validation process established by the supervisors of entities seeking to implement advanced models to calculate regulatory capital. | |
A preparatory "pre-application" phase has now been introduced as part of the supervisory approval process for major changes to advanced models to calculate regulatory capital. This involves the entity providing the supervisor with the necessary documentation beforehand, so that they can assess whether the minimum requirements have been met in order to continue with the formal approval process. If the European Central Bank considers the entity to be initially ready, a request is sent and the supervisor begins a formal review process of the regulatory models.
The approval of changes in Santander Group models, on occasions implies the participation of supervisors from different jurisdictions, often and responding to different legislation, criteria and implementation calendars, which frequently hinders and slows down joint decisions on the approval of internal models on the basis of consolidation and can affect authorisations at local level.
Targeted Review of Internal Models
In October 2019, the latest version of the ECB guide to internal models was published, which included all the comments received in the previous consultation stages and all the consolidated chapters (general aspects and specific chapters on each type of risk). The aim of this guide is to ensure a common and consistent approach to the most significant matters related to internal models for the directly banks supervised by the ECB.
The Targeted Review of Internal Models (TRIM) exercise has continued throughout 2019, with the focus on low default portfolios, Banco Santander has been immersed in the review of various portfolios through small-scale on-site inspections this year. In addition, the final conclusions (findings, requirements and limitations) of the high-default portfolio inspections have gradually been received. It is expected that all the pending ECB conclusions will be received in 2020 and that the final horizontal results of the entire TRIM exercise will be published.
With the aim of complying with regulatory expectations and requirements, and to address the weaknesses found during TRIM, Banco Santander has launched two strategic programmes to improve the quality of our internal models and these have been already been shared with the ECB: IRB 2.0 (internal credit risk models) and MRAP - Market Risk Advanced Platform - (internal market risk models), that will be carried out in the next few years.
2.2.3. Leverage ratio
Basel III established the leverage ratio as a non-risk-sensitive measure designed to limit the excessive growth of the balance sheet relative to available capital.
The ratio is calculated as the coefficient between Tier 1 divided by the leverage exposure. This exposure is calculated as the sum of the following components:
| • | Asset value, without derivatives and without elements considered as deductions in Tier 1 (for example, the loan balance is included but not goodwill). |
| • | Off-balance-sheet accounts (mainly: guarantees, undrawn credit limits, letters of credit) weighted by the conversion factors of the standardised approach to credit risk. |
| • | Inclusion of the net value of derivatives (gains and losses against a single counterparty are netted, minus collateral - provided certain criteria are met) plus a buffer for potential future exposure. |
| • | A buffer for the potential risk of financing securities transactions. |
| • | Lastly, a buffer is included for risk relating to unhedged credit derivatives (CDS). |
The following tables illustrate the ratios published by Santander Group since December 2018. These show that the Bank’s ratio is stable, and with an upward trend.
43 |
| CAPITAL 2019 Pillar 3 Disclosures Report |
| Fully loaded leverage ratio | |
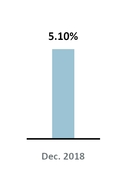
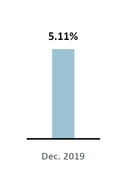
| Phased-in leverage ratio | |
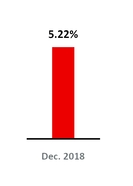
The BCBS revised the definition of the leverage ratio in 2017. In particular, a series of technical adjustments were made to the method for calculating total exposure (the denominator of the leverage ratio), mainly relating to exposure to derivatives and the treatment of off balance sheet exposure.
With the publication of CRR II, the definitive calibration of the leverage ratio was set at 3% for all institutions, with G-SIBs being subject to an additional buffer of 50% of the ratio of the buffer applicable to G-SII. Adjustments to its calculation are also included, chief among which are the exclusion of certain exposures from the measure of total exposure: public loans, transfer loans and officially supported export credits.
Banks must implement the final definition of the leverage ratio for June 2021 and comply with the new ratio calibration (the additional buffer for G-SIBs) from January 2022.
The Group’s leverage ratio as at 31 December 2019 was as follows:
| Table 9. Leverage ratio | ||||
| Million euros | ||||
| 31 Dec. 2019 | ||||
| Fully loaded | Phased -In | |||
| Tier 1 | 78,964 | 79,536 | ||
| Exposure | 1,544,614 | 1,544,614 | ||
| Leverage Ratio | 5.11 | % | 5.15 | % |
The following table gives a breakdown of the ratio calculation:
| Table 10. Leverage ratio details | ||||||||||
| Million euros | ||||||||||
| 31 Dec. 2019 | ||||||||||
| Item | Amounts Consol. Balance Sheet | To be eliminated | To be included | Leverage exposure | Comment | |||||
| Derivatives | 70,631 | 70,631 | 22,141 | 22,141 | Substitution of carrying amount by EAD net of collateral | |||||
| Securities financing transactions | 85,172 | — | 2,218 | 87,391 | A buffer is added for these transactions | |||||
| Assets deducted in Tier 1 | 34,015 | 34,015 | — | — | Deletion to avoid duplication | |||||
| DTAs | 584 | 584 | — | — | Carrying amount of the balance sheet asset adjusted for changes in DTAs, as a result of the recognition of lower reserve account provisions, due to the application of IFRS 9 transitional arrangements. | |||||
| Rest of Assets | 1,316,871 | — | — | 1,316,871 | Fully included | |||||
| Total Assets | 1,507,273 | 105,230 | 24,359 | 1,426,403 | ||||||
| Total Off-Balance-Sheet items | 324,437 | 206,226 | — | 118,211 | Balances are weighted according to their risk | |||||
| Total Exposure (denominator) | 1,544,614 | |||||||||
| Tier 1 (numerator) | 79,536 | |||||||||
| Leverage ratio | 1,402,043 | 5.15 | % | Minimum recommended 3% | ||||||
| 44 | 2019 Pillar 3 Disclosures Report | ||
| CAPITAL 2019 Pillar 3 Disclosures Report |
The leverage ratio is calculated by Santander Group every month and reported to the capital committee and other governing bodies, thus ensuring adequate monitoring of the risk of excessive leverage at its most restrictive measurement: fully loaded. In addition, estimations are made of the leverage ratio at a three year time horizon under different macroeconomic scenarios, including scenarios of recession.
The leverage ratio is one of the metrics that is part of the entity’s Risk Appetite Framework, which is monitored on a regular basis. The Group’s various regulatory reports include the monthly measurement and control of its leverage ratio, with the aim of ensuring that leverage is kept away from minimum levels. Changes in the leverage ratio are reported on a monthly basis to various governing bodies and committees, thus ensuring adequate control of the entity’s leverage levels and ongoing monitoring of the main indicators. Any significant change in any of the main drivers of this indicator is therefore analysed and reported to senior management.
No significant changes occurred in the ratio in 2019. Tier 1 is stable and leverage exposure has responded to changes in balance sheet figures, attributable to business activity and exchange rate movements.
Tables LRSum, LRCom, LRSpl and LRQua can be found in Appendix X of the Pillar 3 2019 Appendices file that is available on Santander Group's website.
2.3. Pillar 2 - Economic capital
Economic capital is the capital needed to support all the risks of our activity with a certain level of solvency. It is measured according to an internal model.
Santander's economic capital model includes in its measurement all the significant risks incurred by the Group in its operations (concentration risk, structural interest rate risk, business risk, pension risk, DTA risk, goodwill risk, and other risks beyond the sphere of Pillar 1 regulatory capital). Economic capital also incorporates the diversification effect which, in the case of Santander Group, due to its multinational nature and multi-business structure, is key when determining and properly understanding the risk and solvency profile of a global group.
For more information on economic capital, including RoRAC and value creation, in addition to capital planning, see section 3.5 of the Economic and financial report of the 2019 Annual Report.
2.4. Recovery and resolution plans and special situation response framework
For details on the main developments made by Santander Group in the area of crisis management, specifically those in relation to viability and resolution plans, and the special situations management framework, see section 3.5 of the Economic and financial report of the 2019 Annual Report.
2.5. Total Loss-Absorbing Capacity (TLAC) and Minimum Requirement for own funds and Eligible Liabilities (MREL)
Information on TLAC and MREL can be found in section 3.5 of the Economic and financial report of the 2019 Annual Report.
For further details on TLAC and MREL, see Fixed Income Presentation available on the Santander Group Website.
45 |
| CAPITAL 2019 Pillar 3 Disclosures Report |
This page is intentionally left blank.
| 46 | 2019 Pillar 3 Disclosures Report | ||
| CAPITAL 2019 Pillar 3 Disclosures Report |
| 3 | ||||||
| Credit risk | ||||||
| Image omitted | ||||||
| 3.1. General aspects | |||
47 |
| CAPITAL 2019 Pillar 3 Disclosures Report |
| Image omitted | ||||
48 |
| CREDIT RISK 2019 Pillar 3 Disclosures Report |
3. Credit risk
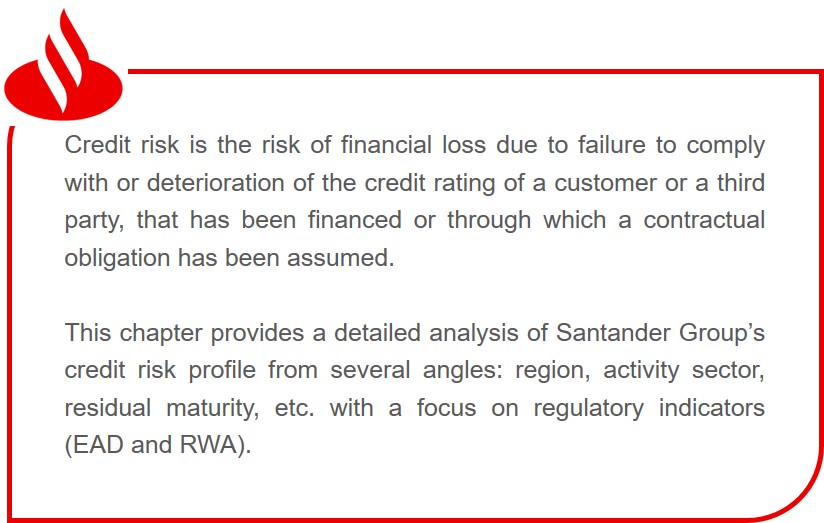
| Main figures * | |||||||||
| Million euros | |||||||||
| EAD | RWA | ||||||||
| 2019 | 2018 | 2019 | 2018 | ||||||
| Credit Risk | 1.311.087 | 1,306,865 | 515,897 | 499,924 | |||||
| Of which, with standard method (SA) | 684,054 | 710,272 | 300,771 | 294,593 | |||||
| Of which, IRB method | 627,033 | 544,532 | 215,126 | 156,063 | |||||
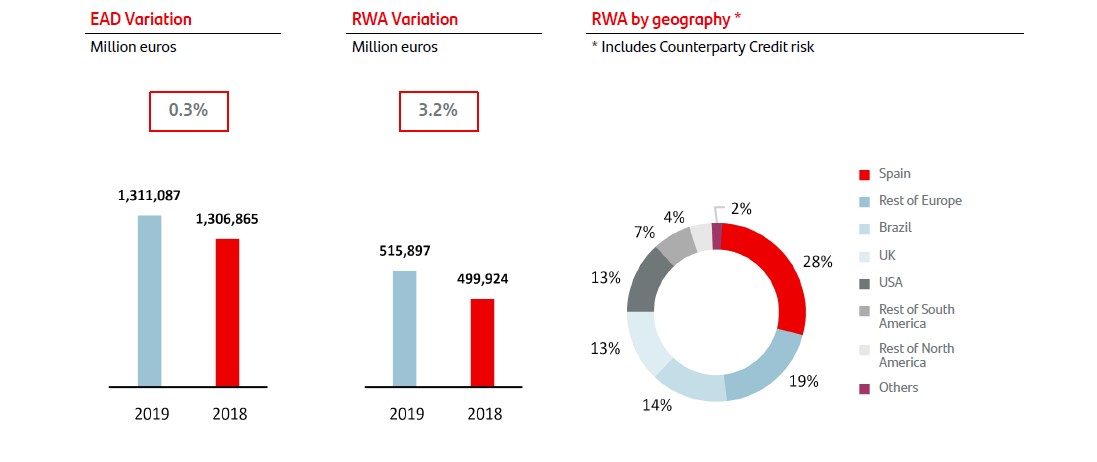
Santander Group ensures that its risk profile remains within the defined risk appetite levels and other limits through the advanced and comprehensive management of all risks, in a robust control environment, based on pillars aligned with its strategy.
For further details on policies and objectives of risk management (CRR article 435) see Corporate Governance chapter and Risk Management Report (Sections 1 and 2) in the Annual Report.
3.1. General aspects
The credit risk management process involves the identification, assessment, control and decision-making in relation to the credit risk incurred in the Group’s operations. It factors in operational aspects, in addition to customer and portfolio factors and the overall view of the credit risk cycle. The business and Risk areas, and senior management area involved in the process.
Santander Group’s profile is mainly retail, with an adequate diversification of credit risk between mature and emerging markets.
49 |
| CREDIT RISK 2019 Pillar 3 Disclosures Report |
| Table 11. Credit risk exposure and CRM effects (IRB approach) (CR4) | ||||||||||||||
| Million euros | ||||||||||||||
| 31 Dec. 2019 | ||||||||||||||
| Exposures before CCF and CRM | Exposures post CCF and CRM | RWAs and RW | ||||||||||||
| On-balance-sheet amount | Off-balance-sheet amount | On-balance-sheet amount | Off-balance-sheet amount | RWAs | RW | |||||||||
| Central governments or central banks | 2,548 | 1,516 | 3,101 | 148 | 843 | 26 | % | |||||||
| Institutions | 37,844 | 12,081 | 34,967 | 5,951 | 8,328 | 20 | % | |||||||
| Corporates | 183,194 | 104,414 | 170,979 | 32,598 | 111,920 | 55 | % | |||||||
| Of which, specialised lending | 20,879 | 4,303 | 20,879 | 1,459 | 18,563 | 83 | % | |||||||
| Of which, SME | 30,235 | 7,799 | 30,051 | 2,378 | 19,519 | 60 | % | |||||||
| Retail | 343,101 | 41,999 | 343,153 | 25,405 | 74,463 | 20 | % | |||||||
| Secured by real estate property | 288,444 | 16,499 | 288,842 | 11,036 | 44,537 | 15 | % | |||||||
| SME | 3,900 | 139 | 3,884 | 29 | 1,072 | 27 | % | |||||||
| Non-SME | 284,544 | 16,360 | 284,958 | 11,006 | 43,464 | 15 | % | |||||||
| Qualifying Revolving | 3,481 | 17,944 | 3,521 | 10,906 | 4,174 | 29 | % | |||||||
| Other Retail | 51,176 | 7,556 | 50,790 | 3,463 | 25,753 | 47 | % | |||||||
| SME | 9,218 | 3,243 | 8,825 | 1,291 | 4,453 | 44 | % | |||||||
| Non-SME | 41,957 | 4,313 | 41,965 | 2,173 | 21,300 | 48 | % | |||||||
| Equity | 10,731 | — | 10,731 | — | 19,572 | 182 | % | |||||||
| Total IRB approach | 577,418 | 160,010 | 562,931 | 64,102 | 215,126 | 34 | % | |||||||
Note: Securitisations not included. Including counterparty credit risk.
| Table 12. Credit risk exposure and CRM effects (Standardised approach) (CR4) | ||||||||||||||
| Million euros | ||||||||||||||
| 31 Dec. 2019 | ||||||||||||||
| Exposures before CCF and CRM | Exposures post CCF and CRM | RWAs and RW | ||||||||||||
| On-balance-sheet amount | Off-balance-sheet amount | On-balance-sheet amount | Off-balance-sheet amount | RWAs | RW | |||||||||
| Central governments or central banks | 209,392 | 9,429 | 219,651 | 1,482 | 29,294 | 13 | % | |||||||
| Regional governments or local authorities | 7,763 | 152 | 17,928 | 121 | 337 | 2 | % | |||||||
| Public sector entities | 12,497 | 184 | 12,288 | 117 | 418 | 3 | % | |||||||
| Multilateral Development Banks | 1,918 | 83 | 3,528 | 85 | 17 | 0 | % | |||||||
| International Organisations | 13 | — | 13 | — | — | — | % | |||||||
| Institutions | 18,901 | 23,788 | 18,200 | 15,689 | 6,095 | 18 | % | |||||||
| Corporates | 63,119 | 29,689 | 58,213 | 5,527 | 63,136 | 99 | % | |||||||
| Retail | 153,914 | 81,192 | 146,948 | 2,369 | 107,669 | 72 | % | |||||||
| Secured by mortgages on immovable property | 95,544 | 9,436 | 95,207 | 161 | 39,182 | 41 | % | |||||||
| Exposures in default | 6,835 | 446 | 6,762 | 445 | 7,583 | 105 | % | |||||||
| Items associated with particularly high risk | 1,445 | 298 | 1,445 | 15 | 2,190 | 150 | % | |||||||
| Covered bonds | 2,093 | — | 2,093 | — | 214 | 10 | % | |||||||
| Claims on institutions and corporates with a short-term credit assessment | 5 | — | 5 | — | 5 | 100 | % | |||||||
| Collective investments undertakings (CIU) | 150 | 1,686 | 150 | 128 | 321 | 115 | % | |||||||
| Equity exposures | 326 | — | 326 | — | 326 | 100 | % | |||||||
| Other exposures | 68,400 | 19,236 | 71,372 | 3,784 | 43,986 | 59 | % | |||||||
| Total Standardised approach | 642,315 | 175,618 | 654,129 | 29,925 | 300,771 | 44 | % | |||||||
Note: Securitisations not included. Including counterparty credit risk.
| 50 | 2019 Pillar 3 Disclosures Report | ||
| CREDIT RISK 2019 Pillar 3 Disclosures Report |
3.2. Capital requirements for credit risk
3.2.1. Internal ratings-based approach (IRB)
The following table shows the main changes in capital requirements for credit risk under the IRB approach:
| Table 13. RWA flow statement of credit risk exposures under IRB (CR8)* | ||||
| Million euros | ||||
| 31 Dec. 2019 | ||||
| RWA | Capital Requirements | |||
| RWA as Dec. 2018 | 203,823 | 16,306 | ||
| Asset size | 3,236 | 259 | ||
| Asset quality | — | — | ||
| Model updates | (1,499 | ) | (120 | ) |
| Methodology and policy | 11,109 | 889 | ||
| Acquisitions and disposals | (572 | ) | (46 | ) |
| Foreign exchange movements | 3,091 | 247 | ||
| Other | (7,280 | ) | (582 | ) |
| RWA as Dec. 2019 | 211,908 | 16,953 | ||
| * | Includes capital requirements of equity (excluding subject to 250% risk weight), securitisations and counterparty credit risk (excluding CVA and CCP) |
The rise in RWAs in the year (EUR 8,085 million ) is mainly due to the regulatory impact of TRIM and the changes to the IRB models in Spain, along with the increase in business (principally in Consumer, UK and USA). This effect was offset by improvements due to securitisation origination and the recalibration of IRB regulatory parameters.
The tables in this section show, for each business segment, the distribution by rating grade (internal and Standard & Poor’s) of the value of exposures, credit risk parameters and capital under the IRB approach, distinguishing between foundation IRB (FIRB) and advanced IRB (AIRB).
51 |
| CREDIT RISK 2019 Pillar 3 Disclosures Report |
| Table 14. AIRB approach. Credit risk exposures by portfolios class and PD range (CR6) | ||||||||||||||||||||||||
| Million euros | ||||||||||||||||||||||||
| 31 Dec. 2019 | ||||||||||||||||||||||||
| PD scale | S&P Levels | Original on-balance-sheet gross exposures | Off-balance-sheet exposures pre-CCF | Average CCF | EAD post CRM and post CCF | Average PD | Number of obligors | Average LGD | Average maturity | RWA | RW | EL | Value adjustments and provisions | |||||||||||
| Central banks and central governments | ||||||||||||||||||||||||
| 0.00 < 0.15 | AAA to BBB+ | 1,229 | 539 | 26.33 | % | 2,673 | 0.04 | % | 24 | 45.21 | % | 1,538 | 630 | 24 | % | 0 | 0 | |||||||
| 0.15 < 0.25 | BBB+ to BBB | 23 | 0 | 38.65 | % | 2 | 0.22 | % | 3 | 49.86 | % | 887 | 1 | 54 | % | 0 | 0 | |||||||
| 0.25 < 0.50 | BBB to BB+ | — | 0 | 26.67 | % | 0 | 0.34 | % | 1 | 50.00 | % | 951 | 0 | 70 | % | — | — | |||||||
| 0.50 < 0.75 | BB+ to BB | 109 | 2 | 23.97 | % | 4 | 0.53 | % | 1 | 50.00 | % | 1,800 | 5 | 119 | % | 0 | 0 | |||||||
| 0.75 < 2.50 | BB to B+ | 926 | 21 | 20.11 | % | 50 | 0.88 | % | 9 | 44.06 | % | 1,480 | 67 | 132 | % | — | 0 | |||||||
| 2.50 < 10.00 | B+ to B- | 721 | 4 | 12.85 | % | 30 | 5.33 | % | 7 | 56.78 | % | 1,686 | 72 | 241 | % | 1 | (1 | ) | ||||||
| 10.00 < 100.00 | B- to C | 0 | 1 | 50.00 | % | 1 | 15.31 | % | 2 | 62.78 | % | 1,271 | 3 | 345 | % | — | 0 | |||||||
| 100.00 (Default) | D | 0 | — | — | % | 0 | 100.00 | % | 2 | 40.14 | % | 360 | 0 | 18 | % | 0 | 0 | |||||||
| Total 2019 | 3,008 | 568 | 26.03 | % | 2,761 | 0.12 | % | 49 | 45.34 | % | 1,538 | 778 | 28 | % | 2 | (2 | ) | |||||||
| Total 2018 | 2,954 | 825 | 33.31 | % | 2,328 | 1.77 | % | 54 | 47.72 | % | 1,580 | 789 | 34 | % | 27 | (27 | ) | |||||||
| Institutions | ||||||||||||||||||||||||
| 0.00 < 0.15 | AAA to BBB+ | 20,228 | 13,522 | 37.44 | % | 32,735 | 0.05 | % | 1512 | 43.73 | % | 461 | 4,747 | 15 | % | 6 | (6 | ) | ||||||
| 0.15 < 0.25 | BBB+ to BBB | 3,610 | 1,065 | 44.62 | % | 2,298 | 0.19 | % | 306 | 43.11 | % | 331 | 791 | 34 | % | 2 | (2 | ) | ||||||
| 0.25 < 0.50 | BBB to BB+ | 1,636 | 208 | 26.87 | 549 | 0.35 | % | 172 | 43.22 | % | 588 | 303 | 55 | % | 1 | (1 | ) | |||||||
| 0.50 < 0.75 | BB+ to BB | 2,028 | 230 | 29.44 | % | 910 | 0.65 | % | 224 | 53.72 | % | 1,289 | 1,125 | 124 | % | 3 | (3 | ) | ||||||
| 0.75 < 2.50 | BB to B+ | 2,929 | 141 | 21.55 | % | 1,701 | 1.62 | % | 839 | 13.89 | % | 1,619 | 689 | 41 | % | 4 | (5 | ) | ||||||
| 2.50 < 10.00 | B+ to B- | 264 | 9 | 95.22 | % | 73 | 5.04 | % | 65 | 16.85 | % | 1,589 | 50 | 69 | % | 1 | (1 | ) | ||||||
| 10.00 < 100.00 | B- to C | 4 | 3 | 76.88 | % | 4 | 12.65 | % | 16 | 39.68 | % | 357 | 6 | 181 | % | 0 | 0 | |||||||
| 100.00 (Default) | D | 14 | 2 | 13.93 | % | 14 | 100.00 | % | 64 | 21.71 | % | 1,438 | 6 | 45 | % | 3 | (3 | ) | ||||||
| Total 2019 | 30,712 | 15,179 | 37.57 | % | 38,283 | 0.19 | % | 3198 | 42.54 | % | 528 | 7,718 | 20 | % | 20 | (20 | ) | |||||||
| Total 2018 | 33,945 | 11,093 | 36.57 | % | 34,321 | 0.22 | % | 2,209 | 42.90 | % | 535 | 7,888 | 23 | % | 22 | (22 | ) | |||||||
| 52 | 2019 Pillar 3 Disclosures Report | ||
| CREDIT RISK 2019 Pillar 3 Disclosures Report |
| Million euros | |||||||||||||||||||||||||
| 31 Dec. 2019 | |||||||||||||||||||||||||
| PD scale | S&P Levels | Original on-balance-sheet gross exposures | Off-balance-sheet exposures pre-CCF | Average CCF | EAD post CRM and post CCF | Average PD | Number of obligors | Average LGD | Average maturity | RWA | RW | EL | Value adjustments and provisions | ||||||||||||
| Corporates | |||||||||||||||||||||||||
| 0.00 < 0.15 | AAA to BBB+ | 43,578 | 40,862 | 37.94 | % | 55,502 | 0.08 | % | 2,709 | 43.09 | % | 785 | 13,602 | 25 | % | 20 | (20 | ) | |||||||
| 0.15 < 0.25 | BBB+ to BBB | 20,402 | 15,480 | 30.17 | % | 26,341 | 0.22 | % | 9,983 | 45.89 | % | 728 | 12,021 | 46 | % | 27 | (27 | ) | |||||||
| 0.25 < 0.50 | BBB to BB+ | 28,839 | 13,596 | 28.83 | 31,833 | 0.37 | % | 15,941 | 43.50 | % | 734 | 17,374 | 55 | % | 51 | (55 | ) | ||||||||
| 0.50 < 0.75 | BB+ to BB | 18,537 | 5,373 | 25.93 | % | 10,789 | 0.66 | % | 7,879 | 43.08 | % | 708 | 7,910 | 73 | % | 30 | (31 | ) | |||||||
| 0.75 < 2.50 | BB to B+ | 24,693 | 7,179 | 31.08 | % | 22,373 | 1.25 | % | 36,819 | 43.77 | % | 705 | 18,019 | 81 | % | 122 | (124 | ) | |||||||
| 2.50 < 10.00 | B+ to B- | 12,471 | 4,049 | 41.10 | % | 11,241 | 4.41 | % | 19,317 | 38.92 | % | 806 | 11,758 | 105 | % | 192 | (191 | ) | |||||||
| 10.00 < 100.00 | B- to C | 1,856 | 507 | 28.24 | % | 1,605 | 23.12 | % | 3,551 | 35.61 | % | 1,124 | 2,747 | 171 | % | 134 | (133 | ) | |||||||
| 100.00 (Default) | D | 7,964 | 1,685 | 21.28 | % | 8,321 | 100.00 | % | 9,845 | 37.16 | % | 1,166 | 503 | 6 | % | 3,063 | (2,948 | ) | |||||||
| Total 2019 | 158,340 | 88,731 | 33.68 | % | 168,004 | 5.81 | % | 106,043 | 43.05 | % | 774 | 83,936 | 50 | % | 3,639 | (3,530 | ) | ||||||||
| Total 2018 | 138,721 | 94,621 | 35.89 | % | 158,501 | 5.86 | % | 88,256 | 42.37 | % | 792 | 78,617 | 50 | % | 3,607 | (3,550 | ) | ||||||||
| Of which, SMEs | |||||||||||||||||||||||||
| 0.00 < 0.15 | AAA to BBB+ | 30 | 12 | 19.02 | % | 33 | 0.08 | % | 551 | 44.21 | % | 574 | 6 | 18 | % | 0 | 0 | ||||||||
| 0.15 < 0.25 | BBB+ to BBB | 2,676 | 1,029 | 27.14 | % | 3,519 | 0.21 | % | 5,481 | 47.00 | % | 842 | 1,287 | 37 | % | 3 | (3 | ) | |||||||
| 0.25 < 0.50 | BBB to BB+ | 5,111 | 1,644 | 27.96 | 6,219 | 0.36 | % | 9,684 | 44.03 | % | 885 | 2,743 | 44 | % | 10 | (10 | ) | ||||||||
| 0.50 < 0.75 | BB+ to BB | 1,640 | 416 | 29.19 | % | 1,774 | 0.63 | % | 3,787 | 44.23 | % | 761 | 916 | 52 | % | 5 | (5 | ) | |||||||
| 0.75 < 2.50 | BB to B+ | 10,153 | 2,530 | 29.72 | % | 10,309 | 1.26 | % | 25,917 | 45.24 | % | 662 | 6,784 | 66 | % | 58 | (57 | ) | |||||||
| 2.50 < 10.00 | B+ to B- | 5,650 | 1,553 | 42.53 | % | 5,634 | 4.38 | % | 13,632 | 40.55 | % | 812 | 4,826 | 86 | % | 98 | (95 | ) | |||||||
| 10.00 < 100.00 | B- to C | 712 | 101 | 38.29 | % | 665 | 24.08 | % | 1,632 | 32.99 | % | 1,206 | 804 | 121 | % | 53 | (52 | ) | |||||||
| 100.00 (Default) | D | 2,018 | 118 | 20.94 | % | 2,043 | 100.00 | % | 2,335 | 35.24 | % | 1,232 | 147 | 7 | % | 708 | (687 | ) | |||||||
| Total 2019 | 27,991 | 7,403 | 31.59 | % | 30,196 | 8.68 | % | 63,019 | 43.31 | % | 813 | 17,512 | 58 | % | 935 | (909 | ) | ||||||||
| Total 2018 | 27,659 | 5,877 | 39.47 | % | 29,702 | 12.61 | % | 53,285 | 39.33 | % | 877 | 14,954 | 50 | % | 1,377 | (1,303 | ) | ||||||||
| 53 |
| CREDIT RISK 2019 Pillar 3 Disclosures Report |
| Table 15. FIRB approach. Credit risk exposures by portfolios class and PD range (CR6) | |||||||||||||||||||||||||
| Million euros | 31 Dec. 2019 | ||||||||||||||||||||||||
| PD scale | S&P Levels | Original on-balance-sheet gross exposures | Off-balance-sheet exposures pre-CCF | Average CCF | EAD | Average PD | Number of obligors | Average LGD | Average maturity | RWA | RW | EL | Value adjustments and provisions | ||||||||||||
| Central banks and central governments | |||||||||||||||||||||||||
| 0.00 < 0.15 | AAA to BBB+ | 488 | — | — | 488 | 0.02 | % | 1 | 45.00 | % | 900 | 65 | 13 | % | — | — | |||||||||
| 0.15 < 0.25 | BBB+ to BBB | — | — | — | — | — | — | — | — | — | — | — | — | ||||||||||||
| 0.25 < 0.50 | BBB to BB+ | — | — | — | — | — | — | — | — | — | — | — | — | ||||||||||||
| 0.50 < 0.75 | BB+ to BB | — | — | — | — | — | — | — | — | — | — | — | — | ||||||||||||
| 0.75 < 2.50 | BB to B+ | — | — | — | — | — | — | — | — | — | — | — | — | ||||||||||||
| 2.50 < 10.00 | B+ to B- | — | — | — | — | — | — | — | — | — | — | — | — | ||||||||||||
| 10.00 < 100.00 | B- to C | — | — | — | — | — | — | — | — | — | — | — | — | ||||||||||||
| 100.00 (Default) | D | — | — | — | — | — | — | — | — | — | — | — | |||||||||||||
| Total 2019 | 488 | — | — | 488 | 0.02 | % | 1 | 45.00 | % | 900 | 65 | 13 | % | 0 | 0 | ||||||||||
| Total 2018 | 215 | — | — | 215 | 0.03 | % | 1 | 45.00 | % | 900 | 30 | 14 | % | 0 | 0 | ||||||||||
| Institutions | |||||||||||||||||||||||||
| 0.00 < 0.15 | AAA to BBB+ | 2,114 | 1,390 | 16.23 | % | 2,340 | 0.06 | % | 239 | 44.60 | % | 400 | 449 | 19 | % | 1 | (1 | ) | |||||||
| 0.15 < 0.25 | BBB+ to BBB | 143 | 119 | 7.14 | % | 151 | 0.19 | % | 49 | 45.00 | % | 553 | 63 | 41 | % | 0 | — | ||||||||
| 0.25 < 0.50 | BBB to BB+ | 111 | 95 | 10.39 | % | 121 | 0.32 | % | 44 | 45.00 | % | 759 | 77 | 63 | % | 0 | — | ||||||||
| 0.50 < 0.75 | BB+ to BB | 18 | 29 | 3.17 | % | 19 | 0.65 | % | 37 | 45.00 | % | 898 | 18 | 96 | % | 0 | — | ||||||||
| 0.75 < 2.50 | BB to B+ | — | 14 | 19.86 | % | 3 | 0.83 | % | 3 | 45.00 | % | 283 | 3 | 97 | % | 0 | — | ||||||||
| 2.50 < 10.00 | B+ to B- | — | — | — | — | — | — | — | — | — | — | — | — | ||||||||||||
| 10.00 < 100.00 | B- to C | — | — | — | — | — | — | — | — | — | — | — | — | ||||||||||||
| 100.00 (Default) | D | — | — | — | — | — | — | — | — | — | — | — | — | ||||||||||||
| Total 2019 | 2,386 | 1,648 | 15.04 | % | 2,634 | 0.09 | % | 372 | 44.64 | % | 429 | 609 | 23 | % | 1 | (1 | ) | ||||||||
| Total 2018 | 3,835 | 2,250 | 33.36 | % | 4,679 | 0.12 | % | 941 | 44.76 | % | 557 | 1,324 | 28 | % | 3 | (3 | ) | ||||||||
| Corporates | |||||||||||||||||||||||||
| 0.00 < 0.15 | AAA to BBB+ | 2,940 | 1,730 | 56.30 | % | 4,060 | 0.08 | % | 55 | 45.00 | % | 859 | 1,168 | 29 | % | 1 | (2 | ) | |||||||
| 0.15 < 0.25 | BBB+ to BBB | 305 | 48 | 44.58 | % | 316 | 0.24 | % | 30 | 45.00 | % | 889 | 177 | 56 | % | 0 | (1 | ) | |||||||
| 0.25 < 0.50 | BBB to BB+ | 2,450 | 187 | 43.97 | % | 2,344 | 0.32 | % | 1,551 | 45.00 | % | 900 | 1,409 | 60 | % | 3 | (14 | ) | |||||||
| 0.50 < 0.75 | BB+ to BB | 1,427 | 301 | 33.69 | % | 1,483 | 0.60 | % | 417 | 44.55 | % | 896 | 1,217 | 82 | % | 4 | (7 | ) | |||||||
| 0.75 < 2.50 | BB to B+ | 2,291 | 433 | 6.94 | % | 2,156 | 1.27 | % | 1,648 | 44.31 | % | 909 | 2,115 | 98 | % | 12 | (13 | ) | |||||||
| 2.50 < 10.00 | B+ to B- | 2,232 | 309 | 12.06 | % | 2,230 | 3.70 | % | 2,403 | 43.43 | % | 904 | 2,757 | 124 | % | 36 | (19 | ) | |||||||
| 10.00 < 100.00 | B- to C | 282 | 53 | 8.99 | % | 283 | 15.92 | % | 717 | 44.26 | % | 907 | 576 | 204 | % | 20 | (6 | ) | |||||||
| 100.00 (Default) | 357 | 9 | 58.11 | % | 362 | 100.00 | % | 232 | 45.00 | % | 903 | — | — | 161 | (92 | ) | |||||||||
| Total 2019 | 12,284 | 3,070 | 40.93 | % | 13,235 | 4.06 | % | 7,053 | 44.56 | % | 889 | 9,420 | 71 | % | 238 | (154 | ) | ||||||||
| Total 2018 | 16,379 | 6,195 | 43.13 | % | 19,019 | 6.71 | % | 6,919 | 43.37 | % | 855 | 13,346 | 70 | % | 520 | (514 | ) | ||||||||
| 54 | 2019 Pillar 3 Disclosures Report | ||
| CREDIT RISK 2019 Pillar 3 Disclosures Report |
| Table 16. AIRB approach. Credit risk exposures by portfolios class and PD range. Retail portfolios (CR6) | |||||||||||||||||||||||
| Million euros | |||||||||||||||||||||||
| 31 Dec. 2019 | |||||||||||||||||||||||
| PD scale | S&P Levels | Original on-balance-sheet gross exposures | Off-balance-sheet exposures pre-CCF | Average CCF | EAD | Average PD | Number of obligors | Average LGD | RWA | RW | EL | Value adjustments and provisions | |||||||||||
| Residential Mortgages | |||||||||||||||||||||||
| 0.00 < 0.15 | AAA to BBB+ | 39,674 | 1,133 | 99.09 | % | 40,797 | 0.07 | % | 611,908 | 13.98 | % | 1,169 | 3 | % | 5 | (5 | ) | ||||||
| 0.15 < 0.25 | BBB+ to BBB | 37,276 | 4,184 | 65.74 | % | 40,077 | 0.22 | % | 350,375 | 11.49 | % | 1,995 | 5 | % | 10 | (9 | ) | ||||||
| 0.25 < 0.50 | BBB to BB+ | 50,422 | 6,164 | 64.76 | % | 54,443 | 0.38 | % | 383,135 | 9.31 | % | 3,298 | 6 | % | 19 | (17 | ) | ||||||
| 0.50 < 0.75 | BB+ to BB | 20,785 | 1,550 | 64.10 | % | 21,827 | 0.55 | % | 202,623 | 8.69 | % | 1,620 | 7 | % | 10 | (9 | ) | ||||||
| 0.75 < 2.50 | BB to B+ | 85,459 | 3,042 | 64.37 | % | 87,597 | 1.25 | % | 561,154 | 9.74 | % | 12,190 | 14 | % | 102 | (84 | ) | ||||||
| 2.50 < 10.00 | B+ to B- | 33,376 | 298 | 65.00 | % | 33,630 | 4.70 | % | 233,527 | 12.47 | % | 13,617 | 40 | % | 202 | (148 | ) | ||||||
| 10.00 < 100.00 | B- to C | 12,929 | 59 | 34.63 | % | 12,979 | 27.67 | % | 118,223 | 12.88 | % | 8,569 | 66 | % | 436 | (353 | ) | ||||||
| 100.00 (Default) | D | 8,523 | 69 | 7.97 | % | 8,529 | 100.00 | % | 93,474 | 26.94 | % | 2,078 | 24 | % | 2,248 | (2,067 | ) | ||||||
| Total 2019 | 288,444 | 16,498 | 66.89 | % | 299,878 | 5.08 | % | 2,554,419 | 11.33 | % | 44,537 | 15 | % | 3,031 | (2,692 | ) | |||||||
| Total 2018 | 269,716 | 13,373 | 64.69 | % | 278,732 | 5.16 | % | 2,525,203 | 10.93 | % | 39,160 | 14 | % | 3,114 | (2,476 | ) | |||||||
| Qualifying Revolving | |||||||||||||||||||||||
| 0.00 < 0.15 | AAA to BBB+ | 504 | 4,846 | 51.61 | % | 3,005 | 0.08 | % | 2,392,726 | 59.01 | % | 93 | 3 | % | 1 | (1 | ) | ||||||
| 0.15 < 0.25 | BBB+ to BBB | 123 | 4,434 | 87.28 | % | 3,992 | 0.17 | % | 6,058,346 | 67.69 | % | 267 | 7 | % | 5 | (2 | ) | ||||||
| 0.25 < 0.50 | BBB to BB+ | 120 | 3,077 | 36.39 | % | 1,240 | 0.31 | % | 1,992,901 | 48.72 | % | 94 | 8 | % | 2 | (9 | ) | ||||||
| 0.50 < 0.75 | BB+ to BB | 78 | 781 | 60.73 | % | 552 | 0.65 | % | 715,822 | 63.87 | % | 102 | 18 | % | 2 | (1 | ) | ||||||
| 0.75 < 2.50 | BB to B+ | 762 | 2,982 | 57.04 | % | 2,468 | 1.43 | % | 2,823,439 | 58.67 | % | 751 | 30 | % | 19 | (13 | ) | ||||||
| 2.50 < 10.00 | B+ to B- | 1,151 | 1,534 | 66.01 | % | 2,174 | 4.97 | % | 2,247,115 | 60.85 | % | 1,633 | 75 | % | 64 | (42 | ) | ||||||
| 10.00 < 100.00 | B- to C | 600 | 264 | 85.19 | % | 848 | 26.90 | % | 772,991 | 60.35 | % | 1,217 | 144 | % | 141 | (90 | ) | ||||||
| 100.00 (Default) | D | 144 | 27 | 15.07 | % | 149 | 100.00 | % | 104,246 | 75.93 | % | 18 | 12 | % | 112 | (99 | ) | ||||||
| Total 2019 | 3,481 | 17,944 | 60.78 | % | 14,427 | 3.72 | % | 17,107,586 | 61.19 | % | 4,174 | 29 | % | 347 | (258 | ) | |||||||
| Total 2018 | 3,234 | 17,720 | 59.41 | % | 13,801 | 3.57 | % | 17,488,846 | 60.99 | % | 3,988 | 29 | % | 321 | (239 | ) | |||||||
| 55 |
| CREDIT RISK 2019 Pillar 3 Disclosures Report |
| Million euros | |||||||||||||||||||||||
| 31 Dec. 2019 | |||||||||||||||||||||||
| PD scale | S&P Levels | Original on-balance-sheet gross exposures | Off-balance-sheet exposures pre-CCF | Average CCF | EAD | Average PD | Number of obligors | Average LGD | RWA | RW | EL | Value adjustments and provisions | |||||||||||
| Retail Others | |||||||||||||||||||||||
| 0.00 < 0.15 | AAA to BBB+ | 1,223 | 286 | 45.62 | % | 1,354 | 0.09 | % | 183,701 | 40.09 | % | 122 | 9 | % | 0 | 0 | |||||||
| 0.15 < 0.25 | BBB+ to BBB | 2,583 | 693 | 42.91 | % | 2,877 | 0.18 | % | 585,845 | 48.63 | % | 533 | 19 | % | 3 | (2 | ) | ||||||
| 0.25 < 0.50 | BBB to BB+ | 8,596 | 869 | 70.43 | % | 9,208 | 0.33 | % | 1,079,847 | 41.31 | % | 2,147 | 23 | % | 13 | (28 | ) | ||||||
| 0.50 < 0.75 | BB+ to BB | 6,302 | 709 | 51.19 | % | 6,646 | 0.61 | % | 963,510 | 46.67 | % | 2,442 | 37 | % | 18 | (26 | ) | ||||||
| 0.75 < 2.50 | BB to B+ | 16,904 | 2,290 | 55.21 | % | 18,134 | 1.28 | % | 2,609,501 | 47.46 | % | 9,367 | 52 | % | 111 | (166 | ) | ||||||
| 2.50 < 10.00 | B+ to B- | 10,828 | 2,050 | 32.59 | % | 11,029 | 4.16 | % | 1,703,132 | 49.51 | % | 7,534 | 68 | % | 227 | (205 | ) | ||||||
| 10.00 < 100.00 | B- to C | 3,012 | 289 | 32.12 | % | 3,072 | 28.39 | % | 543,639 | 47.67 | % | 3,098 | 101 | % | 419 | (301 | ) | ||||||
| 100.00 (Default) | D | 1,898 | 201 | 17.69 | % | 1,934 | 100.00 | % | 386,131 | 71.49 | % | 510 | 26 | % | 1,342 | (1,130 | ) | ||||||
| Total 2019 | 51,346 | 7,386 | 46.89 | % | 54,254 | 6.59 | % | 8,055,306 | 47.48 | % | 25,753 | 47 | % | 2,133 | (1,859 | ) | |||||||
| Total 2018 | 53,444 | 6,783 | 58.56 | % | 56,850 | 5.79 | % | 8,444,589 | 45.57 | % | 25,621 | 45 | % | 1,915 | (1,620 | ) | |||||||
| Of which, SMEs | |||||||||||||||||||||||
| 0.00 < 0.15 | AAA to BBB+ | 16 | 191 | 51.45 | % | 114 | 0.07 | % | 50,583 | 55.58 | % | 9 | 8 | % | 0 | 0 | |||||||
| 0.15 < 0.25 | BBB+ to BBB | 374 | 276 | 37.10 | % | 473 | 0.20 | % | 54,794 | 53.63 | % | 83 | 18 | % | 1 | 0 | |||||||
| 0.25 < 0.50 | BBB to BB+ | 525 | 358 | 53.87 | % | 718 | 0.32 | % | 43,916 | 50.50 | % | 158 | 22 | % | 1 | (3 | ) | ||||||
| 0.50 < 0.75 | BB+ to BB | 729 | 386 | 36.49 | % | 851 | 0.65 | % | 65,856 | 53.33 | % | 303 | 36 | % | 3 | (3 | ) | ||||||
| 0.75 < 2.50 | BB to B+ | 2,610 | 795 | 38.94 | % | 2,885 | 1.30 | % | 185,469 | 46.86 | % | 1,201 | 42 | % | 18 | (33 | ) | ||||||
| 2.50 < 10.00 | B+ to B- | 3,660 | 749 | 49.74 | % | 3,561 | 3.80 | % | 211,123 | 47.74 | % | 1,954 | 55 | % | 65 | (67 | ) | ||||||
| 10.00 < 100.00 | B- to C | 707 | 162 | 27.46 | % | 716 | 25.16 | % | 83,784 | 48.48 | % | 632 | 88 | % | 88 | (80 | ) | ||||||
| 100.00 (Default) | D | 767 | 157 | 19.18 | % | 797 | 100.00 | % | 80,375 | 74.17 | % | 113 | 14 | % | 582 | (524 | ) | ||||||
| Total 2019 | 9,388 | 3,073 | 42.00 | % | 10,116 | 11.45 | % | 775,900 | 50.65 | % | 4,453 | 44 | % | 757 | (710 | ) | |||||||
| Total 2018 | 12,673 | 4,130 | 50.90 | % | 14,359 | 8.33 | % | 686,719 | 42.31 | % | 4,777 | 33 | % | 693 | (622 | ) | |||||||
| 56 | 2019 Pillar 3 Disclosures Report | ||
| CREDIT RISK 2019 Pillar 3 Disclosures Report |
The distribution of exposures and average parameters by segment and geography is as follows:
| Table 17. Exposures and parameters by segment and geography* | ||||||||||||||||
| Million euros | ||||||||||||||||
| 31 Dec. 2019 | ||||||||||||||||
| Central governments and central banks | Institutions | Corporates | Retail Mortgages | Retail SME | Retail Other | Retail Qualifying Revolving | Total | |||||||||
| Santander Group | ||||||||||||||||
| EAD | 3,249 | 40,904 | 172,556 | 291,349 | 9,319 | 43,001 | 14,278 | 574,655 | ||||||||
| Average LGD in % | 45.28 | % | 42.67 | % | 43.17 | % | 10.17 | % | 47.31 | % | 45.27 | % | 60.91 | % | 27.08 | % |
| Average PD in % | 0.10 | % | 0.15 | % | 0.68 | % | 2.30 | % | 3.90 | % | 2.94 | % | 2.72 | % | 1.73 | % |
| Spain | ||||||||||||||||
| EAD | 2,761 | 33,870 | 100,443 | 68,748 | 6,214 | 8,887 | 4,789 | 225,712 | ||||||||
| Average LGD in % | 45.33 | % | 43.91 | % | 44.20 | % | 16.02 | % | 52.03 | % | 46.85 | % | 59.87 | % | 36.24 | % |
| Average PD in % | 0.12 | % | 0.08 | % | 0.80 | % | 1.61 | % | 3.88 | % | 4.51 | % | 2.28 | % | 1.19 | % |
| Rest of Europe | ||||||||||||||||
| EAD | — | 2,569 | 36,333 | 222,601 | 3,105 | 34,113 | 9,489 | 308,210 | ||||||||
| Average LGD in % | — | 44.14 | % | 40.57 | % | 8.36 | % | 38.80 | % | 44.86 | % | 61.44 | % | 18.44 | % | |
| Average PD in % | — | 0.15 | % | 0.92 | % | 2.52 | % | 3.89 | % | 2.58 | % | 2.94 | % | 2.34 | % | |
| Latam | ||||||||||||||||
| EAD | 488 | 4,465 | 30,364 | — | — | — | — | 35,318 | ||||||||
| Average LGD in % | 45.00 | % | 32.42 | % | 42.56 | % | — | — | — | — | 41.31 | % | ||||
| Average PD in % | 0.02 | % | 0.72 | % | 0.53 | % | — | — | — | — | 0.54 | % | ||||
| Rest of world | ||||||||||||||||
| EAD | — | — | 5,415 | — | — | — | — | — | ||||||||
| Average LGD in % | — | — | 44.98 | % | — | — | — | — | 44.98 | % | ||||||
| Average PD in % | — | — | 0.31 | % | — | — | — | — | 0.31 | % | ||||||
| * | EAD and parameters without default. |
| * | EAD does not include neither equities nor specialised lending. |
The following chart depicts exposures using the IRB approach approved in December 2019 (excluding Equities and Specialised Lending), based on the internal credit quality associated with its external rating.
| Distribution of IRB exposures associated with its external rating (Dec. 2019) | ||||
| Million euros | ||||
n n | EAD excluding collaterals EAD including collaterals | |||
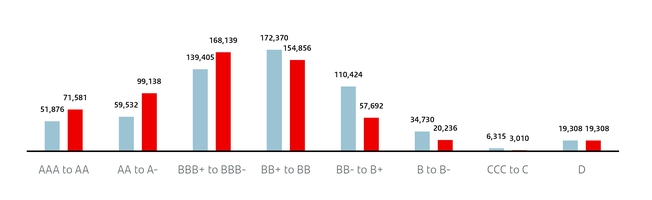
57 |
| CREDIT RISK 2019 Pillar 3 Disclosures Report |
For EAD distribution including guarantees, expected losses have been assigned to the different tranches of PD taking a LGD of 45% in each bucket. It shows that the risk profile of the whole portfolio improves significantly when factoring in guarantees, especially mortgage collateral.
| Table 18. Specialised lending (CR10) | ||||||||||||||
| Million euros | ||||||||||||||
| 31 Dec. 2019 | ||||||||||||||
| Regulatory Categories | Remaining maturity | On-balance-sheet amount | Off-balance-sheet amount | RW | EAD | RWA | Expected loss | |||||||
| Category 1 | < 2,5 years | 298 | 174 | 50 | % | 394 | 197 | 0 | ||||||
| >= 2,5 years | 2,557 | 459 | 70 | % | 2,691 | 1,883 | 11 | |||||||
| Category 2 | < 2,5 years | 4,453 | 1,365 | 70 | % | 4,948 | 3,469 | 20 | ||||||
| >= 2,5 years | 11,920 | 2,250 | 90 | % | 12,635 | 11,276 | 100 | |||||||
| Category 3 | < 2,5 years | 259 | 7 | 115 | % | 260 | 288 | 7 | ||||||
| >= 2,5 years | 662 | 27 | 115 | % | 671 | 769 | 19 | |||||||
| Category 4 | < 2,5 years | 195 | 0 | 250 | % | 195 | 481 | 16 | ||||||
| >= 2,5 years | 79 | 11 | 250 | % | 80 | 201 | 6 | |||||||
| Category 5 | < 2,5 years | 216 | 0 | — | % | 216 | — | 108 | ||||||
| >= 2,5 years | 242 | 11 | — | % | 249 | — | 124 | |||||||
| Total | < 2,5 years | 5,420 | 1,546 | 74 | % | 6,013 | 4,435 | 151 | ||||||
| >= 2,5 years | 15,459 | 2,757 | 87 | % | 16,325 | 14,128 | 260 | |||||||
| EAD-weighted average PD | EAD-weighted average LGD | |||
| % | % | |||
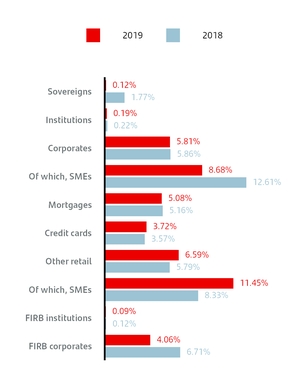
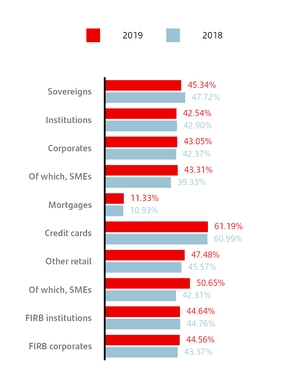
| 58 | 2019 Pillar 3 Disclosures Report | ||
| CREDIT RISK 2019 Pillar 3 Disclosures Report |
| Exposure | RWA/EAD | |||
| Million euros | % | |||
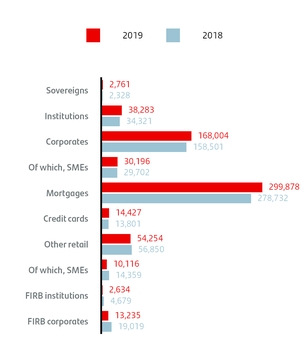
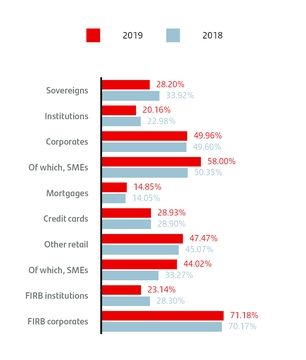
3.2.2. Equity investments and capital instruments not included in the trading book
This section provides definitions of investments in associates, equity instruments classified as other financial assets at fair value through other comprehensive income, and financial assets with mandatory classification at fair value through profit or loss. It also defines the accounting policies and measurement methods applied. Information is also provided on the amounts of those equity instruments not included in the held-for-trading portfolio.
Investments in associates are those stakes affording Santander Group significant influence, but not control or joint control. This capacity is usually observed with 20% or more of the voting power at the investee.
Equity instruments not held for trading issued by entities other than subsidiaries, jointly controlled entities and associates are required to be classified at fair value through profit or loss, unless the entity opts to classify them as financial assets at fair value through other comprehensive income, irrevocably, on initial recognition.
Investments in associates are recognised at cost and Santander Group periodically tests for their impairment.
Equity instruments classified as other financial assets at fair value through other comprehensive income are recognised and measured at fair value with a corresponding entry in equity, under valuation adjustments. Instruments classified as financial assets with mandatory recognition at fair value through profit or loss are recognised and measured at fair value with a corresponding entry in profit or loss.
59 |
| CREDIT RISK 2019 Pillar 3 Disclosures Report |
| Table 19. Equities (CR10) | |||||||||||||||
| Million euros | |||||||||||||||
| 31 Dec. 2019 | |||||||||||||||
| Tranches: | Weighted average PD | Original exposure | EAD | EAD-weighted average LGD | RWA | PE/EAD | RW | ||||||||
| PD/LGD Approach | |||||||||||||||
| 1 | 0.09 | % | 510 | 510 | 90.0 | % | 492 | 0.08 | % | 96 | % | ||||
| 2 | 0.14 | % | 1,215 | 1,215 | 88.2 | % | 1,421 | 0.12 | % | 117 | % | ||||
| 3 | 0.14 | % | 1,511 | 1,511 | 90.0 | % | 1,825 | 0.13 | % | 121 | % | ||||
| 4 | 0.30 | % | 1,533 | 1,533 | 86.3 | % | 2,395 | 0.25 | % | 156 | % | ||||
| 5 | 1.44 | % | 1,473 | 1,473 | 65.0 | % | 2,993 | 0.94 | % | 203 | % | ||||
| Default | 100.00 | % | 1 | 1 | 65.0 | % | — | 65.00 | % | — | % | ||||
| Total Dec. 2019 | 0.49 | % | 6,243 | 6,243 | 82.8 | % | 9,125 | 0.35 | % | 146 | % | ||||
| Total Dec. 2018 | 0.79 | % | 6,603 | 6,603 | 79.3 | % | 10,612 | 0.54 | % | 161 | % | ||||
| Simple-risk weighted approach | |||||||||||||||
| Exposure in private equity | — | 1,348 | 1,348 | — | 2,561 | 0.80 | % | 190 | % | ||||||
| Exposure in equity traded in organised markets | — | 91 | 91 | — | 264 | 0.80 | % | 290 | % | ||||||
| Other exposures in equities | — | — | — | — | — | — | — | ||||||||
| Total Dec. 2019 | — | 1,439 | 1,439 | — | 2,825 | — | — | ||||||||
| Total Dec. 2018 | — | 1,353 | 1,353 | — | 2,654 | — | — | ||||||||
| Internal models approach Dec. 2019 | — | — | — | — | — | — | |||||||||
| Internal models approach Dec. 2018 | 658 | 658 | — | 1,174 | — | 178 | % | ||||||||
| Financial participations Dec. 2019 | 3,049 | 3,049 | — | 7,622 | — | 250 | % | ||||||||
| Financial participations Dec. 2018 | 2,313 | 2,313 | — | 5,784 | — | 250 | % | ||||||||
| Total Dec. 2019 | — | 10,731 | 10,731 | — | 19,572 | — | — | ||||||||
| Total Dec. 2018 | — | 10,927 | 10,927 | — | 20,224 | — | — | ||||||||
| Note: Santander Group has no off-balance-sheet exposures in equities | |||||||||||||||
The total unrealised gains of equity and capital instruments not included in the trading book included in CET1 as of December 19 were EUR 538 million.
| 60 | 2019 Pillar 3 Disclosures Report | ||
| CREDIT RISK 2019 Pillar 3 Disclosures Report |
| Table 20. Equity instruments through other comprehensive income | |||||||
| Million euros | |||||||
| 31 Dec. 2019 | |||||||
| Carrying value | Fair value | Valuation adjustment | |||||
| Quoted | 2,283 | 2,283 | 1,008 | ||||
| Unquoted | 581 | 581 | (364 | ) | |||
| Total | 2,864 | 2,864 | 644 | ||||
| Table 21. Equity instruments mandatory at fair value through profit and loss | |||
| Million euros | |||
| 31 Dec. 2019 | |||
| Fair Value | |||
| Quoted | 29 | ||
| Investment funds | 386 | ||
| Unquoted | 1,559 | ||
| Total | 1,975 | ||
Refer to notes 2.d.iii and 8 of the Auditor’s Report and Financial Statements in the Annual Report for further information on the portfolio of capital instruments classified as other financial assets at fair value through other comprehensive income and with mandatory classification at fair value through profit or loss.
| Table 22. Equity instruments through other comprehensive income. Consolidated gross valuation adjustments | |||
| Million euros | |||
| Fair Value | |||
| Prior-year balance | 672 | ||
| Revaluation gains and losses | (28 | ) | |
| Current-year balance | 644 | ||
Refer to note 29.c of the Auditor’s Report and Financial Statements in the Annual Report for further information on the portfolio of capital instruments classified as other financial assets at fair value through other comprehensive income.
With respect to holdings accounted for using the equity method at year-end 2019, the amounts for associates and jointly controlled entities were EUR 343 million and EUR 7,407 million respectively.
There are also investments in Group entities totalling EUR 1,897 million which are accounted for using the full consolidation method in the public perimeter.
The Group tests these investments for impairment on a regular basis. No evidence of significant impairment was found in 2019.
61 |
| CREDIT RISK 2019 Pillar 3 Disclosures Report |
3.2.3. Standardised approach
For the calculation of regulatory capital under the standardised approach, Santander Group uses the external rating agencies designated as eligible by the ECB (European Central Bank). The agencies used for the capital calculation as of 31 December 2019 are Fitch, Moody’s, DBRS, Standard & Poor’s and Japan Credit Rating Agency.
Additionally, for the central government and central banks category, if the requirements of article 137 of the CRR are met, Santander Group uses the OECD’s Country Risk Classification of the Participants to the Arrangement on Officially Supported Export Credits.
Different risk weights are applied to credit exposures, depending on the rating assigned by the credit rating agencies (e.g. Fitch, Moody’s and Standard & Poor’s for the segments approved under Part III, Title II, Chapter II of the CRR) or the minimum export insurance premium rating (e.g. OECD for the central government and central bank segment, as explained above).
The assignment of weights according to credit ratings complies with the regulatory requirements, aligning the alphanumeric scale of each agency used with the credit quality steps set down in Chapter II, Section II of the CRR, as follows:
| Credit quality step | S&P | Moody's | Fitch | DBRS | Japan Credit Rating Agency |
| 1 | AAA a AA- | AAA a AA3 | AAA a AA- | AAA a AAL | AAA a AA |
| 2 | A+ a A- | A1 a A3 | A+ a A- | AH a AL | A |
| 3 | BBB+ a BBB- | BAA1 a BAA3 | BBB+ a BBB- | BBBH a BBBL | BBB |
| 4 | BB+ a BB- | BA1 a BA3 | BB+ a BB- | BBH a BBL | BB |
| 5 | B+ a B- | B1 a B3 | B+ a B- | BH a BL | B |
| 6 | Inferior a B- | Inferior a B3 | Inferior a B- | CCCH e inferior | CCC a inferior |
| Credit quality step | Central governments and central banks | Public sector entities | Institutions ≤ 3 months rated | Institutions > 3 months rated | Institutions not rated | Corporates |
| 1 | 0% | 20% | 20% | 20% | 20% | 20% |
| 2 | 20% | 50% | 20% | 50% | 50% | 50% |
| 3 | 50% | 100% | 20% | 50% | 100% | 100% |
| 4 | 100% | 100% | 50% | 100% | 100% | 100% |
| 5 | 100% | 100% | 50% | 100% | 100% | 150% |
| 6 | 150% | 150% | 150% | 150% | 150% | 150% |
At present, Santander Group has no process in place for assigning the credit ratings of publicly issued securities to comparable assets that are not included in the held-for-trading portfolio.
In accordance with art. 150 of the CRR, Santander Group always uses the standardised approach for sovereign exposures denominated and funded in the Member State’s local currency, applying a 0% risk weighting.
The tables below show the value of the net exposure after impairment loss allowances after risk mitigation, by segment and credit quality grade.
Guarantees are applied by reallocating exposures to the corresponding asset categories and risk weightings.
When credit institutions use some of their qualifying financial collateral as a credit risk mitigation technique, the valuation of this collateral for the calculation of risk-weighted exposure amounts can either follow the simple method of valuation of financial collateral regulated by article 222 of the CRR, or the comprehensive method regulated by article 223.
| 62 | 2019 Pillar 3 Disclosures Report | ||
| CREDIT RISK 2019 Pillar 3 Disclosures Report |
| Table 23. Standardised approach (including a breakdown of exposures post conversion factor and post mitigation techniques) (CR5) | |||||||||||||||||||||||||||||||||||
| Million euros | |||||||||||||||||||||||||||||||||||
| 31 Dec. 2019 | |||||||||||||||||||||||||||||||||||
| Risk Weight | Total | ||||||||||||||||||||||||||||||||||
| 0 | % | 2 | % | 4 | % | 10 | % | 20 | % | 35 | % | 50 | % | 70 | % | 75 | % | 100 | % | 150 | % | 250 | % | 370 | % | 1250 | % | Otros | Deduc. | ||||||
| Central governments or central banks | 198,050 | — | — | — | 0 | — | 2,926 | — | — | 12,562 | 96 | 6,045 | — | — | — | — | 219,678 | ||||||||||||||||||
| Regional government or local authorities | 17,329 | — | — | — | 364 | — | 0 | — | — | 241 | 0 | — | — | — | — | — | 17,933 | ||||||||||||||||||
| Public sector entities | 10,859 | — | — | — | 1,275 | — | 35 | — | — | 145 | — | — | — | — | — | — | 12,314 | ||||||||||||||||||
| Multilateral development banks | 3,531 | — | — | — | — | — | — | — | — | — | — | — | — | — | — | — | 3,531 | ||||||||||||||||||
| International organisations | 13 | — | — | — | — | — | — | — | — | — | — | — | — | — | — | — | 13 | ||||||||||||||||||
| Institutions | — | — | — | — | 16,535 | — | 789 | — | — | 1,704 | 5 | — | — | — | — | — | 19,033 | ||||||||||||||||||
| Corporates | — | — | — | — | 441 | — | 163 | — | — | 60,643 | 1,140 | — | — | — | — | — | 62,386 | ||||||||||||||||||
| Retail | — | — | — | — | — | — | — | — | 149,267 | — | — | — | — | — | — | — | 149,267 | ||||||||||||||||||
| Secured by mortgages on immovable property | — | — | — | — | — | 73,350 | 12,825 | — | 3,196 | 5,997 | — | — | — | — | — | — | 95,369 | ||||||||||||||||||
| Exposures in default | — | — | — | — | — | — | — | — | — | 6,458 | 750 | — | — | — | — | — | 7,208 | ||||||||||||||||||
| Exposures associated with particularly high risk | — | — | — | — | — | — | — | — | — | — | 1,460 | — | — | — | — | — | 1,460 | ||||||||||||||||||
| Covered bonds | — | — | — | 2,045 | 48 | — | — | — | — | — | — | — | — | — | — | — | 2,093 | ||||||||||||||||||
| Institutions and corporates with a short-term credit assessment | — | — | — | — | — | — | — | — | — | 5 | — | — | — | — | — | — | 5 | ||||||||||||||||||
| Collective investment undertakings | — | — | — | — | — | — | — | — | — | — | — | — | — | — | 150 | — | 150 | ||||||||||||||||||
| Equity | — | — | — | — | — | — | — | — | — | 326 | — | — | — | — | — | — | 326 | ||||||||||||||||||
| Other items | 20,930 | 482 | — | — | 12,164 | — | 14 | — | 116 | 41,429 | 0 | — | — | — | — | — | 75,135 | ||||||||||||||||||
| Total | 250,712 | 482 | — | 2,045 | 30,826 | 73,350 | 16,753 | — | 152,580 | 129,508 | 3,451 | 6,045 | — | — | 150 | — | 665,901 | ||||||||||||||||||
Note: Counterparty credit risk not included
| 63 |
| CREDIT RISK 2019 Pillar 3 Disclosures Report |
3.3. Distribution of exposures
The tables below show information on the Santander Group’s exposures to credit and dilution risk, broken down as follows:
| • | Exposure category |
| • | Business sector |
| • | Geographical area |
| • | Residual maturity |
It also contains information on defaulted exposures, impairment loss allowances, and provisions for contingent liabilities and commitments.
The amounts shown in the tables in this section include the amounts for counterparty credit risk excluding securitisations.
| 64 | 2019 Pillar 3 Disclosures Report | ||
| CREDIT RISK 2019 Pillar 3 Disclosures Report |
| Table 24. Credit quality of exposures by exposure classes and instruments (CR1-A) | |||||||||||||
| Million euros | |||||||||||||
| 31 Dec. 2019 | |||||||||||||
| Gross carrying values of | Specific credit risk adjustment | Accumulated write-offs | Credit risk adjustment charges of the period | Net values | |||||||||
| Defaulted exposures | Non-defaulted exposures | ||||||||||||
| IRB approach | |||||||||||||
| Central governments or central banks | 0 | 4,064 | 2 | — | 0 | 4,063 | |||||||
| Institutions | 15 | 49,910 | 21 | 1 | 0 | 49,904 | |||||||
| Corporates | 10,485 | 277,123 | 4,046 | 1,832 | 969 | 283,562 | |||||||
| Of which, Specialised Lending | 469 | 24,713 | 362 | — | 82 | 24,820 | |||||||
| Of which, SME | 2,267 | 35,767 | 961 | 218 | 342 | 37,073 | |||||||
| Retail | 10,863 | 374,237 | 4,809 | 754 | 1,072 | 380,291 | |||||||
| Secured by real estate property | 8,593 | 296,350 | 2,692 | 251 | 349 | 302,251 | |||||||
| SME | 1,433 | 2,606 | 372 | 157 | 59 | 3,667 | |||||||
| Non-SME | 7,160 | 293,743 | 2,320 | 95 | 291 | 298,584 | |||||||
| Qualifying Revolving | 172 | 21,254 | 258 | 49 | 108 | 21,167 | |||||||
| Other Retail | 2,098 | 56,633 | 1,859 | 454 | 614 | 56,873 | |||||||
| SME | 924 | 11,538 | 710 | 225 | 168 | 11,751 | |||||||
| Non-SME | 1,175 | 45,095 | 1,148 | 229 | 446 | 45,122 | |||||||
| Equity | 1 | 10,730 | — | — | — | 10,731 | |||||||
| Total IRB approach | 21,363 | 716,065 | 8,878 | 2,587 | 2,041 | 728,550 | |||||||
| Standard approach | |||||||||||||
| Central governments or central banks | 20 | 218,827 | 6 | — | 0 | 218,821 | |||||||
| Regional governments or local authorities | 10 | 7,953 | 39 | 0 | 1 | 7,914 | |||||||
| Public sector entities | — | 12,684 | 3 | — | 0 | 12,681 | |||||||
| Multilateral Development Banks | — | 2,001 | — | — | — | 2,001 | |||||||
| International Organisations | — | 13 | — | — | — | 13 | |||||||
| Institutions | 2 | 42,692 | 4 | 1 | 2 | 42,689 | |||||||
| Corporates | 2,565 | 93,358 | 550 | 930 | 901 | 92,808 | |||||||
| of which, SME | 332 | 14,035 | 67 | 364 | 399 | 13,968 | |||||||
| Retail | 8,476 | 240,745 | 5,639 | 8,659 | 11,326 | 235,106 | |||||||
| of which, SME | 859 | 33,486 | 588 | 639 | 516 | 32,898 | |||||||
| Secured by mortgages on immovable property | 4,187 | 105,520 | 541 | 296 | 287 | 104,980 | |||||||
| of which, SME | 607 | 19,452 | 233 | 27 | 53 | 19,219 | |||||||
| Items associated with particularly high risk | 211 | 1,854 | 112 | 2 | 0 | 1,743 | |||||||
| Covered bonds | — | 2,093 | — | — | — | 2,093 | |||||||
| Claims on institutions and corporates with a short-term credit assessment | 6 | 5 | — | — | — | 5 | |||||||
| Collective investments undertakings (CIU) | — | 1,836 | — | — | — | 1,836 | |||||||
| Equity exposures | — | 326 | — | — | — | 326 | |||||||
| Other exposures | 35 | 88,141 | 504 | 48 | 48 | 87,637 | |||||||
| Total Exposures in default (STD Approach only) | 8,020 | — | — | 7,282 | |||||||||
| Total Standardised approach | 15,302 | 818,049 | 15,417 | 9,937 | 12,594 | 817,933 | |||||||
| Total | 36,665 | 1,534,114 | 24,296 | 12,524 | 14,635 | 1,546,483 | |||||||
Notes:
1) The row of Total Exposures in default (SA approach only) is the sumatory of all the defaulted exposures and is included to show the defaulted exposures’ Specific credit risk adjustment.
2) Non-performing exposures do not include high-risk exposures.
65 |
| CREDIT RISK 2019 Pillar 3 Disclosures Report |
The following two tables show all exposures by industry and geographical area:
| Table 25. Credit quality of exposures by industry or counterparty type (CR1-B) | |||||||||||
| Million euros | |||||||||||
| 31 Dec. 2019 | |||||||||||
| Gross carrying values of: | Adjustment for specific Credit risk | Accumulated write-offs | Net values | ||||||||
| Defaulted exposures | Non-defaulted exposures | ||||||||||
| Agriculture, forestry and fishing | 938 | 15,953 | 488 | 210 | 16,404 | ||||||
| Mining and quarrying | 194 | 8,357 | 155 | 34 | 8,395 | ||||||
| Manufacturing | 2,211 | 63,953 | 1,571 | 642 | 64,593 | ||||||
| Electricity, gas, steam and air conditioning supply | 619 | 18,519 | 295 | 117 | 18,843 | ||||||
| Water supply | 7 | 846 | 7 | 2 | 846 | ||||||
| Construction | 900 | 20,263 | 696 | 194 | 20,466 | ||||||
| Wholesale and retail trade | 1,905 | 78,828 | 1,332 | 391 | 79,401 | ||||||
| Transport and storage | 720 | 16,550 | 354 | 94 | 16,917 | ||||||
| Accommodation and food service activities | 541 | 6,851 | 313 | 72 | 7,079 | ||||||
| Information and communication | 96 | 6,392 | 68 | 20 | 6,420 | ||||||
| Real estate activities | 1,415 | 56,307 | 742 | 226 | 56,980 | ||||||
| Professional, scientific and technical activities | 168 | 12,603 | 159 | 75 | 12,612 | ||||||
| Administrative and support service activities | 567 | 13,718 | 303 | 31 | 13,982 | ||||||
| Public administration and defence, compulsory social security | 186 | 230,430 | 138 | 31 | 230,478 | ||||||
| Education | 100 | 5,972 | 97 | 67 | 5,975 | ||||||
| Human health services and social work activities | 490 | 17,786 | 271 | 357 | 18,005 | ||||||
| Arts, entertainment and recreation | 77 | 1,812 | 16 | 39 | 1,872 | ||||||
| Other services | 25,531 | 958,974 | 17,291 | 9,923 | 967,215 | ||||||
| Total | 36,665 | 1,534,114 | 24,296 | 12,524 | 1,546,483 | ||||||
| Table 26. Credit quality of exposures by geography (CR1-C) | |||||||||||||
| Million euros | |||||||||||||
| 31 Dec. 2019 | |||||||||||||
| Gross carrying values of: | Specific credit risk adjustment | Accumulated write-offs | Credit risk adjustment charges of the period | Net values | |||||||||
| Defaulted exposures | Non-defaulted exposures | ||||||||||||
| Europe | 25,293 | 985,589 | 12,355 | 3,958 | 2,862 | 998,527 | |||||||
| Of which, Spain | 17,134 | 370,067 | 7,154 | 2,677 | 1,640 | 380,047 | |||||||
| Of which, UK | 2,628 | 354,793 | 1,120 | 294 | 208 | 356,302 | |||||||
| North America | 3,078 | 241,921 | 4,958 | 4,363 | 8,909 | 240,041 | |||||||
| Of which, USA | 2,192 | 170,549 | 3,862 | 3,366 | 8,063 | 168,879 | |||||||
| South America | 8,087 | 271,785 | 6,798 | 4,106 | 2,758 | 273,074 | |||||||
| Of which, Brazil | 5,712 | 179,369 | 5,236 | 3,335 | 1,837 | 179,845 | |||||||
| Others | 207 | 34,818 | 185 | 97 | 107 | 34,841 | |||||||
| Total | 36,665 | 1,534,114 | 24,296 | 12,524 | 14,635 | 1,546,483 | |||||||
| 66 | 2019 Pillar 3 Disclosures Report | ||
| CREDIT RISK 2019 Pillar 3 Disclosures Report |
The following table shows the credit quality of forborne exposures:
| Table 27. Credit quality of forborne exposures | ||||||||||||||||
| Million euros | ||||||||||||||||
| 31 Dec. 2019 | ||||||||||||||||
| Gross carrying amount/nominal amount of exposures with forbearance measures | Accumulated impairment, accumulated negative changes in fair value due to credit risk and provisions | Collateral received and financial guarantees received on forborne exposures | ||||||||||||||
| Performing forborne | Non-performing forborne | On performing forborne exposures | On non-performing forborne exposures | Of which collateral and financial guarantees received on non-performing exposures with forbearance measures | ||||||||||||
| Of which defaulted | Of which impaired | |||||||||||||||
| Loans and advances | 15,360 | 17,343 | 17,343 | 17,343 | (1,908 | ) | (6,927 | ) | 17,541 | 7,940 | ||||||
| Central banks | — | — | — | — | — | — | — | — | ||||||||
| General governments | 34 | 7 | 7 | 7 | (1 | ) | (1 | ) | 7 | 3 | ||||||
| Credit institutions | — | — | — | — | — | — | — | — | ||||||||
| Other financial corporations | 64 | 38 | 38 | 38 | (2 | ) | (30 | ) | 24 | 4 | ||||||
| Non-financial corporations | 5,635 | 9,125 | 9,125 | 9,125 | (396 | ) | (3,837 | ) | 7,494 | 4,408 | ||||||
| Households | 9,627 | 8,173 | 8,173 | 8,173 | (1,509 | ) | (3,059 | ) | 10,016 | 3,525 | ||||||
| Debt Securities | 110 | 565 | 565 | 553 | (2 | ) | (383 | ) | 83 | 83 | ||||||
| Loan commitments given | 823 | 9 | 9 | 9 | — | 4 | — | — | ||||||||
| Total | 16,293 | 17,917 | 17,917 | 17,905 | (1,910 | ) | (7,306 | ) | 17,624 | 8,023 | ||||||
67 |
| CREDIT RISK 2019 Pillar 3 Disclosures Report |
The following table shows the credit quality of performing and non-performing exposures by past due days:
| Table 28. Credit quality of performing and non-performing exposures by past due days | |||||||||||||||||||||||||
| Million euros | 31 Dec. 2019 | ||||||||||||||||||||||||
| Gross carrying amount/nominal amount | |||||||||||||||||||||||||
| Performing exposures | Non-performing exposures | ||||||||||||||||||||||||
| Not past due or past due 30 days | Past due > 30 days ≤ 90 days | Unlikely to pay that are not past due or are past due ≤ 90 days | Past due > 90 days ≤ 180 days | Past due > 180 days ≤ 1 year | Past due > 1 year ≤ 2 years | Past due > 2 years ≤ 5 years | Past due > 5 years ≤ 7 years | Past due > 7 years | Of which, in default | ||||||||||||||||
| Loans and advances | 1,023,951 | 1,015,238 | 8,712 | 33,309 | 11,925 | 4,345 | 4,390 | 3,370 | 4,778 | 4,253 | 248 | 33,309 | |||||||||||||
| Central banks | 24,990 | 24,990 | — | — | — | — | — | — | — | — | — | — | |||||||||||||
| General governments | 22,161 | 22,155 | 5 | 51 | 14 | 2 | 4 | 1 | 22 | 7 | — | 51 | |||||||||||||
| Credit institutions | 62,111 | 62,111 | — | 1 | 1 | — | — | — | — | — | — | 1 | |||||||||||||
| Other financial corporations | 72,405 | 72,395 | 10 | 60 | 35 | 2 | 3 | 13 | 4 | 3 | — | 60 | |||||||||||||
| Non-financial corporations | 300,687 | 299,335 | 1,352 | 14,016 | 5,500 | 951 | 1,546 | 1,402 | 2,315 | 2,235 | 67 | 14,016 | |||||||||||||
| Of which SMEs | 106,850 | 106,201 | 649 | 9,787 | 3,010 | 731 | 1,166 | 1,028 | 1,827 | 1,969 | 57 | 9,787 | |||||||||||||
| Households | 541,597 | 534,252 | 7,345 | 19,181 | 6,375 | 3,390 | 2,837 | 1,954 | 2,437 | 2,008 | 181 | 19,181 | |||||||||||||
| Debt securities | 134,160 | 134,147 | 12 | 666 | 609 | 53 | 3 | 1 | — | — | — | 666 | |||||||||||||
| Central banks | 4,198 | 4,198 | — | — | — | — | — | — | — | — | — | — | |||||||||||||
| General governments | 101,404 | 101,404 | — | — | — | — | — | — | — | — | — | — | |||||||||||||
| Credit institutions | 6,500 | 6,500 | — | — | — | — | — | — | — | — | — | — | |||||||||||||
| Other financial corporations | 12,561 | 12,561 | — | — | — | — | — | — | — | — | — | — | |||||||||||||
| Non-financial corporations | 9,497 | 9,484 | 12 | 666 | 609 | 53 | 3 | 1 | — | — | — | 666 | |||||||||||||
| Off-balance-sheet exposures | 323,184 | 1,254 | 1,254 | ||||||||||||||||||||||
| Central banks | — | — | — | ||||||||||||||||||||||
| General governments | 4,415 | 3 | 3 | ||||||||||||||||||||||
| Credit institutions | 28,192 | 3 | 3 | ||||||||||||||||||||||
| Other financial corporations | 21,098 | 4 | 4 | ||||||||||||||||||||||
| Non-financial corporations | 154,075 | 1,120 | 1,120 | ||||||||||||||||||||||
| Households | 115,404 | 124 | 124 | ||||||||||||||||||||||
| Total | 1,481,295 | 1,149,385 | 8,724 | 35,229 | 12,534 | 4,398 | 4,393 | 3,371 | 4,778 | 4,253 | 248 | 35,229 | |||||||||||||
| 68 | 2019 Pillar 3 Disclosures Report | ||
| CREDIT RISK 2019 Pillar 3 Disclosures Report |
The following table shows the performing and non-performing exposures and related provisions:
| Table 29. Performing and non-performing exposures and related provisions | |||||||||||||||||||||||||||||||||||||||||||
| Million euros | |||||||||||||||||||||||||||||||||||||||||||
| 31 Dec. 2019 | |||||||||||||||||||||||||||||||||||||||||||
| Gross carrying amount/nominal amount | Accumulated impairment, accumulated negative changes in fair value due to credit risk and provisions | Accumulated partial write-off | Collateral and financial guarantees received | ||||||||||||||||||||||||||||||||||||||||
| Performing exposures | Non-performing exposures | Performing exposures – accumulated impairment and provisions | Non-performing exposures – accumulated impairment, accumulated negative changes in fair value due to credit risk and provisions | On performing exposures | On non-performing exposures | ||||||||||||||||||||||||||||||||||||||
| Of which, stage 1 | Of which, stage 2 | Of which, stage 2 | Of which, stage 3 | Of which, stage 1 | Of which, stage 2 | Of which, stage 2 | Of which, stage 3 | ||||||||||||||||||||||||||||||||||||
| Loans and advances | 1,023,951 | 912,912 | 50,853 | 33,309 | — | 33,285 | (8,454 | ) | (3,962 | ) | (4,492 | ) | (14,114 | ) | — | (14,106 | ) | (2,540 | ) | 661,597 | 14,460 | ||||||||||||||||||||||
| Central banks | 24,990 | 18,517 | — | — | — | — | — | — | — | — | — | — | — | 7,414 | — | ||||||||||||||||||||||||||||
| General governments | 22,161 | 18,393 | 546 | 51 | — | 51 | (43 | ) | (13 | ) | (30 | ) | (9 | ) | — | (9 | ) | — | 4,183 | — | |||||||||||||||||||||||
| Credit institutions | 62,111 | 40,470 | — | 1 | — | 1 | (14 | ) | (14 | ) | — | — | — | 0 | — | 30,579 | — | ||||||||||||||||||||||||||
| Other financial corporations | 72,405 | 51,395 | 152 | 60 | — | 60 | (23 | ) | (17 | ) | (6 | ) | (42 | ) | — | (42 | ) | — | 51,816 | 15 | |||||||||||||||||||||||
| Non-financial corporations | 300,687 | 274,239 | 18,781 | 14,016 | — | 14,008 | (1,977 | ) | (965 | ) | (1,012 | ) | (6,115 | ) | — | (6,111 | ) | (2,407 | ) | 163,891 | 5,762 | ||||||||||||||||||||||
| Of which SMEs | 110,311 | 99,335 | 8,895 | 9,787 | — | 9,787 | (1,211 | ) | (579 | ) | (632 | ) | (4,079 | ) | — | (4,079 | ) | — | 58,491 | 4,635 | |||||||||||||||||||||||
| Households | 541,597 | 509,898 | 31,374 | 19,181 | — | 19,165 | (6,398 | ) | (2,954 | ) | (3,444 | ) | (7,948 | ) | — | (7,944 | ) | (133 | ) | 403,714 | 8,683 | ||||||||||||||||||||||
| Debt securities | 134,160 | 132,184 | 447 | 666 | — | 647 | (28 | ) | (23 | ) | (6 | ) | (452 | ) | — | (446 | ) | — | — | 83 | |||||||||||||||||||||||
| Central banks | 4,198 | 4,130 | 68 | — | — | — | — | — | — | — | — | — | — | — | — | ||||||||||||||||||||||||||||
| General governments | 101,404 | 101,084 | 320 | — | — | — | (7 | ) | (4 | ) | (3 | ) | — | — | — | — | — | — | |||||||||||||||||||||||||
| Credit institutions | 6,500 | 6,500 | — | — | — | — | (1 | ) | (1 | ) | — | — | — | — | — | — | — | ||||||||||||||||||||||||||
| Other financial corporations | 12,561 | 11,535 | — | — | — | — | (3 | ) | (3 | ) | — | — | — | — | — | — | — | ||||||||||||||||||||||||||
| Non-financial corporations | 9,497 | 8,935 | 59 | 666 | — | 647 | (17 | ) | (15 | ) | (3 | ) | (452 | ) | — | (446 | ) | — | — | 83 | |||||||||||||||||||||||
| Off-balance-sheet exposures | 323,184 | 316,829 | 6,355 | 1,254 | — | 1,254 | 562 | 418 | 145 | 177 | — | 177 | 6,784 | 110 | |||||||||||||||||||||||||||||
| Central banks | — | — | — | — | — | — | — | — | — | — | — | ||||||||||||||||||||||||||||||||
| General governments | 4,415 | 4,295 | 120 | 3 | — | 3 | — | — | 0 | — | — | — | 11 | — | |||||||||||||||||||||||||||||
| Credit institutions | 28,192 | 28,033 | 159 | 3 | — | 3 | 8 | 8 | 0 | — | — | 515 | — | ||||||||||||||||||||||||||||||
| Other financial corporations | 21,098 | 21,042 | 56 | 4 | — | 4 | 10 | 10 | 0 | 1 | — | 1 | 83 | — | |||||||||||||||||||||||||||||
| Non-financial corporations | 154,075 | 149,340 | 4,735 | 1,120 | — | 1,120 | 314 | 213 | 101 | 164 | — | 164 | 4,600 | 108 | |||||||||||||||||||||||||||||
| Households | 115,404 | 114,119 | 1,285 | 124 | — | 124 | 230 | 187 | 43 | 12 | — | 12 | 1,575 | 2 | |||||||||||||||||||||||||||||
| Total | 1,481,295 | 1,361,925 | 57,655 | 35,229 | — | 35,186 | (2,540 | ) | 668,381 | 14,653 | |||||||||||||||||||||||||||||||||
69 |
| CREDIT RISK 2019 Pillar 3 Disclosures Report |
The following table shows the collateral obtained by taking possession and execution processes:
| Table 30. Collateral obtained by taking possession and execution processes | ||||
| Million euros | 31 Dec. 2019 | |||
| Collateral obtained by taking possession | ||||
| Value at initial recognition | Accumulated negative changes | |||
| Property, plant and equipment (PP&E) | — | — | ||
| Other than PP&E | 8,442 | (3,155 | ) | |
| Residential immovable property | 1,506 | (317 | ) | |
| Commercial Immovable property | 6,644 | (2,820 | ) | |
| Movable property (auto, shipping, etc.) | 223 | (19 | ) | |
| Equity and debt instruments | 69 | — | ||
| Other | — | — | ||
| Total | 8,442 | (3,155 | ) | |
| Table 31. Changes in stock of general and specific credit risk adjustments (CR2-A) | ||||
| Million euros | ||||
| 31 Dec. 2019 | ||||
| Stage 3 | Stage 1 and 2 | |||
| Opening balance | 15,694 | 8,520 | ||
| Increases due to amounts set aside for estimated loan losses during the period | 13,587 | 5,801 | ||
| Decreases due to amounts reversed for estimated loan losses during the period | (5,140 | ) | (3,254 | ) |
| Decreases due to amounts taken against accumulated credit risk adjustments | (12,524 | ) | — | |
| Impact of exchange rate differences | (103 | ) | 24 | |
| Business combination, including acquisitions and disposals of subsidiaries | — | — | ||
| Other adjustments | 3,039 | (2,609 | ) | |
| Closing balance | 14,553 | 8,482 | ||
| Recoveries on credit risk adjustments recorded directly to the statement of profit or loss | 1,593 | — | ||
| Specific credit risk adjustments recorded directly to the statement of profit or loss | — | — | ||
| Table 32. Changes in stock of non-performing loans and debt securities (CR2-B) | |||
| Million euros | |||
| 31 Dec. 2019 | |||
| Gross book value of non-performing exposures | |||
| Opening balance | 35,936 | ||
| Loans and debt securities that have defaulted or impaired since the last reporting period (1) | 10,279 | ||
| Amounts written off | (12,524 | ) | |
| Other changes | 283 | ||
| Closing balance | 33,974 | ||
1 Figures are referred to net new non-performing.
| 70 | 2019 Pillar 3 Disclosures Report | ||
| CREDIT RISK 2019 Pillar 3 Disclosures Report |
| Table 33. Net amount of exposures (CRB-B) | ||||
| Million euros | ||||
| 31 Dec. 2019 | ||||
| Net exposure at the end of the period | Avarege exposure over the period | |||
| Central governments or central banks | 4,063 | 4,360 | ||
| Institutions | 49,904 | 51,454 | ||
| Corporates | 283,562 | 280,845 | ||
| Of Which: Specialised Lending | 24,820 | 22,060 | ||
| Of Which: SME | 37,073 | 36,366 | ||
| Retail | 380,291 | 372,307 | ||
| Secured by real estate property | 302,251 | 292,256 | ||
| SME | 3,667 | 4,199 | ||
| Non-SME | 298,584 | 288,057 | ||
| Qualifying Revolving | 21,167 | 20,407 | ||
| Other Retail | 56,873 | 59,645 | ||
| SME | 11,751 | 13,626 | ||
| Non-SME | 45,122 | 46,018 | ||
| Equity | 10,731 | 10,548 | ||
| Total IRB approach | 728,550 | 719,514 | ||
| Central governments or central banks | 218,821 | 227,966 | ||
| Regional governments or local authorities | 7,914 | 10,164 | ||
| Public sector entities | 12,681 | 11,387 | ||
| Multilateral Development Banks | 2,001 | 1,843 | ||
| International Organisations | 13 | 21 | ||
| Institutions | 42,689 | 45,255 | ||
| Corporates | 92,808 | 94,288 | ||
| of which: SME | 13,968 | 16,673 | ||
| Retail | 235,106 | 231,566 | ||
| of which: SME | 32,898 | 33,524 | ||
| Secured by mortgages on immovable property | 104,980 | 105,198 | ||
| of which: SME | 19,219 | 18,448 | ||
| Exposures in default | 7,282 | 7,724 | ||
| Items associated with particularly high risk | 1,743 | 1,970 | ||
| Covered bonds | 2,093 | 3,212 | ||
| Claims on institutions and corporates with a short-term credit assessment | 5 | 4 | ||
| Collective investments undertakings (CIU) | 1,836 | 1,354 | ||
| Equity exposures | 326 | 329 | ||
| Other exposures | 87,637 | 84,270 | ||
| Total Standardised approach | 817,933 | 826,551 | ||
| Total | 1,546,483 | 1,546,065 | ||
| Note: Securitisations not included. | ||||
The Group’s average EAD increased by 2.7%, mainly due to the growth of exposure in the categories of central governments or central banks under the standard method, and to the increase of the EAD in the corporate, and retailers segments under the IRB method.
The following graph shows the distribution, by geographical area, of Santander Groups’s exposure to credit and dilution risk.
71 |
| CREDIT RISK 2019 Pillar 3 Disclosures Report |
| Table 34. Geographical breakdown of exposures (CRB-C) | ||||||||||||||||||
| Million euros | ||||||||||||||||||
| 31 Dec. 2019 | ||||||||||||||||||
| Net original exposure | ||||||||||||||||||
| Europe | Of which, Spain | Of which, UK | North America | Of which, USA | South America | Of which, Brazil | Others | Total | ||||||||||
| IRB Approach | ||||||||||||||||||
| Central governments or central banks | 2,738 | 522 | 116 | 325 | 324 | 555 | 59 | 445 | 4,063 | |||||||||
| Institutions | 31,744 | 15,624 | 6,104 | 8,119 | 5,696 | 3,778 | 508 | 6,262 | 49,904 | |||||||||
| Corporate | 201,701 | 102,569 | 46,540 | 37,811 | 20,387 | 26,866 | 20,227 | 17,183 | 283,562 | |||||||||
| Retail | 374,526 | 107,427 | 218,372 | 223 | 128 | 330 | 55 | 5,212 | 380,291 | |||||||||
| Equity | 10,358 | 10,358 | — | — | — | 372 | 363 | — | 10,731 | |||||||||
| Total IRB Approach | 621,067 | 236,500 | 271,132 | 46,479 | 26,535 | 31,902 | 21,213 | 29,102 | 728,550 | |||||||||
| Standard Approach | ||||||||||||||||||
| Central governments or central banks | 128,480 | 51,866 | 40,223 | 32,931 | 13,296 | 53,333 | 45,800 | 4,077 | 218,821 | |||||||||
| Regional governments or local authorities | 7,084 | 6,400 | — | 187 | 187 | 639 | 337 | 4 | 7,914 | |||||||||
| Public sector entities | 486 | 160 | — | 9,721 | 9,659 | 2,474 | — | — | 12,681 | |||||||||
| Multilateral Developments Banks | 2,001 | 0 | 1,789 | — | — | — | — | — | 2,001 | |||||||||
| International Organizations | — | — | — | — | — | 13 | — | — | 13 | |||||||||
| Institutions | 22,317 | 13,518 | 3,044 | 12,579 | 8,684 | 7,602 | 6,303 | 190 | 42,689 | |||||||||
| Corporate | 45,386 | 10,424 | 8,503 | 18,354 | 17,922 | 29,031 | 18,031 | 37 | 92,808 | |||||||||
| Retail | 84,336 | 14,520 | 20,087 | 58,559 | 45,039 | 90,802 | 62,482 | 1,409 | 235,106 | |||||||||
| Secured by mortgages on immovable property | 29,228 | 6,814 | 1,153 | 40,989 | 34,022 | 34,761 | 10,666 | 1 | 104,980 | |||||||||
| Exposures in default | 2,507 | 770 | 156 | 1,540 | 1,161 | 3,227 | 1,844 | 8 | 7,282 | |||||||||
| Items associated with particularly high risk | 329 | — | 150 | 65 | 65 | 1,348 | 577 | — | 1,743 | |||||||||
| Covered Bonds | 2,093 | — | 1,702 | — | — | — | — | — | 2,093 | |||||||||
| Claims on institutions and corporates with a short-term credit assessment | 5 | 5 | — | — | — | — | — | — | 5 | |||||||||
| Collective investments undertakings (CIU) | 148 | 49 | 10 | 1,573 | 2 | 115 | 115 | — | 1,836 | |||||||||
| Equity exposures | 240 | — | — | — | — | 86 | — | — | 326 | |||||||||
| Other exposures | 52,820 | 39,020 | 8,350 | 17,063 | 12,307 | 17,742 | 12,477 | 13 | 87,637 | |||||||||
| Total SA approach | 377,459 | 143,547 | 85,169 | 193,562 | 142,344 | 241,173 | 158,632 | 5,739 | 817,933 | |||||||||
| Total | 998,527 | 380,047 | 356,302 | 240,041 | 168,879 | 273,074 | 179,845 | 34,841 | 1,546,483 | |||||||||
| Note: Securitisations not included. | ||||||||||||||||||
The geographical distribution of standard portfolios is concentrated mainly in Brazil, Spain and the United States. The most important segments remain central administrations (with strong presence in Spain, Brazil and the United Kingdom), retailers and corporates, which have a prominent presence in Brazil, the United States and the United Kingdom.
Regarding the IRB portfolios, most of the exposure is concentrated in retailers and corporates segments from Spain and the United Kingdom.
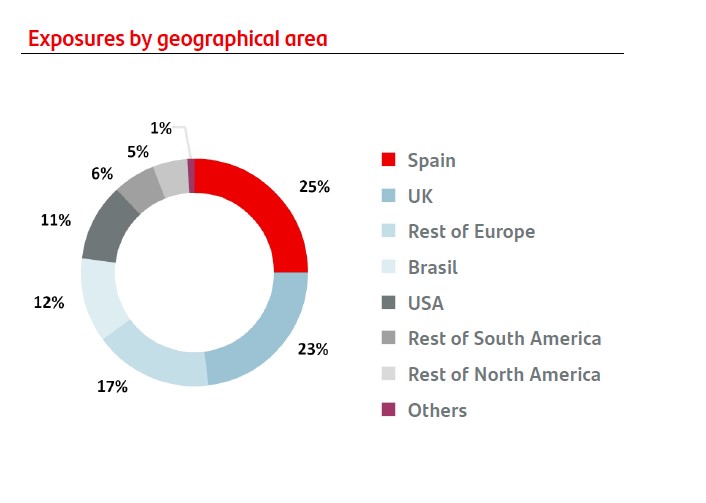
| 72 | 2019 Pillar 3 Disclosures Report | ||
| CREDIT RISK 2019 Pillar 3 Disclosures Report |
| Table 35. Concentration of exposures by industry or counterparty type (CRB-D) | ||||||||||||||||||||||||
| Million euros | ||||||||||||||||||||||||
| 31 Dec. 2019 | ||||||||||||||||||||||||
| Net original exposure | Real estate activities | Accommodation and food service activities | Construction | Manufacturing | Other services | Other Retail (Individuals) | Primary Sector | PublicSector | Professional Services | Utilities | Transport and storage | Total | ||||||||||||
| IRB Approach | ||||||||||||||||||||||||
| Central governments or central banks | — | — | — | — | 3,574 | — | — | 488 | — | — | — | 4,063 | ||||||||||||
| Institutions | — | 200 | — | 13 | 47,417 | — | — | 2,179 | 11 | 38 | 45 | 49,904 | ||||||||||||
| Corporates | 20,281 | 22,307 | 8,917 | 34,910 | 155,250 | — | 9,849 | 7,237 | 4,713 | 12,226 | 7,874 | 283,562 | ||||||||||||
| Retail | 154 | 3,716 | 756 | 2,134 | 243 | 368,177 | 2,564 | 1,252 | 577 | 499 | 217 | 380,291 | ||||||||||||
| Equity | 1,330 | 6 | 917 | 48 | 6,643 | — | 3 | — | 1,719 | — | 64 | 10,731 | ||||||||||||
| Total IRB approach | 21,765 | 26,229 | 10,590 | 37,106 | 213,128 | 368,177 | 12,416 | 11,157 | 7,020 | 12,763 | 8,201 | 728,550 | ||||||||||||
| Standardised Approach | ||||||||||||||||||||||||
| Central governments or central banks | — | — | — | — | 13,348 | — | — | 205,473 | — | — | — | 218,821 | ||||||||||||
| Regional governments or local authorities | — | — | 0 | 0 | 661 | — | 0 | 7,254 | 0 | 0 | 0 | 7,914 | ||||||||||||
| Public sector entities | — | — | 0 | — | 267 | — | — | 12,414 | 0 | 0 | 0 | 12,681 | ||||||||||||
| Multilateral Development Banks | — | — | — | — | 2,001 | — | — | — | — | — | — | 2,001 | ||||||||||||
| International Organisations | — | — | — | — | 13 | — | — | — | — | — | — | 13 | ||||||||||||
| Institutions | — | — | — | — | 42,689 | — | — | — | — | — | — | 42,689 | ||||||||||||
| Corporates | 3,478 | 23,625 | 2,543 | 15,813 | 23,500 | — | 4,488 | 3,606 | 6,469 | 5,487 | 3,800 | 92,808 | ||||||||||||
| Retail | 1,709 | 27,574 | 3,682 | 7,238 | 2,303 | 175,272 | 3,895 | 4,032 | 5,611 | 680 | 3,110 | 235,106 | ||||||||||||
| Secured by mortgages on immovable property | 28,326 | 7,018 | 2,907 | 3,960 | 47,053 | — | 3,592 | 4,290 | 5,527 | 636 | 1,671 | 104,980 | ||||||||||||
| Exposures in default | 629 | 1,688 | 230 | 459 | 3,103 | — | 334 | 233 | 355 | 121 | 131 | 7,282 | ||||||||||||
| Items associated with particularly high risk | 1,046 | 35 | 491 | 9 | 114 | — | 4 | 15 | 27 | — | 2 | 1,743 | ||||||||||||
| Covered bonds | — | — | — | — | 2,093 | — | — | — | — | — | — | 2,093 | ||||||||||||
| Claims on institutions and corporates with a short-term credit assessment | — | — | — | — | 5 | — | — | — | — | — | — | 5 | ||||||||||||
| Collective investments undertakings (CIU) | — | — | — | — | 1,836 | — | — | — | — | — | — | 1,836 | ||||||||||||
| Equity exposures | — | — | — | — | 326 | — | — | — | — | — | — | 326 | ||||||||||||
| Other exposures | 29 | 312 | 23 | 8 | 85,596 | — | 70 | 11 | 1,584 | — | 3 | 87,637 | ||||||||||||
| Total standardised approach | 35,216 | 60,252 | 9,876 | 27,487 | 224,905 | 175,272 | 12,383 | 237,327 | 19,574 | 6,925 | 8,717 | 817,933 | ||||||||||||
| Total | 56,980 | 86,481 | 20,466 | 64,593 | 438,033 | 543,449 | 24,799 | 248,483 | 26,594 | 19,688 | 16,917 | 1,546,483 | ||||||||||||
Note: Securitisations not included
| 73 |
| CREDIT RISK 2019 Pillar 3 Disclosures Report |
In order to simplify the exposures analysis, some sectors have been grouped from 19 to 11 based on its representability:
| • | Primary sector: Agriculture, forestry and fishing; Mining and quarrying. |
| • | Utilities: Electricity, gas, steam and air conditioning supply; Water supply. |
| • | Trade, Accommodation and food service activities; Wholesale and retail trade. |
| • | Professional Services: Professional, scientific and technical activities; Administrative and support service activities. |
| • | Other services: Information and communication; education; arts, entertainment & recreation and another services. |
| • | Public sector: Public administration and defense, compulsory social security; human health services and social work activities. |
For the Standard Approach the business sectors with greater exposure are: individuals, other services and manufacturing . As for IRB, the sectors with the highest exposure are: individuals, public sector and other services.
| Table 36. Maturity of exposures (CRB-E) | ||||||||||||
| Million euros | ||||||||||||
| 31 Dec. 2019 | ||||||||||||
| Net original exposure | On demand | <= 1 year | > 1 year <= 5 years | > 5 years | No stated maturity | Total | ||||||
| IRB Approach | ||||||||||||
| Central governments or central banks | — | 331 | 3,731 | — | — | 4,063 | ||||||
| Institutions | — | 26,294 | 22,684 | 926 | — | 49,904 | ||||||
| Corporates | 434 | 105,542 | 154,452 | 22,124 | 1,010 | 283,562 | ||||||
| Retail | 5,252 | 12,207 | 134,520 | 225,850 | 2,462 | 380,291 | ||||||
| Equity | — | — | — | — | 10,731 | 10,731 | ||||||
| Total IRB approach | 5,686 | 144,374 | 315,387 | 248,900 | 14,202 | 728,550 | ||||||
| Standardised Approach | ||||||||||||
| Central governments or central banks | 44,434 | 104,944 | 24,951 | 38,080 | 6,412 | 218,821 | ||||||
| Regional governments or local authorities | 23 | 7,476 | 179 | 227 | 10 | 7,914 | ||||||
| Public sector entities | 14 | 533 | 969 | 11,137 | 27 | 12,681 | ||||||
| Multilateral Development Banks | — | 0 | 1,606 | 395 | — | 2,001 | ||||||
| International Organisations | — | — | — | — | 13 | 13 | ||||||
| Institutions | 2,301 | 21,865 | 7,091 | 10,028 | 1,404 | 42,689 | ||||||
| Corporates | 2,215 | 30,284 | 38,296 | 14,411 | 7,602 | 92,808 | ||||||
| Retail | 20,498 | 55,521 | 108,798 | 40,138 | 10,151 | 235,106 | ||||||
| Secured by mortgages on immovable property | 1,860 | 7,362 | 19,530 | 71,201 | 5,027 | 104,980 | ||||||
| Exposures in default | 92 | 2,570 | 1,484 | 2,967 | 169 | 7,282 | ||||||
| Items associated with particularly high risk | — | 874 | 532 | 336 | 1 | 1,743 | ||||||
| Covered bonds | — | 499 | 1,360 | 233 | — | 2,093 | ||||||
| Claims on institutions and corporates with a short-term credit assessment | 5 | — | — | — | — | 5 | ||||||
| Collective investments undertakings (CIU) | — | — | 1,836 | — | — | 1,836 | ||||||
| Equity exposures | 0 | — | — | — | 326 | 326 | ||||||
| Other exposures | 7,674 | 45,095 | 16,389 | 7,648 | 10,831 | 87,637 | ||||||
| Total standardised approach | 79,116 | 277,022 | 223,022 | 196,801 | 41,972 | 817,933 | ||||||
| Total | 84,802 | 421,396 | 538,409 | 445,701 | 56,175 | 1,546,483 | ||||||
Note: Securitisations not included.
| 74 | 2019 Pillar 3 Disclosures Report | ||
| CREDIT RISK 2019 Pillar 3 Disclosures Report |
3.4. Internal rating systems
Since 1993, Santander Group has been using its own internal rating and scoring models to measure the credit quality of customers and transactions. Each rating or score indicates a probability of default, measured on the basis of the bank’s historical default experience (except in the case of low default portfolios). More than 400 internal rating models are used in the Group’s credit approval and risk monitoring process.
The global rating tools are those used for SCIB segments: corporate, financial institutions, sovereigns and specialised funding, which are managed centrally in Santander Group, in terms of both allocating the rating and risk monitoring. The rating these tools assign to each customer is obtained using an expert-judgement model, which relies on an analyst’s opinion, supported by a quantitative or automatic module based on balance sheet ratios or macroeconomic variables.
In the global models, the quantitative module is calibrated using the market price of credit default swaps. A model is constructed that relates the market-implied probability of default (PD) extracted from the CDS spreads to country macroeconomic data or company balance sheet data. Consequently, this data can be used to estimate PD even for entities for which no liquid CDS quotes are available. In 2020, this quantitative module based on CDS will be replaced by another module based on AHP (Analytic Hierarchy Process) methodology.
The analyst takes this information as a reference but will revise and adjust it to obtain the final rating, which therefore is decisively expert judgement-based. Occasionally, as in the case of Corporate SCIB, the rating is also adjusted where the company belongs to a group from which it receives explicit support.
For the Corporates and Institutions segment (including SMEs with the highest turnover), the parent of Santander Group has established a single methodology for constructing a rating in each country. In this case the rating is determined by an automatic module which uses initial analyst input and which may or may not be supplemented at a later stage. The automatic module determines the rating in two phases: a quantitative phase and a qualitative phase. The qualitative phase is based on a corrective questionnaire, which allows the analyst to modify the automatic score by a limited number of rating points. Santander Group is moving towards a new rating methodology that aims to incorporate all available information (internal behaviour, external sources, etc.) in a more structured manner, so as to statistically assign a weight to the (automatic) objective score and the (expert) subjective score in accordance with a customer’s characteristics and analyst’s view of its capacity to add value, thus simplifying and improving the assignment of ratings.
Customer ratings are reviewed at periodic intervals to take account of new available information. Ratings are reviewed more frequently when certain automatic alerts are triggered and in the case of customers placed on special watch. The rating tools themselves are also reviewed in order to fine-tune the ratings they generate.
For the Retail segment (individuals and SMEs), Santander Group has scoring tools that automatically assign a score to transactions submitted for approval.
These credit approval systems are supplemented by behavioural rating models, which provide greater predictability of the assumed risk and are used not only when accepting new risks but also when monitoring risk setting limits.
The models committee has approved the following list of internal ratings and their probability of default for the global portfolios.
| Mapping of internal ratings and PD | |||||||||||
| Corporate | Banks | Financial institutions non banks | |||||||||
| Rating | PD | Rating | PD | Rating | PD | ||||||
| 9.3 | 0.008 | % | 9.3 | 0.008 | % | 9.3 | 0.002 | % | |||
| 9.2 | 0.008 | % | 9.2 | 0.009 | % | 9.2 | 0.002 | % | |||
| 9.0 | 0.010 | % | 9.0 | 0.011 | % | 9.0 | 0.003 | % | |||
| 8.5 | 0.017 | % | 8.5 | 0.018 | % | 8.5 | 0.006 | % | |||
| 8.0 | 0.029 | % | 8.0 | 0.030 | % | 8.0 | 0.012 | % | |||
| 7.5 | 0.049 | % | 7.5 | 0.050 | % | 7.5 | 0.024 | % | |||
| 7.0 | 0.083 | % | 7.0 | 0.083 | % | 7.0 | 0.050 | % | |||
| 6.5 | 0.140 | % | 6.5 | 0.138 | % | 6.5 | 0.103 | % | |||
| 6.0 | 0.236 | % | 6.0 | 0.229 | % | 6.0 | 0.212 | % | |||
| 5.5 | 0.397 | % | 5.5 | 0.378 | % | 5.5 | 0.437 | % | |||
| 5.0 | 0.668 | % | 5.0 | 0.624 | % | 5.0 | 0.900 | % | |||
| 4.5 | 1.122 | % | 4.5 | 1.030 | % | 4.5 | 1.853 | % | |||
| 4.0 | 1.879 | % | 4.0 | 1.694 | % | 4.0 | 3.814 | % | |||
| 3.5 | 3.128 | % | 3.5 | 2.776 | % | 3.5 | 7.853 | % | |||
| 3.0 | 5.166 | % | 3.0 | 4.515 | % | 3.0 | 16.169 | % | |||
| 2.5 | 8.415 | % | 2.5 | 7.264 | % | 2.5 | 33.289 | % | |||
| 2.0 | 13.418 | % | 2.0 | 11.483 | % | 2.0 | 45.000 | % | |||
| 1.5 | 20.723 | % | 1.5 | 17.687 | % | 1.5 | 45.000 | % | |||
| 1.0 | 30.600 | % | 1.0 | 26.248 | % | 1.0 | 45.000 | % | |||
These PDs are applied uniformly across the whole Santander Group in line with the global management of the portfolios. As we can observe, the PD assigned to any given internal rating is not exactly the same in different portfolios. Regulatory requirements require a differentiated PD calibration.
75 |
| CREDIT RISK 2019 Pillar 3 Disclosures Report |
3.5. Rating assignment process and parameter estimation
Measuring the credit risk of a transaction involves calculating both the expected and the unexpected loss on the transaction. The unexpected loss is the basis for the calculation of both regulatory and economic capital and refers to a very high, albeit improbable, level of loss that is not considered a recurring cost but must be absorbed by capital. Measuring risk involves two separate steps: estimating the risk, and then assigning the credit risk parameters: PD, LGD and EAD.
PD (probability of default) estimates the likelihood that a customer or a contract will default within 12 months. PD used for regulatory capital is long-term, or TTC (through-the-cycle) PD, which is not linked to a specific point in the cycle.
The default event being modelled is based on the definition given in article 178 of the European Central Bank 1 which considers that default is defined for a customer/contract when at least one of the following circumstances arises:
| • | The institution considers there is a reasonable doubt that the obligor will not pay its credit obligations in full. |
| • | The customer/contract is past due by more than 90 days on any material credit obligation. |
The event to be modelled in corporate portfolios is customer default, whereas PD is estimated on the basis of the contract in retail portfolios.
Calculations of PD are based on the entity’s own internal experience, i.e. on past observations of defaults in ratings or scorings.
LGD (Loss Given Default ) is defined as the mathematical expectation of the percentage of economic loss in the event of a default event. Calculations of LGD are based on internal data concerning income and expense incurred by the institution during the recovery process once the default event has arisen, discounted at the date of commencement of default.
LGD calculated to determine regulatory capital is “downturn” LGD, i.e. considered for a worst-case scenario in the economic cycle.
In addition to the estimation of downturn LGD to be used for normal operations, a specific loss estimate is made for operations in default. This is determined using LGD and ELBE (Expected Loss Best Estimate) parameters. ELBE attempts to provide, at any given time, the best estimate of economic loss based mainly on the time during which the operation has been in default, with due regard to the prevailing economic situation, while LGD for transactions in default is increased by any further unexpected losses that may be reported during the recovery period.
Lastly, EAD, (exposure at default), is calculated, defined as the value of the debt at the time of default. For lending products or any product with no off-balance-sheet amount, EAD equals the balance of the transaction plus any interest accrued but not yet payable. For facility type products, however, it is necessary to estimate any future drawdowns that will be made between the present time and the eventual future default event. The CCF or Credit Conversion Factor is calculated for this reason, to show the percentage of the balance not currently utilised (off-balance-sheet amount) that would be utilised at the time of default.
Historical information on portfolios is essential for estimating regulatory parameters, as established in Regulation (EU) No. 575/2013)2. The minimum data periods to be used in estimates is five or seven years, depending on the parameter and the portfolio, although the period used in the estimate can be broader, in line with the historical information available. The Bank has an internal data model containing historical information on portfolios, which is subject to review by the internal supervisory divisions (validation and audit) and by the supervisory authorities.
The methodology used to estimate the credit risk parameters will be updated accordingly pursuant to the new regulatory guidelines, mainly established in the "Guidelines on PD estimation, LGD estimation and treatment of defaulted assets", to incorporate the requirements and interpretations deriving from these regulatory articles. Likewise, they will be updated in accordance with the new definition of default included in "Guidelines on default definition", and the materiality thresholds set by the competent authorities.
As already mentioned, for regulatory purposes, observations of frequency of default and the associated losses must be averaged out over an entire economic cycle, in the case of PD, or represent a downturn situation in the case of LGD or EAD, or represent the current economic cycle in the case of ELBE for default transactions.
For this reason, recent observations are not directly comparable to regulatory parameters, and backtesting exercises should be treated with due caution. As explained in section 3.10. that the default frequencies (FDOs) recently observed are below regulatory PDs in regions with growth rates above the average for the cycle. Conversely, in regions where economic growth falls short of the average, default observations may exceed regulatory PDs.
The risk parameters must be estimated separately for each entity, country and segment and need to be reviewed at least once a year.
The parameters are then assigned to the transactions recorded on each unit’s balance sheet, so as to calculate the expected losses and capital requirements associated with the unit’s exposure.
The parameters are then assigned to the transactions recorded on each unit’s balance sheet, so as to calculate the expected losses and capital requirements associated with the unit’s exposure.
1 and 2 Regulation (EU) 575/2013 of the European Parliament and of the Council of 26 June 2013 on prudential requirements for credit institutions and investment firms
| 76 | 2019 Pillar 3 Disclosures Report | ||
| CREDIT RISK 2019 Pillar 3 Disclosures Report |
The parameters are then assigned to the transactions recorded on each unit’s balance sheet, so as to calculate the expected losses and capital requirements associated with the unit’s exposure.
In certain portfolios there is so little default experience that alternative approaches to parameter estimation must be adopted. These are known as low default portfolios.
Low default portfolios: Corporates, Banks, Non-bank financial institutions and Central governments
Estimates of PD and LGD in low default portfolios rely chiefly on studies performed by external rating agencies, which reflect the pooled experience of the large numbers of entities and countries rated by the agencies. These databases contain in-depth historical information to help identify complete economic cycles and analyse downturn situations.
The definition of default employed by the agencies is compared in detail with the regulatory requirements. Even if this does not produce a perfect match, the process has sufficient items in common to enable it to be used.
For PD, the agencies do not directly report Through the Cycle (TTC) estimates, but rather the number of annual default observations. The observations are averaged out over an economic cycle by external ratings in order to obtain the TTC PD. This TTC PD is assigned to all counterparties with external ratings, which later helps to calibrate the internal rating. Therefore, the PD will not depend on the counterparty’s external rating, but on its internal rating, and may also be applied to customers with no external rating.
The parameters estimated for global portfolios are the same for all the Group’s units. Thus, a financial institution with a rating of 8.5 will have the same PD, regardless of the unit in which the exposure is booked.
Corporates (including SMEs, specialised lending and receivables)
For portfolios of customers that have an account manager assigned to them with sufficient experienced in internal defaults, the estimation is based on the entity’s own internal experience. The PD is calculated for customers by observing new NPLs in the portfolio and relating these to the ratings assigned to the customers concerned. To this end, long-run observed default frequencies (FDO LR) are calculated for a rating or a group of ratings, and are adjusted to the average PD observed for each portfolio over a complete economic cycle.
In contrast to low default portfolios, Corporates portfolios have specific rating systems in each Santander Group unit, requiring specific PD calibrations in each case.
In Corporates portfolios, LGD is calculated on the basis of observed recoveries of defaulted transactions. This calculation takes into account not only the cash inflows and outflows associated with the recovery process but also the timing of these flows, so as to calculate their present value. As well as the direct and indirect costs of recovery. For regulatory use, LGD estimates must be associated with a period of economic crisis or downturn. The existence of major variables (known as “drivers”) is modelled to explain the emergence of different LGDs for different groups of operations. The main drivers used are the seniority of the transactions, whether there are any guarantees in place, the type of guarantee, the loan to value, etc. These explanatory variables must be of statistical significance and make good business sense. Estimated ELBE and LGD are also calculated for operations in default.
Lastly, EAD, or exposure at default, is estimated by comparing the percentage of use of committed facilities at the time of default and in normal circumstances, in order to estimate the extent to which customers make more use of their credit facilities as they approach default. To estimate CCF, information on past defaults is gathered from databases and balances (on and off the balance sheet) are compared between the time of default and previously, when the downturn in a customer’s credit quality had yet to be observed.
Retail
In portfolios where customers do not have an account manager assigned to them but are treated on a pooled or standardised basis, PDs are also estimated based on the entity’s internal experience, although the data unit for assigning PDs is the transaction, not the customer.
PDs are calculated by observing new NPLs and relating each new NPL to the score assigned to the transaction at the time of approval or, for transactions beyond a certain seniority, to the customer rating. As with the Corporates portfolios, LGD is calculated on the basis of an observed recovery process, adjusted to downturn conditions. Estimated ELBE and LGD are also calculated for operations in default. The EAD estimation is also similar to that of Corporates
For further details, see Appendix XIV, which contains several tables summarizing the parameter models’ by region.
77 |
| CREDIT RISK 2019 Pillar 3 Disclosures Report |
3.6. Uses of internal parameter estimates
One major application of the PD, LGD and EAD credit risk parameters is to determine minimum capital requirements within the CRR framework.
The CRR states that these parameters and their associated metrics, including expected and unexpected loss, are to be used not only for regulatory purposes but also for internal credit risk management.
The Group has adapted its projection methodology to IFRS 9 standards, resulting in an impact on the estimation of the expected loss in each of the IFRS 9 stages associated with scenarios put forward, as well as with other important credit risk metrics deriving from the parameters obtained (non-performing loans, provisions, allowances, etc.).
For Santander Group, the internal credit risk parameter estimates are used in a variety of management tools, including pre-classifications, economic capital allocation, RoRAC (return on risk-adjusted capital) calculation, stress testing, IFRS 9, and scenario analyses, the results of which are reported to senior management through various internal committees.
The pre-classification tool is used to assign limits to customers based on their risk characteristics. For the Corporate Investment Banking (SCIB) segment, limits are established for capital at risk (CaR), nominal CAP and with maximum terms according to the type of transaction (limits for financial institutions are managed using REC models).
Through the calculation and allocation of economic capital, all the different types of risks arising from the lending business are integrated in a single measurement, combining credit risk measurement with the measurement of other risks, including market, operational, business and on-balance-sheet interest rate risk. The economic capital allocation at the business unit level provides a view of the distribution of risk by business activity and geographical area, taking the benefits of diversification into account. By relating economic capital to financial results, it is possible to calculate the risk-adjusted return (RoRAC), which can be compared with the cost of capital to get an idea of how each unit contributes to value creation at Santander Group.
The use of economic capital figures in determining management compensation and setting capital and RoRAC-related targets for the business units further reinforces the integration of economic capital in management.
In scenario analyses, the credit risk parameters (including provisions for IFRS 9) are related to economic variables such as the unemployment rate, GDP growth, interest rates, etc, using statistical models. This allows credit risk to be quantified under different macroeconomic scenarios, and in particular, to assess potential risk levels in stress situations.
For further details on IFRS 9, see the Risk Management and Control chapter (section 3.3) on the 2019 Annual Report.
3.7. Credit risk mitigation techniques
Santander Group applies various credit risk mitigation techniques based on customer and product type, among other factors. Some are inherent in specific operations (such as real estate collateral) while others apply to a series of transactions (like netting or collateral).
The various mitigation techniques can be grouped into the following categories:
Personal guarantees
A personal guarantee is an agreement that makes one person liable for another person’s obligations as before the Group. Examples include sureties, guarantees, stand-by letters of credit, etc. Only personal guarantees provided by persons who meet the minimum requirements established by the supervisor can be recognised for capital calculation purposes.
Guarantees arising on credit derivatives
Credit derivatives are financial instruments that are used mainly to hedge credit risk. By buying protection from a third party, the Bank transfers the risk of the issuer of the underlying instrument. Credit derivatives are over-the-counter (OTC) instruments that are traded on non-organised markets. Hedging with credit derivatives, mainly through credit default swaps, is contracted with front-line financial institutions.
In compliance with one of the transparency recommendations originally issued by the Basel Committee, the distribution of personal guarantees and credit derivatives for the corporates, banks, non-financial institutions and sovereigns segments by rating grade is shown below:
| 78 | 2019 Pillar 3 Disclosures Report | ||
| CREDIT RISK 2019 Pillar 3 Disclosures Report |
| Table 37. Guarantees by external rating | ||||
| Million euros | ||||
| 31 Dec. 2019 | ||||
| Corporates | ||||
| External Rating | Exposures in default | Exposures not in default | ||
| AAA/AA | — | 18 | ||
| A | — | 7,558 | ||
| BBB | — | 16,767 | ||
| BB | 6 | 3,789 | ||
| B | — | 582 | ||
| Resto | 197 | 587 | ||
| Sin rating | — | — | ||
| Total | 203 | 29,300 | ||
| Banks | ||||
| External Rating | Exposures in default | Exposures not in default | ||
| AAA/AA | — | 5,082 | ||
| A | — | 7,991 | ||
| BBB | — | 258 | ||
| BB | — | — | ||
| B | — | — | ||
| Resto | — | — | ||
| Sin rating | — | — | ||
| Total | — | 13,332 | ||
| Other financial institutions | ||||
| External Rating | Exposures in default | Exposures not in default | ||
| AAA/AA | — | 380 | ||
| A | — | 9,975 | ||
| BBB | — | 141 | ||
| BB | — | — | ||
| B | — | — | ||
| Resto | — | — | ||
| Sin rating | — | — | ||
| Total | — | 10,496 | ||
| Sovereign | ||||
| External Rating | Exposures in default | Exposures not in default | ||
| AAA/AA | — | 9,701 | ||
| A | — | 4,601 | ||
| BBB | — | 3,592 | ||
| BB | — | 14 | ||
| B | — | 1 | ||
| Resto | — | — | ||
| Sin rating | — | — | ||
| Total | — | 17,908 | ||
Around 99.6% of operations were accounted for by 15 financial institutions, all of them with a BBB+ rating or higher (96.5% with an A- rating or above) on the Standard & Poor's scale.
Collateral pledged
Collateral is property pledged by a customer or third party to secure the guaranteed obligation. Collateral assets may be financial (cash, securities deposits, gold, etc.) or non-financial (property, other moveable property, etc.). Therefore, the different types of collateral will be:
| • | Collateral pledged by a third party: This collateral grants the creditor a personal right or entitlement that affects the equity of the guarantor. Such a guarantee is provided by third parties other than the debtor in either the credit agreement or in a separate agreement. |
| • | Collateral pledged by the customer: This is collateral pledged on assets (movable or immovable) or rights that are specific and determinate. They are rights that secures for the creditor performance of the main obligation via the special attachment of an asset. As a result of this special attachment, in the event of default on the secured obligation, the creditor may realise the economic value of the asset through a regulated procedure and collect the proceeds, where preference in this method of collection may be upheld against other creditors. Collateral pledged may also be classified as follows: |
| • | Real estate guarantees implemented as first charge real estate mortgages. There are regular appraisal processes, based on real market values, for the different types of property, which meet the requirements established by local and Group regulators. |
| • | Pledges on financial instruments (cash deposits, debt instruments). |
A very important example of financial collateral is that which is used for the purpose (as with the netting technique) of reducing counterparty credit risk. Collateral consists of instruments with economic value and high liquidity that are deposited or transferred by one party in favour of another in order to guarantee or reduce any counterparty credit risk arising from portfolios of risk-bearing transactions between the two. Transactions backed by collateral are marked to market periodically (usually daily) and the parameters defined in the collateral agreement are applied, so as to obtain an amount of collateral (usually cash or securities) to be called from, or returned to, the counterparty.
| • | Other collateral (second and successive mortgages). |
As a general rule, and from a risk acceptance perspective, lending criteria are linked to the borrower’s capacity to fulfil, in due time and proper form, all financial obligations, although this is no impediment to seeking the highest level of collateral or personal guarantees.
Payment capacity will be assessed on the basis of the funds or net cash flows from their businesses or usual sources of income, without depending on guarantors or assets delivered as collateral. These must always be taken into account when considering the granting of the transaction as a second and exceptional method of recovery when the first method has failed. As a general rule, a security is defined as a reinforcement that is added to a credit operations for the purpose of mitigating any loss arising from default on the payment obligation.
79 |
| CREDIT RISK 2019 Pillar 3 Disclosures Report |
Effective securities, for these purposes, are collateral and personal guarantees for which their validity is shown as mitigating the credit risk and whose valuation is compliant with the policies and procedures set out in this document. An analysis of the effectiveness of the guarantee must take into account, among other things, the time necessary for the execution of the security and its capacity of realisation.
Only collateral that meets the minimum qualitative requirements specified in the Basel agreements is taken into account for regulatory capital calculation purposes.
Implementation of the mitigation techniques follows the minimum requirements established in the guarantee management policy: legal certainty (possibility of legally requiring the settlement of guarantees at all times), the lack of substantial positive correlation between the counterparty and the value of the collateral, the correct documentation of all guarantees, the availability of the documented methodologies used for each mitigation technique and appropriate monitoring, traceability and regular control of the goods/assets used for the guarantee.
Establishing a net balance by counterparty
The concept of netting involves offsetting gains and losses on multiple transactions of the same type under the umbrella of a master agreement such as ISDA or similar (CSA, OSLA, ISMA, GMRA, etc.).
Market gains and losses on derivative transactions entered into with a given counterparty are offset against one another, so that if the counterparty defaults, the settlement figure is a single net amount, rather than a large number of positive and negative amounts relating to the individual transactions entered into with that counterparty. An important feature of a master netting agreement is that it entails a single legal obligation, encompassing all the transactions covered by the agreement. This is what makes it possible to offset the risks of all the transactions covered by the agreement with a given counterparty. For the measurement of exposure there are two methodologies: a mark-to-market (MtM) methodology (replacement cost in the case of derivatives), plus an add-on for potential future exposure, and another methodology for certain regions and some products, which includes a calculation of exposure using Montecarlo simulation. The capital at risk or unexpected loss, i.e. the loss which, once the expected loss is subtracted, constitutes the economic capital, net of guarantees and recoveries, is also calculated.
The exposures are recalculated at market close, adjusting all transactions to their new time horizon. The potential future exposure is adjusted and mitigation measures (netting, collateral, etc.) are applied, so that the exposures can be checked on a daily basis against the limits approved by senior management. Risk is controlled using an integrated system that provides real-time information on exposures to any counterparty, product or maturity and in any Group unit.
3.7.1. Recognition of credit risk mitigation
When calculating regulatory capital, credit risk mitigation techniques affect the value of the risk parameters used to determine capital. Identifying and valuing the security associated with the contracts is key here and a distinction is drawn between type of guarantee: collateral and personal guarantees. This mitigation process is carried out whenever the validity of the guarantee has been checked and it is believed they may be enforced. The mitigation process is described in the following section.
Firstly, in portfolios where PD is assigned at customer level, personal guarantees are assessed. Personal guarantees affect the final PD value by effectively replacing the counterparty’s PD under the transaction with the guarantor’s PD. Here, we compare the Risk Weight (RW) of the transaction obtained by applying the customer’s PD with the RW of the transaction calculated by employing the guarantor’s PD. The final PD is the one that generates the lowest RW value.
Secondly, the existence of any associated collateral is verified for all transaction types (retail and non-retail). Under the IRB approach, the existence of collateral impacts the final value of the LGD used to calculate the capital. The process also factors in potentially significant factors such as product type and transaction balance. In the case of mortgage collateral, the LGD of the transaction will depend on the loan-to-value (LTV) ratio.
The tables below show the original hedged exposure by collateral type and exposure category for cases where the collateral could be used to reduce capital requirements.
| Table 38. Credit risk mitigation techniques - IRB and SA (CR3) | ||||||||||
| Million euros | ||||||||||
| 31 Dec. 2019 | ||||||||||
| Exposures unsecured – Carrying amount | Exposures secured - carrying amount | Exposures secured by collateral | Exposures secured by financial guarantees | Exposures secured by credit derivatives | ||||||
| Total IRB exposures (after CCFs) | 397,690 | 320,129 | 314,855 | 5,274 | — | |||||
| of which, default | 7,330 | 7,693 | 7,521 | 172 | — | |||||
| Total STD exposures | 783,972 | 33,961 | 9,207 | 24,754 | — | |||||
| of which, default | 7,208 | 74 | 74 | — | — | |||||
Note: Net original expousure. Equity not included.
| 80 | 2019 Pillar 3 Disclosures Report | ||
| CREDIT RISK 2019 Pillar 3 Disclosures Report |
| Table 39. IRB approach. Credit risk mitigation techniques: credit derivatives and personal guarantees | ||||||||||
| Million euros | ||||||||||
| 31 Dec. 2019 | 31 Dec. 2018 | |||||||||
| Original hedged exposure by collateral type and exposure category | Financial guarantees | Personal guarantees | Financial guarantees | Personal guarantees | ||||||
| IRB Approach | ||||||||||
| Central administrations and banks | — | 3,041 | — | 3,095 | ||||||
| Institutions | 149 | 11,862 | — | 12,414 | ||||||
| Corporates | 7,207 | 32,069 | 5,170 | 25,156 | ||||||
| Retail | — | 589 | — | 1,623 | ||||||
| Total | 7,356 | 47,560 | 5,170 | 42,288 | ||||||
| Table 40. Effect on RWA of credit derivatives used as CRM techniques (CR7)* | |||||
| Million euros | |||||
| 31 Dec. 2019 | |||||
| Pre-credit derivatives RWAs | Actual RWAs | ||||
| Exposures under Foundation IRB | |||||
| Central governments or central banks | 65 | 65 | |||
| Institutions | 609 | 609 | |||
| Corporates - SME | 2,006 | 2,006 | |||
| Corporates - Specialised Lending | 18,563 | 18,563 | |||
| Corporates - Other | 7,414 | 7,414 | |||
| Exposures under Advanced IRB | |||||
| Central governments or central banks | 778 | 778 | |||
| Institutions | 7,718 | 7,718 | |||
| Corporates - SME | 18,692 | 17,512 | |||
| Corporates - Specialised Lending | |||||
| Corporates - Other | 66,423 | 66,423 | |||
| Retail - Secured by real estate SME | 1,073 | 1,072 | |||
| Retail - Secured by real estate non-SME | 43,464 | 43,464 | |||
| Retail - Qualifying revolving | 4,174 | 4,174 | |||
| Retail - Other SME | 4,453 | 4,453 | |||
| Retail - Other non-SME | 21,300 | 21,300 | |||
| Equity IRB | 19,572 | 19,572 | |||
| Other non credit-obligation assets | — | — | |||
| Total | 216,306 | 215,126 | |||
| * | It does not include CCPs. |
81 |
| CREDIT RISK 2019 Pillar 3 Disclosures Report |
3.8. Internal rating system control
A fundamental part of the process carried out by Santander Group to implement advanced models entails establishing robust control and review mechanisms by the Internal Validation and Internal Audit areas so as to effectively monitor and validate the valuation models and their integration in risk management, risk parameters, integrity and quality of information, documentation of the capital calculation process, governance, risk model, technological environment, etc.
The functional segregation model applicable to Santander Group involves a model with different levels of control structured around three lines of defence with an organisational structure and independent, clearly defined functions:
| • | 1st line (model owner and methodology), |
| • | 2nd line (Model Risk, Internal Validation, Capital Risk, and Risk Control and Supervision Units) and |
| • | 3rd line (Internal Audit). |
This separate organisational and functional structure ensures compliance with the regulatory requirements established in the IRB models:
| a) | Existence of a strong governance model. |
| b) | Existence, separation and independence of the Risk Control and Supervision, Internal Validation and Internal Audit areas. |
| c) | Independent annual reviews by Internal Validation and Internal Audit. |
| d) | Communication procedures with management, which ensure all associated risks are reported. |
3.8.1. Model risk
1. Introduction
A model is defined as a system, approach or quantitative method that applies theories, techniques and statistical, economic, financial and mathematical facts to transform input data into quantitative estimates. Models are simplified representations of real-world relationships between characteristics, values and observed facts. This simplification allows for focusing attention on specific aspects considered to be the most important for the application of a given model.
The use of models exposes the Bank to model risk, which is defined as the potential adverse consequences of decisions based on incorrect, inadequate or improperly used models.
According to this definition, the sources of this risk are as follows:
| • | The model itself, due to the use of incorrect or incomplete data, or due to the modelling method used and its implementation in systems. |
| • | The improper use of the model. |
Model risk may result in financial loss, inappropriate commercial or strategic decisions or damage to the Group’s reputation.
Santander Group has been working on the definition, management and control of model risk in recent years, and in 2015 a specific department was set up within its Risks division to control this risk.
Management and control functions are performed at both the corporate centre and at the Group’s main companies and entities. To properly regulate the model risk management there are a series of policies and procedures in place which establish the principles, responsibilities and processes to be following throughout the models’ life cycle, detailing aspects relating to the organisation, governance, model management and validation, among others.
The supervision and control of the risk model is proportional to the importance of each one. In this sense, a concept of tiering is defined as the attribute used to synthesise the model´s level of importance or model significance, from which the intensity of the risk management processes that must be followed is determined.
At the end of 2017, Banco Santander launched a strategic plan, Model Risk Management 2.0 (MRM 2.0), as an anticipatory measure to strengthen model risk management, revisiting each of the governance steps in the models, and suitably addressing the new supervisory expectations set down in the ECB guidelines for internal models.
MRM 2.0, which is currently being developed, has three phases (2018, 2019 and 2020) and encompasses ten initiatives structured into four lines:
| • | Key aspects: Initiatives relating to governance, risk appetite, risk management and policies. |
| • | Processes: initiatives relating to the life cycle phases of the models. |
| • | Communication: internal and external communication (monitoring, reports, training, etc.). |
| • | Model risk facilitators: infrastructure, tools and resources. |
The MRM 2.0 project has progressed in line with the planned timeframes, and is now in its final phase which will be undertaken in 2020.
2. Governance
The corporate model approval forum (MAF) is largely responsible for authorising use of the models. However, there is a system in place for delegating powers whereby less important models are approved in local units and reported periodically to the corporate model approval sub-committee.
The senior management at Santander Group possesses in-depth knowledge of the more important models. It also regularly monitors model risk through a set of reports that provide a consolidated view of the risk and enable the right decisions to be taken.
| 82 | 2019 Pillar 3 Disclosures Report | ||
| CREDIT RISK 2019 Pillar 3 Disclosures Report |
As part of the strategy to improve the effectiveness of the governing bodies that provide support in the area of risk, some committees have been adapted to the new internal governance taxonomy, thereby enhancing their discipline and flexibility, and their members and their roles and responsibilities have also been reviewed. In addition, the model risk control committee (chaired by the chief risk officer or CRO) has been integrated into the risk control committee (also chaired by the chief risk officer or CRO), which has strengthened senior management's involvement in model risk matters and increased the scope to escalate any major issue.
3. Risk management
Model risk management and control is structured around a set of processes regarded as the model life cycle. The following diagram shows the various phases of the model life cycle at Santander Group.
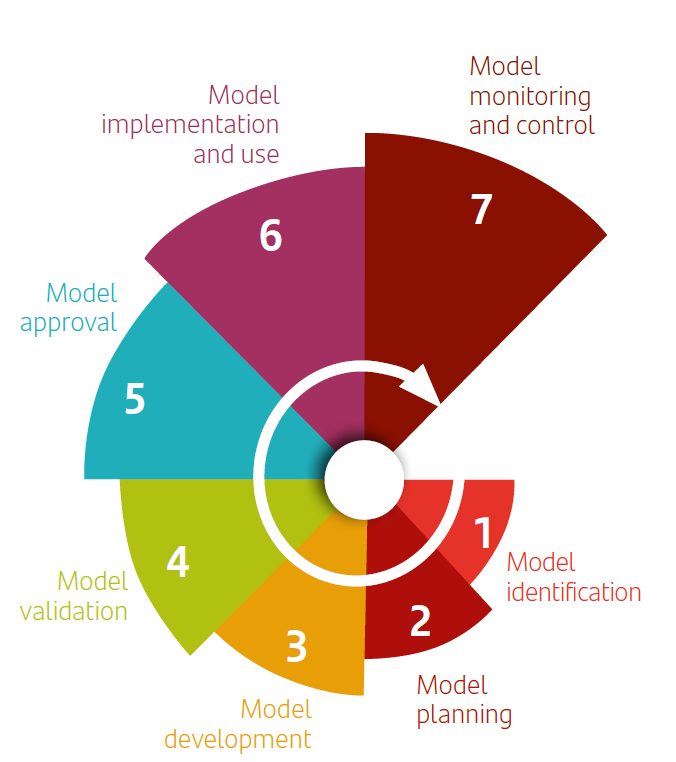
1.- Identification
As soon as a model is identified, it is necessary to ensure that it is included in the model risk control perimeter.
To ensure proper model risk management, a complete and exhaustive inventory of all models in use is essential.
Santander Group keeps a centralised inventory, created on the basis of a uniform taxonomy for all models used at the various business units. The inventory contains all relevant information of each model, which allows for a proper monitoring according to their relevance and the tier criteria.
2.- Planning
Planning is an annual corporate exercise, approved by the local governance bodies and validated at the corporate centre, aimed at establishing a strategic action plan for all models included in the management of the model risk function. It identifies the resource requirements relating to the models to be developed, reviewed and implemented over the year.
3.- Development
This is the model’s construction phase, based on the needs established in the model plan and with the information provided by the specialists for that purpose.
Development takes the form of a standard process defined by the corporate centre for the entire Group. This effectively guarantees the quality of the models used for decision-making.
4.- Internal validation
Independent validation of models is not only a regulatory requirement in certain cases, but it is also a key feature for proper management and control of Santander Group’s model risk.
The Group has therefore set up a specialised unit that is fully independent of both developers and users. This unit issues an expert opinion on the fitness for purpose of the internal models and a set of conclusions on their robustness, utility and effectiveness. The validation opinion is expressed through a rating which summarises the model risk associated with it.
Internal validation brings all models within the model risk control process, ranging from the models used in the risk function (models for credit risk, market risk, structural or operational risk, models for economic and regulatory capital risk, models for provisions, stress test models, etc.) to other types used in different functions that support decision-making.
The scope of the validation extends not only to the more theoretical or methodological aspects, but also technological systems and the quality of the data relied on to ensure their effectiveness. All relevant aspects are typically included in the management process: controls, reporting, uses, involvement of senior management, etc.
The internal validation function is decentralised through five validation units. The coordination of the validation work and harmonisation of validation practices and processes is ensured through a specific initiative, reinforced by the MRM 2.0 project that includes ten basic action pillars to guarantee this objective is met. One of these pillars is the consistency analysis process carried out by the validators, which includes the review of the issued recommendations, the severity thereof and the rating score assigned. It therefore acts as an important point of control for the consistency and comparability of the validation work. Validation work will only be finalised after the consistency stage has been completed.
5.- Approval
Before being implemented and used, a model must be submitted for approval at the relevant bodies, in accordance with the internal regulations in effect and approved delegation processes.
83 |
| CREDIT RISK 2019 Pillar 3 Disclosures Report |
6.- Implementation and use
This is the phase during which the newly developed model is implemented in the system in which it will be used. As already mentioned, the implementation phase is another possible source of model risk, and it is therefore essential that tests are conducted by technical units and the owners of the model so as to certify that it has been implemented in accordance with the methodological definition and to check that it functions as expected.
7.- Monitoring and control
Models have to be regularly reviewed to ensure their correct performance and that they are suitable for their purpose. Otherwise, they must be adapted or redesigned.
In addition, control teams must ensure that model risk management is carried out in accordance with the principles and standards laid down in the model risk framework and related internal rules and regulations.
4. Key metrics
The risk level of a model reflected in the rating assigned to it, which in most cases is generated by an independent validation of the model.
Risk appetite at Group and local level establishes thresholds based on the average rating of the models.
Changes in the distribution of the ratings is also monitored, with a focus on the lowest scores.
Another key metric is model coverage, which synthetically quantifies the level of use of the models for decision-making, in addition to the management of the different risks.
Appetite metrics therefore focus on the quality of the models, based on internal validation ratings. Appetite levels differ according to the relevance of the models, and are the most demanding for the main models.
The metrics are monitored on a monthly basis, and action plans are required if there are any deviations from established levels. Additionally, the proper monitoring of recommendations and the inclusion of the impact on metrics in the planning process are a natural management process to align the quality of the models with the appetite trends established in the event of deviation.
3.8.2. Internal Audit
Internal Audit is part of the third line of defence, carrying out reviews independently on IRB models. In accordance with the EBA document, "ECB Guide to Internal Models" of October 2019, a risk assessment exercise was undertaken, which focused on the aspects in each geography that present the greatest risks in the following lines of action:
| 1) | Reviewing compliance with Santander Group's internal governance model and supervisory requirements for the approval and maintenance of advanced models. Assessing the existence and sufficiency of an organisational and control structure, in addition to a governance model, committee structure and reporting framework, which enable the proper management of IRB models and the calculation of regulatory capital and ensure the involvement of senior management in its management and decision-making. |
| 2) | Managing models and their adequacy and integration. Analysing compliance with requirements for model life cycle management, in order to identify and minimise the risks associated with the building and use of models, their integration into management and the sufficiency of the established controls. |
| 3) | Analysis of correct risk measurement |
Analysis and testing of the consistency and completeness between the Basel databases (corporate data mart) and information sources used in the construction of models.
A review is made to ensure the methodology used in the construction of risk model parameters is consistent with the projected uses and that, overall, the corporate standards and regulatory requirements are followed, in addition to the replication of the calculations made.
Reviewing the reporting control environment and the quality and integrity of the data contained in Basel databases (corporate data mart).
| 4) | Reviewing the regulatory capital calculation and reporting process. |
| 5) | Analysing the technical aspects and applications of the technological environment. Examining the robustness, reliability and security of the infrastructure and processes that support the estimation of risk parameters and the calculation of capital within the BDR-Corporate Calculation Engine. |
After finishing its review, Internal Audit issues a report containing recommendations and observations arising from the review process signed by the unit and/or areas involved. These will stipulate a deadline in which to submit the relevant action and resolution plans.
The auditors and the areas affected will carry out continuous monitoring to ensure that any improvements are made to those areas detected as requiring them. It should be noted that the IRB model review reports are submitted directly to senior management at Santander Group and are available to supervisors (European Central Bank, Bank of Spain and other local supervisors).
Internal Audit undertakes parallel reporting to Santander Group's autonomous audit committee on those recommendations that have not been suitably implemented so that the underlying causes can be examined and their implementation effectively enforced. Finally, Internal Audit maintains direct contact with the supervisors and does so completely independently of the risk control and supervision functions.
| 84 | 2019 Pillar 3 Disclosures Report | ||
| CREDIT RISK 2019 Pillar 3 Disclosures Report |
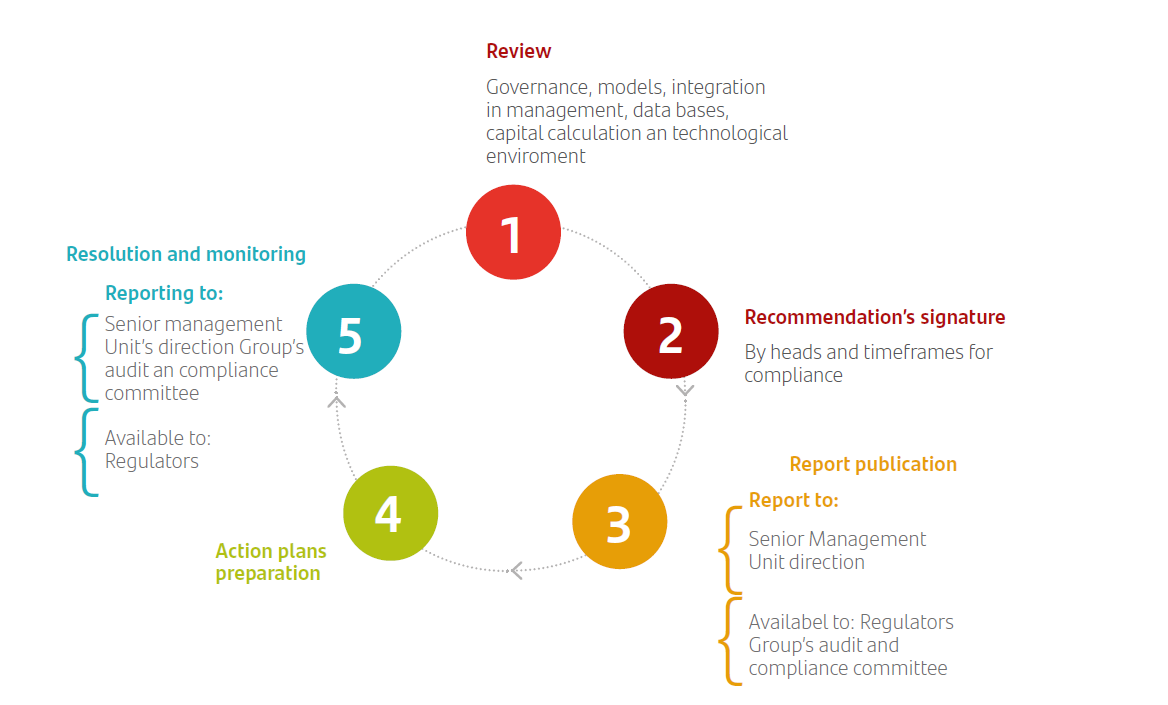
3.9. Impairment losses: influencing factors and comparative analysis
In addition to the advanced approaches described above (details of which are given in the section on economic capital), other standard metrics are employed to help ensure prudent and effective credit risk management based on an assessment of losses on the portfolios.
Credit risk should be monitored continuously and holistically, in order to ensure the early identification of incidents arising in the area of risk, which could affect customers’ credit ratings. This monitoring is carried out through the periodic review of all customers, the allocation of a monitoring score, the establishment of pre-defined actions associated with each category and the implementation of specific measures (predefined or ad-hoc) to correct potential deviations that could have negative impact on the entity.
In the analysis of credit risk, its performance compared to budgets, limits and standards are continuously and systematically assessed, with an evaluation of the effects of future external events or strategic decisions, to establish measures that ensure the profile and volume of the risk profile falls within the established and are aligned with the appetite established by the Group.
To measure and control the cost of credit risk at Santander Group, the following key metrics are used, among others:
| • | Cost of credit: obtained by dividing credit risk provisions net of NPL recoveries by 12 months by average loans and advances to customers, gross, as shown on the balance sheet in those same 12 months. Monitoring and controlling this metric reveals a direct relationship between the Group’s risk appetite and that of its units, allowing it to achieve a medium-low risk profile. |
| • | Concentration: for individuals and SMEs, the monitoring of high risk profile (HRP) portfolios prevents concentration in portfolios with a risk profile that does not correspond to the Group’s medium-low risk target. For SCIB segments, corporates and institutions concentration limits are monitored for sectors, single names, large exposures, underwriting, specialised lending and counterparties with ratings of < 5.0. |
| • | EL (expected loss): estimation, at a specific point of time, of the economic loss the current portfolio is expected to sustain during the following year. It is a further business cost that must be reflected in the transaction price. |
The recovery function also includes the management of non-productive assets (NPAs) relating to the forbearance portfolio, doubtful loans and foreclosed assets, and the NPL portfolio; where the Bank is able to use accelerated reduction mechanisms, such as loan portfolio or foreclosed asset sales.
While these metrics measure the same reality and therefore converge in the long term, differences may exist at certain points in time and these become especially significant at the start of a change of cycle. These differences may be down to applicable accounting law and regulations (mortgages, for example, have a different write-off timeline than consumer loans), shifting policies (such as coverage or write-off), changes in portfolio composition, doubtful assets acquired from new investees, changes in accounting law (such as IFRS 9), portfolio sales, etc.
An overview of the key credit risk figures resulting from activity with customers at year-end 2019, can be found in the Annual Report.
85 |
| CREDIT RISK 2019 Pillar 3 Disclosures Report |
For further details on credit risk key metrics’, see the Risk Management and Control chapter (section 3.3) on the 2019 Annual Report.
3.10. Backtesting of IRB parameters
3.10.1. PD backtest
The aim of the backtesting of PD is to assess the suitability of regulatory PDs by comparing them with the Observed Default Frequencies (ODFs) during the most recent period.
This comparison has been made using the quantitative study required by the European Banking Authority (EBA) in its document, Guidelines on disclosure requirements under part eight of the capital requirements regulation (EU) number 575/2013, of August 2017.
This proposes disclosure of information on backtesting of PD in accordance with Template 24: - IRB approach - Backtesting of PD per exposure class.
Detailed information on backtesting of PD, reported in the table CR9, can be found in Appendix XV. A summary of the conclusions drawn from the results obtained can be found below.
| 1. | In general, there is no major difference between the average exposure weighted PD and the simple average in each band, indicating that exposure is fairly uniformly distributed among the various transactions. This result is quite typical of retail portfolios, but may be less so in the case of corporate portfolios, where certain borrowers may have significant exposures. Nevertheless, as can be seen in the results shown in the Appendix, the corporate portfolios do not reveal any appreciable differences either, only in some ranges, but in any event with levels in line. |
| 2. | Additionally, for a set of the Group’s significant portfolios, in general regulatory PDs are fairly similar to actual default rates, though the following material facts should be noted: |
| • | In general, regulatory PDs are higher than actual default rates. However, there are some exceptions to this rule. These exceptions, with unexpected performance, is because the adjustment applied to obtain regulatory TTC PDs covers a longer period than the last five years. In retail, where portfolios generally have a higher rotation, together with stricter credit policies, this phenomenon is observed more frequently. This has enabled default levels observed in some case to be well below regulatory PDs. |
For further details on PD backtesting, see Appendix XV.
3.10.2. EAD backtest
To test Credit Conversion Factors (CCF), the balance at which transactions defaulted was compared with the regulatory EAD assigned 12 months prior to the default occurring.
The ratio of estimated EAD to actual EAD, known as the coverage ratio, gives an idea of the accuracy of the EAD estimate.
The tables and diagrams provide a comparison between estimated EAD and actual EAD for the most significant portfolios with committed limits.
The data broken down by the percentage use of limits used, given that this is the main driver used to estimate CCF and, therefore, EAD.
In general, coverage ratios are very finely tuned, and in only a few cases are they situated above 100%, indicating slightly conservative EAD estimates. All buckets show similar coverage ratios, with the highest levels in tranches with the lowest utilisation and more so in Cards portfolios, both Microenterprises (Standardised Corporates) and Individualised Companies in Spain.
A high coverage ratio can also be observed for the tranche with the highest off-balance sheet exposure of United Kingdom mortgages, while the Santander Consumer Spain portfolio ratio is slightly below 100% for all tranches, but at acceptable levels.
For further details on EAD backtesting, see Appendix XVI.
3.10.3. Backtest of expected loss
To compare regulatory expected loss with actual losses on the portfolio, a procedure has been devised to compare observed loss figures with estimated losses under regulatory parameters. This exercise allows us to reach conclusions on the following points:
| • | Stability of estimated losses over the life of the study. |
| • | Volatility of the observed losses based on the macroeconomic environment, meaning the extent to which these values exceed estimated losses in periods of economic recession and fall short of the estimates in periods of expansion. |
| 86 | 2019 Pillar 3 Disclosures Report | ||
| CREDIT RISK 2019 Pillar 3 Disclosures Report |
Following on from the previous point, it is important to note that the study period of various portfolios is largely characterised as being a period of economic recession, whereas the estimated losses are based on parameters that embrace a longer period in which the years of recession and expansion better reflect the typical life of an economic cycle.
The recovery processes concluded have been used to estimate observed losses for each year in the study.
The following tables and charts refer to the key portfolios in each geography.
Estimated losses based on regulatory parameters remain stable in the period under analysis for the majority of geographies. In the case of observed losses, the results are more volatile, as expected. Aside from the fluctuations caused by the macroeconomic climate, it is important to bear in mind that the method of carrying out this comparison is very sensitive to any one-off recovery policies that may occur in a particular year, where the losses observed in that year may be attributed to default events originating in previous years. Specifically, the following can be seen:
| • | For the selected portfolios of Santander Consumer Germany, Santander Consumer Norway, Santander Consumer Spain and Mexico, the levels of expected loss are notably situated above those of observed losses for the same period. |
| • | In the years analysed, in other geographies such as Portugal, there is a rise in observed losses to above expected losses in periods with a worse economic environment. This is largely down to the large number of defaults that occurred during the period of economic recession and one-off recovery measures affecting new default events in that period. However, more recently, a certain convergence towards average levels of observed losses has been seen. |
For further details on backtesting, of expected loss, see Appendix XVII.
87 |
| CREDIT RISK 2019 Pillar 3 Disclosures Report |
This page is intentionally left blank.
| 88 | 2019 Pillar 3 Disclosures Report | ||
| CREDIT RISK 2019 Pillar 3 Disclosures Report |
| 4 | ||||||
Counterparty credit risk | ||||||
| Image omitted | ||||||
89 |
| CREDIT RISK 2019 Pillar 3 Disclosures Report |
| Image omitted | |||||
90 |
| COUNTERPARTY CREDIT RISK 2019 Pillar 3 Disclosures Report |
4. Counterparty
credit risk
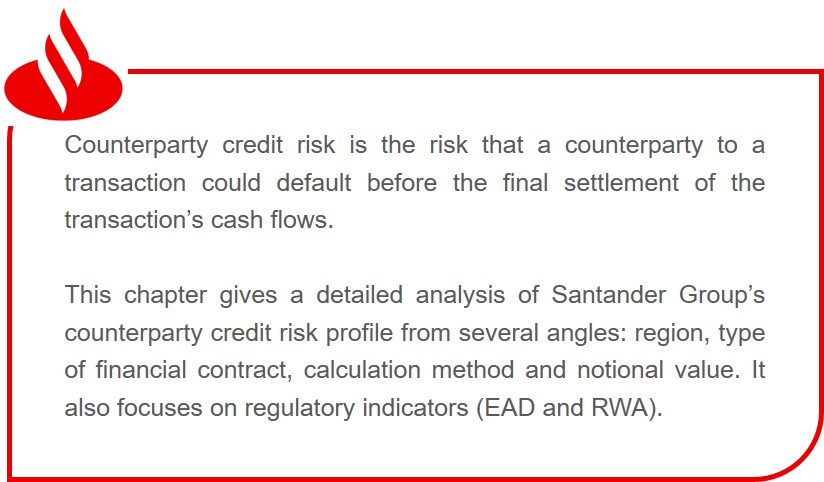
| Main figures | |||||||||
| Million euros | |||||||||
| EAD | RWA | ||||||||
| 2019 | 2018 | 2019 | 2018 | ||||||
| Counterparty credit risk | 33,925 | 46,181 | 11,070 | 11,987 | |||||
| Of which, market appreciation | 24,863 | 32,691 | 9,823 | 9,662 | |||||
| Of which, CCP default | 587 | 284 | 259 | 233 | |||||
| Of which, CVA | 8,475 | 13,206 | 988 | 2,092 | |||||
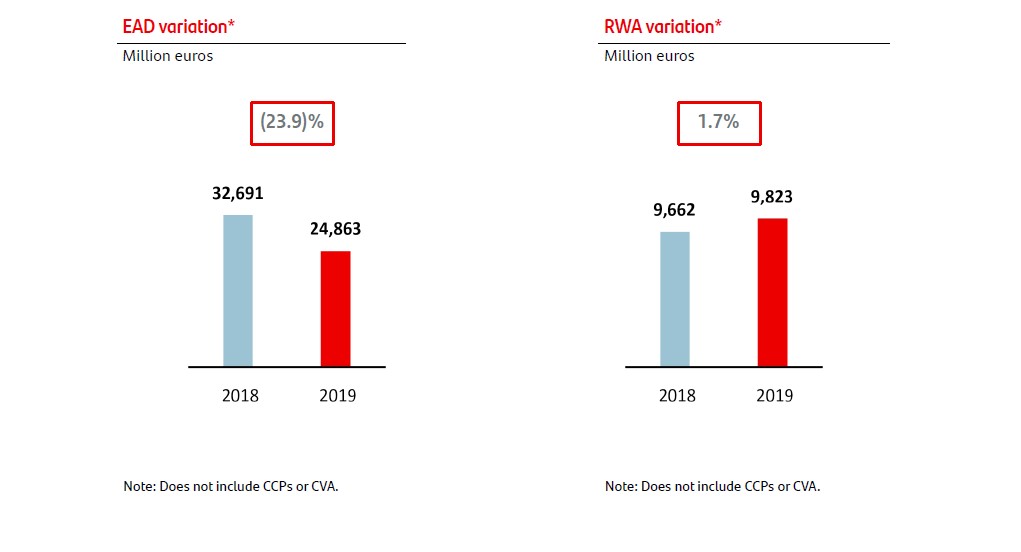
91 |
| COUNTERPARTY CREDIT RISK 2019 Pillar 3 Disclosures Report |
4.1 Counterparty credit risk definition and framework
Chapter 6 of the CRR (Regulation (EU) No 575/2013) describes counterparty credit risk as the risk a counterparty to a transaction could default before the final settlement of the transaction’s cash flows. It includes the following transaction types: derivative instruments, repurchase agreements, securities or commodities lending, long settlement transactions and lending transactions with margin replacement.
Santander Group includes counterparty credit risk in its credit risk framework. For management purposes, it also has a specific counterparty credit risk model and policy in place.
This risk is controlled using an integrated system that provides real-time information so that exposures can be checked on a daily basis against the limits approved by senior management for any counterparty, product or maturity and in any Santander Group unit.
For the measurement of credit equivalent risk (CER) there are two methodologies: a mark-to-market (MtM, replacement cost in the case of derivatives), plus an add-on for potential future exposure, and another methodology for certain regions and some products, which includes a calculation of exposure using Montecarlo simulation.
The capital at risk or unexpected loss, i.e. the loss which, once the expected loss is subtracted, constitutes the economic capital, net of guarantees and recoveries, is also calculated.
4.2. Collateral agreements and guarantees
Transactions subject to collateral agreements are marked to market daily and the parameters agreed in the collateral agreement are applied, giving an amount of collateral to be called from, or returned to, the counterparty.
The counterparty that receives the margin call checks the valuation, at which point discrepancies may arise.
A monitoring committee (discrepancies committee) meets weekly to analyse transactions in which significant discrepancies have been detected.
Currently, most collateral as part of collateral agreements is posted and received in cash. However, the current market trend shows that the use of non-cash collateral is increasing. Santander Group is taking this trend into account in its active collateral management.
4.3. Wrong-way risk
Wrong-way risk exists when the potential exposure of a transaction with a counterparty is highly and positively (adversely) correlated with the credit rating of said counterparty, and therefore if the counterparty’s credit rating deteriorates, its fair value increases. In regard to wrong way risk (WWR), the criterion used by Santander Group for calculating the credit exposure to derivatives with specific WWR is very conservative, given than the exposure to the derivatives with WWR resembles the exposure to a basic financing. In very specific exceptions, with the aim of providing incentives for short-term transactions, with customers with a good rating, liquid underlying and which include collateralisation mechanisms in the derivatives, a decision may be taken to calculate a stressed credit exposure of the derivative.
The Group has defined the criteria to identify those transactions subject to specific wrong way risk on the basis of the legal connection between the counterparty and the issuer of the underlying instrument, and in addition it has defined a method for measuring general wrong way risk.
Where most collateral is in cash, there is practically no risk of adverse effects arising from specific correlations between the collateral and the collateral provider. Any adverse effects arising from correlations in non-cash collateral are immaterial since issuances from the same counterparty and its subsidiaries are excluded from the collateral eligibility policies.
4.4. Credit rating downgrade
It is estimated that in the event that Santander Group’s credit rating was downgraded and it was required to post additional collateral, the impact of that collateral would be relatively limited. This is because the Group’s credit rating affects only a small percentage of its current collateral agreements. In the event of a hypothetical one-notch downgrade in the parent’s credit rating, it is estimated that the resulting impact of the collateral it would have to post would be EUR 106 million.
4.5. Credit value adjustment (CVA)
The team responsible for managing counterparty credit risk in each region charges the corresponding treasury desk a credit premium at the start of each transaction, in exchange for assuming the credit risk involved. The team can then cover the CVA sensitivities through a combination of credit derivatives, interest rate derivatives, currency derivatives and other instruments.
Additionally. CVA regulatory capital is also calculated. The purpose of this charge is to improve banks’ resilience to potential losses of market value associated with a reduction in the solvency of the counterparty in derivatives transactions that are not settled through clearing houses.
The following table shows the credit value adjustment (CVA) for the counterparty.
| 92 | 2019 Pillar 3 Disclosures Report | ||
| COUNTERPARTY CREDIT RISK 2019 Pillar 3 Disclosures Report |
| Table 41. Credit valuation adjustment capital charge (CCR2)* | ||||
| Million euros | ||||
| 31 Dec. 2019 | ||||
| Exposure value | RWA | |||
| Total portfolios subject to the Advanced Method | — | — | ||
| (i) VaR component (including the 3×multiplier) | — | — | ||
| (ii) Stressed VaR component (including the 3×multiplier) | — | — | ||
| All portfolios subject to the Standardised Method | 8,475 | 988 | ||
| Based on Original Exposure Method | — | — | ||
| Total subject to the CVA capital charge | 8,475 | 988 | ||
| * | Figures applying 1 year floor. |
4.6. Central counterparties
Clearing transactions through central counterparties is a habitual market practice for Santander Group. As a member of the clearing houses with which it operates, the Bank contributes to its risk management framework through payments into the default fund, in addition to daily margin calls.
The risk associated with this type of counterparty is managed through the credit risk framework.
The following tables show central counterparty (CCP) exposure following risk mitigation techniques.
| Table 42. Exposures to central counterparties (CCR8) | ||||
| Million euros | ||||
| 31 Dec. 2019 | ||||
| EAD (post CRM) | RWA | |||
| Exposures to QCCPs (total) | 14,325 | 534 | ||
| Exposures for trades at QCCPs (excluding initial margin and default fund contributions); of which | 11,180 | 224 | ||
| (i) OTC derivatives | 9,128 | 183 | ||
| (ii) Exchange-traded derivatives | — | — | ||
| (iii) Securities financing transactions | 2,052 | 41 | ||
| (iv) Netting sets where cross-product netting has been approved | — | — | ||
| Segregated initial margin | — | — | ||
| Non-segregated initial margin | 2,558 | 51 | ||
| Pre-funded default fund contributions | 587 | 259 | ||
| Alternative calculation of own funds requirements for exposures | — | 0 | ||
| Exposures to non-QCCPs (total) | ||||
| Exposures for trades at CCPs non-qualified (excluding initial margin and fund contributions); of which | — | — | ||
| (i) OTC derivatives | — | — | ||
| (ii) Exchange-traded derivatives | — | — | ||
| (iii) Securities financing transactions | — | — | ||
| (iv) Netting sets where cross-product netting has been approved | — | — | ||
| Segregated initial margin | — | — | ||
| Non-segregated initial margin | — | — | ||
| Pre-funded default fund contributions | — | — | ||
| Alternative calculation of own funds requirements for exposures | — | — | ||
93 |
| COUNTERPARTY CREDIT RISK 2019 Pillar 3 Disclosures Report |
4.7. Credit counterparty
credit risk indicators
The following table contains information on the gross positive fair value of the derivative contracts, the potential future exposure, the effect of netting and collateral agreements, and the final exposure value.
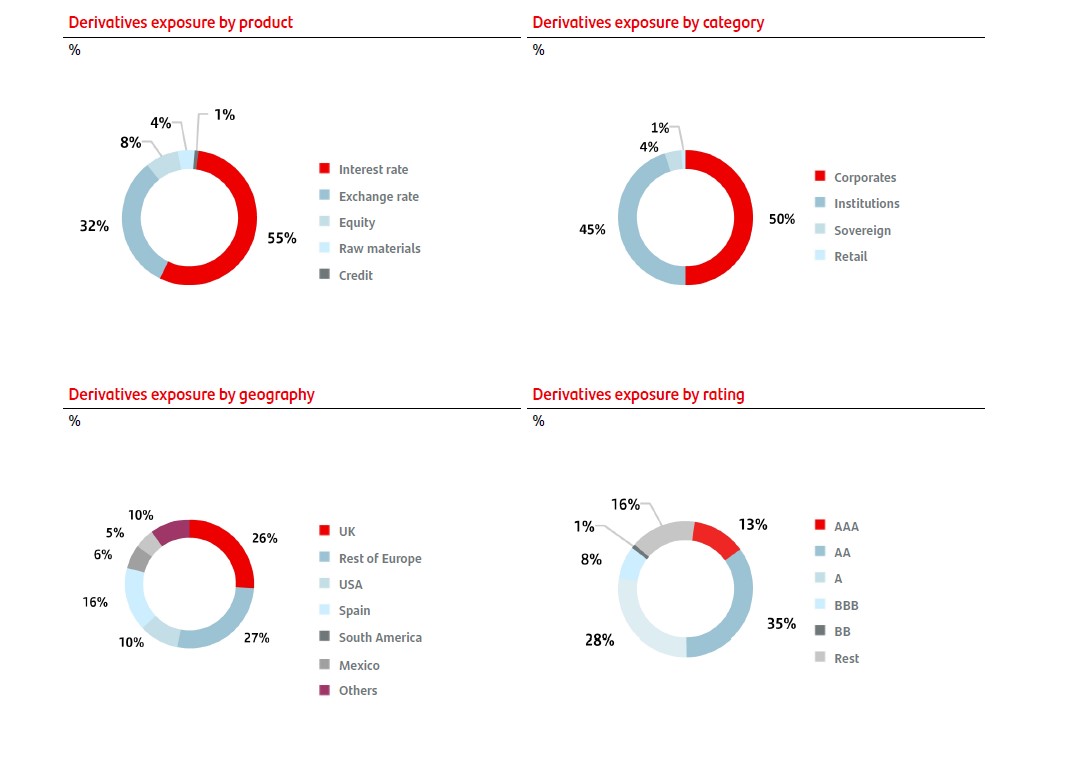
In 2019, derivative transactions were concentrated in counterparties with high credit quality, so that around 76% of the exposure was to counterparties rated A or better.
The distribution by type of counterparty was 45% Institutions and 50% Corporates.
As regards the geographic distribution, 26% of the exposure was accounted for by United Kingdom counterparties (mainly Santander UK’s operations) and, among the other country groupings, mostly by Spain (16%), rest of Europe (27%), the United States (10%) and Latin America (11%).
| 94 | 2019 Pillar 3 Disclosures Report | ||
| COUNTERPARTY CREDIT RISK 2019 Pillar 3 Disclosures Report |
The following table shows exposure to counterparty credit risk based on the calculation methodology employed.
| Table 43. Analysis of the counterparty credit risk (CCR) exposure by approach (CCR1)* | |||||||||||
| Million euros | |||||||||||
| 31 Dec. 2019 | |||||||||||
| Notional | Replacement cost/ Current market value | Potential future exposure | EEPE | Multiplier | EAD postCRM | RWA | |||||
| Mark to market | 210,218 | 13,545 | 22,693 | 9,044 | |||||||
| Original exposure | |||||||||||
| Standardised approach | |||||||||||
| Internal Model Method (for derivatives and SFTs) | |||||||||||
| Financial collateral simple method (for SFTs) | |||||||||||
| Financial collateral comprehensive method (for SFTs) | 2,170 | 504 | |||||||||
| VaR for SFTs | |||||||||||
| Total | 9,548 | ||||||||||
| * | Does not include CCPs |
EAD declined compared to 2019, mainly due to lower exposure to sovereign counterparties in local currency.
95 |
| COUNTERPARTY CREDIT RISK 2019 Pillar 3 Disclosures Report |
The following table details the breakdown of counterparty credit risk exposures. calculated using the standardised approach, by portfolio (counterparty type) and risk weighting (by risk grade attributed to the standardised approach):
| Table 44. Standardised approach – CCR exposures by regulatory portfolio and risk (CCR3) | ||||||||||||||||||||||||||
| Million euros | ||||||||||||||||||||||||||
| 31 Dec. 2019 | ||||||||||||||||||||||||||
| Risk Weight | ||||||||||||||||||||||||||
| 0 | % | 2 | % | 4 | % | 10 | % | 20 | % | 35 | % | 50 | % | 70 | % | 75 | % | 100 | % | 150 | % | Deduc. | Total | |||
| Central governments or central banks | 1,405 | — | — | — | 44 | — | 0 | — | — | 5 | 0 | — | 1,454 | |||||||||||||
| Regional government or local authorities | — | — | — | — | 116 | — | — | — | — | 0 | — | — | 116 | |||||||||||||
| Public sector entities | 92 | — | — | — | 0 | — | — | — | — | — | — | — | 92 | |||||||||||||
| Multilateral development banks | — | — | — | — | 83 | — | — | — | — | — | — | — | 83 | |||||||||||||
| International organisations | — | — | — | — | — | — | — | — | — | — | — | — | — | |||||||||||||
| Institutions | — | 13,738 | — | — | 658 | — | 367 | — | — | 92 | — | — | 14,856 | |||||||||||||
| Corporates | — | — | — | — | 0 | — | 4 | — | — | 1,350 | 0 | — | 1,354 | |||||||||||||
| Retail | — | — | — | — | — | — | — | — | 50 | — | — | — | 50 | |||||||||||||
| Institutions and corporates with a short-term credit assessment | — | — | — | — | — | — | — | — | — | — | — | — | — | |||||||||||||
| Exposure against collective investment institutions (CIIs) | — | — | — | — | — | — | — | — | — | 128 | — | — | 128 | |||||||||||||
| Other items | — | — | — | — | — | — | — | — | — | 20 | — | — | 20 | |||||||||||||
| Total | 1,496 | 13,738 | — | — | 901 | — | 371 | — | 50 | 1,596 | 0 | — | 18,153 | |||||||||||||
| 96 |
| COUNTERPARTY CREDIT RISK 2019 Pillar 3 Disclosures Report |
The following table shows more detailed information on exposure to counterparty credit risk (does not include CCPs and Specialised Lending) by portfolio and PD scale:
| Table 45. IRB approach- CCR exposures by portfolio and PD scale (CCR4) | |||||||||||||||
| Million euros | |||||||||||||||
| Dec. 2019 | |||||||||||||||
| PD Scale | EAD post CRM | Average PD | Number of obligors | Average LGD | Average maturity | RWA | RW | ||||||||
| AIRB. Central banks and central governments | |||||||||||||||
| 0.00 < 0.15 | 26 | 0.05 | % | 9 | 43.70 | % | 4.04 | 5 | 20 | % | |||||
| 0.15 < 0.25 | 0 | 0.22 | % | 1 | 43.10 | % | 2.68 | 0 | 49 | % | |||||
| 0.25 < 0.50 | — | — | — | — | — | — | — | ||||||||
| 0.50 < 0.75 | 0 | — | — | — | — | 0 | — | ||||||||
| 0.75 < 2.50 | 7 | 1.08 | % | 1 | — | 1.00 | 7 | 106 | % | ||||||
| 2.50 < 10.00 | — | — | — | — | — | — | — | ||||||||
| 10.00 < 100.00 | 0 | 15.14 | % | 1 | 66.53 | % | 1.00 | 1 | 322 | % | |||||
| 100.00 (Default) | 0 | 100.00 | % | 1 | 6.60 | % | 1.00 | 0 | 22 | % | |||||
| Sub-total | 33 | 0.49 | % | 13 | 34.59 | % | 3.36 | 14 | 41 | % | |||||
| AIRB. Institutions | |||||||||||||||
| 0.00 < 0.15 | 8,270 | 0.06 | % | 929 | 43.97 | % | 1.60 | 1,301 | 16 | % | |||||
| 0.15 < 0.25 | 236 | 0.20 | % | 87 | 44.33 | % | 0.87 | 74 | 31 | % | |||||
| 0.25 < 0.50 | 144 | 0.33 | % | 81 | 41.41 | % | 0.64 | 61 | 43 | % | |||||
| 0.50 < 0.75 | 258 | 0.65 | % | 62 | 43.87 | % | 3.28 | 231 | 89 | % | |||||
| 0.75 < 2.50 | 45 | 1.45 | % | 28 | 41.71 | % | 2.92 | 50 | 111 | % | |||||
| 2.50 < 10.00 | 0 | 6.66 | % | 3 | 14.48 | % | 0.86 | 0 | 45 | % | |||||
| 10.00 < 100.00 | 0 | 12.53 | % | 1 | 45.00 | % | 0.08 | 0 | 246 | % | |||||
| 100.00 (Default) | 4 | 100.00 | % | 5 | 33.47 | % | 5.00 | 2 | 61 | % | |||||
| Sub-total | 8,958 | 0.14 | % | 1,196 | 43.92 | % | 1.62 | 1,721 | 19 | % | |||||
| AIRB. Corporates | |||||||||||||||
| 0.00 < 0.15 | 4,955 | 0.09 | % | 387 | 46.64 | % | 2.78 | 1,525 | 31 | % | |||||
| 0.15 < 0.25 | 994 | 0.24 | % | 644 | 41.19 | % | 3.01 | 602 | 61 | % | |||||
| 0.25 < 0.50 | 945 | 0.40 | % | 1,265 | 35.76 | % | 2.31 | 685 | 72 | % | |||||
| 0.50 < 0.75 | 342 | 0.69 | % | 487 | 43.07 | % | 3.37 | 295 | 86 | % | |||||
| 0.75 < 2.50 | 300 | 1.54 | % | 3,333 | 27.67 | % | 4.32 | 394 | 132 | % | |||||
| 2.50 < 10.00 | 70 | 3.63 | % | 1,994 | 7.22 | % | 3.49 | 83 | 118 | % | |||||
| 10.00 < 100.00 | 6 | 20.90 | % | 147 | 20.14 | % | 3.21 | 11 | 181 | % | |||||
| 100.00 (Default) | 10 | 94.83 | % | 530 | 17.02 | % | 3.73 | 0 | 1 | % | |||||
| Sub-total | 7,622 | 0.41 | % | 8,787 | 43.16 | % | 2.85 | 3,595 | 47 | % | |||||
| AIRB. Retail | |||||||||||||||
| 0.00 < 0.15 | — | — | — | — | — | — | — | ||||||||
| 0.15 < 0.25 | — | — | — | — | — | — | — | ||||||||
| 0.25 < 0.50 | — | — | — | — | — | — | — | ||||||||
| 0.50 < 0.75 | — | — | — | — | — | — | — | ||||||||
| 0.75 < 2.50 | — | — | — | — | — | — | — | ||||||||
| 2.50 < 10.00 | 0 | 5.68 | % | 3 | 38.88 | % | 1.00 | 0 | 47 | % | |||||
| 10.00 < 100.00 | 27 | 50.24 | % | 15,366 | 78.88 | % | 4.02 | 18 | 67 | % | |||||
| 100.00 (Default) | 1 | 100.00 | % | 46 | 40.00 | % | 5.00 | 0 | 14 | % | |||||
| Sub-total | 28 | 51.28 | % | 15,415 | 78.00 | % | 4.04 | 18 | 66 | % | |||||
97 |
| COUNTERPARTY CREDIT RISK 2019 Pillar 3 Disclosures Report |
| Million euros | |||||||||||||||
| 31 Dec. 2019 | |||||||||||||||
| PD Scale | EAD post CRM | Average PD | Number of obligors | Average LGD | Average maturity | RWA | RWA density | ||||||||
| FIRB. Institutions | |||||||||||||||
| 0.00 < 0.15 | 1,333 | 0.08 | % | 66 | 45 | % | 1.12 | 284 | 21 | % | |||||
| 0.15 < 0.25 | 31 | 0.19 | % | 17 | 45 | % | 1.86 | 16 | 50 | % | |||||
| 0.25 < 0.50 | 42 | 0.33 | % | 18 | 45 | % | 1.51 | 25 | 59 | % | |||||
| 0.50 < 0.75 | 3 | 0.64 | % | 8 | 45 | % | 2.50 | 3 | 103 | % | |||||
| 0.75 < 2.50 | — | — | — | — | — | — | — | ||||||||
| 2.50 < 10.00 | — | — | — | — | — | — | — | ||||||||
| 10.00 < 100.00 | — | — | — | — | — | — | — | ||||||||
| 100.00 (Default) | — | — | — | — | — | — | — | ||||||||
| Sub-total | 1,409 | 0.09 | % | 109 | 45 | % | 1.15 | 327 | 23 | % | |||||
| FIRB. Corporates | |||||||||||||||
| 0.00 < 0.15 | 254 | 0.11 | % | 22 | 45 | % | 2.50 | 88 | 35 | % | |||||
| 0.15 < 0.25 | 26 | 0.24 | % | 10 | 45 | % | 2.50 | 14 | 56 | % | |||||
| 0.25 < 0.50 | 21 | 0.40 | % | 16 | 45 | % | 2.50 | 15 | 73 | % | |||||
| 0.50 < 0.75 | 21 | 0.67 | % | 23 | 45 | % | 2.49 | 20 | 92 | % | |||||
| 0.75 < 2.50 | — | 1.87 | % | 1 | 45 | % | 2.50 | 1 | 131 | % | |||||
| 2.50 < 10.00 | — | — | — | — | — | — | — | ||||||||
| 10.00 < 100.00 | — | — | — | — | — | — | — | ||||||||
| 100.00 (Default) | — | — | — | — | — | — | — | ||||||||
| Sub-total | 322 | 0.17 | % | 72 | 45 | % | 2.50 | 138 | 43 | % | |||||
| Total | 18,371 | 0.33 | % | 25,592 | 43.78 | % | 2.12 | 5,812 | 32 | % | |||||
The following table shows the effects of netting agreements and collateral for exposure to counterparty credit risk. in addition to the type of collateral exchanges in derivatives transactions and SFTL.
| Table 46. Impact of netting and collateral held on exposure values (CCR5-A)* | ||||||||||||
| Million euros | ||||||||||||
| 31 Dec. 2019 | ||||||||||||
| Gross positive fair value or net carrying amount (1) | Add-on | Netting benefits | Netted current credit exposure | Collateral held | Net credit exposure | |||||||
| Derivatives | 70,631 | 26,149 | 62,042 | 34,737 | 13,147 | 21,590 | ||||||
| SFTs | 168,180 | 2,347 | 30,623 | 139,904 | 136,631 | 3,273 | ||||||
| Cross-product netting | — | — | — | — | — | — | ||||||
| Total | 238,811 | 28,496 | 92,666 | 174,641 | 149,778 | 24,863 | ||||||
| * | Does not include CCPs. |
| (1) | Gross positive fair value before applying any mitigation technique. In case of securities financing operations, information is included on the value of the securities or cash delivered to the counterparty. |
| 98 | 2019 Pillar 3 Disclosures Report | ||
| COUNTERPARTY CREDIT RISK 2019 Pillar 3 Disclosures Report |
| Table 47. IRB approach. Composition of collateral for exposures to counterparty credit risk (CCR5-B) | ||||||||||||
| Million euros | ||||||||||||
| 31 Dec. 2019 | ||||||||||||
| Collateral used in derivative transactions | Collateral used in SFTs | |||||||||||
| Fair value of collateral received | Fair value of posted collateral | Fair value of collateral received | Fair value of posted collateral | |||||||||
| Segregated | Unsegregated | Segregated | Unsegregated | |||||||||
| Cash - domestic currency | 149 | 4,750 | 0 | 7,677 | 30,488 | 31,062 | ||||||
| Cash - other currencies | 93 | 4,068 | 2 | 5,401 | 11,879 | 11,621 | ||||||
| Domestic sovereign debt | 438 | 1,504 | 970 | 141 | 51,427 | 58,223 | ||||||
| Other sovereign debt | 868 | 592 | 918 | 1,397 | 15,889 | 17,209 | ||||||
| Government agency debt | — | — | 97 | — | 12 | 47 | ||||||
| Corporate bonds | 319 | 148 | 228 | 2 | 17,559 | 17,735 | ||||||
| Shares | 188 | 29 | 4 | 0 | 9,376 | 5,903 | ||||||
| Other collateral | — | — | — | — | — | — | ||||||
| Total | 2,055 | 11,092 | 2,218 | 14,619 | 136,631 | 141,799 | ||||||
| Table 48. Credit derivatives exposures (CCR6)* | ||||||
| Million euros | ||||||
| 31 Dec. 2019 | ||||||
| Credit derivatives hedges | Other credit derivatives | |||||
| Protection bought | Protection sold | |||||
| Notionals | ||||||
| Single-name credit default swaps | 8,893 | 2,214 | — | |||
| Index credit default swaps | 11,334 | 7,364 | — | |||
| Total return swaps | — | — | — | |||
| Credit options | — | — | — | |||
| Other credit derivatives | — | — | — | |||
| Total notionals | 20,227 | 9,578 | — | |||
| Fair values | (342 | ) | 296 | — | ||
| Positive fair value (asset) | 12 | 299 | — | |||
| Negative fair value (liability) | (1,353 | ) | (4 | ) | — | |
| * | Bought credit derivatives do include loan coverage |
For further details, see the Risk Management and Control chapter (section 3.5) on the 2019 Annual Report.
99 |
| COUNTERPARTY CREDIT RISK 2019 Pillar 3 Disclosures Report |
This page is intentionally blank.
| 100 | 2019 Pillar 3 Disclosures Report | ||
| CREDIT RISK - SECURITISATIONS 2019 Pillar 3 Disclosures Report |
| 5 | ||||||
| Credit risk - Securitisations | ||||||
| Image omitted | ||||||
101 |
| CREDIT RISK - SECURITISATIONS 2019 Pillar 3 Disclosures Report |
| Image omitted | ||||
| 102 | 2019 Pillar 3 Disclosures Report | ||
| CREDIT RISK - SECURITISATIONS 2019 Pillar 3 Disclosures Report |
5. Credit risk - Securitisations
| Main figures | |||||||||
| Million euros | |||||||||
| EAD | RWA | ||||||||
| 2019 | 2018 | 2019 | 2018 | ||||||
| Securitisation exposures in banking book | 43,448 | 33,636 | 6,629 | 5,014 | |||||
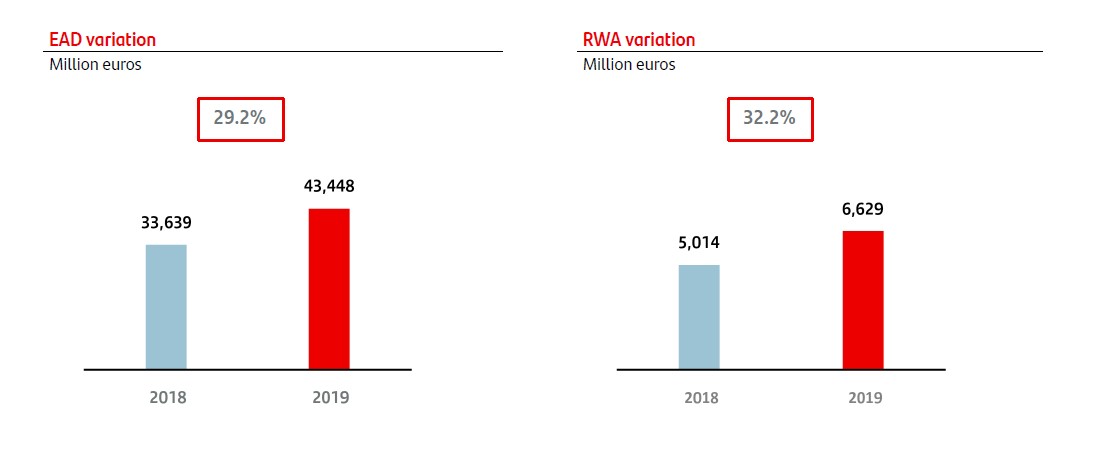
5.1. Theoretical considerations on securitisation
At Santander Group, securitisation is given the treatment stipulated in Chapter 5 of the CRR. The assessment of the characteristics to determine whether or not a securitisation exists, and consequently a transaction that has to be processed under the conditions described in this section, is performed in compliance with the legal format and economic basis of the transaction.
Pursuant to the CRR, the following concepts shall be interpreted using the following regulatory definitions:
Securitisation: a financial transaction or scheme, whereby the credit risk associated with an exposure or pool of exposures is tranched, having both of the following characteristics:
a. Payments in the transaction or scheme are dependant upon the performance of the exposure or pool of exposures.
b. Subordination of tranches determines the distribution of losses during the ongoing life of the transaction or scheme.
Securitisation position: exposures arising from securitisations. For these purposes, the providers of credit risk hedges for a specific securitisation position are considered to hold positions in the securitisation.
Tranche: contractually established segment of the credit risk associated with an exposure or a number of exposures, where a position in the segment entails a risk of credit loss greater than or less than a position of the same amount in each other such segment, without taking account of credit protection provided by third parties directly to the holders of positions in the segment or in other segments. In this respect, the whole securitisation position either forms part of a tranche or is a tranche in itself. The following terms can also be defined:
| • | First loss tranche: this tranche is given a weighting of 1250%. |
103 |
| CREDIT RISK - SECURITISATIONS 2019 Pillar 3 Disclosures Report |
| • | Mezzanine tranche: this is the tranche, other than the first loss tranche, that ranks below the most senior position in the securitisation and below any position in the securitisation assigned a credit rating of 1 in the case of securitisations under the standardised approach or a rating of 1 or 2 in the case of securitisations under the IRB approach. |
| • | Senior tranche: all tranches other than the first loss or mezzanine tranches. Within the senior tranche, the super senior tranche is the top tranche in the priority of payments, without taking into account for these purposes any amounts owed under interest rate or currency derivatives, brokerage charges or similar payments. |
Traditional securitisations: means a securitisation involving the economic transfer of the exposures being securitised to a securitisation special purpose entity (SSPE) that issues securities. This may be accomplished by the transfer of ownership of the securitised exposures from the originator institution to an SSPE or through sub-participation by an SSPE, which shall include, for this purpose, mortgage participation, certificates mortgage transfer certificates and similar securities. The securities issued do not represent payment obligations of the originator institution.
Synthetic securitisation: means a securitisation where the transfer of risk is achieved by the use of credit derivatives or guarantees, and the exposures being securitised remain exposures of the originator institution.
Resecuritisation: means securitisation where the risk associated with an underlying pool of exposures is tranched and at least one of the underlying exposures is a securitisation position.
Asset-backed commercial paper (ABCP) programme: means a programme of securitisations the securities issued by which predominantly take the form of commercial paper with an original maturity of one year or less.
Investment entity: any institution or subject, other than the originator or sponsor institution, holding a securitisation position.
Originator institution: is an institution that:
a. Itself or through related entities, directly or indirectly, was involved in the original agreement which created the obligations or potential obligations of the debtor or potential debtor giving rise to the exposure being securitised; or
b. Purchases a third party’s exposures for its own account and then securitises them.
Sponsor institution: institution other than the originator that establishes and manages an asset-backed commercial paper programme, or other securitisation scheme that purchases exposures from third-party entities and to which liquidity or credit facilities or other credit enhancements are generally granted.
5.2. Securitisation accounting policies
The rule for derecognising securitised assets is that set by IFRS 9 Financial Instruments for the derecognition of a financial asset (section 3.2.). The accounting treatment of transfers of financial assets depends on the form and extent to which the cash flows, risks and rewards are transferred to third parties, along with the control of the assets that are transferred:
| 1. | Where substantially all the risks and rewards are transferred to third parties, e.g. in asset securitisations in which the transferor neither retains subordinated debt nor grants any credit enhancement to the new holders, the transferred financial assets are derecognised and any rights or obligations retained or created in the transfer are recognised simultaneously. The result is recognised for accounting purposes. |
| 2. | Where substantially all the risks and rewards associated with the transferred financial asset are retained (as in securitisations in which subordinated debt or some other type of credit enhancements are retained that absorb substantially all of the expected losses for the transferred asset or the probable variation of its net cash flows), the transferred financial asset is not derecognised and continues to be measured by the same criteria as before the transfer. The following items are also recognised for accounting purposes: |
a. An associated financial liability in an amount equal to the consideration received, thereafter measured at amortised cost, unless the requirements for classification as liabilities at fair value through profit or loss are met, in which case it is measured at fair value.
b. The income from the financial asset that has been transferred but not derecognised and any expense incurred on the new financial liability, without netting.
| 3. | Where substantially all the risks and rewards associated with the transferred financial asset are neither transferred nor retained, e.g. in securitisations in which the transferor takes on subordinated debt or some other type of credit enhancement for a portion of the transferred asset and thus significantly but not substantially reduces its exposure to the variation in the present value of future net cash flows, the following distinction is made: |
a. Where the transferor does not retain control of it, the transferred financial asset is derecognised and any right or obligation retained or created in the transfer is recognised.
b. Where the transferor retains control of the transferred financial asset, it continues to recognise the transferred financial asset on its balance sheet for an amount equal to its exposure to possible changes in value and recognises a financial liability associated with the transferred financial asset. The net amount of the transferred asset and associated liability is the amortised cost of the rights and obligations retained, if the transferred asset is measured at amortised cost, or the fair value of the rights and obligations retained, if the transferred asset is measured at fair value.
| 104 | 2019 Pillar 3 Disclosures Report | ||
| CREDIT RISK - SECURITISATIONS 2019 Pillar 3 Disclosures Report |
Accordingly, financial assets are only derecognised when the rights to the cash flows they generate expire or when substantially all the inherent risks and rewards have been transferred to third parties and when substantially all the risks and rewards are neither transferred nor retained but control of the assets is transferred.
There have been no changes with respect to the previous year in the methods, assumptions and key data used to assess securitised exposures.
There is no specific accounting treatment for synthetic securitisations or assets awaiting securitisation.
5.3. Management of the securitisation activity at Santander Group
5.3.1. Santander Group securitisation objectives and management
Santander Group pursues various objectives through its securitisation activity:
| • | Management and diversification of credit risk: through securitisation transactions and the subsequent sale of the securitisation bonds in the market serve, the Group aims to reduce the credit risk concentrations that can arise naturally from its commercial activity. The effective transfer of risks achieved through these transactions enables the Group to optimise its credit risk exposure and contributes to value creation by reducing the Bank’s need to retain own funds. |
| • | Obtaining liquidity: securitisation enables Santander Group to mobilise its balance sheet by transforming illiquid assets into liquid assets and obtain wholesale funding by selling or collateralising those transformed assets. Also, the retained securitisation positions can be used as collateral to obtain ECB and Bank of England funding. |
| • | Diversifying funding sources: the liquidity obtained from securitisation allows Santander Group to diversify its funding sources in terms of maturity and product. |
| • | Optimisation of capital consumption: in 2019, there were 15 new securitisations originated all involving significant risk transfer. |
Annually, the Financial Management division sets the issuances and securitisations plan for each Santander Group subsidiary/global business, on the basis of the liquidity plan and taking into account certain prudential limits on raising short-term market funding.
5.3.2. Santander Group securitisation functions
Santander Group’s role in the securitisation process is mainly that of originator of the underlying assets being securitised. Nevertheless, in addition to originating the underlying payments, the Group also plays a role in servicing the loans and granting subordinated loans. It also acts as counterparty, when needed, to the interest rate swap agreement for the SSPE that acquires the loans.
Santander Group also acts as an investor, acquiring positions in SSPEs originated by non-Group entities and/or retaining a portion of the positions originated by the Bank itself.
Santander Group is sponsor of a securitisation transaction whose underlying consists of loans granted by various financial institutions to SSPEs of mortgage-backed bonds to cover the reserve fund
Santander Group also structures and places its own securitisations, as it does for third parties, and leads and promotes new structures in different jurisdictions for both funding and risk transfer purposes. This activity is situated in the context of a revival of securitisation as a tool for channelling credit to the real economy, with a special focus on SMEs.
105 |
| CREDIT RISK - SECURITISATIONS 2019 Pillar 3 Disclosures Report |
The following table gives a breakdown of the securitisation positions purchased or retained by securitised asset class and the Bank’s role in the securitisation at 31 December 2019:
| Table 49. Securitisation positions purchased and retained with risk transfer by exposure type in the banking book | |||||||||||||||||||||||||
| Million euros | |||||||||||||||||||||||||
| 2019 | 2018 | ||||||||||||||||||||||||
| Exposure | RWA | EAD | RWA | ||||||||||||||||||||||
| Originator | Investor | Sponsor | Originator | Investor | Sponsor | Originator | Investor | Sponsor | Originator | Investor | Sponsor | ||||||||||||||
| Traditional securitisations | 3,933 | 8,252 | 0 | 578 | 1,351 | 0 | 9,882 | 7,168 | — | 1,795 | 921 | — | |||||||||||||
| Residential mortgages | 19 | 1,891 | — | 3 | 201 | — | 13 | 3,367 | — | 18 | 365 | — | |||||||||||||
| Commercial mortgages | — | — | — | — | — | — | — | — | — | — | — | — | |||||||||||||
| Credit cards | — | 70 | — | — | 9 | — | — | 164 | — | — | 16 | — | |||||||||||||
| Leasing | — | 140 | — | — | 76 | — | — | 22 | — | — | 4 | — | |||||||||||||
| Loans to corporates or to SMEs treated as corporates | — | 1,330 | — | — | 324 | — | 4,159 | 2,134 | — | 374 | 375 | — | |||||||||||||
| Consumer loans | 3,914 | 1,930 | — | 575 | 226 | — | 5,710 | 573 | — | 1,403 | 61 | — | |||||||||||||
| Receivables | — | 898 | — | — | 131 | — | — | — | — | — | — | — | |||||||||||||
| Mortgage covered bonds | — | 1,010 | — | — | 173 | — | — | 50 | — | — | 19 | — | |||||||||||||
| Others | — | 983 | — | — | 210 | — | — | 857 | — | — | 80 | — | |||||||||||||
| Resecuritisations | — | — | — | — | — | — | — | — | 40 | — | — | 25 | |||||||||||||
| Securitisation positions | — | — | — | — | — | — | — | — | 40 | — | — | 25 | |||||||||||||
| Synthetic securitisations | 31,262 | — | — | 4,700 | — | — | 16,550 | — | — | 2,273 | — | — | |||||||||||||
| Loans to corporates or to SMEs treated as corporates | 17,952 | — | — | 2,455 | — | — | 10,105 | — | — | 1,490 | — | — | |||||||||||||
| Consumer loans | 6,023 | — | — | 993 | — | — | 3,310 | — | — | 334 | — | — | |||||||||||||
| Receivables | 7,287 | — | — | 1,252 | — | — | — | — | — | — | — | — | |||||||||||||
| Others | — | — | — | — | — | — | 3,134 | — | — | 448 | — | — | |||||||||||||
| Total | 35,195 | 8,252 | 0 | 5,278 | 1,351 | 0 | 26,432 | 7,168 | 40 | 4,067 | 921 | 25 | |||||||||||||
| 106 | 2019 Pillar 3 Disclosures Report | ||
| CREDIT RISK - SECURITISATIONS 2019 Pillar 3 Disclosures Report |
The following diagram depicts the geographical distribution of Santander Group’s securitisation activity as of 31 December 2019.
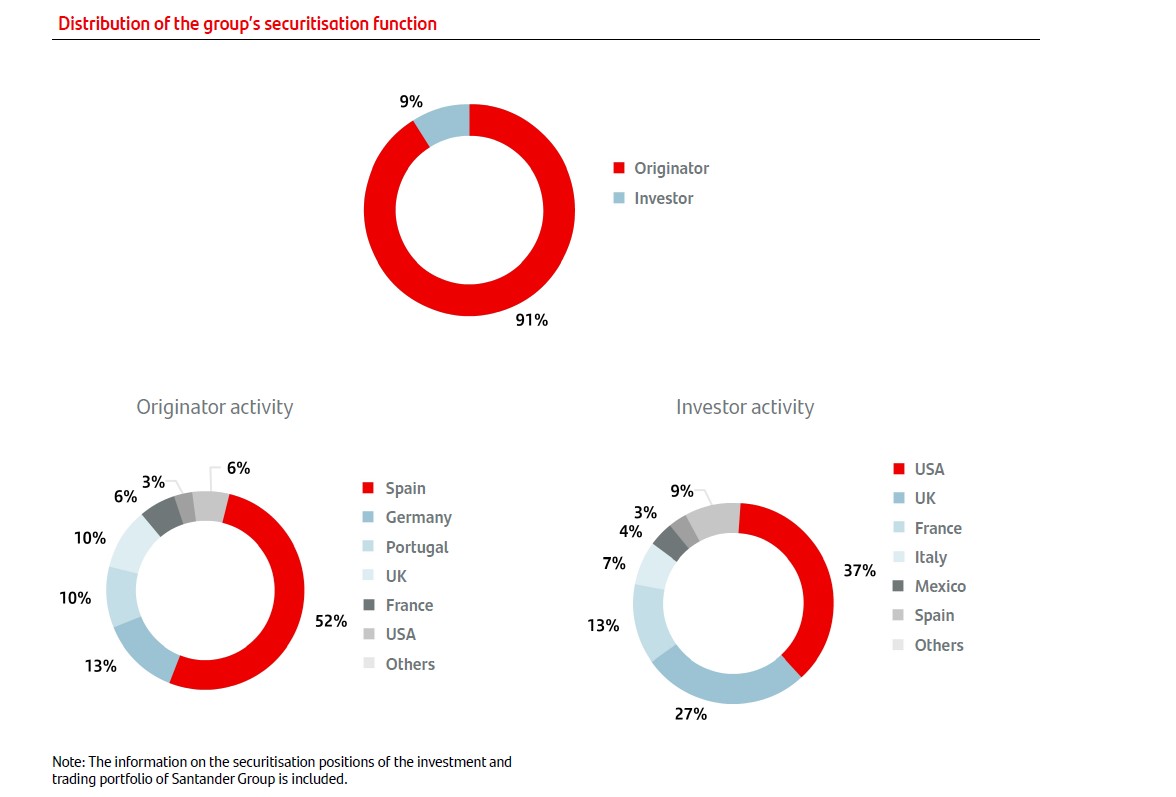
As indicated in the graph, originator activity accounts 91% of Santander Group securitisation activity, with investment activity accounting for 9%.
85% of the volume of securitisations originated by Santander Group is concentrated Spain, Germany, Portugal and the United Kingdom.
On the investment side, 64% of acquisitions of investment positions are concentrated in Spain (37%) and the United Kingdom (27%).
107 |
| CREDIT RISK - SECURITISATIONS 2019 Pillar 3 Disclosures Report |
5.3.3. Risk inherent to the securitisation activity at Santander Group
Securitisation offers advantages in terms of lower funding costs and better risk management. However, it exposes investors to certain inherent risks. Santander Group is not exposed to any additional risk by acting as originator or sole investor in any given SSPE. In fact, doing so reduces liquidity risk by transforming illiquid assets (originated loans) into liquid assets (securitisation bonds).
When Santander Group acts as originator and as one of the investors in the issue, it is subject to the following risks:
| • | Credit risk: the risk that borrowers will fail to meet their contractual obligations in due time and form, with the consequent impairment of the underlying assets backing the securitisation positions. Credit risk is assessed by external credit rating agencies, which assign ratings to the securitisation positions. At Santander Group, the maximum exposure in the banking book is limited by rating (AAA, AA, A, BBB, BB) and by type of underlying. In addition, the Group continuously monitors published data on default of the underlying, credit quality of the originator and mandatory minimum ratios and ratings in the structure, as well as data on granularity, geographical distribution and type of underlying. |
| • | Prepayment risk: the risk of early repayment of all or part of the assets underlying the securitisation, so that the securitisation positions mature before the contractual maturity date of the underlyings. The calculation of the average life, return and duration of the securitisation positions is subject, among other things, to assumptions about the rate at which the underlying loans will be prepaid, which may vary. This risk is practically non-existent at Santander Group as the contractual maturity of the securities issued is usually longer than that of any underlying. |
| • | Basis risk: this risk arises when there is a mismatch between the interest rates or maturities of the securitised assets and those of the securitisation positions. At Santander Group this risk is usually hedged with swaps. |
| • | Exchange rate risk: comes into play in securitisations where the securitised assets and the securitisation positions are denominated in a different currencies. At Santander Group, the risk arising from the currency mismatch between the underlying and the issue is usually hedged in the structure via a swap (excluding synthetic securitisations). The P&L risk assumed in non-euro bonds is managed by the Active Credit Portfolio Management (ACPM) area. |
| • | Liquidity risk: is diminished through the securitisation process, whereby naturally illiquid assets are transformed into debt securities that can be traded on organised financial markets. In some securitisations, however, such as those which issue commercial paper, liquidity risk is still significant and is manifested in the need to cover potential timing mismatches between interest payments on the underlying assets and payments of interest on the securities. At Santander Group this risk tends to be very small and is mitigated by liquidity lines included in the structure (excluding synthetic securitisations). The liquidity risk associated with bond positions is also managed by establishing maximum holding periods. |
| • | Counterparty risk: In synthetic securitisations, there was no portfolio sale to a Special Purpose Vehicle (SPV). The Bank buys financial guarantees from an SPV - which then issues a Credit Link Note (CLN) - or from the end investor, with the aim of transferring risk. The financial guarantees received can be funded or unfunded. In the latter case, the Bank will have to reclaim the losses from the investor and this generates a counterparty risk. |
5.3.4. Santander Group securitisation activity
Santander Group originated 15 securitisations in 2019 with the aim of achieving a significant risk transfer.
Furthermore, Santander Group originates and holds positions in traditional securitisation funds whose underlying portfolios are composed mainly of mortgages, consumer and corporate loans.
Santander Group is also the originator of 19 synthetic securitisation funds, 12 of which originated in 2019. The underlying of those originated this year are loans to SMEs (two cases), corporate loans (four cases), car loans (five cases) and consumer loans (one case).
For each of these traditional structures, and no matter the underlying product, Santander Group is awarded a rating by one or more of the following external rating agencies: Standard & Poors', Moody’s, Fitch, DBRS, Arc, Scope and KROLL. Where a traditional securitisation is placed on the market, the Group obtains ratings from at least two of those agencies.
For two of the synthetic securitisations, two external ratings have been requested.
As for investment activity, Santander Group holds positions in securitisation funds originated by entities outside Santander Group whose underlying assets mainly comprise receivables, credit cards, and corporate, SME and mortgage loans. As Santander Group limits its maximum exposure by rating (AAA,AA, A, BBB, BB), it does not commonly employ hedging techniques to mitigate the risk.
Monitoring changes in associated risk:
| • | Securitisation positions originated: periodic monitoring is the responsibility of the different securitisation fund managers (trustees/management companies) that prepare regular reports containing an update of the rating performance of the bonds’ underlying portfolios. |
| 108 | 2019 Pillar 3 Disclosures Report | ||
| CREDIT RISK - SECURITISATIONS 2019 Pillar 3 Disclosures Report |
| • | Inverse securitisation positions: published NPL metrics (90+, default, recoveries) and prepayments are monitored regularly using specialised software, which additionally checks whether the established rating-based limits are being met. |
The processes mentioned above serve to monitor changes in credit and market risks of both securitisation and re-securitisation exposures.
The performance of the underlying assets particularly affects the duration of the tranches and it is unlikely that this will affect the principal bearing in mind the high levels of subordination and continuous monitoring.
The following tables show the distribution, by type of underlying asset, of the securitisation positions issued and repurchased by Santander Group as originator, as investor and as sponsor as of 31 December 2019, in both the banking book and trading portfolio.
The following table shows the exposure of all securitisations in the banking book, distinguishing between wholesale and retail underlying:
| Table 50. Securitisation exposures in the banking book (SEC1)* | ||||||||||||||||||||
| Million euros | ||||||||||||||||||||
| 31 Dec. 2019 | ||||||||||||||||||||
| Bank acting as originator | Bank acting as sponsor | Bank acting as investor | ||||||||||||||||||
| Traditional | Synthetic | Subtotal | Traditional | Synthetic | Subtotal | Traditional | Synthetic | Subtotal | ||||||||||||
| Retail (total) | 42,622 | 6,056 | 48,677 | — | — | — | 3,892 | — | 3,892 | |||||||||||
| Residential mortgages | 22,956 | — | 22,956 | — | — | — | 1,891 | — | 1,891 | |||||||||||
| Credit card | — | — | — | — | — | — | 70 | — | 70 | |||||||||||
| Other retail exposures | 19,666 | 6,056 | 25,721 | — | — | — | 1,930 | — | 1,930 | |||||||||||
| Resecuritisation | — | — | — | — | — | — | — | — | — | |||||||||||
| Wholesales (total) | 6,541 | 26,996 | 33,537 | 0 | — | 0 | 4,361 | — | 4,361 | |||||||||||
| Corporate loans | 5,616 | 19,709 | 25,325 | — | — | — | 1,330 | — | 1,330 | |||||||||||
| Commercial mortgage | 36 | — | 36 | — | — | — | — | — | — | |||||||||||
| Finance leases and receivables | 888 | — | 888 | — | — | — | 140 | — | 140 | |||||||||||
| Other wholesale exposures | — | 7,287 | 7,287 | — | — | — | 898 | — | 898 | |||||||||||
| Mortgage covered bonds | 1 | — | 1 | — | — | — | 1,010 | — | 1,010 | |||||||||||
| Others | — | — | — | — | — | — | 983 | — | 983 | |||||||||||
| Resecuritisation | — | — | — | 0 | — | 0 | — | — | — | |||||||||||
| Total | 49,162 | 33,051 | 82,214 | 0 | — | 0 | 8,253 | — | 8,253 | |||||||||||
| * | The securitisation portfolio has been considered as a whole (positions bought and retained) |
109 |
| CREDIT RISK - SECURITISATIONS 2019 Pillar 3 Disclosures Report |
| Table 51. Securitisation exposures in the trading book (SEC2) | ||||||||||||||||||||
| Million euros | ||||||||||||||||||||
| 31 Dec. 2019 | ||||||||||||||||||||
| Bank acting as originator | Bank acting as sponsor | Bank acting as investor | ||||||||||||||||||
| Traditional | Synthetic | Subtotal | Traditional | Synthetic | Subtotal | Traditional | Synthetic | Subtotal | ||||||||||||
| Retail (total) | 11 | — | 11 | — | — | — | 99 | — | 99 | |||||||||||
| Residential mortgages | 11 | — | 11 | — | — | — | 59 | — | 59 | |||||||||||
| Credit card | — | — | — | — | — | — | — | — | — | |||||||||||
| Other retail exposures | 1 | — | 1 | — | — | — | 39 | — | 39 | |||||||||||
| Resecuritisation | — | — | — | — | — | — | — | — | — | |||||||||||
| Wholesales (total) | — | — | — | — | — | — | — | — | — | |||||||||||
| Corporate loans | — | — | — | — | — | — | — | — | — | |||||||||||
| Commercial mortgage | — | — | — | — | — | — | — | — | — | |||||||||||
| Finance leases and receivables | — | — | — | — | — | — | — | — | — | |||||||||||
| Other wholesale exposures | — | — | — | — | — | — | — | — | — | |||||||||||
| Resecuritisation | — | — | — | — | — | — | — | — | — | |||||||||||
| Correlation portfolios | — | — | — | — | — | — | — | — | — | |||||||||||
| Total | 11 | — | 11 | — | — | — | 99 | — | 99 | |||||||||||
Finally, in its role as originator and investment entity for securitisations, Santander Group complies with the requirements of Part Five of the CRR relating to the retention of economic interest and requirements established in procedure and control policies for all securitisation funds issued later than 1 January 2011. Therefore, for all securitisations originated after 1 January 2011:
| • | Santander Group consistently retains a minimum of 5% of the net economic interest. |
| • | Santander Group makes available to investors all the necessary information to ensure the risks of the investment are fully known before purchase and to allow the performance of the investment to be monitored on a regular basis. This information includes details of the risk criteria applied to the securitised exposures, which in all cases are the same as for the non-securitised exposures in the originator’s balance sheet. |
Similarly, for investor positions in securitisations originated after 1 January 2011, Santander Group:
| • | Santander Group carries out due diligence to ensure that the investment risks are known before purchase and to be able to monitor the performance of the investment on a regular basis. |
| • | Santander Group checks that the originator of the securitisations retains a net economic interest of no less than 5%. |
Therefore, as the Group complies with these requirements, no capital surcharge is applied.
In 2019, the new STS (simple, transparent and standardised) securitisation framework came into force. If the originators of securitisations meet a series of requirements, they can notify the ESMA that the issuance is STS. The investors in these securitisations that are subject to regulatory capital (mainly banks and insurance companies) can benefit from lower capital consumption. In 2019, Santander Group subsidiaries issued seven STS securitisations and designed their existing master trust securitisations programme of mortgage loans in the United Kingdom as STS.
The accompanying table gives a breakdown of initial balance of the securitisation positions issued and retained by Santander Group in 2019 on their date of origination. See Appendix IX.
| 110 | 2019 Pillar 3 Disclosures Report | ||
| CREDIT RISK - SECURITISATIONS 2019 Pillar 3 Disclosures Report |
5.4. Capital requirements - Securitisations
Santander Group calculates regulatory capital under the securitisation approach only if the securitisation special purpose entity (SSPE) meets the regulatory conditions established in the CRR for significant risk transfer. Otherwise, capital is calculated for the securitised exposures as if they had never been securitised. Capital is also calculated for investment positions in securitisation funds originated by third parties.
On 1 January 2019, Regulation (EU) 2017/2401 on securitisations came into force for all new securitisations closed from 2019 onwards, with a one-year grandfathering period for existing securitisations.
Capital requirements calculation methods are modified within this new framework. Firstly, with the aim of ruling out any form of automatic recourse to external ratings, the entity must use its own calculation of regulatory capital requirements so long as it is authorised to apply the internal ratings-based approach for securitisations (SEC-IRBA). Those entities that cannot use the SEC-IRBA must carry out securitisations using the standardised approach (SEC-SA). The SEC-SA must be based on a formula which takes as its input data, the capital requirements calculated in line with the standardised approach for credit risk. When neither of these two approaches are available, the entities must adopt the approach based on the external ratings-based approach for securitisations (SEC-ERBA). In accordance with SEC-ERBA, capital requirements must be assigned to securitisation tranches on the basis of their external rating.
Capital requirements for securitisation positions are calculated by applying the appropriate risk weight to the exposure value of each position, depending on the approach used by the entity to calculate the risk-weighted exposure amounts of the securitised portfolio.
Those entities which use the standardised approach to calculate capital requirements will differentiate between those securitisations closed before 1 January 2019 and those after this date. Those closed before this date, apply the risk weights stipulated in the CRR based on the credit quality level assigned to the external ratings issued by eligible External Credit Assessment Institutions (ECAIs) for each securitisation or re-securitisation position. Where no external credit rating is available, the entity assigns the weighted-average risk weight applied to securitised exposures, multiplied by the concentration ratio (look-through approach). If the entity has insufficient information on the underlying portfolio, a risk weight of 1250% is assigned.
For securitisations originating after 1 January 2019, the approaches considered in the new Regulation (EU) 2017/2401 on securitisations, referred to above, will be applied.
Those entities which adopt the IRB approach to calculate capital requirements will differentiate between those securitisations closed before 1 January 2019 and those after this date. Those closed before this date, use the IRB approach, applying the risk weights stipulated in the CRR. These weights ultimately depend on whether it is a securitisation or re-securitisation, whether it is the most senior position in the securitisation or not, the effective number of exposures (granularity of the underlying) and the credit quality level assigned to the external credit ratings issued by eligible ECAIs or the ratings inferred from each securitisation position. These risk weights are multiplied by 1.06 to calculate the risk-weighted exposure amounts, except for tranches that already have the maximum weighting of 1250%.
Where no external credit rating is available but PD and LGD estimates are available, the supervisory formula approach may be used. The inputs for this method are tranche thickness, average capital consumption and expected loss on the underlying (KIRB), the average LGD of the underlying and the effective number of exposures.
For new securitisations generated in 2019, capital requirements are calculated taking into account the new approaches considered in the new Regulation (EU) 2017/2401 on securitisations.
The following table shows positions in securitisations with risk transfer and in investment and sponsoring positions on the banking book, based on the approach used to calculate regulatory capital:
111 |
| CREDIT RISK - SECURITISATIONS 2019 Pillar 3 Disclosures Report |
| Table 52. Breakdown of repurchased positions in SSPEs with risk transfer, distributed by function and approach used | ||||||||||||||||||||||
| Million euros | ||||||||||||||||||||||
| 31 Dec. 2019 | 31 Dec. 2018 | |||||||||||||||||||||
| On-balance sheet amount exposures | Off-balance sheet amount exposures | EAD | EAD after capital reductions | RWA | On-balance sheet amount exposures | Off-balance sheet amount exposures | EAD | EAD after capital reductions | RWA | |||||||||||||
| Originator – standardised approach | 691 | — | 669 | 669 | 171 | 1,163 | 1,163 | — | 1,150 | 1,150 | 450 | |||||||||||
| Originator – SEC standardised approach | 3,149 | — | 3,142 | 3,139 | 471 | — | — | — | — | — | ||||||||||||
| Originator – SEC ERB approach | 1,248 | — | 1,218 | 1,183 | 719 | — | — | — | — | — | ||||||||||||
| Originator – RB approach | 7,499 | 1 | 7,501 | 7,498 | 956 | 10,581 | 10,581 | — | 10,581 | 10,581 | 1,702 | |||||||||||
| Originator – SF approach | 9,307 | 767 | 10,074 | 10,065 | 932 | 13,415 | 13,415 | 1,286 | 14,701 | 14,701 | 1,915 | |||||||||||
| Originator – IRB approach | 12,588 | — | 12,588 | 12,520 | 2,030 | — | — | — | — | — | ||||||||||||
| Originator – 1250% | 3 | — | 3 | 2 | — | — | — | — | — | — | ||||||||||||
| Total originator | 34,485 | 768 | 35,195 | 35,076 | 5,278 | 25,159 | 25,159 | 1,286 | 26,432 | 26,432 | 4,067 | |||||||||||
| Investor – standardised approach | 233 | — | 233 | 233 | 176 | 464 | 464 | — | 464 | 464 | 288 | |||||||||||
| Investor – SEC standardised approach | 3,219 | — | 3,219 | 3,219 | 543 | — | — | — | — | — | ||||||||||||
| Investor – SEC ERB approach | 323 | — | 323 | 323 | 147 | — | — | — | — | — | ||||||||||||
| Investor – RB approach | 4,477 | — | 4,477 | 4,477 | 486 | 6,420 | 6,420 | 284 | 6,703 | 6,703 | 633 | |||||||||||
| Investor – SF approach | — | — | — | — | — | — | — | — | — | — | ||||||||||||
| Investor – IRB approach | — | — | — | — | — | — | — | — | — | — | ||||||||||||
| Investor – 1250% | — | — | — | — | — | — | — | — | — | — | ||||||||||||
| Total investor | 8,253 | — | 8,252 | 8,252 | 1,351 | 6,884 | 6,884 | 284 | 7,168 | 7,168 | 921 | |||||||||||
| Sponsor – standardised approach | — | — | — | — | — | — | — | — | — | — | — | |||||||||||
| Sponsor – SEC standardised approach | — | — | — | — | — | — | — | — | — | — | ||||||||||||
| Sponsor – SEC ERB approach | — | — | — | — | — | — | — | — | — | — | ||||||||||||
| Sponsor – RB approach | — | — | — | — | — | — | — | 40 | 40 | 40 | 25 | |||||||||||
| Sponsor – SF approach | — | — | — | — | — | — | — | — | — | — | ||||||||||||
| Sponsor – IRB approach | — | — | — | — | — | — | — | — | — | — | ||||||||||||
| Sponsor – 1250% | — | — | — | — | — | — | — | — | — | — | ||||||||||||
| Total sponsor | — | — | — | — | — | — | — | 40 | 40 | 40 | 25 | |||||||||||
| Total | 42,738 | 768 | 43,448 | 43,328 | 6,629 | 32,043 | 32,043 | 1,609 | 33,640 | 33,640 | 5,014 | |||||||||||
| Of which: traditional securitisations | 12,210 | 1 | 12,185 | 12,172 | 1,929 | 15,493 | 15,493 | 1,609 | 17,090 | 17,090 | 2,741 | |||||||||||
| Of which: synthetic securitisations | 30,528 | 767 | 31,262 | 31,156 | 4,700 | 16,550 | 16,550 | — | 16,550 | 16,550 | 2,273 | |||||||||||
On and off-balance sheet totals before provisions and after outflows to other regulatory reports.
EAD IRB (RBA & SFA): exposures net of collateral, before provisions and deductions and after outflows to other regulatory reports.
EAD SA: exposures net of collateral, before deductions and after provisions and outflows to other regulatory reports.
RWA IRB (RBA & SFA): after provisions, deductions and outflows to other regulatory reports and before application of the limit.
RWA SA: after provisions, deductions and outflows to other regulatory reports and before application of the limit.
| 112 | 2019 Pillar 3 Disclosures Report | ||
| CREDIT RISK - SECURITISATIONS 2019 Pillar 3 Disclosures Report |
It should be noted that for all securitisations which qualify for a risk weight of 1250%, the entity deducts this exposure from equity.
As shown in Table 52, exposure has increase in an 29% due to both the increase in exposures in securitisations originated by Santander Group and in investment positions in third parties. This year, 15 new securitisations with significant risk transfer were originated, with the main goal of optimising capital consumption.
Meanwhile, securitisation positions in the trading book are eliminated from the regulatory capital calculation based on an internal market risk model and are included in the calculation of capital for specific risk, in accordance with art. 335 of the CRR. The correlation trading portfolio is also included among these positions. This portfolio consists of securitisation positions and nth-to-default derivatives that meet all the criteria stated in art. 338.1 of the CRR. Therefore, none of these positions are taken into consideration in the VaR spread and IRC calculation, although they are included in the interest rate VaR calculation (general risk). Capital requirements for these securitisation positions are calculated as if the positions were in the banking book, distinguishing between:
| • | Securitisation positions that are rated by an external rating agency, for which capital requirements are calculated using the external-ratings-based approach described above, and |
| • | Unrated securitisation positions, to which the risk weight resulting from the supervisory formula method is applied. |
Finally, the Regulation (EU) 2017/2402 on securitisations came into force from 1 January 2019. This regulation will change the prudential requirements for credit institutions and investment firms, establishing a new treatment for securitisation positions. One of the most significant changes is that positions in preferential securitisation tranches may not consume more capital than the loan portfolio. It also establishes more favourable treatment for preferential tranches of STS securitisation tranches or those which, with certain conditions, favour funding for SMEs. Provided below is a breakdown of all securitisations in the banking book together with its corresponding capital consumption arranged by RW interval (risk weight) and calculation method employed when Santander Group acts as originator or sponsor:
Provided below is a breakdown of all securitisations in the banking book together with its corresponding capital consumption arranged by RW interval (risk weight) and calculation method employed when Santander Group acts as originator or sponsor:
113 |
| CREDIT RISK - SECURITISATIONS 2019 Pillar 3 Disclosures Report |
| Table 53. Securitisation exposures in the banking book and associated regulatory capital requirements (Bank acting as originator or sponsor) (SEC3) | |||||||||||||||||||||||||
| Million euros | |||||||||||||||||||||||||
| 31 Dec. 2019 | |||||||||||||||||||||||||
| Exposure values (by risk weight bands) | Exposure values (by regulatory approach) | ||||||||||||||||||||||||
| <= 20% | > 20% to 50% | > 50% to 100% | > 100% to 1250% | 1250 | % | IRB RBA | IRB SFA | SA | SEC IRBA | SEC SA | SEC ERBA | 1250 | % | ||||||||||||
| Total exposure | 33,969 | 115 | 341 | 507 | 264 | 7,501 | 10,074 | 669 | 12,588 | 3,142 | 1,218 | 3 | |||||||||||||
| Traditional securitisation | 3,642 | 114 | 98 | 3 | 76 | 3,245 | — | 669 | 8 | — | 8 | 3 | |||||||||||||
| Of which, securitisation | 3,642 | 114 | 98 | 3 | 76 | 3,245 | — | 669 | 8 | — | 8 | 3 | |||||||||||||
| Of which, retail underlying | 3,642 | 114 | 98 | 3 | 76 | 3,245 | — | 669 | 8 | — | 8 | 3 | |||||||||||||
| Of which, wholesale underlying | — | — | — | — | — | — | — | — | — | — | — | — | |||||||||||||
| Of which, resecuritisation | — | — | — | — | — | — | — | — | — | — | — | — | |||||||||||||
| Of which, preference | — | — | — | — | — | — | — | — | — | — | — | — | |||||||||||||
| Of which, non-preference | — | — | — | — | — | — | — | — | — | — | — | — | |||||||||||||
| Synthetic securitisation | 30,327 | — | 243 | 504 | 187 | 4,255 | 10,074 | — | 12,580 | 3,142 | 1,210 | — | |||||||||||||
| Of which, securitisation | 30,327 | — | 243 | 504 | 187 | 4,255 | 10,074 | — | 12,580 | 3,142 | 1,210 | — | |||||||||||||
| Of which, retail underlying | 5,788 | — | 26 | 136 | 90 | — | 1,010 | — | 3,204 | 931 | 878 | — | |||||||||||||
| Of which, wholesale underlying | 24,540 | — | 216 | 368 | 97 | 4,255 | 9,064 | — | 9,376 | 2,211 | 332 | — | |||||||||||||
| Of which, resecuritisation | — | — | — | — | — | — | — | — | — | — | — | — | |||||||||||||
| Of which, preference | — | — | — | — | — | — | — | — | — | — | — | — | |||||||||||||
| Of which, non-preference | — | — | — | — | — | — | — | — | — | — | — | — | |||||||||||||
| Million euros | ||||||||||||||||||||||||||||||
| 31 Dec. 2019 | ||||||||||||||||||||||||||||||
| RWA (by regulatory approach) | Capital change after cap | |||||||||||||||||||||||||||||
| IRB RBA | IRB SFA | SA | SEC IRBA | SEC SA | SEC ERBA | 1250 | % | IRB RBA | IRB SFA | SA | SEC IRBA | SEC SA | SEC ERBA | 1250 | % | |||||||||||||||
| Total exposure | 956 | 932 | 171 | 2,030 | 471 | 719 | — | — | 77 | 75 | 14 | 162 | 38 | 57 | — | |||||||||||||||
| Traditional securitisation | 408 | — | 171 | — | — | — | — | — | 33 | — | 14 | — | — | — | — | |||||||||||||||
| Of which, securitisation | 407 | — | 171 | — | — | — | — | — | 33 | — | 14 | — | — | — | — | |||||||||||||||
| Of which, retail underlying | 407 | — | 171 | — | — | — | — | — | 33 | — | 14 | — | — | — | — | |||||||||||||||
| Of which, wholesale underlying | — | — | — | — | — | — | — | — | — | — | — | — | — | — | — | |||||||||||||||
| Of which, resecuritisation | — | — | — | — | — | — | — | — | — | — | — | — | — | — | — | |||||||||||||||
| Of which, preference | — | — | — | — | — | — | — | — | — | — | — | — | — | — | — | |||||||||||||||
| Of which, non-preference | — | — | — | — | — | — | — | — | — | — | — | — | — | — | — | |||||||||||||||
| Synthetic securitisation | 549 | 932 | — | 2,030 | 471 | 719 | — | — | 44 | 75 | — | 162 | 38 | 57 | — | |||||||||||||||
| Of which, securitisation | 549 | 932 | — | 2,030 | 471 | 719 | — | — | 44 | 75 | — | 162 | 38 | 57 | — | |||||||||||||||
| Of which, retail underlying | — | 66 | — | 560 | 139 | 228 | — | — | — | 5 | — | 45 | 11 | 18 | — | |||||||||||||||
| Of which, wholesale underlying | 549 | 867 | — | 1,470 | 332 | 491 | — | — | 44 | 69 | — | 118 | 27 | 39 | — | |||||||||||||||
| Of which, resecuritisation | — | — | — | — | — | — | — | — | — | — | — | — | — | — | — | |||||||||||||||
| Of which, preference | — | — | — | — | — | — | — | — | — | — | — | — | — | — | — | |||||||||||||||
| Of which, non-preference | — | — | — | — | — | — | — | — | — | — | — | — | — | — | — | |||||||||||||||
| RWA does not include tranches that have a risk weight of 1250% due to they are deducted from Common Equity Tier 1. | ||||||||||||||||||||||||||||||
| 114 | 2019 Pillar 3 Disclosures Report | ||
| CREDIT RISK - SECURITISATIONS 2019 Pillar 3 Disclosures Report |
The following table shows the aggregate amount of securitisation positions purchased and retained in trading book:
| Table 54. Aggregate amount of securitisation positions purchased and retained. Trading book | |||||||||||||
| Million euros | |||||||||||||
| 31 Dec. 2019 | |||||||||||||
| Investor positions | Originator positions | Sponsor positions | |||||||||||
| ABS portfolio | |||||||||||||
| RBA approach | Mark to market | RWA | Mark to market | RWA | Mark to market | RWA | |||||||
| 7-10% | — | — | — | — | — | — | |||||||
| 12-18% | — | — | — | — | — | — | |||||||
| 20-35% | 99 | 22 | 11 | 2 | — | — | |||||||
| 50-75% | — | — | — | — | — | — | |||||||
| 100% | — | — | — | — | — | — | |||||||
| 250% | — | — | — | — | — | — | |||||||
| 425% | — | — | — | — | — | — | |||||||
| 650% | — | — | — | — | — | — | |||||||
| 750% | — | — | — | — | — | — | |||||||
| 1250% | — | — | — | — | — | — | |||||||
| Total ABS Portfolio | 99 | 22 | 11 | 2 | — | — | |||||||
| Correlation portfolio | |||||||||||||
| RBA approach | |||||||||||||
| 40-75 % | — | — | — | — | — | — | |||||||
| 100% | — | — | — | — | — | — | |||||||
| 250% | — | — | — | — | — | — | |||||||
| Supervisory formula method | |||||||||||||
| FS | — | — | — | — | — | — | |||||||
| Total correlation portfolio | — | — | — | — | — | — | |||||||
| Total | 99 | 22 | 11 | 2 | — | — | |||||||
Note: The table does not include the RWA of short position correlation, since it does not consume capital.
115 |
| CREDIT RISK - SECURITISATIONS 2019 Pillar 3 Disclosures Report |
| Table 55. Securitisation exposures in the banking book and associated regulatory capital requirements (bank acts as an investor) (SEC4) | |||||||||||||||||||||||||
| Million euros | |||||||||||||||||||||||||
| 31 Dec. 2019 | |||||||||||||||||||||||||
| Exposure values (by risk weight bands) | Exposure values (by regulatory approach) | ||||||||||||||||||||||||
| <= 20% | > 20% to 50% | > 50% to 100% | > 100% to 1250% | 1250 | % | IRB RBA | IRB SFA | SA | SEC IRBA | SEC SA | SEC ERBA | 1250 | % | ||||||||||||
| Total exposure | 6,911 | 966 | 376 | — | 0 | 4,477 | — | 233 | — | 3,219 | 323 | — | |||||||||||||
| Traditional securitisation | 6,911 | 966 | 376 | — | 0 | 4,477 | — | 233 | — | 3,219 | 323 | — | |||||||||||||
| Of which, securitisation | 6,911 | 966 | 376 | — | 0 | 4,477 | — | 233 | — | 3,219 | 323 | — | |||||||||||||
| Of which, retail underlying | 2,109 | 70 | 14 | — | — | 2,908 | — | 70 | — | 913 | — | — | |||||||||||||
| Of which, wholesale underlying | 4,801 | 895 | 362 | — | 0 | 1,568 | — | 163 | — | 2,306 | 323 | — | |||||||||||||
| Of which, resecuritisation | — | — | — | — | — | — | — | — | — | — | — | — | |||||||||||||
| Of which, preference | — | — | — | — | — | — | — | — | — | — | — | — | |||||||||||||
| Of which, non-preference | — | — | — | — | — | — | — | — | — | — | — | — | |||||||||||||
| Synthetic securitisation | — | — | — | — | — | — | — | — | — | — | — | — | |||||||||||||
| Of which, securitisation | — | — | — | — | — | — | — | — | — | — | — | — | |||||||||||||
| Of which, retail underlying | — | — | — | — | — | — | — | — | — | — | — | — | |||||||||||||
| Of which, wholesale underlying | — | — | — | — | — | — | — | — | — | — | — | — | |||||||||||||
| Of which, resecuritisation | — | — | — | — | — | — | — | — | — | — | — | — | |||||||||||||
| Of which, preference | — | — | — | — | — | — | — | — | — | — | — | — | |||||||||||||
| Of which, non-preference | — | — | — | — | — | — | — | — | — | — | — | — | |||||||||||||
| Million euros | 31 Dec. 2019 | ||||||||||||||||||||||||||||
| RWA (by regulatory approach) | Capital change after cap | ||||||||||||||||||||||||||||
| IRB RBA | IRB SFA | SA | SEC IRBA | SEC SA | SEC ERBA | 1250 | % | IRB RBA | IRB SFA | SA | SEC IRBA | SEC SA | SEC ERBA | 1250 | % | ||||||||||||||
| Total exposure | 486 | — | 176 | — | 543 | 147 | — | 39 | — | 14 | — | 43 | 12 | — | |||||||||||||||
| Traditional securitisation | 486 | — | 176 | — | 543 | 147 | — | 39 | — | 14 | — | 43 | 12 | — | |||||||||||||||
| Of which, securitisation | 486 | — | 176 | — | 543 | 147 | — | 39 | — | 14 | — | 43 | 12 | — | |||||||||||||||
| Of which, retail underlying | 276 | — | 35 | — | 126 | — | — | 22 | — | 3 | — | 10 | — | — | |||||||||||||||
| Of which, wholesale underlying | 210 | — | 140 | — | 417 | 147 | — | 17 | — | 11 | — | 33 | 12 | — | |||||||||||||||
| Of which, resecuritisation | — | — | — | — | — | — | — | — | — | — | — | — | — | — | |||||||||||||||
| Of which, preference | — | — | — | — | — | — | — | — | — | — | — | — | — | — | |||||||||||||||
| Of which, non-preference | — | — | — | — | — | — | — | — | — | — | — | — | — | — | |||||||||||||||
| Synthetic securitisation | — | — | — | — | — | — | — | — | — | — | — | — | — | — | |||||||||||||||
| Of which, securitisation | — | — | — | — | — | — | — | — | — | — | — | — | — | — | |||||||||||||||
| Of which, retail underlying | — | — | — | — | — | — | — | — | — | — | — | — | — | — | |||||||||||||||
| Of which, wholesale underlying | — | — | — | — | — | — | — | — | — | — | — | — | — | — | |||||||||||||||
| Of which, resecuritisation | — | — | — | — | — | — | — | — | — | — | — | — | — | — | |||||||||||||||
| Of which, preference | — | — | — | — | — | — | — | — | — | — | — | — | — | — | |||||||||||||||
| Of which, non-preference | — | — | — | — | — | — | — | — | — | — | — | — | — | — | |||||||||||||||
| 116 | 2019 Pillar 3 Disclosures Report | ||
| CREDIT RISK - SECURITISATIONS 2019 Pillar 3 Disclosures Report |
Santander Group, as an originator institution, retains positions in the funds with the transfer of risks issued by Group entities. Santander Group also acquires positions in SSPEs originated by non-Group entities and is the sponsor of a securitisation fund.
The increase of originator positions is motivated by the origination of 15 new securitisations in 2019.
| Table 56. Securitisation structures with risk transfer | |||||||||||||||||
| Million euros | |||||||||||||||||
| 2019 | 2018 | ||||||||||||||||
| Traditional SPVs | Outstanding balance | Of which, in default | Value adjustments in the period | RWA | Outstanding balance | Of which, in default | Value adjustments in the period | RWA | |||||||||
| Residential mortgages | 794 | — | — | 3 | 921 | — | — | 18 | |||||||||
| Commercial mortgages | — | — | — | — | — | — | — | — | |||||||||
| Loans to corporates or to SMEs treated as corporates | — | — | — | — | 4,150 | 2 | — | 374 | |||||||||
| Consumer loans | 6,873 | 4 | (159 | ) | 575 | 7,025 | 5 | (25 | ) | 1,403 | |||||||
| Others | — | — | — | — | — | — | — | — | |||||||||
| Resecuritisations | |||||||||||||||||
| Securitisation positions | 11 | — | — | — | 33 | — | — | 25 | |||||||||
| Total traditional SPVs | 7,679 | 4 | (159 | ) | 578 | 12,128 | 7 | (25 | ) | 1,820 | |||||||
| Synthetic securitisation SPVs | |||||||||||||||||
| Loans to corporates or to SMEs treated as corporates | 20,098 | 12 | (72 | ) | 2,455 | 9,672 | 5 | (1 | ) | 1,490 | |||||||
| Consumer loans | 7,227 | 11 | (16 | ) | 993 | 3,705 | 9 | — | 334 | ||||||||
| Others | 7,889 | 261 | (12 | ) | 1,252 | 2,845 | 87 | (22 | ) | 448 | |||||||
| Total synthetic securitisation SPVs | 35,214 | 284 | (101 | ) | 4,700 | 16,222 | 101 | (23 | ) | 2,273 | |||||||
| Total | 42,893 | 288 | (260 | ) | 5,278 | 28,350 | 108 | (49 | ) | 4,093 | |||||||
Note: The value adjustments in the period include the value adjustments by asset and provision (generic and specific) deterioration.
As shown in Table 56, during 2019, the outstanding balance of the originated securitisations has increased due to the securitisations with risk transfer originated in the year.
In those securitisation funds without risk transfer, Santander Group retains the majority of it positions in the originated securitisation funds, as they do not meet the regulatory conditions for significant risk transfer. For these funds, capital is calculated for the securitised exposures, as if the exposures had not been securitised.
The underlying securitised assets in the SPVs originated by Santander Group continue to be comprised of residential mortgages and consumer loans.
117 |
| CREDIT RISK - SECURITISATIONS 2019 Pillar 3 Disclosures Report |
This page is intentionally left blank.
| 118 | 2019 Pillar 3 Disclosures Report | ||
| CREDIT RISK - SECURITISATIONS 2019 Pillar 3 Disclosures Report |
| 6 | |||||
| Market risk | |||||
| Image omitted | |||||
119 |
| CREDIT RISK - SECURITISATIONS 2019 Pillar 3 Disclosures Report |
| Image omitted | |||||
120 |
| MARKET RISK 2019 Pillar 3 Disclosures Report |
6. Market risk

| Main figures | |||||
| Million euros | |||||
| RWA | RWA | ||||
| 2019 | 2018 | ||||
| Market risk | 21,807 | 25,012 | |||
| Of which, standardised approach | 7,596 | 11,858 | |||
| Of which, IMA | 14,211 | 13,154 | |||
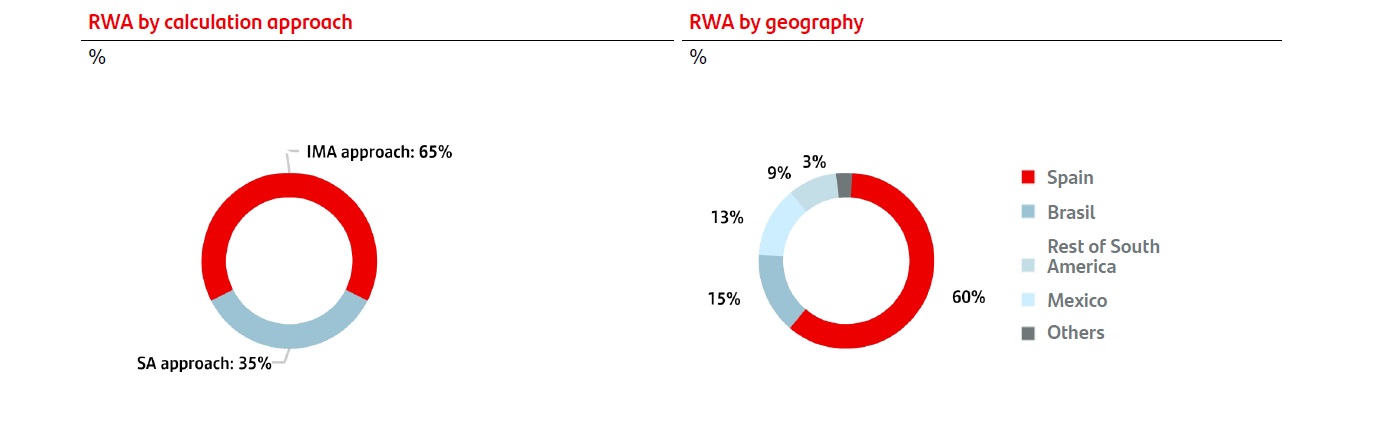
6.1. Activities subject to market risk
The measurement, control and monitoring perimeter of the Market Risk area includes all transactions where patrimonial risk is assumed. This risk arises from changes in the risk factors (interest rate, exchange rate, equities, credit spread, commodity prices and the volatility of each of these factors) and from the liquidity risk of the various products and markets in which Santander Group operates.
The activities are segmented according to the purpose of the risk taken:
| a) | Trading: includes financial services for customers, trading and the taking of positions, mainly in fixed income, equities and currency products. |
| b) | Structural risks: these are composed of the market risks inherent in the balance sheet, excluding the trading portfolio. Namely: |
| • | Structural interest rate risk: this risk arises from timing mismatches in maturities and repricing of all the balance sheet assets and liabilities. |
| • | Structural foreign exchange risk (hedges of results): foreign currency risk arising from the currency in which investments in the consolidated and non-consolidated companies are made (structural exchange rate). This category also includes the positions taken to hedge the foreign currency risk on future results generated in currencies other than the euro (hedges of results). |
| • | Structural equity risk: this includes equity investments in non-consolidated financial and non-financial companies, and the available-for-sale portfolios of equity positions. |
121 |
| MARKET RISK 2019 Pillar 3 Disclosures Report |
6.2. Capital requirements for market risk
This section provides more detailed information on changes in capital requirements for market risk through both internal and standardised models. The Group’s consumption of regulatory capital for market risk at the end of December 2019 breaks down as follows:
| Table 57. Regulatory capital requirements for market risk | ||||
| Million euros | ||||
| 31 Dec. 2019 | 31 Dec. 2018 | |||
| Position risk - Trading book* - Standardised approach | 348 | 436 | ||
| Commodity Risk - Standardised approach | 22 | 15 | ||
| Specific risk in the correlation trading risk portfolio | — | — | ||
| Currency risk - standardised approach | 238 | 498 | ||
| Position and currency risk - Tradingbook - Internal models | 1,137 | 1,052 | ||
| Spain | 632 | 539 | ||
| United Kingdom | — | 58 | ||
| Santander London Branch | 127 | 129 | ||
| Chile | 219 | 109 | ||
| Mexico | 159 | 218 | ||
| Total | 1,745 | 2,001 | ||
| * | Includes structural equity considered as business. |
At year-end 2019 Santander Group had authorisation for the use of the internal market risk model for the calculation of regulatory capital in the trading books of the units in Spain, Chile, Mexico, and the London Branch, by extension of the internal model of Spain.
Santander Group aims to gradually extend this approval to the rest of the units with significant market positions.
The units in the United Kingdom and Portugal left the internal model perimeter in 2019 and began reporting capital by the standardised approach.
The other geographic units calculate capital consumption by market risk through the standardised approach.
Consolidated regulatory capital under the internal market risk model for Santander Group is computed as the sum of the regulatory capital of the units that have the necessary approval from the European Central Bank. This is a conservative criterion when consolidating the Group’s capital, as it takes no account of the capital savings arising from the geographic diversification effect.
The regulatory capital of the trading activity for the perimeter concerned is calculated with advanced approaches, using VaR, Stressed VaR and IRC (incremental risk charge) as the core metrics, in line with the new bank capital requirements under the Basel Accords and, specifically, the CRR.
Currently, the capital resulting from the VaR and SVaR metrics is adjusted through a Kr coefficient, derived from the number of backtesting overshootings existing for each unit in its local internal model.
Likewise, during this year, the "risks not in model" have been included along with the rest of the market risk metrics (VaR, SVaR, etc.) with capital charges. These "risks not in model" are included in the following tables with the consumption of regulatory capital for market risk in the "Add-on" field.
The Group works closely with the European Central Bank to extend the perimeter of authorisation of internal models (at geographic and operational level) and to analyse the impact of new requirements, in line with the documents published by the Basel Committee to strengthen the capital of financial institutions.
| 122 | 2019 Pillar 3 Disclosures Report | ||
| MARKET RISK 2019 Pillar 3 Disclosures Report |
A breakdown of capital requirements in the units that use the internal model is shown below, by geography and component, at year-end:
| Table 58. Capital requirements for market risk. Internal model | ||||||||||||
| Million euros | ||||||||||||
| 31 Dec. 2019 | ||||||||||||
| CR (VaR) | CR (SVaR) | IRC | Risk Not in VaR | Add-On | Total | |||||||
| Spain | 84 | 273 | 254 | 21 | — | 632 | ||||||
| Santander London Branch | 27 | 96 | 4 | — | — | 127 | ||||||
| Chile | 68 | 138 | 2 | 12 | — | 219 | ||||||
| Mexico | 51 | 95 | 12 | — | — | 159 | ||||||
| Total | 229 | 602 | 273 | 33 | — | 1,137 | ||||||
Below is a breakdown of capital requirements and RWAs for market risk with internal model approval from 2018 to 2019:
| Table 59. Market risk under IMA approach (MR2-A) | ||||
| Million euros | ||||
| 31 Dec. 2019 | ||||
| RWA | Capital requirements | |||
| VaR (higher of values a and b) | 3,073 | 246 | ||
| (a) Previous day’s VaR (Article 365(1) of the CRR (VaRt-1)) | 725 | 58 | ||
| (b) Average of the daily VaR (Article 365(1)) of the CRR on each of the preceding 60 business days (VaRavg) x multiplication factor (mc) in accordance with Article 366 of the CRR | 3,073 | 246 | ||
| SVaR (higher of values a and b) | 7,726 | 618 | ||
| (a) Latest SVaR (Article 365(2) of the CRR (SVaRt-1)) | 1,820 | 146 | ||
| (b) Average of the SVaR (Article 365(2) of the CRR) during the preceding 60 business days (SVaRavg) x multiplication factor (ms) (Article 366 of the CRR) | 7,726 | 618 | ||
| IRC (higher of values a and b) | 3,411 | 273 | ||
| (a) Most recent IRC value (incremental default and migration risks calculated in accordance with Article 370 and Article 371 of the CRR) | 2,472 | 198 | ||
| (b) Average of the IRC number over the preceding 12 weeks | 3,411 | 273 | ||
| Comprehensive risk measure (higher of values a, b and c) | — | — | ||
| (a) Most recent risk number for the correlation trading portfolio (Article 377 of the CRR) | — | — | ||
| (b) Average of the risk number for the correlation trading portfolio over the preceding 12 weeks | — | — | ||
| (c) 8% of the own funds requirement in the standardised approach on the most recent risk number for the correlation trading portfolio (Article 338(4) of the CRR) | — | — | ||
| Other | — | — | ||
| Total | 14,211 | 1,137 | ||
123 |
| MARKET RISK 2019 Pillar 3 Disclosures Report |
| Table 60. RWA flow statements of market risk exposures under IMA (MR2-B) | ||||||||||||||
| Million euros | ||||||||||||||
| 31 Dec. 2019 | ||||||||||||||
| VaR | SVaR | IRC | Comprehensive risk measure | Other | Total RWAs | Total capital requirements | ||||||||
| RWA Dec. 2018 | 2,407 | 7,864 | 2,161 | — | 723 | 13,154 | 1,052 | |||||||
| Regulatory adjustment | 1,992 | 6,337 | 361 | — | — | 8,691 | 695 | |||||||
| RWAs at the previous quarter-end (end of the day) | 414 | 1,527 | 1,800 | — | 723 | 4,464 | 357 | |||||||
| Movement in risk levels | 461 | (344 | ) | 1,250 | — | (311 | ) | 1,057 | 85 | |||||
| Model updates/changes | — | — | — | — | — | — | — | |||||||
| Methodology and policy | — | — | — | — | — | — | — | |||||||
| Acquisitions and disposals | — | — | — | — | — | — | — | |||||||
| Foreign exchange movements | — | — | — | — | — | — | — | |||||||
| Other | — | — | — | — | — | — | — | |||||||
| RWAs at the end of the reporting period (end of the day) | 725 | 1,820 | 2,472 | — | 412 | 5,429 | 434 | |||||||
| Regulatory adjustment | 2,142 | 5,701 | 940 | — | — | 8,783 | 703 | |||||||
| RWA Dec. 2019 | 2,867 | 7,520 | 3,411 | — | 412 | 14,211 | 1,137 | |||||||
| Table 61. Market risk under standardised approach (MR1) | ||||
| Million euros | ||||
| 31 Dec. 2019 | ||||
| RWA | Capital requirements | |||
| Outright products | ||||
| Interest rate risk (general and specific) | 3,181 | 255 | ||
| Equity risk (general and specific) | 1,075 | 86 | ||
| Foreign exchange risk | 2,969 | 238 | ||
| Commodity risk | 278 | 22 | ||
| Options | ||||
| Simplified approach | — | — | ||
| Delta-plus method | 69 | 5 | ||
| Scenario approach | — | — | ||
| Securitisation (specific risk) | 24 | 2 | ||
| Total | 7,596 | 608 | ||
Changes in capital requirements and RWAs for market risk using approved standardised models from 2018 to 2019 are shown below:
| Table 62. Capital requirements for market risk. Standardised approach | ||||
| Million euros | ||||
| 31 Dec. 2019 | ||||
| Capital | RWAs | |||
| Starting figure (31 Dec. 2018) | 949 | 11,858 | ||
| Changes in business | (341 | ) | (4,262 | ) |
| Ending figure (31 Dec. 2019) | 608 | 7,596 | ||
Prudent Valuation Adjustments (PVA)
Additionally, there is a breakdown in Appendix XVIII of the constituent elements of the Bank’s PVA for all assets measured at fair value (marked to market or marked to model) and for which PVA are required.
This information is published according to the requirements for Template PV1 contained in the document Pillar 3 disclosure requirements - consolidated and enhanced framework, published by the BCBS in March 2017.
| 124 | 2019 Pillar 3 Disclosures Report | ||
| MARKET RISK 2019 Pillar 3 Disclosures Report |
6.2.1. Internal initiatives on methods for calculating market risk
Santander launched a new global initiative known as the Market Risk Advanced Platform (MRAP) to adapt, transform and strengthen our current market risk calculation, in line with the new requirements of the regulatory framework for market risk published by Basel (FRTB), and to adapt the internal risk models to the latest TRIM (Targeted Review of Internal Models) guidelines and to the supervisor’s expectations.
This programme adopts a multidisciplinary and multi-geographical approach, with the participation of all our entities that carry on activities exposed to market risk and all relevant stakeholders, including Market Risk, Technology, Front Office, and Regulatory Affairs and Compliance.
The MRAP programme introduces significant improvements in terms of functional and IT architecture and in operating models, leading to a change in the culture established in the Group and the generation of synergies among all initiatives and resources.
6.3. Trading activity
Live trading activity at Santander Group is managed by the market risk functions, which monitor market risk positions on a daily basis and analyse the value of a certain set of metrics identified and approved at the Group to control existing market risk.
These functions carry out periodic monitoring to assess and evaluate trends in the market risk metrics and any significant changes, and to ensure compliance with the approved limits for these metrics.
Based on the value of these metrics, periodic reports are prepared and distributed on the basis of this analysis, which ensure the appropriate monitoring of market risk activities within the Group, as well as communication to senior management and other internal and external stakeholders.
In line with the principle of business unit independence, the market risk corporate function monitors positions daily, both at the level of the individual unit and globally, through an exhaustive control of changes in the portfolios so as to detect any incidents and correct them immediately. Preparing a daily income statement is an excellent risk indicator because it helps to identify the impact that changes in financial variables have had on the portfolios.
The positions of each subsidiary are monitored on a daily basis, both for each treasury desk and globally, through an exhaustive control of changes observed in the portfolios and desks, so as to detect any events and correct them immediately.
The main market risk metrics are as follows:
| • | VaR and Stressed VaR |
| • | Equivalent and/or nominal positions 1 |
| • | Sensitivities 2 of the various market risk factors to underlying factors (delta, vega, gamma and theta). |
| • | Delivery risk for short positions in securities (fixed income and equities). |
| • | Volume of effective losses, or to protect the results generated during the period: |
| • | Loss trigger |
| • | Stop loss |
| • | Credit metrics: |
| • | Total exposure |
| • | Jump to default by issuer |
| • | Volume of origination transactions |
| • | P&L of each desk and/or portfolio |
These metrics are used to establish limits and sub-limits, in order to have a sufficiently granular limit structure to enable effective control of the various types of trading market risk factors to which the Group is exposed in its trading activities.
The establishment of trading market risk limits is a dynamic process that responds to the level of risk appetite established by the Group. This process is part of an annual limits plan defined by the Group’s senior management, involving all of the Group’s subsidiaries.
Three categories of limits are established based on their scope of approval and control:
| • | Global approval and control limits, |
| • | Global approval limits with local control, and |
| • | Local approval and control limits |
The limits are requested by the business executive of each country/subsidiary, considering the particular nature of the business in order to achieve the established budget targets, seeking consistency between the limits and the risk/return ratio. They are approved by the corresponding risk bodies, as defined in their governance process.
Business units must comply with the approved limits at all times. In the event that a limit is exceeded, local business executives have to explain, in writing and on the same day, the reasons for the excess and the action plan to correct the situation, which in general may consist of reducing the position until it is once again within the defined limits or setting out the strategy that justifies an increase in the limits.
1 At Santander, positions are used to quantify the net volume of the market values of portfolio transactions, grouped by main risk factor, considering the delta value of any futures or options. All risk positions can be expressed in the base currency of the local unit and the currency used for standardising information. The changes recorded in the positions are monitored on a daily basis to detect any incidents so they can be corrected immediately.
2 Measurements of market risk sensitivity estimate the variation (sensitivity) of the market value of an instrument or portfolio to any changes in a risk factor. The sensitivity of the value of an instrument to changes in market factors can be obtained using analytical approximations through partial derivatives or through a complete revaluation of the portfolio.
125 |
| MARKET RISK 2019 Pillar 3 Disclosures Report |
The basic metric used to control market risk for the trading activity within Santander Group in 2019 was value at risk (VaR). VaR measures the maximum expected loss for a given confidence level and time horizon.
VaR is used because it is easy to calculate and because it provides a good reference for the level of risk incurred. Other measures are also used to give greater control over the risks in the markets in which the Group operates.
One of these other measures is scenario analysis, which consists of defining alternative behaviour for various financial variables and determining the impact on results when these scenarios are applied to the Group’s activities. The scenarios may replicate past events (such as crises) or, conversely, they may describe plausible scenarios unrelated to past events.
6.3.1. Value at Risk
Santander Group’s VaR calculation methodology consists of historical simulation with a 99% confidence level and a one-day horizon for internal risk management, and a ten-day horizon when calculating own funds market risk.
Statistical adjustments are made to enable swift and efficient incorporation of the most recent events affecting the levels of risk assumed. Currently, all units use historical simulation with full revaluation, except for Market Risk Spain, which, while using this methodology for certain portfolios, applies historical simulation using a Taylor series approximation for the bulk of its portfolios.
The Group uses a two-year window, or 520 daily readings, backwards in time from the VaR calculation reference date. Two figures are calculated every day: one applying an exponential decay factor that accords less weight to the observations furthest away in time and another with the same weight for all observations. The reported VaR is the higher of these two figures. Simultaneously, the value at earnings (VaE) is calculated, which measures the maximum potential gain at a certain level of confidence and time horizon, applying the same methodology as for VaR.
VaR by historical simulation has many advantages as a risk metric: it sums up in a single number the market risk of the portfolio and it is based on observed market movements without the need to make assumptions about functional forms or correlations between market factors.
In relation to the VaR, the Expected Shortfall (ES) is also calculated by estimating the expected value of the potential loss when this is greater than the level set by the VaR.
Unlike VaR, ES has the advantage of better capturing the risk of large losses with low probability (tail risk) and of being a sub-additive metric. The Basel Committee considers that a 97.5% confidence interval delivers a similar level of risk to VaR at a 99% confidence interval. ES is calculated by applying uniform weightings to all observations.
At the end of December 2019, Santander Group had authorisation from the Bank of Spain to use the internal market risk model for calculating regulatory capital in the trading portfolios of the Spain, Chile and Mexico units.
The Group’s aim is to gradually extend this approval to the other units that have a trading portfolio, in line with the gradual implementation plan submitted to the Bank of Spain. The total regulatory capital figure using the internal model is calculated as the linear sum of the individual regulatory capital figures of the units that have Bank of Spain approval, that is, without considering diversification between units, along with London Brunch .
At year-end 2019, VaR by region was as follows:
| Table 63. VaR, Stressed VaR and IRC by geography (MR3) | |||||||
| Million euros | |||||||
| Spain | 2019 | 2018 | Variation | ||||
| Var (10 days - 99%) | |||||||
| 1 | Maximum | 36.9 | 41.4 | (11 | %) | ||
| 2 | Average | 18.6 | 16.5 | 13 | % | ||
| 3 | Minimum | 13.5 | 9.4 | 44 | % | ||
| 4 | End of period | 26.8 | 18.9 | 42 | % | ||
| Stressed VaR (10 days - 99%) | |||||||
| 5 | Maximum | 182.5 | 103.1 | 77 | % | ||
| 6 | Average | 88.7 | 75.8 | 17 | % | ||
| 7 | Minimum | 50.5 | 48.7 | 4 | % | ||
| 8 | End of period | 61.3 | 91.6 | (33 | %) | ||
| Incremental Risk Charge (99.9%) | |||||||
| 9 | Maximum | 242.4 | 165.2 | 47 | % | ||
| 10 | Average | 149.2 | 136.5 | 9 | % | ||
| 11 | Minimum | 84.6 | 98.1 | (14 | %) | ||
| 12 | End of period | 85.5 | 128.8 | (34 | %) | ||
| Santander London Branch | 2019 | 2018 | Variation | ||||
| Var (10 days - 99%) | |||||||
| 1 | Maximum | 9.7 | 9.4 | 3 | % | ||
| 2 | Average | 5.8 | 5.9 | (2 | %) | ||
| 3 | Minimum | 3.9 | 2.5 | 56 | % | ||
| 4 | End of period | 6.8 | 6.8 | 0 | % | ||
| Stressed VaR (10 days - 99%) | |||||||
| 5 | Maximum | 35.2 | 27.7 | 27 | % | ||
| 6 | Average | 20.0 | 17.0 | 18 | % | ||
| 7 | Minimum | 13.2 | 6.2 | 114 | % | ||
| 8 | End of period | 25.5 | 22.2 | 15 | % | ||
| Incremental Risk Charge (99.9%) | |||||||
| 9 | Maximum | 103.3 | 53.4 | 93 | % | ||
| 10 | Average | 18.2 | 12.6 | 45 | % | ||
| 11 | Minimum | 0.1 | 0.5 | (90 | %) | ||
| 12 | End of period | 0.1 | 1.4 | (96 | %) | ||
| 126 | 2019 Pillar 3 Disclosures Report | ||
| MARKET RISK 2019 Pillar 3 Disclosures Report |
| Chile | 2019 | 2018 | Variation | ||||
| Var (10 days - 99%) | |||||||
| 1 | Maximum | 45.4 | 13.7 | 231 | % | ||
| 2 | Average | 8.7 | 5.4 | 60 | % | ||
| 3 | Minimum | 3.7 | 3.3 | 13 | % | ||
| 4 | End of period | 13.3 | 4.5 | 193 | % | ||
| Stressed VaR (10 days - 99%) | |||||||
| 5 | Maximum | 36.1 | 23.7 | 52 | % | ||
| 6 | Average | 26.6 | 16.2 | 64 | % | ||
| 7 | Minimum | 18.9 | 11.0 | 73 | % | ||
| 8 | End of period | 33.0 | 20.5 | 61 | % | ||
| Incremental Risk Charge (99.9%) | |||||||
| 9 | Maximum | 17.8 | 16.5 | 8 | % | ||
| 10 | Average | 11.2 | 4.5 | 148 | % | ||
| 11 | Minimum | 0.2 | 0.6 | (70 | %) | ||
| 12 | End of period | 0.2 | 2.4 | (92 | %) | ||
| Mexico | 2019 | 2018 | Variation | ||||
| Var (10 days - 99%) | |||||||
| 1 | Maximum | 16.2 | 55.0 | (70 | %) | ||
| 2 | Average | 9.8 | 17.0 | (43 | %) | ||
| 3 | Minimum | 3.7 | 9.7 | (62 | %) | ||
| 4 | End of period | 11.1 | 9.7 | 14 | % | ||
| Stressed VaR (10 days - 99%) | |||||||
| 5 | Maximum | 40.7 | 43.9 | (7 | %) | ||
| 6 | Average | 22.6 | 29.2 | (23 | %) | ||
| 7 | Minimum | 12.3 | 17.2 | (28 | %) | ||
| 8 | End of period | 25.7 | 30.6 | (16 | %) | ||
| Incremental Risk Charge (99.9%) | |||||||
| 9 | Maximum | 11.8 | 16.2 | (27 | %) | ||
| 10 | Average | 4.8 | 9.5 | (49 | %) | ||
| 11 | Minimum | 1.0 | 2.7 | (62 | %) | ||
| 12 | End of period | 2.1 | 11.4 | (81 | %) | ||
During the year, the Group maintained its strategy of concentrating its trading activity on customer business, minimising net exposure to directional risk as much as possible and maintaining geographic and risk factor diversification.
This was reflected in the VaR of SCIB’s trading portfolio, which, despite market volatility, especially with regard to interest and exchange rates, remained mostly below the trend of the last three years and closed December at EUR 10.2 million.
Santander also continues to have very limited exposure to complex structured instruments or vehicles, reflecting a risk culture in which prudent risk management is one of its hallmarks.
At the end of December 2019, the Group had the following exposures in this regard:
| • | Hedge funds: exposure was EUR 90 million, entirely indirect exposure, acting as counterparty in derivative transactions. |
The risk with this type of counterparty is analysed on a case-by-case basis, establishing percentages of collateralisation on the basis of the features and assets of each fund.
| • | Monolines: no exposure at the end of December 2019. |
The Group’s policy for approving new transactions related to these products remains very prudent and conservative, and is subject to strict supervision by the Group’s senior management.
Our derivatives activity is mainly focused on the sale of investment products and on hedging risks for our customers. Risk management is focused on ensuring that net open risk is as low as possible.
These transactions include options on equities, fixed income and exchange rates. The units where this activity mainly takes place are: Spain, Brazil, the United Kingdom and Mexico.
The following chart shows the VaR Vega performance of the structured derivatives business over the last three years. It fluctuated at around an average of two million euros. In general, periods of higher VaR levels are associated with episodes of significant increases in market volatility, for example as a result of US trade disputes with China and Europe, and periods of political uncertainty in various regions (Argentina, Mexico, Brazil or Italy).
In comparison with other similar financial groups, Santander Group’s trading risk profile can be classified as low. Dynamic management of risk enables Santander Group to adopt changes in strategy to unlock opportunities in an uncertain environment.
For further details, see the Risk Management chapter (section 4) on the 2019 Annual Report.
6.3.2. Stressed VaR
In addition to the regular VaR, a Stressed VaR is calculated daily for the main portfolios. The methodology for calculating stressed VaR is the same as that used to calculate VaR, but with two differences:
| • | Historical window for observing factors: in the stressed VaR calculation a window of 260 data readings is used, instead of the 520 used for computing the ordinary VaR measurement. |
| • | Unlike the method used for the ordinary VaR calculation: stressed VaR is not obtained as the higher of the uniformly weighted percentile and the exponentially weighted percentile; instead, the uniformly weighted percentile is used directly. |
All other aspects of the methodology and inputs for calculating the stressed VaR are the same as for the VaR.
127 |
| MARKET RISK 2019 Pillar 3 Disclosures Report |
When determining the observation period, the methodology area has analysed the history of a subset of market risk factors picked on the basis of expert analysis of the most significant positions in the books. The scope considered comprises the treasury departments for which Bank of Spain approval has been obtained for the use of the internal model at 31 December 2019: Spain, Chile, Mexico and the London Branch.
The windows currently used to calculate stressed VaR are:
| Stress window | |
| Period | |
| Spain | 10/10/2008 - 13/10/2009 |
| SLB | 10/10/2008 - 13/10/2009 |
| Chile | 11/12/2008 - 23/12/2009 |
| Mexico | 22/09/2008 - 02/10/2009 |
These stress windows are regularly reviewed, and a daily check is run on the validity of the window to compare both VaR and stressed VaR. This check may determine that an analysis is required of the loss and gain vectors used to calculate the VaR values in order to determine the positions and market movement that made VaR exceed stressed VaR over a continuous period of time.
The aim of the analysis is to identify and attempt to separate the causes of the exceptions into two basic categories:
| • | Market movements: it may be necessary to review the window. |
| • | Significant changes in the composition of the portfolio: in this case an analysis will need to be conducted with the Business department so as to ascertain whether the new positions will be permanent, or if they are one-off transactions, and thus decide whether the window should be reviewed. |
If the analysis of the exceptions of percentile VaR with respect to stressed VaR reveals that the current window used to calculate daily VaR covers a period with greater market volatility than the stress window used to calculate stressed VaR, then the stress window will be reviewed.
6.3.3. Incremental risk charge
Following the recommendations of the Basel Committee on Banking Supervision and applicable regulations, an additional metric is calculated in relation to the credit risk inherent in the trading portfolios: the incremental risk charge (IRC).
The IRC is intended to measure both rating migration risk and any incremental default risk that is not captured by VaR through changes in the corresponding credit spreads. The IRC metric is calculated, where applicable, for public and private fixed-income bonds, bond derivatives and credit derivatives.
The method used to calculate the IRC, which is essentially similar to that applied to the credit risk of non-trading portfolio exposures, is based on the Merton structural model, which dictates that the default event occurs when the assets of a company fall below a certain level of its debts.
This internally developed model comprises direct measurements on the distribution queues of losses caused by the different credit events it contemplates, i.e. default risk and migration of credit quality subject to a confidence interval of 99.9% and a capital horizon of one year for all positions. The assumed liquidity horizon coincides with the one-year capital horizon, there being no other liquidity horizons of less than one year. The IRC calculation methodology uses a loss distribution generated via Montecarlo simulation, using two transition matrices; one for corporate issues and the other for sovereign issues. The transition matrices used in the IRC model are based on the historical probabilities of transition, published by the rating agencies. These probabilities are processed to remove the non-rated category and adjusted to include the internally estimated probability of default. This calibration process is run once a year to incorporate the latest information. The model does not assume the periodical renewal of positions (roll-over); but rather a model of constant positions along the one-year capital and liquidity horizon, which consists of maintaining the same positions along this horizon independently of the maturity of each of them.
It is a corporate model that incorporates the portfolios from the various geographies in which the IRC has been approved to calculate independent IRC figures.
6.3.4. Analysis of scenarios and stress testing
In addition to the metrics described in the preceding paragraphs, the Group uses other measurements and tools that provide greater control over the risks it faces in the markets in which it operates. One of these metrics is scenario analysis, which consists of defining alternative behaviour for various financial variables and determining the impact on results when these scenarios are applied. These scenarios may replicate past events (such as a crisis) or determine plausible alternatives that are unrelated to past events.
The potential impact of applying different stress scenarios on earnings is calculated and analysed on a regular basis, particularly for trading portfolios, considering the same risk factor assumptions.
At the end of June 2019, this scenario implied, for the global portfolio, increases in interest rates in South American markets and decreases in North American markets, downturns in the stock markets, depreciation of all currencies against the euro, and increased credit spreads.
| • | VaR scenarios: these consist of a new VaR calculation whenever there are changes in risk factors. These scenarios help define a portfolio’s risk profile. |
| • | IRC scenarios: scenarios defined specifically to stress default risk and the risk of ratings migration in the credit positions in the trading portfolio. |
| • | Historical scenarios: scenarios are constructed on the basis of relevant historical events and are used to forecast maximum losses that would occur were these events to repeat themselves. |
| • | Severe crisis scenarios: extreme scenarios based on movements in market variables that have no known historical precedent. |
| 128 | 2019 Pillar 3 Disclosures Report | ||
| MARKET RISK 2019 Pillar 3 Disclosures Report |
| • | Plausible scenarios: another alternative is to conduct the stress test using scenarios based on expectations of future market performance. These expectations are based on scenarios that are not as extreme as the stressed scenarios. |
When defining the scenarios in which the portfolios are to be tested a distinction is drawn between the following:
| • | Global scenarios: affecting all units. These are defined globally and each unit is responsible for calculating the movements of the variables that apply to them. |
| • | Abrupt crisis: ad hoc scenario with sudden market jolts. Rise in interest rate curves, sharp falls in stock markets, strong appreciation of the dollar against other currencies, rise in volatility and in credit spreads. |
| • | Subprime crisis: historical scenario of the crisis triggered in the market on the heels of the subprime mortgage crisis in the United States. The analysis seeks to capture the impact on results of the liquidity crunch in the markets. The scenarios will have two different time horizons: 1 day and 10 days. Both scenarios posit plunges in stock markets, interest rate declines in the core markets and increases in emerging markets, and dollar appreciation against all other currencies. |
| • | Adverse scenario: reflects the systemic threats which are currently considered to be the most serious threats to the stability of the banking sector in the European Union. Events occurring in this scenario take account of increases in global bond yields along with an incremental fall in the creditworthiness of countries with low demand; stagnation of political reforms jeopardising the sustainability of public finances and a lack of the adjustments necessary to maintain reasonable market funding. |
| • | Reverse stress test scenarios: those scenarios that can compromise the Bank’s ongoing viability. Here, the potential vulnerabilities of the business are identified, along with hidden risks and interactions between the different risk factors. |
These inverse scenarios start from a known stress result (such as non-compliance with certain ratios relating to capital, liquidity or capital adequacy) and from there they identify the extreme scenarios in which the movements of the market variables can cause those events that compromise the viability of the business.
| • | Forward-looking scenarios: where the aim is to anticipate possible negative consequences of changes in market variables and come up with options to prevent the ensuing impacts. They help to detect signs of change in the positioning of portfolios and provide better support for decision-making. |
A consolidated monthly stress test is prepared, under the supervision of the global market risk committee, with explanations of the main variations in the results for the different scenarios and units. An alert mechanism is also in place, so that when a scenario returns a loss that is high by historical standards or in terms of the capital consumed by the portfolio in question, the relevant business head is notified. The stress test is performed by applying the same methodologies for all sub-portfolios covered by the internal market risk model.
The stress test reveals that the economic loss suffered by the Group in its trading portfolios, in terms of mark to market, assuming that the stress movements defined in the worst-case scenario materialised in the market, would be EUR 83.8 million, a loss that would mainly affect Europe (in the following order: equities, credit spread, exchange rates and interest rates) and South America (in the following order: interest rates, equities and exchange rates).
| Table 64. Stress scenario: Maximum volatility (worst case) | |||||||||||||||||||||||||
| Million euros | |||||||||||||||||||||||||
| 31 Dec. 2019 | 31 Dec. 2018 | ||||||||||||||||||||||||
| Interest rate | Equities | Foreign currency | Credit spread | Commodities | Total | Interest rate | Equities | Foreign currency | Credit spread | Commodities | Total | ||||||||||||||
| Total Trading | (33.2 | ) | (26.4 | ) | (11.9 | ) | (12.2 | ) | — | (83.8 | ) | (18.9 | ) | (13.1 | ) | (29.4 | ) | (12.8 | ) | — | (74.3 | ) | |||
| Europe | (2.6 | ) | (18.7 | ) | (7.5 | ) | (10.8 | ) | — | (39.5 | ) | (7.9 | ) | (3.8 | ) | (9.2 | ) | (11.1 | ) | — | (32.0 | ) | |||
| South America | (24.9 | ) | (7.7 | ) | (3.5 | ) | — | — | (36.1 | ) | (2.1 | ) | (9.3 | ) | (15.8 | ) | (0.1 | ) | — | (27.3 | ) | ||||
| USA | (4.4 | ) | — | (0.6 | ) | — | — | (5.1 | ) | (8.5 | ) | — | (3.8 | ) | — | — | (12.3 | ) | |||||||
| Global Activities | — | — | (0.1 | ) | (1.4 | ) | — | (1.5 | ) | (0.2 | ) | — | (0.2 | ) | (1.7 | ) | — | (2.1 | ) | ||||||
| Asia | (1.2 | ) | — | (0.3 | ) | — | — | (1.5 | ) | (0.2 | ) | — | (0.4 | ) | — | — | (0.5 | ) | |||||||
129 |
| MARKET RISK 2019 Pillar 3 Disclosures Report |
6.3.5. Backtesting (MR4)
The backtesting exercise consists of comparing the VaR forecasts, given a certain confidence level and time horizon, with the actual losses incurred over a time horizon equal to the VaR time horizon.
The general aim of backtesting is to verify the accuracy of the Value at Risk (VaR) calculation model. In other words, whether to accept or reject the model used to estimate the maximum loss on a portfolio with a given level of confidence, over a certain period of time.
Backtesting is analysed at local level by the local market risk control units. The market risk consolidation unit is responsible for backtest reporting at consolidated level. It is important to note that the backtesting methodology is applied identically to all the sub-portfolios covered by the internal market risk model. The analysis of regulatory backtesting is conducted daily, at portfolio and sub-portfolio level.
Four types of backtesting are defined, depending on the kind of P&L used:
| • | Economic P&L (dirty P&L): refers to the daily P&L calculated on the basis of mark-to-market or mark-to-model securities (depending on the instruments) of the books and records of the bank at the end of the day. It is calculated using Front Office systems (data on positions, pricing models, valuation methods, price parameters, end-of-day market data, etc.). |
| • | "Actual P&L" (dirty P&L without mark-ups): This means the daily P&L calculated by comparing the portfolio's closing value and its actual value at the end of the following day, including losses and gains derived from intraday activities, excluding fees, commissions and net interest income. Santander, in line with what is considered to be acceptable by the Guide for the TRIM (“ECB Guide to Internal Models”, Oct 19) in its paragraph 63, establishes that the net interest income is equal to zero in the trading portfolio. The "actual P&L" includes all passage of time effects (theta). This P&L is used for the regulatory backtesting in accordance with article 366 (3) of the CRR, in order to compute the number of overshootings. Those additional aspects included in the Guide for the TRIM are also taken into consideration. |
| • | Hypothetical P&L (clean P&L due to subtractions): this refers to the daily P&L calculated by comparing the portfolio's closing value and its actual value at the end of the following day, assuming unchanged positions. In this case, time effects are not considered, in order to be consistent with the VaR. Similarly, those additional aspects included in the Guide for the TRIM are also taken into consideration. Specifically, any valuation adjustment made in the "actual P&L" that is not included in the VaR is also not included in the "hypothetical P&L". The hypothetical P&L is obtained from the Front Office platforms by the Market Risk function, without taking into consideration intra-day results or the changes in the positions of the portfolio. This P&L, like the "actual P&L" is used for the regulatory backtesting in accordance with article 366 (3) of the CRR, in order to calculate the number of overshootings. |
| • | Risk-theoretical P&L (clean P&L due to change of factors): this is the hypothetical P&L, similar to the previous one, but calculated using the Market Risk calculation engine (AIRE), without taking into consideration intra-day results, the changes in the positions of the portfolio or the passage of time effect (theta). This P&L is exclusively used to verify the quality of the internal model of VaR. |
Of these four backtesting methods, only the backtesting on the "actual P&L" (dirty P&L without mark-ups) and the hypothetical P&L (clean P&L due to subtractions) are used to measure and report the accuracy of the model, for regulatory purposes.
In order to calibrate and control the effectiveness of the internal market risk measurement and management systems, Santander Group regularly performed the required benchmark tests and analyses throughout 2019, with the conclusion that the model was reliable
Number of overshootings
An overshooting occurs whenever the losses or gains observed in a day exceed the VaR estimate. The number (or percentage) of overshootings recorded is one of the most intuitive indicators for establishing a model’s accuracy.
When the P&L exceeds the previous day’s VaR it is considered to be an overshooting (or exception). The number (or percentage) of overshootings recorded is one of the most intuitive indicators for establishing the model’s accuracy. A regulatory coefficient "K" is calculated on the basis of the number of overshootings in the regulatory backtesting. This affects the calculation of regulatory capital in accordance with the following table:
| Number of overshooting | Kr | |
| <5 | 0.00 | |
| 5 | 0.40 | |
| 6 | 0.50 | |
| 7 | 0.65 | |
| 8 | 0.75 | |
| 9 | 0.85 | |
| >=10 | 1.00 | |
The confidence level for the VaR calculation is a measure of the number of exceptions expected to occur in a given time window. For example, if the daily VaR is calculated with a confidence level of 99%, the percentiles of interest are the 1st and the 99th percentiles of the P&L distribution, so we should expect 2% of exceptions during the days studied (1% due to excess profit and 1% due to excess loss).
If there are significantly more, or fewer, exceptions, this might be a sign of problems in the VaR model employed. With the observed P&L and estimated VaR data it is possible to construct a hypothesis test to check the validity of the VaR/P&L relationship.
| 130 | 2019 Pillar 3 Disclosures Report | ||
| MARKET RISK 2019 Pillar 3 Disclosures Report |
Time between overshootings
The confidence level for the VaR is also a measure of the number of days that can be expected to elapse between two successive overshootings. For instance, if the daily VaR is calculated at 99% confidence (1st and 99th percentiles), we may expect a mean time of approximately 50 days between overshootings.
Similarly to what was explained in relation to the frequency of overshootings, hypothesis-testing can be done based on the time between overshootings as a means of validating the VaR model.
Distance between overshootings
Whereas the VaR predicts with a certain probability the risk that is assumed, the average overshooting (expected shortfall) is a predictor, for that probability, of the average loss once the VaR has been exceeded. This study should be included when analysing the backtesting report in order to obtain the size of the potential losses that exceed the VaR level.
Daily VaR/P&L relationship
To validate the VaR model, it is not enough to analyse the number and type of overshootings that occur in a given time window. Other indicators must be observed in order to ensure the model’s consistency. One such indicator is the daily VaR/P&L relationship. This relationship is defined as follows:
| • | The P&L figure, as a percentage of VaR, on all the days on which there are no overshootings (losses or gains). |
| • | Calculation of its arithmetic mean. |
The percentage should be close to a value determined by the VaR confidence level, because the higher the chosen confidence level, the higher the VaR estimate (and the smaller the P&L results as a percentage of that estimate).
If the percentage observed is much higher than expected, the risk is being underestimated, and the model should be reviewed. Conversely, if the percentage is significantly smaller, then the risk is being overestimated and the VaR model should be adjusted. The latter outcome may be desirable, however, if the aim is to maintain conservative risk estimates.
The diagram regarding the annual backtest at the end of December 2019 for each unit with internal model approval is available on the Appendix XIX.
The following table includes backtesting exceptions for units that account for over 3% of total RWAs for market risk. The number of exceptions at 31 December 2019 for the main units with internal model approval are shown below:
| Table 65. Exceptions at units with internal model | ||||
| 31 Dec. 2019 | ||||
| Exceptions | Model Status | |||
| Spain | 3 | Valid | ||
| SLB | 4 | Valid | ||
| Chile | 3 | Valid | ||
| Mexico | 1 | Valid | ||
Overshootings in Spain relate mainly to movements in the interest rates curve, credit spreads and exchange rates. In the last few months of the year, there was also a depreciation of the Brazilian real, which created major volatility in the Madrid offshore portfolios in Brazil, particularly in fixed income positions.
Overshootings in Mexico relate to abrupt movements in the MXN/USD exchange rate, which also affect movements in the dollar interest rate curve, as in the overshooting of 20 November.
Overshootings in Chile are mainly the result of movements in the USD/ CLP exchange rate and in the dollar interest rate curve.
Valuation adjustments
The fair value of a financial instrument is calculated using market quoted prices, or where necessary, an appropriate valuation model, duly validated and approved. However, valuation adjustments may be needed, however, when no market quotations are available for price comparison purposes.
Sources of risk include uncertain model parameters, illiquid issuers of underlying assets, poor quality market data or unavailable risk factors (sometimes the best alternative is to use limited models with controllable risk). In such situations, calculating and applying valuation adjustments (of model, uncertainty or illiquidity) is a common practice in the industry, which Santander carries out to take account, among other things, of the sources of model risk described below:
| • | For fixed-income markets, examples of model risk include uncertainty about the Bermudan swaptions mean-reversion parameter and the securitisation swaps prepayment parameter. Other sources of risk arise from the estimation of market data, the lack of liquidity in treasury bills, of certain maturities of constant maturity swaps (CMS) or the credit/interest rate correlation for hybrid products |
| • | In equity markets, examples of model risk include modelling the forward skew, and the impact of stochastic interest rates and of correlation (for options on various underlying baskets). Risk may also derive from managing hedges of digital payments, callables and barriers. Also relevant are risk sources that arise from the estimation of market data such as dividends and correlations for quanto options and composites on baskets. |
131 |
| MARKET RISK 2019 Pillar 3 Disclosures Report |
| • | Inflationary markets are exposed to model risk due to uncertainty regarding modelling of the correlation structure between different inflation rates (e.g. between the CPI in the United Kingdom, calculated by the EU, and the RPI calculated locally in the country). Another source of risk may arise from the bid-offer spread of inflation-linked swaps. |
Currency markets are exposed to model risk in their modelling of forward skew and the impact of modelling stochastic interest rates and correlation for multi-asset instruments. Risk may also arise from market data, due to the existence of illiquidity of long-term volatility in foreign exchange pairs.
6.3.6. Internal validation of the models
Market, counterparty and other non-financial risk models
In 2019, in accordance with the model risk policies, the internal validation team carried out its independent review exercises for the main models used in the Group's different geographical areas. The areas covered are counterparty risk (maximum and expected exposures, CVA/DVA), issuer risk (incremental risk charge), valuation (interest rates, FX, equity, credit and commodities), valuation adjustments (AVA, FVA), market risk (VaR/SVaR), structural interest rate and liquidity risk (prepayments, accounts with no specified maturity, mortgages, calculation of EVE/NIM), and other non-financial risks (operational risk, macroeconomic scenarios).
During these exercises, recommendations were issued aimed at improving the models and correcting their weaknesses. In addition, the resolution of the recommendations addressed was certified and an independent opinion was issued on the changes made to the models, in accordance with the policy on material changes.
The Group also continued to monitor on a quarterly basis the VaR & SVaR models used to calculate regulatory capital for market risk, based on key indicators of the quality of the models, in order to proactively and independently monitor the functioning of these models.
6.4. Structural balance sheet risks
The management of IRRBB in the Group aims to ensure the stability and recurrence of the net interest margin of the commercial activity and of the economic value, maintaining at all times levels of risk below those permitted by the risk appetite approved by the board of directors.
Structural risk is inherent to the banking business and arises from the existence of balance sheet items which behave differently with changes in interest rates. This risk includes both the potential losses from price changes of assets recognised at fair value, and economic losses arising from management of assets and liabilities carried at amortised cost of the banking book positions of Santander Group.
The principles governing the control of structural risk at Santander Group are as follows:
| • | Autonomy in management, whereby each entity autonomously manages its balance sheet structure and its capital. |
| • | Control and supervision, which means control and oversight mechanisms of risks must exist. |
| • | Robust systems and quality internal data. |
| • | Use of standardised and aggregable metrics. |
| • | Use of methodologies and models which are standardised and documented. |
| • | Establishment and adaptability of limits. |
| • | Adjustment to the global regulatory environment. |
| 132 | 2019 Pillar 3 Disclosures Report | ||
| MARKET RISK 2019 Pillar 3 Disclosures Report |
For further details, see the Risk Management and Control chapter (section 4.4) on the 2019 Annual Report.
6.4.1. Main interest rate risk in the banking book (IRRBB) metrics
The Group’s structural interest rate risk profile (both in relation to its asset volumes and own funds, as well as the budgeted net interest margin), remained moderate in 2019, in line with previous years.
The metrics used in the management and control of structural interest rate risk are calculated under various scenarios and provide a static and/or dynamic overview of the exposure of the balance sheet and net interest margin to adverse interest rate movements. The main metrics used in the measurement of structural interest rate risk are the following:
| a) | Repricing gap: |
This is the basic concept for identifying the Group’s interest rate risk profile and it measures the difference between the volume of sensitive assets and liabilities on and off balance sheet that re-price (i.e. that mature or are subject to rate revisions) at certain times (called, buckets). This provides an immediate approximation of the sensitivity of the entity’s balance sheet and its net interest margin and market value of equity to changes in interest rates.
| b) | Net interest margin and its sensitivity: |
Net interest margin (NIM) and its sensitivity: Net interest margin is calculated as the difference between the interest income as percentage of assets and the interest cost of the liabilities of the banking book in a determined time horizon (typically from one to three years, with one year being the standard period for measuring net interest margin risk in the Group and also for regulatory purposes). Its sensitivity reflects the impact of changes in interest rates on net interest margin in the given time horizon. Net interest margin sensitivity is calculated as the difference between the net interest margin in a selected scenario and the net interest margin in the baseline scenario. Therefore, net interest margin can have as many sensitivities as scenarios considered. This metric enables the identification of short-term risk, and supplements EVE sensitivity.
| c) | Economic value and its sensitivity: |
Economic value of equity (EVE) and its sensitivity: EVE measures the market value of equity and its sensitivity measures the impact of changes in interest rates on EVE. EVE is calculated as the sum of the assets less the present value of the liabilities of the banking book, excluding own equity and other instruments that do not generate interest. The present values are obtained by discounting the projected cash flows from assets and liabilities in the relevant discount curve(s). EVE sensitivity is calculated as the difference between the EVE in a selected scenario and the EVE in the baseline scenario. Therefore, EVE can have as many sensitivities as scenarios considered. This metric enables the identification of long-term risk, and so supplements net interest margin.
| d) | Value at risk, (VaR), for the purpose of calculating economic capital: |
The measures of value at risk are used to assess the possible impact of changes in market variables on the economic value of equity (EVE). The risk factors to be considered for the calculation of VaR are interest rates and sovereign spreads. The latter in those currencies here this risk is considered high and spread risk confined to the ALCO portfolio.
For balance sheet activity and investment portfolios, this is defined as a percentile of the distribution function of gains and losses in market value of equity, calculated on the basis of the current market value of positions and returns over the last two years, at a statistical confidence level of 99% over a time horizon of 21 days.
In addition, the possible impact of changes in market variables on Group earnings is also assessed when calculating economic capital (with both losses in the net interest margin and losses from price changes in assets recognised at fair value being taken into consideration):
| 1. | The same standard is used to estimate net interest margin losses as is used for VaR, with the only difference being the time horizon of transactions (one year). |
| 2. | To estimate losses from price changes of assets recognised at fair value, the economic P&L is calculated under stress from the fixed-income instruments managed by the ALCO (ALCO portfolios). The impact is then measured that this market stress could have on the portfolio; the change in value of which would reduce the Group’s equity and, therefore, have a negative effect on its capital ratio. The stress has a statistical component, as it is calibrated according to past performances observed in the market, and a forward-looking component, which uses stress scenarios generated by the Group based on macro-economic analysis. |
For further details, see the Risk Management and Control chapter (section 4.5) on the 2019 Annual Report.
133 |
| MARKET RISK 2019 Pillar 3 Disclosures Report |
System for controlling limits
The measurement, analysis and control of structural interest rate risk metrics guarantees that the level of structural balance sheet interest rate risk is aligned with the Group's policies, approved limits and risk appetite.
Within the framework of the annual limits plan, limits are set for IRRBB (interest rate risk in the banking book), responding to the Group’s risk appetite levels. The main limits are:
•Limit of net interest margin sensitivity at one year.
•Limit of market value of equity sensitivity.
The internal metrics used to monitor interest rate risk are based on the sensitivity of economic value and net interest margin to interest rate shocks (-100bps, -75bps, -50bps, -25bps, +25bps, +50bps, +75bps and +100bps), to provide a harmonised overview of the risk in the different Group entities.
| • | Additionally, there are metrics for monitoring the potential impact that the bond portfolio used by the ALCO to manage the balance sheet interest rate could have on own funds given its accounting classification (fair value with changes in equity). |
In the event of that one of these limits or their sub-limits is exceeded, the heads of risk management must explain the reasons and facilitate a corrective action plan.
Methodologies
The calculation of structural interest rate risk metrics requires the use of three main elements:
| • | Yield curves for capitalisation and discount |
| • | Behavioural models that enable the cash flows of certain instruments to be determined |
| • | Assumptions about future changes in the entity's balance sheet and its various items. |
Of these three elements, the behavioural element is the main one subject to modelling. The main models used in the management and control of balance sheet interest rate risk are described below by product type:
| a) | Treatment of non-maturing liabilities |
Accounts with no contractual maturity are subject to two types of option, the customer's option to withdraw their money without prior notice and/or the bank to review the interest paid. The corporate model of non-maturity deposits (NMDs) is divided into three sub-models:
| • | Volumes model: the volumes model is based on the fact that, with the passage of time, changes in non-maturing account balances depend more on customer behaviour and macroeconomic variables (such as the opportunity cost of not investing in other markets, the housing market or interest rates) than on the bank's commercial departments. In this case, a statistical approach is considered: based on the selection of the lower limit of a confidence interval constructed by removing a certain amount of the standard deviations of the trend balance sheet. The balance sheet is split into stable and unstable balances. The model focuses on the stable balances, treating unstable balances with an immediate maturity. |
| • | Run-off model: this sub-model, assumes that there is a natural degradation of the balances, in so far as the existing accounts are liquidated with the passage of time. The model creates a function which produces a fall in the balance down to a maximum maturity defined for the account. |
| • | Beta model: this sub-model defines the relationship between market benchmark interest rates and the remuneration paid to customers. |
This model requires a variety of inputs:
| • | Parameters inherent in the product. |
| • | Customer and/or Bank behavioural parameters (in this case analysis of historic data is combined with expert judgement on the business). |
| • | Market data. |
| • | Historic data of the portfolio. |
The internal policies establish the need to review the prices assigned to NMDs on an annual basis; more frequently if required by market conditions. The most recent review of the parameters used in the valuation of NMDs in the various Group units is on average of 87 days.
| b) | Treatment of non-maturing assets |
The model used on the asset side for products like credit cards or similar, is based on the non-maturing accounts model, sharing some of the same methodology and assumptions.
| c) | Treatment of prepayment of certain assets |
The prepayment option is defined as the possibility given to customers to repay their loans before the contractual maturity date, without this involving a significant additional economic cost for them. Prepayment mainly affects fixed-rate products, such as fixed-rate mortgages in a market where the yield curves for these portfolios are at low levels and there is an incentive for customers to prepay when the market interest rate is below the product's reference interest rate. However, prepayment does not always depend on the level of interest rates, but instead on other more complex factors resulting from macroeconomic or cultural situations on the market, for which reason the normal techniques used to value options cannot be applied directly, and they must be combined with empirical statistical models that aim to capture customer behaviour. Some of the factors conditioning this behaviour are:
| 134 | 2019 Pillar 3 Disclosures Report | ||
| MARKET RISK 2019 Pillar 3 Disclosures Report |
| • | Interest rate: the differential between the fixed rate of the product (e.g. a mortgage) and the market rate at which it could be refinanced, net of cancellation and opening costs. |
| • | Seasoning: trend whereby the pre-payment is downward at the beginning of the instrument life-cycle (signing of the agreement) and then increases, stabilising with the passage of time. |
| • | Seasonality: redemptions or early cancellations tend to take place at specific dates. |
| • | Burnout: decreasing trend in the speed of pre-payment as the instrument’s maturity approaches, which includes: |
| a) | Age, which defines low rates of pre-payment. |
| b) | Cash pooling, which defines as more stable, those loans that have already survived various waves of interest rate reductions. In other words, when a loan portfolio has been through one or more cycles of rate cuts and thus high levels of prepayment, the surviving loans have a significantly lower prepayment probability. |
| c) | Other: geographic mobility, demographic, social and disposable income factors, etc. |
Highlights of the work carried out on models in 2019 include:
| • | Internal validation of all the models used in the various Group units, reaching year-end with around 80% of the models in use having been validated. |
| • | Development of interest rate conditional models. |
| • | Change in the method of calculating the input of the P&L vector for the VaR-EaR used in economic capital, adapting it to the new conditional parameters defined in the models. |
135 |
| MARKET RISK 2019 Pillar 3 Disclosures Report |
The following tables show the bank’s changes in the Economic Value of Equity (EVE) and Net Interest Income (NII) for every interest rate prescribed scenario and for every currency.
| Table 66. Quantitative information on IRRBB | ||||||||
| Million euros | ||||||||
| Total | VaR EVE | VaR NII | ||||||
| Period | Dec 19 | Dec 18 | Dec 19 | Dec 18 | ||||
| Parallel up | (313 | ) | 1,905 | 576 | 1,447 | |||
| Parallel down | (4,716 | ) | (7,966 | ) | (1,209 | ) | (804 | ) |
| Steepener | 2,634 | 1,636 | ||||||
| Flatterner | (5,084 | ) | (3,025 | ) | ||||
| Short rate up | (3,661 | ) | (1,477 | ) | ||||
| Short rate down | (279 | ) | (126 | ) | ||||
| Maximum | (5,084 | ) | (7,966 | ) | (1,209 | ) | (804 | ) |
| Period | Dec 19 | Dec 18 | ||||||
| Tier 1 capital | 78,964 | 75,838 | ||||||
| Note 1: the scenarios assume the shocks established by Basel for each currency before applying management floors limiting their impact on currencies with negative or extremely low interest rates. | ||||||||
| Note 2: the aggregation of EVE sensitivities used follows the criteria set out in the EBA/GL/2018/02 Guidelines on the management of interest rate risk arising from non-trading book activities. For each interest-rate scenario, the positive and negative changes occurring in each currency are added linearly, with a 50% weighting for positive change | ||||||||
| EUR | VaR EVE | VaR NII | ||||||
| Period | Dec 19 | Dec 18 | Dec 19 | Dec 18 | ||||
| Parallel up | 8,423 | 11,204 | 1,316 | 2,369 | ||||
| Parallel down | (4,051 | ) | (7,065 | ) | (734 | ) | (330 | ) |
| Steepener | 2,504 | 1,901 | ||||||
| Flatterner | (754 | ) | 132 | |||||
| Short rate up | 1,881 | 3,642 | ||||||
| Short rate down | (2,480 | ) | (1,868 | ) | ||||
| Maximum | (4,051 | ) | (7,065 | ) | (734 | ) | (330 | ) |
| USD | VaR EVE | VaR NII | ||||||
| Period | Dec 19 | Dec 18 | Dec 19 | Dec 18 | ||||
| Parallel up | (1,136 | ) | (1,088 | ) | 218 | 5 | ||
| Parallel down | (1,104 | ) | (959 | ) | (217 | ) | (40 | ) |
| Steepener | 484 | 230 | ||||||
| Flatterner | (1,234 | ) | (1,019 | ) | ||||
| Short rate up | (997 | ) | (883 | ) | ||||
| Short rate down | 891 | 800 | ||||||
| Maximum | (1,234 | ) | (1,088 | ) | (217 | ) | (40 | ) |
| GBP | VaR EVE | VaR NII | ||||||
| Period | Dec 19 | Dec 18 | Dec 19 | Dec 18 | ||||
| Parallel up | (219 | ) | 643 | 499 | 1,020 | |||
| Parallel down | (610 | ) | (1,767 | ) | (239 | ) | (411 | ) |
| Steepener | 1,367 | 1,073 | ||||||
| Flatterner | (1,562 | ) | (1,144 | ) | ||||
| Short rate up | (1,134 | ) | (477 | ) | ||||
| Short rate down | 792 | 431 | ||||||
| Maximum | (1,562 | ) | (1,767 | ) | (239 | ) | (411 | ) |
| BRL | VaR EVE | VaR NII | ||||||
| Period | Dec 19 | Dec 18 | Dec 19 | Dec 18 | ||||
| Parallel up | (1,732 | ) | (1,531 | ) | (297 | ) | (166 | ) |
| Parallel down | 1,881 | 1,920 | 297 | 166 | ||||
| Steepener | 315 | 594 | ||||||
| Flatterner | (628 | ) | (856 | ) | ||||
| Short rate up | (1,225 | ) | (1,325 | ) | ||||
| Short rate down | 1,356 | 1,582 | ||||||
| Maximum | (1,732 | ) | (1,531 | ) | (297 | ) | (166 | ) |
For further details, see the Risk Management chapter (section 4) on the 2019 Annual Report.
| 136 | 2019 Pillar 3 Disclosures Report | ||
| OPERATIONAL RISK 2019 Pillar 3 Disclosures Report |
| 7 | ||||||
| Operational risk | ||||||
| Image omitted | ||||||
137 |
| OPERATIONAL RISK 2019 Pillar 3 Disclosures Report |
| Image omitted | ||||
138 |
| OPERATIONAL RISK 2019 Pillar 3 Disclosures Report |
7. Operational risk
| Main figures | ||||
| Million euros | ||||
| RWA | RWA | |||
| 2019 | 2018 | |||
| Operational risk | 59,661 | 60,043 | ||
| Of which, standardised approach | 47,986 | 49,627 | ||
| Of which, alternative standardised approach | 11,675 | 10,416 | ||
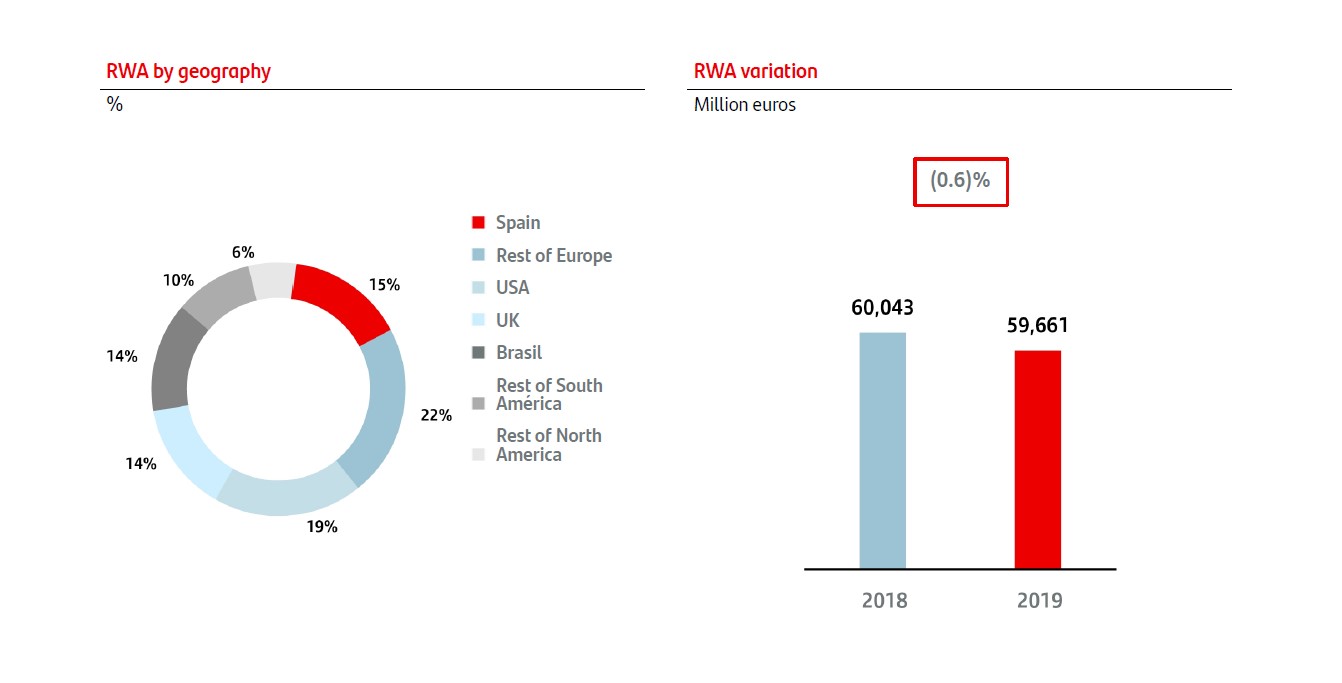
139 |
| OPERATIONAL RISK 2019 Pillar 3 Disclosures Report |
7.1. Definition and objectives
The objective of Santander Group in the management and control of operational risk is focused on the identification, measurement/assessment, monitoring, control and reporting of this risk. The analysis of operational risk exposure contributes to determining the risk management priorities. Santander Group expressly recognises that while a certain volume of expected operational losses may indeed arise, unexpected severe losses as the result of failures in business controls are unacceptable.
Of particular note in 2019, was the improvement in risk analysis, thanks to various initiatives such as the definition of new risk appetite metrics and changes made to other existing ones (in relation to IT, cyber and supplier risk); the inclusion of thematic assessments in the risk control self-assessment (RCSA) exercise; deployment of an advanced supervision and challenge tool that enables the independent assessment of the control environment of the Group and the units; and the development of a framework for the identification, assessment and mitigation of transformation risk, which will be implemented during 2020/1.
Mitigation plans have been rolled out for the management of key risks (fraud, information security and control of suppliers, etc), focusing on both the implementation of corrective measures and the appropriate monitoring and management of projects in development.
For further details, see the Risk Management and Control chapter (section 6) on the 2019 Annual Report
7.2. Capital requirements for Operational Risk
Santander Group uses the standardised method to calculate capital requirements for operational risk, as established by the CRR. The agreement was made by the board of directors on 22 June 2007 and reported to the Bank of Spain’s general supervisory department by the second vice-chairman and CEO on 29 June 2007.
Under the standardised approach, capital requirements are calculated on the basis of relevant income, which is defined as the sum of the following components of the income statement:
•Interest and similar income
•Interest expense and similar charges
•Return on equity instruments
•Fee and commission income
•Fee and commission expense
•Operating income (net)
•Exchange differences (net)
•Other operating income
For this method, the CRR also defines the following segmentation of business lines:
a)Corporate finance
b)Trading and sales
c)Retail brokerage
d)Commercial banking
e)Retail banking
f)Payment and settlement
g)Agency services
h)Asset management
Relevant income
Under the standardised approach, capital requirements are calculated as the simple average over the last three years of the summation, for each year, of the greater of zero and the sum of relevant income across each of the business lines, multiplied by the weight assigned to each business line.
The mathematical expression of these requirements will be as follows:
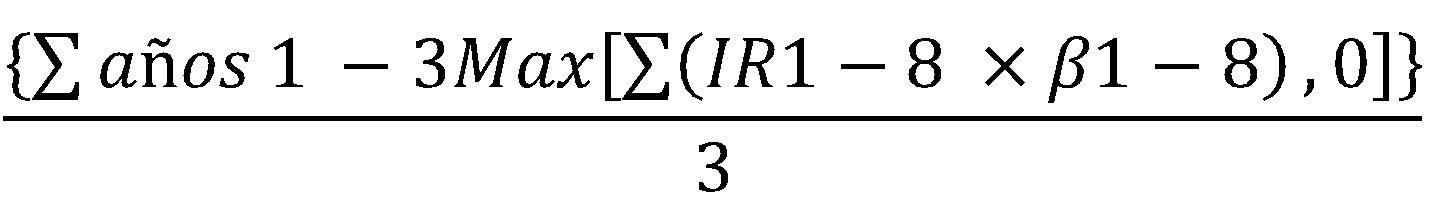
Where:
RI1-8 = Relevant income of each business line, with the appropriate sign, in accordance with the CRR.
ß1-8 = Weight applicable to each business line, in accordance with the CRR.
Obtaining data on relevant income, allocating it to the various business lines and calculating capital requirements is the responsibility of Financial Accounting and Control.
Santander Group obtains the figure for relevant income from the consolidated management information by business line. This information is generated from accounting data.
Consolidated management information is published quarterly in aggregate form and is the basis on which the businesses’ budgetary compliance is measured. It is prepared by the Management Control area, which regulates the business lines of all the Group’s units based on certain corporate criteria, which all units must apply when drawing up their management information.
| 1) | Main segments: |
| a) | Europe: Includes all the business activities carried out in the region. Detailed financial information is provided on Spain, Portugal, Poland, Santander Consumer Finance (which incorporates all the business activities carried out in the region, including the three countries mentioned previously) and the United Kingdom. |
| 140 | 2019 Pillar 3 Disclosures Report | ||
| OPERATIONAL RISK 2019 Pillar 3 Disclosures Report |
| b) | North America: Includes all the business activities carried out in Mexico and the US, which includes the holding company (SHUSA) and the businesses of Santander Bank, Santander Consumer USA, Banco Santander Puerto Rico, Banco Santander International’s specialised unit and the New York branch. |
| c) | South America: Includes all the financial activities carried out by the Group through its banks and subsidiary banks in the region. Detailed information is provided on Brazil, Chile, Argentina, Uruguay, Peru and Colombia. |
| d) | Santander Global Platform: Includes our digital bank Openbank and Open Digital Services, Global Payment Services (Superdigital, Pago FX, Global Merchant Services, Global Trade Services) and Digital Assets (Digital knowledge centres, InnoVentures and digital assets). |
2)Secondary segments. At this secondary level of segment reporting, the Group is structured into Retail & Commercial Banking, Santander Corporate & Investment Banking, Wealth Management & Insurance and Santander Global Platform
| a) | Retail and commercial banking: This covers all customer banking businesses, including consumer finance, except those of corporate banking, which are managed through Santander Corporate & Investment Banking, and asset management, private banking and insurance, which are managed by Wealth Management & Insurance. The results of the hedging positions in each country are also included, conducted within the sphere of each of their assets and liabilities committees. |
| b) | Santander Corporate & Investment Banking (SCIB): This business reflects revenue from global corporate banking, investment banking and markets worldwide including trading desks managed globally (always after the appropriate distribution that takes place with Retail and Commercial Banking customers), as well as the equities business. |
| c) | Wealth Management & Insurance: Includes the asset management business (Santander Asset Management), the corporate unit of Private Banking and International Private Banking in Miami and Switzerland (Santander Private Banking) and the insurance business (Santander Insurance). |
| d) | Santander Global Platform: Includes our digital bank Openbank and Open Digital Services, Global Payment Services (Superdigital, Pago FX, Global Merchant Services, Global Trade Services,) and Digital Assets (Digital knowledge centres, InnoVentures and digital assets). |
In addition to these operating units described, both for the main and secondary segments, the Group continues to maintain the corporate centre, which includes the centralised management businesses relating to financial holdings, financial management of the structural exchange rate position, carried out within the scope of the Group’s assets and liabilities committee, and management of liquidity and own funds through issuances.
As a supplement to the Management Control area’s aggregated business unit-level information, Santander Group uses business area information broken down by segment, product, etc. to distribute relevant income among the business lines defined by the CRR.
Any difference between the total figure of relevant income and the Group’s published consolidated information is allocated to the business line with the highest capital consumption.
The following chart shows the distribution of capital by business line as of 31 December 2019.
| Capital distribution by business line | |
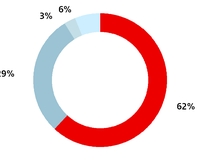
| n | Retail Banking |
| n | Commercial Banking |
| n | Asset management |
| n | Rest |
Changes in capital requirements and RWAs for operational risk from 2018 to 2019 are shown below:
| Table 67. Changes in capital requirements for operational risk | |||||
| Million euros | 31 Dec. 2019 | ||||
| Capital | RWAs | ||||
| Starting figure (31/12/2018) | 4,803 | 60,043 | |||
| Perimeter | (19 | ) | (241 | ) | |
| Exchange rate effect | (15 | ) | (186 | ) | |
| Change in business | 4 | 45 | |||
| Ending figure (31/12/2019) | 4,773 | 59,661 | |||
The standardised approach imposes higher capital requirements for financial institutions operating in jurisdictions with high net interest income, which are often associated with a high risk premium but not necessarily greater operational risk. To avoid this undesired effect, EU legislation (Regulation 575/2013/EU) provides for the use of the alternative standardised approach by businesses that meet certain conditions, subject to the supervisor's approval. This approach uses a normalised indicator which is calculated by multiplying certain balances by 3.5% and thereby providing an average which is more in line with the unit’s operational risk.
On 3 February 2016, the European Central Bank issued authorisation for the alternative standardised approach to be used to calculate consolidated capital requirements for operational risk at Banco Santander Brasil, S.A.
Similarly, on 12 July 2017, the European Central Bank issued authorisation for the alternative standardised approach to be used to calculate consolidated capital requirements for operational risk at Banco Santander México S.A.
141 |
| OTHER RISKS 2019 Pillar 3 Disclosures Report |
This page is intentionally left in blank.
| 142 | 2019 Pillar 3 Disclosures Report | ||
| OPERATIONAL RISK 2019 Pillar 3 Disclosures Report |
| 8 | ||||||
| Other risks | ||||||
| Image omitted | ||||||
143 |
| OPERATIONAL RISK 2019 Pillar 3 Disclosures Report |
| Image omitted | ||||
144 |
| OTHER RISKS 2019 Pillar 3 Disclosures Report |
8. Other risks
More information on other risks not contemplated in this document can be found in the Risk Management and Control chapter of the 2019 Annual Report.
8.1. Liquidity and funding risk
Liquidity risk entails the potential losses that may be incurred by an entity as a result of its inability to secure funding on the market and/or the higher borrowing costs of new sources of finance.
The aim of liquidity risk management is to guarantee that funds shall be available at the right time and cost to enable the entity to meet obligations and carry out its operations.
Risk profile:
| • | Management of liquidity and funding is an essential component of business strategy. |
| • | The liquidity and funding model is decentralised, and is based on autonomous subsidiaries responsible for covering their own liquidity needs. |
| • | Needs arising from business activity in the medium/long term must be funded by medium-term and long-term instruments. |
| • | A large proportion of customer deposits resulting from an essentially retail banking balance sheet. |
| • | Diversification of sources of wholesale funding in terms of instruments/investors, markets/currencies and maturities. |
| • | Limited recourse to short-term wholesale funding. |
| • | Availability of a sufficient liquidity reserve, including a discount capacity with central banks to be used in adverse situations. |
For further details, see the Risk Management chapter (section 4) on the 2019 Annual Report.
8.1.1. Liquidity Coverage Ratio (LCR)
Description of the degree of centralisation of liquidity management and interaction between the Group’s units:
The Group has adopted a decentralised financing model through a structure of autonomous subsidiaries that are self-sufficient when it comes to liquidity. Each subsidiary is responsible for covering the liquidity needs arising from its current and future business, either through deposits captured from its customers in its area of influence or through recourse to the wholesale markets in which it operates, within a framework of management and supervision coordinated at Group level. Therefore, each subsidiary manages and monitors its own LCR ratio, ensuring that it remains at all times within the limits specifically established for that subsidiary. These individual limits are more stringent than regulatory requirements and are reflected in the risk appetite of each subsidiary.
This financing model has proven itself to be highly effective during times of high market stress, since it effectively prevents problems at one division from impacting the borrowing capacity of other areas and therefore of the Group as a whole; this being a definite threat in the case of centralised financing models.
The breakdown of the LCR ratio shown here, is essentially the sum of the individual ratios at each Group unit, stripping out any one-off intra-group transactions.
For further details, see Table LCR in Appendix XX.
145 |
| OTHER RISKS 2019 Pillar 3 Disclosures Report |
Concentration of funding and liquidity sources
To ensure sound liquidity management, the Group seeks to diversify its sources of wholesale financing, meaning diversification by instrument, investor, market, currency and maturities. The Group’s model relies on its presence in major markets, affording it a large degree of diversification. Since most Group units are commercially-oriented, they obtain a large part of their funding from deposits secured from retail customers, which are inherently more stable than wholesale sources of funding.
In view of all these considerations, there is no significant risk of concentration of funding. Even so, the Group has deployed metrics and limits to control any concentration of funding sources.
Derivative exposures and potential collateral calls
Most transactions with derivatives carried out by Group entities are subject to collateral contracts covering the market value of those transactions. Group units include liquidity risk - involving the impact of an adverse market scenario leading to changes in the market values of those derivatives and therefore generating additional liquidity needs due to the need to post collateral - in their LCR ratio using the historical look-back approach, in which the most significant net change in 30 days over the preceding 24 months is calculated and then added as further liquidity needs.
Currency mismatch in the LCR
Santander Group prepares its consolidated LCR ratio for each of its identified significant currencies, which reflect the geographies in which the Group’s various units operate: US dollar (USD), pound sterling (GBP), Brazilian real (BRL), Mexican peso (MXN) and Chilean peso (CLP). Individually, each of the entities draws up its own LCR ratio for its significant currency. The main risk here comes from the positions held in Latin American countries, where the local currencies are not directly convertible. Therefore, the positions held in foreign currency are monitored closely; a process that includes currency-specific stress scenarios.
Other items in the LCR calculation that are not captured in the LCR disclosure template but that the institution considers relevant for its liquidity profile.
Santander Group’s consolidated ratio is largely shaped by the individual ratios of its three main units: Santander Parent, Santander UK and Santander Brazil. These units acquire most of their funding from retail deposits, which are much more stable liabilities that generate fewer potential outflows from the LCR ratio. Most cash outflows from the LCR ratio stem from wholesale funding, which is considerably more unstable, although the Group typically minimises and diversifies the maturities. Meanwhile, the Group has a very high quality stock of liquid assets. On average, approximately 93% of the assets that form part of the LCR numerator are Level 1. This is because the units’ asset portfolios mainly comprise the public debt of the countries in which the Group operates or countries with a good credit rating.
For further details, see the Economic and Financial Report chapter (section 3.4) and the Risk Management and Control chapter (section 4.6) on the 2019 Annual Report.
8.1.2. Asset Encumbrance
In line with the guidelines established by the European Banking Authority (EBA), the concept of asset encumbrance includes both on-balance sheet assets pledged as collateral in operations to obtain liquidity as well as those off-balance sheet assets received and re-used for a similar purpose, in addition to other assets associated with liabilities other than for funding reasons.
Disclosures on Santander Group required by Commission Delegated Regulation (EU) 2017/2295.
The scope used for the disclosures in this report is the same as the liquidity management scope on a consolidated basis, as regulated in CRR 575/2013.
The amount of exposure shown in the tables below was calculated as the median of the values disclosed in the regulatory information for the four quarters of the year, in line with European Banking Authority guidelines.
| 146 | 2019 Pillar 3 Disclosures Report | ||
| OTHER RISKS 2019 Pillar 3 Disclosures Report |
| Table 68. Encumbered and unencumbered assets (AE1) | ||||||||||||||||
| Million euros | 31 Dec. 2019 | |||||||||||||||
| Carrying amount of encumbered assets | Fair value of encumbered assets | Carrying amount of unencumbered assets | Fair value of unencumbered assets | |||||||||||||
| Of which, notionally eligible EHQLA and HQLA | Of which, notionally eligible EHQLA and HQLA | Of which, EHQLA and HQLA | Of which, EHQLA and HQLA | |||||||||||||
| Assets of the reporting institution | 324,105 | 68,997 | 1,175,844 | 147,661 | ||||||||||||
| Equity instruments | 6,296 | 4,590 | 10,267 | 4,566 | ||||||||||||
| Debt securities | 71,582 | 63,193 | 71,794 | 63,387 | 100,862 | 65,860 | 100,254 | 65,425 | ||||||||
| Of which, covered bonds | 1,355 | 1,348 | 1,391 | 1,384 | 1,504 | 1,016 | 1,472 | 1,070 | ||||||||
| Of which, asset-backed securities | 6,149 | 4,637 | 5,912 | 4,626 | 1,896 | 519 | 1,753 | 443 | ||||||||
| Of which, issued by general governments | 62,666 | 59,358 | 62,817 | 59,509 | 67,237 | 61,402 | 66,446 | 61,067 | ||||||||
| Of which, issued by financial corporations | 7,488 | 5,149 | 7,500 | 5,122 | 20,643 | 5,901 | 20,480 | 5,802 | ||||||||
| Of which, issued by non-financial corporations | 1,018 | 54 | 1,045 | 54 | 9,781 | 190 | 9,664 | 195 | ||||||||
| Other assets | 247,781 | 839 | 1,064,904 | 80,041 | ||||||||||||
| Of which, loans | 214,729 | 839 | 901,212 | 71,364 | ||||||||||||
| Table 69. Collateral received and own debt securities issued (AE2) | ||||||||
| Million euros | 31 Dec. 2019 | |||||||
| Fair value of encumbered collateral received or own debt securities issued | Unencumbered | |||||||
| Fair value of collateral received or own debt securities issued available for encumbrance | ||||||||
| Of which, notionally eligible EHQLA and HQLA | Of which, EHQLA and HQLA | |||||||
| Collateral received by the reporting institution | 77,447 | 73,606 | 62,640 | 57,090 | ||||
| Loans on demand | — | — | 4 | — | ||||
| Equity instruments | 4,048 | 2,363 | 7,982 | 5,481 | ||||
| Debt securities | 71,877 | 69,838 | 55,514 | 52,061 | ||||
| Of which, covered bonds | 1,366 | 1,182 | 784 | 721 | ||||
| Of which, asset-backed securities | 483 | 142 | 5,971 | 4,429 | ||||
| Of which, issued by general governments | 64,307 | 63,775 | 45,133 | 45,014 | ||||
| Of which, issued by financial corporations | 7,638 | 6,423 | 7,735 | 5,254 | ||||
| Of which, issued by non-financial corporations | 599 | 309 | 898 | 593 | ||||
| Loans and advances other than loans on demand | 773 | 773 | 4 | — | ||||
| Other collateral received | 2 | — | 25 | — | ||||
| Own debt securities issued other than own covered bonds or asset-backed securities | 3 | — | 1,415 | — | ||||
| Own covered bonds and asset-backed securities issued and not yet pledged | 7,789 | — | ||||||
| Total assets, collateral received and own debt securities issued | 400,448 | 143,548 | ||||||
As table 68 shows, the vast majority of unencumbered assets includes loans that can be pledged as collateral.
Where the own covered bonds and asset-backed securities retained are used, the pledged asset is included in table 68 under loans and the related liability in table 70.
The main sources and types of encumbrances and the level of over-collateralisation are set out in the following table:
147 |
| OTHER RISKS 2019 Pillar 3 Disclosures Report |
| Table 70. Sources of encumbrance (AE3) | |||||
| Million euros | 31 dic. 2019 | ||||
| Matching liabilities, contingent liabilities or securities lent | Assets, collateral received and own debt securities issued other than covered bonds and ABSs encumbered | ||||
| Carrying amount of selected financial liabilities | 251,268 | 333,488 | |||
| Derivatives | 24,026 | 23,501 | |||
| Of which, Over-The-Counter | 17,008 | 15,995 | |||
| Deposits | 148,243 | 204,660 | |||
| Of which, Repurchase agreements | 76,874 | 107,579 | |||
| Of which, central banks | 2,298 | 2,588 | |||
| Of which, Collateralised deposits other than repurchase agreements | 73,857 | 100,151 | |||
| Of which, central banks | 62,892 | 81,352 | |||
| Of which, Debt securities issued | 78,903 | 104,349 | |||
| Of which, covered bonds issued | 48,497 | 59,279 | |||
| Of which, asset-backed securities issued | 30,109 | 43,806 | |||
| Other sources of encumbrance | 52,187 | 66,665 | |||
| Nominal of loan commitments received | 6,247 | 8,231 | |||
| Nominal of financial guarantees received | 1,128 | 1,435 | |||
| Fair value of securities borrowed with non cash-collateral | 24,131 | 24,710 | |||
| Other | 21,374 | 33,251 | |||
| Total sources of encumbrance | 303,702 | 400,448 | |||
The table below shows the amount of own covered bonds and asset-backed securities retained and not used as collateral and the value of the related underlying assets:
| Table 71. Own covered bonds and asset-backed securities issued | ||||
| Million euros | 31 Dec. 2019 | |||
| Non-encumbered | ||||
| Carrying amount of the underlying pool of assets | Fair value of debt securities issued available for encumbrance | |||
| Own covered bonds and asset-backed securities issued | 12,467 | 7,789 | ||
| Retained covered bonds issued | 2,641 | 398 | ||
| Retained asset-backed securities issued | 9,595 | 7,512 | ||
The contribution to the Group’s level of asset encumbrance on a consolidated basis by the various units is uneven across geographies. European units contribute similarly to the Group, while the United States is the largest contributor given the high weight of the consumer lending business (Santander Consumer USA). The contribution by Latin American units is smaller, as their covered bond and asset-backed securities markets are less developed. Moreover, intra-group asset encumbrance is not material.
In each unit, the encumbered assets are denominated in the same currency as the encumbrance, normally the unit’s functional currency.
For further details on encumbered assets (article 433 of the CRR), see the Economic and Financial Report chapter (section 3.4: Liquidity and funding management) on the 2019 Annual Report.
| 148 | 2019 Pillar 3 Disclosures Report | ||
| OTHER RISKS 2019 Pillar 3 Disclosures Report |
8.2. Compliance and conduct risk
Under the current configuration of the three lines of defence, Compliance and Conduct is a second independent line of control, organisationally placed under the Group chief risk officer (CRO), reporting directly and regularly to the board of directors and its committees, through the Group chief compliance officer (GCCO).
The compliance and conduct function comprises all matters related to regulatory compliance, financial crime prevention (FFC), product governance and consumer protection, and reputational risk.
The primary responsibility for compliance and conduct risk management lies with the first lines of defence, jointly with the business units that directly originate such risks and the compliance and conduct function, by assigning compliance activities or tasks to the first line or directly by the compliance and conduct function itself.
The compliance function fosters adherence by Santander Group to rules, supervisory requirements and principles and values of good conduct by setting standards, discussing, advising and reporting in the interests of people, customers, shareholders and communities.
Santander Group’s risk appetite in this area essentially takes the form of a statement of zero appetite for risks of this type, with the clear objective of minimising any economic, regulatory or reputational impact on Santander Group. To help ensure this, Compliance and Conduct Risk carries out a standardised management of this area, using a common methodology and taxonomy, which is fully aligned with the Risk function's principles and establishes a series of compliance and conduct risk indicators, assessment matrices and qualitative statements.
With this objective, in 2019, as in previous years, the annual process of preparing the risk appetite was completed towards the end of the year, with the aim of verifying that the current model is fit for measuring the function’s risk appetite and aligned with the Group's risk appetite.
The composition of the indicators was reviewed and some of their corporate thresholds were lowered, so as to provide a more accurate view and to show proper alignment with the function’s strategy and risk tolerance. These adjustments were approved by the relevant committees and passed on to the units concerned.
For further details on compliance and conduct risk, see the Risk Management chapter (section 7) on the 2019 Annual Report
8.3. Capital risk
Capital risk is defined as lacking sufficient quantity or quality of capital to meet internal business objectives, regulatory requirements, or market expectations.
The capital risk function controls and supervises first line activities and lays down an independent challenge to these mainly through the following processes:
| • | Supervision of capital planning and adequacy for all component elements (balance sheet, income statement, risk-weighted assets and available capital). |
| • | Ongoing supervision of the measurement of the Group's regulatory capital by identifying the key metrics for the calculation, setting tolerance levels for identified metrics and reviewing their consumption and the consistency of the calculations, including single transactions with a capital impact. |
| • | To monitor those securitisations that could be subject to a Significant Risk Transfer (SRT) and, therefore, generating a reduction of risk-weighted assets in accordance with the prudential regulation in force. |
The function aims to provide complete and regular monitoring of capital risk by verifying that capital coverage and adequacy reflect Santander Group's risk profile.
Capital risk control revolves around the capital management model in place at Santander Group, which brings together different processes such as capital planning and adequacy and the resulting implementation and monitoring of the budget, along with the continuous measurement of capital and reporting and disclosure of information on capital, as shown below:
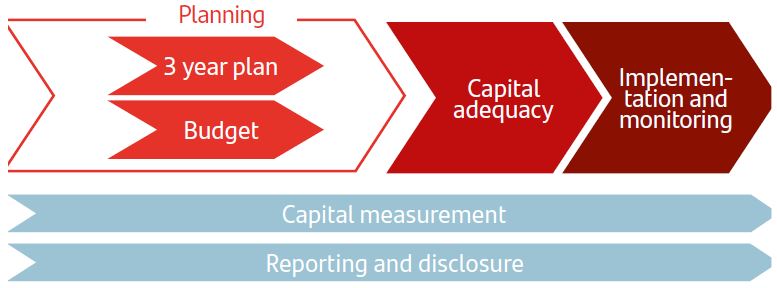
For further details on capital risk, see the Risk management chapter (section 5) of the 2019 Annual Report.
149 |
| OTHER RISKS 2019 Pillar 3 Disclosures Report |
This page is intentionally left in blank.
| 150 | 2019 Pillar 3 Disclosures Report | ||
| REMUNERATION POLICIES 2019 Pillar 3 Disclosures Report |
| 9 | ||||||
Remuneration policies | ||||||
| Image omitted | ||||||
151 |
| OTHER RISKS 2019 Pillar 3 Disclosures Report |
| Image omitted | |||||
152 |
| REMUNERATION POLICIES 2019 Pillar 3 Disclosures Report |
9. Remuneration
policies
9.1.Relevant information contained in other documents
The chapter on Corporate governance of the 2019 Annual report, which was published together with the call to the 2020 general shareholders’ meeting, describes:
| • | The functions of the remuneration committee regarding the remuneration of directors, members of senior management and other executives whose work could have a material impact on Santander Group’s risk profile. |
| • | The composition of the remuneration committee, directors’ attendance at meetings, the involvement of board members on other committees, the approximate time dedicated to each task and how the committee operates. |
| • | The principles of the remuneration policy of directors, in their capacity as such or for their performance of executive duties, and the corporate governance principles regulating remuneration. |
| • | The 2019 remuneration policy for directors and senior management, focusing especially on variable remuneration and how it was applied in the year. |
The board of directors is responsible for approving director and senior management remuneration, as well as the core payment terms of other executives or employees who, while not belonging to senior management, take on risks, carry out control functions (i.e. internal audit, risk management and compliance) or who receive global remuneration that places them in the same remuneration bracket as senior management and employees who take on risk and whose professional activities may have a material impact on the Group’s risk profile (all of these together with the senior management and the Company’s board of directors comprise the so-called "identified staff" or "material risk takers").
The chapter on Corporate governance of the Annual report also includes the following Pillar 3 disclosures:
| • | The decision-making process for setting the remuneration policy of directors, senior managers and the core elements of the remuneration of the identified staff. |
| • | The basic features of the remuneration components. |
| • | Information on the criteria applied for assessing the metrics that determine the variable remuneration of the directors and senior management and their adjustment according to risk, as well as the results of director metrics. |
| • | The basic characteristics of the 2019 digital transformation incentive. |
| • | The deferral policy and other conditions linked to the payment of variable remuneration, including the application of malus and clawback provisions. |
9.2. Remuneration policy applicable to categories of staff that may have a material impact on the risk profile of Santander Group
Santander Group has specific guidelines in its remuneration policy in regard to those professionals qualified internally as identified staff or material risk takers. These guidelines contain:
| • | The principles and criteria that determine which people have a material impact on the Group’s risk profile, based on Commission Delegated Regulation (EU) 604/2014 of 4 March 2014, as explained in the section below. |
| • | The specifics that modify the general remuneration policy for its application to this staff, taking into account all applicable rules and European Banking Authority (EBA) guidelines are described below. |
| • | The mandate to apply Santander Group’s remuneration policy, as adapted in each case so as to comply with local regulatory requirements and recommendations issued by supervisory bodies. |
The remuneration of the identified staff in 2019 is in line with the criteria set out in the Group’s remuneration policy, which is reviewed annually to ensure that it is aligned with the long-term interests of shareholders, the Group’s strategic targets and regulatory requirements.
The subsidiaries formally adhere to the Group's corporate remuneration policy, which implies the alignment of their practices with the principles recognised therein.
153 |
| REMUNERATION POLICIES 2019 Pillar 3 Disclosures Report |
9.3. Main characteristics of the criteria for identifying categories of staff that may have a material impact on the risk profile of Santander Group
The identified staff of the firm have been defined according to the provisions of Law 10/2014, of 26 June, on the restructuring, supervision and solvency of credit institutions, (Law 10/2014 or LOSS), transposing into Spanish law the text of Directive 2013/36/EU of the European Parliament and Council of 26 June 2013 on access to the activity of credit institutions and the prudential supervision of credit institutions and investment firms (CRD IV).
In accordance with the LOSS, professionals that may have a material impact on the Bank’s risk profile will be deemed to include senior management, employees that assume risks, employees that exercise control functions, and all employees that receive global remuneration that includes them in the same remuneration bracket as senior management and employees that assume risks. In addition to the previous definition, European legislation, through the publication of Commission Delegated Regulation (EU) No 604/2014, of 4 March, supplementing CRD IV with regard to regulatory technical standards with respect to qualitative and appropriate quantitative criteria to identify categories of staff whose professional activities have a material impact on an institution’s risk profile (hereinafter, Delegated Regulation 604/2014), has established a closed list of specific criteria that entities must take into consideration in the identification process.
Santander Group has implemented the quantitative and qualitative criteria provided in the regulation in order to determine the members of the identified staff and has further supplemented these criteria with additional internal criteria. The following persons generally qualify as identified staff based on this set of criteria:
| • | Based on qualitative criteria, staff members who work at a material business unit, such as: |
| • | Members of the management, executive or supervisory committees. |
| • | The first line of the unit. |
| • | Heads of material business sub-units in that country or business. |
| • | Heads of Risk, Audit and Compliance and their direct superiors, who effectively perform control functions. |
| • | Heads of Legal or Tax Advisory Services, Financial Accounting and Control, Budgets, Human Resources, Compensation and Technology and Operations. |
| • | Members of senior risk committees and executives with powers to initiate, approve or veto significant credit and market risk proposals. |
| • | Traders that can take major market risk positions. |
| • | Members of the new products committee. |
| • | By quantitative criteria: |
| • | Executives receiving total remuneration of over EUR 500 thousand in 2018. |
| • | Executives whose remuneration falls within the top 0.3% band in Santander Group or their country. |
| • | Executives who in the past year earned more than the member of the identified staff who earned the least remuneration, factoring in the business positions identified in the qualitative criteria. |
| • | By internal criteria: |
| • | Executives with significant responsibility for representing the Group at non-material units. |
| • | Executives with a given level of credit or market risk responsibility at certain non-material units. |
| • | Heads of business units with a banking license. |
Additional criteria have also been defined to identify and classify the units to which the above criteria are applied. These criteria are based on simple and widely recognised parameters, such as capital and gross income, and reflect the relative importance of each identified unit that has an impact on the risk profile of Santander Group.
Current legislation, best practices and market trends are taken into account when defining the proportionality standards. These apply to both the relative importance of the units, as well as the different degrees of responsibility of the positions occupied by the individuals, and facilitate its implementation.
According to these criteria, the identified staff comprised 1,359 executives across Santander Group at year-end 2019, accounting for approximately 0.69% of total staff.
9.4. Specific features of the remuneration policy applicable to Identified Staff members
In general:
| • | Fixed remuneration must represent a significant proportion of total compensation. |
| • | Variable remuneration for the year shall not exceed 100% of the fixed remuneration, in any event, of the members of the independent control functions, and generally for other employees that are part of the identified staff, unless the general shareholders’ meeting has authorised a higher percentage for these, which may not exceed 200%. In this respect, the general shareholders' meeting, held on 12 April 2019, authorised the increase up to 200% of the maximum percentage permitted, for a maximum of 1,071 members of the identified staff in 2019. |
Variable remuneration will typically comprise:
| • | An incentive to be received partly in cash and partly in shares or other eligible financial instruments. Payment of this incentive is deferred for a period of three to five years (up to seven years in the United Kingdom). |
| 154 | 2019 Pillar 3 Disclosures Report | ||
| REMUNERATION POLICIES 2019 Pillar 3 Disclosures Report |
| • | Performance measurement elements in line with the strategy and long-term interests of shareholders. These elements, take into consideration quantitative and qualitative criteria that reflect the entity’s results, return, capital performance, conduct in respect of customers and quality of the services provided thereto, risk management and compliance with legislation. |
| • | Malus and clawback clauses, which are triggered in situations in which there is poor financial performance of either, the Bank as a whole, a specific division or area thereof, or the exposure generated. Following factors should, at least, be taken into account: |
(i) Significant failures in risk management by the Bank, or by a business or risk control unit.
(ii) An increase in capital requirements at the Bank or one of its business units not planned at the time that exposure was generated.
(iii) Regulatory penalties or legal convictions for events that might be attributable to the unit or staff responsible for them. Likewise, failure to comply with the Bank’s internal codes of conduct.
(iv) Improper conduct, whether individual or collective. Negative effects deriving from the marketing of unsuitable products and the liability of persons or bodies making such decisions will be considered especially significant
| • | Ban on hedging deferred or retained shares or instruments and on transferring these in the twelve months following their delivery. |
For control functions, the total remuneration package must be competitive within the market in order to attract sufficiently qualified and experienced employees. The individual objectives of these positions must be pegged to the performance of the control function rather than business results. Performance of the control function must be assessed by staff members who are independent of the supervised business units.
9.5. Application of the remuneration policy for the Identified Staff in 2019
The remuneration policy and the essential remuneration conditions of the individuals who belong to the identified staff have been approved by Banco Santander’s board of directors on a proposal from the remuneration committee. The human resources function, jointly with the risk and compliance functions of each Group company, have duly confirmed that this policy and their remuneration practices comply with applicable law and regulations.
This is confirmed by the third independent report issued in application of article 33.2 of Act 10/2014 of 26 June on the ordering, supervision and solvency of credit institutions. The risk supervision, regulation and compliance committee supervises the remuneration policy and large-impact remuneration schemes so as to ensure that they are suitably aligned with risk management.
The essential elements with regard to variable remuneration include:
| • | The metrics used to determine the variable remuneration of senior management and other top executives have also served to determine that of other members of the identified staff. These metrics are described in section 6.3.B ii) of the chapter on Corporate governance of the 2019 Annual report. |
| • | Deferral percentages and periods for the identified staff based on their category |
Percentage for immediate payment | Deferred percentage | Deferred period (*) | |||
| Executive directors and members of the material risk takers group with total variable remuneration of ≥ EUR 2.7 million | 40 | % | 60 | % | 5 years |
| Senior management and country heads that represent at least 1% of Santander Group’s economic capital and other members of the identified staff with total target variable remuneration of ≥ EUR 1.7 million and< EUR 2.7 million | 50 | % | 50 | % | 5 years |
| Other members belonging to the material risk takers | 60 | % | 40 | % | 3 years |
| * | Up to 7 years in certain jurisdictions. |
Note: Variable reference remuneration for standard compliance (100% of objectives).
155 |
| REMUNERATION POLICIES 2019 Pillar 3 Disclosures Report |
| • | Pegging a part of the deferred amounts to fulfilment of multi-year objectives for executive directors, senior management and other executives based on their category. These metrics are described in section 6.3.B iv) of the chapter on Corporate governance of the 2019 Annual report. |
| • | The suitability of financial instruments used for the portion of deferred remuneration in financial instruments: use of shares in Banco Santander S.A. or in any of its listed subsidiaries (such as Brazil, Mexico and Santander Consumer USA) or equivalent instruments (Chile and Poland); as well as the ratio between different instruments. |
| • | Defining the events that might trigger the application of malus and clawback provisions on the variable remuneration accruing in 2019. These events, which apply to all the identified staff, are described in the previous chapter. |
| • | No discount is applied to deferred variable remuneration when calculating the ratio of variable to fixed components. |
In addition to the general scheme of variable remuneration metrics, the corporate and investment banking business (Santander Corporate & Investment Banking or SCIB) follows a model that is widely applied across all geographies where the business carries out its activities. The model provides remuneration for achieving results using a partial pay-out system, pegging variable remuneration to the division’s ordinary net profit, including provisions and other assimilated costs, as well as the previously established budgetary objectives. The model includes the same categories of metrics - including capital, risks and customers - as those used for the senior management, although they may be adapted accordingly to the needs and requirements of the individual business
For further details, see the Corporate Governance chapter on the 2019 Annual Report.
| 156 | 2019 Pillar 3 Disclosures Report | ||
| REMUNERATION POLICIES 2019 Pillar 3 Disclosures Report |
9.6. Total remuneration of the Identified Staff in 2019
The following table shows the total remuneration of the Identified Staff in 2019:
| Table 72. Total remuneration | |||||||||||||||||
| Thousand euros | |||||||||||||||||
| 2019 | 2018 | ||||||||||||||||
| Identified Staff | Admin. Executives | Other senior managers (5) | Rest of staff (6) | Total | Admin. Executives | Other senior managers(5) | Rest of staff (6) | Total | |||||||||
| Number of persons | 3 | 17 | 1,339 | 1,359 | 3 | 18 | 1,363 | 1,384 | |||||||||
| Total fixed remuneration (1) | 12,317 | 35,533 | 442,308 | 490,158 | 12,916 | 34,904 | 413,262 | 461,082 | |||||||||
| Total variable remuneration (2) (3) | 11,475 | 31,116 | 380,102 | 422,693 | 14,515 | 32,023 | 375,180 | 421,717 | |||||||||
| Payable immediately | |||||||||||||||||
| In cash | 2,573 | 7,668 | 110,962 | 121,203 | 3,254 | 8,300 | 117,825 | 129,380 | |||||||||
| In instruments (4) | 2,573 | 7,668 | 107,951 | 118,192 | 3,254 | 8,300 | 112,196 | 123,750 | |||||||||
| Deferred payment | |||||||||||||||||
| In cash | 3,165 | 6,840 | 74,610 | 84,614 | 4,003 | 7,711 | 72,579 | 84,294 | |||||||||
| In instruments (4) | 3,165 | 8,940 | 86,579 | 98,683 | 4,003 | 7,711 | 72,579 | 84,294 | |||||||||
| Payment for new contracts | |||||||||||||||||
| Total guaranteed remuneration | — | — | 6,822 | 6,822 | — | 633 | 7,484 | 8,117 | |||||||||
| Number of beneficiaries | — | — | 8 | 8 | — | 1 | 16 | 17 | |||||||||
| (1) | Includes fixed salary and supplements, attendance fees and by law-stipulated allotments for executive directors, as well as benefits (including pensions classified as fixed in nature). |
| (2) | The variable remuneration does not include EUR 1,846 thousand in variable component pensions; EUR 13,291 thousand in buyouts or sign on amounts; and EUR 1,443 thousand in local Long-Term Incentive plans (Poland) |
| (3) | Variable remuneration is included at its fair value. Fair value has been determined on the date it was awarded, based on an expert assessment report and taking account of different possible scenarios for the performance of the different variables set out in the plan during the measurement periods. |
| (4) | The following charts show the distribution of instruments according to the companies of Santander Group to which they correspond. |
| (5) | This column includes the remuneration of the members of senior management (excluding executive directors) as at 31 December 2019 and 2018, respectively. |
| (6) | This column includes the remuneration of senior management who resigned their duties during 2019 |
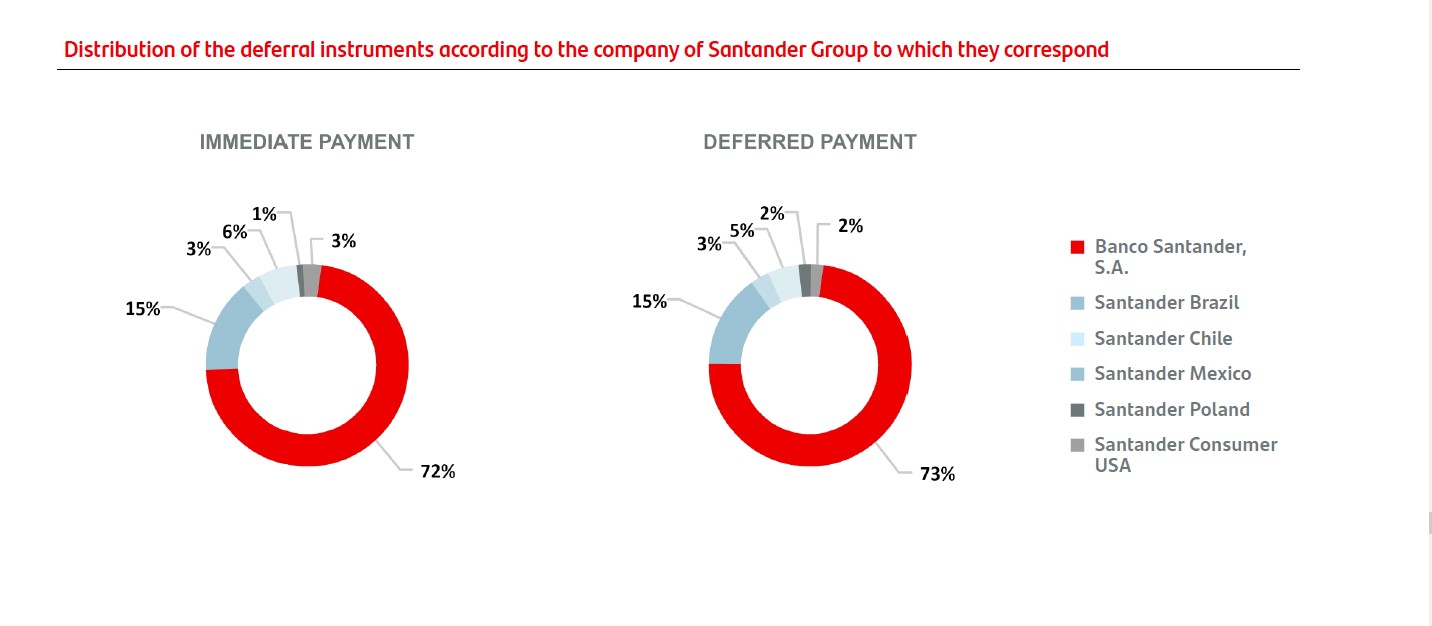
157 |
| REMUNERATION POLICIES 2019 Pillar 3 Disclosures Report |
The total amount of severance payments and other benefits associated with contract termination, including early retirement payments, awarded during the year to members of the identified staff amounted to EUR 42.1 million for a total of 61 people with an average time spent in the company of 13 years. Out of that total, 33 people received an amount corresponding to more than two annual fixed remuneration payments, with a total vested value of severance payments of EUR 38.7 million. Non-compete payments made to executive directors who have held the position at some point in 2019 amounted EUR 1.8 million. The maximum amount of a single pay item amounted to EUR 5.3 million.
The Investment Banking area includes members of the identified staff that belong to businesses related to corporate and investment banking (Santander Corporate & Investment Banking).
The Retail and Commercial Banking area covers all customer banking businesses, including all the people who provide support in the various geographies, whether they are local senior executives or other categories.
The breakdown of total remuneration by area of activity is as follows:
| Table 73. Remuneration by activity area | ||||||||||||||||||
| Thousand euros | 31 Dec. 2019 | |||||||||||||||||
| Admin. Executives | Non-executive directors | Investment banking | Commercial Banking | Asset Management | Corporate functions | Independent control functions | Other | Total | ||||||||||
| No. Of persons | 3 | 11 | 263 | 673 | 38 | 102 | 269 | — | 1,359 | |||||||||
| Top-Management | 3 | — | 1 | 1 | 1 | 10 | 4 | — | 20 | |||||||||
| Rest of Identified Staff | — | 11 | 262 | 672 | 37 | 92 | 265 | — | 1,339 | |||||||||
| Total Remuneration | 23,791 | 3,963 | 201,517 | 404,057 | 25,982 | 112,296 | 141,245 | — | 912,852 | |||||||||
| Top-Management | 23,791 | — | 4,250 | 5,403 | 3,118 | 39,871 | 14,008 | — | 90,441 | |||||||||
| Rest of Identified Staff | — | 3,963 | 197,267 | 398,654 | 22,864 | 72,425 | 127,236 | — | 822,410 | |||||||||
| Areas' fix/variable average ratio | 110 | % | — | 125 | % | 85 | % | 67 | % | 92 | % | 63 | % | — | 89 | % | ||
The Independent Control Functions area includes all functions related to risk management, internal audit, compliance or financial accounting and control, as well as others associated with regulatory capital control.
The corporate functions include people belonging to the identified staff of the corporate support areas (e.g. Human Resources, Technology and Operations, Communication, General Secretariat, Strategy, Financial Planning, etc.) and also the executive directors.
The sum of variable components in 2019 for each member of the identified staff did not exceed the limit established in each case for 2019, which was either 100% or 200% for those cases authorised by the general shareholders’ meeting. Specifically, the ratio of variable components of remuneration to fixed components for all the identified staff was 89% and the limits prescribed for each component were duly observed in all cases.
The following table shows the remuneration schemes for the identified staff, in which the right to receive shares originated in previous years and for which the vesting targets and/or conditions were fulfilled in 2019 or are pending fulfilment.
| Table 74. Vested rights | |||||||||||||||||
| Thousand euros | |||||||||||||||||
| 31 Dec. 2019 | 31 Dec. 2018 | ||||||||||||||||
| Other remuneration entitlement from previous years: consolidated and unpaid (to be consolidated from 2019) | Admin. Executives | Other senior managers | Rest of staff | Total | Admin. Executives | Other senior managers | Rest of staff | Total | |||||||||
| Cash | 3,206 | 6,298 | 84,421 | 93,926 | 2,230 | 4,073 | 50,593 | 56,896 | |||||||||
| Number of Santander shares (1) | 673,841 | 1,356,729 | 9,508,591 | 11,539,161 | 713,893 | 1,337,934 | 12,933,190 | 14,985,017 | |||||||||
| Number of Santander Brazil shares | — | — | 1,223,911 | 1,223,911 | — | — | 1,639,748 | 1,639,748 | |||||||||
| Number of Santander Chile shares | — | — | 43,873,308 | 43,873,308 | — | — | 62,005,861 | 62,005,861 | |||||||||
| Number of Santander Mexico shares | — | — | 2,824,468 | 2,824,468 | — | — | 3,051,500 | 3,051,500 | |||||||||
| Number of Santander Poland shares* | — | — | 8,838 | 8,838 | — | — | 2,289 | 2,289 | |||||||||
| Number of Santander Consumer USA | — | — | 55,888 | 55,888 | — | — | 80,850 | 80,850 | |||||||||
| Number of Phantom shares | — | — | 10,832 | 10,832 | — | — | — | — | |||||||||
| (1) Includes shares corresponding to 2015 LTI | |||||||||||||||||
| *An instrument of Santander Poland (Zachodni WBK) has a value equal to one share of the company | |||||||||||||||||
| 158 | 2019 Pillar 3 Disclosures Report | ||
| REMUNERATION POLICIES 2019 Pillar 3 Disclosures Report |
| Table 75. Unvested rights | |||||||||||||||||
| Thousand euros | |||||||||||||||||
| 31 Dec. 2019 | 31 Dec. 2018 | ||||||||||||||||
| Other remuneration entitlement from previous years: Non-consolidated and unpaid (to be consolidated from 2019) | Admin. Executives | Other senior managers | Rest of staff | Total | Admin. Executives | Other senior managers | Rest of staff | Total | |||||||||
| Cash | 8,722 | 18,773 | 141,588 | 169,083 | 7,047 | 12,996 | 82,199 | 102,242 | |||||||||
| Number of Santander shares | 1,813,998 | 3,942,548 | 15,040,239 | 20,796,785 | 1,352,055 | 2,481,736 | 10,956,258 | 14,790,049 | |||||||||
| Number of Santander Brazil shares | — | — | 1,687,722 | 1,687,722 | — | — | 2,027,550 | 2,027,550 | |||||||||
| Number of Santander Chile shares | — | — | 47,933,722 | 47,933,722 | — | — | 51,756,078 | 51,756,078 | |||||||||
| Number of Santander Mexico shares | — | — | 4,076,259 | 4,076,259 | — | — | 3,420,941 | 3,420,941 | |||||||||
| Number of Santander Polonia shares* | — | — | 10,418 | 10,418 | — | — | 2,292 | 2,292 | |||||||||
| Number of Santander Consumer USA | — | — | 58,659 | 58,659 | — | — | 137,044 | 137,044 | |||||||||
| Number of Phantom shares | — | — | 5,575 | 5,575 | — | — | — | — | |||||||||
| * An instrument of Santander Poland (Zachodni WBK) has a value equal to one share of the company | |||||||||||||||||
| Table 76. Remuneration by salary band* | ||
| Million euros | 2019 | |
| Salary band | No. of persons | |
| 1.0 - 1.5 | 88 | |
| 1.5 - 2.0 | 40 | |
| 2.0 - 2.5 | 22 | |
| 2.5 - 3.0 | 6 | |
| 3.0 - 3.5 | 10 | |
| 3.5 - 4.0 | 4 | |
| 4.0 - 4.5 | 3 | |
| 4.5 - 5.0 | 2 | |
| 5.0 - 6.0 | 3 | |
| 6.0 - 7.0 | — | |
| 7.0 - 8.0 | — | |
| 8.0 - 9.0 | 2 | |
| 9.0 - 10.0 | 1 | |
| *Does not include the deferred part of the 2019 incentive subject to multi-year objectives, the performance and attainment of which will be reviewed at the end of 2021. Payment will be made from 2023 onward, but may be zero, depending on the extent to which the objectives have been met. Notes 5 and 47 of the Group´s annual report contain further information on how the plan works, and amount of the deferred remuneration. Includes 2015 LTI acrrued at 31 December 2019. | ||
9.7. Remuneration policy for 2020 and following years
The 2020 remuneration policy for directors is described in section 6.4 of the chapter on Corporate governance of the Annual report. The main principles of the policy, along with the fixed and variable remuneration components and the variable remuneration policy for members of the identified staff, will follow the rules and procedures for executive directors as set out in the report referred to above. In particular, as regards the variable remuneration policy:
•The existence of a single incentive, which will be determined by a set of quantitative and qualitative metrics.
•Short-term metrics, which include customer, capital, risk and profitability elements.
•Long-term metrics for senior managers: earnings per share, total shareholder return and capital ratio (fully-loaded CET1).
•Part payment in cash and in shares or other instruments.
•Continued-employment, malus and clawback provisions.
•Other conditions, such as the ban on hedging and transferring shares in the twelve months following their delivery.
In 2020, the board of directors of Banco Santander, S.A. approved the second cycle of the digital transformation incentive, as part of the 2020 variable remuneration policy. The 2020 digital transformation incentive is applicable to a maximum of 250 employees, including certain members of the identified staff (excluding Banco Santander directors), whose activity is essential for the Group's growth and digital transformation. This incentive is instrumented 50% in Banco Santander shares and 50% in Banco Santander share options, and its payment will be subject to the meeting of certain objectives for 2020 in the digital transformation process.
Delivery is conditional on the beneficiary remaining in the employment of the Group, and is subject to the deferral rules and other regulatory restrictions such as malus and clawback provisions.
159 |
| REMUNERATION POLICIES 2019 Pillar 3 Disclosures Report |
For further details, see the Corporate Governance chapter on the 2019 Annual Report.
Deferral periods for members of the Identified Staff will be as follows:
| Deferral of the identified collective | |||||||||||
| 31 Dec. 2019 | 31 Dec. 2018 | ||||||||||
Percentage paid immediately | Deferred percentage | Deferred periods’ (*) | Percentage paid immediately | Deferred percentage | Deferred periods’ (*) | ||||||
| Executive directors and members of the material risk takers of the group with total target variable remuneration of ≥ EUR 2.7 million (**) | 40 | % | 60 | % | 5 years | 40 | % | 60 | % | 5 years | |
| Senior management and country heads that represent at least 1% of Santander Group’s economic capital and other members of the identified staff with total target variable remuneration of ≥ EUR 1.7 million and< EUR 2.7 million €. (**) | 50 | % | 50 | % | 5 years | 50 | % | 50 | % | 5 years | |
| Other members belonging to the material risk takers | 60 | % | 40 | % | 3 years | 60 | % | 40 | % | 3 years | |
| * | Up to 7 years in certain jurisdictions. |
| ** | Variable remuneration not denominated in Euros is calculated using the average closing exchange rates in the fifteen trading sessions immediately prior to the Friday, exclusive, of the week before the date on which the board of directors agrees the variable remuneration of the Bank’s executive directors for 2019. |
| 160 | 2019 Pillar 3 Disclosures Report | ||
| APPENDICES 2019 Pillar 3 Disclosures Report |
| 10 | ||||||
| Appendices | ||||||
| Image omitted | ||||||
161 |
| APPENDICES 2019 Pillar 3 Disclosures Report |
| �� | ||||
| Image omitted | ||||
| Appendices available in the Santander Group website: | ||||
| V. Outline of the differences in the scopes of consolidation (Table LI3) | ||||
| VI. Reconciliation: balance under accounting consolidation / balance under regulatory consolidation | ||||
| VII. Capital instruments main features template | ||||
| VIII. Transitional own funds disclosure template | ||||
| IX. List of specialised management companies within the scope of regulatory consolidation - SPVs | ||||
| X. Leverage Ratio (LRSum, LRCom and LRSpl tables) | ||||
| XI. Countercyclical capital buffer (institution-specific amount and geographical distribution) | ||||
| XII. IFRS 9-FL Template: Comparison of institutions’ own funds and capital and leverage ratios with and without the application of transitional arrangements for IFRS 9 or analogous ECLs | ||||
| XIII. Breakdown of exposure by approach to calculating capital employed | ||||
| XIV. IRB parameter models by region | ||||
| XV. Backtesting PD - CR9 | ||||
| XVI. Backtesting EAD | ||||
| XVII. Backtesting Expected Loss | ||||
| XVIII. Prudent Valuation Adjustments (PVA) (PV1) | ||||
| XIX. Comparison of VaR estimates with gains/losses (MR4) | ||||
| XX. LCR disclosure template | ||||
| Image omitted | ||||
| 162 | 2019 Pillar 3 Disclosures Report | ||
| APPENDICES 2019 Pillar 3 Disclosures Report |
Appendix I -
Transparency enhancements
| GUIDELINES ON DISCLOSURE REQUIREMENTS - EBA/GL/2016/11 | ||
| Table | Table title | 2019 Pillar 3 Location |
| OV1 | Overview of RWAs | |
| LI1 | Differences between accounting and regulatory scopes of consolidation and mapping of financial statements categories with regulatory risk categories | |
| LI2 | Main sources of differences between regulatory exposure amounts and carrying amounts in financial statements | |
| LI3 | Outline of the differences in the scopes of consolidation | Appendix V |
| INS1 | Non-deducted participations in insurance undertakings | N/A |
| CRB-B | Net amount of exposures | |
| CRB-C | Geographical breakdown of exposures | |
| CRB-D | Concentration of exposures by industry or counterparty type | |
| CRB-E | Maturity of exposures | |
| CR1-A | Credit quality of exposures by exposure classes and instruments | |
| CR1-B | Credit quality of exposures by industry or counterparty type | |
| CR1-C | Credit quality of exposures by geography | |
| CR2-A | Changes in stock of general and specific credit risk adjustments | |
| CR2-B | Changes in stock of defaulted and impaired loans and debt securities | |
| CR3 | Credit risk mitigation techniques - IRB and SA | |
| CR4 | Credit risk exposure and CRM effects (IRB & Standardised approach) | |
| CR5 | Standardised approach (including a breakdown of exposures post conversion factor and post mitigation techniques) | |
| CR6 | Exposure to Credit risk by porfolio and PD interval | |
| CR7 | Effect on RWA of credit derivatives used as CRM techniques | |
| CR8 | Exposures to central counterparties | |
| CR9 | Backtesting PD by geography and porfolio | Appendix XV |
| CR10 | Specialised lending & equities | |
| CCR1 | Analysis of the counterparty credit risk (CC) exposure by approach | |
| CCR2 | Credit valuation adjustment (CVA) capital charge | |
| CCR3 | Standardised approach – CCE exposures by regulatory portfolio and risk | |
| CCR4 | IRB approach. CCR exposures by portfolio and PD scale | |
| CCR5-A | Impact of netting and collateral held on exposure values | |
| CCR5-B | IRB approach. Composition of collateral for exposures to counterparty credit risk | |
| CCR6 | Credit derivatives exposures | |
| CCR7 | RWA flow statements of CCR exposures under Internal Model Method (IMM) | N/A |
| CCR8 | Exposures to central counterparties | |
| MR1 | Market risk under standardised approach | |
| MR2-A | Market risk under IMA approach | |
| MR2-B | WA flow statements of market risk exposures under IMA | |
| MR3 | VaR, Stressed VaR and IRC by geography | |
| MR4 | Comparison of VaR estimates with gains/losses | Appendix XVIII |
163 |
| APPENDICES 2019 Pillar 3 Disclosures Report |
| REVISED PILLAR 3 DISCLOSURES REQUIREMENTS - BCBS | ||
| Table | Table title | 2019 Pillar 3 Location |
| SEC1 | Securitisation exposures in the banking book | |
| SEC2 | Securitisation exposures in the trading book | |
| SEC3 | Securitisation exposures in the banking book and associated regulatory capital requirements (bank acting originator or sponsor) | |
| SEC4 | Securitisation exposures in the banking book and associated regulatory capital requirements (bank acts as an investor) | |
| PV1 | Prudent Valuation Adjustments (PVA) | Appendix XVIII |
| IRRBB1 | Quantitative information on IRRBB | |
| GUIDELINES ON LCR DISCLOSURE - EBA/GL/2017/01 | ||
| Table | Table title | 2019 Pillar 3 Location |
| LCR | LCR disclosure template | Appendix XX |
| LEVERAGE RATIO - COMMISSION IMPLEMENTING REGULATION (UE) 2016/200 | ||
| Table | Table title | 2019 Pillar 3 Location |
| LRSum | Summary reconciliation of accounting assets and leverage ratio exposures | Appendix X |
| LRCom | Leverage ratio common disclosure | Appendix X |
| LRSpl | Split-up of on balance sheet exposures (excluding derivatives and SFTs) | Appendix X |
| OWN FUNDS REQUIREMENTS - COMMISSION IMPLEMENTING REGULATION (UE) 1423/2013 | ||
| Table | Table title | 2019 Pillar 3 Location |
| Template 1 | Capital instruments’f main features | Appendix VII |
| Template 2 | Transitional own funds disclosure template | Appendix VIII |
| COUNTERCYCLICAL CAPITAL BUFFER - COMMISSION IMPLEMENTING REGULATION (UE) 2015/1555 | ||
| Table | Table title | 2019 Pillar 3 Location |
| Frame 1 | Geographical distribution of credit exposures relevant for the calculation of the countercyclical capital buffer | Appendix XI |
| Frame 2 | Amount of institution-specific countercyclical capital buffer | Appendix XI |
| GUIDELINES ON UNIFORM DISCLOSURES UNDER ARTICLE 473A OF REGULATION (EU) NO 575/2013 AS REGARDS THE TRANSITIONAL PERIOD FOR MITIGATING THE IMPACT OF THE INTRODUCTION OF IFRS 9 ON OWN FUNDS - EBA/GL/2018/01 | ||
| Table | Table title | 2019 Pillar 3 Location |
| IFRS 9-FL Template | Comparison of equity, capital ratios and leverage of entities with or with out the application of the transitional arrangements of IFRS 9 or analog ECL | Appendix XII |
GUIDELINES ON DISCLOSURE OF NON-PERFORMING AND FORBORNE EXPOSURES - EBA/GL/2018/10 | ||
| Table | Table title | 2019 Pillar 3 Location |
| Template 1 | Credit quality of forborne exposures | |
| Template 3 | Credit quality of performing and non-performing exposures by past due days | Table 28 |
| Template 4 | Performing and non-performing exposures and related provisions | |
| Template 9 | Collateral obtained by taking possession and execution processes | |
| 164 | 2019 Pillar 3 Disclosures Report | ||
| APPENDICES 2019 Pillar 3 Disclosures Report |
Appendix II -CRR Mapping
The following table links the CRR’s articles on divulging information (Part 8) to the various sections of the document that provide the information required. The ‘Location’ column specifies the section of Pillar 3 or other public document in which the information is dealt with, in whole or in part. This information may be distributed throughout the document on a piecemeal basis.
| Article | Brief Description | 2019 P3DR Location | Tables | 2019 Annual Report Location |
| 431. Scope of disclosures requirements | ||||
| 431.1 | Requirement to publish Pillar 3 disclosures. | Pillar 3 Disclosures Report (Santander corporate website) | ||
| 431.2 | Permission granted by the competent authorities under Part Three for the instruments and methodologies referred to in Title III shall be subject to the public disclosure by institutions of the information laid down therein. | Section 2.2.2.1. | ||
| 431.3 | Institution must have a policy covering the frequency of disclosures, their verification, comprehensiveness and appropriateness, as well as policies for assuring the overall comprehension of their risk profile by market participants. | Sections 1.2.2. and 1.2.3. | ||
| 431.4 | Explanation of SMEs ratings decision upon request. | Section 3.4. | ||
| 432. Non-material, proprietary or confidential information | ||||
| 432.1 | Institutions may omit information that is not material if certain conditions are respected. | Sections 1.2.1. and 1.2.2. | ||
| 432.2 | Institutions may omit information that is proprietary or confidential if certain conditions are respected. | Section 1.2.2. | ||
| 432.3 | Where 432.2 applies this must be stated in the disclosures, and more general information must be disclosed. | N/A | ||
| 432.4 | Use of 432.1, 432.2 or 432.3 is without prejudice to scope of liability for failure to disclose material information. | N/A | ||
| 433. Frequency of disclosure | ||||
| 433 | Disclosures must be published on an annual basis at a minimum, and more frequently if necessary. | Section 1.2.2. | ||
| 434. Means of disclosure | ||||
| 434.1 | To include all disclosures in one appropriate medium, or provide clear cross-references to the synonymus information in the other media. | Section 1.2.1. | ||
| 434.2 | Disclosures made under other requirements (e.g. accounting, listing) can be used to satisfy Pillar 3 requirements, if appropriate. | Section 1.2.1. | ||
| 435. Risk management objectives and policies | ||||
| 435.1 | Disclose information for each separate category of risk: | |||
165 |
| APPENDICES 2019 Pillar 3 Disclosures Report |
| Article | Brief Description | 2019 P3DR Location | Tables | 2019 Annual Report Location |
| 435.1.a | The strategies and processes to manage risks. | Chapters 3 to 8 | Risk Management Chapter 2. Risk Management and Control Model | |
| 435.1.b | Structure and organization of the risk management function. | Chapters 3 to 8 | Risk Management Chapter 2. Risk Management and Control Model | |
| 435.1.c | Risk reporting and measurement systems. | Chapters 3 to 8 | Risk Management Chapter 2. Risk Management and Control Model | |
| 435.1.d | Hedging and mitigating risk - policies, strategies and processes. | Chapters 2 to 8 | Risk Management Chapter 3.2. Credit risk management 3.5. Other credit risk aspects 4. Trading market risk, structural and liquidity risk 5. Capital risk 6. Operational risk 7. Compliance and conduct risk 8. Model risk 9. Strategic risk | |
| 435.1.e | A declaration of adequacy of risk management arrangements approved by the Board. | Section 1.2.2. | Risk Management Chapter 2. Risk Management and Control Model | |
| 435.1.f | Inclusion of a concise risk statement approved by the Board. | Section 1.2.2. | Risk Management Chapter 2. Risk Management and Control Model | |
| 435.2 | Information on governance arrangements, including information on Board composition and recruitment, and risk committees. | |||
| 435.2.a | Number of directorships held by Board members. | Corporate Governance Chapter | ||
| 435.2.b | Recruitment policy for the selection of Board members, their actual knowledge, skills and expertise. | Corporate Governance Chapter | ||
| 435.2.c | Policy on diversity of Board membership, objectives, and achievement status. | Corporate Governance Chapter | ||
| 435.2.d | Existence of a dedicated risk committee, and number of meetings during the year. | Section 2.1.1.2. | Corporate Governance Chapter Risk Management Chapter | |
| 435.2.e | Description of the information flow on risk to the Board. | Section 2.1.1.2. | Corporate Governance Chapter Risk Management Chapter | |
| 436. Scope of application of the requirements | ||||
| 436 | Institutions shall disclose the following information regarding the scope of application of the requirements of this Regulation in accordance with Directive 2013/36/EU: | |||
| 436.a | Name of institution to which the requirements of this Regulation applies. | Section 1.2.1. | ||
| 166 | 2019 Pillar 3 Disclosures Report | ||
| APPENDICES 2019 Pillar 3 Disclosures Report |
| Article | Brief Description | 2019 P3DR Location | Tables | 2019 Annual Report Location |
| 436.b | Difference in the basis of consolidation for accounting and prudential purposes, briefly describing entities that are: (i) fully consolidated (ii) proportionally consolidated (iii) deducted from own funds (iv) neither consolidated nor deducted | Sections 1.2.1. and 1.3. | Table 1 (LI1) Table 2 (LI2) Appendix V (LI3) Appendix VI | |
| 436.c | Impediments to transfer of own funds between parent and subsidiaries. | Section 2.1.3. | ||
| 436.d | Capital shortfalls in any subsidiaries outside the scope of consolidation. | N/A | ||
| 436.e | The circumstance of making use of articles on derogations from: a) Prudential requirements b) Liquidity requirements for individual subsidiaries/entities. | Section 1.2.1. | ||
| 437. Own funds | ||||
| 437.1 | Institutions shall disclose the following information regarding their own funds: | |||
| 437.1.a | A full reconciliation of Common Equity Tier 1 items, Additional Tier 1 items, Tier 2 items and filters and deductions applied pursuant to Articles 32 to 35, 36, 56, 66 and 79 to own funds of the institution and the balance sheet in the audited financial statements of the institution. | Section 2.2.1. | Tables 4 and 5 Appendix VI Appendix VIII | |
| 437.1.b | Description of the main features of the Common Equity Tier 1 and Additional Tier 1 instruments and Tier 2 instruments issued by the institution. | Section 2.2.1. | Appendix VII Appendix VIII | |
| 437.1.c | Dull terms and conditions of all Common Equity Tier 1, Additional Tier 1 and Tier 2 instruments. | Section 2.2.1. | Appendix VII Appendix VIII | |
| 437.1.d | Disclosure of the nature and amounts of the following: | |||
| 437.1.d.i | Each prudential filter applied pursuant to Articles 32 to 35; | Section 2.2.1. | Appendix VIII | |
| 437.1.d.ii | Each deduction made pursuant to Articles 36, 56 and 66; | Section 2.2.1. | Appendix VIII | |
| 437.1.d.iii | Items not deducted in accordance with Articles 47, 51, 56, 66 and 79. | Section 2.2.1. | Appendix VIII | |
| 437.1.e | Description of all restrictions applied to the calculation of own funds in accordance with this Regulation and the instruments, prudential filters and deductions to which those restrictions apply. | Section 2.2.1. | Appendix VIII | |
| 437.1.f | Explanation of the calculation basis of the disclosed capital ratios estimated using elements of own funds determined, on a basis other than that laid down in this Regulation. | Section 2.2.1. | Appendix VIII | |
| 438. Capital requirements | ||||
| 438 | Institutions shall disclose the following information regarding the compliance by the institution with the requirements laid down in Article 92 of this Regulation and in Article 73 of Directive 2013/36/EU: | |||
| 438.a | Summary of the institution's approach to assessing adequacy of capital levels. | Sections 2.1., 2.2. and 2.3. | ||
| 438.b | Result of ICAAP on demand from authorities. | Sections 2.1.5. and 2.3. | ||
| 438.c | Capital requirements for each Standardised approach credit risk exposure class. | Sections 2.2.2. , 3.2.3. , 4.7. , 5.3.4, and 5.4. | Tables 7 (OV1) and 8 Tables 12 (CR4) and 23 (CR5) Tables 53 (SEC3) and Table 55 (SEC4) | |
167 |
| APPENDICES 2019 Pillar 3 Disclosures Report |
| Article | Brief Description | 2019 P3DR Location | Tables | 2019 Annual Report Location |
| 438.d | Capital requirements for each Internal Ratings Based Approach credit risk exposure class. | Sections 2.2.2. , 3.2.3. , 4.7. , 5.3.4, and 5.4. | Tables 7 (OV1) and 8 Tables 11, 13 (CR8), 14 to 16 (CR6), 17, and 18 to 19 (CR10) Tables 53 (SEC3) and 55 (SEC4) Appendix XIV | |
| 438.e | Capital requirements for market risk or settlement risk. | Sections 2.2.2. and 6.2. | Table 7 (OV1) Tables 57, 58, 59 (MR2-A), 60 (MR2-B), 61 (MR1) and 62 | |
| 438.f | Capital requirements for operational risk, separately for the Basic Indicator Approach, the Standardised Approach, and the Advanced Measurement Approaches as applicable. | Sections 2.2.2. and 7.2. | Tablas 7 (OV1) y 67 | |
| 438 last paragraph | Requirement to disclose specialised lending exposures and equity exposures in the banking book falling under the simple risk weight approach. | Section 3.2.2. | Tables 18 and 19 (CR10) | |
| 439. Exposure to counterparty credit risk | ||||
| 439 | Institutions shall disclose the following information regarding the institution's exposure to counterparty credit risk as referred to in Part Three, Title II, Chapter 6: | |||
| 439.a | Description of process to assign internal capital and credit limits to CCR exposures. | Chapter 4 | ||
| 439.b | Discussion of policies for securing collateral and establishing credit reserves. | Chapter 4 | ||
| 439.c | Discussion of management of wrong-way risk exposures. | Chapter 4 | ||
| 439.d | Disclosure of collateral to be provided (outflows) in the event of a ratings downgrade. | Chapter 4 | ||
| 439.e | Derivation of net derivative credit exposure. | Chapter 4 | Tables 41 (CCR2), 42 (CCR8), 43 (CCR1), 46 (CCR5-A) and 47 (CCR5-B) | |
| 439.f | Exposure values for mark-to-market, original exposure, standardised and internal model methods. | Chapter 4 | Tables 41 (CCR2), 42 (CCR8) and 43 (CCR1) | |
| 439.g | Notional value of credit derivative hedges and distribution of current credit exposure by type of exposure. | Chapter 4 | Table 48 (CCR6) | |
| 439.h | Notional amounts of credit derivative transactions. | Chapter 4 | Table 48 (CCR6) | |
| 439.i | Estimate of alpha, if applicable. | N/A | Table 43 (CCR1) | |
| 440. Capital buffers | ||||
| 440 | Disclosure of the following information in relation to its compliance with the requirement for a countercyclical capital buffer referred to in Title VII, Chapter 4 of Directive 2013/36/EU: | |||
| 440.a | Geographical distribution of credit exposures relevant for the calculation of countercyclical capital buffer. | Section 2.1.5. | Appendix XI | |
| 440.b | Amount of the specific countercyclical capital buffer. | Section 2.1.5. | Appendix XI | |
| 441. Indicators of global systemic importance | ||||
| 441 | Disclosure of the indicators of global systemic importance. | Section 2.1.5. | ||
| 442. Credit risk adjustments | ||||
| 442 | Institutions shall disclose the following information regarding the institution's exposure to credit risk and dilution risk: | |||
| 168 | 2019 Pillar 3 Disclosures Report | ||
| APPENDICES 2019 Pillar 3 Disclosures Report |
| Article | Brief Description | 2019 P3DR Location | Tables | 2019 Annual Report Location |
| 442.a | Definitions, for accounting purposes, of past due and impaired exposures. | Section 3.3. | Risk Management Chapter 3.3. Credit risk - Key metrics | |
| 442.b | Description of the approaches adopted for calculating specific and general credit risk adjustments. | Section 3.3. | Risk Management Chapter 3.3. Credit risk - Key metrics | |
| 442.c | Disclosure of pre-CRM EAD by exposure class. | Section 3.3. | Table 24 (CR1-A) Table 33 (CRB-B) | |
| 442.d | Disclosure of pre-CRM EAD by geography and exposure class. | Section 3.3. | Table 34 (CRB-C) | Risk Management Chapter 3.3. Credit risk - Key metrics |
| 442.e | Disclosure of pre-CRM EAD by industry and exposure class. | Section 3.3. | Table 35 (CRB-D) | Risk Management Chapter 3.3. Credit risk - Key metrics |
| 442.f | Disclosure of pre-CRM EAD by residual maturity and exposure class. | Section 3.3. | Table 36 (CRB-E) | |
| 442.g. (i-iii) | Breakdown of impaired, past due, specific and general credit risk adjustments, and impairment charges for the period, by industry. | Section 3.3. | Table 24 (CR1-A) Table 25 (CR1-B) Table 26 (CR1-C) Tables 27 to 30 | Risk Management Chapter 3.3. Credit risk - Key metrics |
| 442.h | Impaired and past due exposures, broken down by geographical area, and the amounts of specific and general credit risk adjustments related to each geographical area. | Section 3.3. | Table 24 (CR1-A) Table 25 (CR1-B) Table 26 (CR1-C) | Risk Management Chapter 3.3. Credit risk - Key metrics |
| 442.i.(i-v) | Reconciliation of changes in specific and general credit risk adjustments for impaired exposures. | Section 3.3. | Tables 27 to 30 Table 31 (CR2-A) Table 32 (CR2-B) | |
| 442 last paragraph | Specific credit risk adjustments recorded to income statement are disclosed separately. | Section 3.3. | Tables 27 to 30 Table 31 (CR2-A) Table 32 (CR2-B) | |
| 443. Unencumbered assets | ||||
| 443 | Disclosures of unencumbered assets. | Section 8.1.2. | Table 68 (AE1) Table 69 (AE2) Table 70 (AE3) | Economic and Financial Report Chapter 3. Group financial performance (Liquidity and funding management) |
| 444. Use of ECAIs | ||||
| 444 | For institutions calculating the risk-weighted exposure amounts in accordance with Part Three, Title II, Chapter 2, the following information shall be disclosed for each of the exposure classes specified in Article 112: | |||
| 444.a | Names of the ECAIs used in the calculation of Standardised approach risk-weighted assets and reasons for any changes. | Section 3.2.3. | ||
| 444.b | Exposure classes associated with each ECAI. | Section 3.2.3. | ||
| 444.c | Description of the process used to transfer credit assessments to non-trading book items. | Section 3.2.3. | ||
| 444.d | Mapping of external rating to credit quality steps (CQS). | Section 3.2.1. and 3.2.3. | Tables 14, 15 and 16 (CR6) | |
| 444.e | Exposure value pre and post-credit risk mitigation, by CQS. | Section 3.2.1. y 4.7. | Tables 11 (CR4), 23 (CR5) and 44 (CCR3) | |
| 445. Exposure to market risk | ||||
| 445 | Disclosure of position risk, large exposures exceeding limits, FX, settlement and commodities risk. | Section 6.2. | Tables 60 (MR2-B) and 61 (MR1) | |
169 |
| APPENDICES 2019 Pillar 3 Disclosures Report |
| Article | Brief Description | 2019 P3DR Location | Tables | 2019 Annual Report Location |
| 446. Operational risk | ||||
| 446 | Scope of approaches used to calculate operational risk. | Section 7.2. | ||
| 447. Exposures in equities not included in the trading book | ||||
| 447 | Institutions shall disclose the following information regarding the exposures in equities not included in the trading book: | |||
| 447.a | Differentiation of exposures based on their objectives and an overview of accounting techniques and valuation methodologies used. | Section 3.2.2. | Tables 19 (CR10) and 20 to 22 | |
| 447.b | The balance sheet value, the fair value and, for those exchange- traded, a comparison to the market price where it is materially different from the fair value. | Section 3.2.2. | Tables 19 (CR10) and 20 to 22 | |
| 447.c | The types, nature and amounts of exchange-traded exposures, private equity exposures in sufficiently diversified portfolios, and other exposures. | Section 3.2.2. | Tables 19 (CR10) and 20 to 22 | |
| 447.d | Cumulative realised gains or losses arising from sales and liquidations in the period. | Section 3.2.2. | Tables 19 (CR10) and 20 to 22 | |
| 447.e | Total unrealised gains or losses, the total latent revaluation gains or losses, and any of these amounts included in the original or additional own funds. | Section 3.2.2. | Tables 19 (CR10) and 20 to 22 | |
| 448. Exposure to interest rate risk on positions not included in the trading book | ||||
| 448 | Institutions shall disclose the following information on their exposure to interest rate risk on positions not included in the trading book: | |||
| 448.a | Nature of the interest rate risk and the key assumptions, and frequency of measurement of the interest rate risk. | Section 6.4. | Table 66 | Risk Management Chapter 4.4. Structural balance sheet risks management |
| 448.b | Variation in earnings, economic value or other relevant measure used by the bank for upward and downward rate shocks according to the banks method for measuring the interest rate risk, broken down by currency. | Section 6.4. | Table 66 | Risk Management Chapter 4.4. Structural balance sheet risks management |
| 449. Exposure to securitisation positions | ||||
| 449 | Institutions calculating risk weighted exposure amounts in accordance with Part Three, Title II, Chapter 5 or own funds requirements in accordance with Article 337 or 338 shall disclose the following information, where relevant, separately for their trading and non-trading book: | |||
| 449.a | Objectives in relation to securitisation activity | Section 5.3.1. | ||
| 449.b | Nature of other risks in securitised assets, including liquidity. | Section 5.3.3. | ||
| 449.c | Risks in re-securitisation activity stemming from seniority of underlying securitisations and ultimate underlying assets. | Sections 5.3.4. and 5.4. | ||
| 449.d | Roles played by the institution in the securitisation process. | Section 5.3.2. | ||
| 449.e | Extent of the institution's involvement in each of the securitisation roles | Section 5.3.4. and 5.4. | Tables 48 49, 50 (SEC1), 51 (SEC2) 54 and 56 | |
| 449.f | Processes in place to monitor changes in credit and market risks of securitisation exposures, and how the processes differ for re-securitisation exposures. | Section 5.3.4. | ||
| 170 | 2019 Pillar 3 Disclosures Report | ||
| APPENDICES 2019 Pillar 3 Disclosures Report |
| Article | Brief Description | 2019 P3DR Location | Tables | 2019 Annual Report Location |
| 449.g | Description of the institution's policies with respect to hedging and unfunded protection, and identification of material hedge counterparties, by relevant type of risk exposure. | N/A | ||
| 449.h | Approaches to the calculation of risk-weighted assets for securitisations mapped to types of exposures. | Section 5.4. | Table 52 | |
| 449.i | Types of SSPEs used to securitise third-party exposures as a sponsor. | Sections 5.3 and 5.4 | Appendix IX | |
| 449.j | A summary of the institution's accounting policies for securitisation activities, including: | |||
| 449.j.i | whether the transactions are treated as sales or financings; | Section 5.2. | ||
| 449.j.ii | the recognition of gains on sales; | Section 5.2. | ||
| 449.j.iii | the methods, key assumptions, inputs and changes from the previous period for valuing securitisation positions; | Section 5.2. | ||
| 449.j.iv | the treatment of synthetic securitisations if not covered by other accounting policies; | Section 5.2. | ||
| 449.j.v | how assets awaiting securitisation are valued and whether they are recorded in the institution's non-trading book or the trading book; | Section 5.2. | ||
| 449.j.vi | policies for recognising liabilities on the balance sheet for arrangements that could require the institution to provide financial support for securitised assets. | Section 5.2. | ||
| 449.k | Names of ECAIs used for securitisations and type. | Section 5.3.4. | ||
| 449.l | Full description of Internal Assessment Approach. | N/A | ||
| 449.m | Explanation of significant changes in quantitative disclosures, since the last reporting period. | Sections 5.3.4. and 5.4. | ||
| 449.n | As appropriate, separately for the Banking and trading book securitisation exposures: | |||
| 449.n.i | amount of outstanding exposures securitised; | Sections 5.3.4. and 5.4. | Tables 49, 50 (SEC1), 51 (SEC2), 52, 53 (SEC3), 54, 55 (SEC4) y 56 | |
| 449.n.ii | on balance sheet securitisation retained or purchased, and off balance sheet exposures; | Section 5.4. | Tabla 49 | |
| 449.n.iii | amount of assets awaiting securitisation; | Section 5.3.4. | ||
| 449.n.iv | early amortisation treatment, aggregate drawn exposures and capital requirements for securitised facilities; | Section 5.3.3. | ||
| 449.n.v | Deducted or 1250%-weighted securitisation positions; | Sections 5.3.4. and 5.4. | Tables 53 (SEC3) and 55 (SEC4) | |
| 449.n.vi | summary of the securitisation activity of the current period. | Sections 5.3.4. and 5.4. | Tables 49, 50 (SEC1), 51 (SEC2), 52, 53 (SEC3), 54, 55 (SEC4) y 56 | |
| 449.o | Banking and trading book securitisations: | |||
| 449.o.i | Retained and purchased positions and associated capital requirements, broken down by risk-weight bands; | Sections 5.3.4. and 5.4. | Tables 51 (SEC3) and 55 (SEC4) | |
| 449.o.ii | Retained and purchased re-securitisation positions before and after hedging and insurance; exposure to financial guarantors broken down by guarantor credit worthiness. | N/A: Sections 5.3.4. and 5.4. | Tables 53 (SEC3),55 (SEC4) y 56 | |
| 449.p | Impaired assets and recognised losses related to banking book securitisations, by exposure type. | Section 5.4. | Table 56 | |
| 449.q | Exposure and capital requirements for trading book securitisations, separated into traditional and synthetic, and exposure type. | Sections 5.4. and 6.2. | Tables 54 and 61 | |
171 |
| APPENDICES 2019 Pillar 3 Disclosures Report |
| Article | Brief Description | 2019 P3DR Location | Tables | 2019 Annual Report Location |
| 449.r | Whether the institution has provided non-contractual financial support to securitisation vehicles. | N/A | ||
| 450. Remuneration policy | ||||
| 450 | Remuneration disclosures (Material Risk Takers): | Chapter 9 | Tables 72 to 76 | Corporate Governance Chapter |
| 451. Leverage | ||||
| 451.1. (a,b) | Leverage ratio, and breakdown of the total exposure measures, including the reconciliation to financial statements. | Section 2.2.3. | Tables 9 and 10 Appendix X | |
| 451.c | If applicable, the total amount of the derecognized fiduciary items. | N/A | ||
| 451.(d,e) | Description of the processes used to manage the risk of excessive leverage, and factors that impacted the leverage ratio during the year. | Section 2.2.3. | ||
| 452. Use of the IRB Approach to credit risk | ||||
| 452 | Institutions calculating the risk-weighted exposure amounts under the IRB Approach shall disclose the following information: | |||
| 452.a | Permission for use of the IRB approach from the competent authority. | Section 2.2.2.1. | ||
| 452.b | Explanation and review of: | |||
| 452.b.i | Structure of internal rating systems and relation between internal and external ratings; | Sections 3.2.1., 3.4., 3.5., 3.6., 3.7., 3.8. and 3.10. | Tables 14 to 16 (CR6), 17 and 18 to 19 (CR10) | |
| 452.b.ii | Use of internal ratings for purposes other than capital requirement calculations; | Section 3.6. | ||
| 452.b.iii | Management and recognition of credit risk mitigation process; | Section 3.7.1. | ||
| 452.b.iv | Controls mechanisms for rating systems; | Section 3.8. | ||
| 452.c.(i-v) | Description of ratings processes for each IRB asset class, provided separately. | Sections 3.2.1. and 3.5. | Tables 14 to 16 (CR6), 17 and 18 to 19 (CR10) | |
| 452.d | Exposure values by IRB exposure class, separately for Advanced and Foundation IRB. | Section 3.2.1. | Tables 14 to 16 (CR6), 17 and 18 to 19 (CR10) | |
| 452.e.(i-iii) | For each exposure class, disclosed separately by obligor grade, institutions shall disclose: total exposure, separating loans and undrawn exposures where applicable, and exposure-weighted average risk weight. | Section 3.2.1. y 4.7. | Tables 14 to 16 (CR6), 17 and 18 to 19 (CR10) | |
| 452.f | For the retail exposure class, the disclosures outlined in article 452.e, to allow for a meaningful differentiation of credit risk on a pooled basis. | Section 3.2.1. | Table 16 (CR6) | |
| 452.g | Actual specific risk adjustments for the period and explanation of changes. | Sections 3.2.1. y 3.3. | Tables 14 to 16 (CR6) and 24 (CR1-A) | |
| 452.h | Description of the factors that impacted on the loss experience in the preceding period. | Sections 3.2.1., 3.3., 3.9. y 3.10 | Appendix XVII | |
| 452.i | Analysis of the historical estimates of losses against actual losses in each exposure, to help assess the performance of the rating system over a sufficient period. | Section 3.10. | Appendices XV to XVII | |
| 452.j | For all IRB exposure classes: | |||
| 452.j.(i-ii) | Where applicable, PD and LGD by each country where the bank operates. | Section 3.2.1. | Table 17 | |
| 453. Use of credit risk mitigation techniques | ||||
| 453 | Institutions applying credit risk mitigation techniques shall disclose the following information: | |||
| 172 | 2019 Pillar 3 Disclosures Report | ||
| APPENDICES 2019 Pillar 3 Disclosures Report |
| Article | Brief Description | 2019 P3DR Location | Tables | 2019 Annual Report Location |
| 453.a | Use of on and off-balance sheet netting. | Sections 3.7. and 4.7. | Risk Management Chapter 3.2. Credit risk management | |
| 453.b | How collateral valuation is managed. | Sections 3.7. and 4.7. | Risk Management Chapter 3.2. Credit risk management | |
| 453.c | Description of types of collateral used by the institution. | Sections 3.7. and 4.7. | Risk Management Chapter 3.2. Credit risk management | |
| 453.d | Main types of guarantor and credit derivative counterparty, creditworthiness. | Sections 3.7. and 4.7. | Risk Management Chapter 3.2. Credit risk management | |
| 453.e | Market or credit risk concentrations within risk mitigation exposures. | Sections 3.7. and 4.7. | Table 37 | |
| 453.f | Standardised or Foundation IRB Approach, exposure value covered by eligible collateral. | Sections 3.3. , 3.7.1. and 4.7. | Tables 11 a 12 (CR4) Table 38 (CR3) Tables 46 (CCR5-A), 47 (CCR5-B) and 48 (CCR6) | |
| 453.g | Exposures covered by guarantees or credit derivatives. | Sections 3.3. , 3.7. and 4.7. | Tables 11 to 12 (CR4) Table 38 (CR3) Table 40 (CR7) Tables 46 (CCR5-A), 47 (CCR5-B) and 48 (CCR6) | |
| 454. Use of the Advanced Measurement Approaches to operational risk | ||||
| 454 | Description of the use of insurance or other risk transfer mechanisms to mitigate operational risk. | N/A | ||
| 455. Use of Internal Market Risk Models | ||||
| 455 | Institutions calculating their capital requirements in accordance with Article 363 shall disclose the following information: | |||
| 455.a | For each sub-portfolio covered: | |||
| 455.a.i | Disclosure of the characteristics of the market risk models used; | Sections 2.2.2.1. , 6.2. and 6.3. | ||
| 455.a.ii | Disclosure of the methodologies used to measure incremental default and migration risk; | Sections 2.2.2.1. , 6.2. and 6.3. | ||
| 455.a.iii | Descriptions of stress tests applied to the portfolios; | Sections 6.2. and 6.3.4. | ||
| 455.a.iv | Methodology for back-testing and validating the models. | Sections 6.2. , 6.3.5. and 6.3.6. | ||
| 455.b | Scope of permission for use of the models. | Section 6.2. | ||
| 455.c | Policies and processes to determine trading book classification, and to comply with prudential valuation requirements. | Section 6.3. | ||
| 455.d.(i-iii) | High/Low/Mean values over the year of VaR, SVaR and incremental risk charge. | Section 6.3.1. | Table 63 (MR3) | |
| 455.e | The elements of the own fund calculation. | Sections 2.2.2. and 6.2 | Tables 7 (OV1), 58, 59 (MR2-A) and 60 (MR2-B) | |
| 455.f | Weighted average liquidity horizons for each sub-portfolio covered by internal models. | Section 6.3. | ||
| 455.g | Comparison of end-of-day value-at-risk (VaR) measures compared with one-day changes in the portfolio's value. | Section 6.3.5. | Appendix XIX | |
173 |
| APPENDICES 2019 Pillar 3 Disclosures Report |
Appendix III - List of tables
| Click on the page number corresponding to each table to access it. | |
| Num. | Name | Page |
| CHAPTER 1. INTRODUCTION | ||
| Table 1 | Differences between accounting and regulatory scopes of consolidation and mapping of financial statements categories with regulatory risk categories (LI1) | |
| Table 2 | Main sources of differences between regulatory exposure amounts and carrying amounts in financial statements (LI2) | |
| CHAPTER 2. CAPITAL | ||
| Table 3 | Main capital figures and capital adequacy ratios | |
| Table 4 | Reconciliation of accounting capital with regulatory capital | |
| Table 5 | Eligible capital | |
| Table 6 | Regulatory capital. Changes | |
| Table 7 | Overview of RWAs (OV1) | |
| Table 8 | Capital requirements by geographical region | |
| Table 9 | Leverage ratio | |
| Table 10 | Leverage ratio details | |
| CHAPTER 3. CREDIT RISK | ||
| Table 11 | Credit risk exposure and CRM effects (IRB approach) (CR4) | |
| Table 12 | Credit risk exposure and CRM effects (Standardised approach) (CR4) | |
| Table 13 | RWA flow statement of credit risk exposures under IRB (CR8) | |
| Table 14 | AIRB approach. Credit risk exposures by portfolios class and PD range (CR6) | |
| Table 15 | FIRB approach. Credit risk exposures by portfolios class and PD range (CR6) | |
| Table 16 | AIRB approach. Credit risk exposures by portfolios class and PD range. Retail portfolios (CR6) | |
| Table 17 | Exposures and parameters by segment and geography | |
| Table 18 | Specialised lending (CR10) | |
| Table 19 | Equities (CR10) | |
| Table 20 | Equity instruments through other comprehensive income | |
| Table 21 | Equity instruments mandatorily at fair value through profit and loss | |
| Table 22 | Equity instruments through other comprehensive income. Consolidated gross valuation adjustments | |
| Table 23 | Standardised approach (including a breakdown of exposures post conversion factor and post mitigation techniques) (CR5) | |
| Table 24 | Credit quality of exposures by exposure classes and instruments (CR1-A) | |
| Num. | Name | Page |
| Table 25 | Credit quality of exposures by industry or counterparty type (CR1-B) | |
| Table 26 | Credit quality of exposures by geography (CR1-C) | |
| Table 27 | Credit quality of forborne exposures | |
| Table 28 | Credit quality of performing and non-performing exposures by past due days | |
| Table 29 | Performing and non-performing exposures and related provisions | |
| Table 30 | Collateral obtained by taking possession and execution processes | |
| Table 31 | Changes in stock of general and specific credit risk adjustments (CR2-A) | |
| Table 32 | Changes in stock of non-performing loans and debt securities (CR2-B) | |
| Table 33 | Net amount of exposures (CRB-B) | |
| Table 34 | Geographical breakdown of exposures (CRB-C) | |
| Table 35 | Concentration of exposures by industry or counterparty type (CRB-D) | |
| Table 36 | Maturity of exposures (CRB-E) | |
| Table 37 | Guarantees by external rating | |
| Table 38 | Credit risk mitigation techniques - IRB and SA (CR3) | |
| Table 39 | IRB approach. Credit risk mitigation techniques: credit derivatives and personal guarantees | |
| Table 40 | Effect on RWA of credit derivatives used as CRM techniques (CR7) | |
| CHAPTER 4. COUNTERPARTY CREDIT RISK | ||
| Table 41 | Credit valuation adjustment (cva) capital charge (CCR2) | |
| Table 42 | Exposures to central counterparties (CCR8) | |
| Table 43 | Analysis of the counterparty credit risk (CCR) exposure by approach (CCR1) | |
| Table 44 | Standardised approach - CCR exposures by regulatory portfolio and risk (CCR3) | |
| Table 45 | IRB approach. CCR exposures by portfolio and PD scale (CCR4) | |
| Table 46 | Impact of netting and collateral held on exposure values (CCR5-A) | |
| Table 47 | IRB approach. Composition of collateral for exposures to counterparty credit risk (CCR5-B) | |
| Table 48 | Credit derivatives exposures (CCR6) | |
| CHAPTER 5. SECURITISATIONS | ||
| Table 49 | Securitisation positions purchased and retained with risk transfer by exposure type in the banking book | |
| Table 50 | Securitisation exposures in the banking book (SEC1) | |
| Table 51 | Securitisation exposures in the trading book (SEC2) | |
| 174 | 2019 Pillar 3 Disclosures Report | ||
| APPENDICES 2019 Pillar 3 Disclosures Report |
| Num. | Name | Page |
| Table 52 | Breakdown of repurchased positions in SSPE with risk transfer, distributed by function and approach used | |
| Table 53 | Securitisation exposures in the banking book and associated regulatory capital requirements (bank acting originator or sponsor) (SEC3) | |
| Table 54 | Aggregate amount of securitisation positions purchased and retained. Trading book | |
| Table 55 | Securitisation exposures in the banking book and associated regulatory capital requirements (bank acts as an investor) (SEC4) | |
| Table 56 | Securitisation structures with risk transfer | |
| CHAPTER 6. MARKET RISK | ||
| Table 57 | Regulatory capital requirements for market risk | |
| Table 58 | Capital requirements for market risk. Internal model | |
| Table 59 | Market risk under IMA approach (MR2-A) | |
| Table 60 | RWA flow statements of market risk exposures under IMA (MR2-B) | |
| Table 61 | Market risk under standardised approach (MR1) | |
| Table 62 | Capital requirements for market risk. Standardised approach | |
| Table 63 | VaR, Stressed VaR and IRC by geography (MR3) | |
| Table 64 | Stress scenario: Maximum volatility (worst case) | |
| Table 65 | Exceptions at units with internal model | |
| Table 66 | Quantitative information on IRRBB (IRRBB1) | |
| CHAPTER 7. OPERATIONAL RISK | ||
| Table 67 | Changes in capital requirements for operational risk | |
| CHAPTER 8. OTHER RISKS | ||
| Table 68 | Encumbered and unencumbered assets (AE1) | |
| Table 69 | Collateral received (AE2) | |
| Table 70 | Sources of encumbrance (AE3) | |
| Table 71 | Own covered bonds and asset- backed securities issued | |
| CHAPTER 9. REMUNERATION POLICIES | ||
| Table 72 | Total remuneration | |
| Table 73 | Remuneration by activity area | |
| Table 74 | Vested rights | |
| Table 75 | Unvested rights | |
| Table 76 | Remuneration by salary band | |
175 |
| APPENDICES 2019 Pillar 3 Disclosures Report |
Appendix IV -Glossary
Advanced IRB approach: all the credit risk parameters are estimated internally by the entity, including the CCFs for calculating the EAD.
AMA (Advanced Measurement Approach): an operational risk measurement technique set forth in Basel capital adequacy norms, based on an internal modelling methodology.
AQR (Asset Quality Review): asset quality review exercise performed by the European Central Bank.
Asset liability management (ALM): a series of techniques and procedures to ensure correct decision-making on investments and funding at the entity, taking into consideration the interrelation between the various on- balance-sheet and off-balance-sheet items.
Asset securitisation: a financial mechanism that consists of converting certain assets into fixed-income securities that can be traded on a secondary securities market.
AT1 (Additional Tier 1): capital which consists primarily of hybrid instruments.
Backtesting: the use of historical data to monitor the performance of the risk models.
Basel III: a set of amendments to the Basel II regulations published in December 2010, scheduled to take effect in January 2013 and to be gradually implemented until January 2019.
Basic IRB approach: all the risk parameters are determined by the regulator except for the probability of default, which is estimated internally by the bank. The CCFs required to calculate EAD are determined by the regulator.
BCBS: Basel Committee on Banking Supervision.
BIS: Bank for International Settlements.
BRRD (Bank Recovery and Resolution Directive): approved in 2014, the BRRD establishes the framework for the recovery and resolution of banks with the objective of minimising the costs for taxpayers.
CBE 2/2016: Bank of Spain Circular of 2 February 2016 on the supervision and solvency of credit institutions, which completes the adaptation to Spanish law of Directive 2013/36/EU and Regulation (EU) No 575/2013. The new Circular repeals Bank of Spain Circular 3/2008 to credit institutions on the determination and control of minimum own funds (except the parts referred to in Circular 5/2008 regarding the regime established therein) and section 11 of Bank of Spain Circular 2/2014.
CBE 3/2008: Bank of Spain Circular of 22 May 2008 on the calculation and control of minimum capital requirements.
CBE 4/2004: Bank of Spain Circular of 22 December 2004 on public and confidential financial reporting standards and model financial statement forms.
CBE 9/2010: Bank of Spain Circular of 22 December 2010 amending Circular 3/2008.
CCAR (Comprehensive Capital Analysis Review): a framework introduced by the Federal Reserve to review the capital planning and adaptation processes of the main US financial institutions.
CCF (Credit conversion factor): a conversion factor used for converting off-balance-sheet credit risk balances into credit exposure equivalents. Under the AIRB approach Santander Group applies the CCFs in order to calculate the EAD value of the items representing contingent liabilities and commitments.
CCoB (Conservation Buffer): a capital buffer equal to 2.5% of risk-weighted assets (and comprised fully of high-quality liquid assets) to absorb losses generated from the business.
CCP (Central Counterparty Clearing House): entity defined in article 2.1 of Regulation (EU) no. 648/2012.
CCyB (Counter Cyclical Buffer): a buffer whose objective is to mitigate or prevent cyclical risks arising from excessive credit growth at aggregate level. Accordingly, the CCB is designed to build up capital buffers during expansionary phases with a dual objective: to enhance the solvency of the banking system and to stabilise the credit cycle.
CET1 (Common Equity Tier 1): the highest quality capital of a bank.
CoCos (Contingent Convertible Bonds): debt securities that are convertible into capital if a specified event occurs.
Common equity: a capital measure that considers, among other components, ordinary shares, the share premium and retained profits. It does not include preference shares.
Concentration risk: the risk of loss due to large exposures to a small number of debtors to which the entity has lent money.
Confidence level: in the context of value at risk (VaR) and economic capital, this is the level of probability that the actual loss will not exceed the potential loss estimated by value at risk or economic capital.
Counterparty credit risk: the risk that a counterparty will default on a derivatives contract before its maturity. The risk could arise from derivatives transactions in the trading portfolio or the banking portfolio and, as with other credit exposures, it is subject to a credit limit.
| 176 | 2019 Pillar 3 Disclosures Report | ||
| APPENDICES 2019 Pillar 3 Disclosures Report |
Credit default swap: a derivatives contract that transfers the credit risk of a financial instrument from the buyer (who receives the credit protection) to the seller (who guarantees the solvency of the instrument).
Credit risk: the risk that customers are unable to meet their contractual payment obligations. Credit risk includes default, country and settlement risk.
Credit risk mitigation: a technique for reducing the credit risk of a transaction by applying coverage such as personal guarantees or collateral.
CRM (Comprehensive Risk Measure): the estimate of risk in the correlation trading portfolio.
CRR (Capital Requirements Regulation) and CRD IV (Capital Requirements Directive): directive and regulation transposing the Basel II framework into European Union law.
CSP: Commercial strategic plan.
CVA (Credit Valuation Adjustment): the difference between the value of the risk-free portfolio and the true portfolio value, taking into account counterparty credit risk.
DEBA: European Banking Authority. Created in 2010, it entered into operation in 2011. The EBA acts as a coordinator between the national entities responsible for safeguarding values such as the stability of the financial system, transparency of markets and financial products, and the protection of bank customers and investors.
Default risk: the risk that counterparties will not meet their contractual payment obligations.
Derivatives: financial instruments that derive their value from one or more underlying assets, e.g. bonds or currencies.
DLGD (Downturn LGD): the LGD estimated in adverse economic conditions.
DTA: deferred tax assets.
D-SIIs: Domestic Systemically Important Institutions.
EAD (Exposure at Default): the amount that the entity could lose in the event of counterparty default.
ECAI: External Credit Assessment Institution, such as Moody’s Investors Service, Standard & Poor’s Ratings Group and Fitch Group.
ECB Governing Council: the main decision-making body of the ECB, consisting of all members of the Executive Board and the governors of the national central banks of the Euro area countries.
ECB Supervisory Board: the body which undertakes the planning and execution of the ECB’s supervisory tasks, carrying out preparatory work and making proposals for decisions for approval by the ECB Governing Board.
Economic capital: the figure that demonstrates to a high degree of certainty the quantity of capital resources that Santander Group needs at a given point in time to absorb unexpected losses arising from its current exposure.
EDTF (Enhanced Disclosure Task Force): task force that issues recommendations to enhance the transparency of financial institution disclosures to the market.
EL (Expected loss): a regulatory calculation of the average amount expected to be lost on an exposure, using a 12-month time horizon. EL is calculated by multiplying probability of default (a percentage) by exposure at default (an amount) and LGD (a percentage).
EPS (earnings per share): an indicator used to measure a company’s profitability over a specified period of time. EPS is calculated by dividing the company’s profit for the period by the number of shares comprising its share capital.
ESRB (European Systemic Risk Board): the body that has been charged with macroprudential supervision of the financial system in the European Union in order to contribute to preventing or mitigating to systemic risks to financial stability.
Exposure: the gross amount that the entity could lose if the counterparty is unable to meet its contractual payment obligations, without taking into consideration any guarantees, credit enhancements or credit risk mitigation transactions.
FSB (Financial Stability Board): international institution that monitors and makes recommendations on the global el financial system.
Fully-Loaded: denotes full compliance with Basel III solvency requirements (which become mandatory in 2019).
GHOS (Group of Governors and Heads of Supervision): supervisory body of the Basel Committee.
Global rating tools: these assign a rating to each customer using a quantitative or automatic module.
G-SIB (Global Systemically Important Bank) or SIFI (Systemically Important Financial Institution): financial institutions which, because of their size, complexity and systemic interconnectedness, if allowed to fail could cause major disruptions to the financial system and economic activity.
HQLA: High Quality Liquid Assets.
HVCRE: High Volatility Commercial Real Estate.
177 |
| APPENDICES 2019 Pillar 3 Disclosures Report |
ICAAP: internal capital adequacy assessment process.
IFRS: International Financial Reporting Standards.
ILAAP (Internal Liquidity Adequacy Assessment Process): process for the identification, measurement, management and control of liquidity implemented by the entity in compliance with article 86 of Directive 2013/36/EU.
Implicit LGD: this is used to back-test the regulatory LGD estimates. It is based on taking NPLMV as proxy for the Observed Loss, and then dividing the Observed Loss by the PD gives an implicit or observed LGD that can be compared to the regulatory LGD.
Interest rate risk: exposure of the bank’s financial position to adverse movements in interest rates. Acceptance of this risk is a normal part of the banking business and can be a source of significant returns and creation of shareholder value.
Internal ratings-based approach (IRB): an approach based on internal ratings for the calculation of risk-weighted exposures.
Internal validation: a pre-requisite for the supervisory validation process. A sufficiently independent specialised unit of the entity obtains an expert opinion on the adequacy of the internal models for the relevant internal and regulatory purposes, and issues a conclusion on their usefulness and effectiveness.
IRC (Incremental Risk Charge): an estimate of the credit risk associated with unsecuritised positions in the trading book.
IRP: This report, titled Pillar III Disclosures in the English version. (the acronym is for the Spanish Informe de Relevancia Prudencial).
IRRBB: Interest Rate Risk in the Banking Book.
ISDA (International Swaps and Derivatives Association): OTC derivative transactions between financial institutions are usually carried out under a master agreement established by this organisation which details the definitions and general terms and conditions of the contract.
ITS: Implementing Technical Standards.
JST (Joint Supervisory Team): one of the main forms of cooperation between the ECB and the national supervisors.
LCR (Liquidity Coverage Ratio): a ratio that ensures that a bank has an adequate stock of unencumbered high quality liquid assets that can be converted, easily and immediately, into cash in private markets, to meet its liquidity needs for a 30 calendar day liquidity stress scenario.
LDP: low-default portfolio.
Leverage Ratio: a complementary (non-risk based) regulatory capital measure that attempts to guarantee banks’ financial resilience. The ratio is calculated by dividing eligible Tier 1 capital by exposure.
LGD (Loss Given Default): the portion of EAD not recovered at the end of the loan recovery process. It is equal to 1 minus the recovery rate (i.e.: LGD = 1 - recovery rate). The definition of loss used to estimate LGD must be a definition of economic loss, not an accounting loss.
Liquidity risk: the risk that Santander Group might be unable to meet all its payment obligations when they fall due or might only be able to meet them at an excessive cost.
LTV (Loan to value): amount of credit extended / value of guarantees and collateral.
Mark-to-market approach: in regulatory terms, an approach for calculating the value of the credit risk exposure of counterparty derivatives (present market value plus a margin, i.e. the amount that takes into consideration the potential future increase in market value).
Market risk: the risk arising from uncertainty regarding changes in market prices and rates (including interest rates, share prices, exchange rates and commodity prices), the correlations between them and their levels of volatility.
MDA: Maximum Distributable Amount.
Model validation: the process of assessing the effectiveness of a credit risk model using a pre-defined set of criteria, such as the model’s discriminatory power, the appropriateness of the inputs and expert opinions.
MPE (Multiple Point of Entry): a resolution approach based on multiple points of entry.
MREL (Minimum Requirement of Eligible Liabilities): the final loss absorption requirement established in European legislation for institutions based on an assessment of their resolution plans.
Netting: a bank’s ability to reduce its credit risk exposure by setting off the value of its rights against its obligations with the same counterparty.
Non-standardised customers: customers who have been assigned a risk analyst due to the risk assumed. This category includes wholesale banking customers, financial institutions and certain enterprises in retail banking.
NSFR (Net Stable Funding Ratio): a ratio designed to ensure a bank has a balanced balance sheet structure, in which stable funding requirements are funded by stable liabilities.
Operational risk: the risk of incurring losses with regard to employees, contractual specifications and documentation, technology, infrastructure failures and disasters, projects, external influences and customer relations. This definition includes legal and regulatory risk but does not include business and reputational risk.
Over-the-counter (OTC): off-exchange, that is, trading done between two parties (in derivatives, for example) without the supervision of an organised exchange.
Phased-in: refers to compliance with current solvency requirements bearing in mind the transitional period for Basel III implementation.
Pillar 1 – Minimum Capital Requirements: the part of the New Basel Capital Accord that establishes the minimum regulatory capital requirements for credit, market and operational risk.
Pillar 2 - Supervisory Review Process: an internal capital adequacy assessment process reviewed by the supervisor with possible additional capital requirements for risk that are not included in Pillar I and the use of more sophisticated methodologies than Pillar I.
| 178 | 2019 Pillar 3 Disclosures Report | ||
| APPENDICES 2019 Pillar 3 Disclosures Report |
Pillar 3 - Market Discipline: this pillar is designed to complete the minimum capital requirements and the supervisory review process and, accordingly, enhance market discipline through the regulation of public disclosure by the entities.
Point-in-time (PIT) PD: the probability of default at a particular point in time or in particular state of the economic cycle.
Probability of default (PD): this represents the likelihood that a customer or a transaction will fall into default. It is the probability that an event (the default) will occur within a given time horizon.
QIS (Quantitative Impact Study): ad-hoc requests by the EBA for studies analysing and calibrating the impact of new changes in regulation.
Qualifying central counterparty (QCCP): a central counterparty that has either been authorised under article 14 of Regulation (EU) no. 648/2012, or been recognised under article 25 of said Regulation.
Rating: the result of the objective assessment of the counterparties’ future economic situation based on current characteristics and assumptions. The methodology for assigning the ratings depends largely on the type of customer and the available data. A wide range of methodologies for assessing credit risk is applied, such as expert systems and econometric methods.
RDL: Royal Decree Law.
Risk appetite: the amount and type of risks considered reasonable to assume in the execution of its business strategy, so that Santander Group can maintain its ordinary activity in the event of unexpected circumstances. Severe scenarios are taken into account that could have a negative impact on the levels of capital, liquidity, profitability and/or the share price.
Risk limits: approval tools for certain risk types and levels.
Risk-weighted assets (RWA): calculated by assigning a level of risk, expressed as a percentage (risk weighting), to an exposure in accordance with the relevant rules under the standardised approach or the IRB approach.
RoRAC: Return on Risk Adjusted Capital.
RoRWA: Return on Risk-Weighted Assets.
RTS: Regulatory Technical Standards.
RWA density: ratio that compares institutions’ total weighted assets and their total balance sheet, and can be interpreted as an average relative risk measure -according to regulatory criteria- of a bank’s overall operations.
SFT (Securities Financing Transactions): any transaction where securities are used to borrow cash, or vice versa. They mostly include repurchase agreements (repos), securities lending activities and sell/buy-back transactions.
Slotting Criteria: an approach used for calculating risk weights for specialised lending exposures, which consists of mapping the internal ratings to five supervisory categories, each with its own specific risk weight.
Special-purpose vehicle (SPV): a company created for the sole purpose of acquiring certain assets or derivative exposures
and of issuing liabilities that are associated solely with these assets or exposures.
SRB (Single Resolution Board): the single resolution authority, which is the second pillar of the Banking Union after the Single Supervisory Mechanism.
SRB: Systemic Risk Buffer.
SREP (Supervisory Review and Evaluation Process): a review of the systems, strategies, processes and mechanisms applied by credit institutions and of their risks.
SRF: Single Resolution Fund.
SRM: Single Resolution Mechanism.
SSM (Single Supervisory System): the system of banking supervision in Europe. It comprises the ECB and the competent supervisory authorities of the participating EU countries.
Standardised approach: an approach for calculating credit risk capital requirements under Pillar I of Basel II. Under this approach, the risk weightings used in the capital calculation are determined by the regulator.
Standardised customers: customers which have not been expressly assigned a risk analyst. This category generally includes individuals, individual entrepreneurs and retail banking enterprises not classified as non-standardised customers.
Stress testing: used to describe various techniques for measuring the potential vulnerability to exceptional but plausible events.
Stressed VaR: measures the level of risk in stressed historical or simulated market situations.
Synthetic securitisation: transactions that involve a basket of credit swap agreements and bonds serving as collateral. They are called synthetic as rather than containing physical bonds, they carry credit derivatives, also known as synthetic contracts.
Through-the-cycle (TTC) PD: probability of default adjusted to a full economic cycle. It may be taken as a long-term average of the point-in-time PD.
Tier 1: core capital less hybrid instruments.
Tier 2: supplementary capital instruments, mainly subordinated debt and general loan loss allowances, which contribute to the robustness of financial institutions.
TLAC (Total Loss Absorbency Capacity): an additional requirement to the minimum capital requirements set out in the Basel III framework for the absorption of total losses and effecting a recapitalisation that minimises any impact on financial stability, ensures the continuity of critical functions and avoids exposing taxpayers to losses. This requirement is applicable to all G-SIBs.
TLTRO: Targeted Longer-Term Refinancing Operations.
179 |
| APPENDICES 2019 Pillar 3 Disclosures Report |
TRIM: Targeted Review of Internal Models.
TSR (Total Shareholder Return): relative performance of total shareholder returns. An indicator of the returns obtained by owners of a company over a period of one year on capital provided to the company.
Unexpected loss: unexpected losses (not covered by allowances) must be covered by capital.
VaR (Value at Risk): estimate of the potential losses that could arise in risk positions as a result of movements in market risk factors within a given time horizon and for a specific confidence level.
| 180 | 2019 Pillar 3 Disclosures Report | ||

SIGNATURE
Pursuant to the requirements of the Securities Exchange Act of 1934, the registrant has duly caused this report to be signed on its behalf by the undersigned, thereunto duly authorized.
| Banco Santander, S.A. | ||
| Date: 4 March 2020 | By: | /s/ José García Cantera |
| Name: | José García Cantera | |
| Title: | Chief Financial Officer | |